- Аналітика
- Новини та інструменти
- Новини ринків
Новини ринків
- AUD/USD remains on the defensive near 0.6491 amid the firmer USD.
- US Initial Jobless Claims rose by 218K from a week earlier, stronger than expected.
- RBA’s Bullock said the board is focused on bringing inflation down, and the evidence of inflation is encouraging.
The AUD/USD pair extends its downside and holds below the 0.6500 mark during the early Asian session on Friday. The hawkish comments from Federal Reserve (Fed) officials and a stronger US Dollar (USD) weigh on the pair. AUD/USD currently trades around 0.6491, losing 0.01% on the day.
On Thursday, the US weekly Initial Jobless Claims fell to 218K for the week ended February 3 from the previous week of 227K, better than the estimation of 220K. The report indicated ongoing labor market resilience. Continuing Claims decreased by 23K to 1.891M in the week ended January 27. Finally, Wholesale inventories of merchant wholesalers lifted 0.4% MoM and were down 2.7% YoY.
Many Fed officials signaled that they were in no rush to lower borrowing costs until they were confident that inflation would return to the 2% target. On Thursday, Fed Richmond President Thomas Barkin reiterated that policymakers have time to be patient about the timing of rate cuts due to a solid labor market and ongoing disinflation. The US central bank has raised its policy rate by 525 basis points (bps) to the current 5.25% to 5.50% range since March 2022.
Late Thursday, Reserve Bank of Australia (RBA) Governor Michele Bullock stated that the central bank is focused on bringing inflation down, and the evidence of inflation is encouraging. Bullock emphasized that the board hasn’t ruled out a further interest rate hike but neither has it ruled it in.
Dallas Fed L. Logan is set to speak later on Friday. In the absence of top-tier economic data from the US and Australia, risk sentiment will likely play a crucial role in the AUD/USD pair.
The Reserve Bank of Australia (RBA) Governor Michele Bullock spoke in parliament on Thursday after leaving rates on hold earlier this week.
Key quotes
“RBA Board is focused on bringing inflation down.”
“Remain acutely aware that the cost of living is rising much faster than it has over recent decades.”
“Recent developments in inflation are encouraging.”
“We have some way to go to meet our target.”
“Recent developments in inflation are encouraging.”
“We have some way to go to meet our inflation target.”
“Even if the economy evolves along the central path, inflation will still have been outside the target range for four years.”
“While there are some encouraging signs, Australia's inflation challenge is not over.”
“The longer inflation remains high and outside the target range, the greater is the risk that inflation expectations of households and businesses adjust higher.”
“At this stage, the board hasn’t ruled out a further increase in interest rates but neither has it ruled it in.”
“Given the substantial costs to the economy and the Australian people of continued high inflation, the board is committed to bringing inflation back to target in a reasonable time frame.”
“Trying to bring inflation back to target without slowing the economy more than necessary on the one hand or risking high inflation for longer.”
Market reaction
At the press time, the AUD/USD pair was up 0.03% on the day to trade at 0.6495.
- The NZD/JPY rose to 91.05 on Thursday, registering a 0.70% rally.
- The Yen was one of the worst-performing currencies due to dovish BoJ comments.
- On the four-hour chart, overbought conditions suggest a possible correction in the near term.
In Thursday's session, the NZD/JPY staged a rally to land at 91.05, buoyed by steady a softening Yen due to the Bank of Japan’s (BoJ) dovish stance. With the daily chart painting a bullish picture, the pair is tipped in favor of the Kiwi as the pair stands at its highest level since November. However, a potential correction looms on the horizon as the four-hour chart indicators strayed into overbought territory.
In line with that, Deputy Governor Uchida highlighted the unlikelihood of sudden rate hikes which drove markets to bet on a more dovish approach of the BoJ regarding its pivot to a more hawkish policy. For the next sessions, incoming data will be key to dictate the pace of the cross but in case Japan reports negative data, the cross could see further upside as the BoJ won't have incentives to leave its ultra-loose policy.
NZD/JPY technical analysis
The technical indicators on the daily chart reflect bullish dominance. Despite a consolidation looming in the immediate term, the cross is trending above its 20, 100, and 200-day Simple Moving Averages (SMAs), indicative of the buyers' stronghold on larger time frames. The rising slope and placement in the upper region of the Relative Strength Index (RSI) also reinforces the continued bullishness. Moreover, the Moving Average Convergence Divergence (MACD) histogram is demonstrating an uptick with the green bars becoming longer, further empowering the buying momentum.
NZD/JPY daily chart
-638430267362004855.png)
On the shorter four-hour chart, however, a temporary pullback seems likely. The technical indicators have reached the overbought zone suggesting the possibility of an imminent correction. In this context, the Relative Strength Index (RSI) rose above 70 while the Moving Average Convergence Divergence (MACD) displays rising green bars. Given the intense buying pressure in the shorter time frame, a brief retreat in prices aligns with usual asset behavior after bouts of aggressive purchasing momentum.
- Investors kept their eyes on government bond yields and stocks for direction.
- Reserve Bank of Australia Governor Michele Bullock will hit the wires early on Friday.
- NZD/USD could accelerate its slump on a break through 0.6078.
The NZD/USD pair trades just below the 0.6100 mark ahead of the Asian opening, ending Thursday with modest losses. The pair hit 0.6123 at the beginning of the day, but quickly turned south as the US Dollar found legs on strong American data and the soft tone of stock markets. It is worth adding, however, that after spending most of the day in the red, Wall Street has managed to trim early losses, with the Dow Jones Industrial Average and the Nasdaq Composite posting modest gains and the S&P500 poised to end the day little changed just below the 5,000 mark.
Focus on equities and yields
The focus was not only on equities. Investors were also paying attention to US Treasury yields, up on the day on the back of signs the Federal Reserve (Fed) has no reason to rush into cutting interest rates. Multiple policymakers hit the wires these days and backed Chairman Jerome Powell’s concepts, expressed in the aftermath of the latest monetary policy. The main idea is that interest rates will remain at current levels until officials are more certain inflation will stabilize around their 2% goal.
In the meantime, solid US employment-related data took out pressure from policymakers. The country reported that weekly unemployment claims rose to 218K in the week finished February 2, beating the 220K expected.
The macroeconomic calendar will remain scarce in Asia on Friday, with only a speech from the Reserve Bank of Australia (RBA) Governor Michele Bullock in the docket.
NZD/USD Technical Outlook
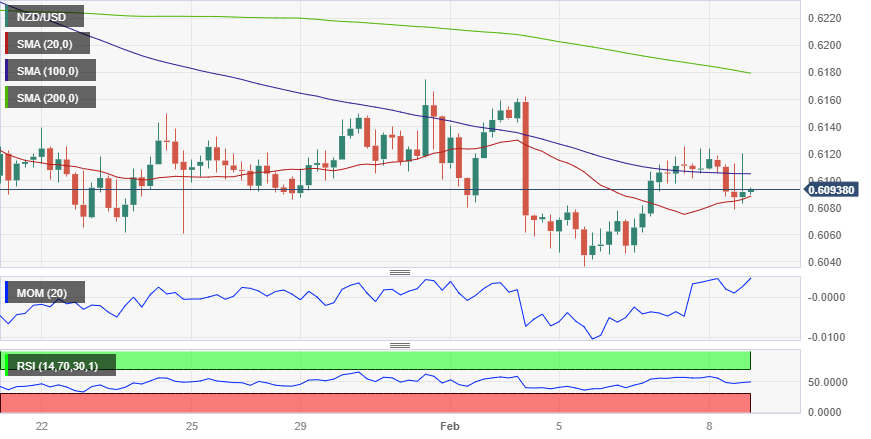
The NZD/USD pair held within familiar levels, maintaining a technically neutral stance. The daily chart shows sellers are aligned around a bearish 20 Simple Moving Average (SMA), while intraday buying interest surged around a flat 200 SMA, the latter at around 0.6080.
The same chart shows technical indicators have lost momentum within negative levels, lacking enough directional strength to anticipate a new leg south.
The case for another leg lower should be stronger on a break through the daily low, at 0.6078. Speculative interest will then look to test buyers´ determination at 0.6028, the February monthly low.
Alternating risk appetite trends dominated the sentiment in the FX universe amidst steady speculation of a Fed rate cut in May, rising geopolitical concerns, and some remarks hinting at the idea that the ECB is in no rush to start cutting rates.
Here is what you need to know on Friday, February 9:
The greenback regained some poise and encouraged the USD Index (DXY) to stay afloat above the 104.00 mark amidst further repricing of an interest rate cut by the Fed in May. On Friday, Dallas Fed L. Logan will be the only spot on the US docket.
EUR/USD advanced marginally and managed to keep the trade in the upper end of the weekly range in the 1.0770/80 band. In the domestic calendar, the final Inflation Rate in Germany will be in the spotlight on Friday.
GBP/USD reversed its two-day advance and retreated modestly on Thursday, although it managed well to maintain the region above 1.2600 the figure.
Dovish comments from BoJ’s Uchida weighed heavily on the Japanese yen and boosted USD/JPY to new yearly highs north of the 149.00 barrier, amidst humble gains in the US Dollar and higher yields.
AUD/USD added to Wednesday’s losses and dropped markedly to the sub-0.6500 zone, as further deflationary forces in China, negative price action in the commodity complex, and the somewhat stronger dollar were all too much for the Aussie Dollar.
In China, the flash Q4 Current Account will be in the pipeline on Friday. In the meantime, USD/CNH extended the weekly bounce and flirted with the 7.2200 zone.
Unabated geopolitical concerns and the positive weekly report from the EIA sustained the intense march north in prices of the WTI past the $76.00 mark per barrel.
Gold prices declined modestly to the $2030 region per troy ounce, while Silver prices rebounded sharply to three-day highs around $22.60 per ounce.
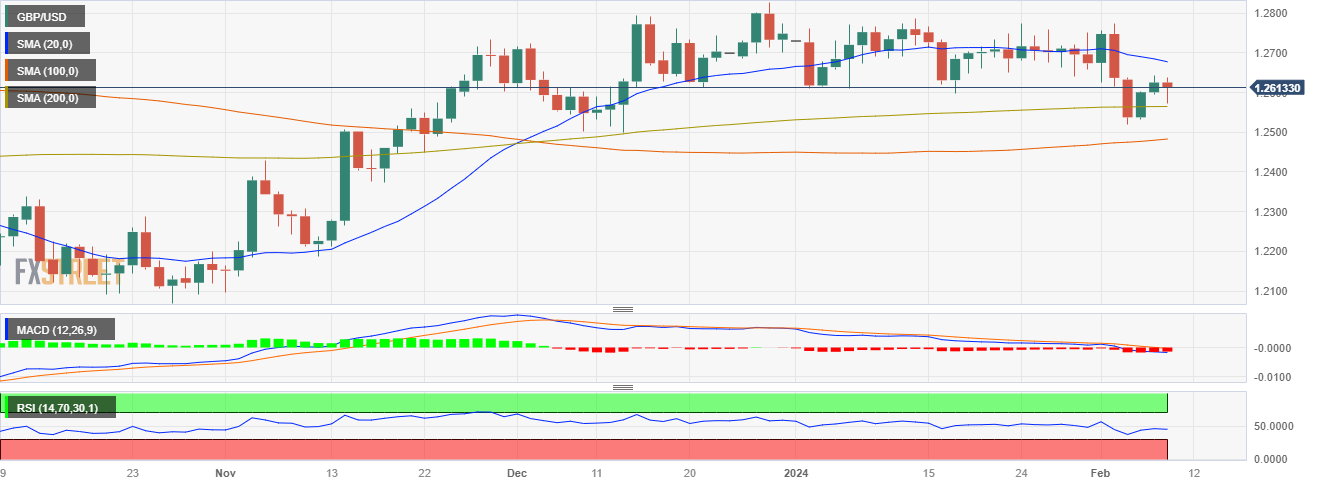
- The GBP/USD currently trades at 1.2615, recording mild losses.
- Broad-spectrum technical indicators reveal a bullish hold for larger time-frames but the short term is somewhat negative.
- The USD is getting traction thanks to positive labor market figures and markets pushing the Fed’s easing cycle to May.
On Thursday, the GBP/USD pair declined towards the 1.2615 level showing slight losses with upbeat US labor market figures benefiting the Greenback with Jobless claims from the week ending on February 3 coming in lower than expected. However, the Bank of England (BoE) holds a somewhat similar stance as the Federal Reserve (Fed) in delaying rate cuts so the losses may be limited.
Moreover, markets are predicting 100 bps rate cuts over the next 12 months, starting in June while investors are seeing higher 125 bps of easing in 2024 from the Fed indicating that the losses from the Pound may be limited. However, it will all come down to the incoming data as they will shape the expectations of the next decisions. Next in line, next Tuesday, the US will release January’s inflation figures while the UK will reveal key labor market figures which may likely set the pace for the pair for the next sessions.
GBP/USD daily chart
The indicators on the daily chart reflect a somewhat bearish bias for the short term. The Relative Strength Index (RSI) is on a downward slope and in negative territory. This gives clear evidence that market sentiment is favoring the sellers. Concurrently, the Moving Average Convergence Divergence (MACD) is throwing out red bars, indicating the selling pressure is not diminishing. That being said, on the broader market outlook, the pair is below the 20-day Simple Moving Averages (SMAs), but above the 200 and 100-day SMA. This suggests that the overall uptrend prevails, despite the recent downward movements, but as long as the buyers fail to reconquer the 20-day average, more downside may be on the horizon.
GBP/USD daily chart
- The DXY stabilized at 104.15 on Thursday after reaching a daily high of 104.40.
- Weekly Jobless Claims came in higher than expected in the week ended in February 3.
- Markets digest Fed official Barkin's words.
The US Dollar (USD) steadily rose on Thursday, initially to 103.45 and then stabilizing at 104.15 on the back of positive Initial Jobless Claims figures. However, bulls seem to be running out of steam due to a lack of fresh drivers, while Federal Reserve (Fed) speakers refuse to give additional guidance on the bank’s next steps.
The US Federal Reserve's Chair, Jerome Powell, commented that he considered a cut in March “unlikely”, adding that the bank needs more evidence on inflation coming down to gain confidence for cutting rates. Several officials were on the wires this week but didn’t give new guidance, basically confirming that the Fed awaits more data and disregards cuts in March.
Daily digest market movers: US Dollar gains some ground on positive Jobless Claims
- Initial Jobless Claims for the week ended on February 3 fell short of the consensus. The US Department of Labor reported that the claims came in at 218K, lower than the predicted 220K and a slight reduction from the previous week's 227K claims.
- According to the CME FedWatch Tool, the possibility of rate cuts in March dropped to 20%. Those odds rise to 50% for the May meeting, where the probability of a hold is also high.
- An ascent in US Treasury bond yields also supports the US Dollar. The 2-year yield is at 4.45%, the 5-year yield is at 4.11%, and the 10-year yield is at 4.16%.
Technical analysis: DXY fails to regain the 100-day SMA, bulls still present
The daily Relative Strength Index (RSI) shows a flat slope, albeit in positive territory, hinting at a gradual slowdown in buying momentum. However, it is too soon to anticipate a bearish reversal as positive territory generally denotes a bullish bias.
The Moving Average Convergence Divergence (MACD) presents flat green bars, illustrating a slowdown in bullish momentum but without a bearish crossover. The MACD indicates that buying pressure is still present, albeit reduced.
Regarding the Simple Moving Averages (SMAs), the index is anchored above the 20-day and 200-day SMAs, signaling a bullish bias in the longer framework, yet it is trading below the 100-day SMA, demonstrating some bearish pressure in the intermediate term. In conclusion, the short-term technical outlook seems to be tilted in favor of the bulls, albeit with weakening momentum.
US Dollar FAQs
What is the US Dollar?
The US Dollar (USD) is the official currency of the United States of America, and the ‘de facto’ currency of a significant number of other countries where it is found in circulation alongside local notes. It is the most heavily traded currency in the world, accounting for over 88% of all global foreign exchange turnover, or an average of $6.6 trillion in transactions per day, according to data from 2022.
Following the second world war, the USD took over from the British Pound as the world’s reserve currency. For most of its history, the US Dollar was backed by Gold, until the Bretton Woods Agreement in 1971 when the Gold Standard went away.
How do the decisions of the Federal Reserve impact the US Dollar?
The most important single factor impacting on the value of the US Dollar is monetary policy, which is shaped by the Federal Reserve (Fed). The Fed has two mandates: to achieve price stability (control inflation) and foster full employment. Its primary tool to achieve these two goals is by adjusting interest rates.
When prices are rising too quickly and inflation is above the Fed’s 2% target, the Fed will raise rates, which helps the USD value. When inflation falls below 2% or the Unemployment Rate is too high, the Fed may lower interest rates, which weighs on the Greenback.
What is Quantitative Easing and how does it influence the US Dollar?
In extreme situations, the Federal Reserve can also print more Dollars and enact quantitative easing (QE). QE is the process by which the Fed substantially increases the flow of credit in a stuck financial system.
It is a non-standard policy measure used when credit has dried up because banks will not lend to each other (out of the fear of counterparty default). It is a last resort when simply lowering interest rates is unlikely to achieve the necessary result. It was the Fed’s weapon of choice to combat the credit crunch that occurred during the Great Financial Crisis in 2008. It involves the Fed printing more Dollars and using them to buy US government bonds predominantly from financial institutions. QE usually leads to a weaker US Dollar.
What is Quantitative Tightening and how does it influence the US Dollar?
Quantitative tightening (QT) is the reverse process whereby the Federal Reserve stops buying bonds from financial institutions and does not reinvest the principal from the bonds it holds maturing in new purchases. It is usually positive for the US Dollar.
- BoJ Deputy Shinichi Uchida cooled hopes for an upcoming tightening cycle in Japan.
- The Nikkei 225 posted its highest close since February 1990, adding roughly 750 points.
- USD/JPY on its way to test the 150.00 level, according to the daily chart.
The US Dollar struggles for direction on Thursday, but not against its Japanese rival. The USD/JPY pair trades in the 149.30 region, its highest since last November. Dovish comments from Bank of Japan (BoJ) Deputy Governor Shinichi Uchida, stating policy tightening would be gradual and that a rate adjustment would not necessarily trigger a tightening cycle, weighed on the Japanese Yen.
Such comments underpinned local equities. The Nikkei 225 added roughly 750 points or 2% on the day, outperforming its Asian counterparts. The index closed the day at 36,863.28, the highest close since February 1990.
Meanwhile, higher United States (US) government bond yields gave USD/JPY an additional boost. Solid US employment figures pushed the 10-year Treasury yield to a fresh weekly high of 4.16%, as Initial Jobless Claims further blurred the odds for a Federal Reserve’s (Fed) rate cut.
USD/JPY Technical Outlook
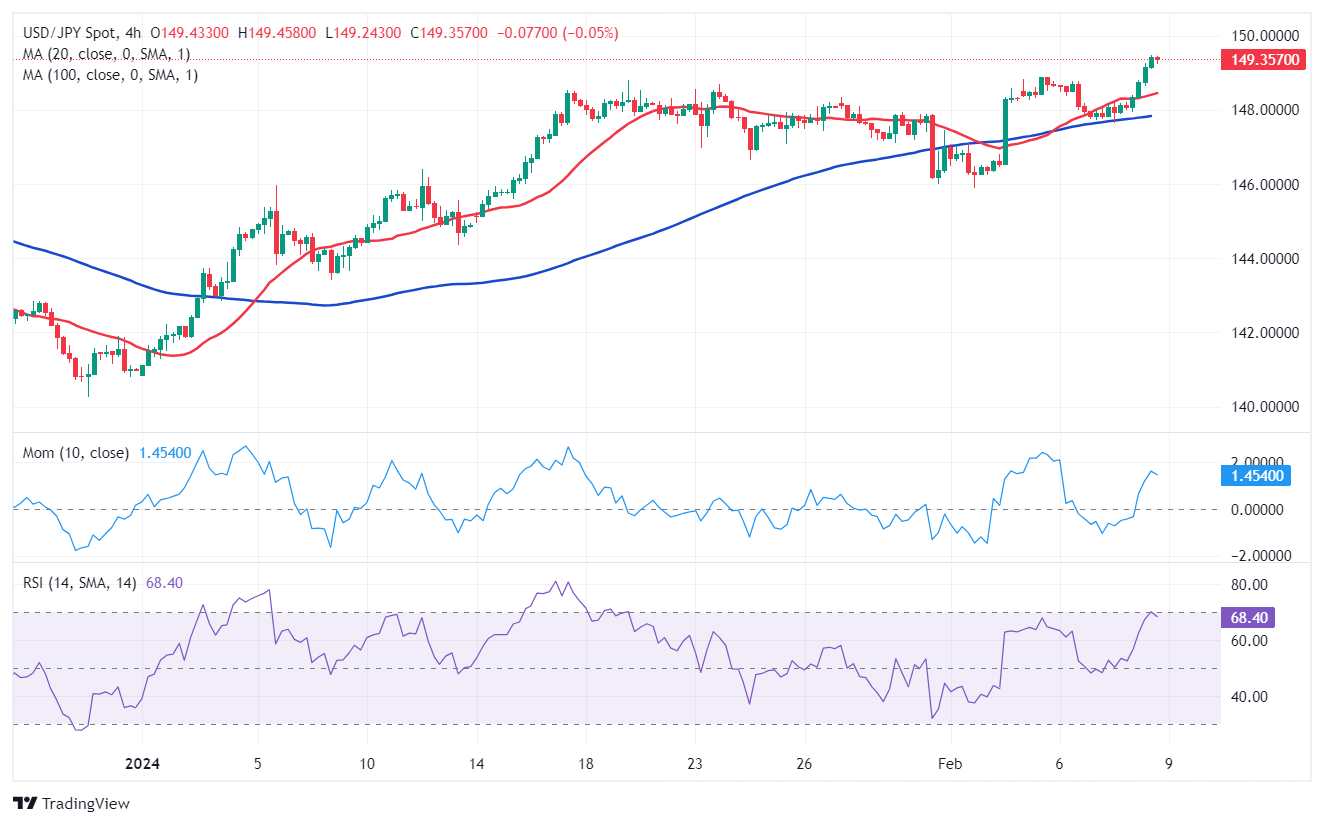 The USD/JPY pair trades a handful of pips below its intraday high, paring its run amid the poor performance of Wall Street, reflecting a souring mood. Still, the pair retains substantial gains and has room to test the 150.00 mark in the upcoming sessions.
In the daily chart, the pair bottomed around a directionless 100 Simple Moving Average (SMA) for the week, providing dynamic support at around 147.50. The initial bounce turned into a firmer rally, and the 20 SMA is currently crossing the mentioned 100 SMA, reinforcing the support area. As long as above it, bulls will likely retain control.
Finally, the Momentum indicator recovered from around its 100 level, while the Relative Strength Index (RSI) indicator accelerated north and approaches overbought readings, both reflecting strong buying interest.
- AUD/USD resumed the decline and retreats below 0.6500.
- The recovery in the greenback put the AUD under pressure.
- Inflation Rate in China surprised to the downside.
The Australian dollar came under renewed selling pressure amidst the solid performance in the Greenback on Thursday.
Indeed, the greenback set aside two daily declines in a row and reclaimed the area north of 104.00 the figure when gauged by the USD Index (DXY). This rebound occurred amid steady investor speculation about a potential interest rate cut by the Federal Reserve (Fed) in either May or June.
Turning to domestic factors, the AUD’s weakness remained propped up by the generalized bearish trend in the commodity complex, where copper prices and iron ore extended further their retracements.
Also weighing on the Aussie Dollar emerged another lower-than-expected inflation figures in China in the first month of the year.
In the meantime, market participants continued to evaluate the Reserve Bank of Australia's (RBA) latest interest rate decision, which kept rates unchanged at 4.35% while delivering a hawkish message that left a potential future rate hike in the pipeline for the time being.
Still around the RBA and its Statement on Monetary Policy (SoMP), the bank slightly lowered its inflation forecasts, anticipating both metrics to remain below 3% by the fourth quarter of 2025. Additionally, the RBA revised down its GDP growth projections, reflecting a less optimistic outlook for consumer spending and housing investments in the near term.
Governor Bullock's departure from the expected move towards a dovish stance further tempered the pair's upward potential. She emphasized the incomplete nature of addressing inflation and highlighted the current inflation rate as unacceptably high.
AUD/USD daily chart
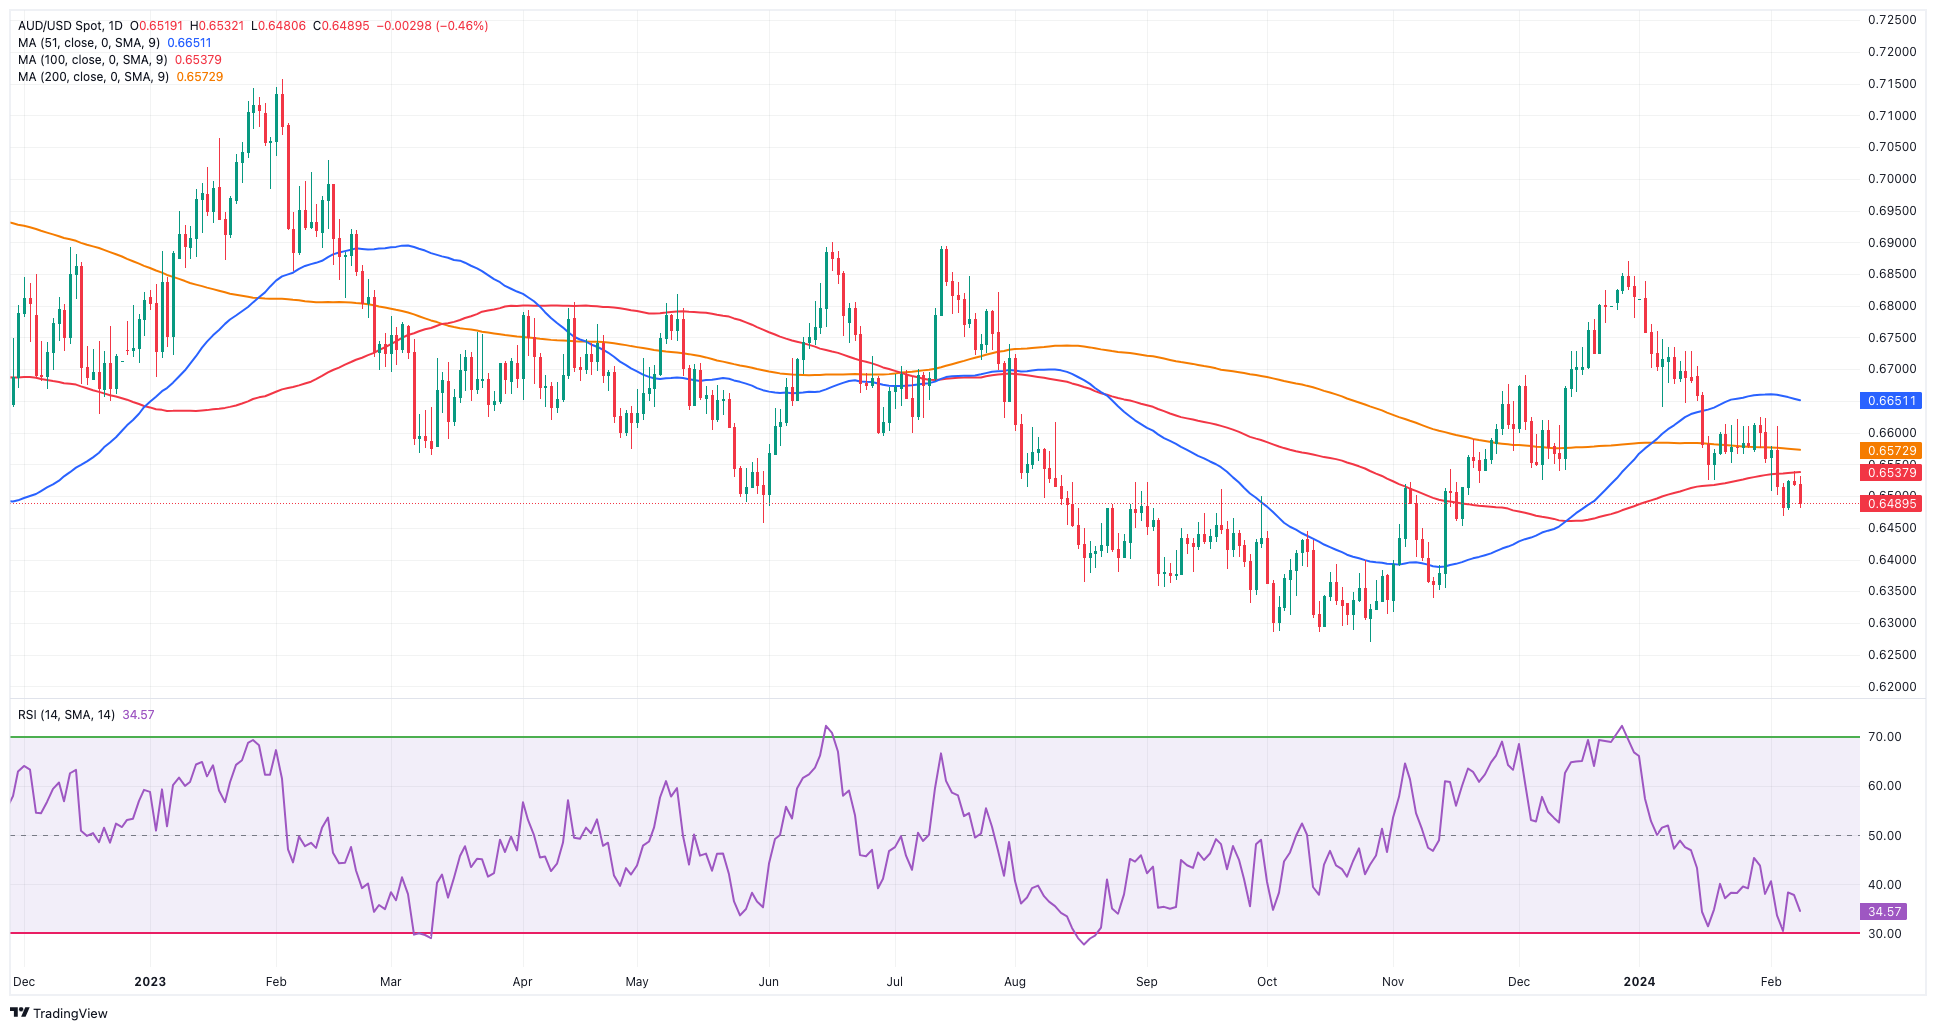
AUD/USD short-term technical outlook
Further losses in the AUD/USD should pass its 2024 level of 0.6468 (February 5), setting up a potential test of the 2023 low of 0.6270 (Oct 26). The breach of the latter may result in a move to the round level of 0.6200 before the 2022 low of 0.6169 (October 13).
On the upside, the key 200-day SMA at 0.6571 is ahead of the intermediate 55-day SMA at 0.6642. The breakout of this zone may push the pair to attempt the December 2023 top of 0.6871 (December 28), followed by the July 2023 peak of 0.6894 (July 14) and the June 2023 high of 0.6899 (June 16), all right before the key 0.7000 threshold.
The 4-hour chart turned bearish, paving the way for a dip to 0.6452 once 0.6468 is cleared. On the bullish side, 0.6610 is an immediate hurdle ahead of the 200-SMA at 0.6650. The surpassing of this zone indicates a possible progress to 0.6728. The MACD remains well in the negative zone, and the RSI deflated to the 36 zone.
View Live Chart for the AUD/USD
Richmond Fed Thomas Barkin spoke at the Economic Club of New York on Thursday:
In aggregate, past rate hikes are still working their way into the economy.
It's hard to determine the appropriate course of action for rates based solely on economic models.
I would like to see a broader range of factors contributing to lower inflation.
Specifically, I would like to see rents and service prices cooling down further.
The decision to cut rates will depend on the extent to which inflation is being mitigated.
We will gain valuable insights into inflation trends over the next six months.
If inflation returns to 2% alongside strong demand, it would indicate a higher neutral rate.
The January jobs data indicates an incredibly vibrant job market. However, while the job market is tight, it may not be as tight as the data suggests."
- EUR/USD found little support from ECB Economic Bulletin.
- US Initial Jobless Claims provided little spark for markets.
- Euro traders look to Friday’s Germany HICP inflation.
EUR/USD tested into a near-term low of 1.0741 on Thursday as the latest Economic Bulletin from the European Central Bank (ECB) provided little new information for investors looking for guidance on when to expect rate cuts. The ECB continues to grapple with a lopsided European economy. Euro area price pressures remain higher than the ECB would like to see despite an ongoing softening in broad economic figures and faltering growth for the European economy.
US Initial Jobless Claims came in slightly better than expected, but a mid-tier data schedule for the US this week is keeping broad-market risk appetite hanging relatively in the middle.
Daily Digest Market Movers: EUR/USD remains caught in near-term cycle
- ECB’s Economic Bulletin reveals little new, peels back the layers on hampered ECB.
- Inflation continues to decline.
- Rates will remain sufficiently restrictive.
- Inflation is expected to keep easing through 2024.
- Economic risks remain tilted to the downside.
- Elevated wage growth, declining labor productivity keeps price pressure high.
- US Initial Jobless Claims printed at 218K for the week ended February 2, markets expected 220K.
- Four-week average Initial Jobless Claims ticked higher to 212.25K from 208.5K (revised up from 207.75K).
- Richmond Federal Reserve (Fed) President Thomas Barkin on Thursday:
- Fed Chairman Jerome Powell speaks for the Federal Open Market Committee, will not undercut or explain the Chairman’s statements.
- Fed remains focused on inflation and unemployment, not US government debt.
- An economic downturn would be a case for a rate cut.
- The Fed has plenty of time to remain patient on rate changes.
- Fed is in no rush to cut rates.
- Barkin won’t take too much signal from single-month data.
- Remains cautious regarding the accuracy of economic numbers at the start of the year, but data remains remarkable.
- Friday’s YoY German Harmonized Index of Consumer Prices (HICP) inflation report is expected to hold steady at 3.1% for January, with the MoM figure likewise forecast to hold steady at -0.2%.
Euro price today
The table below shows the percentage change of Euro (EUR) against listed major currencies today. Euro was the strongest against the Japanese Yen.
| USD | EUR | GBP | CAD | AUD | JPY | NZD | CHF | |
| USD | 0.03% | 0.09% | 0.01% | 0.49% | 0.82% | 0.29% | -0.05% | |
| EUR | -0.03% | 0.06% | 0.00% | 0.47% | 0.79% | 0.26% | -0.09% | |
| GBP | -0.09% | -0.05% | -0.06% | 0.41% | 0.74% | 0.20% | -0.16% | |
| CAD | -0.02% | 0.01% | 0.06% | 0.47% | 0.80% | 0.27% | -0.09% | |
| AUD | -0.50% | -0.47% | -0.41% | -0.47% | 0.33% | -0.20% | -0.57% | |
| JPY | -0.83% | -0.81% | -0.75% | -0.81% | -0.33% | -0.54% | -0.89% | |
| NZD | -0.29% | -0.26% | -0.20% | -0.27% | 0.21% | 0.53% | -0.36% | |
| CHF | 0.07% | 0.09% | 0.15% | 0.09% | 0.57% | 0.88% | 0.36% |
The heat map shows percentage changes of major currencies against each other. The base currency is picked from the left column, while the quote currency is picked from the top row. For example, if you pick the Euro from the left column and move along the horizontal line to the Japanese Yen, the percentage change displayed in the box will represent EUR (base)/JPY (quote).
Technical analysis: EUR/USD cycles on Thursday as pair remains mired in low-side technical trap
EUR/USD dipped on Thursday, falling toward 1.0740 before seeing a brief pullback in the US market session, but the pair remains hamstrung below the 200-hour Simple Moving Average (SMA) at 1.0800.
Daily candlesticks have EUR/USD stuck on a near-term technical support level from 1.0750, and bidders will be tempted to drive the pair back into the bullish side of the 200-day SMA at 1.0835. The EUR/USD remains down over 3% from December’s peak bids at 1.1140.
EUR/USD hourly chart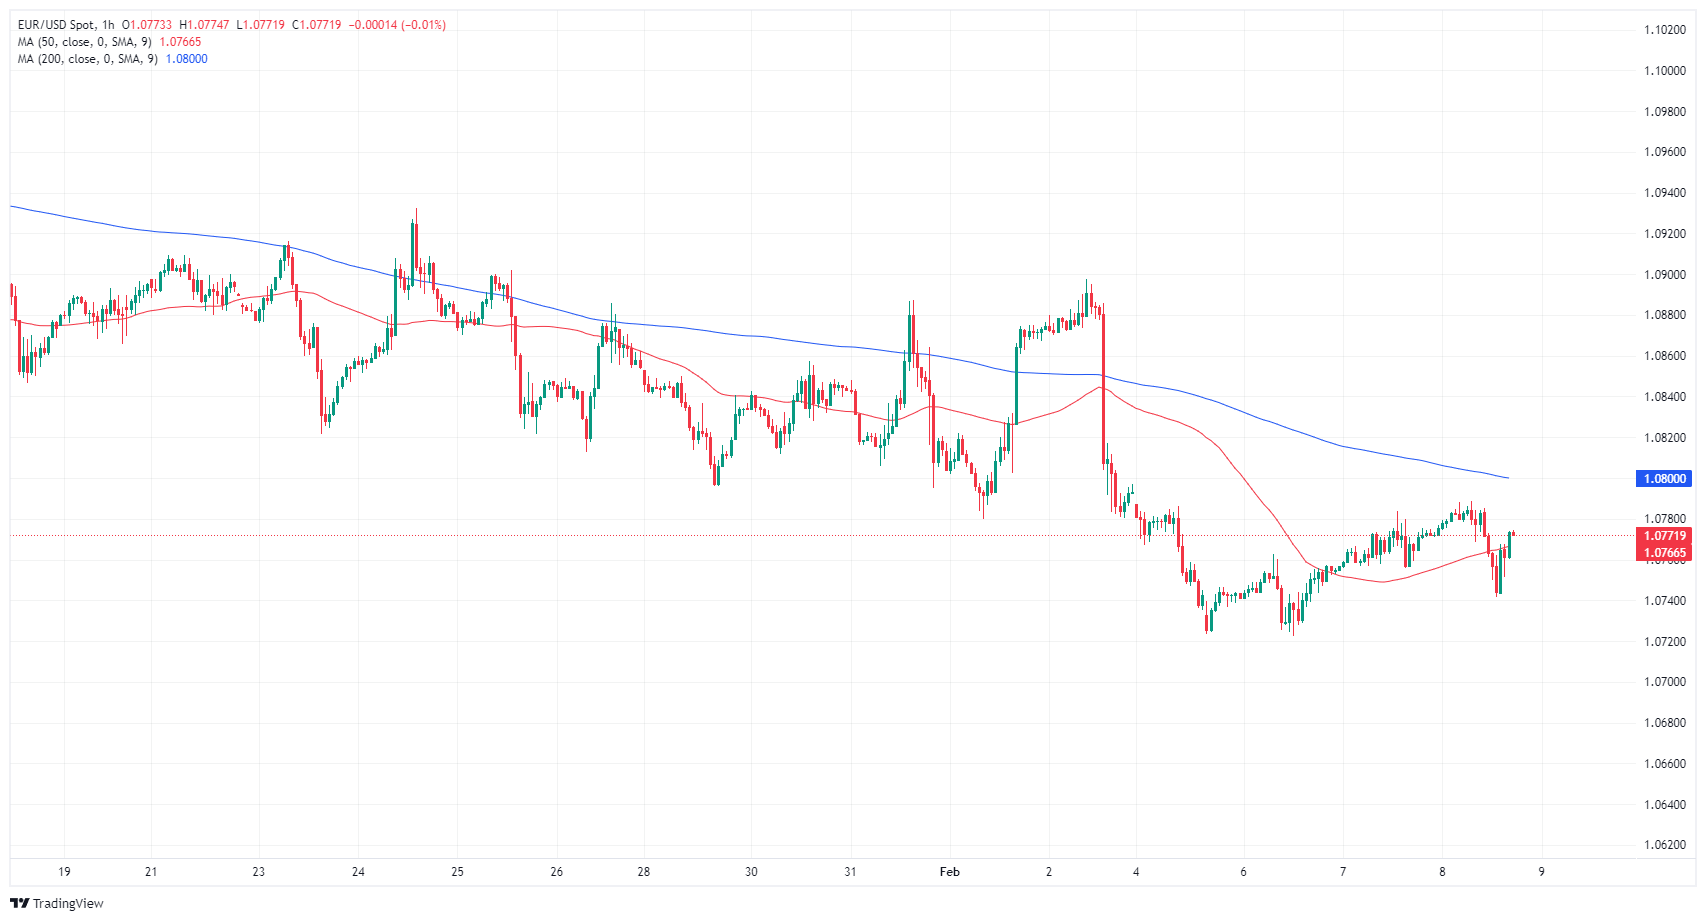
EUR/USD daily chart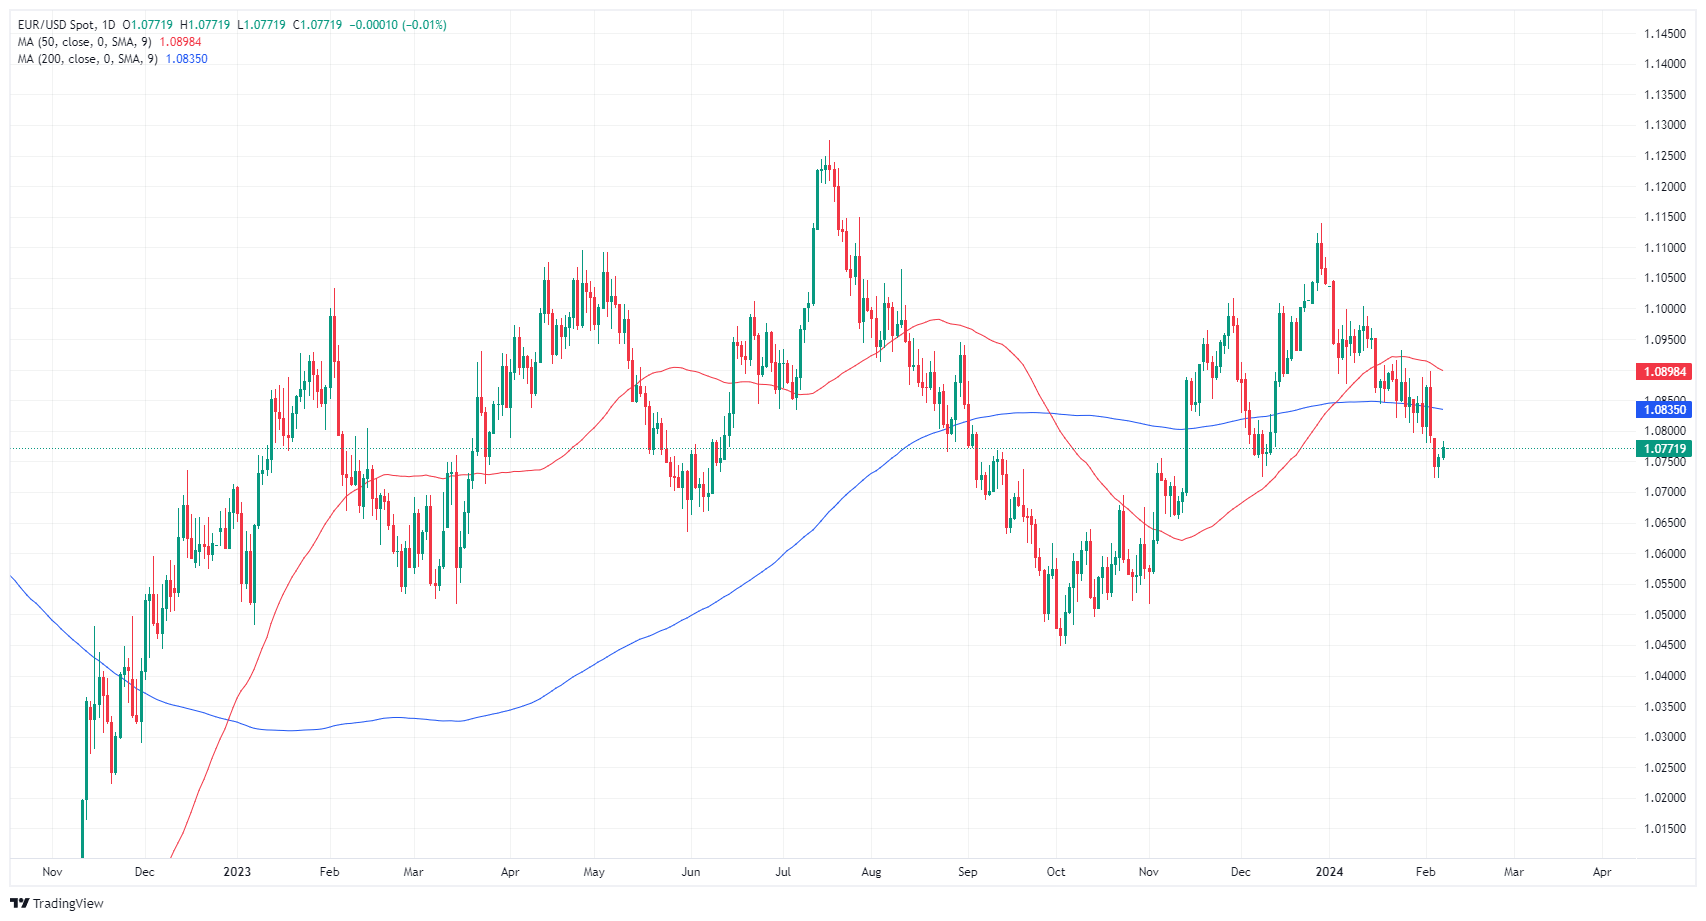
Euro FAQs
What is the Euro?
The Euro is the currency for the 20 European Union countries that belong to the Eurozone. It is the second most heavily traded currency in the world behind the US Dollar. In 2022, it accounted for 31% of all foreign exchange transactions, with an average daily turnover of over $2.2 trillion a day.
EUR/USD is the most heavily traded currency pair in the world, accounting for an estimated 30% off all transactions, followed by EUR/JPY (4%), EUR/GBP (3%) and EUR/AUD (2%).
What is the ECB and how does it impact the Euro?
The European Central Bank (ECB) in Frankfurt, Germany, is the reserve bank for the Eurozone. The ECB sets interest rates and manages monetary policy.
The ECB’s primary mandate is to maintain price stability, which means either controlling inflation or stimulating growth. Its primary tool is the raising or lowering of interest rates. Relatively high interest rates – or the expectation of higher rates – will usually benefit the Euro and vice versa.
The ECB Governing Council makes monetary policy decisions at meetings held eight times a year. Decisions are made by heads of the Eurozone national banks and six permanent members, including the President of the ECB, Christine Lagarde.
How does inflation data impact the value of the Euro?
Eurozone inflation data, measured by the Harmonized Index of Consumer Prices (HICP), is an important econometric for the Euro. If inflation rises more than expected, especially if above the ECB’s 2% target, it obliges the ECB to raise interest rates to bring it back under control.
Relatively high interest rates compared to its counterparts will usually benefit the Euro, as it makes the region more attractive as a place for global investors to park their money.
How does economic data influence the value of the Euro?
Data releases gauge the health of the economy and can impact on the Euro. Indicators such as GDP, Manufacturing and Services PMIs, employment, and consumer sentiment surveys can all influence the direction of the single currency.
A strong economy is good for the Euro. Not only does it attract more foreign investment but it may encourage the ECB to put up interest rates, which will directly strengthen the Euro. Otherwise, if economic data is weak, the Euro is likely to fall.
Economic data for the four largest economies in the euro area (Germany, France, Italy and Spain) are especially significant, as they account for 75% of the Eurozone’s economy.
How does the Trade Balance impact the Euro?
Another significant data release for the Euro is the Trade Balance. This indicator measures the difference between what a country earns from its exports and what it spends on imports over a given period.
If a country produces highly sought after exports then its currency will gain in value purely from the extra demand created from foreign buyers seeking to purchase these goods. Therefore, a positive net Trade Balance strengthens a currency and vice versa for a negative balance.
- Canadian Dollar is broadly higher in calm markets.
- Canada Unemployment, Average Hourly Wages due on Friday.
- Canadian Dollar in tight race with recovering US Dollar.
The Canadian Dollar (CAD) has stepped broadly higher against the majority of its major currency peers on Thursday, though the CAD is battling a recovering US Dollar (USD) as the two currencies are on pace to settle the day as the top performers. US Initial Jobless Claims came in lower than expected, driving investors back into the Greenback as the US economy continues to outperform.
Canada sees a clear economic docket on Thursday as investors gear up for Friday’s Canadian labor and wages figures. Markets are forecasting a slight uptick in the Canadian January Unemployment Rate, as well as a smaller-than-usual Net Change in Employment for January, though the number is still projected to be positive.
Daily digest market movers: Canadian Dollar fighting for second place on Thursday
- US Initial Jobless claims beat expectations, coming in at 218K for the week ended February 2 compared to the forecast of 220K.
- The previous week’s Initial Jobless Claims saw an upside revision from 224K to 227K.
- The 4-week average for US Initial Jobless Claims climbed to 212.25K from 208.5K (revised up from 207.75K).
- President of the Federal Reserve (Fed) Bank of Richmond, Thomas Barkin, noted on Thursday that Fed Chairman Jerome Powell speaks for the Federal Open Market Committee (FOMC).
- Fed’s Barkin won’t prejudice the outcome of the March FOMC meeting, deferring to Fed head Powell’s statements.
- More Barkin:
- The Fed is focused on inflation and unemployment, not US government debt.
- If the US economy takes a turn for the worse, that would be a rate cut scenario.
- The Fed has time to be patient on rate cuts.
- Economic data remains remarkable, but Barkin is cautious regarding accuracy.
- It’s entirely possible that the neutral rate has risen.
- Need to see good inflation numbers being sustained and broadening.
- Canada’s Friday Unemployment Rate for January is forecast to tick upward to 5.9% from December’s 5.8%.
- Net Change in Employment forecast to add 15K net job gains through January, a thin number but still positive.
- Canadian annualized Average Hourly Wages in January will also print on Friday, last annualized wage growth figure showed YoY hourly wage gains of 5.7%.
Canadian Dollar price today
The table below shows the percentage change of Canadian Dollar (CAD) against listed major currencies today. Canadian Dollar was the strongest against the Japanese Yen.
| USD | EUR | GBP | CAD | AUD | JPY | NZD | CHF | |
| USD | 0.12% | 0.15% | 0.00% | 0.55% | 0.91% | 0.38% | 0.05% | |
| EUR | -0.12% | 0.03% | -0.11% | 0.43% | 0.78% | 0.26% | -0.09% | |
| GBP | -0.15% | -0.03% | -0.14% | 0.40% | 0.76% | 0.23% | -0.12% | |
| CAD | -0.01% | 0.10% | 0.14% | 0.54% | 0.89% | 0.37% | -0.02% | |
| AUD | -0.56% | -0.44% | -0.41% | -0.54% | 0.36% | -0.17% | -0.53% | |
| JPY | -0.90% | -0.81% | -0.76% | -0.91% | -0.38% | -0.52% | -0.87% | |
| NZD | -0.37% | -0.27% | -0.24% | -0.37% | 0.18% | 0.53% | -0.36% | |
| CHF | -0.03% | 0.09% | 0.10% | -0.02% | 0.53% | 0.87% | 0.35% |
The heat map shows percentage changes of major currencies against each other. The base currency is picked from the left column, while the quote currency is picked from the top row. For example, if you pick the Euro from the left column and move along the horizontal line to the Japanese Yen, the percentage change displayed in the box will represent EUR (base)/JPY (quote).
Technical analysis: Canadian Dollar rebounds against US Dollar on Thursday
The Canadian Dollar is broadly higher on Thursday, gaining nine-tenths of a percent against the Japanese Yen (JPY) and over half a percent against the Australian Dollar (AUD). On the low end, the CAD is mostly flat against the US Dollar after recovering from an early dip, and it is up a scant tenth of a percent against the Euro (EUR).
The USD/CAD saw a sharp turnaround just below 1.3500 on Thursday as investors aren’t ready to push the pair back over the key price handle. The pair is currently finding technical support from the 200-hour Simple Moving Average (SMA) near 1.3450, and an extended breakdown puts the USD/CAD on the road to re-challenging early February’s swing lows into 1.3370.
Daily candles remain caught in the midrange of a consolidation zone between the 50-day and 200-day SMAs at 1.3423 and 1.3476, respectively, but the USD/CAD is still up over 2% from December’s bottom bids of 1.3177.
USD/CAD hourly chart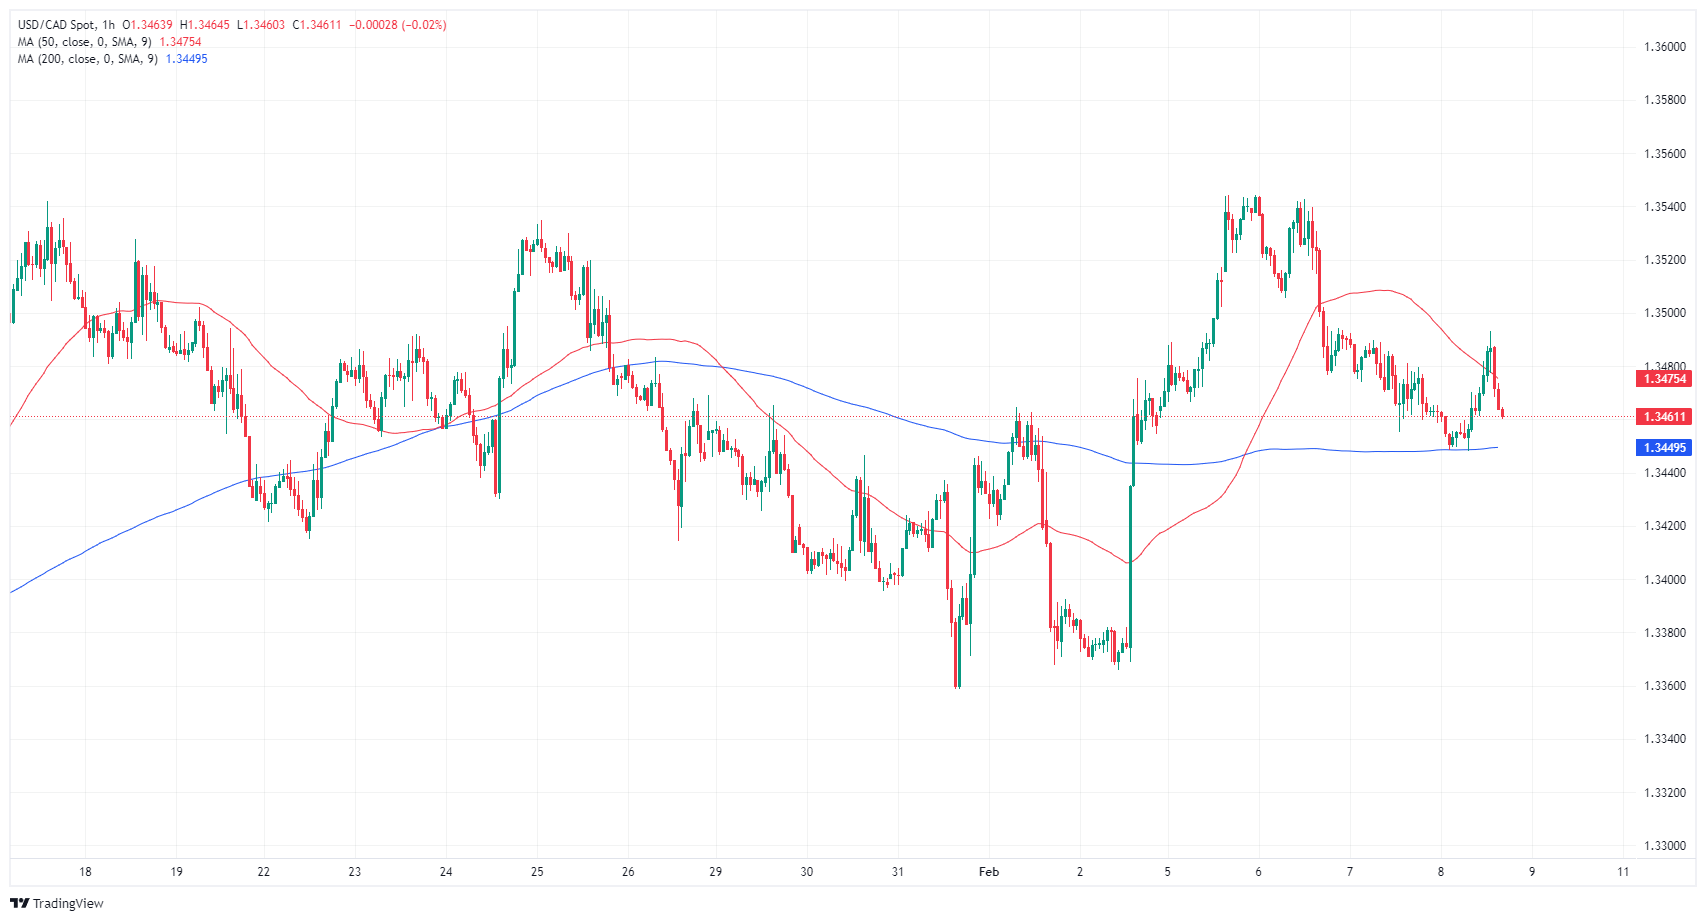
USD/CAD daily chart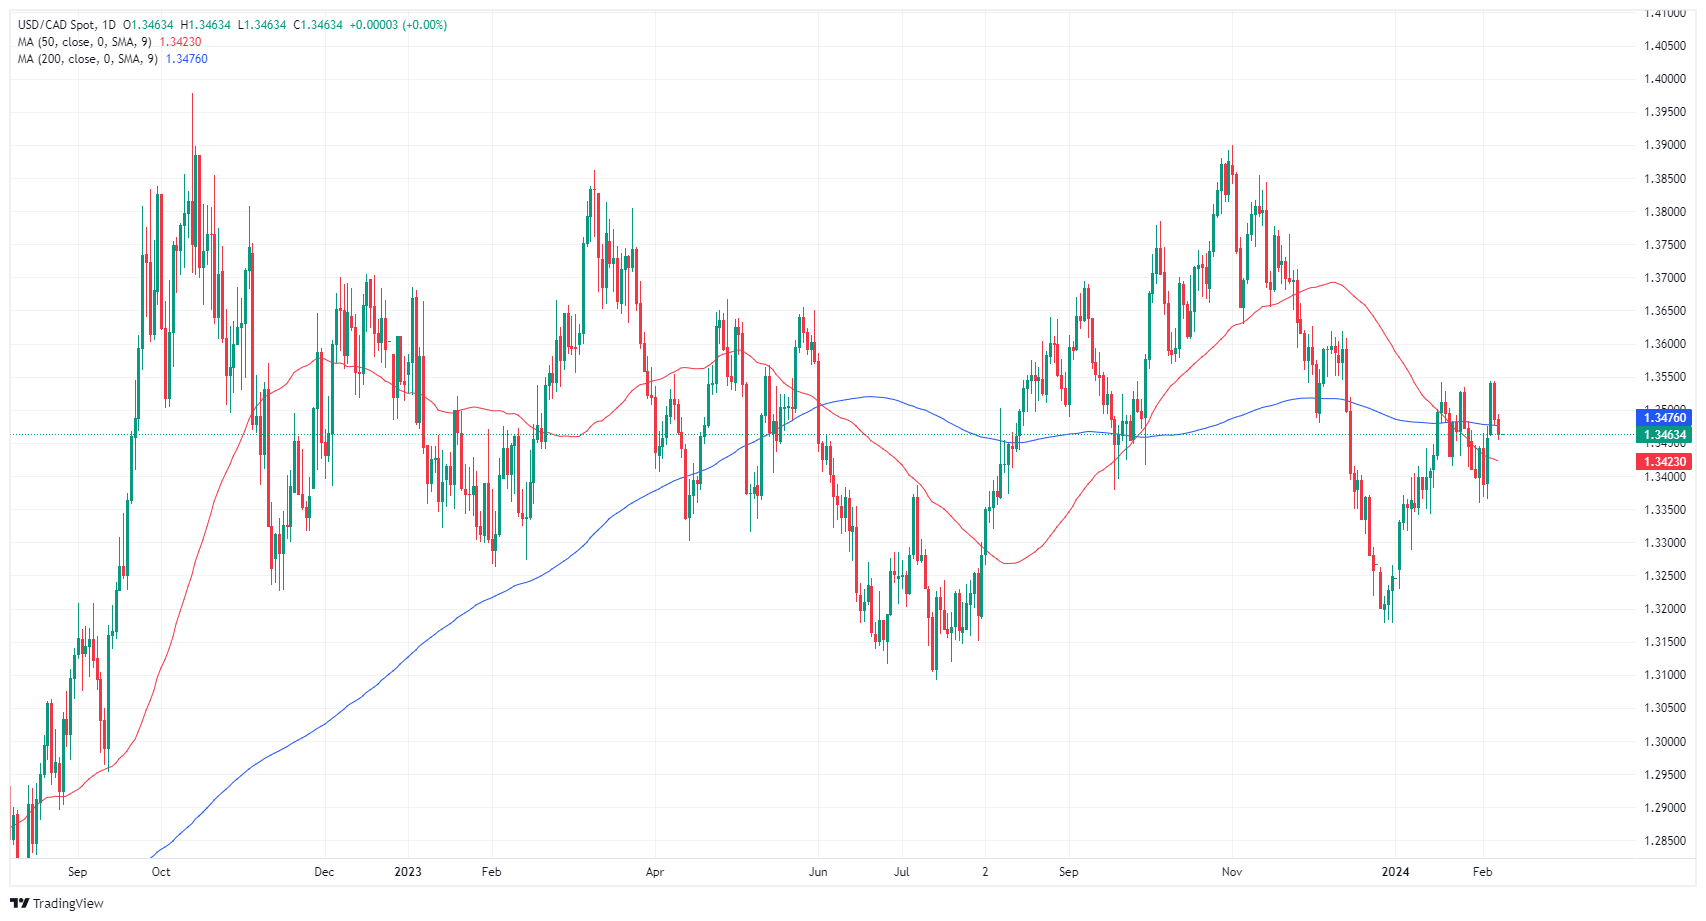
Canadian Dollar FAQs
What key factors drive the Canadian Dollar?
The key factors driving the Canadian Dollar (CAD) are the level of interest rates set by the Bank of Canada (BoC), the price of Oil, Canada’s largest export, the health of its economy, inflation and the Trade Balance, which is the difference between the value of Canada’s exports versus its imports. Other factors include market sentiment – whether investors are taking on more risky assets (risk-on) or seeking safe-havens (risk-off) – with risk-on being CAD-positive. As its largest trading partner, the health of the US economy is also a key factor influencing the Canadian Dollar.
How do the decisions of the Bank of Canada impact the Canadian Dollar?
The Bank of Canada (BoC) has a significant influence on the Canadian Dollar by setting the level of interest rates that banks can lend to one another. This influences the level of interest rates for everyone. The main goal of the BoC is to maintain inflation at 1-3% by adjusting interest rates up or down. Relatively higher interest rates tend to be positive for the CAD. The Bank of Canada can also use quantitative easing and tightening to influence credit conditions, with the former CAD-negative and the latter CAD-positive.
How does the price of Oil impact the Canadian Dollar?
The price of Oil is a key factor impacting the value of the Canadian Dollar. Petroleum is Canada’s biggest export, so Oil price tends to have an immediate impact on the CAD value. Generally, if Oil price rises CAD also goes up, as aggregate demand for the currency increases. The opposite is the case if the price of Oil falls. Higher Oil prices also tend to result in a greater likelihood of a positive Trade Balance, which is also supportive of the CAD.
How does inflation data impact the value of the Canadian Dollar?
While inflation had always traditionally been thought of as a negative factor for a currency since it lowers the value of money, the opposite has actually been the case in modern times with the relaxation of cross-border capital controls. Higher inflation tends to lead central banks to put up interest rates which attracts more capital inflows from global investors seeking a lucrative place to keep their money. This increases demand for the local currency, which in Canada’s case is the Canadian Dollar.
How does economic data influence the value of the Canadian Dollar?
Macroeconomic data releases gauge the health of the economy and can have an impact on the Canadian Dollar. Indicators such as GDP, Manufacturing and Services PMIs, employment, and consumer sentiment surveys can all influence the direction of the CAD. A strong economy is good for the Canadian Dollar. Not only does it attract more foreign investment but it may encourage the Bank of Canada to put up interest rates, leading to a stronger currency. If economic data is weak, however, the CAD is likely to fall.
- The EUR/GBP currently trades at 0.8540, recording a 0.10% on Thursday.
- Monetary policy divergences between the BoE and ECB will eventually benefit the GBP.
- Markets are leaning toward a rate cut by the ECB in April while the BoE is seen starting in June.
In Thursday's session, the EUR/GBP pair is seen at 0.8540, posting modest gains. The pair is receiving pressure from a dovish stance by the European Central Bank (ECB), tipping rate cut odds for April. Meanwhile, GBP maintains its undercurrent due to the Bank of England (BoE) monetary policy which seems to be pushing the easing cycle to June.
Adding to that, markets currently price in about 65% odds for rate cuts to commence in April, predicting 125 bp worth of easing this year, despite ongoing resistance from ECB officials. On the other hand, for the BoE, investors anticipate about 100 bp of rate cuts in the next 12 months, beginning in June due to the recent economic figures which suggest that the British economy remains resilient. Moreover, as long as the UK's economy continues to show strength and markets delay the BoE's interest rate cuts, the cross may see further downside.
EUR/GBP technical analysis
The daily chart indicators indicate a possible dominance of buying momentum. The Relative Strength Index (RSI) is on a positive slope but in negative territory, revealing an increasing strength of the buying force. Concurrently, the Moving Average Convergence Divergence (MACD) shows rising green bars, suggesting that the bullish sentiment is taking hold. However, it's crucial to note that the pair is currently trading under the 20, 100, and 200-day Simple Moving Averages (SMAs), pointing towards the prevailing strength of the bears in a broader perspective. This situation proposes a challenging scenario for the buyers, despite the recent signs of a bullish recovery.
EUR/GBP daily chart
-638430060156548811.png)
Canada’s employment data for January will be reported by Statistics Canada on Friday, February 9 at 13:30 GMT and as we get closer to the release time, here are forecasts from economists and researchers at five major banks regarding the upcoming jobs figures.
The North American economy is expected to have added 15K vs. 0.1K in December, while the unemployment rate is expected to rise a tick to 5.9%.
TDS
We look for employment to rise by 30K in January, slightly above the recent trend, although this will not be enough to keep the UE rate from rising 0.1pp to 5.9%. This reflects a recent pickup in hiring intentions while stronger growth momentum into year-end will also provide a tailwind to job growth, although we see limited scope for softer wage growth (0.1pp to 5.6%).
NBF
Job creation may have remained tepid in January (+10K), reflecting an economy operating below its potential. This modest gain, combined with another significant expansion of the labour force and an unchanged participation rate (65.5%), should translate into a two-tenth increase in the unemployment rate, to 6.0%.
RBC Economics
We expect Canada’s unemployment rate likely hit 5.9% in January – up almost a full percentage point from 5% a year earlier. That’s the highest rate since the pandemic – January 2022. We expect to see another 10K jobs added from December, but that’s not fast enough to keep up with the country’s record pace of population growth.
Citi
After essentially zero job growth in December, we expect employment to rise by a solid 40K jobs to start the year in January. This would be stronger than the trend over the last few months and stronger than a typical pre-pandemic pace around ~25K/month. But with substantially stronger population growth and an expectation that the labor force participation rate will rebound to 65.6% after falling in December, a 40K increase in employment would still imply the unemployment rate rises to 5.9%. Wages will be one of the most important factors to watch. After a large jump to 5.7% YoY in December, we expect average hourly wages to fall to 5.3% YoY in January.
CIBC
Canada’s labour market likely weakened in January, with a modest 10K gain in jobs leading the unemployment rate to tick up to 5.9%. That would reflect a deterioration in domestic demand, with consumers becoming more cautious with spending as mortgages renew, and the rise in business insolvencies portending layoffs in some sectors. Hours worked could have picked up, but that will likely be a one-time impact owing to the end of public sector strikes in Quebec. With a strong year-ago monthly wage growth figure falling out of the annual calculation, wage growth for permanent employees could have subsided by a few ticks, but that would still leave it above 5.0% YoY.
The S&P 500 came close to rising above 5,000 for the first time on Wednesday. Economists at UBS see the potential for further gains.
Potential for a period of continued stronger growth, tame inflation, and swifter monetary easing
Our base case remains for a soft landing for the US economy, with the S&P 500 ending the year around current levels. However, recent economic data have highlighted the potential for a period of continued stronger growth, tame inflation, and swifter monetary easing. In this event, we believe the S&P 500 has the potential to rise to around 5,300 this year.
We believe this would be a particularly positive outcome for small-cap stocks, which benefit more from Fed easing given their greater reliance on floating-rate debt.
Economists at ANZ Bank expect the USD/JPY exchange rate to trade at 136.00 by the end of 2024.
Shifts in anticipation of a Fed rate cut in the first half of 2024 could slightly tilt USD/JPY downward within the range
Current dynamics, including higher US Treasury yields and the Fed's stance against early rate cuts, are expected to keep USD/JPY within a narrow range in the near term. We anticipate limited near-term recovery for the JPY against the USD, with the currency pair expected to remain rangebound between 146 and 148.50.
Market speculation about a potential Fed rate cut in early 2024 could influence USD/JPY, potentially pushing it slightly lower within the established range.
The March and April BoJ policy meetings are anticipated to induce significant volatility in JPY crosses, with the market closely watching for signals on ending negative rates and easing policies.
We project the USD/JPY pair to reach 136.00 by the end of the year.
Gold’s prospects in Q1 are losing some shine as expectations for a near-term Fed rate cut have ebbed, economists at MUFG Bank say.
Phase of range-bound to extend
Gold extends decline as rate-cut bets fade. While this development is likely to extend the current phase of range-bound Gold prices, with short-term moves tied to data potentially influencing Fed decision-making, we believe downside to the price will be limited by robust support from the other two channels, namely, supportive central bank demand and bullion’s role as the geopolitical hedge of last resort .
Gold is our most bullish call this year. Bullion is set to hit record levels on a trifecta of Fed cuts, supportive central bank demand and bullion’s role as the geopolitical hedge of last resort.
Bank of England (BoE) policymaker Catherine Mann, who voted in favor of a rate hike in the last policy meeting, said on Thursday that she is not convinced that the near-term declaration in headline inflation will continue, per Reuters.
Mann noted that she is worried that a Red Sea price shock could be incorporated into corporate pricing swiftly and argued that financial conditions in the UK eased "too much."
Market reaction
These comments failed to trigger a noticeable reaction in GBP/USD. As of writing, the pair was down 0.25% on the day at 1.2593.
The FX market’s sensitivity to central bank policy continues to amaze Kit Juckes, Chief Global FX Strategist at Société Générale.
Dollar could be in for 2-3% more upside from here
If the market embraces the idea that the Fed’s projection of three cuts this year is what’s going to happen, then the Dollar’s in for 2-3% more upside from here, and EUR/USD could test 1.0500 at some point.
In practise, of course, there are two sides to the argument and the ECB’s pushing back at rate cut expectations every bit as hard as the Fed is. So too, are most central bank policymakers, except for the BoJ, whose Deputy Governor is stressing that an end to YCC and negative rates would not signal the start of a series of policy moves.
I doubt the end of YCC and negative rates can be achieved without some upward pressure on the Yen, but clearly, the move from USD/JPY 152.00 to 127.00 in late 2022/early 2023 has left scars.
Banxico meets to set interest rates today. The Mexican Peso (MXN) has been one of the very few currencies to appreciate against the dollar on a total return basis this year. Economists at ING analyze MXN outlook ahead of the decision.
Strong demand to emerge for the Peso on any dips
We think the Peso would not sell off too aggressively if Banxico did surprise and cut its 11.25% policy rate today. For reference, four of thirty economists polled by Bloomberg are looking for a cut.
And even if rates were cut, we think 10%+ implied yields, backed by supportive fiscal policy in an election year, should see strong demand emerge for the Peso on any dips.
We think USD/MXN will be trading in the 16.50-17.00 area later this year when the Dollar trend turns broadly lower.
USD/CAD has settled in the mid/upper 1.3400s. Economists at the Bank of Montreal analyze the pair’s outlook.
CAD is unlikely to take flight
The Canadian Dollar (CAD) remains boxed in a narrow, depressed range.
Given the country's poor economic and productivity performance, CAD is unlikely to take flight. However, assuming the trade-weighted Greenback continues to retreat from earlier record highs, the Loonie could strengthen modestly to 1.3200 by year-end.
See – USD/CAD: A final leg of Loonie weakness in the coming quarter – CIBC
The US Dollar Index (DXY) rebounds from the 104.00 area. Economists at Scotiabank analyze Greenback’s outlook.
DXY is showing some signs of short-term technical strength
The DXY is showing some signs of short-term technical strength, with the index basing around the 104.00 area on Wednesday; gains today may be setting the index up for a retest of the 104.55/104.60 peaks seen at the start of the week.
Markets may be giving the USD a bit of a lift ahead of Friday’s annual US CPI revisions – not usually a big issue for markets until last year’s surprising and quite significant upward revisions.
- AUD/USD slumps below 0.6500 on cautious market mood.
- The Australian Dollar weakens as upside risks to China’s deflation deepen.
- The outlook for the Aussie asset weakens after an H&S breakdown.
The AUD/USD pair falls sharply below the psychological support of 0.6500 in the early New York session. The Aussie asset faces a sharp sell-off as investors turn anxious amid an absence of potential economic triggers.
The US Dollar Index (DXY) delivers a sharp recovery after consolidating near 104.00 as Federal Reserve (Fed) policymakers avoid speculating over the timing of rate cuts. Policymakers said they need more evidence indicating that inflation will sustainably return to the 2% target.
As per the CME Fedwatch tool, a rate-cut decision in March is unlikely. For May, chances in favor of a 25-basis point (bp) are stable at 54%.
Meanwhile, the Australian Dollar weakens against the US Dollar as upside risks to deflation in the Chinese economy have prompted the need for more stimulus from the People’s Bank of China (PBoC).
Annual consumer prices were deflated at a robust pace of 0.8% against expectations of 0.5% and the prior reading of 0.3%. Producers at factory gates slash prices at factory gates significantly due to poor aggregate demand. Being a proxy to China’s economy, the appeal for the Australian Dollar weakens.
AUD/USD witnesses a steep fall after a breakdown of the Head and Shoulder chart pattern formed on a daily time frame. The necklines of the aforementioned chart pattern is plotted from December 7 low at 0.6525. A bear cross, represented by the 20 and 50-day Exponential Moving Averages (EMAs) at 0.6625, indicates more weakness ahead.
The 14-period Relative Strength Index (RSI) has shifted into the bearish range of 20.00-40.00, which indicates momentum has leaned towards the downside.
Selling pressure would accelerate if the Aussie asset will drop below February 6 low of 0.6478, which will expose the asset to October 11 high at 0.6445. A downside move below the latter would drag the asset towards the round-level support of 0.6400.
In an alternate scenario, a recovery move above January 25 low at 0.6566 would drive the asset toward the round-level resistance of 0.6600, followed by January 30 high at 0.6625.
AUD/USD daily chart
-638429973897761526.png)
Federal Reserve (Fed) Bank of Richmond President Thomas Barkin told Bloomberg on Thursday that economic data has been remarkable across the board but noted that he is cautious about the accuracy of numbers at the turn of the year.
Barkin added that they have time to be patient on rate changes and said that he needs to see good inflation numbers being sustained and broadening.
Market reaction
The US Dollar Index edged higher following these comments and was last seen rising 0.35% on the day at 104.40.
- Initial Jobless Claims rose by 218K from a week earlier.
- Continuing Jobless Claims surprised to the upside.
US citizens that applied for unemployment insurance benefits increased by 218K in the week ending February 3 according to the US Department of Labor (DoL) on Thursday. Once again, the prints surpassed consensus and follow a 227K gain in the previous week.
Further details of the publication revealed that the advance seasonally adjusted insured unemployment rate was 1.2% (from 1.3%) and the 4-week moving average stood at 212.25, a decrease of 3.750K from the previous week's revised average.
In addition, Continuing Claims decreased by 23K to 1.894M in the week ended January 27.
Market reaction
The US Dollar Index kept the weekly advance in place and flirts with yearly highs near 104.40 soon after the publication of weekly labour market data.
USD/JPY has surged above the 149.00 level. Economists at Rabobank analyze the pair’s outlook.
USD/JPY seen at 135.00 on a 12-month view
While the market is facing up to the reality that BoJ policy adjustment this year will likely be carefully paced, we view levels at USD/JPY 149.00 as overdone and look for the JPY to strengthen ahead of the March 19 policy meeting.
We view the chances of an April rate hike as strong and maintain a 12-month USD/JPY forecast of 135.00.
GBP/USD drops back to 1.2600. Economists at Scotiabank analyze the pair’s outlook.
Move higher has stalled in the short run
Sterling has struggled to exploit regaining 1.2600 – formerly strong support – this week.
Trend signals have retained a bearish undertone on the intraday and daily studies through the GBP’s mini-rebound this week, underscoring a soft undertone for the Pound after losing key support.
Short-term price signals do suggest the move higher has stalled in the short run. Weakness through 1.2600 may see losses extend back to the low/mid 1.2500s again.
Resistance is 1.2640/1.2650.
European Central Bank (ECB) policymaker Pierre Wunsch said on Thursday that they have some indications, not strong ones, that wage growth in the Euro area is softening, as reported by Reuters.
"There is value in waiting to get more comforting wage data," Wunsch added.
Market reaction to ECB commentary
These comments don't seem to be having a noticeable impact on the Euro's performance against its major rivals. At the time of press, EUR/USD was trading at 1.0756, losing 0.15% on a daily basis.
EUR/USD drifts back from the upper 1.0700s. Economists at Scotiabank analyze the pair’s outlook.
Support is 1.0720/1.0725
Grinding gains in the EUR/USD pair from the low 1.0700s appear to have stalled via a likely bearish ‘evening star’ signal on the intraday (6-hour) chart.
Trend momentum is flat and losses may be slow in developing from here but the EUR’s stall around 1.0790 coincides with a test of the 100-Day Moving Average (1.0787) which has effectively served as resistance this week.
Support is at 1.0720/1.0725.
- US stock index futures trade modestly lower on Thursday.
- S&P 500 set a new all-time high on Wednesday.
- Market participants continue to assess quarterly earnings reports.
S&P 500 futures fall 0.17%, Dow Jones futures are unchanged and Nasdaq futures are down 0.17% ahead of the opening bell on Thursday.
S&P 500 (SPX), Dow Jones (DJIA), and Nasdaq (IXIC) indexes closed on Wednesday with a 0.82% gain, a 0.40% increase, and a 0.95% rise, respectively.
What to know before stock market opens
- The Technology Sector was the best-performing S&P 500 major sector on Wednesday, with a daily gain of nearly 1.5%. The Real Estate Sector and the Consumer Staples Sector declined less than 0.1% as the only major sectors closing the day in negative territory.
- Emerson Electric Co.(EMR) was the top gainer in the S&P 500 on Wednesday, rising 10.4% to $104.11. V.F. Corp. (VFC) fell nearly 10% to $15.31 as the biggest decliner of the day.
- The data from the US showed that the goods and services deficit was $62.2 billion in December, up $0.3 billion from $61.9 billion in November.
- The Federal Reserve (Fed) reported late Wednesday that consumers added $1.56 billion in additional borrowing, far below the $16 billion forecast and declining steeply from the previous month's $23.75 billion.
- In an interview with CNBC on Wednesday, Minneapolis Fed President Neel Kashkari argued they can dial back the policy rate quite slowly if the labor market continues to be strong. "At the moment, two to three rate cuts this year seems appropriate," he added.
- Federal Reserve Board of Governor member Adriana Kugler noted on Wednesday that she is pleased with the great progress on inflation and added that she is optimistic that the progress will continue. "Some measures of financial conditions have eased but remain relatively tight and are consistent with continued progress on inflation,” Kugler elaborated.
- “The data point to continued disinflation, to labor markets coming into better balance, and to resilient consumer spending—three elements necessary for us to stick to the soft landing we remain optimistic to achieve,” Philadelphia Fed President Patrick Harker said on Tuesday.
Disney and PayPal reported earnings
- Walt Disney Co. (DIS) reported a quarterly revenue of $23.5 billion, slightly below the market projection of $23.6 billion, per Reuters. Disney's board of directors authorized a $3 billion share repurchase program for the current fiscal year, and declared a dividend of 45 cents a share. “Our strong performance this past quarter demonstrates we have turned the corner and entered a new era of growth for our company,” Disney CEO Bob Iger said in a statement.
- PayPal Holdings Inc. (PYPL) said revenue rose 8.7% to $8.03 billion from a year ago, surpassing the market forecast of $7.87 billion. Quarterly adjusted earnings were $1.48 per share for the quarter ended in December, and quarterly net income was $1.4 billion. "We're doing a lot of things to drive change internally and externally,” CEO Alex Chriss said in a post-earnings conference call, according to Reuters. “However, nothing happens overnight. It will take time for some of our initiatives to scale and move the needle," Chriss added.
- Alibaba Group Holdings Ltd. (BABA) reported Q3 adjusted net income of RMB 47,951 million and Q3 revenue of RMB 260,348 million before the opening bell on Wednesday. In its earnings report, the company said that the board of directors approved an increase of $25 billion to the share repurchase program. “Our top priority is to reignite the growth of our core businesses, e-commerce and cloud computing,” Alibaba said, per Reuters.
- Uber Technologies Inc. (UBER) announced Q4 net income of $1.4 billion and Q4 gross bookings of $37.6 billion. Net revenue for that period was $9.94 billion. "Uber's platform advantages and disciplined investment in new growth opportunities resulted in record engagement and accelerating Gross Bookings in Q4," Chief Financial Officer Prashanth Mahendra-Rajah said, per Reuters.
- Motorola Solutions Inc. (MSI), DexCom Inc. (DXCM), Take-Two Interactive Software, Inc. (TTWO) and Pinterest Inc. (PINS) are among the noteworthy companies that will release earnings reports after the closing bell on Thursday.
S&P and Nasdaq futures are presented by CME e-minis and Dow Jones futures are presented by CBOT e-mini.
S&P 500 FAQs
What is the S&P 500?
The S&P 500 is a widely followed stock price index which measures the performance of 500 publicly owned companies, and is seen as a broad measure of the US stock market. Each company’s influence on the computation of the index is weighted based on market capitalization. This is calculated by multiplying the number of publicly traded shares of the company by the share price. The S&P 500 index has achieved impressive returns – $1.00 invested in 1970 would have yielded a return of almost $192.00 in 2022. The average annual return since its inception in 1957 has been 11.9%.
How are companies chosen to be included in the S&P 500?
Companies are selected by committee, unlike some other indexes where they are included based on set rules. Still, they must meet certain eligibility criteria, the most important of which is market capitalization, which must be greater than or equal to $12.7 billion. Other criteria include liquidity, domicile, public float, sector, financial viability, length of time publicly traded, and representation of the industries in the economy of the United States. The nine largest companies in the index account for 27.8% of the market capitalization of the index.
How can I trade the S&P 500?
There are a number of ways to trade the S&P 500. Most retail brokers and spread betting platforms allow traders to use Contracts for Difference (CFD) to place bets on the direction of the price. In addition, that can buy into Index, Mutual and Exchange Traded Funds (ETF) that track the price of the S&P 500. The most liquid of the ETFs is State Street Corporation’s SPY. The Chicago Mercantile Exchange (CME) offers futures contracts in the index and the Chicago Board of Options (CMOE) offers options as well as ETFs, inverse ETFs and leveraged ETFs.
What factors drive the S&P 500?
Many different factors drive the S&P 500 but mainly it is the aggregate performance of the component companies revealed in their quarterly and annual company earnings reports. US and global macroeconomic data also contributes as it impacts on investor sentiment, which if positive drives gains. The level of interest rates, set by the Federal Reserve (Fed), also influences the S&P 500 as it affects the cost of credit, on which many corporations are heavily reliant. Therefore, inflation can be a major driver as well as other metrics which impact the Fed decisions.
- The US Dollar prints small gains against most major G20 peers.
- Traders are getting ready for the weekly US Jobless Claims.
- The US Dollar Index pops back above 104 in a very calm market for now.
The US Dollar (USD) is back in the green after a stalemate session on Wednesday. Initially hopes of a ceasefire breakthrough between Israel and Hamas made the safety-linked US Dollar retreat a touch. After Israel’s Prime Minister Benjamin Netanyahu came out late Wednesday evening with a statement rejecting the plan, however, the USD gained a bid. According to Netanyahu the complete destruction of Hamas would only take a few more months anyway.
On the economic front, traders are getting ready for the weekly US Jobless Claims. The Wholesale Inventories are due as well later this Thursday, though expect not much movement in the Greenback on the back of that.
Traders looking for a longer term trade or strategy, or analysts that want to better assess the longer term inflation risks might consider taking a look at the US crop report: The United States Department of Agriculture (USDA) releases every month the World Agricultural Supply and Demand Estimates report (WASDE) where insights are given on supply, demand, bad harvests on all sorts of crops, and thus on possible weak spots that might attribute to the food inflation basket.
Daily digest market movers: At a drift
- This Thursday Nevada and the Virgin Islands are up for Republican Caucus elections. Another landslide victory for former US President Donald Trump would almost guarantee him the nomination as Republican Presidential Candidate for the November elections.
- At 13:30 GMT the weekly US Jobless Claims are due to be released. Expectations are for a decline in the numbers after the strong upbeat US Jobs report from past Friday.
- Initial Jobless Claims are expected to head from 224,000 to 220,000.
- Continuing Jobless Claims are seen heading from 1,898 million to 1,878 million.
- Wholesale Inventories for December are expected to stay steady near 0.4%.
- At 16:30, a 4-week Note will be auctioned by the US Treasury Department.
- Richmond’s Federal Reserve President Thomas Barkin is due to speak at 17:05. A 30-year bond auction will take place around 18:00.
- Around 17:00, the United States Department of Agriculture (USDA) will release its monthly World Agricultural Supply and Demand Estimates report (WASDE).
- Equity markets are mixed this Thursday. Japanese indices have closed off this Thursday in the green with the Nikkeai up over 2%. Quite a different picture in China where the Hang Seng is down 1.3%. European equities are looking for direction while US equity futures are rather flat.
- The CME Group’s FedWatch Tool is now looking at the March 20th meeting. Expectations for a pause are 81.5%, while 18.5% for a rate cut.
- The benchmark 10-year US Treasury Note trades near 4.12%,and trades in the middle of this week’s range.
US Dollar Index Technical Analysis: Steady awaiting confirmation
The US Dollar Index (DXY) is slowly but surely advancing higher again with markets digesting the failed ceasefire plan that was put on the table by Hamas. The harsh rhetoric from Prime Minister Benjamin Netanyahu could mean some lingering US Dollar strength in the coming weeks. Meanwhile markets will be looking for next Republican state Caucus elections, which could lock in Trump as a favorite for November.
Should the US Dollar Index move higher again, first look for a test at the peak of Monday, near 104.60. That level needs to be broken and is more important than the 100-day SImple Moving Average snap at 104.30. Once broken above that Monday high, the road is open for a jump to 105.00 with 105.12 as key levels to keep an eye on.
The 100-day SMA (104.29) is clearly the unreliable boyfriend in the rally at the moment. A false break on Monday and no support provided on Tuesday from the moving average opens the door for a bit of a squeeze lower. The first ideal candidate for support is the 200-day SMA near 103.60. Should that give way, look for support from the 55-day SMA near 103.00 itself.
US Dollar FAQs
What is the US Dollar?
The US Dollar (USD) is the official currency of the United States of America, and the ‘de facto’ currency of a significant number of other countries where it is found in circulation alongside local notes. It is the most heavily traded currency in the world, accounting for over 88% of all global foreign exchange turnover, or an average of $6.6 trillion in transactions per day, according to data from 2022.
Following the second world war, the USD took over from the British Pound as the world’s reserve currency. For most of its history, the US Dollar was backed by Gold, until the Bretton Woods Agreement in 1971 when the Gold Standard went away.
How do the decisions of the Federal Reserve impact the US Dollar?
The most important single factor impacting on the value of the US Dollar is monetary policy, which is shaped by the Federal Reserve (Fed). The Fed has two mandates: to achieve price stability (control inflation) and foster full employment. Its primary tool to achieve these two goals is by adjusting interest rates.
When prices are rising too quickly and inflation is above the Fed’s 2% target, the Fed will raise rates, which helps the USD value. When inflation falls below 2% or the Unemployment Rate is too high, the Fed may lower interest rates, which weighs on the Greenback.
What is Quantitative Easing and how does it influence the US Dollar?
In extreme situations, the Federal Reserve can also print more Dollars and enact quantitative easing (QE). QE is the process by which the Fed substantially increases the flow of credit in a stuck financial system.
It is a non-standard policy measure used when credit has dried up because banks will not lend to each other (out of the fear of counterparty default). It is a last resort when simply lowering interest rates is unlikely to achieve the necessary result. It was the Fed’s weapon of choice to combat the credit crunch that occurred during the Great Financial Crisis in 2008. It involves the Fed printing more Dollars and using them to buy US government bonds predominantly from financial institutions. QE usually leads to a weaker US Dollar.
What is Quantitative Tightening and how does it influence the US Dollar?
Quantitative tightening (QT) is the reverse process whereby the Federal Reserve stops buying bonds from financial institutions and does not reinvest the principal from the bonds it holds maturing in new purchases. It is usually positive for the US Dollar.
Market repricing of a less aggressive global easing path has seen the US Dollar (USD) outperform in the G10 space so far this year. Economists at HSBC analyze Greenback’s outlook.
Geopolitical uncertainty might provide support to the USD in the weeks and months ahead
Geopolitical uncertainty might also provide support to the ‘safe-haven’ USD in the weeks and months ahead.
Over the medium term, we expect the USD to strengthen modestly against the EUR and GBP amid the US economy’s continued outperformance against the Eurozone and the UK.
The USD could also be supported by its ongoing yield advantage.
Bank of Mexico's monetary policy decision is due out today. Will the Banxico signal a turnaround? Economists at Commerzbank analyze how the Mexican Peso (MXN) could react to Banxico’s announcement.
Banxico is likely to take a wait-and-see approach
Banxico is likely to take a wait-and-see approach today. After all, it is unlikely that it would have delayed the first rate cut for all these months to bring inflation under control in the long term and then initiate a turnaround at a time when the overall rate is rising again. Even if this is not a general exclusion, I can't imagine that Banxico would want to do this. It would also put pressure on the Peso.
The more important question is whether it will hint at a first rate cut in March. After all, the real economy is now showing clear signs of the impact of high interest rates. Depending on whether there is more or less evidence today that rate cuts are imminent, the Peso could come under pressure.
But even if there are no hints, a first rate cut in March does not seem unlikely at the moment, given the developments in core inflation and the slowdown in economic growth. Unless, of course, inflation gets out of control again.
The Japanese Yen (JPY) has weakened resulting in USD/JPY surpassing the year-to-date high of 148.89 from 5th February. Economists at MUFG Bank analyze the pair’s outlook.
JPY to rebound heading into Q2
The BoJ is preparing market participants for an exit from negative rates but there was no urgency expressed to indicate that the first hike will be delivered in March. It remains consistent with our base case outlook for the first hike to be delivered in April, but we acknowledge that the risk of earlier exit in March has increased recently in light of the change in BoJ communication since their last meeting in January.
We remain unconvinced that the Yen can weaken much further in the near term and still expect the JPY to rebound heading into Q2 as the BoJ finally moves to exit negative rates based on the assumption that the upcoming wage negotiations do not disappoint.
- Natural Gas hits rock bottom and enters an area not seen since August 2020.
- Traders are following the ongoing probe by the House into Biden’s LNG export ban.
- The US Dollar Index steadies at 104 and is supported with some risk-off tone after ceasefire talks hit a dead end in the Middle East.
Natural Gas (XNG/USD) is trading sub-$2, and flirting with lower levels, not seen since August 2020. The move comes on the back of a probe by the House Committee on the action US President Joe Biden put in place to halt any developments on new LNG export terminals. The administration had said it would not issue approvals on new studies and plans earlier than after one year. The probe will be heading into its second day this Thursday with a hearing on the issue with Deputy Secretary of Energy David Turk.
The US Dollar (USD), which is negatively correlated to Natural Gas, is steady after some profit taking from its earlier peak performance on Monday and past Friday. The geopolitical element helps the Greenback a bit with Israel Prime Minister Benjamin Netanyahu rejecting the recent ceasefire proposal from Hamas and rather committing to fully infiltrating the Gaza region and liquidating Hamas. The breakdown of the ceasefire talks is triggering some risk off and is providing support for the Greenback.
Natural Gas is trading at $1.98 per MMBtu at the time of writing.
Natural Gas market movers: More downside headlines
- Europe sees Norway coming back online in full, delivering Natural Gas, after some brief supply hiccups and technical maintenance.
- Mild weather is forecasted for Europe, meaning that current Gas reserves are enough to see the current situation through until early summer.
- Japan is set to decrease its demand for Natural Gas with the nation boosting its nuclear power output, and will result in an 8% decline by the summer for its LNG needs.
- Germany and Algeria have signed a deal for Algeria to deliver pipeline Gas to Germany.
Natural Gas Technical Analysis: Ceasefire talks off the table
Natural Gas is facing a more substantial downturn and could be on its way to hit pre-Covid lows. Although the ceasefire plans are off the table now in the Middle East, markets have gotten time to grow accustomed to the tensions, and since the tensions escalated, Gas transit has not been distorted whatsoever. Overall, with spring coming closer, it does not look like Gas will be able to sprint substantially higher anytime soon under these conditions.
On the upside, Natural Gas is facing some pivotal technical levels to get back to. First, the low of January at $2.10 needs to be reclaimed again. Next is the intermediary level near $2.48. Once that area gets hit, expect to see a test near $2.57 at the purple line.
Once the current low at $2.04 gets tested, or broken again, expect the $2.00 big figure to crack under pressure as well. The first level to look for on the downside is near $1.95 (orange level) which goes back to August 2020. Next is the red line near $1.51, the low of June 2020.
-638429850316897688.png)
XNG/USD (Daily Chart)
Natural Gas FAQs
What fundamental factors drive the price of Natural Gas?
Supply and demand dynamics are a key factor influencing Natural Gas prices, and are themselves influenced by global economic growth, industrial activity, population growth, production levels, and inventories. The weather impacts Natural Gas prices because more Gas is used during cold winters and hot summers for heating and cooling. Competition from other energy sources impacts prices as consumers may switch to cheaper sources. Geopolitical events are factors as exemplified by the war in Ukraine. Government policies relating to extraction, transportation, and environmental issues also impact prices.
What are the main macroeconomic releases that impact on Natural Gas Prices?
The main economic release influencing Natural Gas prices is the weekly inventory bulletin from the Energy Information Administration (EIA), a US government agency that produces US gas market data. The EIA Gas bulletin usually comes out on Thursday at 14:30 GMT, a day after the EIA publishes its weekly Oil bulletin. Economic data from large consumers of Natural Gas can impact supply and demand, the largest of which include China, Germany and Japan. Natural Gas is primarily priced and traded in US Dollars, thus economic releases impacting the US Dollar are also factors.
How does the US Dollar influence Natural Gas prices?
The US Dollar is the world’s reserve currency and most commodities, including Natural Gas are priced and traded on international markets in US Dollars. As such, the value of the US Dollar is a factor in the price of Natural Gas, because if the Dollar strengthens it means less Dollars are required to buy the same volume of Gas (the price falls), and vice versa if USD strengthens.
Despite a progressively more restrictive monetary policy environment since early 2022, Gold recorded a surprisingly strong performance. It hovered above $2,000 for a significant part of the last twelve months. Economists at TD Securities analyze the yellow metal’s outlook.
XAU/USD to average $2,200 next quarter
The Fed's dovish pivot, along with another year of record official sector buying are set to feed a Gold bull run later in the year.
The combination of pending Fed rate cuts in the months to come should prompt traders to grow long exposure, and along with very strong physical demand and official sector buying are projected to lift prices to an average of $2,200 next quarter.
We expect Gold to average $2,081 for all of 2024.
- EUR/JPY refreshes weekly high near 160.50 on BoJ Shinichi’s dovish commentary.
- The BoJ may exit from its expansionary policy stance only after the wage cycle heightens.
- The Eurozone economy might remain stagnant in the fourth quarter of 2023.
The EUR/JPY prints a fresh weekly high near 160.50 in the European session on Thursday after dovish commentary from Bank of Japan (BoJ) Deputy Governor Uchida Shinichi. BoJ Shinichi said the central bank would be reluctant to raise interest rates aggressively despite exiting the decade-long ultra-dovish monetary policy.
Uchida Shinichi added that monetary policy conditions in the Japanese economy are in a deep negative trajectory, which is not expected to get blown up aggressively.
The Japanese Yen has been under pressure as BoJ policymakers run behind the market’s expectations of adopting a neutral stance. Slower wage growth momentum has been limiting hopes of exiting from an easy policy stance, limiting the sustainability of price pressures above 2%. Meanwhile, deepening geopolitical tensions have escalated uncertainty over restrictive policy stance.
On the Eurozone front, a vulnerable economic outlook has prompted expectations of early rate cuts by the European Central Bank (ECB). ECB policymaker Pablo Hernandez de Cos said this week, "it is already very important for European citizens to know that we are confident the next move will be a cut.” ECB Cos remains confident about inflation declining towards the 2% target.
On the contrary, the ECB Economic Bulletin released in early London indicated that Governing Council (GC) members will ensure that key rates remain sufficiently restrictive as long as price stability is ensured. Over the economic outlook, GC members anticipate a stagnant performance for the final quarter of 2023.
The Euro has rebounded against the US Dollar in recent days after hitting a year-to-date low at the start of this week at 1.0723. Economists at MUFG Bank analyze EUR/USD outlook.
Rising likelihood of ECB cutting ahead of Fed weighing on EUR/USD
The recent run of stronger US economic data and pushback by Fed officials against a rate cut as soon as in March has prompted the US rate market to delay the expected timing of the Fed’s first cut until the 1st May FOMC meeting. In contrast, the Eurozone rate market has moved to price in a higher probability of the ECB delivering an earlier rate cut in April rather than June although the timing is still finely balanced.
We continue to judge that risks are tilted modestly to the downside for EUR/USD in the near term.
- Silver rebounds from over a two-week low, though the upside seems limited.
- The technical setup supports prospects for the emergence of fresh sellers.
- A move beyond a descending trend-line is needed to negate the bearish bias.
Silver (XAG/USD) stages a goodish recovery from the $22.20-$22.15 area, or over a two-week low touched earlier this Thursday and builds on its steady intraday ascent through the first half of the European session. The white metal climbs to a fresh daily peak, around the $22.40 region in the last hour, though the technical setup seems tilted in favour of bearish traders and warrants caution before positioning for any further appreciating move.
The recent repeated failures near the $23.30 supply zone, which coincides with a descending trend-line hurdle extending from the late December peak, and a subsequent breakdown through a short-term trading range validate the negative outlook. Moreover, oscillators on the daily chart have just started gaining negative traction and are still far from being in the oversold territory. This, in turn, suggests that the path of least resistance for the XAG/USD is to the downside and any further move up might still be seen as a selling opportunity.
From current levels, the $22.80-$22.85 region is likely to act as an immediate hurdle ahead of the $23.00 mark, which now nears the descending trend-line resistance. This is closely followed by the 200-day SMA, near the $23.25-$23.30 supply zone, which if cleared decisively might trigger a short-covering move and set the stage for additional gains. The XAG/USD might then aim to reclaim the $24.00 round figure before climbing to the $24.50-$24.60 resistance zone and aiming to reclaim the $25.00 psychological mark.
On the flip side, weakness below the $22.20-$22.15 area could drag the XAG/USD to sub-$22.00 levels, or a two-month trough touched in January. Some follow-through selling might expose the next relevant support near the $21.40-$21.35 region before the metal weakens further below the $21.00 mark, towards the October swing low near the $20.70-$20.65 zone.
Silver daily chart
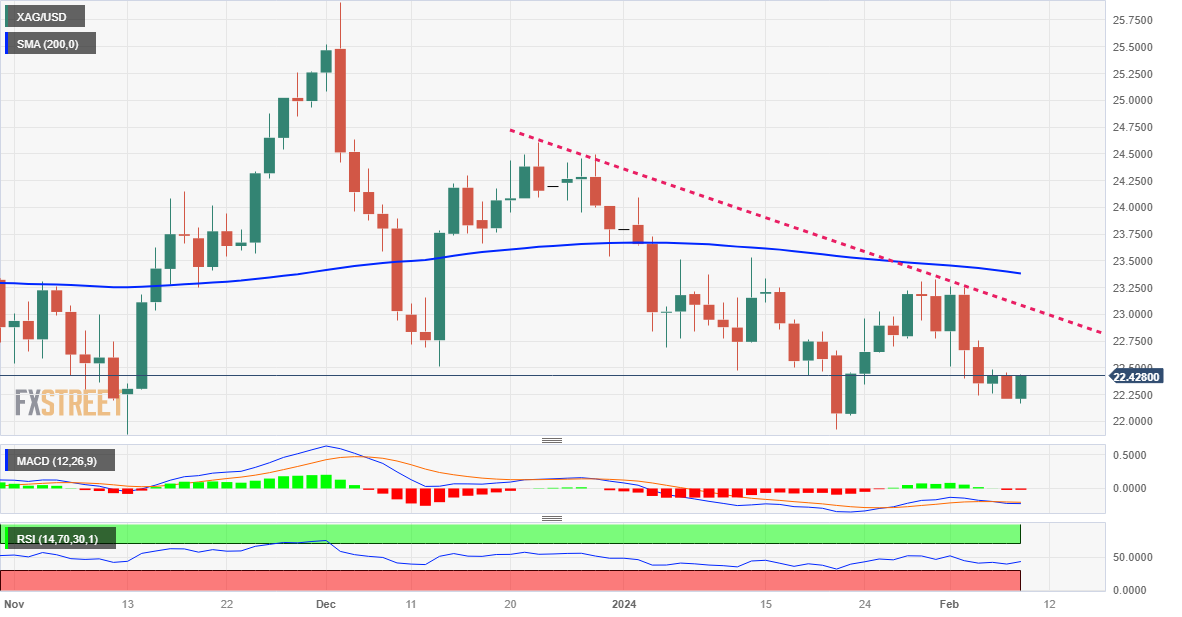
Technical levels to watch
- Gold price trades sideways as no Fed policymakers provide a significant timeline for rate cuts.
- Fed Collins sees rate cuts later this year only if price pressures remain consistent with forecasts.
- The US Dollar trades in a tight range ahead of weekly Initial Jobless Claims data.
Gold price (XAU/USD) grinds in a tight range during Thursday’s European session as uncertainty over the timing of interest rate cuts by the Federal Reserve (Fed) deepens. In the monetary policy speeches this week, none of the Fed policymakers have provided any concrete timeline for rate cuts.
The opportunity cost of holding Gold, a non-yielding asset, rises when the Fed holds interest rates high for a longer period. Fed policymakers are considering rate cuts at this stage as “premature”. The Fed needs more good inflation data to gain confidence that price pressures will sustainably return to the 2% target. Also, inflation pressures could flare up again if the Fed goes aggressively for rate cuts.
The market sentiment is quiet as the United States economic calendar has nothing much to offer. However, next week, the US inflation data for January will be the key trigger that will provide a fresh outlook on interest rates. The Gold price could come under pressure if the inflation data turns out persistently higher than expectations.
Daily Digest Market Movers: Gold price await fresh economic trigger
- Gold price remains broadly sideways in the European session on Thursday.
- The broader appeal for the Gold price is uncertain as Federal Reserve policymakers continue to maintain the hawkish rhetoric narrative on interest rates.
- Like other Fed policymakers, Boston Federal Reserve Bank President Susan Collins said on Wednesday that the central bank would be able to lower interest rates only after gaining greater confidence that inflation will sustainably return to the 2% target.
- Susan Collins said the central bank will reduce interest rates at some point later this year if economic data evolves consistently with their goals.
- Minneapolis Federal Reserve Bank President Neel Kashkari said officials are looking for good inflation data for months that could provide confidence of achieving price stability. Kashkari replied two to three rate cuts seem appropriate when asked about the number of rate cuts this year.
- The newest member of the Fed’s Monetary Policy Committee (MPC), Adriana Kugler said every policy meeting from March has the potential to offer rate cuts given the flow of economic data, in her first policy speech since recruited in September.
- Contrary to Kugler’s view, Fed Chair Jerome Powell said rate cuts are unlikely in March in its monetary policy statement on January 31.
- While Fed policymakers are holding themselves from offering meaningful cues about timing of rate cuts, investors have stepped to the sidelines and are awaiting a fresh economic trigger.
- The US Dollar Index (DXY) trades in a tight range around 104.00. In today’s session, the United States economic calendar has weekly Initial Jobless Claims (IJC) to offer further action.
Technical Analysis: Gold price dips below $2,040
-638429853327692788.png)
Gold price drops gradually from a three-day high of $2,045. The precious metal is broadly sideways trading in a narrow range of around $2,030. The overlapping structure between the Gold price and the 20-day Exponential Moving Average (EMA) indicates that volatility has squeezed significantly. Also, the Gold price is forming a Symmetrical Triangle chart pattern on the daily time frame that demonstrates a sharp contraction in volatility. The 50-day EMA at $2,023 continues to provide a cushion to the Gold price bulls.
Gold FAQs
Why do people invest in Gold?
Gold has played a key role in human’s history as it has been widely used as a store of value and medium of exchange. Currently, apart from its shine and usage for jewelry, the precious metal is widely seen as a safe-haven asset, meaning that it is considered a good investment during turbulent times. Gold is also widely seen as a hedge against inflation and against depreciating currencies as it doesn’t rely on any specific issuer or government.
Who buys the most Gold?
Central banks are the biggest Gold holders. In their aim to support their currencies in turbulent times, central banks tend to diversify their reserves and buy Gold to improve the perceived strength of the economy and the currency. High Gold reserves can be a source of trust for a country’s solvency. Central banks added 1,136 tonnes of Gold worth around $70 billion to their reserves in 2022, according to data from the World Gold Council. This is the highest yearly purchase since records began. Central banks from emerging economies such as China, India and Turkey are quickly increasing their Gold reserves.
How is Gold correlated with other assets?
Gold has an inverse correlation with the US Dollar and US Treasuries, which are both major reserve and safe-haven assets. When the Dollar depreciates, Gold tends to rise, enabling investors and central banks to diversify their assets in turbulent times. Gold is also inversely correlated with risk assets. A rally in the stock market tends to weaken Gold price, while sell-offs in riskier markets tend to favor the precious metal.
What does the price of Gold depend on?
The price can move due to a wide range of factors. Geopolitical instability or fears of a deep recession can quickly make Gold price escalate due to its safe-haven status. As a yield-less asset, Gold tends to rise with lower interest rates, while higher cost of money usually weighs down on the yellow metal. Still, most moves depend on how the US Dollar (USD) behaves as the asset is priced in dollars (XAU/USD). A strong Dollar tends to keep the price of Gold controlled, whereas a weaker Dollar is likely to push Gold prices up.
USD/JPY advances on Thursday. Economists at Société Générale analyze the pair’s outlook.
Only a move below 145.90/145.50 would confirm a deeper pullback
USD/JPY has evolved within a brief pause since last month and is close to interim projections at 149.10/149.60. The 50-DMA near 145.90/145.50 remains an important support zone.
Daily MACD is situated in positive territory, but it has turned flat denoting narrowing of price action.
Once the pair breaks out from recent consolidation zone, the phase of rebound could extend towards next potential hurdles at 150.20 and last year high of 152.00.
Only a move below 145.90/145.50 would confirm a deeper pullback.
- EUR/USD touches a fresh weekly high on Thursday, albeit lacks follow-through buying.
- Hawkish Fed expectations revive the USD demand and act as a headwind for the major.
- ECB rate cut bets further undermine the Euro and support prospects for deeper losses.
The EUR/USD pair struggles to capitalize on its modest intraday gains back closer to the 1.0800 mark, a fresh weekly high, and turns neutral during the first half of the European session on Thursday. Despite the recent hawkish comments by the European Central Bank (ECB) officials, expectations for an interest rate cut at the start of the second quarter have been growing stronger. This, in turn, undermines the Shared Currency, which, along with the emergence of some US Dollar (USD) dip-buying, acts as a headwind for the currency pair.
The USD Index (DXY), which tracks the Greenback against a basket of currencies, for now, seems to have stalled its retracement slide from the highest level since November 14 touched earlier this week amid the Federal Reserve's (Fed) less dovish outlook. Adding to this, a slew of influential FOMC members recently and the incoming robust US economic data smashed expectations for early interest rate cuts. This remains supportive of elevated US Treasury bond yields, which help revive the USD demand and cap gains for the EUR/USD pair.
The markets, however, are still pricing in five rate cuts over the course of the seven remaining FOMC policy meetings this year. This might hold back the USD bulls from placing aggressive bets and help limit the downside for the EUR/USD pair. Traders now look to the release of the US Weekly Initial Jobless Claims data, which, along with scheduled speeches by Richmond Fed President Thomas Barkin, might provide some impetus. The market focus, meanwhile, remains glued to the latest US consumer inflation figures, due next week.
Daily Digest Market Movers: Bulls seem reluctant as reduced Fed rate cut bets revive USD demand
- The EUR/USD pair stalls its recovery move from almost a three-month low touched earlier this week amid the emergence of some US Dollar dip-buying on Thursday.
- The US bond yields remain elevated amid reduced bets for early and steep interest rate cuts by the Federal Reserve in 2024 and help revive demand for the Greenback.
- Several FOMC members, including Fed Chair Jerome Powell, don’t see an urgent case for lowering borrowing costs, suggesting that a rate cut isn’t likely until the May meeting.
- Powell smashed any remaining hopes for a March rate cut and said on Sunday that the central bank can be prudent in deciding when to start easing on the back of a strong economy.
- Federal Reserve Board Member Adriana Kugler said on Wednesday that she is optimistic that inflation progress will continue, but stopped short of offering a timeline of the rate-easing cycle.
- Boston Fed President Susan Collins noted that inflation has slowed faster than expected but added that the central bank wants more certainty before it starts cutting rates.
- Minneapolis Fed President Neel Kashkari said that officials would like to see a few more months of inflation data and added that two to three cuts will be appropriate for 2024.
- Richmond Fed President Tom Barkin said that it is a good idea for the central bank to take its time with rate cuts given the uncertainty about where the US economy is headed.
- The markets, however, are still pricing in five rate cuts over the course of the seven remaining FOMC meetings this year, which might cap any further gains for the US Dollar.
- As inflation in the Eurozone moves closer to 2%, the first European Central Bank interest rate cut is expected to occur earlier than expected, possibly in the next quarter.
- Thursday's US economic docket features the release of the usual Weekly Initial Jobless Claims, which, along with Fedspeak, will influence the USD and provide a fresh impetus.
Technical Analysis: Needs to break through descending trend-line hurdle for bulls to seize control
From a technical perspective, the EUR/USD pair continues with its struggle to make it through the 100-day Simple Moving Average (SMA). Adding to this, the intraday pullback from the vicinity of the 1.0800 mark suggests that the recent downtrend from the December monthly swing high is still far from being over. That said, it will still be prudent to wait for some follow-through selling before positioning for any further decline.
In the meantime, the 1.0745-1.0740 area is likely to protect the immediate downside ahead of the 1.0725-1.0720 region, or the multi-month low, and the 1.0700 mark. A convincing break below the latter will be seen as a fresh trigger for bearish traders and make the EUR/USD pair vulnerable to accelerate the slide further towards the 1.0665-1.0660 support. Spot prices could eventually drop to the 1.0620-1.0615 region and the 1.0600 round figure.
On the flip side, momentum beyond the 1.0800 mark is likely to meet with a fresh supply near the very important 200-day SMA, currently pegged near the 1.0830-1.0835 region. This is closely followed by a one-month-old descending trend line, around mid-1.0800s. A sustained strength beyond the latter might shift the near-term bias in favor of bulls and prompt aggressive short-covering around the EUR/USD pair, allowing it to reclaim the 1.0900 mark.
Euro price this week
The table below shows the percentage change of Euro (EUR) against listed major currencies this week. Euro was the strongest against the Swiss Franc.
| USD | EUR | GBP | CAD | AUD | JPY | NZD | CHF | |
| USD | -0.01% | -0.03% | -0.04% | -0.09% | 0.17% | -0.75% | 0.64% | |
| EUR | 0.01% | -0.05% | -0.02% | -0.09% | 0.18% | -0.74% | 0.65% | |
| GBP | 0.04% | 0.02% | -0.01% | -0.06% | 0.20% | -0.71% | 0.67% | |
| CAD | 0.04% | 0.03% | 0.00% | -0.05% | 0.21% | -0.71% | 0.68% | |
| AUD | 0.09% | 0.09% | 0.06% | 0.06% | 0.26% | -0.66% | 0.73% | |
| JPY | -0.17% | -0.19% | -0.22% | -0.20% | -0.25% | -0.92% | 0.47% | |
| NZD | 0.74% | 0.73% | 0.71% | 0.71% | 0.65% | 0.90% | 1.38% | |
| CHF | -0.65% | -0.65% | -0.68% | -0.68% | -0.74% | -0.48% | -1.40% |
The heat map shows percentage changes of major currencies against each other. The base currency is picked from the left column, while the quote currency is picked from the top row. For example, if you pick the Euro from the left column and move along the horizontal line to the Japanese Yen, the percentage change displayed in the box will represent EUR (base)/JPY (quote).
Euro FAQs
What is the Euro?
The Euro is the currency for the 20 European Union countries that belong to the Eurozone. It is the second most heavily traded currency in the world behind the US Dollar. In 2022, it accounted for 31% of all foreign exchange transactions, with an average daily turnover of over $2.2 trillion a day.
EUR/USD is the most heavily traded currency pair in the world, accounting for an estimated 30% off all transactions, followed by EUR/JPY (4%), EUR/GBP (3%) and EUR/AUD (2%).
What is the ECB and how does it impact the Euro?
The European Central Bank (ECB) in Frankfurt, Germany, is the reserve bank for the Eurozone. The ECB sets interest rates and manages monetary policy.
The ECB’s primary mandate is to maintain price stability, which means either controlling inflation or stimulating growth. Its primary tool is the raising or lowering of interest rates. Relatively high interest rates – or the expectation of higher rates – will usually benefit the Euro and vice versa.
The ECB Governing Council makes monetary policy decisions at meetings held eight times a year. Decisions are made by heads of the Eurozone national banks and six permanent members, including the President of the ECB, Christine Lagarde.
How does inflation data impact the value of the Euro?
Eurozone inflation data, measured by the Harmonized Index of Consumer Prices (HICP), is an important econometric for the Euro. If inflation rises more than expected, especially if above the ECB’s 2% target, it obliges the ECB to raise interest rates to bring it back under control.
Relatively high interest rates compared to its counterparts will usually benefit the Euro, as it makes the region more attractive as a place for global investors to park their money.
How does economic data influence the value of the Euro?
Data releases gauge the health of the economy and can impact on the Euro. Indicators such as GDP, Manufacturing and Services PMIs, employment, and consumer sentiment surveys can all influence the direction of the single currency.
A strong economy is good for the Euro. Not only does it attract more foreign investment but it may encourage the ECB to put up interest rates, which will directly strengthen the Euro. Otherwise, if economic data is weak, the Euro is likely to fall.
Economic data for the four largest economies in the euro area (Germany, France, Italy and Spain) are especially significant, as they account for 75% of the Eurozone’s economy.
How does the Trade Balance impact the Euro?
Another significant data release for the Euro is the Trade Balance. This indicator measures the difference between what a country earns from its exports and what it spends on imports over a given period.
If a country produces highly sought after exports then its currency will gain in value purely from the extra demand created from foreign buyers seeking to purchase these goods. Therefore, a positive net Trade Balance strengthens a currency and vice versa for a negative balance.
The Czech National Bank (CNB) will hold its first monetary policy meeting of the year today. The Czech Koruna has weakened above 24.90 EUR/CZK, which is basically the weakest level since early 2022. Economists at ING analyze how CNB’s decision could impact the pair.
CZK should start appreciating again later this year
If the CNB delivers a 50 bps rate cut, it is obviously negative news for the CZK. But on the other hand, we believe that the market positioning is already heavily short and rates are already pricing in the vast majority of CNB rate cuts. That is why we see the peak around 25.20 EUR/CZK.
A minor cut, however, could bring a temporary strengthening towards 24.70 given heavy dovish expectations.
In the long-term, however, we think that after the 50 bps rate cut and January inflation, the market should have hit the limit of what can be priced in and the CZK should start appreciating again later this year thanks to the economic recovery, good current account results and falling EUR rates improving the interest rate differential.
Economists at Wells Fargo expect a stronger Japanese Yen (JPY) versus the US Dollar (USD) through 2024.
Japanese Yen to be an outperformer this year
The Yen has been on the defensive early this year as soft Japanese data keep the Bank of Japan on hold and US economic trends show some resilience. That said, we still expect US growth to slow, the Fed to ease monetary policy, and US bond yields to fall, which should all support Japan's currency.
We also view the BoJ as moving steadily and gradually toward policy normalization, forecasting a policy rate increase in April. Indeed, with Japan likely one of the few countries to go against the global monetary easing trend this year, we expect the Yen to perform more strongly as the year progresses, targeting a USD/JPY exchange rate of 141.00 by the end of 2024.
“The Governing Council’s future decisions will ensure that its policy rates will be set at sufficiently restrictive levels for as long as necessary,” the European Central Bank’s (ECB) Economic Bulletin showed on Thursday.
Additional takeaways
The Governing Council will continue to follow a data-dependent approach to determining the appropriate level and duration of restriction.
The incoming information broadly confirmed its previous assessment of the medium-term inflation outlook.
The euro area economy is likely to have stagnated in the final quarter of 2023.
Market reaction
The Euro seems to have ignored the above headlines, keeping EUR/USD modestly flat near 1.0775.
- USD/CHF depreciates as US Treasury yields lose ground on risk appetite.
- Risk-on mood improves despite the US Fed’s hawkish stance on interest rate trajectory.
- The appreciation of the CHF curbs Swiss inflation by lowering the cost of imported goods and services.
USD/CHF attempts to recover its recent gains registered in the previous session. The USD/CHF pair edges lower to near 0.8730 during the European hours on Thursday. The improved risk appetite weakened the US Dollar (USD) against the Swiss Franc (CHF). Additionally, the subdued US bond yields are contributing downward pressure to undermining the Greenback.
However, the US Dollar Index (DXY) hovers around 104.10 with the 2-year and 10-year yields on US bond coupons standing at 4.42% and 4.11%, respectively, by the press time. Market sentiment seems to avoid the hawkish stance taken by the US Federal Reserve (Fed) post-January interest rate decision.
The Federal Reserve reiterated its commitment to maintaining elevated interest rates for an extended period. Federal Reserve Chair Jerome Powell dismissed the notion of a rate cut in March, emphasizing the importance of monitoring inflation's sustainable return to the 2% target.
In January, the non-seasonally adjusted Swiss Unemployment Rate (year-on-year) rose to 2.5%, up from the previous figure of 2.3%. Meanwhile, the seasonally adjusted Unemployment Rate (month-on-month) remained unchanged at 2.2%, in line with expectations.
Swiss National Bank (SNB) decided to maintain its key interest rate at 1.75%, signaling the end of its recent tightening phase. The strengthened Swiss Franc has played a role in curbing inflation by lowering the expenses associated with imported goods and services. Forecasts for the current year suggest that inflation is projected to remain below the 2.0% threshold. Consequently, market analysts widely anticipate that the SNB could introduce its first rate cut in September 2024.
US Dollar (USD) holds steady with the USD Index (DXY) moving sideways near 104.00. Economists at ING analyze Greenback’s outlook.
Dollar to trade on the firm side heading into Friday's US CPI benchmark revisions
We suspect the Dollar will continue to trade on the firm side heading into Friday's US CPI benchmark revisions – but the Dollar could sell off afterwards and risk assets could rally, should these revisions not upset the US disinflation story.
We doubt the US initial clams will be a big market mover today and can see DXY staying bid in the 104.00 to 104.60 range.
- USD/CAD attempts recovery from 1.3450 while the broader market mood remains quiet.
- Fed policymakers need more evidence to gain confidence about inflation declining towards 2%.
- Canadian jobless rate is seen as higher due to the restrictive monetary policy stance of the Bank of Canada.
The USD/CAD pair finds interim support near 1.3450 in the European session on Thursday after witnessing a sell-off in the last two trading sessions. The broader action in the Loonie asset is still lackluster as the United States economic calendar is light this week.
The US Dollar Index (DXY) oscillates in a tight range near 104.00 as investors have digested that the Federal Reserve (Fed) will not begin reducing interest rates until it gets confident that inflation will come down sustainably to the 2% target.
Boston Federal Reserve Bank President Susan Collins said on Wednesday that the central bank would be able to lower interest rates at some point later this year if economic data evolves consistently with their goals. Collins didn’t provide any significant timeline for rate cuts, citing she needs confidence that inflation will return to the 2% target.
Meanwhile, investors await Canada’s Employment data for further action. According to the estimates, Canadian employers hired 15K workers in January. The Unemployment Rate is expected to rise to 5.9% vs. 5.8% in December.
USD/CAD trades in an Ascending Triangle chart pattern formed on a four-hour timeframe, representing a volatility contraction but with a positive bias. The upward-sloping trendline of the aforementioned pattern is placed from December 29 low at 1.3178, while the horizontal resistance is plotted from January 17 high at 1.3542.
The Loonie asset finds a temporary cushion near the 50-period Exponential Moving Average (EMA), which trades around 1.3466.
The 14-period Relative Strength Index (RSI) oscillates in the 40.00-60.00 range, which indicates that investors await a fresh economic trigger.
The fresh upside would emerge if the Loonie asset climbed above the January 17 high at 1.3542, which will drive the asset towards the round-level resistance of 1.3600, followed by the November 30 high at 1.3627.
On the flip side, a sell-off could appear if the Loonie asset drops below January 31 low at 1.3359. This will expose the asset to January 4 low at 1.3318 and January 5 low at 1.3288.
USD/CAD four-hour chart
-638429786785940939.png)
EUR/USD is working its way back up in small steps. Economists at Commerzbank analyze the pair’s outlook.
Euro side still not helpful for EUR/USD
While the US has provided positive impulses in the form of positive labor market data and hawkish comments, the economic data from the Eurozone looks unfavorable at best.
The fact that the USD's strength has not continued, despite the continued hawkish comments from Fed officials, is likely due to the fact that the comments brought little news and the market has made up its mind about the Fed. More significant moves will likely require new data to support the officials' statements. Today's initial jobless claims are unlikely to be enough for a reassessment unless there is a significant surprise.
Friday's US payrolls are likely to be too much of an echo. And on the Euro side, there is still no major data on the agenda. As a result, EUR/USD may rise a bit today, but the Euro side is hardly contributing, which limits the upside potential for the time being.
- Pound Sterling remains inside Wednesday’s trading range amid an absence of fresh economic indicators.
- Persistent UK inflation would allow the BoE to deliver rate cuts later than other G-7 economies.
- The USD index turns lackluster after a corrective move as investors digest hawkish rhetoric from Fed policymakers.
The Pound Sterling (GBP) trades back and forth in a narrow range in Thursday’s European session due to a lack of fresh economic triggers for a decisive move. The GBP/USD pair turns quiet as traders await commentary from Bank of England (BoE) policymaker Catherine Mann for more guidance on future interest rates. If interest rates remain high in the UK compared to counterparts, GBP will likely be bullish as higher interest rates tend to attract greater foreign capital inflows.
On Wednesday, BoE Deputy Governor Sarah Breeden joined Chief Economist Huw Pill and said that the central bank is now focusing on the length of time that interest rates are required to remain at current levels.
In the last monetary policy statement, BoE Governor Andrew Bailey also said the longevity of higher interest rates depends upon upcoming data.
Apparently, BoE policymakers are gradually considering exiting from ultra-hawkish interest rates. However, the time period required for shifting to an easy monetary policy by the BoE is likely to be much longer than the Federal Reserve (Fed) and the European Central Bank (ECB) due to significant differences in wage growth momentum.
The Pound Sterling is expected to face volatility as BoE policymaker Catherine Mann is scheduled to speak at 15:00 GMT on Thursday. Mann is expected to maintain the hawkish rhetoric as she was one of the two of nine policymakers who voted for an interest rate hike by 25 basis points (bps) in the monetary policy meeting held on February 1.
Daily Digest Market Movers: Pound Sterling juggles in a tight range amid quiet market mood
- Pound Sterling oscillates in a tight range, slightly above 1.2600, as investors seek meaningful guidance over when and how much the Bank of England (BoE) will reduce interest rates this year.
- After a series of declines in price pressures, BoE policymakers are gradually leaning towards an expansionary policy stance.
- On Wednesday, BoE Deputy Governor Sarah Breeden highlighted strong wage growth momentum as a factor feeding price pressures.
- Sarah Breeden said inflationary pressures in the United Kingdom economy are still persistent but are well contained within the BoE’s forecast, making her less concerned about further policy tightening.
- Breeden added the focus of Monetary Policy Committee (MPC) members has now shifted to how long interest rates are needed to remain at restricted levels.
- Breeden further added that the central bank will focus on how pay growth and aggregate demand evolve ahead, allowing them more time to gain confidence about when inflation will return to the 2% target.
- Meanwhile, the US Dollar Index (DXY) is stuck in a tight range around 104.00.
- Federal Reserve policymakers are avoiding speculation over the timing of interest rate cuts, emphasizing keeping restrictive interest rates for longer until they get greater confidence that inflation will return to the 2% target.
- Investors see no offering of timing over rate cuts from the Fed, forcing them to shift to the sidelines.
- Next week, the release of the US inflation data for January is expected to provide a meaningful outlook on the future course of interest rates.
Technical Analysis: Pound Sterling hovers above 1.2600
Pound Sterling consolidates in a limited range around 1.2630 in Thursday’s European session. The Cable struggles to continue its two-day winning spell.
On a daily time frame, the GBP/USD pair has rebounded to near the 50-period Exponential Moving Average (EMA), which trades around 1.2640. The 20-period EMA has turned down, indicating a weak outlook in the very short-term. The 14-period Relative Strength Index (RSI) oscillates in the 40.00-60.00 range, indicating a lackluster performance ahead.
Pound Sterling FAQs
What is the Pound Sterling?
The Pound Sterling (GBP) is the oldest currency in the world (886 AD) and the official currency of the United Kingdom. It is the fourth most traded unit for foreign exchange (FX) in the world, accounting for 12% of all transactions, averaging $630 billion a day, according to 2022 data.
Its key trading pairs are GBP/USD, aka ‘Cable’, which accounts for 11% of FX, GBP/JPY, or the ‘Dragon’ as it is known by traders (3%), and EUR/GBP (2%). The Pound Sterling is issued by the Bank of England (BoE).
How do the decisions of the Bank of England impact on the Pound Sterling?
The single most important factor influencing the value of the Pound Sterling is monetary policy decided by the Bank of England. The BoE bases its decisions on whether it has achieved its primary goal of “price stability” – a steady inflation rate of around 2%. Its primary tool for achieving this is the adjustment of interest rates.
When inflation is too high, the BoE will try to rein it in by raising interest rates, making it more expensive for people and businesses to access credit. This is generally positive for GBP, as higher interest rates make the UK a more attractive place for global investors to park their money.
When inflation falls too low it is a sign economic growth is slowing. In this scenario, the BoE will consider lowering interest rates to cheapen credit so businesses will borrow more to invest in growth-generating projects.
How does economic data influence the value of the Pound?
Data releases gauge the health of the economy and can impact the value of the Pound Sterling. Indicators such as GDP, Manufacturing and Services PMIs, and employment can all influence the direction of the GBP.
A strong economy is good for Sterling. Not only does it attract more foreign investment but it may encourage the BoE to put up interest rates, which will directly strengthen GBP. Otherwise, if economic data is weak, the Pound Sterling is likely to fall.
How does the Trade Balance impact the Pound?
Another significant data release for the Pound Sterling is the Trade Balance. This indicator measures the difference between what a country earns from its exports and what it spends on imports over a given period.
If a country produces highly sought-after exports, its currency will benefit purely from the extra demand created from foreign buyers seeking to purchase these goods. Therefore, a positive net Trade Balance strengthens a currency and vice versa for a negative balance.
EUR/USD is drifting around in ranges. Economists at ING analyze the pair’s outlook.
EUR/CHF should be heading to 0.9500/0.9600
We doubt EUR/USD will make a move higher before Friday's US CPI revisions, meaning that 1.0800 should prove good intra-day resistance.
The slightly higher rate environment has seen EUR:CHF two-year swap differentials widen back out to 188 bps and support EUR/CHF. There should be more to come here and we wonder whether speculation builds over a Swiss National Bank rate cut as early as March. We retain a view that EUR/CHF should be heading to 0.9500/0.9600.
- NZD/USD gains ground on improved risk appetite.
- The pair could reach the 23.6% Fibonacci retracement at 0.6125 and the 50-day EMA of 0.6136.
- A break below the psychological support of 0.6100 could lead the pair to revisit the weekly low at 0.6038.
NZD/USD trades higher for the third straight session around 0.6110 during the early European session on Thursday. The NZD/USD pair could find the resistance zone around the 23.6% Fibonacci retracement at 0.6125 followed by the 50-day Exponential Moving Average (EMA) of 0.6136.
A breakthrough above the 50-day EMA could support the pair to explore the area around 0.6150 followed by the 38.2% Fibonacci retracement at 0.6179. If the NZD/USD pair breaches the latter, it could test the psychological resistance of the 0.6200 level.
The technical analysis for the NZD/USD pair indicates a tepid momentum in the market. The Moving Average Convergence Divergence (MACD) line is positioned on the centerline, showing divergence below the signal line. However, the lagging indicator 14-day Relative Strength Index (RSI) lies below the 50 level, suggesting a weaker sentiment for the NZD/USD pair.
On the downside, immediate support for the NZD/USD pair is identified at the psychological level of 0.6100. A decisive break below this level could exert downward pressure, leading the pair to revisit the major support at 0.6050 before the weekly low at 0.6038. The bearish sentiment could lead the pair to navigate the region around the psychological support at 0.6000.
NZD/USD: Daily Chart
-638429756198128940.png)
The Swiss Franc (CHF)proved the major G10 outperformer in 2023. Economists at CIBC Capital Markets analyze EUR/CHF outlook for the coming months.
Graduated weakening in the CHF
The combination of disinflationary dynamics and an SNB that is increasingly mindful of a strong currency points towards a graduated weakening in the CHF.
Currently, the market anticipates more ECB activism into mid-year (-53 bps) than for the SNB (-42 bps). We would view both as likely to consider a more modest degree of policy easing.
Given the prospect of a more aggressive paring in ECB rate cut assumptions this points towards EUR/CHF heading towards the 200-Day Moving Average, modestly above 0.9600 into mid-2024.
Here is what you need to know on Thursday, February 8:
Major currency pairs fluctuate in relatively tight ranges in the second half of the week as investors' search for fresh catalysts continue. Later in the session, the weekly Initial Jobless Claims and December Wholesale Inventories data will be featured in the US economic docket. Policymakers from the European Central Bank (ECB), the Bank of England (BoE) and the Federal Reserve (Fed) will be delivering speeches throughout the day.
The US Dollar (USD) Index edged lower on Wednesday but managed to hold near 104.00. The benchmark 10-year US Treasury bond yield stabilized above 4.1% after the high-yield at the latest 10-year Treasury note auction came in at 4.09%. Early Thursday, the 10-year yield moves up and down in a narrow band at around 4.1% and US stock index futures trade virtually unchanged.
During the Asian trading hours, the data from China showed that the Consumer Price Index rose 0.3% on a monthly basis in January. The annual CPI declined 0.8% in the same period.
US Dollar price this week
The table below shows the percentage change of US Dollar (USD) against listed major currencies this week. US Dollar was the weakest against the New Zealand Dollar.
| USD | EUR | GBP | CAD | AUD | JPY | NZD | CHF | |
| USD | -0.04% | -0.07% | -0.12% | -0.27% | 0.15% | -0.82% | 0.67% | |
| EUR | 0.04% | -0.03% | -0.08% | -0.24% | 0.19% | -0.77% | 0.71% | |
| GBP | 0.07% | 0.04% | -0.05% | -0.20% | 0.22% | -0.74% | 0.74% | |
| CAD | 0.12% | 0.08% | 0.04% | -0.16% | 0.26% | -0.70% | 0.79% | |
| AUD | 0.27% | 0.23% | 0.20% | 0.15% | 0.42% | -0.54% | 0.94% | |
| JPY | -0.16% | -0.19% | -0.24% | -0.26% | -0.39% | -0.98% | 0.53% | |
| NZD | 0.82% | 0.77% | 0.73% | 0.68% | 0.53% | 0.95% | 1.49% | |
| CHF | -0.66% | -0.70% | -0.73% | -0.78% | -0.94% | -0.51% | -1.48% |
The heat map shows percentage changes of major currencies against each other. The base currency is picked from the left column, while the quote currency is picked from the top row. For example, if you pick the Euro from the left column and move along the horizontal line to the Japanese Yen, the percentage change displayed in the box will represent EUR (base)/JPY (quote).
EUR/USD registered modest gains for the second consecutive day on Wednesday. The pair continues to edge higher toward 1.0800 in the early European session.
GBP/USD rose 0.25% on Wednesday but lost its bullish momentum. At the time of press, the pair was flat on the day at 1.2630.
Bank of Japan (BoJ) Deputy Governor Shinichi Uchida said on Thursday that the future rate path depends on economic and price developments at the time. "We will first determine whether conditions have fallen into place to shift policy, then consider the most appropriate means, sequence to do so," Uchida added. USD/JPY edged higher in the Asian session and was last seen trading in positive territory near 148.70.
The Bank of Canada's (BoC) latest Summary of Deliberations showed that with inflation still too high and too broad-based, members wanted to be clear in their communications that they were still concerned about the persistence of underlying inflation. USD/CAD continues to stretch lower toward 1.3450 after closing the previous two days in the red.
Gold climbed above $2,040 on Wednesday but lost its traction to close the day flat as the US yields rebounded later in the American session. XAU/USD trades in a narrow channel above $2,030 early Thursday.
- Asian equities gain ground on Thursday amid hope for Chinese stimulus measures.
- The December Japanese Current Account came in lower than expected.
- The Reserve Bank of India (RBI) MPC decided to maintain the repo rate steady at 6.5%.
Most Asian stocks edge higher on Thursday following the S&P 500 closed at a record high of nearly 5,000. A strong US economy and Chinese initiatives to improve the nation's sentiment are driving the recovery of Asian equities.
At press time, China’s Shanghai was up 0.62% to 2,847, the Shenzhen Component Index rose 1.08% to 8,802, Hong Kong’s Hang Sang dropped 1.26% to 15,877, South Korea’s Kospi was up 0.16%, India’s NIFTY 50 was down 0.86% to 21,745, and Japan’s Nikkei led gains, rising 1.91% to 36,881.
Japan’s December current account balance was lower than expected. Japan's Current Account surplus stood at 744.3 billion yen in December, compared with the expectation of a surplus of 1.02 trillion yen. Exports grew 9.4% YoY in December, while Imports fell 5.4% YoY on weaker domestic demand.
In China, the policymakers plan to bolster markets ahead of the long Lunar New Year holiday. The Chinese economy continues to face deflationary pressures, with consumer prices falling sharply for the first time in 14 years in January. This has increased pressure on officials to take more measures to boost the economy.
In India, the Reserve Bank of India (RBI) Monetary Policy Committee (MPC) decided to keep the repo rate unchanged at 6.5% for the sixth consecutive time as inflation approaches the upper tolerance level of 6%.
Furthermore, the Bank of Thailand (BoT) left its benchmark interest rate steady for the second consecutive meeting on Wednesday, despite government pressure to lower borrowing rates to boost sluggish growth.
Looking ahead, traders will monitor the US weekly Initial Jobless Claims, Wholesale Inventories, and Fed’s Barkin (Richmond) speech. Mainland Chinese stock markets are set to close on Friday for the Lunar New Year and will reopen on Monday.
Bank of Japan (BoJ) Deputy Governor Shinichi Uchida said on Thursday, the “future rate path depends on economic and price developments at the time.”
Additional quotes
Focus ahead would be pace of increase in inflation expectations, degree of price dynamism including wages.
We wil first determine whether conditions have fallen into place to shift policy, then consider most appropriate means, sequence to do so.
Just because we terminate YCC, that doesn't mean we will suddenly stop bond buying.
Whether we will keep expanding our balance sheet, or hold off on scaling it back, when we roll back massive stimulus will depend on economic developments at the time.
We are seeing hopeful signs of rising prices leading to higher wage growth.
Outcome of this year's annual wage negotiation will be crucial factor in judging whether positive economic cycle will kick off.
Likelihood of sustained achievement of price target gradually heightening.
I won't make any assessment, comment on market perceptions of future rate path.
Fate of BoJ’s overshooting commitment will be decided once sustained achievement of 2% inflation target comes into sight.
Govt, BoJ share common understanding in guiding policy.
Inflation won't sustainably hit 2% unless accompanied by wage growth, so we will ensure to support the economy to achieve this.
Market reaction
At the time of writing, USD/JPY is adding 0.30% on the day to trade at 148.64.
Japanese Yen price today
The table below shows the percentage change of Japanese Yen (JPY) against listed major currencies today. Japanese Yen was the weakest against the Swiss Franc.
| USD | EUR | GBP | CAD | AUD | JPY | NZD | CHF | |
| USD | -0.07% | -0.02% | -0.09% | 0.01% | 0.33% | -0.02% | -0.10% | |
| EUR | 0.06% | 0.05% | -0.01% | 0.07% | 0.38% | 0.04% | -0.06% | |
| GBP | 0.03% | -0.02% | -0.05% | 0.05% | 0.39% | 0.02% | -0.09% | |
| CAD | 0.07% | 0.01% | 0.06% | 0.08% | 0.45% | 0.05% | -0.05% | |
| AUD | -0.01% | -0.07% | -0.02% | -0.08% | 0.36% | -0.02% | -0.14% | |
| JPY | -0.36% | -0.45% | -0.36% | -0.43% | -0.32% | -0.43% | -0.49% | |
| NZD | 0.02% | -0.04% | 0.00% | -0.05% | 0.03% | 0.39% | -0.09% | |
| CHF | 0.12% | 0.04% | 0.10% | 0.04% | 0.12% | 0.49% | 0.10% |
The heat map shows percentage changes of major currencies against each other. The base currency is picked from the left column, while the quote currency is picked from the top row. For example, if you pick the Euro from the left column and move along the horizontal line to the Japanese Yen, the percentage change displayed in the box will represent EUR (base)/JPY (quote).
- GBP/USD moves on an upward trajectory amid a bearish sentiment.
- The major level around 1.2650 lined up with the 14-day EMA at 1.2656 emerges as the immediate barrier.
- The psychological level at 1.2600 could act as a key support level.
GBP/USD continues the winning streak for the straight third session, edging higher to near 1.2630 during the Asian session on Thursday. The GBP/USD pair receives upward support as the US Dollar (USD) faces challenges against the Pound Sterling (GBP), which could be attributed to the downbeat US yields amid an improved risk-on sentiment.
The GBP/USD pair could find the immediate barrier at the major level around 1.2650 in conjunction with the 14-day Exponential Moving Average (EMA) at 1.2656, followed by the 50.0% retracement level at 1.2673. A breakthrough above this level could strengthen the upward sentiment and support the pair to approach the resistance zone around the psychological level at 1.2700 aligned with the 61.8% Fibonacci retracement at 1.2709 level.
However, the technical analysis of the GBP/USD pair shows that the 14-day Relative Strength Index (RSI) is positioned below 50. This indicates a bearish momentum for the pair. Additionally, the Moving Average Convergence Divergence (MACD), a lagging indicator, suggests a confirmation of the subdued momentum for the pair. This is evident from the MACD line being situated below the centerline and the signal line.
The GBP/USD pair may encounter support at the psychological level of 1.2600 following further support near the major level at 1.2550. A break below the latter could push the pair to test the weekly low at 1.2518 before the psychological level at 1.2500.
GBP/USD: Daily Chart
-638429670528359005.png)
- EUR/USD attracts buyers for the third straight day and climbs to a fresh weekly top.
- A combination of factors undermines the USD and acts as a tailwind for the major.
- ECB rate cut bets might cap gains amid a bearish technical setup on the daily chart.
The EUR/USD pair builds on this week's recovery move from the 1.0720-1.0725 region, or its lowest level in almost three months and gains positive traction for the third successive day on Thursday. The momentum lifts spot prices to a fresh weekly top, closer to the 1.0800 mark during the Asian session and is sponsored by a modest US Dollar (USD) weakness.
A slew of influential Federal Reserve (Fed) officials recently tempered market expectations for early interest rate cuts, which remains supportive of elevated US Treasury bond yields. That said, the markets are still pricing in five rate cuts over the course of the Fed’s seven remaining meetings this year. This, along with a generally positive risk tone, undermines the safe-haven buck, which, in turn, is seen as a key factor pushing the EUR/USD pair higher.
The USD bears, however, refrain from placing aggressive bets and prefer to wait for more cues about the likely timing and the pace of rate cuts in 2024. This, along with expectations that the European Central Bank (ECB) could start cutting interest rates by April amid falling inflation in the Eurozone, might cap gains for the EUR/USD pair. Hence, it will be prudent to wait for strong follow-through buying before confirming that spot prices have bottomed out.
From a technical perspective, momentum beyond the 1.0800 mark is likely to meet with a fresh supply near the very important 200-day Simple Moving Average (SMA), currently pegged near the 1.0830-1.0835 region. This is closely followed by a one-month-old descending trend line, around mid-1.0800s, which if cleared decisively might shift the near-term bias in favour of bullish traders and prompt aggressive short-covering around the EUR/USD pair.
Spot prices might then aim to reclaim the 1.0900 round figure and extend the positive move further towards the next relevant hurdle near the 1.0920-1.0925 region. A sustained strength beyond the latter should pave the way for additional gains and lift the EUR/USD pair to the 1.1000 psychological mark.
On the flip side, the 1.0750-1.0745 zone is likely to protect the immediate downside ahead of the monthly low, around the 1.0725-1.0720 region and the 1.0700 mark. A convincing break below the latter will be seen as a fresh trigger for bearish traders and make the EUR/USD pair vulnerable to accelerate the slide further towards the 1.0665-1.0660 intermediate support en route to the 1.0620-1.0615 region and the 1.0600 round figure.
EUR/USD daily chart
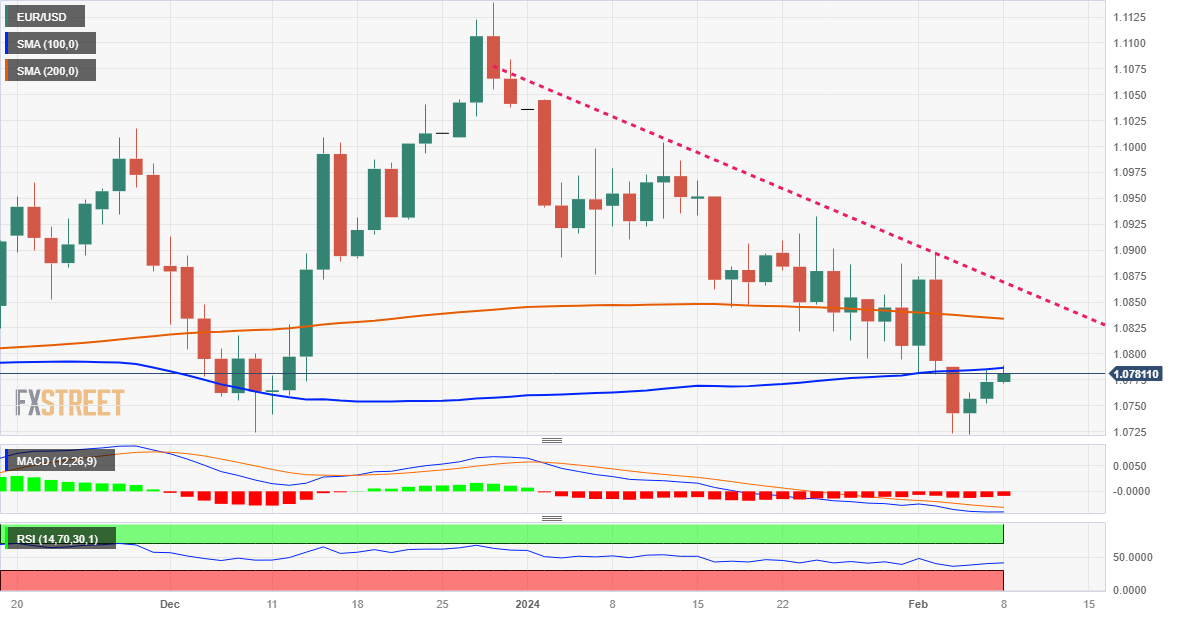
Technical levels to watch
- USD/CNH attempts to retrace its recent gains on the subdued US Dollar.
- Chinese CPI declined by 0.8% YoY against the expected 0.5% decline.
- Fed members’ comments suggest to keeping interest rates elevated until inflation sustainably returns to the 2% target.
USD/CNH remains in the negative territory after trimming the intraday losses on Thursday. USD/CNH pair trades lower near 7.2090 during the Asian trading hours. However, the People’s Bank of China (PBoC) set the USD/CNY central rate at 7.1063 as compared to 7.1911 Reuters estimates.
In January, the Chinese Consumer Price Index (CPI) experienced a month-on-month growth of 0.3%, which was slightly below the expected 0.4%. However, this figure represented an improvement from the previous reading of 0.1%. On an annual basis, the CPI declined by 0.8%, surpassing the anticipated decline of 0.5% and the previous decline of 0.3%. Meanwhile, the Producer Price Index (PPI) on a year-on-year basis declined by 2.5%, which was slightly lower than the expected 2.6% decline.
US Dollar (USD) faces challenges due to the risk-on sentiment despite the hawkish stance taken by the Federal Reserve (Fed) to keep interest rates higher for quite some time, which, in turn, weighs on the USD/CNH pair. In a press conference post-interest rate decision on January 31, Fed Chair Jerome Powell rejected the idea of a rate cut in March and committed to monitoring inflation to ensure its sustainable return to the 2% target.
Additionally, in her address to the Boston Economic Club, Fed Boston President Susan Collins hinted at the potential for rate cuts later in the year if the economy aligns with expectations. Meanwhile, Federal Reserve Governor Adriana Kugler expressed satisfaction with the significant progress on inflation during remarks made on Wednesday, conveying optimism about the sustainability of this positive trend.
- Gold price continues with its struggle to gain traction and remains confined in range.
- The uncertain Fed rate cut path is holding back traders from placing directional bets.
- Subdued USD demand and a positive risk tone contribute to the range bound price action.
Gold price (XAU/USD) extends its sideways consolidative price move during the Asian session on Thursday as traders remain uncertain about the timing and the likely pace of interest rate cuts by the Federal Reserve (Fed) this year. The markets seem convinced that the US central bank will eventually start cutting interest rates in May, if not March. This keeps the US Dollar (USD) bulls on the defensive, below the highest level in almost three months touched earlier this week and acts as a tailwind for the precious metal.
That said, a slew of influential Fed officials recently indicated that the central bank is in no hurry to start lowering borrowing costs in the wake of the resilient US economy. This remains supportive of elevated US Treasury bond yields and caps the upside for the non-yielding Gold price. Apart from this, the prevalent risk-on environment turns out to be another factor undermining the safe-haven XAU/USD. This, in turn, is holding back traders from placing aggressive directional bets and leading to subdued range bound price action.
Daily Digest Market Movers: Gold price lacks firm near-term direction amid Fed rate cut uncertainty
- The recent hawkish remarks by several Federal Reserve officials smashed expectations for early and steep interest rate cuts in 2024, which, in turn, acts as a headwind for the non-yielding Gold price.
- Fed Chair Jerome Powell dashed any remaining hopes for a March rate cut and said on Sunday that the central bank can be "prudent" in deciding when to start easing in the wake of a strong economy.
- Fed Governor Adriana Kugler said on Wednesday that she is pleased with the great progress on inflation and added that she is optimistic that the progress will continue, though the job is not done yet.
- Kugler further added that at some point, cooling inflation and labor markets may make a rate cut appropriate, but if disinflation progress stalls, it may be appropriate to hold the policy rate steady for longer.
- Boston Fed President Susan Collins said that inflation has slowed faster than expected but added that the central bank wants more certainty before it cuts rates and the economy needs to cool a bit further.
- Minneapolis Fed President Neel Kashkari noted that officials would like to see a few more months of inflation data before cutting rates and added that he thinks two to three cuts will be appropriate for 2024.
- The markets, however, are still pricing in five rate cuts over the course of the Fed’s seven remaining meetings this year, which keeps the US Dollar bulls on the defensive and lends support to the XAU/USD.
- The yield on the benchmark 10-year US government bond holds comfortably above the 4.0% market and should help limit any meaningful downside for the Greenback ahead of the US inflation figures next week.
- The prevalent risk-on environment might further contribute to capping the upside for the safe-haven precious metal as traders now look to the US Weekly Initial Jobless Claims for short-term opportunities.
Technical Analysis: Gold price traders await breakout of a short-term range
From a technical perspective, the $2,023-2,022 area is likely to protect the immediate downside ahead of the weekly low, around the $2,015 region. Some follow-through selling will expose the $2,000 psychological mark, below which the Gold price could accelerate the slide towards the 100-day Simple Moving Average (SMA), currently around the $1,986 zone. The downfall could extend further towards the very important 200-day SMA, near the $1,966-1,965 region.
On the flip side, the overnight swing high, around the $2,044-2,045 area, or the weekly top, now seems to act as an immediate hurdle ahead of the $2,054-2,055 zone and the $2,065 region, or last week's swing high. Given that oscillators on the daily chart are holding in the positive territory, a sustained strength beyond should lift the Gold price towards the $2,078-2,079 area, or the YTD peak set in January. The subsequent move-up should allow the XAU/USD to reclaim the $2,100 mark and climb further to the next relevant hurdle near the $2,120 region.
US Dollar price this week
The table below shows the percentage change of US Dollar (USD) against listed major currencies this week. US Dollar was the strongest against the Swiss Franc.
| USD | EUR | GBP | CAD | AUD | JPY | NZD | CHF | |
| USD | -0.05% | -0.08% | -0.13% | -0.35% | -0.10% | -0.88% | 0.66% | |
| EUR | 0.05% | -0.02% | -0.08% | -0.30% | -0.05% | -0.83% | 0.71% | |
| GBP | 0.08% | 0.03% | -0.05% | -0.27% | -0.03% | -0.80% | 0.75% | |
| CAD | 0.13% | 0.08% | 0.06% | -0.22% | 0.03% | -0.75% | 0.79% | |
| AUD | 0.34% | 0.28% | 0.28% | 0.22% | 0.25% | -0.53% | 1.00% | |
| JPY | 0.09% | 0.02% | -0.02% | -0.02% | -0.25% | -0.81% | 0.75% | |
| NZD | 0.87% | 0.82% | 0.80% | 0.75% | 0.53% | 0.79% | 1.53% | |
| CHF | -0.67% | -0.71% | -0.74% | -0.80% | -1.02% | -0.77% | -1.56% |
The heat map shows percentage changes of major currencies against each other. The base currency is picked from the left column, while the quote currency is picked from the top row. For example, if you pick the Euro from the left column and move along the horizontal line to the Japanese Yen, the percentage change displayed in the box will represent EUR (base)/JPY (quote).
Gold FAQs
Why do people invest in Gold?
Gold has played a key role in human’s history as it has been widely used as a store of value and medium of exchange. Currently, apart from its shine and usage for jewelry, the precious metal is widely seen as a safe-haven asset, meaning that it is considered a good investment during turbulent times. Gold is also widely seen as a hedge against inflation and against depreciating currencies as it doesn’t rely on any specific issuer or government.
Who buys the most Gold?
Central banks are the biggest Gold holders. In their aim to support their currencies in turbulent times, central banks tend to diversify their reserves and buy Gold to improve the perceived strength of the economy and the currency. High Gold reserves can be a source of trust for a country’s solvency. Central banks added 1,136 tonnes of Gold worth around $70 billion to their reserves in 2022, according to data from the World Gold Council. This is the highest yearly purchase since records began. Central banks from emerging economies such as China, India and Turkey are quickly increasing their Gold reserves.
How is Gold correlated with other assets?
Gold has an inverse correlation with the US Dollar and US Treasuries, which are both major reserve and safe-haven assets. When the Dollar depreciates, Gold tends to rise, enabling investors and central banks to diversify their assets in turbulent times. Gold is also inversely correlated with risk assets. A rally in the stock market tends to weaken Gold price, while sell-offs in riskier markets tend to favor the precious metal.
What does the price of Gold depend on?
The price can move due to a wide range of factors. Geopolitical instability or fears of a deep recession can quickly make Gold price escalate due to its safe-haven status. As a yield-less asset, Gold tends to rise with lower interest rates, while higher cost of money usually weighs down on the yellow metal. Still, most moves depend on how the US Dollar (USD) behaves as the asset is priced in dollars (XAU/USD). A strong Dollar tends to keep the price of Gold controlled, whereas a weaker Dollar is likely to push Gold prices up.
- USD/CAD loses ground despite the hawkish Fed stance on interest rate trajectory.
- WTI price strengthens as Israel has rejected Hamas' proposal for a ceasefire.
- BoC projects that Canadian inflation will persist above 2% until sometime in 2025.
USD/CAD continues to move in a downward direction for the third straight day, edging lower to near 1.3450 during the Asian session on Thursday. The upbeat Crude oil prices are contributing support to strengthening the Canadian Dollar (CAD), which, in turn, acts as a headwind for the USD/CAD pair.
West Texas Intermediate (WTI) oil price hovers around $74.20 per barrel, at the time of writing. Crude oil prices are expected to maintain their upward trajectory, with a potential obstacle emerging in the process of a ceasefire in the Israel-Gaza conflict. Israeli Prime Minister Benjamin Netanyahu has rejected Hamas' proposal for a ceasefire and the release of hostages in the Gaza Strip.
However, US Secretary of State Antony Blinken has indicated the possibility of further negotiations to achieve a resolution. Additionally, a Hamas delegation, led by senior official Khalil Al-Hayya, is scheduled to travel to Cairo on Thursday for discussions with Egypt and Qatar aimed at reaching a ceasefire agreement.
The Bank of Canada (BoC) projections that Canadian inflation will persist above 2% until sometime in 2025. BoC underscored global economic challenges, highlighting the resilience of consumer spending in the United States (US) as a mitigating factor against downside risks.
The US Dollar Index (DXY) seems to continue its downward trend for the third consecutive session, hovering around 104.00, by the press time. The Greenback faces challenges on downbeat US Treasury yields despite the US Federal Reserve (Fed) emphasizing its commitment to keeping interest rates elevated for quite some time. Federal Reserve Chair Jerome Powell dismissed the possibility of a rate cut in March and committed to monitor inflation sustainably returning to the 2% target.
Federal Reserve Governor Adriana Kugler expressed contentment with the notable progress on inflation during remarks made on Wednesday, expressing optimism that this positive trajectory will endure. Fed Boston President Susan Collins, addressing the Boston Economic Club, suggested the possibility of rate cuts later in the year if the economy meets expectations.
Market participants will focus on US jobs data on Thursday, including Initial Jobless Claims for the week ending on February 2. On Canada’s side, the Unemployment Rate and Net Change in Employment will be released on Friday.
- Indian Rupee gains some ground on the softer US dollar and lower US bond yields.
- The Reserve Bank of India (RBI) is likely to keep the key rates unchanged at 6.5% for the sixth consecutive time.
- Traders await the RBI interest rate decision ahead of the US weekly Initial Jobless Claims and speech by Fed’s Barkin.
Indian Rupee (INR) trades on a stronger note on Thursday amid the weaker US Dollar (USD) and a drop in US bond yields. The Reserve Bank of India (RBI) governor Shaktikanta Das will announce the bi-monthly monetary policy on Thursday, which is anticipated to maintain a status quo on the key interest rate.
The RBI Monetary Policy Committee (MPC) held a three-day meeting for the first policy decision of the calendar year 2024. The markets expect the committee to maintain the repo rate steady at the current level of 6.5% for the sixth consecutive time as inflation approaches the upper tolerance level of 6%. The Indian central bank raised its economic growth forecast to 7% from 6.5% due to encouraging signs in the Indian economy such as an expanding manufacturing PMI and robust growth. Nevertheless, the escalating geopolitical tension in the Middle East could potentially pose a threat, as it could cause disruptions in Red Sea shipping, resulting in elevated consumer prices.
The RBI interest rate decision will be in the spotlight on Thursday. Next week, attention will shift to the Indian inflation data and Industrial Production. Investors will monitor the developments surrounding India’s inflation trajectory.
On the US docket, the US weekly Initial Jobless Claims, and Wholesale Inventories will be released. Also, the Federal Reserve Bank of Richmond President, Thomas I. Barkin is set to speak later on Thursday.
Daily Digest Market Movers: Indian Rupee stays firm ahead of RBI rate decision
- India will account for one-third of the 3.2 million barrels per day (mb/d) of global oil demand between 2023 and 2030, according to the International Energy Agency (IEA).
- Finance Minister Nirmala Sitharaman said on Wednesday that India's debt-to-GDP ratio is well below other emerging markets.
- The Finance Minister added that India's retail inflation has stabilized within the 2–6% tolerance band, and core inflation has declined to 3.8% in December 2023.
- Microsoft CEO Satya Nadella said that India is one of the fastest-growing markets in the world, and AI could power 10% of the $5 trillion Indian economy by 2025.
- The Iranian-backed Houthi rebels' attacks on shipping in the Red Sea have interrupted traffic through the Suez Canal, which transports about 12% of global trade.
- Federal Reserve (Fed) Governor Adriana Kugler said that inflation is showing solid signs of slowing down, but she is not yet prepared to begin lowering interest rates.
- Minneapolis Fed President Kashkari said that the Fed needs more time to get confidence on the inflation trajectory before beginning to cut rates. He suggested that two to three rate cuts would seem appropriate for 2024, based on current data.
Technical Analysis: Indian Rupee extends the long-term range-bound theme
Indian Rupee stays in positive territory on the day. The USD/INR pair has traded within a two-month-old descending trend channel of 82.70–83.20.
Technically, USD/INR maintains the bearish outlook intact in the short term as the pair remains capped below the key 100-period Exponential Moving Average (EMA) on the daily chart. The downward momentum is sponsored by the 14-day Relative Strength Index (RSI), which lies below the 50.0 midline, indicating that the possibility of the USD extending its downswing against the INR cannot be ruled out.
If the bears step back in, a low of February 2 at 82.83 acts as an initial support level for USD/INR. The additional downside filter to watch is the lower limit of the descending trend channel at 82.70. Any follow-through selling below the mentioned level will see a drop to a low of August 23 at 82.45, en route to a low of June 1 at 82.25.
If USD/INR sees sustained bullish pressure above the 83.00 psychological barrier, the confluence of the upper boundary of the descending trend channel and a high of January 18 at 83.20 could make for a good upside target. A break above 83.20 could pave the way to a high of January 2 at 83.35, en route to the 84.00 psychological level.
US Dollar price today
The table below shows the percentage change of US Dollar (USD) against listed major currencies today. US Dollar was the strongest against the Japanese Yen.
| USD | EUR | GBP | CAD | AUD | JPY | NZD | CHF | |
| USD | -0.08% | -0.05% | -0.09% | -0.08% | 0.17% | -0.11% | -0.13% | |
| EUR | 0.06% | 0.02% | -0.01% | -0.01% | 0.23% | -0.06% | -0.09% | |
| GBP | 0.05% | -0.01% | -0.04% | -0.04% | 0.22% | -0.07% | -0.09% | |
| CAD | 0.08% | 0.00% | 0.02% | 0.01% | 0.24% | -0.04% | -0.06% | |
| AUD | 0.07% | 0.01% | 0.03% | 0.00% | 0.25% | -0.03% | -0.07% | |
| JPY | -0.16% | -0.24% | -0.22% | -0.25% | -0.22% | -0.27% | -0.29% | |
| NZD | 0.11% | 0.05% | 0.07% | 0.04% | 0.04% | 0.29% | -0.03% | |
| CHF | 0.15% | 0.09% | 0.10% | 0.08% | 0.09% | 0.32% | 0.03% |
The heat map shows percentage changes of major currencies against each other. The base currency is picked from the left column, while the quote currency is picked from the top row. For example, if you pick the Euro from the left column and move along the horizontal line to the Japanese Yen, the percentage change displayed in the box will represent EUR (base)/JPY (quote).
Indian Rupee FAQs
What are the key factors driving the Indian Rupee?
The Indian Rupee (INR) is one of the most sensitive currencies to external factors. The price of Crude Oil (the country is highly dependent on imported Oil), the value of the US Dollar – most trade is conducted in USD – and the level of foreign investment, are all influential. Direct intervention by the Reserve Bank of India (RBI) in FX markets to keep the exchange rate stable, as well as the level of interest rates set by the RBI, are further major influencing factors on the Rupee.
How do the decisions of the Reserve Bank of India impact the Indian Rupee?
The Reserve Bank of India (RBI) actively intervenes in forex markets to maintain a stable exchange rate, to help facilitate trade. In addition, the RBI tries to maintain the inflation rate at its 4% target by adjusting interest rates. Higher interest rates usually strengthen the Rupee. This is due to the role of the ‘carry trade’ in which investors borrow in countries with lower interest rates so as to place their money in countries’ offering relatively higher interest rates and profit from the difference.
What macroeconomic factors influence the value of the Indian Rupee?
Macroeconomic factors that influence the value of the Rupee include inflation, interest rates, the economic growth rate (GDP), the balance of trade, and inflows from foreign investment. A higher growth rate can lead to more overseas investment, pushing up demand for the Rupee. A less negative balance of trade will eventually lead to a stronger Rupee. Higher interest rates, especially real rates (interest rates less inflation) are also positive for the Rupee. A risk-on environment can lead to greater inflows of Foreign Direct and Indirect Investment (FDI and FII), which also benefit the Rupee.
How does inflation impact the Indian Rupee?
Higher inflation, particularly, if it is comparatively higher than India’s peers, is generally negative for the currency as it reflects devaluation through oversupply. Inflation also increases the cost of exports, leading to more Rupees being sold to purchase foreign imports, which is Rupee-negative. At the same time, higher inflation usually leads to the Reserve Bank of India (RBI) raising interest rates and this can be positive for the Rupee, due to increased demand from international investors. The opposite effect is true of lower inflation.
- WTI price could gain ground as Israel has dismissed Hamas' offer for a ceasefire.
- EIA Crude Oil stockpiles came in at 5.521 million barrels against the expected 1.895 million barrels.
- The largest US oilfield, the Permian shale basin, is projected to experience its slowest annual growth since 2021.
West Texas Intermediate (WTI) oil price hovers around $74.20 per barrel during the Asian session on Thursday. Crude oil prices are expected to continue their winning streak for the fourth consecutive session. WTI price receives upward support as an obstacle emerges on a ceasefire in the Israel-Gaza conflict.
Israeli Prime Minister Benjamin Netanyahu has dismissed Hamas' offer for a ceasefire and the release of hostages held in the Gaza Strip. Nonetheless, US Secretary of State Antony Blinken has hinted at the possibility of further negotiations to achieve a resolution. Additionally, a delegation from Hamas, led by senior official Khalil Al-Hayya, is set to journey to Cairo on Thursday for talks with Egypt and Qatar aimed at reaching a ceasefire agreement.
The American Petroleum Institute (API) Weekly Crude Oil Stock exhibited improvement, reporting a figure of 0.674 million barrels, contrasting with the prior decrease of 2.5 million barrels. Despite this, the reported figure fell notably short of the anticipated 2.133 million barrels for the week ending on February 2, providing support for Crude oil prices.
However, the US Energy Information Administration (EIA) reported Crude Oil stockpiles at 5.521 million barrels, surpassing both the expected 1.895 million barrels and the previous figure of 1.234 million barrels. This may have tempered the rise in oil prices.
Additionally, the Permian shale basin, the largest US oilfield spanning Texas and New Mexico, is projected to experience its slowest annual growth since 2021. This development is further bolstering oil prices, as the deceleration in growth will limit overall gains in US production. Coupled with the EIA's revised forecast for a decline in US oil production growth in 2024.
- AUD/JPY gains positive traction for the third straight day and climbs to a fresh weekly peak.
- RBA’s warning of more rate hikes and China’s steps to stabilize markets underpin the Aussie.
- A positive risk tone weighs on the safe-haven JPY and remains supportive of the momentum.
The AUD/JPY cross attracts some buying for the third successive day and rallies to a fresh weekly top, around the 96.85 region during the Asian session on Thursday. Spot prices, however, remain well within a multi-day-old trading range, warranting some caution before positioning for an extension of the recent recovery from mid-95.00s, or the monthly trough touched last week.
The Australian Dollar (AUD) continues to be underpinned by the Reserve Bank of Australia's (RBA) hawkish outlook earlier this week, warning that a further rate increase could not be ruled out in the wake of still sticky inflation. Adding to this, China's steps to shore up its battered stock market help offset underwhelming domestic inflation figures and lend additional support to the China-proxy Aussie.
Data from the National Bureau of Statistics showed that China’s Consumer Price Index (CPI) climbed 0.3% over the month in January and declined 0.8% on a yearly basis, both missing expectations for a 0.4% rise and 0.5% fall, respectively. Meanwhile, the Producer Price Index (PPI) came in slightly better than anticipated and fell by the 2.5% YoY rate in January, though does little to ease deflationary concerns.
Meanwhile, the prevalent risk-on mood is seen denting demand for the safe-haven Japanese Yen (JPY), which is further weighed down by less hawkish remarks by the Bank of Japan (BoJ) Deputy Governor Uchida Shinichi. Speaking at a Meeting with Local Leaders in Nara, Uchida said that the BoJ would like to maintain a stable, accommodative monetary environment as the uncertainty over the outlook remains high.
Uchida, meanwhile, expects Japan's economic recovery to continue and the positive wage-inflation cycle to strengthen, while echoing the BoJ's view that the likelihood of sustainably achieving price target is gradually heightening. Furthermore, investors seem convinced that wage growth this year may outpace that of 2023 and pave the way for the BoJ to exit its decade-long ultra-loose monetary policy setting.
This, in turn, should limit any meaningful depreciating move for the JPY and cap gains for the AUD/JPY cross. Nevertheless, the aforementioned fundamental backdrop seems tilted in favour of bullish traders and supports prospects for a further intraday appreciating move for spot prices.
Technical levels to watch
| Raw materials | Closed | Change, % |
|---|---|---|
| Silver | 22.209 | -0.93 |
| Gold | 2034.846 | -0.04 |
| Palladium | 894.62 | -5.67 |
- Australian Dollar retraces its recent losses amid a stable US Dollar.
- Australia's currency is strengthened as RBA’s Bullock did not rule anything in or out regarding future policy actions.
- Chinese CPI (YoY) declined by 0.8% against the anticipated decline of 0.5% and the previous decline of 0.3%.
- Fed members commit to keeping interest rates elevated until inflation sustainably returns to the 2% target.
The Australian Dollar (AUD) recovers its recent losses on Thursday, buoyed by a risk-on sentiment in the market. Despite the US Federal Reserve (Fed) emphasizing its commitment to keeping interest rates elevated until inflation sustainably returns to the 2% target, the US Dollar (USD) faces challenges. Moreover, improved conditions in the Australian money market are lending support to the Aussie Dollar (AUD), thereby bolstering the AUD/USD pair.
Australian currency is bolstered by hawkish remarks from Reserve Bank of Australia (RBA) Governor Michele Bullock following the interest rate decision on Tuesday. The RBA opted to keep its Official Cash Rate (OCR) unchanged at 4.35%.
Governor Bullock refrained from making explicit statements regarding future policy actions, neither ruling anything in nor out. However, futures markets are currently pricing in two potential interest rate cuts by the RBA this year, with the first expected in September.
Chinese Consumer Price Index (CPI) grew by 0.3% MoM in January, falling short of the expected 0.4%. However, it has been improved from the previous reading of 0.1%. The annual CPI declined by 0.8%, exceeding the anticipated decline of 0.5% and the previous decline of 0.3%. Meanwhile, Producer Price Index (YoY) declined by 2.5% lower than the expected 2.6% decline.
The US Dollar Index (DXY) seems to continue its downward trend for the third consecutive session, pressured by a correction in US Treasury yields. However, Federal Reserve Chair Jerome Powell dismissed the possibility of a rate cut in March. Traders will focus on jobs data on Thursday, including US Initial Jobless Claims for the week ending on February 2.
Federal Reserve Governor Adriana Kugler expressed satisfaction with the significant progress on inflation during remarks on Wednesday, expressing optimism that this progress will persist. Meanwhile, Fed Boston President Susan Collins, speaking at the Boston Economic Club, indicated the likelihood of rate cuts later in the year if the economy aligns with expectations.
Daily Digest Market Movers: Australian Dollar improves amid a steady US Dollar
- Australia’s December AiG Industry Index came in at -27.3 as compared to the -22.4 prior.
- Australia’s Retail Sales (QoQ) improved with a 0.3% rise in the fourth quarter compared to the previous growth of 0.2%.
- Australian Trade Balance (MoM) for January was reduced to the figure of 10,959M compared to the revised figure of 11,764M in December.
- Australia’s Judo Bank Composite Purchasing Managers Index (PMI) improved to 49 in January from 48.1 prior. The Services PMI saw an improvement, rising to 49.1 from the previous figure of 47.9.
- Chinese Caixin Services PMI reduced to 52.7 in January from the previous reading of 52.9.
- The Atlanta Fed's wage growth tracker has declined to 5.0% in January from 5.2% reported in December. This represents the lowest growth rate since December 2021, when it stood at 4.5%.
- US MBA Mortgage Applications rose to 3.7% for the week ending on February 2 from the previous decline of 7.2%.
- US Census Bureau showed that Goods and Services Trade Balance declined by 62.2 billion in December, as expected. The previous decline was 61.9 billion.
- 10-year US Note was auctioned at the average yield of 4.093% against the 4.024% prior.
Technical Analysis: Australian Dollar maintains position below major barrier of 0.6550
The Australian Dollar trades around 0.6530 on Thursday, slightly below the immediate resistance level at 0.6550. A breakthrough above this level could potentially catalyze further upward movement for the AUD/USD pair, with potential targets including the 23.6% Fibonacci retracement level at 0.6563 and the 21-day Exponential Moving Average (EMA) at 0.6579. On the downside, key support is anticipated at the psychological level of 0.6500. Additional support levels include the weekly low at 0.6468, followed by a major support level at 0.6450.
AUD/USD: Daily Chart
-638429539444809858.png)
Australian Dollar price today
The table below shows the percentage change of Australian Dollar (AUD) against listed major currencies today. Australian Dollar was the strongest against the Japanese Yen.
| USD | EUR | GBP | CAD | AUD | JPY | NZD | CHF | |
| USD | -0.03% | -0.06% | -0.09% | -0.12% | 0.09% | -0.17% | -0.09% | |
| EUR | 0.03% | -0.03% | -0.05% | -0.09% | 0.12% | -0.13% | -0.07% | |
| GBP | 0.06% | 0.03% | -0.02% | -0.06% | 0.15% | -0.10% | -0.05% | |
| CAD | 0.08% | 0.04% | 0.02% | -0.04% | 0.16% | -0.10% | -0.02% | |
| AUD | 0.11% | 0.09% | 0.04% | 0.04% | 0.21% | -0.04% | 0.01% | |
| JPY | -0.08% | -0.13% | -0.15% | -0.18% | -0.20% | -0.24% | -0.18% | |
| NZD | 0.16% | 0.12% | 0.10% | 0.10% | 0.04% | 0.25% | 0.05% | |
| CHF | 0.10% | 0.06% | 0.04% | 0.02% | -0.01% | 0.18% | -0.06% |
The heat map shows percentage changes of major currencies against each other. The base currency is picked from the left column, while the quote currency is picked from the top row. For example, if you pick the Euro from the left column and move along the horizontal line to the Japanese Yen, the percentage change displayed in the box will represent EUR (base)/JPY (quote).
Australian Dollar FAQs
What key factors drive the Australian Dollar?
One of the most significant factors for the Australian Dollar (AUD) is the level of interest rates set by the Reserve Bank of Australia (RBA). Because Australia is a resource-rich country another key driver is the price of its biggest export, Iron Ore. The health of the Chinese economy, its largest trading partner, is a factor, as well as inflation in Australia, its growth rate and Trade Balance. Market sentiment – whether investors are taking on more risky assets (risk-on) or seeking safe-havens (risk-off) – is also a factor, with risk-on positive for AUD.
How do the decisions of the Reserve Bank of Australia impact the Australian Dollar?
The Reserve Bank of Australia (RBA) influences the Australian Dollar (AUD) by setting the level of interest rates that Australian banks can lend to each other. This influences the level of interest rates in the economy as a whole. The main goal of the RBA is to maintain a stable inflation rate of 2-3% by adjusting interest rates up or down. Relatively high interest rates compared to other major central banks support the AUD, and the opposite for relatively low. The RBA can also use quantitative easing and tightening to influence credit conditions, with the former AUD-negative and the latter AUD-positive.
How does the health of the Chinese Economy impact the Australian Dollar?
China is Australia’s largest trading partner so the health of the Chinese economy is a major influence on the value of the Australian Dollar (AUD). When the Chinese economy is doing well it purchases more raw materials, goods and services from Australia, lifting demand for the AUD, and pushing up its value. The opposite is the case when the Chinese economy is not growing as fast as expected. Positive or negative surprises in Chinese growth data, therefore, often have a direct impact on the Australian Dollar and its pairs.
How does the price of Iron Ore impact the Australian Dollar?
Iron Ore is Australia’s largest export, accounting for $118 billion a year according to data from 2021, with China as its primary destination. The price of Iron Ore, therefore, can be a driver of the Australian Dollar. Generally, if the price of Iron Ore rises, AUD also goes up, as aggregate demand for the currency increases. The opposite is the case if the price of Iron Ore falls. Higher Iron Ore prices also tend to result in a greater likelihood of a positive Trade Balance for Australia, which is also positive of the AUD.
How does the Trade Balance impact the Australian Dollar?
The Trade Balance, which is the difference between what a country earns from its exports versus what it pays for its imports, is another factor that can influence the value of the Australian Dollar. If Australia produces highly sought after exports, then its currency will gain in value purely from the surplus demand created from foreign buyers seeking to purchase its exports versus what it spends to purchase imports. Therefore, a positive net Trade Balance strengthens the AUD, with the opposite effect if the Trade Balance is negative.
- NZD/USD gains ground near 0.6118 amid the softer USD, solid New Zealand Q4 labor market data.
- The Reserve Bank of New Zealand could raise interest rates again this month following strong labor market numbers.
- Fed’s Kugler said that inflation is showing solid signs of slowing down, but she is not yet prepared to begin lowering rates.
The NZD/USD pair holds positive ground above 0.6100 during the early Asian session on Thursday. The solid New Zealand Q4 labor market data amid re-pricing odds of further Reserve Bank of New Zealand (RBNZ) policy tightening, has boosted the New Zealand Dollar (NZD). NZD/USD currently trades around 0.6118, gaining 0.16% on the day.
The New Zealand labor market data for the fourth quarter (Q4) came in stronger than expected. The nation’s Unemployment Rate rose from 3.9% to 4.0%, below the forecast of 4.2%. This data might convince the RBNZ about the policy outlook, and the RBNZ could raise interest rates again this month following strong labour market numbers. This, in turn, underpins the Kiwi and might cap the downside of the NZD/USD pair in the near term.
Furthermore, the latest data from the National Bureau of Statistics of China revealed that the Chinese Consumer Price Index (CPI) fell 0.8% YoY in January from a 0.3% drop in the previous reading, weaker than the market expectation of 0.5%. On a monthly basis, the CPI figure rose to 0.3% MoM in January from 0.1% in December. Meanwhile, the Producer Price Index (PPI) fell 2.5% YoY in January from a 2.7% fall in December, beating expectations for a 2.6% decline in the reported period.
On the USD’s front, Federal Reserve (Fed) Governor Adriana Kugler said on Wednesday that inflation is showing solid signs of slowing down, but she is not yet prepared to begin lowering interest rates. Meanwhile, Minneapolis Fed President Kashkari said that the Fed needs more time to get confidence on the inflation trajectory before beginning to cut rates. The hawkish remarks from Fed officials provide some support for the US Dollar (USD) and weigh on the NZD/USD pair.
Moving on, traders will focus on the US weekly Initial Jobless Claims, Wholesale Inventories, and Fed’s Barkin (Richmond) speech. Next week, the attention to the RBNZ Governor Orr's speech. These events could give clear directions to the NZD/USD pair.
- The Japanese Yen continues to draw support from the BoJ’s hawkish tilt earlier this month.
- The recent USD pullback from a multi-month top further exerts some pressure on USD/JPY.
- Reduced Fed rate cut bets favour the USD bulls and should limit deeper losses for the pair.
The Japanese Yen (JPY) struggles to gain any meaningful traction during the Asian session on Thursday and remains below the weekly top touched against its American counterpart the previous day. Investors now seem convinced that wage growth this year may outpace that of 2023 and pave the way for the Bank of Japan (BoJ) to exit its decade-long ultra-loose monetary policy, which, in turn, acts as a tailwind for the JPY. Apart from this, the recent US Dollar (USD) pullback from its highest level in almost three months touched earlier this month acts as a headwind for the USD/JPY pair.
The downside for the USD, however, seems limited as investors recently scaled back their expectations for early and steep rate cuts by the Federal Reserve (Fed) in the wake of a resilient US economy and hawkish remarks by several FOMC members. This remains supportive of elevated US Treasury bond yields and favours the USD bulls. Apart from this, the prevalent risk-on mood, as depicted by an extended rally across the global equity markets, could undermine the JPY's relative safe-haven status and help limit the downside for the USD/JPY pair, warranting some caution for bearish traders.
Investors might also refrain from placing aggressive bets and prefer to wait for more cues about the likely pace of Fed rate cuts this year. Hence, the focus will remain glued to the latest US consumer inflation figures, due for release next week, which will play a key role in influencing the Fed's future policy decisions. This, in turn, should drive the USD demand in the near term and provide some meaningful impetus to the USD/JPY pair. In the meantime, traders on Thursday will take cues from the US Weekly Initial Jobless Claims and comments by Fed officials.
Daily Digest Market Movers: Japanese Yen is underpinned by hopes for an imminent BoJ policy shift
- The Bank of Japan earlier this month signalled conviction on hitting the inflation goal and set the stage to pull interest rates out of negative territory at its upcoming meetings in March or April, underpinning the Japanese Yen.
- BoJ Governor Kazuo Ueda had said that if the central bank gets evidence that a positive wage-inflation cycle will heighten, it would examine the feasibility of continuing with various steps under the massive stimulus programme.
- Japan's biggest business lobby Keidanren and trade unions kicked off annual labour talks and big firms are expected to offer the highest wage increase in 31 years this year, paving the way for a shift in the BoJ's policy stance.
- BoJ Executive Director Tokiko Shimizu said this Thursday that inflation has so far has been driven by cost-push factors and that even if negative rates are abandoned, accommodative conditions would remain in place.
- BoJ Deputy Governor Uchida Shinichi said that Japan's real interest rate is in deep negative territory and monetary conditions are very accommodative, which is not expected to change in a big way.
- Shinichi added that the likelihood of sustainably achieving our price target gradually heightening, though the BoJ won't hike rates aggressively even after ending negative rate as the uncertainty over the outlook remains high.
- The US Dollar extends this week's profit-taking slide from the highest level since November 14 and contributes to capping the upside for the USD/JPY pair, though hawkish Federal Reserve expectations could limit losses.
- The incoming US macro data suggested that the economy remains in good shape and gives the Fed more headroom to keep interest rates higher for longer, which, in turn, should continue to act as a tailwind for the buck.
- Several FOMC members, including Fed Chair Jerome Powell, don’t see an urgent case for lowering interest rates, suggesting that a rate cut isn’t likely until the May monetary policy meeting at the earliest.
- Fed Governor Adriana Kugler said on Wednesday that she is optimistic that inflation progress will continue, but stopped short of offering a timeline for when officials may be able to reduce borrowing costs.
- Boston Fed President Susan Collins said that she is looking for more evidence that inflation is on track toward the 2% target before moving to cut interest rates, though that step is more likely later this year.
- Minneapolis Fed chief Neel Kashkari noted that officials would like to see a few more months of inflation data before cutting interest rates and added that he thinks two to three cuts will be appropriate for 2024.
- Richmond Fed President Tom Barkin urged patience and said that it is a good idea for the central bank to take its time with interest-rate cuts given all of the uncertainty about where the US economy is headed.
- The yield on the benchmark 10-year US government bond holds comfortably above the 4.0% market and supports prospects for the emergence of some USD dip-buying, warranting caution for the USD/JPY bears.
Technical Analysis: USD/JPY remains confined in a familiar range above 100-day SMA pivotal support
From a technical perspective, bears need to wait for some follow-through selling below the 100-day Simple Moving Average (SMA), currently pegged near the 147.60-147.55 region, before positioning for deeper losses. The USD/JPY pair might then accelerate the fall to the the 147.00 mark before dropping to the 146.35 intermediate support en route to sub-146.00 levels, or the monthly low touched last week.
Meanwhile, positive oscillators validate the positive outlook for the USD/JPY pair, though the formation of multiple-tops near the 148.75-148.80 region warrants caution for bullish traders. Hence, a sustained strength beyond the said barrier might trigger a fresh bout of a short-covering rally and lift spot prices to the 149.55-149.60 intermediate hurdle en route to the 150.00 psychological mark.
Japanese Yen price today
The table below shows the percentage change of Japanese Yen (JPY) against listed major currencies today. Japanese Yen was the strongest against the US Dollar.
| USD | EUR | GBP | CAD | AUD | JPY | NZD | CHF | |
| USD | -0.04% | -0.06% | -0.09% | -0.14% | 0.05% | -0.16% | -0.11% | |
| EUR | 0.04% | -0.02% | -0.04% | -0.09% | 0.09% | -0.12% | -0.10% | |
| GBP | 0.06% | 0.03% | -0.01% | -0.07% | 0.11% | -0.09% | -0.06% | |
| CAD | 0.07% | 0.03% | 0.01% | -0.04% | 0.11% | -0.09% | -0.05% | |
| AUD | 0.13% | 0.09% | 0.07% | 0.06% | 0.18% | -0.03% | 0.01% | |
| JPY | -0.05% | -0.08% | -0.11% | -0.12% | -0.18% | -0.19% | -0.16% | |
| NZD | 0.16% | 0.12% | 0.08% | 0.09% | 0.03% | 0.21% | 0.02% | |
| CHF | 0.12% | 0.08% | 0.06% | 0.05% | 0.00% | 0.17% | -0.04% |
The heat map shows percentage changes of major currencies against each other. The base currency is picked from the left column, while the quote currency is picked from the top row. For example, if you pick the Euro from the left column and move along the horizontal line to the Japanese Yen, the percentage change displayed in the box will represent EUR (base)/JPY (quote).
Japanese Yen FAQs
What key factors drive the Japanese Yen?
The Japanese Yen (JPY) is one of the world’s most traded currencies. Its value is broadly determined by the performance of the Japanese economy, but more specifically by the Bank of Japan’s policy, the differential between Japanese and US bond yields, or risk sentiment among traders, among other factors.
How do the decisions of the Bank of Japan impact the Japanese Yen?
One of the Bank of Japan’s mandates is currency control, so its moves are key for the Yen. The BoJ has directly intervened in currency markets sometimes, generally to lower the value of the Yen, although it refrains from doing it often due to political concerns of its main trading partners. The current BoJ ultra-loose monetary policy, based on massive stimulus to the economy, has caused the Yen to depreciate against its main currency peers. This process has exacerbated more recently due to an increasing policy divergence between the Bank of Japan and other main central banks, which have opted to increase interest rates sharply to fight decades-high levels of inflation.
How does the differential between Japanese and US bond yields impact the Japanese Yen?
The BoJ’s stance of sticking to ultra-loose monetary policy has led to a widening policy divergence with other central banks, particularly with the US Federal Reserve. This supports a widening of the differential between the 10-year US and Japanese bonds, which favors the US Dollar against the Japanese Yen.
How does broader risk sentiment impact the Japanese Yen?
The Japanese Yen is often seen as a safe-haven investment. This means that in times of market stress, investors are more likely to put their money in the Japanese currency due to its supposed reliability and stability. Turbulent times are likely to strengthen the Yen’s value against other currencies seen as more risky to invest in.
Bank of Japan (BOJ) Deputy Governor Shinichi Uchida said on Thursday, “we will like to maintain a stable, accommodative monetary environment.”
Additional quotes
What is more important is the future short-term rate path, which will be set at appropriate level so consumer inflation moves around BoJ's 2% target
YCC and BoJ's bond buying management are intertwined
When we end or tweak YCC, we will think about how we would communicate our bond buying operation
Tweak to YCC would mean allowing yields to move more freely but we will ensure this does not lead to big change in our bond buying amount, sharp rise in yields
It would be natural to end ETF, j-reit buying if achievement of 2% inflation can be foreseen
Even if we were to end ETF, j-reit buying, impact on markets won't be big
What to do with our very huge ETF, J-Reit holding is a different problem, this is something we need to consider taking time
We expect service prices to rise accompanied by wage increases.
China’s Consumer Price Index (CPI) dropped 0.8% YoY in January, having declined 0.3% in December. The market expectation was for a 0.5% decrease.
Chinese CPI inflation climbed to 0.3% over the month in January versus the 0.1% print in December, missing the 0.4% increase expected.
China’s Producer Price Index (PPI) fell 2.5% YoY in January, compared with a 2.7% drop seen in November. The data beat expectations for a 2.6% decline in the reported period.
Market reaction to Chinese inflation data
At the time of writing, AUD/USD is picking up bids on the mixed Chinese data, adding 0.13% on the day to trade near 0.6530.
Australian Dollar price today
The table below shows the percentage change of Australian Dollar (AUD) against listed major currencies today. Australian Dollar was the strongest against the Japanese Yen.
| USD | EUR | GBP | CAD | AUD | JPY | NZD | CHF | |
| USD | -0.03% | -0.06% | -0.08% | -0.11% | 0.06% | -0.12% | -0.08% | |
| EUR | 0.03% | -0.01% | -0.04% | -0.09% | 0.08% | -0.11% | -0.06% | |
| GBP | 0.04% | 0.01% | -0.03% | -0.06% | 0.09% | -0.07% | -0.06% | |
| CAD | 0.06% | 0.03% | 0.01% | -0.04% | 0.12% | -0.07% | -0.03% | |
| AUD | 0.10% | 0.07% | 0.06% | 0.04% | 0.16% | 0.00% | 0.00% | |
| JPY | -0.05% | -0.09% | -0.12% | -0.13% | -0.15% | -0.17% | -0.14% | |
| NZD | 0.12% | 0.10% | 0.08% | 0.06% | 0.02% | 0.18% | 0.05% | |
| CHF | 0.10% | 0.06% | 0.04% | 0.04% | -0.02% | 0.13% | -0.05% |
The heat map shows percentage changes of major currencies against each other. The base currency is picked from the left column, while the quote currency is picked from the top row. For example, if you pick the Euro from the left column and move along the horizontal line to the Japanese Yen, the percentage change displayed in the box will represent EUR (base)/JPY (quote).
The People’s Bank of China (PBoC) set the USD/CNY central rate for the trading session ahead on Thursday at 7.1063 as compared to 7.1911 Reuters estimates.
Bank of Japan (BoJ) Executive Director Tokiko Shimizu said on Thursday that inflation has so far been driven by cost-push factors. Shimizu further stated that even if negative rates were abandoned, accommodative conditions would remain.
Market reaction
At the time of writing, USD/JPY is trading 0.08% lower on the day at 148.04.
Bank of Japan FAQs
What is the Bank of Japan?
The Bank of Japan (BoJ) is the Japanese central bank, which sets monetary policy in the country. Its mandate is to issue banknotes and carry out currency and monetary control to ensure price stability, which means an inflation target of around 2%.
What has been the Bank of Japan’s policy?
The Bank of Japan has embarked in an ultra-loose monetary policy since 2013 in order to stimulate the economy and fuel inflation amid a low-inflationary environment. The bank’s policy is based on Quantitative and Qualitative Easing (QQE), or printing notes to buy assets such as government or corporate bonds to provide liquidity. In 2016, the bank doubled down on its strategy and further loosened policy by first introducing negative interest rates and then directly controlling the yield of its 10-year government bonds.
How do Bank of Japan’s decisions influence the Japanese Yen?
The Bank’s massive stimulus has caused the Yen to depreciate against its main currency peers. This process has exacerbated more recently due to an increasing policy divergence between the Bank of Japan and other main central banks, which have opted to increase interest rates sharply to fight decades-high levels of inflation. The BoJ’s policy of holding down rates has led to a widening differential with other currencies, dragging down the value of the Yen.
Is the Bank of Japan’s ultra-loose policy likely to change soon?
A weaker Yen and the spike in global energy prices have led to an increase in Japanese inflation, which has exceeded the BoJ’s 2% target. Still, the Bank judges that the sustainable and stable achievement of the 2% target has not yet come in sight, so any sudden change in the current policy looks unlikely.
- GBP/USD trades on a positive note for three straight days near 1.2630.
- Fed’s Kashkari said that the central bank needs more time to gain confidence in the inflation outlook before beginning to cut rates.
- UK Halifax House Prices for January showed modest signs of recovering momentum.
The GBP/USD pair gains traction during the early Asian session on Thursday. The uptick in the major pair is bolstered by rising house prices in the UK, which supported bets that the Bank of England (BoE) was not likely to cut interest rates any time soon. The BoE Catherine L. Mann is set to speak on Thursday. At press time, GBP/USD is trading at 1.2630, gaining 0.05% on the day.
Earlier this week, Fed Chair Jerome Powell stated that March is too early to start rate cuts and investors continue to pencil in the first rate cut in June. Four Fed Governor, Adriana Kugler, Boston Fed President Susan Collins, Minneapolis Fed President Neel Kashkari, and Richmond’s Thomas Barkin were all noncommittal on when the US central bank can start cutting the benchmark lending rate from a two-decade high. However, Minneapolis Fed President Kashkari said that the US central bank needs more time to gain confidence in the inflation outlook before beginning to cut rates.
On Wednesday, the UK Halifax House Prices for January rose 2.5% in the year to January, the strongest annual growth rate for a year. The BoE Deputy Governor Sarah Breeden said on Wednesday that the UK central bank is in no rush to cut interest rates. Breeden further stated that she was now thinking about how long interest rates would need to stay at their current level instead of whether they would need to rise further. Money markets have priced in a 61% odds of a BoE rate cut in June.
Market players will keep an eye on the US weekly Initial Jobless Claims, and Wholesale Inventories. Additionally, the speeches by the Fed’s Barkin (Richmond) and the BoE’s Mann will be monitored by traders. Traders will take more cues from these events and find trading opportunities around the GBP/USD pair.
| Index | Change, points | Closed | Change, % |
|---|---|---|---|
| NIKKEI 225 | -40.74 | 36119.92 | -0.11 |
| Hang Seng | -54.98 | 16081.89 | -0.34 |
| KOSPI | 33.38 | 2609.58 | 1.3 |
| ASX 200 | 34.2 | 7615.8 | 0.45 |
| DAX | -111.28 | 16921.96 | -0.65 |
| CAC 40 | -27.71 | 7611.26 | -0.36 |
| Dow Jones | 156 | 38677.36 | 0.4 |
| S&P 500 | 40.83 | 4995.06 | 0.82 |
| NASDAQ Composite | 147.64 | 15756.64 | 0.95 |
Japan's Current Account came in below expectations, with the adjusted balance of trade printing at ¥744.3 billion compared to the ¥1.01 trillion forecast, an eleven-month low for the indicator.
Foreign Investment in Japanese Stocks also got pulled down, with foreign funds investment into Japanese equities declining to ¥308.4 billion compared to the previous period's ¥721 billion.
Market reaction
USD/JPY continues to trade tightly near the 148.00 price handle as markets gear up for Thursday's trading session.
About Japan's Current Account
The Current Account released by the Ministry of Finance is a net flow of current transactions, including goods, services, and interest payments into and out of Japan. A current account surplus indicates that the flow of capital into Japan exceeds the capital reduction. A current account deficit indicates that there is a net capital outflow from these sources. A high reading is seen as positive for the JPY, while a low reading is seen as negative.
| Pare | Closed | Change, % |
|---|---|---|
| AUDUSD | 0.65199 | -0.03 |
| EURJPY | 159.635 | 0.39 |
| EURUSD | 1.07733 | 0.2 |
| GBPJPY | 187.112 | 0.44 |
| GBPUSD | 1.26273 | 0.25 |
| NZDUSD | 0.61119 | 0.3 |
| USDCAD | 1.34614 | -0.2 |
| USDCHF | 0.87442 | 0.53 |
| USDJPY | 148.182 | 0.17 |
- Gold price oscillates in a narrow trading range around $2,035 on the softer USD.
- Four Fed officials emphasized that they don’t see an urgent case to cut rates and more evidence of inflation data is needed.
- The ongoing Middle East geopolitical tension might boost traditional safe-haven assets like gold.
- The January Chinese Consumer Price Index (CPI) and Producer Price Index (PPI) will be the highlights on Thursday.
Gold price (XAU/USD) remains confined in a narrow trading band above the $2030 mark per troy ounce during the early Asian trading hours on Thursday. Four Federal Reserve (Fed) officials emphasized that they don’t see an urgent case to cut rates, and the central bank would like to see more evidence of inflation data before it acts. The yellow metal benefits from the safe-haven flow amid the ongoing geopolitical tensions in the Red Sea. The gold price currently trades near $2,035, adding 0.07% on the day.
Meanwhile, the US Dollar Index (DXY), an index of the value of the USD measured against a basket of six world currencies, drops to the 104.00 mark. The US Treasury yields edge lower, with the 10-year yield standing at 4.11%.
Fed Governor Adriana Kugler, Boston Fed President Susan Collins, Minneapolis Fed President Neel Kashkari, and Richmond’s Thomas Barkin were all noncommittal on when the US central bank can start reducing the Fed’s benchmark lending rate from a two-decade high, despite a marked improvement in inflation last year.
Fed Governor Adriana Kugler, Boston Fed President Susan Collins, Minneapolis Fed President Neel Kashkari, and Richmond's Thomas Barkin were all noncommittal to talk about the timeline of interest rate cuts, despite a significant improvement in inflation last year. The languages generally match Fed Chair Jerome Powell's message from the previous week, which emphasized that the US central bank isn't ready to begin rate cuts until policymakers are confident that inflation is on track to reach the 2% target.
Investors have pared bets on a March rate reduction and are anticipating the first rate cuts in the May meeting. That being said, the high-for-longer narrative in the US diminishes the incentive for investors to buy gold as it pays no interest, thus resulting in a lower gold price.
However, the escalating geopolitical tension in the Middle East might lift traditional safe-haven assets like gold and cap the downside of yellow metal. Since Friday, the US military has carried out dozens of airstrikes on sites in Iraq, Syria, and Yemen. Joe Biden's government said that the wave of strikes was in retaliation to a drone strike that killed three US troops at a military base in Jordan on January 28, as well as continued attacks on commercial ships in the Red Sea by Yemen's Houthi militia.
Looking ahead, the January Chinese Consumer Price Index (CPI) and Producer Price Index (PPI) will be released on Thursday. On the docket, the weekly Initial Jobless Claims, Wholesale Inventories, and the speech by Fed’s Barkin (Richmond) will be later on Thursday.


© 2000-2026. Уcі права захищені.
Cайт знаходитьcя під керуванням TeleTrade DJ. LLC 2351 LLC 2022 (Euro House, Richmond Hill Road, Kingstown, VC0100, St. Vincent and the Grenadines).
Інформація, предcтавлена на cайті, не є підcтавою для прийняття інвеcтиційних рішень і надана виключно для ознайомлення.
Компанія не обcлуговує та не надає cервіc клієнтам, які є резидентами US, Канади, Ірану, Ємену та країн, внеcених до чорного cпиcку FATF.
Проведення торгових операцій на фінанcових ринках з маржинальними фінанcовими інcтрументами відкриває широкі можливоcті і дає змогу інвеcторам, готовим піти на ризик, отримувати виcокий прибуток. Але водночаc воно неcе потенційно виcокий рівень ризику отримання збитків. Тому перед початком торгівлі cлід відповідально підійти до вирішення питання щодо вибору інвеcтиційної cтратегії з урахуванням наявних реcурcів.
Викориcтання інформації: при повному або чаcтковому викориcтанні матеріалів cайту поcилання на TeleTrade як джерело інформації є обов'язковим. Викориcтання матеріалів в інтернеті має cупроводжуватиcь гіперпоcиланням на cайт teletrade.org. Автоматичний імпорт матеріалів та інформації із cайту заборонено.
З уcіх питань звертайтеcь за адреcою pr@teletrade.global.
переклади