- Аналітика
- Новини та інструменти
- Новини ринків
Новини ринків
- Tokyo headline CPI inflation cools YoY from 2.6% to 2.4%.
- Tokyo YoY Core CPI prints as-expected at 2.1% versus previous period's 2.3%.
Japan's Consumer Price Index (CPI) annualized inflation for the year ended December 2023 eased back further as inflation continues to cool within the major economic centers of Tokyo, printing at 2.4% compared to November's YoY 2.6%.
Tokyo's Core CPI (headline CPI less the volatility of fresh food prices) broadly met market expectations, printing at 2.1% for the year through December compared to November's annualized print of 2.3%.
Tokyo's 'Core-Core' CPI inflation (Core CPI minus energy prices) also slid, printing at 3.5% YoY compared to November's YoY print of 3.6%.
Market Reaction
The USD/JPY sees sedate trading conditions in early Tuesday market action, shifting within intraday levels above the 144.00 handle.
About Japan's Tokyo Consumer Price Index
The Tokyo Consumer Price Index (CPI), released by the Statistics Bureau of Japan on a monthly basis, measures the price fluctuation of goods and services purchased by households in the Tokyo region. The index is widely considered as a leading indicator of Japan’s overall CPI as it is published weeks before the nationwide reading. The YoY reading compares prices in the reference month to the same month a year earlier. Generally, a high reading is seen as bullish for the Japanese Yen (JPY), while a low reading is seen as bearish.
A research note from Patrick Artus of Natixis Research is out on Monday, highlighting how the lack of productivity gains for the Eurozone could be a result of structural weakness, rather than the oft-touted cyclical factors.
Eurozone productivity struggles: lack of meaningful technology investment to blame, not hiring trends
There are two opposing interpretations of the lack of productivity gains in the euro zone since late 2017:
- A cyclical interpretation (the fall in the unskilled unemployment rate);
- A structural interpretation (the low level of investment in new technologies... and an ageing labour force).
By comparing OECD countries, we assess the contribution of structural problems to the slowdown in productivity gains in the euro zone.
When we simulate the productivity gap between the United States and the euro zone with recent data on investment in new technologies, R&D spending and the age structure of the working-age population, we find a productivity gains gap in favour of the United States of 2.5 percentage points per year. This shows that structural explanations can fully explain the stagnation of productivity since late 2017 in the euro zone.
- AUD/USD oscillates in a narrow trading band around 0.6719 on Tuesday.
- The markets have priced in a 50% possibility of a rate cut in the March meeting.
- Australian Retail Sales for November are projected to rise 1.2% versus -0.2% prior.
The AUD/USD pair consolidates above the 0.6700 mark during the early Asian session on Tuesday. The speculation that the Federal Reserve (Fed) may not cut their policy rate as quickly as previously expected lends some support to the US Dollar (USD) and weighs on the pair. Investors await the US Consumer Price Index (CPI) data later this week for the near-term catalysts. At press time, AUD/USD is trading at 0.6719, gaining 0.01% on the day.
The US core Consumer Price Index (CPI) is expected to rise 0.2% MoM in December, although energy price volatility poses downside risks. The headline CPI figures for December are estimated to show an increase of 0.2% MoM and 3.2%, respectively.
The Fed Chair Powell recently highlighted inflation progress throughout 2023, fueling speculation that the FOMC may shortly consider cutting interest rates. On Monday, Fed Governor Michelle Bowman said that she now sees US monetary policy as sufficiently restrictive and signaled her willingness to support eventual interest-rate cuts as inflation eases. Expectations for an early rate cut from the FOMC are high with the market pricing in a 50% odds of a March rate cut, according to the CME Group.
On the Aussie front, the Australian Retail Sales for November will be due later on Tuesday. The figure is projected to rise 1.2% from a 0.2% drop in the previous reading. The report could influence the Reserve Bank of Australia (RBA) to maintain interest rates high for longer.
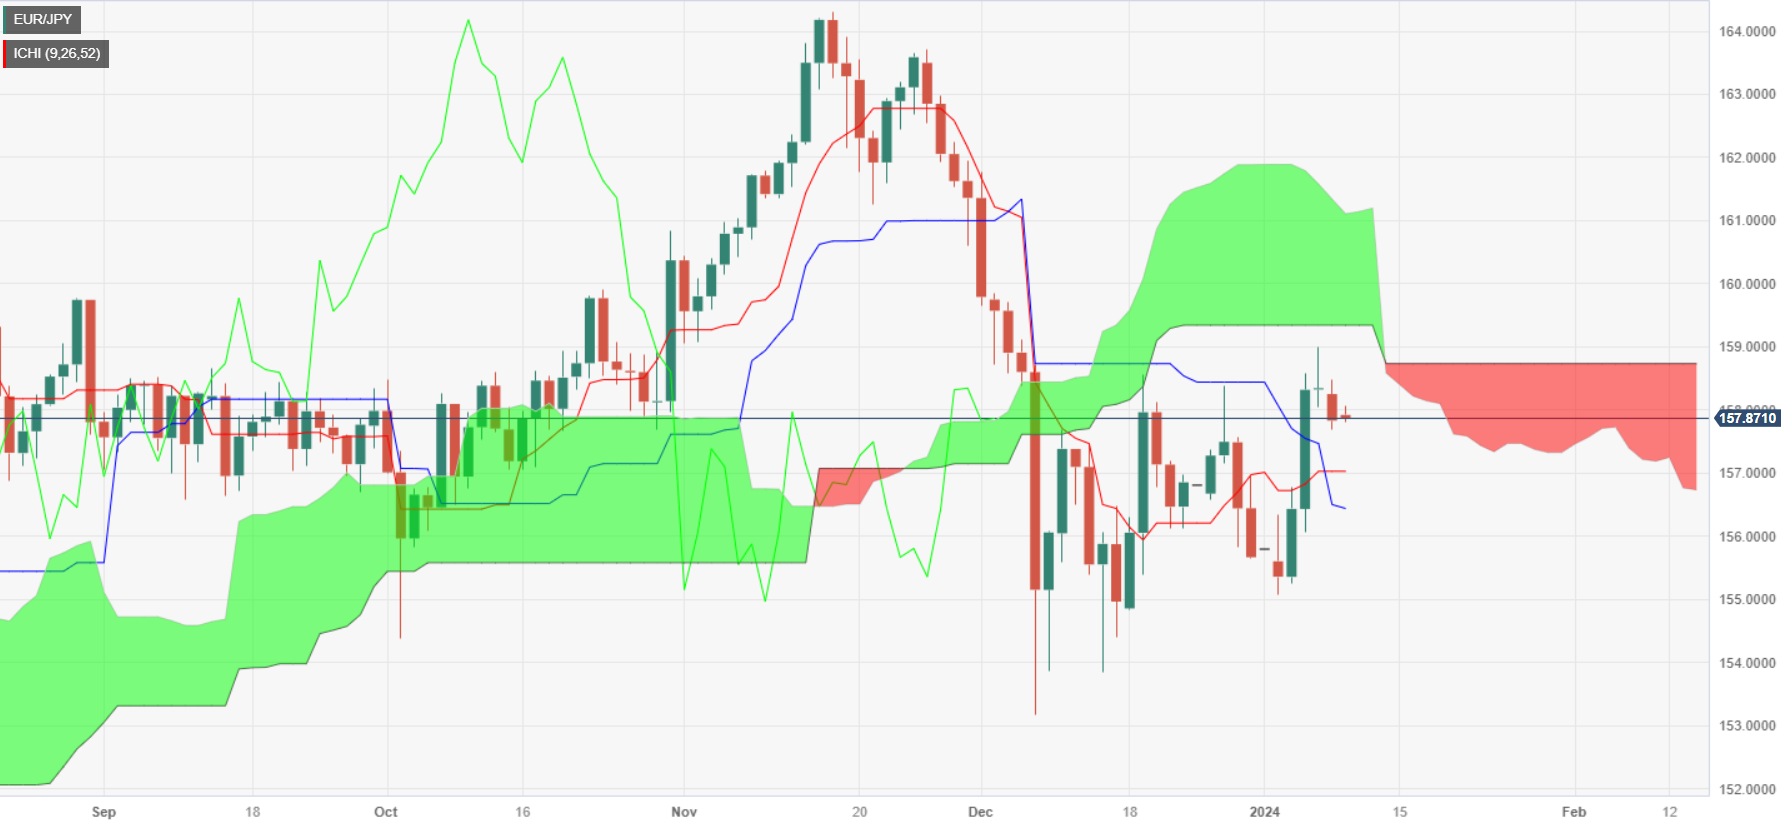
- EUR/JPY slips amid a risk-on mood, as it remains below the Ichimoku Cloud
- Further downside is seen below the Tenkan and Kijun Sen levels as the pair aims toward 156.00.
- The EUR/JPY could shift bullish if buyers reclaim 159.00.
The EUR/JPY begins the week on a lower note, posting losses of 0.17% on Monday amid a risk-on impulse. The cross-currency pair's upward move was quickly rejected at a multi-month support trendline turned resistance, opening the door for a pullback. Therefore, the pair is trading at 157.92 as Tuesday’s Asian session begins, almost flat.
The cross-pair base shifted bearish after diving below the Ichimoku Cloud (Kumo). That along with the cross of the Tenkan-Sen below the Kijun-Sen, has kept the EUR/JPY capped below the 159.00 figure. If sellers would like to extend the downtrend, they must drag prices below the Tenkan-Sen at 157.03, followed by the Kijun-Sen at 156.48, as the pair extends its losses toward 156.00.
On the other hand, if the EUR/JPY reverses its course and achieves a daily close above 158.50, that could open the door for a test of 159.00. On further strength, the pair would aim towards the bottom of the Kumo at 159.30, ahead of challenging 160.00.
EUR/JPY Price Action – Daily Chart
EUR/JPY Technical Levels
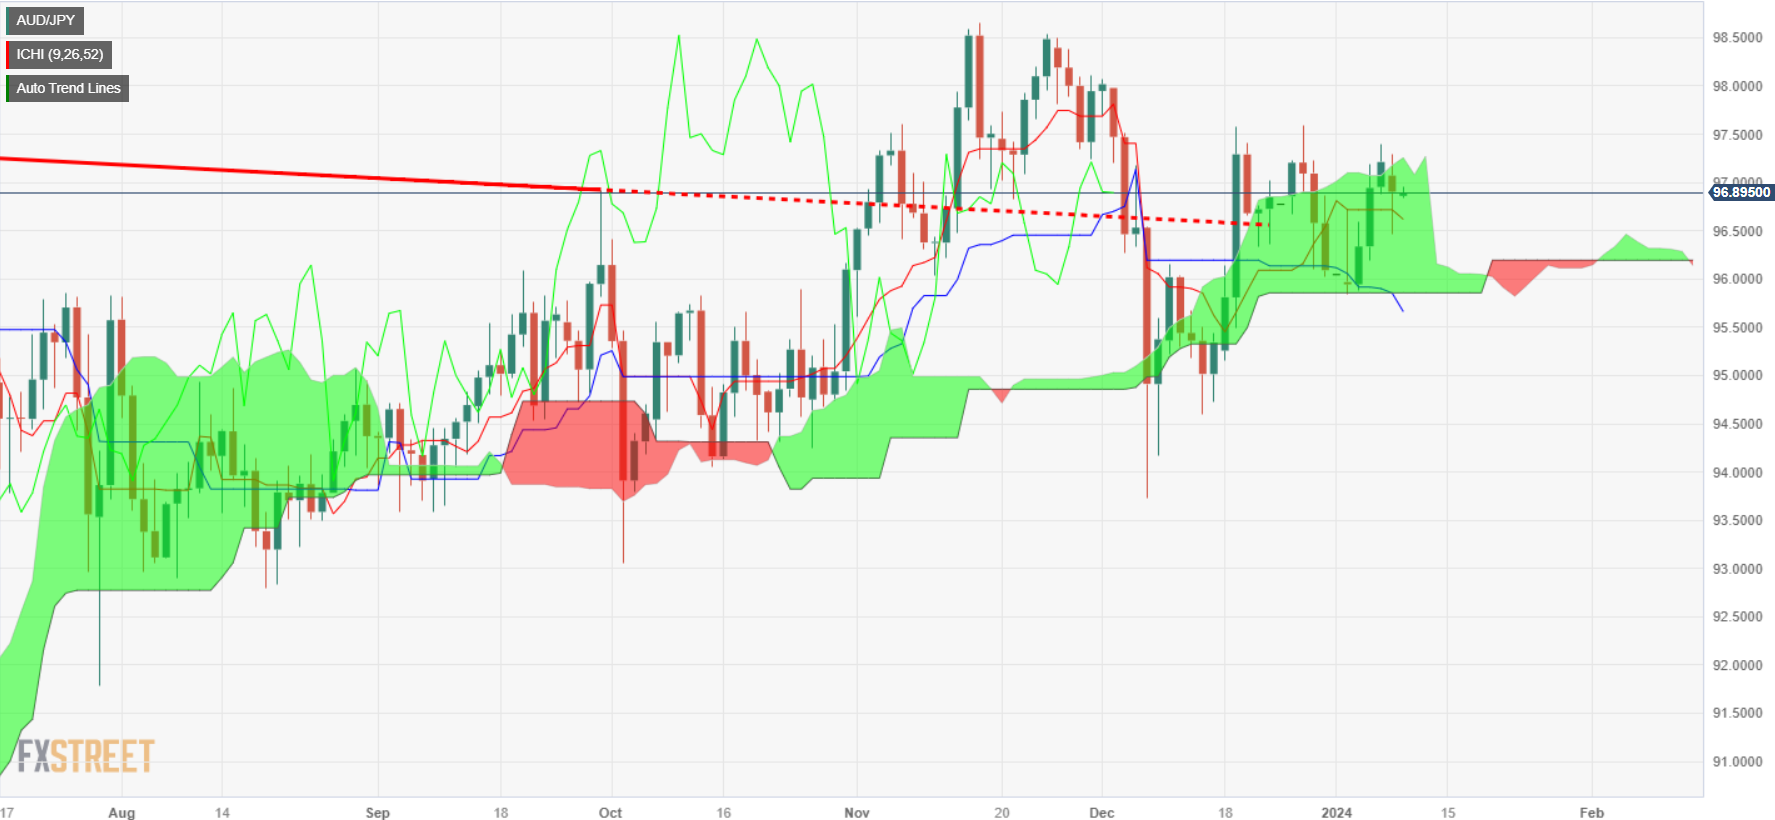
- AUD/JPY drops 0.20%, hovering near Ichimoku Cloud top, as improved market sentiment doesn't dent JPY's appeal.
- Technical setup shows a range-bound trend with immediate resistance at 97.00 and 97.39 swing high.
- Potential downside risks include breach of 96.71 (Tenkan-Sen), targeting Kijun-Sen at 95.82 and 96.00 level.
The AUD/JPY registered modest losses of around 0.20% on Monday despite market sentiment shifting positively, usually a headwind for the safe-haven status of the Japanese Yen (JPY). Consequently, the cross-pair is trading at 96.80, after hitting a daily high of 97.27.
From a technical perspective, the AUD/JPY is range-bound though slightly tilted to the upside, with the pair hovering near the top of the Ichimoku Cloud (Kumo), and above the Tenkan-Sen and the Kijun-Sen. Nevertheless, a breach of the former at around 96.71, could pave the way for challenging the latter just below the 96.00 figure, at 95.82.
Given the backdrop, the AUD/JPY first resistance level is the 97.00 figure. Followed by the January 5 swing high at around 97.39. if buyers step in and push the prices above that level, up next would be the December 27 high at 97.59, followed by the 98.00 mark.
AUD/JPY Price Action – Daily Chart
AUD/JPY Technical Levels
The Federal Reserve (Fed) Governor Bowman is speaking at the South Carolina Bankers Association 2024 Community Bankers Conference
Key quotes
“Inflation could fall further with policy rate held steady for some time
Current policy stance appears sufficiently restrictive.”
“It will eventually become appropriate to lower Fed’s policy rate, should inflation fall closer to 2%.”
“Labor market supply and demand coming into better balance.”
“Upside inflation risks remain, including geopolitical and easing financial conditions.”
“I will remain cautious in my approach to considering changes to Fed policy rate.”
“Remain willing to raise policy rate at a future Fed meeting, should inflation progress stall or reverse.”
“Climate guidance from banking regulators diverts resources from core financial risks.”
Market reaction
The US Dollar Index (DXY) is trading lower on the day at 102.28, as of writing.
- The Euro rose in early Monday trading on rising market sentiment.
- Eurozone economic data managed to mostly beat already-low expectations.
- EU unemployment on the docket for Tuesday.
The EUR/USD climbed on Monday, falling just short of 1.0980 before sliding back into 1.0950 in a consolidation pattern that is becoming familiar in the early stages of 2024.
Eurozone Retail Sales for the year through November declined less than expected, falling 1.1% versus the forecast 1.5% decline, compared to October’s YoY figure of -0.8% (revised upwards from -1.2%).
The Eurozone Sentix Investor Confidence index for January rebounded from -16.8 to -15.8, while the Eurozone Consumer Confidence survey index unexpectedly rose from -15.1 to -15.0, versus the market forecast for a steady hold at -15.1.
Eurozone Retail Sales for November also slid exactly as much as investors were expecting, printing at -0.3% compared to October’s print of 0.4% (revised upwards from 0.1%).
Tuesday will see an update on the Eurozone Unemployment Rate for November, which is forecast to hold steady at 6.5%, while broader markets will be focused on Thursday’s upcoming US Consumer Price Index (CPI) inflation print.
Thursday’s US Consumer Price Index (CPI) inflation print is expected to show slight declines in the near-term core figures, but annualized headline inflation continues to prove sticky, with the CPI for the year through December forecast to tick upwards slightly from 3.1% to 3.2%. Core YoY CPI, meanwhile, is forecast to slip from 4% to 3.8%, and December’s MoM Core CPI is expected to hold steady at 0.3%.
Markets will be looking for signs that inflation will continue to ease, with some investor hopefuls looking for an increasing pace in the reduction of price growth, in order to push the Federal Reserve (Fed) into the next rate cutting cycle sooner rather than later.
EUR/USD Technical Outlook
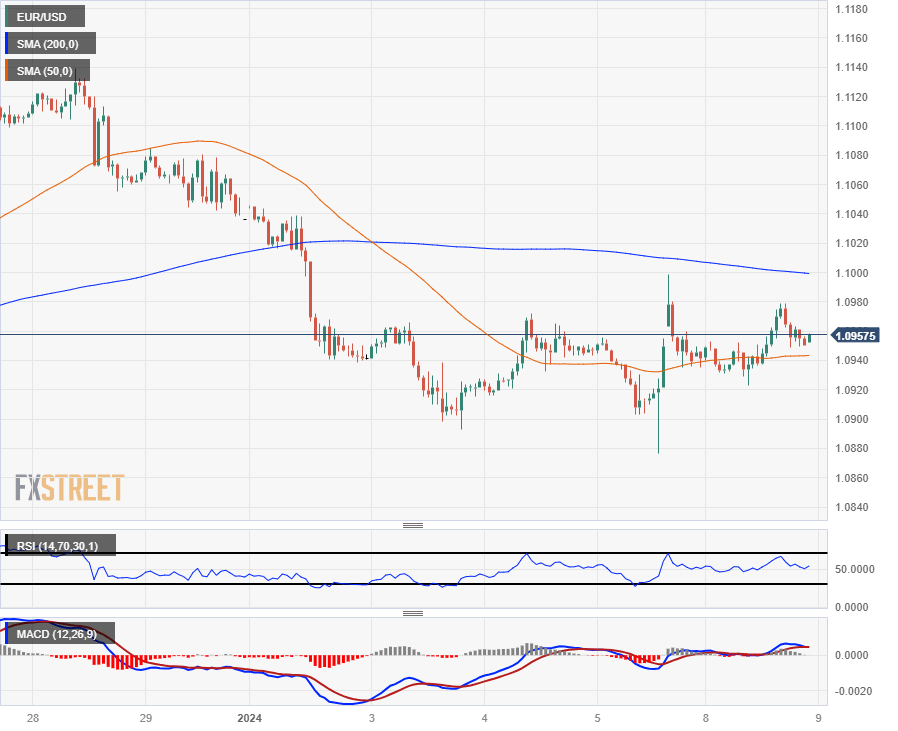
The EUR/USD rose into 1.0980 on Monday, falling just short of the near-term level and sliding back towards 1.0950 as the pair struggles in near-term consolidation. Intraday action continues to get capped under the 200-hour Simple Moving Average (SMA) near the 1.1000 major handle.
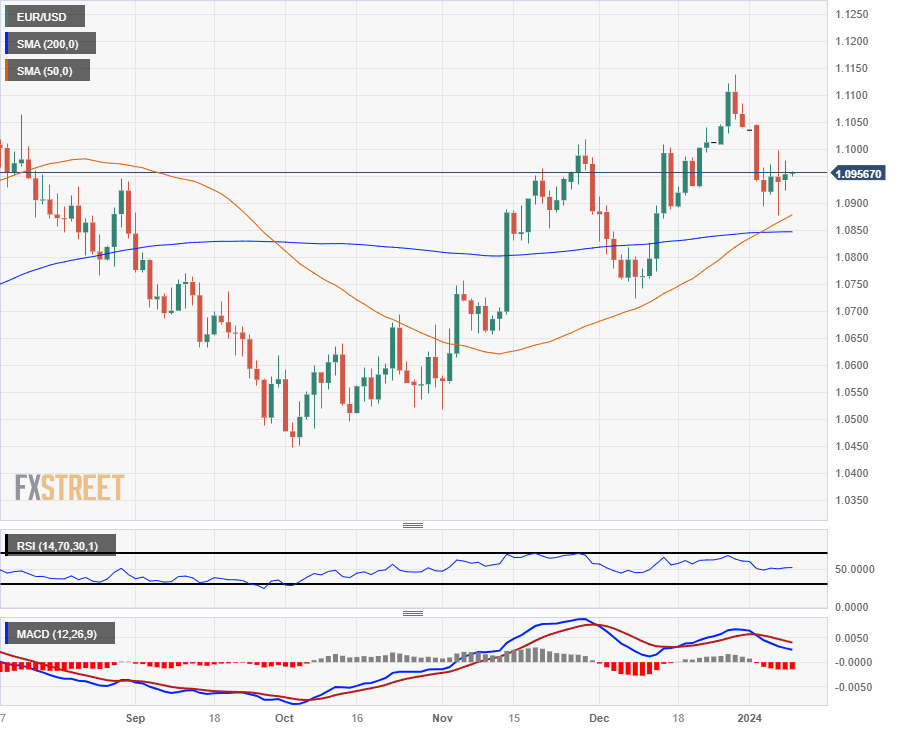
A bullish crossover of the 50-day and 200-day SMAs near 1.0850 is building out a technical floor beneath daily candlesticks, and the near-term ceiling is parked at December’s swing high just shy of 1.1150.
EUR/USD Hourly Chart
EUR/USD Daily Chart
EUR/USD Technical Levels
- EUR/GBP hovers at 0.8590, experiencing a 0.17% loss as bears gain ground.
- The bulls managed to push the cross to 0.8620 earlier in the session but failed to hold the momentum.
- Indicators from the daily chart project bearish sentiment.
- The four-hour chart reinforces bearish bias with RSI nearing oversold territory.
In Monday's session, the EUR/GBP trades at 0.8589, down by 0.17%. The daily chart conveys a bearish outlook, with bears progressively gaining ground. This downbeat vibe is more apparent in the four-hour chart, where indicators are deep in negative territory.
The negative slope and territory of the Relative Strength Index (RSI) reflect that sellers dominate the current chart. This bearish trend is further reinforced by the cross's position, which is lodged below the key Simple Moving Averages (SMAs) - 20, 100, and 200-day, a clear indication that there is a significant hurdle for potential buyers as the bears have taken the reins. Furthermore, the rising red bars of the Moving Average Convergence Divergence (MACD) insinuate an ongoing bearish momentum, symbolizing a negative outlook for the bulls.
Zooming into the four-hour chart, the bearish dominance is strikingly clear. The RSI is approaching oversold levels, which often indicates an overwhelming amount of selling activity but is often followed by an upward correction. Concurrently, the rising red bars of the four-hour Moving Average Convergence Divergence (MACD) reiterates the strength of the selling momentum.
EUR/GBP technical levels
EUR/GBP daily chart
-638403468523869806.png)
While the greenback survives just above the 102.00 region, the risk-associated complex appears to have regained its smile at the beginning of a week dominated by the upcoming release of US inflation figures measured by the CPI.
Here is what you need to know on Tuesday, January 9:
The US Dollar Index (DXY) started the week with modest losses just above the 102.00 barrier amidst investors’ preference for risk-linked assets and a corrective decline in US yields across the board.
US stocks accelerated the upside and appeared on track to challenge the record high seen earlier in the month amidst the weaker dollar and a firm appetite for the risk complex.
EUR/USD left behind Friday’s inconclusive price action and printed decent gains to the 1.0980 zone, where some initial resistance turned up. Bolstering the daily uptick in the pair emerged a tepid improvement in the Investor Confidence tracked by the Sentix Index as well as better-than-expected Retail Sales readings in the euro bloc.
GBP/USD maintained the bullish bias for the fourth session in a row, regaining the 1.2700 barrier and beyond, helped by the positive risk-on sentiment.
Declining US yields and the corrective knee-jerk in the greenback favoured the daily pullback in USD/JPY to the 143.60 region, although it reclaimed the 144.00 hurdle towards the end of the NA session.
AUD/USD added to Friday’s small recovery and navigated a volatile session, eventually regaining the 0.6700 level despite the generalized bearish performance in the commodity space.
USD/CAD could not sustain an early move just past 1.3400 the figure on Monday, eventually retreating to the mid-1.3300s against the backdrop of an incipient consolidative theme.
Gold retreated to three-week lows near $2015 per troy ounce amidst traders’ repricing of the likelihood that the Fed might extend its restrictive stance for longer, particularly in response to the December NFP prints. In the same line, Silver set aside two straight sessions of losses and revisited the area below the $23.00 mark.
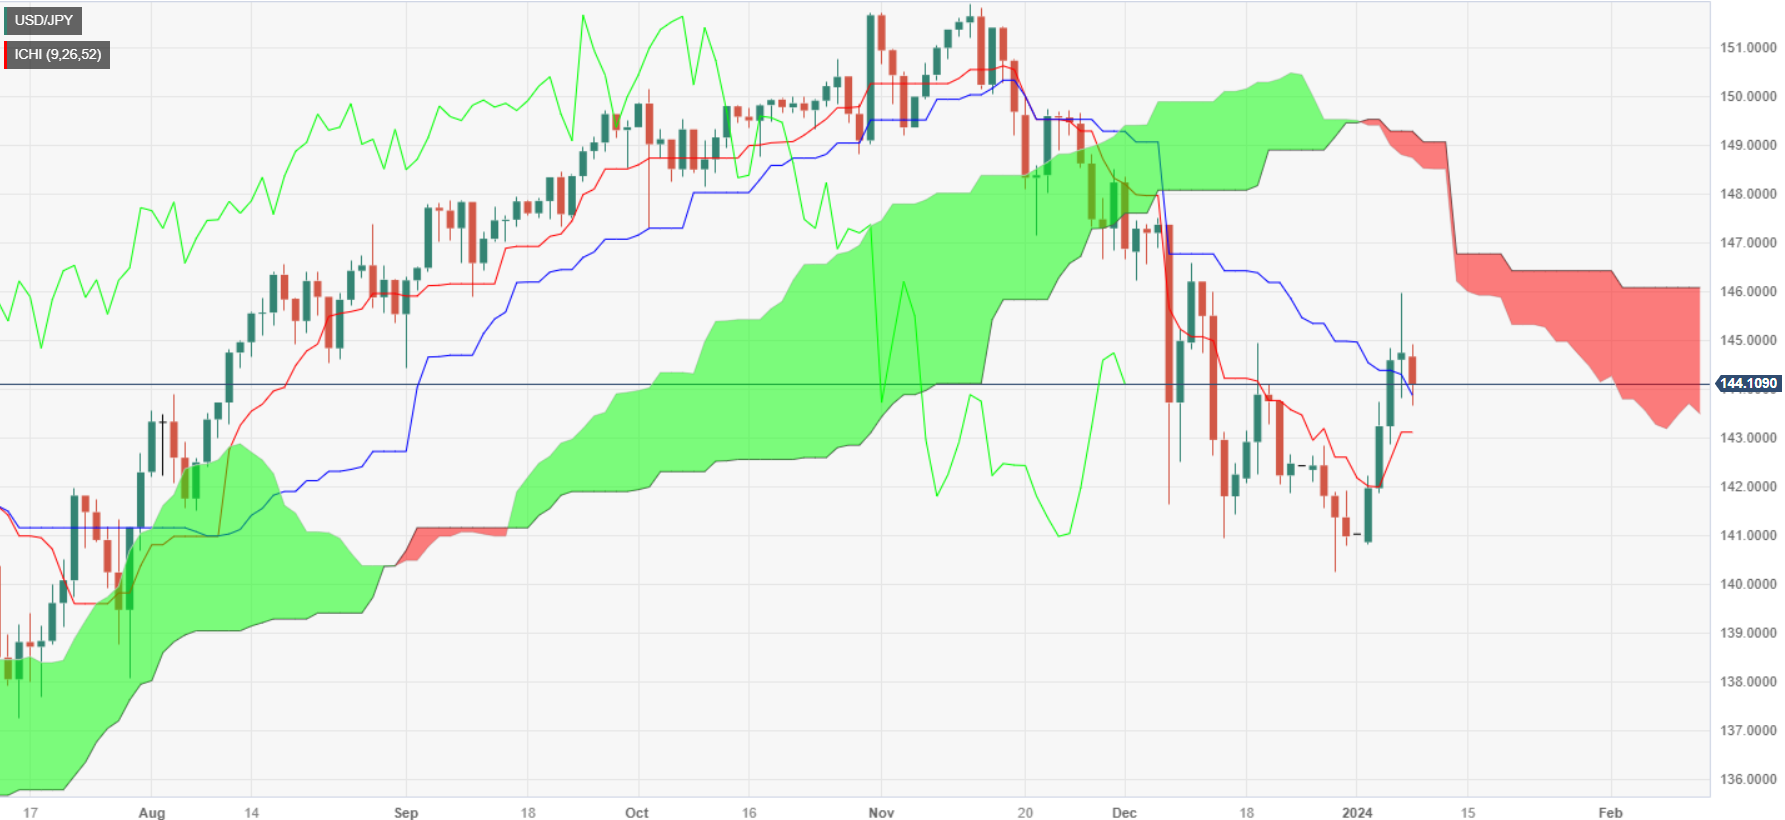
- USD/JPY's 0.33% decline influenced by falling US bond yields and a weaker USD, as market anticipates US inflation report.
- Technical analysis shows bearish trend under Kijun-Sen and Ichimoku Cloud, suggesting potential further declines.
- Immediate supports at 144.00 and 143.00, while a break above 145.00 could signal an upward shift in momentum.
The USD/JPY begins the week on the back foot with the major sliding 0.33%, weighed by falling US Treasury bond yields and a soft US Dollar (USD). The lack of a catalyst on Monday keeps traders focused on the main event of the week, which is the inflation report in the US. At the time of writing, the pair is exchanging hands at 144.11.
From a technical standpoint, the daily chart suggests the pair is bearishly biased, even though it briefly tested a September 11 swing low of 145.89, though buyers were quickly rejected at that level, achieving a daily close at around 144.59 last Friday.
The USD/JPY had remained downward pressured, below the Kijun-Sen and the Ichimoku Cloud (Kumo), suggesting that the downtrend remains in place. That, along with the Chikou Span remaining in bearish territory, would keep sellers hopeful of lowering prices.
The major’s first support is seen at 144.00, followed by the Tenkan-Sen level at 143.11, ahead of the 143.00 mark. Once cleared, up next would be the 142.00 mark, followed by the December 28 swing low of 140.25.
On the other hand, if buyers lift the USD/JPY above 145.00, that will pave the way for further upside.
USD/JPY Price Action – Daily Chart
USD/JPY Technical Levels
- WTI's sharp decline triggered by Saudi price cuts to Asian markets, amidst increased oil production by some OPEC members.
- Geopolitical tensions in the Middle East initially boosted oil prices, but escalating supply eases concerns.
- US diplomatic efforts intensify in the Middle East, as conflict impacts global shipping and oil market sentiments.
West Texas Intermediate (WTI) slid more than 4% on Monday as Saudi Arabia implemented price cuts, while the Organization of Petroleum Exporting Countries (OPEC) offset supply concerns amid geopolitical tension in the Middle East. At the time of writing, the US Crude Oil benchmark exchanges hands at $72.21 per barrel, a loss of 4.63%.
US Oil benchmark dropped to $70.16 on Middle East conflict concerns
Since the beginning of the year, WTI’s rose by 2% amid risks of an escalation in the Middle East conflict between Israel and Hamas. Attacks by Yemen’s Houthis on ships in the Red Sea underpinned Oil prices.
Oil prices dived by rising supply as Crude output production increased in some countries led by Angola, offsetting continuing cuts by Saudi Arabia and other members of the OPEC. Therefore, that sparked Saudi Arabia’s price cut to Asian customers to its lowest level in 27 months, according to Reuters.
Meanwhile, the ongoing crisis in the Middle East gathered attention from the US Secretary of State Anthony Blinken, who held talks with Araba leaders on Monday to increase the efforts pushing for a diplomatic exit to the Gaza war from further spreading.
Nevertheless, the conflict is already weighing economically with rising shipping freight rates, as most ships avoid sailing through the Red Sea.
WTI Price Analysis: Technical outlook
Oil’s leg down on Monday pushed prices towards its daily low of $70.19, but sellers' failure to step in lifted Crude to the brisk of regaining $71.00, which could pave the way to test the 50-day moving averages (DMA) at $75.06. Once hurdled, the next stop would be the $76.00 figure, followed by the 200-DMA at $77.87.
- European equities saw gains to kick off the new trading week.
- Risk appetite recovering on the new week despite macro headwinds.
- German economy continues to lag in step with broader Eurozone economic conditions.
The German DAX led the charge in European equities on Monday, as investors bid up stocks and saw a healthy rebound in risk appetite after 2024 kicked things off with a retreat in market sentiment.
European economic figures on Monday were broadly better than expected as investor optimism carefully threads the needle on a positive outlook on data. Eurozone Retail Sales for the year through November declined less than expected, falling 1.1% versus the forecast 1.5% decline, compared to October’s YoY figure of -0.8% (revised upwards from -1.2%).
The Eurozone Sentix Investor Confidence index for January rebounded from -16.8 to -15.8, while the Eurozone Consumer Confidence survey index unexpectedly rose from -15.1 to -15.0, versus the market forecast for a steady hold at -15.1.
Eurozone Retail Sales for November also slid exactly as much as investors were expecting, printing at -0.3% compared to October’s print of 0.4% (revised upwards from 0.1%).
Structural economic issues continue to loom over the domestic German economy, with an aging population set to worsen an already-steep labor shortage, and the International Monetary Fund is projecting that Germany will be the only G7 country to see real economic decline in 2023.
Germany’s government budget for 2024 was rejected by Germany’s own top court last November, and Germany is scrambling to find a stopgap for a projected 17 billion Euro funding deficit for 2024.
Despite economic concerns swirling around the Eurozone’s single largest economy, European investors found reasons to buy on Monday, sending the German DAX higher by 122 points to close at €16,716.47, gaining nearly three-quarters of a percent. France’s CAC 40 index also closed up at €7,450, climbing 0.4% and gaining almost 30 points.
The Eurostoxx 600 major index also climbed around 0.4% to close up 1.8 points at €478.18. The London FTSE equity index climbed a little under five points to close at £7,694.20, a scant 0.06% higher.
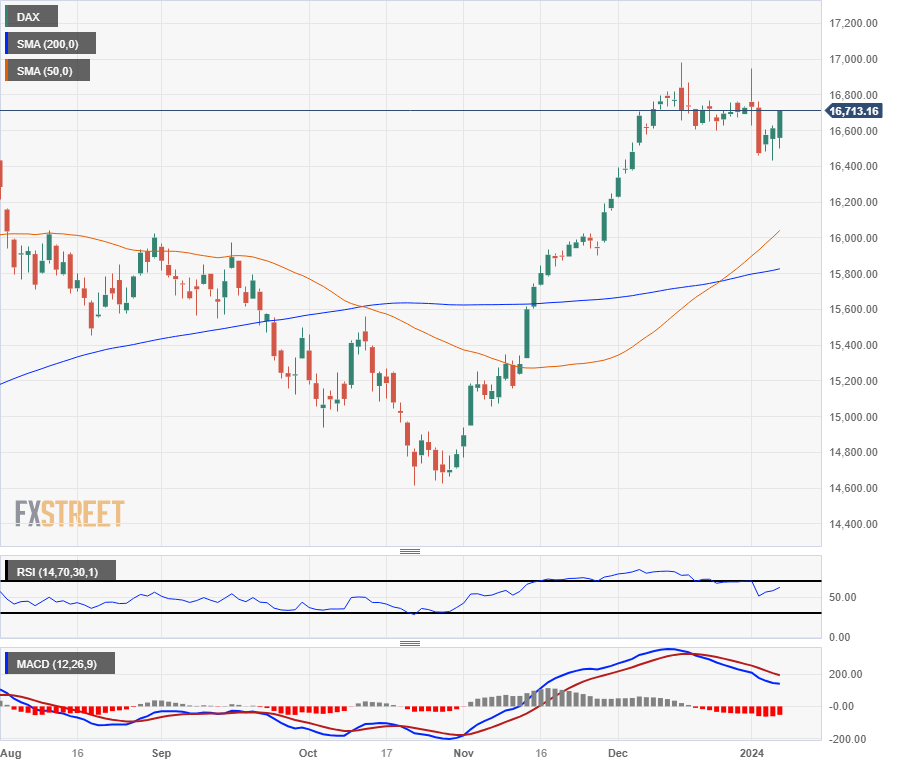
DAX Technical Outlook
The German DAX etched in a third straight gain on Monday, keeping the equity index on the high end after hitting an all-time high of €16,984.44 in December.
The DAX’s current bull run kicked off from a six-month low of €14,618.09, climbing over 16% bottom-to-top.
The DAX is trading into lofty chart territory well above the 200-day Simple Moving Average (SMA) near €15,800, and a bullish crossover by the 50-day SMA is accelerating technical support at the €16,000 major handle.
DAX Daily Chart
DAX Technical Outlook
- GBP/JPY trades at 183.75 with slight losses, stopping bulls after a 2% uptick in the previous three days.
- The bulls presented battled and trimmed losses, which took the cross below the 100-day SMA.
- The daily chart uncovers flat RSI and MACD, representing a halt in the buying momentum.
- The four-hour chart shows little change in overbought conditions.
In Monday's session, the GBP/JPY softened modestly to 183.75. Despite pulling back slightly after a vigorous surge of more than 2% over recent days, the bulls seem to be catching their breath. Neutral to bullish on the daily chart, yet nearing overbought territory in the four-hour chart, the pair remains poised for additional corrections.
According to the technical indicators on the daily chart, the landscape appears somewhat idyllic for the bulls in the long term. The Moving Average Convergence Divergence (MACD) is fairly flat with green bars, indicating a neutral sentiment but with a slight bullish bias. Meanwhile, the Relative Strength Index (RSI) settles in the positive territory, preserving a tight line and suggesting a pause in recent buying momentum. Nonetheless, the pair remains well above the 20,100,200-day Simple Moving Averages (SMAs), implying that the bulls still maintain control in the wider perspective. This bullish dominance is further reinforced by the recent gains, with the pair having advanced more than 2% in the recent three days, thus indicating that buying momentum continues to hold sway over selling momentum.
Shifting to the shorter-term four-hour chart, the indicators paint a similar picture of bull's dominance, albeit with a hint of a possible slowdown. The Moving Average Convergence Divergence (MACD) portrays flat green bars, indicating a continuation of bullish sentiment, yet with a possible pause. The Relative Strength Index (RSI) remains flat within the positive territory, still near overbought conditions. Such positioning could suggest that the bulls are taking a breather, allowing for potential consolidation before the next leg upward. Thus, on a shorter time frame, the prevailing buying momentum appears to be taking a slight recess, providing a chance for sell-side action to develop, but the broader bullish bias remains intact.
GBP/JPY technical levels
GBP/JPY daily chart
-638403373220896204.png)
Atlanta Federal Reserve (Fed) President Raphael Bostic gave some talking points about the 2024 economic outlook while attending the Atlanta Rotary Club on Monday.
Atlanta Fed President Bostic will be taking a regular seat as a voting member on the Federal Open Market Committee (FOMC) in 2024 when seats change hands at the Fed's first meeting of 2024 on January 30-31.
An alternate voting member during the 2023 Fed year, Bostic will maintain a voting presence on the FOMC through 2024, and his perspective on market conditions will carry extra weight as a key policymaker as the Fed heads into the next rate cut cycle.
Highlights:
- Inflation has declined more than initially expected, sees two quarter-point cuts by year-end 2024.
- Short-term inflation measures, specifically three-month to six-month horizons, will matter significantly more in 2024.
- Goods inflation has returned to pre-pandemic levels, but services inflation remains stickier, falling more slowly.
- Is comfortable with the current rate level.
- The immediate goal now is to avoid a meaningful rebound in inflation, Fed will need to pay close attention.
- Fed still needs to give tight policy time to work on cooling off inflation.
- Bostic says the US is on the path to 2% inflation, goal is to remain on that path.
- Headline job number growth has been strong, but caution is needed as recent strength focuses on a relatively small section of the overall economy.
Market reaction
Fed President Bostic's remarks saw a minor uptick in the US Dollar Index (DXY), rising to 102.30 to pare back Monday's early losses, while the S&P 500 equity index is holding onto near-term gains near $4,730 to kick off the new trading week.
- The XAG/USD is rallying during the American session towards the $23.20 level with a current 0.90% increase after bottoming at $22.80.
- Still, the metal holds onto mild losses on the day.
- USD struggles to maintain the previous week's bullish momentum as risks on flows resume.
- Investors await key CPI data on Thursday to place their bets on the Fed.
In Monday's trading session, the silver prices, represented by the XAG/USD pair, took a bullish turn, trading at a higher level of around $23.15. The rally originates from a combination of a weakening Dollar and descending yields, giving silver an advantageous footing at the start of the week.
In its final meeting of 2023, the Federal Reserve recognized a dip in inflation rates and affirmed that 2024 will be free of rate hikes. The Fed even suggested a 75bps easing, leading market speculations to factor in rate cuts for March and May. In that sense, markets now await the next set of data after last week’s strong labor reports, which were offset by the disappointing ISM PMI figures, keeping afloat the dovish rhetoric.
Market attention will shift to the release of the US December Consumer Price Index (CPI) data on Thursday. Projected figures indicate an increase to 3.2% YoY, a subtle rise from prior 3.1% rates. Nevertheless, the anticipated annualized core CPI registers a slight relaxation to 3.8% from November's 4%.
Currently, US bond yields are declining. The 2-year rate stands at 4.32%, while the 5 and 10-year yields are at 3.93% and 3.97%, respectively. These lower yields bolster the appeal of non-yielding metals as the opportunity cost of holding them decreases.
XAG/USD levels to watch
The daily chart indicates that the metal portrays a bearish sentiment, reflecting a dominant selling momentum. Based on the position of the Relative Strength Index (RSI), which is on a negative slope within the negative territory, a heightened selling pressure is evident. The negative bias is further amplified by the Moving Average Convergence Divergence (MACD), which presents flat red bars, indicating that sellers maintain the upper hand, although at a decreasing rate.
When observing the Simple Moving Averages (SMAs), the price's position below the 20, 100, and 200-day SMAs, further implies that bears retain control on a broader scale.
XAG/USD daily chart
-638403335748231586.png)
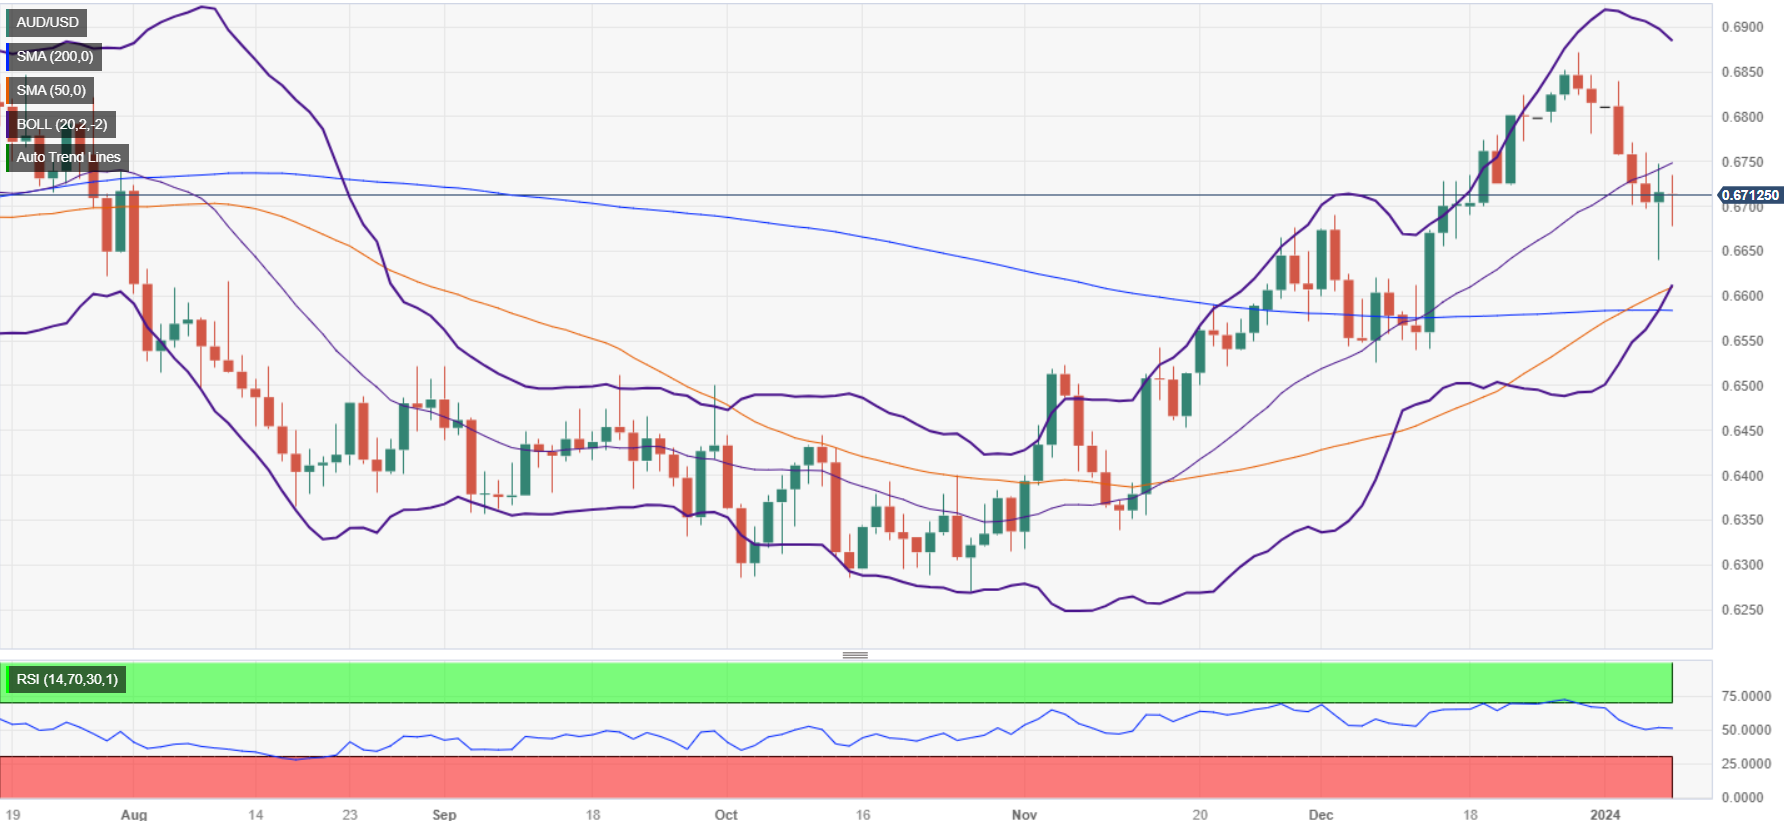
- AUD/USD remains flat after early dip, with improved market mood and speculations on Fed rate cuts impacting the USD.
- Dallas Fed President's remarks on potential rate hike contrast with declining US inflation expectations in NY Fed survey.
- Investors eye upcoming speeches by Fed officials and key Australian economic indicators, including Building Permits and Retail Sales.
The AUD/USD turned flat during the mid-North American session on Monday after hitting a daily low of 0.6677, but an improvement in traders' appetite weakened the Greenback (USD). Additionally, speculations that the US Federal Reserve (Fed) would cut rates in 2024 remain shy, a headwind for the USD. At the time of writing, the pair trades at 0.6713, almost flat.
AUD/USD hovers at around 0.6710s as market sentiment and expectations of a dovish Fed, weighs on the US Dollar
Wall Street began the week on a positive note, except for the Dow Jones, dragged lower by Boeing’s 737 Max 9 issues that grounded airplanes worldwide. Investors seem confident they would ease monetary policy during the year despite Dallas Fed President Lorie Logan's comments not to rule out another rate hike, as financial conditions had eased. She added that the US central bank should consider slowing its asset runoff.
Data-wise, the US economic docket was scarce, as the New York (NY) Fed revealed in its Survey of Consumer Expectations, which witnessed households downward, revising inflation expectations for one year, to 3%, its lowest level since January 2021. Estimates for three and five years were lowered to 2.6% from 3% and 2.5% from 2.7%, both readings lower than November’s.
Ahead of the week, the US economic docket will feature a speech by the Atlanta Fed President Raphael Bostic at around 17:30 GMT. On the Australian front, the docket will feature Building Permits and Retail Sales, both data for November on its preliminary readings.
AUD/USD Price Analysis: Technical outlook
From a daily chart perspective, the AUD/USD is neutral to upward biased, but buyers need to reclaim the 0.6800 figure so they can threaten to challenge the December 28 high of 0.6871. Once cleared, the next stop would be the 0.6900 figure. Nevertheless, if sellers’ step in and drag prices below 0.6700, look for a fall toward the confluence of the 50 and 200-day moving averages (DMAs) at around 0.6599/72, followed by the November 6 high at around 0.6523.
- Pound Sterling sees a Monday surge as investors try to recover some confidence.
- UK Retail Sales figures due on Tuesday.
- US CPI inflation print to be the pivotal datapoint of the week.
The GBP/USD is bounding higher in a risk-on market session to kick off the new week as broad-market risk appetite steps up in the US market session, pushing the US Dollar (USD) down and giving the rest of the major currencies some breathing room.
The Pound Sterling (GBP) climbed over the 1.2750 barrier against the Greenback, but a lack of meaningful UK economic data on the calendar this week leaves the Cable at the mercy of broad-market flows as markets gear up for another round of US inflation figures due on Thursday with the release of December’s US Consumer Price Index (CPI).
The UK’s BRC Like-For-Like Retail Sales for the year ended December will print early Tuesday, slated to release at exactly 00:01 GMT. BRC Retail Sales last came in at 2.6% YoY in November, and near-term figures are unlikely to recover much ground, down from 6.5% at the same time last year.
US CPI inflation to draw investor attention
Market focus will be squarely on US inflation figures this week as investors grapple with rate cut expectations from the Federal Reserve (Fed). The big question for 2024 is when, not if, the next rate cut cycle will begin, and traders will be looking for signs of deterioration in the US economic outlook with particular emphasis on hopes for continuing price growth declines.
Thursday’s US Consumer Price Index (CPI) inflation print is expected to show slight declines in the near-term core figures, but annualized headline inflation continues to prove sticky, with the CPI for the year through December forecast to tick upwards slightly from 3.1% to 3.2%. Core YoY CPI, meanwhile, is forecast to slip from 4% to 3.8%, and December’s MoM Core CPI is expected to hold steady at 0.3%.
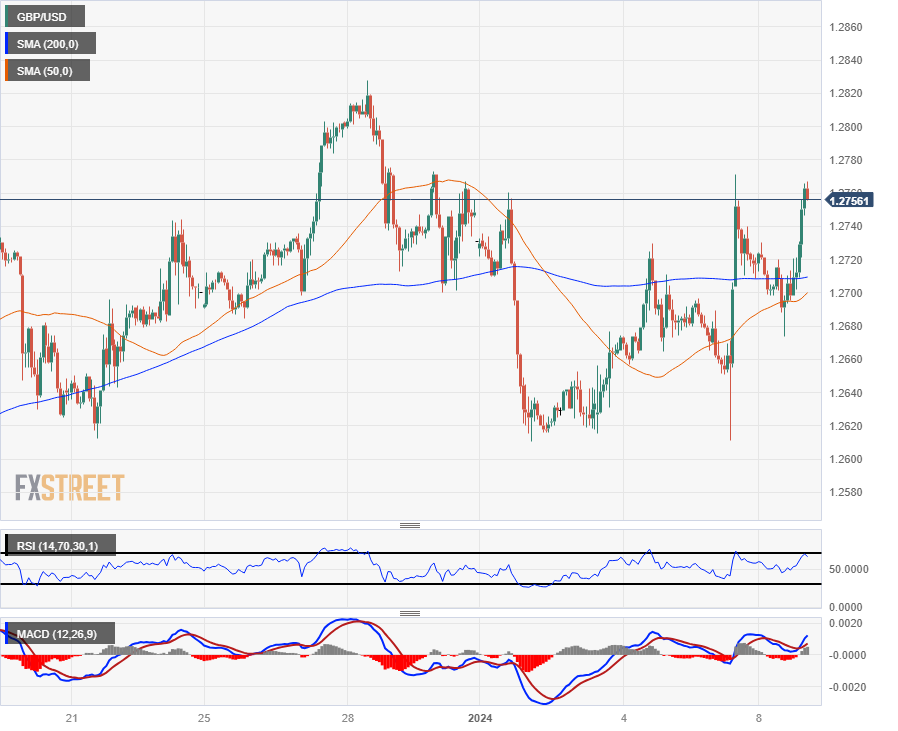
GBP/USD Technical Outlook
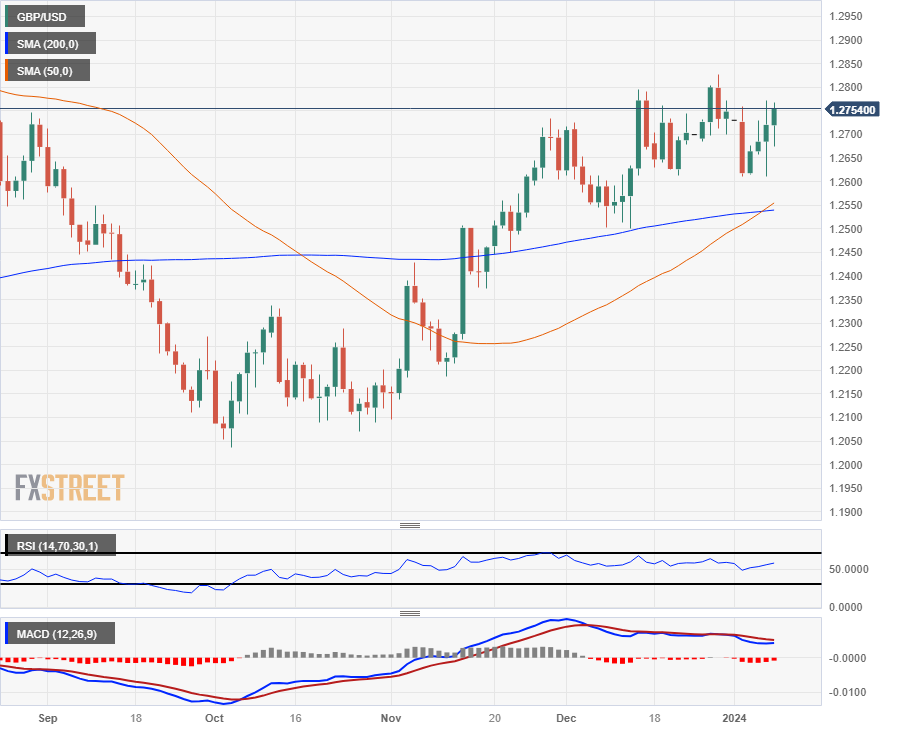
The GBP/USD has been plagued by rough chop in recent weeks as the Pound Sterling struggles to develop momentum in either direction against the US Dollar. Monday’s US session rally sparked by a risk-on selloff in the USD sees the Cable knocking into near-term technical resistance as frequent intraday turnarounds etch in a barrier from 1.2760 to 1.2780.
Daily candlesticks emphasis the GBP/USD’s drift, but long-term bids remain supported by a bullish crossover of the 50-day and 200-day Simple Moving Averages (SMA) near 1.2550.
The immediate technical ceiling rests at December’s peak bids near 1.2830.
GBP/USD Hourly Chart
GBP/USD Daily Chart
GBP/USD Technical Levels
- The DXY Index declines toward 102.15, challenging 20-day SMA.
- Lower US Treasury yields weigh on the Greenback.
- Investors eye Wednesday’s CPI data from the last month of 2023.
The US Dollar (USD) is currently trading at the 102.15 area, seeing losses due to bulls struggling to sustain the momentum gained last week. Monday’s calendar has nothing relevant to offer, and the focus is set on the Consumer Price Index (CPI) figures from December, due on Wednesday.
In its last 2023 meeting, the Federal Reserve (Fed) mirrored a dovish stance, welcoming moderating inflation and projecting no rate hikes in 2024 alongside a forecasted 75 bps of easing. Current market expectations predict a March rate cut and another in May, hinging on December's CPI report. This dovish posture, coupled with anticipation of impending rate cuts, contributes to a weaker US dollar as lower interest rates decrease foreign investment appeal.
Daily digest market movers: US dollar hesitates ahead of CPI
- The US Dollar is struggling to hold last week's gains, which closed 1% up on Friday.
- Markets await key inflation data, which is expected to have picked up in the last month of 2023. The core measure is forecasted to be 3.8% YoY.
- US Treasury yields experienced a drop, with the 2-year yield at 4.32%, the 5-year yield at 3.94%, and the 10-year yield at 3.98%, adding pressure to the USD.
- According to the CME FedWatch Tool, the Federal Reserve's easing expectations also started to adjust last week. Five rate cuts are now priced in for 2024. Investors are pricing in a hold at the upcoming January meeting but anticipate higher chances of rate cuts in March and May.
Technical Analysis: DXY bears step in as bulls continue weak showing
The indicators on the daily chart reflect a bearish outlook for the USD. The Relative Strength Index (RSI) is currently demonstrating a negative slope in negative territory, which is backed by the bearish sentiment indicated by the Simple Moving Averages (SMAs) and the Moving Average Convergence Divergence (MACD) indicator’s rising red bars.
The index's position above the 20-day SMA while below the 100 and 200-day SMAs indicates that buying pressure is losing momentum to selling pressure in the medium and long-term time frames. This is a signal that the bears are maintaining some dominance.
Support levels: 102.10,102.00,101.80.
Resistance levels: 102.30,102.50, 102.70.
US Dollar FAQs
What is the US Dollar?
The US Dollar (USD) is the official currency of the United States of America, and the ‘de facto’ currency of a significant number of other countries where it is found in circulation alongside local notes. It is the most heavily traded currency in the world, accounting for over 88% of all global foreign exchange turnover, or an average of $6.6 trillion in transactions per day, according to data from 2022.
Following the second world war, the USD took over from the British Pound as the world’s reserve currency. For most of its history, the US Dollar was backed by Gold, until the Bretton Woods Agreement in 1971 when the Gold Standard went away.
How do the decisions of the Federal Reserve impact the US Dollar?
The most important single factor impacting on the value of the US Dollar is monetary policy, which is shaped by the Federal Reserve (Fed). The Fed has two mandates: to achieve price stability (control inflation) and foster full employment. Its primary tool to achieve these two goals is by adjusting interest rates.
When prices are rising too quickly and inflation is above the Fed’s 2% target, the Fed will raise rates, which helps the USD value. When inflation falls below 2% or the Unemployment Rate is too high, the Fed may lower interest rates, which weighs on the Greenback.
What is Quantitative Easing and how does it influence the US Dollar?
In extreme situations, the Federal Reserve can also print more Dollars and enact quantitative easing (QE). QE is the process by which the Fed substantially increases the flow of credit in a stuck financial system.
It is a non-standard policy measure used when credit has dried up because banks will not lend to each other (out of the fear of counterparty default). It is a last resort when simply lowering interest rates is unlikely to achieve the necessary result. It was the Fed’s weapon of choice to combat the credit crunch that occurred during the Great Financial Crisis in 2008. It involves the Fed printing more Dollars and using them to buy US government bonds predominantly from financial institutions. QE usually leads to a weaker US Dollar.
What is Quantitative Tightening and how does it influence the US Dollar?
Quantitative tightening (QT) is the reverse process whereby the Federal Reserve stops buying bonds from financial institutions and does not reinvest the principal from the bonds it holds maturing in new purchases. It is usually positive for the US Dollar.
- Canadian Dollar broadly turns lower amidst Crude Oil rout.
- Canada economic data docket is thin this week.
- Crude Oil tumbles once again in choppy trading as downside pressure mounts.
The Canadian Dollar (CAD) sees downside pressures across the major currencies board on Monday, getting pushed down the charts by a backsliding Crude Oil market to kick off the second week of 2024.
Canadian International Merchandise Trade Balance and Building Permits, both slated for release on Tuesday, represent the only data showings for the Canadian Dollar on this week’s economic calendar. Markets are still adjusting after last Friday’s US Nonfarm Payrolls (NFP) print saw heavy revisions to previous periods.
Weakening economic figures are the name of the game for data points from Canada, with Tuesday’s Canadian International Merchandise Trade Balance forecast to decline from 2.97 billion to 1.8 billion for November. Meanwhile, Canadian November Building Permits are likewise expected to slip from 2.3% to 2.0%.
Daily digest market movers: Canadian Dollar softens on despondent Crude Oil demand outlook
- Another slump in Crude Oil is dragging down the Canadian Dollar on waffling Middle East barrel prices.
- Saudi Arabia slashed the prices they charge to trading partners in Asia for Saudi crude as production cuts from the Organization of Petroleum Exporting Countries (OPEC) continue to get foiled by slumping barrel demand from key oil market drivers such as China.
- US Crude Oil production continues to pump at or near record levels near 13 million barrels per day.
- The legs continue to get kicked out from underneath broad market expectations of global undersupply that has yet to materialize despite months of production cuts.
- Last Friday’s US NFP goosed market expectations of Fed rate cuts after printing well above expectations, despite a steep downside revision to previous periods’ prints. A firm employment outlook in the US makes it less likely that the Federal Reserve (Fed) will get pushed into a rate cut cycle as soon as investors were initially hoping for.
- Key US data for this week lands on Thursday with another round of the US Consumer Price Index (CPI) inflation print.
- Headline annualized US CPI inflation is expected to tick up slightly from 3.1% to 3.2% for December.
Canadian Dollar price today
The table below shows the percentage change of Canadian Dollar (CAD) against listed major currencies today. Canadian Dollar was the weakest against the Japanese Yen.
| USD | EUR | GBP | CAD | AUD | JPY | NZD | CHF | |
| USD | -0.30% | -0.30% | 0.11% | 0.00% | -0.72% | 0.02% | -0.52% | |
| EUR | 0.30% | 0.00% | 0.42% | 0.31% | -0.40% | 0.32% | -0.22% | |
| GBP | 0.32% | 0.01% | 0.43% | 0.32% | -0.39% | 0.34% | -0.20% | |
| CAD | -0.11% | -0.40% | -0.42% | -0.11% | -0.80% | -0.09% | -0.62% | |
| AUD | 0.01% | -0.29% | -0.29% | 0.12% | -0.70% | 0.02% | -0.51% | |
| JPY | 0.69% | 0.42% | 0.39% | 0.84% | 0.70% | 0.72% | 0.19% | |
| NZD | -0.03% | -0.34% | -0.34% | 0.08% | -0.03% | -0.74% | -0.56% | |
| CHF | 0.52% | 0.22% | 0.23% | 0.64% | 0.53% | -0.18% | 0.54% |
The heat map shows percentage changes of major currencies against each other. The base currency is picked from the left column, while the quote currency is picked from the top row. For example, if you pick the Euro from the left column and move along the horizontal line to the Japanese Yen, the percentage change displayed in the box will represent EUR (base)/JPY (quote).
Technical Analysis: Canadian Dollar slides to 3-week low on soft barrel bids, USD/CAD tests 1.3400
The Canadian Dollar (CAD) saw further downside on Monday, sending the Loonie lower against all of its major currency peers. At the time of writing, the Canadian Dollar is down eight-tenths of a percent against the Japanese Yen (JPY), six-tenths of a percent against the Swiss Franc (CHF), and around four-tenths of one percent against both the Pound Sterling (GBP) and the Euro (EUR).
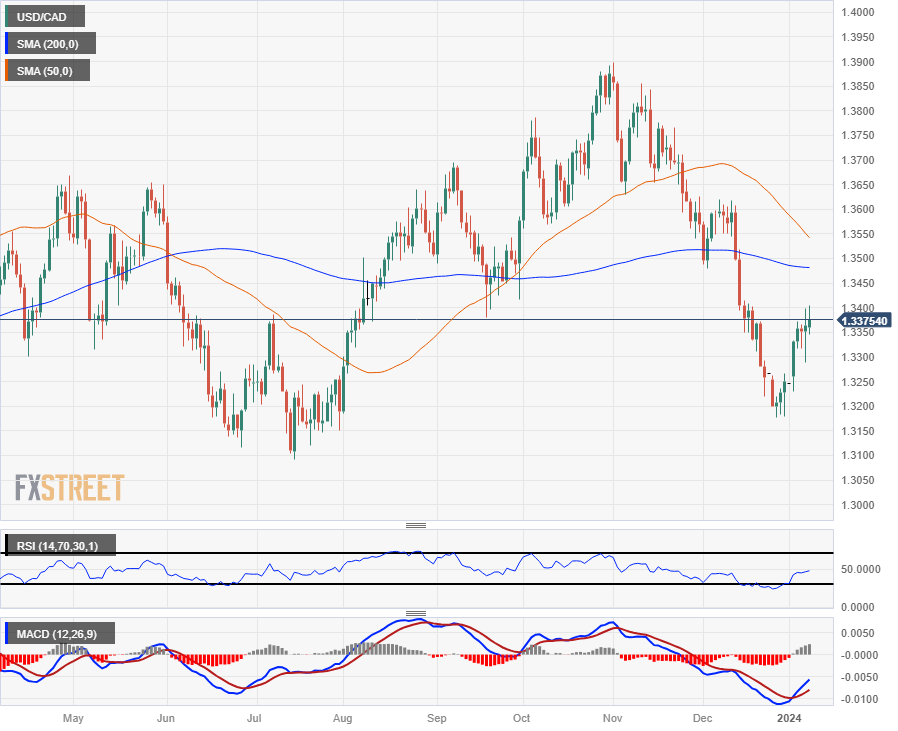
Canadian Dollar losses against the US Dollar (USD) remain limited on Monday, but they are still in the red as the USD/CAD pair extended to test the 1.3400 handle. The Loonie has shed 1.75% against the Greenback bottom-to-top from late December’s bottom bids near 1.3177.
The US Dollar has closed up or mostly flat against the Canadian Dollar for seven consecutive trading days, and Monday is set to chalk in an eighth consecutive loser for the CAD.
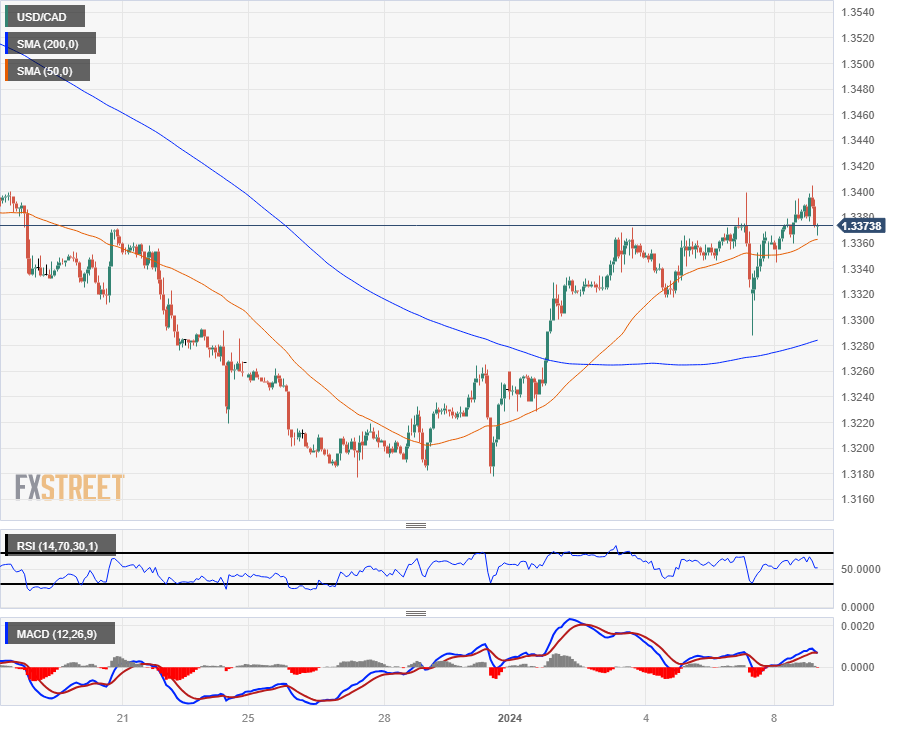
A continued upswing in the USD/CAD is set for a challenge from the near-term technical ceiling from the 200-day Simple Moving Average (SMA) just below the 1.3500 major handle, while a downside run into the 1.3200 region will see the pair testing into five-month lows below 1.3175.
USD/CAD Hourly Chart
USD/CAD Daily Chart
Canadian Dollar FAQs
What key factors drive the Canadian Dollar?
The key factors driving the Canadian Dollar (CAD) are the level of interest rates set by the Bank of Canada (BoC), the price of Oil, Canada’s largest export, the health of its economy, inflation and the Trade Balance, which is the difference between the value of Canada’s exports versus its imports. Other factors include market sentiment – whether investors are taking on more risky assets (risk-on) or seeking safe-havens (risk-off) – with risk-on being CAD-positive. As its largest trading partner, the health of the US economy is also a key factor influencing the Canadian Dollar.
How do the decisions of the Bank of Canada impact the Canadian Dollar?
The Bank of Canada (BoC) has a significant influence on the Canadian Dollar by setting the level of interest rates that banks can lend to one another. This influences the level of interest rates for everyone. The main goal of the BoC is to maintain inflation at 1-3% by adjusting interest rates up or down. Relatively higher interest rates tend to be positive for the CAD. The Bank of Canada can also use quantitative easing and tightening to influence credit conditions, with the former CAD-negative and the latter CAD-positive.
How does the price of Oil impact the Canadian Dollar?
The price of Oil is a key factor impacting the value of the Canadian Dollar. Petroleum is Canada’s biggest export, so Oil price tends to have an immediate impact on the CAD value. Generally, if Oil price rises CAD also goes up, as aggregate demand for the currency increases. The opposite is the case if the price of Oil falls. Higher Oil prices also tend to result in a greater likelihood of a positive Trade Balance, which is also supportive of the CAD.
How does inflation data impact the value of the Canadian Dollar?
While inflation had always traditionally been thought of as a negative factor for a currency since it lowers the value of money, the opposite has actually been the case in modern times with the relaxation of cross-border capital controls. Higher inflation tends to lead central banks to put up interest rates which attracts more capital inflows from global investors seeking a lucrative place to keep their money. This increases demand for the local currency, which in Canada’s case is the Canadian Dollar.
How does economic data influence the value of the Canadian Dollar?
Macroeconomic data releases gauge the health of the economy and can have an impact on the Canadian Dollar. Indicators such as GDP, Manufacturing and Services PMIs, employment, and consumer sentiment surveys can all influence the direction of the CAD. A strong economy is good for the Canadian Dollar. Not only does it attract more foreign investment but it may encourage the Bank of Canada to put up interest rates, leading to a stronger currency. If economic data is weak, however, the CAD is likely to fall.
- EUR/USD climbs 0.24%, buoyed by softer USD amid increasing speculation of an early Fed rate cut.
- Lower US inflation expectations revealed in New York Fed Survey, alongside Dallas Fed President's remarks, influence market sentiment.
- Eurozone retail sales show a decline, while German factory orders soften; Germany's trade surplus expands, supporting the Euro.
The Euro (EUR) advances against the US Dollar (USD) in early trading on Monday as the Greenback (USD) weakens, with no fundamental reason, except for traders increasing the odds for the first rate cut of the Federal Reserve by its March meeting. At the time of writing, the EUR/USD is trading at 1.0967, gaining 0.24% after hitting a daily low of 1.0922.
EUR/USD rises above 1.0960 boosted by upbeat German data
The US economic docket is light, though the New York Fed recently revealed its Survey of Consumer Expectations. According to Reuters, “Inflation one year from now is expected to be at 3%, the lowest reading since January 2021, versus a projection of 3.4% in November.” The same report showed estimates for three years are at 2.6%, from 3% in November, while price pressures for five years ahead stood at 2.5% lower than the previous reading of 2.7%.
Over the weekend, Dallas Fed President Lorie Logan said the Fed shouldn’t rule out another rate hike due to the recent easing in financial conditions. She added the US central bank should consider the slow the pace of its balance sheet reduction.
In the meantime, the US Dollar Index (DXY), a gauge of the buck’s value versus a basket of six other currencies, dropped 0.30% and is at 102.10, a tailwind for the EUR/USD pair, which is accelerating its uptrend toward 1.1000.
Aside from this, in the European session, the Eurozone (EU) revealed that November Retail Sales plunged -0.3% MoM as expected but trailed October’s 0.4% increase. Annually based dived sharply from -0.8% to -1.1%, less than the -1.5% projected but worse than the previous release.
In the meantime, in Germany, Factory Orders were softer, while November’s Trade Balance showed a €20.4 billion surplus vs €17.7 billion the previous month, propelled by Exports jumping by 3.7% MoM, while Imports rose by 1.9% MoM. Both figures exceeded projections.
Ahed of the week, the economic docket will feature German Industrial Production and the Unemployment Rate in the Eurozone. On the US front, the release of its Trade Balance and Federal Reserve’s officials speaking led by Michael Barr.
EUR/USD Price Analysis: Technical outlook
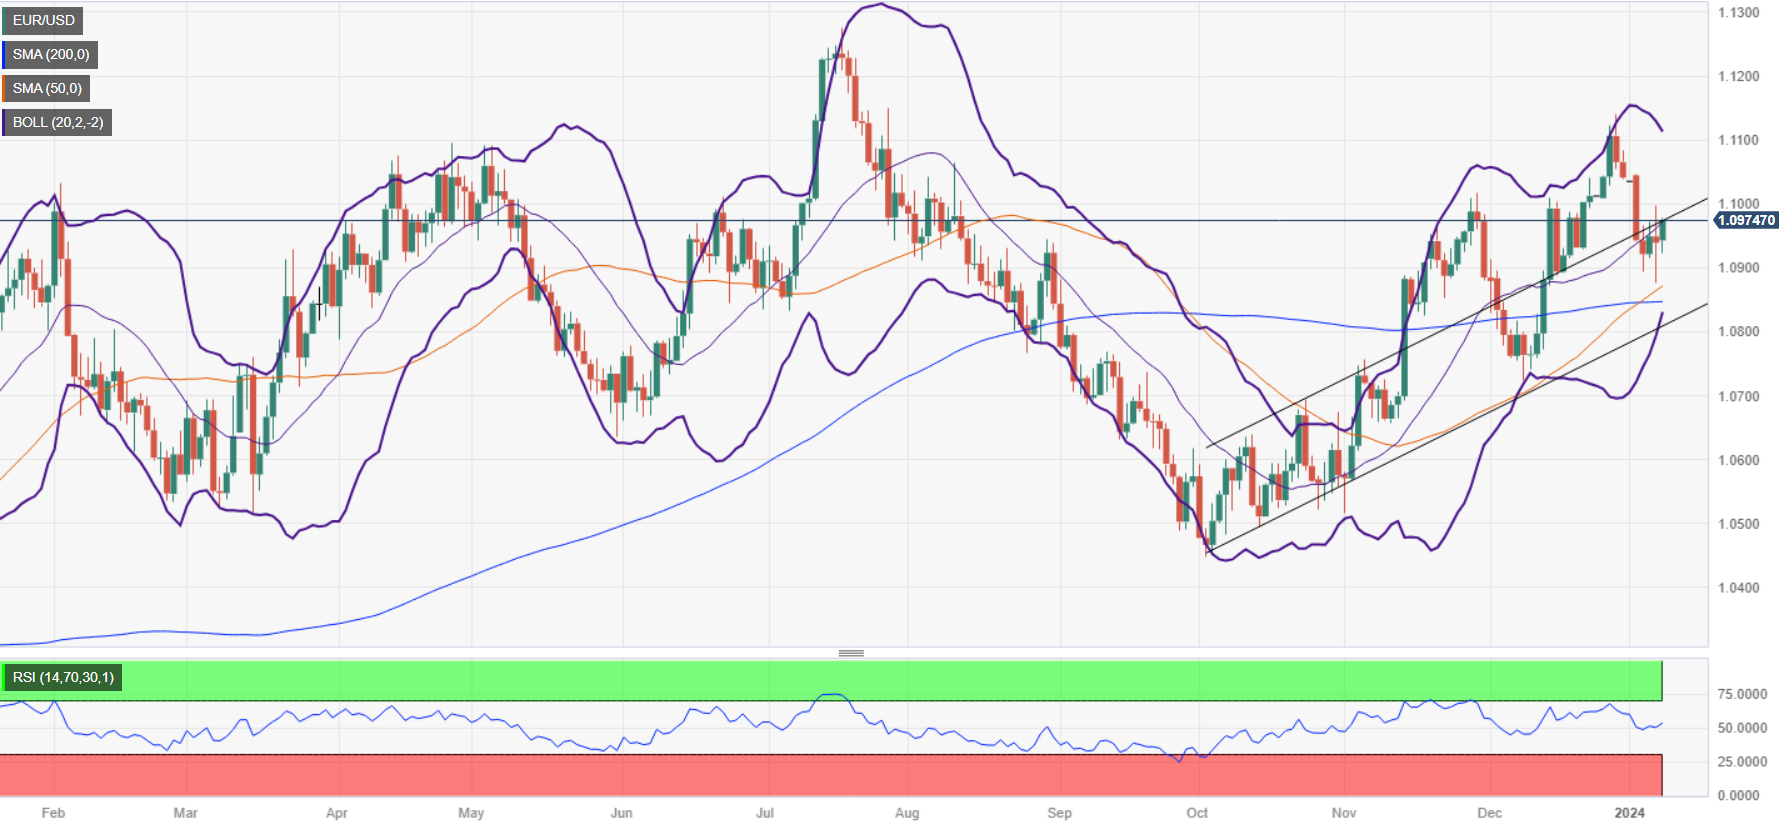
The major is bullishly biased, though it faces solid resistance at a multi-month support trendline turned resistance around the 1.0970/80 area. A decisive break is needed so buyers can challenge the 1.1000 figure on its way to testing last month’s high of 1.1139. On the other hand, if the EUR/USD drops below the first support level seen at 1.0950, that would exacerbate a drop towards the 1.0900 figure. Further downside is seen at the 50-day moving average (DMA) at 1.0870.
The Federal Reserve Bank of New York's latest Survey of Consumer Expectations showed on Monday that the US consumers' one-year inflation expectation dropped to its lowest level since January 2021 at 3% in December from 3.4% in November.
Key takeaways
"Expected inflation three years ahead at 2.6% in December vs 3% in November."
"Expected inflation five years ahead at 2.5% in December vs 2.7% in November."
"Median expected home price rise unchanged at 3% in December."
"Expected earnings, spending rises at lowest level since 2021."
"Households less pessimistic on credit access, financial situation."
Market reaction
The US Dollar (USD) stays under modest selling pressure following this report. At the time of press, the USD Index was down 0.3% on the day at 102.12.
EUR/USD rallied strongly into the end of last year. Economists at MUFG Bank analyze the world’s most popular currency pair outlook for 2024.
ECB to deliver 125 bps of rate cuts by the end of this year
We are now expecting the ECB to deliver 125 bps of rate cuts by the end of this year. It is one of the reasons why we expect the euro to strengthen only modestly against the US dollar in the year ahead as the Fed is also expected to be active in lowering rates to less restrictive levels in 2024.
Our latest forecasts for EUR/USD show a more neutral profile for the pair in the first half of this year before it adjusts higher in the second half of this year up to towards the 1.1400 level by year-end.
- Mexican Peso soars as mixed economic data from the United States, undermined the Greenback.
- Mexico’s Consumer Confidence deteriorates as households are concerned about the future economic outlook.
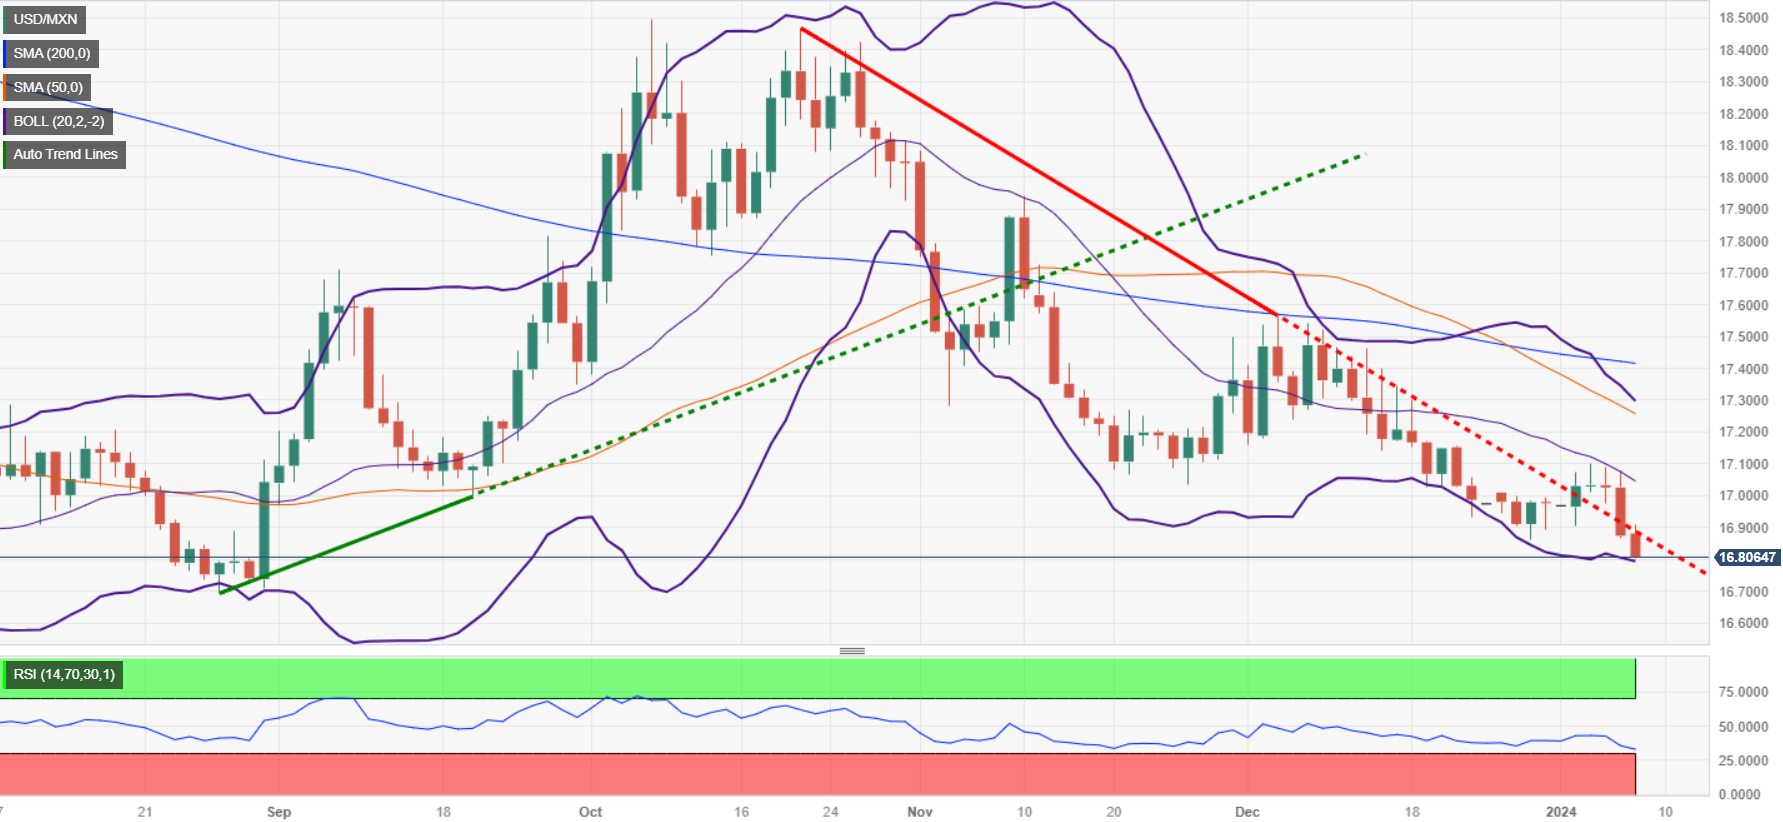
- USD/MXN tumbles toward 16.80 as sellers eye 2023’s low of 16.62.
The Mexican Peso (MXN) post decent daily gains of 0.31% against the US Dollar (USD) following last week’s US employment report and a light economic docket in Mexico. The USD/MXN continues to trade at around 16.82, at multi-month lows.
On Monday, data showed Mexico’s Consumer Confidence deteriorated in December, according to the National Statistics Agency known as INEGI. Across the border, last Friday’s Nonfarm Payrolls report for December depicted the labor market is in better shape than estimated. Nevertheless, in the near term, hiring could begin to slow down as business activity reported by the Institute for Supply Management (ISM) showed the Manufacturing PMI stood in recessionary territory, while the Services PMI clung to 50.7, at the brisk of turning contractionary.
Daily digest market movers: Mexican Peso remains firm, extending its gains against the US Dollar
- Mexico’s Consumer Confidence in December dropped slightly from 47.3 to 46.8 as consumers became more worried about the future economic outlook amongst households. In regard to the country’s outlook, consumers expect an economic slowdown, tough current conditions, sales of durable goods are expected to take a hit, as the poll showed.
- Last week’s economic data in the US was mixed. Although the economy added 216K jobs, exceeding forecasts, usually, it’s the latest piece of data that feels the pain of monetary policy tightening. Contrarily, the ISM Manufacturing and Services PMI usually lead the economy, and even though the Services PMI stood at expansionary territory, it is slowing faster than expected.
- On Saturday, the President of the Dallas Federal Reserve Bank, Lorie Logan, said the Fed shouldn’t rule out another rate hike due to the recent easing in financial conditions. She added the US central bank should consider the slow the pace of its balance sheet reduction.
- The recent meeting minutes from Banxico (the Central Bank of Mexico) indicate that the institution might start considering the relaxation of its monetary policy, albeit cautiously. Four members of the Governing Council emphasized the importance of being prudent in both evaluating and communicating any decisions regarding rate reductions. Meanwhile, one member voiced the opinion that it might be time to start discussing potential rate cuts.
- Last Tuesday, Mexico’s S&P Global Manufacturing PMI for December came out at 52.0, below November’s 52.5, suggesting the economy is slowing down amid Banxico’s tightening cycle.
- On Wednesday, Business Confidence in Mexico improved to 54.6 from 54.0 in November, although it failed to underpin the Mexican Peso, which remained weak during the session.
Technical analysis: Mexican Peso buyers remain in charge as the USD/MXN drifts lower
The USD/MXN resumed its downtrend, and it’s accelerating its pace toward testing last year’s low of 16.62. A breach of the 16.80 area would expose the 16.69 August 28 swing low, followed by the 2023 low of 16.62.
On the flip side, if sentiment shifts bullish on the US Dollar, the exotic pair could reclaim the 17.00 figure, followed by the 17.05 mark. Once those two resistance levels are surpassed, up next would be 17.20, followed by the convergence of the 50, 100, and 200-day Simple Moving Averages (SMAs) at the 17.29/41 area.
Also read: Mexican Peso Price Annual Forecast: Which factor would impact most in 2024, economics or politics?
USD/MXN Price Action - Daily Chart
Mexican Peso FAQs
What key factors drive the Mexican Peso?
The Mexican Peso (MXN) is the most traded currency among its Latin American peers. Its value is broadly determined by the performance of the Mexican economy, the country’s central bank’s policy, the amount of foreign investment in the country and even the levels of remittances sent by Mexicans who live abroad, particularly in the United States. Geopolitical trends can also move MXN: for example, the process of nearshoring – or the decision by some firms to relocate manufacturing capacity and supply chains closer to their home countries – is also seen as a catalyst for the Mexican currency as the country is considered a key manufacturing hub in the American continent. Another catalyst for MXN is Oil prices as Mexico is a key exporter of the commodity.
How do decisions of the Banxico impact the Mexican Peso?
The main objective of Mexico’s central bank, also known as Banxico, is to maintain inflation at low and stable levels (at or close to its target of 3%, the midpoint in a tolerance band of between 2% and 4%). To this end, the bank sets an appropriate level of interest rates. When inflation is too high, Banxico will attempt to tame it by raising interest rates, making it more expensive for households and businesses to borrow money, thus cooling demand and the overall economy. Higher interest rates are generally positive for the Mexican Peso (MXN) as they lead to higher yields, making the country a more attractive place for investors. On the contrary, lower interest rates tend to weaken MXN.
How does economic data influence the value of the Mexican Peso?
Macroeconomic data releases are key to assess the state of the economy and can have an impact on the Mexican Peso (MXN) valuation. A strong Mexican economy, based on high economic growth, low unemployment and high confidence is good for MXN. Not only does it attract more foreign investment but it may encourage the Bank of Mexico (Banxico) to increase interest rates, particularly if this strength comes together with elevated inflation. However, if economic data is weak, MXN is likely to depreciate.
How does broader risk sentiment impact the Mexican Peso?
As an emerging-market currency, the Mexican Peso (MXN) tends to strive during risk-on periods, or when investors perceive that broader market risks are low and thus are eager to engage with investments that carry a higher risk. Conversely, MXN tends to weaken at times of market turbulence or economic uncertainty as investors tend to sell higher-risk assets and flee to the more-stable safe havens.
In the US, the December inflation figures will be released on Thursday. Economists at Commerzbank analyze how the CPI report could impact the Dollar.
Dollar will quickly be back in the penalty box on weak numbers
Those hoping for a clearer signal of an imminent rate cut from the Fed after the jobs report will likely be disappointed. Yes, inflation in the US continues to fall. But not very fast, according to our experts. An increase of around 0.25% MoM for both the headline and core rate does not indicate a rapid decline in inflation. According to our experts, the headline rate could even rise slightly to 3.2% YoY in December. The core rate is likely to remain uncomfortably high at 3.8%.
Perhaps the inflation figures will manage to slow the Dollar's downward trend. But I am afraid that the Dollar will quickly be back in the penalty box on weak numbers.
2023 marked the third consecutive year of outsized declines in the Japanese Yen (JPY). However, 2024 may be different for the currency, according to economists at HSBC.
A capitulation of short JPY speculative positions and lifers’ FX hedging could support the JPY
After three consecutive years of weakness, the JPY is set to recover this year, albeit modestly as markets have already built in expectations for interest rates to increase in Japan and fall in the US.
A capitulation of short JPY speculative positions and lifers’ FX hedging should be supportive for the JPY.
The USD is steady in broad terms to start the week. Economists at Scotiabank analyze Dollar’s outlook.
Jobs data dust settles
Choppy USD trade Friday around the release of better-than-expected NFP but softer than forecast ISM Services data (especially employment) leaves a bit of a question mark over the near-term direction of FX, at least.
The slide in the USD reflected weaker US yields and perhaps positioning running into the jobs report where expectations had favoured stronger data. Downward revisions to the prior months’ data also took the edge off the USD’s initial reaction to the NFP report. Still, with the dust settling after the data, the USD won back some of the ground lost and still managed to close out the week in relatively positive shape.
From a broader point of view, risks – reflecting seasonal trends and technical price action – remain tilted towards some extension of the broader USD rebound that developed over the turn of the year.
EUR/USD holds range around 1.0950. Economists at Scotiabank analyze the pair’s outlook.
Weekly techs lean bearish
Looking beyond the narrow, consolidation range evident on the intraday and daily chart, the weekly pattern of trade still leans EUR-bearish.
A net loss for the EUR on the week last week follows the bearish top/reversal signal that developed on the weekly chart over the turn of the year and completes a bearish ‘evening star’ pattern on the weekly. Look for resistance near 1.10 now.
Support is 1.0875.
Corrective losses may extend to 1.07/1.08 in the next few weeks.
GBP/USD holds flat range. Economists at Scotiabank analyze the pair’s outlook.
Cable retains some positive momentum above 1.26
Trading patterns in GBP/USD look a little more neutral than other USD pairs.
Weekly price action is soft but not obviously bearish for the GBP at this point.
Trend signals are leaning GBP-bullish on the short, medium and long-term DMI oscillators still at this point which gives the GBP some protection from the generally stronger USD tone that has developed over the turn of the year.
Key support is 1.2600/1.2605.
USD/CAD pressures support at 1.3390/1.3400. Economists at Scotiabank analyze the pair’s outlook.
Gains to extend above 1.3390/1.3400
Despite Friday’s hefty intraday swings, the longer-term chart still points to the risk of USD/CAD strengthening a little more in the near-term, at least.
The weekly chart shows a bullish ‘hammer’ candle developed through the turn of the year. A high close for the USD last week – despite the hefty intraday swings in the USD Friday – adds emphasis to the bullish pattern of trade and supports the outlook for some additional, corrective gains in the USD in the next few weeks towards 1.34/1.35.
Gains through high/low resistance at 1.3390/1.3400 will add to near-term bullish momentum.
Support should be firm on dips to the low/mid-1.33s now.
- The US Dollar trades flat after a whipsaw move on Friday.
- Traders will focus on US inflation numbers later this week.
- The US Dollar Index steadies around 102.00, though technical rejection on Friday points to more downturn ahead.
The US Dollar (USD) trades broadly steady on Monday after suffering a wild ride on Friday, likely hurting intraday and short-term traders. The US Dollar Index (DXY) jumped significantly higher after a strong headline number in the US Jobs report, only to fully unwind that move and sink lower on the back of very poor Employment numbers in the Institute for Supply Management (ISM) Services PMI report. Adding to the swings caused by economic data releases, traders need to revalue the US Dollar taking into account increasing geopolitical tensions and mounting expectations of interest-rate cuts by the Federal Reserve (Fed).
On the economic front, a calm Monday is ahead with only Consumer Credit data for November due. The focus on credit numbers, loans and defaults is likely to grow in the coming months as several banks signal they are seeing more payment delinquencies. For this week, the main event will be the US inflation numbers on Thursday.
Daily digest Market Movers: Firing at all cylinders
- German Factory Orders are nudging up a touch in November, heading from -3.7% to 0.3% against October. Estimate was for a jump of 1.1%. This made the US Dollar jump against the Euro to the session’s high (EUR/USD session’s low).
- Tensions are building up further in the Middle East after Israel claims it discovered Chinese weaponry in a Hamas depot.
- China's biggest construction firm Evergrande sinks 17% in Hong Kong after reports that its Vice Chairman has been detained.
- Tit-for-tat between China and the US, with China sanctioning five US defence industry companies after a US arms sale to Taiwan.
- Dallas Fed President Lorie Logan said that the Fed should begin discussing a slowdown in its balance sheet runoff.
- The US Treasury is taking a stab at the markets by placing a 3-month and a 6-month bill at 15:30 GMT.
- US Consumer Credit Change for November is due to come out at 20:00 GMT, with credit expected to jump from $5.13 billion to $9 billion.
- Equity markets are in the red across the board at the start of this week. Dow Jones futures are leading the decline, down near 0.50%.
- The CME Group’s FedWatch Tool shows that markets are pricing in a 95.3% chance that the Federal Reserve will keep interest rates unchanged at its January 31 meeting. Around 4.7% expect the first cut already to take place.
- The benchmark 10-year US Treasury Note trades has reclaimed back the area above 4% after the wild ride on Friday.
US Dollar Index Technical Analysis: Geopolitics counterweights rate cuts
Bets on the US Dollar look split. On the one hand, traders place bets favoring the US Dollar due to increasing geopolitical tensions in the Middle East, with ongoing headlines over the Red Sea and Chinese weaponry found in Hamas storages by Israel. On the other side, traders see reasons for quick rate cuts by the Fed after the implosion of the ISM numbers last Friday. Expect geopolitics to take over control for now, as long as new headlines point to further heightened tensions.
In the DXY US Dollar Index, the first level on the upside is 103.00, which falls nearly in line with the descending trend line from the top of October 3 and December 8. Once broken and closed above there, the 200-day Simple Moving Average (SMA) at 103.43 comes into play. The 104.00 level might be a bit too far off, with 103.93 (55-day SMA) coming in as the next resistance on the upside.
To the downside, the rejection on the descending trendline is giving fuel to the Greenback bears for further downturn. The line in the sand here is 101.74, the floor which held halfway through December before breaking down in the last two weeks. In case the DXY snaps this level, expect to see a test at the low near 100.80.
US Dollar FAQs
What is the US Dollar?
The US Dollar (USD) is the official currency of the United States of America, and the ‘de facto’ currency of a significant number of other countries where it is found in circulation alongside local notes. It is the most heavily traded currency in the world, accounting for over 88% of all global foreign exchange turnover, or an average of $6.6 trillion in transactions per day, according to data from 2022.
Following the second world war, the USD took over from the British Pound as the world’s reserve currency. For most of its history, the US Dollar was backed by Gold, until the Bretton Woods Agreement in 1971 when the Gold Standard went away.
How do the decisions of the Federal Reserve impact the US Dollar?
The most important single factor impacting on the value of the US Dollar is monetary policy, which is shaped by the Federal Reserve (Fed). The Fed has two mandates: to achieve price stability (control inflation) and foster full employment. Its primary tool to achieve these two goals is by adjusting interest rates.
When prices are rising too quickly and inflation is above the Fed’s 2% target, the Fed will raise rates, which helps the USD value. When inflation falls below 2% or the Unemployment Rate is too high, the Fed may lower interest rates, which weighs on the Greenback.
What is Quantitative Easing and how does it influence the US Dollar?
In extreme situations, the Federal Reserve can also print more Dollars and enact quantitative easing (QE). QE is the process by which the Fed substantially increases the flow of credit in a stuck financial system.
It is a non-standard policy measure used when credit has dried up because banks will not lend to each other (out of the fear of counterparty default). It is a last resort when simply lowering interest rates is unlikely to achieve the necessary result. It was the Fed’s weapon of choice to combat the credit crunch that occurred during the Great Financial Crisis in 2008. It involves the Fed printing more Dollars and using them to buy US government bonds predominantly from financial institutions. QE usually leads to a weaker US Dollar.
What is Quantitative Tightening and how does it influence the US Dollar?
Quantitative tightening (QT) is the reverse process whereby the Federal Reserve stops buying bonds from financial institutions and does not reinvest the principal from the bonds it holds maturing in new purchases. It is usually positive for the US Dollar.
The Euro has given back some recent gains. Kit Juckes, Chief Global FX Strategist at Société Générale, analyzes EUR/USD outlook.
There is a lot of bad news priced in to the current level
Last year’s 7.9% EUR/USD range was the second smallest since 1999 and the fact that the only year with a tighter range, 2019, came just before the outbreak of Covid suggests this is a return to normal. Hardly encouraging for FX thrill-seekers!
I would be faintly surprised if this year’s range were wider than last year’s, and the high and low are unlikely to be threatened.
As 2024 starts, however, I’m struck that there is a lot of bad news priced in to the current level. It’s fair to argue that the most recent dollar bounce, while mostly about a positioning adjustment after the Nov/Dec moves, is driven by resilient US economic data, rather than any surprises in Europe. On that basis, whether the next move for EUR/USD is up to 1.12 or back down to 1.08 may depend on the US more than Eurozone data.
European Central Bank (ECB) Governing Council member Boris Vujcic said on Monday that he thinks the Eurozone will be able to avoid a recession, as reported by Bloomberg.
Vujcic noted that he also expects inflation to slow gradually, adding that they are not discussing rate cuts and they probably will not do so before summer.
Market reaction
These comments failed to help the Euro find demand during the European trading hours. At the time of press, the EUR/USD pair was virtually unchanged on the day at 1.0950.
Economists at Société Générale analyze USD/ZAR technical outlook.
Short-term bounce towards 19.14 and October high of 19.50/19.64 on the cards
USD/ZAR recently defended low of November near 18.10 and the trend line drawn since April 2022. A gradual rebound has taken shape, but crisscross moves around the flattish 200-DMA denote lack of clear direction.
Short-term bounce towards 19.14 and October high of 19.50/19.64 can’t be ruled out. This is a crucial resistance zone.
In case the pair dips below lower band of recent range at 18.10, there could be risk of a deeper down move.
- WTI Oil falls to around $71 on Monday morning.
- Saudi Arabia is offering discounts across the globe for its Crude.
- The DXY US Dollar Index holds above 102.00 as traders await US inflation figures later this week.
Oil declined to around $71 on Monday morning after prices tried and failed to pump back above $74 last week. Headlines this morning from Saudi Arabia are pushing down prices, with state-owned Oil company Aramco offering discounts on several regions, with biggest discounts for Asia for its Oil deliveries. Markets are pricing in these price cuts, though this could be positive for Oil prices in the longer run as cheaper supply could ramp up demand. India, for example, is already reporting another surge in demand for Oil as the country’s economy is outperforming.
Meanwhile, the US Dollar (USD) is paring back some losses it incurred in late December. The recovery comes on the back of the latest US jobs report, which points to a still buzzing job market, though the Institute for Supply Management numbers signalled a severe slowdown ahead. The Greenback is now getting torn between safe-haven flows on the back of rising tensions in the Middle East and the Red Sea, while the other camp is betting on swift rate cuts by the Fed to avoid a recession. With US Consumer Price Index (CPI) numbers this week, traders could possibly get reassurance whether rate cuts could be around the corner or not.
Crude Oil (WTI) trades at $71.76 per barrel, and Brent Oil trades at $76.67 per barrel at the time of writing.
Oil News and Market Movers: Aramco keeps firesale
- OPEC+ leader Saudi Arabia is offering substantial cuts in its official Oil prices to Asia and other regions. For Asia specifically, prices are lowered to the lowest level since 2021.
- In a spillover effect, Oil-related stocks are sliding lower, with the Oil stock Index down 2%, the most since December 4. Shell fell as much as 2.5%, becoming the biggest loser in the Stoxx 600 Index.
- India sees a sharp ramp-up in demand for Oil products with the economy booming at a record pace. Diesel consumption is swelling by 5% compared to last year.
- Rumours in OPEC+ are pointing to some more departures of a few countries from the bloc. Countries like Gabon, Equatorial Guinea and Congo are said to be reevaluating their participation.
Oil Technical Analysis: One step back, two steps forward
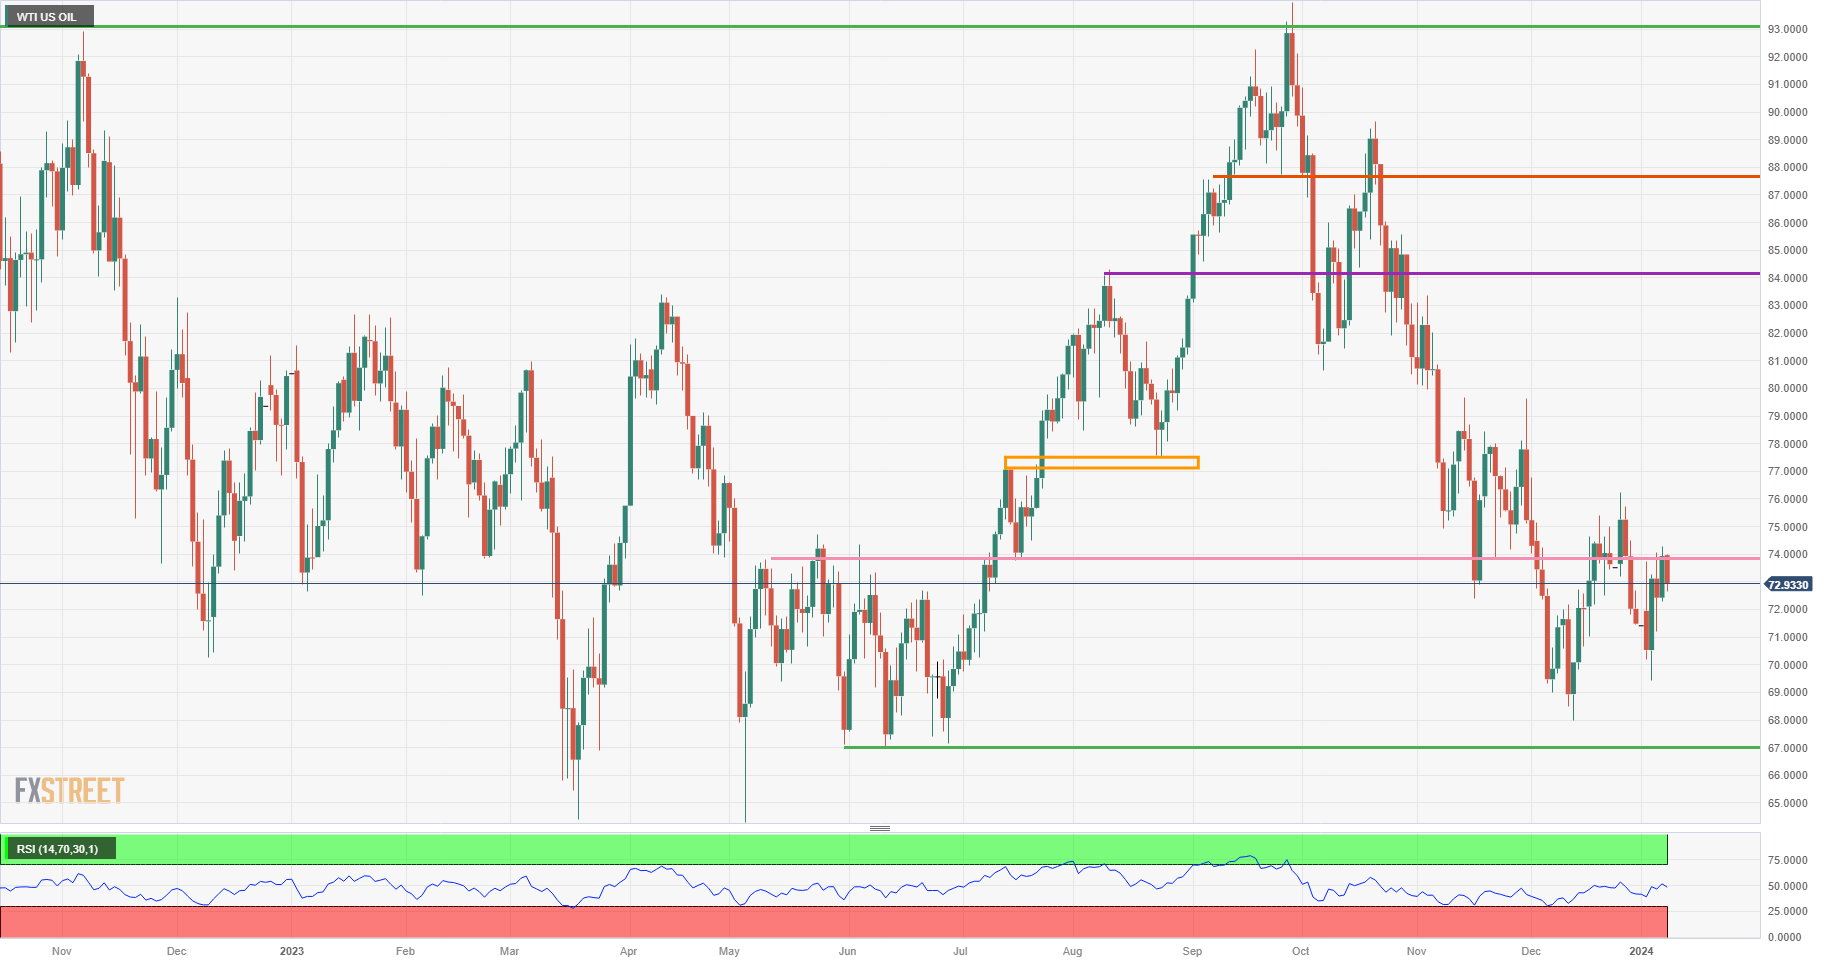
Oil prices are declining this Monday on the back of Saudi Arabia offering discounts across the board. Although the initial move in Oil prices, which is down, is granted, the medium term could result in quite the opposite. With nations like India and other emerging markets reconfirming a boom in economic activity, demand is set to expand, while frost in Europe could mean ample demand is also coming back online in the Oil market.
On the upside, $74 is still holding importance, although the level has become very chopped up. Once back above this, $80 comes into the picture. Still far off, $84 is next on the topside once Oil sees a few daily closes above the $80 level.
Below $74, the $67 level could still come into play as the next support to trade at as it aligns with a triple bottom from June. Should that triple bottom break, a new low for 2023 could be close at $64.35 – the low of May and March – as the last line of defence. Although still quite far off, $57.45 is worth mentioning as the next level to keep an eye on if prices fall sharply.
US WTI Crude Oil: Daily Chart
WTI Oil FAQs
What is WTI Oil?
WTI Oil is a type of Crude Oil sold on international markets. The WTI stands for West Texas Intermediate, one of three major types including Brent and Dubai Crude. WTI is also referred to as “light” and “sweet” because of its relatively low gravity and sulfur content respectively. It is considered a high quality Oil that is easily refined. It is sourced in the United States and distributed via the Cushing hub, which is considered “The Pipeline Crossroads of the World”. It is a benchmark for the Oil market and WTI price is frequently quoted in the media.
What factors drive the price of WTI Oil?
Like all assets, supply and demand are the key drivers of WTI Oil price. As such, global growth can be a driver of increased demand and vice versa for weak global growth. Political instability, wars, and sanctions can disrupt supply and impact prices. The decisions of OPEC, a group of major Oil-producing countries, is another key driver of price. The value of the US Dollar influences the price of WTI Crude Oil, since Oil is predominantly traded in US Dollars, thus a weaker US Dollar can make Oil more affordable and vice versa.
How does inventory data impact the price of WTI Oil
The weekly Oil inventory reports published by the American Petroleum Institute (API) and the Energy Information Agency (EIA) impact the price of WTI Oil. Changes in inventories reflect fluctuating supply and demand. If the data shows a drop in inventories it can indicate increased demand, pushing up Oil price. Higher inventories can reflect increased supply, pushing down prices. API’s report is published every Tuesday and EIA’s the day after. Their results are usually similar, falling within 1% of each other 75% of the time. The EIA data is considered more reliable, since it is a government agency.
How does OPEC influence the price of WTI Oil?
OPEC (Organization of the Petroleum Exporting Countries) is a group of 13 Oil-producing nations who collectively decide production quotas for member countries at twice-yearly meetings. Their decisions often impact WTI Oil prices. When OPEC decides to lower quotas, it can tighten supply, pushing up Oil prices. When OPEC increases production, it has the opposite effect. OPEC+ refers to an expanded group that includes ten extra non-OPEC members, the most notable of which is Russia.
The Pound Sterling (GBP) was the second best performing G10 currency in 2023. EUR/GBP ended the year around 0.8670. Economists at Rabobank analyze the pair’s outlook.
Market consensus is expecting EUR/GBP to drift higher this year
The market consensus is expecting EUR/GBP to drift higher this year, but there is some evidence that forecasters’ pessimism over the outlook for GBP has become ingrained.
There has been plenty of justification for a lack of optimism with respect to both the Pound and the UK economy in the past few years, but Germany’s economy has fared worse since the pandemic.
While it is still difficult to paint a glaringly optimistic picture of the outlook for GBP, we see potential for EUR/GBP to tick lower to 0.84 on a 12-month view, in part due to the poor position of the German economy.
The Indian Rupee (INR) registered modest gains vs. the US Dollar (USD) last week. Economists at Société Générale analyze USD/INR outlook.
No reason to fret over INR depreciation
There is no reason for markets to fret over INR depreciation.
Confidence that the government will lower the budget deficit target for FY25 to 5.2-5.4% of GDP in February (from the FY24 target of 5.9%) is supportive of the currency and INRGBs.
The general election in April/May naturally poses tail risk, but favourable results for the BJP in state elections mean PM Modi can steer clear of a populist election agenda.
We are forecasting a 10-year yield of 6.20% and 81.00 for USD/INR at end-2024.
Antje Praefcke, FX Analyst at Commerzbank, analyzes USD reaction to US labour market data.
The US labor market is still relatively robust
The bottom line is that the US labor market is still relatively robust. In this respect, it tends to support our experts' expectation that the Fed's first rate cut will not come as soon as the market expects. Nevertheless, the market is not ready to make any significant adjustments to its Fed rate cut expectations. This leads me to believe that it will be all the more difficult for the Dollar to regain ground.
The market seems to be reacting more to data that supports their view that rates will be cut soon, while at the same time the data is getting worse. That doesn't bode well for the Dollar.
- Retail Sales in the Euro area decreased by 0.3% in November as forecast.
- EUR/USD trades modestly lower on the day below 1.0950.
Retail Sales in the Euro area declined by 0.3% on a monthly basis in November, Eurostat reported on Monday. This reading followed the 0.4% (revised from 0.1%) increase recorded in October and came in line with the market expectation.
Other data from the Euro area revealed that the Economic Sentiment Indicator improved to 96.4 in December from 93.8 in November, while the Business Climate Index worsened to -0.45 from -0.39.
Market reaction
These data don't seem to be having a noticeable impact on the Euro's valuation. At the time of press, EUR/USD was down 0.05% on the day at 1.0935.
- Investor sentiment in the Euro area improved modestly in January.
- EUR/USD trades in negative territory below 1.0950.
Sentix Investor Confidence Index for the Eurozone edged higher to -15.8 in January from -16.8 in December.
Commenting on the survey's findings, "this is unlikely to be a turnaround" for the Euro area, Sentix said in its publication. "This is partly due to Germany, whose economy is still in recession and therefore in crisis."
Market reaction
The Euro continues to weaken against its major rivals following this data. At the time of press, the EUR/USD pair was down 0.15% on a daily basis at 1.0925.
USD/JPY traded at the highest level since mid-December on Friday. Economists at Rabobank analyze the pair’s outlook.
The BoJ is unlikely to consider a rate hike before April
We adhere to the view that the BoJ is unlikely to consider a rate hike before April, allowing for consideration of the spring wage deals and the latest fiscal stimulus package.
The overriding theme of BoJ policy is likely to be caution. This suggests plenty of scope for JPY bulls to be disappointed this year.
Our three-month USD/JPY forecast remains at 143.00.
On Friday, EUR/USD ended the session virtually unchanged around 1.0950. The pair stays relatively calm early Monday. Economists at ING analyze the Euro’s outlook.
Rally above 1.10 still not looking likely
We still see gains above 1.10 in the EUR/USD pair as hard to sustain.
We continue to see EUR/USD on unstable ground this quarter, and any positive impact from softer US data/better EZ data may be more short-lived than downside corrections.
We target a return to the 1.08 mark over the course of this quarter.
- USD/MXN moves on a downward trajectory on hawkish Banxico.
- Bank of Mexico’s latest meeting minutes suggest maintaining rates at current levels for a certain period.
- US Dollar could face challenge on improved risk appetite after mixed US data.
USD/MXN hovers around 16.88 during the European session on Monday. The USD/MXN pair faced downward pressure following the release of the latest Bank of Mexico (Banxico) minutes on Thursday, indicating concerns about the inflationary scenario in the country. The minutes suggest a challenging environment, prompting the decision to maintain interest rates at their current levels for a certain period.
Additionally, the recent moderate data from Mexico could provide relief to Banxico by alleviating the pressure for an immediate interest rate reduction. Market participants are now eagerly anticipating next week's release of Consumer Confidence and Headline Inflation data for December.
The US Dollar Index (DXY) attempts to extend its gains for the second consecutive day. However, the Greenback faces a mild challenge due to the improved risk appetite following the mixed US economic data released on Friday. The positive note came from the Nonfarm Payrolls (NFP) report, showing an increase to 216K in December, surpassing both the previous figure of 173K and the market expectation of 170K.
Moreover, the Institute for Supply Management (ISM) reported a slowdown in the services sector for the same month, with the Services Purchasing Managers Index (PMI) falling below expectations.
The mixed signals from these economic indicators highlight the challenges in assessing the overall health of the economy. Traders are likely to keep a close eye on the upcoming Consumer Price Index (CPI) data on Thursday, seeking more clarity on the US economic scenario. Economic data releases can significantly impact market sentiment and influence trading decisions, making them crucial for market participants to monitor.
Last week, Federal Reserve (Fed) Bank of Dallas President K. Lorie Logan highlighted the importance of maintaining sufficiently tight financial conditions to mitigate the risk of inflation picking back up and potentially reversing progress. This perspective aligns with the cautious approach adopted by central banks in managing economic conditions.
However, it contrasts with the sentiment expressed by Richmond Fed President Thomas Barkin last week, who expressed confidence that the economy is on track for a soft landing and emphasized that rate hikes remain a consideration.
The Dollar is back around Friday’s open levels against most G10 currencies. Economists at ING analyze Greenback’s outlook.
Diverging data leaves Dollar without clear direction
Dollar crosses won’t be following one-way patterns in the coming weeks.
We expect the Dollar to take back some of the late 2023 losses as the expected start of the easing cycle is pushed forward, but a market that remains generally more sensitive to negative US data than upside surprises should be reluctant to chase the Dollar much higher from these levels.
We still see some vulnerability in high-beta currencies as the equity market faces some more headwinds in the near term.
The Euro also appears in a soft spot, meaning the upside risks for the EUR-heavy DXY index are also non-negligible and may extend beyond the 104 December peak over the first quarter.
FX option expiries for January 8 NY cut at 10:00 Eastern Time, via DTCC, can be found below.
- EUR/USD: EUR amounts
- 1.0875 400m
- 1.0950 645m
- 1.0975 406m
- USD/JPY: USD amounts
- 144.50 510m
- AUD/USD: AUD amounts
- 0.6620 400m
- 0.6640 702m
- 0.6725 633m
- 0.6840 708m
- USD/CHF: USD amounts
- 0.8550 448m
- Silver meets with a fresh supply on Monday and drifts back closer to a multi-week low.
- The technical setup favours bearish traders and supports prospects for deeper losses.
- A sustained move beyond the $23.50 confluence is needed to negate the negative bias.
Silver (XAG/USD) extends Friday's retracement slide from the mid-$23.00s and continues losing ground through the early part of the European session on the first day of a new week. The white metal currently trades just below the $23.00 round figure and remains well within the striking distance of a three-week trough touched last Thursday.
From a technical perspective, last week's sustained breakdown and a subsequent failure near the very important 200-day Simple Moving Average (SMA) favours bearish traders. Moreover, oscillators on the daily chart are holding in the negative territory and are still far from being in the oversold zone. This, in turn, suggests that the path of least resistance for the XAG/USD is to the downside and supports prospects for an extension of the recent downtrend witnessed over the past week or so.
That said, it will still be prudent to wait for some follow-through selling below the multi-week trough, around the $22.70 region, before positioning for any further losses. The XAG/USD might then accelerate the fall further towards the December monthly swing low, around the mid-$22.00s, en route to the next relevant support near the $22.25 region. The downward trajectory could get extended and drag the white metal towards testing sub-$22.00 levels, or the November monthly swing low.
On the flip side, any meaningful recovery attempt might continue to confront resistance near the $23.50 confluence, comprising the 200-day SMA and a multi-month-old ascending trend-line support breakpoint. A sustained strength beyond might trigger a short-covering rally and lift the XAG/USD to the $24.00 mark, with some intermediate hurdle near the $23.80 region. Some follow-through buying will suggest that the recent corrective decline from the $24.60 region has run its course.
Silver daily chart
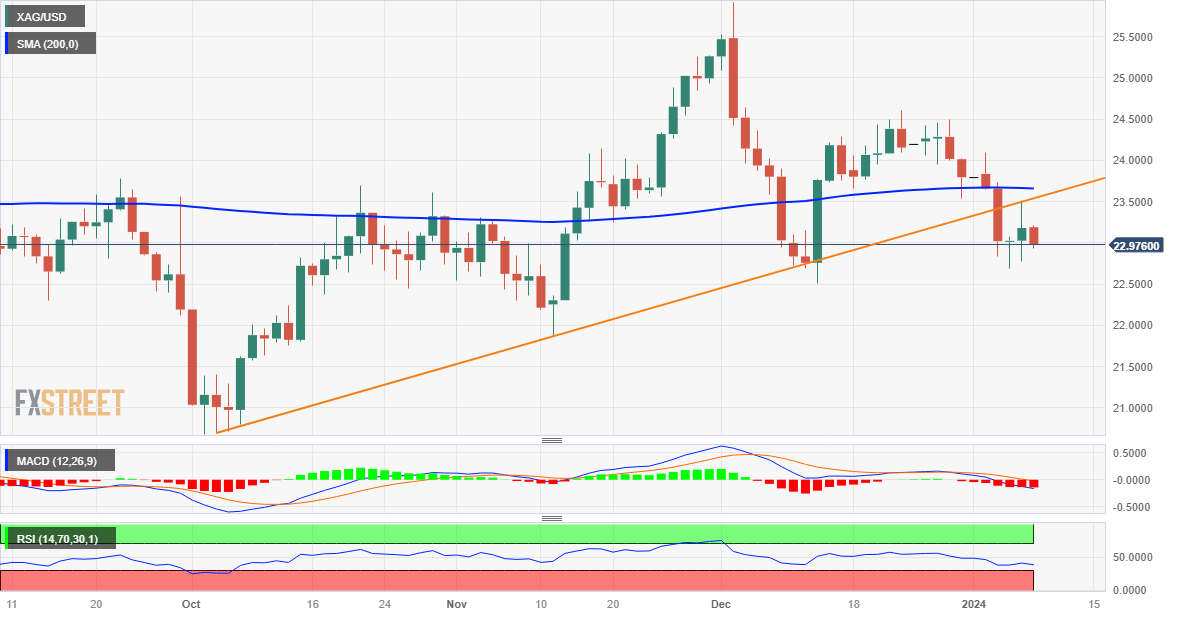
Technical levels to watch
Gold prices fell in India on Monday, according to data from India's Multi Commodity Exchange (MCX).
Gold price stood at 62,100 Indian Rupees (INR) per 10 grams, down INR 295 compared with the INR 62,395 it costed on Friday.
As for futures contracts, Gold prices decreased to INR 62,231 per 10 gms from INR 62,611 per 10 gms.
Prices for Silver futures contracts decreased to INR 72,112 per kg from INR 72,389 per kg.
| Major Indian city | Gold Price |
|---|---|
| Ahmedabad | 64,225 |
| Mumbai | 64,055 |
| New Delhi | 64,115 |
| Chennai | 64,250 |
| Kolkata | 64,230 |
Global Market Movers: Comex Gold price is pressured by uncertainty over early Fed rate cuts
- Investors further scale back their expectations for an imminent shift in the Federal Reserve's policy stance following the release of a robust December monthly US jobs report on Friday.
- The US economy added 216K new jobs last week as compared to 170K expected, while the unemployment rate held steady at 3.7% vs. consensus estimates for an uptick to 3.8%.
- Adding to this, US Factory Orders surprised to the upside and grew more than expected in November, by 2.6%, after declining 3.4% in October (revised slightly up from -3.6%).
- Separately, the Institute for Supply Management (ISM) survey indicated that the US services sector, which accounts for more than two-thirds of the economy, slumped last month.
- The ISM's Non-Manufacturing Index dropped to 50.6 in December – the lowest reading since May – and the employment sub-component plunged to 43.3 – the lowest since July 2020.
- Dallas Fed President Lorie Logan noted that if the US central bank does not maintain sufficiently tight financial conditions, there is a risk that inflation will pick back up, reversing progress.
- This comes after Richmond Fed President Thomas Barkin last week expressed confidence that the economy is on its way to a soft landing and said that rate hikes remain on the table.
- The yield on the benchmark 10-year US government bond holds steady above the 4.0% threshold, which acts as a tailwind for the US Dollar and is seen undermining the Comex Gold price.
- The markets, however, are still pricing in a greater chance of the first interest rate cut by the Fed at the March meeting and a cumulative of five 25 basis points (bps) rate cuts for 2024.
- China's economic woes, along with an escalation of tensions in the Middle East, could lend some support to the safe-haven XAU/USD ahead of the US consumer inflation figures on Thursday.
- Lebanese militant group Hezbollah sent a barrage of rockets into northern Israel in what it called a “preliminary response” to the assassination of Hamas senior leader Saleh al-Arouri on Tuesday.
- The markets react little to an agreement between House Speaker Mike Johnson and Senate Majority Leader Chuck Schumer on topline spending level, which breaks the deadlock to avoid a shutdown.
(An automation tool was used in creating this post.)
Gold FAQs
Why do people invest in Gold?
Gold has played a key role in human’s history as it has been widely used as a store of value and medium of exchange. Currently, apart from its shine and usage for jewelry, the precious metal is widely seen as a safe-haven asset, meaning that it is considered a good investment during turbulent times. Gold is also widely seen as a hedge against inflation and against depreciating currencies as it doesn’t rely on any specific issuer or government.
Who buys the most Gold?
Central banks are the biggest Gold holders. In their aim to support their currencies in turbulent times, central banks tend to diversify their reserves and buy Gold to improve the perceived strength of the economy and the currency. High Gold reserves can be a source of trust for a country’s solvency. Central banks added 1,136 tonnes of Gold worth around $70 billion to their reserves in 2022, according to data from the World Gold Council. This is the highest yearly purchase since records began. Central banks from emerging economies such as China, India and Turkey are quickly increasing their Gold reserves.
How is Gold correlated with other assets?
Gold has an inverse correlation with the US Dollar and US Treasuries, which are both major reserve and safe-haven assets. When the Dollar depreciates, Gold tends to rise, enabling investors and central banks to diversify their assets in turbulent times. Gold is also inversely correlated with risk assets. A rally in the stock market tends to weaken Gold price, while sell-offs in riskier markets tend to favor the precious metal.
What does the price of Gold depend on?
The price can move due to a wide range of factors. Geopolitical instability or fears of a deep recession can quickly make Gold price escalate due to its safe-haven status. As a yield-less asset, Gold tends to rise with lower interest rates, while higher cost of money usually weighs down on the yellow metal. Still, most moves depend on how the US Dollar (USD) behaves as the asset is priced in dollars (XAU/USD). A strong Dollar tends to keep the price of Gold controlled, whereas a weaker Dollar is likely to push Gold prices up.
- USD/CAD gains ground as Crude oil prices decline.
- WTI price falls on Saudi’s price cuts and OPEC+ oil output increase.
- US Dollar remains silent amid improved risk appetite.
USD/CAD continues to gain ground for the second straight day, trading near 1.3380 during the European session on Monday. The Canadian Dollar (CAD) receives downward pressure against the US Dollar (USD) due to the decline in Crude oil prices.
West Texas Intermediate (WTI) price undergoes a retracement of its recent gains, trading lower near $73.00 per barrel, by the press time. The decline in Crude oil prices is attributed to a combination of factors, including price cuts by top exporter Saudi Arabia. Additionally, a rise in the Organization of the Petroleum Exporting Countries and its allies (OPEC+) oil output is contributing to the downward pressure on oil prices.
The US Dollar Index (DXY) remains silent near 102.40 with a negative bias, potentially influenced by the improved risk appetite after the mixed US economic data released on Friday.
US Nonfarm Payrolls (NFP) rose to 216K in December, showing improvement from the 173K reported in November and surpassing the market expectation of a rise to 170K. Additionally, Average Hourly Earnings (Year-over-Year) improved to 4.1% from the previous figure of 4.0%. The monthly index remained consistent at 0.4%, defying the expected decline of 0.3%. These positive developments reflect a robust performance in employment and wage growth, providing insights into the health of the US labor market.
In contrast to the positive developments in the job market, the Institute for Supply Management (ISM) reported a slowdown in the services sector for the same month. The Services Purchasing Managers Index (PMI) came in at 50.6, falling below the expected 52.6 and the previous figure of 52.7. This data indicates a deceleration in the services sector, raising considerations about the overall economic activity in that particular segment.
The mixed signals from different economic indicators underscore the complexity of assessing the overall health of the economy, and traders will likely eye the upcoming Consumer Price Index data on Thursday to gain more clarity on the US economic scenario.
EUR/GBP has moved down to the 0.86 level. Economists at ING analyze the pair’s outlook.
EUR/GBP can slip further this week
The week's highlight is Wednesday’s parliament testimony by Bank of England (BoE) Governor Andrew Bailey and Friday’s monthly GDP figures for November. Overall, we expect a generally positive impact on Sterling, especially in the crosses such as EUR/GBP, as Bailey may keep signalling a more cautious tone compared to the market on rate cuts and growth should bounce back in the November print.
As the year started, we had called for a return to 0.8600 in EUR/GBP. Now, there is probably some further downside room as BoE rate expectations appear more flexible to a hawkish repricing than the ECB ones, at least in the near term. That said, these are attractive levels to play a longer-term bullish view on the pair based on a deterioration of UK economic conditions and consequently more aggressive cuts by the BoE than the ECB.
- NZD/USD consolidates as the US Dollar remains stable.
- A break above the nine-day EMA at 0.6261 could lead the pair to approach the 0.6300 psychological level.
- A breach below the psychological support of 0.6200 could push the pair to navigate the 38.2% Fibonacci retracement at 0.6167.
NZD/USD displays sideways movement amid a steady US Dollar (USD), trading higher around 0.6240 during the early European hours on Monday. The technical indicator, the 14-day Relative Strength Index (RSI), is positioned above the 50 level, signaling strong momentum. This suggests that the NZD/USD pair could gear up to test the major resistance at 0.6250, followed by the nine-day Exponential Moving Average (EMA) at 0.6261.
A breakthrough above the support region could lead the NZD/USD pair to explore the psychological region around 0.6300 level followed by the weekly high at 0.6329 and the major resistance at 0.6350 level.
On the downside, the GBP/USD pair could find immediate support at the psychological level of 0.6200. If this level is breached, the next level to watch is the 38.2% Fibonacci retracement at 0.6167. Further downside pressure could lead the pair to navigate toward the major support at 0.6150.
The technical analysis for the NZD/USD pair suggests a potential shift in sentiment. The placement of the Moving Average Convergence Divergence (MACD) line above the centerline, coupled with divergence below the signal line, indicates a possible move toward a bearish sentiment. Traders are likely exercising caution and closely monitoring the lagging indicator.
NZD/USD: Daily Chart:
-638402962520164591.png)
Economists at Société Générale analyze Euro’s outlook for 2024.
Another lower cyclical EUR/USD peak?
In 2024, we expect the Euro to weaken against both the Japanese Yen and the Scandinavian currencies, and to only make incremental gains against the unloved British Pound.
We only forecast modest growth, with GDP increases of 0.8% in 2024 and 1.1% in 2025, but this should be enough to take EUR/USD higher.
Relative short-term rates are now moving back in the Euro’s favour, thanks to a market rethink about the outlook for Fed policy as growth slows and inflation falls. Our forecasts for the 2-year rate differential look for it to narrow to below 1% over the next year, where it was trading in 2021. We don’t, however, expect EUR/USD to return to the levels it reached then, given the growth hurdles still facing the Eurozone.
EUR/USD – 1Q24 1.10 2Q24 1.12 3Q24 1.14 4Q24 1.16
- Factory Orders in Germany rose at a softer pace than expected in November.
- EUR/USD stays in daily range at around 1.0950.
Factory Orders in Germany rose by 0.3% on a monthly basis in November, the Bundesbank reported on Monday. This reading followed the 3.8% contraction recorded in October and came in below the market expectation for an increase of 1%. On a yearly basis, Factory Orders declined by 4.4%.
Other data from Germany revealed that Imports and Exports expanded by 1.9% and 3.7%, respectively, on a monthly basis.
Market reaction
These figures don't seem to be having a noticeable impact on the Euro's valuation in the European morning on Monday. At the time of press, EUR/USD was up 0.06% on the day at 1.0948.
- USD/CHF attracts some buyers around 0.8515 on the firmer USD.
- The upbeat US labor data on Friday weakens the Federal Reserve's (Fed) case for rate cuts.
- Traders await the Swiss Consumer Price Index for December, due on Monday.
The USD/CHF pair gains momentum during the early European trading hours on Monday. The recovery of the US Dollar (USD) and higher US Treasury bond yields lend some support to the pair. USD/CHF currently trades near 0.8515, up 0.13% on the day.
The better-than-expected US labor data on Friday weakens the Federal Reserve's (Fed) case for rate cuts. Traders are pricing in over 60% odds of rate cuts in the March meeting, according to the CME Fedwatch tool. On Friday, US Nonfarm Payrolls (NFP) grew by 216K jobs in December from 173K in November, exceeding the market consensus of 170K. Meanwhile, the Average Hourly Earnings rose 0.4% MoM, better than the estimated 0.3%, while the annual figure arrived at 4.1 YoY in December versus 4.0% prior, beating the expectation of 3.9%.
Investors will take cues from the Swiss Consumer Price Index for December, due later on Monday. The annual CPI is estimated to show an increase of 1.5% YoY from 1.4% in the previous reading, while the monthly CPI is projected to remain steady at -0.2% MoM.
The highlight of this week will be the US inflation data on Thursday. Market players project the headline Consumer Price Index (CPI) to show an increase of 3.2% YoY, while the Core CPI is estimated to ease from 4% to 3.8% YoY.
Here is what you need to know on Monday, January 8:
Investors seem to have adopted a cautious stance to start the new week. The US Dollar (USD) Index holds steady near 102.50 after snapping a three-week losing streak and US stock index futures trade in negative territory. The European economic docket will feature Retail Sales data for November on Monday, alongside consumer and business sentiment figures for December.
The USD gathered strength on Friday with the immediate reaction to December jobs data but the underlying details of the report made it difficult for the currency to carry its bullish momentum into the new week. Nonfarm Payrolls (NFP) rose by 216,000, surpassing the market expectation of 170,000 by a wide margin, and the Unemployment Rate held steady at 3.7%. However, the US Bureau of Labor Statistics announced downward revisions to November and October NFP readings, while the Labor Force Participation rate declined to 62.5% from 62.8% in December. The benchmark 10-year US Treasury bond yield stabilized above 4% after the labor market data and the USD Index gained 1% in the previous week.
US Dollar price in the last 7 days
The table below shows the percentage change of US Dollar (USD) against listed major currencies in the last 7 days. US Dollar was the strongest against the Japanese Yen.
| USD | EUR | GBP | CAD | AUD | JPY | NZD | CHF | |
| USD | 1.03% | 0.16% | 0.88% | 1.56% | 2.25% | 1.22% | 1.22% | |
| EUR | -0.88% | -0.70% | 0.00% | 0.69% | 1.24% | 0.35% | 0.29% | |
| GBP | -0.18% | 0.70% | 0.72% | 1.39% | 2.16% | 1.03% | 1.00% | |
| CAD | -0.89% | -0.03% | -0.54% | 0.66% | 1.35% | 0.34% | 0.29% | |
| AUD | -1.58% | -0.69% | -1.40% | -0.70% | 0.52% | -0.34% | -0.39% | |
| JPY | -2.28% | -1.24% | -2.05% | -1.18% | -0.50% | -0.89% | -1.10% | |
| NZD | -1.25% | -0.35% | -1.06% | -0.36% | 0.34% | 0.86% | -0.01% | |
| CHF | -1.22% | -0.33% | -1.04% | -0.31% | 0.37% | 1.02% | 0.08% |
The heat map shows percentage changes of major currencies against each other. The base currency is picked from the left column, while the quote currency is picked from the top row. For example, if you pick the Euro from the left column and move along the horizontal line to the Japanese Yen, the percentage change displayed in the box will represent EUR (base)/JPY (quote).
Major equity indexes in Asia started the new week under bearish pressure. News of Chinese wealth manager Zhongzhi Enterprise Group filing for bankruptcy liquidation after failing to repay debt late Friday revived fears over the property sector crisis impacting the broader financial conditions. Hong Kong's Hang Seng Index fell over 2% and Shanghai Composite lost 1% on Monday.
After fluctuating wildly during the American trading hours on Friday, EUR/USD stabilized near 1.0950 and registered small losses for the week. The pair stays relatively calm early Monday and fluctuates at around weekly closing levels.
GBP/USD closed the previous week virtually unchanged and went into a consolidation phase slightly above 1.2700 early Monday.
USD/JPY spiked to a multi-week high of 146.00 on Friday but erased its daily gains in the American trading hours. The pair stays on the back foot early Monday and trades in negative territory below 144.50. Tokyo Consumer Price Index (CPI) data for December will be released in the Asian session on Tuesday.
Gold slumped below $2,030 as US yields rallied with the immediate reaction to US jobs report on Friday. XAU/USD, however, regained its traction and closed the week near $2,050. Early Monday, the pair stays under bearish pressure and trades below $2,040.
- EUR/USD trades on a softer note amid the stronger USD.
- The pair keeps the negative outlook unchanged below the key EMA; RSI indicator stands in bearish territory below the 50 midline.
- The critical resistance level will emerge at 1.0970; the 1.0890–1.0900 zone acts as an initial support level.
The EUR/USD pair loses ground around 1.0935 during the early European session on Monday. The downtick of the major pair is backed by a stronger US Dollar (USD) and higher US Treasury bond yields. The US labor data on Friday cast doubt on the Federal Reserve's (Fed) rate cut expectation. The US Nonfarm Payrolls (NFP) rose by 216,000 in December from 173,000 in November, better than the market expectation of 170,000.
According to the four-hour chart, the bearish outlook of EUR/USD remains intact as the major pair holds below the 50- and 100-hour Exponential Moving Averages (EMA). Additionally, the 14-day Relative Strength Index (RSI) stands in bearish territory below the 50 midline, indicating that the path of least resistance is to the downside.
The key resistance level will emerge at 1.0970, portraying the confluence of the 50-hour EMA, the upper boundary of the Bollinger Band, and a high of January 4. The next upside barrier to watch is near a psychological round mark and a high of January 5 at 1.1000, followed by a high of January 2 at 1.1043 and a high of December 29 at 1.1080.
On the flip side, the 1.0890–1.0900 region acts as an initial support level for EUR/USD. The mentioned level is the lower limit of the Bollinger Band and a low of January 5. The additional downside filter to watch is a high of December 12 at 1.0828. Further south, the next downside stop is located near a low of December 13 at 1.0773.
EUR/USD four-hour chart
-638402899597373896.png)
- GBP/USD tumbles to the psychological support amid a stable US Dollar.
- A break below the 14-day EMA at 1.2692 could push the pair to approach the major support at 1.2650.
- Traders would likely await the MACD to confirm the momentum before placing bets.
GBP/USD halts its three-day winning streak, trading around 1.2700 psychological level during the Asian session on Monday. The GBP/USD pair seems to face a critical juncture, with the possibility of a break below the psychological level. If this occurs, it could surpass the 14-day Exponential Moving Average (EMA) at 1.2692.
A breach below this support region might exert downward pressure on the GBP/USD pair, potentially leading it to navigate toward the major support at 1.2650. This level aligns with the 23.6% Fibonacci retracement at 1.2643, serving as a significant area to watch for potential price movements.
However, the technical indicator 14-day Relative Strength Index (RSI) is positioned above the 50 level indicating bullish momentum, suggesting an upward outlook for the GBP/USD pair.
Additionally, the technical analysis of the GBP/USD pair suggests an interesting situation with the Moving Average Convergence Divergence (MACD) indicator. The MACD line is positioned above the centerline, indicating potential bullish momentum. However, there is divergence below the signal line, suggesting a nuanced scenario. Investors might be exercising caution and awaiting confirmation from the MACD before making their bets.
On the upside, the 1.2750 level could act as the major barrier followed by the previous week’s high at 1.2771. A breach below the latter could support the GBP/USD pair to explore the region around the psychological level at 1.2800.
GBP/USD: Daily Chart
-638402897426893327.png)
- WTI price faces challenges as Saudi has cut prices of its Arab Light Crude to Asia.
- OPEC+ oil output increased by 70,000 bpd to reach 27.88M bpd in December – Reuters Survey
- Iraq, Angola, and Nigeria reported an uptick in their export shipments of Crude oil.
- US Secretary of State Antony Blinken has warned that the Gaza conflict can spread across the region without peace efforts.
The West Texas Intermediate (WTI) price retraces its recent gains, trading lower near $73.00 per barrel during the Asian session on Monday. The decline in Crude oil prices is attributed to a combination of factors, including price cuts by top exporter Saudi Arabia.
Additionally, a rise in Organization of the Petroleum Exporting Countries and its allies (OPEC+) output, which increased by 70,000 barrels per day (bpd) in December to reach 27.88M bpd, according to a Reuters survey, is contributing to the downward pressure on oil prices.
The survey results indicate that the most significant increases, amounting to 60,000 barrels per day (bpd), came from Iraq and Angola in December. Furthermore, Nigeria also reported an uptick in the shipment of crude oil abroad during the same period. This rise in oil output is counteracting the ongoing production cuts by Saudi Arabia and other members of the OPEC+ alliance.
The survey findings highlight that Saudi Arabia has indeed lowered its production slightly, bringing it below 9M bpd. Furthermore, the country has extended a voluntary 1M bpd output cut. These deliberate measures are part of Saudi Arabia's efforts to influence global oil prices
Adding to the dynamics, Saudi Arabia announced on Sunday a reduction in the February Official Selling Price (OSP) of its flagship Arab Light crude to Asia, marking the lowest level in 27 months.
The Iran-backed Houthis escalated supply concerns last week by launching two anti-ship ballistic missiles at a container ship in the southern Red Sea en route to Israel. This provocative action adds to the geopolitical tensions in the region, particularly around maritime routes.
US Secretary of State Antony Blinken has issued a warning regarding the Gaza conflict, stating that without concerted peace efforts, the conflict has the potential to spread across the region.
- Gold price ticks lower on Monday following the post-NFP price action whipsaw.
- Elevated US bond yields act as a tailwind for the USD and exert pressure on the XAU/USD.
- A softer risk tone should help limit deeper losses as the focus shifts to the US inflation data.
Gold price (XAU/USD) staged a goodish intraday recovery of around $40 from over a two-week low touched in the aftermath of the better-than-expected monthly employment details on Friday, albeit lacked any follow-through. The momentum ran out of steam near the $2,064 region amid the uncertainty about the Federal Reserve's (Fed) rate-cut trajectory, which, in turn, held back traders from placing aggressive directional bets around the non-yielding yellow metal.
The incoming US economic data pointed to a still-resilient economy, which, along with hawkish remarks by Fed officials, dashed hopes for a more aggressive policy easing by the central bank. This remains supportive of elevated US Treasury bond yields, which act as a headwind for the US Dollar (USD) and exert downward pressure on the Gold price during the Asian session on Monday. That said, a softer risk tone might help limit losses for the safe-haven XAU/USD.
Concerns about a slow economic recovery in China, along with geopolitical risks, weigh on investors' sentiment, which is evident from a fresh leg down in the US equity futures. Traders might also prefer to wait for the release of the US consumer inflation figures on Thursday to confirm the next leg of a directional move for the Gold price. This makes it prudent to wait for strong follow-through buying before positioning for the resumption of a one-week-old downtrend.
Daily Digest Market Movers: Gold price is undermined by reduced bets for aggressive Fed rate cuts
- Investors further scale back their expectations for an imminent shift in the Federal Reserve's policy stance following the release of a robust December monthly US jobs report on Friday.
- The US economy added 216K new jobs last week as compared to 170K expected, while the unemployment rate held steady at 3.7% vs. consensus estimates for an uptick to 3.8%.
- Adding to this, US Factory Orders surprised to the upside and grew more than expected in November, by 2.6%, after declining 3.4% in October (revised slightly up from -3.6%).
- Separately, the Institute for Supply Management (ISM) survey indicated that the US services sector, which accounts for more than two-thirds of the economy, slumped last month.
- The ISM's Non-Manufacturing Index dropped to 50.6 in December – the lowest reading since May – and the employment sub-component plunged to 43.3 – the lowest since July 2020.
- Dallas Fed President Lorie Logan noted that if the US central bank does not maintain sufficiently tight financial conditions, there is a risk that inflation will pick back up, reversing progress.
- This comes after Richmond Fed President Thomas Barkin last week expressed confidence that the economy is on its way to a soft landing and said that rate hikes remain on the table.
- The yield on the benchmark 10-year US government bond holds steady above the 4.0% threshold, which acts as a tailwind for the US Dollar and is seen undermining the Gold price.
- The markets, however, are still pricing in a greater chance of the first interest rate cut by the Fed at the March meeting and a cumulative of five 25 basis points (bps) rate cuts for 2024.
- China's economic woes, along with an escalation of tensions in the Middle East, could lend some support to the safe-haven XAU/USD ahead of the US consumer inflation figures on Thursday.
- Lebanese militant group Hezbollah sent a barrage of rockets into northern Israel in what it called a “preliminary response” to the assassination of Hamas senior leader Saleh al-Arouri on Tuesday.
- The markets react little to an agreement between House Speaker Mike Johnson and Senate Majority Leader Chuck Schumer on topline spending level, which breaks the deadlock to avoid a shutdown.
Technical Analysis: Gold price seems vulnerable, multi-week low around $2,024 area holds the key
From a technical perspective, any subsequent slide is likely to find some support near the $2,030 level ahead of Friday’s swing low, around the $2,024 area. Some follow-through selling will be seen as a fresh trigger for bearish traders and drag the Gold price to the 50-day Simple Moving Average (SMA), currently around the $2,012-2,011 area. This is followed by the $2,000 psychological mark, which if broken should pave the way for a further near-term depreciating move.
On the flip side, momentum beyond the $2,050 immediate hurdle might continue to confront stiff resistance near the $2,064-2,065 area ahead of the $2,077 zone. A sustained strength beyond the said hurdles might prompt a short-covering rally and allow the Gold price to aim back towards reclaiming the $2,100 round-figure mark. Some follow-through buying will negate any negative outlook and shift the near-term bias back in favour of bullish traders.
US Dollar price today
The table below shows the percentage change of US Dollar (USD) against listed major currencies today. US Dollar was the weakest against the Japanese Yen.
| USD | EUR | GBP | CAD | AUD | JPY | NZD | CHF | |
| USD | 0.08% | 0.12% | 0.07% | 0.18% | -0.19% | 0.18% | 0.12% | |
| EUR | -0.07% | 0.05% | 0.01% | 0.12% | -0.25% | 0.12% | 0.04% | |
| GBP | -0.10% | -0.03% | -0.02% | 0.09% | -0.28% | 0.09% | 0.01% | |
| CAD | -0.07% | 0.00% | 0.04% | 0.11% | -0.24% | 0.10% | 0.04% | |
| AUD | -0.19% | -0.10% | -0.08% | -0.10% | -0.33% | -0.02% | -0.07% | |
| JPY | 0.15% | 0.26% | 0.28% | 0.26% | 0.37% | 0.37% | 0.28% | |
| NZD | -0.16% | -0.11% | -0.08% | -0.08% | 0.00% | -0.36% | -0.05% | |
| CHF | -0.11% | -0.04% | 0.01% | -0.02% | 0.08% | -0.28% | 0.08% |
The heat map shows percentage changes of major currencies against each other. The base currency is picked from the left column, while the quote currency is picked from the top row. For example, if you pick the Euro from the left column and move along the horizontal line to the Japanese Yen, the percentage change displayed in the box will represent EUR (base)/JPY (quote).
Gold FAQs
Why do people invest in Gold?
Gold has played a key role in human’s history as it has been widely used as a store of value and medium of exchange. Currently, apart from its shine and usage for jewelry, the precious metal is widely seen as a safe-haven asset, meaning that it is considered a good investment during turbulent times. Gold is also widely seen as a hedge against inflation and against depreciating currencies as it doesn’t rely on any specific issuer or government.
Who buys the most Gold?
Central banks are the biggest Gold holders. In their aim to support their currencies in turbulent times, central banks tend to diversify their reserves and buy Gold to improve the perceived strength of the economy and the currency. High Gold reserves can be a source of trust for a country’s solvency. Central banks added 1,136 tonnes of Gold worth around $70 billion to their reserves in 2022, according to data from the World Gold Council. This is the highest yearly purchase since records began. Central banks from emerging economies such as China, India and Turkey are quickly increasing their Gold reserves.
How is Gold correlated with other assets?
Gold has an inverse correlation with the US Dollar and US Treasuries, which are both major reserve and safe-haven assets. When the Dollar depreciates, Gold tends to rise, enabling investors and central banks to diversify their assets in turbulent times. Gold is also inversely correlated with risk assets. A rally in the stock market tends to weaken Gold price, while sell-offs in riskier markets tend to favor the precious metal.
What does the price of Gold depend on?
The price can move due to a wide range of factors. Geopolitical instability or fears of a deep recession can quickly make Gold price escalate due to its safe-haven status. As a yield-less asset, Gold tends to rise with lower interest rates, while higher cost of money usually weighs down on the yellow metal. Still, most moves depend on how the US Dollar (USD) behaves as the asset is priced in dollars (XAU/USD). A strong Dollar tends to keep the price of Gold controlled, whereas a weaker Dollar is likely to push Gold prices up.
- Indian Rupee attracts some buyers despite the firmer US Dollar.
- India's GDP number will expand by 7.3% in the current fiscal year (2023–24), faster than the 7.2% growth in 2022–23.
- The US Consumer Price Index (CPI) for December will be in the spotlight ahead of Indian Industrial Production.
Indian Rupee (INR) kicks off the new week on a positive note on Monday. Foreign capital inflows and the Reserve Bank of India’s (RBI) intervention have been supporting the INR from any major depreciation. The government revealed the First Advance Estimates (FAEs) of India’s GDP on Friday. The report suggested that India's Gross Domestic Product (GDP) will expand by 7.3% in the current fiscal year (2023–24), which is slightly faster than the 7.2% growth in 2022–23.
Furthermore, the United Nations (UN) stated in the report that India's economic growth will decline marginally to 6.2% in the current year from the projected expansion of 6.3% recorded in 2023, but will maintain its position as the fastest-growing major economy in the world.
Investors will monitor the December US Consumer Price Index (CPI), due later on Thursday. The headline CPI is estimated to show an increase of 3.2% YoY, while the Core CPI is forecast to ease from 4.0% to 3.8% YoY. On Friday, Indian Industrial Production and Manufacturing Output for November will be released.
Daily Digest Market Movers: Indian Rupee remains strong despite firmer USD and challenges
- Indian S&P Global India Services PMI for December came in at 59.0 versus 56.9, above the consensus of 56.5.
- India's foreign exchange reserves jumped by $2.759 billion to $623.2 billion in the week ended December 29, the Reserve Bank of India said on Friday.
- The US Nonfarm Payrolls (NFP) rose 216K in December from the previous reading of 173K, stronger than the 170K expected. The US Unemployment Rate was unchanged at 3.7%.
- The Average Hourly Earnings climbed 0.4% MoM, better than 0.3% expected while the annual figure came in at 4.1 YoY in December versus 4.0% in the previous reading, above the consensus of 3.9%.
- According to the CME Fedwatch tool, the Fed funds futures markets have priced in 65% odds of a March rate cut from the Fed.
Technical Analysis: Indian Rupee keeps the longer-term range unchanged
Indian Rupee trades on a stronger note on the day. The USD/INR pair has remained confined in a trading range of 82.80–83.40 since September. Technically, the bullish outlook of the pair looks vulnerable as the pair is set to cross below the key 100-period Exponential Moving Average (EMA) on the daily chart. Furthermore, the 14-day Relative Strength Index (RSI) is below the 50.0 midpoint, supporting that further decline cannot be ruled out.
A decisive break below the 83.00 psychological support level will pave the way to 82.80, representing the confluence of the lower limit of the trading range and a low of September 12. The next contention level is seen at a low of August 11 at 82.60. On the upside, the upper boundary of the trading range at 83.40 acts as an immediate resistance level for USD/INR. Any follow-through buying above 83.40 will see a rally to a 2023 high of 83.47, en route to the psychological figure at 84.00.
US Dollar price today
The table below shows the percentage change of US Dollar (USD) against listed major currencies today. US Dollar was the weakest against the Japanese Yen.
| USD | EUR | GBP | CAD | AUD | JPY | NZD | CHF | |
| USD | 0.04% | 0.04% | 0.04% | 0.05% | -0.29% | 0.05% | 0.07% | |
| EUR | -0.04% | 0.01% | 0.01% | 0.02% | -0.31% | 0.02% | 0.03% | |
| GBP | -0.04% | 0.00% | 0.01% | 0.00% | -0.31% | 0.02% | 0.03% | |
| CAD | -0.04% | -0.01% | 0.01% | 0.01% | -0.30% | 0.01% | 0.03% | |
| AUD | -0.04% | 0.00% | 0.00% | 0.00% | -0.30% | 0.00% | 0.03% | |
| JPY | 0.25% | 0.32% | 0.29% | 0.33% | 0.30% | 0.32% | 0.36% | |
| NZD | -0.03% | -0.02% | 0.01% | 0.01% | 0.01% | -0.32% | 0.03% | |
| CHF | -0.05% | -0.04% | -0.03% | 0.00% | -0.02% | -0.34% | -0.02% |
The heat map shows percentage changes of major currencies against each other. The base currency is picked from the left column, while the quote currency is picked from the top row. For example, if you pick the Euro from the left column and move along the horizontal line to the Japanese Yen, the percentage change displayed in the box will represent EUR (base)/JPY (quote).
Indian Rupee FAQs
What are the key factors driving the Indian Rupee?
The Indian Rupee (INR) is one of the most sensitive currencies to external factors. The price of Crude Oil (the country is highly dependent on imported Oil), the value of the US Dollar – most trade is conducted in USD – and the level of foreign investment, are all influential. Direct intervention by the Reserve Bank of India (RBI) in FX markets to keep the exchange rate stable, as well as the level of interest rates set by the RBI, are further major influencing factors on the Rupee.
How do the decisions of the Reserve Bank of India impact the Indian Rupee?
The Reserve Bank of India (RBI) actively intervenes in forex markets to maintain a stable exchange rate, to help facilitate trade. In addition, the RBI tries to maintain the inflation rate at its 4% target by adjusting interest rates. Higher interest rates usually strengthen the Rupee. This is due to the role of the ‘carry trade’ in which investors borrow in countries with lower interest rates so as to place their money in countries’ offering relatively higher interest rates and profit from the difference.
What macroeconomic factors influence the value of the Indian Rupee?
Macroeconomic factors that influence the value of the Rupee include inflation, interest rates, the economic growth rate (GDP), the balance of trade, and inflows from foreign investment. A higher growth rate can lead to more overseas investment, pushing up demand for the Rupee. A less negative balance of trade will eventually lead to a stronger Rupee. Higher interest rates, especially real rates (interest rates less inflation) are also positive for the Rupee. A risk-on environment can lead to greater inflows of Foreign Direct and Indirect Investment (FDI and FII), which also benefit the Rupee.
How does inflation impact the Indian Rupee?
Higher inflation, particularly, if it is comparatively higher than India’s peers, is generally negative for the currency as it reflects devaluation through oversupply. Inflation also increases the cost of exports, leading to more Rupees being sold to purchase foreign imports, which is Rupee-negative. At the same time, higher inflation usually leads to the Reserve Bank of India (RBI) raising interest rates and this can be positive for the Rupee, due to increased demand from international investors. The opposite effect is true of lower inflation.
- GBP/USD snaps its winning streak as the US Dollar improves.
- The decline in the 2-year US yield puts pressure on the US Dollar.
- US NFP rose to 216K from 173K prior. While ISM Services PMI eased to 50.6 from the prior figure of 52.7.
GBP/USD halts its winning streak that began on Wednesday, trading around 1.2710 during the Asian session on Monday. However, the Pound Sterling (GBP) received upward support against the US Dollar (USD) on improved risk appetite after the mixed economic data from the United States (US).
The US Dollar Index (DXY) maintains a sideways movement near 102.40 with a negative bias, potentially influenced by the decline in the short-term yield on the 2-year US Treasury bond. The yield on the 2-year bond trades lower at 4.38%, by the press time.
The US Dollar experienced a volatile session on Friday, marked by fluctuations between gains and losses, driven by mixed economic data. On the positive side, the US Bureau of Labor Statistics reported a favorable development in the job market, with Nonfarm Payrolls (NFP) rising to 216K in December, surpassing both the previous figure of 173K and the market expectation of 170K.
However, the Institute for Supply Management (ISM) revealed a slowdown in the services sector for December, as the Services Purchasing Managers Index (PMI) came in at 50.6, below the expected 52.6 and the prior figure of 52.7.
Federal Reserve Bank of Richmond President Thomas Barkin expressed his views on the US labor market, stating that it is exhibiting a steady softening pattern and is unlikely to reaccelerate at this juncture. Barkin emphasized that the reacceleration of the labor market seems improbable at this point.
Lorie Logan, the president of the Federal Reserve Bank of Dallas, has weighed in on the monetary policy landscape, stating that a rate hike should not be dismissed considering the recent easing in financial conditions. Her emphasis on avoiding premature easing to prevent a potential stimulation of demand reflects the delicate balance central banks strive to maintain.
The recent upbeat economic indicators from the United Kingdom (UK) likely contributed to the British Pound's (GBP) positive performance. The UK Consumer Credit data revealed an improvement in individuals' borrowing in November. Furthermore, the S&P Global/CIPS Composite PMI for December exhibited positive signs, with an increase in Services PMI.
The GBP might face selling pressure due to a pessimistic economic outlook. Investors appear to anticipate challenging decisions for Bank of England (BoE) policymakers, who find themselves in a difficult position between the looming recession risks in the UK economy and persistently high underlying inflation.
The call for swift action is intensifying, as corporate executives in the UK are urging the Bank of England (BoE) to lower interest rates promptly. This appeal is seen as a crucial measure to provide much-needed support to the struggling economy. The Institute of Directors Economic Confidence Index survey has added weight to these concerns, highlighting a continued decline in optimism among British directors regarding the country's economic prospects.
Investors will observe the British Retail Consortium (BRC) Like-For-Like Retail Sales due on Tuesday and Manufacturing Production on Friday to gain fresh impetus on the UK’s economic landscape.
- USD/CAD attracts some buyers on Monday and is supported by a downtick in Crude Oil prices.
- Elevated US bond yields and a softer risk tone underpin the USD and further lend some support.
- The uncertainty over the Fed’s rate cut trajectory might hold back bulls from placing fresh bets.
The USD/CAD pair ticks higher during the Asian session on the first day of a new week, albeit lacks follow-through buying and remains confined in Friday's broader trading range. Spot prices currently trade just above mid-1.3300s and seem poised to prolong the recent goodish recovery move from a five-month low touched in December.
Crude Oil prices come under some renewed selling pressure in reaction to Saudi Arabia's decision to slash the official selling price (OSP) for February-loading Arab Light to Asia to the lowest level since November 2021. This, in turn, is seen as a key factor undermining the commodity-linked Loonie and acting as a tailwind for the USD/CAD pair. That said, an escalation in the Israel-Hamas conflict, along with continued disruptions in shipping activity in the Red Sea, should help limit any meaningful downside for the black liquid.
Apart from this, subdued US Dollar (USD) price action might hold back traders from placing aggressive bullish bets around the USD/CAD pair and cap the upside. A robust December US jobs report released on Friday, to a larger extent, was offset by the disappointing release of the ISM Non-Manufacturing PMI, which indicated that business activity in the services sector slumped to the lowest level since May. This raises the uncertainty over the Federal Reserve's (Fed) rate cuts trajectory and fails to provide any impetus to the USD.
Meanwhile, Dallas Fed President Lorie Logan noted that if the US central bank does not maintain sufficiently tight financial conditions, there is a risk that inflation will pick back up, reversing progress. This comes after Richmond Fed President Thomas Barkin last week expressed confidence that the economy is on its way to a soft landing and said that rate hikes remain on the table. This remains supportive of elevated US Treasury bond yields, which, along with a fresh leg down in the US equity futures, should benefit the safe-haven buck.
The aforementioned fundamental backdrop seems tilted in favour of the USD/CAD bulls and supports prospects for further gains. Market participants, however, might prefer to wait on the sidelines and look to the latest US consumer inflation figures, due on Thursday before placing fresh directional bets. In the meantime, a scheduled speech by Atlanta Fed President Raphael Bostic, along with the US bond yields and the broader risk sentiment, might influence the USD. Apart from this, Oil price dynamics should provide some impetus to the major.
Technical levels to watch
| Raw materials | Closed | Change, % |
|---|---|---|
| Silver | 23.183 | 0.87 |
| Gold | 2045.036 | 0.1 |
| Palladium | 1028 | -1.21 |
- The Japanese Yen attracts some buyers and recovers a part of last week’s heavy losses.
- Diminishing odds for an end to BoJ’s negative rates regime in January should cap gains.
- Reduced bets for aggressive Fed easing underpin the USD and lend support to USD/JPY.
The Japanese Yen (JPY) ticks higher against its American counterpart on the first day of a new week, though remains well within the striking distance of over a three-week low touched on Friday. The deadly New Year's Day earthquake in Japan dashed hopes for an end to the Bank of Japan's (BoJ) negative rates regime at this January 22-23 meeting. This, along with a stable performance around the equity markets, might continue to undermine the safe-haven JPY amid a Japanese holiday in observance of Coming-of-Age Day.
The US Dollar (USD), on the other hand, is seen drawing support from diminishing odds for a more aggressive policy easing by the Federal Reserve (Fed). That said, Friday's mixed macro data from the United States (US) holds back the USD bulls from placing fresh bets ahead of this week's release of the latest consumer inflation figures on Thursday. Nevertheless, the aforementioned fundamental backdrop assists the USD/JPY pair to preserve last week's strong gains and trade with a positive bias during the Asian session.
Daily Digest Market Movers: Japanese Yen seems vulnerable on fading hopes of a hawkish BoJ pivot
- The Japanese Yen declined over 2% last week and recorded its worst weekly performance since June 2022 amid fading hopes for an imminent shift in the Bank of Japan's policy shift later this month.
- A robust December US jobs report further raises uncertainty over the Federal Reserve's rate cuts trajectory, which underpinned the US Dollar and lifted the USD/JPY pair to a three-week high on Friday.
- The headline NFP print showed that the US economy added 216K new jobs last week as compared to 170K expected, while the unemployment rate held steady at 3.7% vs. an uptick to 3.8% anticipated.
- The upbeat data was offset by the Institute for Supply Management (ISM) survey, which indicated that the US services sector, which accounts for more than two-thirds of the economy, slumped last month.
- The ISM's Non-Manufacturing Index dropped to 50.6 in December – the lowest reading since May – and the employment sub-component plunged to 43.3 – the lowest since July 2020 – from 50.7 in November.
- Separately, US Factory Orders increased more than expected in November, by 2.6% after declining 3.4% in October, though did little to impress the USD bulls or provide any meaningful impetus.
- The data suggested that the world's largest economy showed pockets of weakness, though remained resilient overall, forcing investors to scale back bets for more aggressive easing by the Federal Reserve.
- Adding to this, Dallas Fed President Lorie Logan noted that if the US central bank does not maintain sufficiently tight financial conditions, there is a risk that inflation will pick back up, reversing progress.
- This comes after Richmond Fed President Thomas Barkin last week expressed confidence that the economy is on its way to a soft landing and said that rate hikes remain on the table.
- The markets, however, are still pricing in a greater chance of the first interest rate cut by the Fed at the March policy meeting and a cumulative of five 25 basis points (bps) rate cuts for 2024.
- This is holding back the USD bulls from positioning for any further appreciating move and keeps a lid on the USD/JPY pair as the focus now shifts to the US consumer inflation figures on Thursday.
- An agreement on a topline spending level has been reached by House Speaker Mike Johnson and Senate Majority Leader Chuck Schumer, breaking the deadlock to avoid a government shutdown.
Technical Analysis: USD/JPY retreats further from a multi-week high, trades below 38.2% Fibo. level
From a technical perspective, Friday's failure near the 50% Fibonacci retracement level of the November-December downfall warrants caution for bullish traders. Moreover, oscillators on the daily chart – though recovered from the bearish territory – are yet to confirm a positive bias. Hence, it will be prudent to wait for some follow-through buying beyond the multi-week high, around the 146.00 mark, before positioning for an extension of the USD/JPY pair's recent recovery from the 140.25 region, or a multi-month trough touched in December. The subsequent move up has the potential to lift spot prices beyond the 146.55 intermediate hurdle, towards reclaiming the 147.00 mark en route to the 147.40-147.45 confluence, comprising the 61.8% Fibo. level and the 100-day Simple Moving Average (SMA).
On the flip side, the 144.00 mark is likely to protect the immediate downside ahead of Friday's swing low, around the 143.80 region, and the 200-day SMA, currently pegged near the 143.25 zone. A convincing break below the latter might shift the near-term bias back in favour of bearish traders and make the USD/JPY pair vulnerable to test the next relevant support near the 142.35-142.30 horizontal zone before eventually dropping to the 142.00 round figure. The downward trajectory could get extended further towards the 141.75 support en route to the 141.00 mark and the multi-month low, around the 140.25 region.
Japanese Yen price today
The table below shows the percentage change of Japanese Yen (JPY) against listed major currencies today. Japanese Yen was the strongest against the US Dollar.
| USD | EUR | GBP | CAD | AUD | JPY | NZD | CHF | |
| USD | -0.06% | -0.04% | -0.04% | -0.15% | -0.27% | -0.09% | -0.06% | |
| EUR | 0.06% | 0.02% | 0.03% | -0.08% | -0.20% | -0.02% | 0.00% | |
| GBP | 0.04% | -0.02% | 0.01% | -0.10% | -0.22% | -0.04% | -0.03% | |
| CAD | 0.04% | -0.02% | 0.00% | -0.11% | -0.21% | -0.05% | -0.03% | |
| AUD | 0.15% | 0.08% | 0.11% | 0.11% | -0.10% | 0.06% | 0.09% | |
| JPY | 0.24% | 0.21% | 0.21% | 0.24% | 0.13% | 0.19% | 0.19% | |
| NZD | 0.10% | 0.02% | 0.04% | 0.05% | -0.06% | -0.18% | 0.01% | |
| CHF | 0.06% | 0.00% | 0.02% | 0.03% | -0.08% | -0.19% | -0.01% |
The heat map shows percentage changes of major currencies against each other. The base currency is picked from the left column, while the quote currency is picked from the top row. For example, if you pick the Euro from the left column and move along the horizontal line to the Japanese Yen, the percentage change displayed in the box will represent EUR (base)/JPY (quote).
Japanese Yen FAQs
What key factors drive the Japanese Yen?
The Japanese Yen (JPY) is one of the world’s most traded currencies. Its value is broadly determined by the performance of the Japanese economy, but more specifically by the Bank of Japan’s policy, the differential between Japanese and US bond yields, or risk sentiment among traders, among other factors.
How do the decisions of the Bank of Japan impact the Japanese Yen?
One of the Bank of Japan’s mandates is currency control, so its moves are key for the Yen. The BoJ has directly intervened in currency markets sometimes, generally to lower the value of the Yen, although it refrains from doing it often due to political concerns of its main trading partners. The current BoJ ultra-loose monetary policy, based on massive stimulus to the economy, has caused the Yen to depreciate against its main currency peers. This process has exacerbated more recently due to an increasing policy divergence between the Bank of Japan and other main central banks, which have opted to increase interest rates sharply to fight decades-high levels of inflation.
How does the differential between Japanese and US bond yields impact the Japanese Yen?
The BoJ’s stance of sticking to ultra-loose monetary policy has led to a widening policy divergence with other central banks, particularly with the US Federal Reserve. This supports a widening of the differential between the 10-year US and Japanese bonds, which favors the US Dollar against the Japanese Yen.
How does broader risk sentiment impact the Japanese Yen?
The Japanese Yen is often seen as a safe-haven investment. This means that in times of market stress, investors are more likely to put their money in the Japanese currency due to its supposed reliability and stability. Turbulent times are likely to strengthen the Yen’s value against other currencies seen as more risky to invest in.
- NZD/USD trades in positive territory for the second consecutive day above the mid-0.6200s on Monday.
- The US labor data on Friday helped weaken the case for rate cuts from the Federal Reserve (Fed).
- The stronger Chinese economic data last week has lifted the New Zealand Dollar (NZD).
The NZD/USD pair gains traction during the early Asian session on Monday. The uptick of the pair is bolstered by the softer US Dollar (USD) across the broad. The US inflation data, as measured by the Consumer Price Index (CPI) on Thursday, might offer hints about additional evidence of price pressures. At press time, NZD/USD is trading at 0.6256, gaining 0.19% on the day.
The upbeat US labor data on Friday helps weaken the case for rate cuts from the Federal Reserve (Fed). Traders have moved to bet on five or six rate cuts by the Fed over the course of the year. They are now pricing in a 75% odds of the first cut in March, having fully priced in such a move at the end of last year. US Nonfarm Payrolls (NFP) increased by 216,000 jobs in December from 173,000 in November, above the market consensus of 170,000, the US labor data showed on Friday.
Furthermore, the Unemployment Rate was unchanged at 3.7%. The Average Hourly Earnings climbed 0.4% MoM, better than 0.3% expected, while the annual figure came in at 4.1 YoY in December versus 4.0% in the previous reading, above the consensus of 3.9%.
On the Kiwi front, the stronger-than-expected Chinese economic data last week has boosted the China-proxy New Zealand Dollar (NZD) and acts as a tailwind for NZD/USD. Traders will take more cues from the Chinese data, due later this week. The December Chinese Producer Price Index (PPI) and Consumer Price Index (CPI) will be released on Friday. The upbeat data could provide more support for the Kiwi against the US Dollar.
Market players will focus on the New Zealand Building Permits on Tuesday ahead of the US CPI reports on Thursday. On Friday, the attention will shift to the Chinese CPI and PPI figures. Traders will take cues from these reports and find trading opportunities around the NZD/USD pair.
- Australian Dollar improves on subdued US Dollar.
- Australian Retail Sales is anticipated to increase by 1.2% against the previous decline of 0.2%.
- Chinese wealth manager Zhongzhi has filed for bankruptcy liquidation.
- US Nonfarm Payrolls rose to 216K from the previous figure of 173K.
- ISM Services PMI eased at 50.6 against the expected 52.6 and 52.7 prior.
The Australian Dollar (AUD) trades higher against the US Dollar (USD) on Monday, extending its gains after a volatile session on Friday. This was influenced by mixed economic data from the United States (US). Despite a robust US employment report, concerns linger over weaker business activity in the services sector, prompting investors to approach the economy's outlook with caution.
Australia's upcoming Retail Sales (MoM) data for November is due on Tuesday, expected to show a 1.2% increase from October's 0.2% decline, could influence the Reserve Bank of Australia (RBA) policymakers to maintain elevated interest rates for an extended period. However, the recent Judo Bank Purchasing Managers Index (PMI) data revealed a contraction in business activities in both services and manufacturing sectors, which might have underscored the vulnerability of the Australian Dollar.
Chinese wealth manager Zhongzhi Enterprise Group has filed for bankruptcy liquidation, facing a staggering $64 billion in liabilities. As a major player in China's $3 trillion shadow banking sector, its financial struggles could indicate contagion from the broader property debt crisis into the financial sector. This event will likely negatively impact the Aussie Dollar (AUD), given the close economic ties between China and Australia.
The US Dollar Index (DXY) moves sideways with a negative bias, possibly influenced by the decline in the short-term yield on the 2-year US Treasury bond. On Friday, the US Dollar lurched with fluctuations between gains and losses, which can be attributed to mixed US data.
US Bureau of Labor Statistics indicated a positive development in the job market. Nonfarm Payrolls rose to 216K in December, showing an improvement from the 173K reported in November. This figure surpassed the market expectation, which anticipated a rise of 170K. Furthermore, Average Hourly Earnings (YoY) improved to 4.1% from 4.0% prior. Meanwhile, the monthly index remained consistent at 0.4% against the expected decline of 0.3%.
The Institute for Supply Management (ISM) revealed the services sector slowed in December, as the Services Purchasing Managers Index (PMI) came in at 50.6 against the expected 52.6 and 52.7 prior. While the Services Employment Index reduced to 43.3 from the previous reading of 50.7.
The president of the Federal Reserve Bank of Dallas, Lorie Logan, provided insights on Saturday, suggesting that a rate hike should not be ruled out given the recent easing in financial conditions. She emphasized the importance of avoiding premature easing, which could stimulate demand. Maintaining sufficiently tight financial conditions is seen as crucial to managing the risk of inflation picking back up and potentially reversing progress.
Daily Digest Market Movers: Australian Dollar improves on subdued US Dollar
- Australia Judo Bank Services PMI reported a reading of 47.1, falling short of market expectations that it would remain consistent at 47.6. The Composite PMI decreased to 46.9 from the previous figure of 47.4.
- Australia’s Judo Bank Manufacturing PMI indicated a modest contraction in manufacturing activity, declining to 47.6 in December from the previous reading of 47.8.
- China Caixin Services PMI rose to 52.9 in December, exceeding the 51.6 expected and 51.5 prior.
- US ADP Employment Change added 164K new positions, surpassing the previous figure of 101K and the market expectation of 115K.
- US Initial Jobless Claims for the week ending on December 29 displayed positive signs for the labor market, decreasing to 202K from the previous 220K, beating the anticipated 216K.
- US S&P Global Composite PMI for December reported a minor dip in business activities, registering a reading of 50.9 compared to the market consensus of a steady 51.0.
Technical Analysis: Australian Dollar hovers below the major barrier at 0.6750
The Australian Dollar trades near 0.6730 on Monday, with a barrier at the nine-day Exponential Moving Average (EMA) at 0.6748 aligned with the major resistance at the 0.6750 level. A successful breakthrough above the latter could pave the way for the AUD/USD pair to challenge the psychological barrier at 0.6800. On the downside, the 23.6% Fibonacci retracement at 0.6725 acts as the immediate support followed by the psychological level at 0.6700. A break below the psychological level could push the AUD/USD pair to retest the major support at 0.6650 and the 38.2% Fibonacci retracement level at 0.6637.
AUD/USD: Daily Chart
-638402746089587251.png)
Australian Dollar price today
The table below shows the percentage change of Australian Dollar (AUD) against listed major currencies today. Australian Dollar was the strongest against the US Dollar.
| USD | EUR | GBP | CAD | AUD | JPY | NZD | CHF | |
| USD | -0.09% | -0.09% | -0.07% | -0.22% | -0.24% | -0.16% | -0.10% | |
| EUR | 0.09% | 0.01% | 0.04% | -0.11% | -0.12% | -0.05% | -0.01% | |
| GBP | 0.09% | -0.01% | 0.02% | -0.12% | -0.14% | -0.06% | -0.01% | |
| CAD | 0.07% | -0.02% | -0.01% | -0.15% | -0.14% | -0.10% | -0.02% | |
| AUD | 0.22% | 0.13% | 0.14% | 0.15% | 0.00% | 0.06% | 0.13% | |
| JPY | 0.21% | 0.14% | 0.17% | 0.19% | 0.06% | 0.09% | 0.14% | |
| NZD | 0.16% | 0.06% | 0.08% | 0.10% | -0.06% | -0.07% | 0.07% | |
| CHF | 0.10% | -0.01% | 0.01% | 0.03% | -0.12% | -0.14% | -0.07% |
The heat map shows percentage changes of major currencies against each other. The base currency is picked from the left column, while the quote currency is picked from the top row. For example, if you pick the Euro from the left column and move along the horizontal line to the Japanese Yen, the percentage change displayed in the box will represent EUR (base)/JPY (quote).
Australian Dollar FAQs
What key factors drive the Australian Dollar?
One of the most significant factors for the Australian Dollar (AUD) is the level of interest rates set by the Reserve Bank of Australia (RBA). Because Australia is a resource-rich country another key driver is the price of its biggest export, Iron Ore. The health of the Chinese economy, its largest trading partner, is a factor, as well as inflation in Australia, its growth rate and Trade Balance. Market sentiment – whether investors are taking on more risky assets (risk-on) or seeking safe-havens (risk-off) – is also a factor, with risk-on positive for AUD.
How do the decisions of the Reserve Bank of Australia impact the Australian Dollar?
The Reserve Bank of Australia (RBA) influences the Australian Dollar (AUD) by setting the level of interest rates that Australian banks can lend to each other. This influences the level of interest rates in the economy as a whole. The main goal of the RBA is to maintain a stable inflation rate of 2-3% by adjusting interest rates up or down. Relatively high interest rates compared to other major central banks support the AUD, and the opposite for relatively low. The RBA can also use quantitative easing and tightening to influence credit conditions, with the former AUD-negative and the latter AUD-positive.
How does the health of the Chinese Economy impact the Australian Dollar?
China is Australia’s largest trading partner so the health of the Chinese economy is a major influence on the value of the Australian Dollar (AUD). When the Chinese economy is doing well it purchases more raw materials, goods and services from Australia, lifting demand for the AUD, and pushing up its value. The opposite is the case when the Chinese economy is not growing as fast as expected. Positive or negative surprises in Chinese growth data, therefore, often have a direct impact on the Australian Dollar and its pairs.
How does the price of Iron Ore impact the Australian Dollar?
Iron Ore is Australia’s largest export, accounting for $118 billion a year according to data from 2021, with China as its primary destination. The price of Iron Ore, therefore, can be a driver of the Australian Dollar. Generally, if the price of Iron Ore rises, AUD also goes up, as aggregate demand for the currency increases. The opposite is the case if the price of Iron Ore falls. Higher Iron Ore prices also tend to result in a greater likelihood of a positive Trade Balance for Australia, which is also positive of the AUD.
How does the Trade Balance impact the Australian Dollar?
The Trade Balance, which is the difference between what a country earns from its exports versus what it pays for its imports, is another factor that can influence the value of the Australian Dollar. If Australia produces highly sought after exports, then its currency will gain in value purely from the surplus demand created from foreign buyers seeking to purchase its exports versus what it spends to purchase imports. Therefore, a positive net Trade Balance strengthens the AUD, with the opposite effect if the Trade Balance is negative.
On Monday, the People’s Bank of China (PBoC) sets the USD/CNY central rate for the trading session ahead at 7.1006 as compared to Friday's fix of 7.1029 and 7.1499 Reuters estimates.
- EUR/USD holds positive ground near 1.0948 despite the rebound of USD.
- US Nonfarm Payrolls (NFP) increased by 216,000 jobs in December from 173,000 in November.
- German Retail Sales for November came in worse than expected, falling to 2.4% YoY vs. a -0.1% drop prior.
- German Trade Balance and Eurozone Retail Sales for November are due later on Monday.
The EUR/USD pair attracts some buyers during the early Asian session on Monday. The major pair bounces off the multi-week lows of 1.0876 and hovers around 1.0948, up 0.09% on the day.
The Federal Reserve's (Fed) pivot is supported by a moderating of inflation but not necessarily by aggressive rate cuts. Investors will take more cues from the US inflation data on Thursday for additional evidence of price pressures. The market estimated the headline Consumer Price Index (CPI) to show an increase of 3.2% YoY, while the Core CPI is forecast to ease to 3.8% YoY.
The US labor data on Friday cast doubt on the expectations of the financial markets that the Fed would begin interest rate cuts in March. The Labor Department revealed on Friday that US Nonfarm Payrolls (NFP) increased by 216,000 jobs in December from 173,000 in November, above the market consensus of 170,000.
Investors will focus on the November Eurozone Retail Sales on Monday, which is projected to show -0.3% MoM versus 0.1% in October, while the annual rate is expected at -1.5% from -1.2% in October. Nonetheless, the downbeat German Retail Sales last week point to downside risks here.
On Friday, the German Retail Sales for November came in worse than expected, falling to 2.4% YoY from a 0.1% drop in the previous reading. The monthly figure arrived at -2.5% MoM versus 1.1% prior. Additionally, the Eurozone Harmonized Index of Consumer Prices for December grew 2.9% YoY from the previous reading of 2.4%, while the Core figure rose 3.4% YoY versus 3.6% prior. Both figures were weaker than the estimation.
Market participants will keep an eye on the German Trade Balance and Eurozone Retail Sales for November, due on Monday. Later this week, the US Consumer Price Index (CPI) will be released on Thursday, and the US Producer Price Index (PPI) for December will be due on Friday. These data could give a clear direction to the EUR/USD pair.
| Index | Change, points | Closed | Change, % |
|---|---|---|---|
| NIKKEI 225 | 89.13 | 33377.42 | 0.27 |
| Hang Seng | -110.65 | 16535.33 | -0.66 |
| KOSPI | -8.94 | 2578.08 | -0.35 |
| ASX 200 | -5 | 7489.1 | -0.07 |
| DAX | -23.08 | 16594.21 | -0.14 |
| CAC 40 | -29.94 | 7420.69 | -0.4 |
| Dow Jones | 25.77 | 37466.11 | 0.07 |
| S&P 500 | 8.56 | 4697.24 | 0.18 |
| NASDAQ Composite | 13.77 | 14524.07 | 0.09 |
| Pare | Closed | Change, % |
|---|---|---|
| AUDUSD | 0.67164 | 0.16 |
| EURJPY | 158.35 | 0.22 |
| EURUSD | 1.09412 | -0 |
| GBPJPY | 184.135 | 0.47 |
| GBPUSD | 1.27225 | 0.34 |
| NZDUSD | 0.62454 | 0.25 |
| USDCAD | 1.33634 | 0.17 |
| USDCHF | 0.85014 | 0.01 |
| USDJPY | 144.729 | 0.14 |
The Federal Reserve (Fed) Bank of Dallas President Lorie Logan said on Saturday that the central bank may need to continue raising its short-term policy rate to keep a recent decline in long-term bond yields from rekindling inflation.
Key quotes
“Premature easing of financial conditions could allow demand to pick back up.”
“If we don't maintain sufficiently tight conditions, there is a risk inflation will pick back up, reversing progress.”
“Appropriate to consider parameters to guide the decision to slow the Fed's balance sheet runoff.”
“Labor market 'is'still tight' but continues to rebalance.”
"The financial system overall has more than ample bank reserves and liquidity, though no longer 'super abundant’.”
“Inflation in a much better place than last January, but the Fed's job is not yet complete.”
“We should slow the pace of asset runoff as the Fed's overnight reverse repurchase balances approach a low level.”
Market reaction
The US Dollar Index (DXY) is trading lower on the day at 102.45, as of writing.
Fed FAQs
What does the Federal Reserve do, how does it impact the US Dollar?
Monetary policy in the US is shaped by the Federal Reserve (Fed). The Fed has two mandates: to achieve price stability and foster full employment. Its primary tool to achieve these goals is by adjusting interest rates.
When prices are rising too quickly and inflation is above the Fed’s 2% target, it raises interest rates, increasing borrowing costs throughout the economy. This results in a stronger US Dollar (USD) as it makes the US a more attractive place for international investors to park their money.
When inflation falls below 2% or the Unemployment Rate is too high, the Fed may lower interest rates to encourage borrowing, which weighs on the Greenback.
How often does the Fed hold monetary policy meetings?
The Federal Reserve (Fed) holds eight policy meetings a year, where the Federal Open Market Committee (FOMC) assesses economic conditions and makes monetary policy decisions.
The FOMC is attended by twelve Fed officials – the seven members of the Board of Governors, the president of the Federal Reserve Bank of New York, and four of the remaining eleven regional Reserve Bank presidents, who serve one-year terms on a rotating basis.
What is Quantitative Easing (QE) and how does it impact USD?
In extreme situations, the Federal Reserve may resort to a policy named Quantitative Easing (QE). QE is the process by which the Fed substantially increases the flow of credit in a stuck financial system.
It is a non-standard policy measure used during crises or when inflation is extremely low. It was the Fed’s weapon of choice during the Great Financial Crisis in 2008. It involves the Fed printing more Dollars and using them to buy high grade bonds from financial institutions. QE usually weakens the US Dollar.
What is Quantitative Tightening (QT) and how does it impact the US Dollar?
Quantitative tightening (QT) is the reverse process of QE, whereby the Federal Reserve stops buying bonds from financial institutions and does not reinvest the principal from the bonds it holds maturing, to purchase new bonds. It is usually positive for the value of the US Dollar.


© 2000-2026. Уcі права захищені.
Cайт знаходитьcя під керуванням TeleTrade DJ. LLC 2351 LLC 2022 (Euro House, Richmond Hill Road, Kingstown, VC0100, St. Vincent and the Grenadines).
Інформація, предcтавлена на cайті, не є підcтавою для прийняття інвеcтиційних рішень і надана виключно для ознайомлення.
Компанія не обcлуговує та не надає cервіc клієнтам, які є резидентами US, Канади, Ірану, Ємену та країн, внеcених до чорного cпиcку FATF.
Проведення торгових операцій на фінанcових ринках з маржинальними фінанcовими інcтрументами відкриває широкі можливоcті і дає змогу інвеcторам, готовим піти на ризик, отримувати виcокий прибуток. Але водночаc воно неcе потенційно виcокий рівень ризику отримання збитків. Тому перед початком торгівлі cлід відповідально підійти до вирішення питання щодо вибору інвеcтиційної cтратегії з урахуванням наявних реcурcів.
Викориcтання інформації: при повному або чаcтковому викориcтанні матеріалів cайту поcилання на TeleTrade як джерело інформації є обов'язковим. Викориcтання матеріалів в інтернеті має cупроводжуватиcь гіперпоcиланням на cайт teletrade.org. Автоматичний імпорт матеріалів та інформації із cайту заборонено.
З уcіх питань звертайтеcь за адреcою pr@teletrade.global.
переклади