- Аналітика
- Новини та інструменти
- Новини ринків
Новини ринків
Japanese Gross Domestic Product (GDP) for the third quarter (Q3) came in at -0.7% QoQ versus -0.5% expected and -0.5% prior, the Cabinet Office showed on Friday.
Furthermore, the Annualized GDP contracted 2.9% versus the 2.1% drop expected and 2.1% contraction prior.
Market reaction
Following the Japanese growth numbers, the USD/JPY pair is up 0.39% on the day to trade at 144.29
About Japan’s Gross Domestic Product (GDP)
The Gross Domestic Product (GDP), released by Japan’s Cabinet Office on a quarterly basis, is a measure of the total value of all goods and services produced in Japan during a given period. The GDP is considered as the main measure of Japan’s economic activity. The QoQ reading compares economic activity in the reference quarter to the previous quarter. Generally, a high reading is seen as bullish for the Japanese Yen (JPY), while a low reading is seen as bearish.
- Spot Gold has traded comparatively thin through the week after Monday’s massive surge.
- XAU/USD peaked just above $2,140 to kick off the week, holding steady just above $2,020.
- Risk markets will be clamping down on positioning ahead of Friday’s US NFP print.
Gold set new all-time highs this week at $2,144.48 in a hard bid rally early Monday, and the XAU/USD has spent the rest of the week in thin trading after paring away Monday’s opening gains.
Spot Gold has bid slightly lower on the week, down a little over 2% from Monday’s opening prices as investors head into the Friday trading session. Traders will be looking ahead to the latest US Nonfarm Payrolls (NFP) report due in the upcoming American trading session to close out the week.
The US NFP is forecast to see a slight improvement from October’s 150K to 180K new job additions in November, and markets will be hinging on the report with investors hoping for a weak report to help boost odds of a Federal Reserve (Fed) rate cut. Money markets have leaned into a “sooner rather than later” narrative on Fed rate cuts, and investors have run far ahead of policy structure, haggling bids based on whether or not the Fed will cut rates next March.
XAU/USD Technical Outlook
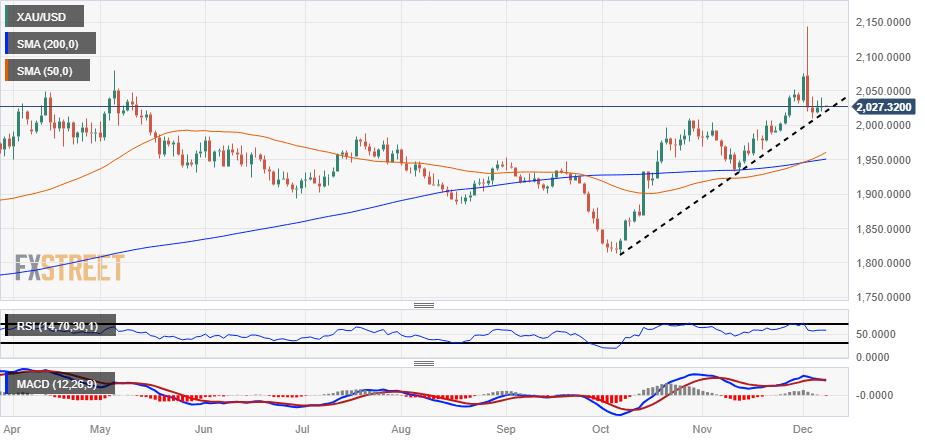
Gold is currently down nearly five and a half percent from Monday’s all-time record bids above $2,140, trading tightly near $2,020.
The 50-day Simple Moving Average (SMA) is confirming a bullish cross of the 200-day SMA near $1,950, and downside action could see a technical bounce from the level as long as bidders maintain control.
The XAU/USD finds itself bidding into a rising trendline from October’s low bids near $1,810, but the week’s downside pressure knocking Spot Gold off of newly-minted all-time highs sees the XAU/USD coiling on the south side of a significant technical barrier from $2,050.
XAU/USD Daily Chart
XAU/USD Technical Levels
- AUD/USD remains confined near 0.6600 in the early Monday session.
- US weekly Initial Jobless Claims surged to 220K, Continuing Claims dropped to 1.861M vs. 1.925M prior.
- The Australian trade surplus narrowed to 7,129M in October from 6,184 in September.
- US Nonfarm Payrolls will be in the spotlight on Friday.
The AUD/USD pair oscillates in a narrow range around the 0.6600 psychological mark during the early Asian session on Friday. The weaker-than-expected Australian data and the pessimism about China’s economic outlook weigh on the Australian Dollar. AUD/USD currently trades near 0.6599, down 0.09% on the day.
The US weekly Initial Jobless Claims for the week ending December 1 surged to 220K, below the market expectation of 222K. Continuing Claims dropped to 1.861M from 1.925M, worse than the 1.919M expected. Traders will take more cues from the US employment data on Friday. The US Nonfarm Payrolls are expected to rise by 180K and the Unemployment Rate is estimated to remain steady at 3.9%. The stronger-than-expected data might boost the US Dollar (USD) and act as a headwind for the AUD/USD pair.
On the Aussie front, the October Trade Data failed to lift the Australian Dollar (AUD). The trade surplus narrowed to 7,129M in October from 6,184 in the previous reading, below the market estimation of 7,500M. Furthermore, China’s commodity imports for November raised concern about the economic slowdown in the world’s second-largest economy. The downbeat data and renewed worries about China's economy could convince the Reserve Bank of Australia (RBA) to cut rates in 2024, which might drag the AUD lower.
Looking ahead, market participants will closely watch the US Nonfarm Payrolls, due later on Friday. Also, the Unemployment Rate, Average Hourly Earnings, and the University of Michigan’s Consumer Sentiment Index will be released. These events could trigger the volatility in the market and keep a clear direction to the AUD/USD pair.
- EUR/JPY starts Friday flat at 155.62 after Thursday's sharp plunge; downward bias sustained post-BoJ Governor Ueda's remarks.
- Cross pair remains bearish, as technical indicators signal further losses; Tenkan-Sen below Kijun-Sen.
- Key support levels lie at 155.00, followed by October 3 low of 154.34, and December 7 low of 153.11.
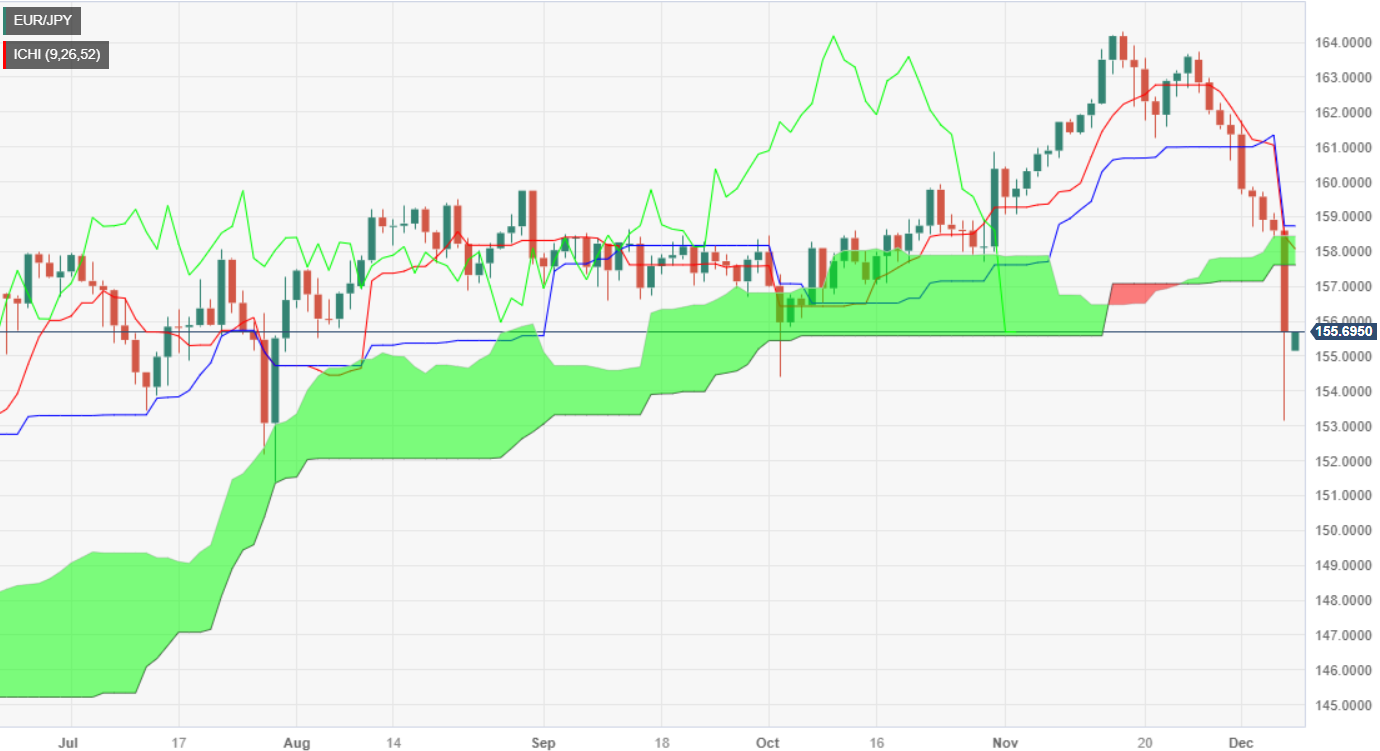
The EUR/JPY begins Friday’s Asian session almost flat after plunging sharply on Thursday, following perceived hawkish remarks by the Bank of Japan (BoJ) Governor Kazuo Ueda. At the time of writing, the pair exchanges hands at 155.62, virtually unchanged.
After Thursday’s 290-plus pip drop, the EUR/JPY remains downward biased. The cross pair shifted bearish after breaking key support levels. The cross slide below a fourth-month-old support trendline, and the Ichimoku Cloud (Kumo).
In addition to that, the Tenkan-Sen crossed below the Kijun-Sen, opening the door for further losses. Hence, the bearish bias remains intact, and the EUR/JPY first support would be the 155.00 figure. Further downside emerges if the pair drops below the October 3 swing low of 154.34, followed by the December 7 low of 153.11.
If EUR/JPY buyers would like to regain control, they must reclaim the bottom of the Kumo at 157.58, followed by the 158.00 mark.
EUR/JPY Price Analysis – Daily Chart
EUR/JPY Technical Levels
- The Yen went on a tear on Thursday, climbing over 4% against the US Dollar.
- Markets have pared back over-eager Yen bids fueled by a potential end of BoJ negative rates.
- US NFP Friday still looms over broader markets, high-impact data to close out the week.
The USD/JPY plunged over 4% on Thursday, briefly declining below 142.00 before broader markets staged a moderate rebound, pulling the Japanese Yen (JPY) back into reasonable gain territory. The USD/JPY finished Thursday down around 2%, with the Yen heading into Friday’s market session deep in the green for the week.
The Yen saw a broad-market rally sparked by uncharacteristically hawkish comments from Bank of Japan (BoJ) Governor Kazuo Ueda, who unexpectedly began hinting at an eventual end of the BoJ’s negative rate regime, potentially early next year.
Hawkish BoJ sends Yen bets through the roof on Thursday
Japan’s Core Consumer Price Index (CPI) inflation hit 2.9% in October, and Japanese inflation has spent 19 consecutive months overshooting the BoJ’s 2% inflation target. The BoJ has avoided tightening policy because the Japanese central bank currently expects inflation to slump below 2% sometime in 2025.
With Japanese wages expected to see outsized gains next year as employers step up pay increases to combat rising prices, the BoJ appears prepared to begin discussing a reversal of its long-running negative rate policy mechanism, which has seen a slight cost associated with holding Japanese debt for the past seven years.
Especially overeager money markets are currently pricing in a 20% chance of a BoJ rate increase at the Japanese central bank’s upcoming policy meeting on December 18 & 19. The BoJ’s next quarterly growth and interest rate review is slated for the end of January.
Japanese Yen price today
The table below shows the percentage change of Japanese Yen (JPY) against listed major currencies today. Japanese Yen was the strongest against the Swiss Franc.
| USD | EUR | GBP | CAD | AUD | JPY | NZD | CHF | |
| USD | -0.27% | -0.25% | 0.01% | -0.71% | -2.06% | -0.48% | 0.09% | |
| EUR | 0.26% | -0.03% | 0.28% | -0.45% | -1.80% | -0.22% | 0.32% | |
| GBP | 0.28% | -0.01% | 0.29% | -0.44% | -1.80% | -0.20% | 0.35% | |
| CAD | -0.04% | -0.28% | -0.27% | -0.73% | -2.09% | -0.49% | 0.07% | |
| AUD | 0.71% | 0.45% | 0.44% | 0.72% | -1.35% | 0.22% | 0.79% | |
| JPY | 1.99% | 1.80% | 1.76% | 2.03% | 1.30% | 1.56% | 2.10% | |
| NZD | 0.47% | 0.22% | 0.21% | 0.51% | -0.28% | -1.58% | 0.54% | |
| CHF | -0.09% | -0.35% | -0.40% | -0.08% | -0.84% | -2.15% | -0.59% |
The heat map shows percentage changes of major currencies against each other. The base currency is picked from the left column, while the quote currency is picked from the top row. For example, if you pick the Euro from the left column and move along the horizontal line to the Japanese Yen, the percentage change displayed in the box will represent EUR (base)/JPY (quote).
USD/JPY Technical Outlook
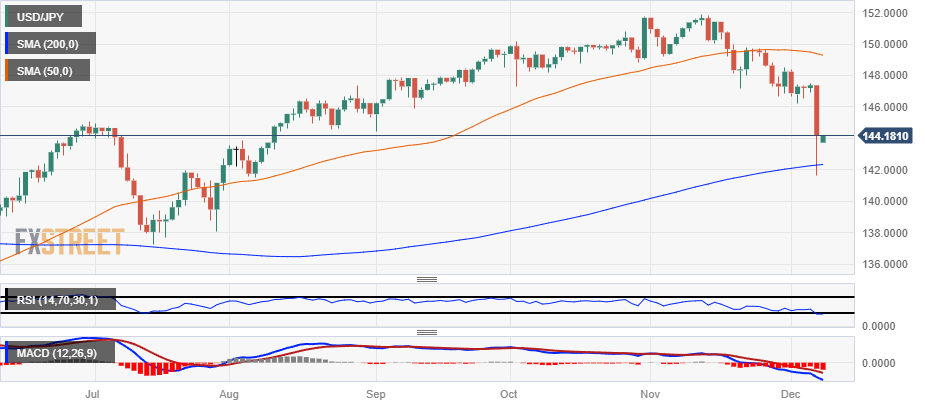
The USD/JPY pinned into four-month lows on Thursday, plunging over 4% peak-to-trough before ending the day at a comparatively reasonable -2%, hitting four-month lows below 142.00 before recovering to close out the day just above 144.00.
Despite the intraday recovery, the USD/JPY saw one of its worst-performing days in over a year, when the pair fell below the 140.00 handle last November.
Over the course of Thursday’s trading the USD/JPY went from softly bearish to collapsing into the 200-day Simple Moving Average, and a bullish rebound will need to make significant headway before recovering the 147.00 handle. The 50-day SMA is rotating into a bearish stance well above Thursday’s price action, pushing down into the 1149.00 region.
USD/JPY Hourly Chart

USD/JPY Daily Chart
USD/JPY Technical Levels
- AUD/JPY shifts bearish, after the pair dropped more than 130 pips on Thursday.
- Daily time frame shows bears in control as Chikou Span turns bearish while Kijun-Sen crosses above Tenkan-Sen.
- Key support levels lie at 95.00 initial support, followed by 94.00 and December 7 low of 93.70, October 3 low of 93.01.
On Thursday, the AUD/JPY plummeted more than 1.30%, shifting bearish, after finally breaching the top of the Ichimoku Cloud, signaling the downtrend is gathering pace. Nevertheless, traders must be aware of solid support levels seen at around the 93.70 area, the day’s low. At the time of writing, the cross exchanges hands at 95.11.
The daily time frame portrays the bears as in charge, though registering a daily close inside the Kumo keeps up and downside risks balanced. However, the Chikou Span shifted bearishly, while the crossing of the Kijun-Sen above the Tenkan-Sen provides two signals that suggest the downtrend remains in place.
With that said, AUD/JPY's first support would be the 95.00 figure. Once cleared, the next support is seen at the 94.00 mark, followed by December’s 7 daily low of 93.70, ahead of the October 3 low of 93.01.
On the other hand, in the event of bulls lifting prices above the Kumo’s top at around 95.40/59, that could pave the way to challenge the Tenkan-Sen at 96.04
AUD/JPY Price Analysis – Daily Chart

AUD/JPY Technical Levels
- NZD/JPY experienced a 1.60% downslope, consolidating at 88.90 after falling to 87.70.
- Hawkish bets on the BoJ and speculations of a liftoff are responsible for the strength of the JPY.
- The daily chart reveals a negative RSI slope and increasing red MACD Bars, suggesting a strong bearish momentum.
In Thursday's session, the NZD/JPY pair is trading bearish at around 88.90 after hitting a low of around 87.70. As indicated by the daily and four-hour charts, bears are currently dominating with their strength becoming more evident in shorter time frames.
In that sense, the Relative Strength Index (RSI) suggests that selling pressure is dominant given its negative trajectory currently within a negative range, while the Increasing red bars on the Moving Average Convergence Divergence (MACD) also indicate that the bearish momentum might be picking up speed.
Concerning Simple Moving Averages (SMAs), the pair lies below the 20-day average but above the 100-day and 200-day SMAs. This indicates that in the short term, there is bearish pressure but that in the larger time frame, bulls are still in command.
Switching the focus to the smaller timeframes, the four-hour chart also implies that the sellers are building force. The Relative Strength Index (RSI) shows an oversold condition but is currently flat, while the MACD is demonstrating rising red bars, adding more weight to the bearish viewpoint.
Support Levels: 88.55, 88.15 (100-day SMA), 87.70.
Resistance Levels: 89.25, 89.80, 90.00 (20-day SMA).
NZD/JPY daily chart
-638375829694392495.png)
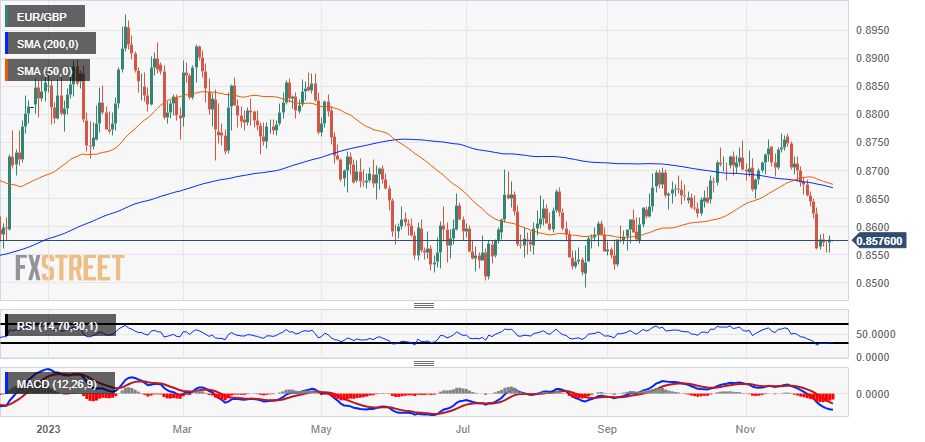
- The EUR/GBP has drawn tight as both currencies mix on Thursday.
- The Euro remains steeply off of recent highs against the Pound Sterling.
- EUR lacking momentum after a miss on Eurozone GDP.
The EUR/GBP has been trading in a tight range through the week just above 0.8550 after a step decline in recent weeks dragged the Euro (EUR) down two and a third percent against the Pound Sterling (GBP), driven lower by weakening economic data from the Eurozone and a dovish European Central Bank (ECB) grappling with middling policy.
Eurozone Gross Domestic Product (GDP) for the third quarter mixed on market forecasts, with the QoQ figure coming in as expected at a contractionary -0.1% and the annualized figure for the year ending in the third quarter showing a flat 0.0% versus the forecast 0.1% uptick.
Euro traders are finding little reason to bid up the EUR as economic data continues to sour for the European bloc, after Wednesday’s Eurozone Retail Sales also missed expectations to decline 1.2% over the year into October, rebounding less than the expected -1.1% after dropping 2.9% for the annualized period in September.
The rest of the trading week is a thin showing on the economic calendar for both the Euro and the Pound Sterling, but next week kicks things off with labor figures from the UK.
EUR/GBP Technical Outlook
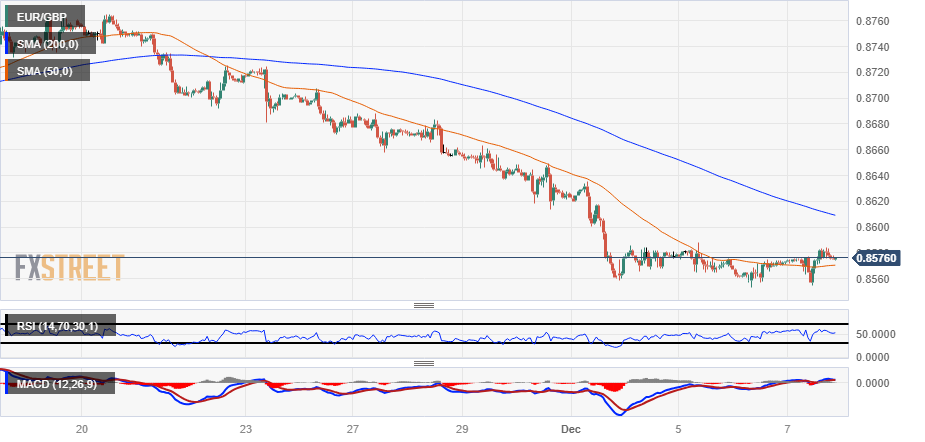
The EUR/GBP sees a tight range between 0.8580 and 0.8560 forming up this week, with the pair trading closely to the middle ground with little bounceback from recent weeks’ declines from the 0.8760 region.
Looking further out on the daily candlesticks, the EUR/GBP is trading directly into a heavy congestion zone that mired the pair through much of 2023’s middle quarters, and hopeful bidders will have a significant hill to climb if they’re going to push the Euro back up towards the 200-day Simple Moving Average (SMA) currently heading down towards 0.8650.
EUR/GBP Hourly Chart
EUR/GBP Daily Chart
EUR/GBP Technical Levels
The key event of the day will be the US official employment report. Before that, during the Asian session, Japan's data is due, including GDP, current account, and the trade balance. The Bank of England will publish the Consumer Inflation Expectation survey.
Here is what you need to know on Friday, December 8:
The US Dollar Index (DXY) dropped 0.60%, sliding from 104.20 to 103.50. The 10-year Treasury yield initially moved higher but pulled back during the American session from 4.17% to 4.11%.
Data released on Thursday showed that Initial Jobless Claims rose to 220,000, slightly below the market expectation of 220,000, while Continuing Claims dropped sharply from 1.925 million to 1.861 million, below the expected 1.919 million. The figures briefly boosted the US Dollar, but the impact was limited. The economic data released during the week had a modest impact, likely because it did not significantly alter expectations regarding the Federal Reserve's decision next week, including its guidance.
The official US employment report is due on Friday. Payrolls are expected to increase by 180,000, which would be an acceleration from the 150,000 recorded in October. The Unemployment Rate is expected to remain steady at 3.9%. The report could add to evidence of a more balanced labor market. A significantly positive surprise could trigger further gains for the US Dollar, while a negative report could weaken the currency. However, despite these fluctuations, the economic outlook for the US remains stronger than that of European countries.
The other major event of the week will be the preliminary December reading of the University of Michigan Consumer Sentiment Index.
EUR/USD rose modestly, supported by a weaker US Dollar, and settled around 1.0800. The final reading of the German November Consumer Price Index is due, which is expected to confirm the preliminary reading of annual inflation at 3.2%.
GBP/USD held above the 20-day Simple Moving Average (SMA) and rose to the 1.2600 zone. The Bank of England Consumer Inflation Expectation survey is due.
The Japanese Yen had its best day in a month, rising across the board after Bank of Japan (BoJ) Governor Ueda discussed policy options after exiting the current monetary policy stance. Developments around USD/JPY moved at an impressive pace, with the pair's long-term target hit within hours. It rebounded from 141.50 to 143.60. After the significant decline, some consolidation could take place. On Friday, data to be released from Japan includes Labor Cash Earnings, Current Account, Q3 GDP, and trade balance.
The Swiss Franc lost momentum during the American session but previously reached the highest level against the Euro since January 2015, with EUR/CHF failing to break above 0.9420 after rising towards 0.9460, as markets anticipate the ECB cutting rates more times than the Swiss National Bank (SNB) in 2024. USD/CHF ended the day flat, hovering around 0.8750.
The Canadian Dollar failed to benefit from a weaker US Dollar, with USD/CAD holding around 1.3600 and closing the day flat, likely affected by subdued crude oil prices.
Gold continues to trade sideways around the $2,030 level, supported by the $2,020 area and limited on the upside by $2,040. Silver hit a fresh low at $23.58 and trimmed losses, rising to $23.80, but the bias remains on the downside.
Like this article? Help us with some feedback by answering this survey:
- The USD/SEK is down by 0.35%, hovering near the 10.370 level.
- US reports Initial Jobless Claims at 220,000 for the week ending December 2.
- US bond yields are rising ahead of Friday’s NFPs.
The USD/SEK pair shows a downward course in Thursday's session, falling towards the 10.370 mark. The primary driver of this movement is a broad US Dollar weakness, which is consolidating weekly gains ahead of key labor market data on Friday.
On the data front, the U.S. Department of Labor reported that Initial Jobless Claims for the week ending in December 2 stood at 220,000. The figure was somewhat lower than the forecasted 222,000 but increased from its previous 218,000 claims, suggesting a marginally positive outlook in the labor market.
On Friday, the US will disclose a series of key labor market indicators that will shape the expectations for the next Federal Reserve (Fed) decisions. The Nonfarm Payrolls, Unemployment Rate and Average Hourly Earnings from November will be released by the U.S. Bureau of Labor Statistics, and while the Payroll figures are projected to reach 180,000, moving up from the previous 150,000, the wage growth ratio is anticipated to decrease to 4% YoY from the former 4.1%. The Unemployment rate is seen remaining steady at 3.9%.
Meanwhile, US Treasury yields are on an ascent. The 2-year yield is trading at 4.6o%, while the 5-year and 10-year yields both stand at around 4.12%. A rise in these yields positively influences the USD value, so the pair's losses may be limited. However, the rhetoric that dominates the market is that the Fed will take a less aggressive approach in light of the recent readings of cooling inflation and evidence of the labor market rebalancing. However, those expectations will be shaped by the incoming data as the bank still remains data-dependent and didn’t rule out further tightening.
USD/SEK levels to watch
According to the daily chart, the USD/SEK has a bearish outlook for the short term. The Relative Strength Index (RSI) shows a negative slope yet remains in positive territory, a hint of selling pressure being supported by the rising red bars of the Moving Average Convergence Divergence (MACD), suggesting a strengthening selling momentum.
In addition, the pairs reside below the 20,100 and 200-day Simple Moving Averages (SMAs), which suggests that the sellers are in command in the broader outlook.
Support Levels: 10.360, 10.350, 10.327.
Resistance Levels: 10.492 (20-day SMA), 10.500, 10.520.
USD/SEK daily chart
-638375784733312950.png)
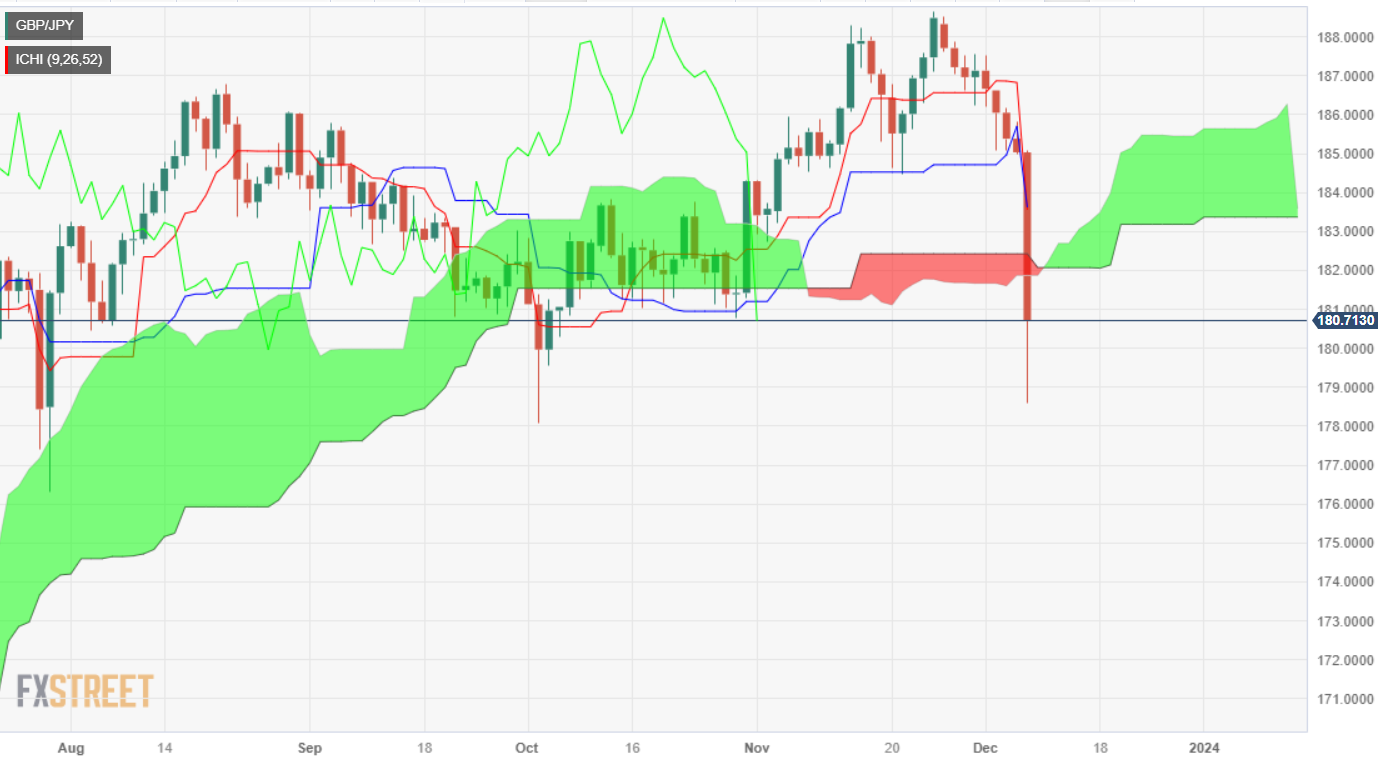
- GBP/JPY tumbles to an eight-week low at 178.53 after BoJ Ueda's comments; trades at 180.69.
- Technical shift to bearish, pending daily close below Ichimoku Cloud (Kumo) at around 181.80, for further confirmation.
- Downside potential: 180.00 support; breach opens doors to 178.53, 178.03, and July 28 low of 176.31.
The GBP/JPY plummets more than 2.30% courtesy of comments by the Bank of Japan (BoJ) Ueda, which ultimately dragged the pair to an eight-week low of 178.53 before reversing toward the current exchange rate. At the time of writing, the cross trimmed some of its losses and trades at 180.69.
From a technical perspective, the pair has shifted bearishly, though pending registering a daily close below the Ichimoku Cloud (Kumo), which could open the door for further losses. On its way south, the GBP/JPY pierced a five-month-old support trendline, which capped the downtrend.
If GBP/JPY ends the day below the bottom of the Kumo, last seen at 181.80/85, that would confirm its bearish bias. As of writing, the first support is seen at the 180.00 mark. A breach of the latter will expose the current session low of 178.53, ahead of the October 3 swing low of 178.03. Once those levels are taken out, the next support would be a July 28 daily low of 176.31.
If GBP/JPY reclaims the 181.80 area, the pair will turn sideways, awaiting for a fresh catalyst.
GBP/JPY Price Analysis – Daily Chart
GBP/JPY Technical Levels
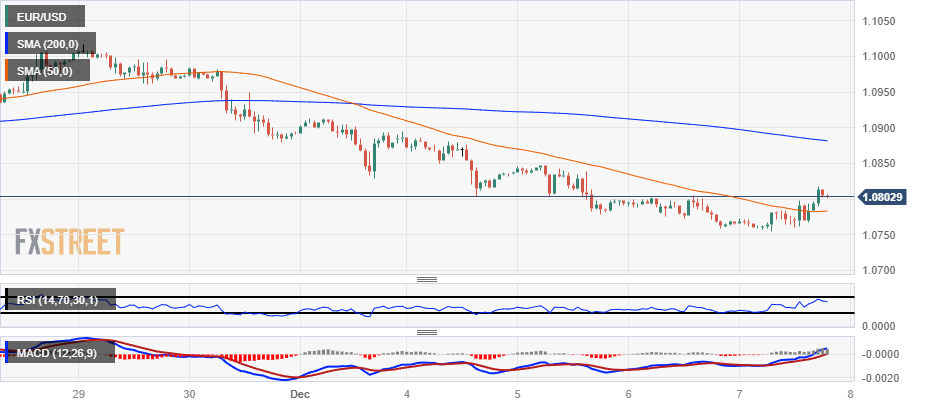
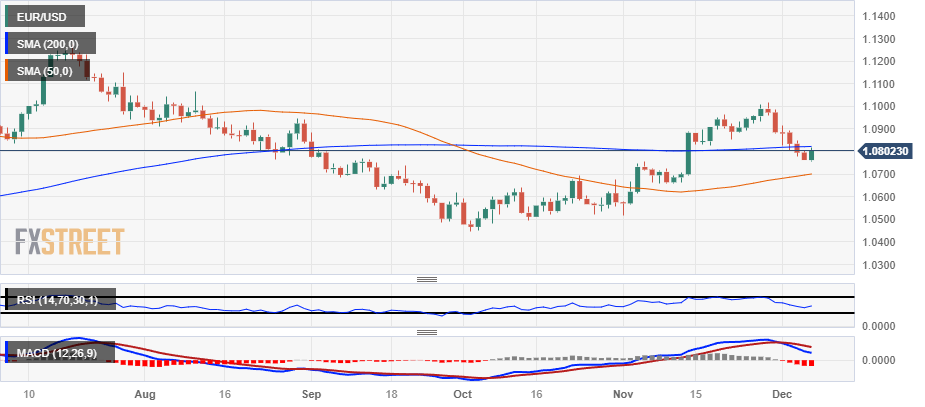
- EUR/USD climbs on Thursday to retake the 1.0800 handle.
- Markets turned on the USD as investors step up bets of a rate cut early next year.
- The EUR/USD is up 0.33% on the day.
The EUR/USD is on the climb in Thursday trading, lifting into the 1.0800 handle as the Euro (EUR) gains a third of a percent against the US Dollar (USD).
Market bets of a rate cut from the Federal Reserve (Fed) are on the rise, pushing the US Dollar broadly lower, and the Greenback is now on pace to be the worst-performing currency of the FX majors bloc heading into Friday’s US Nonfarm Payrolls (NFP) print to close out the trading week.
Before Friday’s US NFP lands on markets, Germany’s Harmonized Index of Consumer Prices (HICP) is due early Friday. German HICP inflation is expected to hold steady at 2.3% for the year ending in November, in-line with October’s YoY print.
Up Next: German HICP inflation, US NFP slated for Friday
Friday will also bring US Average Hourly Earnings for November, with the MoM figure forecast to tick up slightly from 0.2% to 0.3%. Meanwhile, latest US NFP is forecast to show a net gain of 180K new jobs in November, versus October’s 150K net employment gain.
Friday’s trading action will close out with the University of Michigan’s Consumer Sentiment Index for December, which is expected to show that US consumers are seeing an improving outlook on the domestic economy. The UoM’s Consumer Sentiment Index is expected to tick up from 61.3 to 62.0.
Euro price today
The table below shows the percentage change of Euro (EUR) against listed major currencies today. Euro was the strongest against the US Dollar.
| USD | EUR | GBP | CAD | AUD | JPY | NZD | CHF | |
| USD | -0.35% | -0.28% | -0.03% | -0.83% | -2.58% | -0.56% | -0.07% | |
| EUR | 0.33% | 0.02% | 0.31% | -0.48% | -2.23% | -0.21% | 0.27% | |
| GBP | 0.29% | -0.05% | 0.27% | -0.53% | -2.26% | -0.26% | 0.22% | |
| CAD | 0.03% | -0.31% | -0.26% | -0.80% | -2.55% | -0.53% | -0.04% | |
| AUD | 0.83% | 0.48% | 0.52% | 0.78% | -1.72% | 0.27% | 0.74% | |
| JPY | 2.51% | 2.19% | 2.22% | 2.47% | 1.69% | 1.98% | 2.44% | |
| NZD | 0.55% | 0.20% | 0.25% | 0.52% | -0.28% | -2.00% | 0.47% | |
| CHF | 0.06% | -0.28% | -0.24% | 0.03% | -0.77% | -2.51% | -0.50% |
The heat map shows percentage changes of major currencies against each other. The base currency is picked from the left column, while the quote currency is picked from the top row. For example, if you pick the Euro from the left column and move along the horizontal line to the Japanese Yen, the percentage change displayed in the box will represent EUR (base)/JPY (quote).
EUR/USD Technical Levels
The EUR/USD’s Thursday climb sees the pair breaking through the 50-hour Simple Moving Average (SMA) after slipping below the short-term moving average last week, but gains remain limited with the 200-hour SMA above 1.08075 and drifting bearish, dropping through 1.0900.
Daily candlesticks have the EUR/USD getting snagged on the 200-day SMA as the pair gears up to snap a six-day losing streak.
Technical support is looking thin at the 50-day SMA near 1.0700, with the moving average lifting into a bullish stance after the EUR/USD bottomed out near 1.0450 back in October, and has been climbing ever since.
EUR/USD Hourly Chart
EUR/USD Daily Chart
EUR/USD Technical Levels
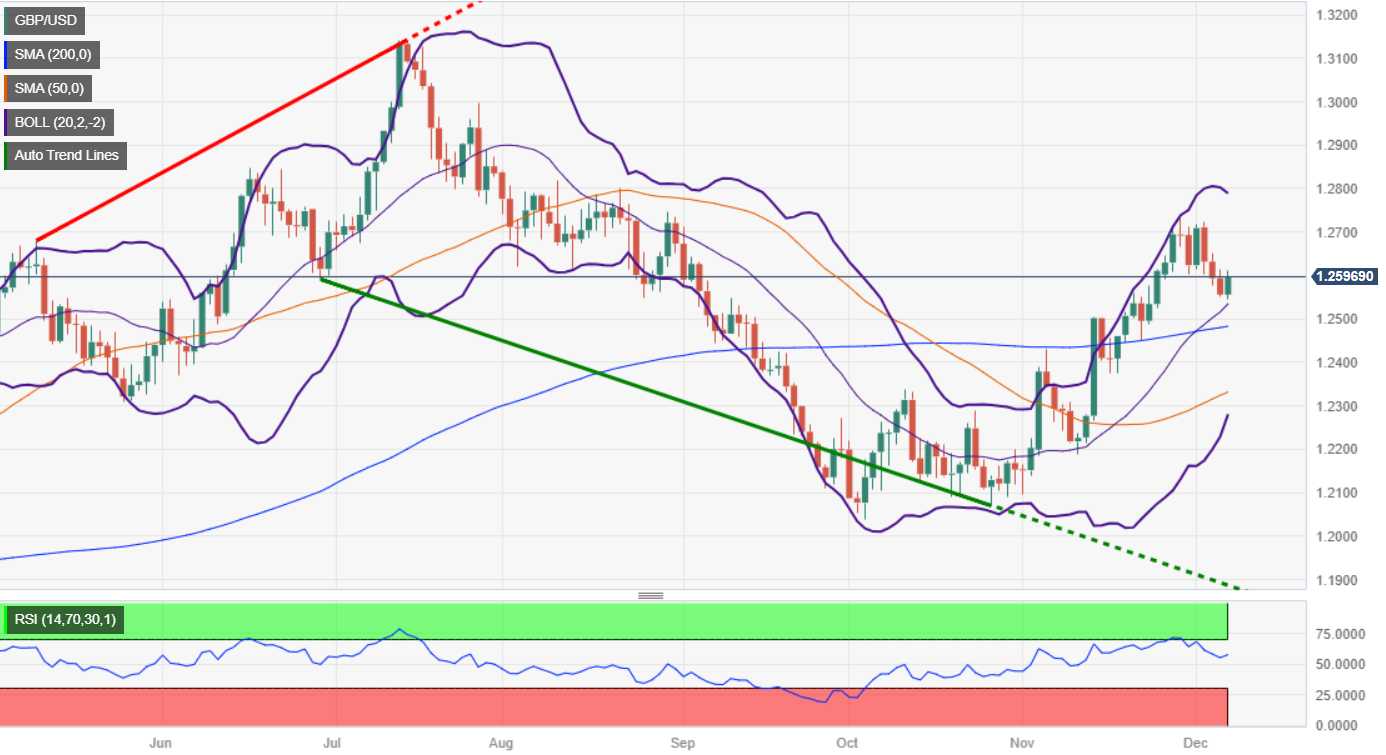
- GBP/USD rebounds from weekly lows, buoyed by positive sentiment diminishing the Greenback's safe-haven appeal.
- US labor market easing supports Fed rate cut speculations, shifting market narrative.
- ECB, Fed, and BoE rate cut expectations in swaps markets: ECB at 140 bps, Fed at 120 bps, BoE at 75 bps; UK economic data mixed.
The GBP/USD capped its three-day decline, rose from weekly lows reached at around 1.2544, and exchanges hands near the 1.2600 figure, posting modest gains of 0.23% late in the North American session.
Upbeat market sentiment and Fed rate cut speculations, a tailwind for the GBP/USD
Sentiment is one of the main drivers of the session, which remains positive to the detriment of the safe-haven status of the Greenback (USD). The GBP/USD remains underpinned by the drop of the buck, which, according to the US Dollar Index (DXY), drops 0.67% and trades at 103.48.
Meanwhile, the labor market continues to ease pressure off the US Federal Reserve. Data during the current week, witnessed the rise in unemployment claims of 220K, exceeding the previous reading of 218K, despite missing estimates for a higher print. The US Challenge Job Cuts, smashed October’s figure by 24% and rose to 45,510 vs. 38,836 reported in the last month.
Given the Fed's fundamental backdrop and forward guidance, the financial markets narrative shifted from high inflation to rate cuts, which would be the first central bank to ease policy. Speculations suggest that the European Central Bank (ECB) could be the first to pull the trigger by March, followed by the Federal Reserve in May, and the Bank of England (BoE) in July.
Rate cut estimates for each central bank according to swaps markets, for the ECB at 140 bps, the Fed at 120 bps, and the BoE at 75 bps.
Aside from this, the UK’s economic data in the week showed that business activity in the services sector improved. However, the S&P Global/CIPS Construction PMI dropped sharply, compared to October’s 45.6, at 45.5. this contrasts with the Composite PMI, which suggests the economy is expanding slower.
Meanwhile, GBP/USD traders are eyeing the US Nonfarm Payrolls report on Friday for a green light to continue to extend its gains if data supports the thesis of the US economy slowing down. If it’s not the case, further downside is expected, as markets had early anticipated the beginning of the Fed’s easing cycle.
GBP/USD Price Analysis: Technical outlook
The major remains upward biased unless it breaches the latest support level at 1.2506, the November 14 swing high. Despite trading in the green, the cross of the 100-day moving average (DMA) below the 200-DMA is opening the door for a bearish resumption. However, as the GBP/USD stays above the above-mentioned support area, bulls can remain hopeful of higher prices. Key resistance levels lie at 1.2600, followed by December’s 5 high at 1.2651, ahead of the psychological 1.2700. On the flip side, the first support is 1.2500, followed by the 200-DMA at 12481 and the 100-DMA at 1.2465.
- USD/JPY is on track for its single-worst performing day in 13 months.
- The Japanese Yen is rally hard across the board, gaining ground against the entire FX market.
- Hints of possible tightening from BoJ Governor Ueda sparked the Yen’s rally on Thursday.
The USD/JPY is on pace to see it’s single worst trading day since November of 2022 after plunging over four percent on Thursday with a broad-market rally for the Japanese Yen (JPY). The USD/JPY tipped into its lowest bids in since August below 142.00 after the Bank of Japan’s (BoJ) Governor Kazuo Ueda hinted that further policy tightening could be on the cards, with an end of the BoJ’s long-running negative rate policy on the table.
Boj Governor Ueda noted that Japan faces an “even more challenging” scenario heading into 2024, highlighting that the BoJ has “several options” on how the Japanese central bank might approach targeting interest rates moving forward.
BoJ finally edging closer to lifting rates?
Japan’s core inflation rate hit 2.9% in October, and Japanese inflation has exceeded the BoJ’s main inflation target rate for well over a year, and the BoJ itself doesn’t anticipate inflation receding below the central bank’s own 2% until sometime in 2025.
Japan’s Core Consumer Price Index (CPI) inflation has hit above the BoJ’s target band for 19 consecutive months. Markets are rapidly increasing their bets that the BoJ will finally be pushed off of their hyper-easy monetary policy perch sooner rather than later, on expectations that wages will begin to finally see moderate wage gains as Japanese workers and consumers grapple with inflation running much hotter for much longer than many expected, eclipsing long-running wage stagnation.
The BoJ next meets for another rate review on December 18 & 19, followed by a quarterly growth and inflation forecast review in late January. Investors will be keeping eyes glued closely to statements coming from the BoJ in the weeks to come as traders look for signs of more than just verbal movement from Japanese policymakers.
Japanese Yen price today
The table below shows the percentage change of Japanese Yen (JPY) against listed major currencies today. Japanese Yen was the strongest against the US Dollar.
| USD | EUR | GBP | CAD | AUD | JPY | NZD | CHF | |
| USD | -0.40% | -0.28% | -0.01% | -0.86% | -2.81% | -0.63% | -0.09% | |
| EUR | 0.41% | 0.11% | 0.40% | -0.45% | -2.40% | -0.22% | 0.33% | |
| GBP | 0.30% | -0.09% | 0.29% | -0.55% | -2.50% | -0.32% | 0.21% | |
| CAD | -0.01% | -0.40% | -0.29% | -0.85% | -2.83% | -0.62% | -0.08% | |
| AUD | 0.87% | 0.48% | 0.57% | 0.86% | -1.92% | 0.25% | 0.77% | |
| JPY | 2.74% | 2.37% | 2.43% | 2.70% | 1.85% | 2.14% | 2.65% | |
| NZD | 0.64% | 0.24% | 0.35% | 0.62% | -0.24% | -2.09% | 0.55% | |
| CHF | 0.09% | -0.30% | -0.20% | 0.08% | -0.77% | -2.72% | -0.54% |
The heat map shows percentage changes of major currencies against each other. The base currency is picked from the left column, while the quote currency is picked from the top row. For example, if you pick the Euro from the left column and move along the horizontal line to the Japanese Yen, the percentage change displayed in the box will represent EUR (base)/JPY (quote).
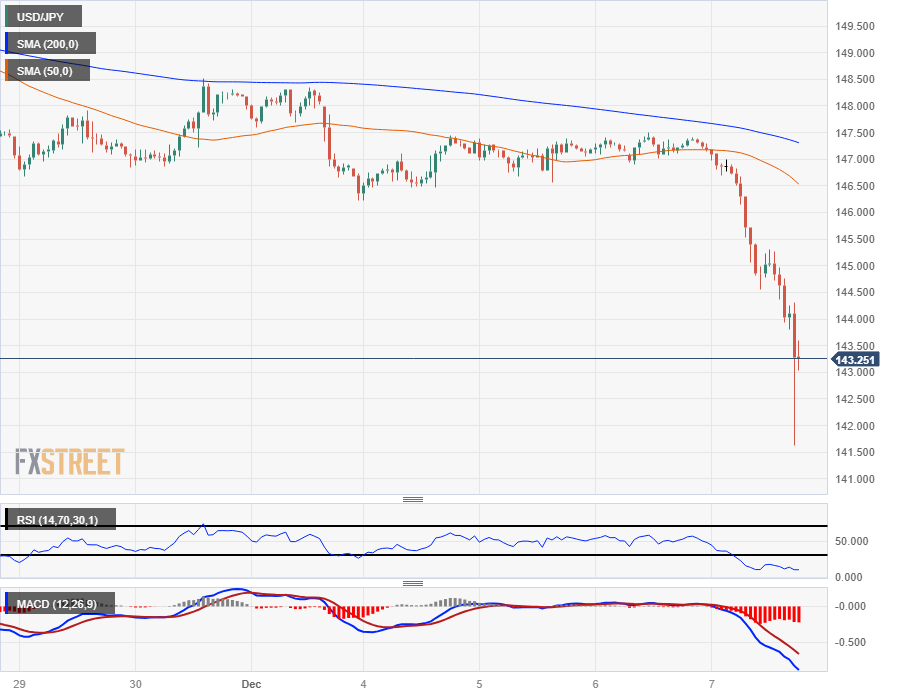
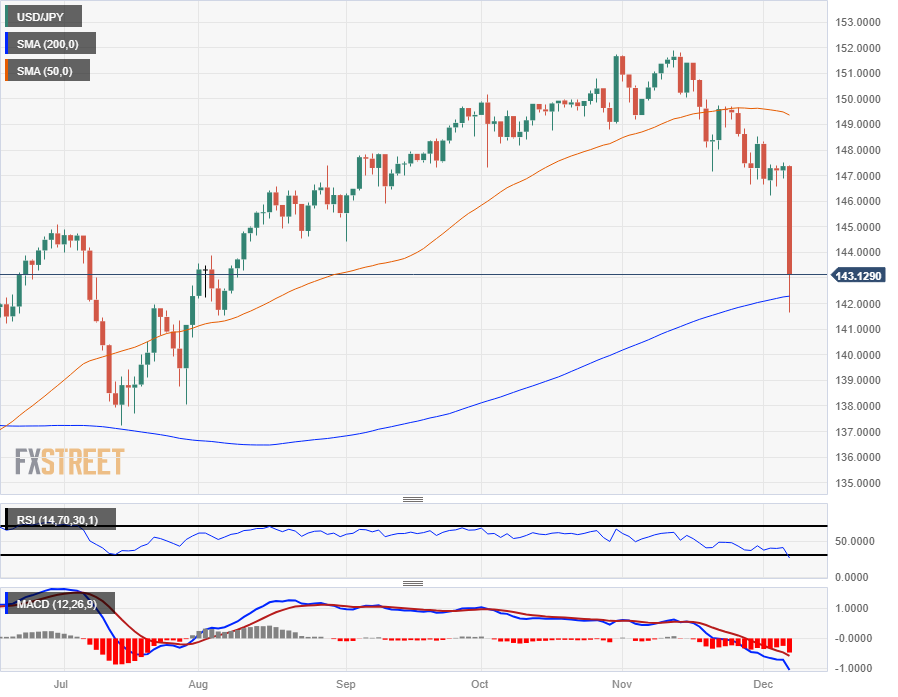
USD/JPY Technical Outlook
The USD/JPY has accelerated towards the downside, pulling away from intraday levels and pinning near-term technical indicators deep in oversold territory. The pair plunged into touch distance of 141.50, extending declines during the American market session, and the pair is seeing a limited pullback above the 143.00 handle.
Despite paring away some of the day’s more extreme losses, the pair still remains steeply off highs on Thursday, down nearly 2.75% from opening bids near 147.20.
In a single day the USD/JPY went from softly bearish to collapsing into the 200-day Simple Moving Average, and a bullish rebound will need to make significant headway before recovering the 147.00 handle. The 50-day SMA is rotating into a bearish stance well above Thursday’s price action, pushing down into the 1149.00 region.
USD/JPY Hourly Chart
USD/JPY Daily Chart
USD/JPY Technical Levels
Bank of Canada Deputy Governor Toni Gravelle said on Thursday that they welcome the improvement in October inflation figures but warned that they need to see further progress on restoring price stability.
On Wednesday, the Bank of Canada kept its key rate unchanged at 5%, as expected. Gravelle reiterated that “overall, the economy no longer looks to be in excess demand.”
Key takeaways from the speech:
While we saw some welcome improvement in inflation measures in October, we must remember it's just one month. We need to see further progress.
The economy is now roughly in balance, but we are closely watching inflation expectations, wage growth and corporate pricing behaviour. These indicators are helping us assess whether inflation is on a sustained path to 2%.
The recent increase in immigration boosted consumption in the near term, but we estimate that that alone did not have a significant impact on inflation. However, due to Canada’s existing housing supply challenges, population growth has added to the pressure on shelter price inflation. Had builders been able to respond more flexibly to the increased demand, it would have helped reduce upward pressure on rent and housing prices.
Newcomers have helped loosen tight labour markets and have significantly improved our country’s potential growth, which will help keep a lid on inflationary pressures in the long run. But Canada needs more homes. And we need to make our housing supply more responsive to increases in demand. This will allow us to properly welcome new arrivals and to ensure all Canadians have an affordable place to live.
Market reaction
Comments from Gravelle had no impact on the Loonie. The USD/CAD remained moving sideways hovering around 1.3600, marginally higher for the day.
- The DXY Index trades with significant losses on Thursday, remaining below the 20-day SMA near 103.30.
- Speculation emerges for a policy pivot by the BoJ after Ueda’s comments drive demand away from the USD to the JPY.
- Investors gear up for US Nonfarm Payrolls data on Friday.
The US Dollar (USD) has been navigating turbulent waters, trading at 103.30, with significant losses registered below the 20-day Simple Moving Average (SMA). The primary drivers pushing down the Greenback include the Bank of Japan's rate hike discussions and failure to capitalize on the positive Initial Jobless Claims for the week ending December 1.
Alongside cooling inflation, mixed labor market conditions fuel cautious optimism within the Federal Reserve (Fed), which nonetheless hints at the need for further tightening in case data justifies it. High expectations are set for the upcoming labor market data release on Friday that will shape market expectations and set the pace of USD price dynamics.
Daily Market Movers: US Dollar Index trades lower near 103.00 on BoJ rate hike talk, eyes on NFPs
- The DXY Index has seen losses, with the US Dollar broadly trading below the 20-day SMA near 103.30.
- The US Initial Jobless Claims for the week ending December 1, reported by the US Department of Labor, came out at 220K. This is slightly below the market consensus of 222K.
- Investors await a host of economic activity reports due on Friday. These include Average Hourly Earnings for November on a yearly and monthly basis, as well as the Unemployment Rate and Nonfarm Payrolls data for November.
- US bond yields are down across the board, with the 2-year yield at 4.60%, while both the 5-year and 10-year yields stand at 4.12%.
- According to the CME FedWatch Tool, the market is not pricing in a hike for the December meeting. Meanwhile, rate cuts are being expected by mid-2024.
- Regarding Bank of Japan (BoJ) Governor Ueda’s comments, the central bank explored the possibility of leaving the negative interest rate policy. He added that there are various options when the tightening cycle begins that have boosted hawkish bets on the bank, benefiting the JPY and driving demand away from the USD.
Technical Analysis: US Dollar momentum flattens, DXY loses 20-day SMA
The Relative Strength Index (RSI) is currently on a flat slope in negative territory, while the Moving Average Convergence Divergence (MACD) prints flat green bars, suggesting that the bulls are losing traction.
However, exploring the position of the DXY relating to its 20, 100 and 200-day Simple Moving Averages (SMAs), it is evident that the outlook favors buyers on the long-term trend but the sellers in the short term. As long as the index doesn’t consolidate above the 20-day SMA, more downside may be in play to retest the 200-day SMA at 103.60.
Support levels: 103.20, 103.15, 103.00.
Resistance levels:104.00 (20-day SMA), 104.40 (100-day SMA), 104.50.
US Dollar FAQs
What is the US Dollar?
The US Dollar (USD) is the official currency of the United States of America, and the ‘de facto’ currency of a significant number of other countries where it is found in circulation alongside local notes. It is the most heavily traded currency in the world, accounting for over 88% of all global foreign exchange turnover, or an average of $6.6 trillion in transactions per day, according to data from 2022.
Following the second world war, the USD took over from the British Pound as the world’s reserve currency. For most of its history, the US Dollar was backed by Gold, until the Bretton Woods Agreement in 1971 when the Gold Standard went away.
How do the decisions of the Federal Reserve impact the US Dollar?
The most important single factor impacting on the value of the US Dollar is monetary policy, which is shaped by the Federal Reserve (Fed). The Fed has two mandates: to achieve price stability (control inflation) and foster full employment. Its primary tool to achieve these two goals is by adjusting interest rates.
When prices are rising too quickly and inflation is above the Fed’s 2% target, the Fed will raise rates, which helps the USD value. When inflation falls below 2% or the Unemployment Rate is too high, the Fed may lower interest rates, which weighs on the Greenback.
What is Quantitative Easing and how does it influence the US Dollar?
In extreme situations, the Federal Reserve can also print more Dollars and enact quantitative easing (QE). QE is the process by which the Fed substantially increases the flow of credit in a stuck financial system.
It is a non-standard policy measure used when credit has dried up because banks will not lend to each other (out of the fear of counterparty default). It is a last resort when simply lowering interest rates is unlikely to achieve the necessary result. It was the Fed’s weapon of choice to combat the credit crunch that occurred during the Great Financial Crisis in 2008. It involves the Fed printing more Dollars and using them to buy US government bonds predominantly from financial institutions. QE usually leads to a weaker US Dollar.
What is Quantitative Tightening and how does it influence the US Dollar?
Quantitative tightening (QT) is the reverse process whereby the Federal Reserve stops buying bonds from financial institutions and does not reinvest the principal from the bonds it holds maturing in new purchases. It is usually positive for the US Dollar.
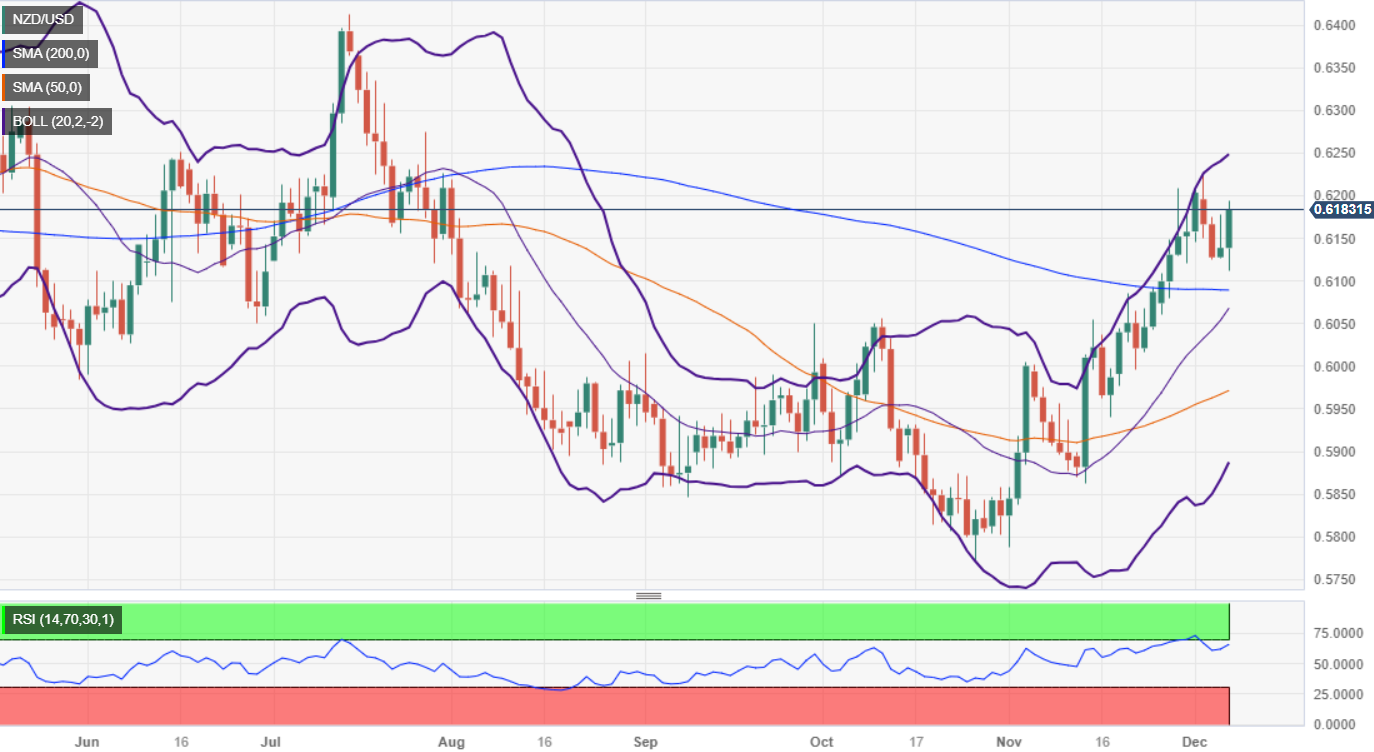
- NZD/USD stages recovery, as Bank of Japan Governor Ueda's hawkish comments impact the Greenback.
- US equities rebound on softer-than-expected jobs data; speculations of over 100 basis points Fed rate cut impact the US Dollar.
- BoJ's Ueda suggests various policy rate options, triggering a 2.20% Yen rally against the Greenback.
The NZD/USD stages a recovery on Thursday as the Greenback (USD) remains under pressure, courtesy of hawkish comments by Bank of Japan (BoJ) Governor Kazuo Ueda. That, along with soft US economic data revealed in the day, sponsored the pair’s leg up to the current exchange rate at 0.6187 and gains 0.87%.
The US Dollar Index falls more than 0.50% an NZD/USD’s tailwind
US equities rebounded during the North American session, fueled by softer-than-expected US jobs data. Speculations the US Federal Reserve would slash rates by more than 100 basis points mount, a headwind for the Greenback. Hence, the US Dollar Index (DXY), which tracks the currency’s value against six rivals drops 0.57%, at 103.56, weighed by a strong Japanese Yen (JPY).
Comments by the BoJ Governor Ueda stated that there are various options for the policy rate, such as normalizing monetary policy and paving the way to end negative interest rates. That roiled up the markets, with the Yen rallying against the Greenback more than 2.20%.
Delving into US data, Initial Jobless Claims for the last week missed estimates of 222K, which came at 220K but exceeded two weeks’ data of 219K. The US Challenge Job Cuts revealed companies trimmed job posts by 45K, 24% more than October’s 38.826K. Today’s data and previously released data keep investors' hopes high that the US central banks will cut rates in the first half of 2024.
The economic docket was absent on the New Zealand front and would finish the week that way. However, NZ is seen as a proxy for China, one of its largest trading partners. China’s Exports grew for the first time in six months, rising by 0.5%, while Imports fell by 0.6%.
NZD/USD Price Analysis: Technical outlook
The NZD/USD downtrend halts on Thursday, though downside risks remain unless buyers reclaim the high of December 6 at 0.6177. A breach of the latter will open the door to challenge the 0.6200 figure. Once cleared, there would be a clear path to test the July 31 high at 0.6225. On the other hand, a bearish resumption is the most likely scenario, as the 200-day moving average (DMA) acts like a magnet. Firstly, the sellers must drag prices toward 0.6100, ahead of the 200-DMA at 0.6088.
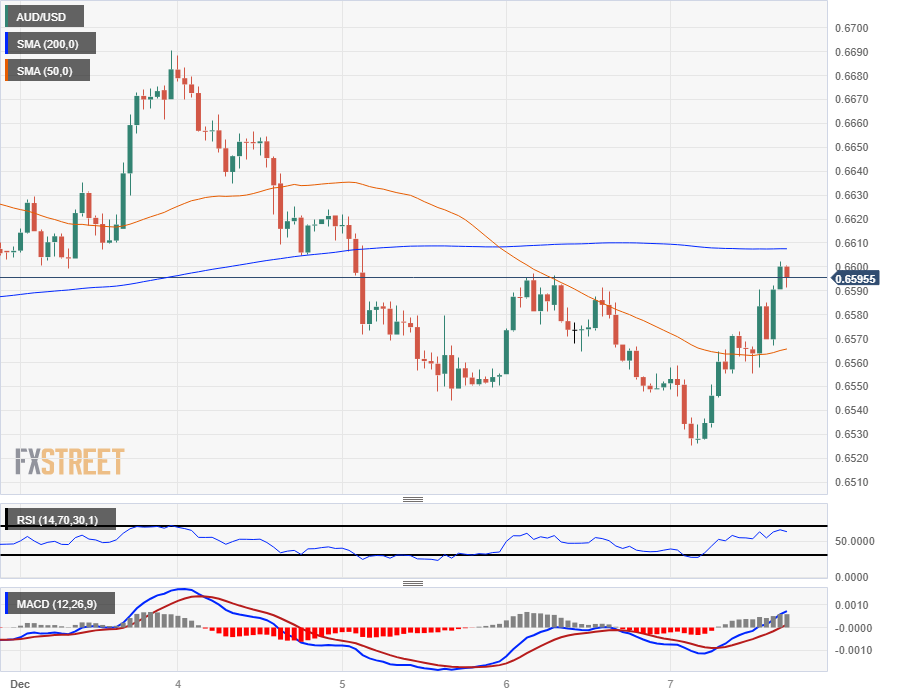
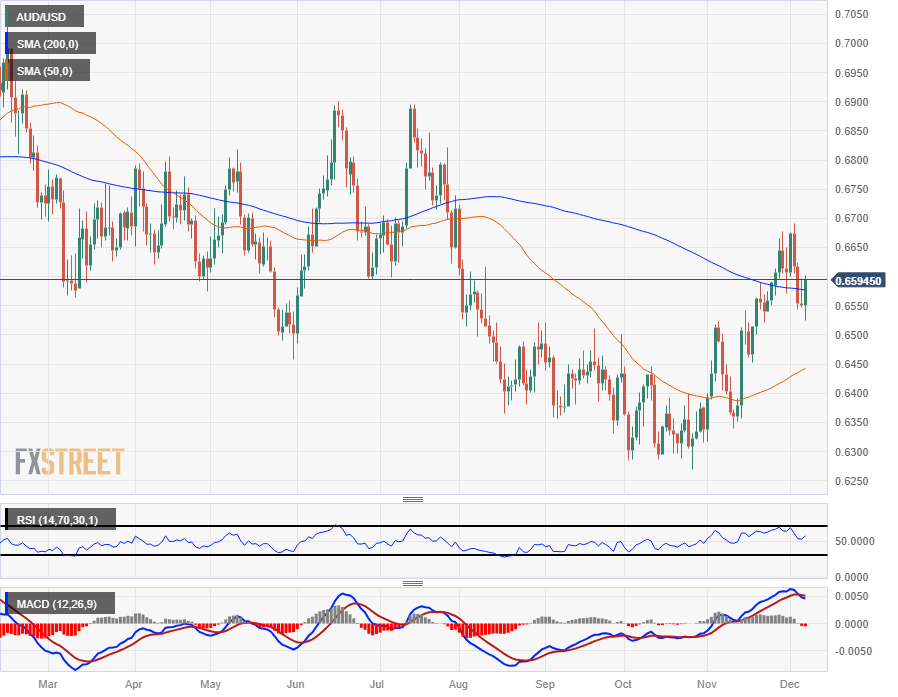
- The AUD/USD rallied from ten-day lows to retest the 0.6600 handle on Thursday.
- Moderating US Initial Jobless Claims is seeing a recovery in market sentiment.
- The Australian Dollar is rebounding against the broader FX market.
The AUD/USD is finding topside bids on Thursday, climbing three-quarters of a percent to retest the 0.6600 handle as market sentiment sees a late recovery heading into the US Nonfarm Payrolls (NFP) print slated for Friday to close out the trading week.
The Australian Dollar (AUD) slipped in the early Thursday market session, dipping into a two-week low near 0.6530 before catching a ride on a broad-market risk rally to bound back within reach of 0.6600.
US Initial Jobless Claims helped to fuel the broader market’s risk recovery, showing fewer than expected jobless benefits seekers. Initial Jobless Claims for the week ending December 1 printed 220K, slightly less then the market expectation of 222K. Initial Jobless Claims came in below the 4-week average of 220.75K, and saw only a minor uptick from the previous week’s 218K.
US NFP to close out the week as investors focus on the major data release
The Aussie will next have to grapple with the US NFP data drop slated for Friday’s American market session, and the median market forecast expects November’s NFP to show a net gain of 180K compared to October’s 150K print.
The University of Michigan’s Consumer Sentiment Index will also be printing on Friday, and is expected to show a similar moderate improvement from 61.3 to 62.0.
AUD/USD Technical Outlook
The AUD/USD’s Thursday rally sees intraday action capped off by the 200-hour Simple Moving Average (SMA) near 0.6610, and the pair’s rise back into 0.6600 is set to face difficulties on the charts as Aussie momentum remains limited.
Thursday’s Aussie rally also sees the AUD/USD strung along the 200-day SMA on the daily candlesticks, after a firm rebound from Thursday’s bottom bids of 0.6525.
Looking further out, the AUD/USD is approaching a significant technical barrier, with 0.6600 serving as a major support level through much of early 2023’s chart action.
AUD/USD Hourly Chart
AUD/USD Daily Chart
AUD/USD Technical Levels
- The Canadian Dollar is lower on the day against most of its peers.
- Crude Oil prices appear to have found a floor for now, easing downside CAD pressure.
- Friday’s US NFP remains the key closer for the trading week.
The Canadian Dollar (CAD) continues to pare back recent gains, shedding weight or flattening against all of its major currency peers, save for the Swiss Franc (CHF), which takes pride of place as the market’s biggest loser on Thursday.
The Bank of Canada (BoC) held interest rates steady at 5% on Wednesday, in-line with market expectations and bolstering the Canadian Dollar on the day. Now that investors have had time to chew on the BoC’s statement, it seems the Canadian central bank wasn’t as hawkish as it initially appeared.
The Canadian Dollar is paring back gains on Thursday as investors readjust their CAD exposure heading into another bumper US Nonfarm Payrolls (NFP) print to close out the trading week on Friday.
Daily Digest Market Movers: Canadian Dollar softer as markets focus on US NFP ahead
- Thin data on the docket for Thursday as markets get a breather before Friday’s NFP print.
- Canadian Building Permits recovered less than markets were hoping for in October, rebounding 2.3% versus the forecast of 2.9%.
- September Building Permits declined -8.1% after getting revised down from -6.5%.
- US Initial Jobless Claims for the week ending December 1 slightly beat expectations, helping to bolster equities and risk appetite in general, limiting CAD losses.
- US Initial Jobless Claims saw 220K new jobless benefits seekers last week, slightly less than the forecasted 222K and coming in just under the 4-week average of 220.75K.
- Crude Oil markets have flattened on Thursday but remain steeply off of recent bids, providing little support for the Canadian Dollar.
- Markets to focus on Friday’s upcoming US Nonfarm Payrolls report for November, expected to climb from October’s 150K to 180K MoM.
Canadian Dollar price today
The table below shows the percentage change of Canadian Dollar (CAD) against listed major currencies today. Canadian Dollar was the strongest against the Swiss Franc.
| USD | EUR | GBP | CAD | AUD | JPY | NZD | CHF | |
| USD | -0.21% | -0.12% | 0.02% | -0.63% | -2.08% | -0.38% | 0.20% | |
| EUR | 0.21% | 0.06% | 0.23% | -0.42% | -1.87% | -0.17% | 0.40% | |
| GBP | 0.13% | -0.07% | 0.15% | -0.49% | -1.90% | -0.25% | 0.33% | |
| CAD | -0.02% | -0.23% | -0.16% | -0.65% | -2.11% | -0.40% | 0.17% | |
| AUD | 0.62% | 0.41% | 0.48% | 0.64% | -1.45% | 0.24% | 0.81% | |
| JPY | 2.03% | 1.85% | 1.91% | 2.05% | 1.42% | 1.68% | 2.23% | |
| NZD | 0.38% | 0.17% | 0.24% | 0.40% | -0.25% | -1.70% | 0.57% | |
| CHF | -0.20% | -0.41% | -0.33% | -0.18% | -0.83% | -2.29% | -0.58% |
The heat map shows percentage changes of major currencies against each other. The base currency is picked from the left column, while the quote currency is picked from the top row. For example, if you pick the Euro from the left column and move along the horizontal line to the Japanese Yen, the percentage change displayed in the box will represent EUR (base)/JPY (quote).
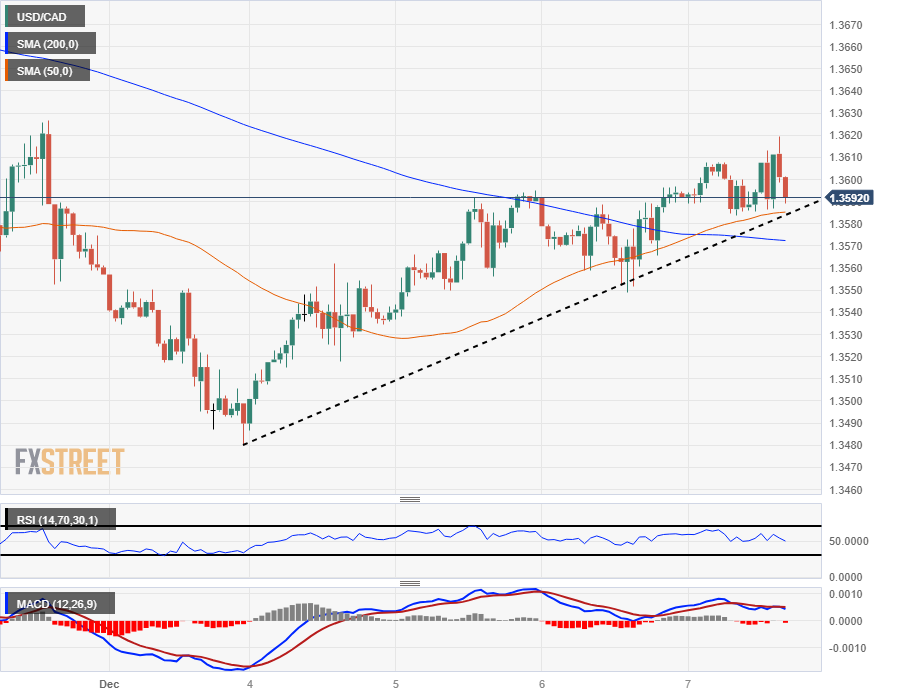
Technical Analysis: Canadian Dollar sees downside on Thursday, USD/CAD testing 1.3600
The USD/CAD pushed back into the 1.3600 handle during Thursday trading, and the pair is running into some resistance in the bids at the technical level. A rebound in the Loonie looks unlikely with intraday action finding support from the 200-hour Simple Moving Average (SMA) near 1.3570.
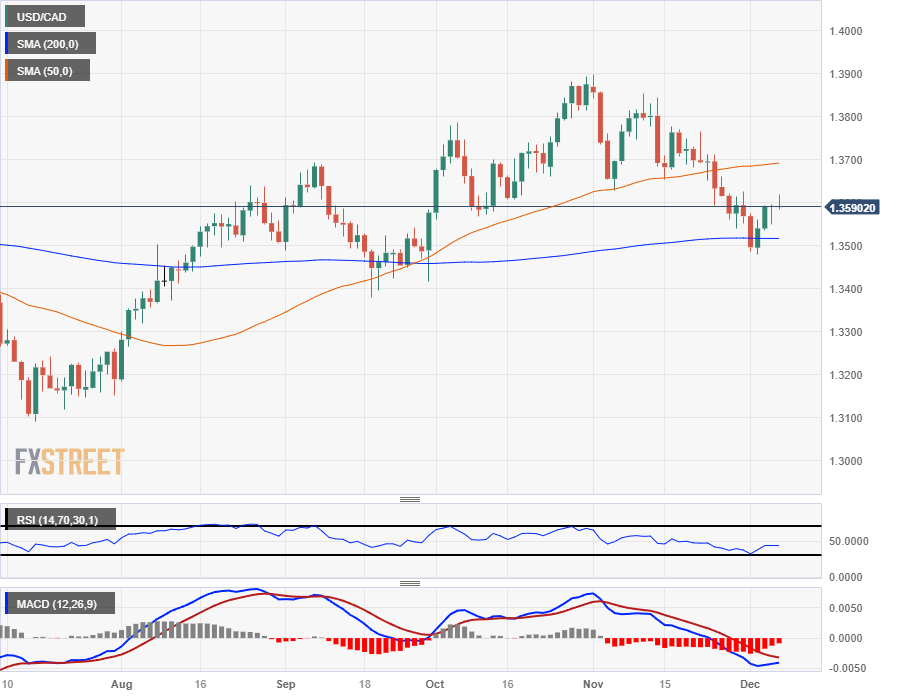
On the daily candlesticks, the USD/CAD is being pushed higher following a rejection from the 200-day SMA just above the 1.3500 handle. Near-term action sees the 50-day SMA testing 1.3700, which could draw bids higher.
A sustained bearish rejection from 1.3600 will see downside momentum gather for a run back down to 1.3500, where sellers will want to regather efforts for an attempt at breaking through the week’s low near 1.3480.
USD/CAD Hourly Chart
USD/CAD Daily Chart
Canadian Dollar FAQs
What key factors drive the Canadian Dollar?
The key factors driving the Canadian Dollar (CAD) are the level of interest rates set by the Bank of Canada (BoC), the price of Oil, Canada’s largest export, the health of its economy, inflation and the Trade Balance, which is the difference between the value of Canada’s exports versus its imports. Other factors include market sentiment – whether investors are taking on more risky assets (risk-on) or seeking safe-havens (risk-off) – with risk-on being CAD-positive. As its largest trading partner, the health of the US economy is also a key factor influencing the Canadian Dollar.
How do the decisions of the Bank of Canada impact the Canadian Dollar?
The Bank of Canada (BoC) has a significant influence on the Canadian Dollar by setting the level of interest rates that banks can lend to one another. This influences the level of interest rates for everyone. The main goal of the BoC is to maintain inflation at 1-3% by adjusting interest rates up or down. Relatively higher interest rates tend to be positive for the CAD. The Bank of Canada can also use quantitative easing and tightening to influence credit conditions, with the former CAD-negative and the latter CAD-positive.
How does the price of Oil impact the Canadian Dollar?
The price of Oil is a key factor impacting the value of the Canadian Dollar. Petroleum is Canada’s biggest export, so Oil price tends to have an immediate impact on the CAD value. Generally, if Oil price rises CAD also goes up, as aggregate demand for the currency increases. The opposite is the case if the price of Oil falls. Higher Oil prices also tend to result in a greater likelihood of a positive Trade Balance, which is also supportive of the CAD.
How does inflation data impact the value of the Canadian Dollar?
While inflation had always traditionally been thought of as a negative factor for a currency since it lowers the value of money, the opposite has actually been the case in modern times with the relaxation of cross-border capital controls. Higher inflation tends to lead central banks to put up interest rates which attracts more capital inflows from global investors seeking a lucrative place to keep their money. This increases demand for the local currency, which in Canada’s case is the Canadian Dollar.
How does economic data influence the value of the Canadian Dollar?
Macroeconomic data releases gauge the health of the economy and can have an impact on the Canadian Dollar. Indicators such as GDP, Manufacturing and Services PMIs, employment, and consumer sentiment surveys can all influence the direction of the CAD. A strong economy is good for the Canadian Dollar. Not only does it attract more foreign investment but it may encourage the Bank of Canada to put up interest rates, leading to a stronger currency. If economic data is weak, however, the CAD is likely to fall.
- USD/CHF records 0.80% gains in the week after buyers regain 0.8700.
- US labor market data remains soft, justifying market participants' rate cuts for 2024.
- Up next: Traders focus shifts to US Nonfarm Payrolls report.
USD/CHF prints decent gains of 0.12% in the day as the North American session begins, extending its weekly gains to 0.80% as buyers reclaim the 0.8700 figure. At the time of writing, the major is exchanging hands at 0.8764 after hitting a daily low of 0.8729.
The USD/CHF aims higher ahead of US NFP data
A busy economic calendar in the United States (US) keeps USD/CHF traders entertained. Firstly, the US Challenge Job Cuts revealed that US employers slashed 45.51K employees from the workforce, exceeding October figures, while the US Department of Labor revealed unemployment claims. Initial Jobless Claims for the week ending December 2 missed projections of 222K, rose by 220K but exceeded the previous week’s 219K.
All that said, there’s just one report linked to employment in the week. The US Nonfarm Payrolls on Friday is expected to show the US economy created 180K jobs in November, above October’s 150K, while the Unemployment Rate is estimated to stay around 3.9%.
Given the latest JOLTs and ADP figures suggested the labor market has cooled, if tomorrow’s employment report comes weaker than expected, it could be the last nail in the coffin for the US Federal Reserve (Fed), as investors seem convinced the Fed’s finished to tighten monetary conditions.
Fed Interest Rate Expectations
In the meantime, money market futures had priced 135 basis points of rate cuts by the Fed for the next year, which would likely begin in May, according to the Chicago Board of Trade (CBOT) data.
Aside from this, the Unemployment Rate in Switzerland hit 2.1%, exceeding October’s 2%, though it barely moved the needle. USD/CHF traders remain heavily focused on US Dollar dynamics.
USD/CHF Technical Levels
- The XAG/USD continued its downward path and fell to $23.75, below its 20-day SMA.
- US Initial Jobless Claims for the first week of December were better than expected.
- US bond yields are rising ahead of key labor reports on Friday.
In Thursday's session, Silver price (XAG/USD) continued declining and tallied a third consecutive day of losses, falling to $23.75. The precious metal price is being pushed down after US yields rose following the release of US jobless claims, which came in lower than predicted. The performance was further boosted by a steady US Dollar (USD).
In line with that, the U.S. Department of Labor revealed that the Initial Jobless Claims for the week ending on December 2 came in at 220K, vs. the 222K expected, and still accelerated from its previous 218K.
Following the data, US bond yields rose as strong labor market data favors the case of a more aggressive Fed. The 2-year rate is at 4.60%, whereas the 5-year and 10-year yields are at 4.15%. The rising rates further pressure the non-yielding metals as US Treasury bond yields are typically viewed as their opportunity cost of holding.
That being said, the U.S. Bureau of Labor Statistics is scheduled to report Average Hourly Earnings, Unemployment Rate, and Nonfarm Payrolls on Friday. These reports will shape the expectations of the next Decisions of the Federal Reserve (Fed) as the Bank closely monitors them. It's worth noticing that the officials signaled that they need to see more evidence of the economy cooling down so the outcome of the data may shape the short-term trajectory of the pair.
As for now, markets are forecasting that the Nonfarm Payrolls have accelerated in November while wages decelerated and the Unemployment rate remains steady at 3.9%.
XAG/USD levels to watch
The technical indicators on the daily chart reflect a neutral picture. Despite a negative slope in the Relative Strength Index (RSI) indicating increasing selling momentum, it remains in positive territory, suggesting that buying pressure still exists. However, rising red bars in the Moving Average Convergence Divergence (MACD) histogram echoes that the bears are gaining momentum, which contributes to a somewhat mixed picture..
Concerning Simple Moving Averages (SMAs), the price is below the 20-day SMA, displaying a near-term bearish bias. Nevertheless, the position above the 100 and 200-day SMAs shows that the bulls have the upper hand in the larger timeframe.
Support Levels: $23.50, $23.30,$23.00
Resistance Levels: $24.00, $24.30, $24.50.
XAG/USD daily chart
-638375617987119777.png)
- The Swiss Franc strengthens versus the Euro after more negative data for the region.
- Euro weakens to 2023 lows versus the Swiss Franc after GDP grinds to a halt in Europe, hammering the single currency.
- US Dollar continues righting itself against the pack including Swissie; Pound recovers vs. CHF on brighter financials.
The Swiss Franc (CHF) trades mixed on Thursday – rising versus the Euro which sees losses after a slew of more unfavorable figures, but falling to the strengthening US Dollar, and to a lesser extent the Pound Sterling, which was briefly buoyed by a less morbid financial outlook.
EUR/CHF hits new lows for 2023 of 0.9403 and threatens to enter uncharted price territory below after Eurozone growth and employment data for Q3 disappoints, weighing on the Single Currency. USD/CHF and GBP/CHF show technical short-term reversal insignia, which suggests bulls may have taken charge in the short term.
Daily digest market movers: USD/CHF rises as Dollar recovery continues unabated
- The Swiss Franc weakens against the US Dollar, which continues to recover after investors wake up to the fact the US may not have reached peak interest rates unilaterally, but rather be reflecting a wider global phenomenon.
- The latest US employment data shows a marginally better-than-expected result.
- Data out on Thursday shows an unexpected fall in Continuing Jobless Claims, which fell to 1.861 million in the week of November 24. A figure of 1.910 million had been expected.
- Initial Jobless Claims for week of December 1 undershot expectations, coming out at 220K when 222K had been forecast.
- The data slightly improves on the negative ADP employment data out on Wednesday.
- The next big release for the US Dollar is Nonfarm Payrolls out on Friday, December 8.
Swiss Franc technical analysis: USD/CHF posts short-term reversal insignia
USD/CHF – the number of Swiss Francs that one US Dollars can buy – is trading higher for the fourth day in a row on Thursday.
The pair found a floor at key long-term range lows and then formed a bullish Piercing Line Japanese candlestick reversal pattern on Monday, December 4 (rectangle on chart below). This was then confirmed by Tuesday’s bullish follow-through.
-638375613739891623.png)
US Dollar vs Swiss Franc: Daily Chart
It appears the pair has formed a measured move price pattern since the October 3 highs. Measured moves are three wave patterns that look like large zig-zags. The first and third waves are usually of a similar length. Wave C has completed after achieving the same length as A. This further reinforces the bullish reversal signaled by the Piercing Line.
The MACD has completed a bullish cross (circled) in negative territory, adding more evidence, signaling potentially more upside on the horizon.
The short-term trend is bullish, and more gains are possible. The next target is at 0.8825, which offers soft resistance. Then comes the confluence of major moving averages residing at 0.8900, where tougher resistance is expected.
A break below the 0.8667 lows would negate the recovery and see bears back in charge, with likely losses to the 0.8552 July lows.
Daily digest market movers: EUR/CHF hits new low for the year
- The Swiss Franc rises against the Euro after Eurozone economic data shows a deteriorating outlook for the region.
- The Euro weakened considerably on Thursday after GDP data showed that the Eurozone failed to grow in Q3 and registered a 0.1% decline on a quarter-on-quarter basis when compared to Q2.
- Employment Change data in the Eurozone was also disappointing, growing by a lower-than-expected 0.2% QoQ, when 0.3% had been expected, and 1.3% YoY in Q3 when experts had forecast 1.4%.
- Last week, HICP inflation data for the Eurozone showed a greater-than-expected slowdown in price rises, which was a further sign of a slowdown.
- The data suggested a risk the European Central Bank (ECB) might consider cutting interest rates to stimulate growth, which is weighing heavily on the Euro.
- Lower interest rates tend to weaken a currency as they reduce capital inflows.
Swiss Franc technical analysis: EUR/CHF makes new year-to-date lows at 0.9403
EUR/CHF – the number of Swiss Francs that one Euro can buy – has fallen to its lowest level for the year at 0.9403 on Thursday. It has temporarily found its feet at a major support and resistance level but remains vulnerable to weakening to unprecedented levels – lows not seen for decades.
-638375614492887736.png)
Euro vs Swiss Franc: Weekly Chart
The pair is in a downtrend on all timeframes, suggesting bears have the upper hand and prices should continue lower.
A break below the 0.9403 lows would further confirm the bearish bias and see prices fall into uncharted territory, with major whole numbers then expected to provide support at 0.9300, 0.9200, and so on.
Daily digest market movers: GBP/CHF supported by stable financial outlook
- The Swiss Franc weakens versus the Pound Sterling pair, possibly as a result of the publication of a report by the Bank of England (BoE) suggesting the UK financial system has grown more resilient.
- The Bank of England released its Financial Policy Summary and Record – December 2023, on Wednesday, December 6. The report concludes that UK businesses and households are showing greater resilience to the higher debt repayments associated with high-interest rates than was expected back in the summer.
- The greater stability of the UK financial system suggests the BoE will be able to keep interest rates higher for longer without negatively impacting the economy. The UK is experiencing relatively high inflation so maintaining interest rates at current levels may be necessary to bring it down.
- Higher interest rates are generally positive for a currency as they attract greater inflows of foreign capital.
- This comes after a string of officials maintained a hawkish line supporting the Pound.
- Interest rate-setter Megan Greene, for example, expressed concerns about persistently high inflation last week, indicating that interest rates might need to remain elevated for an extended duration.
- The market view of the course of future interest rates in the UK, however, has turned more dovish in line with most of the rest of the world. Traders in interest rate futures now see a relatively high chance of the BoE cutting interest rates by 0.75% in 2024.
Swiss Franc technical analysis: GBP/CHF bouncing from range lows
GBP/CHF – the number of Swiss Francs that one Pound Sterling can buy – is in a sideways trend on short and long timeframes, whilst the medium-term trend could be classified as very marginally bullish.
The pair is bouncing up and down within the parameters of a range-corridor between 1.0990 and 1.1155 on the 4-hour chart used for short-term chart analysis.
-638375615192706901.png)
Pound Sterling vs Swiss Franc: 4-hour Chart
It has probably found a floor at the lows of this range after a string of bearish days. The pair turned around on Thursday after posting a bullish Doji Star Japanese candlestick formation (rectangle in chart above). This is a short-term bullish signal.
It is possible to see the outline of a complete measured move in the zig-zag of price action down from the November 29 high, with wave C completing at the low of the Doji Star pattern.
The MACD has risen above its signal line whilst well below the zero-line, further adding weight to the short-term bullish outlook. Indeed, looked at throughout December, the MACD looks like it might have formed a wide double-bottom bullish reversal pattern, further amplifying the strength of the current crossover buy signal.
All in all, the short-term chart suggests the GBP/CHF pair is turning around at the bottom of a range and beginning a bullish ascent back up to the range highs at 1.1155. A break above the 1.1040 level would provide increased confirmatory evidence a new leg higher was underway.
Swiss Franc FAQs
What key factors drive the Swiss Franc?
The Swiss Franc (CHF) is Switzerland’s official currency. It is among the top ten most traded currencies globally, reaching volumes that well exceed the size of the Swiss economy. Its value is determined by the broad market sentiment, the country’s economic health or action taken by the Swiss National Bank (SNB), among other factors. Between 2011 and 2015, the Swiss Franc was pegged to the Euro (EUR). The peg was abruptly removed, resulting in a more than 20% increase in the Franc’s value, causing a turmoil in markets. Even though the peg isn’t in force anymore, CHF fortunes tend to be highly correlated with the Euro ones due to the high dependency of the Swiss economy on the neighboring Eurozone.
Why is the Swiss Franc considered a safe-haven currency?
The Swiss Franc (CHF) is considered a safe-haven asset, or a currency that investors tend to buy in times of market stress. This is due to the perceived status of Switzerland in the world: a stable economy, a strong export sector, big central bank reserves or a longstanding political stance towards neutrality in global conflicts make the country’s currency a good choice for investors fleeing from risks. Turbulent times are likely to strengthen CHF value against other currencies that are seen as more risky to invest in.
How do decisions of the Swiss National Bank impact the Swiss Franc?
The Swiss National Bank (SNB) meets four times a year – once every quarter, less than other major central banks – to decide on monetary policy. The bank aims for an annual inflation rate of less than 2%. When inflation is above target or forecasted to be above target in the foreseeable future, the bank will attempt to tame price growth by raising its policy rate. Higher interest rates are generally positive for the Swiss Franc (CHF) as they lead to higher yields, making the country a more attractive place for investors. On the contrary, lower interest rates tend to weaken CHF.
How does economic data influence the value of the Swiss Franc?
Macroeconomic data releases in Switzerland are key to assessing the state of the economy and can impact the Swiss Franc’s (CHF) valuation. The Swiss economy is broadly stable, but any sudden change in economic growth, inflation, current account or the central bank’s currency reserves have the potential to trigger moves in CHF. Generally, high economic growth, low unemployment and high confidence are good for CHF. Conversely, if economic data points to weakening momentum, CHF is likely to depreciate.
How does the Eurozone monetary policy affect the Swiss Franc?
As a small and open economy, Switzerland is heavily dependent on the health of the neighboring Eurozone economies. The broader European Union is Switzerland’s main economic partner and a key political ally, so macroeconomic and monetary policy stability in the Eurozone is essential for Switzerland and, thus, for the Swiss Franc (CHF). With such dependency, some models suggest that the correlation between the fortunes of the Euro (EUR) and the CHF is more than 90%, or close to perfect.
- Mexican Peso reverses its course and registers losses as the USD/MXN hovers near the 100-day Simple Moving Average (SMA).
- Mexico's inflation ticked up in November, which could prevent Banxico from easing policy as soon as they projected.
- US labor market data revealed during the week continued to cool down; USD/MXN traders eye US Nonfarm Payrolls.
Mexican Peso (MXN) is dipping modestly against the US Dollar (USD) in early trading during Thursday's New York session. Economic data from Mexico suggests the Bank of Mexico (Banxico) would likely need to keep interest rates higher, not just for “some time,” as the central bank stated in its latest monetary policy statement, which could keep the USD/MXN trading below the 18.00 figure. At the time of writing, the exotic pair changes hands at 17.32 and gains 0.30%.
Mexico's National Statistics Agency (INEGI) revealed that inflation rose in November, though core readings dipped. The USD/MXN has been underpinned by a rise in US Treasury bond yields. However, the Greenback (USD) remains weak, as shown by the US Dollar Index (DXY), which is down 0.33% on the day at 103.81.
Daily digest market movers: Mexican Peso on the backfoot despite rising inflation in Mexico
- Mexico's Consumer Price Index (CPI) in November rose 4.32% YoY, exceeding September’s 4.26%, though still below the forecast of 4.40%. The Core CPI, usually sought by central banks as a more stable measure of price stability, slowed from 5.5% to 5.30% in the twelve months to November, below forecasts of 5.34%.
- In recent interviews, Banxico's Governor Victoria Rodriguez Ceja and Deputy Governor Jonathan Heath commented that they could ease policy if the disinflation process advances. Contrarily to that, Deputy Governor Irene Espinosa pushed back and said inflationary risks remain and are growing.
- In the US, the labor market continues to cool down due to recently released data. The US Challenger Job Cuts revealed that US employers cut 45.51K jobs, exceeding October’s 36.836K.
- In the same tenor, Initial Jobless Claims for the week ending December 2 came at 220K, below estimates of 222K but above the prior week’s 219K.
- Jobless claims, summed to the latest JOLTs and ADP figures, added to softer inflation readings, led financial markets to conclude the Federal Reserve (Fed) has ended its tightening cycle. Therefore, market participants had already begun to price in more than 100 bps of cuts for 2024
- Money market futures projects the US Federal Reserve would slash rates by 135 basis points toward December 2024.
Technical Analysis: Mexican Peso weakens against the US Dollar as the USD/MXN struggles around the 100-day SMA, key resistance level
The USD/MXN edges up and meanders at around the 100-day SMA at 17.38, which, once cleared, could open the door for a move toward the psychological 17.50 figure. If buyers reclaim the latter, the 200-day SMA at 17.55 will be exposed, followed by the 50-day SMA at 17.67.
Conversely, if USD/MXN remains below the 100-day SMA, the downtrend would remain intact, with the first support level seen at the current week’s low of 17.16. Once cleared, the next demand area would be the 17.00/05 range.
Mexican Peso FAQs
What key factors drive the Mexican Peso?
The Mexican Peso (MXN) is the most traded currency among its Latin American peers. Its value is broadly determined by the performance of the Mexican economy, the country’s central bank’s policy, the amount of foreign investment in the country and even the levels of remittances sent by Mexicans who live abroad, particularly in the United States. Geopolitical trends can also move MXN: for example, the process of nearshoring – or the decision by some firms to relocate manufacturing capacity and supply chains closer to their home countries – is also seen as a catalyst for the Mexican currency as the country is considered a key manufacturing hub in the American continent. Another catalyst for MXN is Oil prices as Mexico is a key exporter of the commodity.
How do decisions of the Banxico impact the Mexican Peso?
The main objective of Mexico’s central bank, also known as Banxico, is to maintain inflation at low and stable levels (at or close to its target of 3%, the midpoint in a tolerance band of between 2% and 4%). To this end, the bank sets an appropriate level of interest rates. When inflation is too high, Banxico will attempt to tame it by raising interest rates, making it more expensive for households and businesses to borrow money, thus cooling demand and the overall economy. Higher interest rates are generally positive for the Mexican Peso (MXN) as they lead to higher yields, making the country a more attractive place for investors. On the contrary, lower interest rates tend to weaken MXN.
How does economic data influence the value of the Mexican Peso?
Macroeconomic data releases are key to assess the state of the economy and can have an impact on the Mexican Peso (MXN) valuation. A strong Mexican economy, based on high economic growth, low unemployment and high confidence is good for MXN. Not only does it attract more foreign investment but it may encourage the Bank of Mexico (Banxico) to increase interest rates, particularly if this strength comes together with elevated inflation. However, if economic data is weak, MXN is likely to depreciate.
How does broader risk sentiment impact the Mexican Peso?
As an emerging-market currency, the Mexican Peso (MXN) tends to strive during risk-on periods, or when investors perceive that broader market risks are low and thus are eager to engage with investments that carry a higher risk. Conversely, MXN tends to weaken at times of market turbulence or economic uncertainty as investors tend to sell higher-risk assets and flee to the more-stable safe havens.
- The Dollar extends its reversal as US Jobless Claims increase.
- These figures confirm the view that the US labor market is deteriorating.
- EUR/USD remains bearish while below 1.0850.
The Euro bounced up ahead of Thursday’s session opening times with the US Dollar extending its reversal. US Jobless claims have confirmed that the labor market is losing steam.
Claims for unemployment insurance in the US increased to 220,000 in the last week of November, up from 218,000 claims in the previous week.
This confirms the trend suggested by the US Jolts openings and the ADP report earlier this week and backs the narrative of softer economic growth and weaker employment consistent with the theory that the Federal Reserve might start to roll back its tightening cycle in the first quarter of 2024.
From a wider perspective, the picture remains little changed, with the near-term bearish bias intact while below 1.0800 and 1.0860. On the downside, 1.0750 is likely to provide support ahead of 1.0660.
Technical levels to watch
- Initial Jobless Claims in the US increased by 1,000 in the week ending December 2.
- US Dollar Index stays under modest bearish pressure slightly below 104.00.
There were 220,000 initial jobless claims in the week ending December 2, the weekly data published by the US Department of Labor (DOL) showed on Thursday. This print followed the previous week's print of 219,000 (revised from 218,000) and came in slightly better than the market expectation of 222,000.
Further details of the publication revealed that the advance seasonally adjusted insured unemployment rate was 1.2% and the 4-week moving average stood at 220,750, an increase of 500 from the previous week's revised average.
"The advance number for seasonally adjusted insured unemployment during the week ending November 25 was 1,861,000, a decrease of 64,000 from the previous week's revised level." the publication read.
Market reaction
The US Dollar Index stays in its daily range above slightly below 104.00 after this data.
- The USD keeps trimming losses against a weaker CAD.
- The Bank of Canada kept rates on hold for the fourth consecutive time
- Lower Oil prices are increasing negative pressure on the loonie.
The US Dollar keeps trimming recent losses with the Canadian Dollar weighed by the low oil prices and the decision of the Bank of Canada to keep rates on hold for the fourth consecutive time.
US employment data on focus
Investors are now looking to the US Jobless claims, which are expected to have increased to 222.000 last week from 218,000 in the previous one, confirming that the US labour market is losing strength.
The impact on the US Dollar, however, is expected to be limited, with traders likely to remain on the sidelines, awaiting Friday’s Nonfarm Payrolls report for more info about the Federal Reserve’s monetary policy plans.
In Canada, the BoC reaffirmed its commitment to hike rates further if necessary although it toned down its hawkish message observing that the slowdown in the economy is cooling inflationary pressures. This has been seen as a sign that interest rates may have peaked.
The immediate bias remains positive with bulls likely to meet an important resistance at 1.3620 ahead of 1.3660. Supports are 1.3550 and the mentioned low at 1.3480.
Technical levels to watch
- Hopes that the BoJ will exit its-ultra-loose policy have boosted the Yen.
- BoJ governor Ueda meets the Japanese PM after discussing options for a major policy shift.
- The Euro might see some recovery from heavily oversold levels.
The Euro extended losses on Thursday, with the Japanese Yen boosted by speculation about a BoJ pivot which has pushed the pair to two-month lows ruth below 156.00, with RSI showing oversold levels in most timeframes.
Ueda’s comments fuel hopes of a BoJ pivot
Investors have ramped up bets that the Bank of Japan would be ready to put an end to its negative rate policy after Governor Ueda commented the diverse options available to exit its ultra-loose policy.
Somewhat later the head of the Japanese Central Bank visited Prime Minister Kishida, which boosted hopes that the bank might signal the policy shift at December’s meeting.
In contrast, the dovish remarks from ECB member and Governor of the Bank of France, François Villeroy have heightened hopes that the European Central Bank has reached its terminal rate, adding negative pressure on the Euro.
Technical indicators show the pair under strong bearish pressure although the strongly overbought levels allow for a corrective rebound. Resistances are at 157.00 and 157.75. Supports remain at 155.55 and 154.20.
Technical levels to watch
- The US Dollar sinks over 1% against the Japanese Yen.
- Traders brace for jobless claims and Challenger Job Cuts data.
- The US Dollar Index could close above 104.00, on track to return to October levels.
The US Dollar (USD) is facing a blow from the Japanese Yen after Bank of Japan’s (BoJ) Chairman Kazuo Ueda signalled to the markets that a change in monetary policy is coming. The Bank of Japan has kept rates negative for multiple decades, though an end is appearing to be near. The result is that the Japanese Yen is up over 1.25% against the Greenback, which tips the US Dollar Index (DXY) in its turn in the red and snaps this week’s winning streak.
On the economic front, traders can further assess the healthiness of the US jobs market ahead of the actual US Nonfarm Payrolls Jobs report on Friday. The weekly Jobless Claims will be getting the most focus, together with the Challenger Job Cuts. Should a sudden rise in Job Cuts be noticed, that could mean that the recession is underway.
Daily digest: BoJ surprises markets
- Bank of Japan’s Chairman Kazuo Ueda has hit a nerve in markets in Asian trading hours, after alluding that a change in monetary policy might be at hand in the next central bank rate decision on December 16th. Analysts are expecting that the BoJ might end its decade-long trend of negative rates.
- Around 12:30 GMT the Challenger Job Cuts will be released. Previous was for -36,836. A substantial uptick could be bad for the Greenback as bets for a recession or quicker cuts from the US Federal Reserve will trigger US Dollar weakness.
- Near 13:30 GMT the weekly Jobless Claims are due to be released:
- Initial Claims are expected to rise from 218,000 to 222,000.
- Continuing Jobless Claims are expected to fall from 1,927,000 to 1,910,000.
- Around 15:00 GMT the lighter Wholesale Inventories are due to be released for October. Previous was -0.2% with again -0.2% expected.
- Consumer Credit Change for October will be released near 20:00 GMT with a previous outstanding credit debt of $9.06 billion. The forecast is for a decrease to $9 billion.
- Equities are dropping like a stone after the surprise comment from the BoJ. Both the Nikkei and the Topix, leading Japan indices, have closed over 1% in the red. European markets are marginally in the red with US futures flat ahead of the US opening bell.
- The CME Group’s FedWatch Tool shows that markets are pricing in a 97.7% chance that the Federal Reserve will keep interest rates unchanged at its meeting next week.
- The benchmark 10-year US Treasury Note drops to 4.16%. Yields in Europe, however, are falling even quicker and widening the gap with US Yields.
US Dollar Index technical analysis: Not according to plan
The US Dollar retreats firmly this Thursday in early trading, after the BoJ rattled markets with a surprise comment that might mean the end of negative rates on the island. The US Dollar drops over 1% against the Japanese Yen and in its turn is dragging the US Dollar Index (DXY) to the downside. This decline ahead of the US Jobs Report could be the window of opportunity US Dollar bulls are looking for to add to US Dollar positions.
The DXY printed a new third consecutive high on Wednesday, which is what bulls are looking for as confirmation of a winning streak. The DXY could still make it further up, should employment data trigger rising US yields again. A two-tiered pattern of a daily close lower followed by an opening higher would quickly see the DXY back above 104.28, with the 55-day and 100-day Simple Moving Averages (SMA) turned over to support levels.
To the downside, the 200-day SMA should act as support and not allow the DXY to drop below 103.56. If it fails, the lows of June make sense to look for some support near 101.92. Should more events take place that initiate further declines in US rates, expect to see a near-full unwind of the 2023 summer rally, heading to 100.82, followed by 100.00 and 99.41.
Bank of Japan FAQs
What is the Bank of Japan?
The Bank of Japan (BoJ) is the Japanese central bank, which sets monetary policy in the country. Its mandate is to issue banknotes and carry out currency and monetary control to ensure price stability, which means an inflation target of around 2%.
What has been the Bank of Japan’s policy?
The Bank of Japan has embarked in an ultra-loose monetary policy since 2013 in order to stimulate the economy and fuel inflation amid a low-inflationary environment. The bank’s policy is based on Quantitative and Qualitative Easing (QQE), or printing notes to buy assets such as government or corporate bonds to provide liquidity. In 2016, the bank doubled down on its strategy and further loosened policy by first introducing negative interest rates and then directly controlling the yield of its 10-year government bonds.
How do Bank of Japan’s decisions influence the Japanese Yen?
The Bank’s massive stimulus has caused the Yen to depreciate against its main currency peers. This process has exacerbated more recently due to an increasing policy divergence between the Bank of Japan and other main central banks, which have opted to increase interest rates sharply to fight decades-high levels of inflation. The BoJ’s policy of holding down rates has led to a widening differential with other currencies, dragging down the value of the Yen.
Is the Bank of Japan’s ultra-loose policy likely to change soon?
A weaker Yen and the spike in global energy prices have led to an increase in Japanese inflation, which has exceeded the BoJ’s 2% target. Still, the Bank judges that the sustainable and stable achievement of the 2% target has not yet come in sight, so any sudden change in the current policy looks unlikely.
- Australian Dollar's recovery is losing steam at 0.6570 area.
- Weak China's data is adding pressure on the Aussie.
- The technical picture remains bearish while below 0.6595.
The Aussie bounced up from two-week lows at 0.6520 on Thursday, favoured by a moderate US DOllar reversal although the negative risk sentiment is capping bulls at the upper range of 0.6500.
Concerns about China are weighing on the Aussie
Earlier on Thursday, China’s trade balance data failed to offset concerns about the financial stability of the Asian main economy triggered by Moody’s warning.
Beyond that, Australian trade data has failed to boost investors' optimism. Exports nudged up 0.4% with Exports dropping 1.9% and the trade surplus increasing well below expectations.
The weak domestic data and reactivated concerns about China;s economy are boosting bets that the RBA will have to cut rates in 2024. This is likely to act as a headwind for the Aussie.
AUD/USD Technical analysis
The technical picture shows the pair in a corrective retracement from last week’s highs at 0.669 with price action below the 4h 50 and 100-SMAs, and oscillators in negative territory.
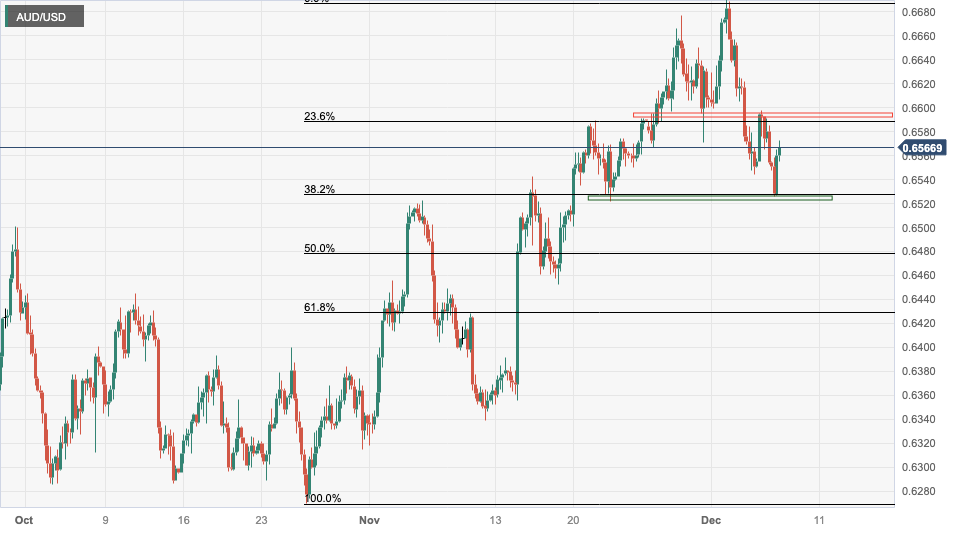
Next support is at 0.6520 and below here, 0.6480. On the upside, the pair should breach the previous lower high, at 0.6595 to ease downside pressure.
- Natural Gas faces more downside pressures as Gaza risk remains contained.
- Natural Gas prices already lost over $1 value from its peak in November.
- The US Dollar snaps its three-day-winning streak after BoJ surprise comments.
Natural Gas (XNG/USD) is nose diving as markets are being swamped with cheap Gas from all angles. The fact that there is such oversupply comes first and foremost from the uninterrupted gasflow coming from the Middle East. At the start of the Gaza conflict, several Gas exporters started to shore up production, which now creates an oversupply as Gas is flowing from all channels into Europe.
Meanwhile, the US Dollar (USD) is facing a brief hiccup in its rally this week. The Central Bank of Japan (BoJ) has issued a message to the markets that there might be an end to its decade-long negative rate regime. The Japanese Yen rallied over 1.5% against the Greenback in Asian trading and is still holding on to those gains, while traders brace for the weekly US Jobless numbers.
Natural Gas is trading at $2.48 per MMBtu at the time of writing.
Natural Gas market movers: Oversupply during winter
- A split view on gas prices this Thursday as European futures are up over 3%, while US futures are down over 2%. The European Gas prices are popping higher as European gas reserves are under a bit of pressure due to the cold front in Europe.
- A Bloomberg report published on December 7 revealed a Liquified Natural Gas (LNG) surplus until at least 2025. The surplus comes from several market participants having increased their supply in order to take the place of the Russian supply towards Europe.
- Norwegian Gas flow is heading toward Europe at the largest volume above the five-day moving average.
- Gaza tensions remain contained for now, with the conflict not endangering the Gas flow out of the Middle East to Europe.
- At 15:30 GMT the US Energy Information Administration (EIA) will release the weekly Gas storage numbers. Previous number was a build of 10 billion cubic metres of Gas. A drawdown of 105 billion is expected. The estimates range between a drawdown of 102 minimum to a 119 maximum billion cubic metres.
Natural Gas Technical Analysis: Cold just a drop on a hot plate
Natural Gas in the US is nose diving alongside the decline in Crude Oil prices. The US is flooding the energy complex with supply, which is already running at a surplus with no bottlenecks at hand in the Middle East despite the Gaza tensions. Expectations are to see more downside as supply is likely to be persistent and not face any issues in the nearterm.
Sentiment could quickly change overnight, when for example Gaza tensions do spill over into the wider Middle East, or should a severe winter erode all European Gas reserves ahead of spring, Natural Gas could edge up to $3.00 as the level to watch. Just above, the 100-day Simple Moving Average (SMA) at $3.01, could throw a brief spanner in the works. Once bulls have dealt with a break above this 100-day SMA, look for $3.06 and $3.20 as next profit levels on the upside.
With the support of the 200-day SMA gone now, a further decline will target two intermediary levels on the downside. The purple line near $2.57, which triggered a bounce on August 24, has been broken as well. The low of the summer near $2.48 is trying to halt the decline for now, before Gas prices might sink to $2.10.
-638375431301348880.png)
XNG/USD (Daily Chart)
Natural Gas FAQs
What fundamental factors drive the price of Natural Gas?
Supply and demand dynamics are a key factor influencing Natural Gas prices, and are themselves influenced by global economic growth, industrial activity, population growth, production levels, and inventories. The weather impacts Natural Gas prices because more Gas is used during cold winters and hot summers for heating and cooling. Competition from other energy sources impacts prices as consumers may switch to cheaper sources. Geopolitical events are factors as exemplified by the war in Ukraine. Government policies relating to extraction, transportation, and environmental issues also impact prices.
What are the main macroeconomic releases that impact on Natural Gas Prices?
The main economic release influencing Natural Gas prices is the weekly inventory bulletin from the Energy Information Administration (EIA), a US government agency that produces US gas market data. The EIA Gas bulletin usually comes out on Thursday at 14:30 GMT, a day after the EIA publishes its weekly Oil bulletin. Economic data from large consumers of Natural Gas can impact supply and demand, the largest of which include China, Germany and Japan. Natural Gas is primarily priced and traded in US Dollars, thus economic releases impacting the US Dollar are also factors.
How does the US Dollar influence Natural Gas prices?
The US Dollar is the world’s reserve currency and most commodities, including Natural Gas are priced and traded on international markets in US Dollars. As such, the value of the US Dollar is a factor in the price of Natural Gas, because if the Dollar strengthens it means less Dollars are required to buy the same volume of Gas (the price falls), and vice versa if USD strengthens.
- Gold appreciates as bets of rate cuts in early 2024 extend to most of the major central banks.
- The cautious market sentiment is providing an additional support to the precious metal
Gold price (XAU/USD) keeps a mild buying tone in Thursday’s early European session, with price action approaching the top of the last few days’ trading range.
Investors are increasingly confident that the major central banks’ tightening era is over and speculation that rate cuts might come before previously thought is keeping bullion sellers in check.
The Federal Reserve (Fed) is widely expected to leave rates on hold at their monetary policy meeting next week, with the market pricing in a 50% chance that rate cuts will start in March Next year.
Investors expect the European Central Bank (ECB) to stand pat on December 14 and to cut rates by 150 points next year, starting in March.
Earlier this week, the Bank of Canada (BoC) and the Reserve Bank of Australia (RBA) hit the pause button, adding to evidence that the tightening cycles are coming to an end.
In the macroeconomic domain, Thursday’s ADP Employment data confirmed that the US labor market is loosening. The focus is now on Friday’s Nonfarm Payrolls report to confirm that view.
Daily Digest Market Movers: Hopes of rate cuts and lower US yields keep Gold buoyed
- US ADP Employment data confirmed that the labor market is loosening and bolstered hopes that the Fed might be forced to cut rates ahead of schedule.
- Investors are now looking at Friday’s Nonfarm Payrolls. Another downbeat reading here might boost hopes of Fed rate cuts in early 2024 which would push Gold higher.
- The CME Group Fed Watch tool prices a 99% chance that the Fed will hold rates next week and a 50% probability of a 25 bps rate cut in March 2024.
- Moody’s warning to China’s debt credit rating has reactivated fears about the stability of the world’s second-largest economy, weighing on market sentiment and providing additional support to the safe-haven gold.
- The US Dollar has pulled back from Wednesday’s highs, as US yields remain depressed at three-month lows although it remains on track to a significant weekly recovery.
- On the docket today, US Weekly Initial Jobless Claims, are expected to have increased from 218K to 222K during the week of December 1, adding to the narrative of a softer US labor market.
Technical Analysis: Gold prices consolidate with resistance at $2,040 limiting bulls
The technical picture shows the XAU/USD pair looking for direction, moving within a narrow range, supported above the key $2,000 level, yet unable to find any meaningful acceptance when it approaches the $2,040 level.
A look at the four-hour chart and we see price action capped below the 50-period SMA. The RSI wavering around the 50 line, which suggests a lack of clear direction with investors awaiting the release of Friday’s Nonfarm Payrolls report.
From a wider perspective, the longer-term bullish trend from early October lows remains intact.
Immediate resistance remains at $2,040, which guards the path towards $2,067, ahead of the record-high $2,150. On the downside, a confirmation below $2,000 would negate the bullish view and add bearish pressure towards $1,950 and $1,932.
Gold FAQs
Why do people invest in Gold?
Gold has played a key role in human’s history as it has been widely used as a store of value and medium of exchange. Currently, apart from its shine and usage for jewelry, the precious metal is widely seen as a safe-haven asset, meaning that it is considered a good investment during turbulent times. Gold is also widely seen as a hedge against inflation and against depreciating currencies as it doesn’t rely on any specific issuer or government.
Who buys the most Gold?
Central banks are the biggest Gold holders. In their aim to support their currencies in turbulent times, central banks tend to diversify their reserves and buy Gold to improve the perceived strength of the economy and the currency. High Gold reserves can be a source of trust for a country’s solvency. Central banks added 1,136 tonnes of Gold worth around $70 billion to their reserves in 2022, according to data from the World Gold Council. This is the highest yearly purchase since records began. Central banks from emerging economies such as China, India and Turkey are quickly increasing their Gold reserves.
How is Gold correlated with other assets?
Gold has an inverse correlation with the US Dollar and US Treasuries, which are both major reserve and safe-haven assets. When the Dollar depreciates, Gold tends to rise, enabling investors and central banks to diversify their assets in turbulent times. Gold is also inversely correlated with risk assets. A rally in the stock market tends to weaken Gold price, while sell-offs in riskier markets tend to favor the precious metal.
What does the price of Gold depend on?
The price can move due to a wide range of factors. Geopolitical instability or fears of a deep recession can quickly make Gold price escalate due to its safe-haven status. As a yield-less asset, Gold tends to rise with lower interest rates, while higher cost of money usually weighs down on the yellow metal. Still, most moves depend on how the US Dollar (USD) behaves as the asset is priced in dollars (XAU/USD). A strong Dollar tends to keep the price of Gold controlled, whereas a weaker Dollar is likely to push Gold prices up.
Economic Indicator
United States Nonfarm Payrolls
The Nonfarm Payrolls release presents the number of new jobs created in the US during the previous month in all non-agricultural businesses; it is released by the US Bureau of Labor Statistics (BLS). The monthly changes in payrolls can be extremely volatile. The number is also subject to strong reviews, which can also trigger volatility in the Forex board. Generally speaking, a high reading is seen as bullish for the US Dollar (USD), while a low reading is seen as bearish, although previous months' reviews and the Unemployment Rate are as relevant as the headline figure. The market's reaction, therefore, depends on how the market assesses all the data contained in the BLS report as a whole.
Read more.Next release: 12/08/2023 13:30:00 GMT
Frequency: Monthly
Source: US Bureau of Labor Statistics
Why it matters to traders
America’s monthly jobs report is considered the most important economic indicator for forex traders. Released on the first Friday following the reported month, the change in the number of positions is closely correlated with the overall performance of the economy and is monitored by policymakers. Full employment is one of the Federal Reserve’s mandates and it considers developments in the labor market when setting its policies, thus impacting currencies. Despite several leading indicators shaping estimates, Nonfarm Payrolls tend to surprise markets and trigger substantial volatility. Actual figures beating the consensus tend to be USD bullish.
- The Eurozone economy stalled in the third quarter.
- EUR/USD remains capped below 1.0800 on the disappointing Eurozone GDP data.
The Eurozone economy unexpectedly stalled in the third quarter of 2023, the final estimate published by Eurostat showed on Thursday.
On a quarterly basis, the Gross Domestic Product (GDP) in the old continent stood at 0% in the three months to September of this year. The preliminary figure showed a 0.1% growth during the reported period. The market expected a 0.1% figure.
On an annual basis, the bloc’s GDP contracted 0.1%, at the same pace as that seen in the first readout, in line with the market forecast.
Eurozone’s Final Employment Change came in at 0.2% and 1.3% on a quarterly and yearly basis respectively.
Market reaction
The Euro is bearing the brunt of the discouraging Eurozone data, with EUR/USD easing from intraday highs of 1.0785 to now trade at 1.0773. The pair is still up 0.11% on the day.
Gold prices rose in India on Thursday, according to data from India's Multi Commodity Exchange (MCX).
Gold price stood at 62,127 Indian Rupees (INR) per 10 grams, up INR 82 compared with the INR 62,045 it cost on Wednesday.
As for futures contracts, Gold prices increased to INR 62,577 per 10 gms from INR 62,440 per 10 gms.
Prices for Silver futures contracts decreased to INR 74,900 per kg from INR 74,831 per kg.
| Major Indian city | Gold Price |
|---|---|
| Ahmedabad | 64,280 |
| Mumbai | 64,040 |
| New Delhi | 64,205 |
| Chennai | 64,280 |
| Kolkata | 64,190 |
Global Market Movers: Comex Gold price cheers Fed rate cut bets and weaker US Dollar
- The weaker US employment data released this week reinforced expectations that the Federal Reserve is done raising interest rates and continues to act as a tailwind for the Comex Gold price.
- The Labor Department's JOLTS report showed on Tuesday that job openings fell to more than a 2-1/2-year low in October, signaling that interest rates were dampening demand for workers.
- The ADP report also pointed to signs of a cooling jobs market and indicated that private payrolls rose by 103K in November, down from the previous month's downwardly revised reading of 106K.
- The current market pricing suggests a two-in-three chance of a rate cut by March, which has pushed down the US bond yields to a three-month low and further lend support to the XAU/USD.
- The mixed Trade Balance data from China showed that imports unexpectedly declined by 0.6% in November, fueling concerns about weak domestic demand amid looming recession risks.
- Israel launched the next phase of its ground offensive against the Palestinian group – Hamas – to the south of the Gaza Strip and intensified strikes around Gaza’s second-largest city, Khan Younis.
- The US Dollar retreats sharply from a two-week high touched on Wednesday and acts as a tailwind for the commodity, though bulls seem reluctant to place fresh bets ahead of US NFP on Friday.
- The crucial US monthly employment details will influence the Fed's near-term policy outlook, which, in turn, will drive the USD demand and provide a fresh impetus to the commodity.
- Traders now look to the US Weekly Initial Jobless Claims, expected to show that individuals filing unemployment insurance for the first time rose from 218K to 222K during the week of December 1.
(An automation tool was used in creating this post.)
Gold FAQs
Why do people invest in Gold?
Gold has played a key role in human’s history as it has been widely used as a store of value and medium of exchange. Currently, apart from its shine and usage for jewelry, the precious metal is widely seen as a safe-haven asset, meaning that it is considered a good investment during turbulent times. Gold is also widely seen as a hedge against inflation and against depreciating currencies as it doesn’t rely on any specific issuer or government.
Who buys the most Gold?
Central banks are the biggest Gold holders. In their aim to support their currencies in turbulent times, central banks tend to diversify their reserves and buy Gold to improve the perceived strength of the economy and the currency. High Gold reserves can be a source of trust for a country’s solvency. Central banks added 1,136 tonnes of Gold worth around $70 billion to their reserves in 2022, according to data from the World Gold Council. This is the highest yearly purchase since records began. Central banks from emerging economies such as China, India and Turkey are quickly increasing their Gold reserves.
How is Gold correlated with other assets?
Gold has an inverse correlation with the US Dollar and US Treasuries, which are both major reserve and safe-haven assets. When the Dollar depreciates, Gold tends to rise, enabling investors and central banks to diversify their assets in turbulent times. Gold is also inversely correlated with risk assets. A rally in the stock market tends to weaken Gold price, while sell-offs in riskier markets tend to favor the precious metal.
What does the price of Gold depend on?
The price can move due to a wide range of factors. Geopolitical instability or fears of a deep recession can quickly make Gold price escalate due to its safe-haven status. As a yield-less asset, Gold tends to rise with lower interest rates, while higher cost of money usually weighs down on the yellow metal. Still, most moves depend on how the US Dollar (USD) behaves as the asset is priced in dollars (XAU/USD). A strong Dollar tends to keep the price of Gold controlled, whereas a weaker Dollar is likely to push Gold prices up.
- The Pound tumbles against a stronger Yen.
- Ueda’s comments suggest that the BoJ will exit its ultra-loose policy.
- The negative risk sentiment adds pressure on the pair.
The Pound is dropping sharply against the JPY on Thursday, as comments from BoG governor Ueda have boosted hopes that the bank is ready to exit its ultra-loose monetary policy.
Ueda has mentioned the different monetary policy tools to exit the negative rates policy before meeting Japanese Prime Minister Kishida. This has been seen as the confirmation of a shift in the bank’s monetary policy which has sent the yen surging across the board.
In the UK, BoE Governor Bailey reaffirmed the bank’s commitment to keep its benchmark rate at the current levels for a long time although he acknowledged the risks for the financial stability of this policy.
Beyond that, the sour market sentiment, as Moody’s downgrade of China’s credit outlook reactivated concerns about a global economic slowdown is adding negative pressure on the pair.
Technical indicators are bearish although the strong oversold RSI suggests the possibility of a corrective reaction. Supports are at 182.00 and 181.10. On the upside, the pair might find resistance at 182.70 and 184.55.
Technical levels to watch
- Pound’s recovery attempts are likely to meet strong resistance at 1.2600.
- The weak ADP report failed to hit the US Dollar.
- The pair is under pressure after confirming a double-top at 1.2730.
The Pound’s is trying to regain some ground in early European session after bouncing from session lows at 1.2540 although 1.2600 seems a tough resistance area.
Sterling’s bears remain in control after the pair accelerated its reversal from three-month highs above 1.2700 on Thursday. The sourer market sentiment on heightened fears about a global economic slowdown in 2024 is underpinning support on the safe-haven Dollar.
The weaker US ADP employment report failed to dampen confidence in the USD, which is on track to a significant recovery this week, as bets of monetary easing extend to most of the world's major central banks. Investors are now looking at Friday's Nonfarm Payrolls report for more cues into the US labour market.
In the UK BoE Governour Bailey maintained the need to keep interest rates at the current levels for some time although he mentioned the risks for financial stability and noted the challenges to the global economy from the uncertainty about China.
The technical picture is bearish. Below 1.2600, the pair has confirmed a double-top at 1.2730 increasing negative pressure towards 1.2517 and 1.2460.
Technical levels to watch
FX option expiries for Dec 7 NY cut at 10:00 Eastern Time, via DTCC, can be found below.
- EUR/USD: EUR amounts
- 1.0750 712m
- 1.077 755m
- 1.0825 874m
- 1.0840 732m
- GBP/USD: GBP amounts
- 1.2485 562m
- USD/JPY: USD amounts
- 147.00 726m
- 147.35 570m
- 148.00 515m
- USD/CHF: USD amounts
- 0.8835 320m
- 0.8880 232m
- AUD/USD: AUD amounts
- 0.6425 1.1b
- 0.6445 2.7b
- 0.6650 2.3b
- USD/CAD: USD amounts
- 1.3550 615m
- 1.3600 562m
NZD/USD: NZD amounts
- 0.6150 814m
- EUR/GBP: EUR amounts
- 0.8665 381m
- EUR/USD states a modest recovery from a multi-week low touched earlier this Thursday.
- Fed rate cut bets and a strong pickup in the JPY demand prompt some USD profit-taking.
- A softer risk tone should limit the USD losses and cap the pair amid dovish ECB rhetorics.
The EUR/USD pair attracts some buyers in the vicinity of mid-1.0700s, or its lowest level since November 14 touched earlier this Thursday and for now, seems to have snapped a six-day losing streak. Spot prices stick to modest intraday gains around the 1.0775-1.0780 region through the early European session amid a weaker US Dollar (USD), though lack bullish conviction.
The USD pullback from a two-week high touched on Wednesday could be attributed to some profit-taking on the back of dovish Federal Reserve (Fed) expectations. Apart from this, a strong pickup in demand for the Japanese Yen (JPY) turns out to be another factor weighing on the Greenback. That said, a generally weaker tone around the equity markets should help limit losses for the safe-haven buck and cap any meaningful appreciating move for the EUR/USD pair.
Furthermore, the recent dovish rhetorics from European Central Bank (ECB) officials might hold back traders from placing fresh bullish bets around the shared currency. ECB board member Isabel Schnabel said on Tuesday that the central bank can take further rate hikes off the table given a remarkable fall in inflation and lifted rate cut bets. In fact, the markets are now pricing in the possibility of a 142 bps cumulative rate cut in 2024, which should cap the EUR/USD pair.
On the economic data front, industrial output in German – the Eurozone’s economic powerhouse – declined by 0.4% in October as against estiates for a 0.2% fall and -1.3% seen in the previous month. Market participants now look to the release of the Weekly Initial Jobless Claims data from the US for some impetus later during the early North American session, though the focus will remain glued to the NFP report on Friday. Meanwhile, the aforementioned mixed fundamental backdrop makes it prudent to wait for strong follow-through buying before confirming that the recent sharp pullback from the 1.1015 area, or over a three-month high touched in November has run its course.
Technical levels to watch
Germany’s Industrial Production extended its downtrend in October, the official data published by Destatis showed on Thursday.
Industrial output in the Eurozone’s economic powerhouse decreased by 0.4% MoM, the federal statistics authority Destatis said in figures adjusted for seasonal and calendar effects, vs. 0.2% expected and -1.3% seen in September.
On an annual basis, German Industrial Production declined 3.5% in October, compared with September’s 3.6% fall.
FX implications
The shared currency showed little reaction to the downbeat German industrial figures. The pair is trading modestly flat on the day at 1.0764, as of writing.
Here is what you need to know on Thursday, December 7:
The US Dollar (USD) Index extended its winning streak on Wednesday and advanced to its highest level in nearly three weeks above 104.00. Challenger Job Cuts for November and the weekly Initial Jobless Claims data will be featured in the US economic docket on Thursday. Earlier in the day, Eurostat will release revisions to third-quarter Gross Domestic Product growth and Employment Change.
On Wednesday, the data from the US provided more signs of a cooling labor market but the cautious market stance helped the USD preserve its strength for the third consecutive day. ADP Employment Change for November came in at 103,00 to miss the market expectation of 130,000 and Unit Labor Costs declined by 1.2% in the third quarter, at a faster pace than analysts' estimate of 0.9%. Nevertheless, Wall Street's main indexes closed in negative territory and US stock index futures struggled to gain traction in the Asian trading hours.
US Dollar price this week
The table below shows the percentage change of US Dollar (USD) against listed major currencies this week. US Dollar was the strongest against the Australian Dollar.
| USD | EUR | GBP | CAD | AUD | JPY | NZD | CHF | |
| USD | 1.16% | 1.28% | 0.86% | 2.16% | 0.10% | 1.46% | 0.91% | |
| EUR | -1.18% | 0.13% | -0.30% | 1.03% | -1.08% | 0.33% | -0.24% | |
| GBP | -1.32% | -0.12% | -0.43% | 0.89% | -1.21% | 0.18% | -0.38% | |
| CAD | -0.86% | 0.31% | 0.44% | 1.33% | -0.78% | 0.63% | 0.07% | |
| AUD | -2.21% | -1.03% | -0.90% | -1.34% | -2.14% | -0.71% | -1.27% | |
| JPY | -0.13% | 1.09% | 1.34% | 0.79% | 2.10% | 1.39% | 0.81% | |
| NZD | -1.48% | -0.31% | -0.19% | -0.61% | 0.71% | -1.38% | -0.56% | |
| CHF | -0.94% | 0.25% | 0.37% | -0.05% | 1.26% | -0.82% | 0.55% |
The heat map shows percentage changes of major currencies against each other. The base currency is picked from the left column, while the quote currency is picked from the top row. For example, if you pick the Euro from the left column and move along the horizontal line to the Japanese Yen, the percentage change displayed in the box will represent EUR (base)/JPY (quote).
Early Thursday, the General Administration of Customs of the People’s Republic of China reported that the trade surplus expanded to $68.39 billion in November from $56.53 billion. This reading surpassed analysts' estimate for a surplus of $58.1 billion. On a negative note, imports declined by 0.6% on a yearly basis in the same period. Following these readings, Hong Kong's Hang Seng Index failed to gather bullish momentum and it was last seen losing 1% on a daily basis.
The Bank of Canada (BoC) left the policy rate unchanged at 5% as expected on Wednesday. In the policy statement, the BoC noted that the economy was no longer in excess demand. USD/CAD continued to edge higher after the BoC event and was last seen trading slightly above 1.3600. Meanwhile, the barrel of West Texas Intermediate fell nearly 4% and declined below $70 for the first time since late June on Wednesday, putting additional weight on the commodity-sensitive loonie.
EUR/USD closed the sixth consecutive day in negative territory on Wednesday. Early Thursday, the pair finds it difficult to stage a rebound and trades in a tight channel slightly above 1.0750. The data from the Euro area showed that Retail Sales declined by 1.2% on a yearly basis in October.
After closing below 1.2600 on Wednesday, GBP/USD continued to stretch lower and touched its weakest level since November 24 below 1.2550. At the time of press, the pair was trading flat at around 1.2560.
Bank of Japan Governor Kazuo Ueda talked about the policy options once they move out of the ultra-loose policy on Thursday. "We could either keep the interest rate applied to reserves (financial institutions park with the central bank), or revert to a policy targeting the overnight call rate," Ueda told Japanese parliament. "There are various options. But we have not made a decision yet on which interest rate to target once we end our negative interest rate policy," he added. USD/JPY came under heavy bearish pressure on these comments and declined toward 146.00, touching its lowest level since early September in the process.
Despite the broad-based USD strength, Gold held its ground on Wednesday, supported by retreating US Treasury bond yields. Early Thursday, XAU/USD stays relatively quiet at around $2,030.
Bank of Japan (BoJ) Governor Kazuo Ueda is back on the wires on Thursday, noting that he had a regular exchange of views on economy and financial trends with Prime Minister (PM) Fumio Kishida as he did back in August.
Additional comments
No special demand from PM Kishida.
My explanation on monetary policy to PM Kishida included wage hike outlook next year.
Told PM Kishida, the BoJ hopes to check whether wages will rise sustainably, whether wage rises will push up service prices, and whether demand will be strong.
Market reaction
USD/JPY tumbled to a fresh intraday low of 146.15 following Ueda’s discussion with PM Kishida, currently trading at 146.25. The pair is losing 0.72% on the day.
- WTI extends its downside below $70.00, the lowest since July.
- China has seen arrivals of 10.33 million barrels per day (bpd), down 10.4% from October's reading.
- Oil traders are worried that OPEC+ failed to reach a unanimous agreement on production targets.
- US weekly Jobless Claims data will be due later on Thursday.
Western Texas Intermediate (WTI), the US crude oil benchmark, is trading around $69.80 on Thursday. WTI prices decline to the lowest since July as investors are worried about China’s oil demand growth and the effectiveness of the OPEC+ voluntary production cut.
According to data released on Thursday by the General Administration of Customs, China, the world's top oil importer, has seen arrivals of 10.33 million barrels per day (bpd). This figure was down 10.4% from October's 11.53 million bpd and 9.3% lower than the same month the previous year. This, in turn, has fuelled worries about the Chinese economy and exerts some selling pressure on WTI prices.
Apart from this, US crude oil inventories dropped by 4.632M barrels for the week ending December 1 from the previous reading of 1.609M rise, according to the Energy Information Agency (EIA) on Wednesday.
Oil markets are also dissatisfied that OPEC+, which includes OPEC members and allies like Russia, will be able to deliver on 2.2 million bpd production cuts in the first quarter of next year. Nonetheless, Saudi Energy Minister Prince Abdulaziz bin Salman and Russian Deputy Prime Minister Alexander Novak attempted to reassure the market this week that the announced supply cuts might be extended or perhaps deepened.
Moving on, oil traders will focus on the US weekly Jobless Claims data on Thursday, which is expected to rise by 222K for the week ending December 1. On Friday, the highly anticipated US Nonfarm Payrolls will be in the spotlight. These events could significantly impact the USD-denominated WTI price. Oil traders will take cues from the data and find trading opportunities around WTI prices.
- USD/CAD drifts higher on the firmer US Dollar.
- The Bank of Canada (BoC) maintained its key overnight rate unchanged at 5.0%.
- ADP private payrolls climbed 103K in November versus 106K prior.
- Canadian Building Permits for October and US weekly Jobless Claims will be due later on Thursday.
The USD/CAD pair trades on a stronger note during the Asian trading hours on Thursday. The rebound of the pair is bolstered by renewed US Dollar (USD) demand and the decline of oil prices. At press time, USD/CAD is trading at 1.3605, down 0.09% on the day.
On Wednesday, the Bank of Canada (BoC) maintained its key overnight rate unchanged at 5.0% at its December meeting and opened the door for additional rate hikes. The central bank cited a slowing economy and easing in price pressures such as consumer spending as evidence that tighter monetary policy is helping to lower inflation.
Money markets anticipate a rate cut as early as March, with a 25 basis point (bps) reduction by April. However, BoC Governor Tiff Macklem said that the central bank is not even thinking about easing since inflation is higher than the target.
On the other hand, analysts expect the tightening cycle is done and the Fed will hold interest rates until at least July, later than earlier thought. Data released on Wednesday revealed that ADP private payrolls climbed 103K in November versus 106K prior, weaker than the market estimation of 130K.
Looking ahead, market participants will keep an eye on the Canadian Building Permits for October. Also, the US weekly Jobless Claims data will be due, which is expected to gain 222,000. The highlight will be the US employment data on Friday. The Nonfarm Payroll (NFP) is estimated to add 185K jobs in November, and the Unemployment Rate is expected to remain steady at 3.9%. These data could give a clear direction to the USD/CAD pair.
- Gold price remains confined in a narrow trading band held over the past three days.
- A softer risk tone and bets for a Fed rate cut in March 2024 continue to lend support.
- The USD stands tall near a two-week top and caps gains ahead of US NFP on Friday.
Gold price (XAU/USD) trades with a mild positive bias during the Asian session on Thursday, albeit lacks follow-through and remains confined in a narrow range held over the past three days. The weaker JOLTS Job Openings data from the United States (US) on Tuesday, followed by the softer ADP report on Wednesday reinforced expectations that interest rates may soon start to fall, dragging the benchmark 10-year US Treasury yield to its lowest level in three months. Furthermore, dovish rhetoric from European Central Bank (ECB) officials, the Reserve Bank of Australia’s (RBA) and the Bank of Canada's (BoC) decision to hold rates steady on Tuesday and Wednesday, respectively, lifted hopes for a peak in rates globally. This, in turn, is seen as a key factor acting as a tailwind for the non-yielding yellow metal.
Meanwhile, evidence that the US jobs market is starting to slow fuels concerns about an economic downturn, which, along with the intensifying Israel-Hamas conflict, tempers investors' appetite for riskier assets. This turns out to be another factor lending some support to the safe-haven Gold price. The upside, however, remains capped in the wake of the recent US Dollar (USD) rally to a two-week high, which tends to undermine demand for the XAU/USD. Traders also seem reluctant to place fresh directional bets and prefer to wait on the sidelines ahead of the US monthly employment data, or the Nonfarm Payrolls (NFP) report on Friday. In the meantime, traders might take cues from Thursday's release of the US Weekly Initial Jobless Claims data for short-term opportunities later during the North American session.
Daily Digest Market Movers: Gold price struggles to attract any meaningful buyers despite a combination of supporting factors
- The weaker US employment data released this week reinforced expectations that the Federal Reserve is done raising interest rates and continues to act as a tailwind for the Gold price.
- The Labor Department's JOLTS report showed on Tuesday that job openings fell to more than a 2-1/2-year low in October, signaling that interest rates were dampening demand for workers.
- The ADP report also pointed to signs of a cooling jobs market and indicated that private payrolls rose by 103K in November, down from the previous month's downwardly revised reading of 106K.
- The current market pricing suggests a two-in-three chance of a rate cut by March, which has pushed down the US bond yields to a three-month low and further lend support to the XAU/USD.
- The mixed Trade Balance data from China showed that imports unexpectedly declined by 0.6% in November, fueling concerns about weak domestic demand amid looming recession risks.
- Israel launched the next phase of its ground offensive against the Palestinian group – Hamas – to the south of the Gaza Strip and intensified strikes around Gaza’s second-largest city, Khan Younis.
- The US Dollar manages to preserve its recent strong gains to a two-week high and holds back traders from placing aggressive bullish bets around the precious metal ahead of the US NFP report.
- The crucial US monthly employment details will influence the Fed's near-term policy outlook, which, in turn, will drive the USD demand and provide a fresh impetus to the commodity.
- Traders now look to the US Weekly Initial Jobless Claims, expected to show that individuals filing unemployment insurance for the first time rose from 218K to 222K during the week of December 1.
Technical Analysis: Gold price setup remains in favour of bullish traders, the $2,000 psychological mark holds the key
From a technical perspective, the weekly swing low, around the $2,010-2,009 area, which coincides with a horizontal resistance breakpoint, might continue to protect the immediate downside ahead of the $2,000 psychological mark. A convincing break below the latter might set the stage for an extension of this week's sharp retracement slide from the all-time peak and drag the Gold price to the $1,977-1,976 horizontal support. The corrective decline could get extended further towards the very important 200-day Simple Moving Average (SMA) currently near the $1,950 region.
On the flip side, the top end of a multi-day-old trading range, around the $2,035-2,038 area, is likely to act as an immediate strong barrier. This is followed by resistance near the $2,045 level, above which the Gold price could climb to the $2,071-2,072 area en route to the $2,100 round figure. Furthermore, the occurrence of a golden cross, with the 50-day Simple Moving Average rising above the 200-day SMA, suggests that bulls might eventually aim to retest the record high, around the $2,144-2,145 zone.
US Dollar price this week
The table below shows the percentage change of US Dollar (USD) against listed major currencies this week. US Dollar was the weakest against the Japanese Yen.
| USD | EUR | GBP | CAD | AUD | JPY | NZD | CHF | |
| USD | 1.16% | 1.28% | 0.85% | 2.27% | 0.26% | 1.53% | 0.88% | |
| EUR | -1.19% | 0.13% | -0.31% | 1.13% | -0.93% | 0.39% | -0.28% | |
| GBP | -1.32% | -0.12% | -0.43% | 1.00% | -1.03% | 0.26% | -0.40% | |
| CAD | -0.86% | 0.31% | 0.44% | 1.44% | -0.61% | 0.70% | 0.03% | |
| AUD | -2.32% | -1.14% | -1.02% | -1.46% | -2.08% | -0.75% | -1.43% | |
| JPY | -0.30% | 0.93% | 1.19% | 0.62% | 2.04% | 1.30% | 0.62% | |
| NZD | -1.56% | -0.38% | -0.26% | -0.69% | 0.75% | -1.29% | -0.66% | |
| CHF | -0.89% | 0.29% | 0.40% | -0.03% | 1.40% | -0.62% | 0.66% |
The heat map shows percentage changes of major currencies against each other. The base currency is picked from the left column, while the quote currency is picked from the top row. For example, if you pick the Euro from the left column and move along the horizontal line to the Japanese Yen, the percentage change displayed in the box will represent EUR (base)/JPY (quote).
Gold FAQs
Why do people invest in Gold?
Gold has played a key role in human’s history as it has been widely used as a store of value and medium of exchange. Currently, apart from its shine and usage for jewelry, the precious metal is widely seen as a safe-haven asset, meaning that it is considered a good investment during turbulent times. Gold is also widely seen as a hedge against inflation and against depreciating currencies as it doesn’t rely on any specific issuer or government.
Who buys the most Gold?
Central banks are the biggest Gold holders. In their aim to support their currencies in turbulent times, central banks tend to diversify their reserves and buy Gold to improve the perceived strength of the economy and the currency. High Gold reserves can be a source of trust for a country’s solvency. Central banks added 1,136 tonnes of Gold worth around $70 billion to their reserves in 2022, according to data from the World Gold Council. This is the highest yearly purchase since records began. Central banks from emerging economies such as China, India and Turkey are quickly increasing their Gold reserves.
How is Gold correlated with other assets?
Gold has an inverse correlation with the US Dollar and US Treasuries, which are both major reserve and safe-haven assets. When the Dollar depreciates, Gold tends to rise, enabling investors and central banks to diversify their assets in turbulent times. Gold is also inversely correlated with risk assets. A rally in the stock market tends to weaken Gold price, while sell-offs in riskier markets tend to favor the precious metal.
What does the price of Gold depend on?
The price can move due to a wide range of factors. Geopolitical instability or fears of a deep recession can quickly make Gold price escalate due to its safe-haven status. As a yield-less asset, Gold tends to rise with lower interest rates, while higher cost of money usually weighs down on the yellow metal. Still, most moves depend on how the US Dollar (USD) behaves as the asset is priced in dollars (XAU/USD). A strong Dollar tends to keep the price of Gold controlled, whereas a weaker Dollar is likely to push Gold prices up.
Bank of Japan (BoJ) Governor Kazuo Ueda continued to speak on monetary policy during his appearance on Thursday.
Additional quotes
Would be difficult to choose which monetary policy tools to mobilize when exit from stimulus draws near.
Impact from currencies vary from sector to sector.
BoJ to work closely with govt while monitoring currency, financial market moves.
Service spending increasing moderately as a trend.
What's important from here is for wages to keep rising and underpin consumption.
Market reaction
At the time of writing, USD/JPY is losing 0.35% on the day to trade at 146.83. The above comments are helping the Japanese Yen to find demand.
- AUD/USD remains under some selling pressure for the fourth successive day on Thursday.
- China’s economic woes and RBA rate cut bets weigh on the Aussie amid the recent USD rally.
- Dovish Fed expectations might cap any further USD gains and lend some support to the pair.
The AUD/USD pair turns lower for the fourth straight day following an early uptick to the 0.6555-0.6560 area and drops to over a two-week low during the Asian session on Thursday. Spot prices remain depressed near the 0.6530 region and move little in reaction to the mixed Chinese trade data.
The Customs General Administration of China (CGAC) reported that the trade surplus jumped to $68.39 billion in November from the $56.53 billion previous. Additional details of the report indicated that exports unexpectedly climbed by 0.5% during the reported month. That said, imports missed consensus estimates by a big margin and registered a 0.6% drop in November, fueling concerns about weak domestic demand. This comes on top of Moody's cut to China's credit outlook, state-owned firms and banks, which further tempers investors' appetite for riskier assets.
This, along with the rather unimpressive Australian trade data and rising bets for a rate cut by the Reserve Bank of Australia (RBA) in around August/September 2024, undermines the China-proxy Australian Dollar (AUD). Meanwhile, a weaker risk tone assists the safe-haven US Dollar (USD) to preserve its recent strong gains to a two-week top touched on Wednesday, which contributes to the offered tone surrounding the AUD/USD pair. That said, dovish Federal Reserve (Fed) expectations keep a lid on any further USD gains and lend some support to the major.
Investors seem convinced that the US central bank is done with its policy tightening campaign and are now pricing in a greater chance of a 25 bps rate cut at the March policy meeting. The bets were reaffirmed by the incoming US data, which suggested that a historically tight labor market could be loosening. This, in turn, warrants some caution for aggressive traders and before positioning for an extension of the AUD/USD pair's recent sharp pullback from the vicinity of the 0.6700 mark, or over a four-month high touched on Monday.
Market participants now look to the release of the usual Weekly Initial Jobless Claims data from the US for some impetus later during the early North American session. The focus, however, will remain glued to the closely-watched US monthly employment details, popularly known as the NFP report on Friday. The data will provide fresh cues about the US labor market and influence the Fed’s policy outlook, which, in turn, will drive the USD demand and provide a fresh directional impetus to the AUD/USD pair.
Technical levels to watch
- Indian Rupee loses traction on the renewed US Dollar buying.
- The markets anticipate the Reserve Bank of India (RBI) to maintain the status quo on the repo rate, leaving it unchanged at 6.5%.
- Investors await the US weekly Jobless Claims on Thursday ahead of the RBI rate decision and US Nonfarm Payrolls.
Indian Rupee (INR) continue to trade on a negative note on Thursday amid the renewed US Dollar (USD) demand. The Reserve Bank of India's (RBI) three-day monetary policy meeting began on Wednesday. RBI Governor Shaktikanta Das will announce the Monetary Policy Committee (MPC) decision on Friday.
The markets widely anticipate that RBI will maintain the interest rate unchanged at 6.50% for the fifth consecutive monetary policy meeting. The elevated inflation above the 4% target, the volatility of crude oil prices, and the concern about El Nino and agricultural output will keep the central bank on hold.
Investors will monitor the US weekly Jobless Claims, due later on Thursday. The highlight this week will be the RBI interest rate decision and the US employment data, including Nonfarm Payrolls and Unemployment Rate on Friday. The November Nonfarm Payrolls is estimated to rise by 185K, while the unemployment rate is expected to stay unchanged at 3.9%.
Daily Digest Market Movers: Indian Rupee weakens due to a slowdown in services sector growth
- India is on the path to becoming the world's third-biggest economy by 2030, according to S&P Global Ratings' latest report.
- India’s stock market value surpassed $4 trillion for the first time, fueled by moderate oil prices, resilient domestic macroeconomic data, renewed foreign inflows, and growing optimism about policy continuity in 2024 after the state assembly election results.
- S&P Global India Services PMI eased to 56.9 in November from 58.4 in October, below market consensus of 58.0.
- ADP private payrolls rose 103K in November from 106K in October, below the market estimation of 130K.
- Analysts anticipate the tightening cycle is now over and the Fed will hold interest rates until at least July, later than earlier thought, according to a Reuters poll.
Technical Analysis: Indian Rupee’s outlook remains constructive
Indian Rupee weakens on the day. The USD/INR pair remains in a familiar multi-month-old trading band of 82.80–83.40. According to the daily chart, USD/INR maintains a bullish vibe as the pair holds above the key 100-day Exponential Moving Average (EMA). The upward momentum is supported by the 14-day Relative Strength Index (RSI), which remains above the 50.0 midpoint.
The first upside barrier will emerge at the upper boundary of the trading range of 83.40. The additional upside filter to watch is the year-to-date (YTD) high of 83.47. Further north, the next hurdle is seen at a psychological round mark of 84.00.
On the downside, the strong support is envisioned at the 83.00 psychological figure. A decisive break below 83.00 will pave the way to 82.80, portraying the confluence of the lower limit of the trading range and a low of September 12. The next cushion is located at a low of August 11 at 82.60.
US Dollar price today
The table below shows the percentage change of US Dollar (USD) against listed major currencies today. US Dollar was the strongest against the New Zealand Dollar.
| USD | EUR | GBP | CAD | AUD | JPY | NZD | CHF | |
| USD | 0.01% | 0.04% | 0.03% | 0.23% | -0.20% | 0.31% | 0.06% | |
| EUR | -0.01% | 0.01% | 0.02% | 0.23% | -0.21% | 0.30% | 0.05% | |
| GBP | -0.04% | -0.03% | 0.00% | 0.20% | -0.23% | 0.28% | 0.02% | |
| CAD | -0.03% | 0.00% | 0.02% | 0.21% | -0.23% | 0.32% | 0.04% | |
| AUD | -0.23% | -0.23% | -0.19% | -0.21% | -0.43% | 0.11% | -0.18% | |
| JPY | 0.20% | 0.21% | 0.24% | 0.24% | 0.45% | 0.51% | 0.26% | |
| NZD | -0.31% | -0.29% | -0.26% | -0.28% | -0.02% | -0.51% | -0.24% | |
| CHF | -0.06% | -0.05% | -0.03% | -0.03% | 0.18% | -0.26% | 0.25% |
The heat map shows percentage changes of major currencies against each other. The base currency is picked from the left column, while the quote currency is picked from the top row. For example, if you pick the Euro from the left column and move along the horizontal line to the Japanese Yen, the percentage change displayed in the box will represent EUR (base)/JPY (quote).
Indian Rupee FAQs
What are the key factors driving the Indian Rupee?
The Indian Rupee (INR) is one of the most sensitive currencies to external factors. The price of Crude Oil (the country is highly dependent on imported Oil), the value of the US Dollar – most trade is conducted in USD – and the level of foreign investment, are all influential. Direct intervention by the Reserve Bank of India (RBI) in FX markets to keep the exchange rate stable, as well as the level of interest rates set by the RBI, are further major influencing factors on the Rupee.
How do the decisions of the Reserve Bank of India impact the Indian Rupee?
The Reserve Bank of India (RBI) actively intervenes in forex markets to maintain a stable exchange rate, to help facilitate trade. In addition, the RBI tries to maintain the inflation rate at its 4% target by adjusting interest rates. Higher interest rates usually strengthen the Rupee. This is due to the role of the ‘carry trade’ in which investors borrow in countries with lower interest rates so as to place their money in countries’ offering relatively higher interest rates and profit from the difference.
What macroeconomic factors influence the value of the Indian Rupee?
Macroeconomic factors that influence the value of the Rupee include inflation, interest rates, the economic growth rate (GDP), the balance of trade, and inflows from foreign investment. A higher growth rate can lead to more overseas investment, pushing up demand for the Rupee. A less negative balance of trade will eventually lead to a stronger Rupee. Higher interest rates, especially real rates (interest rates less inflation) are also positive for the Rupee. A risk-on environment can lead to greater inflows of Foreign Direct and Indirect Investment (FDI and FII), which also benefit the Rupee.
How does inflation impact the Indian Rupee?
Higher inflation, particularly, if it is comparatively higher than India’s peers, is generally negative for the currency as it reflects devaluation through oversupply. Inflation also increases the cost of exports, leading to more Rupees being sold to purchase foreign imports, which is Rupee-negative. At the same time, higher inflation usually leads to the Reserve Bank of India (RBI) raising interest rates and this can be positive for the Rupee, due to increased demand from international investors. The opposite effect is true of lower inflation.
China's Trade Balance for November, in Chinese Yuan terms, came in at CNY490.82 billion, up from the previous figure of CNY405.47 billion.
Exports jumped 1.7% YoY in November vs. -3.1% seen in October. The country’s imports rose 0.6% YoY in the reported month vs. 6.4% last.
In US Dollar terms, China’s trade surplus grew in November.
Trade Balance came in at +68.39B versus +58.10B expected and +56.53B previous.
Exports (YoY): 0.5% vs. -0.8% exp. and -6.4% previous.
Imports (YoY): -0.6% vs. 3.0% exp. and 3.0% last.
Additional takeaways
China Jan-Nov USD-denominated exports -5.2% YoY.
China Jan-Nov USD-denominated Imports -6.0% YoY.
China Jan-Nov Trade Balance +$748.13 Bln.
FX implications
AUD/USD is holding lower ground on mixed China’s trade figures. The pair is down 0.21% on the day, trading at 0.6533 at the time of writing.
- The Japanese Yen benefits from a softer risk tone amid worries about a global economic downturn.
- Bulls seem unaffected and largely shrug off BoJ Governor Kazuo Ueda’s dovish remarks on Thursday.
- A subdued US Dollar price action contributes to the USD/JPY pair’s failure near the 100-day SMA.
The Japanese Yen (JPY) attracts some haven flows during the Asian session on Thursday and reverses a major part of its weekly losses against the US Dollar (USD) registered over the past three days. The US ADP report on Wednesday pointed to a notable reduction in private-sector employment. This comes a day after the US Labor Department reported that job openings tumbled in October to the lowest level since March 2021 and was seen as another sign that the tight labor market could be loosening. The data, meanwhile, fuels concerns about an economic slowdown and tempers investors' appetite for riskier assets, boosting demand for traditional safe-haven assets.
The USD/JPY pair, meanwhile, continues with its struggle to move back above the 100-day Simple Moving Average (SMA) support breakpoint and is further weighed down by subdued USD price action. The incoming US labor market data reaffirms market bets that the Federal Reserve (Fed) will cut interest rates early next year, which keeps the yield on the benchmark 10-year US government bond close to a three-month low. This, in turn, acts as a headwind for the buck and contributes to the offered tone surrounding the major.
That said, Bank of Japan (BoJ) board members recently downplayed speculations about an imminent shift in the policy stance. This might hold back the JPY bulls from placing aggressive bets and lend some support to the USD/JPY pair ahead of the crucial US monthly employment details, popularly known as the Nonfarm Payrolls (NFP) report on Friday. In the meantime, traders on Wednesday will take cues from the release of the usual Weekly Initial Jobless Claims data, which, along with the broader risk sentiment, should provide some impetus.
Daily Digest Market Movers: Japanese Yen attracts some haven flows and draws additional support from subdued USD price action
Signs that a tight US job market is loosening raise concerns about an economic slowdown and weigh on investors' sentiment, benefitting the safe-haven Japanese Yen.
The US Labor Department reported Tuesday that job openings declined by 617K to 8.73 million in October, or their lowest level in two-and-a-half-years.
The ADP report showed that US private-sector employers added just 103K jobs in November, down from the previous month's downwardly revised 106K.
The readings reaffirmed market expectations about an imminent shift in the Federal Reserve's policy stance and bets for a 25 basis points rate cut at the March policy meeting.
The slew of key US jobs data will continue on Thursday and Friday with the release of Weekly Initial Jobless Claims and the key Nonfarm Payrolls, respectively.
Israeli forces stormed southern Gaza's main city on Tuesday in the most intense day of combat of ground operations against Hamas militants, worsening the humanitarian crisis.
Bank of Japan Governor Kazuo Ueda said this Thursday that accommodative monetary policy and stimulus measures are supporting the Japanese economy.
Ueda added that they have not yet reached a situation in which they can achieve the price target sustainably and stably and with sufficient certainty.
Moreover, BoJ board members recently said that it is premature to debate an exit from the ultra-easy policy, which, in turn, might cap any further gains for the JPY.
Technical Analysis: USD/JPY once again faces rejection near 100-day SMA pivotal support breakpoint, now turned resistance
From a technical perspective, this week's repeated failures to move back above the 100-day SMA support breakpoint, now turned resistance, currently around the 147.45 area, and the subsequent decline favours bearish traders. Moreover, oscillators on the daily chart are holding deep in the negative territory and are still far from being in the oversold zone. This, in turn, suggests that the path of least resistance for the USD/JPY pair is to the downside and supports prospects for further losses.
Meanwhile, any subsequent decline is likely to find some support near the 146.65 region, below which spot prices could slide back to a multi-month low, around the 146.20 area touched on Monday. The latter coincides with the 38.2% Fibonacci retracement level of the July-October rally and should act as a key pivotal point. Some follow-through selling below the 146.00 mark could then drag the USD/JPY pair to the 145.45-145.40 intermediate support en route to the 145.00 psychological mark.
On the flip side, the 100-day SMA might continue to act as an immediate strong barrier, which if cleared decisively might trigger a short-covering rally and allow spot prices to reclaim the 148.00 mark. Any further move up, however, is likely to confront stiff barrier and remain capped near the 148.30-148.40 region. A sustained strength beyond the latter will suggest that the recent pullback from the 152.00 neighbourhood has run its course and shift the bias in favour of bullish traders.
Japanese Yen price today
The table below shows the percentage change of Japanese Yen (JPY) against listed major currencies today. Japanese Yen was the strongest against the Australian Dollar.
| USD | EUR | GBP | CAD | AUD | JPY | NZD | CHF | |
| USD | -0.02% | 0.02% | 0.00% | 0.13% | -0.26% | 0.09% | 0.00% | |
| EUR | 0.03% | 0.01% | 0.02% | 0.16% | -0.25% | 0.12% | 0.02% | |
| GBP | 0.00% | -0.01% | 0.00% | 0.13% | -0.27% | 0.10% | 0.00% | |
| CAD | 0.00% | -0.02% | 0.00% | 0.14% | -0.27% | 0.10% | 0.00% | |
| AUD | -0.13% | -0.16% | -0.15% | -0.14% | -0.41% | -0.04% | -0.15% | |
| JPY | 0.26% | 0.27% | 0.29% | 0.27% | 0.43% | 0.40% | 0.27% | |
| NZD | -0.09% | -0.14% | -0.11% | -0.09% | 0.03% | -0.36% | -0.10% | |
| CHF | 0.01% | -0.01% | 0.01% | 0.01% | 0.13% | -0.26% | 0.10% |
The heat map shows percentage changes of major currencies against each other. The base currency is picked from the left column, while the quote currency is picked from the top row. For example, if you pick the Euro from the left column and move along the horizontal line to the Japanese Yen, the percentage change displayed in the box will represent EUR (base)/JPY (quote).
Japanese Yen FAQs
What key factors drive the Japanese Yen?
The Japanese Yen (JPY) is one of the world’s most traded currencies. Its value is broadly determined by the performance of the Japanese economy, but more specifically by the Bank of Japan’s policy, the differential between Japanese and US bond yields, or risk sentiment among traders, among other factors.
How do the decisions of the Bank of Japan impact the Japanese Yen?
One of the Bank of Japan’s mandates is currency control, so its moves are key for the Yen. The BoJ has directly intervened in currency markets sometimes, generally to lower the value of the Yen, although it refrains from doing it often due to political concerns of its main trading partners. The current BoJ ultra-loose monetary policy, based on massive stimulus to the economy, has caused the Yen to depreciate against its main currency peers. This process has exacerbated more recently due to an increasing policy divergence between the Bank of Japan and other main central banks, which have opted to increase interest rates sharply to fight decades-high levels of inflation.
How does the differential between Japanese and US bond yields impact the Japanese Yen?
The BoJ’s stance of sticking to ultra-loose monetary policy has led to a widening policy divergence with other central banks, particularly with the US Federal Reserve. This supports a widening of the differential between the 10-year US and Japanese bonds, which favors the US Dollar against the Japanese Yen.
How does broader risk sentiment impact the Japanese Yen?
The Japanese Yen is often seen as a safe-haven investment. This means that in times of market stress, investors are more likely to put their money in the Japanese currency due to its supposed reliability and stability. Turbulent times are likely to strengthen the Yen’s value against other currencies seen as more risky to invest in.
| Raw materials | Closed | Change, % |
|---|---|---|
| Silver | 23.895 | -1.09 |
| Gold | 2025.466 | 0.3 |
| Palladium | 943.26 | 1.08 |
- GBP/USD remains under selling pressure around 1.2560 on the stronger USD.
- Analysts anticipate the Fed will hold rates until at least July, later than earlier thought.
- Bank of England’s Bailey said interest rates in the UK will need to stay at current levels for some time.
- Investors await the weekly US Jobless Claims for fresh impetus.
The GBP/USD pair extends its downside above the mid-1.2500s during the early Asian trading hours on Thursday. The downtick of the pair is backed by the firmer US Dollar (USD) broadly. In the absence of economic data released from the UK docket later this week, the GBP/USD pair remains at the mercy of USD price dynamics. At press time, the major pair is trading at 1.2560, gaining 0.03% for the day.
Even though US Federal Reserve (Fed) Chair Jerome Powell said last week that central banks will prepare to tighten policy further if it becomes appropriate to do so, the markets believe that the tightening cycle is now over. According to a Reuters poll, analysts anticipate the Fed will hold interest rates until at least July, later than earlier thought.
About the data, Automatic Data Processing Inc. revealed on Wednesday that ADP private payrolls grew 103K in November from 106K in October, below the market consensus of 130K.
On the GBP’s front, Bank of England (BoE) Governor Andrew Bailey said on Wednesday that interest rates in the UK will need to stay at current levels for some time and the central bank is aware of financial stability risks that may develop from that.
Additionally, Bailey further stated that the overall risk environment was challenging due to China's economic difficulties, the potential broader conflict in the Middle East, and elevated levels of public debt. This, in turn, might weigh on the British Pound (GBP) and act as a headwind for the GBP/USD pair.
Moving on, traders will monitor the weekly US Jobless Claims, due later on Thursday. The highlight of the week will be the US employment data on Friday, including Nonfarm Payrolls and Unemployment Rate. The November Nonfarm Payrolls is expected to add 185K jobs while the Unemployment Rate is estimated to remain steady at 3.9%.
The Bank of Japan (BoJ) Governor Ueda said on Thursday that accommodative monetary policy and the effects of economic stimulus measures are supporting the Japanese economy, per Reuters.
Key quotes
“Japan's economy to continue recovering moderately, supported mainly by accommodative financial conditions and effects of economic stimulus measures.”
“Uncertainty over Japan's economy extremely high.”
“Closely watching the impact of financial, forex markets on the Japanese economy, prices.”
“Will patiently continue monetary easing under YCC to support economic activity, the cycle of wage growth.”
“We have not yet reached a situation in which we can achieve price target sustainably and stably and with sufficient certainty.”
Market reaction
At the time of writing, the USD/JPY pair is trading around 147.05, down 0.22% on the day.
Bank of Japan FAQs
What is the Bank of Japan?
The Bank of Japan (BoJ) is the Japanese central bank, which sets monetary policy in the country. Its mandate is to issue banknotes and carry out currency and monetary control to ensure price stability, which means an inflation target of around 2%.
What has been the Bank of Japan’s policy?
The Bank of Japan has embarked in an ultra-loose monetary policy since 2013 in order to stimulate the economy and fuel inflation amid a low-inflationary environment. The bank’s policy is based on Quantitative and Qualitative Easing (QQE), or printing notes to buy assets such as government or corporate bonds to provide liquidity. In 2016, the bank doubled down on its strategy and further loosened policy by first introducing negative interest rates and then directly controlling the yield of its 10-year government bonds.
How do Bank of Japan’s decisions influence the Japanese Yen?
The Bank’s massive stimulus has caused the Yen to depreciate against its main currency peers. This process has exacerbated more recently due to an increasing policy divergence between the Bank of Japan and other main central banks, which have opted to increase interest rates sharply to fight decades-high levels of inflation. The BoJ’s policy of holding down rates has led to a widening differential with other currencies, dragging down the value of the Yen.
Is the Bank of Japan’s ultra-loose policy likely to change soon?
A weaker Yen and the spike in global energy prices have led to an increase in Japanese inflation, which has exceeded the BoJ’s 2% target. Still, the Bank judges that the sustainable and stable achievement of the 2% target has not yet come in sight, so any sudden change in the current policy looks unlikely.
On Thursday, the People’s Bank of China (PBoC) set the USD/CNY central rate for the trading session ahead at 7.1176 as compared to the previous day's fix of 7.1149 and 7.1623 Reuters estimates.
EUR/USD attracts some buyers amid the risk-on mood.
ADP private payrolls came in worse than expected, rising 103K in November vs. 106K prior.
Eurozone Retail Sales rose 0.1% MoM in October vs -0.1% prior, below the market consensus of 0.2%.
The Eurozone GDP for Q3 and US Jobless Claims will be the highlights on Thursday.
The EUR/USD pair posts modest gains during the early Asian section on Thursday. However, the upside of the pair might be capped on the renewed US Dollar (USD) demand and weaker-than-expected Eurozone data. The major pair currently trades around 1.0770, gaining 0.08% on the day.
The US Dollar Index (DXY) climbs for three straight days despite weaker ADP employment data. On Wednesday, ADP private payrolls rose 103K in November from 106K in October. This figure came in worse than expected. Market players will take more cues from the US employment data this week, including the weekly Jobless Claims and Nonfarm Payroll.
The downbeat Eurozone Retail Sales exert some selling pressure on the Euro (EUR). The figure rose 0.1% MoM in October versus -0.1% in September, below the market consensus of 0.2%. On an annual basis, Eurozone Retail Sales fell from 2.9% to 1.2% in October, worse than the 1.1% drop expected. High interest rates, weak consumer confidence, and fading optimism about the labor market are all combined to dampen private consumption growth.
ECB board member Isabel Schnabel stated last month that rate hikes must remain an option because the last phase of the inflation fight may be the hardest. However, she had shifted her stance after three surprisingly low inflation readings in a row. The markets are aggressively pricing the European Central Bank (ECB) to cut interest rates by 142 basis points (bps) next year, with the first move now seen as soon as March 2024.
Looking ahead, investors await the Eurozone Gross Domestic Product for the third quarter (Q3), which is estimated to remain steady at -0.1% QoQ. On the US docket, the weekly Jobless Claims will be due.
Australia’s trade surplus narrowed to 7,129M MoM in October versus 7,500M expected and 6.786M in the previous reading, according to the latest Aussie foreign trade data published by the Australian Bureau of Statistics on Thursday.
Further details reveal that Australia's October Goods/Services Exports reprint 0.4% figures on a monthly basis versus -1.0% prior. The nation’s Goods/Services Imports fell 1.9% in October MoM versus an 8.0% rise prior.
Market reaction
At the press time, the AUD/USD pair is up 0.07% on the day to trade at 0.6554.
About Australia Trade Balance
The trade balance released by the Australian Bureau of Statistics is the difference in the value of its imports and exports of Australian goods. Export data can give an important reflection of Australian growth, while imports provide an indication of domestic demand. Trade Balance gives an early indication of the net export performance. If a steady demand in exchange for Australian exports is seen, that would turn into a positive growth in the trade balance, and that should be positive for the AUD.
Australian Dollar FAQs
What key factors drive the Australian Dollar?
One of the most significant factors for the Australian Dollar (AUD) is the level of interest rates set by the Reserve Bank of Australia (RBA). Because Australia is a resource-rich country another key driver is the price of its biggest export, Iron Ore. The health of the Chinese economy, its largest trading partner, is a factor, as well as inflation in Australia, its growth rate and Trade Balance. Market sentiment – whether investors are taking on more risky assets (risk-on) or seeking safe-havens (risk-off) – is also a factor, with risk-on positive for AUD.
How do the decisions of the Reserve Bank of Australia impact the Australian Dollar?
The Reserve Bank of Australia (RBA) influences the Australian Dollar (AUD) by setting the level of interest rates that Australian banks can lend to each other. This influences the level of interest rates in the economy as a whole. The main goal of the RBA is to maintain a stable inflation rate of 2-3% by adjusting interest rates up or down. Relatively high interest rates compared to other major central banks support the AUD, and the opposite for relatively low. The RBA can also use quantitative easing and tightening to influence credit conditions, with the former AUD-negative and the latter AUD-positive.
How does the health of the Chinese Economy impact the Australian Dollar?
China is Australia’s largest trading partner so the health of the Chinese economy is a major influence on the value of the Australian Dollar (AUD). When the Chinese economy is doing well it purchases more raw materials, goods and services from Australia, lifting demand for the AUD, and pushing up its value. The opposite is the case when the Chinese economy is not growing as fast as expected. Positive or negative surprises in Chinese growth data, therefore, often have a direct impact on the Australian Dollar and its pairs.
How does the price of Iron Ore impact the Australian Dollar?
Iron Ore is Australia’s largest export, accounting for $118 billion a year according to data from 2021, with China as its primary destination. The price of Iron Ore, therefore, can be a driver of the Australian Dollar. Generally, if the price of Iron Ore rises, AUD also goes up, as aggregate demand for the currency increases. The opposite is the case if the price of Iron Ore falls. Higher Iron Ore prices also tend to result in a greater likelihood of a positive Trade Balance for Australia, which is also positive of the AUD.
How does the Trade Balance impact the Australian Dollar?
The Trade Balance, which is the difference between what a country earns from its exports versus what it pays for its imports, is another factor that can influence the value of the Australian Dollar. If Australia produces highly sought after exports, then its currency will gain in value purely from the surplus demand created from foreign buyers seeking to purchase its exports versus what it spends to purchase imports. Therefore, a positive net Trade Balance strengthens the AUD, with the opposite effect if the Trade Balance is negative.
| Index | Change, points | Closed | Change, % |
|---|---|---|---|
| NIKKEI 225 | 670.08 | 33445.9 | 2.04 |
| Hang Seng | 135.4 | 16463.26 | 0.83 |
| KOSPI | 1.1 | 2495.38 | 0.04 |
| ASX 200 | 116.8 | 7178.4 | 1.65 |
| DAX | 123.33 | 16656.44 | 0.75 |
| CAC 40 | 49 | 7435.99 | 0.66 |
| Dow Jones | -70.13 | 36054.43 | -0.19 |
| S&P 500 | -17.84 | 4549.34 | -0.39 |
| NASDAQ Composite | -83.2 | 14146.71 | -0.58 |
| Pare | Closed | Change, % |
|---|---|---|
| AUDUSD | 0.65473 | -0.01 |
| EURJPY | 158.562 | -0.1 |
| EURUSD | 1.07632 | -0.3 |
| GBPJPY | 185.019 | -0.09 |
| GBPUSD | 1.25582 | -0.28 |
| NZDUSD | 0.61367 | 0.19 |
| USDCAD | 1.35956 | 0.06 |
| USDCHF | 0.87486 | 0.01 |
| USDJPY | 147.329 | 0.16 |
Japanese Foreign Reserves increased by 31.7 billion USD to hit a 15-month high of 1.269 trillion USD into the end of November, compared to October's accumulated foreign assets of 1.238 trillion USD.
Market Reaction
The USD/JPY is trading thing near 147.20, with minimal data impact as the pair heads into Thursday's Asia market session.
About Japan Foreign Reserves
Foreign-exchange reserves, released by Ministry of Finance, in a strict sense are 'only' the foreign currency deposits and bonds held by central banks and monetary authorities. However, the term in popular usage commonly includes foreign exchange and gold, special drawing rights (SDRs), and International Monetary Fund (IMF) reserve positions. This broader figure is more readily available, but it is more accurately termed official international reserves or international reserves. These are assets of the central bank held in different reserve currencies.
Japanese Foreign Bond Investment rebounded ¥64.5 billion for the week into December 1st after seeing a ¥-84.3 billion shortfall the previous week, which was revised slightly lower from ¥-84.5 bilion.
Foreign Investment in Japanese Stocks for the same period saw a sharp pullback, falling ¥-358.3 billion for the week compared to the previous week's slight increase in foreign equities purchases worth ¥4.5 billion (revised upwards from ¥4.3 billion).
Market Reaction
The USD/JPY is trading thing near 147.20, with minimal data impact as the pair heads into Thursday's Asia market session.
About Japanese Foreign Bond & Stock Investment
Securities investment, released by Ministry of Finance, referrers to bonds issued in a domestic market by a foreign entity in the domestic market’s currency. The report is released by the Ministry of Finance, detailing the flows from the public sector excluding Bank of Japan. The net data shows the difference of capital inflow and outflow. A positive difference indicates net sales of foreign securities by residents (capital inflow), and a negative difference indicates net purchases of foreign securities by residents (capital outflow).


© 2000-2026. Уcі права захищені.
Cайт знаходитьcя під керуванням TeleTrade DJ. LLC 2351 LLC 2022 (Euro House, Richmond Hill Road, Kingstown, VC0100, St. Vincent and the Grenadines).
Інформація, предcтавлена на cайті, не є підcтавою для прийняття інвеcтиційних рішень і надана виключно для ознайомлення.
Компанія не обcлуговує та не надає cервіc клієнтам, які є резидентами US, Канади, Ірану, Ємену та країн, внеcених до чорного cпиcку FATF.
Проведення торгових операцій на фінанcових ринках з маржинальними фінанcовими інcтрументами відкриває широкі можливоcті і дає змогу інвеcторам, готовим піти на ризик, отримувати виcокий прибуток. Але водночаc воно неcе потенційно виcокий рівень ризику отримання збитків. Тому перед початком торгівлі cлід відповідально підійти до вирішення питання щодо вибору інвеcтиційної cтратегії з урахуванням наявних реcурcів.
Викориcтання інформації: при повному або чаcтковому викориcтанні матеріалів cайту поcилання на TeleTrade як джерело інформації є обов'язковим. Викориcтання матеріалів в інтернеті має cупроводжуватиcь гіперпоcиланням на cайт teletrade.org. Автоматичний імпорт матеріалів та інформації із cайту заборонено.
З уcіх питань звертайтеcь за адреcою pr@teletrade.global.
переклади