- Аналітика
- Новини та інструменти
- Новини ринків
Новини ринків
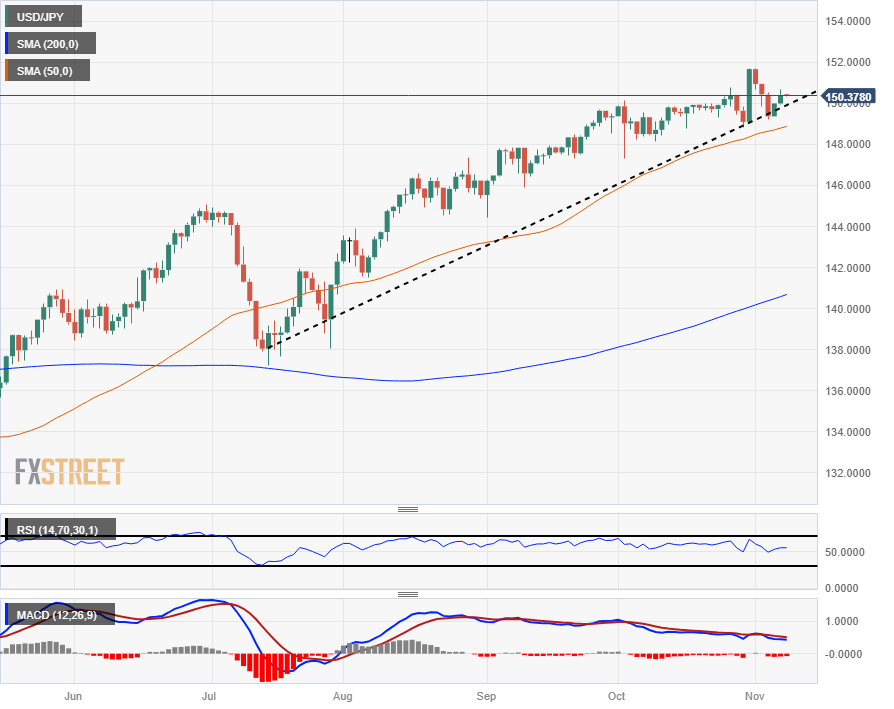
- The USD/JPY is edging higher, retesting chart space above 150.00.
- Bullish momentum appears to be weakening as the pair struggles to reclaim 151.70.
- Fed Chair Powell makes an appearance on Wednesday, Japan Current Account early Thursday.
The USD/JPY is trading into the 150.50 neighborhood after the pair eked out a second straight day of gains following last week's three-day decline into 149.20.
The US Dollar (USD) bulled into 151.72 last Tuesday, a mere 20 pips away from hitting a new 31-year high against the Japanese Yen (JPY) as a stubbornly-dovish Bank of Japan (BoJ) continues to hang the JPY out to dry in favor of maintaining hyper-easy monetary policy, and broad-market risk-off flows continue to prop up the Greenback in safe haven flights.
Forex Today: Dollar's rebound loses momentum; yields remain volatile
Wednesday sees an appearance from Federal Reserve (Fed) Chairman Jerome Powell, who will be speaking at the Division of Research and Statistics Centennial Conference in Washington, DC, and investors will be keeping a close eye on the Fed head looking for hints about the Fed's perspective following last Friday's 30-month low print for the US Nonfarm Payrolls (NFP) jobs report.
Japanese Trade Balance figures will be printing in the early Asia market session for Thursday, and markets are expecting the headline non-seasonally-adjusted Current Account for September to continue growing. The MoM figure is forecast to print at ¥3,000.8 billion compared to August's ¥2,279.7 billion.
USD/JPY Technical Outlook
The USD/JPY continues to grind higher on the daily candlesticks, and the pair is catching some technical lift in a bounce off of a rising trendline from July's swing lows into the 138.00 handle.
Downside pressure sees rising support from the 50-day Simple Moving Average (SMA) currently rising into the 149.00 region.
On the top side, technical resistance is mounting after last week's peak just south of 1152.00, and bidders appear to be running out of gas in the near-term, though the long-term trend remains firmly bullish with the 200-day SMA far below chart action near 141.00.
USD/JPY Daily Chart
USD/JPY Technical Levels
Researchers from Nordea are out with a note highlighting that the Fed's (and other central banks') fight with inflation will remain an ongoing task for longer than most might be expecting, with Nordea currently anticipating a lack of any rate cuts until well into 2025.
Major forecasts: Firmly on hold
The central bank has from the onset of this cycle made clear that they do not want to repeat the mistakes of the 70s in easing policy prematurely, so the bar for rate cuts is also very high.
Since the real economy is more sheltered from the direct effects of higher rates than before, the indirect impact from financial conditions becomes more important.
Even at 5.5%, measures such as the Taylor Rule, suggests policy is too loose. We fully understand that the Fed is cautious about raising rates further, wanting to take the time to gauge the effects of past increases.
With the Fed still unsure if they have tightened enough, a lot of things needs to go wrong before they are sure policy needs to be loosened. We believe this will take at least all of next year.
- Gold prices are trading near the flatline at $1969.09 as the market digests the potential end of the Federal Reserve's rate hikes
- Market sentiment is upbeat as Wall Street printed gains, reducing the appeal of safe-haven assets.
- Investors are now paying attention to Fed Chair Jerome Powell's upcoming speech for further clues on the central bank's rate trajectory and its impact on Gold prices.
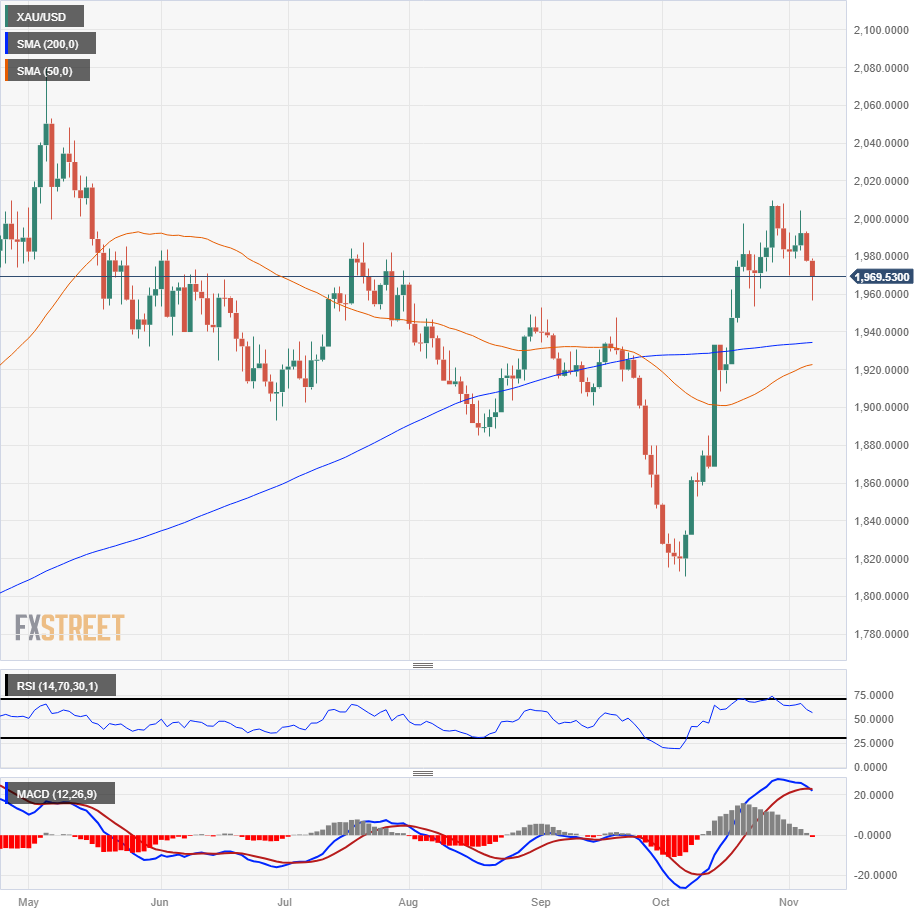
Gold price (XAU/USD) traded to the downside on Tuesday despite investors’ perception that the Federal Reserve (Fed) may be nearing the end of its rate-tightening campaign. This is due to gradually easing consumer inflation and higher US Treasury yields, which have tightened financial conditions. At the time of writing, XAU/USD exchanges hands at $1969.09, almost flat after hitting a ten-day low of $1956.81.
XAU/USD remains under pressure amid higher US Treasury yields and mixed signals from Federal Reserve officials
Wall Street portrayed an upbeat sentiment, hence a headwind for safe-haven assets. Federal Reserve officials continued to cross newswires, led by Fed Governor Lisa Cook. She commented on Monday that the current interest rate policy is sufficiently restrictive to achieve price stability.
Further Fed commentary witnessed Minnesota’s President Neil Kashkari raising questions about whether current policy is tight enough given the strength of the economy and mentioned that an increase in inflation could justify further tightening.
On the other hand, Chicago Fed President Austan Goolsbee acknowledged progress in controlling inflation and suggested that the focus of the conversation might shift to how long interest rates need to remain at their current level.
Of late, Fed Governor Michelle Bowman emphasized the possibility of the Fed needing to raise interest rates further to combat inflation. However, she also recognized the impact of rising Treasury yields on financial conditions.
What to watch?
Federal Reserve Chairman Jerome Powell's commentary on Wednesday will be closely watched, as it may provide insights into whether investors should anticipate additional interest rate hikes this year to achieve the Fed's 2% inflation target.
XAU/USD Technical Levels
- The AUD/USD fell after a dovish RBA hiked rates but talked down expectations at the same time.
- The Aussie shed 1.5% post-RBA 25 basis point rate hike.
- Coming up in the mid-week: Fed Chair Powell speech, Aussie Consumer Inflation Expectations.
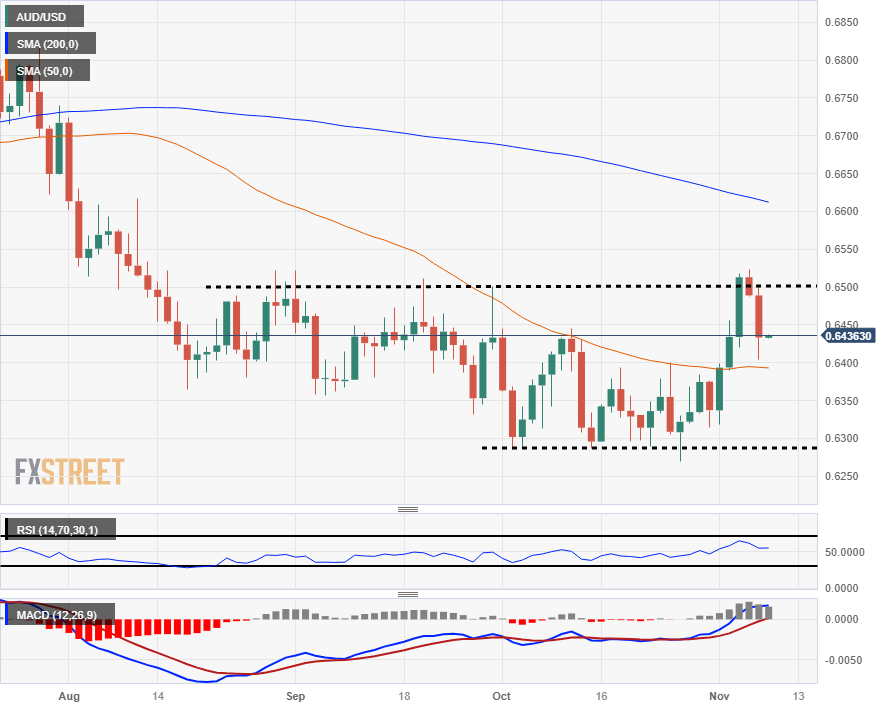
The AUD/USD tumbled 1.5% on Tuesday, falling to 0.6404 after the Reserve Bank of Australia (RBA) delivered a broadly expected 25 basis point rate hike and wrapped it in a dovish statement, sending the Aussie (AUD) skidding against the US Dollar (USD). The Aussie recovered to head into Wednesday trading near 0.6440.
RBA hikes interest rate to a 12-year high of 4.35% in November
Despite the 25 basis point rate hike, the RBA remains concerned about a slowdown impacting the Australian economy as consumer spending remains tepid, even as inflation risks continue to remain high. The RBA's pace of rate hikes may have been too little, too early to eat away at inflation expectations at the street level after the Aussie central bank stood pat on rates for four consecutive meetings.
Wednesday will see an appearance from Federal Reserve (Fed) Chairman Jerome Powell will be delivering speaking notes at a conference at the Division of Research and Statistics in Washington, DC. After last Friday's Nonfarm Payrolls (NFP) disappointment that sparked broad-market hopes of a decisive end to Fed rate hikes, investors will be watching the Fed head carefully.
Early Thursday sees November's Australian Consumer Inflation Expectations, which last came in at 4.8% for October.
AUD/USD Technical Outlook
Tuesday's topside rejection following the dovish RBA showing is seeing the Aussie head back towards the 0.6400 handle, where the 50-day Simple Moving Average (SMA) currently sits, and bulls will be looking to springboard off the moving average in order to make a second bid for clearing technical resistance at the 0.6500 handle.
Near-term technical bookends are capping price moves to the downside near the 0.6300 handle, while bull side momentum will see technical resistance from a descending 200-day Simple Moving Average (SMA) near 0.6600.
AUD/USD Daily Chart
AUD/USD Technical Levels
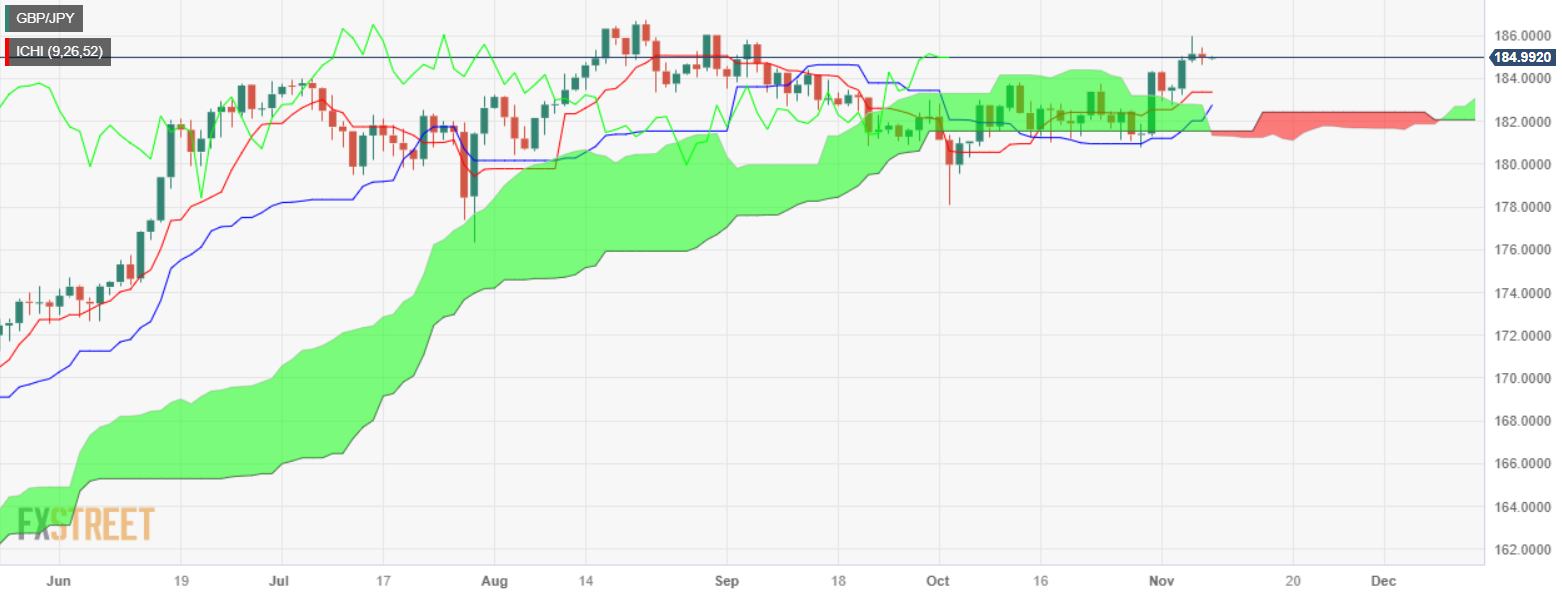
- GBP/JPY has retreated from a two-month peak of 185.95, now trading around 184.92, as the market's risk-on mood tempers the pair's recent rally.
- A decisive move above the 186.00 level could set the stage for a test of the YTD high at 186.76.
- On the downside, a drop below 184.00 could lead to a deeper correction, with supports seen at 183.36, 183.06, and the Kijun-Sen at 182.76.
GBP/JPY suffered a minimal dip on Tuesday after hitting a fresh two-month high at 185.95 and exchanging hands at 184.92, with buyers surrendering the 185.00 figure amid a risk-on impulse.
The pair is neutral to slightly upward biased after the pair broke above the latest cycle high reached in October 31 at 184.29, which opened the door for further upside. If the cross-pair reclaims the 186.00 figure, that can open the door to challenge the year-to-date (YTD) high at 186.76.
However, if GBP/JPY drops below 184.00, that could exacerbate further losses, with key support levels in play. The first support would be the Tenkan-Sen at 183.36, followed by the Senkou-Span A at 183.06. A breach of the latter would expose the Kijun-Sen at 182.76, followed by the top of the Ichimoku Cloud (Kumo) at 181.66.
GBP/JPY Price Action – Daily Chart
GBP/JPY Technical Levels
Economists from the National Bank of Canada's Financial Markets department are out with a note highlighting that recent growth in consumption spending could be highlighting underpinning economic concerns rather than showcasing resilience in the US economy.
The U.S. GDP data released just under two weeks ago were truly impressive...
... with the economy growing by no less than 4.9% annualized in the third quarter, boosted by a significant increase in household spending.
Our doubts stemmed in large part from the fact that rising household spending in Q3 had not been accompanied by a corollary increase in disposable income but was rather the result of a significant drop in the savings rate.
The percentage of outstanding credit card and auto loans transitioning into serious delinquency (90+days) indeed rose to a 12- and 13-year high, respectively, in Q3. In the case of credit cards, the increase in delinquency rates from one quarter to the next was even the largest recorded to date.
We continue to expect a marked slowdown in consumption - and hence GDP growth - in the fourth quarter.
- AUD/JPY corrects from recent highs, trading down by 0.52% at 96.80, after the RBA's decision to increase interest rates.
- The pair’s immediate support is near the 96.00 level, with subsequent levels at 95.92 (Tenkan-Sen), 95.61 (Senkou-Span A), 95.30 (Kijun-Sen), and 95.00 (Ichimoku Cloud top).
- To reverse the bearish outlook, bulls must push the pair back above the 97.00 threshold, aiming for the recent high at 97.59 and the YTD peak at 97.67.
AUD/JPY retreats after hitting a five-month high of 97.59, though it slid toward the 96.80 area after hitting a three-day low of 96.40 late in Tuesday's session. Even though risk appetite improved, the Aussie Dollar (AUD) extended its losses against the Japanese Yen (JPY) after the Reserve Bank of Australia's (RBA's) decision to hike rates. The pair is trading at 96.80, down 0.52%.
The AUD/JPY daily chart portrays the pair as neutral to slightly downward bias, as it formed a bearish-engulfing three-candle chart pattern, which could open the door for further downside. In the event of the cross slumping below the 96.00 mark, next support is seen at the Tenkan-Sen at 95.92. A breach of the latter will expose the Senkou-Span A at 95.61, followed by the Kijun-Sen at 95.30, and the top of the Ichimoku Cloud (Kumo) at 95.00.
For a bullish resumption, AUD/JPY buyers must reclaim the 97.00 figure, followed by Tuesday’s high at 97.59, followed by the year-to-date (YTD) high at 97.67.
AUD/JPY Price Chary – Daily

AUD/JPY Technical Levels
- The Aussie backslid into a 12-day low against the Kiwi after the RBA delivered a dovish rate hike.
- The RBA hiked reference rates 25 basis points, but struck a notably dovish tone.
- RBA sees higher-for-longer inflation pressure, but household consumption to remain weak.
The AUD/NZD belly-flopped into a new November low of 1.0820 after the Reserve Bank of Australia (RBA) delivered a dovish rate hike, lifting the Australian central bank's reference rate by 25 basis points to 4.35%. The Aussie (AUD) fell 0.75% against the Kiwi (NZD) on reaction, and the pair is struggling back into the 1.0850 region.
The RBA noted that, despite the need for an additional rate hike in the face of still-high inflation risks, household consumption remains incredibly weak, and continued rate hikes could threaten to destabilize the Aussie economy as the growth outlook remains uncertain.
RBA hikes interest rate to a 12-year high of 4.35% in November
Next up on the economic calendar will be Wednesday's Reserve Bank of New Zealand (RBNZ) Inflation Expectations for the fourth quarter, which last printed at 2.83%.
Early Thursday will see Aussie Consumer Inflation Expectations for November, which last printed at 4.8% for October, with late Thursday seeing the Business NZ's Purchasing Managers' Index (PMI) for October, which last showed a sub-50.0 printing of 45.3, implying that business expectations remain tepid.
AUD/NZD Technical Outlook
The AUD/NZD continues to see consolidation plays on the chart paper, with the pair cycling closely to the 200-day Simple Moving Average (SMA) for six straight months, and Tuesday's RBA-fueled Aussie dump sees the AUD/NZD testing back into the major moving average, which has gone sideways with a lack of notable long-term trend just north of 1.0800.
A set of both higher highs and lower lows sees the technical charts set for a breakout as whipsaw action gives way to increasing volatility, but traders will want to keep an eye out for any false breaks of the topside barrier at 1.0950 or near 1.0625 down below.
AUD/NZD Daily Chart

AUD/NZD Technical Levels
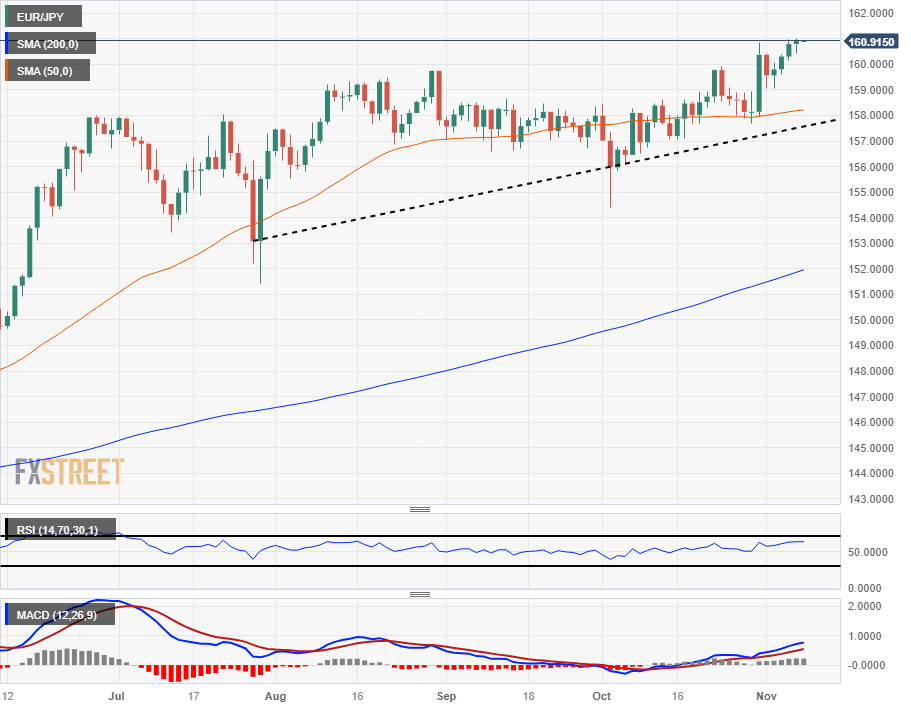
- The EUR/JPY ticked into a new decade-and-a-half high bid, touching the high side of 161.00.
- EU Retail Sales coming around the corner for Wednesday.
- Japan data continues to sour, steepening Yen declines.
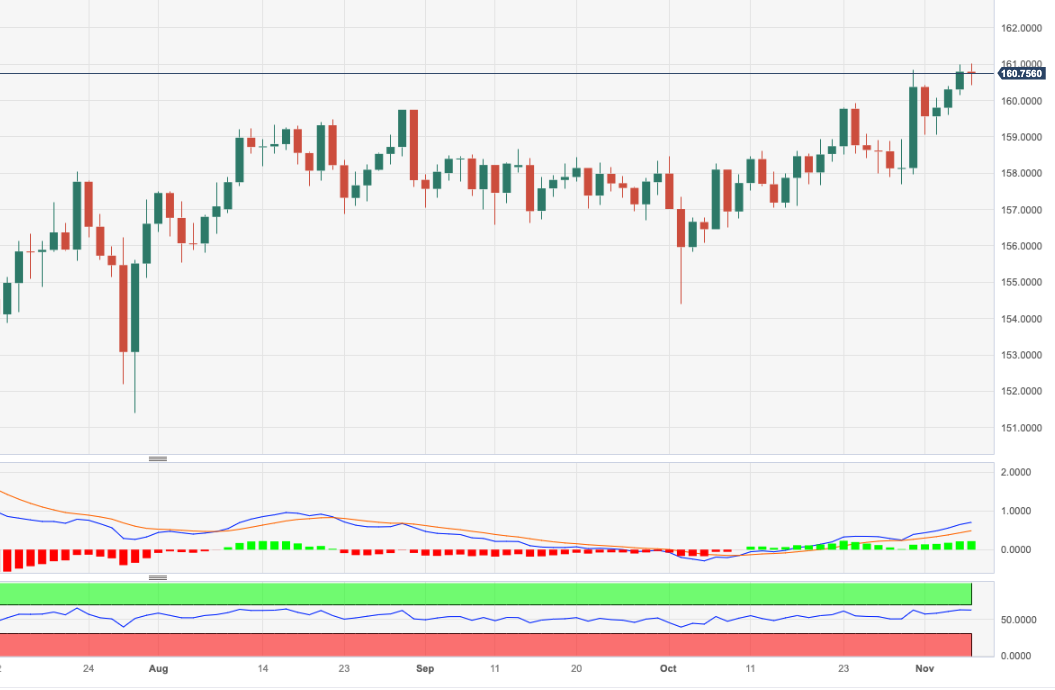
The EUR/JPY clipped the 161.00 handle on Tuesday, etching in a 15-year high as the pair clatters along the ceiling heading into a round of EU Retail Sales figures.
Japan Overall Household Spending for the year into September missed expectations early Tuesday, printing at -2.8% and accelerating the decline from August's -2.5% and missing the median market expectation of -2.7%.
EU Retail Sales are slated for Wednesday's European market session, and markets are expecting further downside in the long tail of the data with an improvement on the cards for the month-on-month figure.
Annualized Retail Sales into September are expected to print at -3.2% versus August's YoY of -2.1%, while September's MoM figure is forecast to rebound from -1.2% to just -0.2%.
EUR/JPY Technical Outlook
The EUR/JPY's bump into the 161.00 handle sets a fifteen year high for the pair, and is continuing to push further away from the 50-day Simple Moving Average (SMA) after rebounding from last week's swing low into the 158.00 price level. The Euro has closed four straight green days against the Yen.
Momentum has been thinning out, and a recent bout of chart congestion between 160.00 and 158.00 has left technical indicators to spool down into their midranges. On the low side, long-term technical support is at the 200-day SMA, far below current price action at 152.00.
EUR/JPY Daily Chart
EUR/JPY Technical Levels
During the Asian session, the Reserve Bank of New Zealand (RBNZ) will release the inflation expectation report for the fourth quarter. Japan will release the Leading Economic Index data. Later in the day, the focus will be on Fed Chair Powell's speech.
Here is what you need to know on Wednesday, November 8:
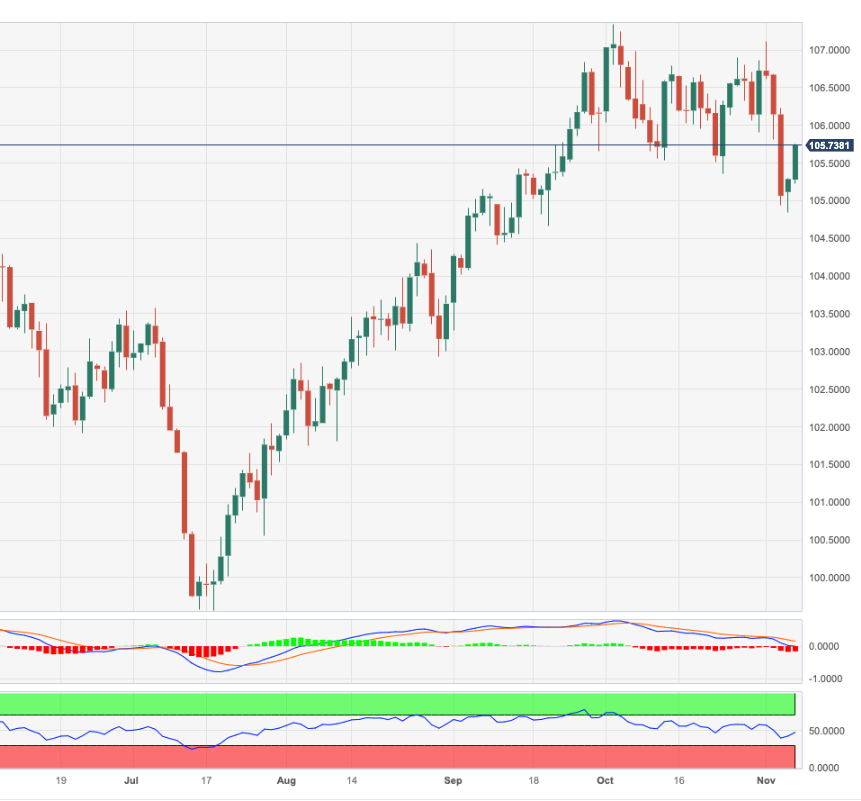
The US Dollar pulled back during the American session and lost momentum amid reversals in Treasury yields and as stocks on Wall Street turned positive. The 10-year yield fell from 4.65% to 4.54%, while the 2-year yield dropped from 4.95% to 4.89%. The US Dollar Index rose for the second day but finished around 105.50 after reaching a two-day high at 105.77.
No top-tier reports are due from the US on Wednesday. The key event will be a speech from Federal Reserve Chair Jerome Powell. There appears to be little room for surprises. Fed officials agreed during their last appearances that data will guide the next decisions. While they do not rule out further tightening, it appears that the Fed is done raising interest rates. However, the decline of the US Dollar remains limited and exposed to important correction as fundamentals still favor the US.
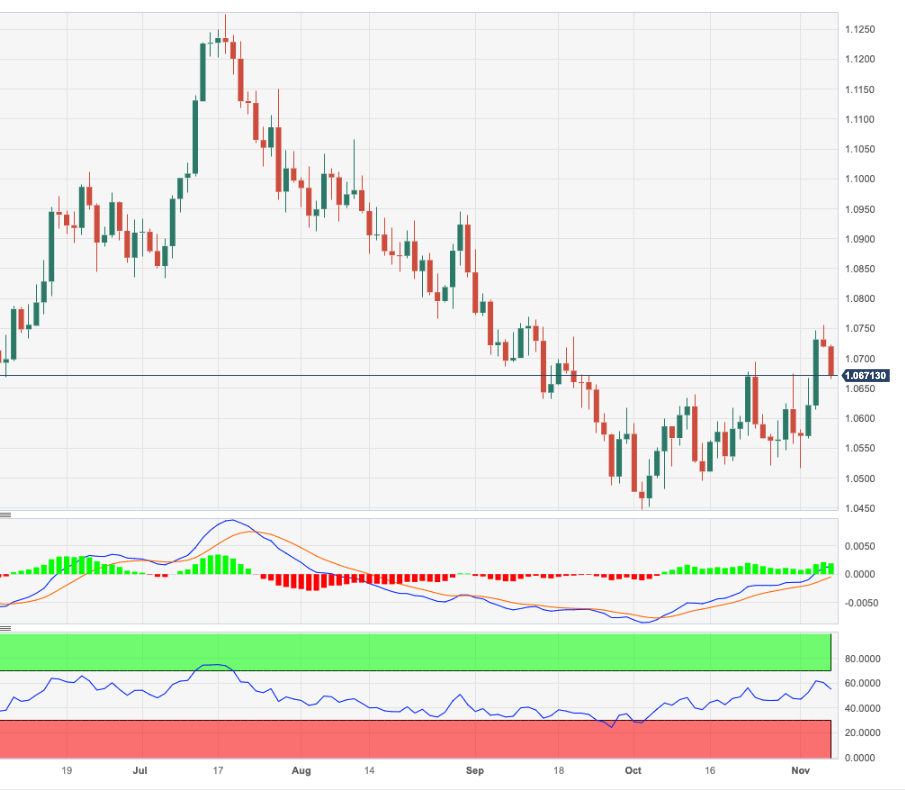
EUR/USD rebounded at 1.0670 and climbed back to the 1.0700 area. The pair lost ground but maintained a bullish tone in the short term. On Wednesday, Germany will release the final reading of consumer inflation, which is expected to bring no surprises, and Eurozone will report September Retail Sales.
The Pound lagged on Tuesday. The Bank of England's (BoE) policy outlook continues to sound dovish after last week's monetary policy meeting. GBP/USD pulled back for the second day in a row and bottomed at 1.2262 before rebounding to 1.2300.
USD/JPY rose for the second day, despite the reversals in US Treasury yields, and tested levels above 150.50. The pair remains bullish in the short term but is losing momentum.
The Australian Dollar was among the worst performers on Tuesday, despite the Reserve Bank of Australia's (RBA) rate hike. The central bank's dovish tone weighed on the Aussie. AUD/USD found support at the 0.6400 zone and rose to 0.6430, boosted by a decline in the US Dollar during the American session.
Analysts at TD Securities on AUD/USD:
Near term, we see the AUD returning to the US$0.63-0.65 range. However, longer term we are bullish the AUD given our view that the USD correction has begun while Chinese stimulus should begin to bear fruit.
NZD/USD pulled back further from 0.6000 and bottomed at 0.5908 before turning higher and reaching 0.5940. The Reserve Bank of New Zealand (RBNZ) will release the inflation expectation report on Wednesday.
Metals remained under pressure. Silver is trading dangerously below $22.80 and hit two-week lows at $22.43. Gold dropped to $1956, a two-week low before trimming losses.
Like this article? Help us with some feedback by answering this survey:
- EUR/USD trades at 1.0696, down by 0.20%, as negative sentiment surrounding the Eurozone's economic outlook weighs on the Euro.
- Disappointing industrial production in Germany stokes recession concerns, contributing to the Euro's decline.
- ECB officials maintain a cautious approach, with de Guindos emphasizing data dependency and Enria warning of the impact of higher rates on property prices.
EUR/USD extended its losses below the 1.0700 figure late in the New York session, failing to extend its uptrend, which peaked at around 1.0756, though sellers dragged prices toward current exchange rates. At the time of writing, the pair is trading at 1.0696, losing 0.20%.
Euro struggles as German industrial data disappoints, while ECB and Fed officials offer varied policy outlooks
Wall Street portrays an upbeat market sentiment, which usually would be harmful to the American Dollar (USD), but not today. Worse than-expected Industrial Production figures from Germany reignited recessionary fears in the Eurozone (EU) area. Consequently, the EUR/USD dropped to a two-day low at 1.0664.
The Eurozone revealed the Producer Price Index (PPI) plunged -12.4% less than -12.5%, foreseen, suggesting that inflation continues to cool down.
European Central Bank (ECB) officials crossed newswires, with ECB’s Vice President Luis de Guindos adopting a vigilant stance, saying the central bank would continue to be data-dependent regarding monetary policy. In the meantime, ECB’s Chiefs Supervisor Andrea Enria noted, “The current higher interest rate environment could put further downward pressure on office and house prices.”
Recently, the Bundesbank President and ECB member Joachim Nagel stated it’s “imperative to remain vigilant” on inflation, as he sees the EU faces risks that inflation could turn out “higher than expected.”
Federal Reserve officials continue to express a range of views. Minnesota Fed President Neil Kashkari indicated that the economy's strength raises questions about whether current policy is tight enough, and he mentioned that an uptick in inflation would justify further tightening.
On the other hand, Chicago Fed President Austan Goolsbee acknowledged progress in controlling inflation and suggested that the conversation might shift to how long rates need to remain at their current level.
EUR/USD Price Analysis: Technical outlook
After its two-day advance, the EUR/USD enjoys a pullback, with sellers failing to register a daily close below the latest cycle high of 1.0694, which could pave the way to resume the uptrend. In that event, the seller's first support would be the 50-day moving average (DMA) at 1.0632, with price action distancing further from the 200-DMA. Up next would be the 1.0600 mark. On the flip side, the EUR/USD first resistance would be the 1.0700 figure, putting into play last Monday’s high of 1.0765. Once breached, the next stop would be the 200-DMA at 1.0805.
- Spot Gold prices are seeing further losses on the week as risk appetite staggers.
- XAU/USD falls through $1,970, further downside on the cards.
- Market sentiment has reversed direction this week.
Spot Gold is getting knocked down for a second day in a row as the week rotates into risk-off flows following last week's sentiment recovery. Markets overwhelmingly heralded the end of rate hikes following last week's Federal Reserve (Fed) rate hold, but Monday saw a pullback as investors moderated their forward-looking positions on rate expectations.
Hawkish comments from Fed officials early Tuesday coupled with souring trade data from China is steepening a spike in risk aversion, adding to further red chart paper for Gold bids.
China trade balance figures came in below expectations, completely missing a forecast growth in headline trade data to show further contraction in China's goods exports. Fears of a global growth slowdown sparked by a faltering Chinese economy are once again drawing investor anxiety, cutting last week's risk rally short.
Fed's Kashkari: We have to let inflation and labor data guide us
Fed policymakers left the doors open for further Fed rate hikes in the future if inflation returns, and the US central bank is likely much further from enacting rate cuts than investors have been hoping for.
Fed member talking points continue to reinforce the "higher for longer" narrative, with several Fed policymakers noting that there will be no movement on rates until the data clearly implies it is time to do so.
XAU/USD Technical Outlook
Spot Gold bids tumbled to $1,956.73 in Tuesday's risk-off slide, bringing the XAU/USD's two-day performance to -1.83%, and despite a recovery back towards the $1,970 region, Gold remains pinned in bear country for the time being.
XAU/USD is down 2% from the last swing high above the $2,000 major handle, but Spot Gold bids still remain above the 200-day Simple Moving Average (SMA) currently lifting into $1,940.
XAU/USD Daily Chart
XAU/USD Technical levels
- GBP/USD falls to 1.2264, marking a 0.63% decline amid a strengthening US Dollar.
- The Pound is weighed down by comments from BoE's Chief Economist Huw Pill, suggesting possible rate cuts in 2024.
- Fed officials present mixed views, with Kashkari noting the economy's strength and Goolsbee acknowledging progress on inflation.
GBP/USD extends its losses past the 1.2300 figure after failing to decisively crack the 200-day moving average (DMA) due to overall US Dollar (USD) strength despite falling US bond yields. The major exchanges hands at 1.2264, down 0.63%.
Sterling falls as the US Dollar gains ground, with BoE's hints at potential rate cuts adding to the downward pressure
Market sentiment remains upbeat, which would usually underpin the GBP/USD. Still, the latest comments from the Bank of England (BoE) Chief Economist Huw Pill, saying that rate cuts could be possible in mid-2024, exacerbated further Pound Sterling (GBP) weakness.
UK’s risks of entering a recession could set the faith of the GBP/USD pair. Weak consumer spending and a higher cost of living for households has witnessed growing pessimism amongst British after an Accenture and YouGov poll showed that two-thirds of UK adults are not interested in participating in Black Friday and Cyber Monday due to the deepening costs of living crisis.
On the US front, Federal Reserve officials continue to cross newswires, led by Minnesota’s Fed President Neil Kashkari, who pushed back against the market's ‘dovish’ perception, saying that the economy's robustness raises the question of whether “is (policy) as tight as we (Fed) assume it currently is.” He added an uptick in inflation would warrant further tightening.
On the dovish side, Chicago Fed President Austan Goolsbee stated that progress in inflation had been made and added the conversation of how high rates need to be, which could shift to how long it would take to keep rates at this level.
Ahead of the week, the UK economic docket will feature a speech by Governor Andrew Bailey on Wednesdays and Gross Domestic Product (GDP) figures for Q3 on Friday. On the US front, the calendar will feature many Fed speakers led by Chairman Jerome Powell, speaking on Wednesday and Thursday. On the data front, unemployment claims and Consumer Sentiment would update labor market data and inflation expectations, seen as essential data for the Fed.
GBP/USD Price Analysis: Technical outlook
The GBP/USD depicts a bearish bias in the near term after failing to crack 1.2400. Consequently, the pullback surpassed the last cycle high at 1.2337, opening the door for deeper losses. Buyers need to keep prices above the October 24 swing high at 1.2288 if they want to remain hopeful for higher prices. Otherwise, the pair would extend its losses, with sellers targeting 1.2069, the October 26 low.
- The EUR/GBP is clawing for further gains, trying to extend the early week's gains.
- EU Retail Sales around the corner, as well as a speech from BoE Governor Bailey.
- UK GDP figures loom ahead on Friday.
The EUR/GBP is looking for further topside on Tuesday with EU Retail Sales data landing on Wednesday.
Before that, Bank of England (BoE) Governor Andrew Bailey will be speaking at the Central Bank of Ireland Financial System Conference in Dublin, and investors will be looking for policy clues ahead of the BoE's next policy meeting after the last meeting saw another rate hold.
BoE moving further away from additional rate hikes
The number of BoE policymakers that voted for a rate hike at the last meeting decreased from 4 to 3, with 6 of the 9 Monetary Policy Committee voting members opting to hold rates unchanged for the third straight meeting. The BoE meets again for a rate vote duting the first week of December.
EU Retail Sales for the year into September are broadly expected to etch in further declines, with the median market forecast calling for an acceleration from -2.1% to -3.2 %.
The MoM figure for September is expected to see a minor recovery from -1.2% to just -0.2%.
EUR/GBP Technical Outlook
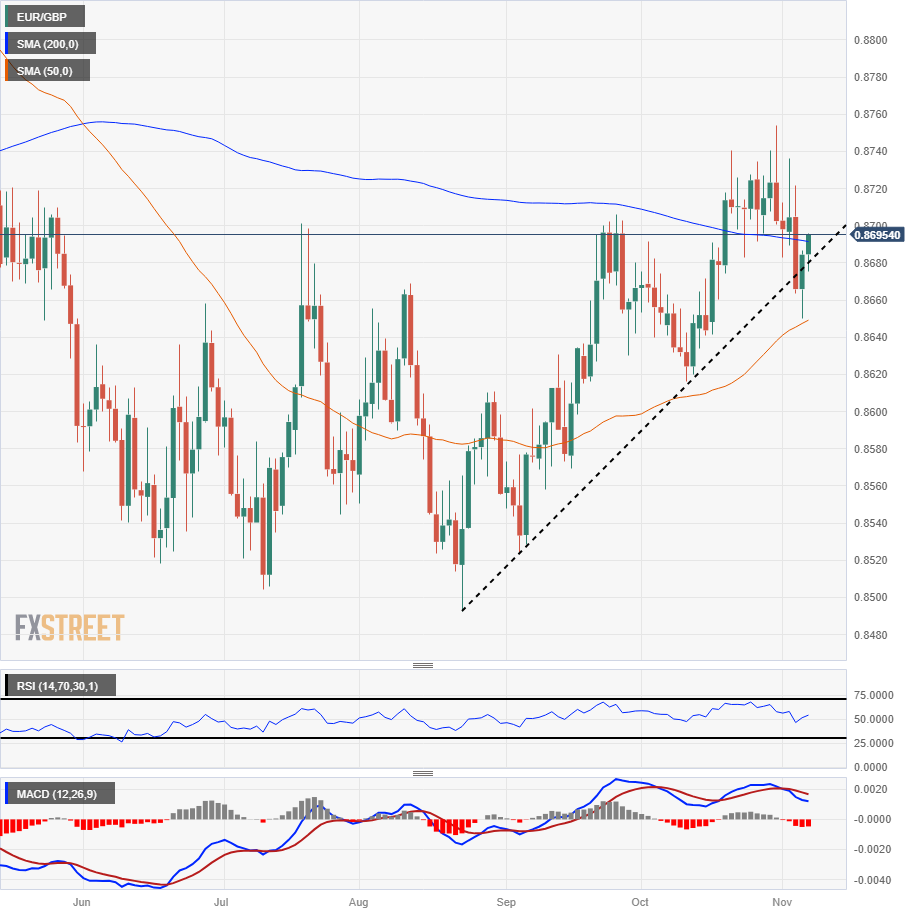
The EUR/GBP is clawing back into the topside after recently tumbling out of consolidation, and the pair is set to confirm a daily close back over the 200-day Simple Moving Average (SMA) near 0.8690.
The pair has rebounded from a false break of a risking trendline from August's swing low below 0.8500, and the pair is catching technical support from the 50-day SMA near 0.8650.
EUR/GBP Daily Chart
EUR/GBP Technical Levels
- The AUD/USD declined to a low near 0.6400, seeing 1.05% losses
- Despite the hiking by 25 bps the AUD failed to gain momentum
- Indicators on the daily chart are starting to favour the bears.
The AUD/USD suffered significant losses in Tuesday's session, reaching a daily low near 0.6400 with a decline of 1.05% and then stabilising around 0.6420. The Reserve Bank of Australia (RBA) hiked rates by 25 bps to 4.35% and left the door open to further increases, but the USD strength is pushing the pair downwards.
In line with that, the daily chart highlights a neutral to the bearish technical outlook for the AUD/USD, as signs of bullish exhaustion become evident after last week’s rally. The Relative Strength Index (RSI) has a negative slope above its midline, indicating weakening buying pressure, while the Moving Average Convergence (MACD) lays out lower green bars. Furthermore, the pair is above the 20-day Simple Moving Average (SMA) but below the 100 and 200-day SMAs, suggesting that the bears are in control of the larger context while bulls are still resilient, holding some momentum in the shorter time frame.
Indicators on the four-hour chart turned somewhat flat after sharply declining during the Asian session, indicating that the pair may face a consolidation in the short term.
Supports: 0.6400, 0.6365 (20-day SMA), 0.6350.
Resistances: 0.6440, 0.6460, 0.6500 (100-day SMA).
AUD/USD Daily chart

- The Canadian Dollar is seeing pullback as investors seek Greenback pastures.
- Canada Trade Balance improves but fails to inspire CAD bidding.
- Broad-market risk sentiment is wobbling, sending safe havens higher.
The Canadian Dollar (CAD) is moving lower, giving up last week’s gains against the US Dollar (USD) as broader market sentiment twists on Tuesday. A large miss for Chinese trade data coupled with hawkish statements from Federal Reserve (Fed) officials are jointly hampering risk appetite.
Canada trade balance figures improved over previous figures, Exports and Imports both printed slight gains for September. Canadian Exports edged higher to $67.03 billion from $65.28 billion (revised upward from $64.56 billion), while Imports saw minor gains to $64.99 billion from August’s $64.33 billion, which was also revised higher from $63.84 billion.
Canada’s overall International Merchandise Trade for September increased to CAD $2.04 billion from August’s $950 million, revised higher from $720 million.
Daily Digest Market Movers: Canadian Dollar paring back recent gains as markets rotate into US Dollar once more
- The CAD is losing steam with global markets seeking safe harbor as last week’s risk-on mood evaporates.
- A miss for China trade figures sent early Tuesday’s markets into the red after Chinese Trade Balance numbers unexpectedly declined.
- Hawkish Fed appearances are chipping away at last week’s rally as Fed officials reiterate that the US central bank is not pre-committed to an end of rate hikes.
- Crude Oil prices are slumping in risk-off flows, further cutting support from the CAD.
- Russia reaffirmed their production reduction, potentially extending through next year’s first quarter, to little Crude Oil market effect.
- The US is acquiring additional Crude shipments to shore up national reserves, and throughput at both Chinese and US refineries is missing demand expectations, leaving more barrels in the pipeline than expected.
- US Treasury yields are easing, 10-year T-note down to 4.587% from 4.66%.
Technical Analysis: Canadian Dollar heading back to 1.3800 as US Dollar bids return
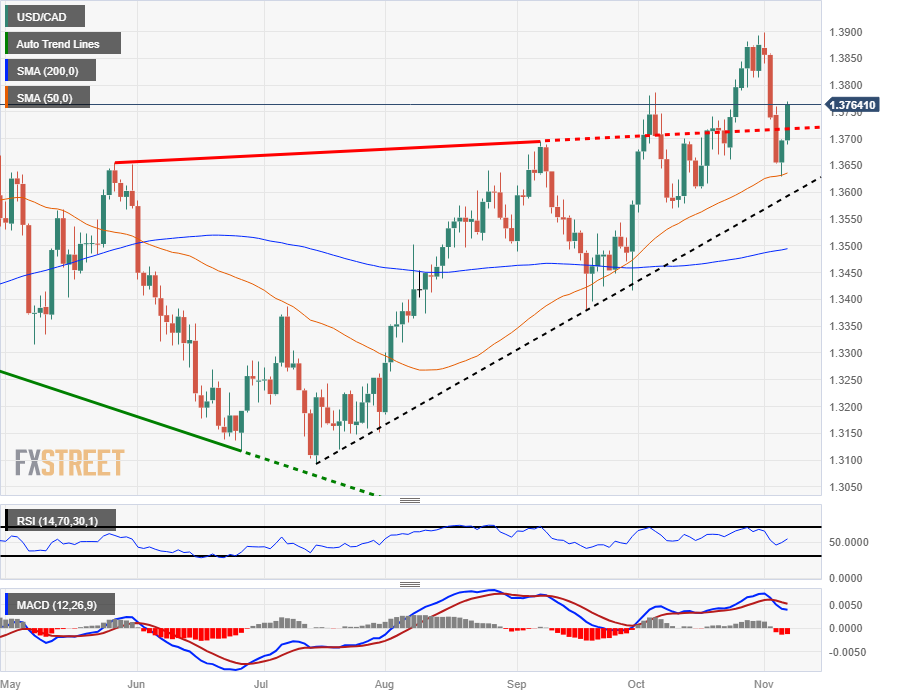
The Canadian Dollar (CAD) has pared back about half of last week’s gains against the US Dollar (USD), sending the USD/CAD back toward the 1.3800 handle after taking a clean bounce from the 50-day Simple Moving Average (SMA) near 1.3630.
A bullish continuation from here will see the pair marking an accelerating pace of higher lows as the USD/CAD begins to break away to the topside from a bullish trendline rising from July’s bottom bids near 1.3100. The near-term technical ceiling for bullish Greenback bidders sits at the last swing high into the 1.3900 handle.
The US Dollar is up over 5% against the Loonie from 2023’s low bids of 1.3092 and up over 1.5% on the year.
USD/CAD Daily Chart
Canadian Dollar FAQs
What key factors drive the Canadian Dollar?
The key factors driving the Canadian Dollar (CAD) are the level of interest rates set by the Bank of Canada (BoC), the price of Oil, Canada’s largest export, the health of its economy, inflation and the Trade Balance, which is the difference between the value of Canada’s exports versus its imports. Other factors include market sentiment – whether investors are taking on more risky assets (risk-on) or seeking safe-havens (risk-off) – with risk-on being CAD-positive. As its largest trading partner, the health of the US economy is also a key factor influencing the Canadian Dollar.
How do the decisions of the Bank of Canada impact the Canadian Dollar?
The Bank of Canada (BoC) has a significant influence on the Canadian Dollar by setting the level of interest rates that banks can lend to one another. This influences the level of interest rates for everyone. The main goal of the BoC is to maintain inflation at 1-3% by adjusting interest rates up or down. Relatively higher interest rates tend to be positive for the CAD. The Bank of Canada can also use quantitative easing and tightening to influence credit conditions, with the former CAD-negative and the latter CAD-positive.
How does the price of Oil impact the Canadian Dollar?
The price of Oil is a key factor impacting the value of the Canadian Dollar. Petroleum is Canada’s biggest export, so Oil price tends to have an immediate impact on the CAD value. Generally, if Oil price rises CAD also goes up, as aggregate demand for the currency increases. The opposite is the case if the price of Oil falls. Higher Oil prices also tend to result in a greater likelihood of a positive Trade Balance, which is also supportive of the CAD.
How does inflation data impact the value of the Canadian Dollar?
While inflation had always traditionally been thought of as a negative factor for a currency since it lowers the value of money, the opposite has actually been the case in modern times with the relaxation of cross-border capital controls. Higher inflation tends to lead central banks to put up interest rates which attracts more capital inflows from global investors seeking a lucrative place to keep their money. This increases demand for the local currency, which in Canada’s case is the Canadian Dollar.
How does economic data influence the value of the Canadian Dollar?
Macroeconomic data releases gauge the health of the economy and can have an impact on the Canadian Dollar. Indicators such as GDP, Manufacturing and Services PMIs, employment, and consumer sentiment surveys can all influence the direction of the CAD. A strong economy is good for the Canadian Dollar. Not only does it attract more foreign investment but it may encourage the Bank of Canada to put up interest rates, leading to a stronger currency. If economic data is weak, however, the CAD is likely to fall.
- WTI sees a significant drop, trading around $78.35, close to its lowest in over two months.
- Disappointing export figures from China raise alarms about potential declines in oil demand, pressuring prices.
- OPEC+ production cuts, led by Saudi Arabia and Russia, provide some support but fail to offset demand-side fears.
West Texas Intermediate (WTI), the US Crude Oil benchmark, plunged more than 2.80% on Tuesday even though Saudia Arabia and Russia underpin the oil market due to its crude output cuts. Nevertheless, weaker-than-expected exports from China triggered the fall of oil. WTI is trading at $78.35, near a two-and-a-half-month low at the time of writing.
US oil benchmark WTI drops sharply as Chinese export data fuels demand concerns, overshadowing OPEC+ production cuts
Economic data from China, particularly exports missing estimates, spurred fears that oil’s demand would be dented. This is mainly because China-based refiners cut their production between November and December, which could weigh on crude oil demand, exacerbating price declines.
Oil prices had been influenced by the recovery of the Greenback (USD), after plunging more than 1.40% last week, on speculations the US Federal Reserve (Fed), ended its hiking cycle. The US Dollar Index, which measures the buck’s performance, against a basket of six currencies, climbs 0.34%, up at 105.62.
Meanwhile, Saudi Arabia and Russia's 1.3 million barrel cut, it’s capping WTI losses, as they have extended their plan toward the end of 2023, with estimates they could extend it through the first quarter of 2024.
WTI Price Analysis: Technical outlook
Oil’s recent uptrend is risky if sellers reclaim the 200-day moving average (DMA) at around $78.15 per barrel. Once that level is breached, the next cycle low at $77.64 would be tested, ahead of the pair extending its losses toward the July 18 daily low of $73.94. On the other hand, if WTI stays above the 200-DMA, that could open the door to challenge $80.00. Once cleared, buyers could challenge the last week’s high of $83.56.
- The NZD/USD plunged to a daily low of 0.5930, down by 0.50%.
- China reported mixed economic figures during the Asian session.
- A strong US Dollar contributed to the downside.
The NZD/USD saw downward movements in Tuesday's session, declining to 0.5930 with a daily loss of 0.50%. On the data front, China reported Trade Balance data while the US Dollar recovering ground is what pushed the pair downwards.
In line with that, after the US DXY Index closed a 1.40% weekly decline last Friday, the Greenback is gaining some traction driven by a cautious market mood and US yields recovering. In addition, markets are awaiting fresh catalysts to continue placing their bets on the next Federal Reserve (Fed) decisions and the focus is set on next week’s Consumer Price Index (CPI) figures from the US from October.
Ahead of Powell’s speech on Wednesday, several Fed officials were on the wires on Tuesday but didn’t provide any new insights on the bank's plans for the next monetary policy decisions.
On the other hand, China, a big trade partner of New Zealand, reported that Exports declined by more than 6% (YoY) in October, while Imports surged by 3% (YoY), but the data failed to trigger any movements on the Kiwi.
NZD/USD Levels to watch
The NZD/USD suggests a neutral to bearish technical outlook on the daily chart as bullish momentum wanes. The Relative Strength Index (RSI) points downwards above its midline, while the Moving Average Convergence (MACD) prints decreasing green bars. Additionally, the pair is above the 20-day Simple Moving Average (SMA), below the 100-day SMA, but above the 200-day SMA, implying that the bears remain in control on a broader scale.
Supports: 0.5915, 0.5900, 0.5880 (20-day SMA)
Resistances: 0.5960,0.6000 (100-day SMA), 0.6030.
NZD/USD Daily chart
-638349707432799862.png)
- Mexican Peso recovers from Monday’s dip, with USD/MXN trading around 17.50.
- Banxico is anticipated to maintain the overnight cash rate unchanged at 11.25%, with markets pricing in a steady approach for the upcoming policy decisions.
- Federal Reserve's pause in rate hikes last week has led to a 3.75% appreciation of the Peso against the Dollar.
Mexican Peso (MXN) stages a comeback, recovering from Monday’s losses against the US Dollar (USD), which was bolstered by higher Treasury bond yields in the United States (US). A scarce economic calendar in Mexico keeps traders eyeing the Bank of Mexico's (Banxico) upcoming monetary policy decision, with traders expecting no change to the overnight cash rate, which is currently sitting at 11.25%. Therefore, the USD/MXN is seen hovering around the 17.50 area, the current spot price, losing a decent 0.17% on the day.
Banxico has two monetary policy decisions left for the rest of 2023. Their officials have struck the markets with hawkish remarks, stating that rates need to be at the current level for a longer period. Contrarily, last Wednesday’s Federal Reserve’s (Fed) decision to keep rates unchanged ignited speculations the Fed has finished its tightening cycle. This bolstered the Peso’s appreciation of 3.75% ever since, as the USD/MXN has plummeted from 18.12 to 17.45.
Lately, the Minnesota Fed President Neil Kashkari pushed back against the market's ‘dovish’ perception, saying that the economy's robustness raises the question of whether “is (policy) as tight as we (Fed) assume it currently is.” He added an uptick in inflation would warrant further tightening. On the dovish side, Chicago Fed President Austan Goolsbee stated that progress in inflation has been made and added the conversation of how high rates need to be, which could shift to how long it would take to keep rates at this level.
Daily digest movers: Mexican Peso boosted by falling US bond yields
- The CME FedWatch Tool shows odds of additional tightening plunging, as participants see a 20% chance for a 25-bp hike in January 2024. On the other side, rate cuts have begun to be priced in, with odds at 51.05% for a May 2024 25-bp rate cut.
- On the data front, the US trade deficit widened 4.9% to $61.5 billion from $58.7 billion, more than the foreseen $59.9 billion.
- Ahead in the calendar will feature more Fed speakers, with Governors Michael Barr, Christopher Waller, and Kansas City Fed President Jeffrey Schmidt.
- Mexico S&P Global October Manufacturing PMI printed at 52.1, above September’s 49.8.
- Mexico’s Gross Domestic Product grew by 0.9% QoQ in the third quarter on its preliminary reading, above the previous quarter and estimates of 0.8%.
- On a yearly basis, Mexico’s GDP for Q3 expanded by 3.3%, above forecasts of 3.2% but trailing the previous 3.6%.
- On October 24, Mexico's National Statistics Agency, INEGI, reported annual headline inflation hit 4.27%, down from 4.45% at the end of September and below forecasts of 4.38%.
- Mexico’s core inflation rate YoY was 5.54%, beneath forecasts of 5.60%.
- The Bank of Mexico (Banxico) held rates at 11.25% in September and revised its inflation projections from 3.50% to 3.87% for 2024, which remains above the central bank’s 3.00% target (plus or minus 1%). The next decision will be announced on November 9.
Technical Analysis: Mexican Peso buyers in charge as they eye the 100-day SMA
The USD/MXN daily chart portrays the pair as bearish, resuming its downtrend despite having undergone a slight recovery on Monday. Even though the pair formed a Japanese hammer candlestick pattern at Friday’s lows, current price action suggests the exotic pair could consolidate at around current price levels ahead of Banxico’s decision.
Hence, if the pair remains sideways, look for key support levels at Monday’s low of 17.40, followed by the 100-day Simple Moving Average (SMA) at 17.31. A breach of the latter will expose the 17.00 figure before the pair aims to test the year-to-date (YTD) low of 16.62.
On the flip side, the USD/MXN first resistance level would be the 50-day SMA at 17.65, followed by the 200-day SMA at 17.69. Once those levels are broken, look out for a challenge of the 18.00 psychological mark.
Mexican Peso FAQs
What key factors drive the Mexican Peso?
The Mexican Peso (MXN) is the most traded currency among its Latin American peers. Its value is broadly determined by the performance of the Mexican economy, the country’s central bank’s policy, the amount of foreign investment in the country and even the levels of remittances sent by Mexicans who live abroad, particularly in the United States. Geopolitical trends can also move MXN: for example, the process of nearshoring – or the decision by some firms to relocate manufacturing capacity and supply chains closer to their home countries – is also seen as a catalyst for the Mexican currency as the country is considered a key manufacturing hub in the American continent. Another catalyst for MXN is Oil prices as Mexico is a key exporter of the commodity.
How do decisions of the Banxico impact the Mexican Peso?
The main objective of Mexico’s central bank, also known as Banxico, is to maintain inflation at low and stable levels (at or close to its target of 3%, the midpoint in a tolerance band of between 2% and 4%). To this end, the bank sets an appropriate level of interest rates. When inflation is too high, Banxico will attempt to tame it by raising interest rates, making it more expensive for households and businesses to borrow money, thus cooling demand and the overall economy. Higher interest rates are generally positive for the Mexican Peso (MXN) as they lead to higher yields, making the country a more attractive place for investors. On the contrary, lower interest rates tend to weaken MXN.
How does economic data influence the value of the Mexican Peso?
Macroeconomic data releases are key to assess the state of the economy and can have an impact on the Mexican Peso (MXN) valuation. A strong Mexican economy, based on high economic growth, low unemployment and high confidence is good for MXN. Not only does it attract more foreign investment but it may encourage the Bank of Mexico (Banxico) to increase interest rates, particularly if this strength comes together with elevated inflation. However, if economic data is weak, MXN is likely to depreciate.
How does broader risk sentiment impact the Mexican Peso?
As an emerging-market currency, the Mexican Peso (MXN) tends to strive during risk-on periods, or when investors perceive that broader market risks are low and thus are eager to engage with investments that carry a higher risk. Conversely, MXN tends to weaken at times of market turbulence or economic uncertainty as investors tend to sell higher-risk assets and flee to the more-stable safe havens.
The Canadian Dollar has been treading water since last July. Economists at the National Bank of Canada analyze Loonie’s outlook.
No much room for CAD appreciation until the second half of 2024
Loonie's slide has been exacerbated by a series of weak economic reports. Market expectations have recently moved in the direction of our forecast of monetary easing. As a result, the CAD is currently facing the double whammy of a widening interest rate differential with the US and weaker commodity prices due to a slowing global economy.
We expect USD/CAD to converge towards 1.42 in the coming months.
We don't see much room for CAD appreciation until the second half of 2024.
Federal Reserve (Fed) Governor Christopher Waller said on Tuesday that the US economy was booming in the third quarter and noted that the Fed is watching that very closely, per Reuters.
Key quotes
"Labor market is cooling and getting close to average from before the pandemic."
"Labor supply also appears to be normalizing to pre-pandemic levels."
"In central banking terms, movement up in 10 year has been an earthquake."
"Policymakers are mulling what drove long-term yields higher."
"What people have in mind now is for prices to return to earlier levels, and that is not going to happen."
Market reaction
These comments don't seem to be having a noticeable impact on the US Dollar's (USD) performance against its major rivals. As of writing, the US Dollar Index was up 0.35% on the day at 105.62.
After two consecutive pauses, what is next for the Federal Reserve? Economists at JP Morgan analyze chances of another hike this cycle.
The Fed will remain data dependent going forward
The Fed will remain data dependent going forward, and having now paused hiking rates for two consecutive meetings this suggests they are willing to exercise patience and proceed carefully.
While a reacceleration in growth and/or inflation could prompt another rate hike either in December or early next year, short-term bumps in a downward trending economy likely keep the Fed on hold well into 2024.
- The USD/CHF is seen at 0.9015 with 0.15% gains.
- The 20-day SMA is about to perform a bearish cross with the 200-day SMA.
- Several Fed officials were on the wires but didn’t provide any highlights. Powell speaks on Wednesday.
The USD/CHF accelerated its gains on Tuesday's session and rose to the 0.9015 zone, with a strong US dollar and a negative market mood contributing to the pair's movements.
As the bears took a breather, the USD/CHF managed to gain additional momentum while there were no highlights during the session. Neel Kashkari, Austan Goolsbee and Michael Barr from the Federal Reserve (Fed) spoke on Tuesday but didn’t provide markets with any new guidance. They were seen as somewhat cautious, welcoming the latest positive inflation figures and still attaching themselves to a data-dependency approach. Chair Powell will speak on Wednesday, where investors will look for further clues on what the Fed will decide in its last meeting of 2023.
As for now, the CME FedWatch tool indicates that the odds of a 25 basis point hike for the December meeting are still low. Next week, the US will report October Consumer Price Index (CPI) data, which will likely make those expectations move based on its outcome.
USD/CHF levels to watch
The daily chart analysis indicates a neutral to bearish outlook for USD/CHF, as the bears seem to be taking a breather after gaining significant ground. The Relative Strength Index (RSI) gained a slight slope in positive territory, while the Moving Average Convergence (MACD) presents decreasing green bars. On the broader picture, markets should we the convergence of the 20 and 200-day Simple Moving Average (SMA) convergence at 0.9000 as they are about to perform a bearish cross, which could reignite the bearish momentum.
Supports: 0.9000 (20 and 200-day SMA convergence), 0.8950, 0.8930.
Resistances: 0.9040, 0.9050, 0.9080
USD/CHF Daily chart
-638349663648719427.png)
EUR/USD experienced another month of volatility, having fallen below the 1.05 mark in October only to appreciate at the beginning of November to slightly above the 1.07 level. Economists at the National Bank of Canada analyze the pair’s outlook.
EUR set to weaken on slow economy and rate cuts
It would be fair to say that the current improvement is not predicated on a sizeable enhancement of the economic situation. Moreover, the central bank has almost assuredly reached the endpoint of tightening monetary policy.
While the Euro has seen some appreciation recently, it was reflective of a weaker US Dollar.
We continue to see weakness for the European currency in the coming quarters with the potential for some improvement later in 2024.
- EUR/USD comes under pressure following Monday’s tops.
- Further decline could revisit the 1.0650 zone in the near term.
EUR/USD faces increasing selling pressure and returns to the sub-1.0700 region afer hitting new highs near 1.0750 at the beginning of the week.
In case the downward bias picks up extra pace, the pair could extend the pullback to the 55-day SMA near 1.0650, which is expected to provide temporary contention.
In the meantime, while below the 200-day SMA at 1.0804, the pair’s outlook should remain negative.
EUR/USD daily chart
- DXY regains composure and adds to Monday’s rebound.
- Once 106.00 is cleared, the index should shift its attention to 107.10.
DXY extends the rebound from Monday’s lows in the sub-105.00 zone and revisits the 105.70 region on Tuesday.
In case the buying interest gathers extra pace, the index could revisit the so far November high at 107.11 (November 1) ahead of the 2023 peak of 107.34 (October 3).
So far, while above the key 200-day SMA, today at 103.53, the outlook for the index is expected to remain constructive.
DXY daily chart
- EUR/JPY climbs to new 2023 peaks just past 161.00.
- Further bullish attempts should target the 2008 high near 170.00.
EUR/JPY advances to fresh YTD highs just above 161.00 the figure on Tuesday.
Further upside appears well on the cards for the cross in the short-term horizon. Against that, the surpass of the 2023 high of 161.02 (November 6) is expected to face the next significant resistance level not before the 2008 top of 169.96 (July 23)
So far, the longer term positive outlook for the cross appears favoured while above the 200-day SMA, today at 151.82.
EUR/JPY daily chart
USD/CAD is rebounding swiftly. Economists at Scotiabank analyze the pair’s outlook.
A firm ceiling sits on top of USD/CAD now at 1.39
Trend signals have turned neutral which suggests choppier range trading may develop in the near term.
The salient feature of the USD/CAD chart remains the big, bearish key reversal signal on the weekly chart, however, which rather suggests the USD’s upside potential should be limited (to the upper 1.37s) and that a firm ceiling sits on top of USD/CAD now at 1.39.
Intraday support is 1.3710/1.3720.
- AUD/USD faces an intense sell-off above 0.6500 amid a risk-off mood.
- A hawkish interest rate decision by the RBA failed to lift the Australian Dollar further.
- Fed Kashkari warned that the Fed’s job would be unfinished if inflation starts to tick back up.
The AUD/USD pair fell sharply after facing intense selling pressure above the psychological resistance of 0.6500 in the early New York session. Bears gripped the Aussie asset tightly as the risk-on market mood faded away.
The S&P500 opens on a negative note as investors turn anxious ahead of the speech from Federal Reserve (Fed) Chair Jerome Powell, which is scheduled for Wednesday. The US Dollar Index (DXY) recovered to near 105.60 amid fears that Fed policymakers could advocate for more rate hikes if the US economy continues to remain resilient.
Minneapolis Fed Bank President Neel Kashkari, said in a statement, that inflation and labor data would guide forward monetary policy actions. He warned that the Fed’s job would be unfinished if inflation starts to tick back up. On Monday, Neel Kashkari warned that the central bank needed to do more to ensure inflation returns to 2%.
Meanwhile, the Australian Dollar faced a sharp sell-off despite the Reserve Bank of Australia (RBA) raising its Official Cash Rate (OCR) by 25 basis points (bps) to 4.35% as expected. The RBA raised interest rates after keeping them unchanged in the last four monetary policy meetings.
RBA Governor Michele Bullock kept hopes of further rate-tightening alive, citing that the progress in inflation declining to 2% has slowed and risks of persistent consumer inflation have escalated.
Going forward, investors will focus on China’s inflation data for October, which will be published on Thursday. Being a proxy to China’s economy, the Australian Dollar would face pressure if deflation risks elevate.
"As long as we are making progress on inflation, the topic is then only how long we keep rates at this level," Federal Reserve Bank of Chicago President Austan Goolsbee told CNBC on Tuesday.
Key quotes
"You have to look through two week movements of long-term yield rates."
"If long rates are sustained at high levels, that is most likely tightening."
"We are all paying attention to figure out what is driving long-term yield rates."
"If coming from term premia we have to take that into account."
"You cannot answer what number on long term yield equals enough tightening."
"We are also getting positive supply side developments in the economy."
"The economy is weakening."
"The job market is getting into better balance."
"Inflation has come down a lot."
"We might equal the fastest drop in inflation in the last century."
"Inflation is a more important part of the mandate right now."
"I don't like pre-committing what rates will be at the next meeting."
"Still a lot of data to parse before then."
"My conditions for Fed being done with rates are that we are clearly back on the path to get inflation back to 2."
"So far we are on a good path on inflation, but not done yet."
"Priority for changing rate stance is inflation rate."
"Financial conditions clearly matter but the market doesn't get to tell the Fed what to do."
"There is possibility of the golden path that allows us to get inflation down without recession."
"That would be a continuation of what we've seen so far."
Market reaction
The US Dollar Index showed no immediate reaction to these comments and was last seen gaining 0.35% on the day at 105.62.
EUR/USD drops. Economists at Scotiabank analyze the pair’s outlook.
Bullish DMIs should curb scope for losses
More drift in EUR/USD may develop below 1.0665, the 38.2% retracement of the rebound in the pair from last week’s low at 1.0517.
Trend momentum remains bullishly aligned on the intraday and daily studies but these signals have weakened with the EUR’s drift lower.
Bullish DMIs should curb scope for EUR losses, at least for now.
Support should firm up in the low 1.06s.
Resistance is 1.0700/1.0710 and 1.0750.
- Silver price has refreshed weekly low near $22.50 as the status of Middle East tensions remains unchanged.
- The appeal for the risk-sensitive assets diminished as investors awaited Powell’s speech.
- Silver price demonstrates a sideways performance in a range of $22.45-23.70.
Silver price (XAG/USD) prints a fresh weekly low near $22.50 amid caution ahead of speeches from Federal Reserve (Fed) policymakers this week. The white metal faces a sell-off amid sustained buying in the US Dollar amid caution that resilience in the US economy could force policymakers to lean towards raising interest rates further.
S&P500 futures generated some losses in the European session. The appeal for the risk-sensitive assets diminished as investors await the speech from Fed Chair Jerome Powell, which is scheduled for Wednesday. The US Dollar Index (DXY) recovered sharply from 105.00 as Minneapolis Fed Bank President Neel Kashkari said Monday that the US economy has proved to be resilient despite elevated interest rates but the central bank has a lot of work ahead to tame consumer inflation.
In addition to sustained US Dollar buying and a recovery in bond yields, the demand for bullions has faded due to an absence of further escalation in the Israel-Hamas war. Israeli Prime Minister Benjamin Netanyahu said that his administration is open to a little pause to the ground invasion in Gaza but not to a general ceasefire.
Silver technical analysis
Silver price demonstrates a sideways performance in a range of $22.45-23.70 on a four-hour scale, signaling a sharp contraction in volatility. The 200-period Exponential Moving Average (EMA) at $22.85 continues to provide support to the Silver price bulls.
The Relative Strength Index (RSI) (14) oscillates in the 40.00-60.00 range, which indicates that investors await a potential trigger.
Silver four-hour chart
-638349588750651319.png)
- The Japanese Yen falls against a stronger US Dollar on Tuesday.
- USD outperforms JPY after hawkish commentary from Fed President Kashkari.
- Indecision over direction of interest rates in both US and Japan is reflected in USD/JPY’s range bound yo-yo-ing.
The Japanese Yen (JPY) trades in a range against the US Dollar (USD) on Tuesday after the Minneapolis Federal Reserve President Neel Kashkari was reported as saying he believed the Fed had more work to do to bring down inflation. His comments helped lift the US Dollar.
Daily digest market movers: Yen falls on Fed uncertainty
- The Yen continues falling against the US Dollar after an article in the Wall Street Journal on Monday quoted Fed’s Kashkari as saying more work needed to be done to bring down inflation.
- His view goes against the grain. The widespread market opinion is that the Fed is done with raising interest rates.
- In contrast, comments from Federal Reserve Governor Lisa Cook on the same day suggested the Fed would not be rushing to hike interest rates.
- Cook argued the rise in longer-term US Treasury yields was not a result of investors pricing in a belief that the Fed would continue raising interest rates, according to Reuters.
- By suggesting the rise in yields was not driven by investor expectations, Cook implied there was no pressure on the Fed to follow through – thus, her comments were taken as dovish.
- The BoJ also gave mixed signals at its last policy meeting: whilst the board of governors made a step towards normalizing policy by relaxing the 1.0% artificial cap it had imposed on 10-year Japanese Government Bond (JGB) yields – essentially a form of quantitative easing – Bank of Japan Governor Kazuo Ueda played down expectations of rate hikes.
- In fact, Governor Ueda stated that most of the inflation in Japan was from higher commodity prices rather than increased demand, suggesting the BoJ would need to continue to keep monetary policy accommodative to support the economy.
- Further, according to Reuters, despite saying it had softened the yield cap, the BoJ actually intervened to defend it on October 31, suggesting the bank’s actions don’t match its words and de facto easing is still in place.
- "Ueda signaled that the prospect of negative rates being reversed this year was very low,” said James Harte, analyst at Tickmill Group, in a note, reported by Barron’s.
- Japanese data out on Monday evening continued to paint a picture of a tight economy not advantageous to the Yen.
- Labour Cash Earnings for September rose by 1.2% YoY, which was above the 1.0% forecast, and 1.1% previous.
- However, Household Spending in the same month showed a deeper-than-expected 2.8% contraction versus the -2.7% change YoY estimated and -2.5% previous.
- The next key event for the pair is Jerome Powell’s speech at 13:15 on November 8.
Japanese Yen technical analysis: USD/JPY climbs back up to kiss the channel line
USD/JPY – the number of Yen that one Dollar buys – continues higher on Tuesday. The recovery means the short-term trend is starting to look range bound, with price sandwiched between the 151.70 highs of October 30 and the key 148.80 lows. As such it will probably continue yo-yoing until a break through on either side confirms directionality.
-638349575932260955.png)
US Dollar vs Japanese Yen: 4-hour Chart
During Tuesday’s action, the pair has returned to the lower channel line of the rising channel it has been in since the summer. It is now meeting resistance at the channel line where it once met support. There are no signs of a reversal back down yet however.
-638349576369449515.png)
US Dollar vs Japanese Yen: Daily Chart
On the daily chart used to assess the medium-term outlook, the pair is still in an uptrend. On this chart too, the 148.80 low holds the key. Ultimately, as the saying goes, the “trend is your friend” and as long as 148.80 remains intact the medium-term trend remains firmly bullish.
If the 151.93 level from October 2022 – which marked a 32-year-high – is breached, the uptrend will gain reconfirmation, with next targets expected to be met at the round numbers – 153.00, 154.00, 155.00 etc.
German economy FAQs
What is the effect of the German Economy on the Euro?
The German economy has a significant impact on the Euro due to its status as the largest economy within the Eurozone. Germany's economic performance, its GDP, employment, and inflation, can greatly influence the overall stability and confidence in the Euro. As Germany's economy strengthens, it can bolster the Euro's value, while the opposite is true if it weakens. Overall, the German economy plays a crucial role in shaping the Euro's strength and perception in global markets.
What is the political role of Germany within the Eurozone?
Germany is the largest economy in the Eurozone and therefore an influential actor in the region. During the Eurozone sovereign debt crisis in 2009-12, Germany was pivotal in setting up various stability funds to bail out debtor countries. It took a leadership role in the implementation of the 'Fiscal Compact' following the crisis – a set of more stringent rules to manage member states’ finances and punish ‘debt sinners’. Germany spearheaded a culture of ‘Financial Stability’ and the German economic model has been widely used as a blueprint for economic growth by fellow Eurozone members.
What are German Bunds?
Bunds are bonds issued by the German government. Like all bonds they pay holders a regular interest payment, or coupon, followed by the full value of the loan, or principal, at maturity. Because Germany has the largest economy in the Eurozone, Bunds are used as a benchmark for other European government bonds. Long-term Bunds are viewed as a solid, risk-free investment as they are backed by the full faith and credit of the German nation. For this reason they are treated as a safe-haven by investors – gaining in value in times of crisis, whilst falling during periods of prosperity.
What are German Bund Yields?
German Bund Yields measure the annual return an investor can expect from holding German government bonds, or Bunds. Like other bonds, Bunds pay holders interest at regular intervals, called the ‘coupon’, followed by the full value of the bond at maturity. Whilst the coupon is fixed, the Yield varies as it takes into account changes in the bond's price, and it is therefore considered a more accurate reflection of return. A decline in the bund's price raises the coupon as a percentage of the loan, resulting in a higher Yield and vice versa for a rise. This explains why Bund Yields move inversely to prices.
What is the Bundesbank?
The Bundesbank is the central bank of Germany. It plays a key role in implementing monetary policy within Germany, and central banks in the region more broadly. Its goal is price stability, or keeping inflation low and predictable. It is responsible for ensuring the smooth operation of payment systems in Germany and participates in the oversight of financial institutions. The Bundesbank has a reputation for being conservative, prioritizing the fight against inflation over economic growth. It has been influential in the setup and policy of the European Central Bank (ECB).
In an interview with Bloomberg on Tuesday, Minneapolis Federal Reserve Bank President Neel Kashkari said that they have to let inflation and labor data guide them, as reported by Reuters.
Key quotes
"The economy will tell us what the right level of policy stance is."
"If inflation starts to tick back up, that would tell me fed's job is not yet done."
"Economic activity running this hot makes me question if we've done enough."
"No discussion at the Fed about rate cuts."
"Labor market continues to be quite robust."
"Not seeing a lot of evidence the economy is weakening."
"If inflation continues to trend down, that would tell me that it's time to back off."
Market reaction
The US Dollar preserves its strength following these comments. At the time of press, the US Dollar Index was up 0.35% on the day at 105.62.
GBP/USD slips back after peaking near 200-DMA. Economists at Scotiabank analyze the pair’s outlook.
More conviction around the idea of the BoE easing policy towards the middle of 2024
Markets are pricing in a bit more conviction around the idea of the BoE easing policy towards the middle of 2024 following BoE Economist Pill’s remarks on Monday which appeared to endorse that idea.
Sterling’s moves are largely tracking the EUR’s drop back from Monday’s high but the GBP’s daily chart looks a little more negative on the face of it after spot stalled at the 200-DMA on Monday (1.2435).
Corrective GBP losses may extend to the low/mid-1.22s in the near term.
- The Greenback partly recovers Friday’s losses.
- US Treasury yields trade sideways around 4.60%.
- The US Dollar Index is trying to recover from last week’s drop, though still has a long way to go.
The US Dollar (USD) is recovering little by little after having recorded a sharp decline on Friday. Traders are trying to let the dust settle in the aftermath of the disappointing US jobs report. Instead, investors try to look forward and might see the US Dollar Index recover some partial losses.
On the economic data front, a few more data points after a very calm Monday. The US trade balance data will be a good element to see how the US trade deficit is behaving. Meanwhile, speeches from Fed Governor Christopher J. Waller and New York Fed President John C. Williams f might deliver some more interest-rate guidance to the markets.
Daily digest: US Dollar recovers a touch
- China trade data showed a decline in exports by 6.4%, while imports rose by 3.0%.
- US Goods and Services Trade Balance for September is due to come out at 13:30 GMT. In August, the US posted a deficit of $58.3 billion, and a wider deficit of $60.2 billion is expected for September.
- At 13:55 GMT, the Redbook Index is due to come out. Previous was at 5.3%.
- The TechnoMetrica Institute of Policy and Politics is due to publish its Economic Optimism Numbers at 14:00 GMT. The previous reading stood at 36.3.
- Many Fed speakers will take the stage: at 15:00 GMT Fed Governor Christopher J. Waller is due to speak, followed by New York Fed President John C. Williams at 17:00 GMT.
- The US Treasury is heading back to the markets for a 3-year note auction .
- Consumer Credit Change numbers for September are due atr 20:00 GMT: Previous data saw a decline of $15.63 billion, and an increase of $10 billion is expected.
- Asian equities are setting the tone: red. That comes on the back of weaker export data out of China. Asian equities are all down over 1%. European equities are mildly in the red, as they areUS equity futures.
- The CME Group’s FedWatch Tool shows that markets are pricing in a 90.2% chance that the Federal Reserve will keep interest rates unchanged at its meeting in December.
- The benchmark 10-year US Treasury yield trades at 4.61%, finding some calmer ground after the volatile week last week.
US Dollar Index technical analysis: US Dollar has long road to recover
The US Dollar is no longer speculators’ favoured trade this year. Recent data from the Commodity Futures Trading Commission (CFTC) sees US dollar contracts coming off their highs. This means that speculators are starting to unwind their US Dollar Index holdings. This could be a sign that more profit taking is underway, and that more weakness could be in the cards for the Greenback.
The DXY is looking for support near 105.00, though it is struggling to find it. Any shock events in global markets could spark a sudden turnaround and favour safe-haven flows into the US Dollar. A return first to 105.51 would make sense, near the 55-day Simple Moving Average (SMA). A break above could mean a test on the descending trend line near 105.88.
On the downside, a big air pocket is developing and could see the DXY drop to 103.98, near the 100-day SMA, before finding ample support. In case it turns into a falling knife, 103.52 – the 200-day SMA – could act as circuit break. If that level snaps as well, the road is open to head to 101.00.
US Dollar FAQs
What is the US Dollar?
The US Dollar (USD) is the official currency of the United States of America, and the ‘de facto’ currency of a significant number of other countries where it is found in circulation alongside local notes. It is the most heavily traded currency in the world, accounting for over 88% of all global foreign exchange turnover, or an average of $6.6 trillion in transactions per day, according to data from 2022.
Following the second world war, the USD took over from the British Pound as the world’s reserve currency. For most of its history, the US Dollar was backed by Gold, until the Bretton Woods Agreement in 1971 when the Gold Standard went away.
How do the decisions of the Federal Reserve impact the US Dollar?
The most important single factor impacting on the value of the US Dollar is monetary policy, which is shaped by the Federal Reserve (Fed). The Fed has two mandates: to achieve price stability (control inflation) and foster full employment. Its primary tool to achieve these two goals is by adjusting interest rates.
When prices are rising too quickly and inflation is above the Fed’s 2% target, the Fed will raise rates, which helps the USD value. When inflation falls below 2% or the Unemployment Rate is too high, the Fed may lower interest rates, which weighs on the Greenback.
What is Quantitative Easing and how does it influence the US Dollar?
In extreme situations, the Federal Reserve can also print more Dollars and enact quantitative easing (QE). QE is the process by which the Fed substantially increases the flow of credit in a stuck financial system.
It is a non-standard policy measure used when credit has dried up because banks will not lend to each other (out of the fear of counterparty default). It is a last resort when simply lowering interest rates is unlikely to achieve the necessary result. It was the Fed’s weapon of choice to combat the credit crunch that occurred during the Great Financial Crisis in 2008. It involves the Fed printing more Dollars and using them to buy US government bonds predominantly from financial institutions. QE usually leads to a weaker US Dollar.
What is Quantitative Tightening and how does it influence the US Dollar?
Quantitative tightening (QT) is the reverse process whereby the Federal Reserve stops buying bonds from financial institutions and does not reinvest the principal from the bonds it holds maturing in new purchases. It is usually positive for the US Dollar.
The CAD had a solid week last week, rising over 1% against the USD in its best weekly performance since July. Economists at Scotiabank analyze Loonie’s outlook.
CAD rebound may have traction
The odds of some further CAD gains (USD weakness) in the next few weeks look decent. And the ceiling on spot around 1.39 which had been under pressure again in recent weeks looks a lot firmer now.
USD/CAD developed a bearish key reversal week through last Friday; after reaching a new cycle high just shy of 1.39, the USD closed out Friday near 1.3655, just below the prior week’s low. Such a strong, bearish reversal signal at such a key point on the chart is hard to ignore. It might not portend to a significant decline in the USD (although it could) but it does strongly suggest the period of sustained USD gains seen in recent weeks is over.
Friday’s Commitments of Traders Report highlighted that speculative, real money (institutional) and leveraged (hedge fund) accounts retain a significant net short CAD position. The net short is close to recent extremes and not far off the peak CAD-bearishness seen in the spring (just prior to the snap higher in the CAD). CAD shorts are prone to a squeeze if the USD continues to slide.
Gold already began crumbling on Friday and the slide continued as the new week of trading got underway. Economists at Commerzbank analyze the yellow metal’s outlook.
Gold shedding some of its geopolitical risk premium again
The US Dollar and bond yields are not currently the main drivers of the Gold price.
The escalation of the Middle East conflict and the resulting demand for Gold as a safe haven played a key role in the upswing since early October.
Because the Middle East conflict has not escalated any further so far, despite the Israeli army’s ground offensive in the Gaza Strip, the Gold price appears to be shedding some of its geopolitical risk premium again.
It looks as if $2,000 will be as good as it gets for the Gold price for the time being.
After the Dollar was sold off last week it was able to recover a little on Monday. Economists at Commerzbank analyze USD outlook.
Focus will probably be on comments by Fed members
Neel Kashkari, President of the Minneapolis-Fed, said that he did not want to overreact to one job report. It would require the publication of further sets of data to illustrate that inflation really was moving in the right direction. It was premature to declare the end of rate hikes at this stage. He preferred over-tightening rather than doing too little, and he was concerned that inflation might tick up again.
Inflation data from the US is due next week. Until then things look rather quiet on the data front. That is why focus will probably be on comments by other Fed members. To what extent will other members share Kashkari’s views and how many members will echo the recently more dovish comments by Fed Chair Jay Powell?
Principally the market could increasingly come to the conclusion that it should wait for further data publications and that the upside risks for inflation are still quite high at present. That is likely to limit the downside potential in USD for now.
- WTI Oil falls to a three-month low.
- The US Dollar holds ground above 105.00 despite abrupt correction.
- Oil faces risk of falling to $78, last line of defence before $70 comes into play.
Oil prices are falling like a rock despite the reaffirmation from Saudi Arabia and Russia that supply cuts will remain for at least until December. Traders are labelling the standing commitment as old news, sending Crude prices further down as China export numbers are showing a substantial slowdown and less demand from the biggest Asian Crude consumer in the region. Oil prices have made a new three-month low and might head further down in current conditions.
Meanwhile, The US Dollar (USD) fell hard last week, and saw its summer rally coming to an end. Several US economic indicators are starting to flash red, meaning that the economy is starting to cope badly with the elevated rate environment. Meanwhile, US spending is going through the roof as US President Joe Biden is pledging millions not only to Ukraine, but to Israel as well, increasing the debt burden for the US Treasury.
Crude Oil (WTI) trades at $79.13 per barrel, and Brent Oil trades at $83.43 per barrel at the time of writing.
Oil news and market movers
- The Ozark pipeline in the US has reported an outage. The pipeline transports mainly US crude from Cushing, Oklahoma, to a Phillips 66 refinery in Illinois. This is good news for the Cushing supply build after being at several substantial low level.
- China economic numbers have shown that exports shrank by a substantial 6.4% , which means that the biggest demand player in the Oil market will show less appetite for buying crude Oil.
- Saudi Arabia and Russia have reconfirmed their commitment to cut Oil output by more than 1 million barrels per day combined. This move suggests that both countries are trying to protect an elevated floor in prices amid bleak demand.
- The weekly American Petroleum Institute Crude Stockpile numbers are due to come out at 21:30 GMT. Previous number was a build of 1.374 million.
Oil Technical Analysis: Sinking lower
Oil prices are retreating further from their peaks. Although some Oil producing countries are trying to put a price cap, the current fade in demand is too big to bear. More selling pressure could be on the horizon as US crude stockpile numbers could reveal a build. Either more supply cuts or a substantial spillover of violence in the Middle East could see Oil prices spiking again.
On the upside, $84.25 is the new resistance. Should Crude be able to print a similar performance as the US Dollar Index did on Tuesday, expect even a quicker sprint to $88. Should Oil prices be able to consolidate above there, the topside for this fall near $93 could come back into play.
On the downside, traders are bracing for the entry of that region near $78. The area should see ample support for buying. Any further drops below this level might see a firm nosedive move, which would likely cause Oil prices to sink below $70.
-638349525097094222.png)
US Crude (Daily Chart)
WTI Oil FAQs
What is WTI Oil?
WTI Oil is a type of Crude Oil sold on international markets. The WTI stands for West Texas Intermediate, one of three major types including Brent and Dubai Crude. WTI is also referred to as “light” and “sweet” because of its relatively low gravity and sulfur content respectively. It is considered a high quality Oil that is easily refined. It is sourced in the United States and distributed via the Cushing hub, which is considered “The Pipeline Crossroads of the World”. It is a benchmark for the Oil market and WTI price is frequently quoted in the media.
What factors drive the price of WTI Oil?
Like all assets, supply and demand are the key drivers of WTI Oil price. As such, global growth can be a driver of increased demand and vice versa for weak global growth. Political instability, wars, and sanctions can disrupt supply and impact prices. The decisions of OPEC, a group of major Oil-producing countries, is another key driver of price. The value of the US Dollar influences the price of WTI Crude Oil, since Oil is predominantly traded in US Dollars, thus a weaker US Dollar can make Oil more affordable and vice versa.
How does inventory data impact the price of WTI Oil
The weekly Oil inventory reports published by the American Petroleum Institute (API) and the Energy Information Agency (EIA) impact the price of WTI Oil. Changes in inventories reflect fluctuating supply and demand. If the data shows a drop in inventories it can indicate increased demand, pushing up Oil price. Higher inventories can reflect increased supply, pushing down prices. API’s report is published every Tuesday and EIA’s the day after. Their results are usually similar, falling within 1% of each other 75% of the time. The EIA data is considered more reliable, since it is a government agency.
How does OPEC influence the price of WTI Oil?
OPEC (Organization of the Petroleum Exporting Countries) is a group of 13 Oil-producing nations who collectively decide production quotas for member countries at twice-yearly meetings. Their decisions often impact WTI Oil prices. When OPEC decides to lower quotas, it can tighten supply, pushing up Oil prices. When OPEC increases production, it has the opposite effect. OPEC+ refers to an expanded group that includes ten extra non-OPEC members, the most notable of which is Russia.
Economists at Nordea expect the EUR/USD pair to remain capped until mid-2024.
USD to do relatively well for some time
We expect EUR/USD to move largely sideways until next summer but with large swings around 1.08.
Our expectations are that the ECB will start lowering rates from summer 2024 while the Fed won’t cut rates before 2025. Such an interest rate development favors a slightly stronger USD against the EUR next year.
However, there are more FX drivers than interest rates and we are still inclined to think that the USD fortunes will turn going into 2025. For one, it is unlikely that the solid US economic outperformance vis-à-vis the rest of the world will last. Moreover, given our view for relative soft landing in the Western world, if the ECB actually cuts next summer, risk sentiment could become more positive and markets are unlikely to send the USD much stronger.
Economists at HSBC still expect a stronger USD ahead.
USD should continue to capitalise on the US growth resilience
The latest FOMC decision to leave the policy rate unchanged again was widely expected. The FOMC made few changes since its last meeting, with Chair Powell offering a mix of hawkish and dovish comments. This meeting does not change our view that the USD is likely to strengthen further, notably against the EUR and GBP.
The USD should continue to capitalise on the US growth resilience, when compared to continued growth disappointments outside the US. As the full impact of earlier rate hikes becomes evident, the prospect of slower global economic growth into 2024 should also support the USD. In addition, heightened geopolitical risk should continue to favour the ‘safe-haven’ USD.
- USD/CAD has extended recovery to near 1.3750 as the risk-on impulse faded.
- The USD Index recovered despite high chances for the Fed to keep interest rates unchanged until the end of 2023.
- USD/CAD recovered strongly after discovering buying interest near the 50% Fibo retracement at 1.3640.
The USD/CAD pair recovered vertically to near 1.3750 as investors cleansed positions from risk-perceived assets and rushed back to the risk-aversion theme. The Loonie asset delivered a sharp recovery as the US Dollar Index (DXY) rebounded to near 105.60.
S&P500 futures have reported some losses in the London session, portraying a dismal market mood. The USD Index recovered despite high chances for the Federal Reserve (Fed) to keep interest rates unchanged in the range of 5.25-5.50% till the end of 2023.
Meanwhile, investors await the speech from Federal Reserve (Fed) Chair Jerome Powell, which is scheduled for Wednesday. Jerome Powell is expected to guide whether investors should be prepared for more interest rate hikes in the December monetary policy meeting.
USD/CAD recovered strongly after discovering buying interest near the 50% Fibonacci retracement (plotted from 9 September at 1.3380 to 1 November high at 1.3900) at 1.3640. The Loonie asset has climbed above the 50-period Exponential Moving Average (EMA), which indicates that the near-term trend has turned bullish.
The Relative Strength Index (RSI) (14) is testing waters in the bullish range of 60.00-80.00. If the RSI (14) manages to sustain, a bullish momentum would get triggered.
Going forward, a decisive break above October 27 high at 1.3880 would expose the round-level resistance at 1.3900, followed by 13 October 2022 high at 1.3978.
In an alternate scenario, a breakdown below October 24 low around 1.3660 would drag the asset to the round-level support of 1.3600. A further breakdown could expose the asset to October 7 low at 1.3570.
USD/CAD two-hour chart
-638349496510386155.png)
USD/JPY extends rebound above 150. Economists at Société Générale analyze the pair’s outlook.
Possibly forming double top
USD/JPY recently faced stiff resistance near 151.70/152 as it failed to overcome the high of 2022. This denotes formation of a possible double top. Daily MACD has been posting negative divergence since July denoting receding momentum.
151.70/152 is likely to remain an important hurdle near term.
A price break i.e., a move below recent pivot low at 148.80 could mean a deeper decline. This can lead the pair lower towards 147.30 and 145.90/145.10, the 23.6% retracement from January.
UOB Group’s Senior Economist at UOB Group Alvin Liew and Associate Economist Jester Koh comment on the release of Retail Sales figures in Singapore.
Key Takeaways
Singapore’s retail sales growth moderated to 0.6% y/y, weaker than Bloomberg’s consensus of 1.6% y/y and materially below Aug’s revised reading of 4.2% y/y. On a seasonally adjusted sequential basis, retail sales contracted 1.6% m/m in Sep, reversing the two prior months of expansion (Aug: 1.9%, Jul: 0.8%). Excluding motor vehicle sales, retail sales contracted by a smaller -0.8% m/m in Sep (Aug: 2.1%), translating to a y/y print of 0.5% in Sep (Aug: 4.0%). In nominal terms, the value of retail sales fell to SGD3.88bn (from SGD4.01bn in Aug).
Ongoing recovery in the tourism sector remains a key factor supporting retail sales growth in Sep and into 2024.
Outlook – We continue to expect retailers to enjoy some level of domestic and external support, complemented by major events such as various sports, popular concerts and BTMICE (Business Travel and Meetings, Incentive Travel, Conventions and Exhibitions) activities... Moderating wage growth alongside incremental uncertainty in the job market may exert some downward pressure on retail sales going forward, in particular on big-ticket items like furniture, household equipment, watches and jewellery.
- USD/JPY aims for stability above 150.00 amid the cheerful market mood starts fading.
- Fed Cook said that current interest rates are adequate to bring down inflation to 2%.
- Japan’s authority is closely watching FX's moves for a stealth intervention.
The USD/JPY pair aims for stability above the psychological figure of 150.00 as a decline in the risk appetite of the market participants has dampened the appeal for risk-sensitive currencies. The asset sharply rebounded from 149.40 on expectations that resilience in the United States economy could make the need for more interest rate hikes from the Federal Reserve (Fed) appropriate.
S&P500 futures generated some losses in the European session, portraying that the risk-taking ability of investors is fading away. US equities surrendered significant gains on Monday and ended the session with some nominal gains as long-term bond yields revived ahead of a speech from Fed Chair Jerome Powell, which is scheduled for Wednesday.
The US Dollar Index (DXY) has extended recovery to near 105.50 after commentary from Minneapolis Fed Bank President Neel Kashkari. The Fed policymaker emphasized the need for more efforts to be made by the central bank to control inflation. Contrary to Kashkari, Fed Governor Lisa Cook said that current interest rates are adequate to bring down inflation to 2%.
The recovery in the US Dollar and bond markets could falter as investors hope that the Fed is done with hiking interest rates. As per the CME Fedwatch tool, traders see an 85% chance for interest rates remaining unchanged in the range of 5.25-5.50% till the year-end.
On the Japanese Yen, Japan’s authority is closely watching FX moves for intervention. A stealth intervention would be insufficient to defend the tide against the Japanese Yen, which is backed by the expansionary monetary policy stance of the Bank of Japan (BoJ). BoJ Governor Kazuo Ueda is not expected to shift policy stance anytime soon till the comfortable stability of inflation above 2% through wage growth.
- Gold price drops to a near two-week low as investors channel funds into the US Dollar and bond yields rise.
- Geopolitical tensions stay more or less unchanged fading the appeal of Gold.
- Fed’s Kashkari acknowledges the need for more work to control inflation.
Gold price (XAU/USD) drops further as safe-haven demand diminishes amid no further escalation in geopolitical tensions. A recovery in the US Dollar and long-term bond yields further weigh on the precious metal.
The downside move in Gold, however, may be short-lived as investors see an end to the Federal Reserve’s (Fed) rate-tightening campaign, due to gradually easing consumer inflation and higher Treasury yields, which have tightened financial conditions significantly.
Commentary from Federal Reserve Chairman Jerome Powell on Wednesday could drive further action in the US Dollar and bond markets. Powell may give an idea of whether investors should expect more interest rate hikes this year to ensure a return of inflation to the Fed’s 2% target.
Fed Governor Lisa Cook said that the current interest rate policy is sufficiently restrictive to achieve price stability on Monday; Fed’s Kashkari, on the other hand, reportedly said the opposite in a Wall Street Journal article published on the same day.
Daily Digest Market Movers: Gold price falls as US Dollar recovers
- Gold price extends correction to near $1,970.00 amid a recovery in the US Dollar and bond yields as Federal Reserve policymakers line up to give guidance on inflation and interest rates this week.
- Gold price fades on an absence of significant escalation in Middle East tensions.
- Israeli Prime Minister Benjamin Netanyahu has allowed entry of humanitarian aid to and the exiting of hostages from Gaza, but rejected a general ceasefire. Geopolitical tensions would keep broader demand for Gold intact.
- The US Dollar Index (DXY) discovered buyers’ interest marginally below the crucial support of 105.00 after commentary from Minneapolis Fed Bank President Neel Kashkari. The commentary from Kashkari indicated that he is leaning towards raising interest rates further.
- Kashkari commented that the economy is performing well despite higher interest rates. He added that the central bank has much work to do to ensure price stability.
- Contrary to Kashkari, Fed Governor Lisa Cook said the current monetary policy is adequate to bring down inflation to 2%. Cook commented that the US financial system is healthy enough to tackle economic challenges.
- The Fed kept interest rates unchanged in the 5.25-5.50% last week for the second time in a row on expectations that higher US bond yields are significantly tightening financial conditions, slowing overall demand and price pressures.
- The correction in Gold could conclude sooner and a revival is highly likely as investors hope that the Fed is done with hiking interest rates.
- A slowdown in labor demand and a decline in the Services PMI has cemented hopes that interest rates won’t be hiked further.
- As per the CME Fedwatch tool, traders see an 85% chance for interest rates remaining unchanged till the year-end.
- Meanwhile, 10-year US Treasury yields managed to attain a firm footing near 4.60% as investors shifted focus to the speech from Fed Chair Jerome Powell, scheduled for Wednesday.
- Powell is expected to provide guidance on the requirement of more interest rate hikes to ensure the achievement of price stability or a time period for which rates will remain elevated and some glimpse into the performance of the economy in the fourth quarter of 2023.
- Before Powell, speeches from other Fed policymakers: Christopher Waller and John C. Williams will be keenly watched.
Technical Analysis: Gold price falls further to near $1,970
Gold price extends downside marginally below $1,970.00 after several failed attempts of stabilization above the psychological resistance of $2,000. The precious metal is exposed to the 20-day Exponential Moving Average (EMA), which trades around $1,960.00. The broader trend is still bullish as the 200-day EMA is sloping higher. Momentum oscillators demonstrate that the bullish momentum has faded.
Gold FAQs
Why do people invest in Gold?
Gold has played a key role in human’s history as it has been widely used as a store of value and medium of exchange. Currently, apart from its shine and usage for jewelry, the precious metal is widely seen as a safe-haven asset, meaning that it is considered a good investment during turbulent times. Gold is also widely seen as a hedge against inflation and against depreciating currencies as it doesn’t rely on any specific issuer or government.
Who buys the most Gold?
Central banks are the biggest Gold holders. In their aim to support their currencies in turbulent times, central banks tend to diversify their reserves and buy Gold to improve the perceived strength of the economy and the currency. High Gold reserves can be a source of trust for a country’s solvency. Central banks added 1,136 tonnes of Gold worth around $70 billion to their reserves in 2022, according to data from the World Gold Council. This is the highest yearly purchase since records began. Central banks from emerging economies such as China, India and Turkey are quickly increasing their Gold reserves.
How is Gold correlated with other assets?
Gold has an inverse correlation with the US Dollar and US Treasuries, which are both major reserve and safe-haven assets. When the Dollar depreciates, Gold tends to rise, enabling investors and central banks to diversify their assets in turbulent times. Gold is also inversely correlated with risk assets. A rally in the stock market tends to weaken Gold price, while sell-offs in riskier markets tend to favor the precious metal.
What does the price of Gold depend on?
The price can move due to a wide range of factors. Geopolitical instability or fears of a deep recession can quickly make Gold price escalate due to its safe-haven status. As a yield-less asset, Gold tends to rise with lower interest rates, while higher cost of money usually weighs down on the yellow metal. Still, most moves depend on how the US Dollar (USD) behaves as the asset is priced in dollars (XAU/USD). A strong Dollar tends to keep the price of Gold controlled, whereas a weaker Dollar is likely to push Gold prices up.
FX markets are consolidating after a few risk-on days. Economists at ING analyze USD outlook.
Waiting for the Fed pushback
For today, it looks like a relatively quiet session, although the focus will be on how aggressively the line-up of Fed speakers wants to push back against the recent weakening of US financial conditions.
Risks look skewed to a mildly stronger Dollar today.
DXY closing above 105.50 undoes some of last week's bearish work. But from where we stand, it looks like DXY might bounce around in a broad 104.50-106.50 range into year-end.
The Reserve Bank of Australia (RBA) raised interest rates by 25 bps. However, AUD was unable to benefit. Economists at Commerzbank analyze Aussie’s outlook.
RBA delivers dovish rate hike
RBA raised interest rates again after four previous meetings with no change. The main reason for this was the uncertain inflation outlook. Inflation in Australia is proving to be quite persistent, justifying a further rate hike.
The RBA did change the wording of the statement slightly, which led to the hike being perceived as a 'dovish hike'. Now the RBA simply says that whether further tightening will be required will depend on the data. This suggests that the bar for another hike has been raised.
If the upcoming data points to continued stubborn inflation, a rate hike could be back on the agenda. Until then, however, the upside potential from the Australian side is likely to remain limited and much will depend on the movement of the USD.
- USD/MXN snaps the recent gains as market risk sentiment is improved.
- The slowdown in the US labor market could influence the Fed to conclude its policy tightening.
- Banxico is expected to remain consistent at 11.25%; the decision is scheduled for release on Thursday.
USD/MXN aims to retrace the recent gains on positive risk sentiment, trading lower around 17.5200 during the European session on Tuesday. United States (US) employment data indicates the slowing down of the labor market as recent data on Non-Farm Payrolls (NFP) came in significantly lower than expected.
As a result, investors are inclined to expect that the US Federal Reserve (Fed) might halt the monetary policy tightening, especially after the dovish decision in November's meeting to keep interest rates between 5.25% and 5.5%. Moreover, the softening labor market in the United States (US) is prompting traders to factor in the possibility of multiple rate cuts by the end of 2024, potentially contributing to the improvement of the risk appetite.
US Dollar Index (DXY) hovers in the positive territory near 105.50, recovering recent losses as US bond yields rebound from the six-week lows, with the 10-year US Treasury yield standing at 4.62% by the press time.
On Monday, Mexico's Consumer Confidence, as reported by the National Statistics Agency (INEGI), declined from 46.8 to 46.0 in October. The Bank of Mexico (Banxico) is set to release the Headline Inflation, with expectations for a decline to 0.39% in October from the previous 0.44%. Additionally, Banxico's Interest rate decision, anticipated to remain consistent at 11.25%, is scheduled for release on Thursday.
The latest comments by BoE Chief Economist Huw Pill could hold Sterling back, in the view of economists at ING.
EUR/GBP could trade back up to 0.8710/0.8720
BoE Chief Economist Huw Pill said that expectations for rate cuts from next summer looked reasonable. We think these comments are a mild Sterling negative and given the risk that Fed-speak puts equities on the back foot again, risk-sensitive Sterling could hand back some of its recent gains.
For example, EUR/GBP could trade back up to 0.8710/0.8720 and GBP/USD could drop back to 1.2290 perhaps 1.2250.
The Australian Dollar has underperformed following the RBA meeting. Economists at MUFG Bank analyze Aussie’s outlook.
RBA signals less confidence in need for further hikes
With the RBA now in data dependent mode, it will require more upside inflation surprises to prompt the RBA to hike further.
While we doubt that the upcoming data flow will trigger further RBA hikes, the RBA’s concern over persistent inflation risks could deter the RBA from lowering rates prematurely next year. We still see room for the Australian rate market to further pare back rate hike expectations which will act as weight on the Australian Dollar going forward.
The external backdrop also remains challenging for the Australian Dollar with global growth weak and likely to weaken further next year in response to tighter monetary policy.
It will be difficult for the AUD/USD pair to raise back above the 200-DMA at just above the 0.6600 level in the near term.
- NZD/USD drifts lower for the second straight day and is pressured by a combination of factors.
- The uncertainty over the Fed’s rate-hike path prompts some follow-through USD short covering.
- China’s economic woes take its toll on the risk sentiment and weigh on the risk-sensitive Kiwi.
The NZD/USD pair extends the previous day's rejection slide from the 0.6000 psychological mark, or a near four-week high and remains under heavy selling pressure for the second straight day on Tuesday. Spot prices extend the descending trend through the first half of the European session and drop to a two-day low, around the 0.5915 region in the last hour.
The US Dollar (USD) gains some follow-through traction and recovers further from its lowest level since September 20 touched on Monday, which, in turn, is seen as a key factor dragging the NZD/USD pair. Federal Reserve (Fed) officials offered a mixed signal over the future rate-hike path on Monday. This, along with a generally weaker risk tone, is seen underpinning the safe-haven Greenback and driving flows away from the risk-sensitive New Zealand Dollar (NZD).
Fed Governor Lisa Cook noted that the central bank's current target interest rate is adequate to return inflation to the Fed's 2% target. This reaffirmed expectations that the Fed is done raising interest rates. In contrast, Minneapolis Fed President Neel Kashkari that the US economy has proved to be very resilient and under tightening will not get inflation back to 2% in a reasonable time. This raises uncertainty over the Fed's next policy move and prompts USD short covering.
The global risk sentiment, meanwhile, takes a hit in reaction to rather unimpressive Chinese trade balance data, which indicated that recovery in the world's second-largest economy remains uneven. In fact, the General Administration of Customs reported that China's trade surplus fell sharply from $77.71 billion to $56.53 billion in October – its worst level since May 2022. Adding to this, a worse-than-expected slide in exports adds to worries about the worsening overseas demand.
That said, a fresh leg down in the US Treasury bond yields might hold back the USD bulls from placing aggressive bets and lend some support to the NZD/USD pair. Traders might also prefer to wait for fresh cues about the Fed's policy outlook. Hence, the focus will remain on speeches by influential FOMC members, including Fed Chair Jerome Powell's appearance on Wednesday and Thursday, which will play a key role in driving the near-term USD demand.
In the meantime, Tuesday's release of Trade Balance data from the US, along with the broader risk sentiment, will be looked upon to grab short-term trading opportunities around the NZD/USD pair. The aforementioned fundamental backdrop, meanwhile, seems tilted in favour of bearish traders and supports prospects for a further depreciating move for spot prices amid expectations that the Reserve Bank of New Zealand (RBNZ) will keep its policy rate unchanged in November.
Technical levels to watch
- The Euro looks offered against the US Dollar.
- European markets open Tuesday’s session in a mixed tone.
- Germany Industrial Production surprised to the downside.
The Euro (EUR) adds to Monday’s decline against the US Dollar (USD), motivating EUR/USD to retreat to the area below 1.0700 on Tuesday.
The Greenback manages to regain further balance and lifts the USD Index (DXY) to the mid-105.00s against the backdrop of renewed weakness in risk appetite, particularly in response to weaker trade results in China. The move lower in the pair is also accompanied by a knee-jerk in both US and German yields.
Regarding monetary policy, markets expect the Federal Reserve (Fed) to keep policy unchanged. The potential for an interest-rate hike in December appears to have lost momentum, particularly after the latest FOMC gathering and Friday's publication of weaker-than-anticipated Nonfarm Payrolls data for October.
As for the European Central Bank (ECB), investors also favour an extended pause of its rate-hiking cycle, most probably until the second half of the year.
On the economic calendar, German Industrial Production contracted more than estimated at a monthly 1.4% in September and 3.7% vs. the same month of 2022. In addition, German Construction PMI receded to 38.3 in October. Looking at the broader eurozone, the Construction PMI ticked lower to 42.7 during last month and Producer Prices are due at 10:00 GMT.
Across the Atlantic, Balance of Trade results for September are due at 13:30 GMT, prior to the IBD/TIPP Economic Optimism index and Consumer Credit Change.
Additionally, market participants are expected to closely follow speeches by FOMC Governor Michael Barr (permanent voter, centrist), FOMC Governor Christopher Waller (permanent voter, hawk), NY Fed President John Williams (permanent voter, centrist), Dallas Fed President Lorie Logan (voter, hawk), Minneapolis Fed President Neel Kashkari (voter, centrist) and Chicago Fed President Austan Goolsbee (voter, centrist).
Daily digest market movers: Euro loses traction as risk appetite fades
- The EUR puts the 1.0700 mark to the test against the USD.
- US and German yields trade slightly on the defensive.
- The Fed is seen keeping its monetary policy unchanged in December.
- The ECB is likely to keep its rates unchanged until H2 2024.
- The Middle East conflict looks everything but abated.
- The RBA raised its OCR by 25 bps, as widely expected.
- Chinese trade balance figures disappoint in October.
Technical Analysis: Euro faces immediate hurdle around 1.0800
EUR/USD corrects lower and revisits the sub-1.0700 zone on Tuesday.
The November peak of 1.0754 (November 6) follows next on the upswing for EUR/USD, seconded by the crucial 200-day Simple Moving Average (SMA) at 1.0805 and another weekly top of 1.0945 (August 30) before the psychological barrier of 1.1000. Beyond this zone, the pair may encounter resistance at the August high of 1.1064 (August 10), ahead of the weekly peak of 1.1149 (July 27) and the 2023 high of 1.1275 (July 18).
Sellers, on the other hand, are anticipated to face support at the weekly low of 1.0495 (October 13), before approaching the 2023 bottom at 1.0448 (October 15) and the round number of 1.0400.
The pair's outlook is predicted to remain bearish as long as it remains below the 200-day SMA.
Euro FAQs
What is the Euro?
The Euro is the currency for the 20 European Union countries that belong to the Eurozone. It is the second most heavily traded currency in the world behind the US Dollar. In 2022, it accounted for 31% of all foreign exchange transactions, with an average daily turnover of over $2.2 trillion a day.
EUR/USD is the most heavily traded currency pair in the world, accounting for an estimated 30% off all transactions, followed by EUR/JPY (4%), EUR/GBP (3%) and EUR/AUD (2%).
What is the ECB and how does it impact the Euro?
The European Central Bank (ECB) in Frankfurt, Germany, is the reserve bank for the Eurozone. The ECB sets interest rates and manages monetary policy.
The ECB’s primary mandate is to maintain price stability, which means either controlling inflation or stimulating growth. Its primary tool is the raising or lowering of interest rates. Relatively high interest rates – or the expectation of higher rates – will usually benefit the Euro and vice versa.
The ECB Governing Council makes monetary policy decisions at meetings held eight times a year. Decisions are made by heads of the Eurozone national banks and six permanent members, including the President of the ECB, Christine Lagarde.
How does inflation data impact the value of the Euro?
Eurozone inflation data, measured by the Harmonized Index of Consumer Prices (HICP), is an important econometric for the Euro. If inflation rises more than expected, especially if above the ECB’s 2% target, it obliges the ECB to raise interest rates to bring it back under control.
Relatively high interest rates compared to its counterparts will usually benefit the Euro, as it makes the region more attractive as a place for global investors to park their money.
How does economic data influence the value of the Euro?
Data releases gauge the health of the economy and can impact on the Euro. Indicators such as GDP, Manufacturing and Services PMIs, employment, and consumer sentiment surveys can all influence the direction of the single currency.
A strong economy is good for the Euro. Not only does it attract more foreign investment but it may encourage the ECB to put up interest rates, which will directly strengthen the Euro. Otherwise, if economic data is weak, the Euro is likely to fall.
Economic data for the four largest economies in the euro area (Germany, France, Italy and Spain) are especially significant, as they account for 75% of the Eurozone’s economy.
How does the Trade Balance impact the Euro?
Another significant data release for the Euro is the Trade Balance. This indicator measures the difference between what a country earns from its exports and what it spends on imports over a given period.
If a country produces highly sought after exports then its currency will gain in value purely from the extra demand created from foreign buyers seeking to purchase these goods. Therefore, a positive net Trade Balance strengthens a currency and vice versa for a negative balance.
EUR/USD did not even get to test resistance at 1.0765 before falling back. Economists at ING analyze the pair’s outlook.
The baseline may be some kind of 1.0550-1.0750 range now
1.0650 seems the risk today given the event risk of hawkish Fed speakers.
The Euro story looks weak and EUR/USD will only rally if the US story is weak enough to trigger some clear bullish flattening of the US yield curve. That scenario looks premature. The baseline may be some kind of 1.0550-1.0750 range now unless the US data takes a decided turn for the worse.
The Reserve Bank of Australia (RBA) raised the Cash Rate by 25 bps at the November meeting. AUD had a knee-jerk reaction lower. Economists at TD Securities analyze Aussie’s outlook.
RBA capitulates on its earlier hawkish stance
The RBA delivered as expected, lifting the Cash Rate 25 bps to 4.35%. However, the surprise for the market was the dovish tweak to the forward guidance in the last paragraph of the Statement. Coupled with the lift in its inflation forecasts, the Bank is arguably setting a higher hurdle for hikes.
While we forecast no further RBA hikes in this cycle, we view either Feb or May'24 as the next possible meetings to potentially draw the Bank back to the hiking table.
Near term, we see AUD/USD returning to the 0.63-0.65 range. However, taking a longer-term view, we remain bullish on Aussie given our view that the USD correction has begun while the Chinese stimulus should begin to bear fruit.
On Monday, USD/JPY climbed back above the 150 level. Economists at Commerzbank analyze the pair’s outlook.
A weakening of USD might be limited for now
At present uncertainty as to whether the Fed really will initiate a rate cut cycle in mid-2024 is likely to be too high still. A soft landing of the US economy is still possible, and as a result, a weakening of USD might be limited for now.
If the economic data from the US will largely disappoint over the coming weeks and if dovish comments from Fed members increase significantly, rate cut speculations might intensify further, putting notable downside pressure on USD. However, that might be a while off and until then politicians in Japan will continue to watch the USD/JPY exchange rate nervously.
- USD/CHF extends gains for the second successive day on improved Greenback.
- US Dollar receives upward support as US bond yields improve.
- Market participants price in multiple rate cuts by the end of the year 2024.
USD/CHF rebounds from the two-week low, extending gains for the second successive session near 0.9010 during the Early European hours on Tuesday. The pair receives upward support as the upbeat US Treasury yields support the US Dollar (USD) to halt its losses.
Switzerland's stable seasonally adjusted Unemployment Rate (MoM) at 2.1% in October seems to have a moderate impact on the Swiss Franc (CHF).
Moreover, the conflict between Israel and Hamas weighed on the USD/CHF pair as capital might have shifted towards the safe-haven CHF. However, the contained situation in the Middle East has improved market sentiment and could lead to a shift of capital from the Swiss Franc toward riskier assets.
US Dollar (USD) recovers recent losses on the back of improved US bond yields, bidding higher near 105.50. The 10-year US Treasury yield maintains its position at 4.65% by the press time.
The USD/CHF faced challenges as the US Federal Reserve (Fed) is expected to conclude its monetary policy tightening following the dovish Fed’s policy decision of keeping interest rates between 5.25% and 5.5% in the November meeting.
Additionally, the softening labor market of the United States (US) influences the traders to price in multiple rate cuts by the end of the year 2024, which could lead to the weakening of the Greenback.
- Pound Sterling faces selling pressure as investors’ risk appetite diminishes.
- BoE Pill cautioned about an excessive economic slowdown due to the restrictive policy stance.
- Israel rejected a ceasefire offer but is open to fighting pauses for aid.
The Pound Sterling (GBP) faces a sell-off on Tuesday, paring some gains from the recent rally, as risks of a slowdown in the United Kingdom economy are unabated due to higher interest rates by the Bank of England (BoE). The GBP/USD pair recovered sharply on Friday and Monday but struggled to maintain strength and trades around 1.2330 amid an absence of fundamental cushion for the Pound Sterling.
The recent recovery in the Cable was backed by an improvement in the market sentiment due to expectations of no more interest rate hikes from the Federal Reserve (Fed) and no further escalation in Middle East tensions. However, risks of the UK economy entering into a recession are high as sectors including manufacturing, services, and housing are struggling to absorb the effect of higher interest rates by the BoE. Already weak British consumer spending is expected to worsen further as individuals face an escalating cost of living crisis.
Daily Digest Market Movers: Pound Sterling weakens on growing slowdown fears
- Pound Sterling dropped to near 1.2330 after facing a sell-off above the round-level resistance of 1.2400 as the risk appetite of the market participants diminished.
- The GBP/USD pair corrects as investors see upside risks of the UK economy entering into a recession due to a historically tight monetary policy by the Bank of England (BoE).
- Weak consumer spending due to higher cost of living has deteriorated the demand outlook. This has led to a slowdown in hiring, scale of production, and business investment.
- A survey from Accenture and YouGov indicated that two-thirds of UK adults are not interested in participating in Black Friday, Cyber Monday, or Boxing Day discounts due to the deepening cost of living crisis.
- S&P Global, in its October report, showed that PMIs in all sectors such as manufacturing, services and construction remained below the 50.0 threshold. The Construction PMI, released on Monday, improved to 45.6 expectations of 44.5 and the former reading of 45.0 but remained below the 50.0 threshold.
- Construction spending has come down significantly as home-buyers have postponed their plans of investment in the housing sector to avoid higher borrowing costs.
- BoE's Chief Economist Huw Pill said Monday that upside risks to an excessive slowdown are high as the central bank is committed to bringing down inflation to 2% by keeping monetary policy restrictive sufficiently longer.
- Pill added that the central bank is aware of the consequences of economic slowdown on people with lower incomes in the fight against stubborn inflation.
- In its latest forecasts, the BoE conveyed that the economy will flatline in the next two years and the growth rate in 2026 would be less than 1%.
- While discussing rate cuts, Pill said that rate cuts before mid-2024 seem totally unreasonable as inflation is still more than thrice the desired rate of 2%.
- This week, investors will keenly focus on the Q3 GDP data, which will show the repercussions of tight monetary policy. According to the preliminary estimates, the UK economy is expected to contract by 0.1%, against 0.2% growth in the April-June quarter.
- Meanwhile, geopolitical tensions keep the market mood at bay. Israeli Prime Minister Benjamin Netanyahu said that his administration is open to little pause to the ground invasion in Gaza but not to a general ceasefire.
- The US Dollar, when tracked by the US Dollar Index, found an intermediate support near 105.00 but the near-term demand seems weak as investors hope that the historically tight rate-hiking campaign by the Federal Reserve (Fed) has concluded.
- Minneapolis Fed Bank President Neel Kashkari said Monday that the US economy has proved to be resilient despite elevated interest rates but the central bank has a lot of work ahead to tame consumer inflation.
Technical Analysis: Pound Sterling falls gradually from 1.2400
Pound Sterling extends its correction to near 1.2320 after facing selling pressure above the crucial resistance of 1.2400. The 200-day Exponential Moving Average (EMA) around 1.2400 has been acting as a critical barrier for the Pound Sterling bulls. The Cable is gradually declining after a breakout of the symmetrical triangle chart pattern formed on a daily time frame, which is a general course of action.
Fresh buying in the GBP/USD pair could appear after completing the correction to near the 50-day or 20-day EMAs.
Pound Sterling FAQs
What is the Pound Sterling?
The Pound Sterling (GBP) is the oldest currency in the world (886 AD) and the official currency of the United Kingdom. It is the fourth most traded unit for foreign exchange (FX) in the world, accounting for 12% of all transactions, averaging $630 billion a day, according to 2022 data.
Its key trading pairs are GBP/USD, aka ‘Cable’, which accounts for 11% of FX, GBP/JPY, or the ‘Dragon’ as it is known by traders (3%), and EUR/GBP (2%). The Pound Sterling is issued by the Bank of England (BoE).
How do the decisions of the Bank of England impact on the Pound Sterling?
The single most important factor influencing the value of the Pound Sterling is monetary policy decided by the Bank of England. The BoE bases its decisions on whether it has achieved its primary goal of “price stability” – a steady inflation rate of around 2%. Its primary tool for achieving this is the adjustment of interest rates.
When inflation is too high, the BoE will try to rein it in by raising interest rates, making it more expensive for people and businesses to access credit. This is generally positive for GBP, as higher interest rates make the UK a more attractive place for global investors to park their money.
When inflation falls too low it is a sign economic growth is slowing. In this scenario, the BoE will consider lowering interest rates to cheapen credit so businesses will borrow more to invest in growth-generating projects.
How does economic data influence the value of the Pound?
Data releases gauge the health of the economy and can impact the value of the Pound Sterling. Indicators such as GDP, Manufacturing and Services PMIs, and employment can all influence the direction of the GBP.
A strong economy is good for Sterling. Not only does it attract more foreign investment but it may encourage the BoE to put up interest rates, which will directly strengthen GBP. Otherwise, if economic data is weak, the Pound Sterling is likely to fall.
How does the Trade Balance impact the Pound?
Another significant data release for the Pound Sterling is the Trade Balance. This indicator measures the difference between what a country earns from its exports and what it spends on imports over a given period.
If a country produces highly sought-after exports, its currency will benefit purely from the extra demand created from foreign buyers seeking to purchase these goods. Therefore, a positive net Trade Balance strengthens a currency and vice versa for a negative balance.
- Silver remains under some selling pressure for the second successive day on Tuesday.
- The formation of a rectangle points to indecision over the next leg of a directional move.
- The technical setup favours bearish traders and supports prospects for additional losses.
Silver (XAG/USD) extends the previous day's rejection slide from the very important 200-day Simple Moving Average (SMA) and continues losing ground for the second successive day on Tuesday. The downward trajectory picks up pace during the early part of the European session and drags the white metal to a two-day low, around the $22.75-$22.70 region in the last hour.
Looking at the broader picture, the XAG/USD has been oscillating in a familiar range over the past three weeks or so, forming a rectangle on the daily chart. This, in turn, points to indecision among traders over the next leg of a directional move. That said, the recent repeated failures to find acceptance above a technically significant 200-day SMA and rejections near the $23.60-$23.70 supply zone favour bearish traders.
Moreover, technical indicators on the daily chart have again started gaining negative traction, suggesting that the path of least resistance for the XAG/USD is to the downside. That said, it will still be prudent to wait for some follow-through selling below the $22.50 support zone before positioning for additional losses. The XAG/USD might then accelerate the fall to the $22.00 mark before dropping to the $21.70 horizontal support zone.
The downward trajectory could get extended further and drag the XAG/USD to the next relevant support near the $21.35-$21.30 region en route to the $21.00 mark. Bearish traders might then aim to challenge a seven-month low, around the $20.70-$20.65 area touched in October.
On the flip side, the $23.00 mark now seems to cap the immediate upside ahead of the 200-day SMA, currently pegged near the $23.25 region. This is followed by the $23.60-$23.70 supply zone, which should act as a key pivotal point for short-term traders. A sustained breakout through will negate the negative outlook and shift the near-term bias in favour of bullish traders, paving the way for a move towards the $24.00 mark.
Some follow-through buying has the potential to lift the XAG/USD beyond the $24.20-$24.25 intermediate resistance and make a fresh attempt to conquer the $25.00 psychological mark.
Silver daily chart
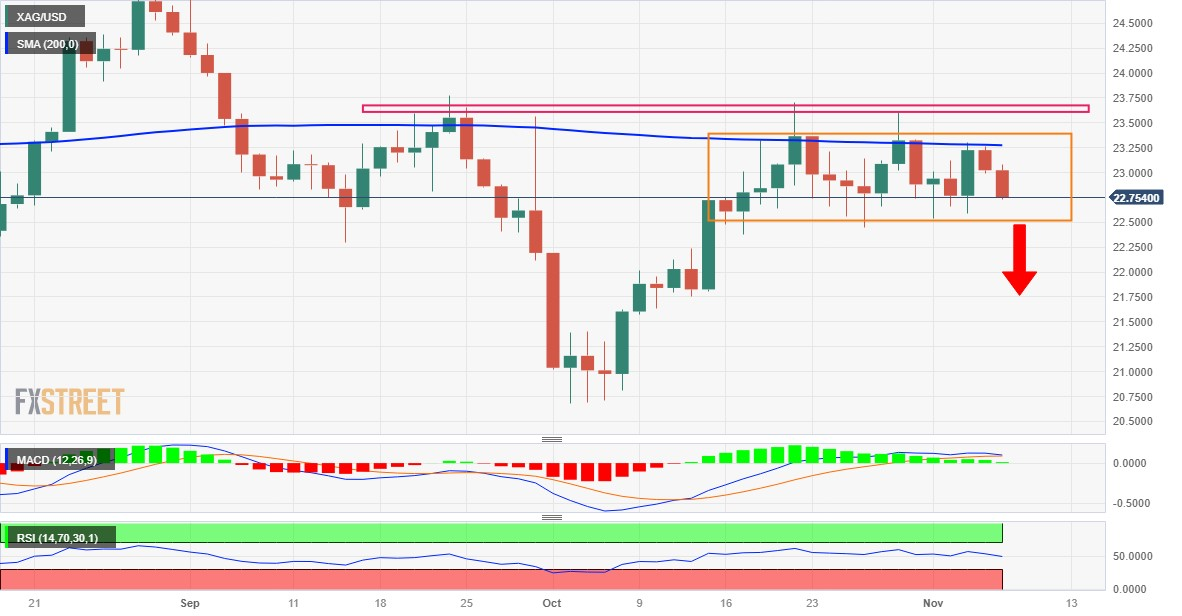
Technical levels to watch
Economist at UOB Group Lee Sue Ann reviews the latest BoE event.
Key Takeaways
As expected, the Bank of England’s (BOE) decided to maintain the Bank Rate at 5.25% on 2 Nov, but said monetary policy will likely need to stay tight for an “extended period of time”. There were little changes to the accompanying Monetary Policy Summary and Minutes, which saw slight tweaks. There were also little surprises in the updated projections set out in the accompanying Nov Monetary Policy Report, where it lowered GDP growth forecasts and raised CPI forecasts across the outlook horizon.
Our view remains data dependent like the BOE, keeping the view that all options are on the table. Barring any huge upside surprises to services inflation or wage data, our base case remains for the Bank Rate to stay at its peak of 5.25% for now, following 515 bps of tightening since Dec 2021.
The next monetary policy meeting is on 14 Dec. Before that, focus will be on the Autumn Statement on 22 Nov, presented by Chancellor of the Exchequer Jeremy Hunt to Parliament, alongside updated projections by the Office for Budget Responsibility. Any policy announcements then could have an impact on growth.
Here is what you need to know on Tuesday, November 7:
The Australian Dollar came under heavy selling pressure early Tuesday even though the Reserve Bank of Australia (RBA) raised its policy rate by 25 basis points to 4.35% after the November policy meeting. Meanwhile, the US Dollar Index extended its rebound toward 105.50 after closing in positive territory on Monday. September Goods Trade Balance data will be featured in the US economic docket. Investors will pay close attention to comments from central bank officials as well.
The RBA's rate hike came in line with the market expectation but the policy statement language saw a dovish tweak. "Whether further tightening of monetary policy is required to ensure that inflation returns to target in a reasonable time frame will depend upon the data and the evolving assessment of risks," the RBA said and caused the AUD to weaken against its rivals. At the time of press, AUD/USD was down nearly 1% on the day at around 0.6420.
Australian Dollar price today
The table below shows the percentage change of Australian Dollar (AUD) against listed major currencies today. Australian Dollar was the weakest against the US Dollar.
| USD | EUR | GBP | CAD | AUD | JPY | NZD | CHF | |
| USD | 0.21% | 0.22% | 0.28% | 1.01% | 0.33% | 0.70% | 0.11% | |
| EUR | -0.20% | 0.02% | 0.09% | 0.79% | 0.14% | 0.51% | -0.07% | |
| GBP | -0.22% | -0.02% | 0.06% | 0.79% | 0.12% | 0.51% | -0.06% | |
| CAD | -0.28% | -0.08% | -0.06% | 0.73% | 0.05% | 0.43% | -0.11% | |
| AUD | -1.00% | -0.80% | -0.78% | -0.71% | -0.66% | -0.28% | -0.84% | |
| JPY | -0.34% | -0.13% | -0.12% | -0.07% | 0.65% | 0.40% | -0.21% | |
| NZD | -0.77% | -0.53% | -0.52% | -0.45% | 0.28% | -0.40% | -0.58% | |
| CHF | -0.14% | 0.05% | 0.08% | 0.14% | 0.84% | 0.19% | 0.56% |
The heat map shows percentage changes of major currencies against each other. The base currency is picked from the left column, while the quote currency is picked from the top row. For example, if you pick the Euro from the left column and move along the horizontal line to the Japanese Yen, the percentage change displayed in the box will represent EUR (base)/JPY (quote).
In an interview with ABC News, Israeli Prime Minister Benjamin Netanyahu said that Israel will not allow a general ceasefire until all hostages are released by Hamas but added that he was open to 'short pauses'. Meanwhile, news outlets reported that the UN Security Council failed to reach an agreement on a draft resolution to end the conflict following a private session on Monday. Markets seem to have adopted a cautious stance early Tuesday, with US stock index futures losing about 0.3% in the European session.
In the early trading hours of the Asian session, the data from China revealed that the trade surplus narrowed to $56.53 billion in October from $77.71 billion in September. On a yearly basis, Exports declined by 6.4% while Imports rose by 3%.
Following Monday's choppy action, EUR/USD started to edge lower on Tuesday and the pair was last seen trading in negative territory slightly below 1.0700. Germany's Destatis reported that Industrial Production fell by 1.4% on a monthly basis in September.
GBP/USD climbed to its highest level in over a month above 1.2400 on Monday but reversed its direction to end the day in the red. Early Tuesday, the pair continues to stretch lower toward 1.2300.
USD/JPY closed above 150.00 on Monday and preserved its bullish momentum early Tuesday. As of writing, the pair was up 0.3% on the day at 150.50.
Gold came under pressure at the beginning of the week as the US Treasury bond yields staged a rebound. XAU/USD stays on the back foot and was last seen trading at a 10-day low near $1,970.
- The index advances further and retakes 105.50.
- US yields look to extend the weekly recovery.
- Balance of Trade, Fedspeak take centre stage on Tuesday.
The USD Index (DXY), which tracks the greenback vs. a basket of its main competitors, manages to regain extra upside traction and reclaims the 105.50 region on turnaround Tuesday.
USD Index now looks at Fedspeak
The index advances for the second session in a row and maintains the optimism well and sound so far in the first half of the week, all amidst the knee-jerk in the risk complex and further recovery in US yields across different timeframes.
In the meantime, investors’ attention is expected to be on upcoming Fedspeak, particularly against the backdrop of now increasing speculation of potential interest rate cuts by the Federal Reserve to start as soon as around the summer of 2024.
In the US docket, September’s Balance of Trade figures are due seconded by the IBD/TIPP Economic Optimism index and Consumer Credit Change.
In addition, FOMC M. Barr (permanent voter, centrist), FOMC C. Waller (permanent voter, hawk), NY Fed J. Williams (permanent voter, centrist), Dallas Fed L. Logan (voter, hawk), Minneapolis Fed N. Kashkari (voter, centrist) and Chicago Fed A. Goolsbee (voter, centrist) are all due to speak later in the NA session.
What to look for around USD
The recent sharp corrective move in the index appears to have met some initial contention near 104.80 so far.
In the meantime, the dollar loses some composure despite the broad-based good health of the US economy and the inflation still running above the Fed’s target, while further cooling of the US labour market now appear to underpin a protracted impasse in the Fed’s current restrictive stance.
Key events in the US this week: Balance of Trade, Consumer Credit Change (Tuesday) – MBA Mortgage Applications, Wholesale Inventories (Wednesday) - Initial Jobless Claims, Chair Powell (Thursday) – Flash Michigan Consumer Sentiment (Friday).
Eminent issues on the back boiler: Persistent debate over a soft or hard landing for the US economy. Speculation of rate cuts in early 2024. Geopolitical effervescence vs. Russia and China. Potential spread of the Middle East crisis to other regions.
USD Index relevant levels
Now, the index is up 0.26% at 105.52 and the breakout of 106.88 (weekly high October 26) could expose 107.34 (2023 high October 3) and finally 107.99 (weekly high November 21 2022). On the other hand, initial support is seen at 104.84 (monthly low November 6) ahead of 104.42 (weekly low September 11) and then 103.53 (200-day SMA).
The Reserve Bank of Australia (RBA) lifted its Cash Rate for the first time in five months by 25 bps to 4.35%. The initial uptick in AUD/USD faded quickly and the pair dropped to levels just above 0.64. Economists at Danske Bank analyze Aussie’s outlook.
RBA failed to confirm the possibility of another hike
The RBA hiked the Cash Rate by 25 bps to 4.35% after four consecutive holds in previous meetings.
Its forward guidance was somewhat more dovish than earlier, as the statement no longer indicated that 'further tightening may be required'.
The door for hiking the policy rate is still open, but given the recent tightening in global financial conditions, we think the RBA is likely to remain on hold from here.
We still maintain a downward-sloping forecast profile for the cross in 12M horizon (0.62).
In its latest report published on Tuesday, the International Monetary Fund (IMF) upgraded its gross domestic product (GDP) growth forecasts for China to 5.4% in 2023 and 4.6% in 2024.
This came in contrast with October’s outlook when the IMF revised down 2023 and 2024 China’s growth forecasts for China to 5.0% and 4.2%, respectively.
Market reaction
The upward revision to the Chinese growth forecasts fails to lift the sentiment around the Australian Dollar, as the AUD/USD pair remains heavily sold-off into the Reserve Bank of Australia’s (RBA) surprisingly dovish language in the policy statement. The pair is down 1.02% on the day, currently trading at 0.6415.
Senior Economist at UOB Group Alvin Liew and Associate Economist Jester Koh comment on the latest PMI releases in Singapore.
Key Takeaways
Singapore’s manufacturing prospects improved further as the latest Purchasing Manager’s Index (PMI) edged up 0.1pt to 50.2 in Oct (Sep: 50.1), the second consecutive expansionary (above 50) reading. Similarly, the electronics PMI rose 0.1pt to 49.9 in Oct (Sep: 49.8), which marks the fourth consecutive month of improvement, although still mildly contractionary (below 50).
The improvement in Oct’s overall PMI was broad-based, new exports (50.2 from 50.0) saw the strongest increase, while other key subindices saw a milder 0.1pt uptick, in particular, production (50.3 from 50.2), employment (50.2 from 50.1) and order backlog (50.5 from 50.4) which is positive for the outlook.
Singapore Manufacturing Outlook – While we are heartened by the broadbased improvement in Oct’s overall PMI, we caution that the manufacturing sector could remain downbeat in the near term given the weak external demand, likely for the rest of 2023 and into early 2024. Headwinds in the manufacturing sector could persist on tight financial conditions stemming from an elevated interest rate environment.
The SEK has been one of the hardest hit G10 currencies since the USD started to rebound in mid-July. Economists at MUFG Bank analyze Krona’s outlook.
SEK to rebound after heavy sell-off over summer
After failing to break above the 11.20 level in recent months, we expect the USD/SEK pair to correct lower towards support at the 200-DMA at just below 10.70.
With the USD in the process of peaking out alongside US yields, conditions are falling into place for at least a relief rally for the SEK.
The SEK is deriving support as well from the Riksbank’s FX reserve hedging program.
Considering advanced prints from CME Group for natural gas futures markets, open interest rose for the fourth session in a row at the beginning of the week, this time by around 24.3K contracts. In the same line, volume went up by around 180.1K contracts after three consecutive daily pullbacks.
Natural Gas: Next on the downside emerges $2.90
Prices of natural gas extended the corrective decline on Monday against the backdrop of increasing open interest and volume, allowing for the continuation of the ongoing decline in the very near term. That said, the next support is now seen at the mid-October lows around the $2.90 region per MMBtu.
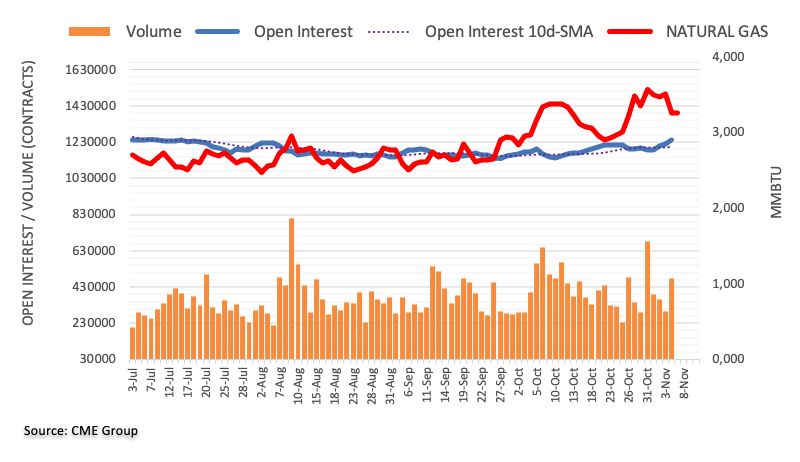
UOB Group’s Senior Economist Julia Goh and Economist Loke Siew Ting review the latest interest rate decision by the Bank Negara Malaysia (BNM).
Key Takeaways
Bank Negara Malaysia (BNM) left the Overnight Policy Rate (OPR) unchanged at 3.00% for the third straight meeting today (2 Nov). The decision was widely expected by us and market consensus. Today’s meeting is the final meeting for the year. The next scheduled meeting and rate decision is on 23-24 Jan 2024.
The latest monetary policy statement (MPS) kept a neutral tone with no changes made to the forward guidance. BNM continued to highlight downside global risks from elevated inflation and higher interest rates, escalating geopolitical tensions, and a sharp tightening in financial market conditions. On the domestic economy, BNM held a positive view that growth would be supported by a further recovery in the labour market, improving tourism activity, a turnaround in the electrical and electronics down cycle, implementation of multi-year investment projects and measures unveiled under the Budget 2024. Inflation risks are subject to volatile commodity prices, changes to domestic policy on subsidies and price controls, as well as financial market developments.
Based on the current growth and inflation outlook, we do not see any compelling reasons for the OPR to be adjusted either way going into 2024. The external environment remains uncertain with more downside risks, which counter a more restrictive monetary policy stance. On the other hand, inflation risks are tilted higher given the implementation of targeted subsidies and service tax rate hike by 2%, making it harder for BNM to lower rates that could further exacerbate the MYR weakness. As such, we maintain our projection for OPR to stay at 3.00% throughout 2024.
Open interest in crude oil futures markets dropped by around 1.4K contracts on Monday, extending the erratic performance seen as of late according to preliminary readings from CME Group. Volume followed suit and went down by nearly 313K contracts after five consecutive daily builds.
WTI: Next on the downside comes $78.00
WTI prices rose marginally and closed just above the $80.00 mark per barrel on Monday. The move, however, was on the back of shrinking open interest and volume, leaving the commodity vulnerable to further weakness in the very near term. That said, the next contention area emerges at the 200-day SMA, today at $78.15.
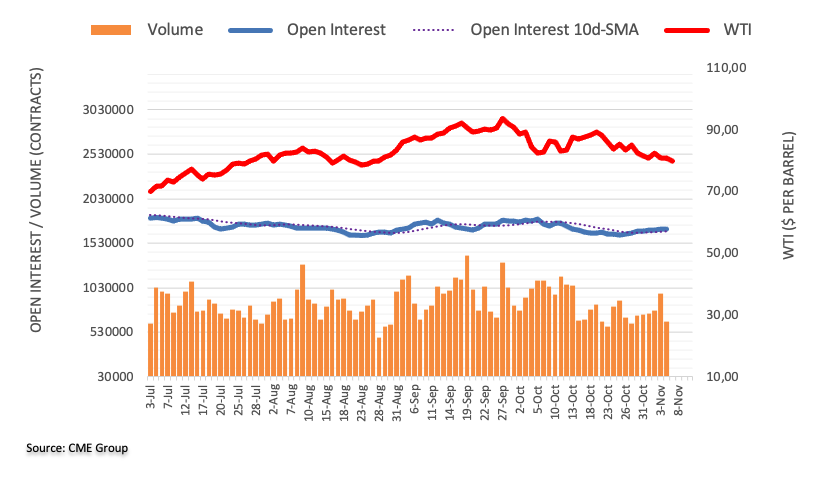
- Crude oil faces challenges after downbeat economic data from the second largest oil consumer China.
- Saudi Arabia and Russia confirmed a 1.2 million barrel cut until the end of 2024.
- A warmer winter in the northern hemisphere could reduce the demand for Crude oil prices.
Western Texas Intermediate (WTI) trades lower near $79.80 per barrel during the Asian hours on Tuesday. Crude oil prices retrace the recent gains, with downbeat economic data from the second largest oil consumer China offsetting the positive impact of Saudi Arabia and Russia's commitment to a 1.2 million barrel cut until the end of 2024.
In October, China's Trade Balance data showed a reduced surplus balance at $56.53 billion, falling short of market expectations for an improvement to $81.95 billion from the previous readings of $77.71 billion. Exports (YoY) saw a notable decline of 6.4%, surpassing the expectations of a 3.1% decline.
UBS analysts suggest that the cuts initiated by Saudi Arabia and Russia might extend into the first quarter of 2024, citing "seasonally weaker oil demand at the start of every year." Meanwhile, global manufacturing PMIs indicate a slowing economic slowdown, which could act as a limiting factor on oil prices as demand decreases.
The contained conflict in the Middle East between Israel and Hamas has a limited impact on the oil supply. However, concerns about a warmer-than-expected winter in the northern hemisphere potentially reducing energy and fuel demand have weighed on Crude oil prices.
US Dollar (USD) recovers recent losses on the back of improved US bond yields. The higher Greenback dampens the value of the black Gold.
Traders expect that the US Federal Reserve (Fed) might pause its monetary policy tightening. This sentiment was fueled by last week's policy decision by the Fed and the indication of a softening labor market through disappointing employment data from the United States (US). Furthermore, market participants price in multiple rate cuts by the end of year 2024.
Market participants will likely focus on China's Consumer Price Index for October scheduled to be released on Thursday, which is expected to decline by 0.1% from being neutral previously.
Germany’s Industrial Production continued to decline further in September, the official data showed on Tuesday, pointing to dwindling manufacturing sector activity.
Industrial output in the Eurozone’s economic powerhouse dropped 1.4% MoM, the federal statistics authority Destatis said in figures adjusted for seasonal and calendar effects, vs. -0.1% expected and -0.2% seen in August.
On an annual basis, German Industrial Production tumbled 3.7% in September, as against a 2.0% drop in August.
EUR/USD reaction to the German data
The shared currency has come under renewed selling pressure against the US Dollar after the downbeat German industrial data. The pair is losing 0.16% on the day to trade at intraday lows near 1.0695, as of writing.
Euro price today
The table below shows the percentage change of Euro (EUR) against listed major currencies today. Euro was the weakest against the US Dollar.
| USD | EUR | GBP | CAD | AUD | JPY | NZD | CHF | |
| USD | 0.20% | 0.21% | 0.25% | 0.93% | 0.26% | 0.63% | 0.16% | |
| EUR | -0.18% | 0.03% | 0.07% | 0.73% | 0.09% | 0.48% | 0.00% | |
| GBP | -0.21% | -0.02% | 0.04% | 0.72% | 0.06% | 0.45% | -0.03% | |
| CAD | -0.25% | -0.10% | -0.04% | 0.69% | 0.01% | 0.41% | -0.06% | |
| AUD | -0.94% | -0.74% | -0.72% | -0.68% | -0.66% | -0.27% | -0.75% | |
| JPY | -0.27% | -0.07% | -0.06% | -0.04% | 0.64% | 0.41% | -0.09% | |
| NZD | -0.66% | -0.47% | -0.45% | -0.41% | 0.27% | -0.39% | -0.48% | |
| CHF | -0.18% | 0.02% | 0.04% | 0.08% | 0.76% | 0.09% | 0.48% |
The heat map shows percentage changes of major currencies against each other. The base currency is picked from the left column, while the quote currency is picked from the top row. For example, if you pick the Euro from the left column and move along the horizontal line to the Japanese Yen, the percentage change displayed in the box will represent EUR (base)/JPY (quote).
Economist at UOB Group Lee Sue Ann assesses the latest ECB monetary policy meeting.
Key Takeaways
CPI rose 2.9% y/y in Oct, down from the previous reading of 4.3%, and lower than expectations of 3.1%. Core CPI also eased to 4.2% y/y, from a previous reading of 4.5%. Month-on-month, inflation in the bloc came in at 0.1% m/m, below consensus forecast and the previous month’s reading of 0.3% m/m. We see inflation at 5.6% in 2023 and 2.7% in 2024.
GDP for the Eurozone decreased by 0.1% q/q in 3Q23, from a revised 0.2% q/q gain in 2Q23 (+0.1% q/q previously). Compared with the same quarter of the previous year, seasonally adjusted GDP increased by 0.1%, following a gain of 0.5% in 2Q23. For now, we continue to expect the Eurozone economy to expand by 0.5% in 2023 and 0.8% in 2024.
The latest growth and inflation backdrop certainly adds to the case of the European Central Bank (ECB) standing pat, as it decided to keep its three key interest rates unchanged at the Oct meeting. The ECB weighs in on 14 Dec for its final monetary policy meeting of the year. Given already restrictive financing conditions and a slowing economy, we expect the ECB to maintain rates at the current levels for now.
CME Group’s flash data for gold futures markets noted traders increased their open interest positions for the third consecutive session on Monday, this time by nearly 3K contracts. Volume, instead, resumed the downtrend and shrank by around 76.2K contracts.
Gold faces a minor support around $1950
Gold kicked off the week on the back foot amidst rising open interest. That said, further weakness appears on the cards for the precious metal in the very near term, with immediate support at the weekly low of $1953 (October 24).
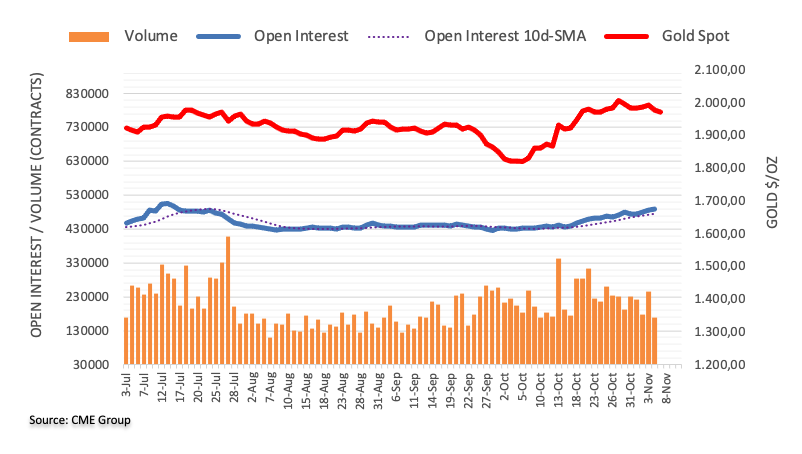
FX option expiries for Nov 7 NY cut at 10:00 Eastern Time, via DTCC, can be found below.
- EUR/USD: EUR amounts
- 1.0650 1.83b
- 1.0500 1.2b
- 1.0490 875m
- GBP/USD: GBP amounts
- 1.2168 430m
- 1.2300 325m
- USD/JPY: USD amounts
- 150.00 882m
- 149.00 765m
- AUD/USD: AUD amounts
- 0.6400 440m
- 0.6610 354m
- USD/CAD: USD amounts
- 1.3615 310m
- EUR/USD could revisit the eight-week high at 1.0756.
- Euro could gain ground as the MACD line shows divergence above the signal line.
- A break below the psychological support at 1.0700 could push the pair to go under the region near mid-1.0600.
EUR/USD losses ground for the second successive day, trading lower near 1.0710 aligned with the psychological support level at 1.0700 during the Asian session on Tuesday.
A firm break below the latter could inspire the bears of the EUR/USD pair to navigate the support region around the mid-1.0600 and the 14-day Exponential Moving Average (EMA) at the 1.0631 level.
However, European Central Bank (ECB) President Christine Lagarde's hawkish remarks over the weekend could provide help to the EUR/USD pair to limit the downside.
The EUR/USD pair might gain upward momentum, considering the 14-day Relative Strength Index (RSI) positioned above the 50 level. This indicates bullish momentum and reflects a bias toward a stronger market sentiment.
The Moving Average Convergence Divergence (MACD) line positions above the centerline and shows the divergence above the signal line implying a potential bullish momentum. The bulls could support the EUR/USD pair to revisit the eight-week high marked recently at 1.0756 followed by the 38.2% Fibonacci retracement at 1.0764 level.
EUR/USD: Daily Chart
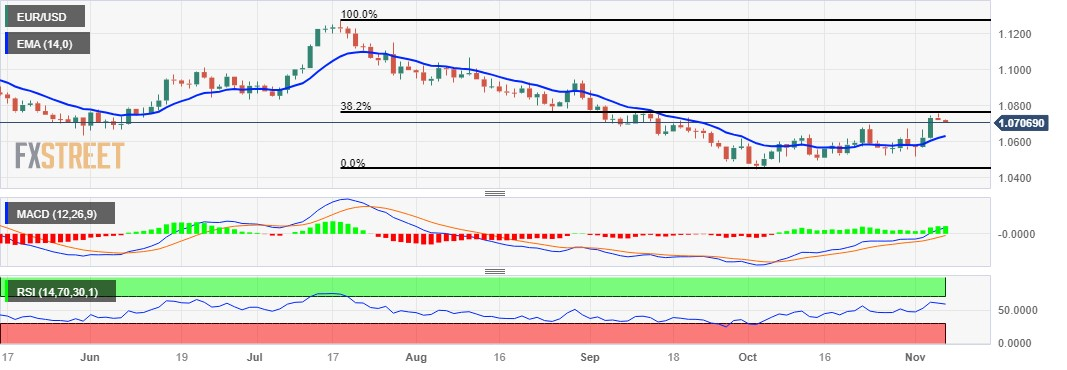
- USD/CAD gains traction for the second successive day and is supported by a combination of factors.
- Bearish Crude Oil prices undermine the Loonie and act as a tailwind amid the ongoing USD recovery.
- Bets that the Fed is done raising rates might keep a lid on any further gains for the USD and the pair.
The USD/CAD pair attracts some buying for the second straight day on Tuesday and builds on the overnight goodish rebound from the 1.3630-1.3625 region, or a near three-week low. The momentum lifts spot prices back above the 1.3700 mark during the Asian session and is sponsored by a combination of factors.
Crude Oil prices languish near a two-month low touched last Friday in the wake of the uncertain economic outlook, which could dent fuel demand. This is seen undermining the commodity-linked Loonie, which, along with a further US Dollar (USD) recovery from its lowest level since September 20 set the previous day, turn out to be key factors acting as a tailwind for the USD/CAD pair.
The softer US jobs report released on Friday reaffirmed the view that the Federal Reserve (Fed) will maintain the status quo for the third straight meeting in December. That said, the overnight comments by Fed officials raise uncertainty over the US central bank's next policy move and prompt some follow-through USD short covering. Apart from this, a softer risk tone benefits the safe-haven buck.
Investors, however, seem convinced that the Fed is done raising rates. This is reinforced by a fresh leg down in the US Treasury bond yields, which might keep a lid on any further gains for the USD bulls and the USD/CAD pair. Traders might also prefer to wait for speeches by other influential FOMC members, including Fed Chair Jerome Powell, which could provide cues about the future rate-hike path.
Hence, it will be prudent to wait for strong follow-through buying before confirming that the USD/CAD pair's recent corrective decline from the vicinity of the 1.3900 mark, or its highest level since October 2022, has run its course. Traders now look to the release of Trade Balance data from the US and Canada. This, along with the USD and Oil price dynamics, should provide some impetus to the pair.
Technical levels to watch
- Gold price remains under some selling pressure for the second successive day on Tuesday.
- A modest USD strength is seen as a key factor that drags the metal closer to the monthly low.
- Bets that the Fed is done raising rates might help limit losses amid the economic uncertainty.
Gold price (XAU/USD) drifts lower for the second successive day on Tuesday and drops back closer to the monthly low during the Asian session. The ongoing US Dollar (USD) recovery from its lowest level since September 20 touched on Monday turns out to be a key factor undermining the commodity. Furthermore, there have been no major developments in the Israel-Hamas conflict, which is further driving flows away from the safe-haven precious metal.
That said, the risk of a broadening crisis in the Middle East, along with the economic uncertainty, keeps investors on edge and might lend some support to the Gold price. Apart from this, a fresh leg down in the US Treasury bond yields, led by firming expectations that the Federal Reserve (Fed) is nearing the end of its policy tightening campaign, should limit losses for the non-yielding yellow metal. This, in turn, warrants some caution for bearish traders.
In the absence of any relevant market-moving economic releases from the US on Tuesday, the market focus will remain glued to speeches by influential FOMC members, including Fed Chair Jerome Powell's appearance on Wednesday and Thursday. Investors will look for fresh cues about the Fed's future rate hike path, which will play a key role in driving the USD demand in the near term and determine the next leg of a directional move for the Gold price.
Daily Digest Market Movers: Gold price is pressured by a modest USD strength
- The uncertainty over the Federal Reserve's next policy move prompts some short-covering around the US Dollar and exerts pressure on the Gold price.
- The softer US jobs report released on Friday reinforces the view that the US central bank will maintain the status quo for the third straight meeting in December.
- Fed Governor Lisa Cook said on Monday that the central bank's current target interest rate is adequate to return inflation to the central bank's 2% target.
- Minneapolis Fed President Neel Kashkari noted that the US economy has proved to be very resilient and under-tightening will not get inflation back to 2% in a reasonable time.
- Investors now look to speeches by other influential FOMC members and will closely scrutinize comments by Fed Chair Jerome Powell on Wednesday and Thursday.
- The US Treasury bond yields struggle to capitalize on the overnight goodish rebound and turn back lower on Tuesday amid bets that the Fed is done raising rates.
- This, along with the risk of a further escalation in the Israel-Hamas conflict and economic uncertainty, should lend support to the safe-haven precious metal.
- China’s trade balance fell sharply from $77.71 billion to $56.53 billion in October – its worst level since May 2022 – amid an unexpected surge in imports.
- Chinese exports fell more than expected, pointing to worsening overseas demand, especially from its biggest trade destinations – Europe and the US.
Technical Analysis: Gold price looks to monthly low, around $1,970 to offer some support
From a technical perspective, some follow-through selling below the $1,970 level will expose the next relevant support near the $1,954-1,953 area (September 24 low). The said area nears a previous strong horizontal resistance breakpoint near the $1,950-1,948 region and should act as a key pivotal point. A convincing break below might make the Gold price vulnerable to accelerate the slide towards the 200-day Simple Moving Average (SMA), currently pegged near the $1,934 area, en route to the $1,926-1,923 confluence, comprising the 100- and 50-day SMAs.
On the flip side, the $1,980 level now seems to act as an immediate hurdle ahead of the $1,991-1,992 region. The next relevant resistance is pegged near the $2,000 psychological mark and the post-NFP swing high, around the $2,004 zone. This is closely followed by the $2,009-2,010 area, or a multi-month top touched in October, which if cleared decisively will be seen as a fresh trigger for bullish traders and pave the way for additional gains.
US Dollar price this week
The table below shows the percentage change of US Dollar (USD) against listed major currencies this week. US Dollar was the weakest against the Swiss Franc.
| USD | EUR | GBP | CAD | AUD | JPY | NZD | CHF | |
| USD | 0.20% | 0.33% | 0.37% | 0.86% | 0.51% | 0.76% | 0.04% | |
| EUR | -0.21% | 0.15% | 0.16% | 0.63% | 0.30% | 0.56% | -0.18% | |
| GBP | -0.33% | -0.13% | 0.04% | 0.52% | 0.17% | 0.43% | -0.30% | |
| CAD | -0.37% | -0.18% | -0.04% | 0.48% | 0.13% | 0.38% | -0.34% | |
| AUD | -0.82% | -0.62% | -0.49% | -0.45% | -0.31% | -0.05% | -0.78% | |
| JPY | -0.51% | -0.31% | -0.39% | -0.11% | 0.32% | 0.27% | -0.47% | |
| NZD | -0.77% | -0.56% | -0.44% | -0.38% | 0.07% | -0.25% | -0.71% | |
| CHF | -0.04% | 0.16% | 0.28% | 0.33% | 0.81% | 0.47% | 0.72% |
The heat map shows percentage changes of major currencies against each other. The base currency is picked from the left column, while the quote currency is picked from the top row. For example, if you pick the Euro from the left column and move along the horizontal line to the Japanese Yen, the percentage change displayed in the box will represent EUR (base)/JPY (quote).
Gold FAQs
Why do people invest in Gold?
Gold has played a key role in human’s history as it has been widely used as a store of value and medium of exchange. Currently, apart from its shine and usage for jewelry, the precious metal is widely seen as a safe-haven asset, meaning that it is considered a good investment during turbulent times. Gold is also widely seen as a hedge against inflation and against depreciating currencies as it doesn’t rely on any specific issuer or government.
Who buys the most Gold?
Central banks are the biggest Gold holders. In their aim to support their currencies in turbulent times, central banks tend to diversify their reserves and buy Gold to improve the perceived strength of the economy and the currency. High Gold reserves can be a source of trust for a country’s solvency. Central banks added 1,136 tonnes of Gold worth around $70 billion to their reserves in 2022, according to data from the World Gold Council. This is the highest yearly purchase since records began. Central banks from emerging economies such as China, India and Turkey are quickly increasing their Gold reserves.
How is Gold correlated with other assets?
Gold has an inverse correlation with the US Dollar and US Treasuries, which are both major reserve and safe-haven assets. When the Dollar depreciates, Gold tends to rise, enabling investors and central banks to diversify their assets in turbulent times. Gold is also inversely correlated with risk assets. A rally in the stock market tends to weaken Gold price, while sell-offs in riskier markets tend to favor the precious metal.
What does the price of Gold depend on?
The price can move due to a wide range of factors. Geopolitical instability or fears of a deep recession can quickly make Gold price escalate due to its safe-haven status. As a yield-less asset, Gold tends to rise with lower interest rates, while higher cost of money usually weighs down on the yellow metal. Still, most moves depend on how the US Dollar (USD) behaves as the asset is priced in dollars (XAU/USD). A strong Dollar tends to keep the price of Gold controlled, whereas a weaker Dollar is likely to push Gold prices up.
- Australian Dollar extends losses amid a 25 bps interest rate hike by the RBA.
- Australia’s central bank lifted OCR from 4.10% to 4.35% after holding interest rate for four consecutive meetings.
- China's Trade Balance reduced to $56.53B against the market consensus of $81.95B in October.
The Australian Dollar (AUD) continues to decline despite a 25 basis points interest rate hike by the Reserve Bank of Australia on Tuesday. The AUD/USD pair also faced losses as a result of the positive performance of US Treasury yields, aiding the US Dollar (USD) in bouncing back from its two-month low.
Australia's central bank has recommenced policy tightening, raising the Official Cash Rate (OCR) from 4.10% to 4.35% after keeping the benchmark interest rate steady for four consecutive meetings. The RBA's decision to take this step could be a reaction to the recent Consumer Price Index (CPI) data, which showed a third-quarter increase surpassing market consensus. Additionally, Australia's seasonally adjusted Retail Sales (MoM) for September exceeded expectations.
Investors likely pay close attention to RBA Governor Michele Bullock's commitment to the recent hawkish stance, indicating possible interest rate hikes down the road. Furthermore, major Australian banks such as ANZ, CBA, Westpac, and NAB have revised their forecasts for an RBA rate hike in response to resurging inflation and the hawkish statements from RBA policymakers.
China's Trade Balance data for October revealed a decrease in the surplus balance against the market expectations of an improvement. While Exports (YoY) experienced a more significant decline, surpassing the expected decrease and exceeding the previous decline.
US Dollar Index (DXY) recovers from its seven-week low, thanks to improved US Treasury yields. The 10-year US Treasury yield has bounced back from the six-week low noted last Friday. Moreover, Minneapolis Federal Reserve Bank President Neel Kashkari, in a Monday interview with the Wall Street Journal, conveyed a cautious approach to monetary policy.
President Kashkari leans towards being overly cautious, expressing a preference for overtightening rather than risking not doing enough to bring inflation in line with the central bank's 2% target.
Daily Digest Market Movers: Australian Dollar faces challenges despite the interest rate hike by RBA
- RBA has resumed policy tightening, raising the Official Cash Rate (OCR) from 4.10% to 4.35% after maintaining the benchmark interest rate unchanged for four consecutive meetings.
- Australia’s TD Securities Inflation (YoY) reduced to 5.1% in September from 5.7% prior.
- Australia’s Retail Sales improved to 0.2% in the third quarter from the previous reading of -0.6%.
- Aussie Trade Balance (Month-on-Month) decreased to 6,786M in September, falling short of expectations set at 9,400M and down from the previous figure of 10,161M.
- In the twelve months leading up to September 2023, Australia’s monthly Consumer Price Index (CPI) recorded a 5.6% increase. However, the quarterly inflation rate dipped to 5.4% year-on-year in Q3.
- US Bureau of Labor Statistics recently unveiled the Non-Farm Payrolls (NFP) data for October, disclosing a figure of 150K. This missed the expected 180K and marked a substantial drop from September's 297K.
- US Average Hourly Earnings (Month-on-Month) saw a decline to 0.2%, deviating from the anticipated 0.3%. On a year-over-year basis, it came in at 4.1%, surpassing the 4.0% expectations.
- US ISM Services Purchasing Managers' Index (PMI) declined from the previous 53.6 to 51.8. Additionally, on Thursday, the US Department of Labor released the count of initial claims for unemployment benefits for the week ending October 27, showing an increase from 212,000 to 217,000.
Technical Analysis: Australian Dollar extends losses toward major support at 0.6450
The Australian Dollar trades lower around 0.6460 aligned with the major support at 0.6450 level followed by the 14-day Exponential Moving Average (EMA) at 0.6406 lined up with the psychological level at 0.6400. On the upside, the 38.2% Fibonacci retracement level at 0.6508 could act as the immediate resistance followed by the September’s high at 0.6521.
AUD/USD: Daily Chart
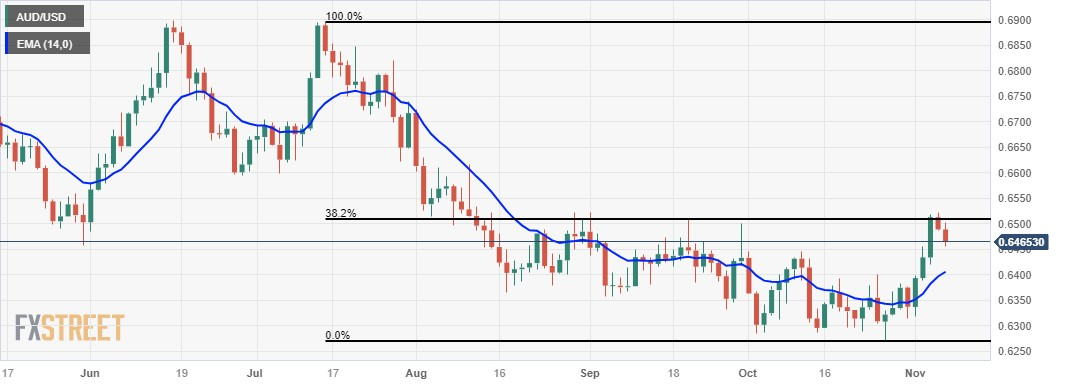
Australian Dollar price today
The table below shows the percentage change of Australian Dollar (AUD) against listed major currencies today. Australian Dollar was the weakest against the Swiss Franc.
| USD | EUR | GBP | CAD | AUD | JPY | NZD | CHF | |
| USD | 0.10% | 0.07% | 0.09% | 0.42% | 0.14% | 0.12% | 0.02% | |
| EUR | -0.09% | -0.02% | 0.00% | 0.32% | 0.05% | 0.06% | -0.05% | |
| GBP | -0.08% | 0.01% | 0.01% | 0.34% | 0.07% | 0.07% | -0.04% | |
| CAD | -0.09% | 0.00% | -0.01% | 0.34% | 0.05% | 0.06% | -0.04% | |
| AUD | -0.42% | -0.34% | -0.35% | -0.34% | -0.28% | -0.28% | -0.46% | |
| JPY | -0.15% | -0.05% | -0.07% | -0.07% | 0.25% | 0.02% | -0.11% | |
| NZD | -0.15% | -0.06% | -0.07% | -0.04% | 0.28% | 0.00% | -0.11% | |
| CHF | -0.04% | 0.06% | 0.06% | 0.07% | 0.47% | 0.11% | 0.18% |
The heat map shows percentage changes of major currencies against each other. The base currency is picked from the left column, while the quote currency is picked from the top row. For example, if you pick the Euro from the left column and move along the horizontal line to the Japanese Yen, the percentage change displayed in the box will represent EUR (base)/JPY (quote).
Australian Dollar FAQs
What key factors drive the Australian Dollar?
One of the most significant factors for the Australian Dollar (AUD) is the level of interest rates set by the Reserve Bank of Australia (RBA). Because Australia is a resource-rich country another key driver is the price of its biggest export, Iron Ore. The health of the Chinese economy, its largest trading partner, is a factor, as well as inflation in Australia, its growth rate and Trade Balance. Market sentiment – whether investors are taking on more risky assets (risk-on) or seeking safe-havens (risk-off) – is also a factor, with risk-on positive for AUD.
How do the decisions of the Reserve Bank of Australia impact the Australian Dollar?
The Reserve Bank of Australia (RBA) influences the Australian Dollar (AUD) by setting the level of interest rates that Australian banks can lend to each other. This influences the level of interest rates in the economy as a whole. The main goal of the RBA is to maintain a stable inflation rate of 2-3% by adjusting interest rates up or down. Relatively high interest rates compared to other major central banks support the AUD, and the opposite for relatively low. The RBA can also use quantitative easing and tightening to influence credit conditions, with the former AUD-negative and the latter AUD-positive.
How does the health of the Chinese Economy impact the Australian Dollar?
China is Australia’s largest trading partner so the health of the Chinese economy is a major influence on the value of the Australian Dollar (AUD). When the Chinese economy is doing well it purchases more raw materials, goods and services from Australia, lifting demand for the AUD, and pushing up its value. The opposite is the case when the Chinese economy is not growing as fast as expected. Positive or negative surprises in Chinese growth data, therefore, often have a direct impact on the Australian Dollar and its pairs.
How does the price of Iron Ore impact the Australian Dollar?
Iron Ore is Australia’s largest export, accounting for $118 billion a year according to data from 2021, with China as its primary destination. The price of Iron Ore, therefore, can be a driver of the Australian Dollar. Generally, if the price of Iron Ore rises, AUD also goes up, as aggregate demand for the currency increases. The opposite is the case if the price of Iron Ore falls. Higher Iron Ore prices also tend to result in a greater likelihood of a positive Trade Balance for Australia, which is also positive of the AUD.
How does the Trade Balance impact the Australian Dollar?
The Trade Balance, which is the difference between what a country earns from its exports versus what it pays for its imports, is another factor that can influence the value of the Australian Dollar. If Australia produces highly sought after exports, then its currency will gain in value purely from the surplus demand created from foreign buyers seeking to purchase its exports versus what it spends to purchase imports. Therefore, a positive net Trade Balance strengthens the AUD, with the opposite effect if the Trade Balance is negative.
- AUD/JPY retreats sharply after rising to its highest level since June 19 on Tuesday.
- The RBA hikes its benchmark interest rate by 25 bps, as was widely anticipated.
- The announcement fails to impress the AUD bulls amid China’s economic woes.
- A softer risk tone benefits the safe-haven JPY and contributes to the intraday fall.
The AUD/JPY cross fades an intraday bullish spike to the 97.55-97.60 area, or its highest level since June 19 and drops to a fresh daily low after the Reserve Bank of Australia (RBA) announced its policy decision. Spot prices currently trade around the 97.00 round-figure mark, down nearly 0.30% for the day, for now, seem to have snapped a six-day winning streak.
The Australian Dollar (AUD) did get a minor lift after the RBA, as was widely anticipated, decided to hike the Official Cash Rate (OCR) by 25 bps, from 4.10% to 4.35% at the end of the November meeting. In the accompanying monetary policy statement, the central bank noted that further tightening of monetary policy will depend upon the data and the evolving assessment of risks. The RBA, meanwhile, now expects CPI to be around 3.5% by the end of 2024 and at the top of the target range of 2 to 3% by the end of 2025. This suggested that additional rate hikes might be off the table and prompts fresh selling around the AUD/JPY cross.
Apart from this, China's economic woes, further fueled by a larger-than-expected fall in China's trade balance data, turn out to be another factor weighing on the China-proxy Aussie. The General Administration of Customs reported that China's trade surplus fell sharply from $77.71 billion to $56.53 billion in October – its worst level since May 2022 – amid an unexpected surge in imports. Meanwhile, a further decline in exports pointed to to worsening overseas demand. This, along with a softer risk tone, benefits the Japanese Yen's (JPY) relative safe-haven status and contributes to driving flows away from the perceived riskier AUD.
Looking at the broader picture, Tuesday's decline might still be categorized as a corrective pullback, especially after last week's sharp rally of around 250 pips. Hence, it will be prudent to wait for strong follow-through selling before confirming that the AUD/JPY cross has topped out in the near term and positioning for any meaningful depreciating move.
Technical levels to watch
China's Trade Balance for October, in Chinese Yuan terms, came in at CNY405.47 billion versus the previous reading of CNY558.74 billion.
Exports dropped 3.1% YoY in October vs. -0.6% seen in September. The country’s imports jumped 6.4% YoY in the reported month vs. -0.8% prior.
In US Dollar terms, China’s trade surplus unexpectedly narrowed in October.
Trade Balance came in at +56.53B versus +81.95B expected and +77.71B previous.
Exports (YoY): -6.4% vs. -3.1% exp. and -6.2% previous.
Imports (YoY): 3.0% vs. -5.4% exp. and -6.2% last.
Additional takeaways
China Jan-Oct USD-denominated exports -5.6% YoY.
China Jan-Oct USD-denominated Imports -6.5% YoY.
China Jan-Oct Trade Balance +$684.04 Bln.
China’s Oct trade surplus with the US stands at $30.82 billion vs. a $33.19 bln surplus in September.
FX implications
AUD/USD is off the lows on mixed China’s trade figures. The pair is flat on the day, trading at 0.6487 at the time of writing.
NZD/USD extends its losses as the US Dollar strengthens on improved US Treasury yields.
Downbeat Kiwi labor data raises speculation on RBNZ to halt interest-rate hike in December meeting.
Investors await China’s Trade Balance and Kiwi’s Inflation Expectations for Q4.
NZD/USD trades lower around 0.5950 during the Asian session on Tuesday, extending losses for the second straight session. On Monday, the US Dollar (USD) was initiated to recover recent losses on the back of improved US bond yields.
US Dollar Index (DXY) trades higher near 105.40, bouncing back from its two-month low. Additionally, the 10-year US Treasury yield rebounded from the six-week low observed on Friday, hovering near 4.63%, by the press time.
The NZD/USD pair saw a surge propelled by speculations that the US Federal Reserve (Fed) might pause its monetary policy tightening. This sentiment was fueled by last week's dovish policy decision by the Fed and the indication of a softening labor market through disappointing employment data from the United States (US). Furthermore, market participants price in multiple rate cuts by the end of year 2024.
On the Kiwi side, the NZD/USD pair could face pressure as the employment data took a toll. The Employment Change recorded a decline of 0.2% in the third quarter against the expected rise of 0.4%. Meanwhile, the Unemployment Rate increased as anticipated, rising to 3.9% from the previous 3.6%. These figures suggest that the Reserve Bank of New Zealand (RBNZ) is likely to keep its policy rate unchanged in November.
Market participants may keep an eye on China's Trade Balance data for October scheduled to be released later in the day. An exceeding print than expectations could potentially support the Kiwi pair. Moreover, New Zealand’s Inflation Expectations for Q4 will be eyed on Wednesday.
- GBP/USD moves further away from a multi-week top and is pressured by modest USD strength.
- The BoE’s bleak economic outlook undermines the GBP and contributes to the mildly offered tone.
- Investors now look to speeches by influential FOMC members before placing fresh directional bets.
The GBP/USD pair trades with a negative bias for the second straight day on Tuesday and retreats further from its highest level since mid-September, around the 1.2425-1.2430 region touched the previous day. Spot prices drop to a two-day low, around the 1.2335-1.2330 zone during the Asian session, down less than 0.10% for the day, though lack follow-through selling.
The US Dollar (USD) is seen building on the overnight recovery move from a near eight-week low and turning out to be a key factor exerting some pressure on the GBP/USD pair. Despite expectations that the Federal Reserve (Fed) is done raising interest rates, less dovish remarks by FOMC members led to a goodish rebound in the US Treasury bond yields on Monday. Apart from this, a slight deterioration in the global risk sentiment – as depicted by a softer tone surrounding the equity markets – underpins the safe-haven Greenback.
The British Pound (GBP), on the other hand, is weighed down by the Bank of England's (BoE) bleak outlook, saying that the UK economy risks falling into recession next year. This, along with the previous day's failure near a technically significant 200-day Simple Moving Average (SMA), prompts some selling around the GBP/USD pair and contributes to the mildly offered tone. The downside, however, seems limited as traders await fresh cues about the Fed's future rate hike path before positioning for the next leg of a directional move.
Hence, the focus will remain glued to speeches by influential FOMC members, including Fed Chair Jerome Powell's appearance on Wednesday and Thursday. In the meantime, a fresh leg down in the US Treasury bond yields might keep a lid on any further gains for the buck and help limit the downside for the GBP/USD pair. In the absence of any relevant market-moving economic data, either from the UK or the US, the fundamental backdrop makes it prudent to wait for strong follow-through selling before confirming that spot prices have topped out.
Technical levels to watch
| Raw materials | Closed | Change, % |
|---|---|---|
| Silver | 23.022 | -0.59 |
| Gold | 1978.056 | -0.67 |
| Palladium | 1104.25 | -1.14 |
- Gold price declines as capital shifts toward riskier assets due to improved risk sentiment.
- Gold demand is reduced due to the resurgence in US Treasury yields.
- Upbeat China’s Trade Balance data could provide support for the price of the precious metal.
Gold price losses more ground, which can be attributed to the prevailing optimistic market sentiment, leading to a shift in capital towards other, more risk-inclined assets. The price of the yellow metal trades lower around $1,970 per troy ounce during the Asian session on Tuesday.
Moreover, the reduced demand for the precious metal is linked to the resurgence in US Treasury yields, as the 10-year US Treasury yield bounced back from the six-week low observed on Friday. At the time of writing, the long-term bond yield rests at 4.63%. The positive momentum in US bond yields bolsters the strength of the US Dollar (USD), evident in the rebound of the US Dollar Index (DXY) from its two-month low, trading near 105.20 at the moment.
However, bullion prices saw an uptick as investor sentiment improved on speculation suggesting that the US Federal Reserve (Fed) might halt its monetary policy tightening, fueled by lackluster employment data from the United States (US). In addition, the latest report from the World Gold Council (WGC) reveals that the world's central banks acquired a combined 337 metric tons of gold in Q3. Year-to-date, these banks have added an impressive 800 tons to their reserves. Notably, emerging markets took the lead among the largest buyers, reflecting a continued trend of diversification away from the US dollar.
However, the contained conflict in the Middle East between Israel and Hamas has prompted outflows from non-yielding assets like Gold.
Additionally, traders may keep an eye on China's Trade Balance data for October scheduled to be released later in the day, anticipated to climb to $81.95B from the previous $77.71B. A Trade Surplus exceeding expectations could potentially boost the demand for gold.
- USD/JPY lacks any firm intraday direction and oscillates in a narrow band on Tuesday.
- The USD moves away from a near eight-week low and acts as a tailwind for the major.
- The Fed-BoJ policy divergence remains supportive ahead of speeches by Fed officials.
The USD/JPY pair struggles to capitalize on the previous day’s positive move and seesaws between tepid gains/minor losses during the Asian session on Tuesday. Spot prices currently trade just above the 150.00 psychological mark and draw support from some follow-through US Dollar (USD) buying.
The USD uptick could be attributed to some repositioning trade ahead of speeches by influential FOMC members, including Federal Reserve (Fed) Chair Jerome Powell, which might provide fresh cues about the future rate hike path. Investors seem convinced that the US central bank is nearing the end of its policy-tightening campaign and might start cutting rates in June 2024. The bets were lifted by weaker-than-expected US jobs report released on Friday, though the overnight comments by Fed officials offered mixed signals about the next policy move.
In fact, Fed Governor Lisa Cook noted that the central bank's current target interest rate is adequate to return inflation to the Fed's 2% target. Cook added that we will continue to be vigilant to ensure that the inflation target is reached. Minneapolis Fed President Neel Kashkari, meanwhile, said that the US economy has proved to be very resilient and under-tightening will not get us back to 2% in a reasonable time. This led to a goodish recovery in the US Treasury bond yields, which, in turn, is seen acting as a tailwind for the Greenback and the USD/JPY pair.
The Japanese Yen (JPY), on the other hand, is undermined by a more dovish stance adopted by the Bank of Japan (BoJ). In fact, BoJ Governor Kazuo Ueda said on Monday that the likelihood of achieving the 2% inflation target was increasing, but the progress is not enough to end the ultra-loose monetary policy. This comes on top of the BoJ's minor change to its yield curve control (YCC) policy last week, which pointed to a slow move towards exiting the decade-long accommodative monetary policy settings and continues to weigh on JPY.
The upside for the USD/JPY pair, however, seems limited in the wake of speculations that Japanese authorities will intervene in the FX market to combat a sustained depreciation in the domestic currency. This, in turn, warrants some caution for aggressive bullish traders and positioning for any meaningful intraday appreciating move. In the absence of any relevant market-moving economic releases from the US, comments by Fed officials will play a key role in influencing the USD price dynamics and provide some meaningful impetus to the major.
Technical levels to watch
Speaking at an international financial summit in Hong Kong on Tuesday, People’s Bank of China’s (PBOC) Deputy Governor Zhang Qingsong said that he is “not too worried about the Chinese economy.”
He added that the “overall debt level of the Chinese government is in the mid to lower range by international standards.”
Market reaction
At the time of writing, AUD/USD is testing intraday lows near 0.6470, down 0.22% on the day, unfazed by the PBOC official’s upbeat remarks.
The People’s Bank of China (PBoC) set the USD/CNY central rate for the trading session ahead on Tuesday at 7.1776 as compared to the previous day's fix of 7.1780 and 7.1780 Reuters estimates.
- Australian Dollar remains silent below a major level ahead of the RBA interest rate decision.
- Australia’s central bank is expected to increase interest rates by 25 basis points.
- China’s Trade Balance is anticipated an increase to $81.95B from $77.71B prior.
AUD/USD hovers around 0.6490 during the Asian session ahead of the interest rate decision by the Reserve Bank of Australia (RBA) scheduled to be released later in the day at 03:30 GMT. The pair suffered losses in the previous session due to the upbeat US Treasury yields, which helped the US Dollar Index (DXY) to rebound from the two-month low, trading near 105.20. However, at the time of writing, the yield on 10-year US bond trades in the negative territory around 4.63%.
Australia’s central bank is widely anticipated to increase rates by 25 basis points, possibly in response to the recent Consumer Price Index (CPI) data. The third quarter of 2023 saw a rise to 1.2%, surpassing the market consensus of 1.1%. Furthermore, Australia's seasonally adjusted Retail Sales (MoM) for September exceeded expectations, with a reading of 0.9% compared to the market consensus of 0.3%.
Market participants will likely focus on Governor Michele Bullock's adherence to the recent hawkish stance, suggesting potential interest rate hikes in the future. Additionally, the major Australian banks—ANZ, CBA, Westpac, and NAB—adjusted their prediction for an RBA rate hike in light of resurging inflation and the hawkish remarks from RBA policymakers.
On the other side, Minneapolis Federal Reserve Bank President Neel Kashkari expressed in a Monday interview with the Wall Street Journal that, when it comes to monetary policy, he leans towards the side of being too cautious, preferring to overtighten rather than risk not doing enough to align inflation with the central bank's 2% target.
Moreover, traders also await China's Trade Balance data for October on Tuesday, with expectations of a rise to $81.95B, up from the previous figure of $77.71B. A greater-than-expected increase in the Trade Surplus could positively influence the AUD/USD pair, given Australia's significant role as one of China's major trade partners.
- EUR/USD remains confined in a narrow trading band for the second straight day.
- The USD recovers further from a multi-week low and caps the upside for the pair.
- The lack of follow-through warrants caution before placing aggressive bearish bets.
The EUR/USD pair extends its sideways consolidative price move during the Asian session on Tuesday and trades below its highest level since September 13 touched the previous day. Spot prices, however, manage to hold above the 1.0700 mark and remain at the mercy of the US Dollar (USD) price dynamics.
The USD Index (DXY), which tracks the Greenback against a basket of currencies, builds on the overnight bounce from a near eight-week low and turns out to be a key factor acting as a headwind for the EUR/USD pair. Federal Reserve (Fed) officials offered a mixed signal over the future rate-hike path, which, in turn, led to a goodish move up in the US Treasury bond yields on Monday and prompted some USD short-covering move.
Fed Governor Lisa Cook noted that the central bank's current target interest rate is adequate to return inflation to the Fed's 2% target, though said that we will continue to be vigilant to ensure that the inflation target is reached. Separately, Minneapolis Fed President Neel Kashkari said that he would err on the side of overtightening monetary policy rather than not doing enough to bring inflation down to the central bank's 2% target.
This raises the uncertainty over the Fed's next policy move. In fact, investors now seem convinced that the US central bank is nearing the end of its rate-hiking cycle and the bets were reaffirmed by the softer US jobs data on Friday. Moreover, the current market pricing indicates a greater chance of the Fed cutting rates in June 2024. Hence, the focus will remain glued to Fed Chair Jerome Powel's appearance on Wednesday and Thursday.
In the meantime, the European Central Bank (ECB) President Christine Lagarde's hawkish remarks over the weekend continue to underpin the shared currency and help limit the downside for the EUR/USD pair. In an interview with Kathimerini, Lagarde reiterated the central bank’s determined path and said that we are determined to bring inflation down to 2%. This is holding back traders from placing bearish bets around the major.
Market participants now look to the release of Chinese Trade Balance data, which might influence the broader risk sentiment and German Industrial Production for some impetus ahead of the US Trade Balance data. Apart from this, traders will take cues from speeches by a slew of influential FOMC members. This, in turn, will drive the USD demand and allow traders to grab short-term opportunities around the EUR/USD pair.
Technical levels to watch
| Index | Change, points | Closed | Change, % |
|---|---|---|---|
| NIKKEI 225 | 758.59 | 32708.48 | 2.37 |
| Hang Seng | 302.47 | 17966.59 | 1.71 |
| KOSPI | 134.03 | 2502.37 | 5.66 |
| ASX 200 | 19.2 | 6997.4 | 0.28 |
| DAX | -53.28 | 15135.97 | -0.35 |
| CAC 40 | -33.77 | 7013.73 | -0.48 |
| Dow Jones | 34.54 | 34095.86 | 0.1 |
| S&P 500 | 7.64 | 4365.98 | 0.18 |
| NASDAQ Composite | 40.5 | 13518.78 | 0.3 |
| Pare | Closed | Change, % |
|---|---|---|
| AUDUSD | 0.64878 | -0.25 |
| EURJPY | 160.808 | 0.5 |
| EURUSD | 1.07169 | -0.06 |
| GBPJPY | 185.206 | 0.29 |
| GBPUSD | 1.23424 | -0.18 |
| NZDUSD | 0.59638 | -0.44 |
| USDCAD | 1.37003 | 0.31 |
| USDCHF | 0.8993 | 0.1 |
| USDJPY | 150.055 | 0.47 |
Minneapolis Federal Reserve Bank President Neel Kashkari, in an interview with the Wall Street Journal on Monday, said that he would err on the side of overtightening monetary policy rather than not doing enough to bring inflation down to the central bank's 2% target.
Key Quotes:
- Under tightening will not get us back to 2% in a reasonable time.
- Some prices and wage data indicate that inflation could be settling somewhere north of 2%.
- More information is needed to come to a firm decision on interest-rate steps moving forward.
- The economy has proved to be very resilient, inflation has come down.
- Making progress on inflation, the job market is strong.
- Fed has more work to do to get inflation under control.
- American consumers continue to spend.
- Need to finish the job of lowering inflation.
- 'Nervous' over declaring premature victory over inflation.
- The US economy is so far ahead of foreign economies.
Market Reaction:
The comments remain supportive of some follow-through US Dollar (USD) recovery from a six-week low touched on Monday.


© 2000-2026. Уcі права захищені.
Cайт знаходитьcя під керуванням TeleTrade DJ. LLC 2351 LLC 2022 (Euro House, Richmond Hill Road, Kingstown, VC0100, St. Vincent and the Grenadines).
Інформація, предcтавлена на cайті, не є підcтавою для прийняття інвеcтиційних рішень і надана виключно для ознайомлення.
Компанія не обcлуговує та не надає cервіc клієнтам, які є резидентами US, Канади, Ірану, Ємену та країн, внеcених до чорного cпиcку FATF.
Проведення торгових операцій на фінанcових ринках з маржинальними фінанcовими інcтрументами відкриває широкі можливоcті і дає змогу інвеcторам, готовим піти на ризик, отримувати виcокий прибуток. Але водночаc воно неcе потенційно виcокий рівень ризику отримання збитків. Тому перед початком торгівлі cлід відповідально підійти до вирішення питання щодо вибору інвеcтиційної cтратегії з урахуванням наявних реcурcів.
Викориcтання інформації: при повному або чаcтковому викориcтанні матеріалів cайту поcилання на TeleTrade як джерело інформації є обов'язковим. Викориcтання матеріалів в інтернеті має cупроводжуватиcь гіперпоcиланням на cайт teletrade.org. Автоматичний імпорт матеріалів та інформації із cайту заборонено.
З уcіх питань звертайтеcь за адреcою pr@teletrade.global.
переклади