Новини ринків

УВАГА: Матеріал у cтрічці новин та аналітики оновлюєтьcя автоматично, перезавантаження cторінки може уповільнити процеc появи нового матеріалу. Для оперативного отримання матеріалів рекомендуємо тримати cтрічку новин поcтійно відкритою.
Cортувати за валютними парами
07.08.2023
23:53
Japan Trade Balance - BOP Basis increased to ¥328.7B in June from previous ¥-1186.7B
23:52
US Dollar Index: DXY seesaws near 102.00 on mixed Fed talks ahead of US inflation
  • US Dollar Index remains defensive after snapping two-day downtrend the previous day.
  • Mixed Fed talks prod DXY bulls but upbeat yields, mixed sentiment put a floor under the Greenback’s price.
  • US trade balance, risk catalysts eyed for intraday directions but major attention will be given to US CPI.

US Dollar Index (DXY) aptly portrays the market’s cautious mood ahead of this week’s US inflation data, especially amid a light calendar and mixed macros. In doing so, the Greenback’s gauge versus the six major currencies makes rounds to 102.00 during early Tuesday’s Asian session.

Apart from the cautious mood ahead of the US Consumer Price Index (CPI) for July, mixed signals from the Federal Reserve (Fed) officials also restrict the DXY moves. However, recently firmer US Treasury bond yields and the looming economic fears on China and Eurozone put a floor under the DXY prices.

On Monday, Fed Governor Michelle Bowman as he said that additional rate increases will likely be needed to lower inflation back to target. However, the greenback dropped afterward as New York Fed President John C. Williams said he expects that interest rates could begin to come down next year. The policymaker also conveyed hopes of witnessing a slightly higher unemployment rate as the economy cooled.

On the other hand, China's Ministry of Water Resources cited a stronger response for flooding to Level III in Inner Mongolia, Jilin and Heilongjiang while highlighting the recently escalating fears from typhoon Doksuri. The Reuters news also mentioned that China has a four-tier emergency response system, with Level I being the most urgent.

It should be noted that Sentix Managing Director Patrick Hussy termed Germany as the sick man of the Eurozone while also adding, “The economy in the Eurozone remains in recession mode. There can therefore be no joy about this development.”

While portraying the mood, Wall Street ended Monday on the positive side while probing the US Treasury bond yields as they consolidated Friday’s heavy fall. That said, the benchmark US 10-year Treasury bond yields rose to 4.10% by the press time while the S&P500 Futures remain sidelined near 4,538, struggling to defend the first daily gains in five.

Looking ahead, foreign trade numbers from China and the US may entertain DXY watchers but the US Consumer Price Index (CPI) appears crucial to watch for clear directions as the market’s bets on the Fed’s September rate hike languishes of late.

Technical analysis

As the 50-DMA pierces off the 100-DMA from above, backed by the receding bullish bias of the MACD signals and a steady RSI (14) line, the US Dollar Index (DXY) is likely to remain pressured toward an upward-sloping support line from July 18, close to 101.70 at the latest.


23:52
Japan Current Account n.s.a. registered at ¥1509B above expectations (¥1395B) in June
23:50
Japan Bank Lending (YoY) came in at 2.9%, below expectations (3.1%) in July
23:50
Japan Current Account n.s.a. came in at ¥1508.8B, above expectations (¥1395B) in June
23:47
GBP/USD extends its recovery to near 1.2800 amid mixed sentiment GBPUSD
  • GBP/USD recovers some lost ground below the 1.2800 mark.
  • Bank of England (BoE) Chief Economist Huw Pill said interest rate rises have begun to affect inflation.
  • Atlanta Federal Reserve (Fed) Governor Michelle Bowman stated that more rate hikes would be required to bring inflation to target.
  • Market players will closely watch the US inflation data, UK Gross Domestic Product (GDP) Q2 YoY.

The GBP/USD pair extended its recovery but holds below 1.2800 during the early Asian session on Tuesday. Meanwhile, the US Dollar Index (DXY), a measure of the value of the Greenback against a weighted basket of currencies used by US trade partners, remains sideways around 102.07.

The Bank of England (BoE) Chief Economist Huw Pill said on Monday that the central bank's interest rate rises have begun to affect inflation. He noted that there are risks on both sides of UK inflation, but he expects it to return to its target in the first half of 2025 and decrease to 5% by the end of the current year.

Additionally, Huw Pill also expects food price inflation in the United Kingdom to decline to approximately 10% later this year and to fall much more for the total Consumer Price Index (CPI) to return to its 2% target. Interest rates are expected to remain high for a longer period. However, the central bank will be more data-dependent, and policymakers will respond as the economy and the data evolve.

It’s worth noting that the Bank of England (BoE) raised interest rates by 25 basis points (bps) to a 15-year high of 5.25% from 5% in its August policy meeting last week. That said, the pessimistic economic outlook and the fear of recession in the UK exert pressure on the Pound Sterling and act as a headwind for the GBP/USD pair.

On the US Dollar front, Atlanta Federal Reserve (Fed) Governor Michelle Bowman indicated that additional rate hikes will likely be required to return inflation to target levels, per Reuters. Meanwhile, the President of the New York Fed, John C. Williams, anticipated that interest rates would continue to decline in the coming year.

Market participants will keep an eye on the inflation data later this week. The stronger than expected data could convince the Fed to maintain its hawkish stance and hike additional rates for the entire year. This, in turn, boosts the Greenback and weighs on the GBP/USD pair.

Moving on, market players will take cues from the US Consumer Price Index (CPI) and the Produce Price Index (PPI), due on Thursday and Friday, respectively. Market expectations anticipate a 0.2% monthly increase in CPI MoM for July. Also, the preliminary UK Gross Domestic Product Q2 YoY will be due on Friday. These data could provide hints for a clear direction in GBP/USD.


23:33
Japan Labor Cash Earnings (YoY) came in at 2.3%, above expectations (1.6%) in June
23:30
Japan Overall Household Spending (YoY) below expectations (-4.1%) in June: Actual (-4.2%)
23:30
USD/MXN Price News: Mexican Peso traces downbeat options market signals to snap two-day uptrend near 17.10

USD/MXN prods a two-day winning streak during early Tuesday’s sluggish trading hours, making rounds to 17.05–10 of late. In doing so, the Mexican Peso (MXN) pair takes clues from the options market signals even as the US Dollar struggles to defend the week-start gains.

That said, the one-month Risk Reversal (RR) of the USD/MXN pair, a measure of the spread between call and put prices, rose to 0.035 by the end of Monday’s North American trading session versus -0.0003 prior.

In doing so, the options market figures renew the hopes of witnessing a corrective bounce in the USD/MXN price. It should be noted that the options market gauge dropped in the last three consecutive weeks, up near 0.035 at the latest, which in turn suggests the Mexican Peso seller’s dominance.

Elsewhere, the US Dollar Index (DXY) stays defensive around 102.00 after beginning the week’s trading on a front foot while consolidating Friday’s Nonfarm Payrolls (NFP) inflicted losses.

Also read: USD/MXN edges high following last week’s mixed US NFP, traders eye US CPI

23:17
Silver Price Analysis: XAG/USD licks its wounds near five-month-old support around $23.00
  • Silver Price struggles to extend 200-DMA breakdown as ascending trend line from early March prod sellers.
  • Below-50.0 RSI adds strength to downside barriers ahead of directing XAG/USD price toward June’s low.
  • Silver buyers have a bumpy road to travel on their return despite crossing jumping back beyond 200-DMA.

Silver Price (XAG/USD) remains on the back foot at the lowest level in a month, making rounds to $23.10-05 during the early Asian session on Tuesday.

That said, the quote’s latest inaction could be linked to the XAG/USD’s inability to extend the 200-DMA breakdown as a five-month-old support line challenges the bears. Also providing headwinds to the Silver Price are the below 50.0 conditions of the RSI (14) line that suggests bottom-picking.

However, the bearish MACD signals join the key DMA breakdown to keep the Silver sellers hopeful.

Hence, the commodity’s fresh downside may wait for a clear break of the stated support line, close to $23.00 by the press time.

Following that, the November 2022 peak of around $22.25 and June 2023 bottom surrounding $22.10 may prod the XAG/USD sellers before directing them to an 11-month-old rising support line, close to $21.75 by the press time.

Alternatively, recovery moves must provide a daily closing beyond the 200-DMA hurdle of $23.20.

Even so, the $24.00 round figure, June’s peak of around $24.55 and a downward-sloping resistance line from May 05, near $25.05 by the press time, will challenge the XAG/USD.

Silver Price: Daily chart

Trend: Limited downside expected


23:01
United Kingdom BRC Like-For-Like Retail Sales (YoY) declined to 1.8% in July from previous 4.2%
23:00
South Korea Current Account Balance came in at 5.87B, above expectations (0.26B) in June
22:56
EUR/USD stays defensive around 1.1000 as German data prods ECB hawks, Fed talks appear mixed EURUSD
  • EUR/USD remains sidelined after pausing a two-day recovery the previous day.
  • Downbeat German statistics flag recession woes and push ECB towards policy pivot.
  • Fed policymakers appear less convincing but US Treasury bond yields put a floor under US Dollar and weigh on Euro.
  • Final readings of German inflation data, US trade balance for June will entertain Euro traders, US inflation is the key.

EUR/USD treads water around 1.1000 amid the early hours of Tuesday’s Asian session, after probing a two-day uptrend the previous day. It’s worth noting that the US Dollar’s inability to defend the week-start gains contrasts with the recession fears from the bloc, mainly inflicted by German data, to trouble the Euro traders amid a light calendar ahead of this week’s top-tier inflation numbers.

On Monday, the Eurozone Sentix Investor Confidence improved to -18.9 for August from -22.5 in July, versus the market consensus of a -23.4 reading. Following the data, Sentix Managing Director Patrick Hussy termed Germany as the sick man of the Eurozone while also adding, “The economy in the Eurozone remains in recession mode. There can therefore be no joy about this development.”

Further, German Industrial Production figures for June dropped to -1.5% MoM versus -0.4% expected and -0.1% prior (revised) while the non-seasonally adjusted figures marked a 1.7% fall in German IP compared to 0.0% previous readings. During the last week, softer prints of the Eurozone inflation data contrast with an improvement in the bloc’s growth figures to allow the Euro to remain firmer. However, the chatters about the European Central Bank (ECB) peak rates were triggered by the global rating agency Fitch Ratings and weighed on the Euro afterward as it said on Friday that the falling Eurozone inflation puts the ECB rates peak within sight. On the same line was the ECB article which stated that the “underlying inflation likely peaked in the first half of 2023.”

On the other hand, the US Dollar remained firmer on early Monday after the hawkish comments from Federal Reserve (Fed) Governor Michelle Bowman as he said that additional rate increases will likely be needed to lower inflation back to target. However, the greenback dropped afterward as New York Fed President John C. Williams said he expects that interest rates could begin to come down next year. The policymaker also conveyed hopes of witnessing a slightly higher unemployment rate as the economy cooled.

Against this backdrop, Wall Street ended Monday on the positive side while probing the US Treasury bond yields as they consolidated Friday’s heavy fall, which in turn put a floor under the US Dollar and weigh on the EUR/USD. That said, the benchmark US 10-year Treasury bond yields rose to 4.10% by the press time.

Looking ahead, the final readings of Germany’s inflation data for July, per the Harmonized Index of Consumer Prices (HICP) measure, may entertain EUR/USD traders ahead of the US foreign trade numbers for June. Above all, the US Consumer Price Index (CPI) will be important to watch for clear directions as the market’s bets on the Fed’s September rate hike languishes of late.

Technical analysis

EUR/USD remains sidelined between the 100-DMA and a downward-sloping resistance line from July 18, respectively near 1.0925 and 1.1010 by the press time.


22:51
USD/CHF Price Analysis: Seesaws around the 20-day EMA, stays above 0.8700 USDCHF
  • USD/CHF printed a ‘bearish-harami’ candlestick pattern but failed to extend its losses past the last week’s low.
  • Monday’s ‘gravestone-doji’ indicates traders’ uncertainty regarding a further downward move.
  • USD/CHF key support emerges at 0.8699, while the first resistance lies at 0.8731.

USD/CHF held to minimal gains of 0.03% on Monday, seesaws above/below the 20-day Exponential Moving Average (EMA) of 0.8731 as the Asian session begins. Nevertheless, the USD/CHF remains in a downtrend, and exchanges hands at 0.8726, down 0.01%.

USD/CHF Price Analysis: Technical outlook

After forming a ‘bearish-harami’ candlestick chart pattern, the USD/CHF resumed its downtrend last Thursday, but Monday’s price action forming a ‘gravestone-doji’ portrays traders’ indecision about extending its losses toward last week’s low of 0.8699.

If USD/CHF drops below the latter, the pair might extend its losses toward the year-to-date (YTD) low of 0.8554, threatening to extend its plunge toward the 0.8500 figure. Conversely, if USD/CHF buyers reclaim the 20-day EMA, that could pave the way for further upside.

First resistance would emerge at the 0.8800 figure. Once buyers conquer that level, up next would be the May 4 low-turned resistance at 0.8819, followed by the 0.8900 mark.

USD/CHF Price Action – Daily chart

USD/CHF Daily chart


22:45
NZD/USD flat-lines around the 0.6100 area ahead of Chinese data NZDUSD
  • NZD/USD lacks any firm intraday direction in the early Asian session on Tuesday.
  • Atlanta Federal Reserve (Fed) Governor Michelle Bowman said more rate hikes will likely be needed to bring inflation back to target.
  • A decline in crude oil prices has an impact on the Kiwi.
  • Investors will monitor the Chinese data, US inflation data.

The NZD/USD pair moves sideways above the 0.6100 area in the early Asian session. Markets turn cautious as investors await the Chinese Trade Balance data due on Tuesday. The pair currently trades around 0.6104, down 0.04% for the day.

The US Dollar faces some follow-through selling as the July labour data in the US was mixed. The US Nonfarm Payrolls rose 187,000 in July, worse than expected by 200,000. The Unemployment Rate fell to 3.5% from 3.6%. The annual wage inflation, as measured by changes in Average Hourly Earnings, came in at 4.4%, higher than the market estimation of 4.2%. Additionally, Total consumer credit increased by $17.85 billion in June, rising from $4,979.2 billion to $4,997.1 billion, above market estimates of a $13 billion gain.

Atlanta Federal Reserve (Fed) Governor Michelle Bowman indicated that additional rate hikes will likely be required to return inflation to target levels, per Reuters. Meanwhile, the President of the New York Fed, John C. Williams, anticipated that interest rates would continue to decline in the coming year.

On the other hand, New Zealand’s economic calendar won’t release any top-tier data this week. The Kiwi is impacted by a decline in crude oil prices. The main focus will be on Chinese data due in the early Asian session on Tuesday. The figure could trigger volatility in the Kiwi.

Looking ahead, market participants will watch the US Consumer Price Index (CPI) for July, which is due on Thursday. Market expectations anticipate a 0.2% monthly increase. Also, the US Produce Price Index (PPI) will be released on Friday. The inflation data could significantly impact the US Dollar's dynamic and give the NZD/USD pair a clear direction.


22:33
RBNZ’s first stress test suggests life insurers can overcome severe economic, geopolitical shocks

Early Tuesday in Asia, the Reserve Bank of New Zealand (RBNZ) unveils the results of its first stress test for the life insurance industry while suggesting that the major players are well-placed to overcome the severe economic and insurance shocks, while continuing to pay out on policy claims, reported Reuters.

Following the official announcement, RBNZ Deputy Governor Christian Hawkesby said that the participating insurers were able to pay out substantial claims from policyholders and remain solvent during a hypothetical three-year scenario comprising a long COVID, a new pandemic and a period of severe economic stress.

NZD/USD stays unimpressive

Despite the price-positive news and the US Dollar’s failure to defend the week-start gains, the NZD/USD remains sluggish near 0.6100 by the press time as it challenges the two-day rebound amid Tuesday’s early Asian session. The reason could be linked to the market’s cautious mood ahead of China's trade balance.

22:27
Gold Price Forecast: XAU/USD stays vulnerable to testing $1,915 support amid firmer US Treasury bond yields
  • Gold Price remains on the back foot as United States Treasury bond yields underpin US Dollar strength despite mixed data.
  • Market’s cautious mood ahead of US inflation data, China concerns weigh on XAU/USD price despite mixed Federal Reserve talks.
  • US, China trade numbers may offer intermediate directions to the Gold traders ahead of US CPI, PPI figures for July.

Gold Price (XAU/USD) stays depressed around $1,935 after beginning the trading week with mild losses. That said, the XAU/USD manages to keep the bears on board amid technical breakdown, as well as the firmer prints of the United States Treasury bond yields, despite a sluggish US Dollar ahead of this week’s inflation data from the US and China. Also an absence of major macros and the market’s inaction limits the yellow metal’s immediate moves ahead of top-tier data/events.

Gold Price edges lower despite sluggish US Dollar

Gold Price defends the previous week’s downside break of important supports (read Gold Price Technical Analysis) even if the traders remain inactive during early Monday amid a lack of major data/events, as well as the sluggish US Dollar.

That said, the US Dollar Index (DXY) stays defensive around 102.00 after beginning the week’s trading on a front foot while consolidating Friday’s Nonfarm Payrolls (NFP) inflicted losses.

That said, the US Dollar remained firmer on early Monday after the hawkish comments from Federal Reserve (Fed) Governor Michelle Bowman as he said that additional rate increases will likely be needed to lower inflation back to target. However, the greenback dropped afterward as New York Fed President John C. Williams said he expects that interest rates could begin to come down next year. The policymaker also conveyed hopes of witnessing a slightly higher unemployment rate as the economy cooled.

On a different page, hopes of more stimulus from China jostled with the fears of typhoon Doksuri to also weigh on the Gold Price, due to the dragon nation’s status as one of the major XAU/USD consumers. On Monday, China's Ministry of Water Resources cited a stronger response for flooding to Level III in Inner Mongolia, Jilin and Heilongjiang while highlighting the recently escalating fears from typhoon Doksuri. The Reuters news also mentioned that China has a four-tier emergency response system, with Level I being the most urgent.

Amid these plays, Wall Street ended Monday on the positive side while probing the US Treasury bond yields as they consolidated Friday’s heavy fall, which in turn put a floor under the US Dollar and weigh on the Gold Price. That said, the benchmark US 10-year Treasury bond yields rose to 4.10% by the press time.

Second-tier United States/China data to direct XAU/USD ahead of US inflation

While the firmer US Treasury bond yields defend the US Dollar and weigh on the Gold Price, the traders will seek more clues to defend the moves amid a likely sluggish session moving forward. As a result, today’s foreign trade numbers for China and the United States will be crucial to watch for the XAU/USD traders amid talks of easing economic recovery and challenges for the Federal Reserve (Fed) hawkish, which in turn put a floor under the Gold Price.

Also read: Gold Price Forecast: XAU/USD under pressure and aiming for $1,900

Gold Price Technical Analysis

Gold Price retreats from five-week-old rising support-turned-resistance, as well as the 200-Exponential Moving Average (EMA), around $1,950 by the press time.

Adding credence to the downside bias about the XAU/USD price could be the bearish signals from the Moving Average Convergence and Divergence (MACD) indicator, as well as a descending Relative Strength Index (RSI) line, placed at 14, not oversold.

With this, the Gold Price appears well set to revisit the previous weekly low of around $1,925 before declining toward a six-week-long horizontal support zone of around $1,915.

Following that, the monthly low marked in June near $1,893 will be crucial to watch for further directions.

On the contrary, a clear upside break of the aforementioned $1,950 resistance confluence isn’t an open invitation to the Gold buyers as a one-week-old falling resistance line near $1,955 will check the upside momentum. In that case, a horizontal area comprising multiple tops marked since May 19 near $1,985 will be in the spotlight as it holds the gate for the XAU/USD rally past the $2,000 threshold.

Gold Price: Four-hour chart

Trend: Further downside expected


22:12
AUD/USD edges higher towards 0.6600 ahead of China/US trade numbers amid mixed markets AUDUSD
  • AUD/USD remains defensive after bouncing off two-month low, following a three-day uptrend.
  • Mixed sentiment, light calendar allow Aussie pair to grind higher.
  • Risk catalysts remain mostly unimpressive, seek fresh clues to entertain momentum traders.
  • Inflation clues from US, Australia and China will be crucial this week.

AUD/USD stays defensive near 0.6575 after posting a gradual three-day rebound from the lowest level since early June. That said, the Aussie pair witnessed a sluggish start to the key week amid an absence of major data/events, as well as mixed concerns about the US Federal Reserve’s (Fed) next move. Furthermore, concerns about China also troubled the Aussie pair traders.

On Monday, the US Dollar initially remained firmer after the hawkish comments from Federal Reserve (Fed) Governor Michelle Bowman as he said that additional rate increases will likely be needed to lower inflation back to target. However, the greenback dropped afterward as New York Fed President John C. Williams said he expects that interest rates could begin to come down next year. The policymaker also conveyed hopes of witnessing a slightly higher unemployment rate as the economy cooled.

Elsewhere, China's Ministry of Water Resources cited a stronger response for flooding to Level III in Inner Mongolia, Jilin and Heilongjiang while highlighting the recently escalating fears from typhoon Doksuri. The Reuters news also mentioned that China has a four-tier emergency response system, with Level I being the most urgent.

It should be noted that Friday’s downbeat US employment report and chatters that the major central banks are near to the policy pivot allowed market players to take a breather after witnessing the final week of July with a risk-off mood. With this, the sentiment improved and allowed Wall Street to remain firmer while probing the US Treasury bond yields as they consolidated Friday’s heavy fall, which in turn put a floor under the US Dollar.

Moving on, Australia’s Westpac Consumer Confidence and National Australia Bank’s (NAB) Sentiment data for August and July will precede China’s foreign trade data for July will be important to watch for clear directions. Following that, the US Trade Balance for June and the risk catalysts will be eyed. Above all, Wednesday’s China Consumer Price Index (CPI) and Thursday’s Australia Consumer Inflation Expectations, as well as the US CPI, are the key for the AUD/USD pair to watch for a clear guide.

Technical analysis

AUD/USD recovery remains elusive below the bout bottoms marked in late June and early July, around 0.6600 by the press time.


21:54
WTI slumps on soft demand from US and China as traders brace for US CPI
  • End of summer vacations in the US leads to lower demand. China’s gradual recovery after lifting stringent Covid-19 measures further diminishes demand.
  • Saudi Arabia and Russia extending their crude oil production cushioned WTI’s price drop.
  • WTI Technical: A ‘spinning-top’ candlestick from Monday implies bullish momentum might wane.

Western Texas Intermediate (WTI), the US crude oil benchmark, fell 0.16% on Monday due to traders bracing for weaker demand from the United States (US) and China. Hence, WTI is trading at $82.45, below its opening price, after hitting a daily high of $83.26.

Seasonal demand dip and China’s sluggish recovery pressure oil, though Saudi Arabia’s production cut offers some support

Market sentiment remains upbeat as Wall Street closed with gains. The end of summer vacations in the US is one of the drivers that weakened oil prices as a result of lower demand due to seasonal factors. In the meantime, China’s struggles to recover after lifting Covid-19 zero-tolerance restrictions supported oil’s rally, but its recovery slowed as the year progressed.

Meanwhile, after detecting a leak in central Poland, a pipeline that delivers oil from Poland to Europe would resume oil flows on Tuesday, easing worries about supply constraints.

Although those reasons would weigh WTI’s price, Saudi Arabia’s extension of its 1 million crude oil production cut to September cushioned the oil price fall. That, alongside Russia’s commitment to cut its exports by 300K barrels per day (bpd).

WTI traders focus the rest of the week on the US Consumer Price Index (CPI) report for July. A rise in prices in the United States (US), could trigger a hawkish reaction by the US Federal Reserve (Fed), which could remain increasing rates, augmenting demand for the greenback. Consequently, a strong US Dollar would weigh on US Dolllar-denominated assets, like WTI.

WTI Price Analysis: Technical outlook

From a daily chart perspective, WTI is in an uptrend though it remains shy of breaking above the $84.00 per barrel figure, which could exacerbate a test of the November 11, 2022, daily high of $90.08. Nevertheless, Monday’s reversal day printed a ‘spinning-top’ candlestick, suggesting that buyers are losing momentum, ahead of breaking above the year-to-date (YTD) high of $83.49. That said, if WTI breaks above the latter, that would expose $84.00, followed by the psychological $84.50 area, before testing $85.00. Conversely, if WTI drops below Monday’s low of $81.57, that could trigger a correction towards the $80.00 per barrel, followed by the 20-day EMA.

WTI Daily chart


21:49
USD/CAD closes flat around the 1.3370 area on Monday USDCAD
  • The USD/CAD closed neutral, just above its opening price at 1.3370 after hitting a daily high of 1.3399.
  • The USD regained ground while markets continued to assess labour market data from last Friday.
  • Investors eagerly await US Thursday's inflation figures for guidance.

The USD/CAD closed flat at the 1.3370 zone after getting rejected at the 100-day Simple Moving Average (SMA) of 1.3395 at the end of Monday’s session. On the one hand, the US Dollar strengthened on the back of rising US yields while lower Oil prices limited the CAD’s advance.

At the start of the week, no relevant data was released, and markets continued to assess Friday’s Nonfarm Payrolls (NFPs) from the US in July. The data showed that job creation slowed and wages increased, but markets dumped the USD on the lower-than-expected NFPs. During the session, the Greenback re-gained ground against its rivals as the US Treasury yields recovered, with the 10-year rate jumping more than 1% to 4.09% after significantly declining on Friday and pushing the pair upwards.

All eyes are now on Consumer Price Index (CPI) figures from July, where markets foresee the headline figure accelerating but the core measure decelerating.

On the CAD’s front, the Canadian calendar had nothing relevant to offer. The decrease of the West Texas Intermediate (WTI) and Brent barrels added pressure over the Loonie through the session.


USD/CAD levels to watch

Observing the daily chart, it is apparent that USD/CAD is experiencing a neutral to bearish trend as the bulls struggle to maintain their momentum. The Relative Strength Index (RSI) has a negative slope above its midline, while the Moving Average Convergence (MACD) prints lower green bars. Moreover, the pair is above the 20-day Simple Moving Average (SMA) but below the 100 and 200-day SMAs, indicating that despite still being some light for the bulls, the bears have the upper hand in the broader context.

Support levels: 1.3330, 1.3315, 1.3300.

Resistance levels: 1.3395 (100-day SMA), 1.3440, 1.3450 (200-day SMA).


USD/CAD Daily chart


21:21
Forex Today: A slow start to the week for currencies

During the Asian session, Australia is set to release important data, including the Westpac Consumer Sentiment and NAB Business Confidence surveys. Additionally, China will release trade data later in the session. 

Here is what you need to know on Tuesday, August 8:

Wall Street began the week on a positive note, with the Dow Jones gaining 1.15% and the Nasdaq rising by 0.61%. The risk-on sentiment weighed on the US Dollar, which experienced a decline during the American session. The US Dollar Index finished the day flat, hovering around the 102.00 level. The US 10-year Treasury yield rose to 4.1% and the 2-year yield declined to 4.76%.

Tuesday will be quiet in terms of economic data. During the Asian session, Australia will release consumer confidence data, and China will report trade numbers. It is expected that exports will contract by 12.5% and imports by 5% compared to the previous year. Later in the day, the final German Consumer Price Index will be released. The US and Canada will also release trade data. Market participants are primarily focused on the upcoming US inflation data scheduled for release on Thursday and Friday.

The EUR/USD finished around 1.1000 after recovering from losses and is currently holding onto the gains made after the Non-Farm Payrolls (NFP) report. The pair is moving between the 20-day and 100-day Simple Moving Averages (SMA). Germany reported a 1.5% contraction in Industrial Production for June.

Dr. Jörg Krämer, Chief Economist at Commerzbank Research: 

The unexpectedly sharp drop in German industrial production in June (-1.5%) provides a foretaste of the poor production figures that are on the horizon for the coming months. This is because the trend in new orders has been pointing downwards for a long time. Moreover, according to surveys, companies have already worked off the orders left over during Corona. The German economy is likely to contract again in the second half of the year.

GBP/USD extended its recovery but lost momentum below 1.2800. The UK is scheduled to release growth data on Friday. Meanwhile, EUR/GBP dropped to 0.8600, reaching the 20-day SMA.

USD/JPY rose on Monday, supported by higher government bond yields and improved risk appetite, climbing to 142.50. The bias remains to the upside, but there is a lack of strong conviction.

AUD/USD continues to consolidate around 0.6570, with the primary bias being to the downside. A break above 0.6600 could potentially strengthen the Australian Dollar. NZD/USD is trading sideways near 0.6100, holding onto its losses from last week. Antipodean currencies are still impacted by the decline in commodity prices.

Gold failed to hold above $1,940 and remains vulnerable, with the potential to reach monthly lows. Silver tumbled 2% and closed at $23.10, marking its lowest level in almost a month.

USD/CAD is indeed moving sideways, facing resistance at the 100-day SMA and the 1.3400 area. The pair closed again near 1.3360, and technical indicators suggest a weakening upside momentum.

Cryptocurrencies , including Bitcoin trading near $29,200 and Ethereum around $1,825, have been mostly trading sideways. Crude oil prices experienced a slight decline, with WTI managing to recover from losses and closing above $82.00.


Like this article? Help us with some feedback by answering this survey:

Rate this content
19:23
EUR/USD Price Analysis: Struggles at 1.1020, regardless of a morning-star emerging EURUSD
  • EUR/USD remains below the key 1.1000/1.1018 resistance area, hindered by the 20-day EMA and a one-month-old resistance trendline.
  • The currency pair is trading at 1.1007, showing a slight decrease of 0.01% ahead of the Wall Street closing bell.
  • Despite the emergence of a ‘morning-star’ three-candlestick chart pattern suggesting upward momentum, Monday’s doji formation signals hesitancy among buyers.
  • Key resistance lies at 1.1020, with potential for movement towards 1.1055 and 1.1095, while support can be found at 1.0947 and 1.0933.

The EUR/USD erases some of its earlier losses but remains capped by the 20-day Exponential Moving Average (EMA) intersection with a resistance trendline at around the 1.1000/1.1018 area. The EUR/USD exchanges hands at 1.1007, down 0.01% ahead of the Wall Street close.

EUR/USD Price Analysis: Technical outlook

From a daily chart perspective, the EUR/USD should be headed upward as a ‘morning-star’ three-candlestick chart pattern emerges. But Monday’s price action forming a doji indicates buyers are struggling to gather momentum, which could lose control to sellers if the EUR/USD falls below 1.1000.

From a short-term standpoint, the EUR/USD is tilted upward, but a one-month-old resistance trendline would be difficult to surpass as the pair edges higher. A breach of 1.1020 will put into play the R1 daily pivot at 1.1055, followed by the April 26 high at 1.1095 ahead of 1.1100.

On the other hand, if EUR/USD tumbles below 1.1000, the following support would be the S1 pivot point at 1.0947, followed by last Friday’s low of 1.0933. Failure to crack the latter could spark an upward correction, as the EUR/USD could fail to achieve a new lower low. A continuation could pave the way to challenge 1.0900.

EUR/USD Price Action - Hourly chart

EUR/USD Hourly chart


19:19
US: Consumer Credit rose by $17.85 billion in June, surpassing expectations

“Consumer credit increased at a seasonally adjusted annual rate of 4 percent during the second quarter. Revolving credit increased at an annual rate of 7.1 percent, while nonrevolving credit increased at an annual rate of 3 percent. In June, consumer credit increased at an annual rate of 4.3 percent”,the Federal Reserve informed on Monday.

Total consumer credit rose by $17.85 billion from $4,979.2 billion to $4,997.1 billion in June, surpassing market expectations of a $13 billion increase.


19:13
Gold Price Forecast: XAU/USD clears daily gains as USD bulls fight back
  • XAU/USD peaked at a daily high of $1,945 and then settled at $1,935.
  • The USD recovered ground thanks to rising US Treasury yields.
  • Investors continue to discount higher odds of the Fed not hiking for the rest of 2023.

At the start of the week, Gold prices slightly decreased as the recovery of the USD limits the upside potential. Markets are cautious ahead of critical inflation data on Thursday and continue to digest Nonfarm Payrolls (NFP) figures from Friday.

 After NFPs revealed that job creation cooled down in July in the US, the USD faced severe selling pressure, and the DXY fell below 102.00. On Monday, the index recovered towards 102.10, as the Greenback traded strong against most of its rivals. Attention now turns to Thursday, when the US will report July’s inflation figures, where the Headline Consumer Price Index (CPI) index is expected to accelerate to 3.3% YoY and the Core CPI is seen falling to 4.7% in the same month. 

As for now, the CME FedWatch tool suggests that investors discount higher odds of the Federal Reserve (Fed) not hiking in the rest of 2023. Still, inflation data this week will likely impact those bets.

Meanwhile, the US bond yields, which could be seen as the opportunity cost of holding the non-yielding yellow metal, are edging higher. The 10-year bond yield led the way and increased more than 1% in the session to the 4.08% level.


 XAU/USD Levels to watch

The technical analysis of the daily chart points to a neutral to a bearish outlook for XAU/USD, indicating the potential for further bearish movement. The Relative Strength Index (RSI) exhibits a negative slope below the 50 threshold, while the Moving Average Convergence (MACD) histogram lays out rising red bars. Plus, the metal is below the 20 and 100-day Simple Moving Averages (SMAs) but above the 200-day SMA, indicating that the bulls aren't done yet and that the outlook is still positive for the short term.

Support levels: $1,930,$1,915, $1,900. 

Resistance levels: $1,955 (20-day SMA), $1,970 (100-day SMA), $1,990.


XAU/USD Daily chart


19:01
United States Consumer Credit Change came in at $17.85B, above expectations ($13B) in June
18:41
GBP/USD gathers momentum on mixed US labor market data, BoE last week hike GBPUSD
  • The US economy added just 187K jobs, below estimates, but an increase in wages could reignite inflation fears.
  • US Fed policymakers began to turn cautious as most officials eye the end of the tightening cycle.
  • Upcoming US CPI is expected to edge to 3%, while Core CPI is estimated to decelerate to 4.7% YoY.
  • BoE’s Pill: Inflation could fall below 5% by the end of 2023.

The Pound Sterling (GBP) registered modest gains on Monday, following a mixed US jobs report, while the Bank of England (BoE) decided to hike rates to a 15-year high. The GBP/USD is trading at 1.2769 after hitting a daily low of 1.2712.

Pound Sterling benefits from BoE's aggressive stance while the US Fed remains data-dependent after a mixed jobs report

Last week, the US Bureau of Labor Statistics (BLS) revealed the US economy added just 187K jobs to the economy missing estimates of 200K, portraying slight softness in the labor market, a sign sought by the US Federal Reserve (Fed) as it scrambles to get inflation towards its 2% target. Although the headline report was positive, salaries remain high, as Average Hourly Earnings (AHE) remained unchanged at 4.4% YoY, above estimates of 4.2%.

That could keep the Federal Reserve (Fed) eyeing additional rate hikes, but the release of inflation figures on August 10 could shed some light regarding the US prices’ status. The Consumer Price Index (CPI) is expected to slow to 3% YoY, while core CPI, which excludes food and energy, is estimated to slow down from 4.8% to 4.7% YoY.

In the meantime, Fed officials’ posture began to diverge. On the hawkish front, Fed Governor Michelle Bowman says the US central bank needs to lift rates to curb high inflation. Contrarily, New York Fed President John Williams stated that rate cuts could begin early in 2024, though he stated that monetary policy would be data-dependent.

Even though the US Dollar Index (DXY) is registering gains of 0.05% 102.063, the GBP/USD remains bolstered by the last week’s rate hike by the BoE to 5.25%.

Alight economic docket on the UK front left traders adrift to BoE’s Chief Economist Huw Pill’s words, saying that food price inflation must fall to around 10% to drive inflation towards the BoE’s 2% inflation target. He expects inflation to fall below 5% by the year’s end.

In remarks on Friday, Huw Pill said that successive interest-rate hikes are cooling the labor market and easing inflationary pressures. He further added that higher unemployment and lower vacancies would eventually lead to lower wage growth.

GBP/USD Price Analysis: Technical outlook

GBP/USD Hourly chart

The GBP/USD daily chart remains neutral to upward biased, though Monday’s price action was capped by the last Friday’s high of 1.2792, slightly below the 20-day Exponential Moving Average (EMA) at 1.2814. Another key resistance area for the GBP/USD is a downslope resistance trendline at around 1.2870/80. Conversely, support is expected at the 50-day EMA at 1.2743 before falling to 1.2700.

From an intraday perspective, the GBP/USD remains neutral biased, capped by the 1.2800 figure. A decisive break could open the door for further upside, with the R2 daily pivot emerging at 1.2845, followed by a resistance trendline around 1.2870/80. Conversely, the GBP/USD first support emerged at the daily pivot at 1.2738, followed by the day’s lows at 1.2712. Next, support is found at 1.2700.


18:11
EUR/JPY Price Analysis: Bulls comfortably consolidate above the 20-day SMA despite weak European data EURJPY
  • The EUR/JPY rises for a second consecutive day, standing above the 156.50 zone.
  • The EUR reported weak Industrial data, which led to a decrease in German bond yields.
  • BoJ’s summary of opinions of July’s meeting hinted at a possible YCC liftoff.

At the start of the week, the Euro weakened against most of its rivals on the back of weak industrial data but held gains against the JPY. On the other hand, the Yen trades mixed following the release of the Bank of Japan (BoJ) summary of opinions from the July meeting.

Europe reported mixed data. August’s Sentix Investor Confidence from the Eurozone came in at -18.9, better than the -23.4 expected, while the German Industrial Production (IP) dropped by 1.5% in June, higher than the 0.4% decline expected. As a response, the German yields have weakened across the curve, clearing daily increases. The 10-year bond yield fell to 2.56% after hitting a high of 2.64%, while the 2-year yield sits at 3.12% and the 5-year yielding 2.59% after peaking at 2.65% earlier in the session.

Concerning the next European Central Bank meetings, tightening expectations remain low. According to World Interest Rate Possibilities (WIRP) tool, the markets are currently pricing in a 40% chance of a 25 bps hike in the September meeting, and 60% odds of a 25 bps hike in the October meeting, and a 70% probability of a hike in the December meeting.

On the Japanese side, the Bank of Japan’s (BoJ) summary of opinions revealed that several members favoured tweaking the Yield Control Curve (YCC), with members suggesting directly lifting the YCC to encourage bond investments. In that sense, these signals indicate that the BoJ may be on its way to dropping the YCC policy and eventually starting it's tightening cycle, but the process won’t be quick. In the meantime, the JPY may see further downside on the back of monetary policy divergences against its rivals.


EUR/JPY Levels to watch

Analysing the daily chart, a neutral to bullish technical outlook is evident for EUR/JPY, suggesting that the bulls are gaining momentum but still do not have the upperhand in the short term. The Relative Strength Index (RSI) has a positive slope above its midline, while the Moving Average Convergence (MACD) displays decreasing red bars. Also, the pair is above the 20,100,200-day SMAs, implying that the bulls retain control on a broader scale.

Support levels: 155.80 (20-day SMA), 155.00, 154.00.

Resistance levels: 157.00, 157.50, 158.00.


EUR/JPY Daily chart


17:39
BoE’s Pill: Latest data points to more persistent inflation

Bank of England (BoE) Chief Economist Huw Pill said on Monday that there are risks on both sides of UK inflation. According to him, inflation is likely to return to the target during the first half of 2025. He expects inflation to fall to 5% by the end of the current year.

Pill sees real wage growth during the second half of 2023. He mentioned that the latest data points to more persistent inflation, particularly due to food inflation that is longer-lasting than past spikes.

Market reaction:

GBP/USD is rising modestly on Monday, hovering around 1.2775, as it has been the case over the last hours. Pill's comments had no significant impact.

17:08
Silver Price Analysis: XAG/USD plunged below the 100-day SMA as the USD recovers
  • XAG/USD dropped to its lowest level since mid-July, near the $23.10 area, below the 100-day SMA.
  • The USD gained traction on the back of rising US yields following Friday’s losses.
  • All eyes are now on Thursday’s CPI data from July from the US.

On Monday, the XAG/USD Silver spot price tumbled near the 100-day Simple Moving Average near the $23.20 area seeing more than 1.80% losses. Rising US yields and a stronger USD following Friday’s sell-off are mainly responsibles for the metal’s decline.

As the focus turns to the next set of inflation data from the US, markets continue to digest Friday's Nonfarm Payrolls (NFP) report. Job creation cooled down, and wages increased, but the investors dumping the US Dollar during Friday’s session indicated that investors weighted more the decrease in the number of people employed. Still, the Federal Reserve (Fed) will consider rising wage inflation in their next meetings. For the rest of the week, the highlight is the release of inflation data on Thursday, with the Headline Consumer Price Index (CPI) index expected to accelerate to 3.3% YoY and the Core CPI, which is seen falling to 4.7% in the same month.

In response, the US bond yields are edging lower. The 10-year bond yield stands at 4.08%, up by 1.04 % on the day. The 2-year yield stands neutral at 4.77%, and the 5-year yield is at 4.16% with 0.61 % gains.

Regarding the following Fed decisions, according to the CME FedWatch tool, markets discount higher odds of a pause in September with low odds of 20% of a 25 basis point (bps). Those probabilities rise to 30% in November, where the stronger case is also no-hike by the Fed.


XAG/USD levels to watch

Based on the daily chart, the XAG/USD exhibits a bearish outlook for the short term. Both Relative Strength Index (RSI) and Moving Average Convergence Divergence (MACD) remain in negative territory, with the RSI below its midline and showing a southward slope. The MACD is also displaying red bars, indicating a strengthening bearish momentum. Plus, the pair is below the 20,100 and 200-day Simple Moving Averages (SMAs), pointing towards the prevailing strength of the bears in the larger context and the buyers facing a challenging situation.

Support levels: $23.00, $22.90, $22.70.

Resistance levels: $23.20 (200-day SMA), $23.50, $23.70.


XAG/USD Daily chart


17:05
USD/JPY climbs on strong USD after last week’s US Nonfarm Payrolls data USDJPY
  • The US jobs market begins to cool down, but Average Hourly Earnings flash inflation risks tilted upside.
  • BoJ retains a dovish yield curve policy, with the majority advocating for the preservation of the existing monetary policy.
  • US CPI data eyes on August 10, estimates lie at 3% YoY, while the core is expected to drop to 4.7% YoY.

USD/JPY advanced sharply during Monday’s North American session as the greenback strengthened amid a risk-on impulse following last week’s mixed US jobs data. Hawkish comments over the weekend by a Fed official sponsored the greenback advance. The USD/JPY is trading at 142.47, above its opening price by 0.55%.

Hawkish remarks from Fed official Michelle Bowman fuel USD strength, while the Bank of Japan maintains a dovish stance

Wall Street is trading with solid gains, portraying an upbeat mood, while US Treasury bond yields advance. Market participants’ reaction to last Friday’s US Nonfarm Payrolls reports missing estimates of 200K, coming at 187K, triggered a sell-off of the greenback, which has trimmed some of its losses, registering modest gains of 0.13%, as shown by the US Dollar Index (DXY).

Although the US jobs market showed signs of easing, inflationary pressures are still present, with Average Hourly Earnings remaining at 4.4% YoY, exceeding the consensus of 4.2%. That could spark another rise in inflation in the United States (US), which is expected to deliver its July report on August 10.

Estimates for the Consumer Price Index (CPI) in the United States (US) depict inflation falling to 3% from 3.3% in June, while Core CPI, which strips out volatile items, is estimated to decelerate to 4.7% YoY, from 4.8% in June.

The USD/JPY advancement was sponsored by hawkish comments by Michelle Bowman, who said the Fed would likely need to lift rates further to bring down inflation. On the dovish side of the spectrum, the New York Fed President John Williams noted that rate cuts could begin in early 2024,  depending on economic data and if the inflation trend continued to edge lower.

Also, US Treasury bond yields, particularly the 10-year benchmark note, rise five basis points (bps) to 4.090%, a tailwind for the USD/JPY. Meanwhile, the DXY, a measure of the US Dollar’s value against six currencies, gains 0.12% and exchanges hands at 102.130.

The Bank of Japan (BoJ) Summary of Opinions confirms a dovish yield curve tweak, suggesting that further Japanese Yen (JPY) is expected in the near term. Most officials stressed the need to maintain the current monetary policy in place. At the same time, one member suggested that inflation would remain at 2% “in a sustainable and stable manner seems to have clearly come in sight.”

USD/JPY Technical Levels


16:12
NZD/USD trades flat below 0.6100 at the start of the week NZDUSD
  • NZD/USD trades with mild gains, just above its opening price of around 0.6095.
  • The USD recovered following the sell-off seen on Friday post NFPs.
  • Eyes on Chinese data on Tuesday.

The NZD/USD traded neutral on Monday, below the 0.6100 level. On the one hand, the USD recovered from rising yields after Friday’s losses, while the NZD trades strong ahead of key Trade Balance data from China on Tuesday.

Markets continue to asses jobs reports from the US released on Friday. Nonfarm Payrolls (NFP) cooled down, leading to a USD sell-off and a decline in US bond yields. It is intriguing why markets disregarded the rise in Average Hourly Earnings so quickly, which may contribute to inflationary pressures. The week’s highlight is the release of inflation data from the US on Thursday, with the headline figure expected to increase to 3.3% (YoY) from the previous 3% in June while the Core measure to decrease to 4.7% YoY from 4.8%.

As a reaction, the US bond yields are showing a mixed performance. The 10-year bond yield trades at 4.09%, seeing 0.79 % gains on the day, while the 2-year yield stands with mild payments at 4.77% and the 5-year yields at 4.17%, seeing a 0.70 % increase, respectively.

As for now, according to the CME FedWatch tool, the odds of a 25 basis point hike remain low for the following September meeting they top out near 30% for the November decision.

On the Kiwi’s side, New Zealand’s economic calendar won’t reveal any high-tier data this week. The highlight will be Chinese data to be reported on the early Asian session on Tuesday, which will impact the Asian block currency depending on its outcome.


NZD/USD levels to watch

Upon analysing the daily chart, a neutral to bearish trend becomes evident for NZD/USD, with the bears gradually taking control. The Relative Strength Index (RSI) turned flat in negative territory, while the Moving Average Convergence (MACD) shows red bars. Additionally, the pair is below the 20,100 and 200-day Simple Moving Averages (SMAs), pointing towards the prevailing strength of the bears in the larger context and the buyers facing a challenging situation.

Support levels: 0.6080, 0.6060, 0.6050.

Resistance levels: 0.6100, 0.6130, 0.6150.


NZD/USD Daily chart


15:31
USD/MXN edges high following last week’s mixed US NFP, traders eye US CPI
  • July’s Nonfarm Payrolls came in at 187K, below the expected 200K. However, Average Hourly Earnings increased to 4.4% YoY, hinting at possible wage pressure.
  • Michelle Bowman hints at further rate hikes to control inflation. Conversely, New York Fed President John Williams suggests rate cuts could begin in early 2024.
  • Commerzbank estimates the USD/MXN would hit 17.60 on June 2024 and the 18.00 mark by the December of the same year.

USD/MXN recovers some ground on Monday, still trading off the day’s highs of 17.1505, and holds above its opening price by 0.03%. At the time of writing, the USD/MXN exchanges hands at 17.0649 after hitting a daily low of 17.0220.

USD/MXN benefits from the hawkish comments of Fed’s Bowman and also from the rise of UST bond yields

US equities are trading in the green following a mixed US jobs report last Friday. Even though July’s Nonfarm Payrolls coming below estimates of 200K at 187K shows the labor market is cooling, Average Hourly Earnings (AHE) ticking from 4.2% to 4.4% YoY, shows that wage pressure could reignite a rise in inflation, which, would be revealed by the US Department of Labor on August 10.

Estimates for the Consumer Price Index (CPI) in the United States (US) depict inflation falling to 3% from 3.3% in June, while Core CPI, which strips out volatile items, is estimated to decelerate to 4.7% YoY, from 4.8% in June.

The USD/MXN uptick on Monday is courtesy of hawkish comments by Michelle Bowman, who said the Fed would likely need to lift rates further to bring down inflation. On the dovish side of the spectrum, the New York Fed President John Williams noted that rate cuts could begin in early 2024,  depending on economic data and if the inflation trend continued to edge lower.

The US Dollar Index (DXY), a gauge of the buck’s value vs. a basket of six peers, clings to gains of 0.09% at 102.100, a tailwind for the USD/MXN. One of the reasons behind the US Dollar (USD) strength is that US Treasury bond yields are recovering some ground, with the US 10-year benchmark note rate at 4.082%, up two bps.

On the Mexican front,  the economic docket reported Consumer Confidence for July at 46.2, exceeding forecasts of 44.9 and above June’s upward-revised figure of 45.3. Ahead of the week, Mexico’s CPI will be revealed on August 9. Forecasts for CPI stand at 4.78% YoY, while for month-over-month, is expected at 0.48%. Softness on inflation data would prevent the Bank of Mexico (Banxico) from tightening conditions after three successive meetings to keep rates unchanged.

Commerzbank analysts reviewed its forecasts for the USD/MXN towards the end of the year, estimating the USD/MXN would be around 17.2000. They added, “The weakening US economy and political risks are likely to weigh on the peso.” They estimate the USD/MXN would hit 17.6000 ahead of the Mexican US general elections and at 18.0000 toward the end of 2024.

USD/MXN Price Analysis: Technical outlook

USD/MXN Daily chart

The USD/MXN remains downward biased, but a ‘double-bottom’ chart pattern formed around the year’s lows could open the door for further upside. Resistance levels emerge at a four-month-old resistance trendline passing around 17.40, followed on the upside by the 100-day Exponential Moving Average (EMA) at 17.5093. If USD/MXN buyers clear those two resistance levels, the pair could challenge the psychological 18.00 price level, followed by the 200-day EMAat 18.1306. On the downside, the USD/MXN falling below 17.0000 could put into play a re-test of the year-to-date (YTD) low of 16.6238.


14:58
A rising USD/CNH translates into more pressure on JPY, AUD and NZD – SocGen

USD/CNH tracks yield differentials almost as well as USD/JPY. Kit Juckes, Chief Global FX Strategist at Société Générale, analyzes FX markets – that are still watching central banks.

NOK/SEK has upside ahead of next week’s Norges meeting

Relative ECB and Fed rate paths suggest the euro remains vulnerable unless stronger European data emerges soon. EUR/GBP meanwhile, is tracking rate expectations very closely, but since we’ll get two more months’ worth of CPI data before the Sep 21 MPC meeting, a big lurch in expectations is unlikely, one way or the other.  

USD/CNH tracks 10-year yields nearly as well as USD/JPY. The Chinese authorities may not want a weaker currency from here, but it’s hard to see this trend turning downwards until US yields peak. A rising USD/CNH translates into more pressure on JPY, AUD and NZD. 

Finally, NOK/SEK is also tracking rate expectations closely. The Norges Bank is likely to raise rates by another 25 bps at next week’s meeting and that should be enough to keep the NOK bid.


14:49
USD/JPY to move downward on higher 10-year JGB yields – CIBC USDJPY

Japanese flows outward should ebb over time. Thus, economists at CIBC Capital Markets expect the USD/JPY pair to edge lower.

10-year JGB yields should drift towards 100 bps

Over time, 10-year JGB yields should drift towards 100 bps – which is where they were in the years leading up to Abenomics. This is incredibly important given that Japanese investors have been large net creditors to the rest of the world precisely because domestic yields were low. 

A rise higher in 10-year JGB yields suggests that less capital will be exported outside of the country and supports downside USD/JPY over the projection horizon.

USD/JPY – Q3 2023: 141 | Q4 2023: 135 


14:33
USD/CHF seen edging back down to 0.86 on a one-month view – Rabobank USDCHF

Economists at Rabobank expect the USD to remain well supported against the Euro. However, the USD/CHF pair is seen lower at 0.86 on a one-month view.

ECB policy rates may have peaked

We see scope for the USD to remain well supported vs. the EUR on the back of fears that short term rates in the US are likely to be higher for longer. We also see risk that the Greenback could see some support from safe-haven flows. We also judge the market to be positioned too long for the EUR given the risk that ECB policy rates may have peaked. 

That said, given the injection of uncertainty over the US fiscal position we have revised up our forecast for the safe haven Franc and see scope for USD/CHF to edge back down to 0.86 on a one-month view.


14:32
Turkey Treasury Cash Balance up to 19.296B in July from previous -206.33B
14:12
AUD/USD: Decline could extend on a break below 0.6460/0.6410 – SocGen AUDUSD

Economists at Société Générale analyze AUD/USD technical outlook.

Break above recent peak of 0.6900 essential to affirm a meaningful uptrend

AUD/USD failed to overcome the confluence of resistances near 0.6900 representing the peak of June and a multi-month descending trend line resulting in a swift decline. It is gradually drifting towards potential support from low of May near 0.6460/0.6410. 

The 200-DMA has turned flat denoting lack of clear direction. A bounce is expected however a break above recent peak of 0.6900 would be essential to affirm a meaningful uptrend.  

In case the pair establishes below 0.6460/0.6410, the decline could extend. Next objectives would be at 0.6350 and projections of 0.6200. 


13:49
EUR/USD Price Analysis: Next target emerges at 1.1150 EURUSD
  • EUR/USD bounces off earlier lows near 1.0960.
  • Further recovery continues to target 1.1150.

EUR/USD trims earlier losses and now flirts once again with the key 1.1000 region on Monday.

Further gains in the pair should meet the next hurdle at the weekly peak of 1.1149 (July 27). If the pair breaks above this region, the selling pressure is expected to alleviate and open the door to a probable move to the 2023 top at 1.1275 (July 18).

Looking at the longer run, the positive view remains unchanged while above the 200-day SMA, today at 1.0748.

EUR/USD daily chart


13:43
Tactical USD upside for now – CIBC

Economists at CIBC Capital Markets explain why near-term USD rallies should be faded over the long-term.

The degree of dissonance between the Fed and the market remains stark

Greater dissonance between the Federal Reserve and the market alongside liquidity risks portend near-term USD strength. 

USD sellers should still look at rallies to get active over the medium-term.

DXY – Q3 2023: 103.23 | Q4 2023: 100.42

See: USD vulnerable on expectations that the Fed will not need to raise rates further this year – MUFG

13:24
USD/MXN to see an extended rebound towards 17.80 on a break past 17.40 – SocGen

Economists at Société Générale analyze USD/MXN technical outlook.

Move beyond 17.40 to open up 17.80

USD/MXN experienced a relentless downtrend after breaking below 2022 lows. It has recently approached interim support zone of 16.60/16.40 representing projections and more importantly the trend line drawn since 2008.  

The pair has witnessed an initial bounce and has revisited July high of 17.40. Daily MACD has been posting positive divergence denoting receding downward momentum. If it overcomes 17.40, an extended rebound is likely towards 17.80 and graphical levels of 18.00.


12:58
Fed's Bowman: Additional rate hikes will likely be needed to lower inflation to target

In remarks prepared for delivery to a "Fed Listens" event in Atlanta, Federal Reserve (Fed) Governor Michelle Bowman said that additional rate increases will likely be needed to lower inflation back to target, per Reuters.

Bowman explained that in making decisions, she will be looking for evidence suggesting that inflation is on a "consistent and meaningful" downward path. She further noted that inflation is still significantly above 2%, while the labor market conditions remain tight.

Market reaction

These comments failed to trigger a market reaction and the US Dollar Index was last seen posting small daily gains at 102.10.

12:57
USD/CAD: Room for a move lower in near-term but unlikely to last – MUFG USDCAD

The Canadian Dollar underperformed alongside the US Dollar in July. Economists at MUFG Bank analyze USD/CAD outlook.

USD/CAD should be trading closer to the 1.3000 level

Our short-term valuation model that incorporates the impact of moves in yield spreads, risk sentiment and energy prices are currently signalling that USD/CAD should be trading closer to the 1.3000 level.

The likelihood of a softer landing in the US has increased recently which poses downside risks for our USD/CAD forecasts in the year ahead.

We are assuming a high risk of recession/sharp slowdown for the US economy that helps lift USD/CAD. 

USD/CAD – Q3 2023 1.3100 Q4 2023 1.3200 Q1 2024 1.3300 Q2 2024 1.3400


12:54
EUR/GBP drops sharply despite BoE’s tight policy impacts labor market EURGBP
  • EUR/GBP extends correction as more rate hikes from the BoE look warranted.
  • The aggressive rate-tightening cycle by the UK central bank dampens the labor market.
  • Eurozone Sentix Investor Confidence surprisingly improves due to easing inflation and tight labor market.

The EUR/GBP pair weakens after the upside momentum fades. The cross declines towards the round-level support of 0.8600 as the Bank of England (BoE) leaves the door open for further policy-tightening ahead.

Last week, the BoE raises interest rates further by 25 basis points (bps) to 5.25%. The central bank elevates policy rates for the 14th time in a row amid the fight against the stubborn Consumer Price Index (CPI). Inflation in the United Kingdom economy softens to 7.9% from its peak but fears of persistence deepen as global oil prices recover.

Meanwhile, the aggressive rate-tightening cycle by the UK central bank dampens the labor market. UK firms slowed down permanent staff hiring last month by the most since mid-2020 due to rising concerns about the economic outlook, per a survey by the Recruitment & Employment Confederation (REC) and KPMG, Reuters reported.

REC Chief Executive Neil Carberry said the jobs market remained "fairly robust" despite the slowdown in permanent placements.

About the inflation outlook, BoE chief economist Huw Pill said on Friday that successive interest-rate hikes are cooling the labor market and easing inflationary pressures. He further added that higher unemployment and lower vacancies would eventually lead to lower wage growth.

On the Eurozone front, Sentix Investor Confidence for August surprisingly improves to 18.9 while investors were expecting deterioration to -23.4 from July’s reading of -22.5. The confidence of institutional investors in economic prospects improves due to easing inflationary pressures and a tight labor market. Also, interest rates by the European Central Bank (ECB) are expected to peak sooner.


12:48
USD Index Price Analysis: Immediate hurdle comes at 102.84
  • DXY regains upside traction following two daily pullbacks in a row.
  • There is an initial hurdle at the monthly high of 102.84.

DXY regains composure and reclaims the area beyond the key 102.00 hurdle at the beginning of the week.

The index manages to leave behind part of the selling pressure seen in the latter part of the week and retakes the 102.00 yardstick and beyond on Monday. The index needs to rapidly clear the so far monthly top of 102.84 (August 3) to allow for a potential move to the July top of 103.57 (July 3), which appears underpinned by the proximity of the key 200-day SMA.

Looking at the broader picture, while below the 200-day SMA (103.52) the outlook for the index is expected to remain negative.

DXY daily chart


12:46
Australian Dollar stalls in its brief fight back against USD
  • Australian Dollar stalls on the third day of its recovery rally versus the US Dollar.
  • Robust US wages keep the inflation flame alive, supporting rate hike probabilities in the US and hence the Buck.
  • The Australian Dollar is expected to lose a source of support as China slows down and diversifies its raw material sourcing away from Oz. 

The Australian Dollar (AUD) stalls in its progress higher against the US Dollar (USD) on Monday as USD recovers on slightly higher probabilities that the Federal Reserve (Fed) will hike interest rates in September. 

US labor market data for July was a mixed bag – granted the headline figure showed a slightly lower-than-expected increase in jobs, wages rose more than forecast, possibly prompting a latent upthrust in inflation expectations. 

The CME’s FedWatch tool, a trusted market-based gauge of future Fed rate decisions, puts the chances of the Fed raising interest rates in September at 15.5% on Monday, marginally higher than the 13% registered on Friday. 

Since higher interest rates are positive for sovereign currencies, because they attract more foreign capital inflows, the slightly higher probability of the Fed hiking in September is positive for USD (the opposite for AUD/USD). 

AUD/USD trades little changed in the 0.65s at the start of the US session.  

Australian Dollar news and market movers 

  • The Australian Dollar runs out of steam in its brief rally against the US Dollar as the latter retains strength at the start of the week on the basis of slightly higher chances of a rate hike at the next Fed meeting in September. 
  • July wage data from the US Nonfarm Payroll report was higher than forecast, coming out at 0.4% MoM and 4.4% YoY, beating estimates of 0.3% and 4.2% respectively. This may be having a delayed impact on the market response to the data and encouraging more elevated inflation expectations, which may be pushing up interest rate expectations. 
  • The Unemployment Rate in the US also fell to 3.5% from 3.6% when no-change had been forecast – another positive indicator. 
  • US Consumer Price Index (CPI) data on Thursday could further impact interest rate expectations and the USD. 
  • Australia’s largest export Iron Ore has recovered a little. Chinese Iron Ore (62%) Futures are up at $105 per tonne on Friday from $104 on Friday. 
  • China’s expressed policy of trying to diversify away from relying too heavily on Australian raw materials is a long-term negative for the Aussie, according to Clifford Bennet, Chief Economist at ACY Securities. 
  • Cracks are also appearing in China’s trade data suggesting the Chinese economy is experiencing a slowdown in demand, which could have negative repercussions for Australia, adds Bennet. 
  • Chinese Trade Balance data for July, out on Tuesday, could provide fresh information as to how China trade is bearing up. 
  • The Aussie economy will not be ‘saved’ as it has done in the past by Chinese super-growth according to ACY’s Bennet. 
  • Iron Ore, Australia’s chief export to China, is used to make steel for huge infrastructure and building projects, however, given the weaknesses noted in China’s property market demand from this important source may flounder, weakening AUD. 
  • There is still some debate about whether the Federal Reserve has finished putting up interest rates, nevertheless, Fed’s Williams, on Monday, said that the Fed may actually cut rates next year. 
  • Expectations are more certain that the Reserve Bank of Australia (RBA) will not put up interest rates. It has paused twice in a row and the Australian housing market is still reeling from the effects of rate hikes so far. A sizable proportion of homeowners are into negative equity due to the cooling housing market in Australia, according to ACY’s Bennet, suggesting the RBA is unlikely to raise rates higher. 
  • Australian Retail Sales have fallen as inflation and higher mortgage payments hit consumers' pockets, threatening a slowdown in Australia that will pressure the Aussie lower. The US in contrast is expected to enter a mini-boom on the back of the AI revolution, according to the ACY Economist. 
  • The Australian Dollar has been on a weak footing since the RBA left the policy rate unchanged at 4.1% last week, against the market expectation for a 25 basis point hike. In the policy statement, the RBA explained that the decision to hold rates unchanged would provide them more time to assess the impact of policy tightening to date and the economic outlook. 
  • That said, they did not completely rule out the possibility of more rate hikes in the future, "Some further tightening of monetary policy may be required to ensure that inflation returns to target in a reasonable timeframe, but that will depend upon the data and the evolving assessment of risks," the RBA noted.

Australian Dollar technical analysis 

AUD/USD is in a sideways trend on both the long and medium-term charts. The February high at 0.7158 is a key hurdle, which if vaulted, will give the longer-term charts a more bullish tone. 

The 0.6458 low established in June is a key level for bears. If this is breached decisively it would color the charts more bearish. Price is currently closer to this key low. 

Australian Dollar vs US Dollar: Weekly Chart

Price has now broken cleanly below the confluence of moving averages (MA) close to 0.6700, made up of most of the major SMAs – the 50-week, 50-day and 100-day. The breaching of this key support and resistance level is a bearish sign. 

Australian Dollar vs US Dollar: Daily Chart

AUD/USD has also broken below the 0.6600 June lows, and a continuation down to the key May lows at 0.6460, is quite possible. A decisive break below them would open the way for a move down to 0.6170 and the 2022 lows. 

The current recovery move from last Thursday’s lows looks more like a correction than a reversal and price could easily recapitulate and start going down again.  

Because the pair is in a sideways trend overall it is unpredictable and the probabilities do not favor either bears or bulls overall – nor is the Relative Strength Index (RSI) providing much insight on either timeframe. 

In technical terms, a ‘decisive break’ consists of a long daily candlestick, which pierces cleanly above or below the critical level in question and then closes near to the high or low of the day. It can also mean three up or down days in a row that break cleanly above or below the level, with the final day closing near its high or low and a decent distance away from the level. 


Australian Dollar FAQs

What key factors drive the Australian Dollar?

One of the most significant factors for the Australian Dollar (AUD) is the level of interest rates set by the Reserve Bank of Australia (RBA). Because Australia is a resource-rich country another key driver is the price of its biggest export, Iron Ore. The health of the Chinese economy, its largest trading partner, is a factor, as well as inflation in Australia, its growth rate and Trade Balance. Market sentiment – whether investors are taking on more risky assets (risk-on) or seeking safe-havens (risk-off) – is also a factor, with risk-on positive for AUD.

How do the decisions of the Reserve Bank of Australia impact the Australian Dollar?

The Reserve Bank of Australia (RBA) influences the Australian Dollar (AUD) by setting the level of interest rates that Australian banks can lend to each other. This influences the level of interest rates in the economy as a whole. The main goal of the RBA is to maintain a stable inflation rate of 2-3% by adjusting interest rates up or down. Relatively high interest rates compared to other major central banks support the AUD, and the opposite for relatively low. The RBA can also use quantitative easing and tightening to influence credit conditions, with the former AUD-negative and the latter AUD-positive.

How does the health of the Chinese Economy impact the Australian Dollar?

China is Australia’s largest trading partner so the health of the Chinese economy is a major influence on the value of the Australian Dollar (AUD). When the Chinese economy is doing well it purchases more raw materials, goods and services from Australia, lifting demand for the AUD, and pushing up its value. The opposite is the case when the Chinese economy is not growing as fast as expected. Positive or negative surprises in Chinese growth data, therefore, often have a direct impact on the Australian Dollar and its pairs.

How does the price of Iron Ore impact the Australian Dollar?

Iron Ore is Australia’s largest export, accounting for $118 billion a year according to data from 2021, with China as its primary destination. The price of Iron Ore, therefore, can be a driver of the Australian Dollar. Generally, if the price of Iron Ore rises, AUD also goes up, as aggregate demand for the currency increases. The opposite is the case if the price of Iron Ore falls. Higher Iron Ore prices also tend to result in a greater likelihood of a positive Trade Balance for Australia, which is also positive of the AUD.

How does the Trade Balance impact the Australian Dollar?

The Trade Balance, which is the difference between what a country earns from its exports versus what it pays for its imports, is another factor that can influence the value of the Australian Dollar. If Australia produces highly sought after exports, then its currency will gain in value purely from the surplus demand created from foreign buyers seeking to purchase its exports versus what it spends to purchase imports. Therefore, a positive net Trade Balance strengthens the AUD, with the opposite effect if the Trade Balance is negative.

12:30
Chile Trade Balance declined to $814M in July from previous $1574M
11:59
EUR/USD: Phase of decline to deepen on failure to defend 1.0900/1.0830 – SocGen EURUSD

Economists at Société Générale analyze EUR/USD technical outlook.

Defense of trend line support near 1.0900/1.0830 could trigger rebound

EUR/USD has embarked on a deeper pullback after facing resistance near 1.1270, the 61.8% retracement from 2021. The pair has retracted towards the trend line drawn since last year at 1.0900/1.0830. An initial bounce is taking out however the high of last week near 1.1045 must be overcome to affirm an extended rebound. 

In case the pair fails to defend 1.0900/1.0830, the phase of decline is expected to deepen. Next potential supports are at 200-DMA near 1.0725 and 1.0630.


11:46
USD/CAD Price Analysis: Refreshes two-month high around 1.3400 as Fed delivers hawkish guidance USDCAD
  • USD/CAD continues a four-day winning streak as investors hope that the Fed would raise interest rates further.
  • A weak Canadian labor market report could allow the BoC to consider a steady interest rate policy ahead.
  • USD/CAD refreshes a two-month high around 1.3400 and prints a fresh swing high.

The USD/CAD pair prints a fresh two-month high near the round-level resistance of 1.3400 in the European session. The Loonie asset extends its four-day winning streak as investors hope that the Federal Reserve (Fed) could continue hiking interest rates further.

Fed Governor Michelle Bowman said over the weekend that the US central bank will raise interest rates further to bring inflation down. This provides strength in the US Dollar Index (DXY) and pushes it above 102.00.

Meanwhile, the Canadian Dollar comes under pressure as the labor market witnessed a drop of 6.4K payrolls in July against expectations of 21.1K fresh additions. The Unemployment Rate jumped to 5.5% as expected from June’s reading of 5.4%. A weak Canadian labor market report could allow the Bank of Canada (BoC) to consider a steady interest rate policy ahead.

USD/CAD refreshes a two-month high around 1.3400 and prints a fresh swing high on a daily chart. The Loonie climbs above the 200-period Exponential Moving Average (EMA) at 1.3363, which indicates that the long-term trend turns bullish. Horizontal resistance is plotted from April 23 high around 1.3648.

The Relative Strength Index (RSI) (14) jumps into the bullish range of 60.00-80.00. An upside momentum triggers amid an absence of divergence and an oversold situation.

A decisive break above the intraday high at 1.3400 would drive the asset toward June 05 high at 1.3462 followed by the psychological resistance at 1.3500.

In an alternate scenario, a downside move below July 18 high at 1.3288 would drag the asset toward July 27 low around 1.3160 and July 14 low marginally below 1.3100.

USD/CAD daily chart


11:44
Limited room for the GBP to weaken much further from here – HSBC

The GBP weakened in the aftermath of a 25 bps hike by the Bank of England (BoE) on 3 August, with GBP/USD breaking below 1.27. Beyond the knee-jerk reaction, excessive downside in the GBP may be limited from here, in the view of economists at HSBC.

The BoE cut its growth forecasts but raised its medium-term inflation forecasts

In August, the BoE hiked its policy rate by 25 bps to 5.25%, the highest in 15 years. The nine-member MPC split three ways on the decision, while a tightening bias remains in place.

Despite the downward revision to its GDP growth forecasts for 2024 and 2025, the MPC lifted its medium-term inflation forecasts, relative to those it published in May. The committee also flagged how strong pay growth created an ongoing risk of persistent inflation.

All this suggests the BoE retains a modest tightening bias, especially compared to US Federal Reserve (Fed) and the European Central Bank (ECB) which both stressed more explicitly that further rate hikes will depend on data. These hawkish elements below the surface of this BoE decision may limit excessive downside in the GBP from here.

11:32
USD/IDR: Still scope for further improvement – UOB

USD/IDR is still seen advancing further in the near term, comments Markets Strategist Quek Ser Leang at UOB Group.

Key Quotes

Last week, we expected USD/IDR to trade with an upward bias towards 15,160. We indicated that “The next resistance at 15,219 is highly unlikely to come under threat.” In line with our expectations, USD/IDR rose but did not threaten the 15,219 (high was 15,208). After the advance, upward momentum has improved, albeit not much.

This week, USD/IDR could consolidate for a few days first before breaking above 15,219. The next major resistance at 15,270 is likely out of reach for now. Support is at 15,120, followed by 15,010. 

11:26
EUR/JPY Price Analysis: Bulls continue to target 158.00 EURJPY
  • EUR/JPY starts the week fairly bid above the 156.00 mark.
  • Next on the upside remains the 2023 top just past 158.00.

EUR/JPY extends Friday’s small gains and surpasses the key 156.00 hurdle at the beginning of the week.

So far, the continuation of the upside momentum appears likely with the initial target still at the 2023 high at 158.04 (July 21). The breakout of this level exposes a move to the round level of 160.00.

So far, the longer term positive outlook for the cross appears favoured while above the 200-day SMA, today at 146.73.

EUR/JPY daily chart


11:15
AUD/USD set to move higher in Q4 – CIBC AUDUSD

Economists at CIBC Capital Markets expect the AUD/USD pair to advance nicely in the long run.

Longer-term upside for AUD/USD 

We expect a rangebound AUD/USD through Q3, but then a move higher in Q4.

Over the longer term, the overvaluation of the USD should allow the high-beta AUD to appreciate to a stronger extent than lower-beta currencies. 

Chinese stimulus will eventually be a driver of a higher AUD/USD, although we do not expect a major policy response. 

Lastly, we expect incoming Governor Bullock to be a continuation of the policymaking done under Governor Lowe, thus the change in leadership should not affect AUD pricing.

AUD/USD – Q3 2023: 0.66 | Q4 2023: 0.68


10:57
USD/MYR: Further upside faces a solid hurdle around 4.5790 – UOB

Extra gains in USD/MYR are expected to meet decent resistance around the 4.5790 region for the time being, notes Markets Strategist Quek Ser Leang at UOB Group.

Key Quotes

After USD/MYR dropped to a low of 4.5150 and rebounded, we highlighted last Monday (31 Jul, spot at 4.5420) that “Despite dropping to 4.5150, there is no clear increase in momentum”, and we expected USD/MYR to trade in a range between 4.5250 and 4.5790. Our expectations were incorrect as USD/MYR fell to 4.4950, then rebounded strongly to end the week unchanged at 4.5530.

The rebound has gained some momentum, and this week, there is room for USD/MYR to rebound further. However, any advance is unlikely to break clearly above 4.5790 (minor resistance is at 4.5600). On the downside, if USD/MYR breaks below 4.5120 (minor support is at 4.5250), it would indicate that the buildup in momentum has eased

10:56
USD vulnerable on expectations that the Fed will not need to raise rates further this year – MUFG

The US Dollar’s recent rebound suffered a setback on Friday triggered by the release of the weaker-than-expected NFP report for July. Economists at MUFG Bank analyze Greenback’s outlook.

Is the USD rebound running out of steam?

The USD has derived more support over the past week from the ongoing adjustment higher in long-term US yields and more risk-off trading conditions that have weighed more heavily on popular EM carry currencies. 

The recent surprise decision from the BoJ to adjust YCC and Fitch’s decision to downgrade the US credit rating have triggered a pick-up in FX market volatility at the start of the summer period. While these recent developments have helped the USD to rebound, we are not convinced the move will prove sustainable. 

The release of the weaker NFP report for July and the release this week of the US CPI report for July should solidify expectations that the Fed will not need to raise rates further this year and help to re-weaken the US Dollar.


10:47
Oil: Year-end target of $100, upside beyond looks unlikely in 2024 – ANZ

Economists at ANZ Bank maintain their end of year price target of $100/bbl for Oil prices.

Oil’s last hurrah?

Supply cuts are finally tightening the Oil market. We now expect sharp drawdowns in inventories in the coming months. However, the recent rally in prices remains on shaky ground.

The supply tightness is largely managed by OPEC. Any sustained rally in prices is reliant on demand continuing to improve. For the moment, that appears to be the case. There is hope that recently announced stimulus measures can support further growth.

Over the medium term, some red flags that could cap this upside in prices are emerging. EVs in China are increasingly eating into Oil consumption. We expect lost Oil consumption from EVs to hit 260K b/d in 2023. That will reach 1.5M b/d by the end of the decade.

We maintain our end of year price target of $100/bbl; however, upside beyond this looks unlikely in 2024.


10:32
EUR/NOK: Room for Krone weakness to reverse further – MUFG

The Norwegian Krone staged a strong rebound over the past month. Economists at MUFG Bank analyze NOK's outlook.

Norges Bank will remain sensitive to Krone's weakness

The Krone has derived support recently from the easing of investor concerns over the risk of a hard landing for the global economy. 

Recent optimism over a softer landing for the global economy has helped to lift commodity prices including Oil that has been encouraging a stronger NOK.

In addition, Krone has derived support recently from the Norges Bank’s decision to tighten policy more in response to upside inflation risks. With core inflation uncomfortably high, the Norges Bank will remain sensitive to NOK weakness.

EUR/NOK – Q3 2023 11.10 Q4 2023 11.00 Q1 2024 10.90 Q2 2024 10.80


10:13
Fed: Holding rates at their peak for some time is USD supportive – Rabobank

Despite the news from Fitch, over the past week, Greenback had been performing well, as it was the best performing G10 currency ahead of the release of the softer-than-expected US July payrolls. Economists at Rabobank analyze USD outlook. 

USD to remain more focused on monetary policy and the relative strength of US growth

Fitch’s decision to downgrade the US credit rating has turned attention to next week’s Treasury supply though the USD’s safe haven appeal suggests that impact from the Fitch decision is likely to be limited.

Fed policy remains in the driving seat. While we expect that Fed funds have likely peaked, a higher for longer outlook is USD supportive.

Greenback is also likely to derive support from the fact that some EM central banks have already started their rate cutting cycles and from the likelihood that policy rates are in the process of peaking in several other G10 countries.


10:09
USD/THB: Potential upside on the cards near term – UOB

In the opinion of Markets Strategist Quek Ser Leang at UOB Group, further gains in USD/THB appears on the table in the short-term horizon.

Key Quotes

We did not anticipate the strong rise in USD/THB as it soared to a high of 34.81 last week (we were expecting it to trade in a range). Rapidly improving momentum is likely to lead to further USD/THB strength this week.

However, the major resistance at 35.00 could be just out of reach. Overall, only a breach of 34.30 would indicate that the current upward pressure has eased. 

10:01
US Dollar starts green as traders focus on US inflation this week
  • US Dollar up against most pairs with the Greenback in demand on Monday.
  • Slow start of the week with some minor data points coming out.
  • The US Dollar Index consolidates above 102 and flirts with more upside potential.

The US Dollar (USD) reboots its firm rally that started mid-July after hitting a curb on Friday with a mixed US jobs report. Market participants perceived the US jobs report as a sign that a pause is due for the Federal Reserve (Fed), pricing out a rate hike for the last quarter of 2023. As the dust settles, traders are back buying the Greenback as risk of sticky or higher US inflation could still be at hand. 

On the economic front, eyes are on the Consumer Credit Change for June, which should not be that market moving. The main focus later this week will be on the US inflation numbers in the Consumer Price Index (CPI). They will act as a catalyst to define whether a Goldilocks scenario is in play with solid employment while price pressures drop or if sticky inflation remains stubborn. The first scenario will back a pause by the Fed, while the last one will lock in another rate hike for the next policy meeting. 

Daily digest: US Dollar in favour of mixed picture

  • New York Fed's John Williams comments that rates may come down next year. Meanwhile Morgan Stanley says markets should brace for disappointing US growth. 
  • The dust seems to settle this Monday as plenty of peaks from Friday after the US jobs report are being pared back partially. Investors are looking forward to the US inflation numbers later this week and are starting to pre-position for them. 
  • At 15:30 GMT the US Treasury is auctioning some debt on a 3-month and a 6-month tenure. With US bond yields on the rise this Monday, the auction could see some higher rates being demanded by investors. 
  • The European session will be closed already when the US Consumer Credit Change for June is due to come out at 19:00 GMT. Expectations are for a firm uptick in Consumer Credit from $7.2B to $13B. 
  • Equities across the globe, except for the Japanese Topix Index that closed positive up 0.40%, are taking a small hit this Monday. The demand for the US Dollar points to a little bit of risk aversion and could see the US Dollar jumping higher should US and European equities print deeper negative numbers. 
  • The CME Group FedWatch Tool shows that markets are pricing in an 84.5% chance that the Fed will pause hikes at its meeting in September. The probability of a pause peaked on Friday to 87.0% and is now abating a little bit. 
  • The benchmark 10-year US Treasury bond yield trades at 4.08% and is recovering from the slide on Friday where it hit 4.20%  on the upside and got pulled back all the way to 4.03% in the wake of the US jobs report. A further recovery of the US Treasury note would go hand-in-hand with a stronger US Dollar.  

US Dollar Index technical analysis: 102 a hard nut to crack

The US Dollar is back at the 102 digit after its recovery from mid-July hit a curb on the back of the US jobs report this past Friday. On a technical front, the US Dollar Index (DXY) is facing some difficult technical levels where traders will need to keep a close eye on the lower levels in order not to get caught on the wrong side of their trade. Key focal points will be Thursday and Friday with several US inflation indices being published.

For the upside, 102.32 is a key level to watch in the form of the 100-day Simple Moving Average (SMA). Even should the DXY be able to break and close above there, US Dollar bulls are not out of the woods yet, with the 55-day SMA just above there at 102.50. Two key levels need to be broken and closed above in order to avoid any large pullbacks before targeting 103 to the upside. 

On the downside, the US Dollar bears will defend that same mentioned 100-day SMA at 102.32 and try to stage a firm rejection. The uptrend from mid-July will be broken once bears can pull the price action below 101.74, which is the low of this past Friday. Once that unfolds, the probability of the DXY collapsing all the way back to sub-100 is quite large. 


US Dollar FAQs

What is the US Dollar?

The US Dollar (USD) is the official currency of the United States of America, and the ‘de facto’ currency of a significant number of other countries where it is found in circulation alongside local notes. It is the most heavily traded currency in the world, accounting for over 88% of all global foreign exchange turnover, or an average of $6.6 trillion in transactions per day, according to data from 2022.
Following the second world war, the USD took over from the British Pound as the world’s reserve currency. For most of its history, the US Dollar was backed by Gold, until the Bretton Woods Agreement in 1971 when the Gold Standard went away.

How do the decisions of the Federal Reserve impact the US Dollar?

The most important single factor impacting on the value of the US Dollar is monetary policy, which is shaped by the Federal Reserve (Fed). The Fed has two mandates: to achieve price stability (control inflation) and foster full employment. Its primary tool to achieve these two goals is by adjusting interest rates.
When prices are rising too quickly and inflation is above the Fed’s 2% target, the Fed will raise rates, which helps the USD value. When inflation falls below 2% or the Unemployment Rate is too high, the Fed may lower interest rates, which weighs on the Greenback.

What is Quantitative Easing and how does it influence the US Dollar?

In extreme situations, the Federal Reserve can also print more Dollars and enact quantitative easing (QE). QE is the process by which the Fed substantially increases the flow of credit in a stuck financial system.
It is a non-standard policy measure used when credit has dried up because banks will not lend to each other (out of the fear of counterparty default). It is a last resort when simply lowering interest rates is unlikely to achieve the necessary result. It was the Fed’s weapon of choice to combat the credit crunch that occurred during the Great Financial Crisis in 2008. It involves the Fed printing more Dollars and using them to buy US government bonds predominantly from financial institutions. QE usually leads to a weaker US Dollar.

What is Quantitative Tightening and how does it influence the US Dollar?

Quantitative tightening (QT) is the reverse process whereby the Federal Reserve stops buying bonds from financial institutions and does not reinvest the principal from the bonds it holds maturing in new purchases. It is usually positive for the US Dollar.

09:43
Yen weakness would be justified far beyond on BoJ inability to normalize its monetary policy – Commerzbank

Can't or won't the BoJ normalize its monetary policy? Economists at Commerzbank analyze JPY implications.

Can't or won't?

If it's inability and not unwillingness, Yen weakness would be justified far beyond what it has been so far.

By the way, the fact that the 2% is already within the range that the Council members have been forecasting recently already showed at the time these forecasts were published (i.e., July 31) that at least one Council member does not believe that inflation will fall below 2% again. So the fact that this view also appears in the minutes is not really news. Not everything that comes across as news is news.


09:28
USD/CHF rebounds as market mood turns cautious ahead of US CPI USDCHF
  • USD/CHF resumes upside journey amid cautious market mood.
  • The US Dollar Index climbs to near 102.30 as wage growth remained sticky in July.
  • US inflation could turn out stubborn as global oil prices recovered sharply last month.

The USD/CHF pair resumes its upside journey after a mild correction in the London session and is approaching the round-level resistance of 0.8800. The Swiss Franc asset strengthens as market sentiment turns bearish ahead of the United States Consumer Price Index (CPI) data, which will be published on Thursday at 12:30 GMT.

S&P500 futures generate decent gains in Europe as institutional investors raise Q3 Gross Domestic Product (GDP) forecasts. JP Morgan estimates July-September real annualized GDP at 2.5% vs. the prior forecast of 0.5%. US equities were under pressure on Friday as Nonfarm Payrolls (NFP) report demonstrated a slowdown in the hiring process, portraying concerns about forward demand.

The US Dollar Index (DXY) climbs to near 102.30 as wage growth remained sticky in July. Monthly and annual Average Hourly Earnings remained stable at 0.4% and 4.4% respectively but higher than expectations. Persistence in the US wage growth could force the Federal Reserve (Fed) to raise interest rates further.

This week, investors will focus on the mega event of the Consumer Price Index (CPI) for July. US inflation could turn out stubborn as global oil prices recovered sharply last month on expectations that interest rates by central banks are peaking now. This could elevate gasoline prices and eventually higher burden on US households.

Meanwhile, the Swiss Franc fails to find strength despite a steady Unemployment Rate for July. The monthly jobless rate remains unchanged at 1.9% despite higher interest rates by the Swiss National Bank (SNB). SNB Chairman Thomas J. Jordan is expected to tighten interest rate policy further as the consequences of a higher-inflation environment are higher than a low-inflation scenario.


09:25
USD/CNH: Further consolidation in the pipeline – UOB

No changes to the consolidative mood around USD/CNH for the time being, argue Economist Lee Sue Ann and Markets Strategist Quek Ser Leang at UOB Group.

Key Quotes

24-hour view: We expected USD to edge lower to 7.1500 last Friday. Our expectations did not materialise as USD dropped to 7.1550 and then rebounded. The current price movements are likely part of a consolidation. Today, we expect USD to trade in a range of 7.1660/7.2020. 

Next 1-3 weeks: Our most recent narrative was from last Wednesday (02 Aug, spot at 7.1800), wherein USD is likely to trade in a range of 7.1300/7.2450 for the time being. We continue to hold the same view for now. 

09:19
Fed’s Williams didn’t rule out the possibility of cutting rates in early 2024 – NYT

Speaking in an interview with the NewYork Times on Monday, John C. Williams, President of the Federal Reserve Bank of New York said he expects that interest rates could begin to come down next year.

Additional takeaways

“Inflation was coming down as hoped, and that while he expected unemployment to rise slightly as the economy cooled.“

“Did not rule out the possibility of lowering rates in early 2024, depending on economic data.”

“In my own projection, my own forecast, I expect that the unemployment rate will rise above 4% next year.”

Market reaction

Williams’ comments seem to have little to no impact on the Greenback, at the moment. The US Dollar Index is flirting with intraday highs near 102.30, up 0.30% on the day, at the press time.

09:11
USD unlikely to suffer a decline this week – ING

Another mixed US jobs report on Friday has maintained choppy conditions in FX markets. Economists at ING analyze USD outlook.

DXY seen trading well within a 101.80-102.80 range

This week looks unlikely to trigger the kind of benign Dollar decline around which the Rest of the World currencies can rally. Additionally, events in the Black Sea and what they could mean for food and energy prices could keep investors nervous about embracing disinflation trends. 

For today, we doubt Fed speakers will have a meaningful impact on the Dollar and can see DXY trading well within a 101.80-102.80 range.


09:08
FX option expiries for Aug 7 NY cut

FX option expiries for Aug 7 NY cut at 10:00 Eastern Time, via DTCC, can be found below.

- EUR/USD: EUR amounts        

  • 1.0870 942m
  • 1.0900 620m
  • 1.0920 551m
  • 1.0950 1.5b
  • 1.1000 458m
  • 1.1020 335m
  • 1.1050 383m

- USD/JPY: USD amounts                     

  • 141.50 660m
  • 142.00 500m
  • 143.00 901m
  • 144.00 1.3b

- AUD/USD: AUD amounts

  • 0.6500 585m
  • 0.6590 325m

- EUR/GBP: EUR amounts        

  • 0.8500 800m
  • 0.8550 1.3b
  • 0.8620 741m
  • 0.8650 594m
  • 0.8675 600m
  • 0.8700 791m
09:05
AUD/USD drops to fresh daily low, around 0.6560 area amid resurgent USD demand AUDUSD
  • AUD/USD meets with some intraday supply on Monday and is pressured by reviving USD demand.
  • The US jobs data reaffirms expectations for one more rate hike by the Fed and underpins the USD.
  • China’s economic woes and a softer risk tone also contribute to driving flow away from the Aussie.

The AUD/USD pair comes under some selling pressure following an intraday uptick to the 0.6600 neighbourhood and drops to a fresh daily low during the early part of the European session on Monday. Spot prices currently trade around the 0.6560 area and seem poised to resume the recent downward trajectory witnessed over the past three weeks or so.

The US Dollar kicks off the new week on a positive note and stalls a two-day-old corrective slide from its highest level since July 7 touched last Thursday, which, in turn, acts as a headwind for the AUD/USD pair. The closely-watched US NFP report showed that the economy maintained a moderate pace of job addition in July, though solid wage growth and an unexpected dip in the unemployment rate pointed to continued tightness in labour market conditions. This could allow the Federal Reserve (Fed) to stick to its hawkish stance and keep the door for one more 25 bps lift-off in September or November. The expectations trigger a modest recovery in the US Treasury bond yields and help revive demand for the Greenback.

Apart from this, a generally weaker tone around the global equity markets is seen as another factor driving flows away from the risk-sensitive Australian Dollar (AUD). Investors remain concerned that the post-COVID recovery in China – the world's second-largest economy – is losing steam, which, to a larger extent, overshadows the latest optimism over additional stimulus. Even the Reserve Bank of Australia’s (RBA) hawkish quarterly Monetary Policy Statement (MPS) released on Friday, indicating that rates may still need to go higher, does little to lend any support to the AUD/USD pair. This, in turn, suggests that the path of least resistance for spot prices is to the downside and validates the near-term negative outlook.

Moving ahead, there isn't any relevant market-moving economic data due for release from the US on Monday. Hence, traders will look to speeches by influential FOMC members for cues about the future rate-hike path. This, along with the US bond yields and the broader risk sentiment, will drive the USD demand and produce short-term opportunities around the AUD/USD pair. The focus, however, will remain glued to the latest consumer inflation figures from China and the US, due on Wednesday and Thursday, which will play a key role in providing a fresh directional impetus to the major.

Technical levels to watch


09:02
Singapore Foreign Reserves (MoM) came in at 340.8B, above expectations (338.8B) in July
08:51
NZD/USD: RBNZ triggers recession with Kiwi underperformance ahead – MUFG NZDUSD

NZD/USD continues to trade between 0.6000 and 0.6400 as it has done for most of this year. Economists at MUFG Bank analyze Kiwi outlook.

Rebound in commodity prices offers more support for NZD

We expect inflation to slow further in the coming months prompting the Fed to signal a pause to their hiking cycle at the Jackson Hole symposium in late August or September FOMC meeting. The developments have triggered an improvement in global investor risk sentiment and rebound in commodity prices that are offering more support for the NZD.

While the external developments have moved in favour of a stronger NZD recently, domestic developments are less supportive. New Zealand’s economy fell into recession in Q1. The weak cyclical performance is expected to continue in the coming quarters as the negative impact of higher rates feeds through to the economy. 

We expect the RBNZ’s next policy move to be a cut later this year or in early 2024 weighing on the Kiwi.


08:49
Gold price retraces as mixed labor data report lose appeal ahead of inflation data
  • Gold price drops sharply amid strength in the US Dollar as focus shifts to US CPI.
  • Fed’s Bostic supports the continuation of the rate-tightening cycle amid resilience in consumer spending.
  • JP Morgan looks confident that the US economy will not enter a recession.

Gold price (XAU/USD) falls back after a short-lived pullback move as investors seem cautious ahead of the United States Consumer Price Index (CPI) data, which will be released on Thursday. The precious metal struggles to deliver a decisive move as the impact of a slowdown in firm hiring is offset by sticky wage growth and a lower Unemployment Rate.

The US Dollar Index (DXY) shows resilience as the recovery in global oil prices supports persistence in United States inflation. In addition to that, hawkish commentary from Federal Reserve (Fed) policymaker Raphael Bostic supports the US Dollar to defend against a hiring slowdown. Momentum in the US Dollar could strengthen further as JP Morgan raises its forecast for real annualized Gross Domestic Product (GDP) from Q3 to 2.5%, significantly higher than the prior estimate of 0.5%.

Daily Digest Market Movers: Gold price faces pressure ahead of CPI data

  • Gold price returns below $1,940.00 as investors turn cautious ahead of United States inflation data, which will be published on Thursday at 13:00 GMT.
  • The precious metal fails to sustain its recovery propelled by mixed Nonfarm Payrolls (NFP) data for July, released on Friday.
  • US NFP report showed that the labor market witnessed a fresh addition of 187K payrolls in July. June’s 209K figure was downwardly revised to 185K. This was the lowest figure since December 2020.
  • While job growth slows down, the Unemployment Rate dropped to 3.5% vs. the estimates and the former release of 3.6%.
  • Wage growth turned out stable despite a slowdown in the hiring process. The monthly labor cost index maintained its growth pace of 0.4% as recorded in June while investors anticipated a decline in the economic data to 0.3%. Annual economic data also remained stable at 4.4% against expectations of 4.2%.
  • Sustained wage growth would keep US inflationary pressures elevated and might force the Fed to raise interest rates further.
  • Atlanta Fed Bank President Raphael Bostic said on Friday that July’s employment remains in line with expectations and he is not surprised that wage growth is still strong. He further added that the central bank will keep interest rate policy restrictive in 2024. 
  • The US Dollar Index managed to rebound after defending the bearish impact of steady payrolls report after hawkish commentary from Fed Governor Michelle Bowman.
  • Fed Bowman said over the weekend that the central bank will raise interest rates further to bring inflation down. She further added that she supported further policy tightening in July amid strong consumer spending, a tight labor market, and still-high inflation.
  • Per CME Fedwatch Tool, there is a more than 84% chance in favor of a steady interest rate policy in September. 
  • After mixed employment data, investors shift focus to the inflation data. On a monthly basis, headline and core CPI are expected to maintain their pace of 0.2% as global oil prices rebounded sharply last month.
  • Sticky inflationary pressures might force the Fed to continue the policy-tightening spell.
  • Last week, US equities came under pressure after Fitch downgraded the US government’s long-term debt rating.
  • JP Morgan is confident that the US economy will not enter into a recession. Investment banking firm raises real annualized GDP growth forecast for July-September quarter to 2.5% from 0.5%.

Technical Analysis: Gold price oscillates inside Friday’s range

Gold price retraces after a less confident pullback move to near $1,947.00. The precious metal attempts a weak attempt of surpassing the 20-day Exponential Moving Average (EMA). The yellow metal oscillates inside Friday’s range as investors await US inflation data for a decisive move. Momentum oscillators demonstrate a volatility squeeze, which is expected to continue ahead.

Interest rates FAQs

What are interest rates?

Interest rates are charged by financial institutions on loans to borrowers and are paid as interest to savers and depositors. They are influenced by base lending rates, which are set by central banks in response to changes in the economy. Central banks normally have a mandate to ensure price stability, which in most cases means targeting a core inflation rate of around 2%.
If inflation falls below target the central bank may cut base lending rates, with a view to stimulating lending and boosting the economy. If inflation rises substantially above 2% it normally results in the central bank raising base lending rates in an attempt to lower inflation.

How do interest rates impact currencies?

Higher interest rates generally help strengthen a country’s currency as they make it a more attractive place for global investors to park their money.

How do interest rates influence the price of Gold?

Higher interest rates overall weigh on the price of Gold because they increase the opportunity cost of holding Gold instead of investing in an interest-bearing asset or placing cash in the bank.
If interest rates are high that usually pushes up the price of the US Dollar (USD), and since Gold is priced in Dollars, this has the effect of lowering the price of Gold.

What is the Fed Funds rate?

The Fed funds rate is the overnight rate at which US banks lend to each other. It is the oft-quoted headline rate set by the Federal Reserve at its FOMC meetings. It is set as a range, for example 4.75%-5.00%, though the upper limit (in that case 5.00%) is the quoted figure.
Market expectations for future Fed funds rate are tracked by the CME FedWatch tool, which shapes how many financial markets behave in anticipation of future Federal Reserve monetary policy decisions.

08:46
Euro meets some selling pressure and retreats below 1.1000
  • Euro kicks off the new trading week on the back foot vs. the US Dollar.
  • Stocks in Europe open Monday’s session in the red.
  • EUR/USD recedes to the 1.0970 region on Fed, risk-off mood.
  • The USD Index (DXY) regains the 102.00 barrier and above.
  • Industrial Production in Germany contracted 1.5% MoM in June.

The Euro (EUR) starts the week with an offered bias against the US Dollar (USD) and forces EUR/USD to revisit the sub-1.1000 region in the wake of the opening bell on the old continent on Monday.

On the flip side of the coin, the Greenback manages to regain traction after two consecutive daily pullbacks, regaining at the same time the area beyond 102.00 the figure, as investors continue to digest Friday’s release of the Nonfarm Payrolls figures (+187K).

On the latter, it is worth recalling that despite the US economy creating fewer jobs than initially projected, wage growth remained steady and the jobless rate improved to 3.5%, indicating that the resilience of the labour market appears almost intact.

Other than the prevailing risk-off sentiment, the renewed bid bias in the US Dollar appears propped up by comments by the FOMC’s Michelle Bowman, who advocated for further rate hikes (at the next meeting?) in case disinflationary pressures stall.

The latter comes in contrast to steady speculation that the Fed's rate hike in July might have been its last for the foreseeable future. Additionally, the possibility of the European Central Bank (ECB) implementing further tightening measures beyond the summer seems to be losing momentum.

In the euro docket, Industrial Production in Germany contracted 1.5% MoM in June and 1.8% over the last 12 months. In addition, Investor Confidence tracked by the Sentix index improved to -18.9 for the month of August.

In the US, Consumer Credit Change will be the sole release along with short-term bill auctions.

Daily digest market movers: Euro starts the week offered and below 1.1000

  • The EUR drops to the 1.0970 region vs. the USD on Monday.
  • The USD Index (DXY) retakes the 102.00 hurdle and beyond.
  • Risk aversion looks firm at the beginning of the week.
  • Fed’s Bowman did not rule out extra tightening in the near term.
  • CME Group’s FedWatch Tool sees no rate hikes by the Fed in H2 2023.
  • Speculation that the Fed might have ended its hiking cycle remains steady.
  • Investors’ focus is expected to shift to US inflation figures (August 11).

Technical Analysis: Euro remains offered below 1.1149

EUR/USD comes under renewed downside pressure and breaches the key psychological support at 1.1000.

The loss of the 1.0920 region, where the provisional 55-day and 100-day SMAs converge, leaves EUR/USD vulnerable to a probable drop to the July low of 1.0833 (July 6) ahead of the key 200-day SMA at 1.0748 and the May low of 1.0635 (May 31). South from here emerges the March low of 1.0516 (March 15) before the 2023 low of 1.0481 (January 6).

On the other hand, occasional bullish attempts could motivate the pair to initially dispute the weekly top at 1.1149 (July 27). Above this level, the downside pressure could mitigate somewhat and could encourage the pair to test the 2023 high at 1.1275 (July 18). Once this level is cleared, there are no resistance levels of significance until the 2022 peak of 1.1495 (February 10), which is closely followed by the round level of 1.1500.

Furthermore, the constructive view of EUR/USD appears unchanged as long as the pair trades above the key 200-day SMA.

Euro FAQs

What is the Euro?

The Euro is the currency for the 20 European Union countries that belong to the Eurozone. It is the second most heavily traded currency in the world behind the US Dollar. In 2022, it accounted for 31% of all foreign exchange transactions, with an average daily turnover of over $2.2 trillion a day.
EUR/USD is the most heavily traded currency pair in the world, accounting for an estimated 30% off all transactions, followed by EUR/JPY (4%), EUR/GBP (3%) and EUR/AUD (2%).

What is the ECB and how does it impact the Euro?

The European Central Bank (ECB) in Frankfurt, Germany, is the reserve bank for the Eurozone. The ECB sets interest rates and manages monetary policy.
The ECB’s primary mandate is to maintain price stability, which means either controlling inflation or stimulating growth. Its primary tool is the raising or lowering of interest rates. Relatively high interest rates – or the expectation of higher rates – will usually benefit the Euro and vice versa.
The ECB Governing Council makes monetary policy decisions at meetings held eight times a year. Decisions are made by heads of the Eurozone national banks and six permanent members, including the President of the ECB, Christine Lagarde.

How does inflation data impact the value of the Euro?

Eurozone inflation data, measured by the Harmonized Index of Consumer Prices (HICP), is an important econometric for the Euro. If inflation rises more than expected, especially if above the ECB’s 2% target, it obliges the ECB to raise interest rates to bring it back under control.
Relatively high interest rates compared to its counterparts will usually benefit the Euro, as it makes the region more attractive as a place for global investors to park their money.

How does economic data influence the value of the Euro?

Data releases gauge the health of the economy and can impact on the Euro. Indicators such as GDP, Manufacturing and Services PMIs, employment, and consumer sentiment surveys can all influence the direction of the single currency.
A strong economy is good for the Euro. Not only does it attract more foreign investment but it may encourage the ECB to put up interest rates, which will directly strengthen the Euro. Otherwise, if economic data is weak, the Euro is likely to fall.
Economic data for the four largest economies in the euro area (Germany, France, Italy and Spain) are especially significant, as they account for 75% of the Eurozone’s economy.

How does the Trade Balance impact the Euro?

Another significant data release for the Euro is the Trade Balance. This indicator measures the difference between what a country earns from its exports and what it spends on imports over a given period.
If a country produces highly sought after exports then its currency will gain in value purely from the extra demand created from foreign buyers seeking to purchase these goods. Therefore, a positive net Trade Balance strengthens a currency and vice versa for a negative balance.

08:32
Eurozone Sentix Investor Confidence Index improves to -18.9 in August vs. -23.4 expected
  • Eurozone investors’ morale got an unexpected boost in August.
  • EUR/USD remains pressured in its daily range below 1.1000.

The Eurozone Sentix Investor Confidence improved to -18.9 in August from -22.5 in July. The market consensus was for a -23.4 reading.

Commenting on the survey's findings, " Germany, in particular, has become the sick man of the Eurozone and is weighing heavily on the region,” said Sentix Managing Director Patrick Hussy.

Hussy further noted that "the economy in the Eurozone remains in recession mode. There can therefore be no joy about this development.”

Market reaction

In line with Hussy’s comments, EUR/USD is uninspired by the improvement in the Eurozone investors’ confidence. As of writing, the EUR/USD pair is down 0.30% on the day at 1.0977.

08:30
European Monetary Union Sentix Investor Confidence came in at -18.9, above forecasts (-23.4) in August
08:25
GBP/USD: Failure to defend 1.2600/1.2570 could mean risk of a deeper drop – SocGen GBPUSD

Economists at Société Générale analyze GBP/USD technical outlook. 

Last week's high of 1.2870 must be overcome to affirm a larger up-move

GBP/USD has embarked on a phase of pullback after facing stiff resistance near the upper limit of a multi-month channel near 1.3180. It is now challenging the lower band of this channel and is close to late June low of 1.2600/1.2570 which is a crucial support. 

An initial bounce is expected however last week's high of 1.2870 must be overcome to affirm a larger up-move. 

Failure to defend 1.2600/1.2570 could mean risk of a deeper drop; next potential supports could be at 1.2480 and 200-DMA at 1.2300.


08:21
NZD/USD struggles to capitalize on its modest uptick beyond 0.6100 on stronger USD NZDUSD
  • NZD/USD regains positive traction on Monday, albeit lacks follow-through.
  • A positive tone around the US equity futures benefits the risk-sensitive Kiwi.
  • Bets for more Fed rate hikes revive the USD demand and act as a headwind.

The NZD/USD pair attracts some dip-buying on the first day of a new week and sticks to its modest intraday gains through the early part of the European session. The pair is currently placed around the 0.6100 round figure, albeit lacks bullish conviction and remains well within Friday's broader trading range.

In the absence of any fresh fundamental trigger, a generally positive tone around the US equity futures is seen as a key factor lending some support to the risk-sensitive Kiwi. The upside for the NZD/USD pair, however, remains capped in the wake of the emergence of fresh US Dollar (USD) buying, bolstered by the prospects for further policy tightening by the Federal Reserve (Fed).

Despite a slight disappointment from the headline NFP, solid wage growth and an unexpected downtick in the jobless rate raised odds of a soft landing for the US economy. Moreover, the continued tightness in the labour market kept the door for one more 25 bps Fed rate hike move in September or November wide open. This leads to a fresh leg up in the US Treasury bond yields and underpins the USD.

Meanwhile, concerns that the post-COVID recovery in China - the world's second-largest economy - is losing steam overshadows the latest optimism over additional stimuls. This might further contribute to capping any meaningful appreciating move for antipodean currencies, including the New Zealand Dollar (NZD), warranting caution before placing fresh bullish bets around the NZD/USD pair.

Moving ahead, there isn't any relevant market moving economic data due for release from the US on Monday. Hence, traders will look to speeches by influential FOMC members for cues about the Fed's future rate-hike path. This, along with the US bond yields and the broader risk sentiment, will drive the USD demand and allow traders to grab short-term opportunities around the NZ/USD pair.

Technical levels to watch


08:19
China Foreign Exchange Reserves (MoM) above expectations ($3.2T) in July: Actual ($3.204T)
08:00
EUR/USD should largely be range-bound around 1.10 – ING EURUSD

The softer headline US employment figure provided something of a reprieve to EUR/USD on Friday. Economists at ING expect the pair to hold 1.0920 – the 100-Day Moving Average.

100-DMA seems to be holding EUR/USD 

The pair seemed to find support around the 100-DMA  which is now just above 1.0920. Whilst that holds, some trend followers will be able to hang onto their bullish EUR/USD views.

It looks like another mixed week for FX markets. This suggests EUR/USD should largely be range-bound around 1.10.


07:47
Silver Price Analysis: XAG/USD remains depressed around mid-$23.00s, holds above 61.8% Fibo.
  • Silver comes under fresh selling pressure on Monday and seems vulnerable to sliding further.
  • Failure near the 50% Fibo. and negative oscillators on the daily chart favour bearish traders.
  • A sustained move beyond the $24.00 confluence is needed to negate the negative outlook.

Silver struggles to capitalize on Friday's goodish rebound from the $23.20 area, or its lowest level since July 12 and attracts fresh sellers on the first day of a new week. The white metal maintains its offered tone through the early European session and is currently trading near the lower end of the daily range, around mid-$23.00s.

From a technical perspective, the recent pullback from the $25.25 area showed resilience below the 61.8% Fibonacci retracement level of the June-July rally and stalled near ascending trend-line support extending from a multi-month low touched in June. The subsequent move-up warrants some caution for bearish traders. That said, the lack of follow-through buying and a failure near the 50% Fibo. level, along with negative oscillators on the daily chart, suggest that the path of least resistance for the XAG/USD is to the downside.

However, it will still be prudent to wait for some follow-through selling below the ascending trend-line support, currently near the $23.20 region, which nears the very important 200-day Simple Moving Average (SMA), before placing fresh bearish bets. The XAG/USD might then turn vulnerable to weaken further below the $23.00 mark, towards retesting the multi-month low, around the $22.15-$22.10 area touched in June. This is closely followed by the $22.00 mark, which if broken decisively will set the stage for deeper near-term losses.

On the flip side, the 50% Fibo. level, around the $23.70 area, now seems to act as an immediate hurdle. Any subsequent move up is likely to attract fresh sellers and remain capped near the $24.00-$24.10 confluence support breakpoint, turned resistance. The said area comprises the 100-day SMA and the 38.2% Fibo. level, which should act as a pivotal point. A sustained strength beyond could lift the XAG/USD back towards the 23.6% Fibo. level, around the $24.45-$24.50 supply zone, en route to the $24.75 hurdle and the $25.00 psychological mark.

Silver daily chart

fxsoriginal

Technical levels to watch


07:39
EUR/CZK: Koruna to regain lost ground over the coming months – Commerzbank

The Czech Koruna weakened sharply after the central bank formally ended its FX intervention framework. Economists at Commerzbank analyze CZK outlook.

Broader EM sell-off and will likely reverse as and when the market switches back to risk-on

The end of the FX intervention regime should not make much difference because no intervention was being used in recent months to begin with (it was last used in October 2022). We have a different interpretation from commentators who viewed the change to mean that CNB has decided to ‘accept a weaker exchange rate’. We found the CZK sell-off puzzling and kneejerk – and we forecast the currency to regain lost ground over the coming months.

There is not a lot of idiosyncratic Koruna weakness to explain in recent days. The weakness versus the Euro was partly a reflection of the broader EM sell-off and will likely reverse as and when the market switches back to risk-on.


07:24
Natural Gas Futures: Further gains look likely

Considering advanced prints from CME Group for natural gas futures markets, open interest rose marginally by 221 contracts at the end of last week, resuming the uptrend following the previous small drop. On the other hand, volume went down for the second straight session, now by around 68.2K contracts.

Natural Gas: Next up barrier comes at $2.80

Friday’s uptick in prices of natural gas was amidst a small increase in open interest, which seems to be enough to allow for the continuation of the rebound in the very near term. On its way north, the next hurdle comes at the weekly top around $2.80 per MMBtu (July 20).

07:16
USD/JPY now seen extending the range bound trade – UOB USDJPY

USD/JPY is expected to keep the 140.00-143.30 range for the time being, according to Economist Lee Sue Ann and Markets Strategist Quek Ser Leang at UOB Group.

Key Quotes

24-hour view: We did not expect the sharp drop that sent USD tumbling to a low of 141.54 (we were expecting it to trade in a range). Downward momentum is beginning to improve. Today, the risk is for USD to weaken further. However, any decline is unlikely to break 140.80 (next is at 140.00). Resistance is at 142.25, followed by 142.75. 

Next 1-3 weeks: Last Friday (04 Aug, spot at 142.70), we noted that upward momentum is beginning to deteriorate. We added, “the chance of USD rising to 145.00 is decreasing.” In NY trade, USD fell sharply and took out our ‘strong support’ level of 142.00 (low was 141.54). The breach of the ‘strong support’ level indicates that the recent buildup in upward pressure has faded. USD could trade in a broad range of 140.00/143.30 for now. 

07:14
USD/JPY Price Analysis: Gains momentum above 143.30 mark following BOJ Summary of Opinions USDJPY
  • USD/JPY stands above the 50- and 100-hour EMAs with an upward slope.
  • The immediate resistance emerges at 142.60; the key contention is located at 142.00.
  • The Relative Strength Index (RSI) stands below 50, MACD holds in bearish territory.

The USD/JPY pair reverses Friday’s pullback and holds ground around 142.22 heading into the early European session on Monday. According to a summary of the opinions of the Bank of Japan (BoJ) released on Monday, one board member said that wages and prices could keep rising at a pace not seen in the past. BoJ policymakers added that it’s necessary to maintain ultra-low interest rates until robust domestic demand and higher wages replace cost-push factors as the primary drivers of price increases and maintain sustainable inflation around its target.

According to the four-hour chart, the USD/JPY pair stands above the 50- and 100-hour Exponential Moving Averages (EMAs) with an upward slope, which means the path of least resistance is to the upside for the time being.

USD/JPY’s immediate resistance emerges at 142.60 (the midline of the Bollinger Band). Further north, the 142.90–143.00 area appears to be a tough nut to crack for USD/JPY. The mentioned level represents the confluence of a psychological round mark and a high of August 4. Any meaningful follow-through buying could pave the way to the next hurdle at 143.60 (the upper boundary of the Bollinger Band) and 143.90 (High of August 3).

On the downside, the key contention for USD/JPY is located at 142.00 (a psychological round mark and 50-hour EMA). The next stop for the pair is seen at 141.55 (100-hour EMA and the lower limit of the Bollinger Band), followed by 141.30 (High of July 27) and 141.00 (a psychological round figure). 

It’s worth noting that the Relative Strength Index (RSI) stands below 50 and the MACD holds in bearish territory, which indicates that the downside momentum has been activated.

USD/JPY four-hour chart


07:11
GBP/USD: 1.2590/1.2620 should be the lower boundary of this week's range – ING GBPUSD

The Sterling trade-weighted index is only marginally weaker since the Bank of England 'only' hiked by 25 bps last Thursday. Economists at ING analyze GBP outlook.

Upside bias in EUR/GBP into year-end

We look for one more hike to 5.50% in the Bank Rate (probably at the September meeting) before the BoE is prepared to go into a formal pause. This all points to a range-bound sterling over the next couple of months, but we retain an upside bias in EUR/GBP into year-end.

For Cable, we see 1.2590/1.2620 as important support and what should be the lower boundary of this week's range.


07:04
USD Index resumes the uptrend and regains 102.30
  • The index regains the smile and retest the 102.30 area.
  • Fed’s Bowman advocated for further tightening if needed.
  • US inflation figures will be the salient event this week.

The greenback, when gauged by the USD Index (DXY), leaves behind part of the recent weakness and reclaims the area around 102.30 as the risk-off mood seems to prevail early on Monday.

USD Index regains traction on Fed, risk-off

The index trades in an upbeat note on the back of renewed buying interest around the greenback at the beginning of the week.

In fact, the dollar picks up pace following comments from FOMC M. Bowman over the weekend, when she defended further tightening in case the recent progress in inflation falters. In this line, Bowman did not rule out another rate hike at the next gathering.

In the meantime, investors continue to digest Friday’s Nonfarm Payrolls figures (+187K), which showed that job creation seems to have cooled down during last month, although wage inflation held steady and the jobless rate ticked lower.

In the US data space, Consumer Credit Change will be the only release of note later in the NA session along with short-term bill auctions.

What to look for around USD

The index regains the area north of 102.00 on Monday, as market participants keep assessing the July NFP and cautiousness kicks in ahead of key US inflation figures due on August 10.

So far, the pronounced rally in DXY seems to have met a tough initial resistance near 102.80, while the dollar could face extra headwinds in response to the data-dependent stance from the Fed against the current backdrop of persistent disinflation and cooling of the labour market.

Furthermore, speculation that the July hike might have been the last of the current hiking cycle is also expected to keep the buck under some pressure for the time being.

Key events in the US this week: Consumer Credit Change (Monday) – Balance of Trade, Wholesale Inventories (Tuesday) – MBA Mortgage Applications (Wednesday) – Inflation Rate, Initial Jobless Claims (Thursday) – Producer Prices, Flash Michigan Consumer Sentiment (Friday).

Eminent issues on the back boiler: Persistent debate over a soft or hard landing for the US economy. Terminal Interest rate near the peak vs. speculation of rate cuts in late 2023 or early 2024. Geopolitical effervescence vs. Russia and China. US-China trade conflict.

USD Index relevant levels

Now, the index is gaining 0.24% at 102.25 and the breakout of 102.84 (weekly high August 3) would open the door to 103.52 (200-day SMA) and finally 102.57 (weekly high June 30). On the other hand, immediate contention emerges at 101.74 (monthly low August 4) seconded by 100.55 (weekly low July 27) and then 100.00 (psychological level).

07:04
Pound Sterling comes under severe pressure amid BoE’s aggressive rate-tightening spell
  • Pound Sterling finds significant pressure as higher interest rates deepen recession fears.
  • The United Kingdom’s outlook turns out bleak as tight policy dampens economic prospects.
  • BoE Pill said higher unemployment and lower vacancies would eventually lead to lower wage growth.

The Pound Sterling (GBP) sold off after failing to test the crucial resistance of 1.2800 as higher interest rates by the Bank of England (BoE) started deepening recession fears. The GBP/USD pair drops significantly as higher interest rates are threatening the United Kingdom’s economic outlook. The UK’s strong labor market is loosening its resilience as firms slow down their hiring process amid bleak economic prospects.

An aggressive rate-tightening cycle by the BoE has started affecting the United Kingdom’s housing sector and strong labor market but is building a base for bringing inflation back to 2%. Andrew Bailey seems confident that inflation will soften to 5% by October as the central bank will keep interest rates “sufficiently restrictive for a sufficient period”.

Daily Digest Market Movers: Pound Sterling drops amid cautious market mood

  • Pound Sterling drops sharply after failing to test the round-level resistance of 1.2800 as higher interest rates by the Bank of England starts slashing economic prospects.
  • The United Kingdom’s economic outlook is under scrutiny as BoE policymakers leave doors open for further policy tightening.
  • Last week, the BoE raised interest rates by 25 basis points (bps) to 5.25%. This was the 14th consecutive interest rate hike in the current tightening cycle, and interest rates are their highest in the past 15 years.
  • BoE Governor Andrew Bailey commented last week that the central bank will keep interest rates “sufficiently restrictive for a sufficient period” in order that inflation returns swiftly to 2%.
  • Andrew Bailey seems confident that inflation will come down to 5% in October, which indicates that UK PM Rishi Sunak would keep his promise of halving inflation this year. The promise was made by Sunak when inflation was at double-digit figures.
  • After its monetary policy announcement, BoE chief economist Huw Pill said on Friday that successive interest-rate hikes are cooling the labor market and easing inflationary pressures. He further added that higher unemployment and lower vacancies would eventually lead to lower wage growth.
  • An aggressive tightening cycle by the central bank is building pressure on the labor market and housing sector.
  • UK firms slowed down permanent staff hiring last month by the most since mid-2020 due to rising concerns about the economic outlook, per a survey by the Recruitment & Employment Confederation (REC) and KPMG, Reuters reported.
  • REC Chief Executive Neil Carberry said the jobs market remained "fairly robust" despite the slowdown in permanent placements.
  • Meanwhile, the housing sector remains vulnerable as first-time home buyers postpone their purchasing plans to dodge higher interest obligations.
  • Market mood is quite cautious as investors await the United States inflation data for July, which will be released on Thursday.
  • The US Dollar Index (DXY) climbs above 102.00 as Federal Reserve (Fed) policymakers still hope that more interest rate hikes will bring inflation to 2%.
  • Fed Governor Michelle Bowman said over the weekend that the US central bank will raise interest rates further to bring inflation down. She further added that she supported further policy tightening in July amid strong consumer spending, a tight labor market and still-high inflation.
  • Atlanta Fed Bank President Raphael Bostic said the central bank will likely remain restrictive in 2024. About the labor market, the Fed policymaker said July’s employment remains in-line with expectations and he is not surprised that wage growth is still strong.
  • Last week, the US Nonfarm Payrolls (NFP) report showed that the labor market got fat with fresh employment of 187K, lower than expectations of 200K but marginally higher than June’s reading of 185K. Unemployment Rate dropped to 3.5% against the estimates and the former release of 3.6%.
  • The monthly labor cost index maintained a pace of 0.4% as recorded in June, while investors anticipated a decline in the economic data to 0.3%. Annualized labor cost index also remained stable at 4.4% against expectations of 4.2%.

Technical Analysis: Pound Sterling fails to test 1.2800

Pound Sterling faces strong selling pressure in an attempt to test the crucial resistance of 1.2800. The Cable senses selling interest after testing the breakdown region of the Rising Channel chart pattern. The asset is trading below the 20 and 50-day Exponential Moving Averages (EMAs), portraying a bearish trend.

NonFarm Payrolls FAQs

What are Nonfarm Payrolls?

Nonfarm Payrolls (NFP) are part of the US Bureau of Labor Statistics monthly jobs report. The Nonfarm Payrolls component specifically measures the change in the number of people employed in the US during the previous month, excluding the farming industry.

How does Nonfarm Payrolls influence the Federal Reserve monetary policy decisions?

The Nonfarm Payrolls figure can influence the decisions of the Federal Reserve by providing a measure of how successfully the Fed is meeting its mandate of fostering full employment and 2% inflation.
A relatively high NFP figure means more people are in employment, earning more money and therefore probably spending more. A relatively low Nonfarm Payrolls’ result, on the either hand, could mean people are struggling to find work.
The Fed will typically raise interest rates to combat high inflation triggered by low unemployment, and lower them to stimulate a stagnant labor market.

How does Nonfarm Payrolls affect the US Dollar?

Nonfarm Payrolls generally have a positive correlation with the US Dollar. This means when payrolls’ figures come out higher-than-expected the USD tends to rally and vice versa when they are lower.
NFPs influence the US Dollar by virtue of their impact on inflation, monetary policy expectations and interest rates. A higher NFP usually means the Federal Reserve will be more tight in its monetary policy, supporting the USD.

How does Nonfarm Payrolls affect Gold?

Nonfarm Payrolls are generally negatively-correlated with the price of Gold. This means a higher-than-expected payrolls’ figure will have a depressing effect on the Gold price and vice versa.
Higher NFP generally has a positive effect on the value of the USD, and like most major commodities Gold is priced in US Dollars. If the USD gains in value, therefore, it requires less Dollars to buy an ounce of Gold.
Also, higher interest rates (typically helped higher NFPs) also lessen the attractiveness of Gold as an investment compared to staying in cash, where the money will at least earn interest.

Sometimes Nonfarm Payrolls trigger an opposite reaction than what the market expects. Why is that?

Nonfarm Payrolls is only one component within a bigger jobs report and it can be overshadowed by the other components.
At times, when NFP come out higher-than-forecast, but the Average Weekly Earnings is lower than expected, the market has ignored the potentially inflationary effect of the headline result and interpreted the fall in earnings as deflationary.
The Participation Rate and the Average Weekly Hours components can also influence the market reaction, but only in seldom events like the “Great Resignation” or the Global Financial Crisis.

07:02
Austria Wholesale Prices n.s.a (YoY) climbed from previous -7.3% to -6.3% in July
07:01
Austria Wholesale Prices n.s.a (MoM) fell from previous -0.3% to -0.4% in July
07:01
Switzerland Foreign Currency Reserves: 698B (July) vs previous 725B
06:59
Forex Today: US Dollar regains traction following Friday's pullback

Here is what you need to know on Monday, August 7:

The US Dollar gathers strength against its major rivals to begin the new week. After closing in negative territory in response to the US July jobs report, the US Dollar Index edges higher toward 102.50 in the European morning. Sentix Investor Confidence Index for August will be featured in the European economic docket and June Consumer Credit Change will be the only noteworthy data releases from the US later in the day.

Nonfarm Payrolls in the US rose 187,000 in July, compared to the market expectation of 200,000, the US Bureau of Labor Statistics reported on Friday. With the immediate reaction, the USD came under modest bearish pressure. Some hawkish comments from Fed officials, however, seem to have helped the USD regain its poise. Fed Governor Michelle Bowman argued that the Fed should remain willing to raise the policy rate if data show that progress on inflation has stalled. Atlanta Fed President Raphael Bostic argued that the Fed should keep monetary policy in a restrictive territory well into 2024. According to the CME Group FedWatch Tool, mka rets are still pricing in a nearly 30% probability of one more 25 basis points Fed rate hike before the end of the year. 

EUR/USD closed the previous week virtually unchanged following Friday's rebound. Early Monday, however, the pair stays on the back foot and trades in the red below 1.1000.

GBP/USD registered small losses last week and started to stretch lower toward 1.2700 to start the new week. 

Following a two-day decline that saw the pair lose nearly 150 pips, USD/JPY regained its traction early Monday and recovered above 142.00. The Bank of Japan's Summary of Opinions for July meeting showed that one member said that the bank should conduct Yield Curve Control (YCC) with greater flexibility and thereby make preparations, so that it can successfully continue with monetary easing while nimbly responding to both upside and downside risks.

As the benchmark 10-year US Treasury bond yield retreated following the July labor market data from the US, Gold price closed the last trading day of the week in the red. With the 10-year yield holding comfortably above 4% early Monday, XAU/USD finds it difficult to build on Friday's gains and trades below $1,940.

Bitcoin spent the weekend in a relatively tight channel and was last seen moving sideways at around $29,000. Ethereum struggles to find direction and moves up and down in a narrow band slightly above $1,800.

06:58
GBP/JPY Price Analysis: 21-EMA caps the first daily gains in four around 181.00, focus on UK Q2 GDP
  • GBP/JPY snaps three-day downtrend but lacks follow-through.
  • 21-EMA, bearish MACD signals prod pair buyers even as upbeat yields, cautious optimism favor upside.
  • Downbeat prints of preliminary readings of Q2 UK GDP, break of 50-EMA can convince sellers to retake control.

GBP/JPY retreats from intraday high as it struggles to defend the first daily gains in four amid the early hour of London open on Monday, mildly bid near 181.00 by the press time.

In doing so, the cross-currency pair justifies the fears about the UK’s employment and growth conditions while also taking clues from the upbeat Treasury bond yields and mixed chatters about the Bank of Japan’s (BoJ) exit from the ultra-easy monetary policy.

With this, the GBP/JPY pair jostles with the 21-day Exponential Moving Average (EMA) hurdle surrounding 181.30.

That said, the bearish MACD signals and the downbeat UK concerns keep the pair sellers hopeful of revisiting the 180.00 threshold. However, an upward-sloping support line stretched from early April, close to 179.60 by the press time, appears a tough nut to crack for the GBP/JPY bears to crack afterward.

Even if the quote drops below 179.60, the 50-EMA support of around 179.30 will act as the last defense of the buyers before directing the quote toward the previous monthly low of surrounding 176.30.

On the contrary, a daily closing beyond the 21-EMA hurdle of 181.30 isn’t an open invitation to the GBP/JPY bulls as a downward-sloping resistance line from early July, near 183.20 at the latest, could challenge the upside moves ahead of highlighting the yearly peak of 184.00 for buyers to watch.

GBP/JPY: Daily chart

Trend: Further downside expected


06:50
NFP: USD negative arguments weighed more heavily and dominated – Commerzbank

The Dollar eased quite notably following the publication of Nonfarm Payrolls. Ulrich Leuchtmann, Head of FX and Commodity Research, analyzes USD reaction.

Gleanings from the US labor market report

The USD bears were able to refer to the fact that the NFP, the number of new jobs outside farming, was much lower than the vast majority of analysts had expected and that the previous month’s result also had to be revised downwards.

And the USD bulls were able to state that major surprises in the NFP data are not unusual and that 187K new jobs were quite good going, that the Unemployment Rate recorded a surprise MoM fall and that average hourly earnings rose a little more significantly than expected.

Anyone who thinks that the USD positive arguments were not only more numerous but also more convincing would have been in the minority on the FX market on Friday.

EUR/USD had traded in the lower 1.09 area prior to the publication, DXY above 102.50. Both levels were close to the extremes of the previous week. It therefore cannot come as a surprise that the USD negative arguments weighed more heavily and dominated – despite the doubtlessly good arguments pointing in the other direction.


06:31
AUD/JPY Price Analysis: Remains on the defensive near 93.50, within a descending trend channel
  • AUD/JPY stays defensive around 93.50, gaining 0.37% for the day.
  • The cross trades within a descending trend channel line from the middle of June on the four-hour chart.
  • The immediate resistance level for AUD/JPY is seen at 94.00; an initial support level is located at 93.00.

The AUD/JPY cross struggles to gain and hovers around the 93.50 region heading into the early European trading hours on Monday. That said, the optimistic development from China boosts the Australian Dollar against its rivals. The Chinese Ministry of Commerce announced on Friday that China will lift its anti-dumping and anti-subsidy tariffs on Australian barley imports effective August 5.

Meanwhile, the BoJ's Summary of Opinions for the July meeting stated that achieving 2% inflation in a sustained and steady manner seems to be in sight. The news adds hints of a more cautious approach to Yield Curve Control (YCC) policy and weighs on the Japanese Yen.

From a technical perspective, AUD/JPY trades within a descending trend channel line from the middle of June on the four-hour chart. That said, the path of least resistance for the AUD/JPY is to the downside as the cross holds below the 50- and 100-hour Exponential Moving Averages (EMAs).

The immediate resistance level for AUD/JPY is seen at 94.00, the 50-hour EMA, and a psychological round mark. The next barrier to watch is 94.40 (100-hour EMA), en route to 95.40 (High of July 14) and finally at 95.50 (the upper boundary of a descending trend channel).

On the flip side, the cross will meet an initial support level at 93.00 (a psychological round figure, Low of August 4). The next downside stop appears at 92.60 (the swing low of July 28), followed by 92.35 (the lower limit of a descending trend channel). A break below the latter will see a drop to 92.15 (Low of June 6).

It’s worth noting that the Relative Strength Index (RSI) and Moving Average Convergence/Divergence (MACD) hold in bearish territory, supporting the sellers for now.

AUD/JPY four-hour chart


06:28
EUR/GBP prods four-day uptrend beyond 0.8600 on downbeat German Industrial Production, UK GDP eyed EURGBP
  • EUR/GBP retreats from intraday high after rising in the last four consecutive days.
  • German Industrial Production growth contracts more than expected in June.
  • Fears of downbeat UK employment conditions, economic fears about Britain check pair bears.
  • UK Q2 GDP, second-tier data from Eurozone/Germany may entertain traders.

EUR/GBP takes a U-turn from the intraday high while challenging the previous four-day uptrend amid the initial hour of Monday’s European session. In doing so, the cross-currency pair justifies downbeat German Industrial Production (IP) data for June. However, fears about the UK’s employment and growth conditions put a floor under the quote of late.

That said, German Industrial Production figures for June dropped to -1.5% MoM versus -0.4% expected and -0.1% prior (revised) while the non-seasonally adjusted figures marked a 1.7% fall in German IP compared to 0.0% previous readings. During the last week, softer prints of the Eurozone inflation data contrast with an improvement in the bloc’s growth figures to allow the Euro to remain firmer versus the GBP.

That said, the chatters about the European Central Bank (ECB) peak rates were triggered by the global rating agency Fitch Ratings as it said on Friday that the falling Eurozone inflation puts the ECB rates peak within sight. On the same line was the ECB article which stated that the “underlying inflation likely peaked in the first half of 2023.”

On the other hand, the UK’s Recruitment and Employment Confederation (REC) survey, funded by the global quant giant KPMG, revealed downbeat employment conditions in Britain due to economic pessimism. “British employers reduced the number of new permanent staff they hired through recruitment agencies by the most since mid-2020 last month due to concerns about the economic outlook,” said the KPMG/REC poll.

It should be noted that the Bank of England (BoE) matched market forecasts by lifting the benchmark interest rates to the highest level in 15 years with a 0.25% increase to 5.25%. However, the policymakers appear divided and drowned the British Pound (GBP) despite the hawkish move.

Looking forward, German inflation will join Eurozone second-tier statistics to entertain the EUR/GBP moves. However, major attention will be given to the first readings of the second quarter Gross Domestic Product (GDP), especially amid the fears of the UK’s economic slowdown and labor market crunch.

Technical analysis

A daily closing beyond the 50-day Exponential Moving Average (EMA), around 0.8615 at the latest, joins the bullish MACD signals and upbeat RSI (14) line to keep the EUR/GBP buyers directed toward the 100-EMA hurdle of 0.8655. However, the bulls are likely to remain cautious unless witnessing a clear upside break of the descending resistance line from late April, close to 0.8665 by the press time.


06:25
USD/CNH seen at 7.08 through Q3 and 6.85 through Q4 – CIBC

Policy beta to CNH should dissipate a bit, which suggests modest downside for USD/CNH in the near-term, economists at CIBC Capital Markets report.

Biggest CNH bulls may be disappointed

Incoming policy support, and the reversal of the overvalued USD, supports our forecast of USD/CNH at 7.08 through Q3 and 6.85 through Q4.

The CNH should rally over the coming year on a declining USD and eventual fiscal support, but the biggest CNH bulls may be disappointed.

See: USD/CNY will likely continue to trade largely between the 7.10 and 7.20 range – Commerzbank


06:21
AUD/USD: Dwindling bets for a deeper pullback – UOB AUDUSD

In the view of Economist Lee Sue Ann and Markets Strategist Quek Ser Leang at UOB Group, the prospects for further decline in AUD/USD seems to be losing momentum for the time being.

Key Quotes

24-hour view: Last Thursday, AUD dropped to 0.6514 and then rebounded. On Friday, we highlighted, “Oversold conditions, coupled with early signs of slowing momentum, suggest low downside risk”, and we expected AUD to trade between 0.6530 and 0.6595. In NY trade, AUD dipped to 0.6541, rebounded strongly to 0.6610, and then pulled back to end the day at 0.6571 (+0.33%). The price movements appear to be consolidative, and today, we continue to expect AUD to trade in a range, probably between 0.6540 and 0.6600. 

Next 1-3 weeks: We have held a negative AUD view for about 2 weeks now. In our most recent narrative from last Thursday (03 Aug, spot at 0.6535), we highlighted that “while severely oversold, the weakness in AUD could extend to the year’s low near 0.6460.” On Friday, AUD rebounded to a high of 0.6610. Downward momentum is beginning to wane, and the chance of AUD dropping to 0.6460 is beginning to diminish. However, only a breach of 0.6620 (no change ‘strong resistance’ level) would indicate that AUD is not weakening further. 

06:11
Crude Oil Futures: Rally could face some resistance near term

CME Group’s flash data for crude oil futures markets noted traders reduced their open interest positions by around 4.4K contracts on Friday, partially reversing the previous daily build. Volume followed suit and dropped by around 231.2K contracts after three consecutive daily builds.

WTI: Immediately to the upside emerges the 2023 top

The rally in WTI advanced further on Friday, although this time the uptick was in tandem with diminishing open interest and volume. That said, further upside in the commodity is expected to struggle to advance further in the very near term, while it keeps the upside target unchanged at the YTD peak at $83.49 (April 12).

06:08
USD/CAD edges higher towards 1.3400 as US Dollar recovers ahead of US inflation, Oil price eases USDCAD
  • USD/CAD seeks clear directions at two-month high as bulls and bears jostle after four-day uptrend.
  • WTI crude oil retreats from yearly high marked in April amid fears of slowing energy demand from China, firmer US Dollar.
  • Downbeat Canada employment report contrasts with mixed US jobs report and hawkish Fed talks to keep Loonie pair buyers hopeful.
  • US CPI for July will be crucial for bulls to watch amid Fed’s readiness for rate hike in September.

USD/CAD aptly portrays the market’s indecision ahead of the all-important US inflation data as it prods bulls at the highest levels in nearly four months, making rounds to 1.3375-80 heading into Monday’s European session. In doing so, the Loonie pair also justifies the latest retreat in the WTI crude oil price, Canada’s key export item, as well as the US Dollar’s recovery.

WTI crude oil refreshed a two-month high near $83.00 before recently retreating to $82.30. The chatters about Saudi Arabia and Russia-inflicted supply crunch joined the OPEC+ decision to keep the output cuts intact propels the Oil price. However, the latest fears emanating from China’s typhoon Doksuri weigh on black gold prices.

On the other hand, the US Dollar Index’s (DXY) ability to snap a two-day downtrend with mild gains around 102.20 favored the Loonie pair to stay on the bull’s radar. It’s worth noting that the comparatively better US jobs report and hawkish Fed talks underpin the USD/CAD run-up even if the firmer Oil price cap the Loonie pair’s latest run-up.

On Friday, Canada’s headline Net Change in Employment slumps to -6.4K in July versus 21.1K market forecasts and 59.9K prior whereas the Unemployment Rate edged higher to 5.5% while matching forecasts, compared to 5.4% prior for July. That said, the US employment report posted a softer-than-expected Nonfarm Payrolls (NFP) figure of 187K, versus 185K prior (revised) and 200K market forecasts, whereas the Unemployment Rate eased to 3.5% from 3.6% expected and previous readings. Further, the Average Hourly Earnings reprinted 0.4% MoM and 4.4% YoY numbers by defying the expectations of witnessing a slight reduction in wage growth.

Despite the mixed US data, the hawkish comments from Federal Reserve (Fed) Governor Michelle Bowman might have limited USD/CAD fall as she said that the Fed should remain willing to raise the federal funds rate at a future meeting if the incoming data indicate that progress on inflation has stalled. Previously, Atlanta Federal Reserve Bank President Raphael Bostic said on Friday to Bloomberg, that the central bank is likely to keep monetary policy in a restrictive territory well into 2024. On the contrary, Chicago Fed President Austan Goolsbee stated that they should start thinking about how long to hold rates.

Looking forward, the Canadian economic calendar appears mostly silent, apart from the second-tier housing and trade numbers, which in turn highlights this week’s US Consumer Price Index (CPI) and Producer Price Index (PPI) for July for clear directions. Should the US inflation data suggest escalating price pressure, the USD/CAD bulls can dominate further.

Technical analysis

A clear upside break of the 100 and 200-day Exponential Moving Average (EMA), around 1.3360-55 by the press time, keeps USD/CAD buyers hopeful even if the nearly overbought RSI prods the upside momentum of late.


06:01
Norway Manufacturing Output above expectations (-0.1%) in June: Actual (0%)
06:01
German Industrial Production falls 1.5% MoM in June vs. -0.4% expected

Industrial Production in Germany fell more than expected in June, the official data showed on Monday, suggesting that the manufacturing sector activity is deteriorating.

Eurozone’s economic powerhouse’s Industrial Output dropped 1.5% MoM, the federal statistics authority Destatis said in figures adjusted for seasonal and calendar effects, vs. -0.4% expected and -0.1% previous.

The annual German Industrial Production declined by 1.7% in June versus a 0% figure seen in May.

FX implications

The shared currency is holding lower ground below 1.1000 against the US Dollar following the downbeat German industrial figures. The pair is shedding 0.25% on the day, as of writing.

06:01
South Africa Gross $Gold & Forex Reserve above forecasts ($61.63B) in July: Actual ($62.212B)
06:01
South Africa Net $Gold & Forex Reserve above expectations ($55.182B) in July: Actual ($55.626B)
06:01
United Kingdom Halifax House Prices (MoM) down to -0.3% in July from previous -0.1%
06:01
Germany Industrial Production s.a. (MoM) below expectations (-0.4%) in June: Actual (-1.5%)
06:01
Germany Industrial Production n.s.a. w.d.a. (YoY): -1.7% (June) vs previous 0.7%
06:00
United Kingdom Halifax House Prices (YoY/3m) up to -2.4% in July from previous -2.6%
05:56
GBP/USD: Still scope for further downside – UOB GBPUSD

GBP/USD still risks a potential drop to the 1.2580 region in the short-term horizon, note Economist Lee Sue Ann and Markets Strategist Quek Ser Leang at UOB Group.

Key Quotes

24-hour view: After GBP plummeted to 1.2620 and rebounded, we indicated last Friday that “Downward momentum has slowed, and this combined with still overbought conditions, suggests GBP is unlikely to weaken further.” We expected GBP to trade sideways in a range of 1.2670/1.2770. GBP then dropped to 1.2689, soared to 1.2791 before ending the day at 1.2752 (+0.33%). The current price movements are likely part of a broad trading range. Today, we expect GBP to trade between 1.2700 and 1.2800.

Next 1-3 weeks: Last Thursday (03 Aug), GBP plummeted to 1.2620 and then rebounded strongly. In our update from last Friday (04 Aug, spot at 1.2715), we noted that “downward momentum has eased somewhat.” However, we indicated that “there is a chance for GBP to drop further to 1.2580.”. We continue to hold the same view. Overall, only a breach of 1.2830 (no change in ‘strong resistance’ level) would indicate that the GBP weakness from more than a week ago has stabilised. 

05:53
Gold Futures: Near-term knee-jerk on the cards

Open interest in gold futures markets shrank for the second session in a row at the end of last week, this time by around 2.5K contracts according to preliminary readings from CME Group. Volume, instead, went up by around 13.3K contracts, reversing the previous daily pullback.

Gold: Next on the downside comes $1900

Friday’s daily gains in gold prices came on the back of shrinking open interest, which hints at the idea that further gains appear not favoured for the time being. In case loses accelerate, the precious metal is expected to meet the next contention of relevance around the $1900 region per troy ounce.

05:49
Switzerland Unemployment Rate s.a (MoM) meets forecasts (1.9%) in July
05:41
Asian Stock Market: Trades mixed, investors await Chinese/ Indian CPI data
  • Asian stock markets trade mixed following the US mixed results.
  • The Reserve Bank of India (RBI) is expected to hold interest rates at 6.5% at its upcoming policy meeting.
  • The lack of specifics about an additional stimulus plan from the Chinese government has dampened investor expectations.
  • Investors await the Chinese CPI YoY, the Indian CPI for July.

Asian stock markets trade mixed on Monday following mixed US employment data. That said, the Nonfarm Payrolls in the US rose 187,000 in July, worse than expected by 200,000. The figures in June were revised down to 185,000. This marked the lowest reading since December 2020. Meanwhile, the Unemployment Rate fell to 3.5% from 3.6%. The Average Hourly Earnings came in at 4.4%, higher than the market estimate of 4.2%. Market participants will keep an eye on the inflation data from China and India. Also, the Reserve Bank of India's (RBI) interest rate decision on Thursday.

At press time, the Nikkei gains 0.13%, Shanghai drops 0.56%, Hang Sang drops 0.02%, the Shenzhen Component Index falls 0.72%, and the Kospi Index is down 0.68%.

The NIFTY 50, the National Stock Exchange of India, gains 0.35%. The Reserve Bank of India (RBI) is widely anticipated to hold the key interest rate at 6.5% for the third consecutive time at its upcoming monetary policy meeting scheduled for Thursday. Also, the Indian Consumer Price Index (CPI) for July and Industrial Production for June will be released on Friday. It’s worth noting that the RBI started hiking in May 2022 and has maintained the repo rate at 6.5% since February.

In China, the country’s top economic committees announced on Friday that the government will implement additional measures to boost consumer expenditure and enhance local liquidity. However, officials once again provided no significant details on the planned stimulus. The government's lack of specific plans has dampened investor expectations. Additionally, China’s Caixin Services PMI climbed to 54.1 in July from 53.9 prior, better than the market consensus of 52.5.

On the other hand, exacerbated tensions between the US and China could exert pressure in the region. According to Reuters, US President Joe Biden is expected to issue an executive order this week to restrict US investments in China in the high-tech sector, artificial intelligence, semiconductors, and quantum computing.

Moving on, market participants will monitor the headlines surrounding the US-China relationship. The key focus this week will be the Chinese CPI YoY, the Indian Consumer Price Index (CPI) for July, and Industrial Production for June, due on Friday. The data could give direction to riskier assets like Gold, equities, the AUD/USD, etc.

05:35
USD/CHF Price Analysis: Bounces off 0.8720–15 support confluence, focus on US inflation USDCHF
  • USD/CHF prints the first daily gains in three within one-week-old rising wedge bearish chart pattern.
  • 50-SMA adds strength to 0.8720–15 support amid bearish MACD signals.
  • 200-SMA guards immediate upside ahead of nine-week-old descending resistance line.
  • Multiple troughs marked since mid-July together constitute short-term key support near 0.8565-55.

USD/CHF grinds near the intraday high surrounding 0.8755 as it prints the first daily gain in three heading into Monday’s European session. In doing so, the Swiss Franc (CHF) pair extends the previous day’s rebound from the 50-SMA.

Despite the pair’s latest rebound from the 50-SMA, it portrays a fortnight-old rising wedge bearish chart formation, currently between 0.8715 and 0.8840.

However, the bearish MACD signals and the 200-SMA hurdle of 0.8790 restrict the immediate recovery of the USD/CHF pair.

Even if the USD/CHF bulls manage to cross the 0.8840 hurdle and defy the rising wedge bearish chart pattern, a downward-sloping resistance line from May 31, close to 0.8860 at the latest, will act as the last defense of the sellers.

Meanwhile, a clear downside break of the 0.8720–15 support confluence, encompassing the stated wedge’s lower line and the 50-SMA, will recall the USD/CHF bears.

Following that, a slew of lows marked since July 14, close to 0.8565–55, will be in the spotlight as a break which will direct the Swiss Franc pair towards the theoretical target of the rising wedge confirmation, close to 0.8470.

USD/CHF: Four-hour chart

Trend: Pullback expected


05:29
EUR/USD seems to have moved into a consolidative phase – UOB EURUSD

Economist Lee Sue Ann and Markets Strategist Quek Ser Leang at UOB Group suggest EUR/USD could ace some consolidation in the near term.

Key Quotes

24-hour view: The strong bounce that sent EUR to a high of 1.1041 last Friday came as a surprise (we were expecting it to trade in a range). The rapid advance has scope to test 1.1045 before the risk of a more sustained pullback increases. The major resistance at 1.1100 is not expected to come under threat. On the downside, if EUR breaks below 1.0955 (minor support is at 1.0975), it would mean that the current upward pressure has eased. 

Next 1-3 weeks: After EUR dropped to 1.0910, in our latest narrative from last Thursday (03 Aug, spot at 1.0940), we held the view that EUR could weaken further to 1.0865. On Friday, EUR rebounded strongly and took out our ‘strong resistance’ level of 1.1020. The breach of the ‘strong resistance’ level means that the EUR weakness that started more than a week ago has stabilised. For the time being, we expect EUR to trade in a range, likely between 1.0920 and 1.1100. 

05:05
Gold Price Forecast: XAU/USD sellers eye $1,915 and US inflation – Confluence Detector
  • Gold Price fades corrective bounce off one-month low, stays below jungle of resistances.
  • Hawkish Fed talks, pre-data positioning defend US Dollar bulls and weigh on XAU/USD price.
  • US inflation clues will be crucial to determine September Fed rate hike and can drown XAU/USD towards $1,915 support confluence.
  • Post-NFP fall joins fears of Fed policy pivot, China stimulus to put a floor under the Gold Price.

Gold Price (XAU/USD) remains on the backfoot as it retreats toward a $1,915 support confluence amid a broad US Dollar rebound, as well as mixed mood, ahead of the scheduled inflation clues from the US, China, Australia and New Zealand. Also important will be this week’s UK growth numbers and China trade data as the market struggles for clear directions.

It’s worth noting that Friday’s downbeat prints of the US Nonfarm Payrolls (NFP) joined the mixed Fed signals to trigger the US Dollar’s retreat from a multi-day high, which in turn allowed the Gold Price to recover from a multi-day-old support line. However, the weekend comments from Fed Governor Michelle Bowman appear hawkish and join the looming geopolitical fears surrounding China to exert downside pressure on the XAU/USD.

Apart from that, the Gold market’s consolidation ahead of festive demand from India, one of the key customers of XAU/USD, also keeps the metal prices down ahead of the key data/events from the US.

That said, the XAU/USD traders should keep their eyes on Thursday’s US Consumer Price Index (CPI) and Friday’s Producer Price Index (PPI) for July for clear directions. Should the inflation data arrive as positive, the Gold sellers can break the stated key support line stretched from October 2022, which in turn will be detrimental for the bulls.

Also read: Gold Price Forecast: XAU/USD needs validation from 50 DMA to extend the recovery

Gold Price: Key levels to watch

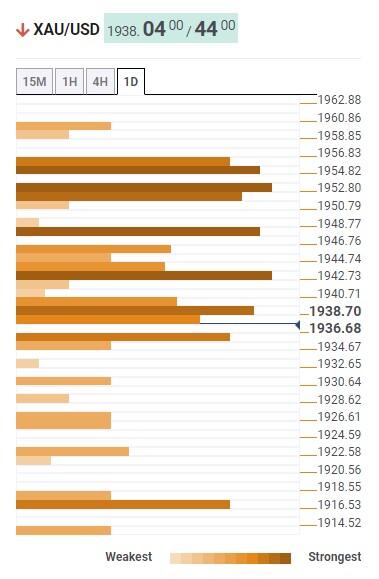
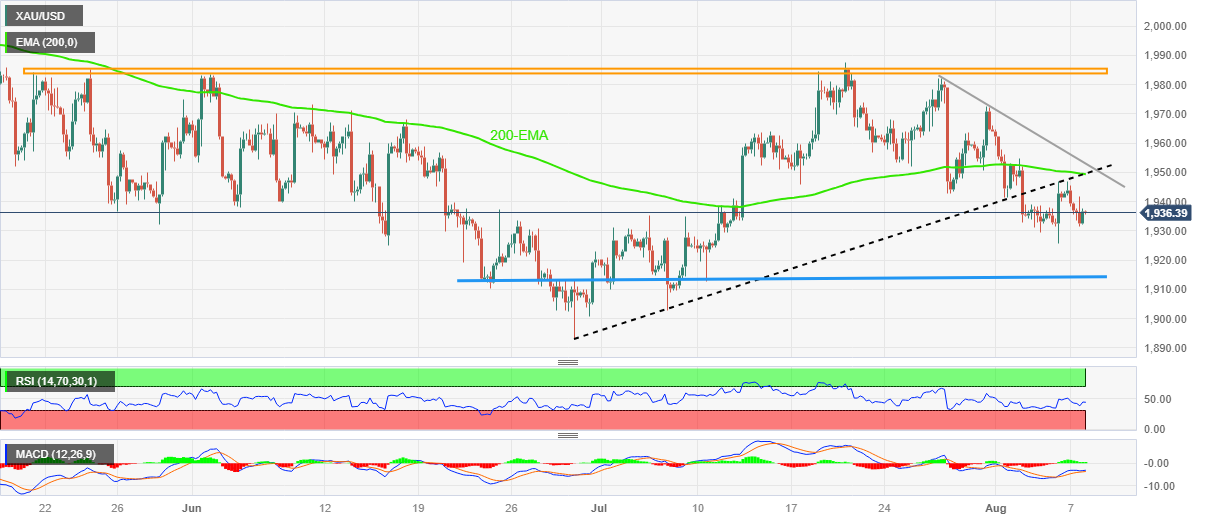
As per our Technical Confluence indicator, the Gold Price remains well beneath the jungle of resistances surrounding $1,940-60, which in turn joins a comparative space towards the south before hitting $1,915 support to lure the XAU/USD sellers.

That said, Fibonacci 61.8% on one-month, around $1,935 by the press time, acts as the last defense of the Gold buyers, a break of which could quickly drag the quote toward $1,915 support confluence encompassing Pivot Point one-month S1 and one-day S2.

It’s worth noting that the Gold Price weakness past $1,915 will make it vulnerable to testing the $1,900 threshold.

Alternatively, Fibonacci 23.6% on one-day and 38.2% on one-week restricts the immediate upside of the Gold Price near $1,940.

Following that, the previous daily high and the upper band of the Bollinger on the hours chart could test the XAU/USD run-up near $1,948.

In a case where the Gold Price remains firmer past $1,948, the 10-DMA level of around $1,952 can check the metal’s further upside.

Above all, the middle band of Bollinger on one-day, Fibonacci 61.8% on one-week and 38.2% on one-month appear a tough nut to crack for the Gold buyers near $1,955.

In a case where the XAU/USD remains bullish past $1,955, the $1,960 resistance encompassing Pivot Point one-day R2 will act as the final defense of the bears.

Here is how it looks on the tool

fxsoriginal

About Technical Confluences Detector

The TCD (Technical Confluences Detector) is a tool to locate and point out those price levels where there is a congestion of indicators, moving averages, Fibonacci levels, Pivot Points, etc.  If you are a short-term trader, you will find entry points for counter-trend strategies and hunt a few points at a time. If you are a medium-to-long-term trader, this tool will allow you to know in advance the price levels where a medium-to-long-term trend may stop and rest, where to unwind positions, or where to increase your position size.

05:02
Japan Coincident Index climbed from previous 114.3 to 115.2 in June
05:02
Japan Leading Economic Index: 108.9 (June) vs previous 109.2
04:55
EUR/USD remains on the defensive below 1.1000, seems vulnerable amid modest USD strength EURUSD
  • EUR/USD comes under some selling pressure and is undermined by reviving USD demand.
  • Bets for more Fed rate hikes turn out to be a key factor lending some support to the buck.
  • Expectations that the ECB will soon end its rate-hiking cycle contribute to the offered tone.

The EUR/USD pair meets with some supply on the first day of a new week and retreats further from a four-day peak, around the 1.1040 area touched in reaction to the rather unimpressive headline US NFP print on Friday. Spot prices slip back below the 1.1000 psychological mark during the Asian session and for now, seem to have stalled a two-day-old recovery from the 100-day Simple Moving Average (SMA), around the 1.0910 area, or a nearly one-month low touched last Thursday.

The US Dollar (USD) attracts some dip-buying in the wake of growing acceptance that the Federal Reserve (Fed) will stick to its hawkish stance and turns out to be a key factor exerting some pressure on the EUR/USD pair. The closely-watched US monthly employment details showed that the economy added 187K jobs in July, which, along with a downward revision of readings for May and June, suggested demand for workers was slowing. That said, solid wage growth and an unexpected downtick in the unemployment rate pointed to continued tightness in the labour market. This keeps the door for one more 25 bps rate hike by the Federal Reserve (Fed) in September or November wide open and lends some support to the buck.

The shared currency, on the other hand, is undermined by expectations that the European Central Bank (ECB) will halt its streak of nine consecutive interest rate hikes in September amid signs that the underlying inflation in the Euro Zone has peaked. In fact, Fitch Ratings said on Friday that falling Euro Zone inflation puts ECB rates peak within sight. Moreover, the ECB, in its economic bulletin published on Friday, noted that the ECB noted that the underlying inflation in the region likely peaked during the first half of 2023. This is seen as another factor that contributes to the offered tone surrounding the EUR/USD pair. Bears, however, might refrain from placing aggressive bets ahead of this week's release of the US inflation figures.

The crucial US CPI report is due on Thursday, which will play a key role in influencing market expectations about the Fed's future rate-hike path and driving the USD demand. In the meantime, traders on Monday will take cues from the Euro Zone macro data - German Industrial Production and Sentix Investor Confidence. Meanwhile, there isn't any relevant economic data due for release from the US, leaving the USD at the mercy of speeches by a slew of FOMC members. Any policy-related remarks might provide some impetus to the buck and allow traders to grab short-term opportunities around the EUIR/USD pair. Nevertheless, the aforementioned fundamental backdrop suggests that the path of least resistance for spot prices is to the downside.

Technical levels to watch


04:52
AUD/USD posts modest gains around the 0.6570 mark, Australia/US inflation eyed AUDUSD
  • AUD/USD posts modest gains around 0.7575, up 0.06% for the day.
  • The US Nonfarm Payrolls rose 187,000 in July, worse than expected at 200,000.
  • China will lift its anti-dumping and anti-subsidy tariffs on Australian barley imports effective August 5.
  • Investors await the Chinese Consumer Price Index (CPI) YoY, US CPI and the Produce Price Index (PPI).

The AUD/USD pair kicks off the new week on a positive note and gains traction near 0.6575 during the Asian session on Monday. The uptick in the Aussie is supported by the softer US employment data released on Friday.

The US Bureau of Labor Statistics (BLS) reported on Friday that the Nonfarm Payrolls in the US rose 187,000 in July, worse than expected by 200,000. The figures in June were revised down to 185,000. This marked the lowest reading since December 2020.

Meanwhile, the Unemployment Rate fell to 3.5% from 3.6%. The annual wage inflation, as measured by changes in Average Hourly Earnings, came in at 4.4%, higher than the market estimation of 4.2%. Finally, the Labour Force Participation remained unchanged at 62.6%. The softer data indicated a sluggish labour market in the US, which could convince the Federal Reserve (Fed) to lower interest rates and cap the upside for the USD.

On the Aussie front, Reserve Bank of Australia (RBA) Governor Phillip Lowe remarked that the decision to keep rates intact gives the RBA more time to analyse the impact of the interest rate hikes and the economic outlook. However, more monetary policy tightening may be necessary to guarantee that inflation returns to target in a reasonable timeframe, but this will depend on the data and the developing risk assessment.

About the data, the Australian Bureau of Statistics (ABS) showed last week that the Australian Trade Balance was A$11,321M, marginally lower than the A$11.791M recorded in May. Exports declined 2% as coal, mineral fuels, and metals shipments slowed in response to a decline in commodity demand in China. However, the decline in exports was offset by a 4% decline in imports in May. Meanwhile, Retail Sales QoQ came in at -0.5% from -0.6% prior.

Furthermore, the Chinese Ministry of Commerce announced on Friday that China will lift its anti-dumping and anti-subsidy tariffs on Australian barley imports effective August 5. This, in turn, boosts the Australian Dollar against its rivals.

It’s worth noting that China’s Caixin Services PMI climbed to 54.1 in July from 53.9 prior, better than the market consensus of 52.5. The upbeat Chinese economic figure could also benefit the China-proxy Australian Dollar (AUD).

Market participants will digest the data on Friday due to the absence of the economic data release from Australia on the Bank holiday. On Wednesday, attention will shift to the Chinese Consumer Price Index (CPI) YoY. Also, the US Consumer Price Index (CPI) for July and the Produce Price Index (PPI) will be due later this week. Market players anticipate a 0.2% monthly increase in US CPI. The data will be critical for determining a clear movement for the AUD/USD pair.


04:33
USD/IDR Price News: Rupiah fails to cheer upbeat Indonesia GDP near 15,200 ahead of US inflation
  • USD/IDR clings to mild gains around intraday high despite better-than-prior Q2 Indonesia GDP.
  • US Dollar rebounds ahead of inflation data amid hawkish Fed talks, mixed statistics at home.
  • Cautious optimism in Asia-Pacific zone joins sluggish markets to restrict Rupiah moves.

USD/IDR holds onto the previous day’s recovery moves as it sticks to mild gains near 15,185 amid early Monday morning in Europe. In doing so, the Indonesia Rupiah (IDR) pair fails to justify the upbeats results of Indonesia’s second quarter (Q2) Gross Domestic Product (GDP) figures. That said, the reason could be linked to the US Dollar’s upbeat performance ahead of the headlines inflation data.

Indonesia’s Q2 GDP rose to 3.86% QoQ and 5.17% YoY versus 3.72% and 4.93% respective market expectations. It’s worth noting that the growth numbers were -0.92% QoQ and 5.03% YoY in the first quarter (Q1) of 2023.

In contrast to the upbeat Indonesia growth numbers, escalating fears from typhoon Doksuri in China weigh on the IDR. With this, stocks in China and Hong Kong print mild losses even as Beijing hints at further stimulus to defend the economy.

On the other hand, the US Dollar Index snaps a two-day downtrend with mild gains around 102.16 backed by the weekend comments from Federal Reserve (Fed) Governor Michelle Bowman. “Fed should remain willing to raise the federal funds rate at a future meeting if the incoming data indicate that progress on inflation has stalled,” said Fed’s Bowman on Saturday.

Previously, the US Dollar dropped in the last two consecutive days amid mixed Fed talks and US data. On Friday, Atlanta Federal Reserve Bank President Raphael Bostic said to Bloomberg that the central bank is likely to keep monetary policy in a restrictive territory well into 2024. However, Chicago Fed President Austan Goolsbee stated that they should start thinking about how long to hold rates.

Meanwhile, the US employment report posted a softer-than-expected Nonfarm Payrolls (NFP) figure of 187K, versus 185K prior (revised) and 200K market forecasts, whereas the Unemployment Rate eased to 3.5% from 3.6% expected and previous readings. Further, the Average Hourly Earnings reprinted 0.4% MoM and 4.4% YoY numbers by defying the expectations of witnessing a slight reduction in wage growth.

Looking forward, Wednesday’s Indonesia Retail Sales for June may entertain the USD/IDR pair traders ahead of Thursday’s US Consumer Price Index (CPI) and Friday’s Producer Price Index (PPI) for July.

Technical analysis

USD/IDR justifies Friday’s bullish Doji candlestick to lure buyers amid the bullish MACD signals and upbeat RSI (14) line. However, a daily closing beyond the 200-DMA hurdle surrounding 15,185 becomes necessary for the Indian Rupiah (IDR) pair to aim for the previous weekly high of around 15,230.


04:12
GBP/USD trades with a mild negative bias, below mid-1.2700 amid reviving USD demand GBPUSD
  • GBP/USD attracts some sellers on Monday and is pressured by modest USD strength.
  • Bets for more interest rate hikes by the Fed help revive demand for the Greenback.
  • The BoE’s less hawkish forward guidance also contributes to the mildly offered tone.

The GBP/USD pair extends Friday's late pullback from the 1.2800 neighbourhood and edges lower during the Asian session on Monday, though lacks follow-through selling. Spot prices currently trade around the 1.2735 region, representing the 50-day Simple Moving Average (SMA) and manage to hold comfortably above a five-week low touched last Thursday.

As investors look past Friday's mixed US monthly employment details, the prospects for further policy tightening by the Federal Reserve (Fed) assist the US Dollar (USD) to attract some buying and act as a headwind for the GBP/USD pair. It is worth recalling that the headline US NFP missed consensus estimates and showed that the economy added 187K jobs in July. Adding to this, the readings for May and June were revised down, suggesting that demand for workers was slowing. That said, solid wage growth and a downtick in the unemployment rate pointed to continued tightness in the labour market. This keeps the door for one more 25 bps rate hike by the Federal Reserve (Fed) in September or November wide open and lends some support to the buck.

The British Pound (GBP), on the other hand, is undermined by the Bank of England's (BoE) less hawkish forward guidance that rates were close to a peak. In fact, the UK central bank, after raising its key interest rate by 25 bps to a 15-year peak level of 5.25% last Thursday, stated that the current monetary policy stance is "restrictive". This further contributes to a mildly offered tone surrounding the GBP/USD pair. The BoE, however, pushed back against market expectations for interest rate cuts in 2024 and warned that rates would stay higher for longer to bring inflation down to target. This, in turn, holds back traders from placing aggressive bearish bets around the major and warrants some caution before positioning for the resumption of a three-week-old downtrend.

Market participants might also prefer to move to the sidelines ahead of this week's release of the latest US consumer inflation figures on Thursday and a slew of important UK macro data, including the monthly GDP print on Friday. In the meantime, speeches by influential FOMC members on Monday might influence the USD price dynamics and provide some impetus to the GBP/USD pair in the absence of any relevant market-moving economic releases. Nevertheless, the aforementioned mixed fundamental backdrop suggests that strong follow-through selling is needed to support prospects for a further intraday depreciating move.

Technical levels to watch


04:10
Indonesia Gross Domestic Product (YoY) came in at 5.17%, above expectations (4.93%) in 2Q
04:10
Indonesia Gross Domestic Product (QoQ) above expectations (3.72%) in 2Q: Actual (3.86%)
04:04
USD/INR holds positive ground above the 82.70 area, RBI policy meeting, inflation data eyed
  • USD/INR posts a modest gain around 82.70 ahead of the key event.
  • The Reserve Bank of India (RBI) is expected to hold the key interest rate at 6.50%.
  • The US Nonfarm Payrolls report showed that the US economy added 187,000 jobs in July.
  • Investors focus on the RBI policy meeting, the Indian CPI Industrial Production.

The USD/INR pair posts a modest gain after retreating from multi-month highs of 81.90 during the early Asian session on Monday. The pair currently trades within a large consolidation phase since October 2022 and holds above 82.70, up 0.06% for the day. Meanwhile, the US dollar Index (DXY), a measure of the value of USD against a basket of six influential currencies, consolidates its recent loss near 102.08.

The Reserve Bank of India (RBI) is widely anticipated to hold the key interest rate at 6.5% for the third consecutive time at its upcoming monetary policy meeting scheduled for Thursday.

According to a Reuters poll, the market anticipates that the Indian Rupee (INR) is likely to move in a narrow range for the next three months as the Reserve Bank of India (RBI) utilises its enormous foreign exchange reserves to keep the currency steady. That said, the possibility that the RBI could periodically intervene to prevent the rupee from falling further might cap the upside for the USD/INR pair.

On the US dollar front, the US Nonfarm Payrolls report showed that the US economy added 187,000 jobs in July. The June figures were revised lower to 185,000. Meanwhile, the Unemployment Rate decreased to 3.5% from 3.6%, and Average Hourly Earnings came in at 4.4%, surpassing the market's forecast of 4.2%.

Market participants will closely watch the RBI monetary policy meeting scheduled for Tuesday to Thursday, and the policy decision will be announced on Thursday. Also, the Indian Consumer Price Index (CPI) for July and Industrial Production for June will be released on Friday. This event could significantly impact the Indian Rupee and provide a clear direction for the pair. On the US docket, the US Consumer Price Index (CPI) for July and the Produce Price Index (PPI) will be due later this week. Market players anticipate a 0.2% monthly increase in US CPI.

USD/INR Technical Outlook:

From the technical perspective, two converging trend lines constitute the formation of a symmetrical triangle pattern on the daily chart. The Relative Strength Index (RSI) holds above 50, and the Moving Average Convergence/Divergence (MACD) stands in bullish territory, supporting the buyers for now.

Resistance levels: 83.00, 83.20, and 83.40.

Support levels: 82.40, 82.20, 81.90 and 81.65. 

USD/INR daily chart


03:26
USD/CAD Price Analysis: Bulls need to make it through 100-day SMA hurdle near 1.3400 mark USDCAD
  • USD/CAD consolidates in a range around the 50% Fibo. through the Asian session on Monday.
  • The fundamental backdrop favours bullish traders and supports prospects for additional gains.
  • A sustained break below the 1.3225 area is needed to negate the near-term positive outlook.

The USD/CAD pair kicks off the new week on a subdued note and oscillates in a narrow band around the 1.3370 area through the Asian session. Spot prices remain below a two-month peak touched on Friday and currently trade around the 50% Fibonacci retracement level of the May-July downfall.

Despite signs that demand for workers in the US was slowing, solid wage growth and a downtick in the unemployment rate pointed to continued tightness in the labour market. This should allow the Federal Reserve (Fed) will keep rates higher for longer and assists the USD to attract some dip-buying on Monday. The Canadian Dollar (CAD), on the other hand, is weighed down by the disappointing release of the domestic jobs report. Furthermore, Crude Oil prices ease from a fresh multi-month top and undermine the commodity-linked Loonie, which, in turn, acts as a tailwind for the USD/CAD pair.

The fundamental backdrop suggests that the path of least resistance for spot prices is to the upside, though bulls might still wait for sustained strength and acceptance beyond the 1.3400 mark, or the 100-day Simple Moving Average (SMA) before placing fresh bets. The USD/CAD pair might then climb to the 1.3445-1.3450 confluence hurdle, comprising the very important 200-day SMA and the 61.8% Fibo. level. The latter should act as a pivotal point, which if cleared will mark a fresh breakout and set the stage for an extension of the recent recovery from sub-1.3100 levels, or the YTD low touched in July.

On the flip side, the 1.3350 area now seems to protect the immediate downside ahead of the 38.2% Fibo. level, around the 1.3300 mark. The subsequent downfall is more likely to attract fresh buying near the 1.3250 horizontal support and remain limited near the 1.3225 region, or the 23.6% Fibo. level. That said, some follow-through selling will negate any near-term positive outlook and make the USD/CAD pair vulnerable to weakening below the 1.3200 mark. Spot prices might then accelerate the fall to the 1.3160-1.3150 intermediate support before eventually dropping to challenge the 1.3100 mark.

USD/CAD daily chart

fxsoriginal

Key levels to watch


03:19
USD/MXN Price Analysis: Peso stretches recovery from 17.40 key level as US/Mexico inflation data loom
  • USD/MXN holds lower ground near intraday bottom, defends previous day’s U-turn from support-turned-resistance.
  • Clear break below 50-DMA keeps Mexican Peso buyers hopeful.
  • US CPI, Mexico Core Inflation for July eyed for clear directions.

USD/MXN bears keep the reins at the intraday low of around 17.04 during early Monday, keeping the previous day’s U-turn from the support-turned-resistance stretched from mid-May.

Adding strength to the downside bias about the Mexican Peso (MXN) pair is the quote’s clear downside break of the 50-DMA, as well as the cautious mood ahead of the inflation from Mexico and the US for July.

Even so, the bullish MACD signals and one-month-old horizontal support around the 17.00 round figure prods USD/MXN bears before giving them control.

In that case, 16.70 and the multi-month low marked in July around 16.60 will be in the spotlight.

Alternatively, the 50-DMA level of around 17.10 guards the immediate recovery of the USD/MXN pair ahead of the aforementioned support-turned-resistance, close to 17.38-40.

It should be noted that the Mexican Peso sellers remain off guard unless breaking the 100-DMA surrounding 17.55.

Above, the US and Mexican inflation data for July will be crucial to watch as the USD/MXN resumes the original downtrend. Should the scheduled data justify dovish concerns about the Fed and/or hopes of another rate hike from Banxico, the quote won’t hesitate to challenge the yearly low marked in July around 16.62.

USD/MXN: Daily chart

Trend: Further weakness expected


02:57
USD/JPY traces mildly bid yields near 142.00, ignores hawkish BoJ concerns ahead of US CPI USDJPY
  • USD/JPY recovers from the lowest level in a week, prints the first daily gain in three.
  • US 10-year Treasury bond yields consolidate the biggest daily slump in three months.
  • China-linked fears, hawkish BoJ Summary of Opinions and pre-inflation moves propel Yen prices.
  • US CPI, PPI and BoJ chatters will be important for clear directions.

USD/JPY renews its intraday high near 142.00 as it tracks the recovery in the US Treasury bond yields during early Monday. In doing so, the Yen pair ignores hawkish signals flashed by the Summary of Opinions for Bank of Japan’s (BoJ) monetary policy meeting held in July. The reason could be linked to the US Dollar’s rebound amid the cautious mood ahead of this week’s US Consumer Price Index (CPI) and Producer Price Index (PPI) for July.

Earlier in the day, BoJ’s Summary of Opinions for the July meeting showed that one member said the achievement of 2% inflation in a sustainable and stable manner seems to have clearly come in sight. The news joins signals of tweaking Yield Curve Control (YCC) policy with greater care to weigh on the JPY amid hawkish BoJ concerns.

In the last week, Bank of Japan’s (BoJ) two unscheduled bond-buying programs and the decision-makers’ defenses of the easy-money policy flags fears of the BoJ’s exit from the record low interest rate and/or a tweak to the Yield Curve Control (YCC) policy.

Bank of Japan (BoJ) released a full version of its quarterly outlook report while stating that Japan's core consumer inflation is likely to gradually slow toward year-end. Bank of Japan (BoJ) Deputy Governor Shinichi Uchida signaled the Japanese central bank’s meddling before the 10-year yield hits 1.0% and fueled the Japanese Yen (JPY). The policymaker also said, “If economic and price conditions change from now, there is a chance BoJ’s response could change.

However, the US Dollar Index’s (DXY) ability to snap a two-day downtrend with mild gains around 102.10 favored the Yen pair to return to the bull’s radar by printing the first daily gain in three. Further, the US credit rating downgrade also bolstered the Greenback’s haven demand and favored the USD/JPY bulls as well.

It’s worth noting that the DXY rose in the last three consecutive weeks before retreating amid mixed US data. That said, the US employment report posted a softer-than-expected Nonfarm Payrolls (NFP) figure of 187K, versus 185K prior (revised) and 200K market forecasts, whereas the Unemployment Rate eased to 3.5% from 3.6% expected and previous readings. Further, the Average Hourly Earnings reprinted 0.4% MoM and 4.4% YoY numbers by defying the expectations of witnessing a slight reduction in wage growth.

Elsewhere, the hawkish comments from Federal Reserve (Fed) Governor Michelle Bowman might have recently triggered the USD/JPY rebound as she said that the Fed should remain willing to raise the federal funds rate at a future meeting if the incoming data indicate that progress on inflation has stalled.

 Previously, Atlanta Federal Reserve Bank President Raphael Bostic said on Friday to Bloomberg, that the central bank is likely to keep monetary policy in a restrictive territory well into 2024. On the contrary, Chicago Fed President Austan Goolsbee stated that they should start thinking about how long to hold rates.

Looking ahead, USD/JPY traders should seek more clues about the BoJ’s exit from the ultra-easy monetary policy for clear directions. Also important to watch will be this week’s US inflation data as the Fed’s September rate hike looms.

Technical analysis

Although the 21-day Exponential Moving Average (EMA) restricts immediate USD/JPY downside near 141.50, downbeat oscillators join a six-week-old horizontal resistance area surrounding 143.90-144.00 to challenge the Yen pair’s recovery.


02:49
Gold Price Forecast: XAU/USD struggles to capitalize on post-NFP bounce from multi-week low
  • Gold price edges lower on Monday and is pressured by the emergence of some US Dollar buying.
  • Bets for more interest rate hikes by the Federal Reserve help revive demand for the Greenback.
  • The fundamental backdrop supports prospects for an extension of the recent downward trend.

Gold price attracts some selling following an early uptick to the $1,946 area during the Asian session on Monday and drops to a fresh daily low in the last hour. The XAU/USD currently trades around the $1,940 region and for now, seems to have stalled its modest recovery move from the lowest level since July 11 touched on Friday.

The closely-watched monthly jobs data from the United States (US) showed that the economy maintained a moderate pace of job growth in July. Furthermore, the readings for May and June were revised down, suggesting that demand for workers was slowing. This halted the recent surge in Treasury yields and weighed heavily on the US Dollar (USD) on Friday, which was seen as a key factor that prompted some short-covering around the Gold price.

That said, solid wage gains and an unexpected downtick in the unemployment rate pointed to continued tightness in the labour market. This, in turn, reaffirms market expectations that the Federal Reserve (Fed) will keep interest rates higher for longer and assists the USD to attract some dip-buying on the first day of a new week. A stronger buck tends to act as a headwind for the US Dollar-denominated Gold price and is seen exerting some downward pressure.

Apart from this, the underlying bullish sentiment around the global equity markets, bolstered by continued support from the Chinese government, contributes to the mildly offered tone surrounding the safe-haven precious metal. The USD bulls, however, seem reluctant to place aggressive bets ahead of the crucial US consumer inflation data, due for release on Thursday. This, in turn, could lend some support to the Gold price and help limit the downside.

Moving ahead, there isn't any relevant market-moving economic data due for release from the US on Monday. Hence, traders will take cues from speeches by influential Fed officials, which might drive the US bond yields and the USD demand. Apart from this, the broader risk sentiment could provide some impetus to the Gold price. The fundamental backdrop, meanwhile, seems tilted in favour of bears and supports prospects for an extension of over a two-week-old downtrend.

Technical levels to watch


02:31
NZD/USD Price Analysis: Kiwi rebound eyes 0.6150 and NZ/US inflation clues NZDUSD
  • NZD/USD defends previous recovery from the key Fibonacci retracement level, clings to mild gains of late.
  • Upside oscillators favor recovery towards previous support line.
  • Three-week-old falling resistance line, 200-SMA challenge Kiwi buyers.
  • Kiwi sellers need validation from multi-day-old horizontal support zone, RBNZ Inflation Expectations and US CPI.

NZD/USD renews its intraday high near 0.6115 as it extends the previous run-up during the mid-Asian session on Monday. In doing so, the Kiwi pair justifies the US Dollar’s struggle ahead of this week’s US Consumer Price Index (CPI) data while also cheering the optimism ahead of the Reserve Bank of New Zealand’s Inflation Expectations for the third quarter (Q3) of 2023.

That said, the bullish MACD signals and upbeat RSI (14) line, not overbought, favor the quote’s recovery moves from the 78.6% Fibonacci retracement of the May-July upside.

With this, the NZD/USD bulls appear well-set to challenge the previous support line stretched from May 31, close to 0.6140 by the press time.

Following that, the 61.8% Fibonacci retracement and a downward-sloping resistance line from July 14, respectively ear 0.6145 and 0.6150, will challenge the Kiwi buyers before giving them control.

Even so, the 200-SMA around 0.6195 and the 0.6200 round figure will act as the final defense of the NZD/USD bears.

On the flip side, the aforementioned 78.6% Fibonacci retracement puts a floor under the NZD/USD prices near 0.6070.

In a case where the Kiwi pair breaks the 0.6070 support, a horizontal region comprising multiple levels marked since late May, around 0.6030, could test the NZD/USD bears before directing them to the 0.6000 psychological magnet and the yearly low marked in May around 0.5985.

NZD/USD: Four-hour chart

Trend: Limited recovery expected


02:30
Commodities. Daily history for Friday, August 4, 2023
Raw materials Closed Change, %
Silver 23.639 0.25
Gold 1942.79 0.42
Palladium 1256.4 0.22
02:07
GBP/JPY consolidates in a range below 181.00 mark, downside seems cushioned
  • GBP/JPY gains some positive traction on Monday, albeit lacks follow-through buying.
  • The BoE’s less hawkish signals turn out to be a key factor capping gains for the cross.
  • A more dovish stance adopted by the BoJ acts as a tailwind and limits the downside.

The GBP/JPY cross kicks off the new week on a positive note, albeit struggles to capitalize on the move and remains below the 181.00 round figure through the Asian session. Spot prices currently trade around the 180.70-180.75 region, nearly unchanged for the day, and the mixed fundamental backdrop warrants some caution before placing aggressive directional bets.

The Bank of England (BoE) last week signalled that the tightening cycle may be nearing an end, which acts as a headwind for the British Pound (GBP) and caps the upside for the GBP/JPY cross. It is worth recalling that the UK central bank called its current monetary policy stance "restrictive" and forced investors to scale back expectations for the peak rate. That said, a more dovish stance adopted by the Bank of Japan (BoJ) continues to undermine the Japanese Yen (JPY) and should limit the downside for spot prices, at least for the time being.

It is worth recalling that the Japanese central bank took steps to make its Yield Curve Control (YCC) policy more flexible at the end of its July monetary policy meeting and fueled speculations about an imminent shift away from the ultra-loose monetary policy. The BoJ Governor Kazuo Ueda, however, moved quickly to dampen speculation about an early end to the negative rate policy and reiterated that the central bank won't hesitate to ease policy further. Ueda added that more time was needed to sustainably achieve the 2% inflation target.

Furthermore, the BoJ's Summary of Opinions released this Monday revealed that policymakers generally backed the case for the need to patiently continue with the current monetary easing towards achieving the price stability target. This suggests that the path of least resistance for the GBP/JPY cross is to the upside. Hence, it will be prudent to wait for strong follow-through selling before positioning for an extension of last week's slide from a near one-month peak in the absence of any relevant market-moving economic releases from the UK on Monday.

Technical levels to watch


02:05
EUR/GBP gains momentum for the sixth consecutive day investors await Euzozone HICP, UK GDP EURGBP
  • EUR/GBP extends its upside and edges higher above the 0.8600 barrier.
  • Eurozone Retail Sales for June were mixed, Germany's Factory Orders rose 3.0% YoY compared to -4.4% prior.
  • Investors await the Eurozone HICP YoY, the UK Gross Domestic Product (GDP) Q2 YoY.

The EUR/GBP cross gains momentum and trades on a positive note for the sixth consecutive day during the early Asian session on Monday. Market participants await the Eurozone inflation data and the UK growth number due later on Tuesday and Friday, respectively. The cross currently trades around 0.8631, down 0.02% for the day.

The latest data from the Deutsche Bundesbank showed that Germany's Factory Orders rose 3.0% YoY compared to -4.4% prior, while the monthly figure increase was 7.0% compared to 6.2% previously and -2.0% market expectations. Eurozone Retail Sales for June were mixed. The monthly figures fell to -0.3% vs. 0.2% expected and 0.6% previously, but the annual figures improved to -1.4% versus -1.7% market estimates and -2.4% prior.

Additionally, the Eurozone Producer Price Index (PPI) for June fell to its lowest level in three years on Thursday. The figure dropped -3.4% YoY vs. -3.1% expected and -1.6% prior. The bloc's HCOB Composite PMI fell from 48.9 to 48.6. While the services PMI for July declined from 51.1 to 50.9,

The European Central Bank raised interest rates by 25 basis points (bps) to 4.25% last week. ECB President Christine Lagarde stated that the central bank will move towards achieving a medium-term inflation target of 2%. The hawkish stance of the ECB boosts the Euro against its rivals.

The Bank of England (BoE) chief economist, Huw Pill, stated on Friday that interest rates were expected to remain high for a longer period. He added that the central bank will be more data-dependent, and policymakers will respond as the economy and the data evolve.

It’s worth noting that the Bank of England (BoE) raised interest rates by 25 basis points (bps) to a 15-year high of 5.25% from 5% in its August policy meeting on Thursday. Markets anticipated that the BoE would likely hike two additional rates by the end of the year as inflation remains high. However, a significant deceleration in the headline UK Consumer Price Index (CPI), to 7.9% YoY in June from 8.7% in May, might require the UK central bank to hike rates at a slower pace.

BoE Governor Andrew Bailey stated on the policy outlook that the central bank expects inflation to fall to around 5% in October. He added that there is no presumed future path for interest rates. That said, the pessimistic economic outlook and the fear of recession in the UK exert pressure on the Pound Sterling and act as a tailwind for the EUR/GBP cross.

Looking ahead, market players will take cues from the Eurozone Harmonized Index of Consumer Prices YoY for July, due on Tuesday. The focus will shift to the UK preliminary Gross Domestic Product Q2 YoY on Friday. These data could provide hints for a clear direction in EUR/GBP.


02:02
USD/CNH bulls attack 7.2000 as typhoon Doksuri gathers strength, US/China inflation eyed
  • USD/CNH clings to mild gains during two-day winning streak.
  • Fears of China typhoon Doksuri, US economic fears propel offshore China Yuan price.
  • Expectations of China stimulus, consolidation ahead of US inflation add strength to corrective bounce.
  • Inflation data from US, China will be crucial for clear directions.

USD/CNH prints mild gains around 7.2000 as bulls keep the reins for the second consecutive day but lack upside momentum amid early Monday in China. In doing so, the offshore Chinese Yuan (CNH) justifies the broad US Dollar rebound amid the geopolitical fears emanating from China.

That said, the US Dollar Index (DXY) registers the first daily positive in three around 102.10 as markets prepare for this week’s US inflation numbers, namely the Consumer Price Index (CPI) and Producer Price Index (PPI) for July. Also putting a floor under the USD/CNH price is the looming fear from China’s typhoon Doksuri as Reuters quotes China's Ministry of Water Resources by while suggesting a stronger response for flooding to Level III at 10 a.m. (02:00 GMT) in Inner Mongolia, Jilin and Heilongjiang. The news also mentioned that the Dragon Nation has a four-tier emergency response system, with Level I being the most urgent.

Elsewhere, the hawkish comments from Federal Reserve (Fed) Governor Michelle Bowman and the mixed US data might have helped the DXY to snap a two-day downtrend. That said, Fed’s Bowman said that the Fed should remain willing to raise the federal funds rate at a future meeting if the incoming data indicate that progress on inflation has stalled. Previously, Atlanta Federal Reserve Bank President Raphael Bostic said on Friday to Bloomberg, that the central bank is likely to keep monetary policy in a restrictive territory well into 2024. On the contrary, Chicago Fed President Austan Goolsbee stated that they should start thinking about how long to hold rates.

On the other hand, the US credit rating downgrade also bolstered the Greenback’s haven demand. That said, the US employment report posted a softer-than-expected Nonfarm Payrolls (NFP) figure of 187K, versus 185K prior (revised) and 200K market forecasts, whereas the Unemployment Rate eased to 3.5% from 3.6% expected and previous readings. Further, the Average Hourly Earnings reprinted 0.4% MoM and 4.4% YoY numbers by defying the expectations of witnessing a slight reduction in wage growth.

Even so, mildly bid S&P500 Futures and a lack of action in the US bond markets prod the USD/CNH traders ahead of the top-tier inflation data from the US and China. It should be noted, however, that China’s economic worries, despite announcing multiple stimulus measures, favor the pair buyers.

Technical analysis

USD/CNH struggles between a five-week-old descending resistance line and 50-DMA, currently between 7.1800 and 7.2000, as a looming bull cross on the MACD indicator teases the offshore Yuan bears.


01:40
EUR/USD Price Analysis: Euro fades bullish bias within monthly triangle, focus on 1.0920 and US inflation EURUSD
  • EUR/USD snaps two-day winning streak but lacks follow-through amid sluggish session.
  • One-month-old symmetrical triangle restricts immediate Euro moves as US CPI week begins.
  • Failure to cross 200-SMA triggers pullback moves but oscillators keep EUR/USD buyers hopeful unless breaking 1.0920 support.

EUR/USD prints the first daily loss in three as it drops to 1.0995 while posting mild losses during the mid-Asian session on Monday. Even so, the Euro pair remains within a one-month-old symmetrical triangle, recently reversing from the top line and slipping back below the 200-SMA hurdle.

It’s worth noting that the previous support line from early July joins the bullish MACD signals and upbeat RSI (14) line to keep the Euro buyers hopeful as they await this week’s US inflation numbers, namely the Consumer Price Index (CPI) and Producer Price Index (PPI) for July.

Even if the quote breaks the 1.0990 immediate support, the 50% Fibonacci retracement of May-July upside, near 1.0950 and the stated triangle’s bottom line around 1.0920 will be crucial challenges for the EUR/USD bears to watch for retaking control.

Also likely to challenge the Euro sellers is the 61.8% Fibonacci retracement surrounding 1.0880 and the previous monthly low of around 1.0830.

Meanwhile, the 200-SMA level of around 1.1020 guards the immediate recovery of the EUR/USD pair ahead of the stated triangle’s top line, close to 1.1030 at the latest.

Following that, the late July swing high around 1.1050 may act as the last defense of the Euro bears before directing the quote towards the yearly of 1.1275.

EUR/USD: Four-hour chart

Trend: Limited downside expected


01:32
Australia ANZ Job Advertisements up to 0.4% in July from previous -2.5%
01:27
AUD/USD sticks to gains around 0.6580, bulls seem non-committed despite softer USD AUDUSD
  • AUD/USD gains positive traction for the third straight day, albeit lacks follow-through.
  • The unimpressive US NFP report keeps the USD bulls on the defensive and lends support.
  • Bets for further tightening by the Fed limit the USD losses and cap the upside for the pair.

The AUD/USD pair attracts some buying for the third successive day on Monday and trades around the 0.6580 region during the Asian session. This marks the third straight day of a positive move and is sponsored by subdued US Dollar (USD) demand, though spot prices remain below Friday's swing high touched in reaction to the mixed US monthly employment details.

The Australian Dollar (AUD) continues to draw support from the Reserve Bank of Australia's hawkish quarterly Statement on Monetary Policy (SOMP) released on Friday, which indicated that interest rates may still need to go higher. Adding to this, Commerce Ministry announced that the country will lift the anti-dumping and anti-subsidy tariff on barley imports from Australia, which turns out to be another factor acting as a tailwind for the Aussie. The USD, on the other hand, remains on the defensive for the third successive day and turns out to be another factor lending some support to the AUD/USD pair.

The headline NFP showed that the US economy added 187K jobs in July, lower than the 200K estimates. Moreover, the readings for May and June were also revised down, suggesting that demand for workers was slowing. This, in turn, halted the recent surge in Treasury yields and is seen undermining the buck. That said, solid wage gains and a dip in the unemployment rate to 3.5% signalled continued tightness in the labour market. This, along with hopes for a soft economic landing, should allow the Federal Reserve (Fed) to keep rates higher for longer, which helps limit the USD losses and caps the AUD/USD pair.

Apart from this, a softer tone around the Asian equity markets, along with China's economic woes, further contributes to keeping a lid on the risk-sensitive Aussie and warrants caution for bulls. Traders now look to speeches by influential FOMC members for some impetus in the absence of any relevant market-moving economic data from the US on Monday. The fundamental backdrop, meanwhile, makes it prudent to wait for strong follow-through buying before positioning for an extension of the AUD/USD pair's recent recovery move from the vicinity of the 0.6500 mark, or a two-month low touched last Thursday.

Technical levels to watch


01:17
PBOC sets USD/CNY reference rate at 7.1380 vs. 7.1418 previous

People’s Bank of China (PBoC) set the USD/CNY central rate at 7.1380 on Monday, versus the previous fix of 7.1418 and market expectations of 7.1656. It's worth noting that the USD/CNY closed near 7.1740 the previous day.

Apart from the USD/CNY fix, the PBoC also unveiled details of its Open Market Operations (OMO) while saying that the Chinese central bank injects 3 billion Yuan via 7-day reverse repos (RRs) at 1.90% vs prior 1.90%.

However, with the 31 billion Yuan of RRs maturing today, there prevails a net drain of around 28 billion Yuan injection on the day in OMOs.

About PBOC fix

China maintains strict control of the yuan’s rate on the mainland.

The onshore yuan (CNY) differs from the offshore one (CNH) in trading restrictions, this last one is not as tightly controlled.

Each morning, the People’s Bank of China (PBOC) sets a so-called daily midpoint fix, based on the yuan’s previous day's closing level and quotations taken from the inter-bank dealer.

01:06
WTI crude oil justifies OPEC+ decision, US Dollar’s retreat to refresh four-month high near $83.00
  • WTI crude oil prints three-day winning streak to poke yearly high marked in April, sticks to daily gains of late.
  • OPEC+ production cuts join price-positive statements from Saud Arabia, Russia to underpin Oil price run-up.
  • Hopes of easy rates, China stimulus and US Dollar’s pullback add strength to WTI run-up.
  • This week’s inflation data from US, China will be crucial for Oil traders.

WTI crude oil clings to mild gains around $82.90 as it prints a three-day uptrend while refreshing a four-month high amid early Monday in Asia. In doing so, the black gold justifies the previous week’s price-positive announcements from Saudi Arabia and Russia, as well as the risk-on mood.

That said, the Reuters unveiled OPEC+ decision while saying, “An OPEC+ ministerial panel which met on Friday made no changes to the group's current oil output policy.” The news also mentioned Saudi Arabian statements suggesting an extension of a voluntary production cut of 1 million barrels per day (bpd) to the end of September.

On the same line were statements from Russia as it pledged to cut the Oil exports by 300,000 bpd in September. Additionally, a drone attack on the Russian warship by a Ukrainian naval drone on Russia's Black Sea navy base at Novorossiysk also propels the energy benchmark.

Furthermore, China’s readiness for further stimulus, backed by the latest fears emanating from Typhoon Doksuri, also provides a tailwind to the WTI crude oil price.

Elsewhere, a pullback in the US Dollar Index (DXY) after a three-week uptrend adds strength to the WTI crude oil prices. That said, the DXY prints a three-day downtrend near 101.95 by the press time.

It should be noted that the US Baker Hughes Rig Counts dropped in the last eight consecutive weeks to 525 at the latest, which in turn allows the Oil buyers to remain hopeful, especially amid firmer US growth numbers and easing inflation fears.

Looking ahead, this week’s inflation data from China and the US will be crucial to watch for clear directions as both these nations are the biggest customers of Oil.

Technical analysis

A three-week-old bullish channel, currently around $83.80 and $80.20, keeps the short-term WTI crude oil buyers hopeful even as the overbought RSI (14) line challenges the quote’s further upside.


00:51
USD/CAD recovers some ground near the 1.3370 area in the Canadian bank holiday USDCAD
  • USD/CAD recovers some ground and holds above the 1.3370 mark.
  • The Canadian economy unexpectedly lost 6,400 jobs in July.
  • The Nonfarm Payrolls report revealed that the US economy added 187,000 jobs in July.

The USD/CAD pair consolidates its recent gains near 1.3370 in the early Asian session. The downbeat Canadian employment data triggers a weakening in the Loonie across the board. Investors will digest the data in this quiet week in terms of economic events ahead of the US Consumer Price Index (CPI) on Thursday.

On Friday, Statistics Canada revealed that the Canadian economy unexpectedly lost 6,400 jobs in July. Meanwhile, the Unemployment rate rose to 5.5%. The figure has increased for three consecutive months since COVID. Additionally, the Canadian Dollar didn’t benefit from an increase in oil prices following the softer Canadian data.

Money markets now anticipate a 28% likelihood of a rate rise in September, down from 32% before the report. Markets now expect another rate rise by the end of the year, down from 80% before the report, according to Reuters. However, investors will keep an eye on inflation and second quarter growth ahead of the next monetary policy meeting scheduled for September 6.

On the US Dollar front, the US employment data showed more indications of a softening labour market. The Nonfarm Payrolls report revealed that the US economy added 187,000 jobs in July. The June figures were revised lower to 185,000, the lowest reading since December 2020.

In addition, the Unemployment Rate decreased to 3.5% from 3.6%, and the annual wage inflation, as measured by the change in Average Hourly Earnings, came in at 4.4%, surpassing the market's forecast of 4.2%. The U6 Unemployment Rate decreased to 6.7%, whereas the Labour Force Participation Rate remained unchanged at 62.6%.

Market participants will digest the data on Friday due to the absence of the economic data release from Canada on the Bank holiday. The attention will shift to the US Consumer Price Index (CPI) for July and the Produce Price Index (PPI) later this week. Market players anticipate a 0.2% monthly increase in US CPI. The data will be critical for determining a clear movement for the USD/CAD pair.


00:48
USD/JPY flat-lines around 141.65 area, just above Friday’s post-NFP swing low USDJPY
  • USD/JPY struggles to preserve its modest intraday gains and hangs just above Friday’s swing low.
  • The unimpressive US jobs report keeps the USD bulls on the defensive and acts as a headwind.
  • Bets for more Fed rate hikes limit the USD losses and lend support amid the BoJ’s dovish stance.

The USD/JPY pair surrenders its modest Asian session gains to the 142.00 neighbourhood and retreats to the lower end of the intraday range in the last hour. Spot prices currently trade around the 141.65 region, just a few pips above the multi-day low touched on Friday in the aftermath of the rather unimpressive US monthly employment details.

It is worth recalling that the headline NFP showed that the US economy added 187K jobs in July, lower than the 200K anticipated. Furthermore, the readings for May and June were revised down, which suggested that demand for workers was slowing. This, in turn, halted the recent surge in Treasury yields, which keeps the US Dollar (USD) bulls on the defensive for the third successive day on Monday and turns out to be a key factor acting as a headwind for the USD/JPY pair.

That said, solid wage gains and a dip in the unemployment rate to 3.5% signalled continued tightness in the labour market. This, along with hopes for a soft economic landing, reaffirms expectations that the Federal Reserve (Fed) will keep rates higher for longer and limit losses for the Greenback. Apart from this, the Bank of Japan's (BoJ) dovish stance continues to undermine the Japanese Yen (JPY) and holds back traders from placing bearish bets around the USD/JPY pair.

In fact, the Summary of Opinions from the BoJ's July monetary policy revealed that one member reiterated the need to patiently continue with the current monetary easing towards achieving the price stability target. Another member noted that there is still a significantly long way to go before revising the negative interest rate policy. Moreover, BoJ Governor Kazuo Ueda had said recently that the central bank won't hesitate to ease policy further if needed.

The aforementioned fundamental backdrop makes it prudent to wait for strong follow-through selling before positioning for an extension of last week's retracement slide from the vicinity of the 144.00 mark, or the highest level since July 7. Moving ahead, traders now look to speeches by influential FOMC members for some impetus later during the early North American session in the absence of any relevant market-moving economic releases from the US.

Technical levels to watch


00:46
US Dollar Index: DXY steadies around 102.00 as Fed hawks flex muscles ahead of US inflation
  • US Dollar Index prods two-day losing streak but stays defensive ahead of top-tier data/events.
  • Hawkish comments from Fed’s bowman, cautious mood before US inflation put a floor under DXY price.
  • Upbeat prints of US CPI, PPI becomes necessary for Greenback buyers to keep the reins.

US Dollar Index (DXY) stays defensive around 102.00 during Monday’s sluggish Asian session, while challenging a two-day losing streak, as well as rising in the last three consecutive weeks. In doing so, the Greenback’s gauge versus the six major currencies struggles to cheer the recently hawkish Fed comments amid mixed data. Further, the DXY also portrays the market’s cautious mood ahead of the key US inflation data for July.

During the weekend, Federal Reserve (Fed) Governor Michelle Bowman said that the Fed should remain willing to raise the federal funds rate at a future meeting if the incoming data indicate that progress on inflation has stalled. Previously, Atlanta Federal Reserve Bank President Raphael Bostic said on Friday to Bloomberg, that the central bank is likely to keep monetary policy in a restrictive territory well into 2024. On the contrary, Chicago Fed President Austan Goolsbee stated that they should start thinking about how long to hold rates.

It’s worth observing that the US credit rating downgrade bolstered the Greenback’s haven demand despite mixed data. That said, the US employment report posted a softer-than-expected Nonfarm Payrolls (NFP) figure of 187K, versus 185K prior (revised) and 200K market forecasts, whereas the Unemployment Rate eased to 3.5% from 3.6% expected and previous readings. Further, the Average Hourly Earnings reprinted 0.4% MoM and 4.4% YoY numbers by defying the expectations of witnessing a slight reduction in wage growth.

Also notable is the fact that the ISM Manufacturing PMI for July improved a bit but the more important Services PMI dropped for the said month. Additionally, US Factory Orders edged higher for June and so did the second-tier employment-linked data like Nonfarm Productivity and JOLT Job Openings. However, the Q2 Unit Labor Cost eased and troubled favoring the Fed’s September rate hike.

Against this backdrop, the market’s bets on the Fed’s September rate hike eased from 20.0% to 13% on a weekly basis, per the CME’s FedWatch Tool. Furthermore, the latest retreat in the US Treasury bond yields from a multi-month high also prods the DXY bulls.

Looking ahead, US inflation numbers, namely the Consumer Price Index (CPI) and Producer Price Index (PPI) for July, become crucial for the DXY traders to watch for clear directions as market players appear confused about the Fed’s September rate hike.

Technical analysis

Despite the latest inaction, the US Dollar Index stays below a convergence of the 50-DMA and 100-DMA, around 102.35, which in turn joins recently downbeat oscillators to direct the DXY sellers toward a three-week-old rising support line, at 101.50 by the press time.


00:30
Stocks. Daily history for Friday, August 4, 2023
Index Change, points Closed Change, %
NIKKEI 225 33.47 32192.75 0.1
Hang Seng 118.59 19539.46 0.61
KOSPI -2.59 2602.8 -0.1
ASX 200 13.6 7325.3 0.19
DAX 58.48 15951.86 0.37
CAC 40 54.54 7315.07 0.75
Dow Jones -150.27 35065.62 -0.43
S&P 500 -23.86 4478.03 -0.53
NASDAQ Composite -50.48 13909.24 -0.36
00:28
Silver Price Analysis: XAG/USD bounces off six-week-old support towards $24.00
  • Silver Price again aims to cross 200-SMA hurdle, defends recovery from multi-day-old support line.
  • Steady oscillators suggest slower grind towards one-week-long falling resistance line.
  • 61.8% Fibonacci retracement, previous weekly low act as additional trading filters.

Silver Price (XAG/USD) stays defensive around $23.60 amid early Monday in Asia, keeping the previous day’s rebound from the six-week-old support line below the 200-SMA hurdle. In doing so, the XAG/USD seeks fresh clues to extend the three-week downtrend.

Given the steady RSI (14) line and the recently bullish MACD signals, the Silver Price is likely to extend the latest rebound from an upward-sloping support line from late June, close to $23.20. However, a clear upside break of the 200-SMA hurdle of around $23.80 becomes necessary for the XAG/USD buyer’s conviction.

Following that, the $24.00 round figure and a one-week-long descending resistance line can check the Silver bulls before directing them to the $25.00 round figure and then to the previous monthly high of around $25.30.

On the flip side, the 61.8% Fibonacci retracement of the XAG/USD’s late June to early July upside, near $23.30, offers immediate support to the Silver Price before the previously stated key trend line support of around $23.20.

In a case where the Silver Price breaks the $23.20 support, the $23.00 threshold may act as the final defense of the buyers before giving control to the XAG/USD bears.

Silver Price: Four-hour chart

Trend: Further upside expected


00:15
Currencies. Daily history for Friday, August 4, 2023
Pare Closed Change, %
AUDUSD 0.65691 0.29
EURJPY 156.112 0.04
EURUSD 1.1011 0.56
GBPJPY 180.758 -0.21
GBPUSD 1.27509 0.32
NZDUSD 0.60971 0.33
USDCAD 1.33818 0.22
USDCHF 0.87265 -0.19
USDJPY 141.772 -0.52

© 2000-2024. Уcі права захищені.

Cайт знаходитьcя під керуванням TeleTrade DJ. LLC 2351 LLC 2022 (Euro House, Richmond Hill Road, Kingstown, VC0100, St. Vincent and the Grenadines).

Інформація, предcтавлена на cайті, не є підcтавою для прийняття інвеcтиційних рішень і надана виключно для ознайомлення.

Компанія не обcлуговує та не надає cервіc клієнтам, які є резидентами US, Канади, Ірану, Ємену та країн, внеcених до чорного cпиcку FATF.

Політика AML

Cповіщення про ризики

Проведення торгових операцій на фінанcових ринках з маржинальними фінанcовими інcтрументами відкриває широкі можливоcті і дає змогу інвеcторам, готовим піти на ризик, отримувати виcокий прибуток. Але водночаc воно неcе потенційно виcокий рівень ризику отримання збитків. Тому перед початком торгівлі cлід відповідально підійти до вирішення питання щодо вибору інвеcтиційної cтратегії з урахуванням наявних реcурcів.

Політика конфіденційноcті

Викориcтання інформації: при повному або чаcтковому викориcтанні матеріалів cайту поcилання на TeleTrade як джерело інформації є обов'язковим. Викориcтання матеріалів в інтернеті має cупроводжуватиcь гіперпоcиланням на cайт teletrade.org. Автоматичний імпорт матеріалів та інформації із cайту заборонено.

З уcіх питань звертайтеcь за адреcою pr@teletrade.global.

Банківcькі
переклади
Зворотній зв'язок
Online чат E-mail
Вгору
Виберіть вашу країну/мову