- Аналітика
- Новини та інструменти
- Новини ринків
Новини ринків
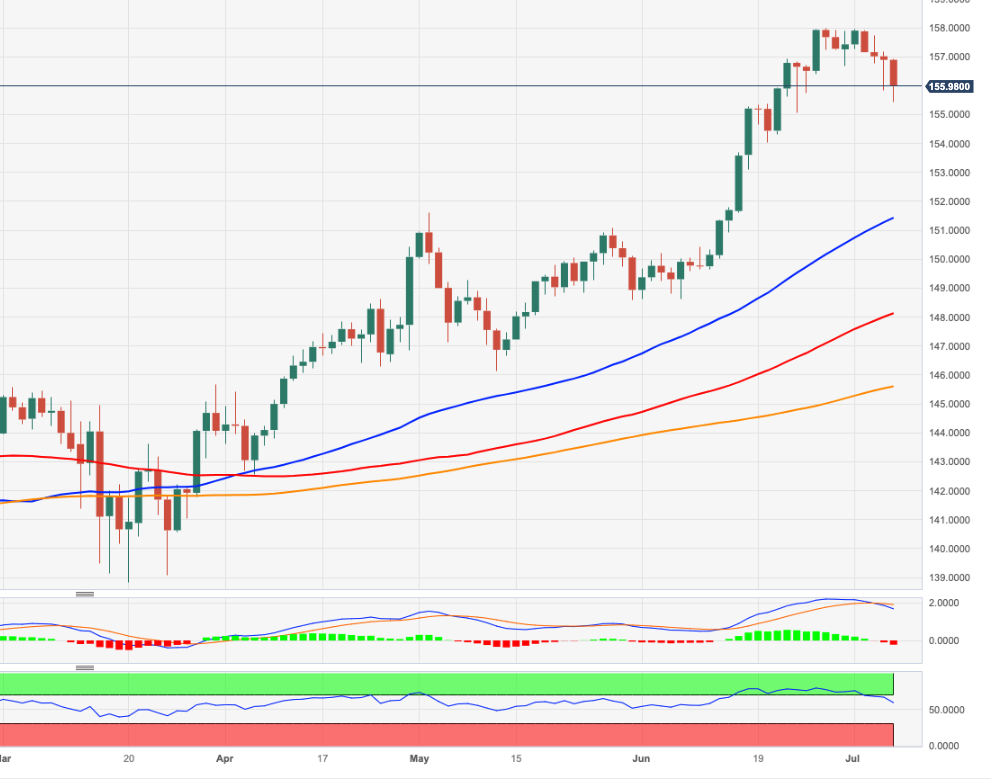
- On Friday, the EUR/JPY found support at the 155.40 area, near the 20-day SMA and then settled at 155.80
- The JPY strengthen agains most of its rivals amid strong Labor Cash Earning data from Japan.
- Eyes on German CPI data next Tuesday.
At the end of the week, the EUR/JPY traded with losses for a fourth consecutive day, falling to 155.40 and tallying a weekly loss of 1%. In that sense, strong labour market data from Japan made the JPY gain ground agains most of its rivals, including the USD,EUR,GPB and AUD.
During the early Asian Japan reported robust Labor Cash Earnings. The average income of regular employees in the country rose by 2.5% compared to the market's expectation of 0.7% year-on-year in May. As a reaction, the yields on the 2,5 and 10-year Japanese yields rose to their highest level since May and provide additional boost to the Yen.
As salaries in Japan seem to be rising, the Bank of Japan (BoJ) policy is on view as strong economic data can potentially make the central bank consider pivoting to a more contractive monetary policy.
On the other hand, according to the World Interest Rate Probability (WIRP), a 25 basis point (bps) hike is already priced in for July 27. Looking forward, the likelihood of another 25 basis point hike is approximately 60% by September 14 but becomes fully priced by October 26. For inventors to continue modelling their expectations, the German Consumer Price Index (CPI) to be released next week, will be looked upon.
EUR/JPY Levels to watch
The daily chart suggests that the bear’s time seems to have arrived. The Relative Strength Index (RSI) shows a pronounced negative slope but in positive territory, while the Moving Average Convergence Divergence (MACD) prints higher red bars. However, on the bigger picture, the outlook favours the EUR as the bulls managed to defend the 20-day Simple Moving Average (SMA) and still holds above the 100 and 200-day averages.
Support levels: 155.57 (20-day SMA),154.30, 154.00.
Resistance levels: 156.50, 157.00, 158 (cycle-high).
EUR/JPY Daily chart
-638243630085330673.png)
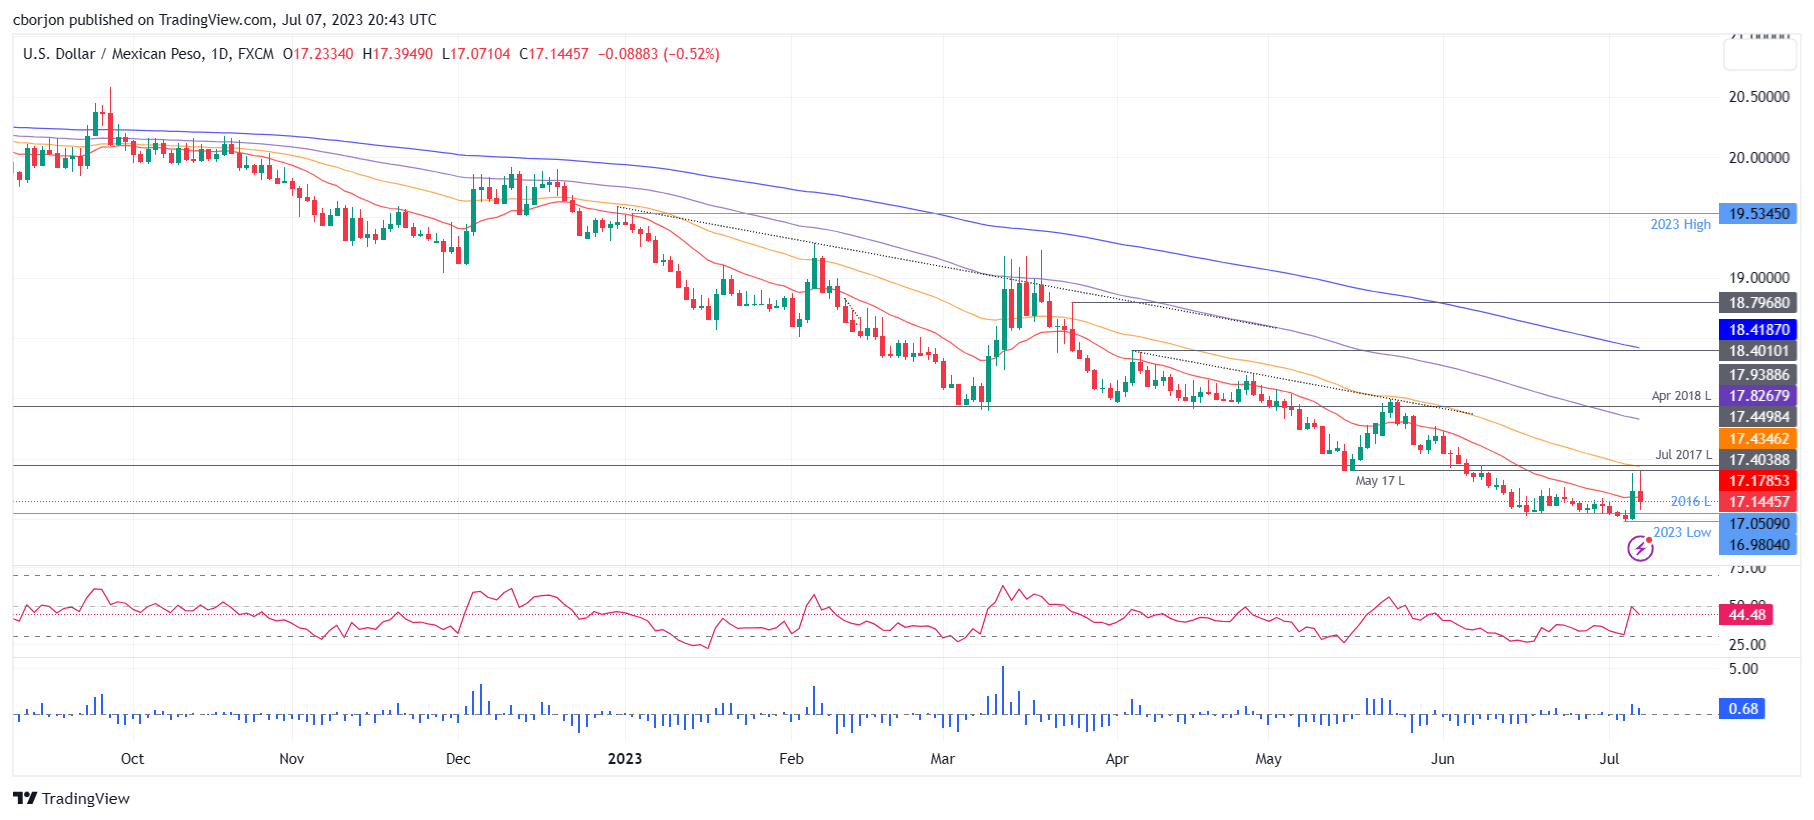
- Mexican Peso recovers as weak US data sparks a sell-off, bringing USD/MXN down from a four-week high.
- US job growth disappoints, triggering Dollar weakness; inflation fears persist as Average Hourly Earnings rise.
- Mexican inflation declines for the fifth month, defying estimates; CME FedWatch Tool shows heightened odds for a Fed rate hike.
The Mexican Peso (MXN) recovered some ground on Friday as soft data on the United States (US) triggered a US Dollar (USD) sell-off. Hence the USD/MXN dropped from four-week highs, trading at 17.1388, down 0.55%.
USD/MXN reacts to underwhelming Nonfarm Payrolls figures and inflation concerns
The US Department of Labor revealed that June’s Nonfarm Payrolls figures for June showed that the economy added 209K jobs, beneath forecasts of 225K, triggering US Dollar weakness across the board. The Unemployment Rate portrayed a tight labor market, with June figures coming at 3.6% vs. 3.7%, while Average Hourly Earning (AHE) expanded 4.4% YoY, above the prior’s month 4.2%, adding to inflationary pressures, keeping the US Federal Reserve (Fed) under pressure.
Following the data, the USD/MXN continued its downtrend, falling from 17.30 to 17.11. Meanwhile, the US 10-year Treasury note yields 4.058%, falls one and a half basis points, while the US Dollar Index (DXY), a gauge of the buck’s value against a basket of six currencies, dives to 102.279, losses 0.81% after staying above the 103.000 during the past four days.
Across the border, the Mexican economic docker revealed June’s inflation fell for the fifth straight month to 5.06%, as shown by INEGI. Consumer prices dropped 0.10% in June from May, exceeding estimates of -0.09%. Annual core CPI which strips volatile items, was 6.89% in June, above forecasts of 6.87%.
Regarding expectations for the US Federal Reserve (Fed) July monetary policy, the CME FedWatch Tool shows odds standing at 92.4%, higher than last week’s 86.8%; nonetheless, investors are not estimating additional hikes, even though the Fed’s dot-plot shows the Federal Funds Rate (FFR) peaking at 5.6%.
USD/MXN Price Analysis: Technical outlook
Given the fundamental backdrop, the USD/MXN would likely continue to edge down as the interest rate differential between Mexico (11.25%), and the US (5.125%) favors the Mexican Peso (MXN). The USD/MXN could be re-testing the 17.0000 figure, but some support levels must be surpassed on its way down. The USD/MXN’s first support level would be the 17.1000 mark, followed by the 17.0000 figure. Breach of the latter will expose the year-to-date (YTD) low at 16.9761.
- US stocks slammed into the close and erode the NFP knee-jerk rally.
- Investors rethink the US data this week and the hawkish sentiment is a dark cloud over Wall Street.
The S&P 500 (US500) index fell on Friday with weakness intensifying into the close. The US Nonfarm Payrolls data from the Labor Department, which offered a mixed view of the US job market, weighed on market sentiment later in the day. The US500 is down some 0.15% at the time of writing, falling from a high of 4,441.50 and reaching a low of 4,397.2.
Nonfarm Payrolls (NFP) in the US rose 209,000 in June, the US Bureau of Labor Statistics reported on Friday. This reading came in below the market expectation of 225,000. May's increase of 339,000 got revised lower to 306,000. The US Dollar came under renewed selling pressure with the initial reaction to the mixed jobs data and the US indexes rallied. However, bears moved in as the combined data this week has suggested the Federal Reserve will likely resume raising interest rates later this month.
For stocks, next week brings quarterly results from some of the big US banks in what will mark the unofficial start of the second-quarter earnings season. As of Friday, analysts expect S&P 500 earnings to have fallen 6.4% in the quarter versus a year ago, a forecast that has weakened since July 1, according to IBES Refinitiv data. The US Consumer Price Index will also be a key event.
US500 technical analysis
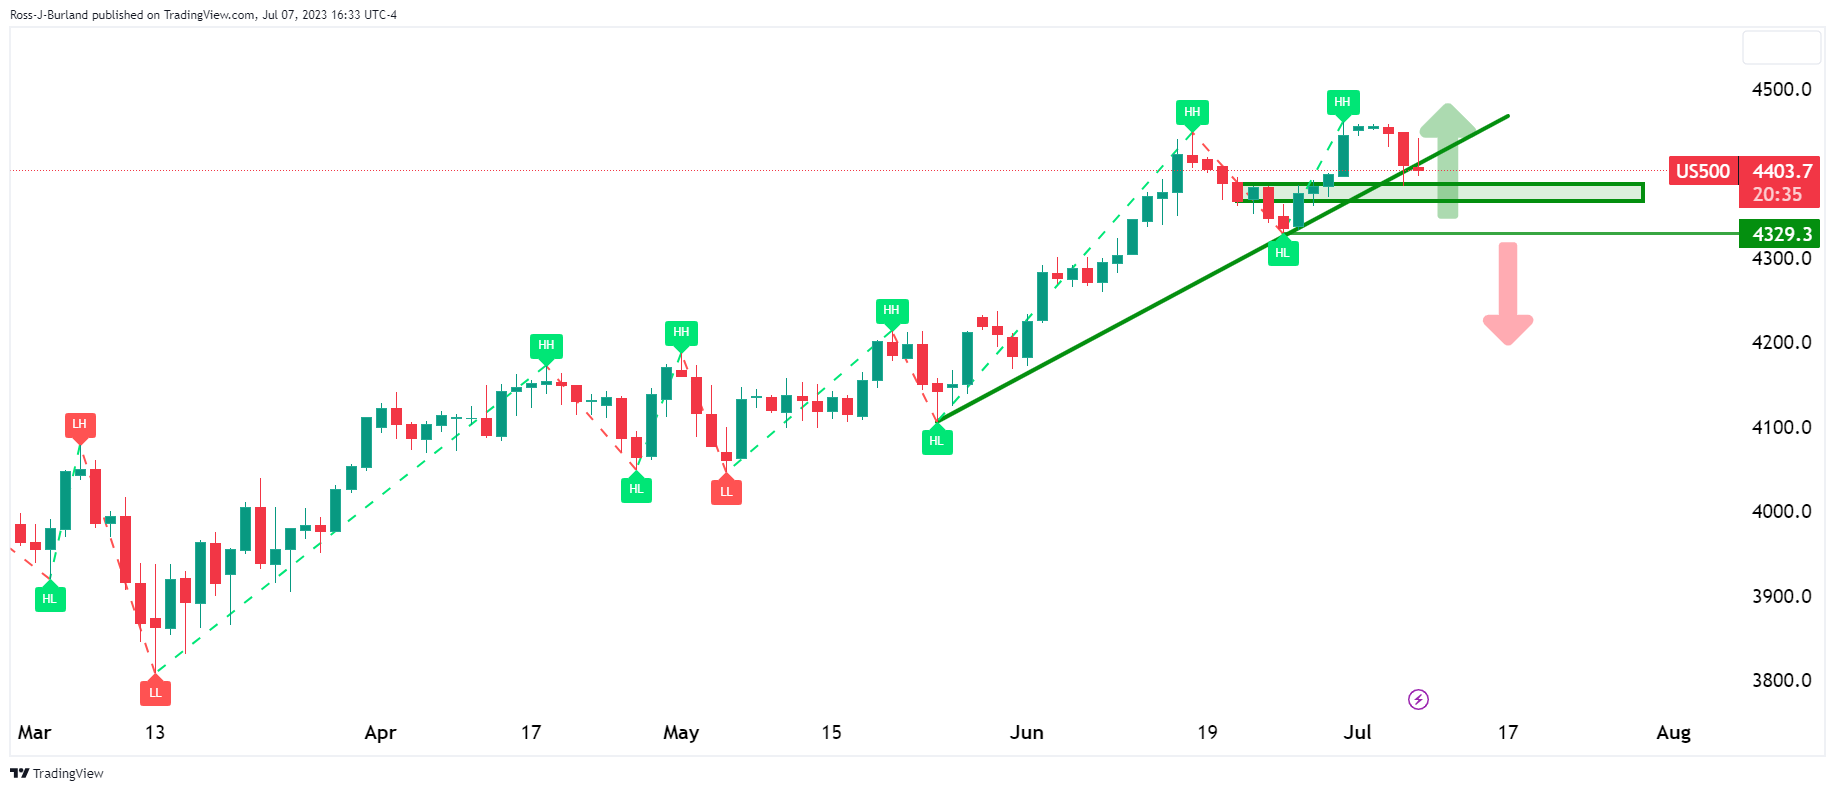
A series of breaks of structure to the upside leaves the bull trend intact but a break of 4329 will leave a bearish outlook on the charts.
- The EUR/GBP traded in the 0.8554-0.8521 and is set to close a 0.50% weekly loss on Friday.
- Lower British yields weakened the made it difficult for the Sterling to find demand.
- Eyes on German Inflation and British labour market data next week.
On Friday, the EUR/GBP traded with losses falling to a low of 0.8521 and then settling around 0.8545. The Eurozone’s and British calendars had nothing relevant to offer, and the focus is next week’s Consumer Price Index (CPI) data from Germany and labour market data from the UK.
During the session, the GBP weakened on failing British yields. The 2-year yield, after jumping on Thursday to multi-year highs, declined by more than 2% to 5.37%, while the 5 and 10-year rates also decreased, to 4.84% and 4.65%, respectively.
The British bond market may see volatility next Tuesday when crucial labour market data will be released. The Claimant Count Change and the Average Earnings data are closely monitored by the Bank of England when deciding its monetary policy. As for now, markets are largely discounting a 50 basis point (bps) for the August 3 meeting, followed by another 0.5% hike in September 21.
On the other hand, investors are pricing a 25 basis points (bps) hike in the next European Central Bank (ECB) meeting in July, and another one in September is nearly 60% discounted. That said, CPI figures from Germany from next week will continue modelling the expectations regarding the ECB’s next steps.
EUR/GBP Levels to watch
According to the daily chart, despite indicators turning flat, the EUR/GBP’s outlook is still tilted to the downside. The Relative Strength Index (RSI) stands neutral in negative territory, while the Moving Average Convergence Divergence (MACD) prints lower green bars, indicating a fading upwards momentum.
Support Levels: 0.8520, 0.8490,0.8450.
Resistance Levels: 0.8560, 0.8571 (20-day Simple Moving Average), 0.8595.
EUR/GBP Daily chart
-638243590394448497.png)
The June US employment report showed the economy added 209,000 jobs, below expectations. Analysts at Wells Fargo point out that the report offered additional evidence that the labor market is slowly coming into better balance as job growth slows and labor supply steadily expands. They expect the Federal Reserve to raise interest rates at the July meeting.
Key quotes:
“Nonfarm payrolls have seemed to defy the gravity weighing down other gauges of the labor market over the past year. However, the June employment report suggests this dynamic has run its course. Nonfarm payrolls increased by 209K in June—a respectable gain in its own right—but below the Bloomberg consensus for the first time in 15 months. Revisions also pointed to recent job growth flying a little closer to Earth.”
“The surprisingly resilient labor market has helped to keep the U.S. economy expanding at a moderate pace despite continued fears about a recession. However, even amid more forthcoming labor supply and gradually cooling labor demand, the weight of the evidence still suggests that the labor market remains too tight to be consistent with 2% inflation. The directional progress towards a more balanced labor market is encouraging and helps explain why the FOMC has slowed the pace of its rate hikes, but today's data point to another 25 bps rate hike at the upcoming FOMC meeting on July 25-26th.”
- Silber bears are moving in as an hourly lower low is put in and a lower high on Friday.
- The weekly and daily charts also lean bearish and readers look for confirmation of a trend change.
Silver rose on Friday and was on track for their first weekly gain in four as the Greenback and US treasury bond yields fell after weaker US Nonfarm Payrolls numbers cast doubts over the Federal Reserve's interest rate hiking path beyond July yet again. November Fed hike odds dropped to 39% from 45% after Nonfarm Payrolls.
At the time of writing, XAG/USD is trading at $23.1038 and has travelled between a low of $22.6165 and a high of $23.1545. The following technical analysis arrived at a bearish thesis, however, for the medium and longer-term:
Silver Weekly charts
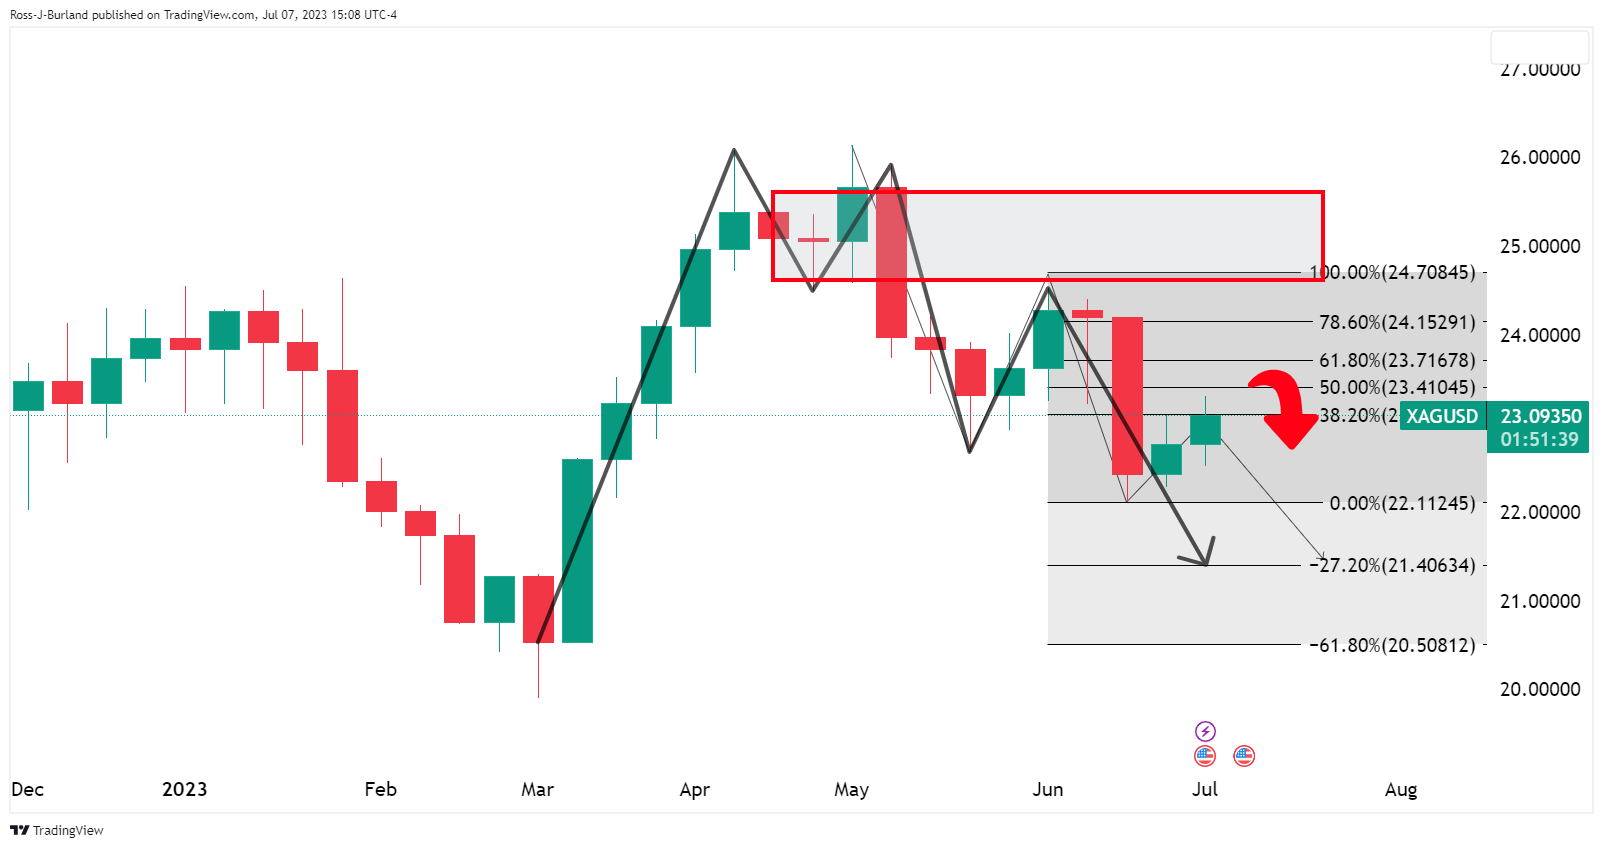

The weekly chart shows the price edging up to test the bearish commitments near the neckline of the M-formation in a 38.2% Fibonacci retracement. While the corrections not showing signs of deceleration, this can be monitored on the lower time frames for clues.
Silver Daily chart
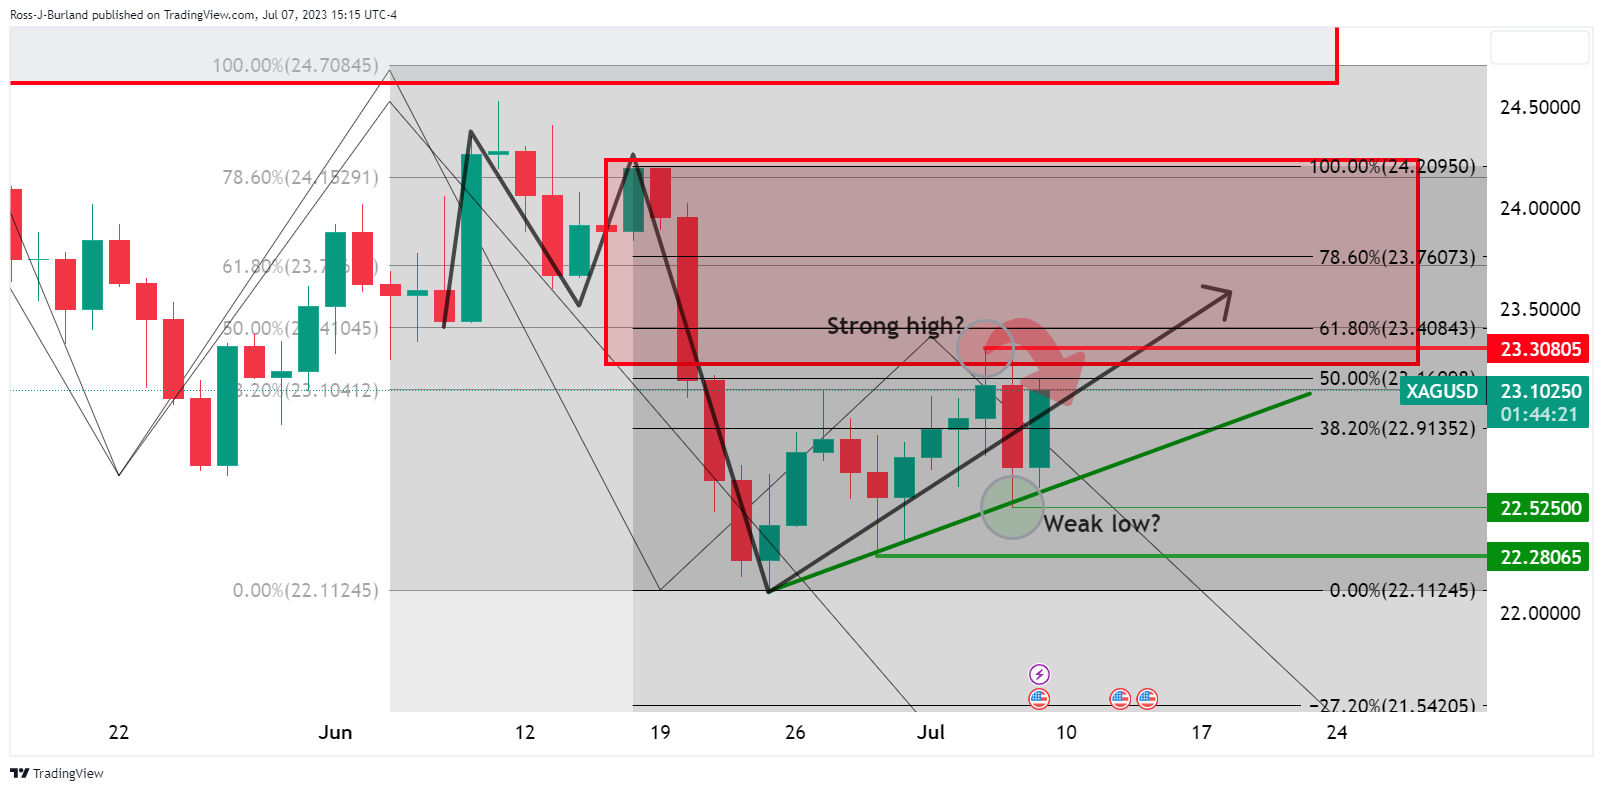
The daily chart is showing the price is moving to a near 61.8% Fibonacci retracement and into the M-formation neckline resistance. A strong high may have been put in already.
Silver H1
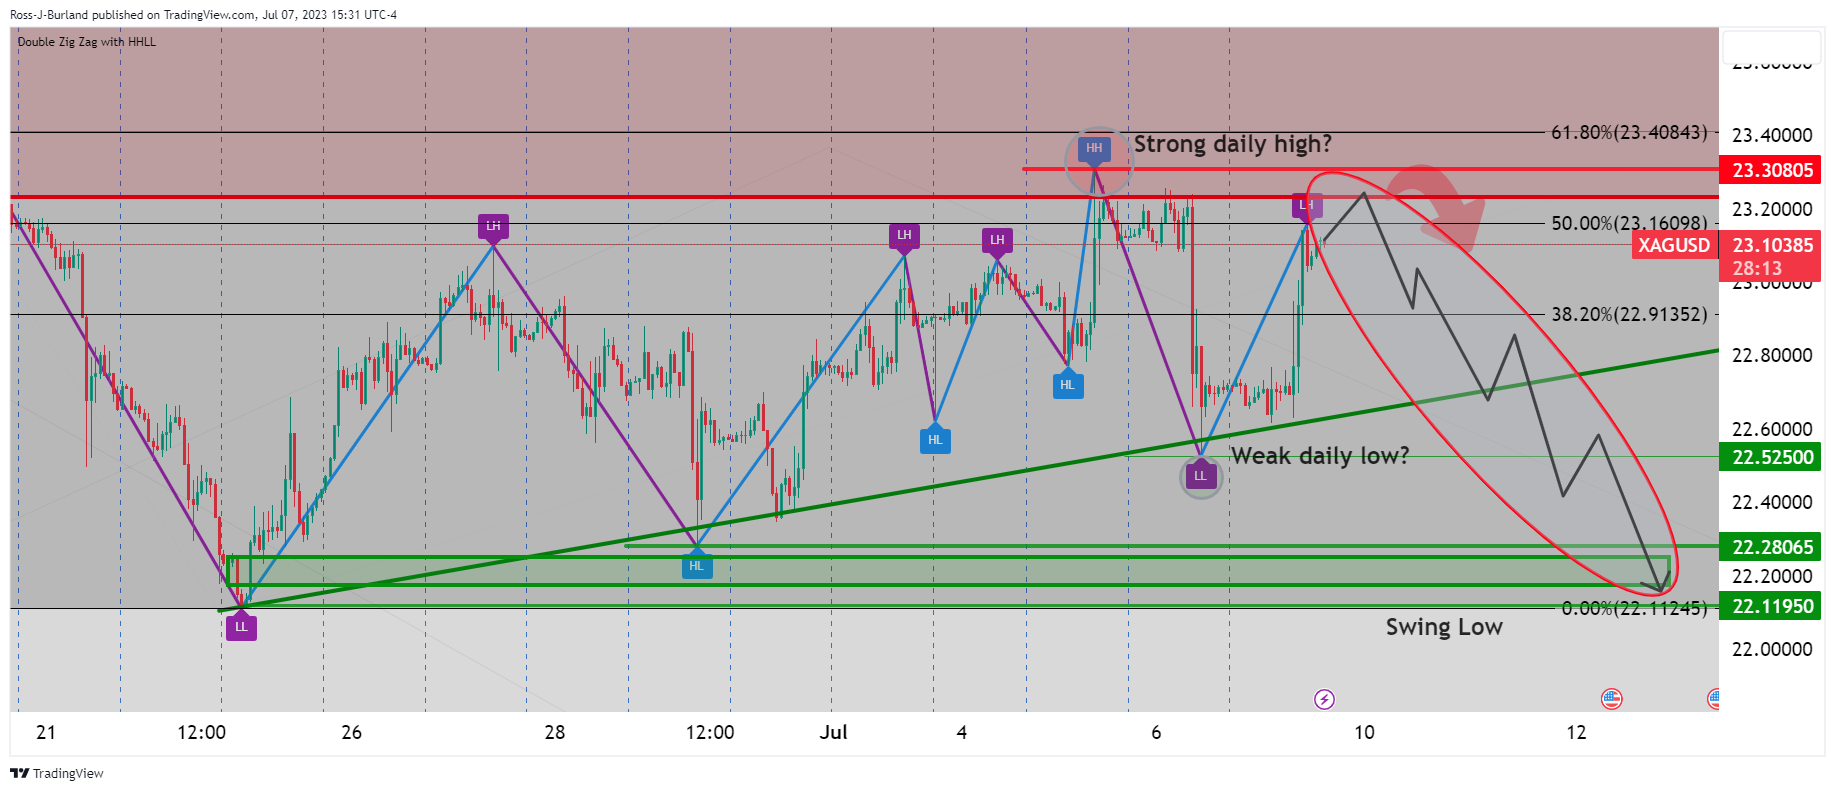
On the hourly time frame, a lower low was recently put in and this could be a sign that the bulls are tiring. A lower high could result in a sell-off and a target is eyed to the swing lows as a potential demand area.
Data released on Friday showed that Canadian employment rose by 60,000 in June, above the 20,000 expected. Analysts at CIBC point out that employment growth was brisk in June, however, they warn that rapid population growth and a rise in participation meant that the unemployment rate rose two ticks to 5.4%, while wage growth decelerated by more than anticipated.
Key quotes:
“This morning's data release was no slam dunk for the Bank of Canada, with a rise in the unemployment rate and slowing wage growth suggesting that labour market conditions are loosening. However, the data are probably just strong enough to see policymakers pull the trigger on another 25bp interest rate hike next week, rather than wait until September as we had previously forecast.”
“We still think that the rate of 5.0% reached at the time of the next hike will prove to be the peak, as evidence that the economy is slowing appears to be mounting.”
Attention will turn next week to US inflation numbers following the labor market data. Those numbers will be watched closely ahead of the July 25-26 FOMC meeting. China will also release inflation data. In the UK, employment data is due on Tuesday. Regarding recent central bank decisions, the Reserve Bank of New Zealand and the Bank of Canada will announce their decisions on Wednesday.
Here is what you need to know for next week:
Data released on Friday shows Nonfarm Payrolls increased by 209,000 in June, coming in below expectations for the first time in 15 months. A positive surprise was expected again after the impressive ADP report released on Wednesday. Despite slowing down, the positive signs from the labor market led the market to expect that the Federal Reserve (Fed) will hike its interest rate by 25 basis points at the July meeting.
The key numbers due next week will be inflation figures from the US, which will impact Fed rate hike expectations. On Wednesday, the June Consumer Price Index (CPI) will be released, and on Thursday, the Producer Price Index (PPI). The CPI is expected to rise by 0.3% on a monthly basis, and the annual rate is expected to decline from 4.0% to 3.1%, while the Core CPI is seen falling from 5.3% to 5.0%.
The US Dollar Index dropped sharply on Friday after NFP and finished the week significantly lower, around 102.25, rejected from above 103.00. The Greenback failed to benefit from higher US yields. The 10-year yield broke above 4.00% for the first time since March, but this time it is holding above.
EUR/USD rebounded from the 20-week Simple Moving Average and finished the week higher, above 1.0950. Next week, the Euro needs to rise above 1.1000 to open the doors to more gains. The pair benefited from higher Eurozone (EZ) bond yields. No key reports are due from the EZ next week. The European Central Bank (ECB) will release the minutes of its latest meeting. A 25 bps rate hike in July is fully priced in.
GBP/USD posted the highest weekly close in more than a year above 1.2800, after rising sharply during Thursday and Friday. The pair is testing year-to-date highs around 1.2850. On Tuesday, the UK will report employment data, and GDP on Thursday.
After falling sharply on Friday, USD/JPY completed the worst week in months, retreating from near the potential intervention area at 145.00 to the 142.00 area. The Japanese yen was the top performer among the G10 space.
USD/CAD fell significantly on Friday after the Canadian jobs report showed the economy added 60,000 jobs. The number helped reaffirm expectations that the Bank of Canada will raise interest rates by 25 basis points at next week's meeting. The pair pulled back from month-to-date highs near 1.3400 toward 1.3250.
Analysts at TD Securities:
We look for the BoC to hike another 25bps to 5.00% in July. Upward revisions in the July MPR will provide the main catalyst for the hike, but we do expect a more balanced statement relative to June after some further erosion of sentiment. We also look for the Bank to leave its guidance open-ended, although we believe 5.00% will mark the terminal rate for the BoC.
The slide of the US dollar boosted the AUD/USD on Friday, which climbed to the 0.6700 area, a level that is relevant in the short-term for the pair. No key data is due from Australia next week. However, Chinese inflation on Monday and trade data on Thursday will be watched closely. Reserve Bank of Australia Governor Lowe will speak on Wednesday.
NZD/USD surged on Friday to test the 0.6220 area. The Reserve Bank of New Zealand will have its monetary policy meeting next Wednesday. It is expected to keep rates unchanged at 0.5%.
Like this article? Help us with some feedback by answering this survey:
- The GBP/JPY cross tallies a second consecutive day of losses, falling below the 182.50 area on Friday.
- The 20-day SMA at 181.44 is poised for a retest.
- The Yen gained ground agains most of its rivals on rising Japanese Yields after Labor Cash Earning data.
On Friday, the GBP/JPY cross lost ground as the JPY trades with agains most of its rivals, including the USD, EUR,GBP and AUD. In that sense, the USD/JPY fell to a two-week low following US Nonfarm Payrolls data pressured down by falling American yields while the Japanese rates are rising.
In that sense, the yield on the 2,5 and 10-year Japanese bonds rose to their highest level since May. On the other hand, after Nonfarm Payrolls from the US from June came in lower than expected at 209K vs the 225k expected, US yields retreated. A 1.70% decrease was seen in the 2-year yield, bringing it down to 4.90%, whereas the rates for the 5-year and 10-year yields dropped to 4.29% and 4.02%, respectively.
In that sense, strong Labor Cash Earnings data from Japan released early in the Asian session seem to have fueled the rise in Japanese yields. In that sense, the average income, before taxes, per regular employee in the Asian country rose by 2.5% YoY in May vs the 0.7% expected by the markets. It is worth noticing that the Bank of Japan (BoJ) expressed that its short-term objective was to see wage growth and rising economic activity. That being said, the expectations of a pivot in monetary policy by the BoJ, may continue to strengthen the JPY.
On the British side, their economic calendar had nothing relevant to offer. The focus is next Tuesday’s labour market data, including Claimant Count and Average Earnings figures.
GBP/JPY Levels to watch
The daily chart, suggest a bearish outlook for the short term. Indicators are starting to show weakess with the Relative Strength Index (RSI) pointing south and the Moving Average Convergence Divergence, printing higher red bars. On the bigger picture, the outlook will favour the GBP as long as the cross holds above its main Simple Moving Averages of 20,100, and 200 days.
Support Levels: 181.45 (20-day SMA), 181.00 and 180.50.
Resistance Levels: 182.70, 183.00,184.00.
GBP/JPY Daily chart
-638243514829813971.png)
- GBP/USD rallies to 1.2845, a gain of 0.83%, following softer-than-expected US Nonfarm Payrolls figures that added pressure on the US Dollar.
- The US economy added just 209K jobs in June, below estimates of 225K, leading to a drop in the value of the US Dollar across the board.
- On the UK front, despite fears of a possible recession scenario, the swaps market continues to forecast several more rate hikes by the Bank of England, potentially as high as 6%.
GBP/USD rallied sharply after briefly edging towards its daily low of 1.2725, but soft data from the United States (US) weighed on the US Dollar (USD), opening the door for a GBP late bounce. At the time of writing, the GBP/USD is past the 1.2800 figure, trading at 1.2845, and gains 0.83%.
Pound Sterling rallies as soft US labor data weighs on the US Dollar
Key economic data from the US, particularly Nonfarm Payrolls figures for June, showed the economy adding just 209K jobs, below estimates of 225K, spurring US Dollar weakness across the board. Furthermore, the Unemployment Rate portrayed a tight labor market, decelerating from 3.7% to 3.6% in June, while Average Hourly Earning (AHE) expanded 4.4% YoY, above the prior’s month 4.2%, adding to inflationary pressures, keeping the US Federal Reserve (Fed) under pressure.
GBP/USD reacted upwards and claimed the 1.2800 mark. Once market analysts dissected the US Nonfarm Payrolls report, the GBP/USD extended its gains past the R1 daily pivot at 1.2840. Consequently, the US Dollar Index (DXY), a measure of the performance of a basket of six currencies against the buck, falls 0.83%, down at 102.249, a tailwind for the GBP/USD.
US Treasury bond yields, mainly the 10-year Treasury note, yielding 4.042%, are almost unchanged. Although the labor market is showing signs of cooling down, traders remain certain the US Federal Reserve (Fed) will increase rates by 25 bps at the July 25-26 meeting, as shown by the CME FedWatch Tool. Odds are at 92.4%, higher than last week’s 86.8%. Nevertheless, they seem not convinced the Fed will hike twice, as the Fed’s dot-plot portrayed.
Of late, Chicago Fed President Aaron Golsbee expressed that the labor market remains strong but cooling. Golsbee added that inflation is too high and that 1 or 2 more rate hikes could be needed to tame elevated inflation.
On the United Kingdom front, the Bank of England (BoE) Governor Andrew Bailey said they must act now to bring inflation to heel, allowing market participants to maintain bets of several more hikes before the Bank decides the end credits of this tightening season roll. The swaps market still shows the BoE will raise rates as high as 6%, even though recent manufacturing and services business activity polls portrayed a possible recession scenario in the country.
Given the fundamental backdrop, further GBP/USD upside is expected, but woes about a UK recession would cap the Pound Sterling (GBP) uptrend. If data proves right, and the UK’s economy remains resilient, the GBP/USD could challenge the 1.3000 figure in the medium term.
GBP/USD Price Analysis: Technical outlook
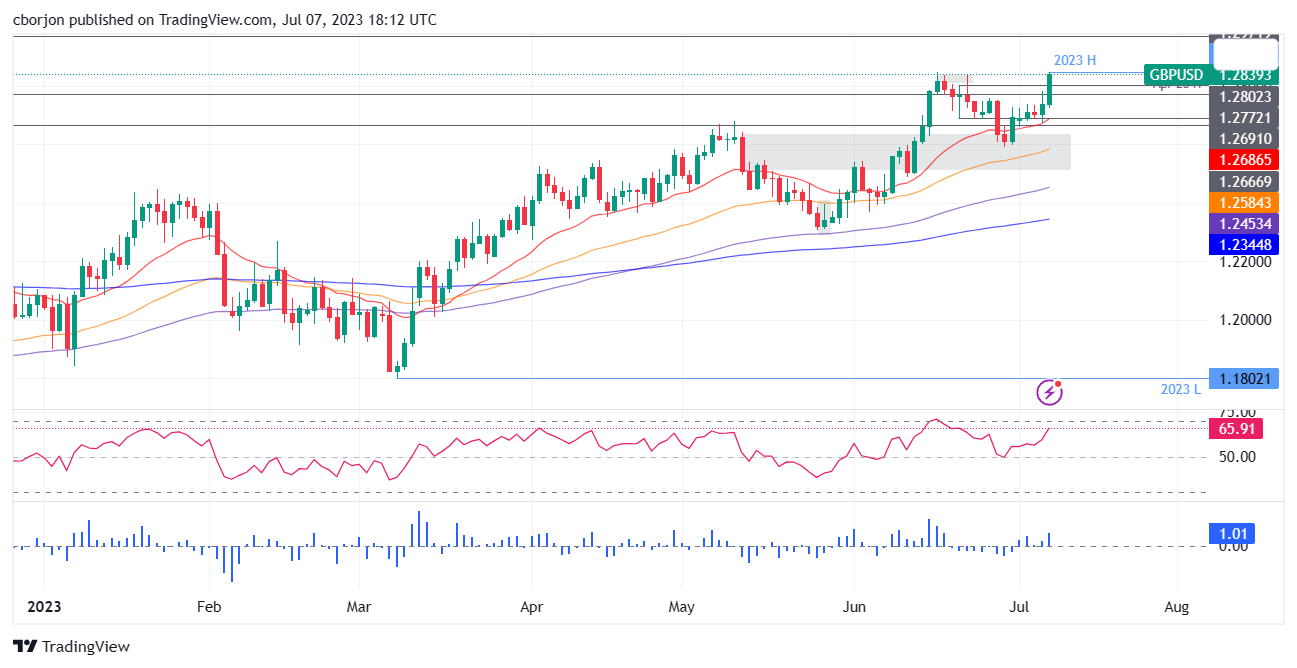
From a technical perspective, the GBP/USD rose to new year-to-date (YTD) highs of 1.2849 after the US data release. If GBP/USD prints a daily close above 1.2850, the 1.2900 figure would be up for grabs. Further rallies could challenge the 1.3000 mark. Conversely, GBP/USD’s failure to register a daily close above 1.2850 would exacerbate a dip towards 1.2800. Break below will expose 1.2700, followed by the 20-day EMA at 1.2687.
- The USD/JPY fell to it lowest point since June 23, recording more than 1% losses on the day.
- NFP report showed that the US added 209K jobs in June vs 225K expected.
- Wage inflation to maintain hawkish bets on the Fed steady.
On Friday, the USD/JPY plunged towards the 142.15 area, a two-week low, and is poised to record a weekly gain after three consecutive weeks of losses. In that sense, the USD faced severe selling pressure after Nonfarm Payrolls came in lower than expected. However, wage inflation still remains sticky.
The recent release by the US Bureau of Labor Statistics indicated that the Nonfarm Payrolls for June fell below expectations. The report reveals that the US economy added 209K jobs in June, which was lower than the anticipated 225K and decreased from the previous figure of 306K. Additionally, wage growth remained positive, with a monthly increase of 0.4%, surpassing the expected 0.3%. The Unemployment rate stood at 3.6%.
As a result of these fIgures, there was a widespread decline in US Treasury yields. The 2-year yield experienced a significant drop of over 1.70%, settling at 4.90%. Similarly, the 5-year and 10-year yield rates reached 4.29% and 4.02%, respectively. It’s worth noticing that Jerome Powell has mentioned the possibility of further tightening due to a tight labor market and warned it can see some “pain”. In addition, while wage inflation remains sticky, the Fed will be pressured to continue tightening or keeping rates high until progress to the downside is seen.
Meanwhile, based on the CME FedWatch Tool, investors are fully factoring in a 25 basis points increase in the upcoming July meeting of the Fed. If this occurs, it will raise the rates within the range of 5.25% to 5.50%, and an additional 25 bps hike by December is nearly 40% priced in.
All eyes are now on the forthcoming release of the Consumer Price Index (CPI) data for June from the US, next Wednesday, as it will continue to shape the expectations regarding the upcoming decision by the Federal Reserve on July 26.
USD/JPY Levels to watch
According to the daily chart, bulls took a big hit and the outlook is starting to favor the JPY. The Relative Strength Index (RSI) has plunged towards 50.00 and the Moving Average Convergence Divergence (MACD) has printed a red bar, indicating that the bears are taking the lead. In addition, the bulls have failed to defend the 20-day Simple Moving Average (SMA), a key support for the pair.
In case of further downside, support levels are seen at 142.00, followed by the 141.40 area and the 140.35 zone. On the upside, the mentioned 20-day SMA stands as the nearest resistance at 142.75, followed by the 143.00 area and 143.60.
USD/JPY Daily chart
-638243478257549391.png)
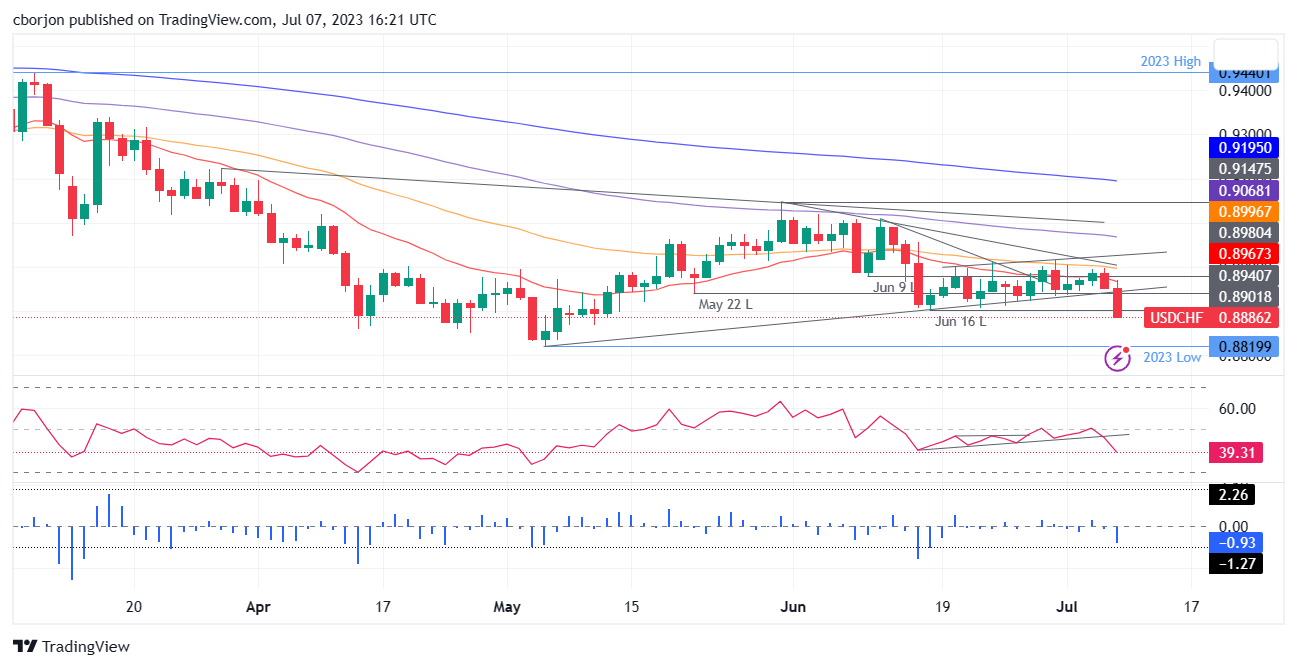
- USD/CHF plunges to a two-month low of 0.8889, down 0.72%, due to weaker-than-expected US labor data and a weakened US Dollar.
- The pair breaches a two-month support trendline, extending losses below 0.8900.
- The next target is the year-to-date low of 0.8819, pending a breakthrough of the 0.8850 psychological level.
- If buyers reclaim 0.8900, initial resistance lies at 0.8950, followed by the 20-day EMA at 0.8967 and the 50-day EMA at 0.8997.
USD/CHF dives into a new two-month-old on Friday after labor data from the United States (US) was softer than expected, weakening the US Dollar (USD). Earlier, the USD/CHF hit a daily high of 0.8970, which dropped below the 0.8900 figure on the data release. The USD/CHF is trading at 0.8889, down 0.72%.
USD/CHF Price Analysis: Technical outlook
From a daily chart perspective, the USD/CHF extended its losses past the 0.8900 mark after breaking a two-month-old support trendline. That exacerbated the USD/CHF fall below the June 16 swing low of 0.8901, intermediate support opening the door for a test of the year-to-date (YTD) low of 0.8819. Nevertheless, the USD/CHF must surpass the 0.8850 psychological level on its way down.
Notably, the Relative Strength Index (RSI) indicator and the three-day Rate of Change (RoC) suggested that sellers remain in charge, as both turned bearish.
Conversely, if USD/CHF buyers reclaim 0.8900, the first resistance would emerge at 0.8950. A breach of the latter, the USD/CHF could rally to the 20-day EMA at 0.8967, followed by the 50-day EMA at 0.8997. A breach of the latter will put into play the 0.9000 figure.
USD/CHF Price Action – Daily chart
- AUD/USD cleared most of the last two session’s losses and is poised for a weekly gain.
- NFPs from the US from June came in at 209K lower than expected, while wage growth remained healthy.
- Lower US yields weight on the USD.
On Friday, the AUD/USD surged to the 0.6680 area as the USD weakened following weak Nonfarm Payrolls from June. However, wages accelerated, which should maintain steady hawkish bets on the Federal Reserve and limit the USD's losses.
US reported lower-than-expected NFPs and accelerating salaries
The US Bureau of Labor Statistics released that the Nonfarm Payrolls from the US from June, and results were lower than expected. In that sense, the report stated that the US gained 209K jobs in June vs the 225k expected and lower than the previous figure of 306K. Wage growth remained healthy at 0.4% MoM, above the 0.3% expected, while the Unemployment rate stood at 3.6%.
Following the data, US Treasury yields decreased across the board. The 2-year yield fell by more than 1.70% to 4.90%, while the 5 and 10-year rates to 4.29% and 4.02%, respectively. That being said, markets are assessing the Federal Reserve's next steps as Jerome Powell stated that further tightening may be required driven by a tight labour market. However, as salaries aren’t declining, they pressure the Fed to maintain its hawkish stance and contemplate further tightening.
As for now, according to the CME FedWatch Tool, investors continue to fully discount a 25 basis points hike in the July meeting of the Fed which would take the rates to the 5.25%-5.50% range. All eyes are now on next Wednesday's Consumer Price Index (CPI) data from June from the US, which will continue modelling the expectations for the next Fed decision.
AUD/USD Levels to watch
The daily chart indicates that the outlook for the Aussie has improved, but still the bigger picture suggests that the sellers are in control. The Relative Strength Index (RSI) and the Moving Average Convergence Divergence (MACD) still hold negative territory while the pair trades below the 20, 100 and 200-day Simple Moving Averages.
Resistance Levels to watch: 0.6685 - 0.6696 area (convergence of the 100 and 200-day SMAs), 0.6730 (20-day MA)
Support Levels to watch: 0.6630,0.6600,0.6570.
AUD/USD Daily chart
-638243432056547914.png)
- The US dollar weakens across the board after the US official jobs report.
- EUR/USD gains momentum after breaking above 1.0930.
- The pair is heading for its highest weekly close since May.
The EUR/USD pair gained momentum amid a weaker US Dollar following the release of US employment data. After breaking above 1.0930, the Euro accelerated and climbed to the 1.0960 area, reaching the highest level in a week.
US Dollar down after NFP
Nonfarm Payrolls (NFP) in the US rose by 209,000 in June, below the market expectation of 225,000. May's increase of 339,000 was revised lower to 306,000. The unemployment rate edged lower to 3.6%. Despite the miss in job creation, the numbers continue to show a strong labor market.
Market continues to see a rate hike at the next FOMC meeting but expectations of a second hike before year-end have eased. Such repricing has kept US yields limited and, as a result, the US Dollar is falling by 0.75%, having the worst day in a week. US stocks are trading mixed, while commodity prices are up.
The EUR/USD is hovering above 1.0960, at the highest since June 27, with bullish momentum intact. It is holding onto weekly gains, above the 20-week Simple Moving Average. If the pair holds above 1.0960, attention would turn to the 1.1000 area and then the June high at 1.1012. On the contrary, a decline under 1.0930 would weaken the short-term outlook for the Euro.
Next week
No key reports are due from the Eurozone next week. The most relevant economic numbers will come from the US with the Consumer Price Index (CPI) on Wednesday and the Producer Price Index (PPI) on Thursday. Inflation figures will be crucial ahead of the July 25-26 FOMC meeting.
Technical levels
In an interview with CNBC on Friday, Chicago Federal Reserve Bank President Austan Goolsbee said that they don't need a recession to eliminate inflation concerns, per Reuters.
Additional takeaways
"Never make too much out of any one month of jobs number."
"It is clear job market is strong but cooling."
"Getting to a more sustainable pace of job gains."
"Would caution taking wage data as a leading indicator of inflation."
"Prices move first, then wages."
"Job market is outstanding, getting back to a balanced, sustainable level."
"Fed's overriding goal is to get inflation down."
"I feel like we are on golden path of avoiding recession."
"We can get unemployment rate not to a recession level and still get prices down."
"There's a lag to monetary policy."
"Goods inflation is the main reason inflation overall has been more persistent."
Market reaction
These comments failed to help the US Dollar find demand. As of writing, the US Dollar Index was down 0.72% on the day at 102.36.
- NZD/USD bounces to 0.6207 from a low of 0.6149, buoyed by a weaker US dollar after a disappointing jobs report.
- US adds 209K jobs, below expectations, but the unemployment rate falls to 3.6%. Wage growth remains strong at 4.4% YoY.
- Traders confident in Fed’s rate hike at July meeting, with odds now at 92.4%.
- Reserve Bank of New Zealand is expected to maintain rates in the upcoming meeting after recent hikes.
NZD/USD climbs back above 0.6200 on Friday as the US Dollar (USD) weakened due to a softer-than-foreseen jobs report in the United States (US), which was expected to deliver solid figures following Thursday’s solid labor market data. The NZD/USD is trading at 0.6207 after hitting a daily low of 0.6149.
NZD/USD strengthens due to weaker US Dollar after disappointing US NFP report
The US Bureau of Labor Statistics (BLS) revealed the economy added just 209K jobs to the economy, as shown by the June Nonfarm Payrolls report. In addition, the data showed the Unemployment Rate dropped from 3.7% in May to 3.6^% in June. Of note, Average Hourly Earnings (AHE) rose from 4.2% to 4.4% YoY, a sign that wage growth remains resilient.
NZD/USD traded volatile after the data, seesawed at around the 0.6159-0.6202 range before stabilizing at current exchange rates, as the greenback edged lower, weighed by US Treasury bond yields drop.
The US 10-year Treasury note yields 4.02%, falls one and a half basis points, while the US Dollar Index (DXY), a gauge of the buck’s value against a basket of six currencies, dives to 102.438, losses 0.66% after staying above the 103.000 during the past four days.
Although the US Nonfarm Payrolls report was soft, traders remain certain the US Federal Reserve (Fed) will increase rates by 25 bps at the July 25-26 meeting, as shown by the CME FedWatch Tool. Odds are at 92.4%, higher than last week’s 86.8%. Nevertheless, they seem not convinced the Fed will hike twice, as the Fed’s dot-plot portrayed.
On the New Zealand (NZ) front, its economic docket for the next week will feature the Reserve Bank of New Zealand (RBNZ) monetary policy meeting. The RBNZ is expected to hold rates unchanged, after 525 bps increases, since late 2021.
NZD/USD Price Analysis: Technical outlook
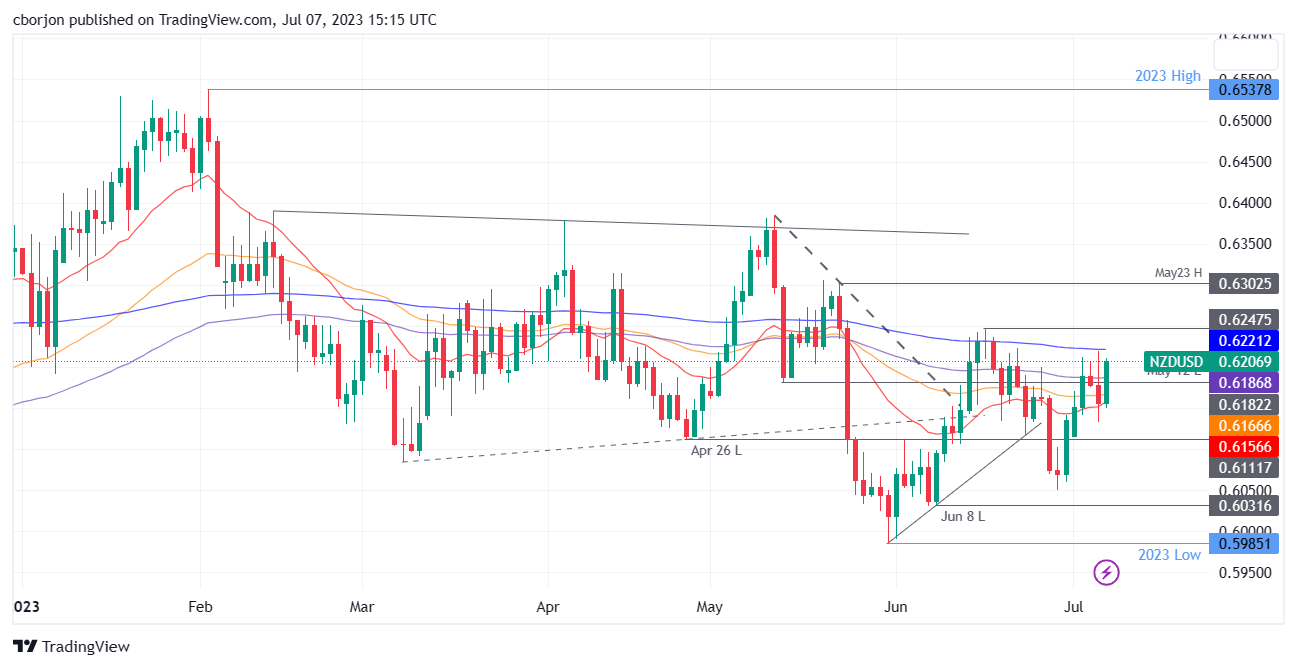
The NZD/USD is neutral-biased, capped on the upside by the 200-day Exponential Moving Average (EMA) at 0.6221. Once the level is surpassed, the pair could rally toward June 16 high at 0.6247, followed by May 23 swing high at 0.6302. On the flip side, the NZD/USD would initially dip to the 100-day EMA at 0.6186 if it struggles to cling above 0.6200. Next, support levels lie at the 50-day EMA at 0.6166, followed by the 20-day EMA at 0.6156.
Gold price has stabilised above the $1,900 mark. Economists at Commerzbank analyze the precious metal outlook.
Gold price to be back at $2,000 by year’s end
Market participants appear to have come to terms with the fact that the interest rate turnaround will take some time yet.
The price will probably continue treading water in the short term but is likely to regain strength when the peak of the (US) rate hike cycle comes more clearly into view.
We expect the Gold price to be back at $2,000 by year’s end.
Halfway through 2023, the MXN is the second-best performing major currency following the COP with a spot return of 14.0% and a total return of 21% against the USD. Economists at Société Général analyze Peso outlook.
Rate cuts to start in 1Q24
We remain constructive on the Peso relative to forwards and expect it to trade within the 16.40-18.11 range in the coming quarters.
Political developments will be key to watch for the Peso heading into the Presidential election in June 2024.
At its latest June MPC meeting, Banxico left the policy rate unchanged at 11.25% and pledged to maintain rates at current levels for ‘an extended period’ of time. This, in our view, means status quo until year-end. We expect rate cuts to start in 1Q24.
How can Türkiye get out of hyperinflation? Continuing to accept exchange rate depreciation means perpetuating the inflation-exchange-rate depreciation loop, analysts at Natixis report.
How can inflation be sharply reduced in Türkiye?
The solution that has been used successfully is to: Move to a fixed exchange rate regime against the Dollar, in a credible and irreversible manner, thereby lowering inflation expectations; Bear the cost of disinflation, i.e. accept the loss of production that results from the slow disinflation relative to the fixed exchange rate.
Continuing to accept exchange rate depreciation would perpetuate the hyperinflation situation.
An acceleration in the transition to renewable energy is supporting metals not usually associated with renewables, such as Silver. And the Silver market may struggle to adjust, economists at ANZ Bank report.
Silver in structural deficit amid surge in demand from solar industry
Due to its high electrical conductivity and durability, Silver has become important to the solar industry. With the installation of solar capacity rapidly growing its role as an industrial metal is developing. This year China is expected to add nearly as much as the total installed capacity in the US. By 2025, we expect industrial demand for Silver (from solar) to make up 53% of total demand. This will place increasing pressure on supplies.
Growth in mine production is largely beholden to other metals projects for which Silver is a by-product. Scrap, which makes up nearly 20% of supply, is also lagging. Above ground inventories remain plentiful but have dropped sharply over the past couple of years.
We estimate the Silver market is entering a period of tightness unseen for decades. This may not be alleviated by higher Silver prices.
Kit Juckes, Chief Global FX Strategist at Société Générale, analyzes G10 FX outlook after US labour market data.
A hike by the BoC can keep USD/CAD downward momentum in place
The Dollar was softer ahead of the data than recent rate/yield moves might have suggested; that’s to say that the very close correlation between USD/JPY and 5-year yield differentials has broken down a bit, and the jobs data narrow that gap slightly. Likewise, EUR/USD, which has been tracking short-term rate differentials, was too high and is now too high by a smaller margin. Meh! We’re unlikely to break ranges with this.
Now the focus switches quickly to Wednesday’s CPI report, where the consensus call is for 5% core inflation. Below that, and maybe more people start wondering, not if the Fed passes up on a July hike, but if that could be the last one. And then, maybe EUR/USD does make a move through 1.10 and USD/JPY can head back towards 140.
The Canadian data posted strong jobs growth (2.4% YoY) but a significant slowdown in wage growth to 3.9%. That’s left the market split about Wednesday’s Bank of Canada meeting. A hike keeps USD/CAD downward momentum in place.
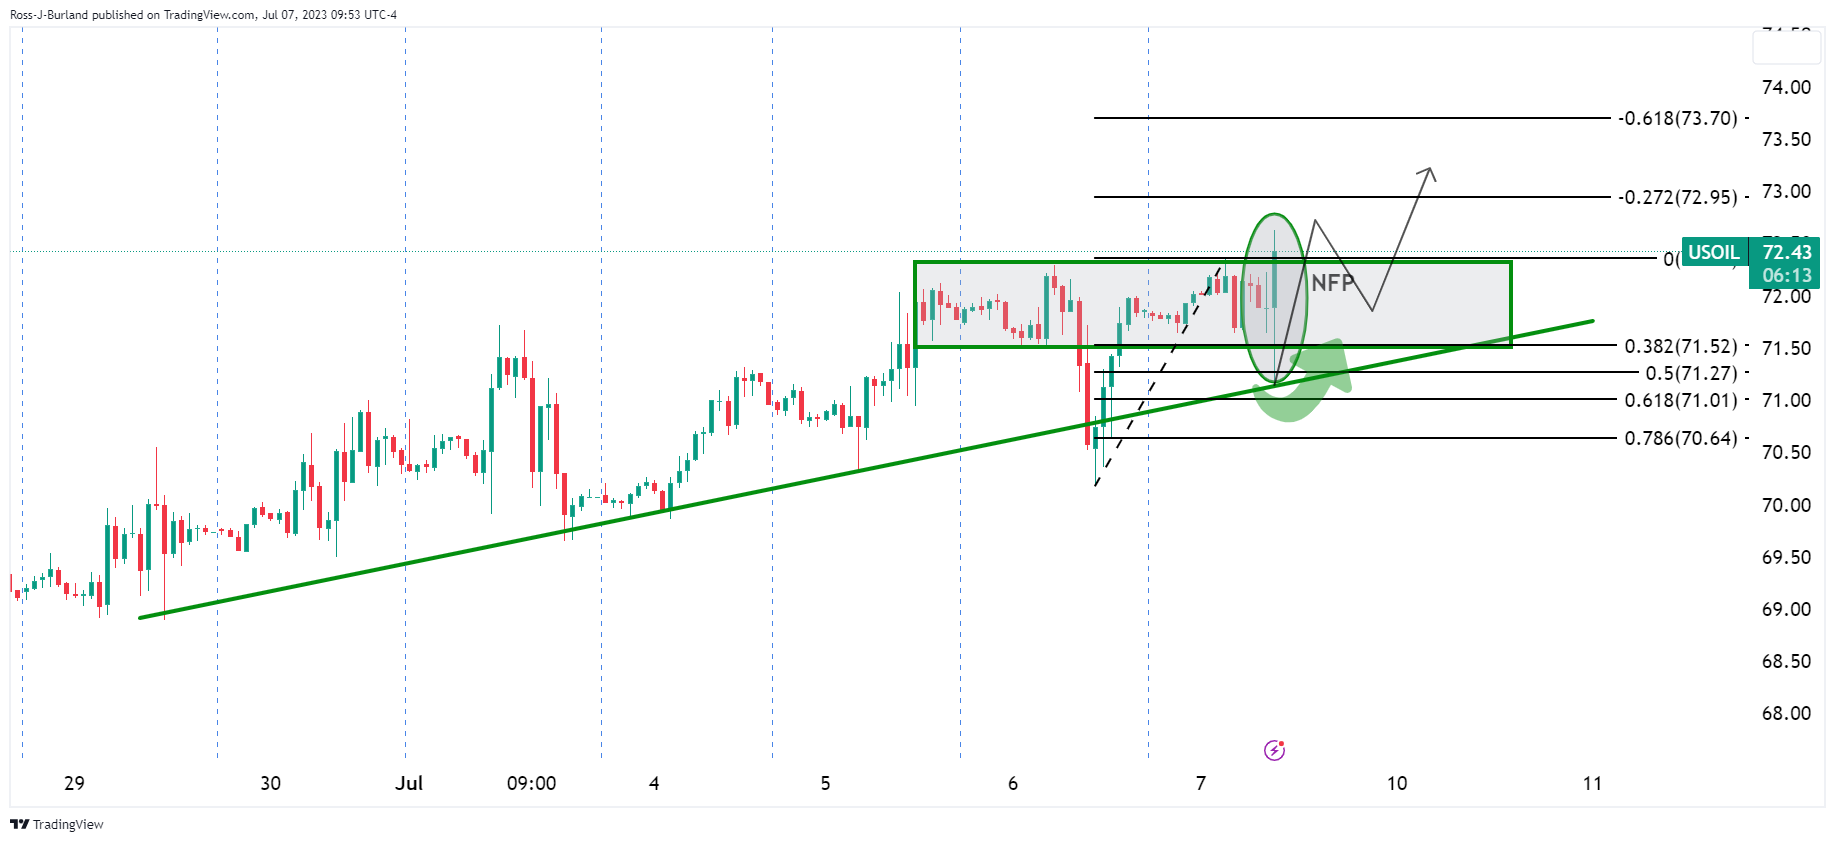
- WTI bulls move in as US Dollar weakness further following NFP.
- WTI makes fresh highs and technicals flip bullish again.
WTI has been volatile in Friday's New York trade, travelling with little sense of direction between $71.24 and $72.36 on the day so far. The US Dollar and risk appetite is the driver following today's Nonfarm Payrolls report.
The US Dollar is suffering in the face of a weaker-than-expected headline in NFP.
Nonfarm Payrolls
Nonfarm Payrolls (NFP) in the US rose 209,000 in June, the US Bureau of Labor Statistics reported on Friday. This reading came in below the market expectation of 225,000. May's increase of 339,000 got revised lower to 306,000.
The Unemployment Rate edged lower to 3.6% from 3.7% as expected and the annual wage inflation, as measured by the Average Hourly Earnings, stood unchanged at 4.4%, compared to analysts' estimate of 4.2%. Finally, the Labor Force Participation Rate held steady at 62.6%, while the Unemployment Rate fell 0.1% to 6.9% from 6.7%.
''We continue to expect that the surge in interest rates since early 2022 will slow demand for workers before driving unemployment higher later this year. But easing in labour demand has not yet shown up in any of the headline numbers,'' analysts at RBC Economics said.
''As noted in the meeting minutes for the last FOMC decision in June, policymakers still view current labour market conditions as too tight, and wage gain too elevated for inflation to sufficiently return to the 2% target over time. We expect the Fed to hike the fed funds rate by 25 bps in July.''
Despite the mixed data, the November Fed hike odds dropped to 39% from 45% after Nonfarm Payrolls and the Greenback is on the back foot, benefitting the oil price as follows:
WTI technical analysis
BRL appreciated to record level in one year, but it might not remain so strong in the medium run, according to economists at MUFG Bank.
Interest differential will continue to shrink
In the external environment, the hawkish speeches delivered by the Fed, ECB and BoE coupled with concerns on Chinese growth hit EM currencies.
In the domestic market, the stronger signs that the Central Bank will start to ease monetary policy in August reinforced our expectation that the interest differential will continue to shrink and reduce the attractiveness of long BRL carry trades. In addition, we expect that the government will face difficulties to increase revenues to meet the fiscal goals, worsening the fiscal balance, and triggering a repricing of the initial positive market reaction to the likely approval of the new fiscal framework in July.
We expect the BRL to weaken heading into year-end lifting USD/BRL up to 5.20.
- USD/JPY resumed its slide after a rebound amidst volatility following NFP.
- The US labor market data came in below expectations.
- Volatility soars in the bond market, triggering reversals in Yen’s crosses.
The USD/JPY fell to 142.41, reaching the lowest level in two weeks after the release of US labor market data. The Greenback weakened after the first miss against expectations in NFP since April 2022.
Labor market is cooling but still tight
Nonfarm Payrolls (NFP) in the US rose by 209,000 in June, below the market expectation of 225,000. May's increase of 339,000 was revised lower to 306,000. The Unemployment rate edged lower to 3.6%.
“The US employment report for June was mixed. It is true that job growth slowed to 209 thousand. But other aspects turned out better than in May. Even though the labor market is cooling, it likely remains too strong from the Fed's perspective. The Fed is therefore likely to raise rates again this month,” explained analysts at Commerzbank.
Volatile bond market
US yields experienced sharp moves following the release of the NFP. The 10-year yield dropped towards 4.00% but then rebounded, hitting fresh cycle highs at 4.09%, and after Wall Street's opening, it was heading lower again. The 2-year yield tumbled to 4.75% and then rebounded to 5.00%.
The market currently shows higher odds of a rate hike at the next meeting, but a decline for a second rate hike before year-end. These moves influenced the USD/JPY pair. As yields turned down again, the pair is moving towards daily lows. It did bounce from the post-NFP bottom, the lowest since June 22, all the way back to 143.40.
The short-term outlook for USD/JPY remains bearish. The dollar needs to break 144.00 to alleviate the negative pressure. On the flip side, below 142.50, the next support area is around 142.00.
On a weekly basis, the Dollar is about to end a three-week positive streak. So far, it is trading 150 pips below the level it had a week ago, enough to become the worst weekly performance since March.
Technical levels
USD/INR defends triangle lower limit at 81.60. Economists at Société Générale analyze the pair’s technical outlook.
Rebound expected
USD/INR has evolved within a large consolidation since last October in the form of an ascending triangle. The pair recently retracted towards the 200-DMA and the lower band of the pattern; April low of 81.60 is an important support.
A short-term bounce is not ruled out towards the upper end of the formation at 82.95/83.30. An ascending triangle generally points towards potential upside.
If the pair overcomes the upper band near 83.30, next leg of uptrend is likely to materialize.
Only if the pair fails to defend 81.60, the pullback is likely to extend.
- AUD/USD has capitulated gains generated after the release of weaker-than-expected US NFP data.
- S&P500 is expected to open on a subdued note as investors are cautious ahead of second-quarter result season.
- The Australian Dollar could show a decent bounce back as investors are hoping for an interest rate hike by the RBA in August.
The AUD/USD pair has surrendered gains generated after the release of the bleak United States Nonfarm Payrolls (NFP) report. The Aussie asset has dropped to near 0.6620 after retreating from 0.6660 as the US Dollar Index (DXY) has found immediate support near 102.60.
S&P500 is expected to open on a subdued note as investors are cautious ahead of second-quarter result season. Aggressively restrictive monetary policy by the Federal Reserve (Fed) and tight credit conditions might have impacted the profitability of corporate.
The USD Index is expected to remain heavily volatile as investors would start assessing the impact of the NFP data on the Federal Reserve’s (Fed) interest rate outlook. As per the US NFP report, the labor market was flooded with fresh additions of 209K payrolls against the consensus of 225K and the former release of 306K.
The Unemployment Rate has dropped to 3.6% as expected by the market participants. Apart from the Employment numbers, the economic catalyst that is under observation is the Average Hourly Earnings data. Monthly economic data maintained a pace of 0.4% and remained higher than the consensus of 0.3%. Also, Annualized Average Hourly Earnings remained at a steady pace of 4.4%.
Meanwhile, the Australian Dollar could show a decent bounce back as investors are hoping for an interest rate hike in August. A poll from Reuters showed that the RBA could push interest rates to 4.35%, Monthly Consumer Price Index (CPI) has softened to 5.6% but is still far from the desired rate of 6.8%.
Today's labor market data did not reach expectations. As a result, the Fed is likely to raise its key interest rates at the July meeting, in the opinion of economists at Commerzbank.
US labor market misses high expectations
The US employment report for June was mixed. It is true that job growth slowed to 209 thousand. But other aspects turned out better than in May.
Even though the labor market is cooling, it likely remains too strong from the Fed's perspective. The Fed is therefore likely to raise rates again this month.
- Gold price rallied to session highs on the US NFP data that missed expectations on the headline.
- Gold bears are moving as the dust settles on the front side of the daily bearish trendline.
Gold price rallied on the knee-jerk and relatively benign Nonfarm Payrolls outcome. Although the data showed a contraction in the headline from the prior month with large revisions to the downside for the prior, the Unemployment Rate was 0.1% lower compared to last month which is another positive in a series of robust US numbers of late. Nevertheless, the Gold price popped to a high of $1,928.40c from a low of $1.920oz.
Meanwhile, 15 minutes after the data, the Gold price is falling and traded back below $1,920.
Nonfarm Payrolls
Nonfarm Payrolls (NFP) in the US rose 209,000 in June, the US Bureau of Labor Statistics reported on Friday. This reading came in below the market expectation of 225,000. May's increase of 339,000 got revised lower to 306,000.
The Unemployment Rate edged lower to 3.6% from 3.7% as expected and the annual wage inflation, as measured by the Average Hourly Earnings, stood unchanged at 4.4%, compared to analysts' estimate of 4.2%. Finally, the Labor Force Participation Rate held steady at 62.6%, while the Unemployment Rate fell 0.1% to 6.9% from 6.7%.
All in all, the data continues to back a robust labour market and accompanies the May JOLTS job openings came in at 9.824 mln vs. 9.9 mln expected and a revised 10.32 mln (was 10.1 mln) in April. Also, Continuing claims came in at 1.72 mln vs. 1.737 mln expected and a revised 1.733 mln (was 1.742 mln) last week. This was the lowest since mid-February. The ADP reported its private sector jobs estimate at 497k vs. 240k expected and a revised 267k (was 278k) in May.
However, November Fed hike odds dropped to 39% from 45% after Nonfarm Payrolls.
Gold technical analysis
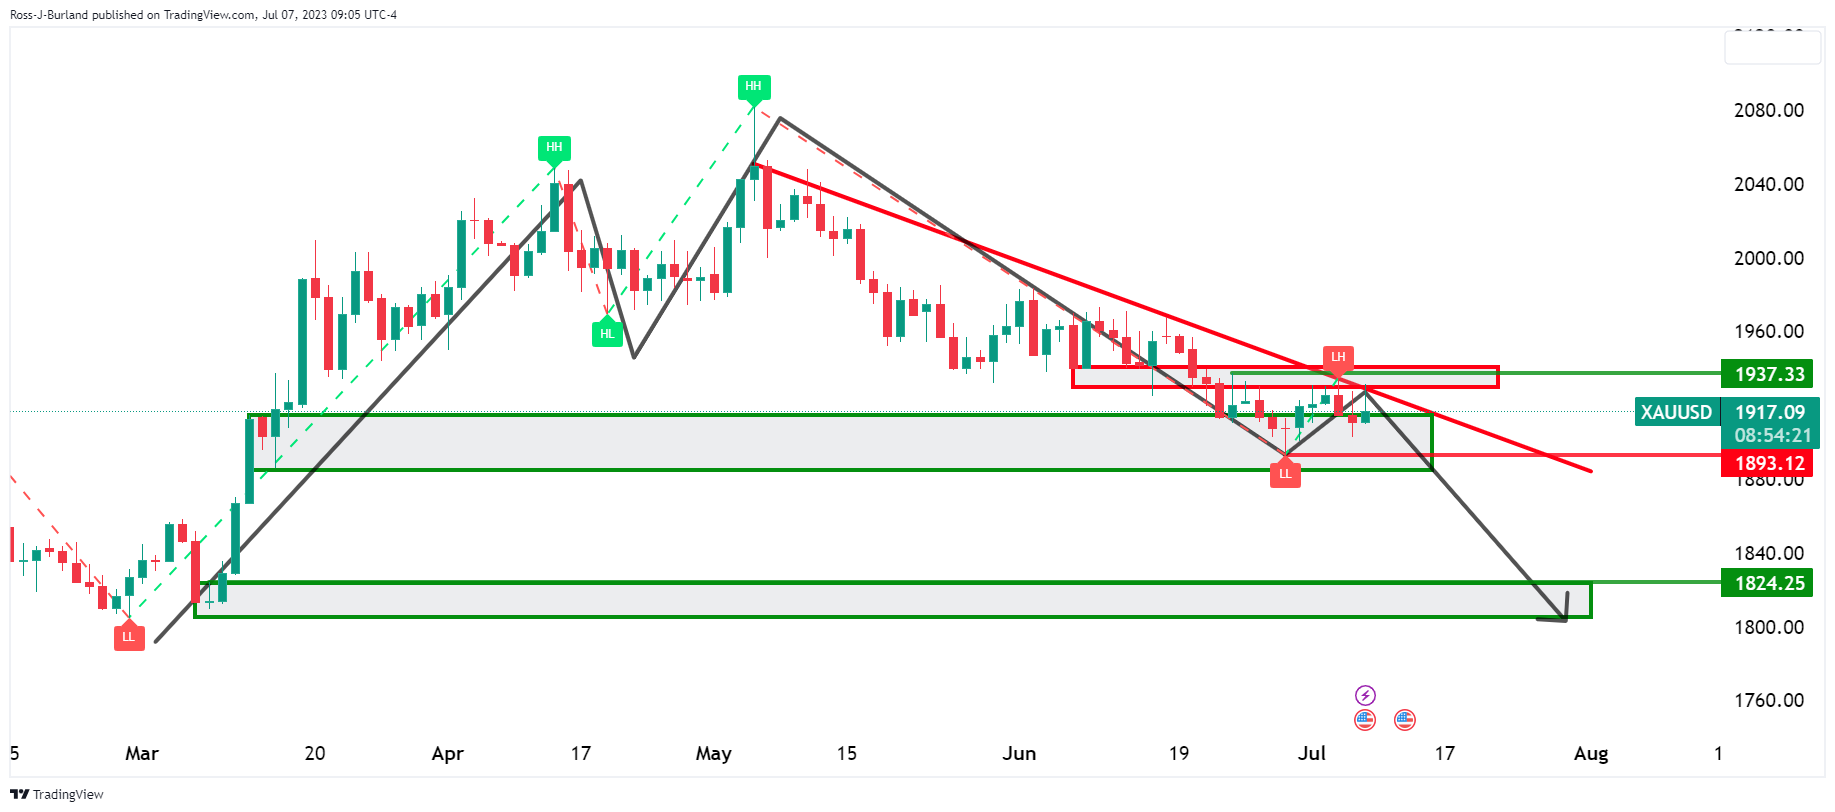
Nevertheless, from a daily perspective, the price is on the front side of the bearish trend and the data has done little to shift the bearish bias so far. Bears look for a break of $1,893 that guards a run to $1,824.25.
The Canadian Dollar was the fifth best performing major currency against the USD in the first half of 2023. Economists at the National Bank of Canada analyze USD/CAD outlook.
H2 unlikely to be as good as H1
One of the main drivers of CAD appreciation in the first half of the year was the significant tightening of Canada-US interest rate differentials. With inflation trending down faster on this side of the border, it is very unlikely that the BoC will want to outpace the Fed on potential summer hikes.
After its recent strength, our model suggests that the USD/CAD is now slightly overvalued.
Looking ahead, we expect USD/CAD to return to the upper end of the 1.33-1.38 range in the second half of 2023 as the global economy shows tangible signs of weakness.
- USD/CAD has dropped sharply to near 1.3320 amid headwinds of upbeat Canadian labor market data and downbeat US NFP.
- Although US Employment numbers missed consensus, a steady pace in wages is sufficient to keep inflation stubborn.
- Upbeat Canadian labor market data has strengthened the chances of one more interest rate hike from the BoC.
The USD/CAD pair demonstrated severe volatile spikes after the release of the labor market data by the United States and Canada. The Loonie asset has slipped to near 1.3320 as the US Employment data has missed estimates while Canada’s labor market outperformed expectations.
US Bureau of Labor Statistics has reported that fresh additions of Nonfarm Payrolls (NFP) in June were 209K while investors were expecting an increase of 225K. In May, fresh payroll additions were 306K. The Unemployment Rate has dropped to 3.6% as expected by the market participants.
No doubt, labor additions failed to match expectations, monthly pace in Average Hourly Earnings was higher than anticipated. Firms' payroll expenditures maintained 0.4% and remained higher than the consensus of 0.3%. Also, Annualized Average Hourly Earnings remained at a steady pace of 4.4%.
Although Employment numbers missed consensus, a steady pace in wages is sufficient to keep inflationary pressures stubborn and might force the Federal Reserve (Fed) to push interest rates higher.
On the Canadian Dollar front, employment numbers have soared dramatically. Statistics Canada has reported fresh additions of 59.9K employees vs. the estimates of 20K. In May Canadian laborforce witnessed a lay-off of 17.3K employees. The jobless rate has increased to 5.4% vs. the estimates of 5.3% and the prior release of 5.2%. Upbeat Canadian labor market data has strengthened the chances of one more interest rate hike from the Bank of Canada (BoC). Investors should note that BoC Governor Tiff Macklem has already raised interest rates to 4.75%.
A poll from Reuters showed that the Bank of Canada (BoC) will hike interest rates by 25 basis points (bps) to 5% in July. This would be the last nail in the coffin and after that, the monetary policy would remain stable for a longer period.
- Unemployment Rate in Canada rose to 5.4% in June.
- Net Change in Employment: 59,900 vs 20,000 expected.
- USD/CAD drops toward 1.3300 after jobs reports.
The data published by Statistics Canada revealed on Friday that the Unemployment Rate rose to 5.4% in June. This reading came in above the market expectation of 5.3%. The Participation Rate increased from 65.5% to 65.7%.
Further details of the publication revealed that the Net Change in Employment was positive by 59,900, surpassing analysts' estimate of a 20,000 increase and follows a 17,300 decline in May. The annual wage inflation arrived at 3.9% in June.
Key takeaways from the report:
- Employment rose by 60,000 (+0.3%) in June, following little change in May. The increase in June was the largest since January 2023. Employment growth had moderated from February to May (averaging 20,000 per month), following strong growth from October 2022 to January 2023 (averaging 79,000 per month).
- Employment gains in June were all in full-time work (+110,000; +0.7%), as the number of people working part-time fell (-50,000; -1.4%).
- The unemployment rate rose to 5.4% (+0.2 percentage points), as more people searched for work.
- The employment rate—the proportion of the population aged 15 and older who are employed—edged up 0.1 percentage points to 62.2% in June.
- Average hourly wages rose 4.2% (+$1.32 to $33.12) on a year-over-year basis in June (not seasonally adjusted). This was the slowest year-over-year growth in average hourly wages since May 2022. From February to May 2023, year-over-year growth in average hourly wages had hovered between 5.1% and 5.4%.
Market reaction:
The USD/CAD tumbled from the 1.3360 area toward 1.3300 following the Canadian and the US labor market reports. Nonfarm payrolls in the US rose by 209,000 below expectations of a 225,000 increase.
-
Canadian Dollar claws back losses suffered overnight after strong US labor data support the Greenback.
-
CAD finds a friend in rising Crude Oil prices after inventory data shows another week of declines.
-
USD/CAD trend is now bullish both on shorter and longer time frames after decisive breach of key 1.3270 lower highs.
Canadian Dollar (CAD) recoups overnight losses against the US Dollar (USD), ahead of key employment data on Thursday, on the back of the continued rally in its primary export Oil, which itself sees gains on falling US stockpiles.
USD/CAD is trading in the upper 1.33s on Thursday as the US session gets underway.
Canadian Dollar news and market movers
-
The Canadian Dollar trades roughly flat versus the US Dollar on the back of higher Oil prices, Canada’s chief export.
-
Oil is rising on the back of data which shows increased demand from summer vacation-driving in the US, according to data from the Energy Information Administration, released Thursday.
-
The EIA figures show Crude stockpiles falling by 1.508 million barrels continuing the trend of last week’s 9.603M decline.
-
The USD/CAD pair has been helped by a strong rally in the US Dollar on Thursday after US labor market data beat expectations.
-
Should the data be followed by a higher-than-expected result for Nonfarm Payrolls in June, out on Friday at 12:30 GMT, the USD could rally further, pushing the pair even higher.
-
Canadian employment data, released at the same time, will also impact USD/CAD.
-
Economists estimate Net Change in Employment for June to come out at 20K, from -17K in May.
-
The Unemployment Rate is forecast to rise to 5.3% from 5.2% previously.
-
CAD came under further pressure on Thursday after data showed the Canadian International Merchandise Trade fell to -3.4B vs. 1.5B expected in May, and Imports outweighed Exports when they had been forecast to come out almost equal.
Canadian Dollar Technical Analysis: Short-term trend turns bullish
USD/CAD is in a long-term uptrend on the weekly chart, which began after price rose following the 2021 lows. Since October 2022, the exchange rate has been in a sideways consolidation within the uptrend. Given the old saying that ‘the trend is your friend’, however, the probabilities overall an eventual continuation higher, favoring longs over shorts.
USD/CAD appears to have completed a large measured move price pattern that began forming at the March 2023 highs. This pattern resembles a 3-wave zig-zag, much like an ABC correction in which the first and third waves are of a similar length (labeled waves A and C on the chart below).
The pair’s measured move looks like it has completed given waves A and C are of a similar length. This suggests price probably bottomed at the June 27 lows and is now at the start of a new cycle higher.
-638243296472090112.png)
US Dollar vs Canadian Dollar: Weekly Chart
A confluence of support situated under the June lows in the upper 1.3000s, that is made up of several longer moving averages and a major trendline, provides a backstop to further losses. Only a decisive break below 1.3050 would indicate this thick band of weighty support has been definitively broken, bringing the uptrend into doubt.
-638243295904074535.png)
US Dollar vs Canadian Dollar: Daily Chart
The daily chart above is looking more bullish, with the move up from the June 27 lows extending to just short of 1.3400. A cursory look at the Relative Strength Index (RSI) indicator shows the move is supported by strong momentum, further enhancing its bullishness.
The price has now broken decisively above the 1.3270 key lower high, confirming a short-term bull trend is now underway. The 1.3400 crossroads where the 50-day Simple Moving Average (SMA) is currently located is the next hurdle.
It will take a decisive break above the 50-day SMA to keep the uptrend momentum going, however, since the break above 1.3270, bulls have the upper hand with the odds favoring a continuation higher.
Nevertheless, a pause in the uptrend before more upside is also likely given the strong run of recent gains, and some backing and filling and a mild correction back down would not come as a surprise.
Canadian Dollar FAQs
What key factors drive the Canadian Dollar?
The key factors driving the Canadian Dollar (CAD) are the level of interest rates set by the Bank of Canada (BoC), the price of Oil, Canada’s largest export, the health of its economy, inflation and the Trade Balance, which is the difference between the value of Canada’s exports versus its imports. Other factors include market sentiment – whether investors are taking on more risky assets (risk-on) or seeking safe-havens (risk-off) – with risk-on being CAD-positive. As its largest trading partner, the health of the US economy is also a key factor influencing the Canadian Dollar.
How do the decisions of the Bank of Canada impact the Canadian Dollar?
The Bank of Canada (BoC) has a significant influence on the Canadian Dollar by setting the level of interest rates that banks can lend to one another. This influences the level of interest rates for everyone. The main goal of the BoC is to maintain inflation at 1-3% by adjusting interest rates up or down. Relatively higher interest rates tend to be positive for the CAD. The Bank of Canada can also use quantitative easing and tightening to influence credit conditions, with the former CAD-negative and the latter CAD-positive.
How does the price of Oil impact the Canadian Dollar?
The price of Oil is a key factor impacting the value of the Canadian Dollar. Petroleum is Canada’s biggest export, so Oil price tends to have an immediate impact on the CAD value. Generally, if Oil price rises CAD also goes up, as aggregate demand for the currency increases. The opposite is the case if the price of Oil falls. Higher Oil prices also tend to result in a greater likelihood of a positive Trade Balance, which is also supportive of the CAD.
How does inflation data impact the value of the Canadian Dollar?
While inflation had always traditionally been thought of as a negative factor for a currency since it lowers the value of money, the opposite has actually been the case in modern times with the relaxation of cross-border capital controls. Higher inflation tends to lead central banks to put up interest rates which attracts more capital inflows from global investors seeking a lucrative place to keep their money. This increases demand for the local currency, which in Canada’s case is the Canadian Dollar.
How does economic data influence the value of the Canadian Dollar?
Macroeconomic data releases gauge the health of the economy and can have an impact on the Canadian Dollar. Indicators such as GDP, Manufacturing and Services PMIs, employment, and consumer sentiment surveys can all influence the direction of the CAD. A strong economy is good for the Canadian Dollar. Not only does it attract more foreign investment but it may encourage the Bank of Canada to put up interest rates, leading to a stronger currency. If economic data is weak, however, the CAD is likely to fall.
- EUR/USD keeps the inconclusive price action around 1.0900.
- Initial contention area emerges at recent lows near 1.0830.
EUR/USD trades in a vacillating fashion and with the upside so far limited by the 1.0900 zone on Friday.
The inability of the pair to regain a convincing upside traction, ideally in the very near term, could motivate sellers to force the pair to revisit recent lows near 1.0830 ahead of the interim support at the 100-day SMA at 1.0826.
Down from here, there are no support levels of significance until the May low of 1.0635 (May 31), which appears also underpinned by the key 200-day SMA, today at 1.0618.
Looking at the longer run, the positive view remains unchanged while above the 200-day SMA.
EUR/USD daily chart
- USD/CHF is facing immense pressure after seeking a weak lead from the USD Index.
- S&P500 futures have remained choppy overnight, portraying a flat opening ahead.
- USD/CHF is on the verge of delivering a breakdown of the Ascending Triangle pattern.
The USD/CHF pair is looking vulnerable near the immediate support of 0.8950 in the London session. The Swiss Franc asset is under severe pressure as the US Dollar Index (DXY) is struggling to find support. The USD Index is facing a sell-off as investors despite the Federal Reserve (Fed) are preparing for restarting its policy-tightening regime.
S&P500 futures have remained choppy overnight, portraying a flat opening ahead. Investors will remain on the tenterhooks ahead of the second-quarter result season and the Nonfarm Payrolls (NFP) data. The 10-year US Treasury yields have jumped to near 4.07%.
Meanwhile, Swiss National Bank (SNB) governing board member, Andrea Maechler, commented “It cannot be ruled out that we will need to further hike interest rates.”
USD/CHF is on the verge of delivering a breakdown of the Ascending Triangle chart pattern on a four-hour scale. The upward-sloping trendline of the aforementioned pattern is plotted from June 22 low at 0.8907 while the horizontal resistance is placed from June 23 high at 0.9013.
The 200-period Exponential Moving Average (EMA) at 0.8987 is acting as a critical barrier for the US Dollar bulls.
The Relative Strength Index (RSI) (14) is oscillating in the 40.00-60.00 range, indicating a sideways performance.
A breakdown below June 30 low at 0.8935 would expose the Swiss Franc asset to May 12 low around 0.8900, followed by April 13 low at 0.8860.
Alternatively, an upside move above the psychological resistance of 0.9000 would fade the bearish bias and will drive the asset toward June 06 low at 0.9033 and May 30 high at 0.9084.
USD/CHF four-hour chart
-638243287594058368.png)
Economists at Société Général analyze GBP/USD outlook.
1.2500/1.2450 is next support
The 50-DMA and December high near 1.2500/1.2450 is an important support zone. A short-term bounce is not ruled out; a break above 1.2850 can lead to an extension in the uptrend.
In case the pair fails to defend 1.2500/1.2450, there is risk of a deeper downtrend. Next potential supports could be at the May low of 1.2300 and 200-DMA at 1.2120.
See – GBP/USD: Gains should pick up more noticeably above 1.2780 – Scotiabank
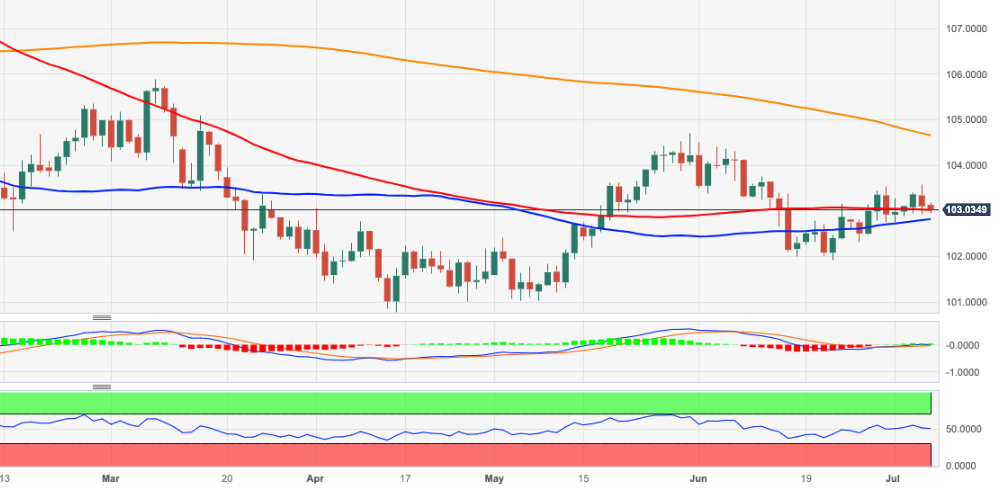
- DXY adds to Thursday’s losses around the 103.00 zone.
- The upside impulse is seen picking up pace beyond 103.50.
DXY looks under pressure and hovers around the 103.00 area ahead of the key Nonfarm Payrolls.
While further consolidation seems probable in the very near term, the continuation of the uptrend in place since mid-June could challenge the weekly high at 103.54 (June 30). Once the latter is cleared, the index could embark on a more serious uptrend to the May high at 104.69 (May 31), which appears reinforced by the 200-day SMA.
Looking at the broader picture, while below the 200-day SMA at 104.65, the outlook for the index is expected to remain negative.
DXY daily chart
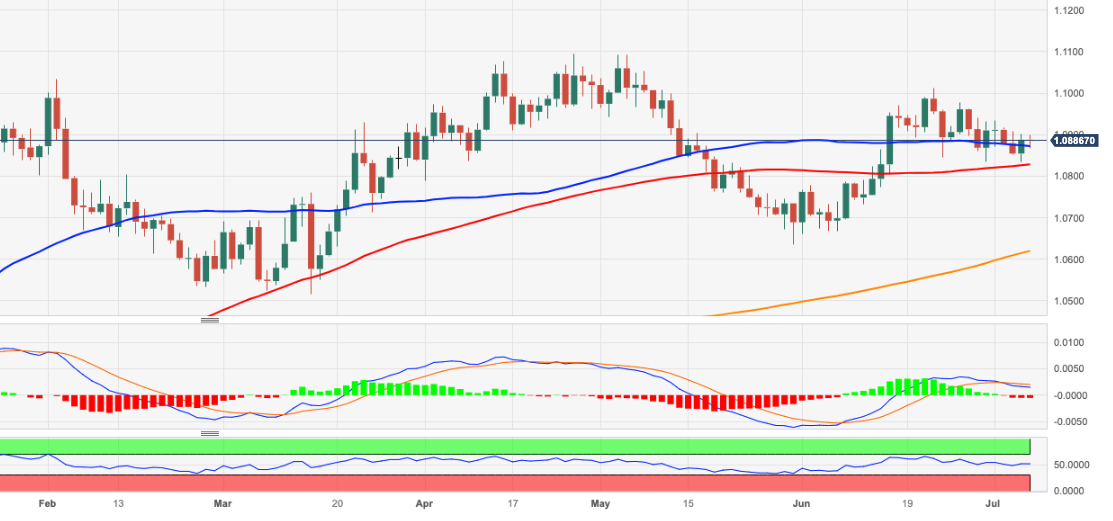
EUR/USD recovers back to the upper 1.08s with some ease. Economists at Scotiabank analyze the pair’s outlook.
Bullish above 1.09
The EUR is heading for a third weekly loss against the USD but weakness has been limited from the 1.10 area and the EUR has found consistent support on dips.
Price action generally is forming a bullish consolidation (wedge pattern) which appears to be setting the EUR up for renewed gains and a retest of 1.10+.
Resistance is 1.0895/05 (bullish break out above here). Support is 1.0825/35.
- EUR/JPY keeps the weekly bearish note well in place.
- The next support of note emerges at the 154.00 region.
EUR/JPY adds to the ongoing weekly decline and revisits the 155.50 zone at the end of the week.
The cross accelerates its losses and leaves behind the overbought territory, revisiting at the same time the mid-155.00s on Friday. Against this backdrop, the continuation of the retracement appears in store in the short term, with the next contention emerging at the weekly low of 154.04 (June 20).
So far, further upside looks favoured while the cross trades above the 200-day SMA, today at 145.57.
EUR/JPY daily chart
Cable is clawing back more of yesterday’s losses against the USD to regain the mid-1.27s. Economists at Scotiabank analyze GBP/USD outlook.
Look for firm support on dips to the low 1.27s intraday
With no major data reports from the UK, positioning and the GBP’s short-term yield premium versus the USD is supporting the GBP rebound.
Trend momentum remains solidly bullish across short, medium, and long-term oscillators, suggesting a push to (and through) the mid-1.28s is still on the cards.
Look for firm support on dips to the low 1.27s intraday. Resistance is 1.2780 but gains should pick up more noticeably above there.
USD/CAD pushed through the low 1.33 zone on Thursday. Economists at Scotiabank analyze Loonie's outlook ahead of employment data.
Strong data should bolster the case for another rate hike from the BoC
Canadian jobs data are expected to rebound in June after the softer May report. The street is looking for a 20K gain while Scotia anticipates a 40K rise. Wage growth is expected to slow (4.6%) but remains at levels that are a clear impediment to the BoC achieving its inflation goal. Hours worked data will shed a little more light on evolving growth trends for Q2 which appear to outperform the BoC’s expectations.
Strong data should bolster the case for another rate hike from the BoC, though perhaps not as soon as next week, and give the CAD a lift.
See – Canada Employment Preview: Banks expect to see early cracks in the labour market
USD struggles to hold post-ADP gains ahead of NFP. Economists at Scotiabank analyze the greenback’s outlook.
USD’s reaction to better-than-consensus data will be limited
The strong ADP data lifted market expectations an upside surprise to the data which may mean the USD’s reaction to better-than-consensus data will be limited. And there is a risk that the ADP data overstate the strength of the labour market relative to the official data significantly, perhaps due to seasonal effects (ADP gains reflected a surge in hospitality/services).
The USD is taking a cautious approach to the data. After gaining on the ADP report on Thursday, the USD slipped broadly and closed lower on the day – a bearish signal both in technical terms and its inability to profit from clearly positive data.
There does appear to be some risk of the USD ending up lower after the US jobs data, absent a significant topside miss.
DXY weakness below 102.75 support would be a clearly bearish cue for markets.
See – Nonfarm Payrolls Preview: Banks see labour market still quite strong
- NZD/USD is marching towards 0.6200 amid an extension in losses in the USD Index.
- Anxiety among market participants has soared ahead of corporate earnings.
- The RBNZ will likely keep interest rates unchanged at 5.50% for the rest of the year, marking an end to its 20-month-long hiking cycle.
The NZD/USD pair is approaching the round-level resistance of 0.6200 in the London session. The Kiwi asset has attracted bets as the US Dollar Index (DXY) is under extreme pressure ahead of the United States labor market data.
S&P500 futures have recovered some of their losses in Europe. The overall market mood is still bearish amid an absence of recovery in the US equities after a sheer sell-off on Thursday. Anxiety among market participants has soared ahead of corporate earnings, which are expected to remain volatile due to aggressively restrictive monetary policy from the Federal Reserve (Fed) and tight credit conditions by commercial banks.
The US Dollar Index (DXY) has extended its downside to near 102.95 despite hopes of more interest rate hikes from the Federal Reserve (Fed) have elevated. Higher employment additions in the US labor market in June have drummed up confirmation of further policy-tightening by the Fed in July. Fed chair Jerome Powell has already conveyed that two more interest rate hikes by the year-end are appropriate.
Meanwhile, the entire focus will be on US Nonfarm Payrolls (NFP) data. Analysts at TD Securities expect payrolls likely remained above-trend in June, registering a firm 240K gain but the data will still represent slowing vs the still booming 317K expansions, on average, in April-May. Analysts also look for the Unemployment Rate to drop a tenth to 3.6% and for wage growth to print 0.3% MoM.
On the New Zealand Dollar front, investors are hoping that the Reserve Bank of New Zealand (RBNZ) will hold interest rates at 5.50% next week as the Kiwi economy has already entered into recession. A poll from Reuters showed that the RBNZ will likely keep interest rates unchanged at 5.50% on Wednesday and for the rest of the year, marking an end to its 20-month-long hiking cycle.
Economists at HSBC only look for a modest decline in Gold prices this year.
Gold prices may remain on the defensive this year
Weak exchange-traded funds (ETF) demand for Gold implies that institutional demand remains lacklustre, while Gold mine production and recycled supply are likely to grow over the near term. Considering also the impact of the mechanics of the futures markets, we believe that the path for Gold may be lower, but only modestly, over the near term.
Looking beyond the near-term movements, we believe that positive real rates should also keep downward pressure on Gold. Considering also the Fed’s prolonging of the tightening cycle, we expect Gold prices to likely stay largely on the defensive this year, but with support on the downside.
Economists at ING had pointed to the third quarter as the period where the Dollar would decisively turn lower. Now in July, they see a prolonged pause in the Dollar decline.
The Dollar downtrend remains on hold
We have to acknowledge that it may still be too early for the Dollar to take a decisive and sustainable turn lower this summer.
Our rates team believes a drop in short-term USD rates now looks more likely to be a fourth-quarter and early-2024 story, which means EUR/USD could mostly bounce around the 1.08-1.10 range this summer, without a very clear sense of direction, before taking a decisive turn higher to 1.15 by year-end.
The Canadian Dollar was among the best three currencies in G10 in the first half of the year. Economists at Société Général analyze USD/CAD outlook.
CAD to enjoy a gradual appreciation to 1.28 against the USD over 12 months
We remain upbeat on the outlook for the CAD and forecast a gradual appreciation to 1.28/USD over 12 months.
The Canadian Dollar typically does well in July but has struggled badly in recent years in August.
See – USD/CAD: Drop unlikely to continue – MUFG
The Rand staged a sharp rebound in June. Economists at MUFG Bank analyze ZAR outlook.
Rand to remain weak
There was no clear fundamental trigger for the Rand rebound in June but the price action most likely reflects that weakness had overshot what was justified by fundamentals in May.
USD/ZAR was more than 2 standard deviations above our short-term valuation model estimate when it peaked at just below the 20.00 level in May. While Rand undervaluation has become less extreme, the ZAR continues to trade at weaker levels reflecting the less supportive external backdrop.
There has been a clear loss of confidence in the actions undertaken by domestic policymakers that are weighing heavily on the Rand and South African assets. Recent worrying developments include i) the decision by the Financial Action Task Force (FATF) to add South Africa to their gray list for increased monitoring given shortcomings in tackling illicit financial flows, ii) the worsening energy supply blackouts that are further dampening the outlook for growth, and iii) the supply of arms to Russia. We expect the Rand to remain weak.
USD/ZAR – Q3 2023 19.00 Q4 2023 19.50 Q1 2024 19.25 Q2 2024 19.75
After rallying in the aftermath of the US debt deal in May, the greenback’s strength has proven elusive. Economists at the National Bank of Canada analyze USD outlook.
Unusually strong correlation with stock market
The recent bout of weakness has coincided with a risk-on sentiment in financial markets, led by a broad-based rally in global equity markets.
The 30-day negative correlation between daily changes in the S&P 500 and the USD broad Dollar index is nearly double its average since 2006. Under these circumstances, we believe that a correction in equity markets is likely to have a disproportionate impact on the USD.
Economists at ING analyze GBP outlook.
Inflation picture should improve later this year
In the UK, the Bank of England published a survey of corporate pricing plans on Thursday, which included some encouraging news for lower inflation.
The inflation picture should improve later this year, which means some pricing out of BoE rate expectations can come hitting the Pound down the road.
For now, it remains hard to see a sustained GBP downtrend.
See: Two factors could set the Pound up for a depreciation at the tail end of the year – NBF
- The US Dollar does not get any tailwinds from market pricing in more rate hikes.
- All eyes turn to Nonfarm Payrolls data on Friday.
- The US Dollar Index hovers near 103.00 in search of direction.
The US Dollar (USD) is unable to bank on the additional rate increase that markets are starting to get priced in for the US, with US Fed Futures showing a rise in the probability of a second hike in November. Although this should not come as a surprise to the markets, the sudden concern has pushed equities around the world in the red for this week and it weighs on the Greenback as well, which is unable to retain its status as safe haven. The quote board shows a very dispersed Greenback, with only smaller gains and rather larger losses against most traded currencies.
On the economic data front, only one big event, or rather a whole report of data set to come out. With the first Friday of the month comes the US jobs report, with all eyes on the change in Nonfarm payrolls. After the positive slew of data from ADP private payrolls and the stronger ISM services numbers, the question will be if the Nonfarm Payrolls report will be strong enough as expectations are tilting towards an upside surprise.
Daily digest: US Dollar to face US jobs data
- Main data point for this Friday comes from the US Bureau of Labor Statistics with the US Nonfarm Payroll number print for June expected to come in at 225,000, lower than the previous 339,000 increase. Average Hourly Earnings will get the attention next with the monthly number expected to be unchanged at 0.3%, while the yearly increase is expected to decline slightly from 4.3% to 4.2%.
- A quick sidenote for the Nonfarm Payroll number: the lowest estimate comes in at 110,00 while the highest estimate tops out at 350,000. The US Dollar will either devalue substantially should the actual number come out below the lowest estimation, while an appreciation of the Greenback is expected should the actual number break above the high estimate of 350,000.
- US Treasury Secretary Janet Yellen said in Beijing that the US seeks to diversify, not decouple with China. Any US security measures are activated to protect national security, not to gain an economic edge on China.
- Another red day for Asian equities, with the Japanese Topic down0.97% and the Hang Seng losing 1%. European equities are not fully taking over the sour tone and are rather flat than selling off. A similar pattern can be seen for US equity futures, which are trading at marginal losses.
- The CME Group FedWatch Tool shows that markets are pricing in a 89.9% chance of a 25 basis points (bps) interest-rate hike on July 26. Chances of a second hike in November are up 36.7% at the moment. So no full conviction just yet, though probabilities are rising.
- The benchmark 10-year US Treasury bond yield trades at 4.03% in European morning trading as the milestone of 4% got broken on Thursday with a peak at 4.08%.
US Dollar Index technical analysis: USD will not see fireworks until NFP
The US Dollar could still close this week off in three possible ways, as the US Dollar Index currently resides right in the middle of this week's price range. It will all come down to the US job report to see whether the US Dollar will appreciate, depreciate or remain steady at current levels. At the moment any gains against most common currencies are rather slim while the losses are rather double as big , which puts the US Dollar Index (DXY) a touch in the red.
On the upside, look for 103.58 as the next key resistance level, which falls in line with Thursday’s high. The 200-day Simple Moving Average (SMA) at 104.73 is still quite far away. So the intermediary level to look for is the psychological level at 104.00 and May 31 peak at 104.70.
On the downside, the 55-day SMA near 102.82 has proven its importance as it clearly underpinned price action at the end of last week by triggering a turnaround after the firm weakening of the Greenback. A touch lower, 102.50 will be vital to hold from a psychological point of view. In case the DXY slips below 102.50, more weakness is expected with a full slide to 102.00 and a retest of June’s low at 101.92.
US Dollar FAQs
What is the US Dollar?
The US Dollar (USD) is the official currency of the United States of America, and the ‘de facto’ currency of a significant number of other countries where it is found in circulation alongside local notes. It is the most heavily traded currency in the world, accounting for over 88% of all global foreign exchange turnover, or an average of $6.6 trillion in transactions per day, according to data from 2022.
Following the second world war, the USD took over from the British Pound as the world’s reserve currency. For most of its history, the US Dollar was backed by Gold, until the Bretton Woods Agreement in 1971 when the Gold Standard went away.
How do the decisions of the Federal Reserve impact the US Dollar?
The most important single factor impacting on the value of the US Dollar is monetary policy, which is shaped by the Federal Reserve (Fed). The Fed has two mandates: to achieve price stability (control inflation) and foster full employment. Its primary tool to achieve these two goals is by adjusting interest rates.
When prices are rising too quickly and inflation is above the Fed’s 2% target, the Fed will raise rates, which helps the USD value. When inflation falls below 2% or the Unemployment Rate is too high, the Fed may lower interest rates, which weighs on the Greenback.
What is Quantitative Easing and how does it influence the US Dollar?
In extreme situations, the Federal Reserve can also print more Dollars and enact quantitative easing (QE). QE is the process by which the Fed substantially increases the flow of credit in a stuck financial system.
It is a non-standard policy measure used when credit has dried up because banks will not lend to each other (out of the fear of counterparty default). It is a last resort when simply lowering interest rates is unlikely to achieve the necessary result. It was the Fed’s weapon of choice to combat the credit crunch that occurred during the Great Financial Crisis in 2008. It involves the Fed printing more Dollars and using them to buy US government bonds predominantly from financial institutions. QE usually leads to a weaker US Dollar.
What is Quantitative Tightening and how does it influence the US Dollar?
Quantitative tightening (QT) is the reverse process whereby the Federal Reserve stops buying bonds from financial institutions and does not reinvest the principal from the bonds it holds maturing in new purchases. It is usually positive for the US Dollar.
Gold price dropped almost back to $1,900 on Thursday following the publication of a noticeably stronger-than-expected rise in private-sector employment in June in the US. Economists at Commerzbank analyze XAU/USD outlook.
Still robust US labour market could necessitate more pronounced rate hikes by the Fed
The still robust US labour market could necessitate more pronounced rate hikes by the US Federal Reserve. Yields on two-year US Treasuries reached 5.11% on Thursday, their highest level since June 2007, making Gold less attractive as a non-interest-bearing investment.
There is a risk that the Gold price will dip briefly below the $1,900 mark if US labour market data prove robust once again when published at 12:30 GMT.
See – Nonfarm Payrolls Preview: Banks see labour market still quite strong
EUR/USD remains capped at the 78.6% retracement of the April/May fall at 1.0998 as looked for, but with key support from the uptrend from last September still holding, now seen at 1.0797. Economists at Credit Suisse analyze the pair’s technical outlook.
EUR/USD may still be in the early stages of a topping process
A break below 1.0797 would be seen to increase the risk we are seeing a potential topping process for a move back to the May low and 200-DMA at 1.0634/15. With further major support seen not far below at the channel bottom at 1.0572, ahead of 38.2% retracement of the 2022/2023 rally and March low at 1.0516/01 we would expect a floor to be found here for now.
A close below 1.0501 remains seen needed to see an important top established, with support then seen initially at 1.0317.
A close above 1.0998 though can clear the way for strength back to the YTD high at 1.1093/97, potentially the channel top at 1.1133, but with a fresh cap expected to be found here.
Senior Economist at UOB Group Alvin Liew reviews the latest publication of the FOMC Minutes of the June 14 meeting.
Key Takeaways
According to the latest FOMC minutes (released on 6 Jul, 2am SGT), while the Federal Reserve (Fed) policymakers in its 13/14 Jun 2023 Federal Open Market Committee (FOMC) meeting unanimously agreed to keep the target range of its Fed Funds Target Rate (FFTR) unchanged at 5.00%-5.25%, it was seen as a less united agreement among an increasingly divided committee. The next move in Jul is almost guaranteed to be a hike, as “almost all” Fed policymakers agreed hikes will be needed this year to continue the Fed’s battle to curb inflation.
According to the minutes, “almost all participants judged it appropriate or acceptable to maintain the target range for the federal funds rate at 5 to 5-1/4 percent at this meeting. Most of these participants observed that leaving the target range unchanged at this meeting would allow them more time to assess the economy's progress toward the Committee's goals of maximum employment and price stability. Some participants indicated that they favored raising the target range for the federal funds rate 25 basis points at this meeting or that they could have supported such a proposal.”
And importantly, “almost all participants noted that in their economic projections that they judged that additional increases in the target federal funds rate during 2023 would be appropriate.”
The participants continued to agree that inflation was unacceptably high and declining slower than they had expected, while core goods inflation had moderated since mid-2022, “it had slowed less rapidly than expected in recent months, despite data and reports from business contacts indicating that supply chain constraints had continued to ease.”
FOMC Outlook – One More Hike In Jul FOMC. The Jun FOMC minutes, Jun Dotplot’s upward revision together with Powell’s hawkish comments affirm more Fed policy tightening ahead. We still expect the Fed to hike one final time by 25bps at this upcoming Jul 2023 FOMC to the range of 5.25-5.50% and pause thereafter for rest of 2023. There is risk for one more hike in 2023 but we believe the Fed is very near the cycle’s end. We continue to expect no rate cuts in 2023, which is also the consensus view at this juncture.
The Kiwi has been trading sideways year-to-date, following a slow bearish channel since the start of February. Economists at Société Générale analyze NZD outlook.
AUD/NZD closely tracks the rates differential, likely to turn positive in the coming months
We expect further NZD/USD weakness, with the 60 cent-low of June likely to be broken. The move should not send the pair as low as the 0.55 support hit in March 2020 (COVID crisis outbreak) and in October 2022 (US inflation peak and short rates peak this year). We target NZD/USD to bottom in the 0.57-0.58 area.
AUD/NZD closely tracks the 5y rates differential, still slightly negative but now likely to turn positive in the coming months in favour of the AUD, reflecting relatively stronger Australian fundamentals. AUD/NZD is thus likely to surge above 1.10, initially targeting 1.15.
- Gold price has moved higher at a snail’s pace to near $1,915.00 ahead of US NFP data.
- S&P500 futures are consistently extending losses as investors are anxious ahead of the labor market data.
- Gold price is in an inventory adjustment stage in which inventory is exchanged among institutional investors and retail participants.
Gold price (XAU/USD) is demonstrating a dull performance after a wild spike-triggered post the release of the United States Automatic Data Processing (ADP) Employment report. The precious metal has walked briskly to near $1,915.00 and is expected to remain sideways ahead of the US Nonfarm Payrolls (NFP) data.
S&P500 futures are consistently extending losses as investors are anxious ahead of the labor market data and upcoming corporate earnings season. The US Dollar Index (DXY) is displaying a subdued performance. The upside for the USD index is restricted near 103.20 for now but bulls can make a comeback if NFP data turns out resilient.
Following a subdued lead from the USD Index, US Treasury yields are also sideways. The yields offered on 10-year US Treasury bonds are hovering around 4.04%.
Meanwhile, all eyes are set on the US NFP data. Analysts at Citi expect after a surprisingly strong 339K increase in nonfarm payrolls in May, we expect a slowing in employment growth in June, although a still-solid 170K jobs were added during the month. This could also be a temporarily softer month of payroll growth with upside risks again to payrolls from July through September. After the unemployment rate unexpectedly rose to 3.7% in May, we expect a decline to 3.6% in June with downside risks.
Gold technical analysis
Gold price is auctioning in an inventory adjustment stage in which inventory is exchanged among institutional investors and retail participants on a four-hour scale. It would be early calling the adjustment process as an ‘accumulation’ or a ‘distribution’ until a decisive move.
The downward-sloping trendline from May 03 high at $2,079.76 and the 100-period Exponential Moving Average (EMA) at $1,926.65 will continue to act as a major barricade for the Gold bulls.
Meanwhile, the Relative Strength Index (RSI) (14) is oscillating in the 40.00-60.00 range, awaiting a potential trigger.
Gold four-hour chart
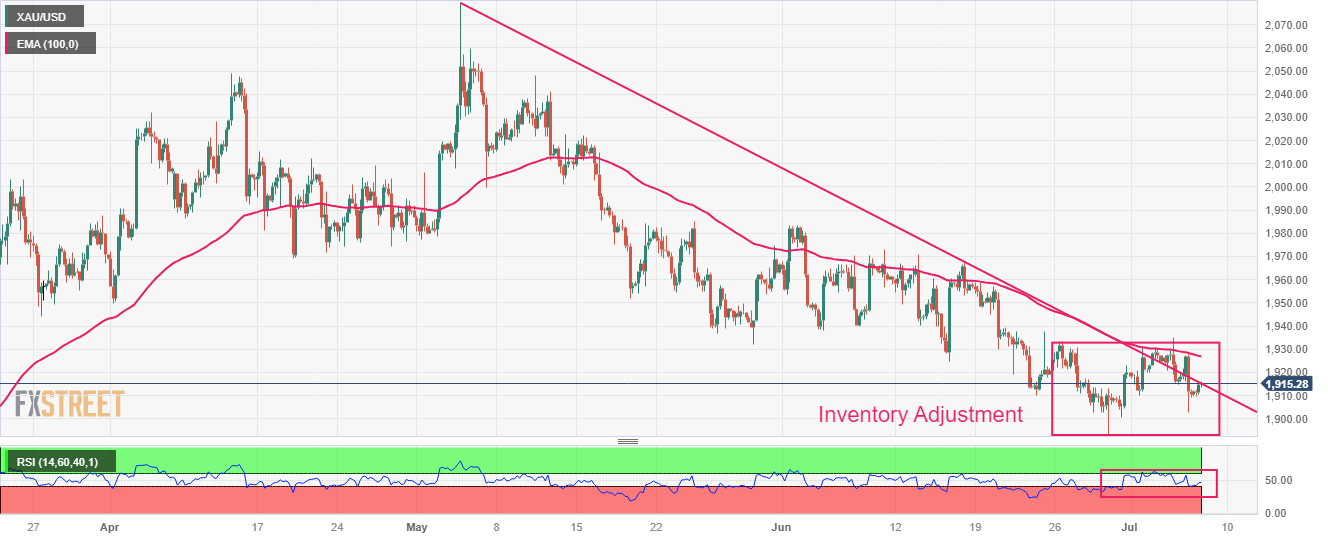
The Pound reached its highest level in a little over a year in the past month. Economists at the National Bank of Canada analyze GBP outlook.
Relative positioning of the BoE can only carry the currency so far
With a nearly 5 cent upward delta with its low point in May, the currency has shown strength on the back of a rather mixed outlook. Certainly, the Bank of England has been remarkably hawkish, as inflation appears to be painfully more resilient than anticipated. But the relative positioning of the BoE can only carry the currency so far.
A downward adjustment to market expectations combined with an American economy teetering on the edge of recession could set the Pound up for depreciation at the tail end of the year.
- Pound Sterling has turned back and forth around 1.2740 ahead of key employment data.
- Households in the United Kingdom are facing a burden as stubborn inflation bites individuals’ pockets.
- Market participants are anticipating that interest rates by the Bank of England will peak around 6.5%.
Pound Sterling is demonstrating a lackluster performance as the impact of higher interest rates by the Bank of England (BoE) has put a heavy burden on United Kingdom households. The GBP/USD pair is struggling to find direction as higher borrowing costs have dampened UK’s housing sector and economic activities.
Andrew Bailey has accused United Kingdom’s industry regulators of overcharging prices for fuel to strengthen aggressive monetary policy. The central bank is looking for options beyond quantitative tools to bring down inflation, which is restricting to leave territory above 8.5%. Going forward, investors will focus on the interest rate guidance from BoE policymakers.
Daily Digest Market Movers: Pound Sterling remains sideways ahead of labor market data
- Higher interest rates in the United Kingdom have started impacting the housing market. Excluding two months of the pandemic, British housebuilding fell in June at the sharpest pace in more than 14 years due to higher borrowing costs, as reported by Reuters.
- The impact of higher borrowing costs due to aggressive policy-tightening by the Bank of England has widened its scope from the realty sector to economic activities.
- June’s Services PMI matched expectations of 53.7 but remained lower than the former release of 55.2. While Manufacturing PMI contracted straight for eleven months.
- Labor shortages in the UK economy are expected to escalate as a poll from Reuters indicated that almost one in three female workers is expecting to consider early retirement because of health issues.
- Investors should note that labor shortages have remained a major trigger behind stubborn UK inflation due to Brexit and early retirement.
- BoE Governor Andrew Bailey has accused regulators of overcharging prices for fuel that have propelled inflationary pressures.
- Andrew Bailey cited on Thursday that borrowers would face severe heat in the process of achieving price stability.
- Market participants are anticipating that interest rates by the Bank of England will peak around 6.5%.
- BoE’s Monthly Decision Maker Panel (DMP) revealed on Thursday, the UK businesses projected year-ahead Consumer Price Index (CPI) inflation at 5.7% in June vs. 5.9% estimated in May.
- Economists at Commerzbank expect that the BoE hesitated for so long means that in the end, an even more restrictive monetary policy will become necessary to anchor inflation expectations and limit second-round effects, which might put strong pressure on the economy.
- The US Dollar Index has rebounded after picking strength near 103.00 as upbeat labor market data has propelled chances of more interest rates from the Federal Reserve (Fed).
- United States Automatic Data Processing (ADP) agency has reported that the payroll figure doubled in June at 497K vs. expectations of 228K and the former release of 278K.
- In addition to the US ADP report, US ISM Services PMI also remained better than expectations. Services PMI landed at 53.9 against the consensus of 51.0 and the prior release of 50.3.
- Going forward, US Nonfarm Payrolls (NFP) data will be keenly watched. Analysts at NBF expect job creation to have slowed to 175K in the month. The household survey could show a slightly bigger gain following May’s unexpected drop, but this should not lead to a change in the unemployment rate (3.7%).
Technical Analysis: Pound Sterling displays signs of volatility squeeze
Pound Sterling is demonstrating a non-directional performance around 1.2774 after a volatile spike inspired by the release of the US ADP Employment data. The Cable is consolidating inside the previous day’s range, which indicates a sheer squeeze in volatility. Investors are awaiting a potential trigger for building fresh positions.
The Pound Sterling is auctioning above short-to-long-term daily Exponential Moving Averages (EMAs), which indicates that the overall trend is extremely bullish. Meanwhile, the Relative Strength Index (RSI) (14) is aiming to shift into the bullish range of 60.00-80.00. An occurrence of the same would activate the upside momentum.
BoE FAQs
What does the Bank of England do and how does it impact the Pound?
The Bank of England (BoE) decides monetary policy for the United Kingdom. Its primary goal is to achieve ‘price stability’, or a steady inflation rate of 2%. Its tool for achieving this is via the adjustment of base lending rates. The BoE sets the rate at which it lends to commercial banks and banks lend to each other, determining the level of interest rates in the economy overall. This also impacts the value of the Pound Sterling (GBP).
How does the Bank of England’s monetary policy influence Sterling?
When inflation is above the Bank of England’s target it responds by raising interest rates, making it more expensive for people and businesses to access credit. This is positive for the Pound Sterling because higher interest rates make the UK a more attractive place for global investors to park their money. When inflation falls below target, it is a sign economic growth is slowing, and the BoE will consider lowering interest rates to cheapen credit in the hope businesses will borrow to invest in growth-generating projects – a negative for the Pound Sterling.
What is Quantitative Easing (QE) and how does it affect the Pound?
In extreme situations, the Bank of England can enact a policy called Quantitative Easing (QE). QE is the process by which the BoE substantially increases the flow of credit in a stuck financial system. QE is a last resort policy when lowering interest rates will not achieve the necessary result. The process of QE involves the BoE printing money to buy assets – usually government or AAA-rated corporate bonds – from banks and other financial institutions. QE usually results in a weaker Pound Sterling.
What is Quantitative tightening (QT) and how does it affect the Pound Sterling?
Quantitative tightening (QT) is the reverse of QE, enacted when the economy is strengthening and inflation starts rising. Whilst in QE the Bank of England (BoE) purchases government and corporate bonds from financial institutions to encourage them to lend; in QT, the BoE stops buying more bonds, and stops reinvesting the principal maturing on the bonds it already holds. It is usually positive for the Pound Sterling.
Jobs figures will be released in Canada at 12:30 GMT in what will be the last major data release before next Wednesday’s Bank of Canada meeting. Economists at ING analyze CAD outlook.
Jobs numbers in focus ahead of BoC meeting
The consensus is expecting a robust headline number (20K), despite a marginal tick-up in unemployment to 5.3%.
We are still inclined to think a print-around consensus should be enough to convince the BoC to hike next week, which is around 60% priced in, suggesting some upside risks for CAD (mostly in the crosses, given our view for a USD rebound in the near term).
See – Canada Employment Preview: Banks expect to see early cracks in the labour market
- NZD/USD attracts fresh buying on Friday and snaps a two-day losing streak.
- A combination of factors underpins the USD and might cap gains for the pair.
- The symmetrical triangle formation also warrants caution for bullish traders.
- The market focus remains glued to the release of the US monthly jobs report.
The NZD/USD pair regains positive traction following the previous day's sharp pullback from the 0.6215-0.6220 area, or a two-week high and maintains its bid tone through the early part of the European session. Spot prices currently trade around the 0.6175-0.6180 region, up nearly 0.35% for the day, and for now, seem to have snapped a two-day losing streak.
The intraday move up, meanwhile, lacks any obvious fundamental catalyst and is more likely to remain capped in the wake of the prevalent risk-off environment, which tends to undermine the risk-sensitive. Apart from this, elevated US Treasury bond yields, bolstered by the prospects for further policy tightening by the Federal Reserve (Fed), act as a tailwind for the US Dollar (USD) and might further contribute to capping the NZD/USD pair. Traders might also refrain from placing aggressive bets ahead of the release of the US monthly jobs report, popularly known as the NFP report, due later during the early North American session.
From a technical perspective, spot prices have been oscillating between two converging trend lines since the latter part of May, which constitutes the formation of a symmetrical triangle on the daily chart. Moreover, the recent repeated failures to find acceptance above the 100-day Simple Moving Average (SMA) warrant caution for bulls. Hence, it will be prudent to wait for some follow-through buying and a sustained strength beyond the 0.6200 mark before positioning for any further appreciating move. The NZD/USD pair might then surpass the 0.6235 intermediate hurdle and test the 0.6280-0.6285 supply zone, or the May monthly swing high.
On the flip side, the 0.6140-0.6130 area now seems to protect the immediate downside ahead of the 0.6100 round figure. Any subsequent decline might find decent support near the lower end of the aforementioned triangle, currently pegged around the 0.6070-0.6065 region. A convincing break below will be seen as a fresh trigger for bearish traders and drag the NZD/USD pair to the 0.6000 psychological mark. Some follow-through selling below the YTD low, around the 0.5985 zone should pave the way for further near-term losses.
NZD/USD daily chart
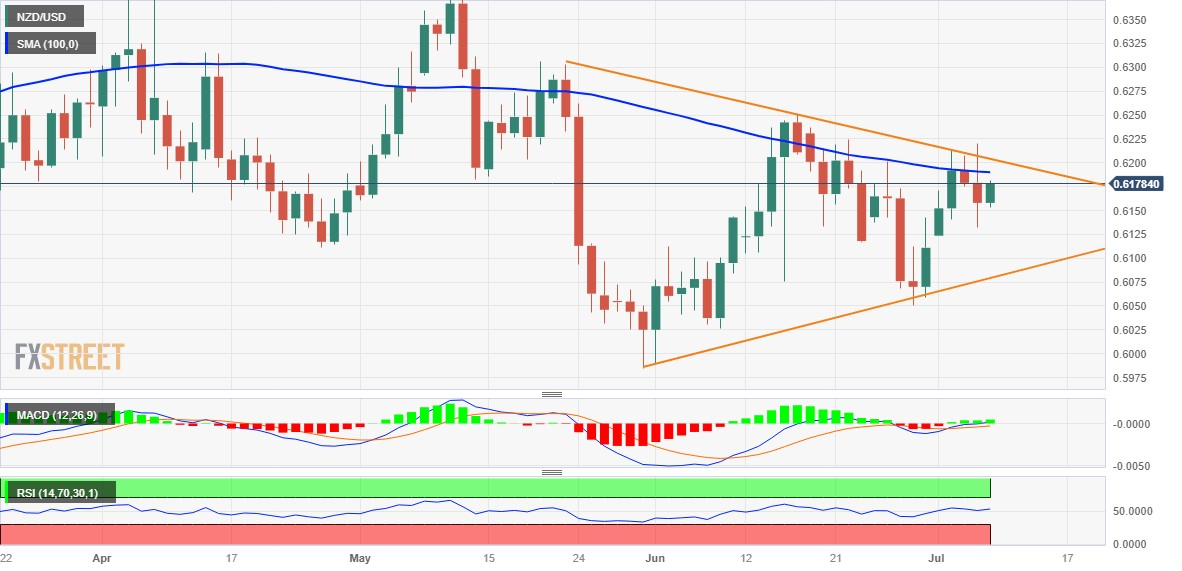
Key levels to watch
- Euro comes under pressure around 1.0880 vs. the US Dollar.
- Stocks in Europe extend the weekly rout so far.
- EUR/USD falters once again around the 1.0900 region.
- US jobs report takes centre stage later in the session.
- ECB’s Christine Lagarde, Luis De Guindos speak later in the day.
The Euro (EUR) fails to surpass the key 1.0900 barrier vs. the US Dollar (USD) so far on Friday, allowing the resumption of the selling bias around EUR/USD amidst the broad-based cautious trade prior to the release of the US labour market report for the month of June.
In the meantime, the Greenback’s price action remains directionless when gauged by the USD Index (DXY), while the recent strong rebound in US seems to be taking a breather at the end of the week.
The potential future actions of the Federal Reserve and the European Central Bank (ECB) in normalizing their monetary policies remain a topic of ongoing debate amidst increasing bets about an economic slowdown on both sides of the Atlantic.
Furthermore, the likeliness of a 25 basis point rate hike by the Fed at its July meeting has been lately reinforced in response to robust results from the US calendar, which kept showing a resilient US economy and a tight labour market.
In the domestic data space, Industrial Production in Germany contracted 0.2% MoM in May, while Retail Sales in Italy expanded 0.7% also in May vs. the previous month.
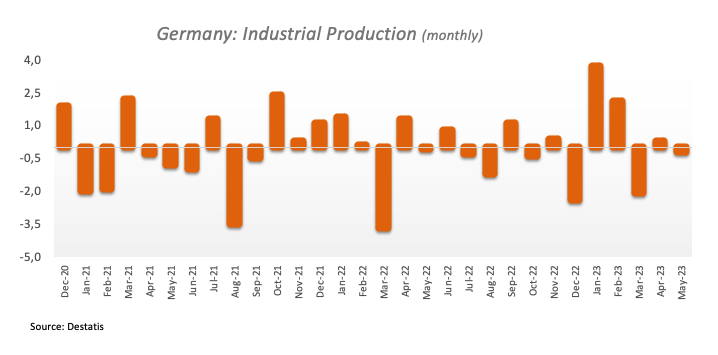
Across the Atlantic, consensus expects the US economy to have created 225K jobs in June and the Unemployment Rate to have eased to 3.6% in the same period.
Daily digest market movers: Euro looks prudent prior to Payrolls
- The EUR keeps the price action subdued for the time being.
- Germany’s Industrial Production surprised to the downside.
- US jobs report grabs all the attention on Friday.
- Investors continue to price in a 25 bps hike by the Fed in July.
- ECB’s Lagarde, de Guindos speak later in the session.
Technical Analysis: Euro faces a tough barrier around 1.0900
The inability of EUR/USD to gather some convincing upside traction has prompted sellers to remain in control of the pair for the time being.
That said, the loss of the weekly low at 1.0833 (July 6) could open the door to a test of the interim 100-day SMA at 1.0826. The breakdown of the latter should meet the next contention area not before the May low of 1.0635 (May 31) ahead of the March low of 1.0516 (March 15) and the 2023 low of 1.0481 (January 6).
On the other hand, occasional bullish attempts should clear the 1.0900 region to expose a potential move to the June peak of 1.1012 (June 22) prior to the 2023 high of 1.1095 (April 26), which is closely followed by the round level of 1.1100. North from here emerges the weekly top of 1.1184 (March 31, 2022), which is supported by the 200-week SMA at 1.1180, just before another round level at 1.1200.
The constructive view of EUR/USD appears unchanged as long as the pair trades above the crucial 200-day SMA, today at 1.0618.
Euro FAQs
What is the Euro?
The Euro is the currency for the 20 European Union countries that belong to the Eurozone. It is the second most heavily traded currency in the world behind the US Dollar. In 2022, it accounted for 31% of all foreign exchange transactions, with an average daily turnover of over $2.2 trillion a day.
EUR/USD is the most heavily traded currency pair in the world, accounting for an estimated 30% off all transactions, followed by EUR/JPY (4%), EUR/GBP (3%) and EUR/AUD (2%).
What is the ECB and how does it impact the Euro?
The European Central Bank (ECB) in Frankfurt, Germany, is the reserve bank for the Eurozone. The ECB sets interest rates and manages monetary policy.
The ECB’s primary mandate is to maintain price stability, which means either controlling inflation or stimulating growth. Its primary tool is the raising or lowering of interest rates. Relatively high interest rates – or the expectation of higher rates – will usually benefit the Euro and vice versa.
The ECB Governing Council makes monetary policy decisions at meetings held eight times a year. Decisions are made by heads of the Eurozone national banks and six permanent members, including the President of the ECB, Christine Lagarde.
How does inflation data impact the value of the Euro?
Eurozone inflation data, measured by the Harmonized Index of Consumer Prices (HICP), is an important econometric for the Euro. If inflation rises more than expected, especially if above the ECB’s 2% target, it obliges the ECB to raise interest rates to bring it back under control.
Relatively high interest rates compared to its counterparts will usually benefit the Euro, as it makes the region more attractive as a place for global investors to park their money.
How does economic data influence the value of the Euro?
Data releases gauge the health of the economy and can impact on the Euro. Indicators such as GDP, Manufacturing and Services PMIs, employment, and consumer sentiment surveys can all influence the direction of the single currency.
A strong economy is good for the Euro. Not only does it attract more foreign investment but it may encourage the ECB to put up interest rates, which will directly strengthen the Euro. Otherwise, if economic data is weak, the Euro is likely to fall.
Economic data for the four largest economies in the euro area (Germany, France, Italy and Spain) are especially significant, as they account for 75% of the Eurozone’s economy.
How does the Trade Balance impact the Euro?
Another significant data release for the Euro is the Trade Balance. This indicator measures the difference between what a country earns from its exports and what it spends on imports over a given period.
If a country produces highly sought after exports then its currency will gain in value purely from the extra demand created from foreign buyers seeking to purchase these goods. Therefore, a positive net Trade Balance strengthens a currency and vice versa for a negative balance.
Today, inflation data for June will be published in Mexico. Economists at Commerzbank analyze MXN outlook ahead of the release.
Support for the MXN from inflation data
In the minutes of the Central Bank of Mexico (Banxico) from the June meeting, it became clear that the Board is in no hurry to cut interest rates. The majority of the Board felt that it was too early to discuss rate cuts. This is good news for the MXN, which should continue to be supported by high real interest rates.
Inflation data for June is expected to show a further decline in inflation. Especially against the backdrop of Banxico's unchanged restrictive stance, weaker results should provide support for the MXN.
In the view of UOB Group’s Economist Lee Sue Ann and Markets Strategist Quek Ser Leang, USD/CNH should maintain the consolidative mood in the short-term horizon.
Key Quotes
24-hour view: Yesterday, we held the view that USD could test the resistance at 7.2800 before a pullback is likely. However, USD did not quite test 7.2800 as it traded between 7.2425 and 7.2734. The current price actions are likely part of a consolidation phase and today, we expect USD to trade in a range of 7.2400/7.2700.
Next 1-3 weeks: There is no change in our view from Wednesday (05 Jul, spot at 7.2280). As highlighted, the recent USD strength has ended USD is likely to trade in a range 7.1800/7.2800 for now.
Gold has achieved Credit Suise’s target/support zone at $1,900/1,890, and the bank looks for a floor here.
A weekly close below $1,862 would be seen to reinforce the longer-term sideways range
Gold has achieved our target of price support and the 38.2% retracement of the 2022/2023 uptrend at $1,900/1,890. With the key rising 200-DMA seen not far below at $1,862, our bias remains for a major floor to be found here.
We thus look for $1,862 to hold on a closing basis for strength back to the 55-DMA at $1,968 initially, then a retest of major resistance at the $2,063/2,075 record highs. We still stay biased to an eventual break to new record highs later in the year, which would then be seen to open the door to a move above $2,300.
A weekly close below $1,862 though would be seen to reinforce the longer-term sideways range, and a fall to support next at $1,810/05.
- USD/JPY drifts lower for the second straight day and hits a nearly two-week low on Friday.
- Intervention fears, along with the risk-off mood, boost the JPY and exerts heavy pressure.
- The Fed-BoJ policy divergence could help limit further losses ahead of the US NFP report.
The USD/JPY pair remains under heavy selling pressure for the second successive day on Friday and drops to a nearly two-week low, around the 143.15 region during the early European session.
Against the backdrop of fear about the potential intervention by Japanese authorities to support the domestic currency, the risk-off mood boosts demand for the safe-haven Japanese Yen (JPY). Investors remain worried about economic headwinds stemming from rapidly rising borrowing costs. Adding to this, the risk of a further escalation in trade conflicts between the US and China - the world's two largest economies - takes its toll on the global risk sentiment. This, along with subdued US Dollar (USD) price-action, contributes to the offered tone surrounding the USD/JPY pair.
The US ISM Services PMI released on Thursday showed that the Prices Paid sub-component fell to a more than two-year low and suggested that inflation is gradually slowing. This, in turn, fuels speculations that the Federal Reserve (Fed) will eventually soften its hawkish stance, sooner rather than later, which, in turn, keeps the USD bulls on the defensive. The markets, however, have nearly fully priced in a 25 bps lift-off at the July FOMC meeting. Moreover, the Fed had signalled in June that borrowing costs may still need to rise as much as 50 bps by the end of this year.
The hawkish outlook allows the yield on the two-year US government bond, which is typically highly sensitive to interest rate expectations, to stand tall near its highest since June 2007. Moreover, the benchmark 10-year US Treasury yield holds steady above the 4.0% threshold and acts as a tailwind for the Greenback. The resultant widening of the US-Japan rate differential, along with expectations that the Bank of Japan's (BoJ) negative interest-rate policy will remain in place at least until next year, supports prospects for the emergence of some dip-buying around the USD/JPY pair.
Hence, the ongoing downfall might still be categorized as a corrective pullback as bullish traders opt to lighten their bets ahead of the release of the closely-watched US monthly employment details. The popularly known NFP report is due later during the early North American session and will play a key role in influencing the Fed's policy outlook. This, in turn, will drive the USD demand and help determine the next leg of a directional move for the USD/JPY pair. Nevertheless, spot prices remain on track to register heavy weekly losses for the first time in the previous four.
Technical levels to watch
- The index exchanges gains with losses around 103.00.
- US yields trade in a cautious note ahead of key data.
- US Nonfarm Payrolls, Unemployment Rate take centre stage.
The USD Index (DXY), which tracks the greenback vs. a bundle of its main competitors, navigates without clear direction around the 103.00 neighbourhood at the end of the week.
USD Index looks at key data, Fed
The index maintains the cautious trade around 103.00 ahead of the publication of the US jobs report for the month of June later in the NA session.
So far, and in light of recent solid prints from US fundamentals, investors continue to anticipate a quarter-point interest rate hike by the Federal Reserve at the July 26 gathering.
Indeed, the latter results from the industrial sector, the ISM Services PMI and monthly ADP figures more than doubling initial estimates all did nothing but emphasize the resilience of the US economy and underpin the resumption of the tightening campaign by the Fed following June’s skip, in line with unabated hawkish narrative from Fed’s rate setters.
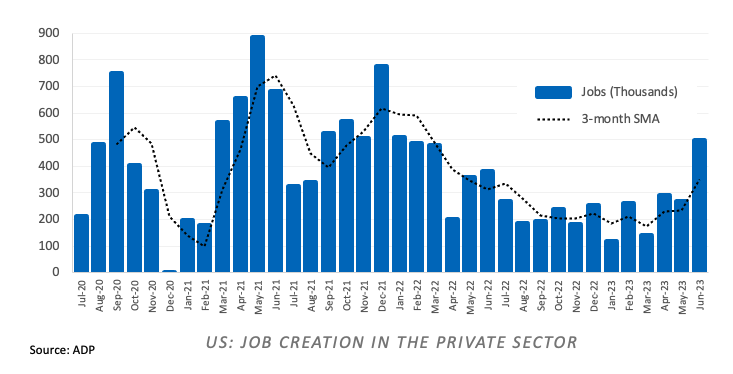
In the US data space, Nonfarm Payrolls and the Unemployment Rate for the month of June will be in the spotlight later in the European afternoon.
What to look for around USD
The index hovers around the 103.00 region amidst rising investors’ prudence prior to the release of the US monthly report on the labour market.
Meanwhile, the likelihood of another 25 bps hike at the Fed's upcoming meeting in July remains high, supported by the continued strength of key US fundamentals such as employment and prices.
This view was further bolstered by comments from Fed Chief Powell at the June FOMC event, who referred to the July meeting as "live" and indicated that most of the Committee is prepared to resume the tightening campaign as early as next month.
Key events in the US this week: Nonfarm Payrolls, Unemployment Rate (Friday).
Eminent issues on the back boiler: Persistent debate over a soft/hard landing of the US economy. Terminal Interest rate near the peak vs. speculation of rate cuts in late 2023/early 2024. Fed’s pivot. Geopolitical effervescence vs. Russia and China. US-China trade conflict.
USD Index relevant levels
Now, the index is up 0.03% at 103.14 and the breakout of 103.54 (weekly high June 30) would open the door to 104.65 (200-day SMA) and then 104.69 (monthly high May 31). On the downside, the next support aligns at 101.92 (monthly low June 16) followed by 100.78 (2023 low April 14) and finally 100.00 (round level).
EUR/USD is finding some support due to the soft-ish USD momentum, despite strong US data. Economists at ING analyze the pair’s outlook.
Not worth chasing EUR/USD higher for now
We see a Dollar comeback as likely, so we would be reluctant to chase EUR/USD much beyond 1.0900. The current set of market conditions would suggest 1.0750/1.0800 to be a more appropriate trading range.
The Eurozone calendar remains uninspiring from a data standpoint but there are some ECB speakers to monitor today. President Christine Lagarde will participate in a panel although it is unclear whether she will discuss monetary policy, and we’ll also hear from Guindos, Stournaras and Nagel.
Here is what you need to know on Friday, July 7:
The US Dollar (USD) is having a hard time finding demand early Friday as investors stay on the sidelines while waiting for the US Bureau of Labor Statistics to release the labor market data for June. Meanwhile, the cautious market stance stays intact amid rising global bond yields, with US stock index futures trading in the red in the European morning. Statistics Canada will also release the June jobs report later in the day and European Central Bank (ECB) President Christine Lagarde will be delivering a speech.
US Nonfarm Payrolls Forecast: June NFP release expected to show moderating job creation.
Upbeat macroeconomic data releases from the US helped the US Dollar Index (DXY) edge higher during the American hours on Thursday. The monthly data published by the ADP revealed that employment in the private sector 497,000 in June, surpassing the market expectation of 228,000 by a wide margin. Additionally, the ISM Services PMI improved to 53.9 from 50.3. The DXY, however, lost its traction in the late American session and closed in negative territory, snapping a three-day winning streak.
EUR/USD registered modest gains on Thursday but failed to stabilize above 1.0900. Early Friday, the pair moves sideways slightly below that level. Earlier in the session, the data from Germany showed that Industrial Production contracted 0.2% in May. In an interview with La Provence on Friday, Lagarde reiterated that they still have work to do to bring inflation back down to their target but this comment was largely ignored by market participants.
GBP/USD climbed toward 1.2800 on Thursday but erased a portion of its daily gains after the US data. Nevertheless, the pair registered its highest daily close in 10 days and was last seen holding steady at around 1.2750.
USD/JPY stays under bearish pressure and continues to stretch lower toward 143.00, with the Japanese Yen benefiting from the risk-averse market atmosphere.
Gold price came within a touching distance of $1,900 amid surging US T-bond yields on Thursday. XAU/USD stages a technical correction and trades above $1,910 early Friday.
US June Nonfarm Payrolls Preview: Analyzing Gold price's reaction to NFP surprises.
Bitcoin closed in the red for the third straight day on Thursday before stabilizing above $30,000 early Friday. Ethereum lost more than 3% on Thursday and was last seen consolidating its losses at around $1,850.
The Canadian labor market report will be closely scrutinized today. Economists at Commerzbank analyze how could the Loonie react to the employment figures.
CAD could find support if the labor market remains relatively robust
If the labor market remains relatively robust despite the past rate hikes and if wage rises are decent, expectations of a second rate hike until year-end might increase, supporting CAD.
A weak labor market report on the other hand might slow the Loonie and send it on a nose dive.
See – Canada Employment Preview: Banks expect to see early cracks in the labour market
- AUD/USD attracts some buyers on Friday and draws support from a softer USD.
- Bets for additional Fed rate hikes act as a tailwind for the buck and cap gains.
- The risk-off mood contributes to keeping a lid on the pair ahead of the US NFP.
The AUD/USD pair builds on the previous day's modest bounce from sub-0.6600 levels, or a one-week trough and gains some positive traction on Friday. Spot prices, however, struggle to capitalize on the move and remain below the 0.6650 level through the early European session.
The uncertainty over the Federal Reserve's (Fed) rate-hike path prompts some US Dollar (USD) selling for the second successive day, which, in turn, is seen as a key factor lending support to the AUD/USD pair. The minutes from the June FOMC meeting released on Wednesday revealed that almost all members supported resuming rate hikes as inflation remains unacceptably high. Furthermore, Thursday's upbeat US ADP report and the ISM Services PMI reaffirmed bets for a 25 bps lift-off at the July FOMC meeting. That said, the Prices Paid sub-component of the ISM survey fell to a more than two-year low, suggesting that the closely watched services inflation is gradually slowing and fueling speculations that the Fed will eventually soften its hawkish stance, sooner rather than latter.
The Fed, however, is still expected to continue with its policy tightening cycle, which keeps the the US Treasury bond yields and helps limit the downside for the USD. In fact, the yield on the rate-sensitive two-year US government bond is placed near its highest since June 2007, while the benchmark 10-year US Treasury yield holds steady above the 4.0% threshold. This, along with the prevalent risk-off environment acts as a tailwind for the safe-haven Greenback and keeps a lid on any meaningful upside for the AUD/USD pair. The market sentiment remains fragile amid worries about a global economic downturn and the worsening US-China relations. Traders also seem reluctant to place aggressive bets and prefer to wait for the release of the US monthly employment details.
The popularly known NFP report is due later during the early North American session and will play a key role in infuencing the Fed's near-term policy outlok. This, in turn, will drive the USD demand and provide some meaningful imptus to the AUD/USD pair. Nevertheless, spot prices, at current levels, seem poised to register modest losses for the third successive week.
Technical levels to watch
USD/JPY is now seen within 142.90-145.00 range in the next few weeks, according to UOB Group’s Economist Lee Sue Ann and Markets Strategist Quek Ser Leang.
Key Quotes
24-hour view: While we expected USD to weaken yesterday, we were of the view that “any decline is likely to face strong support at 143.90.” The anticipated support did not materialize as USD plummeted to 143.54, bounced to 144.69 and then closed at 144.06. After the choppy price actions, the outlook for USD is mixed. Today, USD could continue to trade in a choppy manner, likely between 143.40 and 144.50.
Next 1-3 weeks: We have held a positive USD view since the middle of last month. In our latest narrative from Wednesday (05 Jul, spot at 144.50), we noted that “the USD strength is struggling to maintain its momentum, and the chance for extension to 145.50 appears low”. Yesterday (06 Jul), USD fell below our ‘strong support’ level at 143.90. The breach of the ‘strong support’ indicates that the 3-week USD strength has ended. From here, we expect USD to trade in a range, likely between 142.90 and 145.00.
Economists at ING analyze USD outlook ahead of Nonfarm Payrolls figures.
A return above 104.00 in DXY in the coming days looks likely
Treasuries are hitting key levels on big US data surprises, but the Dollar is not finding real support.
The Dollar may be mirroring some lingering reluctance to align with the dot plot’s two hikes, but market conditions point to a stronger greenback in the near term, barring a substantial downside surprise in payrolls.
The path for a more supported Dollar in the near term appears to be the most obvious one, and a return above 104.00 in DXY in the coming days looks likely.
See – Nonfarm Payrolls Preview: Banks see labour market still quite strong
- USD/CAD has refreshed its three-week high at 1.3375 despite multiple headwinds.
- The USD Index is expected to remain volatile ahead of the release of the US NFP data.
- Oil prices have printed a fresh two-week high at $72.35 despite global central banks preparing for a fresh rate hike cycle.
The USD/CAD pair has refreshed its three-week high at 1.3375 in the London session. The Loonie asset has registered a stellar rally despite sheer weakness in the US Dollar Index (DXY), higher oil prices, and expectations of one more interest rate hike from the Bank of Canada (BoC).
S&P500 futures have extended their downside journey in Europe, initiated on Thursday after the United States labor market turned out more resilient than expected. Market sentiment is bearish as investors are extremely cautious ahead of the second-quarter result season and labor market data.
The US Dollar Index (DXY) has found support near 103.00. The USD Index is expected to remain volatile ahead of the release of the Nonfarm Payrolls (NFP) data. Analysts at RBC Economics expect the US jobs report in June likely saw a 260K increase in payroll employment, down from the +339K in May, but still at a high level. We expect the Unemployment Rate likely edge up to 3.8% (calculated separately from the household survey), from 3.7% in May.
Like the US Dollar, the Canadian Dollar will also react heavily to its domestic employment data. Analysts at NBF believe after a slight hiccup in May, we expect job creation to have resumed in June. But an expected gain of 20K may not be enough to prevent a further rise in the unemployment rate in a context where the labor force is growing at a strong pace. Indeed, we expect the jobless rate to increase from 5.2% to 5.3%, assuming that the participation rate rises by a tenth to 65.6%.
A poll from Reuters showed that the Bank of Canada (BoC) will hike interest rates by 25 basis points (bps) to 5% in July. This would be the last nail in the coffin and after that, the monetary policy would remain stable for a longer period.
On the oil front, oil prices have printed a fresh two-week high at $72.35 despite global central banks preparing for a fresh rate hike cycle. It is worth noting that Canada is the largest exporter of oil to the United States and higher oil prices support the Canadian Dollar.
Considering advanced prints from CME Group for natural gas futures markets, open interest rose for the third session in a row on Thursday, this time by just 603 contracts. Volume, instead, went down by around 15.2K contracts, reversing part of the previous marked build.
Natural Gas faces contention around $2.60
Prices of natural gas dropped for the third session in a row on Thursday. The move was in tandem with a small uptick in open interest and diminishing volume. That said, there are no changes to the broad consolidative phase around the commodity, while prices now appear to face initial contention around the $2.60 mark per MMBtu.
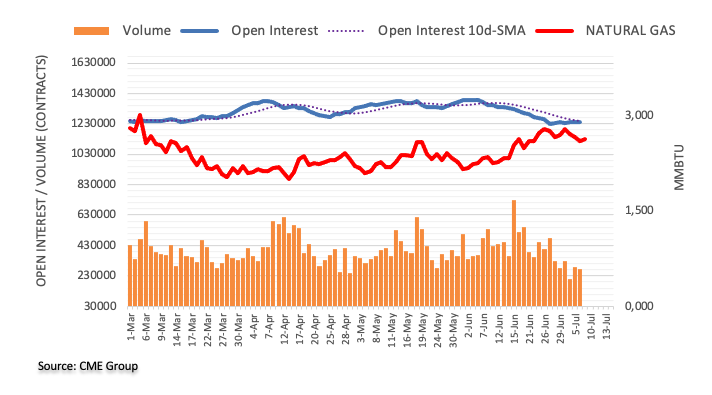
What should we expect from today’s data? Antje Praefcke, FX Analyst at Commerzbank, analyzes how the US labor market report for June could impact the USD.
USD reaction likely to be more pronounced in case of a disappointing result
If the market sees even the smallest indication that the labor market in the US is not as robust as expected, I expect to see a weaker Dollar.
The reaction of the Dollar is likely to be more pronounced in case of a disappointing result. It would probably require a real whopper of a labor market report in order to push EUR/USD at or even below the 1.08 level.
See – Nonfarm Payrolls Preview: Banks see labour market still quite strong
In the opinion of UOB Group’s Economist Lee Sue Ann and Markets Strategist Quek Ser Leang, AUD/USD faces extra retracements while below 0.6595.
Key Quotes
24-hour view: While we expected AUD to weaken yesterday, we held the view that it “is unlikely to break clearly below 0.6620”. However, in NY trade, AUD plunged to a low of 0.6599. The rapid decline appears to be overdone, but there is room for AUD to test the major support at 0.6595 before a more sustained rebound is likely. A sustained drop below 0.6595 is unlikely. Resistance is at 0.6655, followed by 0.6680.
Next 1-3 weeks: Our latest narrative was from two days ago (05 Jul, spot at 0.6695) wherein we held view that AUD is likely to trade in a range of 0.6620/0.6770 for the time being. Yesterday (06 Jul), AUD broke below 0.6620 and fell to a low of 0.6599. Downward momentum appears to be building, albeit tentatively. From here, AUD must break and stay below 0.6595 before a sustained decline is likely. The chance for AUD to break clearly below 0.6595 is not high but it will remain in place as long as AUD stays below 0.6705 in the next few days. Looking ahead, the next support below 0.6595 is at 0.6520.
Economists at ANZ Bank analyze Asian currencies outlook.
Growth-inflation dynamics will bode well for Asia beyond the near term
With Asia mostly done with hiking while Fed Chair Powell highlighting his hawkish rhetoric, from the perspective of interest rate differentials, Asian currencies will likely remain under downward pressure in the near term. Adding to this is the Yuan’s depreciation. It appears that China’s authorities have reintroduced the counter-cyclical factor in the daily Yuan mid-point fixing. This will help slow the Yuan’s decline but is unlikely to reverse it.
That said, interest rate differentials are not the only driver of FX. After diminished growth premiums over the US in 2021-22, Asia is regaining its growth advantage. On inflation, in a rare turn, Asia is now seeing lower inflation than the US. Inflation concerns have eased in Asia while the US is still grappling with sticky inflation. The macro-environment, specifically growth-inflation dynamics, will bode well for Asia beyond the near term.
- EUR/JPY prints four-day losing streak, braces for the first weekly loss in four.
- German Industrial Production for May disappoints, Japan wage numbers came in firmer.
- Fears of BoJ, Japan government intervention to defend Yen soar of late, firmer yields fail to propel EUR/JPY.
- More comments from ECB’s Lagarde, yields and risk catalysts eyed for clear directions.
EUR/JPY renews its intraday low around 156.25, portraying the four-day losing streak heading into Friday’s European session.
The cross-currency pair’s latest weakness could be linked to the downbeat German data, as well as the market’s risk-off mood, and the concerns about Japan’s intervention to defend the Yen (JPY). In doing so, the quote ignores hawkish comments from European Central Bank (ECB) President Christine Lagarde while failing to justify dovish bias at the Bank of Japan (BoJ).
Germany’s Industrial Production for May shrinks by 0.2% MoM versus the market expectations of posting 0.1% growth. That said, industrial Production grew 0.3% in April.
On the other hand, ECB President Lagarde defends her hawkish bias while saying, “We still have work to do to bring inflation back down to our target.”
It should be noted that Japanese officials have repeatedly shown readiness to take measures to defend the Yen in case of severe moves after the Asian currency refreshed yearly tops in the last week. Additionally favoring the JPY is the early-day release of firmer Japan wage growth data for May, as well as recently published upbeat preliminary figures of the Coincident Index and Leading Economic Index for May.
Furthermore, talks of the BoJ’s exit from easy monetary policy and the Yield Curve Control (YCC) have also gained major attention of late and weigh on the EUR/JPY prices, even if the BoJ officials have ruled out the need for any such measures in the near term.
Amid these plays, the US stock futures and Asia-Pacific shares remain pressured while tracing Wall Street’s losses. Further, the Treasury bond yields edge higher following a run-up to refresh a three-month top by the US 10-year and two-year bond coupons.
Looking ahead, a speech from ECB President Christine Lagarde is up for release during the US session and will direct the intraday EUR/JPY moves. Before that, the risk catalysts and BoJ chatters may entertain the momentum traders.
Technical analysis
A daily closing beneath the previous resistance line stretched from late February, around 157.05 by the press time, directs EUR/JPY bears towards the 155.35-30 support confluence comprising the 21-DMA and tops marked during June 18-20.
Open interest in crude oil futures markets resumed the downtrend on Thursday, this time declining by around 11.6K contracts. Volume followed suit and shrank by around 41.6K contracts following a sharp daily build.
WTI: Near-term top remains around $72.60
Thursday’s continuation of the weekly recovery in prices of WTI was against the backdrop of shrinking open interest and volume, which removes strength from further gains in the very near term. So far, the immediate target on the upside remains at the weekly high near $72.70 (June 21).
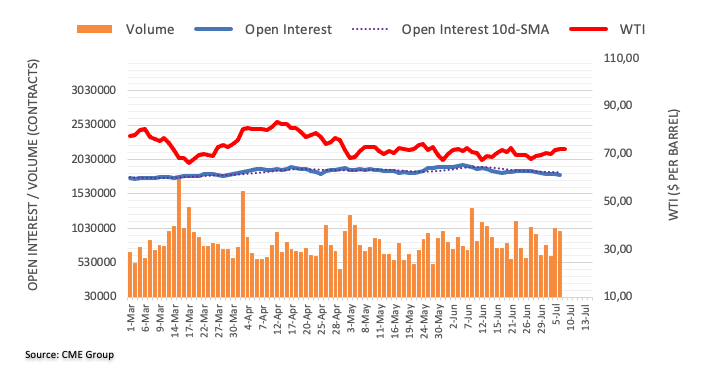
The Euro gained some ground in the last month, having appreciated by 2 cents. It has since stabilized at a level slightly below the highs last seen in May. Economists at the National Bank of Canada analyze EUR outlook.
Data is starting to show that the overarching economy is losing steam
The common area currency has been lifted by a still hawkish central bank, but data is starting to show that the overarching economy is losing steam.
Overall, we see the Euro weakening as policy expectations evolve and with some risk-off USD appreciation.
- Silver price is oscillating around $22.70 as investors await US NFP for further guidance.
- The USD Index has surrendered its entire gains generated after the release of the upbeat US ADP Employment report.
- Silver price is struggling to show a meaningful recovery despite finding strength near the lower portion of the Rising Channel pattern.
Silver price (XAG/USD) is demonstrating back-and-forth moves around $22.70 in the early London session. The white metal is struggling to find direction as investors are awaiting the release of the United States Nonfarm Payrolls (NFP) data for further guidance.
S&P500 futures are displaying a lackluster performance in Europe. The 500-US stocks basket futures are failing to show recovery, which indicates that the market sentiment is bearish. The US Dollar Index (DXY) has extended its losses to near 103.00. The extent of the downside shows that the USD Index has surrendered its entire gains generated after the release of the upbeat US Automatic Data Processing (ADP) Employment report.
Considering strong cues from the US ADP report, US NFP is expected to remain upbeat. Contrarily, analysts at Credit Suisse expect payroll gains to slow to 190K in June, as in our view, all evidence points to a slower, but still historically robust, rate of job gains. We expect the unemployment rate to tick lower to 3.6%, while average hourly earnings should remain at 0.3% MoM.
Further action by the Federal Reserve (Fed) will be heavily based on the release of the employment gamut. For now, an interest rate hike by the Fed in July is likely as core inflation is still stubborn due to resilient demand.
Silver technical analysis
Silver price is struggling to show a meaningful recovery despite finding strength near the lower portion of the Rising Channel chart pattern formed on a two-hour scale. The white metal has failed to sustain above the 200-period Exponential Moving Average (EMA) at $23.00, which indicates that the long-term trend is bearish.
The Relative Strength Index (RSI) (14) has slipped into the bearish range of 20.00-40.00, which indicates more weakness ahead.
Silver two-hour chart
-638243088956144119.png)
During her four-day visit to Beijing, US Treasury Secretary Janet Yellen said on Friday, “US concerned by China's new export controls on critical minerals,” adding that they are “still evaluating impact.”
Additional quotes
'Direct and clear lines' of communication at senior level in best interest of US, China.
Shift toward market reforms would be in China's interests, past reforms spurred rapid growth.
US not seeking 'wholesale separation' of economies, looking to 'diversify' not decouple.
'Particularly troubled' by China's use of punitive actions against US firms.
US seeks level playing field for US businesses will coordinate with allies to address China's 'unfair' economic practices.
Market reaction
At the time of writing, AUD/USD, the Chinese proxy, is trading 0.15% higher on the day at 0.6635.
IDR was leaning on the weaker side against the USD in June. Economists at MUFG Bank analyze USD/IDR outlook.
Supportive current account fundamentals for the IDR
Fundamentals are stable. GDP growth reached 5.03% YoY in Q1, similar to the 5.01% result in Q4-2022. Inflation retreated further. We anticipate that inflation will head lower towards a 2-3% range in the coming months.
We also believe that Indonesia’s trade surplus will be a supportive factor for the IDR.
We expect USD/IDR to fall back to 14,400 in Q2-2024 as yield differentials widen once again in favour of IDR.
- USD/INR clings to mild daily losses, the first in four, while paring weekly gains.
- US Dollar’s retreat amid sluggish session, positioning for US NFP and China news weigh on Indian Rupee of late.
- Risk-off mood, hawkish Fed concerns allow USD/INR to remain firmer.
USD/INR remains on the back foot around the intraday low of 82.62 heading into Friday’s European session. In doing so, the Indian Rupee (INR) pair prints the first daily loss in four while reversing from a six-week high.
That said, the quote’s latest positioning could be linked to the market’s cautious mood ahead of today’s US NFP, as well as mixed headlines about China, not to forget the firmer Oil price.
It’s worth noting that an absence of a harsh tone in China Finance Ministry’s comments about the US-China ties when US Treasury Secretary is in Beijing seems to recently help the market consolidate the previous day’s heavy pessimism.
On the other hand, Oil price remains up for the fourth consecutive day, bracing for a second weekly gain. It should be observed that the WTI crude oil price stays mildly bid near $72.20 by the press time.
Given the Indian Rupee’s inverse correlation with the oil price, mainly due to the nation’s heavy reliance on energy imports, a firmer Oil price can propel the USD/INR pair, especially when the hawkish Fed bets underpin the US Dollar, despite the latest retreat.
Amid these plays, S&P500 Futures print mild losses whereas markets in Asia keep the red. Additionally, the US Treasury bond yields remain firmer at the multi-day high to put a floor under the USD/INR price.
Looking ahead, market players brace for the headline Nonfarm Payrolls (NFP), expected to ease to 225K from 339K, as well as risk catalysts. Should the jobs report arrive as positive and the market sentiment remains downbeat, the USD/INR can witness a fresh upside.
Technical analysis
A successful upside break of the 200-DMA, around 82.20 by the press time, keeps USD/INR bulls hopeful despite the latest retreat. That said, the 83.00 round figure comprising multiple levels marked since October 2022 restricts the short-term upside of the pair.
Further range bound is likely in GBP/USD for the time being, comment UOB Group’s Economist Lee Sue Ann and Markets Strategist Quek Ser Leang.
Key Quotes
24-hour view: We expected GBP to trade in a range between 1.2670 and 1.2740 yesterday. We did not anticipate the spike in volatility as GBP soared to 1.2780, plummeted to 1.2674, and then rebounded to close at 1.2740 (+0.30%). After the sharp but short-lived swings, the outlook for GBP is mixed. Today, GBP could continue to trade in a choppy manner, likely between 1.2680 and 1.2780.
Next 1-3 weeks: Our update from Wednesday (05 Jul, spot at 1.2715) is still valid. As highlighted, for the time being, GBP is likely to consolidate and trade in a range of 1.2630/1.2800.
CME Group’s flash data for gold futures markets noted traders extended the uptrend in open interest and added around 9.5K contracts on Thursday. On the flip side, volume resumed the decline and shrank by around 6.2K contracts following the previous daily build.
Gold: Door open to another test of $1890
Gold prices extended the corrective decline on Thursday amidst increasing open interest, which suggests that further losses could be in the pipeline in the short-term horizon. That said, the immediate contention area emerges at the June low at $1893 per troy ounce (June 23).
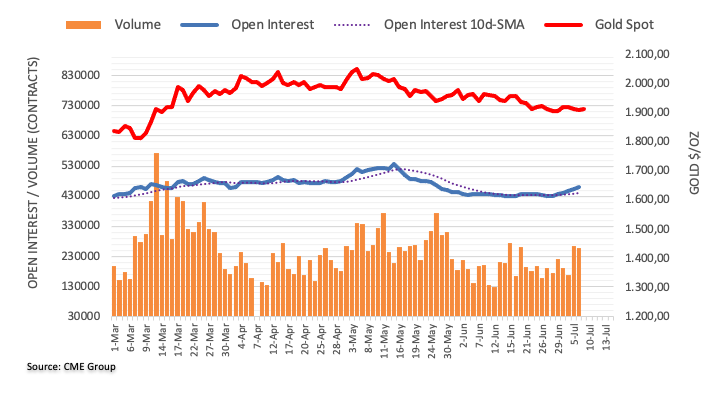
- EUR/USD is looking to recapture the immediate resistance of 1.0900 amid a decline in the US Dollar.
- Far better-than-anticipated employment additions in the US have propelled hopes of more interest rate hikes from the Fed.
- Hopes for more interest rates from ECB Lagarde are strengthening as inflationary pressures in the old continent are still stubborn.
The EUR/USD pair is gathering strength to recapture the round-level resistance of 1.0900 in the early European session. The major currency pair has picked strength as the US Dollar Index (DXY) is facing immense pressure despite stellar chances of 25 basis points (bps) interest rate hike in July by the Federal Reserve (Fed).
S&P500 futures are extended losses in the Asian session. US equities also faced immense selling pressure on Thursday as far better-than-anticipated employment additions in June propelled hopes of more interest rate hikes from the Fed.
The US Dollar Index (DXY) has extended its correction to near 103.05 despite fears of further policy-tightening have electrified. The US labor market is not in the mood to release some heat in spite of higher interest rates and tight credit conditions by the commercial banks.
Going forward, the investing community will focus on the US Nonfarm Payrolls (NFP) data. As per the consensus, the US labor market was added with 225K vs. the former release of 339K. The Unemployment Rate is expected to drop to 3.6% against the prior release of 3.7%.
On the Eurozone front, German monthly Industrial Production has contracted by 0.2% while the street was anticipating a mild expansion of 0.1%. On Thursday, German Factory Orders were upbeat, which indicates that the manufacturing sector could recover ahead.
Meanwhile, hopes for more interest rates from European Central Bank (ECB) President Christine Lagarde are strengthening as inflationary pressures in the old continent are still stubborn.
- US Nonfarm Payrolls data is likely to report 225K in June vs. 339K seen in May.
- The headline NFP and Average Hourly Earnings are key to the Fed’s rate hike outlook.
- US Unemployment Rate is seen a tad lower at 3.6% in June from May’s 3.7% reading.
Following the releases of significant US employment data in the holiday-shortened week, the US Dollar (USD) is geared up for the all-important US Nonfarm Payrolls report due this Friday, which will likely lead to a recalibration of the US Federal Reserve (Fed) rate hike bets in the second half of this year.
Renewed US-China trade tensions, combined with mounting recession fears in the world’s largest economy, are helping the US Dollar find its feet heading toward the highly-anticipated US labor market data. Absent Fedspeak, thin trading and weak US ISM Manufacturing PMI data weighed on the Greenback in the early part of the week.
On Monday, the ISM Manufacturing PMI in the United States shrank for eight consecutive months to 46.0 in June, hitting the lowest level since May 2020. Chris Williamson, Chief Business Economist at S&P Global Market Intelligence, said that “the health of the US manufacturing sector deteriorated sharply in June, fueling fears that the economy could slip into a recession in the second half of the year.”
In response to the data, the closely-watched spread between the 2-year and 10-year US Treasury bond yields hit the widest since 1981, a deeper inversion than the one witnessed in March during the US regional banking crisis. The yield differential between 2 and 10-year Treasuries has been inverted since last July so Monday’s inversion is not unusual but the magnitude of inversion is a signal that a US economic recession is inevitable.
What to expect in the next Nonfarm Payrolls report?
Amidst mounting recession fears and hawkish Fed expectations, markets eagerly look forward to Friday’s critical United States (US) jobs data for June to provide a fresh directional impetus to the US Dollar.
The US economy is widely expected to have added 225K jobs in the sixth month of the year, compared with a 339K jobs growth reported in May. The Unemployment Rate is expected to tick down to 3.6% in June vs. 3.7% reported in May.
Apart from the headline Nonfarm Payrolls number, the Average Hourly Earnings will be closely scrutinized for fresh hints on the country’s wage inflation, which has a strong bearing on the Fed rate hike prospects. The Average Hourly Earnings are seen rising 4.2% on a yearly basis in June as against a 4.3% increase booked previously.
The US labor market remains very tight, as aptly portrayed by the latest data published by Automatic Data Processing (ADP) on Thursday. The United States private sector employment rose by 497,000 in June, followed by the 267,000 increase recorded in May while outpacing estimates of 228,000 by a wide margin. Meanwhile, JOLTS Jobs Openings came in at 9.82 million at the end of May, dropping from an upwardly revised 10.3 million in April, just missing the expectations of 9.935 million.
Analysts at TD Securities noted, “we look for payrolls to stay strong in June, though they would still be losing momentum at the margin following more robust increases in April-May. We also expect the UE rate to drop a tenth to 3.6% as we are assuming job creation in the household survey will normalize after the May plunge. Average hourly earnings likely advanced 0.3% m/m, with the y/y measure staying unchanged at a still-elevated 4.3%.”
When will US June Jobs Report data be released and how could it affect EUR/USD?
The Nonfarm Payrolls number, part of the US jobs report, will be released at 12:30 GMT on July 7. EUR/USD has been struggling around the 1.0900 level so far this week. The labor market data could help determine whether the US Dollar will maintain the upper hand against the Euro.
Stronger-than-expected NFP numbers and hot wage inflation data would strengthen expectations of more Fed tightening in the upcoming months, in line with the Fed’s Dot Plot chart, which suggested two more rate hikes ahead. Fed Chair Jerome Powell also said last week that “a strong majority of Fed policymakers expect two or more rate hikes by year-end.”
Alternatively, the US Dollar could give up the recovery gains and resume its downtrend on signs of cooling wage inflation and below-forecasts NFP data. Downbeat data could raise doubts about the chances of any further rate increases by the Fed after the expected 25 basis points (bps) July hike. In such a scenario, EUR/USD could see a fresh advance toward 1.1000.
Meanwhile, Dhwani Mehta, Asian Session Lead Analyst at FXStreet, offers a brief technical outlook for the EUR/USD pair and explains: “The main currency pair is clinging to the bullish 21-Daily Moving Average (DMA) at 1.08890 in the run-up to the US NFP showdown. EUR/USD buyers could find some support, as the 14-day Relative Strength Index (RSI) sits just above the midline.”
Dhwani also outlines important technical levels to trade the EUR/USD pair: “On the upside, Euro buyers need to find a strong foothold above the 21 DMA barrier at 1.0890 to sustain the previous rebound, with eyes on the 1.0950 psychological barrier. The next critical resistance is seen at the June top of 1.1012. Conversely, immediate support awaits at the mildly bearish 50 DMA at 1.0857, below which the horizontal 100 DMA at 1.0828 will limit the downside. The last line of defense for Euro buyers is envisioned at the 1.0750 key level.”
NonFarm Payrolls FAQs
What are Nonfarm Payrolls?
Nonfarm Payrolls (NFP) are part of the US Bureau of Labor Statistics monthly jobs report. The Nonfarm Payrolls component specifically measures the change in the number of people employed in the US during the previous month, excluding the farming industry.
How does Nonfarm Payrolls influence the Federal Reserve monetary policy decisions?
The Nonfarm Payrolls figure can influence the decisions of the Federal Reserve by providing a measure of how successfully the Fed is meeting its mandate of fostering full employment and 2% inflation.
A relatively high NFP figure means more people are in employment, earning more money and therefore probably spending more. A relatively low Nonfarm Payrolls’ result, on the either hand, could mean people are struggling to find work.
The Fed will typically raise interest rates to combat high inflation triggered by low unemployment, and lower them to stimulate a stagnant labor market.
How does Nonfarm Payrolls affect the US Dollar?
Nonfarm Payrolls generally have a positive correlation with the US Dollar. This means when payrolls’ figures come out higher-than-expected the USD tends to rally and vice versa when they are lower.
NFPs influence the US Dollar by virtue of their impact on inflation, monetary policy expectations and interest rates. A higher NFP usually means the Federal Reserve will be more tight in its monetary policy, supporting the USD.
How does Nonfarm Payrolls affect Gold?
Nonfarm Payrolls are generally negatively-correlated with the price of Gold. This means a higher-than-expected payrolls’ figure will have a depressing effect on the Gold price and vice versa.
Higher NFP generally has a positive effect on the value of the USD, and like most major commodities Gold is priced in US Dollars. If the USD gains in value, therefore, it requires less Dollars to buy an ounce of Gold.
Also, higher interest rates (typically helped higher NFPs) also lessen the attractiveness of Gold as an investment compared to staying in cash, where the money will at least earn interest.
Sometimes Nonfarm Payrolls trigger an opposite reaction than what the market expects. Why is that?
Nonfarm Payrolls is only one component within a bigger jobs report and it can be overshadowed by the other components.
At times, when NFP come out higher-than-forecast, but the Average Weekly Earnings is lower than expected, the market has ignored the potentially inflationary effect of the headline result and interpreted the fall in earnings as deflationary.
The Participation Rate and the Average Weekly Hours components can also influence the market reaction, but only in seldom events like the “Great Resignation” or the Global Financial Crisis.
Industrial Production in Germany unexpectedly declined in May, the official data showed on Friday, suggesting that the manufacturing sector recovery is dwindling.
Eurozone’s economic powerhouse’s Industrial Output dropped 0.2% MoM, the federal statistics authority Destatis said in figures adjusted for seasonal and calendar effects, vs. 0.1% expected and 0.3% previous.
The annual German Industrial Production climbed 0.7% in May versus a 1.6% increase seen in April.
FX implications
The shared currency is holding gains below 1.0900 against the US Dollar following the downbeat German industrial figures. The pair is adding 0.09% on the day, as of writing.
UOB Group’s Economist Lee Sue Ann and Markets Strategist Quek Ser Leang note that the downside bias in EUR/USD is expected to mitigate on a break above 1.0925.
Key Quotes
24-hour view: Yesterday, we highlighted that “the risk for EUR is still on the downside and it could dip below 1.0835, possibly testing the major support at 1.0805”. EUR dipped below 1.0835 twice (once in Asian trade and once in NY trade) and both times, it rebounded quickly after touching 1.0832. Downward pressure has faded, and the risk for EUR is no longer on the downside. Today, EUR is likely to trade in a range between 1.0855 and 1.0925.
Next 1-3 weeks: We highlighted yesterday (06 Jul, spot at 1.0855) that “downward momentum has improved, and the chance of EUR dropping to 1.0805 has increased.” While EUR dropped to a 3-week low of 1.0832, it rebounded strongly and closed higher by 0.33% (1.0887). From here, if EUR breaks above 1.0925 (no change in the ‘strong resistance’ level), it would suggest that 1.0805 is not coming into view this time around.
- USD/JPY braces for the first weekly loss in four, prods intraday low.
- Clear downside break of 50-SMA, bearish MACD signals favor Yen pair sellers.
- 100-SMA, two-month-old support line can join downbeat RSI to restrict short-term downside.
- Bulls need validation from US NFP and 144.60 hurdle to retake control.
USD/JPY renews its intraday low around 143.70, down for the second consecutive day, heading into Friday’s European session. In doing so, the Yen pair justifies the market’s positioning for the US employment report for June. Also exerting downside pressure on the price could be the chatters about the Japanese government’s likely intervention to defend the Yen, as well as talks of the Bank of Japan (BoJ) policy moves.
Also read: USD/JPY remains on the defensive around 144.00, downside seems limited ahead of US NFP
Technically, a clear downside break of the 50-SMA, around 144.35 by the press time, joins the bearish MACD signals to favor the USD/JPY sellers.
However, the 100-SMA and an ascending support line from early May, respectively near 143.25 and 143.00, can challenge the Yen pair bears afterward.
It’s worth noting that the RSI (14) also suggests limited downside room for the USD/JPY pair by being closer to the 36.00 level at the latest.
If at all, the USD/JPY drops below 143.00, the 200-SMA and six-week-old horizontal support, respectively near 141.50 and 141.10–140.90, will be crucial to watch.
On the contrary, an upside break of the 50-SMA, near 144.35, isn’t a call for the USD/JPY upside as a one-week-old descending resistance line, near 144.60, acts as an extra filter towards the north before giving control to the bulls.
USD/JPY: Four-hour chart
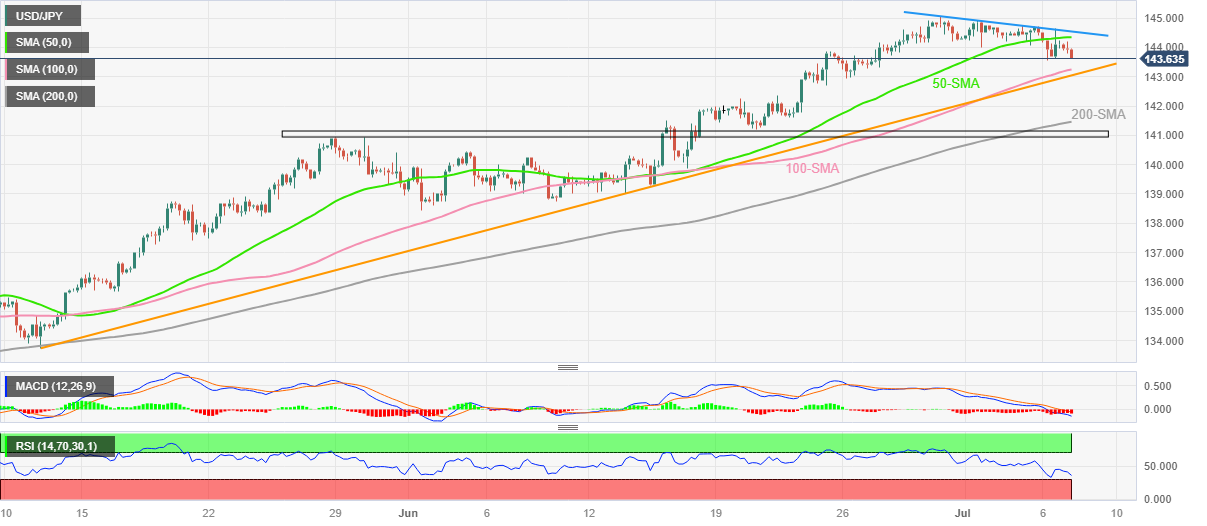
Trend: Limited downside expected
- USD/TRY is oscillating around 26.00 as the focus shifts to US NFP data.
- US equities were heavily sold after the resilient US ADP Employment report drummed up more interest rate hikes from the Fed.
- Turkiye inflation decelerated marginally in June.
The USD/TRY pair is demonstrating a non-directional performance around 26.00 in the late Asian session. The asset is expected to continue its lackluster performance as investors are awaiting the release of the United States Nonfarm Payrolls (NFP) data.
S&P500 futures have shown a choppy performance in Asia. US equities were heavily sold on Thursday after the resilient US Automatic Data Processing (ADP) Employment report drummed up more interest rate hikes from the Federal Reserve (Fed). The overall market mood is quite negative as one more interest rate hike from the Fed cannot be ruled out.
The US Dollar Index (DXY) has dropped sharply to near 103.00 despite a hawkish interest rate outlook. Going forward, investors will focus on the US Nonfarm Payrolls (NFP) data for June. As per the consensus, the US labor market was added with 225K vs. the former release of 339K. The Unemployment Rate is expected to drop to 3.6% against the prior release of 3.7%.
Apart from that, monthly Average Hourly Earnings are seen steady at 0.3%. On an annualized basis, the economic data is expected to decline marginally to 4.2% than 4.3% released earlier. Upbeat earnings would portray that inflationary pressure could propel further and discussions for rate cuts by the Fed would postpone further.
On the Turkish Lira front, inflationary pressures softened in June. The monthly Consumer Price Index (CPI) registered a pace of 3.92% while the street was anticipating a higher pace of 4.84%. In May, the CPI landed at 4.0%. On an annualized basis, CPI decelerated to 38.21% vs. the estimates of 39.47% and the prior figure of 39.59%.
Bank of Japan’s (BoJ) former top economist, Seisaku Kameda, said in a Reuters interview on Friday, the Japanese central bank will likely refrain from making any adjustments to its yield curve control (YCC) policy when it meets to decide on the policy later this month.
Key quotes
“The bank will likely keep its forecasts for 2024 and 2025 roughly unchanged in a sign it is not yet convinced that the 2% target for inflation will be achieved on a sustainable basis.”
"We're seeing positive signs in inflation and wages.”
"But I'm not sure whether they are enough to make the BoJ suddenly turn hawkish on policy."
"Sustainably achieving 2% inflation in Japan is tough, so it's natural for the BoJ to be frank about the uncertainty of success. But it means its policy signals could be quite ambigious."
Market reaction
USD/JPY is holding lower ground near 143.70 despite the dovish comments from the former BoJ policymaker. The pair is down 0.24% on the day, at the time of writing.
In an interview with La Provence on Friday, European Central Bank (ECB) President Christine Lagarde said, “we still have work to do to bring inflation back down to our target.”
Additional quotes
“The priority is to maintain price stability.”
“Inflation has started to decline.”
“A part of that is the initial impact of monetary policy decisions.”
“But inflation is still higher than the 2% target, still have work to do.”
Market reaction
Lagarde’s comments fail to move the needle around the Euro, as EUR/USD keeps its range just shy of the 1.0900 level, awaiting US NFP data for fresh trading impetus.
- Asian stocks are facing sheer pressure as upbeat US Employment report has driven hawkish Fed bets.
- Janet Yellen’s visit to China to improve trade relations might strengthen the overall market mood.
- Chances of BoJ’s intervention have increased as the central bank is expected not to exit from its ultra-dovish interest rate policy.
Markets in the Asian domain have witnessed a steep fall after sensing a negative lead from S&P500. US equities faced a sharp sell-off as the robust addition of fresh payrolls in June has uplifted chances of more than one interest rate hike from the Federal Reserve (Fed).
The United States Automatic Data Processing (ADP) agency has reported that payroll figures doubled in June vs. expectations. In June, the US labor market has been flooded with fresh 497K fresh talent, higher than the expectations of 228K and the former release of 278K.
At the press time, Japan’s Nikkei 225 drops 0.53%, China A50 tumbles 0.80%, Hang Seng plunged 1.30% and Nifty50 remained flat.
Apart from the tight US labor market, ISM Services PMI also remained upbeat and added to filters of supporting hawkish monetary policy outlook.
The US Dollar Index (DXY) is expected to remain volatile ahead of the Nonfarm Payrolls (NFP) data, which will release at 12:30 GMT.
Chinese stocks have failed to capitalize on the visit of US Treasury Secretary Janet Yellen to China to avoid a trade war and improve relations. China’s Finance Minister said “We hope the US to take 'concrete' actions to create a favorable environment for the healthy development of economic, trade ties between China and US,” as reported by Reuters.
Meanwhile, chances of the Bank of Japan’s (BoJ) intervention in the currency market have increased as the central bank is expected not to exit from its ultra-dovish interest rate policy. BoJ Deputy Governor Shinichi Uchida crossed wires via Japan’s Nikkei news, reported Reuters, and ruled out an early end to the ultra-easy monetary policy while also defending the Yield Curve Control (YCC) policy.
On the oil front, oil prices delivered a V-shape recovery, recovering losses inspired by an upbeat US labor market report. The oil price has climbed to near the crucial resistance of $72.00 and is expected to elevate further as the impact of production cuts announced by Russia and Saudi has not faded yet.
- Gold Price remains within a $40.00 trading range inside the key technical level envelope.
- US Dollar struggles to gain acceptance ahead of US NFP, despite upbeat early signals of employment data.
- China news, pause in yields limit prod Gold sellers amid pre-data anxiety.
- Hawkish Fed bets, risk aversion keep XAU/USD bears hopeful.
Gold Price (XAU/USD) stays on the way to posting the fourth consecutive weekly loss despite being defensive at around $1,900 of late. That said, the cautious mood ahead of the top-tier US employment and inflation clues could be linked to the XAU/USD’s latest inaction/consolidation. Also acting as a trading filter for the Gold Price are the headlines from China which fade the worries tone of late.
However, the hawkish Federal Reserve (Fed) bets and concerns about the outflow of funds from markets in China to the neighboring nations, mainly due to the fresh fears surrounding the dragon nation’s housing market. Furthermore, fears of slowing economic growth in one of the world’s biggest Gold consumers, namely China, also weigh on the XAU/USD.
It’s worth noting that concerns about the Fed’s policy pivot and physical demand from Asia allow the World Gold Council (WGC) to remain optimistic about the XAU/USD.
As a result, Friday’s US employment report for June, as well as the mid-June inflation clues, will be crucial for the Gold traders to watch.
Also read: Gold Price Forecast: XAU/USD defends $1,900 but for how long? US Nonfarm Payrolls holds the key
Gold Price: Key levels to watch
As per our Technical Confluence Indicator, the Gold Price edges higher within a $40.00 trading range, between $1,930 and $1,890, as markets brace for the top-tier US employment and inflation data.
That said, a convergence of the previous monthly and weekly low highlights the $1,892 as short-term key support for the XAU/USD traders to watch during the quote’s fresh fall.
On the flip side, Fibonacci 38.2% on one-month joins the previous daily high to highlight the $1,930 resistance confluence.
It’s worth noting that the lower band of the Bollinger on the four-hour (4H) play, the Fibonacci 38.2% on one week and 23.6% on one-day together constitute $1,908 as immediate support.
Following that, Fibonacci 23.6% on one-week, previous daily low and the lower band of the Bollinger on the one-hour can prod the Gold sellers near the $1,900 round figure before directing the bears to the $1,890 key support.
Meanwhile, the previous weekly high and upper band of the Bollinger on the 4H, near $1,935, acts as an extra filter towards the north for the Gold buyers to cross to retake control, even if they manage to piece the $1,930 hurdle.
Here is how it looks on the tool
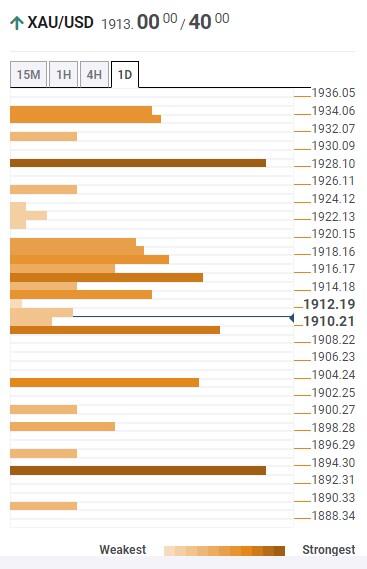
About Technical Confluences Detector
The TCD (Technical Confluences Detector) is a tool to locate and point out those price levels where there is a congestion of indicators, moving averages, Fibonacci levels, Pivot Points, etc. If you are a short-term trader, you will find entry points for counter-trend strategies and hunt a few points at a time. If you are a medium-to-long-term trader, this tool will allow you to know in advance the price levels where a medium-to-long-term trend may stop and rest, where to unwind positions, or where to increase your position size.
- USD/CAD consolidates its recent strong gains to the highest level since June 13.
- Bullish Oil prices underpins the Loonie and caps the upside amid a softer USD.
- Bets for more Fed rate hikes act as a tailwind ahead of US/Canadian jobs data.
The USD/CAD pair enters a bullish consolidation phase and oscillates in a narrow range, just below its highest level since June 13 touched during the Asian session on Friday. Spot prices currently hovers around the 1.3360-1.3365 region, nearly unchanged for the day, as traders keenly await the release of the crucial monthly employment details from the US and Canada.
The Canadian jobs data, however, is more likely to be overshadowed by the closely-watched US NFP report, which could influence the Federal Reserve's (Fed) policy outlook and drive the US Dollar (USD) demand. In the meantime, the uncertainty over the Fed's future rate-hike path keeps the USD bulls on the defensive. Apart from this, the recent bullish run in Crude Oil prices is seen underpinning the commodity-linked Loonie and acting as a headwind for the USD/CAD pair.
The minutes from the June FOMC meeting released on Wednesday revealed that almost all members supported resuming rate hikes as inflation remains unacceptably high. Moreover, Thursday's upbeat US ADP report and the ISM Services PMI reaffirmed bets for a 25 bps lift-off at the July FOMC meeting. That said, the Prices Paid sub-component of the ISM survey fell to a more than two-year low and fueled speculations that the Fed will soften its hawkish stance sooner rather than later.
Crude Oil prices, meanwhile, hold steady near a two-week high touched on Thursday and remain well supported by a larger-than-expected fall in US inventories last week, which pointed to strong refining demand. This comes on after top Oil exporters - Saudi Arabia and Russia - announced a fresh round of output cuts for August and continues to act as a tailwind for the black liquid. That said, worries about a deeper global economic downturn, particularly in China, might cap gains.
Furthermore, the prospects for more interest rate hikes by the Fed remain supportive of elevated US Treasury bond yields, which is seen acting as tailwind for the USD and should lend some support to the USD/CAD pair. In fact, the yield on the two-year US government bond, which typically moves in step with interest rate expectations, is placed near its highest since June 2007, while the benchmark 10-year US Treasury yield is holding steady above the 4.0% threshold.
Nevertheless, the USD/CAD pair remains on track to end in the green for the second successive week and the aforementioned fundamental backdrop favours the USD bulls. That said, it will still be prudent to wait for some follow-through buying before traders start positioning for an extension of the recent strong recovery from the 1.3115 region, or the lowest level since September 2022 touhced last Tuesday.
Technical levels to watch
- AUD/USD extends recovery from weekly low during the first positive day in three.
- Key DMAs challenge Aussie buyers amid bearish MACD signals.
- US NFP, 0.6560 can challenge sellers even if the immediate support breaks.
AUD/USD clings to mild gains around intraday high of 0.6636 as it consolidates the weekly losses ahead of the key US employment report. In doing so, the Aussie pair prints the first daily gains while extending the early Asian session’s rebound from a four-month-old support line heading into Friday’s European session.
While a below 50.00 RSI (14) line joins the aforementioned support line to back the latest rebound, the 100-DMA and 200-DMA challenges the AUD/USD bulls around 0.6685 and 0.6700 in that order amid bearish MACD signals.
Hence, the AUD/USD pair is likely to remain sidelined, which in turn amplifies importance of today’s US Nonfarm Payrolls (NFP), as well as headlines from China.
Also read:
That said, a clear upside break of 0.6700 will aim for the 38.2% Fibonacci retracement of February-May downside, near 0.6725. However, multiple tops marked near the 50% and 61.8% Fibonacci retracements, respectively near 0.6810 and 0.6890, may restrict the Aussie pair’s further advances.
On the flip side, a daily closing below the rising trend line from March, near 0.6600 at the latest, isn’t an open invitation for the AUD/USD bears as early June swing high of near 0.6560 can test the downside before highlighting the odds of witnessing a fresh yearly low, currently near 0.6460.
AUD/USD: Daily chart
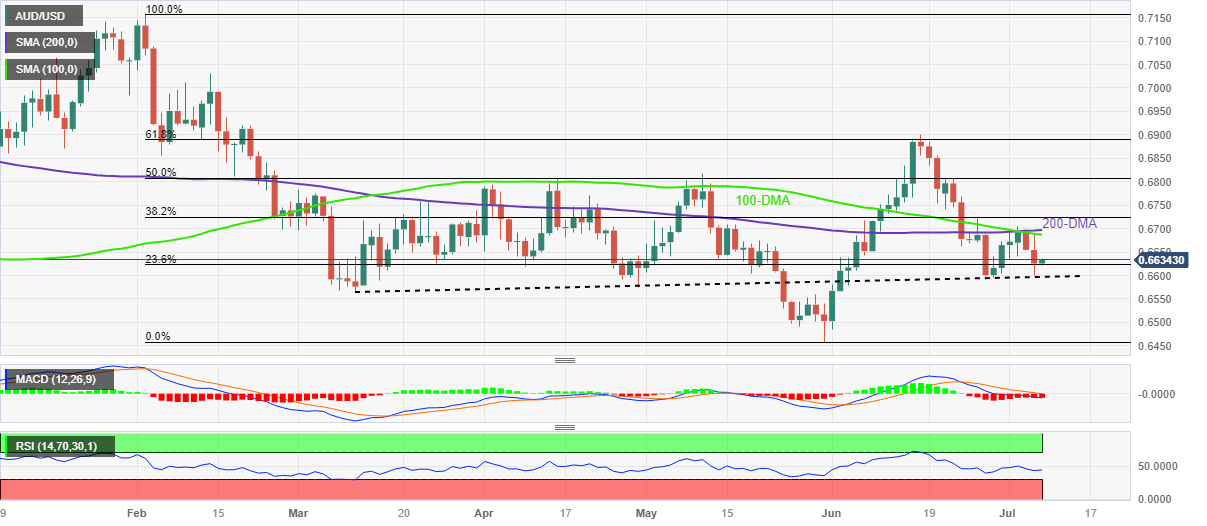
Trend: Limited recovery expected
- NZD/USD gains some positive traction on Friday and draws support from subdued USD demand.
- The divergent Fed-RBNZ policy outlook could lend support to the pair amid looming recession risk.
- Traders might also prefer to wait on the sidelines ahead of the release of the key US NFP report.
The NZD/USD pair catches fresh bids during the Asian session on Friday and reverses a part of the previous day's retracement slide from the 0.6215-0.6220 region, or a two-week high. Spot prices currently trade around the 0.6170 region, up nearly 0.20%, and for now, seem to have snapped a two-day losing streak, though any meaningful upside still seems elusive.
The US Dollar (USD) struggles to gain any meaningful traction and consolidates the overnight losses amid the uncertainty over the Federal Reserve’s (Fed) future rate-hike path, which, in turn, lends some support to the NZD/USD pair. The minutes from the June FOMC meeting released on Wednesday revealed that almost all members supported resuming rate hikes as inflation remains unacceptably high. Adding to this, Thursday's upbeat US ADP report and the ISM Services PMI reaffirmed market bets for a 25 bps lift-off at the upcoming FOMC policy meeting on July 25-26. That said, the Prices Paid sub-component of the ISM survey fell to a more than two-year low and suggested that the closely watched services inflation is gradually slowing. This, in turn, fueled speculations that the Fed will eventually soften its hawkish stance sooner rather than later and keeps the USD bulls on the defensive.
Nevertheless, the US central bank still seems poised to tighten its monetary policy further to combat stubbornly high inflation. In contrast, the Reserve Bank of New Zealand (RBNZ) had signalled that it was done with its most aggressive hiking cycle since 1999 after raising rates by 25 bps to the highest in more than 14 years in May. Moreover, the latest Reuters poll indicates that most economists expect the RBNZ to hold the official cash rate steady on July 12, for the first time in nearly two years. This, along with China's economic woes and the risk of a further escalation in the US-China trade conflict, might continue to weigh on antipodean currencies, including the Kiwi, and cap gains for the NZD/USD pair. Traders might also refrain from placing fresh directional bets and prefer to wait on the sidelines ahead of the release of the closely-watch US jobs data later during the early North American session.
The popularly known NFP report might influence Fed's near-term policy outlook, which, in turn, will play a key role in driving the USD demand and determining the near-term trajectory for the NZD/USD pair. In the meantime, elevated US Treasury bond yields, along with the caution market mood, could act as a tailwind for the safe-haven buck and contribute to keeping a lid on spot prices. Hence, it will be prudent to wait for strong follow-through buying before positioning for the resumption of the recent move-up from the 0.6050 area. Nevertheless, the major seems poised to register modest weekly gains and now looks to the RBNZ policy meeting next Wednesday for a fresh impetus.
Technical levels to watch
- USD/CHF regains some positive traction and reverses a part of the previous day's slide.
- Bets for additional Fed rate hikes act as a tailwind for the USD and lend some support.
- A softer risk tone underpins the CHF and caps the upside ahead of the US NFP report.
The USD/CHF pair attracts some dip-buyers during the Asian session on Friday and reverses a part of the previous day's sharp retracement slide from the vicinity of the 0.9000 psychological mark. Spot prices currently trade around the 0.8960 region, up only 0.10% for the day, and remain confined in a familiar range held over the past three weeks or so.
The prospects for further policy tightening by the Federal Reserve (Fed) help the US Dollar (USD) to stall the overnight pullback from its highest level since June 12, which, in turn, is seen as a key factor acting as a tailwind for the USD/CHF pair. The minutes from the June FOMC meeting released on Wednesday revealed that almost all members supported resuming rate hikes as inflation remains unacceptably high. Adding to this, Thursday's upbeat US ADP report and the ISM Services PMI reaffirmed market bets for a 25 bps lift-off at the upcoming FOMC policy meeting on July 25-26.
This allows the yield on the two-year US government bond, which typically moves in step with interest rate expectations, to stand tall near its highest since June 2007. Moreover, the benchmark 10-year US Treasury yield holds steady above the 4.0% threshold and continues to lend support to the Greenback. Meanwhile, worries over a global economic slowdown, along with the potential risk of a further escalation in the US-China trade conflict, underpins the safe-haven Swiss Franc (CHF). This, in turn, might keep a lid on any meaningful upside for the USD/CHF pair, at least for the time being.
Even from a technical perspective, the recent repeated failures to find acceptance above the 50-day Simple Moving Average (SMA) warrants some caution for bullish traders. Traders might also prefer to wait on the sidelines ahead of the release of the closely-watched US monthly employment details - popularly known NFP report. The crucial jobs data could influence the Fed's rate-hike path and play a key role in driving the USD demand in the near term. Apart from this, the broader risk sentiment might provide some meaningful impetus to the USD/CHF pair on the last day of the week.
Technical levels to watch
- EUR/USD remains sidelined after bouncing off three-week low.
- 50-SMA, five-week-old rising trend line restricts immediate moves.
- 200-SMA acts as additional downside filter, oscillators suggest further upside of Euro price.
- ECB’s Lagarde, US NFP needs to challenge previous pattern to convince Euro buyers.
EUR/USD treads water around 1.0890 as it portrays the market’s cautious mood ahead of the US employment report from June and a speech from European Central Bank (ECB) President Christine Lagarde. In doing so, the Euro pair struggles to defend the previous day’s U-turn from the short-term key support line amid a sluggish Friday morning in Europe.
Also read: EUR/USD: Euro bulls struggle near 1.0900 as US NFP, ECB President Lagarde’s speech loom
Even if the Euro pair remains sidelined, a successful rebound from the five-week-old rising support line and bullish MACD signals, as well as a firmer RSI (14) line, keeps the buyers hopeful.
However, the 50-SMA level surrounding 1.0900 restricts the immediate upside of the EUR/USD pair. Following that, a downward-sloping resistance line from late June, close to 1.0910 at the latest, appears the last defense of the EUR/USD bears.
In a case where the Euro buyers manage to keep the reins past 1.0910, the odds of witnessing a fresh yearly high, currently around 1.1015, can’t be ruled out.
Meanwhile, a convergence of the two-week-old descending support line joins the 200-SMA to highlight 1.0825-30 as the key level to break for the EUR/USD bears to retake control.
EUR/USD: Four-hour chart
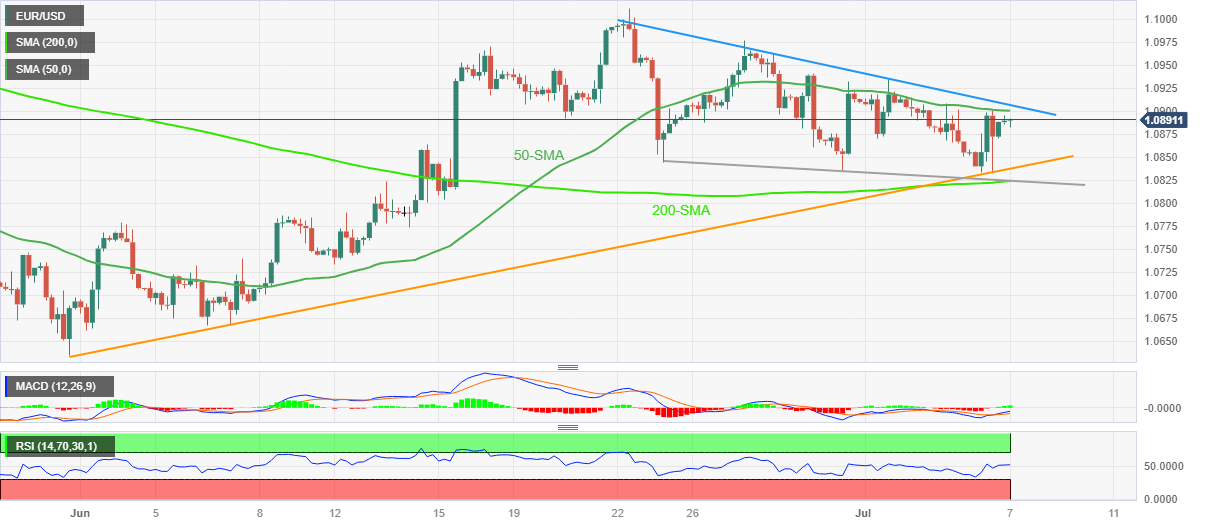
Trend: Limited downside expected
- USD/MXN takes offers to refresh intraday low, consolidates biggest daily gain in four months.
- Risk-aversion, hawkish Fed bets underpin US Dollar strength despite latest pullback amid pre-NFP anxiety.
- Mexican Peso’s repeated bounces off 17.00 tease countertrend traders amid upbeat fundamentals.
- Mexico inflation data, US employment report for June eyed for fresh impulse.
USD/MXN bulls take a breather around the intraday low of 17.20 as it positions for the top-tier data from Mexico and the US on early Friday. In doing so, the Mexican Peso (MXN) pair consolidates the biggest daily gains in three months, marked the previous day, while retreating from the highest levels in a month.
While the pre-data positioning weighs on the USD/MXN price, sour sentiment in the market and concerns favoring more rate hikes from the US Federal Reserve (Fed) put a floor under the prices.
The market’s risk aversion escalates as mostly upbeat US jobs data underpin hawkish Fed bets, even as recession fears loom and the China-linked headlines aren’t impressive. Additionally, the US-China tension is an extra burden for the sentiment, which in turn allows the US Dollar to grind higher.
Thursday’s strong US ADP Employment Change propelled the market’s bets on the Fed’s 0.25% rate hike in July to around 95%. However, However, the odds of witnessing a policy pivot have been on the spike after the US central bank paused the rate lift trajectory in July.
Talking about the data, US ADP Employment Change marked the largest one-month increase since February 2022, to 497K for June versus 228K expected and 267K prior (revised). That said, the ISM Services PMI also improved to 53.9 for the said month from 50.3 in May, versus the market expectation of 51.0. Further, the Challenges Job Cuts also slumps to 40.709K from 80.089K previous readings. However, the JOLTS Job Openings drops to 9.8M from 10.103M, compared to analysts’ estimation of 9.93M. It should be noted that the Initial Jobless Claims also rises to 248K for the week ended on June 30, versus 245K expected and 236K previous readings (revised).
Elsewhere, US Treasury Secretary Janet Yellen is in China to address “unfair practices” termed by the Biden administration per Reuters. The policymaker will meet China's Premier Li Qiang and former economy tsar Liu He, who is a close confidant of President Xi Jinping, the news said. Recently, China's Finance Ministry said, “We hope US to take 'concrete' actions to create favorable environment for healthy development of economic, trade ties between China and US,” per Reuters.
On the other hand, Mexican Consumer Confidence for May improved earlier in the day and the Oil price also remains firmer, eyeing the second consecutive weekly gain, which in turn allows the MXN to remain firmer versus the US Dollar.
Looking forward, Mexico’s Headline, Core and 12-month Inflation data for June will be crucial as Banxico stays ready to increase the benchmark interest rates if needed. On the other hand, traders will pay attention to the US Nonfarm Payrolls (NFP), expected to ease to 225K from 339K, for clear directions. Should the jobs report arrive as positive, the US Dollar can witness further upside.
Technical analysis
USD/MXN bears need to conquer the previous resistance line stretched from early June, close to 17.09 at the latest, to retake control.
- GBP/JPY remains under some selling pressure for the second successive day on Friday.
- The risk-off mood, along with intervention fears, benefit the JPY and weigh on the cross.
- The divergent BoE-BoJ policy outlook favours bullish traders and should help limit losses.
The GBP/JPY cross struggles to capitalize on the previous day's goodish recovery from the 182.50 area, or the weekly low and meets with a fresh supply during the Asian session on Friday. Spot prices currently trade around the 183.35 region, down only 0.10% for the day, and remain well within the striking distance of the highest level since December 2015 touched on Wednesday.
Worries about a global economic slowdown, along the worsening US-China relations, continue to weigh on investors' sentiment, which is evident from a generally weaker tone around the equity markets. Apart from this, the potential risk of intervention by Japanese authorities lends some support to the safe-haven Japanese Yen (JPY). The British Pound (GBP), on the other hand, is undermined by fears that more aggressive interest rate hikes by the Bank of England (BoE) could push the UK economy into recession. This, in turn, exerts some pressure on the GBP/JPY cross, though any meaningful corrective decline still seems elusive.
Market participants seem convinced that BoJ's negative interest-rate policy will remain in place at least until next year. Adding to this, BoJ Deputy Governor Shinichi Uchida, as reported by the Nikkei newspaper, said on Friday that the central bank will maintain its yield curve control (YCC) policy from the perspective of sustaining ultra-loose monetary conditions. This pours cold water on speculations about a change in the BoJ's policy outlook, fueled by data that Japan's nominal base salary grew at the fastest pace in 28 years in May. This could push inflation higher, which has exceeded the 2% goal for more than a year.
In contrast, the markets are currently pricing in the possibility of a further 130 bps of tightening by the BoE through to the turn of the year. Moreover, BoE Governor Andrew Bailey last week justified the decision of a jumbo 50 bps lift-off on June 22 and said that rates could remain at peak levels for longer than traders currently expect. This marks a big divergence in comparison to a dovish stance adopted by the BoJ and suggests that the paht of lease resistance for the GBP/JPY cross is to the downside. Hence, any subsequent downfall might still be seen as a buying opportunity and is more likely to remain cushioned.
Technical levels to watch
- GBP/USD takes offers to extend pullback from the highest level in a fortnight.
- Three-week-old horizontal resistance challenges Cable buyers as US employment report looms.
- BoE hawks reassess previous optimism amid risk-off mood and weigh on the Pound Sterling price.
- Key EMAs, ascending support line from late May restrict short-term downside.
GBP/USD consolidates the first weekly gains in three while refreshing the intraday low near 1.2730 amid very early Friday morning in London. In doing so, the Cable pair justifies the market’s preparations for the all-important US employment report for June, as well as the reassessment of the hawkish bets on the Bank of England (BoE), not to forget the downbeat signals from the options market.
Also read: GBP/USD grinds higher past 1.2700 even as options market signals prod Cable bulls, US NFP eyed
Technically, the Pound Sterling pair’s failure to defend the previous day’s recovery from the 100-Exponential Moving Average (EMA) joins sluggish MACD signals and a U-turn from a three-week-long horizontal resistance near 1.2770-80 to lure GBP/USD bears.
It’s worth noting, however, that a 1.5-month-old rising support line and the 200-EMA, respectively near 1.2655 and 1.2630, appear extra filters toward the south and can easily challenge the bears even if they manage to conquer the 100-EMA support of 1.2680.
Alternatively, an upside break of the 1.2770-80 resistance area can propel the GBP/USD price towards the yearly high marked in June near 1.2850.
However, the RSI conditions challenge the Pound Sterling’s run-up beyond the same, which if ignored could propel prices to the 1.3000 psychological magnet.
GBP/USD: Four-hour chart
-07072023-638242944135980091.png)
Trend: Limited downside expected
| Raw materials | Closed | Change, % |
|---|---|---|
| Silver | 22.716 | -1.81 |
| Gold | 1910.72 | -0.29 |
| Palladium | 1243 | -0.93 |
“We hope US to take 'concrete' actions to create favorable environment for healthy development of economic, trade ties between china and US,” said China Finance Ministry early Friday per Reuters.
Comments from China's Finance Ministry become more important considering US Treasury Secretary Janet Yellen’s presence in Beijing to address “unfair practices” termed by the Biden administration per Reuters.
It’s worth noting that the recent tit-for-tat trade war between the US and China contributes to the market’s risk-off mood and underpins the US Dollar’s safe-haven demand.
However, cautious sentiment ahead of the all-important US employment report for June limits the markets’ reaction to the news.
AUD/USD struggles above 0.6600
With this, the AUD/USD pair remains sidelined around 0.6630 while snapping a two-day losing streak by the press time.
Also read: AUD/USD sticks to modest gains around 0.6630, upside seems limited ahead of US NFP
- AUD/USD attracts some buying on Friday, though any further upside seems elusive.
- China’s economic woes and the worsening US-China relations could cap the Aussie.
- Bets for more Fed rate hikes lend support to the USD and warrant caution for bulls.
- Investors now look forward to the key US NFP report for a fresh directional impetus.
The AUD/USD pair gains some positive traction during the Asian session on Friday and for now, seems to have snapped a two-day losing streak to sub-0.6600 levels, or a one-week low touched the previous day. Spot prices currently trade around the 0.6630 area, up just over 0.10% for the day, though any meaningful appreciating move still seems elusive.
A slew of weak economic data from China released over the past week added to worries about slowing growth in the world's second-largest economy. Furthermore, the risk of a further escalation in the US-China trade conflict continues to weigh on investors' sentiment, which is evident from a generally weaker tone around the equity markets and could act as a headwind for the risk-sensitive Aussie. The US Dollar (USD), on the other hand, attracts some buying on the last day of the week and stalls its retracement slide from the highest level since June 12 touched on Thursday, which might further contribute to capping the AUD/USD pair.
Firming expectations that the Federal Reserve (Fed) will hike interest rates again, by 25 basis points (bps) at its upcoming policy meeting on July 25-26 turn out to be a key factor lending some support to the USD. The bets were reaffirmed by the upbeat US ADP report released on Thursday, which showed that private-sector employers added 497K jobs in June, well above the 267K in the previous month and the most optimistic estimates. In a sign of further economic strength, the US ISM Serices PMI increased to 53.9 in June from 50.3 in the previous month, though the Prices Paid sub-component - a gauge of inflation - fell to more than three-year lows.
Nevertheless, the data pointed to a resilient US economy and supports prospects for a further policy tightening by the Fed. This, in turn, remains supportive of elevated US Treasury bond yields and supports prospects for a further near-term appreciating move for the USD. Traders, however, seem reluctant to place aggressive bets and prefer to wait on the sidelines ahead of the release of the closely-watched US monthly employment details, popularly known the NFP report, due later during the early North American session.
Technical levels to watch
- WTI crude oil fades late Thursday’s corrective bounce amid mixed catalysts.
- Saudi Arabia hikes Oil price to Asia, Iran seizes allegedly smuggled fuel.
- Weekly EIA inventories suggest easy draw; risk-off mood weighs on commodities.
- US employment report, China news eyed for clear directions.
WTI crude oil prints mild losses near $71.80 amid a sluggish Friday morning in Asia. In doing so, the black gold aptly portrays the market’s cautious mood ahead of the all-important US employment data, especially amid catalysts surrounding the energy markets.
Talking about the negatives first, the market’s risk-off mood, backed by the fears of higher rates and strong yields, as well as recession woes, weighs on the WTI crude oil price. That said, the market’s risk aversion escalates as mostly upbeat US jobs data underpin hawkish Fed bets, even as recession fears loom and the China-linked headlines aren’t impressive. Additionally, the US-China tension is an extra burden for the sentiment, which in turn exerts additional downside pressure on the black gold.
Elsewhere, a lesser than previous draw of the weekly Oil inventories, as per the US Energy Information Administration (EIA), also keep the Oil bears hopeful. That said, EIA Crude Oil Stocks Change improved to -1.508 million barrels (M) for the week ended on June 30 versus -9.603M in previous readings.
Alternatively, a fresh round of oil production cuts from top oil exporters Saudi Arabia and Russia join the increase in Saudi Arabia’s official selling prices (OSP) for August-loading Arab Light to Asia to favor the Oil buyers. The news suggests the increase in price by $0.20 per barrel to $3.20.
On the same line, Iran's Revolutionary Guards seized a tanker holding 900 metric tons of "smuggled fuel" and 12 crew members based on a court order, a report by the semi-official Fars news agency said on Friday, reported Reuters.
Against this backdrop, Wall Street closed in the red and the US Treasury bond yields refreshed a multi-day high, before retreating a bit.
Moving on, Oil traders will pay attention to the US Nonfarm Payrolls (NFP), expected to ease to 225K from 339K, for clear directions. Should the jobs report arrive as positive, the US Dollar can witness further upside, which in turn can favor the commodity sellers.
Technical analysis
Thursday’s Gravestone Doji bearish candlestick below the one-month-old resistance line, around $72.05 by the press time, keeps WTI crude oil sellers hopeful of retesting the 21-DMA support surrounding $70.30.
- Gold price oscillates in a narrow trading band just above the weekly low touched on Thursday.
- Bets for more rate hikes by the Federal Reserve underpin the US Dollar and act as a headwind.
- Investors now look to the release of the key US NFP report before placing fresh directional bets.
Gold price struggles to capitalize on the overnight modest bounce from the vicinity of the $1,900 mark, or the weekly low and remains on the defensive through the Asian session on Friday. The XAU/USD currently trades around the $1,910 area, nearly unchanged for the day, and seems vulnerable to prolong over a two-month-old downtrend from the all-time high touched in May.
Hawkish Federal Reserve expectations act as a headwind for Gold price
Firming expectations that the Federal Reserve (Fed) will hike interest rates again, by 25 basis points (bps) at its upcoming policy meeting on July 25-26 continue to act as a headwind for the non-yielding Gold price. The bets were reaffirmed after the data published by Automatic Data Processing (ADP) on Thursday showed that private-sector employers in the United States (US) added nearly 500K jobs in June. The reading marked the largest one-month increase since February 2022 and smashed estimates for an increase of 228K by a big margin. Separately, the Institute of Supply Management (ISM) Non-Manufacturing Purchasing Managers' Index (PMI) (also known as the ISM Services PMI) rose from 50.3 to 53.9 in June, above expectation of 51.
This, to a larger extent, overshadowed data showing Weekly Initial Jobless Claims rose more than anticipated last week and JOLTS Job Opening for May missed consensus estimates. In fact, the US Department of Labor (DOL) reported that there were 248K initial jobless claims during the week that ended on July 1 as compared to the previous week's print of 236K (revised from 239K) and slightly higher than the market expectation of 245K. Furthermore, the US Bureau of Labor Statistics' (BLS) Job Openings and Labor Turnover Survey (JOLTS) data revealed that the number of job openings on the last business day of May stood at 9.8 million against the 9.93 million anticipated and 10.3 million openings in April (revised from 10.1 million).
Elevated US bond yields lends support to USD and also undermine XAU/USD
Nevertheless, the data pointed to a resilient US economy and supports prospects for a further policy tightening by the Fed. This, in turn, pushes the US Treasury bond yields sharply higher and acts as a tailwind for the US Dollar (USD), which is seen as another factor weighing on the US Dollar-denominated Gold price. The downside, however, remains cushioned as traders now seem to have moved to the sidelines ahead of the release of the US monthly employment details. The popularly known Nonfarm Payrolls (NFP) report is due later during the early North American session and might influence expectations about the Fed's rate-hike path. This, in turn, will drive the USD demand and provide a fresh impetus to the XAU/USD.
Gold price technical outlook
From a technical perspective, the overnight swing low, just ahead of the $1,900 mark, might continue to act as an immediate support ahead of the $1,893-$1,892 region or the multi-month low touched last week. A convincing break below the latter will make the Gold price vulnerable to accelerate the downward trajectory towards the very important 200-day Simple Moving Average (SMA), currently around the $1,865-$1,864 region.
On the flip side, the $1,918-$1,919 area now seems to act as an immediate hurdle. This is closely followed by the $1,925-$1,926 region, above which the Gold price could climb back to the 100-day Simple Moving Average (SMA), currently around the $1,947 zone. A sustained strength beyond the latter might trigger a short-covering rally and lift the Gold price to the $1,962-$1,964 area en route to the $1,970-$1,972 supply zone. Some follow-through buying should allow bulls to reclaim the $2,000 psychological mark and test the $2,010-$2,012 resistance.
Key levels to watch
- Natural Gas Price remains pressured for third consecutive day, sluggish near two-week low of late.
- Clear break below 100-SMA, downbeat oscillators favor XNG/USD bears.
- Five-week-old rising support line, 200-SMA challenge Natural Gas bears ahead of US employment report for June.
- XNG/USD bulls need a successful break of $2.76, as well as downbeat US NFP, to retake control.
Natural Gas Price (XNG/USD) prints a three-day losing streak around $2.62 as markets dribble ahead of the all-important US employment report on Friday. In doing so, the XNG/USD holds onto the latest bearish bias at the lowest levels in 12 days, despite being lackluster of late.
That said, the XNG/USD weakness could be linked to the energy instrument’s downside break of the 100-SMA, as well as the bearish MACD signals.
However, the RSI (14) line seesaws around the sub-50.00 area, which in turn favors the odds of the Natural Gas Price’s bottom-picking.
As a result, an upward-sloping support line from early June and the 200-SMA, respectively near $2.56 and $2.53, gains major attention.
In a case where the XNG/USD drops below $2.53, a quick fall to a horizontal area comprising multiple levels marked since May 31, near $2.43-44, can’t be ruled out.
On the contrary, an upside break of the 100-SMA level of around $2.70 isn’t an open invitation to the Natural Gas buyers as a downward-sloping resistance line from June 25, close to $2.76 at the latest, challenges the upside momentum ahead of March’s top surrounding $3.08.
Natural Gas Price: Four-hour chart

Trend: Limited downside expected
People’s Bank of China (PBoC) set the USD/CNY central rate at 7.2054 on Friday, versus previous fix of 7.2098 and market expectations of 7.2423. It's worth noting that the USD/CNY closed near 7.2489 the previous day.
With this, the Chinese central bank's onshore Yuan (CNY) rate defends the week-start pullback from the yearly top.
Apart from the USD/CNY fix, the PBoC also unveiled details of its Open Market Operations (OMO) while saying that the Chinese central bank injects 2 billion Yuan via 7-day reverse repos at 1.90% vs prior 1.90%.
It's worth noting that the 103 billion Yuan of RRs mature today, which in turn highlights a net drain of 101 billion Yuan via the OMOs.
About PBOC fix
China maintains strict control of the yuan’s rate on the mainland.
The onshore yuan (CNY) differs from the offshore one (CNH) in trading restrictions, this last one is not as tightly controlled.
Each morning, the People’s Bank of China (PBOC) sets a so-called daily midpoint fix, based on the yuan’s previous day's closing level and quotations taken from the inter-bank dealer.
- US Dollar Index picks up bids to reverse Thursday’s pullback from three-week high.
- Market sentiment worsens on China data, fears of hawkish central bank moves despite mixed data.
- US employment clues appear mostly upbeat and fuel Treasury bond yields to refresh multi-month high.
- Strong US NFP needed to confirm Fed’s rate hike past July and witness firmer DXY amid hawkish FOMC Minutes.
US Dollar Index (DXY) consolidates the previous day’s heavy losses, the most in a week, while printing mild gains around 103.15-20 amid Friday’s Asian session. In doing so, the greenback’s gauge versus the six major currencies portrays the pre-data positioning for the all-important US employment figures amid firmer US Treasury bond yield and risk aversion.
That said, the market’s risk aversion escalates as mostly upbeat US jobs data underpin hawkish Fed bets, even as recession fears loom and the China-linked headlines aren’t impressive. Additionally, the US-China tension is an extra burden for the sentiment, which in turn puts a floor under the US Dollar Index.
That said, the recently firmer US employment clues underpin hawkish hopes about the Federal Reserve (Fed). However, the odds of witnessing a policy pivot have been on the spike after the US central bank paused the rate lift trajectory in July. The same joins the market’s cautious mood ahead of the data to prod the DXY bulls.
On Thursday, US ADP Employment Change marked the largest one-month increase since February 2022, to 497K for June versus 228K expected and 267K prior (revised). That said, the ISM Services PMI also improved to 53.9 for the said month from 50.3 in May, versus the market expectation of 51.0. Further, the Challenges Job Cuts also slumps to 40.709K from 80.089K previous readings. However, the JOLTS Job Openings drops to 9.8M from 10.103M, compared to analysts’ estimation of 9.93M. It should be noted that the Initial Jobless Claims also rises to 248K for the week ended on June 30, versus 245K expected and 236K previous readings (revised).
It should be noted that US Treasury Secretary Janet Yellen is in China to address “unfair practices” termed by the Biden administration per Reuters. The policymaker will meet China's Premier Li Qiang and former economy tsar Liu He, who is a close confidant of President Xi Jinping, the news said.
Amid these plays, Wall Street closed in the red and the US Treasury bond yields refreshed a multi-day high, before retreating a bit.
Moving on, DXY traders will pay attention to the US Nonfarm Payrolls (NFP), expected to ease to 225K from 339K, for clear directions. Should the jobs report arrive as positive, the US Dollar can witness further upside.
Technical analysis
US Dollar Index bulls remain hopeful unless witnessing a daily closing below the 100-DMA support, around 103.00 by the press time.
- Silver Price remains on the back foot within a fortnight-old bullish channel.
- Downbeat oscillators suggest rejection of bullish chart pattern but XAG/USD sellers need validation from $22.00.
- Convergence of 200-SMA, two-month-old descending resistance line and stated channel’s top line prods Silver bulls.
- Mixed clues for US employment data highlight US NFP release and its market implications.
Silver Price (XAG/USD) remains pressured around $22.70 amid early Friday in Asia, after falling the most in two weeks, as well as snapping a four-day uptrend, the previous day.
Also read: US June Nonfarm Payrolls Preview: Analyzing Gold price's reaction to NFP surprises
In doing so, the XAG/USD seesaws within a fortnight-old bullish channel, approaching the bottom line of the bullish chart formation of late.
Given the bearish MACD signals and the downbeat RSI (14), not oversold, the Silver price is likely to reject the bullish channel by breaking the $22.50 support. However, the previous monthly low of around $22.20 precedes the $22.00 round figure to challenge the XAG/USD bears afterward.
It’s worth noting that the recent positioning for the US employment data for June will allow the XAG/USD traders to lick their wounds.
The same highlights the 100-SMA hurdle of $23.05 as immediate resistance to watch for the Silver buyers.
However, a convergence of the 200-SMA, downward-sloping resistance line from early March and the aforementioned rising channel’s top line, close to $23.30-35 at the latest, appears a tough nut to crack for the Silver buyers to crack for taking control.
Overall, Silver Price is likely to decline further but the south run appears long and bumpy.
Silver Price: Four-hour chart
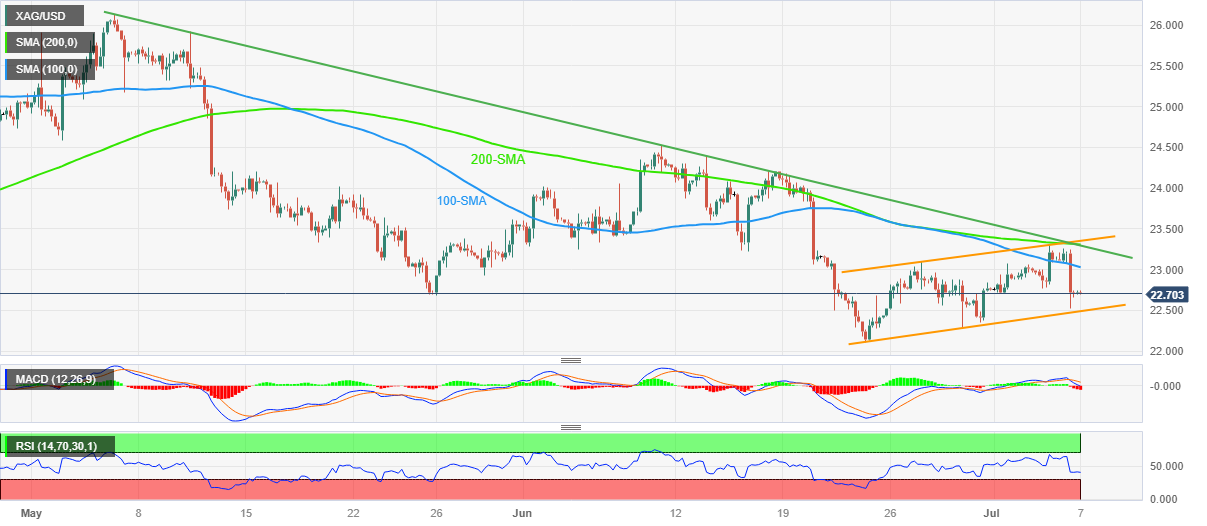
Trend: Limited downside expected
- USD/JPY edges lower for the second straight day, though lacks follow-through selling.
- The risk-off mood, along with intervention fears, benefit the JPY and act as a headwind.
- The Fed-BoJ policy divergence helps limit the downside ahead of the key US NFP report.
The USD/JPY pair attracts some sellers for the second successive day on Friday and remains on the defensive around the 144.00 mark through the Asian session. Spot prices, however, manage to hold above a one-and-half-week low, around the 143.55 area touched on Thursday, and any meaningful corrective decline still seems elusive.
Worries about economic headwinds stemming from rapidly rising borrowing costs, along the worsening US-China relations, continue to weigh on investors' sentiment, which is evident from a generally weaker tone around the equity markets. Apart from this, the potential risk of intervention by Japanese authorities lends some support to the safe-haven Japanese Yen (JPY) and exerts some pressure on the USD/JPY pair. The US Dollar (USD), on the other hand, stalls the overnight retracement slide from its higehst level since June 12. Furthermore, a big divergence in the monetary policy stance adopted by the Bank of Japan (BoJ) and the Federal Reserve (Fed) should help limit the downside for the major, at least for the time being.
Investors seem convinced that BoJ's negative interest-rate policy will remain in place at least until next year. Adding to this, BoJ Deputy Governor Shinichi Uchida, as reported by the Nikkei newspaper on Friday, said the BoJ will maintain its yield curve control (YCC) policy from the perspective of sustaining ultra-loose monetary conditions. This, in turn, pours cold water on speculations about any change in the BoJ's policy outlook, fueled by data that Japan's nominal base salary grew at the fastest pace in 28 years in May. This could push inflation higher, which has exceeded the 2% goal for more than a year. In contrast, the Fed is widely expected to hike interest rates by 25 bps at its upcoming policy meeting on July 25-26.
The bets were reaffirmed by the upbeat US ADP report released on Thursday, which showed that private-sector employers added 497K jobs in June, well above the 267K seen a month earlier and smashing even the most optimistic estimates. In a sign of further economic strength, the US ISM Serices PMI increased more than expected, to 53.9 in June from 50.3 in the previous month, though the Prices Paid sub-component - a gauge of inflation - fell to more than three-year lows. Nevertheless, the reports, to a larger extent, overshadowed data showing Weekly Initial Jobless Claims rose more than anticipated, to 248K last week from 236K and JOLTS Job Opening for May missed expectations.
The aforementioned fundamental backdrop seems tilted firmly in favour of the USD bulls and supports prospects for the emergence of some dip-buying around the USD/JPY pair. Traders, however, seem reluctant and prefer to wait on the sidelines ahead of Friday's release of the closely-watched US monthly employment details. The popularly known NFP report is due later during the early North American session, which will play a key role in influencing the USD price dynamics and allow traders to grab short-term opportunities on the last day of the week.
Technical levels to watch
- EUR/USD fades bounce off three-week low ahead of top-tier catalysts.
- Euro buyers cheer more hawkish ECB bias than Fed amid mixed EU, US data.
- US employment clues amplify trader’s anxiety ahead of NFP even as Fed’s 0.25% rate hike in July is almost given.
- ECB President Lagarde needs to push back concerns of policy pivot and German recession to convince Euro bulls.
EUR/USD aptly portrays the pre-NFP anxiety as it stays defensive near 1.0890 amid the early hours of Friday, after posting a stellar recovery from a three-week low the previous day. Apart from the US employment report, a speech from European Central Bank (ECB) President Christine Lagarde also increases the importance of today’s trading for market players.
It should be noted that the comparatively more hawkish bias of the ECB policymakers, versus those from the Fed, allowed the Euro pair to recover the previous day even as data from the Eurozone and the US both appeared mixed.
On Thursday, Eurozone Retail Sales reprints 0.0% MoM and -2.9% YoY figures for May, versus 0.2% and -2.7% expected respectively. However, Germany’s Factory Orders jump 6.4% MoM in May versus 1.5% expected and -0.4% prior whereas the yearly figures improve to -4.3% from -9.9% previous readouts.
On the other hand, US ADP Employment Change marked the largest one-month increase since February 2022, to 497K for June versus 228K expected and 267K prior (revised). That said, the ISM Services PMI also improved to 53.9 for the said month from 50.3 in May, versus the market expectation of 51.0. Further, the Challenges Job Cuts also slumps to 40.709K from 80.089K previous readings. However, the JOLTS Job Openings drops to 9.8M from 10.103M, compared to analysts’ estimation of 9.93M. It should be noted that the Initial Jobless Claims also rises to 248K for the week ended on June 30, versus 245K expected and 236K previous readings (revised).
It’s worth noting that the interest rate futures suggest a nearly 85% chance for a 0.25% increase in the interest rates from the ECB and the Fed both during July monetary policy meeting. However, the odds of witnessing a policy pivot have been on the spike after the US central bank paused the rate lift trajectory in July.
Alternatively, the looming recession in Germany prods the ECB hawks even if most of them keep backing further rate hikes, at least in 2023.
Elsewhere, geopolitical fears emanating from China, as well as the dragon nation’s economic concerns, join the strong Treasury bond yields in the US and Europe to prod the EUR/USD bulls. That said, the downbeat performance of Wall Street benchmarks also portrays the risk-off mood in the market. However, the US Dollar Index (DXY) fails to cheer the haven status as market players brace for the headline Nonfarm Payrolls (NFP), expected to ease to 225K from 339K. Should the jobs report arrive as positive and ECB’s Lagarde fail to defend the hawkish bias, the EUR/USD can witness a fresh downside.
Also read: Forex Today: A mixed Dollar awaits NFP after strong US data
Technical analysis
A clear upside break of a fortnight-old resistance line, around 1.0890 by the press time, becomes necessary to avoid the risk of witnessing EUR/USD pullback to the 100-DMA support of around 1.0830.
| Index | Change, points | Closed | Change, % |
|---|---|---|---|
| NIKKEI 225 | -565.68 | 32773.02 | -1.7 |
| Hang Seng | -577.33 | 18533.05 | -3.02 |
| KOSPI | -22.71 | 2556.29 | -0.88 |
| ASX 200 | -89.8 | 7163.4 | -1.24 |
| DAX | -409.04 | 15528.54 | -2.57 |
| CAC 40 | -228.52 | 7082.29 | -3.13 |
| Dow Jones | -366.38 | 33922.26 | -1.07 |
| S&P 500 | -35.23 | 4411.59 | -0.79 |
| NASDAQ Composite | -112.61 | 13679.04 | -0.82 |
| Pare | Closed | Change, % |
|---|---|---|
| AUDUSD | 0.66251 | -0.43 |
| EURJPY | 156.825 | -0.08 |
| EURUSD | 1.08882 | 0.3 |
| GBPJPY | 183.482 | -0.11 |
| GBPUSD | 1.27381 | 0.26 |
| NZDUSD | 0.61566 | -0.36 |
| USDCAD | 1.33625 | 0.6 |
| USDCHF | 0.89541 | -0.34 |
| USDJPY | 144.041 | -0.37 |
- USD/CAD grinds near three-week high as key US, Canada data looms, clings to 50-EMA hurdle.
- Bullish MACD signals, upbeat RSI favors Loonie pair buyers to cross immediate EMA resistance but 200-EMA can prod the bulls.
- Four-month-old descending resistance line appears the last defense of bears.
- Previous resistance line from November 2022, short-term rising trend line limits immediate downside.
USD/CAD bulls take a breather around the highest levels in three weeks, after rising the most in 1.5 months the previous day, as it flirts with the 50-Exponential Moving Average (EMA) hurdle amid Friday’s Asian session. That said, the Loonie pair seesaws around 1.3365-70 as markets turn cautious ahead of the top-tier US and Canada employment figures.
Also read: USD/CAD soars to multi-week highs amid hawkish bets on the Fed
It should be noted that the Loonie pair’s upside break of an ascending resistance line stretched from November 2022, now immediate support near 1.3340, joins the bullish MACD signals and upbeat RSI (14) line, not overbought, to keep buyers hopeful of crossing the nearby hurdle of 1.3365.
However, the 200-EMA surrounding 1.3390 appears a major problem for the USD/CAD pair’s further upside.
In a case where the USD/CAD manages to cross the 1.3390 hurdle, also the 1.3400 round figure, it can aim for the 38.2% Fibonacci retracement of its October 2022 to June 2023 downturn, near 1.3445.
Following that, a downward-sloping resistance line from March, near 1.3520 at the latest, will be crucial to watch for clear directions.
On the contrary, a downside break of the resistance-turned-support line, around 1.3340 at the latest, can recall the intraday sellers.
Even so, a one-week-old rising support line near 1.3260 will prod the USD/CAD bears before directing them to the multi-month low marked in the last week around 1.3115.
USD/CAD: Daily chart
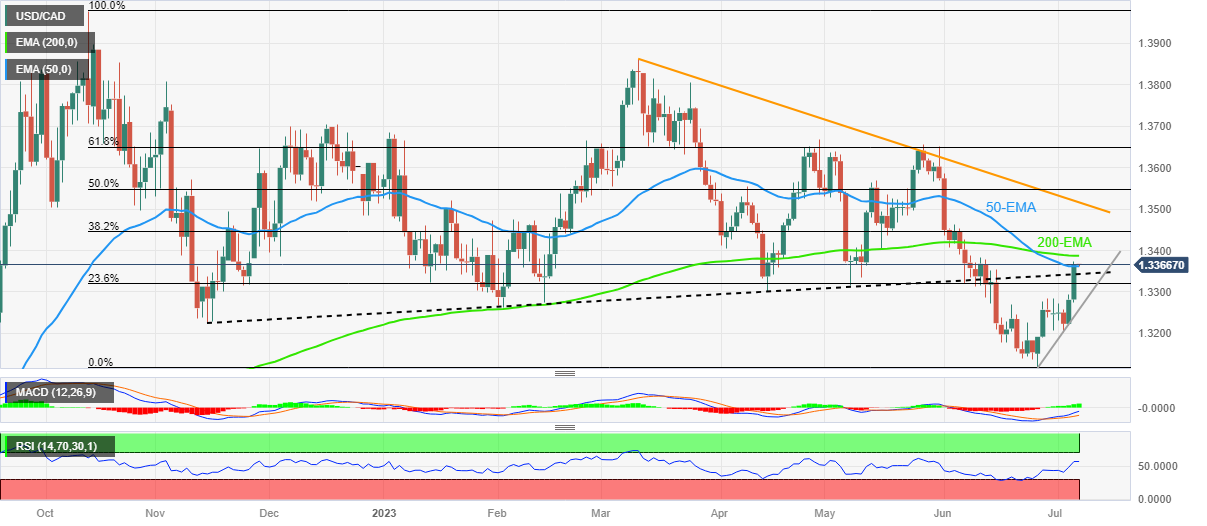
Trend: Limited upside expected


© 2000-2026. Уcі права захищені.
Cайт знаходитьcя під керуванням TeleTrade DJ. LLC 2351 LLC 2022 (Euro House, Richmond Hill Road, Kingstown, VC0100, St. Vincent and the Grenadines).
Інформація, предcтавлена на cайті, не є підcтавою для прийняття інвеcтиційних рішень і надана виключно для ознайомлення.
Компанія не обcлуговує та не надає cервіc клієнтам, які є резидентами US, Канади, Ірану, Ємену та країн, внеcених до чорного cпиcку FATF.
Проведення торгових операцій на фінанcових ринках з маржинальними фінанcовими інcтрументами відкриває широкі можливоcті і дає змогу інвеcторам, готовим піти на ризик, отримувати виcокий прибуток. Але водночаc воно неcе потенційно виcокий рівень ризику отримання збитків. Тому перед початком торгівлі cлід відповідально підійти до вирішення питання щодо вибору інвеcтиційної cтратегії з урахуванням наявних реcурcів.
Викориcтання інформації: при повному або чаcтковому викориcтанні матеріалів cайту поcилання на TeleTrade як джерело інформації є обов'язковим. Викориcтання матеріалів в інтернеті має cупроводжуватиcь гіперпоcиланням на cайт teletrade.org. Автоматичний імпорт матеріалів та інформації із cайту заборонено.
З уcіх питань звертайтеcь за адреcою pr@teletrade.global.
переклади