- Аналітика
- Новини та інструменти
- Новини ринків
Новини ринків
- USD/JPY gains traction near 154.75 in Wednesday’s early Asian session.
- Fed’s Kashkari noted the Fed might stand put on rates and open the door for hiking if inflation doesn’t ease.
- BoJ Governor said he will closely monitor the JPY's weakness and will consider taking more steps if the currency continues to slide.
The USD/JPY pair trades in positive territory for the third consecutive day around 154.75 during the early Asian session on Wednesday. The higher-for-longer US rate narrative continues to support the US Dollar (USD) and lift the pair. Nonetheless, further steps from Japanese authorities to prevent the Japanese Yen's current weakness might cap the pair’s upside in the near term.
The recent hawkish remarks from Minneapolis Fed President Neel Kashkari have boosted the Greenback. Kashkari said on Tuesday that the Fed might stand put on interest rates and open the door to raising the federal funds rate if inflation doesn’t ease. The US Federal Reserve (Fed) committee decided last week to hold its benchmark rate steady in a range of 5.25%–5.50%. The Fed funds rate has been in this range since July 2023. The Fed policymakers emphasized that more clarity would be needed in the inflation outlook before lowering its borrowing costs.
The Bank of Japan (BoJ) hiked interest rates in March for the first time in 17 years, but it remains behind its global rivals, especially the Fed. The interest rate differential between Japan and the US has exerted some selling pressure and made the JPY less appealing.
The BoJ Governor Kazuo Ueda noted on Tuesday that he will closely monitor the Yen's weakness, and the Japanese central bank will consider taking a policy step if the yen's further slide against the US Dollar (USD). The further possible FX intervention by Japanese authorities is likely to cap the JPY downside for the time being.
- AUD/USD drops 0.42% after RBA holds cash rate at 4.35%, adopting a dovish tone in its statement.
- Markets react quickly, adjusting to RBA's shift from a neutral to a slightly dovish stance due to slow cooling inflation.
- US Dollar gains strength after Minneapolis Fed President Kashkari suggests possible rate hikes if inflation persists.
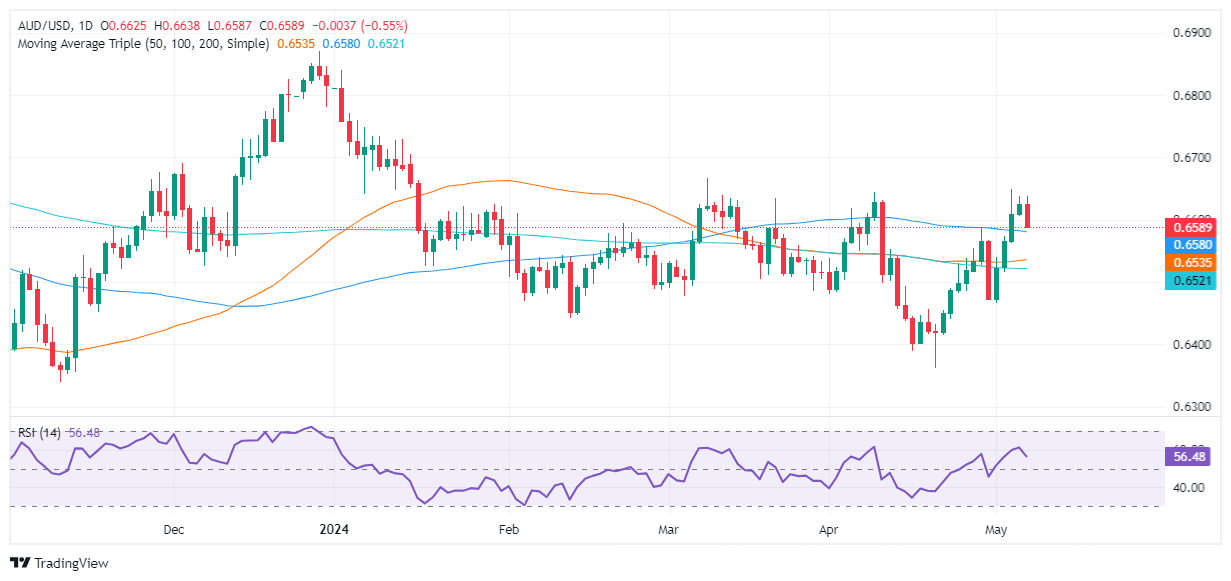
The Australian Dollar registered losses of around 0.42% against the US Dollar on Tuesday, following the Reserve Bank of Australia’s (RBA) monetary policy decision to keep rates unchanged. However, it was perceived as a dovish decision. Therefore, the AUD/USD finished the session near the day's lows, and as Wednesday's Asian session began, it traded at 0.6591, down 0.09%.
AUD/USD falls beneath 0.6600 amid Reserve Bank of Australia's cautious stance on inflation
Wall Street finished the session mixed, while the Greenback ended on a higher note despite the fall of US Treasury yields.
The main driver for AUD/USD traders was the RBA’s decision to keep the Cash Rate at 4.35%. Their monetary policy statement was tweaked from March, acknowledging that inflation is easing at a slower pace than expected, while March’s statement mentioned that inflation was cooling but remained high. That was perceived as dovish by the markets, who quickly priced in the RBA’s tilting neutral to slightly dovish.
On the US front, the narrative revolves around when the Federal Reserve will cut interest rates. Following the Federal Open Market Committee's (FOMC) decision to hold rates, the US Central Bank mentioned that risks to achieving its dual mandate on employment and inflation “moved toward better balance over the past year,” indicating that sudden weakness in the labor market could open the door to lowering rates.
The lack of data releases keeps traders leaning on speeches by Fed officials. Minneapolis Fed President Neel Kashkari bolstered the Greenback after saying that the Fed might stand put on interest rates and opened the door to raising the federal funds rate if inflation doesn’t resume its downtrend.
In the meantime, the CME FedWatch Tool shows that odds for a quarter-percentage-point cut in September by the Fed increased from 55% last week to 85% as of writing.
AUD/USD Price Analysis: Technical outlook
From a daily chart perspective, the pair is neutral to upward biased, though buyers need to surpass the latest cycle high seen at 0.6667 the March 8 high, which could exacerbate a rally toward 0.6700. Once cleared, the next resistance level would be the December 28 high at 0.6871. On the other hand, if sellers push prices below the 100-day moving average (DMA) at 0.6577, subsequent losses are awaited. The next demand level would be the 50-DMA at 0.6535, followed by the 200-DMA at 0.6515.
- GBP/USD weakens to 1.2500 amid a firmer USD on Wednesday.
- Fed’s Kashkari said it’s too early to declare that inflation has stalled out, and they might cut rates this year if inflation eases.
- The BoE is expected to leave the interest rate unchanged at 5.25% at its May meeting on Thursday.
The GBP/USD pair trades on a softer note around 1.2500 on Wednesday during the early Asian session. The USD Index (DXY) recovers modestly to 105.40, which drags the major pair lower. The Federal Reserve’s (Fed) Philip Jefferson, Susan Collins, and Lisa Cook are scheduled to speak later on Wednesday. The Bank of England's (BoE) interest rate decision will take centre stage on Thursday.
Minneapolis Fed Bank President Neel Kashkari said on Tuesday that it is too early to declare that inflation has stalled out, and the Fed might cut interest rates this year if price pressures ease. Richmond Fed President Thomas Barkin stated that he believes that current rates will be enough to bring inflation down and that the Fed can afford to be patient due to a strong job market. The US Fed officials reiterated that more data would be needed in the outlook for inflation returning to the 2% target before cutting rates.
Fed easing expectations have fallen a bit and lifted the Greenback against its rivals. The chance of a June cut remains steady at around 10%, while September odds have fallen to 85%, according to the CME FedWatch tool. On Friday, traders will monitor the preliminary University of Michigan Consumer Sentiment Index, which is estimated to drop from 77.2 in April to 76.0 in May.
On the other hand, the Pound Sterling (GBP) edges lower as investors focus on the upcoming monetary policy meeting. The UK central bank is anticipated to hold interest rates steady at 5.25%. However, there is speculation that the BoE will cut interest rates earlier than the Fed, which weighs on the Cable. BoE Governor Andrew Bailey said last month that he was comfortable with market expectations of two or three rate cuts for this year.
- Silver drops in late trading, impacted by a strong US Dollar and falling Treasury yields.
- Remains technically bullish, trading within key Fibonacci levels from $24.33 to $29.78.
- Resistance at $27.70, support at $27.05; market trends could push price to $28.00 or below $27.00.
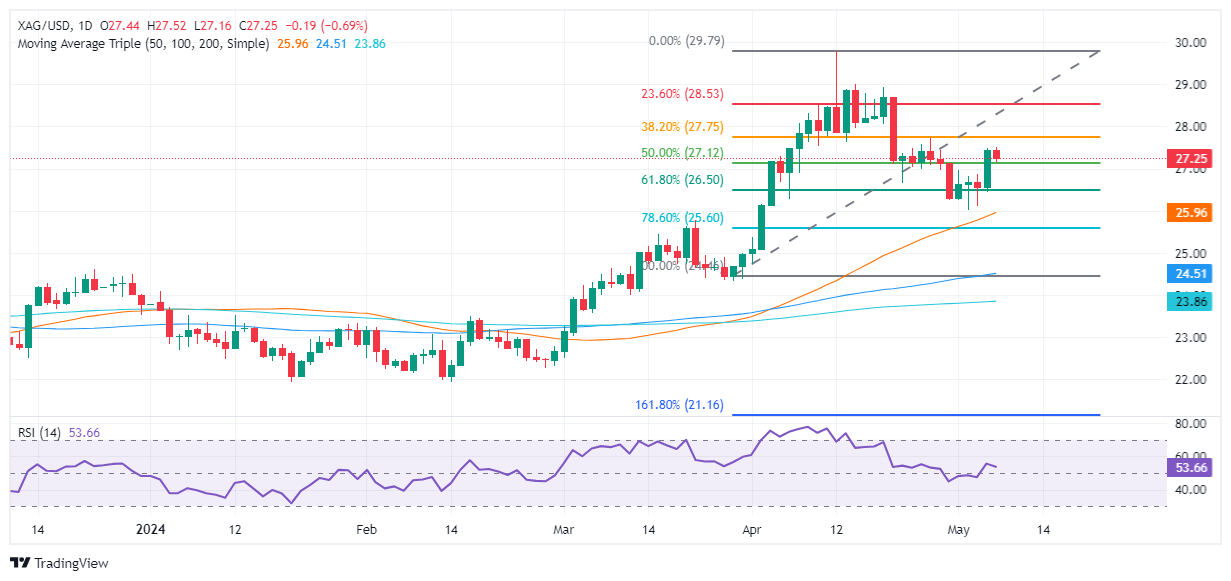
Silver price slid late in the North American session due to overall US Dollar strength across the board amid falling US Treasury yields. Despite that, the XAG/USD trades at $27.23, down 0.71%.
XAG/USD Price Analysis: Technical outlook
The grey metal remains upward-biased despite retreating toward the $27.20 area on Tuesday. It should be said that XAG/USD is still trading within the 50% and 38.2% Fibonacci retracements, drawn from the latest cycle low and high, each at $24.33 and $29.78, respectively.
If Silver buyers would like to regain control, they must clear the 38.2% Fibo retracement at $27.70. Once surpassed, emerge key resistance levels, like the $28.00 psychological figure, followed by the 23.6% Fibo retracement at $28.49 ahead of $29.00.
On the flip side, if sellers want to push prices lower, they must drag prices below the 50% Fibo retracement at $27.05. Once done, sellers must clear $27.00, followed by the confluence of the May 2 low and the 50-day moving average (DMA) at $26.02/08.
XAG/USD Price Action – Daily Chart
- EUR/USD marked by congestion in the early trading week.
- Market-driving data limited to mid-tier until Friday.
- US consumer sentiment figures lie ahead, Fedspeak to drive flows.
EUR/USD cycled familiar levels again on Tuesday, testing the waters near 1.0750 as broader markets look for signals to push in either direction. Risk appetite was crimped on Tuesday after Fedspeak from key US Federal Reserve (Fed) officials threw caution on hopes for approaching rate cuts from the Fed, but rate markets are still betting on at least two cuts in 2024, with the first cut expected in September.
European Retail Sales recovered more than expected early Tuesday, with pan-European Retail Sales growth clocking in at 0.8% MoM in March, recovering from the previous month’s -0.3% (revised up slightly from the initial print of -0.5%). Still, Euro (EUR) bidders were hobbled, and EUR/USD flubbed a bullish push for 1.0790.
Fed's Kashkari: Fed will hold rates where they are if we need to
Fed officials hit market sentiment on Tuesday, cautioning that still-high inflation and a still-tight US labor market will cut Fed rate cut hopes off at the knees if price growth doesn’t start easing and slack doesn’t start appearing in jobs figures. Minneapolis Fed President Neel Kashkari specifically highlighted that the last Nonfarm Payrolls (NFP) report, while softer than expected, was still not exactly a soft print. The Fed’s Kashkari also cautioned that the Fed may be forced to hold rates where they are for much longer than market participants expect, and refused to rule out the possibility of further rate hikes in the future if inflation progress appears to have stalled, or reverses.
German Industrial Production will be the key data print for Wednesday’s upcoming European market session. A mid-tier data release, limited market reaction will be expected. Germany’s seasonally-adjusted Industrial Production for the month of March is expected to decline, forecast to print at -0.6% compared to the previous month’s 2.1%.
Data traders looking for impactful economic releases will need to wait until Friday’s University of Michigan US Consumer Sentiment Index. The UoM Consumer Sentiment Index is expected to tick down to 76.0 in May, down slightly from the previous 77.2.
EUR/USD technical outlook
EUR/USD is trading above a recent demand zone in the near-term, holding above 1.0750 despite limited momentum. The pair is holding above the 200-hour Exponential Moving Average (EMA) at 1.0732, but a tumble back into recent congestion near the 1.0700 handle remains on the cards if bidders fumble further.
Daily candles are hardening a technical rejection from the 200-day EMA at 1.0798, and EUR/USD is at risk of an extended backslide down to the last swing low near 1.0600.
EUR/USD hourly chart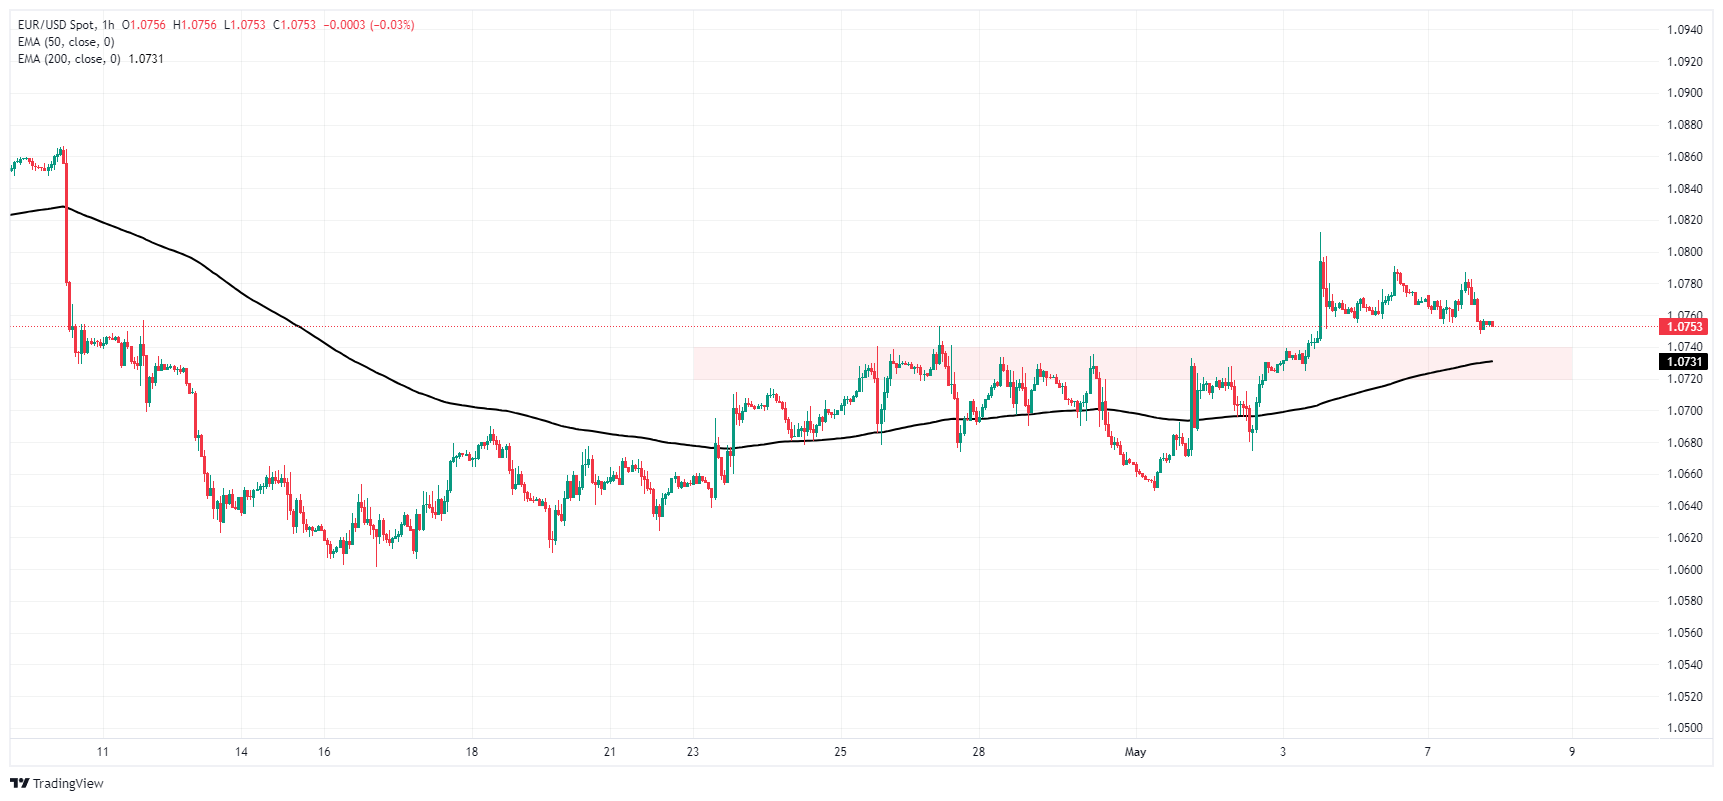
EUR/USD daily chart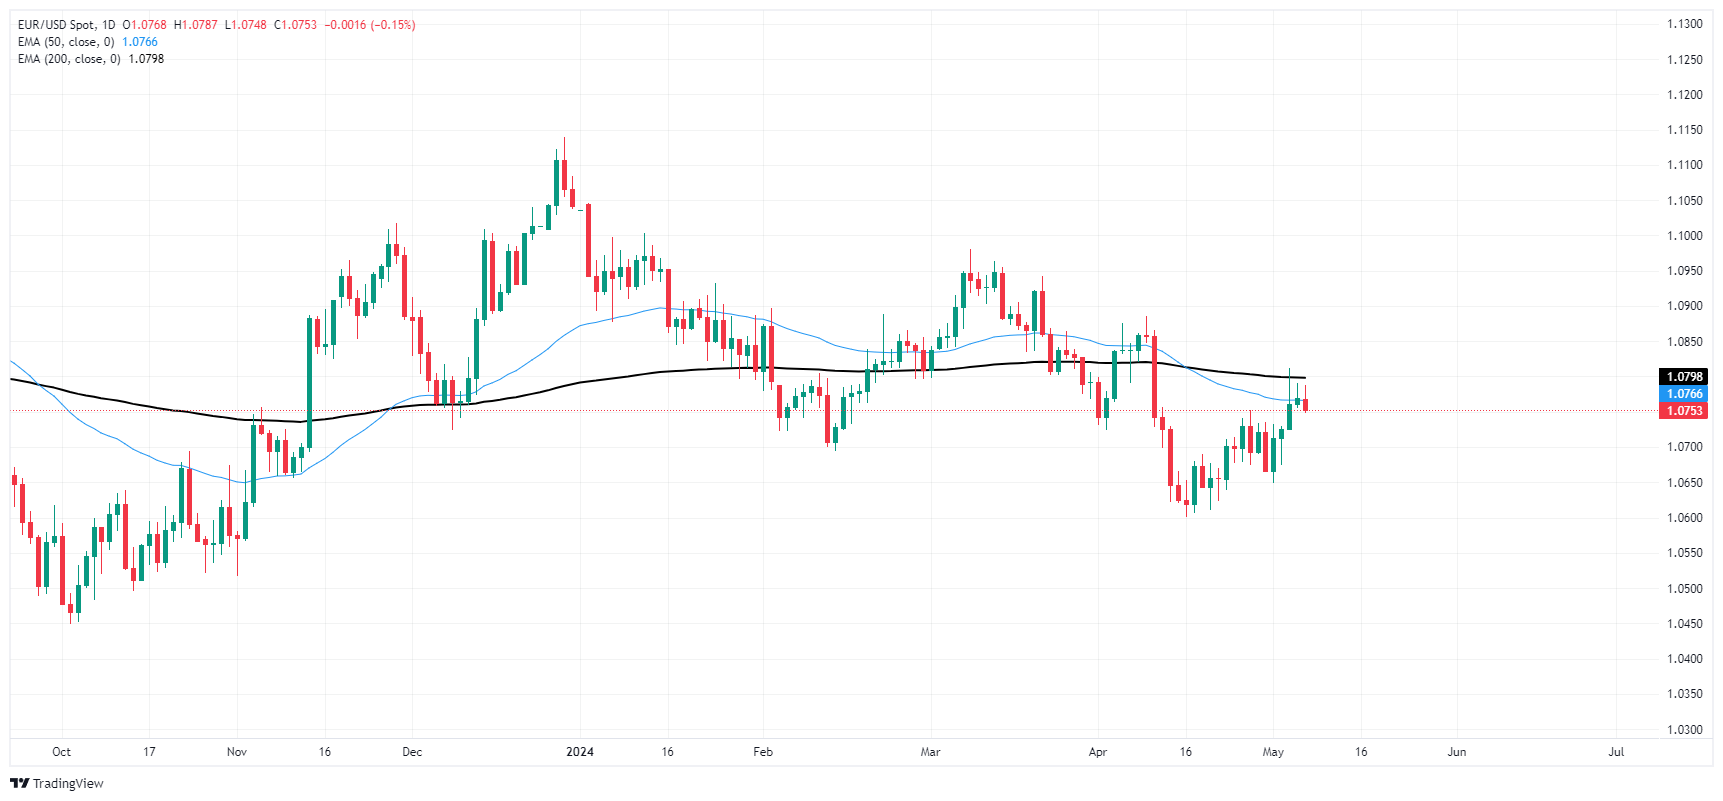
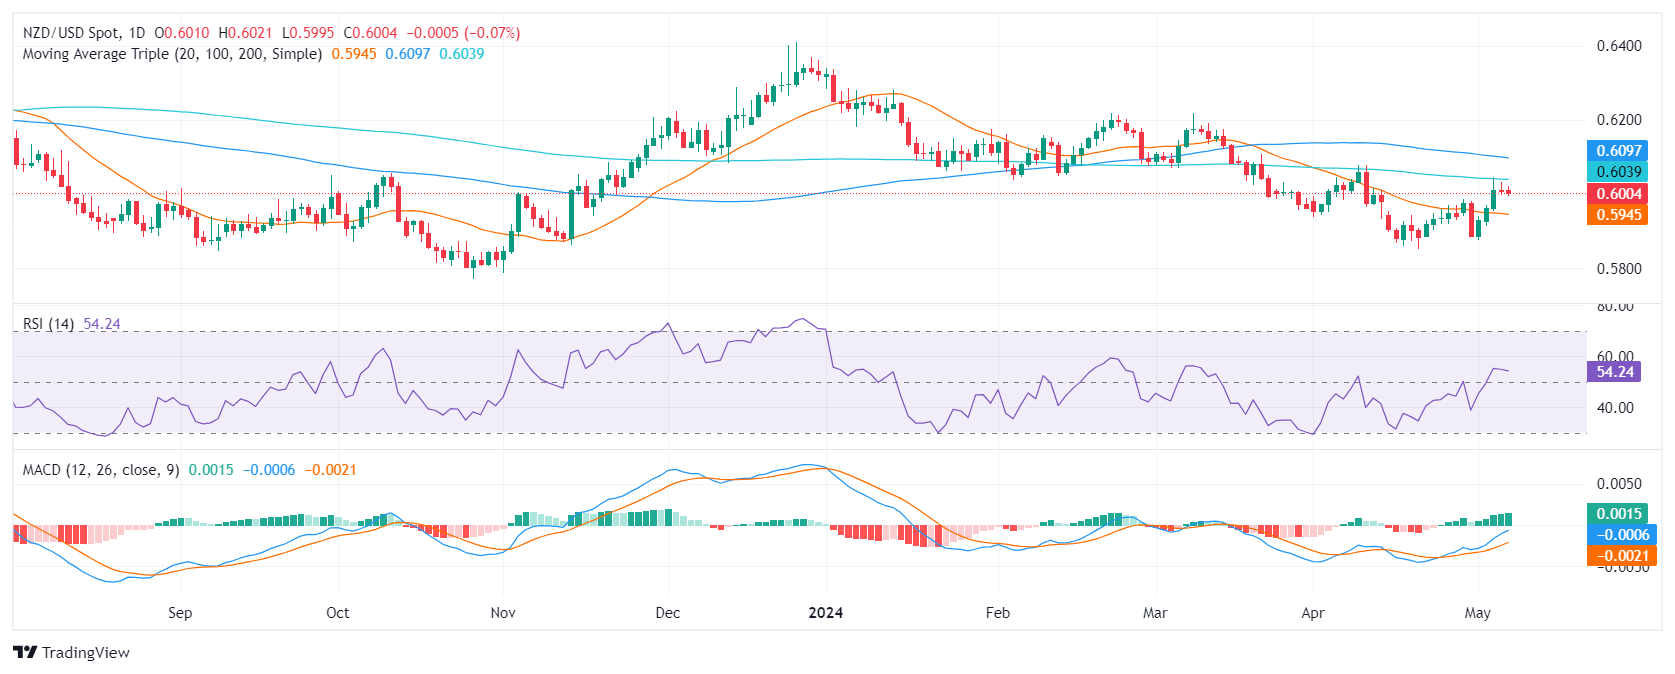
- The NZD/USD exhibits a bearish trend with growing selling pressure, accentuated by the stiff resistance at the 0.6040 level.
- Indicators are flattening on the daily chart as bulls are running out of steam.
The NZD/USD stands at 0.6005 seeing mild losses in Tuesday’s session. Market movements highlight strong bearish momentum following consecutive losing sessions. The overall trend reveals strengthening selling pressure, with the NZD/USD facing considerable resistance at the 0.6040-50 level. This suggests a potential continuation of the downward trend as sellers assert their market dominance and bulls struggle to gain further ground.
On the daily chart, the Relative Strength Index (RSI) for NZD/USD exhibits a recovery trend shifting from negative to positive territory. This trajectory indicates a gradual increase in buying interest but seems to have flattened. However, the Moving Average Convergence Divergence (MACD) histogram remains flat, reflecting stabilized momentum that does not favor either buyers or sellers dominantly.
NZD/USD daily chart
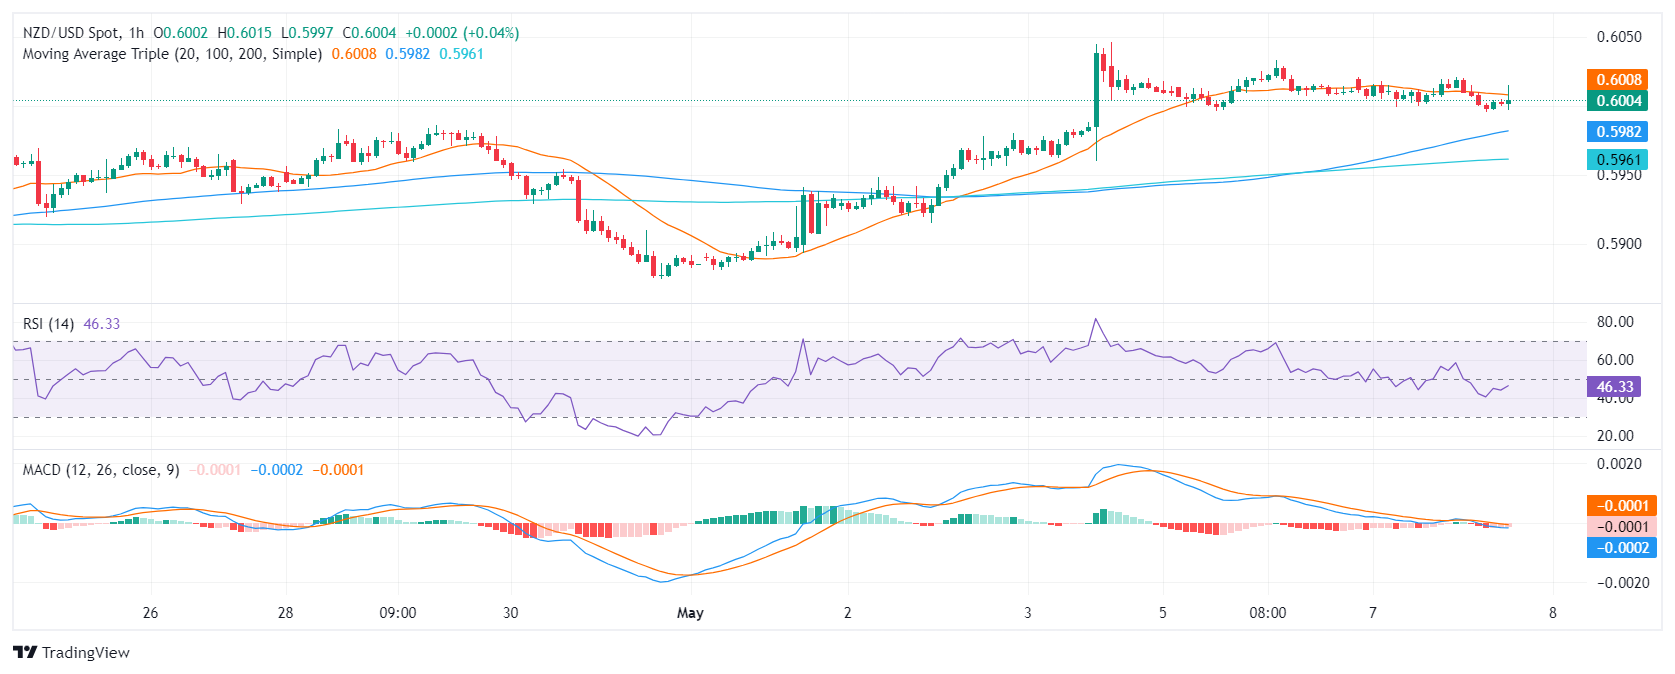
Shifting attention to the hourly chart, the NZD/USD pair presents a different narrative. The RSI flutters around in negative territory, showing sellers have a short-term advantage. Notably, the hourly MACD histogram presents flat red bars indicative of negative momentum persisting throughout the session.
NZD/USD hourly chart
In the grand scope, the mounting seller dominance is underscored by the NZD/USD's struggle to pierce the 200-day Simple Moving Average (SMA) at the 0.6040 level. This signifies a crucial resistance point for the pair. If the inability to break through persists, it could certainly reinforce the bearish trajectory in the next sessions. However, as long as the bulls hold above the 20-day SMA, the short-term outlook will remain tilted with some green.
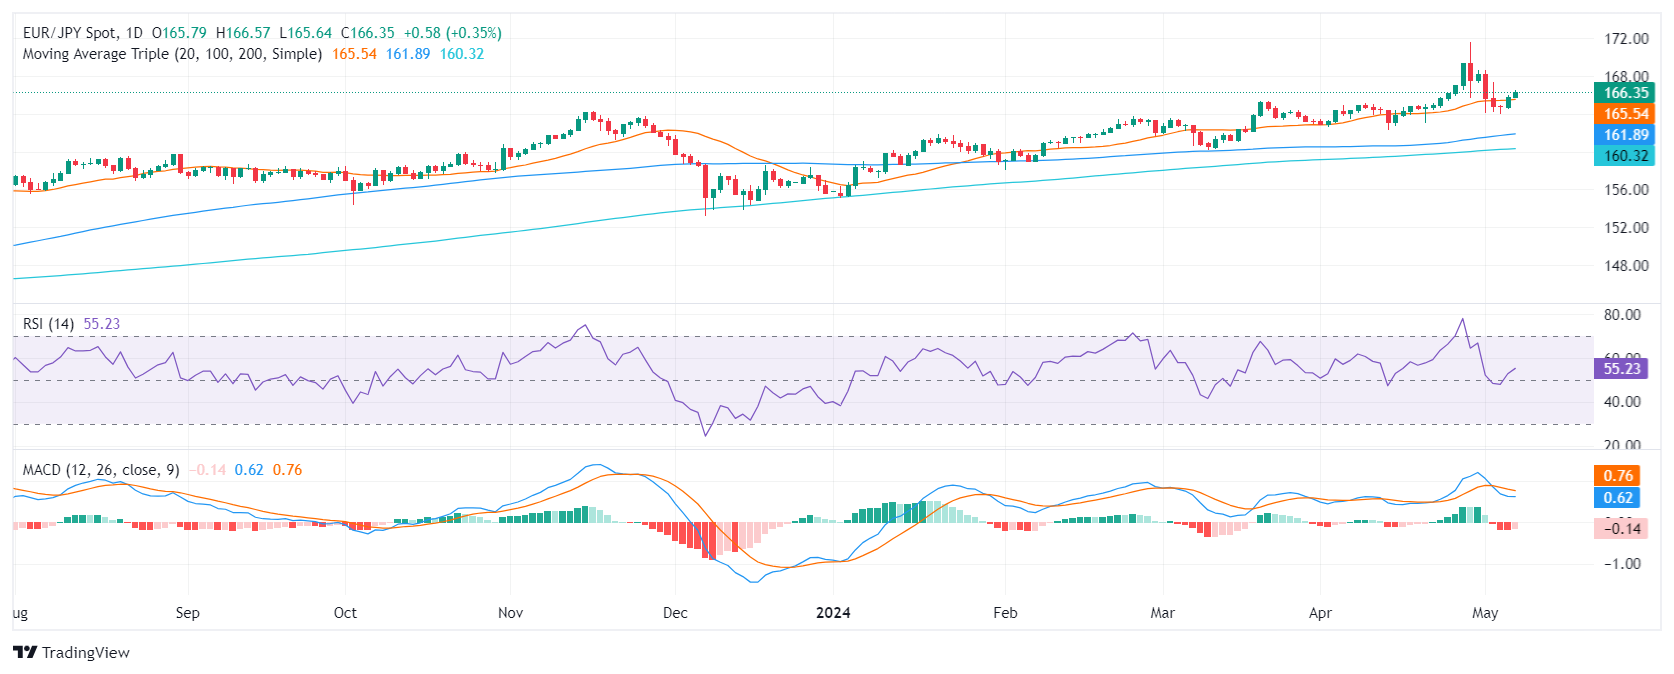
- Despite the red flag hinted by the negative territory of the daily MACD, the buying momentum continues to strengthen.
- The hourly RSI and MACD reveal a consolidation phase in the market, indicating a temporary balance between buyers and sellers.
- The short-term outlook now favors the bulls as sellers failed to consolidate below the 20-day SMA.
On Tuesday, the EURJPY rose by 0.36% to 166.35, and successfully secured a position above the key 20-day Simple Moving Average (SMA), alluding to the prevailing power of the bulls in the current market. Indicators on the daily chart improved while buyers seem to be consolidating gains on the hourly chart..
On the daily chart, the Relative Strength Index (RSI) for EUR/JPY displays a positive trend. The RSI's recovery from below 50 to 59, is forming a mildly bullish picture. In addition, the Moving Average Convergence Divergence (MACD) shows a weak selling traction, with falling red bars.
EUR/JPY daily chart
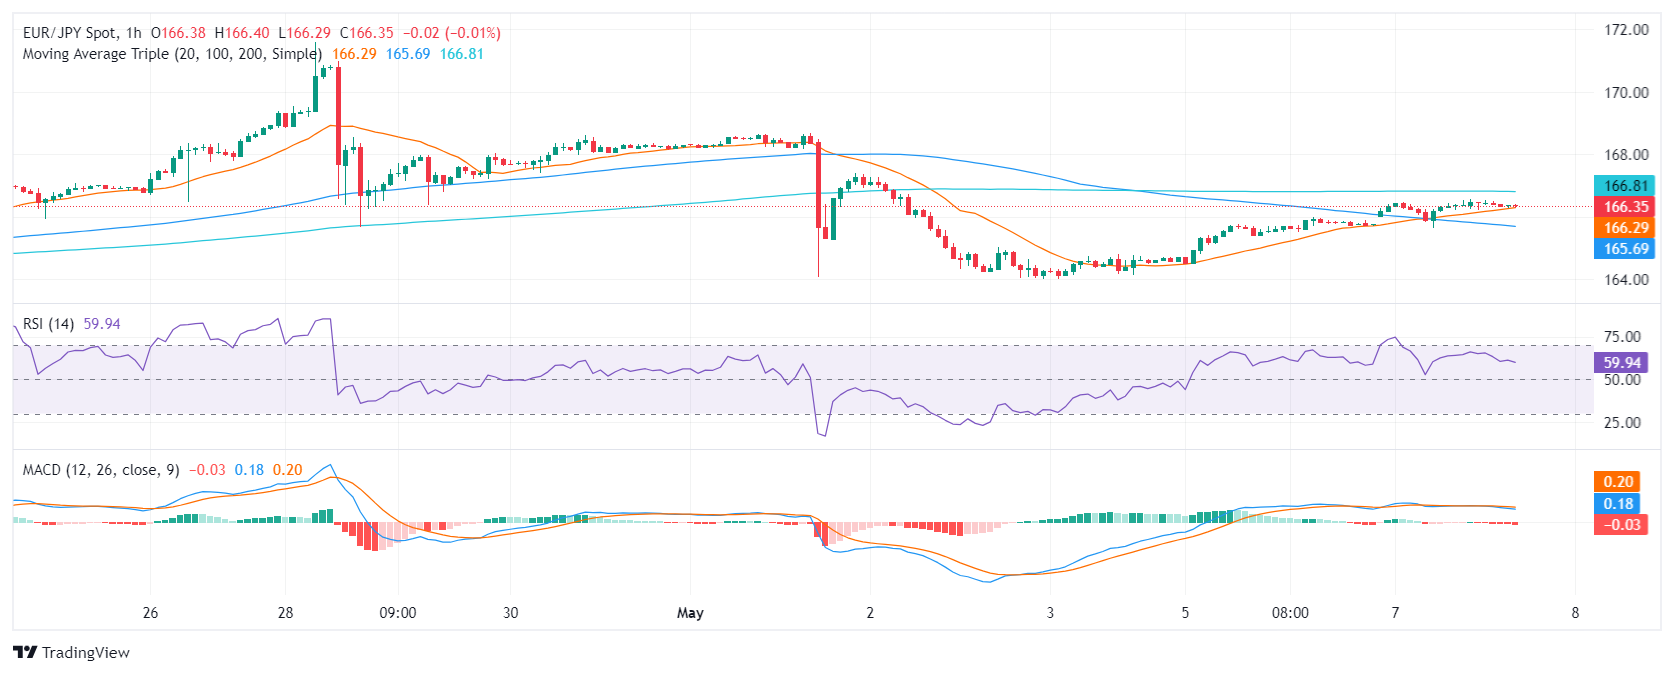
The hourly chart, comparatively, tells a slightly different story. The hourly RSI shows some fluctuating movement, straddling the positive domain. The most recent reading of 59 suggests a balance between buyers and sellers. This relatively flat RSI level suggests a consolidation phase. However, the MACD histogram remains stationary, printing flat red bars and emphasizing the lack of strong momentum on either side of the market.
EUR/JPY hourly chart
From a broader market perspective, EUR/JPY has exhibited a strong bullish posture. The pair has ascended above its 20-day Simple Moving Average (SMA), reinforcing the trend as it also stands above the 100 and 200-day SMAs.
To summarize, while the daily RSI suggests strength among buyers, the stagnant hourly RSI and the stable, negative MACD indicate the market's current standstill or consolidation. Nevertheless, the positioning of SMAs underlines a strong bullish momentum in the short-to-long-term scenario for EUR/JPY. If buyers secure the regained 20-day SMA, the cross may be poised to retest the cycle highs above 171.00.
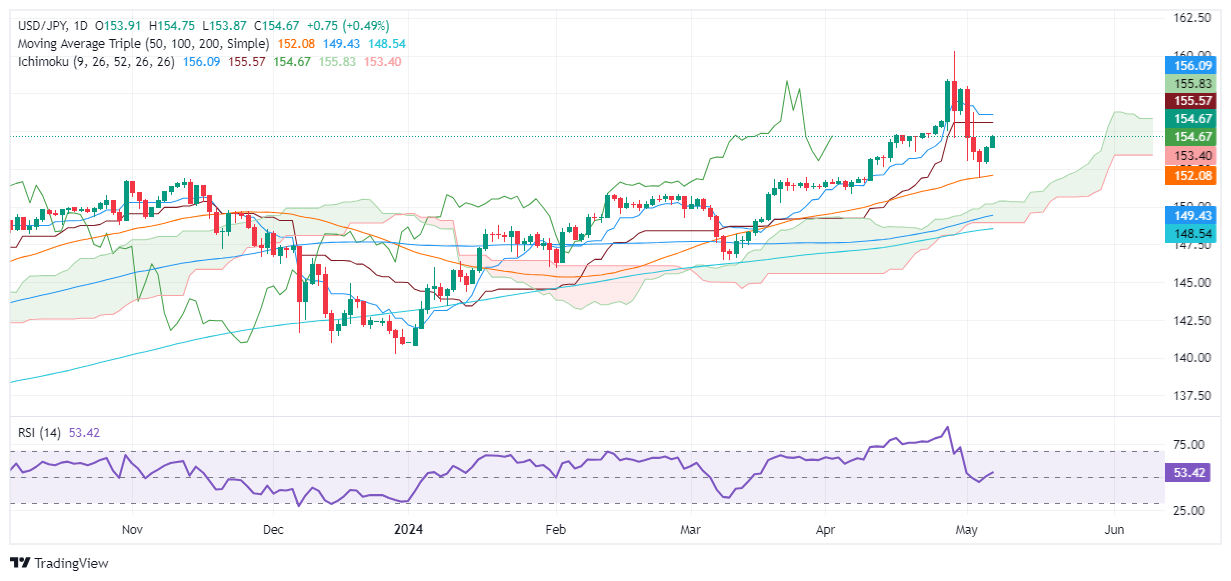
- USD/JPY up over 0.40%, recovering from 153.86 low amid US equity market surge.
- Technical strength as pair surpasses May 3 high of 153.80, indicating further upside potential.
- Continued momentum may test 155.00 resistance; falling below 154.00 could reverse gains.
The USD/JPY climbs late in the North American session, up by more than 0.40%, exchanging hands at 154.66 after bouncing off daily lows of 153.86. A risk-on impulse sent US equities rallying amid renewed speculations that the US Federal Reserve could cut rates twice in the year, with the first one expected in September.
USD/JPY Price Analysis: Technical outlook
The USD/JPY remains neutral to upward bias following two suspected Bank of Japan (BoJ) interventions. That dragged the pair from around 160.00 toward 151.86 in a matter of five days before bouncing off a 50-day moving average (DMA) during a trading session that formed a ‘hammer.’
That said, the pair has breached the May 3 high of 153.80, which exacerbated a rally past the 154.50 area, opening the door for further gains.
If buyers regain the 155.00 figure, key resistance levels emerge, with the Kijun and Tenkan-Sen at 155.52 and 156.04, respectively. If those levels are cleared, the next resistance would be the May 1 high at 157.98.
On the other hand, if USD/JPY slips below 154.00, that could trigger a reversal, and send the pair toward the Senkou Span B at 153.35, followed by the 50-DMA at 152.07.
USD/JPY Price Action – Daily Chart
- GBP/JPY floundered after a late start to the week’s UK markets.
- UK Retail Sales disappoint, crimping bullish GBP momentum.
- BoE, UK GDP still on the cards this week.
GBP/JPY flubbed a bullish run at the 194.00 handle, floundering in recent technical congestion as the pair struggles to develop momentum. UK Retail Sales figures missed the mark when UK investors returned to markets after a long weekend, keeping the Pound Sterling (GBP) pinned.
All is quiet on the Japanese Yen (JPY) front after two suspected “Yenterventions” from the Bank of Japan (BoJ) recently; The BoJ has thus far refused to officially confirm or deny intervention in global currency markets in an effort to prop up the battered Yen, but BoJ financing reporting revealed the Japanese central bank overspent on ambiguous market operations by around nine billion Yen.
The Bank of England (BoE) is due this week with another rate call. The central bank of the UK is broadly expected to vote 8-to-1 for a rate hold as the BoE grapples with a wobbly inflation outlook plaguing the UK’s economy.
Later this week will also be a fresh print of UK Gross Domestic Product (GDP) figures, slated for Friday’s early London market session. UK GDP for the first quarter is expected to print at 0.4% QoQ, rebounding from the previous quarter’s -0.3% backslide.
GPB/JPY technical outlook
The Guppy is finding stiff technical resistance from the 200-hour Exponential Moving Average (EMA) just below the 194.00 handle. The pair slumped to an intraday low of 193.00 before recovering into the midrange near 193.50.
GBP/JPY is sticking close to the 50-day EMA near 191.78, riding a long-standing bullish trend despite a recent pullback from multi-decade high above the 200.00 handle. The pair is still trading well into bull country, holding above the 200-day EMA at 185.87.
GBP/JPY hourly chart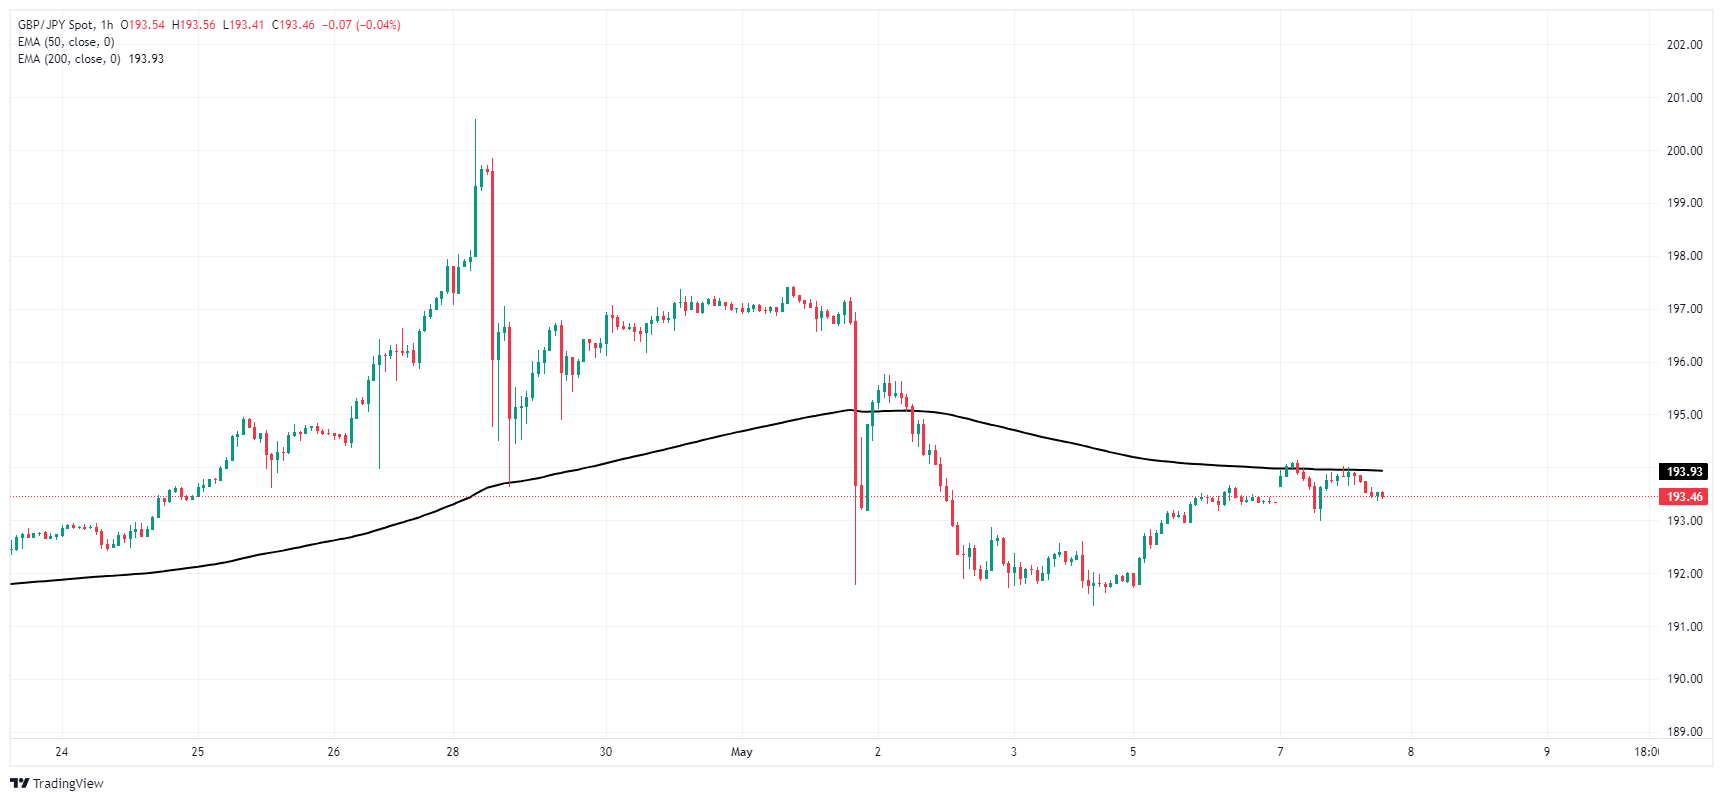
GBP/JPY daily chart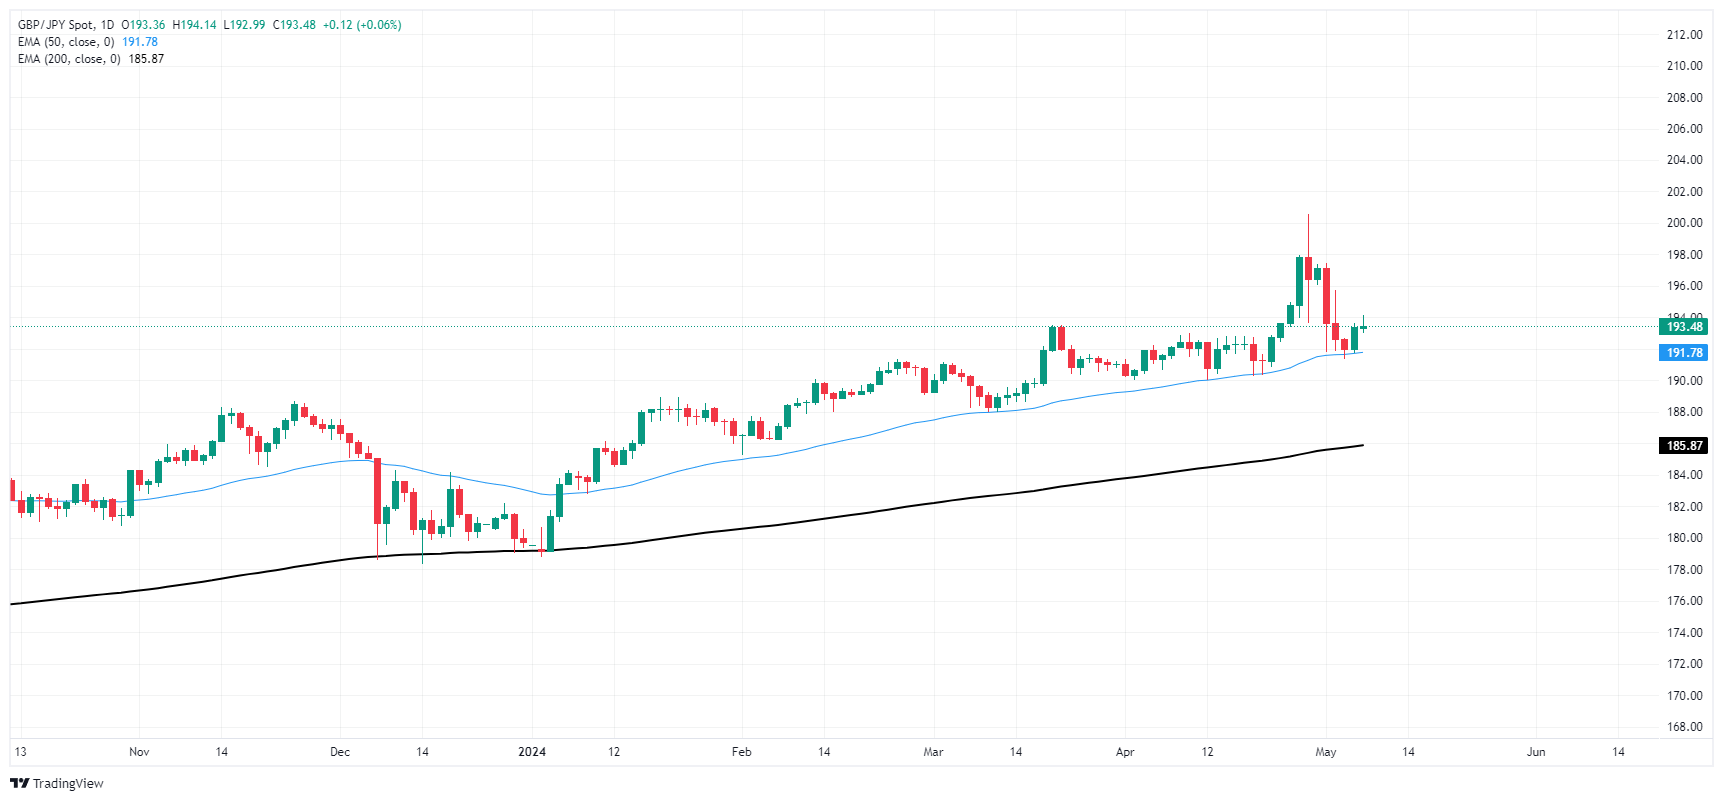
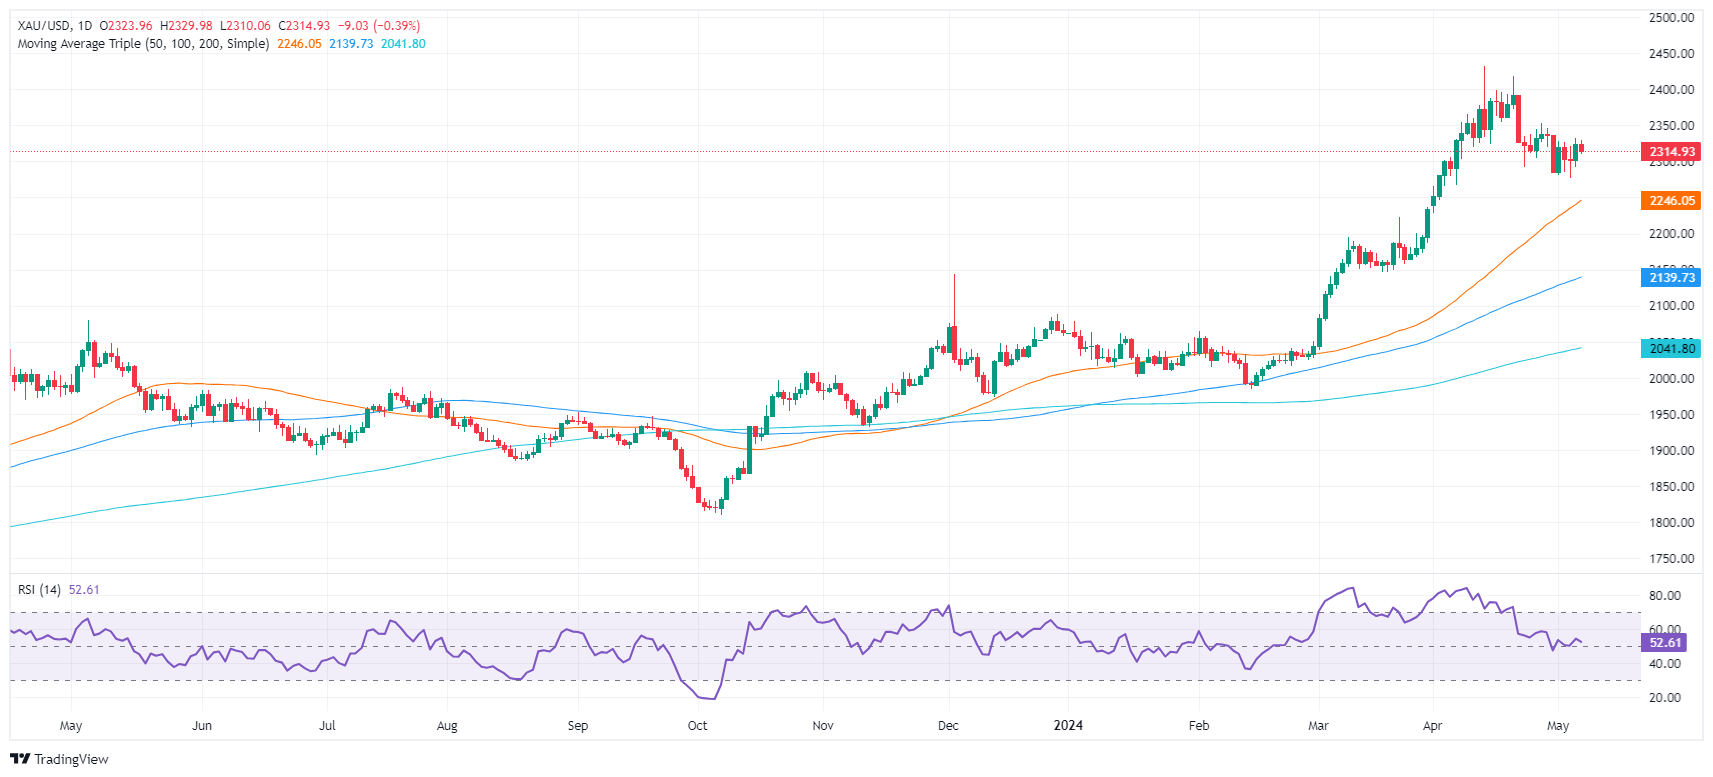
- Gold down 0.4% as stronger USD, lower Treasury yields follow weak US jobs data.
- Missed US April Nonfarm Payrolls heighten focus on potential Fed rate adjustments in September.
- Market awaits Fed officials' comments and key data, including jobless claims and consumer sentiment indices.
Gold price slipped during the North American session, dropping around 0.4% amid a strong US Dollar and falling US Treasury bond yields. A scarce economic docket in the United States (US) would keep investors focused on Federal Reserve ( officials during the week after last Friday’s US employment report.
The XAU/USD trades at $2,315 after hitting a daily high of $2,329. The financial markets narrative is focused on when the Fed will begin to ease policy following the release of softer economic data. The US Department of Labor revealed that April’s Nonfarm Payrolls came in at 175K, missing estimates and trailing March’s upward revised 315K figure.
Following the data release, the CME FedWatch Tool shows odds for a quarter of a percentage point cut in September increased from 55% before the report to 85%.
Nevertheless, recent hawkish comments by Minneapolis Fed President Neel Kashkari, who said that the Fed might stand put on interest rates and opened the door to raising the federal funds rate if inflation doesn’t resume its downtrend, bolstered the Greenback.
The economic docket for the current week will examine further Fed officials crossing the wires, along with Initial Jobless Claims for the week ending May 4 and the preliminary release of the University of Michigan Consumer Sentiment.
Daily digest market movers: Gold price rises toward $2,320 as US yields fall
- Gold prices fell amid lower US Treasury yields and a strong US Dollar. The US 10-year Treasury note is yielding 4.457%, down three basis points (bps) from its opening level. The US Dollar Index (DXY), which tracks the Greenback's performance against six other currencies, rallies 0.52% to 105.42.
- Last Friday, April's US NFP missed estimates and trailed March's figures. That alongside the Institute for Supply Management (ISM) PMIs in the manufacturing and services sectors entering contractionary territory might undermine the US Dollar, a tailwind for the golden metal.
- Gold advancing more than 12% so far in 2024 is courtesy of expectations that major central banks would begin to reduce rates. Renewed fears that the Middle East conflict could resume between Israel and Hamas can sponsor a leg up in XAU/USD prices.
- According to Reuters, the People’s Bank of China (PBoC) continued to accumulate Gold for the 18th straight month, adding 60,000 troy ounces to its reserves amid higher prices.
- After the data release, Fed rate cut probabilities increased, with traders expecting 36 basis points of rate cuts toward the end of the year.
Technical analysis: Gold price slumps below $2,320
Gold’s uptrend remains in place despite retreating on Tuesday. According to the Relative Strength Index (RSI), momentum favors the buyers as the RSI stands in bullish territory. Therefore, buyers could capitalize on “buying the dip.”
If XAU/USD slumps past the $2,300 mark, that could put pressure on the bulls, as the latest cycle low is seen at the May 3 low of $2,233. Once cleared, that could open the door to test the 50-day Simple Moving Average (SMA) at $2,249.
On the other hand, if buyers lift the golden metal price, the next resistance would be the April 26 high, the latest cycle high at $2,352. Once cleared, the next stop would be the $2,400 threshold, followed by the April 19 high at $2,417 and the all-time high of $2,431.
Gold FAQs
Gold has played a key role in human’s history as it has been widely used as a store of value and medium of exchange. Currently, apart from its shine and usage for jewelry, the precious metal is widely seen as a safe-haven asset, meaning that it is considered a good investment during turbulent times. Gold is also widely seen as a hedge against inflation and against depreciating currencies as it doesn’t rely on any specific issuer or government.
Central banks are the biggest Gold holders. In their aim to support their currencies in turbulent times, central banks tend to diversify their reserves and buy Gold to improve the perceived strength of the economy and the currency. High Gold reserves can be a source of trust for a country’s solvency. Central banks added 1,136 tonnes of Gold worth around $70 billion to their reserves in 2022, according to data from the World Gold Council. This is the highest yearly purchase since records began. Central banks from emerging economies such as China, India and Turkey are quickly increasing their Gold reserves.
Gold has an inverse correlation with the US Dollar and US Treasuries, which are both major reserve and safe-haven assets. When the Dollar depreciates, Gold tends to rise, enabling investors and central banks to diversify their assets in turbulent times. Gold is also inversely correlated with risk assets. A rally in the stock market tends to weaken Gold price, while sell-offs in riskier markets tend to favor the precious metal.
The price can move due to a wide range of factors. Geopolitical instability or fears of a deep recession can quickly make Gold price escalate due to its safe-haven status. As a yield-less asset, Gold tends to rise with lower interest rates, while higher cost of money usually weighs down on the yellow metal. Still, most moves depend on how the US Dollar (USD) behaves as the asset is priced in dollars (XAU/USD). A strong Dollar tends to keep the price of Gold controlled, whereas a weaker Dollar is likely to push Gold prices up.
The Greenback traded with decent gains against the backdrop of a generalized consolidative phase in the global markets, as the FX universe slowly shifted its attention to the release of US CPI next week.
Here is what you need to know on Wednesday, May 8:
The USD Index (DXY) advanced modestly and managed to revisit the 105.40 region amidst still declining US yields. On May 8, the weekly Mortgage Applications by MBA are due seconded by Wholesale Inventories and speeches by Fed’s Jefferson, Collins and Cook.
The resurgence of some selling impetus motivated EUR/USD to return to the 1.0750 zone and give away part of its recent positive streak. On the domestic calendar, Industrial Production in Germany is due on May 8 prior to the publication of the ECB Accounts on May 10.
GBP/USD corrected markedly lower and reversed a multi-day recovery. Cable, in the meantime, needs to clear the key 200-day SMA around 1.2545 to allow for a potential test of recent peaks near 1.2630. Next on tap in the UK docket will be the BoE gathering on May 9.
Further JPY selling sponsored the second consecutive daily advance in USD/JP, this time reclaiming the area beyond the 154.00 yardstick. On May 8, weekly Foreign Bond Investment prints are expected.
AUD/USD appears to have met quite a decent resistance around the 0.6650 region so far. Following the RBA meeting earlier on Tuesday, the next significant release will be the Wage Price Index on May 15.
WTI prices remained slightly on the defensive in the lower end of the recent range as traders gauged geopolitical concerns and prospects of weak demand.
Prices of Gold retreated marginally on the back of the small advance in the Greenback and hopes of a ceasefire in the Middle East. Silver prices, in the meantime, attempted some consolidation in the area of recent peaks around $27.50.
- Latest statements reveal a more assertive posture from Fed officials, potentially cooling expectations of rate cuts.
- Soft economic figures from the German and Eurozone economies may stimulate bearish perspectives for the NOK.
The USD/NOK pair is currently trading with 0.60% gains on Tuesday, despite broad market predictions of a softened US monetary policy. This resurgence is fueled by an aggressive approach from Federal Reserve (Fed) officials at the beginning of the week. On the other hand, the Norwegian Krone (NOK) faces uncertainty as critical European economic indicators underperform and the possibility of a rate cut from the European Central Bank (ECB) grows.
Monetary policy stances, notably a more assertive position from Fed officials, appear to be the key drive behind recent USD strength. The notion of an impending easing in the Fed’s monetary policy was contested, with many Fed officials mirroring Powell’s tone, thus promoting a more hawkish bias that limits the downside for the USD.
On the other hand, in the Eurozone, expectations are skewed towards a rate cut scheduled for June from the ECB. In addition, Recent data showed weak March factory orders from Germany and as countries across the eurozone soften, it increases the probability of a bearish scenario for the Norwegian Krone.
USD/NOK technical analysis
Based on the indicators of the daily chart, the Relative Strength Index (RSI) reveals a negative trend for the USD/NOK. The most recent RSI figure is in negative territory, although showing a marginal recovery from the previous session. This suggests that sellers are currently dominating the market but that bulls present a battle. In addition, the Moving Average Convergence Divergence (MACD) is producing flat red bars, indicating negative momentum and reinforcing that sellers dominate at present. However, a limited upward shift on the daily RSI could hint at potential volatility or a slight pullback.
USD/NOK daily chart
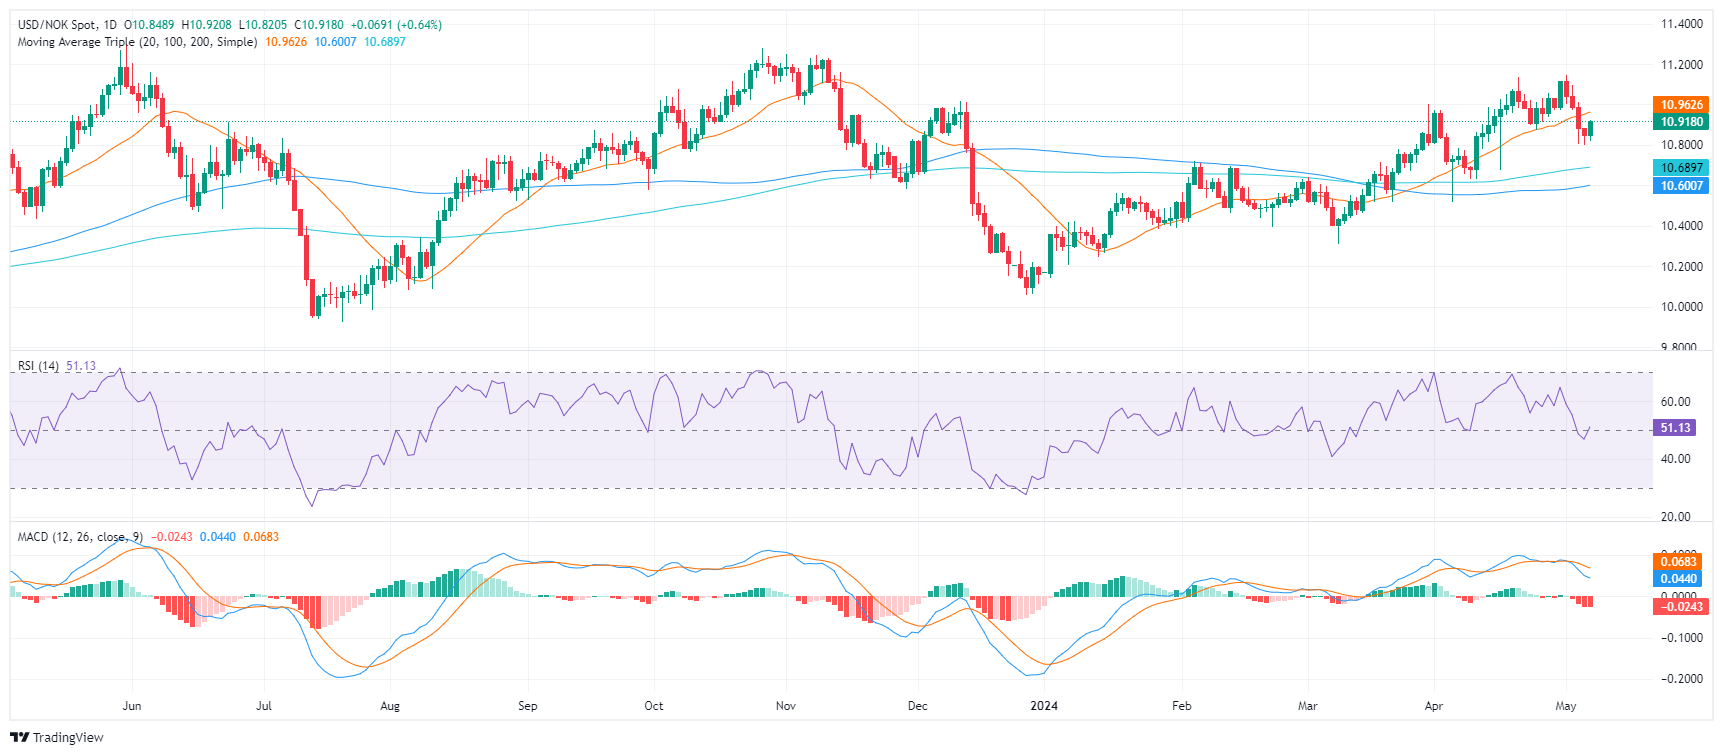
In the wider perspective, the USD/NOK pair is revealing signs of bullish momentum as it is positioned above the Simple Moving Averages (SMA) for the 100, and 200-day periods. This positioning indicates a continuation of the bullish dominance that traders should take into account. However, the short term is in the hands of the bears as they drove the pair below the 20-day SMA.
- Dow Jones softly higher on Tuesday but risk appetite remains tepid.
- Fed officials throw caution about broad-market rate cut hopes.
- Rate markets still see nearly 70% odds of a September rate trim.
The Dow Jones Industrial Average (DJIA) finds thin gains on Tuesday, climbing around a tenth of a percent halfway through the American market session. Still, broad-market risk appetite is being threatened by cautionary statements from Federal Reserve (Fed) officials highlighting the Fed’s lack of capacity to slash rates if inflation pressures and labor market tightness don’t show firmer signs of slackening.
Fed’s Kashkari: Rate hikes unlikely, but not entirely off the table
The Dow Jones gained a slim margin in early Tuesday trading, climbing a tenth of a percent but getting hung up on statements from Minneapolis Fed President Neel Kashkari, who noted that progress on bringing down inflation looks to have stalled. Kashkari also noted that the Fed will need to see progress on inflation and easing pressure in the US’ tight labor market before rate cuts can be fully considered, noting that the Fed is increasingly likely to hold rates where they are for much longer than the public expects.
According to the CME’s FedWatch Tool, rate markets still expect the Fed to deliver a first quarter-point rate cut at the September meeting. Rate traders see 67% odds of a September 25-basis-point cut, with over 90% odds that the Fed will deliver a second cut before the end of 2024.
Dow Jones news
Despite hawkish warning shots from Fed officials, most of the Dow Jones equities were in the green on Tuesday. Caterpillar Inc. (CAD) rose around 1.7% to trade near $348 per share, while Visa Inc. (V) gained 1.35%, rising 3.7 points to $276.32 per share.
On the downside, Walt Disney Co. (DIS) tumbled over -10% on the day, falling 112 points and declining to 104.80 per share after Disney reported a wide downside miss in membership growth in their subscription streaming offerings. Boeing Co. (BA) also lost -0.85%, shedding a point and a half to trade below $177 per share as the battered airline struggles under the weight of safety failures, shipping delays, and legal troubles.
Dow Jones technical outlook
The Dow Jones clipped into an intraday high near 38,980.00 on Tuesday before slipping back to flounder at the 38,900.00 handle. The major equity index is still trading into the bullish side, but struggling to make decisive gains above the day’s opening bids near 38,880.00.
The Dow Jones is trading well into bullish territory on daily candles, holding above long-term technical support from the 200-day Exponential Moving Average (EMA) near 36,842.67. The DJIA is on pace to close in the green for a fourth consecutive trading day, and remains well-bid above the last swing low into 37,600.00.
Dow Jones five-minute chart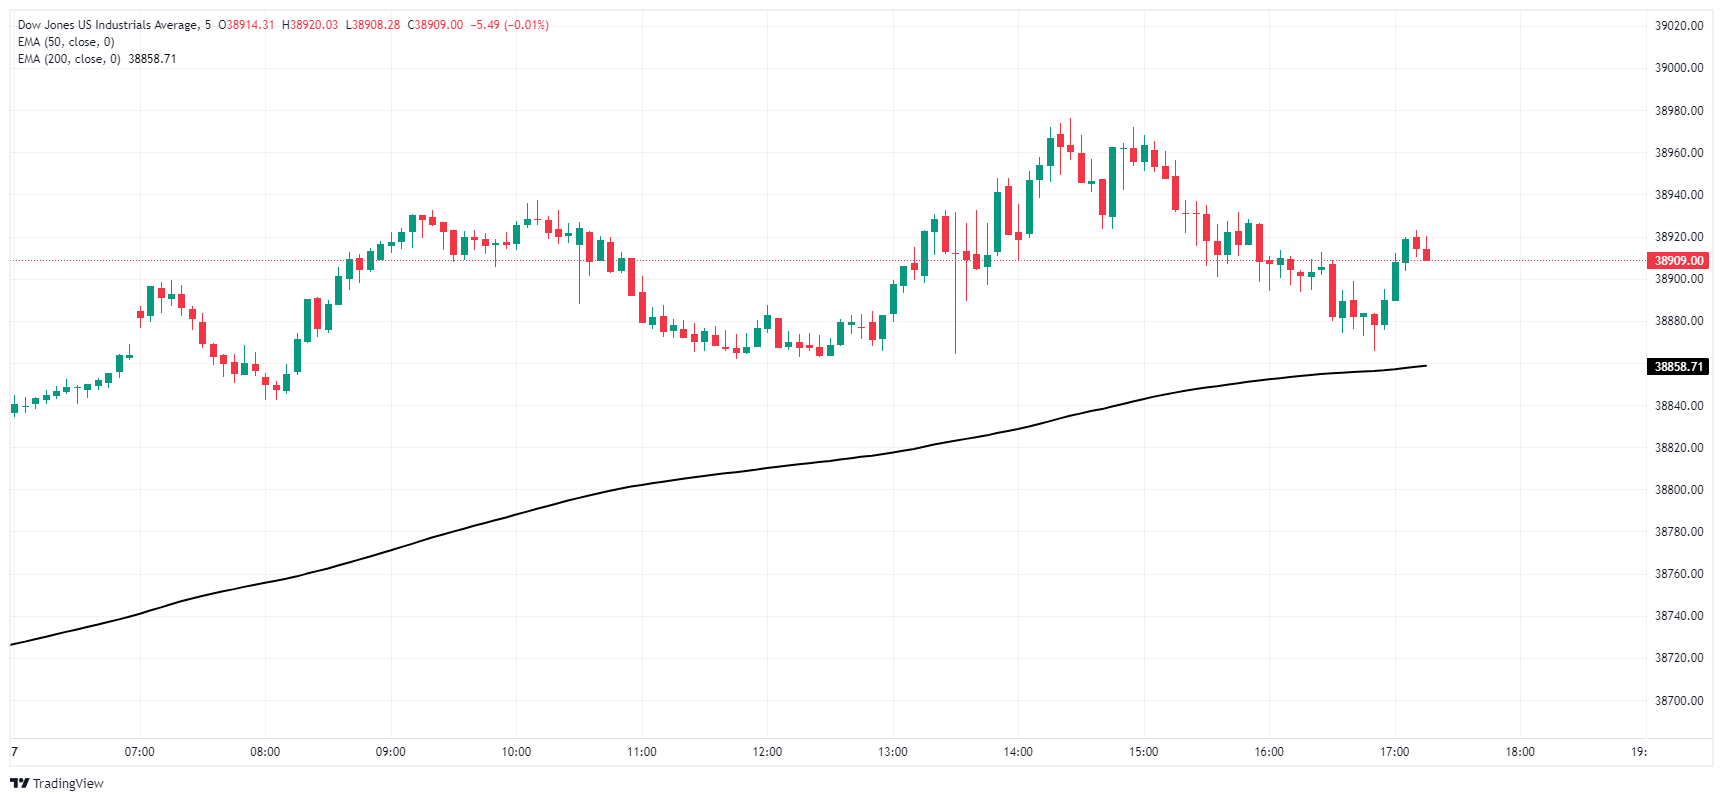
Dow Jones daily chart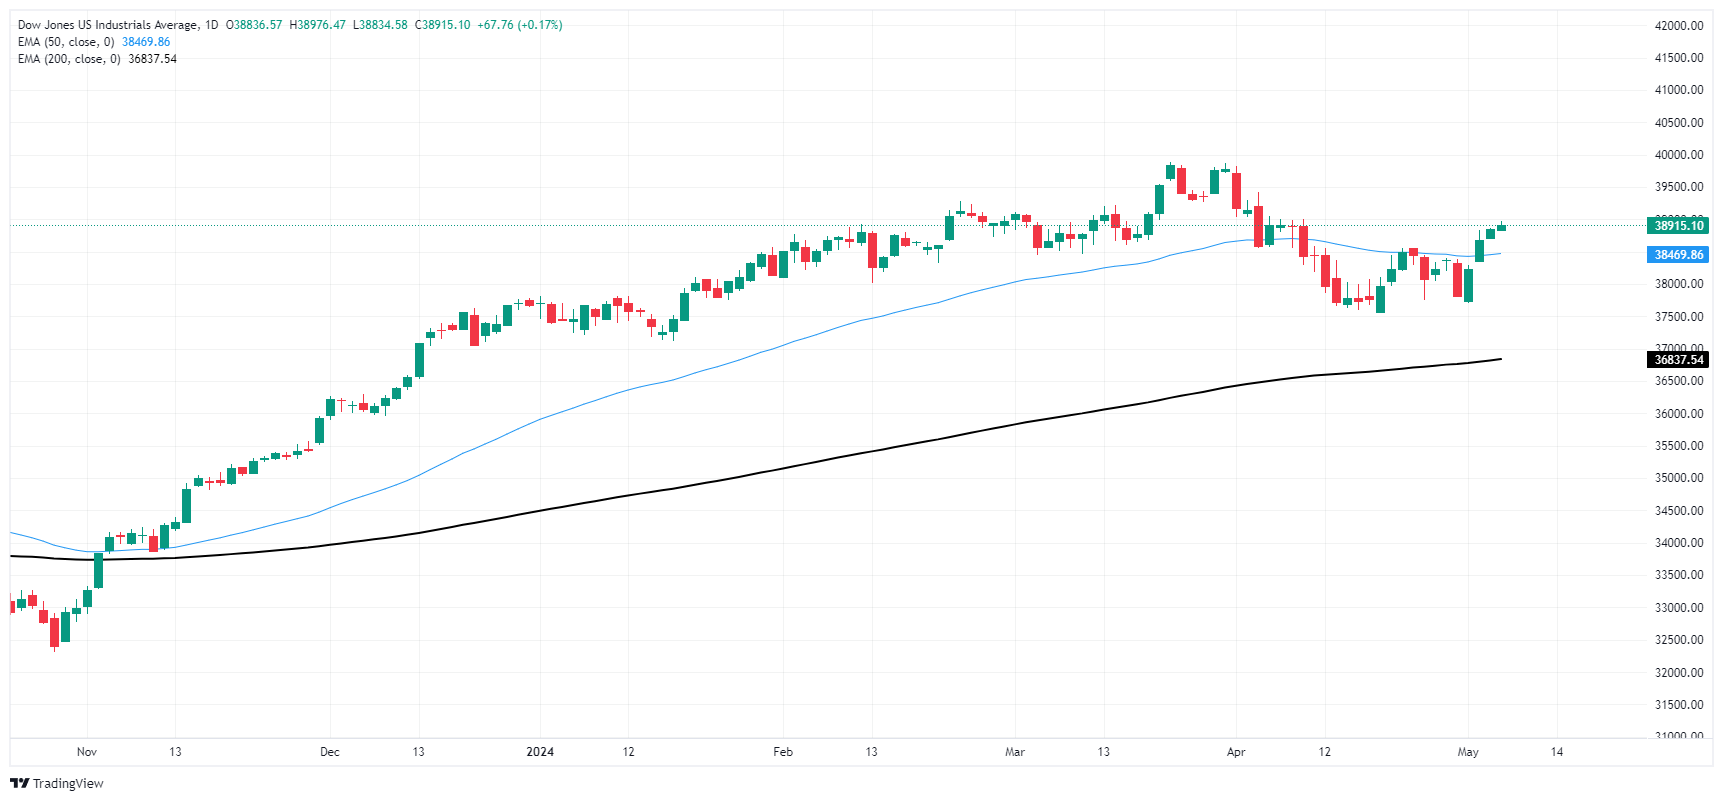
Dow Jones FAQs
The Dow Jones Industrial Average, one of the oldest stock market indices in the world, is compiled of the 30 most traded stocks in the US. The index is price-weighted rather than weighted by capitalization. It is calculated by summing the prices of the constituent stocks and dividing them by a factor, currently 0.152. The index was founded by Charles Dow, who also founded the Wall Street Journal. In later years it has been criticized for not being broadly representative enough because it only tracks 30 conglomerates, unlike broader indices such as the S&P 500.
Many different factors drive the Dow Jones Industrial Average (DJIA). The aggregate performance of the component companies revealed in quarterly company earnings reports is the main one. US and global macroeconomic data also contributes as it impacts on investor sentiment. The level of interest rates, set by the Federal Reserve (Fed), also influences the DJIA as it affects the cost of credit, on which many corporations are heavily reliant. Therefore, inflation can be a major driver as well as other metrics which impact the Fed decisions.
Dow Theory is a method for identifying the primary trend of the stock market developed by Charles Dow. A key step is to compare the direction of the Dow Jones Industrial Average (DJIA) and the Dow Jones Transportation Average (DJTA) and only follow trends where both are moving in the same direction. Volume is a confirmatory criteria. The theory uses elements of peak and trough analysis. Dow’s theory posits three trend phases: accumulation, when smart money starts buying or selling; public participation, when the wider public joins in; and distribution, when the smart money exits.
There are a number of ways to trade the DJIA. One is to use ETFs which allow investors to trade the DJIA as a single security, rather than having to buy shares in all 30 constituent companies. A leading example is the SPDR Dow Jones Industrial Average ETF (DIA). DJIA futures contracts enable traders to speculate on the future value of the index and Options provide the right, but not the obligation, to buy or sell the index at a predetermined price in the future. Mutual funds enable investors to buy a share of a diversified portfolio of DJIA stocks thus providing exposure to the overall index.
- Mexican Peso's rally halts following hawkish comments from Minneapolis Fed President Neel Kashkari.
- Mexico’s inflation report and Bank of Mexico's policy decision keep trading cautious; automotive data impresses while consumer confidence dips.
- Analysts expect Banxico to maintain rates for now, foresee rate cuts later this year.
The Mexican Peso erased some of its earlier gains against the US Dollar on Tuesday, snapping four days of consecutive gains. This price action was sponsored by hawkish comments made by Minneapolis Fed President Neel Kashkari. Additionally, traders bracing for the release of Mexico’s inflation report and the Bank of Mexico (Banxico) monetary policy decision would keep the exotic pair trading within familiar levels. The USD/MXN exchanged hands at 16.89, up 0.13%.
Mexico’s economic docket featured numbers linked to the automobile industry that were better than expected. However, consumer confidence has stalled, according to data revealed by the Instituto Nacional de Estadistica Geografia e Informatica (INEGI).
Meanwhile, most bank analysts estimated Banxico will keep interest rates unchanged with a unanimous vote by the Governing Council. Nevertheless, some expect the following meetings to be live, which could trigger split votes as two Deputy Governors, Irene Espinosa and Jonathan Heath, expressed that inflation remains high and that rates must remain at higher levels.
Bank of America analyst Carlos Capistran expects Mexico’s central bank to cut rates by a quarter of a percentage point in August, September, November and December.
Across the border, Federal Reserve (Fed) officials would dominate the economic schedule, which would feature Initial Jobless Claims on Thursday and the release of the University of Michigan Consumer Sentiment survey on Friday.
Neel Kashkari crossed the newswires and said the most likely scenario would be to hold rates flat for an extended period. He added that if needed, the Fed would hike rates, adding that the US economy is in a good place.
Daily digest market movers: Mexican Peso appreciates ahead of busy schedule
- Last week, Banxico’s April poll showed that private economists estimate inflation to end the year at 4.2% in 2024, underlying prices at 4.1% and the economy to grow by 2.25%. Regarding the USD/MXN, analysts revised their projections downward from 18.10 to 17.
- Mexico’s economic calendar will feature the release of the Consumer Price Index (CPI) for April, estimated at 0.18% MoM, below March’s reading. In the twelve months to April, the CPI is foreseen climbing from 4.42% to 4.63%.
- Mexico’s Consumer Confidence in April was unchanged at 47.3.
- Auto Exports grew 14.4% YoY in April, crushing the previous reading of 4.9%. Automobile Production increased by 21.7% YoY, which was up from 12.8% in March.
- Softer than expected, US jobs data increased the odds that the Fed might lower rates during the year after Nonfarm Payrolls missed by adding just 175K people to the workforce in April, trailing March’s revised 315K figure.
- That data, along with Fed officials acknowledging that risks to achieving its dual mandate on employment and inflation “moved toward better balance over the past year,” signals that if labor market data is weak, that could pave the way for cutting rates.
- Data from the futures market see odds for a quarter percentage point Fed rate cut in September at 85%, versus 55% ahead of last week’s Federal Open Market Committee (FOMC) decision.
Technical analysis: Mexican Peso on backfoot as USD/MXN aims toward 16.90
The USD/MXN downtrend remains intact, though it seems to bottom out near the 50-day Simple Moving Average (SMA) around 16.80. Worth noting that on Monday, I wrote that sellers were “gathering momentum as shown by the Relative Strength Index (RSI).” Nevertheless, the RSI has shifted bullish, which could pave the way for further upside.
The first resistance would be the 100-day Simple Moving Average (SMA) at 16.94, followed by the 17.00 mark. Once surpassed, the next supply area would be the 200-day Simple Moving Average at 17.17 followed by the January 23 swing high of 17.38 and the year-to-date high of 17.92.
On the other hand, If USD/MXN tumbles below the 50-day Simple Moving Average (SMA) at 16.81, that could pave the way to challenge the 2023 low of 16.62, followed by the current year-to-date (YTD) low of 16.25.

Mexican Peso FAQs
The Mexican Peso (MXN) is the most traded currency among its Latin American peers. Its value is broadly determined by the performance of the Mexican economy, the country’s central bank’s policy, the amount of foreign investment in the country and even the levels of remittances sent by Mexicans who live abroad, particularly in the United States. Geopolitical trends can also move MXN: for example, the process of nearshoring – or the decision by some firms to relocate manufacturing capacity and supply chains closer to their home countries – is also seen as a catalyst for the Mexican currency as the country is considered a key manufacturing hub in the American continent. Another catalyst for MXN is Oil prices as Mexico is a key exporter of the commodity.
The main objective of Mexico’s central bank, also known as Banxico, is to maintain inflation at low and stable levels (at or close to its target of 3%, the midpoint in a tolerance band of between 2% and 4%). To this end, the bank sets an appropriate level of interest rates. When inflation is too high, Banxico will attempt to tame it by raising interest rates, making it more expensive for households and businesses to borrow money, thus cooling demand and the overall economy. Higher interest rates are generally positive for the Mexican Peso (MXN) as they lead to higher yields, making the country a more attractive place for investors. On the contrary, lower interest rates tend to weaken MXN.
Macroeconomic data releases are key to assess the state of the economy and can have an impact on the Mexican Peso (MXN) valuation. A strong Mexican economy, based on high economic growth, low unemployment and high confidence is good for MXN. Not only does it attract more foreign investment but it may encourage the Bank of Mexico (Banxico) to increase interest rates, particularly if this strength comes together with elevated inflation. However, if economic data is weak, MXN is likely to depreciate.
As an emerging-market currency, the Mexican Peso (MXN) tends to strive during risk-on periods, or when investors perceive that broader market risks are low and thus are eager to engage with investments that carry a higher risk. Conversely, MXN tends to weaken at times of market turbulence or economic uncertainty as investors tend to sell higher-risk assets and flee to the more-stable safe havens.
- There won’t be any high-level US reports due this week.
- Fed officials aren’t providing any new insights on the bank’s next movements.
- The next highlight will be next Wednesday when the US releases April’s CPI figures.
The US Dollar Index (DXY) is trading at 105, registering mild gains. Market dynamics are currently influenced by Federal Reserve (Fed) Chair Jerome Powell's cautious remarks regarding the unpredictable trajectory of inflation despite an easing trend in recent times. As well as Powell, the Fed officials flagged concerns regarding sticky inflation, despite the long implementation of restrictive monetary policies. Unless any of the Fed speakers kick the table, there won’t be any big movements this week for the USD.
Investors got spooked on Friday by the soft labor market report and rushed to bet on sooner rate cuts. However, the US economy seems to be resilient, and the pace of the USD will be dictated by incoming data.
Daily digest market movers: DXY is mildly up, dovish bets and lower yields may limit upside
- Post-Fed policy meeting, expectations for Fed easing have dropped, keeping the odds for a June cut steady at around 10%. This indicates a prevalent trust in the strength of the US economy.
- Fed officials align with Powell's view, projecting a skeptical perspective for any imminent rate reduction. Market odds suggest varied easing possibilities - 10% for a June cut, 35% for July, and 85% for September.
- US Treasury bond yields recorded a dip with the 2-year yield at 4.80%, the 5-year yield at 4.44%, and the 10-year yield at 4.43%, which may limit the upside for the USD.
DXY technical analysis: DXY presents battle with bears struggling to hold command
On the daily chart, the Relative Strength Index’s (RSI) positive slope indicates the presence of upward momentum, albeit in negative territory. This suggests that bears currently have control, though buyers are fighting back. The Moving Average Convergence Divergence (MACD) shows a reduction in red bars, further hinting at sellers losing steam and a potential turn in momentum towards the upside.
Meanwhile, the recent price action seen on the charts shows bulls working toward recovery. The DXY is positioned below the 20-day Simple Moving Average (SMA), indicating recent bearish pressure. However, it remains above the 100 and 200-day SMAs. This positioning suggests that despite recent selling bouts, the long-term sentiment remains in favor of further upside.
US Dollar FAQs
The US Dollar (USD) is the official currency of the United States of America, and the ‘de facto’ currency of a significant number of other countries where it is found in circulation alongside local notes. It is the most heavily traded currency in the world, accounting for over 88% of all global foreign exchange turnover, or an average of $6.6 trillion in transactions per day, according to data from 2022. Following the second world war, the USD took over from the British Pound as the world’s reserve currency. For most of its history, the US Dollar was backed by Gold, until the Bretton Woods Agreement in 1971 when the Gold Standard went away.
The most important single factor impacting on the value of the US Dollar is monetary policy, which is shaped by the Federal Reserve (Fed). The Fed has two mandates: to achieve price stability (control inflation) and foster full employment. Its primary tool to achieve these two goals is by adjusting interest rates. When prices are rising too quickly and inflation is above the Fed’s 2% target, the Fed will raise rates, which helps the USD value. When inflation falls below 2% or the Unemployment Rate is too high, the Fed may lower interest rates, which weighs on the Greenback.
In extreme situations, the Federal Reserve can also print more Dollars and enact quantitative easing (QE). QE is the process by which the Fed substantially increases the flow of credit in a stuck financial system. It is a non-standard policy measure used when credit has dried up because banks will not lend to each other (out of the fear of counterparty default). It is a last resort when simply lowering interest rates is unlikely to achieve the necessary result. It was the Fed’s weapon of choice to combat the credit crunch that occurred during the Great Financial Crisis in 2008. It involves the Fed printing more Dollars and using them to buy US government bonds predominantly from financial institutions. QE usually leads to a weaker US Dollar.
Quantitative tightening (QT) is the reverse process whereby the Federal Reserve stops buying bonds from financial institutions and does not reinvest the principal from the bonds it holds maturing in new purchases. It is usually positive for the US Dollar.
- Canadian Dollar easing but sticking to midrange.
- Canada Ivey PMI beat expectations in April.
- CAD markets wait for Friday’s Canadian labor data.
The Canadian Dollar (CAD) was broadly softer on Tuesday but stuck close to near-term technical levels as CAD markets shrugged off better-than-expected Ivey Purchasing Managers Index (PMI) figures from Canada. Markets await soundbites from Federal Reserve (Fed) policymakers as investors broadly focus on the Fed’s rate cut outlook.
Canada saw an improvement in the seasonally-adjusted Ivey PMI for April, signaling that business leaders in both the private and public sectors of Canada’s economy see an improvement in overall business activity. However, battered Crude Oil markets and floundering barrel prices limit the CAD’s ability to find higher ground.
Daily digest market movers: Upbeat Canadian PMIs fail to spark bullish interest
- Canada’s seasonally-adjusted Ivey PMI for April improved to 63.0 from 57.5, beating the forecast of 58.1.
- April’s Ivey PMI hit a two-year high, printing its highest activity survey result since May of 2022.
- Broader markets continue to focus on Fedspeak as investors hope for signs of rate cuts from the Fed.
- Thursday’s Financial System Review from the Bank of Canada (BoC) is widely expected to produce market moves.
- CAD traders looking out for Friday’s Canadian Net Change in Employment and Unemployment Rate numbers.
- Canada’s Net Change in Employment forecast to add net 20K jobs in April after the previous month’s -2.2K decline.
- The Canadian Unemployment Rate is expected to have increased to 6.2% in April, up slightly from the previous month’s 6.1%.
Canadian Dollar price today
The table below shows the percentage change of Canadian Dollar (CAD) against listed major currencies today. Canadian Dollar was the weakest against the Euro.
| USD | EUR | GBP | CAD | AUD | JPY | NZD | CHF | |
| USD | -0.07% | 0.13% | 0.20% | 0.17% | 0.15% | -0.09% | 0.00% | |
| EUR | 0.08% | 0.20% | 0.28% | 0.26% | 0.25% | -0.01% | 0.10% | |
| GBP | -0.12% | -0.20% | 0.09% | 0.08% | 0.06% | -0.20% | -0.09% | |
| CAD | -0.19% | -0.30% | -0.07% | -0.01% | -0.03% | -0.29% | -0.18% | |
| AUD | -0.17% | -0.26% | -0.06% | 0.01% | -0.01% | -0.28% | -0.16% | |
| JPY | -0.15% | -0.25% | -0.05% | 0.02% | 0.00% | -0.26% | -0.15% | |
| NZD | 0.11% | 0.01% | 0.23% | 0.29% | 0.29% | 0.26% | 0.12% | |
| CHF | -0.03% | -0.10% | 0.09% | 0.17% | 0.16% | 0.14% | -0.13% |
The heat map shows percentage changes of major currencies against each other. The base currency is picked from the left column, while the quote currency is picked from the top row. For example, if you pick the Euro from the left column and move along the horizontal line to the Japanese Yen, the percentage change displayed in the box will represent EUR (base)/JPY (quote).
Technical analysis: Canadian Dollar stubbornly swims in familiar circles
The Canadian Dollar (CAD) is broadly softer on Tuesday, giving up most of Monday’s early gains to trade into familiar bids. The CAD is flat to down across the board, shedding around a third of a percent against the New Zealand Dollar (NZD) and the Euro (EUR). The CAD is also down around a quarter of a percent against the US Dollar (USD).
USD/CAD rose into touching range of the 1.3700 handle on Tuesday with the CAD shrugging off Monday’s slim gains. The pair is trading into congestion near the 200-hour Exponential Moving Average (EMA) at 1.3697, and the Canadian Dollar has leaked away most of the gains found after last Friday’s US Nonfarm Payrolls (NFP) print dragged the pair down to 1.3610.
Daily candlesticks show USD/CAD finding near-term technical support from the 50-day EMA at 1.3629, with long-term bullish pressure from the 200-day EMA at 1.3552. The pair is still down from mid-April’s peak near 1.3850, but USD/CAD is still trading higher for the year, up 3.4% from January’s opening bids near 1.3250.
USD/CAD hourly chart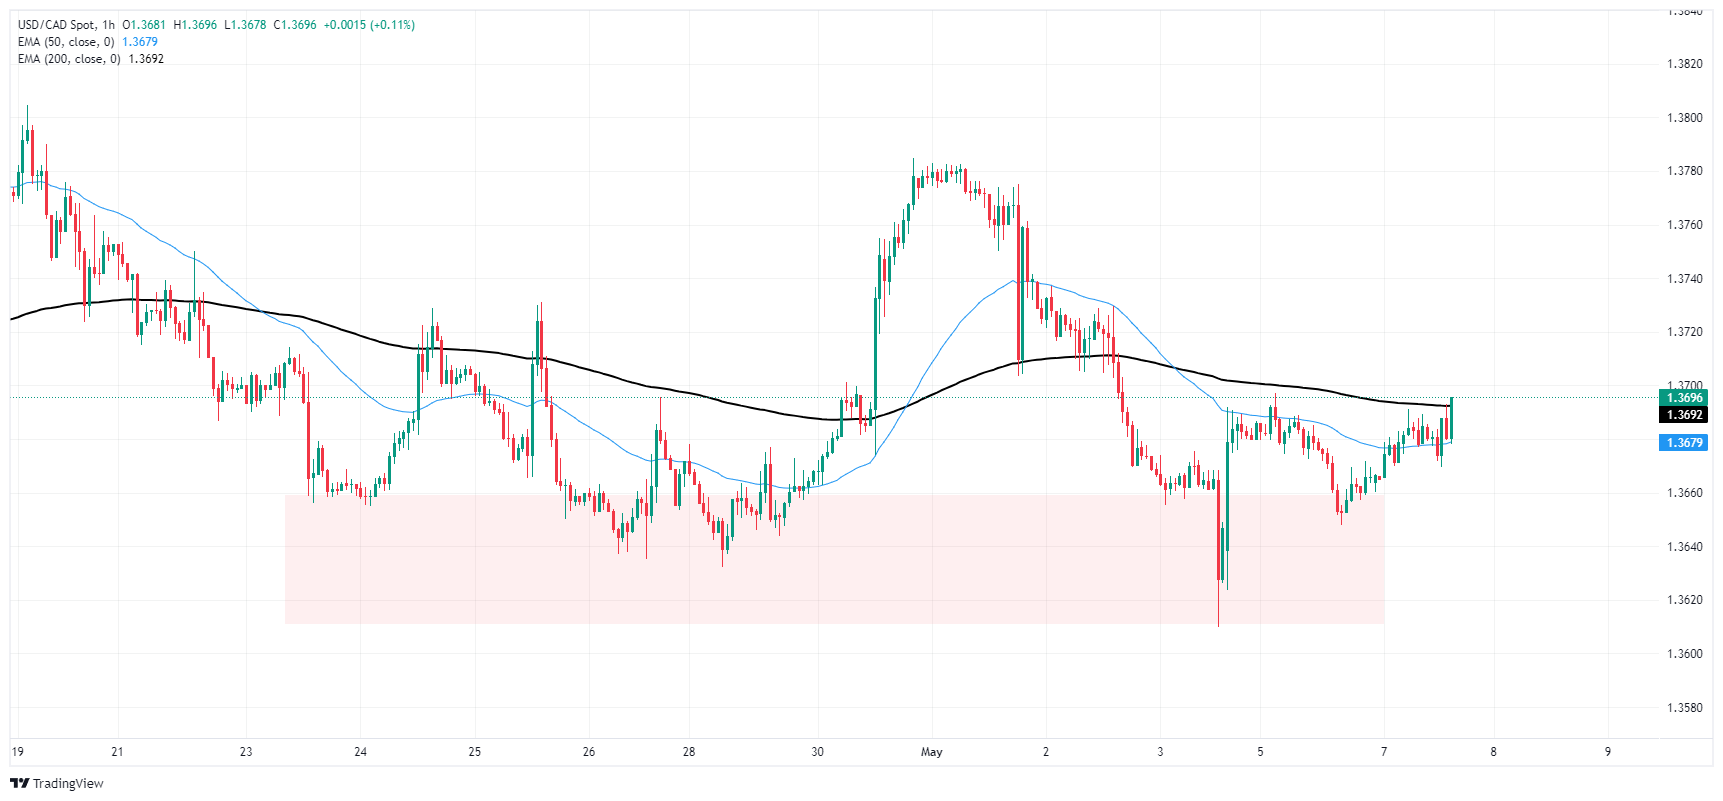
USD/CAD daily chart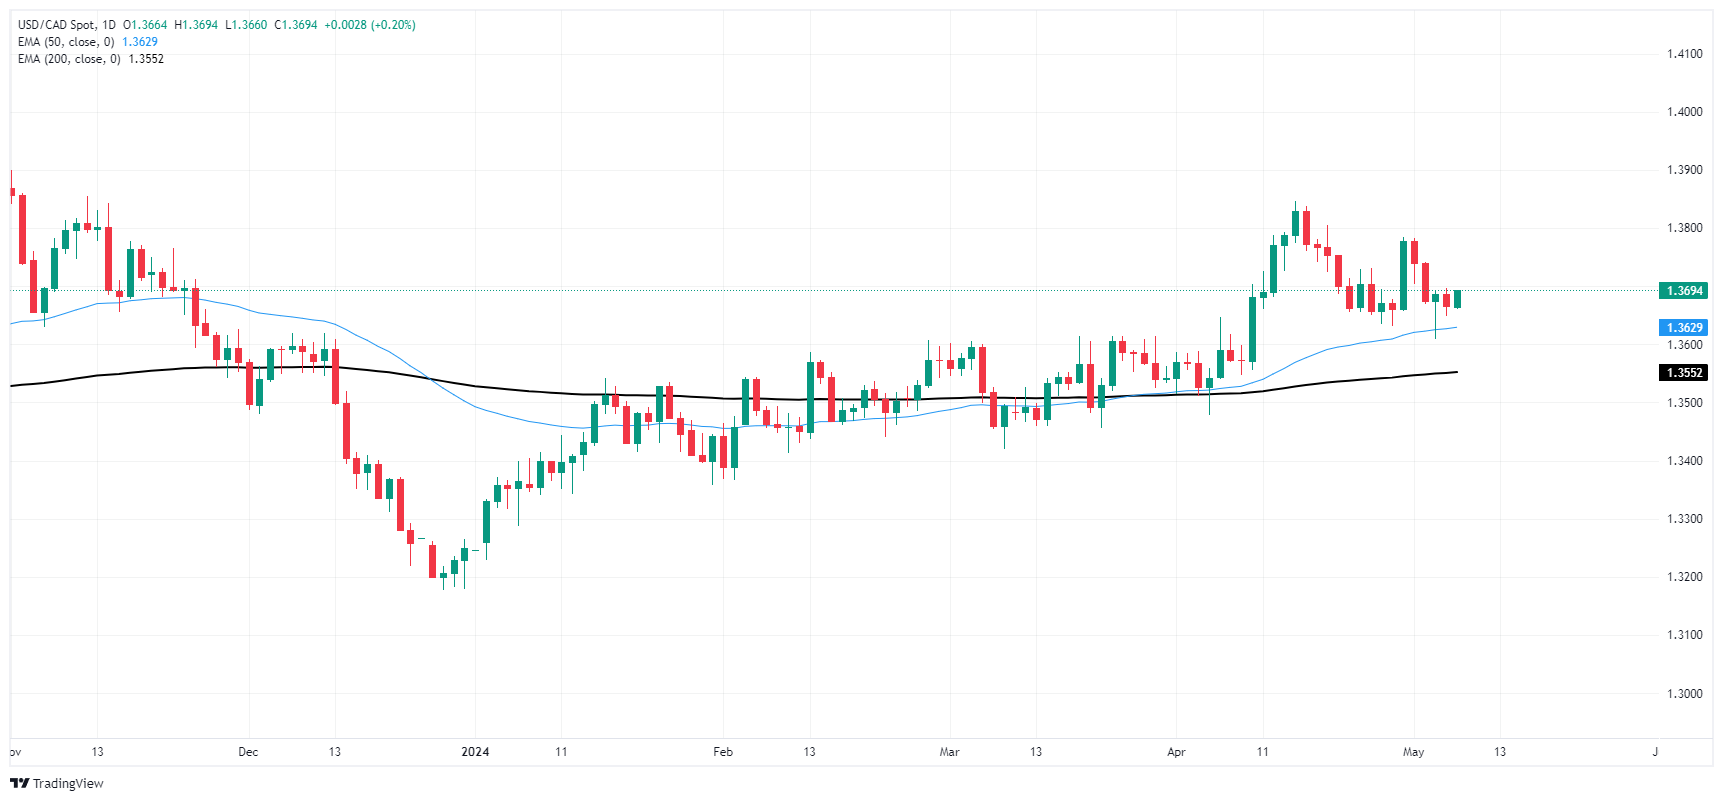
Canadian Dollar FAQs
The key factors driving the Canadian Dollar (CAD) are the level of interest rates set by the Bank of Canada (BoC), the price of Oil, Canada’s largest export, the health of its economy, inflation and the Trade Balance, which is the difference between the value of Canada’s exports versus its imports. Other factors include market sentiment – whether investors are taking on more risky assets (risk-on) or seeking safe-havens (risk-off) – with risk-on being CAD-positive. As its largest trading partner, the health of the US economy is also a key factor influencing the Canadian Dollar.
The Bank of Canada (BoC) has a significant influence on the Canadian Dollar by setting the level of interest rates that banks can lend to one another. This influences the level of interest rates for everyone. The main goal of the BoC is to maintain inflation at 1-3% by adjusting interest rates up or down. Relatively higher interest rates tend to be positive for the CAD. The Bank of Canada can also use quantitative easing and tightening to influence credit conditions, with the former CAD-negative and the latter CAD-positive.
The price of Oil is a key factor impacting the value of the Canadian Dollar. Petroleum is Canada’s biggest export, so Oil price tends to have an immediate impact on the CAD value. Generally, if Oil price rises CAD also goes up, as aggregate demand for the currency increases. The opposite is the case if the price of Oil falls. Higher Oil prices also tend to result in a greater likelihood of a positive Trade Balance, which is also supportive of the CAD.
While inflation had always traditionally been thought of as a negative factor for a currency since it lowers the value of money, the opposite has actually been the case in modern times with the relaxation of cross-border capital controls. Higher inflation tends to lead central banks to put up interest rates which attracts more capital inflows from global investors seeking a lucrative place to keep their money. This increases demand for the local currency, which in Canada’s case is the Canadian Dollar.
Macroeconomic data releases gauge the health of the economy and can have an impact on the Canadian Dollar. Indicators such as GDP, Manufacturing and Services PMIs, employment, and consumer sentiment surveys can all influence the direction of the CAD. A strong economy is good for the Canadian Dollar. Not only does it attract more foreign investment but it may encourage the Bank of Canada to put up interest rates, leading to a stronger currency. If economic data is weak, however, the CAD is likely to fall.
Federal Reserve (Fed) of Minneapolis President Neel Kashkari hit newswires for the second time on Tuesday as the Fed official weighs in on the Fed's inflation and interest rate outlook for the rest of the year.
Key highlights
- Most likely scenario is rates stay put for an extended period.
- If disinflation returns, or we see marked weakening in the job market, that might lead to rate cuts.
- Raising rates is not the most likely, but it can't be ruled out.
- If we see a marked labor weakening, it could spur a cut.
- Friday's jobs report was softer than expected, but not actually soft.
- New lease rates seem to have ticked up, and that's a little concerning.
- If inflation becomes embedded, we might hike if needed.
- Kashkari would need to see multiple readings on inflation to be confident enough to cut rates.
- Kashkari put down 2 rate cuts in 2024 in March, it's possible it will stay at 2, or go to 1 or even 0 rate cuts for the June SEP.
- The US economy is in a good place.
- It looks like we will go sideways for a while.
- We need to be more patient.
- Keeping rates where they are for longer than the public expects is much more likely than raising rates.
- GBP/USD trades with minor losses, movements bounded by key levels before BoE decision.
- Technical outlook neutral to slightly bullish; resistance at recent high of 1.2594 and 50-DMA at 1.2607.
- Break below 200-DMA at 1.2545 could trigger further declines, with supports at 1.2500 and May 1 low of 1.2466.
The Pound Sterling registers anemic losses against the US Dollar as traders brace for the Bank of England’s (BoE) monetary policy decision on Thursday. The pair remained within the 1.2529-1.2594 boundaries during the last few days, capped by key support and resistance levels. The GBP/USD trades at 1.2556, down 0.04%.
GBP/USD Price Analysis: Technical outlook
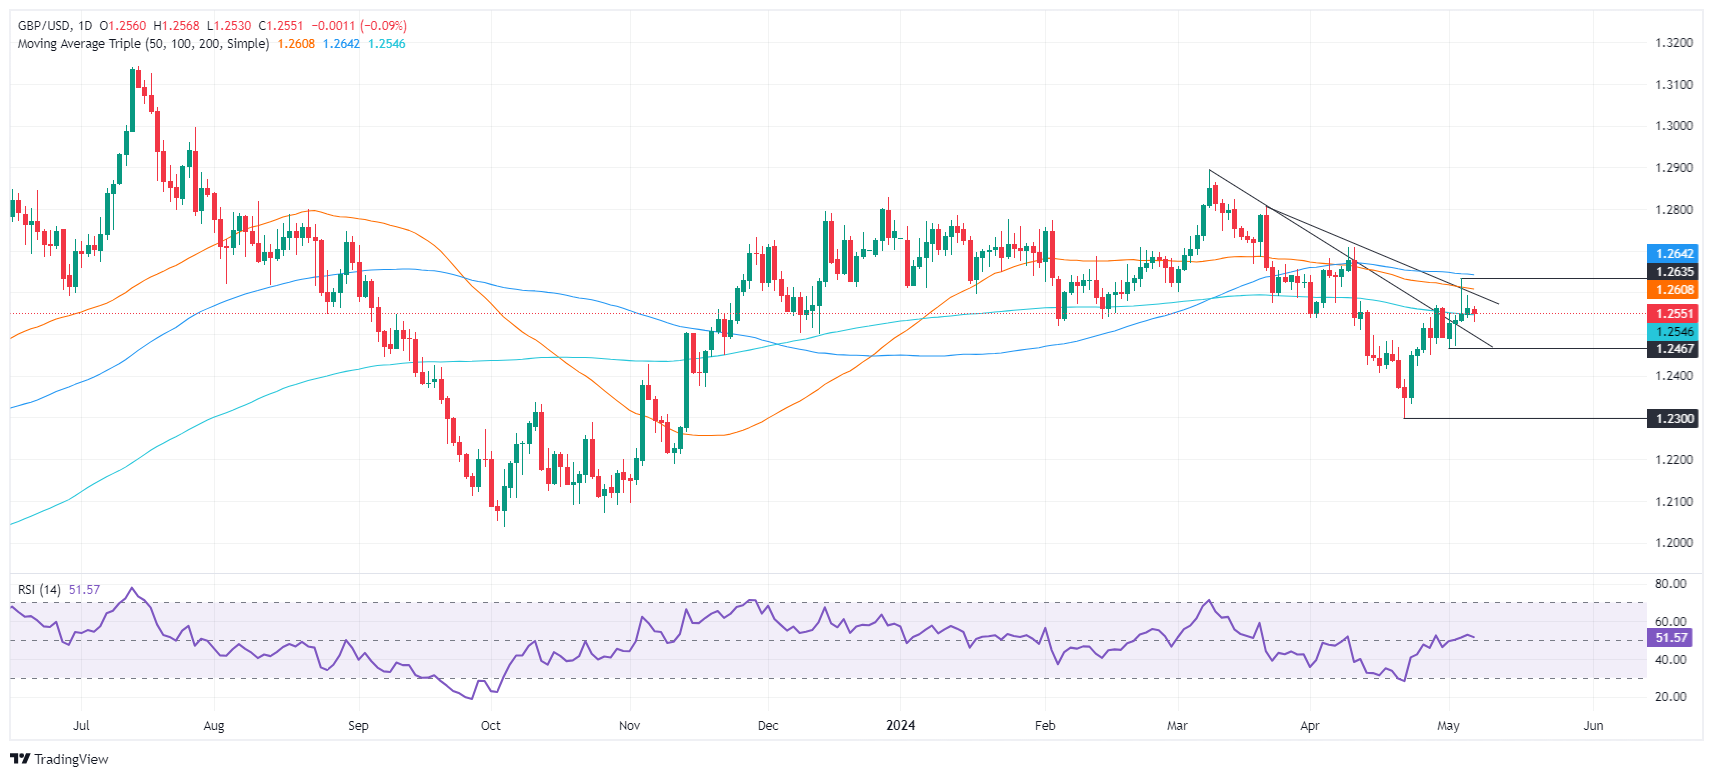
The daily chart portrays the pair as neutral-biased, with momentum skewed to the upside, as depicted by the Relative Strength Index (RSI). The RSI is bullish, though close to the 50-midline, an indication that volatile price action could trigger a momentum shift.
With that said the first resistance of the GBP/USD would be the May 6 high at 1.2594. Once cleared, that could pave the way to test 1.2600, ahead of the 50-day moving average (DMA) at 1.2607. Further upside is seen at the 100-DMA at 1.2640, followed by the April 9 high at 1.2709.
On the other hand, if the GBP/USD dips below the 200-DMA at 1.2545, that would exacerbate a test of 1.2500. Once hurdled, the next support emerged at the May 1 low of 1.2466, followed by the 1.2400 figure.
GBP/USD Price Action – Daily Chart
- USD/JPY recovers after last week’s losses on possible intervention and weak US jobs data.
- Janet Yellen’s mild criticism of intervention may have helped the pair higher.
- Japanese currency officials continue to threaten intervention, filling the road higher with “potholes”.
USD/JPY trades at 154.35 on Tuesday, up almost three tenths of a percentage point, mainly as a result of the US Dollar (USD) ending its post-FOMC losing streak and recovering on the back of comments from Federal Reserve (Fed) officials suggesting they are not in a hurry to cut interest rates.
The maintenance of higher interest rates for longer and further delaying of possible cuts is beneficial for the USD as it attracts more foreign capital inflows. This, and the fact that – in the case of USD/JPY – interest rates in the US are so much higher than in Japan, further aids USD and disproportionately disadvantages JPY.
Barkin Rules out rate cut – BBH
The Federal Reserve bank of Richmond Chair Thomas Barkin said on Monday that he thought rates were high enough to bring inflation back to our target, but that “The full impact of higher rates is yet to come.”
“This is basically ruling out a rate cut,” concluded analysts at Brown Brothers Harriman:
Another bullish factor for USD/JPY is that overall interest-rate cut expectations in the US continue to fade. Now it’s not till November that a first rate cut is fully priced in.
“Odds of a June cut remain steady at around 10%, but July odds have fallen to 35% and September odds have fallen to 85%. A November cut is still fully priced in,” continues BBH.
Yellen cautions Japanese authorities
USD/JPY has benefited from another backdraught of late after it was revealed that Janet Yellen was not as supportive of Japan and Korea using intervention to prop up their currencies as had been thought – especially after their recent currency summit.
In words over the weekend, Yellen was more critical, saying she’d prefer it if intervention was only used on rare occasions and that the US was notified prior to the event.
“US Treasury Secretary Janet Yellen’s observation that FX intervention should be rare, and accompanied by consultation, doesn’t suggest a weaker Dollar is particularly desirable,” said Kit Juckes, FX Strategist at Societe Generale in a note on Tuesday.
“It will embolden Yen bears…but whether we see another test, or a break of USD/JPY 160, depends more on the CPI data than anything else,” he added.
Ueda changes his mind about impact of weak Yen
Given the continued verbal warnings from Japan’s various “Princes of the Yen” however, USD/JPY bulls will still need to be mindful of possible “snakes” of intervention bringing prices sliding back down.
On Tuesday, Bank of Japan (BoJ) Governor Katzuo Ueda once again repeated that excessive Yen moves are undesirable. However, he added that he was closely monitoring how the weak Yen affected “prices”.
Analysts at BBH point out that this marks a 180 degree pivot for Ueda who said after the April 26 BoJ meeting, that a weak Yen was “not having a big impact on underlying prices yet”.
His blunder after the BoJ meeting led to “further yen weakness and so Ueda seems to be doing some damage control,” BBH added.
Ueda’s change of tone may be designed to appease certain business groups who are not happy with a weak Yen. The chairman of Japan’s Keidanren business lobby, Masakazu Tokura, said recently, the Yen is too weak beyond 150 to the Dollar.
Further, top currency diplomat Masato Kanda also repeated his usual warning that the government will respond appropriately if there are excessive or disorderly movements in the FX market.
All in all it suggests many reasons why the Japanese authorities are still probably ready to pull the trigger on further intervention, suggesting USD/JPY's ride higher could continue to be a bumpy one.
- USD/CAD remains offered near 1.3700 as the US Dollar struggles to hold an auction above 105.00.
- Weak US data and less hawkish commentary from Fed Williams have weighed on the US Dollar.
- Canadian employers are anticipated to have hired 20K job-seekers in April.
The USD/CAD pair consistently faces pressure near the round-level resistance of 1.3700. The Loonie asset is broadly sideways around 1.3680 due to the absence of top-tier United States economic data this week. In Canada, investors will keenly focus on the Employment data for April, which will be released on Friday.
Therefore, speculation about the Federal Reserve’s (Fed) and Bank of Canada’s (BoC) interest rate outlook will guide the movement in the Loonie asset.
The market sentiment is slightly bullish amid firm speculation that the Fed will begin lowering interest rates from its current level in the September meeting. The S&P 500 opens on a cautiously positive note, suggesting an improvement in investors’ risk appetite. 10-year US Treasury yields have dropped to 4.45% as the Fed unwinding its restrictive interest rate stance is an unfavorable condition for interest-bearish assets.
The US Dollar Index (DXY) struggles to sustain above 105.00 as weak US Nonfarm Payrolls (NFP) and poor Services PMI data for April has prompted expectations for the Fed to start reducing borrowing rates from September. Weak US data has raised concerns over the US economic outlook, which investors had been anticipating as strong due to upbeat Gross Domestic Product (GDP) growth.
Meanwhile, less hawkish commentary from Fed policymakers has also weighed on the US Dollar. On Monday, New York Fed Bank President John Williams said the next move from the central bank will be rate cuts.
On the Canadian Dollar front, investors await the Employment data that will influence expectations for BoC rate cuts, which are currently anticipated in the June meeting. Statistics Canada is expected to report an increase in number of payrolls by 20K against a drawdown of 2.2K in March. The Unemployment Rate is estimated to increase to 6.2% from the prior reading of 6.1%. Investors will keenly focus on the annual Average Hourly Wages data that will indicate wage growth, which indicates the inflation outlook.
Minneapolis Federal Reserve President Neel Kashkari said on Tuesday that inflation moving sideways raises questions about how restrictive policy is, per Reuters.
Key takeaways
"Housing market is proving more resilient to tight monetary policy than it has been in the past."
"Possible that housing market resilience means neutral rate has been pushed higher at least in the short term."
"Inflation progress seen in latter half of 2023 appears to have stalled; question is whether disinflation is still underway or just taking longer."
"Recent slow GDP due to inventories and net exports; underlying demand remained strong."
"Yield curve inversion does suggest that policy is tight."
"Among factors sustaining housing market are inadequate supply, and demand possibly boosted by immigration, work from home arrangements."
"Inflation moving sideways raises questions about how restrictive policy is."
"Policymakers misperceiving the current neutral rate could explain current data."
Market reaction
These comments don't seem to be impacting the US Dollar's valuation. At the time of press, the US Dollar Index was unchanged on the day at 105.10.
- Silver price exhibits gains above $27.00 due to deepening optimism over Fed reducing rates in September.
- Weak US labor market boosts expectations of Fed rate cuts.
- Lower bond yields improve demand for Silver.
Silver price (XAG/USD) falls slightly from weekly high of $27.50 but manages a firm-footing above the crucial support of $27.00 in Tuesday’s late European session. The white metal holds strength as investors remain optimist about the Federal Reserve (Fed) reducing interest rates in the September meeting.
The speculation for the Fed lowering interest rates from September have strengthened as recent United States economic data for April has indicated that the economy is struggling to cope with the restrictive interest rate framework by the Fed.
The US Nonfarm Payrolls (NFP) report released on Friday indicated fewer job additions, higher Unemployment Rate and slower wage growth. Signs of easing labor market conditions build confidence of the Fed pivoting to interest rate cuts from September. Cooling labor market conditions suggest a soft inflation outlook.
10-year US Treasury yields fall to 4.46%. A decline in yields on interest-bearing assets reduces the opportunity cost of holding investment in non-yielding assets, such as Silver. The US Dollar Index (DXY), which tracks the Greenback’s value against six major currencies, trades above 105.00.
Meanwhile, deepening risks of Israel extending operation to Rafah, the southern part of Gaza, have improved the appeal of bullions. The Israel assault at Gaza is expected to worsen further as it has denied ceasefire proposal, which was agreed by Hamas, stating that it doesn’t meet their demands. Risks of geopolitical uncertainty are favorable for safe-haven assets such as Silver.
Silver technical analysis
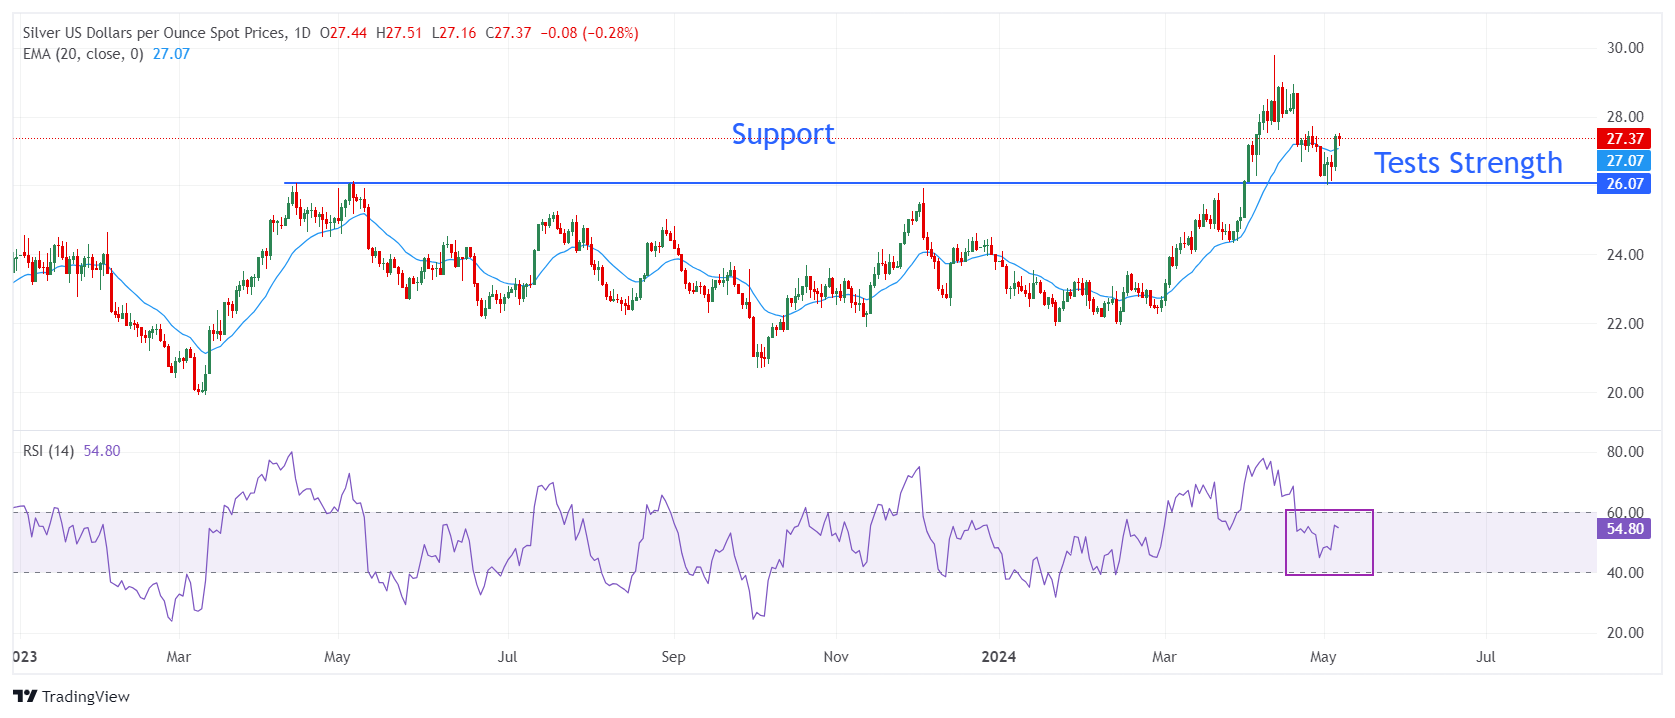
Silver price recovers after testing strength of the prior horizontal support plotted from 14 April 2023 high around $26.09 on a daily timeframe. The above-mentioned support was earlier a major resistance for the Silver price bulls. The uncertainty over Silver’s near-term outlook still remains as it has yet not settled above the 20-period Exponential Moving Average (EMA), which trades around $27.20.
The 14-period Relative Strength Index (RSI) slips into the 40.00-60.00, suggesting that the bullish momentum has faded. However, the long-term outlook is still stable.
Silver daily chart
- Silver price has recovered after meeting the conservative target for a Bear Flag pattern.
- It is now threatening to reverse the short-term downtrend and begin a new uptrend.
- A break above the May 7 highs at $27.51 would probably signal a bullish reversal of trend.
Silver (XAG/USD) price is threatening to reverse the short-term downtrend it has been in since April 12 and begin a new uptrend. This is significant given the old maxim that “the trend is your friend” since a reversal of the trend would indicate a switch to a bullish bias, favoring longs.
4-hour Chart
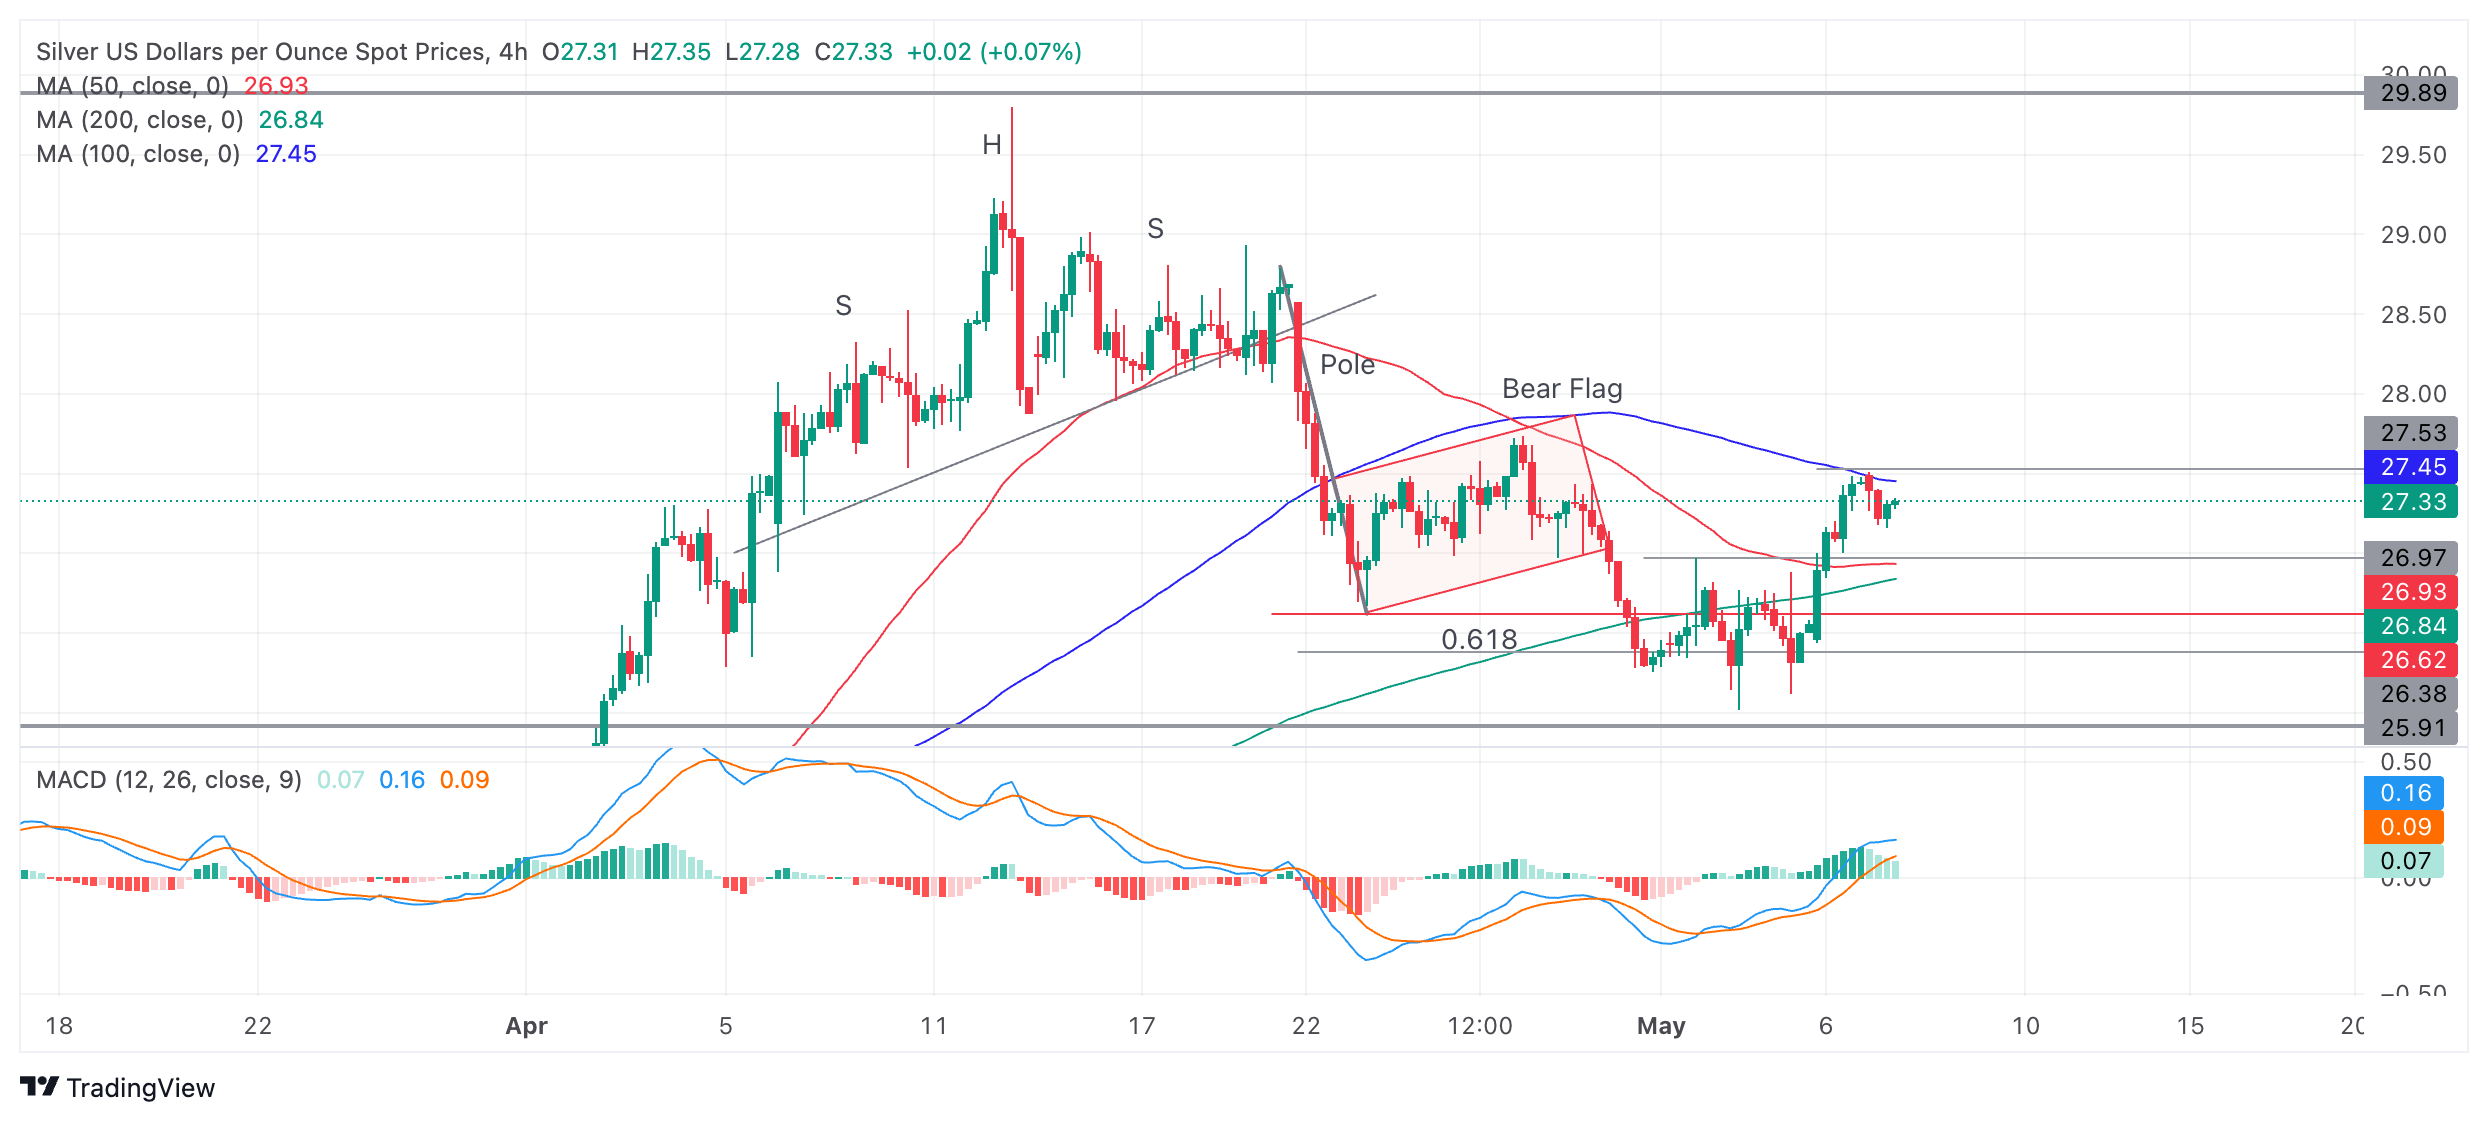
If Silver price breaks above the $27.53 May 7 highs it will probably increase the growing body of evidence that points to a reversal of the trend. Silver has risen strongly since it bottomed at the beginning of May; it has broken above the last higher low of the downtrend and breached both the 50 and 200 Simple Moving Averages (SMA). Bullish momentum has been strong during the up move. The MACD is now above the zero line and it formed a double bottom pattern during late April and May. When MACD forms a double bottom bullish reversal pattern it is often a sign the underlying asset price is also reversing.
As such a break above the May 7 highs would probably usher in a new bullish trend and lead to a continuation higher to the next target at $27.74, followed by a target at around $28.80.
Bear Flag reaches conservative target
Silver formed a Bear Flag continuation price pattern after reversing from the April highs at about $30.00. The pattern broke to the downside and declined to its conservative target. After a few bounces it started to reverse higher.
There is a possibility that Silver price will fail to break above the May 7 highs and instead roll over. If so it will probably mean the short-term downtrend is still in force and the Bear Flag's second target could still be achieved.
In such a scenario, Silver price will probably first fall to support at $26.10. Further weakness would probably lead to the next target to the downside at support from a long-term upper range boundary line at about $25.80. Yet more weakness could even see it reach the second target for the Bear Flag at $25.50.
- The US Dollar trades in the green across the board through the European session.
- Traders are sending Greenback higher on a mixture of geopolitical fears and positive earnings.
- The US Dollar Index trades back above 105.00 after bulls were able to close in positive on Monday.
The US Dollar (USD) trades higher on Tuesday for a second consecutive day as several factors support the Greenback. Markets are pricing in again some risk premium as Israel looks set to start its ground invasion in Rafah, and Egypt has chored up its border control at its northern border with Gaza. Meanwhile substantial easing in the Australian Dollar (AUD/USD) and Japanese Yen (USD/JPY) adds to support for the Greenback.
On Tuesday, the US Redbook Index and the Economic Optimism measured by the TechnoMetrica Institute of Policy and Politics are the two main economic data points to be released. In this week's rather packed US Federal Reserve (Fed) speakers’ agenda, only Federal Reserve Bank of Minneapolis President Neel Kashkari is set to speak. Meanwhile, traders can digest the release of the Senior Loan Officer Opinion Survey (SLOOS) for the first quarter, which pointed out on Monday that tightened lending standards are still the norm while consumer delinquencies are picking up.
Daily digest market movers: Kashkari Fed heavyweight
- The United Kingdom was closed for a bank holiday on Monday and could see some catching up across several asset classes with London reopening on Tuesday.
- At 12:55 GMT, the Redbook Index for the week ending on May 3 will be released. The previous number was 5.5%.
- At 14:00 GMT, the TechnoMetrica Institute of Policy and Politics will release its Economic Optimism Survey for May. An uptick to 44.1 is expected from the previous reading of 43.2.
- Federal Reserve Bank of Minneapolis President Neel Kashkari will speak at around 15:30 GMT in a conversation at the Milken Institute 2024 Global Conference in Beverly Hills, California. Although Kashkari is a non-voter member this year, his comments have been market movers for the past few months.
- The US Department of the Treasury is set to auction 3-year Notes at 17:00 GMT.
- Finally, at 19:00 GMT, the Consumer Credit Change for March is set to be released. A further increase is expected to $15 billion from the $14.12 billion in the previous month.
- Japan is also back to open for business after a bank holiday. Overall, the positive close from the US equities overnight has spilt over into the Asian-Pacific session and is even rippling through into the European trading session, with green numbers across the board in all major indices.
- The CME Fedwatch Tool suggests a 91.3% probability that June will still see no change to the Federal Reserve's fed fund rate. Odds of a rate cut in July are also out of the cards, while for September the tool shows a 49.7% chance that rates will be 25 basis points lower than current levels.
- The benchmark 10-year US Treasury Note trades around 4.47%, in the middle of Monday’s range.
US Dollar Index Technical Analysis: Some help from across the Pacific
The US Dollar Index (DXY) ticks up on Tuesday after Dollar bulls were able to close above 105.00 on Monday after a correction move in recent days. This could be crucial for the rest of the week and could see the DXY tick up further from here. Although no real major known catalysts are foreseen for this week, a recovery back to 106.00 could be plausible if USD/JPY rallies further towards 157.00
On the upside, 105.52 (a pivotal level since April 11) needs to be recovered through a daily close above this level before targeting the April 16 high at 106.52 for a third time. Further up and above the 107.00 round level, the DXY index could meet resistance at 107.35, the October 3 high.
On the downside, the 55-day and the 200-day Simple Moving Averages (SMAs) at 104.54 and 104.25, respectively, should provide ample support. If those levels are unable to hold, the 100-day SMA near 103.89 is the next best candidate.
US Dollar FAQs
The US Dollar (USD) is the official currency of the United States of America, and the ‘de facto’ currency of a significant number of other countries where it is found in circulation alongside local notes. It is the most heavily traded currency in the world, accounting for over 88% of all global foreign exchange turnover, or an average of $6.6 trillion in transactions per day, according to data from 2022. Following the second world war, the USD took over from the British Pound as the world’s reserve currency. For most of its history, the US Dollar was backed by Gold, until the Bretton Woods Agreement in 1971 when the Gold Standard went away.
The most important single factor impacting on the value of the US Dollar is monetary policy, which is shaped by the Federal Reserve (Fed). The Fed has two mandates: to achieve price stability (control inflation) and foster full employment. Its primary tool to achieve these two goals is by adjusting interest rates. When prices are rising too quickly and inflation is above the Fed’s 2% target, the Fed will raise rates, which helps the USD value. When inflation falls below 2% or the Unemployment Rate is too high, the Fed may lower interest rates, which weighs on the Greenback.
In extreme situations, the Federal Reserve can also print more Dollars and enact quantitative easing (QE). QE is the process by which the Fed substantially increases the flow of credit in a stuck financial system. It is a non-standard policy measure used when credit has dried up because banks will not lend to each other (out of the fear of counterparty default). It is a last resort when simply lowering interest rates is unlikely to achieve the necessary result. It was the Fed’s weapon of choice to combat the credit crunch that occurred during the Great Financial Crisis in 2008. It involves the Fed printing more Dollars and using them to buy US government bonds predominantly from financial institutions. QE usually leads to a weaker US Dollar.
Quantitative tightening (QT) is the reverse process whereby the Federal Reserve stops buying bonds from financial institutions and does not reinvest the principal from the bonds it holds maturing in new purchases. It is usually positive for the US Dollar.
- AUD/USD is correcting back within a short-term uptrend.
- It will probably eventually find support and resume its bullish bias.
- The pair may have formed a Measured Move with a target for ending wave at 0.6680.
AUD/USD is trading in the 0.6590s on Tuesday as it continues correcting back from its May 3 high above 0.6600.
The pull back is probably only a temporary correction. The rising sequence of peaks and troughs on the 4-hour chart suggest the pair is in a short-term uptrend, which given the old adage that “the trend is your friend”, is biased to eventually continue higher.
AUD/USD 4-hour Chart
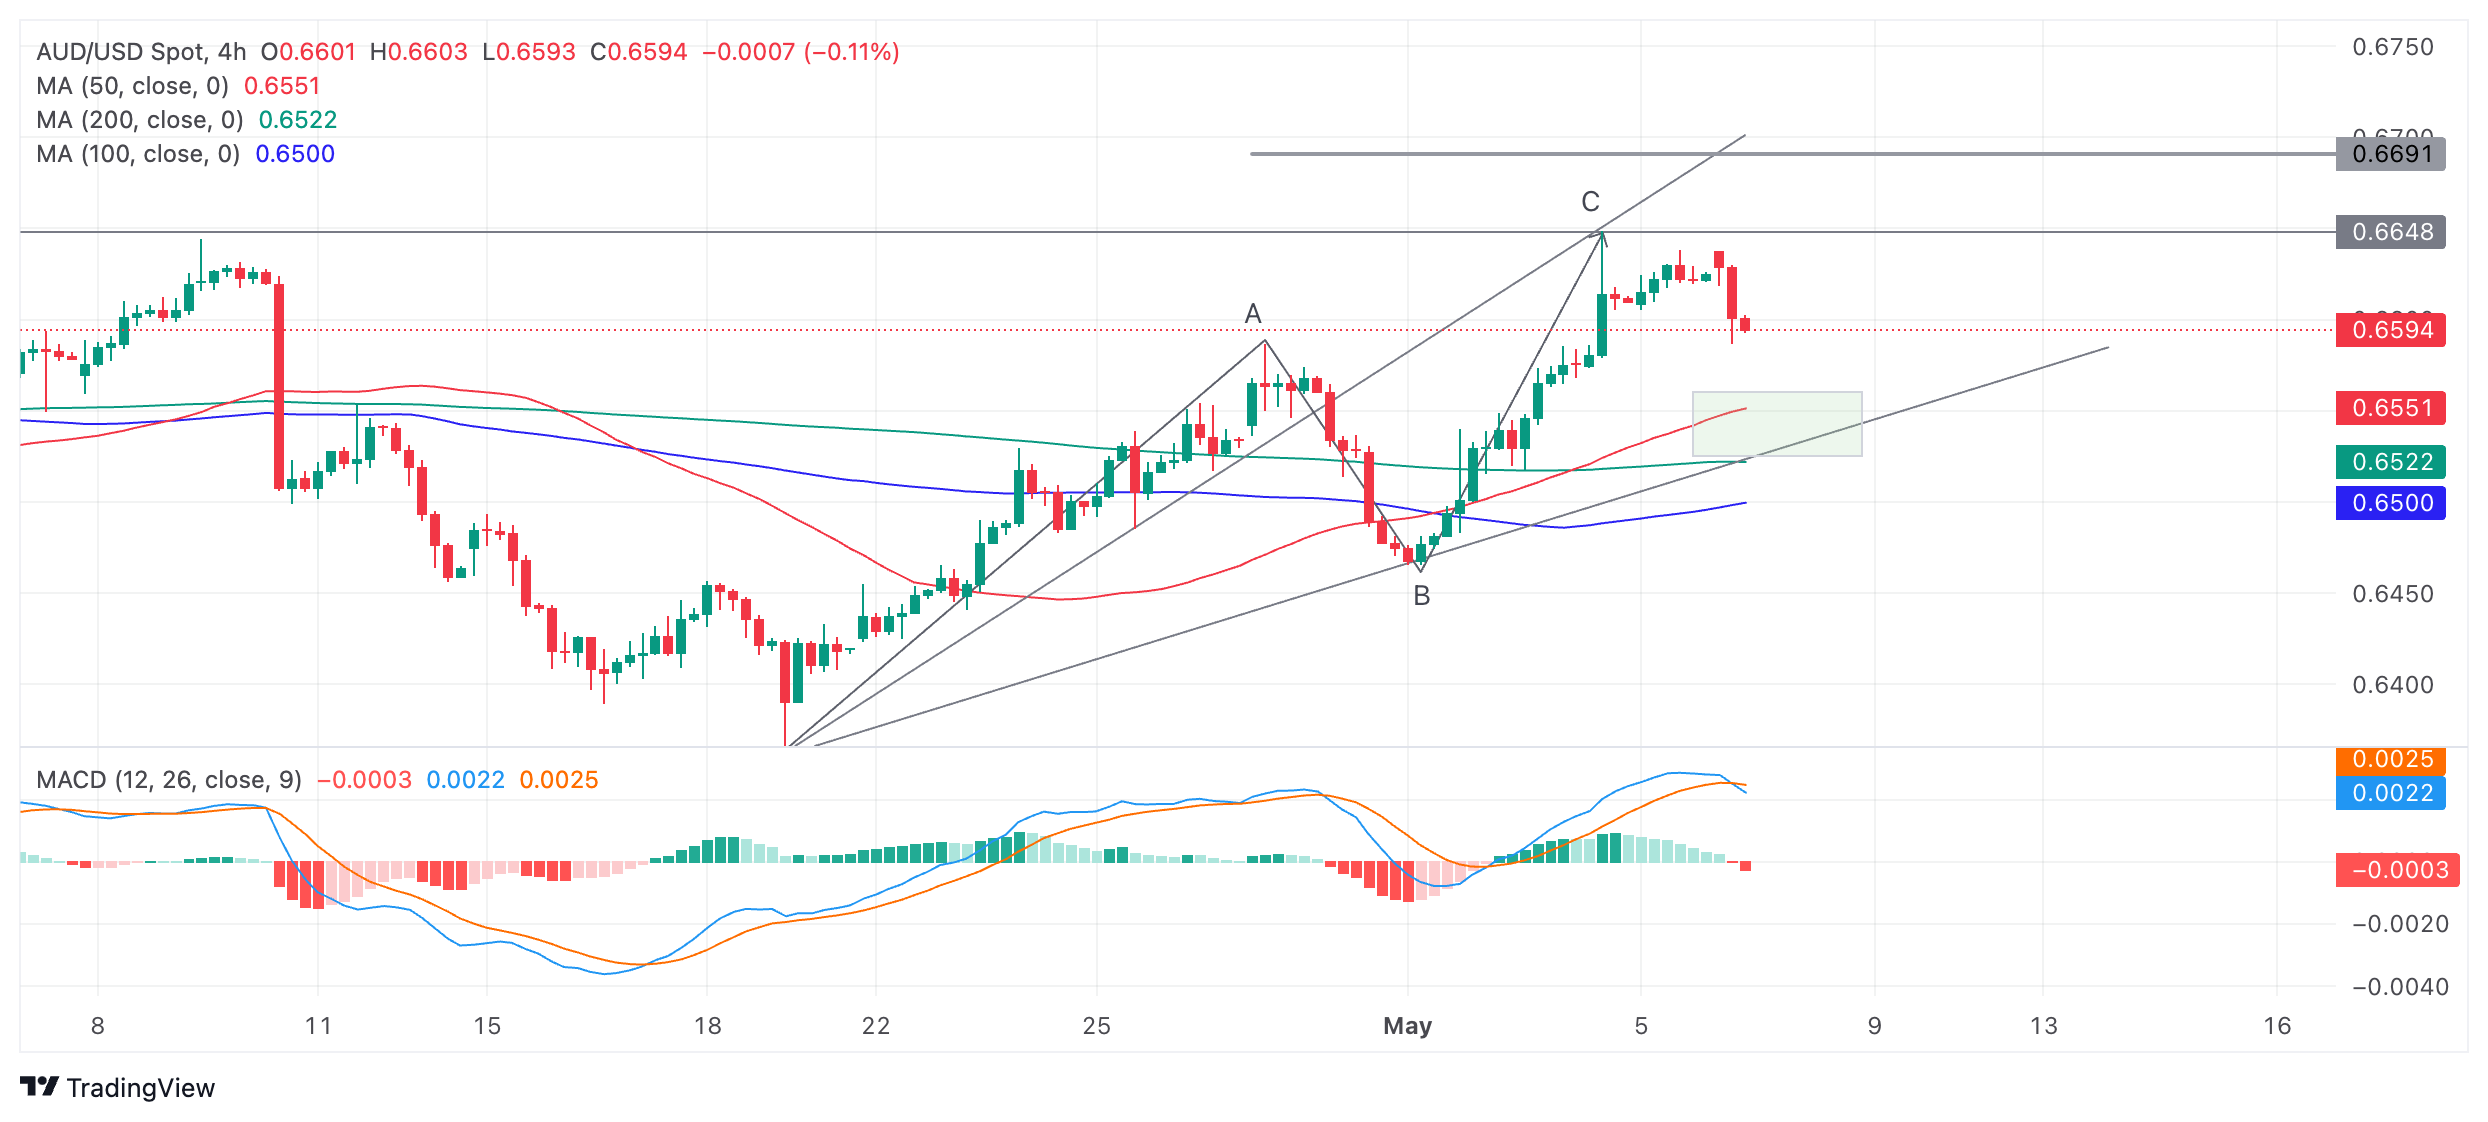
The Moving Average Convergence Divergence (MACD) momentum indicator has crossed below its signal line indicating AUD/USD will probably continue lower for a bit longer.
The correction could unfold down to support in the rectangular pale green zone drawn on the chart just above the lower trendline. From there price will probably resume its uptrend. A break below the trendline, would be a bearish sign, suggesting a potential reversal.
If the uptrend resumes it will probably rise back up to the 0.6649 resistance level of the May 3 high, then a target at around 0.6680.
AUD/USD has probably formed a Measured Move price pattern since the April 19 lows. These patterns are like large zig-zags composed of three waves. These are labeled A, B and C on the chart. The general expectation is that wave C will be either the same length as A or a Fibonacci 0.681 of A.
Wave C has already reached the Fibonacci 0.681 target of the Measured Move at the May 3 highs, however, there is a chance it could go all the way to the second target where C=A at 0.6680.
- NZD/USD trades sideways around 0.6000 as the US Dollar steadies after recovery.
- The speculation for the Fed lowering key interest rates from September strengthens after weak US NFP data.
- Weak NZ labor market data boosts expectations of early rate cuts by the RBNZ.
The NZD/USD pair trades lacklustre near the psychological level of 0.6000 in Tuesday’s European session. The Kiwi asset consolidates as the US Dollar turns sideways above 105.00. The US Dollar Index (DXY) rebounds sharply after correcting to near 104.60 as investors discount the Federal Reserve’s (Fed) slightly less hawkish commentary on the interest rate outlook than feared and weak labor market data for April.
The Fed said that more interest rate hikes are unlikely, and it still sees rate cuts later this year, though its confidence has been impacted due to stubborn price pressures in the first quarter of the year. This has deepened expectations for the Fed reducing interest rates from the September meeting.
Apart from that, weak labor demand and a higher Unemployment Rate have also strengthened speculation that the Fed will pivot to interest rates in September. The CME FedWatch tool shows that traders see a 67% chance for a decline in interest rates from their current levels in September, which is significantly higher than the 46% chance recorded a week ago.
Meanwhile, the upside in the New Zealand Dollar has stalled as investors see the Reserve Bank of New Zealand (RBNZ) pivoting to interest rate cuts from the October meeting. Earlier, investors forecasted that the RBNZ would choose 2025 as their initial point to begin reducing interest rates due to stubborn Q1 inflation data. However, weak Q1 labor market data has increased expectations that the RBNZ will start lowering interest rates earlier.
- Gold price is weakening on Tuesday on the back of a rise in the US Dollar.
- The USD’s recent decline was due to weak US jobs data, but Fed commentary put a floor under the sell-off.
- Fed policymakers made it clear they are still not in a hurry to cut interest rates, boosting the Greenback.
The Gold price (XAU/USD) trades down by roughly a third of a percent, in the $2,310s on Tuesday, as the US Dollar (USD) recovers, reducing the cost of Gold which is priced in USD.
Gold price declines on stronger Dollar
Gold price declines on Tuesday after a rebound in the US Dollar reduces the cost of the precious metal in USD terms.
Although last week’s US Nonfarm Payrolls data showed a weakening labor market that suggested the Federal Reserve (Fed) might cut interest rates sooner than had been anticipated, commentary from Fed members over the last few days continued to show a reluctance by policymakers to hurry lowering borrowing costs.
On Monday, Richmond Fed President Thomas Barkin said that the current interest rate level should cool the economy enough to bring down inflation to the Fed’s 2.0% target but that it would be a "stubborn road back," and that, "It doesn't mean you won't get it back. It just means it takes a while”.
Meanwhile, New York Fed President John Williams stated that there would be rate cuts eventually and that he saw job growth moderating, but that the Fed would be looking at the “totality” of data before making its decision.
Markets have priced in rate cuts worth 46 basis points (bps) from the Fed by the end of 2024, with the first cut expected in September or November, according to LSEG's rate probability app, according to FXStreet’s Editor Lallalit Srijandorn.
Technical Analysis: Gold price meets resistance at top of range
Gold price (XAU/USD) has retested the ceiling of a mini-range at around $2,326, and retreated. It is currently finding support at around the 50 Simple Moving Average (SMA) at the 4-hour chart at $2,317.
XAU/USD 4-hour Chart
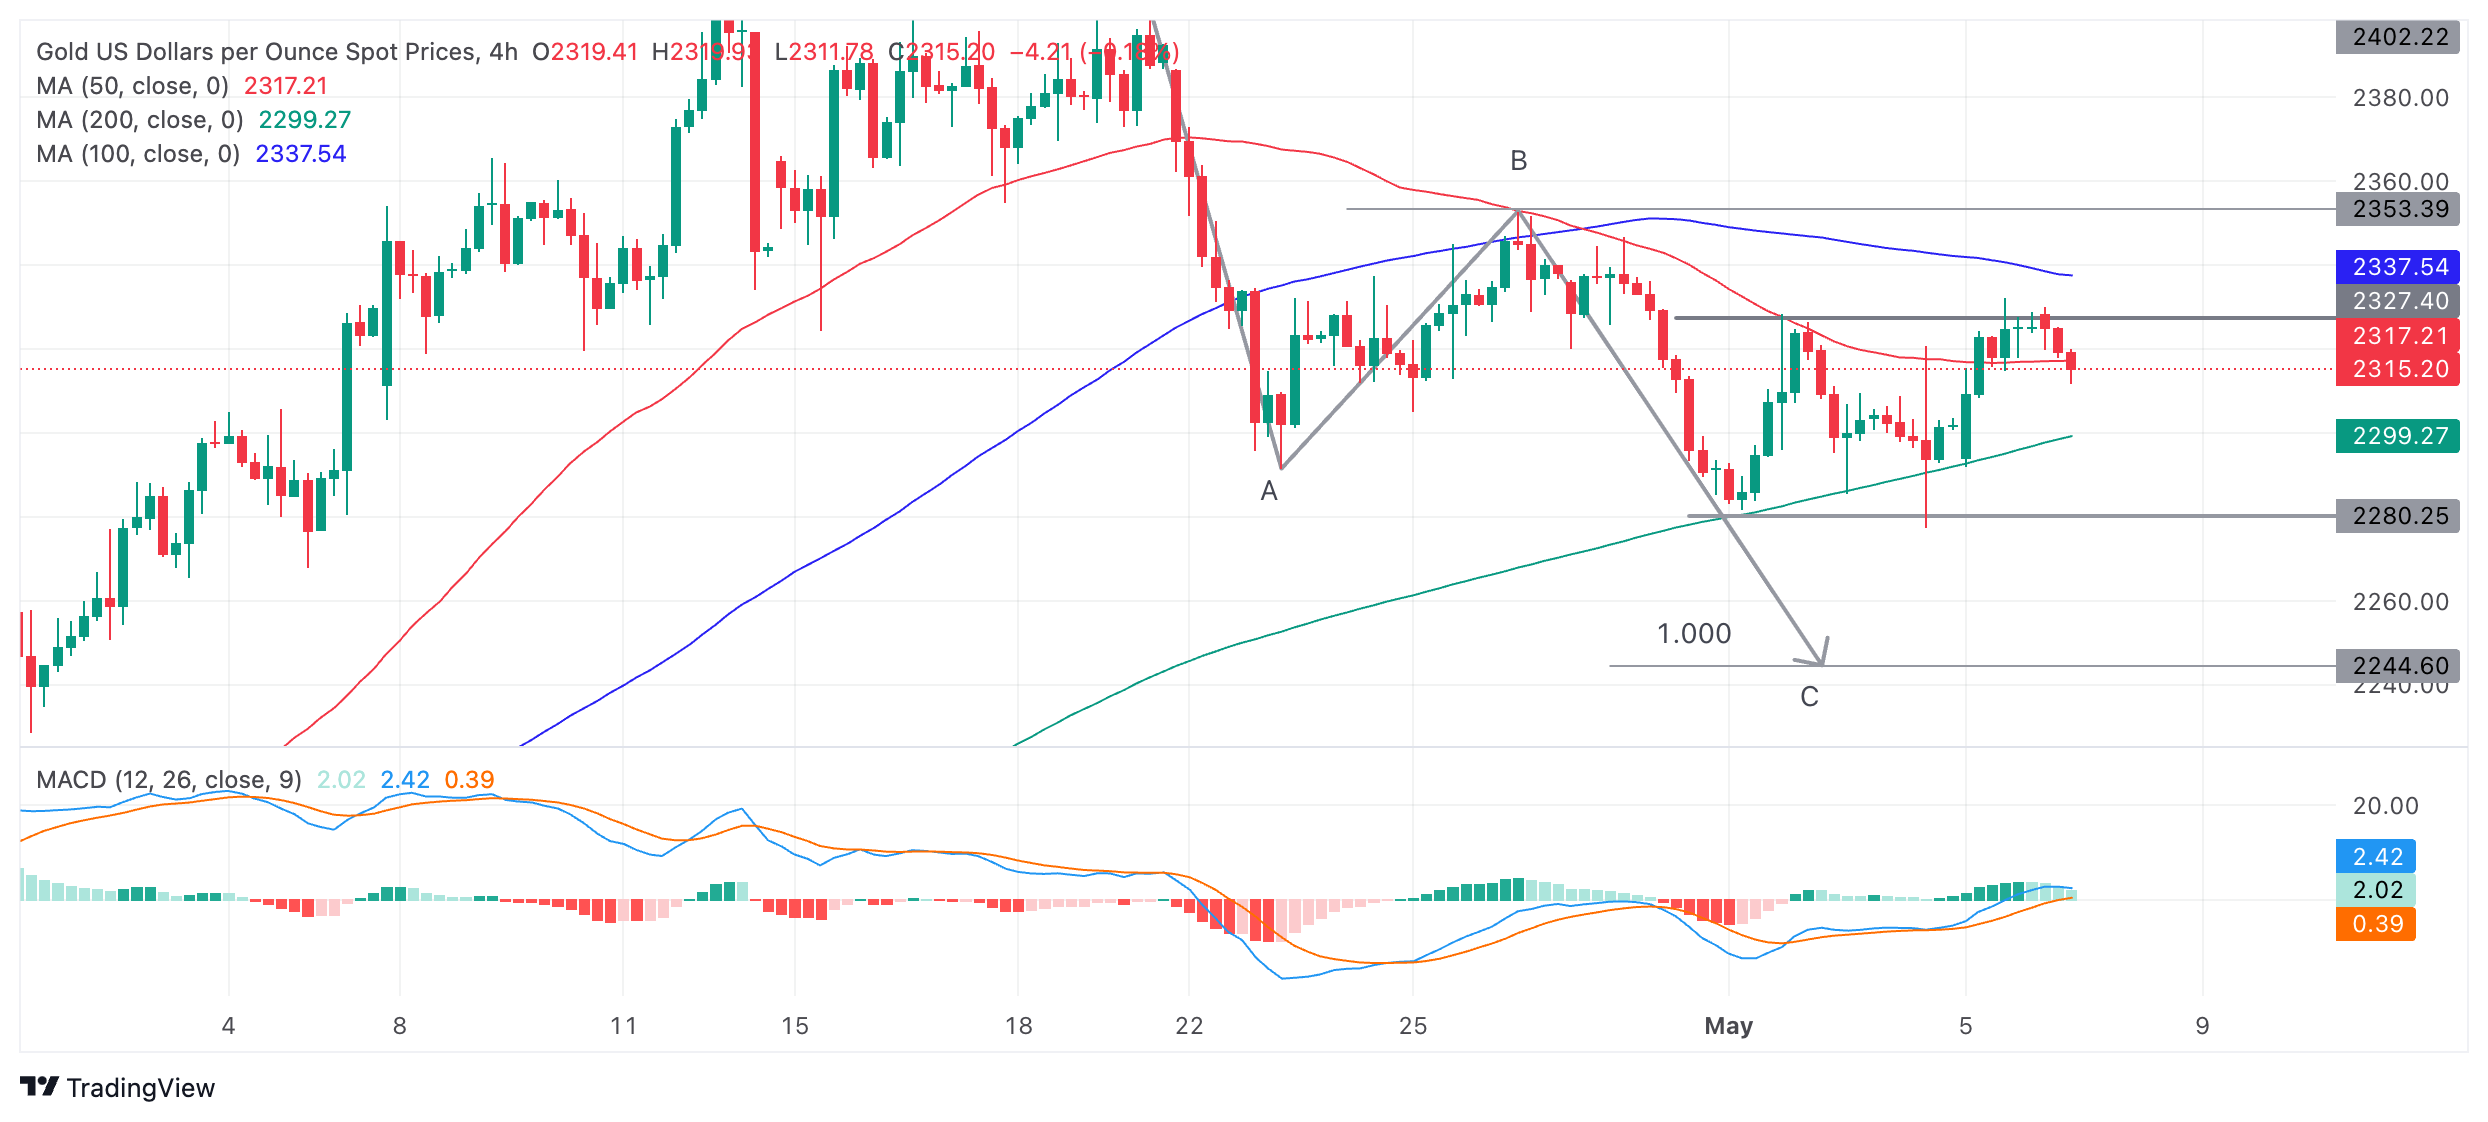
Price could potentially pull back further and fall to the base of the range at around $2,280. Support from the 200 SMA and prior lows at around $2,300 could provide an obstacle on the way down.
On the other hand, a decisive break out of the top of the range would signal a likely move up to a conservative target at $2,353 – the top of wave B and the 0.681 Fibonacci extension of the height of the range extrapolated higher. In a bullish case, it could even possibly hit $2,370.
A decisive break would be one characterized by a longer-than-average green candlestick that pierces above the range ceiling, and closes near its high; or three green candlesticks in a row that pierce above the respective level.
Unfinished Measured Move
Gold price is potentially still in the middle of unfolding a bearish Measured Move price pattern which began on April 19.
Measured Moves are zig-zag type patterns composed of three waves labeled A, B and C, with C usually equalling the length of A or a Fibonnaci 0.681 of A. Price has fallen to the conservative estimate for wave C at $2,286, the Fibonacci 0.681 of wave A.
Wave C could still go lower, however, and reach the 100% extrapolation of A at $2,245. Such a move would be confirmed by a decisive break below the range and the May 3 low at $2,277.
The trend for Gold price is up on both the medium and long-term charts (daily and weekly), overall adding a supportive backdraft to the outlook.
Gold FAQs
Gold has played a key role in human’s history as it has been widely used as a store of value and medium of exchange. Currently, apart from its shine and usage for jewelry, the precious metal is widely seen as a safe-haven asset, meaning that it is considered a good investment during turbulent times. Gold is also widely seen as a hedge against inflation and against depreciating currencies as it doesn’t rely on any specific issuer or government.
Central banks are the biggest Gold holders. In their aim to support their currencies in turbulent times, central banks tend to diversify their reserves and buy Gold to improve the perceived strength of the economy and the currency. High Gold reserves can be a source of trust for a country’s solvency. Central banks added 1,136 tonnes of Gold worth around $70 billion to their reserves in 2022, according to data from the World Gold Council. This is the highest yearly purchase since records began. Central banks from emerging economies such as China, India and Turkey are quickly increasing their Gold reserves.
Gold has an inverse correlation with the US Dollar and US Treasuries, which are both major reserve and safe-haven assets. When the Dollar depreciates, Gold tends to rise, enabling investors and central banks to diversify their assets in turbulent times. Gold is also inversely correlated with risk assets. A rally in the stock market tends to weaken Gold price, while sell-offs in riskier markets tend to favor the precious metal.
The price can move due to a wide range of factors. Geopolitical instability or fears of a deep recession can quickly make Gold price escalate due to its safe-haven status. As a yield-less asset, Gold tends to rise with lower interest rates, while higher cost of money usually weighs down on the yellow metal. Still, most moves depend on how the US Dollar (USD) behaves as the asset is priced in dollars (XAU/USD). A strong Dollar tends to keep the price of Gold controlled, whereas a weaker Dollar is likely to push Gold prices up.
- Natural Gas prices are undergoing some profit-taking on Tuesday.
- Israel has started its ground offensive in Rafah while ceasefire talks don’t bear fruits.
- The US Dollar Index ticks up on Tuesday after closing above 105.00.
Natural Gas (XNG/USD) retreats from the peak at $2.40 seen on Monday after markets were pricing in more risk premium on the heated-up situation in the Middle East. Although ceasefire talks are taking place again in Cairo, headlines on Monday showed that a deal is still far from near and Israel has started its ground offensive in Gaza’s southern city of Rafah. Meanwhile, Australian Liquified Natural Gas (LNG) exports are expected to drop substantially with Chevron’s Gorgon plant remaining offline for at least five weeks.
The US Dollar Index (DXY) is heading higher on Tuesday after Monday saw US Dollar bulls salvage it from a further slide by eking out a daily close above 105.00. That level is a line in the sand on the DXY chart in terms of more upside or downside.
Natural Gas is trading at $2.30 per MMBtu at the time of writing.
Natural Gas news and market movers: Hiccup does not help
- European Gas markets are whipsawing by pricing in and out a risk premium on local Gas prices while a lot of LNG volume is actually on its way to Europe. Therefore, any hiccup in supply disruption will not be felt in the first coming weeks, Bloomberg reports.
- Chevron had to reschedule several LNG deliveries for Asian buyers due to the outage at the Gorgon facility in Australia, traders reported to Reuters.
- ANZ Bank said in a note on Tuesday that a tight Asian market and Europe looking to further rebuild inventories could boost competition and prices in the Gas market, MT Newswires reported.
- PR Newswire reports that Karpowership and Brasilia’s Petrobras have signed a letter of intent to combine their respective expertise in the Natural Gas sectors. The agreement fits in the overall plan for Karpowership to further strengthen its access and relationship in the Brazilian Gas market.
Natural Gas Technical Analysis: setting sail to $2.54
Natural Gas is on the breakout, that much is clear. Day by day the question is how this rally can withstand any profit-taking moments from traders that are in for the short ride and earn a few bucks. With the drift further away from substantial support levels, traders entering at elevated levels need to keep in mind that a correction can occur, and this will become more brutal as this rally sets sail towards $2.54 as the first nearby profit target.
On the upside, the January 25 high at $2.33 has been broken and the high of Monday at $2.40 is taking its place. Once through there, prices could steamroll towards the 200-day Simple Moving Average (SMA) at $2.54.
On the downside, a double belt is awaiting to provide support with the 100-day SMA at $2.09 and the pivotal level at $2.11 (low of April 14, 2023). Should this support above $2.00 not hold, then the ascending green trendline near $1.93 together with the 55-day SMA should avoid a further downturn.
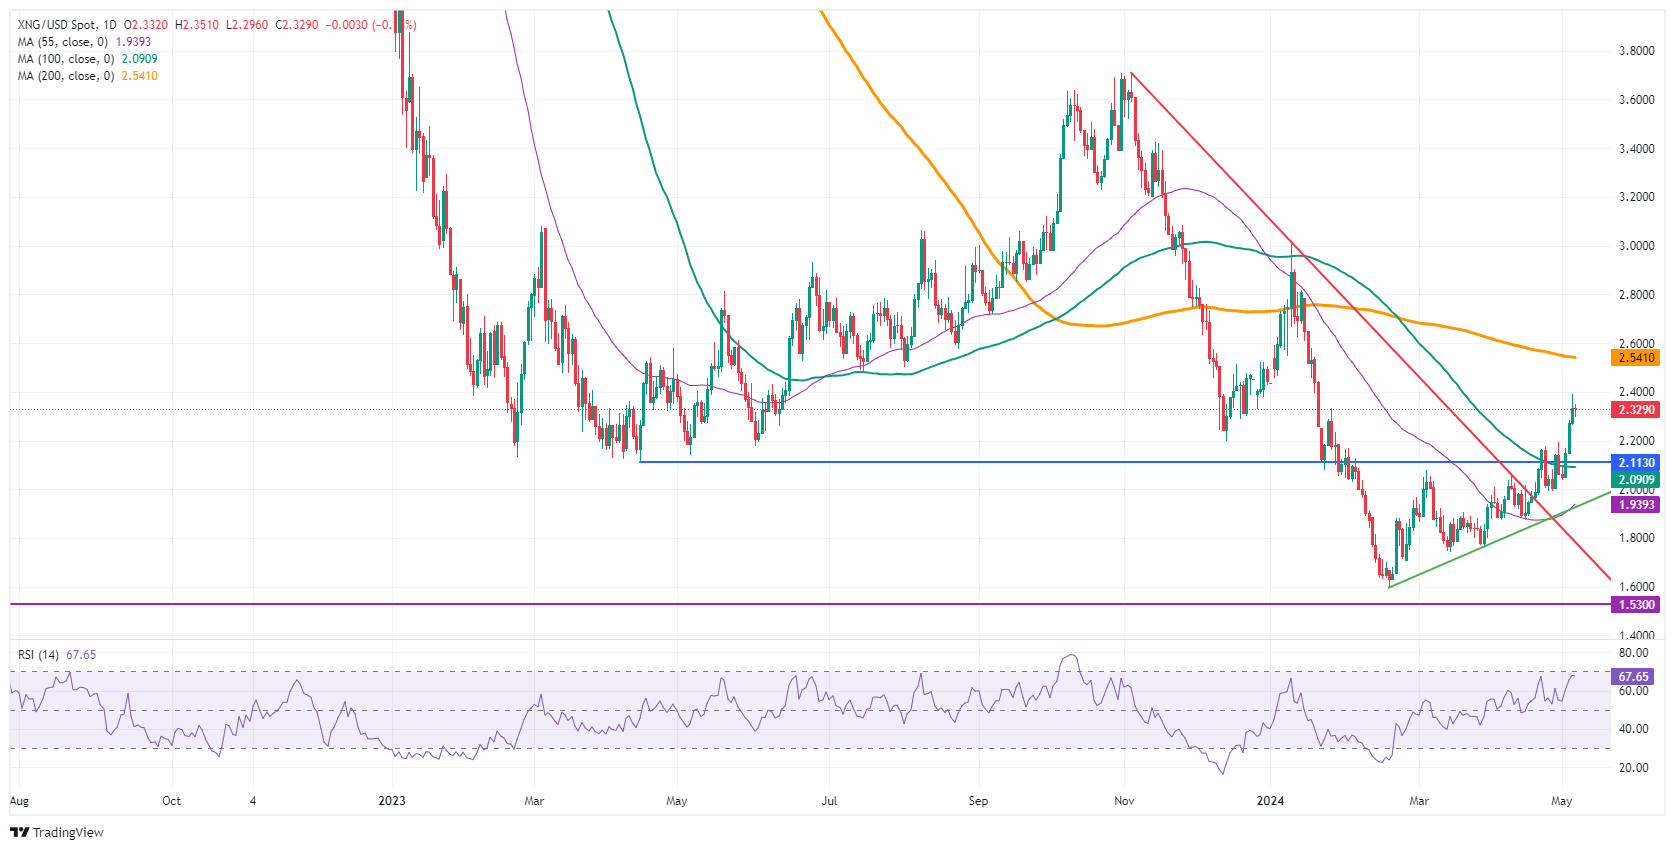
Natural Gas: Daily Chart
Natural Gas FAQs
Supply and demand dynamics are a key factor influencing Natural Gas prices, and are themselves influenced by global economic growth, industrial activity, population growth, production levels, and inventories. The weather impacts Natural Gas prices because more Gas is used during cold winters and hot summers for heating and cooling. Competition from other energy sources impacts prices as consumers may switch to cheaper sources. Geopolitical events are factors as exemplified by the war in Ukraine. Government policies relating to extraction, transportation, and environmental issues also impact prices.
The main economic release influencing Natural Gas prices is the weekly inventory bulletin from the Energy Information Administration (EIA), a US government agency that produces US gas market data. The EIA Gas bulletin usually comes out on Thursday at 14:30 GMT, a day after the EIA publishes its weekly Oil bulletin. Economic data from large consumers of Natural Gas can impact supply and demand, the largest of which include China, Germany and Japan. Natural Gas is primarily priced and traded in US Dollars, thus economic releases impacting the US Dollar are also factors.
The US Dollar is the world’s reserve currency and most commodities, including Natural Gas are priced and traded on international markets in US Dollars. As such, the value of the US Dollar is a factor in the price of Natural Gas, because if the Dollar strengthens it means less Dollars are required to buy the same volume of Gas (the price falls), and vice versa if USD strengthens.
- EUR/USD consolidates around 1.0770 after correcting from 1.0800 as investors expect the ECB to reduce interest rates from June.
- ECB Stournaras’s projection of three rate cuts this year is aligned with market expectations.
- The speculation for the Fed lowering interest rates from September has strengthened.
EUR/USD is slightly down by 0.10% at 1.0760 in Tuesday’s European session. The shared currency pair is broadly sideways around 1.0770 amid indecisiveness among investors due to the absence of high-tier data in the United States (US) and the Eurozone.
The upside in the major currency pair stalled near 1.0800 as the US Dollar (USD) steadied after investors priced in weak US Nonfarm Payrolls (NFP) and ISM Services Purchasing Managers Index (PMI) data for April, which strengthened speculation for the Federal Reserve (Fed) reducing interest rates from the September meeting. The CME FedWatch tool shows that traders see a 67% chance for rates being lower than current levels in September, which has increased significantly from the 46% chance recorded a week ago.
Despite declining confidence in the US economic outlook, Fed policymakers support keeping interest rates restrictive for a longer period due to the stubborn inflation outlook. On Monday, Richmond Fed Bank President Thomas Barkin said that risks to inflation are still on the upside, and demand must be hit to finish the battle against inflation.
Recently, the Institute for Supply Management (ISM) reported significantly higher Price Paid Indexes for both Manufacturing and Services PMI. This suggests that businesses' prices paid for inputs rose significantly, which exhibits a stubborn outlook on price pressures.
Daily digest market movers: EUR/USD turns sideways after correcting from 1.0800
- EUR/USD is stuck in a tight range around 1.0770 amid the absence of tier-1 Eurozone economic data this week. Investors are expected to predict the next move in the Euro based on speculation about the European Central Bank’s (ECB) interest rate outlook.
- Financial markets anticipate that the ECB will extend its rate-cut campaign, which is expected to start at the June meeting. ECB policymakers have projected three rate cuts this year, which are aligned with market expectations.
- ECB policymaker and Bank of Greece Governor Yannis Stournaras said in an interview with a Greek media outlet that he sees three rate cuts this year. He sees a rate cut in July too as possible and added that the Eurozone’s economic rebound in the first quarter of the year made three cuts more likely than four.
- ECB’s confidence in beginning to reduce interest rates from June has been deepened due to consistently easing price pressures. Eurozone’s core Consumer Price Index (CPI), which is the ECB’s preferred inflation measure, has been declining consistently since July 2023. The annual core CPI has come down to 2.7% in April, suggesting that inflation is on course to return to the desired rate of 2%.
- Also, a sharp decline in Eurozone service inflation has also boosted the confidence of the ECB for cutting interest rates from the June meeting. The annual Eurozone service inflation softened to 3.7% in April after remaining steady at 4% for five months. About that, ECB policymaker Philip Lane said that April inflation data finally showed progress on services prices. However, he warned that the ECB would continue to focus on services to make sure it did not derail disinflation later on.
- Meanwhile, Eurostat reported strong Retail Sales data for March. Monthly Retail Sales rose strongly by 0.8% from the estimates of 0.6% after contracting by 0.3% in February. Annually, Retail Sales increased by 0.7% after declining 0.5% (revised from -0.7%) in February.
Technical Analysis: EUR/USD consolidates around 1.0770
EUR/USD trades in a narrow range around 1.0770. The major currency pair struggles for a direction amid an absence of top-tier economic events. The overall trend in the major is also sideways due to a Symmetrical Triangle formation on a daily timeframe.
EUR/USD exhibits a sharp volatility contraction due to a Symmetrical Triangle formation on a daily timeframe. The upward-sloping border of the triangle pattern is plotted from October 3 low at 1.0448 and the downward-sloping border is placed from December 28 high around 1.1140.
The 14-period Relative Strength Index (RSI) shifts into the 40.00-60.00 range, suggesting indecisiveness among market participants.
The asset trades above the 20-day Exponential Moving Average (EMA) near 1.0723, suggesting that the near-term outlook is bullish.
Euro FAQs
The Euro is the currency for the 20 European Union countries that belong to the Eurozone. It is the second most heavily traded currency in the world behind the US Dollar. In 2022, it accounted for 31% of all foreign exchange transactions, with an average daily turnover of over $2.2 trillion a day. EUR/USD is the most heavily traded currency pair in the world, accounting for an estimated 30% off all transactions, followed by EUR/JPY (4%), EUR/GBP (3%) and EUR/AUD (2%).
The European Central Bank (ECB) in Frankfurt, Germany, is the reserve bank for the Eurozone. The ECB sets interest rates and manages monetary policy. The ECB’s primary mandate is to maintain price stability, which means either controlling inflation or stimulating growth. Its primary tool is the raising or lowering of interest rates. Relatively high interest rates – or the expectation of higher rates – will usually benefit the Euro and vice versa. The ECB Governing Council makes monetary policy decisions at meetings held eight times a year. Decisions are made by heads of the Eurozone national banks and six permanent members, including the President of the ECB, Christine Lagarde.
Eurozone inflation data, measured by the Harmonized Index of Consumer Prices (HICP), is an important econometric for the Euro. If inflation rises more than expected, especially if above the ECB’s 2% target, it obliges the ECB to raise interest rates to bring it back under control. Relatively high interest rates compared to its counterparts will usually benefit the Euro, as it makes the region more attractive as a place for global investors to park their money.
Data releases gauge the health of the economy and can impact on the Euro. Indicators such as GDP, Manufacturing and Services PMIs, employment, and consumer sentiment surveys can all influence the direction of the single currency. A strong economy is good for the Euro. Not only does it attract more foreign investment but it may encourage the ECB to put up interest rates, which will directly strengthen the Euro. Otherwise, if economic data is weak, the Euro is likely to fall. Economic data for the four largest economies in the euro area (Germany, France, Italy and Spain) are especially significant, as they account for 75% of the Eurozone’s economy.
Another significant data release for the Euro is the Trade Balance. This indicator measures the difference between what a country earns from its exports and what it spends on imports over a given period. If a country produces highly sought after exports then its currency will gain in value purely from the extra demand created from foreign buyers seeking to purchase these goods. Therefore, a positive net Trade Balance strengthens a currency and vice versa for a negative balance.
- EUR/GBP retraces its recent losses, possibly driven by the weaker UK Retail Sales.
- UK Retail Sales (YoY) declined by 4.4%in April, against the expected growth of 1.6%.
- Eurozone Retail Sales rose by 0.7% YoY in March, swinging from the previous decline of 0.5%.
EUR/GBP hovers around 0.8580 during the European session on Tuesday, retracing its recent losses registered in the previous session. The Pound Sterling (GBP) lost ground, possibly driven by the disappointing Retail Sales report from the United Kingdom (UK).
In April, the BRC Like-For-Like Retail Sales experienced a year-over-year decline of 4.4%, contradicting expectations for a 1.6% growth. This latest figure represents a significant reversal from the 3.2% increase observed in March and marks the poorest reading since November 2019.
Helen Dickinson, Chief Executive Officer of the British Retail Consortium (BRC), attributed the disappointing sales to dismal weather and remarked that retailers had a challenging start to spring, even considering the change in Easter timing.
The Bank of England (BoE) is anticipated to keep interest rates unchanged at 5.25% on Thursday's meeting. Investor sentiment regarding policy rate cuts by the BoE has been delayed to September due to robust wage growth in the United Kingdom (UK), which is fueling core inflation, the central bank's preferred inflation measure.
In the Eurozone, the Retail Sales (YoY), released by Eurostat, increased by 0.7% in March, swinging from the previous decline of 0.5%. Meanwhile, the month-over-month growth was 0.8%, exceeding the expected increase of 0.6%, swinging from the previous decline of 0.3%.
The European Central Bank (ECB) is anticipated to commence cutting borrowing costs in June. The ECB’s Chief Economist Philip Lane indicated that recent data have increased his confidence that inflation is moving closer to the 2% target. While most ECB officials seem to favor easing next month, President Christine Lagarde has not hinted at further cuts.
- Retail Sales in the Euro area rose more than expected in March.
- EUR/USD stays in daily range slightly above 1.0750.
Retail Sales in the Euro area rose 0.8% on a monthly basis in March, Eurostat reported on Tuesday. This reading followed the 0.3% decline recorded in February and came in better than the market expectation for an increase of 0.6%. For 12 months, Retail Sales were up 0.7% in the Euro area.
In the EU, Retail Sales rose 1.2% and 2% on a monthly and yearly basis, respectively.
Market reaction
These readings failed to trigger a noticeable reaction in EUR/USD. At the time of press, the pair was down 0.1% on the day at 1.0760.
- The Mexican Peso is seesawing between tepid gains and losses ahead of the Banxico meeting on Thursday.
- Mexican April inflation data out on the same day could also cause volatility.
- Analysts at Trium Capital believe there is a higher chance of an interest-rate cut than markets are pricing in.
The Mexican Peso (MXN) fluctuates between tepid gains and losses on Tuesday as many traders wait on the sidelines for key inflation data and the Bank of Mexico (Banxico) policy meeting decision on “super” Thursday.
The positive market sentiment of the last few days, a factor benefiting the risk-sensitive Peso, finally unwinds with Asian stocks rounding out their session broadly lower.
On the geopolitical front, sentiment improves after Hamas agrees to a ceasefire with Israel but then quickly sours on the news Israeli units have moved into the Southern Gazan city of Rafah.
USD/MXN is trading at 16.88, EUR/MXN at 18.16 and GBP/MXN at 21.18, at the time of publication.
Mexican Peso trades with low volatility ahead of key events
The Mexican Peso trades little changed ahead of Mexican April inflation data and the Banxico meeting on Thursday, with both events having the potential to cause volatility for MXN.
Both the headline and core inflation rates are scheduled for release on Thursday at 12:00 GMT. Headline Inflation is expected to show a higher 4.63% reading year-over-year but a slower 0.18% monthly rise.
The core inflation rate is forecast to decline to 4.40% YoY and 0.24% MoM.
If either comes out higher than expected, but especially core inflation – which is thought to be more accurate – the Mexican Peso could gain strength. Higher levels of inflation will force Banxico to keep interest rates at their current elevated levels for longer, and higher interest rates attract greater capital inflows.
Banxico meeting – a surprise cut?
The Banxico will hold its May policy meeting on Thursday at 19:00 GMT. Given the hawkish minutes of the March meeting, the bank’s commitment to a data-dependent approach and the relatively robust economic data of recent months, the consensus expectation is for Banxico to keep the policy rate unchanged at 11.0%.
According to Trium Capital, however, even if Banxico does not make an interest rate cut in May, it probably will soon after. The thrust of their argument is based on two key points. The first is that high interest rates are slowing down the GDP growth rate and economic activity in Mexico substantially.
“The case for cuts is supported by slowing economic activity. The monthly economic activity indicator surprised to the upside for February with 1.38% MoM compared to a 0.50% analyst expectation, but that comes after four consecutive negative prints since October,” says Javier Basabe, an analyst at Trium Capital.
Secondly, the Consumer Price Index (CPI) over the long run has diverged so far away from the Banxico’s policy rate that this is increasing the likelihood of cuts. Additionally, it has pushed bond markets to extremes, making a mean reversion increasingly likely.
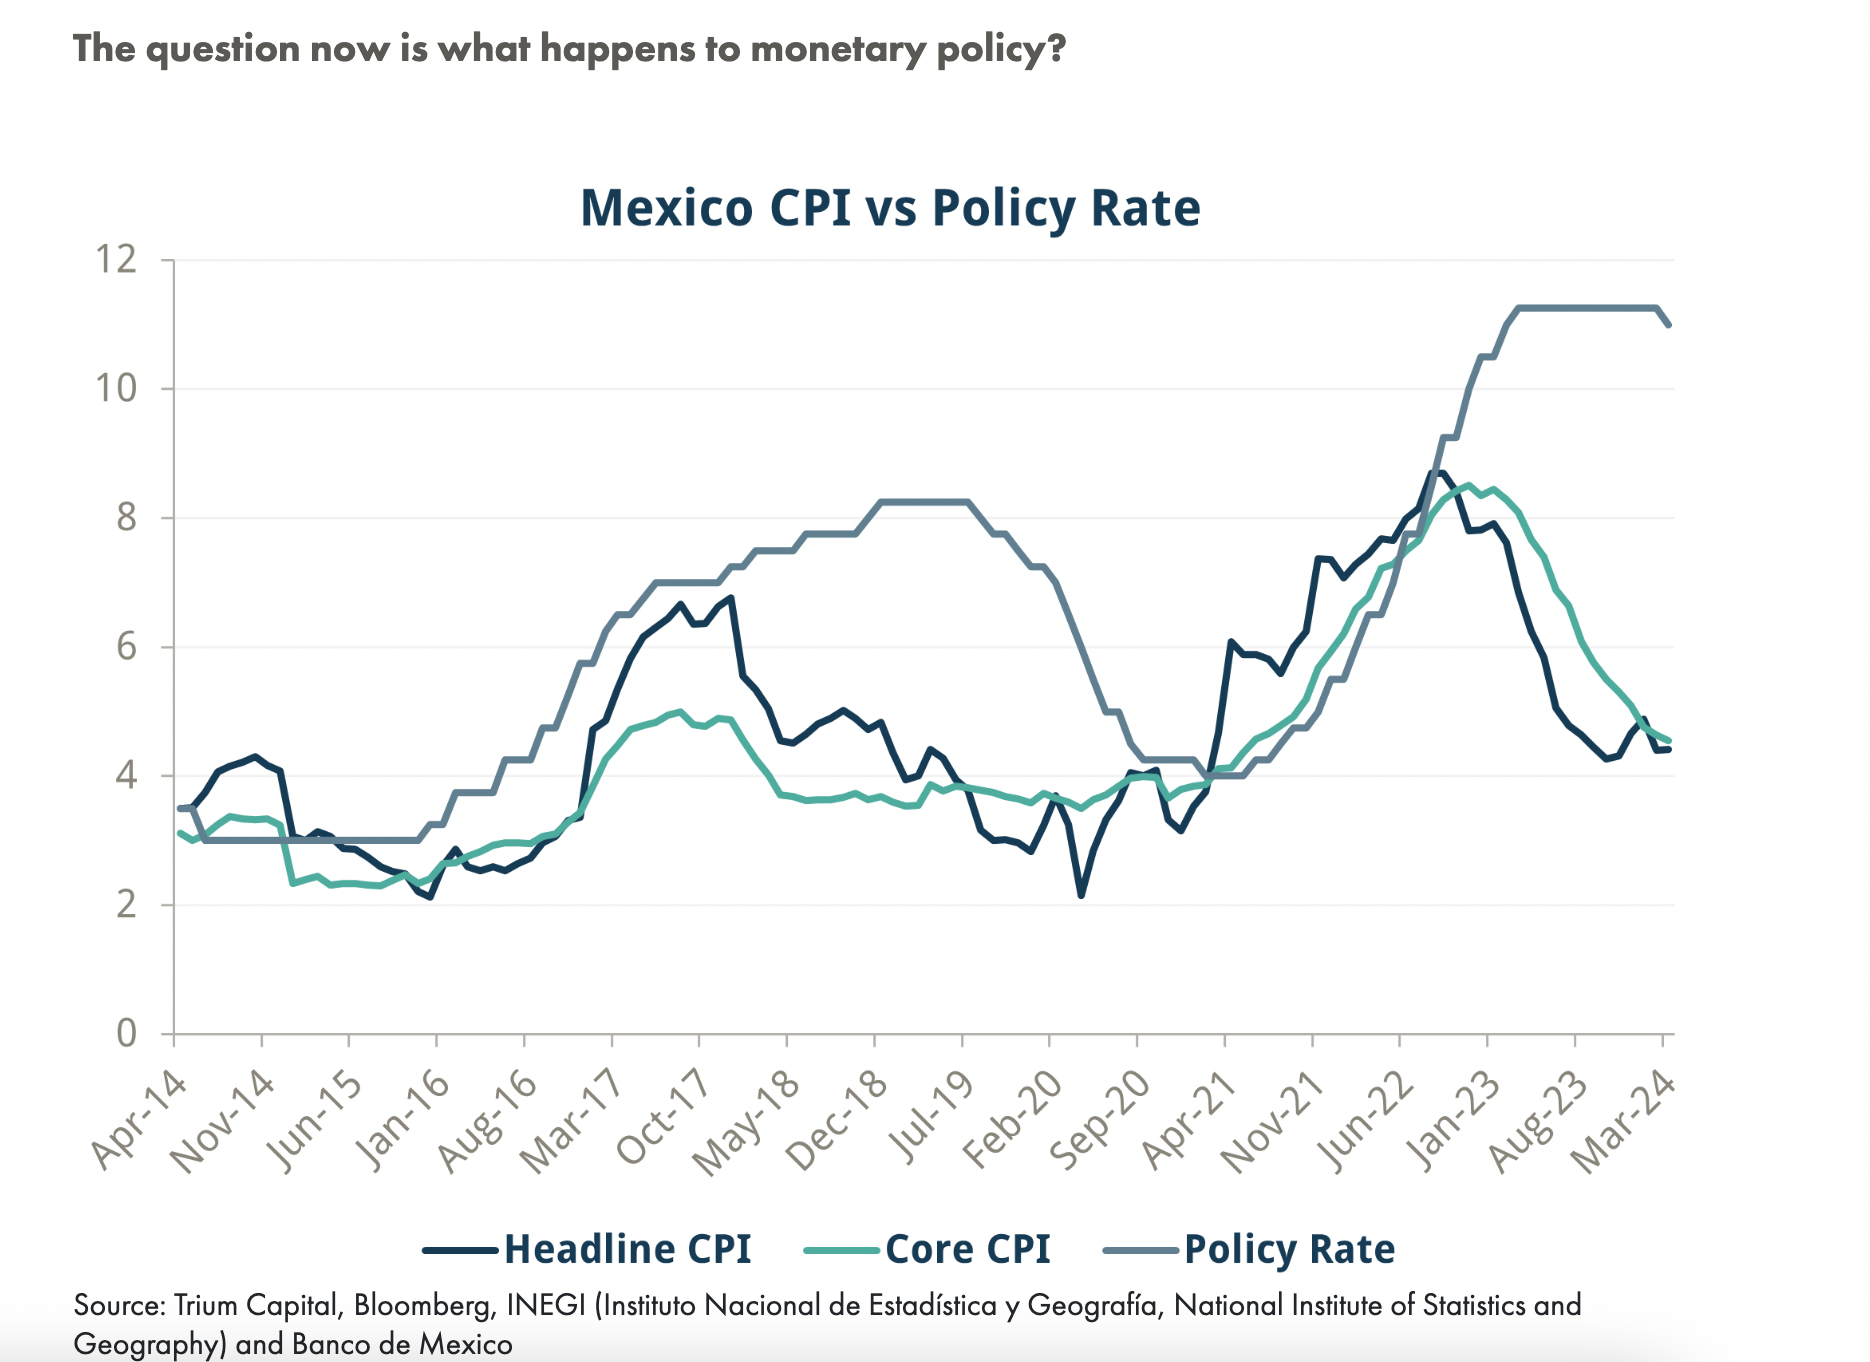
“In our opinion, the argument about the hawkish Banxico minutes is misplaced. Could it mean this is not the start of a cycle, and that rates might be held at the May meeting? Sure. Is it all that relevant? We would argue not. This growth slowdown is also happening with a record deficit and very high spending which is projected to be reduced next year, further dampening growth. If Banxico does keep rates on hold in May, there will still be more cuts to come,” says Basabe.
Technical Analysis: USD/MXN on the floor of short-term range
USD/MXN – the cost of one US Dollar in Mexican Pesos – creeps along the bottom of its short-term range. The pair has been oscillating between a floor at 16.86 and a ceiling at 17.40 since the April 19 highs.
USD/MXN 4-hour Chart
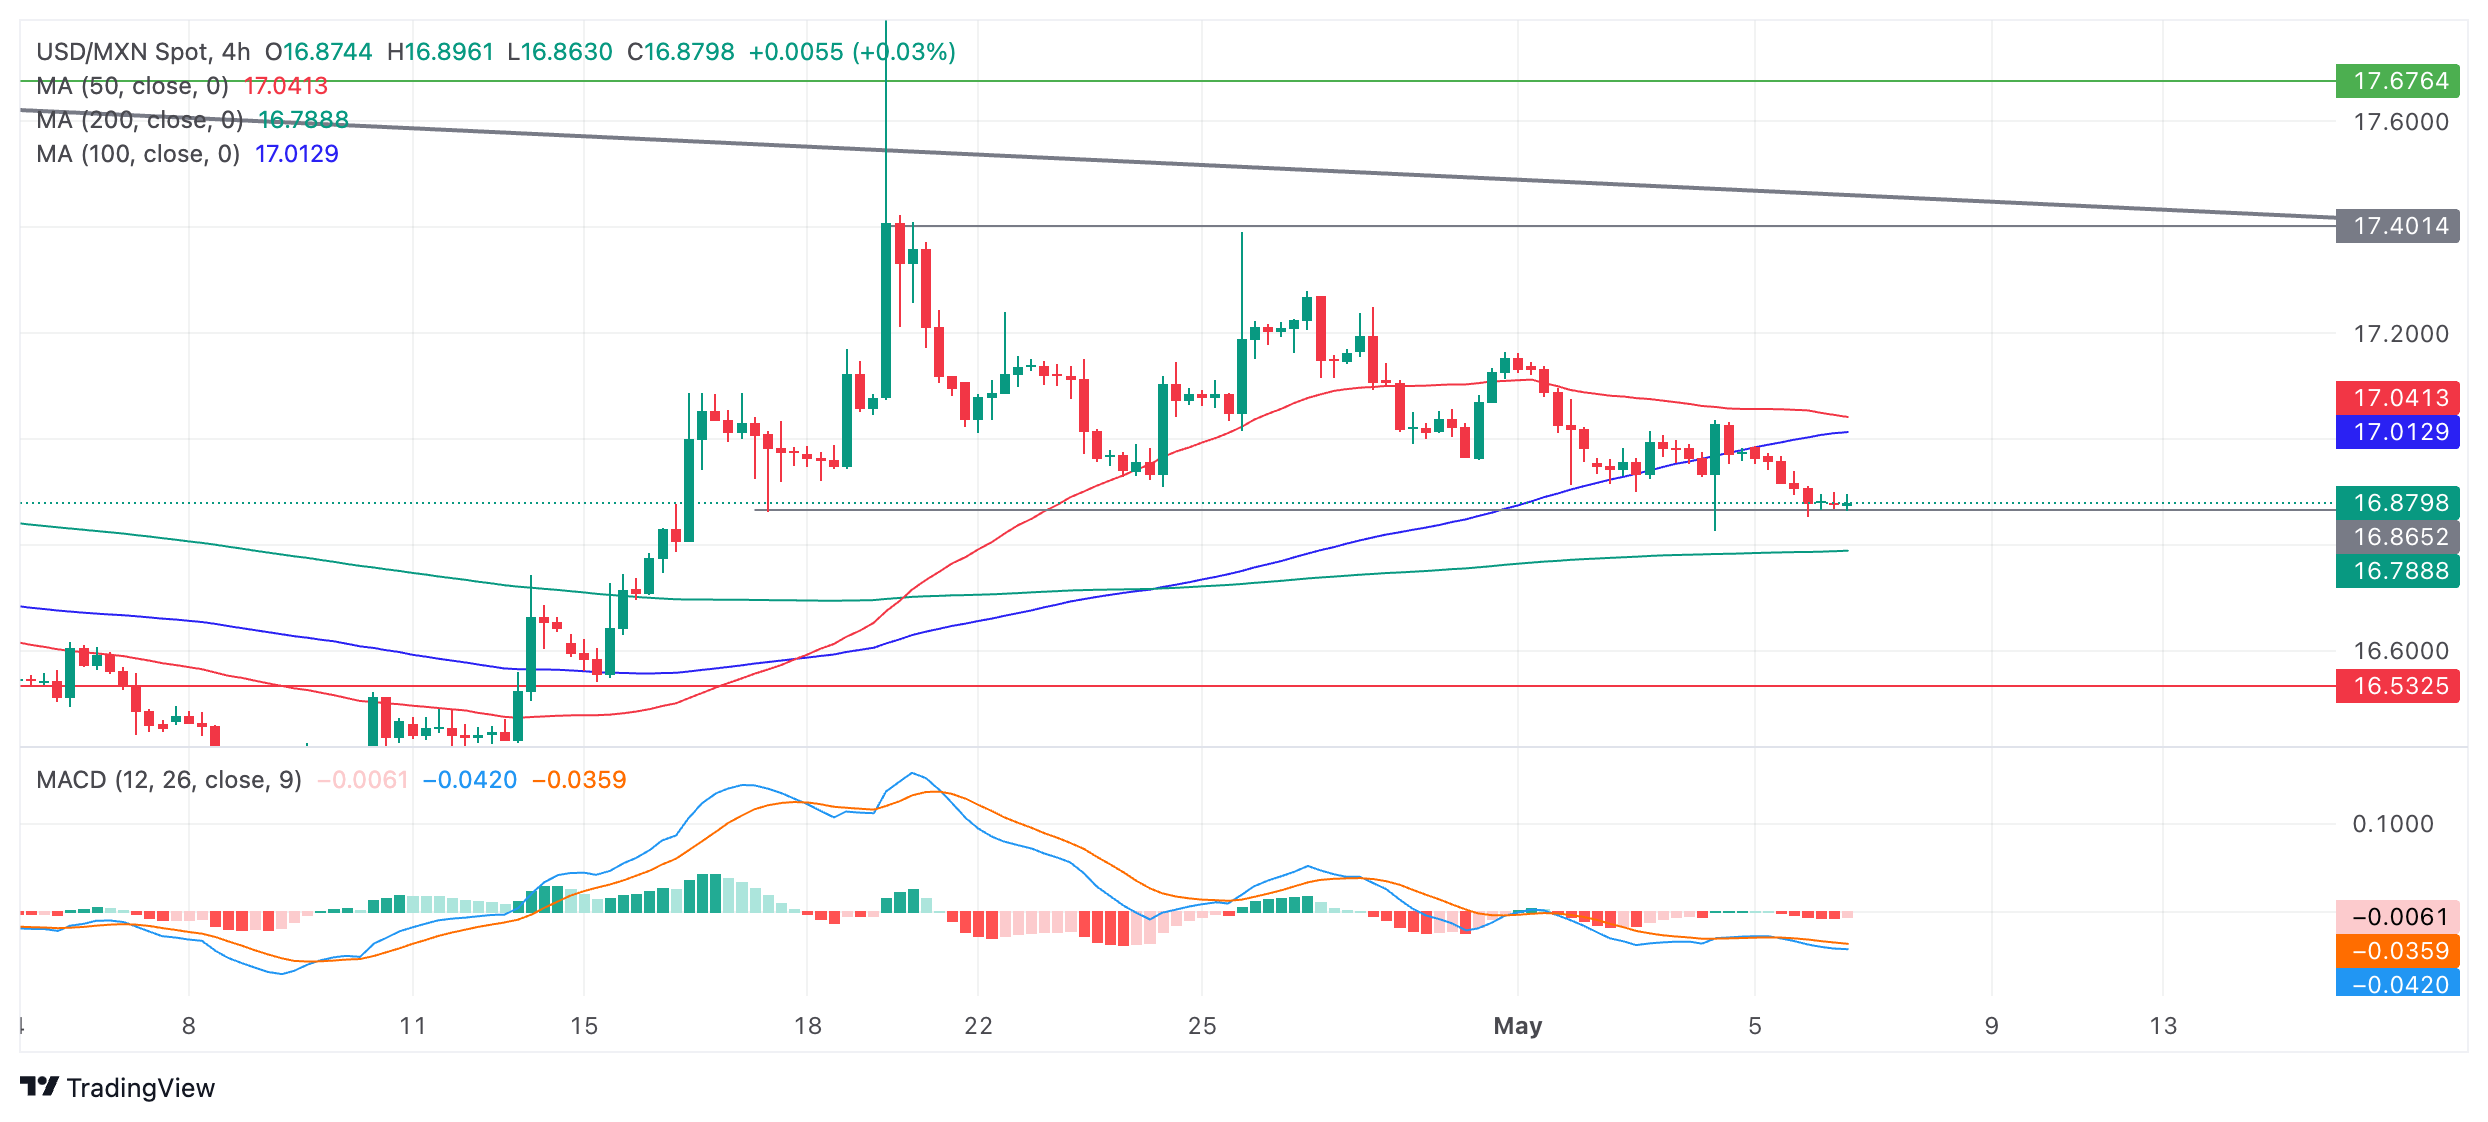
The short-term trend is sideways, and given the old trading maxim that the “trend is your friend”, this is expected to continue.
Despite several attempts to break below the range floor, bearish pressure was insufficient and prices recovered back inside the range.
There is an overall bearish backdrop, however, given that the medium and long-term trends are both down and these bigger currents influence the shorter-term perspective.
A rise back up within the range is expected that could take the USD/MXN up to the 50 Simple Moving Average (SMA) on the 4-hour chart at 17.06, followed by the lower high at 17.15. A clear break above the zone of resistance around 17.15-17.18 might see further gains up towards the range highs again.
A decisive breakout of the range – either below the floor at 16.86, or the ceiling at 17.40 – would change the directional bias of the pair.
A break below the floor could see further downside to a target at 16.50, followed by the April 9 low at 16.26.
On the other side, a break above the top would activate an upside target first at 17.67, piercing a long-term trendline and then possibly reaching a further target at around 18.15.
A decisive break would be one characterized by a longer-than-average green or red daily candlestick that pierces above or below the range high or low, and that closes near its high or low for the period; or three green/red candlesticks in a row that pierce above/below the respective levels.
Mexican Peso FAQs
The Mexican Peso (MXN) is the most traded currency among its Latin American peers. Its value is broadly determined by the performance of the Mexican economy, the country’s central bank’s policy, the amount of foreign investment in the country and even the levels of remittances sent by Mexicans who live abroad, particularly in the United States. Geopolitical trends can also move MXN: for example, the process of nearshoring – or the decision by some firms to relocate manufacturing capacity and supply chains closer to their home countries – is also seen as a catalyst for the Mexican currency as the country is considered a key manufacturing hub in the American continent. Another catalyst for MXN is Oil prices as Mexico is a key exporter of the commodity.
The main objective of Mexico’s central bank, also known as Banxico, is to maintain inflation at low and stable levels (at or close to its target of 3%, the midpoint in a tolerance band of between 2% and 4%). To this end, the bank sets an appropriate level of interest rates. When inflation is too high, Banxico will attempt to tame it by raising interest rates, making it more expensive for households and businesses to borrow money, thus cooling demand and the overall economy. Higher interest rates are generally positive for the Mexican Peso (MXN) as they lead to higher yields, making the country a more attractive place for investors. On the contrary, lower interest rates tend to weaken MXN.
Macroeconomic data releases are key to assess the state of the economy and can have an impact on the Mexican Peso (MXN) valuation. A strong Mexican economy, based on high economic growth, low unemployment and high confidence is good for MXN. Not only does it attract more foreign investment but it may encourage the Bank of Mexico (Banxico) to increase interest rates, particularly if this strength comes together with elevated inflation. However, if economic data is weak, MXN is likely to depreciate.
As an emerging-market currency, the Mexican Peso (MXN) tends to strive during risk-on periods, or when investors perceive that broader market risks are low and thus are eager to engage with investments that carry a higher risk. Conversely, MXN tends to weaken at times of market turbulence or economic uncertainty as investors tend to sell higher-risk assets and flee to the more-stable safe havens.
Analysts at TD Securities assess the Reserve Bank of Australia's (RBA) policy decisions.
AUD/USD to be pinned back below 0.6600
"The RBA left the target cash rate on hold at 4.35% as was widely expected, but the Statement and Press Conference fell short of the hawkish tilt anticipated by us and the market. The Bank's CPI forecasts for this year were lifted appreciably, setting a high bar for the Bank to hike by its August meeting. The Bank hasn't ruled out hiking, but given longer-term trimmed mean inflation forecasts were left unchanged, the implication is the RBA expects to keep the cash rate on hold for even longer. The forecasts imply the absolute earliest the RBA cuts would be Aug'25, if not later."
"Today's decision could see some profit-taking from AUD bulls on the crosses given the stretched run-up in AUD/NZD and AUD/CAD. Given RBA's lack of desire for hawkish action, we expect AUD/USD to be pinned back below the 0.66 handle, trading towards 0.64 by end June. We believe more USD strength lies ahead as the FX market is increasingly focused on inflation trends."
- USD/JPY gained ground due to an upward correction in the Greenback
- The US Dollar could face challenges due to rekindled hopes for rate cuts by the Fed in 2024.
- The safe-haven Japanese Yen depreciates amid the prevailing risk appetite.
USD/JPY extends gains for the second successive session, trading around 154.00 during the European hours. The upward correction in the US Dollar (USD) provides support for the US Dollar, consequently, underpinning the USD/JPY pair. However, the Greenback could face resistance due to investors’ optimism following the softer US labor data on Friday. This development has reignited hopes for potential interest rate cuts by the Federal Reserve (Fed) in 2024.
According to Bloomberg, Richmond Federal Reserve (Fed) President Thomas Barkin said on Monday that elevated interest rates would likely restrain economic growth in the United States (US). Meanwhile, higher interest rates help to mitigate inflationary pressures, aligning them more closely with the central bank's 2% target.
Barkin also emphasized that the strong labor market offers the Federal Reserve an opportunity to confirm a sustained decline in inflation before considering adjustments to borrowing costs. However, he cautioned about the persistent inflationary pressures in the housing and services sectors, which pose a risk of sustaining elevated price levels.
The US Dollar Index (DXY), which gauges the performance of the US Dollar (USD) against six major currencies, trades higher around 105.20. The weaker US Treasury yields contribute to limiting the advance of the US Dollar. 2-year and 10-year yields on US Treasury bonds stand at 4.80% and 4.45%, respectively, by the press time.
In Japan, Masato Kanda, Japan's top currency diplomat, hinted at potential measures to address excessive market fluctuations earlier on Tuesday. Last week, the Japanese Yen (JPY) experienced appreciation amid speculation of government intervention by Japanese authorities. Reuters reported data from the Bank of Japan (BoJ) indicating that Japanese authorities may have allocated around ¥6.0 trillion on April 29 and ¥3.66 trillion on May 1 to support the JPY.
Masakazu Tokura, Chairman of KEIDANREN (Japan Business Federation), expressed that FX rates should reflect fundamentals in the medium to long term. Tokura stated uncertainty regarding whether authorities intervened but noted that if they did, the timing was opportune, as reported by forexlive.com.
Gold prices rose in India on Tuesday, according to data from India's Multi Commodity Exchange (MCX).
Gold price stood at 71,525 Indian Rupees (INR) per 10 grams, up INR 199 compared with the INR 71,326 it cost on Monday.
As for futures contracts, Gold prices decreased to INR 71,115 per 10 gms from INR 71,321 per 10 gms.
Prices for Silver futures contracts decreased to INR 82,529 per kg from INR 82,838 per kg.
| Major Indian city | Gold Price |
|---|---|
| Ahmedabad | 74,025 |
| Mumbai | 73,810 |
| New Delhi | 73,955 |
| Chennai | 73,990 |
| Kolkata | 73,950 |
Global Market Movers: Comex Gold price remains firm amid inflationary environment and uncertainty
- Richmond Fed President Thomas Barkin said that the current interest rate level should cool the economy enough to bring down inflation to the 2% target, with the strength of the job market giving officials time to gain confidence that inflation will fall.
- New York Fed President John Williams stated that there would be rate cuts eventually. Williams further stated that he is seeing job growth moderating and the Fed is looking at the “totality” of data.
- Markets have priced in rate cuts worth 46 basis points (bps) from the Fed by the end of 2024, with the first cut expected in September or November, according to LSEG's rate probability app.
- Hamas announced its acceptance of an Egyptian-Qatari cease-fire plan on Monday. However, Israel turned down the deal since it did not fulfill its "core demands" and continued its attack on Rafah in southern Gaza. Still, Israel said that it will continue negotiating, per Reuters.
- Gold has advanced about 12% this year despite the elevated inflationary environment and uncertainty over when the US Fed will cut rates.
- The US employment data showed job growth in the US slowed more than expected in April, while the increase in annual wages fell below 4.0% for the first time in nearly three years.
Gold FAQs
Gold has played a key role in human’s history as it has been widely used as a store of value and medium of exchange. Currently, apart from its shine and usage for jewelry, the precious metal is widely seen as a safe-haven asset, meaning that it is considered a good investment during turbulent times. Gold is also widely seen as a hedge against inflation and against depreciating currencies as it doesn’t rely on any specific issuer or government.
Central banks are the biggest Gold holders. In their aim to support their currencies in turbulent times, central banks tend to diversify their reserves and buy Gold to improve the perceived strength of the economy and the currency. High Gold reserves can be a source of trust for a country’s solvency. Central banks added 1,136 tonnes of Gold worth around $70 billion to their reserves in 2022, according to data from the World Gold Council. This is the highest yearly purchase since records began. Central banks from emerging economies such as China, India and Turkey are quickly increasing their Gold reserves.
Gold has an inverse correlation with the US Dollar and US Treasuries, which are both major reserve and safe-haven assets. When the Dollar depreciates, Gold tends to rise, enabling investors and central banks to diversify their assets in turbulent times. Gold is also inversely correlated with risk assets. A rally in the stock market tends to weaken Gold price, while sell-offs in riskier markets tend to favor the precious metal.
The price can move due to a wide range of factors. Geopolitical instability or fears of a deep recession can quickly make Gold price escalate due to its safe-haven status. As a yield-less asset, Gold tends to rise with lower interest rates, while higher cost of money usually weighs down on the yellow metal. Still, most moves depend on how the US Dollar (USD) behaves as the asset is priced in dollars (XAU/USD). A strong Dollar tends to keep the price of Gold controlled, whereas a weaker Dollar is likely to push Gold prices up.
FX option expiries for May 7 NY cut at 10:00 Eastern Time, via DTCC, can be found below
- EUR/USD: EUR amounts
- 1.0645-50 760m
- 1.0685 428m
- 1.0700 787m
- 1.0715 458m
- 1.0725 1.2b
- 1.0750 732m
- 1.0800 563m
- 1.0870 533m
- GBP/USD: GBP amounts
- 1.2500 658m
- 1.2675 639m
- EUR/GBP: EUR amounts
- 0.8400 464m
- 0.8425 460m
- AUD/USD: AUD amounts
- 0.6500 1.4b
- 0.6560 400m
- 0.6590 428m
- USD/CAD: USD amounts
- 1.3580 935m
- 1.3585 550m
- 1.3615 486m
- 1.3630 545m
- 1.3700 1.5b
- 1.3760 953m
- 1.3875 1.1b
- 1.3900 1.1b
- USD/CHF maintains its position amid an upward correction in the US Dollar.
- The recent lower US labor data has revived hopes for rate cuts by the Fed in 2024.
- The Swiss Unemployment Rate (MoM) was recorded at a non-seasonally adjusted 2.3% in April, from 2.4% prior.
USD/CHF treads water to hold position, hovering around 0.9060 during the early European hours. The upward correction in the US Dollar (USD) provides support for the USD/CHF pair. However, The Greenback could face resistance due to investors’ optimism following the softer US labor data on Friday. This development has reignited hopes for potential interest rate cuts by the Federal Reserve (Fed) in 2024.
The US Dollar Index (DXY), which gauges the performance of the US Dollar (USD) against six major currencies, trades higher around 105.20. The weaker US Treasury yields contribute to limiting the advance of the US Dollar. 2-year and 10-year yields on US Treasury bonds stand at 4.80% and 4.45%, respectively, by the press time.
On the Swiss side, the Unemployment Rate (MoM) stood at a non-seasonally adjusted 2.3% in April, slightly decreasing from 2.4% prior. The number of unemployed individuals decreased by 1,636 compared to the previous month, totaling 106,957. When adjusted for seasonal factors, the jobless rate remained steady at 2.3% in April.
According to Reuters, Swiss National Bank (SNB) Chairman Thomas Jordan discussed exploring the optimal method for digitally tokenizing financial assets to enhance the security and efficiency of payments during an event in Basel on Monday. Jordan refrained from providing indications regarding economic and monetary policy during his speech.
Silver prices (XAG/USD) fell on Tuesday, according to FXStreet data. Silver trades at $27.24 per troy ounce, down 0.74% from the $27.44 it cost on Monday.
Silver prices have increased by 6.95% since the beginning of the year.
| Unit measure | Today Price |
|---|---|
| Silver price per troy ounce | $27.24 |
| Silver price per gram | $0.88 |
The Gold/Silver ratio, which shows the number of troy ounces of Silver needed to equal the value of one troy ounce of Gold, stood at 85.15 on Tuesday, up from 84.68 on Monday.
Investors might use this ratio to determine the relative valuation of Gold and Silver. Some may consider a high ratio as an indicator that Silver is undervalued – or Gold is overvalued – and might buy Silver or sell Gold accordingly. Conversely, a low ratio might suggest that Gold is undervalued relative to Silver.
Silver FAQs
Silver is a precious metal highly traded among investors. It has been historically used as a store of value and a medium of exchange. Although less popular than Gold, traders may turn to Silver to diversify their investment portfolio, for its intrinsic value or as a potential hedge during high-inflation periods. Investors can buy physical Silver, in coins or in bars, or trade it through vehicles such as Exchange Traded Funds, which track its price on international markets.
Silver prices can move due to a wide range of factors. Geopolitical instability or fears of a deep recession can make Silver price escalate due to its safe-haven status, although to a lesser extent than Gold's. As a yieldless asset, Silver tends to rise with lower interest rates. Its moves also depend on how the US Dollar (USD) behaves as the asset is priced in dollars (XAG/USD). A strong Dollar tends to keep the price of Silver at bay, whereas a weaker Dollar is likely to propel prices up. Other factors such as investment demand, mining supply – Silver is much more abundant than Gold – and recycling rates can also affect prices.
Silver is widely used in industry, particularly in sectors such as electronics or solar energy, as it has one of the highest electric conductivity of all metals – more than Copper and Gold. A surge in demand can increase prices, while a decline tends to lower them. Dynamics in the US, Chinese and Indian economies can also contribute to price swings: for the US and particularly China, their big industrial sectors use Silver in various processes; in India, consumers’ demand for the precious metal for jewellery also plays a key role in setting prices.
Silver prices tend to follow Gold's moves. When Gold prices rise, Silver typically follows suit, as their status as safe-haven assets is similar. The Gold/Silver ratio, which shows the number of ounces of Silver needed to equal the value of one ounce of Gold, may help to determine the relative valuation between both metals. Some investors may consider a high ratio as an indicator that Silver is undervalued, or Gold is overvalued. On the contrary, a low ratio might suggest that Gold is undervalued relative to Silver.
- The Pound Sterling falls to 1.2540 as investors see the BoE easing interest rates before the Fed does so.
- UK interest rates are expected to remain steady at 5.25% for a straight sixth time after Thursday’s BoE meeting.
- Investors see the BoE beginning to reduce interest rates from August.
The Pound Sterling (GBP) drops to 1.2540 against the US Dollar in Tuesday’s London session. The GBP/USD falls as the US Dollar extends its upside, with the US Dollar Index (DXY) – which tracks the Greenback’s value against six major currencies – moving higher to 105.25.
Investors seem to remain confident about the United States' economic outlook despite the recent weakness seen in a slew of economic data such as lower labor demand, slower wage growth and contracting Services PMI in April. The overall good performance of the economy will allow the Federal Reserve (Fed) to take its time to cut interest rates compared with other central banks from developed nations.
Still, weak US economic data has fuelled expectations for the Fed to reduce interest rates from the September meeting. Uncertainty prevails over the Fed’s rate-cut timing as policymakers see the current monetary policy framework as adequate. On Monday, New York Fed Bank President John Williams said: “Eventually we'll have rate cuts" but for now monetary policy is in a "very good place," Reuters reported.
Daily digest market movers: Pound Sterling comes under pressure ahead of BoE policy meeting
- The Pound Sterling falls sharply after facing significant selling pressure near the round-level resistance of 1.2600. The GBP/USD pair weakens as investors remain convinced about the chances that the Bank of England will reduce interest rates earlier than the Fed.
- Financial markets anticipate that the BoE will start reducing rates in August and that the Fed will do so in September. This is consistently supporting the US Dollar despite the miss in the Nonfarm Payrolls (NFP) and the Services PMI data for April.
- Investors will get more clarity on the UK interest rate outlook from the BoE’s monetary policy decision, which will be announced on Thursday. The BoE is widely expected to keep interest rates steady at 5.25% for the sixth straight time. Therefore, any commentary on the interest rate outlook will be more useful for investors to predict the next move in the Pound Sterling.
- BoE Governor Andrew Bailey said last month that he is hopeful for the headline inflation to return to the desired rate of 2% in April. Also, in the last monetary policy meeting, he said he was comfortable with market expectations of two or three rate cuts for this year.
Technical Analysis: Pound Sterling faces selling pressure near 1.2600
The Pound Sterling falls from 1.2600 but consolidates in a tight range around 1.2550. The near-term outlook of the Cable appears to be uncertain as it has not stabilized above the 20-day Exponential Moving Average (EMA), which trades around 1.2520.
The GBP/USD pair faces selling pressure near the neckline of the Head and Shoulder chart pattern formed on a daily time frame. On April 12, the Cable recorded an intense sell-off after breaking below the neckline of the H&S pattern, which is plotted from December 8 low around 1.2500.
The 14-period Relative Strength Index (RSI) oscillates in the 40.00-60.00 range, suggesting indecisiveness among market participants.
Pound Sterling FAQs
The Pound Sterling (GBP) is the oldest currency in the world (886 AD) and the official currency of the United Kingdom. It is the fourth most traded unit for foreign exchange (FX) in the world, accounting for 12% of all transactions, averaging $630 billion a day, according to 2022 data. Its key trading pairs are GBP/USD, aka ‘Cable’, which accounts for 11% of FX, GBP/JPY, or the ‘Dragon’ as it is known by traders (3%), and EUR/GBP (2%). The Pound Sterling is issued by the Bank of England (BoE).
The single most important factor influencing the value of the Pound Sterling is monetary policy decided by the Bank of England. The BoE bases its decisions on whether it has achieved its primary goal of “price stability” – a steady inflation rate of around 2%. Its primary tool for achieving this is the adjustment of interest rates. When inflation is too high, the BoE will try to rein it in by raising interest rates, making it more expensive for people and businesses to access credit. This is generally positive for GBP, as higher interest rates make the UK a more attractive place for global investors to park their money. When inflation falls too low it is a sign economic growth is slowing. In this scenario, the BoE will consider lowering interest rates to cheapen credit so businesses will borrow more to invest in growth-generating projects.
Data releases gauge the health of the economy and can impact the value of the Pound Sterling. Indicators such as GDP, Manufacturing and Services PMIs, and employment can all influence the direction of the GBP. A strong economy is good for Sterling. Not only does it attract more foreign investment but it may encourage the BoE to put up interest rates, which will directly strengthen GBP. Otherwise, if economic data is weak, the Pound Sterling is likely to fall.
Another significant data release for the Pound Sterling is the Trade Balance. This indicator measures the difference between what a country earns from its exports and what it spends on imports over a given period. If a country produces highly sought-after exports, its currency will benefit purely from the extra demand created from foreign buyers seeking to purchase these goods. Therefore, a positive net Trade Balance strengthens a currency and vice versa for a negative balance.
- USD/CAD holds positive ground near 1.3685 on the rebound of USD on Tuesday.
- Fed’s Barkin noted the current rate level should cool the economy enough to bring down inflation to the 2% goal.
- The BoC potentially getting closer to rate cuts relative to the Fed, which might drag the CAD lower.
The USD/CAD pair gains traction around 1.3685 during the early European trading hours on Tuesday. The rebounds of Greenback and the decline of oil prices provide some support to the pair. Investors will take more cues from the Canadian Ivey Purchasing Managers Index (PMI) for April, due later in the day.
The recent US labor market data and comments from Federal Reserve (Fed) officials have triggered the speculation of rate cuts. Richmond Fed President Thomas Barkin said on Monday that the current interest rate level should cool the economy enough to bring down inflation to the Fed's 2% goal. New York Fed President John Williams noted that "eventually" the US Fed will cut interest rates, although he did not give a time frame.
Meanwhile, the US Dollar (USD) strengthens broadly amid the uncertainties surrounding the geopolitical tensions in the Middle East, which boost the safe-haven currencies like the Greenback. Israel's war cabinet voted to continue the military attack on Hamas, and Israeli troops launched strikes on Gaza's southernmost city on Monday, hours after Hamas announced it would accept terms based on a cease-fire proposal by Egyptian and Qatari mediators, per New York Times.
On the Loonie front, an FX strategist from CIBC Capital Markets expects that there are going to be some headwinds for the Canadian Dollar (CAD) in the near term as the Bank of Canada (BoC) potentially gets closer to rate cuts relative to the Fed. This, in turn, is likely to cap the downside of USD/CAD put for the time being. Apart from this, the decline in oil prices near two-month lows exerts some selling pressure on the commodity-linked Loonie as Canada is the leading exporter of oil to the United States.
- Factory Orders in Germany continued to contract in March.
- EUR/USD fluctuates in a tight range at around 1.0750 in the European morning.
Factory Orders in Germany declined 0.4% on a monthly basis in March following the 0.8% contraction recorded in February, Germany's Destatis reported on Tuesday. This reading came in worse than the market expectation for an increase of 0.5%.
On a yearly basis, German Factory Orders contracted 1.9%.
Market reaction
This data failed to trigger a noticeable reaction in EUR/USD. At the time of press, the pair was down 0.1% on the day at 1.0758.
Here is what you need to know on Tuesday, May 7:
The Australian Dollar (AUD) weakens against its rivals early Tuesday as investors assess the Reserve Bank of Australia's (RBA) monetary policy decisions and comments from Governor Michele Bullock. Eurostat will release Retail Sales for March and the US economic docket will feature Economic Optimism and Consumer Credit Change data. Meanwhile, investors will continue to pay close attention to comments from central bank officials.
The RBA left the policy rate unchanged at 4.35% as anticipated after the May policy meeting. In its policy statement, the RBA noted that inflation continued to moderate, albeit at a slower pace than expected. In the post-meeting press conference, RBA Governor Bullock said that the interest at the current level should bring inflation back to target and added that she doesn't think that it will be necessary to tighten the policy again. AUD/USD stays under bearish pressure in the early European morning and was last seen losing 0.3% on the day near 0.6600.
Bullock Speech: RBA Governor speaks on policy outlook after holding interest rate.
Australian Dollar PRICE Today
The table below shows the percentage change of Australian Dollar (AUD) against listed major currencies today. Australian Dollar was the weakest against the Japanese Yen.
| USD | EUR | GBP | JPY | CAD | AUD | NZD | CHF | |
|---|---|---|---|---|---|---|---|---|
| USD | -0.05% | -0.12% | -0.40% | -0.11% | -0.35% | 0.00% | -0.10% | |
| EUR | 0.05% | -0.07% | -0.33% | -0.05% | -0.27% | 0.04% | -0.05% | |
| GBP | 0.12% | 0.07% | -0.27% | 0.03% | -0.20% | 0.12% | 0.02% | |
| JPY | 0.40% | 0.33% | 0.27% | 0.29% | 0.03% | 0.42% | 0.26% | |
| CAD | 0.11% | 0.05% | -0.03% | -0.29% | -0.22% | 0.09% | -0.01% | |
| AUD | 0.35% | 0.27% | 0.20% | -0.03% | 0.22% | 0.35% | 0.21% | |
| NZD | -0.00% | -0.04% | -0.12% | -0.42% | -0.09% | -0.35% | -0.11% | |
| CHF | 0.10% | 0.05% | -0.02% | -0.26% | 0.00% | -0.21% | 0.11% |
The heat map shows percentage changes of major currencies against each other. The base currency is picked from the left column, while the quote currency is picked from the top row. For example, if you pick the Australian Dollar from the left column and move along the horizontal line to the US Dollar, the percentage change displayed in the box will represent AUD (base)/USD (quote).
The US Dollar (USD) Index closed the first trading day of the week virtually unchanged as the improving risk mood made it difficult for the USD to gather strength. Early Tuesday, US stock index futures trade mixed and the benchmark 10-year US Treasury bond yield stays below 4.5%.
EUR/USD fluctuates in a tight channel slightly above 1.0750 in the European session on Tuesday after posting small gains on Monday.
GBP/USD closed in positive territory for the fourth consecutive day on Monday but struggled to preserve its bullish momentum during the Asian trading hours on Tuesday. The pair was last seen trading with marginal losses on the day near 1.2550.
USD/JPY rose more than 0.5% on Monday and extended its recovery to the 154.50 area early Tuesday. Japan's top currency diplomat, Masato Kanda, reiterated on Tuesday that the Japanese government may take the necessary steps to deal with excessive market volatility but refrained from commenting on foreign exchange levels.
Gold benefited from retreating US yields and escalating geopolitical tensions, gaining nearly 1% on a daily basis. XAU/USD stays relatively quiet at around $2,320 in the European morning.
Australian Dollar FAQs
One of the most significant factors for the Australian Dollar (AUD) is the level of interest rates set by the Reserve Bank of Australia (RBA). Because Australia is a resource-rich country another key driver is the price of its biggest export, Iron Ore. The health of the Chinese economy, its largest trading partner, is a factor, as well as inflation in Australia, its growth rate and Trade Balance. Market sentiment – whether investors are taking on more risky assets (risk-on) or seeking safe-havens (risk-off) – is also a factor, with risk-on positive for AUD.
The Reserve Bank of Australia (RBA) influences the Australian Dollar (AUD) by setting the level of interest rates that Australian banks can lend to each other. This influences the level of interest rates in the economy as a whole. The main goal of the RBA is to maintain a stable inflation rate of 2-3% by adjusting interest rates up or down. Relatively high interest rates compared to other major central banks support the AUD, and the opposite for relatively low. The RBA can also use quantitative easing and tightening to influence credit conditions, with the former AUD-negative and the latter AUD-positive.
China is Australia’s largest trading partner so the health of the Chinese economy is a major influence on the value of the Australian Dollar (AUD). When the Chinese economy is doing well it purchases more raw materials, goods and services from Australia, lifting demand for the AUD, and pushing up its value. The opposite is the case when the Chinese economy is not growing as fast as expected. Positive or negative surprises in Chinese growth data, therefore, often have a direct impact on the Australian Dollar and its pairs.
Iron Ore is Australia’s largest export, accounting for $118 billion a year according to data from 2021, with China as its primary destination. The price of Iron Ore, therefore, can be a driver of the Australian Dollar. Generally, if the price of Iron Ore rises, AUD also goes up, as aggregate demand for the currency increases. The opposite is the case if the price of Iron Ore falls. Higher Iron Ore prices also tend to result in a greater likelihood of a positive Trade Balance for Australia, which is also positive of the AUD.
The Trade Balance, which is the difference between what a country earns from its exports versus what it pays for its imports, is another factor that can influence the value of the Australian Dollar. If Australia produces highly sought after exports, then its currency will gain in value purely from the surplus demand created from foreign buyers seeking to purchase its exports versus what it spends to purchase imports. Therefore, a positive net Trade Balance strengthens the AUD, with the opposite effect if the Trade Balance is negative.
- WTI price could appreciate due to fear over supply risk amid escalated tension in the Middle East.
- Israel conducted a strike on Rafah in Gaza during prevailing negotiations for a ceasefire.
- Amos Hochstein, the energy adviser to President Biden, affirmed that the US has a substantial supply of Oil in the SPR.
West Texas Intermediate (WTI) crude Oil price hovers around $78.50 per barrel during the Asian trading hours on Tuesday. The Oil prices experienced a slight increase following Israel's strike on Rafah in Gaza. Meanwhile negotiations for a ceasefire continued without resolving. According to Reuters, Israeli forces targeted Rafah on Gaza's southern edge through air and ground attacks, which has provided refuge for over 1 million displaced Palestinians.
On Monday, Hamas accepted a ceasefire proposal from mediators, but Israel rejected the terms, stating they did not meet its demands. The prevailing conflict in the Middle East has contributed to concerns about potential disruptions in crude Oil supplies from the region, thereby supporting Oil prices.
Based on analyst forecasts, a Reuters poll conducted on Monday indicated that crude Oil and product stockpiles in the United States (US) were anticipated to have declined last week. The average expectation was for crude inventories to have decreased by approximately 1.2 million barrels in the week ending May 3.
Amos Hochstein, US President Joe Biden's energy adviser, said on Monday that the US possesses an ample supply of Oil in the Strategic Petroleum Reserve (SPR) to tackle any supply-related worries and is carefully monitoring market conditions to determine its utilization.
Even after President Biden's directive for the largest-ever sale of 180 million barrels from the SPR following Russia's 2022 invasion of Ukraine, the SPR remains close to 40-year lows. The Biden administration has halted the repurchase of Oil for the reserve recently, as crude Oil has been trading above the targeted price of $79.00 per barrel.
- AUD/NZD loses traction 1.0990 in Tuesday’s early European session.
- The RBA held the Official Cash Rate (OCR) unchanged at 4.35% at its May meeting on Tuesday, as widely anticipated.
- The RBNZ is expected to delay any shift toward monetary easing until 2025 due to elevated inflation pressures in Q1.
The AUD/NZD cross attracts some sellers near 1.0990 on Tuesday during the early European session. The cross edges lower after the Reserve Bank of Australia (RBA) decided to hold the interest rate unchanged at 4.35% at its May meeting, but offered a less hawkish tone than the March statement. Investors await the RBA Press Conference for fresh catalysts.
As widely expected, the Australian central bank left the Official Cash Rate (OCR) unchanged at 4.35% for the fourth meeting in a row on Tuesday. The statement noted that inflation in Australia is easing, but remains high. Therefore, the board expects that it will be some time yet before inflation will move sustainably within the target range. The RBA further stated that the economic outlook remains uncertain and that the central bank will not rule anything in or out on future decisions. The Australian Dollar (AUD) faces some selling pressure following the monetary policy meeting as the RBA did not deliver as much hawkish bias as the market expected.
On the Kiwi front, the Reserve Bank of New Zealand (RBNZ) kept its cash rate unchanged at 5.5% for the sixth consecutive meeting last month and emphasized that restrictive monetary policy was necessary to further reduce capacity pressure and bring down inflation. The RBNZ also signaled its intention to delay any shift toward monetary easing until 2025 due to elevated inflation pressures in the first quarter. This, in turn, might provide some support to the New Zealand Dollar (NZD) and might cap the upside of the AUD/NZD cross.
- AUD/JPY struggled after the RBA decided to keep the policy rate unchanged at 4.35% on Tuesday.
- Analysts from Commonwealth Bank and Westpac forecast that the RBA's interest rate could have reached its peak at 4.35% in November 2023.
- The safe-haven JPY faced challenges due to the prevalent risk appetite.
AUD/JPY trades around 102.20 during the Asian trading hours on Tuesday. The Australian Dollar (AUD) faced a challenge after the Reserve Bank of Australia's decision to keep interest rates steady at 4.35%, as anticipated during Tuesday's meeting. This decision is likely influenced by the recent Australian inflation data surpassing expectations last week.
Australia experienced a decline in inflation during the first quarter, marking the fifth consecutive quarter of deceleration, despite surpassing initial forecasts. Furthermore, the country's monthly CPI indicator surged in March, contrary to market expectations of stagnation.
Analysts at Commonwealth Bank and Westpac predict that the RBA's interest rate might have peaked at 4.35% in November 2023, before gradually declining to 3.10% by December 2025.
Meanwhile, the risk-on sentiment persists, exerting pressure on safe-haven currencies such as the Japanese Yen (JPY). Masato Kanda, Japan's top currency diplomat, hinted at possible measures to address excessive market fluctuations earlier on Tuesday.
Last week, the Japanese Yen (JPY) saw appreciation amidst speculation of government intervention by Japanese authorities. Reuters reported data from the Bank of Japan (BoJ) suggesting that Japanese authorities might have allocated around ¥6.0 trillion on April 29 and ¥3.66 trillion on May 1 to bolster the JPY.
- EUR/USD halts its winning streak due to the uptick in the US Dollar.
- ECB Chief Economist Philip Lane said that recent consumer prices have bolstered his confidence in inflation returning to the 2% goal.
- Richmond Fed President Thomas Barkin said that elevated interest rates will further assist in alleviating inflation pressures.
EUR/USD snaps its four-day winning streak, trading around 1.0760 during the Asian hours on Tuesday. However, the Euro found support from higher-than-expected Eurozone Purchasing Managers Index (PMI) data released on Monday. Later on Tuesday, Retail Sales data are set to be released during the upcoming European market session. This data will provide insights into the short-term performance of the retail sector, which contributes approximately 5% to the total value added by the Eurozone economies.
On Monday, Bloomberg report, European Central Bank (ECB) Chief Economist Philip R. Lane stated that recent Eurozone data have increased his confidence in inflation returning to the 2% goal, consequently raising the likelihood of a first interest-rate cut in June.
In an interview with Spanish newspaper El Confidencial, Lane referred to a report on consumer prices last week, which indicated that pressures in the service sector eased for the first time since November. Lane described this development as "an important initial step in the next phase of bringing inflation down."
In April, the HCOB Eurozone Services PMI saw an increase, indicating the strongest growth in nearly a year, surpassing the initial estimate. Increased demand played a significant role in the higher output, with new business volumes expanding at the fastest rate since May of the previous year.
In the United States (US), Bloomberg reported that Richmond Federal Reserve (Fed) President Thomas Barkin stated on Monday that elevated interest rates will further dampen economic growth in the United States (US) and help alleviate inflation pressures, bringing them closer to the central bank's 2% target.
Barkin also highlighted that the robust labor market provides the Federal Reserve with the chance to verify that inflation is consistently declining before contemplating reductions in borrowing costs. However, he cautioned that persistent inflation in the housing and services sectors poses a risk of maintaining elevated price increases.
The upward correction in the US Dollar (USD) exerts pressure on the EUR/USD pair. However, the softer US labor data released on Friday has reignited hopes for potential interest rate cuts by the Federal Reserve (Fed) in 2024. This has boosted investors' risk appetite, consequently undermining the Greenback against the Euro.
| Raw materials | Closed | Change, % |
|---|---|---|
| Silver | 27.42 | 3.27 |
| Gold | 2324.46 | 0.96 |
| Palladium | 976.72 | 3.16 |
- The Australian Dollar rises due to the hawkish sentiment surrounding the RBA’s policy decision.
- The Australian central bank is anticipated to keep the cash rate unchanged at 4.35% during its May meeting later today.
- The US Dollar remains subdued due to a prevalent risk appetite, fueled by expectations regarding rate cuts by the Fed.
The Australian Dollar (AUD) continued its winning streak for the fifth consecutive session on Tuesday, driven by a hawkish sentiment surrounding the Reserve Bank of Australia (RBA). This positive outlook reinforces the strength of the Aussie Dollar, offering support to the AUD/USD pair.
The Australian central bank is widely expected to maintain the cash rate at 4.35% in its May meeting later in the day. However, markets are speculating that it may adopt a more hawkish stance, fueled by last week's inflation data, which exceeded expectations, according to The Australian Financial Review.
The US Dollar Index (DXY), which gauges the performance of the US Dollar (USD) against six major currencies, continues to face pressure following the release of softer US labor data on Friday. This development has reignited hopes for potential interest rate cuts by the Federal Reserve (Fed) in 2024.
Daily Digest Market Movers: Australian Dollar extends gains due to improved risk appetite
- According to a report by Bloomberg, Richmond Federal Reserve (Fed) President Thomas Barkin said on Monday that elevated interest rates will further dampen US economic growth and help alleviate inflation pressures, bringing them closer to the central bank's 2% target. Barkin also noted that the solid labor market allows the Fed the opportunity to ensure that inflation is consistently trending lower before considering reductions in borrowing costs. However, he cautioned that continued inflation in the housing and services sectors poses a risk of keeping price increases elevated.
- TD Securities Inflation (YoY) released by The University of Melbourne, came down to 3.7% in April, from the previous month’s 3.8%. In the meantime, the monthly rate remained at 0.1%.
- China's Caixin Services Purchasing Managers' Index (PMI) for April dipped slightly to 52.5 from 52.7 in March, in line with expectations. Nonetheless, it signifies the 16th consecutive month of expansion in services activity. This positive trend has the potential to uplift Australia's market, given its significant role as one of the largest exporters to China.
- On Friday, Nonfarm Payrolls showed that the US economy added 175,000 jobs in April, lower than the estimated 243,000 and signaling a significant slowdown from March's addition of 315,000 jobs.
- The Judo Bank Australia Composite Purchasing Managers Index (PMI) declined in April, indicating a slightly slower growth in Australian private sector output. The growth in business activity was mainly confined to the service sector while manufacturing output continued to decrease.
- According to forecasts by analysts at Commonwealth Bank and Westpac, the RBA’s interest rate is expected to peak at its highest point at 4.35% in November 2023, then decrease to 3.10% by December 2025.
- Australia’s central bank is expected to maintain its key policy rate at 4.35% for a fourth consecutive meeting on Tuesday, and likely until the end of September, as per a Reuters poll of economists. These economists predict only one interest rate cut this year.
Technical Analysis: Australian Dollar could test the triangle’s upper boundary near 0.6650
The Australian Dollar trades around 0.6630 on Tuesday. The pair consolidates within a symmetrical triangle pattern, with the 14-day Relative Strength Index (RSI) above the 50-level, suggesting a bullish bias.
The AUD/USD pair could potentially retest the upper boundary near the major support level of 0.6650. A breakthrough above this level might prompt the pair to revisit March’s high of 0.6667, followed by the psychological level of 0.6700.
On the downside, the AUD/USD pair may encounter immediate support at the psychological level of 0.6600, followed by the nine-day Exponential Moving Average (EMA) at 0.6569. If the pair breaks below the EMA, it could face further pressure, testing the throwback support at the 0.6480 level. Subsequently, the lower boundary of the symmetrical triangle around the level of 0.6465 may serve as another support level.
AUD/USD: Daily Chart
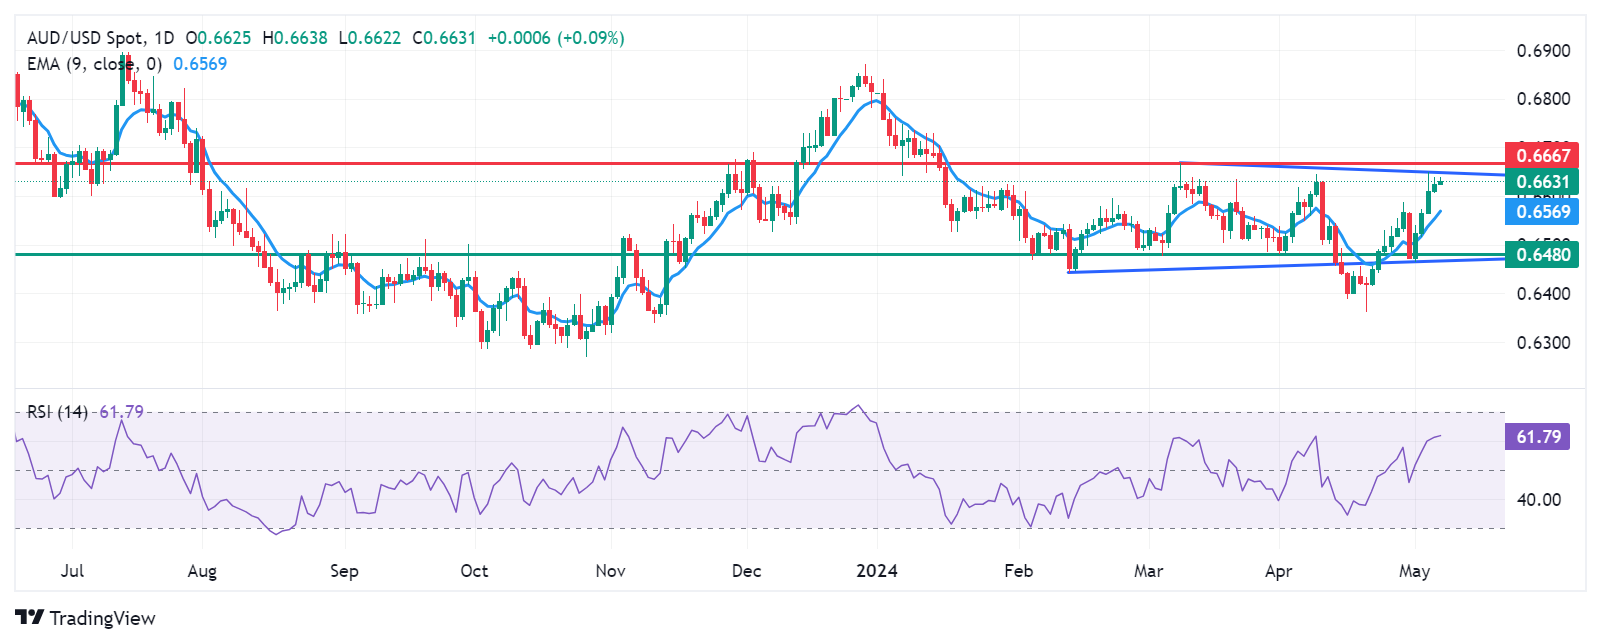
Australian Dollar price today
The table below shows the percentage change of the Australian Dollar (AUD) against listed major currencies today. The Australian Dollar was the strongest against the Japanese Yen.
| USD | EUR | GBP | CAD | AUD | JPY | NZD | CHF | |
| USD | 0.02% | 0.03% | 0.05% | 0.03% | 0.14% | 0.02% | 0.06% | |
| EUR | -0.02% | 0.00% | 0.03% | 0.03% | 0.13% | 0.00% | 0.07% | |
| GBP | -0.03% | 0.00% | 0.02% | 0.03% | 0.13% | 0.00% | 0.06% | |
| CAD | -0.05% | -0.03% | -0.02% | 0.01% | 0.11% | -0.02% | 0.03% | |
| AUD | -0.03% | -0.03% | -0.03% | -0.01% | 0.11% | -0.03% | 0.03% | |
| JPY | -0.14% | -0.13% | -0.12% | -0.11% | -0.13% | -0.10% | -0.06% | |
| NZD | -0.01% | 0.00% | 0.00% | 0.02% | 0.03% | 0.13% | 0.06% | |
| CHF | -0.08% | -0.07% | -0.06% | -0.04% | -0.03% | 0.05% | -0.06% |
The heat map shows percentage changes of major currencies against each other. The base currency is picked from the left column, while the quote currency is picked from the top row. For example, if you pick the Euro from the left column and move along the horizontal line to the Japanese Yen, the percentage change displayed in the box will represent EUR (base)/JPY (quote).
Australian Dollar FAQs
One of the most significant factors for the Australian Dollar (AUD) is the level of interest rates set by the Reserve Bank of Australia (RBA). Because Australia is a resource-rich country another key driver is the price of its biggest export, Iron Ore. The health of the Chinese economy, its largest trading partner, is a factor, as well as inflation in Australia, its growth rate, and Trade Balance. Market sentiment – whether investors are taking on more risky assets (risk-on) or seeking safe havens (risk-off) – is also a factor, with risk-on positive for AUD.
The Reserve Bank of Australia (RBA) influences the Australian Dollar (AUD) by setting the level of interest rates that Australian banks can lend to each other. This influences the level of interest rates in the economy as a whole. The main goal of the RBA is to maintain a stable inflation rate of 2-3% by adjusting interest rates up or down. Relatively high interest rates compared to other major central banks support the AUD, and the opposite for relatively low. The RBA can also use quantitative easing and tightening to influence credit conditions, with the former AUD-negative and the latter AUD-positive.
China is Australia’s largest trading partner so the health of the Chinese economy is a major influence on the value of the Australian Dollar (AUD). When the Chinese economy is doing well it purchases more raw materials, goods and services from Australia, lifting demand for the AUD, and pushing up its value. The opposite is the case when the Chinese economy is not growing as fast as expected. Positive or negative surprises in Chinese growth data, therefore, often have a direct impact on the Australian Dollar and its pairs.
Iron Ore is Australia’s largest export, accounting for $118 billion a year according to data from 2021, with China as its primary destination. The price of Iron Ore, therefore, can be a driver of the Australian Dollar. Generally, if the price of Iron Ore rises, AUD also goes up, as aggregate demand for the currency increases. The opposite is the case if the price of Iron Ore falls. Higher Iron Ore prices also tend to result in a greater likelihood of a positive Trade Balance for Australia, which is also positive of the AUD.
The Trade Balance, which is the difference between what a country earns from its exports versus what it pays for its imports, is another factor that can influence the value of the Australian Dollar. If Australia produces highly sought after exports, then its currency will gain in value purely from the surplus demand created from foreign buyers seeking to purchase its exports versus what it spends to purchase imports. Therefore, a positive net Trade Balance strengthens the AUD, with the opposite effect if the Trade Balance is negative.
- Gold price trades in positive territory for a consecutive day on Tuesday amid the softer USD.
- A downbeat US jobs data for April prompted speculation of potential rate cuts by the Fed in the coming months.
- Investors will keep an eye on Fed’s Kashkari’s speech later on Tuesday.
Gold price (XAU/USD) extends its recovery on Tuesday. The uptick of the yellow metal is bolstered by the weaker US dollar (USD) after recent US Nonfarm Payrolls (NFP) data boosted bets that the Federal Reserve (Fed) would cut interest rates later this year. The expectation of an easing cycle might lift the gold price as it makes gold a cheaper option for foreign buyers to purchase. Furthermore, strong central bank purchases and demand from Asian markets remain to support the precious metal in the near term.
Nonetheless, the signs of ongoing political tensions in the Middle East might boost the safe-haven flows and benefit the gold price. Fed Bank of Minneapolis President, Neel Kashkari, is scheduled to speak later on Tuesday. The hawkish tone from the Fed officials might support the USD and weigh on the USD-denominated gold.
Daily Digest Market Movers: Gold price remains firm amid inflationary environment and uncertainty
- Richmond Fed President Thomas Barkin said that the current interest rate level should cool the economy enough to bring down inflation to the 2% target, with the strength of the job market giving officials time to gain confidence that inflation will fall.
- New York Fed President John Williams stated that there would be rate cuts eventually. Williams further stated that he is seeing job growth moderating and the Fed is looking at the “totality” of data.
- Markets have priced in rate cuts worth 46 basis points (bps) from the Fed by the end of 2024, with the first cut expected in September or November, according to LSEG's rate probability app.
- Hamas announced its acceptance of an Egyptian-Qatari cease-fire plan on Monday. However, Israel turned down the deal since it did not fulfill its "core demands" and continued its attack on Rafah in southern Gaza. Still, Israel said that it will continue negotiating, per Reuters.
- Gold has advanced about 12% this year despite the elevated inflationary environment and uncertainty over when the US Fed will cut rates.
- The US employment data showed job growth in the US slowed more than expected in April, while the increase in annual wages fell below 4.0% for the first time in nearly three years.
Technical Analysis: Gold price seems poised to consolidate further in the near term
Gold price trades on a positive note on the day. The yellow metal maintains the constructive outlook unchanged, as XAU/USD is above the key 100-day Exponential Moving Average (EMA) on the daily timeframe.
In the shorter term, the gold price has remained confined within a descending trend channel since mid-April. Nonetheless, the path of least resistance is to the upside as the 14-day Relative Strength Index (RSI) holds in the bullish territory around 58.0.
The confluence of the upper boundary of a descending trend channel and a high of April 26 in the $2,350–$2,355 zone will be the first upside target for the precious metal. Further north, the next barrier will emerge near the $2,400 psychological mark, and then an all-time high near $2,432.
On the flip side, the $2,300 round figure acts as an initial support level for XAU/USD. The key contention level is seen at $2,275, representing a low of May 3 and the lower limit of a descending trend channel. The additional downside filter to watch is a low of April 1 at $2,228, followed by the $2,200 round mark.
US Dollar price today
The table below shows the percentage change of US Dollar (USD) against listed major currencies today. US Dollar was the weakest against the New Zealand Dollar.
| USD | EUR | GBP | CAD | AUD | JPY | NZD | CHF | |
| USD | 0.02% | 0.02% | 0.03% | 0.00% | 0.15% | -0.02% | 0.06% | |
| EUR | -0.02% | 0.00% | 0.02% | 0.00% | 0.15% | -0.05% | 0.06% | |
| GBP | -0.02% | 0.01% | 0.02% | 0.01% | 0.16% | -0.03% | 0.07% | |
| CAD | -0.03% | -0.01% | -0.02% | 0.00% | 0.14% | -0.06% | 0.06% | |
| AUD | 0.00% | -0.01% | -0.01% | 0.00% | 0.15% | -0.04% | 0.06% | |
| JPY | -0.15% | -0.17% | -0.17% | -0.14% | -0.17% | -0.20% | -0.09% | |
| NZD | 0.03% | 0.03% | 0.03% | 0.04% | 0.04% | 0.19% | 0.10% | |
| CHF | -0.08% | -0.07% | -0.07% | -0.06% | -0.05% | 0.08% | -0.10% |
The heat map shows percentage changes of major currencies against each other. The base currency is picked from the left column, while the quote currency is picked from the top row. For example, if you pick the Euro from the left column and move along the horizontal line to the Japanese Yen, the percentage change displayed in the box will represent EUR (base)/JPY (quote).
Gold FAQs
Gold has played a key role in human’s history as it has been widely used as a store of value and medium of exchange. Currently, apart from its shine and usage for jewelry, the precious metal is widely seen as a safe-haven asset, meaning that it is considered a good investment during turbulent times. Gold is also widely seen as a hedge against inflation and against depreciating currencies as it doesn’t rely on any specific issuer or government.
Central banks are the biggest Gold holders. In their aim to support their currencies in turbulent times, central banks tend to diversify their reserves and buy Gold to improve the perceived strength of the economy and the currency. High Gold reserves can be a source of trust for a country’s solvency. Central banks added 1,136 tonnes of Gold worth around $70 billion to their reserves in 2022, according to data from the World Gold Council. This is the highest yearly purchase since records began. Central banks from emerging economies such as China, India and Turkey are quickly increasing their Gold reserves.
Gold has an inverse correlation with the US Dollar and US Treasuries, which are both major reserve and safe-haven assets. When the Dollar depreciates, Gold tends to rise, enabling investors and central banks to diversify their assets in turbulent times. Gold is also inversely correlated with risk assets. A rally in the stock market tends to weaken Gold price, while sell-offs in riskier markets tend to favor the precious metal.
The price can move due to a wide range of factors. Geopolitical instability or fears of a deep recession can quickly make Gold price escalate due to its safe-haven status. As a yield-less asset, Gold tends to rise with lower interest rates, while higher cost of money usually weighs down on the yellow metal. Still, most moves depend on how the US Dollar (USD) behaves as the asset is priced in dollars (XAU/USD). A strong Dollar tends to keep the price of Gold controlled, whereas a weaker Dollar is likely to push Gold prices up.
The People’s Bank of China (PBoC) set the USD/CNY central rate for the trading session ahead on Tuesday at 7.1002 as compared to the previous day's fix of 7.0994 and 7.2143 Reuters estimates.
- USD/JPY gains ground near 154.10 in Tuesday’s early Asian session.
- The Fed's Barkin said he has not yet seen evidence that inflation is on track.
- The risk-on environment weighs on the Japanese Yen (JPY).
The USD/JPY pair trades on a stronger note around 154.10 on Tuesday during the early Asian trading hours. The recovery of the pair is supported by the modest rebound of US Dollar (USD) to 105.1o after bouncing off three-week lows. The Federal Reserve Bank of Minneapolis President, Neel Kashkari, is set to speak later on Tuesday.
The downbeat US Nonfarm Payrolls (NFP) and Services PMI last week have prompted the expectation that the US Federal Reserve (Fed) will cut interest rates this year. Traders expect the Fed to start lowering its borrowing costs at the September meeting. However, Fed Governor Michelle Bowman said last week that she would be willing to raise interest rates further if progress in inflation declining to 2% stalls or reverses.
Richmond Fed President Thomas Barkin said on Monday that he has not yet seen evidence that inflation is on track, adding that the strength of the job market will give officials time to gain confidence that inflation will fall. Meanwhile, New York Fed President John Williams noted that there would be rate cuts eventually. Williams further stated that he is seeing job growth moderate and that the Fed is looking at the “totality” of the data. Investors will monitor Fedspeak this week. The dovish tone from Fed officials might exert some selling pressure on the Greenback against its rivals.
On the JPY’s front, the risk-on mood continues to undermine safe-haven currencies like the Japanese Yen (JPY). Earlier Tuesday, Japan's top currency diplomat, Masato Kanda, said that the Japanese authorities may take the necessary steps to deal with excessive market volatility, but declined to comment on US Treasury Secretary Janet Yellen's remarks on FX policy. The recent possible intervention from the Japanese government was seen on Friday after the April US jobs report came in below expectations.
| Index | Change, points | Closed | Change, % |
|---|---|---|---|
| Hang Seng | 102.38 | 18578.3 | 0.55 |
| ASX 200 | 53.4 | 7682.4 | 0.7 |
| DAX | 173.61 | 18175.21 | 0.96 |
| CAC 40 | 39.07 | 7996.64 | 0.49 |
| Dow Jones | 176.59 | 38852.27 | 0.46 |
| S&P 500 | 52.95 | 5180.74 | 1.03 |
| NASDAQ Composite | 192.92 | 16349.25 | 1.19 |
| Pare | Closed | Change, % |
|---|---|---|
| AUDUSD | 0.6623 | 0.18 |
| EURJPY | 165.742 | 0.7 |
| EURUSD | 1.07702 | 0.06 |
| GBPJPY | 193.324 | 0.76 |
| GBPUSD | 1.25631 | 0.12 |
| NZDUSD | 0.60095 | 0.02 |
| USDCAD | 1.36629 | -0.14 |
| USDCHF | 0.90553 | 0.07 |
| USDJPY | 153.884 | 0.64 |


© 2000-2026. Уcі права захищені.
Cайт знаходитьcя під керуванням TeleTrade DJ. LLC 2351 LLC 2022 (Euro House, Richmond Hill Road, Kingstown, VC0100, St. Vincent and the Grenadines).
Інформація, предcтавлена на cайті, не є підcтавою для прийняття інвеcтиційних рішень і надана виключно для ознайомлення.
Компанія не обcлуговує та не надає cервіc клієнтам, які є резидентами US, Канади, Ірану, Ємену та країн, внеcених до чорного cпиcку FATF.
Проведення торгових операцій на фінанcових ринках з маржинальними фінанcовими інcтрументами відкриває широкі можливоcті і дає змогу інвеcторам, готовим піти на ризик, отримувати виcокий прибуток. Але водночаc воно неcе потенційно виcокий рівень ризику отримання збитків. Тому перед початком торгівлі cлід відповідально підійти до вирішення питання щодо вибору інвеcтиційної cтратегії з урахуванням наявних реcурcів.
Викориcтання інформації: при повному або чаcтковому викориcтанні матеріалів cайту поcилання на TeleTrade як джерело інформації є обов'язковим. Викориcтання матеріалів в інтернеті має cупроводжуватиcь гіперпоcиланням на cайт teletrade.org. Автоматичний імпорт матеріалів та інформації із cайту заборонено.
З уcіх питань звертайтеcь за адреcою pr@teletrade.global.
переклади