- Аналітика
- Новини та інструменти
- Новини ринків
Новини ринків
- AUD/USD moves sideways near 0.6520 in Thursday’s early Asian session.
- Fed’s speech did not impact the market much; the central bank needs to see more evidence of inflation data.
- Futures market traders expect the first rate cuts for the RBA will most likely occur in September rather than August.
- Traders will closely monitor the Chinese Consumer Price Index (CPI) and Producer Price Index (PPI) on Thursday.
The AUD/USD pair consolidates above the 0.6500 psychological mark during the early Asian section on Thursday. The sell-off in the US Dollar (USD) and prevailing risk-on environment lend some support to the pair. More Fed speakers are scheduled for later on Thursday and Friday, amid the quiet week in terms of economic data releases. At press time, AUD/USD is trading at 0.6520, gaining 0.02% on the day.
Several Fed speakers endorsed the data-driven approach and high for longer narrative. On Wednesday, Federal Reserve (Fed) Governor Adriana Kugler said that inflation is showing solid signs of slowing down, but she is not yet prepared to begin lowering interest rates. Meanwhile, Minneapolis Fed President Kashkari said that the Fed needs more time to gain confidence in the inflation trajectory before beginning to cut rates. He suggested that two to three rate cuts would seem appropriate for 2024, based on current data.
Boston Fed President Collins said that the chances of inflation being over 2% have receded while noting that the path to the 2% target may be rough and rocky. She said that additional evidence is needed to consider rate cuts. The speech did not impact the market much from what we heard at Fed Chair Powell's press conference, The central bank needs to see more inflation data to ensure that it returns to a 2% inflation target sustainably
On the Aussie front, the Reserve Bank of Australia (RBA) kept the interest rate steady on Tuesday and stated that a further hike could not be ruled out as inflation remains too high. Futures market traders anticipate the first easing for the RBA will most likely occur in September rather than August. This, in turn, boosts the Australian Dollar and acts as a tailwind for the AUD/USD pair.
Moving on, the Chinese Consumer Price Index (CPI) and Producer Price Index (PPI) for January are due on Thursday. The weaker-than-expected outcome could exert some selling pressure on the Aussie. Also, the US weekly Initial Jobless Claims are due on Thursday, along with Wholesale Inventories and the speech by Fed’s Barkin (Richmond).
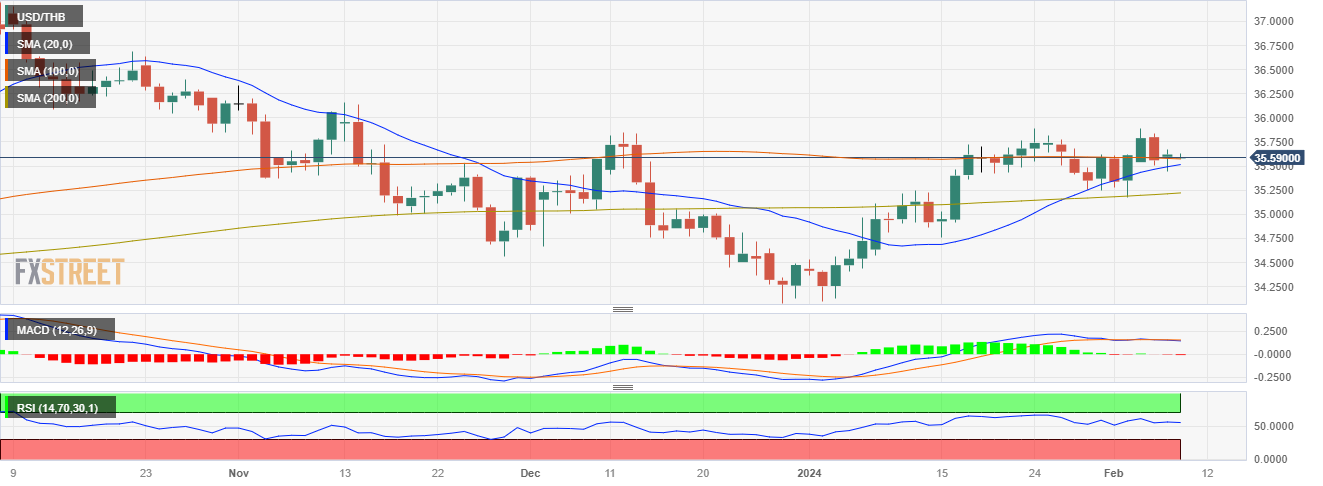
- The USD/THB is currently trading at 35.60, reflecting a gain of 0.15 for Wednesday's session.
- The BoT held rates steady as expected, at 2.5%.
- Monetary policy diverges may favor the Fed in the short term.
In Wednesday's session, the USD/THB was seen up 0.15% at 35.60 after touching a low at 35.45. Considering both the Federal Reserve (Fed) and Bank of Thailand’s stances, the former’s approach which seems to point to delaying cuts limits the downside potential for the pair, as the latest movements could be seen as buyers taking a breather after last week’s rally.
In line with that, the March cut odds from the Fed have fallen below 25% from being fully priced in earlier but it will all come down to the incoming data with January's inflation figures the next highlight for the markets. Meanwhile, the Bank of Thailand (BoT) held rates steady at 2.5%, despite government pressure for cuts. However, the 7-2 dovish hold vote with two members favoring a cut suggests the BoT could start an easing cycle anytime, with the swaps market pricing in a 25 bp easing over the next three months. In that sense, as long as the markets push back rate cuts by the Fed and embrace a dovish BoT, the pair may continue advancing.
USD/THB technical analysis
Indicators on the daily chart suggest a neutral to bullish outlook as indicators seem to have flattened within positive territory. As it stands, the Relative Strength Index (RSI) is neutral above 50 while the Moving Average Convergence Divergence (MACD) echoes this sentiment, showing flat red bars that suggest a neutral tone. As for the Simple Moving Averages (SMAs), the pair is keeping above the 20-day and 200-day SMAs - a bullish signal. However, it's trading below the 100-day SMA, signaling a slight hint of caution for the uptrend. It's worth noticing that the pair increased by 1.30% last week so these movements could be seen as a technical correction as buyers consolidate gains.
USD/THB daily chart
- Markets are pulled into the midrange on thin action.
- Thin data remains a key theme of the trading week.
- Central bankers continue to populate headlines.
USD/JPY is caught in consolidation near the 148.00 handle in the midweek market session as a thin economic calendar leaves markets to churn on rate cut expectations and the odd appearance from central bank policymakers.
Wednesday saw several heads from the US Federal Reserve (Fed) hit markets with soundbites that failed to generate much momentum in either direction.
The Japanese Yen (JPY) saw a broad-market pullback in the midweek, but improving risk sentiment also kept the US Dollar (USD) pinned on the low side, leaving USD/JPY to waffle into near-term congestion levels.
Several Fed officials spoke up on Wednesday, noting that while progress on inflation continues, there still remain risks across multiple fronts, with Boston Fed president Susan Collins specifically highlighting the risk that inflation progress could easily stall. Fed speakers on Wednesday broadly stuck close to the Fed’s projections of two or three rate cuts in 2024, while the market continues to price in a hopeful six cuts beginning possibly in May.
USD/JPY traders will be left in the lurch until next week, with US Consumer Price Index (CPI) inflation figures due on Tuesday, to be followed by Japanese Gross Domestic Product (GDP) growth on the docket for Wednesday.
US CPI headline inflation is forecast to tick down from 0.3% to 0.2% in January, while Japan’s GDP growth is expected to rebound from -0.7% to 0.3% in the fourth quarter.
USD/JPY technical outlook
USD/JPY finds itself trapped in near-term congestion as the pair battles into familiar technical levels near the 200-hour Simple Moving Average (SMA) at 147.75 as the USD/JPY strings along the 148.00 handle.
USD/JPY remains buoyed above the 146.00 level as the pair remains on the higher side of the 200-day SMA near 145.00, but bullish momentum is draining out of the pair that is recovering from December’s dip into 140.25 after the USD/JPY’s declining from just below the 152.00 handle in the last half of 2023.
USD/JPY hourly chart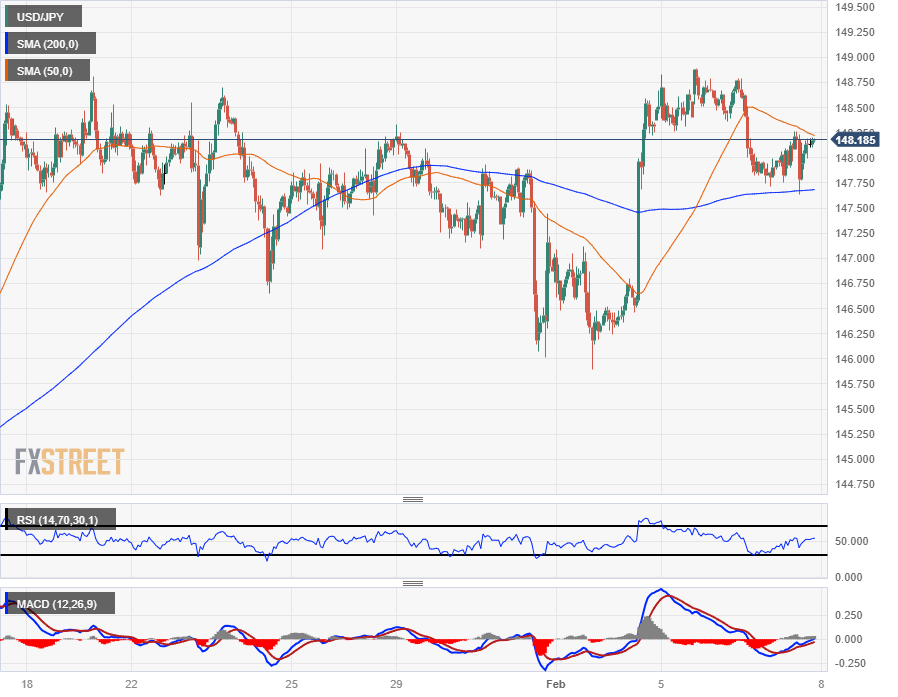
USD/JPY daily chart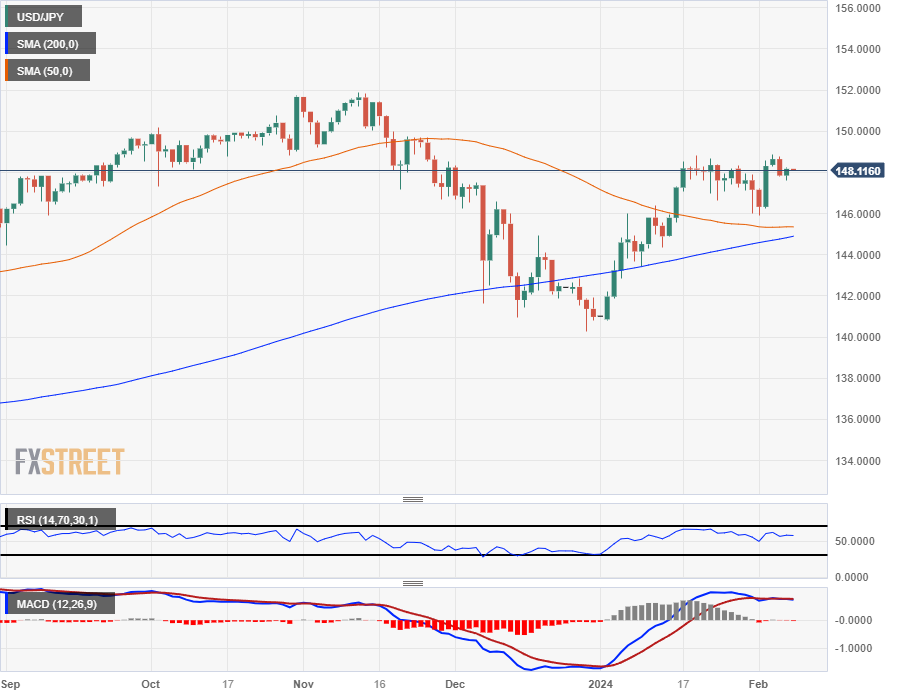
Risk-linked assets managed to gather extra steam on the back of renewed weakness surrounding the Greenback. In the meantime, investors now appear to favour the Fed’s rate cut in May, while geopolitical concerns remained unabated and global yields edged higher on Wednesday.
Here is what you need to know on Thursday, February 8:
Further selling pressure in the greenback prompted the USD Index (DXY) to challenge the 104.00 support amidst marginal moves in US yields and the prevailing risk-on environment. In the US, usual weekly Initial Jobless Claims are due on Thursday, along with Wholesale Inventories and the speech by Fed’s Barkin (Richmond).
EUR/USD traded in a bullish fashion for the second session in a row and revisited the 1.0780 zone amidst persistent risk-on sentiment and somewhat hawkish comments from the ECB’s Schnabel.
GBP/USD added to Tuesday’s gains north of 1.2600 the figure mainly following a persistent downward bias in the US Dollar. On Thursday, BoE’s Dhingra is due to speak.
USD/JPY regained some composure and rose past the 148.00 hurdle on Wednesday, deriving some support from the late small bounce in US yields. In Japan, the Echo Watchers Survey is due on Thursday, followed by Bank Lending figures and weekly Foreign Bond Investment results.
The Aussie dollar was an exception in the risk-associated universe and ended the session with modest losses in the low 0.6500s, as there was no respite for the selling pressure in both copper prices and iron ore.
In China, all the attention is expected to be on the publication of the Inflation Rate for the month of January as well as Producer Prices. USD/CNH traded with decent gains and regained the 7.2000 region, partially reversing Tuesday’s drop.
Unexpected drops in gasoline inventories and distillate stocks, as per the EIA’s weekly report, underpinned another positive performance of WTI prices, which managed to trespass the $74.00 mark per barrel.
Gold prices ended Wednesday’s session barely changed above the $2030 mark per troy ounce, while Silver prices retreated to new two-week lows near $22.20 per ounce.
- Crude Oil prices grind higher in thin markets.
- Price recovery hobbled by another supplies buildup.
- Geopolitical risks remain key driver for bullish price momentum.
West Texas Intermediate (WTI) US Crude Oil is taking halting steps higher on Wednesday, trying to stake ground above $74.00 per barrel as another buildup in US barrel stocks keeps prices pinned on the low end.
The Energy Information Administration (EIA) warned this week that the US could see a significant slowdown in its pace of Crude Oil production growth after hitting record pumping numbers in 2023.
According to the EIA, the US is set to see overall Crude Oil production to expand by an average of 160K barrels per day through 2024 after last year’s record 1.02 million barrel per day production expansion. US Crude Oil is seen rising to 13.21 million bpd through 2024 and then climbing to 13.49 million bpd in 2025.
The EUA reported that US Crude Oil inventories climbed by 5.521 million barrels for the week ended February 2, well above the forecast 1.895 million barrel buildup. Crude Oil stocks climbed an additional 1.234 million barrels the previous week.
Geopolitical risks remain a key support for Crude Oil prices as ceasefire talks between Israel and Palestinian Hamas continue despite frictions, and coalition naval forces continue to squeeze Iranian-backed Houthi rebels out of the Red Sea.
The Yemeni rebel group remains determined to continue attacking civilian cargo ships transiting the Red Sea in a major shipping lane that connects Asia and Europe by way of the Suez Canal. Houthis fired on two civilian ships this week, keeping tensions in the Middle East tightened.
WTI technical outlook
WTI US Crude Oil is struggling to reclaim the $74.00 handle on Wednesday, but remains bolstered into the high side as barrel bids continue to recover after a near-term plunge into $71.50 last week. Price action remains constrained on the south side of the 200-hour Simple Moving Average (SMA) near the $75.00 handle.
WTI remains down after a near-term rejection from the 200-day SMA just below the $78.00 handle, and US Crude Oil continues to trade into the middle of a medium-term congestion range that has hampered price momentum since declining below the 200-day SMA in November.
WTI hourly chart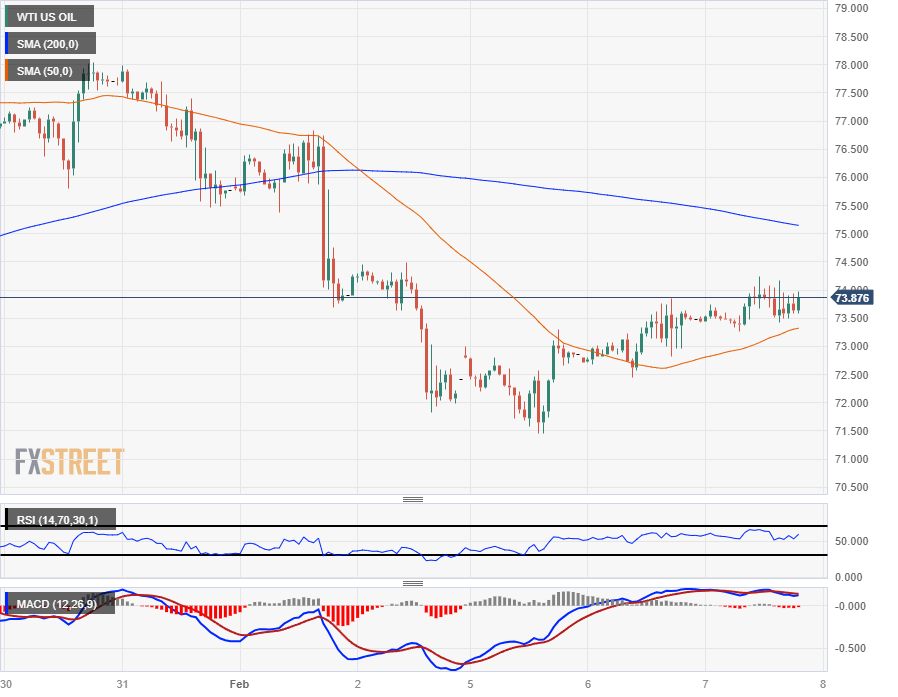
WTI daily chart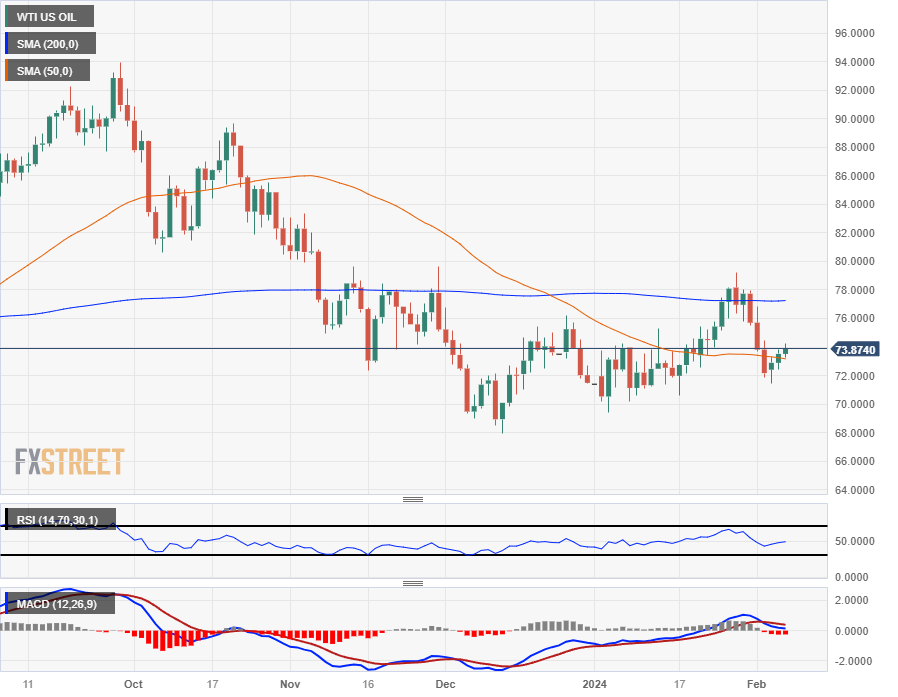
- The NZD/JPY currently trades at 90.40 posting a 0.23% uptick on the day.
- The Kiwi found momentum due to strong employment data reported during the Asian session.
- Daily chart indicators suggest a bullish momentum, with RSI on an upward trajectory in the positive zone and MACD depicting lower red bars.
- On the hourly chart, indicators hint at a pause in bullish impulse as they start to flatten in a bid to consolidate recent gains.
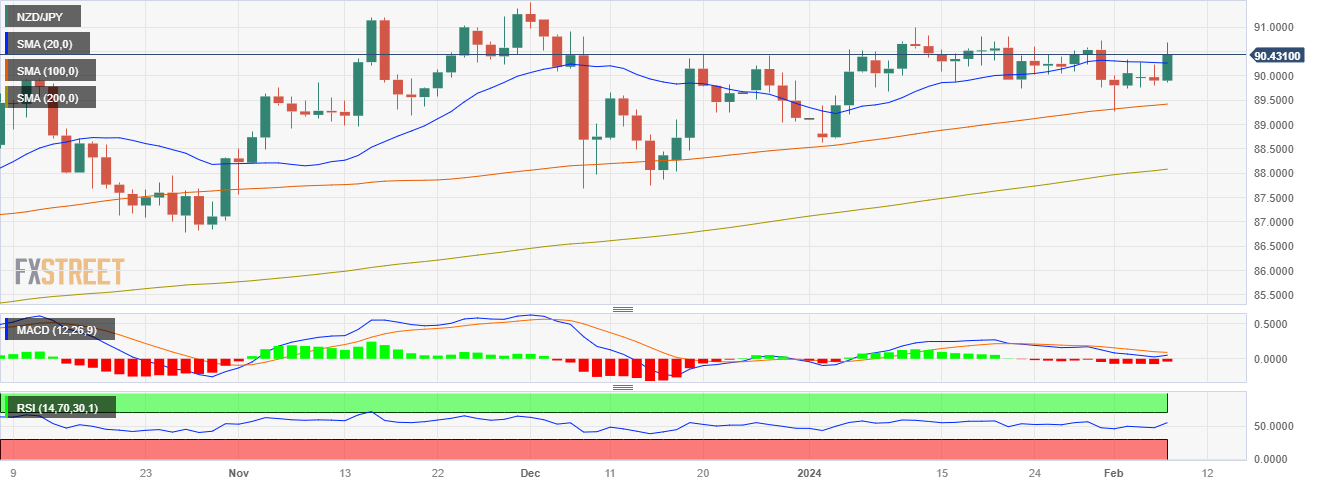
In Wednesday's session, the NZD/JPY stabilised at 90.40, after a surge to 90.70 as the pair found traction on the back of promising employment data from New Zealand reported earlier in the session. However, on the hourly chart, investors are moving to consolidate gains so the cross may side-ways trade for the remainder of the session.
The daily chart indicators reflect a noticeable bullish sentiment. The Relative Strength Index (RSI) reveals a strong buying momentum with its positive slope and presence in the positive territory. Additionally, the Moving Average Convergence Divergence (MACD) strengthens this view by presenting lower red bars indicating growing bullish dynamics. Furthermore, the pair sits comfortably above the 20,100,200-day Simple Moving Averages (SMAs), indicating the bulls hold the reins over the larger picture. The scenario highlights the ongoing attempts by the bulls to recapture lost ground after losing nearly 0.70% in the last two weeks.
NZD/JPY daily chart
On the other hand, assessing the shorter timeframe momentum, the hourly chart paints a slightly different picture. Here, the indicators suggest a pause in buying momentum, with investors likely consolidating gains after recent upward movements. The Relative Strength Index (RSI) appears flat, suggesting a standstill in the positive territory suggesting a slight advantage to buyers. Simultaneously, the four-hour Moving Average Convergence Divergence (MACD) displays red bars, suggesting that for the rest of Wednesday’s session, the cross may continue consolidating.
The Bank of Canada's (BoC) latest Summary of Deliberations highlighted global economic headwinds, noting that surprisingly resilient consumer spending in the US is helping to smooth over downside risks.
The BoC remains concerned that the Canadian economy stalled out in the latter half of 2023, while inflation appears set to remain above 2% until sometime in 2025.
Key takeaways
Global growth had slowed, but not by as much as projected in the October Monetary Policy Report, mainly because of stronger-than-expected growth in the United States.
Canada’s economic growth had stalled since the middle of 2023. However, they expressed concern that unless productivity growth was exceptionally strong, wage growth in this range could hold inflation up.
Overall, Governing Council expected economic growth to remain weak in the first half of 2024 before picking up in the second half. Inflation was expected to remain around 3% for the first half of the year before gradually easing and reaching the 2% target in 2025.
With inflation still too high and too broad-based, members wanted to be clear in their communications that they were still concerned about the persistence of underlying inflation.
- The DXY stood around 104.15 on Wednesday.
- Fed’s Collins, Kashkari and Kugler were on the wires sounding somewhat hawkish.
- US Treasury yields are slightly up and limit the Greenback’s losses.
The US Dollar Index (DXY) is trading neutrally at 104.15 on Wednesday, while markets assess several Federal Reserve (Fed) officials' statements to continue placing their bets on activity at the next few Federal Open Market Committee (FOMC) meetings.
The US Federal Reserve's hawkish hold, justified by a robust jobs report and continuous strong growth in Q1, has made dovish bets on the Fed less attractive over the past week. As a reaction, the USD strengthened on the back of rising US Treasury yields as markets are giving up on a first rate cut arriving in March.
Daily digest market movers: US Dollar holds its ground as markets assess Fed officials’ comments
- Fed’s Adriana Kugler noted that the job on inflation isn’t quite done, but that at some point when the economy cools down, the bank will consider rate cuts.
- Elsewhere, Neel Kashkari stated that two to three rate cuts in 2024 seem appropriate.
- In line with those comments, Susan Collins also cautioned that the bank needs more data to support rate cuts.
- The CME's FedWatch Tool hints at reduced odds for a rate cut in March, which currently stands at 20%. Those odds rise to 50% for the May meeting, but the probabilities of a hold are also high.
Technical analysis: DXY falls below the 100-day SMA, but bulls trim daily losses
The technical indicators on the daily chart reflect a somewhat neutral to bearish short-term momentum. The Relative Strength Index (RSI) paints a picture of weakening bullish momentum, given its negative slope, despite being in positive territory. This condition normally precedes a potential reversal or pullback as the buying force starts to lose its grip.
In the bigger picture, the Simple Moving Averages (SMAs) continue to favor the bulls. Despite the selling pressure pulling the asset below the 100-day SMA, it is comfortably residing above both the 20-day and 200-day SMAs. This demonstration implies that the overall buying force remains dominant.
These signals suggest while the buyers seem to be taking profits, further downside can be expected in the short term. But as long as the bulls defend the mentioned SMAs, the longer-term outlook will be bright.
US Dollar FAQs
What is the US Dollar?
The US Dollar (USD) is the official currency of the United States of America, and the ‘de facto’ currency of a significant number of other countries where it is found in circulation alongside local notes. It is the most heavily traded currency in the world, accounting for over 88% of all global foreign exchange turnover, or an average of $6.6 trillion in transactions per day, according to data from 2022.
Following the second world war, the USD took over from the British Pound as the world’s reserve currency. For most of its history, the US Dollar was backed by Gold, until the Bretton Woods Agreement in 1971 when the Gold Standard went away.
How do the decisions of the Federal Reserve impact the US Dollar?
The most important single factor impacting on the value of the US Dollar is monetary policy, which is shaped by the Federal Reserve (Fed). The Fed has two mandates: to achieve price stability (control inflation) and foster full employment. Its primary tool to achieve these two goals is by adjusting interest rates.
When prices are rising too quickly and inflation is above the Fed’s 2% target, the Fed will raise rates, which helps the USD value. When inflation falls below 2% or the Unemployment Rate is too high, the Fed may lower interest rates, which weighs on the Greenback.
What is Quantitative Easing and how does it influence the US Dollar?
In extreme situations, the Federal Reserve can also print more Dollars and enact quantitative easing (QE). QE is the process by which the Fed substantially increases the flow of credit in a stuck financial system.
It is a non-standard policy measure used when credit has dried up because banks will not lend to each other (out of the fear of counterparty default). It is a last resort when simply lowering interest rates is unlikely to achieve the necessary result. It was the Fed’s weapon of choice to combat the credit crunch that occurred during the Great Financial Crisis in 2008. It involves the Fed printing more Dollars and using them to buy US government bonds predominantly from financial institutions. QE usually leads to a weaker US Dollar.
What is Quantitative Tightening and how does it influence the US Dollar?
Quantitative tightening (QT) is the reverse process whereby the Federal Reserve stops buying bonds from financial institutions and does not reinvest the principal from the bonds it holds maturing in new purchases. It is usually positive for the US Dollar.
- Canadian Dollar found a little room but remains sedate in midweek trading.
- Canada drops Unemployment Rate, job additions figures on Friday.
- An overall thin week on the calendar leaves markets in a quiet lurch.
The Canadian Dollar (CAD) saw soft gains on Wednesday as markets steadily ate away at last week’s surge in the US Dollar (USD) that sent the Loonie skidding into multi-month lows. The Canadian Dollar is sticking close to firmly-entrenched median bids against the Greenback as broad-market momentum bleeds into the midrange.
Canada sees January’s Unemployment Rate and Net Change in Employment figures on Friday, and Loonie traders will be gearing up for the key labor data dump with markets holding steady, rounding the corner on Wednesday.
Daily digest market movers: Canadian Dollar trades thin, but eyes on the upside
- Wednesday’s key headlines focus on talking points from US Federal Reserve (Fed) policymakers with several Fed Board members hitting the newswires.
- The economic calendar remains thin midweek as investors continue to chew on rate cut prospects.
- Money markets remain far out-of-line with current Fed projections on rate cuts.
- Minneapolis Fed President Neel Kashkari reiterated his view of two or three rate cuts through 2024.
- The CME’s FedWatch Tool shows money markets are still pricing in at least six rate cuts this year, though cracks are beginning to show in the odds.
- Money markets now see a 66.4% chance of a rate cut in May, down significantly from being fully priced in just a month ago.
- Canada is expected to see its Unemployment Rate tick upward in January to 5.9% from 5.8%.
- Canada’s Net Change in Employment is forecast to add 15K new jobs in January.
Canadian Dollar price today
The table below shows the percentage change of Canadian Dollar (CAD) against listed major currencies today. Canadian Dollar was the strongest against the Swiss Franc.
| USD | EUR | GBP | CAD | AUD | JPY | NZD | CHF | |
| USD | -0.06% | -0.12% | -0.10% | 0.16% | 0.20% | -0.11% | 0.49% | |
| EUR | 0.04% | -0.06% | -0.04% | 0.22% | 0.26% | -0.05% | 0.55% | |
| GBP | 0.13% | 0.07% | 0.03% | 0.29% | 0.34% | 0.02% | 0.64% | |
| CAD | 0.11% | 0.04% | -0.03% | 0.26% | 0.30% | -0.01% | 0.60% | |
| AUD | -0.16% | -0.22% | -0.29% | -0.26% | 0.04% | -0.27% | 0.34% | |
| JPY | -0.19% | -0.23% | -0.29% | -0.30% | -0.01% | -0.30% | 0.27% | |
| NZD | 0.12% | 0.05% | -0.01% | 0.02% | 0.27% | 0.32% | 0.60% | |
| CHF | -0.50% | -0.59% | -0.62% | -0.60% | -0.34% | -0.28% | -0.64% |
The heat map shows percentage changes of major currencies against each other. The base currency is picked from the left column, while the quote currency is picked from the top row. For example, if you pick the Euro from the left column and move along the horizontal line to the Japanese Yen, the percentage change displayed in the box will represent EUR (base)/JPY (quote).
Technical analysis: Canadian Dollar broadly higher, but action remains thin
The Canadian Dollar (CAD) saw gains against nearly all of its major currency peers on Wednesday, gaining notable ground against the Swiss Franc (CHF) and the Japanese Yen (JPY). The Canadian Dollar is close to flat against the Pound Sterling (GBP), and the Loonie is up around a tenth of a percent against the US Dollar, helping to keep the USD/CAD pair pinned below the 1.3500 handle.
USD/CAD fell below 1.3500 on Tuesday, and the pair remains unable to reclaim the key handle, etching in an intraday low of 1.3455 on Wednesday.
Daily candlesticks have the USD/CAD trading firmly into the 200-day Simple Moving Average (SMA) near 1.3475, and the pair is at risk of tipping back into a congestion zone between the 50-day and 200-day SMAs as long-term trends drift into a consolidation trap.
A tilt into bullish territory will need to break above 1.3550 to make another leg higher, while sellers will be looking for further downside from the near-term swing low into 1.3558.
USD/CAD hourly chart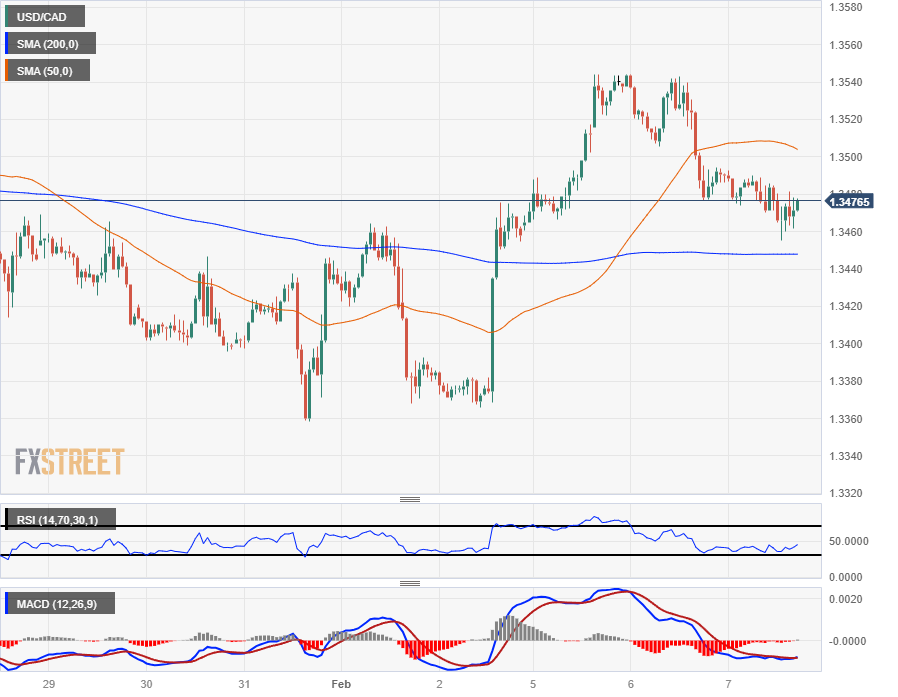
USD/CAD daily chart
Canadian Dollar FAQs
What key factors drive the Canadian Dollar?
The key factors driving the Canadian Dollar (CAD) are the level of interest rates set by the Bank of Canada (BoC), the price of Oil, Canada’s largest export, the health of its economy, inflation and the Trade Balance, which is the difference between the value of Canada’s exports versus its imports. Other factors include market sentiment – whether investors are taking on more risky assets (risk-on) or seeking safe-havens (risk-off) – with risk-on being CAD-positive. As its largest trading partner, the health of the US economy is also a key factor influencing the Canadian Dollar.
How do the decisions of the Bank of Canada impact the Canadian Dollar?
The Bank of Canada (BoC) has a significant influence on the Canadian Dollar by setting the level of interest rates that banks can lend to one another. This influences the level of interest rates for everyone. The main goal of the BoC is to maintain inflation at 1-3% by adjusting interest rates up or down. Relatively higher interest rates tend to be positive for the CAD. The Bank of Canada can also use quantitative easing and tightening to influence credit conditions, with the former CAD-negative and the latter CAD-positive.
How does the price of Oil impact the Canadian Dollar?
The price of Oil is a key factor impacting the value of the Canadian Dollar. Petroleum is Canada’s biggest export, so Oil price tends to have an immediate impact on the CAD value. Generally, if Oil price rises CAD also goes up, as aggregate demand for the currency increases. The opposite is the case if the price of Oil falls. Higher Oil prices also tend to result in a greater likelihood of a positive Trade Balance, which is also supportive of the CAD.
How does inflation data impact the value of the Canadian Dollar?
While inflation had always traditionally been thought of as a negative factor for a currency since it lowers the value of money, the opposite has actually been the case in modern times with the relaxation of cross-border capital controls. Higher inflation tends to lead central banks to put up interest rates which attracts more capital inflows from global investors seeking a lucrative place to keep their money. This increases demand for the local currency, which in Canada’s case is the Canadian Dollar.
How does economic data influence the value of the Canadian Dollar?
Macroeconomic data releases gauge the health of the economy and can have an impact on the Canadian Dollar. Indicators such as GDP, Manufacturing and Services PMIs, employment, and consumer sentiment surveys can all influence the direction of the CAD. A strong economy is good for the Canadian Dollar. Not only does it attract more foreign investment but it may encourage the Bank of Canada to put up interest rates, leading to a stronger currency. If economic data is weak, however, the CAD is likely to fall.
- EUR/USD saw little momentum in thin Wednesday action.
- European economic data continues to soften.
- Friday’s Germany HICP inflation to be key release this week.
EUR/USD saw a thin grind higher on Wednesday before a late break to the downside in the US market session followed by a slim recovery into the day’s mid-range. The pair tested back into familiar territory near 1.0750 after touching a minor intraday high of 1.0784.
European economic figures continue to soften, with multiple mid-week prints missing expectations. Rate cut seekers will be keeping a close eye on Thursday’s European Central Bank (ECB) Economic Bulletin for clues about how close the ECB is to giving markets a rate cut after rates in the euro area hit their current peak last September.
Daily digest market movers: EUR/USD churns below 1.0800 in tight Wednesday trading
- Germany’s MoM Industrial Production declined more than expected in December, printing -1.6% versus the forecast -0.4%. November’s -0.7% saw an upside revision to -0.2%.
- The ECB’s latest Economic Bulletin is slated for release at 09:00 GMT on Thursday.
- ECB’s Elderson, Lane also slated to speak on Thursday.
- Germany’s annualized Harmonized Index of Consumer Prices (HICP) inflation due Friday will be a key data print for the Euro (EUR) this week.
- Germany’s HICP inflation is forecast to hold steady at 3.1% for the year ended January.
- Federal Reserve (Fed) of Minneapolis President Neel Kashkari reaffirms Fed’s rate cut assessment for 2024, sees only 2 or 3 rate cuts through the end of the year.
- Fed’s Kashkari reiterates the need to be patient and take the time to assess data before the Fed makes any cuts.
- Fed Board of Governors member Adriana D. Kugler noted on Wednesday that inflation is progressing in-line with the Fed’s goals, but there’s still more work to be done.
- Fed’s Kugler: remains optimistic on inflation, sees rate cuts as long as price growth continues to recede.
- Fed’s Kugler warns that still-high consumption poses a threat to progress on disinflation as spending remains an elevated contribution to Gross Domestic Product (GDP) growth in the fourth quarter.
Euro price today
The table below shows the percentage change of Euro (EUR) against listed major currencies today. Euro was the strongest against the Swiss Franc.
| USD | EUR | GBP | CAD | AUD | JPY | NZD | CHF | |
| USD | -0.13% | -0.17% | -0.11% | 0.09% | 0.13% | -0.16% | 0.38% | |
| EUR | 0.10% | -0.05% | 0.02% | 0.22% | 0.25% | -0.04% | 0.49% | |
| GBP | 0.17% | 0.04% | 0.06% | 0.27% | 0.30% | 0.01% | 0.56% | |
| CAD | 0.12% | -0.01% | -0.06% | 0.21% | 0.24% | -0.05% | 0.47% | |
| AUD | -0.09% | -0.22% | -0.27% | -0.20% | 0.03% | -0.26% | 0.29% | |
| JPY | -0.14% | -0.23% | -0.29% | -0.25% | -0.02% | -0.29% | 0.22% | |
| NZD | 0.15% | 0.04% | -0.03% | 0.04% | 0.25% | 0.27% | 0.54% | |
| CHF | -0.39% | -0.51% | -0.55% | -0.49% | -0.26% | -0.25% | -0.54% |
The heat map shows percentage changes of major currencies against each other. The base currency is picked from the left column, while the quote currency is picked from the top row. For example, if you pick the Euro from the left column and move along the horizontal line to the Japanese Yen, the percentage change displayed in the box will represent EUR (base)/JPY (quote).
Technical Analysis: EUR/USD remains pinned below 1.0800
EUR/USD continues to trade on the south side of the 1.0800 handle in the mid-week, with the pair capped below the 200-hour Simple Moving Average (SMA) after getting rejected from the 1.0900 region last week.
EUR/USD continues to trade into the low side of a congestion zone between the 50-day and 200-day SMAs near 1.0900 and 1.0850 respectively, but downside momentum remains limited. The pair risks getting pulled back into consolidation above 1.0800 if sellers aren’t able to push the EUR/USD back under December’s low bids near 1.0725.
EUR/USD hourly chart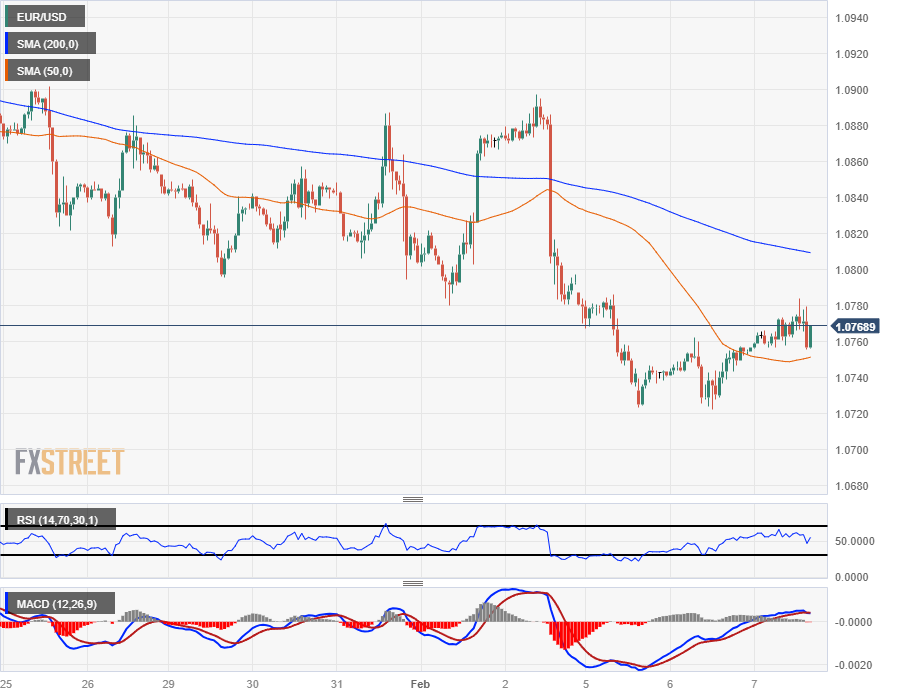
EUR/USD daily chart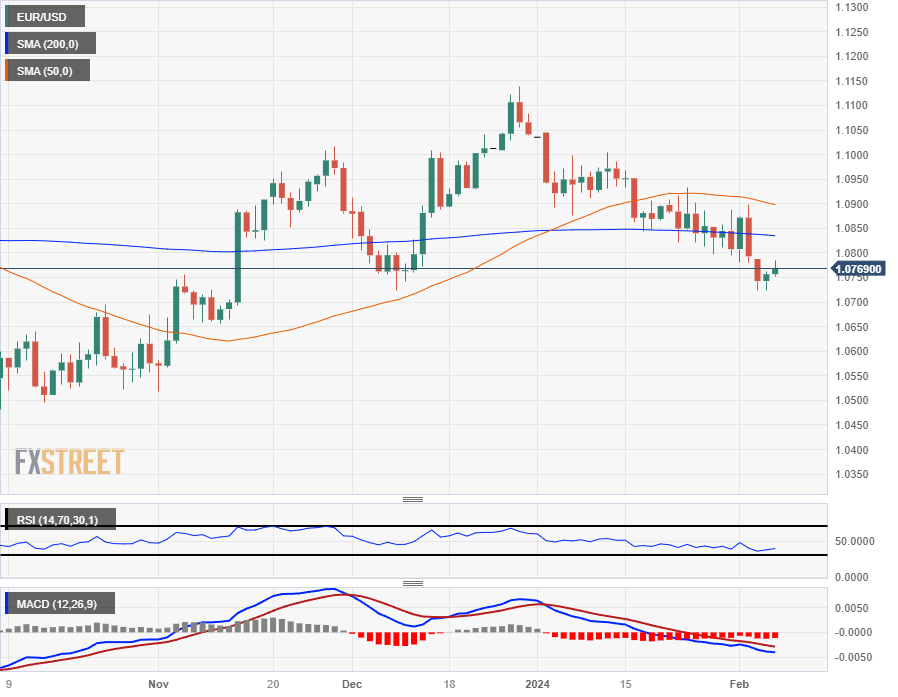
Euro FAQs
What is the Euro?
The Euro is the currency for the 20 European Union countries that belong to the Eurozone. It is the second most heavily traded currency in the world behind the US Dollar. In 2022, it accounted for 31% of all foreign exchange transactions, with an average daily turnover of over $2.2 trillion a day.
EUR/USD is the most heavily traded currency pair in the world, accounting for an estimated 30% off all transactions, followed by EUR/JPY (4%), EUR/GBP (3%) and EUR/AUD (2%).
What is the ECB and how does it impact the Euro?
The European Central Bank (ECB) in Frankfurt, Germany, is the reserve bank for the Eurozone. The ECB sets interest rates and manages monetary policy.
The ECB’s primary mandate is to maintain price stability, which means either controlling inflation or stimulating growth. Its primary tool is the raising or lowering of interest rates. Relatively high interest rates – or the expectation of higher rates – will usually benefit the Euro and vice versa.
The ECB Governing Council makes monetary policy decisions at meetings held eight times a year. Decisions are made by heads of the Eurozone national banks and six permanent members, including the President of the ECB, Christine Lagarde.
How does inflation data impact the value of the Euro?
Eurozone inflation data, measured by the Harmonized Index of Consumer Prices (HICP), is an important econometric for the Euro. If inflation rises more than expected, especially if above the ECB’s 2% target, it obliges the ECB to raise interest rates to bring it back under control.
Relatively high interest rates compared to its counterparts will usually benefit the Euro, as it makes the region more attractive as a place for global investors to park their money.
How does economic data influence the value of the Euro?
Data releases gauge the health of the economy and can impact on the Euro. Indicators such as GDP, Manufacturing and Services PMIs, employment, and consumer sentiment surveys can all influence the direction of the single currency.
A strong economy is good for the Euro. Not only does it attract more foreign investment but it may encourage the ECB to put up interest rates, which will directly strengthen the Euro. Otherwise, if economic data is weak, the Euro is likely to fall.
Economic data for the four largest economies in the euro area (Germany, France, Italy and Spain) are especially significant, as they account for 75% of the Eurozone’s economy.
How does the Trade Balance impact the Euro?
Another significant data release for the Euro is the Trade Balance. This indicator measures the difference between what a country earns from its exports and what it spends on imports over a given period.
If a country produces highly sought after exports then its currency will gain in value purely from the extra demand created from foreign buyers seeking to purchase these goods. Therefore, a positive net Trade Balance strengthens a currency and vice versa for a negative balance.
Boston Fed Susan Collins spoke at the Boston Economic Club:
She suggested that It is likely that we will cut rates later this year if the economy meets expectations.
Collins added that monetary policy is well positioned for the current outlook. Progress back to 2% inflation could be uneven and bumpy.
She suggested that when cuts start, they should be gradual and methodical. While she supported the FOMC decision to keep rates steady last week, she still needs more data before supporting a rate cut.
Collins stressed that the strong January jobs data shows why caution is warranted. The economy needs to moderate to achieve 2% inflation.
Finally, she said she needs to see wage gains moderate to aid the move to 2% inflation. Recent data shows economic resilience, but demand will take time to moderate.
Federal Reserve Governor Adriana Kugler said on Wednesday that she is pleased with the great progress on inflation and added that she is optimistic that the progress will continue, per Reuters.
Key quotes
"Fed’s job on inflation is not done yet."
"Will remain focused on Fed’s inflation goal until confident inflation is returning durably to 2% target."
"Risks to our dual mandate are roughly balanced."
"Our policy stance is restrictive."
"At some point, cooling inflation and labor markets may make rate cut appropriate."
"If disinflation progress stalls, may be appropriate to hold policy rate steady for longer."
"Continued moderation of wage growth, normalization of price-setting, anchored inflation expectations are likely to contribute to continued disinflation."
"Pleased that cooling of labor demand has not led to rise in layoffs."
"Expecting consumer spending to grow more slowly this year, should help with disinflation."
"Some measures of financial conditions have eased but remain relatively tight and are consistent with continued progress on inflation."
"Paying close attention to upside inflation risks from geopolitics."
Market reaction
These comments don't seem to be having a noticeable impact on the US Dollar's valuation. At the time of press, the US Dollar Index was down 0.06% on the day at 104.07.
Significant drivers for a strong Euro (EUR) recovery are absent in the near term, economists at ANZ Bank say.
ECB to initiate rate cuts by early Q2
Current sentiment and disinflation trends in the Euro Area have largely been priced into the EUR, offering some stability but lacking immediate upside momentum.
Core Euro Area inflation's monthly increase contrasts with a yearly easing trend, suggesting continued disinflation. This trajectory, coupled with decelerating growth, is expected to prompt the European Central Bank (ECB) to initiate rate cuts by early Q2, slightly ahead of the Federal Reserve's anticipated Q3 cuts.
The EUR's near-term outlook is closely tied to USD movements. The timing and pace of ECB vs. Fed rate adjustments, highly contingent on forthcoming economic data, will be critical in shaping EUR/USD rate differentials and the Euro's trajectory.
The Pound Sterling (GBP) was the best performing G10 currency in January. Economists at Rabobank analyze GBP outlook.
Potential for GBP to break moderately higher vs. the EUR this year
While we see scope for Cable to dip again near-term as the USD continues to reduce its Fed rate cut hopes, we expect GBP/USD to end the year close to 1.3000.
EUR/GBP is currently positioned close to the bottom of its range. While we expect that the 0.8500 level will offer strong support, we see scope for a break below in the latter part of this year, targeting 0.8400 on a 6-to-12-month view.
The Dollar ekes out modest gains from US exceptionalism. Kit Juckes, Chief Global FX Strategist at Société Générale, analyzes FX market outlook.
Correlation between FX and rate differentials remains strikingly strong
Another week started with a barnstorming US data point, ISM services coming in strong, and the employment index, which was worryingly weak a month ago, bouncing right back. US exceptionalism is in fine fettle. Meanwhile, another Wednesday means another lousy German industrial production report. It was sunny in Munich and it’s raining in Frankfurt, but gloom about the economic outlook is the same in both cities.
In the FX market, this all translates into a slightly stronger Dollar, but the correlation between FX and rate differentials remains strikingly strong, so if strong data don’t move Fed expectations much, they won’t have as big an FX impact as they might otherwise.
US yields have risen slightly more in the last week than European ones, and EUR/USD is lower, but not that dramatically. If we are in thrall to rates, the medium-term question is still whether the Fed eases by more than the ECB, rather than how strong the US economy is.
In EM, the currencies of Mexico and Turkey are outperforming. Economists at ING are still very positive on the Mexican Peso (MXN).
Focus on Banxico's rate meeting
Some banks are looking for a slightly earlier-than-expected rate cut from Banxico at Thursday's meeting. That is a little earlier than currently priced by the markets and presumably would see the Mexican Peso sell off a little. However, Mexico currently has very high real rates – 6% using current inflation – and a modest reduction looks unlikely to do too much damage.
At the same time, MXN price action shows it is far too early to miss out on 11% implied yields in the Peso on the threat that Donald Trump may or may not be elected president in November.
We are still very positive on the Peso.
The US Dollar (USD) is tracking a little lower overall on the session. Economists at Scotiabank analyze Greenback’s outlook.
USD gains overstate spread shift
The USD will need the support strong economic data and/or higher yields to continue advancing.
Short-term spreads have moved in the USD’s favour since mid-January but there are signs that USD gains are overstating the improvement in fundamentals.
Other factors, such as position adjustment, may be helping lift the USD tone – which suggests scope for additional USD is limited unless fresh USD-positive impulses develop
- AUD/USD delivers a sustained move above 0.6500 amid a cheerful market mood.
- The USD Index corrects despite the Fed maintaining a restrictive interest rate stance.
- Going forward, China’s inflation data will guide the Australian dollar.
The AUD/USD pair climbs comfortably above the psychological resistance of 0.6500 in the late European session on Wednesday. The US Dollar Index (DXY) has edged down from an 11-week high of 104.50, although chances of an interest rate cut by the Federal Reserve (Fed) in March’s monetary policy meeting have been ruled out.
S&P500 futures have generated significant gains in the London session, portraying an improvement in the risk appetite of the market participants.
The US Dollar is facing significant pressure despite the Fed emphasizing keeping interest rates higher. Fed policymakers are not convinced that inflation will sustainably return to the 2% target.
Cleveland Federal Reserve Bank President Loretta Mester said on Tuesday deepening uncertainty over inflation is not allowing policymakers to comment about when the central bank will start reducing interest rates. Mester warned that interest rates could be restrictive for longer if price pressures appear to be stalling at a level or above our goal.
Meanwhile, investors await commentaries from Richmond Federal Reserve Bank Thomas Barkin and Federal Reserve Governor Michelle Bowman for further guidance.
On the Australian Dollar front, investors are shifting their focus on China’s Consumer Price Index (CPI) data for January, which will be published on Thursday. Investors anticipate that the Chinese economy was deflated by a higher pace of 0.5% against 0.3% in December. Being a proxy to China’s economic condition, the situation of deflation will weigh on the Australian Dollar.
This week, the Reserve Bank of Australia (RBA) kept its Official Cash Rate (OCR) unchanged at 4.35%, leaving doors open for further policy tightening.
Minneapolis Federal Reserve President Neel Kashkari told CNBC on Thursday that they can dial back the policy rate quite slowly if labor market continues to be strong, per Reuters.
Kashkari said that a few more months of good inflation data will give them confidence that inflation is on its way back to 2%. "At the moment, two to three rates cuts this year seems appropriate," he added.
Market reaction
The US Dollar Index showed no reaction to these comments and was last seen losing 0.15% on a daily basis at around 104.00.
USD/CAD has held little changed in quiet trade. Economists at Scotiabank analyze the pair’s outlook.
1.3540/1.3550 looks firmer resistance now
USD/CAD spent of lot of time this week lingering around the 1.3540 area that capped the USD back in January and never really looked like pushing on to new highs.
1.3540/1.3550 looks firmer resistance now.
Losses through 1.3505 late Tuesday are a minor technical setback for the USD and still imply a little more downside risk for spot today (1.3450/1.3460). A more decisive turn lower is not, yet, evident though and trend dynamics are still, just about, USD bullish on the intraday chart.
USD weakness below 1.3450 would tilt near-term risks a little more decisively lower for the USD.
GBP/USD outperforms on the day as Cable regains 1.2600. Economists at Scotiabank analyze Pound Sterling’s (GBP) outlook.
Regaining 1.2600 is a technical positive
Sterling has recovered all of Monday’s hefty losses and nearly half of the drop seen since last Friday. Regaining 1.2600 – the base of the trading range since mid-December – is a technical positive. There is work still to do, however, and trend dynamics are still leaning GBP-bearish.
GBP gains through 1.2645/1.2650 in the next day or so should bolster the GBP’s recovery and target additional gains to the upper 1.2600s/low 1.2007s.
- US stock index futures trade mixed ahead of Wall Street's opening bell on Wednesday.
- Investors keep a close eye on earnings reports.
- US economic calendar will feature mid-tier data releases.
S&P 500 futures are down 0.06%, Dow Jones futures drop 0.16%, and Nasdaq futures are unchanged.
S&P 500 (SPX), Dow Jones (DJIA), and Nasdaq (IXIC) indexes closed on Tuesday with a 0.23% gain, a 0.37% increase, and unchanged, respectively.
What to know before stock market opens
- Enphase Energy INC (ENPH) was the top-performing stock in the S&P 500 on Tuesday, gaining more than 13% on a daily basis, ahead of GE HealthCare Technologies (GEHC) and Fortinet (FTNT), which rose 11.6% and 7.3%, respectively.
- Kroger (KR), KLA Tencor Corp. and Fiserv Inc. shares were the biggest losers Tuesday, falling more than 2%.
- The US Census Bureau will release Goods Trade Balance data for December on Wednesday. The Federal Reserve will publish Consumer Credit Change later in the day, and Fed Governor Michelle Bowman and Richmond Fed President Thomas Barkin will also be speaking.
- Late Tuesday, Qatar, acting as a mediator, said that Hamas had given a "generally positive" response to a proposed truce deal with Israel. Although it's too early to say whether there will be further progress in peace talks, a de-escalation of the conflict in the Middle East could attract risk flows. According to Israel's Channel 13, an Israeli official said that some of the demands made by Hamas in the counterproposal were entirely unacceptable.
- Alibaba Group Holdings Ltd. (BABA) reported Q3 adjusted net income of RMB 47,951 million and Q3 revenue of RMB 260,348 million on Wednesday. In its earnings report, the company said that the board of directors approved an increase of $25 billion to the share repurchase program. “Our top priority is to reignite the growth of our core businesses, e-commerce and cloud computing,” Alibaba said, per Reuters.
- Uber Technologies Inc (UBER) announced Q4 net income of $1.4 billion and Q4 gross bookings of $37.6 billion. Net revenue for that period was $9.94 billion. "Uber's platform advantages and disciplined investment in new growth opportunities resulted in record engagement and accelerating Gross Bookings in Q4," Chief Financial Officer Prashanth Mahendra-Rajah said, per Reuters.
- Walt Disney Company (DIS), ARM Holdings PLC (ARM) and Paypal Holdings Inc (PYPL) are among top companies scheduled to announce earnings after the closing bell on Wednesday.
- Federal Reserve Bank of Philadelphia President Patrick Harker said on Tuesday that the central bank made the right choice last week to maintain interest rates steady amid an outlook that likely heralds more inflation declines. “The data point to continued disinflation, to labor markets coming into better balance, and to resilient consumer spending—three elements necessary for us to stick to the soft landing we remain optimistic to achieve,” he added.
- The CME FedWatch Tool shows that markets are pricing in a 21.5% probability of a 25 basis points Fed rate cut in March.
S&P and Nasdaq futures are presented by CME e-minis and Dow Jones futures are presented by CBOT e-mini.
S&P 500 FAQs
What is the S&P 500?
The S&P 500 is a widely followed stock price index which measures the performance of 500 publicly owned companies, and is seen as a broad measure of the US stock market. Each company’s influence on the computation of the index is weighted based on market capitalization. This is calculated by multiplying the number of publicly traded shares of the company by the share price. The S&P 500 index has achieved impressive returns – $1.00 invested in 1970 would have yielded a return of almost $192.00 in 2022. The average annual return since its inception in 1957 has been 11.9%.
How are companies chosen to be included in the S&P 500?
Companies are selected by committee, unlike some other indexes where they are included based on set rules. Still, they must meet certain eligibility criteria, the most important of which is market capitalization, which must be greater than or equal to $12.7 billion. Other criteria include liquidity, domicile, public float, sector, financial viability, length of time publicly traded, and representation of the industries in the economy of the United States. The nine largest companies in the index account for 27.8% of the market capitalization of the index.
How can I trade the S&P 500?
There are a number of ways to trade the S&P 500. Most retail brokers and spread betting platforms allow traders to use Contracts for Difference (CFD) to place bets on the direction of the price. In addition, that can buy into Index, Mutual and Exchange Traded Funds (ETF) that track the price of the S&P 500. The most liquid of the ETFs is State Street Corporation’s SPY. The Chicago Mercantile Exchange (CME) offers futures contracts in the index and the Chicago Board of Options (CMOE) offers options as well as ETFs, inverse ETFs and leveraged ETFs.
What factors drive the S&P 500?
Many different factors drive the S&P 500 but mainly it is the aggregate performance of the component companies revealed in their quarterly and annual company earnings reports. US and global macroeconomic data also contributes as it impacts on investor sentiment, which if positive drives gains. The level of interest rates, set by the Federal Reserve (Fed), also influences the S&P 500 as it affects the cost of credit, on which many corporations are heavily reliant. Therefore, inflation can be a major driver as well as other metrics which impact the Fed decisions.
EUR/USD nudges higher. Economists at Scotiabank analyze the pair’s outlook.
Momentum remains EUR-bearish
The EUR’s track higher from Tuesday’s low looks corrective at this point – although the rebound from 1.0720 matches the November low and therefore warrants attention as a potentially more durable base.
EUR/USD has made minor progress on the intraday chart which may allow for EUR gains to extend to 1.0800/1.0810 in the short run but momentum remains EUR-bearish and spot remains some way off more stable (bullish) technical ground (above 1.0875).
- The US Dollar retreats from its peak performance on Monday.
- Traders brace for no less than three Fed speakers this Wednesday.
- The US Dollar Index to snap below 104 in search of support.
The US Dollar (USD) is losing traction from its peak performance on Monday. The effects from the upbeat US Jobs Report and geopolitical tensions – with ceasefire talks evolving in the Gaza region – are starting to favor the Greenback. Hamas has laid out a plan for a 135-day truce in three stages which is now under discussion by all parties.
On the economic front, traders will be getting their hands on some mild data ahead. Nothing market moving is expected from the US Goods Trade Balance. Rather it is comments from the three US Federal Reserve (Fed) members who are due to speak later this Wednesday that could move the dial. These speakers are: Adriana Kruger, a member of the Board of Governors, who is speaking near 16:00 GMT, Thomas Barking from the Richmond Fed, near 17:30 and Michelle Bowman, who like Kruger is also a member of the Board of Governors. She is set to speak near 19:00 GMT.
Daily digest market movers: A light mid-week schedule
- At 12:00 GMT the weekly Mortgage Bankers Applications got released. Previous saw a contraction of 7.2% with this week an uprising of 3.7%.
- Around 13:30, the US Goods and Trade Balance numbers are expected:
- Goods and Services Trade Balance for December is expected to show a deficit of $62.2B versus $-63.2B deficit previously.
- The Goods Trade Balance was showing a $88.5 Billion deficit in the previous report with no forecast for the December number available.
- As mentioned a few paragraphs above, no less than three Fed speakers will be hitting the wires today, Fed’s Kruger, Barking and Bowman.
- Near 18:00 the US Treasury will allot the always important 10-year Note in the market.
- Equity markets are showing no signs of letting go of this bull run. Some very mild losses to report, but with most indices in the green across the board. Only the US Futures are lagging a bit at the start of this Wednesday.
- The CME Group’s FedWatch Tool is now looking at the March 20th meeting. Expectations for a pause are 78.5%, while 21.5% for a rate cut.
- The benchmark 10-year US Treasury Note trades near 4.09%, off the peak from Monday near 4.17%.
US Dollar Index Technical Analysis: Taking a breather
The US Dollar Index (DXY) is taking a breather, so it seems, after its rally on Friday and Monday. The Greenback looks to be on its way to being proclaimed King Dollar again, although no real calls are put out there that DXY could pop back to 107. For now the equilibrium looks to be found with the DXY retreating a touch in search of support.
Should the US Dollar Index move higher again, first look for a test at the peak of Monday, near 104.60. That level needs to be broken and is more important than the 100-day SImple Moving Average snap at 104.30. Once broken above that Monday high, the road is open for a jump to 105 with 105.12 as key level to keep an eye on.
The 100-day SMA is clearly the unreliable boyfriend in the rally at the moment. A false break on Monday and no support provided on Tuesday from the moving average opens the door for a bit of a squeeze lower. The first ideal candidate for support is the 200-day SMA near 103.59. Should that give way, look for support from the 55-day SMA near 103 itself.
US Dollar FAQs
What is the US Dollar?
The US Dollar (USD) is the official currency of the United States of America, and the ‘de facto’ currency of a significant number of other countries where it is found in circulation alongside local notes. It is the most heavily traded currency in the world, accounting for over 88% of all global foreign exchange turnover, or an average of $6.6 trillion in transactions per day, according to data from 2022.
Following the second world war, the USD took over from the British Pound as the world’s reserve currency. For most of its history, the US Dollar was backed by Gold, until the Bretton Woods Agreement in 1971 when the Gold Standard went away.
How do the decisions of the Federal Reserve impact the US Dollar?
The most important single factor impacting on the value of the US Dollar is monetary policy, which is shaped by the Federal Reserve (Fed). The Fed has two mandates: to achieve price stability (control inflation) and foster full employment. Its primary tool to achieve these two goals is by adjusting interest rates.
When prices are rising too quickly and inflation is above the Fed’s 2% target, the Fed will raise rates, which helps the USD value. When inflation falls below 2% or the Unemployment Rate is too high, the Fed may lower interest rates, which weighs on the Greenback.
What is Quantitative Easing and how does it influence the US Dollar?
In extreme situations, the Federal Reserve can also print more Dollars and enact quantitative easing (QE). QE is the process by which the Fed substantially increases the flow of credit in a stuck financial system.
It is a non-standard policy measure used when credit has dried up because banks will not lend to each other (out of the fear of counterparty default). It is a last resort when simply lowering interest rates is unlikely to achieve the necessary result. It was the Fed’s weapon of choice to combat the credit crunch that occurred during the Great Financial Crisis in 2008. It involves the Fed printing more Dollars and using them to buy US government bonds predominantly from financial institutions. QE usually leads to a weaker US Dollar.
What is Quantitative Tightening and how does it influence the US Dollar?
Quantitative tightening (QT) is the reverse process whereby the Federal Reserve stops buying bonds from financial institutions and does not reinvest the principal from the bonds it holds maturing in new purchases. It is usually positive for the US Dollar.
Geopolitical risks have clearly increased. Will geopolitical events derail the recovery in 2024 and 2025? Economists at Citigroup analyze geopolitical tensions.
Present geopolitical tensions should not prevent corporate profits from rising in 2024-2025
A study of past geopolitical and military incidents since 1941 reveals that most events have only had a limited impact on markets. The few exceptions, Pearl Harbor, and the Arab Oil Embargo, significantly altered the path of the economy.
Present geopolitical tensions shouldn’t prevent corporate profits from rising in 2024-2025. So far, the events in the Middle East have impacted shipping costs, but not end prices, indicating that supply chains have been able to compensate for the disruption.
- Natural Gas trades a touch higher after another test on the $2 marker.
- Traders are seeing new gas supply deals emerge which covers longer term Gas supply.
- The US Dollar Index flirts with a break below 104 as the Greenback fails to find nearby support.
Natural Gas (XNG/USD) is trading higher this Wednesday on a pure technical bounce after the dip on Tuesday which briefly broke below $2. The bounce looks to be rather short lived as geopolitical tensions are easing a touch with Hamas having proposed a 135-day ceasefire according to Saudi news channel Al Arabiya. The proposal is now being considered by Israel and other parties in the region.
The US Dollar (USD) is feeling this deescalation in geopolitical tensions with some safe haven outflows. This makes the Greenback, which is negatively correlated to Natural Gas, retreat from Monday’s highs and search for support. The 104 marker does not look that solid and could give way, seeing the US Dollar devalue just a little bit more before finding some solid support in the form of the 200-day SMA near 103.59. As for market-moving events, no less than three US Federal Reserve members are due to speak this Wednesday.
Natural Gas is trading at $2.01 per MMBtu at the time of writing.
Natural Gas market movers: India a big winner
- Qatar agreed to lower its Liquified Natural Gas (LNG) prices in a longer term agreement with India. Petronet concluded the contract with the Emirate for 7.5 million tons of LNG per year for 20 years.
- The UK has concluded a deal to sell 1 million tons of LNG with Repsol, between 2025 and 2027.
- Norway’s biggest Oil and Gas company Equinor ASA, saw its profits fall in the fourth quarter due to substantially lower Gas prices on global markets.
Natural Gas Technical Analysis: Ceasefire talks are always good
Natural Gas is trading in very difficult circumstances to stage a rally in any form or way. Beside the sluggish demand in Europe, markets are starting to consider that even the fact that ceasefire talks are ongoing in the Middle East is a good thing. Where questions on a possible deal were considered a risk and pushed gas prices up, this week signs of talks are considered a good thing with all parties still talking and trying to work out an agreement, which is negative for gas prices for now.
On the upside, Natural Gas is facing some pivotal technical levels to get back to. First, the low of January at $2.10 needs to be reclaimed again. Next is the intermediary level near $2.48. Once that area gets hit, expect to see a test near $2.57 at the purple line.
Once the current low at $2.04 gets tested, or broken again, expect the $2.00 big figure to crack under pressure as well. The first level to look for on the downside is near $1.95 (orange level) which goes back to August 2020. Next is the red line near $1.51, the low of June 2021.
-638428999080228611.png)
XNG/USD (Daily Chart)
Natural Gas FAQs
What fundamental factors drive the price of Natural Gas?
Supply and demand dynamics are a key factor influencing Natural Gas prices, and are themselves influenced by global economic growth, industrial activity, population growth, production levels, and inventories. The weather impacts Natural Gas prices because more Gas is used during cold winters and hot summers for heating and cooling. Competition from other energy sources impacts prices as consumers may switch to cheaper sources. Geopolitical events are factors as exemplified by the war in Ukraine. Government policies relating to extraction, transportation, and environmental issues also impact prices.
What are the main macroeconomic releases that impact on Natural Gas Prices?
The main economic release influencing Natural Gas prices is the weekly inventory bulletin from the Energy Information Administration (EIA), a US government agency that produces US gas market data. The EIA Gas bulletin usually comes out on Thursday at 14:30 GMT, a day after the EIA publishes its weekly Oil bulletin. Economic data from large consumers of Natural Gas can impact supply and demand, the largest of which include China, Germany and Japan. Natural Gas is primarily priced and traded in US Dollars, thus economic releases impacting the US Dollar are also factors.
How does the US Dollar influence Natural Gas prices?
The US Dollar is the world’s reserve currency and most commodities, including Natural Gas are priced and traded on international markets in US Dollars. As such, the value of the US Dollar is a factor in the price of Natural Gas, because if the Dollar strengthens it means less Dollars are required to buy the same volume of Gas (the price falls), and vice versa if USD strengthens.
Economists at Commerzbank discuss the link between growth and the EUR/USD exchange rate.
Higher US inflation or a more hawkish ECB would kill the USD-positive growth story
The US economy seems to be managing a ‘no landing’, i.e. it seems to be able to cope with the interest rate hikes without a slowdown in growth. At the same time, inflation looks set to fall to the Fed's 2% target. High growth without inflation is even better than what economists call a Goldilocks economy. And with the Fed being extremely hawkish at the same time, inflation risks in the US also appear to be low.
Meanwhile, Europe is groaning under near-zero growth, under stagnation. And even those who are as optimistic about the current inflation trend as they are about the US have to admit that the much more dovish ECB could raise inflation concerns in the medium to long term.
As long as this environment persists, EUR/USD will suffer from strong US growth and weak Eurozone growth in particular. Conversely, higher US inflation or a more hawkish ECB would kill the USD-positive growth story. Irrespective of imaginary ‘capital flows’.
- USD/CAD faces selling pressure as the US Dollar Index retreats.
- Fed policymakers keep avoiding speculating over the timing of rate cuts.
- The Canadian Dollar will dance to the tunes of Employment data.
The USD/CAD pair trades near the day’s low around 1.3470 in Wednesday’s European session as the US Dollar Index (DXY) has corrected to near 104.00 from an 11-week high of 104.60. The USD Index failed to hold strength despite Federal Reserve (Fed) policymakers not being ready to speculate about rate cuts.
The market mood seems asset-specific as S&P500 futures are subdued while investors have underpinned risk-perceived currencies against the US Dollar.
Fed policymakers are uncomfortable about offering any time when the central bank will begin reducing interest rates as they still need more confidence that inflation will sustainably return to the 2% target. Strength in the labor market and resilient consumer spending have faded prospects for inflation returning to 2%.
Meanwhile, the Canadian Dollar will be guided by the Employment data for January, which will be published on Friday. The Unemployment Rate is seen rising to 5.9% from 5.8% in December.
USD/CAD faces selling pressure while attempting to deliver a breakout of the Ascending Triangle formation on a four-hour timeframe. The aforementioned chart pattern indicates a volatility contraction but with a positive bias.
The horizontal resistance of the Ascending Triangle chart pattern is plotted from January 17 high at 1.3542, while the upward-sloping trendline is placed from December 29 low at 1.3178. The Loonie asset has dropped near the 20-period Exponential Moving Average (EMA), which trades around 1.3470.
The 14-period Relative Strength Index (RSI) failed to sustain above 60.00, which indicates lower buying strength at higher levels.
A buying opportunity would emerge if the Loonie asset breaks above the January 17 high at 1.3542, which will drive the asset towards the round-level resistance of 1.3600, followed by the November 30 high at 1.3627.
On the flip side, a breakdown below January 31 low at 1.3359 will expose the asset to January 4 low at 1.3318 and January 5 low at 1.3288.
USD/CAD four-hour chart
-638429008186784336.png)
EUR/CUF reached a record low at the end of 2023. Since then, the pair has drifted modestly higher. Economists at Rabobank analyze EUR/CHF outlook.
Swissie can be particularly sensitive to headwinds in the Eurozone
While various geopolitical factors have the potential to spark CHF buying, the Swissie can be particularly sensitive to headwinds in the Eurozone. Economic stagnation, budget constraints and strike action in Germany combined with calls for structural reforms in Europe’s largest economy could limit scope for appreciation in EUR/CHF medium term.
We see scope for further dips to the 0.9300 area on a 1-to-3-month view failing a more dovish stance from the SNB.
- GBP/JPY gains positive traction and is supported by a combination of factors.
- A positive risk tone undermines the JPY and acts as a tailwind for spot prices.
- Bulls seem unaffected by the prospects of BoE rate interest rate cuts in 2024.
The GBP/JPY cross attracts some dip-buyers near the 186.15 area, or the weekly low touched this Wednesday and builds on the momentum through the first half of the European session. Spot prices climb to a fresh daily high in the last hour, with bulls now looking to extend the positive move beyond the 200-hour Simple Moving Average (SMA) and the 187.00 round-figure mark.
The prospect of an Israel-Hamas ceasefire raises hopes for a de-escalation of the crisis in the Middle East and boosts investors' confidence. This is seen as a key factor behind the safe-haven Japanese Yen's (JPY) relative underperformance. The British Pound (GBP), on the other hand, benefits from the ongoing US Dollar (USD) pullback from its highest level in almost three months. This, in turn, assists the GBP/JPY cross to gain some positive traction and rebound over 85 pips from the daily trough.
The GBP bulls, meanwhile, seem rather unaffected by the rising prospect of the Bank of England (BoE) reducing interest rates in 2024. In fact, BoE's chief economist Huw Pill said on Tuesday that the interest rate could drop this year as a reward to the economy for bringing down inflation. This comes on top of BoE Gornover Andrew Bailey's remarks last week, saying that things are heading in the right direction and that the current level of bank interest rate remains appropriate.
Bailey, however, signalled that the central bank was ready to start easing policy. Adding to this, BoE Deputy Governor Sarah Breeden said on Wednesday that she is less concerned that the bank rate might need to be tightened further and that her focus has shifted to how long rates need to remain at their current level. This, however, does little to cap the GBP/JPY cross, though the Bank of Japan’s (BoJ) hawkish tilt earlier this month might hold back bulls from placing fresh bets.
Technical levels to watch
- Gold price consolidates in a tight range near $2,030 while the US Dollar falls from a seven-week high.
- Fed policymakers abstain from offering timing for rate cuts.
- Considering the upbeat labor market, the Fed is expected to achieve a soft landing.
Gold price (XAU/USD) is stuck in a tight range, slightly above $2,030 in the London session on Wednesday. Gold, a non-yielding asset, is both supported and capped by the fact that whilst the Federal Reserve is poised to make rate cuts, uncertainty remains over their timing. Fed policymakers are holding back from unwinding the restrictive monetary policy stance too aggressively due to the current strength in labor demand and upbeat household spending.
The US Dollar Index (DXY) and bond yields, which are negatively correlated to Gold price, have eased despite the fact the Fed is unlikely to cut interest rates in March – something that would usually weigh on the Gold. Even expectations for a rate cut in May have decreased significantly as the Fed lacks evidence that inflation will slow sustainably to its 2% target. Fed policymakers are worried premature action on interest rates could flare up price pressures again, cautioning that the last mile in taming price pressures is always a difficult one.
Going forward, speeches from Fed policymakers’ Richmond Federal Reserve Bank Thomas Barkin and Federal Reserve Governor Michelle Bowman will be of utmost importance.
Daily Digest Market Movers: Gold price remains steady while US Dollar eases, yields correct
- Gold price consolidates in a narrow range around $2,030 as investors await fresh guidance from Federal Reserve policymakers over inflation and interest rates.
- The economic indicators for January released so far have indicated that the United States is outperforming expectations, which signifies a persistent inflation outlook.
- The US economic calendar is light this week, therefore investors are focusing on speeches from Fed policymakers for fresh cues about when the central bank will begin reducing interest rates.
- The speech from Cleveland Federal Reserve Bank President Loretta Mester delivered on Tuesday indicated that deepening uncertainty over inflation is not allowing policymakers to offer any timing for rate cuts.
- Loretta Mester said a robust labor market and resilient household spending have allowed the Fed to keep interest rates restrictive, giving them time to gather evidence about inflation declining sustainably to the 2% target.
- Mester added that the Fed is looking to bring down interest rates, and the forecast of three rate cuts this year is intact.
- Philadelphia Federal Reserve Bank President Patrick Harker didn’t provide any cues about easy policy in his prepared remarks. However, he said the Fed is making “real progress” in bringing inflation down to 2%, and the path to a “soft landing” is very much in sight. A soft landing is when a central bank manages to achieve price stability without triggering a recession.
Technical Analysis: Gold price hovers near 20-DEMA
Gold price trades sideways above $2,030 amid an absence of major economic events this week, while speeches from Fed policymakers will keep investors busy. The precious metal turns sideways after a sharp recovery from a weekly low of around $2,015. The yellow metal oscillates inside Monday’s trading range for the second straight session, which indicates a sharp volatility contraction. The asset is hovering near the 20-day Exponential Moving Average (EMA), which trades around $2,033.
Gold FAQs
Why do people invest in Gold?
Gold has played a key role in human’s history as it has been widely used as a store of value and medium of exchange. Currently, apart from its shine and usage for jewelry, the precious metal is widely seen as a safe-haven asset, meaning that it is considered a good investment during turbulent times. Gold is also widely seen as a hedge against inflation and against depreciating currencies as it doesn’t rely on any specific issuer or government.
Who buys the most Gold?
Central banks are the biggest Gold holders. In their aim to support their currencies in turbulent times, central banks tend to diversify their reserves and buy Gold to improve the perceived strength of the economy and the currency. High Gold reserves can be a source of trust for a country’s solvency. Central banks added 1,136 tonnes of Gold worth around $70 billion to their reserves in 2022, according to data from the World Gold Council. This is the highest yearly purchase since records began. Central banks from emerging economies such as China, India and Turkey are quickly increasing their Gold reserves.
How is Gold correlated with other assets?
Gold has an inverse correlation with the US Dollar and US Treasuries, which are both major reserve and safe-haven assets. When the Dollar depreciates, Gold tends to rise, enabling investors and central banks to diversify their assets in turbulent times. Gold is also inversely correlated with risk assets. A rally in the stock market tends to weaken Gold price, while sell-offs in riskier markets tend to favor the precious metal.
What does the price of Gold depend on?
The price can move due to a wide range of factors. Geopolitical instability or fears of a deep recession can quickly make Gold price escalate due to its safe-haven status. As a yield-less asset, Gold tends to rise with lower interest rates, while higher cost of money usually weighs down on the yellow metal. Still, most moves depend on how the US Dollar (USD) behaves as the asset is priced in dollars (XAU/USD). A strong Dollar tends to keep the price of Gold controlled, whereas a weaker Dollar is likely to push Gold prices up.
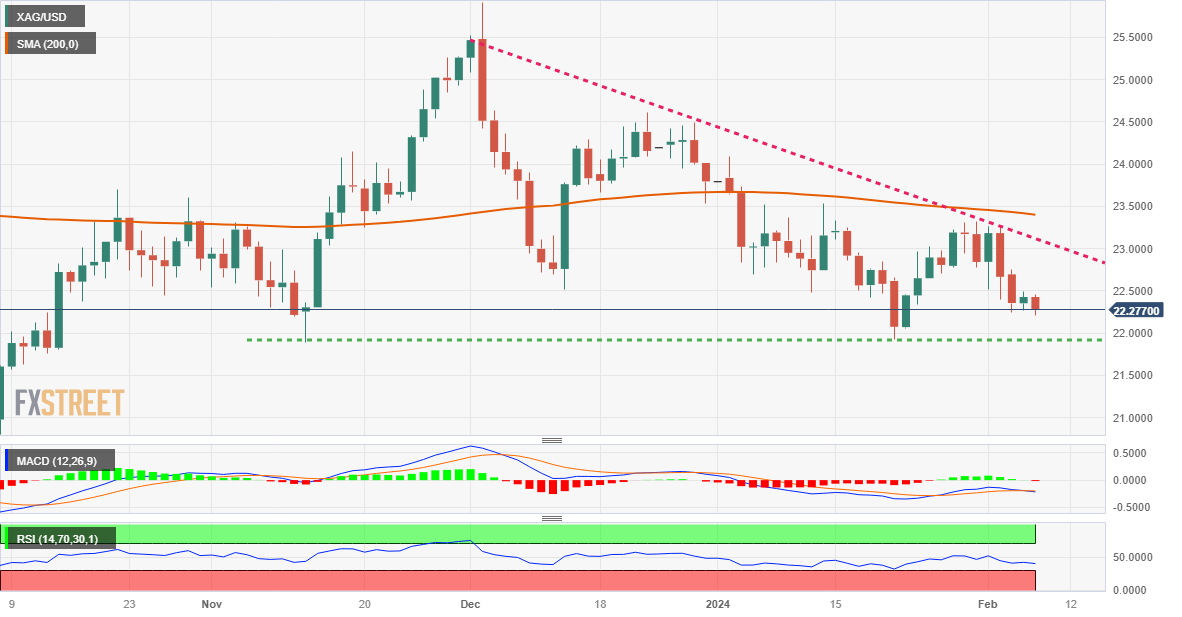
- Silver meets with a fresh supply and touches over a two-week trough on Wednesday.
- The technical setup favours bearish traders and supports prospects for further losses.
- Any attempted recovery could be seen as a selling opportunity and fade rather quickly.
Silver (XAG/USD) comes under some renewed selling pressure following the previous day's modest uptick and drops to over a two-week low during the first half of the European session on Wednesday. The white metal currently trades near the $22.30 area, down just over 0.60% for the day, and seems vulnerable to slide further.
The recent failure near a descending trend-line resistance, ahead of the very important 200-day Simple Moving Average (SMA), and a subsequent breakdown through a short-term trading range validate the negative outlook. Moreover, oscillators on the daily chart have been gaining negative traction and are still far from being in the oversold territory. This, in turn, suggests that the path of least resistance for the XAG/USD is to the downside.
Hence, some follow-through decline towards retesting sub-$22.00 levels, or a two-month low touched in January, looks like a distinct possibility. The downward trajectory could get extended further towards the $21.40-$21.35 intermediate support before the XAG/USD weakens further below the $21.00 mark, towards the October swing low near the $20.70-$20.65 zone.
On the flip side, attempted recovery moves might now confront some resistance near the $22.45-$22.50 area. A sustained move beyond could trigger a short-covering rally, though runs the risk of fizzling out rather quickly ahead of the $23.00 round-figure mark. This is followed by the 200-day SMA, near the $23.25-$23.30 supply zone, which if cleared decisively should set the stage for additional gains and allow the XAG/USD to reclaim the $24.00 mark.
Some follow-through buying has the potential to lift the metal towards the next relevant hurdle near the $24.50-$24.60 area and the $25.00 psychological mark. The momentum could get extended further towards the $25.45-$25.50 intermediate barrier before the XAG/USD eventually climbs to the $26.00 neighbourhood or the December swing high.
Silver daily chart
Technical levels to watch
Kit Juckes, Chief Global FX Strategist at Société Générale, looks at 2-year yield differentials and the Dollar against the AUD.
AUD/USD looks too low, EUR/AUD looks like a sell
I don’t think the AUD is as sensitive as the Euro is to shorter-term rates.
The rate differential has moved against the AUD in recent days for the same reason as it’s moved against the Euro. The RBA may have sounded marginally more hawkish/less dovish on Tuesday than some expected but not enough to change the picture. AUD does, however, look low on this basis.
With an economy in much better shape than the Eurozone’s, and with the Chinese authorities stepping up efforts to revive their economy, short EUR/AUD is still an attractive trade for the medium term.
Poland’s central bank (NBP) announces its monthly rate decision. Economists at Commerzbank analyze Polish Zloty (PLN) ahead of the meeting.
NBP meeting not of much interest
It is unanimously predicted by all surveyed analysts that the central bank will leave its benchmark interest rate unchanged at 5.75%. A pause until (at least) March is the official guidance from NBP, although currency strength and falling inflation could have potentially forced the bank’s hand.
The statement and press conference are unlikely to bring added interest either, for now. We will likely hear repetition that the current interest rate level is adequate for meeting inflation target.
Because of rising political uncertainties, we see a sideways outlook for the Zloty with negative bias.
- EUR/USD attracts some buyers in reaction to hawkish comments by an ECB board member.
- A positive risk tone undermines the safe-haven USD and further lends support to the major.
- Bets that the Fed will keep rates higher for longer favor the USD bulls and should cap gains
The EUR/USD pair builds on the previous day's modest bounce from the 1.0720 area, or a near three-month low and gains some positive traction for the second successive day on Wednesday. The shared currency strengthens a bid in reaction to hawkish comments by the European Central Bank (ECB) Governing Council Member Isabel Schnabel, which, to a larger extent, offsets a disappointing German macroeconomic picture. Furthermore, hopes for a de-escalation of the crisis in the Middle East drag the safe-haven USD away from its highest level since November 14 touched earlier this week and turn out to be another factor acting as a tailwind for the currency pair.
Any meaningful USD downfall, however, still seems elusive as investors continue to price out bets for early interest rate cuts by the Federal Reserve (Fed) in the wake of a still-resilient US economy. This, along with expectations that the ECB could start cutting interest rates by April amid falling inflation in the Eurozone, caps the upside for the EUR/USD pair. Traders now look forward to the release of the US Trade Balance data ahead of speeches by influential FOMC members for short-term impetus later during the North American session.
Daily Digest Market Movers: Benefits from hawkish ECB comments and modest USD weakness
- ECB board member Isabel Schnabel told the Financial Times that the central bank must be patient with cutting interest rates as inflation could flare up again, which, in turn, offers support to the Euro.
- This follows comments by ECB Governing Council member Boris Vujcic on Tuesday, saying that the central bank shouldn't rush to lower rates as there is resilience in services inflation and wages.
- Data published this Wednesday showed that industrial output in Germany – the Eurozone’s top economy – declined by 1.6% in December as against the -0.4% expected and a 0.7% fall in November.
- The prospect of an Israel-Hamas ceasefire lifts hopes for a de-escalation of the crisis in the Middle East and boosts risk sentiment, undermining the safe-haven US Dollar and benefitting the EUR/USD pair.
- Investors continue scaling back their bets for early and steep rate cuts by the Federal Reserve in the wake of robust US macro data released recently and hawkish comments from several FOMC members.
- Fed Chair Jerome Powell, in an interview with US TV show 60 Minutes aired on Sunday, reiterated that the March policy meeting is likely too soon to have confidence to start cutting interest rates.
- Moreover, Philadelphia Fed President Patrick Harker said on Tuesday that the recent news on inflation has been encouraging, though it must be moving sustainably lower to open the rate-cut door.
- Harker added that it would be a mistake to cut rates prematurely as wage gains are too high to achieve the 2% inflation target and that it is possible that inflation may be more persistent than expected.
- Separately, Minneapolis Fed President Neel Kashkari said that we are not done yet on inflation and most of the disinflationary gains have come from the supply-side, but the data is looking positive.
- The yield on the benchmark 10-year US government bond holds steady above 4.0% and favors the USD bulls, warranting caution before placing fresh bullish bets around the currency pair.
- Traders now look to the US Trade Balance data and speeches by Fed officials for short-term opportunities, though the focus remains on the latest US consumer inflation figures next week.
Technical Analysis: Bulls need to wait for strength beyond 100-day SMA before placing fresh bets
From a technical perspective, the 100-day Simple Moving Average (SMA) support breakpoint, currently pegged around the 1.0775-1.0780 region, might continue to act as an immediate hurdle ahead of the 1.0800 mark. Some follow-through buying has the potential to lift the EUR/USD pair to the 200-day SMA, near the 1.0835-1.0840 zone. The latter should act as a key pivotal point, which if cleared decisively might trigger a short-covering rally and allow spot prices to reclaim the 1.0900 round figure.
On the flip side, immediate support is pegged near the 1.0725-1.0720 region, or a nearly three-month low, ahead of the 1.0700 mark. Some follow-through selling will make the EUR/USD pair vulnerable to accelerate the slide further towards the 1.0665-1.0660 intermediate support en route to the 1.0620-1.0615 region and the 1.0600 round figure.
Euro price today
The table below shows the percentage change of Euro (EUR) against listed major currencies today. Euro was the strongest against the Swiss Franc.
| USD | EUR | GBP | CAD | AUD | JPY | NZD | CHF | |
| USD | -0.09% | -0.19% | -0.10% | 0.03% | 0.07% | -0.07% | 0.19% | |
| EUR | 0.08% | -0.09% | 0.02% | 0.14% | 0.17% | 0.02% | 0.28% | |
| GBP | 0.19% | 0.09% | 0.08% | 0.22% | 0.25% | 0.11% | 0.39% | |
| CAD | 0.10% | 0.00% | -0.08% | 0.12% | 0.17% | 0.02% | 0.29% | |
| AUD | -0.03% | -0.13% | -0.23% | -0.13% | 0.04% | -0.11% | 0.16% | |
| JPY | -0.07% | -0.17% | -0.24% | -0.19% | -0.03% | -0.12% | 0.10% | |
| NZD | 0.07% | -0.03% | -0.12% | -0.03% | 0.10% | 0.14% | 0.25% | |
| CHF | -0.20% | -0.30% | -0.38% | -0.29% | -0.13% | -0.11% | -0.26% |
The heat map shows percentage changes of major currencies against each other. The base currency is picked from the left column, while the quote currency is picked from the top row. For example, if you pick the Euro from the left column and move along the horizontal line to the Japanese Yen, the percentage change displayed in the box will represent EUR (base)/JPY (quote).
Euro FAQs
What is the Euro?
The Euro is the currency for the 20 European Union countries that belong to the Eurozone. It is the second most heavily traded currency in the world behind the US Dollar. In 2022, it accounted for 31% of all foreign exchange transactions, with an average daily turnover of over $2.2 trillion a day.
EUR/USD is the most heavily traded currency pair in the world, accounting for an estimated 30% off all transactions, followed by EUR/JPY (4%), EUR/GBP (3%) and EUR/AUD (2%).
What is the ECB and how does it impact the Euro?
The European Central Bank (ECB) in Frankfurt, Germany, is the reserve bank for the Eurozone. The ECB sets interest rates and manages monetary policy.
The ECB’s primary mandate is to maintain price stability, which means either controlling inflation or stimulating growth. Its primary tool is the raising or lowering of interest rates. Relatively high interest rates – or the expectation of higher rates – will usually benefit the Euro and vice versa.
The ECB Governing Council makes monetary policy decisions at meetings held eight times a year. Decisions are made by heads of the Eurozone national banks and six permanent members, including the President of the ECB, Christine Lagarde.
How does inflation data impact the value of the Euro?
Eurozone inflation data, measured by the Harmonized Index of Consumer Prices (HICP), is an important econometric for the Euro. If inflation rises more than expected, especially if above the ECB’s 2% target, it obliges the ECB to raise interest rates to bring it back under control.
Relatively high interest rates compared to its counterparts will usually benefit the Euro, as it makes the region more attractive as a place for global investors to park their money.
How does economic data influence the value of the Euro?
Data releases gauge the health of the economy and can impact on the Euro. Indicators such as GDP, Manufacturing and Services PMIs, employment, and consumer sentiment surveys can all influence the direction of the single currency.
A strong economy is good for the Euro. Not only does it attract more foreign investment but it may encourage the ECB to put up interest rates, which will directly strengthen the Euro. Otherwise, if economic data is weak, the Euro is likely to fall.
Economic data for the four largest economies in the euro area (Germany, France, Italy and Spain) are especially significant, as they account for 75% of the Eurozone’s economy.
How does the Trade Balance impact the Euro?
Another significant data release for the Euro is the Trade Balance. This indicator measures the difference between what a country earns from its exports and what it spends on imports over a given period.
If a country produces highly sought after exports then its currency will gain in value purely from the extra demand created from foreign buyers seeking to purchase these goods. Therefore, a positive net Trade Balance strengthens a currency and vice versa for a negative balance.
It has been another quiet week in FX markets, where the Dollar has largely held onto gains made after Friday's strong jobs report. Economists at ING analyze Greenback’s outlook.
104.00-104.75 looks to be the DXY range near term
Perhaps the only slightly Dollar negative scenario we see this week is one led by a risk-on environment should a Qatari-brokered Israeli-Hamas ceasefire make any progress.
Paying 5.3% on overnight deposits, the Dollar therefore remains an attractive place to park money until some clearer trends develop.
104.00-104.75 looks to be the DXY range near term.
FX option expiries for Feb 7 NY cut at 10:00 Eastern Time, via DTCC, can be found below.
- EUR/USD: EUR amounts
- 1.0700 403m
- 1.0725 1.2b
- 1.0800 559m
- 1.0925 503m
- 1.0935 491m
- 1.0950 2.4b
- USD/JPY: USD amounts
- 146.45 691m
- 147.00 1.1b
- USD/CHF: USD amounts
- 0.8485 600m
- AUD/USD: AUD amounts
- 0.6450 348m
- 0.6600 355m
- USD/CAD: USD amounts
- 1.3500 435m
- NZD/USD: NZD amounts
- 0.5950 532m
- 0.5955 431m
Bank of England (BoE) Deputy Governor Sarah Breeden said on Wednesday that she is less concerned that the bank rate might need to be tightened further, as reported by Reuters.
"My focus has shifted to thinking about how long rates need to remain at their current level," Breeden added and noted that she needs to see further evidence to be confident that the UK economy is progressing as set out in the BoE forecasts.
Market reaction
GBP/USD showed no immediate reaction to these comments and was last seen rising 0.17% on the day at 1.2620.
EUR/USD has declined after hitting 1.1100/1.1150 in December. Economists at Société Générale analyze the pair’s outlook.
Unlike in the US, the Eurozone economy is operating below potential
Unlike in the US, the Eurozone economy is operating below potential, meaning the danger is low of pressure from demand on prices. This hasn’t stopped European rates from correcting with US ones across the curve since last week, though the magnitude has been considerably inferior. The Euro 5y IRS is up 7 bps since Friday compared to 30 bps for the US. The widening of the spread is the driving force for the new low in EUR/USD.
We’ll find out if the pair can convincingly reclaim 1.0780 and repeat the price action of last December when the Fed sparked Dollar profit taking. The landscape has of course changed since then.
Strong US data suggest EUR/USD could keep struggling in the near term.
- USD/MXN moves on a downward trajectory on a weaker US Dollar.
- Downbeat US Treasury yields contribute to weighing on the US Dollar.
- Traders await Swiss inflation data followed by the Banxico policy decision on Thursday.
USD/MXN continues its losing streak for the third successive day, trading lower around 17.03 during the European session on Wednesday. The US Dollar (USD) depreciates against the Mexican Peso (MXN) due to the decline in the US Treasury yields. That, in turn, acts as a headwind for the USD/MXN pair.
US Dollar Index (DXY) continues to lose ground, inching lower to near 104.10 with the 2-year and 10-year yields on US bond notes standing at 4.40% and 4.10%, respectively, by the press time. Nevertheless, the bearish momentum of the Greenback might have been limited by the hawkish remarks from US Federal Reserve (Fed) Chair Jerome Powell. Powell alleviated market expectations of a rate cut in March.
The Mexican Consumer Confidence data is set to be released on Wednesday by INEGI. Furthermore, inflation data is scheduled to get public on Wednesday followed by the Bank of Mexico’s (Banxico) interest rate decision, Core Inflation is expected to be eased to 0.37% in January against the 0.44% prior. However, Headline Inflation is expected to rise by 0.88%, exceeding the previous growth of 0.71%. 12-Month Inflation is anticipated to grow by 4.88%, higher than the 4.66%.
Banxico is anticipated to keep its interest rate steady at 11.25% at February’s policy meeting but a quarter-basis point rate cut is expected in March. Furthermore, markets anticipate a subsequent escalation in the scale of rate cuts by the Banxico throughout 2024.
- EUR/GBP falls to near 0.8530 as soft Eurozone data deepen ECB rate-cut bets.
- ECB Cos is confident about inflation declining towards the 2% target.
- UK companies are becoming optimistic about BoE’s rate-cut prospects.
The EUR/GBP pair falls sharply to near 0.8530 on December's downbeat German Industrial Production data. The industrial output of the world’s fourth largest economy was down at a sharp pace of 1.6% monthly, while market participants projected a decline of 0.6%. In November, the economic data was contracted by 0.2%.
The Eurozone economy is underperforming due to labor market, consumer spending and manufacturing activities. And, now, downbeat Industrial Production data has added to indicators deepening chances of early rate cuts by the European Central Bank (ECB).
Odds of an early rate cuts by the ECB stemmed after policymaker Pablo Hernandez de Cos said on Tuesday, "it is already very important for European citizens to know that we are confident the next move will be a cut.” In the commentary, ECB Cos showed confidence in inflation declining towards the 2% target.
On the contrary, ECB executive board member Isabel Schnabel said in late Asian session on Wednesday that the last mile in bringing down inflation towards the 2% target will be the most difficult one. Schnabel warned that early rate cuts could flare up price pressures again.
Meanwhile, the Pound Sterling performs better against the Euro as the economic prospects of the United Kingdom's economy are improving again. UK service sector and construction companies have become more optimistic about fading recession risks and rate cuts by the Bank of England (BoE) amid easing price pressures.
Gold benefited from falling US yields and rose toward $2,040 on Tuesday. Economists at ANZ Bank analyze the yellow metal’s outlook.
Market’s expectations of an imminent rate cut by the Fed have been in a state of flux
Gold steadied before pushing higher as bond yields fell and the USD weakened.
Market’s expectations of an imminent rate cut by the Fed have been in a state of flux following strong economic data. However, US bonds bounced back after Cleveland Fed Governor Loretta Mester said the central bank will probably gain confidence to cut rates later this year.
Gold has held above $2,000 despite investors cutting their long positions. ETFs have cut their holdings of gold for 13 straight days, bringing this year’s net sales to 1.75Moz according to Bloomberg data.
- USD/CHF moves above towards the psychological level of 0.8700.
- US Dollar registers losses due to weaker US bond yields.
- Swiss Unemployment Rate (YoY) increased by 2.5% in January against the 2.3% prior.
USD/CHF recovers its losses amid a subdued US Dollar, edging higher to near 0.8700 during the early European hours on Wednesday. US Dollar (USD) faces a challenge due to lower yields on US Treasury bonds, consequently, undermining the USD/CHF pair.
US Dollar Index (DXY) continues to lose ground, inching lower to near 104.00 with the 2-year and 10-year yields on US bond notes standing at 4.39% and 4.02%, respectively, by the press time. Nevertheless, the bearish momentum of the Greenback might have been limited by the hawkish remarks from US Federal Reserve (Fed) Chair Jerome Powell. Powell alleviated market expectations of a rate cut in March and underscored the importance of closely monitoring inflation as it approaches the Fed's 2% core target.
Furthermore, Fed Bank of Cleveland President Loretta Mester remarked on Tuesday that the US central bank might consider the possibility of reducing interest rates later in the year. Meanwhile, Fed Bank of Philadelphia President Patrick Harker voiced his support for the Fed's decision to keep interest rates unchanged last week, citing an outlook suggesting ongoing declines in inflation.
Fed members Adriana D. Kugler and Thomas I. Barkin are slated to deliver speeches on Wednesday, with market participants anticipated to closely scrutinize their remarks for additional insights into the Federal Reserve's stance on monetary policy.
The non-seasonally adjusted Swiss Unemployment Rate (YoY) increased by 2.5% in January against the 2.3% prior. While seasonally adjusted Unemployment Rate (MoM) is unchanged at 2.2% as expected. Foreign Currency Reserves increased to 662 billion in January from the previous figure of 654 billion.
Projections for the current year suggest that inflation is anticipated to average below the 2.0% threshold. In light of these considerations, there is a consensus among analysts that the Swiss National Bank (SNB) may embark on its first rate cut in September 2024.
EUR/USD has tested the December low of 1.0725 in recent days. Economists at ING analyze the pair’s outlook.
Bears not particularly enthusiastic
Even though EUR/USD has come lower, the FX options market suggests there has been little conviction about the move.
It seems we are in a new EUR/USD holding pattern at slowly lower levels. That looks likely to be the case into Friday's release of the US CPI revisions.
1.0725-1.0800 looks to be the short-term EUR/USD range.
See: The Euro simply has little to offer against the strength of the USD at the moment – Commerzbank
- Pound Sterling has stretched its upside recovery as the appeal of risk-assets improves.
- UK recession fears have faded on prospects of early BoE rate cuts.
- Fed policymakers refuse to provide timing of rate cuts amid uncertainty over inflation.
The Pound Sterling (GBP) shows some bullish moves in the European session on Wednesday as the appeal for risk-perceived assets has improved significantly. The GBP/USD rebounds strongly despite increasing prospects of early rate cuts by the Bank of England (BoE).
The UK’s construction and service sectors have rebounded as prospects of rate cuts by the BoE have deepened amid easing price pressures. This has improved the confidence of business enterprises in the economic outlook.
The US Dollar has come under pressure despite the Federal Reserve (Fed) now expecting not to rush rate cuts amid a resilient United States economy. Fed policymakers continue to ignore discussions about the timing of rate cuts as the inflation situation is still uncertain due to robust labor market conditions and retail demand.
Daily Digest Market Movers: Pound Sterling advances while US Dollar drops further
- Pound Sterling has extended its upside above 1.2600 as the United Kingdom's economic prospects improve despite the Bank of England (BoE) maintaining interest rates in the restrictive trajectory.
- After robust Services PMI data, UK S&P Global/CIPS Construction PMI rose sharply to 48.8 vs. expectations of 47.3 and the prior reading of 46.8.
- UK construction companies have become more optimistic about fading recession risks and rate cuts by the BoE amid easing price pressures.
- Deepening prospects of loosening financial conditions and improving economic outlook have improved business optimism.
- The odds of early rate cuts by the BoE escalated after a dovish guidance on interest rates by Bank of England Chief Economist Huw Pill.
- Huw Pill said on Monday that the central bank is now focusing on “when” rather than “if” it will start lowering its benchmark interest rates. Pill added inflation indicators are far from endorsing the commencement of an easy policy but the underlying inflation is not needed to return to 2% for rate cuts.
- Also, Stephen Millard, a NIESR deputy director, said the good news for 2024 was that wages would continue to rise while inflation fell quickly towards the BoE's 2% target, probably allowing the central bank to start cutting interest rates in May, Reuters reported.
- For fresh guidance on interest rates, investors will keenly observe how the labor market and service inflation will shape up.
- The US Dollar Index (DXY) has come under pressure despite investors losing conviction over rate cuts by the Federal Reserve in May.
- As per the CME Fedwatch tool, traders see a 53% chance for a rate cut by 25 basis points (bps) in May, which has come down as policymakers push back expectations of early rate cuts.
Technical Analysis: Pound Sterling rebounds above 1.2600
Pound Sterling advances above the round-level resistance of 1.2600 as the risk-appetite of the market participants is improving again. The GBP/USD pair recovers strongly after discovering buying interest near a seven-week low around 1.2500. The near-term outlook of the Cable is still downbeat as it is trading below the 20 and 50-day Exponential Moving Averages (EMAs), which trade around 1.2664 and 1.2634 respectively.
Pound Sterling FAQs
What is the Pound Sterling?
The Pound Sterling (GBP) is the oldest currency in the world (886 AD) and the official currency of the United Kingdom. It is the fourth most traded unit for foreign exchange (FX) in the world, accounting for 12% of all transactions, averaging $630 billion a day, according to 2022 data.
Its key trading pairs are GBP/USD, aka ‘Cable’, which accounts for 11% of FX, GBP/JPY, or the ‘Dragon’ as it is known by traders (3%), and EUR/GBP (2%). The Pound Sterling is issued by the Bank of England (BoE).
How do the decisions of the Bank of England impact on the Pound Sterling?
The single most important factor influencing the value of the Pound Sterling is monetary policy decided by the Bank of England. The BoE bases its decisions on whether it has achieved its primary goal of “price stability” – a steady inflation rate of around 2%. Its primary tool for achieving this is the adjustment of interest rates.
When inflation is too high, the BoE will try to rein it in by raising interest rates, making it more expensive for people and businesses to access credit. This is generally positive for GBP, as higher interest rates make the UK a more attractive place for global investors to park their money.
When inflation falls too low it is a sign economic growth is slowing. In this scenario, the BoE will consider lowering interest rates to cheapen credit so businesses will borrow more to invest in growth-generating projects.
How does economic data influence the value of the Pound?
Data releases gauge the health of the economy and can impact the value of the Pound Sterling. Indicators such as GDP, Manufacturing and Services PMIs, and employment can all influence the direction of the GBP.
A strong economy is good for Sterling. Not only does it attract more foreign investment but it may encourage the BoE to put up interest rates, which will directly strengthen GBP. Otherwise, if economic data is weak, the Pound Sterling is likely to fall.
How does the Trade Balance impact the Pound?
Another significant data release for the Pound Sterling is the Trade Balance. This indicator measures the difference between what a country earns from its exports and what it spends on imports over a given period.
If a country produces highly sought-after exports, its currency will benefit purely from the extra demand created from foreign buyers seeking to purchase these goods. Therefore, a positive net Trade Balance strengthens a currency and vice versa for a negative balance.
Here is what you need to know on Wednesday, February 7:
The US Dollar (USD) struggles to gain traction early Wednesday, with the USD Index (DXY) holding steady slightly above 104.00 after snapping a two-day winning streak on Tuesday. Goods Trade Balance for December will be featured in the US economic docket and the US Treasury will hold a 10-year note auction later in the day. Several Federal Reserve policymakers are scheduled to speak during the American trading hours as well.
The USD weakened against its rivals on Tuesday amid retreating T-bond yields and a positive shift seen in risk mood. In the European morning, US stock index futures trade virtually unchanged and the 10-year yield fluctuates in a tight channel at around 4.1%.
US Dollar price this week
The table below shows the percentage change of US Dollar (USD) against listed major currencies this week. US Dollar was the weakest against the New Zealand Dollar.
| USD | EUR | GBP | CAD | AUD | JPY | NZD | CHF | |
| USD | 0.09% | 0.02% | 0.07% | -0.48% | -0.44% | -0.82% | 0.25% | |
| EUR | -0.09% | -0.07% | -0.02% | -0.56% | -0.54% | -0.90% | 0.16% | |
| GBP | -0.02% | 0.07% | 0.05% | -0.49% | -0.47% | -0.83% | 0.23% | |
| CAD | -0.07% | 0.02% | -0.05% | -0.54% | -0.52% | -0.88% | 0.15% | |
| AUD | 0.45% | 0.57% | 0.48% | 0.53% | 0.02% | -0.34% | 0.71% | |
| JPY | 0.43% | 0.53% | 0.43% | 0.51% | -0.02% | -0.36% | 0.69% | |
| NZD | 0.80% | 0.91% | 0.83% | 0.88% | 0.34% | 0.36% | 1.05% | |
| CHF | -0.27% | -0.16% | -0.22% | -0.20% | -0.71% | -0.71% | -1.08% |
The heat map shows percentage changes of major currencies against each other. The base currency is picked from the left column, while the quote currency is picked from the top row. For example, if you pick the Euro from the left column and move along the horizontal line to the Japanese Yen, the percentage change displayed in the box will represent EUR (base)/JPY (quote).
During the Asian trading hours, the data from New Zealand showed that the Unemployment Rate ticked up to 4% in the fourth quarter from 3.9% in the third quarter. This reading came in below the market expectation of 4.2%. In the same period, the Labor Cost Index was up 3.9% on a yearly basis. NZD/USD edged higher after the labor market data and was last seen trading modestly higher on the day above 0.6100.
The Leading Economic Index in Japan improved to 100 in December's flash estimate from 108.1, while the Coincident Index rose to 116.2 from 114.6. After falling 0.5% on Tuesday, USD/JPY showed no reaction to these figures and was last seen moving sideways slightly below 148.00.
USD/CAD turned south and closed below 1.3500 on Tuesday. The pair stays under modest bearish pressure early Wednesday. Bank of Canada (BoC) Governor Tiff Macklem reaffirmed that the BoC is done with rate hikes, stating that 5% is largely viewed as the level the BoC thinks is necessary to continue draining momentum out of inflation. He added that the policy discussion is shifting from whether or not policy is restrictive enough to how long it should remain restrictive.
EUR/USD extended its recovery toward 1.0800 early Wednesday after posting marginal gains on Tuesday. The data from Germany showed that Industrial Production contracted by 1.6% on a monthly basis in December.
GBP/USD trades in positive territory above 1.2600 in the European morning. On Tuesday, the pair rose 0.5% and erased a large portion of Monday's losses.
Gold benefited from falling US yields and rose toward $2,040 on Tuesday. Early Wednesday, XAU/USD moves up and down in a narrow band near $2,035.
Indonesia will elect a new president on 14 February. Economists at MUFG Bank analyze Rupiah’s outlook as the USD/IDR is trading near the highs seen in October 2023.
Political uncertainty to weigh on the Rupiah
We forecast the USD/IDR at 15,800 in Q1 2024 and 15,500 in end-2024.
Markets are pricing for the US Fed to only cut rates in May after Fed Chair Powell pushed back on a March rate cut. Along with ongoing domestic election uncertainty, which will weigh on capital inflows, we are cautious on the USD/IDR. The BI will be in no rush to cut rates in H1 2024 or front-run the Fed in the rate cutting cycle to avoid inviting unnecessary Rupiah volatility.
Once external pressures from US rates ease and domestic political uncertainty abates, the Rupiah is expected to regain modest strength against the US Dollar.
Germany’s industrial sector downturn stretched into December, the latest data published by Destatis showed on Wednesday.
Industrial output in the Eurozone’s top economy declined 1.6% MoM, the federal statistics authority Destatis said in figures adjusted for seasonal and calendar effects, as against the -0.4% expected and a 0.7% drop recorded in November.
German Industrial Production tumbled at an annual rate of 3.0% in December versus November’s -4.8% slump.
EUR/USD reaction to the German Industrial Production data
The mixed German industrial figures failed to move the needle around the Euro, as EUR/USD trades 0.10% higher on the day at 1.0765 at the press time.
Euro price today
The table below shows the percentage change of Euro (EUR) against listed major currencies today. Euro was the strongest against the Japanese Yen.
| USD | EUR | GBP | CAD | AUD | JPY | NZD | CHF | |
| USD | -0.04% | 0.00% | -0.02% | 0.00% | 0.14% | -0.08% | 0.01% | |
| EUR | 0.03% | 0.05% | 0.03% | 0.05% | 0.19% | -0.04% | 0.05% | |
| GBP | 0.00% | -0.04% | -0.02% | 0.01% | 0.15% | -0.08% | 0.03% | |
| CAD | 0.04% | -0.01% | 0.03% | 0.03% | 0.17% | -0.05% | 0.02% | |
| AUD | 0.01% | -0.03% | 0.00% | -0.02% | 0.12% | -0.10% | 0.01% | |
| JPY | -0.11% | -0.13% | -0.09% | -0.15% | -0.09% | -0.19% | -0.12% | |
| NZD | 0.11% | 0.07% | 0.10% | 0.08% | 0.11% | 0.22% | 0.11% | |
| CHF | -0.03% | -0.06% | -0.01% | -0.03% | 0.02% | 0.14% | -0.09% |
The heat map shows percentage changes of major currencies against each other. The base currency is picked from the left column, while the quote currency is picked from the top row. For example, if you pick the Euro from the left column and move along the horizontal line to the Japanese Yen, the percentage change displayed in the box will represent EUR (base)/JPY (quote).
- China equities trades in positive territory on Wednesday amid the USD's softness.
- Chinese stock markets extend the rally in the hope of more support from the Chinese government.
- Investors await the Chinese Consumer Price Index (CPI), Producer Price Index (PPI), and Reserve Bank of India’s (RBI) rate decision on Thursday.
China stocks edged higher on Wednesday as investors hope for additional support from Chinese authorities to reverse a recent sell-off in the country's equities. Furthermore, the weaker US dollar (USD) and lower US bond rates boost Asian markets.
At press time, China’s Shanghai was up 0.95% to 2,815, the Shenzhen Component Index rose 2.60% to 8,670, Hong Kong’s Hang Sang dropped 0.22% to 16,101, South Korea’s Kospi was up 0.96%, Japan’s Nikkei was down 0.15%, and India’s NIFTY 50 gained 0.14% to 21,957.
Chinese policymakers were also meeting with President Xi Jinping to discuss more supportive measures, while China’s securities regulator said it will encourage more state-backed funds to buy into local markets.
Chinese officials were also meeting with President Xi Jinping to discuss more supporting measures, and China's securities regulator indicated it will encourage more institutional investors, such as mutual funds, state pension funds, and insurers, to enter the stock market.
It’s worth noting that the Chinese and Hong Kong stock markets have wiped out around $6.1 trillion in market value from their previous highs in February 2021, as of Monday, amid the fear of a property crisis in the second world’s largest economies.
In New Zealand, the Unemployment Rate in the fourth quarter (Q4) rose to 4.0% from 3.9% in the third quarter, better than the market expectation of 4.2%. The Employment Change arrived at 0.4% in the fourth quarter versus -0.2% in the previous reading, above the market consensus of a 0.3% rise. This report is crucial for the Reserve Bank of New Zealand (RBNZ).
Investors will keep an eye on the Chinese Consumer Price Index (CPI) and Producer Price Index (PPI) on Thursday. The CPI inflation data is expected to drop 0.5% YoY in January, while the PPI figure is projected to decline 2.6% YoY in the same reported period. Furthermore, the Reserve Bank of India’s (RBI) Monetary Policy Committee (MPC) will announce its interest rate decision on Thursday at 4.30 GMT.
- US Dollar Index loses ground on downbeat US bond yields.
- Fed’s Powell tempered expectations of a rate cut in March.
- Fed Bank of Cleveland President Loretta Mester stated that the US central bank could consider interest rate cuts later in the year.
US Dollar Index (DXY), measures the value of the US Dollar (USD) against the six other major currencies, extends its losses for the second straight session. The DXY remains in negative territory after trimming some of its intraday losses, hovering around 104.10 during the Asian session.
Federal Reserve (Fed) Chair Jerome Powell tempered expectations of a rate cut and stressed the significance of closely monitoring inflation as it approaches the 2% core target. Despite these remarks, the US Dollar is weakened by the prevailing sentiment in the US bond market, which is impacting its performance despite the Federal Reserve's (Fed) cautious stance on monetary policy. The 2-year and 10-year yields on US bond notes stand at 4.39% and 4.02%, respectively, by the press time.
On Monday, the US Dollar witnessed a significant surge in response to strong ISM Services data for January. The ISM Services Purchasing Managers' Index (PMI) surpassed expectations, reaching 53.4, which exceeded both the consensus figure of 52.0 and the previous month's reading of 50.5. Furthermore, there was an improvement in the ISM Services Employment Index, rising to 50.5 from the previous reading of 43.8.
Furthermore, Fed Bank of Cleveland President Loretta Mester stated on Tuesday that the US central bank could entertain the idea of reducing interest rates later in the year. However, she warned against rushing into such a decision. Additionally, Fed Bank of Philadelphia President Patrick Harker expressed his backing for the Fed's choice to keep interest rates unchanged last week, citing an outlook that indicates continued decreases in inflation. Fed members
Fed members Adriana D. Kugler and Thomas I. Barkin are scheduled to deliver speeches on Wednesday, which will likely be closely monitored for further insights into the Fed's stance on monetary policy.
European Central Bank (ECB) executive board member Isabel Schnabel said on Wednesday, “we must be patient and cautious as inflation can flare up again.”
Additional quotes
The last mile in bringing inflation down may be the most difficult one.
We see sticky services inflation, resilient labour market.
There is a loosening of financial conditions as markets aggressively priced in rate cuts.
Recent events in the Red Sea also spark fears of renewed supply chain disruptions.
Taken together, this cautions against adjusting policy stance too soon.
We have made substantial progress on inflation, but we are not there yet
We must be patient, cautious as inflation can flare up again.
Market reaction
At the time of writing, EUR/USD is trading 0.08% higher on the day at around 1.0760, little moved by the above comments.
Euro price today
The table below shows the percentage change of Euro (EUR) against listed major currencies today. Euro was the strongest against the Japanese Yen.
| USD | EUR | GBP | CAD | AUD | JPY | NZD | CHF | |
| USD | -0.04% | 0.02% | -0.02% | 0.03% | 0.10% | -0.06% | 0.01% | |
| EUR | 0.03% | 0.07% | 0.02% | 0.08% | 0.14% | -0.02% | 0.04% | |
| GBP | -0.02% | -0.07% | -0.05% | 0.02% | 0.08% | -0.08% | 0.00% | |
| CAD | 0.02% | -0.02% | 0.04% | 0.05% | 0.11% | -0.04% | 0.00% | |
| AUD | -0.03% | -0.07% | -0.01% | -0.06% | 0.05% | -0.10% | -0.04% | |
| JPY | -0.10% | -0.11% | -0.04% | -0.13% | -0.05% | -0.16% | -0.11% | |
| NZD | 0.06% | 0.02% | 0.08% | 0.04% | 0.10% | 0.16% | 0.06% | |
| CHF | -0.03% | -0.05% | 0.01% | -0.03% | 0.05% | 0.09% | -0.07% |
The heat map shows percentage changes of major currencies against each other. The base currency is picked from the left column, while the quote currency is picked from the top row. For example, if you pick the Euro from the left column and move along the horizontal line to the Japanese Yen, the percentage change displayed in the box will represent EUR (base)/JPY (quote).
- NZD/USD scales higher for the second straight day in reaction to the upbeat domestic jobs data.
- A modest downtick in the US bond yields undermines the USD and lends support to the major.
- The technical setup favours bears and warrants caution before positioning for additional gains.
The NZD/USD pair gains some positive traction for the second straight day on Wednesday and recovers further from its lowest level since November 23 touched earlier this week. Spot prices currently trade around the 0.6100 round-figure mark, up just over 0.30% for the day, and draw support from a combination of factors.
The New Zealand Dollar (NZD) strengthens in reaction to a modest upside surprise from the December quarter labour market report, which showed that the number of people employed rose by a solid 0.4%. Adding to this, the Unemployment Rate was less than the 4.2% anticipated and forecasted by the Reserve Bank of New Zealand (RBNZ). This, along with a modest US Dollar (USD) downtick, acts as a tailwind for the NZD/USD pair.
Any meaningful USD losses, however, seem elusive in the wake of growing acceptance that the Federal Reserve (Fed) will keep interest rates higher for longer amid a still resilient US economy. Apart from this, the risk of a further escalation of geopolitical tensions in the Middle East and worries about slowing growth in China could act as a tailwind for the safe-haven buck, which, in turn, might cap the upside for the NZD/USD pair.
From a technical perspective, the recent downfall from a multi-month peak touched in December has been along a downward-sloping channel. This points to a well-established short-term downtrend and favours bearish traders. Moreover, oscillators on the daily chart – though have been recovering from lower levels – are still holding in the negative territory, suggesting that the path of least resistance for the NZD/USD pair is to the downside.
Hence, any subsequent move up is likely to confront stiff resistance and remain capped near the top end of the aforementioned channel, currently pegged around the 0.6140 region. That said, a sustained breakout through, leading to a subsequent strength beyond the 0.6175 area, or last week's swing high, might trigger a short-covering rally and lift the NZD/USD pair above the 0.6200 mark, towards the 0.6225-0.6230 resistance zone.
On the flip side, the Asian session low, around the 0.6075 area, could protect the immediate downside ahead of the monthly through, around the 0.6040-0.6035 region. The subsequent fall could drag the NZD/USD pair below the 0.6000 psychological mark, towards the descending trend-channel support near the 0.5975 zone. The latter should act as a key pivotal point, which if broken will be seen as a fresh trigger for bearish traders.
NZD/USD daily chart
-638428787792777585.png)
Technical levels to watch
- EUR/USD could gain further towards the psychological barrier at the 1.0800 level.
- Technical analysis suggests a confirmation of a bearish sentiment for the pair.
- The pair can find the major support around 1.0750 followed by the weekly low at 1.0722.
EUR/USD edges higher to near 1.0760 during the Asian session on Wednesday, extending gains for the second session. The psychological level at 1.0800 appears to be the key resistance followed by the 23.6% Fibonacci retracement level at 1.0820.
A breakthrough above the latter could exert upward pressure for the EUR/USD pair to reach the 21-day Exponential Moving Average (EMA) at the 1.0845 level aligned with the major barrier at the 1.0850 level. If the pair breaches the major level, it will navigate the region around the psychological level at 1.0900.
Technical analysis of the EUR/USD pair indicates a bearish momentum in the market, as evidenced by the 14-day Relative Strength Index (RSI) positioned below the 50 mark. Furthermore, the Moving Average Convergence Divergence (MACD), a lagging indicator, suggests a confirmation of this bearish sentiment, with the MACD line positioned below the centerline and exhibiting divergence below the signal line. These signals suggest a prevailing downward trend for the EUR/USD pair, indicating potential selling pressure in the market.
On the downside, the immediate support for the EUR/USD pair can be found at the psychological level at 1.0750 followed by the weekly low at 1.0722 recorded on Tuesday. A decisive break below the weekly low could put downward pressure on the pair to navigate the area around the psychological support at the 1.0700 level.
EUR/USD: Daily Chart
-638428780117107305.png)
(Note: The story was corrected at 4:55 GMT on Wednesday to say "bearish sentiment" instead of "bullish sentiment" in the second bullet point.)
- Indian Rupee trades on a stronger note amid US Dollar weakness.
- OECD revised India’s growth outlook higher for 2024–25 (FY25) to 6.2% from the 6.1% forecast earlier in its November outlook.
- Investors will tune in to the Fed speeches and the Reserve Bank of India (RBI) rate decision this week.
Indian Rupee (INR) snaps a three-day losing streak on Wednesday on the corrective move in the US Dollar (USD) and a downtick in US Treasury yields. On Monday, the Organization for Economic Co-operation and Development (OECD) raised India’s growth outlook for 2024–25 (FY25) to 6.2% from the 6.1% estimated earlier in its November outlook. Nonetheless, OECD warned that the geopolitical tensions in the Middle East posed a threat to the global economy as disruptions in Red Sea shipping may boost consumer prices.
In the absence of top-tier economic data releases from the US, traders will take more cues about the interest rate path from Fedspeak throughout the week. The Reserve Bank of India (RBI) has scheduled the monetary policy meeting for Tuesday to Thursday. On Thursday, RBI Governor Shaktikanta Das will announce the MPC decision at 4.30 GMT.
Daily Digest Market Movers: Indian Rupee stays vulnerable ahead of RBI rate decision
- Foreign investors have purchased $936 million in Indian bonds in February, in addition to $275 million in inflows into local equities.
- The Indian rupee has risen 0.2% versus the US Dollar since the beginning of the year, as decreasing expectations for an early rate cut by the Fed bolstered the USD.
- The RBI is anticipated to keep the repo rate steady at 6.5% in the policy decision, which will be announced on Thursday.
- Fed Bank of Cleveland President Loretta Mester said that she might open the door to lower interest rates later this year if the economy evolves as expected.
- Minneapolis Fed President Neel Kashkari stated that the central bank has not yet reached the goal on year-over-year inflation data, but 3-month and 6-month data is basically there.
- Traders have now priced in 15% odds of rate cuts in the March meeting, according to the CME's FedWatch Tool.
Technical Analysis: Indian Rupee remains confined in longer-term range of 82.70–83.20
Indian Rupee edges higher on the day. The USD/INR pair has traded within a two-month-old descending trend channel of 82.70–83.20.
In the near term, USD/INR keeps the bearish vibe unchanged as the pair remains capped below the key 100-period Exponential Moving Average (EMA) on the daily chart. Furthermore, the 14-day Relative Strength Index (RSI) lies below the 50.0 midline, hinting that further decline cannot be ruled out.
If the bear sustains its momentum, the lower limit of the descending trend channel at 82.70 will attract some sellers. The next potential support level will emerge at a low of August 23 at 82.45, en route to a low of June 1 at 82.25.
On the bright side, the crucial resistance level for USD/INR is located at the confluence of the upper boundary of the descending trend channel and a high of January 18 at 83.20. Any follow-through buying will see a rally to the next upside targets near a high of January 2 at 83.35, and then the 84.00 psychological level.
US Dollar price today
The table below shows the percentage change of Australian Dollar (AUD) against listed major currencies today. Australian Dollar was the weakest against the New Zealand Dollar.
| USD | EUR | GBP | CAD | AUD | JPY | NZD | CHF | |
| USD | -0.03% | 0.02% | -0.04% | -0.05% | 0.04% | -0.06% | 0.00% | |
| EUR | 0.01% | 0.04% | -0.01% | -0.02% | 0.07% | -0.05% | 0.02% | |
| GBP | -0.02% | -0.05% | -0.06% | -0.06% | 0.04% | -0.09% | 0.00% | |
| CAD | 0.05% | 0.01% | 0.06% | 0.00% | 0.08% | -0.02% | 0.01% | |
| AUD | 0.05% | 0.02% | 0.06% | 0.01% | 0.09% | -0.02% | 0.05% | |
| JPY | -0.05% | -0.06% | 0.00% | -0.10% | -0.07% | -0.11% | -0.07% | |
| NZD | 0.07% | 0.04% | 0.09% | 0.03% | 0.02% | 0.11% | 0.07% | |
| CHF | 0.00% | -0.03% | 0.02% | -0.04% | -0.02% | 0.05% | -0.07% |
The heat map shows percentage changes of major currencies against each other. The base currency is picked from the left column, while the quote currency is picked from the top row. For example, if you pick the Euro from the left column and move along the horizontal line to the Japanese Yen, the percentage change displayed in the box will represent EUR (base)/JPY (quote).
Indian Rupee FAQs
What are the key factors driving the Indian Rupee?
The Indian Rupee (INR) is one of the most sensitive currencies to external factors. The price of Crude Oil (the country is highly dependent on imported Oil), the value of the US Dollar – most trade is conducted in USD – and the level of foreign investment, are all influential. Direct intervention by the Reserve Bank of India (RBI) in FX markets to keep the exchange rate stable, as well as the level of interest rates set by the RBI, are further major influencing factors on the Rupee.
How do the decisions of the Reserve Bank of India impact the Indian Rupee?
The Reserve Bank of India (RBI) actively intervenes in forex markets to maintain a stable exchange rate, to help facilitate trade. In addition, the RBI tries to maintain the inflation rate at its 4% target by adjusting interest rates. Higher interest rates usually strengthen the Rupee. This is due to the role of the ‘carry trade’ in which investors borrow in countries with lower interest rates so as to place their money in countries’ offering relatively higher interest rates and profit from the difference.
What macroeconomic factors influence the value of the Indian Rupee?
Macroeconomic factors that influence the value of the Rupee include inflation, interest rates, the economic growth rate (GDP), the balance of trade, and inflows from foreign investment. A higher growth rate can lead to more overseas investment, pushing up demand for the Rupee. A less negative balance of trade will eventually lead to a stronger Rupee. Higher interest rates, especially real rates (interest rates less inflation) are also positive for the Rupee. A risk-on environment can lead to greater inflows of Foreign Direct and Indirect Investment (FDI and FII), which also benefit the Rupee.
How does inflation impact the Indian Rupee?
Higher inflation, particularly, if it is comparatively higher than India’s peers, is generally negative for the currency as it reflects devaluation through oversupply. Inflation also increases the cost of exports, leading to more Rupees being sold to purchase foreign imports, which is Rupee-negative. At the same time, higher inflation usually leads to the Reserve Bank of India (RBI) raising interest rates and this can be positive for the Rupee, due to increased demand from international investors. The opposite effect is true of lower inflation.
- Gold price struggles to capitalize on the overnight gains amid hawkish Fed expectations.
- A modest downtick in the US bond yields undermines the USD and lends some support.
- Geopolitical risks and China’s economic woes also contribute to limiting the downside.
Gold price (XAU/USD) ended in the green on Tuesday and snapped a two-day losing streak to over a one-week low, around the $2,015 region touched the previous day. The precious metal, however, struggles to capitalize on the momentum and oscillates in a narrow band during the Asian session on Wednesday. Traders opt to wait for more cues about the likely pace of interest rate cuts by the Federal Reserve (Fed) this year, which tends to drive sentiment surrounding the non-yielding bullion. Hence, the focus will remain glued to the latest US consumer inflation figures, due for release next week.
In the meantime, firming expectations that the Fed will keep rates higher for longer in the wake of a still resilient US economy continue to act as a headwind for the Gold price. The US Dollar (USD), however, remains depressed below its highest level in almost three months touched on Monday amid a softer tone surrounding the US Treasury bond yields. Apart from this, worries about geopolitical tensions stemming from conflicts in the Middle East and slowing growth in China – the world's second-largest economy – could act as a tailwind for the safe-haven precious metal and limit the downside.
Moving ahead, Wednesday's US economic docket features the only release of Trade Balance data and is unlikely to provide any meaningful impetus. That said, speeches by influential FOMC members, along with the US bond yields, will drive the USD demand later during the North American session. Apart from this, the broader risk sentiment should contribute to producing short-term trading opportunities around the Gold price.
Daily Digest Market Movers: Gold price lacks any firm intraday direction amid mixed fundamental cues
- Investors continue to scale back their expectations for early and steep interest rate cuts by the Federal Reserve, which fails to assist the Gold price to build on the previous day's modest gains.
- The incoming stronger US macro data, influencing Friday's blockbuster NFP report, suggested that the economy is in good shape, giving the Fed the headroom to keep rates higher for longer.
- Furthermore, the recent hawkish remarks by influential FOMC members, including Fed Chair Jerome Powell, squashed market expectations for more aggressive policy easing in 2024.
- Fed Chair Jerome Powell, in an interview with US TV show 60 Minutes aired on Sunday, reiterated that the March meeting is likely too soon to have confidence to start cutting interest rates.
- Philadelphia Fed President Patrick Harker said on Tuesday that inflation must be moving sustainably lower to open the door to rate cutsr and that it would be a mistake to cut interest rates prematurely.
- Harker added that the recent news on inflation has been encouraging, though wage gains are still too high for getting to the 2% target and it is possible that inflation may be more persistent than expected.
- Separately, Minneapolis Fed President Neel Kashkari said that we are not done yet on inflation and most of the disinflationary gains have come from the supply side, but the data is looking positive.
- The yield on the benchmark 10-year US government bond slides back closer to 4.0% and undermines the US Dollar, lending support to the XAU/USD amid persistent geopolitical risks.
- The US continues its campaign against Houthi rebels in Yemen and intends to launch further strikes at Iran-backed groups, raising the risk of a further escalation of tensions in the Middle East.
- Traders now look to the US Trade Balance data and Fed speeches for short-term opportunities, though the focus remains glued to the release of the latest US consumer inflation figures next week.
Technical Analysis: Gold price remains confined in a familiar range around 50-day SMA pivotal point
From a technical perspective, the overnight swing low, around the $2,023 area, now seems to protect the immediate downside ahead of the weekly trough, around the $2,015 region. Some follow-through selling below the $2,012-2,010 area might expose the $2,000 psychological mark. A convincing break below the latter could drag the Gold price towards the 100-day Simple Moving Average (SMA), currently around the $1,985 zone, en route to the 200-day SMA, near the $1,966-1,965 region.
On the flip side, any meaningful positive move is likely to confront stiff resistance near the $2,054-2,055 zone. This is followed by the $2,065 hurdle or last week's swing high. Given that oscillators on the daily chart are holding in the positive territory, a sustained strength beyond has the potential to lift the Gold price towards the $2,078-2,079 area, or the YTD peak set in January. The subsequent move-up should allow the XAU/USD to reclaim the $2,100 mark and climb further to the next relevant hurdle near the $2,020 region.
US Dollar price today
The table below shows the percentage change of US Dollar (USD) against listed major currencies today. US Dollar was the strongest against the Japanese Yen.
| USD | EUR | GBP | CAD | AUD | JPY | NZD | CHF | |
| USD | 0.00% | 0.04% | -0.03% | -0.01% | 0.05% | -0.07% | 0.02% | |
| EUR | -0.01% | 0.05% | -0.03% | 0.02% | 0.05% | -0.07% | 0.02% | |
| GBP | -0.04% | -0.05% | -0.08% | -0.03% | 0.01% | -0.11% | -0.02% | |
| CAD | 0.04% | 0.02% | 0.06% | 0.02% | 0.08% | -0.05% | 0.02% | |
| AUD | 0.01% | -0.02% | 0.03% | -0.04% | 0.03% | -0.09% | 0.01% | |
| JPY | -0.05% | -0.05% | 0.02% | -0.10% | -0.04% | -0.12% | -0.06% | |
| NZD | 0.07% | 0.07% | 0.11% | 0.04% | 0.08% | 0.12% | 0.08% | |
| CHF | -0.03% | -0.02% | 0.03% | -0.05% | 0.02% | 0.04% | -0.09% |
The heat map shows percentage changes of major currencies against each other. The base currency is picked from the left column, while the quote currency is picked from the top row. For example, if you pick the Euro from the left column and move along the horizontal line to the Japanese Yen, the percentage change displayed in the box will represent EUR (base)/JPY (quote).
Gold FAQs
Why do people invest in Gold?
Gold has played a key role in human’s history as it has been widely used as a store of value and medium of exchange. Currently, apart from its shine and usage for jewelry, the precious metal is widely seen as a safe-haven asset, meaning that it is considered a good investment during turbulent times. Gold is also widely seen as a hedge against inflation and against depreciating currencies as it doesn’t rely on any specific issuer or government.
Who buys the most Gold?
Central banks are the biggest Gold holders. In their aim to support their currencies in turbulent times, central banks tend to diversify their reserves and buy Gold to improve the perceived strength of the economy and the currency. High Gold reserves can be a source of trust for a country’s solvency. Central banks added 1,136 tonnes of Gold worth around $70 billion to their reserves in 2022, according to data from the World Gold Council. This is the highest yearly purchase since records began. Central banks from emerging economies such as China, India and Turkey are quickly increasing their Gold reserves.
How is Gold correlated with other assets?
Gold has an inverse correlation with the US Dollar and US Treasuries, which are both major reserve and safe-haven assets. When the Dollar depreciates, Gold tends to rise, enabling investors and central banks to diversify their assets in turbulent times. Gold is also inversely correlated with risk assets. A rally in the stock market tends to weaken Gold price, while sell-offs in riskier markets tend to favor the precious metal.
What does the price of Gold depend on?
The price can move due to a wide range of factors. Geopolitical instability or fears of a deep recession can quickly make Gold price escalate due to its safe-haven status. As a yield-less asset, Gold tends to rise with lower interest rates, while higher cost of money usually weighs down on the yellow metal. Still, most moves depend on how the US Dollar (USD) behaves as the asset is priced in dollars (XAU/USD). A strong Dollar tends to keep the price of Gold controlled, whereas a weaker Dollar is likely to push Gold prices up.
- AUD/JPY gained ground on RBA’s hawkish stance on monetary policy.
- RBA Governor Michele Bullock did not rule anything in or out regarding policy decisions.
- Japan's Foreign Reserves decreased to $1,291.8 billion in January from the previous figure of $1,294.6 billion.
AUD/JPY trends upwards for the second consecutive day on Wednesday, trading around 96.70 during the Asian session. The hawkish remarks from Reserve Bank of Australia (RBA) Governor Michele Bullock on Tuesday have bolstered confidence in the Australian Dollar (AUD), contributing to its strength against the Japanese Yen (JPY).
The Reserve Bank of Australia (RBA) maintained its Official Cash Rate (OCR) at 4.35% on Tuesday, a move that was widely expected. RBA Governor Michele Bullock refrained from making any definitive statements about future policy decisions. She stressed the importance of balanced risks and highlighted the bank's ongoing efforts to gather data confirming a return of inflation to target levels. Governor Bullock mentioned a forecast of 2.8% inflation for the year 2025.
On the other side, Wednesday's release of Japan's Foreign Reserves report indicated a slight decrease, with the figure standing at $1,291.8 billion in January compared to December's figure of $1,294.6 billion. Additionally, on Tuesday, Labor Cash Earnings (Year-over-Year) showed improvement, registering at 1.0% in December compared to the previous reading of 0.7%, albeit falling short of the expected 1.3%.
The Japanese Yen receives support from expectations that another significant pay hike this year will contribute to sustained and stable inflation. This optimism is fueling hopes that the Bank of Japan (BoJ) may gradually move away from its ultra-dovish policy stance. Additionally, the BoJ has hinted at the possibility of ending its negative interest rate cycle, suggesting a potential shift in monetary policy direction.
- USD/CAD drifts lower for the second straight day and is pressured by a combination of factors.
- An uptick in Oil prices underpins the Loonie and weighs on the pair amid a modest USD downtick.
- Hawkish Fed expectations should act as a tailwind for the USD and help limit any further losses.
The USD/CAD pair extends the previous day's retracement slide from the vicinity of mid-1.3500s, or its highest level in almost two months and remains under some selling pressure for the second straight day on Wednesday. The downtick is sponsored by a combination of factors and drags spot prices to the 1.3475 region, or the 200-day Simple Moving Average (SMA) pivotal point during the Asian session.
The US Energy Information Administration (EIA), in the February Short-Term Energy Outlook report released on Tuesday, cut its forecast for domestic Oil output growth for 2024 and eased worries about excess supply. This, along with the recent attacks on shipping by Iranian-backed Houthi rebels in the crucial Red Sea, which sees nearly 12% of the global Oil trade, lends support to the black liquid, which, in turn, is seen underpinning the commodity-linked Loonie. The US Dollar (USD), on the other hand, remains on the defensive below its highest level since November 14 and turns out to be another factor exerting some downward pressure on the USD/CAD pair.
The overnight pullback in the US Treasury bond yields prompted some USD profit-taking, especially after the post-NFP move up, though hawkish Federal Reserve (Fed) expectations should help limit deeper losses. The incoming US macro data suggested that the economy is in good shape, giving the Fed more headroom to keep interest rates higher for longer. Adding to this, the recent hawkish comments by a slew of influential FOMC members further forced investors to continue scaling back their expectations for an aggressive policy easing in 2024. This could act as a tailwind for the US bond yields, which favours the USD bulls and should lend support to the USD/CAD pair.
Moreover, technical indicators on the daily chart – though have been losing traction – are still holding in the positive territory and support prospects for the emergence of some dip-buying at lower levels. Moving ahead, traders now look to the release of Trade Balance data from the US and Canada for some impetus ahead of the EIA data on US Oil inventory, due later during the North American session. Apart from this, speeches by Fed officials will influence the USD, which, along with Oil price dynamics, should provide a fresh impetus to the USD/CAD pair.
Technical levels to watch
- Australian Dollar rises as US Dollar loses ground due to the downbeat US bond yields.
- Australia's currency strengthens on hawkish remarks from the RBA’s Bullock.
- Fed’s Powell emphasized closely monitoring inflation's movement toward the 2%.
The Australian Dollar (AUD) extends its gains for the second consecutive day on a subdued US Dollar (USD), which could be attributed to the decline in the US bond yields. Moreover, the hawkish comments from the Reserve Bank of Australia (RBA) Governor Michele Bullock provided support to strengthening the Aussie Dollar, which in turn, underpinned the AUD/USD pair.
Australian central bank kept its Official Cash Rate (OCR) unchanged at 4.35% on Tuesday, a decision that was widely anticipated. Governor Bullock, in the press conference following the interest rate decision, refrained from making definitive statements about future policy actions, neither ruling anything in nor out. However, there is limited room for RBA policymakers to raise interest rates further as the Australian economy is going through a cost-of-living crisis.
The US Dollar Index (DXY) continues to lose ground despite the hawkish comments from Federal Reserve (Fed) Chair Jerome Powell. Powell dampened expectations of a rate cut and emphasized the importance of closely monitoring inflation's movement toward the 2% core target.
Fed Bank of Cleveland President Loretta Mester remarked on Tuesday that the US central bank might consider lowering interest rates later in the year. However, she cautioned against acting too hastily. Additionally, Fed Bank of Philadelphia President Patrick Harker expressed support for the Fed's decision to keep interest rates steady last week, citing an outlook that suggests further declines in inflation.
Daily Digest Market Movers: Australian Dollar strengthens on a subdued US Dollar
- Australia’s December AiG Industry Index came in at -27.3 as compared to the -22.4 prior.
- Australia’s Retail Sales (QoQ) improved with a 0.3% rise in the fourth quarter compared to the previous growth of 0.2%.
- Australian Trade Balance (MoM) for January was reduced to the figure of 10,959M compared to the revised figure of 11,764M in December.
- Australia’s Judo Bank Composite Purchasing Managers Index (PMI) improved to 49 in January from 48.1 prior. The Services PMI saw an improvement, rising to 49.1 from the previous figure of 47.9.
- Chinese Caixin Services PMI reduced to 52.7 in January from the previous reading of 52.9.
- US ISM Services PMI exceeded expectations, registering at 53.4, surpassing both the consensus figure of 52.0 and the previous month's 50.5.
- The US Services Employment Index saw an improvement, rising to 50.5 from the previous reading of 43.8.
- US Services Prices Paid rose to the reading of 64.0 in January, from December’s reading of 56.7.
Technical Analysis: Australian Dollar hovers below the major resistance at 0.6550
The Australian Dollar trades around 0.6540 on Wednesday, slightly below the immediate resistance at the 0.6550 level. A breakout above this level could potentially trigger further upward movement for the AUD/USD pair, testing the 23.6% Fibonacci retracement level at 0.6563 and possibly reaching the 21-day Exponential Moving Average (EMA) at 0.6585. Conversely, if the pair faces downward pressure, key support is expected at the psychological level of 0.6500. Further support levels include the weekly low at 0.6468, followed by a major support level at 0.6450.
AUD/USD: Daily Chart
-638428693813668361.png)
Australian Dollar price today
The table below shows the percentage change of Australian Dollar (AUD) against listed major currencies today. Australian Dollar was the strongest against the Japanese Yen.
| USD | EUR | GBP | CAD | AUD | JPY | NZD | CHF | |
| USD | -0.08% | -0.06% | -0.10% | -0.16% | 0.02% | -0.17% | -0.03% | |
| EUR | 0.07% | 0.02% | -0.01% | -0.07% | 0.10% | -0.10% | 0.04% | |
| GBP | 0.06% | -0.02% | -0.04% | -0.09% | 0.09% | -0.12% | 0.04% | |
| CAD | 0.11% | 0.02% | 0.04% | -0.05% | 0.12% | -0.08% | 0.05% | |
| AUD | 0.16% | 0.07% | 0.08% | 0.05% | 0.17% | -0.02% | 0.12% | |
| JPY | -0.03% | -0.09% | -0.06% | -0.14% | -0.16% | -0.20% | -0.08% | |
| NZD | 0.18% | 0.09% | 0.11% | 0.08% | 0.03% | 0.20% | 0.14% | |
| CHF | 0.03% | -0.05% | -0.02% | -0.06% | -0.09% | 0.07% | -0.14% |
The heat map shows percentage changes of major currencies against each other. The base currency is picked from the left column, while the quote currency is picked from the top row. For example, if you pick the Euro from the left column and move along the horizontal line to the Japanese Yen, the percentage change displayed in the box will represent EUR (base)/JPY (quote).
Australian Dollar FAQs
What key factors drive the Australian Dollar?
One of the most significant factors for the Australian Dollar (AUD) is the level of interest rates set by the Reserve Bank of Australia (RBA). Because Australia is a resource-rich country another key driver is the price of its biggest export, Iron Ore. The health of the Chinese economy, its largest trading partner, is a factor, as well as inflation in Australia, its growth rate and Trade Balance. Market sentiment – whether investors are taking on more risky assets (risk-on) or seeking safe-havens (risk-off) – is also a factor, with risk-on positive for AUD.
How do the decisions of the Reserve Bank of Australia impact the Australian Dollar?
The Reserve Bank of Australia (RBA) influences the Australian Dollar (AUD) by setting the level of interest rates that Australian banks can lend to each other. This influences the level of interest rates in the economy as a whole. The main goal of the RBA is to maintain a stable inflation rate of 2-3% by adjusting interest rates up or down. Relatively high interest rates compared to other major central banks support the AUD, and the opposite for relatively low. The RBA can also use quantitative easing and tightening to influence credit conditions, with the former AUD-negative and the latter AUD-positive.
How does the health of the Chinese Economy impact the Australian Dollar?
China is Australia’s largest trading partner so the health of the Chinese economy is a major influence on the value of the Australian Dollar (AUD). When the Chinese economy is doing well it purchases more raw materials, goods and services from Australia, lifting demand for the AUD, and pushing up its value. The opposite is the case when the Chinese economy is not growing as fast as expected. Positive or negative surprises in Chinese growth data, therefore, often have a direct impact on the Australian Dollar and its pairs.
How does the price of Iron Ore impact the Australian Dollar?
Iron Ore is Australia’s largest export, accounting for $118 billion a year according to data from 2021, with China as its primary destination. The price of Iron Ore, therefore, can be a driver of the Australian Dollar. Generally, if the price of Iron Ore rises, AUD also goes up, as aggregate demand for the currency increases. The opposite is the case if the price of Iron Ore falls. Higher Iron Ore prices also tend to result in a greater likelihood of a positive Trade Balance for Australia, which is also positive of the AUD.
How does the Trade Balance impact the Australian Dollar?
The Trade Balance, which is the difference between what a country earns from its exports versus what it pays for its imports, is another factor that can influence the value of the Australian Dollar. If Australia produces highly sought after exports, then its currency will gain in value purely from the surplus demand created from foreign buyers seeking to purchase its exports versus what it spends to purchase imports. Therefore, a positive net Trade Balance strengthens the AUD, with the opposite effect if the Trade Balance is negative.
| Raw materials | Closed | Change, % |
|---|---|---|
| Silver | 22.421 | 0.42 |
| Gold | 2035.966 | 0.52 |
| Palladium | 953.3 | 0.74 |
- GBP/USD gains traction for the second consecutive day around 1.2608 on Wednesday.
- The expectation of interest rate cuts from the Federal Reserve (Fed) has waned due to the stronger-than-expected US economic data.
- The potential technical recession in the UK economy might lead Bank of England (BoE) officials to shift to a dovish interest rate stance.
The GBP/USD pair trades on a stronger note amid the US Dollar's (USD) weakness during the early Asian trading hours on Wednesday. The rebound of the major pair is supported by the softer Greenback and lower US Treasury bond yields. At press time, GBP/USD is trading at 1.2608, adding 0.06% on the day.
The expectation of interest rate cuts from the Federal Reserve (Fed) has waned as US economic data came in better than expected. Additionally, Fed Chair Jerome Powell said on Sunday that it would not be appropriate to cut rates until there was greater confidence that inflation is moving to 2%. The markets are now pricing in a 15% possibility of rate cuts in March and priced in 50% odds of rate cuts in the May meeting. This, in turn, lifts the US Dollar (USD) and acts as a headwind for GBP/USD.
On the Pound Sterling (GBP) front, the GBP is at risk of a technical recession, which might lead Bank of England officials to shift to a dovish interest rate stance. The Bank of England (BoE) Chief Economist Huw Pill said on Monday that the question now for most of the central bank's policymakers was when it would be appropriate to start to cut interest rates, not if. Meanwhile, Governor Andrew Bailey said that inflation was moving in the right direction and that the BoE would keep borrowing costs under review.
On Wednesday, the UK Halifax House Prices for January and the US Goods Trade Balance for December will be due. Market players will keep an eye on the Fedspeaks this week for fresh impetus. These events could give a clear direction to the pair.
- The Japanese Yen draws support from a combination of factors, albeit lacks follow-through.
- The USD remains depressed below a multi-month low and also exerts pressure on USD/JPY.
- Hawkish Fed expectations favour the USD bulls and should act as a tailwind for the major.
The Japanese Yen (JPY) ticks higher during the Asian session on Wednesday and is now looking to build on its goodish bounce from the YTD low touched against its American counterpart the previous day. Market participants seem convinced that wage growth this year may outpace that of 2023 and pave the way for the Bank of Japan to exit its decade-long ultra-loose monetary policy. Apart from this, persistent worries about geopolitical tensions stemming from conflicts in the Middle East and slowing economic growth in China continue to act as a tailwind for the JPY. This, along with the overnight US Dollar (USD) pullback from its highest level in almost three months, exerts some downward pressure on the USD/JPY pair.
Meanwhile, Japan's real wages fell for a 21st straight month in December and household spending dropped for a tenth consecutive month, which is seen as an unwelcome development for the BoJ. This, along with the underlying bullish tone across the global equity markets, might hold back traders from placing fresh bullish bets around the JPY. Furthermore, the recent upbeat US macro data, including a blowout jobs report on Friday, and recent hawkish remarks by Federal Reserve (Fed) officials smashed expectations for a more aggressive policy easing in 2024. This remains supportive of elevated US Treasury bond yields, which favours the USD bulls and should help limit any meaningful slide for the USD/JPY pair.
Daily Digest Market Movers: Japanese Yen benefits from hopes for an imminent shift in BoJ’s policy stance
- The Japanese Yen draws support from hopes that another substantial pay hike this year will support sustained and stable inflation, and allow the Bank of Japan to pivot away from its ultra-dovish policy stance.
- Geopolitics, along with China's economic woes, remain key risks for the markets, which benefits the safe-haven JPY and exerts pressure on the USD/JPY pair during the Asian session on Wednesday.
- The overnight sharp pullback in the US Treasury bond yields keeps the US Dollar bulls on the defensive and turns out to be another factor contributing to the mildly offered tone surrounding the major.
- Investors continue to scale back their expectations for early and steep rate cuts by the Federal Reserve in the wake of a resilient US economy and the recent hawkish remarks by influential FOMC members.
- Philadelphia Fed President Patrick Harker said on Tuesday that inflation must be moving sustainably lower to open rate cut door and that it would be a mistake to cut interest rates prematurely.
- Harker added that the recent news on inflation has been encouraging, though wage gains are still too high for getting to the 2% target and it is possible that inflation may be more persistent than expected.
- Separately, Minneapolis Fed President Neel Kashkari said that we are not done yet on inflation and most of the disinflationary gains have come from the supply-side, but the data is looking positive.
- This comes on top of Fed Chair Jerome Powell's remarks on Sunday, saying that a strong economy gives the central bank time to evaluate if inflation will continue to fall before starting to cut interest rates.
- The yield on the benchmark 10-year US government bond holds above 4.0%, which supports prospects for the emergence of USD dip-buying and should act as a tailwind for the USD/JPY pair.
Technical Analysis: USD/JPY could decline to 147.00 once the 100-day SMA support is broken decisively
From a technical perspective, this week's failure to find acceptance above the 148.80 level constitutes the formation of a bearish double-top pattern. That said, oscillators on the daily chart – though have been losing traction – are still holding in the positive territory and warrant some caution before positioning for deeper losses. That said, some follow-through selling below the 100-day Simple Moving Average (SMA), currently pegged near the 147.60-147.55 region, could drag the USD/JPY pair further towards the 147.00 round figure. A convincing break below the latter could accelerate the corrective decline further towards the 146.35 intermediate support en route to sub-146.00 levels, or the monthly low touched last week.
On the flip side, momentum back above the 148.00 mark now seems to confront some resistance near the 148.30-148.35 region. Bulls, meanwhile, are likely to wait for a sustained strength beyond the 148.80 double-top resistance before placing fresh bets. The USD/JPY pair might then surpass an intermediate hurdle near the 149.55-149.60 region and aim to reclaim the 150.00 psychological mark.
Japanese Yen price today
The table below shows the percentage change of Japanese Yen (JPY) against listed major currencies today. Japanese Yen was the strongest against the US Dollar.
| USD | EUR | GBP | CAD | AUD | JPY | NZD | CHF | |
| USD | -0.07% | -0.06% | -0.09% | -0.16% | -0.06% | -0.17% | -0.04% | |
| EUR | 0.05% | 0.01% | -0.01% | -0.07% | 0.01% | -0.08% | 0.02% | |
| GBP | 0.06% | -0.02% | -0.04% | -0.08% | 0.01% | -0.10% | 0.02% | |
| CAD | 0.09% | 0.00% | 0.02% | -0.06% | 0.02% | -0.10% | 0.01% | |
| AUD | 0.13% | 0.06% | 0.07% | 0.05% | 0.07% | -0.04% | 0.09% | |
| JPY | 0.05% | -0.02% | 0.00% | -0.04% | -0.10% | -0.12% | -0.02% | |
| NZD | 0.17% | 0.09% | 0.10% | 0.06% | 0.01% | 0.10% | 0.10% | |
| CHF | 0.03% | -0.03% | -0.01% | -0.05% | -0.07% | 0.00% | -0.11% |
The heat map shows percentage changes of major currencies against each other. The base currency is picked from the left column, while the quote currency is picked from the top row. For example, if you pick the Euro from the left column and move along the horizontal line to the Japanese Yen, the percentage change displayed in the box will represent EUR (base)/JPY (quote).
Japanese Yen FAQs
What key factors drive the Japanese Yen?
The Japanese Yen (JPY) is one of the world’s most traded currencies. Its value is broadly determined by the performance of the Japanese economy, but more specifically by the Bank of Japan’s policy, the differential between Japanese and US bond yields, or risk sentiment among traders, among other factors.
How do the decisions of the Bank of Japan impact the Japanese Yen?
One of the Bank of Japan’s mandates is currency control, so its moves are key for the Yen. The BoJ has directly intervened in currency markets sometimes, generally to lower the value of the Yen, although it refrains from doing it often due to political concerns of its main trading partners. The current BoJ ultra-loose monetary policy, based on massive stimulus to the economy, has caused the Yen to depreciate against its main currency peers. This process has exacerbated more recently due to an increasing policy divergence between the Bank of Japan and other main central banks, which have opted to increase interest rates sharply to fight decades-high levels of inflation.
How does the differential between Japanese and US bond yields impact the Japanese Yen?
The BoJ’s stance of sticking to ultra-loose monetary policy has led to a widening policy divergence with other central banks, particularly with the US Federal Reserve. This supports a widening of the differential between the 10-year US and Japanese bonds, which favors the US Dollar against the Japanese Yen.
How does broader risk sentiment impact the Japanese Yen?
The Japanese Yen is often seen as a safe-haven investment. This means that in times of market stress, investors are more likely to put their money in the Japanese currency due to its supposed reliability and stability. Turbulent times are likely to strengthen the Yen’s value against other currencies seen as more risky to invest in.
- EUR/USD posts modest gains around 1.0760 on the weaker USD.
- Eurozone Retail Sales were down 1.1% MoM in December, its sharpest fall in a year.
- Fed’s Harker said a soft landing for the US economy is in sight, citing declining inflation and a still-strong labor market.
- Investors will focus on German Industrial Production on Wednesday.
The EUR/USD pair bounces off the 2024 lows of 1.0720 and rebounds to 1.0760 on the renewed selling bias in the US Dollar (USD) during the early Asian session on Wednesday. Investors await German Industrial Production on Wednesday, which is estimated to drop 0.4% MoM in December.
On Tuesday, the Federal Reserve Bank of Philadelphia President, Patrick Harker said that the Fed made the right choice last week to leave interest rates unchanged amid an outlook that likely heralds more inflation declines.
Meanwhile, Fed Bank of Cleveland President Loretta Mester said that she might open the door to lower interest rates later this year if the economy evolves as expected. Finally, Fed Chair Jerome Powell said on Sunday night that the central bank remains on track to cut interest rates three times this year, expected to begin as early as May. The delay of monetary policy easing from the Fed could provide some support to the Greenback in the near term. Traders have now priced in 15% odds of rate cuts in the March meeting, according to the CME's FedWatch Tool.
Data released from Eurostat showed on Tuesday that Eurozone Retail Sales fell 1.1% MoM in December from a 0.3% rise in the previous reading, worse than the market expectation of 1.0%. On an annual basis, Eurozone Retail Sales dropped 0.8% YoY in December from a 0.4% decline in November, above the consensus of 0.9% fall.
The European Central Bank (ECB) policymaker Pablo Hernandez de Cos said on Tuesday that he is confident that inflation is coming back to its 2% target and that its next move will be cutting interest rates. However, ECB Governing Council member Boris Vujcic stated that the central bank needs to have patience at the moment before cutting interest rates to make sure that wage costs aren’t translating into sustained wage pressure.
Market players will watch Industrial Production, due later on Wednesday. Later this week, the Economic Bulletin will be released on Thursday, and German Consumer Price Index (CPI) inflation data will be published on Friday.
- WTI price gained ground as EIA projected US oil production to increase by 170K bpd in 2024, lower than the previous estimate of 290K bpd.
- API Weekly Crude Oil Stock recorded a figure of 0.674 million barrels against the expected 2.133 million barrels.
- Hamas has responded to a proposed ceasefire plan; US Secretary of State Antony Blinken may discuss it with Israeli officials on Wednesday.
West Texas Intermediate (WTI) oil price consolidates after recording gains over the previous two sessions, with the price hovering around $73.50 during the Asian session on Wednesday. The American Petroleum Institute (API) Weekly Crude Oil Stock showed improvement, recording a figure of 0.674 million barrels compared to the previous decline of 2.5 million barrels. However, this figure was significantly lower than the expected print of 2.133 million barrels for the week ending on February 2, providing support for Crude oil prices. Investors are now awaiting the release of the US Energy Information Administration (EIA) Crude Oil stockpiles report on Wednesday for further insights into the market.
The increase in Crude oil prices can be attributed to the United States (US) Energy Information Administration revising its forecast for growth in domestic oil production in 2024. The revised projection of 170,000 barrels per day (bpd) is lower than the previous estimate of 290,000 bpd, contributing to a more bullish outlook for oil prices.
According to the EIA Short-Term Energy Outlook (STEO), US Crude oil production is projected to increase to 13.21 million barrels per day (bpd) in the current year. Additionally, total petroleum consumption in the United States is anticipated to reach 20.4 million bpd in 2024 and 20.5 million bpd in 2025.
The potential for a ceasefire in the Israel-Gaza conflict has tempered the upward momentum of Crude oil prices. Hamas has reportedly responded to a proposed ceasefire plan put forward by Israel, the United States (US), Qatar, and Egypt. US Secretary of State Antony Blinken has indicated plans to discuss Hamas's response with Israeli officials on Wednesday. However, US President Joe Biden has expressed skepticism regarding the likelihood of Israeli agreement to Hamas's demands.
| Index | Change, points | Closed | Change, % |
|---|---|---|---|
| NIKKEI 225 | -193.5 | 36160.66 | -0.53 |
| Hang Seng | 626.86 | 16136.87 | 4.04 |
| KOSPI | -15.11 | 2576.2 | -0.58 |
| ASX 200 | -44.3 | 7581.6 | -0.58 |
| DAX | 129.18 | 17033.24 | 0.76 |
| CAC 40 | 49.01 | 7638.97 | 0.65 |
| Dow Jones | 141.24 | 38521.36 | 0.37 |
| S&P 500 | 11.42 | 4954.23 | 0.23 |
| NASDAQ Composite | 11.32 | 15609 | 0.07 |
The Federal Reserve Bank of Philadelphia President, Patrick Harker said on Tuesday that the central bank made the right choice last week to maintain interest rates steady amid an outlook that likely heralds more inflation declines, per Reuters.
Key quotes
“The data point to continued disinflation, to labor markets coming into better balance, and to resilient consumer spending—three elements necessary for us to stick to the soft landing we remain optimistic to achieve.”
“Fed decision to hold rates was the correct decision.”
“Data shows inflation is falling and the labor market is in better balance.
“Consumer spending has been resilient.”
"Economy is on track for a soft landing.”
“The runway at our destination is in sight.”
Market reaction
The US Dollar Index (DXY) is trading lower on the day at 104.15, as of writing.
Fed FAQs
What does the Federal Reserve do, how does it impact the US Dollar?
Monetary policy in the US is shaped by the Federal Reserve (Fed). The Fed has two mandates: to achieve price stability and foster full employment. Its primary tool to achieve these goals is by adjusting interest rates.
When prices are rising too quickly and inflation is above the Fed’s 2% target, it raises interest rates, increasing borrowing costs throughout the economy. This results in a stronger US Dollar (USD) as it makes the US a more attractive place for international investors to park their money.
When inflation falls below 2% or the Unemployment Rate is too high, the Fed may lower interest rates to encourage borrowing, which weighs on the Greenback.
How often does the Fed hold monetary policy meetings?
The Federal Reserve (Fed) holds eight policy meetings a year, where the Federal Open Market Committee (FOMC) assesses economic conditions and makes monetary policy decisions.
The FOMC is attended by twelve Fed officials – the seven members of the Board of Governors, the president of the Federal Reserve Bank of New York, and four of the remaining eleven regional Reserve Bank presidents, who serve one-year terms on a rotating basis.
What is Quantitative Easing (QE) and how does it impact USD?
In extreme situations, the Federal Reserve may resort to a policy named Quantitative Easing (QE). QE is the process by which the Fed substantially increases the flow of credit in a stuck financial system.
It is a non-standard policy measure used during crises or when inflation is extremely low. It was the Fed’s weapon of choice during the Great Financial Crisis in 2008. It involves the Fed printing more Dollars and using them to buy high grade bonds from financial institutions. QE usually weakens the US Dollar.
What is Quantitative Tightening (QT) and how does it impact the US Dollar?
Quantitative tightening (QT) is the reverse process of QE, whereby the Federal Reserve stops buying bonds from financial institutions and does not reinvest the principal from the bonds it holds maturing, to purchase new bonds. It is usually positive for the value of the US Dollar.
| Pare | Closed | Change, % |
|---|---|---|
| AUDUSD | 0.65219 | 0.63 |
| EURJPY | 159.087 | -0.29 |
| EURUSD | 1.07547 | 0.14 |
| GBPJPY | 186.356 | 0.04 |
| GBPUSD | 1.25974 | 0.54 |
| NZDUSD | 0.60958 | 0.76 |
| USDCAD | 1.34916 | -0.32 |
| USDCHF | 0.86974 | -0.07 |
| USDJPY | 147.933 | -0.49 |
- AUD/USD trades in positive territory for two straight days on Wednesday.
- Fed’s Mester said she might open the door to rate cuts if the US economy performs as she expects.
- The Reserve Bank of Australia (RBA) kept interest rates steady at 4.35% on Tuesday.
The AUD/USD pair extends the rally around 0.6530 during the early Asian session on Wednesday. The sell-off in the US Dollar (USD) and the hawkish stance from the Reserve Bank of Australia (RBA) provide some support to the pair. Investors will take more cues from RBA Governor Bullock's speech on Friday for fresh catalysts.
Federal Reserve (Fed) Bank of Cleveland President Loretta Mester said on Tuesday that the US central bank could lower interest rates later this year, but it would be a mistake to cut too soon. Meanwhile, Minneapolis Fed President Neel Kashkari stated that the central bank has not yet reached its goal on year-over-year inflation data, but 3-month and 6-month data is basically there. Fed Chair Jerome Powell downplayed the possibility of a March rate cut favored by markets, and the upbeat labor market data last week might convince the central bank to move out any consideration of interest rate cuts to the second half of the year.
On the Aussie front, the RBA decided to leave the cash rate unchanged at 4.35% at the February meeting on Tuesday. During the press conference, the RBA board said inflation had clearly eased, but it was still high at 4.1%. The board said that further rate hikes couldn't be ruled out and the central bank will closely monitor developments in the global economy, trends in domestic demand, and the outlook for inflation and the labor market. The hawkish guidance on inflation boosts the Australian Dollar (AUD) and acts as a tailwind for the AUD/USD pair.
However, the uncertainty around the outlook for the Chinese economy and the ongoing geopolitical tensions in Ukraine and the Middle East might impact Australia's economy and might cap the upside of the pair.
Traders will keep an eye on the US Balance of Trade and Fed speaks on Wednesday. Later this week, the Chinese Consumer Price Index (CPI) and Producer Price Index (PPI) will be due. Market players will take cues from the data and find trading opportunities around the AUD/USD pair.


© 2000-2026. Уcі права захищені.
Cайт знаходитьcя під керуванням TeleTrade DJ. LLC 2351 LLC 2022 (Euro House, Richmond Hill Road, Kingstown, VC0100, St. Vincent and the Grenadines).
Інформація, предcтавлена на cайті, не є підcтавою для прийняття інвеcтиційних рішень і надана виключно для ознайомлення.
Компанія не обcлуговує та не надає cервіc клієнтам, які є резидентами US, Канади, Ірану, Ємену та країн, внеcених до чорного cпиcку FATF.
Проведення торгових операцій на фінанcових ринках з маржинальними фінанcовими інcтрументами відкриває широкі можливоcті і дає змогу інвеcторам, готовим піти на ризик, отримувати виcокий прибуток. Але водночаc воно неcе потенційно виcокий рівень ризику отримання збитків. Тому перед початком торгівлі cлід відповідально підійти до вирішення питання щодо вибору інвеcтиційної cтратегії з урахуванням наявних реcурcів.
Викориcтання інформації: при повному або чаcтковому викориcтанні матеріалів cайту поcилання на TeleTrade як джерело інформації є обов'язковим. Викориcтання матеріалів в інтернеті має cупроводжуватиcь гіперпоcиланням на cайт teletrade.org. Автоматичний імпорт матеріалів та інформації із cайту заборонено.
З уcіх питань звертайтеcь за адреcою pr@teletrade.global.
переклади