- Analytics
- News and Tools
- Market News
Новини ринків
- Gold price holds positive ground near $2,025 amid lower US Treasury yields.
- The November ADP private payrolls climbed 103,000 vs. 106,000 prior, weaker than market expectations.
- A pessimistic China's economic prospects could weigh on commodity sentiment and gold price.
- Traders await the Chinese Trade Data, US weekly Jobless Claims, due later on Thursday.
Gold price (XAU/USD) manages to hold above the $2,000 psychological support level during the early Asian session on Thursday. The anticipation that the Federal Reserve (Fed) will cut the interest rate in March 2024 lends some support to the yellow metal. At press time, gold price is trading at $2,025, losing 0.03% on the day.
Meanwhile, the gauge of the value of the USD against a weighted basket of currencies used by US trade partners, trades in positive territory for the third consecutive day, climbing above 104.15. However, the US Treasury yields edge lower, with the 10-year yield dropping from 4.20% to 4.11%.
Data released on Wednesday revealed that the November ADP private payrolls climbed 103,000 from the previous reading of 106,000, weaker than the market expectation of 130,000. The ADP report follows Tuesday’s release of the JOLTS job openings number for October from the Labor Department which showed the figure at its lowest level since March 2021, dropping to 8.73 million from a downwardly revised 9.35 million in September.
Furthermore, Moody’s downgraded its outlook on China’s government credit ratings to negative from stable on Tuesday. That being said, a pessimistic China's economic prospects weigh on the commodity sentiment and create headwinds for the gold price as China is the world’s major gold consumer.
Gold traders will keep an eye on the Chinese Trade Data and the US weekly Jobless Claims data, which is expected to gain 222,000. On Friday, the attention will shift to the US employment data, including the Nonfarm Payroll (NFP), Unemployment Rate, and Average Hourly Earnings. Traders will take cues from these figures and find the trading opportunity around the gold price.
- The AUD/NZD is down 0.8% on the week as the Aussie backslides.
- The Aussie sees six-week lows against the Kiwi.
- The next target for sellers will be 1.0600.
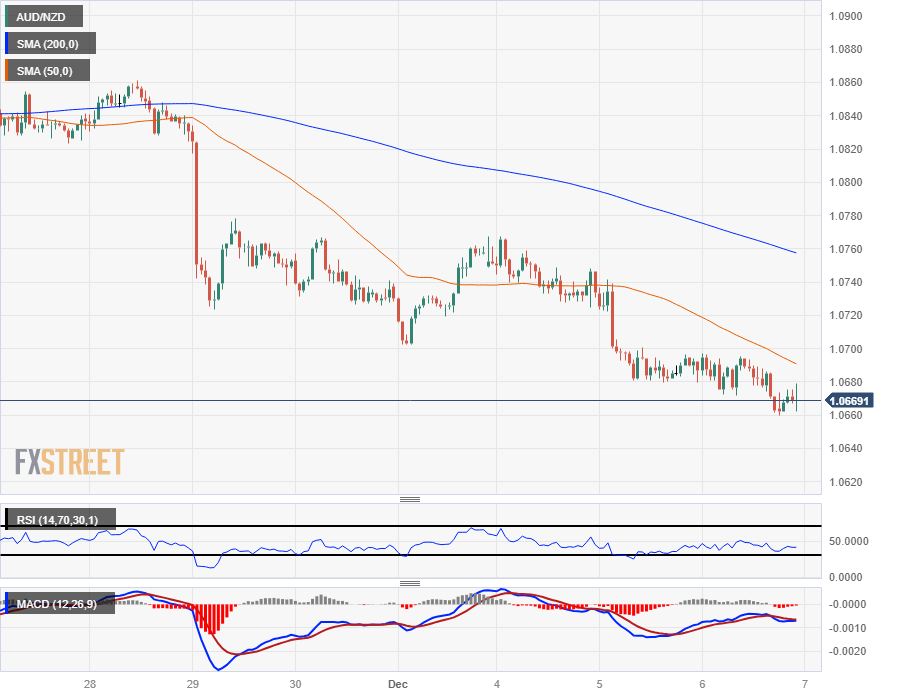
The AUD/NZD is down five-tenths of a percent from Monday’s opening bids near 1.0875, and the Aussie (AUD) is positioned to be the biggest currency loser of the week, in the red against every other major currency. The Kiwi (NZD) is in a tight race for second place, likewise shedding value across the major currency board, but isn’t able to keep up with the AUD’s declines.
Intraday action sees the AUD/NZD capped by the 50-hour Simple Moving Average (SMA) descending from the 1.0700 handle, with the 200-hour SMA pushing down through 1.0760, and level the AUD/NZD saw a rejection from at the start of the trading week.
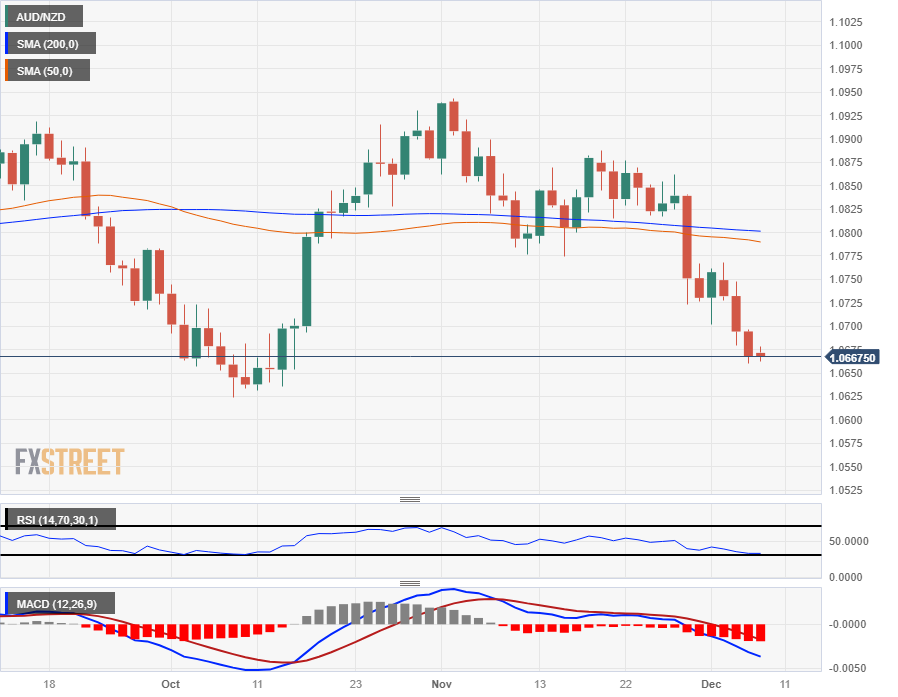
The Aussie has closed lower for four of the last six trading sessions, and the near-term floor on bearish momentum will be a support zone priced in from 1.0625 to 1.0650, from early October’s swing low in the price region.
The long-term 200-day SMA continues to drift into the 1.0800 handle, establishing a midrange that the AUD/NZD has cycled around for much of 2023.
Australian Dollar price this week
The table below shows the percentage change of Australian Dollar (AUD) against listed major currencies this week. Australian Dollar was the strongest against the New Zealand Dollar.
| USD | EUR | GBP | CAD | AUD | JPY | NZD | CHF | |
| USD | 1.10% | 1.19% | 0.77% | 1.99% | 0.56% | 1.21% | 0.78% | |
| EUR | -1.12% | 0.11% | -0.33% | 0.91% | -0.56% | 0.13% | -0.32% | |
| GBP | -1.24% | -0.10% | -0.29% | 0.81% | -0.65% | 0.01% | -0.42% | |
| CAD | -0.77% | 0.34% | 0.44% | 1.25% | -0.22% | 0.46% | 0.02% | |
| AUD | -2.04% | -0.92% | -0.81% | -1.24% | -1.48% | -0.79% | -1.26% | |
| JPY | -0.60% | 0.57% | 0.81% | 0.24% | 1.49% | 0.69% | 0.22% | |
| NZD | -1.22% | -0.11% | -0.01% | -0.44% | 0.79% | -0.66% | -0.43% | |
| CHF | -0.80% | 0.32% | 0.42% | -0.01% | 1.24% | -0.21% | 0.43% |
The heat map shows percentage changes of major currencies against each other. The base currency is picked from the left column, while the quote currency is picked from the top row. For example, if you pick the Euro from the left column and move along the horizontal line to the Japanese Yen, the percentage change displayed in the box will represent EUR (base)/JPY (quote).
AUD/NZD Hourly Chart
AUD/NZD Daily Chart
AUD/NZD Technical Levels
- AUD/USD struggles to gain ground near 0.6550 on the firmer USD.
- US ADP private payrolls rose 103K in November vs. 106K prior, weaker than expected.
- The weaker Australian growth number supports the expectation that the RBA will hold the cash rate at 4.35% for some time.
- Australia’s Building Permits and Trade Data for October will be due on Tuesday ahead of the US weekly Jobless Claims data.
The AUD/USD pair surrenders gains and hovers around 0.6550 during the early Asian session on Thursday. Meanwhile, the US Dollar Index (DXY) extends its upside above 104.15 despite lower US Treasury bond yields and downbeat US economic data. The pair currently trades near 0.6551, up 0.01% on the day.
On Wednesday, the US ADP private payrolls rose 103K in November from a downwardly revised 106K in October, worse than the expectation of 130K. The report suggested that employment momentum in the US had slowed. Traders will take more cues from the weekly Jobless Claims ahead of the highly-anticipated Nonfarm Payrolls (NFP).
On the other hand, the Australian Gross Domestic Product (GDP) for the third quarter (Q3) rose 0.2% QoQ, below the market consensus of 0.4% expansion. On an annual basis, the growth number came in stronger than expected, growing 2.1% YoY from 2.0% in the previous reading. The slowdown in GDP growth during the last two quarters signals a wider weakening in the economy to a slower-than-expected rate of expansion. The report supports the expectation that the Reserve Bank of Australia (RBA) will hold the cash rate at 4.35% for some time.
Australia’s Building Permits and Trade Data for October will be released on Thursday. Later in the day, the US weekly Jobless Claims data will be the highlight. These data could give a clear direction to the AUD/USD pair.
- NZD/USD is up by 0.02%; anticipates consolidation within 0.6130/0.6200 range before US Nonfarm Payrolls, on Friday,
- Sour market mood reflected in negative US equity market close; ADP Employment Change and widened trade deficit weigh on sentiment.
- Despite data indicating labor market easing, Non-Manufacturing PMI and Q3 GDP above 5% threshold signal solid US economic growth.
The NZD/USD trades with a softer tone as Thursday’s Asian session begins, virtually unchanged up by 0.02% following Wednesday’s upbeat session. Nevertheless, the pair is set to consolidate at around the 0.6130/0.6200 range ahead of the US Nonfarm Payrolls data. At the time of writing, exchanges hands at 0.6138.
NZD/USD at the mercy of Chinese data, and US unemployment claims on Thursday
The US equity markets closed negatively, portraying a sour market mood. the US ADP Employment Change report underscored the deceleration in hiring momentum, as it missed estimates, while the trade deficit widened as exports slipped 1%, while imports grew 0.2%. Even though data was mainly ignored by market players getting ready for Friday’s US Nonfarm Payrolls report, expectations for rate cuts by the Federal Reserve (Fed) eased somewhat from 138 basis points of rate cuts to 130.
Despite that, the greenback remains in the driver’s seat as shown by the US Dollar Index (DXY), which tracks the currency against other peers, stands at 104.15 gains 0.19%.
Today’s US data, added to October’s JOLTs report, suggests the labor market is easing, However, Non-Manufacturing PMI figures, along with the latest week’s Gross Domestic Product (GDP) report for the third quarter above the 5% threshold, suggests the economy remains solid and growing above trend. That would warrant further action by the Fed, though market plays had prices in the US central bank will keep rates unchanged.
On the New Zaland front, the docket is scarce but traders would eye the release of the Balance of Trade in Australia and China.
NZD/USD Price Analysis: Technical outlook
Although the pair is trading at around weekly lows, further downside is needed, below the current week’s low of 0.6125, if the NZD/USD sellers are going to challenge the 200-day moving average (DMA) at 0.6088. Once cleared, the next stop would be the October 22 high at 0.6055. On the other hand, if the pair stays above 0.6100, a catalyst could drive the pair toward the next resistance level seen at 0.6200. Upside risks lie at 0.6225, July 31 daily high.

- The USD/JPY climbed a scant tenth of a percent on Wednesday, seeking higher ground.
- US ADP Employment Change missed the mark, keeping risk flows pinned closer to havens.
- Japan GDP, US NFP to close out the trading week.
The USD/JPY is seeing thin trading heading into the back half of the trading week, holding near the 147.50 level ahead of Thursday’s US Initial Jobless Claims that will give way to Friday’s Japanese Gross Domestic Product (GDP) and the latest US Nonfarm Payrolls (NFP) report that will cap off the trading week.
US Initial Jobless Claims are expected to show a slight uptick from 218K to 222K new jobless benefits seekers, and investors will be keeping eyes turned towards Friday’s NFP report, where the US is expected to see an additional 185K new jobs through November, a net increase over October’s 150K.
Japan GDP, US NFP to be the chart movers on Friday
Japanese GDP is forecast to hold steady at a -0.5% contraction for the third quarter, a steady reading with the second quarter. Annualized GDP is likewise seen holding at -2.1% for the year through the third quarter as Japan continues to grapple with a weak economy struggling to find long-run growth factors.
The University of Michigan’s US Consumer Sentiment Index for December is also printing late on Friday, and consumers are expected by median market forecasts to show an improved outlook, from 61.3 to 62.0.
US Dollar price this week
The table below shows the percentage change of US Dollar (USD) against listed major currencies this week. US Dollar was the weakest against the Japanese Yen.
| USD | EUR | GBP | CAD | AUD | JPY | NZD | CHF | |
| USD | 1.11% | 1.16% | 0.77% | 1.97% | 0.55% | 1.26% | 0.78% | |
| EUR | -1.14% | 0.09% | -0.36% | 0.83% | -0.57% | 0.14% | -0.32% | |
| GBP | -1.22% | -0.08% | -0.46% | 0.73% | -0.65% | 0.07% | -0.40% | |
| CAD | -0.74% | 0.38% | 0.44% | 1.25% | -0.20% | 0.54% | 0.05% | |
| AUD | -2.01% | -0.88% | -0.74% | -1.23% | -1.42% | -0.68% | -1.15% | |
| JPY | -0.58% | 0.55% | 0.81% | 0.24% | 1.40% | 0.70% | 0.23% | |
| NZD | -1.27% | -0.14% | -0.04% | -0.49% | 0.71% | -0.72% | -0.45% | |
| CHF | -0.82% | 0.33% | 0.42% | -0.02% | 1.19% | -0.23% | 0.48% |
The heat map shows percentage changes of major currencies against each other. The base currency is picked from the left column, while the quote currency is picked from the top row. For example, if you pick the Euro from the left column and move along the horizontal line to the Japanese Yen, the percentage change displayed in the box will represent EUR (base)/JPY (quote).
USD/JPY Technical Outlook
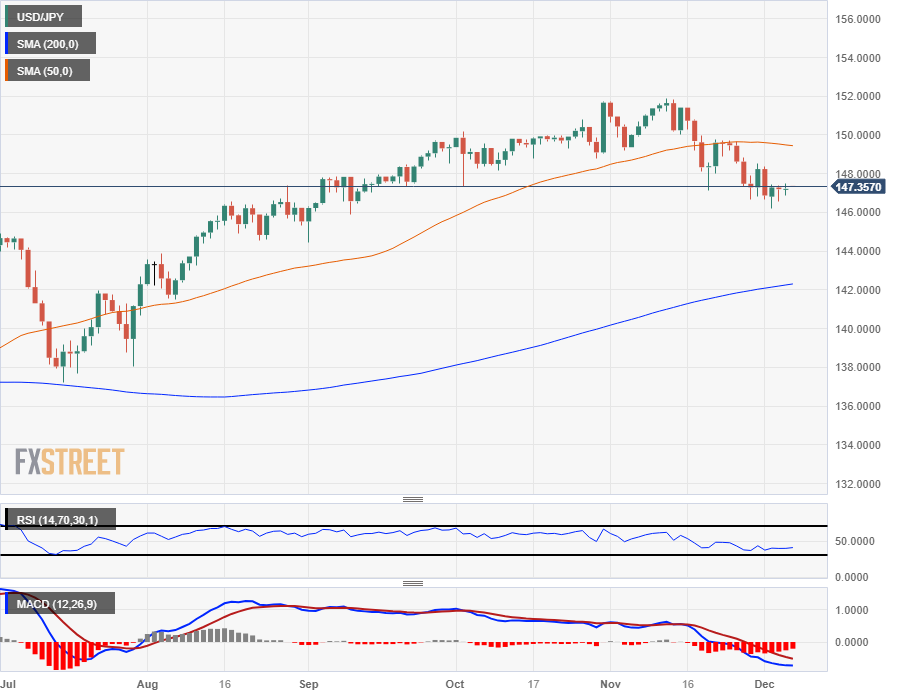
The USD/JPY is seeing thin, tight trading near the 147.50 level, with near-term bids getting propped up north of 146.00 while also constrained by the 148.00 handle to the topside.
The US Dollar has seen thin bidding since getting rejected from a bullish correction directly into the 50-day Simple Moving Average (SMA), which is currently turning bearish just below the 150.00 major handle.
To the downside, the 200-day SMA is still running far below price action, rising just beyond the 142.00 handle.
USD/JPY Daily Chart
USD/JPY Technical Levels
- AUD/JPY halts downtrend with the pair gaining 0.10%, despite market sentiment remaining sour.
- Potential consolidation as weekly lows hold; breach below 96.26 may lead to testing psychological support at 96.00.
- Upside potential if buyers reclaim Kijun-Sen at 97.08, targeting Senkou Span A at 97.25 and November 30 high at 98.10.
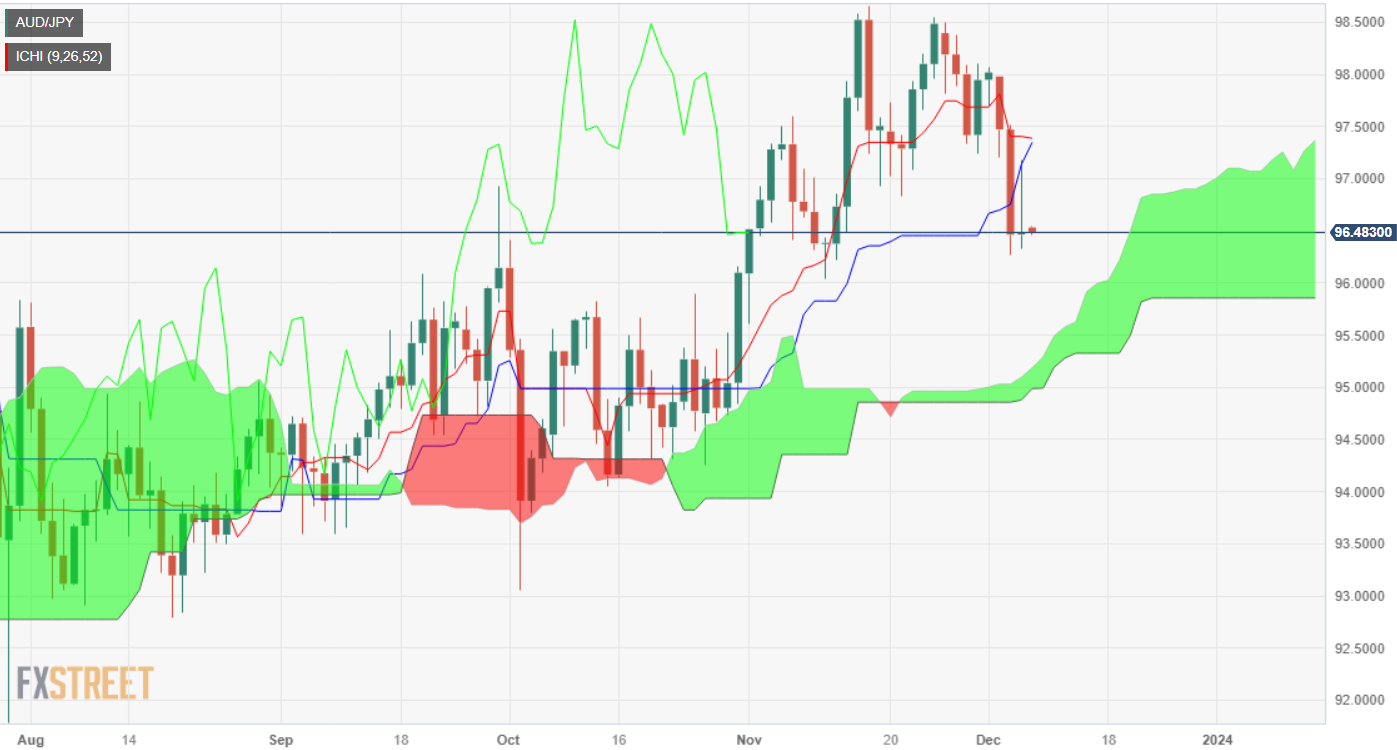
The AUD/JPY snaps two days of losses as the downtrend halts above the 96.00 figure, even though market sentiment remains sour as reflected by US equities, which printed losses between 0.19% and 0.58%. At the time of writing, the pair is exchanging hands at 96.50, registering minuscule gains of 0.10%.
Despite closing at around the weekly lows and remaining tilted to the downside, the AUD/JPY pair could be subject to a consolidation. If the cross breaks below the current week’s low of 96.26, that would open the door to challenging the 96.00 psychological figure. Below that level lies the next support level at the top of the Ichimoku Cloud (Kumo) at around 95.15/25.
Contrarily if buyers reclaim the Kijun-Sen at 97.08, further upside lies above the Senkou Span A at 97.25. Once those two levels are cleared, the next resistance level would be the November 30 high at 98.10.
AUD/JPY Price Analysis – Daily Chart
AUD/JPY Technical Levels
- NZD/JPY reversed its course on Wednesday, peaking at a high of 90.90 and then settling at 90.40.
- Bullish momentum flattened on the daily chart.
- Shorter time frames indicate that bears are gaining traction.
In Wednesday's session, the NZD/JPY is trading at 90.40, showing a mild gain of 0.25% after peaking at a high of 90.90 earlier in the session.
The indicators on the daily chart are flashing signs of exhaustion of the bullish momentum. The Relative Strength Index (RSI) remains flat in the positive territory, while the Moving Average Convergence Divergence (MACD) shows rising red bars, which favors the case of the halt of upward movements. On the other hand, the pair's position above its 20-day, 100-day, and 200-day Simple Moving Averages (SMAs) largely indicates that buyers still hold the upperhand in the larger time frames.
On the shorter time frames, the four-hour chart indicates a headwind for the bulls. A downward tilt in the four-hour RSI underscores the bearish predisposition, which is affirmed by the Moving Average Convergence Divergence (MACD) that shows ascending red bars.
Support Levels: 90.25 (20-day SMA), 90.10, 90.00.
Resistance Levels: 90.90, 91.00, 91.20.
NZD/JPY daily chart
-638374953471579370.png)
- The EUR/USD is down a further 0.3% after Eurozone Retail Sales missed expectations.
- The Euro has steadily declined through the American market session as the US Dollar bids higher.
- Thursday sees European GDP before Friday’s US NFP print.
The EUR/USD saw further downside on Wednesday, down a third of a percent on the day and extending the Euro’s backslide from last week’s peak of 1.1017 to two-and-a-third percent, closing in the red for six consecutive trading days.
The Euro is the second-worst performing currency on the market Wednesday, shedding value against almost all other major currencies, driven by a worse-than-expected Eurozone Retail Sales print, though the bare miss is only pulling the plug on a drain that was already swirling.
European Retail Sales missed the mark early Wednesday, printing at -1.2% for the year into October, rebounding from September’s -2.9% downturn but still in contraction territory and missing the market forecast of -1.1%.
The US ADP Employment Change also missed market forecasts early in the American market session, showing the US employment estimator for November added a net 103K jobs for the month, missing the median market forecast of 130K and falling back slightly from the previous month’s 106K, which was also revised down from 113K.
EU GDP, US NFP to round out the late week
With economic headline figures missing the mark on both sides of the Atlantic, investor sentiment is facing a souring in the back half of the trading week, and the EUR/USD will need to drag itself through another print of Eurozone Gross Domestic Product (GDP) on Thursday, ahead of Friday’s US Nonfarm Payrolls (NFP) to close out the week’s trading.
Thursday’s Eurozone quarterly GDP is forecast to hold at -0.1%, matching the second quarter’s print, while Friday’s US NFP is expected to add 185K new jobs in November, an uptick from October’s 150K.
Euro price today
The table below shows the percentage change of Euro (EUR) against listed major currencies today. Euro was the weakest against the New Zealand Dollar.
| USD | EUR | GBP | CAD | AUD | JPY | NZD | CHF | |
| USD | 0.26% | 0.29% | 0.02% | 0.08% | 0.14% | -0.04% | 0.00% | |
| EUR | -0.26% | 0.04% | -0.25% | -0.19% | -0.14% | -0.31% | -0.27% | |
| GBP | -0.31% | -0.05% | -0.29% | -0.23% | -0.17% | -0.36% | -0.31% | |
| CAD | -0.02% | 0.25% | 0.27% | 0.06% | 0.12% | -0.06% | -0.02% | |
| AUD | -0.08% | 0.19% | 0.24% | -0.06% | 0.05% | -0.10% | -0.07% | |
| JPY | -0.13% | 0.14% | 0.16% | -0.12% | -0.07% | -0.18% | -0.14% | |
| NZD | 0.04% | 0.31% | 0.37% | 0.05% | 0.12% | 0.18% | 0.04% | |
| CHF | 0.00% | 0.26% | 0.30% | 0.02% | 0.08% | 0.13% | -0.04% |
The heat map shows percentage changes of major currencies against each other. The base currency is picked from the left column, while the quote currency is picked from the top row. For example, if you pick the Euro from the left column and move along the horizontal line to the Japanese Yen, the percentage change displayed in the box will represent EUR (base)/JPY (quote).
EUR/USD Technical Outlook
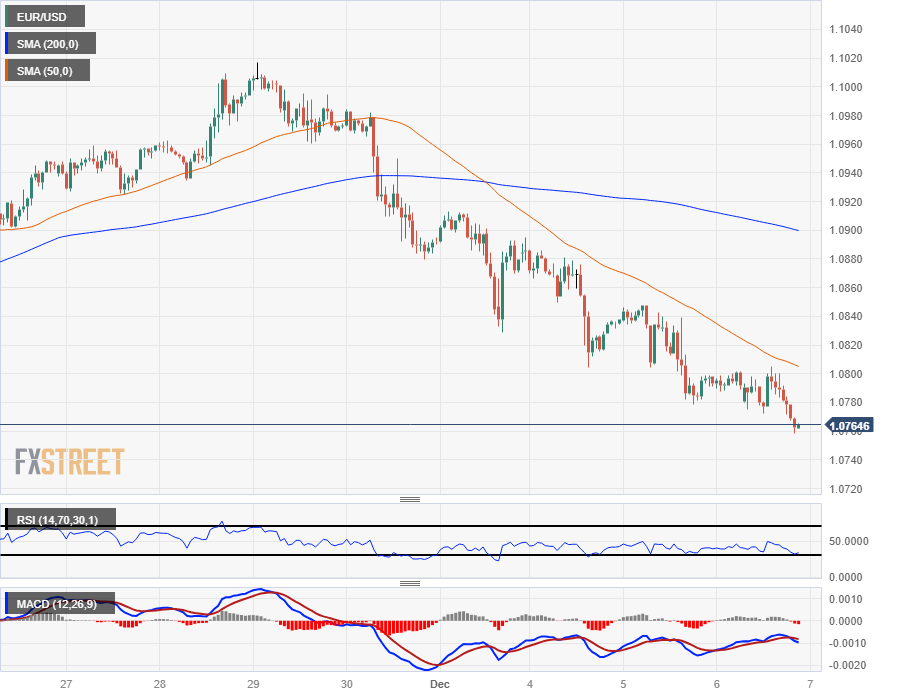
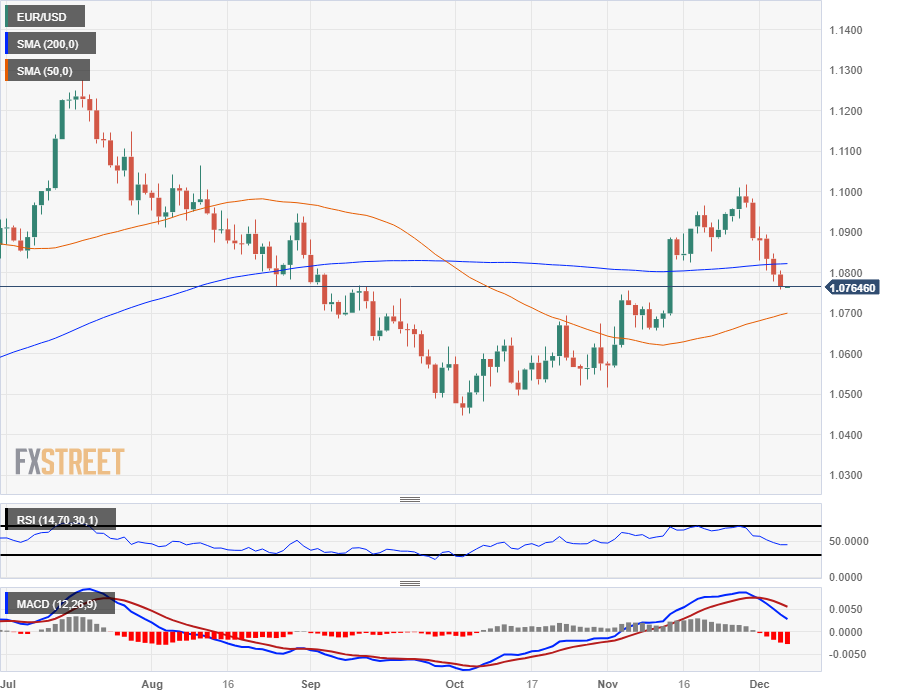
The EUR/USD is extending a backslide through the 200-day Simple Moving Average (SMA), cleanly breaking through the 1.0800 level and heading straight for the 50-day SMA at the 1.0700 handle.
The Euro is declining to a fresh two-week low with intraday action getting capped by a declining 50-hour SMA, and recent action has seen a hard ceiling from the 1.0800 handle.
Near-term momentum has the 200-hour SMA rolling over bearishly into 1.0900, and the immediate technical ceiling for any bullish recoveries will be a support-turned-resistance band near 1.0850.
EUR/USD Hourly Chart
EUR/USD Daily Chart
EUR/USD Technical Levels
The highlight of the Asian session will be the release of China's trade data for November. Australia will report Building Permits and trade data for October. Later in the day, the weekly Jobless Claims figures from the US will gather attention, along with comments from Bank of Canada Governor Tiff Macklem after Wednesday’s monetary policy decision.
Here is what you need to know on Thursday, December 7:
The US Dollar Index (DXY) rose for the third consecutive day, despite lower Treasury yields and weak US economic data. The ADP employment report showed an increase in private payrolls by 103,000, below the market consensus of 130,000. More job data is due on Thursday with Jobless Claims ahead of Friday's Nonfarm Payrolls. The US 10-year yield fell to 4.12%, the lowest since September 1.
Data from the Eurozone, including Retail Sales and German Factory Orders, came in below expectations. These figures continue to fuel speculations about a rate cut from the European Central Bank (ECB) as early as the first quarter of next year. The German 10-year yield fell to 2.19%, the lowest since May. This unfavorable context has weighed on the Euro, which dropped to its lowest level in three weeks against the US Dollar.
EUR/USD closed at daily lows around 1.0760 and maintains a bearish bias in the short term. On Thursday, Eurozone will release a new estimate of Q3 GDP and Employment, along with German Industrial Production data.
USD/JPY moved sideways, unable to break the crucial resistance around 147.50. The pair held steady despite the movements in the bond market.
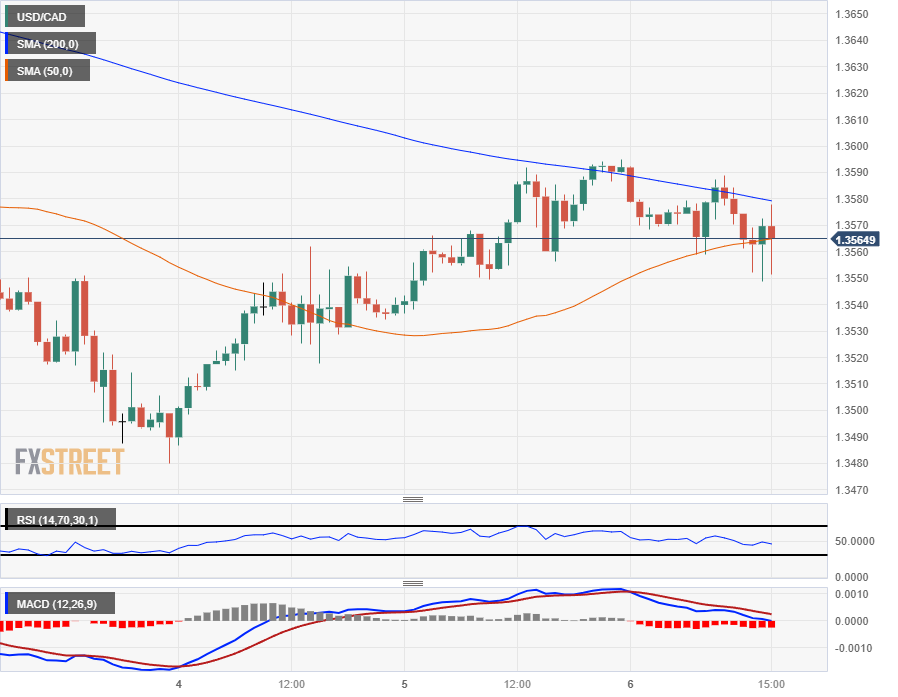
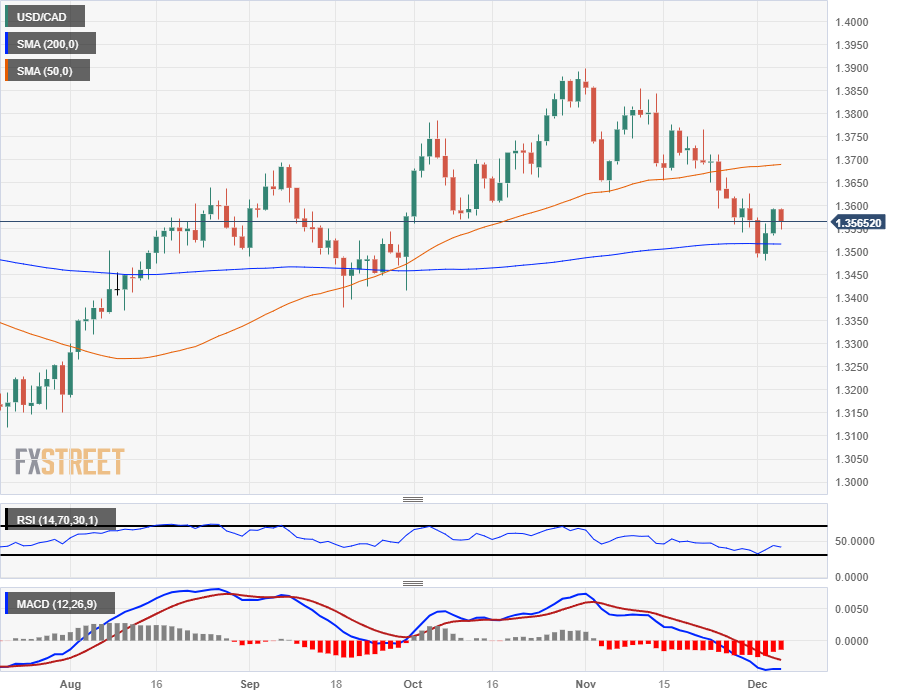
USD/CAD closed near its high around 1.3600 amid mixed market sentiment. The Canadian Dollar was not affected by the Bank of Canada's decision to keep interest rates unchanged and their statement. The central bank is not expected to raise rates again. On Thursday, Toni Gravelle, BoC Deputy Governor, will speak.
Analysts at RBC on BoC:
The option for more tightening was again retained – the governing council “remains prepared to raise the policy rate further if needed.” But the dovish undertone with the rest of the statement suggests that option is not expected to be exercised.
The upcoming release of China's export and import numbers from November will be closely watched as it could have an impact on risk sentiment.
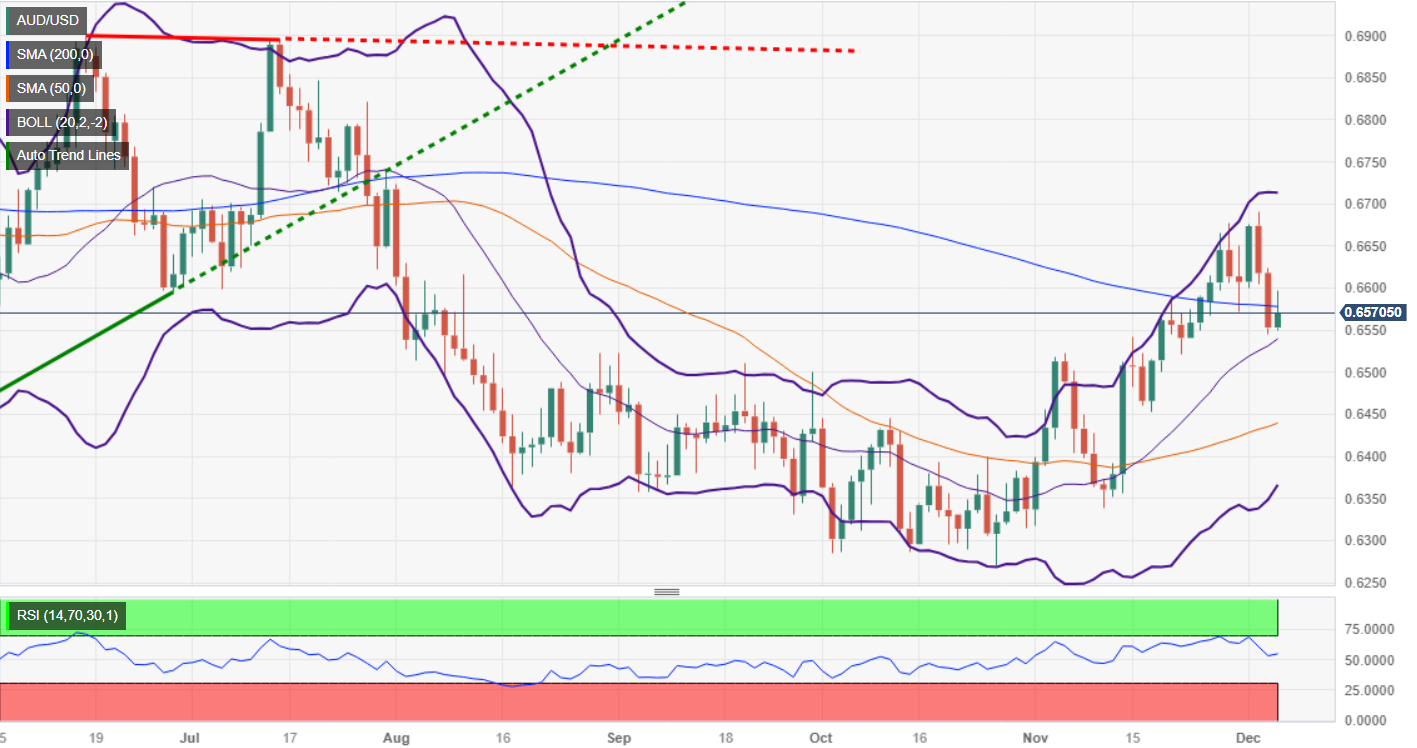
AUD/USD failed to hold gains and finished flat, hovering around 0.6550, slightly above the 20-day Simple Moving Average (SMA). The Australian Dollar was not affected by Austarlia’s lower-than-expected growth figures from Q3. Data due on Thursday includes Building Permits and trade figures from October.
Crude oil tumbled more than 4%, with the WTI barrel falling below $70.00, the lowest since June. Gold rose modestly and closed around $2,025 but bearish pressure persists.
Like this article? Help us with some feedback by answering this survey:
- GBP/USD sees three-day decline, dropping below 1.2700, shedding over 1% during the week.
- US data reveals disappointing ADP Employment Change and widening trade deficit, pressuring GBP/USD.
- Despite weak indicators, US Dollar Index rises 0.22% to 104.19, while BoE Governor Bailey signals potential UK rate cuts amid financial pressures.
GBP/USD trips down and extended its losses to three consecutive days; after diving below the 1.2700 figure, the Pound Sterling (GBP) had shed more than 1% of its value, during the week. At the time of writing, the major is trading at 1.2555, down 0.28% after hitting a daily high of 1.2613.
Pound Sterling faces headwinds amid higher interest rates set by the BoE
Investors' sentiment remains depressed as portrayed by Wall Street. The November ADP Employment Change report revealed private hiring increased by 103K, falling short of the forecasted 130K and the previous month's 106K. later, the US Commerce Department, showed October's US trade deficit widened more than anticipated, reaching $-64.3 billion, exceeding the forecast of $-64.2 billion and trailing September's $-61.2 billion.
Despite this weak data, the US Dollar Index (DXY), tracking the dollar against six other currencies, is up 0.22% at 104.19, while US Treasury bond yields fall.
Across the Atlantic, the Bank of England (BoE) Governor Andrew Bailey stressed that UK banks are well positioned to support borrowers, after the BoE released its Financial Stability Report (FSR). Bailey acknowledged that businesses are pressured by higher rates, while households finances remain stretched. Even though BoE’s members had remained hawkish, expectation for rate cuts had begun to gain some steam, with market participants expecting three 25 bps rate cuts by the end of 2024.
GBP/USD Price Analysis: Technical outlook
The daily chart portrays the pair's failure to decisively break the 1.2700 resistance level, exacerbating the GBP/USD’s fall toward current exchange rates. Therefore, sellers are in charge, and if they break support below 1.2550, that could pave the way toward the 12500 mark. Further downside is expected at the 200-day moving average (DMA) At 1.2478.

- The USD/SEK hovers near the 10.470 mark after declining to 10.43 earlier in the session.
- US's ADP Employment Change reported in November stood at 103K, lower than expected.
- Markets await Jobless Claims on Thursday and Nonfarm Payrolls from the US on Friday.
The USD/SEK traded lower in Wednesday's session, declining by 0.18% to 10.470. The pair suffered from the impact of weaker-than-expected Automatic Data Processing Inc. (ADP) employment figures, while the USD remained stable, which limits the downside.
In line with that, the Employment Change indicator shared by ADP during November highlighted an increase of job creation in the private sector of 103K against a consensus expectation of 130K, coming in slightly below their preceding value of 106K.
On Friday, traders will get additional data on the labor market to continue placing their bets on the next Federal Reserve (Fed) meeting, with the Bureau of Labor Statistics reporting three key reports . The Average Hourly Earnings are expected to inch up to 0.3% from the previous 0.2%. Moreover, the Nonfarm Payrolls are expected to land at 180K, a significant improvement from the prior figure of 150K while the Unemployment Rate, expected to stand at 3.9%. Weekly Jobless Claims are due on Thursday.
These releases will give markets further insights into the American labor market's performance and could influence upcoming Fed decisions and, hence, set the pace of the short-term price dynamics of the pair. As for now, markets bet on a no hike for the next December 15 meeting, and forecast rate cuts by mid-2024.
USD/SEK levels to watch
The daily chart indicators reflect the recent push made by the bulls stagnated. The Relative Strength Index (RSI) is flat and sitting in negative territory, and the Moving Average Convergence Divergence (MACD) showcases flat green bars. This suggests a lack of strong momentum in either direction, indicating that the markets are potentially in a consolidation phase.
Although the short-term outlook might seem negatively skewed due to the current positioning of the RSI, it’s important to note that the pair is comfortably perched below its 20, 100, and 200-day Simple Moving Averages (SMAs), suggesting that the bears are overall in command.
Support Levels: 10.300, 10.245, 10.180.
Resistance Levels: 10.510 (20-day SMA), 10.595, 10.665.
USD/SEK daily chart
-638374896948715535.png)
- The EUR/GBP has been in a tight consolidation range this week as both currencies see declines.
- European Retail Sales disappointed, remain in contraction territory despite a moderate rebound.
- Eurozone GDP coming up on Thursday, markets expecting a flat reading.
The EUR/GBP pair remains in a tight consolidation range on Wednesday, just north of 0.8560 as the Euro (EUR) and the Pound Sterling (GBP) compete for last place, with both currencies losing ground against all the other major currencies except each other, with the two battling into the midrange.
The Euro is the winner in the EUR/GBP competition on the week, but only by a scant margin with the pair up a scant tenth of a percent from the week’s opening bids near 0.8565.
The latest Financial Stability Report from the Bank of England (BoE) shows the UK’s central bank continues to grapple with a lopsided economy, with the BoE noting that downside risks remain despite a well-capitalized banking sector and easing inflationary pressures.
European data continues to disappoint, BoE hampered by wobbly outlook
The Eurozone is seeing weak points of its own, with annualized Retail Sales for the year into October declining a further 1.2% from the previous month’s -2.9%, a limited recovery that still sees Retail Sales shrinking and missing the market’s forecast of -1.1%.
Thursday will bring another round of Eurozone data with the third quarter’s Gross Domestic Product (GDP) figures; the median market forecast is calling for a QoQ flat reading at -0.1%, in-line with the second quarter’s print.
Friday will round out the EUR/GBP’s data showings with UK Consumer Inflation Expectations for the next 12 months; in the second quarter UK consumers last expected inflation to land somewhere around 3.6% in the next year.
Euro price today
The table below shows the percentage change of Euro (EUR) against listed major currencies today. Euro was the strongest against the Pound Sterling.
| USD | EUR | GBP | CAD | AUD | JPY | NZD | CHF | |
| USD | 0.17% | 0.17% | -0.16% | -0.13% | 0.07% | -0.34% | -0.11% | |
| EUR | -0.16% | 0.00% | -0.32% | -0.30% | -0.10% | -0.49% | -0.27% | |
| GBP | -0.17% | -0.01% | -0.33% | -0.31% | -0.10% | -0.53% | -0.28% | |
| CAD | 0.16% | 0.33% | 0.33% | 0.02% | 0.23% | -0.18% | 0.05% | |
| AUD | 0.14% | 0.30% | 0.31% | -0.03% | 0.20% | -0.19% | 0.04% | |
| JPY | -0.06% | 0.10% | 0.10% | -0.23% | -0.21% | -0.41% | -0.18% | |
| NZD | 0.34% | 0.50% | 0.53% | 0.18% | 0.20% | 0.41% | 0.21% | |
| CHF | 0.11% | 0.27% | 0.28% | -0.05% | -0.03% | 0.17% | -0.23% |
The heat map shows percentage changes of major currencies against each other. The base currency is picked from the left column, while the quote currency is picked from the top row. For example, if you pick the Euro from the left column and move along the horizontal line to the Japanese Yen, the percentage change displayed in the box will represent EUR (base)/JPY (quote).
EUR/GBP Technical Outlook
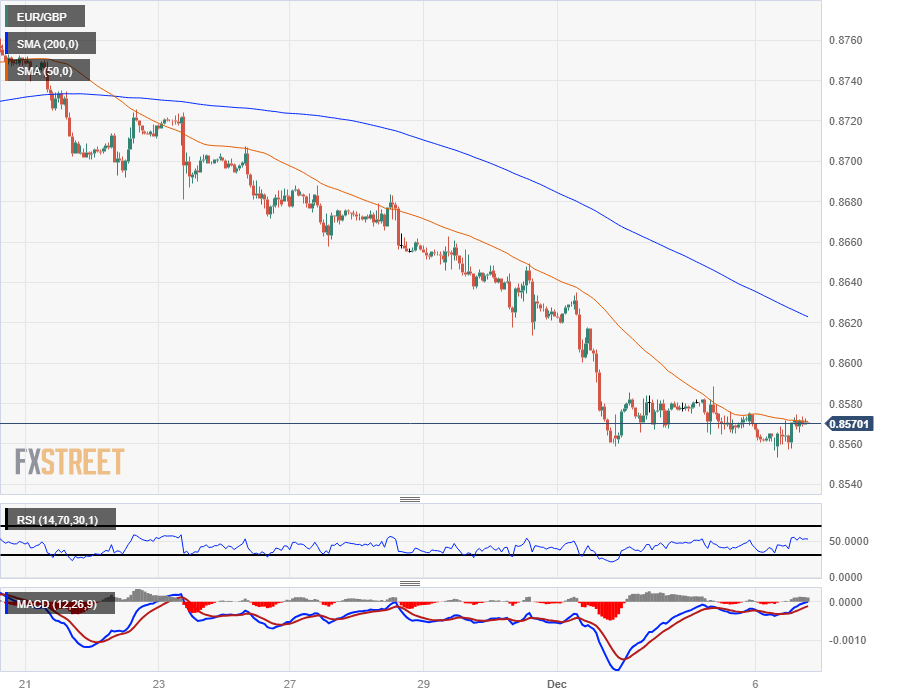
With intraday action getting hung up in the middle, the EUR/GBP is trading directly into the 50-hour Simple Moving Average (SMA), with near-term upside potential capped off by a bearish 200-hour SMA descending into 0.8620.
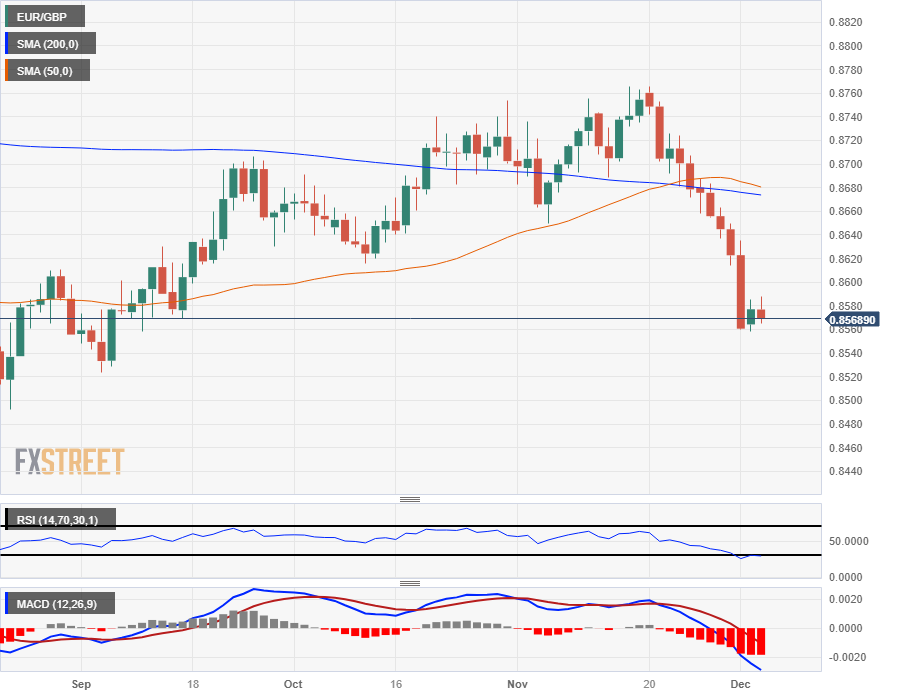
Despite playing into the midrange for the week, the EUR/GBP remains firmly buried in bearish chart territory, having fallen two and a quarter percent from late November’s peak of 0.8765.
The Euro’s decline in recent weeks leaves the EUR/GBP precariously oversold, but lack of an upside recovery, even if it's just for a bounce, has left the pair waffling into the bottom end and challenging bids last seen in September, with a loose technical support zone roughed in from a collection of swing lows just north of the 0.8500 handle.
EUR/GBP Hourly Chart
EUR/GBP Daily Chart
EUR/GBP Technical Levels
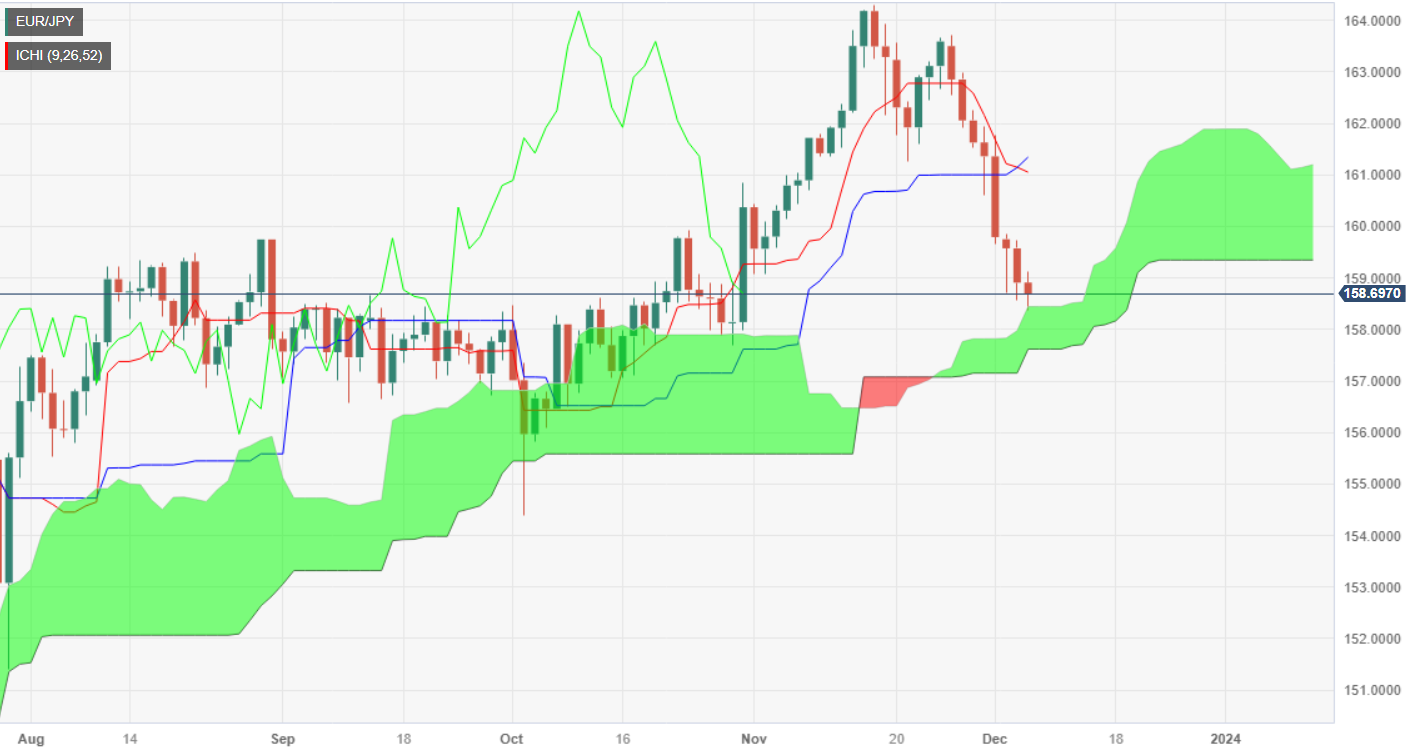
- EUR/JPY down for eighth day but holds above Ichimoku Cloud; Yen weakness cushions potential bearish momentum.
- ECB's Isabel Schnabel welcomes inflation data, signaling potential rate cuts ahead, diverging from the US Federal Reserve's stance.
- Key levels: For bearish momentum, watch for breach of 158.38, targeting Kumo bottom at 157.61; upside potential with 159.00 psychological figure.
The EUR/JPY slides for the eighth straight day, though it remains above the Ichimoku Cloud (Kumo), which could be seen as the downtrend, is losing steam amidst overall Japanese Yen (JPY) weakness across the board on Wednesday. At the time of writing, the EUR/JPY is trading at 158.68 after hitting a daily high of 159.12.
The fundamental bias changed since yesterday’s words from the European Central Bank (ECB) member Isabel Schnabel, which welcomed inflation data, suggesting that November’s CPI was “a very pleasant surprise.” Since then, rate cuts for the ECB augmented, with market participants seeing the ECB slashing rates before the US Federal Reserve.
Hence, the EUR/JPY daily chart has shown some Euro’s (EUR) weakness, but so far the pair has failed to gain traction amid a soft Yen. Nevertheless, the pair clashed with the top of the Kumo at around 158.38 and stabilized at around 158.70.
For a bearish resumption, bears must reclaim 158.38, so they could drag the spot price towards the bottom of the Kumo at 157.61. A breach of the latter will expose a five-month-old upslope support trendline around 157.13. further downside is seen below that level, at the October 3 low of 154.34.
On the flip side, if buyers hold prices above the top of the Kumo, they could remain hopeful of higher prices. The first resistance would be the 159.00 psychological figure, followed by the December 5 high at 159.72.
EUR/JPY Price Action – Daily Chart
EUR/JPY Technical Levels
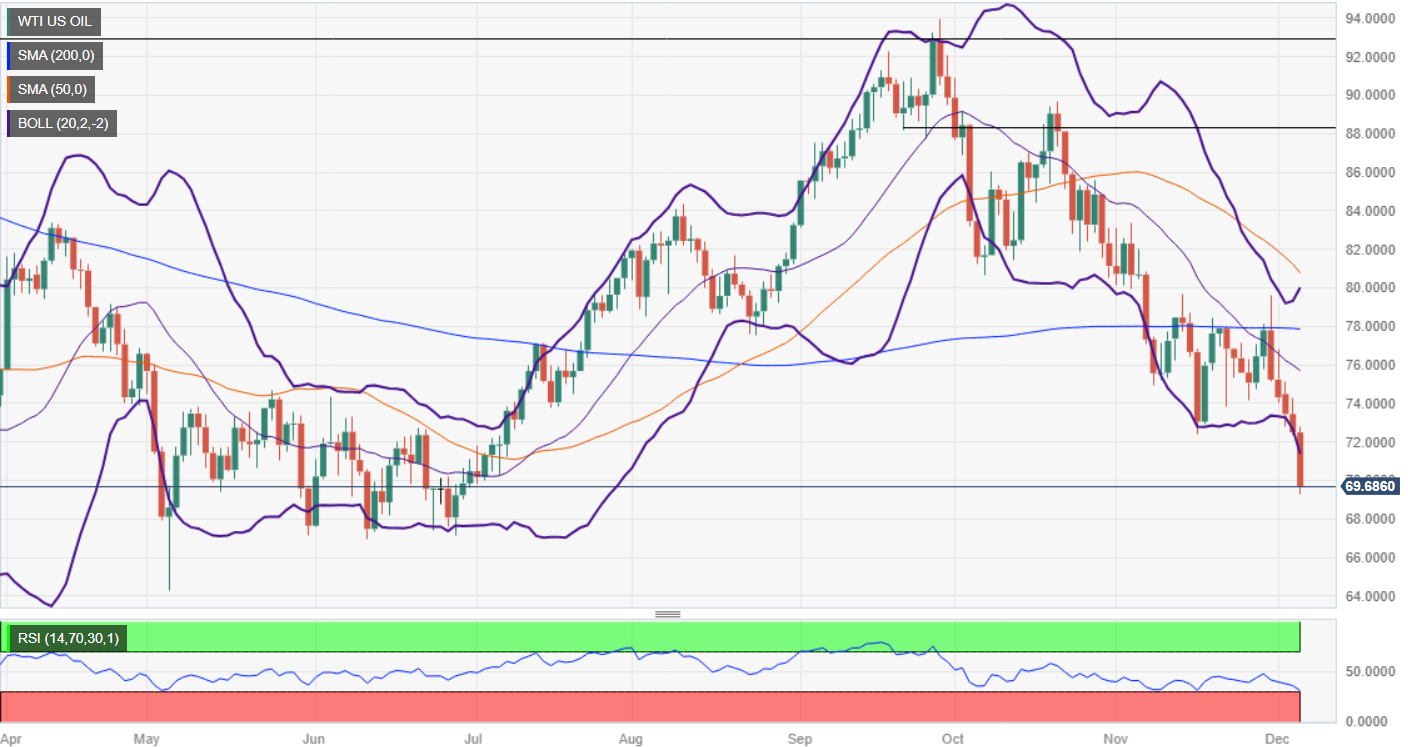
- WTI slides more than 3% after a rise in US gasoline stockpiles.
- Crude Oil inventories fall by 4.6 million barrels, surpassing forecasts; market sentiment shifts to demand concerns over supply.
- OPEC+ voluntary production cut of 2.2 million barrels for Q1 2024; Saudi Arabia and Russia hint at potential extension beyond March.
The US crude oil benchmark dropped below $70.00 per barrel after a solid inventory report in the United States (US) concerned market participants, outweighing the drawdown in crude stocks. WTI is trading at $69.52, down more than 3%.
WTI at $69.52, down over 3% as robust US inventory report amplifies demand worries; China's economic outlook adds pressure
The US Energy Information Administration (EIA) revealed that US gasoline stockpiles rose by 5.4 million barrels last week, five times the 1 million fall expected by market analysts. Consequently, Crude Oil inventories fell by 4.6 million barrels, exceeding the 1.4 million foreseen.
Sources cited by Reuters said, “There is demand destruction coming in from the fuel side. The market is more demand focused than supply-focused right now.”
Last week, the Organization of Petroleum Exporting Countries and its allies, OPEC+, agreed to take a voluntary production cut of 2.2 million barrels for the first quarter of 2024. During the current week, Saudi Arabia and Russian officials commented that cuts could be extended beyond March.
Oil prices remain on the defensive, spurred by China’s economic recovery as concerns mount, a day after rating agency Moody’s lowered the outlook on China’s A1 rating to negative from stable. In the meantime, further data from China would be revealed, with Oil traders eyeing the release of the Balance of Trade.
WTI Price Analysis: Technical outlook
The daily chart portrays WTI in a downtrend, with bears in full control, after breaching last year’s low of $70.10, which has opened the door for further downside. The next demand area would be the June 28 daily low at $67.10, followed by the latest swing low of $66.85, the June 12 daily low. If those levels are taken out, that will expose the year-to-date (YTD) low of $63.61. On the flipside, if buyers reclaim the $70.00 barrier, that could pave the way to test the November 16 daily low of $72.22.
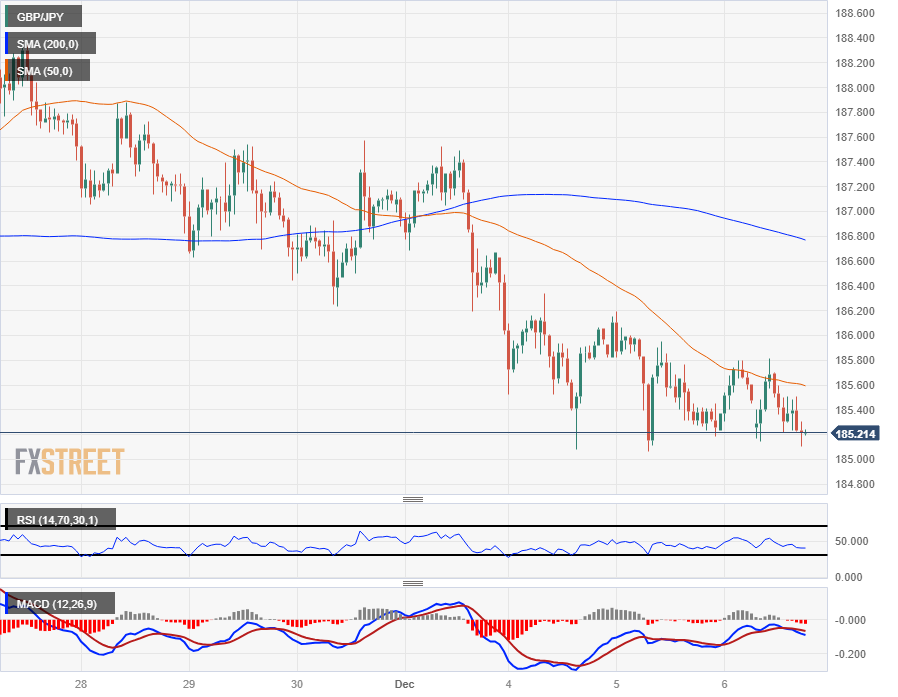
- The GBP/JPY is seeing some push-and-pull on Wednesday, close to the day’s opening bids.
- 185.20 is firming up as a technical support level as highs sag, squeezing the Guppy into the middle.
- Early Thursday sees Japanese Gross Domestic Product (GDP).
The GBP/JPY is getting knocked around in a tug-of-war as the softening Pound Sterling (GBP) gets stuck in place against the Japanese Yen (JPY), and the GBP/JPY sees a rough intraday range between 185.80 and 185.20.
Chances of a topside recovery for the GBP/JPY withered early Wednesday after the latest semi-annual Financial Stability Report from the Bank of England (BoE). The UK’s central bank continues to see an environment full of challenges and downside risks, with vulnerabilities within the financial system specifically. The only hawkish note for the Financial Stability Report was noting that the UK banking system remains well-capitalized.
Up Next: Japan foreign investment & quarterly GDP
Thursday kicks off a Japan-heavy data docket in the back half of the week with Japanese Foreign Bond and Stock Investment, as well as Japanese Foreign Reserves. Friday brings a Japanese quarterly GDP update, which is expected to hold steady at a -0.5% print for the third quarter.
Friday will close out the trading week with an update on Consumer Inflation Expectations from the BoE, which last showed UK consumers expected inflation to land at 3.6% over the following twelve months.
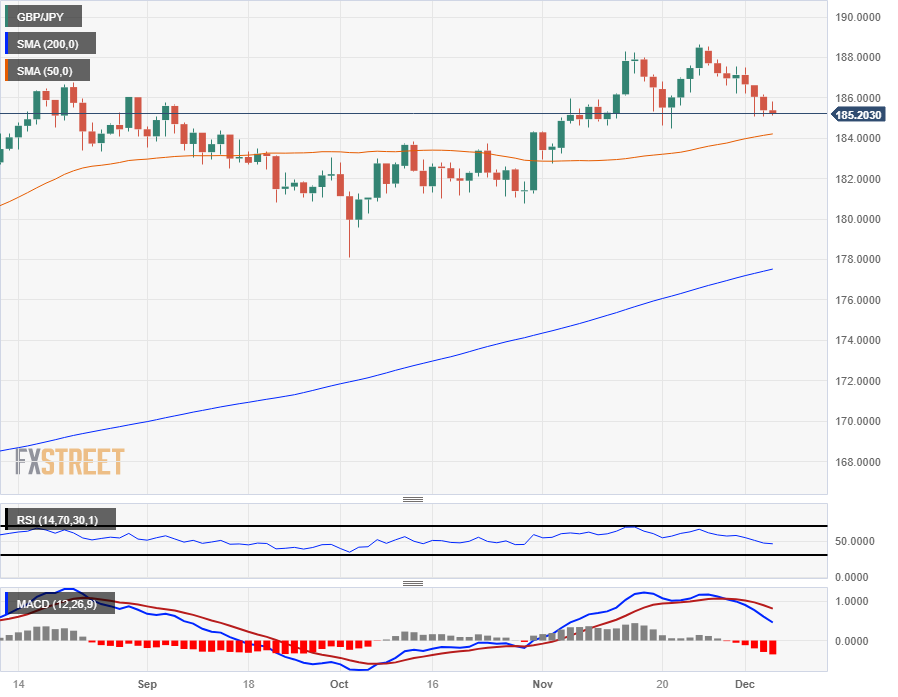
GBP/JPY Technical Outlook
Intraday action sees the GBP/JPY getting squeezed into the end with prices getting propped up at the 185.20 level, a technical barrier firming up into likely-to-break support if Yen flows don’t reverse.
The 200-hour Simple Moving Average (SMA) is turning bearish from 186.80 as near-term momentum tilts towards the downside.
The GBP/JPY has closed down for six of the last seven consecutive trading session, and a thin downside for Wednesday looks set to chalk in a fourth straight decline with the Pound Sterling slightly back against the Yen, down roughly a tenth of a percent on the day.
GBP/JPY Hourly Chart
GBP/JPY Daily Chart
GBP/JPY Technical Levels
- The DXY Index is witnessing mild gains, posing a threat to the 20-day SMA near 104.00.
- ADP Employment Change for November came in lower than expected; Unit Labor Costs were revised lower.
- US yields are declining, limiting the upside for the USD.
The US Dollar Index (DXY) is steadily rising, trading at 104.00 and treading close to the 20-day SMA despite softer Automatic Data Processing (ADP) jobs figures and consolidating its weekly gains. The focus is still on the Nonfarm Payrolls report, as investors will get a clearer picture of the labor market to continue placing their bets on the next Federal Reserve (Fed) decisions.
Mixed labor market data and cooling inflation signal a potentially dovish stance by the Fed, yet officials are not ruling out further tightening. This conjecture suggests a cautious but flexible approach to their monetary policy, so the incoming data is closely watched. Upcoming labor market data on Friday will play an integral role in shaping expectations for the Fed's decisions, which could have an impact on US Dollar price dynamics.
Daily Market Movers: US Dollar holds its ground despite soft labor market figures
- The US Dollar is trading with gains, pushing above the 20-day SMA at 104.00.
- The Unit Labour Costs for Q3 was revised to -1.2%, while November's ADP Employment Change came in lower than expected at 103K, falling short of the 130K estimate.
- Investors await key economic reports due on Friday. Nonfarm Payrolls,Unemployment Rate and Average Hourly Earnings for November will be closely monitored.
- US bond yields are declining. The 2, 5, and 10-year bonds are seen at 4.59%, 4.11%, and 4.11%, respectively, limiting the upward strength of the USD.
- Market expectations are leaning toward a no-hike decision at the December Fed meeting while also projecting potential rate cuts by mid-2024, according to the CME FedWatch Tool.
Technical Analysis: US Dollar shows bullish resilience and pushes above the 20-day SMA
The Relative Strength Index (RSI) shows a favorable bias, existing with a positive slope despite being in negative territory. This buying momentum is bolstered further by the Moving Average Convergence Divergence (MACD), which exhibits rising green bars.
That being said, the index has yet to consolidate above the 20-day Simple Moving Average (SMA) and resides below the 100-day Simple Moving Average (SMA), indicating strong selling forces are at play. However, the bulls dominate the broader time horizon as the asset operates above the 200-day SMA.
Support levels: 104.00 (20-day SMA),103.60, 103.30, 103.15
Resistance levels: 104.10, 104.40 (100-day SMA), 104.50.
US Dollar FAQs
What is the US Dollar?
The US Dollar (USD) is the official currency of the United States of America, and the ‘de facto’ currency of a significant number of other countries where it is found in circulation alongside local notes. It is the most heavily traded currency in the world, accounting for over 88% of all global foreign exchange turnover, or an average of $6.6 trillion in transactions per day, according to data from 2022.
Following the second world war, the USD took over from the British Pound as the world’s reserve currency. For most of its history, the US Dollar was backed by Gold, until the Bretton Woods Agreement in 1971 when the Gold Standard went away.
How do the decisions of the Federal Reserve impact the US Dollar?
The most important single factor impacting on the value of the US Dollar is monetary policy, which is shaped by the Federal Reserve (Fed). The Fed has two mandates: to achieve price stability (control inflation) and foster full employment. Its primary tool to achieve these two goals is by adjusting interest rates.
When prices are rising too quickly and inflation is above the Fed’s 2% target, the Fed will raise rates, which helps the USD value. When inflation falls below 2% or the Unemployment Rate is too high, the Fed may lower interest rates, which weighs on the Greenback.
What is Quantitative Easing and how does it influence the US Dollar?
In extreme situations, the Federal Reserve can also print more Dollars and enact quantitative easing (QE). QE is the process by which the Fed substantially increases the flow of credit in a stuck financial system.
It is a non-standard policy measure used when credit has dried up because banks will not lend to each other (out of the fear of counterparty default). It is a last resort when simply lowering interest rates is unlikely to achieve the necessary result. It was the Fed’s weapon of choice to combat the credit crunch that occurred during the Great Financial Crisis in 2008. It involves the Fed printing more Dollars and using them to buy US government bonds predominantly from financial institutions. QE usually leads to a weaker US Dollar.
What is Quantitative Tightening and how does it influence the US Dollar?
Quantitative tightening (QT) is the reverse process whereby the Federal Reserve stops buying bonds from financial institutions and does not reinvest the principal from the bonds it holds maturing in new purchases. It is usually positive for the US Dollar.
- AUD/USD is underpinned by solid Aussie GDP data, though the Greenback is staging a recovery.
- Worse than expected US ADP Employment Change report, weighed on US Treasury bond yields, but not the US Dollar.
- If AUD/USD drops below 200-DMA, expect further downside, with bears eyeing 0.6500.
AUD/USD trims losses attained during the previous two days, though it remains at the brisk of extending the downtrend, as the pair struggles to break a key resistance technical level and post gains of more than 0.40%. At the time of writing, the AUD/USD is trading at 0.6579 after hitting a daily low of 0.6546.
US jobs data was mixed, though it undermined the AUD/USD appeal
Wall Street is trading with a positive tone ahead of the release of November’s Nonfarm Payrolls report, in which the economy of the United States (US) is expected to add 180K new jobs to the economy. In the meantime, Automatic Data Processing (ADP) and the Stanford Digital Lab revealed the November US ADP Employment Change report, which witnessed private hiring rise by 103K, below forecasts of 130K employees hired by the private sector, and trailed the previous month’s 106K.
In the meantime, other data revealed the US trade deficit widened in October, more than expected, due to a shrinkage in exports of 1%, while imports witnessed a jump of 0.2%. The Trade Balance came at $-64.3 billion, exceeded forecasts of $-64.2 billion, and trailed September’s $-61.2 billion.
Although the data was weak, the US Dollar Index (DXY), which tracks the buck’s performance against other six currencies, is climbing 0.02%, at 103.98. However, the drop in US Treasury bond yields is a headwind for the AUD/USD.
Aside from this in Wednesday’s Asian session, the Aussie’s Gross Domestic Product (GDP) in the third quarter exceeded forecasts of 1.8% YoY, came at 2.1%, while quarterly figures, missed the estimates. Even though the data was mixed, it underpinned the AUD/USD, which rallied to a daily high three pips shy of the 0.6600, before trimming its gains.
AUD/USD Price Analysis: Technical outlook
The pair is hovering around the 200-day moving average (DMA) at 0.6577, which, once cleared o the upside, could pave the way for further gains. Nevertheless, bears had gained momentum after the AUD/USD clashed with a downslope resistance trendline drawn from the YTD high. Hence, the path of least resistance in the near term is consolidation. But a daily close above the 200-DMA, the pair could rally toward 0.6600 and beyond. Otherwise, expect a drop toward the December 5 low of 0.6544, followed by the 0.6500 mark.
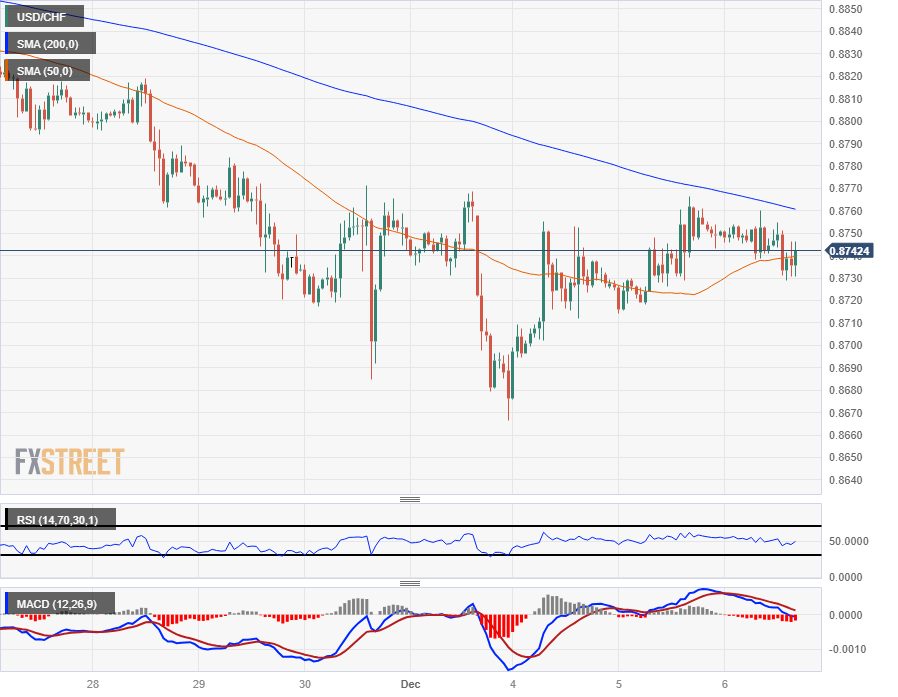
- The USD/CHF is down slightly on Wednesday, but still up around 0.66% on the week.
- US ADP Employment Change added fewer jobs than forecast models predicted.
- The back half of the trading week sees a strong focus on US labor figures.
The USD/CHF shed a little over a tenth of a percent from Wednesday’s peak bids of 0.8760 before a pullback towards the day’s opening prices in the American market session.
Investors are seeing a possible softening of the US’ current rate of job growth after the ADP Employment Change came in below expectations, showing a gain of 103K jobs in November versus the expected 130K. The ADP November Employment Change slipped back from October’s print of 106K (revised down from 113K), reversing investors’ expectations of an increase in new jobs growth.
With the ADP printing its lowest jobs addition since February 2021, focus will be increasing on Friday’s upcoming US Nonfarm Payrolls (NFP) report. Markets are currently forecasting Friday’s US NFP for November to come in at 185K versus October’s 150K. US NFP jobs gains have missed expectations for three of the last five MoM prints.
Friday’s NFP will be be followed up by the University of Michigan’s Consumer Sentiment index, and the monthly consumer outlook survey is expected to come in at 62.0 for December, an increase over November’s 61.3.
Before that, Thursday sees US Initial Jobless Claims for the week into December 1st, where markets are expecting another slight uptick from 218K to 222K new jobless benefits applicants.
USD/CHF Technical Outlook
The USD/CHF is trading thinly through the mid-week market session, trading in a tight Wednesday range between 0.8760 and 0.8730.
Intraday prices are getting hung up on the 50-hour Simple Moving Average (SMA), and overall price momentum appears to have drained out of the pair as bids approach the 200-hour SMA, just above the day’s range near 0.8760.
Despite Wednesday’s price stall the USD/CHF remains in the green, up three-quarters of a percent from Monday’s opening bids, but the pair is still buried deep in bear country, down a little over 4% from November’s peak of 0.9112 and in the red 5.75% on the year.
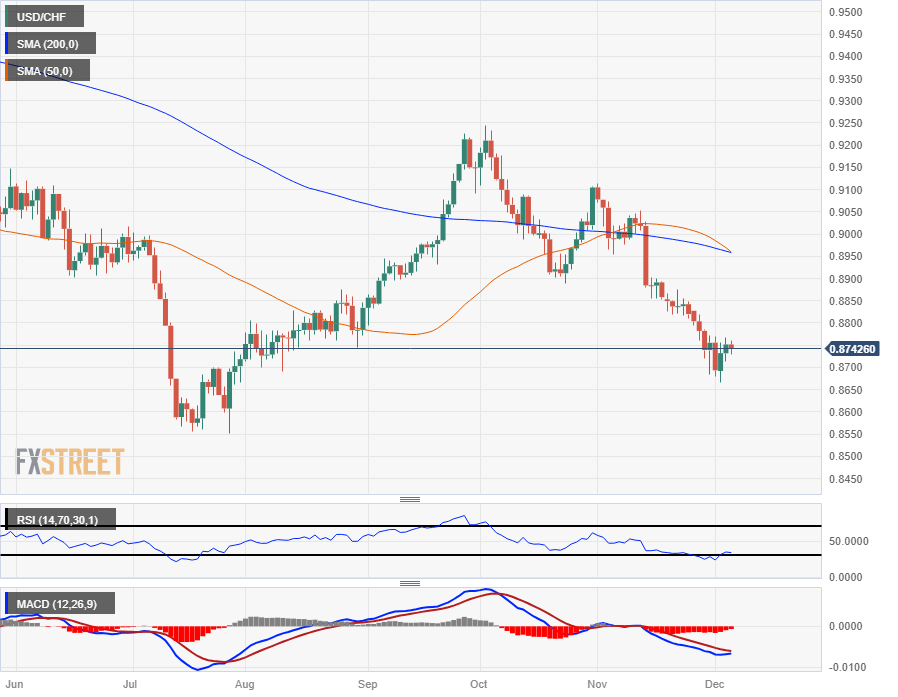
The 50-day SMA is set for a bearish crossover of the longer 200-day SMA, but the fourth quarter’s accelerated declines in the US Dollar against the Swiss Franc leaves price action well below the daily candlestick average, with the 200-day SMA currently drifting down into 0.8950.
USD/CHF Hourly Chart
USD/CHF Daily Chart
USD/CHF Technical Levels
- The XAG/USD stands at $24.05, with mild losses.
- The US Automatic Data Processing Inc. employment Change came in lower than expected.
- US Q3 Unit Labour Costs were revised downwards to -1.2%.
- The US Dollar holds steady in weekly highs; US yields are edging downwards.
The XAG/USD declined to the $24.05 level on Wednesday, trading with mild losses. However, the downward movements may be limited, as negative figures from the US labor market may trigger further dovish bets on the Federal Reserve (Fed), potentially pushing the US yields further down.
The US Unit Labour Costs for Q3 were revised downwards and declined by -1.2%, slightly under the consensus estimate of -0.9%. Additionally, the US Automatic Data Processing Inc. (ADP) reported a lower-than-expected employment change figure for November. These figures clocked in at 103k, compared to the consensus estimate of 130k and the previous figure of 106k, shedding light on a somewhat cooling job creation pace in the labor market.
However, on Friday, traders will keenly follow several key statistics released by the U.S. Bureau of Labor Statistics, which will provide a more conclusive outlook on the US labor market. The Unemployment rate, Nonfarm Payrolls, and Average Hourly Earnings, reports closely monitored by the Fed, may shape the upcoming decisions of the bank and will likely generate volatility in the US bond market and hence on the metals price. In addition, the sector's tendency may start shaping the calendar on when the Fed will start cutting rates, which will also set the pace of the USD price dynamics.
Currently, US bond yields are trending downward. The 2-year rate is fixed at 4.59%, while the 5-year and 10-year yields are observed at 4.11% and 4.12%, respectively. This movement may support non-yielding metals since US Treasury bond yields are often seen as their opportunity cost.
XAG/USD levels to watch
The Relative Strength Index (RSI) is exhibiting a negative slope within positive territory while the presence of rising red bars in the Moving Average Convergence Divergence (MACD) further supports the idea that on the daily chart, sellers are gaining traction.
However, the price trades above the 20, 100, and 200-day Simple Moving Averages (SMAs). This configuration is commonly seen as a solid sign of underlying bullish control, suggesting that buyers might maintain dominance over the midterm's trend despite short-term bearish pressure.
Support Levels: $23.90 (20-day SMA), $23.50, $23.30 (100-day SMA).
Resistance Levels: $24.50, $24.70, $25.00.
XAG/USD daily chart
-638374764382527904.png)
- Mexican Peso stages a comeback as the USD/MXN breaks key support at the 100-day SMA, eyeing 17.00.
- Mexico’s Consumer Confidence improved the most since 2019.
- US ADP Employment Change was softer than expected, weighed on the US Dollar.
Mexican Peso (MXN) gains traction against the US Dollar (USD) as the soft-landing narrative takes place in the financial markets. Expectations for rate cuts by major central banks next year sent global bond yields into a tailspin, while the Greenback (USD) remains firm. Nevertheless, the USD/MXN is trading at 17.24 below its 100-day Simple Moving Average (SMA), posting daily losses of 0.77%.
Mexico’s economic docket revealed Consumer Confidence data, which failed to gain traders’ attention, and remained focused on the release of further economic data from the United States (US) ahead of Friday’s November Nonfarm Payrolls (NFP) report.
Daily digest movers: Mexican Peso continues to strengthen amid growing confidence in Mexican households
- Consumer confidence in Mexico improved to 47.3, seasonally adjusted, exceeding October’s 46.2 reading, its highest level since February 2019.
- Mexico's economic calendar will feature the release of November’s Consumer Price Index (CPI), on Thursday, expected to show a slight climb compared to October’s readings.
- Across the border, Automatic Data Processing (ADP) and the Stanford Digital Lab revealed the US ADP Employment Change report, which shows companies hiring in the US and is seen as a prelude to Nonfarm Payrolls. November’s ADP Employment report showed that 103,000 jobs were added to the economy, below forecasts of 130,000, and trailed downward revised data from October at 106,000.
- Further data showed the US Trade deficit widened more than projected in October due to a decline in exports. The trade deficit was expected at $64.2 billion, and it came to $64.3 billion, spurred by exports of goods and services dropping 1%, while imports rose by 0.2%.
- Meanwhile, October’s JOLTs report showed the labor market is cooling. Jobs data, alongside a decline in the US Federal Reserve’s (Fed) preferred inflation gauge, the Core Personal Consumption Expenditures (PCE) Price Index, have been two of the reasons why market participants are expecting more than 100 basis points of rate cuts by the Fed.
Technical Analysis: Mexican Peso regains control as the USD/MXN extends its losses under the 100-day SMA
The USD/MXN is reversing its previous course, and dropped below the 100-day SMA at 17.38, extending its losses below the 17.30 figure. A daily close below that level would cement its bearish bias. In that outcome, the pair's first support would be the current week’s low 17.16, followed by strong support found at 17.05. Once taken out, the 17.00 figure would be up for grabs.
On the other hand, if USD/MXN climbs past the 100-day SMA, that would pave the way to test at 17.50 and the 200-day SMA at 17.55. A breach of those two levels could open the door to testing he 50-day SMA at 17.68.
Mexican Peso FAQs
What key factors drive the Mexican Peso?
The Mexican Peso (MXN) is the most traded currency among its Latin American peers. Its value is broadly determined by the performance of the Mexican economy, the country’s central bank’s policy, the amount of foreign investment in the country and even the levels of remittances sent by Mexicans who live abroad, particularly in the United States. Geopolitical trends can also move MXN: for example, the process of nearshoring – or the decision by some firms to relocate manufacturing capacity and supply chains closer to their home countries – is also seen as a catalyst for the Mexican currency as the country is considered a key manufacturing hub in the American continent. Another catalyst for MXN is Oil prices as Mexico is a key exporter of the commodity.
How do decisions of the Banxico impact the Mexican Peso?
The main objective of Mexico’s central bank, also known as Banxico, is to maintain inflation at low and stable levels (at or close to its target of 3%, the midpoint in a tolerance band of between 2% and 4%). To this end, the bank sets an appropriate level of interest rates. When inflation is too high, Banxico will attempt to tame it by raising interest rates, making it more expensive for households and businesses to borrow money, thus cooling demand and the overall economy. Higher interest rates are generally positive for the Mexican Peso (MXN) as they lead to higher yields, making the country a more attractive place for investors. On the contrary, lower interest rates tend to weaken MXN.
How does economic data influence the value of the Mexican Peso?
Macroeconomic data releases are key to assess the state of the economy and can have an impact on the Mexican Peso (MXN) valuation. A strong Mexican economy, based on high economic growth, low unemployment and high confidence is good for MXN. Not only does it attract more foreign investment but it may encourage the Bank of Mexico (Banxico) to increase interest rates, particularly if this strength comes together with elevated inflation. However, if economic data is weak, MXN is likely to depreciate.
How does broader risk sentiment impact the Mexican Peso?
As an emerging-market currency, the Mexican Peso (MXN) tends to strive during risk-on periods, or when investors perceive that broader market risks are low and thus are eager to engage with investments that carry a higher risk. Conversely, MXN tends to weaken at times of market turbulence or economic uncertainty as investors tend to sell higher-risk assets and flee to the more-stable safe havens.
text here
- The Canadian Dollar is on the rise on Wednesday, looking to recover lost ground.
- The BoC held rates at 5% as the markets broadly expected.
- The CAD is in the green against the Greenback on Wednesday, but still down for the week.
The Canadian Dollar (CAD) is squeezing out some gains on Wednesday after the Bank of Canada (BoC) decided to hold its benchmark interest rate at 5%, in-line with market expectations. The CAD is seeing a step up against most of the major currency blocs but still remains down against the Antipodeans.
The Bank of Canada (BoC) held rates steady for the third straight meeting in a row, leaving enough hawkish wiggle room on the table to warn that further rate hikes would follow if inflation risks increase.
Daily Digest Market Movers: Canadian Dollar stretches for more after BoC rate hold
- The Canadian Dollar is on the move against the US Dollar, looking to recover ground after getting pushed lower against the Greenback in the early week run-up to the BoC’s rate call.
- The BoC held its benchmark rate at 5% just as markets expected.
- The Canadian central bank also cooled its hawkish rhetoric, paring back statements about inflation risks and keeping the focus on easing price pressures.
- The BoC left some hawkish statements on the table, reiterating that rates can and will go higher if inflationary pressure returns.
- BoC Statement: “Governing Council wants to see further and sustained easing in core inflation, and continues to focus on the balance between demand and supply in the economy, inflation expectations, wage growth and corporate pricing behaviour.”
- US ADP Employment Change figures missed the mark on Wednesday, introducing some jitters into USD-based currency pairs.
- The US ADP Employment Change for November showed 103K new jobs added to the US economy, below the forecasted upswing to 130K and falling back from October’s 106K (revised down from 113K).
- US Initial Jobless Claims for the week of November 24 will be the notable data release on Thursday before markets round the corner into Friday’s US Nonfarm Payrolls (NFP).
Canadian Dollar price today
The table below shows the percentage change of Canadian Dollar (CAD) against listed major currencies today. Canadian Dollar was the strongest against the US Dollar.
| USD | EUR | GBP | CAD | AUD | JPY | NZD | CHF | |
| USD | -0.01% | -0.03% | -0.19% | -0.50% | -0.04% | -0.53% | -0.16% | |
| EUR | 0.01% | -0.01% | -0.19% | -0.48% | -0.02% | -0.51% | -0.15% | |
| GBP | 0.01% | 0.00% | -0.19% | -0.50% | -0.04% | -0.54% | -0.15% | |
| CAD | 0.20% | 0.20% | 0.18% | -0.29% | 0.18% | -0.31% | 0.03% | |
| AUD | 0.48% | 0.48% | 0.47% | 0.29% | 0.44% | -0.04% | 0.34% | |
| JPY | 0.03% | 0.03% | 0.00% | -0.18% | -0.50% | -0.50% | -0.14% | |
| NZD | 0.53% | 0.51% | 0.53% | 0.31% | 0.03% | 0.49% | 0.36% | |
| CHF | 0.13% | 0.14% | 0.15% | -0.04% | -0.32% | 0.12% | -0.36% |
The heat map shows percentage changes of major currencies against each other. The base currency is picked from the left column, while the quote currency is picked from the top row. For example, if you pick the Euro from the left column and move along the horizontal line to the Japanese Yen, the percentage change displayed in the box will represent EUR (base)/JPY (quote).
Technical Analysis:
The Canadian Dollar (CAD) is marginally higher on Wednesday, only losing ground against the Aussie (AUD) and the Kiwi (NZD) for the mid-week market session. The CAD is up around a fifth of a percent against the US Dollar (USD) on the day, dragging the USD/CAD back into familiar chart territory near 1.3550.
The USD/CAD gained ground in the early week, taking the pair from opening bids near 1.3495 directly into the 200-hour Simple Moving Average (SMA) just below the 1.3600 handle.
The Canadian Dollar is in the green for the week against everything except the safe havens. Despite the Loonie’s bid on Wednesday, the USD/CAD still remains down around half a percent from Monday’s opening bids.
USD/CAD Hourly Chart
USD/CAD Daily Chart
Canadian Dollar FAQs
What key factors drive the Canadian Dollar?
The key factors driving the Canadian Dollar (CAD) are the level of interest rates set by the Bank of Canada (BoC), the price of Oil, Canada’s largest export, the health of its economy, inflation and the Trade Balance, which is the difference between the value of Canada’s exports versus its imports. Other factors include market sentiment – whether investors are taking on more risky assets (risk-on) or seeking safe-havens (risk-off) – with risk-on being CAD-positive. As its largest trading partner, the health of the US economy is also a key factor influencing the Canadian Dollar.
How do the decisions of the Bank of Canada impact the Canadian Dollar?
The Bank of Canada (BoC) has a significant influence on the Canadian Dollar by setting the level of interest rates that banks can lend to one another. This influences the level of interest rates for everyone. The main goal of the BoC is to maintain inflation at 1-3% by adjusting interest rates up or down. Relatively higher interest rates tend to be positive for the CAD. The Bank of Canada can also use quantitative easing and tightening to influence credit conditions, with the former CAD-negative and the latter CAD-positive.
How does the price of Oil impact the Canadian Dollar?
The price of Oil is a key factor impacting the value of the Canadian Dollar. Petroleum is Canada’s biggest export, so Oil price tends to have an immediate impact on the CAD value. Generally, if Oil price rises CAD also goes up, as aggregate demand for the currency increases. The opposite is the case if the price of Oil falls. Higher Oil prices also tend to result in a greater likelihood of a positive Trade Balance, which is also supportive of the CAD.
How does inflation data impact the value of the Canadian Dollar?
While inflation had always traditionally been thought of as a negative factor for a currency since it lowers the value of money, the opposite has actually been the case in modern times with the relaxation of cross-border capital controls. Higher inflation tends to lead central banks to put up interest rates which attracts more capital inflows from global investors seeking a lucrative place to keep their money. This increases demand for the local currency, which in Canada’s case is the Canadian Dollar.
How does economic data influence the value of the Canadian Dollar?
Macroeconomic data releases gauge the health of the economy and can have an impact on the Canadian Dollar. Indicators such as GDP, Manufacturing and Services PMIs, employment, and consumer sentiment surveys can all influence the direction of the CAD. A strong economy is good for the Canadian Dollar. Not only does it attract more foreign investment but it may encourage the Bank of Canada to put up interest rates, leading to a stronger currency. If economic data is weak, however, the CAD is likely to fall.
- The Euro bounces up and approaches intra-day highs at 1.0800.
- Weak US ADP data sends the UD Dollar lower across the board.
- Downbeat Euroone figures are limiting the Euro’s recovery.
The Euro is trimming some losses ahead of Wednesday’s US session opening, favoured by a mild US Dollar weakness after the US ADP report showed an unexpected decline in US employment.
US ADP confirms that US labor market is cooling
Job creation increased by 103,000 new payrolls in the US in. November, well below the 130,000 reading forecasted by the market. Apart from that, October’s reading has been revised down to 106,000 from the previously estimated 113,00.
These figures confirm that the impact of the restrictive interest rates is starting to hit the labour market. The impact on the pair however, has been subdued, with the Euro weighed by downbeat German Factory orders and the contracting services activity data seen on Tuesday.
If the Nornfarm Payrolls report confirms this view on Friday, it will boost feeds speculation that the Fed might start curing rates in the first quarter of 2024 and increase negative pressure on the US Dollar.
The broader picture, however, remains little changed. The pair maintains a clear bearish bias, while below 1.0800 and 1.0850. On the downside, support levels are 1.0750 and 1.0660.
Technical levels to watch
- Private sector employment grew at a softer pace than expected in November.
- US Dollar Index continues to fluctuate at around 104.00.
Private sector employment in the US rose by 103,000 in November, the data published by Automatic Data Processing (ADP) showed on Wednesday. This reading followed the 106,000 increase recorded in October (revised from 113,000) and came in below the market expectation of 130,000.
Assessing the survey's findings, "restaurants and hotels were the biggest job creators during the post-pandemic recovery," said Nela Richardson, chief economist, ADP. "But that boost is behind us, and the return to trend in leisure and hospitality suggests the economy as a whole will see more moderate hiring and wage growth in 2024."
Further details of the publication revealed that the annual pay was up 5.6% year-over-year in November.
Market reaction
The US Dollar Index showed no immediate reaction to these figures and was last seen moving sideways at around 104.00.
- Sterling's rebound from 185.00 is capped at 185.60.
- Dovish BoJ rhetoric hurt the Yen.
- The broader bearish trend remains intact.
The pound has nudged higher against a weaker Japanese Yen, weighed by the dovish comments by the BoJ deputy governor and a moderate uptick on US Treasury yields.
BoJ dep gov Himino cooled hopes of momentary policy normalisation in the next months, suggesting that interest rates will remain negative until sustained stable 2% inflation is achieved.
Beyond that, the moderate pick up on US Treasury yields has added pressure on the Yen, which is the most sensitive currency to yield differentials with US bonds.
The hourly chart shows hesitation above 185.00, resulting in a falling triangle pattern. This figure has a bearish bias with next support levels below 185.00, at 18470 and 182.73. Resistances are 185.80 and 186.15.
Technical levels to watch
- The New Zealand Dollar’s rebound failed at 1.6175.
- The USD remains bid ahead of the ADP report.
- NZD/USD is forming an H&S pattern with the neckline at 1.6120.
New Zealand’s dollar remains unable to put a significant distance from the 1.6120 support level tested on Tuesday with upside attempts limited below 0.6175 so far.
US ADP Employment on focus
The moderate risk appetite favours the Kiwi, although the uptick on US Treasury yields maintains the Dollar buoyed on Wednesday, ahead of the release of the US ADP employment report.
Tuesday’s data offered a mixed picture, with the US ISM showing better than expected readings although the JOLTs Job Openings confirmed that the labour market is cooling.
The Technical picture shows the longer-term rally losing steam, with the recent price action forming a Head and Shoulders figure, often a sign of a trend change.
The neckline of the mentioned H&S is at 0.6120, with the next support levels at 0.6050 and 0.6000. Resistances are 0.6220 and 0.6340.
Technical levels to watch
- The DXY US Dollar Index continues to rally for a third straight day.
- Traders will assess US ADP Employment Change and Trade Balance data.
- The US Dollar Index could close above 104.00, on track to return to October levels.
The US Dollar (USD) is entering a third straight day of gains measured by the US Dollar Index (DXY). Although US yields are retreating, the rate differential with other countries and their currencies is getting wider because markets are starting to price in quicker and bigger cuts in other countries than what is foreseen for the US Federal Reserve. On Wednesday, traders will keep a close eye on the Euro against the US Dollar cross (EUR/USD) as a crucial 1.0770 level might open up room for the pair to move towards 1.0600 in the short term.
On the economic front, traders will look for insights from the ADP Employment Change for November. Although markets know that the number holds no correlation with the US Jobs report on Friday, a beat on expectations could trigger another batch of strength for the Greenback. Apart from ADP data, the US Goods Trade Balance could add some more fuel to the move.
Daily digest: ADP on the wire
- At 12:00 GMT, the Mortgage Bankers Association will release its weekly Mortgage Applications Index. Previous was at 0.3%, with no forecast pencilled in.
- At 13:15 GMT, the ADP Employment number for November is expected. Previous was at 113,000, and a slightly higher 130,000 is expected.
- US Trade Balance data for October is due at 13:30 GMT:
- Goods and Services Trade Balance is expected to head from $61.5 billion deficit to $64.1 billion deficit.
- The Goods Trade Balance was at a deficit of $89.8 billion in September, with no forecast pencilled in.
- Nonfarm Productivity for the third quarter, due to be released at 13:30 GMT, is expected to tick up from 4.7% to 4.9%.
- Unit Labor Costs for the third quarter is expected to decline 0.9%, slightly more than the 0.8% contraction seen in the second quarter.
- Equities are trying to turn the tide on their negative performance for December. All indices are up across the globe, with Asian equities rallying over 1%.
- The CME Group’s FedWatch Tool shows that markets are pricing in a 99.7% chance that the Federal Reserve will keep interest rates unchanged at its meeting next week.
- The benchmark 10-year US Treasury Note drops to 4.17%. Yields in Europe are falling even quicker.
US Dollar Index technical analysis: Not back yet
The US Dollar trades around 104.00 and looks set to head into a third straight day of gains. Although yields are declining in the US, they are falling even quicker in Europe and other countries, which means that intrinsically the US Dollar is valued higher in terms of return than most of its peers. This rate differential, which persists even in a declining-rate-environment, could see the US Dollar Index (DXY) head back to levels near 105.00-106.00.
The DXY broke the high on Monday and closed off near 103.54 on Tuesday. The DXY could still make it further up, should employment data trigger rising US yields again. A two-tiered pattern of a daily close lower followed by an opening higher would quickly see the DXY back above 104.28, with the 55-day and 100-day Simple Moving Averages (SMA) turned over to support levels.
To the downside, the 200-day SMA shouldact as support and not allow the DXY to drop below 103.57. If it fails, the lows of June make sense to look for some support near 101.92. Should more events take place that initiate further declines in US rates, expect to see a near-full unwind of the 2023 summer rally, heading to 100.82, followed by 100.00 and 99.41.
US Dollar FAQs
What is the US Dollar?
The US Dollar (USD) is the official currency of the United States of America, and the ‘de facto’ currency of a significant number of other countries where it is found in circulation alongside local notes. It is the most heavily traded currency in the world, accounting for over 88% of all global foreign exchange turnover, or an average of $6.6 trillion in transactions per day, according to data from 2022.
Following the second world war, the USD took over from the British Pound as the world’s reserve currency. For most of its history, the US Dollar was backed by Gold, until the Bretton Woods Agreement in 1971 when the Gold Standard went away.
How do the decisions of the Federal Reserve impact the US Dollar?
The most important single factor impacting on the value of the US Dollar is monetary policy, which is shaped by the Federal Reserve (Fed). The Fed has two mandates: to achieve price stability (control inflation) and foster full employment. Its primary tool to achieve these two goals is by adjusting interest rates.
When prices are rising too quickly and inflation is above the Fed’s 2% target, the Fed will raise rates, which helps the USD value. When inflation falls below 2% or the Unemployment Rate is too high, the Fed may lower interest rates, which weighs on the Greenback.
What is Quantitative Easing and how does it influence the US Dollar?
In extreme situations, the Federal Reserve can also print more Dollars and enact quantitative easing (QE). QE is the process by which the Fed substantially increases the flow of credit in a stuck financial system.
It is a non-standard policy measure used when credit has dried up because banks will not lend to each other (out of the fear of counterparty default). It is a last resort when simply lowering interest rates is unlikely to achieve the necessary result. It was the Fed’s weapon of choice to combat the credit crunch that occurred during the Great Financial Crisis in 2008. It involves the Fed printing more Dollars and using them to buy US government bonds predominantly from financial institutions. QE usually leads to a weaker US Dollar.
What is Quantitative Tightening and how does it influence the US Dollar?
Quantitative tightening (QT) is the reverse process whereby the Federal Reserve stops buying bonds from financial institutions and does not reinvest the principal from the bonds it holds maturing in new purchases. It is usually positive for the US Dollar.
US Dollar recovery stalls with the BoC and US ADP on focus.
The Bank of Canada will leave rates on hold at 5%.
ADP employment is expected to have improved moderately.
The Bank of Canada is expected to leave its benchmark interest rate on hold at 5% for the third consecutive time. Inflation has confirmed its cooling trend, although it remains well above the BoC’s 2% target, while the economy contracted in the third quarter.
BoC’s governor Macklem has maintained a hawkish tone in recent speeches, highlighting the strong price pressures and refusing any chance of rate cuts. Investors will be looking for hints of a dovish turn to sell Canadian Dollars.
Somewhat earlier the US ADP will release its November payrolls report. Job creation is expected to have improved moderately, to 130,000 from 113,000. These figures anticipate Friday’s Nonfarm payroll report, thus any significant deviation from the market consensus might boost USD volatility.
The technical picture is mixed with a recent bullish cross in hourly SMAs offering some hope for bulls. Resistances are 1.3595 and 1.3620. Supports remain at 1.3550 and 1.3480.
Technical levels to watch
- WTI Oil trades near $72 and is set to drop lower as US supply hits the export market.
- Oil looks set to sink even further as OPEC+ countries are reluctant to expand current production cuts.
- The US Dollar gears up for a third straight day of gains when measured by the US Dollar Index.
Oil prices are breaking the November low as more supply is hitting the market with US exports topping nearly 6 million barrels per day. Meanwhile, Saudi Arabia is slashing prices for Crude Exports into the Asian region. It becomes clear that what OPEC+ has reproduced as a deal isn’t enough to counterweight the effect from US Oil barrels hitting the markets.
Meanwhile, the US Dollar (USD) is firming up for a third straight day. The DXY US Dollar Index is near 104.00 and could pop higher during the week. Although US yields are declining, they are declining less rapidly than other peers, which favors the US Dollar against most other currencies.The Euro, the Chinese Yuan and Central European currencies are the biggest losers.
Crude Oil (WTI) trades at $72.32 per barrel and Brent Oil trades at $77.12 per barrel at the time of writing.
Oil news and market movers: US exports become omen for OPEC+
- US Crude exports could reach about 5.7 million barrels a day, according to ship-tracking firms Kpler and Vortexa. The Energy Information Administration (EIA) data on Wednesday could confirm these findings.
- Saudi Arabia has cut its pricing for Crude destined for the Asian market, according to a Bloomberg survey.
- Overnight, the weekly numbers from the American Petroleum Institute (API) revealed a build of 0.594 million barrels against the drawdown of 0.817 million barrels a week earlier.
- On Wednesday, the Energy Information Administration (EIA) is due to release the weekly change in US Crude stockpile. Expectations are for a draw of 2.267 million against the buildup of 1.609 million a week ago.
Oil Technical Analysis: Going down
Oil prices are sinking, breaking below November’s low. While OPEC+ faces a supply surplus, this surplus is getting bigger as the US becomes a big Oil producer. By dumping 6 million barrels per day on the global market, the excess surplus could well linger on for months before OPEC+ can finally tweak its policy in order to adjust production to liquidate the surplus. In this context, more downside is to come forOil prices until an OPEC+ decision or another catalyst takes out the surplus.
On the upside, $80.00 is the resistance to watch out for. Should crude be able to jump above that again, look for $84.00 (purple line) as the next level to see some selling pressure or profit taking. Should Oil prices be able to consolidate above there, the topside for this fall near $93.00 could come back into play.
On the downside, the soft floor near $74.00 is crumbling with a fresh low for November. This level is acting as the last line of defence before entering $70.00 and lower. Watch out for $67.00, which aligns with atriple bottom from June, as the next support level to trade at.
-638374556211463754.png)
US WTI Crude Oil: Daily Chart
WTI Oil FAQs
What is WTI Oil?
WTI Oil is a type of Crude Oil sold on international markets. The WTI stands for West Texas Intermediate, one of three major types including Brent and Dubai Crude. WTI is also referred to as “light” and “sweet” because of its relatively low gravity and sulfur content respectively. It is considered a high quality Oil that is easily refined. It is sourced in the United States and distributed via the Cushing hub, which is considered “The Pipeline Crossroads of the World”. It is a benchmark for the Oil market and WTI price is frequently quoted in the media.
What factors drive the price of WTI Oil?
Like all assets, supply and demand are the key drivers of WTI Oil price. As such, global growth can be a driver of increased demand and vice versa for weak global growth. Political instability, wars, and sanctions can disrupt supply and impact prices. The decisions of OPEC, a group of major Oil-producing countries, is another key driver of price. The value of the US Dollar influences the price of WTI Crude Oil, since Oil is predominantly traded in US Dollars, thus a weaker US Dollar can make Oil more affordable and vice versa.
How does inventory data impact the price of WTI Oil
The weekly Oil inventory reports published by the American Petroleum Institute (API) and the Energy Information Agency (EIA) impact the price of WTI Oil. Changes in inventories reflect fluctuating supply and demand. If the data shows a drop in inventories it can indicate increased demand, pushing up Oil price. Higher inventories can reflect increased supply, pushing down prices. API’s report is published every Tuesday and EIA’s the day after. Their results are usually similar, falling within 1% of each other 75% of the time. The EIA data is considered more reliable, since it is a government agency.
How does OPEC influence the price of WTI Oil?
OPEC (Organization of the Petroleum Exporting Countries) is a group of 13 Oil-producing nations who collectively decide production quotas for member countries at twice-yearly meetings. Their decisions often impact WTI Oil prices. When OPEC decides to lower quotas, it can tighten supply, pushing up Oil prices. When OPEC increases production, it has the opposite effect. OPEC+ refers to an expanded group that includes ten extra non-OPEC members, the most notable of which is Russia.
- Gold is looking for direction with all eyes on US ADP employment figures.
- The precious metal’s broader bullish trend is losing momentum as the Dollar regains lost ground.
- Further evidence that the US is heading into a soft landing underpins demand for Gold.
Gold (XAU/USD) price consolidates around $2,020 on Wednesday as the reversal from all-time highs at $2,150 seen at the week opening has been contained above $2,000. Gold appears to be holding up this psychological level, although the rebound has failed to find acceptance above $2,040.
US Treasury yields are showing a mild pick up on Wednesday after having lost more than 2% on Tuesday. This is providing moderate support for the US Dollar and weighing on the precious metal as we head into the release of the US ADP employment report.
Data from Tuesday offered a mixed picture. The US ISM Services PMI beat expectations, but the US JOLTS job openings survey revealed that the labour market is starting to feel the pinch of higher interest rates.
Later today, November’s ADP employment report is expected to show a moderate increase in job creation. With the Federal Reserve (Fed) on its blackout period ahead of next week’s meeting, the ADP and Friday’s Nonfarm Payrolls data will be scrutinised with interest for further cues into the Fed’s monetary policy plans.
Daily Digest Market Movers: Gold remains steady at high levels on hopes of Fed cuts
- Gold prices remain steady at high levels as the market is increasingly confident that the Fed will start cutting rates in March.
- The CME Group FedWatch Tool keeps pricing a 53% chance that the US central bank will trim its benchmark rate by 25 basis points in March.
- Markets are in a moderately positive mood on Wednesday, with investors increasingly confident that the major central bank’s tightening cycles have ended.
- US JOLTS Job Openings survey showed that the US labour market is losing momentum, adding to evidence that the restrictive monetary policy is starting to hit demand for workers.
- On the other hand, the US ISM Services PMI showed a larger-than-expected improvement, which discards a sharp downturn in the US economy.
- Tuesday’s data endorses the view of slowing US growth and a softer labour market, consistent with a soft landing narrative. This hurts the US Dollar and US yields, and it is good news for precious metals.
- News that Moody’s has cut China’s credit outlook to negative due to the increasing debt risks is weighing on risk appetite.
- At 13:15 GMT, the US ADP Employment Report is expected to show an increase of 130,000 payrolls in November, up from the 113,000 reported in October.
Technical Analysis: Gold prices tread water below $2,040
From a technical perspective, Gold prices remain in a consolidation mood. Downside attempts are contained above a key support area at $2,000, while upside attempts are capped below the $2,040 level.
The broader bullish trend has lost steam after breaking the 50% Fibonacci retracement level of the November 13 - December 5 bull run. Beyond that, Gold’s inverse correlation with a stronger US Dollar suggests that further decline should not be discarded.
On the downside, a confirmation below the $2,000 support area would negate the broader upside trend and increase bearish pressure towards $1,950 and $1,932.
On the upside, a bullish reaction above $2,040 would clear the path towards $2,067, ahead of the record-high $2,150.
US Dollar price this week
The table below shows the percentage change of US Dollar (USD) against listed major currencies this week. US Dollar was the weakest against the Canadian Dollar.
| USD | EUR | GBP | CAD | AUD | JPY | NZD | CHF | |
| USD | 0.94% | 0.99% | 0.67% | 1.72% | 0.69% | 1.16% | 0.80% | |
| EUR | -0.97% | 0.05% | -0.28% | 0.78% | -0.27% | 0.21% | -0.14% | |
| GBP | -1.02% | -0.05% | -0.32% | 0.74% | -0.30% | 0.16% | -0.19% | |
| CAD | -0.67% | 0.25% | 0.33% | 1.06% | 0.01% | 0.49% | 0.13% | |
| AUD | -1.75% | -0.80% | -0.75% | -1.08% | -1.06% | -0.56% | -0.94% | |
| JPY | -0.73% | 0.26% | 0.46% | 0.00% | 1.06% | 0.49% | 0.10% | |
| NZD | -1.17% | -0.20% | -0.16% | -0.47% | 0.58% | -0.45% | -0.35% | |
| CHF | -0.86% | 0.11% | 0.15% | -0.17% | 0.92% | -0.14% | 0.33% |
The heat map shows percentage changes of major currencies against each other. The base currency is picked from the left column, while the quote currency is picked from the top row. For example, if you pick the Euro from the left column and move along the horizontal line to the Japanese Yen, the percentage change displayed in the box will represent EUR (base)/JPY (quote).
Gold FAQs
Why do people invest in Gold?
Gold has played a key role in human’s history as it has been widely used as a store of value and medium of exchange. Currently, apart from its shine and usage for jewelry, the precious metal is widely seen as a safe-haven asset, meaning that it is considered a good investment during turbulent times. Gold is also widely seen as a hedge against inflation and against depreciating currencies as it doesn’t rely on any specific issuer or government.
Who buys the most Gold?
Central banks are the biggest Gold holders. In their aim to support their currencies in turbulent times, central banks tend to diversify their reserves and buy Gold to improve the perceived strength of the economy and the currency. High Gold reserves can be a source of trust for a country’s solvency. Central banks added 1,136 tonnes of Gold worth around $70 billion to their reserves in 2022, according to data from the World Gold Council. This is the highest yearly purchase since records began. Central banks from emerging economies such as China, India and Turkey are quickly increasing their Gold reserves.
How is Gold correlated with other assets?
Gold has an inverse correlation with the US Dollar and US Treasuries, which are both major reserve and safe-haven assets. When the Dollar depreciates, Gold tends to rise, enabling investors and central banks to diversify their assets in turbulent times. Gold is also inversely correlated with risk assets. A rally in the stock market tends to weaken Gold price, while sell-offs in riskier markets tend to favor the precious metal.
What does the price of Gold depend on?
The price can move due to a wide range of factors. Geopolitical instability or fears of a deep recession can quickly make Gold price escalate due to its safe-haven status. As a yield-less asset, Gold tends to rise with lower interest rates, while higher cost of money usually weighs down on the yellow metal. Still, most moves depend on how the US Dollar (USD) behaves as the asset is priced in dollars (XAU/USD). A strong Dollar tends to keep the price of Gold controlled, whereas a weaker Dollar is likely to push Gold prices up.
Bank of England (BoE) Governor Andrew Bailey reiterated on Wednesday that interest rates are likely to need to remain around current levels, per Reuters.
Bailey noted that the outlook for inflation is still uncertain and added that they will remain vigilant to financial stability risks that might arise. He also said that the path of the Chinese economy is a key uncertainty.
Market reaction
These comments don't seem to be having a significant impact on Pound Sterling's performance against its major rivals. As of writing, GBP/USD was virtually unchanged on the day at 1.2595.
- Retail Sales in the Euro area rose modestly in October.
- EUR/USD continues to fluctuate in a tight channel slightly below 1.0800.
Retail Sales in the Euro area and the EU rose by 0.1% and 0.3%, respectively, on a monthly basis in October, Eurostat reported on Wednesday. On a yearly basis, Retail Sales contracted by 1.2% in the Euro area and by 0.9% in the EU.
"In the euro area in October 2023, compared with September 2023, the volume of retail trade increased by 0.8% for non-food products, while it decreased by 0.8% for automotive fuels and by 1.1% for food, drinks and tobacco," Eurostat noted in its publication.
Market reaction
This report failed to trigger a noticeable market reaction. At the time of press, EUR/USD was virtually unchanged on the day at 1.0794.
- The Pound remains vulnerable, capped below 1.2610.
- Weak US macroeconomic data are cushioning sterling’s reversal.
- GBP/USD might trigger a double-top pattern below 1.2600.
Sterling’s recovery attempt from Tuesday’s low at 1.2575 has been capped at 1.2610 earlier on Wednesday, which has left the pair in noman;’s land awaiting the release of the US ADP employment report.
Weak Construction data adds pressure on the Pound
Earlier today, the UK S&P Global/CIPS Construction PMI declined to 45.6, against expectations of an improvement to 46.3 from the 45.6 reading in October, which has weighed on demand for the GBP.
On the other hand, the weak US JOLTs data seen on Tuesday have added to evidence that the high interest rates are starting to pinch the labour market. This feeds hopes that the Fed might start rolling back its tightening cycle early next year, which is hurting the USD.
In this context, the pair remains steady, with investors awaiting the release of the US ADP data and Friday’s US Nonfarm Payrolls for further insight into the Federal Reserve’s monetary policy outlook.
From a wider perspective, technical indicators show the pair losing momentum. Price action has breached the 4h 50 SMA and a key support at 1.2600 is being tested. A confirmation below here would trigger a double-top at 1.2730 increasing pressure towards 1.2517 ahead of the measured target, at 1.2460.
Technical levels to watch
- The Dollar remains moderately bid, ready to test resistance at 147.50.
- Dovish comments from BoJ’s Himino are weighing on the Yen.
- The US ADP later today is likely to determine USD’s near-term path.
The US Dollar keeps a mild bid tone on the Early European trading session, with the pair trading within a narrow range below the 147.45 resistance area and bears contained above 147.00 so far.
The Dollar ticks up on higher US yields and a dovish BoJ
A mild pick up on US Treasury yields and some dovish comments from the BoJ Deputy Governor Himino, cooling expectations about a hawkish turn on the bank’s monetary policy, have increased bearish pressure on the Yen.
The US Dollar however is facing weaknesses of its own. US JOLTs data revealed on Tuesday that the effect of higher rates is starting to spill over the labour market, boosting speculation that the Fed might start cutting rates in early 2024.
If the ADP later today confirms this theory, we might see further USD selling later today.
The technical picture, however, is showing signs of a potential rebound. Four-hour charts show the pair testing the top of a falling wedge pattern right below 147.45, with a bullish divergence on the RSI giving hopes for buyers.
Resistances are 147.50 and 148.50. Supports lie at 146.30 and 146.00.
Technical levels to watch
- The Euro extends losses after weak German factory orders
- Sluggish Eurozone data increases hopes of ECB rate cuts on early 2024
- The EUR/USD approaches an important support area at 1.0750.
The Euro remains offered on Wednesday’s European market opening times. German Factory orders have disappointed, increasing concerns about a deep recession in the Euro Area and adding negative pressure on the Euro.
German factory data weighs on the Euro
New orders for products manufactured in Germany dropped 3.7% in October against market expectations of a flat performance, following a 0.2% increase in September.
These figures come after the region’s services PMI revealed that the sector’s activity contracted for the fourth consecutive month in November, which poses a serious challenge for the ECB’s monetary tightening plans.
Later today, the Retail sales are expected to have improved moderately last month, which might offer some respite to a battered Euro, although the market’s main focus is the US ADP data, due at 12:15 GMT today.
The euro might find some buyers at 1.0750
The near-term bias remains bearish although the confluence of the 4h 200 SMA with a previous resistance area at 1.0750 might provide some support to the Euro. Below here, the next target would be 1.0660
Resistances are at 1.0850 and 1.1010.
Technical levels to watch
- Canadian central bank is forecast to leave the key interest rate unchanged at 5.0% on Wednesday.
- Bank of Canada policymakers are expected to offer little changes to the guidance.
- BoC policy statement could ramp up volatility around the Canadian Dollar.
The Bank of Canada (BoC) is widely expected to leave its policy rate unchanged at 5% for the third consecutive time on Wednesday when it concludes the December policy meeting. The Canadian Dollar (CAD) has been steadily rising against the US Dollar (USD) after USD/CAD broke below 1.3650 two weeks ago, driven by a weaker Greenback across the board. During the current week, the pair rebounded from two months lows below 1.3500, rising to 1.3560.
At the final meeting for 2023, economists expect no changes from the BoC. Canada's economy has had a mixed performance since October. During the third quarter, economic activity contracted, but the central bank anticipates a recovery in the current quarter. Inflation in Canada remains above the 2% target but is moving closer to it. In October, the Consumer Price Index (CPI) rose by 3.1% compared to the same month last year.
Bank of Canada interest rate expectations: No change, no victory
"Inflationary risks have increased since July; inflation is on a higher path than we expected," said Tiff Macklem, Governor of the Bank of Canada, following the October meeting. He further stated that the decision to keep interest rates unchanged aimed to allow monetary policy sufficient time to moderate the economy and alleviate price pressures. Achieving that objective is not yet complete.
Even if inflation reaches the BoC target, it would still require data to indicate that it will remain at that level or below on a sustained basis. However, there is still a long way to go for that scenario to unfold and for the data to reflect it. No “mission accomplished” is likely in the short term. Governor Macklem has stated that it is not the appropriate time to discuss interest rate cuts. This stance will likely continue, and any potential change in that position would only occur early in 2024 if the economy experiences a significant contraction and the labor market data raises concerns.
In October, the BoC decided to keep the policy rate unchanged at 5% for the second time. They reiterated their preparedness to hike rates further if necessary, expressing concerns about the persistence of underlying inflationary pressures. This hawkish bias is expected to prevail, with little room for a dovish surprise.
A softer tone from the BoC is the only possible surprise, but it is improbable. The central bank's credibility is crucial, and they are expected to maintain a firm stance on inflation until they are convinced that it has returned to the target on a permanent basis.
A rate hike from the BoC would also be a surprise since no analysts are currently predicting such a move. Labor market data from Canada released on Friday indicated that employment increased by 25,000 in November, surpassing expectations. However, the Unemployment Rate ticked higher to 5.8%. Full-time jobs primarily drove the positive change in employment, and wages (permanent employees) rose more than anticipated, with a 5% increase compared to the previous year. This data aligns with Macklem's statement in October, highlighting that the “Canadian labor market remains tight and wage pressures persist.” Nonetheless, the report was not a game-changer regarding monetary policy expectations.
A press conference won’t follow the last meeting in 2023, so it is more unlikely for the central bank to change its tone. Hence, the impact on markets is expected to be limited. The current debate in the market regarding interest rates revolves around when the central bank will begin cutting rates in 2024. Therefore, until the BoC offers new perspectives instead of maintaining a “hawkish hold”, the most significant inputs for the markets will continue to be economic data regarding inflation, labor market conditions, and growth.
“To return to low inflation and stable growth in the years ahead, we need these higher interest rates and slow growth in the short term. Our inflation target, our track record and our forceful response will get us through to the other side. We’re well on our way, and we need to stay the course,” Governor Macklem warned Canadians in a speech late in November.
When will the BoC release its monetary policy decision and how could it affect USD/CAD?
The Bank of Canada will announce its policy decision at 15:00 GMT on December 6 through a press release, which will briefly explain the decision. There won’t be a press conference, nor will the quarterly Monetary Policy Report (MPR) be released. The next MPR is scheduled for the next meeting on January 24, 2024.
The impact on the Loonie is expected to be limited. A hawkish hold could reinforce the current downtrend bias in USD/CAD. However, it should be considered that much of the recent decline has been driven by the dynamics of the USD. An even more hawkish tone should boost the Canadian Dollar across the board and potentially expose the recent lows in USD/CAD. The 200-day Simple Moving Average (SMA) at 1.3510 serves as the last defense before a more significant decline, initially targeting September lows at 1.3370 and then a medium-term support level at 1.3300.
An unexpected softer tone from the Bank of Canada would likely weaken the Canadian Dollar, potentially pushing USD/CAD to break above 1.3600 and challenge the 1.3650 area, followed by 1.3665 (confluence of the 20-day and 55-day SMAs). Above that level, the short-term negative bias would be negated.
On Friday, USD/CAD recorded its first weekly close below the 20-week SMA since August. The line currently stands at 1.3590, and another close below it would indicate a consolidation of the bearish momentum.
Economic Indicator
Canada BoC Interest Rate Decision
The Bank of Canada (BoC) announces its interest rate decision at the end of its eight scheduled meetings per year. If the BoC believes inflation will be above target (hawkish), it will raise interest rates in order to bring it down. This is bullish for the CAD since higher interest rates attract greater inflows of foreign capital. Likewise, if the BoC sees inflation falling below target (dovish) it will lower interest rates in order to give the Canadian economy a boost in the hope inflation will rise back up. This is bearish for CAD since it detracts from foreign capital flowing into the country.
Read more.Next release: 12/06/2023 15:00:00 GMT
Frequency: Irregular
Source: Bank of Canada
Gold prices fell in India on Wednesday, according to data from India's Multi Commodity Exchange (MCX).
Gold price stood at 62,045 Indian Rupees (INR) per 10 grams, down INR 223 compared with the INR 62,268 it cost on Tuesday.
As for futures contracts, Gold prices increased to INR 62,509 per 10 gms from INR 62,185 per 10 gms.
Prices for Silver futures contracts decreased to INR 75,440 per kg from INR 75,279 per kg.
| Major Indian city | Gold Price |
|---|---|
| Ahmedabad | 64,240 |
| Mumbai | 64,045 |
| New Delhi | 64,140 |
| Chennai | 64,210 |
| Kolkata | 64,195 |
Global Market Movers: Comex Gold price attempts a bounce, awaits US jobs data
- A combination of supporting factors aids the Comex Gold price to stage a modest comeback on Wednesday. The US Dollar lost its recovery momentum amid an improvement in risk sentiment.
- Moody’s Investors Service downgraded its outlook on China’s government credit ratings to negative from stable.
- China's Caixin Services PMI accelerated from 50.4 in October to 51.5 during the reported month, beating market expectations for a reading of 50.8, though it remains well below pre-COVID levels.
- Despite Federal Reserve Chair Jerome Powell's hawkish remarks on Friday, markets seem convinced that the US central bank is done raising rates and may start easing by the first half of the next year.
- The CME group's FedWatch Tool indicates a nearly 60% chance for an interest rate cut by the Fed in March 2024, which drags the US bond yields lower and acts as a headwind for the US Dollar.
- Furthermore, concerns about a darkening global economic outlook temper investors' appetite for riskier assets and drive some flows toward the perceived traditional safe-haven precious metal.
- Traders now look forward to the US ADP jobs data, which is expected to show that the American private sector added 130K jobs in November, up from 113K jobs addition seen in October.
- The main event risk this week, however, will remain the US monthly employment details, popularly known as the NFP report on Friday. The data will shed more light on the labor market conditions.
(An automation tool was used in creating this post.)
Gold FAQs
Why do people invest in Gold?
Gold has played a key role in human’s history as it has been widely used as a store of value and medium of exchange. Currently, apart from its shine and usage for jewelry, the precious metal is widely seen as a safe-haven asset, meaning that it is considered a good investment during turbulent times. Gold is also widely seen as a hedge against inflation and against depreciating currencies as it doesn’t rely on any specific issuer or government.
Who buys the most Gold?
Central banks are the biggest Gold holders. In their aim to support their currencies in turbulent times, central banks tend to diversify their reserves and buy Gold to improve the perceived strength of the economy and the currency. High Gold reserves can be a source of trust for a country’s solvency. Central banks added 1,136 tonnes of Gold worth around $70 billion to their reserves in 2022, according to data from the World Gold Council. This is the highest yearly purchase since records began. Central banks from emerging economies such as China, India and Turkey are quickly increasing their Gold reserves.
How is Gold correlated with other assets?
Gold has an inverse correlation with the US Dollar and US Treasuries, which are both major reserve and safe-haven assets. When the Dollar depreciates, Gold tends to rise, enabling investors and central banks to diversify their assets in turbulent times. Gold is also inversely correlated with risk assets. A rally in the stock market tends to weaken Gold price, while sell-offs in riskier markets tend to favor the precious metal.
What does the price of Gold depend on?
The price can move due to a wide range of factors. Geopolitical instability or fears of a deep recession can quickly make Gold price escalate due to its safe-haven status. As a yield-less asset, Gold tends to rise with lower interest rates, while higher cost of money usually weighs down on the yellow metal. Still, most moves depend on how the US Dollar (USD) behaves as the asset is priced in dollars (XAU/USD). A strong Dollar tends to keep the price of Gold controlled, whereas a weaker Dollar is likely to push Gold prices up.
Commodity Strategists at TD Securities (TDS) explained their strategy for trading Silver price heading into Friday’s critical US Nonfarm Payrolls release.
Key quotes
"Buying exhaustion in precious metals has morphed into selling activity at a faster pace than initially anticipated, sending active Silver prices towards our target nearly -5% lower.
In fact, our advanced positioning analytics now already suggest that algorithmic trend followers have liquidated the bulk of their net long position, contributing to the downside in prices over the last sessions.
However, the scope for subsequent CTA selling activity is still elevated, with a break in active silver prices below the $23.90/oz range likely to spark notable short acquisitions.
We expect an upside surprise in this week's non-farm payrolls data that could roil rates market pricing for the Fed to begin its cutting cycle as soon as March, extending the slide lower in precious metals with discretionary traders now net long.
While we expect macro headwinds to weigh on precious metals short positions in the medium term, we skate our bid to extend our target towards $22.50/oz and slide our stop towards $25.35/oz (50% retracement) to protect profits on this tactical position. Given that gold prices had led the move higher in precious metals, our trading target at $1950/oz remains in play."
Previewing the US Federal Reserve (Fed) monetary policy decision due next week, analysts at the Australia and New Zealand (ANZ) banking group noted that “the dot plot could be cut by 50+bp. Chair Powell will need to maintain hawkish guidance during the transition to lower growth and inflation so is likely to stress patience. The long run estimate for fed funds could rise.”
Additional quotes
“The extended moderation in inflation is raising confidence that aggregate price gains will return to target. However, progress on inflation is uneven across different cohorts and will take time to become balanced at 2.0%.”
“Inflation has performed better than the Federal Open Market Committee forecast in September. We expect the FOMC will lower the 2023 and 2024 dot plot. Fed funds have not reached predicted levels and inflation is lower.”
FX option expiries for Dec 6 NY cut at 10:00 Eastern Time, via DTCC, can be found below.
- EUR/USD: EUR amounts
- 1.0700 1.6b
- 1.0775 614m
- 1.0800 3.2b
- 1.0850 610m
- 1.0900 1b
- 1.0950 638m
- GBP/USD: GBP amounts
- 1.2500 568m
- 1.2570 496m
- USD/JPY: USD amounts
- 146.65 525m
- 147.20 719m
- 148.00 634m
- AUD/USD: AUD amounts
- 0.6400 1.3b
- 0.6450 1.8b
- 0.6550 417m
- 0.6770 591m
- USD/CAD: USD amounts
- 1.3600 987m
- 1.3640 496m
- NZD/USD: NZD amounts
- 0.6100 1.9b
- 0.6110 452m
Here is what you need to know on Wednesday, December 6:
The US Dollar (USD) outperformed its rivals for the second consecutive day on Tuesday, with the USD Index climbing to its highest level in nearly two weeks. As investors await ADP Employment Change data for November, the USD Index consolidates its weekly gains near 104.00. The US economic docket will also feature Goods Trade Balance for October and Unit Labor Costs for the third quarter. The Bank of Canada (BoC) will announce its interest rate decision in the second half of the day.
The data from the US showed on Tuesday that the business activity in the service sector expanded at a stronger pace than expected in November. In October, the number of job opening declined to 8.7 million from 9.35 million in September. Although the mixed data limited the USD's gains in the early American session, the cautious market mood helped the currency gather strength before the end of the day.
US Dollar price this week
The table below shows the percentage change of US Dollar (USD) against listed major currencies this week. US Dollar was the strongest against the Australian Dollar.
| USD | EUR | GBP | CAD | AUD | JPY | NZD | CHF | |
| USD | 0.96% | 0.90% | 0.62% | 1.44% | 0.46% | 0.81% | 0.81% | |
| EUR | -0.99% | -0.05% | -0.36% | 0.47% | -0.52% | -0.16% | -0.15% | |
| GBP | -0.94% | 0.06% | -0.30% | 0.53% | -0.44% | -0.11% | -0.09% | |
| CAD | -0.62% | 0.36% | 0.31% | 0.83% | -0.16% | 0.20% | 0.21% | |
| AUD | -1.46% | -0.48% | -0.53% | -0.85% | -1.00% | -0.63% | -0.63% | |
| JPY | -0.49% | 0.50% | 0.59% | 0.18% | 1.01% | 0.33% | 0.35% | |
| NZD | -0.83% | 0.15% | 0.09% | -0.20% | 0.63% | -0.36% | -0.01% | |
| CHF | -0.84% | 0.15% | 0.09% | -0.21% | 0.64% | -0.36% | 0.00% |
The heat map shows percentage changes of major currencies against each other. The base currency is picked from the left column, while the quote currency is picked from the top row. For example, if you pick the Euro from the left column and move along the horizontal line to the Japanese Yen, the percentage change displayed in the box will represent EUR (base)/JPY (quote).
In the meantime, the credit rating agency Moody's cut its outlook on China’s sovereign credit rating to 'negative' from 'stable' on Tuesday, citing the increasing risks to growth and a property sector crisis in the world’s second-largest economy, per Reuters.
EUR/USD failed to shake off the bearish pressure and closed the fifth consecutive day in negative territory on Tuesday. The pair stays on the back foot early Wednesday and trades below 1.0800. Eurostat will release Retail Sales data for October later in the session.
USD/CAD advanced to the 1.3600 area on Tuesday but lost its traction early Wednesday. The BoC is widely expected to leave the policy rate unchanged at 5%.
GBP/USD registered losses on Tuesday but managed to stabilize at around 1.2600 early Wednesday. The Bank of England's (BoE) Financial Policy Committee will release a statement following its latest meeting.
Bank of Japan (BOJ) Deputy Governor Ryozo Himino said on Wednesday that he doesn’t have any preset schedule in mind for exiting from the easy monetary policy. USD/JPY edged slightly lower following these comments and was last seen fluctuating in a narrow channel at around 147.00.
Gold extended its downward correction following Monday's volatile action and declined to the $2,010 area on Tuesday. XAU/USD gained traction early Wednesday and was last seen trading in positive territory at around $2,030.
Germany’s Factory Orders unexpectedly declined in October, the official data published by the Federal Statistics Office showed Wednesday, suggesting that the German manufacturing sector recovery is in the doldrums once again.
On a monthly basis, contracts for goods ‘Made in Germany’ dropped 3.7% when compared to a 0.2% increase reported in September, missing the forecasts of a 0% reading.
Germany’s Industrial Orders plunged at an annual rate of 7.3% in the reported month, as against the previous fall of 4.3%.
FX implications
The down German data is weighing on the Euro, with the EUR/USD pair losing 0.08% on the day to trade at 1.0785, as of writing.
- WTI prices trade in negative territory, losing 0.04% on the day.
- Moody’s downgraded China’s sovereign credit rating from stable to negative, citing the increasing risks to growth and a property sector crisis.
- Oil traders are concerned about the effectiveness of voluntary supply cuts by OPEC+.
- US ADP Employment Change and EIA Crude Oil Stocks Change will be due later on Wednesday.
Western Texas Intermediate (WTI), the US crude oil benchmark, is trading around $72.30 on Wednesday. The concern about the effectiveness of OPEC+ supply cuts and worries about a worsening demand outlook in China exert some selling pressure on the WTI prices.
Early Wednesday, Moody’s downgraded China’s sovereign credit rating from stable to negative. The credit rating agency cites the increasing risks to growth and a property sector crisis in China. This development warns lenders that the risk of a default has increased in recent years. That being said, the pessimistic economic outlook in China might cap the WTI’s upside as China is the world's largest oil consumer.
Last week, the Organisation of Petroleum Exporting Countries and its allies, including Russia (OPEC+), agreed on voluntary supply cuts of around 2.2 million barrels per day (bpd) for the first quarter of 2024. These restrictions include a 1.3 million bpd extension of Saudi and Russian voluntary cuts. However, this development fails to boost WTI prices as investors doubt how output cutbacks will be measured.
About the data, US crude oil inventories increased by 594,000 barrels for the week ending December 1 from the previous reading of 817,000 decline, according to the American Petroleum Institute (API). The market consensus expected a 2.267M barrel draw.
Looking ahead, oil traders will monitor the US ADP Employment Change for November and EIA Crude Oil Stocks Change, due later on Wednesday. The highlight of the week will be the US Nonfarm Payrolls (NFP) data on Friday. These events could significantly impact the USD-denominated WTI price. Oil traders will take cues from the data and find trading opportunities around the WTI prices.
- AUD/USD recovers above key 200-day SMA support-turned-resistance, as US Dollar turns south.
- Daily RSI is firming up above the midline while the 21-day SMA at 0.6535 offers strong support.
- If AUD/USD buyers reclaim 97.00, a rally to 98.00 is on the cards.
AUD/USD is on a solid recovery mode above 0.6550 on Wednesday, reversing half the previous day’s sell-off. The pair’s rebound is supported by a retreat in the US Dollar across the board, as traders turn cautious ahead of the key US ADP employment report.
However, Aussie buyers seem to face rejection just shy of the 0.6600 level amid renewed China debt worries. Moody’s Investors Service on Tuesday downgraded its outlook on China’s government credit ratings to negative from stable.
The further upside in the Aussie could remain capped, courtesy of the dovish pause by the Reserve Bank of Australia (RBA) a day ago. The RBA held the interest rate steady at 4.35% in November while maintaining a cautious tone on its interest rate outlook.
AUD/USD technical analysis: Daily Chart
From a short-term technical perspective, the pair has recaptured the 200-day Simple Moving Average (SMA) at 0.6575 on the road to recovery, having settled Tuesday below the latter.
The 14-day Relative Strength Index (RSI) is pointing north while above the midline, justifying the bounce in the Aussie pair.
Buyers need acceptance above the 200-day SMA to initiate a fresh uptrend toward the July 31 high of 0.6740. Ahead of that, the 0.6700 level could challenge the bearish commitments.
On the downside, strong support is envisioned at the 21-day SMA at 0.6535, below which the 0.6500 mark will be the next cushion. Deeper declines will test the 100-day SMA at 0.6469.
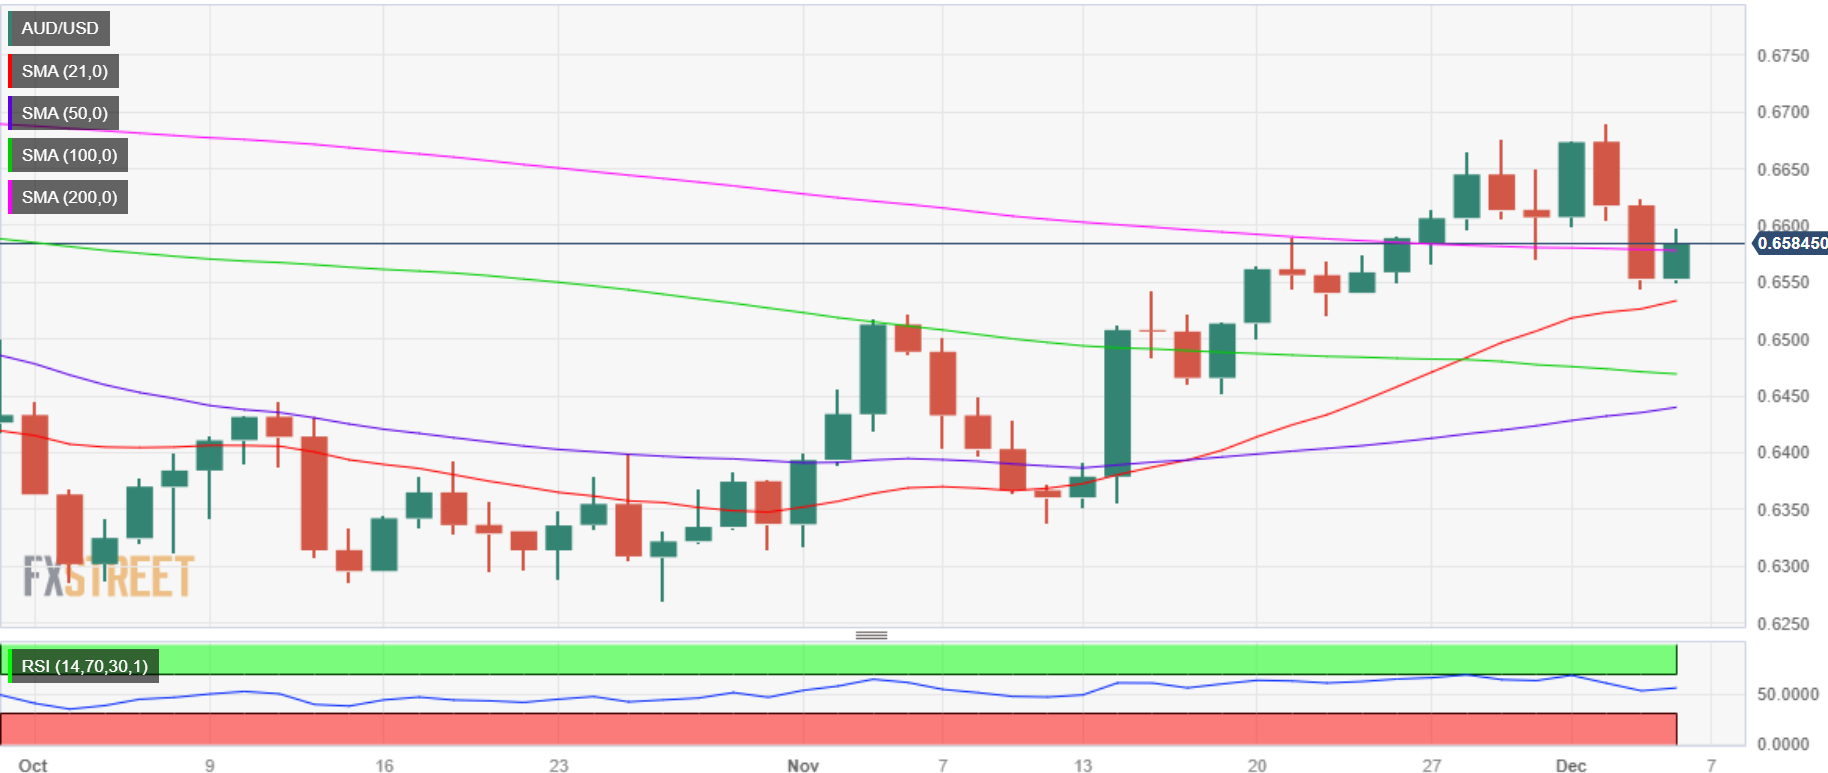
AUD/USD: Additional technical levels
Bank of Japan (BOJ) Deputy Governor Ryozo Himino said on Wednesday that he doesn’t have any preset schedule in mind for exit from easy policy
Additional comments
Inappropriate to set in advance a sequence of ending various monetary easing means.
Aside from wage, price moves, must look at consumption, capex, overseas developments as among factors in deciding when to exit easy policy.
We will have to make a decision at some point while looking at mixed batch of signals coming out from economy.
Not confident to say precisely by how much we are close to sustainably achieving our price target.
There is a chance the side-effects of easy policy may diminish upon an exit.
Tokyo CPI data showed signs of dissipating impact of import price gains
It is said to take more than a year for effect of monetary policy to completely appear on economy, which is why we are patiently maintaining easy policy.
Don't have specific prediction in mind now on when BoJ can judge sustained, stable achievement of price goal can be foreseen.
Market reaction
USD/JPY is off the highs at 147.40, currently trading at 147.18, almost unchanged on the day. The above comments fail to move the needle around the Japanese Yen.
- USD/CAD loses ground around 1.3575 despite the rebound of USD.
- US ISM Services PMI arrived at 52.7 in November vs. 51.8 prior, above the market consensus.
- Bank of Canada (BoC) to hold interest rate steady at 5.0% at its December meeting.
- US ADP Employment Change, BoC monetary policy meeting will be in the spotlight on Wednesday.
The USD/CAD pair snaps the two-day winning streak during the early European session on Wednesday. The pair remains capped under the 100-day Exponential Moving Average (EMA) around 1.3600. The pair attracts some sellers despite the recovery of the US Dollar (USD) Index. USD/CAD currently trades near 1.3575, down 0.12% on the day.
The US data on Tuesday revealed that the ISM Services PMI came in at 52.7 in November from 51.8 in the previous reading, better than the market expectation of 52.0. Meanwhile, the US JOLTS labor data on Tuesday was worse than expected. The US job openings data, as measured by the Job Openings and Labour Turnover Survey (JOLTS) fell by 617,000 to 8.733M in October. This report indicated that US labor market conditions are loosening further.
The Federal Reserve (Fed) maintains its stance while saying that the possibility of additional policy tightening cannot be ruled out. However, market participants believe that the Fed is done with the hiking cycle and will begin cutting the rate in March next year. This, in turn, might cap the upside of the US Dollar and act as a headwind for the USD/CAD pair.
On the Loonie front, the Bank of Canada (BoC) will announce its interest rate decision on Wednesday. BoC governor Tiff Macklem said that higher interest rates have cooled the overheated economy and taken the steam out of inflation. Macklem believes the central bank may have done enough to tame inflation but BoC will raise rates again if inflation persists. The markets anticipate the BoC to hold the interest rate steady at 5.0% at its December meeting.
Meanwhile, a rebound in oil prices might lift the commodity-linked Loonie, as the country is the leading oil exporter to the US.
Market players will monitor the US ADP Employment Change and Unit Labor Costs (Q3). The attention will shift to the BoC interest rate decision later on Wednesday. These events could trigger volatility in the market and give a clear direction to the USD/CAD pair.
- Gold price is picking up fresh bids near $2,020 as the US Dollar slips despite a risk-off mood.
- Positive US Treasury bond yields could cap the Gold price rebound.
- All eyes on US ADP jobs data for a fresh trading impetus on Gold price.
Gold price is finding a floor near $2,020 early Wednesday, snapping a two-day correction from all-time highs of $2,144 set on Monday.
Gold price capitalizes on a broad US Dollar retreat, as Greenback buyers take a breather following this week’s upswing and ahead of the top-tier US ADP Employment Change data.
The US Dollar is struggling despite a risk-averse market environment, as traders weigh fresh concerns on the Chinese economy. Moody’s Investors Service downgraded its outlook on China’s government credit ratings to negative from stable. The news dissuades investors from placing bets on riskier assets, offering the traditional safe-haven, Gold, some support.
However, the rebound in Gold price could be capped by a modest uptick in the US Treasury bond yields, as markets still price about a 60% probability of a US Federal Reserve interest rate cut in March.
A mixed set of US economic data released Tuesday failed to substantially impact the market’s expectations of the Fed interest rate outlook.
The latest data from the Institute for Supply Management (ISM) showed that the Services PMI registered 52.7 in November, firming up from October's reading of 51.8. However, US JOLTS Job Openings slid to more than a 2-1/2-year low of 8.733 million in October, suggesting that labor market conditions are loosening further.
All eyes now turn toward the US ADP Employment Change data slated for release in American trading on Wednesday, which will offer fresh hints on the US labor market condition ahead of Friday’s all-important Nonfarm Payrolls release.
Besides, Gold price will also take cues from the prevalent risk trend and its impact on the US Dollar and the US Treasury bond yields.
Gold price technical levels to consider

Gold price remains exposed to upside risks, especially with the Golden Cross and bullish Relative Strength Index (RSI) in play on the daily chart.
Gold buyers need to find acceptance above the $2,050 psychological barrier on a daily closing basis to resume the uptrend toward the initial hurdle at $2,100. A sustained move above the latter will challenge all-time highs of $2,144 once again.
On the flip side, the immediate support is seen at the $2,000 threshold should the Gold price correction regain traction. The 21-day Simple Moving Average (SMA) at $1,995 will then come to the rescue of Gold buyers. The last line of defense for Gold buyers is seen at the $1,990 round figure.
Gold FAQs
Why do people invest in Gold?
Gold has played a key role in human’s history as it has been widely used as a store of value and medium of exchange. Currently, apart from its shine and usage for jewelry, the precious metal is widely seen as a safe-haven asset, meaning that it is considered a good investment during turbulent times. Gold is also widely seen as a hedge against inflation and against depreciating currencies as it doesn’t rely on any specific issuer or government.
Who buys the most Gold?
Central banks are the biggest Gold holders. In their aim to support their currencies in turbulent times, central banks tend to diversify their reserves and buy Gold to improve the perceived strength of the economy and the currency. High Gold reserves can be a source of trust for a country’s solvency. Central banks added 1,136 tonnes of Gold worth around $70 billion to their reserves in 2022, according to data from the World Gold Council. This is the highest yearly purchase since records began. Central banks from emerging economies such as China, India and Turkey are quickly increasing their Gold reserves.
How is Gold correlated with other assets?
Gold has an inverse correlation with the US Dollar and US Treasuries, which are both major reserve and safe-haven assets. When the Dollar depreciates, Gold tends to rise, enabling investors and central banks to diversify their assets in turbulent times. Gold is also inversely correlated with risk assets. A rally in the stock market tends to weaken Gold price, while sell-offs in riskier markets tend to favor the precious metal.
What does the price of Gold depend on?
The price can move due to a wide range of factors. Geopolitical instability or fears of a deep recession can quickly make Gold price escalate due to its safe-haven status. As a yield-less asset, Gold tends to rise with lower interest rates, while higher cost of money usually weighs down on the yellow metal. Still, most moves depend on how the US Dollar (USD) behaves as the asset is priced in dollars (XAU/USD). A strong Dollar tends to keep the price of Gold controlled, whereas a weaker Dollar is likely to push Gold prices up.
- GBP/USD gains ground on the renewed USD weakness.
- US JOLTS labor data came in worse than expected, US ISM Services PMI arrived stronger than market expectation.
- The markets are now almost fully priced in a first BoE rate cut by June 2024.
The GBP/USD pair snaps the two-day losing streak and holds above the 1.2600 support level during the Asian trading hours on Wednesday. The modest decline of the US Dollar (USD) creates a tailwind for the pair. GBP/USD currently trades near 2607, gaining 0.11% on the day.
The US JOLTS labor data on Tuesday came in worse than expected. The US job openings data, as measured by the Job Openings and Labour Turnover Survey (JOLTS) dropped by 617,000 to 8.733M in October. The figure registered its lowest level since March 2021. The attention now shifts to November’s ADP job report on Wednesday, with an expected rise of 130K.
Additionally, the US ISM Services PMI for November grew to 52.7 from 51.8 in the previous reading, stronger than market expectation. The US employment data this week, including ADP Employment Change and Nonfarm Payrolls (NFP) will be in the spotlight as it could offer some hints about a further interest rate path. However, the market expects the Federal Reserve (Fed) to leave rates unchanged at its December meeting next week.
On the GBP’s front, the markets raise bets on an earlier start to interest rate cuts by the Bank of England (BoE). Financial markets are now almost fully priced in a first BoE rate cut by June 2024. BoE will release its monthly Financial Stability Report on Wednesday, providing investors with insight into how far the BoE is going towards a hawkish or dovish stance.
Traders will take more cues from the UK S&P Global/CIPS Construction PMI for November and the monthly Financial Stability Report. Also, the US ADP private employment and Unit Labor Cost data will be due later on Wednesday. These figures could give a clear direction to the GBP/USD pair.
- NZD/USD is rebounding above 0.6150 early Wednesday.
- Renewed US Dollar weakness is supporting the Kiwi amid a mixed mood.
- Focus shifts to US ADP Employment Change data for fresh impetus.
NZD/USD is staging a solid comeback. Heading toward 0.6200 in the Asian session on Wednesday. The pair is witnessing a relief rally after two days of sharp correction from five-month highs of 0.6223.
A broad-based US Dollar retreat is aiding the turnaround in the New Zealand Dollar (NZD), despite sagging Asian stocks and a fresh buying interest seen around the US Treasury bond yields.
Therefore, the rebound in the pair could be purely technically driven, helped by profit-taking on the recent US Dollar recovery, as traders reposition themselves ahead of the key US ADP Employment Change data due later in American trading on Wednesday.
The US Dollar pauses its recovery momentum, as markets reassess US Federal Reserve (Fed) interest rate cut expectations after a set of mixed US economic data released on Tuesday.
The Institute for Supply Management (ISM) said on Tuesday that its Services PMI rebounded from a five-month low of 51.8 to 52.7 in November while the JOLTS Job Openings totaled 8.73 million for the month, a decline of 617,000, the Labor Department reported Tuesday.
The NZD/USD pair tumbled to a three-day low of 0.6125 a day ago, tracking the sell-off in AUD/USD after the Reserve Bank of Australia (RBA) held the interest rate at 4.35% in November but adopted a cautious approach in its communication.
NZD/USD Technical levels to watch
- Indian Rupee loses ground on the renewed US Dollar demand.
- India’s S&P Global Services PMI for November fell to 56.9 vs 58.4 prior, worse than the 58.0 expected.
- The Reserve Bank of India (RBI) is likely to maintain the repo rate unchanged at 6.5% at its December meeting.
Indian Rupee (INR) edges lower on Wednesday on the firmer US Dollar (USD). According to the "Global Credit Outlook 2024" by S&P, India is projected to be the fastest-growing major economy in the next three years. S&P forecast India's growth of 7% in the 2026–27 fiscal year. Nevertheless, the critical obstacle lies in determining whether the nation can effectively evolve into the next major global manufacturing hub.
On Tuesday, India’s S&P Global Services Purchasing Managers' Index (PMI) for November came in at 56.9 from 58.4 in October, below the market consensus of 58.0. The figure registered the slowest pace of growth since November 2022, but the index remained firm above the 50-mark threshold that separates growth from contraction.
The Reserve Bank of India (RBI) will schedule its three-day Monetary Policy Committee (MPC) meeting starting on Wednesday. The markets anticipate the central bank will maintain the status quo on the repo rate, leaving it unchanged at 6.5% due to the upbeat GDP growth and the easing trend of core inflation.
Daily Digest Market Movers: Indian Rupee remains sensitive to global factors and uncertainties
- S&P Global India Services PMI declined to 56.9 in November from 58.4 in October, below market expectations of 58.0.
- The RBI is likely to sell the US Dollar near 83.38–83.39 levels to cap further depreciation in the Indian Rupee, per Reuters.
- India’s stock market value surpassed $4 trillion for the first time, marking a key milestone for the world’s fifth-biggest equity market.
- As core CPI inflation moderated to 4.5% YoY and CPI inflation moderated to 4.87% YoY on October 23, analysts anticipate that the RBI will maintain the policy repo rate at its December meeting.
- RBI Governor Shaktikanata Das said that headline inflation has moderated, but the Indian economy remains sensitive to overlapping food price shocks caused by global factors and adverse weather events.
- US ISM Services PMI rose to 52.7 in November from 51.8 in the previous reading, better than the market expectation of 52.0.
- JOLTS Job Openings declined by 617,000 to 8.73M in October, falling to their lowest level since March 2021.
- Fed futures are now pricing that the Fed is done hiking rates and could start cutting policy rates as soon as March or May.
Technical Analysis: Indian Rupee's positive outlook remains in place
Indian Rupee trades weaker on the day. The USD/INR pair has traded within a familiar multi-month-old trading band of 82.80–83.40. Technically, the pair’s outlook remains constructive as it holds above the key 100-day Exponential Moving Average (EMA) on the daily chart. This bullish momentum is reinforced by the 14-day Relative Strength Index (RSI), which remains above the 50.0 midpoint, suggesting that the path of least resistance is to the upside.
The USD/INR first resistance level is located at the upper boundary of the trading range of 83.40. A decisive break above 83.40 could pave the way for a recovery toward the year-to-date (YTD) high of 83.47. Further north, the next hurdle will emerge at a psychological round figure of 84.00.
On the downside, the 83.00 psychological mark is the key support level for the pair. A breach of this level could drag prices toward the confluence of the lower limit of the trading range and a low of September 12 at 82.80, followed by a low of August 11 at 82.60.
US Dollar price today
The table below shows the percentage change of US Dollar (USD) against listed major currencies today. US Dollar was the strongest against the Japanese Yen.
| USD | EUR | GBP | CAD | AUD | JPY | NZD | CHF | |
| USD | -0.01% | -0.11% | -0.15% | -0.53% | 0.11% | -0.56% | 0.00% | |
| EUR | 0.02% | -0.09% | -0.14% | -0.52% | 0.12% | -0.55% | 0.01% | |
| GBP | 0.11% | 0.09% | -0.05% | -0.41% | 0.21% | -0.46% | 0.10% | |
| CAD | 0.16% | 0.15% | 0.05% | -0.36% | 0.27% | -0.39% | 0.15% | |
| AUD | 0.54% | 0.48% | 0.42% | 0.36% | 0.62% | -0.02% | 0.55% | |
| JPY | -0.11% | -0.12% | -0.22% | -0.27% | -0.66% | -0.68% | -0.11% | |
| NZD | 0.56% | 0.54% | 0.47% | 0.39% | 0.03% | 0.66% | 0.56% | |
| CHF | 0.01% | -0.01% | -0.10% | -0.15% | -0.51% | 0.11% | -0.55% |
The heat map shows percentage changes of major currencies against each other. The base currency is picked from the left column, while the quote currency is picked from the top row. For example, if you pick the Euro from the left column and move along the horizontal line to the Japanese Yen, the percentage change displayed in the box will represent EUR (base)/JPY (quote).
Indian Rupee FAQs
What are the key factors driving the Indian Rupee?
The Indian Rupee (INR) is one of the most sensitive currencies to external factors. The price of Crude Oil (the country is highly dependent on imported Oil), the value of the US Dollar – most trade is conducted in USD – and the level of foreign investment, are all influential. Direct intervention by the Reserve Bank of India (RBI) in FX markets to keep the exchange rate stable, as well as the level of interest rates set by the RBI, are further major influencing factors on the Rupee.
How do the decisions of the Reserve Bank of India impact the Indian Rupee?
The Reserve Bank of India (RBI) actively intervenes in forex markets to maintain a stable exchange rate, to help facilitate trade. In addition, the RBI tries to maintain the inflation rate at its 4% target by adjusting interest rates. Higher interest rates usually strengthen the Rupee. This is due to the role of the ‘carry trade’ in which investors borrow in countries with lower interest rates so as to place their money in countries’ offering relatively higher interest rates and profit from the difference.
What macroeconomic factors influence the value of the Indian Rupee?
Macroeconomic factors that influence the value of the Rupee include inflation, interest rates, the economic growth rate (GDP), the balance of trade, and inflows from foreign investment. A higher growth rate can lead to more overseas investment, pushing up demand for the Rupee. A less negative balance of trade will eventually lead to a stronger Rupee. Higher interest rates, especially real rates (interest rates less inflation) are also positive for the Rupee. A risk-on environment can lead to greater inflows of Foreign Direct and Indirect Investment (FDI and FII), which also benefit the Rupee.
How does inflation impact the Indian Rupee?
Higher inflation, particularly, if it is comparatively higher than India’s peers, is generally negative for the currency as it reflects devaluation through oversupply. Inflation also increases the cost of exports, leading to more Rupees being sold to purchase foreign imports, which is Rupee-negative. At the same time, higher inflation usually leads to the Reserve Bank of India (RBI) raising interest rates and this can be positive for the Rupee, due to increased demand from international investors. The opposite effect is true of lower inflation.
- USD/JPY is stabilizing above 147.00, having witnessed good two-way action on Tuesday.
- Investors assess Fed rate cut bets after mixed US economic data. US Dollar retreats.
- BoJ policymaker Ryozo Himino’s dovish comments lend support to USD/JPY.
USD/JPY is trading better bid above 147.00 in the Asian session on Wednesday, finding support from a modest uptick in the US Treasury bond yields and dovish comments from Bank of Japan (BoJ) Deputy Governor Ryozo Himino.
Himino said, “the BoJ will patiently maintain the easy policy until the sustained and stable achievement of the price target is in sight.”
Further, a minor rebound in the US Treasury bond yields is helping the USD/JPY to stay afloat amid a retreat in the US Dollar across the board. The US Dollar is failing to capitalize on a cautious market environment, as investors weigh US Federal Reserve (Fed) interest rate cut prospects as early as March 2024.
On Tuesday, US JOLTS Job Openings plunged to a two-year low of 8.733 million in October, adding to further evidence of a cooling US labor market. The downbeat data triggered a knee-jerk selling in the US Dollar, which was soon reversed on the back of strong US ISM Services PMI. US ISM Services PMI rose from 51.8 to 52.7 in November, bettering expectations of a 52.0 print.
The swift US Dollar rebound lifted USD/JPY from daily lows of 146.56, as the pair went on to settle Tuesday almost unchanged at 147.20. From a broader perspective, USD/JPY is holding its recovery from three-month lows of 146.23 reached last Friday, tracking the US Dollar upswing.
Meanwhile, markets took note of the latest Japanese inflation data. Tokyo Core Consumer Price Index (CPI) inflation, excluding volatile items such as fresh food, rose 2.3% in November, data from the Statistics Bureau showed on Tuesday.
The pair tumbled to multi-month troughs on increased expectations that the BoJ will end its negative interest rate policy (NIRP) early next year.
All eyes now turn toward the release of a fresh US employment report, the ADP Employment Change, due later on Wednesday. The data will affirm loosening US labor market conditions. However, the main event risk for this week remains Friday's Nonfarm Payrolls (NFP) data.
USD/JPY Technical levels to consider
| Raw materials | Closed | Change, % |
|---|---|---|
| Silver | 24.151 | -1.39 |
| Gold | 2019.166 | -0.51 |
| Palladium | 930.45 | -3.86 |
Bank of Japan (BOJ) Deputy Governor Ryozo Himino said on Wednesday, the “BoJ will patiently maintain easy policy until sustained and stable achievement of price target is in sight.”
Additional comments
Japan's financial system is likely resilient enough to weather stress from transition to higher interest rates.
Must make appropriate decision on exit timing, procedure by scrutinising wage, inflation developments.
If we do not get the timing exit, procedures wrong, the impact of a positive wage-inflation cycle will likely benefit wide range of households, companies.
BoJ must achieve situation where inflation slows ahead, but not too much.
Japan is seeing steadily changes in price, wage behavior.
Solid progress is observed in the transformation of firms' wage- and price-setting behavior.
Price rises beginning to affect wages.
Pass-through from wages to inflation is also returning somewhat.
Without virtuous cycle between wages and prices, Japan will most likely revert to the deflationary state in the past.
When Japan returns to an economy with positive interest rate, that could improve households' balance as a whole.
Market reaction
USD/JPY is testing session highs of 147.30 on the above comments, currently trading at 147.25, up 0.07% on the day.
The People’s Bank of China (PBoC) set the USD/CNY central rate for the trading session ahead on Wednesday at 7.1149 as compared to the previous day's fix of 7.1127 and 7.1476 Reuters estimates.
- AUD/USD gains ground near 0.6575 following the Australian GDP data.
- Australia’s Gross Domestic Product (GDP) showed the slowest growth in two years.
- US ADP private employment and Unit Labor Costs will be due later on Wednesday.
The AUD/USD pair climbs to 0.6575 during the early Asian trading hours on Wednesday. The pair edges higher following the Australian growth numbers. However, the rebound of the US Dollar (USD) and risk-off mood might cap the further upside of AUD/USD.
Australia's economy unexpectedly slowed in the third quarter, as higher interest rates impacted consumers and trade turned negative. Early Wednesday, the Australian Bureau of Statistics (ABS) revealed that
Australia’s Gross Domestic Product (GDP) expanded by 0.2% in the third quarter of 2023, compared with the 0.4% growth in Q2. This reading came in below expectations of 0.4%. On an annual basis, the growth number rose by 2.1% versus 2.1% growth in Q2, above the market consensus of a 1.8% expansion.
However, the risk-off mood and the pessimistic for China's economic outlooks might cap the China-proxy Australian Dollar (AUD). According to Reuters, the rating agency Moody’s cut its outlook on China’s sovereign credit rating to negative on Tuesday, citing the increasing risks to growth and a property sector crisis in the country.
Investors will take more cues from the US ADP private employment and Unit Labor Cost data on Wednesday. On Thursday, the Australian Trade Balance will be released.
- EUR/USD attracts some sellers around 1.0795 in early Wednesday.
- November's Eurozone Composite PMI arrived at 47.6 vs. 47.1 prior, above the market consensus of 47.1.
- US ISM Services PMI for November came in better than expected, rising to 52.7 from 51.8 in the previous reading.
- Investors await the Eurozone Retail Sales and US ADP private employment data.
The EUR/USD pair remains under selling pressure below the 1.0800 psychological mark during the early Asian session on Wednesday. The upbeat Eurozone PMI data for November failed to inspire the Euro (EUR) amid the persistently weak demand in the Eurozone. At press time, the major pair is trading around 1.0795, up 0.01% on the day.
The HCOB Eurozone Composite PMI, a combined measure of the manufacturing and service sectors, remained below the 50.0 threshold in November, showing an ongoing decline in private sector output levels throughout the eurozone. November's Eurozone Composite PMI arrived at 47.6 versus 47.1 prior, above the market consensus of 47.1. Meanwhile, HCOB Services PMI climbed to 48.7 from the previous reading of 48.2.
Additionally, major eurozone economies experienced a decline in business activity, with France, Germany, and Italy leading the way. This, in turn, weighs on the EUR and acts as a tailwind for the EUR/USD pair.
Across the pond, the US Dollar (USD) gains ground near 104.00 despite the lower US Treasury bond yields. The economic data on Tuesday showed that the US ISM Services PMI for November beat market expectations, rising to 52.7 from 51.8 in the previous reading. Meanwhile, JOLTS Job Openings declined by 617,000 to 8.73 million in October, falling to their lowest level since March 2021, according to a Bureau of Labour Statistics report.
Moving on, traders will focus on the Eurozone Retail Sales for October. The annual figure is expected to drop 1.1% while the monthly figure is estimated to grow 0.2%. On the US docket, the US ADP private employment and Unit Labor Cost data will be due later on Wednesday.
Australia’s Gross Domestic Product (GDP) rose 0.2% in the third quarter of 2023 compared with the 0.4% growth in Q2, the Australian Bureau of Statistics (ABS) showed on Wednesday. This reading came in below expectations of 0.4%.
The annual third-quarter GDP expanded by 2.1%, compared with the 2.1% growth in Q2 while beating estimates of a 1.8% increase.
Additional details
"Government spending and capital investment were the main drivers of GDP growth this quarter.”
"The growth in government expenditure was driven by social benefits to households, including the Energy Bill Relief Fund rebates, and extra payments for childcare, aged care and pharmaceutical products,”
"Investment by public corporations rose 8.9%. Commonwealth, state and territory corporations increased investment in transport, communication and utilities projects,"
Market reaction
Following the Australian growth numbers, the AUD/USD is up on the day to trade at 0.6565, as of writing.
GDP FAQs
What is GDP and how is it recorded?
A country’s Gross Domestic Product (GDP) measures the rate of growth of its economy over a given period of time, usually a quarter. The most reliable figures are those that compare GDP to the previous quarter e.g Q2 of 2023 vs Q1 of 2023, or to the same period in the previous year, e.g Q2 of 2023 vs Q2 of 2022.
Annualized quarterly GDP figures extrapolate the growth rate of the quarter as if it were constant for the rest of the year. These can be misleading, however, if temporary shocks impact growth in one quarter but are unlikely to last all year – such as happened in the first quarter of 2020 at the outbreak of the covid pandemic, when growth plummeted.
How does GDP influence currencies?
A higher GDP result is generally positive for a nation’s currency as it reflects a growing economy, which is more likely to produce goods and services that can be exported, as well as attracting higher foreign investment. By the same token, when GDP falls it is usually negative for the currency.
When an economy grows people tend to spend more, which leads to inflation. The country’s central bank then has to put up interest rates to combat the inflation with the side effect of attracting more capital inflows from global investors, thus helping the local currency appreciate.
How does higher GDP impact the price of Gold?
When an economy grows and GDP is rising, people tend to spend more which leads to inflation. The country’s central bank then has to put up interest rates to combat the inflation. Higher interest rates are negative for Gold because they increase the opportunity-cost of holding Gold versus placing the money in a cash deposit account. Therefore, a higher GDP growth rate is usually a bearish factor for Gold price.
| Index | Change, points | Closed | Change, % |
|---|---|---|---|
| NIKKEI 225 | -455.45 | 32775.82 | -1.37 |
| Hang Seng | -318.19 | 16327.86 | -1.91 |
| KOSPI | -20.67 | 2494.28 | -0.82 |
| ASX 200 | -63.1 | 7061.6 | -0.89 |
| DAX | 128.35 | 16533.11 | 0.78 |
| CAC 40 | 54.4 | 7386.99 | 0.74 |
| Dow Jones | -79.88 | 36124.56 | -0.22 |
| S&P 500 | -2.6 | 4567.18 | -0.06 |
| NASDAQ Composite | 44.42 | 14229.91 | 0.31 |
| Pare | Closed | Change, % |
|---|---|---|
| AUDUSD | 0.65517 | -0.97 |
| EURJPY | 158.894 | -0.2 |
| EURUSD | 1.07981 | -0.29 |
| GBPJPY | 185.342 | -0.21 |
| GBPUSD | 1.25943 | -0.24 |
| NZDUSD | 0.61285 | -0.53 |
| USDCAD | 1.35912 | 0.44 |
| USDCHF | 0.87493 | 0.27 |
| USDJPY | 147.161 | 0.02 |


© 2000-2024. Уcі права захищені.
Cайт знаходитьcя під керуванням TeleTrade DJ. LLC 2351 LLC 2022 (Euro House, Richmond Hill Road, Kingstown, VC0100, St. Vincent and the Grenadines).
Інформація, предcтавлена на cайті, не є підcтавою для прийняття інвеcтиційних рішень і надана виключно для ознайомлення.
Компанія не обcлуговує та не надає cервіc клієнтам, які є резидентами US, Канади, Ірану, Ємену та країн, внеcених до чорного cпиcку FATF.
Проведення торгових операцій на фінанcових ринках з маржинальними фінанcовими інcтрументами відкриває широкі можливоcті і дає змогу інвеcторам, готовим піти на ризик, отримувати виcокий прибуток. Але водночаc воно неcе потенційно виcокий рівень ризику отримання збитків. Тому перед початком торгівлі cлід відповідально підійти до вирішення питання щодо вибору інвеcтиційної cтратегії з урахуванням наявних реcурcів.
Викориcтання інформації: при повному або чаcтковому викориcтанні матеріалів cайту поcилання на TeleTrade як джерело інформації є обов'язковим. Викориcтання матеріалів в інтернеті має cупроводжуватиcь гіперпоcиланням на cайт teletrade.org. Автоматичний імпорт матеріалів та інформації із cайту заборонено.
З уcіх питань звертайтеcь за адреcою pr@teletrade.global.
переклади