- Аналітика
- Новини та інструменти
- Новини ринків
Новини ринків
- AUD/USD sees a halt in its rally in anticipation of the RBA's potential rate hike.
- Major Australian banks forecasting an increase from 4.10% to 4.35%.
- Inflationary pressures and strong retail sales figures bolster the case for further tightening by the RBA.
- RBA officials' hawkish comments have primed markets for a rate adjustment, adding to the upward pressure on the Aussie.
AUD/USD rally stalls around the 0.6520s area as traders brace for the Reserve Bank of Australia (RBA) monetary policy meeting later during Tuesday’s Asian session at 03:30 GMT. The rise in US Treasury bond yields, contrary to Aussie’s, was the main reason behind the pair's 0.36% losses as it trades at around 0.6480s.
Australian Dollar's ascent pauses as markets await the Reserve Bank of Australia's policy meeting, with expectations of a rate hike
The RBA is expected to resume interest-rate hikes from 4.10% to 4.35%, as revealed by four of the biggest Australian banks, like ANZ, CBA, Westpac, and NAB. The latest inflation report from the Australian Bureau of Statistics (ABS) witnessed a jump in inflation in Q3, above forecasts but below the 2% plus-or-minus 1% band.
Even though that data wasn’t a reason for increasing rates, it was the September monthly CPI, rising above 5.6% YoY, exceeding August. That, along with a solid Retail Sales report, spurred speculations that the RBA would further tighten monetary conditions.
Comments from RBA officials, namely Christopher Kent saying the board “may need to raise interest rates in the future to bring inflation down,” alongside RBA’s Governor Michele Bullock suggesting that the RBA board would not hesitate to hike rates “if there is a material upward revision to the inflation outlook,” had further cemented the likelihood of an adjustment in rates.
Read more: Australia Interest Rate Decision Preview: RBA set to tighten further after four straight meetings on hold
On the US front, a scarce economic calendar would leave AUD/USD traders adrift to Federal Reserve’s (Fed) officials' speeches, the Trade Balance, and the IBD/TIPP Economic Optimism.
AUD/USD Price Analysis: Technical outlook
After printing a two-month high at 0.6522, the AUD/USD could rise past that level and threaten to hit 0.6600. That would depend on the RBA’s decision. If the central bank raises rates and keeps the door open, look out for a test of the 200-day moving average (DMA) at 0.6614. On the flip side, a surprising hold, the AUD/USD could plunge toward last Friday’s low of 0.6419, as most market participants expect a hike.
- Spot Gold is settling back from $1,990 as US Treasury yields tick higher.
- Market sentiment is drawing tight in early Tuesday action with a 25 bps rate hike expected from RBA.
- China data also on the docket for Tuesday's early market session.
Gold prices went lower again on Monday, declining 0.75% into $1,977 as US Treasury yields stepped higher once more, pushing the XAU/USD back down after losing the $2,000 handle last Friday.
Gold has faced rejection from the $2,000 handle several times in two weeks, and a technical ceiling could be baking into the XAU/USD.
Tuesday kicks things off with a handful of China data on the economic calendar, to be followed by a broadly-expected 25 basis point rate hike from the Reserve Bank of Australia (RBA).
Australia Interest Rate Decision Preview: RBA set to tighten further after four straight meetings on hold
Before the RBA's forecast rate hike lands on markets, China Trade Balance data lands in the Aisa early Tuesday market session.
China's Exports and Imports are both expected to improve for the year into October; China YoY Exports are forecast to print at -3.1% compared to September's reading of -6.2%.
Meanwhile, annualized Imports for October are forecast to see much less upside, but still improve with a market median forecast of -5.4% compared to September's -6.2%.
With a firmer rebound on the cards for Exports, China's overall Trade Balance for the year into October is expected to print on the upside to $81.85B in US Dollar (USD) terms, compared to September's showing of $77.71B USD.
Forex Today: US Dollar looks vulnerable, RBA expected to raise rates
XAU/USD Technical Outlook
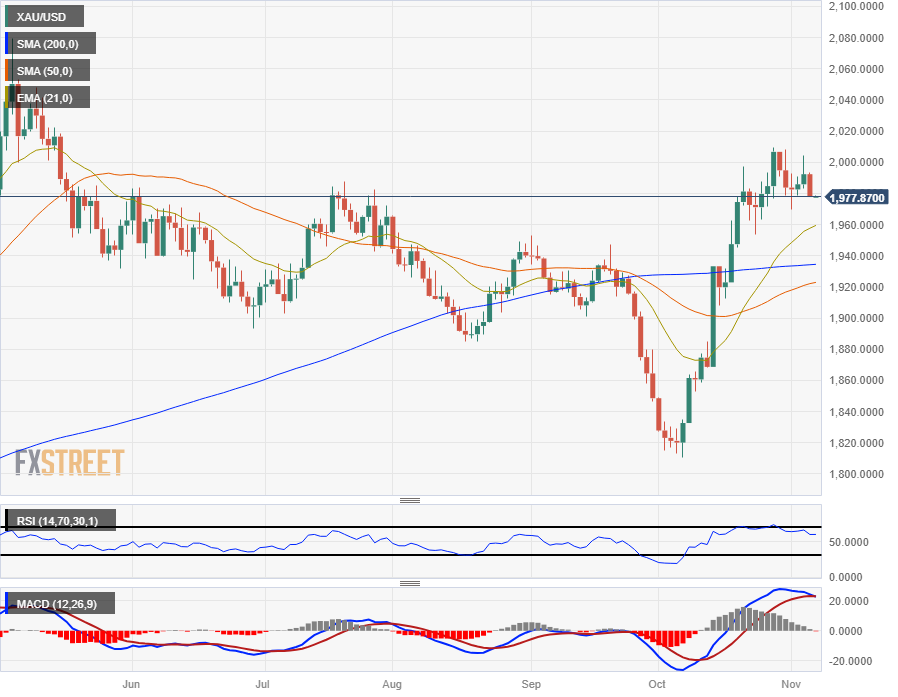
Spot Gold looks set to see a bearish correction on the daily candlesticks barring any bullish resurgence, with XAU/USD beginning to test further away from the $2,000 major handle with each rejection.
Gold bids are looking exhausted trading into seven-month highs, and technical indicators are beginning to flash warning signs of an impending bear move.
The Relative Strength Index (RSI) hit overbought conditions in the last week of October, while the Moving Average Convergence-Divergence (MACD) indicator is seeing a bearish rollover of the signal MA line.
Gold bids are facing potential overbought price levels, and technical support sits at the 200-day Simple Moving Average (SMA), currently grinding higher towards $1,940 and the 21-day Exponential Moving Average (EMA) seeing some lift into $1,960.
Near-term trend momentum appears to be struggling to catch up to both the long and short ends of the MA tails, with the 50-day SMA struggling to lift from the $1,920 level, below both the faster and slower MA lines.
XAU/USD Daily Chart
XAU/USD Technical Levels
- CAD/JPY sees a modest uptick, trading at 105.52, but momentum wanes near the 110.00 psychological barrier.
- The currency pair shows a neutral to bearish technical setup, with a pattern of lower highs and lower lows since hitting the YTD peak.
- A push above 110.00 could open the path towards September highs, while a pullback might see support near key Ichimoku levels.
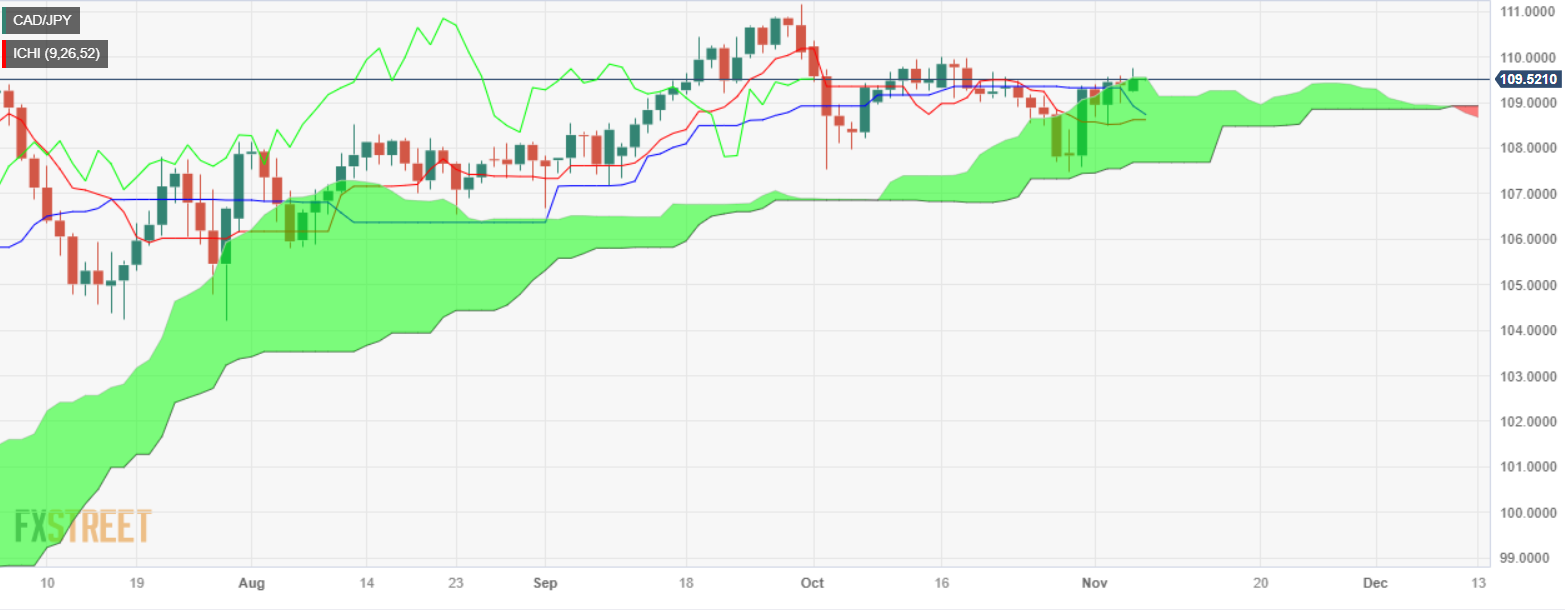
The CAD/JPY advancement stalls some 25 pips shy of the 110.00 mark on Monday, even though market sentiment was upbeat due to speculation that most global central banks won´t raise rates further. The cross-pair is trading at 105.52, gains 0.19%.
From a technical perspective, the CAD/JPY is neutral to downward biased after peaking at a year-to-date (YTD) high of 111.16. Since then, the pair has printed successive series of lower-highs and lower-lows, reaffirming the current neutral-bearish bias.
Nevertheless, if CAD/JPY buyers reclaim 110.00, they would be poised to test the September 19 high at 110.44, followed by the 111.16 mark. A breach of that level would sponsor a leg-up toward 112.00. Conversely, if sellers stepped in, they could drag prices toward the confluence of Kijun-Sen and Senkou-Span B at around 108.92. Once the pair tumbles below the latter, the bear's next target would be the Tenkan-Sen level at 108.62 before dropping to the bottom of the Ichimoku Cloud (Kumo) at 107.71.
CAD/JPY Price Chart – Daily
CAD/JPY Technical Levels
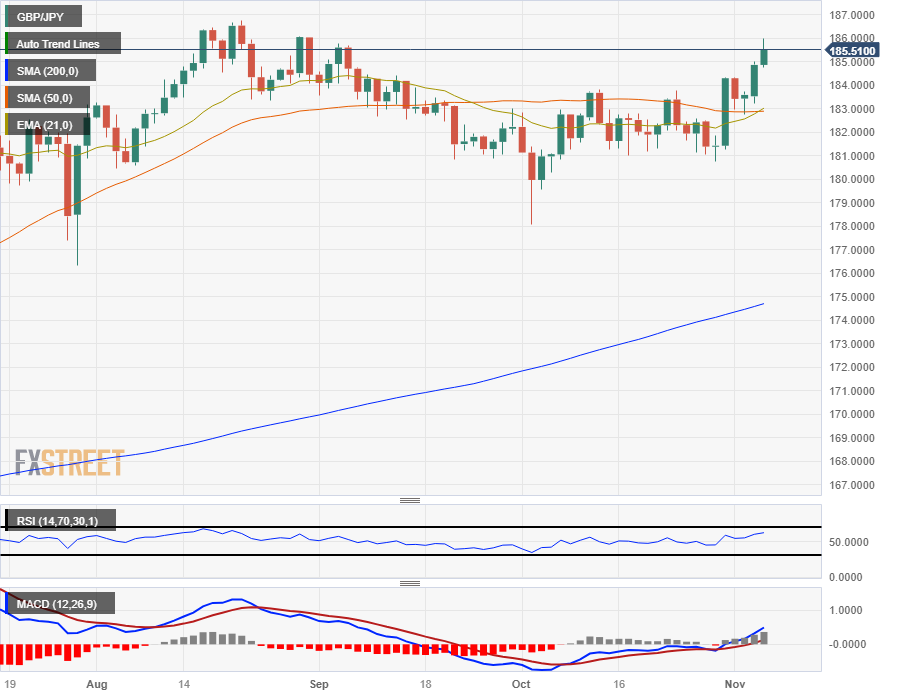
- The GBP/JPY is seeing some pullback after failing to capture the 186.00 price level.
- The Pound Sterling remains incredibly well-bid against the Yen, up nearly 2.5% in six trading days.
- Bullish runs fueled by Yen weakness are sending the Guppy into ten-week highs.
The GBP/JPY is seeing a mild relief pullback towards the 185.00 price level after last week's runup in the pair sent the Guppy just shy of the 186.00 handle.
Monday's pullback sees the pair testing back towards the 50-hour Simple Moving Average (SMA) currently rising into 184.60. Intraday price action is getting snarled on the 21-hour Exponential Moving Average (EMA), and the near-term drop is set for a challenge of support from last Friday's late test into 185.00.
Daily candlesticks see the GBP/JPY continuing a top side break of a sideways pennant flag, and extension will see technical resistance challenges from August's late swing into chart territory just south of the 187.00 handle.
GBP/JPY Hourly Chart

GBP/JPY Daily Chart

GBP/JPY Technical Levels
- XAG/USD declined to $23.00, down by 0.80%.
- The 2,5 and 10-year yields increased by more than 1.50% during the session.
- The week’s highlight will be Chair Powell's speeches on Wednesday and Thursday.
In Monday’s session, the Silver spot price XAG/USD lost traction and declined from $23.25 to $23.00, seeing 0.80% losses on the day. Investors seem to be taking profits after last Friday’s rally, while the rising US Treasury yields also contributed to the downside.
In line with that, the 2,5 and 10-year bond rates rebounded from multi-week lows and jumped to 4.90%, 4.60% and 4.64%, respectively, all up by more than 1.50%. It's worth noticing that the US yields tend to be considered as the opportunity cost of holding the non-yielding grey metal, so as the rates recovered, the XAG/USD saw red.
Focus now shifts to Wednesday's speech by Jerome Powell as investors seek further guidance for the December meeting of the Federal Reserve (Fed). After last week’s meeting, markets are confident that the bank won’t hike again in 2023. Still, Powell’s analysis of the latest job reports data, which hinted at a cooling labor market, will shape the expectations for the next decisions.
As for now, the CME FedWatch tool indicates that the odds of a 25 bps hike in the last meeting of 2023 declined to 10%. However, those expectations will rise and fall in relation to the incoming data as Powell left the door open for further tightening in case the economic reports justify it.
XAG/USD Levels to watch
Evaluating the daily chart, signs of bullish exhaustion for XAG/USD are observed, contributing to a neutral to bearish technical stance. The Relative Strength Index (RSI) shows a downward trend above its midline, suggesting diminishing bullish strength, while the Moving Average Convergence (MACD) prints lower green bars.
Support levels: $22.90,$22.80 (20-day SMA),$22.50.
Resistance levels: $23.20 (100-day SMA), $23.30 (200-day SMA), $23.70
XAG/USD Daily Chart
-638349028291175394.png)
- The AUD/JPY is freezing in place ahead of the Reserve Bank of Australia's rate call.
- Despite the Monday freeze, the Aussie is trading into 5-month highs against the Yen.
- The Reserve Bank of Australia is anticipated to raise rates once more.
The AUD/JPY is making itself comfortable ahead of the Reserve Bank of Australia's (RBA) anticipated rate hike. Money markets are expecting the Australian central bank to hike rates once more, with the median forecast at 25 basis points.
Australia Interest Rate Decision Preview: RBA set to tighten further after four straight meetings on hold
The Yen got no favors from the Bank of Japan (BoJ) this week after BoJ Governor Kazuo Ueda reaffirmed the central bank's dedication to hyper-easy monetary policy.
The BoJ made a minor adjustment to its Yield Curve Control (YCC) mechanism last week, but is otherwise leaving all other aspects of the Japanese central bank's policy framework unchanged.
Markets responded by hammering the Yen into the floorboards, with the JPY broadly selling off across the board.
AUD/JPY Technical Outlook
The Aussie-Yen pairing is largely frozen in place, trading within a tight 25-pip range for Monday's chart action as Aussie traders brace for the RBA. The AUD/JPY is testing on the high side, near 5-month highs and threatening a breakout into a new high for 2023 above 97.68, with 2022's yearly high nearby at 98.57.
The Aussie rallied nearly 2.7% from last week's opening bids near 94.80, closing in the green for five straight trading days and set for a sixth as long as the RBA meets or beats market expectations for early Tuesday's rate call.
AUD/JPY Hourly Chart

AUD/JPY Technical Levels
The key event during the Asian session will be the Reserve Bank of Australia meeting, with a rate hike expected. China will release important trade data. Later in the day, Eurostat will release the Producer Price Index.
Here is what you need to know on Tuesday, November 7:
The US Dollar Index reached a bottom at 104.86, the lowest level since September 21, and then rebounded, rising above 105.00. It closed in positive territory but remains under pressure following last week's Federal Reserve (Fed) meeting and US employment data.
A rebound in Treasury yields supported the Dollar, with the 10-year yield rising to 4.66% and the 2-year climbing from 4.85% to 4.93%. The Dollar's rebound appears to be corrective thus far, and fundamental factors still provide crucial support to the currency
EUR/USD retreated from monthly highs after failing to hold above 1.0750 and dropped to 1.0720. Eurostat will release the Producer Price Index (PPI) on Tuesday, with the annual rate expected at -12.5%.
GBP/USD reached the 200-day Simple Moving Average (SMA) at 1.2439 and turned to the downside, falling to 1.2350. The bias is still tilted to the upside, but there is further potential for correction. The following support level emerges around 1.2300.
The Japanese Yen weakened following Bank of Japan Governor Kazuo Ueda's somewhat dovish comments and the rebound in global government bond yields. USD/JPY rose after three days of losses, approaching the 150.00 area.
AUD/USD encountered resistance around the 0.6520 area and turned to the downside, falling below 0.6500. The Reserve Bank of Australia (RBA) will announce its decision on Tuesday, with many analysts expecting a 25 basis points rate hike.
Analyts at TD Securities on RBA:
We expect a 25bps rate hike; the case for a hike is strong. Q3 Headline & trimmed mean inflation overshot RBA forecasts (largely on domestic factors), property prices are within a whisker of all-time highs, retail sales have firmed and u/e rate is closer to record lows than the Q4'23 3.9% RBA f/c.
USD/CAD fell to 1.3626 and rebounded, rising to the 1.3700 area. The pair posted daily gains after falling during three trading days, losing 250 pips. It remains under the 20-day SMA, with risks tilted to the downside.
Gold lost momentum amid higher US Treasury yields and fell below $1,980. XAG/USD (Silver) was unable to break above the crucial resistance area at $23.30 and dropped to $23.00.
Like this article? Help us with some feedback by answering this survey:
- Gold prices retreat from the $1993.13 peak, trading around $1979.70, pressured by a shift towards riskier assets.
- Geopolitical jitters surround the financial markets, though the Israel-Hamas conflict remains contained.
- The economic calendar for the US is light on data but heavy on Federal Reserve speakers, with the market eyeing their comments for policy direction.
Gold price remains offered during Monday’s New York session dropped more than 0.50% after reaching a daily high of $1993.13, and exchanges hands at around $1979.70 due to a risk-on impulse.
XAU/USD sees a pullback from daily highs as market sentiment improves and central banks signal a potential pause in rate hikes
Investors' spirits are high amid speculation that most global central banks likely finished their tightening cycle. That, along with the Middle East conflict contained to parties involved– Israel and Hamas, spurred outflows from safe-haven assets, particularly non-yielding assets like Gold and Silver.
An uptick in US Treasury bond yields was a headwind for XAU/USD. The Greenback (USD), battered after the latest Fed decision to hold rates unchanged, aims up by 0.13% as the US Dollar Index rises above the 105.20 area.
This week’s economic calendar in the United States (US) will feature more Fed officials speaking, that data to be released, led by the Balance of Trade, the EBD/TIPP Economic Optimism, Initial Jobless Claims, and the University of Michigan (UoM) Consumer Sentiment. On the Fed line-up, Lisa Cook crossed wires on Monday, saying the Fed is “determined to reach the 2% inflation objective,” adding that she hopes that current policy settings are restrictive enough to achieve that task.
On Tuesday, Fed Governors Michal Barr and Christopher Waller would cross newswires, along with Regional Fed Presidents Jeffrey Schmidt, Lorie Logan, and John Williams. On Wednesday, XAU/USD traders would listen to Fed Powell's speech, followed by John Williams, Michael Barr, and Philip Jefferson.
XAU/USD Price Analysis: Technical outlook
Even though XAU/USD is dipping towards a two-week support trendline, Gold is upward biased but at a brisk to a deeper correction. A daily close below $1970 could pave the way to test the 20-day moving average (DMA) at $1955.57 before sellers can challenge the 200-DMA at $1934.20. Nevertheless, the path of least resistance is upward; once buyers reclaim $2000, that could expose the April 23 high at $2048.15, followed by the year-to-date (YTD) high at $2081.82.
- The USD/NOK is seen at 11.0480 with mild gains.
- US government bond yields are rising and rebounded, providing support to the USD.
- Chair Powell and several other Fed officials will be on the wires during the week.
The USD/NOK stayed firm in Monday's session and traded at the 11.0480 area with mild gains, driven by rising US bond yields and a negative market mood, which dictated the pace of the movements during the session. In either country, no relevant data was released, and the week’s highlights will be Jerome Powell and other Federal Reserve (Fed) official's speeches, where investors will look for further clues on the next decisions.
As for now, the USD has weakened significantly, mainly because markets are confident that the Fed is reaching the end of its tightening cycle as the effects of the monetary policy are starting to kick in just now. On Friday, the US Nonfarm Payrolls report saw the job creation pace decelerating and the Unemployment rising, signs that the Fed officials wanted to see. As a reaction, the US yields plummeted, as well as the hawkish bets on the next December meeting of the Fed, as swaps markets are now pricing only 10% odds of a 25 bps hike.
That being said, Powell left the door open for another hike in December in case the data justified it, and the bank will get two inflation readings and a jobs report until then, which will likely shape the decision.
In the meantime, the US Treasury bond yields, which fell to multi-week lows last week, are recovering and have helped the US dollar stop its bleeding. The 2-year bond rate rose to 4.90%, while the 5 and 10-year yields increased to 4.60% and 4.65%.
USD/NOK Levels to watch
Based on the daily chart, USD/NOK maintains a neutral to bearish technical perspective, with the bears gradually asserting themselves but still have more work to do. The Relative Strength Index (RSI) has a flat slope near the bearish territory, while the Moving Average Convergence (MACD) histogram presents bigger red bars.In the larger context, the pair is below the 20-day Simple Moving Average (SMA), but above the 100 and 200-day SMAs, implying that the bulls remain in control on a broader scale.
Supports: 11.038, 11.025, 11.020
Resistances: 11.057 (20-day SMA), 11.110, 11.150.
USD/NOK daily chart
-638348942843269148.png)
- The EUR/JPY is bidding into its highest prices since 2008.
- Dovish BoJ pulling the rug out from underneath Japanese Yen.
- EU Sentix Investor Confidence improves, EU Retail Sales in the pipe.
The EUR/JPY is clipping into new 15-year highs near 161.00, coming within inches of the price handle in Monday trading. The pair hit high bids of 160.98, and further upside could be on the cards for the Euro (EUR) as the Japanese Yen (JPY) flounders under the weight of a dovish Bank of Japan (BoJ).
The European Sentix Investor Confidence Index improved for November to -18.6. October previously printed at -21.9, its second-worst reading in a year.
Eurozone Sentix Investor Confidence Index improves to -18.6 in November vs. -21.9 prior
Next up of note will be European Retail Sales on Wednesday, with the annualized figure for September expected to accelerate to the downside from -2.1% to -3.2%.
BoJ: Another disappointment for JPY bulls – TDS
The Bank of Japan (BoJ) hit Yen markets with further dovish comments, with BoJ Governor Kazuo Ueda noting that the BoJ is firmly dedicated to hyper-easy momentary policy. The Japanese central bank continues to remain concerned about inflation and wage growth both declining below the BoJ's minimum targets in the future.
A dovish BoJ stance is pummeling the Yen, sending it to multi-year lows.
BoJ Governor Ueda: Will continue massive bond buying even under new operation decided last week
EUR/JPY Technical Outlook
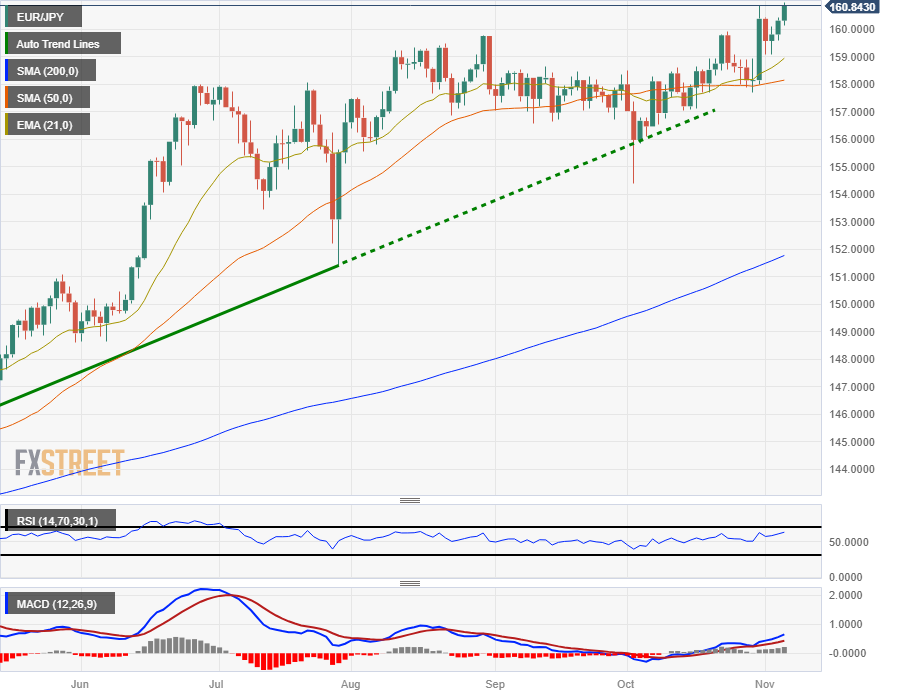
The EUR/JPY tipped into a 15-year high near the 161.00 handle on Monday, climbing as the JPY gets sent into the floorboards across the broad marketspace.
The pair has accelerated away from the 50-day Simple Moving Average (SMA) currently lifting from 158.00, and little remains in the way of technical resistance with the pair tapping multi-year highs.
The EUR/JPY pair's recent consolidation has left technical oscillators hung along the midrange, and the Relative Strength Index (RIS), despite holding firmly in upper bound territory, still hasn't flashed overbought signals.
EUR/JPY Daily Chart
EUR/JPY Technical Levels
- GBP/USD retreats slightly after failing to breach the 200-day moving average, stabilizing near the 1.2370 mark.
- The US Dollar faced a significant drop following a less hawkish stance from Fed Chair Jerome Powell and a softer-than-expected Nonfarm Payrolls report, fueling speculation of an end to rate hikes.
- In the UK, attention turns to the upcoming Q3 GDP data, which is anticipated to show a contraction, highlighting economic challenges.
GBP/USD clings to earlier gains, though it remains trading below the 1.2400 figure after testing the 200-day moving average (DMA) at 1.2433, but failure to clear it, exacerbated a pullback toward the 1.2370 area, almost flat.
British Pound sees a pullback from the 200-DMA as market mood lifts, but central bank policies keep traders cautious
Equities in the United States (US) portray an upbeat market mood, as participants expect most global central banks to end their tightening cycle. Particularly the US Federal Reserve (Fed), which held rates unchanged and kept the door open for additional tightening. However, Fed Chairman Jerome Powell failed to deliver hawkish comments after the US central bank decision pressured the Greenback, which tumbled more than 1.40% last week.
Last Friday’s soft US jobs report increased the odds for the Fed done with rate hikes, as the economy added 150K jobs in October, revealed the US Nonfarm Payrolls report delivered by the Bureau of Labor Statistics (BLS). That, along with weak PMI readings, reignited fears the economy could hit a recession despite “soft landing” talks across Federal Reserve officials.
On the UK front, the docket will feature GDP for Q3, with most economists expecting a negative reading as companies cut expenses on dented demand. Recently, the Bank of England’s (BoE) Chief Economist Huw Pill commented they might be able to reconsider its stance on interest rates. He spoke during an online presentation organized by the BoE.
GBP/USD Technical Levels
Bank of England (BoE) Chief Economist Huw Pill said on Monday that by the middle of next year, they may be able to reconsider its stance on interest rates. He spoke during an online presentation organised by the BoE.
Pill added that it is premature to discuss interest rate cuts and clarified that the Monetary Policy Committee (MPC) believes it is necessary to maintain rates at restrictive levels for a certain period. He also mentioned that rates in the future will likely be higher than those seen before the COVID-19 pandemic.
Market reaction
The GBP/USD is moving sideways around 1.2370, while the EUR/GBP is flat for the day, hovering around 0.8675. Market participants have largely ignored Pill's comments.
- Interest rate in Australia is set to rise by 25 bps from 4.10% to 4.35% in November.
- The Reserve Bank of Australia’s Governor Michele Bullock could stick to the hawkish tone.
- Volatility could ramp up around the Australian Dollar on Melbourne Cup day.
The Reserve Bank of Australia (RBA) is widely expected to resume tightening when it meets on Melbourne Cup Tuesday, having held the benchmark interest rate steady for four straight meetings.
The central focus of the RBA meeting will be on whether Governor Michele Bullock sticks to the recent hawkish rhetoric, hinting at further interest rate hikes.
Reserve Bank of Australia set to resume interest-rate hikes
The current market positioning suggests that a 25 basis points (bps) increase to the Reserve Bank of Australia’s Official Cash Rate (OCR) is fully baked on Tuesday. The decision will be announced at 03:30 GMT, with the RBA expected to lift the interest rate from 4.10% to 4.35% after a four-month hiatus from the tightening cycle.
The big four Australian banks, ANZ, CBA, Westpac and NAB, revised their call for an RBA rate hike, following the resurgence of inflation and hawkish commentary from the RBA policymakers.
Data from the Australian Bureau of Statistics (ABS) showed the Consumer Price Index (CPI) rose 1.2% in the third quarter, above market forecasts of 1.1% and up from a 0.8% increase the previous quarter. For September alone, the CPI rose 5.6% year-on-year, up from 5.2% in August.
A closely-watched measure of core CPI, the trimmed mean, rose 1.2% in the third quarter, topping expectations of 1.1%. Meanwhile, Australian Retail Sales rose for the first time in four quarters in the July-September period, rebounding 0.2% QoQ as against the previous drop of 0.6%.
Despite signs of a cooling Australian labor market, robust consumer spending supports the case for the RBA to resume interest rate hikes. Commenting on the inflation data, Reserve Bank of Australia (RBA) Governor Michele Bullock said that goods prices are coming down but services inflation remains persistent. “Services inflation is higher than what we are comfortable with,” she said.
Bullock had mentioned last month, “[the RBA’s] board will not hesitate to raise rates if there is a material upward revision to the inflation outlook.”
Christopher Kent, the RBA’s assistant governor of financial markets, had said at a Bloomberg event in early October, the board “may need to raise interest rates in the future to bring inflation down. I think that’s a reflection of the fact that we wouldn’t want it to be much slower.”
Previewing the RBA policy decision, analysts at BBH said, “Reserve Bank of Australia meets Tuesday and is expected to hike rates 25 bp to 4.35%. A handful of analysts polled by Bloomberg look for steady rates, while World Interest Rate Probabilities (WIRP) suggest 50% odds. Those odds rise to 75% for December 5 and full priced in for February 6, with odds of a second hike topping out near 35% in Q2 2024.”
How will the RBA interest rate decision impact AUD/USD?
Amidst increased expectations of an interest rate hike, the Australian Dollar (AUD) is likely to witness big moves on the RBA policy announcement. Traders will closely scrutinize the RBA policy statement for its language, signaling whether Governor Bullock keeps the door open for more rate hikes.
Dhwani Mehta, Asian Session Lead Analyst at FXStreet, notes key technicals to trade AUD/USD on the policy outcome. “AUD/USD is sitting at the highest level in three months, clinging to the 100-day Simple Moving Average (SMA) at 0.6511 ahead of Tuesday’s RBA showdown. The 14-day Relative Strength Index (RSI) has flatlined but holds comfortably above the 50 level, keeping the upside risks intact for the Aussie pair.”
“Aussie buyers need acceptance above 100-day SMA at 0.6511 on a daily closing basis to initiate a meaningful recovery toward the downward-sloping 200-day SMA at 0.6618. The next upside barrier is seen at the 0.6650 psychological level. On the downside, static support aligns at 0.6450, below which a test of Friday’s low of 0.6419 cannot be ruled out. Further south, the 50-day SMA at 0.6395 could come into play.”
Economic Indicator
Australia RBA Interest Rate Decision
RBA Interest Rate Decision is announced by the Reserve Bank of Australia. If the RBA is hawkish about the inflationary outlook of the economy and rises the interest rates it is positive, or bullish, for the AUD. Likewise, if the RBA has a dovish view on the Australian economy and keeps the ongoing interest rate, or cuts the interest rate it is seen as negative, or bearish.
Read more.Next release: 11/07/2023 03:30:00 GMT
Frequency: Irregular
Source: Reserve Bank of Australia
RBA FAQs
What is the Reserve Bank of Australia and how does it influence the Australian Dollar?
The Reserve Bank of Australia (RBA) sets interest rates and manages monetary policy for Australia. Decisions are made by a board of governors at 11 meetings a year and ad hoc emergency meetings as required. The RBA’s primary mandate is to maintain price stability, which means an inflation rate of 2-3%, but also “..to contribute to the stability of the currency, full employment, and the economic prosperity and welfare of the Australian people.” Its main tool for achieving this is by raising or lowering interest rates. Relatively high interest rates will strengthen the Australian Dollar (AUD) and vice versa. Other RBA tools include quantitative easing and tightening.
How does inflation data impact the value of the Australian Dollar?
While inflation had always traditionally been thought of as a negative factor for currencies since it lowers the value of money in general, the opposite has actually been the case in modern times with the relaxation of cross-border capital controls. Moderately higher inflation now tends to lead central banks to put up their interest rates, which in turn has the effect of attracting more capital inflows from global investors seeking a lucrative place to keep their money. This increases demand for the local currency, which in the case of Australia is the Aussie Dollar.
How does economic data influence the value of the Australian Dollar?
Macroeconomic data gauges the health of an economy and can have an impact on the value of its currency. Investors prefer to invest their capital in economies that are safe and growing rather than precarious and shrinking. Greater capital inflows increase the aggregate demand and value of the domestic currency. Classic indicators, such as GDP, Manufacturing and Services PMIs, employment, and consumer sentiment surveys can influence AUD. A strong economy may encourage the Reserve Bank of Australia to put up interest rates, also supporting AUD.
What is Quantitative Easing (QE) and how does it affect the Australian Dollar?
Quantitative Easing (QE) is a tool used in extreme situations when lowering interest rates is not enough to restore the flow of credit in the economy. QE is the process by which the Reserve Bank of Australia (RBA) prints Australian Dollars (AUD) for the purpose of buying assets – usually government or corporate bonds – from financial institutions, thereby providing them with much-needed liquidity. QE usually results in a weaker AUD.
What is Quantitative tightening (QT) and how does it affect the Australian Dollar?
Quantitative tightening (QT) is the reverse of QE. It is undertaken after QE when an economic recovery is underway and inflation starts rising. Whilst in QE the Reserve Bank of Australia (RBA) purchases government and corporate bonds from financial institutions to provide them with liquidity, in QT the RBA stops buying more assets, and stops reinvesting the principal maturing on the bonds it already holds. It would be positive (or bullish) for the Australian Dollar.
- West Texas Intermediate (WTI) crude oil sees a rebound, climbing over 1.30% from daily lows, with prices supported by OPEC+ production cut commitments.
- Saudi Arabia and Russia's pledge to maintain a 1.2 million barrel per day cut until year-end contributes to the recovery in oil prices.
- Global manufacturing PMIs indicate a potential economic slowdown, which could limit oil demand and price growth.
West Texas Intermediate (WTI) recovers some ground in the mid-north American session and climbs more than 1.30% after bouncing from a daily low of $80.71. Saudi Arabia and Russia’s commitment to its 1.2 million barrel cut until the end of the year sponsored Oil’s recovery.
Oil prices find support as Saudi Arabia and Russia affirm their production cut plans, with geopolitical tensions and global economic data in focus
According to UBS analysts, cuts implemented by the Saudis and Russia could be extended into the 2024 first quarter due to “seasonally weaker oil demand at the start of every year.” Meanwhile, recent releases of worldwide manufacturing PMIs paint a slowing economic slowdown that could cap oil prices as demand diminishes.
Following weaker-than-expected business activity indicators in China, on Tuesday, Caixin will reveal factory conditions in the country. Analysts expect a 3.3% drop in exports in October, as announced in a Reuters poll, from a decline in September.
Meanwhile, the Middle East conflict looms as a possible cause that could underpin WTI prices higher. Although the conflict remains capped to Gaza’s Strip, risks of broadening around the region are high. Hence, Oil traders need to be focused on geopolitical developments besides the Israe-Hamas conflict.
WTI Price Analysis: Technical outlook
From a technical perspective, WTI's retracement toward the $80.00 mark is just a pullback, sponsored after Oil’s fastest rise from around $77.64 toward the $94.99 mark, though falling shy of $100.00. To resume its uptrend, buyers must reclaim the 20-day moving average (DMA) at $84.69, which could open the door to challenge the 50-DMA at $86.58 before aiming toward the $90.00 psychological level. Conversely, with a drop below $80.00, sellers can challenge the 200-DMA at $78.16.
- DXY index trades flat near 105.05.
- US government bond yields are rising, rebounding from multi-week lows.
- The economic docket had no relevant high-tier reports to offer on Monday.
- Chair Powell will be on the wires on Wednesday.
The US Dollar (USD) traded flat on Monday, and the DXY index stands near 105.05, cushioned by a sour market mood and rising US bond yields. For the rest of the week, investors will put an eye on Chair Powell’s speech on Wednesday to get further clues on the next Federal Reserve meeting in December.
The labor market in the United States showed signs of cooling down after the October Nonfarm Payrolls report last Friday, which made investors practically take off the table an additional hike by the Fed in 2023. That being said, the bank will receive two additional inflation readings and a jobs report before the last meeting of the year. Incoming data will continue refining the model for market expectations.
Daily Digest Market Movers: US Dollar losses limited by recovering yields
- The US Dollar Index stands with mild gains at 105.05.
- The Greenback saw sharp losses on Friday after the US Nonfarm Payrolls report.
- The US Bureau of Labor Statistics reported that the Nonfarm Payrolls from October came in lower than expected. The US added 150,000 jobs in October vs the expected 180,000 and decelerated from its revised previous figure of 297,000.
- The Unemployment Rate came in at 3.9% in October, above the expected 3.8% and accelerated compared to its previous reading of 3.8%.
- Average Hourly Earnings increased by 0.2% MoM but rose 4.1% YoY, higher than the expected 4% and its previous reading of 4.3%.
- After reaching multi-week lows, the 2-year rate increased to 4.90%, while the longer-term 5 and 10-year rates rose nearly 4.57% and 4.64%, which seems to be limiting the downside for the USD.
- According to the CME FedWatch Tool, the odds of a 25-basis-point hike in December are extremely low, around 10%.
Technical Analysis: US Dollar Index bears take a breather; more downside on the horizon
Based on the daily chart, the DXY Index maintains a neutral to bearish technical perspective, suggesting that despite gaining momentum, bulls are not yet in full control. The Relative Strength Index (RSI) shows a downward trend below its midline, while the Moving Average Convergence (MACD) histogram shows bigger red bars.
What gives the outlook neutrality is the index staying below the 20-day Simple Moving Average (SMA) but above the 100 and 200-day SMAs, indicating that the bulls still have the upper hand in the broader picture.
Support levels: 104.90, 104.70, 104.50.
Resistance levels: 105.50, 105.80, 106.00.
US Dollar FAQs
What is the US Dollar?
The US Dollar (USD) is the official currency of the United States of America, and the ‘de facto’ currency of a significant number of other countries where it is found in circulation alongside local notes. It is the most heavily traded currency in the world, accounting for over 88% of all global foreign exchange turnover, or an average of $6.6 trillion in transactions per day, according to data from 2022.
Following the second world war, the USD took over from the British Pound as the world’s reserve currency. For most of its history, the US Dollar was backed by Gold, until the Bretton Woods Agreement in 1971 when the Gold Standard went away.
How do the decisions of the Federal Reserve impact the US Dollar?
The most important single factor impacting on the value of the US Dollar is monetary policy, which is shaped by the Federal Reserve (Fed). The Fed has two mandates: to achieve price stability (control inflation) and foster full employment. Its primary tool to achieve these two goals is by adjusting interest rates.
When prices are rising too quickly and inflation is above the Fed’s 2% target, the Fed will raise rates, which helps the USD value. When inflation falls below 2% or the Unemployment Rate is too high, the Fed may lower interest rates, which weighs on the Greenback.
What is Quantitative Easing and how does it influence the US Dollar?
In extreme situations, the Federal Reserve can also print more Dollars and enact quantitative easing (QE). QE is the process by which the Fed substantially increases the flow of credit in a stuck financial system.
It is a non-standard policy measure used when credit has dried up because banks will not lend to each other (out of the fear of counterparty default). It is a last resort when simply lowering interest rates is unlikely to achieve the necessary result. It was the Fed’s weapon of choice to combat the credit crunch that occurred during the Great Financial Crisis in 2008. It involves the Fed printing more Dollars and using them to buy US government bonds predominantly from financial institutions. QE usually leads to a weaker US Dollar.
What is Quantitative Tightening and how does it influence the US Dollar?
Quantitative tightening (QT) is the reverse process whereby the Federal Reserve stops buying bonds from financial institutions and does not reinvest the principal from the bonds it holds maturing in new purchases. It is usually positive for the US Dollar.
- The Euro is seeing limited recovery against the Pound Sterling after a half percent backslide last Friday.
- The EUR/GBP tested into a 14-day low on Monday before bouncing back.
- Euro traders to keep an eye out for EU Retail Sales in the mid-week.
The EUR/GBP is seeing a rebound on Monday after tipping into a 14-day low of 0.8650, heading for 0.8700 as the Euro recovers following an improved reading of the Euro Sentix Investor Confidence.
The EUR/GBP kicked off the new trading week slipping to a 3-week low before an improvement in the Sentix Investor Confidence indicator, which reversed course from September's -21.9 to print at -18.6 for October. The indicator remains deeply in bearish territory despite the improvement, and Euro upside gains are set to be limited.
Pound Sterling traders will be looking out for any drastic swings in BRC Like-For-Like Retail Sales due on Tuesday, which is expected to decline from 2.8% to 2.4% for the year into October.
Wednesday will see a speech from Bank of England (BoE) Governor Andrew Bailey, while the Euro side sees EU Retail Sales, which is expected to accelerate into the downside for the year into September, from -2.1% to -3.2%.
Room to moderate hawkish expectations for the UK – TDS
The big barn-buster for UK data this week will be UK Gross Domestic Product (GDP), slated to cap off the trading week on Friday.
UK quarterly Gross Domestic Product last printed at 0.2% for the 2nd quarter, and the 3rd quarter print is forecast to slump back into negative territory at -0.1%.
EUR/GBP Technical Outlook
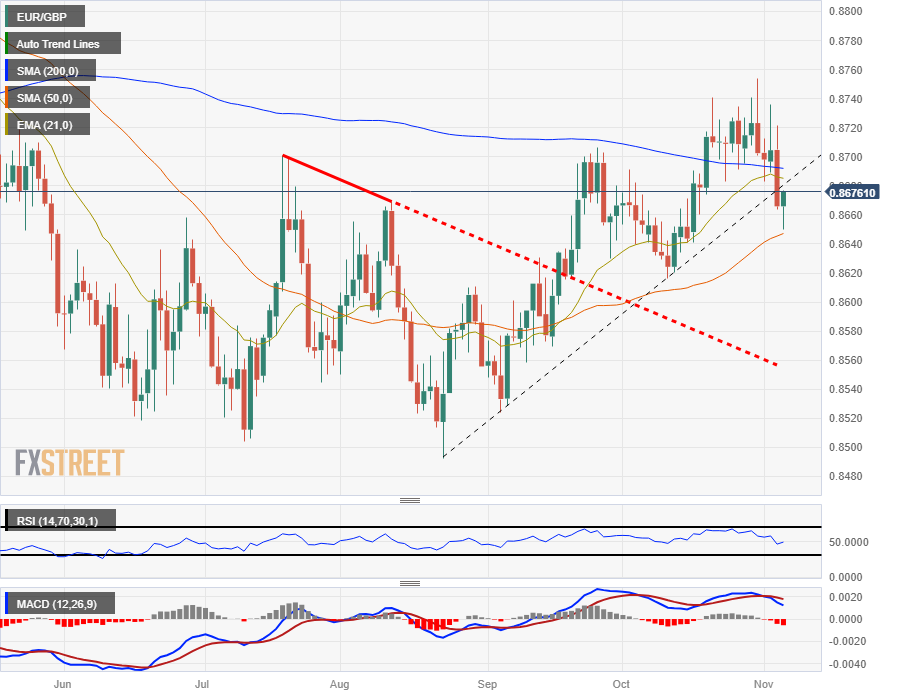
Friday's Euro backslide saw the EUR/GBP tumble through a rising trendline from late August's swing low below 0.8500, and Monday's Euro rebound could see the pair set to re-challenge the trendline break, with the 200-day Simple Moving Average (SMA) acting as a hard barrier just below 0.8700.
The EUR/GBP saw a Monday rebound from just above the 50-day SMA near 0.8650, and a bullish continuation will see a higher lower etched in from here, while a bearish reversal will see a challenge of the previous swing low near 0.8620.
EUR/GBP Daily Chart
EUR/GBP Technical Levels
- The GBP/JPY is grinding towards 186.00 as Bank of Japan confirms dovish stance.
- BoJ to continue massive bond purchases despite new operations.
- GBP/JPY tips into a fresh 9-week high for Monday.
The GBP/JPY continues to climb with the Japanese Yen (JPY) continuing to get pushed into the floorboards by the Bank of Japan (BoJ) and its hyper-dovish policy stance.
BoJ Governor Ueda: Will continue massive bond buying even under new operation decided last week
BoJ Governor Kazuo Ueda confirmed early Monday that the Japanese central bank will continue with its hyper-easy monetary policy stance. Despite lifting the upper bound limit on their Yield Curve Control (YCC) mechanism, the BoJ reaffirmed their determination in buying as many Japanese government bonds as it needs to keep the yield curve tightly capped.
The BoJ also reaffirmed their fears that inflation and wage growth will slump below the central bank's target levels, and have dedicated to keep the doors on easy monetary policy as wide as they need to support the Japanese economy.
UK data this week: thin data spread, speaking notes from BoE Gov Bailey
It's a thin week on the economic calendar for the Pound Sterling (GBP), though S&P Global/CIPS Construction Purchasing Manager Index (PMI) for October came in above expectations, printing at 45.6 compared to the previous month's 45.0, beating the median market forecast of a decline to 44.5.
UK BRC Life-For-Like Retail Sales for the year into October will print early Tuesday, forecast to tick down from 2.8% to 2.4%, and Pound Sterling traders will be keeping an eye out for Bank of England (BoE) Governor Andrew Bailey who will be giving a speech at a conference on Wednesday.
GBP/JPY Technical Outlook
The GBP/JPY's push higher on Monday sets a new 9-week high for the pair, and the Guppy is set for a fresh challenge of the 186.00 handle.
The GBP has gained 2.6% against the Yen since last week's low near 180.75, and the pair is making a clean break higher after getting hung up near the 50-day Simple Moving Average (SMA) and the 21-day Exponential Moving Average (EMA), with the two moving averages braiding around the 183.00 level.
GBP/JPY Daily Chart
GBP/JPY Technical Levels
Federal Reserve Governor Lisa Cook said on Monday that expectations of near-term policy rates do not appear to be driving rise in long-term rates, per Reuters.
Key quotes
"Residential and commercial property prices remain above levels historically associated with fundamentals."
"If commercial mortgage delinquency rates force sales, commercial real estate prices could decline sharply."
"Business borrowing is at high levels, but measures of debt servicing capacity remain strong overall due to profits and limited impact of high interest rates so far."
"For some borrowers debt service capacity has begun to show signs of weakness."
"In terms of debt, household sector looks quite resilient, though there are emerging signs of stress for those with weak credit."
"Banking sectors remains sound and resilient overall, acute stresses have abated."
"Vulnerabilities among non-banks could amplify stress of tightened financial conditions and slowing economy."
"Fed cannot anticipate all risks, but can build resilience to shocks; particularly important to enhance resilience of large banks."
Market reaction
These comments failed to trigger a noticeable market reaction. As of writing, the US Dollar Index was virtually unchanged on the day at 105.05.
- NZD/USD pair is trading down after printing three- days of consecutive gains.
- A resurgence in U.S. Treasury bond yields has provided support to the U.S. Dollar, as indicated by the steadying of the US Dollar Index (DXY).
- Federal Reserve speakers, including Lisa Cook, Michael Barr, Jeffrey Schmid, and Christopher Waller, are scheduled to speak, potentially offering insights into future monetary policy.
NZD/USD capped its advance toward the 0.6000 area as US Treasury bond yields rose and so far dragged the Greenback (USD) toward its Monday’s opening price, as shown by the US Dollar Index (DXY). The pair exchanges hands at 0.5977, down 0.37%.
Kiwi dollar pulls back from highs as rising U.S. Treasury yields bolster the U.S. Dollar, with investors eyeing central bank cues
A scarce economic docket in the United States (US) throughout the present week would witness the update of the Balance of Trade, IBD/TIPP Economic Optimism, unemployment claims, and consumer sentiment. Additionally, US Federal Reserve (Fed) officials will begin their parade on Monday with Lisa Cook, followed by Michael Barr, Jeffrey Schmid, and Christopher Waller on Tuesday.
It should be said that after last week’s decision, it would be interesting to see Fed officials push back against market participants already pricing in 100 bps of cut toward the end of next year. One of the reasons they used to hold rates unchanged was the high yields on the long end of the curve, as most expressed that it tightened monetary conditions and helped them to do the job. However, following the Fed’s hold, the 20 and 30 US bond yields plunged more than 30 bps, as investors suggest the Fed is done raising rates.
It seems that market participants have overreacted to last week’s US Nonfarm Payrolls report, which showed the economy added 150K jobs in October, below forecasts of 180K, and September’s downward revised 297K. Although the labor market is easing, the report is just the second one in eleven months that missed estimates.
On the New Zealand front, the Kiwi would gather direction from the New Zealand Business PMI data. It should be said that a soft labor market and wage growth cooling, would refrain the Reserve Bank of New Zealand (RBNZ) from raising rates, past the 5.50% threshold.
NZD/USD Technical Levels
- The Canadian Dollar is softly reversing course after meager Monday gains.
- Canada Ivey PMI missed expectations but is still positive for now.
- Loonie losses capped by firming Crude Oil bids to start the week.
The Canadian Dollar (CAD) is giving back some of Friday’s gains after kicking off the trading week with a minor downstep into 1.3629 against the US Dollar (USD), and the Loonie heads into a data-light trading week.
Canada Ivey Purchasing Manager Index (PMI) figures missed the mark on Monday, but they still remain in growth territory above 50.0 for the time being.
Daily Digest Market Movers: Canadian Dollar softens, but momentum remains limited
- Canada Ivey PMI for October (non-seasonally-adjusted) came in at 51.9 compared to 54.2 in September.
- The seasonally-adjusted October Ivey PMI printed firmer at 53.4, gaining on the previous month’s 53.1 but missing the median market forecast of 54.0.
- The Canadian Dollar rose to a 12-day high of 1.3629 against the US Dollar to cap off last week’s three-day bull rally.
- The USD/CAD is seeing a relief pullback, and the CAD saw a knockback into 1.3685.
- This week’s economic calendar for the CAD has limited data of a significant nature.
- Tuesday: low-impact Canadian Trade Balance for September, mid-tier speech from the Bank of Canada’s (BoC) Deputy Governor Sharon Kozicki.
- Wednesday: Canada Building Permits (September).
- Crude Oil is seeing a minor uptick for Monday, with West Texas Intermediate (WTI) Crude Oil rising from the week’s opening bid of $80.65 to tap $82.00 per barrel.
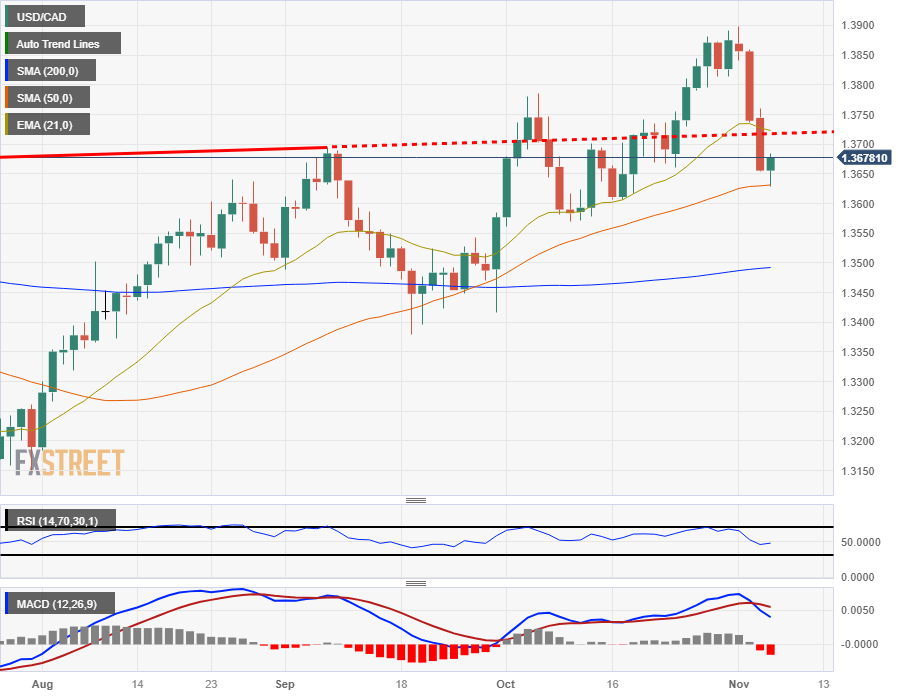
Technical Analysis: Canadian Dollar sees relief pullback after gaining nearly 2% last week
The Canadian Dollar (CAD) is giving back some of the Loonie’s 2% rally from last week’s high of 1.3899 in the USD/CAD, and the CAD is now giving back some chart space to the Greenback.
The USD/CAD pair is trading back toward 1.3700 after seeing a clean early Monday bounce from the 50-day Simple Moving Average (SMA) currently parked near 1.3630. Near-term support from the 200-day SMA sits near the 1.3500 handle, capping off any extended bull runs in the Loonie.
US Dollar bulls will have eyes on last week’s high that landed just shy of claiming the 1.3900 handle, and a broad-market firming up of USD bidding will see the USD/CAD clawing back chart paper.
USD/CAD Daily Chart
Canadian Dollar price this week
The table below shows the percentage change of Canadian Dollar (CAD) against listed major currencies this week. Canadian Dollar was the strongest against the New Zealand Dollar.
| USD | EUR | GBP | CAD | AUD | JPY | NZD | CHF | |
| USD | -0.10% | -0.11% | 0.10% | 0.26% | 0.24% | 0.32% | -0.19% | |
| EUR | 0.10% | -0.01% | 0.21% | 0.37% | 0.33% | 0.42% | -0.10% | |
| GBP | 0.11% | 0.01% | 0.23% | 0.39% | 0.34% | 0.44% | -0.09% | |
| CAD | -0.11% | -0.22% | -0.22% | 0.14% | 0.11% | 0.20% | -0.31% | |
| AUD | -0.28% | -0.38% | -0.40% | -0.18% | -0.04% | 0.04% | -0.48% | |
| JPY | -0.23% | -0.33% | -0.56% | -0.11% | 0.01% | 0.10% | -0.43% | |
| NZD | -0.32% | -0.43% | -0.44% | -0.18% | -0.05% | -0.09% | -0.53% | |
| CHF | 0.19% | 0.09% | 0.08% | 0.30% | 0.45% | 0.43% | 0.52% |
The heat map shows percentage changes of major currencies against each other. The base currency is picked from the left column, while the quote currency is picked from the top row. For example, if you pick the Euro from the left column and move along the horizontal line to the Japanese Yen, the percentage change displayed in the box will represent EUR (base)/JPY (quote).
Canadian Dollar FAQs
What key factors drive the Canadian Dollar?
The key factors driving the Canadian Dollar (CAD) are the level of interest rates set by the Bank of Canada (BoC), the price of Oil, Canada’s largest export, the health of its economy, inflation and the Trade Balance, which is the difference between the value of Canada’s exports versus its imports. Other factors include market sentiment – whether investors are taking on more risky assets (risk-on) or seeking safe-havens (risk-off) – with risk-on being CAD-positive. As its largest trading partner, the health of the US economy is also a key factor influencing the Canadian Dollar.
How do the decisions of the Bank of Canada impact the Canadian Dollar?
The Bank of Canada (BoC) has a significant influence on the Canadian Dollar by setting the level of interest rates that banks can lend to one another. This influences the level of interest rates for everyone. The main goal of the BoC is to maintain inflation at 1-3% by adjusting interest rates up or down. Relatively higher interest rates tend to be positive for the CAD. The Bank of Canada can also use quantitative easing and tightening to influence credit conditions, with the former CAD-negative and the latter CAD-positive.
How does the price of Oil impact the Canadian Dollar?
The price of Oil is a key factor impacting the value of the Canadian Dollar. Petroleum is Canada’s biggest export, so Oil price tends to have an immediate impact on the CAD value. Generally, if Oil price rises CAD also goes up, as aggregate demand for the currency increases. The opposite is the case if the price of Oil falls. Higher Oil prices also tend to result in a greater likelihood of a positive Trade Balance, which is also supportive of the CAD.
How does inflation data impact the value of the Canadian Dollar?
While inflation had always traditionally been thought of as a negative factor for a currency since it lowers the value of money, the opposite has actually been the case in modern times with the relaxation of cross-border capital controls. Higher inflation tends to lead central banks to put up interest rates which attracts more capital inflows from global investors seeking a lucrative place to keep their money. This increases demand for the local currency, which in Canada’s case is the Canadian Dollar.
How does economic data influence the value of the Canadian Dollar?
Macroeconomic data releases gauge the health of the economy and can have an impact on the Canadian Dollar. Indicators such as GDP, Manufacturing and Services PMIs, employment, and consumer sentiment surveys can all influence the direction of the CAD. A strong economy is good for the Canadian Dollar. Not only does it attract more foreign investment but it may encourage the Bank of Canada to put up interest rates, leading to a stronger currency. If economic data is weak, however, the CAD is likely to fall.
- The USD/CHF saw mild losses near 0.8970 after Friday’s sharp declines.
- The US bond yields are recovering from multi-week lows.
- Eyes on Fed speakers.
The USD/CHF was seen mostly flat on Monday, with the pair trading around 0.8970. The pair's price dynamics were set by rising US bond yields, which benefited the Greenback, allowing it to gain traction which limits the downside for the pair. For the rest of the session, no relevant data will be released for either the US or Switzerland.
The US Dollar is gaining momentum on Monday after sharply declining last week amid dovish bets on the Federal Reserve (Fed) after Wednesday’s decision. The bank decided to hold rates steady at 5.25-5.50%, and Chair Powell was seen hinting at the monetary policy reaching its end. As a reaction, the US Treasuries sharply declined, which favoured the downward trajectory of the pair. The downside was exacerbated by soft labor market data released on Friday, which included reports of the US job creation decelerating in October and the Unemployment rate rising.
On Monday, the 2,5 and 10-year rates recovered from multi-week lows, jumping to 4.90%, 4.58% and 4.64%, respectively, which provided a lift to the US Dollar. For the rest of the week, the focus will be on several Fed officials, who will be on the wires for investors to continue placing their bets on the next decisions. As for now, the CME FedWatch tool suggests that the odds of a 25 bps hike declined nearly 10% for the upcoming December meeting. Chair Powell speaks on Wednesday.
USD/CHF Levels to watch
Analysing the daily chart, the technical outlook for the USD/CHF remains neutral to bearish as the bears continue to show signs of gaining ground for the short term. Displaying a slight negative slope in the bearish region, the Relative Strength Index (RSI) indicates a potential continuation of bearish momentum while the Moving Average Convergence (MACD) histogram presents lower green bars. Additionally, the pair is below the 20 and 200-day Simple Moving Average (SMA), but above the 100 SMA, indicating that the buyers are still holding momentum on the bigger picture, holding their some dominance over the sellers.
Supports: 0.8960, 0.8950, 0.8930
Resistances: 0.9000 (20 and 200-day SMA convergence), 0.9020, 0.9040
USD/CHF Levels to watch
-638348827817150386.png)
USD/MXN has experienced a deep pullback after approaching multi-year trend line at 18.48/18.60. Economists at Société Générale analyze the pair’s outlook.
Next supports at 17.00/16.60
USD/MXN failed to reclaim the trend line drawn since November 2021 at 18.48/18.60 recently and this has resulted in a sharp pullback.
The pair has once again given up its 200-DMA and re-integrated within previous base. This denotes upward momentum has disappeared. Inability to reclaim the MA near 17.70 could mean persistence in decline.
Next potential supports are located at 17.00 and July/August lows near 16.60.
The Reserve Bank of Australia (RBA) will announce its next Interest Rate Decision on Tuesday, November 7 at 03:30 GMT and as we get closer to the release time, here are the forecasts by the economists and researchers of 10 major banks regarding the upcoming central bank's decision.
The RBA is expected to hike rates by 25 basis points to 4.35% after the latest higher-than-expected inflation figures in Australia.
Standard Chartered
We expect the RBA to raise rates by 25 bps to 4.35%. We have been calling for a November hike for some time now and the latest higher-than-expected Q3 CPI numbers support our call. But in the event the RBA does not hike, we believe it is a matter of being delayed rather than derailed.
ANZ
We expect the RBA to increase the cash rate by 25 bps after hawkish rhetoric and an uncomfortable CPI outcome. Thereafter we still expect a hawkish hold, with risks skewed towards tightening in the near term. We don’t expect any easing until Q4 2024.
Deutsche Bank
We expect a 25 bps hike.
ING
Given the RBA’s latest indication of a low tolerance for inflation remaining above target together with still tight labour markets, it looks like the new Governor, Michele Bullock, has few credible options except to tighten rates again at the upcoming meeting. A 25 bps hike will take the cash rate to 4.35%.
Westpac
We anticipate that the RBA will raise the cash rate by 25 bps to 4.35%. The Q3 CPI report highlighted that the pace of disinflation was not as fast as the RBA was hoping for, and the risk of a longer return to target – relative to the RBA’s current forecasts – is therefore material. The resilience of the household sector, alongside lingering capacity constraints amid strong population growth, supports the decision to raise rates as well. However, the Board will also recognise that the labour market has turned and the risk of a price-wage spiral is receding. In essence, November’s rate hike decision will be finely balanced.
TDS
We expect a 25 bps hike following the outsized Q3 CPI print. The outcome was material in our view and threatens the RBA's ability to bring inflation under 3% by Q4'25. A hike would be consistent with RBA comments of ‘...a low tolerance returning inflation to target more slowly than currently expected.’ That said, we do acknowledge the decision is a close call.
SocGen
We expect the RBA to increase the cash rate target by 25 bps to 4.35%, implying additional monetary tightening after the four-month ‘pause’ since the July meeting. The policy statement is likely to point out that inflation is returning to target more slowly than the RBA’s current forecast according to the recent data. We think this assessment would be sufficient to implement an additional rate hike in November. We believe there will be no further RBA rate hikes after the level of 4.35% is reached, although we do expect the policymakers to leave the door open to further tightening that should be data-dependent.
OCBC
We see good chance of RBA increasing cash rates by 25 bps, especially following higher CPI, PPI print, better than expected retail sales and following RBA Governor Bullock’s recent remarks. In particular, she said that RBA will not hesitate to hike if there is material upgrade to its inflation outlook.
Wells Fargo
At its last announcement, the RBA indicated ‘some further tightening of monetary policy may be required to ensure that inflation returns to target in a reasonable timeframe.’ Since then, Q3 CPI inflation slowed less than expected, September retail sales were solid, and RBA Governor Bullock offered hawkish comments hinting at further tightening. Against this backdrop, we believe the RBA will resume tightening by raising its Cash Rate 25 bps to 4.35% at its November monetary policy meeting.
Citi
Michele Bullock’s second Board meeting as Governor should conclude with a decision to increase the cash rate target by 25 bps to 4.35%. Inflation remains stickier than expected, risking inflation expectations remaining higher for longer. Stronger data on retail trade shows household activity acclimatizing to the current level of interest rates, supported by high excess savings, rising house prices, a close to record low unemployment rate and above average working age population growth.
- The Mexican Peso (MXN) starts the week with a 0.30% decline against the U.S. Dollar (USD), with the USD/MXN pair rising above the 17.50 level.
- Mexico's Consumer Confidence index fell in October, marking the first significant drop since July 2022, signaling growing consumer pessimism about the economic outlook.
- Market participants are looking ahead to the Bank of Mexico's (Banxico) upcoming policy meeting, where rates are expected to remain at 11.25%.
Mexican Peso (MXN) begins the week on the wrong foot against the US Dollar (USD) and loses at around 0.30%, even though market sentiment remains upbeat. A rebound in US Treasury bond yields underpins the Greenback. Consequently, the USD/MXN advances solidly, trading above the 17.50 figure amid a positive market sentiment.
Mexico’s economic docket featured Consumer Confidence in October, which slipped 0.8 points, from 46.8 to 46, revealed the National Statistics Agency (INEGI). This is the first drop since April 2022, which witnessed a contraction of 0.3, and the most significant since July 2022, when confidence dropped 1.6 points. Although the economy is expected to grow more than 3%, consumers are more pessimistic about the future. Meanwhile, USD/MXN traders brace for Thursday’s Bank of Mexico (Banxico) monetary policy meeting, with expectations that the Mexican central bank will keep rates at 11.25%.
Across the border, the US Federal Reserve’s (Fed) decision to hold rates unchanged was justified by weak PMI readings and a softer US Nonfarm Payrolls report. Nevertheless, the drop in US Treasury bond yields loosened monetary conditions after Fed officials revealed that high yields at the long end of the curve tightened monetary conditions, refraining the US central bank from raising rates further.
Daily digest movers: Mexican Peso losses a step as US bond yields underpin the USD/MXN
- The US Nonfarm Payrolls report reported the economy added 150,000 jobs in October, below estimates of 180,000, and last month’s downwardly revised 297,000.
- The ISM Manufacturing PMI dropped to contractionary territory at 46.7 in October, below forecasts and September’s 49.0 reading.
- Mexico S&P Global October Manufacturing PMI at 52.1, above September’s 49.8.
- Mexico’s Gross Domestic Product grew by 0.9% QoQ in the third quarter on its preliminary reading, above the previous quarter and estimates of 0.8%.
- On a yearly basis, Mexico’s GDP for Q3 expanded by 3.3%, above forecasts of 3.2% but trailing the previous 3.6%.
- On October 24, Mexico's National Statistics Agency, INEGI, reported annual headline inflation hit 4.27%, down from 4.45% at the end of September, and below forecasts of 4.38%.
- Mexico’s core inflation rate YoY was 5.54%, beneath forecasts of 5.60%.
- The Bank of Mexico (Banxico) held rates at 11.25% in September and revised its inflation projections from 3.50% to 3.87% for 2024, which remains above the central bank’s 3.00% target (plus or minus 1%). The next decision will be announced on November 9.
Technical Analysis: Mexican Peso buyers in charge, but sellers eye a recovery past the 50-day SMA
The USD/MXN daily chart portrays the pair as bearish, despite having undergone a slight recovery after diving to a new month low of 17.28 on Friday. The pair also formed a Japanese hammer candlestick pattern at Friday’s lows, although it ended the day painted red, weakening the short-term reversal signal.
If the hammer signals a turnaround, and US Dollar bulls manage to lift the pair past the 50-day Simple Moving Average (SMA) at 17.64, that could open the door to reclaiming the 200-day SMA at 17.69. On the other hand, if bears step in again and drag the exchange rate below the 100-day SMA at 17.11, a test of the 17.00 figure is on the cards.
Mexican Peso FAQs
What key factors drive the Mexican Peso?
The Mexican Peso (MXN) is the most traded currency among its Latin American peers. Its value is broadly determined by the performance of the Mexican economy, the country’s central bank’s policy, the amount of foreign investment in the country and even the levels of remittances sent by Mexicans who live abroad, particularly in the United States. Geopolitical trends can also move MXN: for example, the process of nearshoring – or the decision by some firms to relocate manufacturing capacity and supply chains closer to their home countries – is also seen as a catalyst for the Mexican currency as the country is considered a key manufacturing hub in the American continent. Another catalyst for MXN is Oil prices as Mexico is a key exporter of the commodity.
How do decisions of the Banxico impact the Mexican Peso?
The main objective of Mexico’s central bank, also known as Banxico, is to maintain inflation at low and stable levels (at or close to its target of 3%, the midpoint in a tolerance band of between 2% and 4%). To this end, the bank sets an appropriate level of interest rates. When inflation is too high, Banxico will attempt to tame it by raising interest rates, making it more expensive for households and businesses to borrow money, thus cooling demand and the overall economy. Higher interest rates are generally positive for the Mexican Peso (MXN) as they lead to higher yields, making the country a more attractive place for investors. On the contrary, lower interest rates tend to weaken MXN.
How does economic data influence the value of the Mexican Peso?
Macroeconomic data releases are key to assess the state of the economy and can have an impact on the Mexican Peso (MXN) valuation. A strong Mexican economy, based on high economic growth, low unemployment and high confidence is good for MXN. Not only does it attract more foreign investment but it may encourage the Bank of Mexico (Banxico) to increase interest rates, particularly if this strength comes together with elevated inflation. However, if economic data is weak, MXN is likely to depreciate.
How does broader risk sentiment impact the Mexican Peso?
As an emerging-market currency, the Mexican Peso (MXN) tends to strive during risk-on periods, or when investors perceive that broader market risks are low and thus are eager to engage with investments that carry a higher risk. Conversely, MXN tends to weaken at times of market turbulence or economic uncertainty as investors tend to sell higher-risk assets and flee to the more-stable safe havens.
USD's drubbing continues into a new week. Economists at TD Securities analyze the FX market outlook.
USD lower theme to continue this week
We expect the USD lower theme to continue this week with fewer risk events on the docket.
We expect RBA to hike by 25 bps which is a close call; we expect further upside in AUD from relative rate differentials and a China rebound.
A hold by Banxico should not be market moving for the MXN. CPI will be more important as persistence in core inflation can delay expectations of a cutting cycle in Mexico.
Kit Juckes, Chief Global FX Strategist at Société Générale, analyzes USD outlook after a deluge of softer-than-expected US economic data last week.
Underlying macro story is not universally as Dollar-negative as last week’s moves might suggest
Positioning may be the Dollar’s worst enemy here. CFTC data show USD longs persisted into last week. By contrast, the underlying macro story isn’t universally as Dollar-negative as last week’s moves might suggest.
With the market pricing an earlier ECB cut now, and UK Q3 GDP expected to have fallen, I’m not overly excited about shorting DXY (or selling USD against GBP or EUR).
- The Japanese Yen weakens on Monday as the market mood turns upbeat.
- The BoJ gives mixed signals, saying it is normalizing on the one hand but then still easing.
- USD/JPY shows signs of weakness as the Federal Reserve is widely expected to keep rates unchanged, undermining USD.
The Japanese Yen (JPY) trades lower against most counterparts on Monday as the overall positive market mood tends to favor riskier currencies and not safe havens like the Yen.
The day’s temporary weakness is in line with the longer-term trend. Since 2021, the Japanese Yen – measured by the FXCM Index, which tracks the currency’s value against a basket of peers – has fallen over 33% in value.
The weakness was mainly due to the Bank of Japan’s (BoJ) policy of keeping interest rates sub-zero at a time when most other central banks were raising their interest rates to fight inflation. Since global investors tend to prefer parking their capital where it can manifest the highest risk-free returns, other currencies gained favor at the expense of the Yen.
More recently, with signs many central banks have reached or are close to reaching peak interest rates, the rate differential that was so detrimental to the Yen in the past could be finally closing. If the BoJ continues normalizing policy and other central banks stop raising rates or even begin cutting them, the Yen could start a recovery rally.
Daily digest market movers: Yen retreats as market mood lifts
- The Yen weakens at the start of the week as the market mood turns positive, favoring riskier currencies rather than safe havens.
- At its last meeting, the BoJ gave mixed signals. Whilst the board of governors made a step towards normalizing policy by relaxing the artificial cap it had imposed on 10-year Japanese Government Bond (JGB) yields – essentially a form of quantitative easing – Bank of Japan Governor Kazuo Ueda was clear there were no plans to raise interest rates yet.
- In fact, despite removing the yield cap, the Yen sold off after the meeting.
- The sell-off was put down to Governor Ueda’s remarks that most inflation was from higher commodity prices rather than increased demand, suggesting the BoJ would need to continue to keep monetary policy accommodative.
- Further, according to Reuters, the BoJ actually intervened to defend the 1.0% JGB cap on October 31 when yields almost reached it, suggesting the bank’s actions don’t follow its words, and de facto easing is still in place.
- According to analyst James Harte, of Tickmill Group, the BoJ is unlikely to raise rates anytime soon.
- "Ueda signaled that the prospect of negative rates being reversed this year was very low,” said Harte in a note, reported by Barron’s.
- The next key data release for Japan is Labour Cash Earnings for September, which is forecast to show a 1% rise YoY, when data is released at 22:30 on Monday.
- Overall Household Spending in the same month, released at the same time, is expected to show a -2.7% change YoY.
- If both metrics fall in line with estimates, the Yen is unlikely to gain much traction as it will suggest the subdued earning and spending cycle of past years, which has kept BoJ policy so accommodative, is still in effect.
- On Friday, the Yen gained against the US Dollar (USD) after the release of the October Nonfarm Payrolls report led traders to offload the Dollar.
- The report showed a weakening of most labor metrics in October, suggesting the Federal Reserve (Fed) could be done with raising interest rates.
Japanese Yen technical analysis: USD/JPY bear flag risks reversing short-term uptrend
USD/JPY – the amount of Yen that one Dollar buys – rises on Monday amidst a more upbeat market mood.
From a short-term perspective, the pair’s uptrend is perilously close to reversing. A break below the key 148.80 low of October 30 would provide evidence bears finally have the upper hand, as it is the last major lower high of the short-term uptrend.
Monday’s recovery looked at on the 4-hour chart resembles a bear flag pattern that could soon break lower and challenge those lows.
-638348809047909134.png)
US Dollar vs Japanese Yen: 4-hour Chart
There are further signs of weakness too: the pair has cleanly broken out the rising channel it has been in – disrespecting the lower boundary line for the second time this week.
It has cut straight through the 50 and 100 4-hour Simple Moving Averages (SMA) and is wrestling with the 200.
-638348809605072078.png)
US Dollar vs Japanese Yen: Daily Chart
On the daily chart, which reflects the medium-term trend, the pair is still in an uptrend. This continues to look solid except for the channel breakout. The 148.80 lows is still the level to watch. If it remains intact, a recovery continues to be probable. There is further support at the 50-day SMA at 148.63.
The Moving Average Convergence Divergence (MACD) indicator has been showing bearish divergence for some time. Nevertheless, this is not sufficient on its own to suggest the medium-term uptrend has reversed.
Ultimately, as the saying goes, the “trend is your friend” and for USD/JPY the short, medium and long-term trends are all still bullish, suggesting the odds continue to favor more upside eventually.
If the 151.93 level from October 2022 – which marked a 32-year-high – is breached, the uptrend will gain reconfirmation, with next targets expected to be met at the round numbers – 153.00, 154.00, 155.00 etc.
Bank of Japan FAQs
What is the Bank of Japan?
The Bank of Japan (BoJ) is the Japanese central bank, which sets monetary policy in the country. Its mandate is to issue banknotes and carry out currency and monetary control to ensure price stability, which means an inflation target of around 2%.
What has been the Bank of Japan’s policy?
The Bank of Japan has embarked in an ultra-loose monetary policy since 2013 in order to stimulate the economy and fuel inflation amid a low-inflationary environment. The bank’s policy is based on Quantitative and Qualitative Easing (QQE), or printing notes to buy assets such as government or corporate bonds to provide liquidity. In 2016, the bank doubled down on its strategy and further loosened policy by first introducing negative interest rates and then directly controlling the yield of its 10-year government bonds.
How do Bank of Japan’s decisions influence the Japanese Yen?
The Bank’s massive stimulus has caused the Yen to depreciate against its main currency peers. This process has exacerbated more recently due to an increasing policy divergence between the Bank of Japan and other main central banks, which have opted to increase interest rates sharply to fight decades-high levels of inflation. The BoJ’s policy of holding down rates has led to a widening differential with other currencies, dragging down the value of the Yen.
Is the Bank of Japan’s ultra-loose policy likely to change soon?
A weaker Yen and the spike in global energy prices have led to an increase in Japanese inflation, which has exceeded the BoJ’s 2% target. Still, the Bank judges that the sustainable and stable achievement of the 2% target has not yet come in sight, so any sudden change in the current policy looks unlikely.
The Reserve Bank of Australia (RBA) meets on Tuesday. Economists at Commerzbank analyze Aussie’s outlook ahead of the Interest Rate Decision.
Lower AUD/USD the RBA disappoints again
Market expectations of another rate hike are not entirely unjustified. If the RBA does raise rates, it would be a strong hawkish signal and a sign that the RBA remains committed to fighting inflation. The Aussie should benefit significantly from this.
It should be noted that the market was already pricing in another hike before the August decision, as the data was pointing in that direction. In the end, however, the RBA disappointed, which put the Aussie under considerable pressure. If the RBA disappoints again, we are likely to target lower levels in AUD/USD.
GBP/USD is on the cusp of return above the 200-Day Moving Average (DMA) of 1.2435. Economists at Société Générale analyze the pair’s outlook.
Consolidation and possible profit taking not ruled out
Short covering on Friday and the bounce over 1.23 will have reduced bearish bets.
Consolidation and possible profit taking are not ruled out this week if UK GDP disappoints on Friday. However, this may count for little if US yields remain soft and stocks push ahead.
The 200-DMA (1.2435) is now within reach and a break could hasten a return over 1.25.
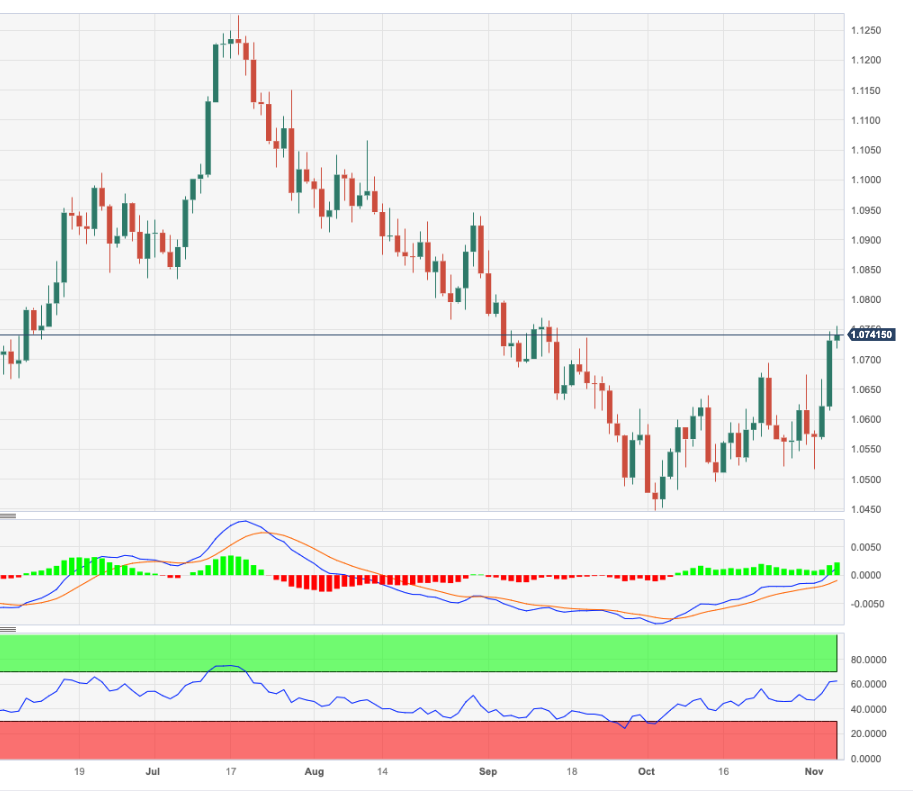
- EUR/USD climbs to multi-week tops near 1.0760.
- Extra advance could see the 1.0770 area revisited near term.
EUR/USD pushes harder and advances to new eight-week highs near 1.0760 on Monday.
Further gains in the pair looks in the pipeline in the short term. Against that, there is a minor hurdle at the weekly high of 1.0767 (September 12) prior to the more relevant 200-day SMA at 1.0805.
In the meantime, while below the 200-day SMA, the pair’s outlook should remain negative.
EUR/USD daily chart
Economists at TD Securities discuss the Reserve Bank of Australia (RBA) Interest Rate Decision and its implications for the AUD/USD pair.
On hold (30%)
The Bank may decide to hold off from hiking for two main reasons: 1) 30% of households were deemed to be 'at risk' of mortgage stress (Roy Morgan Survey) and 2) the impact of prior rate hikes has yet to filter through. Less important but possibly relevant is Gov. Bullock operating without a full bench, with no Deputy Governor and Chief Economist to provide alternatives on monetary policy. AUD/USD -0.50%.
Hike +25 bps, neutral (55%)
The case to hike appears to be rather clear, but we question whether the Bank will send a strong message to deliver a follow-up hike as early as Dec/Feb. If the Bank states 1) ‘The central forecast is for CPI inflation to continue to decline and to be back within the 2-3 percent target range in late 2025’ then this should make a Dec hike less likely and/or 2) ‘To date, medium-term inflation expectations have been consistent with the inflation target and it is important that this remains the case.’ Repeating ‘Some further tightening of monetary policy may be required to ensure that inflation returns to target in a reasonable timeframe’ would suggest the Bank is in no rush to deliver a follow-up hike in Dec. AUD/USD -0.20%.
Hike +25 bps, hawkish (15%)
Historically when the RBA has resumed hiking or cutting after keeping the cash rate on hold for a period of time, the RBA's return has rarely been a one-and-done. A hawkish Statement would therefore be consistent with the Bank signalling a strong intention to deliver a follow-up hike in Dec or Feb. The Bank's language has repeated ‘some further tightening of monetary policy may be required....’ but if this is replaced with ‘The Board will not hesitate to raise the cash rate further....’, this adds emphasis on front-loading rate hikes. AUD/USD +1.00%.
- DXY extends the leg lower to the area below 105.00.
- The immediate contention emerges near 104.40.
DXY accelerates its losses to new multi-week lows near 104.80 on Monday.
The continuation of the selling impulse appears likely in the very near term. That said, the next support is expected to turn up at the weekly low of 104.42 (September 11), ahead of the temporary 100-day SMA at 103.98.
So far, while above the key 200-day SMA, today at 103.51, the outlook for the index is expected to remain constructive.
DXY daily chart
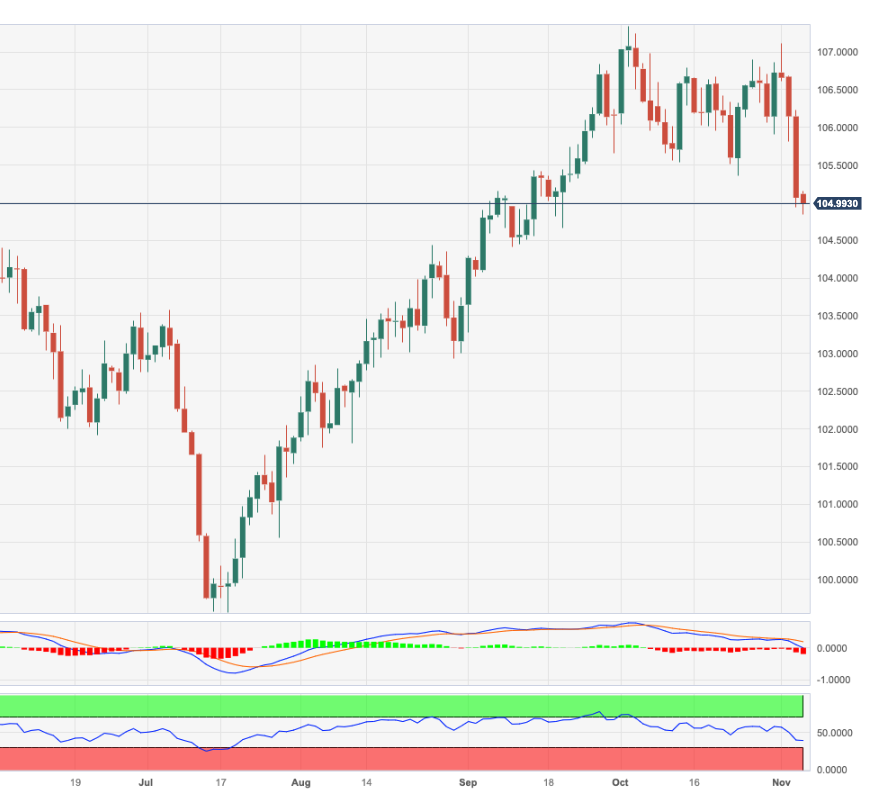
- AUD/USD trades sideways near 0.6500 ahead of the RBA policy.
- The near-term demand for the US Dollar is sluggish due to the risk-off mood.
- An interest rate hike of 25 bps is expected from the RBA.
The AUD/USD pair juggles in a narrow range near the psychological hurdle of 0.6500 in the early New York session. The Aussie asset turns sideways as investors await the interest rate decision by the Reserve Bank of Australia (RBA), which will be announced on Tuesday.
The S&P500 opens on a slightly bullish note amid an upbeat market mood due to no further escalation in the Middle East tensions. Israeli Prime Minister Benjamin Netanyahu rejected calls for a ceasefire when met with US Secretary of State Antony Blinken on Friday. Apart from that, expectations that the Federal Reserve (Fed) is done with hiking interest rates have ramped up after soft labor demand.
Meanwhile, the US Dollar Index (DXY) discovers an intermediate support near 105.00 but the near-term demand is sluggish due to risk-off mood and rising bets for interest rates remaining unchanged in the range of 5.25-5.50%. As per the CME Fedwatch tool, traders see more than 90% in favor of an unchanged interest rate decision from the Fed in December.
This week, investors will focus on commentaries from Fed policymakers over guidance on interest rates and outlook on consumer inflation.
On the Australian Dollar front, a Reuters poll showed that RBA policymakers advocate for raising its Official Cash Rate (OCR) by 25 basis points (bps) to 4.35%. This could be the first hike from new RBA Governor Michele Bullock who earlier said the central bank would not hesitate to hike further if inflation continues to remain persist.
USD/MXN has fallen sharply in recent days. Economists at MUFG Bank analyze the pair’s outlook.
Peso could be undermined as well if US recession risks intensify
The recent improvement in market conditions is favourable for further carry trade performance.
The risk of financial market disruption from a further adjustment higher in US yields has diminished in the near term. The updated Fed guidance and release of the much weaker US NFP report for October should help to prevent a further US bond market sell-off. Market participants should remain more confident that the Fed has already delivered its last rate hike.
The risk is that the MXN could be undermined as well if US recession risks intensify. We are not expecting that to take place in the near term when most other US economic indicators have remained strong.
An unexpected rate cut from Banxico poses another downside risk for the MXN in the week ahead.
AUD/USD has surged above 0.6500. Economists at Société Générale analyze the pair’s outlook.
A new dawn or further frustration for AUD bulls?
SG economics is aligned with consensus for a +25 bps hike in CRT to 4.35%. All of the big four Australian banks forecast an RBA hike.
It is too soon to declare a turning point in the US rate cycle but speculation that the next move will be cut by the Fed in 2024, at a time when the RBA is resuming hikes, gives the AUD a decent chance to mount another attempt to move away from the lows between 0.62-0.63.
Re-correlation with S&P, divergence from China, large short speculative base boost optimism for AUD/USD rebound to 0.67-0.68.
- EUR/JPY advances to new 2023 tops near 161.00.
- Immediately to the upside emerges the 2008 peak near 170.00.
EUR/JPY prints new yearly highs in levels just shy of 161.00 the figure at the beginning of the week.
Further upside appears well on the cards for the cross in the short-term horizon. Against that, the surpass of the 2023 high of 160.98 (November 6) should face the next significant resistance level not before the 2008 top of 169.96 (July 23)
So far, the longer term positive outlook for the cross appears favoured while above the 200-day SMA, today at 151.72.
EUR/JPY daily chart
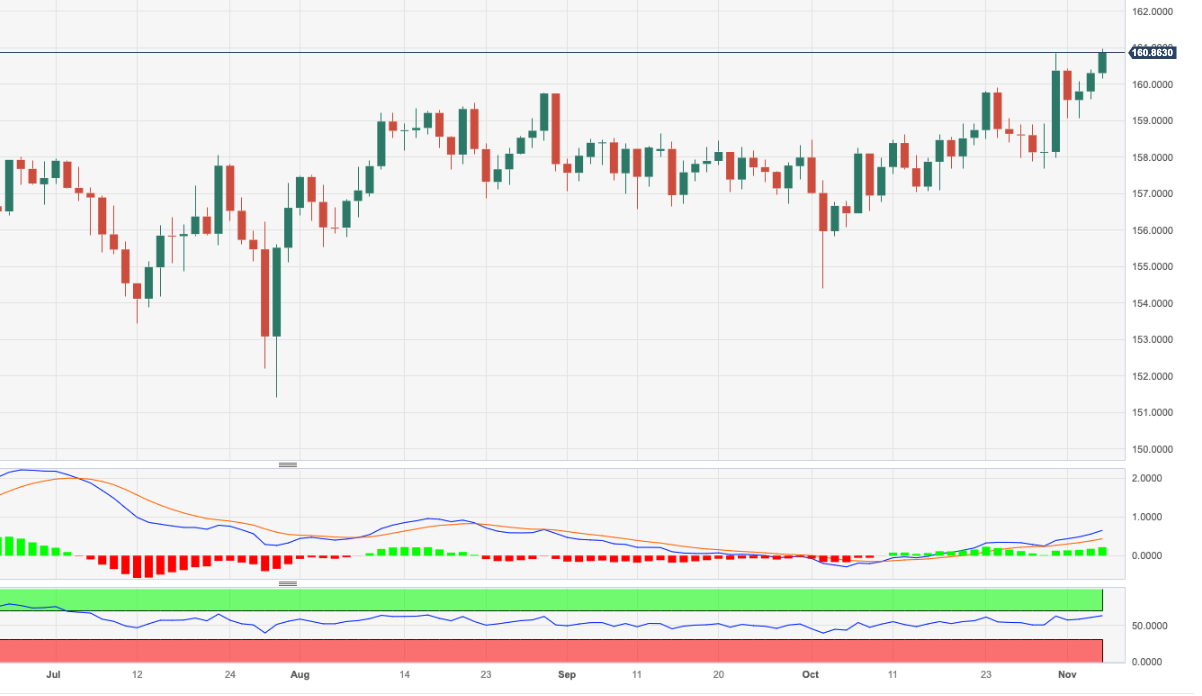
The USD is trading broadly lower to start the week. Economists at Scotiabank analyze the US Dollar Index (DXY) outlook.
Minor rallies will attract sellers
Generally lower US yields, greater conviction that the Fed tightening cycle is done and earlier pricing in of the Fed’s first rate cuts worked against the USD last week and will continue to weigh on USD sentiment for the foreseeable.
Last week saw a clear, technically bearish reversal in the DXY to complement the bearish price action we saw in early October. The top in the DXY rally coincides very closely with major, medium-term retracement resistance at 107.20.
DXY losses through the late October low at 105.40 add to the bearish technical tone and imply scope for additional weakness to the mid/upper 103s in the next few weeks.
The swift drop in the USD last week did leave a gap on the chart which, in theory, will have to be filled. But short-term USD gains in the index back to the 106.50 level are liable to attract renewed selling pressure as investors look to shift positioning on the USD.
Economists at Rabobank expect the economic headwinds facing Germany to rein in upside potential for the EUR/GBP pair.
Levels above 0.87 seen as selling opportunities
While a weak UK Q3 GDP report could encourage GBP bears, in view of the headwinds facing the German economy, we see the potential for EUR/GBP to drop back below the 0.87 level in the weeks ahead.
We view levels above 0.87 as selling opportunities and expect EUR/GBP to edge back towards the 0.86 area in the weeks ahead.
AUD/USD closed above the 0.65 handle for the first time in about three months. Economists at OCBC Bank analyze the pair’s outlook.
RBA likely to hike
For the RBA meeting, we see a good chance of RBA increasing cash rates by 25 bps.
Given that market is 50-50, the chance of a two-way swing is relatively high around timing of the RBA policy announcement.
A hawkish hike should continue to keep AUD better bid while a no hike should see last week’s gains in AUD reversed.
- Silver price trades sideways above $23.00 ahead of the speech from Fed Powell.
- The market mood has improved amid the absence of fresh development in the Israel-Palestine war.
- Silver price demonstrates a sideways performance amid a symmetrical triangle chart formation.
Silver price (XAG/USD) trades back and forth in a narrow range above the crucial support of $23.00 in the late European session. The white metal struggles for a direction as investors seek fresh developments over Middle East tensions and await a speech from Federal Reserve (Fed) Chair Jerome Powell, which is scheduled for Wednesday.
The S&P500 is expected to open the week on a positive note amid a risk-on mood. Investors started digesting Israel-Palestine tensions amid the absence of further escalation by the Israeli troops. The ground invasion plan by the Israel Defense Forces (IDF) has been delayed advance hostage negotiations.
The US Dollar Index (DXY) seeks intermediate support near 105.00 after facing intensified selling. The appeal for the USD index dampens as soft labor demand and stable wage growth data released on Friday, indicated that tight labor market conditions have started easing. This has ramped up expectations of no more interest rate hikes from the Fed.
Meanwhile, Barclays expects that the Fed will raise interest rates in January instead of November. Economists at Barclays said, "We continue to think the FOMC (Federal Open Market Committee) will need to proceed with additional tightening and will have to maintain a higher rate path than expected by the market, with no rate cut prior to September 2024,"
Silver technical analysis
Silver price demonstrates a sideways performance amid a Symmetrical Triangle chart formation on a two-hour scale. The aforementioned chart pattern signals a sharp contraction in volatility. The 200-period Exponential Moving Average (EMA) at $22.85 continues to provide support to the Silver price bulls.
The Relative Strength Index (RSI) (14) oscillates in the 40.00-60.00 range, which indicates that investors await a potential trigger.
Silver two-hour chart
-638348733427119611.png)
GBP/USD adds to solid gains last week. Economists at Scotiabank analyze the pair’s outlook.
Dips to the 1.23 area should remain well-supported
Solid gains in the GBP last week have propelled Cable back to the 200-DMA – or very close to it (1.2436). There is some additional resistance a little above spot (congestion from early September and the 38.2% retracement resistance of the H2 slide in the GBP/USD pair) which may slow gains in the near term in the mid/upper 1.24s. GBP dips to the 1.23 area should remain well-supported, however.
A deeper rebound to the 1.25/1.26 zone looks feasible as bullish trend momentum develops.
CAD stages bull reversal on weak USD. Economists at Scotiabank analyze USD/CAD outlook.
Resistance is 1.3685 and 1.3745/1.3750
USD/CAD closed out Friday near 1.3655, effectively signaling a big, bearish outside/key week reversal for the USD. The USD’s overbought status and the fact that oscillators were not ‘confirming’ the USD’s recent gains had highlighted the risk that USD strength was not sustainable. A quite definitive technical reversal appears to be confirming that now.
The CAD is pushing below daily congestion in the 1.3665/1.3685 zone to start the week and a return to the 1.35 area in the next couple of weeks looks a reasonable technical target.
Resistance is 1.3685 and 1.3745/1.3750.
There seems to be room for extra decline in USD/IDR in the short-term horizon, notes Markets Strategist Quek Ser Leang at UOB.
Key Quotes
We highlighted last Monday (30 Oct 2023, spot at 15,920) that “the rally over the past few weeks is severely overbought.” We also highlighted that “further USD/IDR strength is not ruled out, but in view of the overbought conditions, the pace of any advance is likely to be slower, and USD/IDR may find the major resistance at 16,000 difficult to break.” Instead of strengthening further, USD/IDR turned around and plunged to a low of 15,720.
In Asian trade today, USD/IDR weakened further. While severely oversold, the weakness in USD/IDR could extend to 15,450, possibly 15,360. In order to keep the momentum going, USD/IDR must stay below 15,720.
EUR/USD pushes higher to mid-1.07s. Economists at Scotiabank analyze the pair’s outlook.
Minor dips to remain well-supported
Solid gains in the EUR are bringing spot within easy reach of 1.0766, 38.2 % retracement of the H2 slide in the EUR/USD pair.
Short-term gains look a little stretched but bullish momentum suggests only limited scope for countertrend EUR corrections at this point.
EUR/USD dips to the mid/upper 1.06s are likely to remain well-supported.
Resistance is 1.0805 (100- and 200-DMA signals converge there) and 1.0863 (50% retracement).
- USD/CAD has been exposed to 1.3600 amid multiple tailwinds.
- The market mood turned upbeat amid no significant escalation in geopolitical tensions.
- Soft labor market data in October is expected to allow BoC to keep interest rates unchanged at 5%
The USD/CAD pair has dropped to near 1.330 and is expected to extend its downside near the round-level support of 1.3600. The Loonie asset is seen remaining vulnerable as the US Dollar has faced an intense sell-off.
S&P500 futures generated significant gains in the London session, indicating cheerful market mood. The market sentiment remains bullish as investors hope that the historically aggressive rate-tightening regime by the Federal Reserve (Fed) has concluded now. The Fed is expected to keep interest rates unchanged in the range of 5.25-5.50% in its December monetary policy meeting.
The US Dollar Index (DXY) fell vertically below the crucial support of 105.00 as soft US labor demand ramped up hops that the Fed will not raise interest rates further. Contrary, the 10-year US Treasury yields rebounded to 4.60%.
Meanwhile, an absence of significant escalation in Middle East tensions has improved the appeal for risk-sensitive assets. However, the rejection of the ceasefire proposal from Israeli Prime Minister Benjamin Netanyahu is keeping hopes of ground assault by Israeli troops in Gaza alive.
On the Canadian Dollar front, soft labor market data in October is expected to allow Bank of Canada (BoC) policymakers to keep interest rates unchanged at 5% in the monetary policy meeting next month.
Statistics Canada reported that laborforce was expanded by 17.5K employees against expectations of 22.5K and September’s reading of 63.8K. The Unemployment Rate rose to 5.7% versus. expectations of 5.6% and the former reading of 5.5%.
- The Greenback picks up its sell-off where it left off on Friday.
- US yields are plunging as markets gear up for a possible US recession at hand.
- The US Dollar Index is looking for support and might need to drop another 1% at a minimum.
The US Dollar (USD) is selling-off, continuing its slide lower from past Friday. The disappointing US jobs report shows the US economy is stuttering, while delinquencies on mortgages, loans and credit card bills are soaring. Several traders are starting to cash in on their long USD trade, which means selling pressure is taking over.
On the economic data front a very calm week lies ahead overall with not many pivotal or focal points. If we need to name one, then best chances are jobless numbers on Thursday, which could either confirm or disprove the sudden rise in the rate of unemployment printed on Friday in the US jobs report. Overall a very calm start of the week with no real data points to mention.
Daily digest: US Dollar positioning gets slashed
- Headlines around Israeli troops surrounding Gaza city, and Egypt finally opening up its borders for refugees, are making headlines.
- The Ukraine-Russia war is at a stalemate with no advances of any kind on both fronts. It appears that talks could be underway in this environment as no party is able to claim victory.
- The US Treasury is hitting the markets with a debt auction this Monday, placing a 3-month and a 6-month Bill auction near 16:30 GMT.
- Later this Monday near 19:00 GMT, the Loan Officer Survey will be published.
- Asian equities are soaring, with all indices in the region up above 1%. European futures are looking for clues and are flat, with US equity futures unphased.
- The CME Group’s FedWatch Tool shows that markets are pricing in a 90.2% chance that the Federal Reserve will keep interest rates unchanged at its meeting in December.
- The benchmark 10-year US Treasury yield trades at 4.59%, retreating further after its peak above 5% a few weeks ago.
US Dollar Index technical analysis: US Dollar selling pressure
The US Dollar is no longer speculators’ favoured trade this year. The change of heart comes after the US jobs report was a bit of a disappointment with a less positive number than had been estimated and the unemployment index rising to 3.9%. Investors are taking their money and are getting out of the US Dollar Index ahead of any possible announcement from the US Federal Reserve that it might start to cut its policy rates, in order to avoid or ease any possible recessions in the US economy and growth.
The DXY is looking for support near 105.00, though it is struggling to find it. Any shock events in global markets could spark a sudden turnaround and favour safe-haven flows into the US Dollar. A return first to 105.51 would make sense, near the 55-day Simple Moving Average (SMA). A break above could mean a test on the descending trend line near 105.88.
On the downside, a big air pocket is developing and could see the DXY drop to 103.98, near the 100-day SMA, before finding ample support. In case it turns into a falling knife, 103.52 with the 200-day SMA could act as circuit break. If that one snaps as well, the road is open to head to 101.00.
US Dollar FAQs
What is the US Dollar?
The US Dollar (USD) is the official currency of the United States of America, and the ‘de facto’ currency of a significant number of other countries where it is found in circulation alongside local notes. It is the most heavily traded currency in the world, accounting for over 88% of all global foreign exchange turnover, or an average of $6.6 trillion in transactions per day, according to data from 2022.
Following the second world war, the USD took over from the British Pound as the world’s reserve currency. For most of its history, the US Dollar was backed by Gold, until the Bretton Woods Agreement in 1971 when the Gold Standard went away.
How do the decisions of the Federal Reserve impact the US Dollar?
The most important single factor impacting on the value of the US Dollar is monetary policy, which is shaped by the Federal Reserve (Fed). The Fed has two mandates: to achieve price stability (control inflation) and foster full employment. Its primary tool to achieve these two goals is by adjusting interest rates.
When prices are rising too quickly and inflation is above the Fed’s 2% target, the Fed will raise rates, which helps the USD value. When inflation falls below 2% or the Unemployment Rate is too high, the Fed may lower interest rates, which weighs on the Greenback.
What is Quantitative Easing and how does it influence the US Dollar?
In extreme situations, the Federal Reserve can also print more Dollars and enact quantitative easing (QE). QE is the process by which the Fed substantially increases the flow of credit in a stuck financial system.
It is a non-standard policy measure used when credit has dried up because banks will not lend to each other (out of the fear of counterparty default). It is a last resort when simply lowering interest rates is unlikely to achieve the necessary result. It was the Fed’s weapon of choice to combat the credit crunch that occurred during the Great Financial Crisis in 2008. It involves the Fed printing more Dollars and using them to buy US government bonds predominantly from financial institutions. QE usually leads to a weaker US Dollar.
What is Quantitative Tightening and how does it influence the US Dollar?
Quantitative tightening (QT) is the reverse process whereby the Federal Reserve stops buying bonds from financial institutions and does not reinvest the principal from the bonds it holds maturing in new purchases. It is usually positive for the US Dollar.
Considering advanced prints from CME Group for natural gas futures markets, open interest rose for the third session in a row on Friday, now by nearly 8K contracts. Volume, instead, shrank for the third straight session, this time by around 67.9K contracts.
Natural Gas: Upside looks capped around $3.60
Friday’s inconclusive price action in natural gas prices was on the back of rising open interest and shrinking volume, exposing some consolidation in the very near term amidst the persisting erratic performance. On the upside, in the meantime, the October peaks past $3.60 per MMBtu seems to be quite a decent resistance zone for the time being.
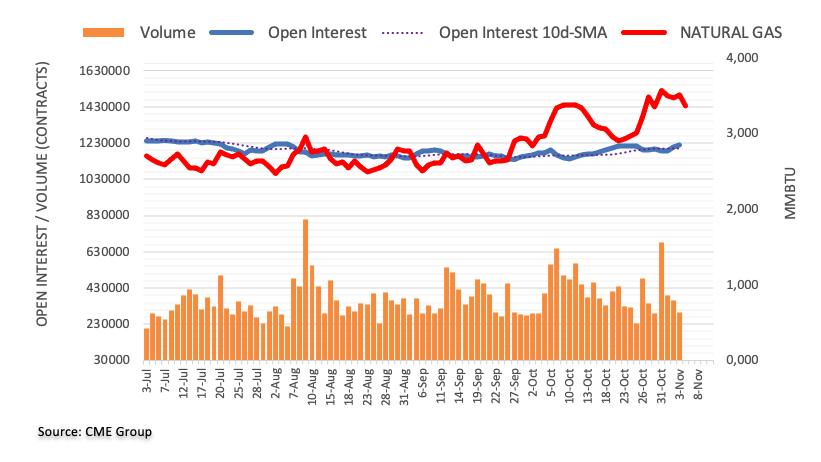
In the opinion of Markets Strategist Quek Ser Leang at UOB, USD/MYR could revisit the 4.6480 region in the near term.
Key Quotes
We highlighted last Monday (30 Oct, spot 4.7540) that “the drop in USD/MYR has increased the likelihood of a pullback to 4.7430, possibly 4.7320.” While our view for USD/MYR to weaken was correct, the anticipated pullback exceeded our expectations as it dropped to a low of 4.7260 last Friday.
In Asian trade today, USD/MYR gapped down upon opening, and the outlook for USD/MYR remains negative. This week, it could drop further to 4.6480. The next support at 4.6300 is likely out of reach. Resistance is at 4.7200, followed by 4.7400.
USD/JPY is back below the 150.00 level. Nonetheless, economists at MUFG Bank expect the pair to rise further.
Yen sellers will remain reassured until the next BoJ policy meeting in December
Rising US interest rates continue to put upward pressure on the USD/JPY.
Concerns about currency intervention by the Japanese authorities have kept the USD/JPY from becoming entrenched at the psychologically significant 150 mark, but this level looks likely to be reached following the closely watched BoJ monetary policy meeting.
The BoJ revised its interest rate control policy again, essentially dismantling YCC. We see this as a stepping stone toward policy normalization, but BoJ failed to covey its true intentions to the foreign exchange market.
We expect Yen sellers will remain reassured until the next policy meeting in December, meaning the USD/JPY could rise further.
EUR/USD carries over gains from Friday after storming back above 1.07. Economists at Société Générale analyze the pair’s outlook.
1.0630 is near-term support
The combination of momentum and higher technicals could guide the pair towards the 200-DMA at 1.08 unless risk sentiment sours and UST/Bund spread rebounds.
The pair has formed a series of higher peaks and troughs in daily timeframe chart which highlights potential upside.
1.0630, the 38.2% retracement of recent rebound is near-term support.
See: EUR/USD may slip back below 1.0700 rather than push higher to 1.0800 – ING
Markets Strategist Quek Ser Leang at UOB Group suggests USD/THB could risk a deeper drop in the near term.
Key Quotes
Last Monday (30 Oct), when USD/THB was trading at 36.03, we held the view that “the ongoing pullback in USD/THB has scope to extend to 35.65 before stabilisation can be expected.” USD/THB did not break 35.65 until last Friday, when it plummeted to a low of 35.40. The surge in downward momentum is likely to lead to further weakness.
In view of the oversold short-term conditions, it remains to be seen if the next major support at 35.05 is within reach this week (there is another support at 35.25). Resistance is at 35.75; a breach of 36.01 would mean that USD/THB is not weakening further.
- Natural Gas prices steady near $3.54.
- The US Dollar undergoes profit-taking in this year’s long-USD trade.
- Natural Gas prices could easily still jump once additional countries are getting involved in the conflict.
Natural Gas is still trading near last week’s high, with $3.64 as the level to keep an eye on. The biggest and foremost element that is underpinning Natural Gas prices at the moment is the lingering risk of a proxy war on the horizon. With Israeli troops having surrounded Gaza city, pressure remains elevated with potential of a full blown war in the Middle East still a possible outcome which would see Gas prices soar to $4.00.
Meanwhile, the US Dollar (USD) is losing traction as more and more unwinds and profit-taking are occurring in this year’s long-US Dollar trade. Recent numbers from the Commodity Futures Trading Commission reveal that the long position in USD futures is starting to contract and is off its high for this year. The recent disappointing US Jobs report reveals that the American engine is starting to stutter and might force the hand of the US Federal Reserve to start cutting sooner than later.
Natural Gas is trading at $3.53 per MMBtu at the time of writing.
Natural Gas news and market movers
- Foreign Evacuations stall as Gaza city is being surrounded by Israeli forces. Meanwhile Iran is keeping pressure on the situation by saying it will retaliate if Israel continues its ground offensive.
- Ample storage capacity meanwhile limits further upside moves in Natural Gas futures in Europe. Benchmark futures dropped by 5.7% as European gas storages are still up 99.6% while temperatures have dipped substantially, showing resilience in the European gas supply.
- Weather forecasts for the whole of Europe reveal rather tepid temperatures, above normal for the time of year, while more demand for gas could come from Scandinavian countries where a cold front is pushing temperatures below normal average expectations.
Natural Gas Technical Analysis: Risk spills over
Natural Gas price is facing a firm technical cap on the topside of charts. That cap comes with European gas storages being full, suggesting demand is non-existent. With European gas storages still overflowing at 99.6%, even with lower temperatures, it does not look like Europe will need to scramble for gas this winter.
Only one big catalyst could break the price ceiling near $3.64, and that is a proxy war in the Middle East. Once the likes of Iran, Saudi Arabia and other countries in the region start mobilising forces, a chunky risk premium needs to be priced in. Expect to see a quick sprint to $4.33, the high of 2023.
On the downside, the upper boundary of the old trend channel which persisted from April to October will probably act as support again, near $3.42. If that gives way, Natural Gas prices could fall to $3.28 to find support and bounce off the green ascending trend line. Should that give way, look for the 55-day Simple Moving Average to do its work near $3.13.
-638348635454615263.png)
XNG/USD (Daily Chart)
Natural Gas FAQs
What fundamental factors drive the price of Natural Gas?
Supply and demand dynamics are a key factor influencing Natural Gas prices, and are themselves influenced by global economic growth, industrial activity, population growth, production levels, and inventories. The weather impacts Natural Gas prices because more Gas is used during cold winters and hot summers for heating and cooling. Competition from other energy sources impacts prices as consumers may switch to cheaper sources. Geopolitical events are factors as exemplified by the war in Ukraine. Government policies relating to extraction, transportation, and environmental issues also impact prices.
What are the main macroeconomic releases that impact on Natural Gas Prices?
The main economic release influencing Natural Gas prices is the weekly inventory bulletin from the Energy Information Administration (EIA), a US government agency that produces US gas market data. The EIA Gas bulletin usually comes out on Thursday at 14:30 GMT, a day after the EIA publishes its weekly Oil bulletin. Economic data from large consumers of Natural Gas can impact supply and demand, the largest of which include China, Germany and Japan. Natural Gas is primarily priced and traded in US Dollars, thus economic releases impacting the US Dollar are also factors.
How does the US Dollar influence Natural Gas prices?
The US Dollar is the world’s reserve currency and most commodities, including Natural Gas are priced and traded on international markets in US Dollars. As such, the value of the US Dollar is a factor in the price of Natural Gas, because if the Dollar strengthens it means less Dollars are required to buy the same volume of Gas (the price falls), and vice versa if USD strengthens.
CME Group’s flash data for crude oil futures markets noted traders added around 18.2K contracts to their open interest positions last Friday, resuming the uptrend following the previous daily drop. In the same line, volume increased for the fifth straight session, now by around 186.7K contracts.
WTI: A drop below $80.00 could reignite the selling impulse
Friday’s decline in prices of WTI came amidst an increasing open interest and volume, leaving the door open to extra losses in the very near term. That said, a breach of the key contention area around $80.00 should spark a deeper pullback to initially, the interim support at the 200-day SMA at $78.16.
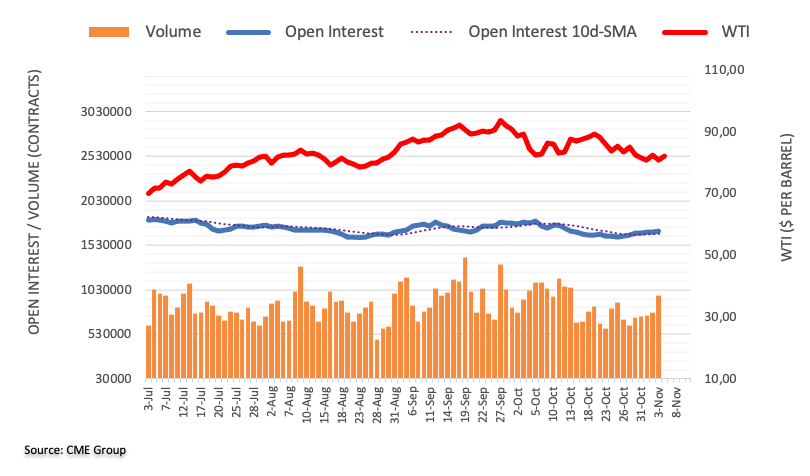
Economists at ING analyze Aussie’s outlook ahead of the Reserve Bank of Australia’s Interest Rate Decision.
A hike by the RBA
We expect a 25 bps increase to 4.35%. For now, our view is that this will be the last hike of the cycle.
Consensus is almost fully aligned with our view for a hike, but markets are pricing in a 50% implied probability. We therefore see upside risks for AUD.
The recent jump in AUD/USD (driven by the USD correction) could extend into the 0.6550/0.6570 area, barring a USD rebound in today’s session.
USD/CNH should accelerate its losses on a breakdown of 7.2700, comment UOB Group’s Markets Strategist Quek Ser Leang and Senior FX Strategist Peter Chia.
Key Quotes
24-hour view: We did not expect USD to plummet to a low of 7.2861 last Friday (we were expecting it to trade in a range). While the outsized decline appears to be overextended, USD could drop to 7.2800 first before stabilisation is likely. The next support at 7.2700 is unlikely to come under threat today. On the upside, if USD breaks above 7.3080 (minor resistance is at 7.2970), it would mean that the weakness has stabilised.
Next 1-3 weeks: Our latest narrative was from last Wednesday (01 Nov, spot at 7.3350), wherein “upward momentum has increased slightly, but USD has to break and stay above 7.3470 before a sustained rise is likely.” We indicated that “the chance of USD breaking clearly above 7.3470 will remain intact as long as it stays above 7.3100 in the next few days.” On Friday, USD broke below 7.3100 and plummeted to a low of 7.2861. Not only has upward momentum dissipated, but downward momentum has also begun to build. However, USD must break clearly below 7.2700 before further decline is unlikely. The risk of USD breaking clearly below 7.2700 will remain intact as long as it stays below 7.3250 in the next few days.
Open interest in gold futures markets rose for the second session in a row on Friday, this time by around 5.2K contracts according to preliminary readings from CME Group. Volume followed suit and went up by around 66.4K contracts after two consecutive daily pullbacks.
Gold continues to target $2000
Gold prices extended their upside momentum on Friday amidst rising open interest and volume, which is supportive of further gains in thew very near term. Against that, the yellow metal is expected to remain focused on the critical hurdle of $2000 per troy ounce for the time being.
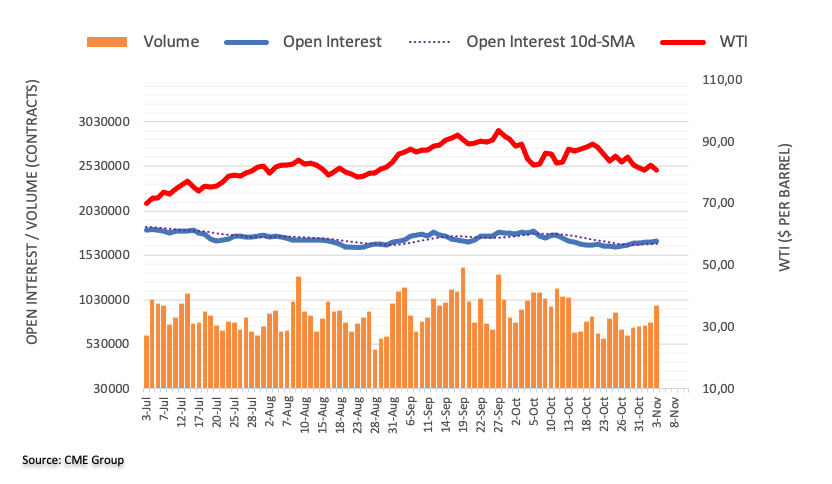
EUR/HUF dropped below 380 on Friday. Economists at ING analyze the pair’s outlook.
Forint has significantly detached from the rate trajectory
The market is still pricing in more rate cuts from the National Bank of Hungary (NBH) and we see the HUF as having significantly detached from the rate trajectory since the last central bank meeting, which in turn indicates a weaker HUF. We see this as unsustainable for the longer term.
We expect more of a retracement of recent gains and a move back above 380 EUR/HUF.
- NZD/USD aims to continue a three-day winning spell amid a risk-on mood.
- Soft US labor demand tempered wage growth would allow the Fed to keep rates steady further.
- The RBNZ is expected to keep its OCR unchanged at 5.50%, consecutively for the fourth time on November 29.
The NZD/USD pair aims to climb above the psychological resistance of 0.6000. The Kiwi asset is expected to continue its winning spell for the fourth trading session as the market mood is quite upbeat due to expectations that the Federal Reserve (Fed) will not raise interest rates further and that Israel would ceasefire war with Palestine.
S&P500 futures have generated decent gains in the European session, portraying further improvement in the risk-taking ability of the market participants. US equities rose significantly on Friday after the Nonfarm Payrolls (NFP) report portrayed soft labor demand and steady wage growth. Fresh payrolls were 150K in October against expectations of 180K and the former reading of 297K. The Unemployment Rate rose to 3.9% against expectations of 3.8%.
Investors hope that soft labor demand will allow the Fed to keep interest rates unchanged in the range of 5.25-5.50%. Slower monthly wage growth by 0.2% also warranted that current rates by the Fed are sufficiently restrictive.
The US Dollar Index (DXY) edges below the crucial support of 105.00 as demand for safe-haven bets eases. Further action in the US Dollar will be guided by the speech from Fed Chair Jerome Powell, which is scheduled for Wednesday.
On the New Zealand Dollar front, soft labor demand and easing wage growth indicate that the Reserve Bank of New Zealand (RBNZ) will keep interest rates unchanged at 5.50% for a longer period. The RBNZ is expected to keep its Official Cash Rate (OCR) unchanged at 5.50%, consecutively for the fourth time on November 29.
The publication of the Swiss inflation rate took a bit of a back seat last week. Economists at Commerzbank analyze Franc’s outlook after the the report was not particularly spectacular.
Inflation development provides little cause for concern for SNB
The most recent inflation data provides little cause for concern. Of course, there are upside risks for inflation and the SNB expects a renewed moderate rise in the annual rate over the coming quarters, but this is unlikely to be sufficient for a further tightening of monetary policy.
Instead, the SNB is likely to maintain its hawkish communication in view of increased uncertainty. Above all, it will continue to favour a strong Franc to limit the upside risks for inflation.
Against the background of the crisis in the Middle East, the Franc is likely to principally remain in demand as a safe haven anyway.
UOB Group’s Markets Strategist Quek Ser Leang and Senior FX Strategist Peter Chia note USD/JPY could now navigate within the 148.80-150.80 range.
Key Quotes
24-hour view: Last Friday, we expected USD to trade in a range between 149.85 and 151.00. Instead of trading in a range, USD dropped to a low of 149.18 in NY trade. Despite the sharp drop, downward momentum has not increased by much, and USD is unlikely to weaken much further. Today, USD is likely to trade sideways, probably between 149.10 and 150.30.
Next 1-3 weeks: We highlighted last Friday (03 Nov, spot at 150.45) that “the recent buildup in upward momentum has waned, and the likelihood of USD breaking above 152.00 has diminished.” USD then fell below our ‘strong support’ level of 149.50 (low of 149.18). USD appears to have entered a range-trading phase, and it is likely to trade between 148.80 and 150.80 for now.
Economists at ING suspect it may be too early to see the deterioration in US activity necessary to drag USD sustainably lower.
Spotlight turning to Federal Reserve Chair Jerome Powell at the IMF conference
We are inclined to think it is still too early to see another large drop in the Dollar because the US activity story simply hasn’t deteriorated enough.
This week, we will hear from Fed Chair Jerome Powell at the IMF conference, along with many other members. Some pushback on the post-Fed dovish market reaction may be on the cards and could help the Dollar recover some ground.
- Gold price pares some gains as US long-term bond yields rebound.
- The precious metal fails to hold gains inspired by soft US Nonfarm Payrolls data.
- Investors anticipate the Fed is done hiking interest rates.
Gold price (XAU/USD) trades around $1,985 on Monday, retreating from Friday’s highs at over $2,000, as US long-term bond yields rebound. The yellow metal is paring back some of the gains registered on Friday after the release of the US employment report for October, which showed softer growth in both jobs and wages. Despite the recent retreat, Gold’s downside remains cushioned by persistent geopolitical tensions in the Middle East as the Israeli authorities reject the proposal for a ceasefire, keeping safe-haven bids firm.
The US Dollar remains on the backfoot as market participants now view the US labor market loosening, which would allow Fed policymakers to advocate for keeping interest rates unchanged in the range of 5.25%-5.50% till the end of 2023. US export orders have fallen sharply due to higher exchange rates for the US Dollar.
Daily Digest Market Movers: Gold price drops as US bond yields revive
- Gold price surrenders gains generated on Friday as US bond yields tick higher. This week, many Federal Reserve (Fed) policymakers are lined up to speak, probably providing further guidance on interest rates. Fed Chair Jerome Powell will speak on Wednesday.
- Richmond Fed President Thomas Barkin said on Friday that it would be early to deliver commentary about interest rates as two inflation reports will be released before the monetary policy meeting in December.
- 10-year US Treasury yields rose to 4.60% on Monday but downside risks are high on expectations that the Fed is done hiking interest rates.
- Minneapolis Federal Reserve Bank President Neel Kashkari said that there is a lot of uncertainty about what is driving long-term yields higher and supported keeping interest rates unchanged in the range of 5.25%-5.50% on November 1.
- As per the CME Fedwatch tool, traders see more than a 90% chance of an unchanged interest rate decision from the Fed in December.
- Gold price witnessed buyers’ interest on Friday after the US NFP report showed weak hiring and tempered wage growth in October.
- US employers added 150K jobs in October against a downwardly revised 297K reading in September. Economists forecasted a higher increase of 180K. The Unemployment rate rose to 3.9% against the consensus and the former reading of 3.8%.
- A slowdown in job growth in October was already anticipated as at least 30K workers of the United Auto Workers (UAW) union went on strike against Detroit's "Big Three" car makers.
- The monthly Average Hourly Earnings rose at a slower pace of 0.2% in October against 0.3% growth in September.
- Annual wage growth rose by 4.1% in October, remaining between expectations of 4.0% and the former reading of 4.2%. While upside risks to wage growth have eased, inflation is still stubborn as Average Hourly Earnings remain above 3.5%, which economists see as consistent with the Fed's 2% target.
- In addition to the labor market data, the Services PMI remained downbeat. The ISM Services PMI, which is a sector that accounts for two-thirds of the US economy, declined to 51.8 against expectations of 53.0 and the 53.6 reading from September.
- Contrary to the downbeat Services PMI, New Orders for the service industry rose significantly to 55.5 against 51.8 in September.
- Meanwhile, investors seek fresh developments on the Israel-Palestine war for further action in the non-yielding safe-haven asset. Israeli Prime Minister Benjamin Netanyahu rejected ceasefire calls when he met with US Secretary of State Antony Blinken on Friday.
Technical Analysis: Gold price falls back from $2,000
Gold price retreats from the psychological resistance of $2,000 as US long-term bond yields recover. Broadly, the precious metal has been consolidating in a range between $1,970 and $2,010 for more than two weeks.
On a daily time frame, Gold price demonstrates signs of inventory adjustment between retail participants and institutional investors. Upward-sloping 20-day and 50-day Exponential Moving Averages (EMAs) indicate that the long-term trend is bullish.
Gold FAQs
Why do people invest in Gold?
Gold has played a key role in human’s history as it has been widely used as a store of value and medium of exchange. Currently, apart from its shine and usage for jewelry, the precious metal is widely seen as a safe-haven asset, meaning that it is considered a good investment during turbulent times. Gold is also widely seen as a hedge against inflation and against depreciating currencies as it doesn’t rely on any specific issuer or government.
Who buys the most Gold?
Central banks are the biggest Gold holders. In their aim to support their currencies in turbulent times, central banks tend to diversify their reserves and buy Gold to improve the perceived strength of the economy and the currency. High Gold reserves can be a source of trust for a country’s solvency. Central banks added 1,136 tonnes of Gold worth around $70 billion to their reserves in 2022, according to data from the World Gold Council. This is the highest yearly purchase since records began. Central banks from emerging economies such as China, India and Turkey are quickly increasing their Gold reserves.
How is Gold correlated with other assets?
Gold has an inverse correlation with the US Dollar and US Treasuries, which are both major reserve and safe-haven assets. When the Dollar depreciates, Gold tends to rise, enabling investors and central banks to diversify their assets in turbulent times. Gold is also inversely correlated with risk assets. A rally in the stock market tends to weaken Gold price, while sell-offs in riskier markets tend to favor the precious metal.
What does the price of Gold depend on?
The price can move due to a wide range of factors. Geopolitical instability or fears of a deep recession can quickly make Gold price escalate due to its safe-haven status. As a yield-less asset, Gold tends to rise with lower interest rates, while higher cost of money usually weighs down on the yellow metal. Still, most moves depend on how the US Dollar (USD) behaves as the asset is priced in dollars (XAU/USD). A strong Dollar tends to keep the price of Gold controlled, whereas a weaker Dollar is likely to push Gold prices up.
- The Euro extends the upside bias vs. the US Dollar.
- European markets trade mostly on the defensive on Monday.
- Germany Final Services PMI came in at 48.2.
The Euro (EUR) preserves its positively robust sentiment at the beginning of the week vs. the US Dollar (USD), lifting EUR/USD to the 1.0750 zone, or multi-week tops.
Conversely, the Greenback encounters extra downward pressure and compels the USD Index (DXY) to break below the 105.00 support amidst a broadly based improvement in the risk-linked galaxy. The persistent weakening of the Greenback comes in contrast to a mild rebound in US yields across diverse maturities.
In the context of monetary policy, a growing consensus has formed amongst market participants that the Federal Reserve (Fed) will probably maintain its present monetary conditions unchanged for the interim, as the potential for a rate amendment in December seems to have lost some impetus particularly in the aftermath of the latest FOMC meeting and Friday's publication of weaker-than-anticipated Nonfarm Payrolls for the month of October.
The European Central Bank (ECB) is likely to follow suit, as investors now favour a protracted hiatus of its tightening campaign, most likely until the latter half of the subsequent year.
On the euro data docket, Germany’s final Services PMI came in at 48.2, and 47.8 when it came to the broader euro area. In addition, Investor Confidence tracked by the Sentix index improved to -18.6 for the euro bloc in November.
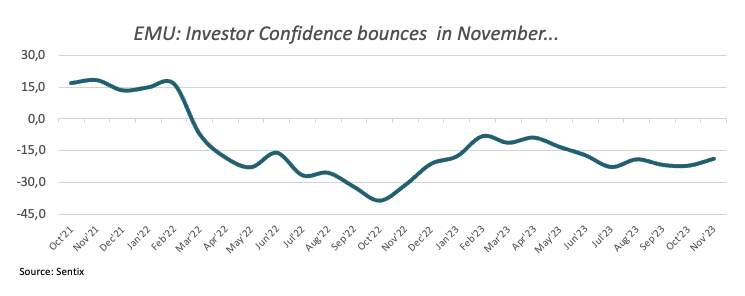
In the US, FOMC Governor Lisa Cook (permanent voter, centrist), is due to speak later in the session.
Daily digest market movers: Euro keeps the bid bias unchanged
- The EUR looks to consolidate the breakout of 1.0700 vs. the USD.
- US and German yields regain some composure on Monday.
- Markets now see the Fed refraining from hiking rates in December.
- The ECB could extend its pause until H2 2024.
- The crisis in the Middle East threatens to extend to other regions.
- BoJ Kazuo Ueda favoured the continuation of large-scale bond purchases.
Technical Analysis: Euro embarks on a visit to the 200-day SMA above 1.0800
EUR/USD accelerates its recent gains and flirts with the 1.0750 region on Monday.
The weekly peak of 1.0767 (September 12) comes before the important 200-day SMA at 1.0805 for EUR/USD, while another weekly high of 1.0945 (August 30) occurs before the psychological barrier of 1.1000. Beyond this zone, the pair may face resistance at the August top of 1.1064 (August 10), followed by the weekly peak of 1.1149 (July 27) and the 2023 high of 1.1275 (July 18).
Sellers, on the other hand, are likely to face the next contention at the weekly low of 1.0495 (October 13), prior to reaching the 2023 bottom at 1.0448 (October 15), and the round number of 1.0400.
Meanwhile, the pair's outlook is expected to stay negative as long as it remains below the 200-day SMA.
Euro FAQs
What is the Euro?
The Euro is the currency for the 20 European Union countries that belong to the Eurozone. It is the second most heavily traded currency in the world behind the US Dollar. In 2022, it accounted for 31% of all foreign exchange transactions, with an average daily turnover of over $2.2 trillion a day.
EUR/USD is the most heavily traded currency pair in the world, accounting for an estimated 30% off all transactions, followed by EUR/JPY (4%), EUR/GBP (3%) and EUR/AUD (2%).
What is the ECB and how does it impact the Euro?
The European Central Bank (ECB) in Frankfurt, Germany, is the reserve bank for the Eurozone. The ECB sets interest rates and manages monetary policy.
The ECB’s primary mandate is to maintain price stability, which means either controlling inflation or stimulating growth. Its primary tool is the raising or lowering of interest rates. Relatively high interest rates – or the expectation of higher rates – will usually benefit the Euro and vice versa.
The ECB Governing Council makes monetary policy decisions at meetings held eight times a year. Decisions are made by heads of the Eurozone national banks and six permanent members, including the President of the ECB, Christine Lagarde.
How does inflation data impact the value of the Euro?
Eurozone inflation data, measured by the Harmonized Index of Consumer Prices (HICP), is an important econometric for the Euro. If inflation rises more than expected, especially if above the ECB’s 2% target, it obliges the ECB to raise interest rates to bring it back under control.
Relatively high interest rates compared to its counterparts will usually benefit the Euro, as it makes the region more attractive as a place for global investors to park their money.
How does economic data influence the value of the Euro?
Data releases gauge the health of the economy and can impact on the Euro. Indicators such as GDP, Manufacturing and Services PMIs, employment, and consumer sentiment surveys can all influence the direction of the single currency.
A strong economy is good for the Euro. Not only does it attract more foreign investment but it may encourage the ECB to put up interest rates, which will directly strengthen the Euro. Otherwise, if economic data is weak, the Euro is likely to fall.
Economic data for the four largest economies in the euro area (Germany, France, Italy and Spain) are especially significant, as they account for 75% of the Eurozone’s economy.
How does the Trade Balance impact the Euro?
Another significant data release for the Euro is the Trade Balance. This indicator measures the difference between what a country earns from its exports and what it spends on imports over a given period.
If a country produces highly sought after exports then its currency will gain in value purely from the extra demand created from foreign buyers seeking to purchase these goods. Therefore, a positive net Trade Balance strengthens a currency and vice versa for a negative balance.
- Eurozone investors’ morale improved in November amid reduced negative momentum.
- EUR/USD holds gains near 1.0750 after the Eurozone data.
The Eurozone Sentix Investor Confidence Index rose to -18.6 in November from -21.9 in October, the latest survey showed on Monday.
The Expectations Index in the Eurozone also climbed to -10.0, from -16.8 in the previous month, hitting its highest level since February.
The Current Situation Index improved only slightly to -26.8 points from -27.0.
Commenting on the survey's findings, Sentix Managing Director Patrick Hussy said that "the decrease in negative momentum is an initial sign of improvement. However, in order to ultimately give the all-clear, the expectation values must turn positive.”
Market reaction
EUR/USD is holding gains near 1.0750 despite the improvement in the Eurozone data. As of writing, the EUR/USD pair is trading at 1.0742, up 0.13% on the day.
Kit Juckes, Chief Global FX Strategist at Société Générale, analyzes AUD/USD and USD/JPY outlook.
USD/JPY can fall further if yields stay here
USD/JPY has tracked yield differentials faithfully and has not overreacted to last week’s development by any stretch. On that basis, EUR/JPY looks very vulnerable, as well as USD/JPY.
As for AUD/USD, the RBA meeting will determine short-term sentiment, but relative yields suggest AUD/USD could break higher towards 0.70. That feels far-fetched, but we expect a 25 bps rate hike to 4.35%.
- Mexican Peso gains ground as US economic data eased in the previous week.
- Fed is expected to conclude its policy tightening after disappointing US NFP.
- Banxico's policymakers stated the importance of maintaining rates at higher levels.
USD/MXN trades lower around 17.4200 post-rebounding from a two-month low. The US Dollar (USD) dropped after a jobs report in the United States (US) surprisingly missed estimates, portraying a labor market that is further cooling.
The moderation in labor market data is viewed as a reaction to the US Federal Reserve's (Fed) strategy to tackle inflationary pressures by implementing higher interest rates. The Greenback encounters challenges, with market participants anticipating that the US Fed might conclude its monetary tightening and foreseeing the possibility of multiple rate cuts in 2024.
US Non-Farm Payrolls (NFP) data exerted downward pressure on the USD/MXN pair, revealing a figure of 150K, marked a significant decline from the 297K recorded in September. The US Unemployment Rate rose to 3.9%, contrary to the market's expectation of remaining stable at 3.8% in October.
US Dollar Index (DXY) weakened on the lackluster US Treasury yields, a reaction to disappointing US labor data. The yield on a 10-year US Treasury bond stands at 4.58% by the press time.
On the Mexican front, the Fiscal Balance took a dip to -132.56B from the previous reading of -39.15B. This week's calendar highlights the Headline Inflation data for October and the monetary policy decision from the Bank of Mexico (Banxico).
According to Banxico's recent minutes, policymakers stressed the importance of maintaining rates at their current levels in the face of elevated inflation. As a result, traders are anticipating that Banxico will keep rates steady at 11.25%.
EUR/USD is currently trading at the highest level since mid-September. Economists at ING analyze the pair’s outlook.
Rates do not justify such a high EUR/USD
USD rates still have some way to fall to justify a continuation of the Dollar correction. From a EUR/USD perspective, this is especially true considering that Euro idiosyncratic support has been scarce, and unlikely to pick up anytime soon in our view.
The Eurozone calendar is quiet this week, and data has hardly given much help to the Euro anyway.
With no key US activity data this week, EUR/USD may slip back below 1.0700 rather than push higher to 1.0800.
- Silver attracts some dip-buying ahead of the $23.00 round figure, albeit lacks follow-through.
- The technical setup favours bullish traders and supports prospects for a further positive move.
- A sustained strength beyond the $23.60-70 supply zone is needed to reaffirm the bullish bias.
Silver (XAG/USD) reverses an intraday dip to the $23.10 area and climbs to the top end of its daily trading range during the first half of the European session on Monday. Bulls still await a sustained strength beyond the very important 200-day Simple Moving Average (SMA) before placing fresh bets.
Any subsequent move up, however, is more likely to confront stiff resistance near the $23.60-$23.70 supply zone, which should act as a key pivotal point. With oscillators on the daily chart holding in the positive territory, a sustained strength beyond will be seen as a fresh trigger for bullish traders and pave the way for some meaningful upside.
The XAG/USD might then aim to surpass the $24.00 mark and test the next relevant hurdle near the $24.20-$24.25 zone. The momentum could get extended further and allow bulls to make a fresh attempt to conquer the $25.00 psychological mark before the white metal eventually climbs to the July swing high, around the $25.20-$25.25 zone.
On the flip side, any meaningful slide below the $23.00 mark is more likely to find decent support and remain limited near the $22.60-$22.50 horizontal support. A convincing break below the latter will shift the bias back in favour of bearish traders and drag the XAG/USD to the $22.00 mark en route to the $21.70 horizontal support zone.
Some follow-through selling will expose the $21.35-$21.30 support, below which the XAG/USD seems all set to accelerate the fall further below the $21.00 mark, towards the $20.70-$20.65 area, or a seven-month low touched in October.
Silver daily chart
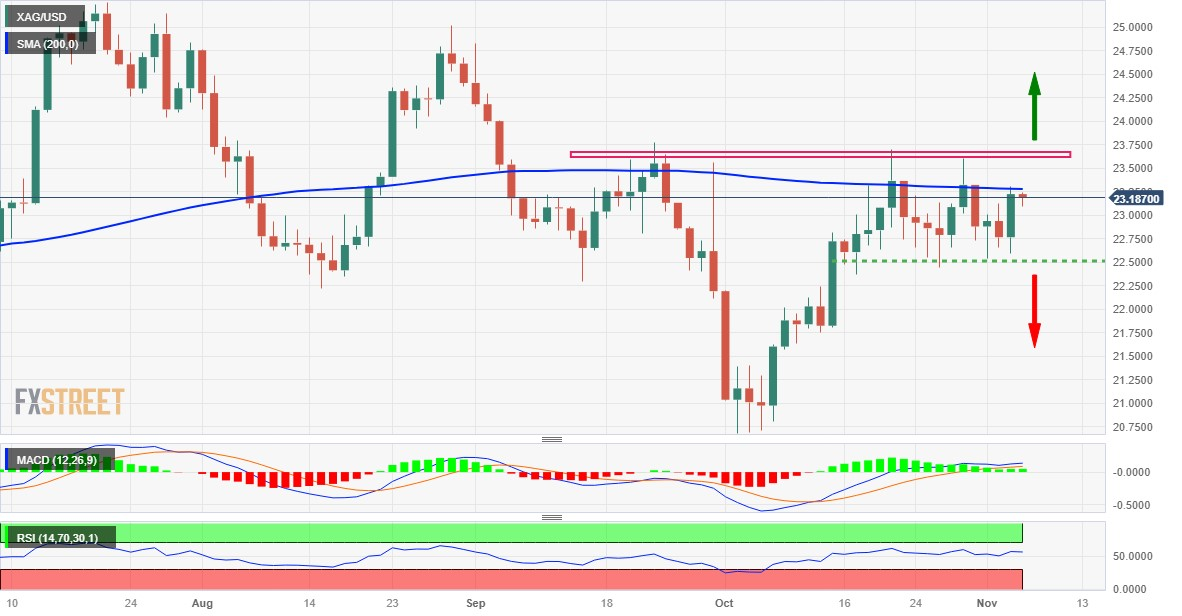
Technical levels to watch
AUD/USD squeezes through 0.65. Economists at Société Générale analyze the pair’s outlook.
Bulls count on RBA hike
This week perhaps constitutes a unique window for the AUD to try and recapture levels closer to 0.66 after the frustration endured over the past month and much of the past year.
A break of the late August high of 0.6522 could send AUD/USD on a path towards 0.66, perhaps 0.67.
The RBA must deliver 25 bps on Tuesday and risk sentiment cannot falter.
The narrowing of the Aussie trade surplus and weak PMIs for October are a warning sign not to get too carried away.
AUD/USD could extend its current rally to the 0.6550 zone in the short-term horizon, suggest UOB Group’s Markets Strategist Quek Ser Leang and Senior FX Strategist Peter Chia.
Key Quotes
24-hour view: Last Friday, we held the view that “there is scope for AUD to retest the 0.6455 level before easing off.” We indicated that “0.6500 is unlikely to come into view.” The anticipated AUD strength exceeded our expectations as it lifted off in NY trade and blew past both 0.6455 and 0.6500 (high has been 0.6518). While there is room for AUD to strengthen further, overbought conditions suggest any advance is unlikely to break clearly above 0.6555. Note that there is another strong resistance at 0.6525. On the downside, if AUD breaks below 0.6450 (minor support is at 0.6485), it would mean that the rally in AUD is ready to take a breather.
Next 1-3 weeks: Last Thursday (02 Nov, spot at 0.6415), we indicated that while upward momentum has improved, AUD must break and stay above 0.6445 before further advance to 0.6500 is likely. On Friday (03 Nov, spot at 0.6425), we indicated that “while there appears to be enough momentum to suggest AUD is heading higher in the coming days, it might take a while before the major resistance at 0.6500 comes into view.” We clearly did not anticipate AUD to surge and break above 0.6500 in NY trade (high has been 0.6518). The price action suggests AUD is likely to break above 0.6525 and head towards another strong resistance level at 0.6555. In order to keep the momentum going, AUD must stay above 0.6425 (‘strong resistance’ was at 0.6340 last Friday). On a short-term note, 0.6450 is already a solid support level.
Gold has started the new week on the back foot. Economists at TD Securities analyze the yellow metal’s outlook.
There may be quite a bit of volatility in the Gold market
Once the market is convinced that the Fed's next move is a cut and they are more certain about the timing, it is likely that investors will continue to build out long exposure. However, with data still strong there may be quite a bit of volatility in the Gold market.
We don’t expect a sustained move toward our $2,100 target until US economic data weakens materially.
- USD/CHF extends its losses on the likelihood of no further interest rate hike by the US Fed.
- Fed is expected to conclude its policy tightening as US economic data ease.
- CHF could lose ground as Swiss CPI persists below the 2% target.
USD/CHF plummets for the fourth successive day, trading lower near 0.8980 during the early European hours on Monday. The pair faces challenges as the US Dollar demonstrates weakening after a slew of disappointing employment data released from the United States (US).
US Non-Farm Payrolls (NFP) data might have exerted downward pressure on the US Dollar (USD), as the slowdown in the labor market could convince the US Federal Reserve (Fed) to conclude its monetary policy tightening. The report, revealing a figure of 150K, marked a significant decline from the 297K recorded in September.
Additionally, the US Unemployment Rate rose to 3.9%, contrary to the market's expectation of remaining stable at 3.8% in October. The cooling down of labor market data is seen as a response to the US Fed's efforts to address inflationary pressures through higher interest rates.
US Dollar Index (DXY) extends losses, trading below 105.00, at the time of writing. The weakening in the US Dollar (USD) can be attributed to downbeat US Treasury yields, a reaction to disappointing US labor data. The yield on a 10-year US Treasury bond stood at 4.59% by the press time.
On the other side, the Swiss Franc (CHF) might encounter challenges against the Greenback especially with the Swiss Consumer Price Index (CPI) persisting below the 2% target. Swiss annual inflation at 1.7% aligned with estimates and the previous release. The monthly inflation saw a slight increase of 0.1%, in line with expectations.
Investors will focus on Swiss seasonally adjusted Unemployment Rate data on Tuesday. Furthermore, the US Michigan Consumer Sentiment Index will be released later in the week.
USD/INR has been rather stable at just above the 83.00 level for the past five weeks. Economists at Commerzbank analyze Rupee’s outlook.
RBI unlikely to consider a shift to an easier policy stance anytime soon
RBI would need to stay vigilant on the inflation front. Headline inflation moderated to 5% YoY in September and back within RBI’s 2-6% target range.
However, RBI is unlikely to consider a shift to an easier policy stance anytime soon. It is expected to keep rates steady at 6.50% for the foreseeable future.
RBI will be content with the stability in INR.
- Pound Sterling is expected to deliver more upside amid a risk-on market mood.
- The UK economy is seen marginally contracting in Q3 due to higher interest rates – a negative for Pound Sterling.
- Deepening Middle East tensions could keep the broader risk profile negative.
The Pound Sterling (GBP) looks set to deliver a fresh upside as the market mood is supportive for risk-sensitive assets. The GBP/USD pair is aiming for more upside as investors hope that the policy divergence between the Federal Reserve (Fed) and the Bank of England (BoE) will not widen further since they are both sufficiently restrictive to ensure price stability.
Further action in the Pound Sterling could be guided by the preliminary Q3 Gross Domestic Product (GDP) for 2023, which will be published later this week. Economists project a marginally negative Q3 GDP as UK firms cut heavily on workforce and inventories due to a poor demand environment. Business investment is expected to remain lower in the July-September quarter as firms postpone their plans for capacity expansion to avoid higher borrowing costs.
Daily Digest Market Movers: Pound Sterling awaits UK Q3 GDP
- Pound Sterling gathers strength for a fresh upside above the immediate resistance of 1.2400 as the market sentiment is quite upbeat on hopes that the Federal Reserve (Fed) will not raise interest rates further.
- Improved market sentiment has strengthened demand for risk-perceived assets. While the US Dollar is expected to extend downside further.
- The GBP/USD pair refreshes a six-week high after US labor demand softened in October, triggering a risk-on impulse.
- The strength in the GBP/USD pair is backed by an intense sell-off in the US Dollar. Therefore, the pair could lose gains once the cleansing of longs in the Dollar is done.
- Pound Sterling recovered significantly last week after the Bank of England (BoE) paused interest rates, leaving them unchanged at 5.25% for the second time in a row.
- Fresh inflation forecasts from the BoE indicated that consumer inflation would come down to 4.6% by the year-end.
- This indicated that the UK Prime Minister Rishi Sunak would manage to accomplish his promise of halving inflation to 5.4% by 2023 ends. UK Sunak promised to halve inflation in January when inflation was at 10.7%.
- This week, investors will keenly focus on the preliminary Q3 GDP for 2023. Economists expect the economy to have contracted by 0.1% against 0.2% growth in the April-June quarter.
- Weak projections for the July-September quarter are based on deteriorating demand conditions due to higher interest rates and the deepening cost of living crisis.
- Business optimism has dropped to a 10-month low due to higher interest rates, which has forced companies to make heavy cuts to employment, purchasing, and inventories.
- The upside risks to Middle East tensions escalate as Israeli Prime Minister Benjamin Netanyahu rejected calls for a ceasefire when meeting with the US Secretary of State Antony Blinken on Friday.
- Meanwhile, investors await S&P Global Construction PMI for October, which will be published at 09:30 GMT. The economic data is seen declining to 44.5 from 45.0 released in September.
- The US Dollar Index (DXY) remains vulnerable as the US economy has started feeling the burden of higher interest rates by the Fed. US labor demand remained weak in October. Employers hired 150K job seekers, which were lower than expectations of 180K and upwardly revised September’s reading of 297K.
- The Services PMI, which gauges activity in the US service sector – a sector that accounts for two-thirds of the US economy-declined to 51.8 against expectations of 53.0, and a 53.6 reading from September.
Technical Analysis: Pound Sterling rises to near 1.2400
Pound Sterling prepares for a fresh upside above the immediate resistance of 1.2400 amid improved market sentiment. The near-term trend for the GBP/USD pair turns bullish as it has delivered a breakout of the Symmetrical Triangle chart pattern formed on a daily timeframe. The Cable has climbed above the 20 and 50-day Exponential Moving Averages (EMAs) and has come closer to the 200-day EMA, which trades around 1.2400.
Pound Sterling FAQs
What is the Pound Sterling?
The Pound Sterling (GBP) is the oldest currency in the world (886 AD) and the official currency of the United Kingdom. It is the fourth most traded unit for foreign exchange (FX) in the world, accounting for 12% of all transactions, averaging $630 billion a day, according to 2022 data.
Its key trading pairs are GBP/USD, aka ‘Cable’, which accounts for 11% of FX, GBP/JPY, or the ‘Dragon’ as it is known by traders (3%), and EUR/GBP (2%). The Pound Sterling is issued by the Bank of England (BoE).
How do the decisions of the Bank of England impact on the Pound Sterling?
The single most important factor influencing the value of the Pound Sterling is monetary policy decided by the Bank of England. The BoE bases its decisions on whether it has achieved its primary goal of “price stability” – a steady inflation rate of around 2%. Its primary tool for achieving this is the adjustment of interest rates.
When inflation is too high, the BoE will try to rein it in by raising interest rates, making it more expensive for people and businesses to access credit. This is generally positive for GBP, as higher interest rates make the UK a more attractive place for global investors to park their money.
When inflation falls too low it is a sign economic growth is slowing. In this scenario, the BoE will consider lowering interest rates to cheapen credit so businesses will borrow more to invest in growth-generating projects.
How does economic data influence the value of the Pound?
Data releases gauge the health of the economy and can impact the value of the Pound Sterling. Indicators such as GDP, Manufacturing and Services PMIs, and employment can all influence the direction of the GBP.
A strong economy is good for Sterling. Not only does it attract more foreign investment but it may encourage the BoE to put up interest rates, which will directly strengthen GBP. Otherwise, if economic data is weak, the Pound Sterling is likely to fall.
How does the Trade Balance impact the Pound?
Another significant data release for the Pound Sterling is the Trade Balance. This indicator measures the difference between what a country earns from its exports and what it spends on imports over a given period.
If a country produces highly sought-after exports, its currency will benefit purely from the extra demand created from foreign buyers seeking to purchase these goods. Therefore, a positive net Trade Balance strengthens a currency and vice versa for a negative balance.
US Dollar consolidates previous week's losses. Economists at Commerzbank analyze Greenback’s outlook.
USD’s upside potential largely exhausted
Due to a lack of new information on central bank policy, EUR/USD will tend to trade sideways this week.
Based on monetary policy the Dollar’s upside potential is more or less used up and the market prices in faster cuts than the Fed signals with its dots.
Only the conflict in the Middle East might mean that the Dollar will be in demand as a safe haven in case of an escalation, but that doesn't look likely at the moment.
The continuation of the upside bias could prompt GBP/USD to revisit the 1.2500 zone in the next few weeks, according to UOB Group’s Markets Strategist Quek Ser Leang and Senior FX Strategist Peter Chia.
Key Quotes
24-hour view: The sudden surge that sent GBP rocketing to a high of 1.2389 came as a surprise (we were expecting it to trade in a range). While severely overbought, GBP could rise above 1.2400 first before levelling off. The next resistance at 1.2430 is likely out of reach for now. Support is at 1.2330, followed by 1.2300.
Next 1-3 weeks: We highlighted last Friday that we maintained our view that GBP “is likely to trade in a range between 1.2085 and 1.2240.” We also highlighted that “looking ahead, the chance of GBP breaking above the top of the expected range first is higher than it breaking below the bottom of the range.” That said, we did not anticipate GBP to lift off and surge by 1.46% (NY close of 1.2380). From a short-term perspective, the outsized rally appears to be overstretched. However, as long as GBP stays above 1.2245 (‘strong support’ level), it could rise above 1.2430, possibly reaching the major resistance of 1.2510.
FX option expiries for Nov 6 NY cut at 10:00 Eastern Time, via DTCC, can be found below.
- EUR/USD: EUR amounts
- 1.0660 793m
- GBP/USD: GBP amounts
- 1.2280 533m
- 1.2375 307m
- USD/JPY: USD amounts
- 150.00 1b
- 150.50 954m
- 152.00 1.7b
- AUD/USD: AUD amounts
- 0.6400 1.2m
- USD/CAD: USD amounts
- 1.3850 310m
- NZD/USD: NZD amounts
- 0.5870 306m
Here is what you need to know on Monday, November 6:
Financial markets started the new week in a quiet manner. After falling more than 1% in the previous week, the US Dollar (USD) Index stabilized near 105.00 early Monday and the benchmark 10-year US Treasury bond yield recovered toward 4.6%. Sentix Investors Confidence data for November will be featured in the European economic docket. The US calendar will not be offering any high-impact data releases later in the day.
Nonfarm Payrolls in the US rose by 150,000 in October, the US Bureau of Labor Statistics (BLS) reported on Friday. This reading came in below the market expectation of 180,000 and pointed to loosening conditions in the labor market. Consequently, the USD continued to weaken against its major rivals ahead of the weekend and risk flows dominated the action in financial markets on growing expectations of the Federal Reserve holding the policy rate steady in December. Early Monday, US stock index futures trade slightly higher on the day.
Meanwhile, the Israel Defense Forces said over the weekend that operations against "Hamas’ leadership and infrastructure in northern Gaza" will continue.
US Dollar price today
The table below shows the percentage change of US Dollar (USD) against listed major currencies today. US Dollar was the strongest against the Australian Dollar.
| USD | EUR | GBP | CAD | AUD | JPY | NZD | CHF | |
| USD | -0.08% | -0.12% | -0.07% | 0.09% | 0.07% | 0.02% | -0.25% | |
| EUR | 0.06% | -0.04% | 0.00% | 0.16% | 0.13% | 0.09% | -0.18% | |
| GBP | 0.12% | 0.04% | 0.05% | 0.20% | 0.19% | 0.13% | -0.14% | |
| CAD | 0.07% | -0.01% | -0.05% | 0.15% | 0.13% | 0.07% | -0.19% | |
| AUD | -0.10% | -0.17% | -0.22% | -0.17% | -0.03% | -0.08% | -0.34% | |
| JPY | -0.08% | -0.15% | -0.41% | -0.12% | 0.00% | -0.04% | -0.33% | |
| NZD | -0.02% | -0.09% | -0.13% | -0.07% | 0.08% | 0.06% | -0.27% | |
| CHF | 0.23% | 0.17% | 0.13% | 0.18% | 0.34% | 0.32% | 0.27% |
The heat map shows percentage changes of major currencies against each other. The base currency is picked from the left column, while the quote currency is picked from the top row. For example, if you pick the Euro from the left column and move along the horizontal line to the Japanese Yen, the percentage change displayed in the box will represent EUR (base)/JPY (quote).
EUR/USD gathered bullish momentum and climbed to its highest level in nearly two months above 1.0700 on Friday. The pair seems to have gone into a consolidation phase slightly below 1.0750 early Monday. The data from Germany showed that Factory Orders increased by 0.2% on a monthly basis in September, better than the market expectation for a decrease of 1%.
GBP/USD gained nearly 200 pips on Friday and continued to inch higher toward 1.2400 on Monday.
Bank of Japan (BoJ) Governor Kazuo Ueda said on Monday that they need to have more conviction that wages will keep rising. "Rising wages lead to service prices and the economy remains strong, to ponder exit from easy policy," Ueda explained. USD/JPY showed no immediate reaction to these comments and the pair was last seen moving sideways at around 149.50.
During the Asian trading hours on Tuesday, the Reserve Bank of Australia (RBA) will announce monetary policy decisions. Additionally, October Trade Balance data from China will be watched closely by market participants. Ahead of these events, AUD/USD stays relatively calm at around 0.6500.
The improving risk mood made it difficult for XAU/USD to benefit from falling US bond yields and the broad-based USD weakness on Friday. Gold started the new week on the back foot and declined toward $1,980.
The Swedish Krona has re-weakened in October giving back most of the gains recorded in September. Economists at MUFG Bank analyze SEK outlook.
Krona still lacks a trigger to rebound from deeply undervalued levels
The renewed sell-off for the Krona will keep pressure on the Riksbank to raise rates further even after the ECB and Fed have paused their hiking cycles.
The Krona still lacks a trigger to rebound from deeply undervalued levels in the near-term.
EUR/SEK – Q4 2023 11.80 Q1 2024 11.70 Q2 2024 11.60 Q3 2024 11.40
- USD/INR snaps the three-day losing streak.
- 21-day SMA at 83.22 acts as the immediate barrier.
- MACD indicator suggests a bearish trend in the market sentiment.
USD/INR trades higher around 83.20 lined up with immediate resistance near the 21-day Simple Moving Average (SMA) at 83.22. The USD/INR pair could gain more profits in the short term as the 50-day SMA lies slightly above the latter at 83.24.
The USD/INR pair bounces back from the recent losses incurred in the previous session, particularly after the release of disappointing US Non-Farm Payrolls data on Friday. The US Bureau of Labor Statistics revealed the October data, indicating a count of 150K, falling short of the anticipated 180K and marking a significant decline from September's 297K.
On the downside, the USD/INR pair could find key support at 83.00 psychological level aligned with October’s low at 82.97.
The Moving Average Convergence Divergence (MACD) line lies below the centerline and shows convergence occurring below the signal line. This configuration typically suggests a bearish trend, indicating potential downward momentum in the USD/INR pair.
The 14-day Relative Strength Index (RSI) hovering around the 50 level indicates that there is no strong bias towards either overbought or oversold conditions, and the market is in a state of equilibrium.
USD/INR: Four-Hour Chart
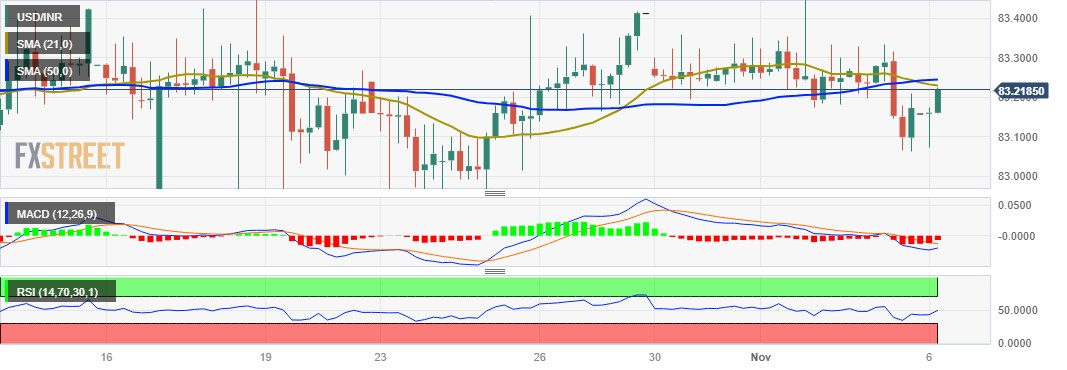
Germany’s Factory Orders unexpectedly rose in September, the official data published by the Federal Statistics Office showed Monday, suggesting that the German manufacturing sector is holding its recovery momentum.
On a monthly basis, contracts for goods ‘Made in Germany’ rose 0.2%, compared with a 3.9% increase reported in August while beating the market forecasts of a 1.0% decline.
Germany’s Industrial Orders dropped at an annual rate of 4.3% in the reported month, as against the previous slump of 6.3%.
FX implications
The upbeat German data is helping Euro bulls regain further ground, with the EUR/USD pair nearing 1.0750, up 0.10% on the day.
- The index extends the decline and challenges 105.00.
- Investors continue to digest Friday’s Nonfarm Payrolls.
- FOMC L. Cook speaks later in the NA session.
The greenback, in terms of the USD Index (DXY), hovers around the area of multi-week lows near 105.00 at the beginning of the week.
USD Index looks at risk trends, Fed
The index retreats for the third session in a row on Monday as market participants continue to adjust to the release of October’s softer-than-estimated labour market report, where the US economy created 150K jobs and the jobless rate ticked higher to 3.9%.
In the meantime, the dollar saw its downside momentum gather extra steam in response to investors’ repricing of the continuation of the Fed’s pause in its tightening campaign along with the probability of interest rate cuts at some point around June-July 2024.
There are no data releases scheduled in the US data space on Monday, while FOMC L. Cook (permanent vote, centrist) will speak later in the NA session.
What to look for around USD
The recent sharp corrective move in the index appears to have met some initial contention in the 105.00 neighbourhood so far.
In the meantime, the dollar loses some composure despite the broad-based good health of the US economy and the inflation still running above the Fed’s target, while further cooling of the US labour market now appear to underpin a protracted impasse in the Fed’s current restrictive stance.
Key events in the US this week: Balance of Trade, Consumer Credit Change (Tuesday) – MBA Mortgage Applications, Wholesale Inventories (Wednesday) - Initial Jobless Claims, Chair Powell (Thursday) – Flash Michigan Consumer Sentiment (Friday).
Eminent issues on the back boiler: Persistent debate over a soft or hard landing for the US economy. Speculation of rate cuts in early 2024. Geopolitical effervescence vs. Russia and China. Potential spread of the Middle East crisis to other regions.
USD Index relevant levels
Now, the index is down 0.05% at 105.01 and faces initial support at initial 104.94 (monthly low November 3) ahead of 104.42 (weekly low September 11) and then 103.51 (200-day SMA). On the other hand, the breakout of 106.88 (weekly high October 26) could expose 107.34 (2023 high October 3) and finally 107.99 (weekly high November 21 2022).
In the view of UOB Group’s Markets Strategist Quek Ser Leang and Senior FX Strategist Peter Chia, further upside could lift EUR/USD to the 1.0770 region in the near term.
Key Quotes
24-hour view: We highlighted last Friday that “there is room for EUR to rise further, but a sustained break of the major resistance at 1.0680 is unlikely.” However, not only did EUR break clearly above 1.0680, it also took out another major resistance at 1.0730 as it surged to a high of 1.0746. While severely overbought, impulsive upward momentum suggests EUR is likely to strengthen further to 1.0770. The major resistance at 1.0800 is unlikely to come into view today. Support is at 1.0705, followed by 1.0680.
Next 1-3 weeks: Last Friday (03 Nov, spot at 1.0620), we highlighted that “while EUR still appears to be trading in a range, if it breaks and stays above 1.0680, it could lead to a quick rise to the next major resistance at 1.0730.” We added, “the chance of EUR breaking clearly above 1.0680 is not high for now, but it will increase further in the coming days if it stays above 1.0550.” While our view was not wrong, we did not anticipate the manner in each EUR blew past 1.0680 as it rocketed by 1.03% (NY close of 1.0729). The 1.03% gain is the largest 1-day rise since mid-July. The impulsive rally is likely to extend to 1.0770, as high as 1.0800. On the downside, the ‘strong support level has moved higher to 1.0640 from 1.0550.
- Australian Dollar gains ground due to the decline in the US Dollar.
- Australia’s TD Securities Inflation reduced to 5.1% in September from 5.7% prior.
- RBA is expected to increase interest rates by 25 basis points in its policy decision on Tuesday.
The Australian Dollar (AUD) holds strong on Monday, aiming to mark a three-month high. The AUD/USD pair continues to gain ground for the fourth successive day, gearing up for the Reserve Bank of Australia's (RBA) interest rate decision set to be unveiled on Tuesday.
Australia's central bank is set to announce its policy decision on Tuesday. Expectations are leaning towards a 25 basis points increase, a move in line with Australian inflation teetering at the edges, providing support to the Australian Dollar (AUD). Moreover, the RBA Shadow Board suggests a cash rate increase in November. It assigns a 62% probability of raising the cash rate to a level above 4.10%.
The AUD/USD pair experiences an additional uplift due to an improved risk appetite. This sentiment is fueled by the possibility that the US Federal Reserve (Fed) has completed its monetary policy tightening, as indicated by cooling economic data from the United States (US).
US Dollar Index (DXY) experienced a significant drop of over 1.0% in the previous session. This decline was influenced by downbeat US Treasury yields, a reaction to the weaker-than-expected nonfarm payrolls released on Friday. The disappointing employment data contributed to subdued sentiment for the US Dollar (USD).
Daily Digest Market Movers: Australian Dollar extends gains on weaker US Dollar, focus on RBA policy decision
- Australia’s TD Securities Inflation (YoY) reduced to 5.1% in September from 5.7% prior.
- Australia’s Retail Sales improved to 0.2% in the third quarter from the previous reading of -0.6%.
- Aussie Trade Balance (Month-on-Month) decreased to 6,786M in September, falling short of expectations set at 9,400M and down from the previous figure of 10,161M.
- In the twelve months leading up to September 2023, Australia’s monthly Consumer Price Index (CPI) recorded a 5.6% increase. However, the quarterly inflation rate dipped to 5.4% year-on-year in Q3.
- US Bureau of Labor Statistics recently unveiled the Non-Farm Payrolls (NFP) data for October, disclosing a figure of 150K. This missed the expected 180K and marked a substantial drop from September's 297K.
- US Average Hourly Earnings (Month-on-Month) saw a decline to 0.2%, deviating from the anticipated 0.3%. On a year-over-year basis, it came in at 4.1%, surpassing the 4.0% expectations.
- US ISM Services Purchasing Managers' Index (PMI) declined from the previous 53.6 to 51.8. Additionally, on Thursday, the US Department of Labor released the count of initial claims for unemployment benefits for the week ending October 27, showing an increase from 212,000 to 217,000.
Technical Analysis: Australian Dollar maintains its position above 0.6500 major level ahead of the RBA decision
The Australian Dollar hovers around 0.6510 near the resistance area at the 38.2% Fibonacci retracement level aligned with the September’s high at 0.6521, followed by the 0.6550 major level. On the downside, the seven-day Exponential Moving Average (EMA) at 0.6436 could act as the immediate support following the annual low at 0.6270.
AUD/USD: Daily Chart
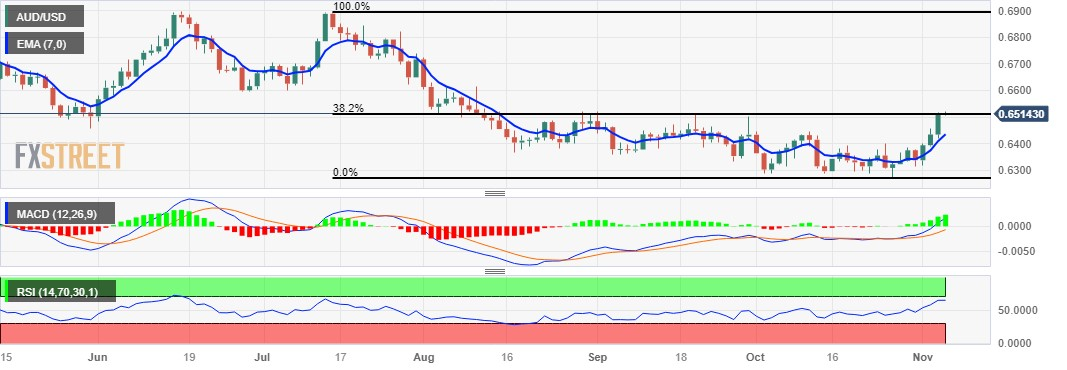
Australian Dollar price today
The table below shows the percentage change of Australian Dollar (AUD) against listed major currencies today. Australian Dollar was the strongest against the Japanese Yen.
| USD | EUR | GBP | CAD | AUD | JPY | NZD | CHF | |
| USD | -0.05% | -0.04% | -0.09% | -0.01% | 0.02% | -0.03% | -0.27% | |
| EUR | 0.04% | 0.00% | -0.05% | 0.02% | 0.06% | 0.01% | -0.23% | |
| GBP | 0.04% | -0.01% | -0.05% | 0.03% | 0.04% | 0.01% | -0.23% | |
| CAD | 0.09% | 0.04% | 0.05% | 0.08% | 0.10% | 0.06% | -0.19% | |
| AUD | 0.00% | -0.06% | -0.05% | -0.09% | 0.02% | -0.03% | -0.27% | |
| JPY | -0.02% | -0.07% | -0.28% | -0.09% | -0.03% | -0.05% | -0.29% | |
| NZD | 0.03% | -0.02% | -0.01% | -0.06% | 0.02% | 0.03% | -0.24% | |
| CHF | 0.26% | 0.22% | 0.22% | 0.17% | 0.26% | 0.28% | 0.23% |
The heat map shows percentage changes of major currencies against each other. The base currency is picked from the left column, while the quote currency is picked from the top row. For example, if you pick the Euro from the left column and move along the horizontal line to the Japanese Yen, the percentage change displayed in the box will represent EUR (base)/JPY (quote).
Australian Dollar FAQs
What key factors drive the Australian Dollar?
One of the most significant factors for the Australian Dollar (AUD) is the level of interest rates set by the Reserve Bank of Australia (RBA). Because Australia is a resource-rich country another key driver is the price of its biggest export, Iron Ore. The health of the Chinese economy, its largest trading partner, is a factor, as well as inflation in Australia, its growth rate and Trade Balance. Market sentiment – whether investors are taking on more risky assets (risk-on) or seeking safe-havens (risk-off) – is also a factor, with risk-on positive for AUD.
How do the decisions of the Reserve Bank of Australia impact the Australian Dollar?
The Reserve Bank of Australia (RBA) influences the Australian Dollar (AUD) by setting the level of interest rates that Australian banks can lend to each other. This influences the level of interest rates in the economy as a whole. The main goal of the RBA is to maintain a stable inflation rate of 2-3% by adjusting interest rates up or down. Relatively high interest rates compared to other major central banks support the AUD, and the opposite for relatively low. The RBA can also use quantitative easing and tightening to influence credit conditions, with the former AUD-negative and the latter AUD-positive.
How does the health of the Chinese Economy impact the Australian Dollar?
China is Australia’s largest trading partner so the health of the Chinese economy is a major influence on the value of the Australian Dollar (AUD). When the Chinese economy is doing well it purchases more raw materials, goods and services from Australia, lifting demand for the AUD, and pushing up its value. The opposite is the case when the Chinese economy is not growing as fast as expected. Positive or negative surprises in Chinese growth data, therefore, often have a direct impact on the Australian Dollar and its pairs.
How does the price of Iron Ore impact the Australian Dollar?
Iron Ore is Australia’s largest export, accounting for $118 billion a year according to data from 2021, with China as its primary destination. The price of Iron Ore, therefore, can be a driver of the Australian Dollar. Generally, if the price of Iron Ore rises, AUD also goes up, as aggregate demand for the currency increases. The opposite is the case if the price of Iron Ore falls. Higher Iron Ore prices also tend to result in a greater likelihood of a positive Trade Balance for Australia, which is also positive of the AUD.
How does the Trade Balance impact the Australian Dollar?
The Trade Balance, which is the difference between what a country earns from its exports versus what it pays for its imports, is another factor that can influence the value of the Australian Dollar. If Australia produces highly sought after exports, then its currency will gain in value purely from the surplus demand created from foreign buyers seeking to purchase its exports versus what it spends to purchase imports. Therefore, a positive net Trade Balance strengthens the AUD, with the opposite effect if the Trade Balance is negative.
Bank of Japan (BoJ) Governor Kazuo Ueda said on Monday, “we need to have more conviction that wages will keep rising, rising wages lead to service prices and the economy remains strong, to ponder exit from easy policy.”
Ueda said, “there will always be new information coming in, so at any meeting there is a chance of making a certain decision,” when asked about the chance of BoJ foreseeing inflation sustainably hitting 2% target at the next policy meeting in December.
He said that “don't expect 10-year JGB yield to rise sharply above 1% even after last week's YCC tweak.”
Meanwhile, the Nikkei Asian Review is reporting that Japan's largest industrial union UA Zensen is seeking a 6% of total wage increase at next spring negotiations.
Market reaction
The above comments fail to move the needle around the Japanese Yen, as the USD/JPY pair is currently trading 0.17% higher on the day at 149.63.
- WTI seesaws between tepid gains/minor losses just above a two-month low touched on Friday.
- Easing fears of supply disruptions from the Middle East and a modest USD strength cap the upside.
- The risk of a further escalation in the Israel-Hamas conflict and tight global supply lend some support.
West Texas Intermediate (WTI) Crude Oil prices struggle to gain any meaning on the first day of a new week and oscillate in a narrow trading band around the $80.70-$80.75 region during the Asian session. The commodity, meanwhile, remains well within the striking distance of its lowest level since August 29 touched on Friday and continues to be weighed down by easing fears of a possible supply disruption from the Middle East.
Apart from this, a modest US Dollar (USD) recovery from a six-week low, supported by rebounding US Treasury bond yields, turns out to be another factor weighing on the USD-denominated commodity. That said, firming expectations that the Federal Reserve (Fed) is down raising interest rates should keep a lid on any meaningful upside for the US bond yields and cap the USD. Furthermore, top exporters Saudi Arabia and Russia said they would stick to extra voluntary oil output cuts until the end of the year, which, in turn, acts as a tailwind for WTI Crude Oil prices.
Israel, meanwhile, rejected calls for a ceasefire and its conflict with the Palestinian Islamist group, Hamas, so far, has shown no signs of de-escalation. Adding to this, Hezbollah leader Sayyed Hassan Nasrallah warned on Friday that a wider conflict in the Middle East was possible and that the fighting on the Lebanese front could turn into a full-fledged war. Moreover, reports suggested that Russia’s Wagner mercenary group planned to provide Hezbollah with air defence systems. This, along with China's economic woes, keeps traders on the edge and caps the upside for Oil prices.
Market participants also seem reluctant to place aggressive directional bets ahead of key macroeconomic data from China, starting with trade data on Tuesday, which should provide more cues on commodity demand in the world's top oil importer. China's inflation figures are also due for release later this week, on Thursday and offer more insight into spending patterns in the country. This, along with developments surrounding the Israel-Hamas conflict and the USD price dynamics, should contribute to producing some meaningful trading opportunities around Crude Oil prices.
Technical levels to watch
- Gold price drifts lower during the Asian session and retreats further from Friday’s post-NFP swing high.
- The USD bounces off a multi-week low amid rebounding US bond yields and weighs on the metal.
- Bets that the Fed is done hiking rates and geopolitical tensions should limit losses for the XAU/USD.
Gold price (XAU/USD) kicks off the new week on a weaker note and extends Friday's retracement slide from levels above the $2,000 psychological mark touched in reaction to softer jobs data from the United States (US). The US Dollar (USD) attracts some buying in the wake of a modest pickup in the US Treasury bond yields and turns out to be a key factor weighing on the precious metal. Apart from this, a generally positive tone around the equity markets drags the safe-haven commodity below the $1,985 level during the Asian session.
That said, growing acceptance that the Federal Reserve (Fed) is nearing the end of its policy tightening campaign should cap any further upside for the USD and continue to lend some support to the non-yielding Gold price. Apart from this, the risk of a further escalation in the Israel-Hamas conflict should help limit the downside for the XAU/USD. This, in turn, warrants some caution for aggressive bearish traders and before positioning for any meaningful corrective decline from the YTD peak, around the $2,009 region touched on October 27.
Daily Digest Market Movers: Gold price is weighed down by rebounding US bond yields and reviving USD demand
- The US Dollar stages a modest recovery from a six-week low touched on Friday and draws support from a goodish pickup in the US Treasury bond yields, which, in turn, is seen weighing on the Gold price.
- Firming expectations that the Federal Reserve will not hike rates again, bolstered by the softer US macro data released on Friday, should keep a lid on any meaningful appreciating move for the Greenback.
- The headline NFP showed that the US economy added 150K jobs in October as compared to 180K estimated and the previous month's reading was also revised down to 297K from 336K reported originally.
- The US ISM Non-Manufacturing PMI fell to a five-month low level of 51.8 in October from 53.6 the previous month, reaffirming bets that the Fed will maintain the status quo again at the December policy meeting.
- On the geopolitical front, Israel on Sunday rejected growing calls for a ceasefire in Gaza and said that Israeli forces are set to intensify their operations against the Palestinian Islamist group, Hamas.
- Israel's chief military spokesperson said the military had attacked terrorist targets of Hezbollah in southern Lebanon in response to a missile attack against tanks that killed an Israeli citizen.
- Hezbollah said it responded by firing rockets at the town of Kiryat Shmona in northern Israel and said that it would never tolerate attacks on civilians and its response would be "firm and strong".
- Lebanon's militant group chief Hassan Nasrallah said that his Iran-backed group was not afraid of US warships and all options were open for an expansion of the conflict into Lebanon.
Technical Analysis: Gold price might continue to attract some buyers at lower levels
From a technical perspective, any subsequent downfall is likely to find some support near the $1,980 level ahead of last week's swing high, near the $1,970 region. Some follow-through selling will make the Gold price vulnerable to slide further towards the $1,964 area en route to the next relevant support to the $1,954-1,953 zone.
On the flip side, the $2,000 mark could act as an immediate barrier ahead of Friday's swing high, around the $2,004 area and the YTD peak, around the $2,009 region. A sustained strength beyond the latter has the potential to lift the Gold price further towards the $2,022 resistance zone.
US Dollar price today
The table below shows the percentage change of US Dollar (USD) against listed major currencies today. US Dollar was the strongest against the New Zealand Dollar.
| USD | EUR | GBP | CAD | AUD | JPY | NZD | CHF | |
| USD | 0.00% | 0.03% | -0.03% | 0.08% | 0.08% | 0.12% | -0.16% | |
| EUR | 0.00% | 0.04% | -0.03% | 0.07% | 0.07% | 0.11% | -0.17% | |
| GBP | -0.03% | -0.03% | -0.07% | 0.04% | 0.04% | 0.07% | -0.20% | |
| CAD | 0.03% | 0.04% | 0.07% | 0.10% | 0.11% | 0.14% | -0.14% | |
| AUD | -0.06% | -0.08% | -0.03% | -0.11% | 0.00% | 0.05% | -0.24% | |
| JPY | -0.08% | -0.07% | -0.27% | -0.09% | 0.00% | 0.03% | -0.25% | |
| NZD | -0.12% | -0.09% | -0.08% | -0.14% | -0.04% | -0.04% | -0.27% | |
| CHF | 0.17% | 0.17% | 0.20% | 0.13% | 0.24% | 0.25% | 0.28% |
The heat map shows percentage changes of major currencies against each other. The base currency is picked from the left column, while the quote currency is picked from the top row. For example, if you pick the Euro from the left column and move along the horizontal line to the Japanese Yen, the percentage change displayed in the box will represent EUR (base)/JPY (quote).
Gold FAQs
Why do people invest in Gold?
Gold has played a key role in human’s history as it has been widely used as a store of value and medium of exchange. Currently, apart from its shine and usage for jewelry, the precious metal is widely seen as a safe-haven asset, meaning that it is considered a good investment during turbulent times. Gold is also widely seen as a hedge against inflation and against depreciating currencies as it doesn’t rely on any specific issuer or government.
Who buys the most Gold?
Central banks are the biggest Gold holders. In their aim to support their currencies in turbulent times, central banks tend to diversify their reserves and buy Gold to improve the perceived strength of the economy and the currency. High Gold reserves can be a source of trust for a country’s solvency. Central banks added 1,136 tonnes of Gold worth around $70 billion to their reserves in 2022, according to data from the World Gold Council. This is the highest yearly purchase since records began. Central banks from emerging economies such as China, India and Turkey are quickly increasing their Gold reserves.
How is Gold correlated with other assets?
Gold has an inverse correlation with the US Dollar and US Treasuries, which are both major reserve and safe-haven assets. When the Dollar depreciates, Gold tends to rise, enabling investors and central banks to diversify their assets in turbulent times. Gold is also inversely correlated with risk assets. A rally in the stock market tends to weaken Gold price, while sell-offs in riskier markets tend to favor the precious metal.
What does the price of Gold depend on?
The price can move due to a wide range of factors. Geopolitical instability or fears of a deep recession can quickly make Gold price escalate due to its safe-haven status. As a yield-less asset, Gold tends to rise with lower interest rates, while higher cost of money usually weighs down on the yellow metal. Still, most moves depend on how the US Dollar (USD) behaves as the asset is priced in dollars (XAU/USD). A strong Dollar tends to keep the price of Gold controlled, whereas a weaker Dollar is likely to push Gold prices up.
- USD/CAD loses ground on the likelihood of no interest rate hike by the US Fed in December.
- US Dollar lost strength due to weaker US economic data released in the previous week.
- BoC is expected to keep interest rates higher for a prolonged period.
USD/CAD aims to lose ground on the fourth consecutive day to continue the losing streak, treading waters near 1.3650 during the Asian hours on Monday. The pair faces downward pressure amid expectations that the US Federal Reserve (Fed) might halt its monetary policy tightening, prompted by the subdued employment data from the United States (US).
On the Canadian side, the weaker labor data could weigh on the Loonie Dollar (CAD). The employment Change released by Statistics Canada on Friday revealed that Net Change in Employment reduced to the figure of 17.5K in October, falling short of 22.5K expectations from 63.8K in September. While Unemployment Rate increased to 5.7% from 5.5% prior.
In a statement last week, Bank of Canada (BoC) Governor Tim Macklem mentioned that indications are suggesting the neutral interest rate is more likely to be higher than lower.
US Dollar Index (DXY) hovers around 105.10, at the time of writing, showing a significant drop of over 1.0% in the previous session. The weakness in the US Dollar (USD) can be attributed to lackluster US Treasury yields, a reaction to disappointing US labor data.
US Non-Farm Payrolls (NFP) data might have cheered up the investors, as they've been anticipating a slowdown in economic data to persuade the US Fed that additional rate hikes are unnecessary. The report revealed a figure of 150K, falling short of the expected 180K and marking a significant decline from the 297K recorded in September.
Additionally, the US Unemployment Rate rose to 3.9%, going against the market's anticipation of remaining stable at 3.8% in October. The ISM Services Purchasing Managers' Index (PMI) declined from the previous 53.6 to 51.8. On Thursday, the US Department of Labor published the count of initial claims for unemployment benefits for the week ending October 27, indicating a rise from 212K to 217K.
Investors will likely watch Canada's Ivey Purchasing Managers Index scheduled to be released on Monday. Furthermore, the US Michigan Consumer Sentiment Index will be eyed later in the week.
China’s newly appointed Finance Minister Lan Foan said over the weekend that the government “will accelerate the issuance and use of government bonds.”
Additional quotes
Will steadily promote the resolution of local government debt risk and increase efforts to better leverage the role of special bonds to boost the economy.
Will continue to implement a proactive fiscal policy.
Focus on improving efficiency.
Better play the effectiveness of fiscal policy.
Some new local government debt quotas for 2024 have been issued in advance to reasonably ensure local financing needs.
Market reaction
At the time of writing, AUD/USD is holding steady near three-month highs of 0.6520, awaiting the Reserve Bank of Australia (RBA) interest rate decision for a fresh leg higher.
- GBP/USD oscillates in a narrow trading band through the Asian session on Monday.
- Rebounding US bond yields help the USD to stall the post-NFP slump and cap gains.
- Bets that the Fed is done hiking rates keeps a lid on the USD and should limit losses.
The GBP/USD pair kicks off the new week on a subdued note and consolidates Friday's strong move up its highest level since September 20. Spot prices currently trade around the 1.2375 region, nearly unchanged for the day, and remain at the mercy of the US Dollar (USD) price dynamics.
The USD Index (DXY), which tracks the Greenback against a basket of currencies, bounces off a six-week trough touched on Friday in the wake of a modest uptick in the US Treasury bond yields and acts as a headwind for the GBP/USD pair. Any meaningful USD recovery, however, seems elusive in the wake of firming expectations that the Federal Reserve (Fed) is likely to hold interest rates steady again at its December meeting.
The bets were reaffirmed by softer-than-expected US macro data released on Friday. In fact, the closely-watched US NFP report showed that the economy added 150K jobs in October as compared to 180K anticipated. Adding to this, the previous month's reading was also revised down to 297K from 336K reported originally. Furthermore, the US ISM Non-Manufacturing PMI fell to a five-month low of 51.8 in October from 53.6 previous.
The aforementioned fundamental backdrop should hold back the USD bulls from placing aggressive bets and continue to lend some support to the GBP/USD pair That said, the Bank of England's (BoE) bleak economic outlook, saying that the economy risks falling into recession next year, might cap gains for the major pair. Moreover, investors seem convinced that the UK central bank's next policy move is more likely to be a rate cut.
In fact, the markets have now fully priced in a 25 bps rate cut by August 2024, which, in turn, warrants some caution before positioning for an extension of last week's strong move up. Market participants now look to the release of the UK Construction PMI for some impetus. Later during the North American session, traders will take cues from Fed Governor Lisa Cook and BoE Chief Economist Huw Pill's scheduled speeches.
Technical levels to watch
- Gold price gained support as cooling US data signals the Fed to conclude its policy tightening.
- US Dollar faces pressure after the subdued Nonfarm Payrolls data released on Friday.
- Improved risk appetite could limit the advance of the precious metal demand.
Gold price hovers around $1,990 per troy ounce during the Asian session on Monday, struggling to continue the winning streak. However, the bullion prices improved on expectations that the US Federal Reserve (Fed) may conclude its monetary policy tightening after the subdued employment data from the United States (US).
However, Gold prices could experience downward pressure amidst a heightened risk appetite as investors may cast out the precious metal in favor of more risk-driven assets, driven by the belief that the US Fed may not attempt an interest rate hike in the upcoming December meeting.
US Dollar Index (DXY) took a notable plunge of more than 1.0% on Friday, influenced by lackluster US Treasury yields following disappointing US labor data. As of now, the 10-year US bond yield is at 4.58%, providing a degree of relief for the prices of the yellow metal.
US Bureau of Labor Statistics unveiled the Non-Farm Payrolls (NFP) data for October on Friday, showing a count of 150K. This missed the expected 180K and represented a notable drop from September's 297K. The month-on-month change in Average Hourly Earnings dipped to 0.2%, deviating from the expected steady 0.3%.
Moreover, the US Unemployment Rate climbed to 3.9%, contrary to the market's expectation of holding steady at 3.8% in October. The ISM Services Purchasing Managers' Index (PMI) dropped to 51.8 from the previous 53.6. On Thursday, the US Department of Labor released the tally of initial claims for unemployment benefits for the week ending October 27, revealing an increase from 212,000 to 217,000.
Gold saw an uptick in demand as a safe haven amid the Israel-Hamas conflict. However, traders could adjust their stance, anticipating a reduced risk premium as concerns ease about the conflict expanding across the broader Middle East. The evolving situation and efforts by multiple nations to broker a ceasefire will be closely monitored for further market insights.
| Raw materials | Closed | Change, % |
|---|---|---|
| Silver | 23.198 | 1.94 |
| Gold | 1992.396 | 0.32 |
| Palladium | 1119.98 | 0.76 |
- USD/JPY regains some positive traction on Monday and snaps a three-day losing streak.
- A modest bounce in the US bond yields helps revive the USD demand and lends support.
- The lack of strong follow-through buying warrants caution for aggressive bullish traders.
The USD/JPY pair attracts some dip-buying on the first day of a new week and for now, seems to have stalled a three-day-old corrective decline from the 151.70 area, or its highest level since October 2022 touched last Tuesday. Spot prices currently trade just above the mid-149.00s, up nearly 0.15% for the day, and draw support from a modest US Dollar (USD) uptick, though lack bullish conviction.
Rebounding US Treasury bond yields assist the USD Index (DXY), which tracks the Greenback against a basket of currencies, to recover a part of Friday's post-US jobs data slump to a six-week low. Apart from this, the Bank of Japan's dovish stance, along with the prevalent risk-on environment, is seen undermining the safe-haven Japanese Yen (JPY) and acting as a tailwind for the USD/JPY pair.
In fact, The BoJ's minor change to its yield curve control (YCC) policy pointed to a slow move towards exiting the decade-long accommodative monetary policy settings. Adding to this, BoJ Governor Kazuo Ueda noted this Monday that there is uncertainty on whether Japan will see a positive cycle of wage and inflation, as we predict and reiterated to patiently maintain policy easing to support economic activity.
This marks a big divergence in comparison to the Federal Reserve's (Fed) relatively hawkish outlook, leaving the door open for additional rate hikes in the wake of the US economic resilience. Investors, however, seem convinced that the US central bank will maintain the status quo in December and the bets were reaffirmed by softer-than-expected US monthly employment details released on Friday.
Apart from this, speculations that Japanese authorities will intervene in the FX market, to combat a sustained depreciation in the domestic currency, further contribute to capping the upside for the USD/JPY pair. This, in turn, warrants caution for bullish traders and before positioning for any further intraday appreciating move in the absence of any relevant marking moving economic releases from the US.
Technical levels to watch
On Monday, the People’s Bank of China (PBoC) set the USD/CNY central rate for the trading session ahead at 7.1780 as compared to the previous day's fix of 7.1798 and 7.2868 Reuters estimates.
Bank of Japan (BoJ) Governor Kazuo Ueda addressing a press conference in Nagoya reiterated to patiently maintain monetary easing to support economic activity.
Key Quotes:
- Japan's economy recovering moderately.
- Japan's economy is likely to continue recovering.
- Long-term rates may rise somewhat but what's important is to look at the real interest rate that takes into account inflation expectations.
- Even if long-term rates rise, real interest rates will move in negative territory so monetary conditions will be sufficiently accommodative.
- There is uncertainty on whether Japan will see the positive cycle of wage and inflation, as we predict.
- We will patiently maintain monetary easing to support economic activity.
- We will continue massive bond-buying even under the new operation we decided last week.
- We will conduct nimble market operations when interest rates rise, depending on the level and speed of moves of long-term rates.
- Even if long-term rates come under upward pressure, don't expect the 10-year JGB yield to sharply exceed 1%.
- Under YCC, we need to carefully weigh the effect of the policy in stimulating the economy, and the side effects.
- AUD/USD extends its gains on subdued US Dollar after weaker NFP data.
- Aussie Dollar receives upward support as the RBA is expected to increase interest rates by 25 basis points.
- Greenback faces challenges on Fed’s dovish tone regarding monetary policy tightening in December.
AUD/USD continues on a four-day winning streak, gearing up for the Reserve Bank of Australia's (RBA) interest rate decision set to be unveiled on Tuesday. The AUD/USD pair holds strong around 0.6520 during the Asian session on Monday, aiming to mark a three-month high.
Anticipated to increase by 25 basis points, the RBA's decision aligns with Aussie inflation hovering at the edges supporting the Aussie Dollar (AUD). The AUD/USD pair is further buoyed by a surge in risk appetite, fueled by the expectation that the US Federal Reserve (Fed) has concluded its monetary policy tightening after cooling economic data from the United States (US), potentially signaling no interest rate hike in the upcoming December meeting.
US Dollar Index (DXY) aims to maintain stability following a significant dip, hovering around 105.10 at the time of writing. The 10-year US bond yield, currently at 4.48%, reflects a negative inclination after the release of weaker nonfarm payrolls on Friday, which fell below expectations, contributing to the subdued sentiment for the US Dollar (USD).
US Bureau of Labor Statistics released US NFP data, revealing a figure of 150K for October. This fell short of the anticipated 180K and marked a significant decline from the 297K recorded in September. Average Hourly Earnings (MoM) declined to 0.2% instead of being consistent at 0.3% as expected. While year-over-year came in at 4.1% against the 4.0% expectations.
Market participants will keenly watch Australia's interest rate decision and China's release of Trade Balance data on Tuesday, given the strong trade ties between the two nations. On the US side, the Michigan Consumer Sentiment Index will be eyed later in the week.
- EUR/USD enters a bullish consolidation phase near a multi-week high touched on Friday.
- A modest USD uptick turns out to be a key factor that is acting as a headwind for the pair.
- Bets that the Fed will maintain the status quo in December should cap gains for the USD.
The EUR/USD pair oscillates in a narrow trading band during the Asian session on Monday and consolidates last week's strong gains to its highest level since September 14 touched on Friday. Spot prices, however, remain below mid-1.0700s in the wake of a modest US Dollar (USD) uptick.
In fact, the USD Index (DXY), which tracks the Greenback against a basket of currencies, recovers a part of Friday's heavy losses to a six-week low touched in the aftermath of softer US monthly employment details. The popularly known NFP report showed that the US economy added only 150K jobs in October as compared to 180K anticipated and the previous month's reading was also revised down to 297K from 336K reported originally.
The data reinforced market expectations the Federal Reserve (Fed) is likely to hold interest rates steady again at its December meeting and led to a further decline in the US Treasury bond yields. Apart from this, the prevalent risk-on environment turns out to be another factor weighing on the safe-haven Greenback. That said, extremely oversold conditions on hourly charts hold back traders from placing fresh bearish bets around the USD.
Nevertheless, the aforementioned fundamental backdrop suggests that the path of least resistance for the Greenback is to the downside and supports prospects for a further near-term appreciating move for the EUR/USD pair. Moving ahead, marking participants now look to the release of the final Eurozone Services PMI, which might influence the USD price dynamics and produce short-term trading opportunities around the EUR/USD pair.
Technical levels to watch
| Index | Change, points | Closed | Change, % |
|---|---|---|---|
| Hang Seng | 433.53 | 17664.12 | 2.52 |
| KOSPI | 25.22 | 2368.34 | 1.08 |
| ASX 200 | 78.5 | 6978.2 | 1.14 |
| DAX | 45.65 | 15189.25 | 0.3 |
| CAC 40 | -13.19 | 7047.5 | -0.19 |
| Dow Jones | 222.24 | 34061.32 | 0.66 |
| S&P 500 | 40.56 | 4358.34 | 0.94 |
| NASDAQ Composite | 184.09 | 13478.28 | 1.38 |
The minutes of the September Bank of Japan (BoJ) meeting showed this Monday that members agreed that sustainable and stable achievement of the price stability target, accompanied by wage increases, had not yet come in sight.
Key Highlights:
- One member said such judgment cannot be made under current circumstances that achievement of the 2 % target is unforeseeable.
- Most members said no need to take additional steps on YCC operations as long-term rates are relatively stable.
This, in turn, suggests that the BoJ will continue with its extremely accommodative policy, which, along with the upbeat market mood undermines the safe-haven Japanese Yen (JPY) and acts as a tailwind for the USD/JPY pair.
| Pare | Closed | Change, % |
|---|---|---|
| AUDUSD | 0.6511 | 1.23 |
| EURJPY | 160.239 | 0.29 |
| EURUSD | 1.07272 | 1 |
| GBPJPY | 184.926 | 0.73 |
| GBPUSD | 1.23789 | 1.45 |
| NZDUSD | 0.59939 | 1.61 |
| USDCAD | 1.3663 | -0.57 |
| USDCHF | 0.89951 | -0.68 |
| USDJPY | 149.389 | -0.7 |


© 2000-2026. Уcі права захищені.
Cайт знаходитьcя під керуванням TeleTrade DJ. LLC 2351 LLC 2022 (Euro House, Richmond Hill Road, Kingstown, VC0100, St. Vincent and the Grenadines).
Інформація, предcтавлена на cайті, не є підcтавою для прийняття інвеcтиційних рішень і надана виключно для ознайомлення.
Компанія не обcлуговує та не надає cервіc клієнтам, які є резидентами US, Канади, Ірану, Ємену та країн, внеcених до чорного cпиcку FATF.
Проведення торгових операцій на фінанcових ринках з маржинальними фінанcовими інcтрументами відкриває широкі можливоcті і дає змогу інвеcторам, готовим піти на ризик, отримувати виcокий прибуток. Але водночаc воно неcе потенційно виcокий рівень ризику отримання збитків. Тому перед початком торгівлі cлід відповідально підійти до вирішення питання щодо вибору інвеcтиційної cтратегії з урахуванням наявних реcурcів.
Викориcтання інформації: при повному або чаcтковому викориcтанні матеріалів cайту поcилання на TeleTrade як джерело інформації є обов'язковим. Викориcтання матеріалів в інтернеті має cупроводжуватиcь гіперпоcиланням на cайт teletrade.org. Автоматичний імпорт матеріалів та інформації із cайту заборонено.
З уcіх питань звертайтеcь за адреcою pr@teletrade.global.
переклади