- Аналітика
- Новини та інструменти
- Новини ринків
Новини ринків
- The AUD/USD caught a much-needed bid in Friday trading after the US NFP report clobbered forecasts.
- The Aussie still remains buried deep in bear country after falling to fresh lows for 2023 in the early week.
- Market focus is set to crystallize on US inflation expectations next week.
The AUD/USD etched in a new high for Friday at the 0.6400 level after catching a broad-market risk appetite bid that sent the US Dollar (USD) lower across the FX marketscape as market risk appetite flipped risk-on to close out the trading week.
US Nonfarm Payrolls soar by 336,000 in September vs. 170,000 forecast
Despite Friday's much-needed reprieve for the Aussie (AUD), which remains down nearly 11% against the USD for the year, market sentiment is due to turn back to US inflationary pressure next week, with US Producer Price Index (PPI) numbers and the Federal Reserve's (Fed) latest meeting minutes slated for next Wednesday, to be followed by the latest US Consumer Price Index (CPI) inflation reading later in the week.
US: All eyes will be on inflation data – RBC
AUD/USD technical outlook
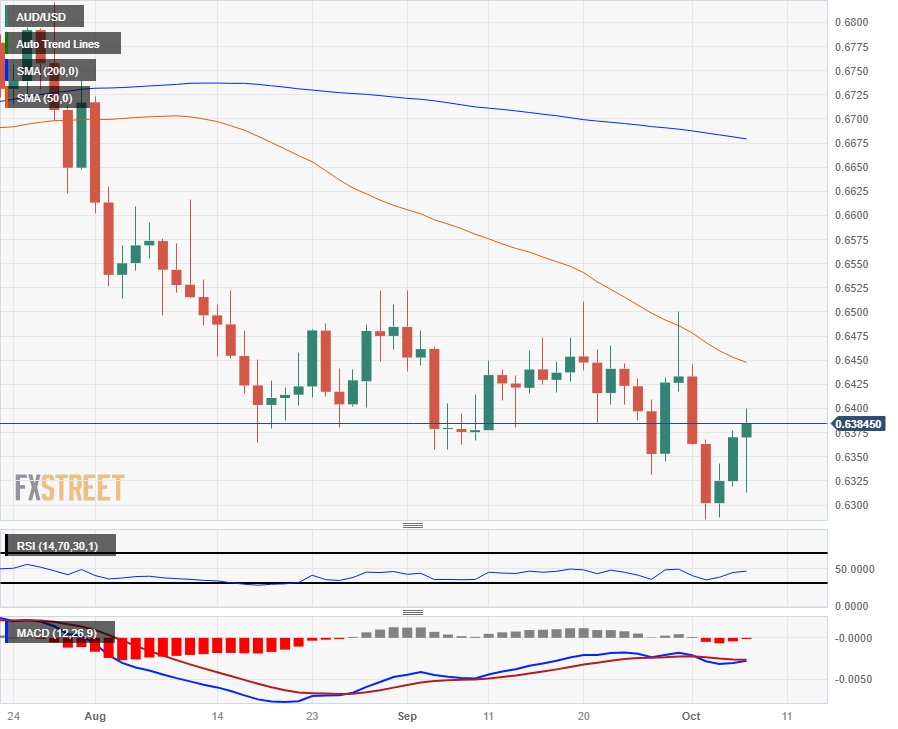
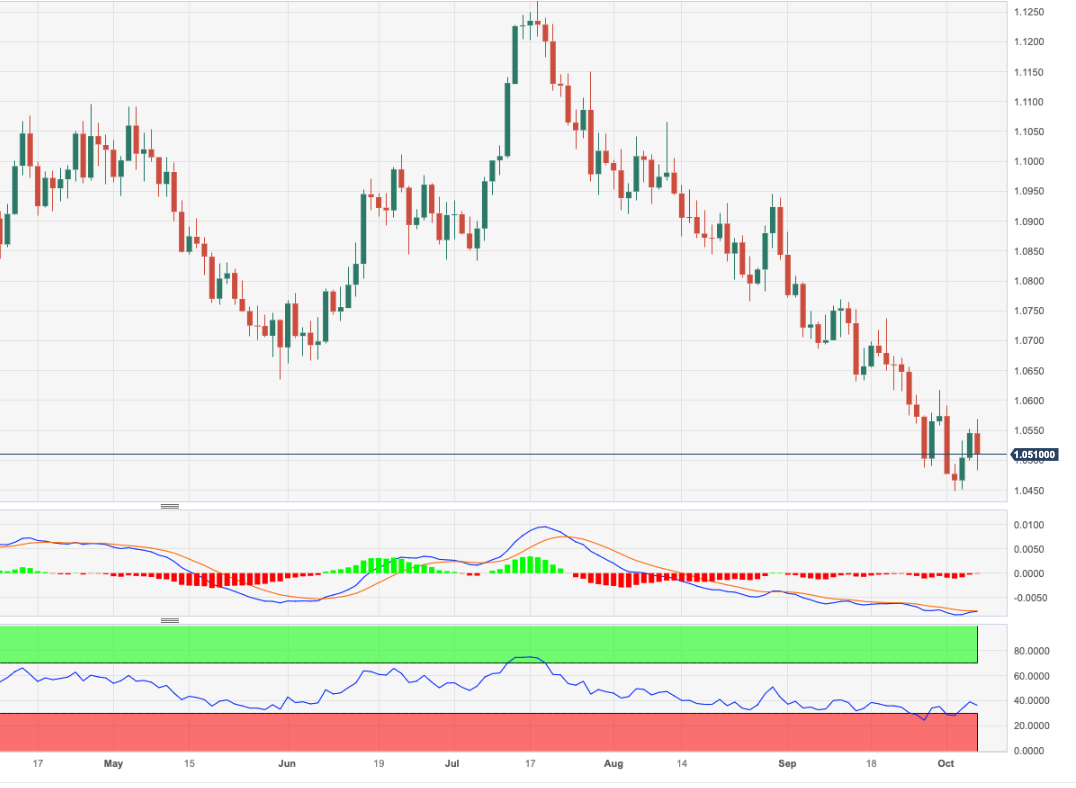
The Aussie rode a wave of market risk appetite higher on Friday close the daily session in the green, but the AUD/USD is still down 0.75% on the week's opening prices near 0.6433.
Despite the late-week bullish push, the AUD/USD remains firmly entrenched in bearish territory, with current price action trading well below the 200-day Simple Moving Average (SMA) at 0.6675, with near-term moves capped by the 50-day SMA near 0.6450.
AUD/USD daily chart
AUD/USD technical levels
- US equities caught a firm bid on Friday after a bumper NFP beat.
- The S&P 500 has pinged a new high for the week as investors pile out of safe havens to close out the trading week.
- Inflation data for the US will be the key focus moving forward as markets watch the Fed carefully.
The Standard & Poor's (S&P) 500 soared late Friday into $4,305 after markets yanked out the stopper and went full risk-on after US Non-Farm Payrolls handily beat the street, printing at a forecast-clobbering 336K against the anticipated 170K, and the previous figure was also revised higher to 227K from 187K.
US Nonfarm Payrolls soar by 336,000 in September vs. 170,000 forecast
US equities have been knocked lower as of late, crushed underfoot by rising US Treasury yields. Investors, fearing that still-high inflationary pressures will keep the Federal Reserve (Fed) stuck in a higher-for-longer rate cycle.
Next week sees US Producer Price Index (PPI) numbers and the latest draft of the Fed's meeting minutes, and investors will be turning an eye towards next week's Consumer Price Index (CPI) to re-focus on inflation pressures after Friday's focus shift.
US: All eyes will be on inflation data – RBC
S&P 500 technical outlook
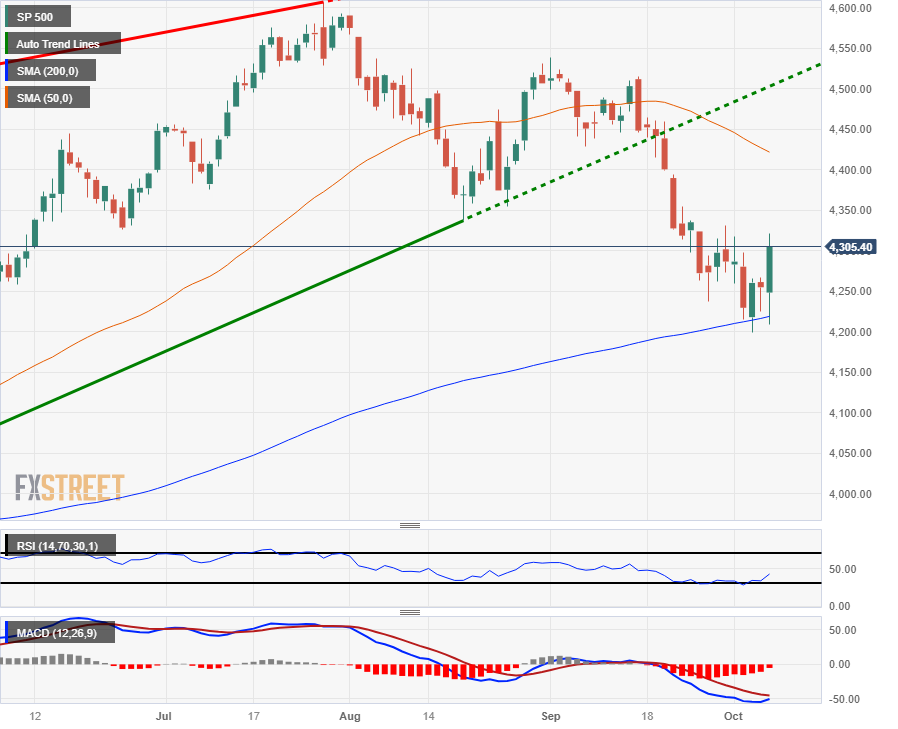
The S&P 500 closed out the trading week at $4,305 after tapping a new weekly high of $4,321.94. The major US equity index fell to an intraday low of $4,208.68 on reaction to the bumper NFP reading, before market sentiment shifted into high gear and giving the S&P a much-needed rebound into a new high for the week.
On the daily candlesticks the S&P 500 is in desperate need of a bullish extension after seeing a bullish rejection from the 200-day Simple Moving Average (SMA) near $4,220, but the index still remains firmly bearish, still down 6.5% from July's peak of $4,607, and is still stuck below technical resistance from the 50-day SMA at $4,421.78.
S&P 500 daily chart
S&P 500 technical levels
- EUR/JPY touches a four-day high of 158.26, buoyed by a sharp rally in EUR/USD, before settling around 158.05.
- Despite breaching the Ichimoku Cloud, immediate resistances at 158.47 and 158.65 cap further upward momentum.
- Potential downside could see the pair target 156.45, with further declines possibly testing the October 3 low of 154.34.
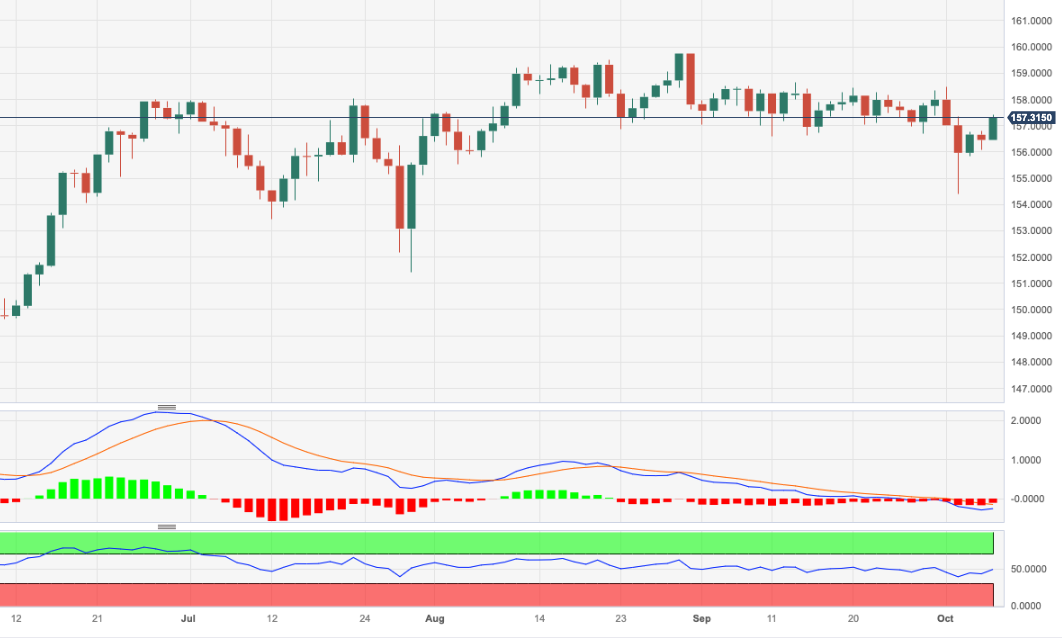
EUR/JPY prints solid gains of more than 0.90% on Friday after the EUR/USD rallied sharply towards a daily high of 1.0600, which lifted the cross-currency pair towards a four-day high of 158.26 before reversing toward current exchange rates at around 158.05.
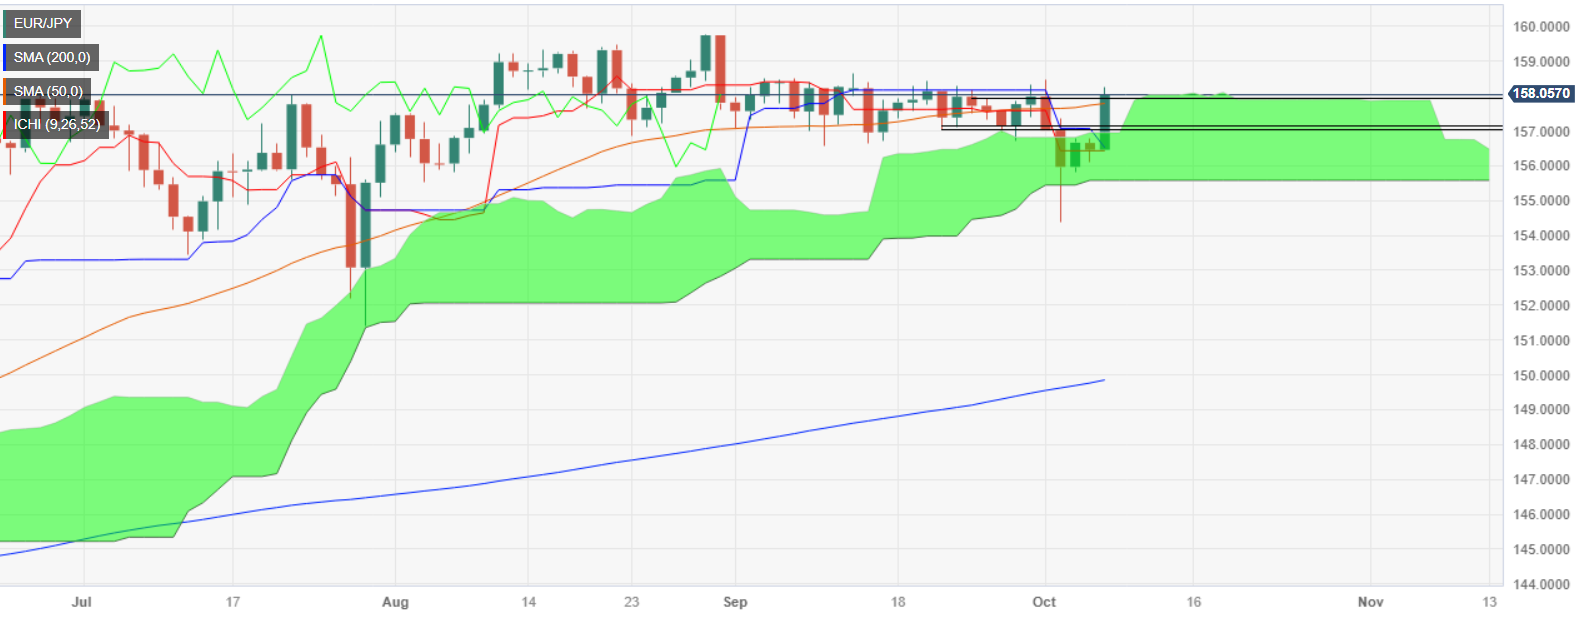
From a technical perspective, the EUR/JPY remains consolidated in the daily chart despite breaking above the Ichimoku Cloud (Kumo), which is usually seen as a bullish signal, but immediate resistance would cap the Euro’s intentions of higher prices. If the pair aims higher, the first resistance is seen at the October 2 high of 158.47, followed by the September 13 daily high of 158.65, before challenging 159.00
On the flip side, if EUR/JPY drops inside the Kumo, it could dive towards the Senkou Span A at 156.45 before challenging the bottom of the Kumo at 156.49. Once those two levels are cleared, the pair could aim towards the October 3 daily/weekly low of 154.34.
EUR/JPY Price Action – Daily chart
EUR/JPY Technical Levels
Data released on Friday showed employment rose by 63,800 in September in Canada, surpassing expectations. Analysts at CIBC point out that weakness under the hood should limit its implications for the Bank of Canada.
Weakness under the hood
While the headline increase in employment was a surprise, the weaker detail and decline in hours worked point to a still sluggish economy to end Q3.
With GDP having basically stalled in Q2 and Q3, and without a clear indication that it was accelerating again heading towards the final quarter, we still see the Bank of Canada remaining on hold despite the stronger-than-anticipated inflation readings recently.
- WTI nudges up to $82.85 per barrel, gaining 0.40%, as the USD experiences a pullback, ending a 12-week rally.
- US job growth impresses with a 336K rise, yet Federal Reserve officials hint at a potential pause on rate hikes.
- Russia’s lifted diesel export ban and a dip in US oil rigs introduce new variables into WTI’s supply-demand equation.
West Texas Intermediate (WTI), the US crude oil benchmark, snaps two days of losses and climbs 0.55% late in the New York session. News that Russia’s lifted a fuel export ban capped the ongoing fally, while global economic headwinds threaten to dent demand.
Oil prices find respite as Russia lifts export bans, US Dollar retreats.
At the time of writing, WTI is trading at $82.85 per barrel and posting minimal gains of 0.40%. Oil’s uptick is attributed to broad US Dollar (USD) weakness, sparked after Greenback’s buyers booked profits ahead of the weekend. Consequently, the US Dollar Index (DXY), which measures the buck’s performance against its rival, posts weekly losses of -12% halting its 12-week rally.
Although the latest raft of US economic data was US Dollar-supportive, an overextended uptrend suggested the buck was headed for a mean reversion move. US job growth rose by 336K in September, as revealed by the Department of Labor, smashing estimates and the previous month’s data.
Meanwhile, Federal Reserve officials remain muted regarding the US Nonfarm Payrolls report, which justifies the need for higher rates. But San Francisco’s Fed President Mary Daly said, “The recent rise in Treasury yields is doing some of the work for the Fed, and if that doesn't reverse and inflation continues to cool, the Fed can leave rates on hold.”
In the meantime, Russia’s lifted its ban on diesel exports for supplies delivered to ports by pipeline, cushioning WTI’s advance as supply increases.
On the oil data front, US oil rigs fell five to 497 this week, the lowest level since February 2022, according to the energy services firm Baker Hughes.
WTI Technical Levels
- The US Dollar Index has gone full reverse in Friday trading following a forecast-busting NFP release.
- The DXY pegged a new low for the week after dropping away from 107.00.
- Market sentiment has twisted the throttle on risk appetite to close out the trading week, piling out of safe havens.
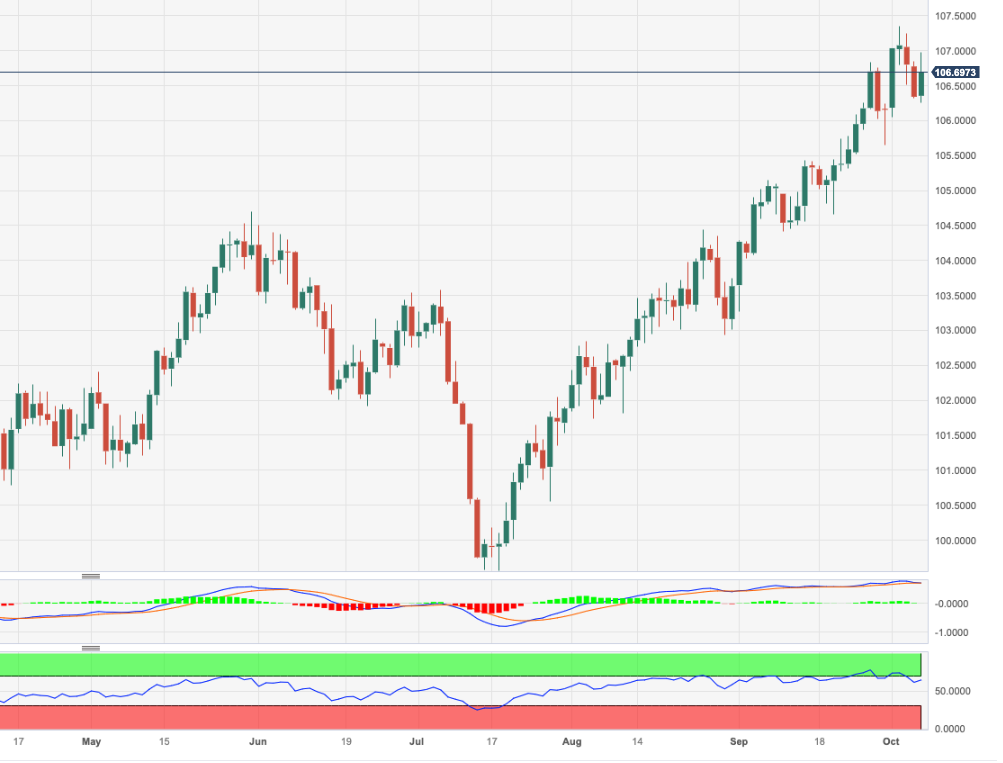
The US Dollar Index (DXY) tumbled in Friday trading after briefly reclaiming the 107.00 handle, sagging into a fresh low for the week at 105.95.
US Non-Farm Payrolls (NFP) figures on Friday handily beat forecasts, adding 336K jobs in September, well above the forecast decline to 170K and surging above the previous month's reading of 227K (revised upwards from 178K).
US Nonfarm Payrolls soar by 336,000 in September vs. 170,000 forecast
Inflation remains a firmly sticky thorn in the Federal Reserve's (Fed) side, and ongoing inflationary pressure is making market participants nervous that the Fed will have no choice but to keep interest rates higher for longer.
US: All eyes will be on inflation data – RBC
Forex Today: US data sustains Dollar strength, focus shifts to inflation
Dollar Index technical outlook
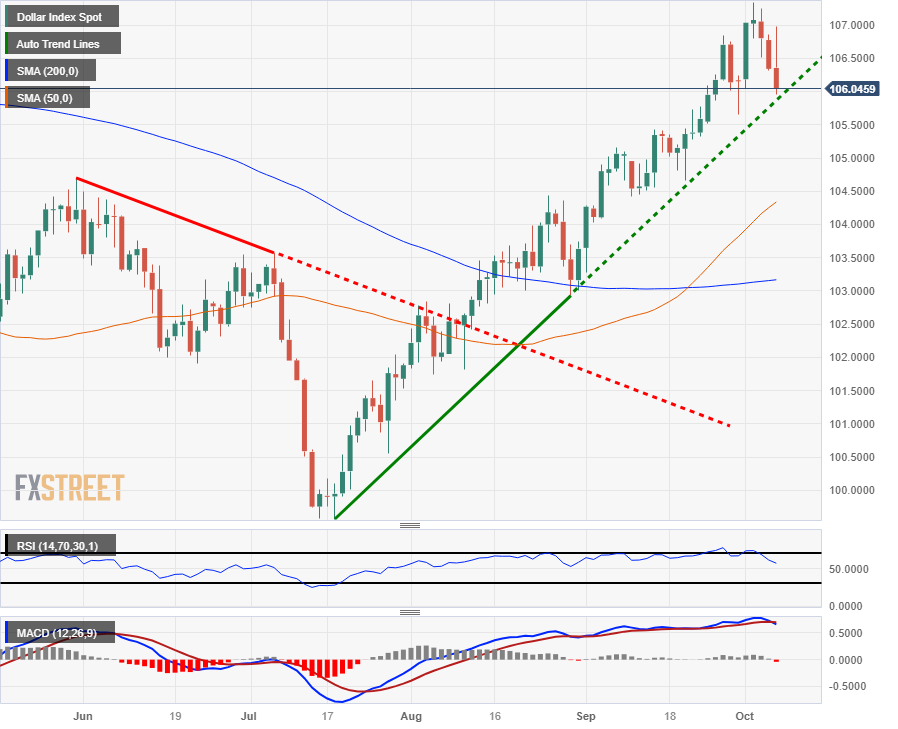
The US Dollar Index spiked to an intraday high just shy of the 107.00 level in Friday's trading on reaction to the better-than-expected NFP report, but broader markets quickly turned risk-on, sending the DXY into a fresh low for the week at 105.95.
The US Dollar is trapped on the low end to close out the trading week after Friday's nearly-1% plunge top-to-bottom, and the DXY is set for a showdown on daily candlesticks with a rising trendline from July's lows at 99.56.
Dollar Index daily chart
Dollar Index technical levels
Nathan Janzen, Assistant Chief Economist at Royal Bank of Canada points out that next week the crucial report in the US will be on Thursday with the Consumer Price Index (CPI). They see a slowdown in inflation, the headline and the core.
US inflation growth to edge lower in September
All eyes will be on U.S. inflation data in an otherwise quiet week of economic data releases. CPI growth likely looked a little better in September – we look for a slowing to a 3.5% year-over-year rate from 3.7% in August.
Fed policymakers will be more focused on ‘core’ measures that are more likely to be impacted by domestic economic conditions than global factors like energy price movements. Those measures have also slowed substantially. We look for price growth excluding food & energy products to edge down to a 4.0% year-over-year rate in September from 4.3% in August.
The Fed won’t hesitate to respond with higher interest rates to cool the economy and keep inflation in check. Although our own base-case assumes that won’t be necessary with the recent run of economic resilience not expected to last.
- GBP/USD rebounds from multi-month lows, climbing to 1.2240s amidst a backdrop of positive US labor market data.
- US Treasury bond yields echo a 'higher-for-longer' sentiment, while Fed officials present a somewhat moderated stance.
- Upcoming data, including US inflation figures and UK GDP, will influence the pair’s trajectory in the coming week.
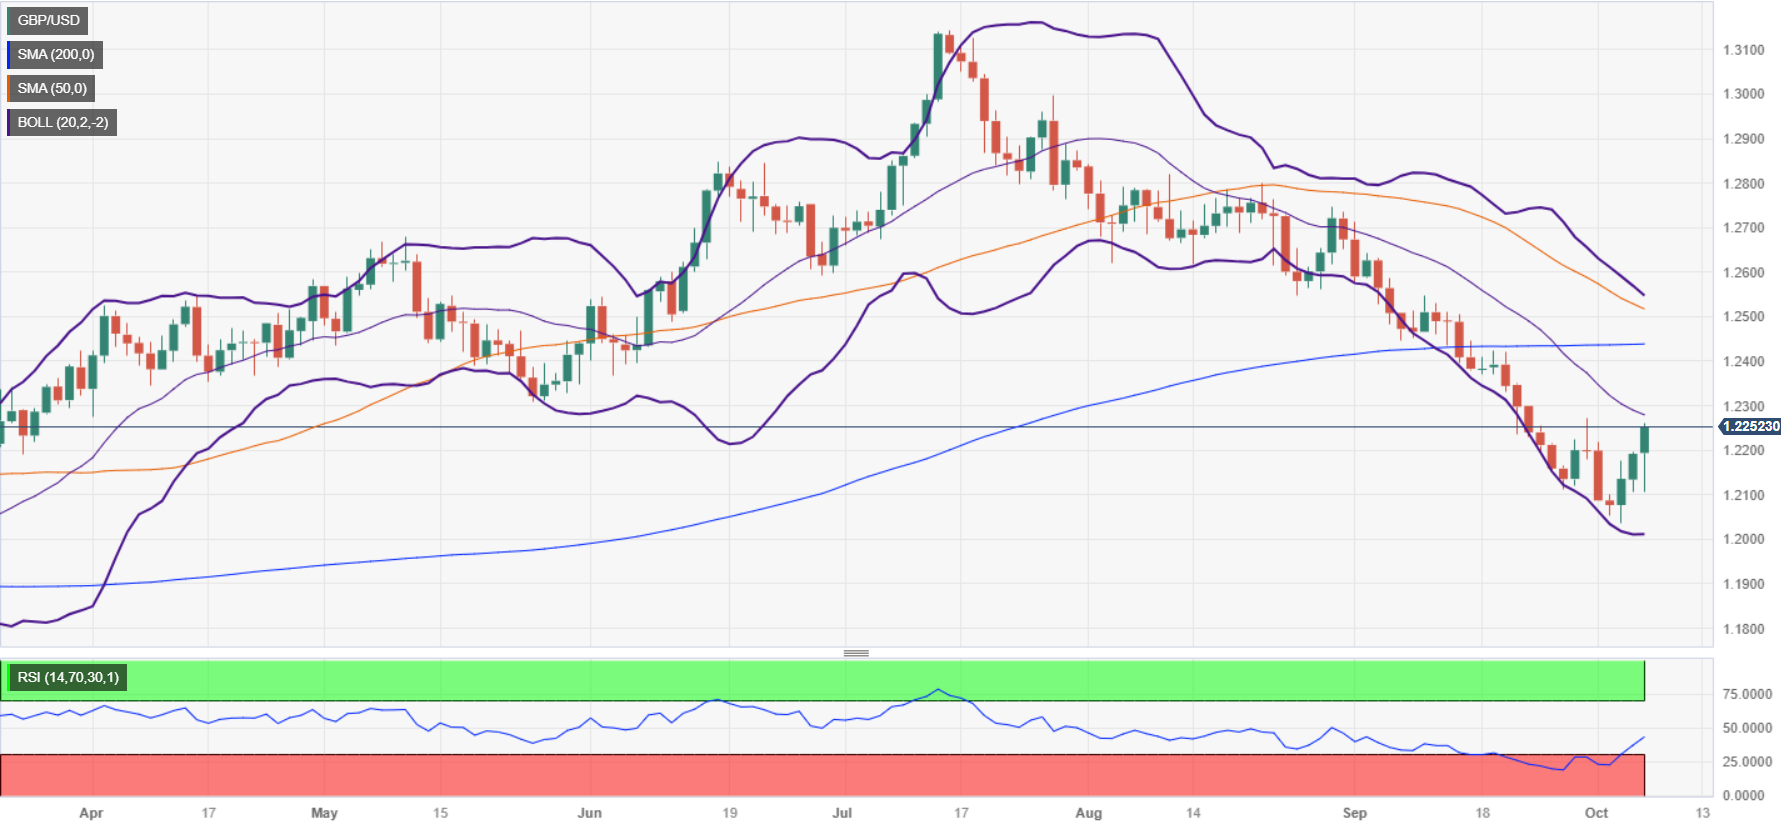
The Pound Sterling (GBP) rallied for the third consecutive day against the US Dollar (USD) on Friday as the North American session began to wind down ahead of the weekend. Although September’s Nonfarm Payrolls report was positive, the GBP/USD recovered after reaching multi-month lows of 1.2037 and has risen more than 1.70% towards 1.2240s.
Pound Sterling leaps vs. USD amid central bank divergence between the BoE and the Fed
During the week, the GBP/USD pair was driven by expectations of further tightening by the US Federal Reserve (Fed). Even though most Fed speakers moderated their tone, US Treasury bond yields reflected the higher-for-longer mantra after reaching highs last seen in 2007. Michelle Bowman was the only Fed official who stated she would like to see another rate hike.
On the data front, the JOLTs Job Openings data was a prelude to today’s US Nonfarm Payrolls, which crushed estimates and the prior month's numbers. However, a moderate deceleration is business activity linked to the services sector portrays the slowing economy, but it remains expanding.
On the UK front, the S&P Global/CIPS Services PMI, although it exceeded estimates, deteriorated a tick. Speculations about a stagnating economy have trimmed the odds for additional tightening by the Bank of England (BoE), even though its Governor, Andrew Bailey, commented that inflation at around 6.7% would continue to fall amidst rates staying at around 5.25%.
Next week, the US economic docket will feature Fed speakers, producer and consumer price inflation figures, unemployment claims, and consumer sentiment. On the UK front, the Gross Domestic Product (GDP) would dictate the future direction for the Pound Sterling, along with the Goods Trade Balance and Industrial Production.
GBP/USD Price Analysis: Technical outlook
After printing a two-candlestick ‘bullis-engulfing’ chart pattern on Wednesday, price action exploded to the upside, but it has remained volatile, as Friday’s low pierced October 5 daily low of 1.2105. Buyers stepped in around the latter; consequently, the major reacted upwards of more than 100 pips. If the GBP/USD breaks above the September 29 latest swing high at 1.2271, the pair could rally towards 1.2300 and challenge the 1.2400 figure. Conversely, the Cable would remain subject to further selling pressure below 1.2271.
- Gold spot prices are catching a late-week lift out of the week's lows following a bumper NFP report.
- XAU/USD is still in bearish territory for the week after draining from $1,850.
- The US NFP firmly beat market expectations, sending risk appetite into the ceiling for Friday.
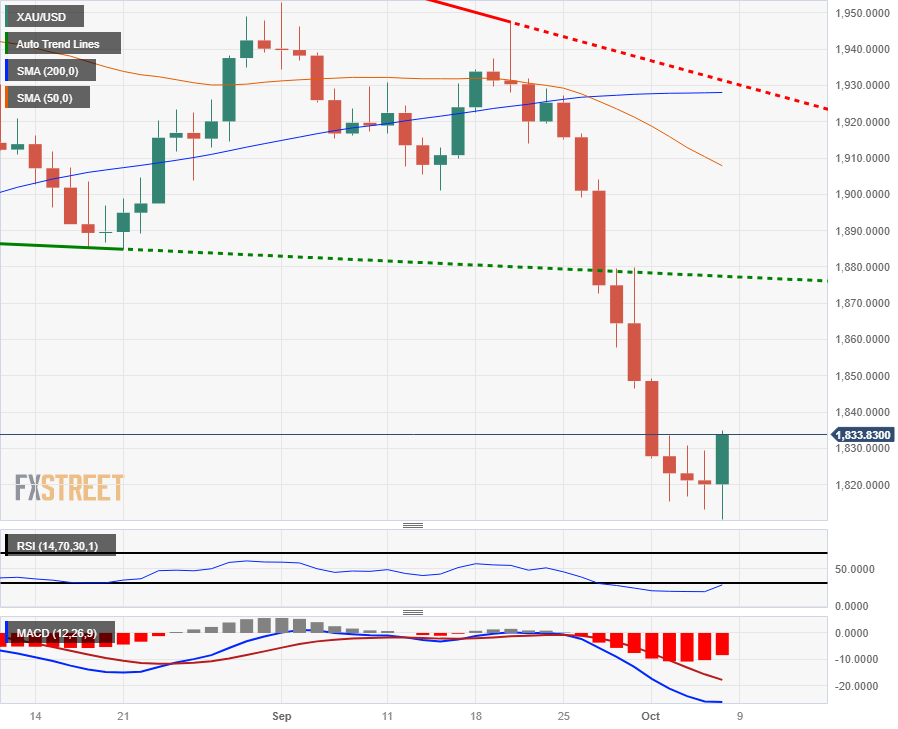
Gold spot prices have climbed into $1,833.00 in late Friday trading after a bumper US Non-Farm Payrolls (NFP) printing, and risk-on market flows are sending XAU/USD bids into fresh highs despite still remaining notably lower than Monday's opening prices.
The US economy added an unexpected 26K jobs to the employment landscape, handily beating the forecast 170K and rising even further from the previous reading of 227K, which was revised upwards from 178K.
Market sentiment has pinned firmly bullish following the NFP beat, taking XAU/USD back up the charts after most of the week saw spot Gold prices firmly on the low end.
US Nonfarm Payrolls soar by 336,000 in September vs. 170,000 forecast
Gold prices have been under immense pressure with US Treasury yields pinning into 17-year highs, pushing investors into safe-haven tunnels and sending the US Dollar soaring.
Markets are catching a brief breather from high-side Treasury yields, but next week will see renewed pressure from US Producer Price Index (PPI) figures and the Federal Reserve's (Fed) latest meeting minutes, where investors will be keeping a close eye on the Fed's internal dialogues, looking for hints about the US central bank's path forward on interest rates.
XAU/USD technical outlook
Despite Friday's bump-and-run in Gold prices, the XAU/USD remains deeply buried in bearish territory, down nearly 6% from mid-September's peak near $1,950.00.
The XAU/USD is set for a bullish relief rally with price action trading far below the 200-day Simple Moving Average (SMA) near $1,930.00, and it will be a challenge for Gold bulls to push spot prices back into near-term bullish territory with the 50-day SMA confirming a bearish cross of the longer moving average.
XAU/USD daily chart
XAU/USD technical levels
After the release of US labor data, the focus turns to inflation data and the FOMC minutes. These upcoming data points are expected to spur movements in the bond market and potentially challenge the dollar's strength.
Here is what you need to know for next week:
The US Dollar Index (DXY) continued its correction on Friday, despite the better-than-expected US employment report. The numbers triggered a rally in the Greenback, which was short-lived, suggesting some exhaustion of the rally. The DXY is set to end the week around 106.00, posting marginal losses and ending an 11-week positive streak. Although the trend remains upward, it has softened. Fundamentals still favor the Dollar, and the slide appears to be corrective in nature.
On Monday, the US market will be closed due to Columbus Day; it will also be a holiday in Canada.
The US will release wholesale inflation data on Wednesday. The Producer Price Index (PPI) is expected to rise by 0.4% in September. Later in the day, the Federal Reserve will release the minutes of its latest meeting, which will be closely watched.
Thursday will be a key day with the release of the US Consumer Price Index (CPI). The headline and core rates are expected to show a 0.3% monthly increase. A surprise with higher inflation would increase expectations of further tightening from the Federal Reserve and could lead to a stronger US Dollar and higher yields, potentially causing market concerns. Conversely, numbers below estimates could fuel risk appetite and weigh on the US Dollar. The weekly Jobless Claims report will also be closely watched, especially after the upbeat Nonfarm Payrolls.
Several Fed officials are scheduled to deliver remarks, including Vice Chair Jefferson and Logan on Monday, and Waller on Tuesday. The next FOMC decision is on November 1.
EUR/USD rose after falling for 11 consecutive weeks, gaining ground after the Nonfarm Payrolls release on Friday. The pair appears to be stabilizing, and a break above 1.0630 could strengthen the rebound. The European Central Bank (ECB) will release the minutes of its latest meeting on Thursday.
GBP/USD rose on Friday for the third day, approaching the 20-day Simple Moving Average (SMA) at 1.2260. The pair had its best week since early July. The UK's monthly GDP and Manufacturing Production data are due on Thursday.
USD/JPY remains near the critical area of 150.00, which is suspected of having triggered intervention from Japanese authorities to curb the yen's strength on Tuesday. The pair posted its highest weekly close in decades around 149.35 and remains supported by the divergence between US and Japanese bond yields.
Commodity-linked currencies were the worst performers during the week. Declines in crude oil prices, metals, and deteriorating market sentiment weighed on these currencies. However, they ended the week on a positive note, with a move that could continue into next week.
China will release trade data on Friday, which will be important for market sentiment and Antipodean currencies. The economic calendar for Australia and New Zealand is quiet for the week ahead.
AUD/USD finished the week slightly lower, hovering around 0.6390 but far from the monthly low it reached earlier. The pair returned to the previous range, and the recovery signals positive momentum for the Aussie. However, it needs to rise above 0.6500 to change the short-term outlook.
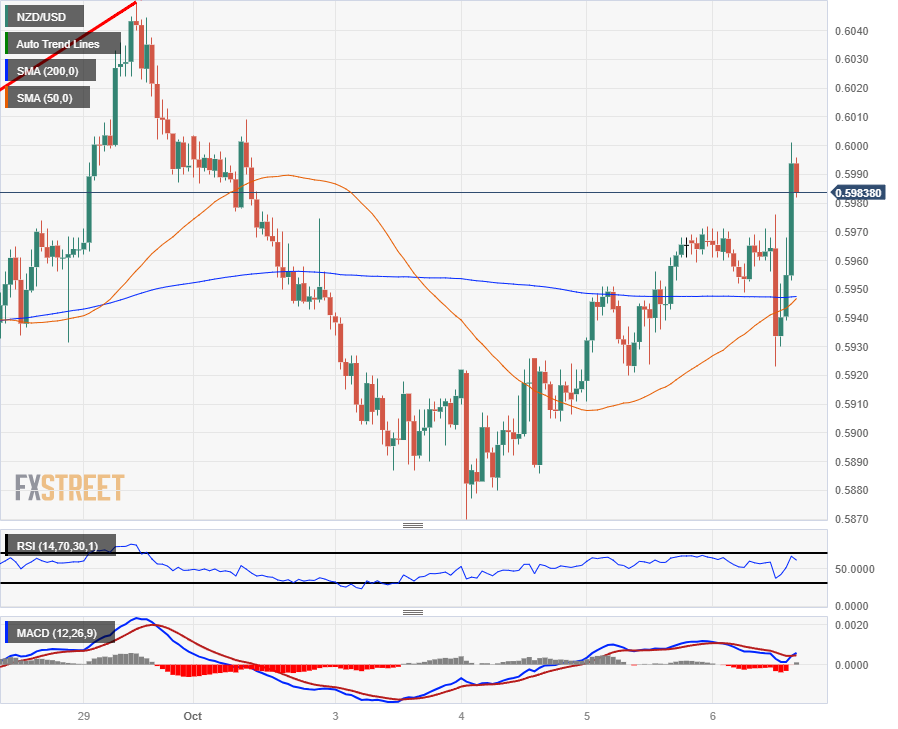
NZD/USD ended the week flat, slightly below 0.6000. It remains below the 20-day Simple Moving Average at 0.6050, an area that could be challenged next week.
Canadian data and the reversal in crude oil prices brought volatility to the Loonie. While the sharp decline in crude oil prices weighed on the currency, positive Canadian employment data boosted it. USD/CAD posted its highest weekly close since March, around 1.3660. The pair peaked at 1.3785 and pulled back sharply, increasing the risk of an extension to the downside.
Gold rebounded at the 200-week SMA and managed to stay above $1,800. On Friday, it staged a recovery, surging above $1,830. The trend is downward, but short-term momentum favors the yellow metal.
Like this article? Help us with some feedback by answering this survey:
- The GBP/JPY is catching a late-week lift as investors jump back into risk assets.
- Market sentiment has flipped positive to close out the trading week.
- The US NFP printing has sent the entire market broadly risk-on and most pairs are recovering the week's downside action.
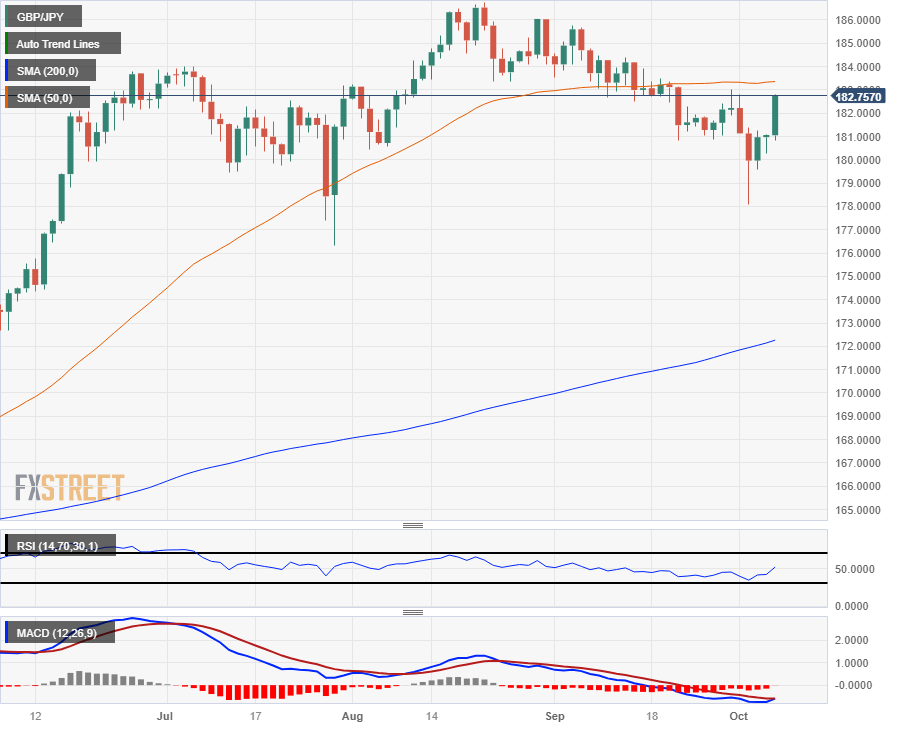
The GBP/JPY is tapping into the week's highs near 182.80 after catching a firm lift on rebounding investor market sentiment, climbing a full 1% from the day's lows just past the 181.00 handle and is now testing 182.75 after a 180-pip climb.
Broader markets went firmly risk-on following the US Non-Farm Payrolls (NFP) data beat, with the NFP showing 336K jobs added to the US economy, well above the forecast 170K. Market sentiment has turned firmly bullish on the bumper reading, sending risk assets back into weekly highs, sending markets broadly into the green for the Friday trading session.
The GBP/JPY tapped into 182.80 on the post-NFP market run-up, and is currently trading into 182.70 as the trading week wraps up another Friday session.
Japanese Labor Cash Earnings missed expectations in the early Friday trading session, holding flat at the previous printing of 1.1% and flubbing market expectations of a rise to 1.5%, and Guppy traders will be looking ahead to Monday's UK BRC Like-For-Like Retail Sales on Monday, which last showed similar retail sales rising 4.3% for the annualized period into August.
GBP/JPY technical outlook
The GBP/JPY is set to close out Friday's trading session firmly bid, testing the week's highs near 182.80 after rising from Friday's early lows near the 181.00 psychological level.
The GBP/JPY is catching a near-term bullish bounce on the daily candles, climbing from Tuesday's low near 178.00 and lifting into the 50-day Simple Moving Average (SMA) just north of current price action at 183.36.
The Guppy has been treading water in firmly bullish territory in the long-term, with candlesticks still trading well above the 200-day SMA at 172.00, and the tricky challenge for GBP/JPY bidders will be pushing the pair back above August's highs past the 186.00 handle.
GBP/JPY daily chart
GBP/JPY technical levels
- Canadian Dollar market flows turn bullish following US & Canada labor data prints.
- Canada Unemployment Rate flat at 5.5%, US unemployment holds at 3.8%.
- US NFP handily beats expectations with slightly softer earnings.
The Canadian Dollar (CAD) is climbing to fresh highs, set to challenge Monday’s trading range following a bumper labor data release, with a firm US Nonfarm Payrolls (NFP) reading for the US Dollar (USD) mixing with misses on hourly wages and unemployment.
Canada labor markets continue to improve, with the Canadian economy adding more jobs than expected, but a bumper NFP reading is seeing mixed results for the USD on lethargic US unemployment rate and wages figures.
Daily Digest Market Movers: Canadian Dollar staggers on labor data, US NFP
- US NFP broadly beat expectations, printing 336K against the expected 170K, and handily vaulting over the previous 227K (revised upwards from 187K).
- US data came in mixed despite the broad NFP beat, with hourly wages holding steady at 0.2% for September against the expected uptick to 0.3%.
- US Unemployment Rate also failed to meet expectations, flat at 3.8% versus the forecast 3.7%.
- Canadian Unemployment Rate held at 5.5% against the forecast 5.6%.
- Canadian jobs change shows a bumper 63.8K change in net employment against the forecast 20K and clearing the previous 39.9K.
- The data-beat for the Loonie was a clean beat for the CAD against the US Dollar, and the USD/CAD pair is dropping back after spending most of the week on the high end.
- US 10-year Treasury yields shot back up to 4.88% for the day, but the Loonie is holding surprisingly resilient.
- Little meaningful data remains until Wednesday’s US Producer Price Index (PPI) figures.
Technical Analysis: Canadian Dollar catches a rise on labor data beats, sending USD/CAD back to 1.3660
The USD/CAD clipped into an intraday high of 1.3746 before getting forced back down the charts into 1.3660, losing contact with the 50-hour Simple Moving Average (SMA) near 1.3720 and making a run for support at the 200-hour SMA near 1.3620.
Despite Friday’s reprieve, the USD/CAD remains firmly bullish on the charts, trading well above the 200-day SMA near 1.3450 and the 50-day SMA confirming a bullish cross of the longer moving average.
The Relative Strength Index (RSI) has pulled back from overbought conditions on the daily chart, and USD/CAD short interest will want a bearish confirmation before following the indicator lower.
Nonfarm Payrolls FAQs
What are Nonfarm Payrolls?
Nonfarm Payrolls (NFP) are part of the US Bureau of Labor Statistics monthly jobs report. The Nonfarm Payrolls component specifically measures the change in the number of people employed in the US during the previous month, excluding the farming industry.
How does Nonfarm Payrolls influence the Federal Reserve monetary policy decisions?
The Nonfarm Payrolls figure can influence the decisions of the Federal Reserve by providing a measure of how successfully the Fed is meeting its mandate of fostering full employment and 2% inflation.
A relatively high NFP figure means more people are in employment, earning more money and therefore probably spending more. A relatively low Nonfarm Payrolls’ result, on the either hand, could mean people are struggling to find work.
The Fed will typically raise interest rates to combat high inflation triggered by low unemployment, and lower them to stimulate a stagnant labor market.
How does Nonfarm Payrolls affect the US Dollar?
Nonfarm Payrolls generally have a positive correlation with the US Dollar. This means when payrolls’ figures come out higher-than-expected the USD tends to rally and vice versa when they are lower.
NFPs influence the US Dollar by virtue of their impact on inflation, monetary policy expectations and interest rates. A higher NFP usually means the Federal Reserve will be more tight in its monetary policy, supporting the USD.
How does Nonfarm Payrolls affect Gold?
Nonfarm Payrolls are generally negatively-correlated with the price of Gold. This means a higher-than-expected payrolls’ figure will have a depressing effect on the Gold price and vice versa.
Higher NFP generally has a positive effect on the value of the USD, and like most major commodities Gold is priced in US Dollars. If the USD gains in value, therefore, it requires less Dollars to buy an ounce of Gold.
Also, higher interest rates (typically helped higher NFPs) also lessen the attractiveness of Gold as an investment compared to staying in cash, where the money will at least earn interest.
Sometimes Nonfarm Payrolls trigger an opposite reaction than what the market expects. Why is that?
Nonfarm Payrolls is only one component within a bigger jobs report and it can be overshadowed by the other components.
At times, when NFP come out higher-than-forecast, but the Average Weekly Earnings is lower than expected, the market has ignored the potentially inflationary effect of the headline result and interpreted the fall in earnings as deflationary.
The Participation Rate and the Average Weekly Hours components can also influence the market reaction, but only in seldom events like the “Great Resignation” or the Global Financial Crisis.
- USD/JPY ascends to 149.50, rebounding from lows, driven by a US jobs report that eclipsed market expectations.
- Despite a surge, USD/JPY retraces slightly, settling around 149.20, with US 10-year note yielding at a sturdy 4.780%.
- Japanese officials express concerns over Yen volatility, while a rise in the 10-year JGB coupon hints at potential BoJ intervention.
USD/JPY climbs during the North American session courtesy of solid US jobs data, which spurred a jump from the last two days' lows of 148.26. On its way north, buyers reclaimed the 149.00 mark and hit a three-day high of 149.50, underpinned by high US bond yields.
US bond yields and employment data boost the USD/JPY, though caution is warranted as Japanese authorities watch volatility
The latest US jobs market data revealed by the US Bureau of Labor Statistics (BLS) witnessed the creation of more than 336K employees in the economy, smashing estimates of 170K and 100K more than the 227K August upward revised data. The report shows the labor market remains hot, though it could be influenced by seasonality adjustments.
On the wage front, Average Hourly Earnings rose by 4.2% below the consensus and August’s 4.3%, and the Unemployment Rate was unchanged at 3.8%, higher than the consensus of 3.7%.
The USD/JPY increased towards a high of 149.53 before reversing its course and stabilizing at around 149.20. the US 10-year benchmark note retreated from 2007 highs of 4.887%, but it remains up six basis points at 4.780%.
On the Japanese front, authorities remain vocal in regard to “excessive” Japanese Yen (JPY) volatility in the FX markets. Masato Kanda said on Wednesday, “If currencies move too much on a single day or, say, a week, that's judged as excess volatility.”
“Even if that's not the case, if we see one-sided moves accumulate into very big moves in a certain period of time, that's also excess volatility,” he said.
Although there was no official statement regarding last Tuesday’s 200 plus pip fall of the USD/JPY from around 150.00, the exchange rate remains well-suited below the latter. Of note, it should be said that the 10-year Japanese Government Bond (JGB) coupon has risen to 0.80%, opening the door for the Bank of Japan (BoJ) to intervene and cap the recent rise in yields.
USD/JPY Technical Levels
- EUR/USD catches a firm lift post-US NFP release, climbing 1.12% from the day's bottom.
- Broad-market flows have gone firmly risk-on following a bumper NFP reading for the USD.
- Euro traders will be looking ahead to Monday's investor confidence indicator for October.
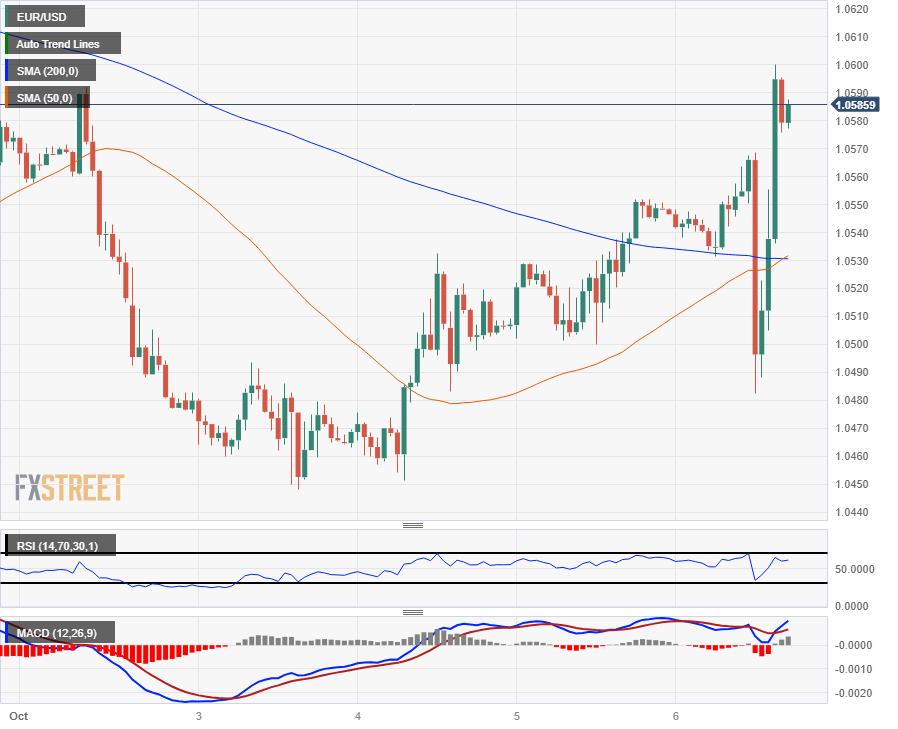
The EUR/USD climbed 117 pips from Friday's bottom bids of 1.0482 to tap into the 1.0600 handle as Friday's US Non-Farm Payrolls (NFP) sends investors piling out of the US Dollar and back into risk assets to close out the trading week. The EUR/USD is now trading back slightly, testing the waters around 1.0580 as investors settle into the Friday close.
US Nonfarm Payrolls soar by 336,000 in September vs. 170,000 forecast
The Euro (EUR) is now back into green territory for the trading week, but only just, after hitting a weekly low near 1.0448. The US added 336K jobs last month, a clean beat of the forecast 170K and a step above the previous print of 176K (revised upwards to 227K).
The economic calendar is looking notably thin for the opening half of next week, with the EU's Sentix Investor Confidence reading for October, which last printed at -21.5.
Next Wednesday will bring US Producer Price Index (PPI) figures, as well as the Federal Reserve's latest meeting minutes.
EUR/USD technical outlook
The EUR/USD is trading just south of 1.0600 after climbing from Friday's bottom, turning the trading day green and erasing the week's downside losses as Euro bulls look to keep the pair trading in positive territory into the closing bell.
The Euro is set to close bullish against the US Dollar for the third straight trading day, but the pair remains steeply in bearish territory with daily candlesticks still trading far below the 200-day Simple Moving Average (SMA) near 1.0825.
A descending trendline from July's peak of 1.1275 remains the target to beat for bidders, and the 50-day SMA will pose an additional technical challenge as it confirms a bearish crossover of the longer moving average.
Technical indicators are moving broadly out of oversold territory, and bidders could use the reversal signals to gain a foothold into higher territory. The Relative Strength Index (RSI) and Moving Average Convergence-Divergence (MACD) indicators are both rolling over from oversold to bidding phases, giving the EUR/USD room to run if investor confidence manages to hold steady.
EUR/USD hourly chart
EUR/USD daily chart
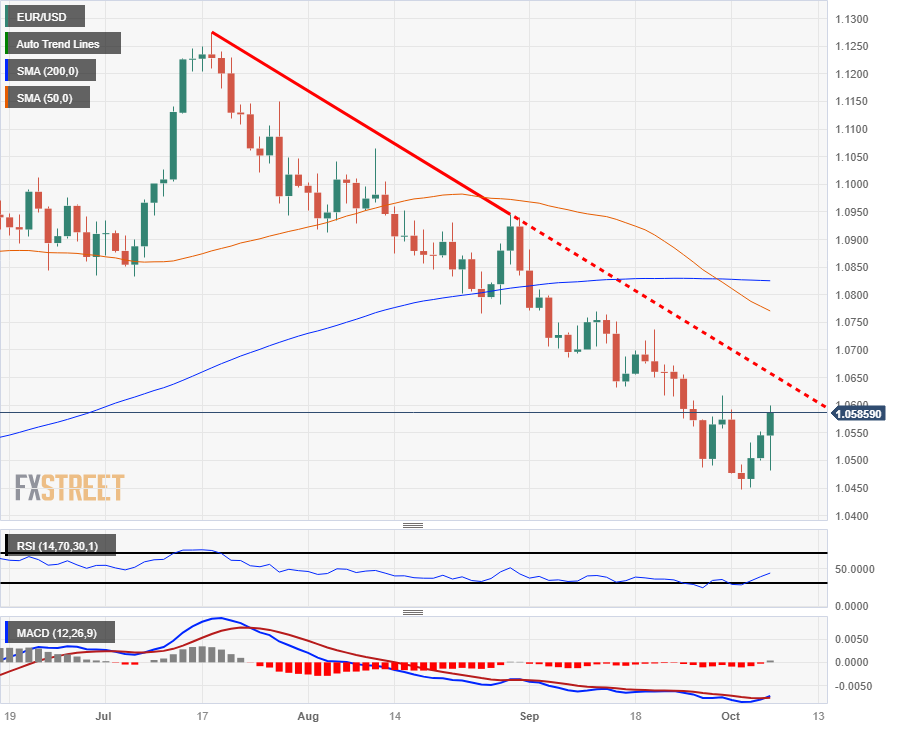
EUR/USD technical levels
- The NZD/USD is bounding higher as the US Dollar falls back on NFP data beats.
- Kiwi catches enough lift to tap the 0.6000 major level post-NFP.
- The Kiwi is now grasping to stay flat on the week.
Friday markets are seeing a broad reversal of the week's flows after the US Non-Farm Payrolls (NFP) figures came ion well above expectations, with the US economy adding 336K jobs, well above the forecast decline to 170K and easily beating the previous figure which was revised from 187K to 220K.
US Nonfarm Payrolls soar by 336,000 in September vs. 170,000 forecast
With the US NFP barrelshot out of the way, markets are stepping away from the US Dollar (USD) to close out the trading week, and the NZD/USD has rebounded from Friday's low of 0.5923 and is now trading back slightly into 0.5980 after briefly tipping into the 0.6000 major handle.
Markets will be rounding the corner into a sedate trading window next week, and meaningful data isn't expected until Wednesday's US Producer Price Index (PPI) figures as well as the Federal Reserve's (Fed) Federal Open Market Committee (FOMC) which will be dropping their latest meeting minutes for investors to review.
NZD/USD technical outlook
The NZD/USD pinged 0.6000 following the US Dollar's broad-market fallback, sending the pair back into the week's opening bids. The pair has climbed 2.2% from the week's bottom near 0.5870, and the Kiwi is set to fall back heading into the Friday close.
On the daily candlesticks the NZD/USD still remains firmly planted in consolidation territory, trading into the 50-day Simple Moving Average (SMA) with the 200-day SMA firmly entrenched just north of 0.6150.
September's bottom of 0.5846 still remains a key technical floor, but the pair is still well off recent highs, down 6.7% from July's peak into 0.6415.
NZD/USD hourly chart
NZD/USD daily chart
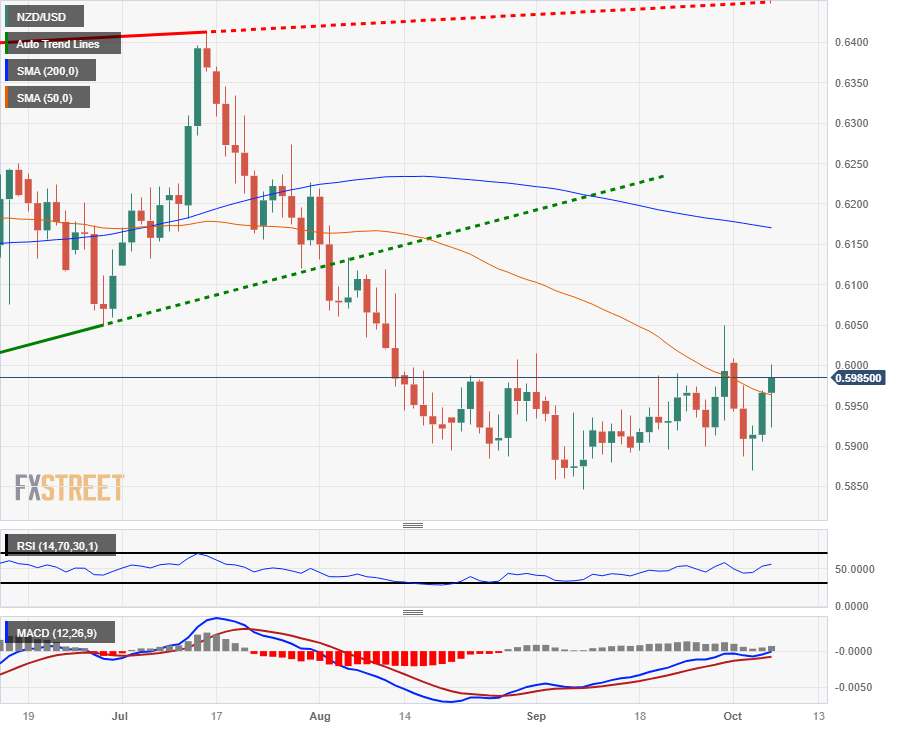
NZD/USD technical levels
- Silver rebounds from a near $20.80 low, surging above $21.50, undeterred by positive US economic reports.
- A critical resistance at $21.60/70 looms, with a breakthrough potentially paving the way to $22.00.
- Downward path highlights supports at $21.00 and a 7-month low of $20.69, with a possible dip to $19.90
Silver price (XAG/USD) stages a recovery after bottoming at around the $20.80 area during the last three days, rising back above $21.50, posting gains of 2.81%. An upbeat report from the United States (US) was not a reason to stop Silver’s climb on Friday.
The daily chart portrays the XAG/USD as neutral to downward biased despite registering solid gains. At the time of writing, Silver is testing the bottom of an upslope support trendline turned resistance, which passes at around $21.60/70, which, if broken, could sponsor another leg-up for XAG/USD towards the $22.00 mark. Once cleared, the next stop would be the 20-day Exponential Moving Average (EMA) at $22.50.
Conversely, and the path of least resistance, the XAG/USD first support would be $21.00, followed by the recent 7-month low of $20.69. A decisive break, Silver’s could test the year-to-date (YTD) low reached on March 2023 at around $19.90.
XAG/USD Price Action – Daily chart
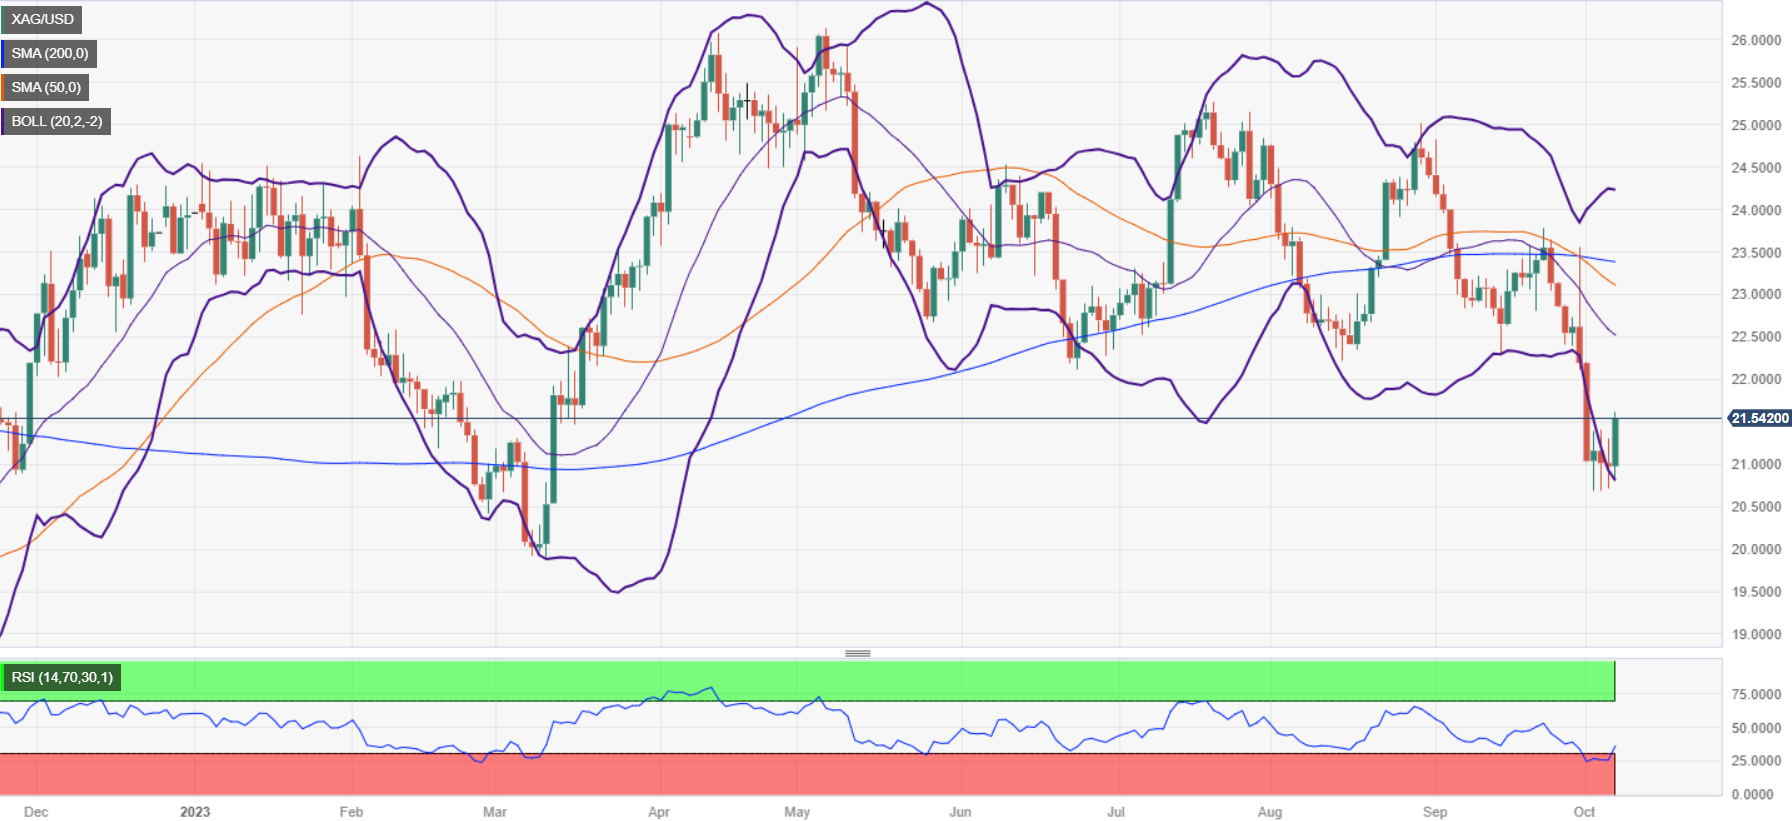
XAG/USD Technical Levels
- USD/CHF spirals to a weekly low of 0.9074, even as US hiring surges to a robust 336K.
- Greenback’s rally falters, with the DXY index retracting 0.34%, slipping back beneath the pivotal 106.00.
- Market eyes on Fed officials, upcoming meeting minutes, and crucial inflation data to discern future USD/CHF dynamics.
The Swiss Franc (CHF) extended its gains versus the US Dollar (USD) as the pair dropped past the 0.9100 figure, which briefly halted the downward pullback, but selling pressure outpaced buyers struggling to cap the downtrend. The USD/CHF is trading at around 0.9080s, hitting a new weekly low of 0.9074.
Despite robust US Nonfarm Payrolls, USD/CHF slumped to a new weekly low
The US Department of Labor revealed the latest Nonfarm Payrolls report, which crushed forecasts as hiring in September rose by 336K, crushed the 170K, and exceeded the upward revised figures for August to 227 K. Digging a little deep into the data, Average Hourly Earnings aimed down from 4.3% to 4.2% below estimates, and the Unemployment Rate stood at 3.8%, unchanged from August.
Even though the data released lifted the USD/CHF toward a daily high of 0.9175, the major has reversed that leg-up and tumbled, as the Greenback rally was overextended. The US Dollar Index (DXY) , which measures the buck’s value against a basket of six currencies, drops 0.34%, below the 106.00 mark.
Meanwhile, market participants had increased the US Federal Reserve’s (Fed) odds for 25 bps for the December meeting, standing at 42.04% according to the CME FedWatch Tool.
For the next week, USD/CHF traders would take some clues from Federal Reserve officials, the Fed's last meeting minutes, and inflation data.
USD/CHF Price Analysis: Technical outlook
From a technical standpoint, the USD/CHF daily chart portrays the pair forming a ‘double-top’, confirmed by price action falling below the last cycle low of 0.9091. That said, the chart pattern price objective would be 0.8960, but on its way south, the major must reclaim the 200-day moving average (DMA) at 0.9025, followed by the 0.9000 mark.
- Mexican Peso is marking over 5% weekly losses as US Nonfarm Payrolls outperform analysts' estimates.
- Mexico's encouraging data fails to lift the Peso’s amid government regulatory changes.
- Rumors of Tesla’s Giga factory cancellation and airport tariff changes amplify investor apprehension in Mexico.
Mexican Peso (MXN) selling pressure continues, with the emerging market currency losing ground against the US Dollar (USD) early in the North American session. The USD/MXN pair climbed to a seven-month high of 18.48, shy of testing the psychological 18.50 price level. Solid economic data from the United States (US) underpins the USD/MXN, which is posting substantial gains of more than 5% in the week.
The US Bureau of Labor Statistics (BLS) revealed the Nonfarm Payrolls report for September, which crushed estimates as job creation was almost twice expectations, with figures coming at 336K vs. 170K forecasts by analysts. Further data showed the Participation Rate was unchanged, while the Unemployment Rate was aligned with August’s figures at 3.8%. Average Hourly Earnings growth, seen as an equivalent of inflation linked to wages, was 4.2% YoY, a tick lower than foreseen.
Daily Digest Market Movers: Mexican Peso weakens further; economists lift estimates for USD/MXN
- US Nonfarm Payrolls for September came at 336K, exceeding forecasts of 170K, and crushed last month’s 227K (upwardly revised from 187K).
- The Unemployment Rate in the US stood at 3.8% above estimates but flat compared with August, while the Participation Rate stood at 62.8%.
- Average Hourly Earnings eased from 4.3% to 4.2% YoY.
- Auto Exports in Mexico rose 16% YoY in September, above the prior month’s 15.7%.
- Mexico’s September auto Production soared 24%, smashing August’s minuscule 2.8% growth.
- According to Reuters, “Rohan Patel, Tesla's senior public policy and business development executive, in a post on the platform X, formerly Twitter, rejected a Mexican media report saying Tesla had canceled its plans and thanked local, state and federal officials.”
- The Mexican Stock Exchange continues to feel the effects of the government’s decision to change airport tariffs, while rumors of Tesla’s canceling its Giga factory plant spooked investors.
- A Citi Banamex poll showed economists estimate headline inflation at 4.70% and core at 5.09% for the year’s end.
- Analysts polled by Citi Banamex foresee the USD/MXN to end 2023 at 17.80, up from 17.60, and for 2024 at 18.86, up from 18.70 two weeks ago.
- On Wednesday, the IMF raised Mexico’s growth projection in 2023 from 2.6% to 3.2% and from 1.5% foreseen in July to 2.1% for 2024.
- Banxico’s September poll amongst economists reported that interest rates are expected to remain at 11.25% while inflation would dip to 4.66%.
- The same poll shows the exchange rate is set to finish at around 17.64, down from 17.75.
- Mexico’s S&P Global Manufacturing PMI for September came at 49.8, sliding to contractionary territory and below August’s 51.2, as the economy loses steam.
- The Bank of Mexico (Banxico) held rates at 11.25% in September and revised its inflation projections from 3.5% to 3.87% for 2024, above the central bank’s 3% target (plus or minus 1%).
- Banxico’s Government Board highlighted Mexico’s economic resilience and the strong labor market as the main drivers to keep inflation at the current interest rate level.
Technical Analysis: Mexican peso at the brisk of testing 18.50
The daily chart shows that the Mexican Peso is set to extend its losses. The USD/MXN pair has hit a new cycle high at 18.48, putting into play a challenge of the psychological 18.50 figure, which could extend towards the April 2018 yearly low of 18.60. With those levels cleared, the next stop would be the March 24 high at 18.79, followed by the psychological 19.00 figure.
Mexican Peso FAQs
What key factors drive the Mexican Peso?
The Mexican Peso (MXN) is the most traded currency among its Latin American peers. Its value is broadly determined by the performance of the Mexican economy, the country’s central bank’s policy, the amount of foreign investment in the country and even the levels of remittances sent by Mexicans who live abroad, particularly in the United States. Geopolitical trends can also move MXN: for example, the process of nearshoring – or the decision by some firms to relocate manufacturing capacity and supply chains closer to their home countries – is also seen as a catalyst for the Mexican currency as the country is considered a key manufacturing hub in the American continent. Another catalyst for MXN is Oil prices as Mexico is a key exporter of the commodity.
How do decisions of the Banxico impact the Mexican Peso?
The main objective of Mexico’s central bank, also known as Banxico, is to maintain inflation at low and stable levels (at or close to its target of 3%, the midpoint in a tolerance band of between 2% and 4%). To this end, the bank sets an appropriate level of interest rates. When inflation is too high, Banxico will attempt to tame it by raising interest rates, making it more expensive for households and businesses to borrow money, thus cooling demand and the overall economy. Higher interest rates are generally positive for the Mexican Peso (MXN) as they lead to higher yields, making the country a more attractive place for investors. On the contrary, lower interest rates tend to weaken MXN.
How does economic data influence the value of the Mexican Peso?
Macroeconomic data releases are key to assess the state of the economy and can have an impact on the Mexican Peso (MXN) valuation. A strong Mexican economy, based on high economic growth, low unemployment and high confidence is good for MXN. Not only does it attract more foreign investment but it may encourage the Bank of Mexico (Banxico) to increase interest rates, particularly if this strength comes together with elevated inflation. However, if economic data is weak, MXN is likely to depreciate.
How does broader risk sentiment impact the Mexican Peso?
As an emerging-market currency, the Mexican Peso (MXN) tends to strive during risk-on periods, or when investors perceive that broader market risks are low and thus are eager to engage with investments that carry a higher risk. Conversely, MXN tends to weaken at times of market turbulence or economic uncertainty as investors tend to sell higher-risk assets and flee to the more-stable safe havens.
US treasury yields have risen substantially in recent weeks. The question is how far yields could rise in the coming years. Another is how far they could fall. Economists at Rabobank address these questions.
Still upward potential in the 10-year US treasury yield in the FOMC scenario
We find that if the economy evolves in line with the FOMC projections, the 10-year yield will rise to over 5% in 2024, followed by a gradual decline to the 3-4% range in the coming years.
In a scenario with inflation rebounding to 5%, the 10-year yield peaks at almost 6.1% in December 2024 and then slides back slowly to about 4.5%.
In a scenario of economic stagnation, the 10-year yield starts to fall in 2024 and continues to decline toward 1% in the following years.
US job growth blew past expectations in September. After NFP, FOMC is watching the Consumer Price Index (CPI ) and Employment Cost Index (ECI) closely, economists at Wells Fargo report.
FOMC to remain on hold at its upcoming November 1 meeting
Today's report drove yet another increase in Treasury yields and fanned the flames that the FOMC may hike the federal funds rate one more time at one of its two remaining meetings of the year.
Another rate hike before the end of the year is a possibility, but for now, our base case remains that the last rate hike of the tightening cycle occurred in July.
The earnings data from the employment report are a somewhat crude measure of wages, so the Employment Cost Index (ECI) to be released on October 31 will be critical to confirming that labor costs are indeed decelerating. If the CPI and ECI data cooperate, we would expect the FOMC to remain on hold at its upcoming November 1 meeting.
In September, the Philippine Peso was volatile against the US Dollar. Economists at MUFG Bank analyze USD/PHP outlook.
Risks PHP come from oil, rice and the US Dollar
We forecast gradual weakness in PHP against the US Dollar at 57.30 in 3M and 57.50 in 12M.
While we continue to note upside risks on global oil and rice prices, we do see some areas of support for PHP, which is reflected in our forecast for gradual weakness in the FX. First, BSP has intervened more aggressively and turned more hawkish. Second, the current account deficit should narrow slightly. Third, FDI flows should also pick up in 2024. Lastly, we still expect inflation to trend lower.
Risks to our PHP forecasts come from oil, rice and the US Dollar.
USD/PHP – Q4 2023 57.30 Q1 2024 57.50 Q2 2024 57.50 Q3 2024 57.50
The Taiwan Dollar extended losses to the lowest against the US Dollar since November 2022. Economists at MUFG Bank analyze USD/TWD outlook.
USD/TWD to range-bound
While overall external demand remains weak and USD remains strong, the marginal recovery of semiconductor sector and potential upside on CNY likely lend some support for the currency.
Net, we expect USD/TWD to range-bound but with a upside bias for TWD against the Dollar in near term, before TWD’s strengthening in medium term on the rebound of AI investment.
USD/TWD – Q4 2023 32.00 Q1 2024 31.80 Q2 2024 31.40 Q3 2024 31.00
- AUD/USD has dropped to near 0.6300 after robust US job data.
- The US laborforce witnessed 336K fresh payrolls, much higher than estimates of 170K.
- Fed Mester was ‘loud and clear’ that the central bank is not done with hiking interest rates.
The AUD/USD pair has faced an intense sell-off to near 0.6300 after the better-than-projected United States Nonfarm Payrolls (NFP) report. The Aussie asset shifted into a bearish trajectory as the market mood has turned cautious as the expectations of one more interest-rate hike from the Federal Reserve (Fed) has accelerated.
The S&P500 opened on a bearish note after the upbeat US job growth in September. The US laborforce witnessed 336K fresh payrolls, much higher than estimates of 170K and the former release of 227K. The jobless rate remains steady at 3.8%, nominally higher than expectations of 3.7%. The monthly wage rate grew by 0.2% but was lower than expectations of 0.3%. The annualized wage rate decelerated to 4.2% vs. the estimates and the former release of 4.3%.
Meanwhile, the US Dollar Index (DXY) jumps to near 106.80 as the odds of one more rate hike from the Fed has increased. As per the CME Fedwatch tool, the chances for interest rates remaining unchanged at 5.25-5.50% have dropped to 70% from 81% after the NFP data release. Also, trades see a 39% chance for Fed increasing rates to 5.50-5.75% by the year-end.
This week, Cleveland Fed Bank President Loretta Mester was ‘loud and clear’ that the Fed is not done with hiking interest rates. Fed Mester said that one more interest rate hike is well-needed this year and they are required to remain high for a longer period. Interest rates should remain high for long enough until the central bank assess the impact of policy-tightening yet done.
On the Aussie front, the Australian Dollar remained under pressure as the Reserve Bank of Australia (RBA) kept the interest rates unchanged at 4.1% as expected by the market participants. The RBA kept monetary policy steady for the fourth time in a row.
The Hong Kong Dollar (HKD) has been a symbol of globalisation since the opening of China’s economy 40 years ago. Economists at ANZ Bank analyze the HKD outlook.
A weak HKD is a market reality
As the US Federal Reserve quantitatively tightens and financial demand in Hong Kong remains lacklustre, the HKD is likely to stay at the weaker side of the band over the next few years.
A weak HKD is a market reality rather than a phenomenon caused by geopolitical pressure.
Economists at ING analyze EUR/USD outlook for the next year.
EUR/USD currently contains a 2% risk premium
Our calculations point to EUR/USD still heading up towards the 1.18 area in the second half of 2024 based solely on our house calls for the Fed and European Central Bank policy trajectories. Yet, as we have seen repeatedly, policy rate differentials are not the sole driver of EUR/USD.
Currently, we estimate that EUR/USD contains a 2% risk premium – a risk premium that can extend to 6% during times of extreme stress in the Eurozone.
A low growth environment in the Eurozone and political uncertainty over the re-introduction of the Stability and Growth Pact will keep that risk premium in the Euro and means that EUR/USD ends this year near 1.06 and that its best levels of 2024 may be closer to 1.15 rather than 1.18.
"For the moment, we are fine with the current level of rates," European Central Bank's (ECB) policymaker Peter Kazimir said on Friday, as reported by Reuters.
On a separate note, ECB policymaker Boštjan Vasle argued that it was impossible to tell today whether more tightening will be needed and said that it was possible to get to the inflation target without a recession.
Market reaction
The EUR/USD pair showed no immediate reaction to these comments and was last seen losing 0.40% on the day at 1.0505.
- USD/JPY prints a fresh three-day high at 149.50 on the robust US NFP report.
- Fresh payrolls in September were higher at 336K than expectations of 170K and 227K reading from August.
- The resilient US labor market data may elevate hopes of one more interest rate increase from the Fed.
The USD/JPY pair prints a fresh three-day high at 149.50 after the release of the better-than-anticipated United States Nonfarm Payrolls (NFP) report. The asset strengthens as resilient labor market conditions are expected to set a hawkish undertone for the Federal Reserve’s (Fed) monetary policy meeting in November.
As per the US NFP report, 336K individuals were hired by US employers in September, which was notably higher than expectations of 170K and 227K reading from August. The Unemployment Rate remained unchanged at 3.8%, a tick higher than expectations of 3.7%.
On the wage front, monthly Average Hourly Earnings grew steadily at a 0.2% pace while investors forecasted a higher pace of 0.3%. The annualized wage data edged down to 4.2% against the consensus and the former release of 4.3%.
The US Dollar Index (DXY) climbs to near 107.00 as the resilient US labor market data is expected to elevate hopes of one more interest rate increase from the Fed. Also, 10-year US Treasury yields jumped to near 4.84%. This week, Fed Bank President Loretta Mester said that interest rates should rise again in November if the economy continues to remain the way it is. Fed’s interest rates could remain unchanged if labor demand turns weak.
On the Japanese Yen front, the clarification from Bank of Japan’s (BoJ) money market data that Tuesday’s flash crash was not due to the central bank’s intervention in the FX domain has impacted the Japanese Yen’s appeal. Things have come back to square, investors continue to await the BoJ’s stealth intervention.
- EUR/USD reverses initial gains and refocuses on 1.0500.
- There is still scope for another visit to the YTD low near 1.0450.
EUR/USD gives away the initial advance to the 1.0570 region and shifts its attention back to the 1.0500 neighbourhood on Friday.
The continuation of the rebound should initially retarget the minor barrier at 1.0617 (September 29) ahead of the weekly peak of 1.0767 (September 12). On the flip side, if bears regain the upper hand, the pair could slip back to the area of yearly lows around 1.0450 (October 3).
Meanwhile, further losses remain on the table as long as the pair navigates the area below the key 200-day SMA, today at 1.0823.
EUR/USD daily chart
- DXY now reverses two daily pullbacks in a row on Friday.
- Further recovery targets the YTD top near 107.30.
DXY stages quite a marked comeback and sets aside two consecutive sessions of losses on Friday.
Considering the ongoing price action, extra gains appear likely in the dollar for the time being. Once the index clears the 2023 top of 107.34 (October 3), it could encourage bulls to challenge the weekly peak at 107.99 (November 21 2022) just ahead of the round level at 108.00.
In the meantime, while above the key 200-day SMA, today at 103.16, the outlook for the index is expected to remain constructive.
DXY daily chart
The US labor market held up surprisingly well in September. Pressure for another rate hike is rising, economists at Commerzbank report.
Data for the previous months were revised significantly upward
In September, job growth in the US amounted to 336K, which was significantly more than expected. The continued strong employment growth – which has been revised significantly upward for the previous months – does not suggest that the labor market is moving into a better balance of supply and demand. This raises questions as to whether the easing in wages is permanent. Pressure is mounting on the Fed to hike rates once again.
No further employment report is due before the next FOMC meeting on October 31/November 1, which could make it clearer whether job growth has re-accelerated, against the Fed's wishes. Thus, the inflation figures scheduled for next week could be the deciding factor as to whether the Fed hikes or prefers to wait for more data.
- The US economy adds 336K jobs in September, surpassing expectations of 170K.
- Canadian employment rose by 64K, also surpassing expectations.
- USD/CAD remains near the 1.3720 area as the Loonie outperforms.
The USD/CAD rose to 1.3745 after the release of US and Canadian labor market data and then reversed, pulling back toward the 1.3700 area. The positive impact of the US figures was offset by the Canadian report.
Upbeat jobs reports
The Unemployment Rate in Canada held steady at 5.5% in September, better than the market consensus of a modest increase to 5.6%. Employment rose by 63,800, above the 20,000 expected.
In the US, Nonfarm payrolls jumped by 336K, largely above the 170K of market consensus. August numbers were revised higher from 187K to 227K. The Unemployment rate remained steady at 3.8%.
The numbers boosted both the US Dollar and the Canadian Dollar, resulting in the USD/CAD remaining in a familiar range around 1.3720. The Loonie is outperforming while the US Dollar Index is up by 0.45%, approaching the 107.00 level.
Kit Juckes, Chief Global FX Strategist at Société Générale, analyzes EUR/USD and USD/JPY outlooks on three scenarios
Hard, soft, or no landing at all?
The base case assumption, which assumes a mild US recession in the middle of next year, looks for 10-year Treasury yields to fall to 3.7% by the middle of next year.
USD/JPY could be just below 150 in mid-2024 on a US no landing, below 130 on a hard landing and just below 140 on our base case.
Our rates forecasts imply EUR/USD reaching 1.15 by mid-2024 on our base case for the economic outlook (mild recession), and 1.02 on the ‘no-recession’ forecast. A hard landing clouds the outlook because the initial reaction is for the relationship between EUR/USD and interest rates to break down, temporarily.
- Canada Unemployment Rate holds steady at 5.5% in September.
- Employment increases by 63,800, above expectations of 20,000.
- USD/CAD remains hovering around 1.3720, modestly higher for the day.
The Unemployment Rate in Canada held steady at 5.5% in September, Statistics Canada reported on Friday, better than the market consensus of a modest increase to 5.6%. Employment rose by 63,800 following an increase of 39,900 in August, and above expectations of 20,000.
"Employment growth in September was concentrated in part-time work, which rose by 48,000 (+1.3%). Since the beginning of the year, growth in part-time work (+1.9%) has outpaced growth in full-time work (+1.0%)," informed Statistics Canada.
Further details of the publication revealed that on a year-over-year basis, average hourly wages rose 5.0% in September, following an increase of 4.9% in August.
Market reaction
The USD/CAD rose after the release of employment reports in the US and Canada, and then pulled back toward 1.3730. While the Loonie outperformed after the data, it was offset by a stronger US Dollar on the back of US data.
- GBP/JPY climbs to near 182.00 as the impact of expectations of BoJ’s intervention starts fading.
- BoJ’s money market data cleared that Tuesday’s flash crash move was not the by-product of stealth intervention.
- GBP/JPY delivers a breakout of the Symmetrical Triangle chart pattern.
The GBP/JPY pair delivered a sharp upside move to near 182.00 in the London session. The asset picks strength as the market sentiment improves. The cross has extended its upside significantly after Tuesday’s ‘flash crash’, which resulted in a huge buying for the Japanese Yen.
Earlier, investors misunderstood the crack in the GBP/JPY pair as a stealth intervention by the Bank of Japan (BoJ) but the BoJ’s money market data showed that it was not the by-product of official intervention. This weakened the appeal for the Japanese Yen again as the BoJ is expected to maintain the expansionary policy stance for a longer period.
Meanwhile, the appeal for the Pound Sterling improves as Bank of England (BoE) Governor Andrew Bailey sees inflation easing to 5% or below by the year-end. If the BoE manages to do so, the promise made by the UK Prime Minister of halving the inflation to 5.2% by the end of 2023 would be fulfilled.
GBP/JPY delivers a breakout of the Symmetrical Triangle chart pattern on an hourly scale, which results in wider ticks and heavy volume. The 20-period Exponential Moving Average (EMA) around 181.40 will continue to provide support to the Pound Sterling bulls.
The Relative Strength Index (RSI) (14) shifts into the bullish range of 60.00-80.00, which indicates that the bullish impulse is already active.
A mean-reversion move to near October 3 high at 181.38 would be a buying opportunity for the market participants. This would drive the asset toward September 28 high at 182.43 followed by September 29 high around 183.00.
In an alternate scenario, a breakdown below October 4 low at 179.47 would expose the asset to October 3 low at 178.00.
GBP/JPY hourly chart
-638321918582509092.png)
The USD is mixed overall against the majors ahead of the US Nonfarm Payrolls report. Economists at Scotiabank analyze Greenack’s outlook.
Extended bull run appears vulnerable
Price action is endangering the bullish run in the DXY that has so far secured eleven, consecutive weekly gains. Double-digit runs like this are rare and it is even rarer for the run of net gains to extend much further. As things stand, the weekly pattern of price action is shaping up bearishly, forming a potential ‘shooting star’ candle pattern which might call time on the trend higher.
If there is anything that is going to stop the USD from notching up a twelfth, consecutive weekly gain, it might well be overblown job expectations.
With a long weekend ahead in North America, trade might fizzle out pretty quickly unless the number produces a major surprise.
EUR/USD grinds higher through mid-1.05s. Economists at Scotiabank analyze the pair’s outlook.
Price moves continue to lean bullish
Price moves continue to lean bullish after the EUR developed a ‘morning star’ reversal pattern through mid-week.
Solid EUR gains on Thursday serve as ‘confirmation’ of the reversal but there is clearly a lot of work ahead for the EUR to build on this development.
Last Friday’s high at 1.0617 is the key, short-term barrier for the EUR to clear if gains are to develop a little more towards 1.0650/1.0750.
Support is 1.0530.
USD/CAD has rallied on the back of USD strength and the spike in US treasury yields. Economists at Société Générale analyze the pair’s outlook.
Prevalence of upward momentum
Daily MACD remains anchored within positive territory denoting prevalence of upward momentum.
Defence of the 50-DMA near 1.3510 could lead to persistence in up move.
The pair has faced interim hurdle at 1.3770, the 76.4% retracement from 2022. Beyond 1.3770, next potential objectives are located at 1.3860 and 2022 high of 1.3980.
See: USD/CAD to slip a little more obviously on losses through 1.3695 – Scotiabank
GBP/USD regains 1.22. Economists at Scotiabank analyze the pair’s outlook.
Technical rebound gathers momentum
Sterling’s solid rebound from its mid-week low via a big, bullish key reversal/outside range signal has extended a little further to reach the low 1.22s.
Late day gains on Thursday through 1.2175/80 added to the GBP’s bullish credentials on the short-term charts and supported the case for some additional progress in the near term towards the 1.23 level.
Support is 1.2185/1.2195.
See – GBP/USD: 1.20 remains a real possibility – ING
- The Greenback holds on to weekly gains despite a three-day losing streak.
- Traders are front running expectations of a weaker US Dollar after the US jobs report as rumours point to a disappointing print.
- US Dollar Index retreats but could still eke out twelfth week of gains.
The US Dollar (USD) sees traders bracing for that final moment that has been keeping every trading desk on edge throughout the week. The monthly US jobs report is due this Friday and will finally confirm or contradict what earlier numbers this week have been suggesting: the US economy and its job market are starting to slow down. There is a very fine nuance here between slowing down instead of contracting: expectations are that numbers will still be positive, pointing to economic growth, though in a less convincing way than previous months.
Expect to see nearly every asset class being locked until 12:30 GMT when the US Nonfarm Payrolls (NFP) report will be released. Markets have already punished the Greenback throughout the week with a less than expected Institute of Supply Management’s (ISM) Purchasing Managers Index (PMI) print for the Service sector and a miss on expectations for the ADP jobs number. The last few trading hours will be crucial to see if the US Dollar Index (DXY) can still eke out that twelfth week of gains. The US jobs number could just as easily supply more Greenback weakness and end the DXY winning streak.
Daily digest: US Dollar under pressure
- The entire market is focused on 12:30 GMT. Nonfarm Payrolls for September are expected to head from 187,000 to 170,000. The Average Hourly Earnings monthly print is expected to marginally tick up from 0.2% to 0.3%. The US Unemployment Rate is expected to head from 3.8% to 3.7%.
- The Change in Nonfarm Payrolls has an estimation range from 90,000 to 250,000. So to have a firm market moving number, it either needs to be firmly below 90,000 or higher than 250,000. Everything within the range could mean that market movements remain short-lived and retract just hours after the initial move occurs.
- Equities are near flat with only Hong Kong’s Hang Seng index up over 1.5%. All other indices and futures are less than 0.5% in the green or red.
- The CME Group FedWatch Tool shows that markets are pricing in a 81.5% chance that the Federal Reserve will keep interest rates unchanged at its meeting in November. The combination of economic numbers this week has erased nearly every probability of another hike.
- The benchmark 10-year US Treasury yield is trading near 4.74% and is off this week’s high from 4.88%.
US Dollar Index technical analysis: End of the line with NFP
The US Dollar sees its engine stuttering: the US economy is starting to show some signs of less growth. In the past week, traders have punished the Greenback three days in a row on disappointing ISM PMI numbers, lower than expected ADP job numbers and rumours that the US Jobs report this Friday might be a big miss. The US Dollar Index is still clinging on to its twelfth straight weekly gain, though any substantial miss in this Friday’s NFP reading might mean the end of the line for the DXY rally.
The US Dollar Index opened around 106.33, though the overheated Relative Strength Index (RSI) is acting as a cap as it trades into an overbought region. With 107.19 – the high of November 30, 2022 – tested on Wednesday, it will be important to see if DXY can get a daily close above that level. If that is the case, 109.30 is the next level to watch.
On the downside, the recent resistance at 105.88 should be seen as first support. Still, that barrier has just been broken to the upside, so it isn’t likely to be strong. Instead, look for 105.12 to do the trick and keep the DXY above 105.00.
Nonfarm Payrolls FAQs
What are Nonfarm Payrolls?
Nonfarm Payrolls (NFP) are part of the US Bureau of Labor Statistics monthly jobs report. The Nonfarm Payrolls component specifically measures the change in the number of people employed in the US during the previous month, excluding the farming industry.
How does Nonfarm Payrolls influence the Federal Reserve monetary policy decisions?
The Nonfarm Payrolls figure can influence the decisions of the Federal Reserve by providing a measure of how successfully the Fed is meeting its mandate of fostering full employment and 2% inflation.
A relatively high NFP figure means more people are in employment, earning more money and therefore probably spending more. A relatively low Nonfarm Payrolls’ result, on the either hand, could mean people are struggling to find work.
The Fed will typically raise interest rates to combat high inflation triggered by low unemployment, and lower them to stimulate a stagnant labor market.
How does Nonfarm Payrolls affect the US Dollar?
Nonfarm Payrolls generally have a positive correlation with the US Dollar. This means when payrolls’ figures come out higher-than-expected the USD tends to rally and vice versa when they are lower.
NFPs influence the US Dollar by virtue of their impact on inflation, monetary policy expectations and interest rates. A higher NFP usually means the Federal Reserve will be more tight in its monetary policy, supporting the USD.
How does Nonfarm Payrolls affect Gold?
Nonfarm Payrolls are generally negatively-correlated with the price of Gold. This means a higher-than-expected payrolls’ figure will have a depressing effect on the Gold price and vice versa.
Higher NFP generally has a positive effect on the value of the USD, and like most major commodities Gold is priced in US Dollars. If the USD gains in value, therefore, it requires less Dollars to buy an ounce of Gold.
Also, higher interest rates (typically helped higher NFPs) also lessen the attractiveness of Gold as an investment compared to staying in cash, where the money will at least earn interest.
Sometimes Nonfarm Payrolls trigger an opposite reaction than what the market expects. Why is that?
Nonfarm Payrolls is only one component within a bigger jobs report and it can be overshadowed by the other components.
At times, when NFP come out higher-than-forecast, but the Average Weekly Earnings is lower than expected, the market has ignored the potentially inflationary effect of the headline result and interpreted the fall in earnings as deflationary.
The Participation Rate and the Average Weekly Hours components can also influence the market reaction, but only in seldom events like the “Great Resignation” or the Global Financial Crisis.
- EUR/JPY regains the upside and surpasses 157.00.
- The ongoing consolidation is expected to persist near term.
EUR/JPY quickly leaves behind Thursday’s inconclusive price action and resumes the upside bias beyond the 157.00 barrier at the end of the week.
In the meantime, the cross remains stuck within the consolidative range and the breakout of it exposes a visit to the so far monthly high of 158.65 (September 13) prior to the 2023 top at 159.76 (August 30), which precedes the key round level at 160.00.
On the downside, the so far monthly low of 154.34 (October 3) emerges as the initial contention in case of bearish attempts.
So far, the longer term positive outlook for the cross appears favoured while above the 200-day SMA, today at 149.81.
EUR/JPY daily chart
All eyes are on the US Nonfarm Payrolls report. Economists at MUFG Bank discuss how employment data could impact yields and the Dollar.
An in-line print could allow the Dollar to adjust a little further weaker
If today’s NFP data was to reveal an acceleration in payrolls it would certainly push further back the expectations on the timing of a downturn, reinforce the ‘higher for longer’ mantra and fuel renewed UST bond selling and Dollar buying.
An in-line print may be greeted with some relief that extends the correction in yields a little further lower from here which would allow the Dollar to adjust a little further weaker too.
The Fed’s Summary of Economic Projections in September revealed expectations of the labour market being stronger (unemployment rate revised down from 4.1% to 3.8% for Q4 2023 – the current level) which means any disappointment in the data like another jump in the unemployment rate has the potential to influence rate expectations that bit more.
See – NFP Preview: Forecasts from seven major banks, losing momentum
USD/CAD trades sideways around 1.3700. Economists at Scotiabank analyze the pair’s technical outlook.
Resistance is 1.3785
The USD’s push through resistance in the low 1.37 area earlier this week has not stuck, giving the impression of a ‘false break’ but the USD’s retreat has not yet been significant enough to ease upward pressure on funds more clearly from a technical point of view.
Intraday losses through 1.3695 should see the USD slip a little more obviously but perhaps only to 1.3600/1.3650 in the short run.
Resistance is 1.3785.
Markets are twiddling their thumbs ahead of the US labour market data. Kit Juckes, Chief Global, FX Strategist at Société Générale, analyzes the outlook for bonds and the Dollar.
Hard, soft, or no landing at all?
The ADP report, which barely correlates at all with the official data on a month-to-month basis, came in weak and that may mean the soft consensus is a little lower than the 160K NFP increase that forecasters are looking for.
I have a bias to think it could be a bad day for bonds, with US politics, debt supply, and strong payrolls all potentially supporting the Dollar as we look ahead to next week’s auctions and CPI data; but I’m biased because I’ve caught, and a cold and it’s darkened my mood!
See – NFP Preview: Forecasts from seven major banks, losing momentum
USD/JPY is trading near 149. Economists at MUFG Bank analyze the pair’s outlook ahead of the US Nonfarm Payrolls report.
USD/JPY to see a clear break higher well through 150.00 before the MoF intervenes
One of the key measures monitored by the BoJ that we track – contractual pay for full-time employees (so ex-bonus and ex-overtime) – slowed from 2.0% to 1.5%, the weakest reading since April. Given that wages will be such a key determinant in assessing whether price stability has been achieved, this data certainly lowers the probability of any near-term surprise removal of NIRP or another change in YCC.
It seems therefore more likely that we will see USD/JPY grind higher and retest that level just above the 150 mark that prompted a sharp reversal. That of course could come as soon as this afternoon if the US jobs report was to prove stronger-than-expected.
We’d still expect a clearer break higher well through 150.00 before the MoF would intervene.
See – NFP Preview: Forecasts from seven major banks, losing momentum
- Natural Gas prices jump to $3.404.
- The US Dollar trades directionless ahead of the US jobs report.
- US Natural Gas prices could head higher on the possibility of a cold front coming in sooner than expected.
Natural Gas prices are increasing to new year-to-date highs as Australian union workers are discussing the possibility to resume strikes. The resurge in strike risk comes after Chevron reneged earlier commitments on pay and conditions to workers. Expectations are that at the earliest Monday, a notice will be given that in seven days industrial action will take place, again risking a 10% supply shortage in the LNG market in the near term.
Meanwhile, the US Dollar (USD) sees traders bracing for the datapoint that has been keeping every trading desk on edge throughout the week. The monthly US jobs report is due later on Friday and will finally confirm or contradict what earlier numbers this week have been suggesting: the US economy and its job market are starting to slow down. There is a very fine nuance between slowing down instead of contracting.Expectations are that the US economy will continue to add jobs, pointing to economic growth, though in a less convincing way than previous months.
Natural Gas is trading at $3.4040 per MMBtu at the time of writing.
Natural Gas news and market movers
- Chevron appears to be backtracking on earlier commitments given to LNG union workers in order to resolve the strikes that took place at the beginning of September.
- On Thursday, workers discussed and endorsed restarting strike actions.
- Expectations are that at the earliest, the legal binding seven-day notice will be delivered by Monday, which means strikes will start in roughly ten days' time.
- Ports in Wheatstone and Gorgon account for nearly 10% of the world’s supply in LNG.
- Shell reported that its earnings from gas trading have rebounded in the third quarter.
- Pakistan is open to sign a long-term liquefied natural gas purchase agreement to make up for an expected shortfall in domestic fuel production.
Natural Gas Technical Analysis: dreaming of $4
Natural Gas peaks to a new year-to-date high with $3.4080 as a new level to pencil in the books. The move comes after Australian union workers are considering going back to strike as Chevron is backtracking on earlier concessions in order to resolve the stalemate between the Union and the energy company. With market supply facing the possibility of a short squeeze of near 10% in the near term, together with a substantial drop in temperature forecasted for Europe in the coming weeks, Natural Gas prices could reach $4.
With the firm peak and breakthrough out of the trend channel on Thursday, it will be crucial going forward that the upper band of that same trend channel acts as support. There aren’t any significant resistance levels except for $3.65, the peak of January 17. From there, the high of 2023 near $4.3080 comes into play as the next level on the upside.
On the downside, the trend channel needs to act as support now, near $3.30. In case that breaks down again, Natural gas prices could sink lower to $.3.07, with that orange line identified from the double top around mid-August. Should the drop become a broader sell-off, prices could sink below $3 towards $2.85, near the 55-day Simple Moving Average.
-638321801805314848.png)
XNG/USD (Daily Chart)
Natural Gas FAQs
What fundamental factors drive the price of Natural Gas?
Supply and demand dynamics are a key factor influencing Natural Gas prices, and are themselves influenced by global economic growth, industrial activity, population growth, production levels, and inventories. The weather impacts Natural Gas prices because more Gas is used during cold winters and hot summers for heating and cooling. Competition from other energy sources impacts prices as consumers may switch to cheaper sources. Geopolitical events are factors as exemplified by the war in Ukraine. Government policies relating to extraction, transportation, and environmental issues also impact prices.
What are the main macroeconomic releases that impact on Natural Gas Prices?
The main economic release influencing Natural Gas prices is the weekly inventory bulletin from the Energy Information Administration (EIA), a US government agency that produces US gas market data. The EIA Gas bulletin usually comes out on Thursday at 14:30 GMT, a day after the EIA publishes its weekly Oil bulletin. Economic data from large consumers of Natural Gas can impact supply and demand, the largest of which include China, Germany and Japan. Natural Gas is primarily priced and traded in US Dollars, thus economic releases impacting the US Dollar are also factors.
How does the US Dollar influence Natural Gas prices?
The US Dollar is the world’s reserve currency and most commodities, including Natural Gas are priced and traded on international markets in US Dollars. As such, the value of the US Dollar is a factor in the price of Natural Gas, because if the Dollar strengthens it means less Dollars are required to buy the same volume of Gas (the price falls), and vice versa if USD strengthens.
- USD/CAD trades sideways around 1.3700 as the focus shifts to US/Canada Employment data.
- The US private sector hired 89K job seekers in September, halved from the August reading of 180K.
- Canada’s fresh payrolls are seen lower at 20K and the jobless rate is seen higher at 5.6%.
The USD/CAD pair trades topsy-turvy near the round-level support of 1.3700 in the European session. The Loonie asset is expected to remain sideways as investors await the labor market data of the United States and Canada for September month.
S&P500 added some gains in the London session while the market mood was quiet. The US Dollar Index (DXY) has extended its downside to near 106.30 as investors expect that US labor market conditions will cool down. Investors' approach towards the US job market is shifting from ‘resilient’ to ‘stable’ after US ADP Employment Change data.
As per the US ADP report, the private sector hired 89K job seekers in September, halved from the August reading of 180K. A soft labor market report may fade expectations of one more interest rate increase by the Federal Reserve (Fed) in any of the last two monetary policy meetings in 2023. Also, the sell-off pace in the US treasuries would ease and hot yields may cool down.
San Francisco Fed Bank President Mary Daly said that another rate hike may not be needed if the labor market slows, inflation remains around 4% and financial conditions remain tight.
On the Canadian Dollar front, investors are also awaiting the labor market data. As per the estimates, fresh payrolls were lower at 20K from the August reading of 39.9K. The Unemployment Rate is seen increasing by a tick to 5.6% from the former release of 5.5%.
Meanwhile, the oil price weakens significantly amid a gloomy macroeconomic outlook. It is worth noting that Canada is the leading exporter of oil to the United States and lower oil prices impact the Canadian Dollar.
Gold endures the longest losing streak in seven years. Economists at Commerzbank analyze the yellow metal’s outlook ahead of the US Nonfarm Payrolls report.
NFP needs to considerably exceed expectations to justify any further marked slide
The outlook for the US economy, and thus for US bond yields, remains the key price determinant. That said, today’s US labour market data would probably need to considerably exceed expectations to justify any further marked price slide.
After all, the precious metal has already shed more than $100 in the space of just two weeks. Even a slightly disappointing labour market report could therefore rather help Gold recover.
See – NFP Preview: Forecasts from seven major banks, losing momentum
UOB Group’s Suan Teck Kin, CFA, and Associate Economist Jester Koh assess the recently published Retail Sales readings in Singapore.
Key Takeaways
Singapore’s retail sales rose 4.0% y/y, higher than Bloomberg’s consensus of 0.9% y/y and Jul’s revised reading of 1.3% y/y. On a seasonally adjusted sequential basis, retail sales rose 1.7% m/m in Aug, the second consecutive month of expansion recorded (Jul: +0.8% m/m). Excluding motor vehicle sales, retail sales increased 1.9% m/m (Jul: -0.9% m/m), translating to a y/y print of 3.7% in Aug (Jul: +0.6%). In nominal terms, the value of retail sales rose to SGD4.01bn (from SGD3.95bn in Jul).
Outlook – We continue to expect retailers to enjoy some level of domestic and external support, complemented by major events such as various sports, popular concerts and BTMICE (Business Travel and Meetings, Incentive Travel, Conventions and Exhibitions) activities. The labour market remains tight by historical standards while still rising employment and resilient wage growth could keep domestic consumption demand supported in the near term. On 28 Sep 2023, the government announced a SGD1.1bn Cost-of-Living Support Package (link), with a concurrent SGD0.8bn top-up to the Assurance Package (AP) bringing the total allocation under the AP to over SGD10bn. The additional cash disbursement of up to SGD200 in Dec 2023 for eligible Singaporeans under the AP and extra SGD200 of CDC vouchers for each Singaporean household (to be issued in Jan 2024) could provide incremental support to retail sales, on top of the handouts already announced in Budget 2023. In addition, consumers may front-load some of their spending (in particular, on big-ticket items like furniture, household equipment, watches and jewellery) ahead of the second tranche of GST increase from the current 8% to 9% on 1 Jan 2024.
In addition to the US labour market data, the Canadian labour market data will be published at the same time. Economists at Commerzbank analyze Loonie’s outlook ahead of the employment report.
The Bank of Canada faces some tough decisions
The economists polled by Bloomberg only expect a moderate rise in new positions of 20K in September. In view of the stronger growth of the active labour force this would probably correspond to a rise in the unemployment rate.
A labour market report roughly in line with expectations should probably not yet be dramatic for the BoC.
However, if the inflation data due the week after next confirms stubborn price developments, the next rate decision is not going to be easy. That means things will remain interesting for the CAD.
- Gold price trades back and forth as investors await US official Employment data.
- Taking cues from the US ADP Employment report, job creation is foreseen to slow.
- Fed’s Daly sees no more rate hikes if the labor market slows and inflation remains close to 4%.
Gold price (XAU/USD) remains directionless, trading at around $1,820, as investors keenly await the United States Nonfarm Payrolls (NFP) data for September. The employment report will set an undertone for the Federal Reserve’s (Fed) upcoming monetary policy decision in November. US labor market conditions are seen softening further considering weak cues from the ADP Employment report released earlier this week, but the outlook is uncertain.
Soft Nonfarm Payrolls data is expected to ease selling pressure in the US Treasuries and would improve the appeal for Gold. Apart from that, expectations of one more interest rate increase from the Fed in the remainder of 2023 would vanish. However, a further acceleration in wage growth would discomfort Fed policymakers and spur consumer inflation expectations.
Daily Digest Market Movers: Gold price awaits US labor market data
- Gold price delivered a bearish closing for nine trading sessions in a row as investors see interest rates remaining higher for a prolonged period.
- The precious metal remained under pressure despite a soft US Services PMI report and further evidence of cooling labor market conditions.
- On Wednesday, ADP reported that the US private-sector added 89K jobs in September, half the number it reported in August. Job growth in the leisure and hospitality sector remained robust, while lay-offs were witnessed in the manufacturing and transportation sectors.
- "We are seeing a steepening decline in jobs this month"."Additionally, we are seeing a steady decline in wages in the past 12 months," Nela Richardson, chief economist at ADP, said.
- US Services PMI for September remained in line with estimates at 53.6, but the New Orders component came in significantly lower at 51.8 against the former release of 57.5. Being a proxy to the US service sector, which accounts for two-thirds of the US economy, a poor demand outlook could weaken the appeal for the US Dollar.
- The US Dollar Index (DXY) has corrected to near 106.30 from its 11-month high of 107.35. Still, the broader outlook will be shaped by the Nonfarm Payrolls data, which will be published at 12:30 GMT.
- US employers are expected to have added 170K employees in September, lower than the 187K jobs created in August. The jobless rate is expected to fall a tick to 3.7% from August reading of 3.8%.
- In addition to the jobs data, investors will watch the Average Hourly Earnings data. Annual wages are expected to grow at a steady pace of 4.3%. On a monthly basis, labor earnings are seen expanding at a higher pace of 0.3% compared with the 0.2% jump recorded in August. Strong wage growth could accelerate consumer inflation expectations.
- Economists at ING said that a strong NFP read could easily put markets back on a bearish track and reignite aggressive Dollar buying.
- Meanwhile, the weekly jobless claims for the week ending September 29 remained broadly unchanged. Individuals claiming jobless benefits for the first time increased marginally to 207K from the former reading of 205K but lower than expectations of 210K.
- The US Treasuries faced an intense sell-off this week due to the collaboration of expectations that interest rates will remain high amid a resilient US economy and concerns over rising fiscal deficits. 10-year US Treasury yields trades around 4.73%.
- Chicago Federal Reserve Bank President Austan Goolsbee sees no more upside in Treasury yields and expects the US economy to remain on the ‘golden path’ towards 2% inflation goal.
- About the interest rate outlook, San Francisco Fed Bank President Mary Daly said that another rate hike may not be needed if the labor market slows, inflation remains around 4% and financial conditions remain tight.
Technical Analysis: Gold price trades directionless above $1,810
Gold price oscillates inside Thursday’s trading range as investors await the US labor market data for further guidance. The precious metal strives for a direction, which will likely be set after the release of the NFP report. A death cross, represented by the 50-day and 200-day Exponential Moving Averages (EMAs) at $1,905.00, warrants more downside. Momentum oscillators have turned extremely oversold.
Nonfarm Payrolls FAQs
What are Nonfarm Payrolls?
Nonfarm Payrolls (NFP) are part of the US Bureau of Labor Statistics monthly jobs report. The Nonfarm Payrolls component specifically measures the change in the number of people employed in the US during the previous month, excluding the farming industry.
How does Nonfarm Payrolls influence the Federal Reserve monetary policy decisions?
The Nonfarm Payrolls figure can influence the decisions of the Federal Reserve by providing a measure of how successfully the Fed is meeting its mandate of fostering full employment and 2% inflation.
A relatively high NFP figure means more people are in employment, earning more money and therefore probably spending more. A relatively low Nonfarm Payrolls’ result, on the either hand, could mean people are struggling to find work.
The Fed will typically raise interest rates to combat high inflation triggered by low unemployment, and lower them to stimulate a stagnant labor market.
How does Nonfarm Payrolls affect the US Dollar?
Nonfarm Payrolls generally have a positive correlation with the US Dollar. This means when payrolls’ figures come out higher-than-expected the USD tends to rally and vice versa when they are lower.
NFPs influence the US Dollar by virtue of their impact on inflation, monetary policy expectations and interest rates. A higher NFP usually means the Federal Reserve will be more tight in its monetary policy, supporting the USD.
How does Nonfarm Payrolls affect Gold?
Nonfarm Payrolls are generally negatively-correlated with the price of Gold. This means a higher-than-expected payrolls’ figure will have a depressing effect on the Gold price and vice versa.
Higher NFP generally has a positive effect on the value of the USD, and like most major commodities Gold is priced in US Dollars. If the USD gains in value, therefore, it requires less Dollars to buy an ounce of Gold.
Also, higher interest rates (typically helped higher NFPs) also lessen the attractiveness of Gold as an investment compared to staying in cash, where the money will at least earn interest.
Sometimes Nonfarm Payrolls trigger an opposite reaction than what the market expects. Why is that?
Nonfarm Payrolls is only one component within a bigger jobs report and it can be overshadowed by the other components.
At times, when NFP come out higher-than-forecast, but the Average Weekly Earnings is lower than expected, the market has ignored the potentially inflationary effect of the headline result and interpreted the fall in earnings as deflationary.
The Participation Rate and the Average Weekly Hours components can also influence the market reaction, but only in seldom events like the “Great Resignation” or the Global Financial Crisis.
UOB Group’s Senior Economist Julia Goh and Economist Loke Siew Ting review the latest inflation figures in the Philippines.
Key Takeaways
The Philippine’s headline inflation marched up to 6.1% y/y in Sep (from +5.3% in Aug), exceeding our estimate (+5.6%) and Bloomberg consensus (+5.3%). It also marked the highest level in four months, predominantly triggered by costlier food items (particularly rice, cereals, vegetables, fruits & nuts), transport, healthcare, education, and recreation, sport & culture services.
We maintain our full-year inflation forecasts at 6.0% for 2023 (BSP est: 5.8%, 2022: 5.8%) and 3.5% for 2024 (BSP est: 3.5%) as risks are still tilted to the upside. The provisional jeepney fare hike by PHP1 starting 8 Oct this year is expected to raise the national inflation by 0.1-0.2ppt amid the lifting of rice price cap on Wed (4 Oct). The Land Transportation Franchising and Regulatory Board will conduct another hearing on 7 Nov for the permanent PHP5 fare increase appeal of three transportation groups in the country. This alongside the potential impact of higher minimum wage adjustments in other regions and knock-on effects of higher toll rates on prices of key agricultural goods, as well as rising global commodity prices are key upside risks to the near-term inflation outlook.
In Scandi-land, both NOK and SEK have enjoyed some well-needed support after the Euro pullback and Riskbank and Norges Bank meetings. Economists at Nordea analyze Scandi FX outlook.
NOK and SEK are not yet in the clear
Neither the SEK nor the NOK are in the clear yet. The main risk for both currencies remains a correction in the stock market and global growth declining more than currently anticipated.
We think Scandi FX weakness will persist until next year, when we expect to see lower global inflation allowing for lower global interest rates and rising growth which in turn should be beneficial for Scandi FX.
- Silver price trades sideways around $21.00 ahead of the US NFP report.
- The weak US ADP Employment report has cast doubts about sustaining resilient labor market conditions.
- The US Dollar Index is making efforts to defend the extension in the losing spell.
Silver price (XAG/USD) delivers topsy-turvy moves in a narrow range of $21.00 as investors have sidelined ahead of the United States labor market data. The volatility in the white metal has squeezed as trading volume has dried.
S&P500 futures generated some losses in the London session, portraying a cautious market mood ahead of the US Nonfarm Payrolls (NFP) report. The US Dollar Index (DXY) is making efforts to defend the extension in the losing spell. The US Dollar has been facing selling pressure for the past three trading sessions as weak US ADP Employment report has cast doubts about sustaining resilient labor market conditions.
As per the RBC economics, the US payroll employment data will likely show the Unemployment Rate holding steady at 3.8%, and employment up by 177K, slightly below the 187K add in August. Labor market conditions remain tight with initial jobless claims trending at low levels. But signs of slowing demand including falling job openings mean we can continue to expect conditions to slow.
Silver technical analysis
Silver price remains back-and-forth in a narrow range of $20.70-21.40 for the past three trading sessions. A consolidation pattern demonstrates a volatility compression and is followed by an explosion, which results in wider ticks and heavy volume.
The 50-period Exponential Moving Average (EMA) at $20.50 continues to act as a major barricade for the Silver price bulls.
The Relative Strength Index (RSI) (14) trades in the 40.00-60.00 range, which indicates that investors await a potential trigger.
Silver hourly chart
-638321817321680147.png)
Citing a source with knowledge of the projections on Friday, Reuters reported that Germany's government sees the economy contracting by 0.4% this year in its draft autumn projections.
“The economy is then expected to grow 1.3% next year and 1.5% in 2025,” the source said.
According to the source, “inflation is expected to come in at 6.1% this year and at 2.6% next year.”
German Economy Minister Robert Habeck is set to present the government's autumn forecast on Wednesday.
Market reaction
At the time of writing, EUR/USD is holding steady at around 1.0550, awaiting the US employment data.
Bank of England Decision Maker Panel survey offered a few interesting highlights. Economists at ING discuss GBP outlook.
EUR/GBP may keep struggling to find any real sense of direction
We think the survey can modestly help our call for a BoE hold in November, although mostly for what that may suggest about ongoing price dynamics rather than how highly regarded the Decision Makers Panel Survey is at the MPC.
EUR/GBP may keep struggling to find any real sense of direction, while GBP/USD looks vulnerable to a Dollar rebound. It is too early to rule out a move to 1.2000.
Canadian jobs figures may tilt market pricing towards another BoC rate hike, but watch for data volatility, economists at ING report.
Key jobs figures to steer rate expectations
As it often happens, Canadian jobs figures will be released at the same time as the US ones, and the USD/CAD reaction will depend on a mix of the two prints.
We think that a jobs report matching consensus would be enough to keep market expectations for more BoC tightening alive. However, data volatility is an issue in Canada, and the chances of a negative read are relatively high.
Unlike previous instances, USD/CAD isn’t overvalued at current levels, and we would favour any CAD strength on the back of good domestic data against other pro-cyclical currencies as opposed to the USD.
See – Canada Employment Preview: Forecasts from five major banks, job growth to slow
- EUR/GBP loses ground amid Germany’s Factory Orders showed robust performance.
- BoE’s dovish tone surrounding the interest rate trajectory could undermine the GBP.
- The varying opinions among ECB officials underscore the challenges facing the Eurozone economy.
EUR/GBP continues the losing streak that began on Tuesday, trading lower around 0.8650 during the European session on Friday. On Friday, better-than-expected United Kingdom’s (UK) housing data could provide minor support for the Pound Sterling (GBP).
Halifax House Prices (MoM) declined 0.4% in September compared to the market consensus of a 0.8% decline and the previous reading of a 1.8% decline in August.
However, the British Pound (GBP) is grappling with a period of underperformance, primarily influenced by the unexpected decision of the Bank of England (BoE) to pause its rate-hiking cycle in September. This departure from the trend observed since December 2021, where the BoE opted not to raise interest rates, has introduced a challenging dynamic.
Compounding the situation, the central bank revised its growth forecast for the July-September period from 0.4% to a mere 0.1%. This downward adjustment provides little indication of any inclination to pursue further rate increases.
Additionally, the cross pair was under pressure due to the downbeat Eurozone’s Retail Sales data on Wednesday. However, Germany’s Factory Orders showed robust performance on a monthly basis, which could support the Euro.
The data reported an upbeat figure of 3.9% against the 1.8% expected, swinging from the previous reading of an 11.3% decline. While yearly performance declined by 4.2% compared to the previous 10.1% decline.
The Eurozone appears to be in a phase of observation and prudence regarding potential interest rate hikes by the European Central Bank (ECB). Recent remarks from ECB officials indicate a measured approach, with a key focus on inflation targeting.
According to ECB Governing Council member Tuomas Välimäki, there's a more optimistic outlook as he doesn't foresee a stagflation prospect in the euro area. On the flip side, ECB Chief Economist Philip Lane acknowledges that there is more work to be done to meet the inflation target, signaling a more cautious stance.
The contrasting viewpoints may reflect the intricate and uncertain economic landscape of the Eurozone, which could pose a headwind for the EUR/GBP pair.
- GBP/JPY scales higher for the third straight day and climbs to a multi-day top on Friday.
- Softer domestic data and a positive risk tone weigh on the JPY and lend some support.
- Expectations that the BoE is done hiking rates and intervention fears to cap the upside.
The GBP/JPY cross builds on this week's recovery move from the 178.00 mark, or its lowest level since July 28 and gains some positive traction for the third successive day on Friday. The buying interest picks up pace during the early part of the European session and lifts spot prices to a multi-day peak, around the 181.70 region in the last hour.
The Japanese Yen (JPY) weakens a bit following the release of softer domestic data, which showed that nominal cash earnings for workers matched the previous month's downwardly revised reading and rose 1.1% from the previous year. Another government report revealed that Japan’s household spending – a key indicator of private consumption – declined for the sixth month in a row, by 2.5% in August. This ensures that the Bank of Japan (BoJ) will stick to its dovish stance in the foreseeable future, which, along with a positive tone around the equity markets, undermines the safe-haven JPY and lends some support to the GBP/JPY cross.
The British Pound (GBP), on the other hand, draws some support from subdued US Dollar (USD) demand ahead of the release of the key US monthly employment details, or the NFP report, due later during the early North American session. This is seen as another factor pushing the GBP/JPY cross higher. The intraday move up could further be attributed to some technical buying above the 200-hour Simple Moving Average (SMA), which might have already set the stage for a further appreciating move. That said, expectations that the Bank of England (BoE) will leave interest rates unchanged at its next meeting in November, might cap the GBP.
Furthermore, speculations that Japanese authorities will intervene in the FX market to combat a sustained depreciation in the JPY might contribute to keeping a lid on the GBP/JPY cross. In fact, Japan's Finance Minister Shunichi Suzuki reiterated this week that currency rates must move stably reflecting fundamentals and that the government was ready to take necessary action against excess volatility, without ruling out any options. Nevertheless, spot prices have now recovered a major part of the weekly losses, though the fundamental backdrop warrants some caution for bullish traders.
Technical levels to watch
- The Euro keeps the bid bias unchanged against the US Dollar.
- Stocks in Europe open with decent gains on Friday.
- EUR/USD rises to the 1.0550 region, or four-day peaks.
- The USD Index (DXY) recedes further and flirts with 106.30.
- Factory Orders in Germany expand in August.
- The US Nonfarm Payrolls will be the salient event across the ocean.
The Euro (EUR) is showing signs of further strength against the US Dollar (USD), motivating EUR/USD to advance to multi-day highs near 1.0550 at the end of the week.
Meanwhile, the Greenback sheds further ground and revisits the 106.30 when tracked by the USD Index (DXY) on the back of extra improvement in the sentiment surrounding the risk-associated universe, despite the tepid rebound in US yields across the curve.
In terms of monetary policy, investors now see the Federal Reserve (Fed) keeping its interest rates unchanged in the latter part of the year. At the same time, market speculation continues about the European Central Bank (ECB) potentially pausing policy adjustments, despite inflation levels surpassing the bank's target and growing concerns about a future recession or stagflation in the region.
On the euro calendar, Factory Orders in Germany expanded at a monthly 3.9% in August, while Retail Sales in Italy contracted 0.4% inter-month also in August.
In the US data space, all the attention will be on the release of September’s Nonfarm Payrolls and the Unemployment Rate. In addition, Consumer Credit Change for the month of August are also due, along with a speech by FOMC Governor Christopher Waller (permanent voter, hawk).
Daily digest market movers: Euro looks bid ahead of key US NFP
- The EUR seems to consolidate the breakout of 1.0500 vs. the USD.
- US and German attempt a mild comeback so far on Friday.
- Investors’ bets for a 25 bps rate hike by the Fed lose traction.
- Markets see the ECB pausing its hiking campaign.
- ECB’s Schnabel does not rule out a (mild?) recession.
- Market talks above FX intervention in USD/JPY appear unabated.
Technical Analysis: Euro now looks at 1.0600 and above
EUR/USD regains the smile and advances further north of 1.0500 the figure so far on Friday.
The potential resumption of selling pressure on EUR/USD may lead to a revisit of the 2023 low at 1.0448 (October 3), with the possibility of testing the significant round level of 1.0400. If this level is surpassed, it could open the door for a potential retest of the weekly lows at 1.0290 (November 30, 2022) and 1.0222 (November 30, 2022).
On the other hand, if the pair continues to gain momentum, it could target the next upside barrier at 1.0617 (September 29), followed by the critical 200-day SMA at 1.0823. Breaking beyond this level might lead to a test of the weekly high at 1.0945 (August 30), as well as the psychological threshold of 1.1000. Should the pair trespass the August peak of 1.1064 (August 10), it could encounter the weekly top of 1.1149 (July 27) and even the 2023 peak at 1.1275 (July 18).
However, it is essential to bear in mind that as long as the EUR/USD remains below the 200-day SMA, there is a possibility of further bearish pressure.
Euro FAQs
What is the Euro?
The Euro is the currency for the 20 European Union countries that belong to the Eurozone. It is the second most heavily traded currency in the world behind the US Dollar. In 2022, it accounted for 31% of all foreign exchange transactions, with an average daily turnover of over $2.2 trillion a day.
EUR/USD is the most heavily traded currency pair in the world, accounting for an estimated 30% off all transactions, followed by EUR/JPY (4%), EUR/GBP (3%) and EUR/AUD (2%).
What is the ECB and how does it impact the Euro?
The European Central Bank (ECB) in Frankfurt, Germany, is the reserve bank for the Eurozone. The ECB sets interest rates and manages monetary policy.
The ECB’s primary mandate is to maintain price stability, which means either controlling inflation or stimulating growth. Its primary tool is the raising or lowering of interest rates. Relatively high interest rates – or the expectation of higher rates – will usually benefit the Euro and vice versa.
The ECB Governing Council makes monetary policy decisions at meetings held eight times a year. Decisions are made by heads of the Eurozone national banks and six permanent members, including the President of the ECB, Christine Lagarde.
How does inflation data impact the value of the Euro?
Eurozone inflation data, measured by the Harmonized Index of Consumer Prices (HICP), is an important econometric for the Euro. If inflation rises more than expected, especially if above the ECB’s 2% target, it obliges the ECB to raise interest rates to bring it back under control.
Relatively high interest rates compared to its counterparts will usually benefit the Euro, as it makes the region more attractive as a place for global investors to park their money.
How does economic data influence the value of the Euro?
Data releases gauge the health of the economy and can impact on the Euro. Indicators such as GDP, Manufacturing and Services PMIs, employment, and consumer sentiment surveys can all influence the direction of the single currency.
A strong economy is good for the Euro. Not only does it attract more foreign investment but it may encourage the ECB to put up interest rates, which will directly strengthen the Euro. Otherwise, if economic data is weak, the Euro is likely to fall.
Economic data for the four largest economies in the euro area (Germany, France, Italy and Spain) are especially significant, as they account for 75% of the Eurozone’s economy.
How does the Trade Balance impact the Euro?
Another significant data release for the Euro is the Trade Balance. This indicator measures the difference between what a country earns from its exports and what it spends on imports over a given period.
If a country produces highly sought after exports then its currency will gain in value purely from the extra demand created from foreign buyers seeking to purchase these goods. Therefore, a positive net Trade Balance strengthens a currency and vice versa for a negative balance.
The main highlight today is the US Nonfarm Payrolls report for September. Economists at Danske analyze how the EUR/USD pair could react to lower-than-expected employment data.
US data starting to disappoint
We look for Nonfarm Payrolls at 140K today, which is 30K lower than the consensus. Additionally, we expect average hourly earnings at 0.2% MoM, slightly below consensus of 0.3% MoM.
If we are right, EUR/USD will most likely move higher on the release, in line with our tactical case based on US data starting to disappoint.
See – NFP Preview: Forecasts from seven major banks, losing momentum
USD/CNH is seen maintaining the consolidative mood in the short-term horizon, comment UOB Group’s Markets Strategist Quek Ser Leang and Senior FX Strategist Peter Chia.
Key Quotes
24-hour view: We noted yesterday that “momentum indicators are mostly neutral,” and we expected USD to trade sideways between 7.3080 and 7.3310. However, USD traded in a lower range than expected (7.3033/7.3236). There is no clear directional bias, and we continue to expect USD to trade sideways, likely between 7.2980 and 7.3220. \
Next 1-3 weeks: Our update from Tuesday (03 Sep, spot at 7.3215) still stands. As highlighted, USD is likely to trade in a range for now, probably between 7.2800 and 7.3600.
Considering advanced prints from CME Group for natural gas futures markets, open interest extended the uptrend and rose by around 18.2K contracts on Thursday. In the same line, volume went up for the fourth session in a row, this time by around 164.1K contracts.
Natural Gas: Next on the upside comes $4.00
Prices of natural gas seem to have broken above the critical resistance zone at $3.00 per MMBtu with certain conviction on Thursday. The move was accompanied by increasing open interest and volume and favours the continuation of the rebound in the very near term. That said, the $4.00 mark per MMBtu is expected to come next for bulls.
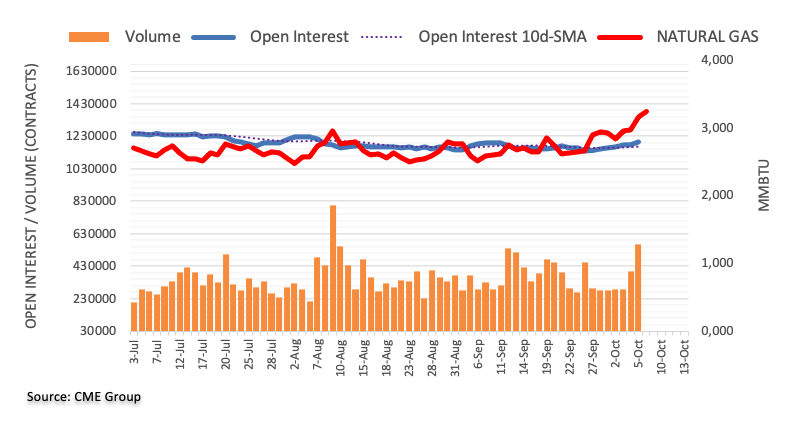
Today’s US Nonfarm Payrolls are the big event of the week. Consensus NFP may be enough to send the Dollar higher, economists at ING report.
Waiting for payrolls to jump back into the Dollar
A strong read could easily put markets back on a bearish track and reignite aggressive Dollar buying.
There is a decent chance that markets are positioned for a modestly sub-consensus read in jobs figures today, and even a consensus figure could send the Dollar higher across the board.
DXY may well return above 107.00 as early as today, or early next week.
See – NFP Preview: Forecasts from seven major banks, losing momentum
USD/JPY remains side-lined within the 145.90-150.50 range for the time being, argue UOB Group’s Markets Strategist Quek Ser Leang and Senior FX Strategist Peter Chia.
Key Quotes
24-hour view: Yesterday, we highlighted that “the outlook for USD remains mixed,” and we expected it trade between 148.00 and 149.55. USD then traded in a narrower range than expected (148.25/149.13). The price action offers no fresh clues, and today, we expected USD to trade between 148.00 and 149.20.
Next 1-3 weeks: There is not much to add to our update from Wednesday (04 Oct, spot at 149.10). As highlighted, the sharp fluctuations earlier this week have mudded the outlook. For the time being, USD could trade in a broad range of 145.90/150.50.
- USD/JPY receives upward support due to the rebound in the US Dollar.
- Former Fed Vice Chair Clarida expects adjustment in the BoJ's approach by early 2024.
- Fed's hawkish stance on policy rate trajectory provides strength to the US Bond yields.
USD/JPY recovers from the recent losses, trading higher around 148.90 during the early European session on Friday. The pair finds support on the upside, which could be attributed to the rebound in the US Dollar (USD) following improved US Treasury yields.
Japan’s Labor Cash Earnings (YoY) remained consistent at 1.1% in August, contrasting with the market expectations of 1.5%.
Former Federal Reserve Vice Chair Clarida suggests that the Bank of Japan (BoJ) policy rate could experience an increase to 0% by early 2024. The recent changes under the new leadership of Governor Kazuo Ueda, including a significant adjustment in July to the yield curve control (YCC) strategy, indicate a shift in the BoJ's approach.
Japanese Finance Minister Shunichi Suzuki reiterated on Thursday his decision not to comment on whether Japan intervened in the foreign exchange (FX) market. The ongoing speculations about potential intervention by Japanese authorities in the foreign exchange market to bolster the domestic currency could persist as a headwind for the USD/JPY pair.
Moreover, BoJ Governor Kazuo Ueda emphasized that the current policy framework has a significant stimulative impact on the economy. Ueda reiterated the central bank's basic stance of patiently maintaining monetary easing.
The US Dollar Index (DXY) rebounds and trades higher around 106.50 as of now. The Greenback’s correction comes after reaching an 11-month high earlier this week.
US Treasury yields hold steady, maintaining their positions near multi-year highs. Market participants are exercising caution due to the US Federal Reserve's (Fed) hawkish stance on the trajectory of interest rates.
The 10-year US Treasury yield remains above 4.70%, close to its highest level since 2007.
US Initial Jobless Claims for the week ending September 29 saw an increase to 207K from the previous reading of 205K. Surprisingly, this surpassed the market expectation of 210K.
US Challenger Job Cuts have significantly decreased from 75.151K to 47.457K in September. Market participants watch for the upcoming release of US Nonfarm Payrolls and Average Hourly Earnings on Friday.
These figures will serve as a confirmation of the tight labor market, and upbeat numbers could potentially trigger a rise in the USD and elevate volatility in the bond market.
CME Group’s flash data for crude oil futures markets noted traders added around 10.6K contracts on Thursday, reversing the previous daily drop. Volume followed suit and increased by the third session in a row, now by around 81.2K contracts.
WTI meets initial contention near $82.00
Prices of WTI dropped significantly in the last couple of sessions. Thursday’s decline was on the back of rising open interest and volume and leaves the door open to the continuation of the downward bias in the very near term. Furthermore, the loss of $82.00 could put a potential test of the key $80.00 mark per barrel back on the radar.
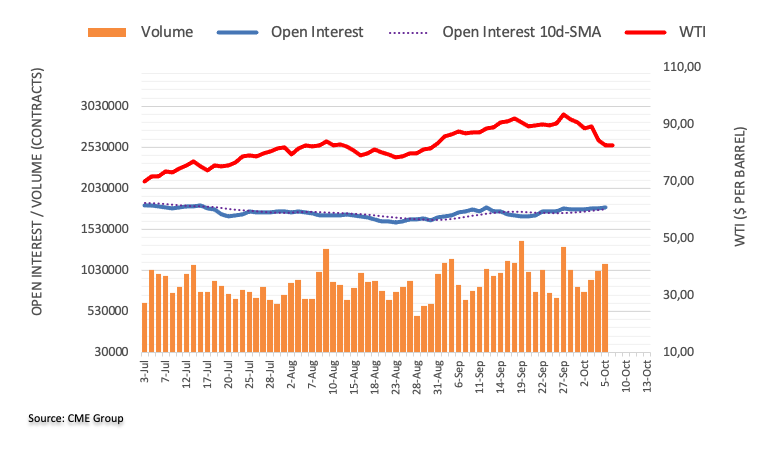
- Pound Sterling aims to climb above 1.22 as market mood remains quiet.
- UK economic activities were broadly vulnerable in September due to poor domestic and overseas demand.
- BoE’s Broadbent remains confident about achieving price stability in two years.
The Pound Sterling (GBP) has become subdued after a three-day range high as investors seem baffled about the United Kingdom’s inflation and economic outlook following September’s PMI data. UK firms were reluctant to utilize their full capacity and reduced hiring as higher interest rates by the Bank of England (BoE) have hit demand significantly.
Investors are not anticipating a quick revival in the UK’s overall demand as the BoE vowed to keep interest rates higher for a longer period to ensure price stability. BoE Deputy Governor Ben Broadbent sees inflation coming down to 2% in two years as restrictive monetary policy has dampened labor market and economic prospects.
Daily Digest Market Movers: Pound Sterling remains sideways amid quiet market mood
- Pound Sterling faces nominal selling pressure from three-day high of 1.2196 as the market mood turns quiet ahead of crucial labor market data.
- The GBP/USD pair struggles to extend its upside as investors remain worried about the UK’s economic outlook due to declining labor demand and weakening economic activities.
- In September, the UK Manufacturing and Construction PMIs remained vulnerable as firms cut back on inventories and labor due to declining demand from domestic and overseas markets. The Services PMI improved significantly but remained below the 50.0 threshold.
- The labor demand from UK firms has slowed due to higher wage growth. Firms restricted them from filling voluntary resignations as the cost of bringing fresh talent is extremely high.
- Few businesses remained optimistic, as surveyed by S&P Global in the PMI data, as the Bank of England has paused policy tightening, but firms with higher dependency on debt are still pessimistic.
- On Thursday, S&P Global reported the UK Construction PMI at 45.0 in September, much lower than expectations of 49.9 and the former release of 50.8. A figure below the 50.0 threshold is considered a contraction.
- A decline in construction spending was widely anticipated as higher mortgage rates have forced households to postpone their demand for new houses. However, the impact of weak Construction PMI data is expected to remain limited as it is relatively a smaller part of the UK economy.
- Meanwhile, a positive outlook on progress in declining inflation from BoE Governor Andrew Bailey and Deputy Governor Ben Broadbent has brought relief for investors.
- This week, Andrew Bailey opposed changing the 2% inflation target and remained optimistic about bringing down inflation to 5% or below by year-end.
- Ben Broadbent sees achievement of price stability in two years. He further added that there are “clear signs” that higher interest rates have hit demand and elevated the Unemployment Rate.
- Meanwhile, the US Dollar delivers a pullback move to near 106.54 from a four-day low around 106.30 as investors turn anxious ahead of the US Nonfarm Payrolls (NFP), which will shape the interest rate outlook for the remainder of 2023.
- Analysts at Commerzbank forecast job growth of 160K. After the surprisingly sharp rise from 3.5% to 3.8% in August, the unemployment rate is likely to have fallen again slightly to 3.7%, as the trend in labor force growth is only around 100K. We do not expect the Unemployment Rate to rise significantly until next year when the economy is likely to slip into recession and employment is likely to shrink.
Technical Analysis: Pound Sterling faces barricades near 1.2200
Pound Sterling struggles to extend upside above the immediate resistance of 1.2200 amid quiet market mood. The recovery move in the GBP/USD pair came after momentum oscillators turned oversold on the daily time frame. The broader outlook of the GBP/USD pair is bearish as the 50 and 200-day Exponential Moving Averages (EMAs) have delivered a Death Cross near 1.2450. A confident downside move could drag the Cable toward the psychological support of 1.2000.
BoE FAQs
What does the Bank of England do and how does it impact the Pound?
The Bank of England (BoE) decides monetary policy for the United Kingdom. Its primary goal is to achieve ‘price stability’, or a steady inflation rate of 2%. Its tool for achieving this is via the adjustment of base lending rates. The BoE sets the rate at which it lends to commercial banks and banks lend to each other, determining the level of interest rates in the economy overall. This also impacts the value of the Pound Sterling (GBP).
How does the Bank of England’s monetary policy influence Sterling?
When inflation is above the Bank of England’s target it responds by raising interest rates, making it more expensive for people and businesses to access credit. This is positive for the Pound Sterling because higher interest rates make the UK a more attractive place for global investors to park their money. When inflation falls below target, it is a sign economic growth is slowing, and the BoE will consider lowering interest rates to cheapen credit in the hope businesses will borrow to invest in growth-generating projects – a negative for the Pound Sterling.
What is Quantitative Easing (QE) and how does it affect the Pound?
In extreme situations, the Bank of England can enact a policy called Quantitative Easing (QE). QE is the process by which the BoE substantially increases the flow of credit in a stuck financial system. QE is a last resort policy when lowering interest rates will not achieve the necessary result. The process of QE involves the BoE printing money to buy assets – usually government or AAA-rated corporate bonds – from banks and other financial institutions. QE usually results in a weaker Pound Sterling.
What is Quantitative tightening (QT) and how does it affect the Pound Sterling?
Quantitative tightening (QT) is the reverse of QE, enacted when the economy is strengthening and inflation starts rising. Whilst in QE the Bank of England (BoE) purchases government and corporate bonds from financial institutions to encourage them to lend; in QT, the BoE stops buying more bonds, and stops reinvesting the principal maturing on the bonds it already holds. It is usually positive for the Pound Sterling.
Economists at Commerzbank analyze GBP outlook after the BoE’s Decision Maker Panel published on Thursday.
Continued strong wage growth in Great Britain
Over the past 12 months until September wages once again rose more notably than the previous month. The expectations for wage growth in the next 12 months were also slightly above the August level.
Although it is of course positive that inflation has eased over the past months, wage developments nonetheless suggest that inflation might turn out to be more stubborn than the BoE is currently hoping.
Thursday’s survey results give rise to doubts, and concerns that the BoE is not taking sufficient action against higher inflation levels might put further pressure on Sterling. At least until there is convincing evidence of a sustainable decline in inflation rates.
In the opinion of UOB Group’s Markets Strategist Quek Ser Leang and Senior FX Strategist Peter Chia, AUD/USD risks a more sustained decline once it breaches 0.6280.
Key Quotes
24-hour view: We expected AUD to trade in a range of 0.6300/0.6360 yesterday. However, AUD traded between 0.6324 and 0.6378. Upward momentum has improved slightly. Today, there is scope for AUD to test 0.6400. A clear break above this level is unlikely. On the downside, a breach of 0.6330 (minor support is at 0.6350) would mean that the current mild upward pressure has eased.
Next 1-3 weeks: On Tuesday (03 Oct, spot at 0.6365), we held the view that AUD “is likely to weaken to 0.6330, possibly 0.6280.” After AUD plunged to a low of 0.6283, we highlighted on Wednesday (04 Oct, spot at 0.6310) that “the swift decline in AUD appears to be overstretched, but it has not stabilised.” We added, “AUD must break and stay below 0.6280 before further decline is likely.” We continue to hold the same view. Overall, only a breach of 0.6400 (no change in ‘strong resistance’ level from yesterday) would indicate that the weakness in AUD has stabilised.
EUR/USD extended the latest rebound and hit 1.0550. Economists at ING analyze the pair’s outlook ahead of the US Nonfarm Payrolls report.
EUR/USD is around 1% undervalued to its market drivers
We currently estimate EUR/USD’s fair value at 1.0650, meaning that the pair is around 1% undervalued to its market drivers, below its 1.5 standard deviation and does not suggest an imminent upward correction.
EUR/USD can slip back below 1.0500 even in the event of a consensus read in US payrolls today.
See – NFP Preview: Forecasts from seven major banks, losing momentum
- WTI Crude Oil prices drift lower for the third successive day and refresh a one-month low on Friday.
- Worries that rising interest rates will hamper economic growth and dent fuel demand exert pressure.
- Expectations that the Oil market will remain tight over the short term do little to lend any support.
West Texas Intermediary (WTI) Crude Oil prices edge lower for the third successive day on Friday – also marking the sixth day of a negative move in the previous seven and hit a fresh one-month low during the early European session. The commodity currently trades just above the $81.00/barrel mark, down over 0.50% for the day, and seems vulnerable to prolonging its recent sharp retracement slide from a 13-month peak touched last Thursday.
Investors remain concerned that economic headwinds stemming from higher interest rates in the United States (US) will dent fuel demand. This has been a key factor behind the recent brutal selloff in Crude Oil prices, which has declined nearly $13, or over 13.5% from the vicinity of the $94.00/barrel mark touched last week. Meanwhile, the negative factor, to a larger extent, overshadows worries about tightening global crude supply and supports prospects for a further depreciating move.
Traders, however, seem reluctant to place aggressive bets and might prefer to wait on the sidelines ahead of the release of the crucial US monthly employment details, due later during the early North American session. The popularly known NFP report will influence the Federal Reserve's (Fed) next policy move, which, in turn, will drive the US Dollar (USD) demand. This, in turn, should provide some meaningful impetus to the US Dollar-denominated commodities, including Crude Oil prices.
Nevertheless, the black liquid remains on track to register heavy weekly losses of over 9% – its sharpest decline since March – and seems poised to depreciate further in the wake of the worsening global economic outlook, particularly in China – the world's largest Oil importer.
Technical levels to watch
NZD/USD is still below 0.60. Economists at ANZ Bank analyze Kiwi’s outlook.
Difficult to see USD exceptionalism being challenged
Price action has been very tame, as you’d expect ahead of key NFP report, and with US bond volatility easing.
It seems almost futile to discuss the strategic backdrop given that the next 1-2 cents in the Kiwi could be determined solely by US data if it surprises. However, when thinking about what might unseat USD exceptionalism, it’s not easy to come up with many candidates.
US bond yields are higher (so far, a USD positive), and could threaten stability and risk appetite, but so far there are no signs of that. And with the RBNZ outwardly comfortable, it’s hard to see things changing a lot (barring a US data surprise) for the Kiwi.
Here is what you need to know on Friday, October 6:
The US Dollar (USD) weakened against its major rivals for the second consecutive on Thursday before finding a foothold early Friday. The USD Index holds steady at around 106.50 in the European morning and the 10-year US Treasury bond yield fluctuates at around 4.75 as markets await the September jobs report, which will include Nonfarm Payrolls (NFP) and wage inflation figures.
US Dollar price this week
The table below shows the percentage change of US Dollar (USD) against listed major currencies this week. US Dollar was the strongest against the Australian Dollar.
| USD | EUR | GBP | CAD | AUD | JPY | NZD | CHF | |
| USD | 0.27% | 0.18% | 1.08% | 1.21% | -0.40% | 0.71% | -0.15% | |
| EUR | -0.28% | -0.09% | 0.80% | 0.93% | -0.68% | 0.43% | -0.43% | |
| GBP | -0.18% | 0.10% | 0.89% | 1.03% | -0.58% | 0.52% | -0.34% | |
| CAD | -1.09% | -0.82% | -0.87% | 0.13% | -1.49% | -0.38% | -1.25% | |
| AUD | -1.23% | -0.95% | -1.04% | -0.13% | -1.62% | -0.51% | -1.39% | |
| JPY | 0.38% | 0.64% | 0.58% | 1.50% | 1.56% | 1.09% | 0.25% | |
| NZD | -0.71% | -0.43% | -0.52% | 0.38% | 0.51% | -1.10% | -0.86% | |
| CHF | 0.14% | 0.42% | 0.33% | 1.23% | 1.36% | -0.25% | 0.86% |
The heat map shows percentage changes of major currencies against each other. The base currency is picked from the left column, while the quote currency is picked from the top row. For example, if you pick the Euro from the left column and move along the horizontal line to the Japanese Yen, the percentage change displayed in the box will represent EUR (base)/JPY (quote).
US Nonfarm Payrolls Forecast: NFP September report set to show broadly stable labor market.
Wall Street's main indexes opened deep in red on Thursday but managed to erase the majority of daily losses. Meanwhile, the 10-year US yields continued to stretch lower and made it difficult for USD. US stock index futures trade modestly lower early Friday, pointing to a cautious market stance. Markets expect NFP to rise 170,000 in September and see the Unemployment Rate declining to 3.7% from 3.8% in August. Meanwhile, International Monetary Fund (IMF) chief Kristalina Georgieva noted that the current pace of global growth was "quite weak" and warned of significant risks on the fiscal front in many countries, due to increased debt burdens on higher interest rates.
NFP Preview: Forecasts from seven major banks, losing momentum.
In its bi-annual Financial Stability Review (FSR), the Reserve Bank of Australia (RBA) said that global financial stability risks were elevated and growing. Following a two-day rebound, AUD/USD lost its bullish momentum and stabilized at around 0.6350 on the last trading day of the week.
USD/CAD rose to its highest level since March near 1.3800 on Thursday before staging a downward correction in the Asian session on Friday. Statistics Canada will also release the September labor market data later in the day.
Canada Employment Preview: Forecasts from five major banks, job growth to slow.
USD/JPY closed in negative territory on Thursday but regained its traction and advanced to the 149.00 area on Friday. Japanese Finance Minister Shunichi Suzuki declined once again on Thursday to comment on whether Japan intervened in the foreign exchange market earlier in the week.
EUR/USD extended its rebound and closed in positive territory near 1.0550 on Thursday. The pair, however, struggled to preserve its recovery momentum and went into a consolidation phase.
GBP/USD benefited from broad USD weakness on Thursday and advanced toward 1.2200. Early Friday, the pair fluctuates in a tight channel above 1.2150 amid cautious market stance.
Gold price moved up and down in a narrow range at around $1,820 on Thursday. With the 10-year US yield staying relatively quiet on Friday, XAU/USD finds it difficult to gather directional momentum.
Today, all eyes are once again on the US labor market report. Economists at Commerzbank analyze in which direction the USD will ultimately move.
FX market could react more sensitively to a negative surprise than to a positive one
A lot of optimism about a soft landing for the US economy already seems to be priced into the FX market, so even a small disappointment could trigger major price movements in the USD.
By contrast, a positive surprise is likely to merely confirm market expectations and thus provide little additional support for the USD – unless, of course, the labor market report turns out exceptionally well.
After the USD rally of the last few weeks, the FX market could react more sensitively to a negative surprise than to a positive one.
See – NFP Preview: Forecasts from seven major banks, losing momentum
- USD/CHF consolidates below 0.9150 ahead of the crucial US employment data.
- MACD indicates a tepid momentum in the price movement.
- The 14-day EMA emerges as immediate support, followed by the 0.9100 major level.
USD/CHF snaps a two-day losing streak, trading higher around 0.9140 lined up with the resistance level at 0.9150 psychological level during the early European session on Friday, following the region around the major level at 0.9200.
A firm break above the latter could open the doors for the USD/CHF pair to explore the area near the weekly high at 0.9244 lined up with the 0.9250 major level.
The pair receives upward support following the rebound in the US Dollar (USD), which could be attributed to the improved US Treasury yields.
On the downside, the 14-day Exponential Moving Average (EMA) at 0.9113 emerges as the immediate support, followed by the 0.9100 psychological level. A break below the level could direct the bears of the pair to reach the 23.6% Fibonacci retracement at 0.9081 level.
The Moving Average Convergence Divergence (MACD) indicator is indicating subdued momentum in the price movement. Currently, the MACD line is situated above the centerline but below the signal line. This configuration suggests a lackluster trend in the market at the moment.
However, the prevailing upward momentum in the USD/CHF pair indicates a bullish bias, as the 14-day Relative Strength Index (RSI) remains above the 50 level.
USD/CHF: Daily Chart
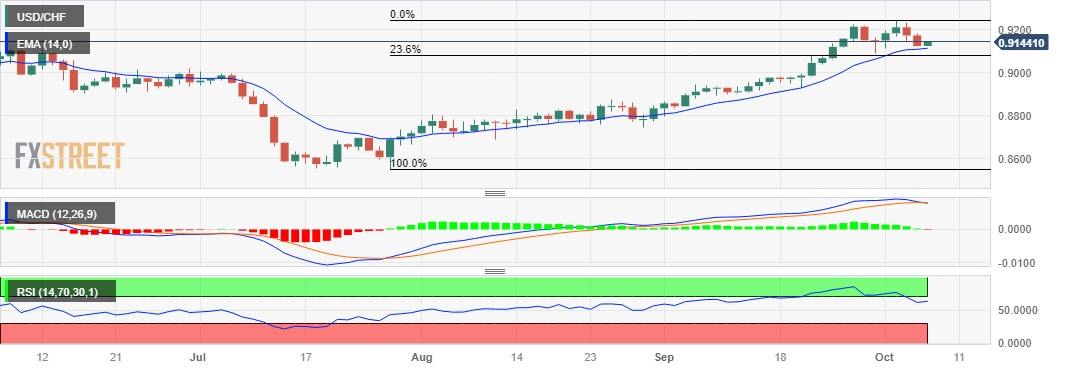
- NZD/USD recovery loses steam and declines to 0.5950 on Friday.
- The Reserve Bank of New Zealand agreed that rates may need to remain at a restrictive level for a longer time.
- The US Initial Jobless Claims last week improved to 207K vs. 205K prior.
- US Nonfarm Payrolls will be a closely watched event on Friday.
The NZD/USD pair reverses its direction after hitting an intraday high of 0.5971 during the early European session on Friday. Markets turn cautious ahead of the key US employment data on Friday. The pair currently trades near 0.5950, losing 0.25% for the day.
Following the Reserve Bank of New Zealand (RBNZ) monetary policy meeting on Wednesday, RBNZ decided to maintain the Official Cash Rate (OCR) unchanged at 5.5%, as widely expected. The committee agreed that interest rates may need to remain at a restrictive level for a more sustained period, according to the RBNZ statement.
On Thursday, New Zealand’s ANZ Commodity Price for September came in at 1.3% versus a 2.9% drop prior. Earlier this week, the nation’s NZIER Business Confidence for the third quarter (Q3) fell to -52% QoQ versus -63% in the previous reading.
The Federal Reserve (Fed) is not expected to abandon its ‘higher-for-longer’ stance on interest rates. Market players await the highly-anticipated US Nonfarm Payrolls for more clarity about labor market conditions. The US Nonfarm Payrolls are expected to rise by 170K while the Unemployment Rate is estimated to decline to 3.7% from 3.8%. The weaker-than-expected figures could exert some selling pressure on the Greenback against its rivals and act as a tailwind for the NZD/USD pair.
US data on Thursday revealed that the weekly Initial Jobless Claims for the week ending on September 30 improved to 207K from 205K in the previous week, below the market estimation of 210K. Additionally, the US Balance of Trade deficit was $58.3B from the $64.7B recorded in July, lower than the market consensus of $ 62.3 B.
In the absence of economic data released from the New Zealand docket on Friday, the NZD/USD pair remains at the mercy of USD price dynamics. The US Nonfarm Payrolls will be in the spotlight and could trigger the volatility in the market. Also, the US Average Hourly Earnings for September, and the Unemployment rate will be released from the US docket on Friday. These events could give a clear direction to the pair.
Canada’s employment data for September will be reported by Statistics Canada on Friday, October 6 at 12:30 GMT and as we get closer to the release time, here are forecasts from economists and researchers at five major banks regarding the upcoming jobs figures.
The North American economy is expected to have added 20K vs. 39.9K in August, while the Unemployment Rate is seen at 5.6% vs. the prior release of 5.5%.
TDS
We look for job growth to slow to 12K in August as softer business sentiment leads some firms to pare back their hiring plans. Services should provide the main driver for job creation, while stronger population growth will see the unemployment rate edge higher to 5.7%. However, we expect limited progress on wages, with wage growth edging lower by 0.1pp to 5.1% YoY.
NBF
Job creation may have slowed to 5K in September, reflecting a loss of momentum in the Canadian economy. This modest gain, combined with another significant expansion of the labour force and an unchanged participation rate (65.5%), should translate into a two-tenth increase in the unemployment rate, to 5.7%.
RBC Economics
We look for a 25K increase in employment in September. But the broader macroeconomic backdrop is continuing to soften. The unemployment rate has begun to rise, climbing to 5.5% over July and August from 5.0% in the spring. We look for another tick up to 5.6% in September with growth in the labour force growth again outpacing that of employment.
CIBC
We expect to see a moderate 20K jobs created, half of the pace seen in August, and more in line with weaker domestic demand signals seen in the GDP and Retail Sales data lately. Brisk population growth has raised the bar for the magnitude of hiring that’s required to prevent a climb in the unemployment rate, with September’s job gain likely not meeting that threshold, causing the jobless rate to tick up to 5.6%. Annual average hourly wage growth will likely also cool, helped by a strong year-ago increase dropping out of the annual calculation. A continued climb in the unemployment rate will likely leave the Bank of Canada on hold as it portends weaker domestic demand, which will compound the negative impact of mortgage renewals on consumption ahead.
Citi
We expect a strong 55K jobs added in September. Hours worked picking up in recent months could also imply stronger Q3 GDP growth after a surprisingly modest decline in GDP in Q2. While too-strong inflation data alone can still prompt further hikes from the BoC, some turn in recently softer activity could make a decision to raise rates again even clearer. Our September employment forecasts would imply both jobs reports since the decision to pause rate hikes in September have shown solid gains in employment.
European Central Bank (ECB) executive board member, Isabel Schnabel, is making some comments on the central bank’s interest rate outlook on Friday.
Schnabel said that “if risks materialize, hikes may be needed eventually.”
“We cannot rule out a recession, though we don't see a deep slump,” the ECB policymaker added.
Market reaction
EUR/USD remains sidelined near 1.0550, down 0.15% on the day.
The Malaysian Ringgit tracked regional currency losses last month amid the strength of the US Dollar. Economists at MUFG Bank analyze USD/MYR outlook.
Ringgit to remain largely range-bound in near term
We expect Ringgit to remain largely range-bound in near term.
Although a positive correlation with CNY could lend some support to Ringgit, this is unlikely to reverse the depreciation pressure coming from a strong Dollar and high US bond rates.
We expect a roughly 4% appreciation of Ringgit against the Dollar in 2024, due to reliance in economic activity, improving chips exports, and a weaker USD in medium term.
USD/MYR – Q4 2023 4.65 Q1 2024 4.60 Q2 2024 4.55 Q3 2024 4.50
- USD/CAD manages to stage a rebound near 1.3720 on Friday.
- The pair holds above the 50- and 100-hour EMAs with a bullish RSI.
- The immediate resistance level is located at 1.3757; 1.3685 acts as an initial support level.
The USD/CAD pair holds positive ground around 1.3720 during the early European session on Friday. The uptick of the pair is bolstered by the renewed US Dollar (USD) demand, along with a decline in oil prices, which weigh on the commodity-linked Loonie.
Market players await the employment data from both the US and Canada. The US Nonfarm Payrolls are expected to rise by 170K while the US Unemployment Rate is estimated to decline to 3.7% from 3.8%. Also, the Canadian Net Change in Employment is expected to gain 20,000 in September. These events could trigger the volatility in the market and give a clear direction to the USD/CAD pair.
From the technical perspective, USD/CAD holds above the 50- and 100-hour Exponential Moving Averages (EMAs) on the four-hour chart, which supports the buyers for the time being. Furthermore, the Relative Strength Index (RSI) is located in the bullish territory above 50, which means the path of the least resistance of USD/CAD is to the upside.
Any decisive follow-through buying above the upper boundary of the Bollinger Band of 1.3757 will pave the way to a high of October 5 at 1.3785. The additional upside filter to watch is near a high of March 24 at 1.3805. Further north, the pair will see a rally to a high of March 10 at 1.3860.
On the downside, the initial support level is located near the lower limit of the Bollinger Band of 1.3685. A break below the latter will see a drop to the next downside stop at 1.3636 (the 50-hour EMA). The key contention level is seen at the 1.3590-1.3600 region, representing the confluence of the 100-hour EMA and a psychological round figure. Further south, 1.3543 will be the next level to watch.
USD/CAD four-hour chart
-638321700208550424.png)
Open interest in gold futures markets increased for the second session in a row on Thursday, this time by around 1.2K contracts according to preliminary readings from CME Group. Volume, instead, shrank for the second straight session, now by nearly 21K contracts.
Gold appears side-lined around $1820
Gold prices extended its multi-session decline on Thursday on the back of rising open interest and an extra pullback in volume. Against that, bullion is projected to maintain its current consolidative mood around the $1820 region per troy ounce for the time being.
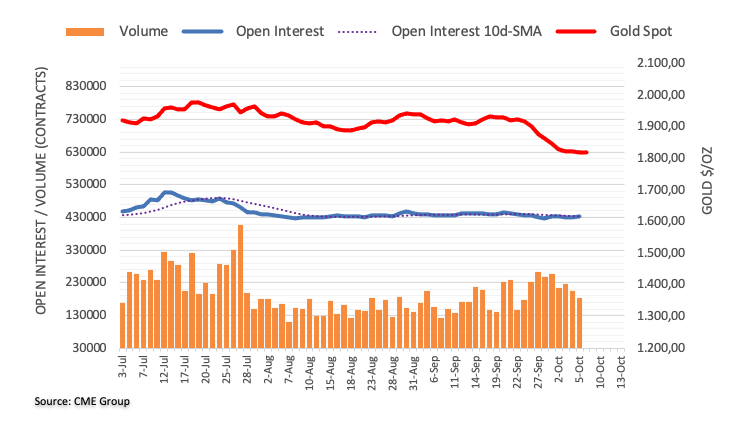
- EUR/USD experiences downward pressure ahead of US data.
- ECB is expected to maintain its current interest rates; weighing on the Euro.
- Fed's assertion on monetary policy is contributing to the strength in US Bond yields.
EUR/USD moves lower after two-day gains, trading slightly lower around 1.0540 during the Asian session on Friday. However, the pair found support on the upside, a trend that could be linked to the correction in the US Dollar (USD) following a decrease in US Bond yields.
Germany's trade surplus for August decreased to €16.6 billion from €17.7 billion in July, surpassing the market's anticipated figure of €15.0 billion.
European Central Bank (ECB) is expected to maintain its current interest rates at 4.50% in the upcoming meeting later this month. Insights from ECB Governing Council member Mario Centeno on Wednesday suggested that inflation in the Euro area is declining more rapidly than its previous ascent. This observation hints at the possibility that the rate cycle may have reached its conclusion under the current conditions.
The US Dollar Index (DXY) rebounds and trades higher around 106.50 as of now. The Greenback’s correction comes after reaching an 11-month high earlier this week.
US Treasury yields hold steady, maintaining their positions near multi-year highs. Market participants are exercising caution due to the US Federal Reserve's (Fed) hawkish stance on the trajectory of interest rates. The 10-year US Treasury yield remains above 4.70%, close to its highest level since 2007.
US Initial Jobless Claims for the week ending September 29 saw an increase to 207K from the previous reading of 205K. Surprisingly, this surpassed the market expectation of 210K.
US Challenger Job Cuts have significantly decreased from 75.151K to 47.457K in September. Market participants watch for the upcoming release of US Nonfarm Payrolls and Average Hourly Earnings on Friday. These figures will serve as a confirmation of the tight labor market, and upbeat numbers could potentially trigger a rise in the USD and elevate volatility in the bond market.
Tthe official data published by the Federal Statistics Office of Germany showed on Friday, the factory orders rebounded firmly in August, suggesting that the German manufacturing sector is regaining traction.
On a monthly basis, contracts for goods ‘Made in Germany’ jumped 3.9%, when compared to a 1.8% increase expected and a -11.3% previous figure.
Germany’s Industrial Orders dropped at an annual rate of 4.2% in the reported month, as against the 10.1% slump in July.
FX implications
The upbeat German data fails to inspire Euro bulls, as the EUR/USD pair trades 0.09% lower on the day at 1.0535, as of writing.
UOB Group’s Markets Strategist Quek Ser Leang and Senior FX Strategist Peter Chia note GBP/USD could extend the consolidative phase in the next few weeks.
Key Quotes
24-hour view: We highlighted yesterday that “the sharp rebound in GBP has room to extend, but any advance is unlikely to reach 1.2200.” We added, “Support is at 1.2110, followed by 1.2080.” Our view was not wrong. GBP dipped to a low of 1.2108 in London trade and then rose quickly to a high of 1.2196. Upward momentum has increased, albeit not by all that much. Today, GBP could rise above 1.2230, but it is unlikely to be able to maintain a foothold above this level. The major resistance at 1.2270 is unlikely to come under threat. Support is at 1.2160, followed by 1.2130.
Next 1-3 weeks: Our update from yesterday (05 Oct, spot at 1.2140) is still valid. As highlighted, the recent downward momentum buildup has faded. The current price movement is likely part of a range-trading phase, and GBP is likely to trade in a range between 1.2030 and 1.2270 for now.
- US Nonfarm Payrolls are set to rise by 170K in September, down from the 187K reported in July.
- US Dollar braces for a volatility spike on headline NFP and Average Hourly Earnings data.
- The Unemployment Rate in the United States is seen modestly lower at 3.7% in September.
Expectations of a final interest-rate hike by the US Federal Reserve (Fed) this quarter were reinforced after US job openings unexpectedly rose by the most in over two years to 9.610 million in August. The JOLTS Job Openings data pointed to a persistently tight labor market in the United States that could provide the Fed some leeway for more tightening.
Following the September policy meeting, several Fed policymakers have supported the narrative of the ‘higher rates for longer’, as the US economy showed encouraging signs of resilience.
The US Dollar Index capitalized on the hawkish Fed rhetoric and hit an 11-month peak above 107.00 while the US Treasury bond yields challenged 16-year highs.
However, odds of a Fed rate hike in November dropped to 23% from about 31%, after downbeat US labor market data released on Wednesday, triggering a long-due correction in the US Dollar and the US Treasury bond yields.
The latest Automatic Data Processing (ADP) report showed that the US private sector added just 89,000 in September, down from an upwardly revised 180,000 in August and far below the 153,000 estimate. US Institute for Supply Management (ISM) Services PMI fell from 54.5 to 53.6 in September, although it matched expectations.
What to expect in the next Nonfarm Payrolls report?
Friday's Nonfarm Payrolls data for September should help clarify if the labor market is still tight, especially after a strong JOLTS report and softer private payrolls data, compelling the Federal Reserve to raise interest rates next month.
The Nonfarm Payrolls data is likely to show that the US economy added 170K jobs last month as against a job gain of 187K jobs in August. The Unemployment Rate is seen a tad lower at 3.7% in the reported period.
Average Hourly Earnings will also garner attention. The measure of wage inflation tends to have a significant impact on the Fed’s monetary policy decision-making. Average Hourly Earnings are seen rising 4.3% on a yearly basis in September, at the same pace as seen in August. On a monthly basis, Average Hourly Earnings are expected to edge 0.3% higher in September when compared to a 0.2% increase in August.
Analysts at TD Securities noted, “in terms of payrolls, we are looking for an above-market rebound to 210k above market expectations of 165k. Friday's report will follow three consecutive prints under the 200k mark. We are also expecting the unemployment rate to stay unchanged at 3.8%.”
When will US September Nonfarm Payrolls data be released and how could it affect EUR/USD?
The Nonfarm Payrolls indicator, part of the US labor market report, will be published at 12:30 GMT on Friday. EUR/USD is attempting a tepid recovery from a ten-month low of 1.0448 set on Tuesday, as the monetary policy and macroeconomic divergences between the Fed and the European Central Bank (ECB) widen.
An upbeat NFP headline print and hot wage inflation data would strengthen market wagers for one more Fed rate hike by year-end, providing an extra leg to the ongoing upsurge in the US Dollar. EUR/USD could test levels below 1.0400.
On the other hand, the US Dollar could see a sharp correction if the data points to loosening labor market conditions and smashes hopes for any further rate hike by the Fed this year. In such a case, EUR/USD could stage a solid recovery toward 1.0650.
Dhwani Mehta, Asian Session Lead Analyst at FXStreet, offers a brief technical outlook for the EUR/USD pair and explains: “The main currency pair has moved away from multi-month troughs but the bearish potential remains intact, as the 14-day Relative Strength Index (RSI) continues to hover below the midline. Failure to find acceptance above the 1.0600 round level on its road to recovery will trigger a fresh downswing toward the 1.0448 YTD low. Deeper declines will then target the 1.0400 round figure.”
“On the flip side, if the 1.0600 static resistance is taken out, Euro buyers will challenge the downward-sloping 21-day Simple Moving Average (SMA) at 1.0616. The next relevant upside barrier is envisioned near 1.0670, where the September 21 and 22 highs align,” Dhwani adds.
Euro price this week
The table below shows the percentage change of Euro (EUR) against listed major currencies this week. Euro was the strongest against the Australian Dollar.
| USD | EUR | GBP | CAD | AUD | JPY | NZD | CHF | |
| USD | 0.25% | 0.16% | 1.08% | 1.22% | -0.48% | 0.68% | -0.19% | |
| EUR | -0.23% | -0.10% | 0.83% | 0.97% | -0.73% | 0.45% | -0.42% | |
| GBP | -0.15% | 0.10% | 0.92% | 1.06% | -0.64% | 0.52% | -0.35% | |
| CAD | -1.09% | -0.83% | -0.89% | 0.14% | -1.57% | -0.40% | -1.28% | |
| AUD | -1.23% | -0.98% | -1.07% | -0.14% | -1.71% | -0.55% | -1.44% | |
| JPY | 0.46% | 0.72% | 0.65% | 1.56% | 1.68% | 1.18% | 0.28% | |
| NZD | -0.66% | -0.44% | -0.52% | 0.43% | 0.54% | -1.17% | -0.88% | |
| CHF | 0.20% | 0.45% | 0.36% | 1.29% | 1.42% | -0.30% | 0.89% |
The heat map shows percentage changes of major currencies against each other. The base currency is picked from the left column, while the quote currency is picked from the top row. For example, if you pick the Euro from the left column and move along the horizontal line to the Japanese Yen, the percentage change displayed in the box will represent EUR (base)/JPY (quote).
Economic Indicator
United States Nonfarm Payrolls
The Nonfarm Payrolls released by the US Bureau of Labor Statistics presents the number of new jobs created during the previous month in all non-agricultural businesses. The monthly changes in payrolls can be extremely volatile due to their high relation with economic policy decisions made by the Federal Reserve. The number is also subject to strong reviews in the upcoming months, and those reviews also tend to trigger volatility in the Forex board. Generally speaking, a high reading is seen as positive (or bullish) for the USD, while a low reading is seen as negative (or bearish), although previous months' reviews and the unemployment rate are as relevant as the headline figure, and therefore market's reaction depends on how the market assets them all.
Read more.Next release: 10/06/2023 12:30:00 GMT
Frequency: Monthly
Source: US Bureau of Labor Statistics
Why it matters to traders
America’s monthly jobs report is considered the most important economic indicator for forex traders. Released on the first Friday following the reported month, the change in the number of positions is closely correlated with the overall performance of the economy and is monitored by policymakers. Full employment is one of the Federal Reserve’s mandates and it considers developments in the labor market when setting its policies, thus impacting currencies. Despite several leading indicators shaping estimates, Nonfarm Payrolls tend to surprise markets and trigger substantial volatility. Actual figures beating the consensus tend to be USD bullish.
- The index manages to gather some upside traction.
- Bets for a rate hike in the latter part of the year dwindle.
- All the attention will be on the US jobs report.
The USD Index (DXY), which tracks the greenback vs. a bundle of its main competitors, looks bid around the 106.50 at the end of the week.
USD Index focuses on data
The index manages to regain some balance and leave behind two consecutive sessions of losses on Friday, regaining the 106.50 region and shifting its focus to another test of the 107.00 neighbourhood.
The recent knee-jerk in the index came pari passu with the equally marked correction in US yields across different maturities, as speculation of further tightening by the Federal Reserve before year-end appears to have been losing momentum as of late.
In the meantime, investors are expected to closely follow the release of the US labour market report, where the economy is expected to have created 170K jobs in September and the Unemployment Rate is projected to have receded to 3.7%.
Other than the US jobs report, the docket includes Consumer Credit Change figures and the speech by FOMC Governor C. Waller (permanent voter, hawk).
What to look for around USD
The dollar attempts a recovery after testing the contention area near 106.50, while th release of US Nonfarm Payrolls for the month of September will take centre stage later in the NA session.
In the meantime, support for the dollar keeps coming from the good health of the US economy, which at the same time appears underpinned by the renewed tighter-for-longer stance narrative from the Federal Reserve.
Key events in the US this week: Nonfarm Payrolls, Unemployment Rate, Consumer Credit Change (Friday).
Eminent issues on the back boiler: Persevering debate over a soft or hard landing for the US economy. Incipient speculation of rate cuts in early 2024. Geopolitical effervescence vs. Russia and China.
USD Index relevant levels
Now, the index is up 0.14% at 106.49 and a breakout of 107.34 (2023 high October 3) would open the door to 107.99 (weekly high November 21 2022) and finally 110.99 (high November 10 2022). On the downside, the next support emerges at 105.65 (low September 29) ahead of 104.42 (weekly low September 11) and then 103.16 (200-day SMA).
- EUR/JPY gains momentum near 156.85 ahead of the German data.
- Germany’s trade surplus came in at €16.6B in August vs. €17.7B prior, above the market expectation.
- Japan’s Coincident Index for August came in at 114.3 vs. 114.2 prior; Leading Economic Index improved to 109.5 vs.108.2 prior.
- Traders will monitor the German Factory Orders due later on Friday.
The EUR/JPY cross attracts some buyers during the early European session on Friday. Market players await the German Factory Orders for August for fresh impetus. The monthly figure is expected to rise 1.8% from an 11.7% fall in the previous reading. The major pair currently trades near 156.85, gaining 0.25% on the day.
On Thursday, Germany’s trade surplus came in at €16.6B in August from €17.7B in July, above the market expectation of €15.0B. Meanwhile, France’s Industrial Production for August contracted 0.3% MoM from a 0.5% rise in the previous reading, missing the market consensus.
Markets anticipate the European Central Bank (ECB) to maintain the interest rate by the end of the year, despite inflation levels exceeding the target and rising concerns of a future recession or stagflation in the region.
On the other hand, the Bank of Japan (BoJ) Governor Kazuo Ueda said last week that there was "a distance to go" for BoJ before exiting its ultra-loose monetary policy. According to the BoJ Summary of Opinions at the Monetary Policy Meeting on September 21 and 22, BOJ said that they do not need to make additional tweaks to YCC as long-term rates moving fairly stably and said that end to negative rate must be tied to the success of achieving 2% inflation.
Apart from this, Japanese Finance Minister Shunichi Suzuki again declined on Thursday to comment on whether Japan intervened in the FX market. Suzuki noted that there are various factors to consider when determining if currency fluctuations are excessive, and there would be no change in how the government handles them. That said, the potential intervention by the Japanese authorities to support JPY might act as a headwind for the EUR/JPY cross.
The latest data on Friday showed that the Japanese preliminary Coincident Index for August came in at 114.3 versus 114.2 prior whereas the Leading Economic Index improved to 109.5 versus 108.2 prior, beating the estimation of 109.0. Earlier Friday, the Japanese Labor Cash Earnings for August rose by 1.1% YoY versus 1.3% prior, below the estimation of 1.5%. Meanwhile, the nation’s Household Spending dropped 2.5% YoY from a 5% fall in the previous reading, better than the expectation of a 4.3% decline.
Moving on, market players will monitor the German Factory Orders and France’s Trade Balance for August. Traders will take cues from these figures and find trading opportunities around the EUR/JPY cross.
FX option expiries for Oct 6 NY cut at 10:00 Eastern Time, via DTCC, can be found below.
- EUR/USD: EUR amounts
- 1.0450 2.69b
- 1.0685 2.56b
- GBP/USD: GBP amounts
- 1.2225 735m
- 1.2200 696m
- USD/JPY: USD amounts
- 150.00 1.82b
- 149.00 825m
- 150.25 704.6m
- AUD/USD: AUD amounts
- 0.6400 2.18b
- 0.6300 1.56b
- USD/CAD: USD amounts
- 1.3625 1.5b
- 1.3665 680m
- EUR/GBP: EUR amounts
- 0.8785 303m
- USD/CNY: USD amounts
- 7.3000 1.6b
- 7.2000 805m
Further upside could encourage EUR/USD to a test the 1.0630 region in the next few weeks, suggest UOB Group’s Markets Strategist Quek Ser Leang and Senior FX Strategist Peter Chia.
Key Quotes
24-hour view: Yesterday, we expected EUR to trade sideways between 1.0470 and 1.0535. However, EUR rose to a high of 1.0551 before closing on a firm note at 1.0548 (+0.43%). While upward momentum has not increased by much, EUR could rise further to 1.0595. The major resistance at 1.0630 is highly unlikely to come into view. On the downside, if EUR breaks below 1.0505 (minor support is at 1.0520), it would indicate that the current upward pressure has eased.
Next 1-3 weeks: On Tuesday (03 Oct, spot at 1.0480), we highlighted that EUR “is still in a bearish phase, and it is likely to weaken to 1.0430, potentially below 1.0400.” EUR then dropped to 1.0547 and rebounded. Yesterday (05 Oct, spot at 1.0505), we noted that “downward momentum is beginning to slow.” We highlighted that if EUR “breaks above 1.0545, it would mean that 1.0530 is not coming into view this time around.” In NY trade, EUR broke above 1.0545 and reached 1.0551. The current price action is likely part of a rebound that could extend to 1.0630, but unlikely to break clearly above this level. The mild upward pressure is intact as long as EUR stays above 1.0460.
- USD/INR holds below the 83.20 mark after the Reserve Bank of India (RBI) rate decision.
- RBI maintained a status quo on rates for the fourth consecutive time at 6.5%.
- US Initial Jobless Claims improved to 207,000 from 205,000 in the previous week.
- The US Nonfarm Payrolls will be a closely watched event for traders on Friday.
USD/INR loses momentum around 83.16 during the Asian trading hours on Friday. Markets turn cautious following the Reserve Bank of India (RBI) monetary policy meeting. Traders await the highly-anticipated US Nonfarm Payrolls data on Friday for the fresh impetus. The figures are expected to rise by 170K and this event could trigger the volatility in the market.
Following its October monetary policy meeting, the Reserve Bank of India (RBI) board members decided to hold the interest rate unchanged at 6.5%, as widely expected. The benchmark repo rate was raised in February and remained unchanged since then due to the higher retail inflation and global factors, particularly high crude oil prices.
During the monetary policy meeting, RBI Chief Shaktikanta Das stated that headline inflation would continue to fall in September while mentioning that cumulative policy rate hikes still working through the economy.
About the data this week, S&P Global India Services PMI for September improved to 61.0 from 60.1 in the previous reading, better than the expectation of 59.5. Meanwhile, the Manufacturing PMI came in at 57.5 in September from 58.6 in August, missing the estimation of 58.1.
On the other hand, US data on Thursday revealed that the weekly Initial Jobless Claims for the week ending on September 30 improved to 207,000 from 205,000 in the previous week, below the market consensus of 210,000. Additionally, the US Balance of Trade deficit was $58.3B from the $64.7B recorded in July, lower than the expected $ 62.3 B.
Earlier this week, US private payrolls for September rose by 89,000 versus 180,000 prior, below the estimation, While, the US ISM Services PMI fell to 53.6 in September from the previous reading of 54.5, matching the market estimation.
Federal Reserve (Fed) is not expected to abandon its ‘higher-for-longer’ stance on interest rates. Market players await the highly-anticipated US Nonfarm Payrolls for more clarity about labor market conditions. The softer figures could exert some selling pressure on the Greenback against its rivals and act as a headwind for the USD/INR pair.
Looking ahead, market players will keep an eye on the US employment data due later in the American session on Friday. The US Nonfarm Payrolls are expected to rise by 170K while the Unemployment Rate is estimated to decline to 3.7% from 3.8%. Traders will take cues from these figures and find trading opportunities around the USD/INR pair.
- Silver edges higher during the Asian session on Friday, albeit lacks follow-through.
- The range-bound price action could be categorized as a bearish consolidation phase.
- The oversold RSI on the daily chart might hold back bears from placing fresh bets.
Silver attracts some buyers during the Asian session on Friday and currently trades around the $21.00 mark, up nearly 0.20% for the day. The white metal, however, remains confined in a familiar range held over the past four days and the technical setup suggests that the path of least resistance is to the downside.
The subdued range-bound price action constitutes the formation of a rectangle on hourly charts. Against the backdrop of the recent sharp rejection slide from a technically significant 200-day Simple Moving Average (SMA), this might still be categorized as a bearish consolidation phase. This, along with last week's breakdown through the $23.30-$23.20 horizontal support, validates the near-term negative outlook for the XAG/USD.
That said, the oversold Relative Strength Index (RSI) on the daily chart is holding back traders from placing fresh bearish bets and positioning for any further depreciating move. Meanwhile, any subsequent move up might still be seen as a selling opportunity near the $21.40 region. A sustained strength beyond, however, might trigger a short-covering rally and allow the XAG/USD to reclaim the $22.00 round-figure mark.
The next relevant hurdle is pegged near the $22.20-$22.30 strong horizontal support breakpoint, which should now act as a key pivotal point for short-term traders. A sustained strength beyond will negate the negative outlook and shift the near-term bias in favour of bullish traders.
On the flip side, the $20.70-$20.65 zone, or a nearly seven-month low touched this week, might continue to act as immediate support and protect the downside. Some follow-through selling, however, should pave the way for a slide towards challenging the YTD trough – levels just below the $20.00 psychological mark touched in March.
Silver daily chart
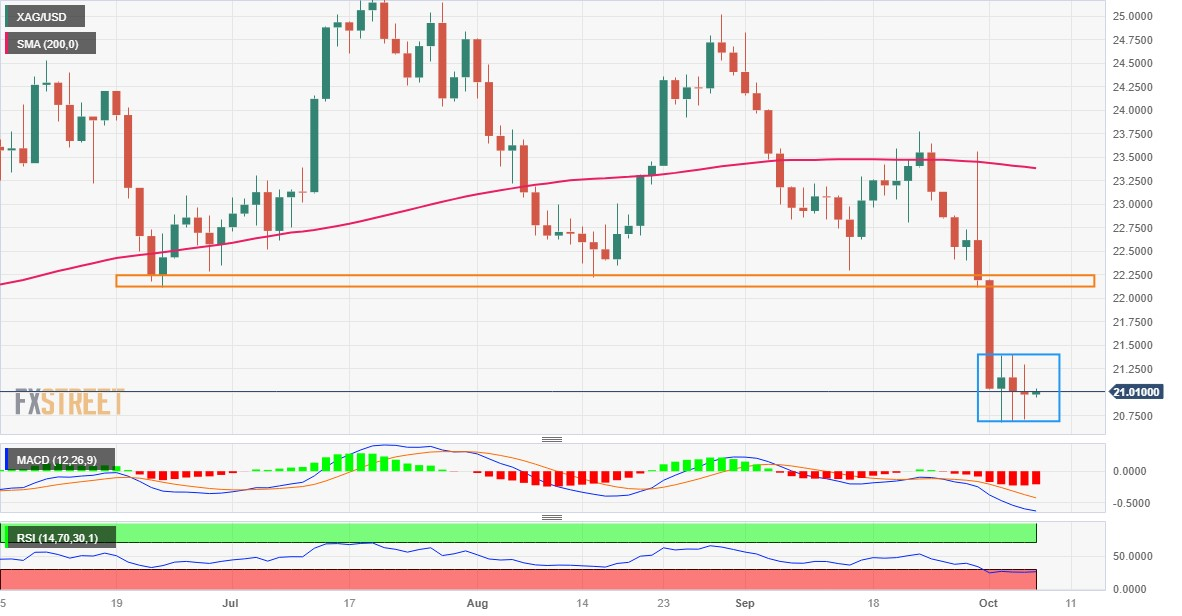
Technical levels to watch
- Gold price attracts some buyers on Friday and snaps a nine-day losing streak to a multi-month low.
- The uptick lacks any obvious catalyst and is likely to remain capped amid hawkish Fed expectations.
- Traders now look forward to the release of the crucial US NFP report for a fresh directional impetus.
Gold price (XAU/USD) edges higher during the Asian session on Friday and for now, seems to have snapped a nine-day losing streak around the $1,813 area, or a fresh seven-month low touched the previous day. Any meaningful upward move, however, still seems elusive as traders may opt to wait on the sidelines ahead of the release of the crucial monthly employment details from the United States (US), due later on Friday.
The widely known Nonfarm Payrolls (NFP) report will influence expectations about the Federal Reserve's (Fed) future rate-hike path and provide a fresh directional impetus to the Gold price. In the meantime, the prospects for further policy tightening by the Fed remain supportive of elevated US bond yields, which helps the US Dollar (USD) to stall a two-day corrective slide from the YTD peak and should cap gains for the precious metal.
Market participants seem convinced that the Fed will stick to its hawkish stance in the wake of resilient US macro data, which remain consistent with expectations for solid growth in the third quarter. Furthermore, stronger US jobs data would mean more pressure on wages and on inflation, which might force the Fed to keep rates higher for longer. This, in turn, should boost the USD and weigh on the US Dollar-denominated Gold price.
Daily Digest Market Movers: Gold price edges higher after declining for nine straight sessions
- Gold price gains some positive traction on Friday and moves away from a seven-month low touched the previous day amid some repositioning trade ahead of the crucial US NFP report.
- The US economy is expected to have added 170K jobs in September, less than the 187K in the previous month, while the jobless rate is anticipated to tick down to 3.7% from 3.8% in August.
- The benchmark 10-year US Treasury bond yield holds steady near a 16-year peak on the back of hawkish Fed expectations and underpins the US Dollar, which should cap upside for XAU/USD.
- Fed officials on Thursday showed little concern about the recent surge in the US bond yields and said that it could actually help the central bank in its fight against persistently high inflation.
- Fed officials have been warning that rates are likely to stay elevated, though the markets are pricing in less than a 40% chance of another rate hike before the end of this year.
- Thursday's US macro data showed that Weekly Jobless Claims rose moderately to 207K last week, though it remained around recent lows and pointed to still-tight labour market conditions.
- The continued tightness in the labour market could exert upward pressure on inflation and necessitate additional interest rate hikes by the US central bank.
Technical Analysis: Gold price could extend the consolidation phase before the next leg down
The occurrence of a death cross, with the 50-day Simple Moving Average (SMA) falling below the key 200-day SMA for the first time since July 2022, signals the potential for further weakness in the Gold price. That said, the Relative Strength Index (RSI) on the daily chart still points to near-term oversold conditions and makes it prudent to wait for a further near-term consolidation or a modest bounce before the next leg down. Nevertheless, the technical setup remains tilted firmly in favour of bearish traders and suggests that the path of least resistance for the XAU/USD is to the downside.
From current levels, any subsequent move up might continue to confront stiff resistance near the $1,830-$1,832 supply zone, above which a bout of a short-covering rally could lift the Gold price to the $1,850 hurdle. The recovery momentum could extend further, though it is more likely to remain capped near the $1,858-1,860 strong barrier. On the flip side, the $1,815-1,813 area, or a multi-month low, now seems to have emerged as an immediate strong support. This is followed by the $1,800 round-figure mark, which if broken decisively will expose the next relevant support near the $1,770-1,760 region.
US Dollar price today
The table below shows the percentage change of US Dollar (USD) against listed major currencies today. US Dollar was the strongest against the Japanese Yen.
| USD | EUR | GBP | CAD | AUD | JPY | NZD | CHF | |
| USD | 0.04% | 0.06% | 0.02% | -0.08% | 0.15% | 0.06% | 0.06% | |
| EUR | -0.04% | 0.02% | -0.02% | -0.13% | 0.12% | 0.03% | 0.03% | |
| GBP | -0.06% | -0.02% | -0.04% | -0.13% | 0.08% | 0.01% | 0.01% | |
| CAD | -0.01% | 0.02% | 0.04% | -0.09% | 0.13% | 0.04% | 0.05% | |
| AUD | 0.07% | 0.11% | 0.11% | 0.09% | 0.22% | 0.15% | 0.14% | |
| JPY | -0.15% | -0.10% | -0.08% | -0.15% | -0.24% | -0.08% | -0.09% | |
| NZD | -0.06% | -0.02% | -0.01% | -0.04% | -0.15% | 0.08% | 0.00% | |
| CHF | -0.07% | -0.03% | -0.01% | -0.05% | -0.15% | 0.09% | 0.00% |
The heat map shows percentage changes of major currencies against each other. The base currency is picked from the left column, while the quote currency is picked from the top row. For example, if you pick the Euro from the left column and move along the horizontal line to the Japanese Yen, the percentage change displayed in the box will represent EUR (base)/JPY (quote).
Economic Indicator
United States Nonfarm Payrolls
The Nonfarm Payrolls released by the US Bureau of Labor Statistics presents the number of new jobs created during the previous month in all non-agricultural businesses. The monthly changes in payrolls can be extremely volatile due to their high relation with economic policy decisions made by the Federal Reserve. The number is also subject to strong reviews in the upcoming months, and those reviews also tend to trigger volatility in the Forex board. Generally speaking, a high reading is seen as positive (or bullish) for the USD, while a low reading is seen as negative (or bearish), although previous months' reviews and the unemployment rate are as relevant as the headline figure, and therefore market's reaction depends on how the market assets them all.
Read more.Next release: 10/06/2023 12:30:00 GMT
Frequency: Monthly
Source: US Bureau of Labor Statistics
Why it matters to traders
America’s monthly jobs report is considered the most important economic indicator for forex traders. Released on the first Friday following the reported month, the change in the number of positions is closely correlated with the overall performance of the economy and is monitored by policymakers. Full employment is one of the Federal Reserve’s mandates and it considers developments in the labor market when setting its policies, thus impacting currencies. Despite several leading indicators shaping estimates, Nonfarm Payrolls tend to surprise markets and trigger substantial volatility. Actual figures beating the consensus tend to be USD bullish.
- GBP/USD faces downward pressure ahead of US employment data.
- Improved US Treasury yields hold positions near multi-year highs due to the Fed’s hawkish stance.
- BoE’s soft tone surrounding policy rates could undermine the Pound Sterling.
GBP/USD looks to retrace recent gains, trading slightly lower around 1.2180 during the Asian session on Friday. However, the pair received upward support, which could be attributed to the correction in the US Dollar (USD) following the decline in US Bond yields.
The US Dollar Index (DXY) attempts to rebound, hovering slightly higher around 106.40 as of now. The Greenback’s correction comes after reaching an 11-month high earlier this week.
US Treasury yields hold steady, maintaining their positions near multi-year highs. Market participants are exercising caution due to the US Federal Reserve's (Fed) hawkish stance on the trajectory of interest rates. The 10-year US Treasury yield remains above 4.70%, close to its highest level since 2007.
Despite the overall stability, the US Initial Jobless Claims for the week ending September 29 saw an increase to 207K from the previous reading of 205K. Surprisingly, this surpassed the market expectation of 210K.
On a positive note, US Challenger Job Cuts have significantly decreased from 75.151K to 47.457K in September. Traders eagerly anticipate the upcoming release of US Nonfarm Payrolls and Average Hourly Earnings on Friday. These figures will serve as a confirmation of the tight labor market, and upbeat numbers could potentially trigger a rise in the US Dollar and elevate volatility in the bond market.
On the other side, the British Pound (GBP) faces a bout of underperformance, largely influenced by the unexpected move from the Bank of England (BoE) to halt its rate-hiking cycle in September. This shift deviates from the trend observed since December 2021, as the BoE chose not to raise interest rates.
Adding to the challenge, the central bank revised down its growth forecast for the July-September period from 0.4% to a mere 0.1%, providing little indication of any inclination to pursue further rate increases. In conjunction with the robust bullish sentiment surrounding the USD, these factors present hurdles for the Pound Sterling (GBP).
- GBP/JPY holds above the 181.00 mark on Friday.
- The downbeat UK economic data added to the country's dismal economic outlook.
- Japanese Labor Cash Earnings for August rose by 1.1% YoY vs. 1.3% prior, below than expected.
The GBP/JPY cross holds positive ground for the third consecutive day after bouncing off the weekly low of 178.08 during the Asian session on Friday. The speculation that Japanese authorities will intervene in the currency remains in traders’s focus in the quiet day of top-tier data released from both Japan and the UK. The cross currently trades near 181.09, up 0.02% on the day.
On Thursday, the downbeat UK S&P Global Construction PMI added to the country's dismal economic outlook, coming in at 45.0 in September from 50.8 in the previous reading, below the market expectation of 49.9. Earlier this week, both the UK’s S&P Global/CIPS Composite PMI and Services PMI for September came in above the market consensus but remained below 50 in contraction territory. This, in turn, weighs on the British Pound (GBP) against the Japanese Yen (JPY)
On the JPY’s front, Japanese Finance Minister Shunichi Suzuki again declined on Thursday to comment on whether Japan intervened in the FX market. Suzuki noted that there are various factors to consider when determining if currency fluctuations are excessive, and there would be no change in how the government handles them. That said, the potential intervention by the Japanese authorities to support JPY might act as a headwind for the GBP/JPY cross.
Earlier Friday, the latest data revealed that Japanese Labor Cash Earnings for August rose by 1.1% YoY versus 1.3% prior, below the estimation of 1.5%. Meanwhile, the nation’s Household Spending dropped 2.5% YoY from a 5% fall in the previous reading, better than the expectation of a 4.3% decline.
Moving on, the Japanese preliminary Coincident Index and Leading Economic Index for August will be released. Also, the UK Halifax House Prices for September will be due later on Friday.
- USD/MXN experienced upward support ahead of US employment data.
- Mexican government altered airport tariffs, which might exert pressure on the MXN.
- Investors await NFP and earnings data for confirmation post positive data on Thursday.
USD/MXN extends its gains on the second day, trading higher around 19.3000 during the Asian session on Friday. The Mexican Peso (MXN) faced a downward push following the announcement from the Mexican government aviation agency about alterations in airport tariffs.
This development triggered volatility in the Mexican Stock Exchange and intensified the Mexican Peso's decline to a fresh six-month low. However, Mexico’s Consumer Confidence improved 46.4 for September from the previous 46.1 readings.
The US Dollar Index (DXY) struggles to retrace recent losses, trading slightly higher around 106.40 at the time of writing. The DXY corrected from an 11-month high due to a decline in the US Treasury yields.
However, the US Initial Jobless Claims for unemployment benefits in the United States (US) for the week ending September 29, increased to 207K from the previous reading of 205K, beating the market expectation of 210K.
US Challenger Job Cuts have come down significantly from the previous figure of 75.151K to 47.457K in September. Traders await the upcoming US Nonfarm Payrolls and Average Hourly Earnings on Friday, seeking confirmation of a tight labor market. Upbeat numbers could trigger the US Dollar (USD) and increase volatility in the bond market.
Additionally, the US Treasury yields hold steady to remain positioned near multi-year highs, as the market exercises caution regarding the hawkish stance of the US Federal Reserve (Fed) on interest rates trajectory. The 10-year US Treasury yield holds above 4.70%, close to the highest level since 2007.
Japanese Finance Minister Shunichi Suzuki declined once again on Thursday to “comment on whether Japan intervened in FX market.”
Additional quotes
There are many factors to determine whether moves in FX are "excessive".
No change in how govt would deal with those.
Market reaction
USD/JPY is trading on the front foot near 148.60, despite the Japanese verbal intervention. The pair is up 0.07% on the day, as of writing.
- EUR/USD struggles to gain any meaningful traction on Friday and oscillates in a narrow band.
- The technical setup seems tilted in favour of bears and supports prospects for further decline.
- Traders now await the release of the key US NFP report before placing fresh directional bets.
The EUR/USD pair is seen oscillating in a narrow trading band during the Asian session on Friday and consolidating its recovery gains registered over the past two days, from mid-1.0400s or the YTD low touched earlier this week. Spot prices currently trade just below the 1.0550 level, nearly unchanged for the day, as traders keenly await the release of the closely-watched US monthly employment details, popularly known as the NFP report.
Heading into the key data risk, the prospects for further policy tightening remain supportive of elevated US Treasury bond yields and act as a tailwind for the US Dollar (USD). Apart from this, a generally weaker tone around the equity markets further seems to underpin the safe-haven Greenback. This, along with expectations that additional rate hikes by the European Central Bank (ECB) may be off the table for now, contributes to keeping a lid on the EUR/USD pair.
From a technical perspective, the recent decline from a 17-month peak touched in June has been along a descending channel and points to a well-established downtrend. Moreover, the Relative Strength Index (RSI) on the daily chart has also recovered from the oversold territory. Hence, any subsequent move up might still be seen as an opportunity to initial fresh bearish positions around the EUR/USD pair and run the risk of fizzling out rather quickly.
Meanwhile, any positive reaction to a disappointment from the US jobs data could lift spot prices beyond the 1.0600 round-figure mark. The momentum could get extended, though is more likely to remain capped near the top boundary of the aforementioned channel, currently around mid-1.0600s. The latter should act as a key pivotal point, which if cleared will suggest that the EUR/USD pair has formed a nea-term bottom and shift the bias in favour of bulls.
On the flip side, the 1.0500 psychological mark now seems to protect the immediate downside. Some follow-through selling could make spot prices vulnerable to refresh the YTD low and challenge the ascending channel support, near the 1.0420-1.0415 region. A convincing break below will be seen as a fresh trigger for bearish traders and pave the way for an extension of the EUR/USD pair's near-three-month-old downward trajectory.
EUR/USD daily chart
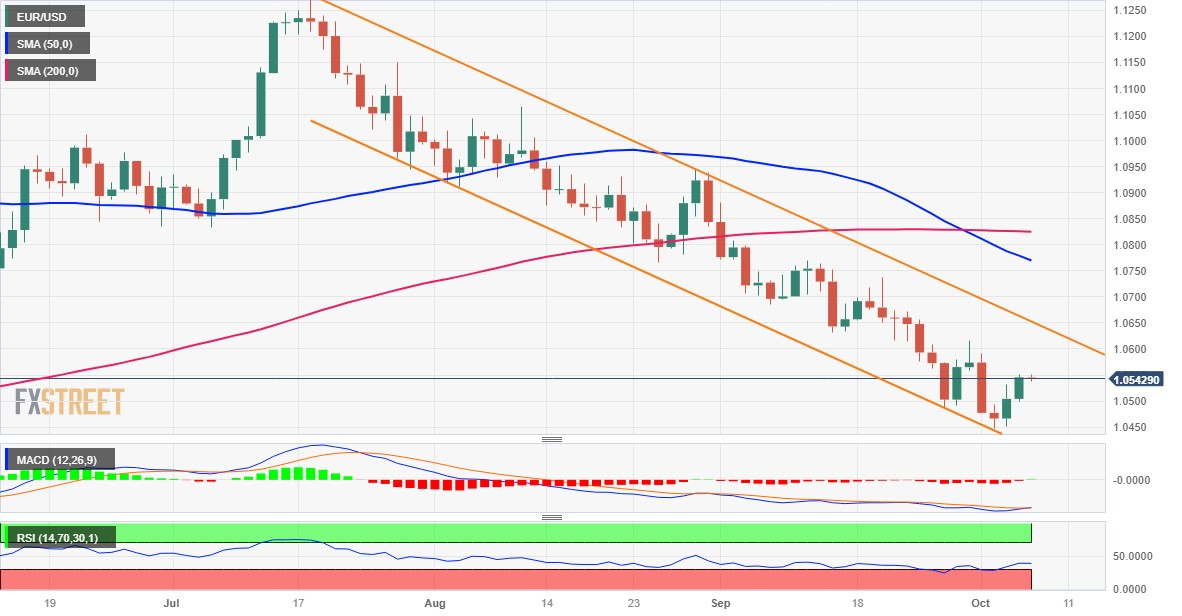
Technical levels to watch
| Raw materials | Closed | Change, % |
|---|---|---|
| Silver | 20.963 | -0.2 |
| Gold | 1820.166 | -0.09 |
| Palladium | 1150.28 | -1.38 |
- US Dollar Index holds ground ahead of US Nonfarm Payrolls.
- Improved US Treasury yields could provide support for the Greenback.
- US unemployment data showed a tight labor market; awaiting NFP and earnings data for confirmation.
The US Dollar Index (DXY) attempts to snap the two-day losing streak, trading slightly higher around 106.40 during the early Asian trading hours on Friday. The DXY corrected from an 11-month high due to a decline in the US Treasury yields.
However, the previous week’s initial claims for unemployment benefits in the United States (US) showed a downtrend, which indicated improvement in the labor market. US Initial Jobless Claims for the week ending September 29, improved to 207K from the previous reading of 205K, beating the market expectation of 210K.
US Challenger Job Cuts have come down significantly from the previous figure of 75.151K to 47.457K in September. Traders await the upcoming US Nonfarm Payrolls and Average Hourly Earnings on Friday, seeking confirmation of a tight labor market. Upbeat numbers could trigger the US Dollar (USD) and increase volatility in the bond market.
Additionally, the US Treasury yields hold steady to remain positioned near multi-year highs, as the market exercises caution regarding the hawkish stance of the US Federal Reserve (Fed) on interest rates trajectory. The 10-year US Treasury yield holds above 4.70%, close to the highest level since 2007.
- USD/CHF ticks higher during the Asian session on Friday and snaps a two-day losing streak.
- The Fed’s hawkish outlook, elevated US bond yields underpin the USD and act as a tailwind.
- Investors keenly await the US NFP report before positioning for a firm near-term direction.
The USD/CHF pair finds some support near the 0.9120 region during the Asian session on Friday and for now, seems to have stalled this week's corrective pullback from its highest level since March 22. Spot prices, however, remain confined in a familiar range held over the past two weeks or so, awaiting a fresh catalyst before the next leg of directional move.
Hence, the market focus will remain glued to the closely-watched US monthly employment details, popularly known as the NFP report, due later today. The US economy is expected to have added 170K jobs in September, less than the 187K in the previous month, while the jobless rate is anticipated to tick down from 3.8% to 3.7% during the reported month. The crucial data will play a key role in influencing market expectations about the Federal Reserve's (Fed) future rate-hike path, which, in turn, will drive the US Dollar (USD) and provide some meaningful impetus to the USD/CHF pair.
Heading into the key data risks, growing acceptance that the Fed will stick to its hawkish stance helps limit a two-day-old US Dollar (USD) retracement from the YTD peak and acts as a tailwind for the major. In fact, the markets have been pricing in the possibility of one more rate hike by the end of this year. Moreover, the US macro data remains consistent with expectations of solid growth in the third quarter and supports prospects for further policy tightening by the Fed. This remains supportive of elevated US Treasury bond yields, underpinning the USD and lending support to the USD/CHF pair.
The aforementioned fundamental backdrop, along with the recent breakout through a technically significant 200-day Simple Moving Average (SMA), suggests that the path of least resistance for the USD/CHF pair is to the upside. Hence, any immediate market reaction to the disappointing US jobs data is more likely to be limited and might still be seen as a buying opportunity. However, it will still be prudent to wait for sustained strength and acceptance above the 0.9200 mark before traders start positioning for an extension of the recent strong uptrend witnessed over the past three months or so.
Technical levels to watch
- USD/CAD holds above the 1.3700 psychological round mark ahead of the key events from the US and Canada.
- US weekly Initial Jobless Claims last week improved to 207,000 vs. 205.000 prior, missing the expectation.
- A decline in oil prices weighs on the commodity-linked Loonie.
- Market players await the US and Canadian employment data on Friday.
The USD/CAD pair finds support above the 1.3700 mark during the early Asian session on Friday. A decline in oil prices continues to exert pressure on the commodity-linked Loonie. Market players await the employment data from both the US and Canada due later in the American session on Friday. The pair currently trades around 1.3706, gaining 0.01% on the day.
On Thursday, the US weekly Initial Jobless Claims for the week ending on September 30 improved to 207,000 from 205,000 in the previous week, below the market consensus of 210,000. Additionally, the US Balance of Trade deficit was $58.3B from the $64.7B recorded in July, lower than the expected $ 62.3 B.
Earlier this week, US private payrolls for September rose by 89,000 versus 180,000 prior, below the estimation, While, the US ISM Services PMI fell to 53.6 in September from the previous reading of 54.5, matching the market estimation.
Federal Reserve (Fed) is not expected to abandon its ‘higher-for-longer’ stance on interest rates. Market players await the highly-anticipated US Nonfarm Payrolls for more clarity about labor market conditions. The softer figures could exert some selling pressure on the Greenback against its rivals and act as a headwind for the USD/CAD pair.
On the Canadian Dollar front, the downtick in oil prices weighs on the Loonie as the country is the leading oil exporter to the US. Earlier this week, a data release showed that the Canadian S&P Global Manufacturing PMI for September came in at 47.5 from the previous reading of 48.0.
Furthermore, market markets have priced in the odds of 65% that the Bank of Canada (BoC) will hike the rate one more time this year. This, in turn, might lift the Canadian Dollar (CAD) against the Greenback.
Market participants will monitor the US and Canadian employment data due on Friday. The US Nonfarm Payrolls are expected to rise by 170K while the Unemployment Rate is estimated to decline to 3.7% from 3.8%. Also, the Canadian Net Change in Employment is expected to gain 20,000 in September. Traders will take cues from these figures and find trading opportunities around the USD/CAD pair.
In its bi-annual Financial Stability Review (FSR), the Reserve Bank of Australia (RBA) noted that “global financial stability risks are elevated and growing.”
Additional takeaways
Risks include China property sector, a disorderly fall in global asset prices, exposure to commercial real estate.
Tightening in global financial conditions could slow growth, lift unemployment.
Fall in global asset prices could raise funding costs in Australia, limit supply of credit.
Australian financial system sound, some pockets of stress among household borrowers.
Australian banks well capitalised, have low exposure to commercial property.
Banks well positioned to manage any increase in mortgage arrears, absorb loan losses.
Small, but rising share of households in early stages of financial stress.
Most borrowers well placed should interest rates rise further.
Most borrowers also well placed to cope with extended period of high rates.
Any increase in unemployment would add to stress, but unlikely to threaten system overall.
Risks posed by non-bank institutions in Australia remain low.
-
Australian Dollar moves sideways ahead of US Nonfarm Payrolls data
- Australian Dollar experienced positive momentum due to the correction in the US Dollar.
- Australia's FSR report stated that Australian banks remain well-positioned despite elevated global and domestic risks.
- Investors await the US NFP report, seeking confirmation of a tight labor market.
The Australian Dollar (AUD) consolidates after recent gains in the last two sessions. The Aussie pair gained support from the correction in the US Dollar (USD) following a decline in US Treasury yields.
Australia’s report for October 2023, Financial Stability Review (FSR) from the Reserve Bank of Australia (RBA) indicates elevated global financial stability risks due to challenging macroeconomic conditions.
The rise in inflation and interest rates since 2021 has strained household and business finances not only in Australia but also globally. Prolonged high levels of inflation and interest rates pose a risk of significant credit quality deterioration, potentially leading lenders to reduce credit provision.
However, the report mentioned that Australian banks remain well-positioned to continue supplying credit to the economy despite elevated global and domestic risks.
Moreover, a November meeting between President Biden and Chinese leader Xi Jinping in San Francisco is in the works, signaling an effort to stabilize relations between the world's top two economies.
This potential summit follows their last meeting in Bali, Indonesia, in November last year, where both leaders stressed the importance of face-to-face diplomacy and expressed hope for the reconstruction of US-China relations.
The US Dollar Index (DXY) attempts to snap the two-day losing streak. The index continued to correct from an 11-month high due to a decline in the US Treasury yields. However, the previous week’s initial claims for unemployment benefits in the United States (US) showed a downtrend, which indicated improvement in the labor market.
Daily Digest Market Movers: Australian Dollar consolidates ahead of US Nonfarm Payrolls
- RBA’s FSR report affirms that Australian banks are in a robust position to maintain credit supply to the economy, even amid heightened global and domestic risks.
- Australia's Trade Balance (MoM) showed improvement in August, reaching 9,640 million, surpassing market expectations of 8,725 million. July's reading stood at 8,039 million.
- Australia’s central bank could go for a rate hike, with expectations pointing toward a peak of 4.35% by the end of the year. This projection aligns with the persistent elevation of inflation above the target.
- Michele Bullock, the newly appointed governor of the RBA, in her inaugural monetary policy statement following the interest rate decision, emphasized the need for additional tightening of monetary policy.
- Bullock noted that recent data align with the return of inflation to the target range. While inflation in Australia has peaked, it remains elevated and is expected to persist for a while.
- US Initial Jobless Claims for the week ending September 29, improved to 207K from the previous reading of 205K, beating the market expectation of 210K. This suggests that labor market conditions continue to be tight.
- The 10-year US Treasury yield stands above 4.70%, close to the highest level since 2007.
- Traders await the upcoming US Nonfarm Payrolls and Average Hourly Earnings on Friday. Upbeat numbers could trigger more USD gains and increase volatility in the bond market.
Technical Analysis: Australian Dollar holds ground above 0.6350, 21-day EMA emerges as the immediate barrier
Australian Dollar trades hovers around 0.6370 against the US Dollar on Friday. The 21-day Exponential Moving Average (EMA) appears to be a key barrier lined up with the 0.6400 psychological level. A firm break above the latter could open the doors for the pair to explore levels around the 23.6% Fibonacci retracement at 0.6429 level. On the downside, the major level at 0.6300 emerges as the immediate support, followed by November's low at 0.6272.
AUD/USD: Daily Chart
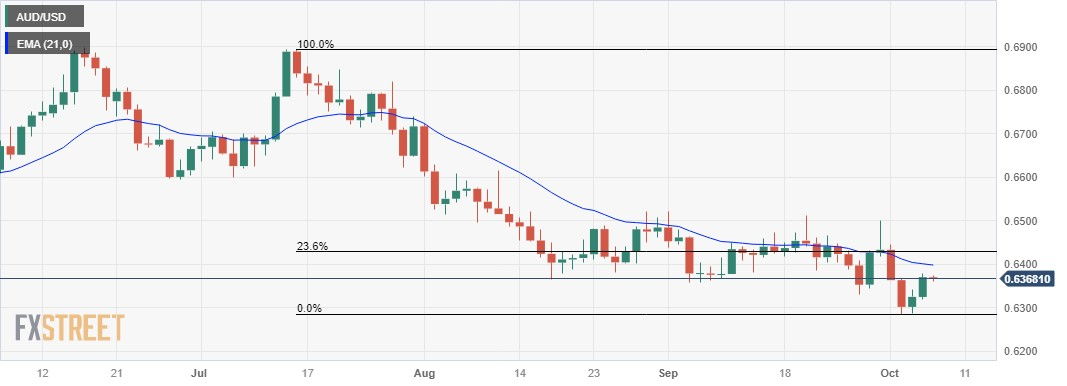
Australian Dollar price today
The table below shows the percentage change of Australian Dollar (AUD) against listed major currencies today. Australian Dollar was the strongest against the Japanese Yen.
| USD | EUR | GBP | CAD | AUD | JPY | NZD | CHF | |
| USD | 0.06% | 0.07% | 0.02% | -0.06% | 0.11% | 0.00% | 0.05% | |
| EUR | -0.07% | 0.00% | -0.04% | -0.14% | 0.04% | -0.07% | -0.01% | |
| GBP | -0.07% | 0.00% | -0.05% | -0.13% | 0.04% | -0.06% | -0.02% | |
| CAD | -0.01% | 0.04% | 0.04% | -0.08% | 0.08% | -0.03% | 0.03% | |
| AUD | 0.05% | 0.10% | 0.11% | 0.07% | 0.14% | 0.06% | 0.09% | |
| JPY | -0.11% | -0.06% | 0.00% | -0.11% | -0.14% | -0.13% | -0.05% | |
| NZD | 0.00% | 0.06% | 0.07% | 0.02% | -0.06% | 0.10% | 0.04% | |
| CHF | -0.05% | 0.02% | 0.01% | -0.03% | -0.12% | 0.05% | -0.06% |
The heat map shows percentage changes of major currencies against each other. The base currency is picked from the left column, while the quote currency is picked from the top row. For example, if you pick the Euro from the left column and move along the horizontal line to the Japanese Yen, the percentage change displayed in the box will represent EUR (base)/JPY (quote).
Australian Dollar FAQs
What key factors drive the Australian Dollar?
One of the most significant factors for the Australian Dollar (AUD) is the level of interest rates set by the Reserve Bank of Australia (RBA). Because Australia is a resource-rich country another key driver is the price of its biggest export, Iron Ore. The health of the Chinese economy, its largest trading partner, is a factor, as well as inflation in Australia, its growth rate and Trade Balance. Market sentiment – whether investors are taking on more risky assets (risk-on) or seeking safe-havens (risk-off) – is also a factor, with risk-on positive for AUD.
How do the decisions of the Reserve Bank of Australia impact the Australian Dollar?
The Reserve Bank of Australia (RBA) influences the Australian Dollar (AUD) by setting the level of interest rates that Australian banks can lend to each other. This influences the level of interest rates in the economy as a whole. The main goal of the RBA is to maintain a stable inflation rate of 2-3% by adjusting interest rates up or down. Relatively high interest rates compared to other major central banks support the AUD, and the opposite for relatively low. The RBA can also use quantitative easing and tightening to influence credit conditions, with the former AUD-negative and the latter AUD-positive.
How does the health of the Chinese Economy impact the Australian Dollar?
China is Australia’s largest trading partner so the health of the Chinese economy is a major influence on the value of the Australian Dollar (AUD). When the Chinese economy is doing well it purchases more raw materials, goods and services from Australia, lifting demand for the AUD, and pushing up its value. The opposite is the case when the Chinese economy is not growing as fast as expected. Positive or negative surprises in Chinese growth data, therefore, often have a direct impact on the Australian Dollar and its pairs.
How does the price of Iron Ore impact the Australian Dollar?
Iron Ore is Australia’s largest export, accounting for $118 billion a year according to data from 2021, with China as its primary destination. The price of Iron Ore, therefore, can be a driver of the Australian Dollar. Generally, if the price of Iron Ore rises, AUD also goes up, as aggregate demand for the currency increases. The opposite is the case if the price of Iron Ore falls. Higher Iron Ore prices also tend to result in a greater likelihood of a positive Trade Balance for Australia, which is also positive of the AUD.
How does the Trade Balance impact the Australian Dollar?
The Trade Balance, which is the difference between what a country earns from its exports versus what it pays for its imports, is another factor that can influence the value of the Australian Dollar. If Australia produces highly sought after exports, then its currency will gain in value purely from the surplus demand created from foreign buyers seeking to purchase its exports versus what it spends to purchase imports. Therefore, a positive net Trade Balance strengthens the AUD, with the opposite effect if the Trade Balance is negative.
- USD/JPY ticks higher during the Asian session, though might struggle to capitalize on the move.
- Intervention fears, along with a softer risk tone, could benefit the JPY and act as a headwind.
- Traders also seem reluctant and look forward to the crucial US NFP report for a fresh impetus.
The USD/JPY pair attracts some dip-buying near the 148.30 area during the Asian session on Friday and reverses a part of the previous day's losses, albeit lacks bullish conviction. Spot prices currently trade around the 148.65 region, up just over 0.10% for the day, as traders prefer to wait on the sidelines ahead of the closely-watched US monthly employment details.
Heading into the key data risk, speculations that Japanese authorities will intervene in the foreign exchange market to support the domestic currency might continue to act as a headwind for the USD/JPY pair. Japan's Finance Minister Shunichi Suzuki reiterated this week that currency rates must move stably reflecting fundamentals and that the government was ready to take necessary action against excess volatility, without ruling out any options. This, along with a generally weaker risk tone, could benefit the safe-haven Japanese Yen (JPY) and contribute to capping gains for the major.
The downside, however, remains cushioned in the wake of a big divergence in the monetary policy stance adopted by the Bank of Japan (BoJ) and the Federal Reserve (Fed). In fact, the Japanese central bank, so far, has refrained from offering any hint about potential alterations to its dovish stance in the foreseeable future. Adding to this, the BoJ Governor Kazuo Ueda had said that the current policy framework has a big stimulative effect on the economy and the basic stance is to patiently maintain monetary easing. In contrast, the Fed struck a more hawkish tone and projected at least one more rate hike in 2023.
Moreover, the incoming US macro data remains consistent with expectations of solid economic growth in the third quarter and should allow the Fed to keep interest rates higher for longer. The outlook, meanwhile, remains supportive of elevated US Treasury bond yields, which assists the US Dollar (USD) to stall a two-day-old corrective slide from the YTD peak and lends some support to the USD/JPY pair. Bulls, however, seem reluctant and now look to the popularly known US NFP report for fresh cues about the Fed's future rate hike path before positioning for a firm near-term direction.
Technical levels to watch
- Gold price remains under pressure near #1,820 on Friday.
- US Initial Jobless Claims last week came in below the expectation.
- Higher US Treasury yields exert some selling pressure on the gold price.
- Gold traders will focus on the US employment data due later on Friday.
Gold price (XAU/USD) remains on the defensive around $1,820 after bouncing off the weekly low of $1,813 during the early Asian session on Friday. The precious metal struggles to gain as the Federal Reserve (Fed) is not expected to abandon its ‘higher-for-longer’ stance on interest rates. Market players await the highly-anticipated US Nonfarm Payrolls for more clarity about labor market conditions.
That being said, the higher US Treasury yields exert some selling pressure on non-yielding assets like Gold. Meanwhile, the US Dollar Index (DXY) declined to 106.40 after retreating from monthly highs. US Treasury yields also edges lower, with the 10-year Treasury yield dropping to 4.73%. While the YS 2-year stays at 5.02%.
On Thursday, the US Initial Jobless Claims for the week ending on September 30 improved to 207K from the previous reading of 205K, according to the US Department of Labor. This figure registered below the market expectation of 210K. Furthermore, the US Balance of Trade deficit was $58.3 billion, lower than the expected of $62.3 billion and the $64.7 billion recorded in July.
The US employment data on Friday will be in the spotlight. The Nonfarm Payrolls are expected to rise by 170K while the Unemployment Rate is estimated to decline to 3.7% from 3.8%. The softer figures could trigger the sell-off in the Greenback against its rivals and might act as a tailwind for XAU/USD.
Gold traders will monitor the US Average Hourly Earnings for September, Nonfarm Payrolls, and the Unemployment Rate. These events could trigger the volatility in the market. Traders will take cues from these events and find trading opportunities around the gold price.
- GBP/USD consolidates its strong recovery gains registered over eth past two days.
- Traders move to the sidelines and keenly await the release of the US NFP report.
- The divergent Fed-BoE policy expectations contribute to capping any further gains.
The GBP/USD pair is seen oscillating in a range during the Asian session on Friday and consolidating its strong recovery gains of over 150 pips registered, from the 1.2035 area, or the lowest level since March 16 touched earlier this week. Spot prices remain below the 1.2200 mark as traders keenly await the release of the closely-watched US monthly jobs data before placing fresh directional bets.
The popularly known NFP report will play a key role in influencing market expectations about the Federal Reserve's (Fed) future rate-hike path. This, in turn, will drive the US Dollar (USD) and provide a fresh directional impetus to the GBP/USD pair. The US economy is expected to have added 170K jobs in September, less than the 187K in the previous month, while the jobless rate is anticipated to tick down from 3.8% to 3.7% during the reported month. A stronger report, meanwhile, would mean more pressure on wages and on inflation, which might force the Fed to stick to its hawkish stance and keep rates higher for longer.
Heading into the key data risk, it has been a mixed week for labour market data. The monthly JOLTS report showed that there were higher than estimated job openings in August, while private payroll numbers from ADP fell short of market expectations. Meanwhile, data released on Thursday showed that Weekly Jobless Claims ticked up from the prior week, though were slightly below expectations. Nevertheless, the incoming US macro data remains consistent with expectations of solid economic growth in the third quarter. Moreover, several Fd officials recently backed the case for at least one more 25 bps lift-off by the year-end.
The prospects for further policy tightening by the Fed remain supportive of elevated US Treasury bond yields and assist the USD in stalling this week's corrective pullback from the YTD. This, along with expectations that the Bank of England (BoE) will again leave interest rates unchanged at its next meeting in November, further contributes to capping the GBP/USD pair. Hence, it will be prudent to wait for strong follow-through buying before confirming that spot prices have formed a near-term bottom and positioning for an extension of the strong recovery move witnessed over the past two trading days.
Technical levels to watch
| Index | Change, points | Closed | Change, % |
|---|---|---|---|
| NIKKEI 225 | 548.48 | 31075.36 | 1.8 |
| Hang Seng | 18.03 | 17213.87 | 0.1 |
| KOSPI | -2.09 | 2403.6 | -0.09 |
| ASX 200 | 35.3 | 6925.5 | 0.51 |
| DAX | -29.7 | 15070.22 | -0.2 |
| CAC 40 | 1.52 | 6998.25 | 0.02 |
| Dow Jones | -9.98 | 33119.57 | -0.03 |
| S&P 500 | -5.56 | 4258.19 | -0.13 |
| NASDAQ Composite | -16.18 | 13219.83 | -0.12 |
| Pare | Closed | Change, % |
|---|---|---|
| AUDUSD | 0.63684 | 0.65 |
| EURJPY | 156.622 | 0.04 |
| EURUSD | 1.05486 | 0.4 |
| GBPJPY | 181.03 | 0.1 |
| GBPUSD | 1.2191 | 0.44 |
| NZDUSD | 0.59629 | 0.79 |
| USDCAD | 1.37036 | -0.27 |
| USDCHF | 0.9124 | -0.46 |
| USDJPY | 148.482 | -0.35 |
The White House has begun planning a November meeting in San Francisco between President Biden and Chinese leader Xi Jinping to stabilize relations between the world's two most powerful nations.
This would be the first meeting between the leaders of the world's two largest economies since they met in November last year in Bali, Indonesia. Both presidents emphasized the value of face-to-face diplomacy and expressed optimism that they might rebuild US-China relations.


© 2000-2026. Уcі права захищені.
Cайт знаходитьcя під керуванням TeleTrade DJ. LLC 2351 LLC 2022 (Euro House, Richmond Hill Road, Kingstown, VC0100, St. Vincent and the Grenadines).
Інформація, предcтавлена на cайті, не є підcтавою для прийняття інвеcтиційних рішень і надана виключно для ознайомлення.
Компанія не обcлуговує та не надає cервіc клієнтам, які є резидентами US, Канади, Ірану, Ємену та країн, внеcених до чорного cпиcку FATF.
Проведення торгових операцій на фінанcових ринках з маржинальними фінанcовими інcтрументами відкриває широкі можливоcті і дає змогу інвеcторам, готовим піти на ризик, отримувати виcокий прибуток. Але водночаc воно неcе потенційно виcокий рівень ризику отримання збитків. Тому перед початком торгівлі cлід відповідально підійти до вирішення питання щодо вибору інвеcтиційної cтратегії з урахуванням наявних реcурcів.
Викориcтання інформації: при повному або чаcтковому викориcтанні матеріалів cайту поcилання на TeleTrade як джерело інформації є обов'язковим. Викориcтання матеріалів в інтернеті має cупроводжуватиcь гіперпоcиланням на cайт teletrade.org. Автоматичний імпорт матеріалів та інформації із cайту заборонено.
З уcіх питань звертайтеcь за адреcою pr@teletrade.global.
переклади