- Аналітика
- Новини та інструменти
- Новини ринків
Новини ринків
- EUR/USD fades corrective bounce off multi-day low as Fed hawks gain acceptance.
- Upbeat US data, Fed Beige Book suggest soft landing in the US and favor hawkish Federal Reserve bias.
- Eurozone statistics, ECB comments fail to defend Euro due to unimpressive outcomes, recession woes.
- German Industrial Production, Eurozone GDP and multiple Fed policymakers’ speeches eyed for fresh impetus.
EUR/USD bears stay in the driver’s seat despite late Wednesday’s corrective bounce, declining to 1.0720 amid early Thursday in Asia. In doing so, the Euro pair reverses the previous day’s corrective bounce off the lowest level in three months while bracing for the eighth consecutive weekly loss.
Be it the firmer US statistics or hawkish Federal Reserve (Fed) talks, not to forget the China-linked boost to the haven assets like the US Dollar, the Greenback has it all to justify its recent strength, which in turn keeps the Euro bears hopeful. On the contrary, the mostly downbeat Eurozone statistics join unimpressive statements from the European Central Bank (ECB) Officials to keep suggesting an end of the rate hike cycle in the bloc, which in turn exerts downside pressure on the EUR/USD price.
On Wednesday, German Factory Orders slumped the most since early 2020 with -11.7% YoY figures compared to -4.0% expected and upwardly revised prior numbers of 7.6%. That said, the monthly number also declined heavily with the -10.5% mark versus 3.3% prior (revised from 3.0%). On the same line, Eurozone Retail Sales matched -0.2% MoM market consensus for July versus 0.2% prior while reprinting the -1.0% YoY figure for the said month compared to -1.2% expected.
That said, European Central Bank's (ECB) Governing Council member Francois Villeroy de Galhau again flagged the nearness to the peak rates while adding, “Our options are open at the next and the upcoming rate meetings.”
On the contrary, ECB Governing Council member Klaas Knot told Bloomberg questioned the market’s favor for no rate hike in next week’s monetary policy meeting. ECB’s Knot also added that an economic slowdown is sure to damp demand, though inflation projections won’t differ much from the last round in June. On the same line was ECB policymaker Peter Kazimir who said, per Reuters, that his preferable option would be to raise the policy rate by 25 basis points at the policy meeting next week. ECB’s Kazimir also said that one more, likely last rate hike, still needed.
Talking about the US catalysts, the ISM Services PMI rose to a six-month high of 54.5 in August versus 52.5 expected and 52.7 prior. Further, the final readings of the S&P Global Composite and Services PMIs eased to 50.2 and 50.5 for the said month compared to the initial estimations of 50.4 and 51.0 in that order. It should be noted that all three major constituents of the ISM Services PMI, namely Employment, New Orders and Prices Paid rose notably beyond the previous readings and helped the US Dollar to reverse early-day pullback. Earlier in the week, the US Factory Orders for July dropped to the lowest since mid-2020 but the details about the orders excluding transport, shipments of goods and inventories were impressive to defend the hawkish Fed bias.
On the other hand, Federal Reserve (Fed) Governor Christopher Waller defended hawkish monetary policy during a CNBC interview and Cleveland Federal Reserve President Loretta Mester ruled out rate cuts. However, Federal Reserve Bank of Boston President Susan Collins cited the risk of an overly restrictive stance on monetary policy to suggest the need for a patient and careful, but deliberate, approach. Furthermore, the Fed’s Beige Book also pushed back expectations of witnessing either a policy pivot or rate cut while stating, “US economic growth was modest amid a cooling labor market and slowing inflation pressures in July and August.”
It should be noted downbeat concerns about China, the world’s second-largest economy, also weighed on the sentiment and favored the EUR/USD bears. That said, China’s Caixin Services PMI joined the market’s lack of confidence in the Dragon Nation’s stimulus to spoil the concerns about Beijing. On the same line could be the US-China tension surrounding the trade conditions and Taiwan.
While portraying the mood, S&P 500 Futures remain depressed after Wall Street benchmarks closed in the red for the second consecutive day. That said, the US 10-year Treasury bond yields rose to a two-week high of around 4.30% and the two-year refreshed weekly top above 5.0%, which in turn offered notable strength to the US Dollar.
Looking ahead, Geremany’s Industrial Production for July and the final readings of the Eurozone Gross Domestic Product (GDP) for the second quarter (Q2) will offer immediate directions to the EUR/USD pair ahead of speeches from a slew of Fed policymakers. Additionally, the weekly US Initial Jobless Claims and the quarterly readings of Nonfarm Productivity, as well as the Unit Labor Costs for the second quarter (Q2) will decorate the calendar and should also be important to watch for clear directions.
Technical analysis
While a two-month-old descending support-turned-resistance line restricts immediate EUR/USD upside near 1.0755, the pair’s run-up remains elusive unless it crosses the previous support line stretched from March surrounding 1.0785. That said, May’s bottom of 1.0635 keeps luring the bears.
- US Dollar Index picks up bids to reverse the previous day’s retreat from YTD high.
- Strong US data underpins soft landing concerns, allowing Fed hawks to defend “higher for longer” bias for rates.
- China woes, Fed Beige Book concerns also keep DXY buyers hopeful via firmer yields.
- Multiple Fed speakers in the line for observation, risk catalysts also eyed for fresh impulse.
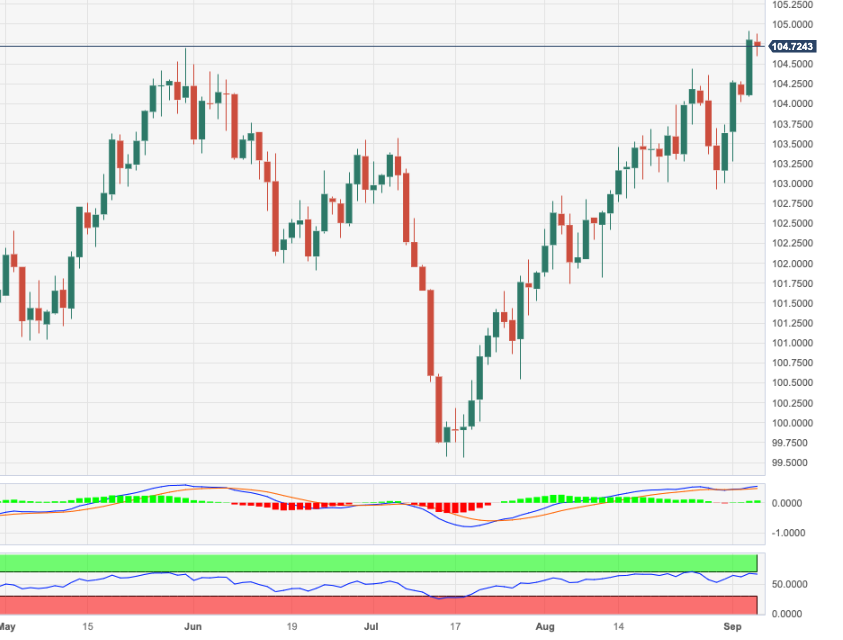
US Dollar Index (DXY) seesaws near the yearly high, recently reversing the pullback from a nearly six-month peak of 105.02, as bulls keep the reins around 104.85 during Thursday’s early Asian session. In doing so, the DXY cheers the increasing odds of witnessing a soft landing in the US, as well as justifies the hawkish Fed concerns, especially amid upbeat statistics from home and strong yields.
Having witnessed upbeat details of the US Factory Orders, a surprise increase in the US ISM Services PMI offered additional strength to the Greenback the previous day. That said, US ISM Services PMI rose to a six-month high of 54.5 in August versus 52.5 expected and 52.7 prior. Further, the final readings of the S&P Global Composite and Services PMIs eased to 50.2 and 50.5 for the said month compared to the initial estimations of 50.4 and 51.0 in that order. It should be noted that all three major constituents of the ISM Services PMI, namely Employment, New Orders and Prices Paid rose notably beyond the previous readings and helped the US Dollar to reverse early-day pullback. Earlier in the week, the US Factory Orders for July dropped to the lowest since mid-2020 but the details about the orders excluding transport, shipments of goods and inventories were impressive to defend the hawkish Fed bias.
The firmer data allowed Federal Reserve (Fed) Governor Christopher Waller to defend hawkish monetary policy during a CNBC interview and also helped Cleveland Federal Reserve President Loretta Mester to rule out rate cuts. However, Federal Reserve Bank of Boston President Susan Collins cited the risk of an overly restrictive stance on monetary policy to suggest the need for a patient and careful, but deliberate, approach. Even so, the Fed’s Beige Book pushed back expectations of witnessing either a policy pivot or rate cut while stating, “US economic growth was modest amid a cooling labor market and slowing inflation pressures in July and August.” The same propelled the DXY via firmer yields.
Additionally, firmer US inflation expectations, per the 10-year and 5-year breakeven inflation rates from the St. Louis Federal Reserve (FRED) data, also favor the Fed hawks and the US Dollar bulls.
On a different page, downbeat concerns about China, the world’s second-largest economy, also weighed on the sentiment and favored the US Dollar’s haven demand. That said, China’s Caixin Services PMI joined the market’s lack of confidence in the Dragon Nation’s stimulus to spoil the concerns about Beijing. On the same line could be the US-China tension surrounding the trade conditions and Taiwan.
Amid these plays, the US 10-year Treasury bond yields rose to a two-week high of around 4.30% and the two-year refreshed weekly top above 5.0%, which in turn offered notable strength to the US Dollar. Further, the Wall Street benchmark closed in the red for the second consecutive day and favored the Greenback’s haven demand.
Looking forward, multiple Federal Reserve (Fed) speakers are scheduled to deliver speeches and can infuse volatility into the markets, making it more important to watch for the US Dollar traders. Further, the weekly US Initial Jobless Claims and the quarterly readings of Nonfarm Productivity, as well as the Unit Labor Costs for the second quarter (Q2) will also be important to watch for clear directions.
Technical analysis
US Dollar Index buyers keep the reins unless they provide a daily closing beneath the 104.70–65 support confluence comprising May’s peak and a two-month-old previous resistance line.
- NZD/USD remains on the defensive below the 0.5900 barrier amid a stronger USD.
- US ISM Services PMI climbed to 54.5 in August vs. 52.7 prior.
- New Zealand’s Manufacturing Sales Q2 improved to 2.9% vs. a 2.1% drop in the previous reading.
- Market players await China’s Trade Balance, US weekly Initial Jobless Claims.
The NZD/USD pair remains under pressure and reaches the lowest level since November 2022 during the early Asian session on Thursday. The pair currently trades near 0.5872, down 0.01% on the day.
The Institute for Supply Management (ISM) revealed on Wednesday that the US ISM Services PMI climbed to 54.5 in August from 52.7 in the previous month, better than the market expectation of 52.5. This figure marks the highest reading since February. Additionally, the final readings of the S&P Global Composite dropped to 50.2 in August from 50.4 in the previous month.
The Federal Reserve (Fed) Governor Christopher Waller stated that they have further room to increase interest rates, but the data will determine whether the Fed needs to hike rates again and if it is done hiking rates.
On the Kiwi front, the latest data from Statistics New Zealand showed on Thursday that the nation’s Manufacturing Sales for the second quarter improved to 2.9% versus a 2.1% drop in the previous reading. Earlier this week, the ANZ Commodity Price for August dropped to 2.9% from a 2.6% decline in July. The New Zealand Terms of Trade Index improved to 0.4% in the second quarter, compared to a decline of 1.5% in the previous reading and an expected drop of 1.3%.
Apart from this, the disappointing Chinese economic data impact market sentiment and exert pressure on the China-proxy New Zealand Dollar (NZD). Even so, China's services activity expanded at its weakest rate in eight months in August. Tuesday, Caixin reported that the Chinese Services Purchasing Managers' Index (PMI) decreased from 54.1 in July to 51.8 in August.
Looking ahead, China’s Trade Balance will be released later in the Asian session. Also, the US weekly Initial Jobless Claims and Unit Labor Costs for the second quarter will be due on Thursday. These figures could give a clear direction for NZD/USD.
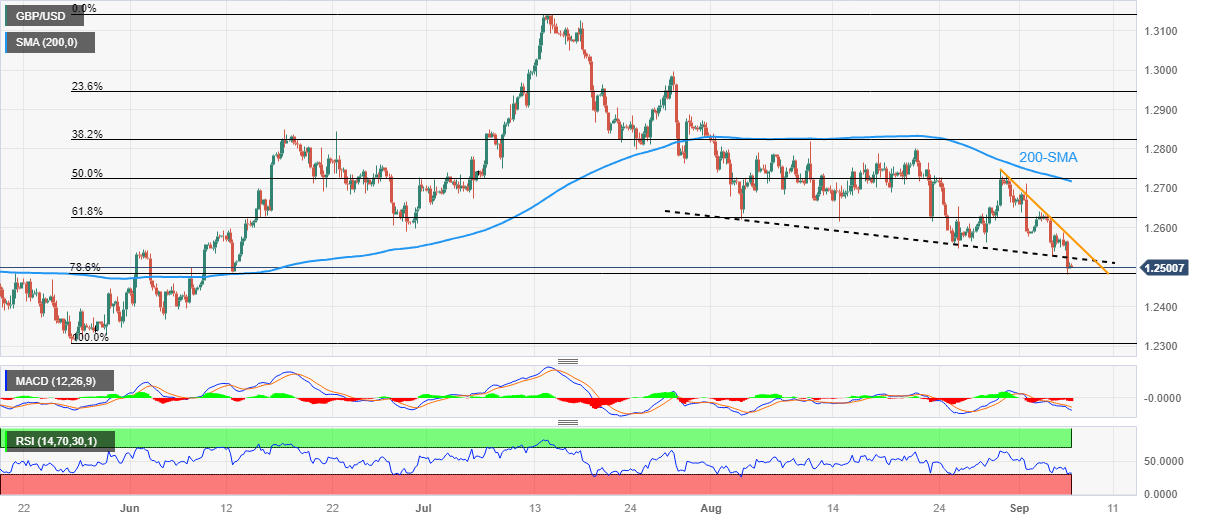
- GBP/USD licks its wounds at three-month low, consolidating recent losses from 78.6% Fibonacci ratio.
- Oversold RSI adds strength to corrective bounce toward previous support line from early August.
- 200-SMA holds the key to Pound Sterling buyer’s conviction.
GBP/USD portrays a corrective bounce off a three-month low to around 1.2500 amid early Thursday morning in Asia. In doing so, the Cable pair justifies the oversold RSI conditions, as well as the Pound Sterling’s sustained rebound from the 78.6% Fibonacci retracement of late May to mid-March upside, near 1.2485.
Even so, the bearish MACD signals and the support-turned-resistance stretched from early August guard immediate recovery of the Pound Sterling pair around 1.2530.
Following that, a one-week-old descending resistance line surrounding 1.2580 will precede the 200-SMA hurdle of around 1.2720 to act as the final defense of the GBP/USD pair sellers.
Alternatively, a daily closing beneath the 78.6% Fibonacci retracement level of 1.2485 could quickly drag the GBP/USD pair’s low marked in June around 1.2370, a break of which will direct the Cable bears toward the yearly low marked in March around 1.1800.
That said, the 1.2000 psychological magnet acts as the intermediate halt between 1.2370 and 1.1800.
Overall, the GBP/USD pair is likely to witness a corrective bounce but the room towards the north is long and bumpy.
On a fundamental side, comparatively more hawkish Federal Reserve (Fed) talks than their Bank of England (BoE) counterparts keep exerting downside pressure on the GBP/USD despite the latest corrective bounce.
GBP/USD: Four-hour chart
Trend: Limited recovery expected
US inflation expectations can be held responsible for the recent run-up in the US Treasury bond yields and the US Dollar, despite the market’s latest consolidation.
That said, the inflation expectations, as per the 10-year and 5-year breakeven inflation rates from the St. Louis Federal Reserve (FRED) data, rose in the last three consecutive days to end Wednesday’s North American session at the highest level in a week.
With this, the 5-year and 10-year inflation expectations per the aforementioned calculations rose to 2.23% and 2.30% at the latest.
It’s worth observing that the Fed officials’ ability to please US Dollar bulls with hawkish statements and upbeat Fed Beige Book report join the firmer US inflation expectations to keep the USD buyers hopeful despite the latest retreat from the yearly high.
Moving on, the weekly US Initial Jobless Claims and the quarterly readings of Nonfarm Productivity, as well as the Unit Labor Costs for the second quarter (Q2), will decorate the calendar but speeches from multiple Fed officials will be the key to watch.
Also read: Forex Today: US Dollar holds firm on risk aversion and US figures; China trade data next
- Gold Price pares recent losses at weekly low after five-day losing streak.
- XAU/USD bears the burden of strong US Dollar, China woes.
- Mostly upbeat United States data, Federal Reserve talks propel yields, US Dollar and weigh on the Gold Price.
- Risk catalysts, mid-tier US data and Fed signals eyed for fresh impulse as bearish bias prods previous two-week rebound.
Gold Price (XAU/USD) portrays a corrective bounce from one-week low to $1,918 amid the initial hours of Thursday’s Asian session, after declining in the last five consecutive days. In doing so, the bright metal seeks more clues to defend the latest downside despite being bearish amid firmer US Dollar and the United States Treasury bond yields, not to forget fears emanating from China.
Gold Price drops as United States data, Federal Reserve signals favor US Dollar
Gold Price remains on the back foot as market players rush towards the US Dollar amid firmer United States data and hawkish Federal Reserve (Fed) signals. The same portrays the brighter odds of the US soft landing versus the fears of hard landing elsewhere in the major economies and increases the Greenback’s allure, weighing on the XAU/USD.
The US Dollar Index (DXY) rose to a fresh high since March 15, after Wednesday’s initial retreat, close to 105.00 by the press time.
On Wednesday, US ISM Services PMI rose to a six-month high of 54.5 in August versus 52.5 expected and 52.7 prior. Further, the final readings of the S&P Global Composite and Services PMIs eased to 50.2 and 50.5 for the said month compared to the initial estimations of 50.4 and 51.0 in that order. It should be noted that all three major constituents of the ISM Services PMI, namely Employment, New Orders and Prices Paid rose notably beyond the previous readings and helped the US Dollar to reverse early-day pullback.
Earlier in the week, the US Factory Orders for July dropped to the lowest since mid-2020 but the details about the orders excluding transport, shipments of goods and inventories were impressive to defend the hawkish Fed bias.
Elsewhere, Federal Reserve (Fed) Governor Christopher Waller defended hawkish monetary policy during a CNBC interview and Cleveland Federal Reserve President Loretta Mester ruled out rate cuts. However, Federal Reserve Bank of Boston President Susan Collins cited the risk of an overly restrictive stance on monetary policy to suggest the need for a patient and careful, but deliberate, approach.
Furthermore, the Fed’s Beige Book also pushed back expectations of witnessing either a policy pivot or rate cut while stating, “US economic growth was modest amid a coolinglabor market and slowing inflation pressures in July and August.”
While the US data and the Fed signals suggest brighter odds of the soft landing in the US and favored the US Dollar, as well as weakened the XAU/USD, economic fears surrounding China, the Eurozone and the UK seem to also direct the market players toward the Greenback and amplify the bearish bias about the Gold Price.
China woes also favor XAU/USD bears
Apart from the United States data and the Federal Reserve (Fed) signals, downbeat concerns about China, one of the world’s biggest Gold customers, also weighed on the precious metal.
Early-week disappointment from China Caixin Services PMI joined the market’s lack of confidence in the Dragon Nation’s stimulus to weigh on the concerns about Beijing, as well as the Gold Price. On the same line could be the US-China tension surrounding the trade conditions and Taiwan.
Late on Tuesday, US Commerce Secretary Gina Raimondo ruled out expectations of witnessing any revisions to US tariffs on China imposed during President Donald Trump's administration until an ongoing review is completed by the US Trade Representative's (USTR) Office, reported Reuters while citing the CNBC interview of the diplomat. These comments flag the continuation of the US-China tension and joined the fears about China’s economic recovery to weigh on the sentiment, which in turn underpinned the US Dollar’s run-up and weighed on the Gold Price.
Against this backdrop, the US 10-year Treasury bond yields rose to a two-week high of around 4.30% and the two-year refreshed weekly top above 5.0%, which in turn offered notable strength to the US Dollar and favored the Gold sellers. Further, the Wall Street benchmark closed in the red for the second consecutive day and challenged demand for riskier assets like Gold.
Multiple catalysts to watch for clear directions
Looking ahead, multiple Federal Reserve (Fed) speakers are scheduled to deliver speeches and can infuse volatility into the markets, making it more important to watch for Gold Price moves. Further, the weekly US Initial Jobless Claims and the quarterly readings of Nonfarm Productivity, as well as the Unit Labor Costs for the second quarter (Q2) will also be important to watch for clear directions. Additionally, headlines about China and recession woes in the major economies outside the US, not to forget the Sino–American tension updates, are also important for fresh impulse.
Also read: Gold Price Forecast: XAU/USD approaches $1,900 as odds for a Fed hike increase
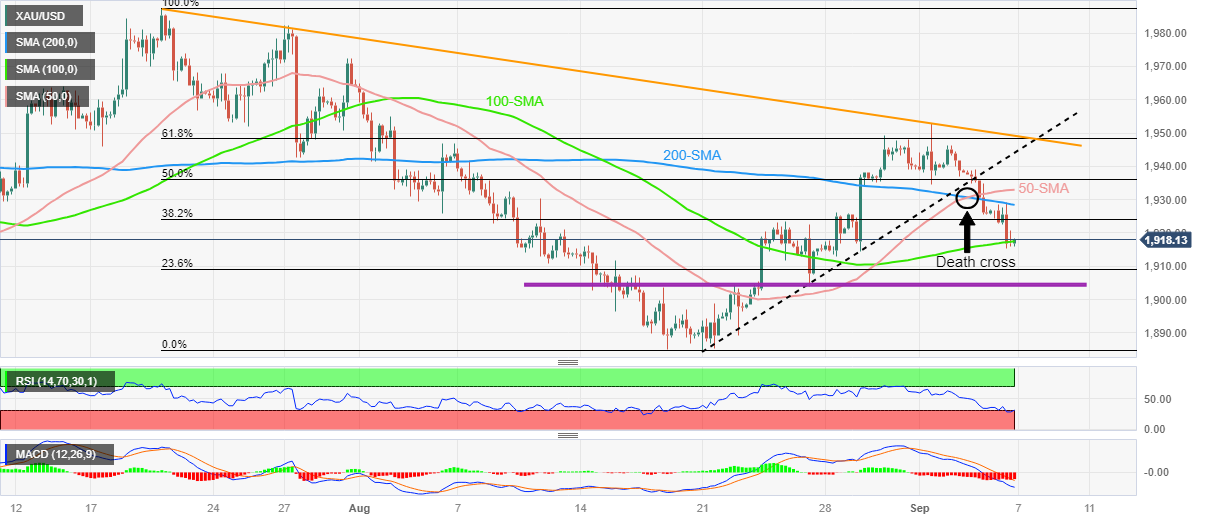
Gold Price Technical Analysis
Gold Price justifies the week-start “Death Cross” bearish moving average crossover while declining in the last five consecutive days, backed by the bearish signals from the Moving Average Convergence and Divergence (MACD) indicator. That said, the 50-bar Simple Moving Average’s (SMA) piercing of the 200-SMA portrays the “Death Cross” bearish crossover suggesting further declines in the underlying asset.
It’s worth noting, however, that the Relative Strength Index (RSI) line, placed at 14, is in the oversold territory, which in turn highlights the 100-SMA support of around $1,917 as a short-term key challenge for the XAU/USD sellers.
In a case where the Gold bears ignore the RSI conditions and break the stated SMA support, a horizontal area comprising multiple levels marked in the last three weeks, around $1,904, quickly followed by the $1,900 round figure to restrict the commodity’s further downside.
If at all the XAU/USD remains bearish past $1,900, the previous monthly low of around $1,885 will act as the final defense of the buyers.
On the contrary, the 200-SMA and 50-SMA guard immediate recovery of the Gold price near $1,929 and $1,933 respectively.
Following that, the previous support line from August 21, close to $1,945, will test the XAU/USD buyers before directing them to the 61.8% Fibonacci retracement of July-August downside, close to $1,949.
It should be observed that a seven-week-long falling resistance line surrounding $1,950 might act as an extra filter for the Gold buyers.
Overall, the Gold price remains bearish but the downside room appears limited.
Gold Price: Four-hour chart
Trend: Further downside expected
- AUD/USD remains sidelined at YTD low ahead of top multiple catalysts.
- Upbeat Australia Q2 GDP seemed to have put a floor under the Aussie pair after initially refreshing yearly low.
- China woes, hawkish Fed talks and firmer US data fuel US Dollar across the board.
- Australia and China will release foreign trade numbers, Lowe will speak for one last time as RBA Governor.
AUD/USD grinds near the Year-To-Date (YTD) low, after fading the corrective bounce off the lowest level in 10 months to 0.6380 a few hours back. That said, the Aussie pair refreshed the yearly bottom to 0.6357 amid broad US Dollar strength but the cautious mood ahead of the key catalysts and reconsideration of the previous day’s Australian growth numbers seemed to have challenged the pair sellers during the early hours of Thursday’s Asian session.
On Wednesday, Australia’s second quarter (Q2) Gross Domestic Product (GDP) rose to 0.4% QoQ versus 0.3% marked expectation and 0.2% prior readings but the yearly figures eased to 2.1% YoY from 2.3% previous readouts, versus the analysts’ estimations of 1.7%.
The Aussie growth numbers defy downbeat comments from Australian Treasurer Jim Chalmers who said before the release that “The slowdown in China's economy and higher interest rates at home will put significant pressure on the Australian economy.” The policymaker, however, added that the country should manage to avoid a recession. With this, the Aussie pair managed to edge higher during the early hours of Wednesday.
However, China's woes and the US data were comparatively more important and drowned the AUD/USD pair afterward.
China’s early-week disappointment via China Caixin Services PMI joined the market’s lack of confidence in the Dragon Nation’s stimulus to weigh on the concerns about Beijing. On the same line could be the US-China tension surrounding the trade conditions and Taiwan.
Late on Tuesday, US Commerce Secretary Gina Raimondo ruled out expectations of witnessing any revisions to US tariffs on China imposed during President Donald Trump's administration until an ongoing review is completed by the US Trade Representative's (USTR) Office, reported Reuters while citing the CNBC interview of the diplomat. These comments flag the continuation of the US-China tension and joined the fears about China’s economic recovery to weigh on the sentiment, which in turn underpinned the US Dollar’s run-up.
On the other hand, US ISM Services PMI rose to a six-month high of 54.5 in August versus 52.5 expected and 52.7 prior. Further, the final readings of the S&P Global Composite and Services PMIs eased to 50.2 and 50.5 for the said month compared to the initial estimations of 50.4 and 51.0 in that order.
It should be noted that all three major constituents of the ISM Services PMI, namely Employment, New Orders and Prices Paid rose notably beyond the previous readings and helped the US Dollar to reverse early-day pullback.
Earlier in the week, the US Factory Orders for July dropped to the lowest since mid-2020 but the details about the orders excluding transport, shipments of goods and inventories were impressive to defend the hawkish Fed bias.
Federal Reserve (Fed) Governor Christopher Waller defended hawkish monetary policy during a CNBC interview and Cleveland Federal Reserve President Loretta Mester ruled out rate cuts. However, Federal Reserve Bank of Boston President Susan Collins cited the risk of an overly restrictive stance on monetary policy to suggest the need for a patient and careful, but deliberate, approach.
Amid these plays, the US Dollar Index (DXY) rose to a fresh high since March 15, after Wednesday’s initial retreat, to close to 105.00 before retreating to 104.85 by the press time. Further, the US 10-year Treasury bond yields rose to a two-week high of around 4.30% and the two-year refreshed weekly top above 5.0%.
Moving on, July trade numbers from Australia and China’s trade data for August will be important to watch for clear directions ahead of the Reserve Bank of Australia (RBA) Governor Philip Lowe’s speech for clear directions. Above all, the risk-off mood and the US Dollar strength appears the key challenge for the AUD/USD buyers.
Technical analysis
Despite the latest corrective bounce, AUD/USD remains on the way to testing a six-month-old downward-sloping support line, around 0.6340 by the press time unless witnessing it provides a daily closing beyond the previous support line stretched from August 17, around 0.6415 at he latest.
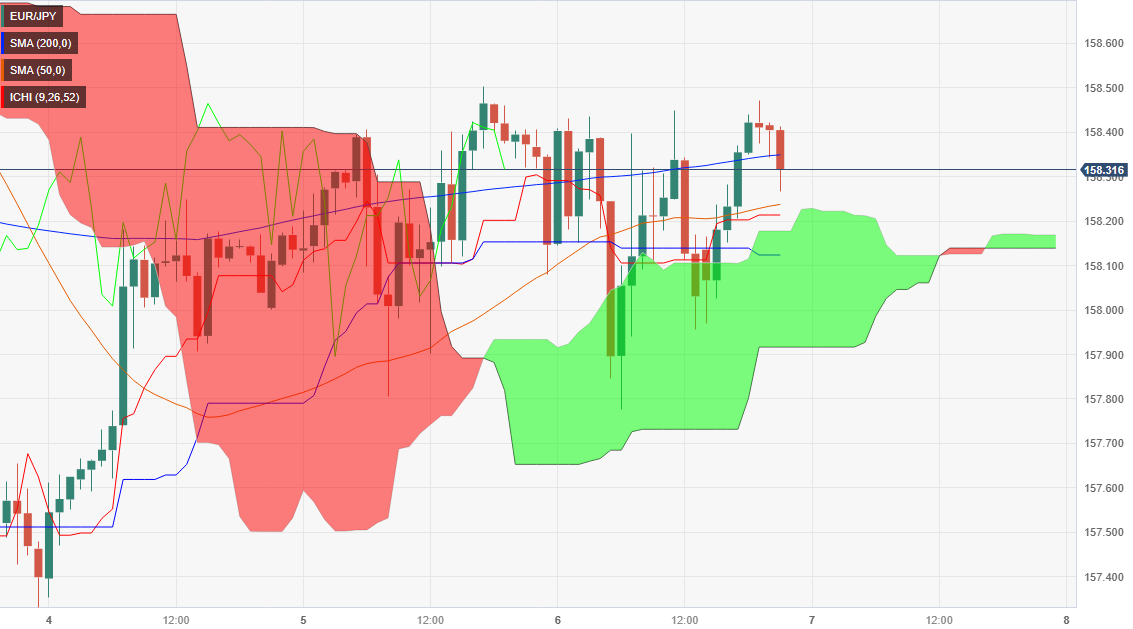
- EUR/JPY trades almost flat at 158.31 as Thursday’s Asian session begins.
- Risk-off sentiment and rumors of possible intervention by Japanese authorities keep the pair in check.
- Technical indicators suggest the pair is in a consolidation phase, with a neutral to a bearish bias.
The Euro (EUR) registers modest losses versus the Japanese Yen (JPY) as Thursday’s Asian session begins. On Wednesday, the pair finished unchanged, on a risk-off impulse and rumors of a possible intervention by Japanese authorities. The EUR/JPY is trading at 158.31, almost flat.
EUR/JPY Price Analysis: Technical outlook
The EUR/JPY daily chart depicts the pair as neutral-biased but tilted to the downside as the cross remains trading near last week’s low of 157.05. It should be said that the Kijun-Sen caps the EUR/JPY fall at 157.65, which would open the door to test the August 23 swing low of 156.87 once cleared. A breach of the latter would resume the cross-currency pair downtrend and test the top of the Ichimoku Cloud (Kumo) at 154.70.
Short-term, the EUR/JPY is bullish biased with the cross exchanging hands above the Kumo, but so far, it has failed to register higher highs, suggesting the pair is consolidating. A break above 158.50 could exacerbate a rally towards the R1 daily pivot at 158.62, followed by the 159.00 figure. Conversely, downside risks emerge at the Tenkan and Kijun-Sen lines at 158.21 and 158.11 each. Once those levels are cleared, the 158.00 figure is up next.
EUR/JPY Price Action - Hourly chart
- XAG/USD fell by more than 1.50% on Wednesday, near $23.00.
- US yields are rising after the release of US August ISM PMIs.
- CME FedWatch tool indicated that the odds of a hike by the Fed in November rose to 44%.
On Wednesday, the XAG/USD Silver Spot price closed near $23.00, as the reports of strong US economic activity fueled expectations of a more aggressive Federal Reserve (Fed) for the remainder of the year.
US bond yields sharply rose, often seen as the opportunity cost of holding non-yielding metals. The rate for the 2-year bond increased to 5%, whereas the rates for the 5-year and 10-year yields are at 4.43% and 4.30%, respectively. In addition, the USD measured by the DXY index turned its course north after the release of August's ISM PMI and increased above 105.00, presenting further challenges to the metal. In addition, the Fed’s Beige Book from July and August from the US reported slower economic growth while it pointed out that the job growth remained “subdued.”
In addition, Wall Street didn’t welcome the ISM figures, and the S&P 500 dropped by nearly 0.80% to its lowest level in a week. The Dow Jones Industrial Average (DJI) and the Nasdaq Composite (NDX) also decreased, with losses between 0.50-0.80%.
XAG/USD Levels to watch
Analysing the daily chart, the XAG/USD technical outlook is bearish in the short term. The Relative Strength Index (RSI) is comfortably positioned below its midline in negative territory with a southward slope, indicating a favourable selling momentum, further supported by the negative signal from the Moving Average Convergence Divergence (MACD), which is displaying red bars, underscoring the growing bearish momentum. Additionally, the pair is below the 20-, 100- and 200-day Simple Moving Averages (SMA), pointing towards the prevailing strength of the bears in the larger context.
Furthermore, the four-hour chart flashes oversold signals, which could suggest that the metal may correct to the upside in the near term.
Support levels: $22.60, $22.30, $22.00
Resistance levels: $23.50 (20- and 200-day SMA convergence), $23.70, $24.00.
XAG/USD Daily Chart
-638296319898582267.png)
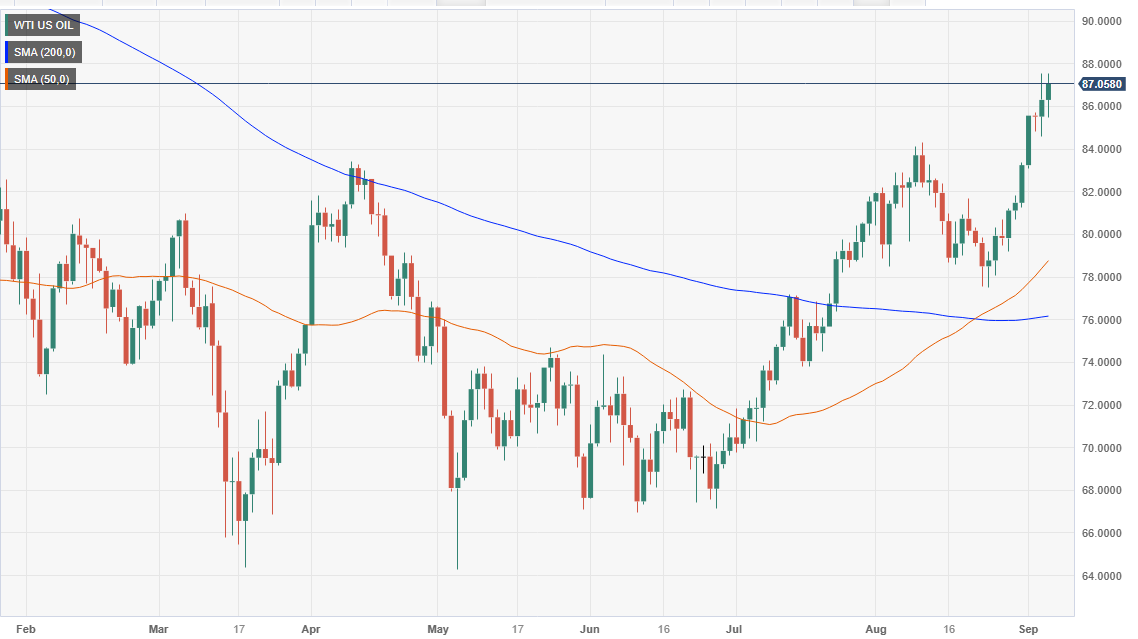
President Joe Biden's White House administration announced plans to officially cancel oil drilling leases granted to the state of Alaska in 2017 to develop and expand oil drilling projects in the Arctic National Wildlife Refuge. The leases, granted under previous president Donald Trump, opened up the wildlife preserve to fossil fuels extraction, which would have potentially provided an additional 11 billion barrels of crude oil to the American energy sector.
The move comes after the Biden administration signed an executive order on their first day in office temporarily suspending any oil drilling efforts in the Alaskan refuge. An official examination found “multiple legal deficiencies” in the analysis done by the Trump administration prior to selling the leases, which drew only three bidders. One of those bidders was the Alaska Industrial Development and Export Authority, a state-run agency. The AIDEA and its director, Randy Ruaro, are expected to challenge the official cancellations in court.
Market Reaction
With US oil markets closed, after-hours trading impacts have been limited. Future limits on US oil production will do little to ease oil prices that are already knocking on the ceiling. The WTI barrel closed on Wednesday at $87.50, its highest level since November 2022.
- EUR/USD trades neutral at the 1.0725 level, with mild gains.
- US and German yields are sharply rising, contributing to the strength of both currencies.
The EUR/USD consolidated Tuesday’s losses, which saw the pair losing more than 0.60%. The Shared Currency’s movements were driven mainly by a broad-based USD and EUR strength against their rivals on the back of higher US and German yields.
The US reported that the ISM Services PMI from the US from August increased to 54.5, higher than the 52.5 expected and the previous 52.7, and that outcome boosted hawkish bets on the Federal Reserve (Fed). After a mixed Nonfarm Payrolls report released last Friday, which made investors refrain from betting on one last hike, the CME FedWatch Tool now indicated that swaps markets are discounting higher odds of a 25 basis point (bps) increase in November.
The US also reported the Fed Beige Book, highlighting that the economy “modestly” grew in July and August and that the job growth was subdued.
On the Euro’s side, the European Central Bank’s (ECB) Governing Council will meet next week, and there are growing expectations that a 25 basis point (bps) hike will be announced. Analysts at Danske Bank pointed out that the persistently high inflation will be the main driver of the decision, which is expected to be the last hike of the cycle. In that sense, those expectations seem to keep the European currency afloat via rising German yields.
EUR/USD Levels to watch
The daily chart flashes signals of a bearish outlook for the short term for the EUR/USD. Regarding indicators, the Relative Strength Index (RSI) resides below its midline in negative territory, exhibiting a southward trajectory. At the same time, the Moving Average Convergence Divergence (MACD) prints red bars, underscoring the growing bearish momentum. Additionally, the presence of selling momentum is seen on the four-hour chart, with both indicators residing deep in negative territory.
On the bigger picture, the pair now resided the 20,100 and 200-day Simple Moving Averages (SMA) for the first time since November 2022, pointing out that the bears are in control.
Support levels: 1.0700, 1.0680, 1.0650.
Resistance levels: 1.0800, 1.0820 (200-day SMA), 1.0850.
EUR/USD Daily Chart
-638296301517491313.png)
During the Asian session, the focus will be on trade data from Australia and China. Additionally, New Zealand will report Q2 Manufacturing Sales. RBA Governor Lowe will deliver a speech. Japan is set to release the preliminary Leading Economic Index for July. Later in the day, the US will release the weekly Jobless Claims report.
Here is what you need to know on Thursday, September 7:
The US Dollar remains resilient amid growth divergence with China and Europe, and expectations that the Federal Reserve will have to hold interest rates above 5% for a longer period of time. The US Dollar Index rose marginally by 0.05% to peak above 105.00 after the US ISM Services PMI surpassed expectations, but then pulled back. US Treasury yields also rose, further supporting the US Dollar, with the 10-year yield climbing to 4.30%.
Risk aversion remains present as US stocks slide again, with the Dow Jones losing 0.57% and the Nasdaq falling by 1.05%. During the Asian session, market participants will closely monitor Chinese trade data. Positive numbers would alleviate concerns about the current state of the Chinese economy.
EUR/USD reached fresh monthly lows but managed to remain above 1.0700. It finished flat after a timid recovery. Eurostat will release a new estimate of Q2 employment and GDP. Germany will report July Industrial Production.
Jan von Gerich, Chief Analyst at Nordea Research on next week’s European Central Bank meeting:
The ECB is torn between whether to hike rates again or not next week. We think the Governing Council will pause, but signal preparedness to do more at upcoming meetings, if needed. Both inflation and growth forecasts could see downward revisions.
GBP/USD fell to as low as 1.2481, the lowest level in three months, and then rebounded to 1.2500. The pair continues to move with a bearish bias, with the 200-day Simple Moving Average (SMA) at 1.2430 in sight. The Pound was among the worst performers, weakened after comments from Bank of England officials.
- BoE's Dhingra: Policy is already sufficiently restrictive
USD/JPY remains at its highest level since November, trading above 147.50, and has put the market on alert for a potential intervention by Japanese authorities. So far, it has been limited to verbal intervention.
The Australian economy slowed less than expected during the second quarter, showing a 0.4% expansion, which was above the market consensus of 0.3%. Additionally, Q1 figures were revised higher. Despite the positive outcome, the Australian Dollar remained unaffected. AUD/USD finished flat after a sharp fall on Tuesday, with the pair consolidating between 0.6355 and 0.6400. On Thursday, Australian trade data is due, but more importantly, Chinese trade figures.
NZD/USD failed to regain levels above 0.5900 and tested the 0.5870 area. The Kiwi remains under pressure amid risk aversion and a stronger US Dollar.
USD/CAD hit fresh monthly highs but then pulled back below 1.3650. The pair remains influenced by high crude oil prices. As expected, the Bank of Canada kept its key interest rates unchanged at 5%.
Analysts at CIBC on BoC:
Today's decision was widely expected, particularly in the wake of the Q2 GDP data which even a hawkish central bank couldn't ignore. We don't see any reason for forecasters or investors to alter whatever views they had prior to today's news.
The day after Russia and Saudi Arabia surprised the market by announcing an extension of voluntary oil production cuts, crude oil prices soared and rose again on Wednesday. The WTI barrel posted its highest close since November at $87.50.
Metals continue to decline. Gold dropped to $1,915, matching the 20-day SMA, and posted its lowest close in almost two weeks. Silver tested $23.00 and recorded its sixth consecutive decline; however, it finished slightly away from the lows.
Like this article? Help us with some feedback by answering this survey:
- S&P 500 closes down 0.70%, Nasdaq 100 drops over 1%, and Dow Jones Industrial Average falls 0.57%.
- ISM Non-Manufacturing data for August fuels speculation of an additional rate hike by the Fed.
- CME FedWatch Tool shows a 50% chance of a 25 bps rate hike by the Fed in November.
Wall Street finished Wednesday’s session with losses of between 0.57% and 0.70% after data put into the table additional rate hikes by the US Federal Reserve (Fed), as business activity accelerated in the services sector. Consequently, US Treasury bond yields rose, and the Greenback hit a 10-month high before finishing the session almost unchanged.
The S&P 500 ended the session with losses of 0.70%, while the heavy-tech Nasdaq 100 dropped more than 1%, and the Dow Jones Industrial Average slumped 0.57%.
Wall Street indices close in the red; Technology, Consumer Discretionary, and Health sectors lead the decline
Sector-wise, the biggest loser was Technology, followed by Consumer Discretionary and Health, each down by 1.37%, 0.97% and 0.61%. On the flip side, Utilities and Energ post modest gains of 0.20% and 0.14%.
The Institute for Supply Management (ISM) revealed that Non-Manufacturing activity improved in August, sparking speculations that an additional rate hike by the Fed is on the table. According to money market futures, there’s a 50% chance the US central could hike 25 bps at the November meeting, as shown by the CME FedWatch Tool.
In the meantime, the Federal Reserve released its Beige Book, which showed modest economic growth and inflation slowed in most parts of the country.
Boston Fed’s President Susan Collins said the US central bank needs to be patient when deciding the path of monetary policy while emphasizing the Fed’s commitment to bring inflation toward its 2% target.
WTI rose almost by 1% in the commodity space underpinned by Saudi Arabia and Russia’s 1.3 million barrel supply cut as traders eyed the release of US crude oil inventories.
S&P 500 Price Action – Daily Chart
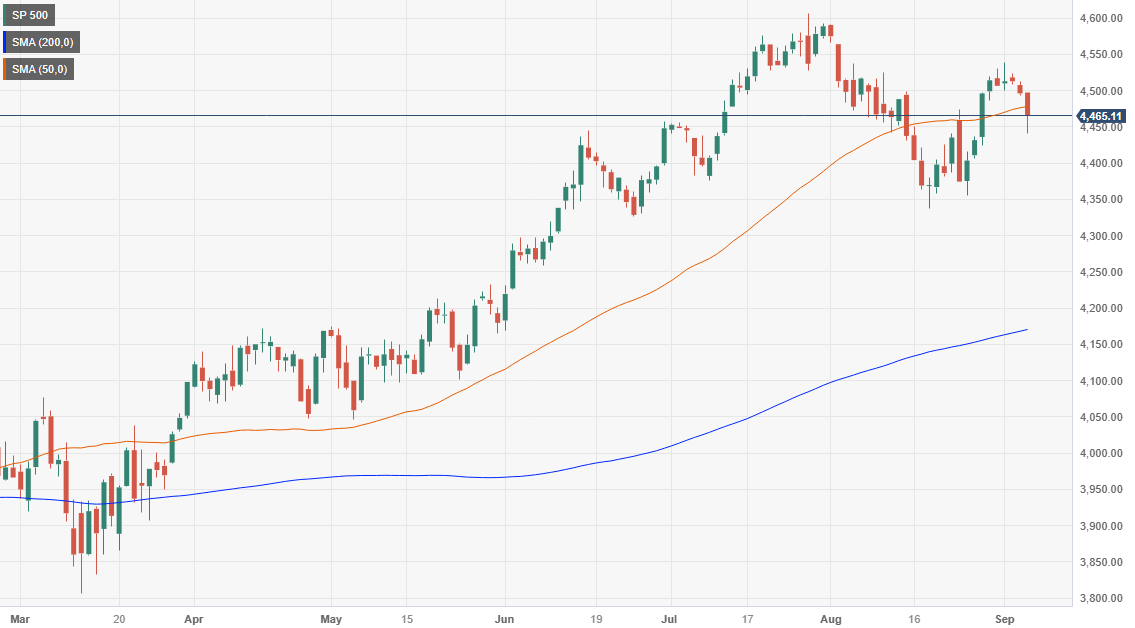
S&P 500 Technical Levels
- Saudi Arabia and Russia extended their crude oil production cuts, reducing supply by 1 million and 300K barrels, respectively.
- According to a Reuters poll, American Petroleum Institute (API) expected to report a draw of 2.1 billion barrels in US crude inventories for the week ending September 1.
- Strong US business activity data initially boosts the US Dollar, causing a pullback in WTI prices, before reversing course.
Western Texas Intermediate (WTI), the US crude oil benchmark, advanced some 1% on Wednesday due to further draws on US crude oil inventory, while Saudi Arabia and Russia extended their production cuts. WTI is trading at $87.15 after hitting a daily low of $85.49.
WTI advances to $87.15, eyeing the $90.00 mark as major oil producers prolong supply cuts
According to a Reuters poll, the American Petroleum Institute (API) is expected to deliver crude inventories, which analysts expect a drop of 2.1 billion barrels in the week to September 1.
The data comes one day after Russia and Saudi Arabia prolonged their crude output production cuts, with the former slashing 300K barrels of production, while Saudi Arabia's reduced supply by 1 million. That exacerbated the WTI jump of more than 1%, as traders eye $90.00 a barrel.
Earlier data during the day spurred a pullback in WTI after the Institute for Supply Management (ISM) revealed that business activity in the services sector improved sharply, reaching 54.5, crushing estimates of 2.5. That sponsored a leg-up in the Greenback (USD), which pushed to ten-month highs above 105.000, before reversing its course, though it remains positive.
Oil analysts noted that prices would be upward pressured as US refineries enter their maintenance period. However, speculation that Iran, Venezuela, and Lybia could increase oil supply could cap the rise in WTI price.
WTI Price Analysis: Technical outlook
From a technical perspective, WTI is expected to extend its uptrend, with buyers eyeing the November 11 high of $90.08 per barrel. Also, the daily chart depicts a golden cross formed in late August and high oil prices trading at year-to-date (YTD) levels, which could exacerbate a push toward the latter. Nevertheless, buyers must conquer the $88.00 figure before challenging $90.00. Conversely, If WTI drops below the September 5 daily low of $85.07, that could pave the way for a deeper pullback.
- US Non-Manufacturing PMI data beats expectations, fueling speculation of a possible Fed rate hike in November.
- BoE interest rate probabilities show an 84% chance of a 25 bps hike in September, taking the Bank Rate to 5.50%.
- Boston Fed’s President Susan Collins urges patience in monetary policy decisions, emphasizing the Fed’s commitment to a 2% inflation target.
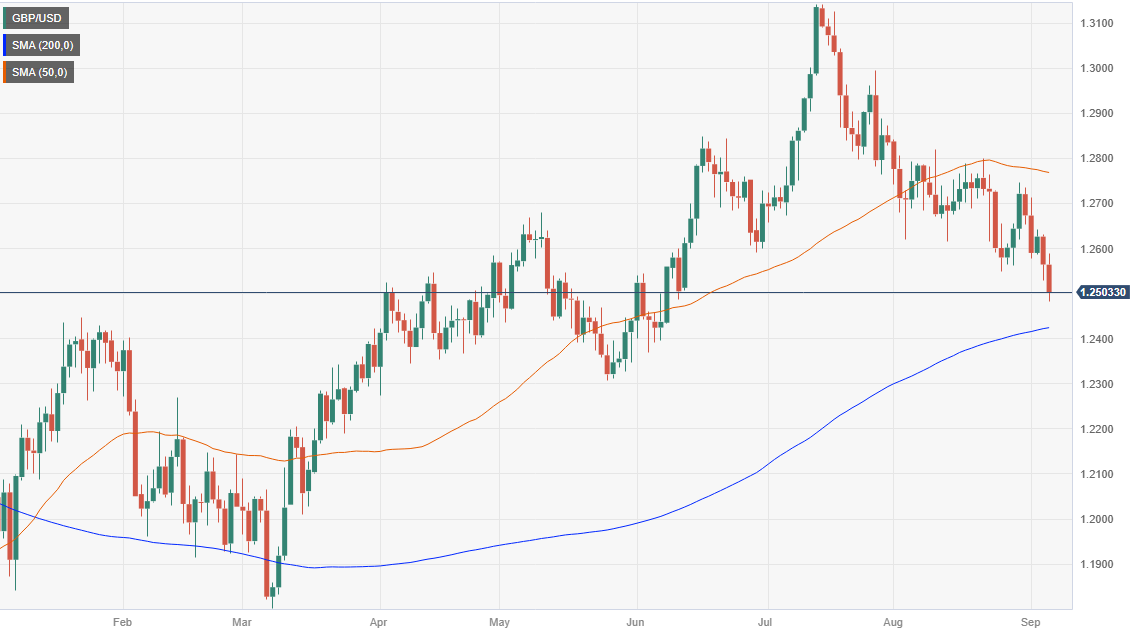
The British Pound (GBP) continues its free fall against the US Dollar (USD), after the Bank of England’s (BoE) official comments suggest the central bank is about to reach its peak interest rates. This, and data from the United States (US) showing business activity picked up, increases Federal Reserve hike expectations. The GBP/USD is trading at 1.2502 after hitting a daily high of 1.2588.
BoE’s Governor Andrew Bailey’s comments signaling a peak in rates weighed on the GBP; US Non-Manufacturing PMI exceeds forecasts
The appearance of BoE’s Governor Andrew Bailey at the parliament’s Treasury Committee weighed on the Pound, which is set to finish the week with solid losses. In his appearance, Bailey said the BoE is near the top of the cycle of higher interest rates and added that inflation is indeed coming down, but could inflation expectations also come down?
The BoE raised rates 14 times since December 2021 and would hike 25 bps in September, taking the Bank Rate to 5.50%, as shown by interest rate probabilities odds, displaying an 84% chance, as demonstrated by the picture below. The BoE is expected to hike in early 2024, with the markets seeing the Bank Rate at around 5.71%.
Bank of England Interest Rates Expectations
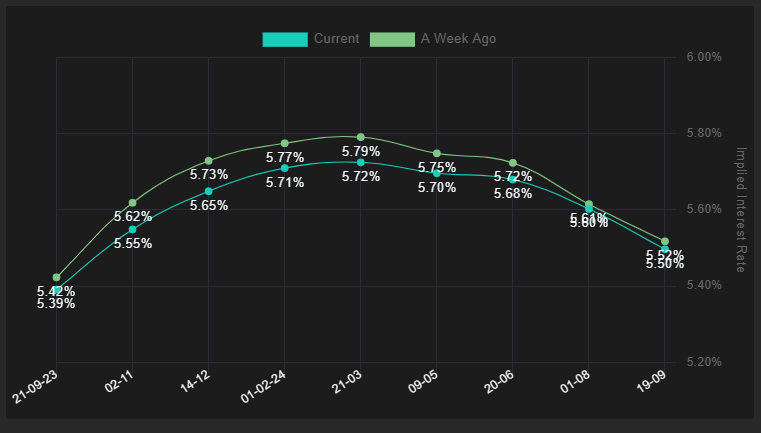
Source: Financialsource
Recently, BoE’s policymakers made similar comments but stressed that rates are unlikely to fall quickly due to the high level of inflation. In the meantime, John Cunliffe said the labor market is cooling down “quite slowly,” while adding that upward pressure in wages was now “crystallizing.” He said future decisions would be “finely balanced.” Swati Dhingra stuck to her dovish stance, says that rates are sufficiently restrictive and can threaten economic growth.
In the United States (US), the pickup in business activity, mainly in the services sector, as revealed by the US Non-Manufacturing PMI, triggered a reassessment of the US Federal Reserve’s monetary policy. The futures market shows odds of 25 bps for November at around 47%.
Recently, the Federal Reserve released its Beige Book, which showed modest economic growth and inflation slowed in most parts of the country.
Boston Fed’s President Susan Collins said the US central bank needs to be patient when deciding the path of monetary policy while stressing the central bank’s commitment to tame inflation to its 2% target. She added Fed officials are discussing if the current level of rates is restrictive enough or more is needed.
GBP/USD Price Analysis: Technical outlook
Given that the pair reached a daily low of 1.2481, buyers claimed the 1.2500 figure, downside pressures remain. The break of an upslope support trendline drawn from around late May lows accelerated the GBP/USD drop, putting the uptrend into question. If the major achieves a daily close below 1.2500, that could put into play the 200-day Moving Average (DMA) at 1.2422, followed by the May 25 swing low of 1.2308.
- AUD/USD traded in the 0.6360 - 0.6400 range on Wednesday.
- USD gained momentum after ISM Service PMIs and the Fed’s Beige Book releases.
- The odds of one last hike by the Fed are gaining more relevance.
In Wednesday's session, the AUD/USD traded neutral but remained vulnerable below 0.6400. On the one hand, strong economic activity reports from the US strengthened the USD, while the AUD struggled to gain momentum after Tuesday's Reserve Bank of Australia (RBA) decision.
ISM Services PMI lived up to the expectations in August. The figure came in at 54.5, higher than the expected figure of 52.5 and above the previous 52.7. Regarding the Fed, Beige’s book, which reports on the US's current economic situation through interviews with key business contacts and economists gathered by each of the 12 Federal Reserve Districts, revealed that economic growth was “modest” and job growth “subdued” in July and August. However, it also stated that imbalances persisted with the availability of skilled workers and the number of applicants constrained.
Meanwhile, US bond yields jumped back to weekly highs and depicted that markets are gearing up for another Federal Reserve hike (Fed) hike, which would lift rates to 5.75%. According to the CME FedWatch tool, the odds of a 25 basis point (bps) increase in November rose above 40%, making the USD gain interest. It's worth highlighting that the Fed stated that it needs to see the economy “cooling” to end its tightening cycle, to strong economic figures fuel hawkish bets for the remainder of the year.
On the AUD’s side, it is struggling to gather momentum after the Reserve Bank of Australia (RBA) held interest steady at 4.10% on Tuesday, adopted a wait-and-see approach and didn’t commit to further hikes.
AUD/USD Levels to watch
The AUD/USD daily chart analysis points to a bearish outlook for the short term. The Relative Strength Index (RSI) is situated below its midline in negative territory, displaying a southward trajectory. Likewise, the Moving Average Convergence Divergence (MACD) reveals lower green bars, signifying a growing bearish momentum for the pair. Furthermore, the pair is below the 20,100 and 200-day Simple Moving Averages (SMAs), implying that the bears retain control on a broader scale.
Support levels:0.6360, 0.6350, 0.6330.
Resistance levels: 0.6400, 0.6440 (20-day SMA), 0.6470.
AUD/USD Daily Chart
-638296217781241775.png)
According to Federal Reserve’s Beige Book, economic growth was modest during July and August. It added that job growth was subdued. “Most Districts reported price growth slowed overall, decelerating faster in manufacturing and consumer-goods sectors,” the Beige Book noted.
Key Takeaways:
Contacts from most Districts indicated economic growth was modest during July and August. Consumer spending on tourism was stronger than expected, surging during what most contacts considered the last stage of pent-up demand for leisure travel from the pandemic era. But other retail spending continued to slow, especially on non-essential items. Some Districts highlighted reports suggesting consumers may have exhausted their savings and are relying more on borrowing to support spending
Job growth was subdued across the nation. Though hiring slowed, most Districts indicated imbalances persisted in the labor market as the availability of skilled workers and the number of applicants remained constrained
Most Districts reported price growth slowed overall, decelerating faster in manufacturing and consumer-goods sectors. However, contacts in several Districts highlighted sharp increases in property insurance costs during the past few months. Contacts in several Districts indicated input price growth slowed less than selling prices, as businesses struggled to pass along cost pressures.
Nearly all Districts reported the inventory of homes for sale remained constrained. Accordingly, new construction activity picked up for single-family housing.
Market reaction
The US Dollar Index remained steady after the Federal Reserve's Beige Book release, hovering around 104.80, marking marginal gains for the day.
- GBP/JPY trades lower at 184.70, down 0.56%, amid a risk-off environment and potential intervention threats from Japanese authorities.
- The pair shows signs of sideways trading on the daily chart, with a critical support level of 183.35.
- Intraday technicals suggest bearish momentum, as the pair has broken below the Ichimoku Cloud (Kumo).
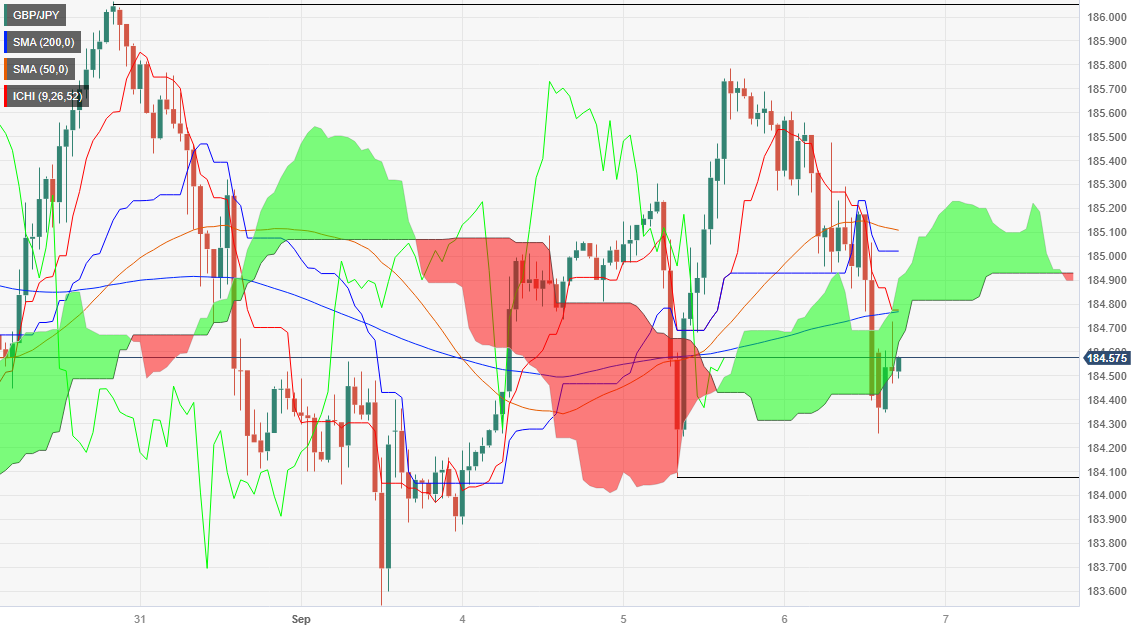
The Pound Sterling (GBP) losses steam against the Japanese Yen (JPY) after threats of a possible intervention by Japanese authorities. Also, a report from yesterday portraying a global economic slowdown triggered a risk-off impulse, favoring the Yen’s safe-haven status. The GBP/JPY is trading at 184.70, down 0.56%, after hitting a daily high of 185.62.
GBP/JPY Price Analysis: Technical outlook
The daily chart depicts the cross as upward biased, but of late, the GBP/JPY has printed a successive series of lower highs but failed to print lower lows. Hence, the pair is trading sideways, at the brisk of breaking support formed during the last three weeks at around 183.35. If buyers reclaim last week’s high of 186.06, expect a retest of the year-to-date (YTD) high of 186.76. Conversely, a drop towards the top of the Ichimoku Cloud (Kumo), at around 179.96, is possible.
On an intraday basis, the GBP/JPY has broken below the Kumo, turning bearish, but its fall was cushioned by the S1 daily pivot point at 184.48. Once cleared, the next support would be the September 5 daily low of 184.07, followed by the September 1 swing low of 183.53. Conversely, if the pair breaks above the Tenkan-Sen at 184.76 and climbs above the Kumo, that could expose the daily pivot at 185.15.
GBP/JPY Price Action – Hourly chart
- USD/CHF rose to monthly highs since July, towards 0.8920.
- ISM Services PMI from the US rose sharply in August.
- Hawkish bets on the Fed and rising US yields make the USD gain appeal.
The USD/CHF’s bulls continue to gain momentum and rose towards the 0.8930 area, it highest level since early July. The USD is one of the top performers in the session as it released strong Service sector data, which fueled hawkish bets on the Federal Reserve (Fed). On the Swiss side, nothing relevant will be released today, and the focus is on Friday’s Unemployment figures from August.
The ISM Services PMI from the US came in higher than expected at 54.5, above the consensus of 52.5 and the previous reading of 52.7. The Services sector is holding the US economy afloat and is the last man standing globally, as the European figures came in weak on Tuesday.
As the Federal Reserve (Fed) expects the economy to cool down to contribute to inflation coming down, strong economic figures strengthen the case for another hike this year. In that sense, US year yields are sharply rising, with the 2-year rate rising back to 5%, seeing a 2.40% daily rise. According to the CME FedWatch tool, this rise in bond yields depicts that the odds of a 25 basis point (bps) hike have risen to 44% from nearly 35% in November and December. Those hawkish bets benefit the USD, and its DXY index rose significantly after the release above 105.00.
For the rest of the session, investors will closely monitor the Fed’s Beige book, an important gauge of the US economic activity.
USD/CHF Levels to watch
Analysing the daily chart, it is evident that USD/CHF is bullish in the short term. The Relative Strength Index (RSI) is comfortably settled above its midline in positive territory, exhibiting an upward trajectory. Green bars on the Moving Average Convergence Divergence’s (MACD) histogram reinforce the bullish momentum. Plus, the pair is above the 20 and 100-day Simple Moving Averages (SMAs) but below the 200-day SMA, suggesting that the bulls are in command over the bears on the bigger picture.
Support levels: 0.8900, 0.8877 (100-day SMA), 0.8850.
Resistance levels: 0.8950, 0.9000, 0.9030.
USD/CHF Daily Chart
-638296172017878849.png)
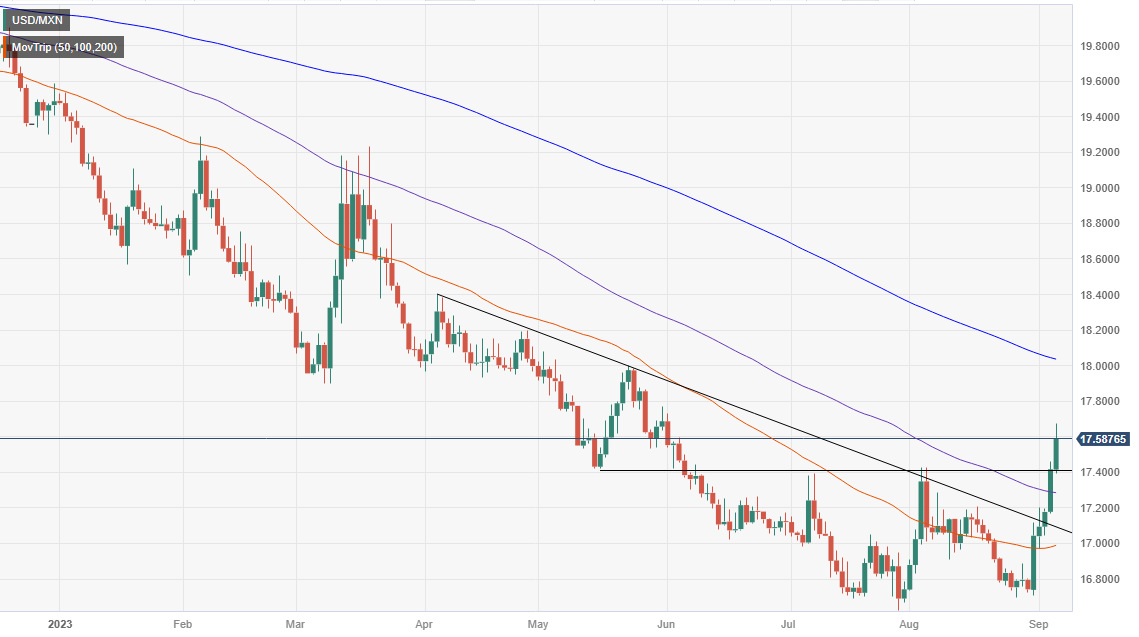
- USD/MXN pair breaks crucial resistance at 17.4038, trading at 17.5481, as US ISM Non-Manufacturing PMI beats expectations, renewing rate hike possibilities.
- US 10-year Treasury yields and the Dollar Index surge, with odds for a November Fed rate hike jumping to 47.2%, according to the CME FedWatch Tool.
- Mexico’s inflation data, due Thursday, is expected to slow down; the Bank of Mexico is unlikely to cut rates.
The Mexican Peso (MXN) extended its losses versus the US Dollar (USD) on Wednesday, climbing above a crucial resistance level seen at 17.4038, which, if it holds, could pave the way for further upside. Data from the United States (US) put rate hike expectations back on the table, boosting the Greenback. The USD/MXN is trading at 17.5481 after hitting a daily low of 17.3912, gains 0.78%.
The Mexican Peso weakens vs. the US Dollar amid rising US bond yields and data increasing speculations for further tightening
Earlier in the North American session, the Institute for Supply Management (ISM) announced that business activity in the services segment, the Non-Manufacturing PMI for August, was better than expected, with the reading coming at 54.5 from the 52.5 expected and above July’s 52.7. The same report showed that the price index subcomponent climbed by 58.9 in August from 56.8 in July.
Following the data, expectations for further tightening by the Fed grew. The CME FedWatch Tool shows odds for a 25 bps increase in November hit 47.2%, above yesterday’s 42% chance. Furthermore, rates are also expected to stay at the 5.50%-5.75% range for December before the US central bank cut rates early in 2024.
Consequently, US Treasury bond yields soared, with the 10-year benchmark note rate at 4.296%, gains 10 basis points, while the US Dollar Index reached a seven-month high of 105.024, up 0.21%.
In the meantime, Boston Fed’s President Susan Collins said the US central bank needs to be patient when deciding the path of monetary policy while stressing the central bank’s commitment to tame inflation to its 2% target. She added Fed officials are discussing if the current level of rates is restrictive enough or more is needed.
Across the border, Mexico’s inflation expected on Thursday would likely shrink for the seventh straight month, according to a Reuters poll. Analysts expect headline inflation at 4.61% while estimating that core would slow to 6.12%, the lowest reading since December 2021. In the meantime, the Bank of Mexico (Banxico) is not expected to cut rates, as said by its Governor Victoria Rodriguez Ceja.
Upcoming events in the week would feature the Mexican Consumer Price Index (CPI), estimated to slow down. On the US front, Initial Jobless Claims, alongside the Fed officials parade ahead of their blackout period for the upcoming September meeting, would shed some clues regarding monetary policy stances.
USD/MXN Price Analysis: Technical outlook
From a technical standpoint, the pair is getting upward traction, set to test the May 23 swing high of 17.9976, some pips shy of the 200-day Moving Average (DMA) at 18.0879. A decisive break of that area could expose the April 5 daily high at 18.4010, followed by the 18.5000 psychological level. Conversely. If the USD/MXN drops below the May 17 daily low of 17.4038, that would pave the way for further losses. Next, support would emerge at the 100-DMA at 17.2788, followed by the 20-DMA at 17.0221.
USD/MXN Price Action – Daily chart
- The NZD/USD cleared daily gains and retreated to 0.5870.
- The US ISM Services PMI unexpectedly accelerated in August and shows a resilient US economy.
- Attention turns to the Fed’s Beige book, to be released later in the session.
In Tuesday’s session, the NZD/USD reversed its course and cleared daily gains, which took the pair to a high above 0.5900 and settled near 0.5870. The pair trajectory is mainly driven by the USD’s strength, which gained interest after strong US ISM PMI figures, which strengthened the case of one more hike by the Federal Reserve in this tightening cycle.
Hawkish bets on the Federal Reserve (Fed) got a boost following the release of August’s ISM Service PMIs, which revealed that the sector expanded. The index reached 54.5, above the expected 52.5 and the previous 52.7. Both Chair Powell and several other Fed officials have stated that the next decisions will be taken carefully, analysing incoming data, so strong economic figures may push the Fed to continue tightening as inflation risks arise.
In line with that, the US bond yields are seeing solid increases across the board. The 2-year rate rose to 5%, up by 2.40%, while the 5 and 10-year yields surged to 4.42% and 4.28%, seeing 2.73% and 2.18% daily increases. In that sense, investors seem to be dumping bonds because they are betting on higher odds of another hike by the Fed in this cycle, and the CME FedWatch tool indicates that the probabilities of a 25 basis point (bps) increase in the November meeting, rose back to 44%.
NZD/USD Levels to watch
Analysing the daily chart, the NZD/USD presents a bearish outlook for the short term. The Relative Strength Index (RSI) and Moving Average Convergence Divergence (MACD) remain in negative territory, with the RSI positioned below its midline and showcasing a southward slope. Additionally, the MACD displays red bars, further supporting the intensifying bearish momentum. Additionally, the pair is below the 20,100 and 200-day Simple Moving Averages (SMAs), pointing towards the prevailing strength of the bears in the larger context and the buyers facing a challenging situation.
Support levels:0.5858, 0.5830, 0.5800.
Resistance levels: 0.5900, 0.5940 (20-day SMA), 0.5980.
NZD/USD Daily Chart
-638296132502704838.png)
Next week, the European Central Bank (ECB) will have its Governing Council meeting. Analysts at Danske Bank anticipate that the ECB will implement a final 25 basis points rate hike. According to them, this decision is driven by the persistently strong inflation momentum and the projected inflation levels above the target.
Key Quotes:
We expect the ECB to deliver a final 25bp rate hike during next week’s ECB meeting due to still too strong inflation momentum and projected inflation above the target. We also expect an advancement of the end to full reinvestment process of PEPP currently guided for Dec24 to be on the cards. Specifically, we expect ECB to ‘task committees’ for an announcement at the October meeting.
The economic outlook has worsened since the July meeting, but the momentum in inflation is yet to show convincing dynamics, and given ECB’s sole inflation mandate, we expect this inflation momentum to prevail.
A compromise in the governing council could be no hike and an acceleration of the balance sheet normalisation, but given the policy rate is the primary tool to calibrate its monetary policy stance, we expect a rate hike.
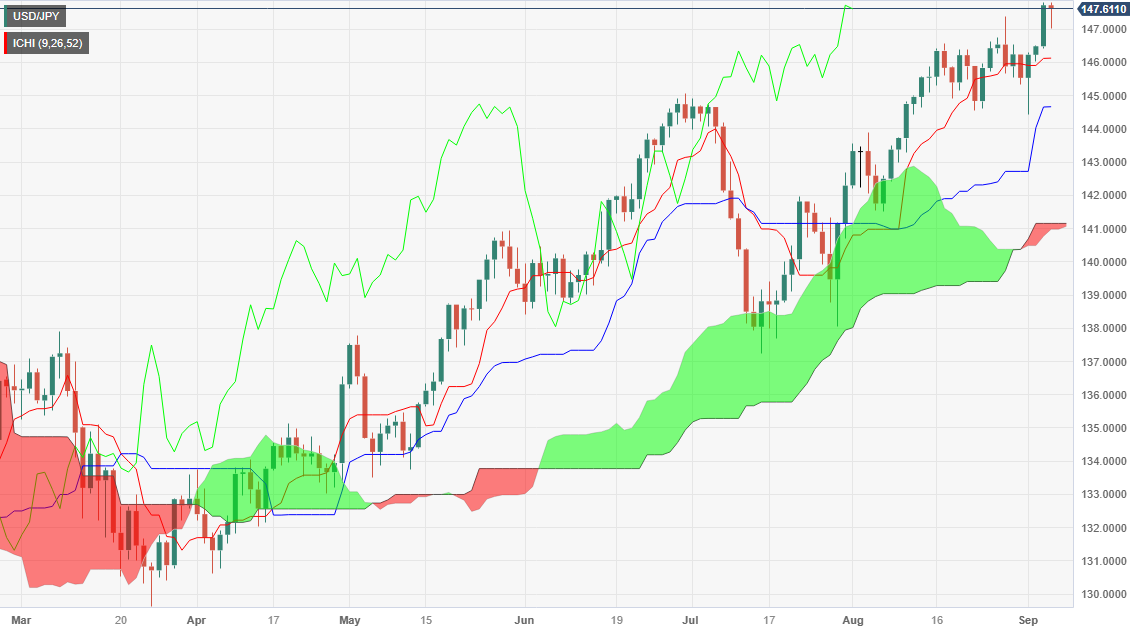
- USD/JPY recovers ground after the US ISM Non-Manufacturing PMI for August beats expectations, coming in at 54.5 versus the anticipated 52.5.
- US Treasury bond yields surge, with the 10-year note rate gaining 10 basis points to 4.296%, as traders reconsider a November rate hike by the Fed.
- Japanese officials weigh options amid currency speculation; traders should be aware of the 148.00/150.00 range.
The Greenback (USD) recovered some lost ground against the Japanese Yen (JPY) on Wednesday after data from the United States (US) surprised the markets. That triggered a jump in the USD/JPY, which traders volatile at around 147.30/98, remains negative.
USD/JPY remains volatile after surprising US ISM report; rising US bond yields
The Institute for Supply Management (ISM) revealed the Non-Manufacturing PMI for August, also called services, which showed that business activity is gaining traction. The reading came at 54.5 from the 52.5 expected and above July’s 52.7. The price index subcomponent rose by 58.9 in August from 56.8 in July.
Even though the latest measures of inflation depict the US Federal Reserve (Fed) job is on track to achieve its 2% goal, the latest report of the Fed’s preferred inflation gauge, PCE, rose by 3.3% in July, a minor setback on its task. Given that and the last ISM report, traders put back on the table a 25 basis point rate hike in November, which would witness the Federal Funds Rate (FFR) reaching the 5.50%-5.75% range.
Consequently, US Treasury bond yields soared, with the 10-year benchmark note rate at 4.296%, gains 10 basis points, while the US Dollar Index reached a seven-month high of 105.024, up 0.21%.
The USD/JPY trimmed some losses after news from the Asian session witnessed Japanese officials considering options amid currency speculation. Hence, market participants and authorities would greatly scrutinize the 148.00/150.00 range, so caution is warranted before placing fresh, long bets on the pair.
The Japanese economic docket would feature a speech by the Bank of Japan’s (BoJ) Nakagawa. On the US front, unemployment claims and speeches by a slew of Fed officials could give some direction on the US central bank’s monetary policy path.
USD/JPY Price Analysis: Technical outlook
From a technical perspective, the USD/JPY remains upward biased, and it might test the 148.00 figure if not for Japanese authorities threatening to intervene in the FX markets to propel its currency. The next resistance would be the November 1 daily high at 148.82. On the downside, risks emerge at last week’s high-turned support at 147.37, followed by the 147.00 mark. A breach of the latter will expose the Tenkan-Senat 146.12.
USD/JPY Price Action - Daily chart
Data released on Thursday showed that the US trade deficit widened in July after revisions. Analysts at Wells Fargo explained that trade flows are continuing to normalize, and the initial indication for Q3 GDP is that net exports will contribute slightly to overall growth.
Key quotes:
U.S. trade flows continue to come back to earth after pandemic-related disruptions. The overall trade balance widened by $1.3 billion to -$65.0 billion in July, but that comes after large upward revisions leave the balance narrower over the past few months. Revisions help bring the monthly data in line with quarterly net exports in the GDP accounts, which previously suggested a larger drag from trade in Q2.
Given monthly volatility in trade flows, it is still early yet to back into a precise read on Q3 trade. In real terms, exports rose 1.1%, while imports were up 1.8%. But coming off of a modest drag in Q2 and having fairly neutral assumptions in the remaining months of the quarter suggests net exports will provide a modest boost to Q3 headline GDP growth.
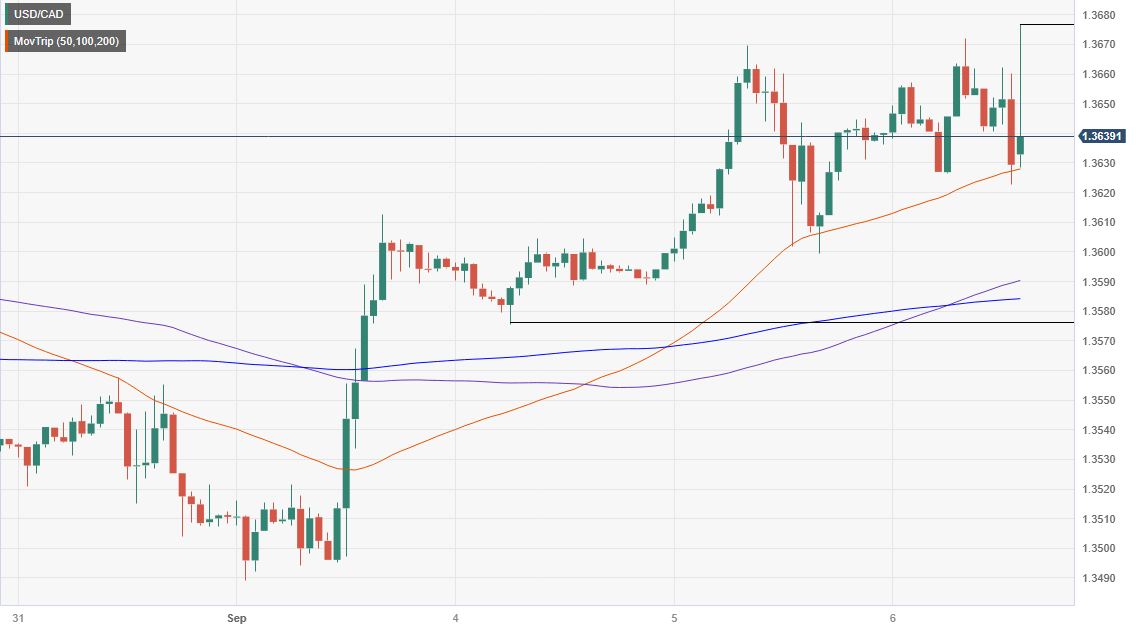
- USD/CAD reacted with volatility, hitting a daily high of 1.3676 after the Bank of Canada kept rates unchanged but maintained a hawkish stance on inflation.
- Despite a -0.2% annual contraction in Canada’s Q2 GDP, the BoC expresses concerns about the “persistence of underlying inflationary pressures.”
- Technical outlook suggests further upside if the pair reclaims its daily high; downside support lies at the 200-HSMA at 1.3584 and the week’s low of 1.3575.
The USD/CAD trades volatile earlier in the North American session after the Bank of Canada (BoC) decided to hold rates unchanged at 5%, though it maintained a hawkish tone in its monetary policy statement. At the time of writing, the major trades in a wide 1.3620/70 range.
Bank of Canada holds rates unchanged at 5.00%; USD/CAD remains steady
Given that last week’s Canadian Gross Domestic Product (GDP) shrank annually by -0.2% in Q2, triggering market participants’ expectations, the BoC would keep rates unchanged.
In its statement, the BoC Governing Council said that excess demand is cooling. Still, they kept their options open, as they remain concerned about “the persistence of underlying inflationary pressures,” as mentioned in the monetary policy statement.
The BoC added that measures of core inflation remain high, with major global central banks focused on restoring price stability. BoC policymakers added the economy entered a period of weaker growth, which is needed to alleviate price pressures.
USD/CAD Reaction to the BoC’s decision
The USD/CAD reacted to the upside, reaching a daily high of around 1.3676 before retreating somewhat towards the 50-hour Simple Moving Average (SMA) at 1.3627. Further upside is seen if the major reclaims the daily high, which could pave the way towards 1.3700. On the flip side, if the USD/CAD dives below the 50-HSMA, the next support emerges at the 200-HSMA at 1.3584 before testing the current week’s low of 1.3575.
USD/CAD Price Action – Hourly chart
- US ISM Services PMI rises unexpectedly in August, to its strongest level since February
- US Dollar Index surges to fresh highs above 105.00.
The economic activity in the US service sector continued to expand in August, for the eighth consecutive month, with the ISM Services PMI rising from 52.7 to 54.5. This reading came in above the market expectation of 52.5.
Further details of the publication revealed that the Employment Index edged higher from 50.7 to 54.7, while the Prices Paid Index climbed to 58.9 from 56.8, "indicating a faster rate of increases and a movement from equilibrium."
Commenting on the data, “there has been an increase in the rate of growth for the services sector, reflected by increases in all four subindexes that directly factor into the composite Services PMI and faster supplier deliveries. Sentiment among Business Survey Committee respondents varies by industry; however, the majority of panelists are positive about business and economic conditions there has been a slight pullback in the rate of growth for the services sector."
Market reaction
The US Dollar Index jumped to 105.02, reaching the highest intraday level since March.
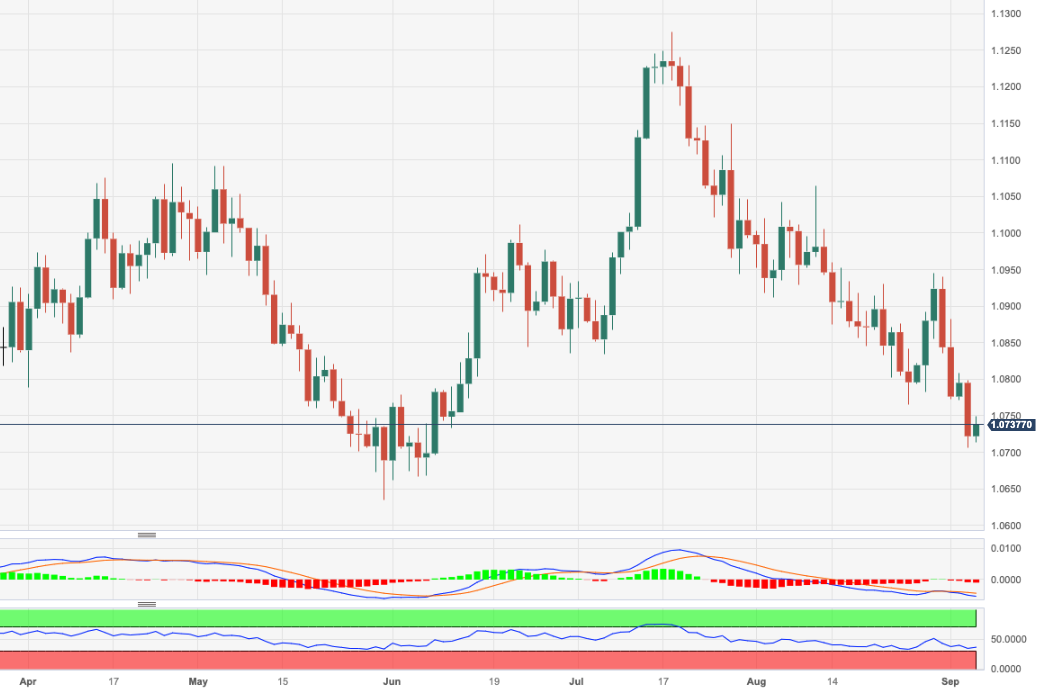
- EUR/USD manages to bounce off recent lows near 1.0700.
- The next contention appears at the 1.0630 zone.
EUR/USD recoups part of the ground lost on Tuesday’s sell-off and reclaims the 1.0740 area on Wednesday.
Despite the ongoing rebound, the pair remains well under pressure and the door remains open to extra losses in the short-term horizon. Against that, the loss of the 1.0700 support is expected to motivate the pair to challenge the May low of 1.0635 (May 31) in the not-so-distant future.
In the meantime, further losses remain in the pipeline while below the key 200-day SMA, today at 1.0820.
EUR/USD daily chart
Many indicators are pointing to a fall in inflation, which will be "quite marked," Bank of England Governor Andrew Bailey said while testifying before the UK Treasury Select Committee on Wednesday.
Key quotes
"When I look at it today, many of the indicators are now moving as we would expect them to move and are signalling that the fall in inflation will continue and as I've said a number of times I think will be quite marked by the end of this year."
"Wage bargaining, of course, is one thing but it has surprised us the other way in recent months."
"And the question now is as headline inflation comes down, will we see inflation expectations continue to come down? And will that be reflected into wage bargaining?"
"We are no longer in a phase where it was clear that rates needed to rise, we are now data-driven as policy is restrictive."
"Judgements on monetary policy are much finer."
"We are much nearer peak of rates, not saying we are at peak."
Market reaction
GBP/USD stays under bearish pressure and trades in negative territory below 1.2550 following these comments.
- Silver price extends its five-day losing spell amid firmer US Dollar.
- The appeal for the US Dollar has improved as fears of a recession in the US economy are mild.
- Silver price corrects vertically to near the 200-day EMA, which trades around $23.30.
Silver price (XAG/USD) continues its five-day losing spell after slipping below Tuesday’s low of $23.48 in the early New York session. The white metal faces immense selling interest as the US Dollar remains resilient due to deepening global recession fears.
Investors continue to pump money into the US Dollar as developing economies are expected to report recession due to restrictive monetary policy by the Western central bankers. The appeal for the US Dollar has improved as fears of a recession in the United States economy are mild. Disappointed Chinese economic growth is the major driver of strength in the US Dollar.
S&P500 opens on a negative note as the market sentiment remains downbeat due to global uncertainties. The US Dollar Index (DXY) gathers strength for a fresh upside and is expected to extend gains above the immediate resistance of 105.00. Investors should prepare for an action in the US Dollar after the release of the US ISM Services PMI for August, which will be published at 14:00 GMT.
Meanwhile, Boston Fed President Susan Collins commented about the interest rate outlook and that further action will be based on incoming data. Fed Collins expects a slowdown in coming months and the central bank is far from containing inflation.
Silver technical analysis
Silver price corrects vertically to near the 200-day Exponential Moving Average (EMA), which trades around $23.30. The white metal forms a Head and Shoulder chart pattern, which is a bearish reversal pattern. The neckline of the aforementioned formation is placed from June 22 low at $22.18.
The Relative Strength Index (RSI) (14) drops to near 40.00. A bearish impulse would be activated if it breaks below the same.
Silver daily chart
-638296051911189512.png)
- The Polish zloty depreciates to the 4.5700 region.
- The NBP reduced the policy rate by 75 bps to 6.00%.
EUR/PLN rose to levels last seen in early May around the 4.5700 zone in response to the unexpected interest rate cut by the National Bank of Poland (NBP).
EUR/PLN now targets the 200-day SMA around 4.5900
EUR/PLN rapidly added to the weekly move higher after the NBP caught everybody off guard and reduced its policy rate by 75 bps to 6.00% at its monetary policy meeting on Wednesday.
The sudden move by the Polish central bank was the first rate cut since it raised rates to 6.75% (from 6.50%) exactly a year ago.
The NBP's decision to trim rates comes in a context of declining inflation, albeit still elevated by domestic standards. Furthermore, tracked by the CPI, consumer prices rose at an annualized 10.1% in August, retreating for the seventh month in a row after hitting highs past 18% in February.
EUR/PLN levels to consider
So far, spot is up 1.63% at 4.5671 and a breakout of 4.5900 (200-day SMA) would open the door to 4.6158 (monthly high May 1) and then 4.7233 (monthly high March 20). On the other hand, the next support emerges at 4.4545 (55-day SMA) seconded by 4.3985 (2023 low July 31) and finally 4.3753 (monthly low August 18 2020).
The seasonally adjusted final S&P Global US Services PMI Business Activity Index posted 50.5 in August, down sharply from 52.3 in July. The number was revised lower from the preliminary 51. The Composite Index was also revised lower from 50.4 to 50.2, the lowest since February.
"The survey data send a hint of rising stagflation risks, as stubborn price pressures are accompanied by a near-stalling of business activity”, said Chris Williamson, Chief Business Economist at S&P Global Market Intelligence.
Key takeaways:
On the inflation front, input prices rose at a steeper pace in August, which was largely driven by higher wage bills. Firms were hesitant to pass through the full extent of increased input prices to their clients, however, as selling prices rose at a softer pace
the fall in new orders was the first in six months and signalled a marked turnaround from the sharp upturn seen in the second quarter of 2023
Firms remained upbeat in their assessment of the outlook for output over the coming year, despite the current muted demand.
The final S&P Global US Composite PMI Output Index* posted 50.2 in August, down from 52.0 in July, to signal only a fractional increase in business activity at US private sector firms. The slowdown in growth stemmed from a weaker service sector expansion and a renewed decrease in manufacturing output.
Market reaction
The US Dollar weakened moderately after the report. Market participants are now eagerly awaiting more data from the sector, with the ISM Services PMI.
The monetary policy is already "sufficiently restrictive," Bank of England (BoE) policymaker Swati Dhingra said during the Monetary Policy Hearings before the UK Treasury Select Committee on Wednesday, per Reuters.
Additional takeaways
"Domestic factors are likely to continue to ease the pressure on CPI inflation."
"Not yet evidence to suggest firms will seek to increase their margins."
"Labour market continues to ease as MPC's recent hiking cycle takes effect with a lag."
"Wage growth is one of the last outcomes to be impacted in the transmission of monetary policy to the real economy."
"A deferred pass-through of level changes to wages would not necessarily pose a risk to our target in the medium term."
"Will continue to focus on composition of wage growth, as well as headline figures for clearer sense of the outlook."
"Lagged effects of further tightening pose serious risks of output volatility in order to make a small dent on inflation."
Market reaction
GBP/USD came under renewed bearish pressure and dropped to a fresh 12-week low below 1.2530.
- DXY comes under some mild downside pressure on Wednesday.
- Extra advance is seen revisiting the YTD highs near 105.90.
DXY faces some tepid selling pressure and retreats from the area of recent multi-week highs near 104.90 on Wednesday.
If bulls push harder, the index should shift its focus to the round level at 105.00, while the breakout of this level could put a potential test of the 2023 peak at 105.88 (March 8) back on investors’ radar.
While above the key 200-day SMA, today at 103.02, the outlook for the index is expected to remain constructive.
DXY daily chart
- AUD/USD faces selling pressure near 0.6400 as the US Dollar remains resilient.
- Australian Q2 GDP outperformed expectations despite tight interest rate policy.
- AUD/USD tests the breakdown of the sideways channel and is expected to resume its downside journey.
The AUD/USD pair faces selling interest near the round-level resistance of 0.6400 in the late European session. The upside in the Aussie asset remains restricted due to the resilient US Dollar and China’s vulnerable economic outlook.
The Australian Dollar witnessed some buying early Wednesday due to upbeat Gross Domestic Product (GDP) data for the April-June quarter. The economy grew at a steady pace of 0.4%, a higher-than-expected growth rate of 0.3%. On an annualized basis, Q2 GDP dropped to 2.1% from the Q1 growth rate of 2.4% but remained higher than expectations of 1.7%.
Meanwhile, investors await US ISM Services PMI for August, which will be published at 14:00 GMT. Analysts at TD Securities expect the US ISM Services PMI to hold steady at 52.7 in August.
AUD/USD tests the breakdown of the sideways channel near the round-level resistance of 0.6400 on a two-hour scale. The asset remains vulnerable as the 20-period Exponential Moving Average (EMA) near 0.6400 continues to act as a barrier for the Australian Dollar bulls.
The Relative Strength Index (RSI) (14) rebounds into the 40.00-60.00 range while the downside bias remains firmer.
A fresh downside would appear if the Aussie asset dropped below August 17 low around 0.6360. This would expose the asset to the round-level support of 0.6300 followed by 03 November 2022 low at 0.6272.
On the contrary, a recovery move above August 15 high around 0.6522 will drive the asset to August 9 high at 0.6571. Breach of the latter will drive the asset towards August 10 high at 0.6616.
AUD/USD two-hour chart
-638296016799817506.png)
In a prepared speech delivered on Wednesday, “the risk of inflation staying higher for longer must now be weighed against the risk that an overly restrictive stance of monetary policy will lead to a greater slowdown in activity than is needed to restore price stability,” said Federal Reserve Bank of Boston President Susan Collins.
She explained that this context calls for a "patient and careful, but deliberate, approach to policy," that would provide time for policymakers to assess the effects of actions taken to date.
Additional takeaways
"Too soon to say inflation is sustainably moving back to target."
"Fed can likely achieve goals without causing notable economic pain."
"Demand continues to outstrip supply, creating inflation pressure."
"There is still too much job market demand, rebalancing process is incomplete."
"Wage growth remains elevated compared to 2% inflation target."
"Core services inflation moderation has been modest."
Market reaction
The US Dollar Index showed no immediate reaction to these comments and was last seen losing 0.1% on the day at 104.70.
- USD/CAD trades near a five-month high around 1.3670 as the focus shifts to BoC policy.
- The BoC is expected to keep interest rates steady at 5% amid a soft labor market.
- Investors underpinned the US Dollar as a safe haven despite hopes that the Fed is done with hiking interest rates.
The USD/CAD pair oscillates near a fresh five-month high of around 1.3670 ahead of the interest rate decision by the Bank of Canada (BoC). A power-pack action is anticipated in the Loonie asset after the announcement of the monetary policy decision by BoC Governor Tiff Macklem.
Analysts at CIBC point out that the decline in consumption is likely to hinder any future interest rate hikes by the BoC. Canada’s labor market has been soft as its Unemployment Rate has been increasing for the past three months. Also, Canadian employers have laid off workers two times in the past three months. An absence of strength in the labor market would allow the BoC to keep interest rates unchanged at 5%. However, policymakers would keep room open for further policy tightening.
Later this week, Canada’s labor market data for August will be keenly watched. The Unemployment Rate is seen further rising to 5.6% while a fresh addition of 15K employees is expected vs. retrenchment of 6.4K employees.
Meanwhile, S&P500 futures generated some losses in the London session, portraying caution among market participants due to global recession fears. For the action, investors will focus on the United States ISM Services PMI for August, which will be published at 14:00 GMT. Analysts at TD Securities expect the US ISM Services PMI to hold steady at 52.7 in August.
The US Dollar Index (DXY) remained sideways around 104.50 on Wednesday while the broader bias is strong amid jittery global growth. Investors underpinned the US Dollar as a safe haven despite slower wage growth boosting hopes of a steady interest rate policy by the Federal Reserve (Fed) in September.
- EUR/JPY trades in a vacillating tone above 158.00.
- Further gains are expected to dispute the 2023 peak at 159.76.
EUR/JPY seems to have met some decent resistance around the 158.40 zone so far this week.
The continuation of the uptrend could see the cross challenging the recent 2023 peak at near 159.76 (August 30) ahead of the key round level at 160.00. The surpass of the latter should not see any resistance level of note until the 2008 high at 169.96 (July 23).
In the meantime, the resumption of the selling pressure is expected to meet initial support at the weekly low around 157.00 (September 1), an area reinforced by the temporary 55-day SMA (157.02).
So far, the longer term positive outlook for the cross appears favoured while above the 200-day SMA, today at 148.20.
EUR/JPY daily chart
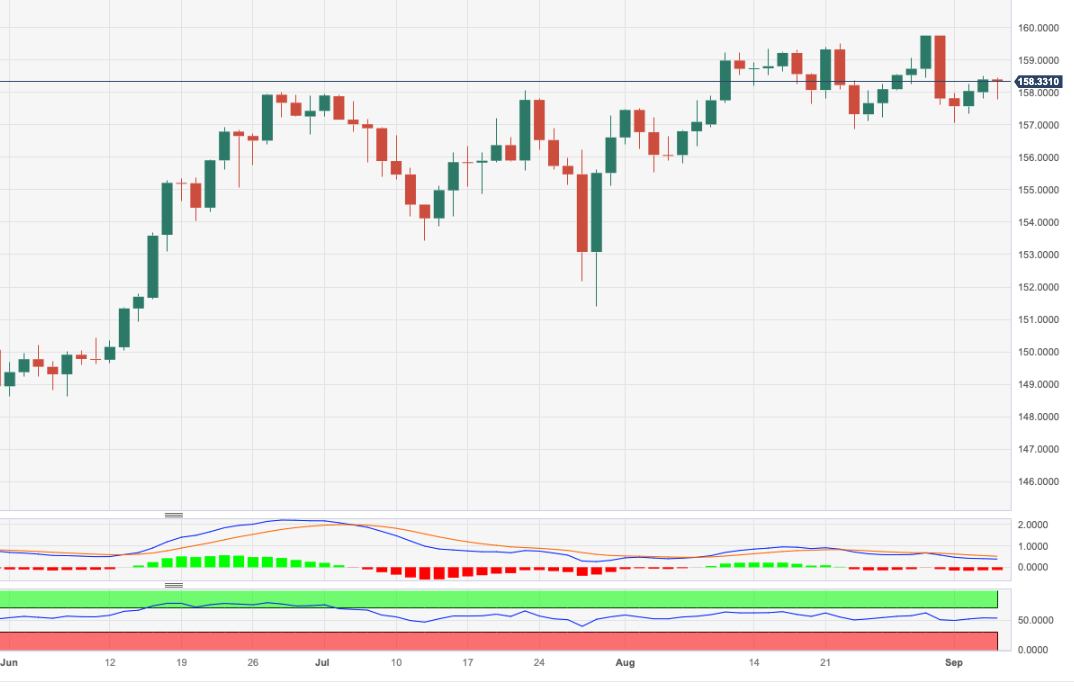
- The US Dollar sees its summer rally stall in European trading on Wednesday.
- Surprise comments from ECB member Knot triggered a surge in EUR.
- The US Dollar Index fades just ahead of nearly reaching 105.00 and could head lower in search of support.
The US Dollar (USD) is losing some steam on Wednesday on hawkish comments from European Central Bank (ECB) member Klaas Knot. The voting ECB member in the upcoming rate decision warned markets that they are underestimating the possibility of another hike from the ECB. This triggered a pop in the Euro and saw the Greenback take a step back.
A very chunky calendar is ahead for Wednesday as data points this week are moving one day later than usual because of the US holiday on Monday. The S&P Global Composite Purchasing Manager Index (PMI) will be important to watch, although this is a final reading with no big surprises expected. Rather look for the Institute for Supply Management (ISM) Services PMI number to come out as the most market moving element for this Wednesday.
Daily digest: US Dollar eases a touch
- The Mortgage Bankers Association (MBA) will issue its Mortgage Applications for the first week of September at 11:00 GMT. Previous print was 2.3%.
- At 12:30 GMT, US Trade Balance numbers for July are expected. The Goods and Services Trade Balance for July is anticipated to post a deficit of $65.8 billion, broadly unchanged from the $65.5 billion deficit registered a month earlier.
- At 13:45, the final reading from the S&P Global Composite and Services PMI for August will be released. Expectations are an unchanged print for both, with the Composite PMI at 50.4 and the Services PMI at 51.0. This would mark a clear divergence from the European PMI numbers published on Tuesday, which showed that services activity in every major EU country was in contraction.
- The most important data point for Wednesday is the publication of New Orders and Services PMI numbers from the Institute for Supply Management (ISM) at 14:00 GMT. The headline Services PMI is expected to shrink a touch from 52.7 to 52.5. The Services Employment Index was at 50.7 in July, with no expectations pencilled in. Similar for the New Orders Index, which stood at 55.0, and the Prices Paid Index, which came in at 56.8.
- Some US Federal Reserve members took the stage as well. Federal Reserve Bank of Boston President Susan Collins will speak at 14:30, while Dallas Fed President Lorie Logan will also speak at 19:00.
- Equities are looking for direction after the small decline seen on t Tuesday. The UK’s FTSE 100 leads declines, down nearly 1%.
- The CME Group FedWatch Tool shows that markets are pricing in a 93% chance that the Federal Reserve will keep interest rates unchanged at its meeting in September.
- The benchmark 10-year US Treasury bond yield trades at 4.26% and keeps heading higher after the US Treasury issued quite a lot of debt paper on Tuesday. The auctions flooded the markets with supply and saw yields ramping up.
US Dollar Index technical analysis: looking for support
The US Dollar eases a touch after its steep climb on Tuesday, when the Greenback was rolling through the markets. The US Dollar Index (DXY) broke lower after some surprise comments from ECB member Klaas Knot which made markets price in again a 50% chance of a rate hike in September, despite the contracting PMI numbers throughout Europe. The Greenback got outpaced by the Euro and saw several other currencies going along for the ride, forcing the DXY to take a small step back.
All eyes are on 105.00 after the DXY nearly reached this level on Tuesday. So only a few cents to go and the DXY will be at a new yearly high for the second time this week. Next levels are at 105.23, the high of March 2022, which would make an 18-month high. If the index reaches this last level, some resistance might kick in.
On the downside, the 104.30 figure is vital to keep the US Dollar Index sustained at these elevated levels. Some room lower, the 200-day Simple Moving Average (SMA) at 103.06 comes into play, which could bring substantially more weakness once the DXY starts trading below it. The double belt of support at 102.42, with both the 100-day and the 55-day SMA, are the last lines of defence before the US Dollar sees substantial and longer-term depreciation.
US Dollar FAQs
What is the US Dollar?
The US Dollar (USD) is the official currency of the United States of America, and the ‘de facto’ currency of a significant number of other countries where it is found in circulation alongside local notes. It is the most heavily traded currency in the world, accounting for over 88% of all global foreign exchange turnover, or an average of $6.6 trillion in transactions per day, according to data from 2022.
Following the second world war, the USD took over from the British Pound as the world’s reserve currency. For most of its history, the US Dollar was backed by Gold, until the Bretton Woods Agreement in 1971 when the Gold Standard went away.
How do the decisions of the Federal Reserve impact the US Dollar?
The most important single factor impacting on the value of the US Dollar is monetary policy, which is shaped by the Federal Reserve (Fed). The Fed has two mandates: to achieve price stability (control inflation) and foster full employment. Its primary tool to achieve these two goals is by adjusting interest rates.
When prices are rising too quickly and inflation is above the Fed’s 2% target, the Fed will raise rates, which helps the USD value. When inflation falls below 2% or the Unemployment Rate is too high, the Fed may lower interest rates, which weighs on the Greenback.
What is Quantitative Easing and how does it influence the US Dollar?
In extreme situations, the Federal Reserve can also print more Dollars and enact quantitative easing (QE). QE is the process by which the Fed substantially increases the flow of credit in a stuck financial system.
It is a non-standard policy measure used when credit has dried up because banks will not lend to each other (out of the fear of counterparty default). It is a last resort when simply lowering interest rates is unlikely to achieve the necessary result. It was the Fed’s weapon of choice to combat the credit crunch that occurred during the Great Financial Crisis in 2008. It involves the Fed printing more Dollars and using them to buy US government bonds predominantly from financial institutions. QE usually leads to a weaker US Dollar.
What is Quantitative Tightening and how does it influence the US Dollar?
Quantitative tightening (QT) is the reverse process whereby the Federal Reserve stops buying bonds from financial institutions and does not reinvest the principal from the bonds it holds maturing in new purchases. It is usually positive for the US Dollar.
European Central Bank (ECB) policymaker Peter Kazimir said on Wednesday that his preferable option would be to raise the policy rate by 25 basis points at the policy meeting next week, perhaps for the last time, per Reuters.
"One option is to take a break in September and, if necessary, deliver another (hopefully final) increase by 25 basis points in October or December," Kazimir elaborated and noted that inflation remains stubbornly high, with price growth expectations holding "too far above 2%."
Market reaction
EUR/USD edged slightly higher following these comments and was last seen rising 0.23% on the day at 1.0745.
Nordea economists explain three plausible scenarios for the outcome of the European Central Bank's monetary policy meeting next week:
"The ECB hikes rates and keeps its tightening bias intact; this would be a hawkish scenario that would likely boost interest rate expectations more durably. We think this is the least likely of the three scenarios."
"The ECB raises rates by another 25bp, but softens its tightening bias to suggest the bar for further hikes has risen; such an outcome would likely boost rate expectations only briefly."
"The ECB leaves rates unchanged while retaining its tightening bias; we think such an outcome would put some downward pressure on interest rate expectations, even if it would be considered a hawkish hold. This is also our baseline scenario."
Analysts at TD Securities note that they expect the US ISM Services PMI to hold steady at 52.7 in August.
"Regional surveys suggest a mixed picture for the ISM services index in August following a modest retreat to 52.7 in the last report. All told, we look for the series to stay unchanged, keeping the index in expansion territory for an additional month in August (TD: 52.7; consensus: 52.5)."
"With that said, if our forecast is realized, the index will remain notably below its average levels pre-pandemic at 55.5 for 2019 and 58.9 for 2018 (the average for 2022 was 56.1). Note that the ISM manufacturing index surprised to the upside last week, rising to 47.6 from 46.4 in July."
Senior Economist Alvin Liew and Associate Economist Jester Koh at UOB Group assess the release of Retail Sales in Singapore.
Key Takeaways
Singapore’s retail sales increased 1.1% y/y in Jul, lower than Bloomberg’s consensus of 2.1% y/y but a tad higher than Jun’s revised reading of 1.0% y/y. On a seasonally-adjusted sequential basis, retail sales rose 0.6% m/m in Jul, reversing the two preceding months of sequential contraction (Jun: -0.8% m/m, May: -0.1% m/m). Excluding motor vehicle sales, retail sales fell by 1.1% m/m (Jun: 0.1% m/m), translating to a milder y/y print of 0.4% (Jun: 2.3% y/y). In nominal terms, the value of retail sales rose to S$3.94bn (from S$3.84bn in Jun).
Outlook – We continue to expect retailers to enjoy some level of domestic and external support, complemented by major events such as various sports, popular concerts and BTMICE (Business Travel and Meetings, Incentive Travel, Conventions and Exhibitions) activities.
Downside risks to retail sales in 2H23 include a more cautionary external environment, easing in labour market conditions (slowing wage growth; uptick in unemployment and underemployment rates; weaker hiring sentiment across sectors) and a slower than expected return of inbound Chinese tourists. Given the recent softening in retail sales prints and elevated prices (especially on food and transport) which increasingly weigh on household spending, we downgrade our 2023 retail sales growth forecast to 3.5% from 5.0%.
- Oil (WTI) takes a step back after hitting $87.50 on Tuesday.
- The US Dollar eases a touch after a roaring performance on Tuesday.
- The American Petroleum Institute will release its weekly Crude Oil numbers on Wednesday.
Oil price has increased 12% in just two weeks as several OPEC+ members came out with extended and enlarged production cuts. Although the outcome on the back of these headlines was very binary on Tuesday, the dust starts to settle and markets are digesting recent numbers. It might not be an easy path forward for Oil, with EU economic data points pointing to a contraction, China not recovering as quickly as expected and Saudi Arabia being a wild card as the country might still backtrack and even jack up its production.
Meanwhile, the US Dollar was the king on Tuesday as stock markets traded in the red across the globe. The US Dollar Index (DXY) was in the green against every major G20 peer. On Wednesday, the US Dollar took a step back as European Central Bank member Klaas Knot said that a surprise hike might still come in September, making markets pare back bets of no hikes to a 50-50 valuation in favour of a stronger Euro and weaker US Dollar.
At the time of writing, Crude Oil (WTI) price trades at $85.61 per barrel and Brent Oil at $89.10.
Oil news and market movers
- OPEC+ heavyweights have pencilled in their commitments. The dust starts to settle as markets have digested the announcements, although questions remain around Saudi Arabia’s commitments. The country has been known for backtracking and even performing knee jerk reactions on previous statements.
- Brent Oil is being labelled with a price target of $100 per barrel, with several banks and analysts revising their projections higher.
- Markets have not heard yet of US president Joe Biden as these elevated oil levels will trickle into higher gasoline prices at the pumps. A bad omen for the current ruling president in his quest to get inflation down and control gasoline prices for households. Chances of a substantial coordinated release of oil reserves might be again the playbook.
- As production-related headlines start to die down, the focus is likely to shift to the inventory side.
- The American Petroleum Institute will publish at 20:30 GMT its weekly Crude Oil stock numbers. Previous reading was a drawdown of 11.486 million barrels. Any buildup in the stockpile could further weaken oil prices.
- Equity markets are in the red on Wednesday, with biggest losses in the United Kingdom, where the FTSE 100 is down near 1%.
Oil Technical Analysis: boiling over
Oil prices are boiling over as the Relative Strength Index (RSI) heads into overbought territory. This means that less buying will start to take place as traders will see less upside potential when entering into a long Crude Oil position at these elevated levels. Look for the RSI to cool down a touch before the next upswing materialises.
On the upside, $84.28, the high of August 10, has been broken and should hold as support. IfWTI continues to rally on the back of lower supply and more demand, not many elements could be standing in the way of reaching that green line at $92.80. Of course, the $90 psychological level needs to be faced first.
On the downside, a temporary bottom is being formed around $77.50, which acted as a base for this week. Should the API stockpile count jump substantially higher, expect to see the floor tested as more supply is bound to come on the markets. Once bears make it through the yellow box level plotted in the chart, expect to see more downside toward $74 before finding ample support to slow down the sell-off.
-638295896761592817.png)
WTI US OIL daily chart
WTI Oil FAQs
What is WTI Oil?
WTI Oil is a type of Crude Oil sold on international markets. The WTI stands for West Texas Intermediate, one of three major types including Brent and Dubai Crude. WTI is also referred to as “light” and “sweet” because of its relatively low gravity and sulfur content respectively. It is considered a high quality Oil that is easily refined. It is sourced in the United States and distributed via the Cushing hub, which is considered “The Pipeline Crossroads of the World”. It is a benchmark for the Oil market and WTI price is frequently quoted in the media.
What factors drive the price of WTI Oil?
Like all assets, supply and demand are the key drivers of WTI Oil price. As such, global growth can be a driver of increased demand and vice versa for weak global growth. Political instability, wars, and sanctions can disrupt supply and impact prices. The decisions of OPEC, a group of major Oil-producing countries, is another key driver of price. The value of the US Dollar influences the price of WTI Crude Oil, since Oil is predominantly traded in US Dollars, thus a weaker US Dollar can make Oil more affordable and vice versa.
How does inventory data impact the price of WTI Oil
The weekly Oil inventory reports published by the American Petroleum Institute (API) and the Energy Information Agency (EIA) impact the price of WTI Oil. Changes in inventories reflect fluctuating supply and demand. If the data shows a drop in inventories it can indicate increased demand, pushing up Oil price. Higher inventories can reflect increased supply, pushing down prices. API’s report is published every Tuesday and EIA’s the day after. Their results are usually similar, falling within 1% of each other 75% of the time. The EIA data is considered more reliable, since it is a government agency.
How does OPEC influence the price of WTI Oil?
OPEC (Organization of the Petroleum Exporting Countries) is a group of 13 Oil-producing nations who collectively decide production quotas for member countries at twice-yearly meetings. Their decisions often impact WTI Oil prices. When OPEC decides to lower quotas, it can tighten supply, pushing up Oil prices. When OPEC increases production, it has the opposite effect. OPEC+ refers to an expanded group that includes ten extra non-OPEC members, the most notable of which is Russia.
UOB Group’s Economist Lee Sue Ann reviews Tuesday’s interest rate decision by the RBA.
Key Takeaways
As expected, the Reserve Bank of Australia (RBA), for the third consecutive time, decided to leave the cash rate target unchanged at 4.10%. This is RBA Governor Philip Lowe’s final meeting as his seven-year term ends on 17 Sep.
Incoming RBA Governor, Michele Bullock, has said that inflation will be her first priority. Our view remains for the RBA to keep policy unchanged at the next meeting on 3 Oct, although we are penciling a chance it will hike one last time this year, taking the cash rate target to a peak of 4.35%.
All eyes will now turn to Australia’s 2Q23 GDP report due for release on 6 Sep, where the economy is expected to grow by 0.4% q/q, 1.8% y/y. Attention will then turn to RBA Governor Philip Lowe speech on Thu (7 Sep) titled `Some Final Remarks,' just 10 days before his term expires.
- EUR/GBP finds nominal selling pressure after Eurozone Retail Sales contracted by 0.2%, in line with expectations.
- Households’ demand in Eurozone softens as the real income is squeezed due to persistent inflationary pressures.
- UK’s service sector starts shrinking as consumer spending slows due to rising prices.
The EUR/GBP pair finds some selling pressure near 0.8550 after recovering from a two-week low around 0.8534 in the European session. The cross faces pressure as Eurozone Retail Sales for July contracted as expected by market participants.
Eurostat reported that Retail Sales contracted by 0.2%, in line with expectations. The economic data was expanded by 0.2% in June. On an annual basis, the economy maintains a contraction pace of 1.0% while investors forecast consumer spending shrinking by 1.2%.
Households’ demand in the Eurozone softens as the real income of individuals is squeezed due to persistent inflationary pressures. Higher interest rates by the European Central Bank (ECB) have elevated periodic installment obligations and the burden of the same has squeezed the spending power of the general public.
Meanwhile, investors remained mixed about whether the ECB will raise interest rates further or will keep the current monetary policy unchanged. ECB Governing Council member Klaas Knot told Bloomberg on Wednesday that investors betting against an interest rate increase next week are possibly underestimating the likelihood of its happening.
On the Pound Sterling front, the United Kingdom economy is facing the repercussions of aggressively restrictive monetary policy by the Bank of England (BoE). UK’s service sector starts shrinking as consumer spending slows due to rising prices. S&P Global reported that the Services PMI for August dropped to 49.5 vs. July’s reading of 51.5 but remained higher than estimates of 48.7. The economic data remains below the 50.0 threshold for the first time since January.
Economist Lee Sue Ann and Markets Strategist Quek Ser Leang at UOB Group argue that USD/CNH could have embarked on a potential move to 7.3500.
Key Quotes
24-hour view: We expected USD to trade sideways yesterday. However, USD took off and soared to a high of 7.3120. Unsurprisingly, upward momentum has increased significantly. USD is likely to rise further even though it is unlikely to reach 7.3500 today (there is another resistance at 7.3300). On the downside, 7.2900 is a solid support (minor support is at 7.3000).
Next 1-3 weeks: On Monday (04 Sep, spot at 7.2670), we indicated that “there is a slight increase in downside risk.” We also indicated that USD “must break and stay below 7.2390 before a sustained decline is likely.” However, USD did not break 7.2390. Instead, it broke above our ‘strong resistance’ level of 7.3000 and soared to 7.3120. The price action has shifted the risk to the upside, likely towards 7.3500. The upside risk is intact as long as USD stays above 7.2800.
- Gold price extends a two-day losing spell as investors channel funds into the US Dollar.
- US recession fears recede sharply due to cooling inflationary pressures and stable job growth.
- Investors await the US ISM Services PMI data for August for fresh guidance.
Gold price (XAU/USD) continues its two-day losing streak on Wednesday as investors keep pumping money into the US Dollar due to deepening global recession fears. Investors underpinned the US Dollar as a safe haven as developing economies are facing the wrath of higher interest rates from Western central banks and potential upside risks of deflation to the Chinese economy.
Fundamentally, it doesn’t seem bad for the Gold price as the US Unemployment Rate rose sharply to 3.8% and wage growth slowed in August. Investors hope that the Federal Reserve (Fed) is done with hiking interest rates. Fed Governor Christopher Waller supported the view, citing the latest batch of economic data that has provided more room to the central bank to assess whether the cost of borrowing needs to be increased again.
Daily Digest Market Movers: Gold price weakens amid strength in the US Dollar
- Gold price resumes its downside journey, tests territory below the crucial support of $1,925.00 as investors underpin the US Dollar as a safe-haven asset amid deepening global uncertainties.
- The precious metal fails to find attention despite the Federal Reserve being expected to keep interest rates steady at 5.25-5.50% for the remaining year.
- As per the CME Fedwatch Tool, there is a 53% chance that interest rates will remain unchanged at 5.25%-5.50% by year-end.
- Fed Governor Christopher Waller said on Tuesday the latest batch of economic data has provided more room to the central bank to assess whether interest rates need to increase again. Fed Waller further added that he doesn’t see any trigger forcing further policy tightening.
- A higher Unemployment Rate and a slower wage growth rate for August are supportive catalysts that would allow Fed policymakers to deliver an unchanged interest rate decision.
- Contrary to Fed Waller, Cleveland Fed Bank President Loretta Mester said there is still a lot of time before the FOMC decision in late September and the central bank will get a lot of data and information by then.
- The US Dollar hovers near a fresh five-month high, marginally lower than 105.00. The Greenback is walking on thin ice as investors hope that the Fed is done with hiking interest rates further.
- US Factory Orders for July contracted sharply by 2.1% after expanding for four straight months, while investors forecasted 0.1% shrinkage. In June, the economic data expanded significantly by 2.3%.
- New Orders for manufactured goods were contracted due to a sharp decline in demand for durable goods as corporations banked on backlogs amid a weak demand outlook.
- On Wednesday, investors will keenly focus on the ISM Services PMI for August, which will be published at 14:00 GMT. Investors anticipate a nominal drop to 52.5 vs. 52.7 in July.
- Investors will also focus on commentary from Fed policymakers: Boston Fed President Susan Collins and Dallas Fed President Lorie Logan.
- Last week, the US ISM Manufacturing PMI for August remained stabilized but continued to stay below the 50.0 threshold, which signals contraction in economic activity.
- US firms stated that they are focusing more on sustaining margins, operating with the available labor force and inventories due to easing confidence in household spending.
- The US Dollar has been performing well as recession fears in the US economy recede due to the stable job market and cooling inflationary pressures. Analysts at Goldman Sachs see a 15% chance that the US economy will slide into a recession. Earlier, the expectations of a recession in the US economy reached at 20%.
- Meanwhile, discussions about US-China trade relations have also underpinned the US Dollar. US Commerce Secretary Gina Raimondo said on Tuesday, “Don’t expect any changes to US tariffs on China imposed by Trump.”
Technical Analysis: Gold price extends losing spree
Gold price extends its two-day losing streak, skids below Tuesday’s low of $1,925.37 as the US Dollar remains resilient due to the risk-off mood. The precious metal slips below the 20 and 50-day Exponential Moving Averages (EMAs). Selling interest in the yellow metal after a recovery move to near $1,950.00 indicates that investors considered the pullback as a fresh selling opportunity. The 200-day EMA will continue to act as a strong cushion for Gold bulls.
Fed FAQs
What does the Federal Reserve do, how does it impact the US Dollar?
Monetary policy in the US is shaped by the Federal Reserve (Fed). The Fed has two mandates: to achieve price stability and foster full employment. Its primary tool to achieve these goals is by adjusting interest rates.
When prices are rising too quickly and inflation is above the Fed’s 2% target, it raises interest rates, increasing borrowing costs throughout the economy. This results in a stronger US Dollar (USD) as it makes the US a more attractive place for international investors to park their money.
When inflation falls below 2% or the Unemployment Rate is too high, the Fed may lower interest rates to encourage borrowing, which weighs on the Greenback.
How often does the Fed hold monetary policy meetings?
The Federal Reserve (Fed) holds eight policy meetings a year, where the Federal Open Market Committee (FOMC) assesses economic conditions and makes monetary policy decisions.
The FOMC is attended by twelve Fed officials – the seven members of the Board of Governors, the president of the Federal Reserve Bank of New York, and four of the remaining eleven regional Reserve Bank presidents, who serve one-year terms on a rotating basis.
What is Quantitative Easing (QE) and how does it impact USD?
In extreme situations, the Federal Reserve may resort to a policy named Quantitative Easing (QE). QE is the process by which the Fed substantially increases the flow of credit in a stuck financial system.
It is a non-standard policy measure used during crises or when inflation is extremely low. It was the Fed’s weapon of choice during the Great Financial Crisis in 2008. It involves the Fed printing more Dollars and using them to buy high grade bonds from financial institutions. QE usually weakens the US Dollar.
What is Quantitative Tightening (QT) and how does it impact the US Dollar?
Quantitative tightening (QT) is the reverse process of QE, whereby the Federal Reserve stops buying bonds from financial institutions and does not reinvest the principal from the bonds it holds maturing, to purchase new bonds. It is usually positive for the value of the US Dollar.
- USD/CHF treads waters to surpass the 0.8900 psychological level.
- US-China trade tension could reinforce the appeal of the safe-haven Swiss Franc (CHF).
- Investors await US PMI data, seeking fresh impetus on the inflation outlook.
USD/CHF holds ground near 0.8900 during the European session on Wednesday, treading waters to extend gains for the second successive day. The strength in the US Dollar (USD) contributes support to underpin the USD/CHF pair as investors expect the Federal Reserve (Fed) to keep interest rates at a higher level for a prolonged period.
Additionally, the financial markets are factoring in the odds for a 25 basis points (bps) interest rate hike by the end of the year 2023. This optimistic stance continues to support the US Treasury yields, bolstering the confidence of Greenback’s bulls.
The resurgence of trade tensions between the US and China could potentially reinforce the appeal of the traditional safe-haven Swiss Franc (CHF) and act as headwinds for the USD/CHF pair. US Commerce Secretary Gina Raimondo expects no revisions to the US tariffs on China, which were imposed during Trump's administration until the ongoing review by the US Treasury Office is completed.
US Dollar Index (DXY) hovers around 104.70, which measures the value of the US Dollar (USD) against the six other major currencies. The 10-year US bond yield rose to 4.25%, up by 1.66%, which underpinned the strength in the US Dollar (USD).
Investors will likely watch the upcoming economic data from the United States (US). The release of the US ISM Services PMI for August and the US S&P Global PMIs during the North American session will carry substantial importance. These data releases will supply valuable insights into the present inflation scenario in the United States and may help provide a more distinct direction for the USD/CHF currency pair.
Analysts at Danske Bank maintain a negative outlook for the Chinese economy and recently revised down growth forecast to 4.8% this year, and 4.2% in 2024.
Key Quotes:
“Financial stress has increased again with another major developer, Country Garden, at brink of default. Contagion to the shadow banking system has also come to the surface with a big trust company, Zhongrung International Trust Co missing payments. On top of this economic data has disappointed across the board with both consumer spending, home sales and exports undershooting expectations in recent months. Taking these developments into account we have revised down growth to 4.8% this and 4.2% next year. In our baseline scenario we expect policy makers to step up stimulus as broadly signalled following the Politburo meeting in late July and to take more measures to improve financing channels for developers and lift home sales. We also expect them to provide the necessary lifelines to local governments and facilitate a restructuring of major shadow banking entities in distress. We believe they will still strive to reach their 5% target and do what is necessary to at least put a floor under growth so it does not fall below 4-4½%.”
“In early September China took new steps to support the economy by lowering mortgage rates and reducing the required down payments for house purchases. Early indications are that it has already spurred some home buyer interest but if needed China can ease more via these tools. Funding channels for developers can also be improved and on Friday18 August, PBOC and financial regulators met with bank executives telling them to direct more lending to support an economic recovery. China is also likely to cut Reserve Requirement Ratios (RRR) for banks to free up more liquidity to buy credit bonds and increase lending. The RRR for small and medium sized banks is 7.75% while it is 10.75% for large banks and thus has plenty of room to be lowered. Finally, if needed, China could opt for quantitative easing (QE) with PBOC buying bonds directly in the market. This would serve as a strong signal that they step in as lender of last resort.”
- Eurozone Retail Sales came in at -0.2% MoM in July vs. -0.2% expected.
- Retail Sales in the bloc arrived at -1.0% YoY in July vs. -1.2% expected.
Eurozone’s Retail Sales dropped 0.2% MoM in July, as against an increase of 0.2% in June, the official data published by Eurostat showed on Wednesday. The market consensus was for a -0.2% reading.
On a yearly basis, the bloc’s Retail Sales fell 1.0% in July versus -1.0% booked in June and -1.2% expected.
FX implications
The Euro is little affected by the upbeat Eurozone consumer spending data. At the time of writing, the major is trading at 1.0733, up 0.11% on the day
About Eurozone Retail Sales
The Retail Sales released by Eurostat are a measure of changes in sales of the Eurozone retail sector. It shows the performance of the retail sector in the short term. Percent changes reflect the rate of changes of such sales. The changes are widely followed as an indicator of consumer spending. Usually, positive economic growth anticipates "Bullishness" for the EUR, while a low reading is seen as negative, or bearish, for the EUR.
- EUR/JPY cross attracts some dip-buying in reaction to hawkish remarks by ECB’s Knot.
- Intervention fears, along with the cautious mood, benefit the JPY and cap the upside.
- The divergent ECB-BoJ policy suggests that the path of least resistance is to the upside.
The EUR/JPY cross struggles to capitalize on its positive move witnessed over the past two days and comes under some selling pressure on Wednesday. Spot prices, however, manage to rebound around 40-50 pips from the daily trough touched during the early part of the European session and currently trade with modest intraday losses, around the 158.15-158.20 region, down less than 0.15% for the day.
The shared currency attracts some buyers in reaction to hawkish comments by European Central Bank (ECB) Governing Council member Klaas Knot, which, in turn, assists the EUR/JPY cross to rebound from the 157.75 region. Knot told Bloomberg that investors betting against an interest rate increase next week are possibly underestimating the likelihood of it happening. This, in turn, pushes back against market expectations for an imminent pause in the rate-hiking cycle and prompts some intraday short-covering around the cross.
Knot, however, added that a rate hike is a possibility, not a certainty. This, along with a verbal intervention by Japan's top currency diplomat Masato Kanda, keeps a lid on any further upside for the EUR/JPY cross. In fact, Kanda warned against the recent sell-off in the Japanese Yen (JPY) and said that authorities won't rule out any options if speculative moves in the currency market persist. Apart from this, the cautious market mood benefits the safe-haven JPY and contributes to the mildly offered tone surrounding the cross.
A private survey showed on Tuesday that business activity in China's services sector expanded at its slowest pace in eight months and fueled worries about the worsening conditions in the world's second-largest economy. Apart from this, persistent US-China trade tensions temper investors' appetite for riskier assets. The downside for the EUR/JPY cross, however, remains cushioned in the wake of a dovish stance adopted by the Bank of Japan (BoJ), which remains the only central bank in the world to maintain negative rates.
Furthermore, BoJ policymaker Hajime Takata said earlier today that the central bank must patiently maintain easy policy given very high uncertainty on the outlook, ensuring an extension of the ultra-loose policy settings until next summer. This marks a big divergence in comparison to other major central banks, including the ECB, which might continue to undermine the JPY and suggests that the path of least resistance for the EUR/JPY cross is to the upside. Hence, any meaningful corrective slide might be seen as a buying opportunity.
Technical levels to watch
- The Euro attempts a tepid rebound against the US Dollar.
- Stocks in Europe opened with broad-based losses.
- EUR/USD appears to have met some contention near 1.0700.
- The USD Index (DXY) shed some ground after recent peaks.
- The US ISM Services PMI will be in the limelight on Wednesday.
- Germany’s Factory Orders plunged 11.7% on month in July.
The Euro (EUR) regains some balance against the US Dollar (USD) on Wednesday, helping EUR/USD to leave behind Tuesday’s multi-week lows in the 1.0700 neighbourhood.
After advancing to fresh six-month tops just below the 105.00 figure in the previous session, the Greenback faces some selling pressure and recedes to the 104.80-104.70 band when tracked by the USD Index (DXY). The small downtick in the index came despite the marked bounce in US yields across different timeframes.
In the meantime, steadfast confidence pervades the market with regards to the Federal Reserve's (Fed) resolution to cease its campaign of raising interest rates for the remainder of the year. At the same time, investors seem to be assuming that any interest rate reductions may not come until March 2024.
Conversely, the European Central Bank (ECB) finds itself traversing a landscape fraught with heightened uncertainty regarding the future trajectory of interest rates beyond the summer season. Market deliberations revolve around the notion of stagflation, amplifying the prevailing air of ambiguity.
In the euro docket, the Construction PMI in Germany improved marginally to 41.5 in August, and Factory Orders contracted markedly by 11.7% in July on month. Later in the session, Retail Sales in the broader euro area are also due.
In the US, the usual weekly Mortgage Applications tracked by MBA are followed by the IBD/TIPP Economic Optimism index, the Balance of Trade, the final S&P Global Services PMI for August, and the always-relevant ISM Services PMI.
Daily digest market movers: Euro meets initial contention near 1.0700
- The EUR attempts a mild recovery against the USD midweek.
- US yields resume the marked march north.
- ECB’s Klaas Knot does not rule out another interest-rate raise.
- Disinflation and cracks in the US labour market support the Fed’s pause.
- Markets continue to price in Fed rate cuts in Q2 2024.
Technical Analysis: Euro risks deeper retracements
EUR/USD has met some initial respite to the ongoing intense retracement around the 1.0700 region. However, the recent breakdown of the critical 200-day Simple Moving Average (SMA) at 1.0820 continues to favour extra losses in the short term.
If EUR/USD accelerates its losses, it could revisit the May 31 low of 1.0635 prior to the March 15 low of 1.0516. The loss of the latter could prompt a potential test of the 2023 low at 1.0481 seen on January 6.
On the upside, spot is expected to target the critical 200-day SMA at 1.0820. North from here, bulls should meet the the weekly top of 1.0945 from August 30 ahead of the interim 55-day SMA at 1.0953 and prior to the psychological 1.1000 barrier and the August 10 top at 1.1064. Once the latter is cleared, spot could challenge July 27 peak at 1.1149. If the pair surpasses this region, it could alleviate some of the downward pressure and potentially visit the 2023 peak of 1.1275 seen on July 18.
A sustained decline is likely in EUR/USD while it remains below the 200-day SMA.
Euro FAQs
What is the Euro?
The Euro is the currency for the 20 European Union countries that belong to the Eurozone. It is the second most heavily traded currency in the world behind the US Dollar. In 2022, it accounted for 31% of all foreign exchange transactions, with an average daily turnover of over $2.2 trillion a day.
EUR/USD is the most heavily traded currency pair in the world, accounting for an estimated 30% off all transactions, followed by EUR/JPY (4%), EUR/GBP (3%) and EUR/AUD (2%).
What is the ECB and how does it impact the Euro?
The European Central Bank (ECB) in Frankfurt, Germany, is the reserve bank for the Eurozone. The ECB sets interest rates and manages monetary policy.
The ECB’s primary mandate is to maintain price stability, which means either controlling inflation or stimulating growth. Its primary tool is the raising or lowering of interest rates. Relatively high interest rates – or the expectation of higher rates – will usually benefit the Euro and vice versa.
The ECB Governing Council makes monetary policy decisions at meetings held eight times a year. Decisions are made by heads of the Eurozone national banks and six permanent members, including the President of the ECB, Christine Lagarde.
How does inflation data impact the value of the Euro?
Eurozone inflation data, measured by the Harmonized Index of Consumer Prices (HICP), is an important econometric for the Euro. If inflation rises more than expected, especially if above the ECB’s 2% target, it obliges the ECB to raise interest rates to bring it back under control.
Relatively high interest rates compared to its counterparts will usually benefit the Euro, as it makes the region more attractive as a place for global investors to park their money.
How does economic data influence the value of the Euro?
Data releases gauge the health of the economy and can impact on the Euro. Indicators such as GDP, Manufacturing and Services PMIs, employment, and consumer sentiment surveys can all influence the direction of the single currency.
A strong economy is good for the Euro. Not only does it attract more foreign investment but it may encourage the ECB to put up interest rates, which will directly strengthen the Euro. Otherwise, if economic data is weak, the Euro is likely to fall.
Economic data for the four largest economies in the euro area (Germany, France, Italy and Spain) are especially significant, as they account for 75% of the Eurozone’s economy.
How does the Trade Balance impact the Euro?
Another significant data release for the Euro is the Trade Balance. This indicator measures the difference between what a country earns from its exports and what it spends on imports over a given period.
If a country produces highly sought after exports then its currency will gain in value purely from the extra demand created from foreign buyers seeking to purchase these goods. Therefore, a positive net Trade Balance strengthens a currency and vice versa for a negative balance.
- NZD/USD struggles to approach 0.5900 ahead of the US PMI releases.
- Fed is expected to increase another 25 basis points rate hike by the end of 2023.
- US-China trade tension exerts downward pressure on the New Zealand Dollar (NZD).
NZD/USD grapples to snap the losing streak that began on Friday, holding grounds near 0.5880 during the European session on Wednesday. The strength in the US Dollar (USD) weighed on the pair as market participants anticipate the Federal Reserve (Fed) to keep interest rates at a higher level for a prolonged period.
Furthermore, the markets are pricing in the possibility of a 25 basis points (bps) rate hike by the end of 2023. This hawkish outlook continues to underpin the yields on the US Treasury bonds, which provides confidence to the Greenback’s buyers.
The resurgence of trade tensions between the US and China could potentially reinforce the fears over China’s gloomy economic outlook. US Commerce Secretary Gina Raimondo anticipates that there will be no revisions to the US tariffs on China, which were imposed during Trump's administration until the ongoing review by the US Treasury Office is completed.
Given the close trade relationship between China and New Zealand, this situation may potentially exert downward pressure on the New Zealand Dollar (NZD) due to its susceptibility to developments in the Chinese economy.
US Dollar Index (DXY), which measures the value of the US Dollar (USD) against the six other major currencies, hovers around 104.70 at the time of writing. The yield on the 10-year US Treasury bond rose to 4.26%, up by 1.90%, which is contributing the support in underpinning the US Dollar (USD).
Investors will closely monitor the forthcoming economic data from the United States (US). The release of the US ISM Services PMI for August and the US S&P Global PMIs later in the North American session will be significant. These data releases will provide valuable insights into the current economic conditions in the United States and could potentially offer a clearer direction for the NZD/JPY currency pair.
The European Central Bank (ECB) Governing Council member Klaas Knot told Bloomberg on Wednesday that Investors betting against an interest rate increase next week are possibly underestimating the likelihood of it happening.
Additional Quotes:
A rate hike is a possibility, not a certainty.
Hitting the 2% inflation target by the end of 2025 is the bare minimum.
An economic slowdown is sure to damp demand, though inflation projections won’t differ much from the last round in June.
Market Reaction:
The shared current reacts little to the hawkish-sounding comments and trades with a mild positive bias, around the 1.0730-1.0725 region against the US Dollar (USD).
- The Bank of Canada is forecast to leave the policy rate unchanged at 5.0% on September 6.
- BoC policymakers are expected to keep the interest rate steady until the end of the year.
- BoC policy statement could ramp up volatility around the Canadian Dollar.
The Bank of Canada (BoC) is widely expected to leave its policy rate unchanged at 5% when it concludes the September policy meeting on Wednesday, following the 25 basis points rate hike announced in July. The Canadian Dollar has been struggling to find demand since the previous BoC policy meeting and has lost nearly 2.5% against the US Dollar.
The BoC’s latest Participants Survey, published on July 24, showed that most market participants expected the bank to hold its policy rate at 5% until the end of 2023. Moreover, participants also forecast the BoC to reduce the key interest rate to 3.50% in the fourth quarter of 2024.
Bank of Canada interest rate expectations: Steady policy as activity slows
The BoC had a batch of data releases to assess since the July meeting as it looks to set the monetary policy in a way to tame inflation, while limiting the damage to the economy.
After declining to 2.8% in June, the annual Consumer Price Index (CPI) inflation climbed to 3.3% in July. In the meantime, the Canadian economy stagnated in the second-quarter, following a 0.6% (QoQ) real Gross Domestic Product (GDP) growth recorded in the first. This reading came in below the market expectation for a 0.3% expansion. On a monthly basis, Canada’s real GDP contracted by 0.2% in June.
Analysts at TD Securities (TDS) said that the latest GDP figures reaffirm that the BoC will opt to leave the policy rate unchanged:
“The below consensus print on Q2 GDP should give the Bank of Canada enough conviction that its rate hikes are working to step back to the sidelines in September, especially with interest sensitive parts of the economy leading the slowdown. The monthly figures for June & July also leave Q3 GDP tracking well below BoC projections which should help make the Bank's decision a little easier next week.”
The BoC is likely to leave its policy unchanged to buy more time to assess the developments. Rising energy prices since August could cause the bank to adopt a cautious stance regarding the inflation outlook in its policy statement. Signs of cooldown in the labor market and consumer activity, however, could force the BoC to refrain from leaving the door open to additional policy tightening. Retail Sales ex Autos declined 0.8% in June, while the Unemployment Rate ticked up to 5.5% in July from 5.4% in June.
When will the BoC release its monetary policy decision and how could it affect USD/CAD?
The Bank of Canada will announce its policy decision on Wednesday, September 6, at 14:00 GMT. The policy decisions will not be accompanied by the central bank’s updated forecasts and there will not be a press conference by Governor Tiff Macklem following the release of the policy statement.
The Canadian Dollar (CAD) lost nearly 2.5% against the US Dollar since the BoC’s July meeting. Markets seem to have already priced in a no-change in the bank’s policy settings in September. At this point, a 25 basis points rate hike in response to stronger-than-forecast July CPI readings would be a significant hawkish surprise. Such a decision, however, is very unlikely given the gloomy economic climate.
If the BoC notes that it could consider another rate increase in case inflation proves to be more persistent than estimated, the initial market reaction could provide a boost to the CAD and trigger a leg lower in USD/CAD.
On the other hand, USD/CAD could extend its uptrend if the BoC puts more emphasis on the growth outlook, while maintaining a neutral stance on inflation. In this scenario, even if a ‘buy the rumor sell the fact’ market reaction could initially weigh on the pair, it is unlikely to be persistent enough to trigger a downtrend.
Eren Sengezer, European Session Lead Analyst at FXStreet, offers a brief technical outlook for the USD/CAD pair and writes:
“The Relative Strength Index (RSI) indicator on the daily chart climbed above 70 this week, suggesting that USD/CAD could stage a downward correction before the next leg higher. Nevertheless, the bullish bias remains intact in the near term outlook."
Eren also outlines important technical levels for USD/CAD: “1.3600 (psychological level) aligns as interim support ahead of 1.3550 (20-day Simple Moving Average), 1.3500 (psychological level) and 1.3450 (200-day SMA). On the upside, 1.3700 (psychological level) could be seen as first resistance before 1.3750 (static level from April) and 1.3860 (2023-high set on March 10).
Canadian Dollar FAQs
What key factors drive the Canadian Dollar?
The key factors driving the Canadian Dollar (CAD) are the level of interest rates set by the Bank of Canada (BoC), the price of Oil, Canada’s largest export, the health of its economy, inflation and the Trade Balance, which is the difference between the value of Canada’s exports versus its imports. Other factors include market sentiment – whether investors are taking on more risky assets (risk-on) or seeking safe-havens (risk-off) – with risk-on being CAD-positive. As its largest trading partner, the health of the US economy is also a key factor influencing the Canadian Dollar.
How do the decisions of the Bank of Canada impact the Canadian Dollar?
The Bank of Canada (BoC) has a significant influence on the Canadian Dollar by setting the level of interest rates that banks can lend to one another. This influences the level of interest rates for everyone. The main goal of the BoC is to maintain inflation at 1-3% by adjusting interest rates up or down. Relatively higher interest rates tend to be positive for the CAD. The Bank of Canada can also use quantitative easing and tightening to influence credit conditions, with the former CAD-negative and the latter CAD-positive.
How does the price of Oil impact the Canadian Dollar?
The price of Oil is a key factor impacting the value of the Canadian Dollar. Petroleum is Canada’s biggest export, so Oil price tends to have an immediate impact on the CAD value. Generally, if Oil price rises CAD also goes up, as aggregate demand for the currency increases. The opposite is the case if the price of Oil falls. Higher Oil prices also tend to result in a greater likelihood of a positive Trade Balance, which is also supportive of the CAD.
How does inflation data impact the value of the Canadian Dollar?
While inflation had always traditionally been thought of as a negative factor for a currency since it lowers the value of money, the opposite has actually been the case in modern times with the relaxation of cross-border capital controls. Higher inflation tends to lead central banks to put up interest rates which attracts more capital inflows from global investors seeking a lucrative place to keep their money. This increases demand for the local currency, which in Canada’s case is the Canadian Dollar.
How does economic data influence the value of the Canadian Dollar?
Macroeconomic data releases gauge the health of the economy and can have an impact on the Canadian Dollar. Indicators such as GDP, Manufacturing and Services PMIs, employment, and consumer sentiment surveys can all influence the direction of the CAD. A strong economy is good for the Canadian Dollar. Not only does it attract more foreign investment but it may encourage the Bank of Canada to put up interest rates, leading to a stronger currency. If economic data is weak, however, the CAD is likely to fall.
Japan Chief Cabinet Secretary, Hirokazu Matsuno, said on Wednesday, he is “watching FX moves with a high sense of urgency.”
Additional quotes
Sharp FX moves are undesirable.
Important for FX to move stably reflecting fundamentals.
Will respond appropriately if necessary without ruling out any option.
Economist at UOB Group Lee Sue Ann suggests the Bank Negara Malaysia (BNM) would likely maintain its policy rate intact at 3.00% at its meeting later in the week.
Key Takeaways
Both the latest inflation reading and slower-than-expected real GDP growth for 2Q23 reinforces our view for the OPR to be kept unchanged at 3.00% for the rest of the year.
Increasing uncertainties from the external front alongside a persistent labour market slack and year-ago high base effects have posed more challenges to Malaysia to sustain its growth momentum in the coming quarters, limiting room for BNM to further tighten its monetary policy.
- The index faces some selling pressure following recent tops.
- US yields add to Tuesday’s upside across the curve.
- Investors’ attention is expected to be on the US services sector.
The greenback appears somewhat offered around the 104.70 region when tracked by the USD Index (DXY) on Wednesday.
USD Index focused on data, Fedspeak
Following Tuesday’s climb to new six-month highs around 104.90, the index now faces some selling bias and gives away part of its recent gains despite the resumption of the upside momentum in US yields across different maturities.
In the meantime, the persistent march north in the greenback has been bolstered by the equally intense weakness in the risk complex as well as the breakout of the critical 200-day SMA (103.02), all against the backdrop of rising speculation that the Fed might start cutting rates around Q2 2024.
Data-wise, in the US, MBA Mortgage Applications are due in the first turn, seconded by Balance of Trade figures, while the services sector will take centre stage with the release of the final prints of the S&P Global Services PMI and the ISM Services PMI. Finally, the Fed’s Beige Book should shed details on the regional performance in the past few weeks.
Additionally, Boston Fed Susan Collins (2025 voter, centrist) and Dallas Fed Lorie Logan (voter, hawk) are due to speak.
What to look for around USD
The recent strong recovery in the index has opened the door to a potential visit to the 105.00 region sooner rather than later.
In the meantime, support for the dollar keeps coming from the good health of the US economy, which seems to have reignited the narrative around the tighter-for-longer stance from the Federal Reserve.
Running on the opposite side of the road, the idea that the dollar could face headwinds in response to the data-dependent stance from the Fed against the current backdrop of persistent disinflation and cooling of the labour market appears to have regained some traction as of late.
Key events in the US this week: MBA Mortgage Applications, Balance of Trade, Final S&P Global Services PMI, ISM Services PMI, Fed Beige Book (Wednesday) – Initial Jobless Claims (Thursday) – Wholesale Inventories, Consumer Credit Change (Friday).
Eminent issues on the back boiler: Persistent debate over a soft or hard landing for the US economy. Incipient speculation of rate cuts in H1 2024. Geopolitical effervescence vs. Russia and China.
USD Index relevant levels
Now, the index is retreating 0.07% at 104.72 and the breach of 103.02 (200-day SMA) would open the door to 102.93 (weekly low August 30) and then 102.51 (55-day SMA). On the other hand, the next up barrier emerges at 104.90 (monthly high September 5) ahead of 105.00 (round level) and finally 105.88 (2023 high March 8).
Dr Ralph Solveen, Senior Economist at Commerzbank, offers a brief review of Wednesday's release of German Factory Orders, which contracted for the first time in three months and plunged by 11.7% in July.
Key Quotes:
“The rollercoaster ride in German industrial order intake continues. After rising strongly in May and June, more than offsetting the significant decline in March, they literally collapsed again in July with a drop of 11.7%. However, the sharp movements in the past three months are primarily attributable to a varying number of big ticket orders. Excluding these, new orders have hardly changed on balance in the past four months. For July, this "core variable" even showed a slight increase of 0.3%.”
“However, it would probably be premature to interpret this recent sideways movement in core orders as the start of a stabilization in demand. In the surveys for the PMI and the Ifo Business Climate, companies have simply assessed current demand too negatively of late for this to be the case. In addition, the central banks' interest rate hikes are unlikely to have had already their full impact on global demand for German goods. We therefore expect the trend in new orders to point downwards again in the coming months. This will increasingly feed through to production, with the result that industry is likely to be a major contributor to the German economy contracting again in the second half of the year.”
- Pound Sterling recovered, but the broader bias remains weak due to deteriorating demand from households and corporations.
- After a series of contracting factory activities, the UK service sector shrunk for the first time since January.
- Market sentiment remains dampened as investors worry about global recession fears.
The Pound Sterling (GBP) weakened further after S&P Global reported that the United Kingdom’s service sector started shrinking due to infirm demand from households and the private sector amid a high-interest rate environment. The GBP/USD pair is attempting a recovery after printing a fresh 11-week low, though it could be used as a selling opportunity by market participants as the overall market sentiment is bearish.
The UK’s economy is expected to weaken further as the Bank of England (BoE) is preparing to raise interest rates further to sharpen monetary tools against a persistently high core Consumer Price Index (CPI). Investors anticipate a quarter-to-a-basis interest rate hike from the BoE on September 21, which will push interest rates to 5.50%. Meanwhile, investors await the S&P Global Construction PMI for August, which will be released at 08:30 GMT.
Daily Digest Market Movers: Pound Sterling recovery seems less confident
- Pound Sterling attempts recovery after a fresh 11-week low near 1.2530, while the broader bias is still bearish as the UK economy turns vulnerable due to restrictive monetary policy by the Bank of England (BoE).
- After declining UK factory activities, the service sector also comes under pressure as higher interest rates and rising prices ease household demand.
- Corporate demand has also dropped due to faltering economic growth and sticky inflation, weighing heavily on the economic outlook.
- S&P Global reported that the Services PMI for August dropped to 49.5 vs. July’s reading of 51.5 but remained higher than estimates of 48.7. The economic data remains below the 50.0 threshold for the first time since January.
- It seems that the cooling effects of higher interest rates by the BoE are impacting the overall spending and confidence of households and corporations in the UK economy.
- Tim Moore, Economics Director at S&P Global Market Intelligence, said, "Service providers saw customer spending reverse course during August as higher borrowing costs, subdued business confidence, and stretched household finances all acted to curtail sales opportunities.
- Meanwhile, BoE policymakers are gearing up to raise interest rates straight for the 15th time to sharpen monetary tools in the battle against persistent inflation.
- The BoE will announce the monetary policy on September 21. An interest rate hike of 25 basis points (bps) is expected, which will push interest rates to 5.50%.
- Going forward, investors will focus on the S&P Global UK Construction PMI for August, which will be published at 8:30 GMT. The economic data is seen dropping to 50.7 from 51.7 in July. UK construction activities weakened as households postponed home demand to avoid higher installment obligations.
- The market sentiment remains bearish as investors remain worried about the deteriorating global outlook in the battle against stubborn inflation.
- Risk-sensitive currencies are facing repercussions of higher interest rates by their respective central banks such as economic shrinkage and slower labor growth.
- The US Dollar reported a subdued performance on Wednesday morning, but the broader bias remains bullish as US recession fears recede significantly.
- Analysts at Goldman Sachs see a 15% chance that the US economy will slide into a recession as inflation cools down and job growth remains solid. Earlier, expectations of a recession in the US economy were at 20%.
- Further action in the US Dollar will be based on the US ISM Services PMI for August, which will be published at 14:00 GMT. The PMI data is seen dropping marginally to 52.5 vs. 52.47 in July.
Technical Analysis: Pound Sterling oscillates inside Tuesday’s range
Pound Sterling trades inside Tuesday's range of 1.2530 to 1.2630 as investors await more guidance on the interest rate outlook. The Cable remains vulnerable after stabilizing below the 20 and 50-day Exponential Moving Averages (EMAs). The asset is expected to extend its downside journey and may find an intermediate cushion near the 200-day EMA, which trades marginally below 1.2500. Momentum oscillators demonstrate that the bearish impulse is strengthening again.
Pound Sterling FAQs
What is the Pound Sterling?
The Pound Sterling (GBP) is the oldest currency in the world (886 AD) and the official currency of the United Kingdom. It is the fourth most traded unit for foreign exchange (FX) in the world, accounting for 12% of all transactions, averaging $630 billion a day, according to 2022 data.
Its key trading pairs are GBP/USD, aka ‘Cable’, which accounts for 11% of FX, GBP/JPY, or the ‘Dragon’ as it is known by traders (3%), and EUR/GBP (2%). The Pound Sterling is issued by the Bank of England (BoE).
How do the decisions of the Bank of England impact on the Pound Sterling?
The single most important factor influencing the value of the Pound Sterling is monetary policy decided by the Bank of England. The BoE bases its decisions on whether it has achieved its primary goal of “price stability” – a steady inflation rate of around 2%. Its primary tool for achieving this is the adjustment of interest rates.
When inflation is too high, the BoE will try to rein it in by raising interest rates, making it more expensive for people and businesses to access credit. This is generally positive for GBP, as higher interest rates make the UK a more attractive place for global investors to park their money.
When inflation falls too low it is a sign economic growth is slowing. In this scenario, the BoE will consider lowering interest rates to cheapen credit so businesses will borrow more to invest in growth-generating projects.
How does economic data influence the value of the Pound?
Data releases gauge the health of the economy and can impact the value of the Pound Sterling. Indicators such as GDP, Manufacturing and Services PMIs, and employment can all influence the direction of the GBP.
A strong economy is good for Sterling. Not only does it attract more foreign investment but it may encourage the BoE to put up interest rates, which will directly strengthen GBP. Otherwise, if economic data is weak, the Pound Sterling is likely to fall.
How does the Trade Balance impact the Pound?
Another significant data release for the Pound Sterling is the Trade Balance. This indicator measures the difference between what a country earns from its exports and what it spends on imports over a given period.
If a country produces highly sought-after exports, its currency will benefit purely from the extra demand created from foreign buyers seeking to purchase these goods. Therefore, a positive net Trade Balance strengthens a currency and vice versa for a negative balance.
- AUD/USD stages a modest recovery from the YTD trough, albeit lacks follow-through.
- A slightly better Australian GDP lends support to the pair amid subdued USD demand.
- China’s economic woes cap any meaningful gains ahead of the US ISM Services PMI.
The AUD/USD pair finds some support in the vicinity of mid-0.6300s for the second straight day and stages a modest recovery from a fresh low since November 2022 touched this Wednesday. Spot prices, however, struggle to capitalize on the move and remain below the 0.6400 round-figure mark through the early European session.
The US Dollar (USD) takes a brief pause and digests the recent rise to a six-month peak, which, along with the better-than-expected release of the Australian GDP report, prompts some intraday short-covering around the AUD/USD pair. In fact, the Australian Bureau of Statistics reported that the economy expanded by 0.4% during the April-June period, a touch higher than the 0.3% rise anticipated and the 0.2% growth registered in the previous quarter. The yearly rate also surpassed market expectations and came in at 2.1% as compared to the 2.3% seen in the first quarter.
The AUD/USD pair, however, lacks bullish conviction amid concerns about the worsening economic conditions in China. Apart from this, persistent US-China trade tensions keep a lid on the China-proxy Australian Dollar (AUD). In the latest development, US Secretary of Commerce Gina Raimondo said that she doesn't expect any changes to the US tariffs imposed on China by the Trump administration until the completion of the ongoing review by the US Treasury. This comes on top of expectations that the Reserve Bank of Australia (RBA) is done raising interest rates.
It is worth recalling that the Australian central bank decided to stick to its wait-and-see stance and left the Official Cash Rate (OCR) unchanged at 4.10% for the third straight month on Tuesday. Furthermore, the accompanying monetary policy statement offered little hawkish surprise and fueled speculations that the RBA policy tightening cycle is over. In contrast, the markets are still pricing in the possibility of one more 25 bps rate hike by the Federal Reserve (Fed) in 2023. The outlook remains supportive of elevated US Treasury bond yields and favours the USD bulls.
The aforementioned fundamental backdrop, along with the overnight breakdown through the bearish flag pattern, suggests that the path of least resistance for the AUD/USD pair is to the downside. Hence, any attempted recovery might still be seen as a selling opportunity and runs the risk of fizzling out rather quickly. Traders now look to the release of the US ISM Services PMI, due later during the early North American session. Apart from this, the US bond yields will influence the USD and contribute to producing short-term trading opportunities around the major.
Technical levels to watch
- USD/JPY treads waters below 147.50 ahead of the US PMI releases.
- Japan's currency diplomat Kanda indicated market intervention; underpins the Japanese Yen (JPY).
- The resurgence of trade tensions between the US and China weighed on the pair.
USD/JPY snaps a three-day winning streak, trading lower around 147.40 during the early trading hours in the European session on Wednesday. The pair retreated from a new high since November 2022 marked on Tuesday. The pair is encountering downward pressure following a statement from Japan's top currency diplomat, Masato Kanda, as reported by Reuters.
Kanda issued a warning against the recent sell-off of the Japanese Yen (JPY) and indicated that authorities won't rule out any options if speculative movements in the currency market continue. This statement has had a bearish impact on the USD/JPY pair.
According to a private survey released on Tuesday, business activity in China's services sector expanded at its slowest rate in eight months. This development has raised concerns about the deteriorating economic conditions in the world's second-largest economy, which may impact Japanese exports to the country.
Furthermore, US Commerce Secretary Gina Raimondo anticipates that there will be no changes to the US tariffs on China, which were imposed during President Donald Trump's administration until the ongoing review by the US Trade Representative's (USTR) Office is completed. This resurgence of trade tensions between the US and China could potentially reduce investors' appetite for riskier assets, which makes it difficult to achieve a significant corrective decline in the pair.
Additionally, market expectations for the Bank of Japan's (BoJ) continued commitment to an accommodative monetary policy were reinforced by comments from BoJ policymaker Hajime Takata on Wednesday. Takata emphasized the need for the central bank to maintain its accommodative stance patiently, citing the high uncertainty in the economic outlook.
US Dollar Index (DXY), which measures the value of the US Dollar (USD) against the six other major currencies, hovers around 104.70 at the time of writing. Investors appear to be increasingly accepting the no-interest rate hike by the US Federal Reserve (Fed) during the upcoming September policy meeting. However, the markets are still factoring in the possibility of one more 25 basis points (bps) rate hike by the end of this year.
Furthermore, the Federal Reserve (Fed) is anticipated to keep interest rates at a higher level for a more extended period. This hawkish outlook continues to support the US Treasury bond yields, which favors the Greenback’s bulls.
Investors will indeed keep a close eye on the upcoming data releases from the United States (US). The US ISM Services PMI for August and the US S&P Global PMIs are scheduled for release later in the North American session. These data releases will offer valuable insights into the present economic scenario in the United States and have the potential to provide a more defined direction for the USD/JPY pair.
There is still scope for USD/JPY to visit the 148.00 region in the short-term horizon, comment Economist Lee Sue Ann and Markets Strategist Quek Ser Leang at UOB Group.
Key Quotes
24-hour view: While we expected USD to move higher yesterday, we were of the view that it “is unlikely to break the major resistance at 147.20.” Not only did USD break above 147.20, but it also surged further and closed at a 10-month high of 147.71 (+0.85%). Solid upward momentum suggests continuing USD strength. In view of the severely overbought conditions, it seems unlikely USD can reach 149.00 today (there is another resistance at 148.30). In order to keep the momentum going, USD must stay above 147.00 (minor support is at 147.30).
Next 1-3 weeks: After USD pulled back from 147.36, we highlighted last Thursday (30 Aug, spot at 146.00) that it “is likely to trade in a range between 144.50 and 147.20.” USD then dropped slightly below 144.50 and touched 144.43 before rebounding. Yesterday, USD lifted off and blasted to a high of 147.80. The price actions suggest USD is likely to rise further, probably to 148.00. In order to maintain the rapid buildup in momentum, USD must stay above 146.45.
Considering advanced prints from CME Group for natural gas futures markets, open interest rose by around 22.3K contracts after three consecutive daily drops on Tuesday. In the same direction, volume remained choppy and rose by around 90.5K contracts following the previous daily drop.
Natural Gas: Next contention emerges near $2.40
Natural gas prices extended the weekly leg lower on Tuesday. The daily pullback was in tandem with increasing open interest and volume and seems to favour further retracements in the very near term. That said, there is an interim contention around the 100-day SMA near $2.50 ahead of the August low near the $2.40 mark per MMBtu.
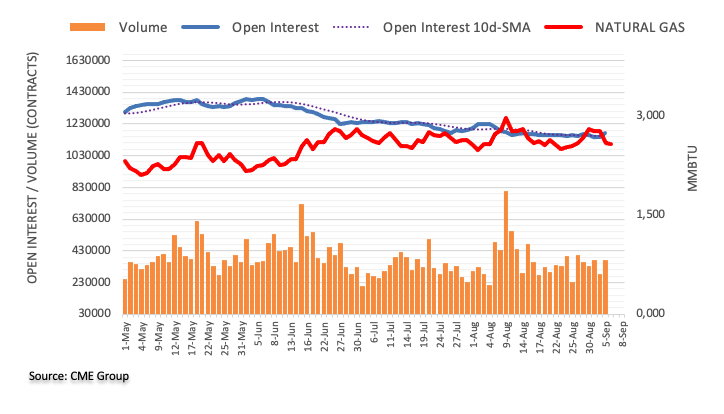
- USD/MXN gains momentum for the fourth straight day, holds above the 50- and 100-day EMAs on the daily chart.
- Relative Strength Index (RSI) stands above 50 and MACD is located in bullish territory.
- The immediate resistance level is seen at 17.77; the first support level is located at 17.35.
The Mexican Peso (MXN) trades in negative territory for the fourth consecutive day against the US Dollar (USD). USD/MXN currently trades near 17.50, gaining 0.48% on the day.
From the technical perspective, USD/MXN just holds above the 50- and 100-day Exponential Moving Averages (EMAs) on the daily chart, which means the path of the least resistance is to the upside. Meanwhile, the Relative Strength Index (RSI) stands above 50 and the Moving Average Convergence/Divergence (MACD) is located within the bullish territory, suggesting that buyers the further upside looks favorable for the time being.
Therefore, the pair could meet the immediate resistance level at 17.77 (a high of May 31). The additional upside filter to watch is near a psychological round mark and a high of May 24 at 18.00. Further north, the next barrier is seen at 18.20 (a high of April 27) and finally at 18.40 (a high of April 5).
On the downside, the first support level is seen at 17.35, representing the 50-day EMA. Any extended weakness below the latter will challenge the critical contention at the 17.00-17.10 region. The mentioned level is a confluence of the midline of Bollinger Band, a psychological round figure, and the 50-day EMA. The next downside stop to watch is near a Year-To-Date (YTD) low of 16.60. Further south, the pair will see a drop to a psychological round figure at 16.00.
USD/MXN daily chart
-638295808845666060.png)
Extra decline in AUD/USD is expected to meet a tough barrier at the 0.6300 level for the time being, suggest Economist Lee Sue Ann and Markets Strategist Quek Ser Leang at UOB Group.
Key Quotes
24-hour view: We expected AUD to consolidate yesterday. Instead of consolidating, AUD nosedived to a low of 0.6358 before closing lower by a whopping 1.34% (0.6379). The outsized selloff appears to be overextended, but there is a chance for AUD to test 0.6340 first before levelling off. The major support at 0.6300 is unlikely to come under threat. On the upside, if AUD breaks above 0.6420 (minor resistance is at 0.6400), it would mean the weakness in AUD has stabilised.
Next 1-3 weeks: On Monday (04 Sep, spot at 0.6450), we highlighted that AUD “is likely to trade in a range of 0.6390/0.6525 for the time being.” We did not anticipate the sharp selloff yesterday, as AUD plunged to a low of 0.6358. Further AUD weakness appears likely, but severely oversold conditions suggest a slow pace of decline. At this stage, the likelihood of AUD breaking clearly below 0.6300 is not high. Overall, only a breach of the ‘strong resistance’ level (now at 0.6450) would indicate that AUD is not weakening further.
- USD/TRY picks up bids to refresh two-week high, consolidating late August slump.
- US Dollar Index (DXY) retreats from multi-day high amid market’s preparations for this week’s US data.
- Concerns about US soft landing contrasts with economic fears surroudning Türkiye to favor Turkish Lira bears.
- US data, risk catalysts eyed for clear directions, CBRT gains less importance of late.
USD/TRY remains on the front foot around 26.81 amid early Wednesday morning in Europe. In doing so, the Turkish Lira (TRY) pair ignores the latest retreat of the US Dollar amid fears of witnessing more hardships for Türkiye, which contrasts to the upbeat economic expectations for the US.
Rainstorms and floods appear the latest worries for Türkiye’s economic watchers as the nation struggles to tame the previous damages done through the heavy inflation, higher rates and geopolitical calamities in Ankara.
“Fierce rainstorms have battered neighboring Greece, Türkiye and Bulgaria, triggering flooding that caused at least seven deaths, nine per the latest counts,” said The Guardian.
Earlier in the week, Turkish Consumer Price Index (CPI) jumped 9.09% MoM and 58.94% YoY for July while the Producer Price Index eased to 5.89% MoM despite rising to 49.1% on the yearly basis for the said month. With the overall higher inflation, the Central Bank of the Republic of Türkiye’s (CBRT) is pushed towards higher rates even as the actions haven’t been received properly during the last few rate increases.
Elsewhere, the US Dollar Index (DXY) traces a pullback in the US Treasury bond yields to print mild losses at the highest level since March 15, marked the previous day, as it drops to 104.70 at the latest. That said, the benchmark US 10-year Treasury bond yields retreated to 4.25% after rising eight basis points (bps) to 4.26% the previous day.
It should be observed that the Greenback jumped the most in five weeks on the upbeat details of the US Factory Orders, as well as comments from the Federal Reserve (Fed) officials. On Tuesday, the US Factory Orders for July dropped to the lowest since mid-2020 while posting -2.1% MoM figures versus -0.1% expectations and 2.3% previous growth. However, the orders excluding transport rose 0.8% MoM, Shipments of goods stayed firmer and inventories marked the first increase in three months. That said, Federal Reserve (Fed) Governor Christopher Waller’s defense of hawkish monetary policy during a CNBC interview and Cleveland Federal Reserve President Loretta Mester’s rejection of rate cuts favor the US Dollar bulls.
Additionally, fears about China's recession, despite likely stimulus for China’s real estate sector, per the Chinese media, seem to have fueled the property shares, especially backed by Country Garden’s avoidance of default, but have failed to tame the US Dollar of late. The same appears as the key catalyst challenging the market’s previous risk-off mood and testing the USD/TRY bulls.
Looking forward, US ISM Services PMI and the second-tier activity, as well as employment, clues will be eyed for clear directions of the USD/TRY pair. Above all, the divergence between the US and the Turkiye’s growth matrix keeps the pair buyers hopeful.
Technical analysis
A daily closing beyond the 21-DMA hurdle of around 26.80 becomes necessary for the USD/TRY bulls to challenge the yearly high marked during late August, around 27.23.
CME Group’s flash data for crude oil futures markets noted traders increased their open interest positions for the third consecutive session on Tuesday, now by around 15.5K contracts. In the same direction, volume extended its uptrend and went up by around 47.5K contracts.
WTI: Immediately to the upside comes $90.00
WTI prices extended their rally to the $88.00 region per barrel on Tuesday. The daily uptick was accompanied by increasing open interest and volume and leaves the door open to the continuation of the current move in the very near term. Against that, the next hurdle for bulls appears at the key $90.00 mark.
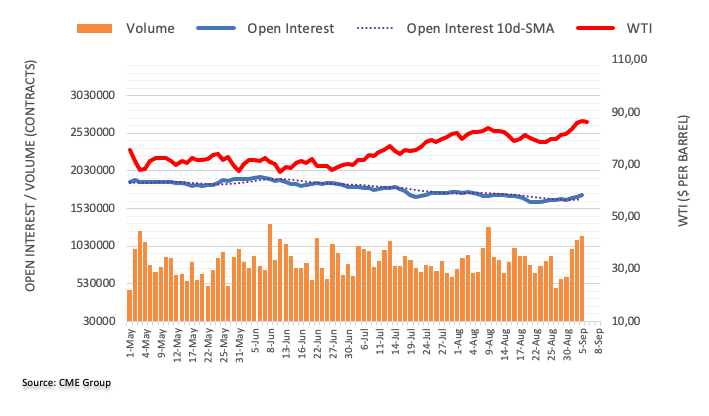
Here is what you need to know on Wednesday, September 6:
The US Dollar Index (DXY) retreats early Wednesday after touching its highest level since March near 105.00 on the back of surging Treasury bond yields. Markets await the Bank of Canada's (BoC) policy announcements and August ISM Services PMI report from the US. The European economic docket will feature July Retail Sales and the Federal Reserve will release its Beige Book in the American trading hours.
Following a three-day weekend in the US, the 10-year US Treasury bond yield climbed above 4.2% on Tuesday and helped the US Dollar (USD) outperform its rivals. The bearish opening in Wall Street also helped the currency continue to gather strength. With major equity indexes in the US staging a rebound later in the session, DXY lost its momentum and went into a consolidation phase in the Asian trading hours. In the meantime, the Shanghai Composite and Hang Seng indexes found a foothold on Wednesday, following a two-day slide.
US Dollar price today
The table below shows the percentage change of US Dollar (USD) against listed major currencies today. US Dollar was the weakest against the Australian Dollar.
| USD | EUR | GBP | CAD | AUD | JPY | NZD | CHF | |
| USD | -0.06% | 0.02% | 0.03% | -0.24% | -0.14% | -0.20% | -0.07% | |
| EUR | 0.08% | 0.10% | 0.09% | -0.18% | -0.07% | -0.13% | 0.00% | |
| GBP | -0.03% | -0.09% | 0.00% | -0.27% | -0.16% | -0.22% | -0.09% | |
| CAD | -0.03% | -0.08% | 0.01% | -0.26% | -0.16% | -0.22% | -0.09% | |
| AUD | 0.25% | 0.17% | 0.28% | 0.27% | 0.09% | 0.04% | 0.17% | |
| JPY | 0.16% | 0.06% | 0.15% | 0.13% | -0.14% | -0.05% | 0.06% | |
| NZD | 0.19% | 0.13% | 0.22% | 0.22% | -0.04% | 0.07% | 0.13% | |
| CHF | 0.07% | 0.00% | 0.09% | 0.08% | -0.19% | -0.06% | -0.14% |
The heat map shows percentage changes of major currencies against each other. The base currency is picked from the left column, while the quote currency is picked from the top row. For example, if you pick the Euro from the left column and move along the horizontal line to the Japanese Yen, the percentage change displayed in the box will represent EUR (base)/JPY (quote).
The data from Australia showed that the real Gross Domestic Product expanded at an annual rate of 2.1% in the second quarter. This reading followed the 2.4% growth recorded in the first quarter but came in better than the market expectation of 1.7%. Pressured by risk-aversion and the Reserve Bank of Australia's cautious tone on policy outlook, AUD/USD touched a fresh 2023-low of 0.6356 on Tuesday. Early Wednesday, the pair clings to recovery gains at around 0.6400.
EUR/USD dropped to a three-month low and came within a touching distance of 1.0700 on Tuesday. The pair edges higher in the European morning but stays below 1.0750. The data from Germany showed on Wednesday that Factory Orders contracted 11.7% on a monthly basis in July, compared to the market expectation for a decrease of 4%.
USD/JPY climbed above 147.00 and reached its highest level since November 2022. In response to ongoing Japanese Yen weakness, Japan's top currency diplomat Masato Kanda said that they are closely monitor the Foreign Exchange moves with a high sense of urgency and reiterated that all options for the FX moves are on the table. Meanwhile, “I believe the Bank of Japan (BoJ) must patiently maintain easy policy given very high uncertainty on outlook,” BoJ board member Hajime Takata said.
GBP/USD closed deep in negative territory on Tuesday amid broad USD strength. The pair struggles to stage a rebound on Wednesday and trades flat slightly above 1.2550.
USD/CAD trades at its highest level in five months at around 1.3650 in the European morning. The BoC is widely expected to leave its key rate unchanged at 5% following the September policy meeting.
Following a quiet start to the week, Gold price turned south and declined below $1,930 on Tuesday as the 10-year US yield rose sharply. XAU/USD consolidates its losses near $1,925 in the early European session on Wednesday.
FX option expiries for Sept 6 NY cut at 10:00 Eastern Time, via DTCC, can be found below.
- EUR/USD: EUR amounts
- 1.0740 1b
- 1.0750 1.5b
- 1.0900 629m
- GBP/USD: GBP amounts
- 1.2500 1.2b
- 1.2650 756m
- USD/JPY: USD amounts
- 144.50 942m
- 145.50 503m
- 146.50 641m
- USD/CHF: USD amounts
- 0.8750 520m
- AUD/USD: AUD amounts
- 0.6395 450m
- 0.6445 739m
- 0.6550 529m
- 0.6600 1.8b
- USD/CAD: USD amounts
- 1.3600 1.4b
- NZD/USD: NZD amounts
- 0.6300 1.2b
- USD/RUB loses momentum near 97.70 amid the rally in oil prices.
- Russia's economic growth will be towards the top end of the 1.5%-2.5% expected range in 2023.
- Investors anticipate a 25 basis point (bps) rate increase from the Fed for the entire year, bringing rates to 5.75%.
- US ISM Services PMI data will be in the spotlight on Wednesday.
USD/RUB loses ground below the 98.00 mark during the early European session on Wednesday. The pair currently trades around 97.70, up 0.79% on the day.
Russian central bank deputy governor Alexei Zabotkin said on Tuesday that Russia's economic growth this year will be towards the top end of the 1.5%-2.5% expected range, per Reuters. Furthermore, Russia’s Finance Minister Anton Siluanov forecasted last week that the Russian economy will expand by at least 2.5% in 2023, with inflation hovering around 6%. He also said that he will collaborate with the Central Bank to take all necessary steps to bring down inflation to a sustainable level.
Apart from this, the Russian Ruble gains ground on Wednesday due to a rally in oil prices after the country extends its voluntary oil supply cuts. That said, Saudi Arabia and Russia, the world’s major oil exporters stated that they will extend oil production cuts for the rest of 2023. Russia's Deputy Prime Minister Alexander Novak said on Tuesday that the nation would reduce its exports by 300,000 barrels per day through the end of 2023.
However, the upside of RUB seems limited as the country has increased its military spending objective for 2023 to more than $100 billion, representing a third of all state expenditure, as the escalating costs of the Ukraine conflict place an increasing strain on Moscow's finances. This, in turn, might act as a tailwind for the USD/RUB pair.
On the US Dollar front, market participants speculate a 25 basis point (bps) rate increase from the Federal Reserve (Fed) for the entire year, bringing rates to 5.75%, according to the World Interest Rates Probabilities (WIRP) tool. Fed Governor Christopher Waller stated that the Fed has further room to increase interest rates, but the data will determine whether the Fed needs to hike rates again and if it is done hiking rates.
Moving on, market participants will focus on the US ISM Services PMI data due on Wednesday ahead of the weekly Initial Jobless Claims on Thursday. These figures could give a clear direction for USD/RUB. Also, the headline surrounding Russia’s war in Ukraine remains in focus.
European Central Bank's (ECB) Governing Council member Francois Villeroy de Galhau reiterated on Wednesday, “our options are open at the next and the upcoming rate meetings,” adding that “we are near or very near the peak regarding interest rates.”
Additional quotes
There is slowdown but no recession.
May even raise a bit our growth forecast for france for 2023.
Had first successes on battle against inflation but we need to persevere.
We must bring inflation down to 2% level between now and 2025.
Recent petrol prices variation can impact monthly rhythm of inflation, but this does not change underlying disinflation trend.
Tackling inflation remains our priority.
In our fight against inflation, maintaining rates for a sufficiently long period now counts for more than further significant rises.
Market reaction
EUR/USD is unperturbed by the ambiguous remarks from the ECB policymaker, currently trading 0.15% higher on the day at 1.0733.
- USD/CHF trades sideways around 0.8890 ahead of the US PMI releases.
- Fed Governor Christopher Waller stated that the interest rates decision would be data-driven.
- US Commerce Secretary Gina Raimondo expects no revisions to the US tariffs on China.
USD/CHF consolidates around 0.8890 during the Asian session on Wednesday, grappling to retreat the losses from the previous session. However, the pair experienced downward pressure, primarily driven by the strength of the US Dollar (USD). The yield on the 10-year US Treasury bond rose to 4.25%, up by 1.51%, which is contributing the support in underpinning the US Dollar (USD).
Investors will closely watch the upcoming data set to be released later in the day. This data includes the US ISM Services PMI for August and the US S&P Global PMIs. These releases will provide valuable insights into the current economic conditions in the United States and could provide a clearer direction for the USD/CHF currency pair.
On Tuesday, as per Reuters, US Commerce Secretary Gina Raimondo expects no revisions to the US tariffs on China that were implemented during President Donald Trump's administration until the US Trade Representative's (USTR) Office completes its ongoing review. This renewed tension in the trade war between the US and China could potentially boost the appeal of the traditional safe-haven Swiss Franc (CHF) and create headwinds for the USD/CHF currency pair.
US Dollar Index (DXY), which measures the value of the Greenback against the basket of six other major currencies, hovers around 104.70 at the time of writing. Market participants appear to be increasingly acknowledging the no-interest rate hike by the US Federal Reserve (Fed) during the upcoming September policy meeting.
Moreover, United States (US) Factory Orders for July dropped to their lowest levels since mid-2020. On Tuesday, the data showed a print of -2.1%, falling short of the market consensus of -0.1% figure, and swinging from the 2.3% growth seen in the previous month. The
According to the CME FedWatch Tool, there is a 93% probability that the interest rate will remain unchanged. Additionally, Fed Governor Christopher Waller, in an interview with CNBC, emphasized that the decision on interest rates would depend on the data. Waller's statement regarding the data suggests a favorable soft-landing scenario has played a role in bolstering the strength of the US Dollar (USD).
In the view of Economist Lee Sue Ann and Markets Strategist Quek Ser Leang at UOB Group, GBP/USD does not rule out a break below the 1.2500 support in the near term.
Key Quotes
24-hour view: Our view for GBP to trade in a range yesterday was incorrect, as it fell to a low of 1.2529 and then rebounded to end the day at 1.2564 (0.51%). While the rebound in oversold conditions has caused momentum to slow, it is too early to expect a bottom. Today, as long as GBP stays below 1.2615 (minor resistance is at 1.2590), it might drop further. In view of the oversold conditions, a clear break of 1.2500 is unlikely.
Next 1-3 weeks: Our most recent narrative was from two days ago (04 Sep, spot at 1.2590), when we highlighted that “the risk for GBP appears to have shifted to the downside.” We also highlighted that “as downward momentum is only beginning to build, any weakness is likely to face solid support at 1.2545 and 1.2500.” Yesterday, GBP broke below 1.2545 and dropped to 1.2529. In view of the increase in downward momentum, it seems likely that GBP will break 1.2500. However, it bears noting that there is another strong support level at 1.2470. Overall, only a breach of 1.2640 (‘strong resistance’ level was at 1.2680) would suggest that the downside risk has faded.
- EUR/USD struggles to extend corrective bounce off three-month low after downbeat German data.
- German Factory Orders dropped the most since early 2020s with -11.7% YoY figures.
- Eurozone recession fears contrast with US soft landing chatters to underpin bearish bias about the Euro pair.
- Eurozone Retail Sales for July, US ISM Services PMI for August eyed for clear directions.
EUR/USD retreats from intraday high to 1.0730 while fading the corrective bounce off the lowest level in three months after downbeat German data publishing early Wednesday. In doing so, the Euro pair struggles to cheer the US Dollar’s pullback amid recession woes surrounding the Old Continent versus the hopes of witnessing a soft landing for the US. Even so, cautious mood ahead of the Eurozone Retail Sales for July and the US ISM Services PMI for August prods the pair sellers of late.
German Factory Orders slump the most since April 2020 with a -11.7% YoY figures compared to -4.0% expected and upwardly revised prior numbers of 7.6%. That said, the monthly statistics also declined heavily with -10.5% mark versus 3.3% prior (revised from 3.0%).
On the same line could be the downbeat prints of the previous day’s Eurozone Producer Price Index (PPI) for July and the economic fears cited in the European Central Bank’s (ECB) monthly survey of consumer expectations for inflation.
It should be noted that the upbeat details of the US Factory Orders and comments from the Federal Reserve (Fed) officials defend the US Dollar bulls even as a retreat in the yields allows the Greenback buyers to take a breather. On Tuesday, the US Factory Orders for July dropped to the lowest since mid-2020 while posting -2.1% MoM figures versus -0.1% expectations and 2.3% previous growth. However, the orders excluding transport rose 0.8% MoM, Shipments of goods stayed firmer and inventories marked the first increase in three months. That said, Federal Reserve (Fed) Governor Christopher Waller’s defense of hawkish monetary policy during a CNBC interview and Cleveland Federal Reserve President Loretta Mester’s rejection of rate cuts favor the US Dollar bulls.
Elsewhere, concerns about more stimulus for China’s real estate sector, per the Chinese media, seem to have fueled the property shares, especially backed by Country Garden’s avoidance of default. The same appears the key catalyst challenging the market’s previous risk-off mood and puts a floor under the EUR/USD price.
Against this backdrop, stock futures in the US and Europe print mild losses while tracing the Wall Street benchmarks whereas the US Dollar Index (DXY) seesaws at the highest level since March 15, dicey near 104.80 at the latest.
Moving on, more details of the US soft landing and the Eurozone recession will be eyed for clear directions.
Technical analysis
A daily closing below the ascending support line stretched from March, now immediate resistance near 1.0790, directs the EUR/USD bears toward June’s low of 1.0635.
Open interest in gold futures markets increased by just 858 contracts after two consecutive daily pullbacks on Tuesday according to preliminary readings from CME Group. Volume followed suit and added around 34.2K contracts to the previous daily build.
Gold: Next on the downside comes the 200-day SMA
Gold prices dropped for the second session in a row on Tuesday amidst rising open interest and volume, which is indicative that further losses appear on the cards for the precious metal in the very near term. That said, the 200-day SMA at $1916 per ounce troy now emerges as the immediate support.
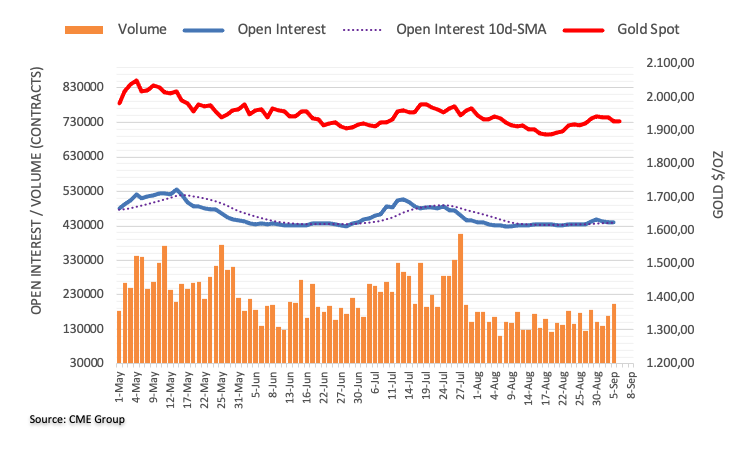
According to the official data released by the Federal Statistics Office of Germany, the Factory Orders data showed a sharp decline in July, suggesting that the German manufacturing sector is in the doldrums once again.
On a monthly basis, contracts for goods ‘Made in Germany’ slumped 11.7%, compared with -4.0% expected and 7.6% previous figure.
Germany’s Industrial Orders tumbled at an annual rate of 10.5% in the reported month, as against the 3.3% increase in June.
FX implications
The weak German data fails to deter Euro bulls, as the EUR/USD pair holds the recovery mode intact near 1.0730, at the time of writing, up 0.09% so far.
Further downside momentum could drag EUR/USD to the 1.0630 region in the next few weeks, according to Economist Lee Sue Ann and Markets Strategist Quek Ser Leang at UOB Group.
Key Quotes
24-hour view: The sharp selloff in EUR that sent it plunging to a low of 1.0705 came as a surprise (we were expecting it to trade sideways). What is not surprising is that the sharp and swift drop is oversold. However, there are no signs of stabilisation just yet. From here, as long as EUR stays below 1.0760 (minor resistance is at 1.0745), it could dip below 1.0700 first before the risk of a rebound increases. The next support at 1.0660 is unlikely to come under threat.
Next 1-3 weeks: Two days ago (04 Sep, spot at 1.0775), we noted “there is a tentative buildup of downward momentum”, and held the view that “this could cause EUR to edge lower to 1.0720.” We indicated that “looking ahead, EUR must break and stay below 1.0720 before a sustained decline can be expected.” Yesterday, EUR plunged to a low of 1.0705 before closing at 1.0720 (-0.69%). The marked increase in momentum suggests EUR is likely to continue to weaken. The level to watch is May’s low of 1.0635. The downside risk is intact as long as EUR stays below 1.0800 (‘strong resistance’ level previously at 1.0860).
- Silver Price prints mild gains at two-week low after falling the most in a month.
- Oversold RSI (14) allows XAG/USD to prod five-day losing streak at multi-day bottom.
- Downbeat MACD signals, Bull Cross test Silver sellers amid sluggish markets.
- XAG/USD rebound remains elusive below $23.75, descending trend line from late July is a tough nut to crack for buyers.
Silver Price (XAG/USD) licks its wounds while posting mild gains near $23.55 heading into Wednesday’s European session. In doing so, the bright metal bounces off the lowest level in two weeks, marked the previous day, as it consolidates the biggest daily loss in a month.
That said, the oversold RSI conditions seem to help the risk takers while the XAG/USD prints the first daily gain in six, so far.
However, the bearish MACD signals and an impending Bull Cross between the 100-SMA and the 200-SMA, a bullish signal for the asset’s price when the short-term SMA pierces the longer-term ones from below, test the Silver bears of late.
In a case where the Silver buyers manage to confirm the bull cross by surpassing the SMA confluence surrounding $23.75, a quick run-up towards the 61.8% Fibonacci retracement of July–August downside, near $24.15, and then to the 50-SMA level of $24.25 can’t be denied.
Even so, a downward-sloping resistance line from July 20, close to $24.65 at the latest, appears a tough nut to crack for the Silver buyers past $24.25.
On the contrary, the 38.2% and 23.6% Fibonacci ratios, respectively near $23.40 and $22.95, will challenge the Silver bears before directing them to the previous monthly low of around $22.25.
Silver Price: Four-hour chart
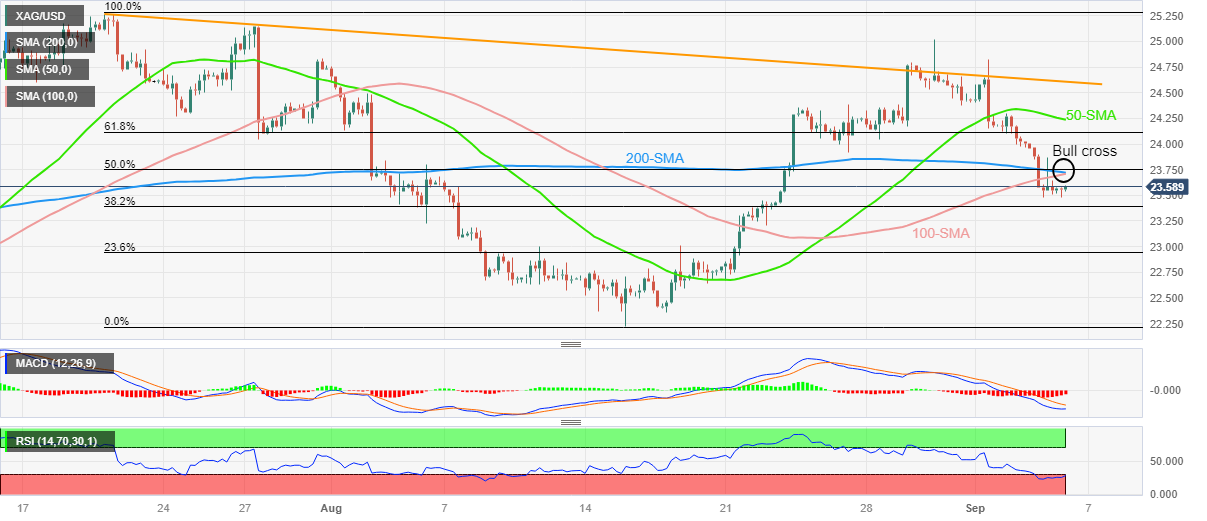
Trend: Further Downside expected
- GBP/JPY loses momentum, snaps two-day winning streak on Wednesday.
- UK S&P Global/CIPS Composite PMI fell to 48.6 in August vs. 50.8 prior.
- Japanese policymakers will closely monitor FX movements with a sense of urgency.
- The attention will shift to Japan’s Gross Domestic Product (GDP) due on Friday.
The GBP/JPY cross struggles to gain and edges lower to 185.28 during the early European session on Wednesday. Markets turn cautious amid the fear of FX intervention by the Bank of Japan (BoJ).
On Tuesday, the UK S&P Global/CIPS Composite PMI fell to 48.6 in August from 50.8 in the previous month. This figure marked its lowest level since January. Meanwhile, the Services PMI printed 49.5, which is below the 50 threshold indicating the contraction. Service providers witnessed a reversal in customer spending in August as higher financing costs, diminished business confidence, and constrained household finances all acted to dampen sales opportunities.
Traders anticipate that the Bank of England (BoE) is likely to raise 25 basis points (bps) in the upcoming meeting to combat high inflation. However, the BoE’s aggressive tightening of monetary policy might put some pressure on the British Pound (GBP) since investors are concerned about the effect on the UK economy.
Data released on Tuesday showed that Japanese Household Spending fell 5.0% year on year in July, below the market expectation of a 2.5% drop. This figure indicated the sixth straight month of decline. Apart from this, Japan's top currency diplomat Masato Kanda stated a willingness to closely monitor Foreign Exchange movements with a sense of urgency while adding that all the options are on the table. Additionally, Bank of Japan (BoJ) board member Hajime Takata reaffirmed on Wednesday that the central bank will maintain easy monetary policy due to uncertainty on the economic and price outlook. It's worth noting that the monetary policy divergence between the US and Japan might limit GBP/JPY’s downside for the time being.
Looking ahead, the UK S&P Global Construction PMI for August will be due on Wednesday in the European session. The attention will shift to Japan’s Gross Domestic Product (GDP) for the second quarter on Friday. The quarterly growth number is expected to expand 1.3% from the previous reading of 1.5%. Traders will find the trading opportunity around the GBPJPY cross.
Bank of Japan (BoJ) board member Hajime Takata is back on the wires on Wednesday, expressing his take on inflation while refraining from commenting on the exchange rate value.
Key quotes
There's still distance to achieve 2.0% inflation target.
Question remains on sustainability of inflation expectations.
No comment on FX levels.
Stronger than expected US economy impacting on currencies.
Uncertainty is high on price outlook.
Various hard data shows Chinese economy deviating downwardly.
Market reaction
USD/JPY was last seen trading at 147.35, down 0.25% on the day.
- Gold Price seesaws within key trading range despite the previous day’s heavy loss.
- Market’s consolidation amid China stimulus hopes, anxiety ahead of US data allow XAU/USD bears to take a breather.
- Fears of economic slowdown in Beijing contradict US soft landing chatters and weigh on the Gold Price.
- US ISM Services PMI, Fed talks eyed for fresh impulse.
Gold Price (XAU/USD) portrays a corrective bounce from the weekly low as it prods the four-day losing streak ahead of the key US data amid sluggish markets. In doing so, the XAU/USD price struggles to justify the latest cautious optimism driven by Chinese property stocks, amid hopes of more stimulus for the real estate sector, as fears of economic slowdown in Beijing join hawkish statements from the Fed officials.
Recently upbeat US employment and activity data defends the Fed’s “higher for longer” bias for the rates and defends the hopes of witnessing a soft landing in the US, which in turn underpins the US Dollar and weighs on the Gold Price. Elsewhere, strong yields and the US Dollar, as well as the US-China tensions, also exert downside pressure on the market’s risk appetite and the XAU/USD.
Moving forward, the US ISM Services PMI and the final prints of the US S&P Global PMIs will be crucial to confirm the US growth concerns, as well as back the hawkish Fed talks, which in turn may keep the Gold bears hopeful on flashing upbeat outcomes. Also, the market’s fears emanating from China and developments surrounding the same could act as additional catalysts for the XAU/USD traders to watch.
Also read: Gold Price Forecast: XAU/USD remains vulnerable, looks to $1,916 confluence support
Gold Price: Key levels to watch
As per our Technical Confluence indicator, the Gold Price seesaws within a strong trading range between $1,935 and $1,915 despite the previous day’s heavy fall, the biggest in five weeks.
That said, the Pivot Point one-day R1, Fibonacci 61.8% on one-month and 50-SMA on the hourly (H1) play restricts the immediate upside of the XAU/USD.
On the contrary, a convergence of the Fibonacci 38.2% on one-month, Pivot Point one-day S2, one-week S1 and 200-SMA on one-day puts a floor under the Gold Price.
It’s worth noting that the Fibonacci 38.2% on one-day and 200-SMA on one-day, around $1,931, restricts the immediate upside of the Gold Price while the Fibonacci 23.6% on one-month, close to $1,905 acts as an extra filter towards the south.
Meanwhile, Fibonacci 23.6% on one-week and Pivot Point one-day R2, close to $1,943, acts as the last defense of the Gold sellers.
Overall, the Gold Price remains depressed despite the latest inaction within the key trading range.
Here is how it looks on the tool
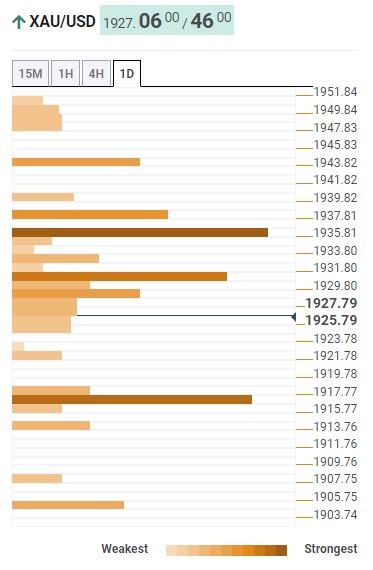
About Technical Confluences Detector
The TCD (Technical Confluences Detector) is a tool to locate and point out those price levels where there is a congestion of indicators, moving averages, Fibonacci levels, Pivot Points, etc. If you are a short-term trader, you will find entry points for counter-trend strategies and hunt a few points at a time. If you are a medium-to-long-term trader, this tool will allow you to know in advance the price levels where a medium-to-long-term trend may stop and rest, where to unwind positions, or where to increase your position size.
- Markets in Asia-Pacific zone edge lower amid China economic woes.
- Real-estate shares in China rebound on hopes of more stimulus for property sector in Beijing.
- US soft landing concerns, hawkish Fed talks and strong Oil price exert downside pressure on sentiment.
- US ISM Services PMI eyed for clear directions, growth headlines are the key.
Asia-Pacific equities grind lower on early Wednesday, despite a corrective bounce in China property stocks, as market players consolidate the previous day’s heavy losses amid a cautious mood ahead of the US ISM Services PMI.
While portraying the mood, the MSCI’s Index of Asia-Pacific shares outside Japan dropped nearly 1.0% whereas Japan’s Nikkei 225 prints 0.75% intraday gains around 33,250 by the press time of early European morning.
It’s worth noting China’s downbeat Caixin Services PMI for August, to 51.8 from 54.1 prior flagged economic fears about the Dragon Nation the previous day. The same were joined were fears of the Sino-American tussles, flagged by comments from US Commerce Secretary Gina Raimondo as she defended the current US tariffs on China until the four-year review is complete.
Also challenging the sentiment were upbeat details of the US Factory Orders and comments from the Federal Reserve (Fed) officials. On Tuesday, the US Factory Orders for July dropped to the lowest since mid-2020 while posting -2.1% MoM figures versus -0.1% expectations and 2.3% previous growth. However, the orders excluding transport rose 0.8% MoM, Shipments of goods stayed firmer and inventories marked the first increase in three months. That said, Federal Reserve (Fed) Governor Christopher Waller’s defense of hawkish monetary policy during a CNBC interview and Cleveland Federal Reserve President Loretta Mester’s rejection of rate cuts favor the US Dollar bulls. It’s worth noting that Fed’s Waller also added, "Data is looking good for soft landing scenario,” which in turn defends the Fed’s preference for “higher for longer” rates.
While the aforementioned catalysts sour the sentiment in the Asia-Pacific region, the recent headlines from Chinese media suggesting more stimulus from the nation’s real estate sector, seem to have fueled the property shares, especially backed by Country Garden’s avoidance of default.
Even so, most Chinese indices remain in the red while tracing the downbeat Wall Street benchmarks and S&P 500 Futures. Apart from that, the US Dollar Index (DXY) seesaws at the highest level since March 15, dicey near 104.80 at the latest, while prices of Gold and WTI Crude Oil tread water around $1,925 and $86.40 as we write. With this, stocks in New Zealand, Hong Kong and India are also downbeat by the press time. It should be noted that Australia’s better-than-forecast figures fail to impress Aussie equity traders as the nation’s key index ASX 200 drops 0.80% on a day as we write.
Looking ahead, the concerns about China’s economic recovery and the US soft landing will dominate the market moves and hence clues for the same should be observed closely for clear directions.
Also read: S&P 500 Futures portray risk-off mood even as yields seesaw at weekly top after a jump
- USD/CAD oscillates in a narrow trading band below the multi-month top set on Tuesday.
- Bullish Oil prices underpin the Loonie and cap the upside amid subdued USD price action.
- Traders now look forward to the BoC policy decision before placing fresh directional bets.
The USD/CAD pair lacks any firm intraday directional bias on Wednesday and seesaws between tepid gains/minor losses through the Asian session. Spot prices currently trade just below mid-1.3600s and remain well within the striking distance of the highest level since March 28 touched on Tuesday.
Crude Oil prices stand tall near the YTD peak and seem to underpin the commodity-linked Loonie. The US Dollar (USD), on the other hand, consolidates its recent strong gains to a nearly six-month top and remains well supported by growing acceptance that the Federal Reserve (Fed) will keep interest rates higher for longer. The aforementioned diverging forces fail to provide any meaningful impetus to the USD/CAD pair as investors now look to the Bank of Canada (BoC) policy decision for a fresh impetus.
From a technical perspective, the overnight sustained strength beyond the 1.3600 mark was seen as a fresh trigger for bullish traders. The USD/CAD pair, however, struggles to find acceptance above the 1.3645-1.3650 horizontal barrier. This, along with the fact that the Relative Strength Index (RSI) on the daily chart has moved on the verge of breaking into the overbought territory, warrants some caution before positioning for any further appreciating move heading into the key central bank event risk.
In the meantime, any corrective slide now seems to find support near the 1.3600 round figure, below which the USD/CAD pair could decline towards the next relevant support near the 1.3525 region. Some follow-through selling could drag spot prices further below the 1.3500 psychological mark, towards testing the very important 200-day Simple Moving Average (SMA), currently around the 1.3460 area. The latter should act as a pivotal point, which if broken might shift the bias in favour of bearish traders.
On the flip side, the 1.3665-1.3670 area, or the overnight swing high, could act as an immediate resistance, which if cleared should allow the USD/CAD pair to reclaim the 1.3700 mark. The positive momentum could get extended further towards the 1.3730 resistance zone en route to the 1.3800 round figure and the YTD peak, around the 1.3860 region touched in March.
USD/CAD daily chart
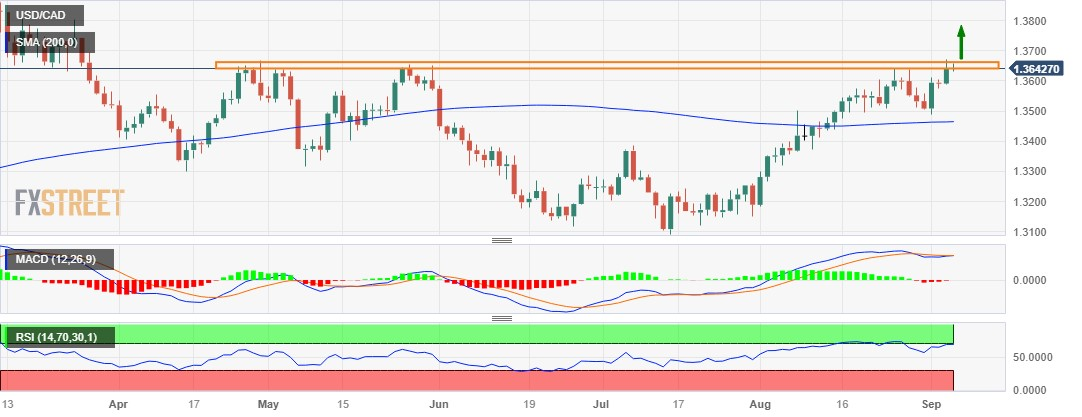
Technical levels to watch
- AUD/USD consolidates after Australia’s upbeat GDP data.
- Momentum indicators suggest that the pair remains to be bearish in the short term.
- The region near 0.6350 psychological level emerges as the immediate support.
AUD/USD extends its losses, trading lower around 0.6380 during the Asian session on Wednesday. The pair experiences downward pressure due to the firmer US Dollar (USD) as investors appear to be increasingly accepting the reduced likelihood of an interest rate hike by the US Federal Reserve (Fed) during the upcoming September policy meeting.
However, Australia’s upbeat Gross Domestic Product (GDP) data is providing minor support to the AUD/USD pair. As said, GDP (MoM) showed a growth of 0.4% in the second quarter, exceeding the expectations of 0.3%. The index grew by 0.2% in the first quarter. GDP (YoY) for the said quarter reduced to a growth of 2.1% from the previous reading of 2.3%. This was expected to grow at a rate of 1.7%.
The Moving Average Convergence Divergence (MACD) line lies below the centerline but remains above the signal line. This suggests that the recent momentum is relatively subdued.
The pair could meet the immediate support around the weekly low at 0.6357 lined up with the 0.6350 psychological level.
On the upside, the pair could face a challenge around the 0.6400 psychological level. A firm break above the latter could open the doors for the AUD/USD pair to explore the region around the 21-day Exponential Moving Average (EMA) at 0.6467 aligned to 23.6% Fibonacci retracement at 0.6484.
The 14-day Relative Strength Index (RSI) stays below 50, which suggests the AUD/USD pair remains to be bearish in the short term.
AUD/USD: Daily Chart
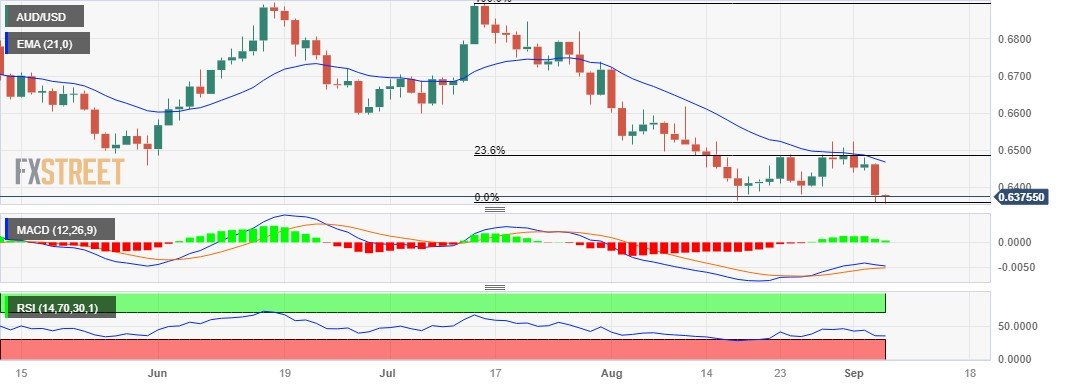
- EURUSD attracts some sellers near 1.0735 amid fears of a potential recession.
- Eurozone Producer Price Index fell for the seventh straight month in July.
- US Factory Orders for July dropped to the lowest since mid-2020; investors anticipate another 25 basis point (bps) rate hike.
- Market players will focus on the German Factory Orders, Eurozone Retail Sales ahead of the US ISM Services PMI.
The EUR/USD pair remains under selling pressure near 1.0732 during the early Asian session on Wednesday. The Euro is weakened against the US Dollar (USD) amid fears of a recession in the Eurozone following the weaker economic data.
Data released by the Eurostat revealed on Tuesday that producer prices in the Eurozone fell for the seventh straight month in July. The Eurozone Producer Price Index (PPI) for July dropped to -0.5% MoM from -0.4% prior while the annual figure fell -7.6% from the previous’s reading of -3.4%. Additionally, HCOB Composite PMI for August declined to 46.7 from 47.0 in July. Finally, the HCOB Services PMI for the same period dropped to 47.9 from 48.3 in July. In response to the downbeat data, the Euro extends its downside as investors worry about the potential recession. The discouraging data might convince the European Central Bank (ECB) to abandon its hawkish stance for the upcoming meeting.
Earlier this week, ECB President Christine Lagarde emphasized the importance of central banks keeping inflation expectations firmly anchored. The ECB Council Member Joachim Nagel advocated for price stability but refrained from providing further details while his colleague Pierre Wunsch said that the central bank could do a little bit more and it's too early to talk about ending hikes entirely.
Across the pond, the US Factory Orders for July dropped to the lowest since mid-2020. The figure came in at -2.1% MoM, compared with a rise of 2.3% last month, and lower than the market's forecast of 0.1%. About last week’s data, the US Nonfarm Payrolls (NFP) for August came in at 187K, above the previous readings of 157K and above the market consensus of 170K.
Market participants anticipate a 25 basis point (bps) rate hike for the entire year, bringing rates to 5.75%, according to the World Interest Rates Probabilities (WIRP) tool. Apart from this, Federal Reserve (Fed) Governor Christopher Waller said the Fed has more room to raise interest rates. He added that the data will determine if the Fed needs to raise rates again and whether the Fed is done raising rates. This hawkish remark boosts the US Dollar firmer against the EUR and acts as a headwind for the EUR/USD pair.
Market participants will monitor the German Factory Orders and Eurozone Retail Sales for July for fresh impetus later in the day. On the US docket, the US ISM Services PMI for August will be released on Wednesday. Traders will take cues from the statement and find trading opportunities around the EUR/USD pair.
- USD/JPY retreats after hitting a fresh YTD peak and snaps a three-day winning streak.
- Intervention fears, a softer risk tone underpin the JPY and exert pressure on the pair.
- The divergent BoJ-Fed policy stance should help limit any meaningful corrective slide.
The USD/JPY pair attracts some intraday sellers near the 147.80 region, or a fresh high since November 2022 touched this Tuesday and for now, seems to have snapped a three-day winning streak. Spot prices, however, manage to hold above the Asian session low and currently trade around the 147.55 region, down just over 0.10% for the day.
Japan's top currency diplomat Masato Kanda warned against the recent sell-off in the Japanese Yen (JPY) and said that authorities won't rule out any options if speculative moves in the currency market persist. This, along with the cautious market mood, benefits the JPY's safe-haven status and exerts downward pressure on the USD/JPY pair. A private survey showed on Tuesday that business activity in China's services sector expanded at its slowest pace in eight months and fueled worries about the worsening conditions in the world's second-largest economy. Apart from this, persistent US-China trade tensions temper investors' appetite for riskier assets.
In the latest development, US Secretary of Commerce Gina Raimondo said that she doesn't expect any changes to the US tariffs imposed on China by the Trump administration until the ongoing review by the US Treasury is complete. That said, any meaningful corrective decline for the USD/JPY pair seems elusive in the wake of a big divergence in the monetary policy stance adopted by the Bank of Japan (BoJ) and other major central banks, including the Federal Reserve (Fed). It is worth mentioning that the BoJ is the only central bank in the world to maintain negative interest rates and is widely expected to stick to its ultra-loose monetary policy setting.
The bets were further reaffirmed by BoJ policymaker Hajime Takata's comments this Wednesday, saying that the central bank must patiently maintain easy policy given very high uncertainty on the outlook. In contrast, the Fed is anticipated to keep rates higher for longer. Moreover, the markets are still pricing in the possibility of one more 25 bps lift-off by the end of this year, The hawkish outlook remains supportive of elevated US Treasury bond yields, which favours the USD bulls and should help limit losses for the USD/JPY pair.
Market participants now look to the release of the US ISM Non-Manufacturing PMI, due later during the early North American session. This, along with the US bond yields, will influence the USD price dynamics and provide some impetus to the USD/JPY pair. Traders will further take cues from the broader risk sentiment to grab short-term opportunities. Nevertheless, the aforementioned fundamental backdrop seems tilted firmly in favour of bulls and suggests that the path of least resistance for spot prices is to the upside.
Technical levels to watch
- USD/INR retreats from the highest level in fortnight, pares the biggest daily gains in three weeks.
- Strong Oil price, diminishing energy supplies from Russia negatively affects Indian Rupee.
- US soft landing concerns, China recession fears jostle with firmer Indian growth figures to test USD/INR bulls.
- US ISM Services PMI, risk catalysts and energy market moves eyed for fresh impulse.
USD/INR pares the biggest daily jump in three weeks while reversing from a fortnight-high to 83.00 during early Wednesday. In doing so, the Indian Rupee (INR) pair traces the US Dollar’s retreat from the multi-day high amid cautious market sentiment ahead of the US ISM Services PMI. Even so, strong Oil prices, fears surrounding China’s economic weakness and the US soft landing, as well as the Sino-American tension, keep the pair buyers hopeful.
India’s heavy reliance on Oil imports drowned the INR the most in three weeks the previous day after the WTI Crude Oil Price refreshed its yearly high to $87.55, around $86.32 by the press time. That said, the black gold rallied after Russia and Saudi Arabia announced the extension of the voluntary supply cuts through the end of 2023. It should be noted that Russia has been a major energy source for India and supply cuts by the nation mean an increase in Oil prices, as well as a wider deficit, which in turn weighs on the Indian Rupee.
Even so, strong Indian growth figures for the second quarter (Q2) prod the Rupee sellers and might have played their role in the latest USD/INR retreat. As per the figures released last week, India’s second quarter (Q2) Gross Domestic Product (GDP) offered a positive surprise the previous week by rising to 7.8% YoY from 6.1% previous readings and 7.7% market forecasts.
Elsewhere, the China-induced risk-off mood joins the mostly upbeat US data and hawkish Fed talks to keep the USD/INR bulls hopeful. That said, China’s downbeat Caixin Services PMI for August, to 51.8 from 54.1 prior flagged economic fears about the Dragon Nation the previous day. Earlier in the day, US Commerce Secretary Gina Raimondo defended the current US tariffs on China until the four-year review is complete, which in turn joins the Taiwan concerns to highlight the Sino-American tension and fuel the pair.
It should be observed that China recently announced a slew of quantitative and qualitative measures to defend the economy from losing the post-COVID-19 recovery but has gained little positive response from the market. Also pushing back the bears was the news suggesting the ability to avoid default by China’s biggest reality player Country Garden.
On the other hand, the US Factory Orders for July dropped to the lowest since mid-2020 while posting -2.1% MoM figures versus -0.1% expectations and 2.3% previous growth. However, the orders excluding transport rose 0.8% MoM, Shipments of goods stayed firmer and inventories marked the first increase in three months.
Despite the mixed US data, Federal Reserve (Fed) Governor Christopher Waller’s defense of hawkish monetary policy during a CNBC interview and Cleveland Federal Reserve President Loretta Mester’s rejection of rate cuts favor the US Dollar bulls. It’s worth noting that Fed’s Waller also added, "Data is looking good for soft landing scenario,” which in turn defends the Fed’s preference for “higher for longer” rates.
Against this backdrop, S&P 500 Futures print mild losses after a downbeat Wall Street close, lacking moves around the 4,500 threshold by the press time, while the benchmark US 10-year Treasury bond yields remain sidelined near 4.26% after rising eight basis points (bps) the previous day.
Moving on, the US ISM Services PMI for August, expected 52.6 versus 52.7 prior, as well as the final readings of the US S&P Global PMIs for the said month, will be important for clear directions of the USD/INR price. Also important to watch will be China headlines and Oil price moves.
Also read: ISM Services PMI Preview: Strength may spook markets, boosting US Dollar
Technical analysis
A daily closing beyond the 21-DMA, around 82.90 by the press time, keeps the USD/INR buyers hopeful despite the pair’s latest pullback.
- EUR/GBP struggles to recover from the previous day’s losses on the Eurozone’s weaker data
- UK’s better-than-expected PMIs reinforce the weakening of the cross pair.
- Investors await the Eurozone's Retail Sales for further indications on the economic outlook.
EUR/GBP grapples to recover from the previous day’s losses, treading waters around 0.8540 during the Asian session on Wednesday. The pair is experiencing pressure due to the disappointing data released from the Eurozone on Tuesday. While the economic activities statistics from the United Kingdom (UK) showed improvement.
As said, the Eurozone Producer Price Index (PPI) for July showed a decline to -0.5% on month-on-month and -7.6% on a yearly basis from the previous readings of -0.4% and -3.4%, respectively. While HCOB Composite PMI growth for August fell to 46.7 from the previous reading of 47, which was expected to remain consistent.
The disappointing data has raised the probability of the European Central Bank (ECB) moving away from its more aggressive stance, driven by worries of a potential economic downturn. Consequently, this is placing downward pressure on the Euro (EUR).
ECB President Christine Lagarde emphasized the importance of central banks maintaining a firm grip on inflation expectations. Similarly, Joachim Nagel, President of the Deutsche Bundesbank and an ECB Council member, expressed his backing for price stability, although he abstained from providing further details at that particular moment.
On the British front, the S&P Global/CIPS Composite PMI for August surpassed expectations, reaching 48.6, which was higher than the anticipated 47.9 but slightly lower than the previous reading of 47.9. The services survey posted a reading of 49.5, exceeding the previous reading of 48.7. The index was expected to be consistent.
Market participants continue to believe that the Bank of England (BoE) will raise interest rates by a quarter basis points (bps) in the September meeting. Investors will likely monitor BoE Monetary Policy Report Hearings scheduled to be released on Thursday. The report may provide insights into the UK economic outlook and BoE’s monetary policy strategy.
On the Eurozone docket, datasets are set to be released later in the day, including German Factory Orders and Eurozone Retail Sales for July.
- USD/CNH remains firmer at two-week high despite latest retreat, rises for the third consecutive day.
- China economic woes exert downside pressure on Yuan, pushing Chinese banks to defend the currency in spot Forex markets.
- US soft landing concerns keep the Greenback firmer despite mixed US data, recent retreat in yields.
- US ISM Service PMIs, risk catalysts eyed for clear directions.
USD/CNH prints mild gains during a three-day winning streak surrounding 7.3200 on early Wednesday as the pair buyers cheer pessimism surrounding China and broadly firmer US Dollar to ignore Chinese forex intervention.
Reuters recently came out with the news suggesting China state banks’ mopping of offshore Yuan liquidity via selling the US Dollar onshore. The same might have triggered the offshore Chinese Yuan’s (CNH) bounce off the multi-day low of 7.3278 to 7.3170 by the press time.
However, concerns that property market restrictions in the Dragon Nation are negative, per the Chinese media, seem to keep the USD/CNH buyers hopeful.
Earlier in the day, US Commerce Secretary Gina Raimondo defended the current US tariffs on China until the four-year review is complete, which in turn joins the Taiwan concerns to highlight the Sino-American tension and fuel the offshore Chinese Yuan pair.
It’s worth mentioning that China recently announced a slew of quantitative and qualitative measures to defend the economy from losing the post-COVID-19 recovery but has gained little positive response from the market. Also pushing back the bears was the news suggesting the ability to avoid default by China’s biggest reality player Country Garden.
Talking about the US catalysts, the US Factory Orders for July dropped to the lowest since mid-2020 while posting -2.1% MoM figures versus -0.1% expectations and 2.3% previous growth. However, the orders excluding transport rose 0.8% MoM, Shipments of goods stayed firmer and inventories marked the first increase in three months.
Also, Federal Reserve (Fed) Governor Christopher Waller signaled during a CNBC interview that data will drive whether the Fed needs to lift rates again, as well as confirm whether the Fed is done raising rates. The policymaker also added, "Data is looking good for soft landing scenario,” which in turn defends the Fed’s preference for “higher for longer” rates and weighs on the sentiment.
Amid these plays, S&P 500 Futures print mild losses after a downbeat Wall Street close, lacking moves around the 4,500 threshold by the press time. On the same line, the benchmark US 10-year Treasury bond yields remain sidelined near 4.26% after rising eight basis points (bps) the previous day.
Looking ahead, the US ISM Services PMI for August, expected 52.6 versus 52.7 prior, as well as the final readings of the US S&P Global PMIs for the said month, will be important for clear directions of the USD/CNH price.
Technical analysis
USD/CNH pair’s successful upside trading beyond the three-week-old descending resistance line, close to 7.2850 by the press time, directs buyers toward the yearly high marked in August around 7.3500.
- GBP/USD oscillates in a range just above its lowest level since June 13 touched on Tuesday.
- The USD consolidates its recent gains to a multi-month peak and lends support to the major.
- Bets for more BoE rate hikes act as a tailwind, though looming recession risks cap the upside.
- The BoE's Monetary Policy Report Hearings eyed for some impetus ahead of US ISM PMI.
The GBP/USD pair struggles to capitalize on the overnight modest bounce from the 1.2530-1.2525 region, or its lowest level since June 13 and oscillates in a narrow trading band through the Asian session on Wednesday. Spot prices currently hover around the 1.2570 region, up less than 0.10% for the day, and remain at the mercy of the US Dollar (USD) price dynamics.
The USD Index (DXY), which tracks the Greenback against a basket of currencies, consolidate its recent move up to a nearly six-month top, which, in turn, is seen as a key factor acting as a tailwind for the GBP/USD pair. Apart from this, expectations that the Bank of England (BoE) will continue with its policy tightening cycle to combat high inflation lends some support to the British Pound (GBP). In fact, money market futures indicate over 85% chance that the BoE will hike interest rates by 25 bps, for the fifteenth time in September.
That said, looming recession risks might hold back traders from placing aggressive bullish bets around the GBP. Furthermore, growing acceptance that the Federal Reserve (Fed) will keep interest rates higher for longer should continue to act as a tailwind for the Greenback and contribute to limiting the upside for the GBP/USD pair. In fact, the markets are still pricing in the possibility of one more 25 bps Fed rate hike move by the end of this year, which remains supportive of elevated US Treasury bond yields and favours the USD bulls.
The aforementioned fundamental backdrop suggests that the path of least resistance for the GBP/USD pair is to the downside and any attempted recovery might still be seen as a selling opportunity. Market participants now look to the BoE Monetary Policy Report Hearings, where comments by Governor Andrew Bailey and several MPC members should influence the Sterling Pound. Later during the early North American session, traders will take cues from the US ISM Services PMI to grab short-term opportunities around the pair.
Technical levels to watch
- USD/CHF seesaws at the highest level in two months, lacks momentum of late.
- Nearly overbought RSI prods Swiss Franc pair buyers but 100-DMA breakout, bullish MACD signals favor the pair’s upside moves.
- Previous resistance line from March, seven-week-old rising support line adds to the downside filters.
- US ISM Services PMI, risk catalysts eyed for clear directions.
USD/CHF retreats to 0.8895 after refreshing a two-month high the previous day, mostly unchanged during early Wednesday. In doing so, the Swiss Franc (CHF) pair portrays the market’s cautious mood ahead of the US ISM Services PMI for August and the final readings of the US S&P Global PMIs for the said month.
That said, a daily closing beyond the 100-DMA, around 0.8875 at the latest, joins the bullish MACD signals to keep the USD/CHF buyers hopeful despite the latest inaction.
Apart from the 100-DMA, the previous resistance line from March, surrounding 0.8810, as well as a seven-week-old rising support line of around .8770 will also challenge the USD/CHF pair sellers before giving them control.
It’s worth noting, however, that the overbought RSI suggests the pullback moves of the USD/CHF pair but the downside room appears limited.
On the contrary, the 0.9000 psychological magnet and late June swing high of around 0.9015 lure the short-term USD/CHF pair buyers ahead of the 200-DMA hurdle of 0.9057.
Following that, a descending resistance line from November 2022, near 0.9165 at the latest, will check the USD/CHF bulls prior to highlighting the yearly high marked in March around 0.9440.
USD/CHF: Daily chart
-06092023-638295659417328391.png)
Trend: Pullback expected
- Market sentiment remains sour amid China-inflicted fears, hawkish Fed concerns.
- US soft landing concerns, risk aversion underpin US Dollar strength and weigh on Antipodeans, commodities.
- Oil Price lacks clear directions as firmer Greenback contrasts with supply cuts from Russia, Saudi Arabia.
- US ISM Services PMI eyed for clear directions as S&P500 Futures, yields lack momentum.
The market’s risk appetite remains downbeat on early Wednesday even as the bears take a breather ahead of the key US ISM Services PMI. The reason could be linked to downbeat concerns about China and fears of hawkish Federal Reserve (Fed) moves, not to forget Eurozone recession woes.
While portraying the mood, S&P 500 Futures print mild losses after a downbeat Wall Street close, lacking moves around the 4,500 threshold by the press time. On the same line, the benchmark US 10-year Treasury bond yields remain sidelined near 4.26% after rising eight basis points (bps) the previous day.
Elsewhere, the US Dollar Index (DXY) seesaws at the highest level since March 15, dicey near 104.80 at the latest, while prices of Gold and WTI Crude Oil tread water around $1,925 and $86.40 as we write.
It should be noted that growing fears of China recession and Eurozone economic slowdown weigh on the market sentiment while the mostly firmer US data and hawkish comments from the Federal Reserve (Fed) officials seem to underpin the risk aversion of late. On the same line could be the concerns about the US-China diplomatic tussles.
On Tuesday, China's Caixin Services Purchasing Managers' Index (PMI) for August dropped to the lowest level of the year with 51.8 figures versus 54.1 prior.
With this, the market’s lack of confidence in the Chinese measures to defend the economy joins the US businesses’ discomfort in Beijing to challenge the market sentiment.
Alternatively, China recently announced a slew of quantitative and qualitative measures to defend the economy from losing the post-COVID-19 recovery but has gained a little positive response from the market. Also pushing back the bears was the news suggesting the ability to avoid default by China’s biggest reality player Country Garden.
Earlier in the day, US Commerce Secretary Gina Raimondo defended the current US tariffs on China until the four-year review is complete, which in turn joins the Taiwan concerns to highlight the Sino-American tension.
On a different page, the US Factory Orders for July dropped to the lowest since mid-2020 while posting -2.1% MoM figures versus -0.1% expectations and 2.3% previous growth. However, the orders excluding transport rose 0.8% MoM, Shipments of goods stayed firmer and inventories marked the first increase in three months.
Also, Federal Reserve (Fed) Governor Christopher Waller signaled during a CNBC interview that data will drive whether the Fed needs to lift rates again, as well as confirm whether the Fed is done raising rates. The policymaker also added, "Data is looking good for soft landing scenario,” which in turn defends the Fed’s preference for “higher for longer” rates and weighs on the sentiment.
Looking ahead, the US ISM Services PMI for August, the Bank of Canada (BoC) Interest Rate Decision and Eurozone Retail Sales for July will decorate the calendar. However, major attention will be given to the risk catalysts for clear directions.
Also read: Forex Today: US Dollar jumps, Oil soars and Gold tumbles; Australia GDP next
| Raw materials | Closed | Change, % |
|---|---|---|
| Silver | 23.533 | -1.89 |
| Gold | 1925.916 | -0.66 |
| Palladium | 1217.6 | -0.39 |
- Gold price remains depressed for the third straight day and is pressured by a bullish US Dollar.
- Hawkish Fed expectations remain supportive of elevated US bond yields and underpin the buck.
- The prevalent cautious market mood might hold back traders from placing aggressive bearish bets.
Gold price trades with a negative bias for the third successive day on Wednesday and retreats further from a nearly one-month top, around the $1,952-$1,953 region touched last week. The XAU/USD slides to over a one-week low during the Asian session, albeit lacks follow-through and is currently placed near the $1,925 level, down less than 0.10% for the day.
Growing acceptance that the Federal Reserve (Fed) will keep interest rates higher for longer lifts the US Dollar (USD) to its highest level since March 10, which, in turn, is seen undermining the Gold price. The Fed is widely expected to pause its rate-hiking cycle at its September monetary policy meeting. The bets were reaffirmed by Fed Governor Christopher Waller on Tuesday, saying that currently there is nothing that will force a move towards boosting the short-term borrowing cost again. That said, the recent macro data from the United States (US) showed that the pace of inflation remains steady and pointed to an extremely resilient economy. This should allow the Fed to keep policy restrictive in the near term.
In fact, the markets are still pricing in the possibility of one more 25 basis points (bps) lift-off by the end of this year. This, in turn, remains supportive of elevated US Treasury bond yields, which continue to lend support to the Greenback and further contribute to a softer tone surrounding the non-yielding Gold price. The downside, however, remains cushioned in the wake of the prevalent cautious market mood, which tends to benefit the precious metal's safe-haven status. A private survey showed on Tuesday that business activity in China's services sector expanded at its slowest pace in eight months and fueled concerns about the worsening conditions in the world's second-largest economy, tempering investors' appetite for riskier assets.
Apart from this, persistent US-China trade tensions could drive some haven flows towards the Gold price and act as a tailwind. It is worth mentioning that US Secretary of Commerce Gina Raimondo doesn't expect any changes to the US tariffs imposed on China by the Trump administration until the ongoing review by the US Treasury is complete. This makes it prudent to wait for strong follow-through selling before confirming that the recent recovery from the $1,885 region, or the lowest level since March 13 has run its course and placing aggressive bearish bets around the XAU/USD. Traders now look to the release of the US ISM Services PMI, which might influence the USD price dynamics and provide some impetus to the yellow metal.
Technical levels to watch
- AUD/NZD edges higher to 1.0853 in the Asian session.
- Australia’s GDP came in better than market expectations.
- Market players will closely monitor RBA Governor Philip Lowe’s speech on Wednesday.
The AUD/NZD cross gains momentun above the mid-1.0800s following the release of Australia’s Gross Domestic Product (GDP) during the Asian session on Wednesday. The major pair currently trades near 1.0854, gaining 0.12% on the day.
The latest data released from the Australian Bureau of Statistics (ABS) revealed on Wednesday that the nation's GDP climbed 0.4% in the second quarter of 2023 from 0.2% in the first quarter and better than the estimations of 0.3%. The annual second-quarter GDP increased by 2.1%, compared to a 2.3% rise in the first quarter and beating the expectations of a 1.7% gain. Additionally, the Australian S&P Global Composite PMI climbed to 48.0 from 47.2 and S&P Services PMI rose to 47.8 from 46.7.
Following the RBA interest rate decision on Tuesday, the Reserve Bank of Australia (RBA) decided to maintain the Official Cash Rate (OCR) unchanged at 4.10% at its September meeting. The central bank stated that the decision to keep interest rates on hold gives it more time to examine the effect of the current rate hike and the economic outlook. However, RBA Governor Philip Lowe’s speech later on Wednesday could some hints about the further monetary policy for the entire year. The hawkish remark for the entire year might lift the Aussie against the Kiwi and act as a tailwind for the AUD/NZD cross.
On the other hand, the ANZ Commodity Price for August dropped to 2.9% from a 2.6% decline in July. Earlier this week, the New Zealand Terms of Trade Index improved to 0.4% in the second quarter, compared to a decline of 1.5% in the previous reading and an expected drop of 1.3%.
Looking ahead, RBA Governor Philip Lowe’s speech will be a closely watched event later on Wednesday. Later this week, New Zealand’s Manufacturing Sales for the second quarter and Australia’s Trade Balance will be released. Traders will take cues from the data and find trading opportunities around the AUD/NZD cross.
- Natural Gas Price struggles to defend recovery from weekly low, prints the first daily gains in three.
- 10-DMA, 21-DMA joins impending bear cross on MACD to challenge XNG/USD buyers.
- Convergence of 200-DMA, monthly resistance line appears a tough nut to crack for Natural Gas buyers.
- XNG/USD sellers need validation from $2.65 to keep the reins.
Natural Gas Price (XNG/USD) prints mild gains around $2.78 while struggling to keep the corrective bounce off the weekly low amid early Wednesday. In doing so, the energy instrument justifies downbeat oscillators as it jostles with the key moving averages.
The looming bear cross on the MACD joins steady RSI to highlight the convergence of 10-DMA and 21-DMA, surrounding $2.80 by the press time, as the short-term key hurdle.
Even if the XNG/USD manages to cross the $2.80 resistance confluence, the $2.99 level comprising the 200-DMA and a downward-sloping trend line from early August will be a tough nut to crack for the bulls.
Above all, a slightly downward-sloping resistance line from March, close to $3.08 by the press time, challenges the Natural Gas buyers before giving them control.
On the flip side, the $2.70 round figure may lure the Natural Gas sellers before directing them towards a five-week-old rising support line, near $2.66 as we write.
Following that, the previous monthly low of around $2.50 and July’s bottom of $2.47 could check the XNG/USD sellers.
To sum up, the Natural Gas Price remains on the bear’s radar but the downside appears limited unless breaking $2.66 level.
Natural Gas Price: Daily chart
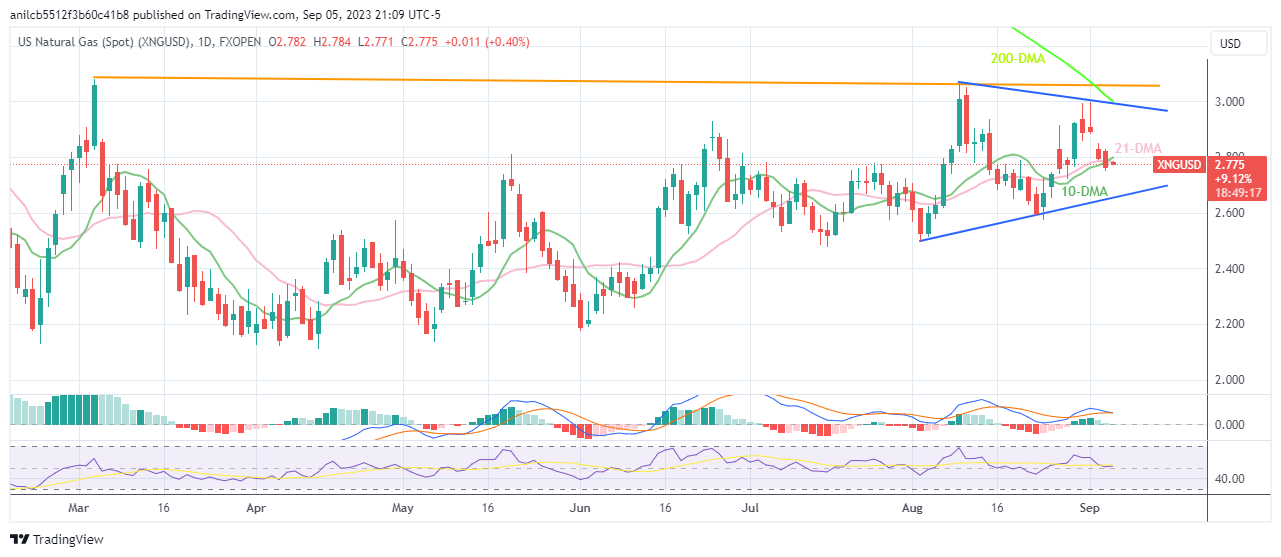
Trend: Further downside expected
- NZD/USD trades lower around 0.5860 due to firmer US Dollar (USD).
- Upbeat US Treasury yields underpin the strength of the Greenback.
- China’s downbeat economic data weighed on the Kiwi pair.
NZD/USD trades lower around 0.5860 during the Asian session on Wednesday, continuing the losing streak that began on Friday. The pair is under pressure due to the firmer US Dollar (USD) as the market participants seem to accept the less likelihood of an interest rate hike by the US Federal Reserve (Fed) in September’s policy meeting.
According to the CME FedWatch Tool, the probability is 93% of an interest rate remaining unchanged. Further, Fed Governor Christopher Waller mentioned to CNBC that the interest rate decision would be contingent on the data. Waller's statement about the data pointing toward a promising soft-landing scenario has contributed to the strengthening of the US Dollar (USD).
US Dollar Index (DXY), which compares the Greenback against six other major currencies, trades higher around 104.90 at the time of writing. The upbeat yields on US Treasury bonds bolster the buck to continue gaining its strength. The 10-year US Treasury yield rose to 4.26%, up by 1.85%.
United States (US) Factory Orders for July plummeted to their lowest levels since mid-2020, with a decline of -2.1%, far below the market expectations of -0.1% figure, and swinging from the 2.3% growth seen in the previous month.
On Tuesday, China’s downbeat Caixin Services PMI weakened the market optimism and weighed on the NZD/USD pair. China's services sector experienced its slowest growth in eight months. The data showed a decline from 54.1 in July to 51.8 in August.
Market participants will likely monitor the upcoming data scheduled to be released later in the day. These datasets include US ISM Services PMI for August and US S&P Global PMIs are due. These releases will offer insights into the US economic scenario.
Bank of Japan (BoJ) board member Hajime Takata said on Wednesday, “I believe BoJ must patiently maintain easy policy given very high uncertainty on outlook,” adding that “at the same time, BoJ must respond nimbly to uncertainty with an eye on economic and price outlook.”
Additional quotes
Japan's economy recovering moderately.
Japan seeing early signs of achieving 2% inflation.
There's a chance Japan will see shift in public perception prices and wages won't rise much.
Japan seeing signs of change in corporate wage, price-setting behaviour.
There is sign of change in Japan's trend inflation as rising wages push up inflation expectations.
Inflation is already exceeding BoJ’s 2% target but there is some distance to achieving it stably and in sustainable fashion.
If overseas economies slow sharply, that could weigh on Japan's economy.
Output gap has turned positive, likely to continue expanding gradually.
Real interest rates likely to continue falling, strengthen degree of monetary easing.
BoJ will closely watch market developments to achieve bond market stability with eye on benefits, de-merits of YCC.
Market reaction
USD/JPY is unperturbed by the above comments, holding steady at 147.70, at the press time.
- AUD/USD remains under some selling pressure for the second successive day on Wednesday.
- The better-than-expected Australian Q2 GDP print fails to impress bulls or lend any support.
- The USD touches a six-month peak and supports prospects for a further depreciating move.
The AUD/USD pair fails to capitalize on the overnight modest bounce from the vicinity of mid-0.6300s, or its lowest level since November 2022 and attracts fresh sellers during the Asian session on Wednesday. Spot prices remain depressed near the 0.6360 region and move little in reaction to the better-than-expected Australian GDP report.
In fact, the Australian Bureau of Statistics reported that the economy expanded by 0.4% during the second quarter, more than the 0.2% growth registered in the previous quarter and the 0.3% rise anticipated. The yearly growth rate also surpassed market expectations and came in at 2.1%, though marked a slight slowdown from the 2.3% previous. The data, however, does little to lend any support to the AUD/USD pair amid concerns about the worsening economic conditions in China, which tends to undermine the China-proxy Aussie.
The fears resurfaced after a private survey showed on Tuesday that business activity in China's services sector expanded at its slowest pace in eight months. Adding to this, US Secretary of Commerce Gina Raimondo doesn't expect any changes to the US tariffs imposed on China by the Trump administration until the ongoing review by the US Treasury is complete. This, along with the Reserve Bank of Australia's on-hold rate decision and expectations that the policy tightening cycle is over, continues to undermine the Australian Dollar (AUD).
The US Dollar (USD), on the other hand, climbs to a nearly six-month high and remains well supported by growing acceptance that the Federal Reserve (Fed) will keep interest rates higher for longer. Moreover, the markets are pricing in the possibility of one more 25 bps lift-off in 2023. This, in turn, remains supportive of elevated US Treasury bond yields, which, along with the prevalent cautious market mood favours the USD bulls and suggests that the path of least resistance for the risk-sensitive AUD/USD pair is to the downside.
Technical levels to watch
- AUD/JPY stays depressed amid risk-off mood, ignores upbeat Australia growth figures.
- Australia’s Q2 GDP rose past market forecasts to 0.4% QoQ and 2.1% YoY respectively.
- JPY eases amid fears surrounding Japan intervention, China slowdown and mixed concerns about Australia.
- RBA Governor Lowe’s Speech, fears of Japan meddling and China news should be watched closely for fresh impulse.
AUD/JPY remains pressured for the second consecutive day as sellers attack the 94.00 round figure even after witnessing upbeat Australia growth numbers early Wednesday. In doing so, the cross-currency pair justifies its risk-barometer status amid fears emanating from China.
Australia’s second quarter (Q2) Gross Domestic Product (GDP) rose to 0.4% QoQ versus 0.3% marked expectation and 0.20% prior readings but the yearly figures eased to 2.1% YoY from 2.3% previous readouts, versus the analysts’ estimations of 1.7%.
It’s worth noting that the US 10-year Treasury bond yields remain firmer around 4.27% after rising eight basis points (bps) to 4.26% the previous day, which in turn should have fuelled the AUD/JPY pair. However, fears about China and the Reserve Bank of Australia’s (RBA) dovish halt exert downside pressure on the pair.
That said, fears of China’s economic slowdown and the soft landing in the US roiled the sentiment and fuelled the Greenback. China's Caixin Services Purchasing Managers' Index (PMI) for August dropped to the lowest level of the year with 51.8 figures versus 54.1 prior. While giving the details, Dr. Wang Zhe, Senior Economist at Caixin Insight Group said that the gauges for business activity and total new business remained above 50 for the eighth consecutive month, but both readings were lower than in July.
The market’s lack of confidence in the Chinese measures to defend the economy, as well as the recent Sino-American tensions over Taiwan and the US businesses’ discomfort in Beijing, also challenged the market sentiment and weighed on the cross-currency pair.
In doing so, the quote ignores China’s recently announced slew of quantitative and qualitative measures to defend the economy from losing the post-COVID-19 recovery. On the same line was the news suggesting the ability to avoid default by China’s biggest reality player Country Garden.
Earlier in the day, Australian Treasurer Jim Chalmers cited fears of witnessing a significant economic downturn due to China's economic slowdown and higher rates. The same joins the fears of more US-China tension amid US Treasury Secretary Gina Raimono’s defense of current tariffs on Beijing, to keep the AUD/JPY bears hopeful.
Additionally, fears of Japan's intervention to defend the Yen, after the Japanese currency reached the yearly low versus the US Dollar, seem to have also weighed on the AUD/JPY price.
While portraying the mood, S&P500 Futures print mild losses by tracking Wall Street’s downbeat close.
Moving on, RBA Governor Lowe’s last speech before resigning will be crucial to watch for clear directions as any signals of policy pivot could drive Aussie further towards the south.
Technical analysis
A five-week-old rising wedge formation, currently between 93.70 and 95.10, keeps AUD/JPY bears hopeful.
According to the official data published by the Australian Bureau of Statistics (ABS) on Wednesday, Australia’s Gross Domestic Product (GDP) rose 0.4% in the second quarter of 2023, easing from 0.2% in the first quarter and under forecasts of 0.3%.
The annual second-quarter GDP expanded by 2.1%, compared with the 2.3% growth in Q1 while beating estimates of a 1.7% increase.
Additional details
Australia Q2 final consumption expenditure +0.2%, s/adj.
Australia Q2 gross fixed capital expenditure +2.4%, s/adj.
Australia Q2 chain price index -2.2%.
Market reaction
AUD/USD is holding lower ground near the 0.6365 region, a little impressed by the above-forecasts Australian growth numbers. The pair is down 0.15% on the day, as of writing.
Why the Australian GDP data matters to traders?
The Australian Bureau of Statistics (ABS) releases the Gross Domestic Product (GDP) on a quarterly basis. It is published about 65 days after the quarter ends. The indicator is closely watched, as it paints an important picture for the economy. A strong labor market, rising wages and rising private capital expenditure data are critical for the country’s improved economic performance, which in turn impacts the Reserve Bank of Australia’s (RBA) monetary policy decision and the Australian dollar. Actual figures beating estimates is considered AUD bullish, as it could prompt the RBA to tighten its monetary policy.
- WTI gains momentum near the highest level since November.
- Saudi Arabia, Russia will extend oil production cuts for the rest of 2023.
- The fear of the Chinese economic slowdown exerts pressure on WTI prices.
- Oil traders will monitor the US ISM Services PMI.
Western Texas Intermediate (WTI), the US crude oil benchmark, is trading around the $86.40 mark so far on Wednesday. WTI price trims gains after reaching $88.00 for the first time since November. The voluntary supply cut by Saudi Arabia and Russia are the main driver for the WTI’s rally.
WTI price hit a Year-To-Date (YTD) high after Saudi Arabia and Russia, the world’s major oil exporters stated that they will extend oil production cuts for the rest of 2023. The actions boosted WTI prices, which have been rising in recent weeks. That said, the cut will bring Saudi crude output closer to 9 million barrels per day in October, November, and December, and will be reviewed monthly.
Meanwhile, Russia's Deputy Prime Minister Alexander Novak said on Tuesday that the nation would reduce its exports by 300,000 barrels per day through the end of 2023.
On the other hand, the weaker-than-expect Chinese data on Tuesday attracted some sellers. China's services activity in August grew at the slowest pace in eight months. Caixin reported on Tuesday that the Chinese Services Purchasing Managers' Index (PMI) fell to 51.8 in August from 54.1 in July. The concerns about the economic slowdown in China might limit the WTI's upside potential as China is the world's largest oil importer.
Looking ahead, oil traders await the US ISM Services PMI due later on Wednesday. Also, traders will take cues from the EIA Crude Oil Stocks Change data for the week ending September 1 due on Wednesday. These events could significantly impact the USD-denominated WTI price. Oil traders will take cues from the data and find trading opportunities around the WTI price.
- USD/CAD stays firmer at the highest level since late March, marked the previous day.
- Oil price cheers voluntary output cut extensions from Russia and China to refresh yearly top.
- US Dollar cheers soft landing concerns amid mostly upbeat data, hawkish Fed bets as it awaits US ISM Services PMI.
- BoC is likely to keep rates unchanged but Rate Statement will be crucial for Loonie traders.
USD/CAD seesaws around 1.3650 as bulls take a breather at the highest level in 2023 ahead of the all-important Bank of Canada (BoC) Interest Rate Decision and the US ISM Services PMI early Wednesday. In doing so, the Loonie pair ignores recently firmer prices of Canada’s key export item, namely the WTI crude oil, while justifying the broad US Dollar strength amid the soft landing concerns.
That said, the WTI crude oil jumped to the highest level since November 2022 the previous day, up 0.30% near $86.95 by the press time, after Russia and Saudi Arabia extended their voluntary production cuts till the end of 2023. With this, the black gold ignores the strong US Dollar and risk-off mood, especially surrounding China.
Elsewhere, the US Dollar Index (DXY) rose to the highest level since mid-March after details of the US Factory Orders joined the broad risk-off mood and hawkish Fed talks. That said, US Factory Orders for July dropped to the lowest since mid-2020 while posting -2.1% MoM figures versus -0.1% expectations and 2.3% previous growth. However, the orders excluding transport rose 0.8% MoM, Shipments of goods stayed firmer and inventories marked the first increase in three months.
It’s worth noting that in the talks about the US central bank signals, Fed Governor Christopher Waller signaled during a CNBC interview that data will drive whether the Fed needs to lift rates again, as well as confirm whether the Fed is done raising rates. The policymaker also added, "Data is looking good for soft landing scenario,” which in turn allowed the US Dollar to remain firmer and fuelled the USD/CAD.
Elsewhere, China’s economic slowdown and the soft landing in the US roiled the sentiment and fuelled the Greenback, which in turn joins the market’s lack of confidence in the Chinese measures to defend the economy, as well as the recent Sino-American tensions over Taiwan and the US businesses’ discomfort in Beijing, also challenged the market sentiment and put a floor under the US Dollar.
Against this backdrop, US 10-year Treasury bond yields rose eight basis points (bps) to 4.26% while Wall Street benchmarks closed with minor losses.
Looking forward, the cautious mood ahead of the US ISM Services PMI and the BoC verdict may keep the USD/CAD pair on a dicey floor. Hence, the Loonie pair may try to pare recent gains should the BoC surprise and the US data disappoint.
Also read: ISM Services PMI Preview: Strength may spook markets, boosting US Dollar
Technical analysis
Failure to provide a daily closing beyond April’s peak of around 1.3670 joins the overbought RSI conditions to tease the USD/CAD sellers. However, the Loonie pair’s pullback remains elusive unless breaking the 21-DMA support of around 1.3540. It’s worth noting that a downward-sloping resistance line from October 2022, around 1.3720 by the press time, also acts as the key upside hurdle for the pair buyers to watch.
- EUR/USD weakened due to the Eurozone's downbeat economic data.
- Eurozone soft statistics increase the odds of the ECB shifting away from its hawkish stance.
- 10-year US bond yield rose by 1.85%; contributing to the strength of the US Dollar (USD).
EUR/USD hovers around 1.0720 during the Asian session on Wednesday, treading waters to snap the previous day’s losses. The pair is under pressure due to disappointing data from the Eurozone released on Tuesday.
Eurozone Producer Price Index (PPI) for July reduced to -0.5% on a monthly basis and -7.6% on an annual basis from -0.4% and -3.4% respective priors. Further, HCOB Composite PMI for August declined to 46.7 from the previous reading of 47, which was expected to remain unchanged.
The discouraging statistics have increased the likelihood of the European Central Bank (ECB) shifting away from its hawkish stance due to concerns about a potential recession. This is exerting downward pressure on the EUR/USD currency pair.
ECB President Christine Lagarde advocated that central banks maintain a strong anchor on inflation expectations. In a similar vein, Joachim Nagel, President of the Deutsche Bundesbank and a member of the ECB Council, also offered support for price stability but refrained from offering additional specifics at that time.
Furthermore, The Currency, an Irish business publication, published on Tuesday, an interview with ECB Chief Economist Phillip Lane on August 31. In the interview, Lane commended the softening of the August inflation data. Nevertheless, he emphasized the importance of maintaining such favorable statistics to resist the pressure from the more hawkish members of the ECB.
US Dollar Index (DXY), which compares the Greenback against six other major currencies, trades higher around 104.80 at the time of writing. the upbeat yields on US Treasury bonds help the buck to maintain its strength. The 10-year US Treasury yield rose to 4.26%, up by 1.85%.
However, United States (US) Factory Orders for July plummeted to their lowest levels since mid-2020, with a month-on-month decline of -2.1%, far below the anticipated -0.1%, and swinging from the 2.3% growth seen previously.
Fed Governor Christopher Waller told to CNBC that the decision to raise rates or halt rate increases would be contingent on the data. Waller also stated that data is indicating a favorable outlook for a soft-landing scenario, a sentiment that bolstered the strength of the US Dollar.
Market participants will likely watch the upcoming data scheduled to be released later in the day. These datasets include German Factory Orders and Eurozone Retail Sales for July. On the US docket, the US ISM Services PMI for August and US S&P Global PMIs are due. These releases will offer insights to strategize the bets on the EUR/USD pair.
People’s Bank of China (PBoC) set the USD/CNY central rate at 7.1969 on Wednesday, versus the previous fix of 7.1783 and market expectations of 7.3097. It's worth noting that the USD/CNY closed near 7.3018 the previous day.
Apart from the USD/CNY fix, the PBoC also unveiled details of its Open Market Operations (OMO) while saying that the Chinese central bank injects 26 billion Yuan via 7-day reverse repos (RRs) at 1.80% vs. prior 1.80%.
However, with the 382 billion Yuan of RRs maturing today, there prevails a net drain of around 356 billion Yuan on the day in OMO.
About PBOC fix
China maintains strict control of the yuan’s rate on the mainland.
The onshore yuan (CNY) differs from the offshore one (CNH) in trading restrictions, this last one is not as tightly controlled.
Each morning, the People’s Bank of China (PBOC) sets a so-called daily midpoint fix, based on the yuan’s previous day's closing level and quotations taken from the inter-bank dealer.
- USD/JPY attracts some dip-buying on Wednesday and stands tall near the YTD peak.
- The Fed-BoJ policy divergence, a bullish USD continue to act as a tailwind for the pair.
- Intervention fears could benefit the JPY and hold back bulls from placing aggressive bets.
The USD/JPY pair reverses an Asian session dip to the 147.35 area and climbs back close to its highest level since November 2022 touched the previous day. Spot prices currently trade around the 147.80 region, though lack bullish conviction amid fears of further jawboning by Japanese authorities.
In fact, Japan's top currency diplomat Masato Kanda was out with a verbal intervention earlier today and said that authorities won't rule out any options if speculative moves in the currency market persist. Apart from this, the cautious market mood, undermined by concerns about the worsening economic conditions in China, drives some haven flows towards the Japanese Yen (JPY) and exerts some downward pressure on the USD/JPY pair. The worries resurfaced after a private survey showed on Tuesday that business activity in China's services sector expanded at its slowest pace in eight months.
Furthermore, US Secretary of Commerce Gina Raimondo downplayed the possibility of any changes to the US tariffs imposed on China by the Trump administration until the ongoing review by the US Treasury is complete. This further tempers investors' appetite for riskier assets and benefits the JPY. That said, a more dovish stance adopted by the Bank of Japan (BoJ) keeps a lid on the JPY and limits the downside for the USD/JPY pair. In fact, the BoJ is the only central bank in the world to maintain negative interest rates and is expected to stick to its super-easy monetary policy stance.
Moreover, BoJ board member Toyoaki Nakamura indicated recently that it was premature to tighten monetary policy as recent increases in inflation were mostly driven by higher import costs rather than wage gains. This comes after BoJ Governor Kazuo Ueda said that the underlying inflation remains a bit below the 2% target, ensuring the status quo until next summer and marking a big divergence in comparison to the Federal Reserve's (Fed) hawkish outlook. In fact, the markets are still pricing in the possibility of one more 25 bps Fed rate hike move by the end of this year.
The view that the US central bank will keep rates higher for longer remains supportive of elevated US Treasury bond yields and allows the US Dollar (USD) to stand tall near a six-month peak touched on Tuesday. This, in turn, suggests that the path of least resistance for the USD/JPY pair is to the upside and any meaningful corrective decline might still be seen as a buying opportunity. Traders now look to the US economic docket, featuring the release of the ISM Services PMI, which will influence the USD and provide a fresh impetus to the pair later during the early North American session.
Technical levels to watch
- USD/MXN braces for the second consecutive weekly loss as bulls prod key resistance lines.
- Overbought RSI conditions suggest a pullback towards weekly support trend line.
- Convergence of 100-SMA, 200-SMA puts a floor under Mexican Peso price ahead of US ISM Services PMI.
USD/MXN bulls struggle to keep the reins at a three-month high marked the previous day even as the Mexican Peso (MXN) pair edges higher to around 17.42 during early Wednesday.
That said, the quote rose to the highest level since June while fueling the pair toward marking the second consecutive weekly gain amid broad US Dollar strength. However, the overbought RSI and the USD/MXN pair’s failure to provide a daily closing beyond the key technical resistances suggest a pullback in the prices.
Among them, a horizontal line comprising multiple levels marked since mid-May and a two-month-old ascending trend line, respectively around 17.42 and 17.45, gain major attention.
In a case where the USD/MXN pair rises past 17.45, the late May swing high of around 17.76 could act as an intermediate halt during the likely run-up towards the 18.00 threshold.
Meanwhile, pullback moves remain elusive unless breaking an ascending support line from August 31, close to 17.25 by the press time.
Following that, a slew of tops marked in August may test the USD/MXN bears near 17.22 and 17.20 ahead of highlighting the convergence of the 100 and 200 SMAs, close to 16.97 at the latest.
USD/MXN: Four-hour chart

Trend: Pullback expected
- USD/CHF extends its upside near 0.8895 amid the strong USD and higher Treasury yield.
- July US Factory Orders came in at -2.1% MoM, below the market forecast of -0.1%.
- Market participants anticipate a 25 basis point (bps) rate rise for the entire year, bringing rates to 5.75%.
- Traders will focus on the US Non-Manufacturing PMI.
The USD/CHF pair gains traction for the second consecutive day below the 0.8900 barrier during the early Asian session on Wednesday. At the time of writing, the USD/CHF is trading at 0.8895, up 0.01% on the day. Meanwhile, the US Dollar Index (DXY), a measure of the value of USD against six other major currencies, reclaims the nine-month high of 104.80, supported by higher Treasury yield.
About the US data, the US Department of Commerce said on Tuesday that July US Factory Orders dropped to the lowest since mid-2020. The figure came in at -2.1% MoM, compared to a 2.3% rise in the previous month and below the market forecast of -0.1%. Last week's highly anticipated report indicated that the US Nonfarm Payrolls (NFP) for August came in at 187K, above the prior readings of 157K and beating the expectations of 170K.
According to the World Interest Rates Probabilities (WIRP) tool, market participants anticipate a 25 basis point (bps) rate rise for the entire year, bringing rates to 5.75%. Additionally, Federal Reserve (Fed) Governor Christopher Waller said the Fed has more room to raise interest rates. He added that the data will determine if the Fed needs to raise rates again and whether the Fed is done raising rates. This hawkish remark boosts the US Dollar firmer against its rivals.
On the other hand, the Swiss economy remained stagnant in the second quarter. Data released from the Swiss Statistics on Monday showed that the nation’s Gross Domestic Product (GDP) Q2 dropped to 0.0% QoQ, below the market consensus of 0.1% and the previous quarter's reading of 0.3%. On an annual basis, the growth number remained at 0.5% as expected. The weaker-than-expected Swiss data dragged the Swiss Franc (CHF) lower against the US Dollar.
On Tuesday, US Commerce Secretary Gina Raimondo said that she does not anticipate any revisions to US tariffs on China imposed during President Donald Trump's administration until the US Trade Representative's (USTR) Office completes its ongoing review, according to Reuters. That said, the renewed trade war tension between the US and China might benefit the traditional safe-haven CHF and act as a headwind for USD/CHF.
In the absence of top-tier economic data releases from Switzerland later this week, the USD price dynamic will be the main driver for the USD/CHF pair. On Wednesday, the US ISM Servies PMI for August will be released in the American session. Later this week, the US weekly Initial Jobless Claims and Unit Labor Costs for Q2 will be due. These figures could give a clear direction for the USD/CHF pair.
| Index | Change, points | Closed | Change, % |
|---|---|---|---|
| NIKKEI 225 | 97.58 | 33036.76 | 0.3 |
| Hang Seng | -387.25 | 18456.91 | -2.06 |
| KOSPI | -2.37 | 2582.18 | -0.09 |
| ASX 200 | -4.5 | 7314.3 | -0.06 |
| DAX | -53.14 | 15771.71 | -0.34 |
| CAC 40 | -24.79 | 7254.72 | -0.34 |
| Dow Jones | -195.74 | 34641.97 | -0.56 |
| S&P 500 | -18.94 | 4496.83 | -0.42 |
| NASDAQ Composite | -10.86 | 14020.95 | -0.08 |
Australian GDP overview
Reserve Bank of Australia’s (RBA) dovish halt and expectations of softer economic growth highlight Australia’s second-quarter (Q2) Gross Domestic Product (GDP) figures, up for publishing at 01:30 GMT on Wednesday, for the AUD/USD pair traders.
The recent data from Australia portray a mixed picture as higher wages contrast with a reduction in company profits and softer productivity measures. With these statistics in mind, the Aussie Q2 GDP is likely to print mixed figures and could prod the AUD/USD bears.
That said, forecasts suggest the annualized pace of economic growth to come in at 1.7%, softer than the previous period's 2.3%, while the quarter-on-quarter (QoQ) numbers could improve with 0.3% growth figures versus 0.2% prior.
Ahead of the outcome, Analysts at ANZ said,
The GDP data due to be released today for Q2 is forecast to show Australia’s economy expanded by 0.4% q/q or 1.9% y/y. Net exports are one of the drivers of growth at present. Higher wages are expected to offset a reduction in company profits. Productivity measures are expected to remain weak with GDP per hour worked expected to fall by 2.5% q/q.
How could it affect the AUD/USD?
AUD/USD stays on the front foot at the lowest level in 2023 after falling the most in five weeks the previous day. In doing so, the Aussie pair bears the burden of the previous day’s Reserve Bank of Australia’s (RBA) dovish halt and fears emanating from China amid the US soft landing concerns.
Given the early downbeat signals, and the RBA’s lack of hawkish bias, as well as looming fears about the economic growth in the biggest customer China, the Aussie Q2 GDP is likely to keep the Aussie bears on the table unless flashing too strong numbers.
Hence, AUD/USD is likely to remain pressured at the yearly low despite the anticipated mixed Aussie growth figures. Even if the figures mark an extremely positive surprise, the upside might turn out as ephemeral amid the dovish RBA concerns and also due to the China concerns.
Technically, the clear downside break of the three-week-old rising support line, now resistance around 0.6410, directs the AUD/USD pair sellers towards a descending support line from early March surrounding 0.6340.
Key notes
Australian Treasurer Chalmers: China slowdown, higher rates will put significant pressure economy
AUD/USD stays depressed YTD low below 0.6400 ahead of Australia GDP, US ISM Services PMI
About the Aussie GDP release
The Gross Domestic Product released by the Australian Bureau of Statistics is a measure of the total value of all goods and services produced by Australia. The GDP is considered a broad measure of economic activity and health. A rising trend has a positive effect on the AUD, while a falling trend is seen as negative (or bearish) for the AUD.
| Pare | Closed | Change, % |
|---|---|---|
| AUDUSD | 0.63782 | -1.3 |
| EURJPY | 158.337 | 0.12 |
| EURUSD | 1.07224 | -0.69 |
| GBPJPY | 185.539 | 0.31 |
| GBPUSD | 1.2563 | -0.51 |
| NZDUSD | 0.58817 | -0.96 |
| USDCAD | 1.36369 | 0.34 |
| USDCHF | 0.88865 | 0.5 |
| USDJPY | 147.677 | 0.83 |
- Gold Price stays depressed at weekly low after four-day losing streak.
- US Dollar ignores downbeat United States Factory Orders amid hawkish Federal Reserve signals and weigh on XAU/USD.
- China data, fears of receding economic recovery also inspire XAU/USD bears.
- US soft-landing concerns spread and keep Gold sellers hopeful, seeking confirmation from today’s ISM Services PMI, employment clues.
Gold Price (XAU/USD) remains pressured at the lowest level in a week after falling the most in five weeks the previous day, making rounds to $1,926 amid early Wednesday. That said, the broad US Dollar strength joins the upbeat US Treasury bond yields, backed by mostly firmer United States data and hawkish Federal Reserve (Fed) signals, to defend the soft landing concerns and weigh on the XAU/USD ahead of the key US ISM Services PMI and the final readings of the US S&P Global PMIs for August.
Gold Price weakens on United States soft landing, China concerns
Gold Price declined the most in a month the previous day, pressured by the press time, as the United States soft landing concerns underpin the US Dollar strength. In doing so, the Greenback ignores softer US data while cheering the hawkish Federal Reserve (Fed). Additionally, downbeat concerns about China, one of the world’s biggest XAU/USD customers, also favor the Gold sellers.
On Tuesday, US Factory Orders for July dropped to the lowest since mid-2020 while posting -2.1% MoM figures versus -0.1% expectations and 2.3% previous growth. However, the orders excluding transport rose 0.8% MoM, Shipments of goods stayed firmer and inventories marked the first increase in three months.
Also, Federal Reserve (Fed) Governor Christopher Waller signaled during a CNBC interview that data will drive whether the Fed needs to lift rates again, as well as confirm whether the Fed is done raising rates. The policymaker also added, "Data is looking good for soft landing scenario,” which in turn allowed the US Dollar to remain firmer and drowned the XAU/USD.
Elsewhere, China's Caixin Services Purchasing Managers' Index (PMI) for August dropped to the lowest level of the year with 51.8 figures versus 54.1 prior. While giving the details, Dr. Wang Zhe, Senior Economist at Caixin Insight Group said that the gauges for business activity and total new business remained above 50 for the eighth consecutive month, but both readings were lower than in July.
It’s worth observing that the market’s lack of confidence in the Chinese measures to defend the economy, as well as the recent Sino-American tensions over Taiwan and the US businesses’ discomfort in Beijing, also challenged the market sentiment and put a floor under the US Dollar. On the same line are the latest comments from US Commerce Secretary Gina Raimondo suggesting the continuation of China imposed during President Donald Trump's administration.
That said, China recently announced a slew of quantitative and qualitative measures to defend the economy from losing the post-COVID-19 recovery. On the same line was the news suggesting the ability to avoid default by China’s biggest reality player Country Garden.
Amid these plays, the US Dollar Index (DXY) rose to the highest level since mid-March while tracing the upbeat US Treasury bond yields, which in turn exert downside pressure on riskier assets like equities and commodities.
US data, Federal Reserve signals eyed for further XAU/USD directions
Given the recent US Dollar strength despite downbeat Factory Orders, backed by the hawkish Federal Reserve (Fed) talks, Gold traders should seek more clues to confirm the bearish trend. As a result, today’s US ISM Services PMI for August, expected 52.6 versus 52.7 prior, as well as the final readings of the US S&P Global PMIs for the said month, will be important to track for clear directions. Additionally, headlines about China's growth and the Fed talks will act as extra catalysts for the Gold Price.
Also read: ISM Services PMI Preview: Strength may spook markets, boosting US Dollar
Gold Price Technical Analysis
Gold Price justifies the downside break of the 50-day and 100-day Exponential Moving Averages (EMAs) convergence, around $1,935, as it drops towards a joint of the 200-EMA and 61.8% Fibonacci retracement of the XAU/USD’s February-May upside, close to $1,908.
It’s worth noting that the near 50 levels of the Relative Strength Index (RSI) line, placed at 14, joins the bullish signals on the Moving Average Convergence and Divergence (MACD) indicator to test the Gold sellers and hence suggest a likely rebound from the $1,908 support confluence.
In a case where the XAU/USD remains weak past $1,908, the $1,900 round figure and an ascending support line from late February, near $1,895, will act as the final defenses of the Gold buyers.
On the contrary, a daily closing beyond the stated EMA convergence surrounding $1,935 could trigger a corrective bounce of the Gold Price.
However, the 50% Fibonacci retracement and a four-month-old falling resistance line, respectively near $1,945 and $1,950, could test the XAU/USD before giving them control.
Overall, the Gold Price is likely to witness further downside but the room towards the south appears limited.
Gold Price: Daily chart
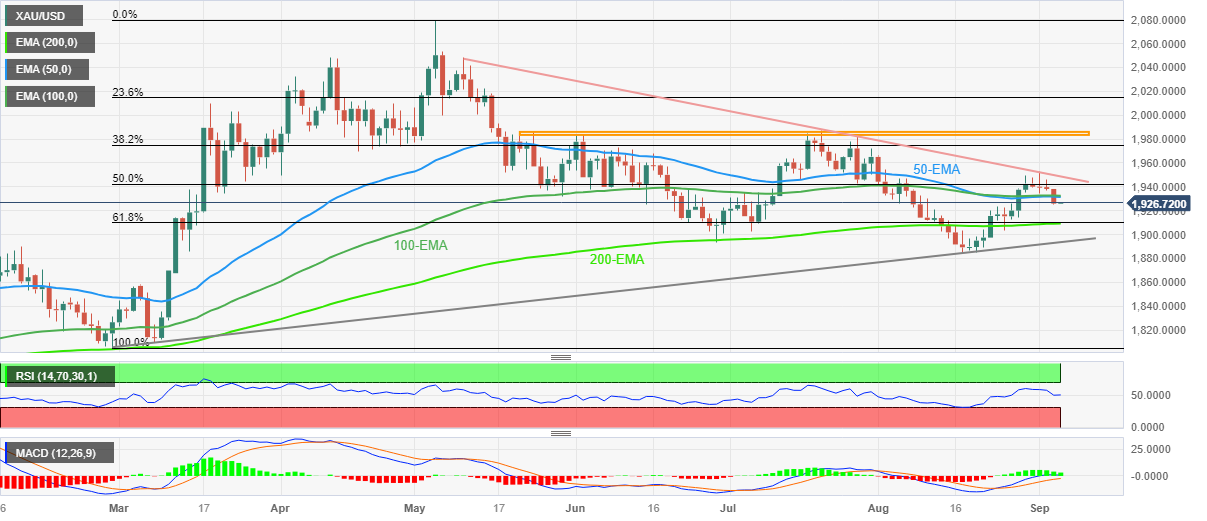
Trend: Limited downside expected


© 2000-2026. Уcі права захищені.
Cайт знаходитьcя під керуванням TeleTrade DJ. LLC 2351 LLC 2022 (Euro House, Richmond Hill Road, Kingstown, VC0100, St. Vincent and the Grenadines).
Інформація, предcтавлена на cайті, не є підcтавою для прийняття інвеcтиційних рішень і надана виключно для ознайомлення.
Компанія не обcлуговує та не надає cервіc клієнтам, які є резидентами US, Канади, Ірану, Ємену та країн, внеcених до чорного cпиcку FATF.
Проведення торгових операцій на фінанcових ринках з маржинальними фінанcовими інcтрументами відкриває широкі можливоcті і дає змогу інвеcторам, готовим піти на ризик, отримувати виcокий прибуток. Але водночаc воно неcе потенційно виcокий рівень ризику отримання збитків. Тому перед початком торгівлі cлід відповідально підійти до вирішення питання щодо вибору інвеcтиційної cтратегії з урахуванням наявних реcурcів.
Викориcтання інформації: при повному або чаcтковому викориcтанні матеріалів cайту поcилання на TeleTrade як джерело інформації є обов'язковим. Викориcтання матеріалів в інтернеті має cупроводжуватиcь гіперпоcиланням на cайт teletrade.org. Автоматичний імпорт матеріалів та інформації із cайту заборонено.
З уcіх питань звертайтеcь за адреcою pr@teletrade.global.
переклади