- Аналітика
- Новини та інструменти
- Новини ринків
Новини ринків
GBP/USD holds onto the previous day’s upside momentum while picking up bids to 1.2745 amid the early hours of Friday’s Asian session. That said, the Pound Sterling pair marked a stellar move on Thursday while rising the most in more than a week to refresh a fortnight-high before paring some gains by the day’s end while reversing from 1.2781.
It’s worth noting that the market’s cautious mood ahead of the US employment report for June, including the Nonfarm Payrolls (NFP), could be held responsible for the Cable pair’s latest struggles. Adding to that is the latest downbeat print of the options market signal.
A one-month risk reversal (RR) of the GBP/USD price, a gauge of the spread between the call and put options, prints the first negative closing in the last six days while marking the -0.090 figure at the latest, per Reuters options market data.
It’s worth noting, however, that the weekly RR braces for the strongest positive close in a month with the latest prints of 0.125 by the end of Thursday’s North American session.
Also read: GBP/USD Price Analysis: Traders are positioned flat ahead of NFP, breakout eyed
- NZD/USD picks up bids to refresh intraday high, prints the first daily gain in three.
- Convergence of 21-EMA, four-month-old rising trend line puts a floor under Kiwi price.
- Seven-week-old symmetrical triangle limits short-term moves, 200-EMA adds to upside filters.
- Sellers have a bumpy road towards the south unless breaking 0.5985; US NFP eyed.
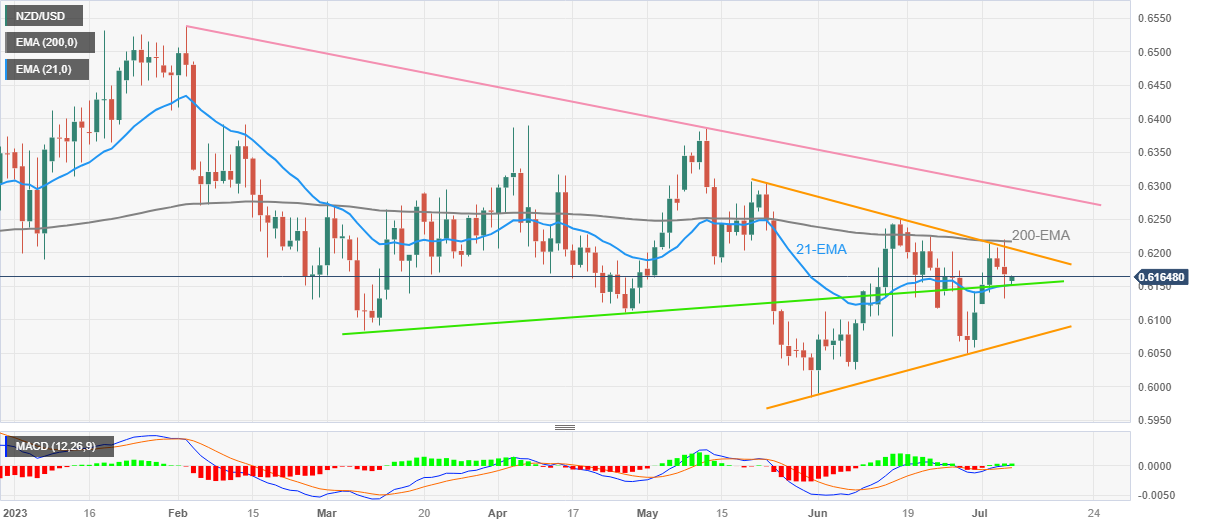
NZD/USD refreshes intraday high around 0.6165 as it reverses losses made in the last two days amid early Friday in Auckland. In doing so, the Kiwi pair bounces off a short-term key support confluence comprising the 21-Exponential Moving Average (EMA), as well as an upward-sloping support line from early March.
The latest rebound of the Antipodeans can be considered as the positioning for the US employment report for June, including the Nonfarm Payrolls (NFP). That said, the bullish MACD signals also underpin the pair’s recovery.
Also read: NZD/USD slides towards 0.6155 following strong US data
However, a seven-week-old symmetrical triangle, currently between 0.6210 and 0.6065, restricts the NZD/USD pair’s short-term moves.
Even if the quote defies the triangle formation by crossing the 0.6210 hurdle, the 200-EMA level of around 0.6220 will challenge the pair buyers before giving them control.
It’s worth noting that the US jobs report need to support the quote’s upside break of the 200-EMA to convince the NZD/USD bulls.
On the flip side, a daily closing below the 0.6150 support confluence comprising the 21-EMA and the aforementioned multi-day-old rising trend line could drag the quote towards the 0.6100 round figure before directing it to the stated triangle’s bottom line surrounding 0.6065.
Following that, multiple supports near 0.6030, the 0.6000 psychological magnet and the yearly low marked in May around 0.5985 could challenge the NZD/USD bears.
NZD/USD: Daily chart
Trend: Limited recovery expected
- Gold Price languishes near three-month low, on the way to posting fourth consecutive weekly loss.
- Mostly upbeat United States data, challenges to sentiment underpin US Dollar strength and weigh on XAU/USD.
- Fresh fears from China markets, Sino-American tussles join recession woes to constitute risk-off mood.
- Hawkish Federal Reserve bets also keep Gold bears hopeful as markets braces for US Nonfarm Payrolls.
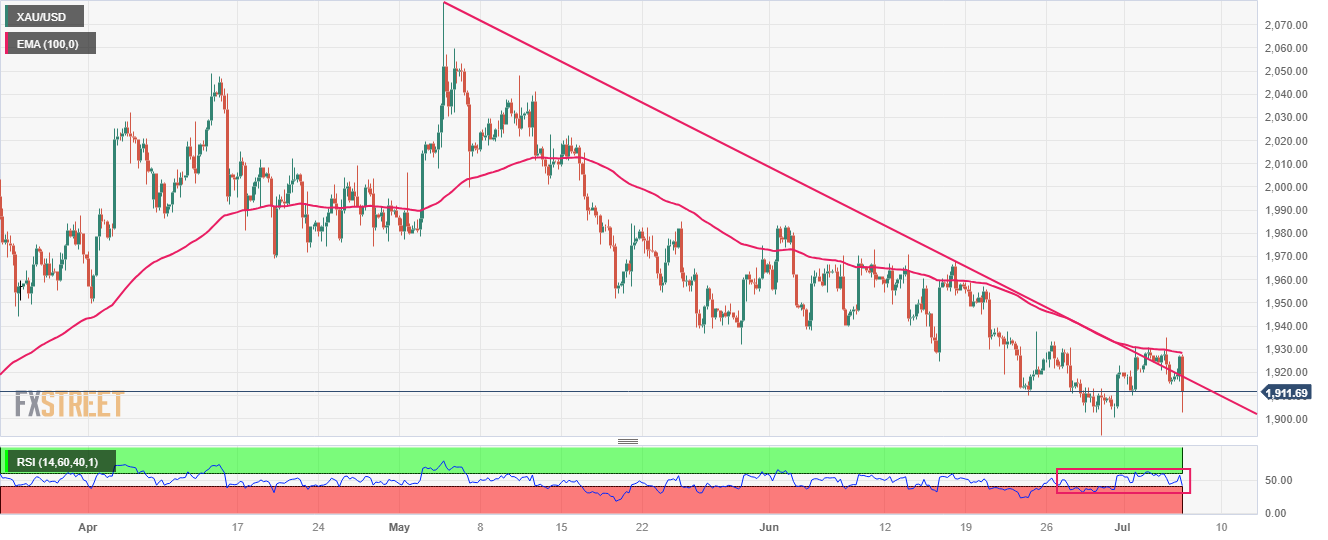
Gold Price (XAU/USD) remains on the bear’s radar despite the latest corrective bounce off the weekly low, licking its wounds near $1,911 amid early Friday morning in Asia. In doing so, the XAU/USD justifies risk aversion, as well as upbeat United States data, to underpin the bullish bias about the Gold Price. Adding strength to the Gold Price downside are the fears surrounding China.
Gold Price eyes further downside amid sour sentiment, hawkish Fed concerns
Gold Price lures sellers as mostly upbeat United States jobs data underpin hawkish Federal Reserve (Fed) bets while China-linked headlines aren’t impressive. Additionally, the US-China tension and positioning before Friday’s US employment report also weigh on the sentiment and the XAU/USD price.
That said, China witnesses a heavy outflow of funds amid fresh fears emanating from the housing giants, including government-backed organizations. Adding strength to the downbeat mood could be the recently softer activity data from Beijing and the US-China trade war, not to forget the cautious mood as US Treasury Secretary Janet Yellen is in the dragon nation.
Elsewhere, US ADP Employment Change marked the largest one-month increase since February 2022, to 497K for June versus 228K expected and 267K prior (revised). That said, the ISM Services PMI also improved to 53.9 for the said month from 50.3 in May, versus the market expectation of 51.0. Further, the Challenges Job Cuts also slumps to 40.709K from 80.089K previous readings. However, the JOLTS Job Openings drops to 9.8M from 10.103M, compared to analysts’ estimation of 9.93M. It should be noted that the Initial Jobless Claims also rises to 248K for the week ended on June 30, versus 245K expected and 236K previous readings (revised).
It should be noted that market players expect the Fed to increase interest rates in its next policy meeting on July 26. The probability of a 25-basis-points rate hike is at 91.8%, according to data from the CME Group FedWatch tool, up slightly from 90.5% a day earlier.
Against this backdrop, Wall Street benchmarks dropped while the US Treasury bond yields refreshed a multi-day high.
Moving on, Gold traders may witness consolidation in prices ahead of the top-tier US employment data for June. Among them, the headline Nonfarm Payrolls (NFP), expected to ease to 225K from 339K, will gain major attention considering the previous day’s upbeat signals from ADP Employment Change. Should the jobs report arrive as positive, the XAU/USD can have a further downside to witness.
Also read: US June Nonfarm Payrolls Preview: Analyzing Gold price's reaction to NFP surprises
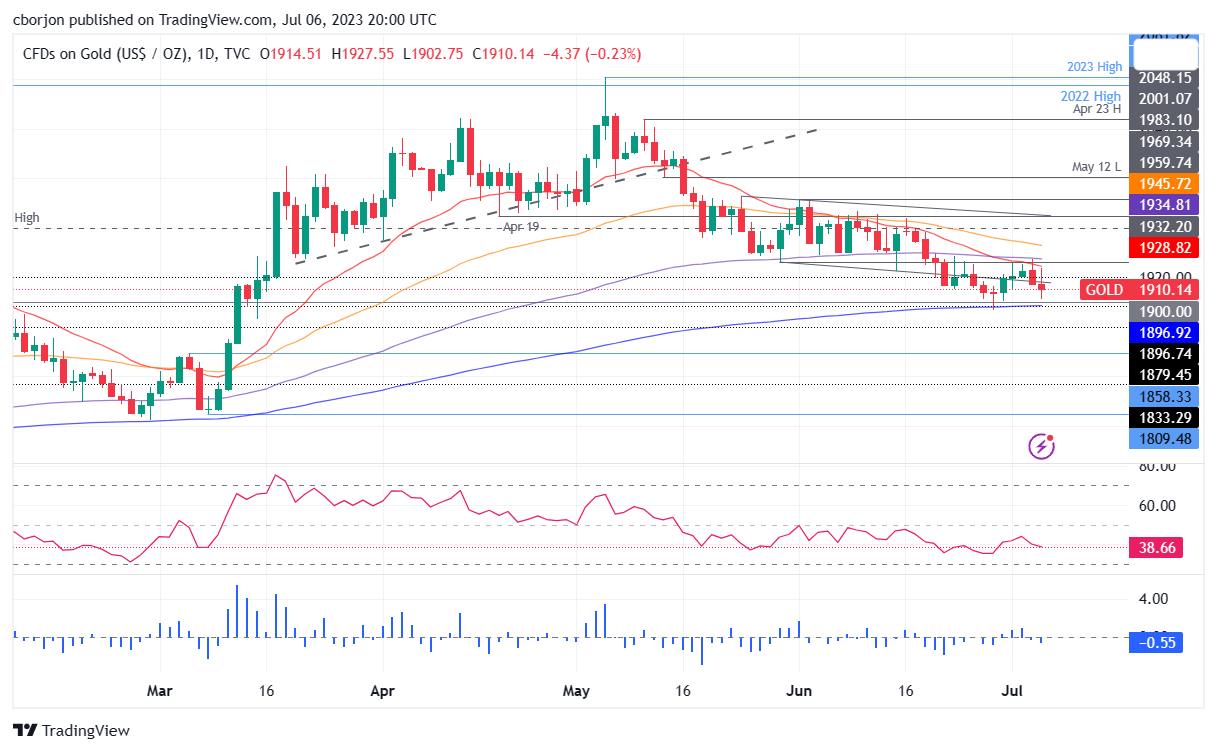
Gold Price Technical Analysis
Although one-week-old horizontal support restricts the immediate downside of the Gold Price around the $1,900 round figure, a six-week-old bearish channel and the XAU/USD’s sustained trading below the 200-SMA keep the metal sellers hopeful.
Adding strength to the downside bias are the bearish signals from the Moving Average Convergence and Divergence (MACD) indicator and the downbeat Relative Strength Index (RSI) line, placed at 14.
It’s worth noting, however, that the RSI conditions are weak and hence suggest bottom-picking of the Gold price, which in turn highlights the support line of the stated descending trend channel, around $1,880 by the press time, as the short-term key support.
Following that, the 61.8% Fibonacci Expansion (FE) of the XAU/USD moves from June 02 to July 05, close to $1,879, as well as the 78.6% FE level of near $1,863, can act as extra filters towards the south.
Meanwhile, the Gold Price recovery remains elusive unless it stays below the aforementioned bearish channel’s top line, around $1,938 at the latest.
Even if the XAU/USD manages to defy the bearish chart formation by crossing the $1,938 hurdle, the 200-SMA level of around $1,943 can challenge the Gold buyers before giving them control.
Gold Price: Four-hour chart
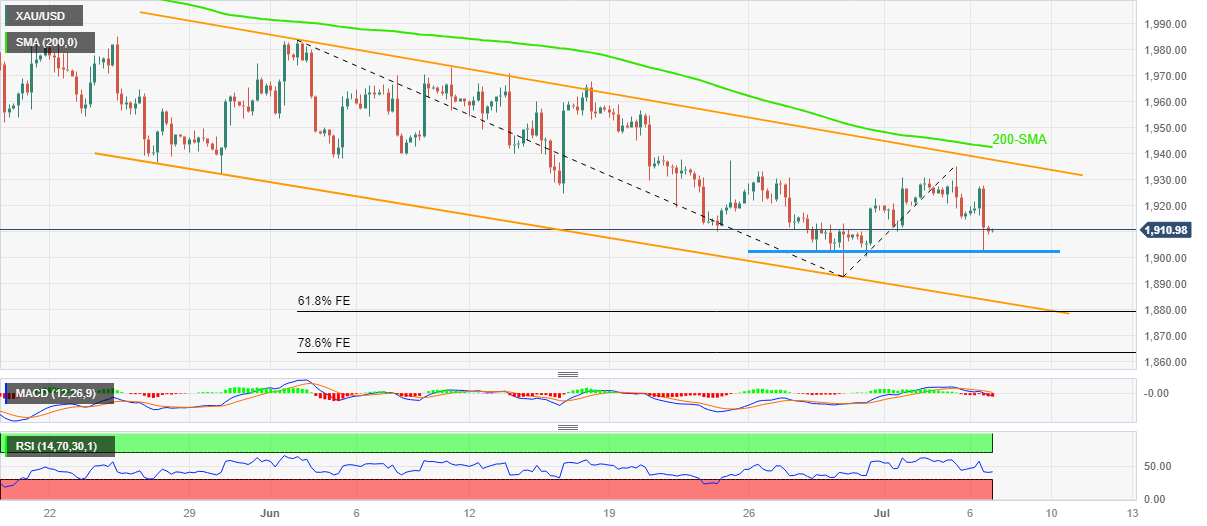
Trend: Bearish
- AUD/JPY experiences a plunge due to rising risk aversion; global business indicators hint at a potential slowdown.
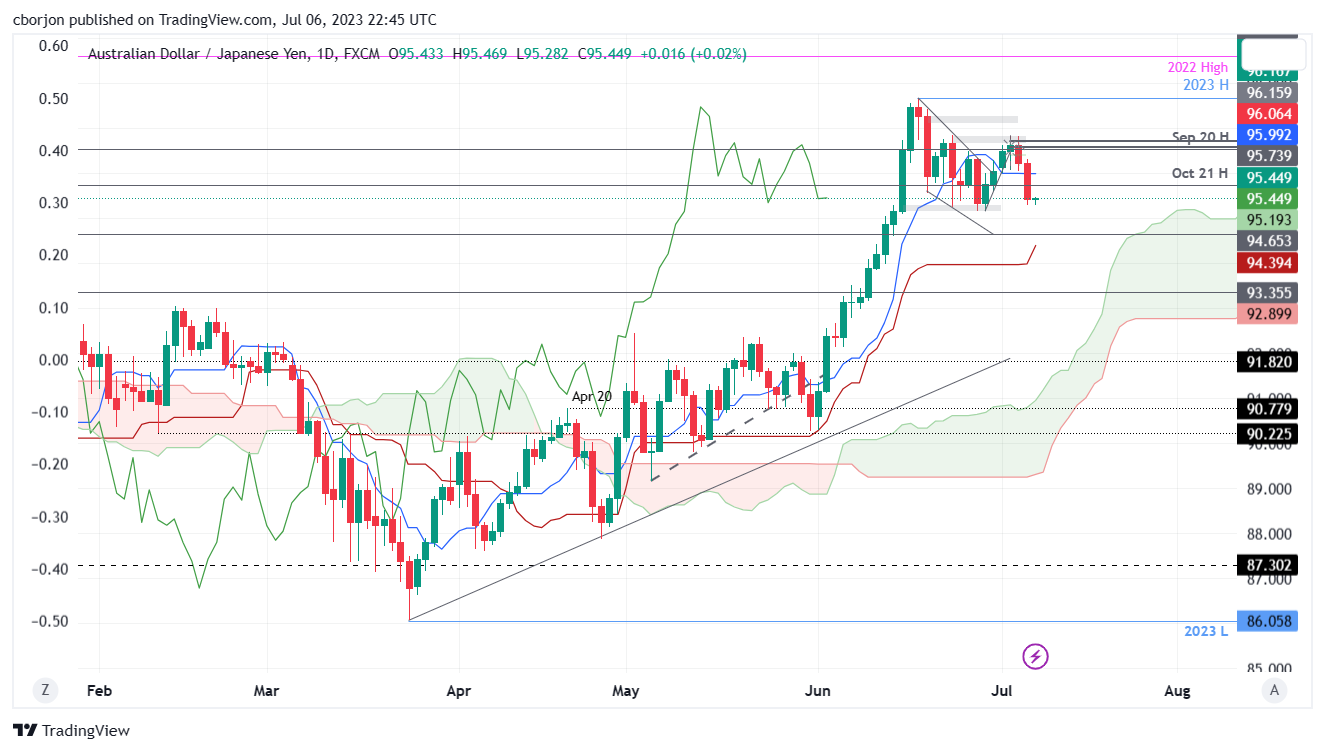
- Despite an upward medium-term bias, the pair could extend its pullback towards the Senkou Span A level at 95.19.
- Key resistance levels are at the Tenkan-Sen line at 95.99 and the year-to-date high at 97.67.
AUD/JPY plunges due to risk aversion, as solid data from the United States (US) increased the odds for further tightening by the US Federal Reserve (Fed). That, alongside worldwide business activity indicators showing signs of slowing down, ignited recession risks. The AUD/JPY is trading at 95.44, down 0.83%.
AUD/JPY Price Analysis: Technical outlook
The AUD/JPY remains upward biased from a medium-term perspective, though the ongoing pullback could extend toward the Senkou Span A at 95.19. If AUD/JPY slides below that level, the cross-currency pair would test the 95.00 psychological level. A breach of the latter will expose the Kijun-Sen line at 94.39, followed by the 94.00 figure.
If AUD/JPY aims toward 95.00 and bounces off that level, the first resistance would be the Tenkan-Sen line at 95.99. If that level is surpassed, the AUD/JPY first resistance would be 97.00. Once broken, the next ceiling level would be the year-to-date (YTD) high at 97.67.
AUD/JPY Price Action – Daily chart
Bank of Japan (BOJ) Deputy Governor Shinichi Uchida crossed wires via Japan’s Nikkei news, reported Reuters, as he ruled out an early end to the ultra-easy monetary policy while also defending the Yield Curve Control (YCC) policy.
BoJ’s Uchida cites current economic conditions while turning down talks of exiting negative rate policy.
“BOJ ‘strongly acknowledges’ the side-effects of YCC such as the impact on market function,” said Uchida per Nikkei reported Reuters.
It should be noted, however, that the policymaker also signaled the need for the bank to react to the signs of change in corporate wage and price-setting behavior.
BoJ’s Uchida was quoted saying that the risk of missing the opportunity to achieve our 2% target with a premature policy shift is bigger than that of being too late in tightening policy and allowing inflation to continue running above 2%.
USD/JPY implications
While the BoJ official tried to defend the Japanese central bank’s easy-money policy, the recent US data backs the odds of witnessing higher rates from the Federal Reserve (Fed). That said, market players expect the Fed to increase interest rates in its next policy meeting on July 26. The probability of a 25-basis-points rate hike is at 91.8%, according to data from the CME Group FedWatch tool, up slightly from 90.5% a day earlier.
Also read: USD/JPY Price Analysis: Pullback from YTD highs, intervention threats weight on the USD
- AUD/USD licks its wounds at weekly low, after two-day losing streak.
- US Dollar trades mixed but rose versus Antipodeans amid China-inspired risk aversion, mostly upbeat US data and hawkish Fed bets.
- Strong Australia trade numbers failed to impress bulls for long, despite upbeat start.
- Absence of major data at home may allow AUD/USD to pare recent losses ahead of key US employment report.
AUD/USD struggles to defend the corrective bounce off the weekly low around 0.6625 amid the early hours of Friday morning in Asia. That said, the Aussie pair dropped in the last two consecutive days while refreshing the weekly low on Thursday. In doing so, the risk-barometer pair aptly justifies the market’s sour sentiment while also taking clues from upbeat US data and hawkish Fed bets as the top-tier US jobs report looms.
The market’s risk aversion escalates as mostly upbeat US jobs data underpin hawkish Fed bets while China-linked headlines aren’t impressive. Additionally, the US-China tension and this week’s Reserve Bank of Australia (RBA) meeting are extra burdens on the AUD/USD, which in turn stopped the quote from cheering upbeat Aussie data at home.
While portraying the mood, Wall Street benchmarks dropped while the US Treasury bond yields refreshed a multi-day high.
It’s worth noting that China witnesses a heavy outflow of funds amid fresh fears emanating from the housing giants, including government-backed organizations. Adding strength to the downbeat mood could be the recently softer activity data from Beijing and the US-China trade war, not to forget the cautious mood as US Treasury Secretary Janet Yellen is in the dragon nation.
On the other hand, the RBA paused its two-time rate hike trajectory but showed readiness for further rate increases. On Thursday, Australia’s trade surplus rises to 11,791M MoM for May, compared with the expectations of 10,500M and 11,158M prior. Further, Exports grow 4.0% on a monthly basis while reversing the previous contraction of 5.0%. On the same line, imports rises 2% MoM and seasonally adjusted vs. 2.0% booked in April.
Elsewhere, US ADP Employment Change marked the largest one-month increase since February 2022, to 497K for June versus 228K expected and 267K prior (revised). That said, the ISM Services PMI also improved to 53.9 for the said month from 50.3 in May, versus the market expectation of 51.0. Further, the Challenges Job Cuts also slumps to 40.709K from 80.089K previous readings. However, the JOLTS Job Openings drops to 9.8M from 10.103M, compared to analysts’ estimation of 9.93M. It should be noted that the Initial Jobless Claims also rises to 248K for the week ended on June 30, versus 245K expected and 236K previous readings (revised).
Moving on, markets are likely to witness consolidation and can allow the AUD/USD pair to extend the latest rebound from the weekly low ahead of the top-tier US employment data for June. Among them, the headline Nonfarm Payrolls (NFP), expected to ease to 225K from 339K, will gain major attention considering the previous day’s upbeat signals from ADP Employment Change. Should the jobs report arrive as positive, the AUD/USD can have a further downside to witness.
Technical analysis
A daily closing below a five-week-old rising support line, now immediate resistance near 0.6635, keeps AUD/USD bears hopeful. However, the previous weekly bottom prods intraday sellers around 0.6595.
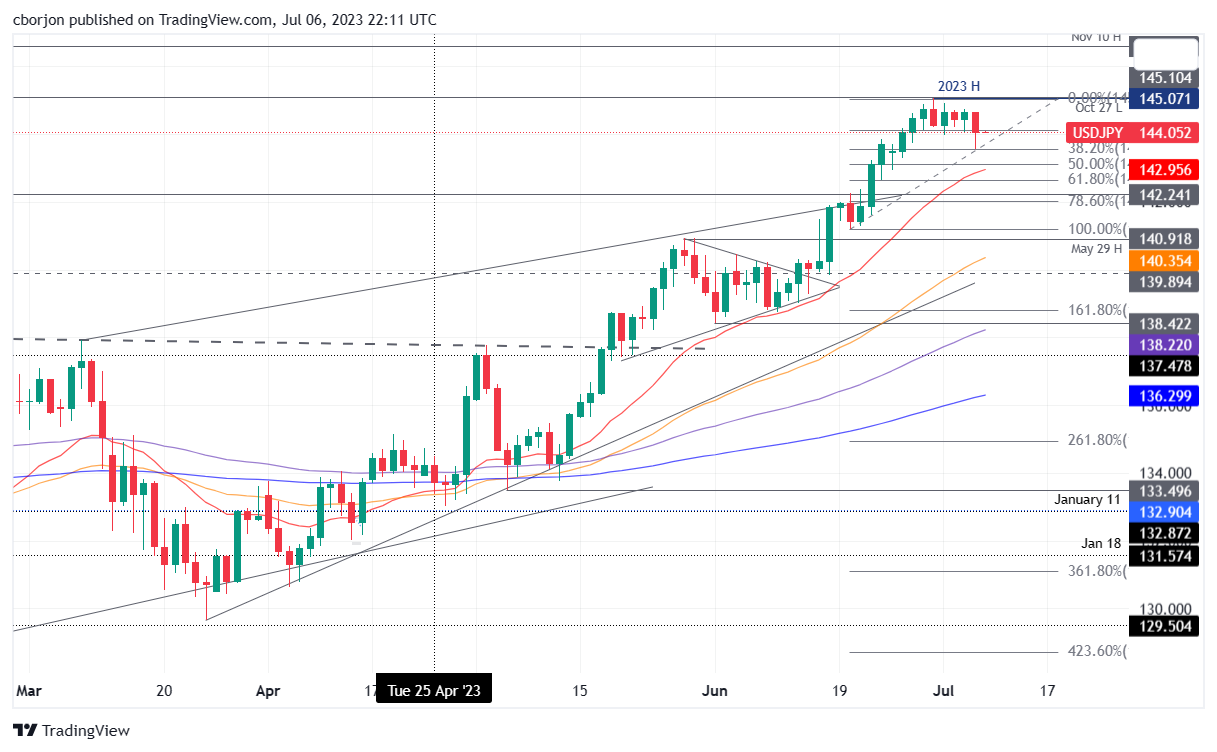
- USD/JPY trades lower, retreating from its year-to-date (YTD) high amid signals of potential intervention by Japanese authorities.
- Despite the upward bias, USD/JPY may extend its losses below the 144.00 mark, potentially reaching the 20-day Exponential Moving Average (EMA) at 142.95.
- Resistance levels lie at the YTD high of 145.07 and the May 10 high of 146.59.
USD/JPY retreats from the year-to-date (YTD) high of 145.07, extending its losses below the 144.10 area, as the US Dollar (USD) weakens despite US Treasury bond yields, particularly the 10-year benchmark note rate edged above the 4.00% threshold. At the time of writing, the USD/JPY exchanges hand at 144.06, down 0.40%.
USD/JPY Price Analysis: Technical outlook
USD/JPY price action suggests the pair is headed for a deeper pullback after Japanese authorities threatened to intervene in the Forex market. The USD/JPY remains upward biased, but the pullback could extend past the 144.00 mark toward the 20-day Exponential Moving Average (EMA) at 142.95.
Of note, the USD/JPY achieved a daily close below the July 3 daily open of 144.08. That could exacerbate a drop below 144.00, exposing the 143.50 psychological level, followed by the 20-day EMA at 142.95. Downside risks will emerge at the June 21 daily high of 142.37, followed by the 142.00 mark.
On the upside, immediate resistance lies at the year-to-date (YTD) high of 145.07, followed by the May 10 high at 146.59.
USD/JPY Price Action – Daily chart
- EUR/USD bulls are building positons ahead of key NFP.
- A blow off to the downside could be in order sooner than later.
EUR/USD has been carving out the upside on Thursday and this could be teeing up a set-up for Friday as volumes start to get trapped up high within the week's range. More on that below. Meanwhile, the US Dollar eased after a brief rebound on Thursday as data showed the US labour market remains strong. This comes ahead of Friday's Nonfarm Payrolls data on Friday.
Forex is being driven by the sentiment in the futures markets that have raised the probability of the Fed hiking interest rates by 25 basis points to 92.4% when policymakers conclude a two-day meeting on July 26, the CME Group's FedWatch Tool showed on Thursday.
Meanwhile, going to the charts, we can see that the bulls are in the market:
EUR/USD H4 chart
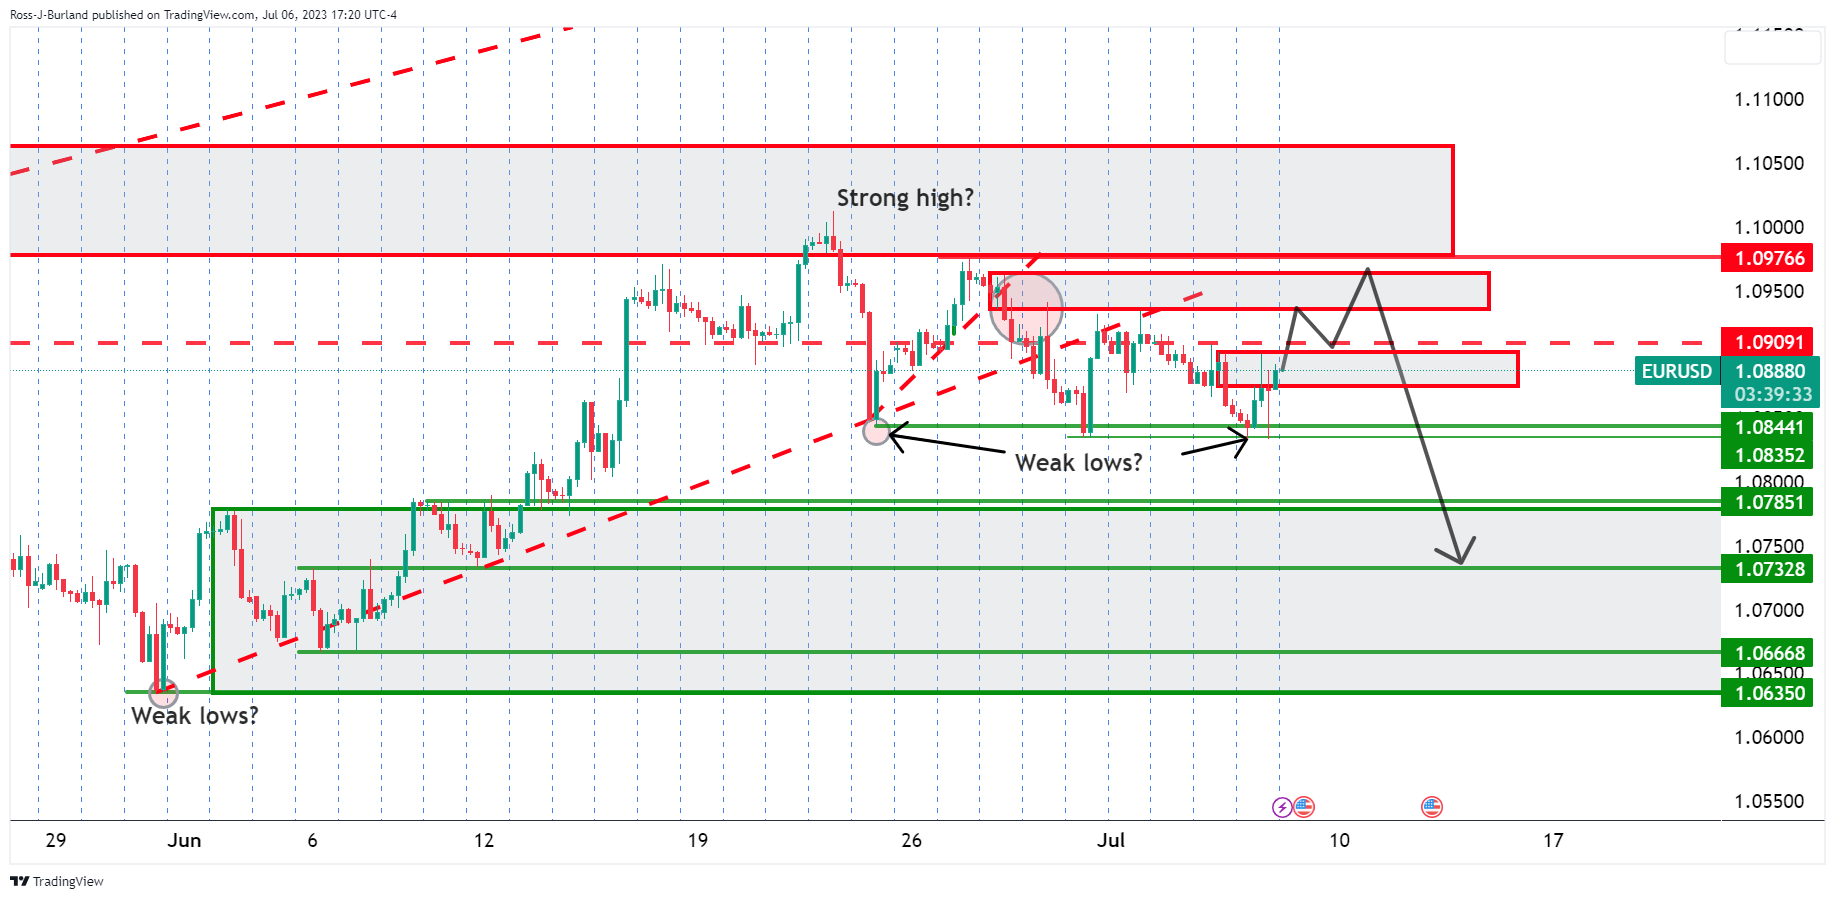
We have seen the price rally from an area that could turn out to be weak lows. We have started to build up a long market from here and that leaves the length vulnerable to a squeeze for the days ahead.
EUR/USD H1 charts
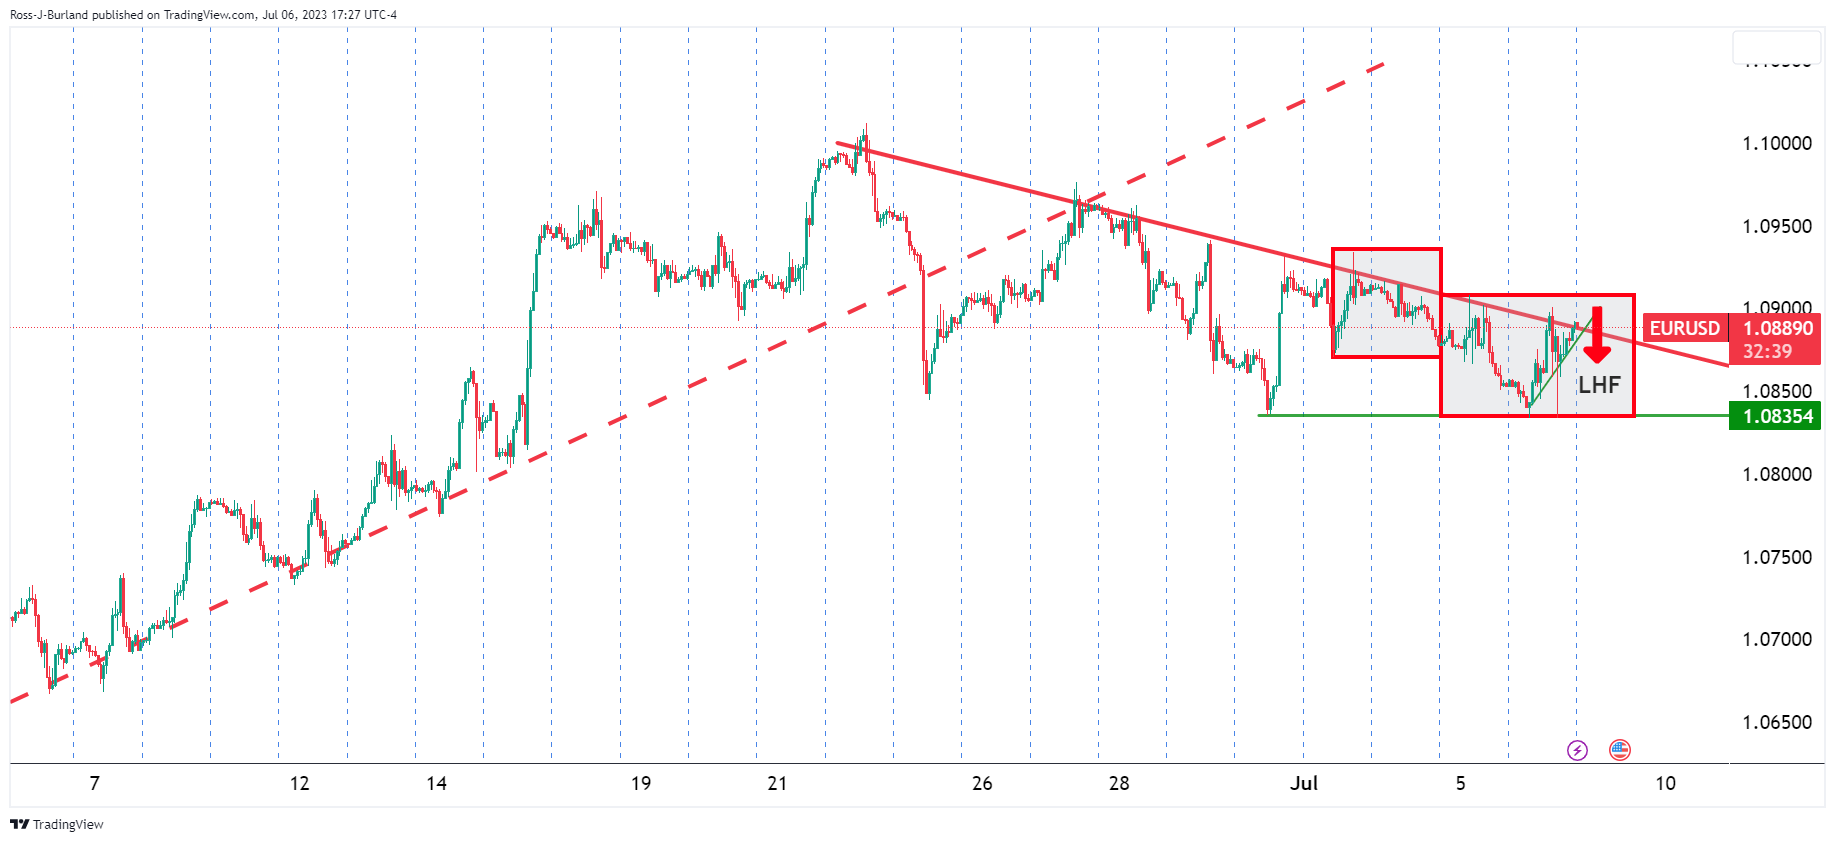
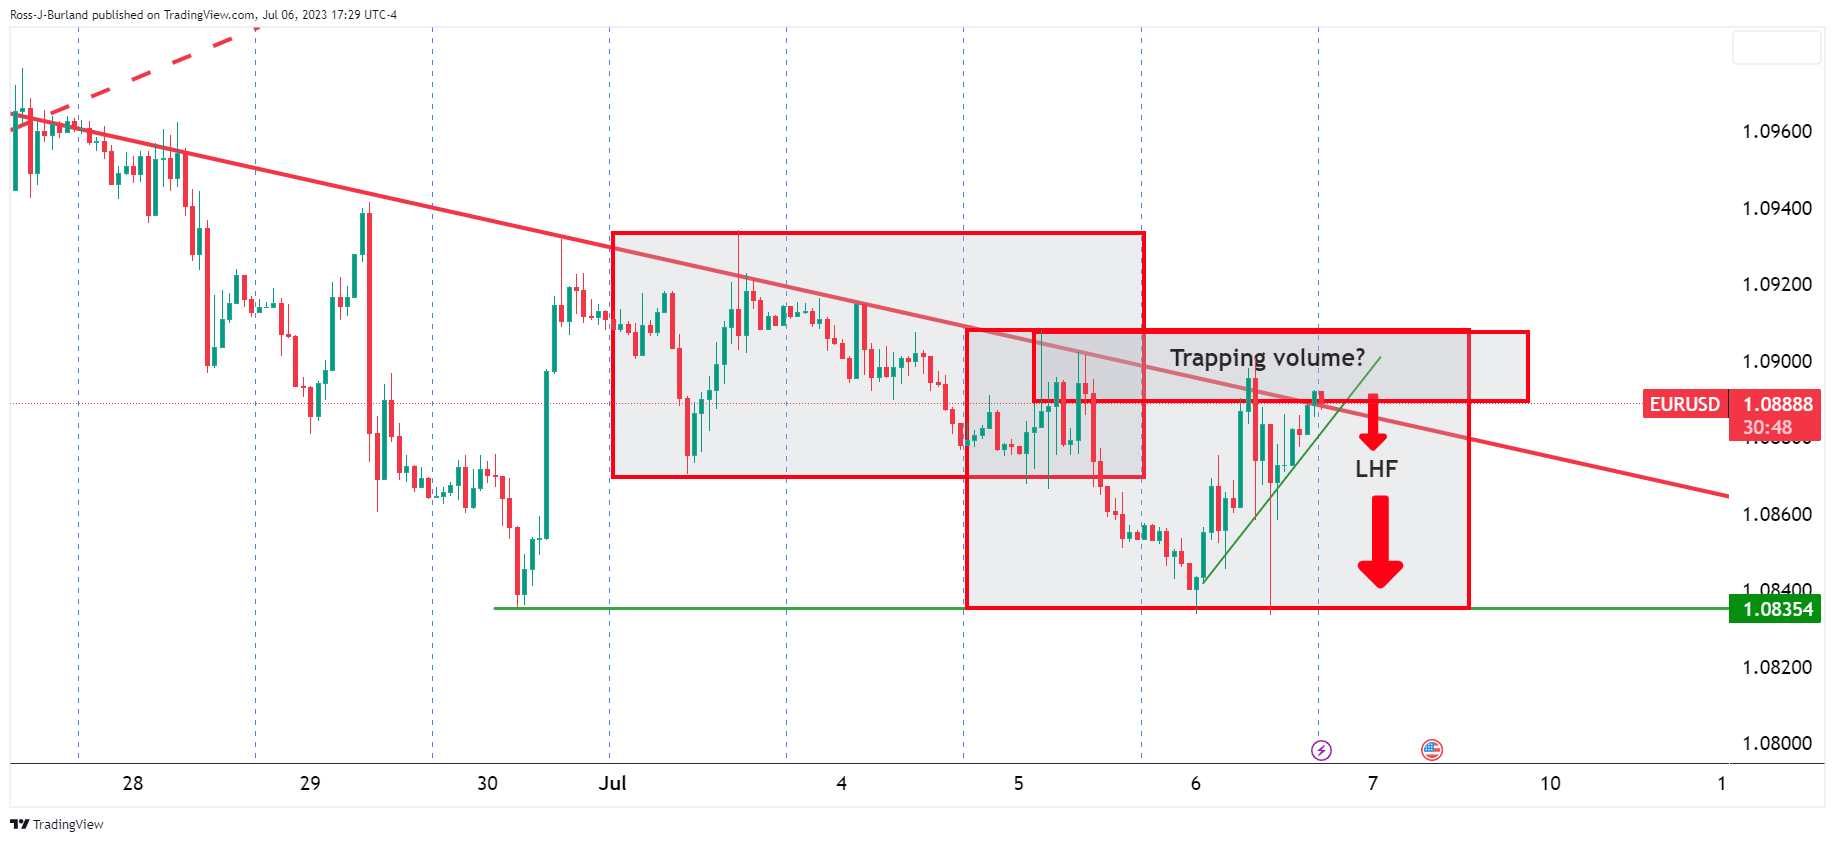
However, zooming in on the hourly chart, should 1.0900 territories hold up, after a move into trendline liquidity, then we could be facing a break to the downside for the day ahead based on the weekly template.
The first three days of the week that reset as a new three-day cycle on Wednesday saw a blow-off from below-trapped volumes up high and we could be seeing the same phenomenon play out for Friday as illustrated above. A drop below the higher volumes and trendline support will target low-hanging fruit, LHF, below.
- USD/CAD rose more than 0.60% on Thursday towards the 1.3370 level.
- ADP and ISM Service data from the US fueled a rising in US bond yields.
- Eyes on Canadian and American employment data on Friday.
The USD/CAD gained momentum in Thursday’s session and jumped to its highest since mid-June to 1.3370. On the other hand, the DXY index still trades in the red but cleared some daily losses, trading at the 103.10 area.
According to the Employment Change report from Automatic Data Processing, Inc., the US economy added 497K new jobs in June, surpassing expectations of 228K and showing an increase from the previous month's figure of 278K and fueling hawkish bets in the Federal Reserve (Fed).
It's worth mentioning that at the European Central Bank (ECB) forum in late June, Chair Powell from the Fed warned that a tight labour market could justify additional hikes, so ADP figures support a more aggressive stance from the Fed. That being said, Nonfarm Payrolls (NFPs) figures, expected to increase by 225K (previous 339K), will be the highlight of Friday’s session, providing additional information to markets regarding the US labour market.
Canada will also release labour market data. The Net Employment change is expected to come in at 20k from its previous figure of -17.3K, while Average Hourly Earnings to expand by 0.3% MoM and the Unemployment rate to rise to 5.3% from its prior 5.2%.
USD/CAD Levels to watch
The daily chart suggests that the USD/CAD’s outlook has turned neutral to bullish for the short term. In that sense, technical indicators are gaining ground, with the Relative Strength Index pointing north and jumping to positive territory and the Moving Average Convergence Divergence (MACD) printing green bars. However, the pair still has some work to do as it trades below the 100- and 200-day Simple Moving Averages (SMAs).
Resistance Levels to watch: 1.3380, 1.3390, 1.3340.
Support Levels to watch: 1.3280, 1.3250 (20-day SMA), 1.3220.
USD/CAD Daily chart
-638242760754990947.png)
- The EUR/GBP pair shows signs of stabilization in the 0.8540s region after falling to a weekly low.
- Technical patterns suggest a possible double-bottom formation, hinting at a potential upside if confirmed by further price action.
- A break below year-to-date lows could push the EUR/GBP toward the 0.8500 mark, whereas surpassing 0.8555 could open doors for a rally to the 20-day EMA at 0.8584.
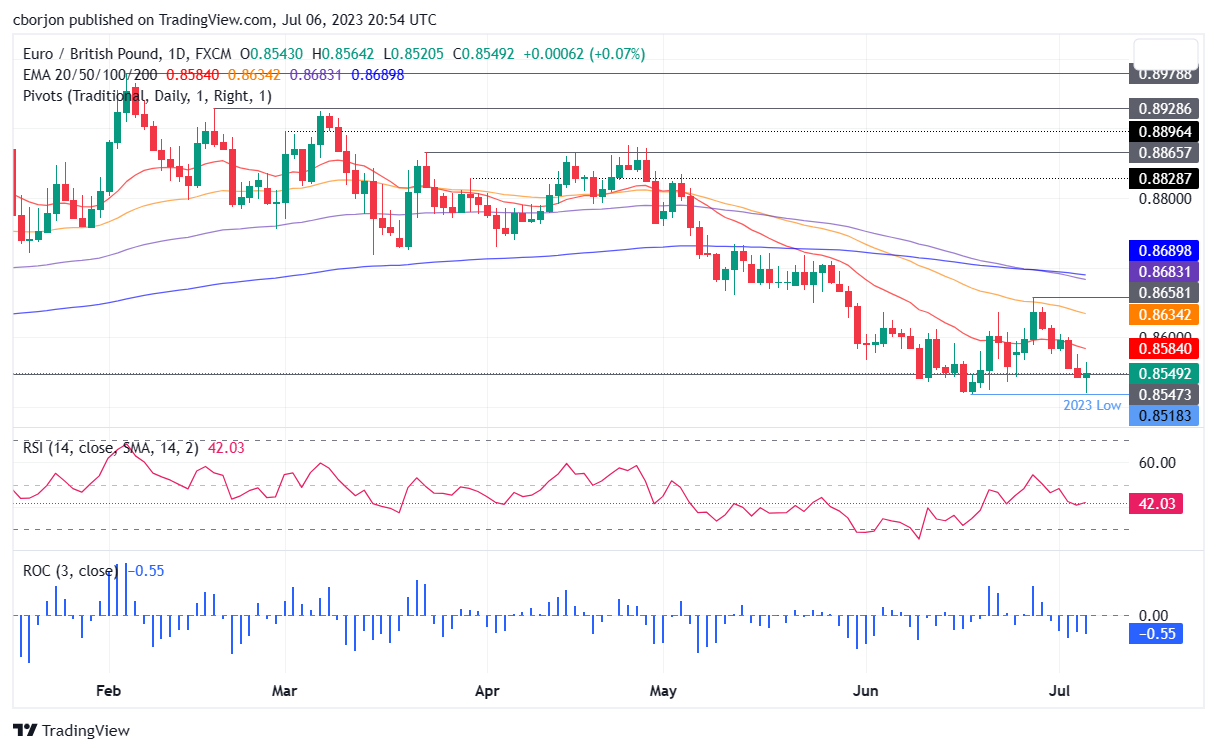
In a volatile trading session, EUR/GBP hovers around the 0.8540s area, which witnessed the cross pair falling to a weekly low of 0.8521 but later recovering toward 0.8560 before settling around current exchange rates. As of writing, the EUR/GBP exchanges hands at 0.8548, gains 0.06%.
EUR/GBP Price Analysis: Technical outlook
The EUR/GBP is neutral to downward bias, with the exchange rate below the daily Exponential Moving Averages (EMAs). After the EUR/GBP dropped below the 20-day Exponential Moving Average (EMA), it exacerbated a fall to test the year-to-date (YTD) low of 0.8520, but later, the EUR/GBP stabilized at around 0.8540s.
Of note, the EUR/GBP’s daily chart portrays a double bottom formation, but it would need a daily close above the July 5 open of 0.8555 to pave the way for further upside. Additionally, the price action of the last two days would form a bullish engulfing candle pattern.
In that outcome, the EUR/GBP first resistance would be the 20-day EMA at 0.8584. A breach of the latter will expose the 0.8600 figure, followed by the 50-day EMA at 0.8634, before testing the June 28 daily high of 0.8658.
Conversely, the EUR/GBP would extend its losses if it cracks to new year-to-date (YTD) lows, past the current 0.8518, exposing the 0.8500 figure for a test.
EUR/GBP Price Action – Daily chart
After some upbeat US economic reports on Thursday, Friday marks the release of the highly anticipated Nonfarm Payrolls report. During the Asian session, Japan is set to release data, including Household Spending, Bank Lending, and the Leading Index. Later in the day, Germany will release Industrial Production data. Canada will also report labor market data.
Here is what you need to know on Friday, July 7:
The US Dollar posted mixed results, weakening versus the Euro, the Pound, and the Yen, and rising sharply against commodity currencies. Upbeat US data boosted expectations of another interest rate hike from the Federal Reserve (Fed) and weighed on US stocks. The deterioration in market sentiment and lower commodity prices drove the AUD, CAD, and NZD to the downside.
The Dow Jones lost 1.07%, and the Nasdaq tumbled 0.82% on Friday. The decline was accelerated by upbeat US data, as market participants anticipate more monetary tightening ahead. Meanwhile, US Treasury Secretary Yellen is currently in China, and there is a new social platform called Threads by Meta.
The Automatic Data Processing (ADP) report showed an increase in private payrolls of 497K, surpassing the market consensus of 228K. Initial Jobless Claims rose to 248K, while Continuing Claims fell to 1.72 million, the lowest level since February. The ISM Services PMI rose from 50.3 to 53.9 in June, and the Employment Index improved to 54.4. On the negative front, JOLTS Job Openings dropped slightly below expectations in May, falling from 10.3 million to 9.8 million.
Analysts at Wells Fargo:
The service sector continues to benefit from robust demand; that is pushing many businesses to staff up in a way that has been lacking in recent months. Factoring in the jump in the employment component, we have lifted our June payrolls forecast to 260K from 245K.
Following the data, government bond yields rose in both Europe and the US. The 10-year Treasury bond yield climbed to 4.06%, matching the year-to-date high, while the 2-year yield hit the highest intraday level since 2007 at 5.11%.
On Friday, the US official employment report is due. Market consensus expects the economy to have created 225K jobs in June; however, after the release of recent data, market participants are looking at the possibility of a positive surprise. The unemployment rate is expected to tick lower from 3.7% to 3.6%. Market participants will also be looking at income data. If the numbers confirm that the labor market remains tight, it could cement the likelihood of another interest rate hike from the Fed. However, equally important will be next week's US inflation data.
Data released on Thursday showed that German Factory Orders rebounded more than expected by 6.4%, while Eurozone (EZ) retail sales dropped by 2.3% in May. German data is due on Friday with the release of May Industrial Production figures. European Central Bank's De Guindos is scheduled to speak during the European session. The EUR/USD pair tested the 1.0830 region twice and rebounded towards 1.0900. The Euro benefited from higher EZ yields.
The GBP/USD pair posted its highest daily close in a week near 1.2750, despite negative US data and risk aversion. However, the EUR/GBP pair rebounded from weekly lows to 0.8550.
The Yen held up well and outperformed on Thursday, despite rising government bond yields. The currency was supported by the decline in equity markets. USD/JPY dropped but finished far from the lows, consolidating slightly above 144.00. It was the worst day for the pair in a month. Japan is set to release Household Spending, Bank Lending, and the Leading Economic Index on Friday.
The AUD/USD pair dropped for the second day in a row but found support at the 0.6600 area. The NZD/USD pair pulled back from weekly highs and was rejected again from above 0.6200.
The Loonie lagged on Thursday, with USD/CAD rising for the second day in a row and accumulating a 150-pip gain as it approached 1.3400. Canadian trade data surprised with the largest swing on record, from a CAD 0.89 billion surplus in April to a deficit of 4.3 billion in May, against expectations of a 1.5 billion surplus. The Canadian Employment Report is due on Friday. A positive net change in employment of 20K in June is expected, and the unemployment rate is expected to rise slightly from 5.2% to 5.3%.
Analysts at TD Securities:
We look for the labour market to bounce back with 25k jobs added in June after the 17k decline the prior month. Services should drive hiring, while a pullback in manufacturing employment weighs on the goods sector. Our forecast would leave the unemployment rate stable at 5.2%, although wages are set to decelerate sharply as base effects offset another large (0.4%) m/m increase.
The USD/MXN surged on Thursday, having its best day in months. It climbed from the lowest level in years under 17.00 to 17.38.
Metals dropped on the back of higher yields. Gold lost $10 but held above $1,900, while Silver lost 1.75%, falling to as low as $22.50, erasing weekly gains. Cryptocurrencies weakened after the release of negative US data. Bitcoin fell 0.65% to $30,260, and Ethereum dropped to $1,880.
Like this article? Help us with some feedback by answering this survey:
- EUR/JPY tallies a third consecutive day of losses as the pair continues to correct overbought conditions.
- Retail Sales from the EZ remained unchanged in May.
- Rising German and American yields to limit the JPY’s advance.
On Thursday, the EUR/JPY trades with losses and fell to it lowest point in seven days of 155.84 and then stabilised at 156.90, still holding daily losses. In that sense, the Euro lost traction after weak Retail Sales data, but rising German yields limit the European currency downside potential. In addition, hot labour market from the US fueled a rise in American yields and provide further challenges for the Yen to advance.
Retail Sales from the Eurozone remained unchanged in May while the markets expected a 0.2% increase, and the yearly measure now shows a 2.9% contraction. However, the 2,5 and 10-year German yields are advancing today, showing more than 1.5% increases and providing further support to the Euro. In addition, Factory Orders from Germany came in strong as they increased 6.4% in May vs the 1.5% expected by the markets and may also limit the Euro’s losses in the session.
Across the pond, the US reported hot labour market data. The Employment Change released by Automatic Data Processing, Inc showed that generally speaking, the US economy added 497K newly employed people in June, exceeding by far the expectations of 228K and accelerating from its previous figure of 278K. As a reaction, the 2-year American bond yield rose to its highest level since 2007 to 5.08% as these figures support a more aggressive Federal Reserve and provide another challenge for the Yen. Focus now shifts to Friday’s Nonfarm Payrolls (NFP) , expected to drop 225K from the previous 339K.
EUR/JPY Levels to watch
As expected, the EUR/JPY seems to have entered in a period of consolidation after more than two weeks showing overbought conditions. In that sense, the Relative Strength Index (RSI) points south and retreated from the overbought threshold while the Moving Average Convergence Divergence (MACD) printed a red bar suggesting that bears are gaining strength. However, looking at the bigger picture, the cross still holds a positive outlook as it trades above its main Simple Moving Averages of 20,100 and 200 days.
Support Levels: 155.85, 155.25 (20-day SMA), 154.00.
Resistance Levels: 157.00, 157.50,158.00.
-638242718440664572.png)
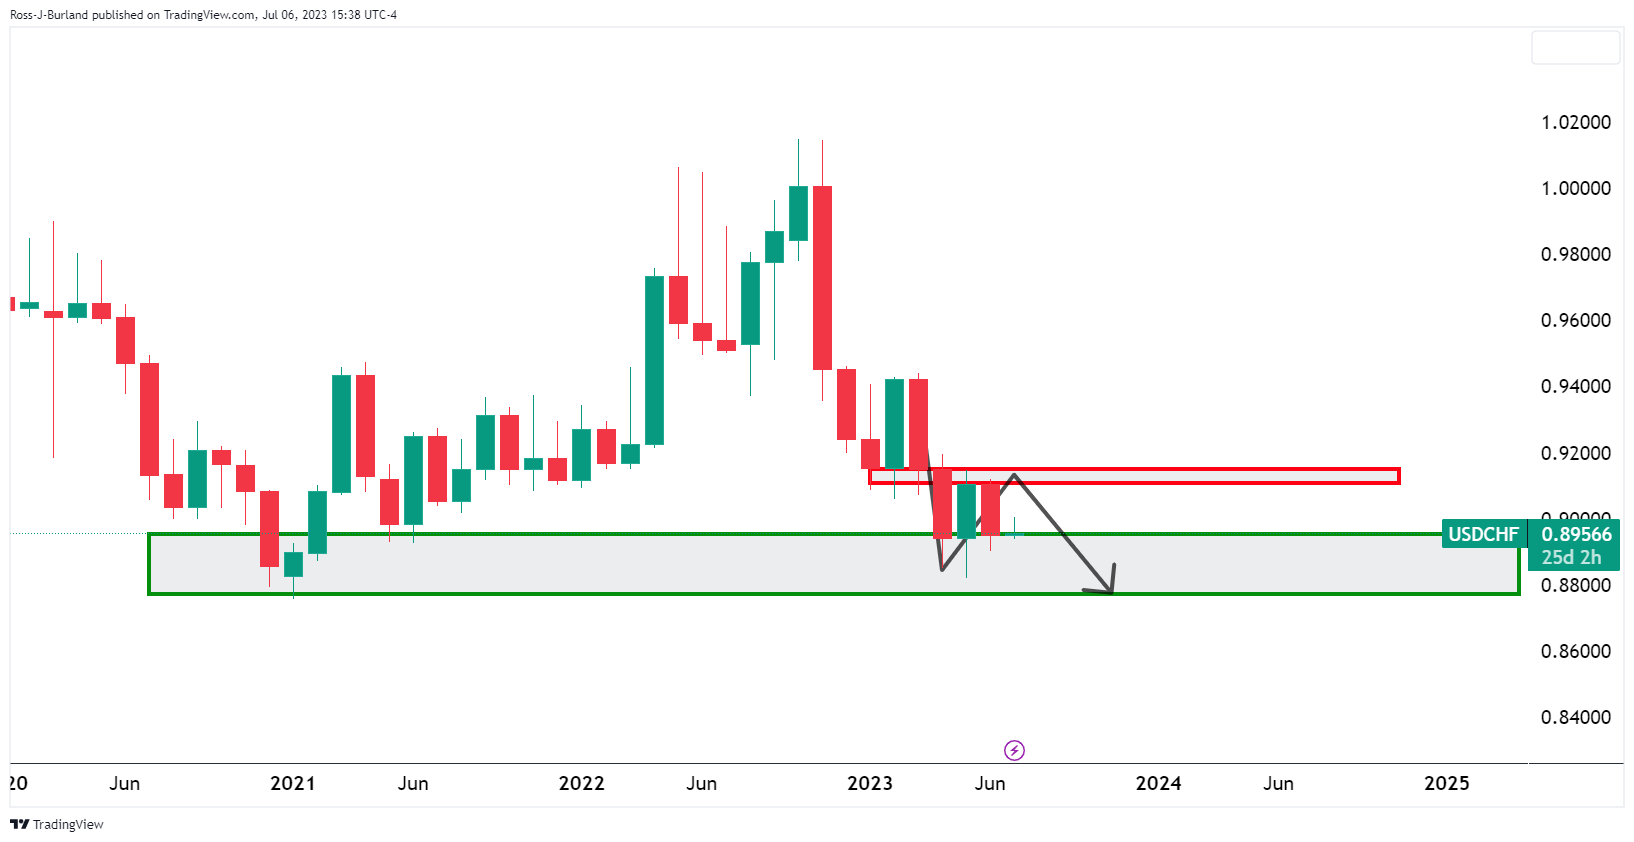
- USD/CHF bears need to get below trendline support on the daily chart.
- USD/CHF's dynamic resistance is holding, so far.
Despite the slowing price growth in the Swiss economy that has limited the possibility of further rate hikes by the Swiss National Bank, USD/CHF is offered on the day and has fallen from a high of 0.8997 to a low of 0.8950. Markets are jittery ahead of Friday's Nonfarm Payrolls event and we have seen swings from top to bottom in the US Dollar on Thursday. This leaves a clouded technical outlook for the pair as the following will illustrate:
USD/CHF monthly chart
From a longer-term viewpoint, USD/CHF is wedged between support and resistance leaning with a downside bias.
USD/CHF weekly charts


There is a case of both bullish and bearish on the weekly chart as illustrated above.
USD/CHF daily chart

The daily chart's outlook is mildly bearish as the correction is long in the tooth which indicates the bears are reluctant but at least holding the price below dynamic resistance. A break of trendline support opens the risk of a downside continuation.
- Gold suffers a 0.20% loss as robust US job figures and mounting rate hike prospects drive US Treasury yields higher.
- Hawkish comments from Dallas Fed President Lorie Logan and a strong ADP report underpin expectations of a July rate hike.
- Traders anticipate further clues from the upcoming US Nonfarm Payrolls report, which could impact Gold’s trajectory.
Gold price slides for two consecutive days after a busy economic calendar in the United States (US) emphasized the resilience of the economy, which justifies the Federal Reserve (Fed) 25 bps rate hike at the upcoming July meeting. On Thursday, the XAU/USD, after reaching a daily high of $1927.55, prints losses of 0.20% and exchanges hands at $1910.70.
Gold continues downward slide: US economic resilience and imminent Fed tightening dampen bullish appeal
The yellow metal is under pressure as the latest US ADP National Employment report surprised market participants, as private hiring witnessed the creation of 497,000 jobs in the US economy, surpassing the 228,000 foreseen by analysts. The report came before the US Department of Labor announced that unemployment claims (Initial Jobless Claims) for the week ending July 1 climbed to 248K, exceeding 245K estimates, but the ADP report overshadowed the data.
After the data, XAU/USD’s dropped from around $1928 to $1902, as US Treasury bond yields skyrocketed. The US 10-year Treasury note rises 4.045%, gaining 10 basis points. The US real yields soared to a new yearly high of 1.821%, though, as of writing, it sits at 1.781%, a headwind for the non-yielding metal.
Gold traders will get more clues about the yellow metal’s direction on Friday, as the US Bureau of Labor Statistics (BLS) will reveal the US Nonfarm Payrolls report. Analysts estimate the US economy addd 225K jobs to the economy, and the Unemployment rate is estimated to dip to 3.6%,
The Federal Reserve (Fed) meeting minutes showed that most officials wanted to raise rates but agreed to wait as they assessed the impact of cumulative tightening. Additionally, “almost all” FOMC members agreed that further tightening will be needed this year, suggesting July’s rate hike is almost inevitable.
Regarding that theme, the Dallas Fed President Lorie Logan at a Columbia University event in New York, stated she favored June’s hike, adding “two-thirds of FOMC participants projected at least two more rate increases this year.”
XAU/USD Price Analysis: Technical outlook
The XAU/USD daily chart depicts Gold as neutral to downward biased, with the 20, 50, and 100-day Exponential Moving Average (EMAs) remaining above the current spot price. For a bearish resumption, XAU/USD must drop below the 200-day EMA at $1896.93, and once done, the XAU/USD next support would be the March 6 daily high at $1879.45, followed by the March 8 swing low at $1809.48.
If XAU/USD remains above $1900, the first resistance would be the 20-day EMA at $1928.88. Once cleared, the next supply zone would be the 50-day EMA at $1945.75.
- After jumping to a high of 0.6218, the NZD/USD retreated to 0.6155 as bulls struggle to gain momentum.
- ADP and ISM Services PMI came in above expectations.
- Hawkish bets on the Federal Reserve made the 2-year yield jump to their highest level since 2007.
The NZD/USD pared daily gains and fell towards the 0.6155 area as expectations of further tightening by the Federal Reserve (Fed) underpined the USD. In that sense, the hot ADP figures and strong Service sector data from the US favored a more aggressive stance by the Fed.
The latest Employment Change report from Automatic Data Processing, Inc. revealed that the US economy added 497K new jobs in June, surpassing expectations of 228K and showing an increase from the previous month's figure of 278K. In addition, the Institute Supply Management (ISM) reported that its Service PMI came in at 53.9 vs the 51 expected and accelerated from its previous figure of 50.3.
The release of the data caused a significant surge in US Treasury yields. The 2-year bond yield reached its highest level since 2007, rising to 5.08%. Likewise, the 5-year and 10-year rates increased to 4.40% and 4.03%, respectively, showing gains of over 2.50%. This spike in yields contributed to a recovery of the US Dollar, as reflected in the DXY Index. After hitting a daily low of 102.87, which aligned with its 20-day Simple Moving Average (SMA), the index rebounded to 103.25, although it remains in negative territory.
On Friday, investors will eye the release of the Nonfarm Payrolls (NFP) report for June in the US anticipated to show a decline to 225K from the previous figure of 339K.
On New Zealand’s side, the gloomy economic outlook means the Kiwi is losing interest. United Overseas Bank (UOB) said the economy has entered a technical recession as the Gross Domestic Product (GDP) contracted by 0.1% QoQ in the first quarter of 2023, significantly lower than the Reserve Bank of New Zealand (RBNZ) expectations. Its worth noting that in Q4 of 2022, a 0.7% contraction was recorded, so consecutive GDP contractions is considered an indication of a technical recession.
NZD/USD Levels to watch
The technical outlook for the NZD/USD, according to the daily price chart, is neutral with a slightly bearish tone, with technical indicators somewhat flat in negative territory. The 20, 100 and 200-day SMA converge towards the 0.6200 area still suggesting that the pair is waiting for a fundamental catalyst to define the short-term trajectory.
Support Levels to watch: 0.61350, 0.6100,0.6090.
Resistance Levels to watch: 0.6160 (20-day SMA), 0.6170 (200-day SMA), 0.6190 (100-day SMA).
NZD/USD Daily chart
-638242684795574835.png)
- GBP/USD bulls are riding dynamic trendline support.
- The market is now trading at the middle of the range ahead of NFP on Friday.
GBP/USD has shown signs of a classic pre-Nonfarm Payroills clear out as the pair sweeps liquidity on both sides of the bulk of this week's range. GBP/USD rallied in Asia from the lows and reached as high as 1.2781 before collapsing to the day's lows in late US morning trade of 1.2673, taking out Tuesday's inside day's lows.
GBP/USD H4 chart

GBP/USD is pretty much at the equilibrium of the range for this week ahead of Nonfarm Payrolls while riding the trendline support and leaning against the prior bearish trendline that is now acting as counter-trendline support.
The low for the week is at 1.2658 and is a keen area of interest as this guards space to a test below 1.2600 as a target area on the downside. On the upside, a break of 1.2781 opens the risk of a run to test the 1.2850s upside target area.
- Silver slides 1.82% as soaring US Treasury bond yields and heightened odds of a Fed rate hike in July weigh heavy.
- Silver’s drop below the 200-day EMA may trigger further losses unless the $22.53 swing low offers a reprieve.
- A possible rebound could see Silver testing the $23.00 mark and, if breached, a recovery to the 20-day EMA at $23.06.
Silver price dropped below the $23.00 mark as US Treasury bond yield soared after the latest Fed’s minutes and a tranche of US economic data increased the odds for Fed’s July rate hike. At the time of writing, the XAG/USD is trading at $22.69, down 1.82%.
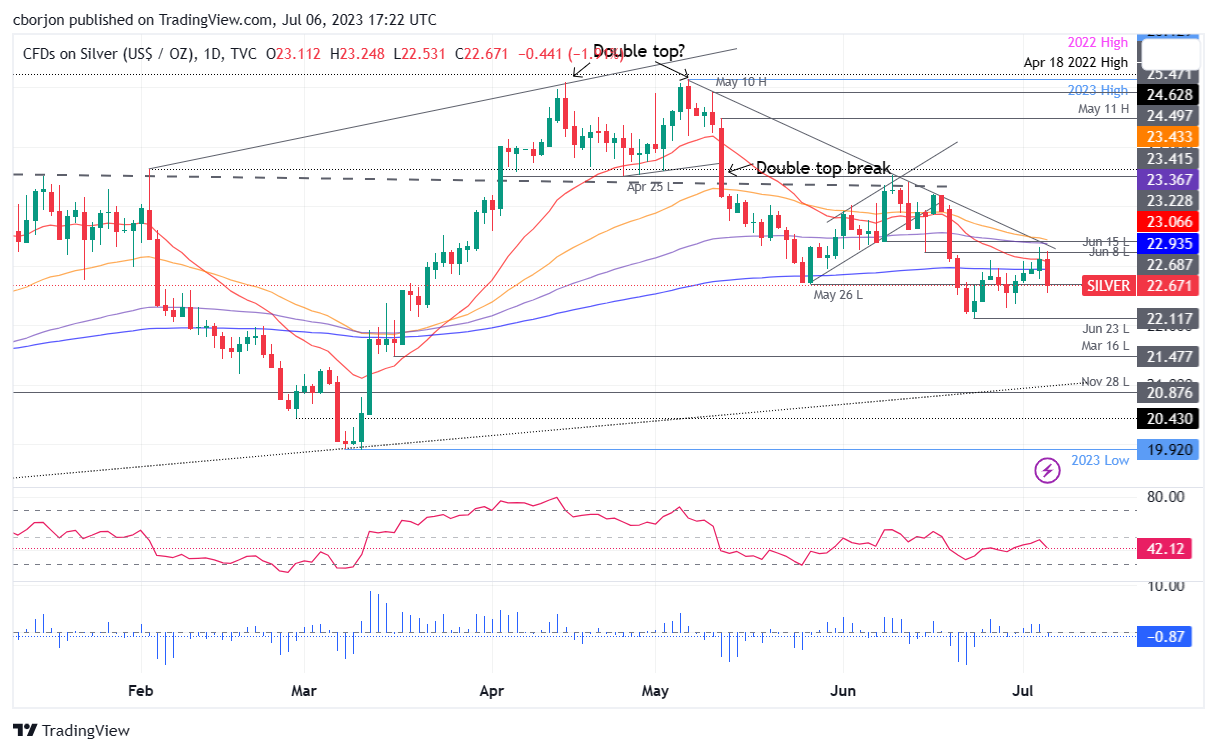
XAG/USD Price Analysis: Technical outlook
XAG/USD turned bearish during Thursday’s session. Silver’s price dropping below the 200-day Exponential Moving Average (EMA) at $22.93 opened the door for further losses, though so far failed to crack the May 26 swing low of $22.53.
If XAG/USD stays above the latter, the white metal could consolidate at around the $22.50-$22.90 range. Otherwise, Silver’s sliding below the bottom of the range will expose the June 22 swing low of $22.11 before testing $22.00. Once cleared, the XAG/USD next support will be the March 16 swing low of $21.47.
Conversely, if XAG/USD stages a comeback and reclaims the 200-day EMA, the XAG/USD’s next resistance will be the $23.00 psychological level. A breach of the latter will increase the odds for a recovery to the 20-day EMA at $23.06.
XAG/USD Price Action – Daily chart
- GBP/JPY fell towards the 182.50 level and then stabilised above 183.00.
- Rising British and American yields limit the Yen’s advance.
- Eyes on Labor Cash Earnings data from Japan and NFP data from the US.
On Thursday, the GBP/JPY trades with losses after three consecutive gains as the cross retreats from overbought conditions. After falling towards 182.50, the pair jumped back towards 183.30, but further downside shouldn’t be ruled out.
That being said, the rising British due to UK Debt Management Office selling bond yielding 5.668% will limit the GBP’s losses. The 2-year gilt stands rose to 5.55%, its highest level since 2007, while the 5 and 10-year yields stand at 4.95% and 4.70%, respectively, more than 3% increases.
Moreover, ADP’s hot employment figures from the US fueled an increase of US Treasury yields which also limited the JPY advance.
On Friday, at the early Asian session, investors will eye Labor Cash Earnings data from Japan from May, expected to decelerate to 0.7% YoY from the previous 1%. In addition, the focus will be Non-Farm Payrolls (NFP) from June from the US, which are expected to slip to 225K from the previous 339K. In that sense, the outcome of the NFP figures may fuel volatility in the US bond market and hence affect the JPY and GBP’s price dynamics.
GBP/JPY Levels to watch
According to the daily chart, the cross is still poised for further downside. Technical indicators, specifically the Relative Strength Index (RSI) and Moving Average Convergence Divergence (MACD), show weakness, indicating that the bears are starting to take the lead.
On the downside, support levels for the cross line up at the daily low of 182.50, followed by the 182.00 zone and the 181.50 area. On the flip side, resistances to monitor line up at 183.50 and the cycle high at 184.00.
-638242594328593546.png)
May's trade data from Canada may surprise with a large unexpected trade deficit and weigh on the Loonie. Analysts at CIBC point out that the numbers suggest that net trade won't be a big positive contributor to Q2 GDP, as had seemed likely prior to the release.
Key quotes:
“The $3.44bn deficit was the largest since October 2020 and followed a downwardly revised $0.9bn surplus in the prior month.”
“The large swing relative to the prior month reflected both a decline in exports (-3.8%) and a rise in imports (+3.0%).”
“Today's large swing in the trade balance suggests that net trade won’t be the big positive contributor to GDP in Q2 that seemed likely prior to today's release. That doesn't necessarily guarantee that the flash estimate of 0.4% growth for monthly GDP in May is an overestimation, because inventory accumulation could be stronger than previously assumed, although today's data does heighten downside risks.”
- WTI drops more than 1% as a stronger US Dollar and Fed tightening speculations weigh on dollar-denominated commodities.
- Mixed signals from US labor market data and improved business activity intensify prospects of a June rate hike.
- Recession fears sparked by business activity measures in China and Europe threaten to dampen oil demand.
Western Texas Intermediate (WTI) slumps more than 1%, as speculations for further tightening by the US Federal Reserve (Fed) underpins the greenback, a headwind for dollar-denominated assets. At the time of writing, WTI is trading at $70.94 after hitting a daily high of $72.30.
WTI pressured: Fed speculations and global economic jitters dent oil’s upward trajectory
US data revealed on Thursday gave mixed signals about the labor market. US unemployment claims rose above estimates, while a drop in job vacancies, as revealed by the JOLTs report, flashed the labor market is cooling. Nonetheless, the ADP National Employment Report for June crushing estimates could refrain the Fed from pausing for a second straight meeting.
In the meantime, a measure of business activity in the US in the services sector improved. That keeps traders braced for a 25 bps rate hike in June, as the CME FedWatch Tool shows odds remaining above 90%.
Additionally, the latest Fed minutes showed that policymakers agreed to pause the ongoing tightening cycle, despite most officials wanting to raise rates in June.
Meanwhile, global measures of business activity in China and Europe sparked recessionary fears, which could dent oil demand.
The US Energy Information Administration (EIA) revealed that US crude stockpiles fell more than estimates last week. Inventories dropped by 1.5 million barrels in the last week, above forecasts of 1 million.
OPEC ministers and oil company executives told a two-day Vienna conference that governments needed to turn their attention from supply to demand.
WTI Technical Levels
- The AUD/USD retreated near the 0.6615 area posting more than 0.50% losses.
- The US added nearly 500K jobs in June, and the ISM Services PMI rose to 53.9.
- Rising US yields give the US traction.
At the time of writing the AUD/USD stands at the 0.6615 area, posting a 0.59% loss on the day. In that sense, the DXY index cleared losses as hawkish bets on the Federal Reserve (Fed) strengthened the USD via rising US yields.
The Employment Change released by Automatic Data Processing, Inc showed that generally speaking, the US economy added 497K newly employed people in June, exceeding by far the expectations of 228K and accelerating from its previous figure of 278K. On the other hand, Initial Jobless Claims for the week ending in June 30, increased as expected but came in slightly higher than the consensus at 248K vs the 245K expected. Other data showed that ISM Services PMI came in at 53.9 vs the 51 expected from its previous figure of 50.3.
As a reaction, US Treasury yields soared across the board following the data. The 2-year bond yield led the way, jumping to its highest level since 2007 at 5.08%. The 5 and 10-year rates also increased to 4.40% and 4.03%, respectively, showing more than 2.50% increases. Focus will now shift to Friday’s Non-Farm Payrolls (NFP), expected to drop 225K from the previous 339K. In that sense, the outcome could provide further volatility in the bond market and the AUD/USD price dynamics.
It's worth mentioning that FOMC (Federal Open Market Committee) minutes revealed that some members considered appropriate hiking as a tight labor market would contribute to high inflation. That being said, a 25 basis point (bps) hike in July is priced in, while the odds of an additional hike stand around 40%.
AUD/USD Levels to watch
According to the daily chart, the AUD/USD appears to be bearish in the short term. The Relative Strength Index (RSI) points south, and Moving Average Convergence Divergence (MACD) stands deep in negative territory, indicating that the bears are in command. In addition, traders should eye the 0.6700 area where the 20, 100 and 200-day Simple Moving Averages seem to be converging.
In case of more downside, support levels are seen at 0.6600, 0.6585 and 0.6550. On the flip side, the mentioned 0.6700 stands as the main resistance to recover for the bull with next targets at 0.6730 and 0.6750.
AUD/USD Daily chart
-638242564288525373.png)
- USD/MXN rebounds off year-to-date lows, climbing towards 17.20, fueled by positive US economic data.
- Private hiring data and upbeat consumer sentiment in the US signal economic resilience, hinting at a potential Fed rate hike.
- Comments from Dallas Fed President Lorie Logan further support the USD/MXN rally, as she voices favor for a June rate hike.
USD/MXN rebounds off year-to-date (YTD) lows reached beneath the 17.00 figure, rises steadily past the 17.10 mark on solid data from the United States (US), showing the economy’s resilience despite 500 bps of tightening and expectations for more aggressive monetary policy. Hence, the USD/MXN moved upwards from a YTD low of 16.9761 to the 17.20 region at the time of writing.
US economy demonstrates tenacity: A catalyst for USD/MXN’s leap from yearly lows
A busy US economic calendar on Thursday began with the ADP National Employment report from June, which shows that private hiring skyrocketed to 497K, above estimates of 228K. The latest consumer sentiment poll showed that Americans were upbeat about the labor market in the last month, relative to May. Further data showed that Initial Jobless Claims exceeded 245K estimates and rose by 248K in the week ending July 1. Although it showed signs of easing, private hiring revealed by ADP could be a prelude to Friday’s US Nonfarm Payrolls, reported to be announced on July 7.
JOLTs data revealed that job vacancies dropped in May though they remained high, with figures rising by 9.824M, falling almost 500K, and missing the 9.935M estimated.
Aside from labor market data, the US ISM Non-Manufacturing PMI for June came above estimates of 51 and climbed to 53.9. Digging deep into the report, a measure of prices paid showed signs of deflation.
After the data, money market futures showed odds for a 25 bps hike by the Federal Reserve (Fed) increased to 95%, while for the November meeting increased to 38%. Consequently, US Treasury bond yields advanced above 4% for the first time since March 2023.
The USD/MXN resumed its uptrend on higher US Treasury bond yields. Also, comments from the Dallas Fed President Lorie Logan that she favored a rate hike in June were a catalyst for USD/MXN to lift the exchange rate from 17.12 toward the 17.20s area.
USD/MXN Price Analysis: Technical outlook
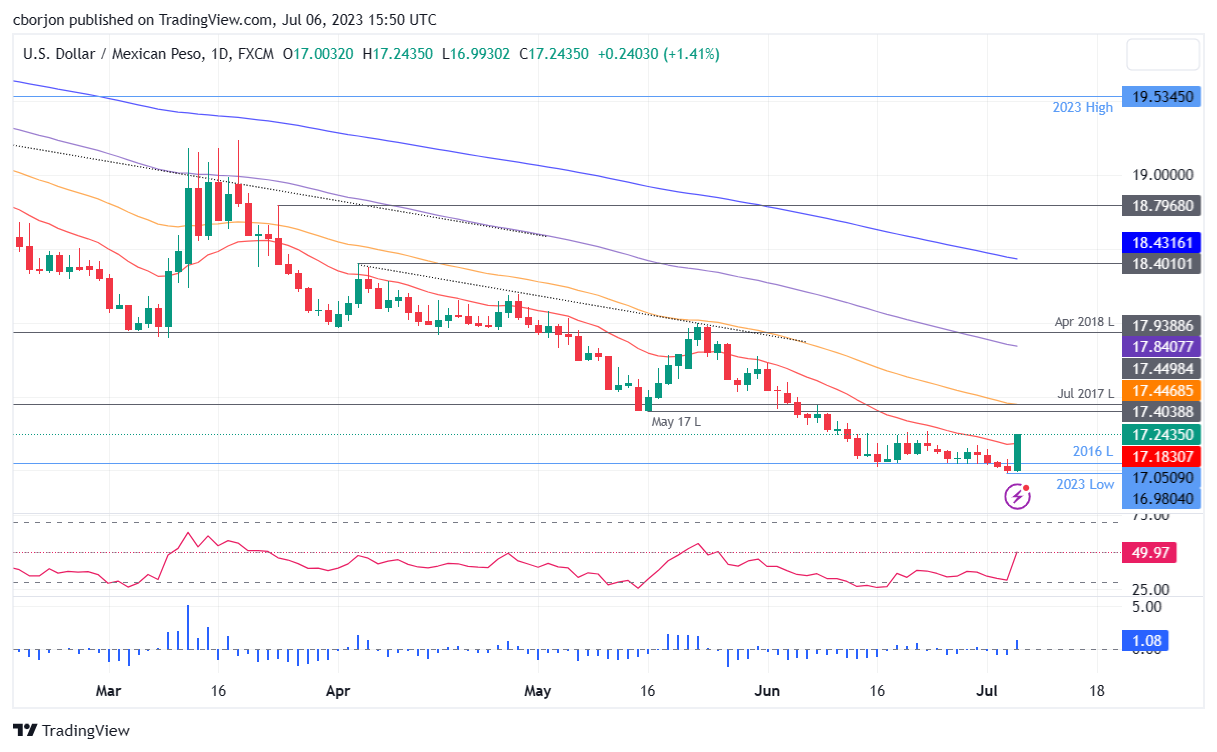
The USD/MXN remains downward biased but jumped above the 20-day Exponential Moving Average (EMA) at 17.1802. If USD/MXN achieves a daily close above the latter, the USD/MXN can rally toward the May 17 daily low of 17.4039, a crucial resistance level that, once cracked, can pave the way to challenge the 50-day EMA at 17.4460 before challenging 17.5000. Conversely, if USD/MXN drops beneat 17.1802, the pair could test the 17.00 mark.
Canada’s employment data for June will be reported by Statistics Canada on Friday, July 7 at 12:30 GMT and as we get closer to the release time, here are forecasts from economists and researchers at five major banks regarding the upcoming jobs figures.
The North American economy is expected to have added 20K jobs vs. -17.3K in May, with the Unemployment Rate expected to rise a tick to 5.3%. Meanwhile, the Participation Rate is expected to have remained stable at 65.5%.
TDS
We look for employment to rise by 25K, leaving the UE rate stable at 5.2%. Services should drive hiring, while wage growth is expected to fall 0.6pp to 4.5% YoY.
RBC Economics
We still look for a 20K increase in employment in June. But with population growth also surging, this won’t be enough to prevent another uptick in the unemployment rate to 5.3%.
NBF
After a slight hiccup the prior month, we expect job creation to have resumed in June. But an expected gain of 20K may not be enough to prevent a further rise in the unemployment rate in a context where the labour force is growing at a strong pace. Indeed, we expect the jobless rate to increase from 5.2% to 5.3%, assuming that the participation rate rises by a tenth to 65.6%.
CIBC
We expect a modest rebound of 20K in June which, with a slight recovery in participation as well, would keep the unemployment rate steady at 5.2%. Wage growth could have edged down slightly, but will have remained firm at around 5% YoY. Hours worked have been starting to lag the trend in employment again recently, partly because excess hours lost due to illness have been climbing again, and that trend could have continued into June. While a rebound in June may be enough to prevent the unemployment rate from rising further, the underlying trend within the labour market still appears to be weakening. We continue to expect that job growth for the remainder of the year will fall short of the rapid increase in population, seeing the jobless rate climb to around 6% by yearend.
Citi
We expect a modest 15K bounce-back in employment in the Labor Force Survey in June, the last key release ahead of the BoC July rate decision in a few weeks. May employment data was likely in part impacted by some technical and seasonal adjustment issues, as the decline was entirely in self-employment and corresponded with a similar decline in self-employed workers in the household employment survey in the US as well. This suggests the possibility of some common issue that could be impacting the two similar datasets in both countries in May that is unlikely to repeat.
The Canadian Dollar was the second best performing G10 currency in June. Economists at MUFG Bank analyze USD/CAD outlook.
US recessionary conditions tend to result in CAD weakness
We believe CAD performance reflects the ongoing resilience of equity markets but suspect that we could soon see a correction to the downside which will increasingly weigh on CAD. History of CAD movement also indicates US recessionary conditions tend to result in CAD weakness.
The strong inter-linkage for the Canadian economy means expectations of weaker growth in Canada will intensify, helping drag CAD lower.
Given the scale of drop in USD/CAD of late, we have altered our USD/CAD forecast profile to show a clearer path higher given our view of the limits of CAD strength from current levels.
USD/CAD – Q3 2023 1.31 Q4 2023 1.32 Q1 2024 1.34 Q2 2024 1.35
The US Bureau of Labor Statistics (BLS) will release the June jobs report on Friday, July 7 at 12:30 GMT and as we get closer to the release time, here are the forecasts by the economists and researchers of 12 major banks regarding the upcoming employment data.
Nonfarm Payrolls are expected to add 225K jobs in June vs. 339K in May with the Unemployment Rate expected to fall a tick to 3.6%. Average Hourly Earnings are also seen a tick lower to 4.2% year-on-year.
Commerzbank
The labor market is probably neither as strong as the job gain suggests, nor is it just collapsing as other indicators signal. Accordingly, we forecast a job gain of 240K in the June report, which would be less than in May, but still well above the 100K expected on trend based on population trends. Moreover, measured against the consensus forecast of 213K, it would be the 15th consecutive month in which consensus expectations were exceeded. We also expect the unemployment rate to partly reverse May's jump: we forecast a slight decline to 3.6%. Such a report would probably not make the Fed believe that the labor market is already almost back in balance. Accordingly, we still consider a rate hike of 25 bps at the next meeting at the end of July to be likely.
Danske Bank
We forecast June NFP at 180K, and if we do see further signs of wage inflation cooling followed by a lower Core CPI release on 12 July, we think the Fed could still end up staying on hold in the next meeting.
ING
Last month, the rise in NFP was immensely strong at 339K, but we do expect to see a moderation this month with something closer to the 225K mark. The unemployment rate jumped to 3.7% from 3.4% last month given the household survey data painted a very different picture to the payrolls data – with households reporting that employment actually fell. We see this reversing part of the jump and coming in at 3.6%. Meanwhile, average hourly earnings should soften a touch with another 0.3% MoM print, which would bring the annual rate of wage growth down to 4.2%.
TDS
Payrolls likely remained above-trend in June, registering a firm 240K gain but the data will still represent slowing vs the still booming 317K expansions, on average, in April-May. That is at least directionally what the Fed would be looking for. We also look for the UE rate to drop a tenth to 3.6% and for wage growth to print 0.3% MoM. age growth also likely printed 0.3% MoM again, keeping the YoY pace unchanged at 4.3%.
Credit Suisse
We expect payroll gains to slow to 190K in June, as in our view, all evidence points to a slower, but still historically robust, rate of job gains. We expect the unemployment rate to tick lower to 3.6%, while average hourly earnings should remain at 0.3% MoM.
Deutsche Bank
We expect headline (consensus +225K, DB +200K vs. +339K previously) and private (consensus +200K, DB +175K vs. +283K) payroll gains to slow relative to their three-month averages of +283K and +231K, respectively. This should still edge unemployment back down a tenth to 3.7% (consensus 3.6%) after a surprise spike last month. Hours worked were weak last month and we expect that to bounce from 34.3 to 34.4hrs. Hourly earnings are expected to be steady at 0.3%.
RBC Economics
US jobs report in June likely saw 260K increase in payroll employment, down from the +339K in May, but still at a high level. We expect the unemployment rate likely edged up to 3.8% (calculated separately from the household survey), from 3.7% in May.
NBF
We expect job creation to have slowed to 175K in the month. The household survey could show a slightly bigger gain following May’s unexpected drop, but this should not lead to a change in the unemployment rate (3.7%).
SocGen
We again expect strong employment readings. Our forecast is for a 250K NFP increase and a decline in the unemployment rate to 3.6%.
CIBC
Initial jobless claims jumped in early June, suggesting that hiring could have slowed to a 185K pace over the month. That’s also in line with the decline in aggregate hours worked seen in several industries lately including information, manufacturing, retail trade, and transportation and warehousing. The household survey showed a sizable drop in jobs in May and a return to job growth in that survey would keep the unemployment rate at 3.7%, in line with potentially more progress in participation in the core 25-54 age group, which would have also left room for further job gains without additional wage pressures. We’re below the consensus on hiring which could put pressure on bond yields.
Wells Fargo
We expect NFP growth to moderate in June. Demand for workers continues to subside, with initial jobless claims moving up between survey weeks and the four-week average up nearly 20% over the past year. Meanwhile, job postings in June continued to slide. However, cooling in the jobs market remains incremental rather than abrupt. Therefore, we look for what we would consider to be a still robust gain of 245K new jobs in June, but will be closely watching revisions to May given the 22-year low in the survey response rate. After shooting up 0.3 percentage points in May, we look for the unemployment rate to tick back down to 3.6% in anticipation of some bounce-back in the household measure of employment. The recent trend in average hourly earnings is likely little changed, leading us to expect another 0.3% monthly increase that would push down the 12-month change only slightly to 4.2%.
Citi
After a surprisingly strong 339K increase in nonfarm payrolls in May, we expect a slowing in employment growth in June, although to a still-solid 170K jobs added during the month. This could also be a temporarily softer month of payroll growth with upside risks again to payrolls from July through September. After the unemployment rate unexpectedly rose to 3.7% in May, we expect a decline to 3.6% in June with downside risks. While the expectation for a 170K increase in NFP in June would be the softest since December 2020, not all elements of the June employment report would be indicative of a loosening labor market. Indeed, some of the weakness in June hiring relative to strong seasonal patterns could still be indicative of labor shortages, especially in sectors leisure and hospitality where employment is still below pre-pandemic levels. This would imply upward pressure on wages, and we expect a solid 0.4% MoM increase in average hourly earnings in June.
- US ISM Services PMI climbed to 53.9 in June.
- US Dollar Index continues to push higher toward 103.50.
The business activity in the US service sector continued to expand at a strengthening pace in June, with the ISM Services PMI rising to 53.9 in June from 50.3 in May. This reading came in above the market expectation of 51.
Further details of the publication revealed that the Prices Paid Index edged lower to 54.1 from 56.2 and the Employment Index climbed to 53.1 from 49.2.
Commenting on the survey's findings, “there has been an uptick in the rate of growth for the services sector," noted Anthony Nieves, Chair of the Institute for Supply Management (ISM) Services Business Survey Committee.
"This is due mostly to the increase in business activity, new orders and employment. Increased capacity, backlog reduction and continued improvements in logistics have impacted delivery times (resulting in a decrease in the Supplier Deliveries Index)," Nieves further explained. "The majority of respondents indicate that business conditions remain stable; however, they are cautious relative to inflation and the future economic outlook.”
Market reaction
The US Dollar Index extended its daily rebound after this report and was last seen posting small daily gains at 103.40.
USD/JPY has spent the last 18 months tracking US-Japanese yield differentials with impressive consistency. Economists at Société Générale analyze the pair’s outlook.
The Yen has not been this cheap since the 1970s
Our rates strategists expect the US 5y yield to fall to 2.66% by this time next year, which would suggest USD/JPY would break below 130 if JGB yields stay at current levels and reach 125 if there were one further small adjustment to the band.
Correlations are there to be broken, but the current level of USD/JPY bears little relation to the performance of the economy, and in real effective terms, the yen is cheaper today relative to the USD than it has been at any point since the 1970s. Bigger mispricing can last longer than we ever used to think, but this one is extraordinary, and once rates start to re-converge, the Yen will surely rally.
- Gold price has faced immense selling pressure as US Employment conditions have tightened further.
- The US labor market has been flooded with fresh 497K fresh talent in June, higher than the expectations of 228K and the former release of 278K.
- S&P is expected to open on a bearish note as investors have turned extremely cautious ahead of the quarterly reason season.
Gold price (XAU/USD) has tumbled to near the round-level support of $1,900.00 in the early New York session. The precious metal faced an intense sell-off as the labor market conditions in the United States tightened significantly.
The US Automatic Data Processing (ADP) agency has reported that payroll figures doubled in June vs. expectations. In June, the US labor market has been flooded with fresh 497K fresh talent, higher than the expectations of 228K and the former release of 278K.
Contrary to the US ADP Employment report, the number of individuals filing for initial jobless claims has jumped to 248K for the week ending June 30 vs. expectations of 245K and the former release of 236K.
Meanwhile, S&P is expected to open on a bearish note as investors have turned extremely cautious ahead of quarterly reason season and tight labor market conditions. The higher addition of Employment numbers is going to infuse confidence among Federal Reserve (Fed) policymakers for raising interest rates further.
The US Dollar Index (DXY) has rebounded after dropping to near 103.00 as hopes of further interest rate hikes from the Fed have solidified. The yields offered on 10-year US Treasury bonds have jumped to near 4.04%.
Gold technical analysis
Gold price has faced severe selling pressure while attempting to surpass the 100-period Exponential Moving Average (EMA) plotted around $1,929.00. The precious metal failed to sustain above the downward-sloping trendline plotted from May 03 high at $2,079.76.
The Relative Strength Index (RSI) (14) is oscillating in the 40.00-60.00. Bearish momentum would trigger if it drops below 60.00.
Gold four-hour chart
The Brazilian Real has shown its strong side so far this year. Economists at Commerzbank analyze BRL outlook.
Real should continue to be supported by an attractive real interest rate for the foreseeable future
The BCB's credible monetary policy argues for a prudent approach, which is why the Real should continue to be supported by an attractive real interest rate for the foreseeable future. For the time being, we, therefore, see the BRL at a sustained high level.
Towards the end of next year, however, we fear growing doubts about a continued hawkish stance as the term of the current BCB governor expires and there is speculation about a more pro-government successor. This is likely to weigh on the Real next year.

Source: Commerzbank Research
- EUR/USD reverses three consecutive daily pullbacks.
- The pair’s bullish attempt faltered just ahead of 1.0900.
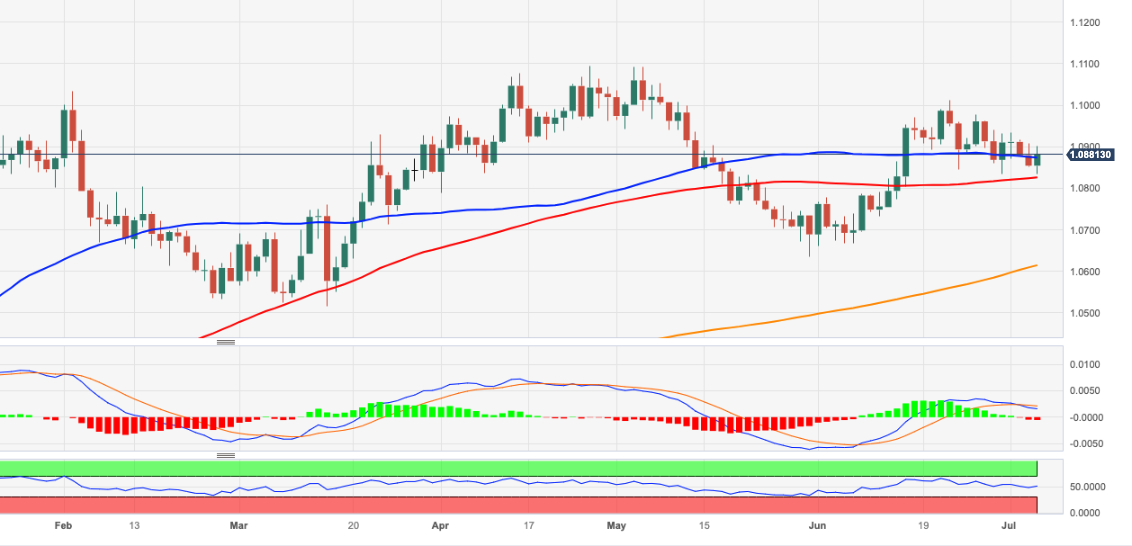
EUR/USD manages to leave behind part of the recent decline and trades with decent gains near the 1.0900 barrier on Thursday.
The inability of the pair to regain a convincing upside traction, ideally in the very near term, could motivate sellers to force the pair to revisit recent lows near 1.0830 ahead of the interim support at the 100-day SMA at 1.0824.
Looking at the longer run, the positive view remains unchanged while above the 200-day SMA, today at 1.0613.
EUR/USD daily chart
USD/MXN traded below 17 on Wednesday. Economists at Société Générale analyze the pair’s technical outlook.
Signals of a meaningful rebound are not yet visible
USD/MXN has experienced a relentless downtrend after breaking below the sideways consolidation during 2021/2022. The move is a bit stretched however signals of a meaningful rebound are not yet visible.
Next potential supports are located at projections of 16.95 and 16.60/16.40.
The 50-DMA at 17.50 is short-term hurdle. The pair must re-establish above this to affirm an extended bounce.
- DXY comes under some selling pressure and tests 102.90.
- Extra gains meet the next target of note around 103.50.
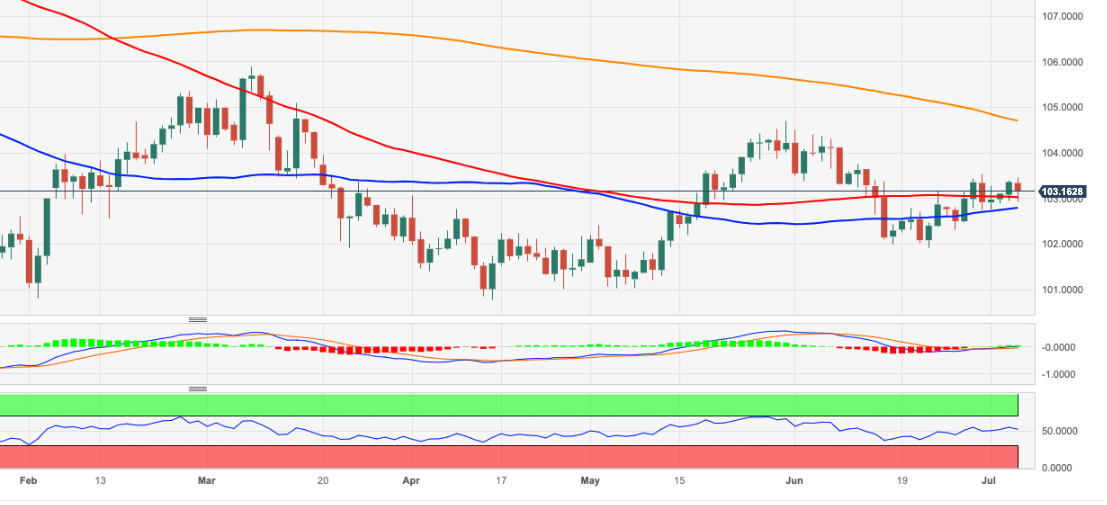
DXY comes under some moderated selling pressure after three consecutive daily advances on Thursday.
While further consolidation seems probable in the very near term, the continuation of the uptrend in place since mid-June could challenge the weekly high at 103.54 (June 30) prior to the May high at 104.69 (May 31), which appears reinforced by the 200-day SMA.
Looking at the broader picture, while below the 200-day SMA at 104.70, the outlook for the index is expected to remain negative.
DXY daily chart
- EUR/JPY adds to the weekly knee-jerk and breaches 156.00.
- Further pullbacks could retest the 154.00 region in the near term.
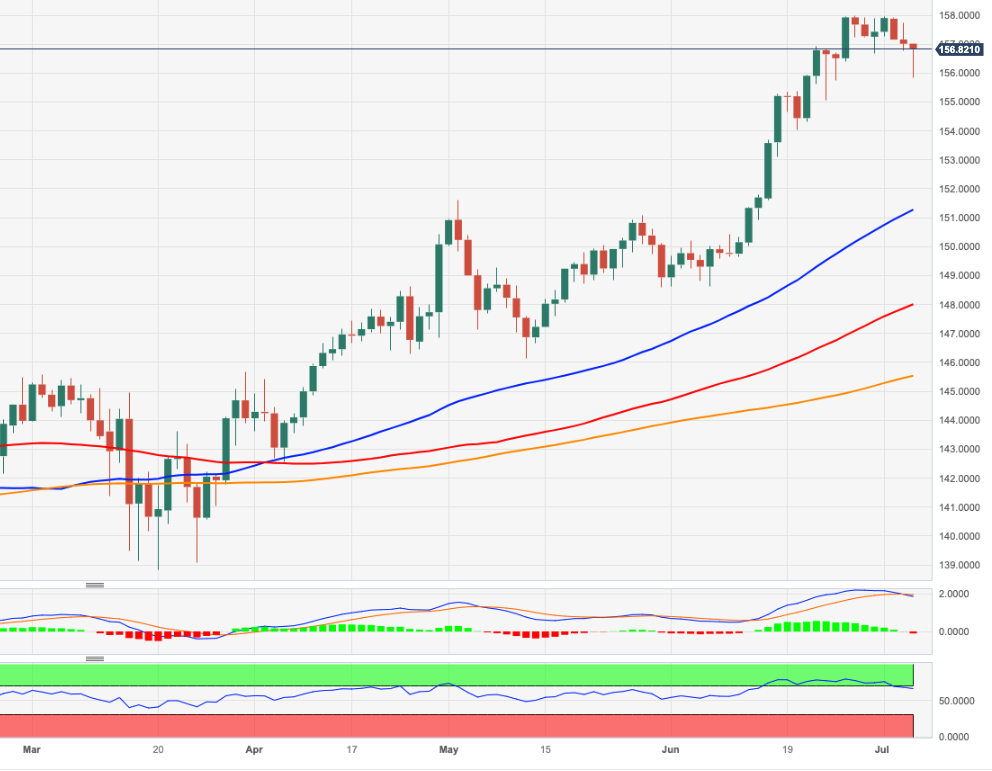
EUR/JPY extends the weekly bearish note to the sub-156.00 region on Thursday, where some initial support seems to have turned up.
The cross continues to retreat from overbought levels and further decline should not be ruled out for the time being. Against that, the door now appears open for the cross to challenge the weekly low at 154.04 (June 20).
So far, further upside looks favoured while the cross trades above the 200-day SMA, today at 145.50.
EUR/JPY daily chart
- AUD/USD has fallen back swiftly to 0.6640 as US payroll additions were doubled in June than expected.
- The US labor market was added with fresh 497K fresh talent, higher than the expectations of 228K and the former release of 278K.
- Volatility in the USD Index is expected to remain elevated ahead of the US ISM Services PMI data.
The AUD/USD pair has retreated swiftly from 0.6688 as the United States Automatic Data Processing (ADP) Employment report has posted sharply higher payroll additions in June than expected. According to the ADP report, the US labor market added fresh 497K fresh talent, higher than the expectations of 228K and the former release of 278K.
Stellar additions of fresh Employment indicate that the US labor market conditions are upbeat and sufficient to propel inflationary pressures. On Wednesday, released Federal Open Market Committee (FOMC) minutes showed that all policymakers are favoring more interest rate hikes, and now upbeat Employment data have strengthened the need for extremely restrictive monetary policy.
Meanwhile, S&P500 futures have extended losses dramatically as fears of more interest rates from the Fed have propelled. The overall market mood has turned quite negative and has improved the appeal of the US Dollar Index (DXY).
The USD Index has rebounded strongly after vertically correcting to near 102.92. Also, the 10-year US Treasury yields have jumped swiftly to near 4.03%.
Volatility in the USD Index is expected to remain elevated as investors are now shifting their focus toward the release of the US ISM Services PMI data. The economic data is seen higher at 51.0 vs. the former release of 50.3. While New Orders Index is seen declining to 53.3 against the prior release of 56.2.
On the Australian Dollar front, the Reserve Bank of Australia (RBA) kept the interest rate decision unchanged at 4.10%. RBA Governor Philip Lowe kept monetary policy steady but kept doors open for further interest rate hikes. Investors should note that Australia’s monthly Consumer Price Index (CPI) softened sharply to 5.6% vs. the prior release of 6.8%.
- Initial Jobless Claims in the US increased 12,000 in the week ending July 1.
- US Dollar Index holds above 103.00 after the data.
There were 248,000 initial jobless claims in the week ending July 1, the weekly data published by the US Department of Labor (DOL) showed on Thursday. This print followed the previous week's print of 236,000 (revised from 239,000) and came in slightly higher than the market expectation of 245,000.
Further details of the publication revealed that the advance seasonally adjusted insured unemployment rate was 1.2% and the 4-week moving average was 253,250, a decrease of 3,500 from the previous week's revised average.
"The advance number for seasonally adjusted insured unemployment during the week ending June 24 was 1,720,000, a decrease of 13,000 from the previous week's revised level," the DOL further added in its press release.
Market reaction
The US Dollar Index holds above 103.00 following this data.
- Oil prices are holding gains built near $72.00 as US Dollar has dropped sharply.
- Investors have digested fears of more interest rate hikes from the Fed.
- WTI has delivered a breakout of the Descending Triangle chart pattern, which indicates an expansion in volatility.
West Texas Intermediate (WTI), futures on NYMEX, are holding gains built near $72.00 in the London session. The oil price is expected to continue to rally as Russia and Saudi have announced voluntary cuts to stabilize prices. However, UAE has denied supporting production cuts.
The US Dollar Index (DXY) has fallen like a house of cards as investors have digested fears of more interest rate hikes from the Federal Reserve (Fed). Going forward, investors will keep an eye on the United States labor market data.
Meanwhile, fears of a bleak global outlook are solid as central banks are preparing for a fresh rate hike cycle to sharpen their monetary policy tools in the fight against stubborn inflation.
WTI has delivered a breakout of the Descending Triangle chart pattern on a four-hour scale, which indicates an expansion in volatility. The downward-sloping trendline of the aforementioned pattern is plotted from June 04 high at $74.36 while the horizontal support is placed from May 31 low at $67.12.
The black gold is confidently trading above the 200-period Exponential Moving Average (EMA) at $71.00, which indicates that the long-term trend is bullish.
Meanwhile, the Relative Strength Index (RSI) (14) is aiming to shift into the bullish range of 60.00-80.00, which indicates that the upside momentum is activating.
Should the oil price break above the intraday high at $72.35, bulls will strengthen and approach upcoming resistances to June 04 high at $74.36 and April 28 high at $76.85.
On the flip side, a downside move below May 31 low at $67.12 will drag the asset toward the $65.00 support followed by the ultimate support around $64.31.
WTI four-hour chart
-638242425727492279.png)
- Employment in the US private sector rose sharply in June.
- US Dollar Index recovered above 103.00 after the upbeat data.
Private sector employment in the US rose 497,000 in June, the data published by Automatic Data Processing (ADP) showed on Thursday. This reading marked the largest one-month increase since February 2022 and surpassed the market expectation for an increase of 228,000 by a wide margin.
Assessing the findings of the report, “consumer-facing service industries had a strong June, aligning to push job creation higher than expected,” said Nela Richardson, chief economist, ADP. “But wage growth continues to ebb in these same industries, and hiring likely is cresting after a late-cycle surge.”
"Job stayers saw a year-over-year pay increase of 6.4 percent, down from 6.6 percent in May," the ADP further noted in its publication. "For job changers, pay gains slowed for the 12th straight month, to 11.2 percent, the slowest pace of growth since October 2021."
Market reaction
The US Dollar gathered strength against its rivals on the upbeat ADP jobs report and the US Dollar Index recovered above 103.20 from below 103.00 ahead of the data.
EUR/USD recovers from low 1.08s support. Economists at Scotiabank analyze the pair’s technical outlook.
EUR/USD is forming a bullish reversal
Short-term charts suggest a major rejection of the low 1.08 area has developed. Recall that the 40-Day Moving Average sits at 1.0826 currently.
Intraday price action shows the EUR forming a bullish reversal (outside range on the 6-hour chart) off the earlier low.
Major trend resistance sits at 1.0905; a break above here puts 1.10 in reach again.
See: EUR/USD to have a chance to get back closer to the pandemic peak level – SocGen
GBP/USD gains strongly. Economists at Scotiabank analyze the pair's technical outlook.
GBP/USD has formed an inverse Head & Shoulders pattern
The GBP/USD pair has formed an inverse Head & Shoulders pattern over the turn of the month following the sharp rebound from the 1.26 zone.
Intraday gains have pushed through the neckline trigger (1.2730, now support) and look poised to push on to retest the 1.2800/50 range.
See: EUR/GBP may find some support around current levels and even converge back to 0.8600 – ING
- USD/CHF has slipped strongly as investors have shrugged-off uncertainty associated with the Fed interest rate outlook.
- Investors have shrugged-off uncertainty associated with the hawkish interest rate outlook from Fed policymakers.
- SNB Maechler commented that further hikes in interest rates cannot be ruled out.
The USD/CHF pair has witnessed an intense sell-off, following the footprints of the declining US Dollar Index (DXY) in the European session. The Swiss Franc asset has slipped sharply to near 0.8950 as investors have shrugged-off uncertainty associated with the hawkish interest rate outlook from Federal Reserve (Fed) policymakers and upcoming Employment data.
S&P500 futures have recovered nominal losses posted in London, however, the overall market sentiment is bearish. The US Dollar Index (DXY) has slipped vertically to near 103.00 despite more interest rate hikes from the Fed being highly likely.
Federal Open Market Committee (FOMC) minutes showed that all policymakers have favored more interest rate hikes as inflation is extremely stubborn. Fed policymakers decided to skip policy-tightening in June as the central bank would get sufficient time to assess monetary policy conditions and the impact of interest rate hikes yet made.
Meanwhile, New York Fed Bank President John Williams crossed showed support for slowing down on the rate hike trajectory. Fed policymaker also showed his data dependency for future central bank decisions.
Apart from that, the United States Automatic Data Processing (ADP) Employment report will be keenly watched. As per the estimates, the US ADP report will show fresh additions of 228K in June vs. the former addition of 278K.
On the Swiss Franc front, Swiss National Bank (SNB) governing board member, Andrea Maechler, commented “It cannot be ruled out that we will need to further hike interest rates.” Investors should note that the Swiss Consumer Price Index (CPI) slipped below 2% in May.
Economists at Scotiabank analyze USD/CAD outlook after the pair tested the 1.33 area earlier in the day.
Markets may shy away from moving the CAD too far on the day ahead of Friday’s data reports
Canada releases Merchandise Trade data today but the jobs (and wages) data tomorrow should be important influences on the CAD’s near-term direction. Markets may shy away from moving the CAD too far on the day ahead of Friday’s data reports.
The pair nudged briefly above 1.33 earlier in the day, keeping a test of noted resistance at 1.3315/25 on the radar.
Short-term trend momentum is positive, which may limit scope for USD losses in the short run to support in the upper 1.32s.
Key USD support is 1.3200/05.
USD trades mixed versus majors. Economists at Scotiabank analyze how US data could impact the greenback.
Firm data may give the USD a lift
US data reports are dominated by employment figures – ADP data is expected to reflect a gain of 225K in private sector jobs in June (down from 278K in May) while weekly claims are forecast to rise modestly. We also get Trade numbers, final S&P PMI Services and Composite data and the June ISM Services Index.
Firm data may give the USD a lift but short-term patterns in the DXY suggest gains are becoming a bit of a grind and the Dollar may find it hard to extend through the 103.50 area.
Support for the index is 103.00/05 and may come under pressure if the labour market data disappoint.
Economists at MUFG Bank analyze CHF outlook.
SNB continues to favour stronger CHF
The rhetoric of the SNB is indicative of ongoing concerns over price stability. The hawkish rhetoric from the SNB looks to us to be in part an attempt to ensure there is no perception of divergence that could fuel CHF weakness.
Another 25 bps rate hike in September seems more likely than not at this stage. Another rate hike with core CPI unchanged at the current level (1.9%) or lower would take the SNB’s policy rate in real terms into positive territory – joining the RBNZ, the Fed and the BoC.
The SNB lowered its forecast for inflation this year from 2.6% to 2.2% but raised the 2024 and 2025 forecasts by 0.2ppt and 0.1ppt to 2.2% and 2.1%. This underlines the SNB’s bias to tighten further which will help support CHF.
Given our view of EUR/USD moving modestly higher and the ECB hiking in July and September, the scope for EUR/CHF to move higher will be relatively limited over the forecast period.
EUR/CHF – Q3 2023 0.9750 Q4 2023 0.9850 Q3 2024 1.0100 Q2 2024 1.0000
USD/CHF – Q3 2023 0.8860 Q4 2023 0.8790 Q3 2024 0.8940 Q2 2024 0.9090
EUR/USD is currently stuck in a range. Economists at Société Générale analyze the pair’s outlook.
More ECB than Fed tightening in H2
We expect more ECB than Fed tightening in H2, Fed easing in H1 2023 as the US slips into a mild recession, and EUR/USD to have a chance to get back closer to the pandemic peak level (1.23, Jan 2021).
The biggest risk is that we stay in a much narrower range, i.e., EUR/USD meanders in a 1.05-1.15 range for the foreseeable future, in the face of a synchronised global slowdown.
Looking at the G10 currencies in June shows that the Dollar weakened, but that the Yen softened even further. Yen selling is likely to continue in the short term, in the view of economists at MUFG Bank.
A policy shift by the BoJ could result in a considerable strengthening of the Yen
We expect USD/JPY to come under downward pressure from moves by the BoJ and the Japanese authorities in the short term and by changes in the Fed's monetary policy over the medium term.
A policy shift by the BoJ could result in a considerable strengthening of the Yen. However, in the immediate term, or if the BoJ does not shift gears at the July monetary policy meeting, we see the risk of the Yen weakening further.
The decline in the Yen real interest rate, which has been driving the recent weakening of the Yen, is also approaching its limit. Market proverbs warn of the danger of picking market highs and lows, but based on last year's experience, we expect the USD/JPY to head toward 150 if it breaks past 145 with momentum. We have therefore raised the upper end of our forecast range.
USD/JPY – Jul-Sep 2023 134~150 Oct-Dec 132~148 Jan-Mar 2024 130~146 Apr-June 128~144
Senior Economist at UOB Group Alvin Liew reviews the recently published retail sales readings in Singapore.
Key Takeaways
Singapore’s retail sales rose in line with expectations, by 1.8% y/y in May (easing from a revised 3.7% y/y in Apr) versus the Bloomberg median estimate of 1.9% y/y. On a seasonally-adjusted sequential basis, retail sales fell by -0.2% m/m (from +0.5% m/m in Apr). Excluding motor vehicle sales, the sequential decrease was slightly worse at -0.4% m/m, but it still translated to a 1.8% y/y increase in May (from a revised 4.3% y/y in Apr). Despite the less robust headline growth in May (compared to Apr), retail sales value was higher at S$4.03bn in May, from S$3.90bn in Apr.
Outlook – We continue to expect domestic retailers to enjoy domestic and external supports, complemented by major events such as various sports, high profile concerts and BTMICE (Business Travel and Meetings, Incentive Travel, Conventions and Exhibitions) activities which will help anchor further improvement in leisure, business travel and inbound tourism, while strong employment and wage growth conditions in Singapore will likely contribute further to domestic consumption demand.
China’s influence on Asian FX is strong. Economists at Société Générale analyze the outlook for Asian currencies.
AUD/USD is affected by what the Yuan does
Exchange rates always involve two parties directly, but they can be affected by other currencies, indirectly. How much is USD/CNY a function of a strong Dollar, and how is it a function of a weaker Yuan? To the extent that the soft Chinese data matters for the CNY, it matters for all the Asia-Pacific region, including Japan, New Zealand, and Australia.
I’m not sure anything can stop USD/JPY following yield differentials at the moment, but AUD/USD is likely to be capped by the softness of the Yuan and China’s underwhelming reopening.
- The US Dollar jumped higher overnight, and sees some positions being pared back this Thursday.
- Main focus lies on ADP employment and ISM Service numbers for June.
- The US Dollar Index is back above 103.00, but is unable to consolidate gains.
The US Dollar (USD) holds up on Thursday, albeit paring some earlier gains, after the Federal Reserve (Fed) FOMC Minutes showed a vote split in terms of hiking interest-rates in June instead of pausing. This tilted the minutes to a hawkish result, putting the future path in rates back on top of the bulletin board in terms of drivers. The prospect of further hikes by the Fed prompts the Dollar to diverge against several G10 currencies as some central banks have already announced either a steady monetary policy rate or even signalled cuts soon. The best example is the Polish Zloty, which falls back nearly 0.50% against the Greenback, as the country’s central bank has said that it is ready to cut interest rates soon.
On the economic data front, Thursday will bring the weekly jobless claims data ahead of Friday’s key US jobs report. Lorie K. Logan, the president of the Federal Reserve Bank of Dallas, is due to speak at 12:45 GMT. Although a lagging indicator, the JOLTS report for May – due at 14:00 GMT – is expected to shrink below the 10 million number.
Daily digest: US Dollar to face a lot of moving parts this Thursday
- Some tensions and risks to keep in mind as well with an OPEC meeting taking place in Vienna today. Watch out for any comments on more Oil production cuts. Meanwhile, overnight Iran allegedly tried to seize two oil tankers in the Hormuz Strait. The attempt got foiled by the US military. Western Texas Intermediate (WTI) Crude oil price is very much correlated with the US Dollar.
- Automatic Data Processing Inc. (ADP) is set to issue its monthly Employment change numbers for June at 12:15 GMT. Expectations are for a job gain of 228,000, lower than the 278,000 increase reported in the previous month.
- More labor-market related data will come out at 12:30 GMT, namely the initial and continuing jobless claims for the week ended June 30. Initial claims are expected to edge up to 245,000 from 239,000 a week earlier, while the continuing claims are expected to increase from 1.742 million to 1.751 million.
- Lorie K. Logan, the president of the Federal Reserve Bank of Dallas, will speak at 12:45 GMT.
- The Institute for Supply Management (ISM) will come out with several indicators about the services sector at 14:00 GMT. The Services Purchasing Managers Index (PMI) for June is expected to increase from 50.3 to 51.0. Services New Order Index is seen jumping from 52.9 to 55.9, and the Services Prices Paid Index is anticipated to cool down from 56.2 to 53.3. In the latest Fed meeting , Fed Chairman Jerome Powell mentioned that services is one of the key components that is keeping core inflation sticky and elevated.
- The US Bureau of Labor Statistics is to issue the JOLTS Job Openings report at 14:00 GMT. Although it is a lagging indicator, it has been important these past few months because it is considered a barometer to measure if the demand for work is still elevated or is cooling down. Markets expect job openings to decline to 9.93 million in May from 10.103 million in April.
- With the US holiday on Tuesday, the US Energy Information Administration (EIA) will provide US stockpile information on crude and other derivatives at 15:00 GMT.
- The Chinese central bank, the People’s Bank of China (PBoC), is stepping up its efforts to support the Yuan by fixing the Chinese currency this morning at 7.2098, lower than the 7.2458 estimated.
- In the slew of the Fed FOMC report, John Williams, president of the Federal Reserve Bank of New York, said that inflation is still too high.
- The US Dollar is stuck in choppy trading against the Euro as Purchasing Manager Index numbers fell below 50 for France and Italy. Both Europe and the US are thus seeing contractions in their PMIs. At the same time, the European Central Bank (ECB) published a survey of inflation expectations, which have been revised to the downside. This adds to evidence of subsiding inflation pressures, making it more likely that the ECB will end its hiking cycle sooner than markets anticipate.
- The release of the Fed FOMC Minutes showed that there was a vote split in June, with some hawks in favor of hiking interest rates. This was considered as hawkish by market participants, as did the closing remark that all officials expect more rate increases, in plural, for the remainder of 2023.
- Asian markets got spooked by the hawkish tone of the Fed and are seeing investors chun away from risk assets. The Japanese Topix is down 1.26%, and the Hang Seng is having a gruesome day as it falls nearly 3%. European equities take over the sour tone and are down over 1% halfway through the European morning trading session. US futures are also in the red, but only around 0.50%.
- The CME Group FedWatch Tool shows that markets are pricing in a 91.1% chance of a 25 basis points (bps) interest-rate hike on July 26. Markets remain reluctant though to price in another rate hike for later this year, while the recent Fed Minutes clearly confirmed at least two more hikes are due instead of just one.
- The benchmark 10-year US Treasury bond yield halted trading at 3.96% on Thursday after a wild ride on Wednesday evening, when the FOMC Minutes got published. Equities drop and bonds sold off, making rates shoot higher as more hikes look inevitable in the fall of this year.
US Dollar Index technical analysis: USD holding on above 103.00
The US Dollar jumped substantially in the first reaction on the FOMC Minutes on Wednesday, only to pare back some of its gains against a few of the G10 currencies. The dispersed move comes as investors are cherry picking the coins where the local central bank is supporting possibly more hikes, while the Greenback advances against those currencies supervised by central banks that have recently signalled to either have reached their pivot interest-rate level or will be cutting them soon. Proof of that is on the quote board, with the US Dollar strengthening 0.5% against the Polish Zloty (USD/PLN). Greenback also sees gains against Scandinavian pairs, up more than 0.25% against both the Norwegian Krone (USD/NOK) and the Swedish Krona (USD/SEK). This makes the US Dollar Index (DXY) head lower, though not in a firm nosedive move, but rather a step back that could be undone if the data later today supports the currency.
On the upside, look for 103.54 as the next key resistance level, which falls in line with the last week’s high. The 200-day Simple Moving Average (SMA) at 104.77 is still quite far away. So the intermediary level to look for is the psychological level at 104.00 and May 31 peak at 104.70.
On the downside, the 55-day SMA near 102.80 has proven its importance as it clearly underpinned price action on Friday and Monday by triggering a turnaround after the firm weakening of the Greenback. A touch lower, 102.50 will be vital to hold from a psychological point of view. In case the DXY slips below 102.50, more weakness is expected with a full slide to 102.00 and a retest of June’s low at 101.92.
US Dollar FAQs
What is the US Dollar?
The US Dollar (USD) is the official currency of the United States of America, and the ‘de facto’ currency of a significant number of other countries where it is found in circulation alongside local notes. It is the most heavily traded currency in the world, accounting for over 88% of all global foreign exchange turnover, or an average of $6.6 trillion in transactions per day, according to data from 2022.
Following the second world war, the USD took over from the British Pound as the world’s reserve currency. For most of its history, the US Dollar was backed by Gold, until the Bretton Woods Agreement in 1971 when the Gold Standard went away.
How do the decisions of the Federal Reserve impact the US Dollar?
The most important single factor impacting on the value of the US Dollar is monetary policy, which is shaped by the Federal Reserve (Fed). The Fed has two mandates: to achieve price stability (control inflation) and foster full employment. Its primary tool to achieve these two goals is by adjusting interest rates.
When prices are rising too quickly and inflation is above the Fed’s 2% target, the Fed will raise rates, which helps the USD value. When inflation falls below 2% or the Unemployment Rate is too high, the Fed may lower interest rates, which weighs on the Greenback.
What is Quantitative Easing and how does it influence the US Dollar?
In extreme situations, the Federal Reserve can also print more Dollars and enact quantitative easing (QE). QE is the process by which the Fed substantially increases the flow of credit in a stuck financial system.
It is a non-standard policy measure used when credit has dried up because banks will not lend to each other (out of the fear of counterparty default). It is a last resort when simply lowering interest rates is unlikely to achieve the necessary result. It was the Fed’s weapon of choice to combat the credit crunch that occurred during the Great Financial Crisis in 2008. It involves the Fed printing more Dollars and using them to buy US government bonds predominantly from financial institutions. QE usually leads to a weaker US Dollar.
What is Quantitative Tightening and how does it influence the US Dollar?
Quantitative tightening (QT) is the reverse process whereby the Federal Reserve stops buying bonds from financial institutions and does not reinvest the principal from the bonds it holds maturing in new purchases. It is usually positive for the US Dollar.
- Gold price has failed to sustain above $1,920.00 amid a hawkish interest rate outlook from the Fed.
- Fed policymakers are in support of more restricting monetary policy as inflation is still stubborn due to robust demand.
- Gold price has faced severe selling pressure while attempting to surpass the 100-period EMA plotted around $1,929.00.
Gold price (XAU/USD) has sensed selling pressure while attempting to sustain above the crucial resistance of $1,920.00 in the European session. The precious metal is struggling to attract bets as Federal Reserve (Fed) policymakers remained hawkish on interest rate outlook, according to Federal Open Market Committee (FOMC) minutes.
Despite deepening worries about the economic outlook due to tight credit conditions, Fed policymakers are in support of more restricting monetary policy as inflation is still stubborn due to robust demand.
S&P500 futures have posted meaningful losses in Europe as investors are cautious ahead of Employment data and quarterly result season. On Thursday, investors will focus on the Automatic Data Processing (ADP) Employment Change report. As per the estimates, the US ADP report will show fresh additions of 228K in June vs. the former addition of 278K.
In addition to the ADP Employment report, US ISM Services PMI will also be on the radar. The economic data is seen higher at 51.0 vs. the former release of 50.3. While New Orders Index is seen declining to 53.3 against the prior release of 56.2.
Meanwhile, the US Dollar Index (DXY) is expected to turn sideways as investors have sidelined ahead of key economic indicators. However, the 10-year US Treasury yields have climbed to 3.97%.
Gold technical analysis
Gold price has faced severe selling pressure while attempting to surpass the 100-period Exponential Moving Average (EMA) plotted around $1,929.00. The precious metal failed to sustain above the downward-sloping trendline plotted from May 03 high at $2,079.76.
The Relative Strength Index (RSI) (14) is oscillating in the 40.00-60.00. Bearish momentum would trigger if it drops below 60.00.
Gold four-hour chart
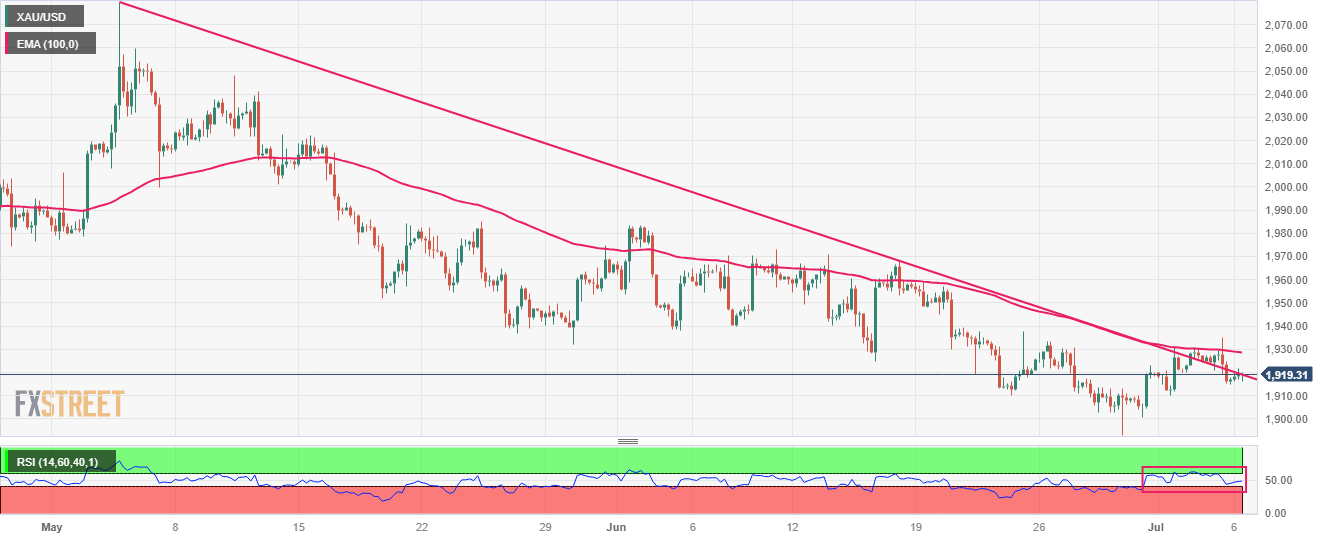
The main event on the calendar in the CEE region is the meeting of the National Bank of Poland. Economists at ING analyze the monetary policy decision and its implications for the Zloty.
EUR/PLN to see some stabilisation around 4.460
We expect rates to remain unchanged and the main focus will be on the new forecast and Friday's press conference. Both can be expected to be dovish in tone. The market has moved significantly in that direction over the past two weeks and is pricing in roughly 100 bps of rate cuts by year-end at this point. Thus, the news from the NBP should not come as a surprise to the market though pressure to price in even more rate cuts could be expected.
In the case of PLN, despite the dovish NBP, we should not see much pressure for further weakness on the day but rather some stabilisation around 4.460 EUR/PLN.
The latest survey conducted by the Bank of England (BoE) Monthly Decision Maker Panel (DMP) revealed on Thursday, the UK businesses projected year-ahead Consumer Price Index (CPI) inflation at 5.7% in June vs. 5.9% estimated in May.
Additional findings
“Realised output price inflation declined to 6.9% in June, down from 7.6% in May. The three-month moving average also fell from 7.6% to 7.3%.”
“Businesses expect output price inflation to fall over the next year as the year-ahead output price inflation was expected to be 5.3% in the three months to June, down from 5.4% in the three months to May. “
“One-year ahead CPI inflation expectations decreased to 5.7% in June, down from 5.9% in May. However, three-year ahead CPI inflation expectations slightly increased to 3.7% in June, up 0.2 percentage points relative to May.”
Market reaction
GBP/USD keeps its range above 1.2700, last seen trading at 1.2712, up 0.07% on the day.
Economists at OCBC Bank analyze USD/CNH outlook.
Markets are looking for fiscal stimulus measures to support domestic demand
We continued to watch the fix vs. expectations to gauge policymakers’ comfort level with the recent pace of depreciation. But such action probably can only slow the pace of RMB depreciation and not reverse the RMB weakening trend.
7.28-7.30 probably seen as the next line in the sand for now but more crucially it is the pace of depreciation, excessive volatility, and herd behaviour (one-side move) the PBoC is likely targeting rather than any specific level. More importantly, markets are looking for fiscal stimulus measures to support domestic demand.
- EUR/JPY has found some support near 156.00 after upbeat German Factory Orders data.
- Rising wages in Japan are strengthening demand-driven triggers to maintain inflation steadily above 2%.
- Softening of the preliminary Eurozone inflation has provided some relief to ECB policymakers.
The EUR/JPY pair has attempted a recovery move after a perpendicular sell-off to near 156.00 in the London session. The cross is expected to deliver more downside below 156.00 as threats of intervention in the currency markets by the Bank of Japan (BoJ) or other Japanese diplomats are higher.
The Japanese Yen has depreciated to 145.00 against the US Dollar and a poll from Reuters showed that an intervention by the BoJ could come at these levels. Also, there has been a verbal communication from Japan's top financial diplomat Masato Kanda that authorities were in close contact with US Treasury Secretary Janet Yellen and other overseas officials "almost every day" on currencies and broader financial markets.
Meanwhile, rising wages in Japan are strengthening demand-driven triggers to maintain inflation steadily above 2%. BoJ Governor Kazuo Ueda has yet not conveyed a sign of a tweak in the negative interest rates and Yield Control Curve (YCC).
On the Eurozone front, upbeat German Factory Orders data (May) have provided some strength to the Euro bulls. Monthly economic data expanded by 6.4% against expectations of 1.5%. In April, Factory Orders were contracted by 0.4%. On an annualized basis, Factory Orders have contracted by 4.3% against a prior contraction of 9.9%.
Softening of the preliminary Eurozone inflation due to lower oil prices has provided some relief to the European Central Bank (ECB), however, further policy-tightening is in the pipeline as the journey towards 2% inflation is far from over. ECB President Christine Lagarde has already cleared that more interest rate hikes are appropriate.
- JOLTS report will be watched closely by Fed officials this week.
- Job openings are forecast to fall below 10 million in May.
- US labor market conditions remain out of balance despite tight Fed policy.
The Job Openings and Labor Turnover Survey (JOLTS) will be released on Thursday, July 6, by the US Bureau of Labor Statistics (BLS). The publication will reveal the change in the number of job openings in May, alongside the number of layoffs and quits.
JOLTS data will be scrutinized by market participants as it could provide valuable insights regarding the supply-demand dynamics in the jobs report.
What to expect in the next JOLTS report?
The number of job openings on the last business day of May is forecast to decline to 9.93 million from 10.1 million in April. "Over the month, the number of hires changed little at 6.1 million. Total separations decreased to 5.7 million," the BLS said in April’s JOLTS. "Within separations, quits (3.8 million) changed little, while layoffs and discharges (1.6 million) decreased."
The Federal Reserve (Fed) has been paying close attention to the job openings data to assess whether labor market conditions remain tight. In May, the BLS reported that there were more than 6 million unemployed. Following the June policy meeting, Fed Chairman Jerome Powell acknowledged that they were observing sings of softening in the labor market but noted that demand and supply were still out of balance. Nearly 10 million job openings for around 6 million unemployed means that there are still more than 1.5 jobs for each person looking for work. Fed officials are concerned that the slow recovery in the supply side of the labor market could lead to higher wages and make it difficult for them to bring inflation back to target.
FXStreet Analyst Eren Sengezer thinks that a reading above 10 million could feed into expectations for two more 25 basis points Fed rate hikes in the remainder of the year.
“Following three straight months of declines, the number of job openings rose back above 10 million in April,” Eren notes. “Another reading above 10 million should allow the Fed to continue to raise rates without worrying about hurting the labor market. On the other hand, a noticeable decline toward 9.5 million could cause hawkish Fed bets to recede at least until Friday’s jobs report.”
When will the JOLTS report be released and how could it affect EUR/USD?
Job openings data will be published on Thursday, July 6, at 14:00 GMT. The report could influence the US Dollar’s (USD) valuation, with market participants trying to figure out whether the Fed will continue to tighten the policy later in the year. “We believe there's more restriction coming, driven by labor market,” Powell said when speaking at a policy panel at the 2023 ECB Forum on Central Banking.
Eren shares his views on how EUR/USD could react to JOLTS data:
“The Relative Strength Index (RSI) indicator on the daily chart declined below 50 and EUR/USD closed below the 20-day Simple Moving Average on Wednesday, pointing to a bearish tilt in the short-term outlook. With an upward surprise, the pair could continue to stretch lower. In that case, 1.0820 (100-day SMA) aligns as key support. A daily close below that level could open the door for an extended slide toward 1.0760 (static level) and 1.0700 (psychological level, static level”
"A noticeable decline in job openings could weigh on the USD and help EUR/USD recover toward 1.0900 (psychological level, 20-day SMA). If the pair rises above that level and confirms it as support, 1.0950 (static level) and 1.1000 (psychological level) could be set as next bullish targets."
US Dollar FAQs
What is the US Dollar?
The US Dollar (USD) is the official currency of the United States of America, and the ‘de facto’ currency of a significant number of other countries where it is found in circulation alongside local notes. It is the most heavily traded currency in the world, accounting for over 88% of all global foreign exchange turnover, or an average of $6.6 trillion in transactions per day, according to data from 2022.
Following the second world war, the USD took over from the British Pound as the world’s reserve currency. For most of its history, the US Dollar was backed by Gold, until the Bretton Woods Agreement in 1971 when the Gold Standard went away.
How do the decisions of the Federal Reserve impact the US Dollar?
The most important single factor impacting on the value of the US Dollar is monetary policy, which is shaped by the Federal Reserve (Fed). The Fed has two mandates: to achieve price stability (control inflation) and foster full employment. Its primary tool to achieve these two goals is by adjusting interest rates.
When prices are rising too quickly and inflation is above the Fed’s 2% target, the Fed will raise rates, which helps the USD value. When inflation falls below 2% or the Unemployment Rate is too high, the Fed may lower interest rates, which weighs on the Greenback.
What is Quantitative Easing and how does it influence the US Dollar?
In extreme situations, the Federal Reserve can also print more Dollars and enact quantitative easing (QE). QE is the process by which the Fed substantially increases the flow of credit in a stuck financial system.
It is a non-standard policy measure used when credit has dried up because banks will not lend to each other (out of the fear of counterparty default). It is a last resort when simply lowering interest rates is unlikely to achieve the necessary result. It was the Fed’s weapon of choice to combat the credit crunch that occurred during the Great Financial Crisis in 2008. It involves the Fed printing more Dollars and using them to buy US government bonds predominantly from financial institutions. QE usually leads to a weaker US Dollar.
What is Quantitative Tightening and how does it influence the US Dollar?
Quantitative tightening (QT) is the reverse process whereby the Federal Reserve stops buying bonds from financial institutions and does not reinvest the principal from the bonds it holds maturing in new purchases. It is usually positive for the US Dollar.
UOB Group’s Senior Economist Julia Goh and Economist Loke Siew Ting assess the latest release of inflation figures in the Philippines.
Key Takeaways
The Philippines’ headline inflation continued on a downward trend, decelerating for a fifth straight month to 5.4% y/y in Jun (May: +6.1%). It also marked the lowest reading since May 2022 and came in lower than our estimate (5.7%) and Bloomberg consensus (5.5%). There was a broad-based moderation across CPI components, led by transport, food & non-alcoholic beverages, and housing, utilities & other fuels amid the dissipating of year-ago high base effects.
Given that inflation downtrend remains in line with our expectation, we maintain our full-year inflation forecasts at 5.3% for 2023 (BSP est: 5.4%, 2022: 5.8%) and 2.5% for 2024 (BSP est: 2.9%). Our baseline projections have not factored in any potential changes in domestic policy and unexpected circumstances particularly from weather, with inflation gradually returning to BSP’s 2.0%-4.0% target range by 4Q23. Meanwhile, upside risks could emanate from persistent supply constraints of key food items, upward adjustments in public transport fares and wages, possible knock-on effects of higher toll rates on agricultural prices, adverse weather, currency fluctuation, and volatile global commodity prices.
The latest batch of inflation readings and stable currency support our view for an extended interest rate pause by BSP until year-end. Real interest rates have turned positive for the second consecutive month and core inflation eased for a third straight month, further reflecting the lagged effects of past rate hikes. While exercising caution in its response to the Fed’s latest hawkish remarks, BSP will likely prioritize on domestic growth momentum and inflation expectations against a narrowing interest-rate differential with US rates at this juncture. The Monetary Board will next meet on 17 Aug.
The Dollar has drawn some strength from the hawkish FOMC minutes. Economists at ING analyze USD outlook ahead of US data.
Hawkish Fed minutes raise the bar for data disappointment
Wednesday’s release of the June FOMC minutes gave very few reasons to doubt the Fed’s determination to keep raising rates. In a way, the bar for data disappointment and consequent dovish repricing may now be higher. Still, expect a hit to the Dollar if the ISM services fall into contractionary territory.
The Dollar's reaction to today’s data may not prove particularly long-lived, especially if Friday’s payrolls continue to point to a tight jobs market and keep a post-July hike on the table.
- AUD/USD rebounds from the weekly low touched on Thursday, albeit lacks follow-through.
- A modest intraday USD pullback is seen as a key factor lending some support to the major.
- The Fed’s hawkish outlook, the risk-off impulse limits the USD losses and cap the Aussie.
The AUD/USD pair stages a goodish intraday recovery from a fresh weekly low touched this Thursday and rallies over 50 pips from the 0.6635-0.6630 area, though lacks follow-through. Spot prices quickly retreat a few pips from the daily top and currently trade around the 0.6665-0.6670 region, up just over 0.20% for the day.
The US Dollar (USD) pulls back from the vicinity of its highest level since June 12 touched last Friday and for now, seems to have stalled the uptrend witnessed since the beginning of the current week. This turns out to be a key factor that prompts some intraday short-covering around the AUD/USD pair. That said, the prospects for further policy tightening by the Federal Reserve (Fed), along with the risk-off impulse, help limit losses for the USD and cap the risk-sensitive Aussie.
The minutes from the June FOMC meeting released on Wednesday revealed that almost all members supported resuming rate hikes as inflation remains unacceptably high. This, in turn, reaffirms market bets for a 25 bps lift-off at the upcoming FOMC meeting on July 25-26 and leads to a further rise in the US Treasury bond yields. Adding to this, economic woes and the risk of a further escalation in the US-China trade conflict temper investors' appetite for riskier assets.
It is worth recalling that China on Monday announced fresh export curbs on two metals - widely used in semiconductors, electric vehicles and high-tech industries - to the US. The announcement raises concerns about retaliatory measures and might cause more disruption to global trade. This could further undermine already weak economic conditions, which, in turn, takes its toll on the risk sentiment and forces investors to take refuge in safe-haven assets, including the USD.
The aforementioned fundamental backdrop makes it prudent to wait for strong follow-through buying before positioning for an extension of the AUD/USD pair's recent bounce from sub-0.6600 levels. Market participants now look to the US economic docket - featuring the ADP report on private-sector employment, the usual Weekly Initial Jobless Clams, the ISM Services PMI and JOLTS Job Openings data - for a fresh impetus later during the early North American session.
Technical levels to watch
The ADP index and the job openings today will give an indication of the labour market. The ISM for the service sector is also on the agenda. Antje Praefcke, FX Analyst at Commerzbank, analyzes how data could impact the EUR/USD pair.
Today’s data unlikely to be sufficient to push EUR/USD below 1.08 on a sustainable basis
The data publications today will cause a few pips more or less in EUR/USD.
The market is likely to react more sceptically to negative surprises than to positive ones. As it is ‘only’ a question of 25 bps more or less the effects are likely to be moderate though; unless we receive such positive data that doubt in the Fed’s approach is hardly justified any longer. In this case, the 1.08 level will likely be broken to the downside.
It seems unlikely to me though that today’s data will be sufficient to push EUR/USD below 1.08 on a sustainable basis. That would probably require a real whopper of a labour market report on Friday.
- USD/JPY plummets to over a one-week low on Thursday, albeit lacks follow-through selling.
- The sharp intraday slide stalls near the 23.6% Fibo level., warranting some caution for bears.
- A sustained strength beyond 145.00 is needed to support prospects for any further move-up.
The USD/JPY pair comes under intense selling pressure on Thursday and dives to a one-and-half-week low during the early part of the European session. Spot prices, however, manage to rebound a few pips in the last hour and currently trade around the 144.00 round-figure mark, still down nearly 0.50% for the day.
Fears of a possible intervention by Japanese authorities to prop up the domestic currency, along with the risk-off impulse, provide a goodish lift to the safe-haven Japanese Yen (JYP) and prompt aggressive selling around the USD/JPY pair. Apart from this, a modest US Dollar (USD) pullback from the weekly top further contributes to the offered tone.
That said, a big divergence in the monetary policy stance adopted by the Bank of Japan (BoJ) and other major central banks, including the Federal Reserve (Fed), caps any further gains for the JPY. Apart from this, a further rise in the US Treasury bond yields acts as a tailwind for the Greenback and limits losses for the USD/JPY pair, at least for now.
From a technical perspective, the sharp intraday slide finds support near the 143.60 region, or the 23.6% Fibonacci retracement level of the June rally, which should now act as a pivotal point. Some follow-through selling will validate a breakdown through a short-term trading range held over the past week or so and pave the way for further losses.
The USD/JPY pair might then accelerate the corrective decline towards testing the 100-period Simple Moving Average (SMA), currently pegged around the 143.00 round figure. This is closely followed by the 142.70-142.65 support or the 38.2% Fibo. level, which if broken decisively will suggest that spot prices have topped out near the 145.00 mark.
On the flip side, any recovery back above the trading range support breakpoint, around the 144.15-144.20 area, is likely to confront some resistance near the 144.70-144.75 supply zone. This is followed by the critical 145.00 psychological mark, above which the USD/JPY pair might aim to surpass the 145.35-145.40 barrier and reclaim the 146.00 round figure.
USD/JPY 4-hour chart
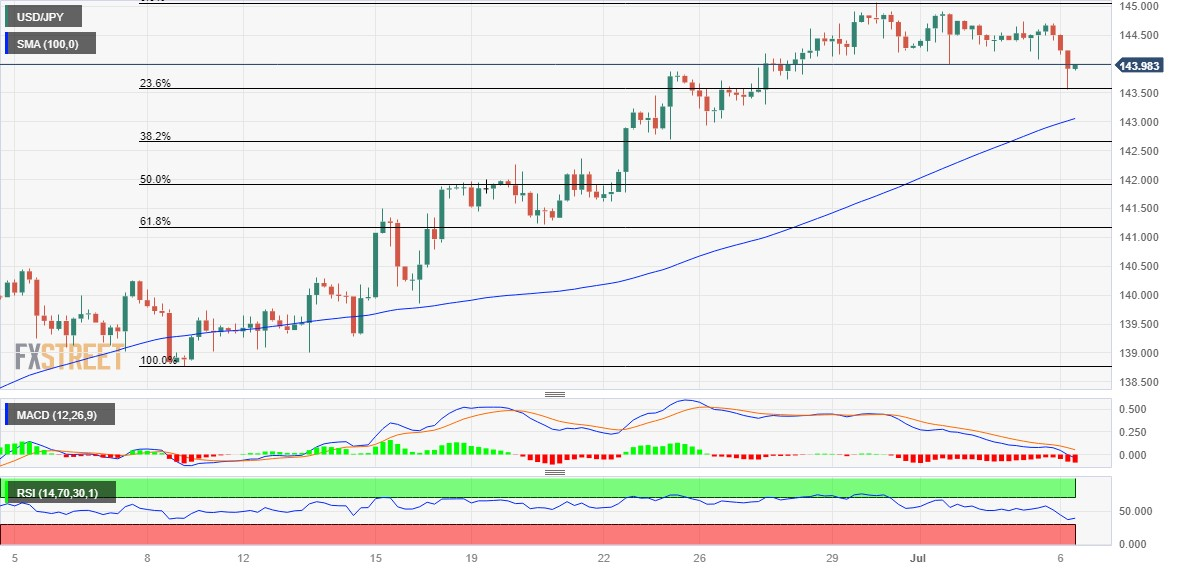
Key levels to watch
The continuation of the consolidation theme in USD/CNH appears the most likely scenario in the short-term horizon, comment Economist Lee Sue Ann and Markets Strategist Quek Ser Leang at UOB Group.
Key Quotes
24-hour view: The strong advance in USD that sent it to a high of 7.2649 came as a surprise (we were expecting it to dip to 7.2080). The rapid rise appears to be overdone but with no signs of weakness just yet, USD could test the resistance at 7.2800 before a pullback is likely. On the downside, a breach of 7.2350 (minor support is at 7.2470) would indicate that the current mild upward pressure has faded.
Next 1-3 weeks: There is no change in our update from yesterday (05 Jul, spot at 7.2280). As highlighted, the recent USD strength has ended USD is likely to trade in a range 7.1800/7.2800 for now.
Economists at ING analyze how UK data could impact the British Pound (GBP).
Watch for data outliers
Today’s focus will be on the Bank of England’s Decision Maker survey, which has pointed to easing pay and price expectations over the coming months.
Markets remain highly sensitive to any incoming developments on the price side and the still quite aggressive BoE tightening expectations (140 bps by January 2024) do point to some risk of recalibration (and GBP downside risks) around any release.
EUR/GBP has been weakening in the past two sessions, but may find some support around current levels and even converge back to 0.8600 as the overbought Pound faces some BoE repricing threat.
- The index faces some selling pressure and recedes to 103.20.
- Risk appetite regains traction and weighs on the greenback.
- ADP report, weekly Claims, ISM Services next on tap
The greenback comes under further downside pressure and approaches the key 103.00 region when tracked by the USD Index (DXY) on Thursday.
USD Index looks at data
The renewed improvement in the risk complex puts the dollar under some mild downside pressure and relegates the index to trade in the proximity of the key support at 103.00 the figure in the wake of the opening bell in Euroland on Thursday.
There are no meaningful changes to the monetary policy front so far, as investors continue to anticipate a 25 bps rate hike by the Federal Reserve at its meeting later in the month. On this, the imminent publication of the Nonfarm Payrolls (Friday) and US inflation figures (July 12) should have their say in the Committee’s decision on rates.
In the US docket, the labour market will take centre stage with the publication of the ADP report and the usual weekly Initial Jobless Claims, all preceding the relevant ISM Services and the final print of the S&P Global Services PMI.
What to look for around USD
The index keeps the trade above the 103.00 zone as key results from the US calendar are expected later in the session.
Meanwhile, the likelihood of another 25 bps hike at the Fed's upcoming meeting in July remains high, supported by the continued strength of key US fundamentals such as employment and prices.
This view was further bolstered by comments from Fed Chief Powell at the June FOMC event, who referred to the July meeting as "live" and indicated that most of the Committee is prepared to resume the tightening campaign as early as next month.
Key events in the US this week: ADP Employment Change, Balance of Trade, Initial Jobless Claims, Final Services PMI, ISM Services PMI (Thursday) – Nonfarm Payrolls, Unemployment Rate (Friday).
Eminent issues on the back boiler: Persistent debate over a soft/hard landing of the US economy. Terminal Interest rate near the peak vs. speculation of rate cuts in late 2023/early 2024. Fed’s pivot. Geopolitical effervescence vs. Russia and China. US-China trade conflict.
USD Index relevant levels
Now, the index is down 0.07% at 103.27 and faces the next support at 101.92 (monthly low June 16) followed by 100.78 (2023 low April 14) and finally 100.00 (round level). On the upside, the breakout of 103.54 (weekly high June 30) would open the door to 104.69 (monthly high May 31) and then 104.70 (200-day SMA).
- NZD/USD has climbed sharply to 0.6215 amid a sheer sell-off in the USD index.
- US corporate earnings are expected to remain uncertain amid higher interest rates.
- Going forward, US Employment and Services PMI data will be keenly watched.
The NZD/USD pair has printed a fresh two-week high at 0.6215 in the London session. The Kiwi asset has picked significant strength amid sheer weakness in the US Dollar Index (DXY). The USD Index has cracked sharply to near 103.10 as investors are getting cautious ahead of the Employment and Services PMI data.
Sell-off has been extended by the S&P500 futures are investors have been sidelined ahead of the second-quarter result season. Corporate earnings are expected to remain uncertain amid higher interest rates and tight credit conditions by commercial banks.
The release of the Federal Open Market Committee (FOMC) minutes showed that policymakers are worried that the economy faced headwinds from tighter credit conditions, including higher interest rates, for households and businesses, which would likely weigh on economic activity, hiring, and inflation, although the extent of this effect remained uncertain.
Going forward, US Nonfarm Payrolls (NFP) data will be keenly watched. The Unemployment Rate is expected to drop to 3.6% vs. the former release of 3.7%. While Nonfarm Payrolls (NFP) report for June is expected to show fresh 225K payrolls vs. the prior addition of 339K. Monthly Average Hourly Earnings are seen steady at 0.3%.
But before that, US ISM Services PMI will remain in focus. Unlike factory activities, US Services PMI is in expansion territory. The economic data is seen expanding to 51.0 vs. the former release of 50.3. While New Orders Index is seen declining to 53.3 against the prior release of 56.2.
On the New Zealand Dollar front, investors are worried that more interest rate hikes from the Reserve Bank of New Zealand (RBNZ) could falter the economic outlook. Economists at UOB cited that New Zealand has entered a technical recession, with the economy contracting by 0.1% q/q in 1Q23, in comparison to the revised 0.7% q/q fall in 4Q22 (-0.6% q/q previously). The reading was sharply below the Reserve Bank of New Zealand (RBNZ)’s projection for 0.3% growth.
The Rouble has resumed the weakening trend against the US Dollar that has been in place since late last year following a brief period of consolidation in May. Economists at MUFG Bank analyze USD/RUB outlook.
Oil to rebound in H2
For this year as a whole the surplus is expected to shrink in half from last year’s total of just over 10% of GDP reflecting: i) lower energy prices, ii) the EU’s Oil embargo, iii) the G7 oil price cap and recovering import demand. Russia remains heavily reliant on oil export revenues to help finance the cost of its invasion of Ukraine.
The ongoing decline in the price of Oil especially with Russian Oil continuing to trade at a discount is making life more challenging. Our commodity analyst does though expect the price of Oil to rebound in H2 in response to tightening demand and supply conditions.
The Rouble sell-off in June has also coincided with greater concern over political and social stability in Russia. The uprising by the Wagner mercenary group has cast doubt on President Putin's grip on power amidst the negative fallout from the ongoing conflict in Ukraine.
USD/RUB – Q3 2023 91.87 Q4 2023 94.88 Q1 2024 92.58 Q2 2024 92.82
EUR/RUB – Q3 2023 101.10 Q4 2023 106.30 Q1 2024 104.60 Q2 2024 102.10
Data continue to point to strong economic momentum in India. Economists at Commerzbank discuss INR outlook.
No urgency for another hike
Headline inflation has moderated in recent months to around 4% in May. This was helped by lower food and energy prices. It is back to the middle of RBI’s 2-6% inflation target. It provides scope for RBI to stay on hold for the foreseeable future.
There’s no urgency for another hike. Nevertheless, RBI would need to stay vigilant on a potential reversal in food prices. It would need to keep a close eye on the upcoming monsoon season and the underlying cost pressures.
The strong growth picture, stable inflation, and net equity inflows are all contributing to a relatively stable INR.
USD/INR continues to hold within the 81-83 range since the start of the year.
- Silver scales higher for the fifth straight day and sticks to gains near a two-week high.
- The intraday technical setup favours bulls and supports prospects for additional gains.
- A sustained break below the $22.70-65 area is needed to negate the positive outlook.
Silver attracts some buying for the fifth successive day on Thursday and sticks to its modest intraday gains through the early part of the European session. The white metal currently trades around the $23.20-$23.25 region, up nearly 0.50% for the day, and remains well within the striking distance of over a two-week high touched on Wednesday.
From a technical perspective, the recent recovery from the vicinity of the $22.00 mark, or the multi-month low touched in June, has been along an upward-sloping channel. Adding to this, the overnight sustained strength beyond the $23.00 round figure, which coincided with the 38.2% Fibonacci retracement level of the downfall from the June swing high, was seen as a fresh trigger for bullish traders. This, along with positive oscillators on hourly charts, supports prospects for a further appreciating move for the XAG/USD.
That said, technical indicators on the daily chart are yet to confirm a positive outlook and make it prudent to wait for some follow-through buying beyond the $23.35-$23.40 confluence before placing fresh bullish bets. The said barrier comprises the 200-period Simple Moving Average (SMA) on the 4-hour chart, the top end of the aforementioned channel and the 50% Fibo. level. A convincing breakthrough should lift the XAG/USD towards the $23.60 area, or the 61.8% Fibo., en route to the $24.00 mark and the $24.25 resistance.
On the flip side, the $23.00 resistance breakpoint (38.2% Fibo.) might now protect the immediate downside. Any further slide is more likely to attract some buying and remain limited near the $22.65-$22.70 area, or the 23.6% Fibo. level, which should act as a pivotal point for the XAG/USD. Failure to defend the said support levels could make the XAG/USD vulnerable to slide back towards challenging the $22.00 mark.
Some follow-through selling below the $22.00 mark should pave the way for deeper losses towards the $21.70-$21.65 zone en route to the $21.25 support before the XAG/USD eventually drops to the $21.00 round-figure mark.
Silver 4-hour chart
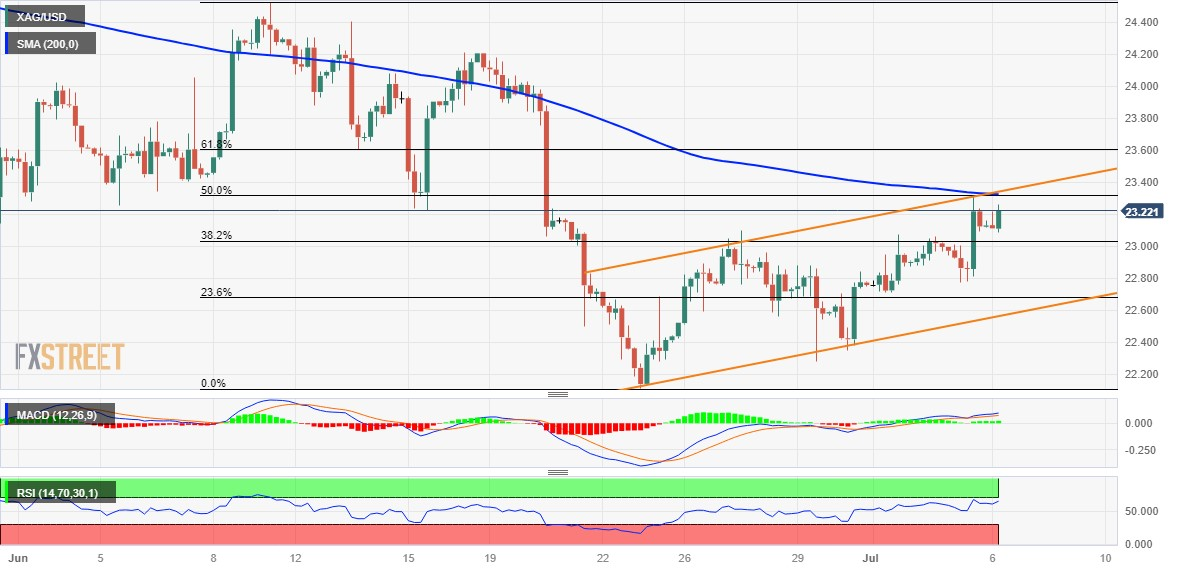
Key levels to watch
- USD/CAD has sensed selling pressure around 1.3300 as the focus shifts to labor market data.
- Contrary to the sell-off in the USD Index, 10-year US Treasury yields have jumped to near 3.96%.
- As per the estimates, the labor market added fresh 20K employees in June vs. a lay-off of 17.3K payrolls.
The USD/CAD pair has sensed delicate barricades near the round-level resistance of 1.3300 in the early London session. The Loonie asset is expected to remain on tenterhooks as investors have shifted their focus toward the release of the United States and Canada’s Employment data.
S&P500 futures have faced selling pressure in early Europe, portraying bearish market sentiment ahead of corporate earnings. The US Dollar Index (DXY) has dropped sharply to near 103.17 despite an interest rate hike by the Federal Reserve (Fed) in its July monetary policy meeting is widely anticipated.
Contrary to the sell-off in the USD Index, 10-year US Treasury yields have jumped to near 3.96%. As per the CME Fedwatch tool, more than 88% chances are in favor of a 25 basis point (bp) interest rate hike to 5.25-5.50%.
Going forward, investors will focus on the United States Employment data. The US Automatic Data Processing (ADP) Employment Change report is expected to show fresh additions of 228K in June vs. the former addition of 278K.
On the Canadian Dollar front, investors will also await labor market data, which will release on Friday at 12:30 GMT. As per the estimates, the labor market added fresh 20K employees in June vs. a lay-off of 17.3K payrolls. The Unemployment Rate is expected to increase to 5.3% against the 5.2% released last month. Apart from payroll figures, investors will focus on the Average Hourly Earnings data.
Meanwhile, oil prices are facing marginal pressure around $72.00, however, more upside is still favored as the impact of production cuts announcement by Saudi has not faded yet.
It is worth noting that Canada is the leading exporter of oil to the United States and higher oil prices would support the Canadian Dollar.
Economists at ING analyze EUR/USD outlook.
Downside risks into the weekend
Today, the Eurozone calendar is very light, and EUR/USD will trade in line with the Dollar's reaction to US data.
We suspect the pair is facing some downside risks in the latter part of the year after the FOMC minutes set the bar quite high for data to convince markets to price out Fed rate hikes.
EUR/USD could slip below 1.0800 before the end of the week if US data were to come in on the strong side.
USD/JPY now faces dwindling bets for a probable visit to the 145.50 region, suggest Economist Lee Sue Ann and Markets Strategist Quek Ser Leang at UOB Group.
Key Quotes
24-hour view: We noted yesterday that “the price actions appear to be consolidative” and we expected USD to trade in a range of 144.20/144.80. Our view of consolidation was not wrong even though USD traded in a lower range than expected (144.07/144.74). The underlying tone appears to have softened, and USD is likely to edge lower today. However, any decline is expected to face strong support at 143.90. Resistance is at 144.60, followed by 144.80.
Next 1-3 weeks: We continue to hold the same view as yesterday (05 Jul, spot at 144.50). As highlighted, the USD strength that started in the middle of last month is struggling to maintain its momentum. The prospect for the USD strength to extend to 145.50 appears to be low. All in all, only a break of 143.90 (no change in ‘strong support’ level) would suggest that the USD strength has come to an end.
CME Group’s flash data for natural gas futures markets noted traders added just 469 contracts to their open interest positions on Wednesday, reaching the second consecutive daily build. In the same direction, volume went up by around 82.2K contracts, partially reversing the previous strong pullback.
Natural Gas keeps the range bound theme intact
Wednesday saw a modest decline in prices of natural gas amidst increasing open interest and volume. Against that, the continuation of the corrective decline appears on the cards in the very near term, always amidst the broad consolidation phase in place since March.
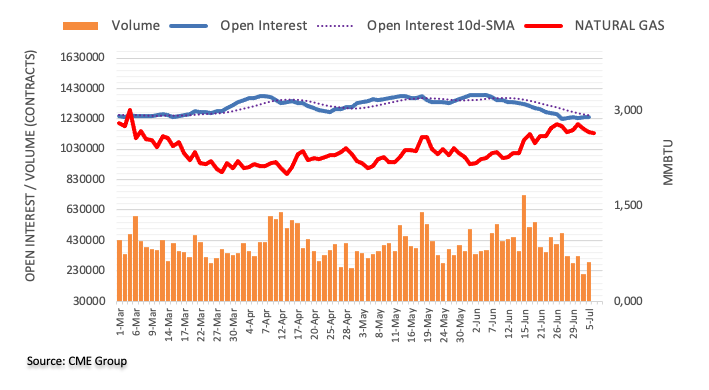
Economists at Commerzbank analyze the Bank of England's (BoE) policy outlook and its implications for the British Pound (GBP).
Fears of a recession in the UK
The fact that the BoE hesitated for so long means that in the end, an even more restrictive monetary policy will become necessary to anchor inflation expectations and limit second round effects, which might put strong pressure on the economy.
So whereas on the one hand, a more hawkish BoE approach – that is certainly the impression the central bank gave more recently – is positive for Sterling, the concerns about the effects on the economy leave a bitter taste. And that is likely to make it more difficult for Sterling to record gains, regardless of a continued rise in rate expectations.
- USD/CHF snaps three-day winning streak but struggles to defend bears.
- 200-HMA, two-week-long rising support line restrict immediate downside.
- Downward-sloping trend line from Monday challenges recovery moves ahead of top-tier US data.
- SNB’s Maechler teases further rate hikes, Fed’s 25 bps rate increase in July appears almost given.
USD/CHF pares intraday losses, the first in four, as it prods the 200-HMA amid the early hours of Thursday’s European session. In doing so, the Swiss Franc (CHF) pair justifies hawkish comments from Swiss National Bank (SNB) governing board member, Andrea Maechler, as well as cheers the broad US Dollar retreat. That said, the major currency pair bounces off an intraday low of 0.8965 to 0.8970 by the press time.
Earlier in the day, SNB’s Maechler said that the SNB does not rule out further rate hikes, per Reuters.
On the other hand, hawkish Federal Open Market Committee (FOMC) Minutes for the June meeting challenge the USD/CHF pair, which in turn justifies the quote’s rebound from the 200-Hour Moving Average (HMA) of around 0.8965.
However, the USD/CHF pair’s recovery needs validation from the weekly resistance line, close to 0.8995, as well as the 0.9000 round figure, to convince the buyers. Additionally important to watch will be today’s US ISM Services PMI and ADP Employment Change for June, as well as China headlines and recession woes.
Meanwhile, an upward-sloping support line from June 22, around 0.8950 by the press time, appears a tough nut to crack for the USD/CHF bears. Following that, it can slump to the yearly low, marked in June at around 0.8900.
USD/CHF: Hourly chart
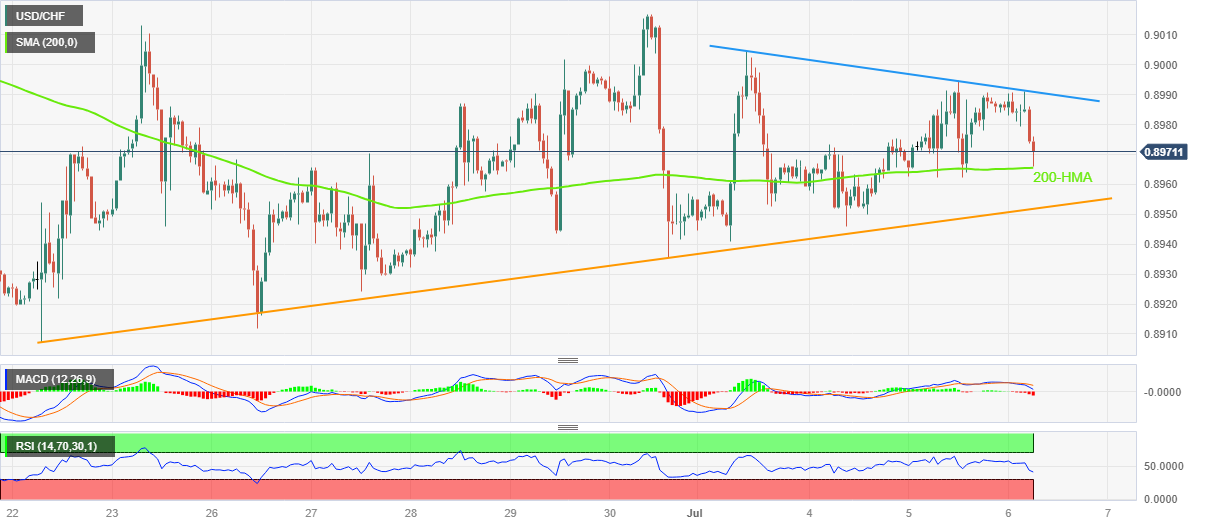
Trend: Limited downside expected
Here is what you need to know on Thursday, July 6:
The US Dollar Index edges lower but manages to hold above 103.00 after having closed in the positive territory for three straight days. The market mood remains cautious early Thursday, with US stock index futures trading in the red. ADP Employment Change for June, weekly Initial Jobless Claims and JOLTS Job Openings data for May will be featured in the US economic docket. The ISM will release the June Services PMI survey as well.
The Federal Open Market Committee (FOMC) released the minutes of its June meeting late Wednesday. The publication revealed that some officials favoured a 25 basis points (bps) rate hike. “Almost all participants noted that in their economic projections that they judged that additional increases in the target federal funds rate during 2023 would be appropriate," the Fed said, reaffirming the hawkish dot plot.
Wall Street's main indexes registered small losses on Wednesday, while the benchmark 10-year US Treasury bond yield climbed to its highest level since March, above 3.9%.
EUR/USD fell to a fresh three-week-low below 1.0840 early Thursday before recovering above 1.0860 in the European morning. The data from Germany revealed that Factory Orders rose 6.4% on a monthly basis in May following the 0.4% contraction recorded in April. This reading surpassed the market expectation for a 1.5% growth by a wide margin. Eurostat will publish May Retail Sales data later in the session.
Despite the broad US Dollar strength, GBP/USD stayed in a tight range on Wednesday. In the early European session, the pair continues to move sideways, slightly above 1.2700.
Following Wednesday's choppy action, USD/JPY came under renewed bearish pressure and dropped below 144.00.
Gold price climbed to a 10-day high of $1,935 on Wednesday but turned south when US yields surged higher. XAU/USD edges higher early Thursday and trades near $1,920.
USD/CAD gathered bullish momentum and rose above 1.3300 for the first time since mid-June early Thursday. Statistics Canada will release International Merchandise Trade data for May.
Bitcoin broke below $31,000 and closed in the negative territory for the second straight day on Wednesday. BTC/USD stages a rebound and trades above $30,500 in the European morning. Ethereum lost more than 1% on Wednesday and dropped below $1,900 before recovering back above that level early Thursday.
Economists at Rabobank analyze the minutes of the FOMC meeting on June 13-14.
Skipper Powell needs a minute
The minutes of the June 13-14 meeting of the FOMC reveal that some participants actually wanted to raise rates. In contrast, at the press conference on June 14, Powell said he wanted a more moderate pace.
Meanwhile, the Fed staff seems less convinced of its recession forecast. Or is this pressure from the FOMC?
Finally, in a show of thought control, the minutes did not use the words ‘skip’ or ‘pause.’ So, whatever it was in June: it was neither a skip nor a pause.
Looking ahead, we continue to have our doubts about a second rate hike after July, as long as Powell clings to a more moderate pace of the hiking cycle.
NZD/USD is expected to extend the upside on a breakout of the 0.6250 level, according to Economist Lee Sue Ann and Markets Strategist Quek Ser Leang at UOB Group.
Key Quotes
24-hour view: Yesterday, we held the view that “the overbought NZD strength is likely to extend but is unlikely to threaten last month’s high near 0.6250.” Our expectation did not materialize as NZD traded in a range of 0.6178/0.6206. The current price actions are likely part of a consolidation phase. Today, we expect NZD to trade in a range between 0.6155 and 0.6200.
Next 1-3 weeks: Yesterday (05 Jul, spot at 0.6190), we highlighted that “upward momentum is beginning to build, but NZD has to break and stay above last month’s high near 0.6250 before further advance is likely.” There is no change in our view. The chance of NZD breaking clearly above 0.6250 will remain intact as long as it stays above 0.6125 in the next few days.
Considering advanced prints from CME Group for crude oil futures markets, open interest reversed a multi-session downtrend and increased by around 4.3K contracts on Wednesday. In the same line, volume kept the choppy activity well in place and went up by nearly 401K contracts.
WTI now targets the $72.60 region
Wednesday’s gains in WTI prices was accompanied by rising open interest and volume. That said, the continuation of the multi-day recovery would have further legs to go and could challenge the late June tops around $72.60 per barrel.
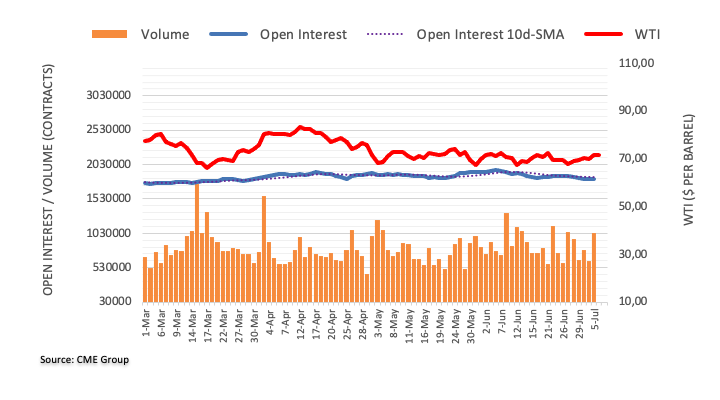
Kiwi edged lower on Wednesday, having fallen victim to a bounce in the USD as bond yields ratcheted another notch higher. Economists at ANZ Bank analyze NZD/USD outlook.
There are some offsets to higher US bond yields
Amid yet another quiet data week locally and with the RBNZ on track to pause next week we’re left mulling over things like the impact NZGB issuance will have on the Kiwi given most of the buyers will be foreign, and tentative signs USD/CNY may have topped out, potentially limiting AUD and NZD downside. So there are some offsets to higher US bond yields.
Support 0.5750/0.5900/0.6085
Resistance 0.6365/0.6540
- EUR/GBP picks up bids to recover from the lowest levels in two weeks.
- German Factory Order jumps in May, BoE Governor Andrew Bailey cites qualitative measures to tame inflation.
- Concerns about the need for a strong BoE rate hike contrasts with mixed EU data to keep sellers hopeful.
- Eurozone Retail Sales, risk catalysts eyed for clear directions.
EUR/GBP recovers from the lowest level in two weeks while bracing for the first daily gains in three around 0.8545 amid the early hours of the European trading session on Thursday. In doing so, the cross-currency pair cheers strong German Factory Orders data. However, Bank of England (BoE) Governor Andrew Bailey seems to challenge the corrective bounce, despite failing of late.
Germany’s Factory Orders jump 6.4% MoM in May versus 1.5% expected and -0.4% prior whereas the yearly figures improve to -4.3% from -9.9% previous readouts.
On Wednesday, the Eurozone Producer Price Index (PPI) declines to -1.5% YoY for May versus -1.3% expected and 0.9% prior (revised) whereas the monthly readings came in as -1.9% for the said month compared to -1.8% expected and -3.2% previous readings. Further, the final readings of Eurozone and German HCOB Composite PMIs for June ease to 50.6 and 49.9 versus 50.8 and 50.3 initial forecasts respectively. Further, the HCOB Services PMIs appear less worrisome as it matches the flash predictions of 54.1 for Germany but drops to 52.0 from 52.4 preliminary expectations.
On the other hand, BoE’s Bailey cites the need for more regulations on retail prices by saying that some retailers charge higher prices from customers. It’s worth noting that the “Old Lady”, as the BoE is informally known, is likely to propel the benchmark rates amid strong inflation but the recently softer activity data seem to prod the British Pound (GBP) buyers.
That said, UK’s S&P Global/CIPS Composite PMI and Services PMI both match initial forecasts of 52.8 and 53.7 preliminary forecasts for June.
It’s worth noting that the European Central Bank’s (ECB) latest monthly survey of consumer expectations for inflation suggests that inflation expectations among Eurozone consumers decreased further in May. However, European Central Bank (ECB) policymaker and Bundesbank Chief Joachim Nagel, as well as German Chancellor Olaf Scholz both suggest higher rates.
Looking forward, Eurozone Retail Sales for May, expected to deteriorate to -2.7% YOY from -2.6% prior, can recall the EUR/GBP bears. However, either a no change or firmer prints of the UK’s final readings of S&P Global Construction PMI for June, expected 50.9 versus 51.6 prior, becomes necessary for the same.
Technical analysis
EUR/GBP recovery remains elusive unless crossing the 50-DMA hurdle surrounding 0.8640. That said, a downward-sloping support line from September 2022, close to 0.8515 at the latest, appears a tough nut to crack for the bears.
Economist Lee Sue Ann and Markets Strategist Quek Ser Leang at UOB Group, GBP/USD is still expected to navigate the 1.2630-1.2800 range in the next few weeks.
Key Quotes
24-hour view: We indicated yesterday that “there is a chance for GBP to test 1.2755 before the risk of a pullback increases.” Our view did not materialize, as GBP traded in a relatively narrow range between 1.2689 and 1.2735 before closing largely unchanged (1.2703, -0.09%). The current price movements are likely part of a consolidation phase and GBP is likely to continue to trade in range, expected to be between 1.2670 and 1.2740.
Next 1-3 weeks: Our update from yesterday (05 Jul, spot at 1.2715) is still valid. As highlighted, for the time being, GBP is likely to consolidate and trade in a range of 1.2630/1.2800.
In June, the Indian Rupee reversed some of its losses from the previous month. Economists at MUFG Bank discuss INR outlook.
India’s current account deficit to widen from the March 2024 quarter
We expect India’s current account deficit to widen from the March 2024 quarter given the improvement in domestic demand we are forecasting, but to ultimately remain manageable at around 1-2% of GDP.
Portfolio flows have improved.
We maintain a positive view on INR in the year ahead.
USD/INR – Q3 2023 81.50 Q4 2023 80.50 Q1 2024 79.50 Q2 2024 79.00
Open interest in gold futures markets extended the uptrend on Wednesday, this time rising by around 6.5K contracts, according to preliminary readings from CME Group. Volume followed suit and went up by around 95.3K contracts after two consecutive daily drops.
Gold could revisit the June low near $1890
Wednesday’s downtick in gold prices came amidst increasing open interest and volume and is indicative that gold could face further weakness in the very near term. That said, a drop of the yellow metal to the June low of $1893 per troy ounce should not be ruled out.
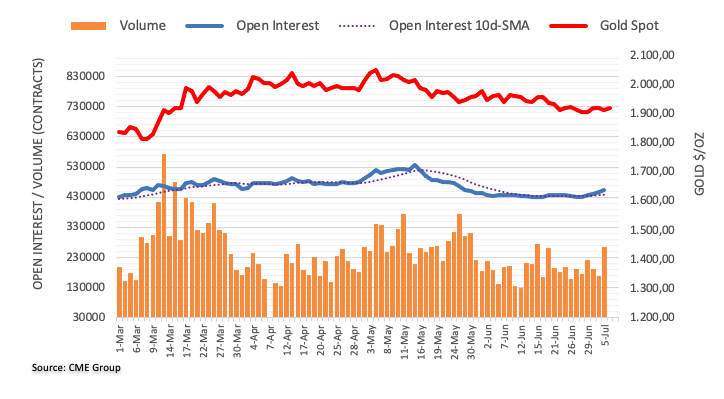
- EUR/USD has picked some strength near 1.0834 after upbeat German Factory Orders data.
- S&P500 futures have shown decent losses in Asia, portraying negative market sentiment.
- EUR/USD is hovering near the horizontal support of the Descending Triangle pattern plotted from 1.0844.
The EUR/USD pair has found an intermediate support around 1.0834 in the early European session. The shared currency pair has found support after the release of the upbeat German Factory Orders data. Monthly economic data expanded by 6.4% in May against expectations of 1.5%. In April, Factory Orders were contracted by 0.4%. On an annualized basis, Factory Orders have contracted by 4.3%.
The US Dollar Index (DXY) has corrected sharply to near 103.22 after posting a fresh four-day high at 103.40. S&P500 futures have shown decent losses in Asia, portraying negative market sentiment.
Going forward, investors will keep an eye on the United States ISM Services PMI data (June). As per the consensus, Services PMI is seen expanding to 51.0 vs. the former release of 50.3. While New Orders Index is seen declining to 53.3 against the prior release of 56.2.
EUR/USD is hovering near the horizontal support of the Descending Triangle chart pattern formed on a two-hour scale plotted from June 23 low at 1.0844. The downward-sloping trendline of the aforementioned chart pattern is placed from June 22 high at 1.1012.
The major currency pair is trading below the 50-period Exponential Moving Average (EMA) at 1.0885, which indicates that the short-term trend is bearish.
The Relative Strength Index (RSI) (14) has slipped into the bearish range of 20.00-40.00. Downside momentum would activate after a breakdown of the Descending Triangle pattern.
A decisive break below the intraday low at 1.0834 would expose the asset to June 15 low at 1.0804 followed by May 19 low at 1.0760.
On the contrary, a confident break above July 03 high at 1.0934 would send the asset towards June 27 high at 1.0977 and June 22 high at 1.1012.
EUR/USD two-hour chart
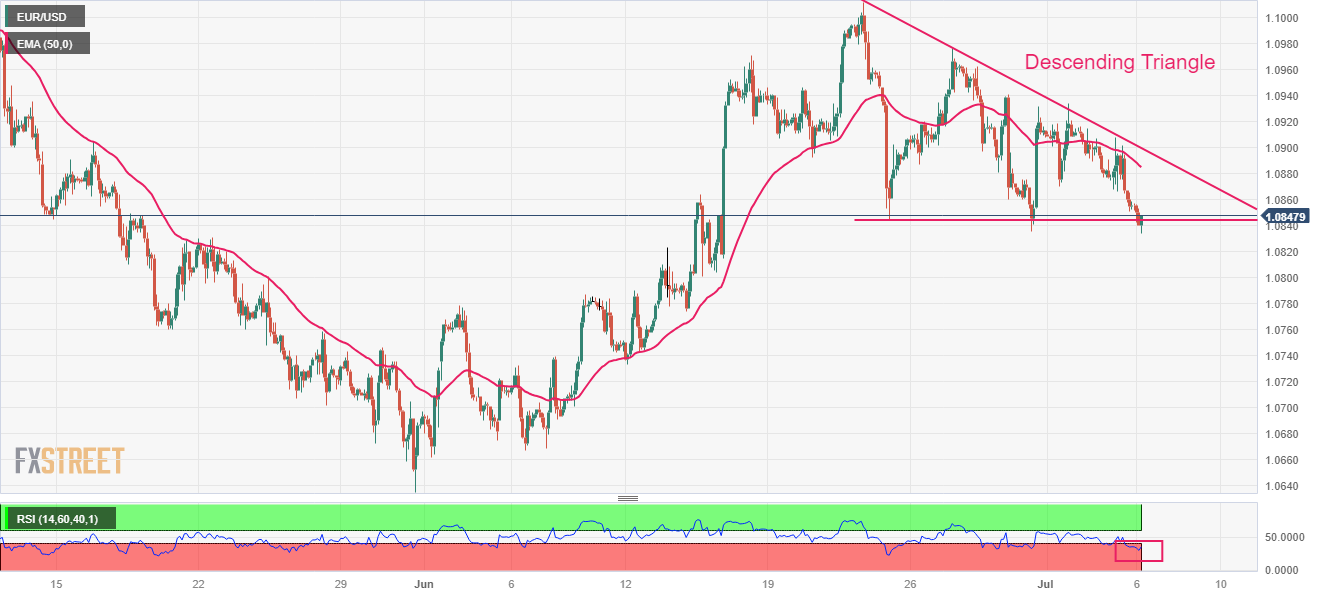
- Gold Price reverses the previous day’s U-turn from two-week high, eyes the first weekly gain in four.
- Fears of higher rates, Sino-American tension and China economic woes prod XAU/USD bulls.
- Softer US data fails to justify hawkish Fed bets, suggesting proximity to policy pivot and favor Gold buyers in turn.
- $20.00 trading range restricts immediate XAU/USD moves but doubts about US puts a floor under the Gold Price.
Gold Price (XAU/USD) remains on the front foot as markets brace for early signals of the US employment, inflation and activity conditions amid the risk-off mood. It’s worth noting, however, that the US Dollar’s struggle to justify the sour sentiment, maybe due to Wednesday’s softer US data, seems to underpin the Gold Price upside, enabling it to challenge the three-week downturn.
That said, fears of economic slowdown join the major central banks’ push for higher rates, despite softer data, to spoil the risk appetite and fuel the XAU/USD of late, due to the market’s traditional haven status. However, fears about China’s economic recovery and heavy outflow of funds from Beijing to neighboring countries prod the Gold buyers. On the same line could be the recently escalated US-China trade war, as well as geopolitical woes surrounding Russia, Ukraine and Iran.
While portraying the mood, the US stock futures drop for the third consecutive day and the Asian equities are down too. More importantly, the US 10-year and two-year Treasury bond yields jumped to a fresh three-month high before retreating in the last hour.
Looking ahead, today’s US ISM Services PMI and ADP Employment Change for June, as well as China headlines and recession woes, will be crucial for the Gold Price directions.
Also read: Gold Price Forecast: XAU/USD needs a sustained move above $1,918 to unleash the upside
Gold Price: Key levels to watch
Our Technical Confluence Indicator shows that the Gold Price edges higher within a $20.00 trading range, between $1,916 and $1,936, as markets brace for the top-tier US data.
That said, a convergence of the Fibonacci 23.6% on one-month joins the previous daily low to highlight the short-term key support around $1,916.
Alternatively, the previous daily and weekly high, as well as the middle band of the Bollinger on the daily chart, highlights the $1,936 as the short-term key upside hurdle for the XAU/USD.
That said, Fibonacci 61.8% on one-day and 38.2% on one-month joins Pivot Point one-day R1 to signal the $1,928-29 as nearby upside hurdle.
Meanwhile, 5-DMA and Fibonacci 61.8% on one-week marks the $1,918 as the nearby support for the Gold sellers to watch during the metal’s fresh fall.
It should be noted that a convergence of the Fibonacci 38.2% on one-week and Pivot Point one-day S1 acts as the final defense of the Gold buyers near $1,908 while Pivot Point one-week R1 pin-points $1,940 as an extra filter towards the north.
Here is how it looks on the tool
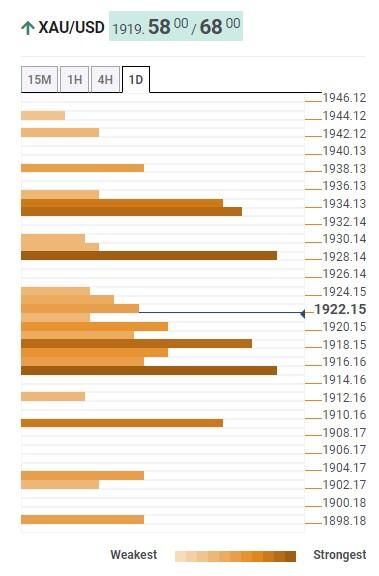
About Technical Confluences Detector
The TCD (Technical Confluences Detector) is a tool to locate and point out those price levels where there is a congestion of indicators, moving averages, Fibonacci levels, Pivot Points, etc. If you are a short-term trader, you will find entry points for counter-trend strategies and hunt a few points at a time. If you are a medium-to-long-term trader, this tool will allow you to know in advance the price levels where a medium-to-long-term trend may stop and rest, where to unwind positions, or where to increase your position size.
FX option expiries for July 6 NY cut at 10:00 Eastern Time, via DTCC, can be found below.
- EUR/USD: EUR amounts
- 1.0730-35 1.4b
- 1.0800 451m
- 1.0840 519m
- 1.0890 775m
- 1.0950 785m
- 1.1000 412m
- GBP/USD: GBP amounts
- 1.2850 490m
- USD/JPY: USD amounts
- 143.00 1.4b
- 144.00 2.4b
- 145.00 1.1b
- 146.00 475m
- USD/CAD: USD amounts
- 1.3200 722m
- 1.3350 876m
- German Factory Orders rebounded 6.4% MoM in May vs. 1.5% expected.
- German Factory output dropped 4.3% YoY in May vs. -9.9% previous.
- EUR/USD picks up bids near 1.0860 on strong German data.
The German Factory Orders data showed an improvement in May, suggesting that the manufacturing sector recovery is finding its momentum.
Contracts for goods ‘Made in Germany’ came in at 6.4% on the month vs. 1.5% expected and -0.4% previous, the latest data published by the Federal Statistics Office showed on Thursday.
On a yearly basis, Germany’s Industrial Orders arrived at -4.3% in the reported month, compared with -9.9% booked in April.
FX implications
The shared currency draws some support from the strong German factory data. At the time of writing, EUR/USD is trading at 1.0861, holding 0.10% gains on the day.
In the opinion of Economist Lee Sue Ann and Markets Strategist Quek Ser Leang at UOB Group, EUR/USD could slip back to the 1.0805 region in the next few weeks.
Key Quotes
24-hour view: We highlighted yesterday that EUR was under mild downward pressure and could edge lower but “is unlikely to break 1.0835.” We added, “there is another support at 1.0855.” Our view was not wrong as EUR fell to a low of 1.0849. While there is no significant increase in momentum, the risk for EUR remains on the downside. This time around, EUR could dip below 1.0835, possibly testing the next major support at 1.0805. The downside risk is intact as long as EUR stays below 1.0895 (minor resistance is at 1.0775).
Next 1-3 weeks: Yesterday (05 Jul, spot at 1.0880), we indicated that the bias for EUR is tilted to the downside. However, we were of the view that “any decline is likely to face solid support at 1.0835, ahead of 1.0805.” EUR then fell to a low of 1.0849. Downward momentum has improved, and the chance of EUR dropping to 1.0805 has increased. Overall, only a breach of 1.0925 (‘strong resistance’ level previously at 1.0950) would suggest EUR is not weakening further.
- AUD/USD has found some support near 0.6640 amid mild pressure in the USD Index.
- FOMC members favored a skip in the policy-tightening regime to buy some time to assess the economy’s progress.
- The Australian Dollar failed to find strength despite better-than-anticipated monthly Trade Balance data.
The AUD/USD pair has found some support near 0.6640 in the late Asian session. The Aussie asset has sensed some buying interest after mild pressure in the US Dollar Index (DXY). The USD Index has witnessed a minor sell-off after printing a fresh four-day high at 103.40.
Mild losses posted by S&P500 on Wednesday have extended sharply overnight as fears of a recession in the United States have elevated considering the fact that the Federal Reserve (Fed) will raise interest rates further. In June monetary policy meeting, Fed policymakers were mixed about skipping the rate-tightening spell.
Federal Open Market Committee (FOMC) members judged it appropriate or acceptable to maintain the target range for the federal funds rate at 5 to 5-1/4 percent at this meeting. And, favored a skip in the policy-tightening regime to buy some time to assess the economy’s progress toward achieving price stability and full employment levels.
On Thursday, investors will focus on the Automatic Data Processing (ADP) Employment Change report. As per the estimates, the US ADP report will show fresh additions of 228K in June vs. the former addition of 278K.
Meanwhile, the Australian Dollar failed to find strength despite better-than-anticipated monthly Trade Balance data. Headline Goods/Services Trade Balance came in at 11,791M MoM for May, compared with the expectations of 10,500M and 11,158M prior.
This week, the Reserve Bank of Australia (RBA) kept the interest rate decision unchanged at 4.10%. RBA Governor Philip Lowe kept monetary policy steady as the monthly Consumer Price Index (CPI) softened sharply to 5.6% vs. the prior release of 6.8%.
Swiss National Bank (SNB) governing board member, Andrea Maechler, made some comments on the interest rates outlook during her speech on Thursday.
She said: “It cannot be ruled out that we will need to further hike interest rates.”
Market reaction
On the hawkish remarks, USD/CHF is testing daily lows near 0.8980, down 0.07% on the day.
- GBP/JPY eyes the biggest daily loss in a week after confirming bearish chart formation, pressured around intraday low of late.
- US 10-year, two-year Treasury bond yields refresh three-month high amid hawkish Fed bets, recession woes.
- Theoretical target of 180.90 can prod GBP/JPY bears on their way to 180.00 psychological magnet.
- Bulls have a long road to travel before retaking control, 184.00 is the key.
GBP/JPY takes offers to refresh the weekly low around 182.70 heading into Thursday’s London open. The cross-currency pair's latest weakness could be linked to the market's risk-off mood. However, the firmer yields should have prod the quote of late.
Also read: Asian stocks drop as S&P500 Futures slide to 4,470, US Treasury bond yields refresh three-month high
In doing so, the cross-currency pair justifies the previous day’s confirmation of the one-week-old rising wedge bearish chart pattern. Additionally favoring the pair sellers is the quote’s sustained break of the 200-Hour Moving Average (HMA), as well as the bearish MACD signals.
That said, the GBP/JPY becomes vulnerable to testing the rising wedge’s theoretical target of around 180.90. However, the late June swing high near 181.50 and the 180.00 round figure are extra filters toward the south that gain the market’s attention.
Meanwhile, the June 20 swing low of around 179.90 appears the last defense of the short-term GBP/JPY buyers.
On the flip side, 200-HMA and the bottom line of the aforementioned wedge limit short-term recovery of the GBP/JPY pair around 183.10 and 183.20 in that order.
Following that, an upward-sloping support line from June 21 and the stated wedge’s top line, respectively near 183.50 and 184.05, can challenge the GBP/JPY buyers before giving them control.
GBP/JPY: Hourly chart
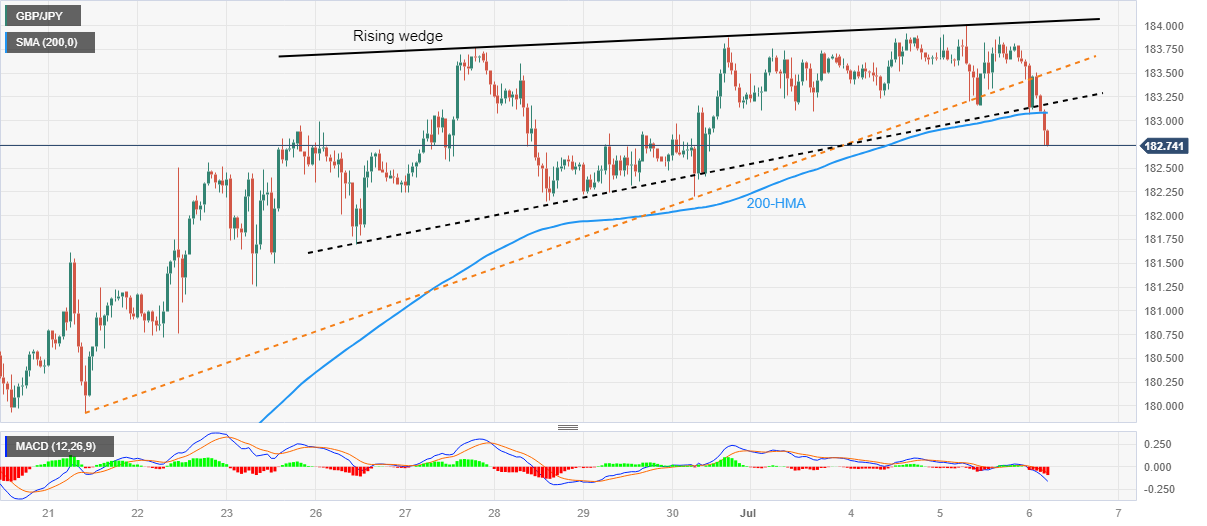
Trend: Further weakness expected
“There is evidence some retailers are overcharging customers,” Bank of England (BoE) Governor, Andrew Bailey, said on Thursday.
He said that “moves by regulators on retail prices will help to lower inflation.”
Market reaction
At the time of writing, GBP/USD is back on the bids at around 1.2710, still hovering within its weekly range.
- USD/JPY has printed a fresh weekly low around 144.00 as fears of BoJ’s intervention have elevated.
- Contrary to the sell-off in the USD/JPY pair, the US Dollar Index has printed a fresh four-day high at 103.40.
- FOMC minutes conveyed that policymakers were mixed between a small interest rate hike and a skip.
The USD/JPY pair has slipped sharply to near 144.00 in the Tokyo session. The asset has registered a fresh weekly low at 143.92 as fears of intervention in the currency market by the Bank of Japan (BoJ) have soared.
S&P500 futures have posted significant losses in the Asian session. US equities also faced selling pressure on Wednesday after a holiday mood amid uncertainty propelled ahead of the quarterly result season. Investors are not anticipating overall decent improvement as monetary policy remained extremely tight by the Federal Reserve (Fed) and commercial banks maintained tight credit conditions to protect asset quality in a turbulent environment.
Contrary to the sell-off in the USD/JPY pair, the US Dollar Index has printed a fresh four-day high at 103.40 as investors are confident that an interest rate hike by 25 basis points (bps) from the Fed cannot be ruled out.
Federal Open Market Committee (FOMC) minutes released on Wednesday conveyed that policymakers were mixed between a small interest rate hike and a skip. Fed policymakers are uncertain about the economic outlook considering that inflation is still elevated and will take time to reach the 2% target.
Meanwhile, fears of intervention in the FX domain by the BoJ or Japanese diplomats have elevated as the Japanese Yen has depreciated to 145.00 against the US Dollar. Earlier, a poll from Reuters showed that Japanese diplomats could intervene in the FX domain if the Japanese Yen depreciates to 145.00 against the US Dollar.
In addition to a Reuters poll, Japan's top financial diplomat Masato Kanda said this week that authorities were in close contact with US Treasury Secretary Janet Yellen and other overseas officials "almost every day" on currencies and broader financial markets, as reported by Reuters.
- USD/TRY fades latest run-up amid pre-data consolidation, edges lower around intraday bottom of late.
- Turkish inflation catalysts like CPI and PPI came in softer on YoY for June but PPI MoM jumped.
- Hawkish Fed Minutes, risk-off mood propel US Dollar and put a floor under Turkish Lira price.
- US ADP Employment Change, ISM Services PMI eyed for clear directions.
USD/TRY clings to mild losses around 26.05 heading into Thursday’s European session. In doing so, the Turkish Lira (TRY) pair ignores the broad US Dollar gains while printing the first daily loss, so far, in three.
While tracing the catalysts, receding fears of worrisome inflation leading to the economic debacle in Turkiye seem to allow the TRY to lick its wounds of late. On Wednesday, Turkish Consumer Price Index (CPI) and Producer Price Index (PPI) for June eased to 38.21% and 40.42% on a yearly basis versus 39.59% and 40.76% respectively priors. Notably, the PPI MoM jumped to 6.5% from 0.65% prior.
Late in June, the Central Bank of the Republic of Türkiye (CBRT) hiked rates for the first time since August 2021, to 15% from 8.5% versus the 21% market forecasts. Together with the Interest Rate Decision, the CBRT also reiterated its commitment to the 5% inflation target and did not rule out additional monetary tightening measures to achieve this target. The same initially drowned the TRY but it appears that the move was rightly taken after the previous day’s softer inflation data.
On the other hand, downbeat US Factory Orders failed to push back the market’s hawkish Fed bets surrounding a 0.25% rate hike in July, which in turn joins the broad risk-off mood to fuel the US Dollar and put a floor under the USD/TRY price.
That said, a jump in Chinese investor buying Hong Kong and Macau wealth products join pessimism about China’s top-tier housing players like Shimao Group, as well as the government-backed Sino-Ocean Group, to amplify economic fears about the world’s biggest industrial player China. Additionally, tit-for-tat trade war measures by the US and China join the
While portraying the mood, S&P500 Futures dropped for the third consecutive day to 4,4712, down 0.30% intraday, whereas the US 10-year and two-year Treasury bond yields jump to a fresh three-month high of around 3.96% and 4.97% in that order.
Moving on, today’s US ISM Services PMI and ADP Employment Change for June, as well as China headlines and recession woes, will be crucial for clear market directions.
Technical analysis
USD/TRY sellers should wait for a clear downside break of the weekly low of around 25.82 for fresh short positions. That said, the 5-DMA level of around 25.97 restricts immediate downside of the Turkish Lira pair. Alternatively, the all-time high around 26.08 appears to be the buyer’s favorite entry-point for portraying a gradual rise towards the 30.00 psychological magnet.
- USD/CHF attracts buying for the fourth straight day and is supported by modest USD strength.
- The hawkish FOMC minutes reaffirm bets for a 25 bps lift-off in July and underpins the buck.
- The softer risk tone benefits the safe-haven CHF and acts as a headwind ahead of the US data.
The USD/CHF pair trades with a positive bias for the fourth straight day on Thursday, albeit lacks follow-through and remains below the 0.9000 psychological mark through the Asian session.
The US Dollar (USD) adds to its weekly gains and climbs back closer to its highest level since June 12 touched last Friday, which, in turn, is seen as a key factor acting as a tailwind for the USD/CHF pair. The minutes from the June FOMC meeting released on Wednesday revealed that almost all members supported resuming rate hikes as inflation remains unacceptably high, reaffirming bets for a 25 bps lift-off at the upcoming FOMC meeting on July 25-26. This led to the overnight sharp rise in the US Treasury bond yields and continues to lend support to the Greenback.
The USD/CHF pair, however, still seem to struggle to capitalize on the move beyond the 50-day Simple Moving Average (SMA) and remains confined in a familiar trading range held over the past three weeks or so. A generally weaker risk tone, which tends to underpin the safe-haven Swiss Franc, holds back traders from placing aggressive bullish bets and seems to cap the upside for the major. The market sentiment remains fragile in the wake of worries over a global economic slowdown and the potential risk of a further escalation in the US-China trade conflict.
It is worth recalling that China introduced fresh export curbs on two metals - widely used in semiconductors, electric vehicles and high-tech industries - to the US. The abrupt move, which is set to take effect on August 1, might cause more disruption to global trade and hamper already weak economic conditions. This, in turn, takes its toll on the global risk sentiment and makes it prudent to wait for sustained strength and acceptance above the 0.9000 psychological mark before positioning for any further near-term appreciating move for the USD/CHF pair.
Market participants now look forward to the US economic docket, featuring the release of the ADP report on private-sector employment, the usual Weekly Initial Jobless Claims, the ISM Services PMI and JOLTS Job Openings data. Apart from this, the US bond yields, will influence the USD price dynamics, which, along with the broader risk sentiment, should provide some impetus to the USD/CHF pair. The focus, however, will remain glued to the closely-watched US monthly employment details, popularly known as the NFP report on Friday.
Technical levels to watch
- USD/CAD justifies 21-EMA breakout to refresh three-week high.
- Risk-aversion, hawkish Fed bets underpin US Dollar run-up, weigh on Oil price.
- Upbeat oscillators suggest further upside towards 50-EMA, support-turned-resistance line confluence.
- Mid-tier US, Canada statistics eyed for clear directions past 1.3360.
USD/CAD picks up bids to refresh the highest levels in three weeks around 1.3305 heading into Thursday’s European session.
In doing so, the Loonie pair takes clues from the market’s broad risk aversion which propels the US Dollar while weighing on the prices of commodities and antipodeans. It’s worth noting that the grim concerns about China, one of the world’s biggest commodity users exert additional downside pressure on the Oil Price, which in turn propels the major currency pair due to Canada’s reliance on energy export as the key earning source.
Also read: Asian stocks drop as S&P500 Futures slide to 4,470, US Treasury bond yields refresh three-month high
Technically, a clear upside break of the 21-Exponential Moving Average (EMA), around 1.3275 by the press time, joins the bullish MACD signals and upbeat RSI (14) line, not overbought, to propel the Loonie pair.
That said, lows marked during April and May near 1.3300 and 1.3315 restrict immediate upside of the USD/CAD pair ahead of the key 1.3360 resistance confluence comprising the 50-EMA and previous support line stretched from February.
On the flip side, pullback in the USD/CAD price remains elusive unless staying beyond the one-week-old rising support line, near 1.3245 at the latest.
Following that, the 1.3200 round figure and the latest multi-month low marked the last week around 1.3115 can’t be ruled out.
USD/CAD: Daily chart
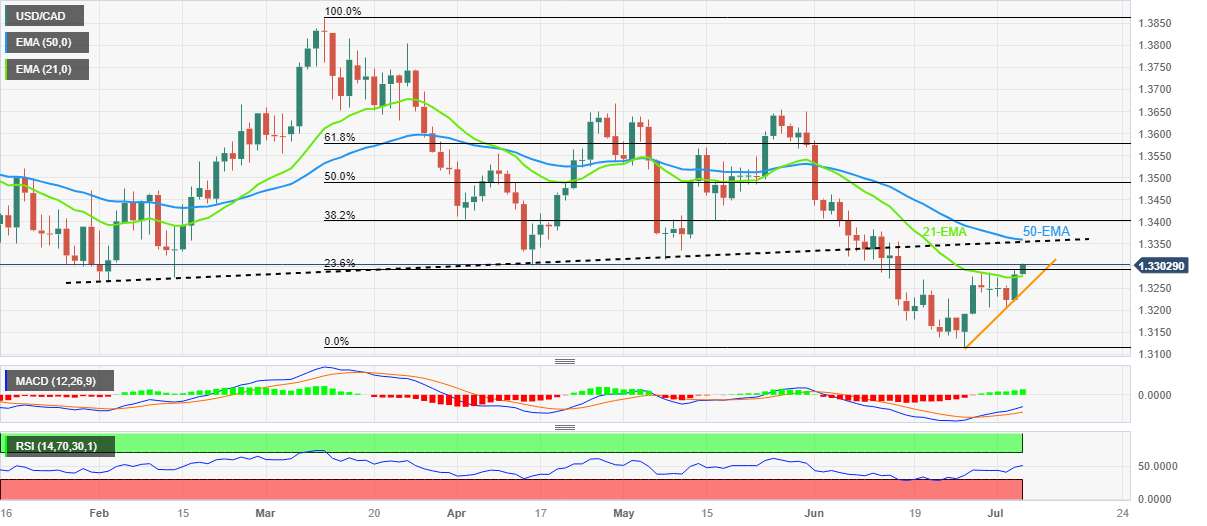
Trend: Limited upside expected
- USD/INR scales higher for the third straight day and climbs to a multi-week high on Thursday.
- The overnight sustained breakout through the 82.25 confluence hurdle favours bullish traders.
- Acceptance back below the 82.00 mark is needed to negate the near-term positive outlook.
The USD/INR pair attracts some buying for the third successive day on Thursday and climbs to over a three-week high during the Asian session. Spot prices currently trade just below mid-82.00s, up less than 0.10% for the day, and seem poised to build on the recent strong recovery from the 81.75 region, or the lowest level since May 8 touched on Monday.
The overnight sustained strength beyond the top end of a multi-week-old trading range, which coincided with a technically significant 200-day Simple Moving Average (SMA), was seen as a fresh trigger for bullish traders. Moreover, oscillators on the daily chart have been gaining positive traction and are still far from being in the overbought zone. This, in turn, validates the positive outlook for the USD/INR pair.
From current levels, the 82.70-82.75 region is likely to act as an immediate resistance, above which spot prices could make a fresh attempt to conquer the 83.00 round figure. The said handle has been acting as a strong barrier since October 2022. Hence, some follow-through buying will mark a fresh bullish breakout and pave the way for a further near-term appreciating move for the USD/INR pair.
On the flip side, the 200-day SMA, around the 82.25 region, now seems to protect the immediate downside ahead of the 82.00 mark. This is followed by the monthly low, around the 81.75 zone, which if broken decisively will shift the bias in favour of bearish traders. The USD/INR pair might then accelerate the slide towards the 81.50 support before dropping to test sub-81.00 levels or the YTD low touched in January.
USD/INR daily chart
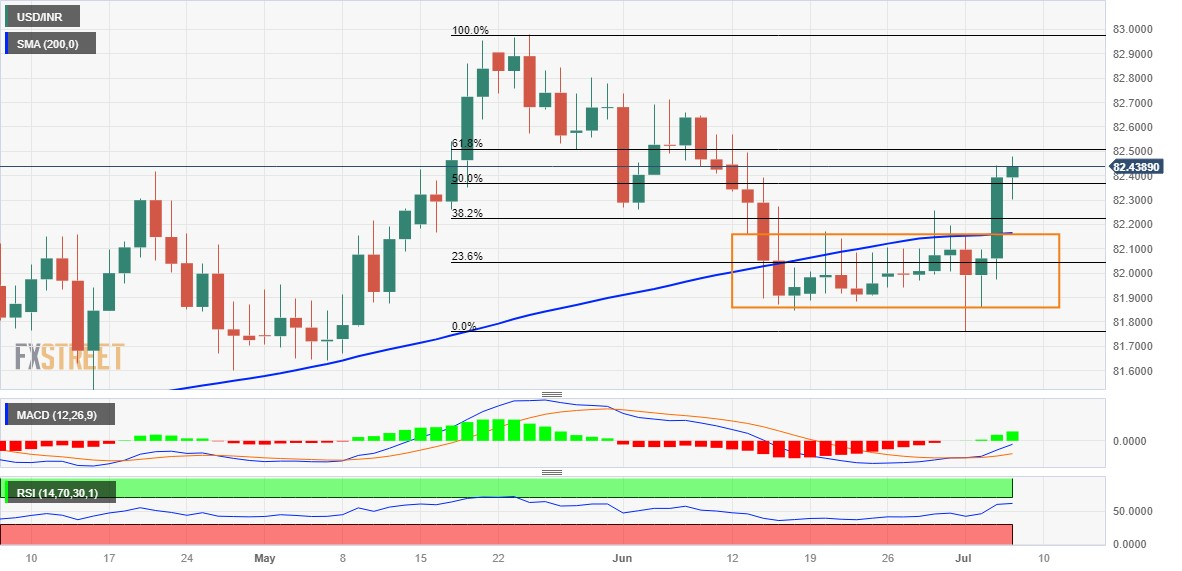
Key levels to watch
- Market sentiment worsens as China-linked fears escalate, economic slowdown looms.
- S&P500 Futures drop for third consecutive day after Wall Street’s downbeat close.
- US 10-year, two-year Treasury bond yields cheer hawkish Fed Minutes, market’s rush towards risk-safety by refreshing multi-day top.
- Asian equities also portray risk-off mood led by Hang Seng’s 3.25% intraday loss.
The risk profile remains downbeat during early Thursday as market players sense an economic slowdown amid softer statistics from top-tier economies and due to geopolitical tensions. Adding strength to the sour sentiment are hawkish concerns of the leading central banks.
While portraying the mood, S&P500 Futures dropped for the third consecutive day to 4,4712, down 0.30% intraday, whereas the US 10-year and two-year Treasury bond yields jump to a fresh three-month high of around 3.96% and 4.97% in that order.
Additionally, the MSCI’s index of the Asia-Pacific shares, ex-Japan, extends the previous day’s pullback from a two-week high, down 1.60% intraday by the press time of early Thursday in Europe.
It should be noted that Japan’s Nikkei 225 drops 1.50% in a day while Hong Kong’s Hang Seng gains major attention by declining nearly 3.5% intraday at the latest. In doing so, the equities in Hong Kong fail to justify the Chinese influx of funds amid fears of a recession in Beijing.
That said, a jump in Chinese investor buying Hong Kong and Macau wealth products join pessimism about China’s top-tier housing players like Shimao Group, as well as the government-backed Sino-Ocean Group, to amplify economic fears about the world’s biggest industrial player China.
Elsewhere, tit-for-tat trade war measures by the US and China join the hawkish Federal Open Market Committee (FOMC) Minutes for the June meeting to weigh on the sentiment.
It’s worth noting that downbeat US Factory Orders failed to push back the market’s hawkish Fed bets surrounding a 0.25% rate hike in July. On the same line, softer statistics from Europe and the UK also couldn’t tame expectations of witnessing “higher for longer rates” at the European Central Bank (ECB) and the Bank of England (BoE).
With this, stocks in China, Australia and New Zealand see the red whereas equities from Indonesia and India struggle to fight back the bears. It should be observed that Australia’s upbeat trade numbers for May allowed Aussie equity sellers to take a breather.
Looking ahead, today’s US ISM Services PMI and ADP Employment Change for June, as well as China headlines and recession woes, will be crucial for clear market directions. Additionally, a likely deterioration in the Eurozone Retail Sales for May should also be watched carefully for extra guidance.
Also read: Forex Today: US Dollar shows positive signs, attention turns to US labor market
- EUR/JPY drifts lower for the third successive day and drops to a nearly two-week low on Friday.
- Intervention fears, a softer risk tone benefit the safe-haven JPY and exert pressure on the cross.
- The ECB-BoJ policy divergence favours bullish traders and should help limit any further decline.
The EUR/JPY cross remains under some selling pressure for the third successive day on Thursday and drops to a one-and-half-week low, around the 156.35-156.30 region during the Asian session.
The potential risk of intervention by Japanese authorities, along with a weaker tone around the equity markets, revives demand for the safe-haven Japanese Yen (JPY). The shared currency, on the other hand, is undermined by less hawkish remarks by the European Central Bank (ECB) Governing Council member Ignazio Visco on Wednesday, backing the case for a pause in the rate-hiking cycle. Addressing the annual general meeting of the Italian Banking Association (ABI), Visco said rates had reached restrictive territory and that the ECB could bring inflation back in line with its price stability goal by holding rates for a certain period of time rather than hiking them more.
Market participants, however, seem convinced that the ECB will increase borrowing costs again in July and September meetings despite signs the Euro Zone economy is flagging. In fact, ECB President Christine Lagarde said last week that inflation in the Euro Zone is too high and is set to remain so for too long. This, in turn, cemented market expectations for a ninth consecutive lift-off in July and also lifted bets for more rate hikes from the ECB this year. Even the International Monetary Fund (IMF) said on Friday that the ECB should continue to raise rates to bring down inflation. In contrast, the Bank of Japan (BoJ) is expected to stick to its dovish stance, which should limit losses for the EUR/JPY cross.
Market participants seem convinced that BoJ's negative interest-rate policy will remain in place at least until next year. Moreover, BoJ Governor Kazuo Ueda, despite the fact that inflation in Japan has exceeded the 2% goal for more than a year, ruled out the possibility of any change in ultra-loose policy settings and signalled no immediate plans to alter the yield curve control measures. This makes it prudent to wait for strong follow-through selling before placing fresh bearish bets around the EUR/JPY cross and positioning for an extension of the recent pullback from the 158.00 mark, or its highest level since September 2008 touched last Wednesday.
Technical levels to watch
- Gold price regains some positive traction on Thursday and recovers a part of the overnight losses.
- A generally weaker risk tone benefits the safe-haven XAU/USD, though the upside seems limited.
- Hawkish major central banks might hold back bulls from placing aggressive bets around the metal.
Gold price attracts some dip-buying during the Asian session on Thursday and reverses a part of the previous day's retracement slide from the $1,935 region, or a nearly two-week high. The XAU/USD currently trades just below the $1,920 level, up 0.20% for the day, though any meaningful appreciating move still seems elusive.
Economic woes and worsening US-China ties lend support to Gold price
A private survey showed on Wednesday that business activity in China’s service sector grew less than expected in June and further fueled worries about a global economic downturn. Apart from this, the potential risk of a further escalation in a trade conflict between China and the US - the world’s largest economies - tempers investors' appetite for perceived riskier assets. This is evident from a generally weaker tone around the equity markets and turning out to be a key factor lending some support to the safe-haven Gold price. That said, the prospects for further policy tightening by the Federal Reserve (Fed) might hold back traders from placing aggressive bullish bets around the non-yielding yellow metal.
Bets for more rate hikes by Federal Reserve might cap XAU/USD
The minutes from the June Federal Open Market Committee (FOMC) policy meeting released on Wednesday revealed that almost all members supported resuming rate hikes as inflation remains unacceptably high. Furthermore, some members were in Favor of raising rates rather than pausing at the June meeting, flagging a very tight labor market that threatens to push wages and inflation higher. The outlook reaffirms market bets for a 25 basis points (bps) lift-off at the upcoming FOMC meeting on July 25-26 and led to the overnight sharp rise in the US Treasury bond yields. This, along with a more hawkish stance adopted by other major central banks, might contribute to capping gains for the Gold price.
Hawkish outlooks by BoE and ECB warrant caution for bulls
The current market pricing indicates the possibility of a further 130 bps of tightening by the Bank of England (BoE) by the end of this year. Moreover, BoE Governor Andrew Bailey last week justified the decision to hike interest rates by a jumbo 50 bps on June 22 and said that rates could remain at peak levels for longer than traders currently expect. Moreover, the European Central Bank (ECB) policymakers expect to increase borrowing costs again in July and September meetings despite signs the Euro Zone economy is flagging. This makes it prudent to wait for strong follow-through buying before positioning for the resumption of the recent recovery in the Gold price from its lowest level since mid-March.
Gold price technical outlook
From a technical perspective, the $1,925-$1,926 region is likely to act as an immediate hurdle ahead of the overnight swing high, around the $1,935 area. This is followed by the 100-day Simple Moving Average (SMA), currently around the $1,947 zone. A sustained strength beyond the latter might trigger a short-covering rally and lift the Gold price to the $1,962-$1,964 area en route to the $1,970-$1,972 supply zone. Some follow-through buying should allow bulls to reclaim the $2,000 psychological mark and test the $2,010-$2,012 resistance.
On the flip side, the $1,915-$1,914 region now seems to protect the immediate downside ahead of the $1,908-$1,907 area and the $1,900 mark. The next relevant support is pegged near the $1,893-$1,892 region or the multi-month low touched last week. A convincing break below the said support levels will make the Gold price vulnerable to accelerate the downward trajectory towards the very important 200-day Simple Moving Average (SMA), currently around the $1,860 zone.
Key levels to watch
- WTI clings to mild gains around two-week high, up for the third consecutive day.
- Clear break of six-week-old falling resistance line, weekly bullish channel keep Oil buyers hopeful.
- Overbought RSI, cautious mood ahead of key US data prod energy bulls.
- WTI crude oil sellers need to break $70.70 to retake control.
WTI crude oil struggles to refresh a two-week high while sticking to mild gains around $72.00 amid early Thursday in Europe. In doing so, the black gold remains within a one-week-old rising trend channel as it makes rounds to the weekly top.
The oil benchmark’s latest upside also takes clues from the clear upside break of a previously important resistance line stretched from late May, as well as the quote’s run-up beyond the 61.8% Fibonacci retracement of May 24 to June 12 downside, near $71.70-65 at the latest.
Further, bullish MACD signals also favor black gold buyers.
However, the overbought RSI conditions and the nearness to the one-week-old rising channel’s top line, close to $72.40 by the press time, challenge the WTI bulls. Following that, the late June swing high of around $72.70 can act as the final defense of the oil bears.
Meanwhile, the market’s positioning for the US ISM Services PMI and ADP Employment Change for June, as well as the Eurozone Retail Sales for May, seem to play its role in challenging the Oil traders of late.
That said, a downside break of $71.65 can trigger a quick fall of the WTI price towards a $70.80 support confluence including the 50% Fibonacci retracement and 200-SMA.
Though, the aforementioned bullish channel’s support line, close to $70.70 at the latest, can challenge the Oil bears afterward.
WTI crude oil: Four-hour chart
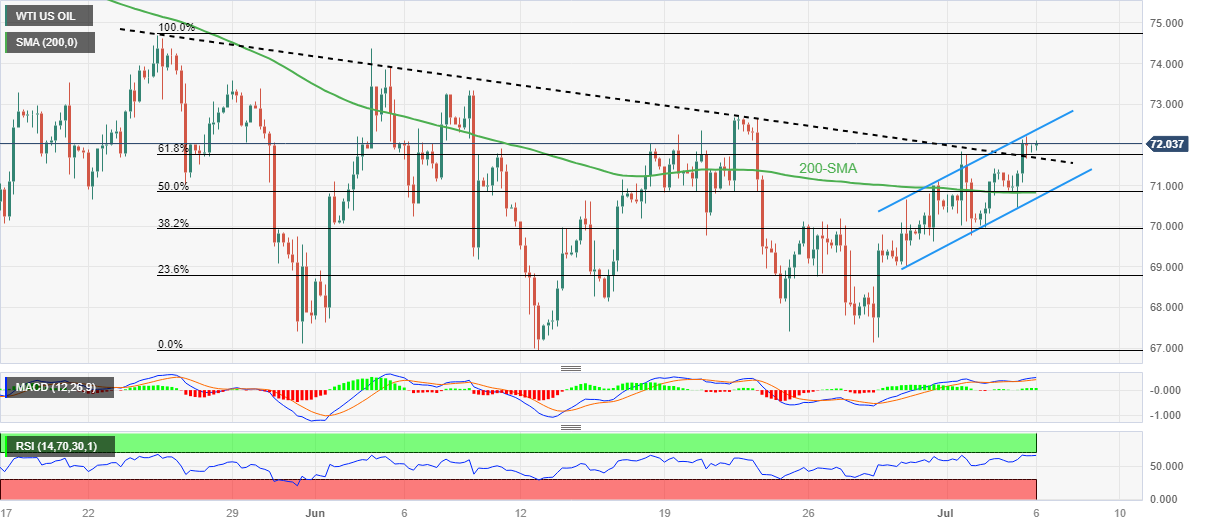
Trend: Pullback expected
- EUR/USD rebounds from intraday/weekly low but struggles to gain upside momentum.
- 50-DMA break, hawkish Fed Minutes and risk-off mood together weighs on the Euro pair.
- Softer US data prods sellers ahead of mid-tier Eurozone, United States data.
- Headlines about China, recession will also be important for fresh impulse.
EUR/USD picks up bids to consolidate recent losses around the weekly low as it bounces off 1.0842 to 1.0850 amid very early Thursday morning in Europe. In doing so, the Euro pair prepares for the top-tier statistics from Eurozone and the United States.
That said, the market’s preparations for Thursday’s Eurozone Retail Sales for May, US ADP Employment Change for June and the US ISM Services PMI for June appear to recently trigger the EUR/USD pair’s corrective bounce. Adding strength to the rebound could be the softer US data and a cautious mood ahead of the key catalysts. That said, US Factory Orders reprints 0.3% MoM growth for May versus 0.8% expected. The official publication also mentioned that the new orders for manufactured durable goods in May rose for the third consecutive month. Earlier in the week, the US ISM Manufacturing PMI and S&P Manufacturing PMI came in softer and weighed on the US Dollar Index.
It’s worth observing that the hawkish Federal Reserve (Fed) Meeting Minutes join mixed comments from the European Central Bank (ECB) officials and the risk-negative catalysts to weigh on the EUR/USD price.
On Wednesday, European Central Bank (ECB) policymaker and Bundesbank Chief Joachim Nagel said, “interest rates must rise further,” adding that it is “too early to say how far.” On the same line, German Chancellor Olaf Scholz said on Wednesday, “We cannot carry on with 0% interest rates,” and noted that they support the European Central Bank (ECB) in its battle against inflation, as reported by Reuters.
Alternatively, ECB policymaker Ignazio Visco stated, “More rate hikes are not the only way to curb inflation.”
It should be noted that the ECB’s latest monthly survey of consumer expectations for inflation suggests that inflation expectations among Eurozone consumers decreased further in May for the next year, but remained unchanged for upcoming three years.
Talking about the data, the Eurozone Producer Price Index (PPI) declines to -1.5% YoY for May versus -1.3% expected and 0.9% prior (revised) whereas the monthly readings came in as -1.9% for the said month compared to -1.8% expected and -3.2% previous readings.
Further, the final readings of Eurozone and German HCOB Composite PMIs for June ease to 50.6 and 49.9 versus 50.8 and 50.3 initial forecasts respectively. Further, the HCOB Services PMIs appear less worrisome as it matches the flash predictions of 54.1 for Germany but drops to 52.0 from 52.4 preliminary expectations.
On the other hand, a jump in Chinese investor buying Hong Kong and Macau wealth products join pessimism about China’s top-tier housing players like Shimao Group, as well as the government-backed Sino-Ocean Group, to amplify economic fears about the world’s biggest industrial player China.
Further, downbeat prints of China’s Caixin Services PMI for June, to 53.9 versus 57.1 prior, joined the escalating fears of the US-China tussle amid fresh warnings of further trade restrictions from Beijing to weigh on the sentiment and fuel the DXY.
That said, China’s Global Times and former Vice Commerce Minister flagged hardships for the US IT companies, as well as metal players. Earlier on Wednesday, China announced abrupt controls on exports of some gallium and germanium products, effective from August 1. The dragon nation’s latest retaliation is in reaction to the US curb on AI chips’ shipments to Beijing.
Amid these plays, the markets almost priced in the July Fed rate hike by 0.25% and propel the US Dollar Index while the Wall Street benchmarks closed in the red and the US Treasury bond yields jumped. It should be noted that the S&P500 Futures print mild losses whereas the US 10-year and two-year Treasury bond yields refresh a three-month high at the latest.
Looking forward, today’s US ISM Services PMI and ADP Employment Change for June, as well as China headlines and recession woes, will be crucial for clear directions of the EUR/USD. Additionally, a likely deterioration in the Eurozone Retail Sales for May should also be watched carefully for clear directions.
Technical analysis
A daily closing beneath the 1.0865 key support, now immediate resistance comprising the 50-DMA and 38.2% Fibonacci retracement of January-April upside, keeps EUR/USD sellers hopeful. However, a convergence of the 100-DMA and a fortnight-old descending trend line, around 1.0825 by the press time, appears a tough nut to crack for the Euro bears.
| Raw materials | Closed | Change, % |
|---|---|---|
| Silver | 23.127 | 0.78 |
| Gold | 1914.84 | -0.59 |
| Palladium | 1253.4 | 0.96 |
- GBP/USD lacks any firm intraday direction and oscillates in a narrow range on Friday.
- Bets for more Fed rate hikes, a softer risk tone underpins the USD and caps the pair.
- Looming recession risks act as a headwind for the GBP and favours bearish traders.
The GBP/USD pair struggles to gain any meaningful traction and seesaws between tepid gains/minor losses during the Asian session on Thursday. Spot prices, however, manage to defend the 200-hour Simple Moving Average (SMA) and currently trade around the 1.2700 mark, nearly unchanged for the day.
The prospects for further policy tightening by the Federal Reserve (Fed) push the US Dollar (USD) to a fresh weekly high, which, in turn, acts as a headwind for the GBP/USD pair. In fact, minutes from the June FOMC policy meeting released on Wednesday showed that almost all members supported resuming rate hikes as inflation remains unacceptably high. Furthermore, some members were in Favor of raising rates rather than pausing at the June meeting, flagging a very tight labor market that threatens to push wages and inflation higher.
The hawkish outlook reaffirms market bets for a 25 bps lift-off at the upcoming FOMC meeting on July 25-26 and led to the overnight sharp rise in the US Treasury bond yields. Apart from this, a generally weaker risk tone further benefits the safe-haven Greenback and should contribute to keeping a lid on any meaningful upside for the GBP/USD pair. Against the backdrop of worries about a global economic downturn, the risk of a further escalation in a trade conflict between China and the US tempers investors' appetite for perceived riskier assets.
Apart from this, fears that more aggressive interest rate hikes by the Bank of England (BoE) could push the UK economy into recession suggests that the path of least resistance for the GBP/USD pair is to the downside. In fact, the markets are currently pricing in the possibility of a further 130 bps of tightening through to the turn of the year. Moreover, BoE Governor Andrew Bailey last week justified the decision to hike interest rates by a jumbo 50 bps on June 22 and said that rates could remain at peak levels for longer than traders currently expect.
The aforementioned fundamental backdrop warrants some caution before positioning for an extension of the recent bounce from sub-1.2600 levels touched last week. Market participants now look to the UK Construction PMI for some impetus ahead of the US economic docket - featuring the ADP report on private-sector employment, the usual Weekly Initial Jobless Claims, the ISM Services PMI and JOLTS Job Openings data. The focus, however, remains glued to the closely-watched US monthly jobs data - popularly known as the NFP report on Friday.
Technical levels to watch
- AUD/USD bounces off intraday low to print mild gains, pokes 50-SMA hurdle.
- Australia Trade Surplus widens, Exports and Imports grew in May.
- Clear downside break of weekly bullish channel, bearish MACD signals keep Aussie bears hopeful.
- Bulls need to cross 0.6700 trend line hurdle to retake control.
AUD/USD portrays a corrective bounce from the intraday low while picking up bids to 0.6665 after Australia trade numbers for May offer a positive surprise on early Thursday. In doing so, the Aussie pair prods the 50-SMA hurdle while reversing the previous day’s U-turn from the highest level in a week, as well as pares the first daily loss in five.
That said, Australia’s trade surplus rises to 11,791M MoM for May, compared with the expectations of 10,500M and 11,158M prior. Further, Exports grow 4.0% on a monthly basis while reversing the previous contraction of 5.0%. On the same line, imports rises 2% MoM and seasonally adjusted vs. 2.0% booked in April.
Also read: Australia Trade Surplus increases in May, AUD/USD remains pressured around mid-0.6600s
While the latest Aussie data lures AUD/USD buyers, the broad risk-off mood and the previous day’s rejection of a one-week-old bullish channel join the bearish MACD signals to keep the pair sellers hopeful.
That said, the latest recovery needs to reverse from the 50-SMA hurdle surrounding 0.6665, if not the stated channel’s bottom line of around 0.6670 and the 200-SMA level of near 0.6675 could challenge the AUD/USD bulls afterward.
It should be noted that the risk-barometer pair’s recovery past 0.6675 needs validation from a downward-sloping resistance line from June 27, close to the 0.6700 round figure, to convince the buyers.
Meanwhile, a one-week-old horizontal support zone around 0.6640-35 restricts the immediate downside of the AUD/USD pair before directing it towards the previous weekly bottom of 0.6595.
Following that, March’s low of near 0.6565 can act as the last defense of the AUD/USD buyers before highlighting the fears of witnessing a fresh yearly low, currently around 0.6460.
AUD/USD: Four-hour chart
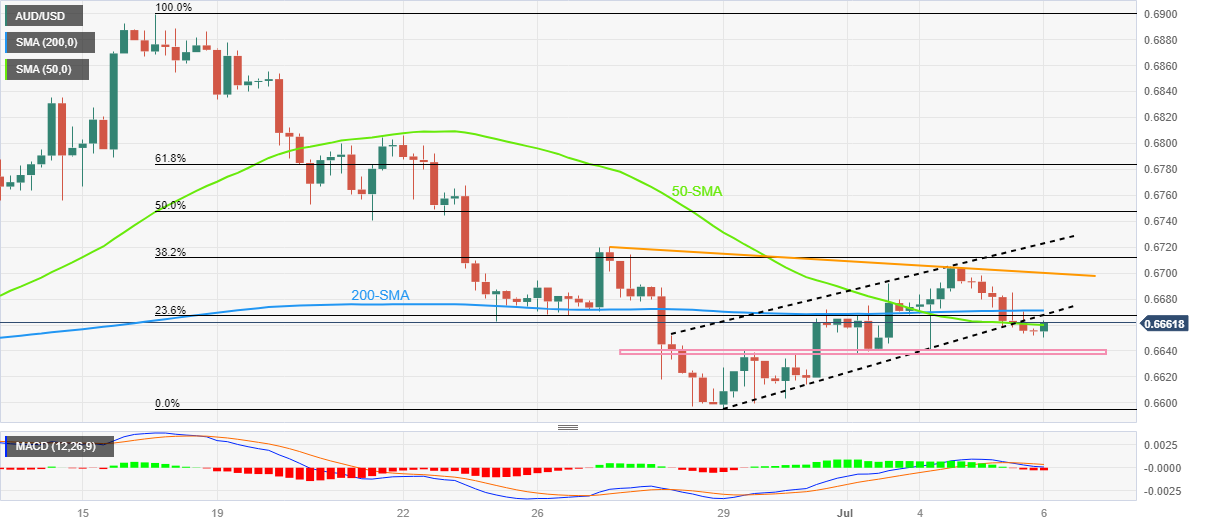
Trend: Bearish
- NZD/USD struggles to extend the previous day’s U-turn from a fortnight high, seesaws near intraday low of late.
- Downside break of weekly support line, bearish MACD signals favor Kiwi sellers.
- Two-month-old previous resistance line limits immediate fall, convergence of 50-EMA, 200-EMA appears strong support.
- Recovery needs validation from 0.6250 to convince bulls.
NZD/USD remains directionless at the intraday low surrounding 0.6170 during the mid-Asian session on Thursday. In doing so, the Kiwi pair struggles to extend the previous day’s losses, the first in four, while also reversing the pullback from the highest levels in two weeks.
The kiwi pair’s previous losses could be linked to a downside break of the one-week-old rising trend line, now immediate resistance around 0.6200, as well as bearish MACD signals. Adding strength to the downside bias could be the RSI (14) line’s U-turn from the overbought territory.
However, the resistance-turned-support stretched from early May, near 0.6165 by the press time, restricts the immediate downside of the NZD/USD pair.
Following that, a convergence of the 50-bar and 200-bar Exponential Moving Averages (EMAs), around 0.6150 at the latest, will be a tough nut to crack for the Kiwi bears.
Meanwhile, a corrective bounce past the immediate weekly resistance line, previous support near 0.6200, can propel the NZD/USD buyers to challenge the weekly high of around 0.6215.
Even so, the 61.8% Fibonacci retracement of the pair’s May month downside and the previous monthly peak, respectively near 0.6235 and 0.6250, could challenge the NZD/USD bulls before giving them control.
NZD/USD: Four-hour chart

Trend: Corrective bounce expected
- USD/CAD scales higher for the second straight day and hits a three-week high on Thursday.
- The Fed’s hawkish outlook, along with a softer risk tone, benefits the USD and lend support.
- Bullish Crude Oil prices could underpin the Loonie and cap gains ahead of the US macro data.
The USD/CAD pair attracts some buying for the second straight day on Thursday and touches a fresh three-week high during the Asian session, which bulls now awaiting a sustained move beyond the 1.33000 mark before placing fresh bets.
The US Dollar (USD) adds to its weekly gains and remains well supported by the Federal Reserve's (Fed) hawkish outlook, which, in turn, is seen as a key factor acting as a tailwind for the USD/CAD pair. The US central bank, at its June policy meeting, opted for a pause to assess the impact of 10 previous rate hikes, though the minutes released Wednesday indicated a greater likelihood of further policy tightening. In fact, almost all members supported resuming rate hikes at a future meeting as inflation remains unacceptably high.
The prospects for further policy tightening by the Fed led to the overnight sharp rise in the US Treasury bond yields, which, along with a generally weaker risk tone, further benefit the safe-haven Greenback. The disappointing release of services data from China on Wednesday exacerbated worries about a global economic downturn. Apart from this, the potential risk of a further escalation in a trade conflict between China and the US - the world’s largest economies - tempers investors' appetite for perceived riskier assets.
China introduced export curbs on two metals - widely used in semiconductors, electric vehicles and high-tech industries - to the US. The abrupt move is viewed as a response to efforts by the US to curtail China's technological advancements and might cause more disruption to global trade. This takes its toll on the global risk sentiment and drives some haven flows towards the buck. That said, bullish Crude Oil prices underpin the commodity-linked Loonie and could act as a headwind for the USD/CAD pair, at least for the time being.
Market participants now look forward to the US economic docket - featuring the ADP report on private-sector employment, the usual Weekly Initial Jobless Claims, the ISM Services PMI and JOLTS Job Openings data. Apart from this, the US bond yields and the broader risk sentiment will drive the USD demand. This, along with Crude Oil price dynamics, should contribute to producing short-term trading opportunities around the USD/CAD pair ahead of the critical monthly jobs data from Canada and the US, due for release on Friday.
Technical levels to watch
According to the latest Aussie foreign trade data published by the Australian Bureau of Statistics, Australia’s trade surplus rose more than expected in May.
That said, the headline Goods/Services Trade Balance came in at 11,791M MoM for May, compared with the expectations of 10,500M and 11,158M prior.
Further details reveal that Australia May Goods/Services Exports rose 4.0% on a monthly basis while reversing the previous contraction of 5.0%.
That said, the country’s May Goods/Services Imports rose 2% MoM and seasonally adjusted vs. 2.0% booked in April.
AUD/USD appears unimpressed
Despite the upbeat Aussie data, AUD/USD remains pressured around the intraday low near 0.6650, keeping the previous day’s U-turn from the weekly top.
Also read: AUD/USD awaits Australia trade data around 0.6650 as China woes, hawkish Fed clues lure sellers
People’s Bank of China (PBoC) set the USD/CNY central rate at 7.2098 on Thursday, versus previous fix of 7.1968 and market expectations of 7.2510. It's worth noting that the USD/CNY closed near 7.2520 the previous day. With this, the Chinese central bank's onshore Yuan (CNY) rate consolidates the week-start pullback from the yearly top.
Apart from the USD/CNY fix, the PBoC also unveiled details of its Open Market Operations (OMO) while saying that the Chinese central bank injects 2 billion Yuan via 7-day reverse repos at 1.90% vs prior 1.90%.
It's worth noting that the 193 billion Yuan of RRs mature today, which in turn highlights a net drain of 191 billion Yuan via the OMOs.
About PBOC fix
China maintains strict control of the yuan’s rate on the mainland.
The onshore yuan (CNY) differs from the offshore one (CNH) in trading restrictions, this last one is not as tightly controlled.
Each morning, the People’s Bank of China (PBOC) sets a so-called daily midpoint fix, based on the yuan’s previous day's closing level and quotations taken from the inter-bank dealer.
- US Dollar Index seesaws around weekly top after rising in the last three consecutive days.
- FOMC Minutes confirm July rate hike even as softer US data prods DXY bulls.
- Traders seek solace in US Dollar as yields portray recession fears, China-linked headlines appear grim.
- US ISM Services PMI, ADP Employment Change eyed, risk catalysts are the key for clear directions.
US Dollar Index (DXY) seesaws at the weekly top surrounding 103.40 as market players await the key US data, as well as risk catalysts, to keep the DXY bulls on the board amid an early Asian session on Thursday.
In doing so, the US Dollar Index stays on the front foot after posting a three-day winning streak, mainly backed by the hawkish Federal Reserve (Fed) concerns and Chine-inflicted fears, while ignoring the softer US data.
As per the latest, Federal Open Market Committee (FOMC) Minutes for the June meeting, almost all members agreed to a pause in the rate hike trajectory while some policymakers showed an inclination for a July rate hike of around 0.25%. The same highlights hawkish bias at the US central bank and propel the US Dollar Index.
Elsewhere, downbeat prints of China’s Caixin Services PMI for June, to 53.9 versus 57.1 prior, joined the escalating fears of the US-China tussle amid fresh warnings of further trade restrictions from Beijing to weigh on the sentiment and fuel the DXY. That said, China’s Global Times and former Vice Commerce Minister flagged hardships for the US IT companies, as well as metal players. Earlier on Wednesday, China announced abrupt controls on exports of some gallium and germanium products, effective from August 1. The dragon nation’s latest retaliation is in reaction to the US curb on AI chips’ shipments to Beijing.
It should be noted that a jump in Chinese investor buying Hong Kong and Macau wealth products join pessimism about China’s top-tier housing players like Shimao Group, as well as the government-backed Sino-Ocean Group, to amplify economic fears about the world’s biggest industrial player China.
Apart from what’s mentioned above, a Reuters poll of 80 FX strategists for the US Dollar also underpins a bullish bias for the greenback. That said, the survey of the Forex strategists cites the hopes of further DXY run-up on resilient US economy. The poll also hints at receding US Dollar short positions while quoting the data from the Commodity Futures Trading Commission to also favor the US Dollar Index bulls.
Alternatively, softer US data and a cautious mood ahead of the key catalysts prod the DXY bulls. That said, US Factory Orders reprints 0.3% MoM growth for May versus 0.8% expected. The official publication also mentioned that the new orders for manufactured durable goods in May rose for the third consecutive month. Earlier in the week, the US ISM Manufacturing PMI and S&P Manufacturing PMI came in softer and weighed on the US Dollar Index.
Against this backdrop, the markets almost priced in the June Fed rate hike by 0.25% and propel the US Dollar Index while the Wall Street benchmarks closed in the red and the US Treasury bond yields jumped.
Looking ahead, today’s US ISM Services PMI and ADP Employment Change for June, as well as China headlines and recession woes, will be crucial for clear directions of the DXY.
Technical analysis
Although a fortnight-old restricts immediate downside of the US Dollar Index around 103.25, backed by bullish MACD signals and upbeat RSI (14) conditions, the DXY bulls need validation from a downward-sloping resistance line from June 12, near 103.50, to keep the reins.
- USD/JPY once again fails ahead of the 145.00 mark and meets with a fresh supply on Thursday.
- Intervention fears, along with a softer risk tone, benefit the safe-haven JPY and exert pressure.
- The BoJ-Fed policy divergence favours bullish traders and should help limit any further losses.
The USD/JPY pair struggles to capitalize on the previous day's goodish bounce of nearly 70 pips from the 144.00 neighbourhood and meets with a fresh supply during the Asian session on Thursday. Spot prices currently trade around the 144.35 region, down 0.35% for the day, though remain well within a familiar band held over the past one-and-half-week or so.
The potential risk of intervention by Japanese authorities above the 145.00 psychological mark, along with a weaker tone around the equity markets, benefits the Japanese Yen (JPY) and exerts pressure on the USD/JPY pair. Against the backdrop of worries about a global economic downturn, the worsening US-China relations turn out to be a key factor weighing on investors' sentiment. In fact, China introduced export curbs on two metals - widely used in semiconductors, electric vehicles and high-tech industries - to the US, which is viewed as a response to efforts by the US to curtail China's technological advancements. This marks a potential escalation in a trade conflict between the world’s largest economies and might cause more disruption to global trade. This, in turn, could further undermine already weak economic conditions and takes its toll on the risk sentiment.
That said, a more dovish stance adopted by the Bank of Japan (BoJ) might keep a lid on any meaningful gains for the JPY and help limit the downside for the USD/JPY pair, at least for the time being. Investors seem convinced that BoJ's negative interest-rate policy will remain in place at least until next year. Moreover, BoJ Governor Kazuo Ueda, despite the fact that inflation in Japan has exceeded the 2% goal for more than a year, ruled out the possibility of any change in ultra-loose policy settings and signalled no immediate plans to alter the yield curve control measures. This marks a big divergence in comparison to the Federal Reserve's (Fed) hawkish outlook, indicating a greater likelihood of further policy tightening to combat inflation.
In fact, minutes from the June FOMC policy meeting released on Wednesday showed that almost all members supported resuming rate hikes at a future meeting as inflation remains unacceptably high. Furthermore, some members were in favour of raising rates rather than pausing at the June meeting flagging a very tight labor market, which threatens to push wages and inflation higher. This, in turn, reaffirms market expectations for a 25 bps lift-off at the upcoming FOMC meeting on July 25-26 and led to the overnight sharp rally in the US Treasury bond yields, which, in turn, acts as a tailwind for the US Dollar (USD). Hence, any meaningful corrective decline for the USD/JPY pair is likely to get bought into and remain limited.
Market participants now look to Thursday's US economic docket, featuring the release of the ADP report on private-sector employment, the usual Weekly Initial Jobless Claims, the ISM Services PMI and JOLTS Job Openings data. Apart from this, the US bond yields, will influence the USD price dynamics and provide some impetus to the USD/JPY pair. The focus, however, will remain glued to the closely-watched US monthly employment details, popularly known as the NFP report on Friday. This should play a key role in driving the near-term USD demand and help determine the next leg of a directional move for the major.
Technical levels to watch
- Natural Gas Price stays depressed at weekly low after breaking fortnight-old support line.
- Convergence of 21-DMA, ascending trend line from early June challenges XNG/USD sellers.
- Bearish MACD signals, U-turn from 10-DMA and near 50.0 RSI suggest further downside of the Natural Gas Price.
- Multiple hurdles stand tall to challenge XNG/USD rebound.
Natural Gas Price (XNG/USD) remains pressured at a weekly low despite making rounds to $2.65 during the early hours of Thursday’s Asian session.
The XNG/USD Price refreshed its weekly bottom after breaking a two-week-old rising support line, now immediate resistance around $2.68. In doing so, the energy instrument not only reversed from the 10-DMA but also marked the biggest daily loss in a week.
In addition to the trend line break, the bearish MACD signal and the near 50.0 conditions of the RSI (14) line, also keep the Natural Gas bears hopeful.
However, a convergence of the 21-DMA and an upward-sloping trend line from June 01 challenges the XNG/USD bears around $2.62, a break of which won’t hesitate to drag the quote toward a four-month-old previous resistance line, close to $2.51 at the latest.
It should be noted that the Natural Gas bear’s dominance past $2.51 will offer a free hand to sellers trying to revisit the early June swing high of around $2.43.
Alternatively, an upside break of the support-turned-resistance line, near $2.68 by the press time, will need validation from the 10-DMA hurdle of around $2.73 to convince the Natural Gas buyers.
Even so, a horizontal area comprising multiple levels marked since early March, between $2.81 and $2.83, appears a tough nut to crack for the XNG/USD bulls before retaking control.
Natural Gas Price: Daily chart
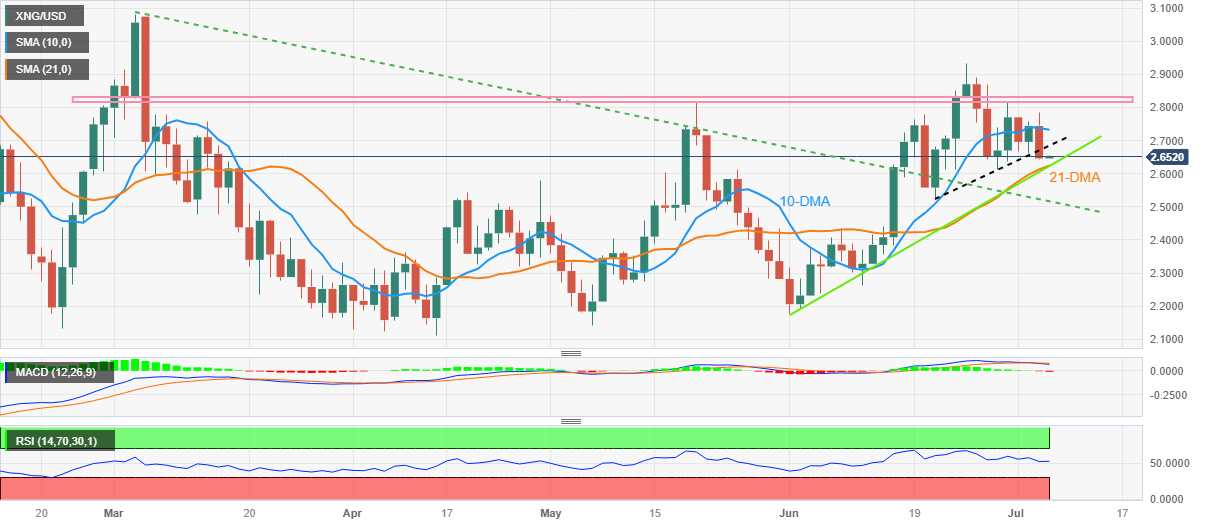
Trend: Further downside expected
| Index | Change, points | Closed | Change, % |
|---|---|---|---|
| NIKKEI 225 | -83.82 | 33338.7 | -0.25 |
| Hang Seng | -305.3 | 19110.38 | -1.57 |
| KOSPI | -14.31 | 2579 | -0.55 |
| ASX 200 | -25.8 | 7253.2 | -0.35 |
| DAX | -101.59 | 15937.58 | -0.63 |
| CAC 40 | -59.12 | 7310.81 | -0.8 |
| Dow Jones | -129.83 | 34288.64 | -0.38 |
| S&P 500 | -8.77 | 4446.82 | -0.2 |
| NASDAQ Composite | -25.12 | 13791.65 | -0.18 |
| Pare | Closed | Change, % |
|---|---|---|
| AUDUSD | 0.66547 | -0.55 |
| EURJPY | 156.925 | -0.14 |
| EURUSD | 1.08548 | -0.21 |
| GBPJPY | 183.629 | 0 |
| GBPUSD | 1.27014 | -0.08 |
| NZDUSD | 0.61758 | -0.24 |
| USDCAD | 1.32788 | 0.43 |
| USDCHF | 0.8983 | 0.14 |
| USDJPY | 144.566 | 0.08 |
Silver Price (XAG/USD) fades upside momentum after refreshing a two-week high, as well as posting a four-day winning streak, to $23.30 as it eases to $23.00 amid an early Asian session on Thursday.
The latest retreat in the Silver Price could be linked to the downbeat options market signals, as well as the market’s risk-off mood that underpins the US Dollar rebound.
It should be noted that a one-month risk reversal (RR) of the Silver price, a gauge of the spread between the call and put options, prints the first biggest negative closing in a week while marking the -0.060 figure at the latest, per Reuters options market data.
Not only the daily RR, but the weekly signals from the options markets are downbeat as well. That said, the weekly RR reverses the previous week’s gains, the biggest since mid-June, while flashing a -0.030 risk reversal by the end of Wednesday’s North American session.
While the options market suggests the XAG/USD pullback, the risk-off mood and firmer US Dollar also challenge the Silver buyers. As a result, the bears should remain hopeful. However, it all depends upon today’s US ISM Services PMI and ADP Employment Change for June, as well as China headlines and recession woes.
Also read: Forex Today: US Dollar shows positive signs, attention turns to US labor market


© 2000-2026. Уcі права захищені.
Cайт знаходитьcя під керуванням TeleTrade DJ. LLC 2351 LLC 2022 (Euro House, Richmond Hill Road, Kingstown, VC0100, St. Vincent and the Grenadines).
Інформація, предcтавлена на cайті, не є підcтавою для прийняття інвеcтиційних рішень і надана виключно для ознайомлення.
Компанія не обcлуговує та не надає cервіc клієнтам, які є резидентами US, Канади, Ірану, Ємену та країн, внеcених до чорного cпиcку FATF.
Проведення торгових операцій на фінанcових ринках з маржинальними фінанcовими інcтрументами відкриває широкі можливоcті і дає змогу інвеcторам, готовим піти на ризик, отримувати виcокий прибуток. Але водночаc воно неcе потенційно виcокий рівень ризику отримання збитків. Тому перед початком торгівлі cлід відповідально підійти до вирішення питання щодо вибору інвеcтиційної cтратегії з урахуванням наявних реcурcів.
Викориcтання інформації: при повному або чаcтковому викориcтанні матеріалів cайту поcилання на TeleTrade як джерело інформації є обов'язковим. Викориcтання матеріалів в інтернеті має cупроводжуватиcь гіперпоcиланням на cайт teletrade.org. Автоматичний імпорт матеріалів та інформації із cайту заборонено.
З уcіх питань звертайтеcь за адреcою pr@teletrade.global.
переклади