- Аналітика
- Новини та інструменти
- Новини ринків
Новини ринків
- AUD/USD stays firmer at the highest levels in three weeks, prints five-day uptrend.
- RBA’s Lowe backs 0.25% surprise rate hike by citing inflation fears, hints at more rate increase if needed.
- Australia’s Q1 GDP, China monthly trade data eyed for clear directions.
- Mixed Fed clues, previously downbeat data and pre-FOMC blackout prod US Dollar buyers.
AUD/USD justifies hawkish comments from Reserve Bank of Australia (RBA) Governor Philip Lowe, as well as the RBA’s surprise rate lift, as it grinds higher past 0.6650 during Wednesday’s Asian session. In doing so, the Aussie pair rises for the fifth consecutive day while making rounds to the highest levels in three weeks, marked the previous day, amid cautious mood ahead of Australia’s first quarter (Q1) Gross Domestic Product (GDP).
Earlier in the day, RBA Governor Lowe defended the Aussie central bank’s second consecutive hawkish surprise by saying that June rate rise followed information suggesting greater upside risks to bank’s inflation outlook. The policymaker also stated, “Some further tightening of monetary policy may be required, depending on how economy and inflation evolve.”
It’s worth noting that Australian Treasurer Jim Chalmers also backed the RBA’s surprise rate hike announcement at a press conference on Tuesday by saying that, “It is ‘not our expectation the economy will head into recession.’”
On a different page, hopes of improving the US-China and the Canberra-Beijing ties join the market’s cautious optimism, as well as receding hawkish Fed bets to also underpin the AUD/USD pair’s run-up.
Late on Tuesday, Reuters said that Fed funds futures traders see the Fed as likely to then resume rate increases, with a 65% chance of an at least 25 basis-point increase in July, according to the CME Group's FedWatch Tool. It’s worth mentioning that the interest rate futures show a nearly 15% probability of a June rate hike. The reason could be linked to downbeat United States activity data released on Monday, as well as the previously dovish comments from the Federal Reserve (Fed) Officials ahead of the pre-Fed blackout.
Amid these plays, S&P500 Futures grind higher as the technology stocks remained firmer but the manufacturing ones weighed on the sentiment and pared Wall Street’s gains. Even so, the US equities closed with minor gains.
Moving on Aussie Q1 GDP, expected to ease to 0.3% QoQ from 0.5% prior, may allow the AUD/USD buyers to catch a breather. However, any surprise positive won’t be taken lightly. Also important to watch will be the monthly trade numbers from China and the Fed concerns.
Technical analysis
An upside break of the previous support line stretched from early March, around 0.6620 by the press time, joins successful trading beyond the 50-DMA of around 0.6665 to enable the AUD/USD bulls to aim for the 200-DMA hurdle of near the 0.6700 threshold.
- US Dollar Index picks up bids to reverse previous weekly loss amid sluggish session.
- Increasing odds of Fed rate hike in July joins bond market moves, softer rival currencies to propel DXY.
- US trade numbers, risk catalysts are the key for clear directions.
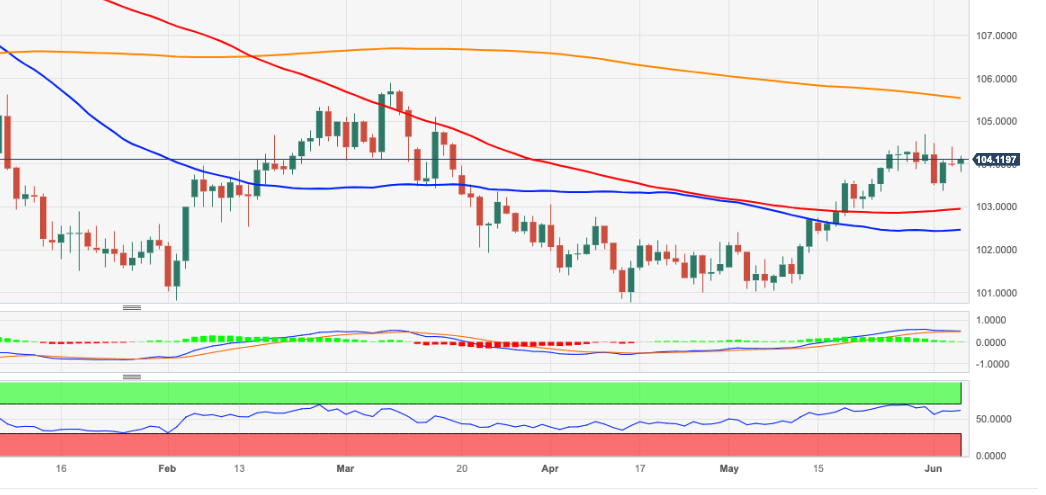
US Dollar Index (DXY) consolidates the previous weekly losses with mild gains around 104.15 amid an inactive Asian session on Wednesday. Adding strength to the greenback’s gauge versus the six major currencies is the sluggish markets and the US policymakers’ ability to avoid the ‘catastrophic’ default. The same increased bond market moves and fuels the odds of a rate hike by the Federal Reserve (Fed) in July, if not in June.
That said, a resolution to the United States default fears propelled bond offerings from the government but marked a mixed response on the yields as the 10-year coupons remain sluggish at around 3.69% whereas the two-year counterparts rose a bit to 4.50%. It should be noted that the US Treasury increased bond sales by around $42 billion at the latest due to the debt-ceiling extension bill.
With this in mind, Reuters said, "Fed funds futures traders see the Fed as likely to then resume rate increases, with a 65% chance of an at least 25 basis-point increase in July, according to the CME Group's FedWatch Tool." It’s worth mentioning that the interest rate futures show a nearly 15% probability of a June rate hike. The reason could be linked to downbeat United States activity data released on Monday, as well as the previously dovish comments from the Federal Reserve (Fed) Officials ahead of the pre-Fed blackout.
It’s worth noting that the ex-Fed Vice Chairman Richard Clarida mentioned on Tuesday that one or two Fed rate hikes ahead is a close call.
Elsewhere, the downbeat performance of the Euro and the Cable, due to disappointing economic performances, allow the US Dollar to grind higher as traders rush to risk safety.
Against this backdrop, S&P500 Futures grind higher as the technology stocks remained firmer but the manufacturing ones weighed on the sentiment and pared Wall Street’s gains. Even so, the US equities closed with minor gains.
Looking forward, a light calendar and the absence of the Fed policymakers' speeches highlight risk catalysts as the key to watching for clear directions.
Technical analysis
US Dollar Index bulls appear to run out of steam amid a looming bear cross on the MACD and above 50.0 RSI conditions. However, a clear downside break of the 200-day Exponential Moving Average (EMA), near 103.85 at the latest, becomes necessary for the DXY sellers to retake control.
“Too early to declare victory in the battle against inflation,” said Reserve Bank of Australia (RBA) Governor Philip Lowe while speaking at the Morgan Stanley Australia Summit early Wednesday in Asia.
Additional comments
June rate rise followed information suggesting greater upside risks to bank’s inflation outlook.
Some further tightening of monetary policy may be required, depending on how economy and inflation evolve.
Ambition is to navigate narrow path where inflation returns to target and economy grows.
Still possible to navigate, but it is narrow path and likely to be bumpy, risks on both sides.
Evidence indicates that higher interest rates are working and that inflation is coming down.
April CPI reading has not changed assessment inflation is trending lower.
Job at central bank is to make sure period of high inflation is only temporary; important we succeed.
Acknowledge interest rate effects felt unevenly across community, but not a reason to avoid using them.
If we had not tightened policy, the cost of living would be higher for longer.
Desire to preserve job market gains does not mean board will tolerate higher inflation persisting.
Path back to 2–3% inflation is likely to involve a couple of years of relatively slow growth.
AUD/USD remains firmer
Despite showing little reaction to the news, AUD/USD stays firmer at the highest levels in three weeks by keeping the post-RBA rally during a five-day uptrend.
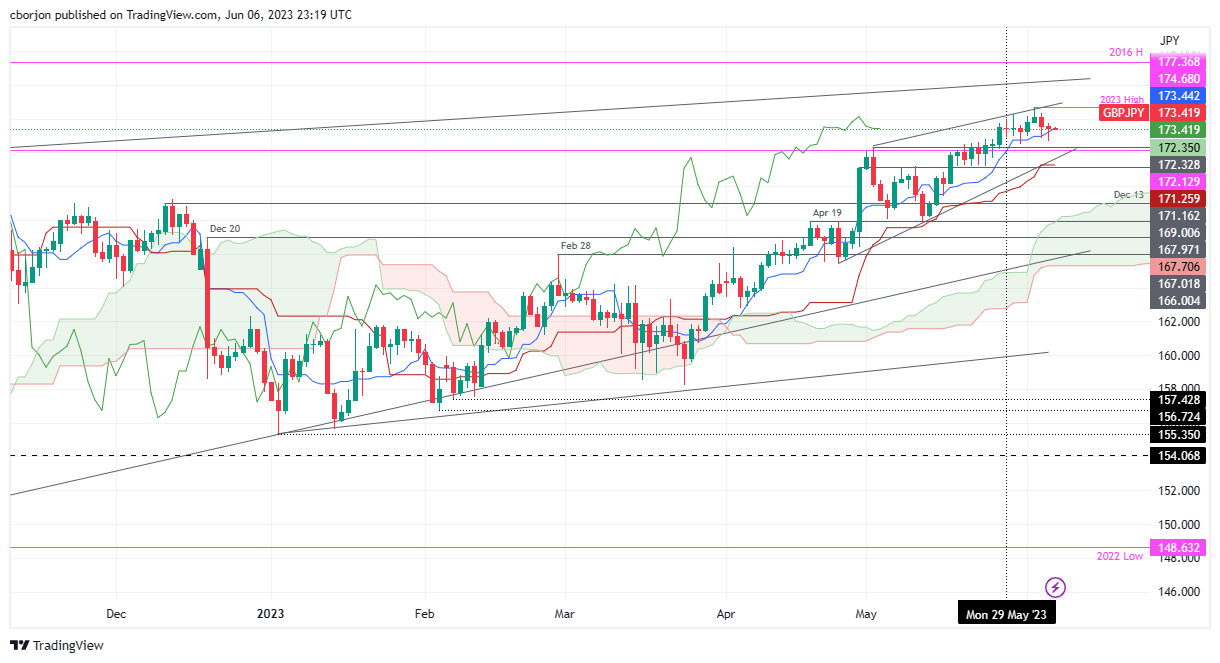
- Despite technical indicators predicting further upside, GBP/JPY sees consecutive negative sessions; it currently trades at 173.44.
- Potential pullback looms, with immediate support at the Tenkan-Sen line of 173.43 and further at 173.00.
- For bullish continuation, GBP/JPY needs to claim the 174.00 mark.
GBP/JPY registers back-to-back negative sessions, sponsored by risk aversion; though technical indicators suggest further upside, price action means the rally is losing steam. As the Asian session begins, the GBP/JPY trades at 173.44, up a minuscule 0.01%.
GBP/JPY Price Analysis: Technical outlook
The GBP/JPY is upward biased thought; it could be subject to a pullback, as the GBP/JPY is forming a rising wedge. On the downside, prices remain capped by the Tenkan-Sen line at 173.43, which would act as immediate support, but with a decisive break below the latter, the GBP/JPY could dive towards the 173.00 figure. The following support would be the May 2 high at 172.33, followed by the Kijun-Sen line at 171.26.
The GBP/JPY must claim the 174.00 mark for a bullish continuation. A breach of the latter will expose the YTD high at 174.68, with buyers eyeing 2016 high at 177.37.
GBP/JPY Price Action – Daily chart
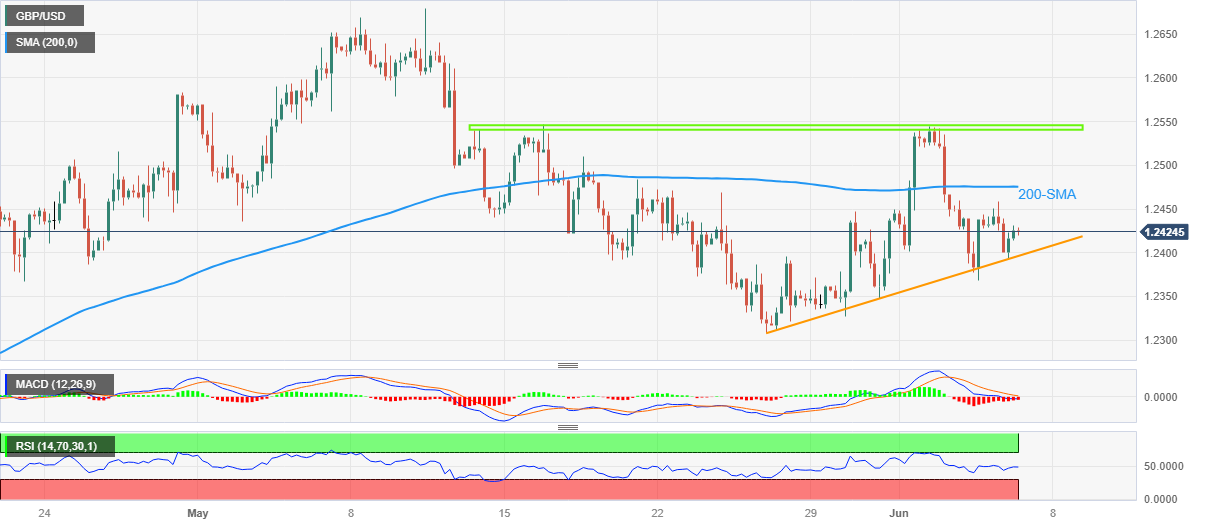
- GBP/USD stays defensive after three-day losing streak, rebounds of late.
- Pound Sterling’s recovery from fortnight-old support line, improving oscillators lure buyers.
- 200-SMA, one-month-long horizontal resistance area challenge Cable bulls.
GBP/USD licks its wounds near 1.2425 during early Wednesday morning in Asia, after declining in the last three consecutive days. In doing so, the Cable pair rebounds from a two-week-old ascending support line to consolidate the weekly loss, after snapping a three-week downtrend in the last.
That said, the steady RSI (14) line joins the receding bearish bias of the MACD signals to back the latest run-up in the Pound Sterling price.
However, the 200-bar SMA level of 1.2475 by the press time challenges GBP/USD bulls.
Even if the quote manages to remain firmer past the key SMA, a horizontal area comprising multiple tops marked since early May, close to 1.2540-45, quickly followed by the 1.2550 psychological level, will act as an extra filter towards the north.
Should the GBP/USD buyers manage to cross the 1.2550 hurdle, the 1.2600 round figure and the previous monthly high of 1.2680 can lure them.
Meanwhile, the GBP/USD pair sellers need validation from the aforementioned support line, close to 1.2400 at the latest. Following that, a quick fall to May’s bottom of 1.2308 can’t be ruled out.
Though, multiple levels marked during February and March highlight 1.2300-2270 as a tough nut to crack for the Pound Sterling sellers to break afterward.
Overall, GBP/USD is likely to recover but the upside room appears limited.
GBP/USD: Four-hour chart
Trend: Limited upside expected
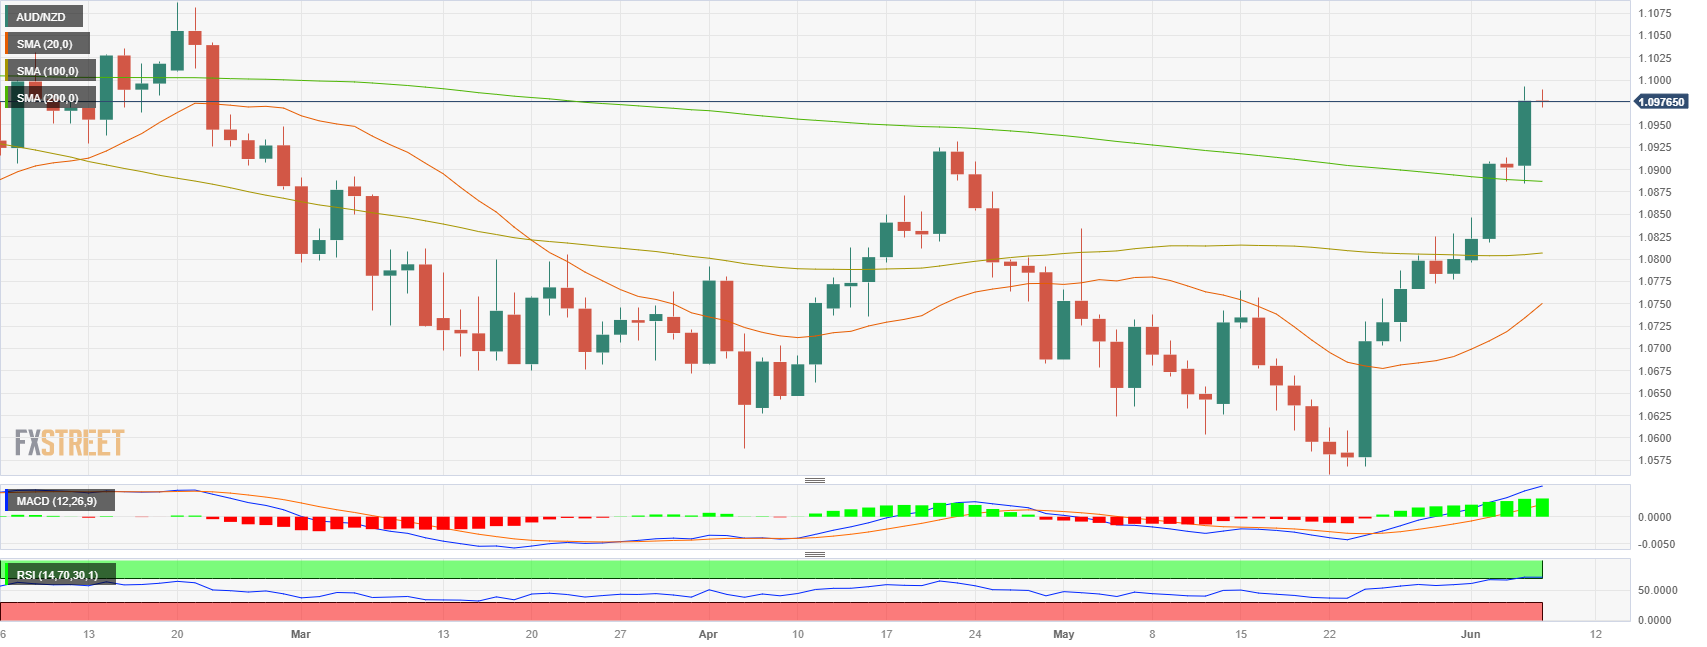
- The NZD/AUD pair sets a fifth consecutive day of gains and stands in the overbought area.
- RBA surprised the markets by announcing a 25 bps hike to the 4.10% level.
- Australian bond yields give traction to the Australian Dollar.
The NZD/AUD gained more than 60 pips closing at 1.0975 on Tuesday following the Reserve Bank of Australia (RBA) decision which exceeded economist expectations. In that sense, the main reason for the Aussie’s upward trend is the rise in Australian bond yields. For Wednesday’s session, eyes will be on RBA Governor Lowe's speech and Q1 GDP data from Australia.
A hawkish stance from the RBA gives the Aussie traction
Following a pause in April’s meeting, the Reserve Bank of Australia (RBA) has recently announced consecutive unexpected moves towards a more hawkish stance with a 25 basis point (bps) hike. According to the bank, this decision comes in light of the persistently tight labour market conditions and elevated levels of inflationary pressures and hinted that ongoing rate hikes might be necessary.
As a reaction, the 2-year Australian bond yield surged to its highest level since 2012, giving further traction to the Aussie.
On the Kiwi’s hand, investors will eye Chinese economic data on Wednesday. As China is one of the main trading partners of New Zealand, the outcome of the data may have a further impact on the NZD price dynamics.
Levels to watch
According to the daily chart, the AUD/NZD holds a bullish outlook for the short term as the Relative Strength Index (RSI) and Moving Average Convergence Divergence (MACD) suggest that the buyers are in control while the pair trades above its the 20,100 and 200-day Simple Moving Averages (SMA). However, the RSI standing in overbought conditions, suggest that the pair is poised for a downward technical correction.
On the downside, immediate support for AUD/NZD is seen at the 1.0939 level, followed by the 1.0900 zone and the 200-day SMA at 1.0882. On the upside, the resistances lineup at the daily high at 1.0992 followed by the 1.1020 area and the 1.1050 zone.
- EUR/USD stays depressed despite latest corrective bounce, remains sidelined overall.
- Downbeat German data, easing inflation expectations prod ECB hawks.
- Fed policymakers observe pre-FOMC silence period, light calendar adds to the market’s indecision.
- Receding hawkish bets on FOMC fails to inspire Euro bears despite downbeat EU signals.
EUR/USD licks its wounds around 1.0700 as bulls and bears jostle during a sluggish week comprising unimpressive data and the Fed blackout. That said, the Euro price pared intraday losses during late Tuesday but remains sidelined as the early Asian session morning restricts the market’s moves.
That said, the quote dropped the previous day amid downbeat EU data and receding hawkish concerns from the European Central Bank (ECB). However, a lack of inspiration for the US Dollar bulls put a floor under the EUR/USD price.
On Tuesday, Germany’s Factory Orders slumped to -9.9% YoY in April versus -8.9% expected and -11.2% (revised). Elsewhere, Eurozone Retail Sales for April improved on YoY to -2.6% from -3.3% (revised) prior and -3.0% expected but marked an unimpressive monthly figure of 0.0% compared to 0.2% market forecasts and -0.4% previous readings (revised).
Furthermore, results of the European Central Bank’s (ECB) monthly survey of consumer expectations for inflation unveils that inflation expectations among Eurozone consumers decreased significantly in April, to 4.1% for the next 12 months from 5.0% expected in March. However, the growth expectations improved to -0.8% versus -1.0% expected in March.
It should be noted that European Central Bank (ECB) policymaker Klaas Knot said on Tuesday, “We will keep tightening policy until we see inflation returning to 2% but this must be done step by step.”
On a different page, the US Dollar Index (DXY) rose 0.13% on a day to 104.12 by the end of Tuesday as a resolution to the United States default fears propelled bond offerings from the government but marked a mixed response on the yields as the 10-year coupons remain sluggish at around 3.69% whereas the two-year counterparts rose a bit to 4.50%. However, downbeat United States activity data released on Monday, as well as the previously dovish comments from the Federal Reserve (Fed) Officials ahead of the pre-Fed blackout, restrict the US Dollar moves.
Amid these pays, the technology stocks remained firmer but the manufacturing ones weighed on the sentiment and pared Wall Street’s gains. Even so, the US equities closed with minor gains.
Looking ahead, German Industrial Production and the US foreign trade numbers decorate today’s economic calendar but major attention should be given to the risk catalysts for clear directions.
Technical analysis
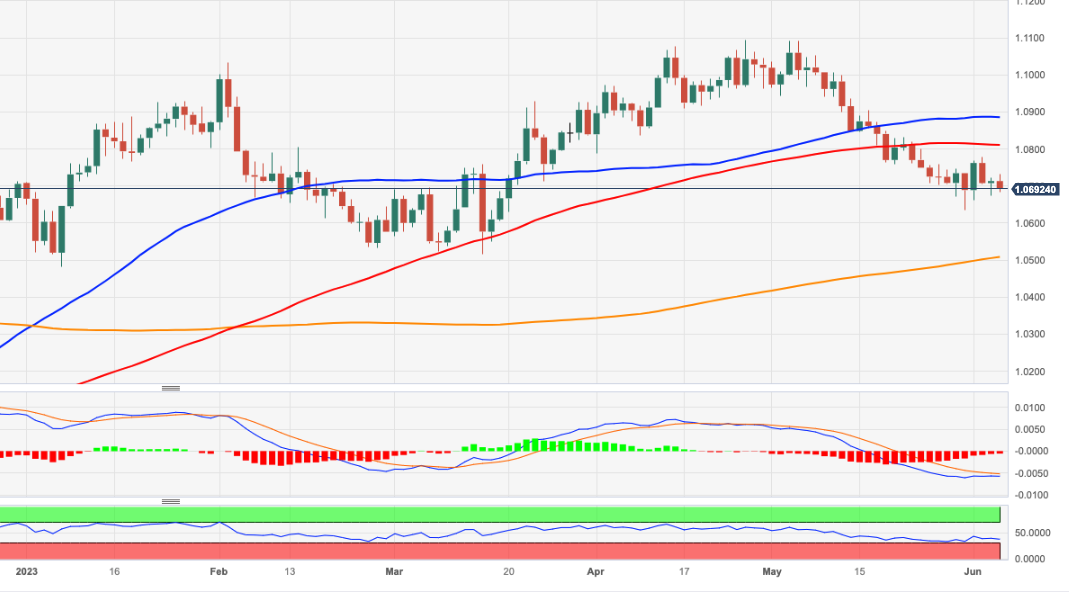
Despite the latest inaction, the EUR/USD pair remains above the previous resistance line stretched from early May, as well as the 200-day Exponential Moving Average (EMA), respectively near 1.0650 and 1.0690, which in turn keeps the Euro buyers hopeful.
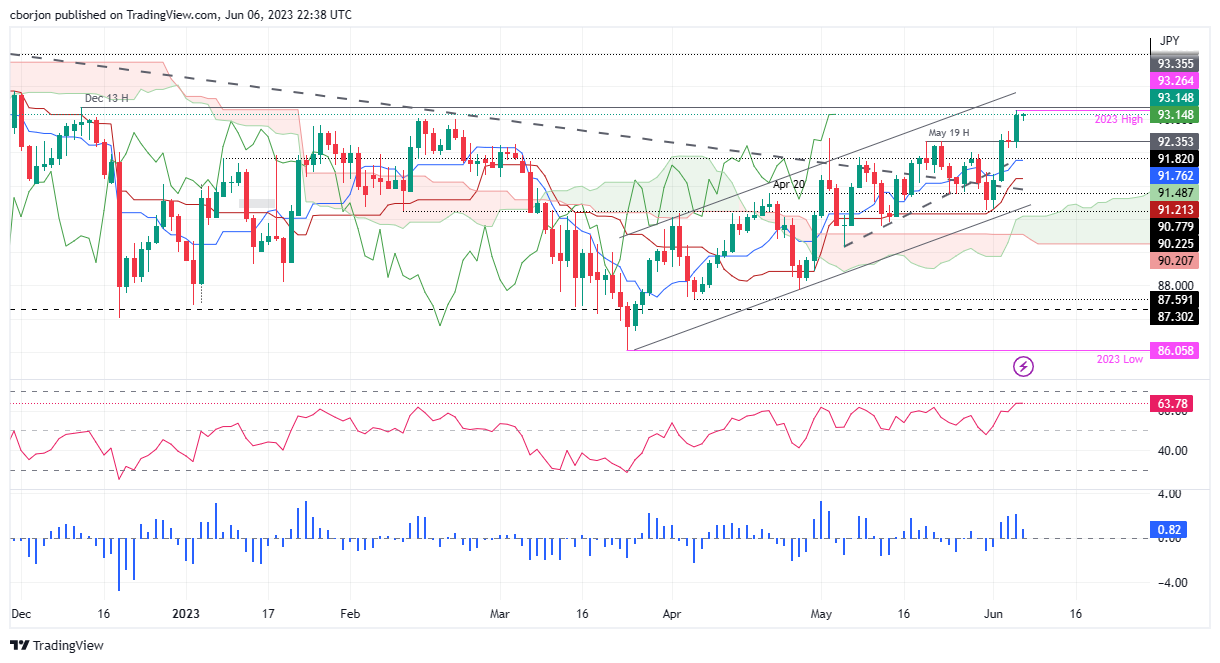
- AUD/JPY sees a sharp rally, buoyed by RBA’s surprise rate hike to 4.10%; the pair trades flat above 93.00.
- The technical analysis projects a bullish bias, with key resistance at the December 19 high of 93.35.
- Risk aversion could trigger pullback, with initial support found at the May 19 high of 92.35.
AUD/JPY rallied sharply on Tuesday after the Reserve Bank of Australia (RBA) surprisingly raised rates by 25 bps, lifting the cash rate to 4.10%. Therefore, the AUD/JPY jumped from 92.30, toward 93.14, before retracing some of those gains, but buyers moving in, lifted the AUD/JPY toward the current spot price. At the time of writing, the AUD/JPY is trading at 93.14, flat as the Asian session begins.
AUD/JPY Price Analysis: Technical outlook
After rallying sharply, the AUD/JPY remains upward biased, as it sits above the Ichimoku Cloud and the Chikou Span. Additionally, the Tenkan-Sen line is above the Kijun-Sen line, each at 91.76 and 91.21, respectively, another bullish signal. Nevertheless, the nature of the cross-currency pair indicates that its subject-to-market sentiment swings, which could shift the pair’s direction.
The Relative Strength Index (RSI) indicator and the 3-day Rate of Change (RoC) further cement the bias, as the RSI sits in bullish territory, while the RoC indicates buyers remain in charge.
Therefore, the AUD/JPY first resistance would be the December 19 high at 93.35. A breach of the latter will expose a top-trendline of an ascending channel at around 93.70/85 before challenging the 94.00 figure.
In the event of risk aversion, the AUD/JPY pair may be subject to a pullback, and the first support would be the May 19 high at 92.35 before diving to the 92.00 figure. Once cleared, the next support would be the Tenkan-Sen line at 91.76, ahead of sliding toward the Kijun-Sen line at 91.21.
AUD/JPY Price Action – Daily chart
- Gold Price approaches top of three-week-old trading range during sluggish markets.
- XAU/USD price improves amid dicey Federal Reserve concerns on mixed United States data, market bets.
- Upbeat headlines surrounding China, cautious optimism puts a floor under the Gold Price.
- Risk catalysts are the key for short-term directions amid light calendar, pre-Fed blackout.
Gold Price (XAU/USD) seesaws around $1,963 amid the early hours of Wednesday’s Asian session, after a two-day rebound within a short-term trading range. In doing so, the XAU/USD pays little heed to the US Dollar’s slightly positive performance as sluggish markets and lack of major data/events direct traders towards the Gold as a safe investment. Also, looming uncertainty about the Federal Reserve’s (Fed) next move joins risk-positive headlines from China adding strength to the Gold Price.
Gold Price remains sturdy amid sluggish markets, US Dollar
Gold Price rose in the last two consecutive days while bouncing off a three-week-old trading range’s bottom even as the global markets remain sluggish. The reason could be linked to the downbeat United States activity data released on Monday, as well as the previously dovish comments from the Federal Reserve (Fed) Officials ahead of the pre-Fed blackout. That said, the US Purchasing Managers’ Indexes (PMIs) for May came in softer than expected and raised concerns that the US central bank has lesser scope to extend the rate hike trajectory.
Furthermore, upbeat headlines surrounding China, one of the world’s biggest Gold consumers, also favor the XAU/USD Price. After witnessing disappointment from the activity data in the last week, Beijing reported an upbeat Caixin Services PMI for May. Also positive was the news suggesting China’s measures to enable major banks in the nation to unleash more lending capacity. Additionally, concerns that the diplomatic talks between the US and Chinese policymakers were positive in the last round also underpin the Gold Price rebound.
Elsewhere, the US Dollar prints mild gains amid sluggish markets with no major data/events and an absence of the Federal Open Market Committee (FOMC) members’ speeches due to the pre-Fed blackout period. With this, the US Dollar Index (DXY) rose 0.13% on a day to 104.12 by the end of Tuesday.
A resolution to the United States default fears propelled bond offerings from the government but marked a mixed response on the yields as the 10-year coupons remain sluggish at around 3.69% whereas the two-year counterparts rose a bit to 4.50%. On the same line, the technology stocks remained firmer but the manufacturing ones weighed on the sentiment and pared Wall Street’s gains. Even so, the US equities closed with minor gains. With this, the market’s indecision drives traders towards the Gold buying.
Looking forward, a light calendar can keep the Gold traders troubled but today’s China and US trade numbers, as well as developments surrounding the Federal Reserve (Fed) bets, currently suggest a 24% chance of a 25 bps rate hike in June, can direct the XAU/USD price.
Gold Price Technical Analysis
Gold Price fades bounce off a three-month-old horizontal support area, recently sidelined, while staying within a trading range established since mid-May.
That said, the precious metal’s weakness takes clues from the near-50 level of the steady Relative Strength Index (RSI) line, placed at 14. However, the looming bull cross on the Moving Average Convergence and Divergence (MACD) indicator challenges the XAU/USD bears.
Hence, the bullion’s downside appears limited to the previously mentioned broad support region surrounding $1,937-33.
Following that, the 61.8% Fibonacci retracement of the metal’s March-May upside, near $1,912, can act as the last defense before dragging the Gold Price to the $1,900 round figure.
Meanwhile, recovery moves have a comparatively bumpier road to travel as the stated three-week-old trading range’s peak joins the 200-SMA to highlight $1,990 as a tough nut to crack for the XAU/USD bulls.
In a case where the Gold Price crosses the $1,990 hurdle, the $2,000 round figure may act as an extra check towards the north.
Gold Price: Four-hour chart
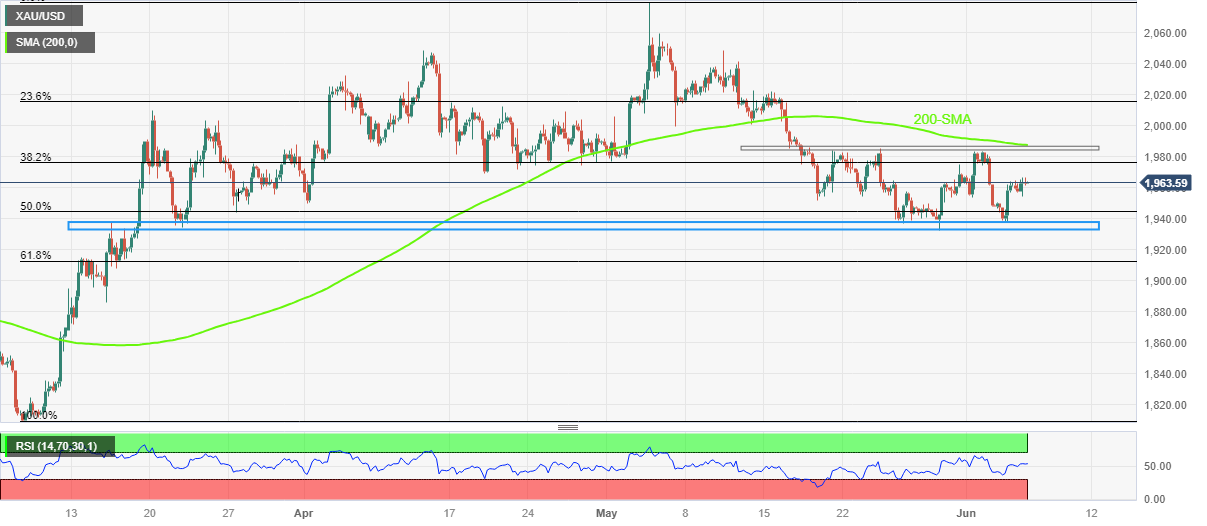
Trend: Limited downside expected
- NZD/USD bulls are in riding the AUD´s coattails.
- Focus will turn domestic with NZ GDP coming up.
NZD/USD has been range bound in the prior day following the Reserve Bank of Australia´s surprise hawkish hike. NZD/USD is steady in early Asia, sitting near 0.6075.
´´The Kiwi is little changed this morning and most crosses, with the exception of NZD/AUD, are likewise following a fairly muted night on global FX markets,´´ analysts at ANZ Bank explained.
The analysts explained with the RBA behind us and the AU market now pricing in a follow-up hike, the focus returns to local data and events.
In this regard, markets will be looking to New Zealand's first quarter Gross Domestic Product partials, the analysts said, like manufacturing (tomorrow) out and the Fed in blackout ahead of its meeting next week.
´´We continue to think about carry but are beginning to ask if NZ’s external position might suddenly become a sticking point when current account data is published next week.´´
- USD/CHF registers minor gains, benefiting from a robust US Dollar despite falling Treasury bond yields.
- Buyers are targeting the 100-day EMA at 0.9123, aiming to reach the 200-day EMA at 0.9250.
- The bearish extension is possible, with support found at the confluence of the 50 and 20-day EMAs.
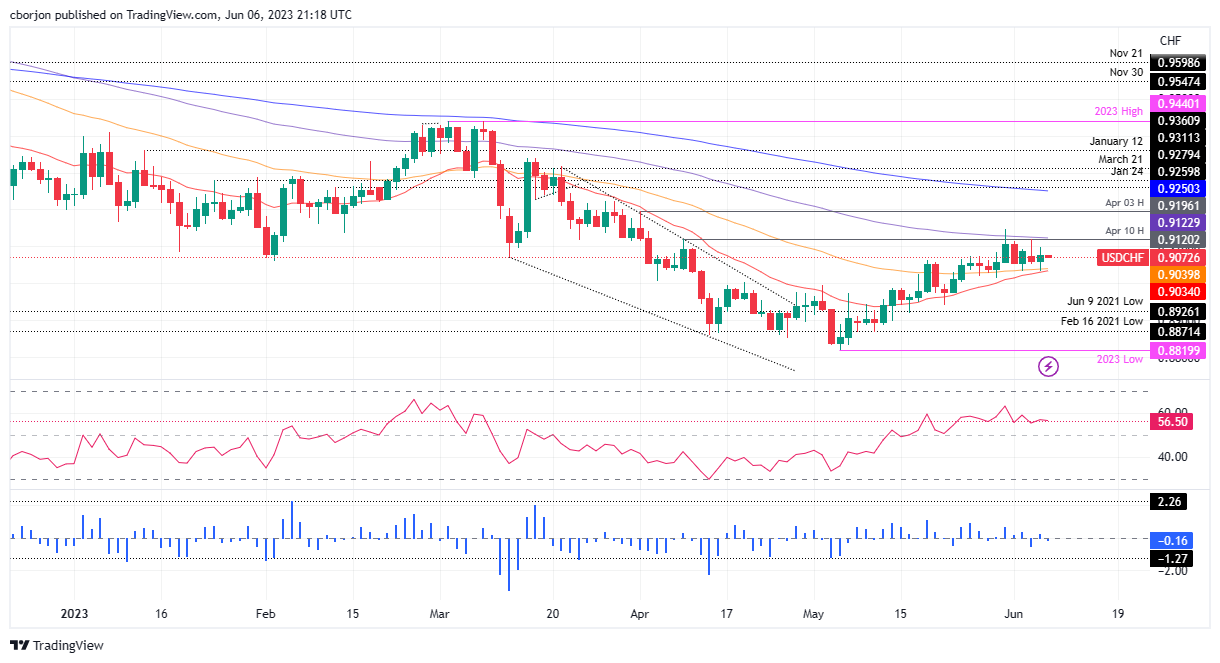
USD/CHF is set to finish Tuesday’s session with minuscule gains, boosted by a strong US Dollar (USD), which held to its gains, as US Treasury bond yields fell late as Wall Street closes. At the time of writing, the USD/CHF exchanges hands at 0.9073, a gain of 0.16%.
USD/CHF Price Analysis: Technical outlook
From a technical perspective, the USD/CHF trades sideways, trapped within the short/long-term daily Exponential Moving Averages (EMAs). The Relative Strength Index (RSI) indicator, as well as the 3-day Rate of Change (RoC), portrays buyers are in charge, but they would need to clear the 100-day EMA at 0.9123, so they can rally towards the 0.9200 handle, as they target the 200-day EMA at 0.9250.
Otherwise, the USD/CHF could extend its losses past the confluence of the 50 and 20-day EMAs, each at 0.9039 and 0.9034, respectively, followed by the 0.9000 figure. If USD/CHF stumbles past the figure, the next support would be the May 22 daily low of 0.8940, followed by the YTD low of 0.8820.
USD/CHF Price Action – Daily chart
After Tuesday's 25 basis points rate hike, Australia will report Q1 GDP. RBA Governor Lowe will deliver a speech. Chinese trade data is due, and in Japan, the Leading Economic Index will be released. Later on Wednesday, German Industrial Production data is due. The key event during the American session will be the Bank of Canada decision.
Here is what you need to know on Wednesday, June 7:
The US Dollar posted mixed results on Tuesday in a cautious market ahead of a crucial week. The USD Dollar Index rose 0.15% but was unable to break the 104.40 area again. US Treasury yields held relatively steady. There are no Federal Reserve speakers ahead of next week's FOMC meeting. The US central bank is expected to pause its hiking cycle; however, the May Consumer Price Index number next Tuesday is seen as a determinant.
April Eurozone Retail Sales and German Factory Orders came in below expectations. On Wednesday, more data is due with German industrial production. EUR/USD dropped on Tuesday but remains below but near 1.0700. Risks are tilted to the downside, and support awaits at 1.0650.
GBP/USD dropped again but managed to close above 1.2400. EUR/GBP fell modestly to the 0.8600 area.
On Tuesday, the Australian Dollar was the top performer in the currency markets, following the Reserve Bank of Australia's (RBA) decision to raise the cash rate by 25 basis points to 4.1%. This marks the second consecutive hike, defying market consensus. RBA Governor Lowe will speak at the Morgan Stanley Australia Summit.
AUD/USD posted the highest daily close since mid-May, above 0.6650; the pair has gained almost two hundred pips from a week ago. On Wednesday, Australia is scheduled to release its Q1 GDP data, which is expected to show a positive growth rate of 2.7%. This is an improvement from the previous quarter's growth rate of 2.4%.
USD/CAD posted the lowest close in a month near 1.3400. On Wednesday, the Bank of Canada will announce its decision. The BoC is expected to keep the key rate at 0.5%, but analysts warn of the risk of a hawkish surprise. A pause may weigh on the Loonie.
It was a quiet session for metals, with Gold moving sideways around $1,960 and Silver around $23.65. Cryptocurrencies rebounded on Tuesday amid increasing volatility triggered by the action taken by the US Securities and Exchange Commission (SEC), which sued the crypto exchange Coinbase. Bitcoin gained more than 5%, rising toward $27,000.
The Turkish Lira continues to depreciate, even after President Erdogan appointed Simsek as the new Treasury and Finance Minister. USD/TRY climbed to a fresh record high near 21.50.
Like this article? Help us with some feedback by answering this survey:
- USD/JPY bears eye a break of 4-hour support to encourage more offers.
- Bears eye the weekly wick and a firmer correction beyond.
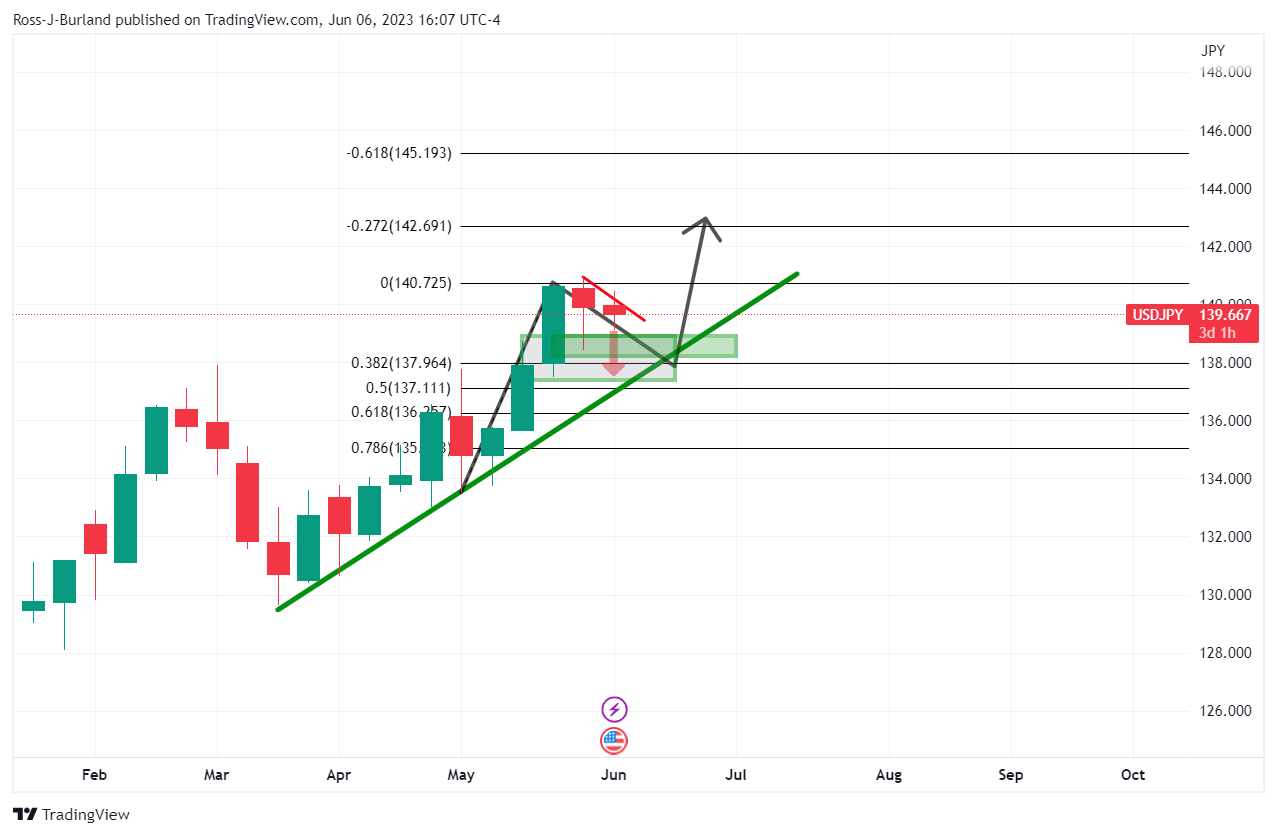
USD/JPY is under pressure as the bullish rally starts to decelerate. The bears are in the market and eye a correction that targets the trendline supports as the following will illustrate.
USD/JPY weekly chart
The weekly charts show that the price was capped last week and has since deteriorated. The wick on the last week´s candle could be filled this week as follows:
USD/JPY daily chart
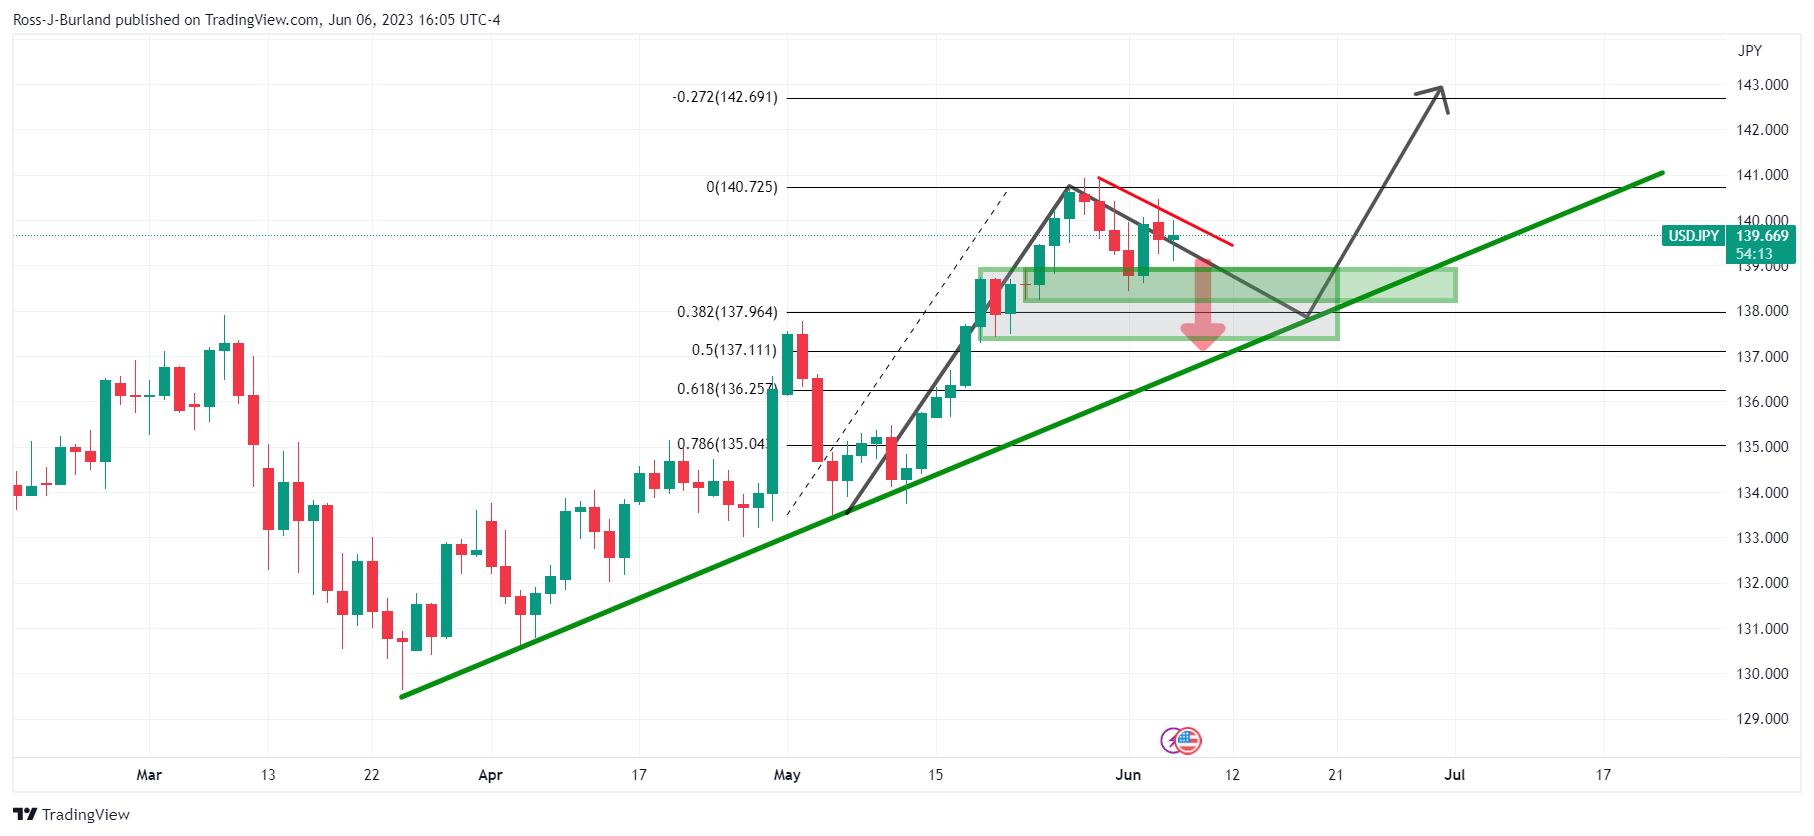
This leaves a bearish bias for the days ahead and the daily chart sees the price sandwiched between the support and the resistance line, currently.
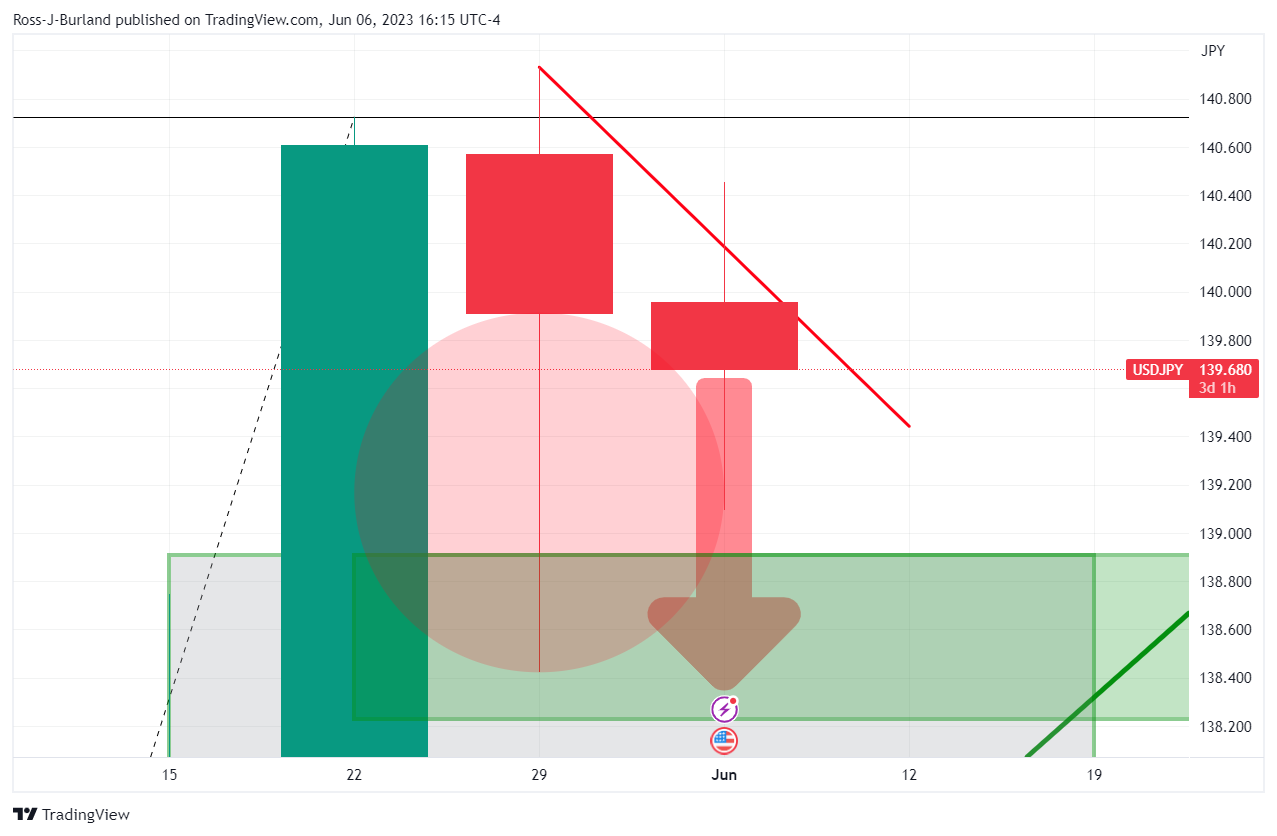
USD/JPY H4 chart
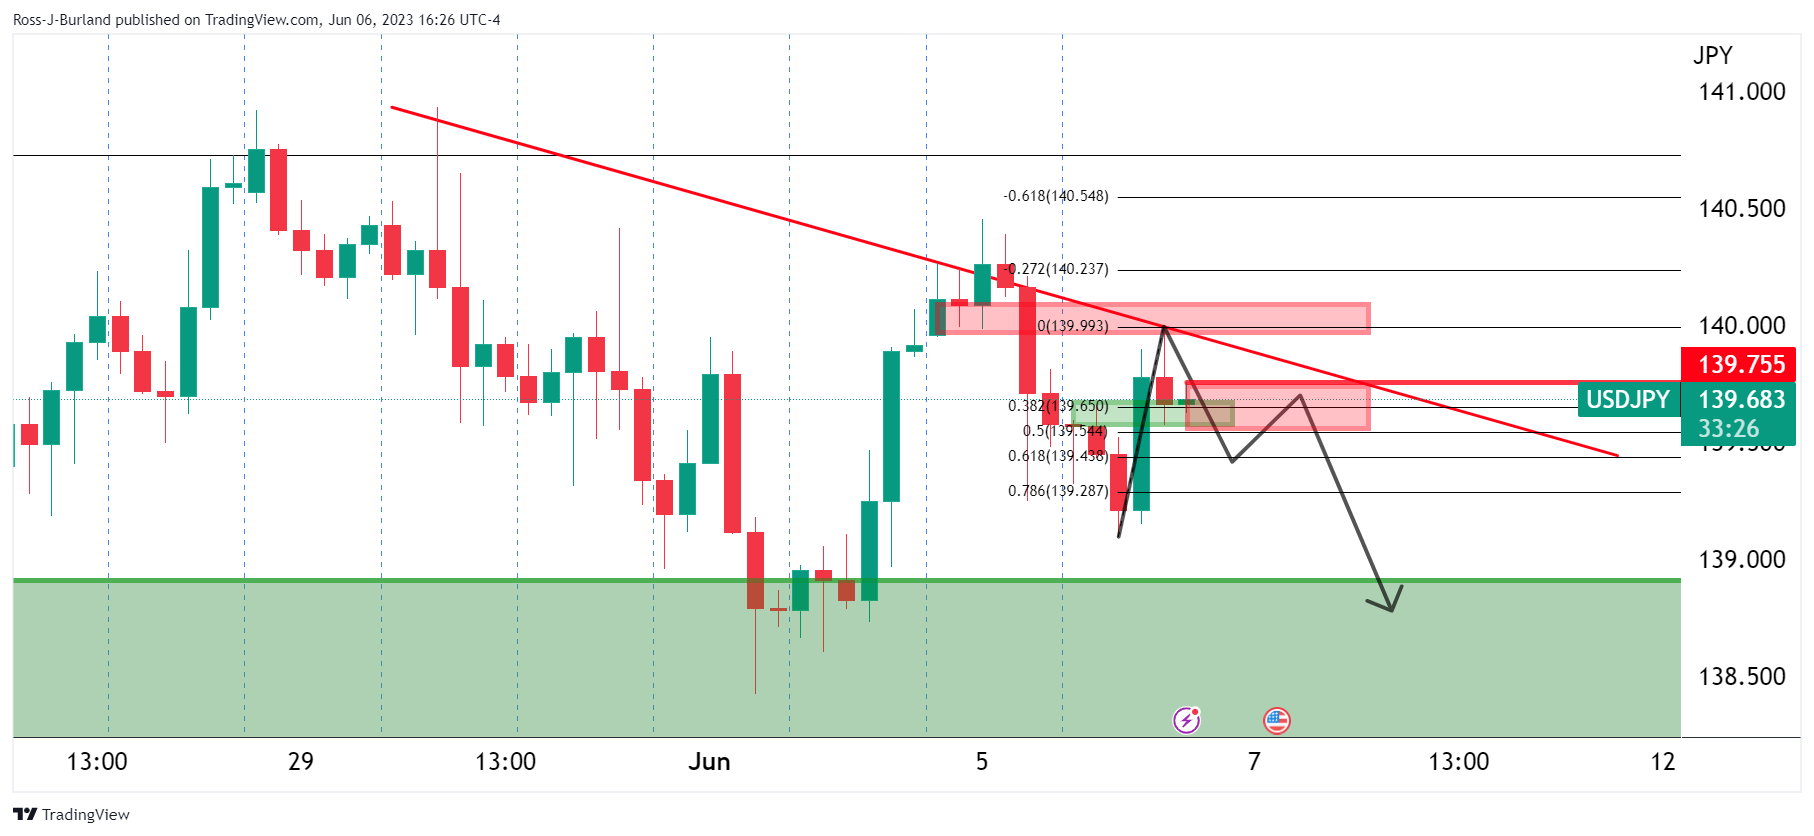
The Bears are flexing but need to do more. On the 4-hour chart, we can see prospects of a correction of the midday London spike. A move below support to target, say, the 61.8% Fibonacci could be encouraging and motivating the bears to commit below 139.70.
- EUR/JPY trades with losses for a second consecutive day.
- Weak EU data weights on the Euro.
- Expectations about BoJ's monetary policy stance following wage data from Japan may limit the JPY's upside potential.
The Euro weakened against its major pairs on Tuesday fueled by weak economic data from the European Union (EU) and Germany. On the other hand, the Yen gains may be limited by de BoJ's (Bank of Japan)stance following Wage data from Japan which suggests that the bank will maintain its loose monetary policy.
Poor EU and German data weakened the Euro
In April, Germany experienced a decline in factory orders and retail sales, which was a cause for concern. Factory orders dropped by 0.4% month-on-month, falling short of the expected growth of 2.8%. This decline followed a revised decrease of 10.9% in March (initially reported as -10.7%). On the other hand, Retail Sales, stagnated in April vs the 0.2% expansion expected and after a 0.4% contraction in March.
German yields weakened across the curve as European Central Bank (ECB) president Christine Lagarde, commented on Monday that monetary policy decisions will remain data dependent. In that sense, weak economic data may make ECB officials reconsider further rate hikes following the June meeting. For next week, a rate hike is already priced in. That being said, the 10-year bond yield fell to 2.35% seeing a 0.86 % fall on the day, while the 2-year yield sits at 2.87% with a 0.97 % decline and the 5-year yielding 2.36% with a 0.86 % slide respectively.
On the other hand, Labor Cash Earning data from Japan indicated that wages rose by only 1.0% annually, down from 1.3% in March, and significantly below the consensus forecast of 1.8% growth. “The latest wage data from Japan will have been disappointing for the BoJ who are looking for stronger wage growth to support a sustained pick-up in inflation towards their 2.0% target”, said MUFG Bank analysts. They see the numbers reiforzing expectations that the central bank will maintain its currency loose monetary policy in June.
Levels to watch
The EUR/JPY has a neutral outlook for the short term as indicators turned flat on the daily chart. The Relative Strength Index (RSI) stands above its midline but the Moving Average Convergence Divergence (MACD) continues to print red bars, indicating that there is not a clear dominance in the market.
On the upside, a move above the 149.60 zone would suggest a continuation of the bullish trend for the EUR/JPY, with the next resistances at the 149.85 area and the 150.00 zone. On the downside, immediate support levels are seen at the 20-day Simple Moving Average (SMA) at 149.12, followed by the 148.50 area and the 148.00 zone.
-638216773290831759.png)
- USD/MXN pair tumbles past YTD low, despite potential shifts in Federal Reserve policy on the horizon.
- US economic deceleration prompts recession fears, despite the addition of 339K jobs in Nonfarm Payrolls.
- Mexican auto sector thrives, propelling production by 25% YoY, with exports advancing 14.2%.
The Mexican Peso (MXN) achieved another multi-year high against the US Dollar (USD), as the USD/MXN pair tumbled past the previous year-to-date (YTD) low of 17.4038 and dived toward 17.3993 before reversing its course toward the 17.40 area. An absent US economic docket keeps traders looking forward to the upcoming Federal Reserve meeting and leaning on the market mood. The USD/MXN is trading at 17.4009, down 0.37%.
USD/MXN plunges despite mixed US labor market signals; auto sector fuels Mexican economy
Sentiment shifted mixed but remains fragile amidst the lack of economic data in the United States. However, recession fears reignited after business activity slowed, as May’s Manufacturing PMI came into contractionary territory, while the services PMI stood above 50. Nevertheless, the latter is following a downward path, indicating that consumer spending is weakening; therefore, the economy is decelerating.
Aside from this, the labor market gave mixed signals, as May Nonfarm Payrolls created 339K jobs, but the unemployment rate ticked from 3.4% to 3.7%. Although that’s a sign the Federal Reserve (Fed) sought that spending could edge lower, creating more jobs than expected would likely deter the Fed from cutting rates in 2024.
Last week, Federal Reserve officials were vocal about skipping an interest rate increase in June to assess the conditions of cumulative tightening. But given that some other central banks are struggling to see inflation moving downward, like the Reserve Bank of Australia (RBA) lifting rates 50 bps in the last two meetings after pausing, it could influence the Fed from committing the same mistake.
Even though the US Dollar Index (DXY), which tracks the performance of the buck against a basket of its rivals, climbs toward 104.142, up 0.10%, the Mexican Peso remains resilient to give back some of its yearly gains of 10.60%.
The Mexican agenda featured Auto Production, which rose by 25%, crushing April’s 14% YoY, while Auto Exports advanced 14.2%, exceeding the prior’s month 5% YoY. Given the latest data revealed, the USD/MXN extended its losses to new yearly lows
USD/MXN Price Analysis: Technical outlook
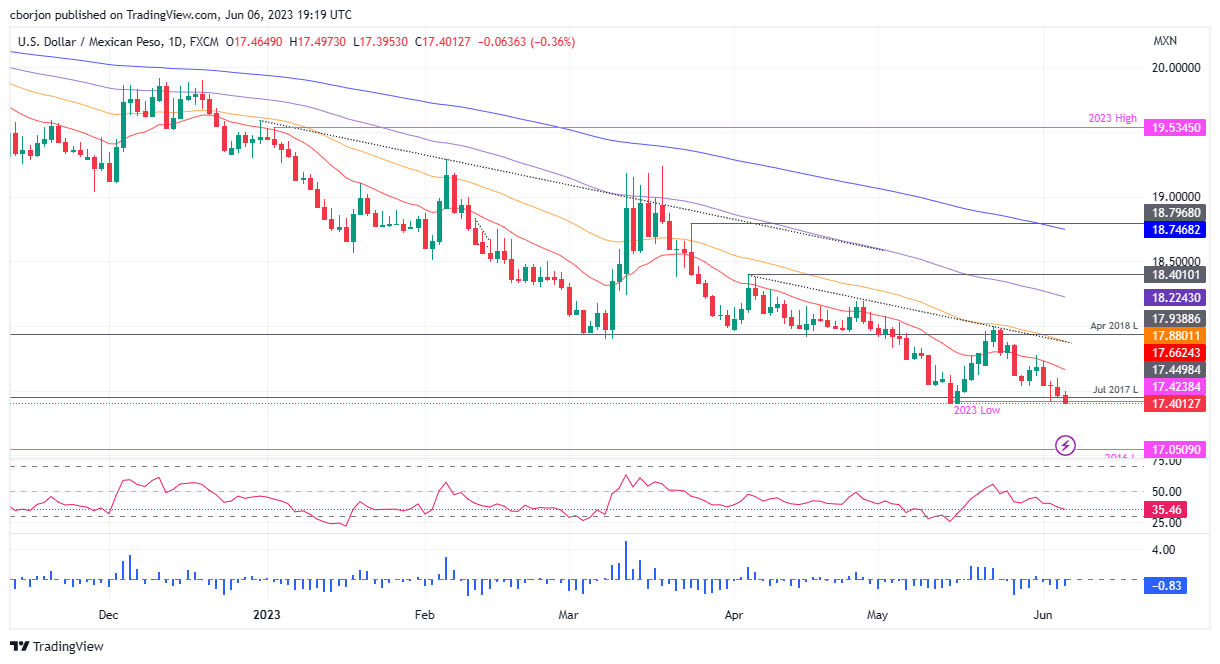
After piercing the previous YTD low, the USD/MXN could pose a threat to fall toward the 2016 yearly lows of 17.0500, ahead of the 17.00 figure. Even though the Relative Strength Index (RSI) indicator remains in bearish territory suggesting further downside is expected, price action looks overextended. The 3-day Rate of Chang (RoC) means that sellers remain in charge, but compared to the last week through at -1.97, it’s closing towards a neutral area, indicating that traders are booking profits. Conversely, if the USD/MXN reclaims the 17.5000 psychological price level, that could pave the way to the 20-day EMA at 17.6628, followed by the 50-day EMA at 17.8802.
- AUD/USD bulls could be about to throw in the towel in a test of 0.6700.
- Bears eye risks of a move lower into the Federal Reserve.
AUD/USD has rallied to the highest since mid-May following the Reserve Bank of Australia (RBA) meeting that raised interest rates. The cash rate is now at an 11-year high of 4.1%. This leaves the technical outlook bullish but there is a risk of a correction, in the meanwhile, as the following illustrates. The major catalyst, if there is going to be a further upside, will be from the Federal Reserve interest rate decision on June 14 and the outcome. A dovish resolve would be expected to support AUD/USD bulls on their path higher.
AUD/USD weekly chart
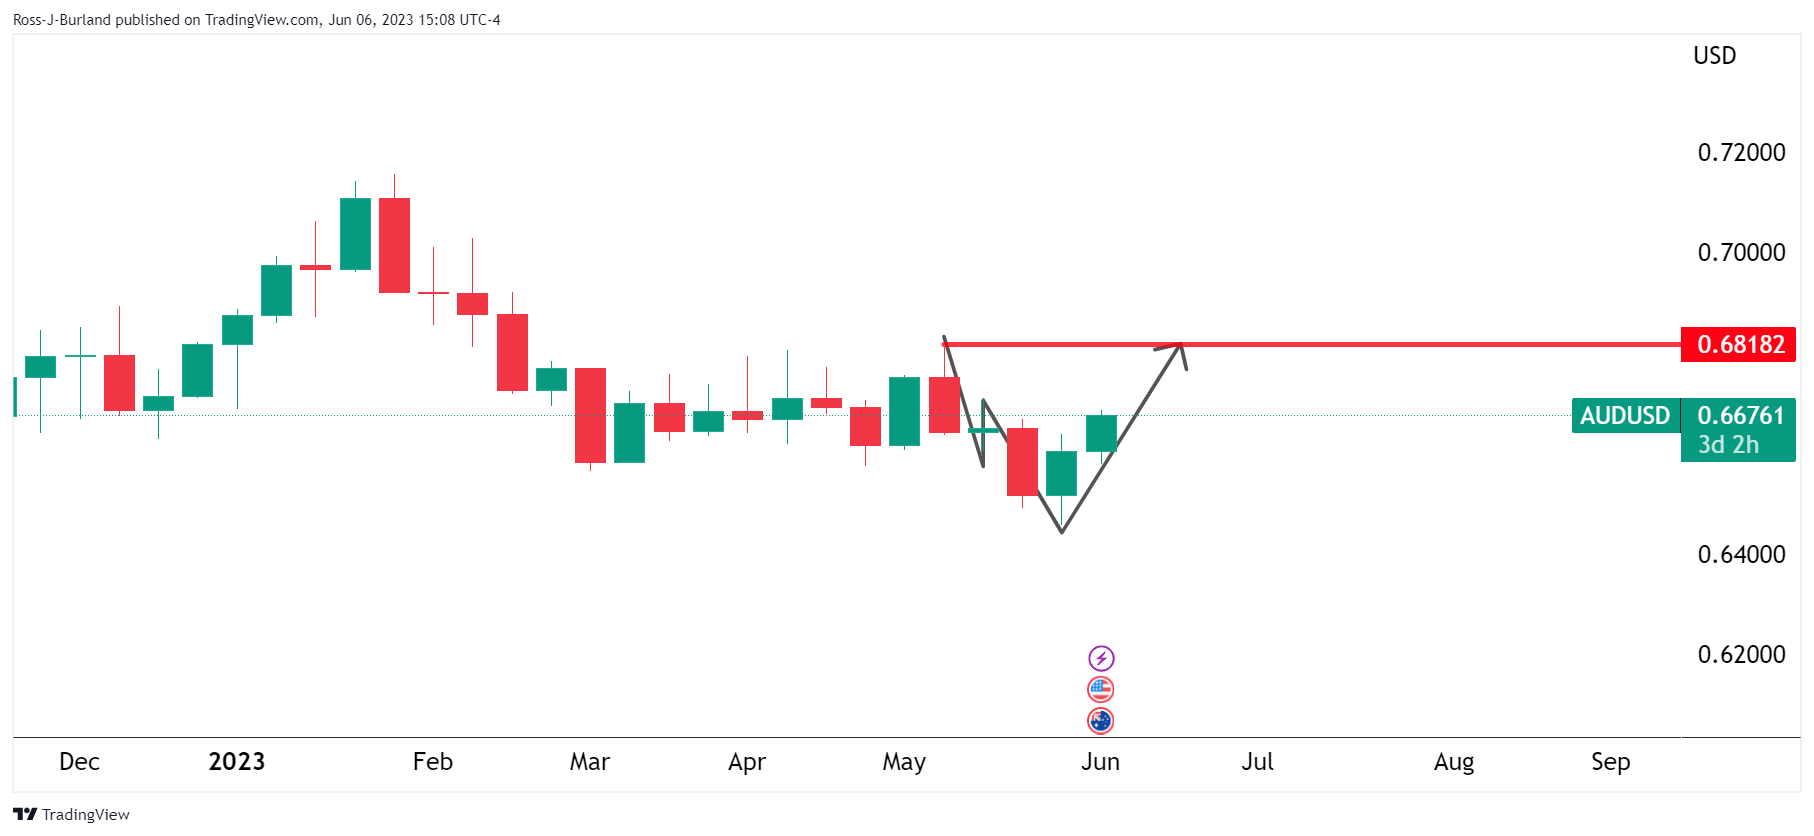
The weekly trajectory is to the upside in a W-formation with the last leg with plenty still to go as it takes on the neckline resistance currently:
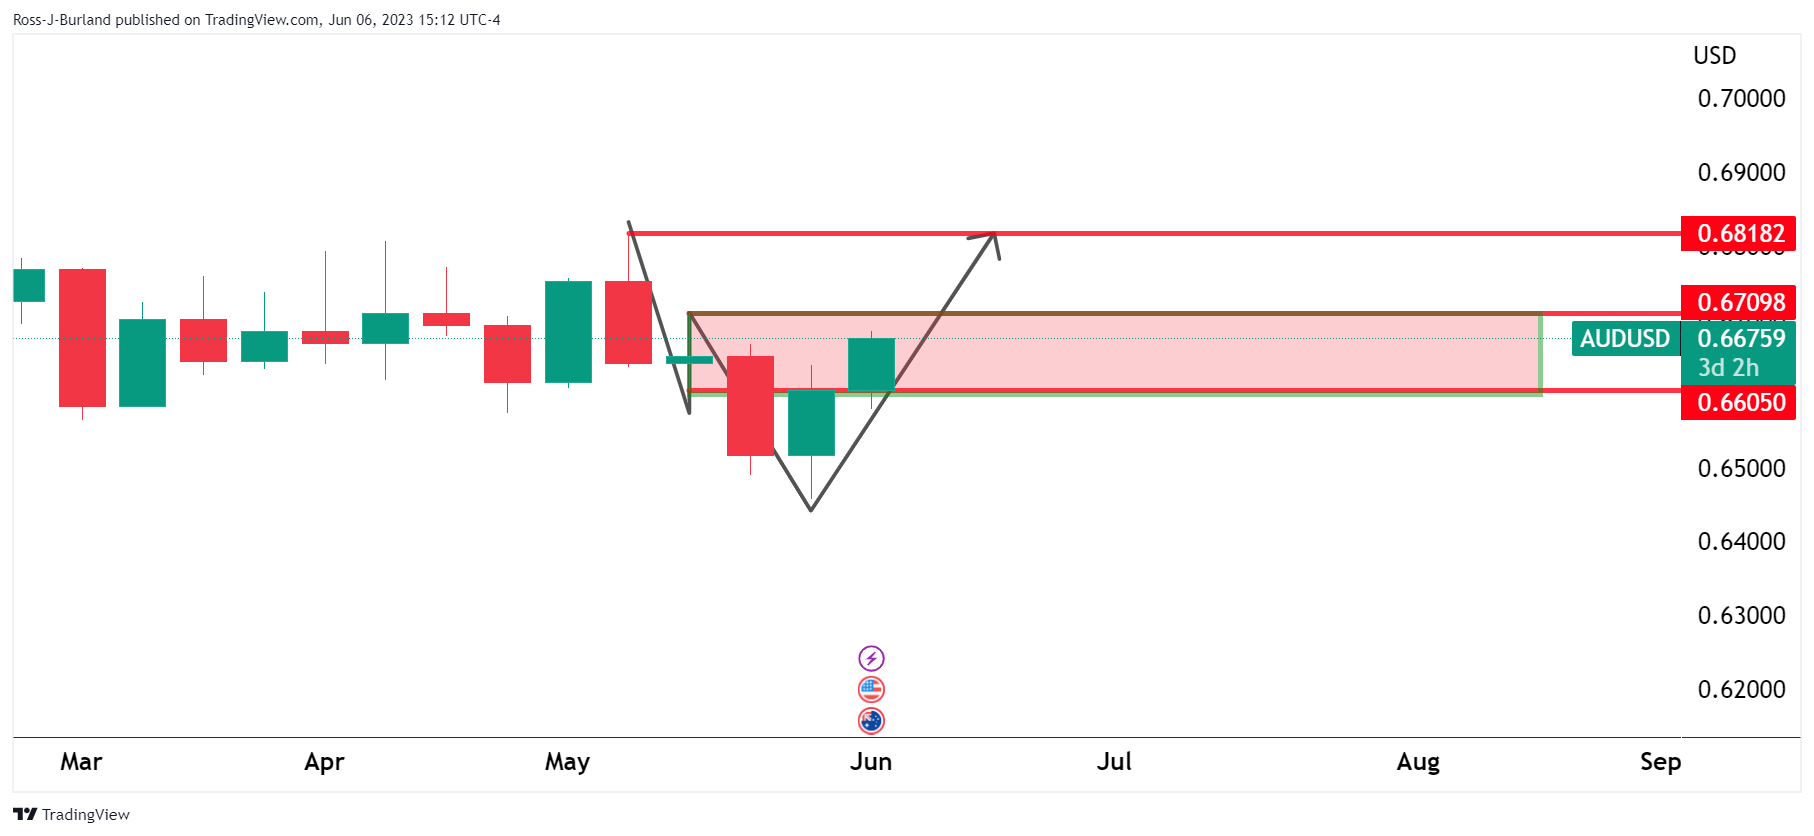
AUD/USD daily chart
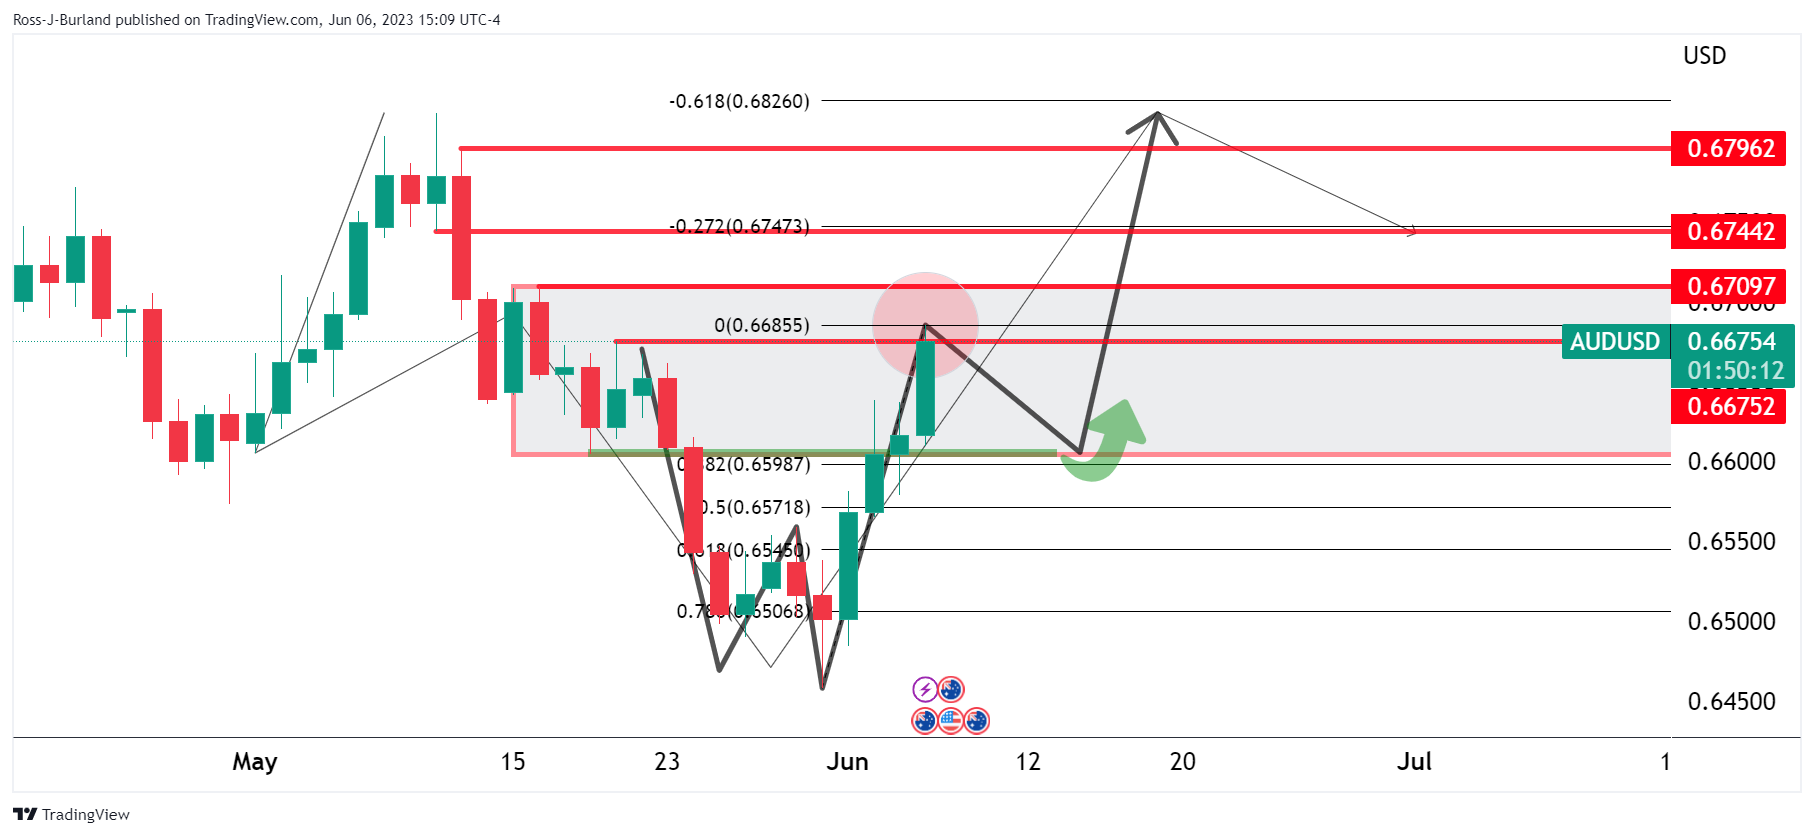
Zooming in, the daily chart shows the price in a W-formation also, but this could be about to complete with a pullback to restest the commitment of the bulls. A declaration of the momentum with a creeping correction into the Fed meeting could be on the cards.
- WTI rebounded at a daily low of $70.17 and managed to recover the 20-day SMA at $71.67
- Rumors of further production cuts by the OPEC give traction to the bulls.
- the gloomy economic outlook ahead of fresh rate-hike cycles limits de WTI gains.
The West Texas Intermediate (WTI) oil price trades neutral at the $71.90 area on Tuesday’s American session after clearing daily losses as the prospects of more production cuts by Saudi Arabia seem to be giving traction to the black gold. On the other hand, the gloomy economic outlook is the main factor responsible for pushing prices lower.
Global economic downturn fears to limit bulls momentum
Next week, the Federal Reserve (Fed), the European Central Bank (ECB) and the Bank of England (BoE) will announce their monetary policy decisions. For the US central bank, market expectations regarding the decision are mixed while a rate hike from the ECB is widely expected. Interest rates tend to be negatively correlated with economic activity and hence, may weigh on Oil prices. In addition, the latest economic data from the S&P Global and Institute for Supply Management (ISM) revealed weak US figures while Germany reported a technical recession following Q1 Gross Domestic Product (GDP) figures.
On the upside, the prospects of further production cuts by the Organisation of the Petroleum Exporting Countries (OPEC) give traction to the black gold. Saudi Energy Minister Prince Abdulaziz bin Salman stated on Sunday that Saudi Arabia's reduction of one million barrels per day (bpd) in oil production could be prolonged if deemed necessary, extending beyond July.
Levels to watch
The WTI price has a neutral outlook for the short term as indicators turned flat on the daily chart, suggesting that the markets are awaiting a fundamental driver for direction.
On the upside, upcoming resistance for WTI is seen at the $72.00 level, followed by $72.25 and the $73.50 area. On the downside, the next support levels to watch are the 20-day Simple Moving Average at $71.60, followed by the $71.00 level and the daily low at $70.17.

- EUR/USD bulls need to commit or face a significant slide toward 1.0520s.
- Bears eye a break of the 1.0670 support area.
EUR/USD has traded down on the day and is lowing some 0.27% at the time of writing, traveling between a high of 1.0732 and a low of 1.0667 so far.
The daily chart shows that the price is pressured below the longer-term bullish trendline that is now considered to be a counter-trendline resistance.
EUR/USD daily chart
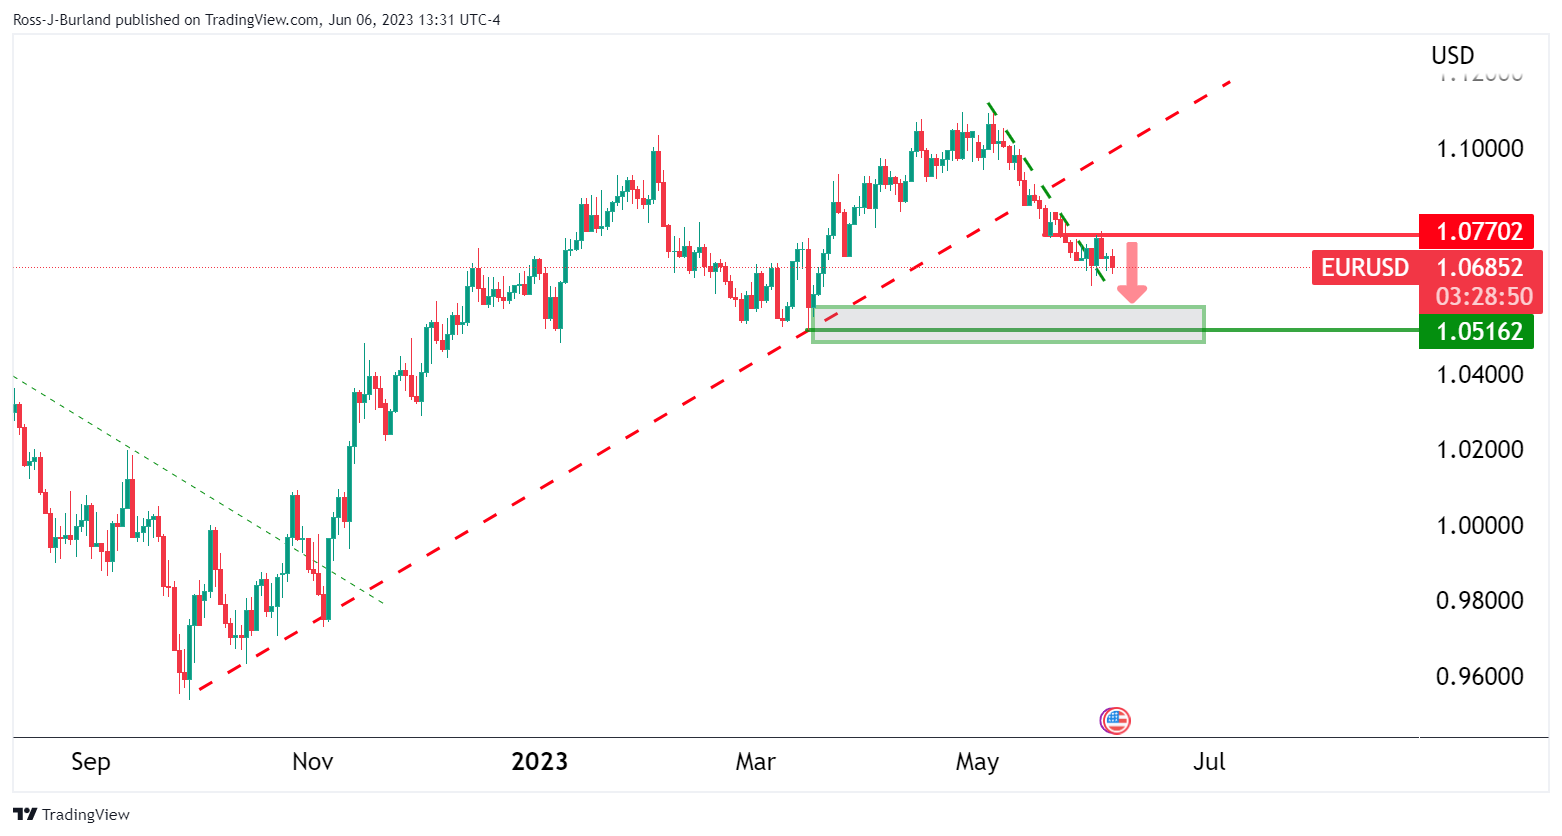
The price is also pressured below horizontal resistance, although it is sliding sideways out of the bearish trend.
EUR/USD H4 charts
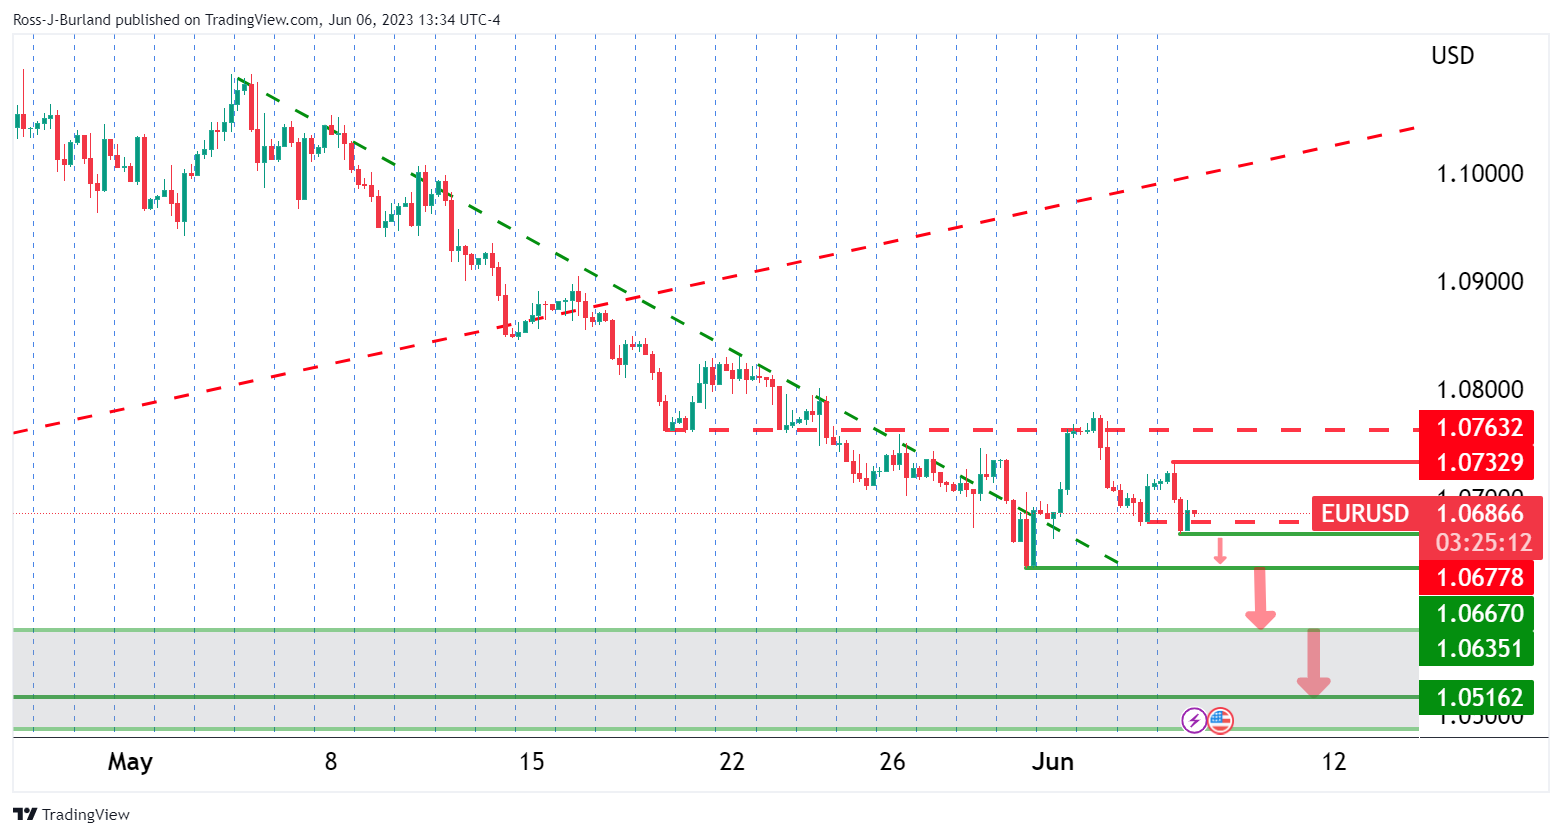
Moving down to the 4-hour charts for a closer inspection, we can see the price is trading sideways between 1.0670ish and 1.0730ish. While below resistance, 1.0770ish, the focus is on the downside and a test of the 1.0670ish support area. A break of here will open risk to test a daily 1.0520ish support area.
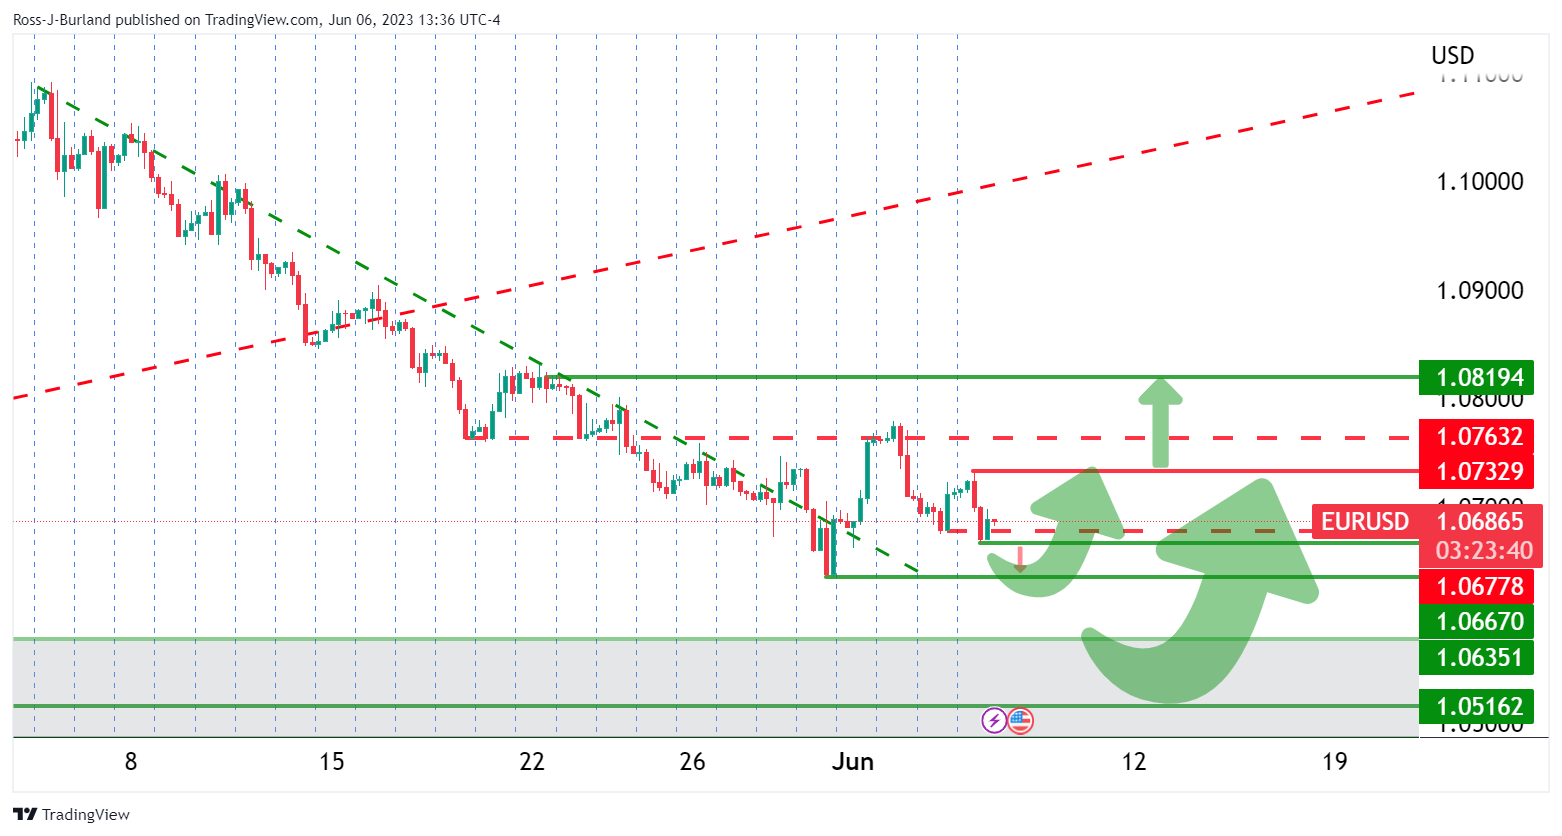
On the other hand, given we are on the backside of the old bearish trend, the market could just as easily stall at this juncture, or lower down, and turn higher as the above schematic illustrates.
- The USD/CAD pair fell to its lowest level since May 11 at 1.3390.
- Investors await BoC's decision, expected to maintain rates at 4.5%.
- Canadian yields increase, giving support to the CAD.
The USD/CAD stretched lower on Tuesday trading in the 1.3389 - 1.3452 range despite the US dollar maintaining its foot versus other peers, with the DXY index trading with gains at the 104.20 level. Ahead of Wednesday’s Bank of Canada (BoC) interest rate decision, Canadian yields are edging higher, giving the Canadian Dollar traction.
Canadian yields rise ahead of BoC decision
On Wednesday, investors will eye BoC's interest rate decision where Governor Tiff Macklem and the rest of the policymakers are expected to keep interest rates at 4.5%. In that sense, the clear deceleration in the previous inflation figures gives room for the BoC to keep rates steady. In addition, the Canadian Ivey PMI came in weak in May, retreating to 53.5 vs the 57.2 expected, supporting expectations of a no-hike as economic activity shows weakness.
Meanwhile, Canadian bond yields are advancing across the curve. The 10-year bond yield rose to 3.33%, while the 2-year yield stands at 4.42% and the 5-year yield stands at 3.57%.
Taking into account the upcoming Federal Reserve (Fed) decision, according to the CME FedWatch Tool, investors are betting on a 73.6% probability of the Fed not hiking rates at their next meeting in June and maintaining the target rate at 5.25%. However, the decision will rely heavily on upcoming May Consumer Price Index (CPI) data, where the headline inflation is expected to decelerate to 4.2% (YoY) from 4.9%, while the Core rate to accelerate to 5.6% (YoY) from the last 5.5% reading. In that sense, the expectations of the upcoming decision may have an impact on the US Dollar.
Levels to watch
Technically speaking, the USD/CAD maintains a bearish outlook for the short term, as per indicators on the daily chart. The Relative Strength Index (RSI) and Moving Average Convergence Divergence (MACD) are both showing weakness standing in negative territory, and the pair trades below its main moving averages indicating that the sellers have the upper hand. The shorter-term charts as the 4-hour also suggest bears' dominance with technical indicators deep in the red.
On the downside, the next support levels to watch are the daily low at the 1.3389 zone, followed by the 1.3350 and 1.3335 areas. On the other hand, a move above the 1.3450 zone may reignite the bulls' momentum, with next resistances at 1.3470 and the convergence of the 20-,100- and 200-day Simple Moving Averages (SMAs) around the 1.3500 area.
- GBP/USD swings in a 60-pip range, impacted by US bond yields and lack of domestic data.
- The World Bank ups 2023 US growth forecast to 1.1% but slashes projections for 2024 amidst the manufacturing slump.
- Central bank policy decisions are in the spotlight as RBA hikes rates; BoC takes center stage, Fed decision awaited.
GBP/USD hovers around the 1.2420s area after traveling around a 60-pip range on Tuesday, capped by the lack of economic data from the United States (US) and mixed market sentiment. Factors linked to US bond yields and the greenback, weighed on the Pound Sterling (GBP), set to register back-to-back days of losses. At the time of writing, the GBP/USD is trading at 1.2420.
Sterling pressured; Wall Street mixed as central banks navigate inflation uncertainty
Wall Street is trading mixed. Traders ignored data during the European session, as the construction PMI for the United Kingdom (UK) came in at 51.6 in May, exceeding the prior’s month reading of 51.1. Yet, the GBP/USD failed to gain traction as the US dollar rose.
Earlier in the North American session, the World Bank improved the economic outlook for the US, forecasting the economy will grow 1.1%, double January’s forecast of 0.5% in 2023. Even though it’s a good sign, projections for 2024 were slashed to 0.8%.
Meanwhile, the latest ISM PMIs release revealed that the economy is worsening as the manufacturing PMI contracted for the seven-straight month. Even though the services PMI expanded, the trend leans downward, increasing woes for a recession in the US.
Contrarily to weakening PMIs, was the latest jobs data, which further reinforces the thesis of doing more by the Federal Reserve. May Nonfarm Payrolls have added 339K jobs to the economy, portraying a resilient labor market. But the jump in the Unemployment Rate keeps the Fed at crossroads as it scrambles to curb sticky inflation at around double its target.
Given the backdrop, investors’ expectations for a hold at the June meeting lie at 76%, as shown by the CME FedWatch Tool. However, traders must be aware of the current week’s central banks’ monetary policy decisions amongst the G10, as the Reserve Bank of Australia (RBA) raised rates, while the Bank of Canada (BoC) took center stage on Wednesday. The latest round of inflation in Australia and Canada showed that inflation stabilized but later resumed upwards, pressuring the central banks.
GBP/USD Price Analysis: Technical outlook
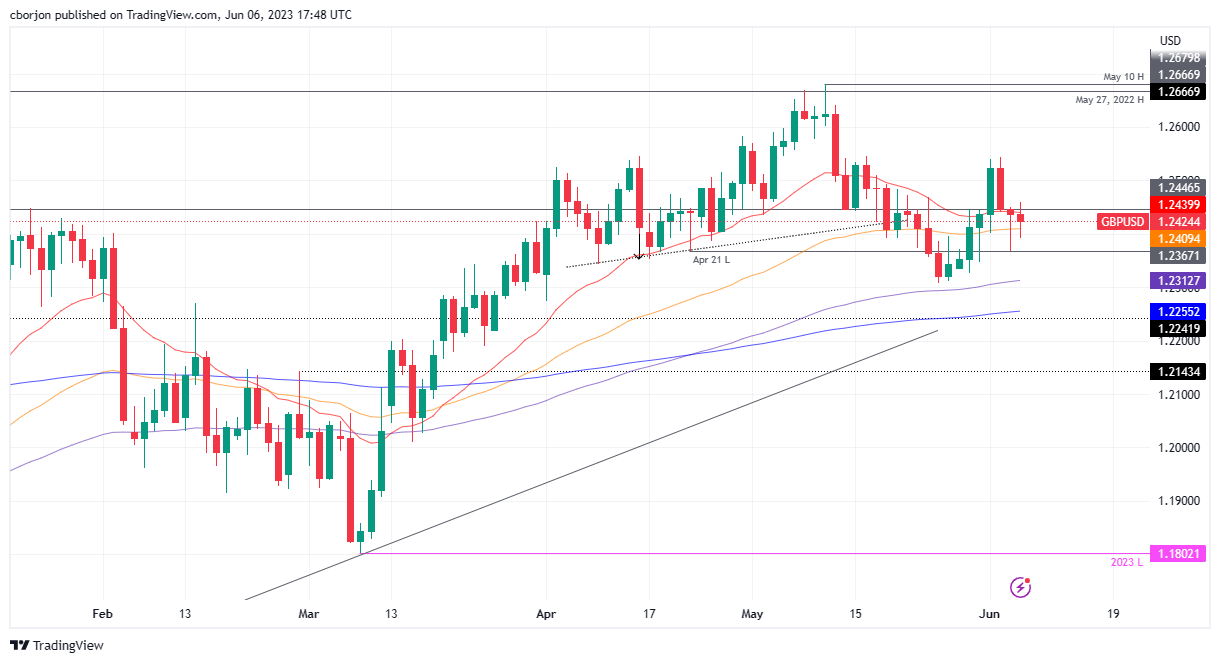
From a technical perspective, the GBP/USD remains supported by long-term daily EMAs below the exchange rate, depicting an uptrend but capped by the 20-day EMA at 1.2439. In addition, the 1.2500 handle is well defended by solid resistance with a bearish-harami formation around that area, which spurred a retracement from the late May rally, towards the June 2 high of 1.2544, before the ongoing pullback. Upside risks lie above 1.2459 and once cleared, the GBP/USD could test 1.2500. On the other hand, the GBP/USD could extend its losses below the 50-day EMA at 1.2409 and challenge the 100-day EMA at 1.2312.
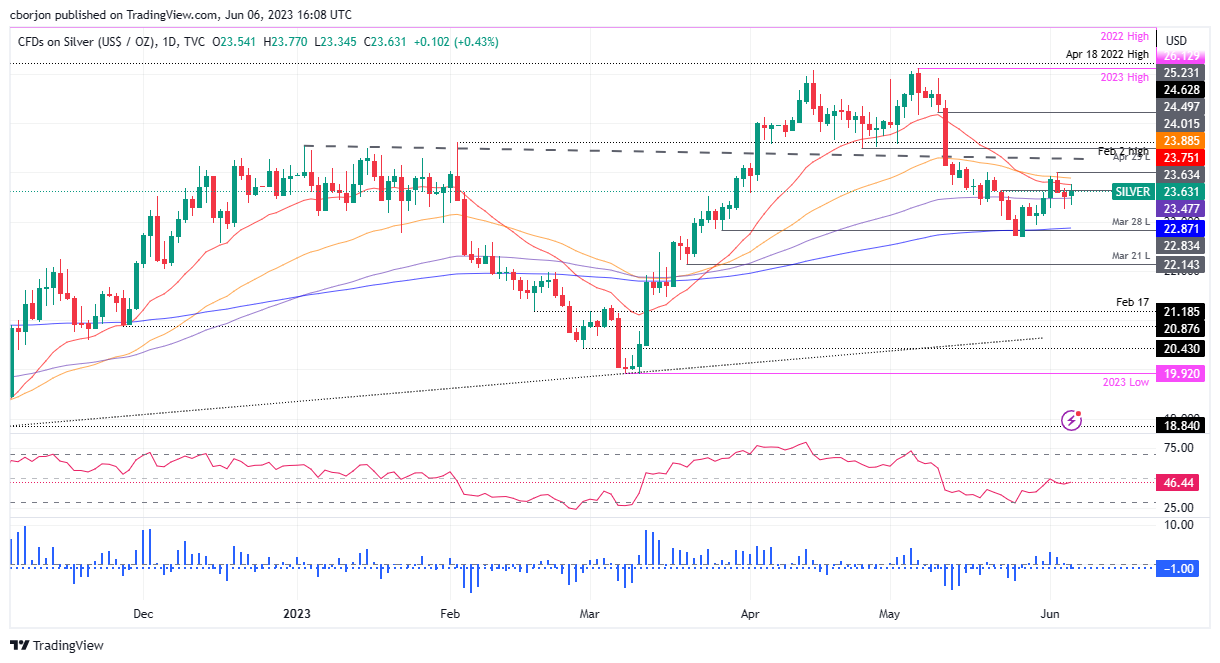
- Rising US bond yields curtail Silver’s momentum as it moves between key daily Exponential Moving Averages.
- XAG/USD breaking resistance at around $23.88 may propel Silver to challenge $24.00.
- A drop below the 100-day EMA and the June 5 low of $23.25 could trigger a steeper decline.
Silver price stopped its fall amidst rising US Treasury bond yields, cushioned by the 100-day Exponential Moving Average (EMA) lying at $23.47. Still, it also failed to rally, capped by solid resistance at around the $23.74-88 area, where the 20 and 50-day EMAs lie. Therefore, XAG/USD is trading at $23.52, almost flat.
Must read: Gold Price Forecast: XAU/USD steadily around $1960s amid higher US bond yields
XAG/USD Price Analysis: Technical outlook
From a daily chart perspective, the XAG/USD path remains unclear, trapped between daily EMAs, pending cracking resistance at around $23.74-88, which would pave the way to challenge the June 2 high of $24.01. A breach of the latter would shift Silver upwards and open the door to test the April 25 low turned resistance at $24.49 before aiming towards February 2 high at $24.63.
Conversely, XAG/USD falling below the 100-day EMA and sliding beneath the June 5 low of $23.25 could exacerbate a more profound fall toward the May 30 daily low of $22.93. Once broken, the XAG/USD next challenge will be the 200-day EMA at $22.87
The Relative Strength Index (RSI) indicator is in bearish territory, while the 3-day Rate of Change (RoC) followed suit. Therefore, in the near term, Silver’s path could be downwards.
XAG/USD Price Action – Daily chart
- Gold’s rise was capped by US bond yields despite concerns for a gloomy economic outlook in the US sparked by weakness in business activity.
- The US Federal Reserve is expected to maintain interest rates unchanged at the June reunion, but recent central bank decisions worldwide suggest tightening monetary conditions loom.
- Technical analysis of XAU/USD suggests a potential inverse head-and-shoulders pattern, with a crucial resistance confluence of the 50 and 20-day EMAs to validate it.
Gold price retreats after hitting a daily high of $1966.34 as US bond yields edge higher, a headwind for the yellow metal. Investors sentiment is negative after reports of business activity in the United States (US) raised worries about a recession, underpinned the US Dollar (USD) by last week’s Federal Reserve (Fed) dovish comments, cushioned XAU/USD fall. At the time of writing, XAU/USD is trading at $1959.40, with losses of 0.10%.
Investor sentiment cools Gold’s rally as increasing US bond yields and signs of persistent inflation pressure the precious metal.
Sentiment improvement keeps the Gold price pressured. After dropping sharply on Monday, US Treasury bond yields recover, with the 10-year note rate at 3.708%, two basis points higher than the open, while US 10-year TIPS, a proxy for real yields, are at 1.521%, above the 1.50% mark, after Monday’s close below the latter.
Gold witnessed an increase in flows after the Institute for Supply Management’s (ISM) May figures for manufacturing and services painted a gloomy scenario in the United States (US). Even though the US jobs report was outstanding, with May Nonfarm Payrolls printing 339K jobs added to the economy, the Unemployment Rate advancing 0.3% to 3.7%, eased the Fed’s job of tackling stubbornly sticky inflation. That triggered a jump in US bond yields as investors disregarded a possible rate hike in June.
Traders expect a 76% chance that the US Federal Reserve would keep rates unchanged at the June 13-14 reunion, as shown by the CME Fed Watch Tool. Nevertheless, it should be noted that some central banks that paused rate hikes earlier re-engaged toward tightening monetary conditions as inflation proves to be persistent.
Amongst those, the latest surprise happened Tuesday early in the Asian session, with the Reserve Bank of Australia (RBA) lifting rates for the second straight meeting. Gold traders should remember that the RBAs skipped a meeting, just to witness a jump in inflation and wages. After that, 50 bps of tightening had been added to its cash rate, now at 4.10%.
On Wednesday’s Bank of Canada (BoC) decision, which also paused its tightening cycle but sounded more hawkish than expected on the latest meeting. TDS analysts noted, “We look for the BoC to hike by 25bp in June and 25bp in July. Ongoing economic resilience will lengthen the path back to 2.0% inflation, and as such, we believe the BoC needs to tighten further.” Furthermore, “Recent data have cleared the bar to additional hikes.”
Given the backdrop, we will see what the Federal Reserve decides the next week, but current central bank decisions could delineate what the Fed could do.
XAU/USD Price Analysis: Technical outlook
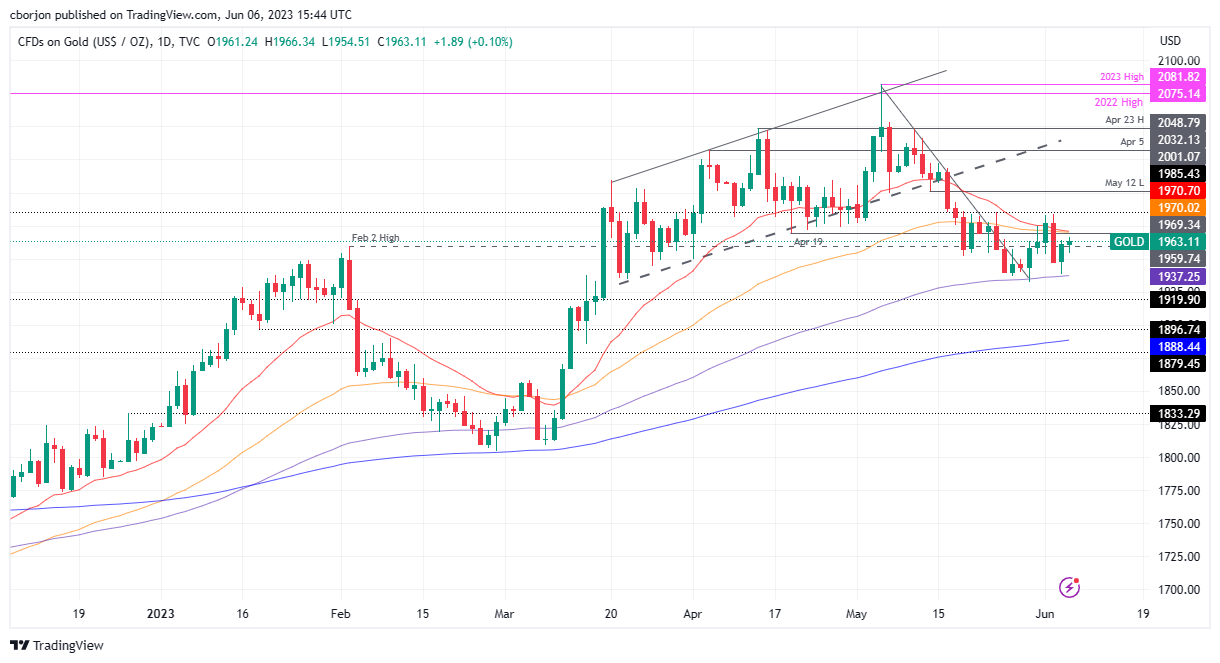
XAU/USD daily chart suggests the yellow metal is trading sideways, but an inverse head-and-shoulders could be forming. However, to validate the chart pattern, XAU/USD must rally past the confluence of the 50 and 20-day Exponential Moving Averages (EMAs) at $1969.90 and $1970.41, respectively. Once cleared, that would pave the way for the last week’s high of $1983.44, before aiming toward the May 12 low-shifted resistance at $1985.43, on XAU’s path toward the $2000 mark. Conversely, the pattern would be negated if XAU/USD tumbles below the 100-day EMA at $1937.19, followed by the May 30 daily low of $1932.20.
Economists at Commerzbank analyze Gold price outlook ahead of the central bank meetings that are scheduled to take place next week.
Prospect of rising interest rates likely to cap Gold for now
Though it seems certain that the ECB will hike its rates again, it is unclear what interest rate decision will be taken by the Fed. The market sees the chance of another rate increase, whereas our economists still believe that interest rates have peaked in the US.
Yesterday’s weaker-than-expected ISM index for the service sector did sow some seeds of doubts on the market with respect to its rate hike expectation next week; all the same, it appears unlikely that it will be completely priced out again. The prospect of rising rates will presumably weigh on the Gold price until the meeting, in other words.
However, a more pronounced and lasting correction is then on the cards after the Fed’s interest rate decision – assuming our experts are right – because the market’s positioning would then turn out to have been too hawkish.
USD/JPY in May had ranged from a low of 133.50 on the 4th to a high of 140.93 on the 30th. Economists at MUFG Bank discuss the pair’s outlook.
Room to rise to around 145
A return to the high of 142.25 on 22 November last year could be a temporary target. However, a break past this point would bring 145.00 into view, partly because there was a sharp decline at the time. We have therefore concluded that it is necessary to raise the upper limit of our forecast range.
USD/JPY is already overshooting if we consider only the difference in interest rates. The stance of the Japanese authorities also makes it hard to imagine that the yen will rise further and reach the 150 level again. Rather, we see the risk of a sharp decline in the USD/JPY going forward.
With a US rate cut still some time away, we, therefore, expect the BoJ will play a leading role in pushing down the USD/JPY over the next few months.
USD/JPY: Jun 2023 135~145 Jul-Sep 129~145 Oct-Dec 127~143 Jan-Mar 2024 125~141
Period-end forecast: Jun 2023 138 Jul-Sep 133 Oct-Dec 131 Jan-Mar 2024 129
Being bearish on the Dollar is ING’s baseline view.
A weaker Dollar can export lower US rates around the world
Our baseline view in FX markets is that the Dollar over the coming months will be entering a cyclical bear trend. This is premised on tighter US credit conditions adding to tighter monetary conditions and delivering the long-awaited US disinflation story.
Should the Fed be in a position to cut rates sharply later this year, we are convinced that the dollar would trade lower. Under that scenario, we think EUR/USD should be somewhere in the 1.15+ area by year-end, while USD/JPY should be below 130.
A weaker USD should be a positive story for global growth. Many countries, especially emerging market countries, have had to support local currencies with higher rates. A turn in the broad Dollar trend should give them some breathing room and perhaps attract to emerging markets the kind of positive portfolio inflows not seen since late 2020.
- USD/TRY extends the upside to the 21.5000 region.
- There seems to be no respite for the lira meltdown so far.
- Inflation in Türkiye dropped below 40% YoY in May.
Further weakness in the Turkish currency props up a new record high in USD/TRY, this time hitting the 21.5000 zone on Tuesday.
USD/TRY: Next target… the moon?
USD/TRY keeps the march north unabated, in the meantime, as investors continue to dump the lira following President Erdogan’s win at the general elections on Sunday and despite the appointment of well-known orthodox M. Simsek.
Recently, finmin Simsek emphasized the crucial importance for Turkey to bring down inflation to single digits once more in the medium term. Additionally, he stressed the need to accelerate the process of structural transformation, which would help alleviate the current account deficit.
It is worth recalling that Monday saw the CPI rise 39.59% YoY in May and 0.04% vs. the previous month.
The lira has lost already more than 15% since the beginning of the year and nearly 150% since the Turkish central bank (CBRT) embarked on its easing cycle in August 2021.
What to look for around TRY
USD/TRY maintains its upside bias well in place, always underpinned by the relentless meltdown of the Turkish currency.
In the meantime, investors are expected to closely monitor upcoming decisions on monetary policy, particularly after President R. T. Erdogan named former economy chief M. Simsek as the new finance minister following the cabinet reshuffle in the wake of the May 28 second round of general elections.
The appointment of Simsek has been welcomed with optimism by market members in spite of the fact that it is not yet clear whether his orthodox stance on monetary policy can survive within Erdogan’s inclination to battle inflation via lower interest rates.
In a more macro scenario, price action around the Turkish lira is supposed to continue to spin around the performance of energy and commodity prices - which are directly correlated to developments from the war in Ukraine, broad risk appetite trends, and dollar dynamics.
Key events in Türkiye this week: Industrial Production (Friday).
Eminent issues on the back boiler: Persistent skepticism over the CBRT credibility/independence. Absence of structural reforms. Bouts of geopolitical concerns.
USD/TRY key levels
So far, the pair is gaining 1.27% at 21.4938 and faces the next hurdle at 21.5136 (all-time high June 5) followed by 22.00 (round level). On the downside, a break below 19.5815 (55-day SMA) would expose 19.2495 (100-day SMA) and finally 18.8910 (200-day SMA).
Economists at Société Générale analyze EUR/USD outlook.
Short-term rate differentials are helping the Dollar
EUR/USD has continued to track short-term rates, which now discounts the same ECB-Fed rate differential in December 2023 as when we were heading into the US regional bank crisis in March. On that basis alone, a fall in EUR/USD towards the year’s low above 1.05 wouldn’t be unreasonable, and only a change in the outlook for Fed and/or ECB rate prospects can turn the trend around.
So far, softer-than-expected eurozone (headline) CPI data and another robust US labour market report don’t suggest a major change in trend and do therefore suggest caution.
The economy is slowing, the Fed is near the end of its hiking cycle, and neither the global energy backdrop nor the US balance of payments is a supportive factor anymore. So, we’ll wait for a better chance to buy the EUR.
- EUR/GBP edges lower on Tuesday, albeit manages to hold above the 0.8600 mark.
- Expectations for additional ECB rate hikes underpin the Euro and offer support.
- The fundamental backdrop warrants some caution for aggressive bullish traders.
The EUR/GBP cross attracts some intraday sellers near the 0.8625 region, albeit lacks any follow-through and manages to hold above the 0.8600 mark through the mid-European session.
The shared currency continues to draw support from rising bets for additional interest rate hikes by the European Central Bank (ECB), which, in turn, is seen as a key factor acting as a tailwind for the EUR/GBP cross. Against the backdrop of the recent hawkish comments by several ECB officials, President Christine Lagarde indicated on Monday that additional interest rate rises were likely as there is no clear evidence that underlying inflation has peaked.
This, in turn, reaffirms expectations that the central bank is not done raising rates despite a fall in inflationary pressures. It is worth recalling that the headline Eurozone CPI decelerated more than anticipated to the 6.1% YoY rate in May from 7.0% previous. Moreover, Core CPI slowed from 5.6% YoY to 5.3% last month. That said, resurgent US Dollar (USD) demand is weighing on the Euro and exerting some pressure on the EUR/GBP cross.
Furthermore, speculations that the Bank of England (BoE) will be far more aggressive in policy tightening to contain stubbornly high inflation further contributes to capping the upside for the EUR/GBP cross. This, in turn, makes it prudent to wait for strong follow-through buying before confirming that spot prices have formed a near-term bottom and positioning for any meaningful recovery from a fresh YTD low, around the 0.8565 region touched last week.
Technical levels to watch
USD/JPY has continued to trade at just below the 140.00 level. Economists at MUFG Bank analyze Yen outlook.
Wage data disappoints further dampening expectations for BoJ shift
The latest wage data from Japan will have been disappointing for the BoJ who are looking for stronger wage growth to support a sustained pick-up in inflation towards their 2.0% target. The report revealed that labour cash earnings increased by an annual rate of just 1.0% in April down from 1.3% in March, and much lower than the consensus forecast for an increase of 1.8%.
The report is a setback for the BoJ and will reinforce market expectations for the BoJ to maintain current loose policy settings at this month’s policy meeting on 16th June and for the rest of this year unless evidence of much stronger wage growth emerges in the coming months.
Without a shift in BoJ policy, the Yen is more likely to continue trading at weak levels.
- USD/CAD had extended its recovery above 1.3440 amid strength in the US Dollar.
- The overall market mood is cautious despite the improving United States-China trade relationship.
- A continuation of a steady interest rate policy is anticipated by the BoC.
The USD/CAD pair has stretched its recovery to near 1.3440 in the early New York session. The Loonie asset rebounded firmly from near the round-level support of 1.3400 amid strength in the US Dollar Index (DXY). The USD Index has sensed marginal selling pressure after printing a fresh day high to near 104.40.
S&P500 is expected to open on a flat note considering cues from overnight performance. A volatile action is widely anticipated amid voting for a US debt-ceiling raise in Congress. The overall market mood is cautious despite the improving United States-China trade relationship. Reuters reported on Tuesday, China's Vice Foreign Minister and a senior US State Department official had a frank, constructive, and fruitful communication on promoting Sino-US relations and properly managing differences.
A solid recovery from the USD Index has supported the US Treasury yields. The yields offered on 10-year US government bonds have climbed above 3.7%.
Going forward, the interest rate decision by the Bank of Canada (BoC) will remain in focus. BoC Governor Tiff Macklem is expected to keep interest rates steady at 4.5% as Canada’s inflationary pressures are steadily decelerating. Canada’s inflation has already slowed to 4.4% from its recent high of 8.1%. Therefore, the BoC has the luxury of keeping interest rates steady.
On the oil front, oil prices have found intermediate support near $70.00 after a vertical sell-off. More downside in the oil price seems solid as global central banks are preparing for a fresh interest rate hike cycle. It is worth noting that Canada is the leading exporter of oil to the United States and a rebound in the oil price might support the Canadian Dollar.
- USD/JPY reverses an intraday dip and draws support from the emergence of USD dip-buying.
- A goodish intraday pickup in the US Treasury bond yields helps revive demand for the buck.
- Intervention fears, a softer risk tone could underpin the JPY and cap the upside for the major.
The USD/JPY pair attracts some dip-buying in the vicinity of the 139.00 mark on Tuesday and stalls the overnight retracement slide from a multi-day peak. Spot prices build on the steady intraday ascent through the early North American session and climb to a fresh daily high, back closer to the 140.00 psychological mark in the last hour.
As investors look past Monday's disappointing release of the US ISM Services PMI, the US Dollar (USD) regains positive traction and turns out to be a key factor acting as a tailwind for the USD/JPY pair. The intraday USD uptick could be attributed to an intraday uptick in the US Treasury bond yields, though is likely to remain limited in the wake of rising bets for an imminent pause in the Federal Resreve's policy tightening cycle.
In fact, the markets are pricing in a greater chance that the US central bank will leave interest rates unchanged at the end of a two-day policy meeting on June 14. This might hold back the USD bulls from placing aggressive bets. Apart from this, the prospect of Japanese authorities intervening in the markets might further contribute to keeping a lid on any meaningful appreciating move for the USD/JPY pair, at least for the time being.
Furthermore, the prevalent cautious mood - as depicted by a softer tone around the equity markets - could benefit the JPY's relative safe-haven status. That said, a more dovish stance adopted by the Bank of Japan (BoJ) might continue to undermine the JPY and limit the downside for the USD/JPY pair. In the absence of any relevant macro data from the US, the mixed fundamental backdrop warrants caution for aggressive traders.
Technical levels to watch
Economists at Société Générale analyze S&P 500 Index technical outlook.
Beyond 4320, next objectives are 4400/4420 and 4510
S&P 500 Index is heading towards last August high of 4320 which is also close the 61.8% retracement of the whole decline during 2022. In case the move falters around this level, an initial pullback is not ruled out however upper end of previous range at 4200/4180 should be first layer of support.
Beyond 4320, next objectives are located at 4400/4420 and projections of 4510.
GBP/USD trades a little weaker but downside potential looks limited in the short run, in the view of economists at Scotiabank.
Weakness through the mid-1.23 area could signal more downside risk in the short run
Positive price action last week suggests firm support for the GBP should emerge on modest weakness through the upper 1.23 area but trends are not well defined at the moment and weakness through the mid-1.23 area could signal more downside risk for the Pound in the short run.
Gains above 1.2460 are needed to drive Sterling higher.
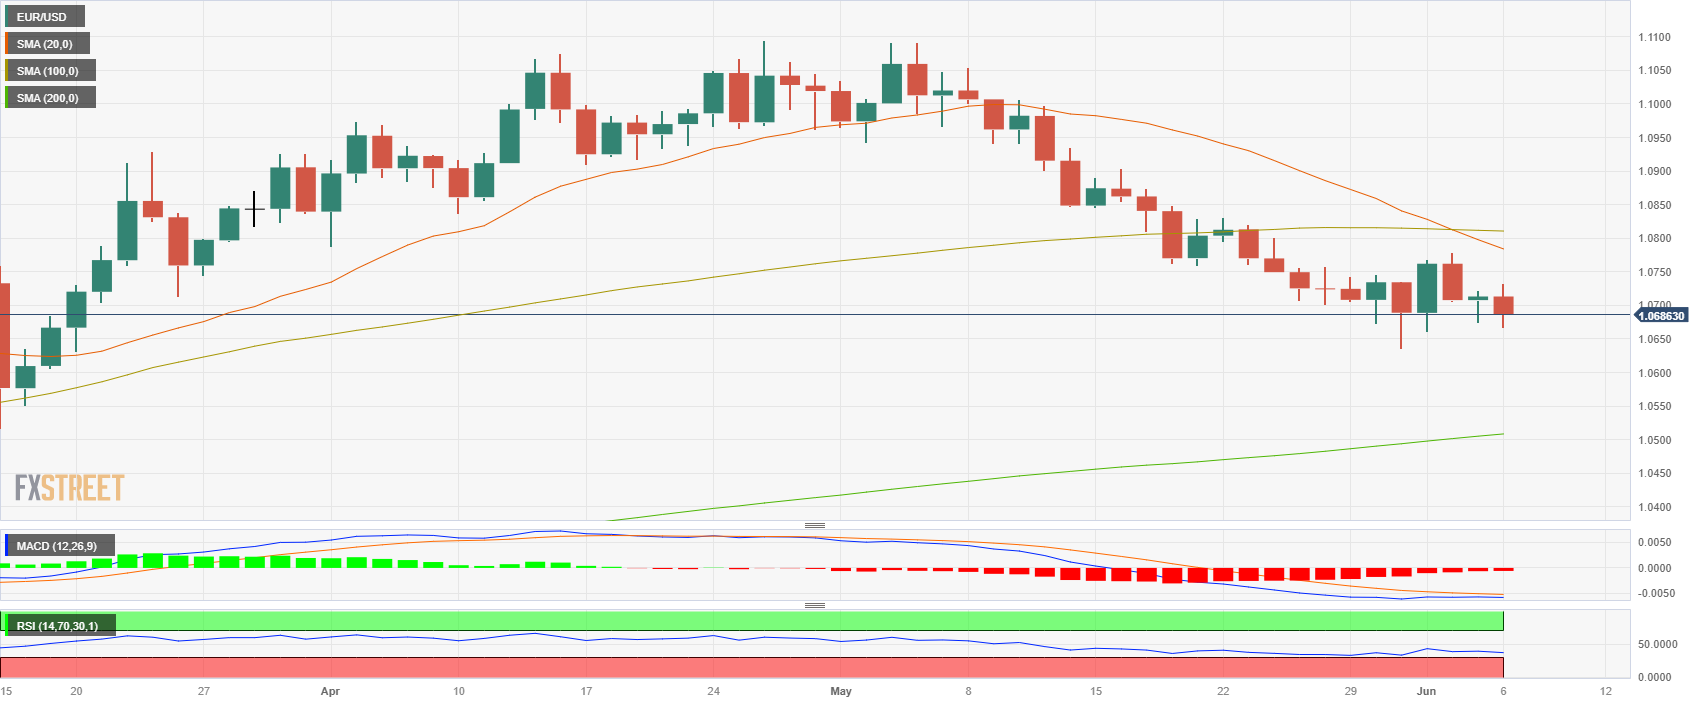
- EUR/USD has displayed a sheer downside to near 1.0670 posts the release of weak German Factory Orders and Eurozone Retail Sales.
- US firms are facing the wrath of higher interest rates by the Federal Reserve and tight credit conditions by regional banks.
- The European Central Bank is expected to raise interest rates further despite a decline in overall demand.
- EUR/USD is expected to retrace the entire placement of the Fibonacci retracement tool plotted from March 15 low at 1.0516 to April 26 high at 1.1095.
EUR/USD witnessed a vertical fall after retreating from 1.0733 in the early New York session. The major currency pair has dropped to near 1.0670 after the release of weaker-than-anticipated German Factory Orders, Eurozone Retail Sales, and an upbeat US Dollar. The shared currency pair is expected to extend its downside further.
S&P500 futures are holding nominal losses in the late London session. US equities were mildly offered on Monday after the release of the downbeat United States Services PMI reported by the Institute of Supply Management (ISM) agency.
The overall market mood is extremely cautious as weak US economic activities have raised hopes of a recession in the economy ahead. However, Goldman Sachs has shared distinct views about the US recession. The giant investment banking firm has slashed the probability of the US economy reporting recession to 25% from prior chances of 35%. The catalysts behind receding fears of the US recession are a strong labor market and improved business sentiment, as reported by Bloomberg.
Meanwhile, the US Dollar Index (DXY) has extended its resilient recovery to near 104.26 despite mixed cues about Federal Reserve’s (Fed) June monetary policy. Going forward, the lack of US economic indicators releases would keep the entire focus on macroeconomic events.
Contrary to that, the demand for US government bonds has increased ahead of voting for US debt-ceiling bill in Parliament. This has led to a fall in 10-year US Treasury yields to near 3.68%. A poll from Reuters showed that neither US President Joe Biden's Democrats nor Republicans in Congress emerged as a clear winner in the battle to raise the $31.4 trillion debt ceiling.
Mixed responses to Federal Reserve’s policy
The puzzle of whether the Federal Reserve will raise interest rates in June or will keep the monetary policy steady has remained the talk of the town. And, now the release of weak US Services PMI on Monday has added to uncertainty.
On Monday, US ISM Services PMI managed to dodge the 50.0 threshold that separates the boundary of expansion from the contraction phase. The Service PMI for May landed lower at 50.3 vs. the consensus of 51.5. This indicates that the economic indicator has hardly defended the contraction phase and a mild expansion is being recorded in service activity.
Last week, the US Manufacturing PMI contracted for the seventh straight month. It is highly likely that a collaborative impact of contracting factory activity and mildly expanded service activity could push the United States economy into recession.
It seems that firms in the United States region are facing the wrath of higher interest rates by the Federal Reserve and tight credit conditions by US regional banks, which has led to a decline in their overall productivity.
On the other side, the number of fresh talent additions in the labor market is significantly growing each month, which could keep consumer spending at elevated levels and accelerate demand-pull inflation. Therefore, the street is divided about Federal Reserve’s interest rate policy stance for June.
Euro faces pressure after weak German Factory Orders and Eurozone Retail Sales
Economic indicators belonging to Eurozone released in the early London session have uncovered its economic conditions. Deutsche Bundesbank reported a contraction in monthly Factory Orders by 0.4% while the street was anticipating an expansion by 3.8%. Annual Factory Orders contracted significantly by 9.9% vs. the estimates of 8.4% contraction.
Also, Eurozone Retail Sales (April) displayed a poor show. Monthly Retail Sales remained stagnant while the street was anticipating an expansion by 0.2%. Annual Retail Sales contracted by 2.6% vs. expectations of -1.8%. Weak spending and Factory Orders that indicate forward demand indicate that the overall demand in the economy is losing its resilience, which will weigh more pressure on inflation ahead.
In spite of contracting activities, the European Central Bank (ECB) is expected to raise interest rates further to tame stubborn inflation. European Central Bank (ECB) President Christine Lagarde reiterated on Monday that price pressure remains strong in the Euro area.
Economists at Nomura expect the European Central Bank to raise rates twice more from here, i.e. 2x25 bps hikes in June and July for a terminal rate of 3.75%. Thereafter, assuming core price momentum has slowed sufficiently, we think the ECB may call it a day on the hiking cycle.
EUR/USD technical outlook
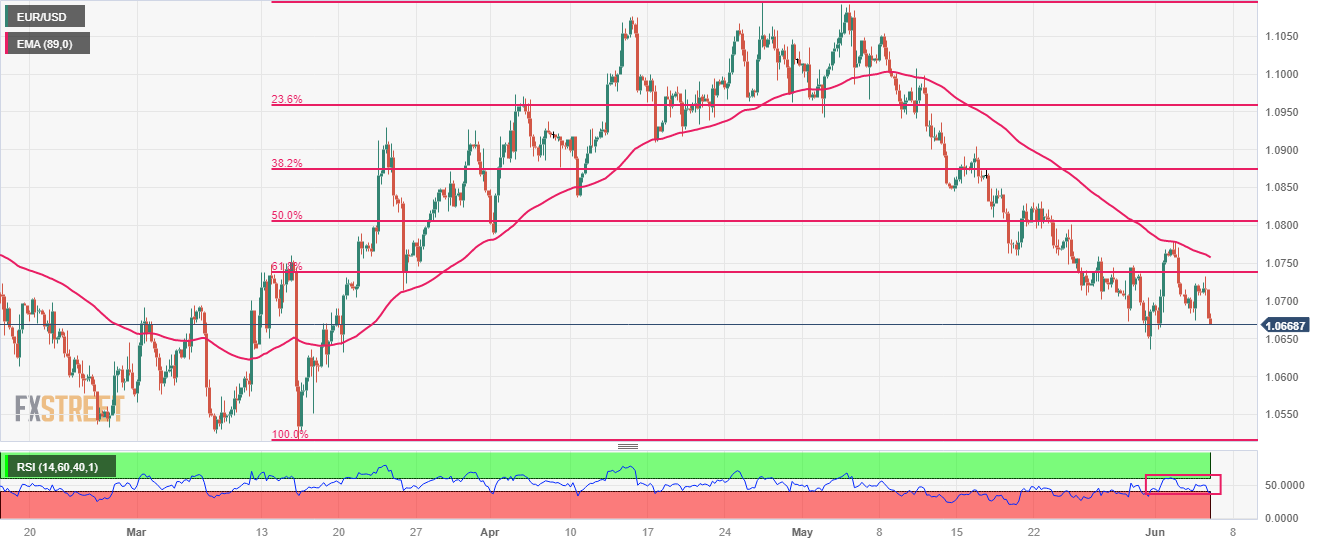
EUR/USD has retreated after a mean-reversion to near the 89-period Exponential Moving Average (EMA) at 1.0758 on a four-hour scale. The major currency pair is expected to retrace the entire placement of the Fibonacci retracement tool plotted from March 15 low at 1.0516 to April 26 high at 1.1095.
Investors might see a downside momentum if the Relative Strength Index (RSI) (14) drops into the bearish range of 20.00-40.00.
- EUR/USD retreats to the sub-1.0700 region on Tuesday.
- Further weakness could challenge the 1.0630 region.
EUR/USD comes under fresh downside pressure and drops below the key support at 1.0700 the figure on turnaround Tuesday.
The pair remains well under pressure and the continuation of the selling bias should prompt a probable test of the May low at 1.0635 (May 31) to emerge on the horizon in the short term. If spot clears the 1.0600 support it could then open the door to a deeper decline to the March low at 1.0516 (March 15).
Extra losses to the 2023 low of 1.0481 (January 6) would likely need a sharp deterioration of the outlook, which appears not favoured for the time being.
Looking at the longer run, the constructive view remains unchanged while above the 200-day SMA, today at 1.0505.
EUR/USD daily chart
- AUD/USD spikes to its highest level since mid-May in reaction to the RBA’s surprise 25 bps lift-off.
- The cautious market mood revives the USD demand and caps gains for the risk-sensitive Aussie.
- The fundamental backdrop favours bullish traders and supports prospects for additional gains.
The AUD/USD pair gains strong positive traction for the fourth successive day on Tuesday and jump to its highest level since mid-May. Spot prices, however, trim a part of intraday gains and trade around mid-0.6600s, still up nearly 0.50% for the day heading into the North American session.
The Australian Dollar (AUD) strengthens across the board in reaction to the Reserve Bank of Australia's (RBA) surprise 25 bps rate-hike and provides a goodish lift to the AUD/USD pair. The unexpected lift-off for the second straight month pushes the benchmark interest rates above 4% for the first time in nearly 12 years. Moreover, RBA Governor Philip Lowe acknowledged that inflation is still too high and that high prices would cause more economic damage than a near-term rise in interest rates.
Adding to this, the central bank maintains a hawkish bias and said that some further tightening of monetary policy may be required to bring inflation back to its target range within a reasonable timeframe, which further underpins the Aussie. That said, the prevalent cautious mood around the equity markets helps revive demand for the safe-haven US Dollar (USD), which holds back bullish traders from placing fresh bets around the AUD/USD pair and caps any further upside, at least for the time being.
Any meaningful upside for the USD, however, seems limited amid expectations for an imminent pause in the Federal Reserve's (Fed) policy tightening cycle. In fact, the current market pricing indicates a greater chance that the US central bank will leave interest rates unchanged at its upcoming monetary policy meeting on June 13-14. This leads to a further decline in the US Treasury bond yields, which, in turn, should act as a headwind for the Greenback and supports prospects for a further appreciating move for the AUD/USD pair.
The aforementioned fundamental backdrop suggests that the path of least resistance for spot prices is to the upside and any meaningful pullback might still be seen as a buying opportunity. There isn't any relevant market-moving economic data due for release from the US on Tuesday. Hence, market participants now look forward to RBA Governor Philip Lowe's speech and the release of the first quarter GDP report from Australia for some meaningful impetus during the Asian session on Wednesday.
Technical levels to watch
EUR/USD drifts around 1.07. Economists at Scotiabanka nalyze the pair’s technical outlook.
EUR’s undertone remains soft from a short-term technical point of view
EUR’s undertone remains soft from a short-term technical point of view, with spot failing to hold gains overnight and retreating fairly easily back under 1.07. However, the USD itself is struggling to build on gains and really can’t break away from the 1.07 area at this point.
More range trading around the figure seems likely in the short run. The longer the EUR can hold around the 1.07 point, the harder it will be for the USD to strengthen further.
- NZD/USD has attempted a recovery move after correcting to near 0.6070.
- The street is in a tug of war between weak US economic activities and bumper employee additions in the labor market.
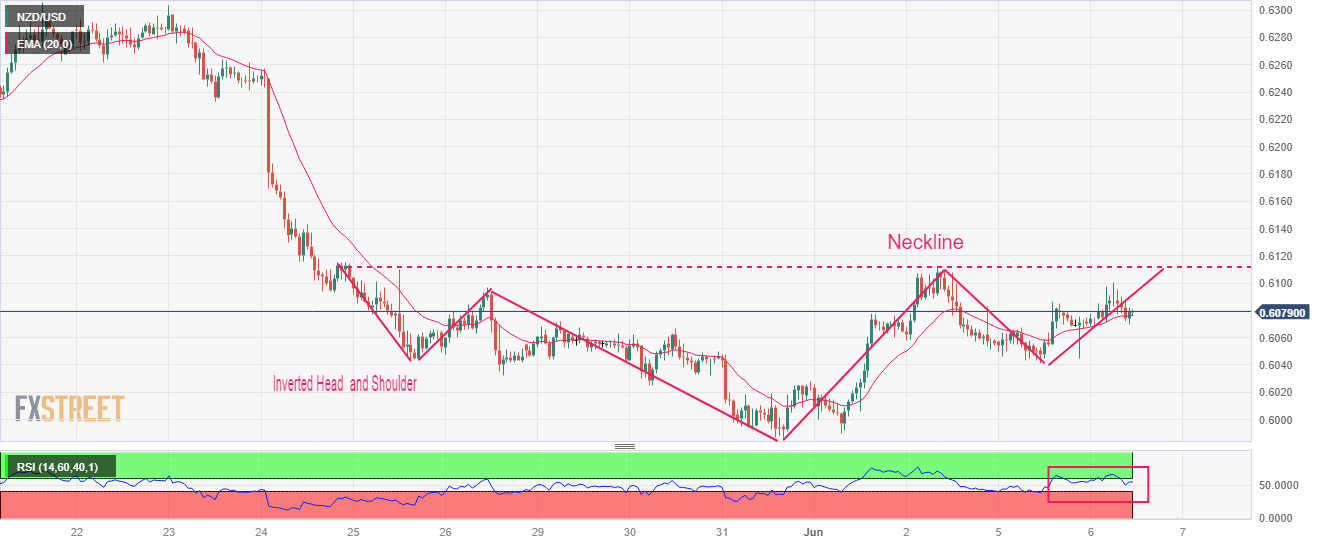
- NZD/USD is forming an Inverted Head and Shoulder chart pattern whose breakout propels a bullish reversal.
The NZD/USD pair has attempted a recovery move after correcting to near 0.6070 in the London session. The Kiwi asset is expected to show volatile moves amid an absence of critical triggers.
The US Dollar Index (DXY) has extended its solid recovery to near 104.20 despite the street is mixed about interest rate policy by the Federal Reserve (Fed) for June’s meeting. The street is in a tug of war between weak economic activities and bumper employee additions in the labor market.
Meanwhile, world’s second largest economy has asked its biggest banks to slash down deposit rates in order to boost the economic prospects. Higher liquidity flush into the economy would allow firms to utilize their full capacity. It is worth noting that New Zealand is one of the leading trading partners of China and higher factor and service activities in China will support the New Zealand Dollar.
NZD/USD is forming an Inverted Head and Shoulder chart pattern on an hourly scale, which indicates a prolonged consolidation, and a breakout of the same results in a bullish reversal. The neckline of the aforementioned chart pattern is plotted from May 25 high at 0.6110.
The 20-period Exponential Moving Average (EMA) at 0.6076 is providing cushion to the Kiwi bulls.
Meanwhile, the Relative Strength Index (RSI) (14) is making efforts for shifting into the bullish range of 60.00-80.00. An occurrence of the same will trigger an upside momentum.
A confident break above May 25 high at 0.6110 will drive the Kiwi asset toward May 01 low at 0.6160 followed by the round-level resistance at 0.6200.
Alternatively, a downside move below the intraday low at 0.6015 will expose the asset for a fresh six-month low toward 11 November 2022 low at 0.5984. A slippage below the latter would expose the asset toward 02 November 2022 high at 0.5941.
NZD/USD hourly chart
CAD gets a minor lift ahead of tomorrow’s BoC decision. Economists at Scotiabank analyze USD/CAD outlook.
USD/CAD to retest the low 1.33 zone once below 1.34
A minority of forecasters (including a couple of other Canadian banks and two, large Wall St firms) have joined Scotia’s call for a 25 bps hike this week but this remains a non-consensus call.
Markets may hold intraday – considering tomorrow’s nontechnical event risk – before a move develops but the technical pointers are tilted lower.
Resistance is 1.3465 and 1.3525/50.
Below 1.34, spot should retest the low 1.33 zone.
- DXY reverses the negative price action seen at the beginning of the week.
- Extra recovery could see the May high around 104.80 revisited.
DXY manages to regain some composure following Monday’s retracement and revisits the 104.20 region on Tuesday
Considering the current price action, another visit to the May peak of 104.79 (May 31) should remain on the table in the relatively near term. From here, the index could target the minor hurdle at the round level of 105.00 ahead of the crucial 200-day SMA, today at 105.53.
Looking at the broader picture, while below the 200-day SMA, the outlook for the index is expected to remain negative.
DXY daily chart
Economists at Société Générale analyze EUR/USD technical outlook.
Upside capped at 1.0860/1.0900
The pair has formed an interim trough near 1.0630. An initial bounce is underway, however, it would be interesting to see if it can reclaim 1.0860/1.0900, the 61.8% retracement of the down move. Failure could mean possibility of one more down leg.
Next important support zone is located at 1.0510/1.0480 representing low of March and the 200-DMA. In case the pair fails to defend it, there would be risk of a larger downtrend.
- GBP/JPY has rebounded back above 173.00 as the odds for an interest rate hike by the BoE remain upbeat.
- The BoJ is committed to continuing quantitative easing to push inflation steadily above 2%.
- UK’s consumer spending for durables has dropped as households are facing the burden of higher interest rates and stubborn inflation.
The GBP/JPY pair has shown a V-shape recovery after printing an intraday low of 172.68 in the European session. The cross witnessed a stellar buying interest as the Bank of Japan (BoJ) is committed to continuing quantitative easing to push inflation steadily above 2%.
Inflation in Japan is majorly derived from higher imported goods while less dependent on domestic demand and higher wages. The BoJ is consistently making efforts for increasing wages in order to increase domestic demand to keep inflation higher.
This week, Japan’s Gross Domestic Product (GDP) will be keenly watched. Thursday’s GDP data is expected to expand by 0.5% vs. prior expansion of 0.4% on a quarterly basis. Annualized Q1 GDP is seen steady at 1.6%.
Meanwhile, the headline came that the Bank of England (BoE) has allotted 10 million Pound Sterling in six-month Indexed Long-Term repo (ILTR) operations to match banks’ bids. Investors should note that LTRs allow market participants to borrow central bank reserves for a six-month period in exchange for less liquid assets.
In the United Kingdom, consumer spending for non-essential items has dropped as households are facing the burden of higher interest rates and stubborn inflation. Households are restricting themselves from purchasing durables as interest obligations are higher over time.
The British Retail Consortium (BRC) said spending in its members' stores increased 3.9% in annual terms last month, well above the 1.1% fall a year ago, however, sales were below the 5.2% rise in April, as reported by Reuters. However, the odds for one more interest rate hike by the Bank of England (BoE) remain resilient in order to secure the promise of halving inflation made by UK PM Rishi Sunak.
- EUR/JPY adds to Monday’s pullback and breaches 149.00.
- Occasional bullish attempts should meet a tough barrier near 151.00.
EUR/JPY corrects further south and retreats to the sub-149.00 region on Tuesday.
In case bulls regain the initiative, there is an immediate hurdle at the so far monthly high at 150.19 (June 5). The convincing surpass of this level could put the weekly top at 151.07 (May 29) back on the radar prior to the 2023 peak at 151.61 (May 2).
So far, further upside looks favoured while the cross trades above the 200-day SMA, today at 144.05.
EUR/JPY daily chart
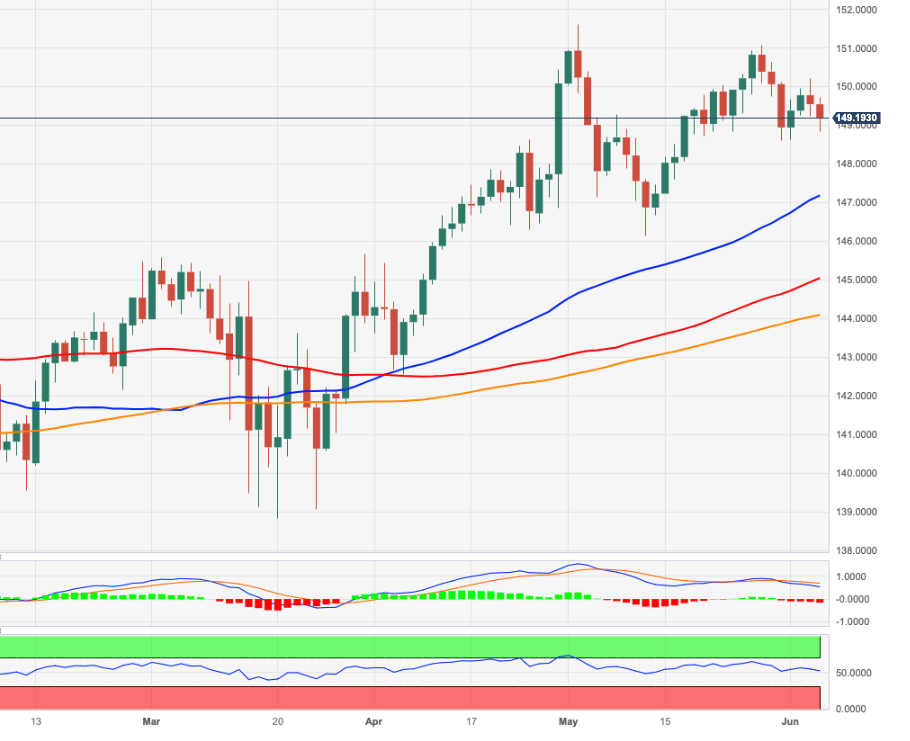
Economists at TD Securities analyze AUD outlook after the RBA hikes 25 bps.
ANZ/NZD to target next resistance level at 1.108
The 25 bps hike today favours short-term AUD/NZD upside given compressing rates differential between the RBA and the RBNZ.
With the RBNZ flagging that it is done with its hiking cycle, a hawkish RBA will bode well for more AUD strength on RV basis.
AUD/NZD has broken through the downtrend since the Sep'22 highs, and we see it targeting the next resistance level at 1.108 (Feb High), another 1.2% away from current levels.
We prefer to express AUD strength against NZD rather than USD given the USD resilience amid firmer US data. Post decision, the lift in AUD/USD only brings us back to the familiar 0.660/0.680 range, which has been established since early March this year.
- Gold price remains confined in a narrow band through the first half of the European session.
- A modest US Dollar strength is seen acting as a headwind for the US Dollar-denominated metal.
- Bets for an imminent pause in the Federal Reserve’s rate-hiking cycle help limit the downside.
Gold price struggles to capitalize on the previous day's modest recovery from the 100-day Simple Moving Average (SMA) and oscillates in a narrow trading band through the first half of the European session on Tuesday. The XAU/USD currently trades just above the $1,960 level, nearly unchanged for the day and well within the striking distance of over a two-month low touched last week.
Reviving US Dollar demand caps gains for Gold price
The US Dollar (USD) attracts some dip-buying and stalls the overnight slide that followed the disappointing release of the United States (US) macro data and turns out to be a key factor acting as a headwind for the Gold price. In fact, a survey from the Institute for Supply Management (ISM) showed that economic activity in the US services sector barely grew in May and fueled speculations that the world’s largest economy was cooling. Adding to this, the Prices Paid sub-component fell to a three-year low and reaffirmed bets for an imminent pause in the Federal Reserve (Fed) rate-hiking cycle.
Dovish Federal Reserve expectations lend support to XAU/USD
It is worth recalling that a slew of influential Fed officials last week backed the case for skipping an interest rate hike in June. Moreover, the markets are currently pricing in a greater chance that the US central bank will leave interest rates unchanged at the June 13-14 Federal Open Market Committee (FOMC) policy meeting. This, in turn, leads to a further decline in the US Treasury bond yields and might hold back the USD bulls from placing aggressive bets. Apart from this, the prevalent cautious market mood continues to act as a tailwind for the safe-haven Gold price and limits the downside.
The focus remains glued to the June 13-14 FOMC meeting
The aforementioned fundamental backdrop suggests that the path of least resistance for the XAU/USD is to the upside. Traders, however, seem reluctant and prefer to wait for more clarity about the Fed’s near-term policy outlook. Hence, the focus will remain glued to the highly-anticipated FOMC decision, scheduled to be announced at the end of a two-day policy meeting next Wednesday. In the meantime, the US bond yields will continue to play a key role in influencing the USD price dynamics in the absence of any relevant market-moving economic releases from the US on Tuesday.
Gold price technical outlook
From a technical perspective, the recent repeated failures to find acceptance below the 100-day SMA and the subsequent move-up warrants caution for bearish traders. That said, the lack of any meaningful buying makes it prudent to wait for a sustained strength beyond the $1,983-$1,985 supply zone before confirming that the recent pullback from the all-time high touched in May has run its course. The Gold price might then aim to reclaim the $2,000 psychological mark and climb further towards the next relevant hurdle near the $2,010-$2,012 region.
On the flip side, bearish traders need to wait for a convincing breakdown below the 100-day SMA, currently pegged around the $1,940-$1,939 zone, before placing fresh bets. Some follow-through selling below the May monthly swing low, around the $1,932 area, will reaffirm the negative bias and make the Gold price vulnerable to accelerate the fall towards the $1,900 round figure. The downward trajectory could get extended further and drag the XAU/USD towards the $1,876-$1,875 horizontal support en route to the very important 200-day SMA, currently around the $1,840-$1,839 region.
Key levels to watch
Economists at Société Générale analyze USD/JPY technical outlook.
138/137.20 is key support if profit taking crystallizes
USD/JPY has so far defended the graphical levels of 138/137.20 which is also the 200-DMA. It is worth noting that this region had acted as a hurdle since December and is expected to be an intermittent support. Only a break below would denote possibility of a deeper decline.
In case USD/JPY establishes beyond recent high of 141, the phase of rebound could extend towards 142.50/142.80, the 61.8% retracement from last October and 144.40.
Antje Praefcke, FX Analyst at Commerzbank, discusses EUR/CHF outlook.
Statement versus data
Martin Schlegel, Vice Chairman of the Governing Board, sees increasing signs that inflation is spreading to other goods and services that are not related to energy and supply shortages.
Even though inflation eased to 2.2% in May (from 2.6%), the SNB still seems to be concerned about second-round effects.
I would weigh Schlegel’s comments stronger than the May inflation data.
A rate hike in two weeks’ time to then 1.75% is likely to be a fait accompli. The market sees the likelihood that key rates in Switzerland might even rise to 2%. As long as there is no indication that these expectations are too high, the Franc is likely to remain strong against the Euro.
Considering advanced prints from CME Group for natural gas futures markets, open interest resumed the uptrend and went up by around 5.1K contracts on Monday. Volume, in the meantime, remained erratic and rose by around 20.5K contracts following the previous pullback.
Natural Gas remains stuck within the range
Prices of natural gas extended the recovery on Monday against the backdrop of rising open interest and volume, paving the way for the continuation of this trend in the very near term. That said, there is an immediate hurdle around the $2.50 region per MMBtu, although the commodity is largely anticipated to maintain the current multi-week consolidative phase for the time being.
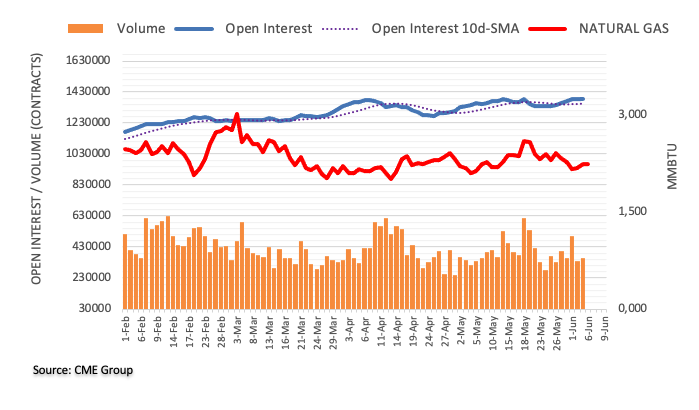
EUR/ PLN sank to the lowest level in nearly two years to below 4.4700 yesterday. Economists at Société Générale analyze the pair’s technical outlook.
First resistance is at 4.50
EUR/PLN underwent a brief pause in May however the upside has remained capped near April / May 2022 lows of 4.55. It has now breached the lower limit of recent consolidation denoting resumption in down move.
The pair is expected to head lower towards next projections at 4.45 and perhaps even towards 2021 low of 4.43.
First resistance is at 4.50, the 38.2% retracement of last bout of down move.
- USD/CHF has shown a solid recovery from below 0.9040 following the footprints of the USD Index.
- The appeal for the USD Index has improved amid the risk-off market mood.
- USD/CHF is marching towards the downward-sloping trendline of the Descending Triangle pattern plotted from 0.9148.
The USD/CHF pair has paused for a while after a solid recovery from below 0.9040 in the European session. The Swiss Franc asset is expected to extend its recovery move above the immediate resistance of 0.9070. The major is following the footprints of the US Dollar Index (DXY) which has refreshed its day’s high to near 104.10.
Losses in the S&P500 futures have increased further as investors are worried about the United States' economic prospects. The market participants have underpinned the risk aversion, which has improved the appeal of the US Dollar Index.
Meanwhile, investors are anticipating that the Swiss National Bank (SNB) will raise interest rates further as SNB Chairman Thomas J. Jordan told that the demerits of a highly inflated environment are higher than higher interest rates.
USD/CHF is marching towards the downward-sloping trendline of the Descending Triangle chart pattern plotted from May 31 high at 0.9148 on an hourly scale. The horizontal support of the aforementioned chart pattern is placed from June 02 low at 0.9035. The Descending Triangle formation indicates a volatility contraction that is followed an expansion in the same.
The Swiss Franc asset has sharply moved above the 20-period Exponential Moving Average (EMA) at 0.9062, which indicates that the short-term trend has turned bullish and the upside momentum is extremely strong.
Adding to that, the Relative Strength Index (RSI) (14) has rebounded into the 40.00-60.00 range from the bearish range of 20.00-40.00, portraying a bullish reversal.
Going forward, a decisive break above the intraday high at 0.9073 will drive the asset toward the round-level resistance of 0.9100 followed by March 28 low at 0.9137.
In an alternate scenario, a downside move below May 16 low at 0.8929 will drag the asset toward April 14 low at 0.8867. A slippage below April 14 low will further drag the asset toward May 04 low at 0.8820.
USD/CHF hourly chart
-638216408709329426.png)
- GBP/USD turns lower for the third straight day amid a modest USD uptick.
- The cautious market mood is seen benefitting the safe-haven Greenback.
- Bets for an imminent Fed rate hike pause might continue to cap the buck.
The GBP/USD pair struggles to capitalize on the previous day's goodish rebound of over 70 pips and attracts fresh sellers near the 1.2455-1.2460 region, or the 50-day Simple Moving Average (SMA), on Tuesday. Spot prices turn lower for the third straight day and trade just above the 1.2400 round-figure mark during the first half of the European session.
The prevalent cautious mood around the equity markets lends some support to the safe-haven US Dollar (USD), which, in turn, is seen as a key factor acting as a headwind for the GBP/USD pair. That said, any meaningful upside for the USD seems elusive amid rising bets for an eventual pause in the Federal Reserve's (Fed) policy tightening cycle. In fact, the current market pricing points to a greater chance that the US central bank will leave interest rates unchanged next week.
It is worth recalling that a slew of influential Fed officials last week backed the case for skipping an interest rate hike at the June policy meeting. Adding to this, the disappointing release of the US ISM Services PMI on Monday, which fell to 50.3 in May, signals more cooling in the US economy and offers lesser headroom for the US central bank to keep raising interest rates. This leads to a further decline in the US Treasury bond yields and acts as a headwind for the Greenback.
Apart from this, expectations that the Bank of England (BoE) will be far more aggressive in policy tightening to contain stubbornly high inflation might further contribute to limiting the downside for the GBP/USD pair. This, in turn, suggests that any subsequent decline might still be seen as a buying opportunity and remain limited. In the absence of any relevant market-moving economic releases from the US, the USD price dynamics will continue to play a key role in influencing the major.
Technical levels to watch
Economists at ING analyze EUR/GBP and GBP/USD outlooks.
Investors are unlikely to chase EUR/GBP through 0.8550 anytime soon
In EUR/GBP, 0.8550 has been the best level of the last year for Sterling (the pair bounced off 0.8565 last week) and we doubt investors want to chase Sterling through those levels anytime soon.
The GBP/USD pair is consolidating in a 1.2350-1.2550 range and should stay there if we are correct with our EUR/USD call.
See: BoE's hesitant stance to pummel the Pound – Commerzbank
The latest survey of consumer expectations for inflation, conducted by the European Central Bank (ECB) on a monthly basis, reveals that inflation expectations among Eurozone consumers decreased significantly in April.
Additional takeaways
“Economic growth expectations for the next 12 months at -0.8% in April vs -1.0% in March.”
“Consumers expect nominal incomes to rise more slowly over the next 12 months.”
“Median expectations for inflation over the next 12 months fell to 4.1% in April from 5.0% in March.”
“Expectations for inflation 3 years ahead fell to 2.5% from 2.9%.”
Market reaction
EUR/USD is feeling the pull of gravity on softening of inflation expectations in the old continent. The pair is currently trading at 1.0695, down 0.16% on the day.
- USD/JPY has found a fragile cushion around 139.10 after a recovery in the US Dollar Index.
- Investors seem puzzled after crucial US economic indicators as they have divided the street about Fed’s policy.
- BoJ Ueda is committed to continuing quantitative easing until the achievement of the inflation target.
The USD/JPY pair has found an intermediate cushion around 139.00 in the London session. The downside momentum in the asset has been intervened as the US Dollar Index (DXY) has displayed a decent recovery move after defending the crucial support around 103.80.
S&P500 futures are showing nominal losses in Europe, portraying a cautious market mood. Investors seem puzzled after crucial United States economic indicators for May as they have divided the street about Federal Reserve (Fed)’s interest rate policy for June month.
The USD Index is making efforts for keeping its auction comfortable above 104.00. Investors are mixed about Fed’s policy as the consistent addition of fresh payrolls in the labor market is expected to keep spending levels at a peak, which would result in demand-pull inflation. While weakening scale of economic activities supports a neutral interest rate policy to avoid the United States economy from falling into recession.
Meanwhile, lending from US commercial banks is still higher despite soaring interest rates by the Fed. In a CNBC interview on Monday, International Monetary Fund (IMF) Managing Director Kristalina Georgieva said that "We don't yet see a significant slowdown in lending.” She further added, “There is some, but not on the scale that would lead to the Fed stepping back,”
The Japanese Yen is still getting strength despite dovish commentary from Bank of Japan (BoJ) Governor Kazuo Ueda. BoJ Ueda said the central bank will continue quantitative easing until the achievement of the inflation target," He further added changes are emerging gradually to a deflationary mindset that prices and wages are hard to rise.
- Eurozone Retail Sales came in at 0% MoM in April vs. 0.2% expected.
- Retail Sales in the bloc arrived at -2.6% YoY in April vs. -1.8% expected.
Eurozone’s Retail Sales came in at 0% MoM in April versus 0.2% expected and -0.4% previous, the latest official figures released by Eurostat showed on Tuesday.
On a yearly basis, the bloc’s Retail Sales dropped 2.6% in April versus -3.3% booked in March and -1.8% expected.
FX implications
The Euro is unperturbed by the mixed Eurozone consumer spending data. At the time of writing, the major is trading at 1.0700, down 0.12% on the day
About Eurozone Retail Sales
The Retail Sales released by Eurostat are a measure of changes in sales of the Eurozone retail sector. It shows the performance of the retail sector in the short term. Percent changes reflect the rate of changes of such sales. The changes are widely followed as an indicator of consumer spending. Usually, positive economic growth anticipates "Bullishness" for the EUR, while a low reading is seen as negative, or bearish, for the EUR.
AUD/USD builds gains from last week’s 0.6458 low after surprise RBA hike. Economists at Société Générale discuss the pair’s outlook.
Further tightening may be required to bring inflation back to target in a reasonable timeframe
The RBA delivered its second straight policy surprise by lifting the CRT by another 25 bps to 4.10%. This brings the cumulative tightening to 400 bps.
In the statement, the central bank says further tightening may be needed to bring inflation back to target in a reasonable timeframe.
The AUD gains on knee-jerk buying but the hurdle for a sustained period of appreciation is high. We've been down this path many times before when the bounce peters out and sellers step in. Fed policy, China’s growth path and industrial metals take precedence over the RBA.
- USD/CAD meets with a fresh supply on Tuesday and drops to a nearly four-week low.
- Weaker Oil prices undermine the Loonie and lend support amid a modest USD bounce.
- The mixed fundamental backdrop warrants some caution before placing directional bets.
The USD/CAD pair struggles to capitalize on the previous day's modest gains and comes under some renewed selling pressure on Tuesday. Spot prices continue drifting lower through the early part of the European session and drop to a nearly four-week low in the last hour, albeit showed some resilience below the 1.3400 round-figure mark.
The initial market reaction to additional supply cuts by Saudi Arabia and OPEC fades rather quickly amid persistent concerns over slowing economic growth and weakening demand. This, in turn, drags Crude Oil prices lower for the second straight day, which, along with the emergence of some US Dollar (USD) dip-buying, helps limit the intraday losses for the USD/CAD pair. Any meaningful upside for the USD, however, seems limited amid expectations that the Federal Reserve (Fed) will skip hiking interest rates next week.
In fact, the current market pricing indicates a greater chance that the US central bank will leave interest rates unchanged at the June policy meeting. Against the backdrop of last week's dovish rhetoric from several FOMC officials, the disappointing release of the US ISM Services PMI on Monday, which fell to 50.3 in May, reaffirmed market bets for an imminent pause in the Fed's rate-hiking cycle. This keeps the US Treasury bond yields depressed, which might hold back the USD bulls from placing bets and cap the USD/CAD pair.
That said, the prevalent cautious market mood could lend some support to the safe-haven Greenback and the USD/CAD pair. In the absence of any relevant market-moving economic releases from the US, the mixed fundamental backdrop makes it prudent to wait for some follow-through selling before positioning for any further depreciating move. Market participants now look to the release of the Canadian Ivey PMI, which, along with Oil price dynamics, might influence the Canadian Dollar (CAD) and provide some impetus to the major.
Technical levels to watch
Strategists at TD Securities analyze Gold (XAU/USD) outlook.
Data has not supported hopes of a Fed pause just yet
The data has not supported hopes of a Fed pause just yet.
Discretionary capital has continued to flow away from the yellow metal, with our gauge still suggesting that discretionary traders have added shorts, in contrast to total non-commercial trading activity. Still, we expect this cohort will ultimately become a boon for Gold bugs, as our proxy of discretionary trader positioning displays a strong historical correlation to market expectations for Fed funds 12m forward.
Growing expectations for deepening cuts over the next year should soon begin to support higher Gold prices.
- EUR/GBP is expected to extend its downside journey below 0.8610 as the German recession could deepen further.
- German Factory Orders have contracted at a higher pace than forecasted amid higher interest rates by the ECB.
- UK’s inflation is extremely stubborn and the BoE cannot pause its policy-tightening spell at this juncture.
The EUR/GBP pair has slipped sharply to near 0.8610 in the London session. The asset witnessed a steep fall after the release of weak German Factory Orders data. Deutsche Bundesbank reported a contraction in monthly Factory Orders by 0.4% while the street was anticipating an expansion by 3.8%. Annual Factory Orders contracted significantly by 9.9% vs. the estimates of 8.4% contraction.
European Central Bank’s (ECB) aggressively tight monetary policy has squeezed lending from Eurozone commercial banks. Firms seem reluctant to raise funds for augmenting fixed and working capital requirements at higher interest rates due to which less capacity is in utilization.
Investors should note that the German economy has already registered a recession after posting a contraction in Gross Domestic Product (GDP) for straight two quarters. And, now weak German Factory Orders are demonstrating a bleak economic outlook.
However, the ECB might continue raising interest rates further amid persistence in core inflation. ECB President Christine Lagarde reiterated in front of the European Parliament in Brussels on Monday that price pressure remains strong in the Euro area. Also, ECB policymaker Klaas Knot said recently, “We will keep tightening policy until we see inflation returning to 2% but this must be done step by step.”
Meanwhile, the Pound Sterling has been underpinned by the market participants despite a decline in United Kingdom households’ spending on non-essential items. The British Retail Consortium (BRC) said spending in its members' stores increased 3.9% in annual terms last month, well above the 1.1% fall a year ago, however, sales were below the 5.2% rise in April, as reported by Reuters.
In spite of that, UK’s inflation is extremely stubborn and the Bank of England (BoE) cannot pause its policy-tightening spell at this juncture.
Economists at ING analyze EUR/USD outlook.
May be too early to expect EUR/USD to add to yesterday's gains
With US two-year yields holding onto around three-quarters of their rise since Friday's jobs report, it may be too early to expect EUR/USD to add to yesterday's gains.
EUR/USD may trade well within a 1.0680-1.0780 range into tomorrow's Bank of Canada meeting. It may also take its cue from this week's China data, including May trade data released tomorrow and aggregate financing data later in the week.
- WTI has dropped perpendicularly to near $70.63 after headlines that US Blinken is visiting Saudi Arabia.
- Global central banks are gearing up for a fresh interest rate hike to strengthen their side in the battle against stubborn inflation.
- Hopes of a recession will skyrocket as lending activity by commercial banks would further reduce due to higher interest rates.
West Texas Intermediate (WTI), futures on NYMEX, have witnessed an intense sell-off in the European session. The oil price has shown a vertical decline and has dropped to near $70.63. The black gold has surrendered the majority of gains added to optimism about production cuts by Saudi Arabia.
The US Dollar Index (DXY) has displayed a decent recovery move after finding strength near the crucial support at 103.80. A solid recovery in the USD Index has also weighed on the oil price.
Despite the announcement of production cuts by Saudi Arabia, oil prices are failing to come out of the bearish trajectory. It seems that gloomy demand is the major catalyst that is dragging the oil price lower. Global central banks are gearing up for a fresh interest rate hike to strengthen their side in the battle against stubborn inflation.
This month, the Federal Reserve (Fed), the European Central Bank (ECB), and the Bank of England (BoE) are expected to tighten their monetary policy further. The street is confident that central banks belonging to the shared continent will definitely step up their interest rates whole views about Fed’s interest rate decision are mixed.
After a fresh rate hike cycle, hopes of a recession in the global economy will skyrocket as lending activity by commercial banks would further reduce. Investors should note that Germany has already reported a recession after displaying a contraction in the Gross Domestic Product (GDP) consecutively.
The oil price has come under pressure as U.S. Secretary of State Antony Blinken is traveling to Saudi Arabia for June 6-8. The visit to the world's largest oil exporter has been scheduled days after Riyadh pledged to further cut oil production, a move likely to add tension to a U.S.-Saudi relationship already strained by the kingdom's human rights record and disputes over America's Iran policy, as reported by Reuters.
USD/INR is still holding within the 81-83 trading range since the start of the year. Economists at Commerzbank analyze Rupee outlook after Indian inflation figures.
RBI may be forced to resume rate hikes if core inflation starts increases sustainably beyond 6%
The good news is that core inflation, excluding food and energy, dipped to 5.3% YoY in April. We could see an uptick in May but as long as it stays near or below 6% in the coming months, it could keep RBI on the sidelines. However, if core inflation starts to show a sustain increase beyond 6%, RBI may be forced to resume rate hikes.
RBI is expected to leave rates unchanged at 6.50% this Thursday, but it could sound a bit more hawkish and point to the upside risks to inflation. This could help to anchor INR.
- NZD/USD edges higher for the second straight day amid a modest USD weakness.
- Bets for an imminent pause in the Fed’s rate-hiking cycle undermine the Greenback.
- The cautious market mood keeps a lid on any further gains for the risk-sensitive Kiwi.
The NZD/USD pair gains some positive traction for the second successive day on Tuesday and maintains its bid tone through the early part of the European session. Spot prices, however, lack bullish conviction and remain below the 0.6100 round figure, warranting some caution before positioning for an extension of the recent bounce from the YTD low touched last week.
The US Dollar (USD) trades with a mild negative bias amid expectations for an imminent pause in the Federal Reserve's (Fed) rate-hiking cycle and turns out to be a key factor lending some support to the NZD/USD pair. In fact, the current market pricing indicates a greater chance that the US central bank will leave interest rates unchanged at the end of a two-day policy meeting on June 14. The bets were reaffirmed by the disappointing release of the US ISM Services PMI on Monday, which fell to 50.3 in May.
This comes on the back of last week's dovish rhetoric from several FOMC officials and reaffirmed market bets that the US central bank will skip hiking interest rates next week. The expectations, meanwhile, led to the overnight sharp intraday slide in the US Treasury bond yields and keeps the USD bulls on the defensive, which, in turn, lends support to the NZD/USD pair. That said, the cautious market mood limits losses for the safe-haven buck and caps any meaningful upside for the risk-sensitive Kiwi.
Apart from this, the Reserve Bank of New Zealand's (RBNZ) explicit signal that it was done with its most aggressive hiking cycle since 1999 might hold back bulls from placing aggressive bets around the NZD/USD pair. Moving ahead, there isn't any relevant market-moving economic data due for release from the US, leaving the buck at the mercy of the US bond yields. This, along with the broader risk sentiment, could allow traders to grab short-term opportunities around the major.
Technical levels to watch
- EUR/USD looks direction in the low-1.0700s on Tuesday.
- ECB will release its Consumer Expectation Survey later.
- ECB’s Knot favoured further tightening until inflation reaches target.
The single currency alternates gains with losses vs. the greenback and motivates EUR/USD to gyrate without a clear direction just above the 1.0700 yardstick on Tuesday.
EUR/USD focused on data and ECB
EUR/USD continues to navigate on a vacillating note amidst the equally inconclusive price action surrounding the dollar and the absence of strong catalysts in the macro scenario.
On the latter, unchanged expectations continue to see the Fed pausing its hiking cycle as soon as at the June gathering, while further tightening remains well in place for the ECB at the June and July meetings.
Still around the ECB, Board member K. Knot favoured extending the rate hikes until inflation hits the bank’s target. He acknowledged that inflation remains too high, although the worst now appears to be in the past. He added that he still needs to see the full effect of ECB tightening at the time when second-round effects appear to have started to show up.
Data-wise in the euro docket, the HCOB Construction PMI in Germany improved to 43.9 in May, while Retail Sales in the euro area are due next along with the ECB’s Consumer Expectation Survey.
Across the pond, the IBD/TIPP Economic Optimism Index will be the only release later in the NA session.
What to look for around EUR
EUR/USD hovers around the 1.0700 region amidst the generalized lack of direction in the global markets on Tuesday.
In the meantime, the pair’s price action is expected to closely mirror the behaviour of the US Dollar and will likely be impacted by any differences in approach between the Fed and the ECB with regards to their plans for adjusting interest rates.
Moving forward, hawkish ECB speak continues to favour further rate hikes, although this view appears to be in contrast to some loss of momentum in economic fundamentals in the region.
Key events in the euro area this week: Germany Construction PMI/Factory Orders, EMU Retail Sales (Tuesday) – Germany Industrial Production (Wednesday) - EMU Flash GDP Growth Rate (Thursday).
Eminent issues on the back boiler: Continuation of the ECB hiking cycle in June and July (and September?). Impact of the Russia-Ukraine war on the growth prospects and inflation outlook in the region. Risks of inflation becoming entrenched.
EUR/USD levels to watch
So far, the pair is losing 0.03% at 1.0708 and faces initial support at 1.0635 (monthly low May 31) seconded by 1.0516 (low March 15) and finally 1.0481 (2023 low January 6). On the upside, the surpass of 1.0779 (weekly high June 2) would target 1.0809 (100-day SMA) en route to 1.0884 (55-day SMA).
Here is what you need to know on Tuesday, June 6:
The Australian Dollar outperforms its rivals early Tuesday following the Reserve Bank of Australia's (RBA) unexpected decision to raise the policy rate by 25 basis points to 4.1%. The US Dollar struggles to find demand as markets see a growing possibility of the Federal Reserve (Fed) leaving its key rate unchanged at the next meeting. Retail Sales from the Euro area and the IBD/TIPP Economic Optimism Index from the US will be featured in the economic calendar.
For the second meeting in a row, the RBA went against the market expectation and opted for an increase in its policy rate. In its policy statement, the RBA reiterated that the board remains resolute in its determination to return inflation to target and added that some further tightening of monetary policy may be required. AUD/USD rose sharply during the Asian trading hours and was last seen rising more than 0.5% on the day above 0.6650.
RBA: Some further tightening of monetary policy may be required.
On Monday, the ISM Services PMI report revealed a loss of momentum in the service sector's growth in May. Additionally, the publication showed a contraction in the sector's employment alongside a softening of input inflation. In turn, the US Dollar Index (DXY) came under renewed bearish pressure and erased its gains to close the day flat. In the European morning, DXY stays in negative territory slightly below 104.00 and the benchmark 10-year US Treasury bond yield consolidates Monday's losses at around 3.7%.
EUR/USD stage a late rebound on Monday and closed the day above 1.0700. Early Tuesday, the pair moves up and down in a tight range amid a lack of fresh catalysts. While speaking before the European Parliament in Brussels on Monday, European Central Bank (ECB) President Christine Lagarde reiterated that there was no clear evidence that underlying inflation has peaked.
GBP/USD erased the majority of its daily losses in the American session on Monday. The pair stays flat slightly below 1.2450 in the European session.
Gold price benefited from falling US yields on Monday and registered modest daily gains. Early Tuesday, XAU/USD fluctuate in a narrow channel near $1,960.
USD/JPY broke below 140.00 on Monday and extended its slide toward 139.00 during the Asian trading hours on Tuesday. Bank of Japan Governor Kazuo Ueda said earlier in the day that the Quantitative and Qualitative Monetary Easing (QQE) will continue until they achieve the inflation target.
Bitcoin came under heavy selling pressure and lost more than 5% on Monday. BTC/USD consolidates its losses near $25,800 on Tuesday. Ethereum stays dangerously close to $1,800 in the European morning after having decline 4% on Monday.
The Dollar opens Europe a little weaker. Economists at ING discuss the DXY outlook.
There is still a lot to like about the Mexican Peso
While the Dollar is slightly offered today, we think investors may be reluctant to rebuild Dollar shorts until next week's double event risk of CPI/FOMC has been overcome.
In the meantime, FX volatility levels continue to sink and the high yielders – especially the EM high yielders – are in demand. It is no doubt a crowded trade, but there is still a lot to like about the Mexican Peso which offers 12.5% implied yields through the three-month forwards.
DXY should trade well within a 103.50-104.50 range today.
European Central Bank (ECB) policymaker Klaas Knot said on Tuesday, “we will keep tightening policy until we see inflation returning to 2% but this must be done step by step.”
Additional quotes
“Inflation still way too high but the worst is behind us.”
“Underlying price pressures will prove more difficult to bring down.“
“Seeing first signs that monetary policy tightening is being transmitted to real economy.”
Market reaction
EUR/USD was last seen trading at 1.0717, modestly flat on the day, despite the hawkish remarks from the ECB official.
- AUD/USD is struggling to surpass 0.6680, more gains in the pipeline as RBA raised OCR further.
- A surprise interest rate hike of 25 bps by the RBA has trimmed the RBA-Fed policy divergence.
- AUD/USD witnessed a sharp recovery despite delivering a breakdown of the consolidating formed in a range of 0.6563-0.6808.
The AUD/USD pair is struggling in extending the current rally above 0.6680 inspired by the surprise interest rate hike announcement by the Reserve Bank of Australia (RBA). RBA Governor Philip Lowe raised its Official Cash Rate (OCR) by 25 basis points (bps) to 4.10% considering the fact that current Australian inflation is extremely far from the desired level. This has trimmed the RBA-Federal Reserve (Fed) policy divergence.
S&P500 futures are displaying a subdued performance amid an absence of potential triggers. The overall market mood is cautious as investors have divided about June’s monetary policy meeting by the Fed.
The US Dollar Index (DXY) has found an intermediate cushion around 103.80 after a sell-off propelled by weaker-than-anticipated United States ISM Services PMI.
AUD/USD witnessed a sharp recovery despite delivering a breakdown of the consolidating formed in a range of 0.6563-0.6808 on a daily scale. Lack of follow-up selling in the Aussie asset after a consolidation breakdown triggered a solid recovery.
The Aussie asset has climbed above the 20-period Exponential Moving Average (EMA) at 0.6607, which indicates that the short-term trend has turned bullish.
Meanwhile, the Relative Strength Index (RSI) (14) has rebounded into the 40.00-60.00 range from the bearish range of 20.00-40.00, which indicates that the downside momentum has receded.
Should the Aussie asset breaks above the round-level resistance of 0.6700, the Australian Dollar bulls will drive the asset toward April 18 high at 0.6748 followed by May 10 high at 0.6818.
On the flip side, if the Aussie asset breaks below June 01 low at 0.6484, US Dollar bulls would drag the asset to 01 November 2022 high around 0.6464 followed by the round-level support at 0.6400.
AUD/USD daily chart
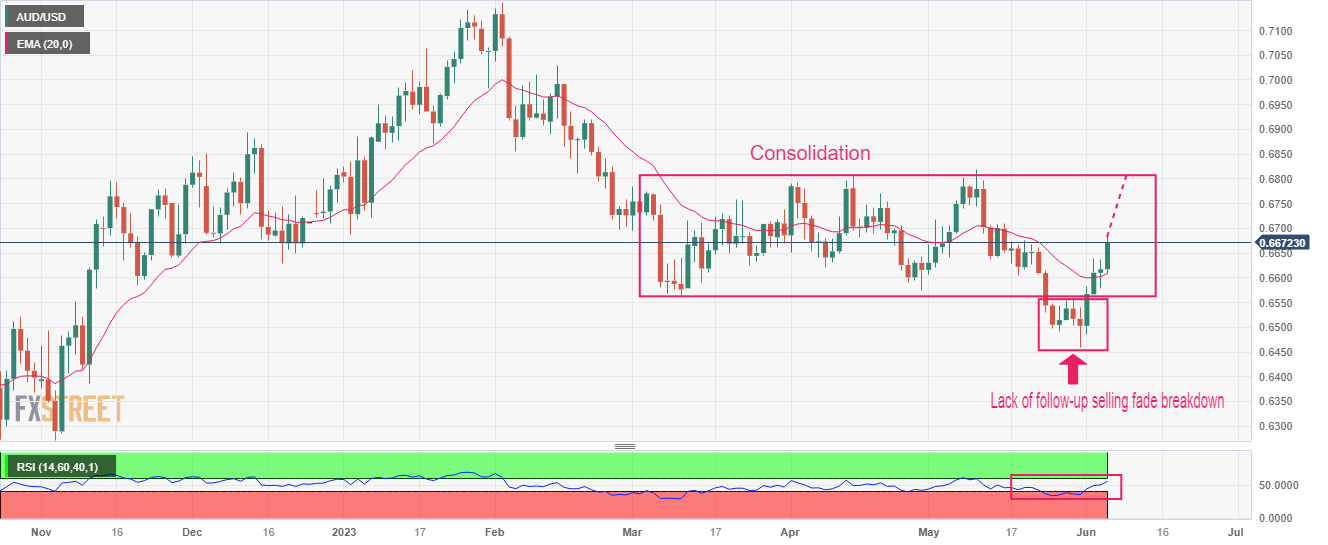
- Silver remains confined in a range for the second successive day on Tuesday.
- The technical setup warrants some caution before placing fresh directional bets.
- A move beyond the $24.00 mark is needed to support prospects for further gains.
Silver continues with its struggle to gain any meaningful traction and oscillates in a narrow trading band for the second straight day on Tuesday. The white metal extends its sideways consolidative price move through the early European session and currently trades around mid-$23.00s, representing the 23.6% Fibonacci retracement level of the downfall witnessed in May.
From a technical perspective, last week's rejection slide from the $24.00 mark, or the 38.2% Fibo. level, showed some resilience below the 200-hour Simple Moving Average (SMA) on Monday. The latter, currently pegged around the $23.35-$23.30 area, should act as a pivotal point for intraday traders. Some follow-through selling below the said support might turn the XAG/USD vulnerable to accelerate the fall below testing the $23.00 round figure.
The downward trajectory could get extended further towards the next relevant support near the $22.70-$22.65 region, or over a two-month low touched in May. The XAG/USD could eventually drop to the $22.00 mark, which represents the very important 200-day SMA and help limit any further losses.
On the flip side, the overnight swing high, around the $23.85 region, now seems to act as an immediate barrier ahead of the $24.00 mark. This is closely followed by the $24.15-$24.20 horizontal resistance. A sustained strength beyond the latter will be seen as a fresh trigger for bullish traders and lift the XAG/USD further towards the 50% Fibo. level, around the $24.45-$24.50 region en route to the $24.80 zone, or the 61.8% Fibo. level, and the $25.00 psychological mark.
Silver 1-hour chart
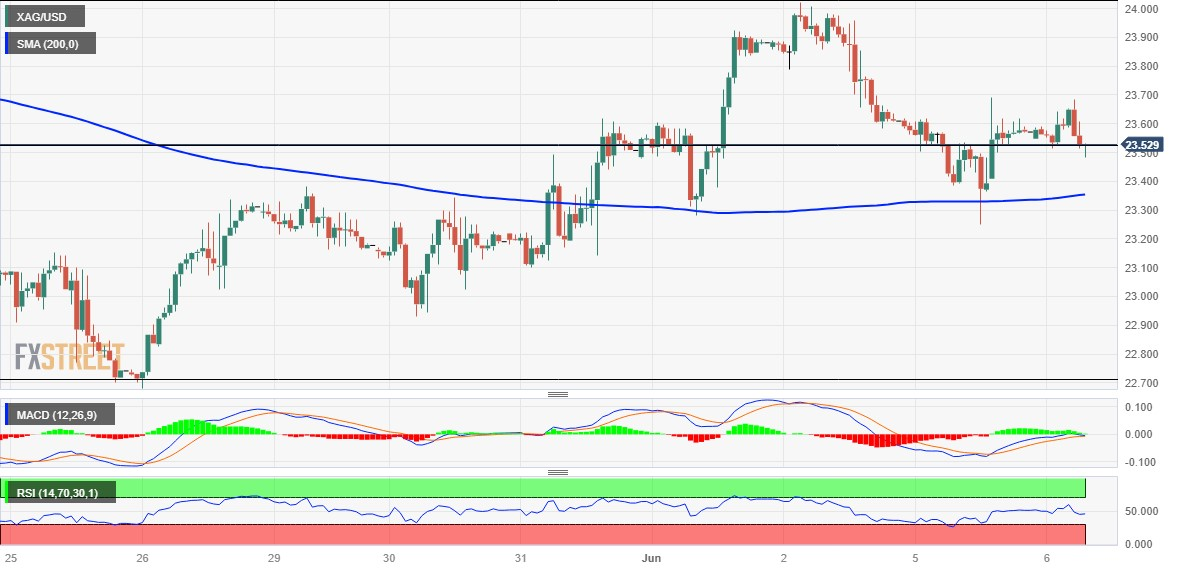
Key levels to watch
The RBA hiked its policy rate by 25 bps this morning and said that further tightening may be required. The AUD jumped upwards after the rate decision. Economists at Commerzbank analyze Aussie outlook.
RBA not yet done
RBA raised the policy rate again by 25 bps to 4.10% and held out the prospect that ‘some further tightening of monetary policy may be required to ensure that inflation returns to target in a reasonable timeframe, but that will depend upon how the economy and inflation evolve’.
This does not sound like an interest rate pause any time soon. Especially as long as inflation remains high, as it recently rose again in April to 6.8% year-on-year.
Now the upcoming data releases on the labour market and inflation will determine whether the AUD will be able to hold its gains. For as long as the RBA remains on a restrictive course, it should remain supported.
- USD/ZAR drops to the lowest levels in two weeks during four-day downtrend.
- Bears cheer downside break of 100-SMA, previous support line from mid-May.
- 200-SMA can prod South African Rand buyers amid oversold RSI conditions.
- South Africa Gross Domestic Product appears the key data to watch for clear directions.
USD/ZAR bears stay in the driver’s seat for the fourth consecutive day after it refreshed an all-time high in the last week. That said, the South African Rand (ZAR) pair drops to the fresh low in a fortnight while taking offers to 19.21 ahead of the South After Gross Domestic Product (GDP) release, scheduled for publishing at 09:30 AM GMT on Tuesday.
Although the GDP data is less likely to allow the USD/ZAR sellers to keep the reins, technical details are favoring further downside of the quote.
That said, a clear break of the 100-SMA and a three-week-old support-turned-resistance adds strength to the bearish bias about the USD/ZAR pair. The same direct the sellers toward the mid-May low surrounding the 19.00 round figure.
However, the oversold RSI conditions appear to challenge the USD/ZAR bears around the 200-SMA level of 18.94.
Following that, an upward-sloping support line from late March, close to 18.62 at the latest, appears the last defense of the USD/ZAR buyers.
On the flip side, the USD/ZAR recovery needs to cross the previous support line and a one-week-old descending resistance line, respectively near 19.33 and 19.39.
Should the quote manages to remain firmer past 19.39, the 19.40 round figure and the 100-SMA level of around 19.43 may challenge the USD/ZAR bulls.
Overall, USD/ZAR is likely to decline further but the South African GDP has a history of disappointing optimists and the same prods the pair sellers.
USD/ZAR: Four-hour chart
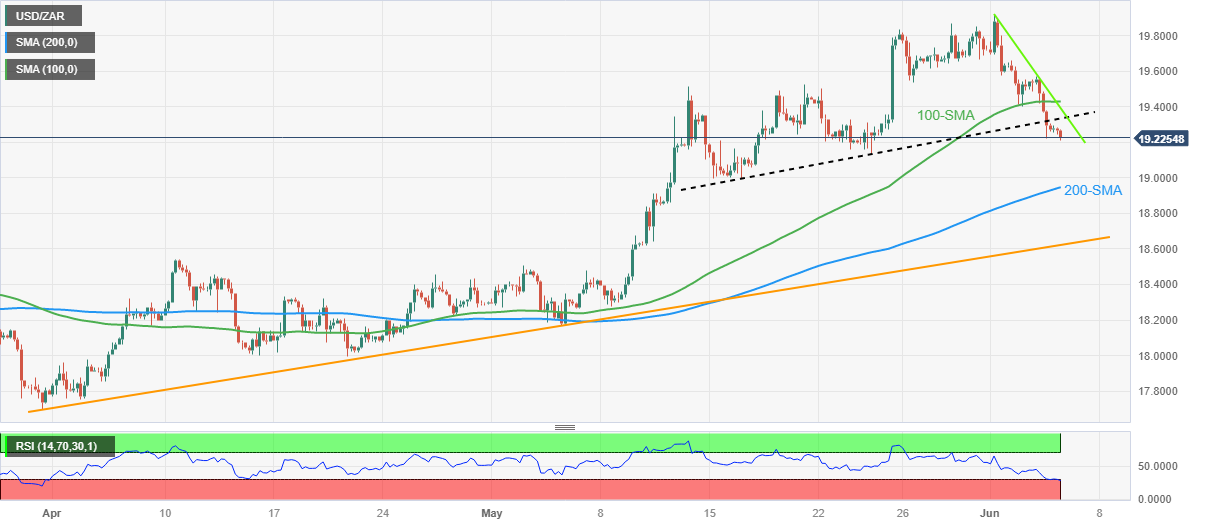
Trend: Further downside expected
Antje Praefcke, FX Analyst at Commerzbank, discusses EUR/USD outlook.
Not the time for new positions
There is uncertainty as to what the Fed will do and how it will communicate its monetary policy decision. And as we are unlikely to know more by next week, while the inflation data might cause further confusion, I assume that the Dollar will not receive any new stimulus for now.
Just like with the Fed the ECB Council members too are prevented from commenting the week before the next meeting. That means the Euro is also likely to lack any momentum for significant moves.
I assume that over the coming days, EUR/USD will linger around 1.07 due to a lack of clear momentum, with the market waiting for the central bank decisions to give direction next week. It does not really make sense to enter major new positions before that.
- Gold price is juggling in a narrow range as the investing community is divided about June’s monetary policy.
- US banks seem reluctant in distributing credit to households and firms in order to maintain their asset quality.
- Gold price is consolidating around the 50% Fibonacci retracement at $1,960.00.
Gold price (XAU/USD) is auctioning inside the woods around $1,960.00 in the early London session. The precious metal is displaying back-and-forth action as the investing community is divided about the interest rate decision by the Federal Reserve (Fed) to be taken in June’s monetary policy meeting.
S&P500 futures have surrendered nominal gains added in Asia, portraying a decline in the risk appetite of the market participants. The US Dollar Index (DXY) has witnessed an intervention in its downside momentum after dropping to near 103.80. More downside in the USD Index seems solid as United States economic activities are broadly contracting due to the Fed’s aggressive tight monetary policy and the addition of more filters into credit disbursement procedure used by US regional banks.
US banks seem reluctant in distributing credit to households and firms in order to maintain their asset quality in the turbulent environment.
Meanwhile, mixed views about Fed’s June policy restricting the Gold price from any major action. Higher additions of fresh payrolls in the US labor market in a steady manner bolsters the need of raising rates further while consistently contracting factory activity and sub-normal service activity states that the Fed should pause its policy-tightening for once and observe the impact of interest rates raised yet.
Gold technical analysis
Gold price is consolidating in a narrow range of $1,957-1,964 on an hourly scale. The precious metal has turned sideways around the 50% Fibonacci retracement (plotted from June 02 high at $1,983.50 to June 05 low at $1,938.15) at $1,960.0.
The 50-period Exponential Moving Average (EMA) at $1,959.38 is providing cushion to the Gold bulls.
Meanwhile, the Relative Strength Index (RSI) (14) is oscillating in the 40.00-60.00 range, which indicates that investors await a fresh trigger for a decisive move.
Gold hourly chart
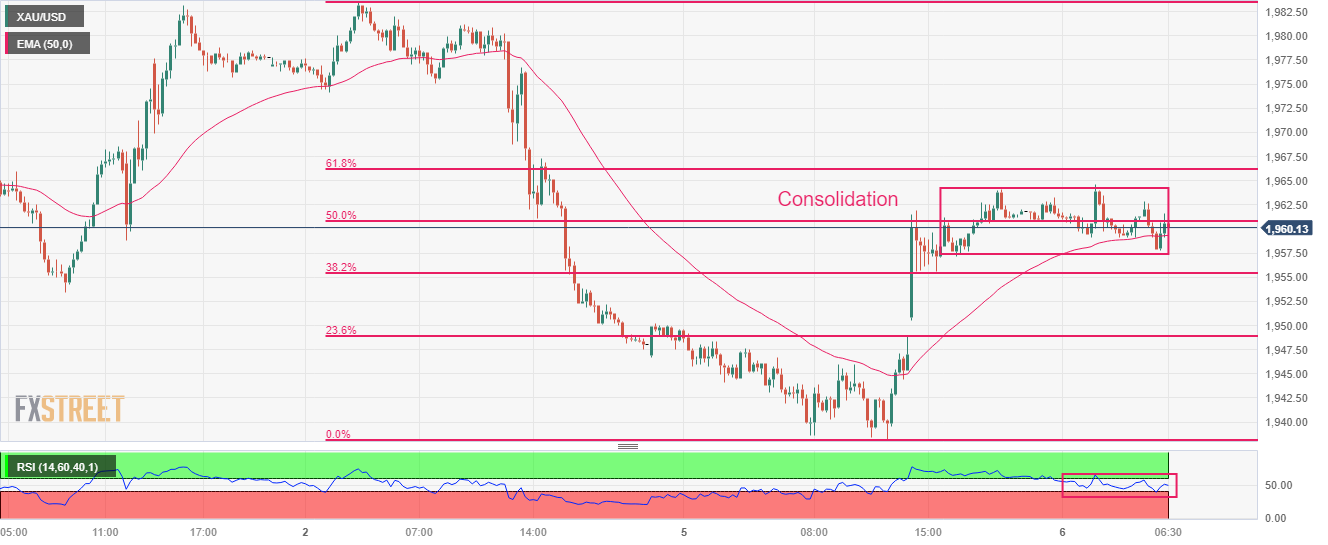
Platinum and Palladium are following different paths. Economists at Commerzbank share their forecasts for both metals.
The outlook for Platinum is more favourable
We envisage only limited upside potential for the Palladium price and confirm our price forecast for the end of 2023 at $1,600, but have recently lowered our forecast for the end of 2024 to $1,700 (previously $2,000).
We are confirming our forecast for the Platinum price at the end of 2023 at $1,150, but have raised our forecast for the end of 2024 to $1,300 (previously $1,250).
In contrast to Palladium, structural supply deficits are looming for Platinum in the coming years.
- EUR/JPY takes offers to reverse from intraday low, stays pressured for the second consecutive day.
- German Factory Orders disappoint, BoJ’s Ueda shows readiness to keep QQE until inflation slows.
- One-month-old symmetrical triangle, 200-SMA challenge sellers amid steady RSI.
EUR/JPY bears cheer downbeat German data to portray the second consecutive daily loss near 149.50 heading into Tuesday’s European session. In doing so, the cross-currency pair also ignores dovish comments from Bank of Japan (BoJ) Governor Kazuo Ueda.
That said, Germany’s Factory Orders slumped to -9.9% YoY in April versus -8.9% expected and -11.2% (revised). On the other hand, BoJ’s Ueda signaled that the Japanese central bank will continue QQE until the achievement of the inflation target.
Technically, the cross-currency pair remains on the buyer’s radar due to the previous weeks’ rebound from the convergence of the 200-SMA and the bottom line of a one-month-old symmetrical triangle.
However, the steady RSI (14) line suggests a continuation of the lower grind and hence keeps the sellers hopeful.
With this, the EUR/JPY bears approach the aforementioned triangle’s bottom line, close to 149.15 by the press time, ahead of poking the 200-SMA support level surrounding 148.85.
It’s worth noting that the previous weekly low of around 148.60 also challenges the EUR/JPY sellers before giving them control.
Alternatively, a one-week-old descending resistance line, close to the 150.00 psychological magnet, caps the short-term upside of the pair.
Following that, the stated triangle’s top line near 151.00 will be crucial for the EUR/JPY bulls to cross to regain power.
EUR/JPY: Four-hour chart
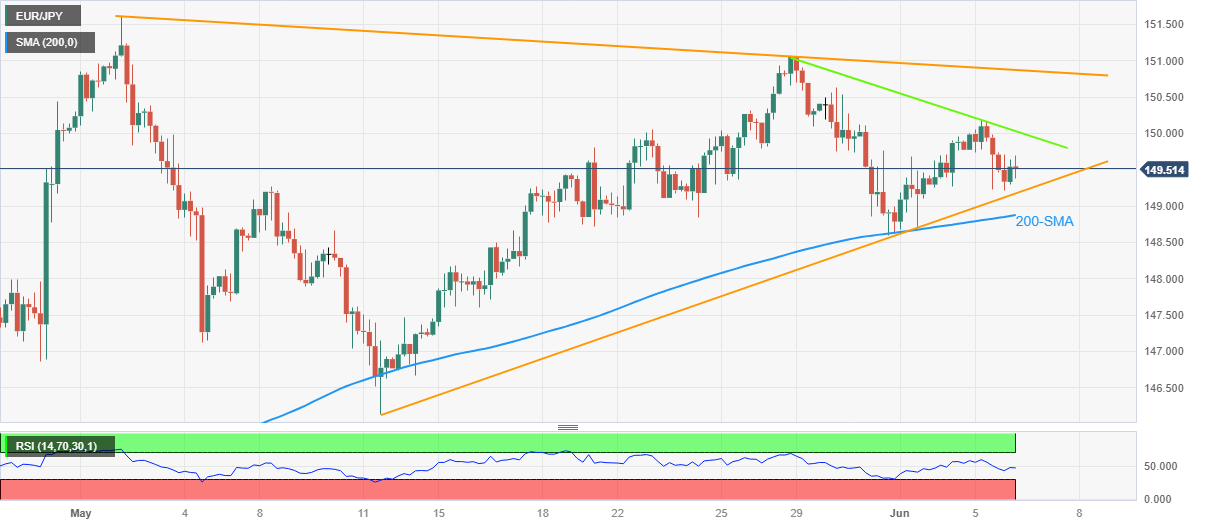
Trend: Further recovery expected
Open interest in crude oil futures markets rose for the fifth consecutive session at the beginning of the week, this time by more than 11K contracts. Volume, in the same direction, reversed two consecutive daily pullbacks and rose by around 167.8K contracts.
WTI initially targets the 200-day SMA ahead of $80.00
WTI prices extended the rebound to the boundaries of the $75.00 mark per barrel on Monday amidst increasing open interest and volume. Against that, further gains remains in store in the very near term with the immediate target at the 200-day SMA at $79.17 ahead of the key $80.00 mark per barrel.
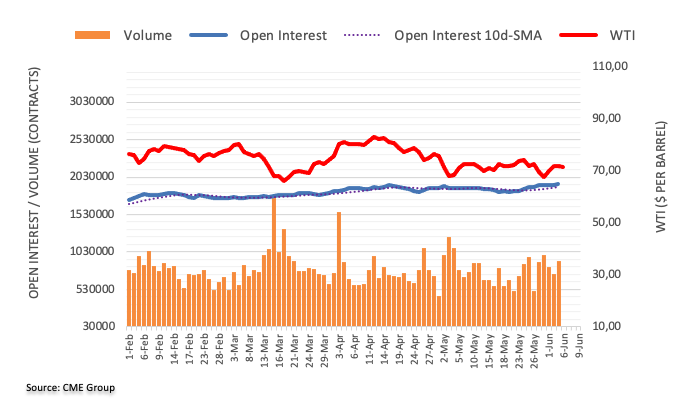
- GBP/USD has faced fragile barricades around 1.2450, however, more upside seems favored.
- US Services PMI hardly defended the contraction phase and expansion in service activity was extremely mild.
- UK households are facing the wrath of high inflation that has led to a decline in their spending for non-essential items.
The GBP/USD pair has witnessed delicate barricades after climbing to near 1.2450 in the early European session. The Cable is expected to remain on tenterhooks as the USD Dollar Index (DXY) has attempted a recovery after dropping to near 103.81. More downside for the US Dollar Index (DXY) seems solid as the United States economy is moving towards recession.
S&P500 futures have taken nominal gains in the European session, portraying a mild recovery in the risk appetite of the market participants. US equities witnessed some selling pressure on Monday after the United States Institute of Supply Management (ISM) agency reported weaker-than-anticipated Services PMI data. The demand for US government bonds has retreated. The 10-year US Treasury yields have jumped to near 3.71%.
On Tuesday, US ISM Services PMI managed to dodge the 50.0 threshold that bifurcates expansion from the contraction phase. The Service PMI for May landed lower at 50.3 than the expectation of 51.5. This indicates that the economic indicator has hardly defended the contraction phase and expansion in service activity was extremely mild.
Last week, the US Manufacturing PMI contracted for the seventh straight month. A collaborative impact of contracting factory activity and mildly expanded service activity could push the United States economy into recession. US firms are facing the heat of higher interest rates by the Federal Reserve (Fed) and tight credit conditions by US regional banks, which has led to a decline in their overall productivity.
On the Pound Sterling front, United Kingdom’s households are facing the wrath of high inflation, which has led to a decline in their spending for non-essential items. The British Retail Consortium (BRC) said spending in its members' stores increased 3.9% in annual terms last month, well above the 1.1% fall a year ago, however, sales were below the 5.2% rise in April, as reported by Reuters.
This might provide some relief to Bank of England (BoE) policymakers from persistence in core inflation due to labor shortages. BoE Governor Andrew Bailey is expected to raise interest rates further in June to bring down extremely stubborn inflation.
FX option expiries for June 6 NY cut at 10:00 Eastern Time, via DTCC, can be found below.
- EUR/USD: EUR amounts
- 1.0685 951m
- 1.0700 649m
- 1.0750 359m
- 1.0775 340m
- 1.0850 540m
- USD/JPY: USD amounts
- 136.10 400m
- 138.50 350m
- 139.05 406m
- 140.00 1.6b
- 140.50 410m
- 141.25 529m
- AUD/USD: AUD amounts
- 0.6500 450m
- 0.6540 321m
- 0.6645 674m
- 0.6800 825m
- USD/CAD: USD amounts
- 1.3365 500m
- 1.3600 409m
- German Factory Orders dropped 0.4% MoM in April vs. 3.8% expected.
- German Factory output tumbled 9.9% YoY in April vs. -8.4% expected.
- EUR/USD remains unfazed near 1.0725 following the downbeat German data.
The German Factory Orders data showed an unexpected drop in April, suggesting that the manufacturing sector recovery is losing further momentum.
Contracts for goods ‘Made in Germany’ came in at -0.4% on the month vs. 3.8% expected and -10.9% previous, the latest data published by the Federal Statistics Office showed on Tuesday.
On an annualized basis, Germany’s Industrial Orders arrived at -9.9% in the reported month vs. -8.4% expected and an 11.2% collapse seen in March.
FX implications
The shared currency shrugs off downbeat German factory data. At the time of writing, EUR/USD is trading at 1.0723, holding 0.11% gains on the day.
- USD/CHF drops for the second consecutive day as bears attack key support line.
- US Dollar remains depressed as weak data weighs on Fed bets amid pre-FOMC blackout.
- Cautious optimism allows US stock futures, yields to rebound amid mixed feelings, light calendar.
USD/CHF extends the previous day’s losses as sellers prod a one-month-old rising support line around 0.9050 amid early Tuesday morning in Europe. That said, a broad US Dollar weakness allows the Swiss Franc (CHF) pair to please sellers for the second consecutive day. In doing so, the quote justifies the upbeat inflation numbers from Switzerland.
That said, the US Dollar Index (DXY) extends the previous day’s downbeat performance while registering a 0.13% intraday loss near 103.85 by the press time. In doing so, the greenback’s gauge versus the six major currencies suffers from the downbeat data at home, as well as the mildly positive sentiment.
On Monday, the Swiss Consumer Price Index (CPI) rose to 0.3% MoM in May from 0.0% prior, versus 0.4% expected, whereas the YoY figures crossed 2.1% market consensus with 2.2% figures but stayed below 2.6% previous readings. On the other hand, most of the US PMIs for May, be it the ISM Services PMI or the final readings of S&P Global Composite PMI and Services PMI, as well as the US Factory Orders for the said month, marked downbeat figures and pushes back the hawkish Fed concerns. On the other hand, IMF’s Georgieva flagged concerns about more Fed rate hikes.
It should be noted that the latest headlines suggesting a risk-positive dialogue between the US and China join the receding hawkish Fed bets to allow the market sentiment to improve. As a result, the US Treasury bond yields reverse the week-start losses whereas the S&P500 Futures print mild gains despite the downbeat closing of Wall Street.
Looking ahead, a light calendar and an absence of the Fed talks, due to the 15-day silence period ahead of the monetary policy meeting on May 13-14, will restrict the USD/CHF moves. Even so, the cautious optimism in the markets and easing calls of the Fed’s rate hike keep the pair sellers hopeful.
Technical analysis
USD/CHF pair’s sustained U-turn from the 100-DMA hurdle, around 0.9125 by the press time, joins downbeat oscillators to favor sellers as they prod the ascending support line stretched from early May, around 0.9050 at the latest.
"The Bank of Japan (BoJ) will continue QQE until the achievement of the inflation target," the central bank Governor Kazuo Ueda said on Tuesday.
Additional quotes
Inflation expectations have remained low because of prolonged zero inflation and deflation.
Inflation and inflation expectations are heightening.
Japan is gradually seeing change in norm under which the public acts on assumption that wage and inflation will stay low.
Changes are emerging gradually to deflationary mindset that prices and wages are hard to rise.
When inflation target is achieved, inflation expectations would also be at 2%.
Market reaction
At the press time, USD/JPY is trading close to 139.50, down 0.09% on the day.
- The index loses further ground and revisits 103.80.
- Expectations of a Fed’s pause in June remain high.
- The IBD/TIPP index will be the only release in the docket.
The greenback, when tracked by the USD Index (DXY), adds to Monday’s retracement and slips back to the 103.80 region ahead of the opening bell in Euroland on Tuesday.
USD Index looks at risk trends, Fed
The index now extends the pessimism seen at the beginning of the week and leaves behind the 104.00 barrier on the back of firmer appetite for the risk-associated complex.
Collaborating with the softer tone in the dollar appears the firmer expectations of an impasse by the Federal Reserve at its gathering on June 14. The latter gathered pace following comments from a couple of Fed officials last week (Jefferson and Harker) and was somewhat underpinned after wage inflation eased further in May, as per the latest Nonfarm Payrolls figures.
In the calendar, the IBD/TIPP Economic Optimism index will be the sole release along with the weekly report by the API on US crude oil inventories.
What to look for around USD
The corrective pullback in the index picks up further pace and breaks below the key 104.00 support on turnaround Tuesday.
In the meantime, bets of another 25 bps at the Fed’s next gathering in June suddenly reversed course in spite of the steady resilience of key US fundamentals (employment and prices, mainly), denting the recent rally in the dollar and favouring a further decline in US yields.
Bolstering a pause by the Fed instead appears to be the extra tightening of credit conditions in response to uncertainty surrounding the US banking sector.
Key events in the US this week: Final Services PMI, ISM Services PMI, Factory Orders (Monday) – IBD/TIPP Economic Optimism index (Tuesday) – MBA Mortgage Applications, Balance of Trade, Consumer Credit Change (Wednesday) – Initial Jobless Claims, Wholesale Inventories (Thursday).
Eminent issues on the back boiler: Persistent debate over a soft/hard landing of the US economy. Terminal Interest rate near the peak vs. speculation of rate cuts in late 2023/early 2024. Fed’s pivot. Geopolitical effervescence vs. Russia and China. US-China trade conflict.
USD Index relevant levels
Now, the index is losing 0.11% at 103.87 and faces the next support at 103.38 (monthly low June 2) seconded by the 100-day SMA at 102.94 and finally 102.45 (55-day SMA). On the other hand, the breakout of 104.69 (monthly high May 31) would open the door to 105.53 (200-day SMA) and then 105.88 (2023 high March 8).
- USD/JPY extends previous day’s fall within one-week-old bearish chart formation.
- Sustained trading below 100-EMA, bearish MACD signals favor Yen pair sellers.
- RSI conditions suggest bottom-picking around golden Fibonacci ratio.
- Multiple hurdles stand tall to challenge Yen buyers.
USD/JPY holds a lower ground near the intraday bottom surrounding 139.35 heading into Tuesday’s European session. In doing so, the Japan Yen (JPY) pair defends the previous day’s bearish bias with a one-week-old ascending triangle formation.
Apart from the bearish triangle, the downbeat MACD signals and the quote’s sustained trading below the 100-Exponential Moving Average (EMA) also favor the USD/JPY sellers.
However, a clear downside break of the stated triangles’ bottom line, around 139.30 by the press time, becomes necessary for the Yen pair seller’s confirmation.
Even so, the RSI (14) is near the oversold region and hence the 61.8% Fibonacci retracement of its May 19-30 upside, near 138.75, also known as the golden Fibonacci ratio, can challenge the USD/JPY bears.
In a case where the Yen pair drops below 138.75 Fibonacci support, the 138.00 round figure and the early May peak of around 137.70 could gain the market’s attention.
On the flip side, the 100-EMA level of 139.65 restricts the immediate upside of the USD/JPY pair. Following that, the 140.00 psychological magnet and the stated triangle’s top line near 140.45-50, can challenge the bulls ahead of directing them to the multi-month high marked in May around 140.91.
USD/JPY: Hourly chart
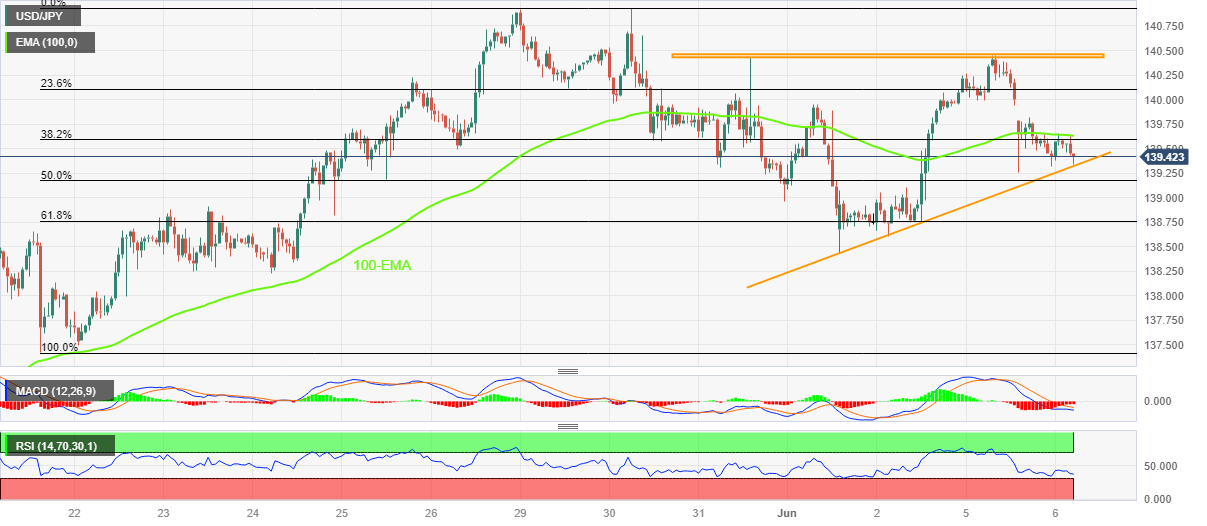
Trend: Further downside expected
Following the Reserve Bank of Australia (RBA) surprise rate hike announcement, Australian Treasurer Jim Chalmers said at a press conference on Tuesday, it is “not our expectation the economy will head into recession.”
Meanwhile., the RBA surprised the market by raising the cash rate 25 basis points (bps) to 4.10% on Tuesday, citing that "some further tightening of monetary policy may be required to ensure that inflation returns to target in a reasonable timeframe.”
Market reaction
At the time of writing, AUD/USD is consolidating RBA-inspired gains near 0.6670, still up 0.79% on the day.
- EUR/USD has come out of the woods after the USD Index extends its downside.
- Unlike US Manufacturing PMI, Services PMI has managed to maintain above the 50.0 threshold but landed lower at 50.3.
- EUR/USD has delivered a breakout of the consolidation formed in a narrow range of 1.0707-1.0724.
The EUR/USD pair has delivered an upside break of the consolidation formed in a narrow range below 1.0730 in the Asian session. The major currency pair has got strength as the US Dollar Index (DXY) has shifted its auction below 104.00.
The USD Index is attracting offers after the release of the downbeat United States ISM Services PMI. Unlike Manufacturing PMI, Services PMI has managed to maintain above the 50.0 threshold but landed lower at 50.3 than the expectation of 51.5.
Meanwhile, the Euro is expected to show a power-pack action amid the release of the Eurozone Retail Sales data (April). Monthly data is seen expanding by 0.2% vs. a contraction of 1.2% recorded last month. Annual data is seen contracting by 1.8% against a contraction of 3.8%.
On Monday, while speaking at the Hearing before the Committee on Economic and Monetary Affairs (ECON) of the European Parliament in Brussels, European Central Bank (ECB) President Christine Lagarde reiterated that price pressure remains strong in the Euro area.
EUR/USD has delivered a breakout of the consolidation formed in a narrow range of 1.0707-1.0724 on an hourly scale. Earlier, the shared currency pair delivered a break above the downward-sloping trendline from May 16 high at 1.0904, which resulted in a bullish reversal.
The 20-period Exponential Moving Average (EMA) at 1.0714 is providing a cushion to the Euro bulls.
Adding to that, the Relative Strength Index (RSI) (14) has jumped into the bullish range of 60.00-80.00, indicating more upside ahead.
Going forward, a decisive break above May 30 high at 1.0746 will drive the asset towards June 02 high at 1.0779 followed by the round-level resistance at 1.0800.
In an alternate scenario, the downside move will resume if the shared currency pair drops below the June 05 low at 1.0675. This will drag the asset towards May 31 low at 1.0635 followed by March 03 low at 1.0588.
EUR/USD hourly chart
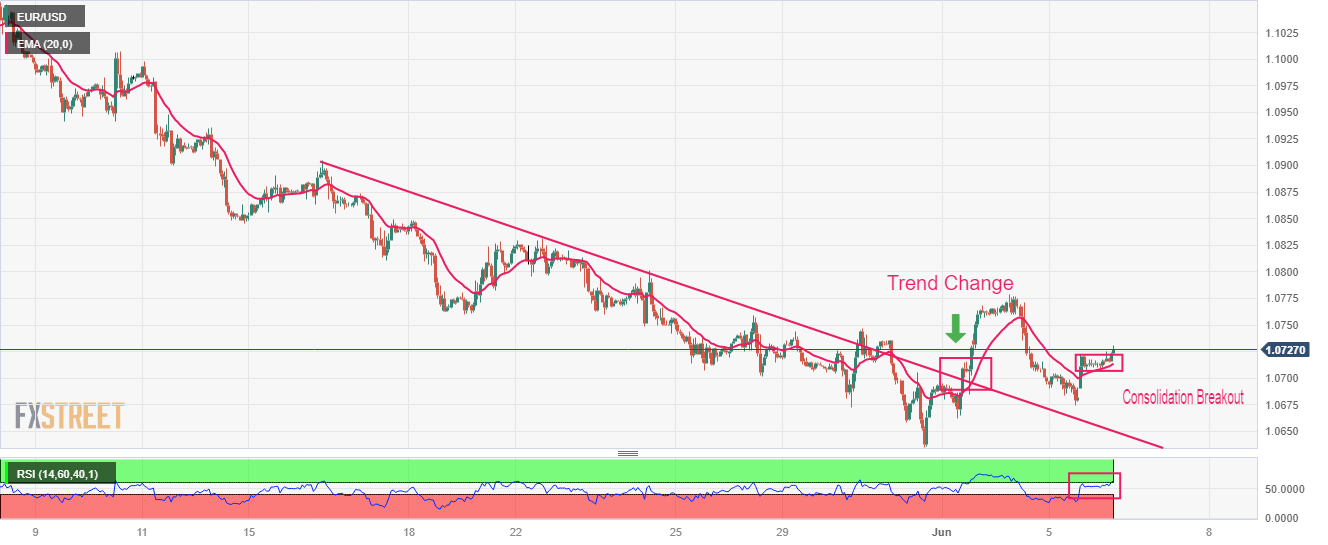
CME Group’s flash data for gold futures markets noted traders trimmed their open interest positions by around 1.2K contracts on Monday, extending further the downward trend. Volume followed suit and shrank by around 29.4K contracts, partially fading the previous daily build.
Gold: Upside remains capped around $1980
Gold started the week in a positive fashion and with decent gains. The uptick, however, was accompanied by shrinking open interest and volume and hints at the idea that a more sustainable advance seems out of favour for the time being. In the meantime, occasional bouts of strength should meet initial resistance around $1980 per ounce troy.
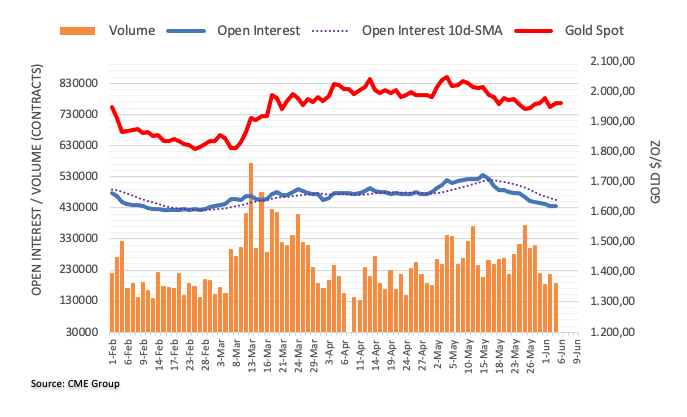
- USD/CAD takes offers to refresh intraday low, reverses week-start rebound.
- Sluggish sentiment, mixed Fed bias weigh on US Dollar.
- Oil price grinds near $72.00 as OPEC+, Saudi Arabia inspired run-up fades.
- Second-tier Canada statistics eyes ahead of BoC, Friday’s jobs data from Ottawa.
USD/CAD reverses the week-start rebound while refreshing intraday low near 1.3410 heading into Tuesday’s European session. In doing so, the Loonie pair fails to justify sluggish Oil price but cheers downbeat US Dollar and cautiously optimistic sentiment.
It’s worth noting that the US Dollar Index (DXY) extends the previous day’s downbeat performance while registering a 0.13% intraday loss near 103.85 by the press time. In doing so, the greenback’s gauge versus the six major currencies suffers from the downbeat data at home, as well as the mildly positive sentiment.
On Monday, most of the US PMIs for May, be it the ISM Services PMI or the final readings of S&P Global Composite PMI and Services PMI, as well as the US Factory Orders for the said month, marked downbeat figures and pushes back the hawkish Fed concerns. On the other hand, IMF’s Georgieva flagged concerns about more Fed rate hikes.
That said, recent headlines suggest the Sino-American talks are going smoothly but the Taiwan tension keeps poking the optimists.
It should be noted that the mixed concerns about Oil demand from China and the US prod the WTI crude oil buyers as they struggle to extend the three-day uptrend around $72.00 at the latest.
While portraying the mood, the US Treasury bond yields remain pressured as traders rush to the US bonds for risk safety.
Looking ahead, Canada’s Ivey Purchasing Managers Index for May could entertain intraday traders ahead of Wednesday’s Bank of Canada (BoC) Monetary Policy Meeting and Friday’s Canada employment report for May. While the recent easing in the hawkish Fed concerns keep USD/CAD bears hopeful, expectations of no change in BoC policy and likely weak Canada jobs report prods the Loonie pair sellers amid a sluggish day.
Technical analysis
A daily closing below the 200-day Exponential Moving Average (EMA), around 1.3420 by the press time, becomes necessary for the USD/CAD bears to aim for the key support line stretched from November 2022, close to 1.3330 at the latest.
- AUD/JPY tested 93.00 after the RBA surprisingly raised interest rates y 25 bps to 4.10%.
- RBA believes that inflation in Australia has passed its peak, but at 7% is still too high.
- The BoJ is expected to make a stealth intervention in the currency market to provide some cushion to the Japanese Yen.
The AUD/JPY pair has jumped to near the crucial resistance of 93.00 after the announcement of a hawkish interest rate decision by the Reserve Bank of Australia (RBA). The RBA has raised its Official Cash Rate (OCR) by 25 basis points (bps) to 4.10%.
Considering the fact that Australian inflation turned stubborn again as the monthly Consumer Price Index (CPI) indicator rose to 6.8% in April from March’s 6.3% figure, RBA Governor Philip Lowe was forced to raise interest rates again so that the impact of sticky inflation could get restricted.
The commentary from RBA’S Lowe has opened doors for further policy tightening as he stated that some further tightening of monetary policy may be required. The central bank believes that inflation in Australia has passed its peak, but at 7% is still too high and it will be some time yet before it is back in the target range.
Going forward, Australia’s Q1 Gross Domestic Product (GDP) will be keenly watched. As per the estimates, the Australian GDP is seen expanding at a slower pace of 0.3% than the 0.5% expansion recorded in the last quarter. On an annual basis, the economic data is expected to drop to 2.4% vs. the prior release of 2.7%.
On the Japanese Yen front, the Bank of Japan (BoJ) is expected to make a stealth intervention in the currency market to provide some cushion to the Japanese Yen, which is facing the heat of expansionary monetary policy.
According to a Reuters report, bets against the Japanese Yen have risen to $8.6 billion equivalent, which was a similar level when Japan’s authorities intervened last year.
- AUD/NZD jumps 60 pips on RBA’s 25 bps rate hike.
- Market’s cautious optimism, upbeat Aussie/Kiwi data also keeps the pair buyers hopeful.
- RBA Officials’ speeches, second-tier data eyed for clear directions.
AUD/NZD aptly portrays the market’s surprise from the Reserve Bank of Australia’s (RBA) rate hike as it jumps nearly 60 pips to the highest levels since late February, around 1.0955 heading into Tuesday’s European session.
The RBA defies market forecasts of announcing no change to its benchmark interest rate by fueling the key rate to 4.10% at the latest, providing the second consecutive hawkish surprise.
Also read: RBA: Some further tightening of monetary policy may be required
Earlier in the day, Australia’s first quarter (Q1) Current Account Balance came in 12.3 billion versus 5.175 billion expected and 14.1 billion prior. Additionally, New Zealand’s (NZ) ANZ Commodity Price Index for May rose past -1.7% prior readings and -0.2% expected figures to 0.3%.
Apart from the RBA moves and data, cautious optimism in the market also underpins Antipodeans, mainly due to the risk-positive headlines surrounding the US-China ties.
Reuters came out with headlines suggesting improvement in the US-China relations, by citing Chinese media, amid early Tuesday in Europe. The news quotes, “a frank, constructive and fruitful communication on promoting Sino-US relations and properly managing differences,” between China's Vice Foreign Minister and a senior US State Department official.
It should be noted, however, that a lack of major data/events elsewhere joins the fears of the policy pivot at the RBA and the Reserve Bank of New Zealand (RBNZ) to prod the AUD/NZD buyers.
As a result, Wednesday’s speeches from RBA Governor Philip Lowe and Deputy Governor Michele Bullock will be the key to watch for clear directions of the AUD/NZD pair.
Technical analysis
A successful break of the 200-DMA, around 1.0885 by the press time, allows the AUD/NZD buyers to aim for the key resistance line stretched from late October 2022, close to 1.1000 by the press time.
Following are the key headlines from the Reserve Bank of Australia’s (RBA) June monetary policy statement, via Reuters, as presented by Governor Phillip Lowe.
Board remains resolute in its determination to return inflation to target.
Some further tightening of monetary policy may be required.
The path to achieving a soft landing remains a narrow one.
Inflation in australia has passed its peak, but at 7 per cent is still too high and it will be some time yet before it is back in the target range.
Further increase in interest rates is to provide greater confidence that inflation will return to target within a reasonable timeframe.
Higher interest rates and cost-of-living pressures is leading to a substantial slowing in household spending.
Upside risks to the inflation outlook have increased and the board has responded to this.
At the aggregate level, wages growth is still consistent with the inflation target, provided that productivity growth picks up.
Conditions in the labour market have eased, although they remain very tight.
Board remains alert to the risk that expectations of ongoing high inflation contribute to larger increases in both prices and wages.
Growth in public sector wages is expected to pick up further and the annual increase in award wages was higher than it was last year.
At the aggregate level, wages growth is still consistent with the inflation target, provided that productivity growth picks up.
Firms report that labour shortages have eased.
-
AUD/USD jumps towards 0.6700 as RBA again surprises with 0.25% rate hike, Governor Lowe’s speech eyed
About RBA rate decision
RBA Interest Rate Decision is announced by the Reserve Bank of Australia. If the RBA is hawkish about the inflationary outlook of the economy and rises the interest rates it is positive, or bullish, for the AUD. Likewise, if the RBA has a dovish view on the Australian economy and keeps the ongoing interest rate, or cuts the interest rate it is seen as negative, or bearish.
- AUD/USD picks up bids to refresh intraday high during four-day uptrend.
- RBA announces a surprise rate increase of 0.25% to 4.10%.
- Cautious optimism in the market, upbeat Aussie Current Account Balance favor Aussie buyers despite RBA’s inaction.
- Speeches from RBA officials, Australia PMIs eyed for clear directions amid light calendar elsewhere.
AUD/USD gains near 50 basis points (bps) on the Reserve Bank of Australia’s (RBA) second surprise rate hike during early Tuesday. That said, the Aussie pair initially jumped to 0.6673 on the RBA’s verdict before retreating to 0.6668 by the press time.
That said, RBA defies market forecasts of announcing no change to its benchmark interest rate by fueling the key rate to 4.10% at the latest. It’s worth noting that the Australian central bank surprised markets in the previous monetary policy meeting with a 0.25% rate increase and hence some traders on the floor expected such a move ahead of the Interest Rate Decision.
As a result, early Wednesday’s speeches from RBA Governor Philip Lowe and Deputy Governor Michele Bullock will be the key to gaining any hints for future rate hikes from the Aussie central bank. The same, if offered, can propel AUD/USD prices.
Elsewhere, Australia’s first quarter (Q1) Current Account Balance flashed better-than-expected figures while the market sentiment remains dicey amid lackluster US stock futures and inactive Treasury bond yields.
While tracing the catalysts for the currently mixed mood, lack of uniform concerns about the Federal Reserve’s (Fed) rate hike and the diplomatic ties between the US and China seem to gain major attention. That said, headlines suggest the Sino-American talks are going smoothly but the Taiwan tension keeps poking the optimists. On the other hand, softer US data and previous Fed talks push traders to anticipate nearness to the policy pivot. However, the comments from International Monetary Fund (IMF) Managing Director Kristalina Georgieva hint at more rate hikes from the US central bank and challenge the US Dollar sellers. Furthermore, the US debt-ceiling deal passage and looming fears about the banking sector adds strength to the downside bias surrounding AUD/USD.
Amid these plays, the US Treasury bond yields remain pressured as traders rush to the US bonds for risk safety. That said, the US stock futures and the US Dollar Index (DXY) remain directionless of late.
Looking ahead, mixed sentiment and the US Dollar’s unimpressive performance keep the AUD/USD on the front foot, which in turn allows the Aussie pair to remain firmer and weigh on the US Dollar, as well as the other risk-sensitive assets. That said, a lack of major data/events can prod the Aussie pair traders ahead of Wednesday’s speeches from RBA Governor Philip Lowe and Deputy Governor Michele Bullock.
Technical analysis
AUD/USD rebounds from the support line of a falling wedge established in late December 2022, as well as stays beyond the 61.8% Fibonacci retracement of October 2022 to February 2023, which in turn joins upbeat oscillators to favor the Aussie pair buyers.
As a result, the risk-barometer pair is all set to confront a convergence of the 50% Fibonacci retracement level and the 50-DMA, around 0.6660, unless falling below the stated wedge’s bottom line, close to 0.6495 at the latest.
Following a surprise 25 basis points (bps) rate hike delivered in May, the Reserve Bank of Australia (RBA) board members decided to hike the Official Cash Rate (OCR) by another 25 bps to 4.10% at its June policy meeting, a hawkish surprise once again.
According to the latest Reuters poll, nearly a two-thirds majority of economists, or 21 of 32, expected the RBA to hold its benchmark interest rate at 3.85% this Tuesday.
AUD/USD reaction
In a knee-jerk reaction to the RBA decision, the AUD/USD pair jumped nearly 50 pips to test 0.6675 before retreating to 0.6600, where it now wavers. The pair is up 0.66% on the day.
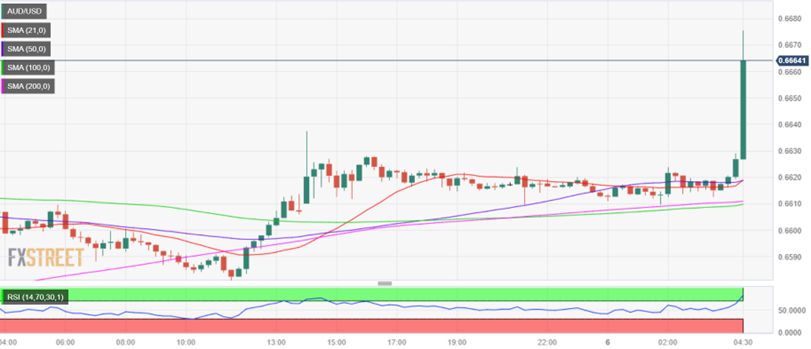
AUD/USD: 15-minutes chart
About RBA rate decision
RBA Interest Rate Decision is announced by the Reserve Bank of Australia. If the RBA is hawkish about the inflationary outlook of the economy and rises the interest rates it is positive, or bullish, for the AUD. Likewise, if the RBA has a dovish view on the Australian economy and keeps the ongoing interest rate, or cuts the interest rate it is seen as negative, or bearish.
- Gold Price fades week-start recovery from key support confluence amid dicey markets.
- Mixed concerns about Federal Reserve, US-China ties prod XAU/USD traders.
- Light calendar, pre-FOMC blackout of Fed policymakers restrict market moves.
- Softer Treasury bond yields exert downside pressure on US Dollar, put a floor under the Gold Price.
Gold Price (XAU/USD) aptly portrays the sluggish markets heading into Tuesday’s European session, after an indecisive week. In doing so, the XAU/USD highlights a lack of major data/events on the economic calendar, as well as mixed concerns about the Federal Reserve’s (Fed) moves and the diplomatic ties between the US and China.
Recent headlines suggest the Sino-American talks are going smoothly but the Taiwan tension keeps poking the optimists. On the other hand, softer US data and previous Fed talks push traders to anticipate nearness to the policy pivot. However, the comments from International Monetary Fund (IMF) Managing Director Kristalina Georgieva hint at more rate hikes from the US central bank and weigh on the Gold Price. Furthermore, the US debt-ceiling deal passage and looming fears about the banking sector adds strength to the downside bias surrounding XAU/USD.
Against this backdrop, the US Treasury bond yields remain pressured as traders rush to the US bonds for risk safety. That said, the US stock futures and the US Dollar Index (DXY) remain directionless of late.
Also read: Gold Price Forecast: XAU/USD could see choppy trading between two key DMAs
Gold Price: Key levels to watch
Our Technical Confluence Indicator signals that the Gold Price seesaws with the short-term trading range, dropping towards the support line of late.
That said, a convergence of the middle of the Bollinger on the one-hour joins the 200-HMA to highlight $1,955 as the short-term key support.
Following that, the Fibonacci 61.8% in one-week will join the 10-SMA on four-hour chart to signal $1,952 as an extra filter towards the south.
On the contrary, the Fibonacci 38.2% in one-week and previous daily top together highlight $1,965 as an immediate key upside hurdle.
In a case where the Gold Price crosses the $1,965 hurdle, the Pivot Point one-day R1, the upper of the Bollinger on the one-hour and Fibonacci 23.6% in one-week together carve out $1,973 as the last defense of the XAU/USD bears.
It should be noted that the Gold Price upside past $1,973 won’t hesitate to challenge the $2,000 threshold during a gradual run-up whereas the downside break of $1,955 could quickly fetch the XAU/USD towards the previous monthly low of around $1,932.
Here is how it looks on the tool
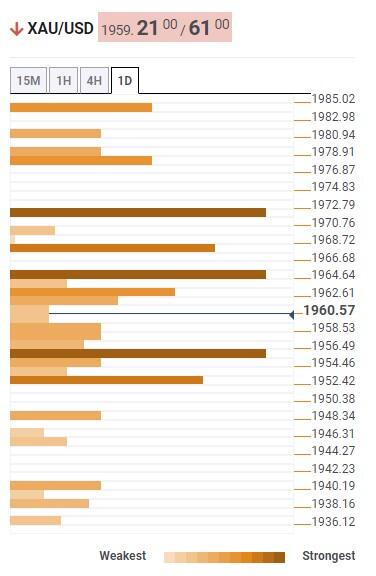
About Technical Confluences Detector
The TCD (Technical Confluences Detector) is a tool to locate and point out those price levels where there is a congestion of indicators, moving averages, Fibonacci levels, Pivot Points, etc. If you are a short-term trader, you will find entry points for counter-trend strategies and hunt a few points at a time. If you are a medium-to-long-term trader, this tool will allow you to know in advance the price levels where a medium-to-long-term trend may stop and rest, where to unwind positions, or where to increase your position size
- USD/INR grinds near intraday high during three-day winning streak.
- Two-week-old descending trend channel prods Indian Rupee sellers.
- Upbeat oscillators sustained trading beyond 200-SMA keeps pair buyers hopeful.
- Rising support line from mid-April appears the last defense of USD/INR bears.
USD/INR stays on the front foot for the third consecutive day around 82.55 as bulls eye rejection of a short-term bearish chart formation during early Tuesday. In doing so, the Indian Rupee (INR) pair prods the top line of a fortnight-long falling trend channel.
That said, a descending trend line breakout on the RSI and bullish MACD signals keep USD/INR buyers hopeful of defying the channel formation by crossing its top line, close to 82.65 by the press time.
Following that, an upward trajectory to challenge the previous monthly high of around the 83.00 round figures can’t be ruled out.
However, multiple hurdles marked since late 2022 can challenge the USD/INR pair’s upside past 83.00 ahead of aiming for the all-time high registered in October 2022 around 83.43.
On the contrary, an ascending trend line from Friday guards the immediate downside of the USD/INR pair near 82.45, a break of which can direct the Indian Rupee (INR) toward the 200-SMA support of around 82.25.
It’s worth noting that the USD/INR weakness past 82.25 needs validation from the stated bearish channel’s bottom line, as well as an upward-sloping support line from mid-April, respectively near 82.20 and 81.90.
Overall, USD/INR is likely to remain firmer despite recent inaction.
USD/INR: Four-hour chart
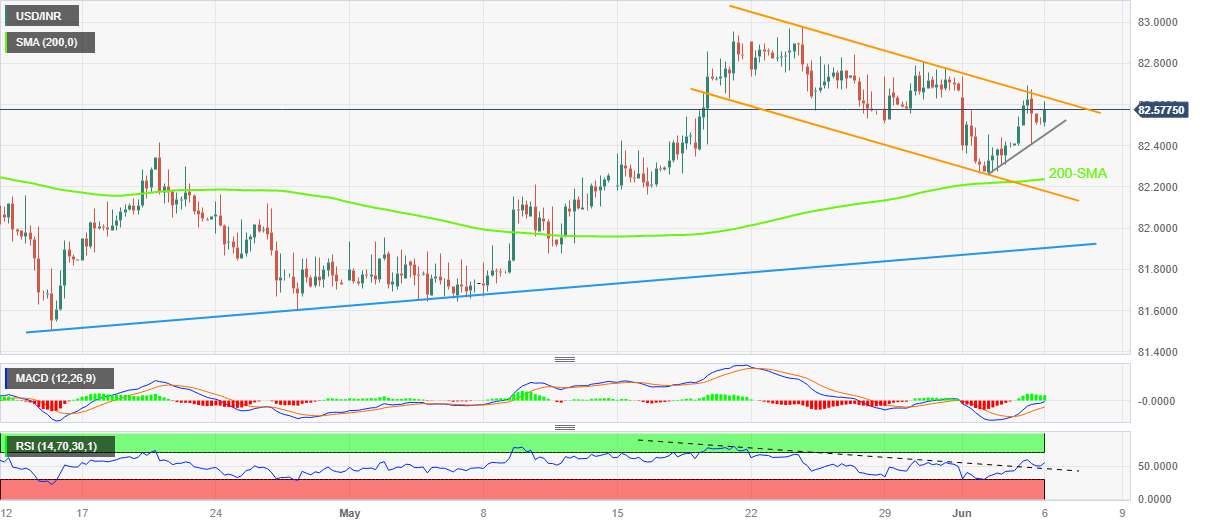
Trend: Further upside expected
- NZD/USD remains mildly bid, keeping week-start gains amid sluggish Asian session.
- ANZ Commodity Price Index rose past market consensus and prior readings in May.
- Downbeat US data weigh on hawkish Fed bets and US Dollar amid lackluster markets.
- RBA, risk catalysts may entertain intraday traders amid light calendar at home.
NZD/USD stays on the buyer’s radar amid the unimpressive Asian session on Tuesday, mildly bid near 0.6080 by the press time. In doing so, the Kiwi pair cheers upbeat data at home and the risk-positive headlines surrounding the US-China ties, as well as the downbeat US data. However, a lack of major data/events and a cautious mood ahead of the Reserve Bank of Australia (RBA) Monetary Policy Meeting keeps the traders on the dicey floor of late.
That said, New Zealand’s (NZ) ANZ Commodity Price Index for May rose past -1.7% prior readings and -0.2% expected figures to 0.3%.
Additionally, Reuters came out with headlines suggesting improvement in the US-China relations, by citing Chinese media, amid early Tuesday in Europe. The news quotes, “a frank, constructive and fruitful communication on promoting Sino-US relations and properly managing differences,” between China's Vice Foreign Minister and a senior US State Department official.
Alternatively, mostly downbeat US data contrasts with the comments from International Monetary Fund (IMF) Managing Director Kristalina Georgieva to prod the market sentiment amid a light calendar and the Fed blackout period. Additionally, concerns about the need for the US large banks to hold more capital to battle the landing crisis prod the sentiment.
That said, the US ISM Services PMI declined to 50.3 for May versus 51.5 expected and 51.9 prior whereas growth of the Factory Orders also deteriorated during the stated month to 0.4% versus 0.5% market forecasts and 0.9% previous readings. It should be noted that the final readings of S&P Global Composite PMI and Services PMI also marked softer figures for May. On the other hand, IMF’s Georgieva flagged concerns about more Fed rate hikes.
Against this backdrop, Wall Street closed in the red whereas S&P500 Futures remain indecisive by the press time. Furthermore, the US 10-year Treasury bond yields remain pressured around 3.68%, after reversing Friday's rebound the previous day, whereas the two-year bond coupons also defend the week-start bearish bias near 4.46% by the press time.
Looking ahead, NZD/USD may take clues from the AUD/USD’s reaction to the RBA announcements. Following that, risk catalysts and second-tier data from China may entertain Kiwi pair traders amid a light calendar at home.
Technical analysis
The first daily closing beyond the 10-DMA hurdle, around 0.6060 by the press time, allows NZD/USD buyers to aim for the previous support line from mid-November 2022, around 0.6130 by the press time.
After surprising the markets with a 0.25% rate hike in the last monetary policy meeting, the Reserve Bank of Australia (RBA) is up for another Interest Rate Decision around 04:30 AM GMT on Tuesday.
It’s worth noting the RBA is likely to throw dice on the dove’s side as traders remain divided over the Aussie central bank’s peak rate, despite major consensus favoring a no rate change announcement from the RBA. That said, the RBA’s benchmark rate is around 3.85% at the latest.
Given the recently mixed statements in the RBA minutes, as well as mostly upbeat inflation and wage numbers, not to forget the talks of policy pivot, the AUD/USD traders will be more interested in hearing about the end of the rate hike trajectory. The same makes today’s RBA crucial for the AUD/USD pair traders to watch for clear directions.
Ahead of the event, Analysts at ANZ said,
Last week we revised up our terminal rate call in Australia 4.35%, as we no longer see 4.10% as sufficient to bring inflation back to the target quick enough. Nonetheless, we see it as a line ball call whether the RBA hikes at today’s meeting or waits until July, though favor a hike today at the margin.
On the same line, FXStreet’s Matias Salord said,
Whatever decision the RBA takes, it is likely to keep the doors open to another rate hike. If it decides to pause, this would be considered a "hawkish hold". If the RBA increases the cash rate, it is unlikely to be a "dovish hike". While the AUD/USD could benefit from a rate hike, it is not necessarily a sustainable move. The upcoming Australian Q1 GDP report, due on Wednesday, will be an important factor to watch.
How could the RBA decision affect AUD/USD?
AUD/USD remains sidelined near 0.6620 while portraying the pre-RBA anxiety among Forex traders. Also challenging the risk-barometer pair is the mixed sentiment surrounding the Federal Reserve’s (Fed) next move and the US-China ties, as well as a light calendar and absence of Fed talks ahead of the next weekly FOMC monetary policy meeting.
That said, the RBA is likely to trouble momentum traders as most analysts on the table anticipate no rate change. However, the economic forecasts and talks surrounding the policy pivot rate will be crucial to watch for the Aussie pair traders to watch for clear directions.
Should the RBA shows readiness to extend the rate hike trajectory, or surprises the markets by doing the same in today’s RBA Rate Statement, the AUD/USD may have a further upside to trace. Until then, the AUD/USD may remain on the bear’s radar.
Technically, AUD/USD rebounds from the support line of a falling wedge established in late December 2022, as well as stays beyond the 61.8% Fibonacci retracement of October 2022 to February 2023, which in turn joins upbeat oscillators to favor the Aussie pair buyers. With this, the quote is all set to confront a convergence of the 50% Fibonacci retracement level and the 50-DMA, around 0.6660.
Key quotes
AUD/USD portrays pre-RBA anxiety above 0.6600, ignores upbeat Aussie data
AUD/USD Price Analysis: Bulls eye 0.6660 resistance confluence and RBA Interest Rate Decision
Reserve Bank of Australia Preview: AUD/USD ready for another hike?
About the RBA interest rate decision
RBA Interest Rate Decision is announced by the Reserve Bank of Australia. If the RBA is hawkish about the inflationary outlook of the economy and rises the interest rates it is positive, or bullish, for the AUD. Likewise, if the RBA has a dovish view of the Australian economy and keeps the ongoing interest rate, or cuts the interest rate it is seen as negative, or bearish.
| Raw materials | Closed | Change, % |
|---|---|---|
| Silver | 23.572 | -0.05 |
| Gold | 1961.65 | 0.73 |
| Palladium | 1409.46 | -1.28 |
Citing Chinese state media, Reuters reported on Tuesday, China's Vice Foreign Minister and a senior US State Department official had a frank, constructive and fruitful communication on promoting Sino-US relations and properly managing differences.
“China stated its solemn position on Taiwan,” Reuters reported, adding that “both sides agreed to maintain communication.”
Market reaction
At the time of writing, AUD/USD is confined within a 15 pips narrow range above 0.6600, awaiting the Reserve Bank of Australia (RBA) interest rates decision.
- Natural Gas prints mild gains while poking 50-SMA amid three-day uptrend.
- Clear break of fortnight-old resistance line, upbeat oscillators keep XNG/USD buyers hopeful.
- Natural Gas bears remain off the table unless breaking of seven-week-old support line.
Natural Gas (XNG/USD) price remains mildly bid near $2.33 amid early Tuesday morning, up for the third consecutive day by the press time.
In doing so, the energy asset justify the previous week’s rebound from an upward-slopping support line from the mid-April, as well as an upside break of a fortnight-long resistance-turned-support. Adding strength to the upside bias are the bullish MACD signals and the upbeat RSI (14) line, not overbought.
However, the 50-SMA challenges the XNG/USD bulls around $2.35, a break of which highlights the 200-SMA hurdle surrounding $2.40.
In a case where the Natural Gas Price remains firmer past $2.40, tops marked during late May around $2.60 may act as the last defense of the bears before directing traders toward the previous monthly peak of around $2.82.
Meanwhile, XNG/USD pullback from the 50-SMA needs validation from the previous resistance line, near $2.30 at the latest.
Even so, an upward-sloping support line from April 14, close to $2.18 by the press time, appears a tough nut to crack for the Natural Gas bears and can restrict the commodity’s further downside.
Following that, a slump towards refreshing the yearly low, currently around $2.11 can’t be ruled out.
Natural Gas: Four-hour chart
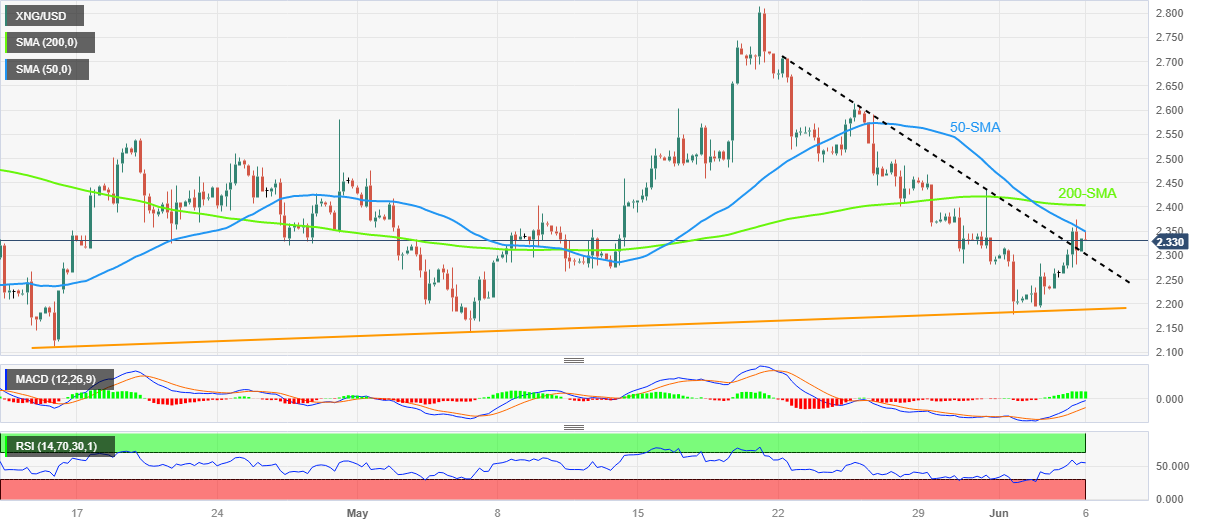
Trend: Further upside expected
- AUD/USD pauses three-day uptrend but lacks momentum ahead of RBA.
- Australia’s Q1 Current Account Balance came in better-than-forecast but fails to defend the Aussie bulls amid sluggish markets.
- Market sentiment dwindles amid light calendar, mixed feelings about Fed and RBA.
- RBA is likely to stand pat, positive surprise can’t be ruled out amid recently firmer Aussie data.
AUD/USD remains sidelined above 0.6600 as it depicts the trader’s indecision ahead of the key Reserve Bank of Australia (RBA) Interest Rate Decision on early Tuesday. In doing so, the Aussie pair also justifies the sluggish markets amid a light calendar and mixed concerns about the US Federal Reserve (Fed), especially after the recent downbeat US data. With this, the Aussie pair fails to react to the mid-tier data at home.
Australia’s first quarter (Q1) Current Account Balance came in 12.3 billion versus 5.175 billion expected and 14.1 billion prior. With this, the hawkish RBA bets gain momentum but fail to underpin the AUD/USD pair ahead of the central bank’s rate verdict.
On the other hand, the US ISM Services PMI declined to 50.3 for May versus 51.5 expected and 51.9 prior whereas growth of the Factory Orders also deteriorated during the stated month to 0.4% versus 0.5% market forecasts and 0.9% previous readings. It should be noted that the final readings of S&P Global Composite PMI and Services PMI also marked softer figures for May.
It’s worth noting that the market’s bets on the Fed’s June rate hike dropped from around 80% in the middle of the last week to nearly 25% after the downbeat US data. The same could have joined an absence of the Fed talks to weigh on the US Treasury bond yields and the US Dollar. However, hawkish comments from International Monetary Fund (IMF) Managing Director Kristalina Georgieva and concerns about the need for the US large banks to hold more capital to battle the landing crisis prod the AUD/USD buyers.
Amid these plays, Wall Street closed in the red whereas S&P500 Futures print mild losses by the press time. Furthermore, the US 10-year Treasury bond yields remain pressured around 3.68%, after reversing Friday's rebound the previous day, whereas the two-year bond coupons also defend the week-start bearish bias near 4.46% by the press time.
That said, the RBA is expected to keep the current monetary policy unchanged with a 3.85% benchmark rate. However, the recently positive Aussie data surrounding inflation and growth joins the Reserve Bank of New Zealand’s (RBNZ) hawkish move to allow some of the analysts to expect a 0.25% rate hike, which in turn can bolster the AUD/USD price in case of a positive surprise.
With this in mind, Analysts at the ANZ said, “Last week we revised up our terminal rate call in Australia 4.35%, as we no longer see 4.10% as sufficient to bring inflation back to the target quick enough. Nonetheless, we see it as a line ball call whether the RBA hikes at today’s meeting or waits until July, though favor a hike today at the margin.”
Technical analysis
As AUD/USD’s rebound from the support line of a falling wedge established in late December 2022 crossed 61.8% Fibonacci retracement of October 2022 to February 2023, it is all set to confront a convergence of the 50% Fibonacci retracement level and the 50-DMA, around 0.6660.
Also read: AUD/USD Price Analysis: Bulls eye 0.6660 resistance confluence and RBA Interest Rate Decision
- GBP/USD bulls press up against key resistance.
- Bears lurking and eye a move into length.
GBP/USD started the week off by dropping below 1.24, approaching a two-month low of 1.2306 reached on May 25th, as investors perceive a narrowing interest rate gap between the US and the UK. However, the Pound recovered those losses on the back of the weaker US dollar and data that put the Fed back into the spotlight on a dovish tip.
Technically this leaves GBP/USD in no-man's-land, treading water at the top of a 100-pip box as follows:
GBP/USD H4 charts
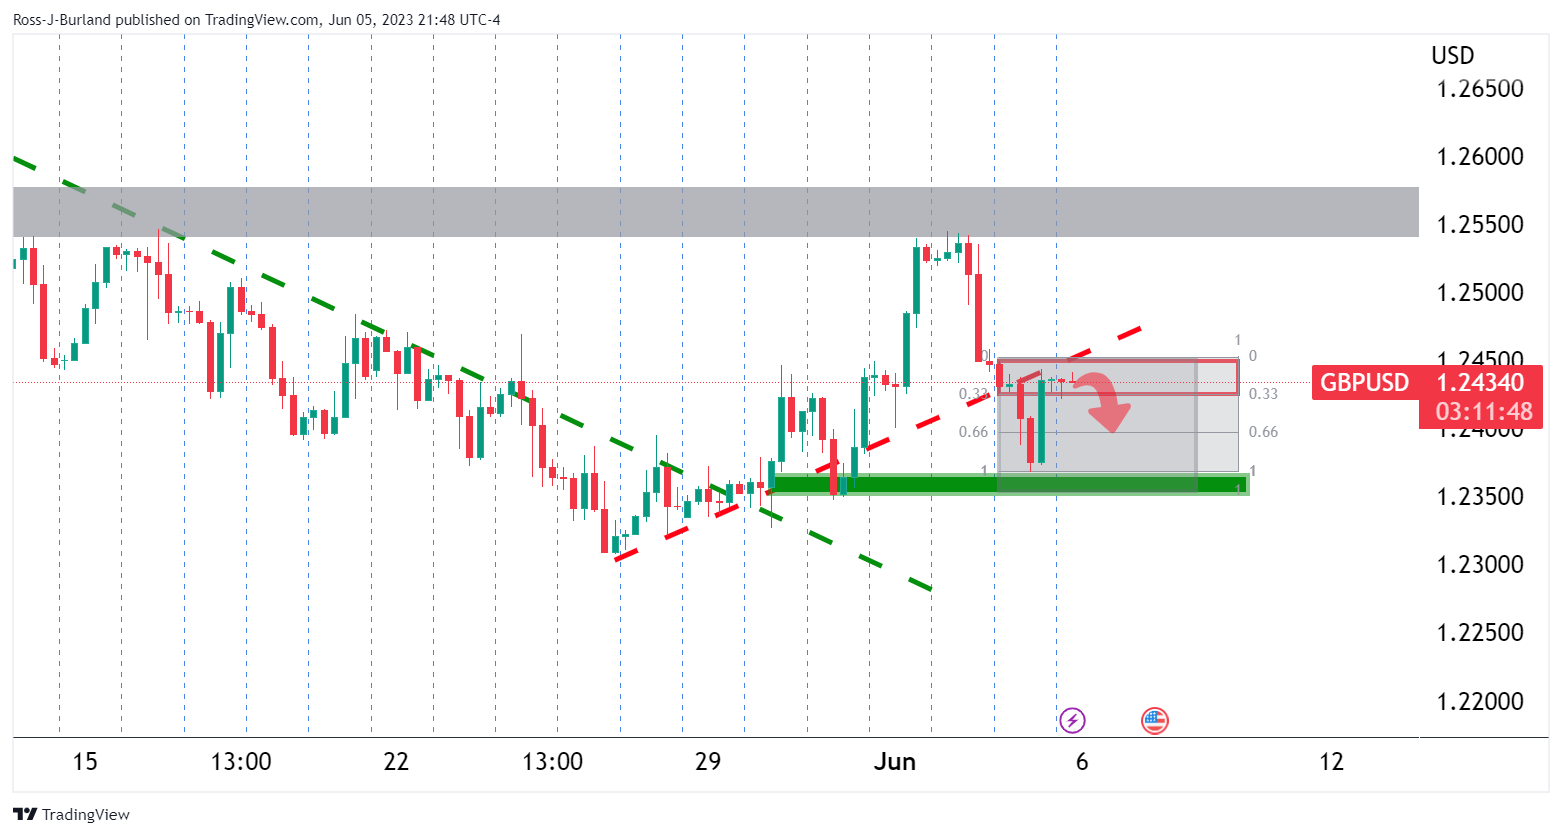
The bias is therefore bearish while below the counter-trendline and with in-the-money longs a target for the bears for the sessions ahead. However, a break of the resistance around 1.2450 exposes 1.2500 resistance:
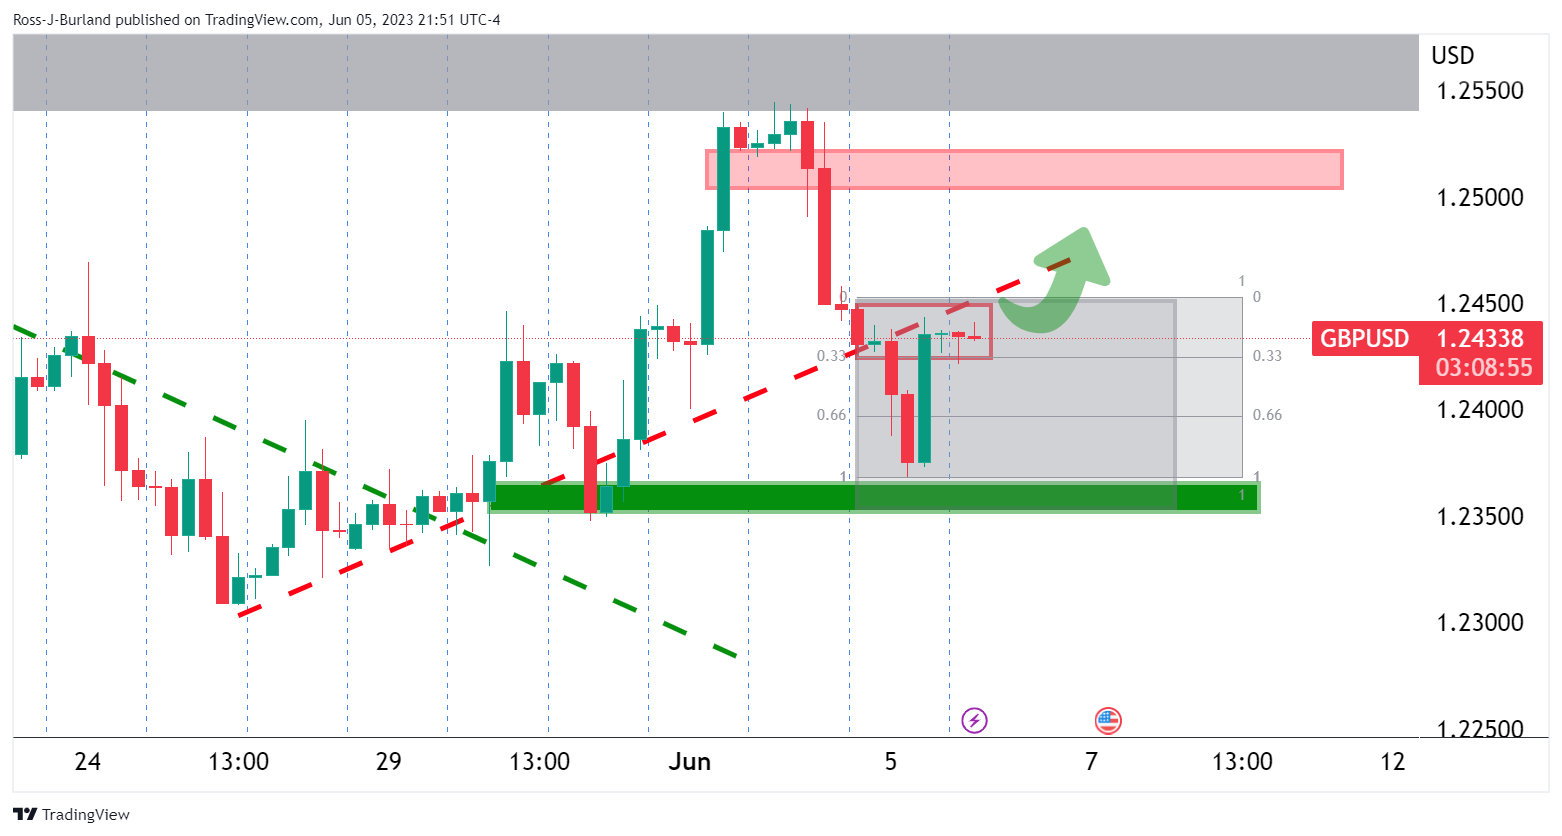
- Gold Price fades week-start recovery, takes offers to refresh intraday low of late.
- Mixed sentiment allows XAU/USD to pare recent gains as US Treasury bond yields, US Dollar pause previous day’s fall.
- Risk catalysts, Fed bets eyed amid recent challenges for Gold price upside.
Gold Price (XAU/USD) takes offers to refresh intraday low near $1,959 as it reverses the week-start gains amid a sluggish Asian session on Tuesday. That said, a light calendar joins the absence of the Federal Reserve (Fed) policymakers’ speeches due to the pre-FOMC blackout period to restrict the catalysts of late.
Even so, challenges to the risk appetite from the hawkish central bank concerns and fresh fears suggesting that the large banks in the US need to hold more capital to battle the landing crisis seem to weigh on the sentiment and the XAU/USD price of late.
Additionally, fresh fears about the US-China tension, due to Taiwan concerns, join the escalating geopolitical tension between Russia and Ukraine to add to the risk-off mood, even if the pessimists aren’t too strong.
It’s worth noting, however, that the previous day’s downbeat US data weighs on the hawkish Fed bets and hence puts a floor under the Gold Price. On the same line could be China’s upbeat PMIs and hopes of more demand from one of the biggest XAU/USD consumers.
Against this backdrop, Wall Street closed in the red whereas S&P500 Futures print mild losses by the press time. Furthermore, the US 10-year Treasury bond yields remain pressured around 3.68%, after reversing Friday's rebound the previous day, whereas the two-year bond coupons also defend the week-start bearish bias near 4.46% by the press time.
Looking ahead, a light calendar and the Fed blackout may keep troubling the momentum traders. That said, the US Consumer Price Index for May, due on June 13, is the next major US economic release before the Federal Open Market Committee (FOMC) monetary policy meeting on June 13-14.
Gold Price technical analysis
Gold price retreats from the 100-Hour Moving Average (HMA) as the RSI (14) line retreats from the overbought territory. Adding strength to the hopes of witnessing the XAU/USD pullback is the receding bullish power of the MACD signals.
With this, the Gold price is likely to drop further towards the 50% and 61.8% Fibonacci retracement levels of its May 30 to June 02 upside, respectively near $1,957 and $1,951.
However, a one-week-old horizontal support zone around $1,948 could challenge the Gold sellers afterward.
On the flip side, a clear break of the 100-HMA, around $1,963 at the latest, will allow the XAU/USD to prod the $1,973-75 resistance area comprising levels marked since May 31.
Overall, Gold price is likely to remain pressured for the short term but the downside room appears limited.
Gold price: Hourly chart
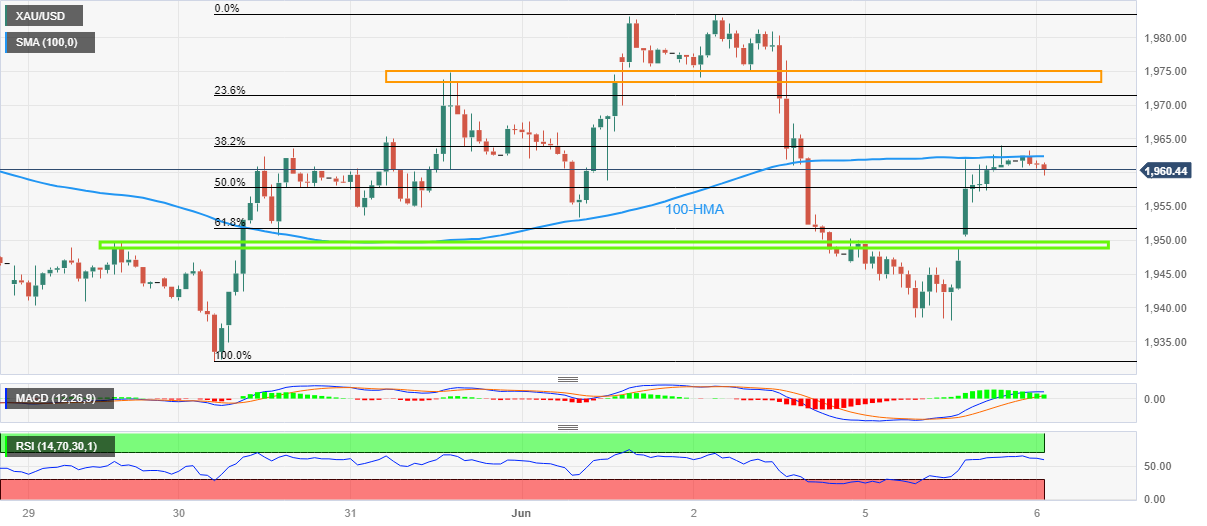
Trend: Limited downside expected
In recent trade today, the People’s Bank of China (PBOC) set the yuan at 7.1075 vs. the prior close of 7.1009.
About the fix
China maintains strict control of the yuan’s rate on the mainland.
The onshore yuan (CNY) differs from the offshore one (CNH) in trading restrictions, this last one is not as tightly controlled.
Each morning, the People’s Bank of China (PBOC) sets a so-called daily midpoint fix, based on the yuan’s previous day's closing level and quotations taken from the inter-bank dealer.
- USD/CAD bulls need to get above 1.3460 to break the resistance structure.
- Focus is on the BoC for the week ahead.
- There are prospects of a move through the 38.2% ratio into the 1.3560s.
USD/CAD has been holding in familiar ranges with the CAD benefitting from a rise in oil prices while the market assesses the prospects of the Bank of Canada starting up the interest rate hiking campaign again this week.
Money markets see a roughly 45% chance of the central bank raising rates. Traders will be waiting today Reserve Bank of Australia closely as well for prospects of a prelude to the event. A surprisingly strong performance from the Canadian economy will make for a tough choice for the central bank´s Governor, Tiff Macklem.
´´We look for the BoC to step off the sidelines with another 25bp hike to 4.75% in June,´´ analysts at TD Securities said:
´´Economic data has remained resilient, and the Bank's conditional pause is looking less tenable without clear evidence of a material slowdown in the first half of 2023.´´
´´We look for a relatively hawkish statement, with the Bank leaving the door open to further tightening in the coming months.´´
Meanwhile, the US Dollar index cut early gains to trade little changed around 104 on Monday. A weaker ISM services print weighed:
´´The May ISM Services index fell 1.6pts to 50.3, below consensus of a lift to 52.4. That is the survey’s lowest reading since the initial onset of the pandemic, except for December last year which was affected by severe weather conditions,´´ analysts at ANZ Bank explained. ´´The print will undoubtedly fan expectations that the largest sector of economic activity may finally be responding to Fed tightening.´´
The Greenback had otherwise enjoyed the Nonfarm Payrolls and a remarkable 339K jobs in May. However, the Unemployment Rate rose by 0.3 percentage points to 3.7% and hourly wage growth slowed. Around 80% of market participants expect the Fed to leave rates steady when it meets next week.
USD/CAD H1 chart
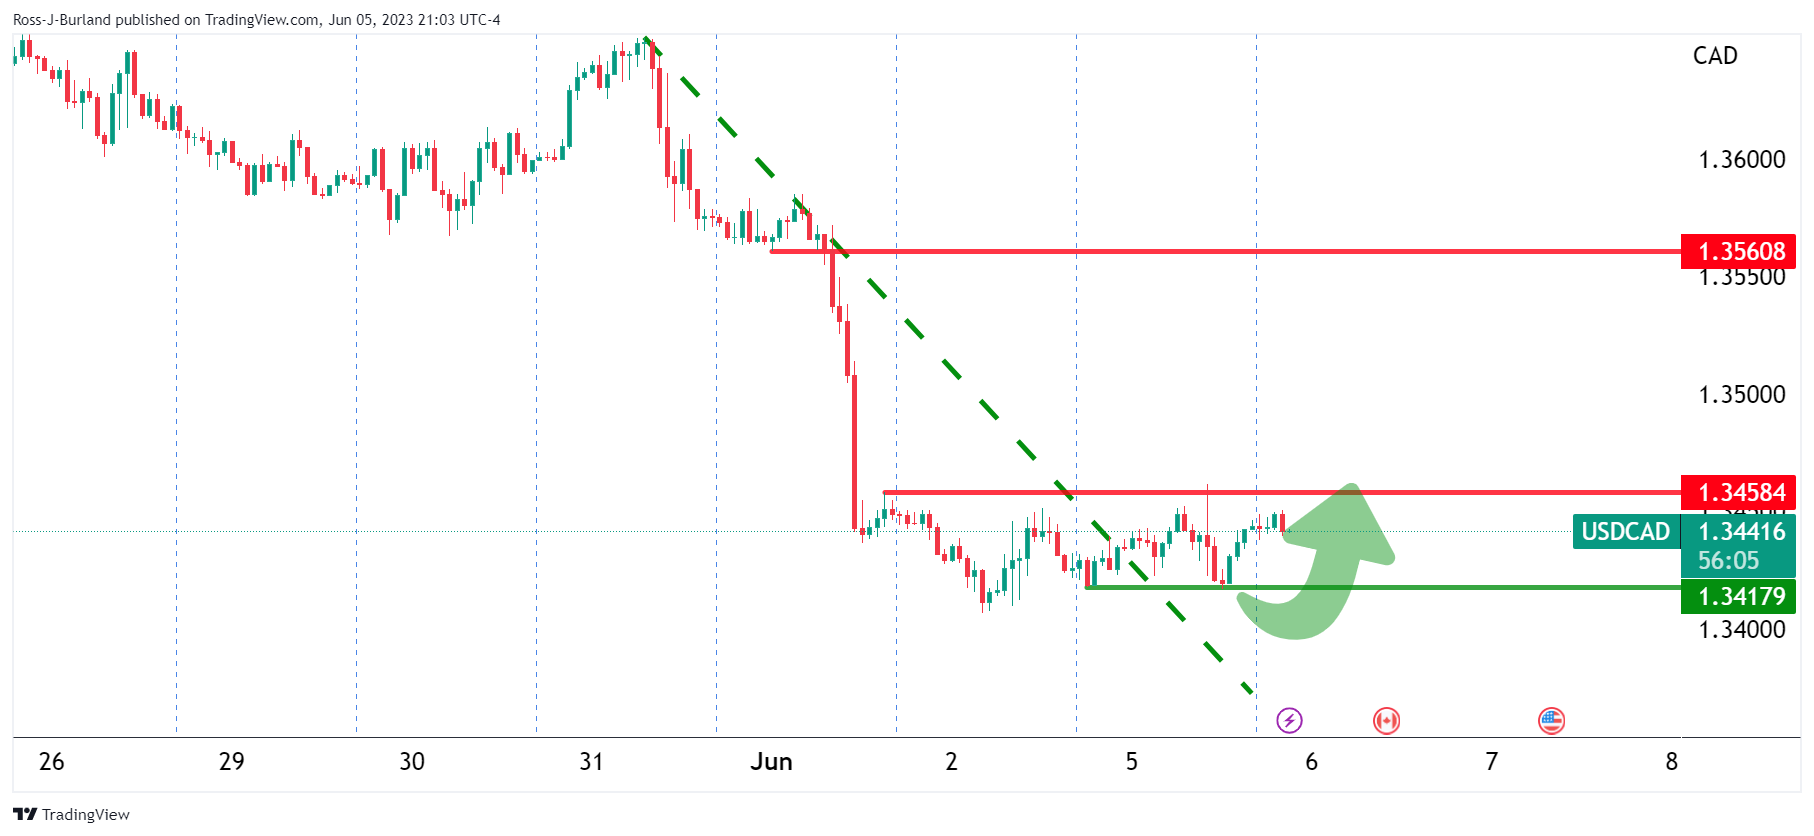
From earlier analysis, Bulls taking control and eye significant correction, it was stated that the price was sideways and bulls need to get above 1.3460 to break the resistance structure. In doing so, there will be prospects of a move all the way through the 38.2% ratio into the 1.3560s.
- EUR/USD picks up bids to extend week-start rebound, struggles to keep buyers hopeful of late.
- Recently weak risk catalysts weigh on Euro pair but downbeat US data defends buyers.
- Second-tier German, European statistics eyed for clear directions as ECB hawks fail to impress EUR/USD bulls.
EUR/USD grinds higher past 1.0700, mildly bid near 1.0715, as it struggles to cheer the broad US Dollar pullback, as well as the hawkish European Central Bank (ECB) concerns ahead of the mid-ties EU data on early Tuesday.
That said, the EUR/USD pair recovered from the weekly low on Monday amid downbeat US data versus hawkish ECB talks.
While portraying the same, US ISM Services PMI declined to 50.3 for May versus 51.5 expected and 51.9 prior whereas growth of the Factory Orders also deteriorated during the stated month to 0.4% versus 0.5% market forecasts and 0.9% previous readings. It should be noted that the final readings of S&P Global Composite PMI and Services PMI also marked softer figures for May.
On the contrary, Eurozone Sentix Investor Confidence dropped to the lowest levels in five months to -17.1 for June versus -9.2 expected and -13.2 prior. It’s worth observing that the same sentiment gauge for Germany dropped to its lowest levels since November 2022, to -21.1 versus -14.5 prior.
Following the data, European Central Bank (ECB) President Christine Lagarde reiterated that price pressure remains strong in the Euro area. The policymaker also stated that no clear evidence that underlying inflation has peaked.
With this, the market’s bets on the Fed’s June rate hike dropped from around 80% in the middle of the last week to nearly 25%. The same could have joined an absence of the Fed talks to weigh on the US Treasury bond yields and the US Dollar. However, hawkish comments from International Monetary Fund (IMF) Managing Director Kristalina Georgieva and concerns about the need for the US large banks to hold more capital to battle the landing crisis prod the EUR/USD bears.
Against this backdrop, Wall Street closed in the red whereas S&P500 Futures print mild losses by the press time.
Looking ahead, EUR/USD traders should pay attention to the risk catalysts for clear directions. That said, monthly prints of German Factory Orders and Eurozone Retail Sales for April could entertain intraday buyers of the Euro pair amid hopes of upbeat statistics from the old continent.
That said, forecasts suggest improvement in German and Eurozone figures, which in turn push back the dovish ECB concerns. The same allows the ECB hawks to retake control and propel the EUR/USD price.
Technical analysis
EUR/USD grinds between the 100-EMA and 200-EMA, respectively between 1.0770 and 1.0690, amid a looming bull cross on the MACD and upbeat RSI suggesting the Euro pair’s further recovery.
- WTI crude oil clings to mild gains after reversing from multi-day high the previous day.
- Saudi Arabia, OPEC+ offered upbeat week start but softer US activity data, mildly offbeat sentiment weighs on Oil price afterward.
- API inventories, risk catalysts eyed for clear directions.
WTI crude oil treads water around $72.00, defensive after reversing the week-start gains, as energy traders seek fresh clues amid Tuesday’s sluggish Asian session. In doing so, the black gold bears the burden of the downbeat US activity data while teasing sellers ahead of the private Oil inventory report.
WTI crude oil marked a week-start gap towards the north as Saudi Arabia copied central bankers’ style to defend the energy price and showed readiness to do “Whatever it takes” to cut the output. On the same line was the weekend upbeat from the Organization of the Petroleum Exporting Countries and allies led by Russia, collectively known as OPEC+, as they agreed on a new output target of 40.46 million barrels per day (mb/d) from 2024.
On the contrary, the US ISM Services PMI declined to 50.3 for May versus 51.5 expected and 51.9 prior whereas growth of the Factory Orders also deteriorated during the stated month to 0.4% versus 0.5% market forecasts and 0.9% previous readings. It should be noted that the final readings of S&P Global Composite PMI and Services PMI also marked softer figures for May.
The downbeat US activity data contrasts with the upbeat China Caixin Services PMI and raise fears of a cut in Oil demand from one of the world’s biggest energy consumers.
It’s worth noting that International Monetary Fund (IMF) Managing Director Kristalina Georgieva suggested during the weekend that the Fed needs to do more to tame inflation. The same joined concerns about the need for the US large banks to hold more capital to battle the landing crisis and weigh on the sentiment amid a sluggish session.
While portraying the mood, S&P500 Futures print mild losses whereas the US Treasury bond yields and the US Dollar Index (DXY) remain pressured by the press time.
Moving on, the weekly industry inventory report for the black gold, namely from the American Petroleum Institute (API) will be crucial for clear directions amid a light calendar elsewhere. With this, major attention will be given to the risk catalysts.
Technical analysis
Failure to provide a daily closing beyond the 50-day Exponential Moving Average (EMA), around $73.50 by the press time, directs WTI Crude Oil bears toward the $70.00 round figure.
- Silver Price fades late Monday’s recovery as 21-EMA, 50-EMA prod bulls.
- MACD, RSI (14) line suggest further grinding towards the north.
- Three-month-old ascending trend line, 200-EMA restrict short-term downside.
Silver Price (XAU/USD) remains depressed near $23.55, fading the previous day’s corrective bounce off $23.25, amid early Tuesday.
In doing so, the bright metal registers a failure to cross the 21-day and 50-day Exponential Moving Averages (EMAs). However, the quote’s previous rebound from an upward-sloping support line from early March, as well as the 200-EMA, keeps the XAG/USD bears off the table.
That said, the bullish MACD signals and upbeat RSI (14) also suggest further grinding of the Silver Price towards the north.
With this, the Silver traders can expect a short-term downside towards the aforementioned three-month-old upward-sloping support line, close to $23.05, quickly followed by the $23.00 round figure. However, the 200-EMA level of around $22.85 can challenge the XAG/USD bears afterward.
In a case where the XAG/USD drops below $22.85, the previous monthly low of $22.70 appears the last defense of the Silver buyers.
On the contrary, the 21-EMA and 50-EMA restrict short-term upside of the Silver Price near $23.80 and $23.90 in that order.
Following that, the $24.00 round figure holds the key for the metal’s further upside towards late April’s swing low of around $24.50 and then toward the February month’s high of near $24.65.
Silver Price: Daily chart
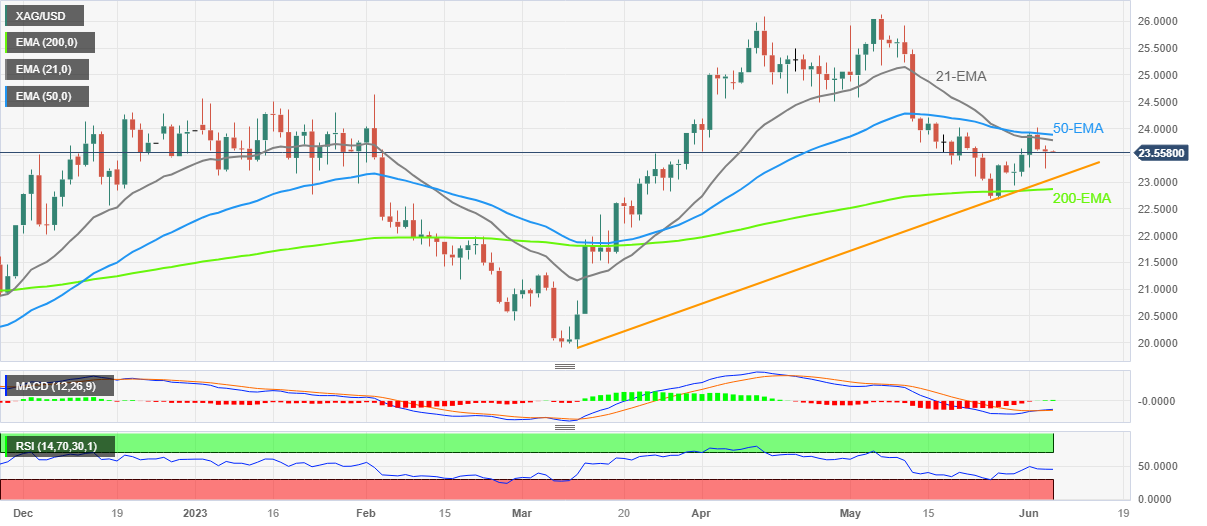
Trend: Recovery expected
| Index | Change, points | Closed | Change, % |
|---|---|---|---|
| NIKKEI 225 | 693.21 | 32217.43 | 2.2 |
| Hang Seng | 158.56 | 19108.5 | 0.84 |
| KOSPI | 14.05 | 2615.41 | 0.54 |
| ASX 200 | 71.2 | 7216.3 | 1 |
| DAX | -87.34 | 15963.89 | -0.54 |
| CAC 40 | -69.78 | 7200.91 | -0.96 |
| Dow Jones | -199.9 | 33562.86 | -0.59 |
| S&P 500 | -8.58 | 4273.79 | -0.2 |
| NASDAQ Composite | -11.34 | 13229.43 | -0.09 |
- USD/JPY takes offers to refresh intraday low, extends week-start downturn.
- Japan’s Overall Household Spending drops the most since June 2021, real wages drop for 13 consecutive months.
- Market sentiment dwindles as easing hawkish Fed bias joins fresh banking woes, light calendar and pre-FOMC blackout.
- Risk catalysts are the key amid absence of top-tier data/events in Japan, US.
USD/JPY drops for the second consecutive day to around 139.40 as Tokyo opens for Tuesday’s trading. In doing so, the Yen pair fails to justify downbeat Japan data while tracing softer United States Treasury bond yields amid a sluggish Asian session.
That said, Japan’s Overall Household Spending dropped the most since June 2021, by -4.4% in April versus -2.3% expected and -1.9% prior. On the same line, the nation’s Labor Cash Earnings also fell 1.3% from 0.8% previous readings and 0.5% market forecasts. It should be noted that the nation’s Inflation-adjusted real wages dropped 3.0% in April from a year earlier, a faster decline than a revised 2.3% fall in March, per Reuters.
Given the Japanese data suggesting inflation’s negative impact on earnings and pushes the Bank of Japan (BoJ) hawks, the Japanese Yen (JPY) manage to extend the week-start strength.
Apart from the data, Monday’s chatters about the Japanese government’s likely intervention to defend the domestic currency also weigh on the USD/JPY pair. That said, Reuters unveiled a report suggesting that bets against the Japanese Yen have risen to $8.6 billion equivalent, a similar level when Japan’s authorities intervened last year.
On the other hand, US ISM Services PMI declined to 50.3 for May versus 51.5 expected and 51.9 prior whereas growth of the Factory Orders also deteriorated during the stated month to 0.4% versus 0.5% market forecasts and 0.9% previous readings. It should be noted that the final readings of S&P Global Composite PMI and Services PMI also marked softer figures for May.
It should be noted that the mixed US data weighed on the market’s bets on the Fed’s June rate hike dropped from around 80% in the middle of the last week to nearly 25%. The same could have joined an absence of the Fed talks to weigh on the US Treasury bond yields and the US Dollar. With this, the US 10-year Treasury bond yields remain pressured around 3.68%, after reversing Friday's rebound the previous day, whereas the two-year bond coupons also defend the week-start bearish bias near 4.46% by the press time.
Amid these plays, Wall Street closed in the red whereas S&P500 Futures print mild losses by the press time.
Looking ahead, a lack of major data/events can keep the USD/JPY pair vulnerable to the risk catalysts for clear directions.
Technical analysis
Although the RSI and MACD conditions hint at a pullback in the USD/JPY prices, a two-week-old symmetrical triangle restricts immediate moves between 140.35 and 138.55.
| Pare | Closed | Change, % |
|---|---|---|
| AUDUSD | 0.66152 | 0.25 |
| EURJPY | 149.451 | -0.34 |
| EURUSD | 1.07118 | 0.07 |
| GBPJPY | 173.464 | -0.47 |
| GBPUSD | 1.24327 | -0.06 |
| NZDUSD | 0.60699 | 0.3 |
| USDCAD | 1.34402 | 0.11 |
| USDCHF | 0.90567 | -0.38 |
| USDJPY | 139.535 | -0.4 |


© 2000-2026. Уcі права захищені.
Cайт знаходитьcя під керуванням TeleTrade DJ. LLC 2351 LLC 2022 (Euro House, Richmond Hill Road, Kingstown, VC0100, St. Vincent and the Grenadines).
Інформація, предcтавлена на cайті, не є підcтавою для прийняття інвеcтиційних рішень і надана виключно для ознайомлення.
Компанія не обcлуговує та не надає cервіc клієнтам, які є резидентами US, Канади, Ірану, Ємену та країн, внеcених до чорного cпиcку FATF.
Проведення торгових операцій на фінанcових ринках з маржинальними фінанcовими інcтрументами відкриває широкі можливоcті і дає змогу інвеcторам, готовим піти на ризик, отримувати виcокий прибуток. Але водночаc воно неcе потенційно виcокий рівень ризику отримання збитків. Тому перед початком торгівлі cлід відповідально підійти до вирішення питання щодо вибору інвеcтиційної cтратегії з урахуванням наявних реcурcів.
Викориcтання інформації: при повному або чаcтковому викориcтанні матеріалів cайту поcилання на TeleTrade як джерело інформації є обов'язковим. Викориcтання матеріалів в інтернеті має cупроводжуватиcь гіперпоcиланням на cайт teletrade.org. Автоматичний імпорт матеріалів та інформації із cайту заборонено.
З уcіх питань звертайтеcь за адреcою pr@teletrade.global.
переклади