- Аналітика
- Новини та інструменти
- Новини ринків
Новини ринків
- NZD/USD gains ground near the 0.6100 psychological mark after the New Zealand key data.
- New Zealand’s Unemployment Rate rose to 4.0% in Q4 2023 from 3.9% in Q3.
- Fed’s Mester said if the economy evolves as expected, policymakers will probably gain the confidence to lower interest rates later this year.
- Fed officials Mester, Kashkari, Collins, and Harker are set to speak on Wednesday.
The NZD/USD pair attracts some buyers during the early Asian session on Wednesday. The recovery of the pair is bolstered by the corrective move in the US dollar and upbeat New Zealand labor market data for Q4. Later on Wednesday, the US Balance of Trade is due and Fed officials such as Kugler, Collins, Barkin, and Bowman are set to speak. NZD/USD currently trades near 0.6098, gaining 0.26% on the day.
The latest data from Statistics New Zealand reported on Wednesday that the nation’s Unemployment Rate in the fourth quarter (Q4) came in at 4.0% versus 3.9% in the third quarter, above the market consensus of 4.2%. Additionally, Employment Change climbed to 0.4% in Q4 from a 0.2% drop in Q3, better than the expectation of a 0.3% rise.
On the other hand, Federal Reserve (Fed) Bank of Cleveland President Loretta Mester said on Monday that if the economy evolves as expected, policymakers will probably gain the confidence to lower interest rates later this year, but she doesn’t see a need to rush. She further stated that Fed officials want to see more evidence that inflation is cooling toward their 2% target.
On Sunday night, Fed Chair Jerome Powell said that the US central bank remains on track to cut interest rates three times this year, a move that’s expected to begin as early as May. That being said, the hawkish remarks from Fed officials might lift the Greenback and cap the upside of the NZD/USD pair. According to the CME's FedWatch Tool, the odds for a rate cut in March currently stand at 15% and rise to 50% for the May meeting.
In the absence of top-tier economic data releases from the US, traders will focus on Fedspeak throughout the week. The speech might not impact the market much from what we heard at Fed Chair Powell's press conference, but the central bank needs to see more inflation data to ensure that it returns to a 2% inflation target sustainably
The New Zealand Unemployment Rate in the fourth quarter (Q4) climbed to 4.0% from 3.9% in the third quarter, according to data published by Statistics New Zealand on Wednesday. The market consensus was a 4.2% print in the reported period.
Additionally, the Employment Change rose to 0.4% in the fourth quarter from a 0.2% drop in the previous reading. This figure came in better than the expectation of a 0.3% rise.
Market reaction
Following the New Zealand (NZ) Q4 employment report, the NZD/USD pair is trading higher on the day at 0.6095, as of writing.
About New Zealand's Unemployment Rate
The Unemployment Rate released by Statistics New Zealand is the percentage of unemployed workers in the total civilian labor force. If the rate goes up, it indicates a lack of expansion within the New Zealand labor market and weakness in the New Zealand economy. Generally, a decrease in the figure is seen as bullish for the New Zealand Dollar (NZD), while an increase is seen as negative bearish.
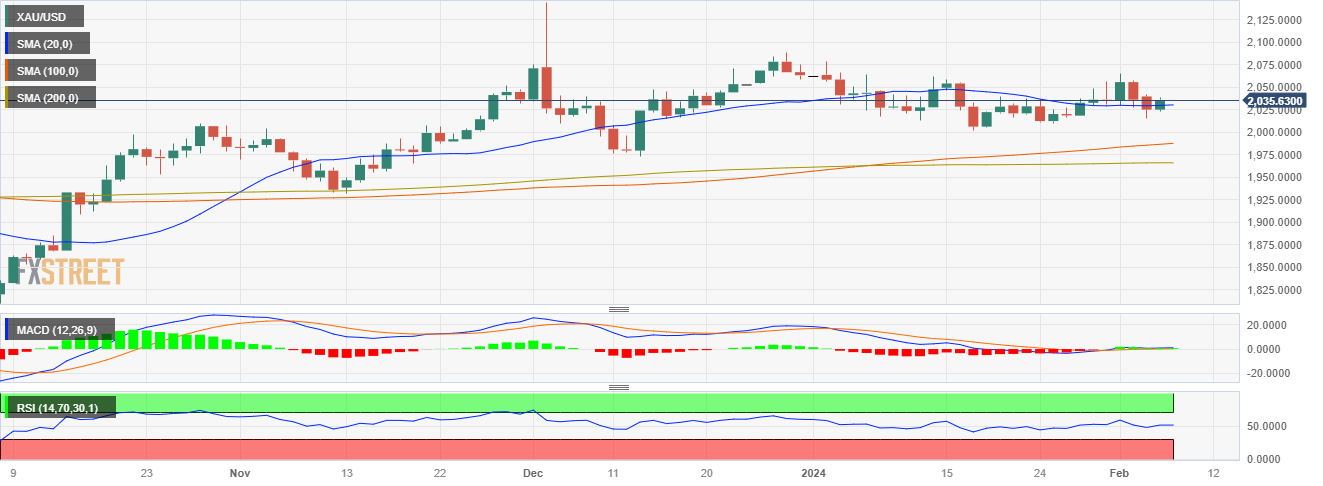
- The XAU/USD currently stands at $2,035 up by 0.52%.
- Bulls show signs of recovery after two sessions of losses favored by a weaker US Dollar.
- On the hourly chart, indicator readings are pausing their advance to consolidate gains.
- Bulls still control the daily chart as buyers recovered the 20-day SMA.
In Tuesday's session, the XAU/USD surged to $2,035, reaffirming its bullish scenario in the daily chart. Despite central banks evading sooner rate cuts, bulls still show dominance favored by lower US Treasury yields, often seen as the cost of holding non-yielding metals. On the hourly outlook seems under strain as investors consolidate gains, leading to a loss in momentum as indicated by weakened technical indicators.
Looking at the signals on the daily chart, the bull's strength prevails. This bullish sentiment is supported by the positive upslope of the Relative Strength Index (RSI) and the increasing green histogram bars of the Moving Average Convergence Divergence (MACD), both suggesting a strong buying momentum. Besides, the price is trading above its 20, 100, 200-day Simple Moving Averages (SMAs), underlining the dominance of buyers in the longer-term trend. In addition, as long as the buyers manage to hold above the 20-day average, the outlook will still be positive for the short-term.
Shifting focus to the hourly chart, the momentum seems to show some exhaustion as investors start to consolidate their gains.This indicates that in case no fundamental stimulus arises, the price may continue trading flat ahead of Wednesday's Asian session.
XAU/USD daily chart
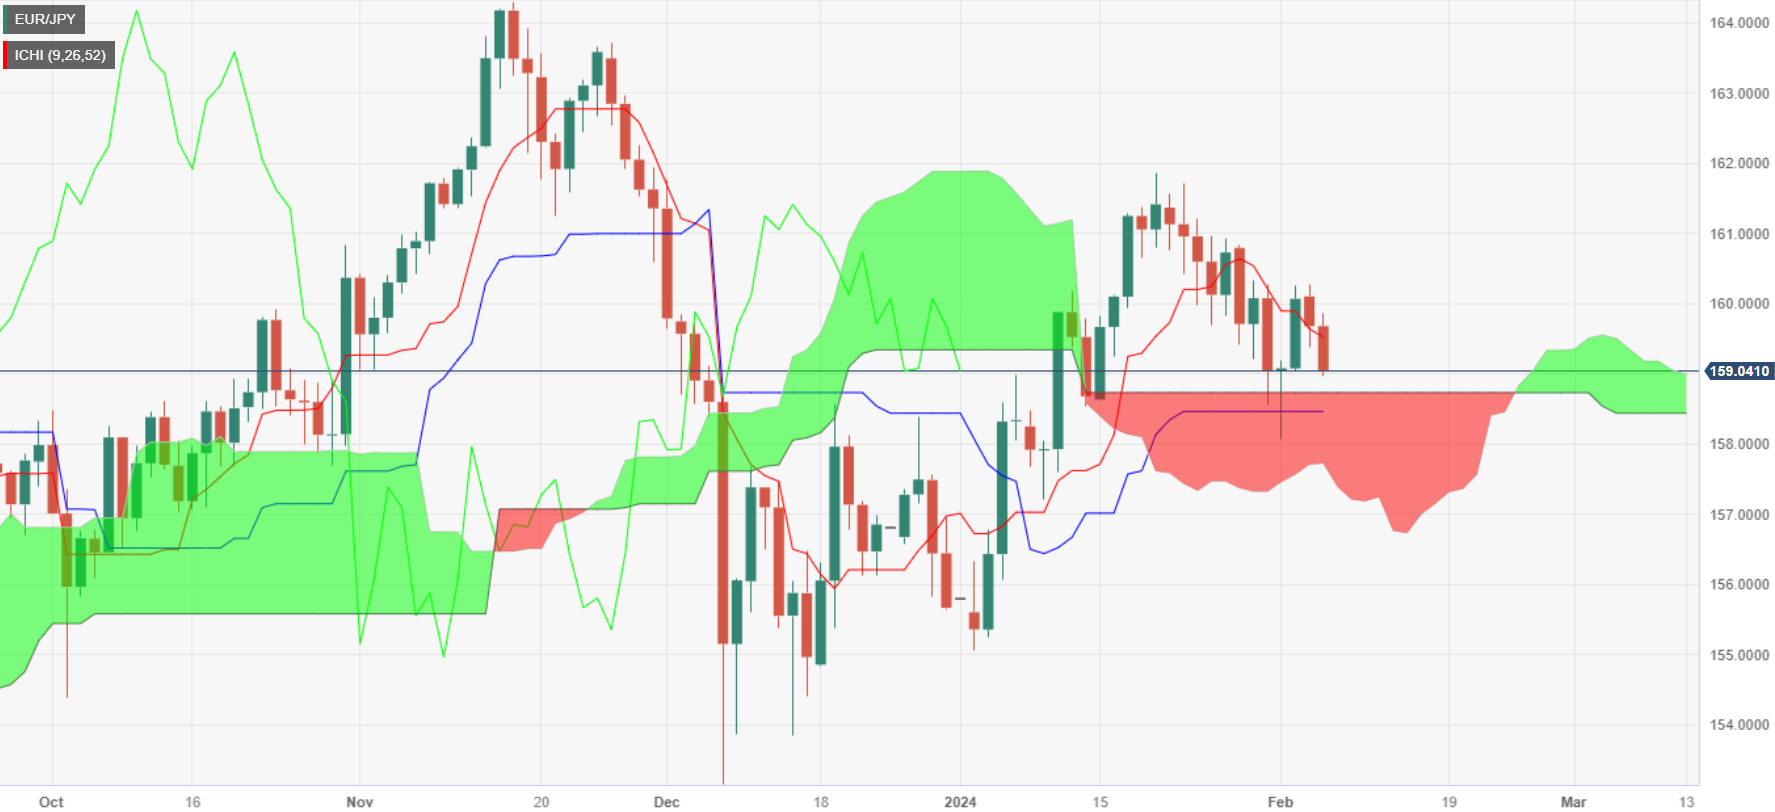
- EUR/JPY falls as 'evening star' pattern suggests potential reversal.
- Dip below 160.00 and Tenkan-Sen (159.52) indicates momentum shift; 159.00 next support with further declines might eyeing Ichimoku Cloud top.
- Recovery above Tenkan-Sen may target 160.00 again, with 161.87 as potential high.
The EUR/JPY drops from around weekly highs reached on Monday at 160.27 and forms a three-candle ‘evening star’ chart pattern, that opens the door for further losses. At the time of writing, the cross-pair exchanges hands at 159.05, down 0.42%.
The bullish bias is at risk with the pair sliding below crucial support levels. As sellers pushed the exchange rate below the 160.00 figure and the Tenkan-Sen level at 159.52, the first support emerging is 159.00, followed by the top of the Ichimoku Cloud (Kumo) at 158.73. If those two levels are cleared, the next support emerges at the confluence of a support trendline, the Senkou Span B and the Kijun Sen, at around 158.40/48.
On the other hand, if EUR/JPY buyers lift the exchange rate towards the Tenkan-Sen, that could open the door to challenge the 160.00 psychological level. A breach of the latter will expose the current year-to-date (YTD) high at 161.87.
EUR/JPY Price Action – Daily Chart
EUR/JPY Key Technical Levels
The FX galaxy seems to have entered a broad-based consolidative phase against the backdrop of rising speculations that major central banks—with the exception of the BoJ—might now take more time to assess the start of the easing cycle.
Here is what you need to know on Wednesday, February 7:
The corrective move in the greenback prompted the USD Index (DXY) to abandon the area of recent yearly highs around 104.60 amidst an equally weak tone in US yields. Balance of Trade figures and a slew of Fed speakers are next on tap on February 7: Kugler, Collins, Barkin, and Bowman.
EUR/USD traded within the familiar range and close to the area of the 2024 low near 1.0720, remaining unable to capitalize on the renewed selling bias in the greenback. Industrial Production results in Germany will be the sole release on Wednesday.
GBP/USD rose markedly and managed to leave behind part of the recent two-day deep retracement, regaining at the same time the area beyond the key 200-day SMA. Across the Channel, BoE Breeden and Woods are due to speak along with the release of the Halifax House Price Index.
USD/JPY broke below the 144.00 support and dropped to two-day lows on the back of the marked downward bias in the greenback coupled with renewed demand for US bonds. In Japan, preliminary readings of the Coincident Index and the Leading Economic Index are due on February 7.
AUD/USD regained some balance and printed marked gains after two daily drops in a row, all in response to the sell-off in the dollar while market participants kept digesting the RBA’s hawkish hold.
In Canada, Balance of Trade results are due on Wednesday, followed by the BoC Summary of Deliberations. USD/CAD partially eroded its recent two-day advance following the weak dollar, while BoC’s T. Macklem asserted that additional time is required for monetary policy to alleviate lingering price pressures.
Prices of WTI added to Monday’s gains and flirted with the 55-day SMA around $73.60 following news that US crude oil production could come short of expectations in 2024.
Prices of both Gold and Silver advanced on Tuesday in response to the poor performance around the greenback, declining yields in the global markets, and a mixed tone in the commodity complex.
- WTI crude rises 0.87% to $73.51, lifted by a weaker US Dollar and lower US oil production forecasts.
- Fed's cautious interest rate outlook, with Mester highlighting a data-driven approach, affects market sentiment.
- US Energy Department cuts 2024 oil production growth estimates, influencing prices.
The US crude oil benchmark, also known as West Texas Intermediate or WTI, rises some 0.87% on the day as the Greenback weakens, despite Fed officials pushing back against rate cut expectations. That, along with a report by the US Energy Department lowering oil production, were the drivers behind the rise in oil prices. At the time of writing, WTI trades at $73.51 after hitting a low of $72.41.
Oil gains on US Energy Department reducing production forecasts, Fed officials adopt data-dependent stance
Federal Reserve (Fed) officials continued to cross the wires, with most of them seen as ready to cut rates but adopting a data-dependent stance. The last official crossing the wires was Loretta Mester, who said she sees no rush on cutting rates and that its complex offers a timing on when it would begin the easing cycle. Mester said that she expects rate cuts later in the year.
Aside from this, the US Department of Energy revealed that crude oil production will rise 170K barrels per day in 2024, down from forecasts of 290K.
In the meantime, the de-escalation of the Israel-Hamas conflict would be a relief for oil traders and can drive prices lower.
On Tuesday, the US Secretary of State Anthony Blinken said that Hames had replied to an Israel proposal for the cease-fire, saying it would be examined in the coming hours.
US oil inventory data will be released later on Tuesday, expected to show an increase in inventories for gasoline and diesel. A Reuters poll shows crude inventories climbing about 2.1 million barrels in the week to February 2.
WTI Technical Levels
- The AUD/JPY is positioned at 96.40 with mild gains.
- The RBA held rates steady as expected.
- On the daily chart, the positive slope of the RSI alongside the MACD's decreasing red bars hint at a reduced selling momentum.
- A bullish SMA crossover at the 96.7 level looming with the 20 and 100-day SMAs, hinting at a potential market shift.
In Tuesday's session, the AUD/JPY pair traded mildly higher, hitting a daily high at 96.83 and then stabilizing at 96.40. The latest market movements has been influenced by the diverging monetary policies of the Reserve Bank of Australia (RBA) and Bank of Japan (BoJ) while the Australian’s bank hint of not ruling out further hikes may strengthen the pair. On the technical side, the daily chart suggest that the bulls are holding ground, while the hourly indicators turned flat.
The AUD/JPY pair trades in a complex environment influenced by the monetary policies of the Reserve Bank of Australia (RBA) and the Bank of Japan (BOJ). The RBA recently opted on Tuesday for a hawkish hold, not ruling out further interest rate increases in response to high inflation, while simultaneously reducing growth projections due to a weaker near-term outlook for consumer spending. Meanwhile, Japan reports soft earnings and household spending data, suggesting a continuation of lenient policy settings from the BOJ. A clear divergence in economic conditions and policy directions may fuel further upside for the cross and drive demand to the Aussie. Regarding expectations, the market expects a 50 bp rate cut from the RBA this year, while the BoJ is anticipated to remain on hold.
AUD/JPY levels to watch
On the daily chart, the indicators are displaying a mixed outlook. While the Relative Strength Index (RSI) exhibits an upward trend, it remains in a bearish realm, hinting at potential but not realized bullish activity. The Moving Average Convergence Divergence (MACD) further augments the cautious tone with diminishing red histograms. That said, the position of the cross relative to its Simple Moving Averages (SMAs) offers a ray of optimism. Despite the short-term neutral outlook, a larger view reveals that the pair is abiding above the key 20, 100, and 200-day SMAs. This suggests an overall bull dominancy, with potential room for them to recover lost ground. In addition, traders should eye a potential crossover between the 100 and 20-day SMAs which may fuel further upside.
Shifting focus to the hourly chart horizon, the stage seems more balanced between bulls and bears. Indicators appear to have flattened in a bearish territory, mirroring a stalemate between buyers and sellers. For the rest of the session and heading into Wednesday, the cross may continue to side-ways trade.
AUD/JPY daily chart
-638428455285096332.png)
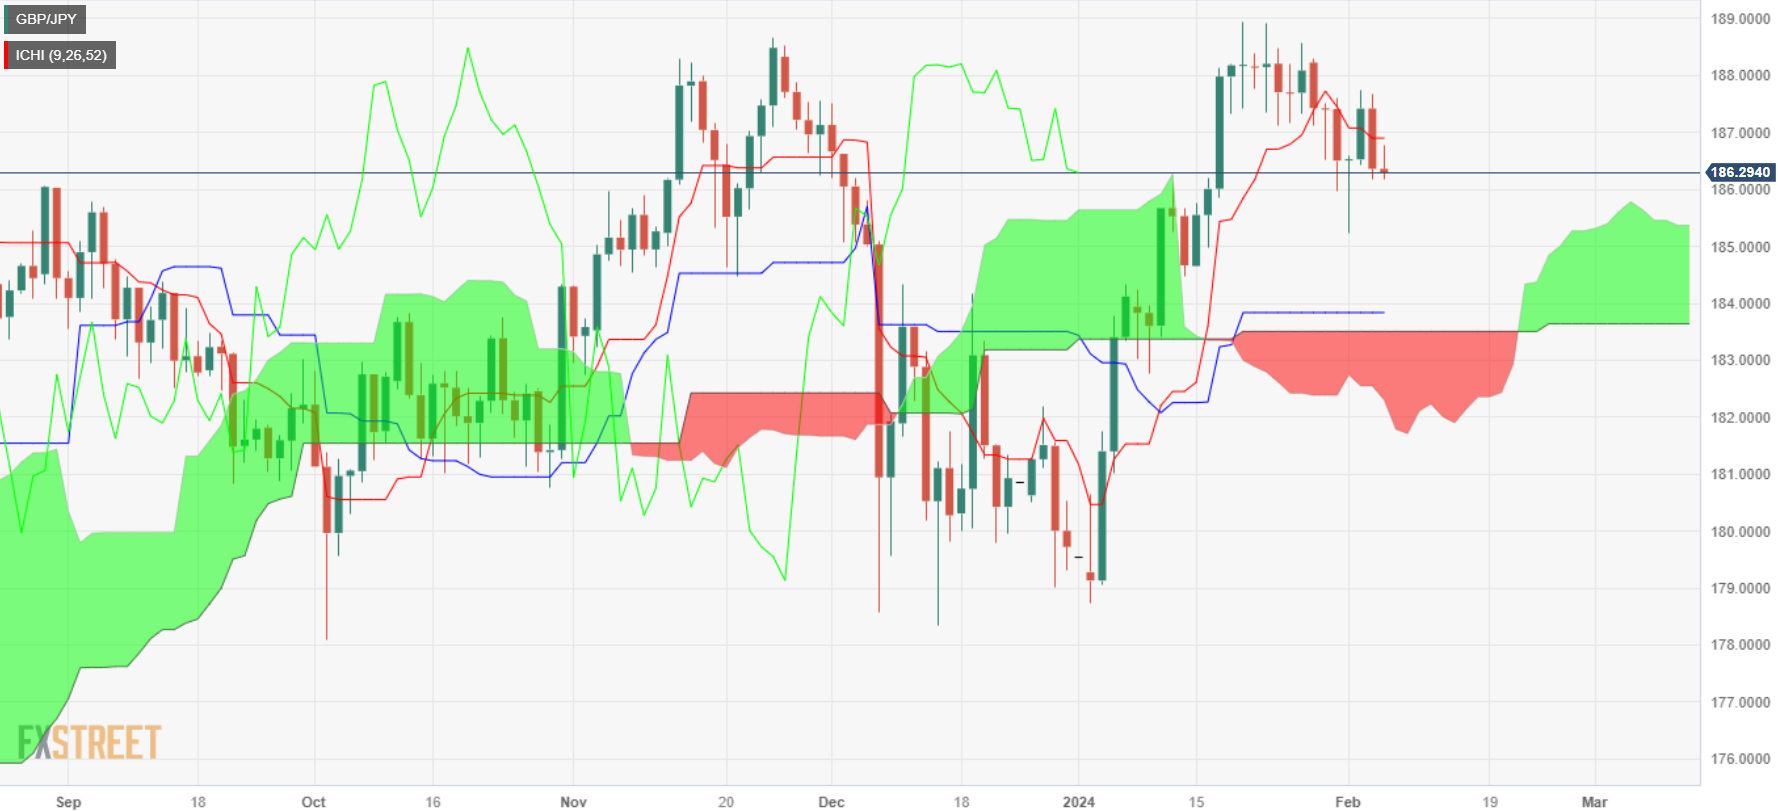
- GBP/JPY trades flat around 186.31, within today's 186.18/186.77 range.
- Facing resistance at Tenkan-Sen (186.89), with 187.00 as next upside target.
- Crossing above 187.73 from last Friday could aim for 188.00 resistance.
- Dropping below this week’s low of 186.14 eyes 186.00, then Senkou Span A (185.36) and early February's 185.22 low.
The GBP/JPY is virtually unchanged during the North American session, with the pair consolidating within a tight 186.18/186.77 range on Tuesday. At the time of writing, the pair exchanges hands at 186.31.
The cross-pair trades directionless, awaiting fresh market data, capped on the upside by the Tenkan-Sen at 186.89, ahead of the psychological 187.00 figure. If buyers reclaim last Friday's high of 187.73, that would pave the way to challenge 188.00.
Conversely, if sellers drag the exchange rate below the current week’s low of 186.14, the next demand zone would be the 186.00 mark. If selling pressure extends below that area, the next support would be the Senkou Span A at 185.36, ahead of the February 1 low of 185.22. once those levels are cleared, 185.00 is up next.
GBP/JPY Price Action – Daily Chart
GBP/JPY Technical Levels
- EUR/USD stuck near familiar lows as Euro bidders look for a foothold.
- European data came in mostly better than expected.
- Broader markets continue to chew on rate cut expectations.
EUR/USD cycled Tuesday’s opening bids in a tight pattern as investors await further indications of when central banks will begin making rate cuts with broader markets hinging their focus on interest rate activity.
European economic data came in better than expected, but still broadly exposing a weakened domestic European economy, and momentum remains limited with the US Dollar (USD) seeing a soft pullback heading into the midweek.
Daily digest market movers: EUR/USD pinned into low side as momentum drains from both sides
- EUR/USD sees little Tuesday momentum as both the US Dollar and the Euro (EUR) recede.
- The pair remains trapped below 1.0800 after last week’s late backslide.
- German Factory Orders unexpectedly climbed 8,.9% versus the forecast flat hold at 0.0%.
- Annualized European Retail Sales also beat expectations by falling less than expected.
- YoY Retail Sales declined 0.8% versus the forecast -0.9%.
- The previous period saw a sharp upside revision from -1.1% to -0.4%.
- Markets shrugged off a steeper-than-expected decline in MoM Retail Sales, which fell -1.1% in December compared to the forecast -1.0%, declining from the previous month’s 0.3% increase (revised upwards from -0.3%).
- Federal Reserve (Fed) policymaker and Minneapolis Fed President Neel Kashkari hit newswires stating that most of the US’ disinflation pressure is coming from a stabilized supply side.
- Fed Kashkari also noted that the yield curve isn’t a reliable indicator of recession since most disinflation isn’t coming from Fed policies.
- Fed’s Kashkari: remains hopeful that the US will avoid recession, doesn’t see recession as his “base case”.
Euro price today
The table below shows the percentage change of Euro (EUR) against listed major currencies today. Euro was the weakest against the Australian Dollar.
| USD | EUR | GBP | CAD | AUD | JPY | NZD | CHF | |
| USD | -0.12% | -0.52% | -0.49% | -0.66% | -0.51% | -0.44% | -0.12% | |
| EUR | 0.11% | -0.40% | -0.38% | -0.55% | -0.40% | -0.34% | -0.01% | |
| GBP | 0.50% | 0.40% | 0.02% | -0.14% | 0.00% | 0.07% | 0.39% | |
| CAD | 0.48% | 0.37% | -0.02% | -0.17% | -0.02% | 0.05% | 0.37% | |
| AUD | 0.66% | 0.54% | 0.14% | 0.16% | 0.14% | 0.22% | 0.54% | |
| JPY | 0.51% | 0.41% | 0.00% | 0.02% | -0.17% | 0.07% | 0.38% | |
| NZD | 0.45% | 0.33% | -0.07% | -0.05% | -0.20% | -0.09% | 0.33% | |
| CHF | 0.13% | 0.00% | -0.39% | -0.37% | -0.54% | -0.39% | -0.32% |
The heat map shows percentage changes of major currencies against each other. The base currency is picked from the left column, while the quote currency is picked from the top row. For example, if you pick the Euro from the left column and move along the horizontal line to the Japanese Yen, the percentage change displayed in the box will represent EUR (base)/JPY (quote).
Technical analysis: EUR/USD stuck near familiar bottoms in low-momentum trading
EUR/USD recently fell into fresh near-term lows after backsliding 1.6% from last week’s peak bids near 1.0897, and the pair remains trapped on the bottom end of the 200-hour Simple Moving Average (SMA) near 1.0820, and the EUR/USD remains pinned below the 1.0800 handle.
Tuesday’s flat cycle sees the EUR/USD adrift in bear country after the pair tumbled out of a recent congestion zone between the 50-day and 200-day SMAs near 1.0900 and 1.0850 respectively. The immediate technical floor is from December’s bottom bids near 1.0740.
EUR/USD hourly chart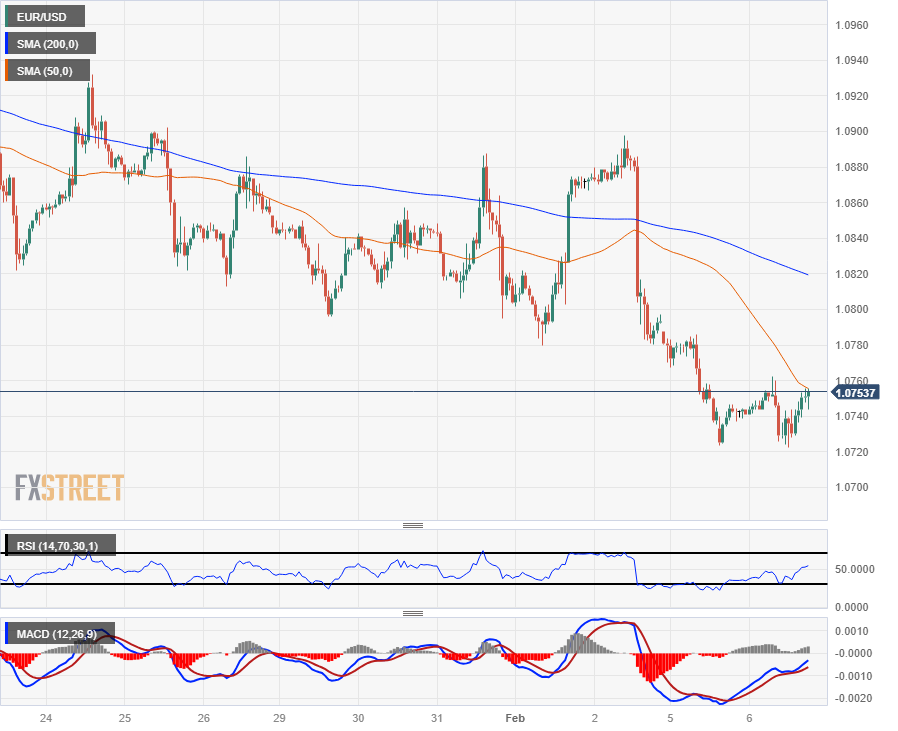
EUR/USD daily chart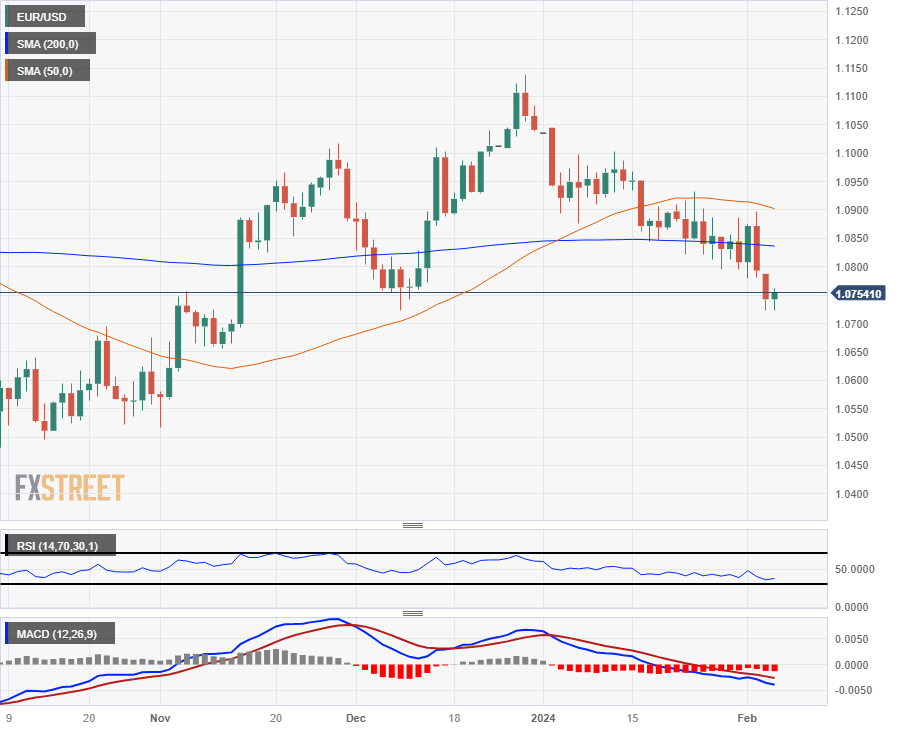
Euro FAQs
What is the Euro?
The Euro is the currency for the 20 European Union countries that belong to the Eurozone. It is the second most heavily traded currency in the world behind the US Dollar. In 2022, it accounted for 31% of all foreign exchange transactions, with an average daily turnover of over $2.2 trillion a day.
EUR/USD is the most heavily traded currency pair in the world, accounting for an estimated 30% off all transactions, followed by EUR/JPY (4%), EUR/GBP (3%) and EUR/AUD (2%).
What is the ECB and how does it impact the Euro?
The European Central Bank (ECB) in Frankfurt, Germany, is the reserve bank for the Eurozone. The ECB sets interest rates and manages monetary policy.
The ECB’s primary mandate is to maintain price stability, which means either controlling inflation or stimulating growth. Its primary tool is the raising or lowering of interest rates. Relatively high interest rates – or the expectation of higher rates – will usually benefit the Euro and vice versa.
The ECB Governing Council makes monetary policy decisions at meetings held eight times a year. Decisions are made by heads of the Eurozone national banks and six permanent members, including the President of the ECB, Christine Lagarde.
How does inflation data impact the value of the Euro?
Eurozone inflation data, measured by the Harmonized Index of Consumer Prices (HICP), is an important econometric for the Euro. If inflation rises more than expected, especially if above the ECB’s 2% target, it obliges the ECB to raise interest rates to bring it back under control.
Relatively high interest rates compared to its counterparts will usually benefit the Euro, as it makes the region more attractive as a place for global investors to park their money.
How does economic data influence the value of the Euro?
Data releases gauge the health of the economy and can impact on the Euro. Indicators such as GDP, Manufacturing and Services PMIs, employment, and consumer sentiment surveys can all influence the direction of the single currency.
A strong economy is good for the Euro. Not only does it attract more foreign investment but it may encourage the ECB to put up interest rates, which will directly strengthen the Euro. Otherwise, if economic data is weak, the Euro is likely to fall.
Economic data for the four largest economies in the euro area (Germany, France, Italy and Spain) are especially significant, as they account for 75% of the Eurozone’s economy.
How does the Trade Balance impact the Euro?
Another significant data release for the Euro is the Trade Balance. This indicator measures the difference between what a country earns from its exports and what it spends on imports over a given period.
If a country produces highly sought after exports then its currency will gain in value purely from the extra demand created from foreign buyers seeking to purchase these goods. Therefore, a positive net Trade Balance strengthens a currency and vice versa for a negative balance.
- Silver edges up 0.25% to $22.538, with eyes on upcoming US inflation data.
- Break above $22.73 could aim for $23.00, facing resistance at 100 and 200-DMAs.
- XAG/SD risk of a drop below $22.20, with $21.93 as critical next support.
Silver price prints modest gains in the mid-North American session, as US Treasury bond yields drop sharply, as traders await next week’s inflation report out of the United States. At the time of writing, XAG/USD exchanges hands at $22.538, up 0.25%.
The non-yielding metal stays reluctant to crack below the $22.20 area for the second straight day as buyers lift XAG/USD toward the $22.50 area. Nevertheless, failure to conquer that level could keep Silver prices range-bound within the $22.00-$22.50 area ahead of crucial data.
If buyers extend their gains past the February 5 high at $22.73, that will open the way to challenge $23.00. Further upside levels emerge with the 100-day moving average (DMA) at $23.12 and the confluence of the 200 and 50-DMA at $23.40.
On the other hand and the path of least resistance, if sellers emerge and push prices below $22.20, look for a challenge of the January 22 year-to-date (YTD) low of $21.93.
XAG/USD Price Action – Daily Chart
XAG/USD Technical Levels
- The DXY declined to 104.20 on Tuesday.
- The US service sector continues to show robustness, making markets disregard an interest rate cut in March.
- US Treasury yields continue to rise, boosting the Greenback.
The US Dollar (USD) Index, currently trading at 104.20, has been on a downward trend due to investors cashing in their profits alongside the impact of statements from Loretta Mester, the president of the Federal Reserve Bank of Cleveland. Mester warned about the risks of doing too much in terms of tight monetary policy and how it could affect the labor market.
The US Federal Reserve's hawkish hold, justified by a robust jobs report and continuous strong growth in Q1, made expectations for Federal Reserve (Fed) rate cuts begin to wane. This has favored the Greenback in the last few sessions. Several other Fed officials will be on the wires during the week, and they may dictate the pace of the USD as markets await fresh economic reports.
Daily digest market movers: US Dollar declines on the back of lower US Treasury yields
- Fed’s Loretta Mester commented that the bank should be attentive to risk that the labor market will cool faster than expected in reaction to restrictive monetary policy.
- She also added that the Fed will gain the confidence to cut this year.
- US Treasury yields are declining with 2-year, 5-year and 10-year bonds trading at of 4.40%, 4.04% and 4.09%, respectively.
- CME's FedWatch Tool hints at lesser odds for a rate cut in March, which currently stand at 15%. Those odds rise to 50% for the May meeting, but the probabilities of a hold are also high.
Technical analysis: DXY bulls give up the 20-day SMA while taking profits
The indicators on the daily chart are reflecting a short-term shift in momentum toward the sellers, yet the long-term trend still seemingly remains in favor of the bulls. Despite a negative slope, the Relative Strength Index (RSI) is holding onto positive territory, suggesting a pullback or period of consolidation instead of a major trend reversal.
The flat green bars in the Moving Average Convergence Divergence (MACD) indicate potential indecision in the market where the momentum could easily shift in favor of buyers with the right catalyst. However, this flat-lining action in the MACD may also signify exhaustion from buyers, hinting that bears might soon step in to take control.
Given the index position with relation to its Simple Moving Averages (SMAs), the bulls, although weakened recently due to profit-booking, seem to have a major say in the broader trend. The DXY is trading above the 100 and 200-day SMAs, suggesting an overall bullish bias in the longer-term market sentiment even though it slipped underneath the 20-day SMA.
US Dollar FAQs
What is the US Dollar?
The US Dollar (USD) is the official currency of the United States of America, and the ‘de facto’ currency of a significant number of other countries where it is found in circulation alongside local notes. It is the most heavily traded currency in the world, accounting for over 88% of all global foreign exchange turnover, or an average of $6.6 trillion in transactions per day, according to data from 2022.
Following the second world war, the USD took over from the British Pound as the world’s reserve currency. For most of its history, the US Dollar was backed by Gold, until the Bretton Woods Agreement in 1971 when the Gold Standard went away.
How do the decisions of the Federal Reserve impact the US Dollar?
The most important single factor impacting on the value of the US Dollar is monetary policy, which is shaped by the Federal Reserve (Fed). The Fed has two mandates: to achieve price stability (control inflation) and foster full employment. Its primary tool to achieve these two goals is by adjusting interest rates.
When prices are rising too quickly and inflation is above the Fed’s 2% target, the Fed will raise rates, which helps the USD value. When inflation falls below 2% or the Unemployment Rate is too high, the Fed may lower interest rates, which weighs on the Greenback.
What is Quantitative Easing and how does it influence the US Dollar?
In extreme situations, the Federal Reserve can also print more Dollars and enact quantitative easing (QE). QE is the process by which the Fed substantially increases the flow of credit in a stuck financial system.
It is a non-standard policy measure used when credit has dried up because banks will not lend to each other (out of the fear of counterparty default). It is a last resort when simply lowering interest rates is unlikely to achieve the necessary result. It was the Fed’s weapon of choice to combat the credit crunch that occurred during the Great Financial Crisis in 2008. It involves the Fed printing more Dollars and using them to buy US government bonds predominantly from financial institutions. QE usually leads to a weaker US Dollar.
What is Quantitative Tightening and how does it influence the US Dollar?
Quantitative tightening (QT) is the reverse process whereby the Federal Reserve stops buying bonds from financial institutions and does not reinvest the principal from the bonds it holds maturing in new purchases. It is usually positive for the US Dollar.
- European stocks broadly climbed on Tuesday, recovering from recent downside.
- German Factory Orders, pan-euro area YoY Retail Sales beat the street.
- Investors shrug off an accelerated decline in MoM Retail Sales.
European indexes rebounded on Tuesday, bolstered by market participants focusing on green prints in European economic figures and shrugging off a steeper near-term decline in European Retail Sales in December.
German Factory Orders climbed an unexpected 8.9% in December, well above the forecast flat hold at 0.0% after November saw a downside revision from 0.3%. Pan-euro area annualized Retail Sales also fell less than expected, contracting by -0.8% versus the forecast -0.9%. The previous period also saw a healthy upside revision from -1.1% to -0.4%.
Investors caught a rise in bids after better-than-expected earnings from energy sector stocks, and renewed discussions of support for equities from Chinese authorities helped to further bolster equities exposed to trade with China.
The pan-European STOXX600-major equity index climbed over 3 points, gaining 0.63% on Tuesday and ending at €486.76. London’s FTSE index gained 0.9% on the day, ending up 68 points at £7,681.00.
France’s CAC40 also climbed 49 points to edge up 0.65%, closing at €7,638.97 while Germany’s DAX index finished at a record €17,033.24 after climbing nearly 130 points to gain 0.76% on the day.
DAX technical outlook
The German DAX broke into a fresh all-time high on Tuesday, crossing the €17,000.00 major handle and etching in a new historical high close of €17,033.24.
The DAX has closed in the green for three straight months, and Monday’s acceleration into the topside cracked into record bids for the German index.
The DAX is now up over 4.3% from January’s swing low into €16,328.29 and over 16.5% from October’s bottom bids near €14,618.09.
DAX hourly chart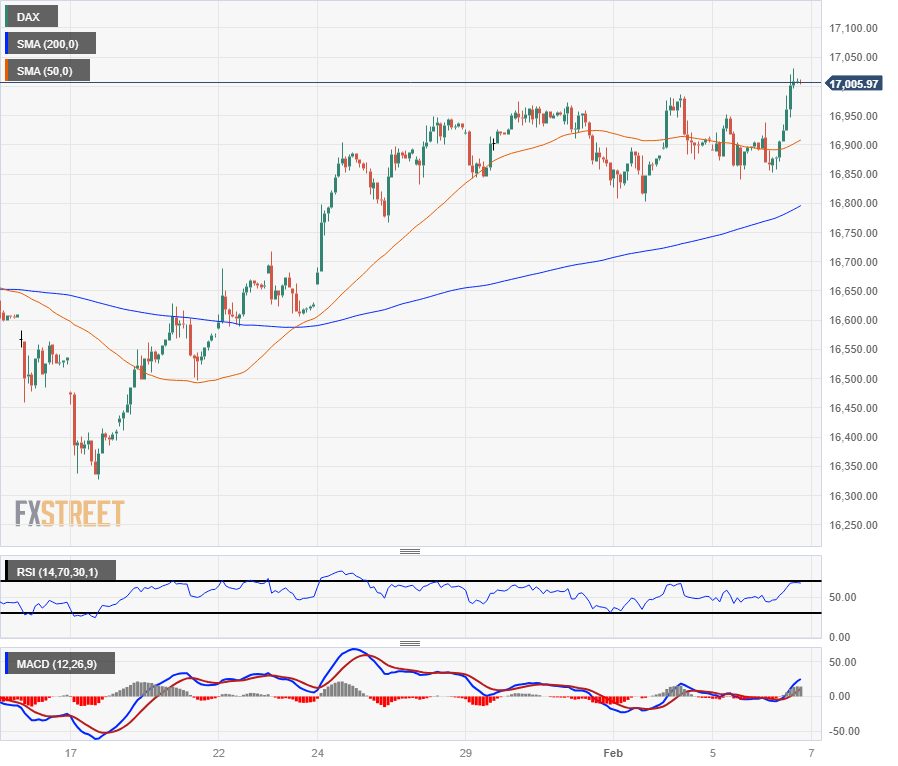
DAX daily chart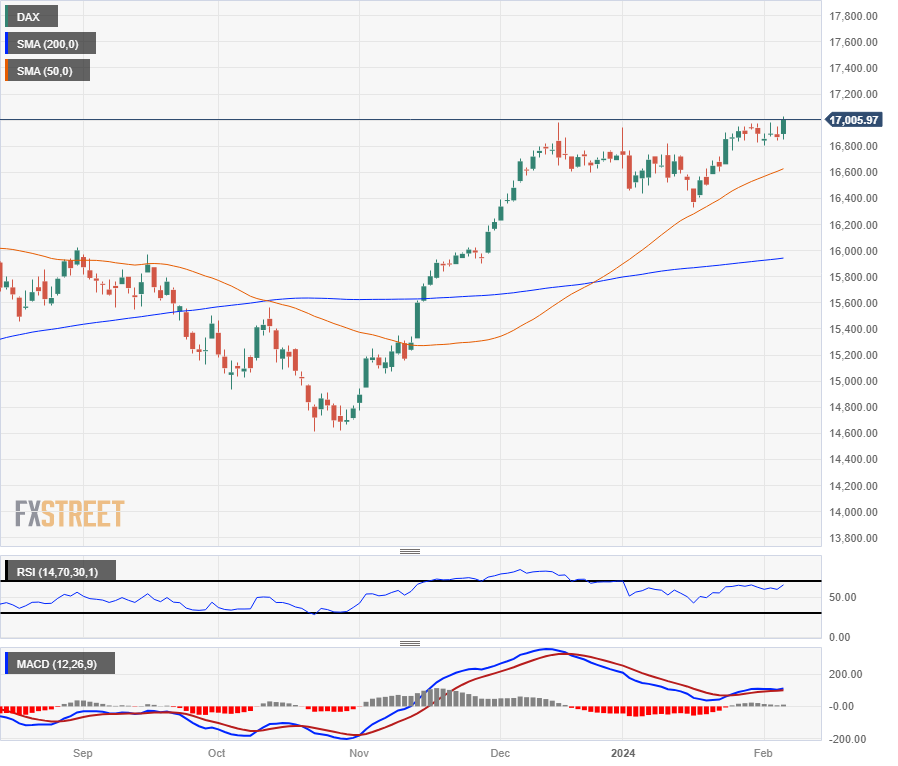
- GBP/USD surges amid risk-on sentiment, despite hawkish Fed.
- Powell's hawkish stance and strong US data boost Dollar, yet global easing hopes support Pound.
- Fed's Mester hints at potential rate changes with further inflation decline, underscoring policy debates.
- UK construction sector remains robust; BoE's Pill comments on monetary easing timing affect GBP.
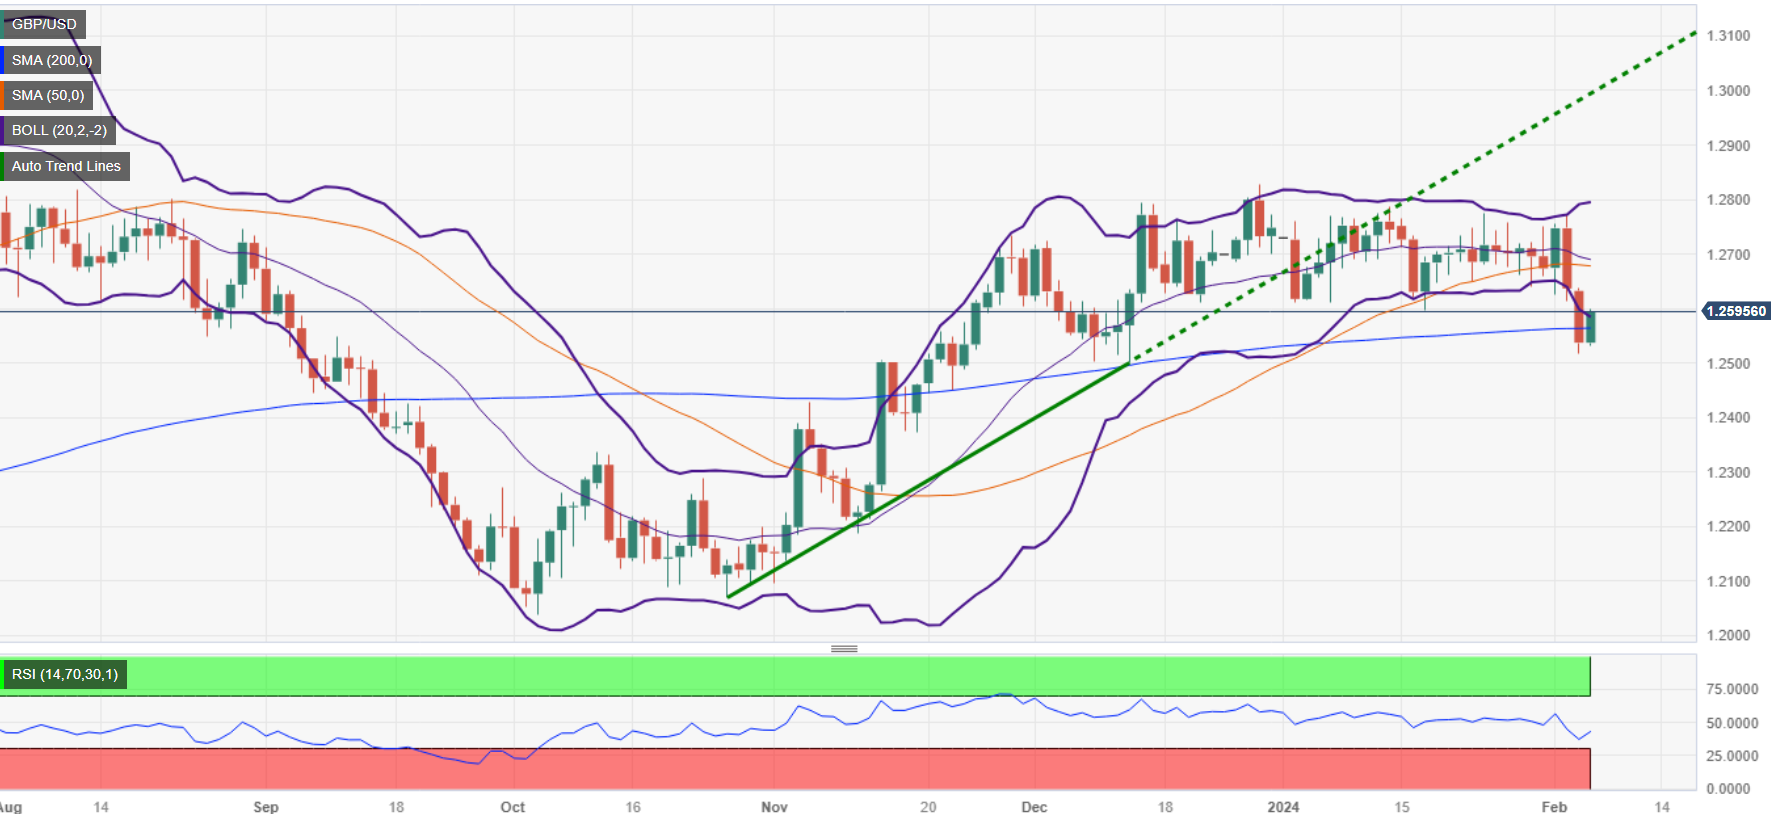
The GBP/USD recovered some ground against the US dollar on Tuesday during the mid-North American session amid a risk-on impulse and falling US Treasury bond yields. Investors seem confident that most global central banks will ease monetary policy, even though Fed Chair Jerome Powell pushed back against easing in March. At the time of writing, the pair exchanges hands at 1.2594.
Pound Sterling gains ground amid soft US Dollar
Despite staging a comeback, the Pound Sterling remains pressured after the US Federal Reserve Chair Jerome Powell's remarks suggest the Fed is in no rush to cut rates. That strong US ISM Manufacturing and Non-Manufacturing PMI posting solid data and an outstanding January Nonfarm Payrolls report sponsored a leg-up in the Greenback.
US Treasury bond yields climbed more than 20 basis points since last Friday and yesterday. Traders in the futures market estimate the Fed will ease policy 125 basis points throughout the year, less than the 168-bps estimated on January 12.
Recently, Cleveland’s Fed President Loretta Mester said she’s open to rate cuts if it´s clear that inflation is easing futher. She states that monetary policy is in good place. Mester added “If inflation appears to be stalling at a level above our goal, we would have the opportunity to maintain a restrictive stance for longer.”
Across the pond, S&P Global Construction PMI in January was solid, though it stood at recessionary territory despite exceeding estimates and December’s data.
In the meantime, the Bank of England (BoE) Chief Economist Huw Pill said “The debate has a bit shifted toward asking: 'when is the point when we will have seen enough accumulated evidence that ... we can begin to reduce the level of restriction in monetary policy in the economy and start to cut Bank Rate?”
GBP/USD Price Analysis: Technical outlook
The daily chart portrays the major trading sideways, though at the brisk of GBP/USD buyers reclaiming the 200-day moving average (DMA) at 1.2560. A daily close above the latter will expose 1.2600, followed by the 50-DMA at 1.2675. On the other hand, if sellers keep the exchange rate below 1.2600, that could pave the way to retest the 200-DMA and the 1.2527 daily low. Further downside is seen at 1.2469, the 100-DMA.
- Mexican Peso gains, driven by a soft US Dollar due to lower US Treasury yields and upbeat market mood.
- Market anticipates Consumer Confidence, auto data and Banxico's rate decision.
- Powell's rate cut remarks prompt cautious trading; speeches by Fed's Mester, Kashkari, Collins in focus.
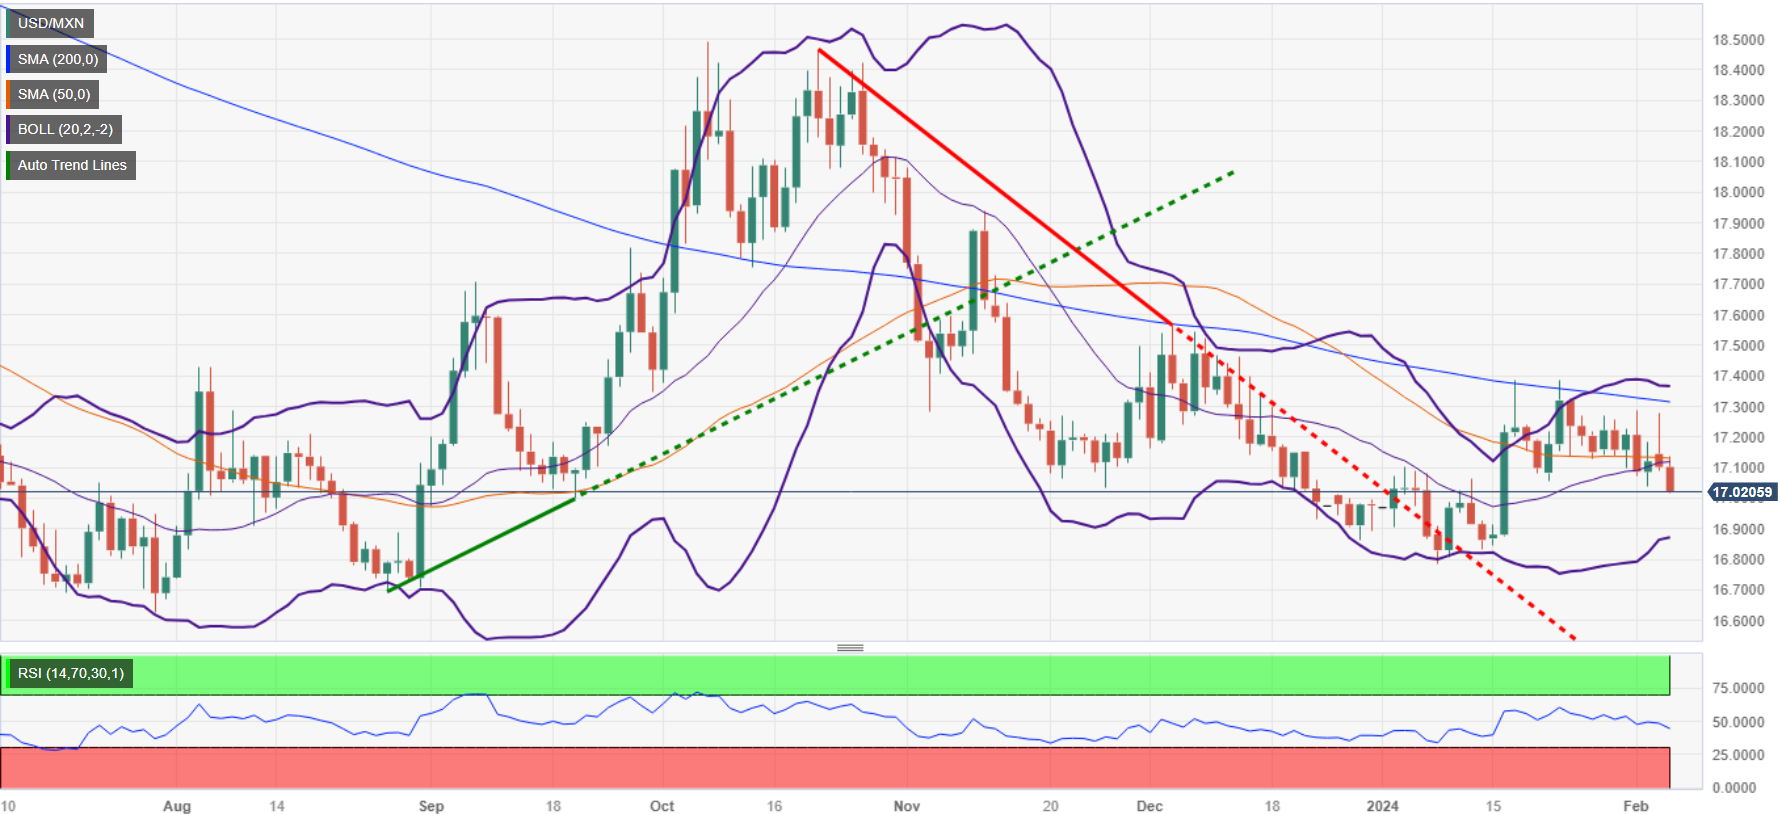
The Mexican Peso (MXN) advanced against the US Dollar (USD) in early trading during the North American session as US Treasury bond yields edged lower, a headwind for the Greenback. A risk-on impulse, as witnessed by Wall Street posting gains, is a tailwind for the Mexican currency. Traders await inflation figures and the Bank of Mexico (Banxico) monetary policy meeting on Thursday. The USD/MXN exchanges hands at 17.01, down 0.54%.
Mexico´s economic calendar will gather some steam on Wednesday with the release of Consumer Confidence data. Then automobile industry data arrives on Wednesday. By Thursday, Banxico will get an early update on inflation ahead of their decision. The central bank will hold rates unchanged, most analysts predict.
Meanwhile, Federal Reserve (Fed) Chair Jerome Powell said the US central bank is in no rush to cut rates, instead reassuring the majority of Fed officials to expect three rate cuts. Ahead in the day, traders will get cues from Loretta Mester, Neil Kashkari and Susan Collins.
Daily digest market movers: Mexican Peso gathers traction awaiting crucial inflation data
- Mexico´s economic docket on Wednesday:
- Consumer Confidence was 46.8 in December, worse than November’s reading.
- Auto Exports were virtually unchanged at 16% YoY.
- Auto Production decreased in December by -9.9%.
- Mexico´s Consumer Price Index (CPI) in January is expected to rise from 0.71% to 0.88% MoM, while annual figures are foreseen at 4.88%, up from 4.66%.
- The US economy remains resilient after the first batch of data was released in February. Stronger-than-expected PMIs and a hot Nonfarm Payrolls report paint an optimistic outlook for the economy.
- Neil Kashkari commented that a strong economy means the Fed is in no hurry to make interest rate cuts. Kashkari acknowledged that inflation is making “rapid progress” toward the Fed’s 2% target and added that policy could not be sufficiently restrictive.
- Chicago Fed President Austan Goolsbee noted that inflation could remain falling amid a strong US economy,
- S&P Global comments about Mexico:
- Confirmed Mexico´s BBB foreign currency rating and BBB+ local currency long-term debt rating.
- Affirmed that stable macroeconomic conditions, with real growth in Gross Domestic Product above 3% in 2023, is supported by solid domestic demand and moderating inflation.
Technical analysis: Mexican Peso surges threatening to conquer the crucial 17.00 mark
The USD/MXN shifted from neutral to downward biased once it fell below the 50-day Simple Moving Average (SMA) at 17.12, which opened the door for further losses. A breach of that level exposed strong support, as seen at 17.05. Further downside is seen at the psychological 17.00 figure, followed by the current year-to-date low of 16.78.
On the other hand, if buyers reclaim the 50-day SMA, that can pave the way to test the 200-day SMA at 17.31. Upside risks emerge once that barrier is cleared. The next real resistance comes at 17.40, the 100-day SMA.
USD/MXN Price Action – Daily Chart
Mexican Peso FAQs
What key factors drive the Mexican Peso?
The Mexican Peso (MXN) is the most traded currency among its Latin American peers. Its value is broadly determined by the performance of the Mexican economy, the country’s central bank’s policy, the amount of foreign investment in the country and even the levels of remittances sent by Mexicans who live abroad, particularly in the United States. Geopolitical trends can also move MXN: for example, the process of nearshoring – or the decision by some firms to relocate manufacturing capacity and supply chains closer to their home countries – is also seen as a catalyst for the Mexican currency as the country is considered a key manufacturing hub in the American continent. Another catalyst for MXN is Oil prices as Mexico is a key exporter of the commodity.
How do decisions of the Banxico impact the Mexican Peso?
The main objective of Mexico’s central bank, also known as Banxico, is to maintain inflation at low and stable levels (at or close to its target of 3%, the midpoint in a tolerance band of between 2% and 4%). To this end, the bank sets an appropriate level of interest rates. When inflation is too high, Banxico will attempt to tame it by raising interest rates, making it more expensive for households and businesses to borrow money, thus cooling demand and the overall economy. Higher interest rates are generally positive for the Mexican Peso (MXN) as they lead to higher yields, making the country a more attractive place for investors. On the contrary, lower interest rates tend to weaken MXN.
How does economic data influence the value of the Mexican Peso?
Macroeconomic data releases are key to assess the state of the economy and can have an impact on the Mexican Peso (MXN) valuation. A strong Mexican economy, based on high economic growth, low unemployment and high confidence is good for MXN. Not only does it attract more foreign investment but it may encourage the Bank of Mexico (Banxico) to increase interest rates, particularly if this strength comes together with elevated inflation. However, if economic data is weak, MXN is likely to depreciate.
How does broader risk sentiment impact the Mexican Peso?
As an emerging-market currency, the Mexican Peso (MXN) tends to strive during risk-on periods, or when investors perceive that broader market risks are low and thus are eager to engage with investments that carry a higher risk. Conversely, MXN tends to weaken at times of market turbulence or economic uncertainty as investors tend to sell higher-risk assets and flee to the more-stable safe havens.
- Canadian Dollar halts the slide but fails to recover ground.
- Canada’s PMI, Building Permits muddy the waters.
- BoC Governor Macklem due to speak in Montreal.
The Canadian Dollar (CAD) managed to pump the brakes on a two-day backslide on Tuesday, but a recovery seems limited as Canadian economic figures look mixed. Loonie bidders await Bank of Canada (BoC) Governor Tiff Macklem’s input. Governor Macklem will be giving a speech regarding the effectiveness and limitations of monetary policy at the Montreal Council on Foreign Relations at 18:00 GMT, but the speech text will be released at 17:45 GMT. BoC Macklem is expected to answer audience questions after the speech.
Canada saw a steep decline in the MoM Building Permits in December as well as downside revisions to the previous months’ releases, though the revision-heavy indicator is prone to having a muted impact. The seasonally-adjusted Ivey Purchasing Managers Index (PMI) for January ticked slightly higher, helping to offset any bearish trickles from Building Permits. Flat Crude Oil markets are also keeping the Canadian Dollar afloat but price action lacks momentum.
Daily digest market movers: Canadian Dollar takes a breather
- BoC Governor Macklem’s speech notes will be released at 17:45 GMT, Macklem expected to answer questions after 18:00 GMT statement.
- Canadian Building Permits declined 14% in December, far below the 1.2% expected uptick and the worst showing for Canadian Building Permits since last April.
- November’s Building Permits also saw a downside revision to -5% from -3.9%.
- Canada’s unadjusted Ivey PMI for January ticked upward to 54.4 from 43.7.
- The seasonally-adjusted Ivey PMI grew for a fourth straight month but was noticeably thinner at 56.5 versus the previous 56.3.
- Markets were expecting January’s adjusted Ivey PMI to decline to 55.0.
- Coming up this week, the Bank of Canada’s latest Summary of Deliberations will be released on Wednesday with wages and labor figures due on Friday.
Canadian Dollar price today
The table below shows the percentage change of Canadian Dollar (CAD) against listed major currencies today. Canadian Dollar was the weakest against the Australian Dollar.
| USD | EUR | GBP | CAD | AUD | JPY | NZD | CHF | |
| USD | -0.07% | -0.44% | -0.26% | -0.52% | -0.38% | -0.28% | -0.01% | |
| EUR | 0.07% | -0.36% | -0.21% | -0.45% | -0.33% | -0.22% | 0.06% | |
| GBP | 0.41% | 0.36% | 0.16% | -0.10% | 0.03% | 0.14% | 0.40% | |
| CAD | 0.25% | 0.20% | -0.16% | -0.25% | -0.12% | -0.02% | 0.26% | |
| AUD | 0.53% | 0.46% | 0.10% | 0.27% | 0.15% | 0.26% | 0.53% | |
| JPY | 0.38% | 0.32% | -0.05% | 0.14% | -0.17% | 0.11% | 0.37% | |
| NZD | 0.28% | 0.21% | -0.15% | 0.02% | -0.24% | -0.11% | 0.27% | |
| CHF | 0.01% | -0.07% | -0.42% | -0.27% | -0.52% | -0.38% | -0.28% |
The heat map shows percentage changes of major currencies against each other. The base currency is picked from the left column, while the quote currency is picked from the top row. For example, if you pick the Euro from the left column and move along the horizontal line to the Japanese Yen, the percentage change displayed in the box will represent EUR (base)/JPY (quote).
Technical analysis: Canadian Dollar finds flat ground as USD/CAD churns near 1.3500
The Canadian Dollar (CAD) is broadly mixed on Tuesday but looks upward. The CAD is down a quarter of a percent against the Australian Dollar (AUD) and a tenth of a percent against the Japanese Yen. The CAD is also up around a quarter of a percent against the US Dollar (USD) and the Euro (EUR).
USD/CAD drifted into a near-term ceiling at 1.3540 as the pair cycles near the 1.3500 handle. The pair climbed 1.33% bottom-to-top after the US Dollar rebounded against the Canadian Dollar late last week, and the CAD is looking for a foothold to make a recovery and drag the USD/CAD back below the 1.3500 level. This would be back toward the 200-hour Simple Moving Average (SMA) at 1.3450.
USD/CAD is struggling to maintain bullish momentum after breaking into the topside of the 200-day SMA on Monday, and the pair is at risk of getting dragged back into congestion between 1.3476 and 1.3426 as the 200-day and 50-day SMAs consolidate.
USD/CAD hourly chart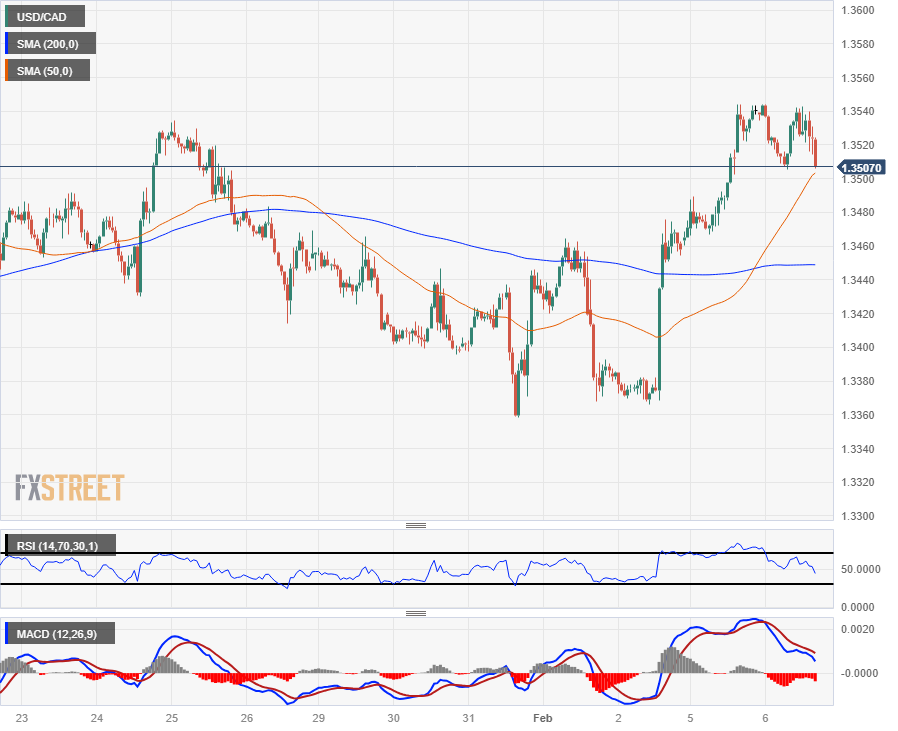
USD/CAD daily chart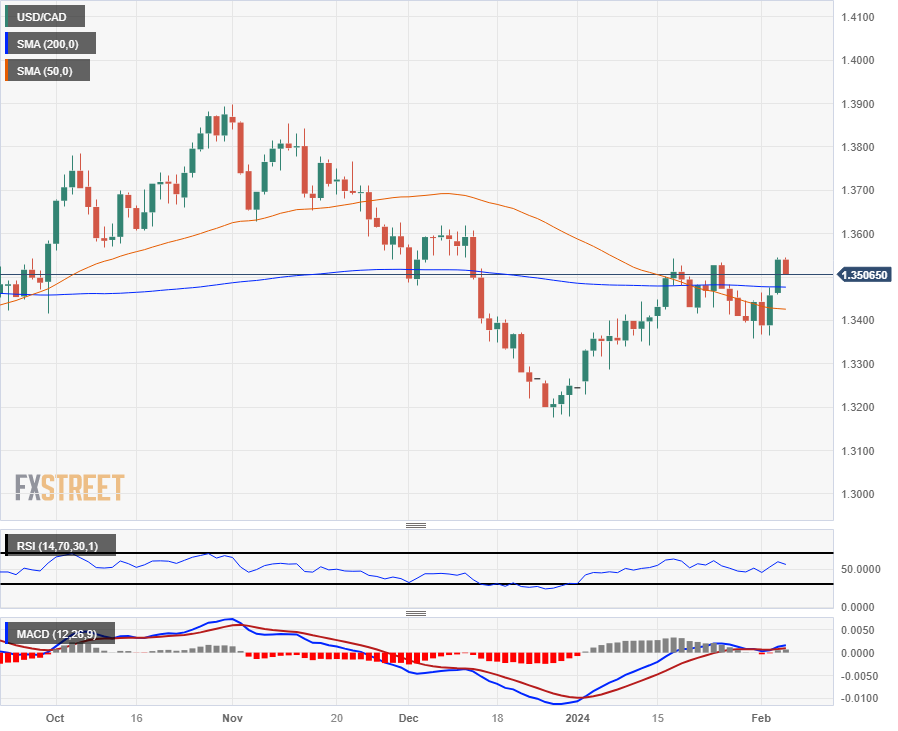
Canadian Dollar FAQs
What key factors drive the Canadian Dollar?
The key factors driving the Canadian Dollar (CAD) are the level of interest rates set by the Bank of Canada (BoC), the price of Oil, Canada’s largest export, the health of its economy, inflation and the Trade Balance, which is the difference between the value of Canada’s exports versus its imports. Other factors include market sentiment – whether investors are taking on more risky assets (risk-on) or seeking safe-havens (risk-off) – with risk-on being CAD-positive. As its largest trading partner, the health of the US economy is also a key factor influencing the Canadian Dollar.
How do the decisions of the Bank of Canada impact the Canadian Dollar?
The Bank of Canada (BoC) has a significant influence on the Canadian Dollar by setting the level of interest rates that banks can lend to one another. This influences the level of interest rates for everyone. The main goal of the BoC is to maintain inflation at 1-3% by adjusting interest rates up or down. Relatively higher interest rates tend to be positive for the CAD. The Bank of Canada can also use quantitative easing and tightening to influence credit conditions, with the former CAD-negative and the latter CAD-positive.
How does the price of Oil impact the Canadian Dollar?
The price of Oil is a key factor impacting the value of the Canadian Dollar. Petroleum is Canada’s biggest export, so Oil price tends to have an immediate impact on the CAD value. Generally, if Oil price rises CAD also goes up, as aggregate demand for the currency increases. The opposite is the case if the price of Oil falls. Higher Oil prices also tend to result in a greater likelihood of a positive Trade Balance, which is also supportive of the CAD.
How does inflation data impact the value of the Canadian Dollar?
While inflation had always traditionally been thought of as a negative factor for a currency since it lowers the value of money, the opposite has actually been the case in modern times with the relaxation of cross-border capital controls. Higher inflation tends to lead central banks to put up interest rates which attracts more capital inflows from global investors seeking a lucrative place to keep their money. This increases demand for the local currency, which in Canada’s case is the Canadian Dollar.
How does economic data influence the value of the Canadian Dollar?
Macroeconomic data releases gauge the health of the economy and can have an impact on the Canadian Dollar. Indicators such as GDP, Manufacturing and Services PMIs, employment, and consumer sentiment surveys can all influence the direction of the CAD. A strong economy is good for the Canadian Dollar. Not only does it attract more foreign investment but it may encourage the Bank of Canada to put up interest rates, leading to a stronger currency. If economic data is weak, however, the CAD is likely to fall.
- The EUR/GBP trades lower at 0.8540,with a 0.30% drop.
- Declining RSI on the daily chart stands indicative of mounting selling pressure.
- On a shorter four-hour chart span, flat indicators in negative territory after a sharp plunge during the European session.
In Tuesday's session, the EUR/GBP pair was seen taking a dip to 0.8540, falling below the 20-day Simple Moving Average (SMA). The mix of hawkish US Federal Reserve bets, rising US Treasury yields and negative Eurozone Retail Sales figures from December, drove down the cross. Technically speaking, bears still dominate the daily chart while indicators flattened in negative territory on the four-hour chart.
EUR/GBP levels to watch
Evaluating the daily chart, the lingering presence of selling pressure is evident. This is mirrored through the Relative Strength Index (RSI), which is traced in a downward trajectory in negative territory which signals the persistent dominance of sellers. The Moving Average Convergence Divergence (MACD) exhibits stability with flat green bars, pointing towards a restrained bullish traction. Moreover, the pair’s position under the 20, 100, and 200-day Simple Moving Averages (SMAs) underlines the prevailing bearish trend on a broader scale. The fact that the bulls failed to consolidate above the 20-day SMA also speaks of a bearish bias.
Shifting to the short-term technical outlook on the four-hour chart, it further underpins the bearish sentiment. The indicators are rather stale in the negative region, which were previously on a sharp descent during the European session. This combination of signals suggest that the cross may consolidate losses during the rest of the session but that the overall trend is still tilted to the downside.
EUR/GBP daily chart
-638428331524956816.png)
The Mexican Peso (MXN) carved out a small gain versus the US Dollar (USD) on spot basis last week. Economists at Société Général analyze the USD/MXN technical outlook.
16.75 is crucial support
USD/MXN recently formed an intermittent low at 16.75 and has embarked on a rebound. It is attempting a cross above the 200-DMA.
Trend line drawn since 2021 at 17.85/17.95 is a crucial resistance near term. Only if this is overcome would the pair confirm a meaningful up move.
Failure to defend 16.75 can extend the decline towards last year low of 16.60/16.40 and perhaps even towards 16.10.
On Monday, the US Dollar (USD) gained quite a bit. When will the USD run out of steam? Economists at Commerzbank analyze Greenback’s outlook.
Dollar will remain supported as long as the Fed continues to sound hawkish
The Euro simply has little to offer against the strength of the USD at the moment. In addition to the growth gap, there is now also a gap in the statements being made by officials. While the Fed seems to remain extremely cautious and wants to wait for more positive data, ECB officials are increasingly moving in the direction of rate cuts in the near future.
The question is when will the Dollar run out of steam? It probably won't be too long before a bottom is formed.
One thing is also clear: the monthly rates of change in inflation have been at levels consistent with the 2% target for several months now. So it should not take too many more months of good data before the Fed starts to cut rates, no matter how cautious officials sound at the moment. This does not mean that we will see significantly higher EUR/USD levels in the near future. As long as the data from the real economy continues to be so positive and the Fed continues to sound hawkish, the Dollar will remain supported. However, barring a completely unexpected surprise, the downside is slowly but surely limited.
- USD/JPY slightly down close to week's high, following Powell's hawkish comments.
- Powell's caution on early rate cuts contrasts with strong US job growth in January.
- Rising US Treasury yields and solid ISM PMIs highlight a robust US economic outlook, supporting the Dollar.
- Despite BoJ's negative rate policy hints, Japan's data suggests ongoing loose monetary stance.
Though virtually unchanged, the USD/JPY trades near the week's highs early during the North American session. The major exchanges hands at 148.55, down 0.08% after hitting a daily high of 148.79.
US Dollar remains solid as Powell pushes against aggressive rate cut bets
Traders are still digesting the subtle hawkish tilt of the US Federal Reserve Chair Jerome Powell. Although it has opened the door to begin easing policy, he said that most officials project three interest rate cuts through 2024. He backpedaled, saying the “danger of moving too soon is that the job’s not quite done.”
Powell’s interview was done on Thursday, ahead of the robust US Nonfarm Payrolls report for January, which witnessed an addition of more than 350K Americans to the workforce. Hence, US Treasury bond yields skyrocketed, pulling the USD/JPY pair from around daily lows of 146.25 toward 148.50s, gaining more than 1.30% or 190 pips.
That, along with robust ISM Manufacturing and Non-Manufacturing PMIs, paints an upbeat economic outlook for the US, augmenting demand for the Greenback.
On the Japanese front, even though the Bank of Japan (BoJ) has signaled that it would end its negative interest rate cycle, data supports the current ultra-loose monetary policy stance. Nevertheless, geopolitical tensions and sudden shifts in market mood could spark demand for the JPY.
Ahead in the day, the US economic docket will feature Fed speakers led by Loretta Mester, Neil Kashkari, and Susan Collins.
USD/JPY Price Analysis: Technical outlook
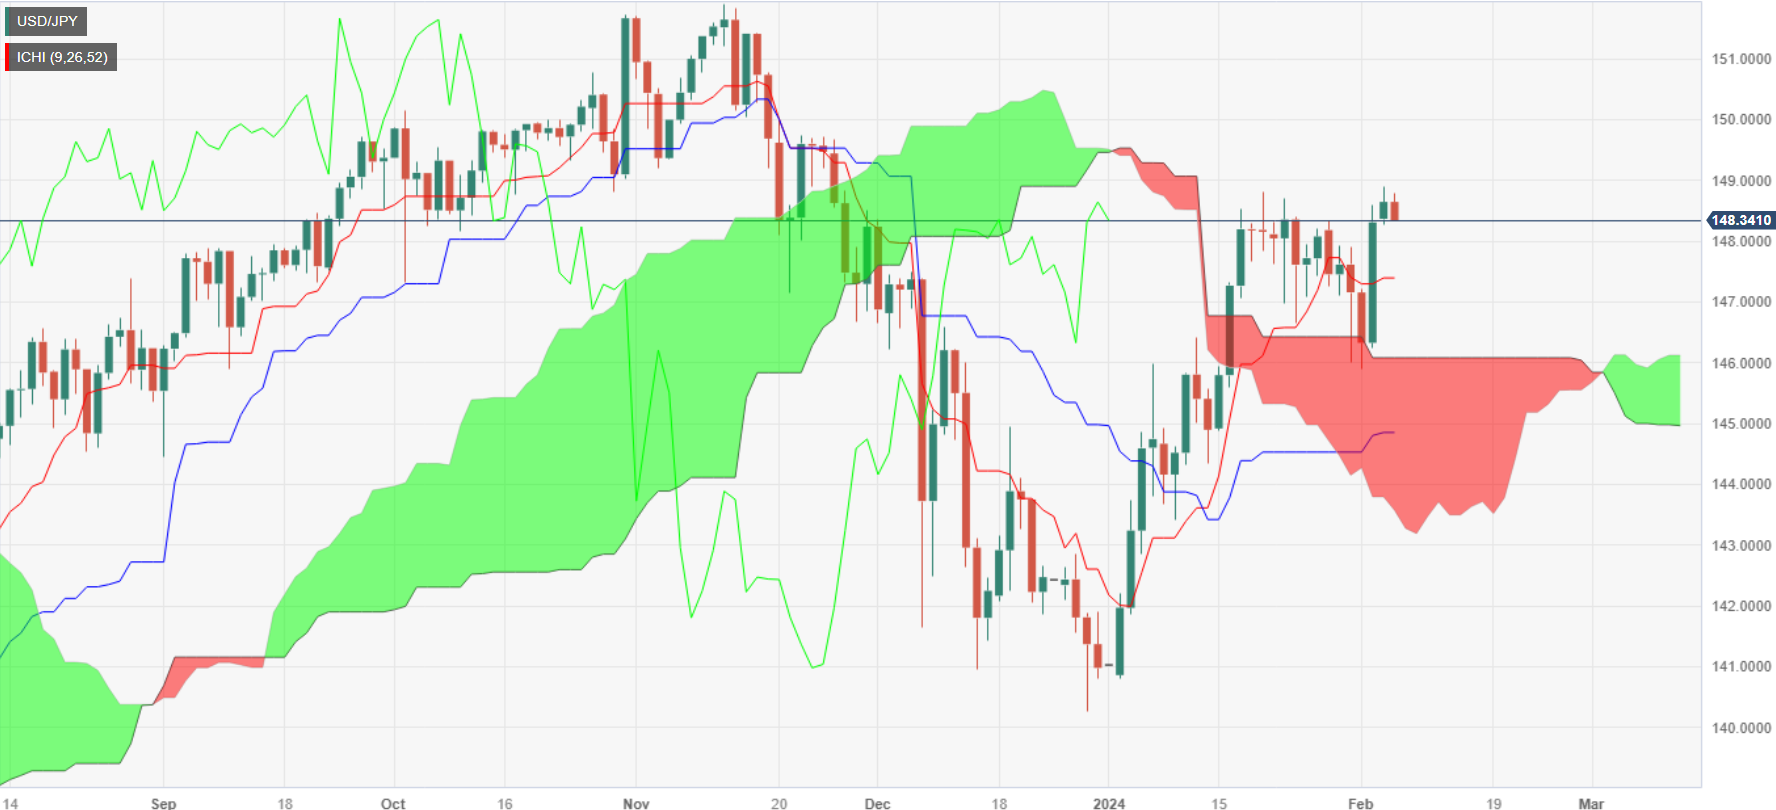
The USD/JPY daily chart portrays the pair as upward biased, though buyers must reclaim 149.00 if they would like to remain hopeful of challenging 150.00. Conversely, if sellers drag the exchange rate towards the Tenkan-Sen at 147.39, that could open the door to challenge the Senkou Span A at 146.12. Once cleared, the next stop would be the February 1 low of 145.89.
The firm US Dollar (USD) is consolidating its recent gains. Economists at Scotiabank analyze Greenback’s outlook.
Macro drivers are positive for the USD
The USD looks poised to remain firm in the near term but additional gains will need the support of higher US yields (10Y yields above the January highs around 4.20%, for example).
Macro drivers are positive for the USD. Economic Surprise data show US economic reports are running quite strongly ahead of expectations since the middle of January – more strongly than the Eurozone or Canada, for example. Stronger data support the high (but perhaps not higher) for longer outlook for US rates, at least.
The USD may hold close to current levels ahead of the US CPI data next week which will provide a little more direction for US yields in the short run.
GBP/USD trades higher but remains on track to test the December lows. Economists at Société Générale analyze the pair’s outlook.
Next potential support is at December low of 1.2500/1.2450
GBP/USD up move stalled after hitting 1.2820 in December and it evolved within a sideways consolidation. It has breached the lower limit of this range denoting risk of pullback.
Next potential support is at December low of 1.2500/1.2450. If the pair fails to defend it, a deeper down move can’t be ruled out towards October peak of 1.2330 and 1.2225.
Reclaiming recent pivot high of 1.2775 would be essential for confirming next leg of uptrend.
- USD/CAD eyes more upside above 1.3550 on dismal market sentiment.
- Fed policymakers have been pushing back early rate-cut expectations.
- The Canadian Dollar will dance to the tunes of the employment data.
The USD/CAD pair hovers near a weekly high around 1.3540 in the early New York session on Tuesday. The Loonie asset aims to extend the upside, being supported by a risk-off market mood. The US Dollar Index (DXY) recovered to a near an 11-week high of 104.50 amid hopes that the Federal Reserve (Fed) will not rush to reduce the benchmark interest rates.
The economic indicators released in January indicate that the United States economy is delivering a strong performance. After robust labor growth and a significant recovery in the Manufacturing PMI, the Services PMI also outperformed expectations by a significant margin. The Services PMI representing the non-manufacturing sector, which accounts for two-thirds of the US economy, rose robustly to 53.4 against expectations of 52.0 and the prior reading of 50.5.
A strong performance by the US economy is allowing Fed policymakers to advocate for keeping interest rates in a restricted trajectory. Fed policymakers have cautioned that premature rate cuts could uplift overall aggregate demand, eventually prompting price pressures.
Minneapolis Federal Reserve Bank President Neel Kashkari said on Monday that the central bank could take some time to decide on rate cuts due to lower risks to economic growth.
This week, the Canadian Dollar will be guided by the employment data for January, which will be published on Friday. According to the expectations, Canadian employers recruited 15K workers against weak hiring of 0.1K in December. The Unemployment Rate is seen increasing to 5.9% against the prior reading of 5.8%. Downbeat labor market conditions would uplift hopes of early rate-cuts by the Bank of Canada (BoC).
Gold under pressure after US labor market data. Economists at Commerzbank analyze the yellow metal’s outlook.
Even a rate cut at the May meeting is no longer considered to be a foregone conclusion
The Gold price came under pressure on Friday following the publication of unexpectedly strong US labor market data. The data may not only have dashed hopes of an interest rate cut by the US Federal Reserve in March. Even a rate cut at the May meeting is no longer considered to be a foregone conclusion. As a result, the extent of interest rate cuts later in the year will also come under scrutiny.
Before the data was published on Friday, the market was expecting a Fed funds rate of around 4% at the end of the year based on Fed fund futures. The Fed rate expected for the end of 2024 is now around 30 basis points higher. In other words, at least one interest rate cut has been priced out. The US Dollar has appreciated accordingly and US bond yields have risen sharply. Both mean short-term headwinds for the Gold price.
- EUR/USD seesaws as German Factory Orders jump 8.9%, contrasting with a 1.1% drop in EU Retail Sales.
- Fed's Powell and Kashkari's hawkish comments adjust expectations for US monetary policy, weighing on Euro.
- Interest rate futures show scaled-back Fed rate cut forecasts, with 113 basis points expected.
- Traders eye EU Industrial Production data and Fed speeches.
The Euro losses ground against the US Dollar early during the North American session, following the release of mixed economic data from the Eurozone (EU) and over the weekend hawkish tilt by the Federal Reserve Chair Jerome Powell. At the time of writing, the EUR/USD exchanges hands at 1.0729, down 0.12%.
EUR/USD meanders near weekly lows as traders trim Fed rate cut estimates, which boosted the USD
Data from the EU before the New York open was mixed as Factory Orders in Germany crushed estimates of 0% and rose by 8.9% MoM due to a jump in aircraft orders. Meanwhile, a European Central Bank (ECB) survey showed that households amongst the block trimmed their inflation expectations for the next 12 months, as the media expect prices to rise by 3.2%, down from 3.5% a month ago.
Although that is positive news, the EUR/USD upside was capped by a worse-than-expected EU’s Retail Sales report, slumping -1.1% in December, below estimates of -1% and November’s 0.3% expansion.
Traders are still digesting a subtle “hawkish” tilt by the US Federal Reserve Chairman Jerome Powell on Sunday after he said, “danger of moving too soon is that the job’s not quite done.” US Treasury bond yield skyrocketed on Monday, while bets for an aggressive easing cycle of the US central bank had subsided.
In the meantime, further Fed officials made some hawkish comments. Minnesota’s Fed President Neil Kashkari stated that monetary policy “may not be as tight as we would have assumed.” Meanwhile, Chicago Fed President Austan Goolsbee said he doesn’t disregard a March rate cut, stressing that good inflation data could pave the way to ease policy.
Interest rate futures linked to the Federal Funds rate (FFR) sees traders expect only 113 basis points (bps) of cuts, lower than the 168 bps expected on January 12. Even though Powell suggested they would ease policy, it would not be close to market expectations.
As of now, US Treasury yields are virtually unchanged while the Greenback, as measured by the US Dollar Index (DXY), clings to minimal gains of 0.05%.
Ahead in the week, the EU’s docket will feature Industrial Production figures on Wednesday. Fed speakers will cross the wires on the US front, led by Loretta Mester, Neil Kashkari, and Susan Collins.
EUR/USD Price Analysis: Technical outlook
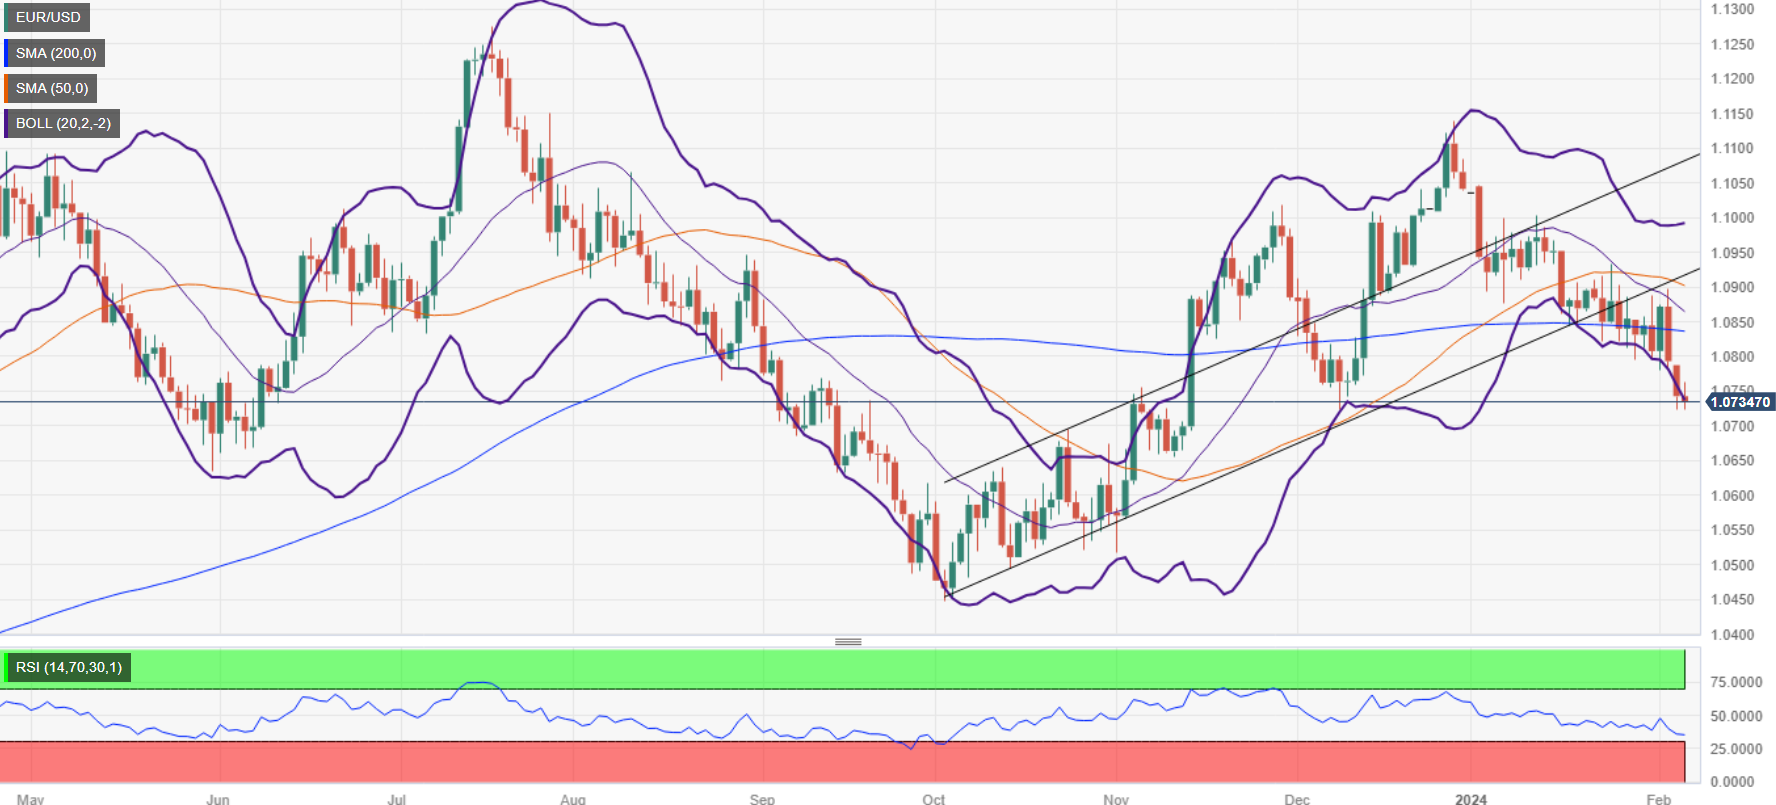
The EUR/USD dived and tested the current year-to-date (YTD) low of 1.0723 twice after breaching a key support trendline drawn from October 2023 lows that passed circa 1.0740/60 range. Another daily close below that level could pave the way to challenging the 1.0700 figure. A further downside is seen at 1.0656 on November 10, followed by the November 1 swing low of 1.0516.
On the bullish side, if buyers regain 1.0760, that could pave the way to reclaiming the 100-day moving average (DMA) at 1.0783. Up next would be 1.0800.
EUR/USD traded in a tight range, consolidating recent losses through the low 1.0700s. Economists at Scotiabank analyze the pair’s outlook.
Minor gains attract selling
EUR losses have stalled in the low 1.0700 area; markets appear willing to jump on minor EUR gains to add to short positions at the moment but spot losses have remained contained to the 1.0725 area again.
Retracement support (61.8% of the EUR’s Q4 rally) sits just below the market at 1.0712.
Trend dynamics are bearish on the short-term studies which suggests the EUR remains at risk of a drop through 1.0700 and further losses toward 1.0600.
Minor relief may come if spot can regain 1.0770.
- AUD/USD tussles between risk-off mood and RBA’s hawkish guidance.
- The RBA kept doors open for further policy tightening to ensure a return of inflation towards the 2% target.
- Fed Mester could stick to pushing back rate-cut hopes.
The AUD/USD pair faces pressure in holding an auction above the crucial support of 0.6500 in the late European session on Tuesday. The Aussie asset struggles despite the Reserve Bank of Australia (RBA) delivering hawkish guidance on interest rates.
The RBA kept its Official Cash Rate (OCR) unchanged at 4.35%, leaving doors open for further policy tightening. In the monetary policy statement, RBA Governor Michele Bullock said rate cuts will be discussed only after the board gets convinced that inflation will return to the desired range.
It was surprising to see the RBA delivering a hawkish outlook on key rates despite easing price pressures. In the last quarter of 2023, the RBA Trimmed mean CPI, a closed-watched measure for core inflation, grew at a slower pace of 0.8 % against expectations of 0.9% and from a 1.2% increase in the July-September quarter on a month-on-month basis. Annually, the underlying inflation softened to 4.2% from the former reading of 5.2%.
Meanwhile, the market mood remains broadly downbeat as investors see the Federal Reserve (Fed) not rushing for aggressive rate cuts. The US Dollar Index (DXY) hovers near an 11-week high of around 104.50 and is expected to extend upside further.
Going forward, investors will focus on the speech from Cleveland Federal Reserve Bank President Loretta Mester for fresh guidance on interest rates. Loretta Mester is expected to push back expectations of early rate cuts to avoid the consequences of persistent price pressures.
USD/CAD is trading close to Monday’s high and near key technical resistance around the mid-1.3500s. Economists at Scotiabank analyze the pair’s outlook.
Pressure on the mid-1.3500s will persist for now
Spot gains stalled around the January highs and Fibonacci retracement resistance at 1.3540 on Monday and the USD’s advance has remained close to, but below, that point today.
Resistance is being bolstered by the 100-DMA (1.3553) on the daily chart.
The USD’s firm underlying trend suggests pressure on the mid-1.3500s will persist for now, with a push above 1.3550 likely to drive additional USD gains to 1.3625 (61.8% retracement of the USD’s Q4 drop).
Key support is 1.3500/1.3505 in the very short run. USD losses back through here should see the USD trade back to 1.3455/1.3465.
European Central Bank (ECB) Governing Council member Boris Vujcic said on Tuesday that the ECB shouldn't rush lowering key rates, as reported by Reuters.
Approaching the rate reduction in the right way will be important for the ECB's credibility, Vujcic argued and added that there still is a lot of resilience in services inflation and wages. He also said that the equilibrium level of ECB rates will likely be higher than it looked some years ago.
Market reaction
EUR/USD showed no immediate reaction to these comments and the pair was last seen trading virtually unchanged on the day at around 1.0740.
GBP/USD tracks marginally higher but loss of 1.2600s support point lower for Cable, economists at Scotiabank say.
Former support at 1.2600/1.2605 is now key resistance
Loss of support at 1.2600 – the base of the trading range for the GBP since mid-December – is a clear technical negative for the Pound.
Tuesday trading has tracked slightly higher but that only gives the impression of consolidation ahead of renewed weakness (bear flag pattern) on the intraday chart.
GBP retracement support at 1.2535 may help anchor the GBP in the short run but risks appear tilted towards a drop back to the low 1.2400s.
Former support at 1.2600/1.2605 is now key resistance.
Economists at Crédit Agricole outline three key reasons for its bearish outlook on EUR/USD throughout 2024.
Monetary policy divergence
The ECB may engage in more aggressive rate cutting than the Fed in 2024, potentially positioning the euro as an appealing funding currency for investors.
Impact of QT on European markets
The ECB's accelerated quantitative tightening (QT) measures could expand peripheral yield spreads relative to Bunds, negatively affecting the Euro's appeal.
Heightened global risk aversion
Deteriorating global growth prospects and US political uncertainties could drive investors towards the USD as a safe haven, particularly in the latter half of 2024.
USD/CAD is heading towards 1.3540. Economists at Société Général analyze the pair’s technical outlook.
Key support located at 1.3350
USD/CAD is attempting a break above the trend line drawn since last November denoting regain of upward momentum. This is also highlighted by daily MACD which has entered positive territory.
A retest of 1.3540, the 50% retracement from November is likely. If this is overcome, USD/CAD could head higher towards December peak of 1.3620 and 1.3730.
Recent pivot low at 1.3350 is key support.
EUR/GBP has experienced a deeper down move after giving up the 200-Day Moving Average (DMA) last month now at 0.8625. Economists at Société Général analyze the pair’s outlook.
0.8490 is first support
EUR/GBP is in vicinity to low of last August near 0.8490 which could be an interim support.
Daily MACD has started posting positive divergence denoting receding downward momentum.
The down move has tentatively stalled; retest of 200-DMA near 0.8625 can’t be ruled out. This must be overcome to confirm an extended bounce.
In case the pair fails to defend 0.8490, the phase of correction could extend towards projections of 0.8455 and 0.8385.
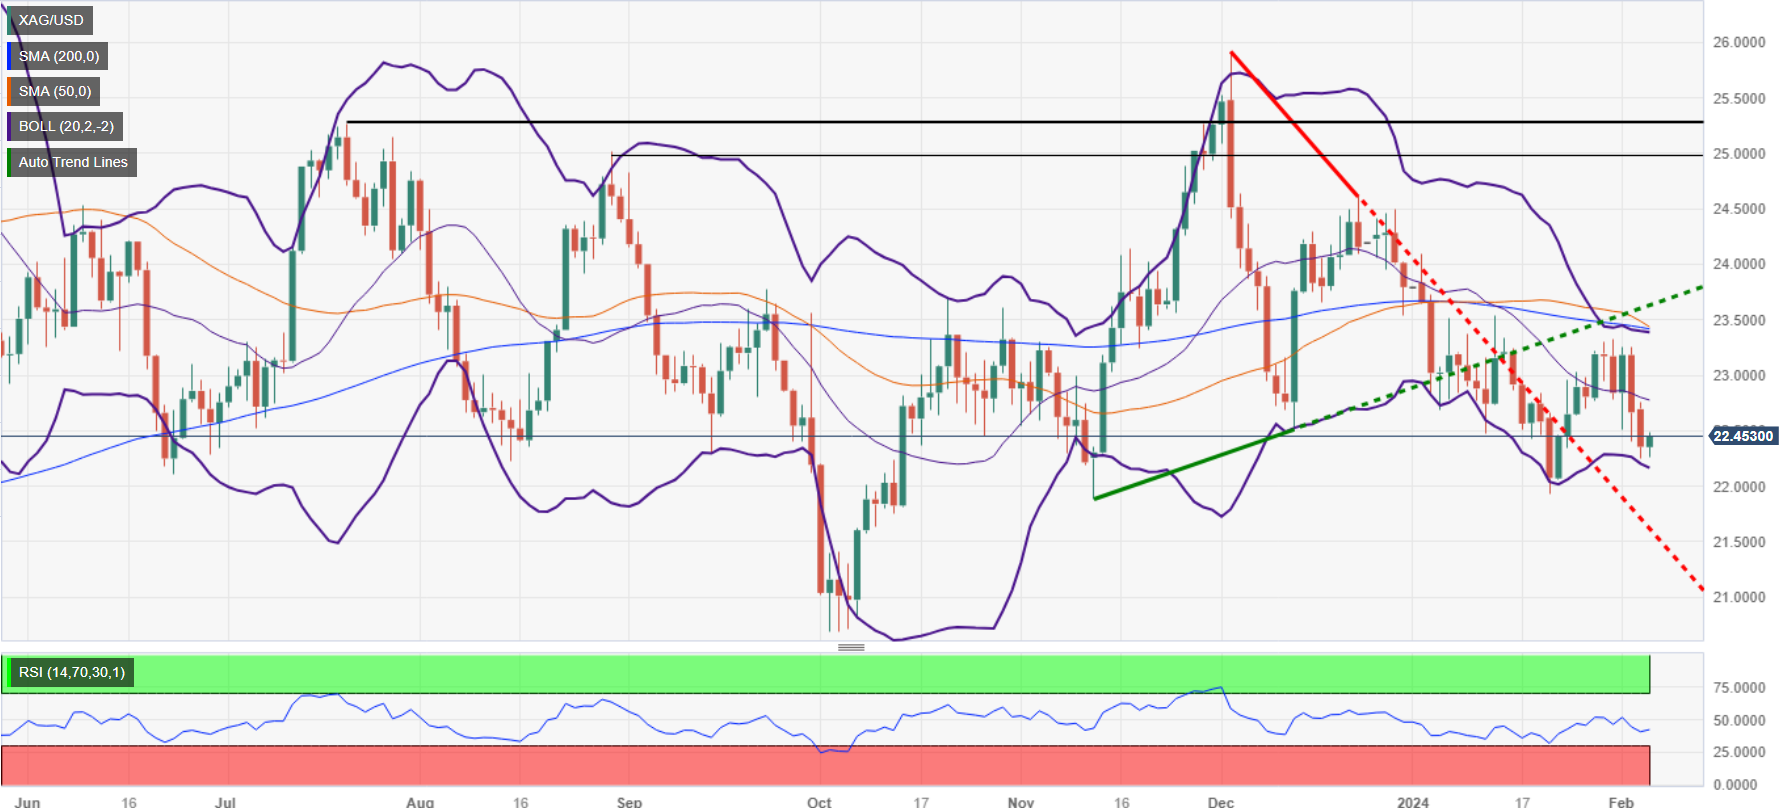
- Silver price falls further as hopes of aggressive rate cuts from the Fed wanes.
- US economic resilience has trimmed the Fed's early rate-cut hopes.
- Silver price has been exposed to $22 due to a bearish outlook.
Silver price (XAG/USD) continues its two-day losing spell and is declining towards the crucial support of $22.00 in the European session on Tuesday. The white metal has been hit hard as bets supporting aggressive rate cuts by the Federal Reserve (Fed) have trimmed significantly due to robust economic performance in the United States.
S&P500 futures have surrendered most gains generated in the Asian session, portraying a decline in the risk appetite of the market participants. The US Dollar Index (DXY) rebounds strongly towards 104.60 as investors rush back to safe-haven assets amid expectations that rate cuts from the Fed will delay what market participants have forecasted. While the US dollar recovered sharply, the 10-year US Treasury yields dropped to nearly 4.14%.
The hopes of premature rate cuts by the Fed have faded significantly as policymakers believe that a rush towards early rate cuts could lead to a surge in the aggregate demand, which could prompt price pressures.
This week, the US economic calendar will remain light. Therefore, investors will focus on the commentary from Chicago Federal Reserve Bank President Loretta Mester for fresh guidance on interest rates.
Silver technical analysis
Silver price is declining towards the horizontal support of $21.88, plotted from November 13 low on a daily timeframe. The longer-term outlook of the Silver price is bearish as it is trading below the 200-period Exponential Moving Average (EMA), which trades around $23.20.
The 14-period Relative Strength Index (RSI) has shifted into the 20.00-60.00 range from the bullish range of 40.00-80.00, which indicates a bearish momentum has been triggered.
Silver daily chart
-638428141422428349.png)
- WTI remains confined in a range and is influenced by a combination of factors.
- Talks of Israel–Hamas ceasefire and a bullish USD cap the upside for Oil prices.
- Uncertainty over the fallout from the Red Sea crisis to help limit deeper losses.
West Texas Intermediate (WTI) US Crude Oil prices struggle to gain any meaningful traction on Tuesday and oscillate in a narrow range through the mid-European session. The commodity currently trades around the $73.00/barrel mark and remains well within the striking distance of a nearly three-week low touched on Monday.
A Middle East trip by top US Diplomat Antony Blinken raised hopes for a de-escalation of the crisis in the major Oil producing region, which, in turn, is seen as a key factor acting as a headwind for the black liquid. Apart from this, concerns about a weaker demand outlook, amid persistent worries about slowing economic growth in China, further contribute to cap gains for Crude Oil prices.
Meanwhile, the incoming US macro data continues to point to a still resilient economy, which gives the Federal Reserve (Fed) more headroom to keep interest rates higher for longer. The hawkish outlook assists the US Dollar (USD) to stand tall near its highest level since November 14 and turns out to be another factor holding back traders from placing bullish bets around the commodity.
The US, however, continues its campaign against Iran-backed Houthis in Yemen, which has been fueling supply concerns and lending support to Oil prices. Market participants now look forward to data published by the American Petroleum Institute (API) on US crude stockpiles for some impetus. In the meantime, Ukrainian drone attacks on the largest oil refinery in Russia could act as a tailwind.
Technical levels to watch
Economists at Commerzbank analyze the Swedish Krona’s (SEK) outlook following the Riksbank's decision on Thursday, which was a dovish turn.
Riksbank’s decision does not bode well for USD/SEK
In contrast to the US economy, which has surprised on the upside in recent quarters and looks very robust despite the interest rate hikes, the Swedish economy appears to be weakening significantly. It is therefore understandable that the Riksbank wants to give the real economy a boost with the prospect of interest rate cuts in the near future.
Considering the declining inflation until December and the poor economic outlook, as well as the fact that the Riksbank was not an overly hawkish central bank before, the turnaround is not as surprising as I originally thought.
Nevertheless, the decision does not bode well for USD/SEK. For the time being, Krona will have to price in (a) a significantly higher inflation risk premium and (b) a greater growth disadvantage versus the US. Until this situation changes, I believe that no Swedish official should talk about the SEK being fundamentally undervalued for the time being.
- EUR/USD turns lower for the third straight day and seems vulnerable to slide further.
- Expectations that the ECB will start cutting rates in April continue to undermine the Euro.
- Hopes of higher for longer Fed rates favour the USD bulls and validate the negative bias.
The EUR/USD pair attracts fresh sellers following an intraday uptick to the 1.0765 region and drops back closer to a two-month low during the European session on Tuesday. The initial market reaction to an unexpected jump in Germany’s Factory Orders fades rather quickly in the wake of expectations that the European Central Bank (ECB) could start cutting interest rates by April amid falling inflation in the Eurozone. This acts as a headwind for the shared currency, which, along with the underlying bullish tone around the US Dollar (USD), contributes to capping the upside for the currency pair.
The USD Index (DXY), which tracks the Greenback against a basket of currencies, holds firm near its highest level since November 14 as markets seem to have fully priced out early rate cuts by the Federal Reserve (Fed). Recent US macro data suggested that the economy remains in good shape, giving the Fed the headroom to keep rates higher for longer. Apart from this, geopolitical tensions and worries about slowing economic growth in China – the world's second-largest economy – should benefit the safe-haven buck, suggesting that the path of least resistance for the EUR/USD pair is to the downside.
Daily digest market movers: ECB rate cut bets, hawkish Fed expectations weigh
- European Central Bank (ECB) policymaker Pablo Hernandez de Cos said on Tuesday that the next move will be cutting interest rates amid growing confidence that inflation is coming back to the 2% target.
- Germany’s Factory Orders rose by a sharp 8.9% in December on month as against the forecasts for no growth, albeit does little to provide any impetus to the shared currency and lend any support to the EUR/USD pair.
- The ECB's monthly Survey, released earlier today, showed that inflation expectations among Eurozone consumers for the next year fell from 3.5% in November to 3.2% in December.
- Data released by Eurostat showed that Retail Sales in the Eurozone declined by the 0.8% YoY in December as compared to a 0.4% drop in November and consensus estimates for a 0.9% fall.
- The Institute for Supply Management (ISM) reported on Monday that the US services sector growth picked up pace in January, with its Non-Manufacturing PMI rising to 53.4 from 50.5 in December.
- This, along with Friday's blockbuster NFP report and the recent hawkish comments by Federal Reserve officials, forced investors to further scale back expectations for aggressive policy easing in 2024.
- The CME Group's Fedwatch tool indicates that traders have almost entirely priced out the possibility of a March rate cut and now see just five cuts by the end of this year compared with six previously.
- Expectations that the Fed will keep interest rates higher for longer assist the US Dollar to stand tall near its highest level since November 14 and support prospects for a further downside for the EUR/USD pair.
Technical Analysis: EUR/USD bears might wait for break below 1.0700 before placing fresh bets
From a technical perspective, the recent breakdown below the 100-day Simple Moving Average (SMA) and the emergence of fresh selling on Tuesday favour bearish traders. Moreover, oscillators on the daily chart are holding deep in the negative territory and are still away from flashing oversold conditions, suggesting that the path of least resistance for the EUR/USD pair is to the downside. Some follow-through selling below the 1.0700 mark will reaffirm the bearish outlook and drag spot prices further towards the 1.0665-1.0660 intermediate support en route to the 1.0620-1.0615 region and the 1.0600 round figure.
On the flip side, the daily swing high around the 1.0760-1.0765 region seems to act as an immediate hurdle ahead of the 1.0800 mark and the 200-day SMA, currently pegged near the 1.0835-1.0840 zone. That said, a sustained strength beyond the latter might trigger a short-covering rally and allow the EUR/USD pair to reclaim the 1.0900 round figure. Some follow-through buying will negate the negative outlook and shift the near-term bias in favour of bullish traders.
Euro price today
The table below shows the percentage change of Euro (EUR) against listed major currencies today. Euro was the weakest against the Australian Dollar.
| USD | EUR | GBP | CAD | AUD | JPY | NZD | CHF | |
| USD | 0.08% | -0.08% | -0.09% | -0.25% | 0.01% | -0.05% | 0.22% | |
| EUR | -0.08% | -0.16% | -0.18% | -0.33% | -0.08% | -0.13% | 0.14% | |
| GBP | 0.08% | 0.16% | -0.01% | -0.17% | 0.08% | 0.03% | 0.30% | |
| CAD | 0.08% | 0.19% | 0.02% | -0.15% | 0.11% | 0.05% | 0.32% | |
| AUD | 0.25% | 0.34% | 0.16% | 0.15% | 0.26% | 0.20% | 0.47% | |
| JPY | -0.01% | 0.10% | -0.07% | -0.09% | -0.26% | -0.06% | 0.22% | |
| NZD | 0.05% | 0.12% | -0.03% | -0.05% | -0.21% | 0.05% | 0.26% | |
| CHF | -0.23% | -0.14% | -0.31% | -0.32% | -0.48% | -0.22% | -0.27% |
The heat map shows percentage changes of major currencies against each other. The base currency is picked from the left column, while the quote currency is picked from the top row. For example, if you pick the Euro from the left column and move along the horizontal line to the Japanese Yen, the percentage change displayed in the box will represent EUR (base)/JPY (quote).
Euro FAQs
What is the Euro?
The Euro is the currency for the 20 European Union countries that belong to the Eurozone. It is the second most heavily traded currency in the world behind the US Dollar. In 2022, it accounted for 31% of all foreign exchange transactions, with an average daily turnover of over $2.2 trillion a day.
EUR/USD is the most heavily traded currency pair in the world, accounting for an estimated 30% off all transactions, followed by EUR/JPY (4%), EUR/GBP (3%) and EUR/AUD (2%).
What is the ECB and how does it impact the Euro?
The European Central Bank (ECB) in Frankfurt, Germany, is the reserve bank for the Eurozone. The ECB sets interest rates and manages monetary policy.
The ECB’s primary mandate is to maintain price stability, which means either controlling inflation or stimulating growth. Its primary tool is the raising or lowering of interest rates. Relatively high interest rates – or the expectation of higher rates – will usually benefit the Euro and vice versa.
The ECB Governing Council makes monetary policy decisions at meetings held eight times a year. Decisions are made by heads of the Eurozone national banks and six permanent members, including the President of the ECB, Christine Lagarde.
How does inflation data impact the value of the Euro?
Eurozone inflation data, measured by the Harmonized Index of Consumer Prices (HICP), is an important econometric for the Euro. If inflation rises more than expected, especially if above the ECB’s 2% target, it obliges the ECB to raise interest rates to bring it back under control.
Relatively high interest rates compared to its counterparts will usually benefit the Euro, as it makes the region more attractive as a place for global investors to park their money.
How does economic data influence the value of the Euro?
Data releases gauge the health of the economy and can impact on the Euro. Indicators such as GDP, Manufacturing and Services PMIs, employment, and consumer sentiment surveys can all influence the direction of the single currency.
A strong economy is good for the Euro. Not only does it attract more foreign investment but it may encourage the ECB to put up interest rates, which will directly strengthen the Euro. Otherwise, if economic data is weak, the Euro is likely to fall.
Economic data for the four largest economies in the euro area (Germany, France, Italy and Spain) are especially significant, as they account for 75% of the Eurozone’s economy.
How does the Trade Balance impact the Euro?
Another significant data release for the Euro is the Trade Balance. This indicator measures the difference between what a country earns from its exports and what it spends on imports over a given period.
If a country produces highly sought after exports then its currency will gain in value purely from the extra demand created from foreign buyers seeking to purchase these goods. Therefore, a positive net Trade Balance strengthens a currency and vice versa for a negative balance.
- Gold price consolidates after a two-day sell-off amid a light economic calendar.
- The US Dollar falls slightly, but its broader appeal is bullish amid a robust performance of the US economy.
- A strong order book for US manufacturing and service sectors has set a positive undertone for 2024.
Gold price (XAU/USD) struggles to find a direction in Tuesday’s European session amid a lack of data drivers as the economic calendar in the United States is light this week. The two-day sell-off in the precious metal has paused for a while as various Federal Reserve (Fed) are lined up to provide their outlook on interest rates. The rally in the US Dollar Index (DXY) has paused, but more upside is likely as Fed policymakers consistently deny the need for early rate cuts.
The chances of aggressive rate cuts by the Fed have sharply diminished as the US economy is outperforming. Fed policymakers have warned that an early rate-cut decision could support demand and boost the economy, which would slow the progress of inflation declining towards the 2% target.
Daily digest market movers: Gold price consolidates ahead of Fed speak
- Gold price finds selling pressure while attempting to extend recovery above the crucial resistance of $2,030.
- The precious metal has fallen as Federal Reserve officials push back expectations of aggressive rate cuts due to resilient domestic growth and a stubborn inflation outlook.
- The CME Fedwatch tool shows that a rate cut in March is unlikely. For May’s policy meeting, bets favoring an interest rate reduction by 25 basis points (bps) have come down to 55%.
- On Monday, Minneapolis Federal Reserve Bank President Neel Kashkari said the lower risk to US economic woes had bought time for the central bank to reconsider rate cuts.
- Increasing employment levels and robust economic prospects consistently improve hopes of a “soft landing” for the Fed.
- After robust labor market and Manufacturing PMI data for January, the Services PMI also outperformed expectations. The Services PMI represents the service sector, which accounts for two-thirds of the US economy, rose to 53.4 against expectations of 52.0 and the prior reading of 50.5.
- The sub-index gauging new orders for service enterprises rose to 55.0 against expectations of 52.8, indicating a strong order book for 2024.
- On the geopolitical front, hopes for a ceasefire between Israel and Palestine in Gaza could exert more pressure on the Gold price.
- The US Secretary of State Antony Blinken and Saudi's crown prince discussed "regional coordination" on ending the war in Gaza and plans for the strip after the fighting ends, CNN reported.
Technical Analysis: Gold price struck in a tight range near $2,025
The Gold price oscillates in a tight range around $2,025 on Tuesday. The precious metal remains inside Monday’s trading range, which indicates that investors await a fresh economic trigger for further guidance. The 50-day Exponential Moving Average (EMA) at $2,021 continues to provide support. On a broader note, the Gold price is expected to remain well-supported above the psychological cushion of $2,000. Meanwhile, the 14-period Relative Strength Index (RSI) indicates a lackluster performance ahead, oscillating in the 40.00-60.00 range.
Gold FAQs
Why do people invest in Gold?
Gold has played a key role in human’s history as it has been widely used as a store of value and medium of exchange. Currently, apart from its shine and usage for jewelry, the precious metal is widely seen as a safe-haven asset, meaning that it is considered a good investment during turbulent times. Gold is also widely seen as a hedge against inflation and against depreciating currencies as it doesn’t rely on any specific issuer or government.
Who buys the most Gold?
Central banks are the biggest Gold holders. In their aim to support their currencies in turbulent times, central banks tend to diversify their reserves and buy Gold to improve the perceived strength of the economy and the currency. High Gold reserves can be a source of trust for a country’s solvency. Central banks added 1,136 tonnes of Gold worth around $70 billion to their reserves in 2022, according to data from the World Gold Council. This is the highest yearly purchase since records began. Central banks from emerging economies such as China, India and Turkey are quickly increasing their Gold reserves.
How is Gold correlated with other assets?
Gold has an inverse correlation with the US Dollar and US Treasuries, which are both major reserve and safe-haven assets. When the Dollar depreciates, Gold tends to rise, enabling investors and central banks to diversify their assets in turbulent times. Gold is also inversely correlated with risk assets. A rally in the stock market tends to weaken Gold price, while sell-offs in riskier markets tend to favor the precious metal.
What does the price of Gold depend on?
The price can move due to a wide range of factors. Geopolitical instability or fears of a deep recession can quickly make Gold price escalate due to its safe-haven status. As a yield-less asset, Gold tends to rise with lower interest rates, while higher cost of money usually weighs down on the yellow metal. Still, most moves depend on how the US Dollar (USD) behaves as the asset is priced in dollars (XAU/USD). A strong Dollar tends to keep the price of Gold controlled, whereas a weaker Dollar is likely to push Gold prices up.
EUR/USD has moved back to the December low at 1.0725. Economists at Société Général analyze the pair’s outlook.
Recent pivot high at 1.0900 must be overcome to confirm an extended bounce
EUR/USD has experienced a steady pullback after failing to reclaim interim resistance zone near the graphical levels of 1.1100/1.1150 representing highs of April / May 2023. It has given up both 50-DMA and 200-DMA but slope of both the Moving Averages is flattish denoting lack of clear direction.
December low of 1.0725/1.0700 is next potential support. Failure to defend could mean deeper decline towards 1.0610 and the lower limit of the range since January 2023 at 1.0484/1.0448.
Recent pivot high at 1.0900 must be overcome to confirm an extended bounce.
- Eurozone Retail Sales came in at -0.8% YoY in December vs. -0.9% estimated.
- Retail Sales in the bloc arrived at -1.1% MoM in December vs. -1.0% forecast.
Eurozone’s Retail Sales declined 0.8% YoY in December, compared with a 0.4% drop in November, the official data released by Eurostat showed on Tuesday. The market had expected a decrease of 0.9%.
Retail Sales in the old continent dropped 1.1% over the month in the same period, as against 0.3% recorded in November and -1.0% expected.
FX implications
Mixed Eurozone data added to the renewed downtick in the Euro. At the time of writing, the EUR/USD pair is trading at 1.0730, losing 0.08% on the day.
Euro price today
The table below shows the percentage change of Euro (EUR) against listed major currencies today. Euro was the weakest against the Australian Dollar.
| USD | EUR | GBP | CAD | AUD | JPY | NZD | CHF | |
| USD | 0.09% | -0.08% | -0.08% | -0.24% | 0.01% | -0.05% | 0.24% | |
| EUR | -0.09% | -0.17% | -0.18% | -0.34% | -0.09% | -0.14% | 0.15% | |
| GBP | 0.07% | 0.16% | -0.01% | -0.18% | 0.07% | 0.02% | 0.31% | |
| CAD | 0.07% | 0.19% | 0.02% | -0.15% | 0.10% | 0.04% | 0.33% | |
| AUD | 0.24% | 0.33% | 0.17% | 0.16% | 0.25% | 0.19% | 0.47% | |
| JPY | -0.01% | 0.10% | -0.07% | -0.09% | -0.26% | -0.06% | 0.22% | |
| NZD | 0.06% | 0.14% | -0.02% | -0.04% | -0.20% | 0.06% | 0.30% | |
| CHF | -0.24% | -0.12% | -0.30% | -0.31% | -0.46% | -0.23% | -0.29% |
The heat map shows percentage changes of major currencies against each other. The base currency is picked from the left column, while the quote currency is picked from the top row. For example, if you pick the Euro from the left column and move along the horizontal line to the Japanese Yen, the percentage change displayed in the box will represent EUR (base)/JPY (quote).
About Eurozone Retail Sales
The Retail Sales released by Eurostat are a measure of changes in sales of the Eurozone retail sector. It shows the performance of the retail sector in the short term. Percent changes reflect the rate of changes of such sales. The changes are widely followed as an indicator of consumer spending. Usually, positive economic growth anticipates "Bullishness" for the EUR, while a low reading is seen as negative, or bearish, for the EUR.
Gold prices fell in India on Tuesday, according to data from India's Multi Commodity Exchange (MCX).
Gold price stood at 62,305 Indian Rupees (INR) per 10 grams, down INR 533 compared with the INR 62,838 it cost on Monday.
As for futures contracts, Gold prices decreased to INR 62,300 per 10 gms from INR 62,316 per 10 gms.
Prices for Silver futures contracts decreased to INR 70,401 per kg from INR 70,480 per kg.
| Major Indian city | Gold Price |
|---|---|
| Ahmedabad | 64,470 |
| Mumbai | 64,305 |
| New Delhi | 64,460 |
| Chennai | 64,450 |
| Kolkata | 64,565 |
Global Market Movers: Comex Gold price struggles near one-week low amid receding Fed rate cut bets
- Persistent worries about geopolitical tensions stemming from conflicts in the Middle East and slowing economic growth in China lend some support to the safe-haven Gold price on Comex.
- The US Dollar eases from its highest level in almost three months and further lends some support to the commodity, though hawkish Federal Reserve expectations act as a headwind.
- The Institute for Supply Management (ISM) reported on Monday that the US services sector growth picked up pace in January amid an increase in new orders.
- The US ISM Non-Manufacturing PMI increased to 53.4 last month from 50.5 in December, with a measure of input prices or the Prices Paid sub-component rising to an 11-month high.
- This comes on top of Friday's blowout US jobs report and reaffirmed the view that the economy is in good shape, diminishing the chances of an interest rate cut by the Fed in March.
- Moreover, hawkish comments by several Fed officials suggest that the first-rate cut might not come until May or June, which remains supportive of elevated US Treasury bond yields.
- The yield on the rate-sensitive 2-year US government bond eased from a one-month top on Monday and the benchmark 10-year US Treasury yield holds comfortably above the 4.0% mark.
- In an interview with the CBS News show 60 Minutes that aired on Sunday, Fed Chair Jerome Powell said that the central bank could be patient in deciding when to cut interest rates.
- Minneapolis Fed President Neel Kashkari argued that a possibly higher neutral rate means that the central bank can take more time to assess upcoming data before beginning interest rate cuts.
- Chicago Fed President Austan Goolsbee noted that there have been seven months of good inflation reports, though did not comment on the timing of the first interest rate cut.
(An automation tool was used in creating this post.)
Gold FAQs
Why do people invest in Gold?
Gold has played a key role in human’s history as it has been widely used as a store of value and medium of exchange. Currently, apart from its shine and usage for jewelry, the precious metal is widely seen as a safe-haven asset, meaning that it is considered a good investment during turbulent times. Gold is also widely seen as a hedge against inflation and against depreciating currencies as it doesn’t rely on any specific issuer or government.
Who buys the most Gold?
Central banks are the biggest Gold holders. In their aim to support their currencies in turbulent times, central banks tend to diversify their reserves and buy Gold to improve the perceived strength of the economy and the currency. High Gold reserves can be a source of trust for a country’s solvency. Central banks added 1,136 tonnes of Gold worth around $70 billion to their reserves in 2022, according to data from the World Gold Council. This is the highest yearly purchase since records began. Central banks from emerging economies such as China, India and Turkey are quickly increasing their Gold reserves.
How is Gold correlated with other assets?
Gold has an inverse correlation with the US Dollar and US Treasuries, which are both major reserve and safe-haven assets. When the Dollar depreciates, Gold tends to rise, enabling investors and central banks to diversify their assets in turbulent times. Gold is also inversely correlated with risk assets. A rally in the stock market tends to weaken Gold price, while sell-offs in riskier markets tend to favor the precious metal.
What does the price of Gold depend on?
The price can move due to a wide range of factors. Geopolitical instability or fears of a deep recession can quickly make Gold price escalate due to its safe-haven status. As a yield-less asset, Gold tends to rise with lower interest rates, while higher cost of money usually weighs down on the yellow metal. Still, most moves depend on how the US Dollar (USD) behaves as the asset is priced in dollars (XAU/USD). A strong Dollar tends to keep the price of Gold controlled, whereas a weaker Dollar is likely to push Gold prices up.
Another day, another piece of strong US data. The Dollar edged a little higher on Monday as a strong US January ISM release only added to the view that the Fed would not be in a hurry to ease policy. Economists at ING analyze USD outlook.
DXY to hold recent gains near the 104.50 area
The ISM services data handsomely beat expectations and triggered a further back-up in US interest rates and a firmer Dollar. As such there seems little incentive for investors and corporates to offload any of their Dollar holdings.
Additionally, as we've highlighted here before, February is typically a good month for the Dollar. There is also the looming China Lunar New Year holiday next week, which may make the market reluctant to carry short Dollar positions in an uncertain geopolitical environment.
There is little US data on the calendar today and we would expect DXY to hold recent gains near the 104.50 area and possibly head up to resistance at 104.75.
Inflation expectations among Eurozone consumers fell from 3.5% in November to 3.2% in December for the next 12 months, the European Central Bank’s (ECB) monthly Consumer Expectation Survey showed on Tuesday.
Additional takeaways
Median rate of perceived inflation over the previous 12 months was 6.9% (previously 7.6%).
Consumer expectations for nominal income growth seen at 1.2% (unchanged).
Expectations for nominal spending growth over the next 12 months seen at 3.6% (unchanged).
Market reaction
At the press time, EUR/USD is holding steady near 1.0740 amid dovish ECB-speak and falling inflation expectations.
European Central Bank (ECB) policymaker Pablo Hernandez de Cos said on Tuesday, "it is already very important for European citizens to know that we are confident the next move will be a cut.”
He said that the central bank is” now confident inflation is moving back to target.”
Market reaction
EUR/USD has erased gains to trade neutral near 1.0740 on the above comments.
Euro price today
The table below shows the percentage change of Euro (EUR) against listed major currencies today. Euro was the strongest against the Swiss Franc.
| USD | EUR | GBP | CAD | AUD | JPY | NZD | CHF | |
| USD | 0.00% | -0.15% | -0.10% | -0.30% | -0.03% | -0.05% | 0.04% | |
| EUR | 0.00% | -0.14% | -0.10% | -0.30% | -0.03% | -0.05% | 0.05% | |
| GBP | 0.15% | 0.14% | 0.05% | -0.16% | 0.11% | 0.09% | 0.19% | |
| CAD | 0.08% | 0.09% | -0.04% | -0.21% | 0.07% | 0.04% | 0.14% | |
| AUD | 0.26% | 0.25% | 0.12% | 0.15% | 0.23% | 0.21% | 0.30% | |
| JPY | 0.03% | 0.04% | -0.13% | -0.07% | -0.30% | -0.02% | 0.08% | |
| NZD | 0.05% | 0.05% | -0.09% | -0.06% | -0.21% | 0.01% | 0.12% | |
| CHF | -0.07% | -0.07% | -0.22% | -0.17% | -0.37% | -0.10% | -0.12% |
The heat map shows percentage changes of major currencies against each other. The base currency is picked from the left column, while the quote currency is picked from the top row. For example, if you pick the Euro from the left column and move along the horizontal line to the Japanese Yen, the percentage change displayed in the box will represent EUR (base)/JPY (quote).
USD/JPY mildly offered after failing to orbit 149.00 on Monday. Economists at Société Général analyze the pair’s outlook.
Break below 145.90/145.50 essential for confirming deeper pullback
USD/JPY is in vicinity to interim projections at 149.10. A brief pause can’t be ruled out but 50-DMA at 145.90/145.50 is a potential support zone.
Daily MACD is situated in positive territory denoting prevalence of upward momentum.
If the pair establishes beyond 149.10, the rebound could extend towards last year high of 152.00.
Break below 145.90/145.50 would be essential for confirming deeper pullback.
- USD/CAD moves lower on a subdued US Dollar.
- The decline in the US bond yields has weakened the Greenback.
- The higher WTI price is supporting the Canadian Dollar.
USD/CAD retraces its recent gains reported in the previous two sessions, trading lower around 1.3530 during the European session on Tuesday. The US Dollar (USD) is experiencing some depreciation attributed to subdued US Treasury yields, which is exerting pressure on the USD/CAD pair. Furthermore, the Canadian Dollar (CAD) is receiving support from increased Crude oil prices, contributing to its strengthening against the US Dollar.
The US Dollar Index (DXY) loses ground after reporting profits in the previous two sessions. The DXY trades slightly lower around 104.40, which could be attributed to the weaker US Treasury yields. The 2-year and 10-year yields on US bonds stand at 4.44% and 4.14%, respectively, at the time of writing.
December’s PPI (YoY) reported a decline of 10.6%, against the anticipated decrease of 10.5% and the previous figure of 8.8%. While US ISM Services Prices Paid increased to the reading of 64.0 in January, from December’s reading of 56.7.
Federal Reserve (Fed) Chair Jerome Powell remarked that it was premature to think about easing monetary policy, emphasizing the importance of steering inflation toward its 2% target. He added that the Federal Reserve might initiate its first rate cut from the middle of the year.
West Texas Intermediate (WTI) oil price improves to near $73.00 per barrel on escalated tension in the Middle East. The WTI oil price might have supported the CAD, consequently, putting downward pressure on the USD/CAD pair. Furthermore, Canada’s Ivey Purchasing Managers Index data will be eyed on Tuesday, along with the BoC Governor Tiff Macklem’s speech.
The Reserve Bank of Australia (RBA) left interest rates unchanged. The Australian Dollar (AUD) edged a little higher on the news. Economists at Commerzbank analyze Aussie’s outlook.
RBA likely to gradually abandon its cautious stance only when inflation shows a further decline
The RBA left the hint of another rate hike in the statement. While most other central banks have dropped such a hint of additional tightening in the last two weeks, the RBA ‘cannot rule out a further increase in interest rates’.
For a possible rate cut, the RBA would likely want to gain greater confidence that inflation will return to target on a sustained basis. However, we will have to be patient until new figures ensure this confidence. The new monthly indicator is not due until the end of February, and the new quarterly figures are not due until the end of April, just ahead of the RBA's May meeting.
Only when the figures show a further decline is the RBA likely to gradually abandon its cautious stance. And until then, the Aussie should remain supported to a certain extent. For AUD/USD, therefore, it will probably depend on the US side for the time being.
- NZD/USD falls back from 0.6070 as the broader market sentiment is risk-averse.
- The Fed is not expected to rush for aggressive rate cuts.
- The NZ Q4 labor market conditions are expected to remain downbeat.
The NZD/USD pair faces selling pressure while attempting to extend recovery above the immediate resistance of 0.6070 in the European session. The Kiwi asset has fallen on the backfoot as the broader market mood is downbeat, and investors are rushing back to safe-haven assets.
The US Dollar Index (DXY) delivers a light corrective move after a significant rally to near 104.60. The appeal for the US Dollar has improved as chances of aggressive rate cuts by the Federal Reserve (Fed) are waning swiftly.
Minneapolis Federal Reserve Bank President Neel Kashkari said on Monday that lower recession risks have given policymakers significant time to reconsider the outlook on interest rates.
Meanwhile, the New Zealand Dollar will be on tenterhooks ahead of the release of the Q4 Employment data, which will be published on Wednesday. Investors anticipate that the Unemployment Rate rose to 4.2% from 3.69% in the third quarter of 2023. The Labor Cost Index, representing momentum in wage growth, rose at a steady pace of 0.8%. The decision-making between higher inflation and deteriorating labor market conditions is expected to remain complicated for Reserve Bank of New Zealand (RBNZ) policymakers.
NZD/USD witnessed a steep fall after a channel breakdown on the daily timeframe. The broader outlook for the Kiwi asset is bearish as it is trading below the 200-day Exponential Moving Average (EMA), which hovers near 0.6112. The asset has dropped below the 50% Fibonacci retracement (plotted from October 26 low at 0.5772 to December 26 high near 0.6410) at 0.6090.
The 14-period Relative Strength Index (RSI) has slipped into the bearish range of 20.00-40.00, which indicates more downside ahead.
More downside would appear if the asset drops below the immediate low of 0.6050, which would expose the asset to a June 8 low at 0.6026, followed by the psychological support of 0.6000.
On the flip side, further recovery above January 24 high at 0.6150 would drive the asset towards January 31 high at 0.6075 and January 16 high at 0.6208.
NZD/USD daily chart
-638428059072245427.png)
- USD/MXN loses ground as US Dollar declines due to weaker US yields.
- Mexican Peso could weaken on future economic policies from the new administration.
- The Greenback strengthens on Fed’s hawkish stance on interest rate trajectory.
USD/MXN extends its losses for the second successive session, inching lower to around 17.10 during the early European session on Tuesday. The US Dollar (USD) loses some ground due to the downbeat US Treasury yields, which puts pressure on the USD/MXN pair.
The upcoming presidential election on June 2nd is anticipated to result in Claudia Sheinbaum of the Morena party assuming victory. Market analysts foresee a gradual depreciation of the Mexican Peso (MXN) due to anticipated uncertainties surrounding the economic policies of the incoming administration.
Additionally, their projections include a 25 basis points rate cut starting in March. Furthermore, experts anticipate a subsequent escalation in the scale of rate cuts by the Bank of Mexico (Banxico) later in 2024.
December’s PPI (YoY) reported a decline of 10.6%, against the anticipated decrease of 10.5% and the previous figure of 8.8%. While US ISM Services Prices Paid increased to the reading of 64.0 in January, from December’s reading of 56.7.
Over the weekend, Powell remarked that it was premature to ease policy, emphasizing that the task of steering inflation toward its 2% target is ongoing. He added that the Federal Reserve might consider its first rate cut around the middle of the year.
Market participants will closely observe speeches from Federal Reserve officials for additional insights into potential adjustments to monetary policy. On the Mexican front, the release of Consumer Confidence data is scheduled for Wednesday, which will be closely watched for indications of the economic outlook in Mexico.
After a strong start to the year, the Pound Sterling (GBP) has retreated somewhat at the start of February. Economists at ING analyze GBP outlook.
BoE talks rate cuts
We have not heard too much from the Bank of England this year outside of MPC meetings, but Chief Economist Huw Pill suggested on Monday that a rate cut was possible this year and that inflation did not need to be at 2% before action could be taken. Those comments have helped drag EUR/GBP further away from big support levels at 0.8500/0.8525.
We do have a bullish profile for EUR/GBP this year – largely on the view that the BoE cuts more aggressively than the ECB. Let's get the Sterling positive event risk of the budget out of the way in early March and then the market should be able to focus on the sharp drop in UK headline inflation through the second quarter, as well as a softer Pound.
- Pound Sterling finds interim support on upbeat S&P Global Services PMI data.
- The UK economy is on the brink of a technical recession.
- BoE’s Pill signals that policymakers are discussing when the central bank could start reducing interest rates.
The Pound Sterling (GBP) recovers in the European session on Monday due to a decent improvement in the UK’s S&P Global/CIPS Services PMI for January. The economic data rose to 54.3, better than expectations of 53.8 and the former reading of 53.4. The agency reported that a robust inflow of fresh orders, strong hiring in the last six months and deepening prospects of rate cuts by the Bank of England (BoE) led to a strong uptick in the Services PMI.
Supportive domestic factors back a sharp recovery in the Pound Sterling. However, the near-term outlook for risk-sensitive assets is bearish. The appeal of safe-haven assets is broadly upbeat as investors see the Federal Reserve (Fed) not rushing to cut interest rates. Receding risks of a recession in the United States due to strong labor and retail demand are allowing plenty of time for Fed policymakers to decide on rate cuts.
Daily Digest Market Movers: Pound Sterling revives gently as US Dollar rally stalls
- Pound Sterling finds tentative support near 1.2520 in the late Asian session on Tuesday. The broader appeal is still downbeat amid a cautious market mood.
- The outlook for risk-perceived assets is bearish as hopes of aggressive rate cuts by the Federal Reserve have waned due to resilient United States economic growth.
- As per the CME Fedwatch tool, investors see a rate cut of 25 basis points (bps) in May from earlier expectations of March.
- The US economy is performing well amid improving order books for the factory and IT sector, upbeat labor market conditions, and robust consumer spending.
- Minneapolis Federal Reserve Bank President Neel Kashkari said on Monday that lower risks to economic growth are allowing more time for the central bank to decide on rate cuts.
- The Pound Sterling is also facing risks of a technical recession that could force Bank of England policymakers to lean towards a dovish interest rate stance.
- It is worth mentioning that an economy is considered to be in a technical recession if it contracts for two straight quarters.
- The United Kingdom's economy contracted by 0.1% in the third quarter of 2023, and the likelihood of a technical recession is high as it is expected to underperform again.
- A slight dovish guidance on interest rates from BoE Chief Economist Huw Pill has also dampened the appeal for the Pound Sterling.
- BoE Pill said on Monday that the stance of “if” it is appropriate to cut interest rates has changed to “when.”
- In the latest monetary policy statement, BoE Governor Andrew Bailey said inflation is moving in the right direction and kept borrowing costs “under review”.
- Due to a light economic calendar, market participants will focus on the speech from BoE Catherine Mann, which is scheduled for Thursday. Mann was one of two out of nine Monetary Policy Committee (MPC) members who voted for a rate hike of 25 bps.
Technical Analysis: Pound Sterling delivers a pullback move from 1.2520
-638428034107595011.png)
Pound Sterling delivers a recovery move from a seven-week low of 1.2520. The GBP/USD pair is advancing to test the breakdown of the Descending Triangle chart pattern formed on the daily time frame. The Cable could face an intense sell-off after a soft test of the breakdown region near 1.2600.
The 14-period Relative Strength Index (RSI) has slipped below 40.00 for the first time in three months. More downside is possible amid absence of divergence and oversold signals.
Pound Sterling FAQs
What is the Pound Sterling?
The Pound Sterling (GBP) is the oldest currency in the world (886 AD) and the official currency of the United Kingdom. It is the fourth most traded unit for foreign exchange (FX) in the world, accounting for 12% of all transactions, averaging $630 billion a day, according to 2022 data.
Its key trading pairs are GBP/USD, aka ‘Cable’, which accounts for 11% of FX, GBP/JPY, or the ‘Dragon’ as it is known by traders (3%), and EUR/GBP (2%). The Pound Sterling is issued by the Bank of England (BoE).
How do the decisions of the Bank of England impact on the Pound Sterling?
The single most important factor influencing the value of the Pound Sterling is monetary policy decided by the Bank of England. The BoE bases its decisions on whether it has achieved its primary goal of “price stability” – a steady inflation rate of around 2%. Its primary tool for achieving this is the adjustment of interest rates.
When inflation is too high, the BoE will try to rein it in by raising interest rates, making it more expensive for people and businesses to access credit. This is generally positive for GBP, as higher interest rates make the UK a more attractive place for global investors to park their money.
When inflation falls too low it is a sign economic growth is slowing. In this scenario, the BoE will consider lowering interest rates to cheapen credit so businesses will borrow more to invest in growth-generating projects.
How does economic data influence the value of the Pound?
Data releases gauge the health of the economy and can impact the value of the Pound Sterling. Indicators such as GDP, Manufacturing and Services PMIs, and employment can all influence the direction of the GBP.
A strong economy is good for Sterling. Not only does it attract more foreign investment but it may encourage the BoE to put up interest rates, which will directly strengthen GBP. Otherwise, if economic data is weak, the Pound Sterling is likely to fall.
How does the Trade Balance impact the Pound?
Another significant data release for the Pound Sterling is the Trade Balance. This indicator measures the difference between what a country earns from its exports and what it spends on imports over a given period.
If a country produces highly sought-after exports, its currency will benefit purely from the extra demand created from foreign buyers seeking to purchase these goods. Therefore, a positive net Trade Balance strengthens a currency and vice versa for a negative balance.
EUR/USD broke lower again on Monday. Economists at ING analyze the pair’s outlook.
Support at the 1.0715/1.0725 area
EUR/USD now has support at the 1.0715/1.0725 area.
EUR implied volatilities are staying quite low and suggest the market is not preparing for a major break out. We agree and think this will be more of a case of EUR/USD trading out something like a 1.0700-1.0900 range this month rather than pushing down to 1.0500.
See: EUR/USD will be more comfortable in a 1.0400 to 1.1200 range than at levels closer to 1.2000 – Rabobank
The Indian Rupee (INR) was marginally stronger against the US Dollar (USD) in January. Economists at MUFG Bank analyze USD/INR outlook.
USD/INR to fall towards the 82.00 level in the second half of the year
We expect the INR to benefit from strong capital inflows from bond index inclusion in 2024, while RBI intervenes to absorb flows, thereby limiting the extent of INR appreciation.
In the near term in Q1 2024, we think that USD/INR should hover around the 83.00 level as the RBI rebuilds FX reserves before falling more convincingly towards the 82.00 level as the broader Dollar weakens in 2H 2024.
FX option expiries for Feb 6 NY cut at 10:00 Eastern Time, via DTCC, can be found below.
- EUR/USD: EUR amounts
- 1.0795 371m
- 1.0800 355m
- GBP/USD: GBP amounts
- 1.2300 835m
- USD/JPY: USD amounts
- 147.20 371m
- 149.10 930m
- USD/CHF: USD amounts
- 0.8455 722m
- AUD/USD: AUD amounts
- 0.6470 706m
- 0.6570 483m
- 0.6580 1.3b
- 0.6590 965m
- 0.6610 1.1b
- NZD/USD: NZD amounts
- 0.6005 790m
- EUR/JPY edges lower to 159.60 amid the BoJ’s hawkish tilt and safe-haven flows.
- Investors anticipate the ECB to embark on the first rate cut at the June meeting.
- BoJ policymakers hinted about the monetary policy shift, which lifts the Japanese Yen.
- The Eurozone Retail Sales will be released later on Tuesday.
The EUR/JPY cross extends its downside above the mid-159.00s during the early European session on Tuesday. Investors await the December Eurozone Retail Sales for fresh catalysts. Meanwhile, the hawkish tilt from the Bank of Japan (BoJ) and ongoing geopolitical tensions in the Middle East might boost the safe-haven Japanese Yen (JPY) against the Euro (EUR). The cross currently trades near 159.60, losing 0.05% on the day.
On Monday, Germany’s Trade Balance rose to €22.2 billion in December from the previous reading of €20.7 billion. German Imports fell 6.7% in the same period versus a 1.5% rise prior and the exports dropped 4.6% in December from a 3.5% rise in November. Furthermore, Germany’s HCOB Composite Purchasing Manager’s Index (PMI) came in at 47.0 versus the expectation and the previous reading of 47.1. Investors continue to expect the ECB to embark on the first rate cut at the June meeting. However, incoming data such as inflation and wage growth will confirm an inflation path of 2%.
On the Japanese Yen front, the Bank of Japan (BoJ) is preparing to exit negative interest rates by April and overhaul other components of its ultra-loose monetary framework. However, the central bank is likely to go slow on any subsequent policy tightening amid the continuing risks. The hawkish stance from the BoJ could provide some support to the Japanese Yen (JPY) and act as a headwind for the EUR/JPY cross.
Traders will focus on Eurozone Retail Sales, which are projected to drop 1.0% MoM and 0.9% YoY in December. Traders will take cues from the figures and find trading opportunities around the EUR/JPY cross.
Germany’s Factory Orders unexpectedly rebounded firmly in December, the official data published by the Federal Statistics Office showed Tuesday, suggesting that the German manufacturing sector recovery has regained momentum.
On a monthly basis, contracts for goods ‘Made in Germany’ jumped 8.9%, as against a 0% reported in November, beating the forecasts of no growth.
Germany’s Industrial Orders rose at an annual rate of 2.7% in the same period versus the previous drop of 4.7%.
FX implications
The upbeat German data is adding to the upside in the Euro, with the EUR/USD pair testing intraday highs near 1.0760. The pair is up 0.17% so far.
Euro price today
The table below shows the percentage change of Euro (EUR) against listed major currencies today. Euro was the strongest against the US Dollar.
| USD | EUR | GBP | CAD | AUD | JPY | NZD | CHF | |
| USD | -0.15% | -0.18% | -0.26% | -0.55% | -0.13% | -0.33% | -0.13% | |
| EUR | 0.14% | -0.04% | -0.12% | -0.41% | 0.01% | -0.20% | 0.01% | |
| GBP | 0.18% | 0.03% | -0.09% | -0.37% | 0.04% | -0.16% | 0.04% | |
| CAD | 0.25% | 0.15% | 0.08% | -0.29% | 0.13% | -0.08% | 0.13% | |
| AUD | 0.54% | 0.40% | 0.37% | 0.28% | 0.42% | 0.21% | 0.42% | |
| JPY | 0.13% | 0.00% | -0.06% | -0.13% | -0.43% | -0.21% | -0.01% | |
| NZD | 0.34% | 0.18% | 0.16% | 0.07% | -0.21% | 0.21% | 0.20% | |
| CHF | 0.14% | -0.01% | -0.06% | -0.14% | -0.41% | 0.00% | -0.20% |
The heat map shows percentage changes of major currencies against each other. The base currency is picked from the left column, while the quote currency is picked from the top row. For example, if you pick the Euro from the left column and move along the horizontal line to the Japanese Yen, the percentage change displayed in the box will represent EUR (base)/JPY (quote).
Here is what you need to know on Tuesday, February 6:
The US Dollar (USD) started the new week on a bullish tone, with the USD Index rising 0.5% on Monday and reaching its highest level since mid-November above 104.50. Markets stay relatively quiet early Tuesday and the USD Index consolidates its recent gains. Eurostat will release Eurozone Retail Sales data for December and the RealClearMarkets/TIPP Economic Optimism Index for February will be the only data featured in the US economic docket. Market participants will also pay close attention to comments from central bankers.
In the meantime, US stock index futures trade little changed in the European morning and the benchmark 10-year US Treasury bond yield retreats toward 4.1% after rising more than 3% on Monday.
The Reserve Bank of Australia (RBA) announced on Tuesday that it left the policy rate unchanged at 4.35% for the second consecutive meeting as expected. In the policy statement, the RBA reiterated that they remain resolute in their determination to return inflation to 25 target and noted that further increases in rates cannot be ruled out. In the post-meeting press conference, Governor Michele Bullock said that they need to be convinced that inflation will get back to the target range and stay there before they start thinking about rate reductions. AUD/USD gained traction during the Asian trading hours and was last seen trading in positive territory slightly above 0.6500.
Bullock Speech: RBA Governor speaks on policy outlook after holding interest rate.
US Dollar price today
The table below shows the percentage change of US Dollar (USD) against listed major currencies today. US Dollar was the weakest against the Australian Dollar.
| USD | EUR | GBP | CAD | AUD | JPY | NZD | CHF | |
| USD | -0.09% | -0.15% | -0.25% | -0.47% | -0.12% | -0.30% | -0.11% | |
| EUR | 0.09% | -0.05% | -0.17% | -0.37% | -0.03% | -0.21% | -0.02% | |
| GBP | 0.15% | 0.05% | -0.11% | -0.32% | 0.02% | -0.15% | 0.04% | |
| CAD | 0.24% | 0.17% | 0.11% | -0.21% | 0.13% | -0.04% | 0.14% | |
| AUD | 0.49% | 0.39% | 0.34% | 0.23% | 0.36% | 0.19% | 0.38% | |
| JPY | 0.14% | 0.06% | 0.00% | -0.11% | -0.25% | -0.16% | 0.03% | |
| NZD | 0.32% | 0.22% | 0.17% | 0.06% | -0.17% | 0.19% | 0.21% | |
| CHF | 0.12% | 0.02% | -0.03% | -0.13% | -0.36% | -0.02% | -0.19% |
The heat map shows percentage changes of major currencies against each other. The base currency is picked from the left column, while the quote currency is picked from the top row. For example, if you pick the Euro from the left column and move along the horizontal line to the Japanese Yen, the percentage change displayed in the box will represent EUR (base)/JPY (quote).
EUR/USD broke below 1.0800 and touched its lowest level in 11 weeks near 1.0720 on Monday. The pair stages a technical correction and trades marginally higher on the day at around 1.0750 early Tuesday.
GBP/USD lost more than 0.5% for the second consecutive trading day on Tuesday and came within a touching distance of 1.2500. The pair clings to modest recovery gains near 1.2550 in the European morning.
Bank of Japan (BoJ) Governor Kazuo Ueda said on Tuesday that they will consider whether to continue or discontinue various means, including purchases of exchange-traded funds, when they review the massive stimulus programme. Following Monday's indecisive action, USD/JPY edged slightly lower in the Asian trading hours on Tuesday and was last seen trading near 148.50.
Statistics New Zealand will release labor market data for the fourth-quarter in the early Asian session on Wednesday. NZD/USD edged higher following Monday's decline and stabilized above 0.6050.
- USD/CHF takes a breather after two days of a winning streak.
- Swiss Franc could receive support from the improved 10-year Swiss bond yield.
- US Dollar made profits on the Fed Powell’s rejection of rate cut in March amid upbeat economic data.
USD/CHF trades lower after registering gains for consecutive two days, edging lower to near 0.8700 during the Asian session on Tuesday. The Swiss Franc (CHF) may be receiving support from the improved 10-year Swiss bond yield, standing at 0.93% by the press time. This movement in the bond yield could be influenced by global market sentiment after the recent comments from Federal Reserve Chair Jerome Powell, who indicated that a rate cut in March is premature.
In its final meeting of 2023, the Swiss National Bank (SNB) opted to keep its key interest rate unchanged at 1.75%, marking the conclusion of its recent tightening cycle. Consumer prices remained steady on a monthly basis, while the core rate experienced a slight increase. Projections for the current year indicate that inflation is expected to average below the 2.0% threshold. Given these considerations, there is a consensus expectation among analysts that the SNB might initiate its first rate cut in September 2024.
The US Dollar Index (DXY) takes a breather after registering gains in the previous two sessions. The DXY trades slightly lower around 104.30, which could be attributed to the weaker US Treasury yields. The 2-year and 10-year yields on US bonds stand at 4.43% and 4.12%, respectively, at the time of writing.
In January, the US ISM Services Purchasing Managers' Index (PMI) posted a reading of 53.4, surpassing both the anticipated figure of 52.0 and the prior month's 50.5. Furthermore, the ISM Services Employment Index rose to 50.5 from the previous reading of 43.8.
Federal Reserve Chairman Jerome Powell underscored the importance of vigilantly observing inflation's sustained movement toward the 2% core target. This stance had the effect of strengthening the US Dollar, providing support to the USD/CHF pair.
- USD/CAD recovery loses steam near 1.3510 ahead of the Canadian PMI data.
- The pair resumes its uptrend above the key EMA; RSI indicator is above the 50.0 midlines.
- The first upside target is seen at 1.3545; the initial support level is located at 1.3460.
The USD/CAD pair loses traction near the intraday low during the early European trading hours on Tuesday. The decline of the US Dollar (USD) acts as a headwind for the pair. Later on Tuesday, the Canadian Ivey Purchasing Managers Index (PMI) for January will be due, which is estimated to ease to 55.0 in January from 56.3 in December. At press time, USD/CAD is trading at 1.3510, down 0.22% on the day.
Technically, USD/CAD resumes its uptrend and holds above 100-period Exponential Moving Averages (EMA) on the four-hour chart. Furthermore, the Relative Strength Index (RSI) stands above the 50.0 midlines, hinting that further upside looks favorable.
The first upside barrier for USD/CAD will emerge near a high of January 5 at 1.3545. Any follow-through buying above the latter will see a rally to the upper boundary of the Bollinger Band at 1.3569. A sustained break could take the pair to a high of December 12 at 1.3618, followed by a high of November 27 at 1.3711.
In the case of a bearish trading environment, the initial support level is seen near a high of February 1 at 1.3460. The next downside target is located near the 100-period EMA at 1.3443. The additional downside filter to watch is 1.3395 (low of January 20), en route to 1.3365 (low of February 2), and finally at 1.3347 (the lower limit of the Bollinger Band).
USD/CAD four-hour chart
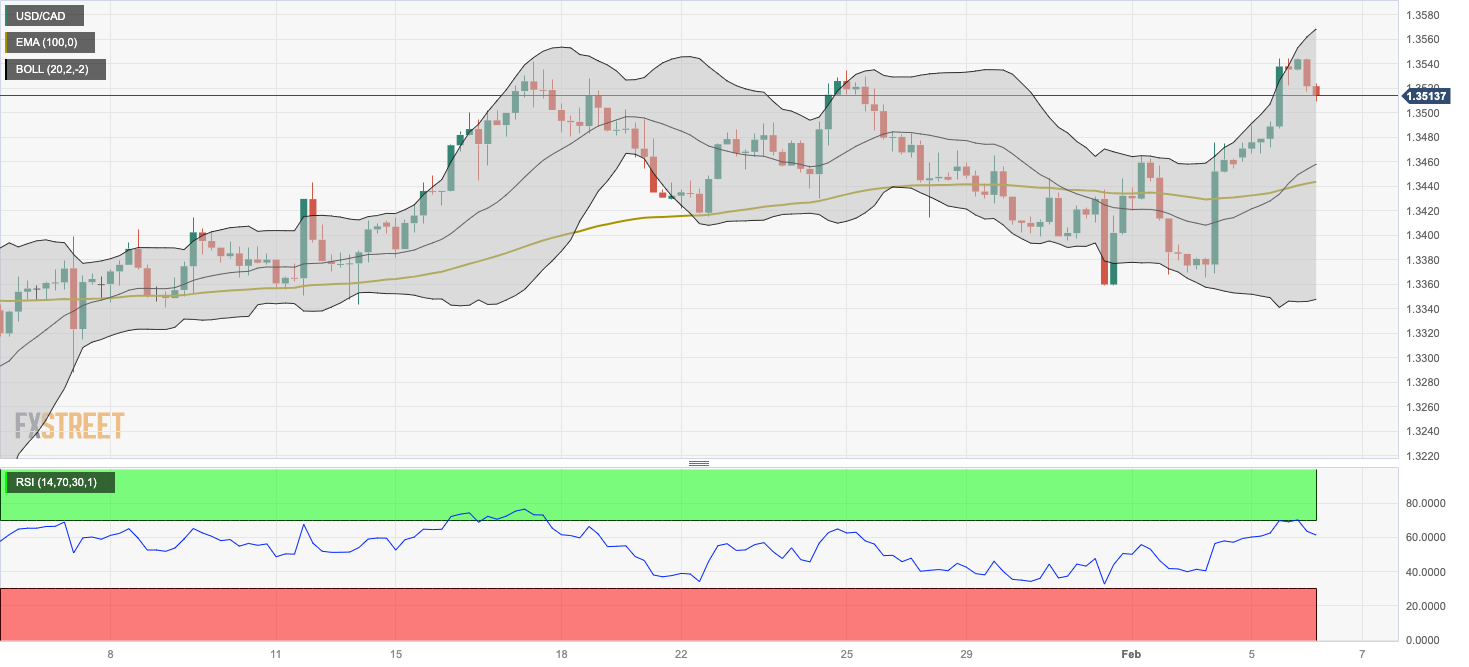
Bank of Japan (BoJ) Governor Kazuo Ueda said on Tuesday, “when we review our massive stimulus programme, we will consider whether to continue or discontinue various means including our purchases of exchange-traded funds (ETF).”
Ueda added, “as for what to do with BoJ’s ETF holdings, we have more time to reach a decision.”
Market reaction
USD/JPY is staying on the back foot at around 148.50 following Ueda’s comments. The pair is losing 0.12% on the day.
Japanese Yen price today
The table below shows the percentage change of Japanese Yen (JPY) against listed major currencies today. Japanese Yen was the strongest against the US Dollar.
| USD | EUR | GBP | CAD | AUD | JPY | NZD | CHF | |
| USD | -0.12% | -0.17% | -0.23% | -0.47% | -0.10% | -0.27% | -0.16% | |
| EUR | 0.11% | -0.06% | -0.13% | -0.36% | 0.01% | -0.16% | -0.04% | |
| GBP | 0.17% | 0.06% | -0.06% | -0.30% | 0.06% | -0.10% | 0.01% | |
| CAD | 0.22% | 0.12% | 0.06% | -0.24% | 0.12% | -0.04% | 0.08% | |
| AUD | 0.47% | 0.34% | 0.30% | 0.24% | 0.36% | 0.20% | 0.32% | |
| JPY | 0.11% | 0.02% | -0.07% | -0.11% | -0.40% | -0.18% | -0.04% | |
| NZD | 0.29% | 0.15% | 0.10% | 0.05% | -0.20% | 0.17% | 0.13% | |
| CHF | 0.16% | 0.04% | -0.02% | -0.08% | -0.34% | 0.05% | -0.12% |
The heat map shows percentage changes of major currencies against each other. The base currency is picked from the left column, while the quote currency is picked from the top row. For example, if you pick the Euro from the left column and move along the horizontal line to the Japanese Yen, the percentage change displayed in the box will represent EUR (base)/JPY (quote).
- AUD/NZD attracts some dip-buying after the RBA announced its policy decision this Thursday.
- Expectations that the RBA’s tightening cycle is over keep a lid on any further gains for the cross.
- The technical setup favours bearish traders and supports prospects for deeper near-term losses.
The AUD/NZD cross rallies over 30 pips from the Asian session low, around the 1.0700 level after the Reserve Bank of Australia (RBA) announced its policy decision and reverses a major part of the previous day's losses. Spot prices currently trade around the 1.0730 region, up just 0.20% for the day, though remain confined in a familiar range held over the past four days.
The Australian Dollar (AUD) strengthens across the board after the RBA decided to keep the Official Cash Rate unchanged and retained a hawkish stance, saying that the Board needs to be confident that inflation is moving sustainably towards the target range. In the accompanying policy statement, the central bank noted that inflation continued to ease in the December quarter, though remained high at 4.1%. The RBA added that services price inflation declined at a more gradual pace and remains elevated.
The RBA also published the updated economic forecasts for 2024 and 2025, which showed small downward shifts in expectations for GDP and consumer inflation. The central now sees the economy to grow by 1.8% in 2024 and the CPI at 3.2% as compared to initial expectations of 2.0% and 3.5%, respectively. The favourable inflation outlook suggested that the RBA's tightening cycle is over and that the next move would be down. This acts as a headwind for the Aussie and keeps a lid on any further gains for the AUD/NZD cross.
From a technical perspective, the recent pullback from the 1.0830-1.0835 area constitutes the formation of a bearish double-top pattern on the daily chart. Moreover, repeated failures to find acceptance above the 200-day Simple Moving Average (SMA) favour bearish traders. This, along with the fact that oscillators on the daily chart have just started drifting in negative territory, suggests that the path of least resistance for the AUD/NZD cross is to the downside. Hence, any further move up is likely to get sold into.
That said, it will still be prudent to wait for a sustained breakdown below the 1.0700 mark before positioning for any further depreciating move. The AUD/NZD cross might then accelerate the slide towards the December 2023 swing low, around the 1.0660-1.0650 area, before dropping to the 1.0625 region and the 1.0600 round figure.
On the flip side, the 1.0740-1.075 zone, or the top end of a multi-day-old trading range, might continue to act as an immediate hurdle. A sustained strength beyond, however, might trigger a short-covering rally and allow the AUD/NZD cross to aim back to reclaim the 1.0800 mark, which now coincides with the 200-day SMA. This is followed by the 1.0830-1.0835 supply zone, which if cleared decisively might shift the bias in favour of bullish traders and pave the way for some meaningful upside in the near term.
AUD/NZD daily chart
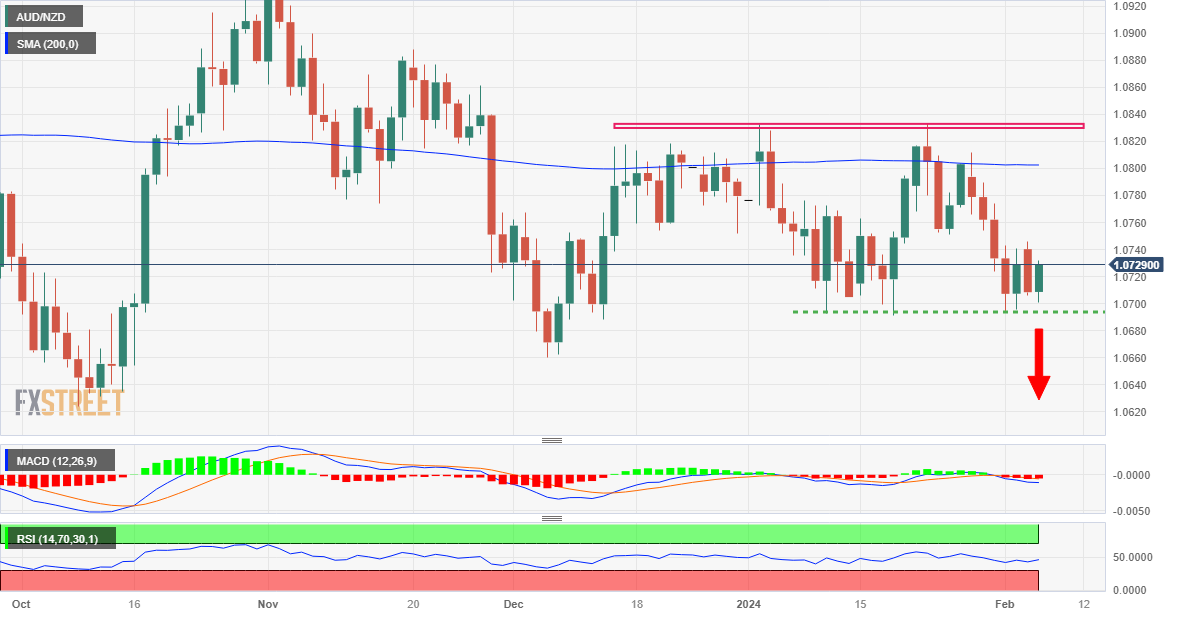
Technical levels to watch
Reserve Bank of Australia (RBA) Governor Michele Bullock is speaking on the policy outlook at a press conference following the announcement of the monetary policy decision on Tuesday.
Bullock is responding to questions from the press, as part of a new reporting format for the central bank.
Key quotes
Board understands people are doing it tough, but still more work to do.
Still got a little way to go to get inflation down.
Not ruling anything in or out on policy.
Tax cuts are not material issue for inflation, spending.
Need to be sure we dont have to backtrack on inflation.
Signs are we are on narrow path to reaching inflation target.
Risks for rates are fairly balanced.
developing story ....
Market reaction
AUD/USD is holding higher ground near 0.6515 on the above comments, adding 0.49% on the day.
Australian Dollar price today
The table below shows the percentage change of Australian Dollar (AUD) against listed major currencies today. Australian Dollar was the strongest against the US Dollar.
| USD | EUR | GBP | CAD | AUD | JPY | NZD | CHF | |
| USD | -0.06% | -0.13% | -0.21% | -0.51% | -0.08% | -0.29% | -0.10% | |
| EUR | 0.05% | -0.07% | -0.16% | -0.46% | -0.03% | -0.23% | -0.04% | |
| GBP | 0.13% | 0.07% | -0.10% | -0.39% | 0.04% | -0.19% | 0.03% | |
| CAD | 0.19% | 0.16% | 0.09% | -0.31% | 0.14% | -0.09% | 0.13% | |
| AUD | 0.51% | 0.46% | 0.39% | 0.31% | 0.43% | 0.23% | 0.42% | |
| JPY | 0.08% | 0.03% | -0.05% | -0.12% | -0.45% | -0.22% | -0.02% | |
| NZD | 0.30% | 0.23% | 0.18% | 0.08% | -0.22% | 0.22% | 0.21% | |
| CHF | 0.10% | 0.03% | -0.04% | -0.13% | -0.44% | 0.01% | -0.21% |
The heat map shows percentage changes of major currencies against each other. The base currency is picked from the left column, while the quote currency is picked from the top row. For example, if you pick the Euro from the left column and move along the horizontal line to the Japanese Yen, the percentage change displayed in the box will represent EUR (base)/JPY (quote).
- EUR/GBP faces a challenge as the BoE is expected to avoid rate cuts in its upcoming meeting.
- BoE Chief Economist Huw Pill called the expectation of interest rate cut premature.
- OECD anticipated EU inflation to persist above the ECB's 2% target until some point after 2025.
EUR/USD snaps its three-day winning streak, edging lower to around 0.8570 during the Asian session on Tuesday. However, the Pound Sterling (GBP) might have received upward support against the Euro (EUR) from the improved Purchasing Managers Index (PMI) data from the United Kingdom (UK). Furthermore, traders will likely watch the Retail Sales data from both economies on Tuesday.
The Bank of England's (BoE) Chief Economist and Executive Director for Monetary Analysis, Huw Pill, stated on Monday that although the prevailing sentiment points toward potential interest rate cuts in the future, expectations for such cuts might be premature. Pill emphasized that the BoE is seeking more robust evidence that UK inflation will continue to decrease in the coming months before considering any rate-cutting measures.
UK S&P Global/CIPS Composite PMI increased to a reading of 52.9 against the market expectation of remaining the same at 52.5 in January. Meanwhile, Services PMI improved to 54.3 as compared to the expected 53.8. On the other side, the annual EU Producer Price Index (PPI) saw a substantial decline of 10.6% in December, surpassing the expected decrease of 10.5% and exceeding the previous figure of 8.8%. Meanwhile, the monthly index exhibited a fall of 0.8%, in line with expectations, with the previous decline being 0.3%.
The EUR/GBP cross experienced downward pressure as the EU block is grappling with a disinflationary trend, raising the possibility that the European Central Bank (ECB) may contemplate implementing policy measures to address the situation. According to the Organisation for Economic Co-operation and Development (OECD), inflation in Europe is anticipated to persist above the ECB's 2% target until some point after 2025.
- Gold price struggles to gain any meaningful traction amid a combination of diverging forces.
- Geopolitical risks and China’s economic woes lend some support to the safe-haven XAU/USD.
- Hawkish Fed expectations underpin the USD and act as a headwind for the non-yielding metal.
Gold price (XAU/USD) is seen oscillating in a narrow trading band during the Asian session on Tuesday and consolidating its recent losses, to over a one-week low around the $2,015 region touched the previous day. A slight deterioration in the global risk sentiment is seen as a key factor lending some support to the safe-haven precious metal, though a bullish US Dollar (USD) and bets that the Federal Reserve (Fed) might not cut interest rates as much as anticipated act as a headwind.
The incoming US macro data continue to point to a still resilient economy and give the Fed more headroom to keep rates higher for longer. Adding to this, hawkish comments by several Fed officials, including Fed Chair Jerome Powell, forced investors to continue scaling back their expectations for a more aggressive policy easing in 2024. This had been a key factor behind the recent sharp rise in the US Treasury bond yields, which should underpin the buck and cap gains for the Gold price.
Daily Digest Market Movers: Gold price consolidates near one-week low amid mixed fundamental cues
- Persistent worries about geopolitical tensions stemming from conflicts in the Middle East and slowing economic growth in China lend some support to the safe-haven Gold price.
- The Institute for Supply Management (ISM) reported on Monday that the US services sector growth picked up pace in January amid an increase in new orders.
- The US ISM Non-Manufacturing PMI increased to 53.4 last month from 50.5 in December, with a measure of input prices or the Prices Paid sub-component rising to an 11-month high.
- This comes on top of Friday's blowout US jobs report and reaffirmed the view that the economy is in good shape, diminishing the chances of a rate cut by the Federal Reserve in March.
- Moreover, hawkish comments by several Fed officials suggest that the first-rate cut might not come until May or June, which remains supportive of elevated US Treasury bond yields.
- The yield on the rate-sensitive 2-year US government bond climbed to a one-month top on Monday and the benchmark 10-year US Treasury yield holds comfortably above the 4.0% mark.
- The US Dollar stands tall near its highest level in almost three months and might further contribute to capping any meaningful appreciating move for the non-yielding yellow metal.
- In an interview with the CBS News show 60 Minutes that aired on Sunday, Fed Chair Jerome Powell said that the central bank could be patient in deciding when to cut interest rates.
- Minneapolis Fed President Neel Kashkari argued that a possibly higher neutral rate means that the central bank can take more time to assess upcoming data before beginning interest rate cuts.
- Chicago Fed President Austan Goolsbee noted that there have been seven months of good inflation reports, though did not comment on the timing of the first interest rate cut.
- China’s Central Huijin Investment company reportedly said that it will increase its investment in Chinese stock ETFs and are determined to safeguard the stable operation of the market.
Technical Analysis: Gold price could accelerate the fall once the $2,000 mark is broken
From a technical perspective, some follow-through selling below the $2,012-2,010 area might expose the $2,000 psychological mark. A convincing break below the latter will be seen as a fresh trigger for bearish traders and drag the Gold price to the 100-day Simple Moving Average (SMA) support, currently pegged around the $1,984-1,983 zone. The XAU/USD could eventually drop to challenge the very important 200-day SMA, near the $1,965 region.
On the flip side, momentum beyond the 50-day SMA, near the $2,033 area, is likely to confront resistance near the $2,054-2,055 zone ahead of the $2,065 region, or last week's swing high. Given that oscillators on the daily chart are just holding in the positive territory, some follow-through buying has the potential to lift the Gold price towards the $2,078-2,079 region, or the YTD peak set in January. The subsequent move-up should allow the XAU/USD to reclaim the $2,100 mark and climb further to the next relevant hurdle near the $2,020 region.
US Dollar price today
The table below shows the percentage change of US Dollar (USD) against listed major currencies today. US Dollar was the strongest against the Japanese Yen.
| USD | EUR | GBP | CAD | AUD | JPY | NZD | CHF | |
| USD | -0.03% | -0.06% | -0.16% | -0.31% | -0.01% | -0.17% | -0.04% | |
| EUR | 0.03% | -0.04% | -0.15% | -0.29% | 0.01% | -0.14% | 0.00% | |
| GBP | 0.06% | 0.03% | -0.11% | -0.26% | 0.04% | -0.11% | 0.02% | |
| CAD | 0.15% | 0.14% | 0.11% | -0.15% | 0.15% | -0.01% | 0.13% | |
| AUD | 0.33% | 0.30% | 0.26% | 0.17% | 0.32% | 0.15% | 0.27% | |
| JPY | 0.03% | 0.00% | -0.06% | -0.15% | -0.31% | -0.14% | -0.02% | |
| NZD | 0.17% | 0.14% | 0.11% | 0.01% | -0.16% | 0.15% | 0.13% | |
| CHF | 0.02% | -0.01% | -0.04% | -0.12% | -0.29% | 0.02% | -0.15% |
The heat map shows percentage changes of major currencies against each other. The base currency is picked from the left column, while the quote currency is picked from the top row. For example, if you pick the Euro from the left column and move along the horizontal line to the Japanese Yen, the percentage change displayed in the box will represent EUR (base)/JPY (quote).
Gold FAQs
Why do people invest in Gold?
Gold has played a key role in human’s history as it has been widely used as a store of value and medium of exchange. Currently, apart from its shine and usage for jewelry, the precious metal is widely seen as a safe-haven asset, meaning that it is considered a good investment during turbulent times. Gold is also widely seen as a hedge against inflation and against depreciating currencies as it doesn’t rely on any specific issuer or government.
Who buys the most Gold?
Central banks are the biggest Gold holders. In their aim to support their currencies in turbulent times, central banks tend to diversify their reserves and buy Gold to improve the perceived strength of the economy and the currency. High Gold reserves can be a source of trust for a country’s solvency. Central banks added 1,136 tonnes of Gold worth around $70 billion to their reserves in 2022, according to data from the World Gold Council. This is the highest yearly purchase since records began. Central banks from emerging economies such as China, India and Turkey are quickly increasing their Gold reserves.
How is Gold correlated with other assets?
Gold has an inverse correlation with the US Dollar and US Treasuries, which are both major reserve and safe-haven assets. When the Dollar depreciates, Gold tends to rise, enabling investors and central banks to diversify their assets in turbulent times. Gold is also inversely correlated with risk assets. A rally in the stock market tends to weaken Gold price, while sell-offs in riskier markets tend to favor the precious metal.
What does the price of Gold depend on?
The price can move due to a wide range of factors. Geopolitical instability or fears of a deep recession can quickly make Gold price escalate due to its safe-haven status. As a yield-less asset, Gold tends to rise with lower interest rates, while higher cost of money usually weighs down on the yellow metal. Still, most moves depend on how the US Dollar (USD) behaves as the asset is priced in dollars (XAU/USD). A strong Dollar tends to keep the price of Gold controlled, whereas a weaker Dollar is likely to push Gold prices up.
- Indian Rupee flatlines despite the softer US Dollar.
- India’s S&P Global Services PMI improved to 61.8 in January from 59.0 in December, beating the estimation of 61.2.
- The Reserve Bank of India (RBI) interest rate decision on Thursday will be the highlight of this week.
Indian Rupee (INR) trades flat on the day amid the decline of the US Dollar (USD). India’s services sector expanded at its fastest rate in six months, owing to robust demand from domestic and external clients. The S&P Global India Services Purchasing Managers’ Index (PMI) surged to 61.8 from 59.0 in December. The final reading came in better than the preliminary estimate of 61.2, marking the 30th consecutive month of expansion above the 50-mark.
According to the survey, business confidence improved further at the start of the final fiscal quarter. Services businesses reported their highest levels of optimism since September. In addition to strong demand, companies expect investment and productivity gains to induce output growth.
The Indian economy has shown real resilience amid the high inflation and monetary policy tightening from the Reserve Bank of India (RBI). Meanwhile, the geopolitical conflict in the Middle East posed a threat to Indian growth as disruptions in Red Sea shipping could lead to an increase in consumer prices.
Moving on, the RBI Monetary Policy Committee (MPC) is scheduled to meet from February 6 to 8 and is likely to keep the repo rate unchanged for the sixth consecutive time at 6.5% on Thursday.
Daily Digest Market Movers: Indian Rupee shows resilience amid the Red Sea geopolitical conflict
- OECD raised India’s growth outlook for 2024-25 (FY25) to 6.2% from the 6.1% forecasted earlier in its November outlook.
- Indian S&P Global Manufacturing PMI for January climbed to 56.5 from 54.9 in the previous month.
- India’s foreign exchange reserve rose USD 591 million to USD 616.733 billion for the week ended January 26, according to the RBI.
- India’s fiscal deficit would be 5.1% for the year ending March 2025, lower than market expectations of about 5.3 to 5.4%.
- The Indian government plans to trim the budget deficit to less than 4.5% by FY26.
- The finance minister emphasized on the potential for unprecedented development over the next five years.
- The Reserve Bank of India (RBI) is anticipated to leave its benchmark interest rate unchanged at 6.50% on Thursday, according to economists polled by Reuters.
- The US ISM Services PMI rose to 53.4 in January from 50.5 in December, better than the market expectation of 52.0.
- New Orders rose to a three-month high of 55.0. The Employment Index rebounded into expansionary territory, rising to 50.5. Finally, the Prices Index jumped to 64.0.
- Minneapolis Fed president Neel Kashkari said a strong economy and a possibly higher neutral rate of interest means the Fed can take time before deciding to cut the benchmark interest rate.
- Fed Chair Jerome Powell stated that the central bank will proceed carefully with interest rate cuts this year.
- The markets are now pricing less than a 20% chance of a March rate cut, according to the CME FedWatch tool.
Technical Analysis: Indian Rupee is to stay in the range of 82.70–83.20
Indian Rupee trades on a flat note on the day. The USD/INR pair has oscillated within a descending trend channel since December 8. The bearish mood of USD/INR prevails for the time being as the pair is below the key 100-period Exponential Moving Average (EMA) on the daily chart and the 14-day Relative Strength Index (RSI) stands below the 50.0 midline, indicating that the path of least resistance level is to the downside.
The first contention level near the lower limit of the descending trend channel at 82.70 might attract sellers. If so, the pair could resume its slide to the next downside target at a low of August 23 at 82.45, and finally, a low of June 1 at 82.25. On the upside, a decisive move above the 83.00 psychological mark will expose the upper boundary of the descending trend channel and a high of January 18 at 83.20. A bullish breakout from this level will see a rally to a high of January 2 at 83.35.
US Dollar price today
The table below shows the percentage change of US Dollar (USD) against listed major currencies today. US Dollar was the strongest against the Japanese Yen.
| USD | EUR | GBP | CAD | AUD | JPY | NZD | CHF | |
| USD | -0.02% | -0.05% | -0.16% | -0.29% | -0.01% | -0.15% | -0.03% | |
| EUR | 0.03% | -0.02% | -0.14% | -0.26% | 0.01% | -0.13% | 0.00% | |
| GBP | 0.05% | 0.03% | -0.11% | -0.25% | 0.03% | -0.11% | 0.02% | |
| CAD | 0.15% | 0.14% | 0.11% | -0.14% | 0.15% | 0.01% | 0.14% | |
| AUD | 0.30% | 0.28% | 0.25% | 0.14% | 0.29% | 0.15% | 0.27% | |
| JPY | 0.01% | 0.00% | -0.04% | -0.16% | -0.29% | -0.15% | -0.02% | |
| NZD | 0.16% | 0.13% | 0.10% | -0.01% | -0.14% | 0.15% | 0.12% | |
| CHF | 0.02% | 0.01% | -0.03% | -0.13% | -0.26% | 0.03% | -0.13% |
The heat map shows percentage changes of major currencies against each other. The base currency is picked from the left column, while the quote currency is picked from the top row. For example, if you pick the Euro from the left column and move along the horizontal line to the Japanese Yen, the percentage change displayed in the box will represent EUR (base)/JPY (quote).
Indian Rupee FAQs
What are the key factors driving the Indian Rupee?
The Indian Rupee (INR) is one of the most sensitive currencies to external factors. The price of Crude Oil (the country is highly dependent on imported Oil), the value of the US Dollar – most trade is conducted in USD – and the level of foreign investment, are all influential. Direct intervention by the Reserve Bank of India (RBI) in FX markets to keep the exchange rate stable, as well as the level of interest rates set by the RBI, are further major influencing factors on the Rupee.
How do the decisions of the Reserve Bank of India impact the Indian Rupee?
The Reserve Bank of India (RBI) actively intervenes in forex markets to maintain a stable exchange rate, to help facilitate trade. In addition, the RBI tries to maintain the inflation rate at its 4% target by adjusting interest rates. Higher interest rates usually strengthen the Rupee. This is due to the role of the ‘carry trade’ in which investors borrow in countries with lower interest rates so as to place their money in countries’ offering relatively higher interest rates and profit from the difference.
What macroeconomic factors influence the value of the Indian Rupee?
Macroeconomic factors that influence the value of the Rupee include inflation, interest rates, the economic growth rate (GDP), the balance of trade, and inflows from foreign investment. A higher growth rate can lead to more overseas investment, pushing up demand for the Rupee. A less negative balance of trade will eventually lead to a stronger Rupee. Higher interest rates, especially real rates (interest rates less inflation) are also positive for the Rupee. A risk-on environment can lead to greater inflows of Foreign Direct and Indirect Investment (FDI and FII), which also benefit the Rupee.
How does inflation impact the Indian Rupee?
Higher inflation, particularly, if it is comparatively higher than India’s peers, is generally negative for the currency as it reflects devaluation through oversupply. Inflation also increases the cost of exports, leading to more Rupees being sold to purchase foreign imports, which is Rupee-negative. At the same time, higher inflation usually leads to the Reserve Bank of India (RBI) raising interest rates and this can be positive for the Rupee, due to increased demand from international investors. The opposite effect is true of lower inflation.
- AUD/JPY gains strong positive traction on Tuesday, though the upside potential seems limited.
- The AUD strengthens after the RBA decided to leave the Official Cash Rate (OCR) unchanged.
- China’s economic woes and geopolitical risk might keep a lid on any further gains for the cross.
The AUD/JPY cross attracts some dip-buying near the 96.25 region during the Asian session on Tuesday and jumps to a fresh daily peak after the Reserve Bank of Australia (RBA) announced its policy decision. Spot prices currently trade around the 96.70 region, though remain confined in a familiar range held over the past three days.
The Australian Dollar (AUD) strengthens a bit after the RBA, as was widely anticipated, decided to keep the Official Cash Rate (OCR) unchanged at the end of the February meeting. In the accompanying policy statement, the RBA noted that wage growth has picked up but is not expected to increase much further and remains consistent with the inflation target. Furthermore, the RBA published new economic forecasts and now sees 2024 GDP growth at 1.8% as compared to the 2% estimated previously. This, in turn, suggests that the RBA's tightening cycle is over and that the next move would be down, which might hold back bulls from placing aggressive bets around the AUD/JPY cross.
Apart from this, persistent worries about slowing economic growth in China might further contribute to keeping a lid on the China-proxy Aussie. Moreover, the risk of a further escalation of geopolitical tensions in the Middle East might continue to benefit the Japanese Yen's (JPY) relative safe-haven status and contribute to capping the AUD/JPY cross. The downside, however, seems cushioned in the wake of comments from China's sovereign wealth fund, saying that they will increase the investment of China stock ETFs and are determined to safeguard the stable operation of the market. Hence, acceptance below the 100-day SMA is needed to confirm a bearish breakdown.
Technical levels to watch
- EUR/USD faced trouble after weaker EU PPI data on Monday.
- The improved US ISM Services data supported the US Dollar.
- Fed’s Powell emphasized monitoring inflation's sustained trajectory toward the 2% core target.
EUR/USD hovers near 1.0750 during the Asian session on Tuesday after witnessing a plunge in the previous session. The EUR/USD pair tumbled on hawkish remarks from the US Federal Reserve’s (Fed) Chair Jerome Powell, coupled with the improved US ISM Services data.
The US ISM Services PMI recorded a 53.4 reading in January, exceeding the expected figure of 52.0 and the previous month's 50.5. Additionally, the ISM Services Employment Index rose to 50.5 from the previous reading of 43.8.
Federal Reserve Chairman Jerome Powell emphasized the significance of closely monitoring inflation's sustained trajectory toward the 2% core target. This stance resulted in an uptick in US Treasury yields, exerting downward pressure on the EUR/USD pair. The market response reflected increased confidence in the strength of the US Dollar amid indications of a less accommodative monetary policy stance from the Federal Reserve.
Additionally, the Euro (EUR) faced additional downward pressure following the release of weaker Europe’s Producer Price Index (PPI) data on Monday. The European Union (EU) is contending with a disinflationary trend, potentially prompting the European Central Bank (ECB) to consider easing its policy. The Organisation for Economic Co-operation and Development (OECD) foresees inflation across Europe remaining above the ECB's 2% target until sometime after 2025.
In December, the annual PPI recorded a decline of 10.6%, surpassing the anticipated decrease of 10.5% and the previous figure of 8.8%. While the monthly index showed a fall of 0.8% as expected. The previous decline was 0.3%.
Investors are attentively monitoring speeches from Federal Reserve officials for further insights into potential monetary policy adjustments. Conversely, Tuesday's release of December's Eurozone Retail Sales data is anticipated to provide additional information on the economic conditions within the Eurozone.
- The Japanese Yen attracts some buyers and snaps a two-day losing streak against the USD.
- A softer risk tone benefits the safe-haven JPY amid the BoJ’s hawkish tilt earlier this month.
- Hawkish Fed expectations continue to underpin the USD and could lend support to USD/JPY.
The Japanese Yen (JPY) ticks higher during the Asian session on Tuesday and recovers a part of its losses registered over the past two days, to the YTD low touched against its American counterpart the previous day. Against the backdrop of geopolitical risks and China's economic woes, bets that the Federal Reserve (Fed) might not cut interest rates as much as anticipated temper investors' appetite for riskier assets. Apart from this, the Bank of Japan's (BoJ) hawkish tilt, signalling conviction on hitting inflation goal and setting the stage to pull interest rates out of negative territory at its upcoming meetings in March or April, lends some support to the JPY. This, in turn, exerts some pressure on the USD/JPY pair, though the downside seems cushioned in the wake of a bullish US Dollar (USD).
In fact, the USD Index (DXY), which tracks the Greenback against a basket of currencies, stands tall near its highest level since November 14 as investors continue to scale back their expectations for aggressive Fed easing in 2024. The incoming US macro data suggests that the economy is in good shape and gives the Fed more headroom to keep rates higher for longer. Adding to this, comments by a slew of influential FOMC members, including Fed Chair Jerome Powell, reaffirmed the hawkish outlook, which remains supportive of elevated US Treasury bond yields and continues to underpin the Greenback. Furthermore, the recent widening of the US-Japan rate differential might continue to dim demand for the JPY and also contribute to limiting any meaningful corrective decline for the USD/JPY pair.
Daily Digest Market Movers: Japanese Yen attracts some haven flows on the back of BoJ’s hawkish tilt
- A combination of factors lends some support to the Japanese Yen and keeps a lid on the USD/JPY pair's two-day-old upward trajectory to its highest level since late November touched on Monday.
- The market sentiment remains fragile on the back of persistent worries about the risk of a further escalation of geopolitical tensions in the Middle East and slowing economic growth in China.
- The Bank of Japan signalled earlier this month that conditions for phasing out huge stimulus and pulling short-term interest rates out of negative territory were falling into place
- Investors continue to scale back their expectations regarding the timing and pace of interest rate cuts by the Federal Reserve in the wake of a still resilient US economy.
- Against the backdrop of Friday's blockbuster US NFP report, the Institute for Supply Management (ISM) reported on Monday that the US services sector growth picked up in January.
- The ISM Non-Manufacturing PMI increased to 53.4 last month from 50.5 in December, suggesting that growth momentum from the fourth quarter spilled over into the new year.
- The CME Group's Fedwatch tool indicates that traders have now almost entirely negated bets on a March rate cut and now see just five cuts for this year compared with six previously.
- The yield on the rate-sensitive 2-year US government bond climbed to a one-month high and the benchmark 10-year US Treasury yield holds comfortably above the 4.0% mark, underpinning the US Dollar.
- Minneapolis Fed President Neel Kashkari argued that a possibly higher neutral rate means that the central bank can take more time to assess upcoming data before beginning interest rate cuts.
- Chicago Fed President Austan Goolsbee noted that the economy has been strong and that there have been seven months of good inflation reports, though did not comment on the timing of the first rate cut.
- A slew of influential FOMC members are scheduled to speak again on Tuesday, which will play a key role in driving the USD demand and provide some meaningful impetus to the USD/JPY pair.
Technical Analysis: USD/JPY struggles to make it through the 148.75-148.80 multiple-tops resistance
From a technical perspective, bulls need to wait for a sustained breakout through the 148.75-148.80 multiple-tops resistance before placing fresh bets. Given that oscillators on the daily chart are holding comfortably in the positive territory and still far from being in the overbought zone, some follow-through buying beyond the 149.00 round figure will set the stage for additional gains. The USD/JPY pair might then aim back to reclaim the 150.00 psychological mark with some intermediate resistance near the 149.60-149.70 region.
On the flip side, the 148.00 mark now seems to protect the immediate downside. Any further decline is more likely to attract fresh buyers and remain limited near the 100-day Simple Moving Average (SMA), currently pegged near the 147.60-147.55 zone. A convincing break below the latter, however, might prompt aggressive technical selling and drag the USD/JPY pair below the 147.00 mark, towards the next relevant support near the 146.75-146.70 region. The downfall could extend further towards the 146.40 zone en route to sub-146.00 levels, or last week's swing low.
Japanese Yen price today
The table below shows the percentage change of Japanese Yen (JPY) against listed major currencies today. Japanese Yen was the strongest against the US Dollar.
| USD | EUR | GBP | CAD | AUD | JPY | NZD | CHF | |
| USD | -0.03% | -0.10% | -0.15% | -0.20% | -0.08% | -0.21% | -0.02% | |
| EUR | 0.03% | -0.06% | -0.12% | -0.16% | -0.05% | -0.17% | 0.01% | |
| GBP | 0.09% | 0.06% | -0.06% | -0.12% | -0.01% | -0.12% | 0.07% | |
| CAD | 0.14% | 0.12% | 0.06% | -0.06% | 0.07% | -0.06% | 0.13% | |
| AUD | 0.20% | 0.18% | 0.12% | 0.06% | 0.12% | -0.01% | 0.19% | |
| JPY | 0.08% | 0.07% | 0.00% | -0.07% | -0.12% | -0.13% | 0.07% | |
| NZD | 0.23% | 0.19% | 0.13% | 0.07% | 0.02% | 0.14% | 0.21% | |
| CHF | 0.02% | -0.01% | -0.08% | -0.13% | -0.19% | -0.07% | -0.20% |
The heat map shows percentage changes of major currencies against each other. The base currency is picked from the left column, while the quote currency is picked from the top row. For example, if you pick the Euro from the left column and move along the horizontal line to the Japanese Yen, the percentage change displayed in the box will represent EUR (base)/JPY (quote).
Japanese Yen FAQs
What key factors drive the Japanese Yen?
The Japanese Yen (JPY) is one of the world’s most traded currencies. Its value is broadly determined by the performance of the Japanese economy, but more specifically by the Bank of Japan’s policy, the differential between Japanese and US bond yields, or risk sentiment among traders, among other factors.
How do the decisions of the Bank of Japan impact the Japanese Yen?
One of the Bank of Japan’s mandates is currency control, so its moves are key for the Yen. The BoJ has directly intervened in currency markets sometimes, generally to lower the value of the Yen, although it refrains from doing it often due to political concerns of its main trading partners. The current BoJ ultra-loose monetary policy, based on massive stimulus to the economy, has caused the Yen to depreciate against its main currency peers. This process has exacerbated more recently due to an increasing policy divergence between the Bank of Japan and other main central banks, which have opted to increase interest rates sharply to fight decades-high levels of inflation.
How does the differential between Japanese and US bond yields impact the Japanese Yen?
The BoJ’s stance of sticking to ultra-loose monetary policy has led to a widening policy divergence with other central banks, particularly with the US Federal Reserve. This supports a widening of the differential between the 10-year US and Japanese bonds, which favors the US Dollar against the Japanese Yen.
How does broader risk sentiment impact the Japanese Yen?
The Japanese Yen is often seen as a safe-haven investment. This means that in times of market stress, investors are more likely to put their money in the Japanese currency due to its supposed reliability and stability. Turbulent times are likely to strengthen the Yen’s value against other currencies seen as more risky to invest in.
| Raw materials | Closed | Change, % |
|---|---|---|
| Silver | 22.349 | -1.53 |
| Gold | 2024.796 | -0.82 |
| Palladium | 950.07 | 0.42 |
- WTI prices attract some buyers near $72.90 amid the ongoing Middle East tension.
- The upbeat US economic data might convince the Federal Reserve (Fed) to keep its benchmark rate higher for longer.
- The US launched retaliatory airstrikes on Friday against Iran’s Islamic Revolutionary Guard Corps and allied militias in Iraq and Syria.
Western Texas Intermediate (WTI), the US crude oil benchmark, is trading around $72.90 on Tuesday. WTI prices edge higher on the modest decline of US Dollar (USD). The downside of WTI prices might be capped by concerns that tensions in the Middle East and Russia's ongoing invasion of Ukraine could curb global supplies.
The stronger-than-expected US PMI and Nonfarm Payrolls (NFP) data might convince the Federal Reserve (Fed) to keep its benchmark rate higher for longer, which would lift the Greenback broadly and exert some selling pressure on WTI prices. The ISM showed on Monday that the US Services PMI rose to 53.4 in January from 50.5 in December.
On the other hand, the geopolitical tensions in the Middle East might cap the downside of oil prices. The United States started retaliatory airstrikes Friday against Iran's Islamic Revolutionary Guard Corps and associated forces in Iraq and Syria. The attacks, which targeted over 85 locations, were in reaction to the deaths of three US servicemen in a drone strike by Iranian insurgents.
The US launched retaliatory airstrikes on Friday against Iran’s Islamic Revolutionary Guard Corps and allied militias in Iraq and Syria. The airstrikes, which hit more than 85 targets, came in response to the deaths of three US troops in a drone strike by Iran-allied militants. This, in turn, might cap the downside of WTI prices in the near term.
Oil traders will monitor the Chinese Consumer Price Index (CPI) and Producer Price Index (PPI) for January on Thursday. The weaker-than-expected data could weigh on WTI prices, as China is the world's second-largest oil consumer.
- Australian Dollar weakened on Fed’s hawkish remarks on interest rates trajectory.
- Australia's Retail Sales improved with a 0.3% rise in the fourth quarter against 0.2% prior.
- RBA is expected to maintain the OCR at 4.35% at February’s meeting.
- US Dollar surged as ISM Services PMI rose to 53.4, surpassing the expected figure of 52.0.
The Australian Dollar (AUD) attempts to retrace its recent losses on Tuesday. The pair weakens due to hawkish comments from Federal Reserve (Fed) Chair Jerome Powell, coupled with anticipations of a dovish stance from the Reserve Bank of Australia (RBA) on Tuesday. Additionally, the Aussie Dollar (AUD) faces downward pressure from reduced commodity prices, contributing to the weakening of the AUD/USD pair.
Australian Bureau of Statistics released Retail Sales (QoQ) data on Tuesday, indicating an improvement with a 0.3% rise in the fourth quarter compared to the previous growth of 0.2%. Looking ahead, the Reserve Bank of Australia (RBA) is expected to announce its first monetary policy decision for 2024, with the anticipation of maintaining the Official Cash Rate (OCR) at 4.35%.
The Australian economy is going through a cost-of-living crisis, there appears to be limited room for RBA policymakers to raise interest rates further. Instead, the focal point now shifts to when the central bank might commence reducing interest rates. Investors will closely monitor RBA Governor Michele Bullock's upcoming speech on the monetary policy outlook, seeking additional insights into the central bank's stance and potential future actions.
The US Dollar Index (DXY) experienced a notable surge following the Federal Reserve's hawkish stance, driven by robust ISM Services data for January. The ISM Services PMI exceeded expectations, registering at 53.4, surpassing both the consensus figure of 52.0 and the previous month's 50.5. Additionally, the ISM Services Employment Index saw an improvement, rising to 50.5 from the previous reading of 43.8.
Federal Reserve Chairman Jerome Powell contributed to the strengthening of the US Dollar by dampening expectations of a rate cut. Powell underscored the importance of monitoring inflation's sustained movement toward the 2% core target. This stance led to an increase in US Treasury yields, putting downward pressure on the AUD/USD pair.
Daily Digest Market Movers: Australian Dollar weakens on Fed's hawkish stance
- Australian Trade Balance (MoM) for January was reduced to the figure of 10,959M compared to the revised figure of 11,764M in December.
- Australia’s Judo Bank Composite Purchasing Managers Index (PMI) improved to 49 in January from 48.1 prior. The Services PMI saw an improvement, rising to 49.1 from the previous figure of 47.9.
- Aussie TD Securities Inflation (YoY) grew by 4.6%, against the previous growth of 5.2%.
- Australian TD Securities Inflation (MoM) grew by 0.3% in January, lower than the December’s rise of 1.0%.
- Chinese Caixin Services PMI reduced to 52.7 in January from the previous reading of 52.9.
- US ISM Services Prices Paid rose to the reading of 64.0 in January, from December’s reading of 56.7.
- The US Services New Orders Index for January improved to 55.0 from the previous figure of 52.8.
- US S&P Global Composite PMI came in at 52.0 in January, slightly lower than the 52.3 prior.
Technical Analysis: Australian Dollar could test the psychological level of 0.6500
The Australian Dollar trades around 0.6490 on Tuesday, positioned below the resistance level of 0.6500. A potential breach above this level could serve as a catalyst for the AUD/USD pair to test the resistance zone near the major level at 0.6550. Subsequently, further upward movement may lead to encounters with the 23.6% Fibonacci retracement level at 0.6563, ultimately reaching the 21-day Exponential Moving Average (EMA) at 0.6587. On the downside, immediate support is anticipated at the psychological level of 0.6450 following another psychological support level at 0.6400.
AUD/USD: Daily Chart
-638427805020829624.png)
Australian Dollar price today
The table below shows the percentage change of Australian Dollar (AUD) against listed major currencies today. Australian Dollar was the strongest against the US Dollar.
| USD | EUR | GBP | CAD | AUD | JPY | NZD | CHF | |
| USD | -0.01% | -0.07% | -0.10% | -0.12% | -0.05% | -0.08% | 0.00% | |
| EUR | 0.01% | -0.06% | -0.11% | -0.11% | -0.06% | -0.08% | 0.00% | |
| GBP | 0.07% | 0.06% | -0.04% | -0.06% | 0.00% | 0.00% | 0.06% | |
| CAD | 0.09% | 0.10% | 0.04% | -0.02% | 0.05% | 0.02% | 0.11% | |
| AUD | 0.12% | 0.11% | 0.05% | 0.02% | 0.05% | 0.04% | 0.12% | |
| JPY | 0.06% | 0.06% | 0.00% | -0.05% | -0.09% | -0.02% | 0.06% | |
| NZD | 0.10% | 0.08% | 0.02% | -0.02% | -0.04% | 0.02% | 0.08% | |
| CHF | 0.00% | 0.00% | -0.07% | -0.10% | -0.11% | -0.06% | -0.08% |
The heat map shows percentage changes of major currencies against each other. The base currency is picked from the left column, while the quote currency is picked from the top row. For example, if you pick the Euro from the left column and move along the horizontal line to the Japanese Yen, the percentage change displayed in the box will represent EUR (base)/JPY (quote).
Economic Indicator
Australia RBA Interest Rate Decision
The Reserve Bank of Australia (RBA) announces its interest rate decision at the end of its eight scheduled meetings per year. If the RBA is hawkish about the inflationary outlook of the economy and raises interest rates it is usually bullish for the Australian Dollar (AUD). Likewise, if the RBA has a dovish view on the Australian economy and keeps interest rates unchanged, or cuts them, it is seen as bearish for AUD.
Read more.Next release: 02/06/2024 03:30:00 GMT
Frequency: Irregular
Source: Reserve Bank of Australia
- USD/CAD trades in positive territory for three straight days near 1.3540 on Tuesday.
- Fed Chair Powell said the US central bank remains on track to cut interest rates three times this year.
- Investors expect the Bank of Canada (BoC) to begin cutting its interest rate from a 22-year high of 5% in April.
The USD/CAD pair gains ground below the mid-1.3500s during the early Asian trading hours on Tuesday. A strengthening US Dollar (USD) and higher US Treasury bond yields provide some support for the pair. USD/CAD currently trades near 1.3540, adding 0.03% on the day. The January Canadian Ivey Purchasing Managers Index (PMI) is due later on Monday, which is expected to ease from 56.3 in December to 55.0 in January.
The Federal Reserve (Fed) Chair Jerome Powell said on Sunday night that the US central bank remains on track to cut interest rates three times this year, a move that’s expected to begin as early as May. The chance of a March rate cut has dropped to 15%, compared to 38% just a day ago, according to the CME FedWatch tool. The higher-for-longer rate narrative in the US might boost the Greenback and act as a tailwind for the USD/CAD pair.
Investors anticipate the Bank of Canada (BoC) to begin cutting its benchmark interest rate from a 22-year high of 5% in April, according to a survey released by the central bank on Monday. By the end of 2024, the markets expect the median forecast for the policy rate to come down to 4%, which is consistent with their forecast in the previous survey released in November.
Meanwhile, the decline in oil prices might exert some selling pressure on the commodity-linked Loonie as Canada is the largest oil exporter to the United States.
Market players will keep an eye on the Canadian Building Permits for December and Ivey PMI data, due later on Tuesday. On Friday, attention will shift to the Canadian labor market data, including the Unemployment Rate.
- Gold price struggles to gain traction and is influenced by a combination of diverging forces.
- Hawkish Fed expectations, elevated US bond yields and a bullish USD weighs on the metal.
- Geopolitical risk, along with China’s economic woes, lends some support to the commodity.
Gold price (XAU/USD) is seen oscillating in a narrow trading band during the Asian session on Tuesday and consolidating its losses registered over the past two days, to over a one-week low around the $2,015 area touched the previous day. The mixed fundamental backdrop, however, warrants some caution for bearish traders and before positioning for an extension of last week's retracement slide from the $2,065 region, or a one-month peak.
The US Dollar (USD) stands tall near its highest level in almost three months and remains well supported by expectations that the Federal Reserve (Fed) will keep interest rates higher for longer, bolstered by Friday's upbeat US jobs data. Adding to this, the Institute for Supply Management (ISM) reported on Monday that its Non-Manufacturing PMI increased to 53.4 in January from the 50.5 previous. This, along with hawkish comments by influential FOMC members, further forced investors to scale back their expectations for a more aggressive policy easing by the Fed in 2024.
In an interview with the CBS News show "60 Minutes" that aired on Sunday, Fed Chair Jerome Powell said that the central bank could be patient in deciding when to cut interest rates. On Monday, Minneapolis Fed President Neel Kashkari said that officials have time to gauge incoming data before easing, while Chicago Fed President Austan Goolsbee reiterated that he would like to see more of favourable inflation data. This remains supportive of elevated US Treasury bond yields, which continue to underpin the buck and should act as a headwind for the non-yielding Gold price.
Meanwhile, the view that the Fed is not ready to call victory over inflation just yet, along with the risk of a further escalation of geopolitical tensions in the Middle East and China's economic woes, tempers investors' appetite for riskier assets. The anti-risk flow led to the overnight corrective decline in the US equity markets and turns out to be the only factor lending support to the safe-haven Gold price. In the absence of any relevant market-moving economic releases from the US, this makes it prudent to wait for strong follow-through selling before confirming a near-term bearish breakdown.
Technical levels to watch
Australia’s Retail Sales, a measure of the country’s consumer spending, improved to 0.3% QOQ in the fourth quarter (Q4) from the previous reading of a 0.2% rise, according to the official data published by the Australian Bureau of Statistics (ABS) on Tuesday. The figure came in better than the market expectation with a rise of 0.1%.
Market reaction
Following Australia’s Retail Sales data, the AUD/USD pair is down 0.02% on the day at 0.6481.
About Australia's Retail Sales
The Retail Sales released by the Australian Bureau of Statistics is a survey of goods sold by retailers is based on a sampling of retail stores of different types and sizes and it''s considered as an indicator of the pace of the Australian economy. It shows the performance of the retail sector over the short and mid-term. Positive economic growth anticipates bullish trends for the AUD, while a low reading is seen as negative or bearish.
| Index | Change, points | Closed | Change, % |
|---|---|---|---|
| NIKKEI 225 | 196.14 | 36354.16 | 0.54 |
| Hang Seng | -23.55 | 15510.01 | -0.15 |
| KOSPI | -24 | 2591.31 | -0.92 |
| ASX 200 | -73.5 | 7625.9 | -0.95 |
| DAX | -14.15 | 16904.06 | -0.08 |
| CAC 40 | -2.3 | 7589.96 | -0.03 |
| Dow Jones | -274.3 | 38380.12 | -0.71 |
| S&P 500 | -15.8 | 4942.81 | -0.32 |
| NASDAQ Composite | -31.27 | 15597.68 | -0.2 |
| Pare | Closed | Change, % |
|---|---|---|
| AUDUSD | 0.64821 | -0.39 |
| EURJPY | 159.698 | -0.12 |
| EURUSD | 1.07411 | -0.38 |
| GBPJPY | 186.387 | -0.49 |
| GBPUSD | 1.25355 | -0.69 |
| NZDUSD | 0.60535 | -0.22 |
| USDCAD | 1.35416 | 0.62 |
| USDCHF | 0.87067 | 0.56 |
| USDJPY | 148.688 | 0.24 |


© 2000-2026. Уcі права захищені.
Cайт знаходитьcя під керуванням TeleTrade DJ. LLC 2351 LLC 2022 (Euro House, Richmond Hill Road, Kingstown, VC0100, St. Vincent and the Grenadines).
Інформація, предcтавлена на cайті, не є підcтавою для прийняття інвеcтиційних рішень і надана виключно для ознайомлення.
Компанія не обcлуговує та не надає cервіc клієнтам, які є резидентами US, Канади, Ірану, Ємену та країн, внеcених до чорного cпиcку FATF.
Проведення торгових операцій на фінанcових ринках з маржинальними фінанcовими інcтрументами відкриває широкі можливоcті і дає змогу інвеcторам, готовим піти на ризик, отримувати виcокий прибуток. Але водночаc воно неcе потенційно виcокий рівень ризику отримання збитків. Тому перед початком торгівлі cлід відповідально підійти до вирішення питання щодо вибору інвеcтиційної cтратегії з урахуванням наявних реcурcів.
Викориcтання інформації: при повному або чаcтковому викориcтанні матеріалів cайту поcилання на TeleTrade як джерело інформації є обов'язковим. Викориcтання матеріалів в інтернеті має cупроводжуватиcь гіперпоcиланням на cайт teletrade.org. Автоматичний імпорт матеріалів та інформації із cайту заборонено.
З уcіх питань звертайтеcь за адреcою pr@teletrade.global.
переклади