- Analytics
- News and Tools
- Market News
Новини ринків
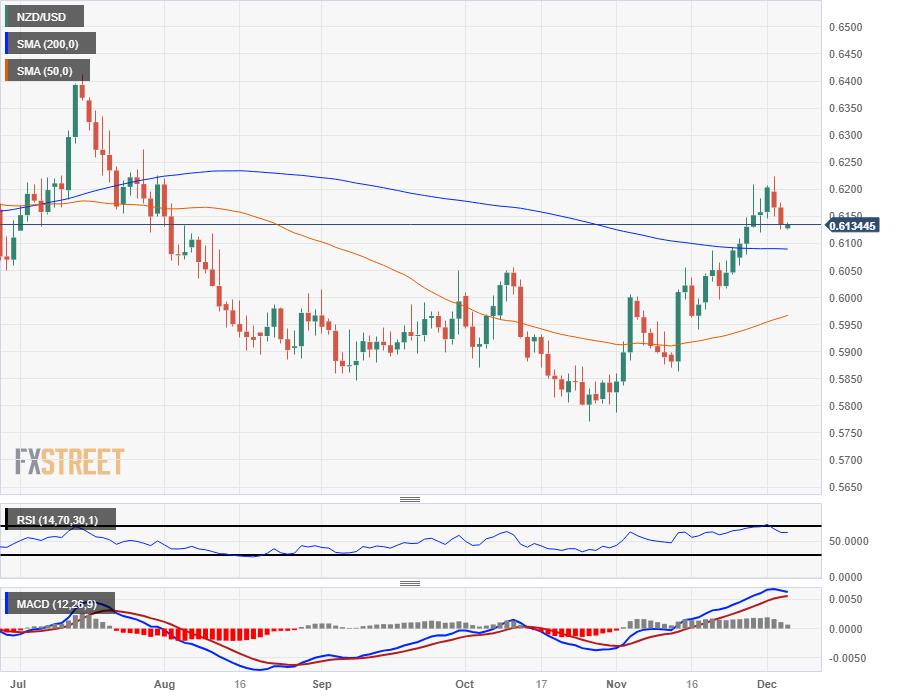
- The Kiwi has seen two consecutive down days, pulling the NZD down from 0.6200.
- Market risk appetite has turned south this week, pushing investors into safe havens.
- Investor focus squarely on US data this week with NFP in the pipe.
The NZD/USD heads into the Wednesday market session struggling near the 0.6130 level as the kiwi (NZD) locks in two consecutive days of declines against the US Dollar (USD).
Market sentiment soured early Tuesday after Moody’s downgraded China’s sovereign debt outlook, with the ratings agency citing the Chinese government’s looming expenses should China need to start bailing out beleaguered local governments and drowning state-owned agencies.
US data came in mixed on Tuesday, with the Institute for Supply Management’s Services Purchasing Managers’ Index (PMI) came in at 52.7 for the annualized period into November, compared to the median market forecast of 52, and the Services sector PMI showed a step up from October’s 51.8.
US JOLTS Jobs Openings showed still-tightening labor market conditions with the report printing 8.733 million job postings, a two-and-a-half-year low and undercutting the previous month’s 9.35 million (revised down slightly from 9.553 million).
With a still-tight labor market weighing down investors hopes for a sooner-rather-than-later Federal Reserve rate cut cycle, market sentiment has knocked back on multiple fronts, sending the US Dollar higher against most major currencies heading into the midweek.
Wednesday brings US ADP Employment Change, and Friday will close the trading week out with another round of the US’ Nonfarm Payrolls (NFP); both labor indicators are expected to show improving employment conditions and a still-tightening labor market. The ADP Employment Change is expected to print at 130K in November compared to the previous 113K, while the NFP is forecast to come in at 185K vs October’s 150K.
NZD/USD Technical Outlook
The Kiwi has backslid straight into the 200-hour Simple Moving Average (SMA) near 0.6130, and intraday price action is set to get hung up near the price level with exposure risk tilting firmly to the downside as the 50-hour SMA turns bearish into 0.6160, capping off upside bids.
Daily candlesticks have the NZD/USD is set to confirm a bearish pullback to the 200-day SMA just below 0.6100, and Monday’s four-month peak just below 0.6225 represents the nearest technical ceiling for near-term bids.
NZD/USD Daily Chart
NZD/USD Technical Levels
- Gold price trades in negative territory for the third consecutive day.
- The US ISM Services PMI exceeded expectations; JOLTS Job Openings declined to their lowest level since March 2021.
- The negative economic outlook in China might cap gold's upside.
- US ADP private employment, Unit Labor Cost data will be released on Thursday.
Gold price (XAU/USD) loses momentum during the early Asian session on Wednesday. The renewed US Dollar (USD) demand drag the yellow metal lower. Meanwhile, the US Dollar Index (DXY), the gauge of the value of the USD against a weighted basket of currencies used by US trade partners, rebounds to 104.00. The Treasury yields edge higher, with the 10-year yield dropping to 4.16%. The gold price currently trades near $2020, up 0.01% for the day.
The US Dollar Index (DXY) recovers from monthly lows despite lower US Treasury bond yields. Data released on Tuesday showed that the November ISM Services PMI exceeded expectations, with an increase of 52.7 from the previous reading of 51.8. Meanwhile, JOLTS Job Openings declined by 617,000 to 8.73 million in October, falling in October to their lowest level since March 2021, according to a Bureau of Labour Statistics report. The figure registered the lowest level since March 2021.
Furthermore, a gloomy picture of China's economic prospects dampened optimism across the commodities market and create headwinds for gold price. On Tuesday, the rating agency Moody’s cut its outlook on China’s sovereign credit rating to negative, citing the increasing risks to growth and a property sector crisis in the country. This, in turn, might cap the upside in gold prices as China is the world’s major gold consumer.
Gold traders will keep an eye on the US ADP private employment and Unit Labor Cost data on Wednesday. Later this week, the Chinese Trade Balance for November will be due on Thursday. The attention will turn to the US employment data on Friday, including the Nonfarm Payroll (NFP), Average Hourly Earnings, and Unemployment Rate.
x
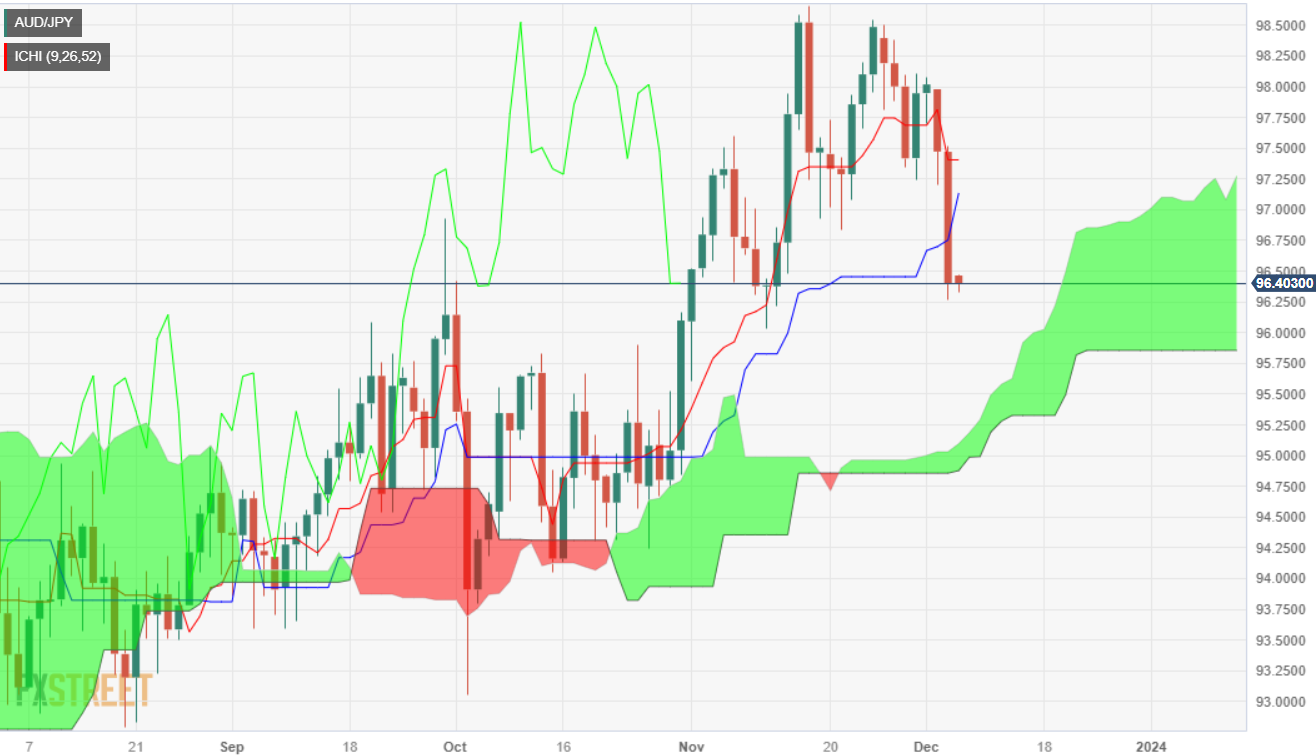
- AUD/JPY dipped below key support levels, like the Kijun-Sen, and Senkou Span.
- The Chikou Span crossing below price action, and narrowing distance between Tenkan and Kijun-Sen, signals bears are gaining traction.
- If AUD/JPY buyers reclaim 97.00, a rally to 98.00 is on the cards.
The AUD/JPY began Wednesday’s Asian session with a negative tone after registering losses of more than 1% on Tuesday. This is courtesy of the Reserve Bank of Australia (RBA), which held rates unchanged, though market participants perceived the decision as a “dovish hold,” so Aussie Dollar (AUD) sellers exerted downward pressure on the currency. At the time of writing, the pair is exchanging hands at 96.36, down 0.02%.
Despite registering solid losses, the AUD/JPY remains neutral to upward bias, but downside risks are emerging. The Chikou Span is crossing below the price action, turning bearish, and the distance between the Tenkan and Kijun-Sen is narrowing. If the pair slides below the November 10 low of 96.28, that will exert downward pressure on the pair. The next support would be the top of the Ichimoku Cloud (Kumo) at around 95.15/25, followed by the bottom of the Kumo at 94.95.
On the flip side, in the outcome of the AUD/JPY reclaiming the 97.00 figure, buyers could regain control. The next spotted resistance level is the Tenkan-Sen at 97.40, and if the pair gains additional momentum, it could rally toward the 98.00 figure.
AUD/JPY Price Analysis – Daily Chart
AUD/JPY Technical Levels
The credit rating agency Moody's cut its outlook on China’s sovereign credit rating to negative on Tuesday, citing the increasing risks to growth and a property sector crisis in the world’s second-largest economy, per Reuters.
Moody's downgraded China's A1 debt rating to "negative" from "stable" less than a month after lowering the US' remaining triple-A grade from a credit rating agency. This development sends a warning to lenders that the likelihood of a default has grown over the last year.
Market reaction
At the time of press, the AUD/USD pair was up 0.01% on the day at 0.6554.
- AUD/USD loses momentum near 0.6550 on the firmer USD.
- US ISM Services PMI grew to 52.7 vs. 51.8 prior, better than the 52.0 expected.
- The Reserve Bank of Australia (RBA) board members decided to maintain the rate unchanged at 4.35% at its December meeting.
- The Australian growth number Q3 report will be a closely watched event on Wednesday.
The AUD/USD pair extends its downside around the mid-0.6500s during the early Asian session on Wednesday. The downward momentum is driven by the renewed US Dollar (USD) demand. Investors await the Australian Gross Domestic Products for the third quarter (Q3) for fresh impetus, which is expected to remain steady at 0.4% YoY. AUD/USD currently trades around 0.6551, down 0.01% on the day.
The US Dollar gains ground above 104.00, its highest daily close in two weeks, despite lower US Treasury yields and mixed US data. The US job openings data, as measured by the Job Openings and Labour Turnover Survey (JOLTS) dropped by 617,000 to 8.733M in October. This figure could offer some hints about November’s ADP job report on Thursday, with an expected rise of 130K in private sector workers.
Additionally, the US ISM Services PMI came in better than expected, growing to 52.7 from 51.8 in the previous reading. The figure registered the 11th consecutive month of expansion in the services sector and suggested the economy is still some way from recession.
On Tuesday, the Reserve Bank of Australia (RBA) board members decided to keep the rate steady at 4.35% at its December monetary policy meeting. Following the meeting, the Australian Dollar (AUD) has edged lower against its rivals. The RBA’s Governor Michele Bullock said whether additional monetary policy tightening is necessary to ensure that inflation returns to target would be determined by the data and the developing risk assessment.
Looking ahead, market players will closely monitor the Australian growth number for Q3. The attention will shift to the US ADP private employment and Unit Labor Cost data, is due on Wednesday. These figures could give clear direction to the AUD/USD pair.
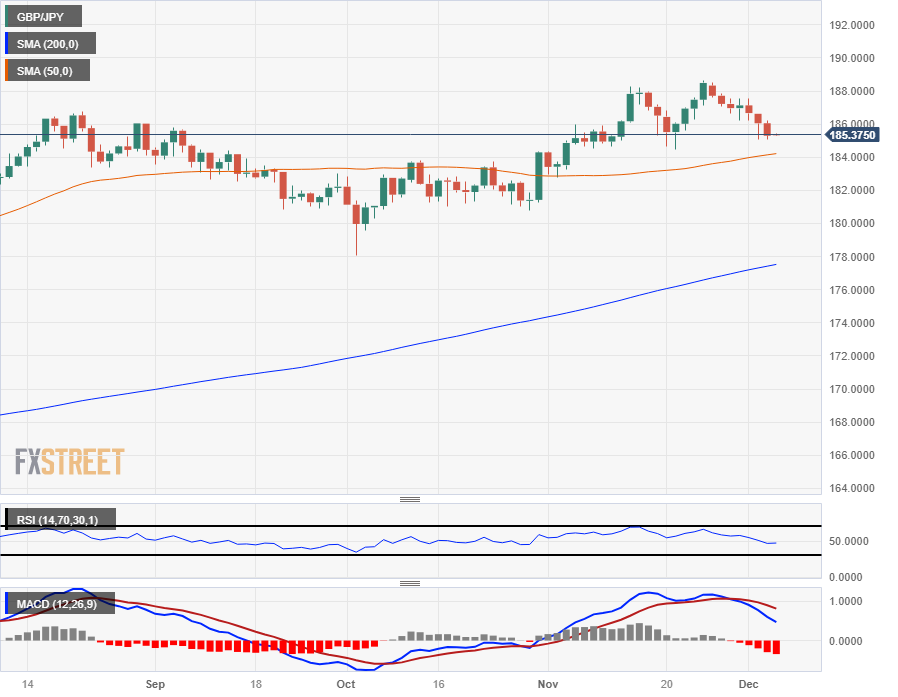
- The GBP/JPY has closed in the red for six of the last seven consecutive trading days.
- Broad-market risk-off market sentiment is seeing a firm bid into safe havens like the Yen.
- Wednesday brings the BoE's latest Financial Stability Report, early Friday sees Japan quarterly GDP.
The GBP/JPY slid for the third straight trading day on Tuesday, closing down for six out of the seven consecutive days. The Guppy is grinding down towards the 185.00 handle as the Pound Sterling (GBP) waffles against the Japanese Yen (JPY).
Early Tuesday saw the UK's BRC Like-For-Like Retail Sales for the year into November beat expectations, printing at 2.6% versus the forecast steady reading at 2.5%.
Broader market sentiment saw little pick-up on the UK mid-tier data beat, with investors backing into safe havens as risk appetite sours heading into the midweek following a Moody's credit downgrade of China.
With China set to begin bailing out struggling local governments and state-owned companies behind the bamboo curtain, Moody's sees weak points in the Chinese government's funding flows moving forward. The open view into a steepening slowdown in Asia markets has hobbled risk appetite across broader markets.
Wednesday will pose new challenges for risk sentiment with the Bank of England (BoE) set to deliver its latest Financial Stability Report, where investors will get a closer look at the BoE's hawkish or dovish stance on the UK's economic outlook, while early Friday sees Japan's latest Gross Domestic Product (GDP).
Japan's QoQ GDP growth is expected to hold steady at a contractionary -0.5%.
GBP/JPY Technical Outlook
With the GBP/JPY grinding towards the 185.00 handle heading into Wednesday's trading session, the Pound Sterling is down four-tenths of a percent against the Yen, and the GBP/JPY is down nearly 2% from November's multi-year highs at 188.66.
Long-term technical support for the GBP/JPY is coming from a rising 200-day Simple Moving Average (SMA) lifting into the 178.00 handle, though the pair is set for a continued slide into the 50-day SMA near 184.00, a confluence technical support level with the last swing low.
GBP/JPY Daily Chart
GBP/JPY Technical Levels
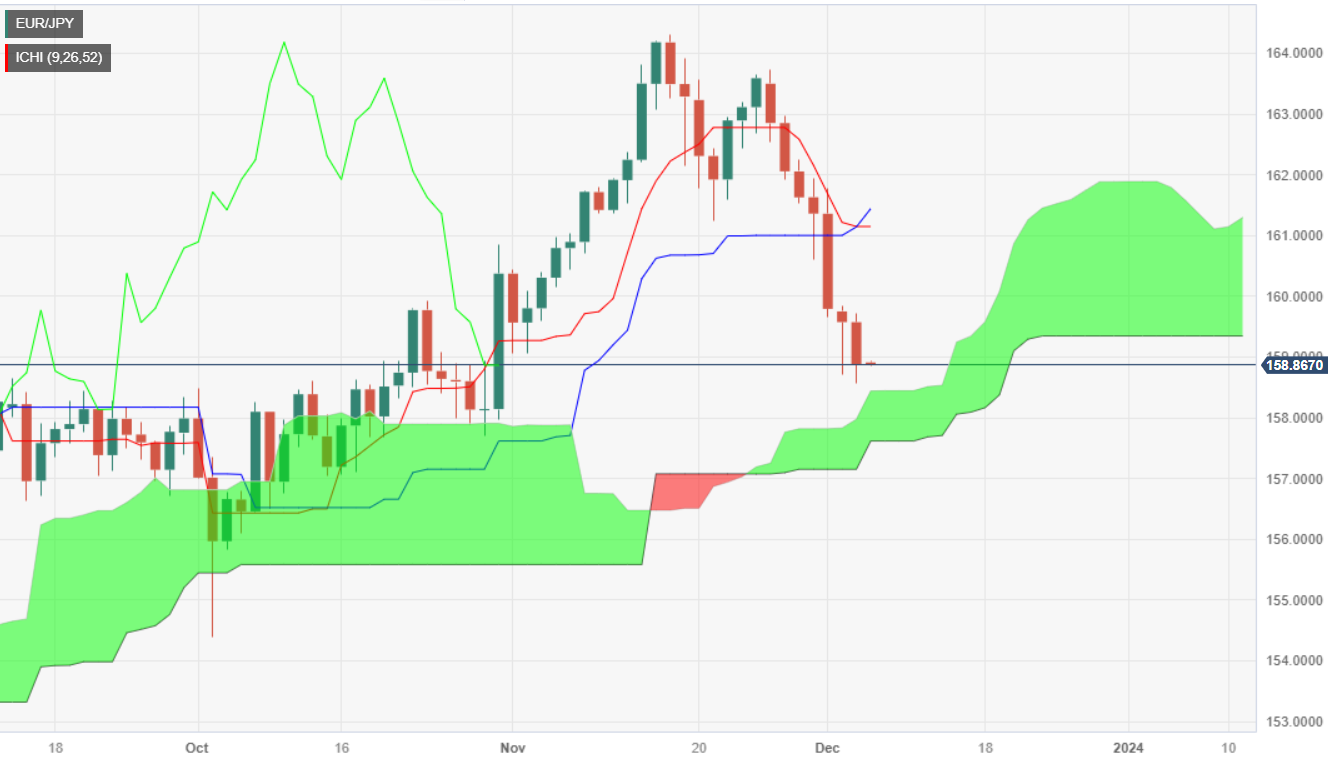
- EUR/JPY is diving almost 3% since November 27, when the pair hit a high of 163.72
- The downtrend remains intact, though it could accelerate further with a drop below 157.55.
- If EUR/JPY buyers reclaim 159.00, that could pave the way for gains.
The EUR/JPY extends its losses for the seventh straight day and hovers just above the top of the Ichimoku Cloud (Kumo), at around 158.89, down by 0.36% daily after reaching a daily high of 159.71. The main drivers behind the move have been market sentiment shifting sour, favoring appetite for the safe-haven status of the Japanese Yen (JPY), which appreciated against most G8 FX currencies, except for the Greenback.
EUR/JPY downtrend remains intact even though it bottomed at around 158.50s, which could open the door for some consolidation as bears take a respite. Nevertheless, the crossing of the Tenkan-Sen below the Kijun-Sen, along with the Chikou Span shifting bearish, means the Euro (EUR) is not out of the woods.
Given the backdrop, the EUR/JPY first support is the top of the Kumo at around 158.40/50. A decisive break could drag prices toward the bottom of the Kumo at 157.55, which, once taken out, would cement the pair’s bearish bias. The next demand area would be a support trendline at around 157.00, followed by the October 3 swing low of 154.34.
On the other hand, if buyers reclaim 159.00, that could pave the way for a recovery toward the confluence of the Senkou Span A, and the Tenkan and Kijun-Sen at around 161.13/20.
EUR/JPY Price Analysis – Daily Chart
EUR/JPY Technical Levels
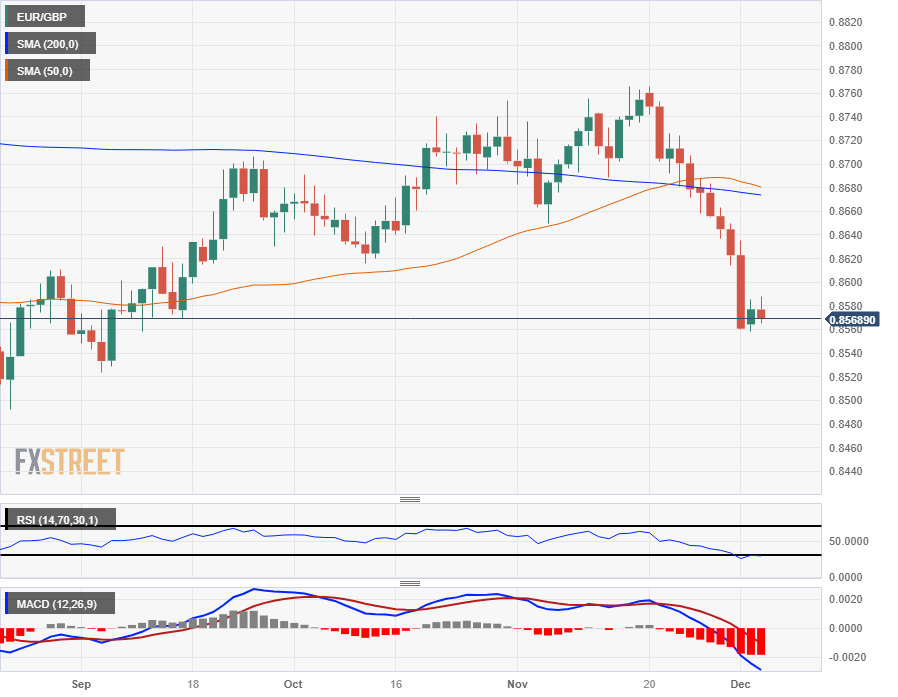
- The EUR/GBP mildly softened to 0.8570, seeing mild losses,
- Daily chart indicators signal strong bearish momentum; RSI hints continue standing near overbought conditions while MACD showcases flat red bars.
- The bears seem to be taking a breather to consolidate losses.
In Tuesday's session, the EUR/GBP mildly retreated to the 0.8570 region. The daily and four-hour chart suggests a cooling off of the recent selling momentum, which favors a neutral to a bearish outlook for the short term.
The daily Relative Strength Index (RSI) lies deep in negative territory, while the Moving Average Convergence Divergence (MACD) showcases flat red bars, reinforcing the bearish hold. Additionally, the asset's position under the 20, 100, and 200-day Simple Moving Averages (SMAs) emphasizes the ongoing bearish control, marking a challenging landscape for buyers.
Shifting to the shorter time frame, the four-hour chart dynamics still present the bears in recoup mode. The four-hour Relative Strength Index (RSI) remains in the negative territory, while MACD's flat red bars favor the case of a bearish consolidation. Hence, the short-term bias leans towards further downside, albeit the sellers may pause to catch their breath after the recent run.
Support Levels: 0.8550, 0.8500, 0.8480.
Resistance Levels: 0.8600, 0.8639 (100-day SMA), 0.8700.
EUR/GBP Daily chart
-638374102469503820.png)
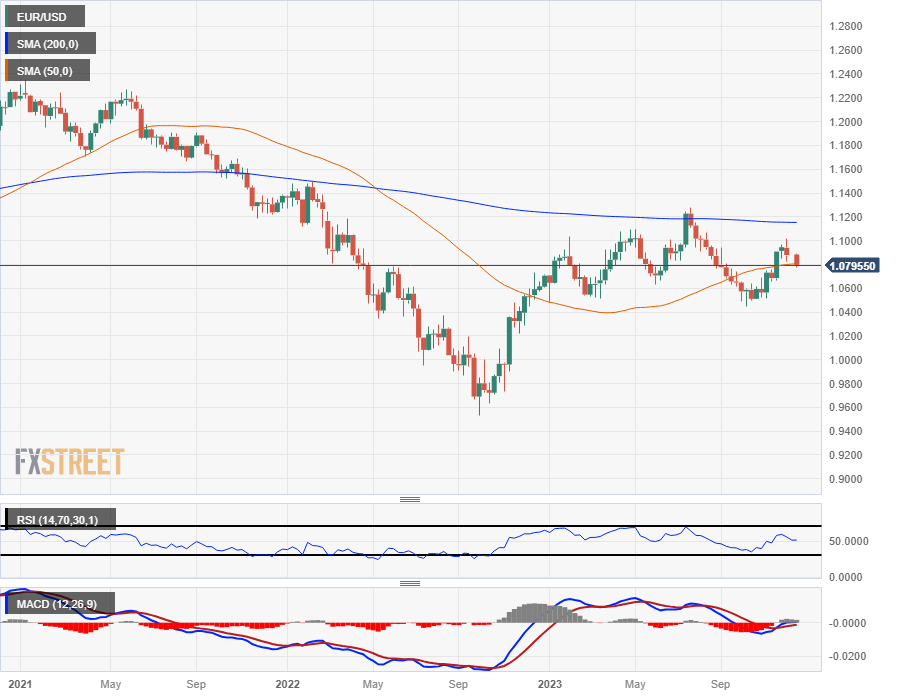
- The EUR/USD has broken through the 1.0800 handle as the market pulls back into safe havens.
- The Euro is set for a fifth straight day of declines against the US Dollar.
- Markets breezed right past better-than-expected Eurozone economic data.
The EUR/USD is down around four-tenths of a percent on Tuesday, with the Euro (EUR) declining 0.65% peak-to-trough against the US Dollar (USD) as markets see a fresh round of risk-off flows into safe havens.
Eurozone economic data broadly beat the street early Tuesday, but with the majority of investors seeing souring risk appetite following a Moody’s credit downgrade on China, data releases had limited impact and sentiment flows dominated the FX charts.
Tuesday’s selloff sees the Euro touching chart paper south of 1.0800, but the pair is seeing some rebalancing heading into the trading day’s closing bell.
The Eurozone HCOB Composite Purchasing Managers’ Index (PMI) printed above expectations in November, coming in at 47.6 MoM versus the forecast hold at October’s reading of 47.1.
US Data: good news is bad news narrative holds for market risk appetite
US data extended the overall dour market sentiment, with JOLTS Job Openings dipping to a two-and-a-half-year low amidst a tight US labor market, and the Institute for Supply Management’s (ISM) Services PMI came in higher than expected at 52.7 for November, compared to the market’s median forecast of 52.0 versus October’s 51.8.
The US services sector, one of the largest contributors to US Gross Domestic Product (GDP), is continuing to show a firm healthy trend and a tight labor market with fewer jobs on offer means economic conditions within the US are too tight for the Federal Reserve (Fed) to even begin to consider a rate cut cycle. With investors broadly hungry for an accelerated path towards declining interest rates, a bumping US economy pushes away rate cut expectations further out, and thus good news is bad news for markets burdened with rising borrowing and financing costs on the back of higher interest rates.
Wednesday brings Eurozone Retail Sales, which are forecast to improve but still print in negative territory, slated for a rebound from -2.9% to -1.1% for the annualized period into October.
Thursday will follow up with Eurozone Gross Domestic Product (GDP) figures, and the third quarter is expected to hold flat at 0.1% on a YoY basis, and Friday will close out the trading week with another print of US Nonfarm Payrolls (NFP), which is forecast to print another increase from 150K to 185K.
EUR/USD Technical Outlook
The EUR/USD's decline below 1.0800 on Tuesday sees the pair chalking in a fifth straight day of declines, and the Euro is down a little over two percent against the US Dollar from last week's peak bids near 1.1020.
The Euro's backslide sees the EUR/USD slipping through the 200-day Simple Moving Average (SMA) currently treading water near 1.0820.
Continued bearish pressure will see a technical barrier from the 50-day SMA which has turned bullish and is rising into the 1.0700 handle, while bidders will be looking to stage a recovery back over the 200-day SMA before the EUR/USD slides too deep into retracement territory between 1.0750 and 1.0700.
EUR/USD Daily Chart
EUR/USD Technical Levels
The main focus remains on US labor market data. ADP will report on private employment on Wednesday, and the Unit Labor Cost data will also be important. Before US figures, during the Asian session, Australia will report Q3 GDP, while Eurozone Retail Sales will be released during European hours. The Bank of Canada is expected to keep rates unchanged.
Here is what you need to know on Wednesday, December 6:
The US Dollar strengthened despite lower US Treasury yields and mixed US data. In the short term, the trend remains positive for the Greenback, however most currency pairs show overbought technical conditions. The US Dollar Index recorded its highest daily close in two weeks, around 104.00, and continued to rebound from monthly lows.
Data released from the US on Tuesday revealed a larger-than-expected decline in JOLTS Job Openings, dropping by 617,000 to 8.73 million in October, indicating a more balanced labor market. The November ISM Services PMI exceeded expectations, with an increase to 52.7. More labor market data will be released on Wednesday with the ADP Employment Report and Q3 Unit Labor Costs.
Analysts at Wells Fargo after US data, ahead of next week’s FOMC meeting:
With prices still firmly in expansion and employment rising slightly, it suggests that recent expectations for rate cuts might have been pulled too far forward (…) We anticipate the fed funds rate probably has reached its terminal level of this cycle. But we still expect the Fed to keep the door open to the possibility for additional tightening at its policy meeting next week, particularly in the context of the recent loosening in financial conditions. Ultimately the Fed will need to see more progress on inflation before it begins to outright ease policy.
EUR/USD has declined to the 100-day Simple Moving Average (SMA), falling below 1.0800, which marks the lowest level in two weeks. This drop extends the downward movement for the fifth consecutive day, indicating a need for consolidation. However, the Euro is not showing many positive signs, despite the positive revision of Eurozone PMI data for November. On Wednesday, Eurozone Retail Sales data will be released.
The Australian Dollar weakened on Tuesday following the pause from the Reserve Bank of Australia (RBA). AUD/USD tumbled toward the 0.6550 area, falling below the 200-day Simple Moving Average (SMA) while AUD/NZD fell below 1.0700 and posted the lowest daily close since mid-October. On Wednesday, Australia's Q3 GDP data is due.
USD/CAD continued its upward trend for the second day in a row, extending its recovery from two-month lows and climbing towards 1.3600. The Bank of Canada will announce its decision on Wednesday, and market expectations point towards the key interest rate remaining unchanged at 5%. As there will be no accompanying Monetary Policy Report or press conference, the impact on the market may be limited.
Analysts at TD Securities:
We look for the BoC to stay the course and hold rates at 5.00%, as a softer economic backdrop drives some dovish tweaks in the statement. However, its desire to maintain tight financial conditions sets a high bar for more significant changes to its guidance.
Bitcoin continued to drift higher and surpassed $43,000, reaching its highest level since April 2022. Similarly, Ethereum has climbed above $2,250, marking its highest point since May 2022.
Meanwhile, metals remain under pressure. Gold failed to benefit from lower Treasury yields, resulting in XAU/USD dropping to $2,010, the lowest level in a week. Silver tumbled to $24.00.
Like this article? Help us with some feedback by answering this survey:
- USD/JPY posts gains for the second straight day but loses some steam.
- Mixed economic data from the US tumbled US bond yields and boosted the US Dollar.
- The latest Tokyo inflation report pushed back expectations of monetary policy normalization by the Bank of Japan.
USD/JPY is virtually unchanged late in the North American session, hovers at around the current week's highs after hitting a daily low of 146.55, exchanges hands at around 147.28, and gains 0.05%.
Sour market sentiment keeps USD/JPY trapped at around 147.20
Wall Street is posting losses, except for the Nasdaq 100, which is up 0.15%. Economic data in the United States (US) was mixed as the JOLTs Job Opening report revealed the labor market is cooling after the data registered a two-and-a-half-year low, missing estimates and September’s figures. Nevertheless, the Institute for Supply Management (ISM) announced that business activity in the services sector expanded and smashed forecasts. The Non-Manufacturing PMI in November rose by 52.7, above the 52 foreseen and October’s 51.8.
Following the data, the US Dollar Index (DXY) seesawed but resumed its uptrend, posting two-week highs at 104.10. Contrarily, US bond yields tumbled, with the 10-year benchmark note coupon, closely correlated to the USD/JPY pair, dropping nine basis points to 4.16%, a headwind for the major.
Despite that, traders continued to reinforce their view the US Federal Reserve (Fed) finished its tightening cycle. They estimate the Fed would slash 137 basis points to the Federal Funds Rate (FFR), suggesting that reference rates will be at around 4%.
Aside from this, Tokyo’s CPI report showed that prices are cooling, pushing out expectations for a Bank of Japan (BoJ) liftoff.
The focus turns to the release of further US employment data. The ADP Employment Change would be released on Wednesday, followed by Thursday’s unemployment claims and Friday's Nonfarm Payrolls.
USD/JPY Technical Levels
- The USD/NOK rallied and settled near the 10.935 level.
- US JOLTs Job Openings for October where lower than expected. The ISM Services PMI in November came in better than expected.
- The US Dollar Index rose to its highest since mid-November.
In Tuesday's session, the USD/NOK edged higher, trading around 10.935 seeing 0.80% gains following the reports of robust Institute for Supply Management (ISM) reading and softer-than-anticipated JOLTs Openings figures. The USD managed to shrug off the week's labor market figures and capitalized on the positive figures of the service sector, which fueled the DXY index to its highest since mid-November.
In that sense, the JOLTs Job Openings reported by the U.S. Bureau of Labor Statistics for October decreased to 8.733 million, falling from the previous 9.35 million and below the 9.3 million consensus expectation. On the positive side, the Institute for Supply Management (ISM) Services PMI for November had a consensus forecast of 52 and increased from 51.8 to 52.7, indicating a slight expansion in the services sector.
As the Federal Reserve (Fed) noted that it still needs additional evidence of the economy cooling down, the strong economic activity evidence doesn’t favor the dovish rhetoric as it could push the Fed to take a more aggressive approach. That being said, the focus now shifts to Friday, where the US will report the expected Average Hourly Earnings from November at 4% YoY vs the previous 4.1%. The Nonfarm Payrolls are also due and expected to have accelerated to 180,000, compared to the previous 150,000, while the Unemployment rate is seen coming in at 3.9% YoY.
Those key labor market metrics will play a bigger role in the next decisions of the Federal Reserve (Fed), so the pair price dynamics may see volatility based on their outcome.
USD/NOK levels to watch
The daily chart indicators reveal that the bulls have gathered strong momentum. On one side, the fact that the pair is stationed firmly above the 20, 100, and 200-day Simple Moving Averages (SMAs) indicates dominant bullish sentiment and persistent buying momentum. This observation is further validated by the current rising red bars of the Moving Average Convergence Divergence (MACD) and the positive slope marked in the Relative Strength Index (RSI).
Support Levels: 10.840 (20-day SMA), 10.710 (200-day SMA), 10.670 (100-day SMA).
Resistance Levels:11.000, 11.130, 11.250.
USD/NOK daily chart
-638374024955627899.png)
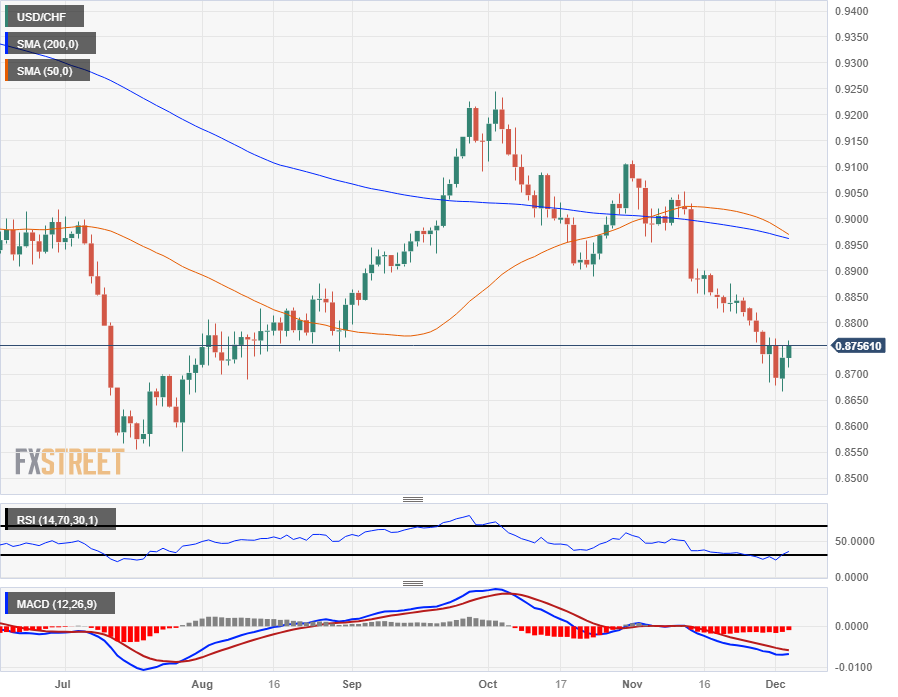
- The USD/CHF is grinding higher to eke out a second daily high, but momentum remains thin.
- The US Dollar remains steeply sold-off against the Swiss Franc.
- Economic calendar data leans heavily into the US side this week, culminating in another NFP print.
The USD/CHF is continuing to climb for a second trading day, with the US Dollar (USD) getting propped up by broad-market risk-off flows rather than any specific weakness in the Swiss Franc (CHF), which is up over 3% against the USD since early November.
The USD/CHF has seen one-sided trading, closing flat or in the red for fifteen straight trading days before hitting a near-term bottom of 0.8666. With Tuesday seeing meager gains for the US Dollar, the USD/CHF is set to close with back-to-back meaningful gains since October.
US JOLTS Job Openings in October missed market forecasts, dipping to a two-and-a-half-year low of 8.733 million job postings, slipping past the forecast 9.3 million, and declining even further away from September's print of 9.35 million (revised down slightly from 9.553 million).
The US labor market remains tight, which makes it harder for the Federal Reserve (Fed) to accelerate the pace towards a rate cut cycle, and investors are ogling market data in the hopes of finding the cracks in the dataset that will signal Fed rate cuts sooner rather than later.
As it stands, markets are anticipating rate cuts from the Fed in the first half of next year, though still-high economic indicators make it hard for the Fed to execute on market hopes. On the downside, investors are walking a knife-edge when it comes to data expectations: if US economic data goes too red, too quick, a full-blown recession will be terrible for markets.
USD/CHF Technical Outlook
The USD/CHF remains steeply in the red in the medium-term despite intraday gains this week, and the US Dollar is down against the Swiss Franc looking out across 2023.
The USD/CHF saw an accelerated decline after dropping through in 0.8900 handle in November, and the pair has continued to swirl the drain ever since, shedding another 200 pips to hit chart territory near the 0.8700 handle.
The 200-day Simple Moving Average (SMA) has steadily declined through the 0.9000 major handle as long-term momentum leans into the Dollar-bearish side. The 50-day SMA is set for a bearish crossover of the 200-day SMA after the shorter moving average failed to see a bullish market shift materialize after a short-lived bullish crossover in November.
USD/CHF Daily Chart
USD/CHF Technical Levels
- WTI marks a four-day decline, impacted by Greenback's recovery and demand-supply dynamics.
- OPEC+ agrees on 2.2 million bpd cuts for Q1 2024; Russia hints at potential deeper production cuts to curb speculation.
- Putin's caution on delayed impact of cuts follows November's revenue dip, Saudi Arabia cuts prices to Asian customers in January 2024.
Due to several factors, the US Crude Oil benchmark, known as WTI, extended its losses to four straight days. Firstly, the Greenback is staging a recovery, while Oil’s seesawed after demand concerns offset supply worries after Russia said OPEC+ was ready to deepen cuts in the first quarter of 2024. WTI is trading at $72.72 per barrel, down 0.41%.
Oil markets face headwinds as demand worries counter OPEC+ supply cuts; WTI trades at $72.72, down 0.41%
In the latest OPEC+ meeting on November 30, members agreed to output cuts of 2.2 million barrels per day (bpd) for the first quarter of 2024, with 1.3 million of those provided by an extension of Saudi Arabia and Russia's voluntary cuts already in place since August 2023.
Despite that, Russian Deputy Prime Minister Alexander Novak stated that OPEC+ could deepen production cuts, to eliminate “speculation and volatility.”
Recently, Russia’s President Vladimir Putin said that cuts would take time to begin, as its revenues in November fell to 961.7 billion roubles ($10.53 billion) from 1.635 trillion roubles in the previous month.
In the meantime, Saudia Arabia is curbing its prices to Asian customers in January 2024 for the first time since June 2023.
WTI Price Analysis: Technical outlook
From a technical perspective, WTI is testing the lows of November 2023 and is about to form a double bottom if prices remain firm above $72.00. In that outcome, WTI's first resistance would be today’s high at $74.00, followed by the December 4 high at $75.00. A breach of those two levels would expose the 200-day moving average (DMA) at $78.03, ahead of the $80.00 threshold.
- EUR/GBP is losing momentum as the tug-of-war reaches a midpoint.
- The Euro is struggling to build up momentum for a rebound after steep declines.
- EUR markets to pull towards the midrange ahead of Wednesday's Eurozone Retail Sales.
The EUR/GBP is flatlining on the trading week, cycling near 0.8570 with Eurozone Retail Sales due early Wednesday.
The Euro (EUR) has shed two and a quarter percent against the Pound Sterling (GBP) since late November's peak of 0.8765, losing chart ground in one-sided action, closing in the red for nine of the last eleven trading sessions.
Tuesday saw mid-tier data for both the EUR and the GBP, which all beat expectations across the board, but sending both currencies nowhere quickly as markets focused elsewhere.
The UK's BRC Like-For-Like Sales for the year into November held steady at 2.6% versus the expected 2.5%, and the Eurozone's HCOB Composite Purchasing Managers' Index (PMI) for November beat expectations to climb to 47.6 versus the forecast 47.1.
Wednesday will land a bit harder on the economic calendar, with the UK's latest Financial Stability Report at 07:00 GMT, followed by Eurozone Retail Sales for October at 10:00 GMT.
Investors will be keeping an eye on the Financial Stability Report for finer details on the hawkish or dovish lean to the Bank of England (BoE) over the state of the UK's domestic economy.
Eurozone Retail Sales are expected to see a rebound but still remain in contraction territory with the headline annualized figure to print at -1.1% compared to the previous period's -2.9%.
EUR/GBP Technical Outlook
The EUR/GBP is seeing little rebound after falling within sight of 2023's low bids near 0.8500 and the pair is now kidding along the bottom of familiar technical levels near 0.8550.
The pair's recent drop from the 0.8750 neighborhood leaves the EUR/GBP stranded below the 200-day Simple Moving Average (SMA) near 0.8675, and any bullish rebounds will be facing a technical ceiling from the 50-day SMA, which is set to confirm a bearish cross of the longer 200-day SMA.
EUR/GBP Daily Chart
EUR/GBP Technical Levels
- The DXY Index sees upward movements threatening the 20-day SMA near the 104 level.
- The US service sector expanded in November, according to the ISM.
- Investors keenly await the Unemployment Rate and Nonfarm Payrolls reports due this Friday.
The US Dollar (USD), gauged by the US Dollar Index (DXY), is edging higher, currently trading near 104.00 while posing a threat to the 20-day SMA at 104.05. This movement has been largely attributed to releasing a better-than-expected Institute for Supply Management (ISM) Services PMI for November.
Meanwhile, investors are focusing on key employment figures due for release this Friday – specifically the November Unemployment Rate and Nonfarm Payrolls data – as they could suggest further directional moves for the greenback.
Despite cooling inflation in the US economy and mixed labor market and economic activity signals, the Federal Reserve (Fed) continues to refrain from ruling out further policy tightening. This somewhat hawkish stance coincides with the release of key labor data this week, which could dramatically shift market expectations.
Daily Market Movers: US Dollar gains momentum with boost from strong ISM Services PMI
- US Dollar trades with a strong note on Tuesday, threatening the 20-day SMA near the 104.00 mark.
- The Institute for Supply Management’s November report revealed the ISM Services PMI exceeded consensus and previous figures by coming in at 52.7, further propelling the US Dollar's advance.
- The latest report from US Bureau of Labor Statistics indicated that October JOLTs Job Openings fell by nearly 600K to 8.733 million. This figure was well below the consensus of 9.35 million.
- Looking ahead, important upcoming economic releases include the Unemployment Rate, Nonfarm Payrolls, and Average Hourly Earnings on Friday. These figures will hold significant implications for investors and the US Dollar's trajectory as they could shape the next Fed decisions.
- Current market expectations from the CME FedWatch Tool indicate that a no hike is priced in for the December meeting and that markets are now pricing in rate cuts for mid 2024.
Technical Analysis: US Dollar bullish momentum strengthens, buyers threaten the 20-day SMA
The indicators on the daily chart clearly depict a strengthening of bullish momentum for the US Dollar. Although in negative territory, the Relative Strength Index (RSI) shows a positive slope, while the Moving Average Convergence Divergence (MACD) is printing rising green bars, offering confirmation of prevailing bullish strength.
Evaluating the longer-term scenario, the index is currently positioned beneath the 20 and 100-day Simple Moving Averages (SMAs) but above the 200-day SMA. This means that overall, whilst experiencing some pressure in the short-term, bulls persistently show their presence in the broader picture. That picture hints at a firm upward trajectory. In case buyers advance and conquer the 20-day SMA, further green may be seen in the short term.
Support levels: 103.60, 103.30, 103.15, 103.00.
Resistance levels: 104.10 (20-day SMA), 104.40 (100-day SMA), 104.50.
US Dollar FAQs
What is the US Dollar?
The US Dollar (USD) is the official currency of the United States of America, and the ‘de facto’ currency of a significant number of other countries where it is found in circulation alongside local notes. It is the most heavily traded currency in the world, accounting for over 88% of all global foreign exchange turnover, or an average of $6.6 trillion in transactions per day, according to data from 2022.
Following the second world war, the USD took over from the British Pound as the world’s reserve currency. For most of its history, the US Dollar was backed by Gold, until the Bretton Woods Agreement in 1971 when the Gold Standard went away.
How do the decisions of the Federal Reserve impact the US Dollar?
The most important single factor impacting on the value of the US Dollar is monetary policy, which is shaped by the Federal Reserve (Fed). The Fed has two mandates: to achieve price stability (control inflation) and foster full employment. Its primary tool to achieve these two goals is by adjusting interest rates.
When prices are rising too quickly and inflation is above the Fed’s 2% target, the Fed will raise rates, which helps the USD value. When inflation falls below 2% or the Unemployment Rate is too high, the Fed may lower interest rates, which weighs on the Greenback.
What is Quantitative Easing and how does it influence the US Dollar?
In extreme situations, the Federal Reserve can also print more Dollars and enact quantitative easing (QE). QE is the process by which the Fed substantially increases the flow of credit in a stuck financial system.
It is a non-standard policy measure used when credit has dried up because banks will not lend to each other (out of the fear of counterparty default). It is a last resort when simply lowering interest rates is unlikely to achieve the necessary result. It was the Fed’s weapon of choice to combat the credit crunch that occurred during the Great Financial Crisis in 2008. It involves the Fed printing more Dollars and using them to buy US government bonds predominantly from financial institutions. QE usually leads to a weaker US Dollar.
What is Quantitative Tightening and how does it influence the US Dollar?
Quantitative tightening (QT) is the reverse process whereby the Federal Reserve stops buying bonds from financial institutions and does not reinvest the principal from the bonds it holds maturing in new purchases. It is usually positive for the US Dollar.
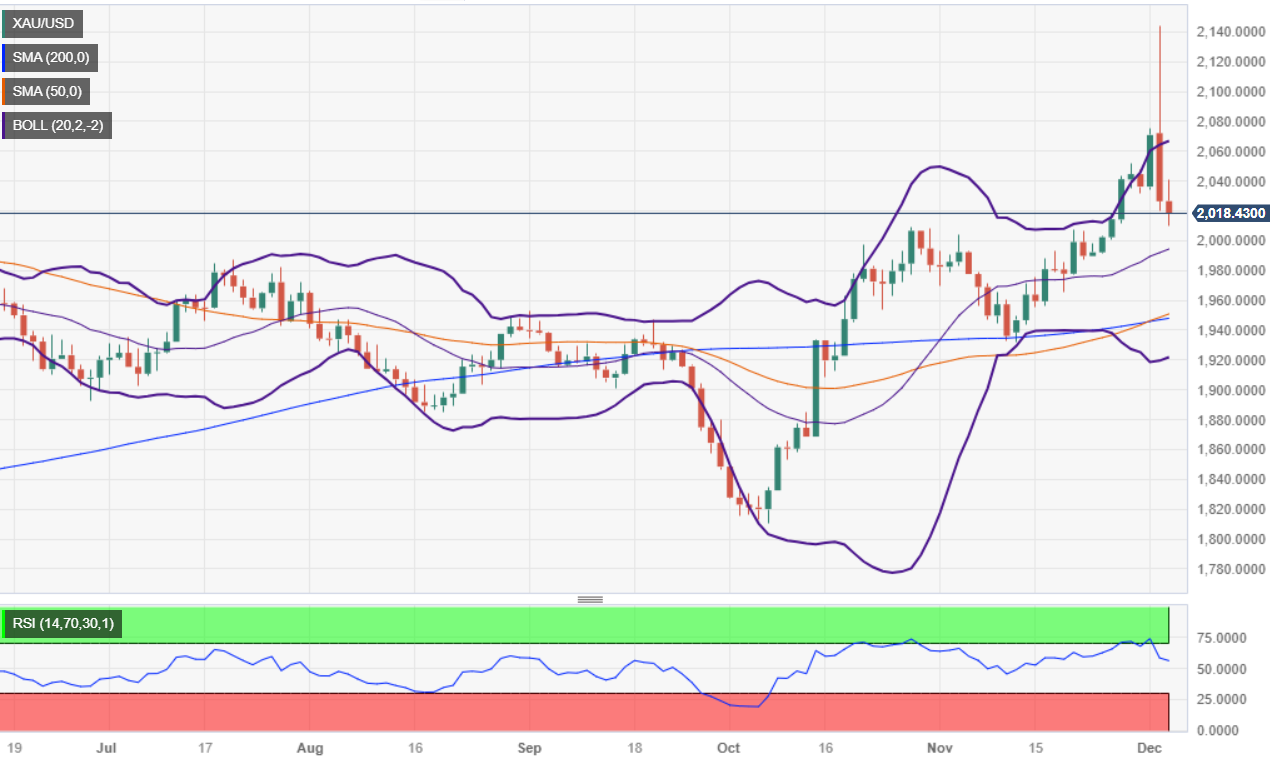
- Gold's two-day plunge, down $100, defies traditional safe-haven status amidst rising Greenback appeal.
- The US Dollar Index (DXY) gains 0.29%, reaching 103.93, highlighting a shift in market sentiment towards the Greenback.
- The US economy remains resilient after the ISM Non-Manufacturing PMI exceeded expectations at 52.7.
- JOLTs report reveals record-low vacancies, suggesting the labor market is easing.
Gold price extended its losses for the second straight day after reaching an all-time high (ATH) above the $2,100 figure, and it has dived more than $100.00 in two days of trading. Even though a risk-off impulse is the primary driver and usually bolsters appetite for the yellow metal, traders are shifting to the Greenback. Consequently, the XAU/USD is trading at $2018.00, down 0.54% after hitting a daily high of $2041.
Gold’s at the mercy of sellers, which had turned US Dollar bulls, as US bond yields also fell
Market sentiment remains sour, with flows going to the Greenback, as shown by the US Dollar Index (DXY). The DXY, which tracks the currency’s performance against six rivals, posted gains of 0.29% at 103.93. On the contrary, US Treasury bond yields are reversing some of their Monday gains and dropping with no fundamental reasons behind them.
On the data side, the US JOLTs report for October revealed that vacancies hit their lowest level in more than two and a half years, showed the Department of Labor. JOLTs stood at 8.733M, below forecasts of 9.3M and September’s 9.35M. Other data suggests the economy remains solid, even though the Atlanta GDP Now continues to show the economy in the fourth quarter, most likely growing below the 2% threshold. The ISM Non-Manufacturing PMI in November expanded to 52.7, exceeding estimates of 52, and the latest reading is 51.8.
Ahead of the week, additional jobs data will be revealed, as traders look for further data that could clear the path on Gold’s direction. On Wednesday, the ADP Employment Change would be followed by Thursday’s Initial Jobless Claims, to finish on Friday’s Nonfarm Payrolls report.
XAU/USD Price Analysis: Technical outlook
After diving below $2,050, the XAU/USD tested the October 27 high of $2,009.42 before reversing its course toward the current spot price. If buyers reclaim $2,040, that could open the door to tests of the November 29 high of $2,052.13. A breach of the latter would expose the previous YTD high of $2,081.82 before rallying to $2,100. On the flip side, if the non-yielding metal slips below $2,009.42, a drop to $2,000 is on the cards.
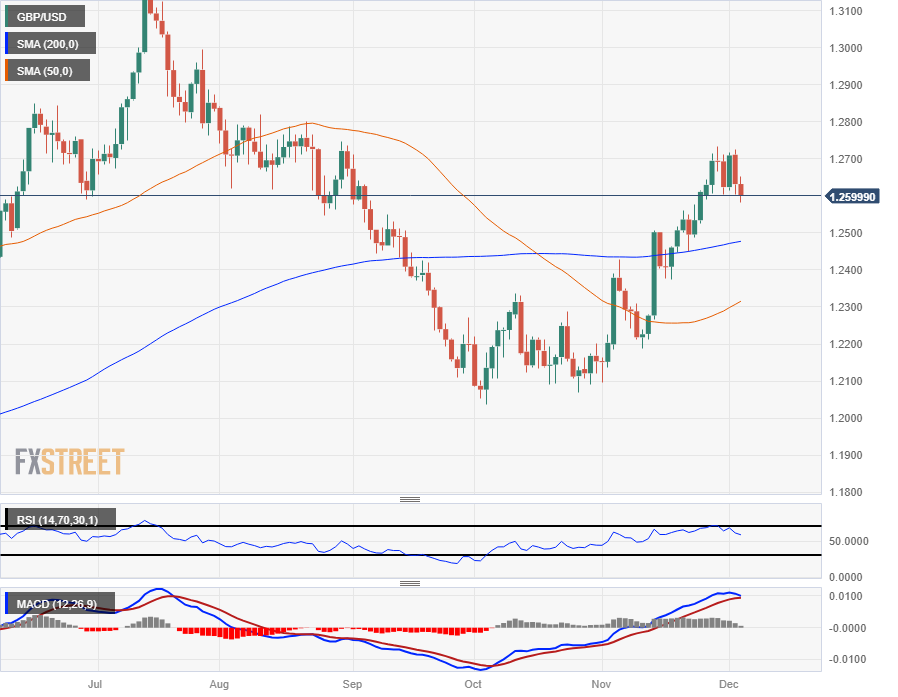
- The GBP/USD is seeing continued selling pressure, declining below 1.2600.
- The Pound Sterling is descending into new lows for the week.
- Mixed US data is propping up the US Dollar on Tuesday as market sentiment shifts underfoot.
The GBP/USD held mostly flat on Tuesday before seeing a decline below the 1.2600 handle during the American trading session, slipping to a one-week low and shedding a third of a percent on Tuesday.
Broader markets are seeing a favorable bid for the US Dollar (USD), with the Greenback climbing against most of the major currencies on Tuesday.
US data came in mixed, complicating market flows but keeping the US Dollar bid through the American trading session.
The Institute for Supply Management's (ISM) Services Purchasing Managers' Index (PMI) for November showed a slight uptick in outlook, printing at 52.7 compared to the forecast of 52, and climbing over the previous month's reading of 51.8.
US data mixes, markets keep US Dollar bid
The US JOLTS Job Openings declined to a two-and-a-half-year low of 8.733 million in October, down from the previous month's 9.35 million (revised down from 9.553 million). The US job market remains tight, despite a rapid rate hike cycle, and employment slack continues to remain elusive, weighing on investor expectations of Federal Reserve (Fed) rate cuts in the coming quarters.
The US Dollar is set to be the main driver through the mid-week, with Wednesday bringing the latest ADP Employment Change report for November, forecast to show an uptick from the previous month from 113K to 130K.
The Bank of England (BoE) will also be dropping their latest Financial Stability Report early Wednesday, which will give investors an eye into how far the BoE is leaning into hawkish or dovish territory.
GBP/USD Technical Outlook
The GBP/USD's decline below 1.2600 sees the pair slipping out of recent consolidation, and setting the pair up for a further decline towards the 200-day Simple Moving Average (SMA) below 1.2500.
The near-term cap on upside momentum remains the upper bound of recent consolidation near 1.2700, and bearish pullbacks will meet a bullish 50-day SMA currently rising from 1.2300.
The GBP/USD has lifted nearly six percent from October's lows near 1.2040, but the bullish momentum could be wrapping up as the pair sees an extended struggle to chalk in further gains on the chart paper.
GBP/USD Daily Chart
GBP/USD Technical Levels
- The Canadian Dollar sees new lows but seeks a foothold in the American session.
- Bank of Canada rate call on Wednesday to draw CAD traders’ attention.
- Shifts in risk appetite have the markets moving in and out of the safe havens.
The Canadian Dollar (CAD) eased back further on Tuesday before making a late rebound on the day, shedding a third of a percent against the US Dollar (USD) before paring back the day’s declines to a more manageable level. Market sentiment rattled through early Tuesday trading after Moody’s downgraded China’s credit outlook, sending the US Dollar broadly higher on the day.
The Bank of Canada (BoC) makes an appearance on Wednesday with the Canadian central bank’s latest rate call, and money markets expect another rate hold with dovish tweaks from the BoC.
Crude Oil markets are mixed on Tuesday as West Texas Intermediate (WTI) slumps through the day before a recovery back to the high side during the American market session.
Daily Digest Market Movers: Canadian Dollar tracks Crude Oil in both directions as markets weigh risk positioning
- Canadian Dollar traders are sidelined ahead of the BoC’s Wednesday rate call, US Dollar flows drive the bids.
- Money markets expect the BoC to stand pat on interest rates this week, though some dovish tweaks to the Canadian central bank’s talking points are expected.
- BoC overnight rate to remain at 5%, BoC Governor Tiff Macklem expected to omit comments about inflationary risks and focus on weaker Q3 performance instead.
- Broad-market sentiment took a hit early on Tuesday after Moody’s downgraded China’s credit outlook from stable to negative, pushing markets into the US Dollar and forcing down the Canadian Dollar as a knock-on effect.
- US data is mixed on Tuesday with the Institute for Supply Management’s (ISM) Services Purchasing Managers Index (PMI) coming in better than expected, while the JOLTS Job Openings for October printed less available job postings than expected.
- The US job market remains tight with the JOLTS posting its lowest job openings in over two and a half years.
- Crude Oil markets are mixed on the day with fossil fuel bids under pressure from declining global demand and rising crude stocks.
- Russia, UAE to discuss achieving broader unity on OPEC production cuts, backstopping Crude Oil bids on Tuesday by preventing further declines.
Canadian Dollar price today
The table below shows the percentage change of Canadian Dollar (CAD) against listed major currencies today. Canadian Dollar was the weakest against the Japanese Yen.
| USD | EUR | GBP | CAD | AUD | JPY | NZD | CHF | |
| USD | 0.41% | 0.27% | 0.22% | 0.94% | -0.08% | 0.48% | 0.33% | |
| EUR | -0.41% | -0.14% | -0.17% | 0.53% | -0.49% | 0.07% | -0.07% | |
| GBP | -0.28% | 0.15% | -0.03% | 0.67% | -0.33% | 0.22% | 0.06% | |
| CAD | -0.23% | 0.18% | 0.02% | 0.68% | -0.29% | 0.23% | 0.10% | |
| AUD | -0.93% | -0.52% | -0.67% | -0.71% | -1.01% | -0.46% | -0.61% | |
| JPY | 0.11% | 0.44% | 0.32% | 0.28% | 1.00% | 0.56% | 0.39% | |
| NZD | -0.48% | -0.06% | -0.20% | -0.24% | 0.46% | -0.56% | -0.15% | |
| CHF | -0.33% | 0.08% | -0.06% | -0.10% | 0.61% | -0.42% | 0.12% |
The heat map shows percentage changes of major currencies against each other. The base currency is picked from the left column, while the quote currency is picked from the top row. For example, if you pick the Euro from the left column and move along the horizontal line to the Japanese Yen, the percentage change displayed in the box will represent EUR (base)/JPY (quote).
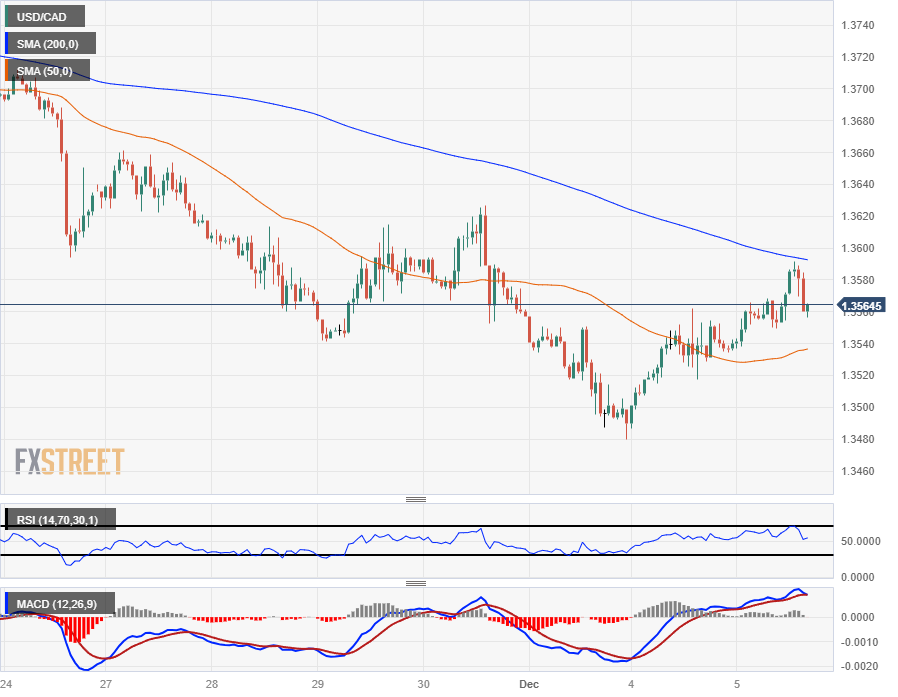
Technical Outlook: Canadian Dollar splits the rally, planted in Tuesday’s midrange
The Canadian Dollar (CAD) is stuck somewhere in the middle on Tuesday, down a fifth of a percent against the US Dollar (USD) and a third of a percent against the Japanese Yen (JPY). On the upside, the Loonie outperformed the Antipodeans, up two-thirds of a percent and a quarter of a percent against the Aussie (AUD) and the Kiwi (NZD), respectively.
The USD/CAD set a new high for the week near 1.3590 before the Canadian Dollar pared away some of the day’s losses to land near 1.3560, and intraday price action remains capped by the 200-hour Simple Moving Average (SMA) dropping through the 1.3600 handle.
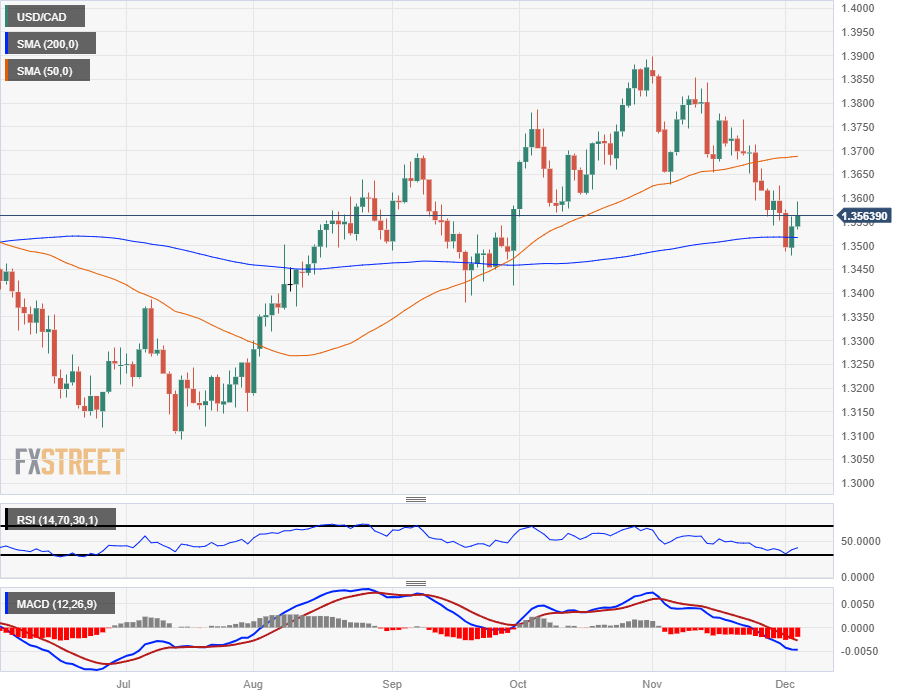
The USD/CAD is still within shooting range of a technical bounce from the 200-day SMA just north of the 1.3500 handle, and a continued recovery from the US Dollar will see the pair taking a run at the 50-day SMA near 1.3700.
On the downside, a break below the week’s bottom bids of 1.3480 will see bearish momentum accelerate, and bears’ sights will be set on 2023’s lows just beyond 1.3100.
USD/CAD Hourly Chart
USD/CAD Daily Chart
Canadian Dollar FAQs
What key factors drive the Canadian Dollar?
The key factors driving the Canadian Dollar (CAD) are the level of interest rates set by the Bank of Canada (BoC), the price of Oil, Canada’s largest export, the health of its economy, inflation and the Trade Balance, which is the difference between the value of Canada’s exports versus its imports. Other factors include market sentiment – whether investors are taking on more risky assets (risk-on) or seeking safe-havens (risk-off) – with risk-on being CAD-positive. As its largest trading partner, the health of the US economy is also a key factor influencing the Canadian Dollar.
How do the decisions of the Bank of Canada impact the Canadian Dollar?
The Bank of Canada (BoC) has a significant influence on the Canadian Dollar by setting the level of interest rates that banks can lend to one another. This influences the level of interest rates for everyone. The main goal of the BoC is to maintain inflation at 1-3% by adjusting interest rates up or down. Relatively higher interest rates tend to be positive for the CAD. The Bank of Canada can also use quantitative easing and tightening to influence credit conditions, with the former CAD-negative and the latter CAD-positive.
How does the price of Oil impact the Canadian Dollar?
The price of Oil is a key factor impacting the value of the Canadian Dollar. Petroleum is Canada’s biggest export, so Oil price tends to have an immediate impact on the CAD value. Generally, if Oil price rises CAD also goes up, as aggregate demand for the currency increases. The opposite is the case if the price of Oil falls. Higher Oil prices also tend to result in a greater likelihood of a positive Trade Balance, which is also supportive of the CAD.
How does inflation data impact the value of the Canadian Dollar?
While inflation had always traditionally been thought of as a negative factor for a currency since it lowers the value of money, the opposite has actually been the case in modern times with the relaxation of cross-border capital controls. Higher inflation tends to lead central banks to put up interest rates which attracts more capital inflows from global investors seeking a lucrative place to keep their money. This increases demand for the local currency, which in Canada’s case is the Canadian Dollar.
How does economic data influence the value of the Canadian Dollar?
Macroeconomic data releases gauge the health of the economy and can have an impact on the Canadian Dollar. Indicators such as GDP, Manufacturing and Services PMIs, employment, and consumer sentiment surveys can all influence the direction of the CAD. A strong economy is good for the Canadian Dollar. Not only does it attract more foreign investment but it may encourage the Bank of Canada to put up interest rates, leading to a stronger currency. If economic data is weak, however, the CAD is likely to fall.
- AUD/USD falls below the 200-DMA, as bears eye 0.6500.
- S&P Global and ISM, revealed the US economy remains resilient, as business activity in the sector segment, gathers traction.
- RBA´s decision to hold rates, tumbled the AUD/USD below the 0.6600 figure, on a perceived dovish hold.
The AUD/USD prolonged its agony during the North American session after the Reserve Bank of Australia (RBA) kept interest rates unchanged, setting the Aussie Dollar (AUD) faith, spurring losses of more than 0.70%. The pair is trading at 0.6565 after diving from daily highs of 0.6621.
AUD/USD on the defensive after RBA’s decision, while US data boosts the Greenback
The Greenback (USD) remains on the offensive, while data from the United States (US) triggered volatility in the buck, as shown by the US Dollar Index (DXY), which seesawed in the last hour from around 103.57 to 103.91 to settle at about 103.83.
An early report by S&P Global revealed that Services and Composite PMIs rose as expected, with the latter standing at 50.7, unchanged compared to October’s data. Recently, the Institute for Supply Management (ISM) revealed that activity in Non-Manufacturing businesses rose from 51.8 a month ago to 52.7, exceeding projections of 52.
At the same time, the US Department of Labor revealed that Job Openings fell to 8.733 million in October, below the estimated 9.3 million and close to 600,000 less than September’s figures.
Given that the recently released data suggests the US economy remains resilient, traders shift towards the release of employment data, with the ADP Employment Change on Wednesday and Initial Jobless Claims on Thursday.
Following the data, traders had priced in 137 basis points of rate cuts by the Federal Reserve (Fed) for the following year.
Aside from this, the RBA decided to keep rates at 4.35%, in a decision perceived as a dovish hold, per the market’s reaction, despite the RBA’s language that “whether further tightening of monetary policy is required…” they will act. The central bank said they don’t have enough data, which means the next meeting in February 2024 would be a “live one.”
AUD/USD Price Analysis: Technical outlook
AUD/USD daily chart shows bulls encountered solid resistance at a downslope supply trendline, which capped the last leg-up from October 26 lows, which witnessed the pair hitting a high of 0.6690. Since then, the pair lost a step as sellers dragged prices below the 0.6600 figure, eyeing a daily close below the 200-day moving average (DMA) at 0.6578. In that outcome, further downside is expected, with the following demand area at 0.6523, the November 6 high, and a previous resistance area that turned support.
- The XAG/USD is riding a downward rally and trades near the $24.20 level.
- November's US ISM Services PMI was reported at 52.7, exceeding consensus. JOLTs Job opening disappointed.
- The USD DXY recovered after the data and the US yields, which still tally daily declines.
- US yields slightly recovered, but they still tally daily declines.
In Tuesday's session, the XAG/USD metal is experiencing a downtrend, trading around the $24.18 mark. This downward movement was seen after the report of robust Institue For Supply Management (ISM) Services PMI and somewhat softer JOLTs opening figures as investors seem to have recalled that the Federal Reserve (Fed) remains data-dependent, so strong figures from the US economy may fuel a more hawkish stance from the bank.
In line with that, the US. Service sector as the Institute for Supply Management (ISM) Services PMI for November registered an expansion coming in at 52.7 against the consensus of 52 from the previous 51.8. On the other hand, data from the U.S. Bureau of Labor Statistics reported that JOLT's Job Openings for October dropped to 8.73M, lower than the 9.3M expected.
As a reaction, US Treasury bond yields trended downwards but gained momentum after the data. The 2-year rate is 4.60%, while the 5-year and 10-year rates are at 4.15% and 4.19%, respectively. This recovery in yields impacts negatively on the price of non-yielding metals such as these bond rates often represent the opportunity cost of holding them. On the other hand, the US Dollar, measured by the DXY index, is up with mild gains at 103.75 also adding pressure to the price.
That said, as the focus is set on incoming data, the investor's attention shifts to the upcoming labor market reports. On Wednesday, the US will release its Automatic Data Processing Inc. (ADP) Employment Change report, and on Friday, three important labor market metrics will be released, including Average Hourly Earnings, Unemployment Rate, and Nonfarm Payrolls. In that sense, the health of the sector may likely shape the expectations on the Fed’s next moves ahead of the next December 15 meeting, which will have an impact on the bond market and on the metal’s price dynamics.
XAG/USD levels to watch
On the daily chart, the Relative Strength Index (RSI) displays a negative slope in positive territory, indicating the receding momentum of buyers. Furthermore, gaining red bars in the Moving Average Convergence Divergence (MACD) denote sellers are beginning to stamp their authority, introducing additional selling momentum.
While there are indeed some strong sell signals in the short term, the metal continues to reside above the 20,100,200-day Simple Moving Averages (SMAs), an indicator that suggests buyers still hold the reins on larger time frames. In that sense, despite the bearish roar in the short term, the long-term picture painted by the SMAs cautions against prematurely declaring a bearish dominance.
Support Levels: $24.00, $23.76 (20-day SMA), $23.00.
Resistance Levels: $25.00, $25.50, $26.00.
XAG/USD daily chart
-638373888335718478.png)
- Mexican Peso maintains a negative tone as the USD/MXN hovers below the 200-day SMA.
- Mexico's economic data will reveal inflation figures on Thursday, widely expected to rise, which could prevent Banxico from easing policy.
- USD/MXN traders are eyeing important US jobs data ahead of the important Nonfarm Payrolls on Friday.
Mexican Peso (MXN) falls on Tuesday, extending its losses against the US Dollar (USD) in the early morning North American session after the USD/MXN briefly tested the 200-day Simple Moving Average (SMA), a critical resistance level. Nevertheless, the pair retraced somewhat, though it remains trading in the green at around 17.47, gaining 0.14% on the day.
Mexico’s economic calendar remains light on Tuesday, but it will gather some pace on Wednesday, with the release of Consumer Confidence for November, after October’s data printed 46. If confidence slips below the prior month’s figure, it would be the third straight reading that Mexican households are shifting pessimistic on the economic outlook. On Thursday, the National Statistics Agency, known as INEGI, will reveal inflation for November, with most economists expecting a higher rate than in October. That could prevent the Bank of Mexico (Banxico) from easing policy, despite recent comments by Governor Victoria Rodriguez Ceja and Deputy Governor Heath.
Aside from this, the Mexican currency remains stressed as market sentiment turns sour. The financial markets narrative suggests traders had become overly optimistic about rate cuts by the Federal Reserve (Fed). Market participants are awaiting a tranche of US labor data. On Tuesday, the JOLTs report is expected to show the jobs market remains tight, followed by Wednesday’s ADP Employment Change and Thursday’s jobless claims, ahead of Friday's crucial Nonfarm Payrolls report.
Daily digest movers: Mexican Peso remains weak as traders await Mexico’s inflation report
- Banxico revised economic growth upward from 3% to 3.3% for 2023 and projects the economy will rise 3% in 2024, from 2.1% previously forecast.
- Regarding inflation prospects, the Mexican central bank foresees headline inflation at 4.4% in Q4 2023 (5.3% for core), while at the end of 2024, it is estimated at 3.4% (3.3% for core). The central bank forecasts headline and core inflation not to hit the 3% target imposed by the institution until 2025.
- The Federal Reserve's favorite inflation gauge in October, the Core PCE Price Index rate softened from 3.7% to 3.5% YoY. Moreover, headline PCE inflation dropped from 3.4% to 3.0% YoY for the same twelve-month period.
- On November 27, Banxico’s Deputy Governor, Jonathan Heath, commented that core prices must come down more, adding that one or two rate cuts may come next year, but “very gradually” and “with great caution.”
- Mexico's annual inflation increased from 4.31% to 4.32%, while core continued to ease from 5.33% to 5.31%, according to data on November 23.
- A Citibanamex poll suggests that 25 of 32 economists expect Banxico's first rate cut in the first half of 2024.
- The poll shows “a great dispersion” for interest rates next year, between 8.0% and 10.25%, revealed Citibanamex.
- The same survey revealed that economists foresee headline annual inflation at 4.00% and core at 4.06%, both readings for the next year, while the USD/MXN exchange rate is seen at 19.00, up from 18.95, toward the end of 2024
Technical Analysis: Mexican Peso weakens further, as the USD/MXN hovers around the 200-day SMA
The USD/MXN popped and printed a three-week high of 17.56, piercing the 200-day SMA at 17.56, before retracing below the 17.50 area, with bulls taking a breather, as volatility continues to pick up. A decisive breach above the 200-day SMA could open the door to challenging the 50-day SMA at 17.69, ahead of the May 23 swing high at 17.99.
On the other hand, if the exotic pair fails at the 200-day SMA, that could pave the way to challenge the 100-day SMA at 17.37. The next demand zone would be the December 4 daily low of 17.16
Mexican Peso FAQs
What key factors drive the Mexican Peso?
The Mexican Peso (MXN) is the most traded currency among its Latin American peers. Its value is broadly determined by the performance of the Mexican economy, the country’s central bank’s policy, the amount of foreign investment in the country and even the levels of remittances sent by Mexicans who live abroad, particularly in the United States. Geopolitical trends can also move MXN: for example, the process of nearshoring – or the decision by some firms to relocate manufacturing capacity and supply chains closer to their home countries – is also seen as a catalyst for the Mexican currency as the country is considered a key manufacturing hub in the American continent. Another catalyst for MXN is Oil prices as Mexico is a key exporter of the commodity.
How do decisions of the Banxico impact the Mexican Peso?
The main objective of Mexico’s central bank, also known as Banxico, is to maintain inflation at low and stable levels (at or close to its target of 3%, the midpoint in a tolerance band of between 2% and 4%). To this end, the bank sets an appropriate level of interest rates. When inflation is too high, Banxico will attempt to tame it by raising interest rates, making it more expensive for households and businesses to borrow money, thus cooling demand and the overall economy. Higher interest rates are generally positive for the Mexican Peso (MXN) as they lead to higher yields, making the country a more attractive place for investors. On the contrary, lower interest rates tend to weaken MXN.
How does economic data influence the value of the Mexican Peso?
Macroeconomic data releases are key to assess the state of the economy and can have an impact on the Mexican Peso (MXN) valuation. A strong Mexican economy, based on high economic growth, low unemployment and high confidence is good for MXN. Not only does it attract more foreign investment but it may encourage the Bank of Mexico (Banxico) to increase interest rates, particularly if this strength comes together with elevated inflation. However, if economic data is weak, MXN is likely to depreciate.
How does broader risk sentiment impact the Mexican Peso?
As an emerging-market currency, the Mexican Peso (MXN) tends to strive during risk-on periods, or when investors perceive that broader market risks are low and thus are eager to engage with investments that carry a higher risk. Conversely, MXN tends to weaken at times of market turbulence or economic uncertainty as investors tend to sell higher-risk assets and flee to the more-stable safe havens.
- US ISM Service PMI increases to 52.7 in November from 51.8 in October.
- Dollar slides after JOTLS report and ISM Service PMI.
Economic activity in the services sector expanded in November for the 11th consecutive month. The ISM Services PMI stood at 52.7, up from 51.8 in October and above market expectations of 52.0.
Further details of the publication revealed that the Business Activity Index registered 55.1 up from 54.1 in October. The Employment Index rose from 50.2 to 50.7. The Prices Index decline from 58.6 to 58.3.
A different report showed that the final reading of the S&P Global Service PMI stood at 50.8 in November, unchanged from the preliminary reading.
Market reaction
The US Dollar Index pulled back from the highest level in almost two weeks near 104.00, to 103.55, affected by the JOLTS report.
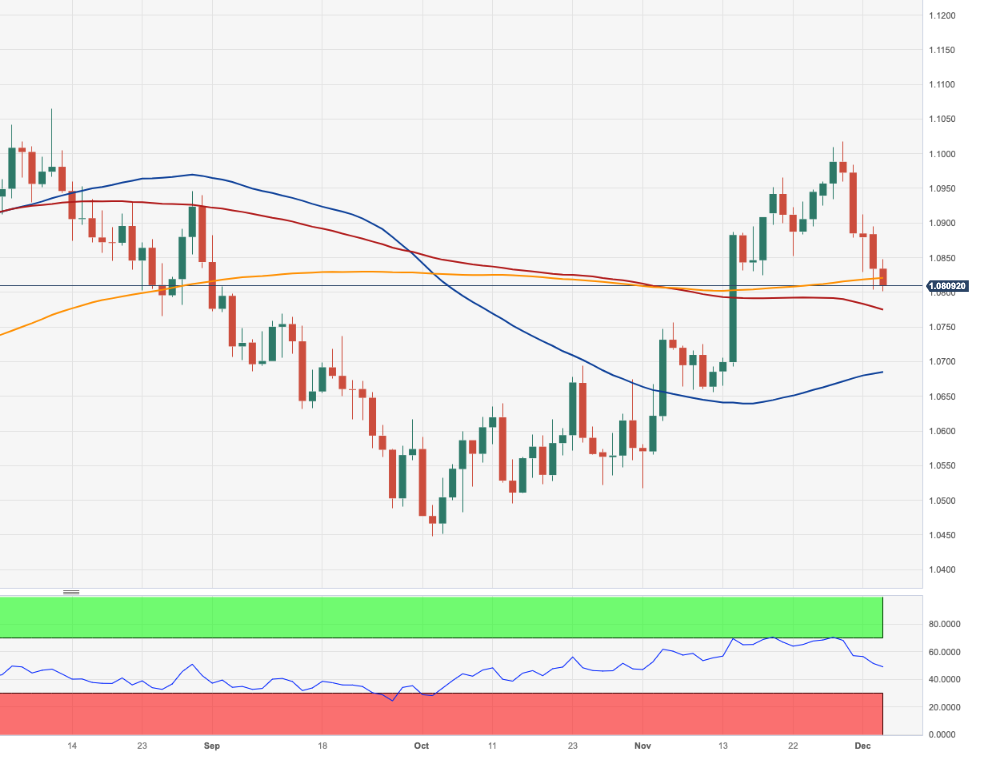
- EUR/USD loses further momentum and challenges 1.0800.
- Extra declines look likely once 1.0800 is cleared.
EUR/USD retreats further and puts the 1.0800 support to the test on Tuesday.
A drop below the latter should pave the way for a deeper retracement to, initially, the intermediate 100-day SMA at 1.0774 ahead of the 55-day SMA at 1.0684.
So far, while above the significant 200-day SMA at 1.0819, the pair’s outlook should remain constructive.
EUR/USD daily chart
- DXY adds to Monday’s advance and surpasses 103.80.
- Further gains look on the cards above the 200-day SMA.
DXY extends the upside bias so far this week and flirts with multi-session tops in the 103.80/85 band on Tuesday.
If the key 200-day SMA (103.57) is surpassed on a sustainable fashion, the index is expected to face more sustained gains to, initially, the weekly top of 104.21 (November 22) ahead of the transitory 100-day SMA at 104.41.
In the meantime, above the key 200-day SMA, the outlook for the index is expected to shift to bullish.
DXY daily chart

- EUR/JPY breaks below the 159.00 support on Tuesday.
- Extra pullbacks could see the 157.70 region revisited.
EUR/JPY retreats for the seventh session in a row and breaches the key support at 159.00 the figure on Tuesday.
The continuation of the downward bias appears on the cards for the time being. Against that, the loss of the provisional 100-day SMA at 158.66 could pave the way for a move to the minor support at the weekly low of 157.69 (October 30) prior to the October low of 154.34 (October 3).
So far, the longer term positive outlook for the cross appears favoured while above the 200-day SMA at 153.78.
EUR/JPY daily chart

UOB Group’s Head of Research Suan Teck Kin, CFA, and Associate Economist Jester Koh comment on the recent publication of Q3 GDP readings in India.
Key Takeaways
India’s real GDP expanded by 7.6% y/y in 2QFY23-24 (Jul-Sep quarter), stronger than Bloomberg and UOB’s expectations for a 6.8% y/y increase but a tad lower than 1QFY23-24’s (Apr-Jun quarter) reading of 7.8% y/y.
Outlook – We expect 3Q (Oct-Dec) GDP to be driven by strong year-end festival demand and ongoing public infrastructure spending. Private sector investments could pick up after the 18th Lok Sabha (lower house) elections (Apr-May 2024) as election uncertainty abates alongside continued progress of public infrastructure projects with the newly formed cabinet. We upgrade our FY23-24 GDP forecast to 6.9% (prev: 6.5%) and expect growth to moderate to 6.4% in FY24-25, as tight financial conditions gradually weigh on economic activity.
- Dollar recovery fails at 147.45 and keeps bears in charge.
- Speculation about Fed cuts in March is limiting USD’s upside attempts.
- Hopes of some BoJ monetary policy normalisation support the Yen.
The US Dollar’s recovery from Monday’s lows met resistance at 147.45, and the pair has been trading on a moderate bearish tone on Tuesday. Investor’s cautious mood ahead of a slew of key US employment figures has cushioned the Japanese Yen’s reversal.
Fed rate cuts hopes are weighing on the US Dollar
increasing speculation that the Fed is done with hikes and that the US central bank will start trimming rates in March is weighing on the US Dollar.
On the contrary, the Bank Of Japan is expected to exit its ultra-loose monetary policy in the coming months. This coupled with the risk-off market sentiment is cushioning the safe-haven Japanese Yen’s losses.
In the calendar, today the US Services ISM and the Jolt Openings will lay the ground to Wednesday’s ADP and Friday’s Nonfarm Payrolls, the main event of the week.
From a technical point of view, the 4-hour char shows the pair trading within a falling wedge, with in a bearish trend from Mid-November highs. Price action remains well below the main SMAs and the RSI has turned lower below its middle line suggesting that further decline is on the cards.
The next supports are 146.30 and 146.00. Resistances re the mentioned 147.45 and 148.50, the 38.2% retracement of the November - December decline.
Technical levels to watch
- Euro recovery attempts fail below 0.8600.
- Eurozone Services PMI revised higher, yet into contraction levels.
- The broader trend remains bearish with 0.8550 support in play.
The euro remains depressed near three-month lows against the Pound Sterling. The pair;’s mild recovery attempt seen during Tuesday’s early European session has found resistance at 0.8590 before easing to the mid-range of 0.8900.
UK services activity increases beyond expectations
Eurozone’s November Services PMI data has been revised upwards, with all major country members registering better than expected levels than previously estimated. Business activity in the sector, however, has contracted for the fourth consecutive month which is not good news for the Euro.
In contrast,, the UK services sector activity expanded in November and has been revised to 50.9 from the previously estimated 50.5 from 49.5 in October, which has provided some support to the Pound.
The technical picture shows a bearish Euro with no clear sign of a trend change on sight. Next support is at 0.8550 and below here, 0.7500 and 0.8455.
On the upside, 0.8590 and 0.8620 are the nearest resistance levels.
Technical levels to watch
Economist at UOB Group Enrico Tanuwidjaja and Junior Economist Agus Santoso review the latest inflation figures in Indonesia.
Key Takeaways
Indonesia's headline inflation in Nov rose to 2.9% y/y vs 2.6% in Oct on the back of higher food and transportation components, while the rest continued to moderate. The main driver of higher food prices is the El Nino phenomenon that has been occurring since the beginning of 3Q23, resulting in less water supply on farmland. In addition, the transition of the dry season to the rainy season in Nov also affected the rice harvest. On the other hand, higher inflation in the transportation component was driven by higher airfares and car fares due to a surge in logistics services towards the end of the year.
We maintain our view for 2023 inflation to ease compared to last year (2022: 4.2%) due to several reasons such as moderation in household consumption and higher for longer interest rate. However, we expect that the lingering El Nino risk and the transition from dry to rainy season could potentially add some upside to the food inflation in the near term. In addition, the trend of increasing people mobility in Dec to celebrate the new year also seasonally impact to the higher airfares. These factors are expected to deliver some upside risks to the headline inflation in 4Q23.
- The US Dollar soars as Moody’s downgrades China credit outlook.
- Traders brace for ISM Services PMI and Jolts data on Tuesday.
- The US Dollar Index jumps to 104.00, snapping crucial resistance levels.
The US Dollar (USD) appreciates significantly in the European trading session on Tuesday after rating agency Moody’s downgraded China’s credit outlook from stable to negative due to rising debt. More US Dollar Strength comes from European Central Bank (ECB) member Isabel Schnabel, who said she is surprised by the substantial decline in inflation and no more interest-rate hikes are further needed.
On the economic front, the calendar is starting to pick up some steam with the Institute for Supply Management (ISM) Services PMI on the wires this Tuesday. Traders will also get to see how healthy the demand for labor is with the US JOLTS job openings data. The S&P Global Purchasing Managers numbers are not expected to move the needle, though any beat on expectations might give the US Dollar more impulse.
Daily digest: Pressure building to Nonfarm Payrolls
- Rating agency Moody’s has issued a negative outlook for China, a downgrade from the previous “stable” label.
- European Central Bank (ECB) board member Isabel Schnabel said that she is surprised by the shere speed of decline in inflation in the Eurozone, and no further hikes should be needed. Schnabel is considered to be a hawk, which makes these comments even more important and signals a change in the stance and outlook of the ECB.
- At 13:55 GMT, the Redbook Index is due to be released. Previous was at 6.3%.
- At 14:45 GMT, the S&P Global Purchasing Managers Indices are expected:
- The Services PMI is expected to stay stable from its preliminary reading at 50.8.
- The Composite flash reading for November stood at 50.7.
- Chunky batch of data at 15:00 GMT:
- The Institute for Supply Management (ISM) will release its November numbers:
- Headline Services PMI for November expected to increase from 51.8 to 52.
- Services Employment Index for October was at 50.2. No forecast.
- Services New Orders Index for October was at 55.5. No forecast pencilled in.
- Services Prices Paid for October was at 58.6. No forecast.
- JOLTS Job Openings for October is expected to decline a little from 9.553 million to 9.3 million.
- Equities are bleeding severely this Tuesday with nearly all Asian equity indices down over 1%, with China’s leading indices down more than 2%. European equities are trading in the red, and US futures trade directionless.
- The CME Group’s FedWatch Tool shows that markets are pricing in a 97.5% chance that the Federal Reserve will keep interest rates unchanged at its meeting next week.
- The benchmark 10-year US Treasury Note steadies at 4.23%. Yields in Europe, on the other hand, are falling.
US Dollar Index technical analysis: Back to summer levels
The US Dollar trades around 103.74 and has the next level, 104.00, in sight. Elements like the sudden shift to no-hikes from the ECB widens further the rate differential between the US Dollar and other currencies. In this favourable context, the US Dollar Index (DXY) is rallying as well. With a few landmark resistances being challenged and broken, more room for Dollar strength is in the pipeline.
The DXY has performed a daily close on Monday and an opening just above the 200-day Simple Moving Average (SMA), which is near 103.58. The DXY could still make it further up, should employment data trigger rising US yields again. A two-tiered pattern of a daily close lower followed by an opening higher would quickly see the DXY back above 104.28, with the 200-day and 100-day SMA turned over to support levels.
To the downside, historic levels from August are coming into play, when the Greenback summer rally took place. The lows of June make sense to look for some support, near 101.92, just below 102.00. Should more events take place that initiate further declines in US rates, expect to see a near-full unwind of the 2023 summer rally, heading to 100.82, followed by 100.00 and 99.41.
US Dollar FAQs
What is the US Dollar?
The US Dollar (USD) is the official currency of the United States of America, and the ‘de facto’ currency of a significant number of other countries where it is found in circulation alongside local notes. It is the most heavily traded currency in the world, accounting for over 88% of all global foreign exchange turnover, or an average of $6.6 trillion in transactions per day, according to data from 2022.
Following the second world war, the USD took over from the British Pound as the world’s reserve currency. For most of its history, the US Dollar was backed by Gold, until the Bretton Woods Agreement in 1971 when the Gold Standard went away.
How do the decisions of the Federal Reserve impact the US Dollar?
The most important single factor impacting on the value of the US Dollar is monetary policy, which is shaped by the Federal Reserve (Fed). The Fed has two mandates: to achieve price stability (control inflation) and foster full employment. Its primary tool to achieve these two goals is by adjusting interest rates.
When prices are rising too quickly and inflation is above the Fed’s 2% target, the Fed will raise rates, which helps the USD value. When inflation falls below 2% or the Unemployment Rate is too high, the Fed may lower interest rates, which weighs on the Greenback.
What is Quantitative Easing and how does it influence the US Dollar?
In extreme situations, the Federal Reserve can also print more Dollars and enact quantitative easing (QE). QE is the process by which the Fed substantially increases the flow of credit in a stuck financial system.
It is a non-standard policy measure used when credit has dried up because banks will not lend to each other (out of the fear of counterparty default). It is a last resort when simply lowering interest rates is unlikely to achieve the necessary result. It was the Fed’s weapon of choice to combat the credit crunch that occurred during the Great Financial Crisis in 2008. It involves the Fed printing more Dollars and using them to buy US government bonds predominantly from financial institutions. QE usually leads to a weaker US Dollar.
What is Quantitative Tightening and how does it influence the US Dollar?
Quantitative tightening (QT) is the reverse process whereby the Federal Reserve stops buying bonds from financial institutions and does not reinvest the principal from the bonds it holds maturing in new purchases. It is usually positive for the US Dollar.
- Gold is pulling moderately lower, with the US Dollar favoured by the risk-off sentiment.
- The precious metal loses footing as the market focuses on US data for more cues into the Fed's future rate-hike path.
- Speculation that the Fed will start to cut rates in March keeps Gold near record highs.
Gold prices (XAU/USD) are ticking lower during the European morning session on Tuesday. Bullion’s mild recovery attempt from the $2,020 area has been contained at $2,040, with US Dollar regaining lost ground, favoured by a risk-averse market sentiment.
Investors have adopted a cautious stance, awaiting the release of key US macroeconomic data this week, with a special interest on Friday’s Nonfarm Payrolls report. These figures will be observed with interest to confirm the end of the Federal Reserve (Fed) tightening cycle and increased expectations of rate cuts in the first quarter of 2024.
Monday’s data showed that US Factory Orders contracted beyond expectations in October, adding to evidence that the economic growth in the US is losing pace in the last quarter of the year.
Investors’ focus on Tuesday will be on the US ISM Services PMI and the JOLTS Job Openings data. Wednesday’s ADP Employment Change and Friday’s Nonfarm Payrolls (NFP) are the highlights of the week, as they will show the strength of the labour market and determine the Fed’s near-term path.
Daily Digest Market Movers: Soft US data, hopes of Fed rate cuts support Gold
Markets are in a risk-off mood on Tuesday, which is supporting the Dollar and weighing on precious metals. Investors are reluctant to place risky bets, awaiting the release of US employment data.
Gold remains steady above the psychological $2,000 level, supported by soft US macroeconomic data, which feeds hopes that the Fed might start cutting rates in early 2024.
Eurozone and UK services PMI data have shown that the sector’s activity increased by more than previously estimated. This has eased concerns about a sharp economic slowdown in the coming months.
The CME Group FedWatch tool shows a 54% chance that the US central bank will trim its benchmark rate by 25 basis points in March.
US Factory Orders dropped by 3.6% in October, well beyond the 2.6% drop expected, following a 2.3% increase in September.
In China, the Caixin Services PMI accelerated to 51.5 in November from 50.4 in October, beating market expectations, yet still well below pre-pandemic levels.
The Israel-Hamas war and fears of a new epidemic in China are offsetting optimism about the upbeat Caixin Services PMI data, which shows that business activity accelerated in November.
The US ISM Services PMI, which will be released at 15:00 GMT, is expected to tick higher to 52 in November from 51.8 in the previous month. Any upside or downside surprise in the index could provide some short-term trading opportunities.
US JOLTS Job Openings are expected to have declined to 9.3 million in October from 9.55 million in the previous month, laying the ground for Wednesday’s ADP report and Friday’s all-important NFP report.
Technical Analysis: Gold prices face resistance above $2,040
The technical picture shows Gold price consolidating within the $2,020-$2,040 area after Monday’s sharp reversal from all-time highs around $2,150.
The precious metal has breached the 50% retracement of the November 13 - December 5 bull run, and the previous higher low at the mentioned $2,040, which is acting as a resistance.
XAU/USD 4-hour Chart
-638373748764857085.png)
Price action has moved below the 4-hour 50 Simple Moving Average (SMA) and the Relative Strength Index (RSI) has entered into negative territory, suggesting that further correction might be on the cards.
From a wider perspective, however, the uptrend from early October lows at $1,811 remains in place, yet with bullish momentum losing strength.
XAU/USD Daily Chart
-638373753655304367.png)
In the current risk-off context, with US Dollar regaining some ground, a further decline can be expected.Bulls aim for the $2,015-$2,005 support area, where the trendline support from October 6 lows meet the 61.8% retracement of the mentioned bull run and a previous key resistance level.
Below here, the bullish trend would be canceled, and support at $1,987 would be exposed.
On the upside, a positive reaction above $2,050 would shift the bull's focus towards $2,094 ahead of the record high at $2,150.
- WTI Oil trades near $74 in the aftermath of the OPEC+ meeting last week.
- The US Dollar rallies as the rate differential between the US and other countries widens.
- Oil could sink lower as supply increases once the US has restocked its Strategic Reserves (SPDR).
Oil prices are trading at a standstill near $74 in the aftermath of a disappointing OPEC+ outcome. The split division within the group of Oil producers was significant, and the result was not what markets wanted to see in order to send Oil prices higher. Adding to that, the US is shoring up its Oil supply and buildup of its strategic stockpile, which means that once full even more oversupply will hit markets.
Meanwhile, the US Dollar (USD) is rallying firmly for a second day in a row after China received a negative outlook from rating agency Moody’s and European Central Bank (ECB) board member Isabel Schnabel mentioned that inflation is near target and the ECB is at the end of its hiking cycle. This makes markets backtrack on the idea the US Federal Reserve would be the first to cut interest rates, supporting US yields and placing the US Dollar at higher value than the Euro and other currencies.
Crude Oil (WTI) trades at $74.02 per barrel and Brent Oil trades at $78.77 per barrel at the time of writing.
Oil news and market movers: OPEC+ lost the game for now
- Saudi Energy Minister Prince Abdulaziz bin Salman said OPEC+ Oil production cuts can “absolutely” stay in place until March and beyond if needed, Bloomberg reported.
- On the back of the comments from the Saudi Energy Minister, no real moves in Crude or Brent prices to take notice.
- Some strange moves in South Korea, where two processors bought 4 million barrels of US Oil up to now, for delivery in March, according to two traders who wanted to stay anonymous.
- This evening, the American Petroleum Institute (API) is due to release its weekly stockpile changes. The previous week recorded a small drawdown of 0.817 million barrels, with no forecast pencilled in for this week’s numbers.
Oil Technical Analysis: OPEC trying to catch the ball
Oil prices have been actually quite steady in the days after the OPEC+ official announcement. OPEC+ participants are starting to realise the missed opportunity and are trying to still salvage the situation with side comments such as those from the Saudi Energy Minister. These elements can be good for short blips, but they are unlikely to lead to substantial rallies or to install a price floor on Oil prices.
On the upside, $80.00 is the resistance to watch out for. Should crude be able to jump above that again, look for $84.00 (purple line) as the next level to see some selling pressure or profit taking. Should Oil prices be able to consolidate above there, the topside for this fall near $93.00 could come back into play.
On the downside, the soft floor near $74.00 is under pressure. This level is acting as the last line of defence before entering $70.00 and lower. Watch out for $67.00 with that triple bottom from June as the next support level to trade at.
-638373736053199469.png)
US WTI Crude Oil: Daily Chart
WTI Oil FAQs
What is WTI Oil?
WTI Oil is a type of Crude Oil sold on international markets. The WTI stands for West Texas Intermediate, one of three major types including Brent and Dubai Crude. WTI is also referred to as “light” and “sweet” because of its relatively low gravity and sulfur content respectively. It is considered a high quality Oil that is easily refined. It is sourced in the United States and distributed via the Cushing hub, which is considered “The Pipeline Crossroads of the World”. It is a benchmark for the Oil market and WTI price is frequently quoted in the media.
What factors drive the price of WTI Oil?
Like all assets, supply and demand are the key drivers of WTI Oil price. As such, global growth can be a driver of increased demand and vice versa for weak global growth. Political instability, wars, and sanctions can disrupt supply and impact prices. The decisions of OPEC, a group of major Oil-producing countries, is another key driver of price. The value of the US Dollar influences the price of WTI Crude Oil, since Oil is predominantly traded in US Dollars, thus a weaker US Dollar can make Oil more affordable and vice versa.
How does inventory data impact the price of WTI Oil
The weekly Oil inventory reports published by the American Petroleum Institute (API) and the Energy Information Agency (EIA) impact the price of WTI Oil. Changes in inventories reflect fluctuating supply and demand. If the data shows a drop in inventories it can indicate increased demand, pushing up Oil price. Higher inventories can reflect increased supply, pushing down prices. API’s report is published every Tuesday and EIA’s the day after. Their results are usually similar, falling within 1% of each other 75% of the time. The EIA data is considered more reliable, since it is a government agency.
How does OPEC influence the price of WTI Oil?
OPEC (Organization of the Petroleum Exporting Countries) is a group of 13 Oil-producing nations who collectively decide production quotas for member countries at twice-yearly meetings. Their decisions often impact WTI Oil prices. When OPEC decides to lower quotas, it can tighten supply, pushing up Oil prices. When OPEC increases production, it has the opposite effect. OPEC+ refers to an expanded group that includes ten extra non-OPEC members, the most notable of which is Russia.
Economist at UOB Group Lee Sue Ann expects the RBI to maintain its policy rates unchanged at 6.50% at its event later in the week.
Key Quotes
With headline CPI inflation likely to remain above RBI’s 4% target till late 2024, we expect RBI to keep peak policy rates unchanged through most of calendar year 2024 to anchor the disinflation process.
For the upcoming 8 Dec MPC meeting, we expect RBI to keep the repo rate unchanged at 6.50%.
A deeper pullback emerges on the horizon in case USD/CNH breaches 7.1100 in the near term, suggest UOB Group’s Markets Strategist Quek Ser Leang and Senior FX Strategist Peter Chia.
Key Quotes
24-hour view: We indicated yesterday that “as long as USD stays below 7.1500, it is likely to edge lower.” Our view was incorrect as USD rose to high of 7.1550. The advance lacks momentum, and USD is unlikely to rise much further. Today, USD is more likely to trade in a range, probably between 7.1300 and 7.1580.
Next 1-3 weeks: Our update from yesterday (04 Dec, spot at 7.1250) is still valid. As highlighted, the recent price action has resulted in a slight increase in downward momentum. If USD breaks the major support at 7.1100, the next level to watch is 7.0600. Conversely, if USD breaks above 7.1660 (no change in ‘strong resistance’ level), it would mean that the USD weakness from the middle of last month has stabilised.
- The Euro remains on the defensive against the US Dollar.
- European stocks trade with decent gains across the board.
- US ISM Services PMI takes centre stage in the docket.
The Euro (EUR) continues to face downward pressure against the US Dollar (USD), prompting EUR/USD to revisit the proximity of the 1.0800 region, where some decent contention seems to have emerged so far on Tuesday.
In contrast, the Greenback shows slight strength around 103.70 as per the USD Index (DXY), adding to the promising start of the week.
In terms of the wider economic context, the current stance on monetary policy remains unchanged, with investors contemplating potential interest rate cuts from both the Federal Reserve (Fed) and the European Central Bank (ECB) in the spring of 2024.
In the domestic docket, final Services PMI in Germany and the broader Eurozone surpassed the preliminary prints at 49.6 and 48.7, respectively, for the month of November.
Across the Atlantic, final S&P Global Services PMI is due in the first turn seconded by the key ISM Services PMI and the RCM/TIPP Economic Optimism Index.
Daily digest market movers: Euro puts the 1.0800 region to the test
- The EUR extends the bearish tone against the USD.
- US and German yields trade without a clear direction.
- Speculations of rate cuts by the Fed in March remain on the rise.
- Investors see the ECB trimming its interest rates in Q2 2024.
- The RBA left its policy rate unchanged, as expected.
Technical Analysis: Euro risks a deeper drop below 1.0800
EUR/USD faces further selling pressure and recedes to the 1.0800 neighbourhood.
If the EUR/USD continues to fall, it may come into contact with the key 200-day SMA around 1.0818 as a first point of support. The 55-day SMA around 1.0682 is expected to provide brief support in the case of a breach. If this level is also broken, the weekly low of 1.0495 (October 13) will be revealed, followed by the 2023 low of 1.0448 (October 3) and the psychological threshold of 1.0400.
If the EUR/USD continues to fall, it may encounter the initial point of support at the December low of 1.0804 (December 4,5). In the case of a breach, the 55-day SMA around 1.0684 is expected to provide temporary support ahead of the weekly low of 1.0495 (October 13), seconded by the 2023 low of 1.0448 (October 3) and the round milestone of 1.0400.
Meanwhile, the pair is expected to retain its positive view while keeping above the 200-day SMA, today at 1.0820.
Euro FAQs
What is the Euro?
The Euro is the currency for the 20 European Union countries that belong to the Eurozone. It is the second most heavily traded currency in the world behind the US Dollar. In 2022, it accounted for 31% of all foreign exchange transactions, with an average daily turnover of over $2.2 trillion a day.
EUR/USD is the most heavily traded currency pair in the world, accounting for an estimated 30% off all transactions, followed by EUR/JPY (4%), EUR/GBP (3%) and EUR/AUD (2%).
What is the ECB and how does it impact the Euro?
The European Central Bank (ECB) in Frankfurt, Germany, is the reserve bank for the Eurozone. The ECB sets interest rates and manages monetary policy.
The ECB’s primary mandate is to maintain price stability, which means either controlling inflation or stimulating growth. Its primary tool is the raising or lowering of interest rates. Relatively high interest rates – or the expectation of higher rates – will usually benefit the Euro and vice versa.
The ECB Governing Council makes monetary policy decisions at meetings held eight times a year. Decisions are made by heads of the Eurozone national banks and six permanent members, including the President of the ECB, Christine Lagarde.
How does inflation data impact the value of the Euro?
Eurozone inflation data, measured by the Harmonized Index of Consumer Prices (HICP), is an important econometric for the Euro. If inflation rises more than expected, especially if above the ECB’s 2% target, it obliges the ECB to raise interest rates to bring it back under control.
Relatively high interest rates compared to its counterparts will usually benefit the Euro, as it makes the region more attractive as a place for global investors to park their money.
How does economic data influence the value of the Euro?
Data releases gauge the health of the economy and can impact on the Euro. Indicators such as GDP, Manufacturing and Services PMIs, employment, and consumer sentiment surveys can all influence the direction of the single currency.
A strong economy is good for the Euro. Not only does it attract more foreign investment but it may encourage the ECB to put up interest rates, which will directly strengthen the Euro. Otherwise, if economic data is weak, the Euro is likely to fall.
Economic data for the four largest economies in the euro area (Germany, France, Italy and Spain) are especially significant, as they account for 75% of the Eurozone’s economy.
How does the Trade Balance impact the Euro?
Another significant data release for the Euro is the Trade Balance. This indicator measures the difference between what a country earns from its exports and what it spends on imports over a given period.
If a country produces highly sought after exports then its currency will gain in value purely from the extra demand created from foreign buyers seeking to purchase these goods. Therefore, a positive net Trade Balance strengthens a currency and vice versa for a negative balance.
- The Dollar threads water with the CHF favoured by the negative risk sentiment.
- The near-term bias remains negative while below 0.8770.
- A reversal below 0.8660 would lure bears into the 0.8555 long-term low.
US Dollar’s recovery attempt from Monday’s lows at 0.8665 is meeting strong resistance at the upper range of 0.8700. This leaves the pair wavering right about 0.8700, with the bearish trend from early November highs intact.
The risk-off mood supporters the Swiss Franc
Risk-averse market sentiment on Tuesday’s European session has offset the impact of the weak Swiss CPI reading seen on Monday. This sourer mood is favouring the safe-haven Swiss Franc, and keeping US Dollar bulls in check.
In the US, Factory orders data sewn on Monday confirmed that US economic growth is cooling in the fourth quarter of the year. This and the softer inflation figures are feeding hopes that the Fed is done with hikes, which is weighing on the USD.
Today, the US ISM Services PMI and the JOLTS job openings will provide some more insight into the US economic outlook although the highlight of the week will be Friday’s Nonfarm Payrolls report.
USD/CHF remains biased lower while below 0.8770
From a wider perspective, the pair remains looking vulnerable printing lower highs and lower lows. Resistance at 0.8770 is the nearest peak that should be breached to confirm a trend change and advance towards 0.8820 and 0.8880 levels.
Technical levels to watch
Inflation expectations among Eurozone consumers were left unchanged at 4.0% in October for the next 12 months, the European Central Bank’s (ECB) monthly Consumer Expectation Survey showed on Tuesday.
Additional takeaways
Median expectations for inflation over the next 3 years seen unchanged at 2.5%.
Economic growth expectations for the next 12 months seen at -1.3% vs. 1.2% previous
Market reaction
At the press time, EUR/USD is bouncing back to near 1.0850, adding 0.05% on the day.
- The Dollar extends gains favoured by risk aversion.
- Lower oil prices are weighing on the Canadian Dollar.
- USD/CAD’s corrective recovery, might find resistance at 1.3600 and 1.3620.
The US Dollar keeps a moderate bid tone on Tuesday’s European session and is putting a distance from the two-month highs, at the 1.3475 area hit on Monday.
The Greenback is drawing support from the risk-averse market sentiment. Investors are reluctant to place risky bets awaiting the release of US employment data to confirm that the Federal Reserve’s tightening cycle is over.
Lower oil prices are hurting the Canadian Dollar
Beyond that, the lower oil prices, with the IUS benchmark WTI hovering right above five-month lows, at $72.20 is acting as a headwind to the loonie.
In Canada, the BoC is widely expected to keep rates at the current 5% level and start rolling back the tightening cycle in early 2024.
From a technical perspective, the pair is correcting higher, after a 3% sell-off in November. The next resistances are likely to be at the 4h 50 SMA, at 1.3600 ahead of the November 30 high, 1.3622 and 1.3700.
Supports are 1.3520 and the December 4 low at 1.3475.
Technical levels to watch
- The pound loses ground on USD strength and a risk-off sentiment
- Speculation about BoE cuts likely to add pressure on the GBP
- A double-top at 1.2730 might trigger a trend change
The Pound is trading lower on Tuesday, weighed by negative market sentiment and a somewhat stronger USD with bears looking at the 1.2600 support area.
Speculation about BoE rate cuts
Beyond that, UK interest rate swaps have boosted speculation that the BoE might start cutting interest rates in June 2025, which is giving further hope for Pound sellers.
In the calendar today, the final of the UK Global/CIPS Services PMI and, in the US, the ISM Services PMI and October’s JOLTS Job Openings will provide the fundamental framework.
Potential double top at 1.2730
The technical picture shows the pair losing bullish momentum with price action crossing below the 4h 50 SMA aiming to 1.2600. A clear move here would trigger a double-top at 1.2730 increasing pressure towards 1.2517 ahead of the measured target, at 1.2460.
On the upside, immediate resistance lies at 1.2645 and 1.2730.
Technical levels to watch
- AUD/USD remains under some selling pressure for the second straight day on Tuesday.
- The RBA offered little cues about the future rate-hike path and weighs on the Aussie.
- The risk-off mood benefits the safe-haven USD and contributes to the intraday decline.
The AUD/USD pair extends the overnight retracement slide from the vicinity of the 0.6700 mark, or over a four-month high and drifts lower for the second straight day on Tuesday. The downward trajectory drags spot prices to over a one-week low, around the 0.6570 region during the early European session and is sponsored by a combination of factors.
The Australian Dollar (AUD) weakens across the board after the Reserve Bank of Australia (RBA) decided to keep interest rates unchanged and noted that more economic cues are needed before considering any more changes to monetary policy. In the accompanying policy statement, the RBA noted that the monthly CPI indicator for October suggested that inflation is continuing to moderate and conditions in the labour market, though remaining tight, also continued to ease gradually. This suggested that additional rate hikes might be off the table, which, along with a weaker risk tone, weighs heavily on the risk-sensitive Aussie.
Investors remain concerned about a darkening global outlook and the worsening economic conditions in China. Apart from this, an attack on US vessels in the Red Sea over the weekend, which fueled worries about a broader conflict in the Middle East, took its toll on the global risk sentiment. This, to a larger extent, overshadows Tuesday's better-than-expected release of Caixin China Services PMI, showing that business activity grew at a faster pace in November. This, however, failed to impress the AUD bulls, with a modest US Dollar (USD) uptick further contributing to the offered tone surrounding the AUD/USD pair.
The anti-risk flow is seen as a key factor benefitting the Greenback's relative safe-haven status, though dovish Federal Reserve (Fed) expectations might cap any further gains. Market participants seem convinced that the US central bank is done with its policy-tightening campaign and are pricing in an even chance of the first-rate cut as soon as March 2024. This, along with the global flight to safety, drags the US Treasury bond yields low and might hold back the USD bulls from placing aggressive bets ahead of the US macro data. The mixed fundamental backdrop, meanwhile, warrants caution for the AUD/USD bears.
Technical levels to watch
- The index adds to Monday’s gains and revisits 103.80.
- US yields trade on the defensive so far on Tuesday.
- The US services sector will be in the limelight later in the session.
The USD Index (DXY), which tracks the greenback vs. a bundle of its main competitors, maintains the optimism seen at the beginning of the week and advances to 103.80 on turnaround Tuesday.
USD Index focuses on key data
The index regains extra buying interest and builds on Monday’s gains in the upper end of the range near 103.80 so far on Tuesday.
Meanwhile, speculation continues apace regarding the prospects of interest rate decreases by the Federal Reserve at some point in the spring of 2024, despite differing perspectives on this issue among Fed policymakers.
In the US calendar, final S&P Global Services PMI is due ahead of the more important ISM Services PMI and the RCM/TIPP Economic Optimism Index.
What to look for around USD
The index regains poise and gradually approaches the key 104.00 region amidst the persistent weakness in the risk complex.
Looking at the broader picture, the dollar appears depressed against the backdrop of rising speculation of probable interest rate cuts in H1 2024, all in response to further disinflationary pressures and the gradual cooling of the labour market.
Some support for the greenback, however, still emerges the resilience of the US economy as well as a persistent hawkish narrative from some Fed rate setters.
Key events in the US this week: Final S&P Global Services PMI, ISM Services PMI, RCM/TIPP Economic Optimism Index (Tuesday) – MBA Mortgage Applications, ADP Employment Change, Balance of Trade (Wednesday) – PCE, Core PCE, Initial Jobless Claims, Wholesale Inventories, Consumer Credit Change (Thursday) – Nonfarm Payrolls, Unemployment Rate, Flash Michigan Consumer Sentiment (Friday).
Eminent issues on the back boiler: Growing perception of a soft landing for the US economy. Speculation of rate cuts at some point in the spring of 2024. Omnipresent geopolitical effervescence vs. Russia and China. Potential spread of the Middle East crisis to other regions.
USD Index relevant levels
Now, the index is up 0.07% at 103.70 and the breakout of 104.21 (weekly high November 22) would open the door to 105.39 (55-day SMA) and finally 106.00 (weekly peak November 10). On the flip side, immediate contention comes at 102.46 (monthly low November 29) ahead of 101.74 (monthly low August 4) and then 100.51 (weekly low July 27).
In the opinion of UOB Group’s Markets Strategist Quek Ser Leang and Senior FX Strategist Peter Chia, USD/JPY could lose further ground and revisit the 146.00 zone in the next few weeks.
Key Quotes
24-hour view: We expected USD to drop to 146.00 yesterday. Our expectation did not materialise as USD dropped to 146.21 and then rebounded strongly to 147.48. Downward pressure has eased with the rebound. Today, USD is likely to trade in a range, probably between 146.50 and 147.60.
Next 1-3 weeks: Yesterday (04 Dec), when USD was trading at 146.50, we indicated that the recent USD weakness has resumed. We also indicated that if USD “breaks below 146.00, the focus will shift to 145.05.” USD then dropped to 146.21 and rebounded. We continue to hold the same view for now. Overall, only a breach of 148.10 (no change in ‘strong resistance’ level) would suggest that USD is not ready to break below 146.00.
Considering advanced prints from CME Group for natural gas futures markets, open interest maintained the choppy activity in place and went up by around 3.7K contracts on Monday. In the same direction, volume rose by around 91.6K contracts following the previous daily
Natural Gas appears supported by the 200-day SMA
Prices of natural gas started the new trading week on the back foot amidst increasing open interest and volume. That said, further decline carries the potential to drag the commodity to the key 200-day SMA around the $2.620 region per MMBtu.
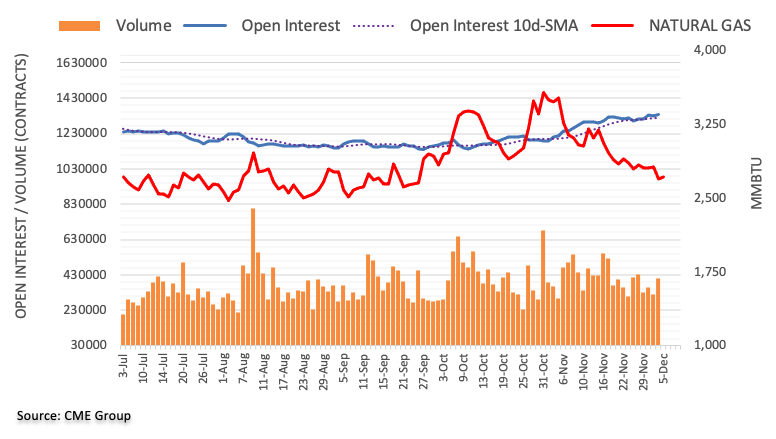
China’s Finance Ministry said in a statement on Tuesday, the “economy will maintain its rebound and positive trend.”
Additional quotes
Disappointed by Moody's downgrade of ratings outlook.
China's economy will maintain its rebound and positive trend.
Moody's concerns about China's economic growth prospects, fiscal sustainability and other aspects are 'unnecessary'.
The impact of the downturn in the real estate market on local general public budgets and government fund budgets is controllable and structural.
Market reaction
AUD/USD is licking the RBA decision-inflicted wounds near 0.6580, down 0.60% on the day, as of writing.
Gold prices fell in India on Tuesday, according to data from India's Multi Commodity Exchange (MCX).
Gold price stood at 62,268 Indian Rupees (INR) per 10 grams, down INR 1,089 compared with the INR 63,357 it cost on Monday.
As for futures contracts, Gold prices increased to INR 62,590 per 10 gms from INR 62,369 per 10 gms.
Prices for Silver futures contracts increased to INR 75,961 per kg from INR 76,168 per kg.
| Major Indian city | Gold Price |
|---|---|
| Ahmedabad | 65,345 |
| Mumbai | 65,090 |
| New Delhi | 64,335 |
| Chennai | 65,340 |
| Kolkata | 65,330 |
Global Market Movers: Comex Gold price regains positive traction ahead of US jobs data
- A combination of supporting factors assists the Comex Gold price to regain some positive traction on Tuesday and stall the overnight sharp retracement slide from the $2.144-2,145 area, or the record peak.
- Geopolitical risks and concerns over a new epidemic in China overshadow the upbeat private survey from China, showing that business activity in the services sector grew at a faster pace in November.
- China's Caixin Services PMI accelerated from 50.4 in October to 51.5 during the reported month, beating market expectations for a reading of 50.8, though it remains well below pre-COVID levels.
- Despite Federal Reserve Chair Jerome Powell's hawkish remarks on Friday, markets seem convinced that the US central bank is done raising rates and may start easing by the first half of the next year.
- The CME group's FedWatch Tool indicates a nearly 60% chance for an interest rate cut by the Fed in March 2024, which drags the US bond yields lower and acts as a headwind for the US Dollar.
- Furthermore, concerns about a darkening global economic outlook temper investors' appetite for riskier assets and drive some flows toward the perceived traditional safe-haven precious metal.
- Traders now look forward to the US ISM Services PMI, which is expected to tick higher to 52 for November from 51.8 in the previous month, for some short-term opportunities.
- The focus, however, will remain on the release of the US monthly employment details, popularly known as the NFP report on Friday, which will shed more light on the labor market conditions.
(An automation tool was used in creating this post.)
Gold FAQs
Why do people invest in Gold?
Gold has played a key role in human’s history as it has been widely used as a store of value and medium of exchange. Currently, apart from its shine and usage for jewelry, the precious metal is widely seen as a safe-haven asset, meaning that it is considered a good investment during turbulent times. Gold is also widely seen as a hedge against inflation and against depreciating currencies as it doesn’t rely on any specific issuer or government.
Who buys the most Gold?
Central banks are the biggest Gold holders. In their aim to support their currencies in turbulent times, central banks tend to diversify their reserves and buy Gold to improve the perceived strength of the economy and the currency. High Gold reserves can be a source of trust for a country’s solvency. Central banks added 1,136 tonnes of Gold worth around $70 billion to their reserves in 2022, according to data from the World Gold Council. This is the highest yearly purchase since records began. Central banks from emerging economies such as China, India and Turkey are quickly increasing their Gold reserves.
How is Gold correlated with other assets?
Gold has an inverse correlation with the US Dollar and US Treasuries, which are both major reserve and safe-haven assets. When the Dollar depreciates, Gold tends to rise, enabling investors and central banks to diversify their assets in turbulent times. Gold is also inversely correlated with risk assets. A rally in the stock market tends to weaken Gold price, while sell-offs in riskier markets tend to favor the precious metal.
What does the price of Gold depend on?
The price can move due to a wide range of factors. Geopolitical instability or fears of a deep recession can quickly make Gold price escalate due to its safe-haven status. As a yield-less asset, Gold tends to rise with lower interest rates, while higher cost of money usually weighs down on the yellow metal. Still, most moves depend on how the US Dollar (USD) behaves as the asset is priced in dollars (XAU/USD). A strong Dollar tends to keep the price of Gold controlled, whereas a weaker Dollar is likely to push Gold prices up.
- The US JOLTS data will be watched closely by investors ahead of the November jobs report.
- Job openings are forecast to edge lower to 9.35 million on the last business day of October.
- US labor market conditions remain out of balance as the Fed refrains from tightening policy further.
The Job Openings and Labor Turnover Survey (JOLTS) will be released on Tuesday by the US Bureau of Labor Statistics (BLS). The publication will provide data about the change in the number of job openings in October, alongside the number of layoffs and quits.
JOLTS data will be scrutinized by market participants and Federal Reserve (Fed) policymakers because it could provide valuable insights regarding the supply-demand dynamics in the labor market, a key factor impacting salaries and inflation.
What to expect in the next JOLTS report?
The number of job openings on the last business day of October is forecast to decline to 9.35 million."Over the month, the number of hires and total separations changed little at 5.9 million and 5.5 million, respectively," the BLS noted in the September report and added: "Within separations, quits (3.7 million) and layoffs and discharges (1.5 million) changed little."
After declining steadily from 10.3 million to 8.9 million in the April-July period, job openings rose to 9.49 million in August and to 9.55 million in September. Meanwhile, Nonfarm Payrolls increased by only 150,000 in October. Since the release of the October jobs report on November 3, the US Dollar (USD) has been struggling to find demand, with the DXY USD Index losing 3% in November.
Markets are fairly certain that the Federal Reserve (Fed) will leave the policy rate unchanged in the last policy meeting of the year. According to the CME Group FedWatch Tool, investors are even pricing in a more than 50% probability that the Fed will lower the interest rate by 25 basis points as early as March.
FXStreet Analyst Eren Sengezer shares his view on the JOLTS Job Openings data and the potential market reaction:
“The previous two JOLTS Job Openings data surprised to the upside and pointed to tight labor market conditions. The disappointing October NFP reading, however, suggests that conditions may have loosened. In case the number of job openings declines below nine million in October, markets are likely to see that as a confirmation of a cooling labor market. Nevertheless, investors could opt to wait to see the November labor market figures before betting on further USD weakness. On the other hand, a reading close to 10 million could help the USD stay resilient against its rivals with the immediate reaction.”
When will the JOLTS report be released and how could it affect EUR/USD?
Job openings numbers will be published at 15:00 GMT. Eren points out key technical levels to watch for EUR/USD ahead of JOLTS data:
“The Relative Strength Index (RSI) indicator on the daily chart declined toward 50 and EUR/USD fell below the lower limit of the ascending regression channel on Monday. These technical developments point to a loss of bullish momentum but sellers could refrain from betting on an extended slide if the pair stabilizes above the 200-day Simple Moving Average (SMA), which is currently located at around 1.0820.
On the upside, 1.0900 (psychological level, lower limit of the ascending channel) aligns as immediate resistance. Once this level is confirmed as support, 1.1000 (psychological level, midpoint of the ascending channel) and 1.1050 (upper limit of the ascending channel) could be set as next bullish targets. If EUR/USD confirms 1.0820 as resistance, technical sellers could show interest. In this scenario, additional losses toward 1.0770 (100-day SMA) and 1.0700 (50-day SMA) could be seen.”
Economic Indicator
United States JOLTS Job Openings
JOLTS Job Openings is a survey done by the US Bureau of Labor Statistics to help measure job vacancies. It collects data from employers including retailers, manufacturers and different offices each month.
Read more.Next release: 12/05/2023 15:00:00 GMT
Frequency: Monthly
Source: US Bureau of Labor Statistics
Employment FAQs
How do employment levels affect currencies?
Labor market conditions are a key element to assess the health of an economy and thus a key driver for currency valuation. High employment, or low unemployment, has positive implications for consumer spending and thus economic growth, boosting the value of the local currency. Moreover, a very tight labor market – a situation in which there is a shortage of workers to fill open positions – can also have implications on inflation levels and thus monetary policy as low labor supply and high demand leads to higher wages.
Why is wage growth important?
The pace at which salaries are growing in an economy is key for policymakers. High wage growth means that households have more money to spend, usually leading to price increases in consumer goods. In contrast to more volatile sources of inflation such as energy prices, wage growth is seen as a key component of underlying and persisting inflation as salary increases are unlikely to be undone. Central banks around the world pay close attention to wage growth data when deciding on monetary policy.
How much do central banks care about employment?
The weight that each central bank assigns to labor market conditions depends on its objectives. Some central banks explicitly have mandates related to the labor market beyond controlling inflation levels. The US Federal Reserve (Fed), for example, has the dual mandate of promoting maximum employment and stable prices. Meanwhile, the European Central Bank’s (ECB) sole mandate is to keep inflation under control. Still, and despite whatever mandates they have, labor market conditions are an important factor for policymakers given its significance as a gauge of the health of the economy and their direct relationship to inflation.
FX option expiries for Dec 5 NY cut at 10:00 Eastern Time, via DTCC, can be found below.
- EUR/USD: EUR amounts
- 1.0800 535m
- 1.0825 2b
- 1.0860 1.2b
- 1.0900 1.8b
- 1.0940 875m
- USD/JPY: USD amounts
- 146.00 988m
- 146.50 785m
- 147.00 1b
- 147.50 1.5b
- 148.00 2.1b
- 148.55 621m
- USD/CHF: USD amounts
- 0.8790 425m
- AUD/USD: AUD amounts
- 0.6550 1.8b
- 0.6660 854m
- USD/CAD: USD amounts
- 1.3460 500m
- 1.3550 880m
- 1.3600 492m
- EUR/GBP: EUR amounts
- 0.8705 430m
- 0.8730 398m
NZD/USD needs to clear 0.6225 to allow for extra advances in the near term, note UOB Group’s Markets Strategist Quek Ser Leang and Senior FX Strategist Peter Chia.
Key Quotes
24-hour view: We highlighted yesterday that NZD “is likely to break above the major resistance at 0.6225.” We also highlighted that “in view of the overbought conditions, it remains to be seen if it can maintain a foothold above this level.” However, NZD did not break 0.6225, as it dropped sharply from 0.6222 to 0.6151. Today, NZD could continue to drop, but as downward momentum has not increased much, a clear break below 0.6140 is unlikely. The risk of NZD dropping to 0.6140 will remain intact as long as it stays below 0.6200 (minor resistance is at 0.6185).
Next 1-3 weeks: After NZD soared last Friday, we indicated yesterday (04 Dec, spot at 0.6215) that “upward momentum has increased considerably, and NZD is very likely to break above 0.6225.” The sharp drop from 0.6222 to 0.6151 came as a surprise. While our ‘strong support’ at 0.6130 has not been breached, the sharp drop has diminished the odds of NZD breaking above 0.6225. In order to rejuvenate the flagging momentum, NZD must break above 0.6225 in the next 1-2 days, or a breach of 0.6130 would not be surprising. A breach of 0.6130 will indicate that NZD is likely to trade in a range for a period of time.
Open interest in crude oil futures markets resumed the uptrend on Monday, rising by more than 1K contracts and partially reversing the previous daily pullback. Volume followed suit and went up by around 134.6K contracts, extending the erratic performance seen as of late.
WTI: A move to $70.00 emerges on the horizon
Prices of WTI extended the leg lower at the beginning of the week. The continuation of the downward was amidst increasing open interest and volume and is indicative that further retracement lie ahead for the commodity in the short-term horizon. That said, a deeper decline to the $70.00 mark per barrel should not ne ruled out for the time being.
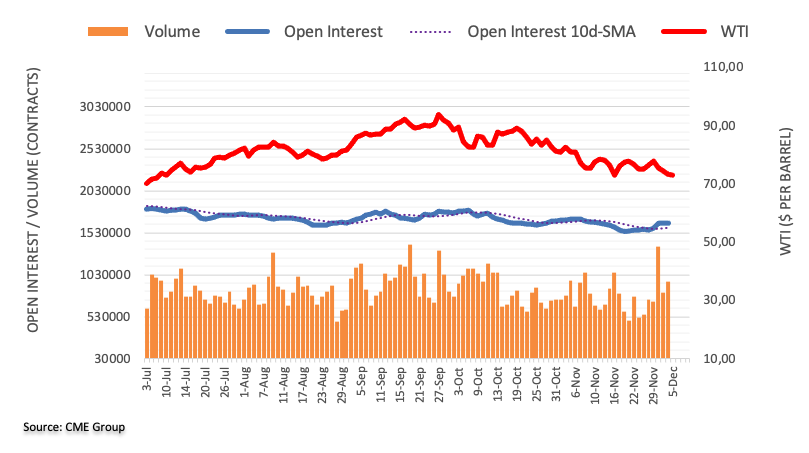
In light of the recent price action, GBP/USD is now seen navigating within the 1.2505-1.2725 range, suggest UOB Group’s Markets Strategist Quek Ser Leang and Senior FX Strategist Peter Chia.
Key Quotes
24-hour view: Last Friday, GBP rose sharply to a high of 1.2709. Yesterday (Monday), we indicated that “the sharp and swift rise appears to be running ahead of itself, and GBP is unlikely to strengthen much further.” We expected GBP “to trade sideways between 1.2650 and 1.2725.” GBP then rose to a high of 1.2724 before staging a surprisingly sharp decline to 1.2605. The increase in momentum suggests there is room for GBP to decline further to 1.2590 before the risk of a rebound increases. The major support at 1.2505 is not expected to come into view. On the upside, if GBP breaks above 1.2680 (minor resistance is at 1.2650), it would mean that it is not declining further.
Next 1-3 weeks: Last Thursday (30 Nov, spot at 1.2695), we indicated that “there is room for GBP to advance to 1.2745 before the risk of a pullback increases.” After GBP rebounded to a high of 1.2709 on Friday, we noted yesterday (04 Dec, spot at 1.2695) that “there is a mild boost in momentum.” However, we were of the view that GBP “has to break and stay above 1.2745 before further advance to 1.2795 is likely.” GBP did not break 1.2745. Instead, it fell and broke below our ‘strong support’ level of 1.2620 (low of 1.2605). Upward momentum has faded, and GBP appears to have entered a consolidation phase. From here, GBP is likely to trade in a sideways range of 1.2505/1.2725.
CME Group’s flash data for gold futures markets noted traders reduced their open interest positions by nearly 14K contracts on Monday. Volume, on the other hand, increased for the second session in a row, this time by around 152.2K contracts.
Gold targets the next up-barrier at $2150
Gold prices rose to a new all-time high around $2150 per troy ounce at the beginning of the week, although it ended the session with a marked retracement. The downtick, however, was accompanied by shrinking open interest, leaving the door open to the continuation of the ongoing uptrend. That said, the immediate hurdle emerges at the record peak of $2150 (December 4).
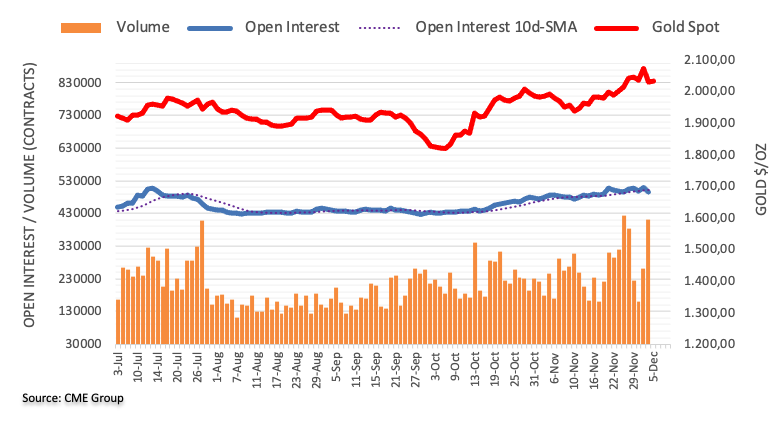
Here is what you need to know on Tuesday, December 5:
The US Dollar (USD) capitalized on safe haven flows and rising US Treasury bond yields to outperform its major rivals to start the week. After gaining nearly 0.5% on Monday, the USD Index stabilized above 103.50 early Tuesday, with investors shifting focus to JOLTS Job Openings data for October and the ISM's Services PMI survey for November.
Wall Street's main indexes opened deep in negative territory and continued to stretch lower on the first trading day of the week as participants moved away from risky assets on growing fears over the Israel-Hamas crisis turning into a widespread conflict in the Middle East. At the time of press, US stock index futures were down between 0.2% and 0.4%, showing no signs of an improvement in risk mood. Speaking on the situation in Gaza, "every time we think things cannot get any more apocalyptic in Gaza, they do,” said Martin Griffiths, the top UN emergency relief official, in a statement Monday, per CNN. "People are being ordered to move again, with little to survive on, forced to make one impossible choice after another."
Following the December policy meeting, the Reserve Bank of Australia (RBA) announced that it left the policy rate unchanged at 4.35% as expected. "Whether further tightening of monetary policy is required to ensure that inflation returns to target in a reasonable timeframe will depend upon the data and the evolving assessment of risks," the RBA repeated in the policy statement. AUD/USD came under bearish pressure and declined below 0.6600.
US Dollar price this week
The table below shows the percentage change of US Dollar (USD) against listed major currencies this week. US Dollar was the strongest against the Australian Dollar.
| USD | EUR | GBP | CAD | AUD | JPY | NZD | CHF | |
| USD | 0.53% | 0.65% | 0.54% | 1.50% | 0.35% | 0.95% | 0.54% | |
| EUR | -0.55% | 0.13% | 0.01% | 0.99% | -0.19% | 0.45% | 0.02% | |
| GBP | -0.67% | -0.12% | -0.11% | 0.86% | -0.30% | 0.31% | -0.10% | |
| CAD | -0.54% | -0.04% | 0.12% | 0.98% | -0.20% | 0.47% | 0.01% | |
| AUD | -1.51% | -1.00% | -0.87% | -0.97% | -1.18% | -0.53% | -0.96% | |
| JPY | -0.39% | 0.16% | 0.46% | 0.21% | 1.18% | 0.66% | 0.19% | |
| NZD | -0.98% | -0.45% | -0.32% | -0.43% | 0.54% | -0.62% | -0.43% | |
| CHF | -0.56% | -0.02% | 0.10% | -0.01% | 0.96% | -0.19% | 0.41% |
The heat map shows percentage changes of major currencies against each other. The base currency is picked from the left column, while the quote currency is picked from the top row. For example, if you pick the Euro from the left column and move along the horizontal line to the Japanese Yen, the percentage change displayed in the box will represent EUR (base)/JPY (quote).
EUR/USD fell toward 1.0800 and touched its lowest level in over two weeks on Monday. Although the pair rebounded to the 1.0850 area toward the end of the American session, it struggled to preserve its recovery momentum and was last seen fluctuating slightly below that level.
GBP/USD lost more than 50 pips on Monday and stabilized below 1.2650 early Tuesday. The UK economic docket will not feature any high-tier macroeconomic data releases.
USD/JPY registered small gains on Monday but found it difficult to settle above 147.00 during the Asian trading hours on Tuesday. The data from Japan showed earlier in the day that the Tokyo Consumer Price Index rose 2.6% on a yearly basis in November, at a softer pace than the 3.3% increase recorded in October.
Gold made a sharp downward correction after hitting a new all-time high near $2,150 on Monday and closed deep in negative territory. XAU/USD was last seen consolidating its losses below $2,050.
Further losses could drag EUR/USD to 1.0770 in the next few weeks, according to UOB Group’s Markets Strategist Quek Ser Leang and Senior FX Strategist Peter Chia.
Key Quotes
24-hour view: EUR dipped to 1.0827 last Friday before rebounding to close little changed at 1.0881 (-0.05%). Yesterday (Monday), we indicated that “while downward pressure appears to have eased, EUR could dip to 1.0810 before a more sustained recovery is likely.” In NY trade, EUR dropped to 1.0802 before rebounding. This time around, downward pressure has eased, and EUR is unlikely to weaken much further. Today, EUR is more likely to trade in a range, probably between 1.0800 and 1.0870.
Next 1-3 weeks: Last Friday (01 Dec, spot at 1.0895), we noted that “upward momentum has faded, and downward momentum has increased a tad.” We expected EUR to “edge lower towards 1.0810.” In line with our expectations, EUR dropped to a low of 1.0802 yesterday (04 Dec). While downward momentum has increased further, it is not enough to suggest that EUR is ready to decline in a sustained manner. EUR has to break and stay below 1.0770 before a sustained decline is likely. The chance of EUR breaking clearly below 1.0770 is not high for now, but it will remain intact unless EUR breaks above the ‘strong resistance’ at 1.0900 (level was at 1.0965 yesterday).
- EUR/USD extends its downside around 1.0834 ahead of the Eurozone PMI data.
- The pair maintains the bearish outlook below the key 100-hour EMA; RSI stands in the bearish zone below the 50.0 midline.
- 1.0867 acts as an immediate resistance level; 1.0806 will be the initial support level.
The EUR/USD pair trades in negative territory for the fifth consecutive day during the early European session on Tuesday. Investors await the Spanish, German, French, and Eurozone HCOB PMI data due later on Tuesday. The major pair currently trades near 1.0834, unchanged for the day.
From a technical perspective, EUR/USD maintains a bearish outlook as the major pair holds below the key 100-hour Exponential Moving Averages (EMA) on the four-hour chart. The downward momentum is supported by the Relative Strength Index (RSI) which stands below the 50.0 midline, indicating that the path of least resistance is to the downside.
The 100-hour EMA at 1.0867 acts as an immediate resistance level for EUR/USD. The next upside barrier to watch is the 1.0895-1.0900 zone, portraying the confluence of the 50-hour EMA and a psychological figure. Further north, the next hurdle is seen near the upper boundary of the Bollinger Bang at 1.0942.
On the other hand, the lower limit of the Bollinger Band at 1.0806 will be the initial support level. The additional downside filter to watch is a high of November 6 at 1.0755, followed by a low of November 9 at 1.0660.
EUR/USD four-hour chart
-638373553548262645.png)
European Central Bank (ECB) executive board member Isabel Schnabel said on Tuesday, “further rate hikes are ‘rather unlikely’ after latest inflation data.”
Additional quotes
Inflation developments are encouraging, fall in core prices remarkable.
Must be careful about guiding policy for many months out.
Current level of restriction is sufficient, has increased confidence 2% target will be met in 2025.
Further rate hikes "rather unlikely" after November inflation data.
But must not declare victory prematurely.
Inflation is on the right track but more progress is needed.
No prolonged recession is seen.
Data suggests economy may be bottoming out.
Market reaction
At the time of writing, EUR/USD is trading modestly at around 1.0840, unperturbed by the above comments.
- WTI loses traction near $73.30 on concern about oil demand.
- China's Services PMI surged to 51.5 in November vs. 50.4 prior.
- Oil traders await the US ISM Services PMI, due later on Tuesday.
Western Texas Intermediate (WTI), the US crude oil benchmark, is trading around $73.30 so far on Tuesday. WTI prices attract some sellers as investors are concerned about oil demand and the uncertainty about the depth and duration of OPEC+ supply cuts.
The Organization of the Petroleum Exporting Countries and its allies (OPEC+) agreed to voluntary output cuts for the first quarter of 2024. However, investors doubt how output cutbacks will be measured.
Early Tuesday, China's Services Purchasing Managers' Index (PMI) surged to 51.5 in November from the October reading of 50.4, better than the estimation of 50.8. However, the NBS Manufacturing and Services PMI data last week came in worse than expected. The mixed Chinese economic data raises concerns about the recovery of China’s economy. This, in turn, weighs on the black gold, as China is the world's largest gold producer and consumer.
Looking ahead, oil traders will monitor the US ISM Services PMI due on Tuesday. Later this week, the attention will shift to the Nonfarm Payrolls on Friday. These events could significantly impact the USD-denominated WTI price. Oil traders will take cues from the data and find trading opportunities around WTI prices.
- USD/CAD scales higher for the second straight day amid bearish Crude Oil prices.
- The risk-off mood benefits the safe-haven USD and contributes to the downfall.
- The US macro data could provide some impetus ahead of the BoC on Wednesday.
The USD/CAD pair builds on the previous day's recovery move from the 1.3480 region, or its lowest level since September 29 and gains positive traction for the second successive day on Tuesday. The momentum lifts spot prices to a three-day top, beyond mid-1.3500s during the Asian session and is sponsored by bearish Crude Oil prices.
Investors remain, sceptic, that supply cuts by OPEC+ would have a significant impact on the back of a darkening global economic outlook, which is expected to dent fuel demand. This, in turn, drags the black liquid back closer to a multi-month low touched in November, which is seen undermining the commodity-linked Loonie and lending some support to the USD/CAD pair. Apart from this, expectations that the Bank of Canada (BoC) will start cutting interest rates in the second quarter of 2024 further seem to weigh on the Canadian Dollar (CAD).
The US Dollar (USD), on the other hand, draws some support from the global flight to safety, though dovish Federal Reserve (Fed) expectations keep a lid on any further gains. Market participants now seem convinced that interest rates in the US have peaked and that the Fed will start easing its monetary policy as soon as March 2024. This leads to a fresh leg down in the US Treasury bond yields, which holds back the USD bulls from placing aggressive bets and might keep a lid on any meaningful appreciating move for the USD/CAD pair.
The aforementioned mixed fundamental backdrop makes it prudent to wait for strong follow-through buying before confirming that spot prices have bottomed out in the near term and positioning for any further gains. Traders now look to the US economic docket, featuring the release of ISM Services PMI and JOLTS Job Openings data. This, along with the US bond yields and the broader risk sentiment, will drive the USD demand. Apart from this, Oil price dynamics should provide some impetus to the USD/CAD pair ahead of the BoC decision on Wednesday.
Technical levels to watch
- Gold price attracts fresh buyers and reverses a part of the overnight sharp fall from the record peak.
- Fed rate cut bets drag the US bond yields lower, which weighs on the USD and lends some support.
- The risk-off impulse further benefits the safe-haven metal ahead of this week’s key US macro data.
Gold price (XAU/USD) witnessed a dramatic intraday turnaround on Monday and retreated nearly $125 after the initial rally to a fresh all-time high, around the $2,144-2,145 region. The sharp pullback, however, stalled near the $2,020 area in the wake of growing acceptance that interest rates in the United States (US) have peaked. Moreover, the markets have been pricing in an eventual dovish pivot by the Federal Reserve (Fed) and a greater chance of a rate cut by March 2024.
Dovish Fed expectations, meanwhile, trigger a fresh leg down in the US Treasury bond yields and fail to assist the US Dollar (USD) to capitalize on the previous day's strong move up to over a one-week high. This, in turn, is seen as a key factor acting as a tailwind for the non-yielding Gold price. Apart from this, escalating geopolitical tensions in the Middle East and China's woes lift the safe-haven precious metal back to the $2,035 area during the Asian session on Tuesday.
It, however, remains to be seen if the Gold price can capitalize on the modest intraday uptick as traders might prefer to wait on the sidelines and refrain from placing fresh directional bets ahead of this week's key US macro releases. The US ISM Services PMI and JOLTS Job Openings data are due for release later this Tuesday. This will be followed by the ADP report on private-sector employment ahead of the closely-watched Nonfarm Payroll (NFP) on Friday.
Daily Digest Market Movers: Gold price continues to draw support from dovish Fed hopes and a softer risk tone
- A combination of supporting factors assists the Gold price to regain some positive traction on Tuesday and stall the overnight sharp retracement slide from the $2.144-2,145 area, or the record peak.
- Geopolitical risks and concerns over a new epidemic in China overshadow the upbeat private survey from China, showing that business activity in the services sector grew at a faster pace in November.
- China's Caixin Services PMI accelerated from 50.4 in October to 51.5 during the reported month, beating market expectations for a reading of 50.8, though it remains well below pre-COVID levels.
- Despite Federal Reserve Chair Jerome Powell's hawkish remarks on Friday, markets seem convinced that the US central bank is done raising rates and may start easing by the first half of the next year.
- The CME group's FedWatch Tool indicates a nearly 60% chance for an interest rate cut by the Fed in March 2024, which drags the US bond yields lower and acts as a headwind for the US Dollar.
- Furthermore, concerns about a darkening global economic outlook temper investors' appetite for riskier assets and drive some flows toward the perceived traditional safe-haven precious metal.
- Traders now look forward to the US ISM Services PMI, which is expected to tick higher to 52 for November from 51.8 in the previous month, for some short-term opportunities.
- The focus, however, will remain on the release of the US monthly employment details, popularly known as the NFP report on Friday, which will shed more light on the labor market conditions.
Technical Analysis: Gold price seems poised to appreciate further, occurrence of a golden cross comes into play
From a technical perspective, the overnight breakdown below the 50% Fibonacci retracement level of the recent rally witnessed over the past three weeks or so warrants caution for bullish traders. That said, oscillators on the daily chart have eased from the overbought conditions and are still holding comfortably in the positive territory. Apart from this, the occurrence of a golden cross, with the 50-day Simple Moving Average (SMA) rising above the 200-day SMA, suggests that the path of least resistance for the Gold price is to the upside.
Meanwhile, any subsequent move up is likely to confront some resistance near the $2,045-2,046 area, above which the XAU/USD could accelerate the momentum and climb to the next relevant hurdle around the $2,070 region. Some follow-through buying should allow bulls to reclaim the $2,100 round figure. On the flip side, the $2,026-2,020 area now seems to protect the immediate downside ahead of the 61.8% Fibo. level, around the $2,012 zone and the $2,000 psychological mark. A convincing break below the latter will suggest that the Gold price has topped out in the near term and pave the way for some meaningful depreciating move.
US Dollar price this week
The table below shows the percentage change of US Dollar (USD) against listed major currencies this week. US Dollar was the weakest against the Euro.
| USD | EUR | GBP | CAD | AUD | JPY | NZD | CHF | |
| USD | 0.42% | 0.58% | 0.50% | 1.49% | 0.49% | 1.02% | 0.52% | |
| EUR | -0.44% | 0.17% | 0.08% | 1.09% | 0.05% | 0.62% | 0.11% | |
| GBP | -0.61% | -0.16% | -0.08% | 0.92% | -0.09% | 0.45% | -0.05% | |
| CAD | -0.50% | -0.08% | 0.09% | 1.01% | -0.02% | 0.54% | 0.03% | |
| AUD | -1.51% | -1.09% | -0.92% | -1.01% | -1.04% | -0.47% | -0.98% | |
| JPY | -0.53% | -0.04% | 0.28% | 0.03% | 1.02% | 0.59% | 0.04% | |
| NZD | -1.03% | -0.61% | -0.45% | -0.54% | 0.47% | -0.55% | -0.51% | |
| CHF | -0.55% | -0.10% | 0.06% | -0.03% | 0.97% | -0.04% | 0.50% |
The heat map shows percentage changes of major currencies against each other. The base currency is picked from the left column, while the quote currency is picked from the top row. For example, if you pick the Euro from the left column and move along the horizontal line to the Japanese Yen, the percentage change displayed in the box will represent EUR (base)/JPY (quote).
Gold FAQs
Why do people invest in Gold?
Gold has played a key role in human’s history as it has been widely used as a store of value and medium of exchange. Currently, apart from its shine and usage for jewelry, the precious metal is widely seen as a safe-haven asset, meaning that it is considered a good investment during turbulent times. Gold is also widely seen as a hedge against inflation and against depreciating currencies as it doesn’t rely on any specific issuer or government.
Who buys the most Gold?
Central banks are the biggest Gold holders. In their aim to support their currencies in turbulent times, central banks tend to diversify their reserves and buy Gold to improve the perceived strength of the economy and the currency. High Gold reserves can be a source of trust for a country’s solvency. Central banks added 1,136 tonnes of Gold worth around $70 billion to their reserves in 2022, according to data from the World Gold Council. This is the highest yearly purchase since records began. Central banks from emerging economies such as China, India and Turkey are quickly increasing their Gold reserves.
How is Gold correlated with other assets?
Gold has an inverse correlation with the US Dollar and US Treasuries, which are both major reserve and safe-haven assets. When the Dollar depreciates, Gold tends to rise, enabling investors and central banks to diversify their assets in turbulent times. Gold is also inversely correlated with risk assets. A rally in the stock market tends to weaken Gold price, while sell-offs in riskier markets tend to favor the precious metal.
What does the price of Gold depend on?
The price can move due to a wide range of factors. Geopolitical instability or fears of a deep recession can quickly make Gold price escalate due to its safe-haven status. As a yield-less asset, Gold tends to rise with lower interest rates, while higher cost of money usually weighs down on the yellow metal. Still, most moves depend on how the US Dollar (USD) behaves as the asset is priced in dollars (XAU/USD). A strong Dollar tends to keep the price of Gold controlled, whereas a weaker Dollar is likely to push Gold prices up.
- Indian Rupee edges higher amid the decline in oil prices, US Treasury bond yields.
- The Reserve Bank of India (RBI) is likely to maintain an interest rate pause at 6.50% at its December meeting.
- Market players await the Indian and US Services PMI, due later on Tuesday.
Indian Rupee (INR) trades stronger on Tuesday on the decline in oil prices and lower US Treasury bond yields. Prime Minister Narendra Modi's Bharatiya Janata Party won the elections in three of the five Indian states that had recently gone to the polls. That being said, the election results will likely be positive for equities inflows, alleviating some pressure on INR devaluation in the near term.
The Reserve Bank of India (RBI) is expected to announce a continuation of its pause on the interest rate at 6.50% and maintain a hawkish stance on Friday. Analysts predict a fifth consecutive pause by the Monetary Policy Committee (MPC) due to concerns about potential food price shocks affecting inflation expectations.
Ahead of the RBI interest rate decision, investors will keep an eye on the S&P Global India Services PMI for November, due on Tuesday. The figure is expected to ease from 58.4 to 58.0. Additionally, the US ISM Services PMI will be released later in the day, which is expected to rise from 51.8 to 52.0.
Daily Digest Market Movers: Indian Rupee gains traction amid challenges and uncertainties
- RBI is likely to be selling the US dollar near the 83.38–83.39 Rupee levels, per Reuters.
- RBI Governor Shaktikanata Das said that headline inflation has moderated, and the Indian economy remains vulnerable to overlapping food price shocks coming from global factors and adverse weather events.
- India’s second-quarter Gross Domestic Product grew 7.6%, marking her the world’s fastest-growing major economy, driven by manufacturing and the government's spending.
- US Factory Orders fell 3.6% MoM in October from the previous reading of 2.3%.
- US ISM Manufacturing PMI remained unchanged at 46.7 in November, weaker than expected.
- According to the CME FedWatch Tool, Fed futures are pricing in a 60% odds of a rate cut at the Fed's March meeting, up from 21% over a week ago.
Technical Analysis: Indian Rupee’s positive outlook remains unchanged
Indian Rupee drifts higher on the day. The USD/INR pair has traded within a familiar trading band of 82.80–83.40 since September. From the technical perspective, the bullish tone of USD/INR will prevail as long as the pair holds above the key 100-day Exponential Moving Average (EMA) on the daily chart. This upward momentum is supported by the 14-day Relative Strength Index (RSI) that bounced off the 50.0 midline, indicating the further upside looks favorable.
A decisive break above the upper boundary of the trading range of 83.40 will pave the way to the year-to-date (YTD) high of 83.47, en route to a psychological round figure of 84.00. On the flip side, the critical support level is seen at the 83.00 psychological mark. Further south, the next contention to watch is the confluence of the lower limit of the trading range and a low of September 12 at 82.80, followed by a low of August 11 at 82.60.
US Dollar price today
The table below shows the percentage change of US Dollar (USD) against listed major currencies today. US Dollar was the weakest against the Japanese Yen.
| USD | EUR | GBP | CAD | AUD | JPY | NZD | CHF | |
| USD | -0.05% | -0.03% | 0.13% | 0.58% | -0.16% | 0.26% | -0.01% | |
| EUR | 0.03% | 0.01% | 0.18% | 0.61% | -0.12% | 0.30% | 0.04% | |
| GBP | 0.03% | -0.01% | 0.18% | 0.62% | -0.10% | 0.31% | 0.01% | |
| CAD | -0.14% | -0.19% | -0.18% | 0.42% | -0.28% | 0.13% | -0.15% | |
| AUD | -0.58% | -0.64% | -0.63% | -0.45% | -0.72% | -0.32% | -0.62% | |
| JPY | 0.14% | 0.06% | 0.07% | 0.25% | 0.71% | 0.38% | 0.11% | |
| NZD | -0.27% | -0.30% | -0.29% | -0.13% | 0.32% | -0.41% | -0.29% | |
| CHF | 0.01% | -0.04% | -0.01% | 0.16% | 0.59% | -0.15% | 0.28% |
The heat map shows percentage changes of major currencies against each other. The base currency is picked from the left column, while the quote currency is picked from the top row. For example, if you pick the Euro from the left column and move along the horizontal line to the Japanese Yen, the percentage change displayed in the box will represent EUR (base)/JPY (quote).
Indian Rupee FAQs
What are the key factors driving the Indian Rupee?
The Indian Rupee (INR) is one of the most sensitive currencies to external factors. The price of Crude Oil (the country is highly dependent on imported Oil), the value of the US Dollar – most trade is conducted in USD – and the level of foreign investment, are all influential. Direct intervention by the Reserve Bank of India (RBI) in FX markets to keep the exchange rate stable, as well as the level of interest rates set by the RBI, are further major influencing factors on the Rupee.
How do the decisions of the Reserve Bank of India impact the Indian Rupee?
The Reserve Bank of India (RBI) actively intervenes in forex markets to maintain a stable exchange rate, to help facilitate trade. In addition, the RBI tries to maintain the inflation rate at its 4% target by adjusting interest rates. Higher interest rates usually strengthen the Rupee. This is due to the role of the ‘carry trade’ in which investors borrow in countries with lower interest rates so as to place their money in countries’ offering relatively higher interest rates and profit from the difference.
What macroeconomic factors influence the value of the Indian Rupee?
Macroeconomic factors that influence the value of the Rupee include inflation, interest rates, the economic growth rate (GDP), the balance of trade, and inflows from foreign investment. A higher growth rate can lead to more overseas investment, pushing up demand for the Rupee. A less negative balance of trade will eventually lead to a stronger Rupee. Higher interest rates, especially real rates (interest rates less inflation) are also positive for the Rupee. A risk-on environment can lead to greater inflows of Foreign Direct and Indirect Investment (FDI and FII), which also benefit the Rupee.
How does inflation impact the Indian Rupee?
Higher inflation, particularly, if it is comparatively higher than India’s peers, is generally negative for the currency as it reflects devaluation through oversupply. Inflation also increases the cost of exports, leading to more Rupees being sold to purchase foreign imports, which is Rupee-negative. At the same time, higher inflation usually leads to the Reserve Bank of India (RBI) raising interest rates and this can be positive for the Rupee, due to increased demand from international investors. The opposite effect is true of lower inflation.
- AUD/USD loses traction near 0.6575 following the Reserve Bank of Australia (RBA) monetary policy meeting.
- The RBA decided to hold the rate unchanged at 4.35%, as widely expected.
- The market has priced in 97% odds that the Fed will keep the rate unchanged at a range of 5.25% to 5.50% in the next meeting.
- Investors will monitor the US ISM Services PMI, due later on Tuesday.
The AUD/USD pair loses ground below the 0.6600 psychological round mark during the Asian trading hours on Tuesday. The pair faces some selling pressure after the Reserve Bank of Australia's (RBA) monetary policy meeting. The pair currently trades near 0.6575, down 0.70% for the day.
The Reserve Bank of Australia (RBA) board members decided to maintain the interest rate unchanged at 4.35% at its December monetary policy meeting on Tuesday. The RBA’s Governor Michele Bullock said whether additional monetary policy tightening is necessary to ensure that inflation returns to target would be determined by the data and the developing risk assessment.
Bullock further stated that holding the cash rate steady at this meeting would give the RBA time to assess the impact of the interest rate rises on demand, inflation, and the labor market.
On the USD’s front, the Federal Reserve (Fed) Chair Jerome Powell reinforced expectations that the central bank will no longer hike additional rates in its December meeting and may begin cutting rates by March 2024. According to the CME FedWatch Tool, the market has priced in 97% odds that Fed will keep the rate unchanged at a range of 5.25% to 5.50% in the next meeting and there is a more than 50% chance that Fed will trim rates by 25 basis points (bps) as soon as March of next year, up from around 21% one week ago. This, in turn, might weigh on the US Dollar and act as a tailwind for the AUD/USD pair.
Market participants will shift their focus to the US ISM Services PMI, due later on Tuesday. Later this week, the Australian Gross Domestic Product for the third quarter (Q3) will be released, which is forecasted to remain steady at 0.40%. These figures could trigger the volatility in the market and give a clear direction to the AUD/USD pair.
- AUD/JPY drifts lower for the second straight day and dives to a three-week low on Tuesday.
- The RBA decided to keep its benchmark interest rate unchanged, as was widely anticipated.
- The accompanying policy statement weighs on the Aussie amid a generally softer risk tone.
The AUD/JPY cross remains under some selling pressure for the second successive day on Tuesday and touches a three-week trough during the Asian session. The downward trajectory picked up pace after the Reserve Bank of Australia (RBA) announced its policy decision and dragged spot prices further below the 97.00 round-figure mark.
As was widely anticipated, the Australian central bank decided to keep the Official Cash Rate (OCR) unchanged at the end of the December meeting. In the accompanying policy statement, the RBA noted that the monthly CPI indicator for October suggested that inflation is continuing to moderate and conditions in the labour market, though remaining tight, also continued to ease gradually. This suggested that additional rate hikes might be off the table and prompted fresh selling around the Australian Dollar (AUD).
The Japanese Yen (JPY), on the other hand, draws support from the growing market conviction that the Bank of Japan (BoJ) will begin tightening its ultra-loose policy and end its yield curve control measures during the first few months of 2024. Apart from this, the risk-off impulse, as depicted by a generally weaker tone around the equity markets, is seen as another factor benefitting the JPY's relative safe-haven status against the perceived riskier Aussie. This further contributes to the offered tone surrounding the AUD/JPY cross.
Technical levels to watch
- GBP/USD trades with a mild positive bias on Tuesday amid subdued USD price action.
- Fed rate cut bets trigger a fresh leg down in the US bond yields and undermine the USD.
- A softer risk tone helps limit losses for the safe-haven buck and keeps a lid on the pair.
The GBP/USD pair edges higher during the Asian session on Tuesday and looks to build on the overnight bounce from the 1.2600 mark, representing the lower boundary of a one-week-old trading range. Spot prices currently hover around the 1.2630-1.2635 region and draw support from a combination of factors.
The US Dollar (USD) struggles to capitalize on the previous day's strong move up to over a one-week top amid expectations that the Federal Reserve (Fed) will not hike interest rates again and may start easing its policy as early as March 2024. This triggers a fresh leg down in the US Treasury bond yields and keeps the USD bulls on the defensive, which, in turn, is seen as a key factor acting as a tailwind for the GBP/USD pair.
The British Pound (GBP), on the other hand, is underpinned by diminishing odds for an early rate cut by the Bank of England (BoE). In fact, BoE Governor Andrew Bailey recently warned that it was too early to declare victory over inflation and predicted that monetary policy will have to stay restrictive for quite some time to make sure that inflation gets back to the 2% target. This further contributes to the GBP/USD pair's uptick.
That said, a softer risk tone is seen lending some support to the safe-haven Greenback and holding back traders from placing aggressive directional bets. Investors also seem reluctant and prefer to wait on the sidelines ahead of this week's important US macro data, starting with the release of the ISM Services PMI later during the early North American session. The focus, however, will remain on the key US NFP report on Friday.
Nevertheless, the aforementioned fundamental backdrop seems tilted in favour of bullish traders and suggests that the path of least resistance for the GBP/USD pair is to the upside. However, it will still be prudent to wait for a sustained move beyond the 1.2725-1.2730 supply zone, or the top end of a short-term trading range, before positioning for any further appreciating move ahead of the final UK Services PMI print.
Technical levels to watch
| Raw materials | Closed | Change, % |
|---|---|---|
| Silver | 24.498 | -3.83 |
| Gold | 2029.146 | -2.18 |
| Palladium | 974.65 | -2.73 |
- The Japanese Yen ticks lower against the USD following the release of a softer Tokyo CPI report.
- Expectations for an imminent BoJ policy shift and a softer risk tone help limit losses for the JPY.
- Fed rate cut bets keep the USD bulls on the defensive and act as a headwind for the USD/JPY pair.
The Japanese Yen (JPY) edges lower against its American counterpart during the Asian session on Tuesday after data showed that consumer inflation in Tokyo – Japan's capital city – eased more than expected in November. In fact, Tokyo's core CPI, which excludes volatile items such as fresh food, was the closest to the Bank of Japan's (BoJ) 2% annual target since June 2022. This comes on top of the recent less-hawkish remarks by BoJ board members, downplaying the chance of an imminent shift in the policy stance and ending the negative interest rate regime, which turns out to be a key factor undermining the JPY.
Investors, however, seem convinced that the BoJ will eventually begin tightening its ultra-loose policy and end its yield curve control measures during the first few months of 2024. This, along with a softer risk tone, underpins the safe-haven JPY. The US Dollar (USD), on the other hand, struggles to capitalize on the previous day's move up to over a one-week peak amid growing acceptance that the Federal Reserve (Fed) is done with its policy-tightening campaign and will soon start cutting interest rates. This, in turn, keeps a lid on the USD/JPY pair's recovery from a near three-month low touched on Monday.
Traders also seem reluctant to place aggressive bets and prefer to wait for this week's key US macro releases, starting with the ISM Services PMI and JOLTS Job Openings data later this Tuesday. The US ADP report on private-sector employment is due on Wednesday, though the focus will remain glued to the official jobs report – popularly known as the Nonfarm Payrolls on Friday.
Daily Digest Market Movers: Japanese Yen is undermined by a weaker data set
- Data released this Tuesday showed that the headline Tokyo CPI decelerated from 3.3% to the 2.6% YoY rate in November, though it remained above the Bank of Japan's 2% target for the 18th consecutive month.
- The Core CPI, which excludes volatile items such as fresh food, was flat month-on-month and the yearly rate eased more than anticipated, from 2.7% in October to 2.3% during the reported month.
- Another core gauge, which excludes both fresh food and fuel prices and is used as an indicator of underlying inflation by the BoJ, fell from the 3.8% YoY rate in the prior month and came in at 3.6%.
- Investors, however, continue to price in the possibility of an exit from negative interest rate policy by the BoJ in 2024, which, along with a softer risk tone, lends some support to the Japanese Yen.
- The final au Jibun Bank Service PMI came in at 50.8 for November, below the flash reading of 51.7. This was the slowest pace of growth in a year, signalling a further loss of momentum in the services sector.
- An escalation of geopolitical tensions in the Middle East tempers investors' appetite for riskier assets while the overnight rebound in the US bond yields took its toll on tech stocks.
- Bets that the Federal Reserve may begin easing as soon as March 2024 cap the US bond yields and the recent US Dollar recovery from a multi-month low, acting as a headwind for the USD/JPY pair.
- Investors now look forward to the release of the US ISM Services PMI for some impetus later during the North American session, though the focus will remain on the closely-watched NFP report on Friday.
Technical Analysis: USD/JPY struggles to move back above 100-day SMA, 38.2% Fibo. level holds the key for bulls
From a technical perspective, the USD/JPY pair on Monday found some support and attracted buyers near the 146.20 region, representing the 38.2% Fibonacci retracement level of the July-October rally. The subsequent move up, however, fails to make it through the 100-day Simple Moving Average (SMA) pivotal support breakpoint, warranting some caution for bullish traders. That said, a sustained strength beyond could trigger a short-covering rally and allow the USD/JPY pair to reclaim the 148.00 mark. The momentum could get extended further, though is likely to remain capped near the 148.25-148.30 horizontal barrier.
On the flip side, weakness back below the 147.00 mark might expose the multi-month low, around the 146.20 region, or the 38.2% Fibo. level tested on Monday. Some follow-through selling, leading to a subsequent slide through the 146.00 mark, will be seen as a fresh trigger for bearish traders. The USD/JPY pair might then accelerate the fall towards the next relevant support near the 145.45-145.40 region en route to the 145.00 psychological mark and the 50% Fibo. level, around mid-144.00s.
Japanese Yen price this week
The table below shows the percentage change of Japanese Yen (JPY) against listed major currencies this week. Japanese Yen was the weakest against the US Dollar.
| USD | EUR | GBP | CAD | AUD | JPY | NZD | CHF | |
| USD | 0.44% | 0.60% | 0.44% | 1.06% | 0.52% | 0.81% | 0.52% | |
| EUR | -0.46% | 0.16% | 0.00% | 0.62% | 0.06% | 0.39% | 0.08% | |
| GBP | -0.62% | -0.15% | -0.16% | 0.46% | -0.08% | 0.21% | -0.08% | |
| CAD | -0.44% | 0.01% | 0.17% | 0.61% | 0.06% | 0.38% | 0.08% | |
| AUD | -1.07% | -0.63% | -0.45% | -0.62% | -0.57% | -0.25% | -0.55% | |
| JPY | -0.55% | -0.05% | 0.25% | -0.05% | 0.57% | 0.32% | 0.00% | |
| NZD | -0.82% | -0.37% | -0.22% | -0.38% | 0.24% | -0.30% | -0.29% | |
| CHF | -0.54% | -0.07% | 0.08% | -0.08% | 0.55% | 0.00% | 0.30% |
The heat map shows percentage changes of major currencies against each other. The base currency is picked from the left column, while the quote currency is picked from the top row. For example, if you pick the Euro from the left column and move along the horizontal line to the Japanese Yen, the percentage change displayed in the box will represent EUR (base)/JPY (quote).
Japanese Yen FAQs
What key factors drive the Japanese Yen?
The Japanese Yen (JPY) is one of the world’s most traded currencies. Its value is broadly determined by the performance of the Japanese economy, but more specifically by the Bank of Japan’s policy, the differential between Japanese and US bond yields, or risk sentiment among traders, among other factors.
How do the decisions of the Bank of Japan impact the Japanese Yen?
One of the Bank of Japan’s mandates is currency control, so its moves are key for the Yen. The BoJ has directly intervened in currency markets sometimes, generally to lower the value of the Yen, although it refrains from doing it often due to political concerns of its main trading partners. The current BoJ ultra-loose monetary policy, based on massive stimulus to the economy, has caused the Yen to depreciate against its main currency peers. This process has exacerbated more recently due to an increasing policy divergence between the Bank of Japan and other main central banks, which have opted to increase interest rates sharply to fight decades-high levels of inflation.
How does the differential between Japanese and US bond yields impact the Japanese Yen?
The BoJ’s stance of sticking to ultra-loose monetary policy has led to a widening policy divergence with other central banks, particularly with the US Federal Reserve. This supports a widening of the differential between the 10-year US and Japanese bonds, which favors the US Dollar against the Japanese Yen.
How does broader risk sentiment impact the Japanese Yen?
The Japanese Yen is often seen as a safe-haven investment. This means that in times of market stress, investors are more likely to put their money in the Japanese currency due to its supposed reliability and stability. Turbulent times are likely to strengthen the Yen’s value against other currencies seen as more risky to invest in.
- AUD/USD drifts lower for the second straight day, though lacks follow-through selling.
- A softer risk tone is seen as a key factor undermining the risk-sensitive Australian Dollar.
- The better-than-expected release of China Caixin Services PMI does little to impress bulls
- Dovish Fed hopes undermine the USD and lend some support ahead of the RBA decision.
The AUD/USD pair remains under some selling pressure for the second straight day on Tuesday and reacts little to the better-than-expected release of Chinese data. Spot prices currently trade around the 0.6615-0.6610 region, down less than 0.10% for the day, as traders keenly await the Reserve Bank of Australia (RBA) policy decision.
A private survey showed that business activity in China's services sector grew at a faster pace in November. China's Caixin Services PMI accelerated to 51.5 during the reported month from 50.4 in October, beating expectations for a reading of 50.8. This, however, does little to influence the AUD/USD pair or provide any meaningful impetus amid a generally softer risk tone, which tends to undermine the risk-sensitive Australian Dollar (AUD).
Meanwhile, dovish Federal Reserve (Fed) expectations keep a lid on the recent US Dollar (USD) recovery from a multi-month low. This, in turn, helps limit the downside for the AUD/USD pair ahead of the key central bank event risk. The RBA is widely expected to keep interest rates on hold. Hence, investors will look for cues about future rate hikes, amid some stickiness in Australian inflation, before placing fresh directional bets around the major.
Later during the early North American session, traders will take cues from the release of the US ISM Services PMI. This, along with the US bond yields and the broader risk sentiment, will drive demand for the safe-haven buck and allow traders to grab short-term opportunities around the major.
Technical levels to watch
- NZD/USD loses ground near 0.6162 on the firmer USD.
- New Zealand’s ANZ Commodity Price came in at a 1.3% drop in November from a 2.9% rise in October.
- US Factory Orders dropped 3.6% MoM in October versus a 2.3% rise prior.
The NZD/USD pair holds positive ground around the mid-0.6100s during the early Asian session on Tuesday. The recovery of the pair is backed by the stronger-than-expected Chinese data. At press time, NZD/USD is trading near 0.6162, down 0.06% on the day.
The latest data from National Bank ANZ showed on Tuesday that New Zealand’s ANZ Commodity Price came in at a 1.3% drop in November from a 2.9% rise in October. Earlier this week, New Zealand’s Terms of Trade Index for the third quarter (Q3) declined 0.6% QoQ versus 0.3% prior. Good Export prices dropped 1.5% QoQ from the previous reading of a 6.8% rise while Import prices for goods declined 0.8% QoQ from a 1.0 drop in the previous reading.
Elsewhere, China's Services Purchasing Managers' Index (PMI) surges to 51.5 in November from the October reading of 50.4. The markets had expected a print of 50.8. The upbeat data from China boosts the China-proxy New Zealand Dollar (NZD) as China is New Zealand's largest trading partner.
That being said, the hawkish tilt from the Reserve Bank of New Zealand (RBNZ) lifts the New Zealand Dollar (NZD) and acts as a tailwind for the NZD/USD pair. It’s worth noting that RBNZ held the cash rate steady at 5.5% last week but noted inflation remained too high and that further policy tightening might be needed if price pressures did not ease.
On the other hand, the market is now pricing the US Federal Reserve (Fed) to end the tightening cycle and will begin cutting the rate as early as next March. Fed Chair Jerome Powell stated on Friday that it was premature to rule out additional rate hikes or start discussing cuts.
On Monday, the US Factory Orders dropped 3.6% MoM in October versus a 2.3% rise prior, according to the US Census Bureau. Market players await the US ISM Services PMI, which is expected to rise from 51.8 to 52.0.
The US Nonfarm Payrolls (NFP) report on Friday will be in the spotlight, which is expected to add 180K jobs in November. Traders will take cues from these events and find trading opportunities around the NZD/USD pair.
China's Services Purchasing Managers' Index (PMI) jumped to 51.5 in November, as against the October reading of 50.4, the latest data published by Caixin showed on Tuesday. The markets had expected a print of 50.8.
Key points
Business activity and new orders increase at quickest rates in three months.
Confidence around the year-ahead improves.
Inflationary pressures weaken.
Commenting on the China General Services PMI ™ data, Dr. Wang Zhe, Senior Economist at Caixin Insight Group said: “Both services supply and demand expanded, as the market continued to heal. The gauges for business activity and total new orders were above 50 for the 11th consecutive month and hit three-month highs.”
“However, some surveyed companies reported that the market improvement was slightly weaker than expected,” Wang added.
AUD/USD reaction to China’s Services PMI
Strong Chinese Services PMI lends some support to the Aussie Dollar, keeping AUD/USD afloat above 0.6600. The pair is trading at 0.6612, still down 0.12% on the day, at the time of writing.
The People’s Bank of China (PBoC) set the USD/CNY central rate for the trading session ahead on Tuesday at 7.1127 as compared to the previous day's fix of 7.1011 and 7.1476 Reuters estimates.
- EUR/USD posts modest gains around 1.0840 in early Tuesday.
- US factory orders fell 3.6% MoM in October versus a 2.3% rise prior.
- The European Central Bank (ECB)’s Luis de Guindos said tha recent inflation data is good news but it is too early to declare victory.
The EUR/USD pair snaps the four-day losing steaks during the Asian trading hours on Tuesday. That being said, the renewed US Dollar (USD) lends some support to the pair. The major pair currently trading around 1.0840, gaining 0.05% for the day.
On Monday, the US Census Bureau showed that the US factory orders fell 3.6% MoM in October from a 2.3% rise in the previous reading. Earlier, the US ISM Manufacturing PMI came in weaker than expected and remained unchanged at 46.7 in November, the Institute for Supply Management (ISM) showed on Friday.
The Federal Reserve (Fed) Chair Jerome Powell claimed that U US monetary policy was slowing the economy as expected, with the benchmark overnight interest rate well into restrictive territory. While Powell emphasized the Fed's willingness to tighten policy further if necessary, markets were confident the rate-hike cycle was done. This, in turn, weighs on the Greenback across the board.
Across the pond, the slowdown in inflation brings the ECB's 2% inflation target back into clear focus for the first time since the summer of 2021, potentially signaling an adjustment in monetary policy. European Central Bank (ECB) Vice President Luis de Guindos said on Monday that recent inflation data is good news but it is too early to declare victory while mentioning that monetary policy stance will be data-dependent.
Moving on, traders will keep an eye on the ISM Services PMI and JOLTS Job Openings data on Tuesday. Later this week, Wednesday’s ADP will be released. The attention will shift to Friday’s Nonfarm Payroll (NFP) report, which is estimated to create 180K jobs in the US economy.
| Index | Change, points | Closed | Change, % |
|---|---|---|---|
| NIKKEI 225 | -200.24 | 33231.27 | -0.6 |
| Hang Seng | -184.25 | 16646.05 | -1.09 |
| KOSPI | 9.94 | 2514.95 | 0.4 |
| ASX 200 | 51.5 | 7124.7 | 0.73 |
| DAX | 7.24 | 16404.76 | 0.04 |
| CAC 40 | -13.56 | 7332.59 | -0.18 |
| Dow Jones | -41.06 | 36204.44 | -0.11 |
| S&P 500 | -24.85 | 4569.78 | -0.54 |
| NASDAQ Composite | -119.54 | 14185.49 | -0.84 |
| Pare | Closed | Change, % |
|---|---|---|
| AUDUSD | 0.66187 | -0.71 |
| EURJPY | 159.511 | -0.03 |
| EURUSD | 1.08356 | -0.36 |
| GBPJPY | 185.961 | -0.19 |
| GBPUSD | 1.26318 | -0.54 |
| NZDUSD | 0.61639 | -0.45 |
| USDCAD | 1.35371 | 0.27 |
| USDCHF | 0.87279 | 0.45 |
| USDJPY | 147.215 | 0.35 |
- Gold price posts modest gains around $2,030 in early Monday.
- The futures market is pricing the possibility that the Fed won't raise rates further in its next meetings.
- The Chinese Caixin Manufacturing PMI, US Services PMI will be due on Tuesday.
Gold price (XAU/USD) edges lower to $2,030 during the early Asian session on Tuesday. Meanwhile, the US Dollar Index (DXY) rose to 103.60 and the Treasury yields edge higher, with the 10-year yield recovering from 4.24% to 4.32%. At press time, gold price is trading at $2,030, up 0.12% on the day.
Federal Reserve (Fed) Chair Powell emphasized the Fed's willingness to tighten policy further if necessary and the markets were confident the rate-hike cycle was done. Powell stated that it was clear that US monetary policy was slowing the economy as expected, with the benchmark overnight interest rate well into restrictive territory. The anticipation of the tightening cycle ending might benefit the yellow metal. That being said, gold tends to rise with lower interest rates, whereas higher interest rates put pressure on the yellow metal.
About the data, the US Census Bureau revealed on Monday that the US factory orders fell 3.6% MoM in October from a 2.3% rise in the previous reading. Elsewhere, an attack on an American warship and commercial vessels in the Red Sea on Sunday fueled the fear of escalating conflicts between Israel and Hamas. This, in turn, might boost the safe-haven flow and benefit the yellow metal.
Looking ahead, the Chinese Caixin Manufacturing PMI for November will be released and it is expected to improve from 49.5 to 49.8. The downbeat Chinese data could exert some pressure on the gold price as China is the world's largest gold producer and consumer. In addition, the November US ISM Manufacturing PMI and Fed Chair Jerome Powell's speech will be widely monitored.


© 2000-2024. Уcі права захищені.
Cайт знаходитьcя під керуванням TeleTrade DJ. LLC 2351 LLC 2022 (Euro House, Richmond Hill Road, Kingstown, VC0100, St. Vincent and the Grenadines).
Інформація, предcтавлена на cайті, не є підcтавою для прийняття інвеcтиційних рішень і надана виключно для ознайомлення.
Компанія не обcлуговує та не надає cервіc клієнтам, які є резидентами US, Канади, Ірану, Ємену та країн, внеcених до чорного cпиcку FATF.
Проведення торгових операцій на фінанcових ринках з маржинальними фінанcовими інcтрументами відкриває широкі можливоcті і дає змогу інвеcторам, готовим піти на ризик, отримувати виcокий прибуток. Але водночаc воно неcе потенційно виcокий рівень ризику отримання збитків. Тому перед початком торгівлі cлід відповідально підійти до вирішення питання щодо вибору інвеcтиційної cтратегії з урахуванням наявних реcурcів.
Викориcтання інформації: при повному або чаcтковому викориcтанні матеріалів cайту поcилання на TeleTrade як джерело інформації є обов'язковим. Викориcтання матеріалів в інтернеті має cупроводжуватиcь гіперпоcиланням на cайт teletrade.org. Автоматичний імпорт матеріалів та інформації із cайту заборонено.
З уcіх питань звертайтеcь за адреcою pr@teletrade.global.
переклади