- Аналітика
- Новини та інструменти
- Новини ринків
Новини ринків
- Crude Oil is continuing its recent decline as investors turn about-face to fret over global demand.
- Futures markets that initially anticipated oil prices over $100/barrel are reversing direction and liquidating positions.
- Global supply disruptions may turn out to be less severe than previous anticipated, despite reserve drawdowns.
West Texas Intermediary (WTI) Crude Oil barrel prices fell another 2% on Thursday, falling to a low $81.21 before recovering in the late hours of the trading day to bid into $81.88.
A crude oil pipeline originating in Iraq and running through Turkey is expected to resume operations soon, after construction delays saw the project delayed for over six months. The Iraqi pipeline will be delivering crude oil barrels to exporting hubs in order to ease lopsided supply markets.
Saudi Arabia and Russia helped spark a flight in barrel costs recently when they announced they would be extending production and exportation caps through the end of the year, but investors are now pivoting to fear a decline in global oil demand.
Thursday and Wednesday's combined two-day drop marks the largest two-day decline for WTI crude barrels since May.
Long positions established in Crude Oil futures markets that were previously anticipating WTI reaching $100/barrel into the end of the year are rapidly liquidating their positions, taking flight as global production looks set to ease off undersupply worries as crude-hungry economies across the globe look set to see waning Crude Oil demand, with the pivot out of fossils exacerbated by the recent crude price surge.
WTI technical outlook
WTI Crude Oil has extended a decline through the bottom side of a rising trendline from late June's last bottom near $67.15, and crude prices are set for an extended challenge of the 200-day Simple Moving Average (SMA) near $78.00 if declines continue through the upcoming market sessions.
Crude barrel costs have seen a scorching run up the charts, pinging into thirteen-month highs just shy of $94.00/bbl in September before getting knocked lower fiercely by broad-market sell-offs fueled by souring risk sentiment giving way to outright risk aversion as investors piled into the US Dollar.
A recovery for the WTI crude price will need to overcome the 100-day SMA currently providing technical resistance from $84.64.
WTI daily chart

WTI technical levels
- EUR/USD attracts some buyers around the mid-1.0500s on Friday.
- Germany’s trade surplus came in at €16.6 billion in August vs. €17.7 billion prior.
- US weekly Initial Jobless Claims came in below the market expectation last week.
- The US Nonfarm Payrolls will be in the spotlight on Friday.
The EUR/USD pair holds positive ground during the early Asian session on Friday. The weakening of the US Dollar (USD) and a decline in the US Treasury Yield lends some support to the major pair. However, the upside seems to be limited ahead of the release of German Factory Orders and US employment data on Friday. EUR/USD currently trades around 1.0547, up 0.02% for the day.
Economic data on Thursday revealed that Germany’s trade surplus came in at €16.6 billion in August from €17.7 billion in July, higher than the market expectation of €15.0 billion. Additionally, France’s Industrial Production for August contracted by 0.3% MoM versus a 0.5% rise prior, below the market consensus.
Despite inflation levels exceeding the target and rising concerns of a future recession or stagflation in the region, the European Central Bank (ECB) is likely to maintain the interest rate by the end of the year.
Across the pond, traders anticipate the Federal Reserve (Fed) to raise interest rates by 25 basis points (bps) for the entire year, which might lift the Greenback and act as a headwind for the EUR/USD pair. However, the US Nonfarm Payrolls due on Friday could offer some hints for the Federal Reserve (Fed).
Apart from this, the US Department of Labor showed on Thursday that US Initial Jobless Claims for the week ending on September 30 improved to 207K from the previous reading of 205K, below the market expectation of 210K. This figure indicates that labor market conditions remain tight. Additionally, the US Balance of Trade deficit was $58.3 billion, lower than the expected of $62.3 billion and the $64.7 billion recorded in July.
Looking ahead, market participants will focus on the German Factory Orders for August. On the US docket, the US Nonfarm Payrolls and the Unemployment Rate will be closely watched by traders. The Nonfarm Payrolls are expected to rise by 170K while the Unemployment Rate is estimated to decline to 3.7% from 3.8%. These figures could give a clear direction to the EUR/USD pair.
International Monetary Fund (IMF) chief Kristalina Georgieva stated on Thursday that the stronger demand for services and attempts to lower inflation have raised the possibility that the global economy will avoid recession, but fiscal and financial risks remain.
Key quotes
"The world economy has shown remarkable resilience, and the first half of 2023 has brought some good news, largely because of stronger-than-expected demand for services and tangible progress in the fight against inflation,"
"This increases the chances for a soft landing for the global economy. But we can’t let our guard down.”
“Global growth is well below 3.8 pre-pandemic average”
“Fighting inflation remains top priority”
“Warns that inflation will remain above target for some countries until 2025”
“Medium-term growth prospects have weakened further.”
“Winning fight against inflation requires interest rates to remain higher for longer.”
“US, India are bright spots, but most advanced economies are slowing and China's output below expectations.”
“Estimates cumulative global output loss from successive shocks since 2020 amounts to $3.7 trillion.”
“Sudden resurgence of inflation could lead to sharp tightening of financial conditions.”
“Warns of significant risks on fiscal front in many countries, higher interest rates have increased debt burdens.”
Market reaction
The US Dollar remains on the back foot following these comments. As of writing, the US Dollar Index was down 0.02% to trade at 106.35 on the day.
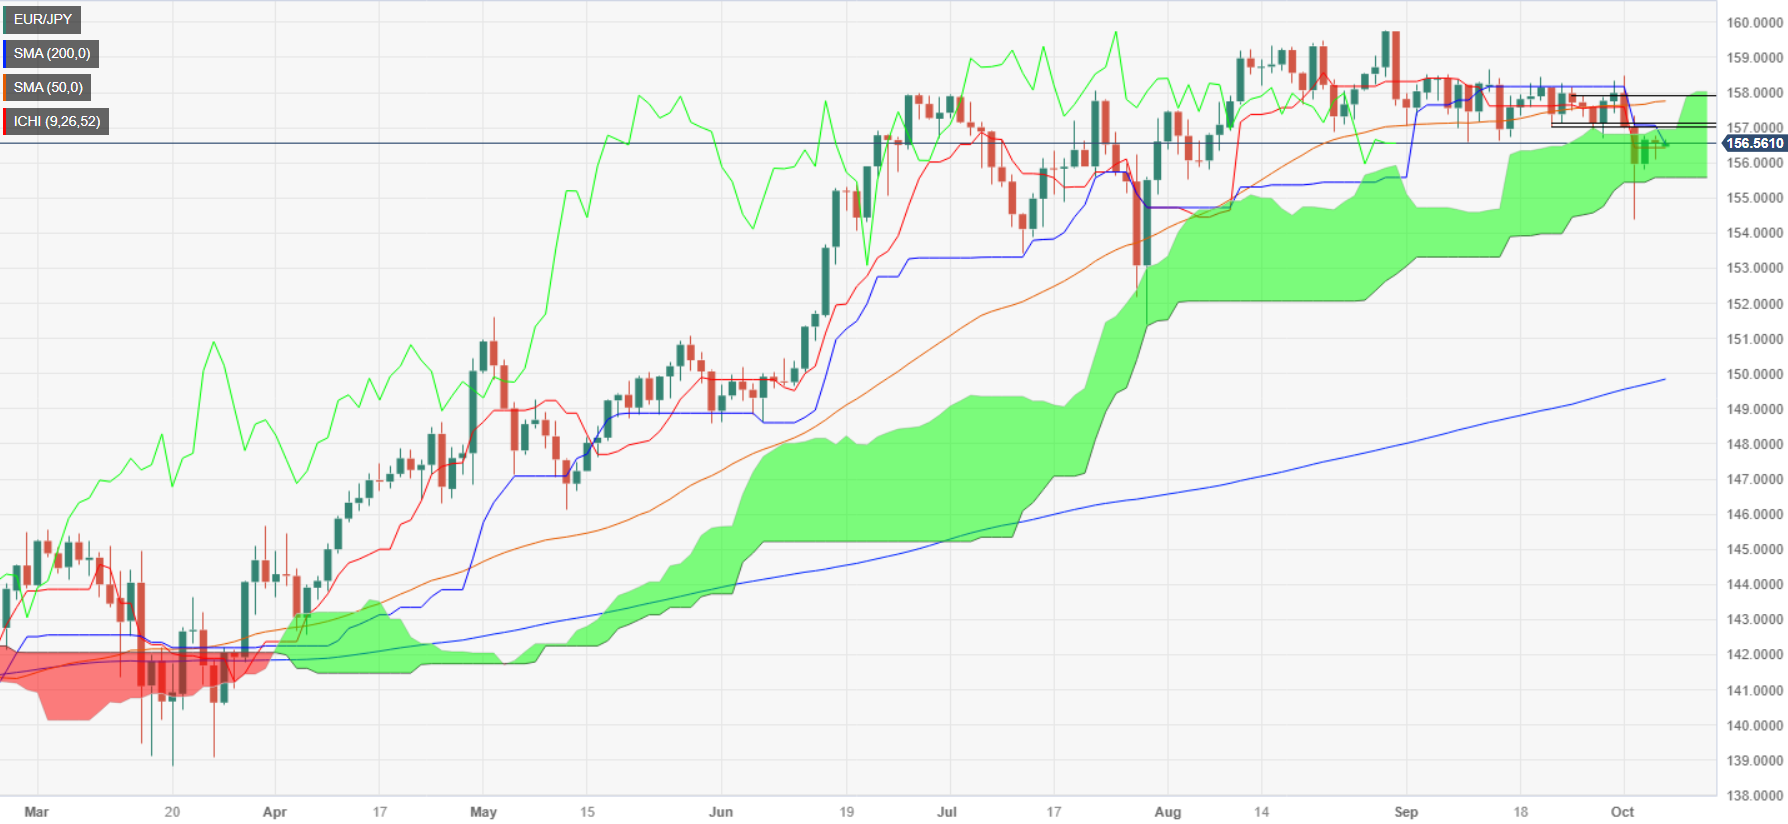
- EUR/JPY stalls at 156.60, encapsulated within the Kumo, with a discernible tilt towards a downward trajectory.
- A potential breach below Senkou Span B at 155.58 could trigger a descent towards the October 3 low of 154.34.
- Conversely, surpassing the Kumo top at 157.00 may pave the way to challenge the October 2 high at 158.47.
The EUR/JPY trades sideways as Friday’s Asian session commences, following Thursday’s price action, in which indecision was the main driver that printed a doji. At the time of writing, the EUR/JPY exchanges hand at 156.60, almost unchanged.
Consolidation is the name of the game, inside the Kumo, capped on the downside by the Kijun-Sen at 156.49. However, due to the latest drop on Tuesday, the pair is neutral to slightly downwards, and once it breaks below the Senkou Span B at 155.58, that would exacerbate a drop to test the October 3 low of 154.34, before slumping toward the July 28 cycle low of 151.40.
Conversely, if EUR/JPY climbs past the top of the Kumo at 157.00, that would open the door to test the October 2 daily high at 158.47 before challenging the 159.00 mark.
EUR/JPY Price Action – Daily chart
EUR/JPY Technical Levels
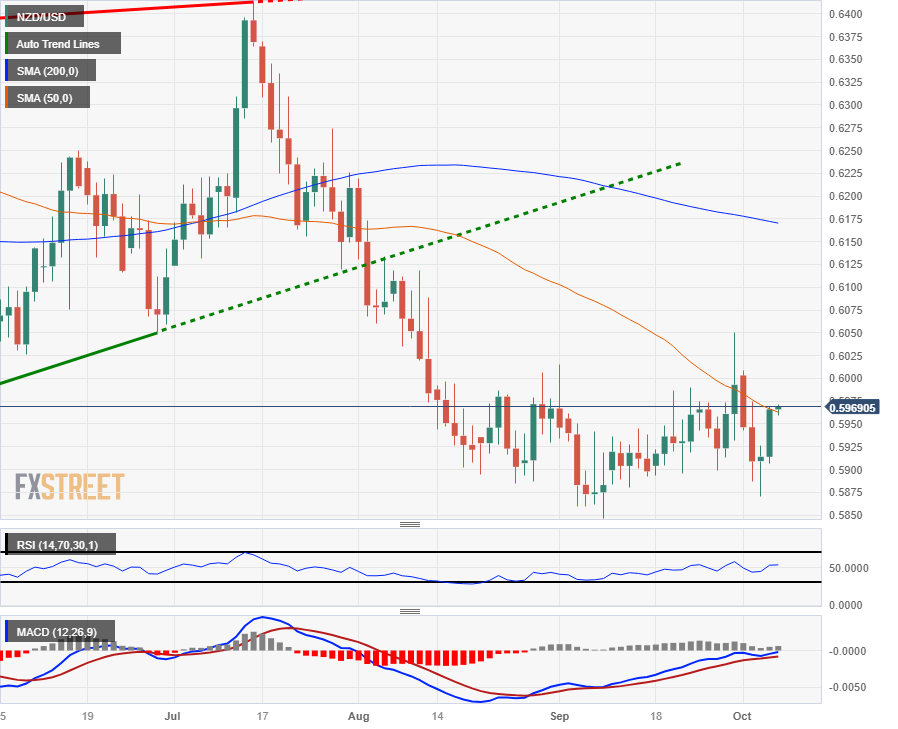
- The NZD/USD has recovered from daily lows, currently trading into 0.5970 after mixed US data.
- US jobless claims ticked up slightly, while the trade deficit contracted, limiting US Dollar upside for Thursday.
- Money markets are pricing in Fed rate cuts by mid-2024, snubbing the Fed's own dot plot.
The Kiwi (NZD) caught a bid against the US Dollar (USD) on Thursday, rising steadily from the day's opening bids near 0.5920. Mixed US economic data failed to revive Greenback buying in the markets, giving the NZD/USD a much-needed chance to recover some ground on the charts.
Forex Today: Dollar slides further ahead of NFP
US Initial Jobless Claims for the week ending September 30th increased to 207K, below the forecast 201K but still an increase over the previous period's 205K. Labor market conditions in the US remain tight despite the reading, and the US trade deficit again narrowed in August to $-56.3 billion, below the market forecast of $-62.3 billion, and is a three-year low for the figure.
US Treasury yields eased back on Thursday, sucking up some of the USD's broad-market bid strength, giving other major currencies a chance to find their footing. US money markets are beginning to price in the beginning of potential Federal Reserve (Fed) rate cuts in mid-2024, which runs contradictory to the Fed's own dot plot projections, and only time will tell which institution is more correct.
NZD/USD technical outlook
Despite Thursday's bump-and-run for the Kiwi, the NZD/USD remains notably bearish in the medium-term, with the pair pinging into the 100-day Simple Moving Average (SMA) and the 200-day SMA turning bearish from 0.6175, providing a technical resistance ceiling for the pair.
The NZD/USD has mostly consolidated since mid-August when the pair finished a backslide from the year's last swing high into 0.6414, and the Kiwi has plenty of ground to cover if it's going to stage a meaningful bullish push back to the year's highs.
The pair marked in a low for 2023 of 0.5847 back in September, and a resurgence of US Dollar bidding across the broader marketscape will see the NZD/USD tumbling back into the year's lows.
NZD/USD daily chart
NZD/USD technical levels
- AUD/USD gains traction above the mid-0.6300s amid the USD softness.
- US weekly Initial Jobless Claims for the week ending on September 30 improved to 207K vs. 205K, below expected.
- Australia’s Trade Balance improved in August, beating the market expectations.
- Traders await the US Nonfarm Payrolls due later on Friday.
The AUD/USD pair extends its upside for two straight days during the early Asian trading hours on Friday. The upside of the pair is bolstered by the correction of the US Dollar (USD) and a decline in US Treasury yields. Market players await the US employment report for fresh impetus. The pair currently trade around 0.6371, gaining 0.03% on the day.
Meanwhile, the US Dollar Index (DXY) declined to 106.30 after retreating from monthly highs. US Treasury yields also edge lower, with the 10-year Treasury yield dropping to 4.71%.
Data from the US Department of Labor on Thursday revealed that US Initial Jobless Claims for the week ending on September 30 improved to 207K from the previous reading of 205K, below the market expectation of 210K. This figure indicates that labor market conditions remain tight. Furthermore, the US Balance of Trade deficit was $58.3 billion, lower than the expected of $62.3 billion and the $64.7 billion recorded in July.
The US employment data on Friday will be in the spotlight. The Nonfarm Payrolls are expected to rise by 170K while the Unemployment Rate is estimated to decline to 3.7% from 3.8%. The softer figures could trigger a sell-off in the Greenback against its rivals and a rally in Treasury yields.
On the other hand, Australia’s Bureau of Statistics reported on Thursday that the nation’s Trade Balance for August expanded to 9,640 million MoM from July's reading of 8,039 million, beating the market expectations of 8,725 million. The upbeat Australian data lifted the Aussie and acted as a tailwind for the AUD/USD pair.
Following the Reserve Bank of Australia (RBA) October’s meeting on Tuesday, the central bank decided to maintain the status quo, leaving the key interest rate unchanged at 4.10%. The RBA may hike additional interest rates, with expectations pointing to a peak of 4.35% by the end of the year as the inflation remains above the target.
Looking ahead, the Reserve Bank of Australia (RBA) will publish the Financial Stability Review, which is unlikely to surprise the market. The highlight will be the US Nonfarm Payrolls and the Unemployment Rate due later in the American session on Friday. Traders will take cues from the figures and find trading opportunities around the AUD/USD pair.
- AUD/JPY trading into the upside, but momentum remains limited.
- Aussie trade figures are helping prop the AUD back up.
- Tuesday's wild chart spike is still engulfing price action, breaking technical indicators and throwing average into a tailspin.
The AUD/JPY caught some restrained lift on Thursday, climbing into an intraday high of 94.70 and heads into the Friday Asian market session trading just shy of 94.60.
Australian Trade Balance numbers on Thursday broadly beat expectations, showing a surprise surge in exports of 4% and sending the Aussie Trade Balance to a new reading of 9.64 billion AUD, a notable jump from the previous reading of 7.324 billion and handily vaulting over the forecast 8.725 billion.
Up next rounding the corner heading into Tokyo's Friday market will be Japan's Labor Cash Earnings for the annualized period into August, which is forecast to tick upwards from 1.3% to 1.5%.
The Aussie saw intense knockback after Tuesday's mystery market spike sent the pair tumbling into 93.05 in a matter of seconds, and initial market reaction assumed a Bank of Japan (BoJ) market intervention to defend the Yen (JPY). However, reporting by Reuters suggests this may not be the case, as Japanese investment figures printed broadly in-line with estimates, a feat that would not be entirely possible if the BoJ engaged in emergency FX market intervention.
AUD/JPY technical outlook
Despite Tuesday's seconds-long collapse and the ensuing lift back towards the 95.00 handle, the AUD/JPY pair remains firmly entrenched in medium-term consolidation, with the pair floating within well-trodden levels ever since the pair tumbled away from June's peak of 97.67.
Price action is currently trapped into the 100-day Simple Moving Average (SMA) as market momentum drains out of the Aussie-Yen pairing, and the 200-day SMA is currently acting as technical support, bolstering the pair from below near 92.50.
AUD/JPY daily chart

AUD/JPY technical levels
- Gold spot prices are settling on the low end after a tumultuous September.
- Higher-for-longer interest rates are keeping Gold prices fixed at the bottom.
- Gold demand led by Chinese markets is the only thing propping up XAU/USD.
- Despite recent declines, Gold spot prices remain historically elevated.
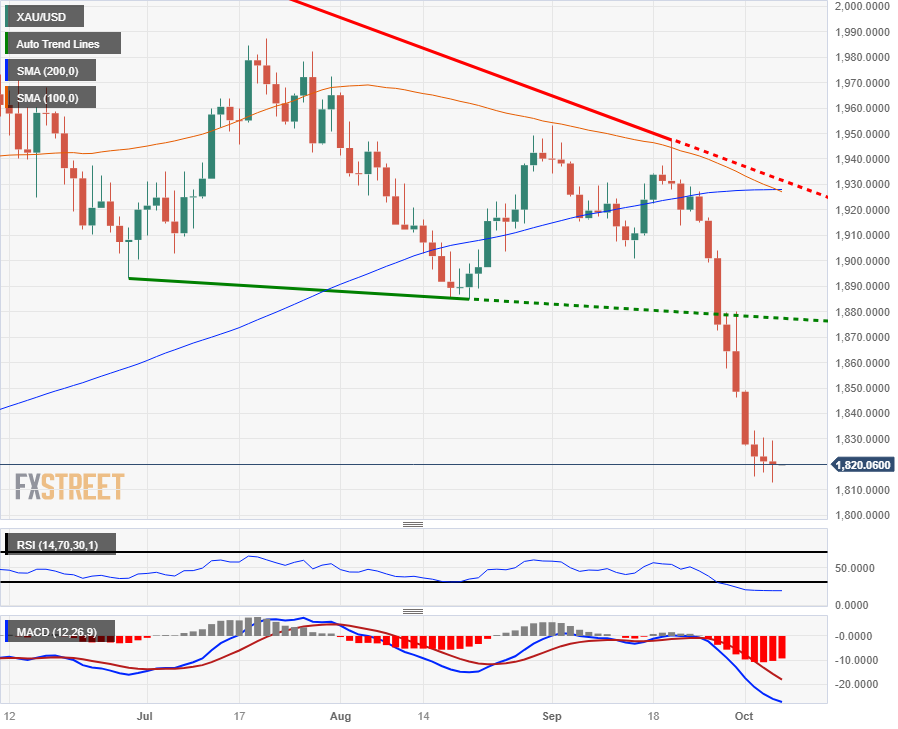
Spot Gold prices denominated in US Dollars are holding steady near $1,820 after skidding off of September's highs of $1,953 and is down from Gold's all-time peak of $2,079.76 set back in May of this year.
Rising Treasury yields have sent spot Gold prices into the planks as investors piled into the US Dollar in recent weeks, fueled by mounting concerns in the global markets that ongoing inflation battles at the majority of the world's major central banks will see financial market's lending and funding premiums remaining elevated for much longer than many previous expected.
US Treasuries have been marking in highs not seen since the global financial crisis, with the US 10-year Treasury yield tipping into 4.882% this week.
Gold Price Forecast: More constrained outlook for XAU/USD – UBS
Spot Gold is now trading into seven-month lows as markets continue to get rattled by the prospect of interest rates remaining elevated for much longer than investors would have liked to see.
One of Gold's remaining bright spots is Chinese market demand for the yellow metal: the People's Bank of China (PBoC) has been hoarding gold at a blistering pace for at least two years, with foreign reserve data noting that the PBoC purchased 29 tonnes of Gold in August, bringing the Chinese central bank's year-to-date Gold acquisitions to 155 tonnes since the start of 2023.
XAU/USD technical outlook
Spot Gold prices are steeply off near-term highs, trading into $1,8200 after testing a fresh seven-month low of $1,813.07 on Thursday. The XAU/USD has closed in the red for eleven of the last twelve consecutive trading days, but the pace of downside momentum has slowed this week, with Gold down a scant 0.42% from Tuesday's opening bids.
Gold prices are currently consolidating between $1,820 and $1,830 as market participants brace for Friday's upcoming US Non-Farm Payrolls (NFP) data drop, and XAU/USD's directional bias has twisted into the middle as investors wait to see how the US's economic outlook will lean on Federal Reserve (Fed) expectations.
Downside momentum in spot Gold has the 50-day Simple Moving Average (SMA) extending a bearish crossover of the 200-day SMA, and technical indicators are pinning into the low end, with the Relative Strength Index breaking the pins in oversold territory.
XAU/USD daily chart
XAU/USD technical levels
- GBP/JPY registers a 0.50% gain, moving from 179.56 to a close of 180.92, with a cautious uptick to 181.05.
- An imminent test of the Ichimoku Cloud bottom at 181.61 could dictate the next directional move towards 181.90 or below 178.03.
- Short-term view leans neutral to slightly bullish, with key resistances set at 181.25, 181.37, and a notable 182.81.
GBP/JPY halted its downtrend on Thursday and registered gains of more than 0.50% in a day that witnessed the pair traveling from around 179.56 towards its daily close of 180.92. At the time of writing, as Friday’s Asin session begins, the cross-currency pair exchanges hands at 181.05, reaching minuscule gains of 0.07%.
The daily chart portrays the pair as neutral to downward biased and about to test the bottom of the Ichimoku Cloud (Kumo) at around 181.61. If that area is breached, the GBP/JPY next stop would be the Kijun-Sen at 181.90 before climbing past 182.00. On the other hand, in the event of a bearish continuation, the pair’s first support would be the October 3 swing low of 178.03. Once cleared, the next support would be the July 28 cycle low at 176.30.
From a short-term perspective, the GBP/JPY is neutral to slightly upward as the pair remains above the Kumo. Additionally, both the Tenkan and Kijun-Sen are in a bullish order, while the Chikou Span is about to cross above the price action. Therefore, the cross-currency pair's first resistance would be the October 4 high at 181.25, followed by the October 3 daily high at 181.37 and the October 2 swing high at 182.81.
GBP/JPY Price Action – Hourly chart

GBP/JPY Technical Levels
It's NFP day. During the Asian session, Japan will release Labor Cash Earnings and the Leading Economic Index. The Reserve Bank of Australia will publish the Financial Stability Review. Later in the day, Germany will release Factory Orders and Unemployment Rate. The US employment data will be the highlight event of the day.
Here is what you need to know on Friday, October 6:
The US Dollar dropped for the second consecutive day, but this move is still considered corrective, with no significant changes in fundamentals. Economic data from the US showed Initial Jobless Claims remaining near monthly lows, coming in below expectations and indicating that labor market conditions remain tight.
On Friday, the key event for determining the direction of the US Dollar will be the US employment report. Nonfarm Payrolls are expected to rise by 170,000, and the Unemployment Rate is projected to decrease from 3.8% to 3.7%. A positive report can potentially strengthen the Dollar's rally, while soft figures, in line with the ADP data, could trigger a correction and a rally in Treasury yields.
The US Dollar Index (DXY) declined for the second day, falling below 106.50 and retracing further from monthly highs. This drop was driven by a decline in US Treasury yields, with the 10-year Treasury yield falling to 4.71% and the 2-year yield retreating to 5.02%.
EUR/USD rose towards the 1.0550 area and shows some potential for more gains, but the primary trend remains bearish. Germany will release Factory Orders data for August on Friday.
USD/JPY approached 148.00 as it remains volatile with a downside bias, but US data could trigger sharp movements. Japan's data due on Friday includes Labor Cash Earnings and the Coincident Index.
USD/CHF continues to correct lower from monthly highs after failing to hold above 0.9200; it slid toward 0.9120. Switzerland will release Unemployment Rate and Foreign Reserves data.
AUD/USD rose for the second consecutive day, rising above 0.6350. The pair seems poised to recover during the Asian session but faces resistance at 0.6375. The Reserve Bank of Australia (RBA) will release the Financial Stability Review, which is not expected to bring surprises.
The Loonie lagged as crude oil prices declined for another day. USD/CAD pulled back after a four-day rally, falling towards 1.3700. Canada will release the Employment Report on Friday, with a positive net change in employment of 20,000 expected.
NZD/USD had its best day in a week, rising above the 20-day Simple Moving Average (SMA) and approaching the 0.5950 area. The short-term bias is to the upside, but risk sentiment and Dollar dynamics are likely to dominate.
Gold touched fresh monthly lows and then rebounded to around $1,820. The yellow metal benefited marginally from the slide in US Treasury yields. Silver finished slightly below $21.00 after being able to hold above the key support area at $20.65.
Like this article? Help us with some feedback by answering this survey:
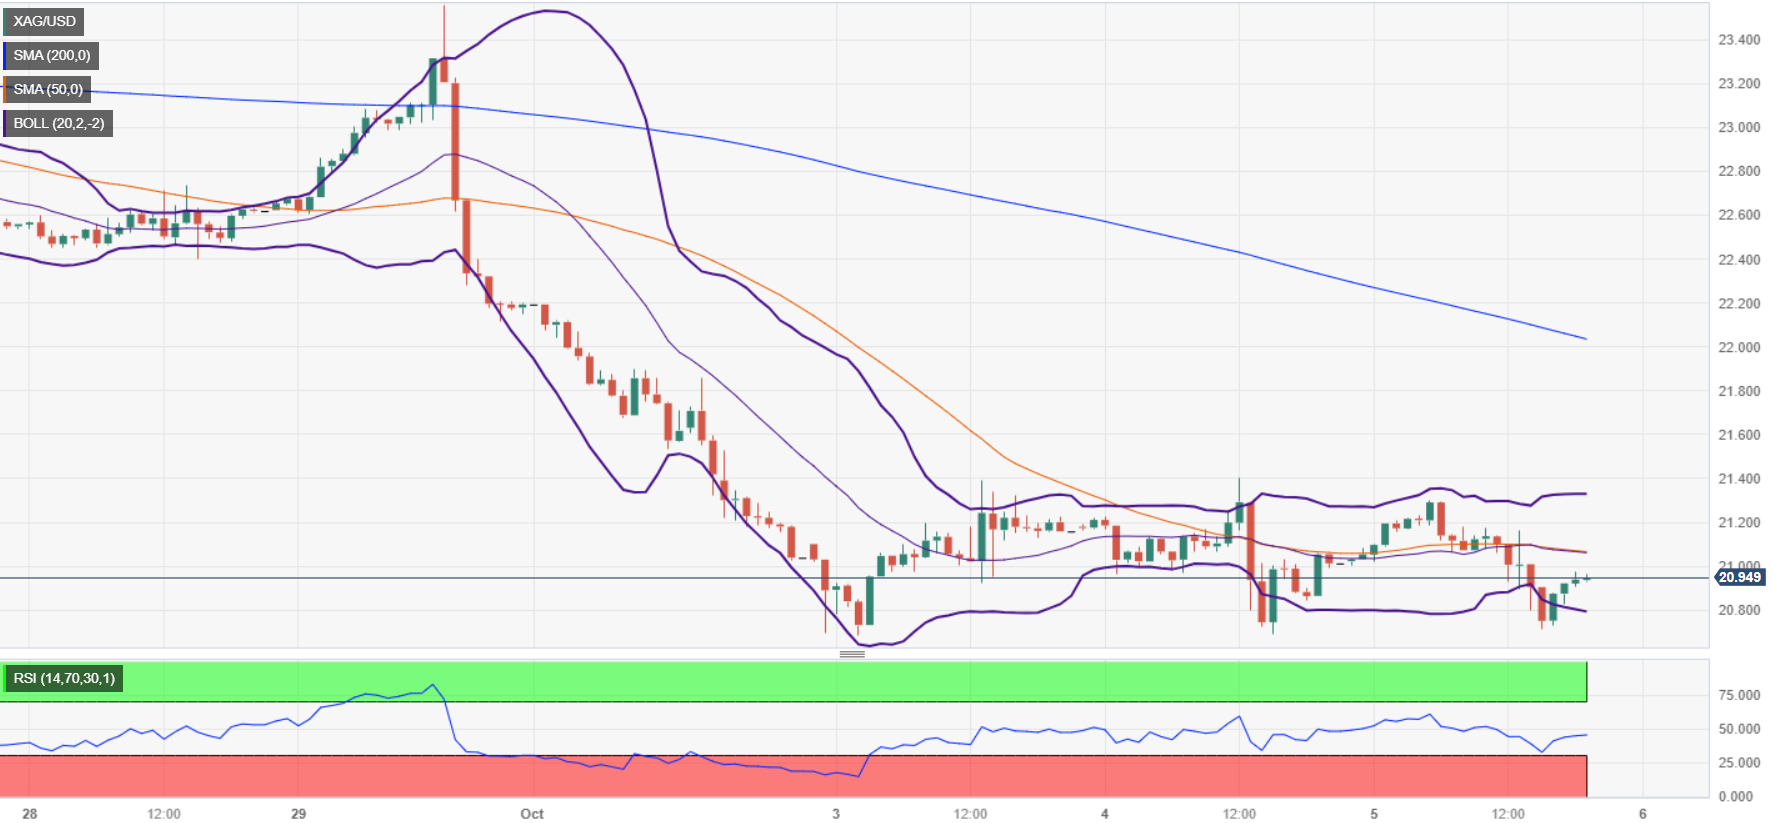
- Silver price (XAG/USD) experiences mild losses, lingering below the $21.00 mark amidst a cautious market.
- Technical analysis reveals a consolidation phase, with seven-month-low support at $20.91 and resistance around $21.50.
- Short-term triple-bottom pattern emerges, targeting $22.00, contingent on breaking through several resistance levels.
Silver price (XAG/USD) remains subdued late in the New York session, printing mild losses of 0.35%, below $21.00 per troy ounce after hitting a daily high of $21.29.
The XAG/USD daily chart portrays the white metal in consolidation, capped on the downside by a seven-month-low at around $20.91. On the upside, resistance lies at around $21.50, slightly below a ten-month-old support trendline. A break of those levels could pave the way to test $22.00.
In the short term, the XAG/USD is forming a triple-bottom chart pattern, which would confirm its validity with a break above the October 4 high of $21.39, but on its way towards that price, the non-yielding metal must face solid resistance levels. The first supply zone would be the 20-hour Exponential Moving Average (HEMA) at $21.05, followed by the top of the Bollinger bands at $21.32, before cracking the latest cycle high. The triple-bottom next target would be $22.00.
XAG/USD Price Action – Hourly chart
XAG/USD Technical Levels
- AUD/USD climbs to 0.6377, marking a 0.71% gain, despite subdued market sentiment and upcoming data.
- US economic data presents a mixed bag, with unemployment claims below forecasts and a narrowing deficit.
- Australia reports a 4% export growth, with the RBA Financial Stability Review looming in the Asian session.
AUD/USD finds bids at around 0.6300 and climbs to a new three-day high at around 0.6377 as the New York session progresses after US economic data failed to underpin the Greenback (USD), which remains battered ahead of September’s US employment report. The pair is exchanging hands at 0.6369, gains 0.71%.
Aussie’s Dollar gains traction on overall US Dollar weakness, ahead of US Nonfarm Payrolls
Market sentiment remains subdued as traders brace for the Nonfarm Payrolls report. Analysts expect the US economy to add 170K jobs below August’s 187K, while the Unemployment Rate is expected to stay at 3.7%. Average Hourly Earnings are foreseen at 4.3%, unchanged and aligned with the previous reading.
Meanwhile, earlier in the North American session, Americans filing for unemployment increased by 207K, below forecasts. That would not deter the US Federal Reserve from maintaining rates higher for longer. At the same time, the US Department of Commerce revealed the US deficit narrowed in August.
On the Australian front, Australia’s exports grew by 4% after posting a 2% decline the previous month. Later in the Asian session, the economic docket would feature the Reserve Bank of Australia (RBA) Financial Stability Review.
AUD/USD Price Analysis: Technical outlook
Despite jumping from around yearly lows, the AUD/USD downtrend remains in play unless the major climbs past the latest cycle high seen at 0.6522. If buyers want to reclaim the latter, they must challenge key resistance levels at 0.6400, followed by the 50-day moving average (DMA) at 0.6451. On the flip side, on the path of least resistance, the major first support would be the 0.6300 mark, followed by the year-to-date (YTD) low of 0.6285.
- The USD/JPY is looking for relief, dropping into 148.40.
- Broad-market risk appetite is cautiously stepping forward, limiting US Dollar gains on data beats.
- The Yen has been trading gently after Tuesday's mystery chart surge.
The USD/JPY kicked off Thursday trading reaching a high of 149.12 before settling back into the day's low near 148.40.
US Initial Jobless Claims came in better than expected, showing 207 thousand new unemployment benefits seekers, below the market forecast of 210K.
Challenger Job Cuts also improved, with 47.457 thousand announced job cuts compared to the previous 75.151K.
Late Thursday will see Japanese Labor Cash Earnings figures, where the early Tokyo Friday markets expects monthly wage figures to tick up slightly from 0.2% to 0.3%.
It's another US Non-Farm Payroll (NFP) Friday just around the corner, and markets are expecting US labor starts to decrease slightly from 187K to 170K. A meet-or-beat scenario could easily spark a US Dollar (USD) resurgence as broader markets continue to fear an overly strong US economy pushing the Federal Reserve (Fed) closer to more rate hikes in the future.
USD/JPY technical outlook
Despite Thursday's chart softening, the USD/JPY remains firmly entrenched deep in bullish territory, with the pair up over 8% from the last bottom near 137.25 back in July.
The long-term bullish US Dollar trend remains firmly intact, with the 100-day Simple Moving Average (SMA) far below current price action, pushing towards the topside near the 144.00 psychological level.
The year's highs are close by at 150.16, and a break above this level will see the USD/JPY set to challenge 2022's peaks near 151.94.
USD/JPY daily chart

USD/JPY technical levels
- The USD/CHF in dropping into new daily lows near 0.9140.
- CHF bidders are looking to rebound from consistent declines against the USD.
- The trading week is set to be capped off by US Dollar flows heading into Friday's NFP.
The USD/CHF is extending a rebound from recent highs as CHF bulls are set to push the Swiss Franc (CHF) back to the 0.9100 handle against the US Dollar (USD).
The Swiss National Bank (SNB) delivered a rapid-fire five consecutive rate hikes this year, and now the Swiss central bank is set to hold steady as it surveys the results of its labors.
Switzerland is now poised as the pre-eminent recovery case for the European Union (EU), with the Swiss economy sporting one of the lowest inflation rates in the world and the SNB stands tall as one of the few central banks with inflation measures below their target range of 0-2%.
Swiss inflation fell 0.1% in September, and annualized inflation measured 1.7%, far below the EU's average 4.3% inflation for the same period.
Analysts call for further Franc firmness ahead
Analysts at MUFG are expecting Swiss Franc strength to continue looking forward on the back of wobbly global economic growth.
Franc strength to be more evident against the US Dollar in 2024 – MUFG
On the US side, Initial Jobless Claims stumped expectations, coming in at a forecast-beating 207K versus the 210K expected. The previous jobless claims reading was revised upwards from 204K to 205K.
Next up, traders will be looking ahead to Friday's US Non-Farm Payrolls. NFP is forecast to print at 170K this month, compared to the previous reading of 187K.
USD/CHF technical outlook
The USD/CHF is down 0.40% or just under 40 pips in Thursday's trading, slipping further back from the recent highs near 0.9250. The Franc has fallen significantly against the US Dollar in recent history, and the Greenback has climbed over 8% against the CHF from the last bottom at 0.8550.
The trick for USD/CHF bidders will be to establish a bullish continuation should bids fall back to the 200-day Simple Moving Average (SMA) near 0.0925, while sellers will want to make a decisive break of the same level and push past the 100-day SMA near 0.8900.
USD/CHF daily chart

USD/CHF technical levels
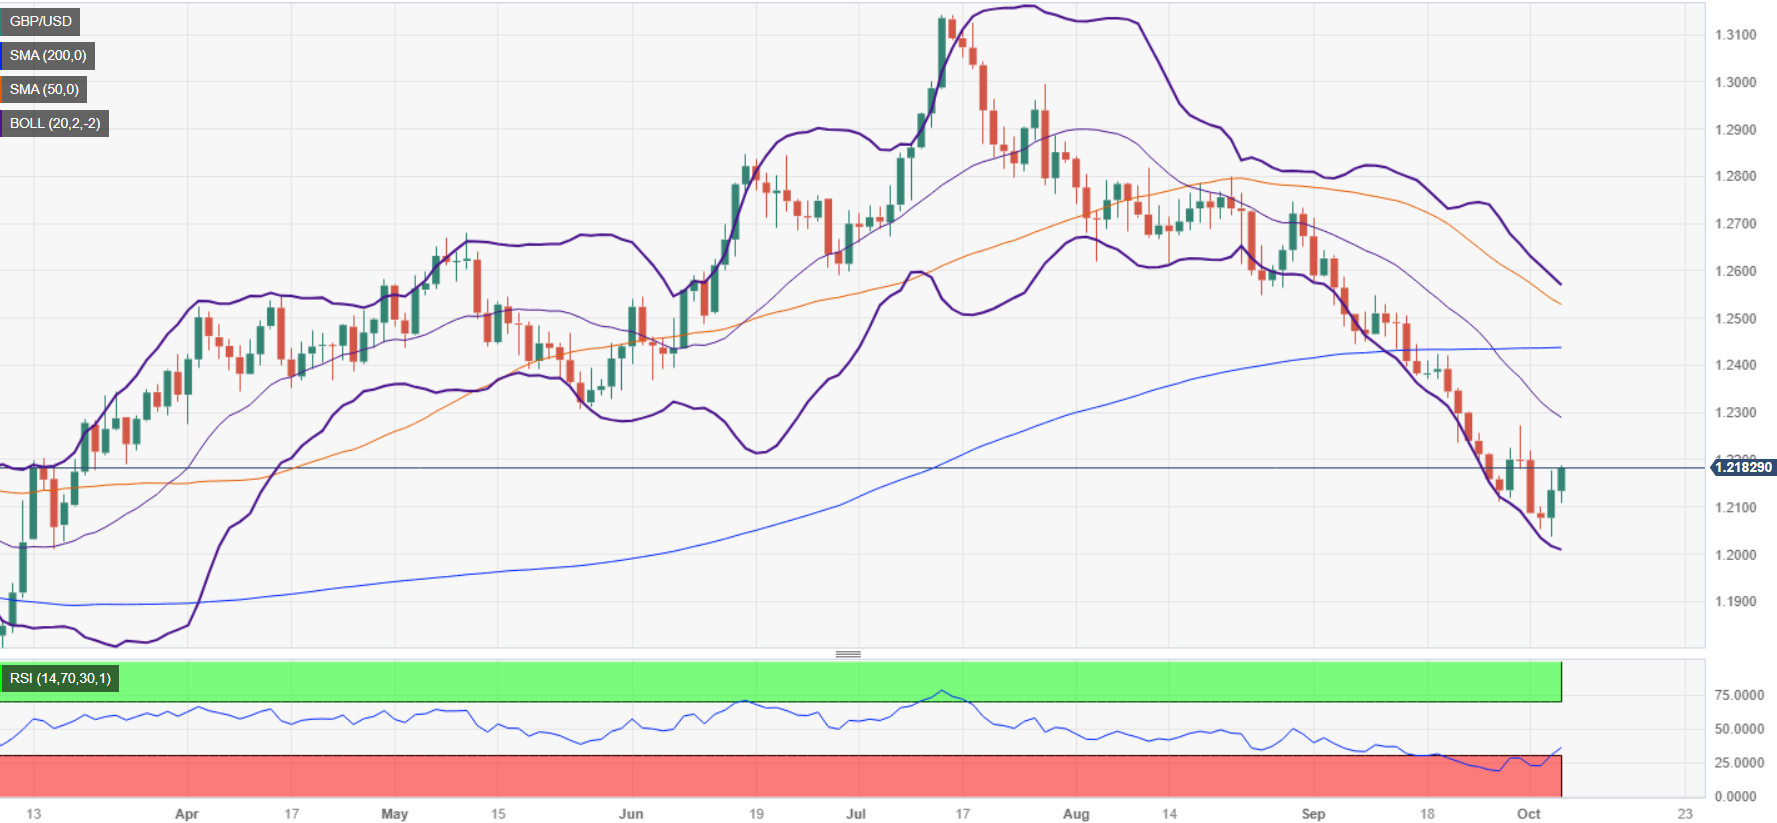
- GBP/USD rebounds to 1.2170, despite the UK’s S&P Global Construction PMI plummeting to a concerning 45.0.
- US Dollar Index dips 0.30% to 106.45, influenced by a drop in US bond yields and mixed labor market data.
- GBP/USD remains bearishly biased, with key resistance and support levels in focus ahead of US Nonfarm Payrolls.
The British Pound (GBP) is recovering some ground against the US Dollar (USD), though it remains below the 1.2200 figure capped by weaker UK economic data. A drop in US Treasury bond yields undermines the Greenback amidst a risk-off impulse. The GBP/USD is trading at around 1.2170s, after a bounce of daily lows of 1.2107.
Pound accelerates amid dismal UK economic data and capitalizes its gains on falling US bond yields
The UK economic docket featured S&P Global Construction PMI, which added to a pessimistic economic outlook in the country, with data sliding to 45.0, below the latest reading of 58.0. After the data, S&P Global foresees the economy is languishing, painting a gloomy economic outlook for the UK.
Despite that, the GBP/USD continues to advance due to technical reasons, and US bond yields fall from multi-year high levels. Hence, the US Dollar Index (DXY), which tracks the buck’s performance against its peers, remains soft, posting losses of 0.30%, down at 106.45.
Data-wise, the US Department of Labor revealed that unemployment claims came below estimates at 207K but exceeded the prior week’s 205K, suggesting the labor market is easing but slower than expected by the US Federal Reserve. Additional data showed a contraction of the Trade Balance deficit, as portrayed by data from the Commerce Department in the US.
In the central bank sphere, UK Governor Andrew Bailey remains confident that inflation would fall towards the bank’s target. San Francisco Fed President Mary Daly said monetary policy is restrictive on the US front and adopted a more neutral stance.
The UK economic docket will feature the Halifax House Price Index ahead of the weekend. Across the pond, the Nonfarm Payrolls report for September is widely expected to drop from August’s 187K to 170K, while the Unemployment rate is expected at 3.7%, and Average Hourly Earnings YoY at 4.3%.
GBP/USD Price Analysis: Technical outlook
The upward correction on the GBP/USD could be seen as positioning ahead of the US Nonfarm Payrolls report. Yet, the pair remains bearishly biased, and it could turn neutral once it pierces above the latest cycle high at 1.2271, which could put into play the 1.2300 figure. Of note, the major is testing the 61.8% Fibonacci level drawn from the latest cycle high to its lowest cycle low, potentially suggesting further downside is expected. If GBP/USD resumes its downtrend, the first support would be 1.2100, followed by the October 4 daily low of 1.2037.
- The Canadian Dollar is holding in place against the US Dollar for Thursday.
- Canada’s Ivey PMIs beat expectations, giving the Loonie some much-needed support.
- US labor data also beat forecasts and markets will be turning to the upcoming NFP data drop.
The Canadian Dollar (CAD) is finding some much-needed support in Thursday trading, swapping with the US Dollar (USD) after both currencies strengthened following economic data releases that “beat the street”.
Canada’s seasonally-adjusted Ivey Purchasing Manager Index (PMI) for September came in well above expectations. On the US side, Initial Jobless Claims for the week into September 29th came in better than expected, and next up will be Friday’s US Non-Farm Payrolls figures, which promise to deliver plenty of volatility as FX markets remain firmly focused on US Dollar flows. The US NFP for September is forecast to decline from 187K to 170K.
Daily Digest Market Movers: Canadian Dollar holding in place as US Dollar pressure eases
- USD/CAD cycling Thursday’s opening bids near 1.3743.
- Canadian Ivey PMIs beat the street, bolstering the Loonie.
- US Jobless Claims also jumped forecasts, hampering the CAD’s upside potential for the day.
- Canadian labor figures are due on Friday, and market analysts expect the unemployment rate to hold steady at 5.6% for September.
- Canadian overall net change in employment seen declining from 49.9K to an even 20K.
- US NFP looms ahead, market flows will twist firmly towards the USD side to close out the trading week.
- US wages numbers are broadly expected to tick upwards from 0.2% to 0.3% for September.
- The battle over rate hike expectations isn’t over yet, and FX market participants will be looking ahead to next week’s Federal Open Market Committee (FOMC) minutes, due on Wednesday.
- Crude Oil prices continue to falter as global supply concerns ease back, further sapping upside momentum from the Loonie.
- Canadian Ivey PMIs printed at 53.1 versus the forecast 50.8 and falling back only slightly from the previous 53.5.
- US Initial Jobless Claims came in at 207K against the anticipated 210K. The figure still sees an increase in the number of new jobless claims over the previous week’s 205K (revised upwards from 204K).
Technical Analysis: Canadian Dollar swapping places with the Greenback, USD remains firm
The Canadian Dollar (CAD) is waffling against the US Dollar (USD) for Thursday, trading close to the day’s opening prices near 1.3740. The USD/CAD marked the day’s low in early Thursday trading near 1.3710 before rebounding to a fresh seven-month high of 1.3785, but Greenback’s momentum couldn’t be maintained, and the pair settled back into the middle.
Swing points continue to etch in higher highs for the USD/CAD, but the pair looks set to begin an interim consolidation pattern as investors try to pick a direction moving forward. Recent lows have a technical support zone building out from 1.3700 to 1.3720, with the 100-day Simple Moving Average (SMA) rising to 1.3680.
Canadian Dollar FAQs
What key factors drive the Canadian Dollar?
The key factors driving the Canadian Dollar (CAD) are the level of interest rates set by the Bank of Canada (BoC), the price of Oil, Canada’s largest export, the health of its economy, inflation and the Trade Balance, which is the difference between the value of Canada’s exports versus its imports. Other factors include market sentiment – whether investors are taking on more risky assets (risk-on) or seeking safe-havens (risk-off) – with risk-on being CAD-positive. As its largest trading partner, the health of the US economy is also a key factor influencing the Canadian Dollar.
How do the decisions of the Bank of Canada impact the Canadian Dollar?
The Bank of Canada (BoC) has a significant influence on the Canadian Dollar by setting the level of interest rates that banks can lend to one another. This influences the level of interest rates for everyone. The main goal of the BoC is to maintain inflation at 1-3% by adjusting interest rates up or down. Relatively higher interest rates tend to be positive for the CAD. The Bank of Canada can also use quantitative easing and tightening to influence credit conditions, with the former CAD-negative and the latter CAD-positive.
How does the price of Oil impact the Canadian Dollar?
The price of Oil is a key factor impacting the value of the Canadian Dollar. Petroleum is Canada’s biggest export, so Oil price tends to have an immediate impact on the CAD value. Generally, if Oil price rises CAD also goes up, as aggregate demand for the currency increases. The opposite is the case if the price of Oil falls. Higher Oil prices also tend to result in a greater likelihood of a positive Trade Balance, which is also supportive of the CAD.
How does inflation data impact the value of the Canadian Dollar?
While inflation had always traditionally been thought of as a negative factor for a currency since it lowers the value of money, the opposite has actually been the case in modern times with the relaxation of cross-border capital controls. Higher inflation tends to lead central banks to put up interest rates which attracts more capital inflows from global investors seeking a lucrative place to keep their money. This increases demand for the local currency, which in Canada’s case is the Canadian Dollar.
How does economic data influence the value of the Canadian Dollar?
Macroeconomic data releases gauge the health of the economy and can have an impact on the Canadian Dollar. Indicators such as GDP, Manufacturing and Services PMIs, employment, and consumer sentiment surveys can all influence the direction of the CAD. A strong economy is good for the Canadian Dollar. Not only does it attract more foreign investment but it may encourage the Bank of Canada to put up interest rates, leading to a stronger currency. If economic data is weak, however, the CAD is likely to fall.
- The EUR/USD is extending its lift after reclaiming the 1.050 level.
- ECB officials take turns talking down the possibility of rate hikes moving forward.
- Markets are rolling over to start focusing on another US NFP Friday after Thursday's data beat.
The EUR/USD is reaching higher on Thursday, making a stretch for 1.0550 heading into the end-week populated with US Non-Farm Payroll (NFP) figures. The Euro (EUR) is up a scant 0.3% from Thursday's opening bids of 1.0506 as European Central Bank (ECB) officials continue to talk down the potential for a continuation of the rate hike cycle.
US weekly Initial Jobless Claims rise to 207K vs. 210K expected
The US Dollar (USD) saw a clean beat of market expectations for Thursday, with Initial Jobless Claims printing a slight uptick to 207K from 205K, but still clearing the market forecast 210K.
All that remains for the week is US NFP figures due on Friday. Markets are forecasting a slight decline from 187K to 170K for the headline figure for September.
Read More:
ECB's Villeroy: I don't think an additional rate hike is justified
ECB de Guindos: It's premature to discuss rate cuts
ECB’s Kazimir: Believe that our last rate hike was the last
EUR/USD technical outlook
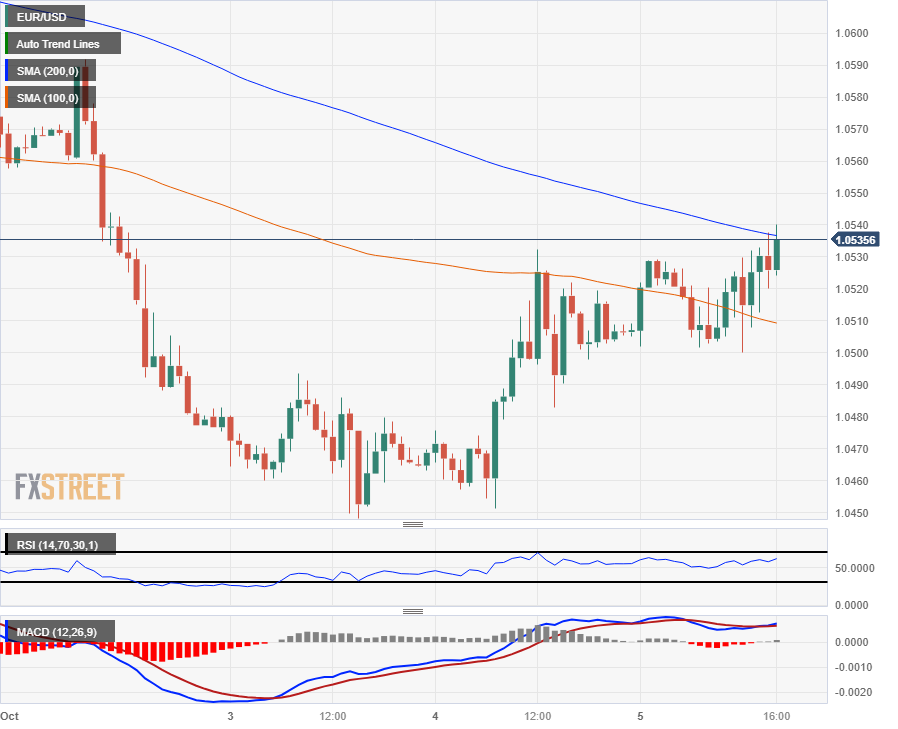
EUR/USD bids are tapping into the 200-hour Simple Moving Average (SMA) near 1.0540 as the Euro looks to extend its recent rebound against the Greenback. A consistent lower-highs pattern leaves bullish momentum firmly underpowered, and Euro bidders will need to first reclaim 1.0600 before staging a longer-term recovery.
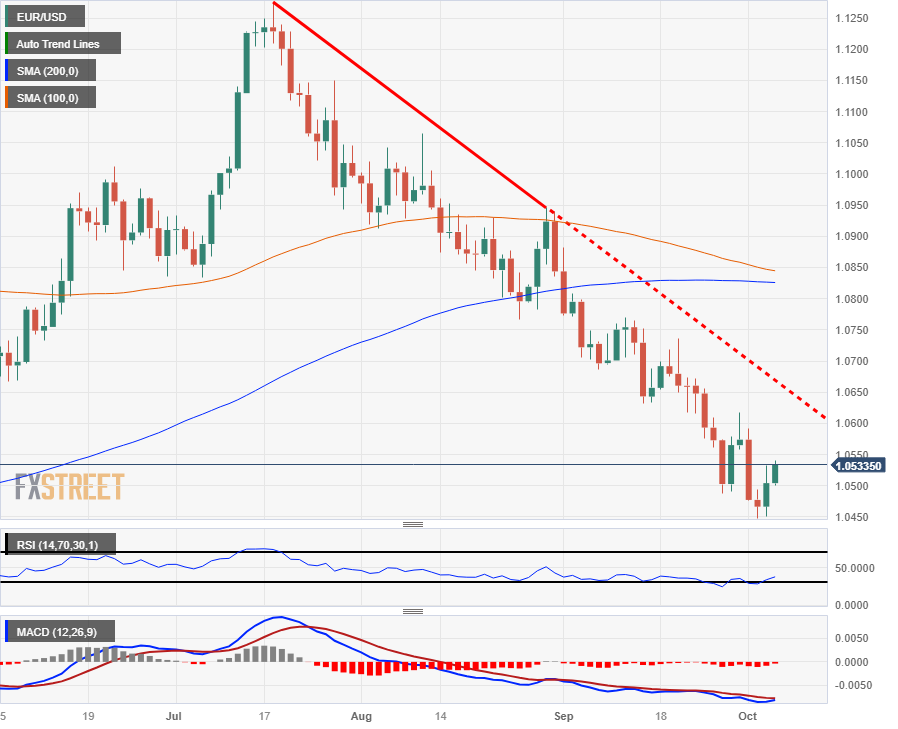
On the daily candlesticks the EUR/USD remains firmly bearish, down over 6.5% from Juily's peaks, and price action remains far below the 200-day SMA near 1.0825. Bidders will need to break and hold above a descending trendline from 1.1275, and a downside slip will see new eleven-month lows below 1.0448.
EUR/USD hourly chart
EUR/USD daily chart
EUR/USD technical levels
With the recent rise in US Treasury bond yields, the need to do additional tightening by the Federal Reserve is not there, San Francisco Federal Reserve President Mary Daly said while speaking at the Economic Club of New York on Thursday.
Key quotes
"The economy still has considerable momentum."
"We are a long way from 2% inflation, and a long way from sustainable employment."
"Even with recent slowing in labor market, job growth remains well above what's needed to keep pace with growth."
"It's possible the slowing so far will translate into a steady march toward goals."
"There are real risks in inflation projections."
Will need to see progress on super-core inflation to be confident we are on path to 2%."
"If we continue to see labor market and inflation cooling, we can hold rates steady."
"If financial conditions remain tight, that reduces the need for more action from the Fed. But if cooling in inflation stalls or financial conditions loosen, will need to raise rates further."
"Need to keep an open mind, have optionality on rates."
"I don't see dysfunction in the markets right now."
"Markets have a better sense now, I think, about the Fed's reaction function - that we want to get inflation down to 2%."
"We are not in a wage-price spiral."
"Short-run inflation expectations have come down, and that releases wage pressure."
Market reaction
The US Dollar (USD) stays under modest bearish pressure in the American session. As of writing, the USD Index was down 0.3% on the day at 106.45.
- WTI experiences a sharp 1.50% drop, extending losses amidst global economic slowdown fears and hedge fund liquidations.
- OPEC+ maintains current production levels despite the WTI price slide, with no indication of extending cuts into 2024.
- US business activity decelerates, while the Eurozone economy faces potential contraction in the upcoming quarter, per HCOB PMIs.
West Texas Intermediate (WTI), the US crude oil benchmark, dropped almost 1.50% on Thursday, extending its losses to two straight days amid renewed fears of a global economic slowdown. Even though OPEC+ countries aim to keep a narrow supply, WTI price slides below $83.000 per barrel after hitting a daily high of $84.88.
Oil price slumps below $83, on traders booking profits, OPEC+ decision, economic concerns
On Wednesday, oil prices slid more than $5, according to sources cited by Reuters, due to “heavy hedge fund liquidation on fears that higher interest rates with inflation keep sapping fuel demand.” In the meantime, a sharp jump in gasoline inventories in the US warranting that demand was weak in the last week.
The Organization of Petroleum Exporting Countries and allies – also known as OPEC+, stick to its current oil production, which included recent output cuts of 1.3 million barrels by Saudi Arabia and Russia, extended into the end of 2023. The OPEC+ did not mention if those cuts would be prolonged until 2024.
Regarding the global economic outlook, business activity in the US slowed down, while the Eurozone (EU) economy would likely shrink in the last quarter, according to HCOB’s Services and Composite PMIs.
WTI Price Analysis: Technical outlook
Oil price is dropping below the latest cycle high before WTI reached a year-to-date (YTD) high of $94.99, at around $84.85. In doing so, the 50-day moving average (DMA) was surpassed, putting into play a test of the $80.00 figure. A breach of the latter would expose the 200-DMA at $77.47, which, once cleared, could open the door to test last year’s low of $70.10. Conversely, if oil prices jump above the 50-DMA at $85.03, the following resistance would be the $90.00 mark.

"We've had good inflation numbers and in parallel an increase in long-term rates. It can be considered to be excessive but it helps tighten financing conditions in the European economy," European Central Bank (ECB) policymaker Francois Villeroy de Galhau told German business newspaper Handelsblatt on Thursday, as reported by Reuters.
"So today, I don't think an additional increase in ECB rates is justified," Villeroy added.
Market reaction
EUR/USD showed no immediate reaction to these comments and the pair was last seen trading at 1.0528, where it was up 0.25% on a daily basis.
- Mexican Peso registers losses against the US Dollar, trading above 18.00 during the North American session.
- Mexico’s Consumer Confidence holds steady, but subcomponents signal pessimism regarding domestic and US economic conditions.
- USD/MXN advances steadily after US unemployment claims were slightly up but failed to undermine the US Dollar.
Mexican Peso (MXN) registered moderated losses against the US Dollar (USD) in early trading during the North American session. A slew of data from Mexico and the United States (US) seems to have taken a toll on the Peso, lifting USD/MXN past the 18.00 figure.
The economic calendar in Mexico showed that Consumer Confidence was unchanged compared to August’s data. However, two of the five subcomponents showed a slight deterioration due to fears of a slowdown in the US. Households turned pessimistic about their economic outlook one year from now, and simultaneously, they expect the future economic conditions in Mexico to worsen.
Before Mexico’s data, the US docket delivered unemployment claims, which came slightly above the prior week but below forecasts. At the same time, the US Balance of Trade deficit narrowed, compared to July’s data, while Exports rose and Imports diminished.
Daily Digest Market Movers: Mexican Peso tanks in early trading, with USD/MXN buyers eyeing 18.20
- Consumer Confidence in Mexico came at 46.7 in September, unchanged from August.
- US Initial Jobless Claims for the week ending on September 30 advanced to 207,000, above the previous week’s 205,000, but trailed forecasts of 210,000.
- The US Balance of Trade showed a narrower deficit of $58.3 billion, below the $62.3 billion of the consensus and July’s $64.7 billion.
- US Exports rose by $256 billion, exceeding the previous reading of $251.9 billion.
- US Imports decreased to $314.3 billion from $316.6 in July.
- On Wednesday, the IMF raised Mexico’s growth projection in 2023 from 2.6% to 3.2% and from 1.5% foreseen in July to 2.1% for 2024.
- US ADP Employment figures came at 89,000, below forecasts of 153,000 ahead of the official government Nonfarm Payrolls report on Friday.
- US ISM Services PMI came at 53.6, as foreseen by analysts, though moderately slowed down.
- Banxico’s September poll amongst economists reported that interest rates are expected to remain at 11.25% while inflation would dip to 4.66%.
- The same poll shows the exchange rate is set to finish at around 17.64, down from 17.75.
- Mexico’s S&P Global Manufacturing PMI for September came at 49.8, sliding to contractionary territory and below August’s 51.2, as the economy loses steam.
- The Bank of Mexico (Banxico) held rates at 11.25% in September and revised its inflation projections from 3.5% to 3.87% for 2024, above the central bank’s 3% target (plus or minus 1%).
- Banxico’s Government Board highlighted Mexico’s economic resilience and the strong labor market as the main drivers to keep inflation at the current interest rate level.
- Mexico’s Unemployment Rate edged lower from 3.1% in July to 3.0% in August, according to the National Statistics Agency (INEGI).
Technical Analysis: Mexican peso is vulnerable to further losses
The daily chart shows that the Mexican Peso is set to extend its losses on Thursday. With the USD/MXN exchange rate hovering near the weekly high of 18.20, a decisive break above 18.21 could put into play the next resistance seen at the April 5 high at around 18.40, as the pair continues its uptrend towards the April 2018 yearly low of 18.60. With those levels cleared, the next stop would be the March 24 high at 18.79, followed by the psychological 19.00 figure.
Mexican Peso FAQs
What key factors drive the Mexican Peso?
The Mexican Peso (MXN) is the most traded currency among its Latin American peers. Its value is broadly determined by the performance of the Mexican economy, the country’s central bank’s policy, the amount of foreign investment in the country and even the levels of remittances sent by Mexicans who live abroad, particularly in the United States. Geopolitical trends can also move MXN: for example, the process of nearshoring – or the decision by some firms to relocate manufacturing capacity and supply chains closer to their home countries – is also seen as a catalyst for the Mexican currency as the country is considered a key manufacturing hub in the American continent. Another catalyst for MXN is Oil prices as Mexico is a key exporter of the commodity.
How do decisions of the Banxico impact the Mexican Peso?
The main objective of Mexico’s central bank, also known as Banxico, is to maintain inflation at low and stable levels (at or close to its target of 3%, the midpoint in a tolerance band of between 2% and 4%). To this end, the bank sets an appropriate level of interest rates. When inflation is too high, Banxico will attempt to tame it by raising interest rates, making it more expensive for households and businesses to borrow money, thus cooling demand and the overall economy. Higher interest rates are generally positive for the Mexican Peso (MXN) as they lead to higher yields, making the country a more attractive place for investors. On the contrary, lower interest rates tend to weaken MXN.
How does economic data influence the value of the Mexican Peso?
Macroeconomic data releases are key to assess the state of the economy and can have an impact on the Mexican Peso (MXN) valuation. A strong Mexican economy, based on high economic growth, low unemployment and high confidence is good for MXN. Not only does it attract more foreign investment but it may encourage the Bank of Mexico (Banxico) to increase interest rates, particularly if this strength comes together with elevated inflation. However, if economic data is weak, MXN is likely to depreciate.
How does broader risk sentiment impact the Mexican Peso?
As an emerging-market currency, the Mexican Peso (MXN) tends to strive during risk-on periods, or when investors perceive that broader market risks are low and thus are eager to engage with investments that carry a higher risk. Conversely, MXN tends to weaken at times of market turbulence or economic uncertainty as investors tend to sell higher-risk assets and flee to the more-stable safe havens.
- NZD/USD rebounds from daily lows, trading at 0.5944, amidst a backdrop of varied US economic data.
- US Initial Jobless Claims slightly up, while the trade deficit narrows to a three-year low, offering a mixed impact on the USD.
- Money market futures begin pricing in potential Fed rate cuts for June 2024, despite Fed projections.
The New Zealand Dollar (NZD) gained traction versus the Greenback (USD) early in the New York session, following a round of economic data from the United States that failed to underpin the safe-haven status of the USD. At the time of writing, the NZD/USD exchanges hands at 0.5944 after bouncing from daily lows of 0.5907.
The NZD/USD resumed its uptrend as US economic data, US Treasury bond yields present a mixed picture
The ongoing pullback in the Greenback is bolstering most G7 currencies. The US Bureau of Labor Statistics (BLS) revealed the Initial Jobless Claims for the week ending September 30 raised to 207K, below forecasts of 210K, but exceeding the prior week’s reading of 205K. Although it shows a minuscule uptick, the labor market remains tight. At the same time, the US Department of Commerce announced the US trade deficit narrowed to a three-year low in August, with numbers coming at $-56.3 billion, below the consensus of $-62.3 billion, and July’s $-64.7 billion.
Although the data was US Dollar-supportive, the drop in US Treasury bond yields is a headwind for the buck. The US Dollar Index (DXY), which measures the Greenback’s value against six currencies, falls 0.21% to 105.54.
US bond yields are dropping while money market futures began to price in US Federal Reserve (Fed) rate cuts for June of 2024. That contradicts the latest Fed projections of keeping rates at around 5.10%, by Fed officials. According to the CME FedWatch Tool, traders expect rates to drop towards 4.50%-4.75%.
Aside from this, the New Zealand (NZ) economic docket during the Asian session revealed the Commodity Price Index for September, which showed an increase of 1.2%, above the latest -2.9% plunge in the previous period. In addition, the latest NZIER Business Confidence dropped 52% in Q3 compared to Q2’s 63% slump.
NZD/USD Key Technical Levels
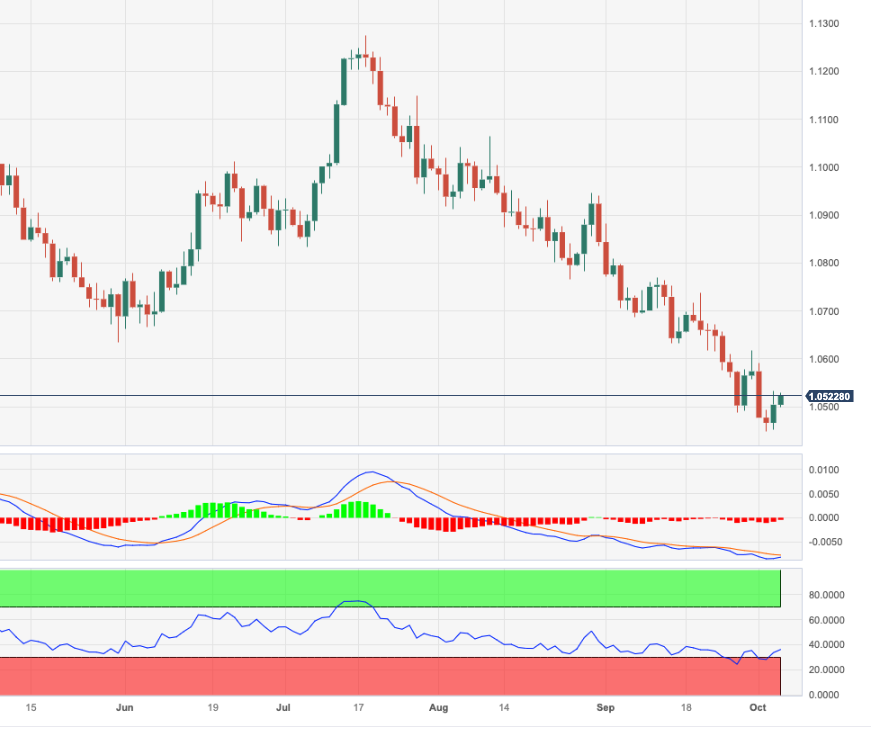
Gold has lost $100 an ounce to $1,820, its lowest level since March. Economists at UBS analyze the yellow metal’s outlook.
Near-term risks to Gold remain
Uncertainty over where US yields and the Dollar will peak are a headwind for Gold in the near term. The metal typically comes under pressure when risk-free rates rise and when the US currency strengthens, which raises the price for non-dollar investors and suppresses demand.
With opportunity costs for Gold on the rise, we now also see a more constrained outlook for Gold, with the metal ending the year around $1,850 from $1,950 previously, and rising to $1,950 by the end of June 2024 down from $2,100 previously.
In recent weeks, the bond market has seen another hawkish lurch. Economists at ABN Amro look at the drivers of the move so far and make an assessment of whether the rise in yields can be sustained.
What is going on in the bond markets?
Given the recent economic development in both the US and EZ, with core inflation slowing down, labor market deteriorating, and intensification of financial tightening, an economic slowdown is on the cards.
Weaker economic activity is indeed likely to weigh on short term rate expectations which will push the 10Y yield lower in turn.
Therefore, we judge that the market should reflect better this economic outlook once the higher-for-longer theme subsides and thus will be supportive of lower rates.
- USD/JPY juggles around 149.00 as the volatility propelled by Tuesday’s flash crash will take time to heal.
- A possibility of BoJ’s intervention cannot be ruled as the central bank is maintaining an easy monetary policy.
- Investors await the US NFP data for further guidance.
The USD/JPY pair trades back and forth in a narrow range around 149.00 in the early New York session. The volatility of the pair contracts after Tuesday’s ‘flash crash’ near the psychological resistance of 150.00, which was misguided as a Bank of Japan’s (BoJ) intervention in the FX domain to defend further downside in the Japanese Yen.
The upside in the Japanese Yen is broadly restricted to the resilient US Dollar. However, the possibility of BoJ’s or Japan's authority’s intervention in the FX market cannot be ruled as the central bank is maintaining an expansionary monetary policy. The BoJ has vowed to keep inflation confidently above 2%, which could be achieved by higher wage growth.
Early Thursday, Japanese Prime Minister Fumio Kishida vowed to make a surge of wage rises sustainable as inflation above 2% is majorly driven by external forces.
The S&P500 opens on a flat note as investors shift focus to the United States Nonfarm Payrolls (NFP) data, which will be published on Friday. Analysts at Commerzbank forecasted job growth of 160K. After the surprisingly sharp rise from 3.5% to 3.8% in August, the unemployment rate is likely to have fallen again slightly to 3.7%, as the trend in labor force growth is only around 100K. We do not expect the unemployment rate to rise significantly until next year when the economy is likely to slip into recession and employment is likely to shrink.
The US Dollar Index (DXY) trades in a narrow range around 106.50-106.86 after the release of the US weekly jobless claims data for the week ending September 29, which remains almost unchanged at 207K.
The US Dollar has rallied about 2% since the last FOMC meeting in September. Economists at ING are deferring their call for a Dollar sell-off this year.
Strong Dollar remains the only game in town
Even though November and December are seasonally weak months for the Dollar, it is hard to call a turn in the USD trend before year-end.
US data is showing no signs of turning just yet. For that reason, it seems hard for the market to completely price out the risk of one last Fed hike before year-end. This should keep short-dated US yields anchored above 5% and prevent the Dollar from falling too far during any corrections.
Looking into 2024, our call for US economic and rate convergence with stagnant growth elsewhere in the world should mean the Dollar turns lower.
Economists at TD Securities discuss the Nonfarm Payrolls report and its implications for the rates market.
NFP to remain firm in September
We look for NFP to remain firm in September, reflecting a jump above the 200K mark for the first time in four months. We also expect the unemployment rate to stay unchanged at 3.8%, as we are assuming job creation in the household survey will print a softer gain vs. that of the establishment survey. Average hourly earnings likely advanced 0.3% MoM, with the YoY measure staying unchanged at 4.3%.
A strong payroll report could spark a continuation of the recent bear steepening in rates as 10y Treasuries remain in their 4.50-5.32% technical air pocket. However, an unexpected softening in payrolls could pour some cold water on the sell-off, allowing the market to retrace a portion of recent weakness and find some temporary stability.
EUR/CAD rebounds. Economists at Scotiabank analyze the pair’s outlook.
A major low/reversal might be developing
Weekly price action suggests a major low/reversal might be developing (bullish ‘morning star’ candle signal, contingent on a high EUR close this week).
EUR gains may hold around 1.4485/1.4515 resistance in the short run but a clear move back through 1.4510/1.4515 should add to near-term EUR momentum for a push on to the mid-1.46s.
Support is 1.4325 and (stronger, assuming a high EUR close on the week) at 1.4160 now.
- AUD/USD fails to extend upside above 0.6380 as the focus shifts to US labor market data.
- The US labor demand is seen softening considering the ADP Employment Change data.
- AUD/USD faces selling pressure after testing the breakdown of the consolidation formed in a range of 0.6366-0.6522.
The AUD/USD pair faces selling pressure near 0.6380 while attempting to extend recovery in the early New York session. The Aussie asset struggles to extend recovery as the US Dollar finds a cushion to near 106.50 after correcting from an 11-month high at 107.35.
The US Dollar is expected to remain volatile ahead of the US Nonfarm Payrolls (NFP) data, which will be published on Friday. The labor demand is seen softening considering the ADP Employment Change data, released on Wednesday, which showed private payrolls halving to 89K in September from the former release of 180K.
Meanwhile, the US Department of Labor reported the weekly Jobless Claims data for the week ending September 29 almost unchanged at 207K.
On the Australian Dollar front, monthly Trade Balance data increased significantly to 9,640M, higher than expectations of 8,725M and the former release of 7,324M.
AUD/USD faces selling pressure after testing the breakdown of the consolidation formed in a range of 0.6366-0.6522 on a daily scale. The 50-day Exponential Moving Average (EMA) at 0.6464 continues to act as a barricade for the Australian Dollar bulls.
A bearish impulse would trigger if the Relative Strength Index (RSI) (14) shifts into the bearish range of 20.00-40.00.
A fresh downside would appear if the Aussie asset drops below October 03 low around 0.6286. This would expose the asset to 21 October 2022 low at 0.6212, followed by 13 October 2022 low at 0.6170.
In an alternate scenario, a decisive break above August 15 high around 0.6522 will drive the asset to August 9 high at 0.6571. Breach of the latter will drive the asset towards August 10 high at 0.6616.
AUD/USD daily chart
-638321102412586164.png)
A massive sell-off in bond markets has over the past weeks pushed long US government bond yields to new highs. Economists at Danske Bank analyze the 10-year US Treasury yield outlook.
Yields not bound to remain high for long
The recent uptick in long-end UST yields reflects rising term premium, while risk-neutral rate expectations have remained stable.
Tightening financial conditions tilt the balance of growth risks to the downside, we still expect consumption and inflation to cool towards the winter.
Unfavourable supply-demand dynamics are likely to persist into Q4, but we still see improving demand driving yields lower, with 12M 10y forecast at 3.70%, though risk is tilted to the upside.
- EUR/USD adds to Wednesday’s recovery attempt past 1.0500.
- Immediate resistance emerges around 1.0620.
EUR/USD keeps the bid bias unchanged and adds to Wednesday’s advance north of 1.0500 the figure on Thursday.
The continuation of the rebound should initially retarget the minor barrier at 1.0617 (September 29) ahead of the weekly peak of 1.0767 (September 12).
Meanwhile, further losses remain on the table as long as the pair navigates the area below the key 200-day SMA, today at 1.0824.
EUR/USD daily chart
How high is too high for bond yields? These are Société Générale’s best-estimate ranges for US 10-year yields in various scenarios.
Bond yields have a substantial impact on the S&P 500
No recession: US 10y yields ranging between 4-5%, S&P 500 = 4,050-4,750.
Mild recession (SG 2024e base case): US 10y yields ranging between 3-3.5%, S&P 500 = 3,800.
Hard landing (recession): US 10y yields ranging between 2.5-3%, S&P 500 = 3,100-3,500.
Irrational exuberance (no landing and risk of a global event trigger Fed easing): an ‘exuberance’ value for the S&P 500 in this scenario would be new highs.
We expect profit growth to accelerate over the next two quarters, hence our S&P 500 target range of 4,050-4,750. A mild recession in the middle of 2024 should lead to a higher risk premium, driving the S&P 500 back to 3,800.
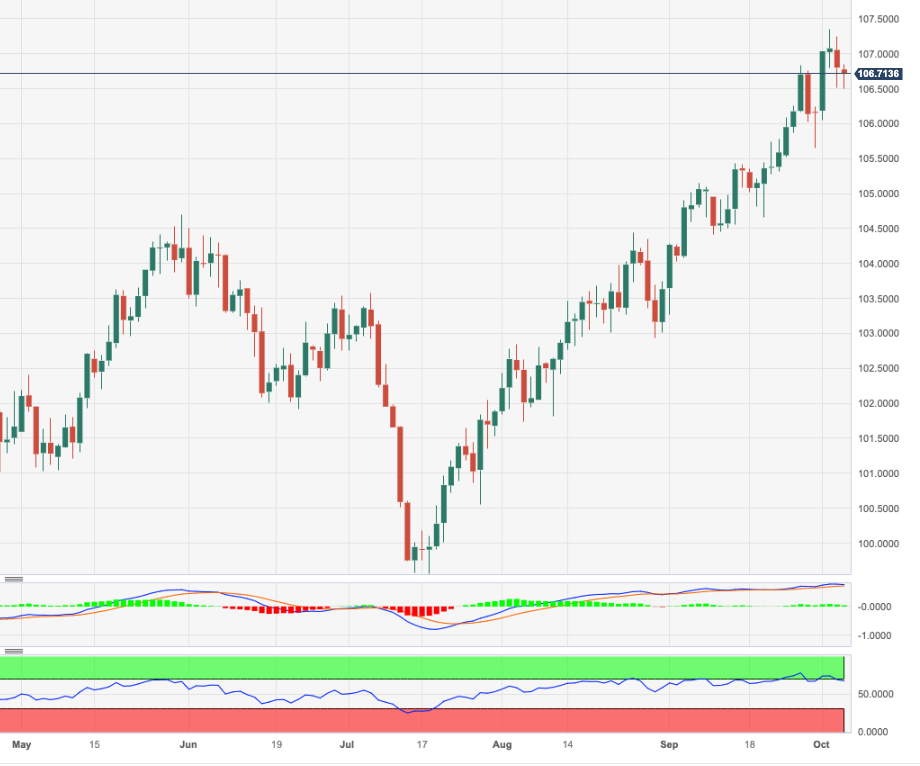
- DXY adds to Wednesday’s pullback and recedes to 106.50.
- Another test of the 2023 peak remains in store near term.
DXY deflates to the 106.50 zone, where it meets some decent contention so far on Thursday.
Considering the ongoing price action, extra gains appear likely in the dollar for the time being. Once the index clears the 2023 top of 107.34 (October 3), it could encourage bulls to challenge the weekly peak at 107.99 (November 21 2022) just ahead of the round level at 108.00.
In the meantime, while above the key 200-day SMA, today at 103.14, the outlook for the index is expected to remain constructive.
DXY daily chart
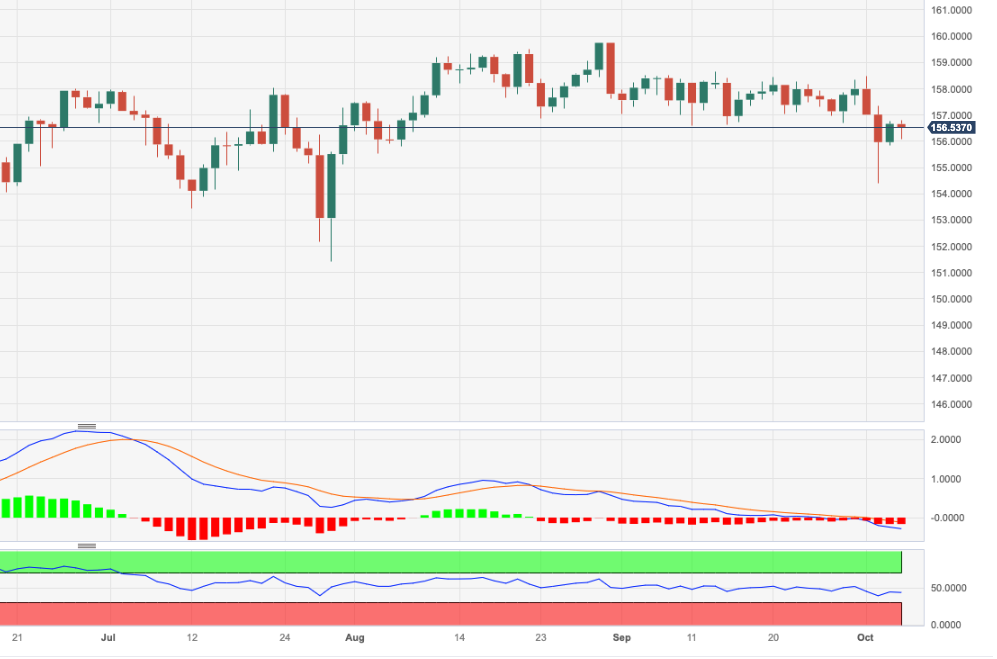
- EUR/JPY trades in a vacillating fashion below the 157.00 hurdle.
- Extra range bound appears on the cards for the time being.
EUR/JPY alternates gains with losses in the sub-157.00 region on Thursday, following the recovery attempt seen in the previous day.
In the meantime, the cross remains stuck within the consolidative range and the breakout of it exposes a visit to the so far monthly high of 158.65 (September 13) prior to the 2023 top at 159.76 (August 30), which precedes the key round level at 160.00.
On the downside, the so far monthly low of 154.34 (October 3) emerges as the initial contention in case of bearish attempts.
So far, the longer term positive outlook for the cross appears favoured while above the 200-day SMA, today at 149.72.
EUR/JPY daily chart
The US Bureau of Labor Statistics (BLS) will release the September jobs report on Friday, October 6 at 12:30 GMT and as we get closer to the release time, here are the forecasts by the economists and researchers of seven major banks regarding the upcoming employment data.
Nonfarm Payrolls are forecast to increase by 170K in September vs. 187K in August. The Unemployment Rate is expected to fall a tick to 3.7% while Average Hourly Earnings are expected to remain steady at 4.3% year-on-year.
Deutsche Bank
We expect a 150K gain for September and see the unemployment rate ticking higher to 3.9%, with earnings growth still at +0.2%.
Commerzbank
We forecast job growth of 160K. After the surprisingly sharp rise from 3.5% to 3.8% in August, the unemployment rate is likely to have fallen again slightly to 3.7%, as the trend in labor force growth is only around 100K. We do not expect the unemployment rate to rise significantly until next year when the economy is likely to slip into recession and employment is likely to shrink.
NBF
Hiring could have accelerated in the month if previously released soft indicators such as S&P Global’s Composite PMI are any guide. Layoffs, meanwhile, may have decreased slightly judging by the decline in jobless claims between the August and September reference periods. With these two trends reinforcing each other, we expect job creation to have accelerated to 200K in the month. The household survey could show a similar gain, a development which would translate into a one-tick decline of the unemployment rate to 3.7%, assuming the participation rate slipped one tick to 62.7%.
RBC Economics
The next round of US payroll employment data will likely show the unemployment rate holding steady at 3.8%, and employment up by 177K, slightly below the 187K add in August. Labour market conditions remain tight with initial jobless claims trending at low levels. But signs of slowing demand including falling job openings mean we can continue to expect conditions to slow.
CIBC
We expect more of what we’ve seen over past six months: a gradual weakening of job growth and further evidence of a slow but steady rebalancing of the labour market. The unemployment rate and the participation rate should hold at 3.8% and 62.8% respectively.
Citi
We expect NFP to rise by a strong 240K in September, partly reflecting the reversal of seasonal issues that led to a softer 105K increase in June (which has been revised lower from an initial 209K). Average hourly earnings should rise 0.3% MoM, although with upside risks of a print that rounds to 0.4%. This would reflect a rebound in wage growth from a modestly softer increase in August. Meanwhile, we expect the unemployment rate to decline back to 3.6% in September after an unexpected increase to 3.8% in August. The increase in August was largely due to a rise in the participation rate, which increased from 62.6% to 62.8%.
Wells Fargo
We forecast that the US economy added 150K jobs in September, a step down from 187K in August. Looking beyond payrolls, we anticipate that the labor force ebbed a bit in September after last month’s jump. If realized, this would nudge the unemployment rate a tick down to 3.7%. Meanwhile, the trend in average hourly earnings growth continues to gradually ease as turnover settles down and the supply and demand for labor have moved toward a better balance. We estimate that average hourly earnings growth picked up slightly to 0.3% in September, although that would be enough to push down the three-month annualized pace of wage gains below 4%.
- Silver price juggles around $21.00 as the focus shifts to the US NFP report.
- US weekly jobless claims were almost unchanged near 207K for the week ending September 29.
- Silver price weakens after breaking down the H&S neckline at $22.11.
Silver Price (XAG/USD) remains directionless around $21.00 in the late European session. The asset struggles to find a direction as US Treasury yields ease to near 4.77% on expectations of cooling labor market conditions.
The white metal has remained inside the woods as investors shift focus to the US Nonfarm Payrolls (NFP), which will provide a snapshot of the current status of the labor market. Cues from the US ADP Employment Change data were weak as private payrolls rose by 89K in September, halved from August reading of 180K.
As per the estimates, the US laborforce witnessed fresh additions of 170K employees, lower than the former release of 187K. The Unemployment Rate is seen declining to 3.7% vs. the August reading of 3.8%. In addition to the job data, labor earnings data will be keenly watched. Monthly Average Hourly Earnings data is foreseen to expand at a higher pace of 0.3% against the 0.2% pace recorded in August.
Meanwhile, the US Department of Labor reported weekly Jobless Claims data for the week ending September 29. Individuals claiming jobless benefits for the first time increased marginally to 207K from the former reading of 205K but lower than expectations of 210K.
Silver technical analysis
Silver price delivers a breakdown of the Head and Shoulder chart pattern on a daily scale, which results in a vertical sell-off. The white metal breaks sharply below the neckline of the aforementioned chart pattern plotted from June 23 low at $22.11. Potential support is placed from March 08 low at $19.93.
The asset trades below the 20-day Exponential Moving Average (EMA), which indicates that the short-term trend is bearish.
The Relative Strength Index (RSI) (14) trades in the bearish range of 20.00-40.00, which warrants more downside.
Silver daily chart
-638321069471611388.png)
- Initial Jobless Claims in the US increased by 2,000 in the week ending September 30.
- US Dollar Index stays in daily range below 107.00 after the data.
There were 207,000 initial jobless claims in the week ending September 30, the weekly data published by the US Department of Labor (DOL) showed on Thursday. This print followed the previous week's print of 205,000 (revised from 204,000) and came in slightly better than the market expectation of 210,000.
Further details of the publication revealed that the advance seasonally adjusted insured unemployment rate was 1.1% and the 4-week moving average stood at 208,750, a decrease of 2,500 from the previous week's revised average.
"The advance number for seasonally adjusted insured unemployment during the week ending September 23 was 1,664,000, a decrease of 1,000 from the previous week's revised level," the publication read.
Market reaction
The US Dollar Index recovered modestly from daily lows after this data and was last seen trading flat on the day at 106.75.
USD consolidates as yields remain supportive. Economists at Scotiabank analyze Greenback’s outlook.
DXY gains remain stretched
High US yields and wide rate differentials will keep the USD well-supported in the near-term at least but the disruptive impact of the US Treasury sell-off is a niggling concern for investors and may be increasing the risk of a hard landing in the US.
Technical signals suggest the rally in the DXY is very stretched (overbought oscillator signals and a twelfth consecutive weekly gain – so far) and prone to some consolidation or a modest correction at least. A significantly lower USD may have to await some unwind in elevated US yields, however.
USD/CAD is on the cusp of testing the 1.38 level. Economists at Scotiabank analyze the pair’s outlook.
Trend higher remains well-supported by bullish trend momentum signals
While the USD trend higher remains well-supported by bullish trend momentum signals, these oscillators also reflect a degree of stretch in the USD’s latest move up.
The 1-hour and 6-hour RSI measures are also showing clear signs of diverging with higher spot levels which can be a warning sign of a correction. But there is not much else to suggest the USD cannot push on to retest 1.3860 – the March high – in the short run.
Support is 1.3700/1.3710.
EUR/USD is holding in a tight range just above 1.05. Economists at Scotiabank analyze the pair’s outlook.
Charts suggest sell-off steadying
Short-term price action is flat but moderate EUR gains from the early week low do point to some – potential – strength (it’s all relative) in the EUR, with a bullish ‘morning star’ signal on the daily chart.
EUR gains through 1.0540/1.0545 short-term trend resistance may signal a push to the low 1.06s.
Support is 1.0480/1.0490 and 1.0450.
See: EUR/USD may lack enough buyers above the 1.0530/1.0550 area – ING
Sterling is little changed on the session. Economists at Scotiabank analyze GBP/USD outlook.
Charts lean bullish
A positive session for the GBP on Wednesday delivered some bullish technical cues in the form of outside range signals on the intraday and daily charts. But that has not yet translated into clear upside progress in Cable.
A push through intraday trend resistance at 1.2185 is needed to lift the GBP more obviously. The charts suggest firm support on softness to the 1.2050/1.2075 zone from here, however.
UOB Group’s Head of Research Suan Teck Kin, CFA, and Associate Economist Jester Koh, assess the latest PMI readings and their prospects in Singapore.
Key Takeaways
Singapore’s manufacturing prospects improved further as the latest Purchasing Manager’s Index (PMI) rose 0.2pt to 50.1 in Sep (from 49.9 in Aug), the first expansionary (above 50) reading recorded since Jul 2022 (Overall: 50.1, Electronics: 50.5), marking the 4th consecutive month of improvement. Similarly, the electronics sector PMI increased 0.3pt to 49.8 in Sep (from 49.5 in Aug), recording the third successive month of improvement but the reading remains contractionary (below 50) for 14 months in a row.
Singapore Manufacturing PMI Outlook – While we are heartened by the expansionary reading recorded in Sep’s overall PMI and some of its subindices, headwinds in the manufacturing sector remain given the weak external demand, which could persist for the rest of 2023, exacerbated by tight financial conditions stemming from an elevated interest rate environment. As for the improvement in the Sep electronics PMI, we remain hesitant to call for a trough in the current electronics downcycle as the reading still remains contractionary (below 50) but the latest improvement in order backlog for both the overall manufacturing and electronics sectors is an encouraging sign for demand recovery.
The Swiss Franc weakened versus the US Dollar and the Euro in September. Economists at MUFG Bank analyze CHF outlook.
Volatility set to pick up
With the global growth outlook so fragile and volatility set to pick up, we believe ongoing CHF strength is likely.
Given our EUR/USD profile, we expect CHF strength to be more evident against the US Dollar in 2024.
EUR/CHF – Q4 2023 0.9700 Q1 2024 0.9650 Q2 2024 0.9600 Q3 2024 0.9500
USD/CHF – Q4 2023 0.9280 Q1 2024 0.8770 Q2 2024 0.8570 Q3 2024 0.8480
USD/CNH is still seen navigating the 7.2800-7.3600 range in the next few weeks, comment Markets Strategist Quek Ser Leang and Senior FX Strategist Peter Chia at UOB Group.
Key Quotes
24-hour view: We highlighted yesterday that “the price action appears to be part of a consolidation, and further sideways trading will not be surprising, likely in a range of 7.3100/7.3300.” USD then traded in a range that was close to our expectations (7.3097/7.3289). Momentum indicators are mostly neutral, and we continue to expect USD to trade sideways, probably between 7.3080 and 7.3310.
Next 1-3 weeks: Our update from two days (03 Sep, spot at 7.3215) still stands. As highlighted, USD is likely to trade in a range for now, probably between 7.2800 and 7.3600.
- Traders brace for a second day this week with the weekly jobless numbers.
- Traders are clueless toward Friday’s NFP as ADP and ISM were mixed.
- US Dollar Index sinks below 107, though rally is still intact.
The US Dollar (USD) is turning very mixed this Thursday with several asset classes trying to claw back against the ferocious Greenback. After parts of the equity, commodity and bond markets all reached yearly lows over the past week, it does not come as a surprise that all these elements are up this Thursday. The ADP and Institute of Supply Management (ISM) numbers from Wednesday took a fair bit of wind out of the sales of the US Dollar Index.
While traders are still trying to assess the data releases from Wednesday, already the next batch of data ahead of Friday’s Nonfarm Payrolls are due. With the decline in the ADP Employment Change data, all eyes will be on the Initial Jobless Claims. Should that number be an upbeat surprise, expect to see the DXY start testing the support of the 2023 rally.
Daily digest: US Dollar starts to lose steam
- Near 11:30 GMT, the Challenger Job Cuts for September is due to come out. Previous data was for -75,151. No forecast is pencilled in this time.
- At 12:30 GMT, the only real data points of importance for this Thursday are the Initial Jobless Claims and the Trade Balance. Initial Jobless Claims are expected to head from 204,000 to 210,000. The Continuing Claims are expected to head 1.67 million to 1.675 million. An uptick is thus already expected, though any bigger number might trigger some US Dollar weakness.
- For the Goods Trade Balance, a contraction is expected from -$65 billion to -$62.3 billion.
- Fed speakers might shed some light in this turbulent week with the Fed’s Loretta Mester from Cleveland speaking at 13:00 GMT. At 15:30 GMT, Thomas Barking from Richmond is due to speak, followed by Mary Daly from San Francisco near 16:00 GMT.
- Equities are bored with the constant sell-off and are trying to turn the tide with some green figures: Both the Nikkei and the Topix indices in Japan advanced nearly 2% on Thursday. China is as good as flat for this Thursday. European stocks are flat, and US futures are mildly in the red, less than 0.50%.
- The CME Group FedWatch Tool shows that markets are pricing in a 77% chance that the Federal Reserve will keep interest rates unchanged at its meeting in November. The earlier rise in probability for a hike is being erased again as both ISM and ADP on Wednesday were coming in under expectations and might signal that the economy is starting to struggle with these elevated rates.
- The benchmark 10-year US Treasury yield is peaking at 4.74%, off the highs from 4.85% earlier in the week.
US Dollar Index technical analysis: Failing its first test
The US Dollar Index is under pressure as traders are no longer awarding the Greenback for growing economic indicators when they are contracting against the previous print. Traders are starting to embrace the idea that the extensive growth cycle for the US might be nearing its end and is over its peak. That could translate into a substantially weaker US Dollar Index (DX), which might start to break down as more data points are issued in the coming days and weeks.
The US Dollar Index opened around 106.77, though the overheated Relative Strength Index (RSI) is acting as a cap that it is trading in an overbought regime. With 107.19 – the high of November 30, 2022 – tested on Wednesday, it will be important to see if DXY can get a daily close above that level. If that is the case, 109.30 is the next level to watch.
On the downside, the recent resistance at 105.88 should be seen as first support. Still, that barrier has just been broken to the upside, so it isn’t likely to be strong. Instead, look for 105.12 to do the trick and keep the DXY above 105.00.
US Dollar FAQs
What is the US Dollar?
The US Dollar (USD) is the official currency of the United States of America, and the ‘de facto’ currency of a significant number of other countries where it is found in circulation alongside local notes. It is the most heavily traded currency in the world, accounting for over 88% of all global foreign exchange turnover, or an average of $6.6 trillion in transactions per day, according to data from 2022.
Following the second world war, the USD took over from the British Pound as the world’s reserve currency. For most of its history, the US Dollar was backed by Gold, until the Bretton Woods Agreement in 1971 when the Gold Standard went away.
How do the decisions of the Federal Reserve impact the US Dollar?
The most important single factor impacting on the value of the US Dollar is monetary policy, which is shaped by the Federal Reserve (Fed). The Fed has two mandates: to achieve price stability (control inflation) and foster full employment. Its primary tool to achieve these two goals is by adjusting interest rates.
When prices are rising too quickly and inflation is above the Fed’s 2% target, the Fed will raise rates, which helps the USD value. When inflation falls below 2% or the Unemployment Rate is too high, the Fed may lower interest rates, which weighs on the Greenback.
What is Quantitative Easing and how does it influence the US Dollar?
In extreme situations, the Federal Reserve can also print more Dollars and enact quantitative easing (QE). QE is the process by which the Fed substantially increases the flow of credit in a stuck financial system.
It is a non-standard policy measure used when credit has dried up because banks will not lend to each other (out of the fear of counterparty default). It is a last resort when simply lowering interest rates is unlikely to achieve the necessary result. It was the Fed’s weapon of choice to combat the credit crunch that occurred during the Great Financial Crisis in 2008. It involves the Fed printing more Dollars and using them to buy US government bonds predominantly from financial institutions. QE usually leads to a weaker US Dollar.
What is Quantitative Tightening and how does it influence the US Dollar?
Quantitative tightening (QT) is the reverse process whereby the Federal Reserve stops buying bonds from financial institutions and does not reinvest the principal from the bonds it holds maturing in new purchases. It is usually positive for the US Dollar.
CAD/JPY gains have stalled following the break above 109.50 resistance. Economists at Scotiabank analyze the pair’s outlook.
Near-term losses may extend to the upper 106s
Weekly price action formed a bearish ‘gravestone’ doji last week – which largely does what it says on the tin in terms of implications.
Net CAD losses through trend support so far this week add to the negative tone of short-term price trends.
Near-term losses may extend to the upper 106s to retest the ceiling of the channel that held price action through Q3.
Resistance is 109.00 and (strong) at 111.15 (last week’s high).
EUR/USD surpassed the 1.05 level as the Dollar rally took a breather on Wednesday. Economists at Commerzbank analyze the pair’s outlook.
Today's session to be dominated by everyone waiting for NFP report
The longer EUR/USD trades at levels around 1.04/1.05/1.06 the less fundamental support is required to justify these levels.
As the official labor market due for publication on Friday traditionally has considerable effect on the USD exchange rates, today's session will likely be dominated by everyone waiting for Friday's report.
Ahead of the publication, today’s data should therefore not have the same effect as US data had in previous days. In case of considerable surprises, we might nonetheless see reactions in the USD exchange rates though.
- USD/CAD marches towards 1.3800 as the correction in the US Dollar concludes.
- The oil price extends downside amid a volatile macroeconomic outlook.
- The US Dollar and the Canadian Dollar are likely to dance to the tune of respective official labor market data.
The USD/CAD pair refreshes a six-month high at 1.3785 and is expected to extend its rally towards the round-level resistance of 1.3800 in the European session. The Loonie asset capitalizes on a recovery in the US Dollar and more downside in the oil price. The black gold remains in the bearish territory as investors are worried about the oil demand outlook due to deepening global slowdown fears.
It is worth noting that Canada is the leading exporter of oil to the United States and lower oil prices negatively impact the Canadian Dollar.
The US Dollar Index (DXY) finds buyers’ interest after correcting to near 106.60 despite easing labor market conditions. The US ADP reported fresh private payrolls at 89K in September, almost halved from August reading of 189K. This could impact the strength of the United States' economic outlook ahead.
The US Dollar and the Canadian Dollar are likely to dance to the tune of respective official labor market data, which will be published on Friday.
USD/CAD delivers a breakout of an inverted Head and Shoulder chart pattern formed on the daily scale, which warrants a bullish reversal after a prolonged consolidation. The neckline of the aforementioned chart pattern was plotted from April 28 high at 1.3668. The 50-day Exponential Moving Average (EMA) at 1.3500 continues to provide cushion to the US Dollar bulls. Horizontal resistance is plotted from 12 October 2022 high at 1.3978.
The Relative Strength Index (RSI) (14) shifts into the bullish range of 60.00-80.00, which indicates an activation of the bullish impulse.
A decisive break above March 24 high around 1.3800 would expose the asset to March 10 high at 1.3860, followed by the round-level resistance at 1.3900.
In an alternate scenario, a breakdown below September 25 low around 1.3450 would drag the asset toward September 20 low near 1.3400. A further breakdown could expose the asset to a six-week low near 1.3356.
USD/CAD daily chart
-638320982470165367.png)
- Natural Gas price soars near $3.20.
- The US Dollar eases after soft figures for both ISM Services PMI and ADP Employment Change.
- US Natural Gas prices could head higher on the possibility of a cold front coming in sooner than expected.
Natural Gas prices are soaring higher despite lacklustre demand from Europe. Traders appear to be focusing on the potential cold front that should kick in later this week. It looks like the current grace period for European gas consumption will not be that long and that by the end of this month households will jack up their thermostats.
Meanwhile, the US Dollar (USD) is turning very mixed on Thursday with several asset classes trying to claw back against the Greenback. After parts of the equity, commodity and bond markets all reached yearly lows over the past week, it does not come as a surprise that all these are up on Thursday. The ADP and Institute of Supply Management (ISM) numbers from Wednesday took a fair bit of wind out of the sales of the US Dollar Index.
Natural Gas is trading at $3.176 per MMBtu at the time of writing.
Natural Gas news and market movers
- European storage sites are reporting another hike in reserves to 96.33%.
- Fuel shipments from Norway, the top gas supplier for the EU, are recovering and are set to hit the highest level since August once the last gas fields are fully back online.
- The most recent weather models show a substantial drop in temperatures by mid-October in Europe, which means that the current higher-than-normal temperatures aren’t expected to last long.
- Meanwhile in Australia, Chevron has reneged on the commitment it gave to the Fair Work Commission and could dent the current agreement in place in order to dissolve the strikes in Wheatstone and Gorgon LNG facilities. Union workers are set to reconvene on Thursday to discuss a possible restart of strikes.
- Turkey’s Energy Minister Alparslan Bayraktar says he will travel to Israel in November to meet his counterpart and energy companies operating in the gas industry. Turkey wants to develop a framework with Israel when it comes to energy. Turkey would buy natural gas from Israel for domestic use and would also send a fraction to the European market.
- In all these headlines, one would almost forget that near 14:30 GMT the weekly Energy Information Administration (EIA) Natural Gas Storage Change for the last week of September is due. Expectations are for another build from 90 to 92 Billion cubic feet.
Natural Gas Technical Analysis: $3.3 a good end of the line
Natural Gas is soaring higher this week, with traders ignoring the higher temperatures in Europe and rather focusing on the cold front coming in. Traders are presuming that the EU will want to keep its gas reserves filled to the brim, and will buy at any time. With this prepositioning, a quick squeeze higher in the coming weeks could materialise.
The pivotal level near $3.07 has been broken again to the upside. This level needs to hold now as a new floor, squeezing prices higher. With respect of the ascending trend channel, the upside looks limited toward $3.30 to test the upper barrier.
On the downside, the newly formed floor at $3.07 should act as support together with the psychological $3 big figure. In case demand abates further, or more supply out of Norway comes back online, expect to see an initial drop back to the green ascending trendline near $2.95. Should that give way, $2.80 is an area with two moving averages (the 55-day and the 100-day) and the lower barrier of the trend channel that could encourage bulls to catch any falling price action.
-638320939616951616.png)
XNG/USD (Daily Chart)
Natural Gas FAQs
What fundamental factors drive the price of Natural Gas?
Supply and demand dynamics are a key factor influencing Natural Gas prices, and are themselves influenced by global economic growth, industrial activity, population growth, production levels, and inventories. The weather impacts Natural Gas prices because more Gas is used during cold winters and hot summers for heating and cooling. Competition from other energy sources impacts prices as consumers may switch to cheaper sources. Geopolitical events are factors as exemplified by the war in Ukraine. Government policies relating to extraction, transportation, and environmental issues also impact prices.
What are the main macroeconomic releases that impact on Natural Gas Prices?
The main economic release influencing Natural Gas prices is the weekly inventory bulletin from the Energy Information Administration (EIA), a US government agency that produces US gas market data. The EIA Gas bulletin usually comes out on Thursday at 14:30 GMT, a day after the EIA publishes its weekly Oil bulletin. Economic data from large consumers of Natural Gas can impact supply and demand, the largest of which include China, Germany and Japan. Natural Gas is primarily priced and traded in US Dollars, thus economic releases impacting the US Dollar are also factors.
How does the US Dollar influence Natural Gas prices?
The US Dollar is the world’s reserve currency and most commodities, including Natural Gas are priced and traded on international markets in US Dollars. As such, the value of the US Dollar is a factor in the price of Natural Gas, because if the Dollar strengthens it means less Dollars are required to buy the same volume of Gas (the price falls), and vice versa if USD strengthens.
Kit Juckes, Chief Global FX Strategist at Société Générale, analyzes Treasury yields outlook following Wednesday's correction.
The bond market – and the Dollar – was moving too fast
September is often a bad month for risk sentiment (October sees a bounce more often than not, despite 1987). But two years in a row, the pace of the sell-off in Treasuries, and the rally in the Dollar, was too fast and caused an overshoot followed by a correction and period of position adjustment, before a return to fundamental drivers.
Will the spike in yields have a lasting impact on some market participants (as it did with Silicon Valley Bank)? Will the speed of the Dollar’s rally trigger a reaction (was a break of USD/JPY 150 enough to ensure that the BoJ changes policy in December?). This may be just a brief pause while we wait for Friday’s labour market data and next week’s US Treasury supply and CPI data.
If the labour market data are strong, pressure will return sooner than it did last year.
I still think the Treasury market will take yields higher until something breaks in the system, just as the Gilt market took yields high enough and the FX market took the Pound low enough a year ago, to force change in the UK Government.
- Gold price strives for a direction despite easing labor market conditions.
- The US economy could lose its resilience if the Nonfarm Payrolls report misses expectations.
- The latest US Services PMI Orders dropped significantly, portraying a deteriorating demand outlook.
Gold price (XAU/USD) has traded sideways since Tuesday as investors await the Nonfarm Payrolls (NFP) report, which will give a snapshot of the current status of the United States labor market. The precious metal failed to climb above the $1,830 ceiling on Wednesday despite soft ADP Employment Change and new Services PMI orders, as the Federal Reserve (Fed) is not expected to surrender its ‘higher-for-longer’ stance on interest rates.
The US Dollar (USD) has risen due to rising real rates amidst falling inflation, however, easing labor market conditions could dent its appeal.
This week, Cleveland Fed Bank President Loretta Mester said that interest rates should rise again in November if the economy continues to remain the way it is. Evidence of weakening labor demand, however, could prove a spoiler leading to the Fed’s interest rates staying unchanged.
Daily Digest Market Movers: Gold price awaits the US NFP report
- Gold price falls back while attempting a break above the immediate resistance of $1,830.00 as the US Dollar rebounds after correcting to near 106.50. 10-year US Treasury yields improve to near 4.74%.
- The precious metal failed to capitalize on soft US Institute of Supply Management (ISM) Services PMI and a weak ADP Employment Change report for September.
- The US ADP reported that employers hired 89K fresh talent in September, almost half August’s reading of 180K and lower than expectations of 153K. This was the lowest labor growth since January 2021.
- Nela Richardson, chief economist at ADP said "We are seeing a steepening decline in jobs this month"." Additionally, we are seeing a steady decline in wages in the past 12 months."
- Loosening labor market conditions is expected to dent expectations for one more interest rate increase by the Federal Reserve in the remainder of 2023, which were propelled by hawkish interest rate guidance from Cleveland Fed Bank President Loretta Mester and Fed Governor Michelle Bowman.
- The US Services PMI for September matched expectations at 53.6 but dropped from the 54.5 reading in August. Being a proxy for the US service sector, which accounts for two-thirds of the US economy, the economic data carries weight and importance.
- New Services PMI Orders dropped significantly to 51.8 against the former release of 57.5, indicating a poor demand outlook.
- On the US factory activity front, the Manufacturing PMI for September improved significantly. A revival in the US manufacturing sector is anticipated. New Factory Orders in August expanded by 1.2% vs. expectations of a 0.3% gain on a monthly basis. In July, orders for US-made goods contracted by 2.1%.
- The US Dollar Index (DXY) faced selling pressure after weak US data on Wednesday but has revived gradually as investors appear to have placed less significance on the September ADP Employment Change. The Fed is scheduled to announce its next monetary policy move in November. Policymakers are expected to give more preference to October’s private payrolls data.
- Meanwhile, investors await the NFP report for September, which will provide more clarity about labor market conditions.
- According to estimates, the US labor force is expected to have witnessed fresh additions of 170K employees – lower than the former release of 187K. The Unemployment Rate is seen declining to 3.7% vs. August’s reading of 3.8%.
- In addition to the jobs data, investors will watch out for the Average Hourly Earnings data. On a monthly basis, labor earnings are forecast to have expanded at a higher pace of 0.3% against a 0.2% jump recorded in August. The annual data is seen unchanged at 4.3%. Higher wages could elevate consumer inflation expectations ahead.
Technical Analysis: Gold price trades in $1,820-1,830 range
Gold price remains inside the woods in a $1,820-1,830 range from late Tuesday as investors await the US NFP report. The precious metal struggles for a direction but the downside bias seems favored as the 50 and 200-day Exponential Moving Averages (EMAs) have delivered a bear cross. A seven-day losing spell has been recorded in the Gold price. Momentum oscillators trade in the oversold zone but more downside cannot be ruled out.
Fed FAQs
What does the Federal Reserve do, how does it impact the US Dollar?
Monetary policy in the US is shaped by the Federal Reserve (Fed). The Fed has two mandates: to achieve price stability and foster full employment. Its primary tool to achieve these goals is by adjusting interest rates.
When prices are rising too quickly and inflation is above the Fed’s 2% target, it raises interest rates, increasing borrowing costs throughout the economy. This results in a stronger US Dollar (USD) as it makes the US a more attractive place for international investors to park their money.
When inflation falls below 2% or the Unemployment Rate is too high, the Fed may lower interest rates to encourage borrowing, which weighs on the Greenback.
How often does the Fed hold monetary policy meetings?
The Federal Reserve (Fed) holds eight policy meetings a year, where the Federal Open Market Committee (FOMC) assesses economic conditions and makes monetary policy decisions.
The FOMC is attended by twelve Fed officials – the seven members of the Board of Governors, the president of the Federal Reserve Bank of New York, and four of the remaining eleven regional Reserve Bank presidents, who serve one-year terms on a rotating basis.
What is Quantitative Easing (QE) and how does it impact USD?
In extreme situations, the Federal Reserve may resort to a policy named Quantitative Easing (QE). QE is the process by which the Fed substantially increases the flow of credit in a stuck financial system.
It is a non-standard policy measure used during crises or when inflation is extremely low. It was the Fed’s weapon of choice during the Great Financial Crisis in 2008. It involves the Fed printing more Dollars and using them to buy high grade bonds from financial institutions. QE usually weakens the US Dollar.
What is Quantitative Tightening (QT) and how does it impact the US Dollar?
Quantitative tightening (QT) is the reverse process of QE, whereby the Federal Reserve stops buying bonds from financial institutions and does not reinvest the principal from the bonds it holds maturing, to purchase new bonds. It is usually positive for the value of the US Dollar.
European Central Bank (ECB) Vice President, Luis de Guindos, said on Thursday, “it's premature to discuss rate cuts.”
Additional quotes
“We are data dependent.”
“The current level of rates will help tame inflation.”
Market reaction
The Euro is little affected by the ECB commentary, as EUR/USD continues to trade close to 1.0500. The pair is up 0.05% on the day.
- GBP/JPY remains lackluster near 180.50 despite the UK’s economic turmoil.
- BoE Bailey sees inflation likely at or below 5% by the year-end.
- Japan Kishida vowed to make a surge of wage rises sustainable to keep inflation above 2%.
The GBP/JPY pair struggles for a direction as the impact of the Bank of Japan’s (BoJ) intervening expectations starts fading. The cross fails to find a decisive move despite a significant decline in the UK’s Constructing PMI data for September.
S&P Global reported the Construction spending at 45.0, much lower than expectations of 49.9 and the former release of 50.8. A figure below the 50.0 threshold is considered as contraction in the construction activities. Households’ spending on construction was expected to remain weak as higher mortgage rates have forced them to postpone their demand for new houses.
The UK’s housing sector is expected to remain vulnerable as mortgage rates are expected to remain high for a longer period. Also, Bank of England (BoE) Governor Andrew Bailey warned about possible inflation shocks ahead. The BoE is expected to keep interest rates in a restrictive territory for a sufficiently longer period as Andrew Bailey opposed changing the UK’s 2% inflation target. On the inflation outlook, Bailey sees inflation likely at or below 5% by the year-end.
On Wednesday, the Pound Sterling remained volatile after the release of the S&P Global Services PMI data. The economic data improved significantly to 49.3 from expectations and the former release of 47.2. The S&P Global reported that the improvement came in the economic data due to sustained easing of inflationary pressures and a few businesses were optimistic as the BoE paused the policy-tightening spell.
On the Japanese Yen front, Japanese Prime Minister Fumio Kishida vowed to make a surge of wage rises sustainable, which is highly required to keep inflation comfortably above the 2% target as current inflationary pressures are broadly contributed by external factors.
The Riksbank and prompted a short-lived SEK rally as it asked the Swedish Debt Office to consider phasing out the debt currency exposure at a slower pace. Economists at ING analyze Krona’s outlook.
Riksbank steps up FX protest
The Debt Office is planning to bring its debt FX exposure to zero by end-2026: quite a long period for a relatively small residual amount, meaning the impact on the Krona should be negligible.
Even the Riksbank seemed to acknowledge the limited direct implications on the exchange rate but lamented how the debt office is selling SEK while the Riksbank is buying SEK.
The first set of data on the RB's hedging operations is due at the end of this week or next, and will tell us whether – as we are inclined to think – the Riksbank is buying more SEK at higher USD/SEK/EUR/SEK.
The Riksbank seems to have lost some grip on the market with FX operations, and both pairs may grind higher in the unstable risk environment.
Lee Sue Ann, Economist at UOB Group, expects the RBI to maintain its monetary conditions unchanged at its event later in the week.
Key Quotes
RBI’s policy priority is containing inflation pressures while mindful of the ongoing pass-through of input costs, and concerns over weak external demand, and protracted geopolitical tensions, which pose risks to the outlook.
Notwithstanding the renewed inflationary pressures, we expect the RBI to keep the key Repo rate at 6.50% in Oct.
In the view of Markets Strategist Quek Ser Leang and Senior FX Strategist Peter Chia at UOB Group, USD/JPY is now expected to maintain a consolidative mood, likely between 145.90 and 150.50.
Key Quotes
24-hour view: Yesterday, we held the view that the outlook for USD is mixed, and it “could trade in a choppy manner between 148.00 and 149.90.” However, it traded in a relatively narrow range between 148.72 and 149.31 before closing little changed at 149.12 (+0.07%). The outlook remains mixed. Today, we expect USD to trade between 148.00 and 149.55.
Next 1-3 weeks: There is not much to add to our update from yesterday (04 Oct, spot at 149.10). As highlighted, the sharp fluctuations two days ago have mudded the outlook. For the time being, USD could trade in a broad range of 145.90/150.50.
Open interest in natural gas futures markets rose for the fifth consecutive session on Wednesday, this time by around 3.7K contracts according to preliminary readings from CME Group. Volume followed suit and added to the weekly uptrend, now by around 109.3K contracts.
Natural Gas: Sustained gains look likely above $3.00
Prices of natural gas surpassed the key $3.00 region to chart new nne-month highs on Wednesday, although the commodity ended up closing the session around the $2.96 zone. The uptick was amidst increasing open interest and volume and leaves the prospects for extra gains intact for the time being. There is scope for a more sustained advance once the $3.00 zone per MMBtu is cleared in a convincing fashion.
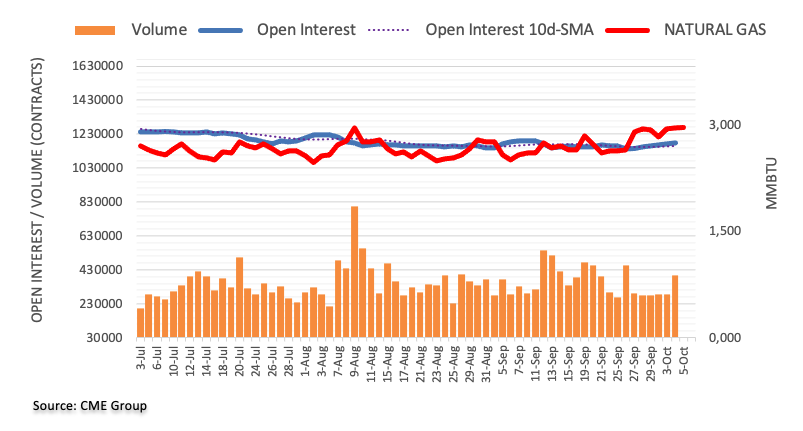
The European Central Bank's (ECB) Slovakian policymaker Peter Kazimir reiterated on Thursday, I “believe that our last rate hike was the last.”
Additional quotes
On Eurozone Sept core inflation confirms our expectations.
We need to be convinced we are at top of rates, based on data available at December and March meetings.
Asked for what would trigger dec hike: this is not a scenario I'd like.
We are on trajectory of decliing inflaiton.
Inflation decline taking somehwat longer.
Market reaction
At the press time, EUR/USD is adding 0.10% on the day to trade at 1.0512, defending the 1.0500 level.
Economists at Société Générale analyze Oil’s outlook after the slide in Brent Crude.
An initial bounce is expected
Brent has experienced a sharp pullback after facing stiff resistance at low of March near $96.50/$97.00. It has breached the lower band of a multi month channel and interestingly it has re-integrated within previous multi month base. $85/84.60, the 50% retracement from June is next support.
An initial bounce is expected. However recent gap at $93.35 must be overcome to affirm a larger up move.
If pullback deepens below $85/$84.60, the 200-DMA and recent pivot low near $81.80 could be next crucial support.
- NZD/USD could further lose ground as US Dollar initiates recovery.
- Improved US Treasury yields could underpin the Greenback.
- RBNZ emphasized the need for interest rates to stay higher for an extended duration.
NZD/USD recovered from the four-week low on Wednesday, extending gains on the second successive day. However, the Kiwi pair trims intraday gains, yet, trades higher around 0.5930 during the European session on Thursday. The uplift in the pair could be attributed to the recent correction in the US Dollar (USD).
US Dollar Index (DXY) struggles to snap the previous session’s losses, trading around 106.80 at the time of writing. Improved US bond yields might have limited the potential of the NZD/USD pair.
The 10-year US Treasury yield recovers from its intraday losses and retraces the losses registered in the previous session, standing at 4.75% by the press time.
Additionally, the market seems to be biased toward the US Federal Reserve's (Fed) hawkish tone regarding interest rate trajectory, which could lend support to the Greenback.
The Reserve Bank of New Zealand (RBNZ) opted to keep the Official Cash Rate (OCR) steady at 5.5% during its October meeting on Wednesday, aligning with market expectations. The committee emphasized the potential necessity for interest rates to stay at a restrictive level for an extended duration, as indicated in the RBNZ statement.
On Thursday, ANZ reported that New Zealand's Commodity Price for September registered a 1.3% increase, contrasting with the 2.9% decline in the previous period. Additionally, on Tuesday, the NZIER Business Confidence for the third quarter dropped 52%, compared to the previous reading of 63% decline.
Market participants will likely watch the upcoming Jobless Claims on Thursday and Nonfarm Payrolls on Friday, seeking further clues on labor market conditions. Favorable figures in these reports could stimulate additional gains for the USD.
EUR/CHF continues to edge lower after September’s spike to 0.97. Economists at ING analyze Franc’s outlook.
SNB will have to get a stronger Swiss Franc via a lower EUR/CHF
The sense that the SNB has ‘got the Swiss Franc’s back’ has helped make it the strongest G10 currency this year. With the Dollar looking like it wants to stay strong over coming months, the SNB will have to get a stronger Swiss Franc via a lower EUR/CHF. That is why we can see it trading back to 0.95 over coming months.
Also helping EUR/CHF lower should be European political developments and the risk that a re-introduction of the Stability and Growth Pact collides with some loose fiscal policies in southern Europe.
- EUR/GBP gains some positive traction on Thursday and snaps a two-day losing streak.
- The technical setup favours bullish traders and supports prospects for additional gains.
- A convincing break below the 0.8600 mark is needed to negate the constructive outlook.
The EUR/GBP cross attracts some dip-buying near the 0.8650-0.8645 region on Thursday and builds on its steady intraday ascent through the first half of the European session. Spot prices touch a fresh daily peak, around the 0.8675-0.8680 zone in the last hour and for now, seem to have snapped a two-day losing streak.
From a technical perspective, oscillators on the daily chart – though have been losing traction – manage to hold in the positive territory and support prospects for a further appreciating move. That said, the recent failure to build on the momentum beyond the 0.8700 mark, which now coincides with the very important 200-day Simple Moving Average (SMA), warrants some caution before placing aggressive bullish bets around the EUR/GBP cross.
Hence, any subsequent move up might continue to confront stiff resistance near the 0.8700-0.8705 region, or a four-month high touched on September 28. A convincing breakthrough will be seen as a fresh trigger for bullish traders and lift the EUR/GBP cross towards the next relevant hurdle near the 0.8735-0.8740 area. The momentum could get extended further towards the 0.8775-0.8780 resistance before spot prices reclaim the 0.8800 round figure.
On the flip side, the 0.8645-0.8640 zone, or the weekly trough touched on Wednesday, might continue to protect the immediate downside. Some follow-through selling should pave the way for a slide towards the 100-day SMA, currently pegged near the 0.8600 mark. The said handle should act as a strong base for the EUR/GBP cross, which if broken decisively will negate any positive outlook and shift the near-term bias in favour of bearish traders.
EUR/GBP daily chart
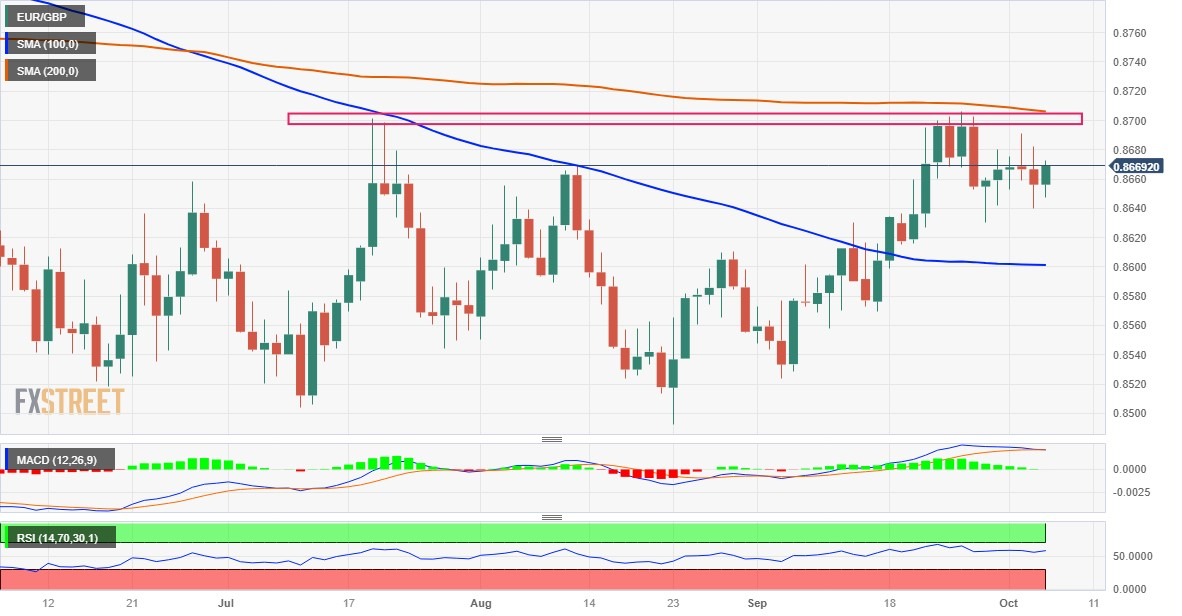
Technical levels to wach
Gold’s decline has extended after the break below June/August lows of $1,885/$1,893. Economists at Société Générale analyze the yellow metal’s technical outlook.
Signals of trend reversal are not yet visible
Gold has recently met downside projections near $1,815 which is also the lower limit of the channel within which down move since May has evolved. A rebound can’t be ruled out however signals of trend reversal are not yet visible; lower band of previous range near $1,885/1,$893 could provide resistance.
In case Gold fails to defend $1,815, the down move is likely to persist towards February low of $1,805 and $1,786/$1,778, the 61.8% retracement from September 2022; this could be an important support zone.
- The Euro extends its weekly recovery against the US Dollar.
- Stocks in Europe open Thursday’s session in a mixed tone.
- EUR/USD clings to daily gains above the 1.0500 barrier.
- The USD Index (DXY) appears under pressure in the sub-107.00 zone.
- The Construction PMI in Germany weakens in September.
- The usual weekly Claims and Fedspeak take centre stage across the ocean.
The Euro (EUR) looks to extend the weekly rebound against the US Dollar (USD), motivating EUR/USD to hover around the area just above the 1.0500 hurdle on Thursday.
In the meantime, the Greenback manages to reverse an initial drop to the 106.50 region when measured by the USD Index (DXY) amidst some loss of momentum in the risk-associated galaxy and the still absence of a clear direction in US yields across different maturities.
On the monetary policy front, investors still anticipate the Federal Reserve (Fed) to raise interest rates by 25 bps before the end of the year. Simultaneously, market speculation about the European Central Bank (ECB) halting policy adjustments continues, despite inflation levels beyond the bank's target and rising worries of a future recession or stagflation in the region.
Data-wise, in the euro region, Construction PMI in Germany receded to 39.3 in September and improved a tad to 43.6 when it comes to the broader euro area. Earlier in the session, Germany’s trade surplus widened to €16.6B in August, while Industrial Production in France contracted at a monthly 0.3% in the same month.
In the US, the usual weekly Initial Jobless Claims are due along with Balance of Trade results and speeches by Cleveland Fed Loretta Mester (2024 voter, haw), Richmond Fed Thomas Barkin (2024 voter, centrist), San Francisco Fed Mary Daly (2024 voter, hawk), and FOMC Governor Michael Barr (permanent voter, centrist).
Daily digest market movers: Euro looks to USD dynamics for direction
- The EUR remains bid above 1.0500 vs. the USD on Thursday.
- US and German yields retreat from multi-year highs.
- Investors expect the Fed to hike rates one more time before year end.
- Markets anticipate that the ECB's tightening effort will come to a halt.
- Speculation of FX intervention in USD/JPY remains high.
Technical Analysis: Euro’s outlook remains negative below the 200-day SMA
EUR/USD seems to have regained composure and looks to consolidate the breakout of the 1.0500 barrier.
The resumption of the selling pressure could force EUR/USD to revisit the 2023 low of 1.0448 (October 3) and challenge test the round level of 1.0400. The breakdown of this level could put a potential test of the weekly lows of 1.0290 (November 30, 2022) and 1.0222 (November 30, 2022) back on the radar.
Further gains could encourage the pair to hit the next up-barrier at 1.0617 (September 29), before reaching the critical 200-day SMA at 1.0824. If the pair breaks beyond this level, it might test the weekly high of 1.0945 (August 30) as well as the psychological barrier of 1.1000. Once the August peak of 1.1064 (August 10) is cleared, spot could confront the weekly top of 1.1149 (July 27) and the 2023 peak of 1.1275 (July 18).
However, it is crucial to remember that as long as the EUR/USD continues below the 200-day SMA, additional bearish pressure is possible.
Euro FAQs
What is the Euro?
The Euro is the currency for the 20 European Union countries that belong to the Eurozone. It is the second most heavily traded currency in the world behind the US Dollar. In 2022, it accounted for 31% of all foreign exchange transactions, with an average daily turnover of over $2.2 trillion a day.
EUR/USD is the most heavily traded currency pair in the world, accounting for an estimated 30% off all transactions, followed by EUR/JPY (4%), EUR/GBP (3%) and EUR/AUD (2%).
What is the ECB and how does it impact the Euro?
The European Central Bank (ECB) in Frankfurt, Germany, is the reserve bank for the Eurozone. The ECB sets interest rates and manages monetary policy.
The ECB’s primary mandate is to maintain price stability, which means either controlling inflation or stimulating growth. Its primary tool is the raising or lowering of interest rates. Relatively high interest rates – or the expectation of higher rates – will usually benefit the Euro and vice versa.
The ECB Governing Council makes monetary policy decisions at meetings held eight times a year. Decisions are made by heads of the Eurozone national banks and six permanent members, including the President of the ECB, Christine Lagarde.
How does inflation data impact the value of the Euro?
Eurozone inflation data, measured by the Harmonized Index of Consumer Prices (HICP), is an important econometric for the Euro. If inflation rises more than expected, especially if above the ECB’s 2% target, it obliges the ECB to raise interest rates to bring it back under control.
Relatively high interest rates compared to its counterparts will usually benefit the Euro, as it makes the region more attractive as a place for global investors to park their money.
How does economic data influence the value of the Euro?
Data releases gauge the health of the economy and can impact on the Euro. Indicators such as GDP, Manufacturing and Services PMIs, employment, and consumer sentiment surveys can all influence the direction of the single currency.
A strong economy is good for the Euro. Not only does it attract more foreign investment but it may encourage the ECB to put up interest rates, which will directly strengthen the Euro. Otherwise, if economic data is weak, the Euro is likely to fall.
Economic data for the four largest economies in the euro area (Germany, France, Italy and Spain) are especially significant, as they account for 75% of the Eurozone’s economy.
How does the Trade Balance impact the Euro?
Another significant data release for the Euro is the Trade Balance. This indicator measures the difference between what a country earns from its exports and what it spends on imports over a given period.
If a country produces highly sought after exports then its currency will gain in value purely from the extra demand created from foreign buyers seeking to purchase these goods. Therefore, a positive net Trade Balance strengthens a currency and vice versa for a negative balance.
- USD/JPY catches fresh bids following an intraday dip to 148.25, albeit lacks follow-through.
- Intervention fears turn out to be the only factor holding back bulls from placing fresh bets.
- The technical setup suggests that the path of least resistance for the pair is to the upside.
The USD/JPY pair attracts some dip-buying following an intraday slide to the 148.25 region on Thursday and climbs to the top end of its daily range during the first half of the European session. Spot prices currently trade around the 149.00 mark, though lack follow-through in the wake of speculations that Japanese authorities will intervene in the FX market to defend the domestic currency.
The initial market reaction to Wednesday's rather unimpressive US macro data, meanwhile, turns out to be short-lived amid firming expectations that the Federal Reserve (Fed) will keep interest rates higher for longer. This, in turn, triggers a fresh leg up in the US Treasury bond yields, which assists the US Dollar (USD) to stall its corrective slide from an 11-month peak and acts as a tailwind for the USD/JPY pair.
From a technical perspective, the intraday decline showed some resilience below the 100-period Simple Moving Average (SMA) on the 4-hour chart. This comes on the back of a solid rebound from the 200-period SMA on the 4-hour chart, around the 147.30 area, or the lowest level since September 14 touched on Tuesday, and supports prospects for a further near-term appreciating move for the USD/JPY pair.
Moreover, oscillators on the daily chart – though have been retreating recently – are still holding comfortably in the positive territory. This, in turn, favours bullish traders and suggests that the path of least resistance for the USD/JPY pair is to the upside. Any subsequent move up, however, might confront some barrier near the 149.60 area, above which bulls might aim back to challenge the 150.00 intervention level.
The latter should act as a key pivotal point for short-term traders, which if cleared decisively will confirm a fresh breakout and pave the way for an extension of the recent well-established uptrend witnessed over the past two months or so. The subsequent move up has the potential to lift the USD/JPY pair towards the 151.00 mark en route to a multi-decade higher, closer to the 152.00 mark touched in October 2022.
On the flip side, the daily swing low, around the 148.25 region, now seems to protect the immediate downside ahead of the 148.00 mark. Failure to defend the said support levels might prompt some technical selling and drag the USD/JPY pair back towards the weekly trough, around the 147.30 region. This is followed by the 147.00 round figure, which if broken will suggest that spot prices have topped out in the near term.
USD/JPY 4-hour chart
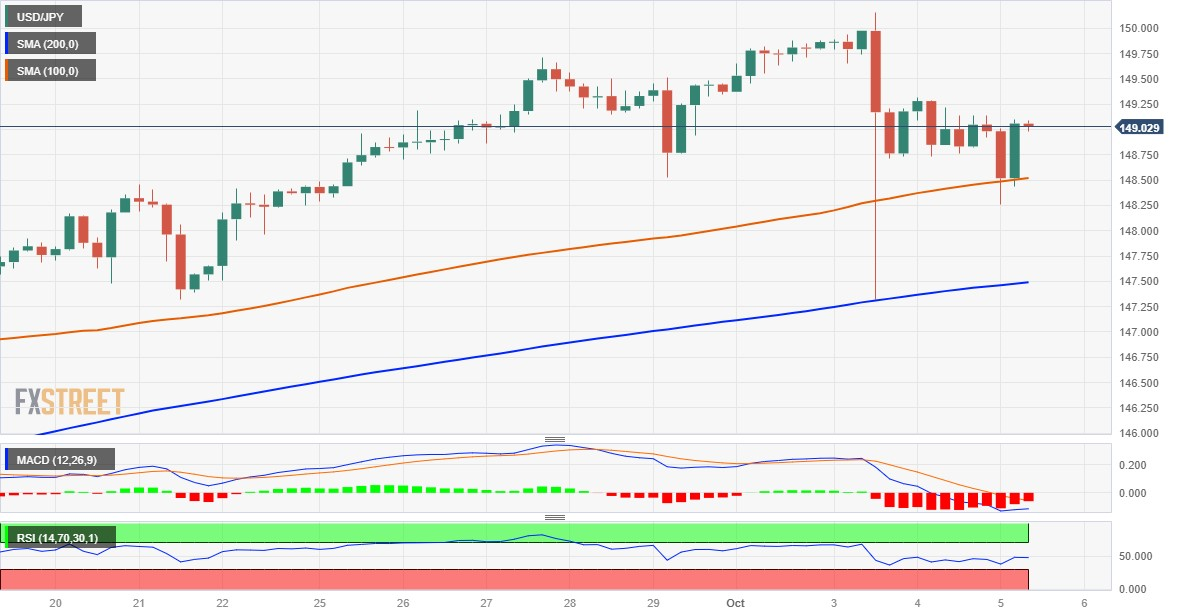
Technical levels to watch
- Crude oil prices lose ground due to the solid performance of the US Dollar.
- Improved US Treasury yields are providing support for the Greenback as it recovers from intraday losses.
- OPEC+ reaffirmed the joint commitment of Saudi Arabia and Russia to maintain their voluntary supply cut, but it failed to boost oil prices.
Western Texas Intermediate (WTI) oil price continues to lose ground for the third consecutive week, trading lower around $83.23 per barrel during the European trading session on Thursday. The drop in Crude oil prices could be attributed to the recent surge in the US Dollar (USD).
US Dollar Index (DXY) recovers its intraday losses, supported by the recovery in US bond yields. The DXY is currently trading around 106.70. Additionally, market turn bias toward the US Federal Reserve's (Fed) hawkish tone regarding interest rate trajectory, which could lend support to the Greenback.
The 10-year US Treasury yield recovers from its intraday losses and retraces the losses registered in the previous session, standing at 4.74% by the press time.
Traders will likely pay close attention to the upcoming Jobless Claims and Nonfarm Payrolls on Friday. Favorable figures in these reports could stimulate additional gains for the USD and increase volatility in the bond market.
On the other side, weekly US crude oil inventories reported by the US Energy Information Administration (EIA) showed a decline of 2.224 million barrels for the week ending September 29, compared to the previous drop of 2.17 million barrels. The market consensus had expected a smaller decline of 0.446 million barrels.
Additionally, API reported a larger decrease of 4.21 million barrels during the same period, swinging from the previous stockpile increase of 1.586M.
At the OPEC Joint Ministerial Monitoring Committee (JMMC) online meeting on Wednesday, the group kept the output policy unchanged. OPEC and its allies reiterated the joint Saudi-Russian vow to continue its voluntary supply cut of at least 1.3M barrels a day from the two nations' daily output through the end of the year.
Kuwait's oil minister Saad Al Barrak mentioned on Wednesday that balancing supply and demand are leading the oil market in a favorable direction, while Deputy Prime Minister of Russia, Alexander Novak also stated that joint supply cuts have helped to balance oil markets.
Here is what you need to know on Thursday, October 5:
Major currency pairs trade in familiar ranges early Thursday following Wednesday's volatile action. The US Dollar Index consolidates its recent losses below 107.00 as investors await August Goods Trade Balance and the weekly Initial Jobless Claims data from the US. Market participants will also pay close attention to comments from Federal Reserve policymakers later in the day.
Disappointing data releases from the US caused the US Dollar (USD) to lose interest mid-week. ADP's monthly report showed that employment in the private sector increased by 89,000 in September, falling short of the market expectation of 153,000 by a wide margin. Additionally, the ISM Services PMI declined to 53.6 from 54.5 in August. Meanwhile, the downward correction seen in US Treasury bond yields further weighed on the USD during the American trading hours. Early Thursday, the 10-year US yield holds steady at around 4.75% and US stock index futures trade modestly lower on the day.
US Dollar price this week
The table below shows the percentage change of US Dollar (USD) against listed major currencies this week. US Dollar was the strongest against the Australian Dollar.
| USD | EUR | GBP | CAD | AUD | JPY | NZD | CHF | |
| USD | 0.49% | 0.44% | 1.29% | 1.42% | -0.35% | 1.04% | 0.18% | |
| EUR | -0.49% | -0.03% | 0.81% | 0.94% | -0.83% | 0.55% | -0.31% | |
| GBP | -0.45% | 0.05% | 0.85% | 0.98% | -0.80% | 0.59% | -0.27% | |
| CAD | -1.30% | -0.83% | -0.82% | 0.14% | -1.67% | -0.26% | -1.12% | |
| AUD | -1.44% | -0.94% | -0.99% | -0.14% | -1.79% | -0.39% | -1.28% | |
| JPY | 0.34% | 0.84% | 0.80% | 1.64% | 1.75% | 1.39% | 0.53% | |
| NZD | -1.04% | -0.55% | -0.59% | 0.26% | 0.39% | -1.39% | -0.86% | |
| CHF | -0.18% | 0.31% | 0.27% | 1.11% | 1.25% | -0.53% | 0.87% |
The heat map shows percentage changes of major currencies against each other. The base currency is picked from the left column, while the quote currency is picked from the top row. For example, if you pick the Euro from the left column and move along the horizontal line to the Japanese Yen, the percentage change displayed in the box will represent EUR (base)/JPY (quote).
The data from Australia showed that Exports rose 4% in August, while Imports remained virtually unchanged. AUD/USD gained traction in the Asian session and climbed toward 0.6400 before retreating to the 0.6350 area by the European morning.
The Joint Ministerial Monitoring Committee (JMMC) of the Organization of the Petroleum Exporting Countries (OPEC) announced on Wednesday that they left the output policy unchanged following their monthly meeting. Crude oil prices turned south and the barrel of West Texas Intermediate (WTI) lost more than 5% on a daily basis to settle below $85. Despite the broad USD weakness, USD/CAD closed in positive territory as the commodity-sensitive Canadian Dollar struggled to find demand. Early Thursday, the pair clings to modest daily gains above 1.3750.
EUR/USD edged higher and close above 1.0500 on Wednesday before going into a consolidation phase on Thursday. Earlier in the day, Germany's Destatis reported earlier in the day that the trade surplus contracted to €16.6 billion in August from €17.7 billion in July.
GBP/USD benefited from improving risk mood and the selling pressure surrounding the USD on Wednesday and ended the day above 1.2100. Early Thursday, the pair fluctuates in a tight channel slightly below 1.2150.
USD/JPY declined sharply in the early Asian session on Thursday but managed to recover back to the 149.00 area.
Gold price closed virtually unchanged on Wednesday as falling US yields helped XAU/USD find demand. In the European morning, the pair moves sideways slightly above $1,820.
In September, the Singapore Dollar weakened against the US Dollar. Economists at MUFG Bank analyze USD/SGD outlook.
SGD to move more in line with US Dollar trend with MAS remaining on hold
We raise our USD/SGD forecasts to 1.3750 in three months and 1.3200 in 12 months.
We see SGD moving more in line with the US Dollar trend with MAS remaining on hold over the forecast horizon, but with the next move tilted slightly towards an easing move given slow global growth.
USD/SGD – Q4 2023 1.3750 Q1 2024 1.3550 Q2 2024 1.3350 Q3 2024 1.3200
NZD/USD needs to clear the 0.5970 level to reduce the risks of further retracements, argue Markets Strategist Quek Ser Leang and Senior FX Strategist Peter Chia at UOB Group.
Key Quotes
24-hour view: We highlighted yesterday that NZD “could dip to 0.5880, but any decline is likely part of a lower trading range of 0.5880/0.5930.” NZD then traded in a slightly lower range than expected (0.5871/0.5922) before closing largely unchanged at 0.5913 (+0.08%). NZD is likely to continue to range trade, even though the underlying tone has firmed a tad, and this suggests a higher range of 0.5895/0.5950.
Next 1-3 weeks: Two days ago (03 Oct, spot at 0.5945), we held the view that NZD “is likely to weaken, but any decline is likely to face strong support at 0.5880.” Yesterday, NZD dipped briefly to a low of 0.5871 and then rebounded. Downward momentum has not improved, but there is a chance for NZD to test September’s low of 0.5860 before the risk of a more sustained and robust rebound increases. However, if NZD breaks above 0.5970 (no change in ‘strong resistance’ level from yesterday), it would indicate that it is not weakening further.
There is a risk that the breather in bonds and the Dollar correction are too reliant on expectations of a jobs data miss, economists at ING report.
Hard to follow a Dollar correction now
Any tentative Dollar correction is not finding too many followers. The swing in rate advantage after the recent bond sell-off makes the Dollar a very hard sell, and cautious trading ahead of US payrolls on Friday shouldn’t help.
DXY may stabilise around 107.00 today, as markets will assess whether jobless claims can continue to surprise on the downside (bearish for bonds, positive for the Dollar), while a number of Federal Reserve speakers are scheduled to deliver remarks. Most speakers are hawks, so expect more support for another hike.
CME Group’s flash data for crude oil futures markets noted traders scaled back their open interest positions by around 2.6K contracts on Wednesday, reversing the previous daily build. On the other hand, volume increased for the second session in a row, now by 105.7K contracts.
WTI: Next on the downside emerges the $78.00 region
Prices of WTI retreated markedly on Wednesday, flirting with the interim 55-day SMA around the $84.00 zone. The sharp downtick was on the back of shrinking open interest and suggests that a sustained decline is not favoured for the time being. on the downside, the next support of note emerges at the August low of $77.64 (August 24).
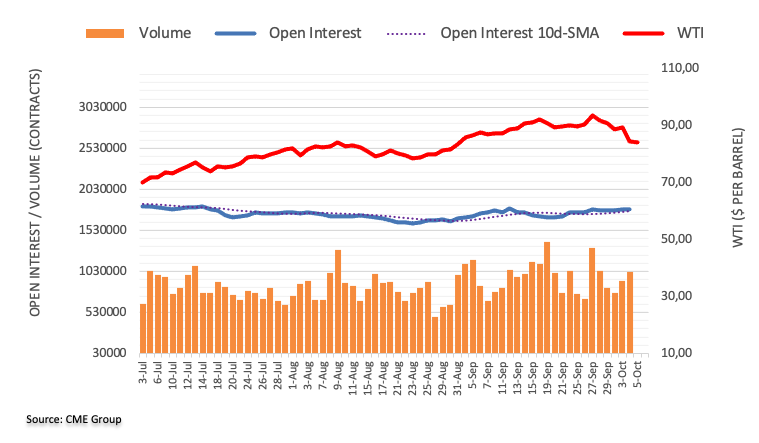
USD/JPY still trades around the 149 level. Economists at Commerzbank analyze the pair’s outlook.
The risk of long USD/JPY positions seemed too high
Given Tuesday's exchange rate move (chart below), why is no one really sure if we've seen an intervention? Well, there had been a lot of speculation in the run-up that the MOF might take action on a break of the 150 level in USD/JPY.
Therefore, it stands to reason that quite a few market participants wanted to sell USD/JPY as soon as this event occurred – because then the risk of long USD/JPY positions seemed too high. If many do this at the same time, a market reaction can occur that looks like an intervention.

Source: Bloomberg
- USD/CHF recovered the intraday losses ahead of US jobs data.
- Economic indicators suggest bullish sentiment regarding the US Dollar.
- The 12-day EMA emerges as key support, followed by the 0.9100 psychological level.
USD/CHF retraces the intraday losses, trading around 0.9170 lined up with the support level at 0.9150 psychological level during the early European session on Thursday, followed by the 12-day Exponential Moving Average (EMA) at 0.9127.
A firm break below the latter could influence the USD/CHF bears to navigate the region around the major level at 0.9100, followed by the 23.6% Fibonacci retracement at 0.9082 level.
The pair receives downward pressure following the extended losses in the US Dollar (USD), which could be attributed to the downbeat US employment data on Wednesday.
In September, the US ISM Services PMI decreased from 54.5 to 53.6, aligning with expectations. The ADP Employment Change for the same month increased by 89,000, falling below the market consensus of 153,000 and marking the lowest level since January 2021.
However, the prevailing upward momentum in the USD/CHF pair indicates a bullish bias, as the 14-day Relative Strength Index (RSI) remains above the 50 level.
On the upside, the immediate barrier is likely at the 0.9200 psychological level, followed by the weekly high at 0.9244 lined up with the 0.9250 major level.
The Moving Average Convergence Divergence (MACD) indicator is signaling strength for bulls of the USD/CHF pair, with the MACD line positioned above the centerline and the signal line. This setup indicates potentially strong momentum in the price movement.
USD/CHF: Daily Chart

- Pound Sterling struggles to extend upside amid multiple headwinds.
- Despite a significant improvement, the UK Services PMI failed to conquer the 50.0 threshold.
- Andrew Bailey remains confident of bringing down inflation to 5% or below by year-end.
The Pound Sterling (GBP) recovers as the appeal for risk-perceived assets improves but struggles to extend the upside. The upside in the GBP/USD pair seems limited as the United Kingdom’s economy is approaching a slowdown due to vulnerable economic activities, potential inflation shocks, and deteriorating demand.
In spite of an improvement in the UK Services PMI, the economic data remains below the 50.0 threshold, suggesting a contraction. The UK economy is failing to absorb the consequences of higher interest rates by the Bank of England (BoE), rising oil prices, and supply chain disruptions due to the Russia-Ukraine war.
Daily Digest Market Movers: Pound Sterling awaits Construction PMI data
- Pound Sterling aims to extend upside toward the round-level resistance of 1.2200 as the US Dollar shifts on the backfoot after the release of the weaker-than-anticipated US ADP Employment Change data.
- A decline in appeal for the US Dollar has improved market sentiment and en-route investment into the risk-perceived assets.
- The GBP/USD pair made a recovery attempt on Wednesday after a better-than-projected UK Services PMI for September.
- S&P Global reported that the Services PMI remained below the 50.0 threshold for the second straight time but outperformed expectations meaningfully.
- The Services PMI landed at 49.3, higher than expectations and the former release of 47.2. S&P Global reported that the improvement came in the economic data due to sustained easing of inflationary pressure. Several businesses were optimistic as the Bank of England paused the policy-tightening spell.
- The data-collecting agency warned that the broader outlook is still sluggish amid higher borrowing costs and a weak order book due to subdued economic conditions. British producers have cut back on new orders and labor due to tepid demand. Rising oil prices and supply chain disruptions could keep the UK economy on the backfoot.
- Meanwhile, BoE Governor Andrew Bailey warned about potential inflation shocks but remained confident of bringing down inflation to 5% or less by year-end. Andrew Bailey opposed changing the UK’s 2% inflation target.
- Earlier, BoE policymaker Katherine Mann also warned that policymakers are facing a “world where inflation shocks are likely to be more frequent” with stronger price growth, meaning interest rates will need to be permanently higher.
- Going forward, investors will focus on the S&P Global Construction PMI data for September, which will be published at 08:30 GMT. As per the estimates, the economic data is foreseen easing to 49.9 against the 50.8 reading from August.
- UK construction spending is expected to decline as households are reluctant to invest in the housing sector due to higher mortgage rates.
- The US Dollar Index (DXY) finds an intermediate cushion near 106.50, but a volatile action is widely anticipated as investors shift focus to the September Nonfarm Payrolls (NFP) report after weak ADP job data.
- ADP reported that fresh additions of private payrolls in September were halved to 89k from the August reading. Investors already anticipated lower hiring at 153k.
- Soft labor market data is expected to fade expectations of one more interest rate hike from the Federal Reserve (Fed) in the remainder of 2023, which were supported by Cleveland Fed Bank President Loretta Mester and Fed Governor Michelle Bowman.
- The US ISM Services PMI matched expectations at 53.6 but remained below the August reading of 54.5. New Orders dropped significantly to 51.8 against the former release of 57.5.
Technical Analysis: Pound Sterling faces volatility contraction near 1.2150
The Pound Sterling demonstrates a volatility squeeze after recovering to near 1.2150. The GBP/USD outlook turns vulnerable as the 50 and 200-day Exponential Moving Averages (EMAs) have delivered a Death Cross, which warrants more downside. A confident downside move could drag the Cable toward the psychological support of 1.2000. Momentum oscillators indicate signs of an oversold situation, but the further downside cannot be ruled out.
BoE FAQs
What does the Bank of England do and how does it impact the Pound?
The Bank of England (BoE) decides monetary policy for the United Kingdom. Its primary goal is to achieve ‘price stability’, or a steady inflation rate of 2%. Its tool for achieving this is via the adjustment of base lending rates. The BoE sets the rate at which it lends to commercial banks and banks lend to each other, determining the level of interest rates in the economy overall. This also impacts the value of the Pound Sterling (GBP).
How does the Bank of England’s monetary policy influence Sterling?
When inflation is above the Bank of England’s target it responds by raising interest rates, making it more expensive for people and businesses to access credit. This is positive for the Pound Sterling because higher interest rates make the UK a more attractive place for global investors to park their money. When inflation falls below target, it is a sign economic growth is slowing, and the BoE will consider lowering interest rates to cheapen credit in the hope businesses will borrow to invest in growth-generating projects – a negative for the Pound Sterling.
What is Quantitative Easing (QE) and how does it affect the Pound?
In extreme situations, the Bank of England can enact a policy called Quantitative Easing (QE). QE is the process by which the BoE substantially increases the flow of credit in a stuck financial system. QE is a last resort policy when lowering interest rates will not achieve the necessary result. The process of QE involves the BoE printing money to buy assets – usually government or AAA-rated corporate bonds – from banks and other financial institutions. QE usually results in a weaker Pound Sterling.
What is Quantitative tightening (QT) and how does it affect the Pound Sterling?
Quantitative tightening (QT) is the reverse of QE, enacted when the economy is strengthening and inflation starts rising. Whilst in QE the Bank of England (BoE) purchases government and corporate bonds from financial institutions to encourage them to lend; in QT, the BoE stops buying more bonds, and stops reinvesting the principal maturing on the bonds it already holds. It is usually positive for the Pound Sterling.
EUR/USD gains traction above the 1.05 level. Economists at ING analyze the pair’s outlook.
The Dollar remains an expensive sell
EUR/USD has rebounded from the 1.0450 lows but may lack enough buyers above the 1.0530/1.0550 area.
The Dollar remains an expensive sell, and there simply isn’t a compelling story in the Eurozone to counter the US exceptionalism narrative.
The ability of EUR/USD to stay attached to 1.0500 is almost entirely linked to the US bond market enjoying two consecutive days of reprieve. That may be possible due to the lack of key US data today outside of jobless claims, but the pair is facing the tangible possibility of another leg lower with US payrolls on Friday.
- NZD/USD holds positive ground around 0.5935 amid the USD weakness.
- US private payrolls for September rose by 89,000 vs.180,000 prior.
- The Reserve Bank of New Zealand (RBNZ) maintained its monetary policy at its October meeting.
- Traders will monitor the weekly US Jobless Claims on Thursday.
The NZD/USD pair attracts some buyers near 0.5935 during the early European session on Thursday. The downbeat US labor data exert some selling pressure on the US Dollar (USD) and lend support to the pair. Meanwhile, the US Dollar Index (DXY) drops to 106.65 after retracing from the 11-month high of 107.34.
According to Automatic Data Processing (ADP) on Thursday, US private payrolls for September rose by 89,000 from 180,000 in the previous reading. This figure came in below the estimation of 153,000 and posted the lowest level since January 2021. Additionally, the US ISM Services PMI fell to 53.6 in September from the previous reading of 54.5, matching the market estimation.
However, market players will take cues from additional labor market data, including the US Nonfarm Payrolls (NFP) on Friday. The US economy is expected to create 170,000 jobs in September. The weaker-than-expected Nonfarm Payrolls data could trigger some sell-off in the Greenback and act as a tailwind for the NZD/USD pair.
On Tuesday, Cleveland Federal Reserve President Loretta Mester stated that she is likely to favor an interest rate hike at the next meeting if the current economic situation holds while mentioning that the Fed is likely at or near peak for interest rate target. Meanwhile, Atlanta Fed President Raphael Bostic said he will be patient and there is an urgency for us to do anything more.
On the Kiwi front, the Reserve Bank of New Zealand (RBNZ) decided to hold the Official Cash Rate (OCR) unchanged at 5.5% at its October meeting on Wednesday, as widely expected. The committee agreed that interest rates may need to remain at a restrictive level for a more sustained period of time, according to the RBNZ statement.
About the data, the National Bank ANZ reported on Thursday that New Zealand’s ANZ Commodity Price for September came in at 1.3% versus a 2.9% drop prior. On Tuesday, the nation’s NZIER Business Confidence for the third quarter (Q3) fell to -52% QoQ versus -63% in the previous reading.
Looking ahead, market participants will keep an eye on the US weekly Jobless Claims due on Thursday. The attention will shift to the highly-anticipated US Nonfarm Payrolls on Friday. This event could trigger the volatility in the market. Traders will take cues from the figure and find the trading opportunities around the NZD/USD pair.
Gold prices continued to inch lower on Wednesday. Strategists at ANZ Bank analyze the yellow metal’s outlook.
Expectations of a tighter monetary policy to sustain for longer raised
Weak ADP job reports lowered market expectations of a November rate hike from 30% to 20% as suggested by Bloomberg. However, Gold selling continued.
Investors responded to increasing market conviction of ‘higher for longer’ interest rates by selling Gold ETF holdings.
See – Gold Price Forecast: XAU/USD could bottom out at just shy of $1,820 – Commerzbank
USD/KRW hit a 10-month high by the end of September. Economists at MUFG Bank analyze the pair’s outlook.
South Korea’s chips exports recovery would give KRW some advanges
We expect KRW to be the best performing Asian currency in Q4, although the degree of its appreciation would still be modest, amid a strong US dollar and high US interest rates.
South Korea’s chips exports recovered a bit from recent trough, the potential continuation of this trend in light of AI investment trend would give KRW some advanges.
USD/KRW – Q4 2023 1,330 Q1 2024 1,320 Q2 2024 1,290 Q3 2024 1,270
- USD/CAD weakens due to weaker employment data on Wednesday.
- The lower US Treasury yields exert pressure on the US Dollar.
- BoC is expected to go for another rate hike by the end of the year.
USD/CAD retreats from a seven-month high, trading lower around 1.3730 during the Asian trading session on Thursday. The pair receives downward pressure following the extended losses in the US Dollar (USD), which could be attributed to the downbeat US employment data on Wednesday.
In September, the US ISM Services PMI decreased from 54.5 to 53.6, aligning with expectations. The ADP Employment Change for the same month increased by 89,000, falling below the market consensus of 153,000 and marking the lowest level since January 2021.
US Dollar Index (DXY) retreats from an 11-month high, propelled by the pullback in US bond yields. The DXY is currently trading lower around 106.50. Nevertheless, market caution regarding the US Federal Reserve's (Fed) interest rate trajectory may lend support to the USD/CAD pair.
The likelihood of the Fed’s higher interest rates for an extended period propelled US yields to multi-year highs before experiencing a rebound. The 10-year US Treasury yield, which peaked at 4.88% on Wednesday, the highest since 2007, stands at 4.71% by the press time.
Traders will likely pay close attention to the upcoming Jobless Claims and Nonfarm Payrolls on Friday. Favorable figures in these reports could stimulate additional gains for the USD and increase volatility in the bond market.
On Canada’s side, S&P Global Manufacturing PMI data revealed a decline from the previous reading of 48.0 to 47.5 in September.
Bank of Canada Deputy Governor Nicolas Vincent said that Canadian businesses, influenced by the pandemic, have implemented larger and more frequent price changes, passing on elevated costs to consumers, which could advance inflation.
Vincent's remarks supported Canadian bond yields, with market sentiment indicating an ongoing expectation for another rate hike from the Bank of Canada (BoC). The potential for one more rate hike this year could offer crucial support to the Canadian Dollar (CAD), as reflected in a 65% probability in money markets.
However, the Loonie faced downward pressure as Crude oil prices followed the downward traction, a key commodity for Canada as a leading oil exporter to the US. Despite the weaker US Dollar (USD), West Texas Intermediate (WTI) Crude Oil struggled to show positive momentum, with the spot trading around $83.50 per barrel at the moment.
Looking ahead, market participants will monitor the release of the Canadian Ivey Purchasing Managers Index (PMI) for September, followed by the job reports on Friday.
FX option expiries for Oct 5 NY cut at 10:00 Eastern Time, via DTCC, can be found below.
- EUR/USD: EUR amounts
- 1.0500 1.3b
- 1.0525 792m
- 1.0575 478m
- 1.0600 546m
- 1.0650 402m
- GBP/USD: GBP amounts
- 1.2100 506m
- USD/JPY: USD amounts
- 147.85 375m
- 148.00 512m
- 148.40 565m
- 149.00 1.1b
- AUD/USD: AUD amounts
- 0.6400 584m
- 0.6425 352m
- 0.6450 744m
- USD/CAD: USD amounts
- 1.3485 352m
- 1.3650 441m
GBP/USD is now expected to trade within the 1.2030-1.2270 range in the next few weeks, according to Markets Strategist Quek Ser Leang and Senior FX Strategist Peter Chia at UOB Group.
Key Quotes
24-hour view: We did not anticipate the sharp swings yesterday as GBP dropped briefly to 1.2039 and then rebounded strongly to a high of 1.2177 (we were expecting it to consolidate). The strong rebound has room to extend, but as upward momentum has not improved much, any advance is unlikely to reach 1.2200 (there is another resistance at 1.2170). Support is at 1.2110, followed by 1.2080.
Next 1-3 weeks: Our latest narrative was from two days ago (03 Oct, spot at 1.2090). We highlighted that “the recent GBP weakness has resumed, likely towards 1.2000.” Yesterday, GBP dropped to 1.2039 and then rebounded strongly to take out our ‘strong resistance’ level of 1.2160. The breach of the ‘strong resistance’ indicates that the downward momentum buildup has faded. The current price movement is likely part of a range-trading phase, probably between 1.2030 and 1.2270.
- EUR/USD gains traction for two straight days amid the USD softness.
- The major pair holds below the 50- and 100-hour EMAs with a non-directional RSI.
- The immediate resistance level for EUR/USD is located at 1.0543; the first support level is seen at 1.0488.
The EUR/USD pair gains momentum during the early European session on Thursday. Market players await the German Trade Balance for August, which is expected to decline to €15B from the previous reading of €15.9B. The major pair currently trades around 1.0525, up 0.20% on the day.
According to the four-hour chart, the EUR/USD pair holds below the 50- and 100-hour Exponential Moving Averages (EMAs) with a downward slope, which means the path of least resistance for the pair is to the downside. However, the Relative Strength Index (RSI) is located in the 40-60 zone, indicating a non-directional movement in the major pair.
That being said, the immediate resistance level for EUR/USD is located near the 50-hour EMA at 1.0543. The additional upside filter will emerge near the upper boundary of the Bollinger Band at 1.0565. Any follow-through buying above the latter will see a rally to 1.0600, representing the confluence of the 100-hour EMA and a psychological round mark. Further north, the cross will challenge the next hurdle at 1.0635 (a low of September 14), followed by 1.0670 (a high of September 22), and finally at a psychological figure at 1.0700.
On the downside, the first support level is seen at a low of September 27 at 1.0488. The next contention to watch is near a low of October 3 at 1.0448. The next downside stop is located at 1.0433 (the lower limit of the Bollinger Band). A decisive break below the latter will see a drop to a round mark at 1.0400.
EUR/USD four-hour chart
-638320821028434544.png)
- The index adds to Wednesday’s pullback and revisits 106.50.
- US yields correct lower from recent peaks.
- Weekly Claims, Balance of Trade, Fedspeak next on tap.
The greenback extends further its ongoing correction from 2023 peaks near 107.30 when gauged by the USD Index (DXY).
USD Index focuses on data and Fed speakers
The index retreats for the second consecutive session and revisits the 106.50 region on the back of further improvement in the risk complex and some profit taking in light of the recent strong gains in the dollar.
In addition, the corrective knee-jerk in US yields across different time frames also contributes to the daily downtick in the index, amidst unchanged speculation of further tightening by the Federal Reserve before the end of the year.
In the US calendar, usual weekly Initial Claims are due seconded by Balance of Trade figures and speeches by Cleveland Fed L. Mester (2024 voter, haw), Richmond Fed T. Barkin (2024 voter, centrist), San Francisco Fed M. Daly (2024 voter, hawk) and FOMC Governor M. Barr (permanent voter, centrist).
What to look for around USD
The dollar’s rally has so far met initial resistance in the 107.30 region, always bolstered by the relentless march north in US yields.
In the meantime, support for the dollar keeps coming from the good health of the US economy, which at the same time appears underpinned by the renewed tighter-for-longer stance narrative from the Federal Reserve.
Key events in the US this week: Initial Jobless Claims, Balance of Trade (Thursday) – Nonfarm Payrolls, Unemployment Rate, Consumer Credit Change (Friday).
Eminent issues on the back boiler: Persevering debate over a soft or hard landing for the US economy. Incipient speculation of rate cuts in early 2024. Geopolitical effervescence vs. Russia and China.
USD Index relevant levels
Now, the index is losing 0.19% at 106.57 and faces the next support at 105.65 (low September 29) ahead of 104.42 (weekly low September 11) and then 103.14 (200-day SMA). On the flip side, a breakout of 107.34 (2023 high October 3) would open the door to 107.99 (weekly high November 21 2022) and finally 110.99 (high November 10 2022).
Considering advanced prints from CME Group for gold futures markets, open interest rose by just 9 contracts on Wednesday following the previous daily pullback. On the other hand, volume shrank by nearly 21K contracts, keeping the choppy activity well in place for yet another session.
Gold: Support emerged around $1815
Gold prices charted an inconclusive session on Wednesday. The move was on the back of a marginal uptick in open interest and shrinking open interest, leaving the outlook unclear for the time being. In the meantime, the recent sharp sell-off in the yellow metal seems to have met contention around $1815 per troy ounce.
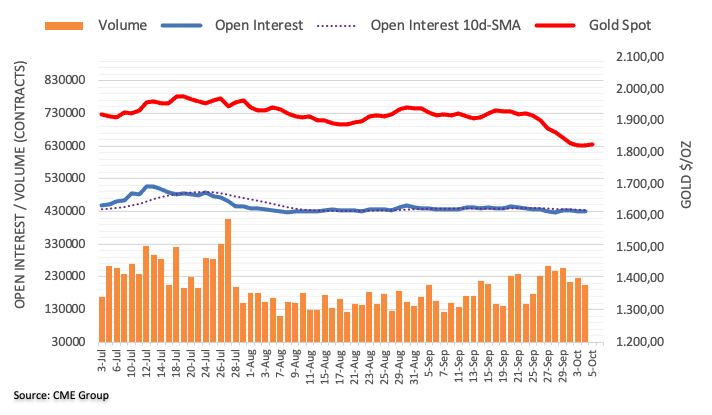
The selling pressure in EUR/USD appears mitigated above 1.0545, note Markets Strategist Quek Ser Leang and Senior FX Strategist Peter Chia at UOB Group.
Key Quotes
24-hour view: Yesterday, we held the view that EUR could test the support at 1.0430 before levelling off. Our view was incorrect. After dipping to 1.0450, EUR rebounded to a high of 1.0532. The price action is likely part of a sideways trading phase. Today, we expect EUR to trade between 1.0470 and 1.0535.
Next 1-3 weeks: Two days ago (03 Oct, spot at 1.0480), we highlighted that EUR “is still in a bearish phase, and it is likely to weaken to 1.0430, potentially below 1.0400.” EUR dropped to 1.0547 and has since rebounded. Downward momentum is beginning to slow, and if EUR breaks above 1.0545 (no change in ‘strong resistance’ level from yesterday), it would mean that 1.0530 is not coming into view this time around.
- EUR/GBP oscillates around the 0.8647-0.8661 region in a narrow trading band on Thursday.
- Eurozone Retail Sales came in at -2.1% YoY in August vs.-1%, worse than expectation.
- UK’s S&P Global/CIPS Composite PMI and Services PMI for September came in above the market consensus.
- Traders will monitor the German Trade Balance for August due later on Thursday.
The EUR/GBP cross consolidates its recent losses around the mid-0.8600s during the Asian session on Thursday. Market players await the German Trade Balance data for August ahead of the European Central Bank (ECB) official’s speech later on Thursday. The cross currently trades near 0.8654, losing 0.02% for the day.
On Wednesday, the Eurozone Retail Sales dropped 2.1% YoY in August from the previous reading of a 1% fall, worse than the expectation of a 0.3% decline. On a monthly basis, the figure fell by 1.2% versus a 0.1% drop prior. Additionally, the Eurozone Producer Price Index (PPI) declined by 0.6%, matching the market expectation.
Markets expect the European Central Bank (ECB) to keep interest rates unchanged in the next meeting. On Wednesday, ECB Governing Council member Mario Centeno said that inflation in the Eurozone declined faster than it was rising and that the central bank may anticipate the rate cycle to be finished by now, while ECB Vice President Luis de Guindos remarked that the ECB would continue to take a data-driven approach.
On the other hand, the stronger UK economic data lifts the British Pound (GBP) against the Euro. Both the UK’s S&P Global/CIPS Composite PMI and Services PMI for September came in above the market consensus but remained below 50 in contraction territory.
Looking ahead, market players will focus on the German Trade Balance for August ahead of the ECB Philip Lane’s speech. On Friday, the UK’s Halifax House Prices data and German Factory Orders will be released. These figures could give a clear direction to the EUR/GBP cross.
- Silver attracts fresh buyers on Thursday, albeit remains confined in a three-day-old trading range.
- The recent breakdown below the $22.30-20 strong horizontal support still favours bearish traders.
- Any subsequent move up might still be seen as a selling opportunity and is likely to remain capped.
Silver regains positive traction during the Asian session on Thursday and builds on the overnight bounce from the $20.70-$20.65 area, or its lowest level since March 13. The white metal currently trades around the $21.20 region, up nearly 1% for the day, though remains confined in a range held over the past three days.
From a technical perspective, the oversold Relative Strength Index (RSI) on the daily chart is seen as a key factor prompting some short-covering around the XAG/USD. That said, last week's breakdown through the $23.30-$23.20 horizontal support supports prospects for an extension of the recent downtrend. Moreover, the range-bound price action might still be categorized as a bearish consolidation phase, against the backdrop of the recent sharp decline from the very important 200-day Simple Moving Average (SMA).
Hence, any subsequent move up might still be seen as a selling opportunity near the $21.40 region. A sustained strength beyond, however, might trigger a short-covering rally and allow the XAG/USD to aim back towards reclaiming the $22.00 round-figure mark. Any subsequent move up is more likely to remain capped near the $22.20-$22.30 strong horizontal support breakpoint, now turned resistance. The latter should act as a pivotal point, which if cleared might shift the near-term bias in favour of bullish traders.
On the flip side, the $21.00 round figure now seems to protect the immediate downside, below which the XAG/USD could slide back to the $20.70-$20.65 zone, or a nearly seven-month low touched on Tuesday. The downward trajectory could get extended further towards challenging the YTD trough – levels just below the $20.00 psychological mark set in March.
Silver daily chart
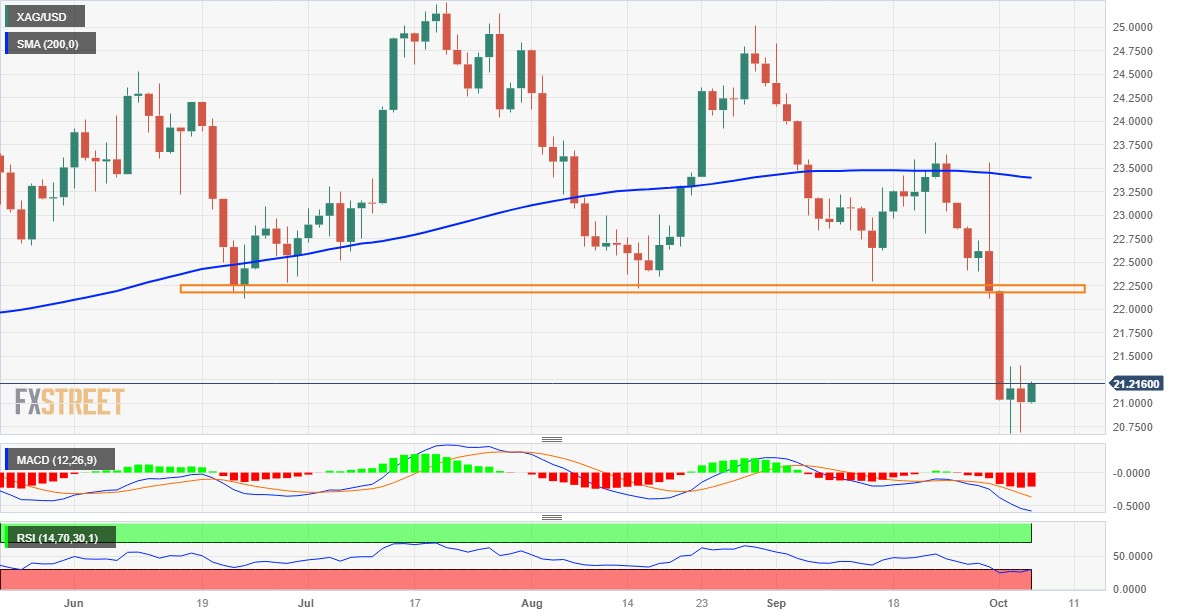
Technical levels to watch
- GBP/USD trades sideways around 1.2160 amid the USD softness.
- The pair holds below the 50- and 100-hour EMAs; RSI is located above 50 in the bullish territory.
- The key resistance level will emerge at the 1.2200-1.2210 zone; the initial support level is located at 1.2110.
The GBP/USD pair remains flat above the mid-1.2100s during the Asian session on Thursday. In the absence of the top-tier economic data from the UK docket, the major pair remains at the mercy of the US Dollar (USD) price dynamics. GBP/USD currently trades near 1.2160, gaining 0.21% on the day.
That said, the rebound of the pair is supported by the weaker US Dollar (USD) following the softer US labor market data. Automatic Data Processing (ADP) reported on Thursday that the US private payrolls for September rose by 89,000 from the previous reading of 180,000, below the market expectation of 153,000. This figure posted the lowest level since January 2021.
Technically, GBP/USD holds below the 50- and 100-hour Exponential Moving Averages (EMAs) with a downward slope on the four-hour chart, which means further downside looks favorable. Furthermore, the Relative Strength Index (RSI) holds above 50 in the bullish territory, indicating that buyers are likely to retain control soon.
The critical resistance level for GBP/USD will emerge near the upper boundary of the Bollinger Band and a psychological round figure at the 1.2200-1.2210 region. The additional upside filter to watch is near the 100-hour EMA at 1.2257. The next barrier for the pair is seen at 1.2270 (a high of September 29). Further north, a high of September at 1.2324 will be the next stop.
On the other hand, the initial support level is located at 1.2110 (a low of September 27). The next contention level will emerge near a low of October 3, en route to the lower limit of the Bollinger Band at 1.2028. Any decisive follow-through selling below will see a drop to 1.1965 (a low of February 16).
GBP/USD four-hour chart
-638320762123992555.png)
- Gold price recovers from a multi-month low and is supported by a combination of factors.
- Reduced bets for more Fed rate hikes in 2023 drag the US bond yields and the USD lower.
- The upside seems limited as traders might prefer to wait for the US NFP report on Friday.
Gold price (XAU/USD) gains some positive traction during the Asian session on Thursday and for now, seems to have snapped an eight-day losing streak. The US Treasury bond yields and the US Dollar (USD) pullback from the recent highs as investors now seek more clarity about the Federal Reserve's (Fed) next policy move, which, in turn, is seen lending support to the metal. A report published by Automatic Data Processing (ADP) on Wednesday shows signs of a cooling labor market in the United States (US). Adding to this, a survey from the Institute for Supply Management (ISM) indicated a moderation in the US services sector, giving the Fed some incentive to stop raising interest rates. This triggers a corrective decline in the US bond yields and prompts traders to lighten their USD bullish bets.
Any meaningful recovery for the Gold price, from a near seven-month low touched on Tuesday, still seems elusive. The US macro data is still consistent with expectations for solid economic growth in the third quarter. Moreover, the recent comments by several Fed officials backed the case for further policy tightening to bring inflation back to the 2% target. This keeps the door open for at least one more Fed rate hike in 2023, which, in turn, should act as a tailwind for the US bond yields and help limit the USD corrective decline. Hence, it will be prudent to wait for strong follow-through buying before confirming that the XAU/USD has formed a near-term bottom and positioning for further gains.
Traders might also prefer to wait on the sidelines ahead of the release of the closely-watched US monthly employment details on Friday. The popularly known NFP report will play a key role in influencing expectations about the Fed's future rate-hike path, which, in turn, will drive the USD demand in the near term and provide a fresh directional impetus to the Gold price. Heading into the key data risk, the US Weekly Initial Jobless Claims data will be examined for short-term opportunities later during the early North American session this Thursday.
Daily Digest Market Movers: Gold price draws support from retreating US bond yields, US Dollar
- Gold price attempts a recovery from its lowest level since March touched on Tuesday as US bond yields and the US Dollar pulled back from recent highs.
- The benchmark 10-year US Treasury yield retreats from its 16-year top and drags the US Dollar away from its highest level since November 2022 touched on Tuesday.
- The US ADP report showed that private-sector employers added 89K jobs in September as compared to the previous month's upwardly revised reading of 180K.
- The US ISM Services PMI declined from 54.5 to 53.6 in September and forced investors to trim their bets for one more Fed rate hike move by the end of this year.
- The Fed is still expected to stick to its hawkish stance and keep interest rates higher for longer, which should keep a lid on any meaningful upside for the XAU/USD.
- The US NFP report will now be looked upon for cues about the Fed's future rate-hike path and should help determine the next leg of a directional move for the metal.
Technical Analysis: Gold price could attract fresh sellers at higher levels
The uptick on Thursday might still be categorized as a technical bounce from oversold conditions and runs the risk of fizzling out rather quickly. Hence, any subsequent move up is likely to confront stiff resistance near the $1,830-1,832 horizontal zone. A sustained strength beyond, however, might trigger a short-covering rally and lift the Gold price to the $1,850 resistance en route to the $1,858-1,860 barrier. On the flip side, the $1,815, or a multi-month low seems to have emerged as an immediate strong support. This is followed by the $1,800 round-figure mark, which if broken decisively will expose the next relevant support near the $1,770-1,760 region.
US Dollar price today
The table below shows the percentage change of US Dollar (USD) against listed major currencies today. US Dollar was the strongest against the Euro.
| USD | EUR | GBP | CAD | AUD | JPY | NZD | CHF | |
| USD | -0.17% | -0.20% | -0.24% | -0.69% | -0.30% | -0.48% | -0.32% | |
| EUR | 0.17% | -0.02% | -0.06% | -0.52% | -0.13% | -0.31% | -0.14% | |
| GBP | 0.20% | 0.02% | -0.05% | -0.51% | -0.11% | -0.29% | -0.13% | |
| CAD | 0.24% | 0.06% | 0.05% | -0.45% | -0.06% | -0.25% | -0.08% | |
| AUD | 0.69% | 0.52% | 0.50% | 0.45% | 0.39% | 0.22% | 0.38% | |
| JPY | 0.30% | 0.13% | 0.13% | 0.05% | -0.36% | -0.18% | -0.02% | |
| NZD | 0.46% | 0.30% | 0.29% | 0.24% | -0.22% | 0.18% | 0.16% | |
| CHF | 0.32% | 0.15% | 0.13% | 0.08% | -0.38% | 0.02% | -0.16% |
The heat map shows percentage changes of major currencies against each other. The base currency is picked from the left column, while the quote currency is picked from the top row. For example, if you pick the Euro from the left column and move along the horizontal line to the Japanese Yen, the percentage change displayed in the box will represent EUR (base)/JPY (quote).
- USD/MXN has retraced the intraday gains due to a decline in US Bond yields.
- Banxico is expected to maintain its current interest rate level, following the economic resilience and the robust labor market.
- The pullback in US Dollar could be attributed to weaker employment data on Wednesday.
USD/MXN struggles to retrace the recent losses, trading around 17.9410 during the Asian trading session on Thursday. The pair has almost trimmed the intraday gains amid the correction in the US Dollar (USD), following the downbeat US employment data on Wednesday.
US ISM Services PMI declined from 54.5 to 53.6 in September, in line with expectations. The ADP Employment Change for September rose by 89,000, falling short of the market consensus of 153,000 and marking the lowest level since January 2021.
However, the market caution regarding the interest rate trajectory of the US Federal Reserve (Fed) could provide support for the USD/MXN pair. The US Dollar Index (DXY) pulls back from an 11-month high due to the pullback in US bond yields. The DXY trades lower around 106.50 at the time of writing.
However, the initial bond sell-off pushed US yields to levels not witnessed in years, followed by a rebound. The 10-year US Treasury yield has corrected from 4.88%, a level reached on Wednesday, which was the highest since 2007. Investors will closely monitor the bond market, recognizing its pivotal role in driving financial markets.
Traders are likely on the lookout for the upcoming Jobless Claims and Nonfarm Payrolls on Friday. Positive figures could spur further USD gains and elevate volatility in the bond market.
On the Mexican side, the upgraded economic forecasts from the International Monetary Fund (IMF) reflect the strength in various sectors of Mexico's economy, including consumption, services, and automotive production. The revised growth projections, particularly the increase from 2.6% to 3.2% for 2023, indicate optimism about Mexico's economic performance.
Bank of Mexico’s (Banxico) decision to maintain the benchmark interest rate at 11.25% suggests a commitment to its current monetary policy stance. Additionally, the revision of inflation projections from 3.5% to 3.87% for 2024 indicates concerns about potential inflationary pressures, surpassing the central bank's target range of 3%.
Banxico's decision to emphasize Mexico's economic resilience and the robust labor market as factors supporting the current interest rate level indicates a cautious approach to monetary policy. While the risk-on sentiment temporarily halted the depreciation of the Mexican Peso, the overall bias remains bearish.
Investors will likely watch Mexican Consumer Confidence for the month of September, which could provide further cues on country’s economic overview.
- USD/INR holds negative ground around 83.20 amid the USD softness.
- The Reserve Bank of India (RBI) is likely to maintain interest rates for the fourth consecutive time at its October meeting.
- US private payrolls for September rose by 89,000 from the previous reading of 180,000, worse than expected.
- Traders will closely watch the RBI rate decision, US Nonfarm Payrolls on Friday.
USD/INR loses traction around 83.20 during the Asian session on Thursday. The weaker US Dollar (USD) following the downbeat labor market data on Wednesday triggers some follow-through selling to the pair. Market participants await the Reserve Bank of India (RBI) rate decision on Friday for fresh impetus.
RBI will announce its monetary policy on Friday, which is likely to maintain a status quo on interest rates for the fourth consecutive time. The benchmark repo rate was raised to 6.5% in February and remained unchanged since then due to the higher retail inflation and global factors, particularly high crude oil prices.
According to the Automatic Data Processing (ADP) reported on Thursday, the US private payrolls for September increased by 89,000 from the previous reading of 180,000, below the market expectation of 153,000. This figure posted the lowest level since January 2021.
Additionally, the US ISM Services PMI dropped to 53.6 in September versus 54.5 prior, matching the market estimation. The softer labor US data exerts some selling pressure on the US dollar and acts as a headwind for the USD/INR pair.
Market players will take cues from US weekly Jobless Claims due on Thursday ahead of the highly-anticipated US Nonfarm Payrolls on Friday. The US economy is expected to create 170,000 jobs in September. These events might trigger the volatility in the market and give a clear direction to the USD/INR pair.
- WTI prices remain on the defensive near $83.50 on Thursday.
- OPEC and its allies maintained the output policy unchanged through the end of 2023.
- The higher-for-longer US rate narrative weighs on the WTI prices.
- Oil traders await the US Nonfarm Payrolls on Friday for fresh impetus.
Western Texas Intermediate (WTI), the US crude oil benchmark, is trading around $83.50 so far on Thursday. WTI trades in negative territory for the third consecutive week and hits the lowest level in two months as investors are concerned about the oil demand outlook.
According to the US Energy Information Administration (EIA) on Wednesday, the weekly US crude oil inventories fell 2.224M barrels for the week ending September 29 from the previous reading of 2.17M barrels drop. The market consensus expected a 0.446 million-barrel decline. During the same period, API reported that crude oil stockpiles declined by 4.21M barrels compared to an increase of 1.586M in the previous week.
At the OPEC Joint Ministerial Monitoring Committee (JMMC) online meeting on Wednesday, the group maintained the output policy unchanged. OPEC and its allies reiterated the joint Saudi-Russian vow to continue its voluntary supply cut of at least 1.3M barrels a day from the two nations' daily output through the end of the year.
Kuwait's oil minister Saad Al Barrak stated on Wednesday that oil markets are heading in the right way by balancing supply and demand, while Deputy Prime Minister Alexander Novak also said joint supply cuts by Russia and Saudi Arabia have helped to balance oil markets.
Apart from this, oil traders turn cautious amid the higher-for-longer US rate narrative. The Federal Reserve (Fed) is likely to raise interest rates one more time this year. This, in turn, exerts some selling pressure on WTI prices. It's worth noting that higher interest rates raise borrowing costs, which can slow the economy and diminish oil demand.
Oil traders will monitor the weekly Jobless Claims report due on Thursday. The attention will shift to the US Nonfarm Payrolls on Friday. The US economy is expected to create 170,000 jobs in September. These events could significantly impact the USD-denominated WTI price. Oil traders will take cues from the data and find trading opportunities around the WTI prices.
- USD/JPY meets with a fresh supply on Thursday, albeit lacks follow-through.
- A combination of factors boosts the JPY and exerts pressure on the major.
- Reduced bets for more Fed rate hikes drag the USD away from the YTD top.
The USD/JPY pair comes under some renewed selling pressure following the previous day's modest uptick and drops closer to the 148.00 mark during the Asian session on Thursday. This marks the second day of a negative move in the previous three, though spot prices manage to recover a few pips in the last hour and hold above the lowest level since September 14 touched on Tuesday.
The market is attributing the fall in the USD/JPY pair to Gotobi, which refers to the practice in Japan of making certain payments on specific days of the month that end in a "5" or "0" (like the 5th, 10th, 15th, 20th, 25th, and 30th). Furthermore, speculation that Japanese authorities may have intervened in the FX market, especially after the Japanese Yen (JPY) weakened below the 150.00 psychological mark against its American counterpart earlier this week, prompt some long-unwinding.
The US Dollar (USD), on the other hand, extends the overnight pullback from a nearly 11-month top touched on Tuesday and turns out to be another factor exerting downward pressure on the USD/JPY pair. The disappointing release of the US ADP report on Wednesday, along with a moderation in the US services sector, gives the Federal Reserve (Fed) some incentive to stop raising interest rates. This leads to a further decline in the US Treasury bond yields and undermines the USD.
That said, the recent comments by several Fed officials backed the case for further policy tightening to bring inflation back to the 2% target. Moreover, the markets have been pricing in the possibility of at least one more lift-off by the end of this year and seem convinced that the Fed will keep rates higher for longer. This should act as a tailwind for the US bond yields and the Greenback, which, in turn, warrants some caution before placing aggressive bearish bets around the USD/JPY pair.
Investors might also prefer to wait on the sidelines ahead of the release of the closely-watched US monthly employment details, popularly known as the NFP report on Friday. In the meantime, traders on Thursday will take cues from the release of the usual Weekly Initial Jobless Claims data from the US. Apart from this, the US bond yields might influence the USD price dynamics and produce short-term trading opportunities around the USD/JPY pair.
Technical levels to watch
- EUR/USD recovers on the correction in the Greenback.
- ECB is expected to hold interest rates in the upcoming policy meeting.
- US Dollar continues to lose due to a pullback in US Bond yields.
EUR/USD continues on the gains registered in the previous session, trading higher around 1.0520 during the Asian trading session on Thursday. The pair encountered challenges amid market caution regarding the interest rate trajectory of the US Federal Reserve (Fed).
Furthermore, the upbeat Eurozone’s HCOB Purchase Manufacturing Index (PMI) on Wednesday might provide support for the Euro. The report revealed that the Composite PMI for September improved from 47.1 to 47.2, which was expected to remain consistent.
German Composite PMI showed a reading of 46.4, which was 46.2 prior. Services PMI improved to 50.3, exceeding the market consensus of 49.8. However, Retail Sales (YoY) fell 2.1%, exceeding the expected 1.2% decline.
European Central Bank (ECB) is expected to keep interest rates unchanged at 4.50% in the upcoming meeting later in the month. On Wednesday, ECB Governing Council member Mario Centeno noted that inflation in the Euro area is decreasing faster than its earlier ascent, indicating that the rate cycle may have concluded under current conditions.
Additionally, ECB Vice President Luis de Guindos emphasized the bank's commitment to a data-dependent approach.
The US Dollar Index (DXY) pulls back from an 11-month high after weaker US employment data on Wednesday, which might lower US Treasury yields. The DXY beats lower around 106.60 at the time of writing.
However, the initial bond sell-off pushed US yields to levels not witnessed in years, followed by a rebound. The 10-year US Treasury yield has corrected from 4.88%, reached on Wednesday, the highest since 2007. Investors will closely monitor the bond market, recognizing its pivotal role in driving financial markets.
US ISM Services PMI declined from 54.5 to 53.6 in September, in line with expectations. The ADP Employment Change for September rose by 89,000, falling short of the market consensus of 153,000 and marking the lowest level since January 2021.
Traders are likely on the lookout for the upcoming Jobless Claims and Nonfarm Payrolls on Friday. Positive figures could spur further USD gains and elevate volatility in the bond market.
German Trade Balance will also be eyed on Thursday, which is expected to decline from €15.9B to €15B for the month of August.
| Raw materials | Closed | Change, % |
|---|---|---|
| Silver | 20.988 | -0.91 |
| Gold | 1820.846 | -0.16 |
| Palladium | 1166.91 | -0.15 |
- Gold price halts a losing streak due to correction in the US Dollar.
- Greenback extends losses after weaker-than-expected US employment data.
- Higher US Treasury yields beat the non-yielding assets like Gold.
Gold price snaps the losing streak that began on September 25, trading around $1,830 per troy ounce during the early Asian trading session on Thursday. However, the prices of Gold could face challenges due to market caution regarding the US Federal Reserve's (Fed) interest rate trajectory.
The market sentiment leans towards lower year-end forecasts for spot Gold prices, driven by still-high expectations of higher-for-longer rates from the US Federal Reserve (Fed).
The US Dollar Index (DXY) pulls back from an 11-month high after weaker US employment data on Wednesday, which might lower US Treasury yields. The DXY beats lower around 106.60 at the time of writing.
However, the initial bond sell-off pushed US yields to levels not witnessed in years, followed by a rebound. The 10-year US Treasury yield has corrected from 4.88%, reached on Wednesday, the highest since 2007. Investors will closely monitor the bond market, recognizing its pivotal role in driving financial markets.
US ISM Services PMI declined from 54.5 to 53.6 in September, in line with expectations. The ADP Employment Change for September rose by 89,000, falling short of the market consensus of 153,000 and marking the lowest level since January 2021.
Gold Traders are likely on the lookout for the upcoming Jobless Claims and Nonfarm Payrolls on Friday. Positive figures could spur further USD gains and elevate volatility in the bond market.
- The US Dollar drifts lower for the second straight day and is pressured by retreating US bond yields.
- Wednesday US macro data forced investors to trim bets for more aggressive tightening by the Fed.
- The markets are still pricing in at least one more rate hike in 2023, which should limit the USD slide.
The US Dollar Index (DXY), which tracks the Greenback against a basket of currencies, trades with a negative bias for the second straight day and languishes near the overnight swing low during the Asian session on Thursday. The index, however, manages to preserve some of its weekly gains to a nearly 11-month top touched on Tuesday as traders look for fresh cues about the Federal Reserve's (Fed) next policy move.
The US ADP report released on Wednesday showed that private-sector employers added 89K jobs in September, missing expectations and marking a sizeable drop from August's upwardly revised reading of 180K. Adding to this, the US ISM Services PMI declined from 54.5 to 53.6 in September, giving the Fed some incentive to stop raising interest rates. This leads to a further decline in the US Treasury bond yields and prompts some follow-through USD profit-taking,
The recent comments by several Fed officials, meanwhile, backed the case for further policy tightening to bring inflation back to the 2% target. This comes on the back of the Fed's hawkish outlook and higher-for-longer interest rates narrative. Moreover, the markets are still pricing in the possibility of at least one more lift-off by the end of this year. This, in turn, should limit any further decline in the US bond yields and act as a tailwind for the USD, warranting caution for bearish traders.
Investors might also prefer to wait on the sidelines ahead of the closely-watched US monthly jobs data on Friday. The popularly known NFP report will play a key role in influencing market expectations about the Fed's future rate-hike path and determine the near-term trajectory for the USD. In the meantime, Thursday's release of the usual Initial Weekly Jobless Claims data from the US, along with the US bond yields, should provide some impetus later during the early North American session.
Technical levels to watch
- USD/CHF extends its retracement slide from a multi-month low for the second straight day.
- Sliding US bond yields prompt some follow-through USD profit-taking and exert pressure.
- Hawkish Fed expectations could help limit the USD losses and warrant caution for bears.
The USD/CHF pair drifts lower for the second successive day on Thursday and moves further away from over a six-month top, around the 0.9245 region touched earlier this week. The steady descent drags spot prices to a multi-day low, below mid-0.9100s during the Asian session and is sponsored by a modest US Dollar (USD) downtick.
The USD Index (DXY), which tracks the Greenback against a basket of currencies, extends the overnight pullback from a nearly 11-month top touched on Tuesday and is weighed down by reduced bets for another interest rate hike by the Federal Reserve (Fed) in 2023. The US ADP report released on Wednesday showed that private-sector employers added 89K jobs in September, missing expectations and marking a sizeable drop from August's upwardly revised reading of 180K.
Adding to this, the US ISM Services PMI declined from 54.5 to 53.6 in September, giving the Fed some incentive to stop raising interest rates. This is reinforced by the ongoing retracement slide in the US Treasury bond yields and prompts some follow-through USD profit-taking, which, in turn, is seen exerting some downward pressure on the USD/CHF pair. Investors, however, still seem convinced that the Fed will stick to its hawkish stance and keep interest rates higher for longer.
The hawkish outlook could act as a tailwind for the US bond yields and help limit any meaningful USD corrective decline. This, along with signs of stability in the equity markets, which tends to undermine the safe-haven Swiss Franc (CHF), warrants some caution before placing aggressive bearish bets around the USD/CHF pair. Traders might also prefer to wait on the sidelines ahead of the closely-watched US monthly jobs data – popularly known as the NFP report on Friday.
In the meantime, Thursday's release of the usual Initial Weekly Jobless Claims data from the US, along with the US bond yields and the broader market risk sentiment, will be looked upon for some impetus later during the early North American session. Nevertheless, the fundamental backdrop makes it prudent to wait for strong follow-through selling in order to confirm that the USD/CHF pair has topped out in the near term and positioning for any meaningful depreciating move.
Technical levels to watch
- Australian Dollar receives upward support after witnessing solid growth in the country’s exports.
- Australia's Trade Balance reached 9,640 million, surpassing market expectations of 8,725 million.
- US Dollar pulls back after the weaker employment data on Wednesday.
The Australian Dollar (AUD) exhibits positive momentum, striving to build on the gains from the previous session. The Aussie pair received upward support due to the correction in US Dollar (USD), following the decline in US Treasury yields.
Australia’s Bureau of Statistics revealed that Trade Balance data improved for the month of August, reflecting solid growth in Australian exports, which could underpin the Australian Dollar (AUD).
However, the AUD/USD pair could face challenges due to market caution regarding the US Federal Reserve's (Fed) interest rate trajectory, which increases the pressure on the AUD/USD pair. Moreover, the dovish stance taken by the Reserve Bank of Australia (RBA) in its policy decisions adds to the downward pressure on the Australian Dollar.
The US Dollar Index (DXY) corrects from an 11-month high after a downbeat US employment data on Wednesday, coupled with a pullback in the US Treasury yields. However, the initial bond sell-off pushed US yields to levels not witnessed in years, followed by a rebound. Investors will closely monitor the bond market, recognizing its pivotal role in driving financial markets.
Daily Digest Market Movers: Australian Dollar recovers due to correction in US Dollar amid Aussie Trade Balance improves
- Australia's Trade Balance (MoM) showed improvement in August, reaching 9,640 million, surpassing market expectations of 8,725 million. July's reading stood at 8,039 million.
- RBA opted to maintain the status quo, leaving the current interest rate unchanged at 4.10% in the recent policy meeting on Tuesday.
- Australia’s central bank could attempt a rate hike, with expectations pointing toward a peak of 4.35% by the end of the year. This projection aligns with the persistent elevation of inflation above the target.
- Michele Bullock, the newly appointed governor of the RBA, in her inaugural monetary policy statement following the interest rate decision, emphasized the need for additional tightening of monetary policy.
- Bullock noted that recent data align with the return of inflation to the target range. While inflation in Australia has peaked, it remains elevated and is expected to persist for a while.
- US ISM Services PMI declined from 54.5 to 53.6 in September, in line with expectations. The ADP Employment Change for September rose by 89,000, falling short of the market consensus of 153,000 and marking the lowest level since January 2021.
- The 10-year US Treasury yield has corrected from 4.88%, a level reached on Wednesday, which was the highest since 2007.
- Traders await the upcoming Jobless Claims and the Nonfarm Payrolls on Friday. Upbeat numbers could trigger more USD gains and increase volatility in the bond market.
Technical Analysis: Australian Dollar trades above 0.6350, nine-day EMA emerges as the immediate barrier
Australian Dollar trades around the major level at 0.6350 on Thursday. The nine-day Exponential Moving Average (EMA) at 0.6368 appears to be a key barrier, following the region around 0.6400 psychological level. A firm break above the latter could open the doors for the pair to explore levels around the 23.6% Fibonacci retracement at 0.6428 level. On the downside, the major level at 0.6300 emerges as the immediate support, followed by November's low at 0.6272.
AUD/USD: Daily Chart
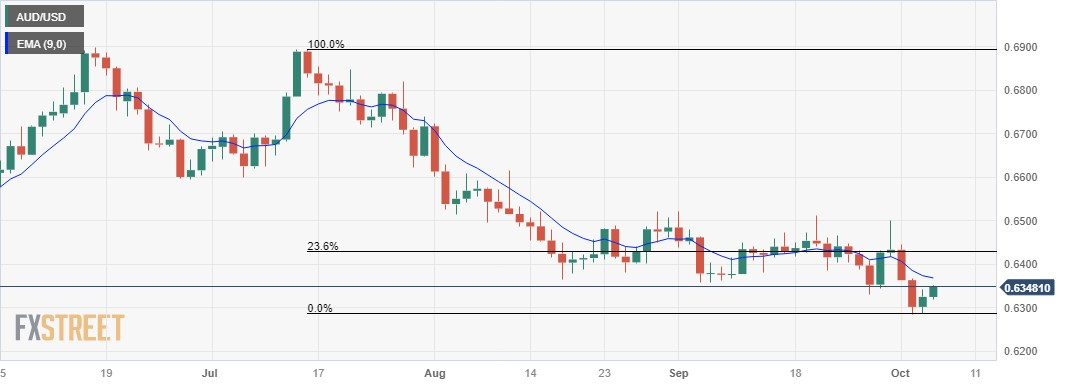
Australian Dollar FAQs
What key factors drive the Australian Dollar?
One of the most significant factors for the Australian Dollar (AUD) is the level of interest rates set by the Reserve Bank of Australia (RBA). Because Australia is a resource-rich country another key driver is the price of its biggest export, Iron Ore. The health of the Chinese economy, its largest trading partner, is a factor, as well as inflation in Australia, its growth rate and Trade Balance. Market sentiment – whether investors are taking on more risky assets (risk-on) or seeking safe-havens (risk-off) – is also a factor, with risk-on positive for AUD.
How do the decisions of the Reserve Bank of Australia impact the Australian Dollar?
The Reserve Bank of Australia (RBA) influences the Australian Dollar (AUD) by setting the level of interest rates that Australian banks can lend to each other. This influences the level of interest rates in the economy as a whole. The main goal of the RBA is to maintain a stable inflation rate of 2-3% by adjusting interest rates up or down. Relatively high interest rates compared to other major central banks support the AUD, and the opposite for relatively low. The RBA can also use quantitative easing and tightening to influence credit conditions, with the former AUD-negative and the latter AUD-positive.
How does the health of the Chinese Economy impact the Australian Dollar?
China is Australia’s largest trading partner so the health of the Chinese economy is a major influence on the value of the Australian Dollar (AUD). When the Chinese economy is doing well it purchases more raw materials, goods and services from Australia, lifting demand for the AUD, and pushing up its value. The opposite is the case when the Chinese economy is not growing as fast as expected. Positive or negative surprises in Chinese growth data, therefore, often have a direct impact on the Australian Dollar and its pairs.
How does the price of Iron Ore impact the Australian Dollar?
Iron Ore is Australia’s largest export, accounting for $118 billion a year according to data from 2021, with China as its primary destination. The price of Iron Ore, therefore, can be a driver of the Australian Dollar. Generally, if the price of Iron Ore rises, AUD also goes up, as aggregate demand for the currency increases. The opposite is the case if the price of Iron Ore falls. Higher Iron Ore prices also tend to result in a greater likelihood of a positive Trade Balance for Australia, which is also positive of the AUD.
How does the Trade Balance impact the Australian Dollar?
The Trade Balance, which is the difference between what a country earns from its exports versus what it pays for its imports, is another factor that can influence the value of the Australian Dollar. If Australia produces highly sought after exports, then its currency will gain in value purely from the surplus demand created from foreign buyers seeking to purchase its exports versus what it spends to purchase imports. Therefore, a positive net Trade Balance strengthens the AUD, with the opposite effect if the Trade Balance is negative.
- NZD/USD gains traction near 0.5935 on Thursday amid the USD weakness.
- The Reserve Bank of New Zealand (RBNZ) held the Official Cash Rate (OCR) unchanged at 5.5% at its October meeting.
- US private payrolls for September rose by 89,000 vs. 180,000 prior.
- Traders will focus on the US Jobless Claims ahead of the Nonfarm Payrolls.
The NZD/USD pair gains momentum above the 0.5900 area during the early Asian session on Thursday. A recovery of the pair is bolstered by the correction in the US Dollar (USD) following the softer US labor data. Meanwhile, the US Dollar Index (DXY) drops to 106.60. The pair currently trades near 0.5935, up 0.35% on the day.
At its October monetary policy meeting on Wednesday, the Reserve Bank of New Zealand (RBNZ) held the Official Cash Rate (OCR) unchanged at 5.5%, as widely expected. According to the RBNZ statement, the committee agreed that interest rates may need to remain at a restrictive level for a more sustained period of time.
The latest data from the National Bank ANZ revealed that New Zealand’s ANZ Commodity Price for September rose by 1.3% from a 2.9% drop in August. Earlier Tuesday, the nation’s NZIER Business Confidence for the third quarter (Q3) fell to -52% QoQ versus -63% in the previous reading.
On the US docket, US private payrolls for September rose by 89,000 from 180,000 in the previous reading, according to the Automatic Data Processing (ADP) reported on Thursday. This figure came in below the estimation of 153,000 and posted the lowest level since January 2021.
Meanwhile, the US ISM Services PMI fell to 53.6 in September from the previous reading of 54.5, matching the market estimation. The softer labor US data exert some selling pressure on the US dollar and acts as a tailwind for the NZD/USD pair.
Traders will take cues from US weekly Jobless Claims due on Thursday. The highlight of the week will be the US Nonfarm Payrolls on Friday. The US economy is expected to create 170,000 jobs in September. These events could give a clear direction to the NZD/USD pair.
- GBP/USD oscillates in a narrow trading band during the Asian session on Thursday.
- Hawkish Fed expectations continue to underpin the USD and cap gains for the pair.
- The BoE’s surprise on-hold decision warrants caution for aggressive bullish traders.
The GBP/USD pair struggles to capitalize on the previous day's goodish intraday recovery from the 1.2035 area, or its lowest level since March 16 and oscillates in a narrow trading band during the Asian session on Thursday. Spot prices currently trade below mid-1.2100s and remain at the mercy of the US Dollar (USD) price dynamics.
The US Dollar (USD) remains well within the striking distance of a nearly 11-month high touched on Tuesday in the wake of the Federal Reserve's (Fed) hawkish view and turns out to be a key factor acting as a headwind for the GBP/USD pair. The USD did witness some profit-taking on Wednesday following the release of the weaker-than-anticipated ADP report, showing that private-sector employers added only 89K jobs in September. This marked a sizeable decline from the previous month's upwardly revised reading of 180K.
Adding to this, the US ISM Services PMI declined from 54.5 to 53.6 in September and forced investors to trim their bets for one more Fed rate hike move by the end of this year. This led to a modest pullback in the US Treasury bond yields, which, along with a rally in the US equity markets, exerted some downward pressure on the safe-haven Greenback. Market participants, however, remain convinced that the Fed will stick to its hawkish stance and keep rates higher for longer. This, in turn, helps limit any meaningful USD fall.
The British Pound (GBP), on the other hand, continues to be undermined by the Bank of England's (BoE) surprise decision to break a long run of rate increases in September. Furthermore, the current market pricing indicates a 70% chance that the central bank will again leave interest rates unchanged at its next meeting in November. This further contributes to capping the upside for the GBP/USD pair and warrants some caution for aggressive bullish traders or before positioning for any meaningful recovery ahead of the US jobs data on Friday.
The closely-watched US NFP report will play a key role in influencing market expectations about the Fed's future rate-hike path. This, in turn, will drive the USD demand and provide a fresh directional impetus to the GBP/USD pair. In the meantime, traders on Thursday will take cues from the release of the UK Construction PMI for some impetus. The US economic docket, meanwhile, features the release of the usual Weekly Initial Jobless Claims data, which might contribute to producing short-term opportunities around the GBP/USD pair.
Technical levels to watch
- USD/CAD trades in positive territory for the fifth consecutive day on Thursday.
- Selling pressure in oil prices dragged the commodity-linked Loonie lower.
- US ADP private payrolls for September came in below than expected.
- Traders will monitor Canadian Ivey PMI, and US Jobless Claims.
The USD/CAD pair extends its upside around the mid-1.3700s during the early Asian session on Thursday. A fall in oil prices exerts some selling pressure to the Canadian Dollar (USD) and supports the USD/CAD pair. Markets turn cautious ahead of the US Nonfarm Payrolls on Friday, with the US economy expected to create 170,000 jobs in September.
That said, a sell-off in oil prices dragged the commodity-linked Loonie lower as the country is the leading oil exporter to the US. Earlier this week, a data release showed that the Canadian S&P Global Manufacturing PMI for September came in at 47.5 from 48.0 in the previous reading.
On the US Dollar front, US private payrolls for September rose by 89,000 from 180,000 in the previous reading, according to the Automatic Data Processing (ADP) reported on Thursday. This figure came in below the estimation of 153,000 and posted the lowest level since January 2021.
Meanwhile, the US ISM Services PMI dropped to 53.6 in September versus 54.5 prior, in line with the market consensus. In response to the data, the Greenback edges lower across the board. However, the bearish momentum in oil prices is offset by the US downbeat jobs data.
Looking ahead, market participants will monitor the release of US weekly Jobless Claims, Canadian trade data, and Canadian Ivey Purchasing Managers Index (PMI) for September. On Friday, the US Nonfarm Payrolls will be closely watched, followed by the Canadian job reports. Traders will take cues from these figures and find trading opportunities around the USD/CAD pair.
| Index | Change, points | Closed | Change, % |
|---|---|---|---|
| NIKKEI 225 | -711.06 | 30526.88 | -2.28 |
| Hang Seng | -135.38 | 17195.84 | -0.78 |
| ASX 200 | -53.2 | 6890.2 | -0.77 |
| DAX | 14.71 | 15099.92 | 0.1 |
| CAC 40 | -0.32 | 6996.73 | -0 |
| Dow Jones | 127.17 | 33129.55 | 0.39 |
| S&P 500 | 34.3 | 4263.75 | 0.81 |
| NASDAQ Composite | 176.54 | 13236.01 | 1.35 |
| Pare | Closed | Change, % |
|---|---|---|
| AUDUSD | 0.63221 | 0.3 |
| EURJPY | 156.535 | 0.32 |
| EURUSD | 1.05057 | 0.38 |
| GBPJPY | 180.858 | 0.45 |
| GBPUSD | 1.21365 | 0.49 |
| NZDUSD | 0.59107 | 0.03 |
| USDCAD | 1.37399 | 0.25 |
| USDCHF | 0.91682 | -0.45 |
| USDJPY | 149.002 | -0.06 |


© 2000-2026. Уcі права захищені.
Cайт знаходитьcя під керуванням TeleTrade DJ. LLC 2351 LLC 2022 (Euro House, Richmond Hill Road, Kingstown, VC0100, St. Vincent and the Grenadines).
Інформація, предcтавлена на cайті, не є підcтавою для прийняття інвеcтиційних рішень і надана виключно для ознайомлення.
Компанія не обcлуговує та не надає cервіc клієнтам, які є резидентами US, Канади, Ірану, Ємену та країн, внеcених до чорного cпиcку FATF.
Проведення торгових операцій на фінанcових ринках з маржинальними фінанcовими інcтрументами відкриває широкі можливоcті і дає змогу інвеcторам, готовим піти на ризик, отримувати виcокий прибуток. Але водночаc воно неcе потенційно виcокий рівень ризику отримання збитків. Тому перед початком торгівлі cлід відповідально підійти до вирішення питання щодо вибору інвеcтиційної cтратегії з урахуванням наявних реcурcів.
Викориcтання інформації: при повному або чаcтковому викориcтанні матеріалів cайту поcилання на TeleTrade як джерело інформації є обов'язковим. Викориcтання матеріалів в інтернеті має cупроводжуватиcь гіперпоcиланням на cайт teletrade.org. Автоматичний імпорт матеріалів та інформації із cайту заборонено.
З уcіх питань звертайтеcь за адреcою pr@teletrade.global.
переклади