- Analytics
- News and Tools
- Market News
Новини ринків
US Commerce Secretary Gina Raimondo said on Tuesday she does not expect any revisions to U.S. tariffs on China imposed during President Donald Trump's administration until an ongoing review is completed by the US Trade Representative's (USTR) Office, reported Reuters while citing the CNBC interview of the diplomat.
More to come
- GBP/USD licks its wounds after refreshing three-month low.
- 10-week-old descending support line, sluggish MACD signals and the below-50 RSI favor corrective bounce.
- Convergence of 100-EMA, 38.2% Fibonacci ratio guards immediate recovery of Cable pair.
- Pound Sterling traders seek directions from US ISM Services PMI amid light calendar at home.
GBP/USD portrays a corrective bounce off the short-term key support line while picking up bids to 1.2570 during the early hours of Wednesday’s trading.
The Cable pair dropped to the lowest level since June 13 amid broad US Dollar strength before a 2.5-month-long falling trend line joined downbeat oscillators to trigger the quote’s bounce. However, the cautious mood ahead of the US ISM Services PMI for August, expected 52.6 versus 52.7 prior, as well as the final readings of the US S&P Global PMIs for the said month, prod the Pound Sterling traders of late.
Also read: ISM Services PMI Preview: Strength may spook markets, boosting US Dollar
Given the GBP/USD pair’s rebound from the aforementioned key support line, backed by sluggish MACD signals and the below-50.0 RSI (14) conditions, the quote is likely to edge higher.
However, a convergence of the 100-day Exponential Moving Average (EMA) and the 38.2% Fibonacci retracement of its March–July upside, near 1.2630, will be a crucial upside hurdle to convince the Cable buyers to return to the table.
Following that, a downward-sloping resistance line from late July, around the 1.2700 round figure, will act as the final defense of the GBP/USD bears.
On the contrary, a downward-sloping support line from late June, around 1.2530 by the press time, puts a floor under the GBP/USD price ahead of the 200-EMA support of 1.2490.
In a case where the Pound Sterling remains bearish past 1.2490, the odds of witnessing a slump to the 61.8% Fibonacci retracement level, also known as the Golden Ratio, surrounding 1.2315 can’t be ruled out.
GBP/USD: Daily chart
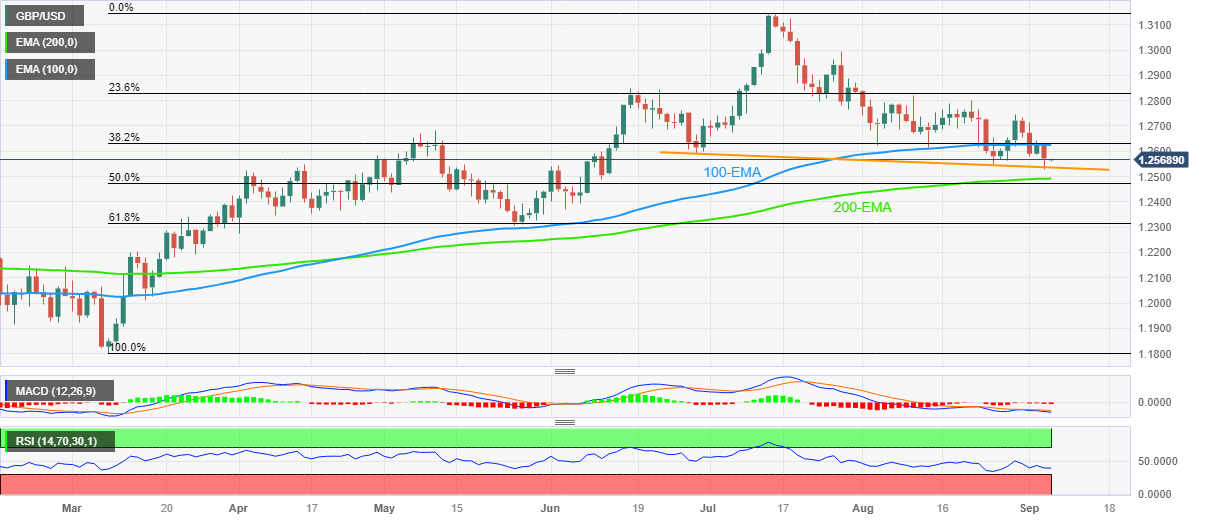
Trend: Corrective bounce expected
Australian Treasurer Jim Chalmers said on Wednesday, “The slowdown in China's economy and higher interest rates at home will put significant pressure on the Australian economy, though the country should manage to avoid a recession.” The policymaker spoke to ABC Radio during early Wednesday per Reuters.
The policymaker also said that Australia had not been immune from weakness in the global economy while also citing the recent events in China as "most concerning".
"We've seen, particularly in their property sector but also in relation to their retail and relation to their exports, that the Chinese economy has been slowing quite considerably. And that's obviously important to us," said Aussie Treasurer Chalmers.
AUD/USD stays depressed
With the downbeat comments from the key Aussie policymaker ahead of Australia’s second quarter (Q2) Gross Domestic Product (GDP), the AUD/USD pair licks its wounds at the lowest level in 2023 after falling the most in five weeks, mildly offered near 0.6375 at the latest.
Also read: AUD/USD stays depressed YTD low below 0.6400 ahead of Australia GDP, US ISM Services PMI
- NZD/USD attracts some sellers near 0.5885 amid a stronger USD.
- US Factory Orders for July marked the lowest since mid-2020.
- The downbeat Chinese data exert some pressure on the Kiwi.
- Investors will focus on the US ISM Services PMI.
The NZD/USD pair remains on the defensive below the 0.5900 mark during the early Asian trading hours on Wednesday. The pair currently trades around 0.5885, gaining 0.04% on the day. The downbeat Chinese economic data weigh on the market sentiment, which lifts the US Dollar Index (DXY) to a nearly nine-month high.
The US Department of Commerce reported on Tuesday that US Factory Orders for July marked the lowest since mid-2020. The figure came in at -2.1% MoM from 2.3% in the previous month and below the market consensus of -0.1%. The highly anticipated data last week showed that the US Nonfarm Payrolls (NFP) for August came in at 187K, beating the expectations of 170K and 157K in the previous reading. While, The Unemployment Rate dropped significantly to 3.8%, compared to the market consensus of 3.5% and 3.5% prior.
According to the CME FedWatch Tool, the possibility of an interest rate hold at the September meeting remains at 93%, which might cap the upside in the USD. However, the hawkish remark by officials lifted the greenback broadly. That said, Federal Reserve (Fed) Governor Christopher Waller said the Fed has more room to raise more interest rates. He added that the data will determine if the Fed needs to raise rates again and whether the Fed is done raising rates.
On the Kiwi front, the ANZ Commodity Price for August dropped to 2.9% from a 2.6% decline in July. Earlier this week, the New Zealand Terms of Trade Index improved to 0.4% in the second quarter, compared to a decline of 1.5% in the previous reading and an expected drop of 1.3%.
Furthermore, the weaker-than-expected Chinese Services PMI data weigh on the risk sentiment and exert pressure on the China-proxy New Zealand Dollar (NZD). China's services activity in August grew at the slowest pace in eight months. Caixin reported on Tuesday that the Chinese Services Purchasing Managers' Index (PMI) fell to 51.8 in August from 54.1 in July.
Moving on, market players will closely watch the US ISM Servies PMI for August due later on Wednesday. The figure is expected to ease to 52.6 in August from 52.7 in the previous month. Traders will take cues from the data and find trading opportunities around the NZD/USD pair.
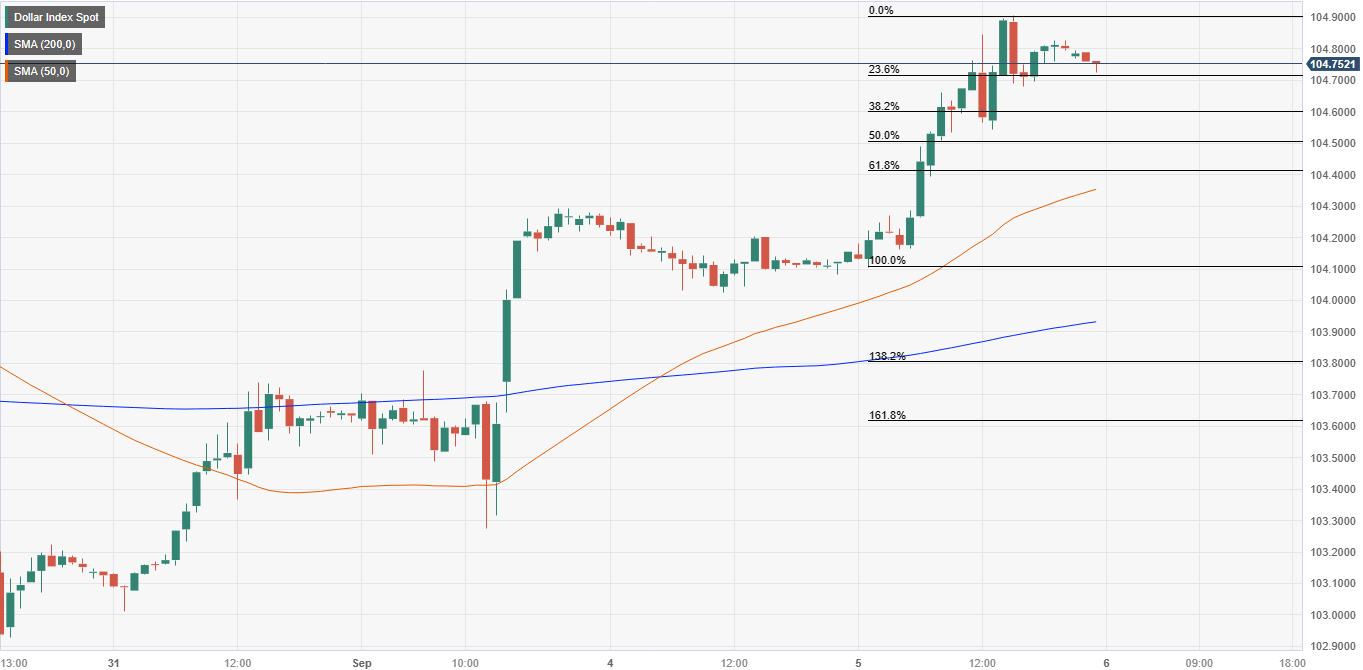
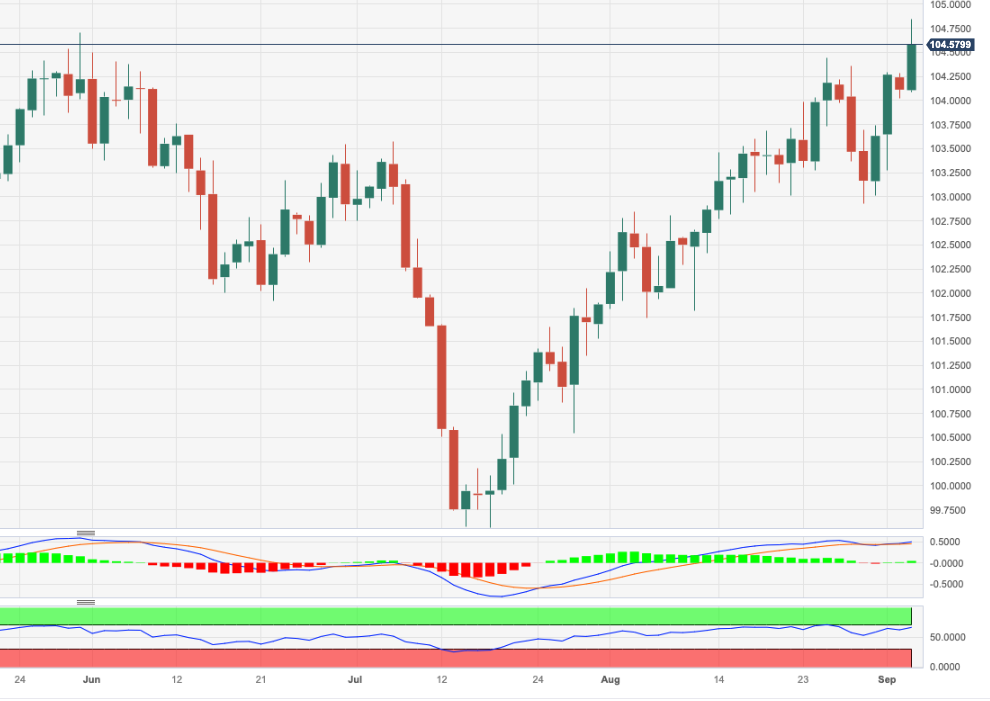
- The US Dollar Index (DXY) gains 0.60% to trade at 104.789, breaking past the 104.000 mark to hit a new five-month high.
- From a daily chart perspective, the DXY shows an upward bias after crossing the 200-day Moving Average at 103.033, with eyes on reclaiming the year-to-date high at 105.882.
- Short-term analysis suggests the DXY needs to clear 104.900 to aim for 105.000, while a recent lower high could signal the potential for a pullback.
The US Dollar Index (DXY) measures the Greenback’s performance against a basket of six currencies, extends its gains past the 104.000 figure, and hit a five-month new high at 104.907. As the Asian session begins, the DXY trades at 104.789 and gains 0.60%.
DXY Price Analysis: Technical outlook
From a daily chart perspective, the DXY is upward biased after it cracked the 200-day Moving Average (DMA) at 103.033. However, to further cement its upward bias, the DXY must reclaim the year-to-date (YTD) high at 105.882, which would expose the 106.000 mark. A breach of that level would expose the November 30 daily high at 107.195 before rallying towards 107.993, at March’s 21 high. Conversely, if the Greenback drops below 104.699, that would pave the way for a correction, targeting the 200-DMA.
Short-term, the DXY remains upward biased, but it needs to clear the 104.900 area so it can threaten to conquer 105.000. Recently, it achieved a lower high, which could pave the way for a pullback. Suppose the DXY retreats below the 23.6% Fibonacci retracement at 104703. In that case, the next support emerges at the 38.2% Fibonacci level at 104.574, confluence with the intermediate level seen on Tuesday at 104.543, followed by the 50-hour Simple Moving Average (HSMA) at 10.333.
DXY Price Action – Hourly chart
Having witnessed the biggest daily jump in five weeks, as well as the fresh high of 2023, Japan's top currency diplomat Masato Kanda crossed wires, via Reuters, early Wednesday.
The government official initially cited readiness to closely monitor the Foreign Exchange (Forex or FX) moves with a high sense of urgency before suggesting that all options for the FX moves are on the table.
Japan’s Kanda also showed the desirability for the currency to reflect fundamentals while criticizing rapid moves as bringing uncertainty to firms and households.
It’s worth observing that Japan’s Top FX Diplomat also cited speculation as the catalyst behind recent moves of the Yen.
USD/JPY retreats
Given the escalating fears of Japan meddling at higher levels of the USD/JPY, such comments from the key Japan FX Diplomat triggered a pullback in the Yen pair towards 147.50 after it rose to the yearly high of 147.80 the previous day.
Also read: USD/JPY renews yearly high to 147.80 but lacks follow-through amid Japan meddling fears, US data eyed
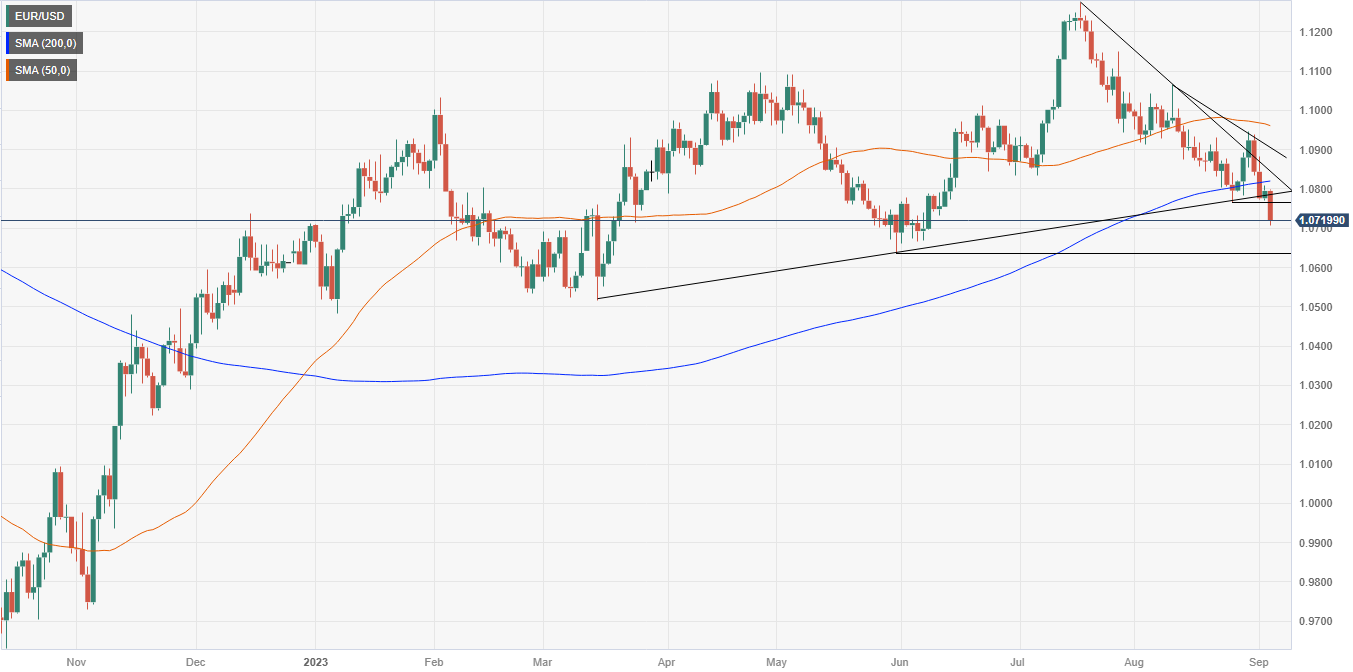
- EUR/USD remains sidelined at the lowest level in three months after breaking the key support.
- Downbeat EU data joins unimpressive ECB talks to bolster recession woes for the bloc.
- US statistics, hawkish Fed comments favor softer landing concerns and fuel Greenback.
- Eurozone Retail Sales, US ISM Services PMI eyed to confirm technical signals suggesting further fall towards June’s low of 1.0635.
EUR/USD stays defensive around 1.0730 as it seeks more clues to confirm the latest bearish bias that pleased bears with a three-month low. That said, the contrasting economic concerns about the Eurozone and the US seemed to have weighed on the Euro pair the previous day before the pre-data anxiety that prods the pair sellers amid early hours of Wednesday’s trading.
With most of the Eurozone statistics coming out as disappointing, the European Central Bank (ECB) officials’ data-dependency seem to direct them towards exiting the hawkish cycle amid fears of the recession. The same drowns the Old Continent’s currency versus major counterpart of late. On the contrary, the US data and Federal Reserve (Fed) talks have been impressive to the US Dollar, along with the upbeat Treasury bond yields.
On Tuesday, Eurozone Producer Price Index (PPI) for July deteriorated to -0.5% MoM and -7.6% YoY from -0.4% and -3.4% respective priors.
Further, the European Central Bank’s (ECB) monthly survey of consumer expectations for inflation hints at no change in the next 12-month figure of 3.4% in July but an upward revision to the three-year ahead version to 2.4% for the said month versus 2.3% expected in June. The ECB survey details also said that the expectations for economic growth over the next 12 months became slightly more negative, however the expected unemployment rate in 12 months' time was unchanged.
Earlier on Tuesday, Irish Business Publication, The Currency, released ECB Chief Economist Phillip Lane’s August 31 interview where he praised softening in the August inflation data. The policymaker, however, cited the need for continuation of such statistics to push back the hawks.
Earlier in the week, ECB President Christine Lagarde highlighted the need for central banks to keep the inflation expectations firmly anchored. On the same line, Deutsche Bundesbank President and the ECB Council Member Joachim Nagel also advocated for price stability but hesitated providing further details.
On the other hand, US Factory Orders for July dropped to the lowest since mid-2020 while posting -2.1% MoM figures versus -0.1% expectations and 2.3% previous growth. However, the orders excluding transport rose 0.8% MoM, Shipments of goods stayed firmer and inventories marked the first increase in three months.
That said, Fed Governor Christopher Waller signaled during a CNBC interview that data will drive whether the Fed needs to lift rates again, as well as confirm whether the Fed is done raising rates. The policymaker also added, "Data is looking good for soft landing scenario,” which in turn allowed the US Dollar to remain firmer.
Amid these plays, US 10-year Treasury bond yields rose eight basis points (bps) to 4.26% while Wall Street benchmarks closed with minor losses. It’s worth noting that the US Dollar Index (DXY) rose to the highest level since mid-March the previous day.
Moving on, German Factory Orders and Eurozone Retail Sales for July will offer immediate directions to the EUR/USD pair ahead of the US ISM Services PMI for August, expected 52.6 versus 52.7 prior, as well as the final readings of the US S&P Global PMIs for the said month.
Also read: ISM Services PMI Preview: Strength may spook markets, boosting US Dollar
Technical analysis
A daily closing below the ascending support line stretched from March, now immediate resistance near 1.0790, directs the EUR/USD bears toward June’s low of 1.0635.
- USD/CAD gains momentum near 1.3640 amid the USD demand.
- US Factory Orders came in at -2.1% MoM versus 2.3% prior and worse than -0.1% expected.
- BoC is anticipated to keep its benchmark interest rate unchanged at 5.00% on Wednesday.
- Market players will closely watch the Bank of Canada (BoC) monetary policy meeting, US ISM Services PMI.
The USD/CAD pair edges higher to 1.3640 after bouncing off the low of 1.3600 during the early Asian session on Wednesday. A higher Treasury yield and cautious mood boost the US Dollar (USD) broadly. Meanwhile, the US Dollar Index (DXY) trades near a nine-month high of around 104.90. Investors await the Bank of Canada (BoC) interest rate decision and markets anticipate an unchanged policy.
The data released by the US Department of Commerce revealed on Tuesday that US Factory Orders for July came in at -2.1% MoM versus 2.3% prior and worse than market expectation of -0.1%. The figure marked the lowest since mid-2020.
Furthermore, Federal Reserve (Fed) Governor Christopher Waller made a hawkish remark by saying that the Fed has more room to raise interest rates. He added that the data will determine if the Fed needs to raise rates again and whether the Fed is done raising rates.
On the Loonie front, The BoC’s interest rate decision is scheduled for Wednesday. According to a Reuters poll, BoC is anticipated to keep its benchmark interest rate unchanged at 5.00% on Wednesday and to keep it there until at least the end of March 2024. Meanwhile, the rally in oil prices might lift the Loonie as Canada is the largest exporter of crude to the US.
About the data last week, Canadian real Gross Domestic Product (GDP) Annualized for the second quarter contracted at 0.2% YoY against the previous reading of 2.6%. The growth number was worse than expected with a 1.2% expansion.
Looking ahead, the BoC interest rate decision and the US ISM Non-Manufacturing PMI will be announced later in the North American session on Wednesday. The figure is expected to rise 52.6. Also, the BoC's Governor Tiff Macklem's speech and the Canadian Unemployment data will be due on Friday. These data could give a clear direction for the USD/CAD pair.
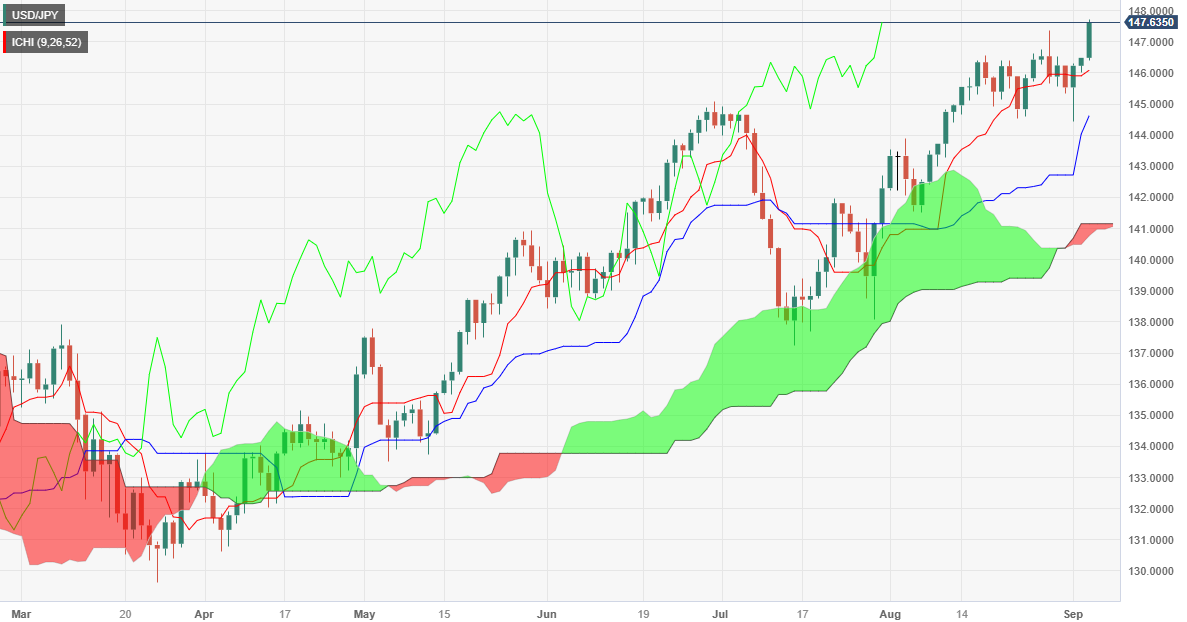
- USD/JPY seesaws at the highest level in 2023 after rising the most in five weeks.
- Strong yields, unimpressive Japan data and hawkish Fed talks allowed Yen buyers to refresh YTD top.
- Expectations of Japan intervention escalate after a sharp rise and can drag the quote unless yields, US data support bulls.
USD/JPY bulls take a breather around 147.65, after refreshing the Year-To-Date (YTD) high, as fears of Japan intervention join pre-data anxiety amid early Wednesday. That said, the Yen pair traced firmer US Treasury bond yields the previous day to print the highest level of 2023 after unimpressive Japan data contrasted with upbeat details of the US statistics and hawkish Federal Reserve (Fed) talks. It should be noted that the risk-aversion also underpinned the US Dollar’s haven demand and fueled the major currency pair.
On Tuesday, Japan’s Jibun Bank Services PMI for August confirmed the 54.3 initial forecasts and failed to impress the JPY buyers. That said, the Bank of Japan (BoJ) officials have repeatedly defended their dovish bias and the latest unimpressive data allows them to smile.
Elsewhere, the US Dollar Index (DXY) rose to the highest level since mid-March after details of the US Factory Orders joined the broad risk-off mood and hawkish Fed talks. That said, US Factory Orders for July dropped to the lowest since mid-2020 while posting -2.1% MoM figures versus -0.1% expectations and 2.3% previous growth. However, the orders excluding transport rose 0.8% MoM, Shipments of goods stayed firmer and inventories marked the first increase in three months.
Talking about the US central bank signals, Fed Governor Christopher Waller signaled during a CNBC interview that data will drive whether the Fed needs to lift rates again, as well as confirm whether the Fed is done raising rates. The policymaker also added, "Data is looking good for soft landing scenario,” which in turn allowed the US Dollar to remain firmer and fuelled the USD/JPY.
Elsewhere, fears of China’s economic slowdown and the soft landing in the US roiled the sentiment and fuelled the Greenback. China's Caixin Services Purchasing Managers' Index (PMI) for August dropped to the lowest level of the year with 51.8 figures versus 54.1 prior. While giving the details, Dr. Wang Zhe, Senior Economist at Caixin Insight Group said that the gauges for business activity and total new business remained above 50 for the eighth consecutive month, but both readings were lower than in July.
It’s worth observing that the market’s lack of confidence in the Chinese measures to defend the economy, as well as the recent Sino-American tensions over Taiwan and the US businesses’ discomfort in Beijing, also challenged the market sentiment and put a floor under the US Dollar.
That said, China recently announced a slew of quantitative and qualitative measures to defend the economy from losing the post-COVID-19 recovery. On the same line was the news suggesting the ability to avoid default by China’s biggest reality player Country Garden.
Against this backdrop, US 10-year Treasury bond yields rose eight basis points (bps) to 4.26% while Wall Street benchmarks closed with minor losses.
Moving on, a light calendar in Japan and fears of the market intervention may allow USD/JPY to pare its latest gains ahead of the US ISM Services PMI for August, expected 52.6 versus 52.7 prior, as well as the final readings of the US S&P Global PMIs for the said month.
Also read: ISM Services PMI Preview: Strength may spook markets, boosting US Dollar
Technical analysis
A daily closing beyond a nine-week-old rising resistance line, now support around 147.10, directs the USD/JPY buyers toward the November 2022 high of near 148.80.
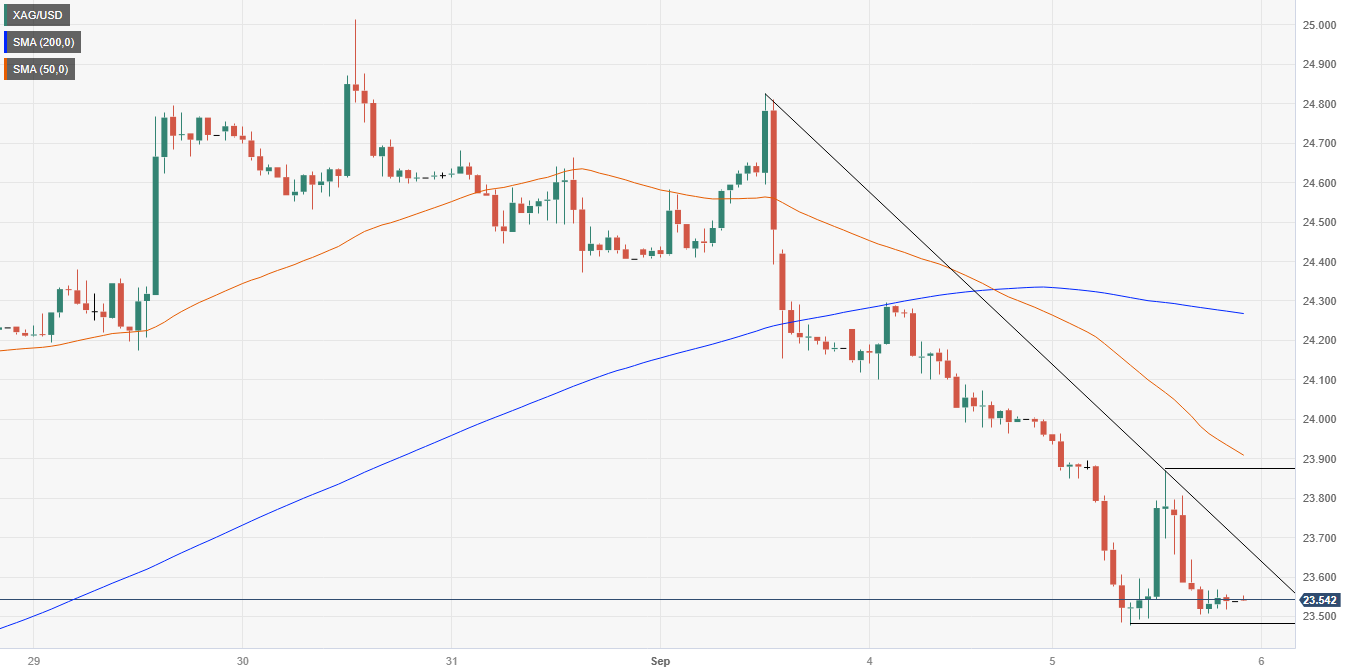
- Silver price falls below the 50-day Moving Average to close at $23.53.
- Technical outlook suggests a bearish tilt, with the 200-DMA at $23.46 as a key support level that could trigger further downside to $23.00 and $22.23.
- Intraday analysis shows first support at yesterday’s low of $23.46, first resistance at the daily pivot of $23.68, followed by the R1 daily pivot at $23.86.
Silver price retraces and breaks technical support at the 50-day Moving Average (DMA) on Tuesday after hitting a daily high of $23.99. The $23.71 area was surpassed late in the New York session, which witnessed the white metal printing a daily close of $23.53. At the time of writing, XAG/USD is trading at $23.53, registering minuscule gains of 0.03%.
XAG/USD Price Analysis: Technical outlook
The XAG/USD price action shows the white metal is tilted to the downside, but the trend is unclear. As of writing, it’s shy of clearing the 200-DMA at $23.46, which is seen as a bearish signal that could make prices tumble. In that case, the first support would be the $23.00 psychological level, followed by the August 15 swing low of $22.23. On the flip side, the XAG/USD first resistance would be the 50-DA at $23.71, followed by the $24.00 mark.
From an intraday perspective, XAG/USD is downward biased, with first support emerging at yesterday’s low of $23.46. Once cleared, the next support would be the S1 daily pivot at $23.34, followed by the S2 pivot point at $23.14. On the flip side, the daily pivot at $23.68 is the first resistance level, followed by the R1 daily pivot at $23.86.
XAG/USD Price Action – Hourly chart
- AUD/USD holds lower grounds at yearly bottom after falling the most in five weeks the previous day.
- RBA’s dovish halt, firmer US Treasury bond yields and China concerns keep Aussie sellers hopeful.
- US Factory Orders came in downbeat but details were impressive to defend soft landing talks.
- Australia Q2 GDP, speech from RBA’s Lowe and US ISM Services PMI for August eyed for further directions.
AUD/USD bears lick their wounds at the lowest level in 2023 after falling the most in five weeks as traders await Australia’s second quarter (Q2) Gross Domestic Product (GDP) details on early Wednesday. That said, the Aussie pair seesaws near 0.6380 after falling to 0.6357, the lowest since November 2022 on multiple catalysts.
Be it China’s disappointing data or the Reserve Bank of Australia’s (RBA) dovish halt, not to forget the broad US Dollar strength amid firmer yields and mostly upbeat statistics at home, everything contributed to the AUD/USD pair’s slump the previous day. However, the market’s consolidation ahead of the Aussie Q2 GDP, US ISM Services PMI and RBA Governor Philip Lowe’s last speech before leaving the designation seem to help the pair sellers take a breather.
On Tuesday, the Reserve Bank of Australia (RBA) matched market forecasts by keeping the benchmark rates unchanged at 4.10% while suggesting, via the RBA Rate Statement, that inflation appears peaking. It’s worth noting, however, that the statements suggesting Australia’s below-trend growth and expectations supporting the continuation of the same pattern for a while also seemed to have drowned the Australian Dollar (AUD) afterward.
Further Australia’s S&P Global Composite PMI and Services PMI rose to 48.0 and 47.8 versus 47.1 and 46.7 respective priors but failed to impress the Aussie pair buyers.
Elsewhere, China's Caixin Services Purchasing Managers' Index (PMI) for August dropped to the lowest level of the year with 51.8 figures versus 54.1 prior. While giving the details, Dr. Wang Zhe, Senior Economist at Caixin Insight Group said that the gauges for business activity and total new business remained above 50 for the eighth consecutive month, but both readings were lower than in July.
It’s worth observing that the market’s lack of confidence in the Chinese measures to defend the economy, as well as the recent Sino-American tensions over Taiwan and the US businesses’ discomfort in Beijing, also challenged the market sentiment and put a floor under the US Dollar.
That said, China recently announced a slew of quantitative and qualitative measures to defend the economy from losing the post-COVID-19 recovery. On the same line was the news suggesting the ability to avoid default by China’s biggest reality player Country Garden.
Talking about the US data, US Factory Orders for July dropped to the lowest since mid-2020 while posting -2.1% MoM figures versus -0.1% expectations and 2.3% previous growth. However, the orders excluding transport rose 0.8% MoM, Shipments of goods stayed firmer and inventories marked the first increase in three months.
More importantly, Federal Reserve (Fed) Governor Christopher Waller signaled during a CNBC interview that data will drive whether the Fed needs to lift rates again, as well as confirm whether the Fed is done raising rates. The policymaker also added, "Data is looking good for soft landing scenario,” which in turn allowed the US Dollar to remain firmer.
Against this backdrop, the US Dollar Index (DXY) rose to the highest level since mid-March while tracing the upbeat US Treasury bond yields, which in turn exerted downside pressure on riskier assets like equities, commodities and Antipodeans including the AUD/USD pair.
Looking ahead, the AUD/USD traders should pay close attention to Australia’s Q2 GDP, expected to improve on QoQ to 0.30% from 0.2% but ease to 1.7% YoY from 2.3%. Following that, the US ISM Services PMI for August, expected 52.6 versus 52.7 prior, will be important to watch. Above all, RBA Governor Lowe’s last speech before resigning will be crucial to watch for clear directions as any signals of policy pivot could drive Aussie further towards the south.
Also read: ISM Services PMI Preview: Strength may spook markets, boosting US Dollar
Technical analysis
A clear downside break of three-week-old rising support line, now resistance around 0.6410, directs the AUD/USD pair sellers towards a descending support line from early March surrounding 0.6340.
- XAU/USD lost more than 0.60%, falling to the $1,925 area.
- The US DXY index rose to its highest level since March.
- The cautious market mood amid the fragile Chinese situation may limit Gold’s downside.
In Tuesday’s session, the XAU/USD sharply declined, as the USD showed strong gains during the session, and the spot price closed at $1,925.
In that sense, the USD, measured by the DXY index, rose more than 0.50% to its highest level since March, around 104.80, while US bond yields, often seen as the opportunity cost of holding hold, saw more than 1% increases with the 2, 5 and 10-year bond rates rising to 4.96%,4.37% and 4.26%. That yield increase could be explained by Christopher Waller from the Federal Reserve (Fed) flirting with an additional hike, stating that it won’t cause a recession.
On a positive note, investors are closely monitoring the Chinese economic situation, as data on Tuesday showed that service activity fell to its lowest level in eight months, and the fear of a global economic downturn may limit the downside for the yellow metal.
XAU/USD Levels to watch
Based on the daily chart, XAU/USD maintains a neutral to bearish technical perspective, suggesting that the bears are gradually gaining momentum but are not yet in total control. The Relative Strength Index (RSI) points south above its middle point, while the Moving Average Convergence (MACD) histogram shows decreasing green bars.
Support levels: $1,915 (20 and 200-day SMA convergence), $1,900, $1,890.
Resistance levels: $1,930, $1,950, $1,970.
XAU/USD Daily Chart
-638295477185249020.png)
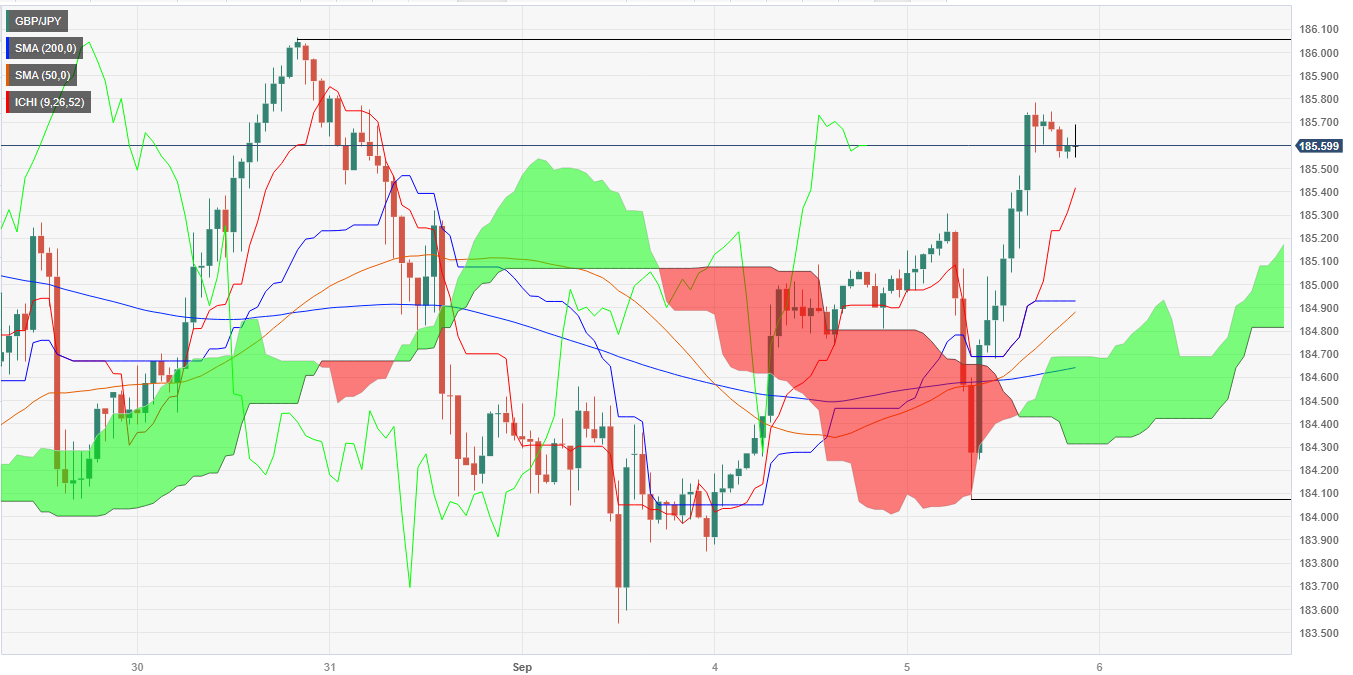
- GBP/JPY pair trades nearly flat at 185.58 as risk aversion strengthens the USD/JPY pair, indirectly softening the Yen against most G8 currencies.
- Technical analysis shows the pair with an upward bias, facing next resistance at the August 30 high of 186.06 and a year-to-date high at 186.76.
- Short-term hourly chart suggests a sideways but slightly upward tilt, with crucial support and resistance levels identified at 185.17 and 186.19, respectively.
The Pound Sterling (GBP) gained ground against the Japanese Yen (JPY) amid risk aversion, which triggered flows toward the safe-haven status of the Greenback (USD). Hence, strength in the USD/JPY pair weighed on the JPY, which remained soft against most G8 currencies. The GBP/JPY exchanges hands at 185.58, almost flat as the Asian session begins.
GBP/JPY Price Analysis: Technical outlook
The daily chart portrays the pair as upward biased, though it still needs to clear the next resistance seen at the August 30 high at 186.06. An upside break would expose the year-to-date (YTD) high of 186.76 before the GBP/JPY tests 187.00. Conversely, downside risks emerge at the Tenkan-Sen line at 184.70, followed by the Senkou Span at 184.14. Once that area is cleared, the pair’s next stop would be the Kijun-Sen line at 183.58.
In the short term, the GBP/JPY hourly chart portrays the pair as sideways, though slightly tilted upwards. If the pair breaks the August 30 high of 186.06, the R1 daily pivot would be the next resistance at 186.19. A breach of the latter would expose the YTD high at 186.76, shy of the R2 pivot point at 186.84. On the downside, the first support would be the confluence of the daily pivot and the Senkou Span A at 185.17, followed by the psychological 185.00 figure.
GBP/JPY Price Action – Hourly chart
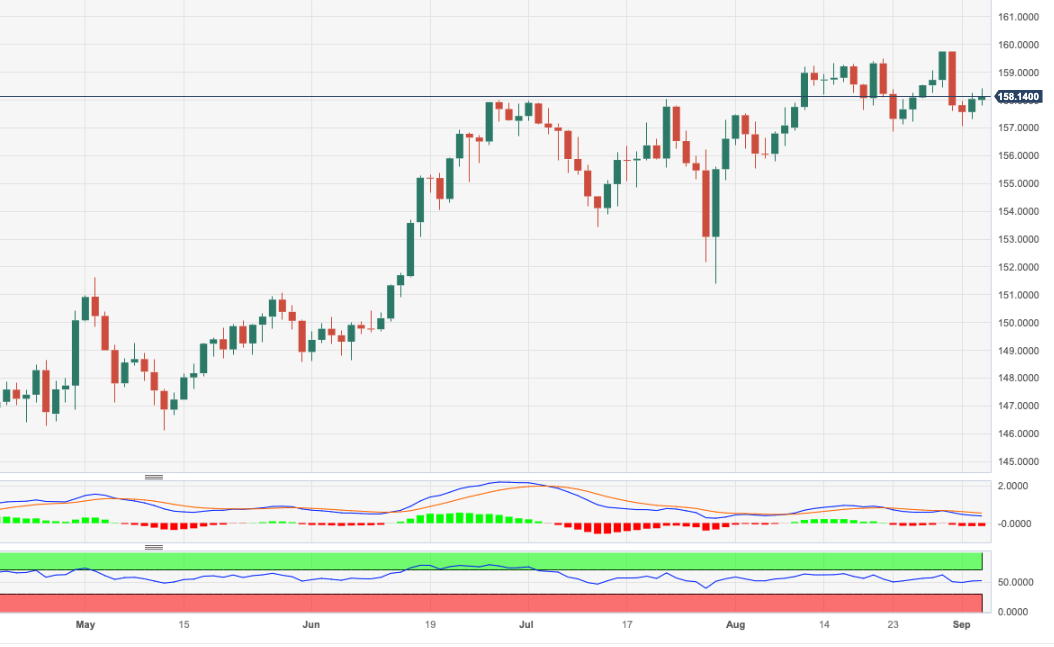
- EUR/JPY bears are presenting a battle to the bulls at the 20-day SMA, with the buyers struggling to consolidate above.
- The daily chart flashes bullish signals, with the four-hour indicators indicating at exhaustion.
- Fundamentals favour the EUR over the JPY.
On Tuesday, the EUR/JPY cross slightly advanced to the 158.36 area over the 20-day Simple Moving Average (SMA), but the buyers struggle to make a significant upward movement.
The technical analysis of the daily chart suggests a neutral to bullish stance for EUR/JPY as the bulls work on recovering their ground and seem to be slow. The Relative Strength Index (RSI) demonstrates a favourable upward trend above its midline, while the Moving Average Convergence (MACD) histogram displays fading red bars.
However, on the four-hour chart, the same indicators show signs of bullish exhaustion, with the RSI turning south and the MACD displaying flat green bars.
Regarding trends, the pair is above the 20,100,200-day Simple Moving Average (SMA), pointing towards the prevailing strength of the bulls in the larger context. However, if the buyers fail to consolidate above the 20-day SMA, another downward leg may be in sight for the pair. On the fundamental’s side, the outlook is more favourable for the EUR, mainly driven by monetary policy divergences between the European Central Bank (ECB) and the Bank of Japan (BoJ).
EUR/JPY Levels to watch
Support levels: 158.37 (20-day SMA), 158.00, 157.00.
Resistance levels: 159.00, 159.50, 160.00
EUR/JPY Daily Chart
-638295437542097547.png)
Important economic events for the day include the release of Australia's Q2 GDP numbers. German Factory Orders and Eurozone Retail Sales data are due. The Bank of Canada will hold its monetary policy meeting.
Here is what you need to know on Wednesday, September 6:
The US Dollar Index hit a nine-month high on Tuesday, supported by higher Treasury yields and cautious market sentiment. Economic data from China and the Eurozone weighed on market sentiment.
The Euro lagged following a downward revision to the August Services PMI, raising doubts about the next move from the European Central Bank (ECB). EUR/USD dropped to around 1.0700, reaching its lowest since June. The overall trend remains bearish. Additionally, EUR/GBP fell again, reaching 0.8525.
GBP/USD also reached monthly intraday lows; it trimmed losses during the American session but remained below 1.2600.
USD/JPY accelerated its upward momentum, breaking above 147.50, driven by higher Treasury yields. Intervention comments and speculations are likely.
USD/CAD rose on Tuesday but finished far from its highs after the Canadian Dollar (Loonie) outperformed during the American session, supported by the rally in crude oil prices. The pair peaked at 1.3671, the highest intraday level since November, before returning to 1.3620. The Bank of Canada will announce its monetary policy decision on Wednesday, with no changes expected.
Analysts at TD Securities on BoC:
We look for the Bank of Canada to keep the overnight rate at 5.00% as slowing activity data and moderating labour markets allow the Bank to look past stronger CPI. We do not expect any material change to the Bank's guidance as they will keep hikes on the table going forward.
The Aussie (AUD) lagged on Tuesday after the Reserve Bank of Australia (RBA) kept its interest rate unchanged as expected and mentioned downside risks to the economy. AUD/USD broke below 0.6400, reaching its lowest level since November. On Wednesday, Australia will release Q2 GDP growth data.
NZD/USD suffered its worst daily losses in weeks due to a stronger US Dollar. The pair dropped below 0.5900 and bottomed at 0.5859.
Gold ended its consolidation phase with a decline from nearly $1,940 to $1,925. The bias remains to the downside, pressured by higher yields and the US Dollar. Silver fell for the fifth consecutive day, finding support above the 20-day SMA at $23.50.
Crude oil prices jumped on Tuesday after Russia and Saudi Arabia announced an extension of their unilateral production cut. The WTI reached $88.00 for the first time since November before trimming gains.
Like this article? Help us with some feedback by answering this survey:
- EUR/USD pair fell to 1.0726, down 0.63%, as the Eurozone Producer Price Index and PMI data weakened than expected, signaling a slowing economy.
- Despite a contraction in business activity, ECB President Christine Lagarde maintains a hawkish stance on inflation, which remains above 5% on the consumer front.
- US Factory Orders beat estimates, and Fed officials hint at room for rate adjustments as traders await key US PMI.
The Euro (EUR) extended its losses against the US Dollar in the mid-North American session on Tuesday after data revealed that business activity in the Eurozone (EU) is slowing down amid the most aggressive tightening cycle of the European Central Bank (ECB). This underpinned the Greenback, alongside Fed officials giving a green light for higher rates. The EUR/USD is trading at 1.0726, with losses of 0.63%.
EUR/USD drops 0.63% as EU’s PMI disappoints, while inflation cools down; market eyes upcoming US PMI data and Fed decisions
Risk aversion triggered flows towards the Greenback; consequently, the Euro dropped. Data-wise, the Eurozone revealed its Producer Price Index (PPI) for July, which came at -0.5% less than estimates of -0.6% contraction, though worse than June’s -0.4% plunge. Despite showing the inflation trend continues downwards, inflation on the consumer front remains above 5%.
In the meantime, the EU’s economic strength faltered after S&P Global revealed its PMI for the bloc was below estimated and the prior month’s data, well below the 50 threshold that flashes expansion or contraction.
ECB policymakers, led by President Christine Lagarde, remain hawkish regarding inflation while acknowledging that the economy in the bloc is slowing down. Yet, Mrs. Lagarde has emphasized in her speeches since Jackson Hole that inflation is too high and that it’s the central bank’s job to keep inflation expectations anchored.
Nevertheless, a recent ECB consumer survey report showed that inflation expectations are climbing. Europeans see inflation for three years peaking at 2.4% in July from 2.3% in June, while speculations for one year stood at 3.4% unchanged.
On the US front, a scarce economic agenda in the United States (US), witnessed August’s Factory Orders in the United States (US) came in at -2.1%, better than the estimated -2.5%, according to the US Department of Commerce. This follows four straight months of increases.
In central bank news, Fed Governor Christopher Waller noted that the Fed has room to pause or hike in the next interest rate decision. Later, Cleveland’s Fed President Loretta Mester said the Fed would not continue to tighten monetary policy until inflation hits 2%, nor wait until it gets there, to lower rates.
The impact of 525 bps of tightening by the Federal Reserve continues to cool the US economy. Traders expect that the Fed will not raise rates at the upcoming meeting but still see a possible increase in November.
The August US ISM Non-Manufacturing PMI release is anticipated to show a minor slowdown from 52.7 to 52.5. Similarly, the S&P Global Services PMI is likely to exhibit a comparable trend, with estimates at 51, compared to July’s 52.3. If both readings align with expectations, this could exert pressure on the US Dollar. Such outcomes might reinforce the Federal Reserve’s pause in September and diminish the likelihood of an additional interest rate increase in November.
EUR/USD Price Analysis: Technical outlook
After dropping below the 200-day Moving Average (DMA) at 1.0819, the EUR/USD slipped below the 1.0800 figure, extending its losses towards a new three-month low of 1.0706. Yet, buyers stepped in and cushioned the major’s fall, which is still pressured. First support would emerge at 1.0700, the May 31 daily low of 1.0635, and the March 15 swing low of 1.0516. Conversely, upside risks would emerge above 1.0800, followed by the 200-DMA at 1.0810, before the pair challenges 1.0900.
- GBP/USD pair falls 0.42% to trade at 1.2567 as the UK's S&P Global/CIPS Composite PMI drops to 48.6, entering contraction territory for the first time since January.
- Despite weaker-than-expected PMIs, the UK’s central bank is expected to raise rates 25-bps.
- US Factory Orders beat estimates but remained in recessionary territory and might influence Fed officials’ decision at the upcoming meeting.
The Pound Sterling (GBP) erased Monday’s gains against the Greenback (USD) after business activity entered recessionary territory in the UK. That alongside global services PMIs coming weaker than expected, favored flows toward safe-haven assets. Hence, the GBP/USD is trading at 1.2567 down 0.42%, after hitting a daily high of 1.2631.
Pound Sterling drops amid gloomy UK PMI data, global economic slowdown
During the European session, the UK S&P Global/CIPS Composite PMI slumped to 48.6 in August from 50.8 in July, its lowest reading since January, dragged downward by a falling Services PMI, which printed 49.5, below the 50 threshold that separates expansion/contraction territory. In the meantime, data from China and the Eurozone (EU) highlighted most global economies are decelerating.
Even though the data suggests economic conditions would not warrant an additional rate hike by the Bank of England (BoE), money market futures expect a 25-bps rate hike, as shown by interest rate probabilities. Chances lie at 87% the BoE would raise the Bank Rate for the fifteen times, since Andrew Bailey and Co began its tightening cycle in December 2021. As shown by the bottom picture, market participants estimate the BoE will hike again in early 2024.
Bank of England: Interest rate probabilities
Source: Financialsource
Across the pond, August Factory Orders in the United States (US) came in at -2.1%, better than the estimated -2.5%, according to the US Department of Commerce. This follows four straight months of increases. The impact of 525 bps of tightening by the Federal Reserve continues to cool the US economy. Traders expect that the Fed will not raise rates at the upcoming meeting but still see a possible increase in November.
In central bank news, Fed Governor Christopher Waller noted that the Fed has space to decide the next interest rate decision. Later, the Cleveland Fed President Loretta Mester said the Fed would not continue to tighten monetary policy until inflation hits 2%, nor wait until it gets there, to lower rates.
US Treasury bond yields are moderately rising, with the 10-year Treasury note yielding 4.263%, gaining six basis points and underpinning the Greenback (USD). The US Dollar Index (DXY), a measure of the buck’s value against a basket of peers, advances 0.60%, up at 104.777, the highest level since March 13 of last year.
In upcoming events, the US ISM Non-Manufacturing PMI release for August is anticipated to show a minor slowdown from 52.7 to 52.5. Similarly, the S&P Global Services PMI is likely to exhibit a comparable trend, with estimates at 51, compared to July’s 52.3. If both readings align with expectations, this could exert pressure on the US Dollar. Such outcomes might reinforce the Federal Reserve’s pause in September and diminish the likelihood of an additional interest rate increase in November.
GBP/USD Technical Levels
- After a month of side-ways trading, the USD/CHF jumped above the 100-day SMA.
- The USD is one of the top performers of the session on the back of risk aversion and hawkish Waller.
- All eyes are now on Wednesday’s ISM PMIs from the US from August.
The USD/CHF finally saw action after several sessions of sideways trading and jumped above the 100-day Simple Moving Average (SMA) of 0.8880. Despite reporting weak Factory Orders figures from July, the USD traded strongly against most of its rivals.
In line with that, the US DXY index rose to highs since March near 104.80, which a cautious market sentiment could explain as investors await fresh catalysts on a quiet session. Regarding the next Federal Reserve (Fed) decisions, bond yields are trading neutral, with mild gains. At the same time, the World Interest Rates Probabilities (WIRP) tool indicates that market participants are still seeing some probabilities of a 25 basis point (bps) hike for the remainder of the year, which would take rates to 5.75%.
On Tuesday, Christopher Waller from the Fed stated that until inflation comes down, the Fed will have to keep rates at restrictive levels and that one more hike won’t send the economy into a recession. Those hawkish comments contributed to the USD strength.
On the CHF side, the Swiss Q2 Gross Domestic Product (GDP) was reported on Monday to have remained steady and failed to live up to the expectations of a 0.1% increase expected by the markets, which also explains the upward movements of the pair.
USD/CHF Levels to watch
Considering the daily chart, USD/CHF presents a neutral to bullish outlook, with the bulls recovering and gaining momentum. The Relative Strength Index (RSI) has a positive slope above its midline, while the Moving Average Convergence (MACD) histogram prints bigger green bars. Additionally, the pair is above the 20 and 100-day Simple Moving Averages (SMAs) but below the 200-day SMA, highlighting the continued dominance of bulls in the broader perspective.
Support levels: 0.8880 (100-day SMA), 0.8800 (20-day SMA), 0.8750.
Resistance levels: 0.8900, 0.8930, 0.8950.
USD/CHF Daily Chart
-638295328689283730.png)
AUD/USD is headed toward its lowest daily close since November, trading below 0.6400. Analysts at Rabobank are cautioning that the decline could potentially extend to 0.62 on a three-month perspective.
Key quotes:
The worsened growth outlook for the world’s second economy is being reflected in downside pressure on the AUD, despite the fact that the price of iron ore has been holding up well and irrespective of the strength of Australia’s trade balance.
Concern over the Chinese economic outlook suggests there is risk of dips to the AUD/USD 0.62 area on a 3-month view. However, we see the relative strength of Australian fundamentals as suggesting a recovery back to 0.70 on a 12-month view.
- EUR/GBP lost nearly 0.42% so far this week and fell to 0.8535.
- July’s EU PPI came in higher than expected, while Services PMI from August came in soft.
- British PMI figures from the same month came in better than expected but remained in contraction territory.
- Tightening expectations remain steady for the BoE.
The EUR/GBP turned south on Tuesday after Services PMIs from the Eurozone from August disappointed investors. On the other hand, the British ones came in higher than expected, benefiting the Pound, while hawkish bets on the Bank of England (BoE) remain steady and provide further cushion to the GBP.
Investors assess mid-tier economic activity data from Europe and the UK
The Producer Price Index (PPI) exceeded expectations in July. The figure came in at -0.5%, higher than the expected decline of -0.6 and beat the previous -0.4%. In addition, the EU S&P Global and Hamburg Commercial Bank (HCOB) Services PMI missed the consensus in August at 47.9, lower than the expected figure of 48.3 and lower than the previous 48.3. The German surveys aligned with expectations, with the Services index remaining at 47.3.
As a reaction, tightening expectations on the European Central Bank (ECB) and the German yields remain steady. The 2,5 and 10-year rates are holding their ground at the 3.03%, 2.59% and 2.60% areas with mild gains. Meanwhile, World Interest Rates Probabilities (WIRP) indicates the odds of a 25bps hike in the upcoming Sep 14, 2023 declined to nearly 25%. For the following meetings, the odds of a 25 bps hike in October and December stand at 45% and 60%, and the hawkish bets on the ECB remaining low leave the door for further downside for the EUR.
On the British Side, Global/CIPS Composite PMI from August exceeded expectations and rose to 48.6, higher than the expected figure of 47.9 but lower than the previous 47.9. Still, it remains in contraction territory. Likewise, the Services survey came in at 49.5, higher than the expected figure of 48.7 and lower than the previous 48.7. WIRP suggest that investors still discount that the Bank of England (BoE) will lift rates somewhere between 5.75-6% in this tightening cycle.
EUR/GBP Levels to watch
Upon analyzing the daily chart, bearish bias is evident for the short term for the EUR/GBP cross. The Relative Strength Index (RSI) resides below its midline in negative territory, exhibiting a southward trajectory. This aligns with a negative signal from Moving Average Convergence Divergence (MACD), as its red bars show, underscoring the growing bearish momentum. Additionally, the pair is below the 20,100 and 200-day Simple Moving Averages (SMAs), indicating that on the broader picture, the bears are still in command, and the buyers have some work to do.
Support levels: 0.8515, 0.8500, 0.8480.
Resistance levels: 0.8570 (20-day SMA), 0.8590, 0.8600.
EUR/GBP Daily Chart
-638295312822422397.png)
- USD/MXN pair gained 0.88% to trade at 17.3270 after the Bank of Mexico slashed its currency hedge program, adding volatility to the currency pair.
- Fueled by disappointing PMIs from China and the Eurozone, risk aversion drives investors toward the US Dollar and boosts US Treasury bond yields.
- Upcoming US ISM Non-Manufacturing PMI and S&P Global Services PMI data could influence the Greenback and Federal Reserve’s interest rate decisions, with readings expected to show a minor slowdown.
The Mexican Peso (MXN) extended its slide for four straight days against the Greenback (USD) after the Bank of Mexico (Banxico) decided to slash its currency hedge program, designed to stabilize currency fluctuations that could trigger volatility in the USD/MXN pair. That, alongside risk aversion, hurts the emerging market currency, as the pair trades at 17.3270 and gains 0.88% at the time of writing.
Mexican Peso slides for the fourth consecutive day amid global economic concerns and rising US treasury yields
Risk aversion due to the latest results of PMIs from China and the Eurozone (EU) worsened the global economic outlook. Hence, traders seeking safety flock towards the Greenback (USD), while US Treasury bond yields rose.
China revealed its Caixin Services PMI expanding at a lower rate than estimates of 53.6 at 51.8 and below the previous month’s reading of 54.1. In the meantime, data from the United States showed that Factory Orders decreased -2.1% less than market expectations of a -2.5% plunge after four consecutive months of increases, as the US Department of Commerce revealed.
In the meantime, Fed speakers crossing newswires boosted the US Dollar. Christopher Waller, a Fed Governors said the Fed has space to decide its next interest rate decision, while Cleveland’s Fed President Loretta Mester said the Fed would not continue to tighten monetary policy until inflation hits 2%, nor wait until it gets there, to lower rates.
Meanwhile, US Treasury bond yields are persistently on the rise, notably the 10-year Treasury bond yield, which has surged by six basis points to reach 4.261%. This upward movement is favorably impacting the USD/MXN pair. The US Dollar Index (DXY), which gauges the US Dollar’s performance against six major currencies, has shown significant gains of 0.61%, reaching 104.794. This marks its highest point since March 13, 2023.
In the upcoming events, the release of the US ISM Non-Manufacturing PMI for August is anticipated to show a minor slowdown from 52.7 to 52.5. Similarly, the S&P Global Services PMI is likely to exhibit a comparable trend, with estimates at 51, compared to July’s 52.3. If both readings align with expectations, this could exert pressure on the US Dollar. Such outcomes might reinforce the Federal Reserve’s pause in September and diminish the likelihood of an additional interest rate increase in November.
USD/MXN Price Analysis: Technical outlook
The daily chart portrays the pair as neutral biased, though the USD/MXN exchange rate sits above the 100-day Moving Average (DMA); a daily close above the latter could put into play a challenge of the crucial May 17 swing low-turned resistance at 17.4039. Once cleared, the pair could edge towards the 18.0000 figure. Downside risks would emerge if the pair drops below the 17.0000 mark.
- The NZD/USD lost nearly 1%, falling below the key level of 0.5900.
- The USD benefits from a cautious market sentiment.
- Factory orders decreased in the US in July at a higher pace than expected.
- The RBA held rates steady, just as expected.
The NZD/USD faced selling pressure mainly driven by a stronger USD in a cautious market environment. The US reported weak Factory Orders from July, which declined faster than expected but didn’t stop the Greenback’s momentum. On the other hand, alongside the AUD, the NZD is the worst performer of the session after the Reserve Bank of Australia (RBA) decided to hold rates steady at 4.10%, just as expected.
No relevant data will be released for the US for the rest of the session, but its DXY index climbed to a multi-month high of 104.80 as the Greenback benefits from a cautious market sentiment. In that sense, markets await fresh catalysts to continue placing their bets on the next Federal Reserve (Fed) decisions. The World Interest Rates Probabilities (WIRP) suggests that markets still foresee some possibilities of the Fed pursuing an additional 0.25% tightening by the December meeting, with the target rate ultimately reaching 5.75%.
The New Zealander calendar was also empty on Tuesday. Meanwhile, the Interest Rates Probabilities (WIRP) tool suggests that investors are firmly convinced that the Reserve Bank of New Zealand (RBNZ) will not announce any rate increases leading up to the February meeting and will keep rates stable at 5.5%. In that sense, if the Fed doesn't end its tightening cycle, monetary policy divergences may continue to weaken the NZD.
NZD/USD Levels to watch
Analyzing the daily chart, the NZD/USD technical outlook is bearish in the short term. The Relative Strength Index (RSI) is comfortably positioned below its midline in negative territory. It has a southward slope, indicating a favourable selling momentum and it is further supported by the negative signal from the Moving Average Convergence Divergence (MACD), which displays red bars, underscoring the growing bearish momentum. Moreover, the pair is below the 20,100 and 200-day Simple Moving Averages (SMAs), indicating that the sellers dominate the broader perspective.
Support levels: 0.5850, 0.5830, 0.5800.
Resistance levels: 0.5900, 0.5950 (20-day SMA), 0.5970.
NZD/USD Daily Chart
-638295265155806169.png)
- USD/JPY pair reaches a 10-month high of 147.70, driven by risk aversion and a surge in US 10-year Treasury bond yields to 4.261%.
- Despite positive business activity data from Japan, the Yen remains weak as China’s lower-than-expected Caixin Services PMI fuels global economic concerns.
- Upcoming US ISM Non-Manufacturing PMI and S&P Global Services PMI could pressure the Greenback.
The Japanese Yen (JPY) fell to a 10-month low against the US Dollar (USD), spurred by risk aversion and a jump in US Treasury bond yields, mainly the 10-year as business activity decelerates worldwide, as revealed by S&P Global. Hence, the USD/JPY is trading at 147.65 after hitting a yearly high of 147.70.
Japanese Yen hits yearly low as investors flock to Greenback; upcoming PMI data could influence Fed’s next move
Market sentiment remains downbeat, as China revealed its Caixin Services PMI expanding at a lower rate than estimates of 53.6 at 51.8, and also below the previous month’s reading of 54.1. That triggered fears globally, and investors seeking safety went towards the Greenback and US Treasury bond yields.
Even though Japan reported that business activity for August improved, as revealed by the Jibun Bank Services PMI at 54.3, as expected and above July’s 53.8, it failed to underpin the battered JPY.
On the United States (US) front, after a Labor Day holiday, the docket revealed that Factory Orders for August showed a slight improvement despite plummeting to -2.1%, above estimates of -2.5%. Data from the US Department of Commerce ended a four-month streak of gains.
On the central bank space, the US Federal Reserve board member Christopher Waller stated that recent data gives the US central bank space to decide its next interest rate decision. As of late, Cleveland’s Fed President Loretta Mester said the Fed would not continue to tighten monetary policy until inflation hits 2%, nor wait until it gets there, to lower rates.
In the meantime, US Treasury bond yields continue to trend higher, with the 10-year Treasury bond yield advancing six basis points at 4.261%, a tailwind for the USD/JPY pair. The US Dollar Index (DXY), a measurement of the buck’s performance against six currencies, posted solid gains of 0.61%, at 104.794, its highest level since March 13, 2023.
Upcoming events, like the release of the US ISM Non-Manufacturing PMI for August, is expected to slightly decelerate from 52.7 to 52.5, while the S&P Global Services PMI would likely follow suit, with estimates at 51 from July’s 52.3. If both readings come as expected, the Greenback could be under pressure, as it could reassure the Fed’s pause in September while denting the odds for another interest rate increase in November.
USD/JPY Price Analysis: Technical outlook
From a daily chart perspective, the USD/JPY remains upward biased as it pushes towards new year-to-date (YTD) highs at around the session. The next stop would be the 148.00 psychological level, followed by last November’s high at 148.82, before challenging 149.00. Conversely, if sellers stepped in, downside risks emerged at the Tenkan-Sen line at 146.09, followed by Senkou Span A at 145.35. A breach of the latter will expose the Kijun-Sen at 144.62 and then the 144.00 mark.
Analysts TD Securities expect the Bank of Canada (BoC) to leave its policy rate unchanged at 5% on Wednesday.
Most of CAD interest will play through the crosses
"We look for the Bank of Canada to keep the overnight rate at 5.00% as slowing activity data and moderating labour markets allow the Bank to look past stronger CPI. We do not expect any material change to the Bank's guidance as they will keep hikes on the table going forward."
"We don’t expect the BoC to generate many fireworks. Most of the CAD interest will play through the crosses, where we are short GBPCAD. Still, we favour fading rallies in USDCAD."
"We will certainly not continue to raise interest rates until inflation has already fallen to 2%," Cleveland Federal Reserve President Loretta Mester told Borsen Zeitung in an interview.
"Nor will we wait to lower interest rates until inflation is at 2%," Mester added and noted that she does not currently expect that they will cut interest rates early next year.
When asked about whether it is better to do too much than too little in case of doubt, "we still have quite strong demand at the moment. And the same goes for the labour market. I think the cost of undershooting in monetary policy at the moment is still higher than the costs of overshooting," she responded.
Market reaction
The US Dollar Index preserves its bullish momentum after these comments and was last seen rising 0.7% on the day at 104.87.
- Silver price attempts recovery while the downside bias remains solid due to the resilient US Dollar.
- Fed Waller said more economic data is needed to say that the Fed is done raising rates.
- Silver price delivers a mean-reversion move to near the 20-EMA around $23.80.
Silver price (XAG/USD) discovers buying interest near $23.50 in the early New York session. The white metal attempts recovery after a sharp sell-off, which was inspired by the resilient US Dollar. The broader bias remains negative as the US Dollar Index (DXY) is expected to extend its upside journey.
S&P500 opens on a negative note as the market mood remains cautious due to the deepening risks of the global recession. The US Dollar capitalizes on downbeat global data, especially on weak China’s Services PMI. The economic data for August dropped significantly to 51.8 vs. the former release of 54.1. China’s service sector faces the pressure of deflation risks due to the deteriorating demand environment.
The US Dollar Index faces profit-booking after printing a fresh five-month high near 104.80 as Federal Reserve (Fed) Governor Christopher Waller remains uncertain about the interest rate outlook. Fed Governor told CNBC on Tuesday that the economic data will guide whether the Fed needs to lift rates again and added that he would need more data to say the Fed is done raising rates, per Reuters. He further added one more interest rate hike unlikely to send the economy into a recession.
About the labor market, the Fed Governor cited that the higher Unemployment Rate was not surprising. The job market has started softening but is still very strong.
Silver technical analysis
Silver price delivers a mean-reversion move to near the 20-period Exponential Moving Average (EMA) around $23.80. The asset attempts recovery after testing the 50% Fibonacci retracement (plotted from August 15 low at $22.23 to August 30 high at $25.02) at $23.62.
The Relative Strength Index (RSI) climbs into the 40.00-60.00 range from the bearish range of 20.00-40.00, which indicates that the bearish impulse has lost strength.
Silver hourly chart
-638295199323832129.png)
- Factory Orders in the US declined sharply in July.
- US Dollar Index trades at multi-month highs above 104.50.
The data published by the US Census Bureau revealed on Tuesday that new orders for manufactured goods - Factory Orders - decreased $12.7 billion, or 2.1%, to $579.4 billion in July. This print followed the 2.3% increase recorded in June and came in worse than the market expectation for a decrease of 0.1%.
"New orders for manufactured durable goods in July, down following four consecutive monthly increases, decreased $15.7 billion, or 5.2 percent, to $285.5 billion, unchanged from the previously published decrease," the publication further read.
Market reaction
The US Dollar preserves its strength despite the disappointing data. As of writing, the US Dollar Index was up 0.6% on the day at 104.80.
- AUD/USD prints a fresh 10-month low due to the resilient US Dollar.
- A power-pack action is expected in equities as the US markets will open after an extended weekend.
- IMF Gopinath warned that external conditions had become more challenging for emerging markets due to tightening financial conditions.
The AUD/USD pair refreshes a 10-month low near 0.6360 ahead of the New York opening session. The Aussie asset witnessed an immense sell-off after the Reserve Bank of Australia (RBA) kept interest rates unchanged at 4.10%. RBA policymakers kept doors open for further policy tightening and warned that inflation is still too high and will remain so for some time.
The S&P500 is expected to open on a negative note, considering bearish cues from overnight futures. A power-pack action is expected in US equities as US markets will open after an extended weekend. On Monday, US markets were closed on account of Labor Day. The market tone is negative as investors worry about global growth knowing that western central banks will keep interest rates higher for a longer period.
IMF First Deputy Managing Director Gita Gopinath warned that external conditions had become more challenging for emerging markets due to rising geopolitical fragmentation, tightening financial conditions, and the growing costs of climate change.
Global market mood turned bearish after the Caixin Manufacturing PMI for August dropped significantly to 51.8 vs. the former release of 54.1.
The US Dollar Index (DXY) faces nominal selling pressure after printing a fresh five-month high near 104.84 as global economic activities remain downbeat, facing pressure of aggressive policy tightening by central banks.
Going forward, the US Dollar will dance to the tune of the ISM Services PMI for August. The PMI data is expected to remain broadly unchanged at 52.7.
For further action in the Australian Dollar, investors will keenly watch the Q2 Gross Domestic Product (GDP) data. As per expectations, the Australian economy grew at a 0.3% pace vs. a 0.2% pace, being recorded for Q1. On an annualized basis, the Australian GDP is seen expanding at a slower pace of 1.7% vs. the former pace of 2.3%.
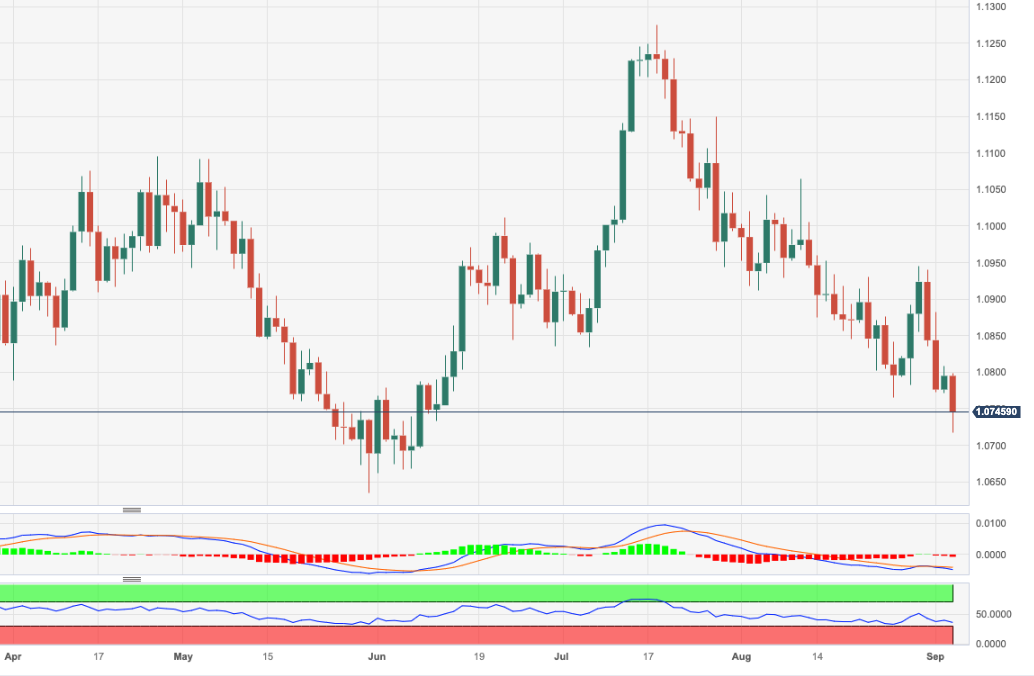
- EUR/USD sees its decline gather pace and test the 1.0715 level.
- Down from here comes the May low in the 1.0630 zone.
EUR/USD sets aside Monday’s decent bounce and resumes the downtrend on Tuesday.
The sharp retracement seen in the latter part of last week seems to have shifted the attention to the downside once again. Against that, the loss of the 1.0700 support is expected to motivate the pair to challenge the May low of 1.0635 (May 31) in the not-so-distant future.
In the meantime, further losses remain in the pipeline while below the key 200-day SMA, today at 1.0819.
EUR/USD daily chart
Economist Enrico Tanuwidjaja and Junior Economist Agus Santoso at UOB Group give their opinion on the release of inflation data in Indonesia.
Key Takeaways
ndonesia's headline inflation in Aug rose to 3.3% y/y viz. 3.1% in Jul on the back of higher food and fuel prices. The increase in food prices was mainly driven by higher prices of rice, garlic, chicken meat, and eggs due to limited supply and higher production costs. Disruption in the global rice supply chain as a result of export restrictions by several rice exporters has caused rice prices to increase since early Aug.
Higher inflation in Aug can be attributed to the increase in food & beverages (F&B) and transportation, while the other 11 components continued to moderate. F&B inflation rose to 3.5% (y/y) from previous month's 1.9% (y/y). Meanwhile, transportation inflation stood at 9.7% (y/y), up 0.1pt from previous' 9.6%.
Inflation in Aug 2023 in line with consensus forecast of 3.3% y/y. However, there is still notable potential upside risks to prices due to several factors. The risk of global food supply chain disruption has started to impact Indonesia's food prices, especially rice, wheat and corn. In addition, Pertamina's policy to increase fuel prices on Sep 1, 2023 is also expected to drive up fuel inflation to continue in Sep’23. All in all, we continue to maintain our view for the headline inflation forecast in 2023 will be at 3.8% y/y.
UOB Group’s Senior Economist Alvin Liew and Associate Economist Jester Koh comment on the publication of the PMI results in Singapore.
Key Takeaways
Singapore’s manufacturing outlook improved marginally as the latest Purchasing Managers’ Index (PMI) inched higher by 0.1 point to 49.9 in Aug (from 49.8 in Jul), the third consecutive month of improvement. However, the reading implies the 6th straight month of contraction (i.e. sub-50) in overall activity for the manufacturing sector, after a neutral print of 50.0 in Feb 23.
Singapore Manufacturing PMI Outlook – While we are heartened by the third consecutive month of marginal improvement in the headline PMI, the sub-50 print corroborates our view that Singapore still faces headwinds in the manufacturing sector as many key sub-indices of the PMI remain in contraction territory.
We may see a few more months of sub-50 PMI prints for the electronics sector before positive prints emerge towards the end of the year while the headline PMI could turn expansionary (above 50.0) in the next few months. We maintain our forecast for Singapore’s 2023 manufacturing to contract by 5.4%.
- DXY accelerates gains to multi-week highs past 104.80.
- Further gains could see the 105.00 barrier revisited.
DXY rapidly leaves behind Monday’s small downtick and resumes the uptrend to the area of 104.80, levels last seen in late March.
If bulls push harder, the index should shift its focus to the round level at 105.00 prior to the 2023 high at 105.88 (March 8).
While above the key 200-day SMA, today at 103.03, the outlook for the index is expected to remain constructive.
DXY daily chart
Federal Reserve (Fed) Governor Christopher Waller told CNBC on Tuesday that data will drive whether the Fed needs to lift rates again and added that he would need more data to say the Fed is done raising rates, per Reuters.
Key takeaways
"Recent data will allow the Fed to proceed carefully."
"Recent data gives Fed space before making next rate decision."
"The job market is starting to soften."
"Not surprising the unemployment rate has ticked up."
"Data is looking good for soft landing scenario."
"If inflation keeps coming down, economy is in pretty good condition."
"One more hike unlikely to send economy into recession."
"Job market is still very strong."
"Hard to determine monetary policy lags."
"Clear monetary policy lags are shorter."
"Until inflation comes down, Fed will have to keep rates up."
Market reaction
Despite these hawkish comments, the US Dollar Index retreated slightly ad was last seen rising 0.45% on the day at 104.65.
- USD/CAD refreshes a five-month high near 1.3670 as the BoC is expected to keep interest rates unchanged.
- The BoC might keep interest rates unchanged at 5% as hiring and consumer spending slowed due to higher inflation.
- USD/CAD recovered sharply after sensing decent buying interest near the 20-day EMA.
The USD/CAD pair prints a fresh five-month high at 1.3670 ahead of the interest rate decision by the Bank of Canada (BoC), which will be announced on Wednesday. Investors anticipate that the policy divergence between the Federal Reserve (Fed) and the BoC will remain stable as the latter is expected to keep the monetary policy unchanged.
BoC Governor Tiff Macklem might keep interest rates unchanged at 5% as hiring and consumer spending slowed due to higher inflationary pressures.
S&P500 futures posted nominal losses in the European session, indicating a cautious opening after an extended weekend. The US Dollar Index (DXY) prints a fresh five-month higher at 104.70 as US recession fears receded due to cooling inflation and a stable job market. The 10-year US Treasury yields climb to near 4.23%. A power-pack action is anticipated from the USD Index in the New York session as US markets will open after a long weekend.
USD/CAD extends its rally and prints a fresh five-month high at 1.3670. The pair recovered sharply after sensing decent buying interest near the 20-day Exponential Moving Average (EMA) around 1.3520. The Relative Strength Index (RSI) (14) trades in the bullish range of 60.00-80.00, and is not showing signs of oversold and divergence.
For more upside, the Loonie asset needs to surpass the round-level resistance of 1.3700 decisively, which will open doors for further upside to March 27 high at 1.3746 and March 24 high around 1.3800.
On the flip side, a breakdown below September 1 low around 1.3490 would drag the asset towards August 15 low around 1.3440, followed by July 7 high at 1.3387.
USD/CAD daily chart
-638295134610459159.png)
Senior Economist at UOB Group Alvin Liew assesses the latest release of the US NFP for the month of August.
Key Takeaways
The latest US Labor Market Report showed a mixed picture. Even as job creation was above expectations at 187,000 in Aug (versus Bloomberg est 170,000), the jobs prints for Jun & Jul were revised lower by 110,000. Jobless rate spiked unexpectedly to 3.8% (Jul: 3.5%), highest since Feb 2022 as unemployed numbers rose by half million and participation rate rose 0.2ppt to 62.8%. Wage growth was a tad below forecast, and m/m pace was slowest since Feb 2022.
Disparity in job creation was surprisingly stark within services in Aug as job increases were led mainly by health care and social assistance while specific factors drove job losses in transport and information sectors.
The jump in Aug jobless rate and slower wage growth added to market expectations for the Fed to keep its policy rate unchanged in Sep and rest of the year. We continue to expect no rate cuts in 2023, with the FFTR terminal rate at 5.50% lasting through this year. Another 25-bps hike in 2H remains a risk but the Fed hiking cycle is likely near/at its end.
- US Dollar price jumps higher across the board on Tuesday in European trading.
- The PBoC failed to fix its Yuan stronger, while European PMI data suggest contraction in the eurozone economy.
- The US Dollar Index consolidates above 104.00 and could post a new yearly high.
The US Dollar (USD) jumps higher against every G20 peer on Tuesday as US markets reopen after the Monday holiday. Many tailwinds are helping the Greenback to edge higher. The US appears to be the single green spot in terms of economic performance, with Goldman Sachs erasing its projection for a recession or hard landing as the last bank standing. Meanwhile, both China and Europe seem to be lagging behind. Recent Purchasing Managers Index (PMI) data suggested a slowdown in China’s services sector, while it showed a persisting contraction in Europe, adding to signs that the old continent’s economy could be on the verge of a hard landing.
There is a very light economic calendar this week. Nonetheless, every datapoint could add to the conviction that the US is actually the place to be in order to pursue that soft landing. One datapoint to watch will be Factory Orders at 14:00 GMT, which is expected to contract slightly and might cause some paring back of this US Dollar strength..
Daily digest: US Dollar firm
- The People's Bank of China (PBoC) tried to squeeze speculators in their Yuan currency by fixing it substantially lower. Markets shrugged off the strong fixing and devalued the Yuan substantially further against both the Euro and the US Dollar.
- The weekly Redbook Index is expected at 12:55 GMT. Previous was at 4.2%.
- Factory Orders, at 14:00 GMT, are expected to contract 0.1% in July on month after increasing 2.3% in June.
- The US Treasury will be very active with three auctions on Tuesday: a 3-month, a 52-week and a 6-month Bill will be auctioned.
- Total Vehicle Sales data for August will come out at 19:30 GMT. Previous figure was 15.7 million.
- Equities present a red picture halfway through the European trading session, with the Chinese Hang Seng as the biggest loser, down 2.06%. European equities are in the red after EU PMI numbers pointed to a full contraction for the top five biggest economies in the EU bloc. US futures have taken this negative tone.
- In the central bank interest rate differential between the Eurozone and the US, the projection of an additional hike by the ECB has been erased due to the downbeat PMI numbers. This made the Euro depreciate substantially against the Greenback.
- The CME Group’s FedWatch Tool shows that markets are pricing in a 93% chance that the Federal Reserve will keep interest rates unchanged at its meeting in September.
- The benchmark 10-year US Treasury bond yield trades at 4.21% and gapped higher at the opening bell in Asia after trading was halted on Monday for the US Labor Day holiday.
US Dollar Index technical analysis: strongest in the pack
The US Dollar turns substantially higher against every main G20 currency, with several US indicators outpacing foreign indicators in terms of economic growth. It looks like the US and its Federal Reserve will be able to succeed in engineering a soft landing, whereas this is highly uncertain on the other side of the Atlantic Ocean. This makes the US Dollar more popular from an investment point of view.
The number to beat for the US Dollar Index (DXY) is 104.69 intraday, which is not far as the index already peaked at 104.66. So only a few cents to go and the DXY will be at a new six-month high. Next levels are at 105.23, the high of March 2022, making it an 18-month high. If the index reaches this last level, some resistance might kick in.
On the downside, the big 104.00 figure is vital to hold and keep the US Dollar Index sustained at these elevated levels. Some room lower, the 200-day Simple Moving Average (SMA) at 103.06 comes into play, which could bring substantially more weakness once the DXY starts trading below it. The double belt of support at 102.42, with both the 100-day and the 55-day SMA, are the last lines of defence before the US Dollar sees substantial and longer-term depreciation.
US Dollar FAQs
What is the US Dollar?
The US Dollar (USD) is the official currency of the United States of America, and the ‘de facto’ currency of a significant number of other countries where it is found in circulation alongside local notes. It is the most heavily traded currency in the world, accounting for over 88% of all global foreign exchange turnover, or an average of $6.6 trillion in transactions per day, according to data from 2022.
Following the second world war, the USD took over from the British Pound as the world’s reserve currency. For most of its history, the US Dollar was backed by Gold, until the Bretton Woods Agreement in 1971 when the Gold Standard went away.
How do the decisions of the Federal Reserve impact the US Dollar?
The most important single factor impacting on the value of the US Dollar is monetary policy, which is shaped by the Federal Reserve (Fed). The Fed has two mandates: to achieve price stability (control inflation) and foster full employment. Its primary tool to achieve these two goals is by adjusting interest rates.
When prices are rising too quickly and inflation is above the Fed’s 2% target, the Fed will raise rates, which helps the USD value. When inflation falls below 2% or the Unemployment Rate is too high, the Fed may lower interest rates, which weighs on the Greenback.
What is Quantitative Easing and how does it influence the US Dollar?
In extreme situations, the Federal Reserve can also print more Dollars and enact quantitative easing (QE). QE is the process by which the Fed substantially increases the flow of credit in a stuck financial system.
It is a non-standard policy measure used when credit has dried up because banks will not lend to each other (out of the fear of counterparty default). It is a last resort when simply lowering interest rates is unlikely to achieve the necessary result. It was the Fed’s weapon of choice to combat the credit crunch that occurred during the Great Financial Crisis in 2008. It involves the Fed printing more Dollars and using them to buy US government bonds predominantly from financial institutions. QE usually leads to a weaker US Dollar.
What is Quantitative Tightening and how does it influence the US Dollar?
Quantitative tightening (QT) is the reverse process whereby the Federal Reserve stops buying bonds from financial institutions and does not reinvest the principal from the bonds it holds maturing in new purchases. It is usually positive for the US Dollar.
Suan Teck Kin, CFA, Head of Research at UOB Group, reviews the latest GDP figures in India.
Key Takeaways
India’s real GDP in the first quarter of FY23-24 (Apr-Jun quarter) expanded 7.8% y/y, the strongest in 4 quarters, accelerating from the 6.1% y/y pace in 4QFY2223. This is in line with the consensus view but ahead of our call of 7.0% forecast.
As has been the case for most of the year, private spending and investment remained the two key growth drivers, accounting for nearly 92% share of the 7.8% y/y expansion in the quarter. On the supply side, the manufacturing sector extended its momentum further from the gains in 4QFY22-23 which reversed two consecutive quarters of declines, while construction activities and services sector output expanded across the quarter.
Outlook – India’s growth started on a robust footing for fiscal 2023-24 with the robust performance in 1Q. This is in line with our view that the first half of the fiscal year was likely to benefit from positive momentum despite the central bank’s aggressive rate tightening. However, the second half of the fiscal year may be less sanguine given the renewed concerns over inflation amidst rising food prices and a potentially weak monsoon season pattern. Nonetheless, we are maintaining our GDP growth forecast for FY23-24 at 6.5% (RBI: 6.5%), slower compared to 7.2% in FY22-23. The next key event to watch will be RBI’s rate meeting scheduled for 4-6 Oct 2023.
- EUR/JPY alternates gains with losses around the 158.00 zone.
- Next on the upside comes the 2023 peak at 159.76.
EUR/JPY navigates within a narrow range around the 158.00 region on Tuesday.
The continuation of the uptrend could see the cross challenging the recent 2023 peak at near 159.76 (August 30) ahead of the key round level at 160.00. The surpass of the latter should not see any resistance level of note until the 2008 high at 169.96 (July 23).
In the meantime, the resumption of the selling pressure is expected to meet initial support at the weekly low around 157.00 (September 1), an area reinforced by the temporary 55-day SMA (157.02).
So far, the longer term positive outlook for the cross appears favoured while above the 200-day SMA, today at 148.12.
EUR/JPY daily chart
Further downside in USD/CNH should not be ruled out in the near term, comment UOB Group’s Economist Lee Sue Ann and Markets Strategist Quek Ser Leang.
Key Quotes
24-hour view: We expected USD to trade sideways in a range of 7.2460/7.2860 yesterday. USD then traded in a narrower range than expected (7.2550/7.2779). We continue to expect USD to trade sideways, even though the slightly firmer underlying tone suggests a higher range of 7.2650/7.2930.
Next 1-3 weeks: Our update from yesterday (04 Sep, spot at 7.2670) still stands. As highlighted, there is a slight increase in downside risk. However, USD must break and stay below 7.2390 before a sustained decline is likely. The chance of USD breaking clearly below 7.2390 will remain intact as long as USD stays below 7.3000 in the next few days.
- Oil (WTI) prints new yearly high at $85.70.
- US Dollar firmly stronger after the US holiday on Monday.
- The American Petroleum Institute is due to print its weekly Crude Oil numbers.
Oil is on a tear with prices soaring substantially, although the tide could be turning. After wild rumors and large numbers pencilled in for expected supply cuts from OPEC+ members, it looks like no more announcements will be made as a large deficit is projected by Goldman Sachs. This could mean that the Crude Oil price is about to see some profit-taking, but traders await further confirmation of more OPEC+ members and their possible firm commitments toward supply cuts.
Meanwhile, the US Dollar is heading higher after a very lacklustre Monday where US markets were closed for Labor Day. The Greenback is soaring on the back of weak Chinese data and several Purchase Manager Index (PMI) numbers out of Europe that are pointing to a full blown contraction in the bloc. This provides tailwinds for the US Dollar Index.
At the time of writing, Crude Oil (WTI) price trades at $84.72 per barrel and Brent Oil at $87.99.
Oil news and market movers
- India starts to pay more conventional market prices for oil as the supply out of Russia is diminishing quickly with discounts nearly gone.
- Analysts at Goldman Sachs calculated that after all the announced cuts, OPEC+ would have a 2.3 million barrels per day deficit under current demand. Some announcements might be eased lower or even be recalled.
- The fact that the European economy is further falling into contraction alongside already weak growth in China could mean less demand for Crude.
- All eyes on the American Petroleum Institute at 20:30 GMT on Tuesday for its weekly print. Previous reading was a drawdown of 11.486 million barrels. Any buildup in the stockpile could further weaken oil prices.
- Equity markets are in the red this Tuesday with China taking a turn for the worse as its Hang Seng Index drops over 2%.
Oil Technical Analysis: Test for support before next jump
Oil price takes a small step back on Tuesday after its five-day-winning streak and is under pressure from some profit-taking. With the projections from Goldman Sachs pointing to a chunky daily deficit if all cuts are being applied, the oil price could start to overheat too quickly. Should some OPEC+ participants begin to loosen their firm talk on cuts, expect to see a further unwinding of the recent peak in oil prices.
On the upside, $84.28, the high of August 10, has been broken and now should hold as support. Should WTI continue to rally on the back of lower supply and more demand, not many elements could be standing in the way of reaching that blue line at $92.80. Of course, the $90 psychological level needs to be faced first.
On the downside, a temporary bottom is being formed around $77.50, which acted as a base for this week. Should the Baker Hughes Rig Count jump substantially higher, expect to see the floor tested as more supply is bound to come online. Once bears make it through that yellow box level, expect to see more downside toward $74 before finding ample support to slow down the sell-off.
-638295009664880083.png)
WTI US OIL daily chart
WTI Oil FAQs
What is WTI Oil?
WTI Oil is a type of Crude Oil sold on international markets. The WTI stands for West Texas Intermediate, one of three major types including Brent and Dubai Crude. WTI is also referred to as “light” and “sweet” because of its relatively low gravity and sulfur content respectively. It is considered a high quality Oil that is easily refined. It is sourced in the United States and distributed via the Cushing hub, which is considered “The Pipeline Crossroads of the World”. It is a benchmark for the Oil market and WTI price is frequently quoted in the media.
What factors drive the price of WTI Oil?
Like all assets, supply and demand are the key drivers of WTI Oil price. As such, global growth can be a driver of increased demand and vice versa for weak global growth. Political instability, wars, and sanctions can disrupt supply and impact prices. The decisions of OPEC, a group of major Oil-producing countries, is another key driver of price. The value of the US Dollar influences the price of WTI Crude Oil, since Oil is predominantly traded in US Dollars, thus a weaker US Dollar can make Oil more affordable and vice versa.
How does inventory data impact the price of WTI Oil
The weekly Oil inventory reports published by the American Petroleum Institute (API) and the Energy Information Agency (EIA) impact the price of WTI Oil. Changes in inventories reflect fluctuating supply and demand. If the data shows a drop in inventories it can indicate increased demand, pushing up Oil price. Higher inventories can reflect increased supply, pushing down prices. API’s report is published every Tuesday and EIA’s the day after. Their results are usually similar, falling within 1% of each other 75% of the time. The EIA data is considered more reliable, since it is a government agency.
How does OPEC influence the price of WTI Oil?
OPEC (Organization of the Petroleum Exporting Countries) is a group of 13 Oil-producing nations who collectively decide production quotas for member countries at twice-yearly meetings. Their decisions often impact WTI Oil prices. When OPEC decides to lower quotas, it can tighten supply, pushing up Oil prices. When OPEC increases production, it has the opposite effect. OPEC+ refers to an expanded group that includes ten extra non-OPEC members, the most notable of which is Russia.
Rabobank analysts note that they have revised down the 12-month EUR/GBP forecast to 0.87 from 0.90 and explain:
Long EUR positions have started to be pared back
"Since the last ECB rate hike in late July, the market has become less sure about the chances of another policy move. While it is likely to be a close call, it has been our view for some time that the Governing Council will stand pat at the September meeting and recent soft economic data have supported this outlook. Germany’s IFO business climate survey highlighted a further deterioration in confidence in August while German and French PMI surveys were shockingly soft."
"CFTC speculators’ data highlight that net long EUR positions have started to be pared back. However, net longs remain high from a historical perspective. If the ECB keeps policy on hold next week, the EUR is likely to be vulnerable. This could trigger a move in EUR/GBP towards the bottom of its recent range at 0.85. Considering the weakness of Germany growth we have revised down our 12-month EUR/GBP forecast to 0.87 from 0.90.
Analysts at TD Securities expect the data from Australia to show a 0.2% (QoQ) growth in real Gross Domestic Product in the second quarter.
We don't foresee a huge market reaction
"We expect Q2 GDP growth to come in at +0.2% q/q, +1.6% y/y, matching the RBA's Aug SoMP forecast but below consensus (mkt: 0.4%, 1.9%), reflecting subdued growth conditions in the economy. Real retail spending will pose a drag on consumption, likely subtracting 0.1%-pt from quarterly GDP growth while a sharp drop in net exports also poses downside risk to our forecast."
"On the other hand, the jump in housing market activity could translate to a stronger construction pipeline and help to offset the weaker growth over the quarter. As the Q2 GDP growth is released after the RBA Sep meeting, we don't foresee a huge market reaction but a weaker print will strengthen our conviction that the RBA is likely to be on hold for the rest of the year."
- AUD/JPY dropped vertically after the RBA announced a steady interest rate decision.
- Investors expect that the Japanese economy grew by 1.3% in Q2, slower than the growth rate of 1.5% reported for Q1.
- AUD/JPY delivers a breakdown of the Ascending Triangle chart pattern, which opens the door for a fresh downside.
The AUD/JPY pair finds an intermediate cushion near 93.60 after a vertical fall inspired by the steady interest rate decision from the Reserve Bank of Australia (RBA). The RBA kept the Official Cash Rate (OCR) unchanged at 4.10% but warned that some further tightening of monetary policy may be required as inflation is still too high and will remain so for some time yet.
Market participants expect that the RBA is done with hiking interest rates as uncertainty over the Chinese economic outlook increases due to faltering prospects.
Meanwhile, the Japanese Yen remains on tenterhooks as investors await the April-June quarter report. As per the estimates, the Japanese economy grew by 1.3%, slower than the growth rate of 1.5% reported for Q1.
AUD/JPY delivers a breakdown of the Ascending Triangle chart pattern formed on a four-hour scale, which opens the door for a fresh downside. For the time being, the asset is expected to remain well-supported above the horizontal support plotted from July 21 low at $91.79. The 20-period Exponential Moving Average (EMA) at $94.30 continues to act as a barricade for the Australian Dollar bulls.
The Relative Strength Index (RSI) (14) skis into the bearish range of 20.00-40.00, which indicates that the bearish momentum has been activated.
Further downside below August 14 low at $93.57 would expose the asset to August 18 low at $92.79 followed by July 21 low at $91.79.
In an alternate scenario, a recovery move above the previous week's high at $95.00 will drive the asset toward July 25 high at $95.86. Breach of the latter would further drive the asset towards July 4 high at $96.83.
AUD/JPY four-hour chart
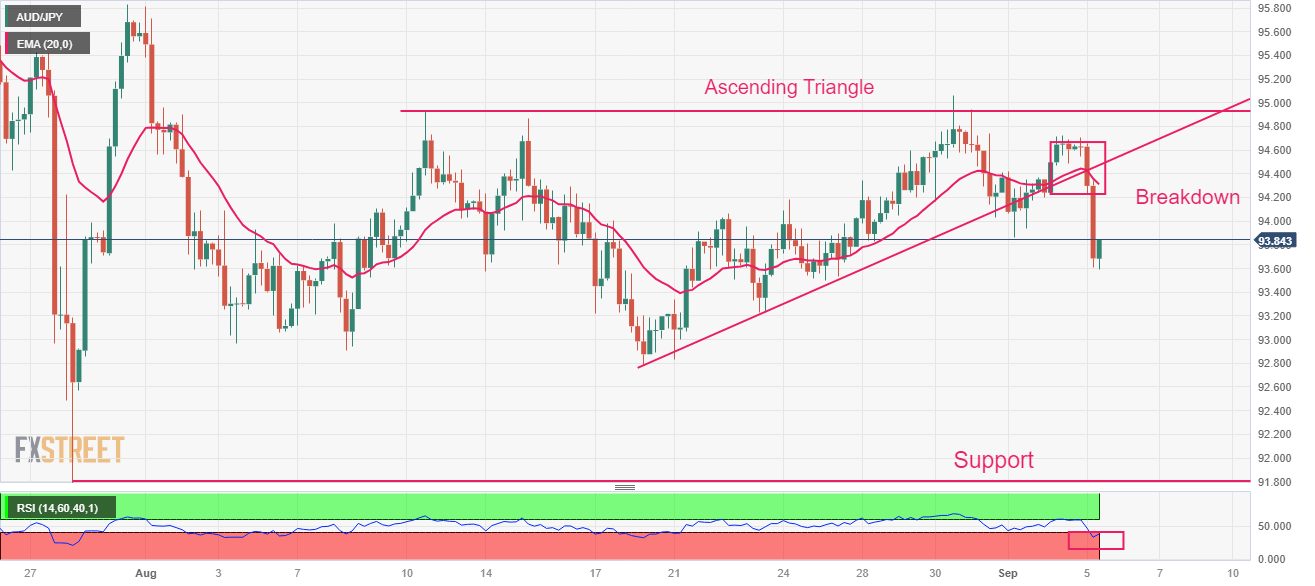
In the opinion of UOB Group’s Economist Lee Sue Ann and Markets Strategist Quek Ser Leang, USD/JPY is now seen navigating the 144.50-147.20 range.
Key Quotes
24-hour view: Yesterday, we held the view that USD could rebound further. We were also of the view that “any advance is likely part of a higher trading range of 145.40/146.80, and a clear break above 146.80 is unlikely.” However, USD did not quite rebound as it traded between 146.00 and 146.51. The underlying tone appears to be firm. Today, USD is likely to edge higher, but it is unlikely to break the major resistance at 147.20 (146.80 remains a relatively strong resistance level). On the downside, if USD breaches 146.00, it would indicate that the current mild upward pressure has subsided.
Next 1-3 weeks: Our latest narrative was from last Thursday (30 Aug, spot at 146.00). At that time, we were of the view that USD “is likely to trade in a range between 144.50 and 147.20.” On Friday, USD dropped briefly to 144.43, and then rebounded strongly. The price actions reinforce our view, and we continue to expect USD to trade in a range between 144.50 and 147.20.
- Gold price hits a four-day low as the US Dollar strengthens.
- US wage growth slows as workers become more reluctant to switch jobs frequently.
- Hopes for a soft landing are boosted as the US Unemployment Rate rose sharply to 3.8%.
Gold price (XAU/USD) consolidates its downward trend as the US Dollar remains resilient due to bearish market sentiment and steady employment growth in the US. The yellow metal faces pressure as the Federal Reserve (Fed) will likely keep interest rates higher for a longer period. The appeal for the US Dollar improves significantly as the US economy is expected to avoid a recession due to easing inflation and a stable job market.
US wage growth slowed in August as employees appear to be sticking to their current jobs due to declining confidence in the job market. After last week’s data pointed to stable job growth, slower wage growth, and broadly steady factory activity investors shifted their focus to the ISM Services PMI for August, which will be released on Wednesday. The PMI is expected to be broadly steady at 52.6 as demand for services remains resilient.
Daily Digest Market Movers: Gold price edges down on US Dollar strength
- Gold price corrects below the five-day consolidation formed in a range between $1,939 and $1,945 even though the broader bias remains positive as investors hope that the Federal Reserve is done hiking interest rates.
- According to the CME Group FedWatch Tool, there is a 60% chance that interest rates will remain unchanged at 5.25%-5.50% by year-end.
- The precious metal remains sideways due to holiday-thinned trade. US markets were closed on Monday on account of Labor Day.
- Hopes for the Fed’s soft landing were boosted on Friday as data showed that the US Unemployment Rate rose sharply to 3.8% and wage growth slowed in August, which adds to signs of a cooling labor market.
- Recent data suggests that US workers avoid switching jobs as frequently as in recent months, a sign of less confidence in the labor market. Still, Wage growth remains higher for those employees who switch jobs than for those who stay.
- Slower wage growth, and thus lower money for disposal, would slow down consumer spending momentum and ease more heat from sticky inflation.
- The US Dollar Index (DXY) hits a three-month high above 104.50. The USD looks supported by still strong labor market data in August, offsetting the fact that the Manufacturing PMI remained below the 50.0 threshold for a tenth straight month.
- In spite of significantly easing hawkish Fed bets, the US Dollar remains resilient as fears of a recession in the US economy have receded.
- Analysts at Goldman Sachs see a 15% chance that the US economy will slide into a recession as inflation cools down and job growth remains solid. Earlier, expectations of a recession in the US economy were at 20%.
- Cleveland Fed Bank President Loretta Mester said on Friday that demand and supply in the labor market is coming into a better balance but the job market is still strong. She further added that while job growth has slowed and job openings are down, the Unemployment Rate is low.
- Factory Orders data for July will remain in focus. Orders are seen contracting by 0.1% on month. In June, new orders expanded by 2.3%. The manufacturing ISM data showed last week that firms cut spending on inventory build-up and focused on improving margins.
- This week, the major focus will be on the ISM Services PMI for August, which will be published on Wednesday. The PMI is expected to be broadly steady at 52.6.
- Investors expect that the Fed will keep interest rates steady in September but the US central bank is likely to keep the doors open for further policy tightening. Investors remain mixed about whether the Fed will discuss rate cuts.
Technical Analysis: Gold price refreshes four-day low
Gold price refreshes a four-day low after a breakdown of the consolidation formed in a range of $1,939-$1,945 as the US Dollar Index extends its upside trend. The precious metal falls to near the 50-day Exponential Moving Average (EMA) at $1,932.00. Still, it remains above the 20-day EMA, which indicates that the short-term trend is bullish.
The Relative Strength Index (RSI) struggles to climb into the bullish range of 60.00-80.00. If the index does reach these levels, it will activate the bullish impulse.
US Dollar FAQs
What is the US Dollar?
The US Dollar (USD) is the official currency of the United States of America, and the ‘de facto’ currency of a significant number of other countries where it is found in circulation alongside local notes. It is the most heavily traded currency in the world, accounting for over 88% of all global foreign exchange turnover, or an average of $6.6 trillion in transactions per day, according to data from 2022.
Following the second world war, the USD took over from the British Pound as the world’s reserve currency. For most of its history, the US Dollar was backed by Gold, until the Bretton Woods Agreement in 1971 when the Gold Standard went away.
How do the decisions of the Federal Reserve impact the US Dollar?
The most important single factor impacting on the value of the US Dollar is monetary policy, which is shaped by the Federal Reserve (Fed). The Fed has two mandates: to achieve price stability (control inflation) and foster full employment. Its primary tool to achieve these two goals is by adjusting interest rates.
When prices are rising too quickly and inflation is above the Fed’s 2% target, the Fed will raise rates, which helps the USD value. When inflation falls below 2% or the Unemployment Rate is too high, the Fed may lower interest rates, which weighs on the Greenback.
What is Quantitative Easing and how does it influence the US Dollar?
In extreme situations, the Federal Reserve can also print more Dollars and enact quantitative easing (QE). QE is the process by which the Fed substantially increases the flow of credit in a stuck financial system.
It is a non-standard policy measure used when credit has dried up because banks will not lend to each other (out of the fear of counterparty default). It is a last resort when simply lowering interest rates is unlikely to achieve the necessary result. It was the Fed’s weapon of choice to combat the credit crunch that occurred during the Great Financial Crisis in 2008. It involves the Fed printing more Dollars and using them to buy US government bonds predominantly from financial institutions. QE usually leads to a weaker US Dollar.
What is Quantitative Tightening and how does it influence the US Dollar?
Quantitative tightening (QT) is the reverse process whereby the Federal Reserve stops buying bonds from financial institutions and does not reinvest the principal from the bonds it holds maturing in new purchases. It is usually positive for the US Dollar.
Economists at ABN Amro note that China’s Manufacturing PMIs improved in August, narrowing the gap between services and manufacturing.
Key quotes
“China’s PMIs for August published over the past couple of days bring some signs of stabilization, with the manufacturing PMIs surprising to the upside. For the first time since February, both manufacturing PMIs published by NBS and Caixin picked up from the previous month.”
“Earlier this year, the services PMIs in both the official and Caixin’s survey showed a big jump, as the services sectors benefited the most from the zero-Covid exit initiated in December 2022.“
“As a result, the divergence between services and manufacturing PMIs rose to multi-year highs in the first part of this year.”
“However, with the reopening rebound fading, services PMIs have come down over the past months, and – also with manufacturing PMIs now bottoming out – the gap between services and manufacturing PMIs has narrowed rapidly.”
- WTI Crude oil trades lower due to the reduction in the Chinese services economy.
- Market optimism buoyed by China’s fiscal measures has strengthened oil prices.
- OPEC+ is expected to extend production cuts through the end of 2023.
Western Texas Intermediate (WTI) Crude oil trades lower around $84.80 during the European session on Tuesday. The price of black gold is experiencing downward pressure due to the reduction in the Chinese services economy. China’s downbeat Caixin Services PMI for August declined to the reading of 51.8 from 54.1 prior.
The data report bolsters the fears about gloomy economic conditions in the world's second-largest economy, which weighs on Oil prices. However, the black gold cheered China's stimulus measures. Indeed, China's commitment to opening up its services sector, along with improvements in manufacturing, forms part of a comprehensive strategy to lower mortgage rates and infuse additional liquidity into the economy to support the prices of Crude oil.
Organization of the Petroleum Exporting Countries (OPEC) and its allies (OPEC+) are expected to extend production cuts through the end of 2023. Additionally, there is widespread expectation that Saudi Arabia, the world's leading oil exporter, will continue its voluntary reduction of 1 million barrels per day (bpd) for a fourth consecutive month into October.
Additionally, Russian Deputy Prime Minister Alexander Novak has announced that Moscow agrees with OPEC+ partners regarding the terms for ongoing output cuts in October. Investors expect more details to be revealed this week, seeking more cues on the deal.
- A combination of factors prompts aggressive selling around AUD/USD on Tuesday.
- Weaker Chinese data and the RBA’s on-hold rate decision undermine the Aussie.
- The USD advances to over a three-month peak and contributes to the steep fall.
The AUD/USD pair comes under intense selling pressure on Tuesday and extends its steep intraday downfall through the first half of the European session. The momentum drags spot prices to the 0.6370 area, back closer to the YTD low touched in August, and is sponsored by a combination of factors.
The Australian Dollar (AUD) started weakening after a private survey showed that business activity in China's services sector expanded at its slowest pace in eight months. In fact, the Caixin/S&P Global Services PMI dropped from 54.1 to 51.8 in August, registering the lowest reading since December 2022 and reviving concerns about the worsening conditions in the world's second-largest economy. This, in turn, tempers investors' appetite for riskier assets, which, along with the Reserve Bank of Australia's (RBA) on-hold decision, prompt aggressive selling around the AUD/USD pair.
As was widely anticipated, the Australian central bank decided to stick to its wait-and-see stance and left the Official Cash Rate (OCR) unchanged at 4.10% for the third straight month. In the accompanying monetary policy statement, the RBA reiterated that some further tightening may still be needed to curb inflation, which remains on track to reach the 2-3% target range by mid-2025. The pause, along with the lack of fresh hawkish signals, fuels speculations that the policy tightening cycle might be over and does little to impress bullish traders or lend any support to the AUD/USD pair.
Tuesday's sharp decline could further be attributed to resurgent US Dollar (USD) demand, bolstered by growing acceptance that the Federal Reserve (Fed) will keep interest rates higher for longer. Despite signs that labour market conditions in the US were easing, the markets are still pricing in the possibility of one more 25 bps Fed rate hike move by the end of this year. This, in turn, triggers a fresh leg up in the US Treasury bond yields and pushes the USD to over a three-month high, which further contributes to the heavily offered tone surrounding the AUD/USD pair.
Apart from the aforementioned fundamental factors, a sustained break through an ascending trend-line, extending from the YTD low, aggravates the bearish pressure. Moreover, acceptance below the 0.6400 round-figure mark could be seen as a fresh trigger for bearish traders and suggests that the path of least resistance for the AUD/USD pair is to the downside. That said, the extremely oversold Relative Strength Index (RSI) on hourly charts makes it prudent to wait for some intraday consolidation before traders start positioning for any further depreciating move.
Technical levels to watch
The European Central Bank’s (ECB) monthly survey of consumer expectations for inflation showed on Tuesday, inflation expectations among Eurozone consumers remained unchanged in July.
Additional takeaways
“Median consumer inflation expectations for the next 12 months were unchanged, while those for three years ahead edged up.”
“Expectations for nominal income growth over the next 12 months declined slightly, but expectations for nominal spending growth remained unchanged.”
“Expectations for economic growth over the next 12 months became slightly more negative, however the expected unemployment rate in 12 months' time was unchanged.”
“Expectations for growth in the price of homes over the next 12 months remained unchanged, while expectations for mortgage interest rates 12 months ahead increased slightly; the share of respondents reporting that they applied for credit in the previous three months increased compared with April.”
Market reaction
EUR/USD is challenging intraday lows near 1.0740, weighed further down by the survey findings amidst a fresh leg higher in the US Dollar. The pair is currently trading at 1.0749, down 0.42% on the day.
Analysts at TD Securities (TDS) expect the Reserve Bank of Australia (RBA) is unlikely to hike interest rates further, though still see the possibility of an insurance hike in November. Earlier this Tuesday, the Australian central bank decided to stick to the wait-and-see stance and left its benchmark interest rate unchanged for the third straight month.
Key Quotes:
“The RBA kept the cash rate on hold at 4.10% as was widely anticipated by the analyst and trading community. Of more interest for markets was the tone of the Bank's commentary, in particular the last paragraph. As we expected, the Bank reiterated its conditional tightening bias."
“Despite the conditional tightening bias, our sense was that it was diluted at the margin. While the Bank continues to focus on assessing the lagged impact of rate hikes delivered so far, we read a touch more emphasis on downside risks regarding the uncertainty around the economic outlook.”
“On the labour market, it's no longer 'very tight', but 'tight'. On growth the Bank reiterated its outlook for growth to be sub-trend, but based on data so far 'growth has slowed'. Further, the Bank referred to increased uncertainty around the Chinese economy as a factor weighing on the outlook.”
“Our read is the RBA will continue to assess the outlook for the cash rate meeting by meeting, but we don't see the RBA in a rush to hike. We retain our call for no further RBA hikes but don't rule out the possibility of an insurance hike in November after Q3 CPI is released in late October, or should inflation offshore resume its trek higher.”
Further consolidation still remains in store for NZD/USD for the time being, note UOB Group’s Economist Lee Sue Ann and Markets Strategist Quek Ser Leang.
Key Quotes
24-hour view: Our expectation for NZD to trade with a downward bias did not materialise, as it traded sideways between 0.5933 and 0.5960 before closing largely unchanged at 0.5940 (-0.03%). Flat momentum indicators suggest NZD might continue to trade sideways, likely between 0.5920 and 0.5960.
Next 1-3 weeks: There is not much to add to our update from yesterday (04 Sep, spot at 0.5945). As highlighted, the recent upward pressure has faded, and NZD is likely to trade between 0.5890 and 0.6015 for now.
- USD/CAD rallies to over a four-month top and draws support from a combination of factors.
- Retreating Crude Oil prices undermines the Loonie and acts as a tailwind amid a bullish USD.
- Technical buying above the 1.3600 mark also contributes to the strong positive momentum.
The USD/CAD pair catches aggressive bids following the previous day's subdued/range-bound price action and jumps to its highest level since April 28 during the early European session on Tuesday. Spot prices currently trade just above mid-1.3600s, up over 0.50% for the day, and seem poised to prolong the recent upward trajectory witnessed over the past month or so.
Crude Oil prices retreat from the YTD peak and undermine the commodity-linked Loonie, which, along with the emergence of fresh US Dollar (USD) buying, provides a goodish lift to the USD/CAD pair. Weaker Chinese data revived concerns that the worsening conditions in the world's second-largest economy will dent fuel demand. This overshadows expectations that OPEC+ will extend output cuts to the end of the year and weighs on the black liquid.
Meanwhile, China's slow approach to rolling out more stimulus measures tempers investors' appetite for riskier assets, which is evident from the prevalent cautious mood around the equity markets. Apart from this, expectations that the Federal Reserve (Fed) will keep interest rates higher for longer, reinforced by a fresh leg up in the US Treasury bond yields, acts as a tailwind for the safe-haven buck and contributes to the USD/CAD pair's strong move up.
Despite signs that labour market conditions in the US were easing, the markets are still pricing in the possibility of one more 25 bps Fed rate hike move by the end of this year. The bets were lifted following the hotter-than-expected release of inflation data from South Korea, Thailand and the Philippines. This, in turn, pushes the USD Index (DXY), which tracks the Greenback against a basket of currencies, to over a three-month high and favours the USD/CAD bulls.
Even from a technical perspective, acceptance above the 1.3600 mark and a subsequent strength beyond the 1.3635-1.3640 hurdle validate the near-term positive outlook. That said, the Relative Strength Index (RSI) is flashing overbought conditions on hourly charts and warrants some caution before placing fresh bullish bets. Nevertheless, the aforementioned fundamental backdrop suggests that the path of least resistance for the USD/CAD pair is to the upside.
Technical levels to watch
- USD/CHF holds ground above 0.8850 on the back of recovery in the Greenback.
- MACD suggests that recent momentum is stronger; regains August’s highest level.
- 21-day EMA emerges as the key support lined up with 23.6% Fibo at 0.8799.
USD/CHF snaps the previous day’s losses, trading higher around 0.8870 during the early trading hours in the European session on Tuesday. The pair experiences upward support due to the firmer US Dollar (USD) and Swiss downbeat Gross Domestic Product (GDP) for the second quarter (Q2) of 2023.
As said, the Swiss GDP reduced to 0.0% against the market consensus of 0.1%, which was recorded at 0.3% in the previous quarter. Additionally, the Greenback strengthens as investors appear to accept the potential nearing end of the interest rate-hike cycle by the US Federal Reserve (Fed).
The Moving Average Convergence Divergence (MACD) line remains above the centerline and the signal line, which indicates that recent momentum is stronger.
The pair could face a challenge around August’s high at 0.8876 level, followed by the 0.8900 psychological level.
On the flip side, the 21-day Exponential Moving Average (EMA) at 0.8807 could act as the immediate support, lined up with the 0.8800 psychological level and 23.6% Fibonacci retracement at 0.8799.
A firm break below the latter could open the doors for the USD/CHF pair to navigate the area around the 0.8750 psychological level.
In the short term, the USD/CHF pair remains to be bullish as long as the 14-day Relative Strength Index (RSI) stays above 50.
USD/CHF: Daily Chart
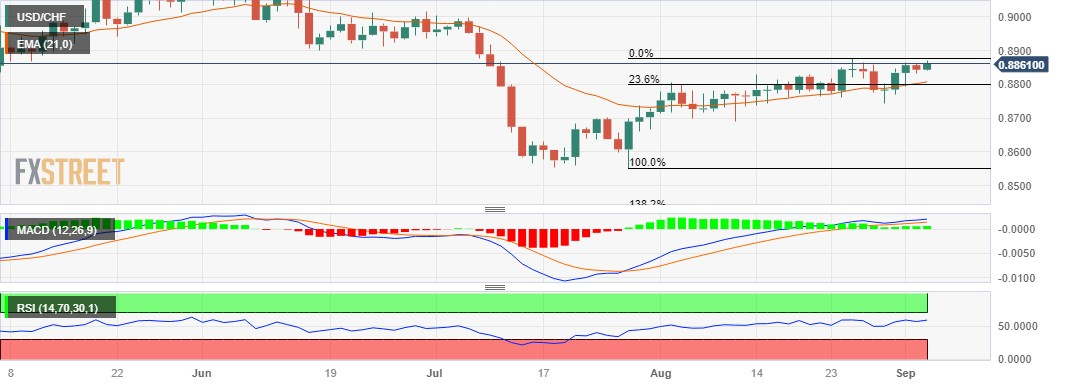
- The Euro resumes its decline vs. the US Dollar.
- Stocks in Europe open Tuesday’s session in the red.
- EUR/USD challenges the 1.0750 region, or multi-week lows.
- The USD Index (DXY) advanced to three-month tops.
- US markets return to their usual activity following Monday’s holiday.
- The final Services PMIs are due in the euro area.
- The ECB will release its Consumer Expectation Survey.
- The ECB’s Schnabel, De Guindos, Fernandez-Bollo are due to speak.
The Euro (EUR) loses further ground vs. the US Dollar (USD) and drags EUR/USD to print new multi-week lows near the 1.0750 level on turnaround Tuesday. The resurgence of selling pressure around the pair appears underpinned by lower prints from the Services sector in China, as per PMI results published by Caixin earlier in the Asian trading hours.
The investors’ bias towards the safe-have universe lends support to the Greenback early in the European morning and lifts the USD Index (DXY) to new highs around 104.50 amidst the still unclear direction in US and German yields.
Meanwhile, there remains strong confidence in the market regarding the Federal Reserve's decision to halt its campaign of interest rate hikes for the remainder of the year. In addition, speculation has begun to emerge, suggesting that interest rate cuts may not materialize until March 2024.
On the other hand, the European Central Bank (ECB) finds itself navigating a climate of heightened uncertainty surrounding the potential course of interest rates beyond the summer months. Market discussions revolve around the concept of stagflation, further contributing to the prevailing sense of ambiguity.
In the domestic calendar, the release of the final Services PMI for the month of August is followed by the publication of the ECB’s Consumer Expectations Survey and speeches by Board members Eduardo Fernandez-Bollo, Isabel Schnabel, and Luis De Guindos.
Daily digest market movers: Euro suffers another bout of weak Chinese prints
- The EUR faces extra headwinds vs. the USD on Tuesday.
- Chinese Caixin Services/Composite PMIs weakened in August.
- The Services sector will take centre stage in the euro docket.
- Disinflation and cracks in the US labour market support the Fed’s impasse.
- Investors see the Fed potentially cutting rates in Q2 2024.
- The RBA left the OCR unchanged at 4.10%, as expected.
Technical Analysis: Euro risks a drop to 1.0635
EUR/USD remains well under pressure and the recent breach of the key 200-day SMA (1.0819) seems to prop up the likelihood of extra losses in the short-term horizon.
If EUR/USD accelerates its losses, it could revisit the May low of 1.0635 (May 31) prior to the March low of 1.0516 (March 15). The loss of the latter could prompt a potential test of the 2023 low at 1.0481 (January 6) to emerge on the horizon.
On the upside, spot is now expected to target the critical 200-day SMA at 1.0819. North from here, bulls should meet the the weekly top of 1.0945 (August 30) ahead of the interim 55-day SMA at 1.0958 and prior to the psychological 1.1000 barrier and the August top at 1.1064 (August 10). Once the latter is cleared, spot could challenge the weekly peak at 1.1149 (July 27). If the pair surpasses this region, it could alleviate some of the downward pressure and potentially visit the 2023 peak of 1.1275 (July 18). Further up comes the 2022 high at 1.1495 (February 10), which is closely followed by the round level of 1.1500.
Furthermore, sustained losses are likely in EUR/USD once the 200-day SMA is breached in a convincing fashion.
Euro FAQs
What is the Euro?
The Euro is the currency for the 20 European Union countries that belong to the Eurozone. It is the second most heavily traded currency in the world behind the US Dollar. In 2022, it accounted for 31% of all foreign exchange transactions, with an average daily turnover of over $2.2 trillion a day.
EUR/USD is the most heavily traded currency pair in the world, accounting for an estimated 30% off all transactions, followed by EUR/JPY (4%), EUR/GBP (3%) and EUR/AUD (2%).
What is the ECB and how does it impact the Euro?
The European Central Bank (ECB) in Frankfurt, Germany, is the reserve bank for the Eurozone. The ECB sets interest rates and manages monetary policy.
The ECB’s primary mandate is to maintain price stability, which means either controlling inflation or stimulating growth. Its primary tool is the raising or lowering of interest rates. Relatively high interest rates – or the expectation of higher rates – will usually benefit the Euro and vice versa.
The ECB Governing Council makes monetary policy decisions at meetings held eight times a year. Decisions are made by heads of the Eurozone national banks and six permanent members, including the President of the ECB, Christine Lagarde.
How does inflation data impact the value of the Euro?
Eurozone inflation data, measured by the Harmonized Index of Consumer Prices (HICP), is an important econometric for the Euro. If inflation rises more than expected, especially if above the ECB’s 2% target, it obliges the ECB to raise interest rates to bring it back under control.
Relatively high interest rates compared to its counterparts will usually benefit the Euro, as it makes the region more attractive as a place for global investors to park their money.
How does economic data influence the value of the Euro?
Data releases gauge the health of the economy and can impact on the Euro. Indicators such as GDP, Manufacturing and Services PMIs, employment, and consumer sentiment surveys can all influence the direction of the single currency.
A strong economy is good for the Euro. Not only does it attract more foreign investment but it may encourage the ECB to put up interest rates, which will directly strengthen the Euro. Otherwise, if economic data is weak, the Euro is likely to fall.
Economic data for the four largest economies in the euro area (Germany, France, Italy and Spain) are especially significant, as they account for 75% of the Eurozone’s economy.
How does the Trade Balance impact the Euro?
Another significant data release for the Euro is the Trade Balance. This indicator measures the difference between what a country earns from its exports and what it spends on imports over a given period.
If a country produces highly sought after exports then its currency will gain in value purely from the extra demand created from foreign buyers seeking to purchase these goods. Therefore, a positive net Trade Balance strengthens a currency and vice versa for a negative balance.
Here is what you need to know on Tuesday, September 5:
Following Monday's choppy action, markets seem to have turned cautious early Tuesday. The Australian Dollar stays under heavy bearish pressure following the Reserve Bank of Australia's (RBA) policy announcements and the US Dollar benefits from the risk-averse atmosphere. S&P Global will release revisions to August PMI data, Eurostat will publish Producer Price Index (PPI) data for July and the US economic docket will feature July Factory Orders later in the day.
Following the September monetary policy meeting, the RBA announced that it left the policy rate - the Official Cash Rate (OCR) - unchanged at 4.10%, as widely expected. The bank reiterated that "some further tightening of monetary policy may be required," in its policy statement and noted that higher interest rates are working to establish a "more sustainable balance" between supply and demand. AUD/USD turned south following the RBA event and was last seen losing 1.3% on a daily basis at 0.6375.
Australian Dollar price today
The table below shows the percentage change of Australian Dollar (AUD) against listed major currencies today. Australian Dollar was the weakest against the US Dollar.
| USD | EUR | GBP | CAD | AUD | JPY | NZD | CHF | |
| USD | 0.26% | 0.37% | 0.40% | 1.26% | 0.27% | 0.92% | 0.22% | |
| EUR | -0.27% | 0.13% | 0.15% | 1.02% | 0.02% | 0.68% | -0.03% | |
| GBP | -0.39% | -0.11% | 0.02% | 0.89% | -0.10% | 0.55% | -0.16% | |
| CAD | -0.42% | -0.15% | -0.02% | 0.85% | -0.10% | 0.55% | -0.17% | |
| AUD | -1.27% | -1.03% | -0.90% | -0.87% | -1.00% | -0.34% | -1.06% | |
| JPY | -0.26% | 0.00% | 0.12% | 0.15% | 1.01% | 0.67% | -0.04% | |
| NZD | -0.96% | -0.65% | -0.56% | -0.49% | 0.38% | -0.66% | -0.66% | |
| CHF | -0.22% | 0.02% | 0.18% | 0.17% | 1.03% | 0.04% | 0.69% |
The heat map shows percentage changes of major currencies against each other. The base currency is picked from the left column, while the quote currency is picked from the top row. For example, if you pick the Euro from the left column and move along the horizontal line to the Japanese Yen, the percentage change displayed in the box will represent EUR (base)/JPY (quote).
Meanwhile, the data from China showed that Caixin Services PMI declined to 51.8 in August from 54.1, reviving concerns over a slowdown in the Chinese economy. Reflecting the souring market mood, the Shanghai Composite Index fell nearly 1% and the Hang Seng Index lost close to 2%.
Following a three-day weekend, US stock index futures were down 0.3% at the time of press. The US Dollar Index was trading at its highest level since late May near 104.50 and the 10-year US Treasury bond yield was flat near 4.2%.
Pressured by the renewed USD strength, EUR/USD started to stretch lower in the early European morning and was last seen trading near 1.0770.
GBP/USD closed the first day of the week in positive territory but retreated back below 1.2600 early Tuesday, erasing all the gains it registered on Monday.
USD/JPY gained traction early Tuesday and advanced to the 147.00 area. Jibun Bank Services PMI in Japan came in at 54.3, matching the flash estimate and the market expectation.
Gold price closed flat near $1,940 on Monday but came under modest bearish pressure early Tuesday, with the 10-year US Treasury bond yield holding steady following the upsurge seen on Friday.
- Silver remains under heavy selling pressure for the fifth straight day on Tuesday.
- A sustained break below the 200-period SMA on the 4-hour chart favours bears.
- The oversold RSI on hourly charts makes it prudent to wait for some consolidation.
Silver prolongs last week's rejection slide from the $25.00 psychological mark, or over a one-month peak and continues to lose ground for the fifth successive day on Tuesday. The downfall remains uninterrupted through the early European session and drags the white metal to a two-week low, around the $23.65 region in the last hour.
From a technical perspective, sustained break and acceptance below the $23.80-$23.75 area, representing the 200-period Simple Moving Average (SMA) on the 4-hour chart could be seen as a fresh trigger for bearish traders. Moreover, oscillators on the daily chart have just started gaining negative traction and support prospects for a further near-term depreciating move. That said, the Relative Strength Index (RSI) on hourly charts is flashing oversold conditions and might assist the XAG/USD to consolidate near current levels, representing the 50% Fibonacci retracement level of $22.25-$25.00 rally.
A convincing break below, however, will make silver vulnerable to accelerate the fall towards the 61.8% Fibo. level, around the $23.30-$23.25 region en route to the $23.00 round-figure mark. The downward trajectory could get extended further and drag the XAG/USD further below the $22.65-$22.60 area, towards challenging a strong horizontal support near the $22.20-$22.10 zone.
On the flip side, the 200-period SMA breakpoint, around the $23.75-$23.80 region, now seems to act as an immediate barrier ahead of the $24.00 round-figure mark. The latter represents the 38.2% Fibo. level, above which a bout of a short-covering move has the potential to lift the XAG/USD towards the 23.6% Fibo. level, around the $24.30-$24.35 area. Some follow-through buying might expose a four-month-old descending trend line resistance, currently near the $24.70-$24.75 zone. A sustained breakthrough, leading to a subsequent strength beyond the $25.00 mark, might shift the bias in favour of bullish traders.
Silver 4-hour chart
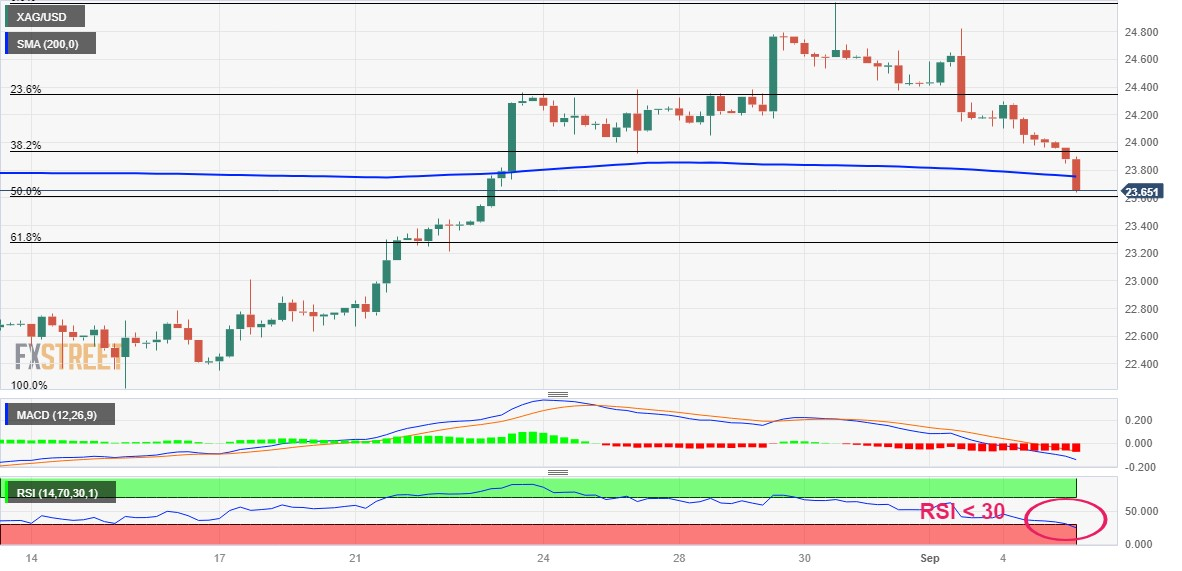
Technical levels to watch
- USD/MXN gains traction for the fourth consecutive day on Tuesday.
- The immediate resistance level is located at the 17.30-17.35 region; the initial support is seen at the 17.00-17.05 zone.
- Relative Strength Index (RSI) stands above 50, within bullish territory.
The Mexican Peso (MXN) extends its downside against the US Dollar (USD) during the early European session on Tuesday as the Bank of Mexico will reduce its currency hedging program to tame volatility in the market. USD/MXN currently trades near 17.25, gaining 0.45% on the day.
According to the daily chart, USD/MXN holds below the key 100-day Exponential Moving Average (EMA) which means further downside looks favorable. Therefore, the pair could meet the immediate resistance level of the 17.30-17.35 region, representing the upper boundary of the Bollinger Band and the 100-day EMA. The additional upside filter to watch is near a psychological round mark and a high of May 24 at 18.00. Further north, the next barrier is seen at 18.20 (a high of April 27) and finally at 18.40 (a high of April 5).
On the flip side, the initial support level is located at the 17.00-17.05 region. The mentioned level is a confluence of the midline of Bollinger Band, a psychological round figure, and the 50-day EMA. Any extended weakness below the latter will challenge the critical contention at the 16.60-16.70 region, portraying the lower limit of the Bollinger Band and a Year-To-Date (YTD) low. Further south, the pair will see a drop to a psychological round figure at 16.00.
It’s worth noting that the Relative Strength Index (RSI) stands above 50, within bullish territory, suggesting that buyers will likely retain control soon.
USD/MXN daily chart

- EUR/GBP picks up bids to reverse week-start losses.
- ECB policymakers flash mixed signals but push back rates cuts and help Euro to stay firmer.
- Mixed UK spending data, fears about British recession keeps pair buyers hopeful.
- Eurozone PPI, ECB’s Lagarde and UK PMIs will be important for fresh impulse.
EUR/GBP remains on the front foot around 0.8550 as it reverses the week-start losses heading amid the early hours of the European session on Tuesday. In doing so, the cross-currency pair struggles to justify the European Central Bank (ECB) statements amid mixed signals from the UK spending clues. Also likely to challenge the pair traders is the cautious mood ahead of the key data from the Eurozone and the UK, not to forget ECB President Christine Lagarde’s speech.
The Irish Business Publication, The Currency, recently shared details of the August 31 interview with ECB Chief Economist Phillip Lane where the policymaker praised softening in the August inflation data but cited the need for sustained easing in inflation to defend the policy doves.
That said, ECB President Christine Lagarde highlighted the need for central banks to keep the inflation expectations firmly anchored on Monday. On the same line was the President of the Deutsche Bundesbank and the ECB Council Member Joachim Nagel who advocated for price stability while hesitating from further details.
Elsewhere, Reuters came out with the Barclay Card data while saying, “Annual growth in the UK consumer spending on credit and debit cards slowed to 2.8% in August from 4.0% in July.” However, the UK’s BRC Like-for-Like Retail Sales grew 4.3% YoY for August versus 1.8% prior.
While the British spending details are mixed, a suggestion from the UK Think Tank to infuse more liquidity into the UK capital markets with pensions seems to lure the Bank of England (BoE) hawks, due to the likely lift to the inflation, which in turn lures the EUR/GBP bears.
However, a confirmation from the Eurozone Producer Price Index (PPI) for July, US Factory Orders for the said month and a speech from ECB’s Lagarde become necessary for clear directions. Above all, Thursday’s Bank of England (BoE) Monetary Policy Report Hearings will be crucial for traders to watch to watch as the hawkish bias about the UK central bank recedes of late.
Technical analysis
A two-month-old bullish triangle formation, currently between 0.8510 and 0.8630, keeps the EUR/USD pair buyers hopeful.
- NZD/USD trades lower around 0.5880 after China’s downbeat Caixin Services PMI.
- Moderate jobs data contribute to support the US Dollar (USD).
- Investors seem to accept the nearing end of the rate-hike cycle by the Fed.
- China’s Country Garden made delayed interest payments, avoiding an immediate default.
NZD/USD extends its losing streak for the third consecutive day, trading lower around 0.5890 during the Asian session on Tuesday. The pair is experiencing downward pressure due to China’s downbeat Caixin Services PMI for August, which declined to the reading of 51.8 from 54.1 prior. The report reinforces worries about deteriorating economic conditions in the world's second-largest economy, which exerts downward pressure on the NZD/USD pair.
Additionally, the moderate labor growth in August and the recovery in US Treasury yields helped the buck to maintain its strength against the New Zealand Dollar (NZD).
The Kiwi pair was not able to cheer the market optimism due to China's stimulus measures and positive developments surrounding the Country Garden. China's largest property developer informed its creditors on Tuesday that it had successfully made a delayed interest payment. This will avoid an immediate default on its debts and ensure the company's financial viability, at least for the time being.
US Dollar Index (DXY), which measures the Greenback against the basket of six major currencies, trades higher around 104.30 at the time of writing.
Moreover, investors appear to accept the potential approach of the end of the rate-hike cycle by the US Federal Reserve (Fed). This sentiment could encourage sellers of the NZD/USD pair to enter the market and weaken the currency pair further.
Market participants expect that the Fed will keep interest rates unchanged during its policy meeting in September due to modest jobs data. Also, Federal Reserve Bank of Cleveland President Loretta J. Mester expressed support for the Fed's hawkish stance and dismissed any inclination towards rate cuts in a speech on Friday.
Market participants will likely watch the release of US Factory Orders (Jul) scheduled to be released later in the North American session. On Wednesday, US ISM Services PMI (Aug) will be eyed as it could provide valuable guidance to track the Greenback’s trajectory.
While further retracements in GBP/USD appear on the cards in the near term, there is a strong support around the 1.2545 level, according to UOB Group’s Economist Lee Sue Ann and Markets Strategist Quek Ser Leang.
Key Quotes
24-hour view: Our view for GBP to weaken further was incorrect, as it rose to a high of 1.2638 before settling at 1.2629 (+0.31%). Despite the advance, there is no significant increase in momentum, and GBP is unlikely to rise much further. Today, GBP is more likely to trade in a range of 1.2595/1.2655.
Next 1-3 weeks: We maintain the same view as yesterday (04 Sep, spot at 1.2590). As highlighted, the risk for GBP appears to have shifted to the downside. However, as downward momentum is only beginning to build, any weakness is likely to face solid support at 1.2500 (there is another strong support at 1.2545). Resistance-wise, if GBP breaks above 1.2680, it would mean that the momentum buildup has faded
FX option expiries for Sept 5 NY cut at 10:00 Eastern Time, via DTCC, can be found below.
- EUR/USD: EUR amounts
- 1.0695 450m
- 1.0725 350m
- 1.0840 916m
- GBP/USD: GBP amounts
- 1.2500 335m
- USD/JPY: USD amounts
- 145.00 524m
- 145.15 400m
- USD/CHF: USD amounts
- 0.8885 380m
- AUD/USD: AUD amounts
- 0.6510 384m
- 0.6515 640m
- USD/CAD: USD amounts
- 1.3545 454m
- 1.3600 526m
- 1.3750 941m
- The index resumes the upside and revisits 104.30.
- US markets return to the activity following Monday holiday.
- Factory Orders will be in the limelight later in the NA session.
The USD Index (DXY), which tracks the greenback vs. a bundle of its main rival currencies, manages to pick up some pace and reclaim the 104.30 region on Tuesday.
USD Index retargets the 104.50 zone
The index leaves behind Monday’s small pullback and flirts with the 104.30 region on turnaround Tuesday amidst a mild improvement in the risk-off sentiment.
As US markets return to the normal activity following Monday’s Labor Day holiday, investors continue to assess the increasing likelihood that the Federal Reserve might start cutting rates around Q2 2024.
This view seems to be behind the drop in US yields across different maturities sparked in the latter part of August.
In addition, from the speculative community, net longs in USD dropped to three-week lows during the week ended on August 29 according to CFTC. During that period, the index climbed to fresh multi-week tops near 104.50 on the back of further evidence of the resilience surrounding the US economy.
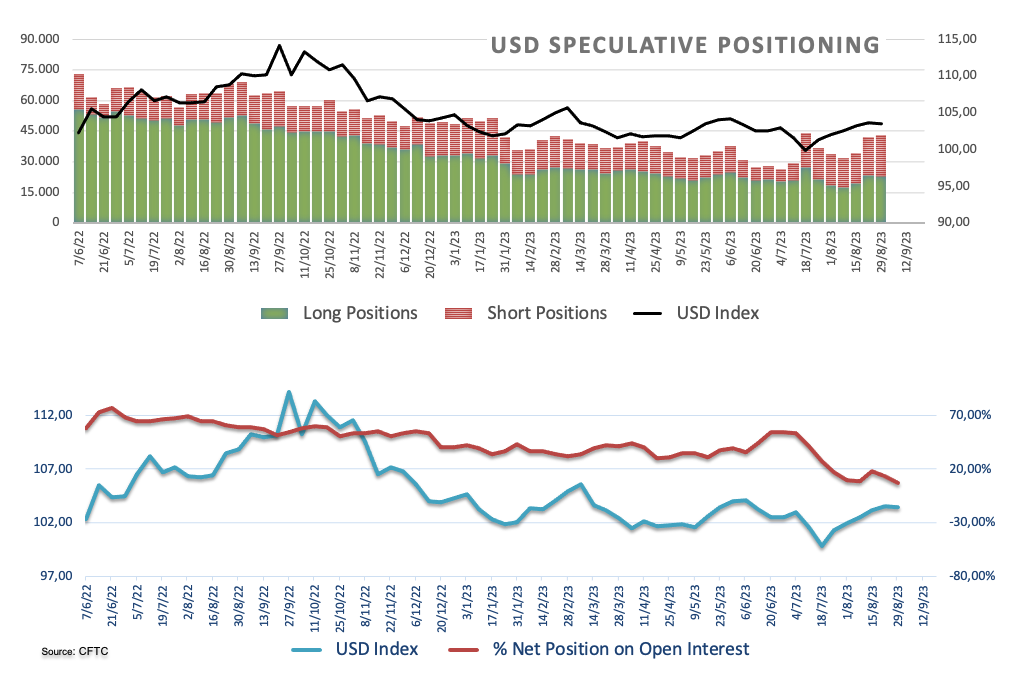
Data-wise in the US docket, Factory Orders will be the only scheduled release on Tuesday.
What to look for around USD
The recent strong recovery in the index seems to have met some initial up barrier near the 104.50 region so far.
In the meantime, support for the dollar keeps coming from the good health of the US economy, which seems to have reignited the narrative around the tighter-for-longer stance from the Federal Reserve.
Running on the opposite side of the road, the idea that the dollar could face headwinds in response to the data-dependent stance from the Fed against the current backdrop of persistent disinflation and cooling of the labour market appears to have regained some traction as of late.
Key events in the US this week: Factory Orders (Tuesday) – MBA Mortgage Applications, Balance of Trade, Final S&P Global Services PMI, ISM Services PMI, Fed Beige Book (Wednesday) – Initial Jobless Claims (Thursday) – Wholesale Inventories, Consumer Credit Change (Friday).
Eminent issues on the back boiler: Persistent debate over a soft or hard landing for the US economy. Incipient speculation of rate cuts in H1 2024. Geopolitical effervescence vs. Russia and China.
USD Index relevant levels
Now, the index is gaining 0.29% at 104.40 and the next hurdle comes at 104.44 (monthly high August 25) ahead of 104.69 (monthly high May 31) and finally 105.88 (2023 high March 8). On the flip side, the breach of 103.03 (200-day SMA) would open the door to 102.93 (weekly low August 30) and then 102.46 (55-day SMA).
- AUD/USD takes offers to refresh weekly low, prods short-term key support line.
- Unimpressive RBA verdict, US Dollar’s rebound favor Aussie pair sellers.
- Clear downside break of 10-DMA, U-turn from important resistance zone add strength to bearish bias.
11-month-old rising support line, below-50.0 RSI will test sellers during further dominance.
AUD/USD stands on slippery grounds as it refreshes the weekly low around 0.6395 during early Tuesday in Europe. In doing so, the Aussie pair justifies the Reserve Bank of Australia’s (RBA) inaction, as well as a cautious view about the economic growth and inflation conditions.
Technically, the risk barometer pair extends the early-day break of the 10-DMA as sellers attack a two-week-long rising support line.
It’s worth noting that the quote’s inability to cross the levels marked in late May and early June, around 0.6500 joins the looming bear cross on the MACD to also keep the AUD/USD sellers hopeful of breaking the immediate support line surrounding 0.6400.
However, the below-50.0 levels of the RSI (14) line suggest bottom-picking of the Aussie pair and hence highlights an upward-sloping support line from October 2022, close to 0.6370 at the latest, as an important support to watch. Also acting as the downside filter is the previous monthly low of around 0.6365.
Alternatively, a daily closing beyond the 10-DMA hurdle of around 0.6450 isn’t an open invitation to the AUD/USD buyers as a descending resistance line from July 13 surrounding 0.6480 challenges the pair’s immediate upside.
Following that, the aforementioned resistance area comprising levels marked in May–June, around 0.6500, will be in the spotlight.
Overall, the AUD/USD pair is likely to decline further but the downside appears limited as the key support line holds.
AUD/USD: Daily chart
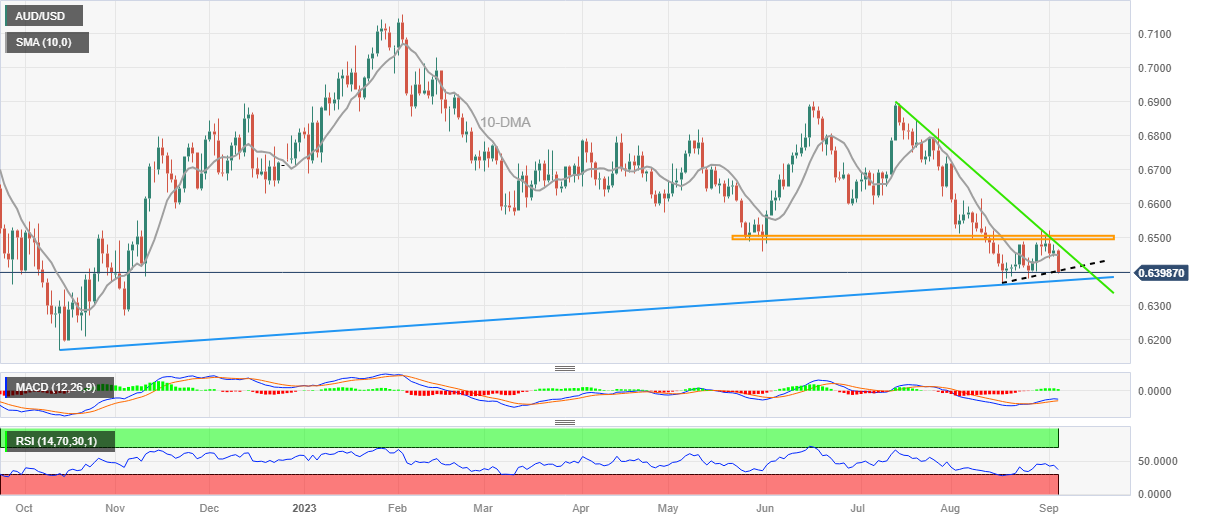
Trend: Limited downside expected
- USD/RUB extends its upside above the 97.00 mark.
- The Russian Ruble extends its downside; Russia's budget is under pressure as a result of the Ukraine conflict.
- A mixed US employment data and upbeat manufacturing PMI decreases Fed tightening expectations.
- Investors await the US Factory Orders, the US ISM Services PMI.
USD/RUB gains momentum and trades in positive territory for the third consecutive week during the early European session on Monday. The pair currently trades near 97.23, up 0.37% for the day.
The economic data released last week revealed that Russia's S&P Global Manufacturing PMI for August came in at 52.7 compared to the market estimate of 52.1. The figure rose to its highest level in three months. The Unemployment Rate for July declined to a new all-time low of 3.0% from 3.1% in June and the 3.2% market expectation.
The Russian Ruble has been falling sharply in recent months and Russia's budget is under pressure as a result of the Ukraine conflict. The Bank of Russia increased the interest rate by 350 basis points (bps) to reach 12% on August 15 to stop the depreciation of the Ruble. Apart from this, Russia has increased its military spending objective for 2023 to more than $100 billion, representing a third of all state expenditure, as the escalating costs of the Ukraine conflict place an increasing strain on Moscow's finances.
Nonetheless, Russian Finance Minister Anton Siluanov forecasts that the Russian economy will expand by at least 2.5% in 2023, with inflation hovering around 6%. He also said that he will collaborate with the Central Bank to take all necessary steps to bring down inflation to a sustainable level.
On the US Dollar docket, Market players speculate on a less aggressive Federal Reserve (Fed) stance following the mixed economic data results last week. The possibility of holding an interest rate at the September meeting remains at 93%, according to the CME FedWatch Tool. Meanwhile, the odds of hiking rates at the November meeting are about 38%. That said, Fed Chairman Jerome Powell stated at the Jackson Hole Symposium that a potential additional rate hike would be depending on incoming data.
Looking ahead, market participants will focus on the US Factory Orders due later on Tuesday and then shift their focus to the US ISM Services PMI data on Wednesday. These figures could give a clear direction for USD/RUB. Also, the headline surrounding Russia’s war in Ukraine remains in focus.
- EUR/USD fades the week-start rebound from a multi-day-old rising support line.
- ECB talks appreciate recent data but push back policy pivot concerns, hawks lack market acceptance.
- Upbeat US NFP, Moody’s upward revision to growth forecasts join hawkish Fed talks to defend US Dollar bulls.
- Bears flex muscles as slew of catalysts stand ready to fuel market moves after US holiday.
EUR/USD prints mild losses around 1.0780 as it prods a 5.5-month-old rising support line amid the early hours of Tuesday’s European session. In doing so, the Euro pair reverses the previous day’s rebound from the stated support line as the European Central Bank (ECB) officials fail to produce hawkish signals while the US Dollar traces yields to remain firmer ahead of multiple catalysts from the Eurozone and the US.
Recently, the August 31 interview from ECB Chief Economist Phillip Lane crossed wires, via Irish Business Publication, The Currency, as he praised softening in the August inflation data. The policymaker, however, cited the need for continuation of such statistics to push back the hawks.
On Monday, ECB President Christine Lagarde highlighted the need for central banks to keep the inflation expectations firmly anchored. On the same line was the President of the Deutsche Bundesbank and the ECB Council Member Joachim Nagel who advocated for price stability while hesitating from further details.
It’s worth noting, however, that Friday’s upbeat US Nonfarm Payrolls (NFP) and the global rating giant Moody’s upward revision to the US growth forecasts seem to justify the hawkish Fed concerns and weighed on the Euro price. That said, Cleveland Fed President Loretta J. Mester defended the US central bank’s hawkish move and ruled out the rate cut bias in her speech on Friday.
Elsewhere, the market’s lack of confidence in the Chinese measures to defend the economy, as well as the recent Sino-American tensions over Taiwan and the US businesses’ discomfort in Beijing, prod the market sentiment and put a floor under the US Dollar. That said, China recently announced a slew of quantitative and qualitative measures to defend the economy from COVID-19. On the same line is the latest news suggesting the ability to avoid default by China’s biggest reality player Country Garden.
Against this backdrop, the the US Dollar Index (DXY) prints mild gains around 104.25, after pausing a two-day uptrend the previous day. That said, S&P 500 Futures prints mild losses whereas the US 10-year Treasury bond yields rose three basis points (bps) to 4.21% after a holiday-driven inaction.
Talking about the data, the Eurozone Sentix Investor Confidence Index and the Expectations Index slid for September but the Current Situation Index dropped to the lowest level since November 2022 and bolstered the dovish bias about the EUR/USD pair.
Looking forward, the market’s lack of acceptance to the ECB hawks and comparatively downbeat Eurozone data keeps theEUR/USD sellers hopeful as they await the bloc’s Producer Price Index (PPI) data for July for immediate directions ahead of the US Factory Orders for the said month.
Technical analysis
The EUR/USD pair’s failure to extend the week-start rebound from an ascending support line from March 15, close to 1.0780 by the press time, beyond the 200-DMA level of 1.0820 joins the bearish MACD signals to keep the Euro sellers hopeful.
UOB Group’s Economist Lee Sue Ann and Markets Strategist Quek Ser Leang suggest further downside could drag EUR/USD to the 1.0720 region in the next few weeks.
Key Quotes
24-hour view: Our expectations for EUR to break below 1.0765 did not materialise. Instead, EUR traded in a relatively narrow range between 1.0770 and 1.0808 before closing at 1.0794 (+0.19%). Momentum indicators are mostly flat, suggesting EUR is likely to trade sideways today, probably between 1.0770 and 1.0820.
Next 1-3 weeks: We continue to hold the same view as yesterday (04 Sep, spot at 1.0775). As highlighted, there is a tentative buildup of downward momentum. This could cause EUR to edge lower to 1.0720. Looking ahead, EUR must break and stay below 1.0720 before a sustained decline can be expected. On the upside, if EUR breaks above 1.0860, it would mean that the momentum buildup has faded.
- GBP/USD struggles to extend the previous day’s rebound from multi-month low as 50-SMA prods Cable buyers.
- UK BRC Like-for-Like Retail Sales growth rallies but Barclay card data suggests deterioration in British spending.
- US Dollar edges higher while tracing yields as full markets return.
- Final readings of UK S&P Global/CIPS PMIs for August, US Factory Orders eyed for intraday directions.
GBP/USD justifies the Cable traders’ indecision amid mixed catalysts while making rounds to 1.2630 heading into Tuesday’s London open. Apart from the unclear signals, the cautious mood ahead of the key US and UK data also prods the Pound Sterling moves of late.
Earlier in the day, Reuters came out with the Barclay Card data while saying, “Annual growth in the UK consumer spending on credit and debit cards slowed to 2.8% in August from 4.0% in July.” However, the UK’s BRC Like-for-Like Retail Sales grew 4.3% YoY for August versus 1.8% prior.
While the British spending details are mixed, a suggestion from the UK Think Tank to infuse more liquidity into the UK capital markets with pensions seems to lure the Bank of England (BoE) hawks, due to the likely lift to the inflation, which in turn lures the Pound Sterling bulls.
Elsewhere, the US Dollar Index (DXY) prints mild gains around 104.25, after pausing a two-day uptrend the previous day, as it traces the firmer US Treasury bond yields ahead of the key US data. That said, the US 10-year Treasury bond yields rose three basis points (bps) to 4.21% after a holiday-driven inaction.
It should be noted that Friday’s mostly upbeat US jobs report and hawkish Fed talks, as well as the challenges to sentiment emanating from China, seem to keep the Greenback firmer of late. That said, the US Nonfarm Payrolls (NFP) renewed hawkish bias about the Fed, even if the Unemployment Rate and Average Hourly Earnings kept the policy pivot concerns on the table afterward. Following that, the global rating agency Moody’s revised up the US Gross Domestic Product (GDP) predictions for 2023 to 1.9% versus 1.1% expected in May. That said, Federal Reserve Bank of Cleveland President Loretta J. Mester defended the US central bank’s hawkish move and ruled out the rate cut bias in her speech on Friday.
On a different page, the market’s lack of confidence in the Chinese measures to defend the economy, as well as the recent Sino-American tensions over Taiwan and the US businesses’ discomfort in Beijing, prod the market sentiment and put a floor under the US Dollar. It should be noted that China recently announced a slew of quantitative and qualitative measures to defend the economy from COVID-19. On the same line is the latest news suggesting the ability to avoid default by China’s biggest reality player Country Garden.
Against this backdrop, S&P 500 Futures prints mild losses while the Asia-Pacific equities edge higher.
Looking forward, the final readings of the UK PMIs for August and the Bank of Japan (BoJ) concerns may entertain the intraday traders ahead of the US Factory Orders for July. Should the scheduled statistics keep suggesting a less dovish Bank of England (BoE), versus the Fed’s capacity to keep the rates higher for longer, the GBP/USD pair may witness a pullback.
Technical analysis
Even if the 50-SMA on four, close to 1.2630 by the press time, restricts the immediate upside of the GBP/USD pair, its successful rebound from an ascending trend line stretched from late May, around 1.2580 by the press time, joins the looming bull cross on the MACD to keep the buyers hopeful.
- USD/JPY trades in positive territory for the third consecutive day on Tuesday.
- Japanese Household Spending suffered its largest decline in nearly two and a half years.
- A mixed US employment data and upbeat manufacturing PMI decreases Fed tightening expectations.
- Market players await the US Factory Orders ahead of the US ISM Services PMI, Japanese Gross Domestic Product (GDP).
The USD/JPY pair extends its upside above the mid-146.00s during the early European session on Tuesday. The major pair currently trades near 146.72, gaining 0.16% on the day.
Japanese household expenditure suffered its largest decline in nearly two and a half years. According to the most recent data released on Tuesday, Japanese Household Spending fell 5.0% year on year in July, below the market expectation of a 2.5% drop. This figure indicated the sixth straight month of decline. Earlier, the Japanese Monetary Base data for August revealed a rise of 1.2% YoY compared to the previous reading of a 1.3% drop.
It is worth mentioning that the Bank of Japan (BOJ) maintains its loose monetary policy while shifting away from yield curve control. BoJ Board member Toyoaki Nakamura said last week that policymakers need more time to move to monetary tightening. However, the monetary policy divergence between the US and Japan may limit the USD/JPY pair's downside for the time being.
Furthermore, Japanese Finance Minister Shunichi Suzuki stated last week that although sudden fluctuations in currencies are undesirable, there is no visible indication of intervention in the market to shore up the weak yen. However, the policymaker will closely watch the currency move.
Following last week's mixed economic data results, market participants place bets on the Federal Reserve (Fed) taking a less aggressive posture. According to the CME FedWatch Tool, the possibility of keeping interest rates at the September meeting remains at 93%, while the odds of hiking rates at the November meeting are about 38%.
About US data last week, August's Nonfarm Payrolls (NFP) came in at 187K, better than market expectations of 170K and the previous reading of 157K. Nevertheless, the Unemployment Rate fell substantially to 3.8%, compared to the market consensus and the previous rate of 3.5%. The US Manufacturing PMI came in at 47.6 versus 46.4 previously and exceeded expectations of 47.0. The upside of the Greenback seems limited as Wall Street is closed today in observance of Labor Day.
Market players will keep an eye on the US Factory Orders due later in the day. The attention will shift to the US ISM Services PMI on Wednesday. On Friday, the Japanese Gross Domestic Product (GDP) for Q2 will be released. The quarterly growth number is expected to grow by 1.3%. Traders will find the trading opportunity around the USD/JPY pair.
Reuters publishes excerpts of an interview of European Central Bank (ECB) Chief Economist Phillip Lane, with Irish Business Publication, The Currency, on August 31.
Key quotes
August flash inflation data welcome but 'we need to see that continue'.
Easing in services inflation helps limit narrative that tourism to keep services inflation high.
We do expect bumpiness in easing of energy, food inflation.
Market reaction
EUR/USD is currently trading at 1.0786, down 0.06% on the day, awaiting a fresh trading impetus.
- Gold Price stays pressured for the fourth consecutive day despite lacking downside momentum.
- Upbeat headlines from China, Country Garden fails to impress XAU/USD buyers as US Dollar traces firmer yields.
- US Factory Orders, ISM Services PMI and risk catalysts eyed for clear Gold Price directions.
- XAU/USD bears have a tough time keeping control unless breaking $1,930 and $1,915 key support confluences.
Gold Price (XAU/USD) remains on the back foot for the fourth consecutive day even as the bears struggle to gain market acceptance ahead of the top-tier US data. In doing so, the yellow metal portrays the trader’s cautious optimism as full markets return after a long weekend in the US.
That said, the doubts about China’s capacity to defend the economic recovery join firmer US Treasury bond yields, which in turn underpins the US Dollar’s rebound amid a sluggish session.
It should be noted that Friday’s upbeat US Nonfarm Payrolls (NFP), global rating agency Moody’s upbeat revision to the US growth forecasts and hawkish comments from Federal Reserve Bank of Cleveland President Loretta J. Mester seem to keep the US Dollar firmer, as well as exert downside pressure on the Gold Price.
Alternatively, the risk-positive news from China’s biggest reality player Country Garden and Beijing’s efforts to defend economic recovery via multiple qualitative and quantitative measures should have prod the Gold sellers but failed to do so amid the recently firmer Greenback.
Moving on, the full markets’ reaction to the latest shift in sentiment and today’s US Factory Orders for July, as well as the Fed concerns, will be important to watch for clear directions.
Also read: Gold Price Forecast: XAU/USD struggles below $1,950 amid a Bear Cross
Gold Price: Key levels to watch
As per our Technical Confluence indicator, the Gold Price floats firmly beyond the $1,930-32 support confluence comprising the Pivot Point one-day S2, 50-day SMA and 200-SMA on four-hour (4H).
That said, a convergence of the Pivot Point one-day S1, Fibonacci 61.8% on one-month and the lower band of the Bollinger on the 4H restricts the immediate downside of the Gold Price near $1,935.
In a case where the Gold Price remains bearish past $1,930, the 200-day SMA, the middle band of the Bollinger and Fibonacci 38.2% on one-month, close to $1,915 by the press time, will act as the last defense of the XAU/USD buyers.
Alternatively, a convergence of the Fibonacci 38.2% on one-day and the middle band of the Bollinger on 4H, close to $1,945, guards immediate recovery of the Gold Price.
Following that, the Pivot Point one-day R3, 100-day SMA and Fibonacci 161.8% on one-day, will act as a tough nut to crack for the Gold buyers around $1,955.
It’s worth noting that the Gold Price run-up beyond $1,955 will enable buyers to aim for an area comprising multiple hurdles marked during May and July, around $1,985.
Here is how it looks on the tool
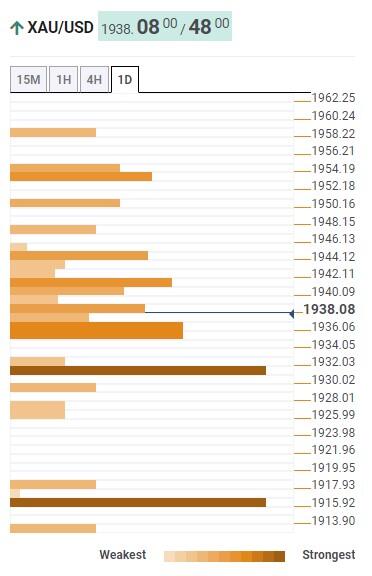
About Technical Confluences Detector
The TCD (Technical Confluences Detector) is a tool to locate and point out those price levels where there is a congestion of indicators, moving averages, Fibonacci levels, Pivot Points, etc. If you are a short-term trader, you will find entry points for counter-trend strategies and hunt a few points at a time. If you are a medium-to-long-term trader, this tool will allow you to know in advance the price levels where a medium-to-long-term trend may stop and rest, where to unwind positions, or where to increase your position size.
- Asian stock markets edge lower on Tuesday amid the concern over China’s economic woes.
- China's services activity in August grew at the slowest pace in eight months.
- The Japanese spending suffered its largest decline in nearly two and a half years.
Asian stock markets are trading lower on Tuesday, with Chinese equities leading losses amid the ongoing concerns about an economic slowdown and a property sector crisis.
At press time, China’s Shanghai is down 0.63% to 3,157, the Shenzhen Component Index declines 0.46% to 10,562, Hong Kong’s Hang Sang dips 1.57% to 18,545, South Korea’s Kospi is down 0.08% and Japan’s Nikkei is down 0.14%.
Chinese stocks were the worst performers on Tuesday, led by Hong Kong’s Hang Sang. Concerns over the overwhelmed property developer Country Garden Holdings impacted on the regional market. On Tuesday, Reuters reported that Country Garden, China's biggest private property developer, paid interest on two US Dollar bonds due last month. The grace period for coupon payments ended on Tuesday, but Country Garden avoided default. However, the risk sentiment is still dampened as investors are concerned about the economic slowdown in China.
China's services activity in August grew at the slowest pace in eight months. Caixin reported on Tuesday that the Chinese Services Purchasing Managers' Index (PMI) fell to 51.8 in August from 54.1 in July.
In Japan, the nation’s spending suffered its largest decline in nearly two and a half years. That said, the Japanese household spending plunged 5.0% YoY in July, worse-than-expected of a 2.5% drop. This figure marked the fall for the fifth consecutive month.
Philippine inflation accelerated for the first time in seven months in August, owing mostly to an increase in food and transport costs. Consumer Prices increased 5.3% YoY in August from the previous reading of a 4.7% increase in July.
On the Aussie front, the Reserve Bank of Australia (RBA) decided to maintain the Official Cash Rate (OCR) unchanged at 4.10% at its September’s meeting. The central bank stated that the decision to keep interest rates on hold gives it more time to examine the effect of the current rate hike and the economic outlook.
Looking ahead, the US Factory Orders will be due on Tuesday in the American session. The attention will then shift to the US ISM Services PMI on Wednesday. Market participants will closely watch the release of Chinese Trade data on Thursday ahead of the Japanese Gross Domestic Product (GDP) for Q2 on Friday.
- AUD/JPY trades lower around 94.20 amid RBA maintains interest rate at 4.10%
- China’s disappointing Caixin Services PMI weighed on the Australian Dollar (AUD).
- Investors seek RBA’s statement for insights into future rate hikes, following Australia’s GDP.
- Japan's Household Spending data declined the most since February, 2021.
AUD/JPY traces back to the previous day’s gains, trading lower around 94.20 during the Asian session on Tuesday. The cross is experiencing downward pressure as the Reserve Bank of Australia (RBA) keeps the interest rate unchanged as expected. The RBA maintains the key policy rate at 4.10% as inflation seems to be stabilizing.
Additionally, the downbeat China’s economic data weighed on the Australian Dollar (AUD). Caixin Services PMI (Aug) reduced to 51.8 figure from 54.1 prior.
The spotlight will be on the Reserve Bank of Australia (RBA) Statement, which could provide insights into future rate hikes, potentially supporting the Australian Dollar (AUD). Traders will likely monitor the release of Australia's Gross Domestic Product (GDP) for the second quarter, scheduled for Wednesday. The quarterly growth figure is expected to increase by 0.3%.
Japan's disappointing Household spending (YoY) data for July, which was revealed on Monday, could be providing support to undermine the Japanese Yen (JPY). The data showed the worst drop since February, 2021, with the actual reading printed at -5.0%, notably worse than the anticipated -2.5%. June's figure was -4.2%.
The Bank of Japan (BOJ) is continuing to uphold its accommodative monetary policy. BOJ Board member Toyoaki Nakamura mentioned last week that policymakers require additional time to shift towards monetary tightening. Given this situation, the disparity in monetary policy between Australia and Japan could limit the downside potential of the AUD/JPY cross for the foreseeable future.
- AUD/NZD remains pressured at one-week low despite RBA’s inaction, risk-positive China updates.
- RBA keeps benchmark rates unchanged at 4.1%, shows readiness for rate hikes to tame inflation.
- China’s Country Garden managed to avoid default by paying $22.5 million US bond coupons.
- Softer China PMI contrasts with Beijing’s efforts to defend economic recovery and prods pair sellers.
AUD/NZD takes offers to refresh intraday low around 1.0850 even after the Reserve Bank of Australia (RBA) matches market forecasts of keeping the benchmark rates unchanged on early Tuesday.
That said, the Aussie central bank keeps the benchmark rate intact at 4.1% but shows readiness to lift the rates as and when necessary to tame the inflation woes.
Not only the RBA’s status quo but headlines from China, a major customer for Australia and New Zealand, also should have put a floor under the AUD/NZD prices but were largely ignored.
That said, China’s biggest reality player Country Garden manages to avoid default by paying $22.5 million US bond interest. It’s worth noting that the Chinese real-estate giant won approval from onshore creditors to extend a private bond payment worth CNY3.9 billion ($536 million).
Elsewhere, China’s Commerce Ministry pledged to support the qualified enterprises to make good use of domestic and overseas listing, as well as bond issuance. On Monday, China’s readiness for opening up the services industry, as well as developments of the manufacturing activities, joined a slew of measures to cut mortgage rates and infuse more liquidity to keep the Asia-Pacific markets hopeful.
It should be noted that upbeat prints of Australia’s S&P Global Composite PMI and Services PMI, to 48.0 and 47.8 versus 47.1 and 46.7 respective priors, also occupy the positive side and prods the AUD/NZD bears.
Against this backdrop, the S&P 500 Futures print mild losses around 4,515, down 0.15% intraday after reversing from a one-month high the previous day, while the US 10-year Treasury bond yields rose two basis points (bps) to 4.20% after the US holiday-driven inaction.
Looking forward, Australia’s Gross Domestic Product (GDP) for the second quarter (Q2) of 2023 and a speech from the outgoing RBA Governor Philip Lowe will be important for clear directions.
Technical analysis
A one-month-old rising wedge bearish chart pattern, currently between 1.0840 and 1.0900, keeps the AUD/NZD sellers hopeful.
- AUD/USD comes under fresh selling pressure and is weighed down by a combination of factors.
- The disappointing Chinese PMI and RBA's on-hold decision drive flows away from the Aussie.
- Bets for one more Fed rate hike in 2023 underpin the USD and contribute to the ongoing decline.
The AUD/USD pair struggles to capitalize on the previous day's modest gains and meets with a fresh supply during the Asian session on Tuesday. Spot prices remain depressed near the 0.6430-0.6420 region, or a one-week low and move little after the Reserve Bank of Australia (RBA) announced its policy decision.
As was widely anticipated, the RBA decided to leave the Official Cash Rate (OCR) unchanged at 4.10% for the third time in a row at the end of the September meeting. In the accompanying policy statement, the central bank said that the on-hold decision provides further time to assess the impact of the increase in interest rates to date and the economic outlook. This, along with the weaker Chinese PMI, undermines the Australian Dollar (AUD). Apart from this, the emergence of some US Dollar (USD) buying contributes to the offered tone surrounding the AUD/USD pair.
In fact, the USD Index (DXY), which tracks the Greenback against a basket of currencies, stands tall just below a nearly three-month peak touched in August and remains well supported by expectations that the Federal Reserve (Fed) will keep rates higher for longer. Despite signs that labour market conditions in the US were easing, the markets are still pricing in the possibility of one more 25 bps lift-off by the end of this year. This, in turn, remains supportive of elevated US Treasury bond yields, which lends support to the buck and weighs on the AUD/USD pair.
The aforementioned fundamental backdrop favours bearish traders and suggests that the path of least resistance for spot prices is to the downside. Hence, a subsequent fall back towards challenging the YTD low, around the 0.6365 region touched on August 17, looks like a distinct possibility. Some follow-through selling will be seen as a fresh trigger for bearish traders and pave the way for an extension of the AUD/USD pair's well-established downtrend witnessed since July 14, from the vicinity of the 0.6900 mark, which constituted the bearish double-top on the daily chart.
Technical levels to watch
- USD/TRY extends its consolidative price move and remains confined in a range.
- The technical setup supports prospects for some meaningful appreciating move.
- A break below the ascending trend-line support will negate the positive outlook.
The USD/TRY pair struggles to capitalize on the overnight goodish rebound from the 26.15 area, or a four-day low and oscillates in a narrow band through the Asian session on Tuesday. Spot prices currently trade just above the 26.75 region, nearly unchanged for the day.
From a technical perspective, the recent recovery from the 25.30 zone, or a nearly two-month low touched in August, has been along an upward-sloping sloping trend-line. Moreover, the USD/TRY pair now seems to have found acceptance above the 200-houe Simple Moving Average (SMA), which, along with positive oscillators on daily/hourly charts, supports prospects for some meaningful appreciating move.
Hence, a subsequent move up, back towards reclaiming the 27.00 round-figure mark, looks like a distinct possibility. Some follow-through buying beyond the next relevant hurdle near the 27.25 region should allow the USD/TRY pair to aim back to challenge the all-time high, around the 27.85-27.90 zone set in August. This is followed by the 28.00 mark, which if cleared will be seen as a fresh trigger for bullish traders.
On the flip side, the 26.55-26.50 area, or the 200-hour SMA, could protect the immediate downside ahead of the aforementioned trend-line support, currently around the 26.35 region. The latter should act as a pivotal point, which if broken decisively might shift the bias in favour of bears. Some follow-through selling below the overnight swing low, around the 26.15 region, will reaffirm the negative outlook.
The USD/TRY pair might then turn vulnerable to weaken further below the 26.00 mark and accelerate the downfall towards the 25.70-25.65 intermediate support en route to mid-25.00s and the August monthly swing low, around the 25.30 region.
USD/TRY 1-hour chart
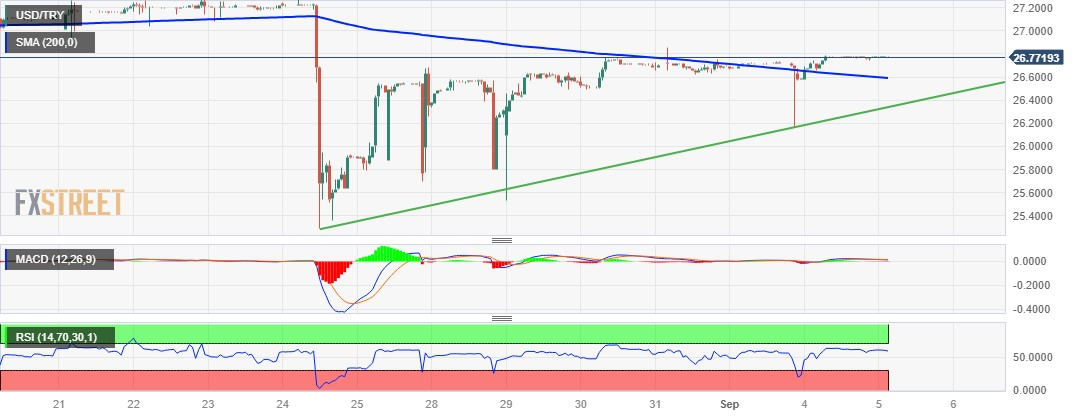
Citing a person close to the company, Reuters reported on Tuesday, China's largest private property developer, Country Garden, managed to honor interest payments on two US Dollar bonds, due last month.
The grace period for the coupon payments was due to end on Tuesday but Country Garden averted a default.
The embattled Chinese property giant failed to make coupon payments totalling $22.5 million due on August. 6. Both payments had 30-day grace periods, ending on the global Tuesday, as Reuters reported.
Last Friday, Country Garden won approval from onshore creditors to extend a private bond worth CNY3.9 billion ($536 million).
- USD/INR trades sideways as China’s stimulus reinforces the positivity in the market.
- China’s Country Garden made an agreement with creditors for an extension, undermining the US Dollar (USD).
- Traders expect no interest rate hike in the September meeting by the Fed.
USD/INR hovers around 82.80 during the Asian session on Tuesday, struggling to continue the mild gains on the second day. United States (US) modest employment data reinforced the likelihood of no interest rate change by the Federal Reserve (Fed) in the September meeting.
However, the bets are now on a 25 basis points (bps) rate hike in December, 2023. Additionally, Federal Reserve Bank of Cleveland President Loretta J. Mester advocated for the Fed’s hawkish tone and denied the odds of a bias toward rate cuts in a speech on Friday. Market participants await the US Factory Orders (Jul) to gain clear insights into the inflation and economic scenarios.
Analysts at MUFG Bank anticipate that the USD/INR pair will remain at 82.70 by the end of the third quarter and then decline to 81.50 by the end of the first quarter of 2024. Their short-term outlook for the Indian Rupee is neutral. Analysts also mentioned some headwinds for the Indian Rupee in the near term due to the higher inflation recorded in July than anticipated. They also suggested that the Reserve Bank of India (RBI) should hold the hawkish stance for a prolonged period.
US Dollar Index (DXY), which compares the Greenback against six other major currencies, trades higher around 104.20 at the time of writing. The moderate labor growth in August and the recovery in US Treasury yields helped the buck to maintain its strength.
The safe-haven Greenback was under pressure as improved market optimism due to China's stimulus measures and the agreement between Country Garden and creditors for an extension on onshore debt repayments worth 3.9 billion yuan ($536 million). The positive sentiment in the market could support the Asian currencies including the Indian Rupee. Furthermore, Chinese Authorities plan to ease home-purchase restrictions to support economic growth.
- USD/CHF picks up bids to refresh intraday high, reverses the previous day’s pullback from one-week high.
- Softer Swiss GDP growth contrasts with upbeat US NFP, firmer yields to keep pair buyers hopeful.
- US Factory Orders, risk catalysts may entertain intraday traders.
USD/CHF renews its intraday high around 0.8855 while reversing the week-start losses amid early Tuesday morning in Europe. In doing so, the Swiss Franc (CHF) pair takes clues from the US Dollar recovery, as well as the previous day’s downside Swiss Gross Domestic Product (GDP) for the second quarter (Q2) of 2023.
US Dollar Index (DXY) prints mild gains around 104.25, after pausing a two-day uptrend the previous day, as it traces the firmer US Treasury bond yields ahead of the key US data. That said, the US 10-year Treasury bond yields rise three basis points (bps) to 4.21% after a holiday-driven inaction.
Apart from the yields, the US Dollar’s latest rebound could also be linked to Friday’s mostly upbeat US jobs report and hawkish Fed talks, as well as the challenges to sentiment emanating from China.
That said, the US Nonfarm Payrolls (NFP) renewed hawkish bias about the Fed, even if the Unemployment Rate and Average Hourly Earnings kept the policy pivot concerns on the table afterward. Following that, the global rating agency Moody’s revised up the US Gross Domestic Product (GDP) predictions for 2023 to 1.9% versus 1.1% expected in May.
Elsewhere, Federal Reserve Bank of Cleveland President Loretta J. Mester defended the US central bank’s hawkish move and ruled out the rate cut bias in her speech on Friday. That said, the market’s bets on the Federal Reserve’s (Fed) status quo in September contrasts with a recent improvement in the odds favoring a rate hike during late 2023.
Furthermore, the market’s lack of confidence in the Chinese measures to defend the economy, as well as the recent Sino-American tensions over Taiwan and the US businesses’ discomfort in Beijing, prod the market sentiment and put a floor under the US Dollar.
On the other hand, Swiss Q2 GDP growth eased to 0.0% QoQ and 0.5% YoY versus 0.3% and 1.5% respective priors.
To sum up, the USD/CHF run-up appears legitimate and may keep the buyers on the table. However, today’s US Factory Orders for July and the headlines about China, as well as the Fed concerns, will be important to watch for clear directions.
Technical analysis
USD/CHF buyers remain hopeful unless they witness a clear downside break of the six-month-old previous resistance line, now support around 0.8810.
- EUR/USD meets with fresh supply on Tuesday and is weighed down by a modest USD uptick.
- The technical setup suggests that the path of least resistance for spot prices is to the downside.
- Attempted recovery might still be seen as a selling opportunity and is likely to remain capped.
The EUR/USD pair struggles to capitalize on the previous day's modest gains and attracts fresh sellers in the vicinity of the 1.0800 round-figure mark during the Asian session on Tuesday. Spot prices, meanwhile, remain well within the striking distance of over a two-month low, around the 1.0765 region touched in July and seem vulnerable below a technically significant 200-day Simple Moving Average (SMA).
The negative outlook for the EUR/USD pair is reinforced by the fact that oscillators on the daily chart are holding deep in the bearish territory and are still far from being in the oversold zone. Apart from this, the emergence of some US Dollar (USD) buying suggests that the path of least resistance for spot prices is to the downside. Hence, a subsequent slide to the 1.0765 region, en route to the 1.0700 mark, looks like a distinct possibility.
The next relevant support is pegged near the May monthly swing low, around the 1.0635 region. This is followed by the 1.0600 round figure, which if broken decisively will be seen as a fresh trigger for bearish traders and pave the way for deeper losses. The EUR/USD pair might then turn vulnerable and accelerate the fall towards the 1.0530-1.0525 intermediate support before eventually dropping to the 1.0500 psychological mark.
On the flip side, recovery above the 1.0800 level is likely to confront stiff resistance near the 200-day SMA, currently around the 1.0815-1.0820 region. A sustained strength beyond might trigger a short-covering rally and allow the EUR/USD pair to reclaim the 1.0900 round-figure mark. Any subsequent move up, however, might still be seen as a selling opportunity and remain capped near last week's swing high, around the 1.0840-1.0845 zone.
The latter should act as a pivotal point for the EUR/USD pair, which if cleared decisively will suggest that the recent sharp pullback from the 1.1275 region, or a 17-month peak touched in July has run its course. This, in turn, will set the stage for some meaningful near-term appreciating move.
EUR/USD daily chart
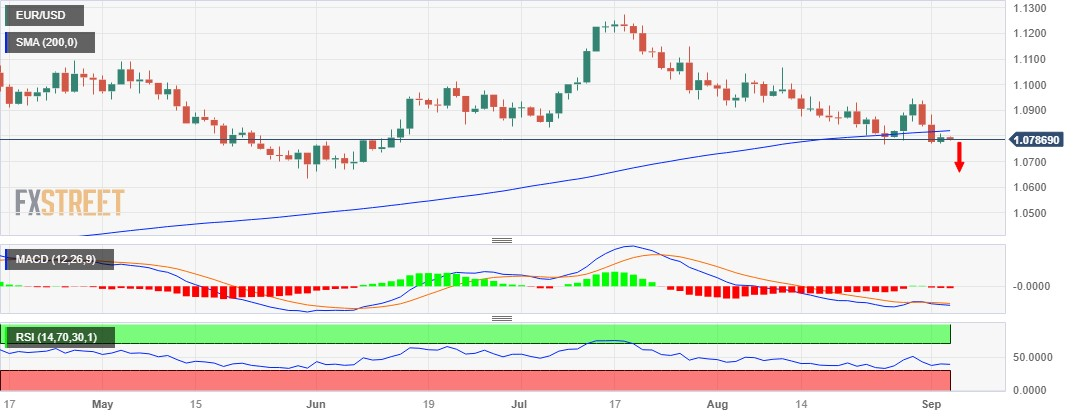
Technical levels to watch
- AUD/JPY drops to 94.25 following the weaker Chinese Services PMI data.
- RBA will maintain its benchmark interest rate at 4.10% on Tuesday.
- Japanese household spending suffered its largest decline in nearly two and a half years.
- Market players await the Reserve Bank of Australia (RBA) interest rate decision, Australia’s GDP.
The AUD/JPY cross loses traction near 94.25 during the Asian trading hours on Tuesday. The weaker-than-expected Chinese PMI data drags the Aussie lower. Investors await the key event, the Reserve Bank of Australia (RBA) interest rate decision. This event might trigger volatility in the Australian Dollar (AUD) in the next session.
RBA is likely to maintain its benchmark interest rate at 4.10% on Tuesday as inflation eases, according to a Reuters poll. However, market players anticipate that the central bank will maintain its hawkish stance and open the door for additional rate hikes.
The latest data from Caixin on Tuesday showed that the Chinese Services Purchasing Managers' Index (PMI) declined to 51.8 in August from 54.1 in July. The downbeat Chinese exert some selling pressure on the AUD as investors perceive the Aussie as a proxy for the Chinese economy.
As a result of growing prices, Japanese household expenditure suffered its largest decline in nearly two and a half years. Tuesday's data showed that household spending plunged 5.0% YoY in July, worse-than-expected of a 2.5% drop. This figure marked the fall for the fifth consecutive month. The Bank of Japan (BOJ) maintains its loose monetary policy while shifting away from yield curve control. BoJ Board member Toyoaki Nakamura said last week that policymakers need more time to transition to monetary tightening. That said, the monetary policy gap between Australia and Japan might cap the downside of the AUD/JPY cross for the time being.
Market participants will closely watch the Reserve Bank of Australia (RBA) interest rate decision later on Tuesday. RBA is expected to maintain its key interest rate unchanged at 4.10% on its Wednesday’s meeting. The attention will shift to the Australian Gross Domestic Product (GDP) for the second quarter due on Wednesday. The quarterly growth number is expected to grow 0.3%. On Friday, the Japanese GDP for Q2 will be released. Traders will take cues from these data and find trading opportunities around the AUD/JPY cross.
- USD/CAD picks up bids to reverse the week-start retreat, poking downward-sloping resistance line from late April at the latest.
- Sustained trading beyond the key Fibonacci ratio, 21-DMA favor Loonie pair buyers.
- Nearly overbought RSI line suggests pullback; bulls should remain cautious below 1.3670.
USD/CAD pierces the 1.3600 threshold as buyers attack a downward-sloping resistance line from late April amid the very early Tuesday morning in Europe.
Also read: USD/CAD trades sideways below the 1.3600 mark, BoC rate decision, US Services PMI eyed
The Loonie pair justified overbought conditions of the RSI (14) line to retreat the previous day. Even so, the quote stayed beyond the 61.8% Fibonacci retracement of the March–July downside, not to mention its defense of the recovery from the 21-DMA.
Also keeping the USD/CAD buyers hopeful is the early-August run-up beyond the six-month-old previous resistance line.
Hence, the quote stays on the bull’s radar but the further upside appears limited, which in turn highlights the immediate resistance line surrounding 1.3610.
Following that, the previous monthly high of 1.3640 will precede the tops marked in May and April, respectively near 1.3655 and 1.3670, to challenge the USD/CAD buyers.
In a case where the Loonie pair buyers keep the reins past 1.3670, the odds of witnessing its gradual rise toward March’s peak of 1.3861 can’t be ruled out.
On the contrary, a daily closing beneath the 61.8% Fibonacci ratio and the 21-DMA, respectively near 1.3570 and 1.3530, becomes necessary to recall the USD/CAD bears.
In those conditions, the 50% Fibonacci retracement level of .3480 could lure the USD/CAD sellers before challenging them with the 1.3400 support confluence comprising the 100-DMA and previous resistance line stretched from early March.
USD/CAD: Daily chart
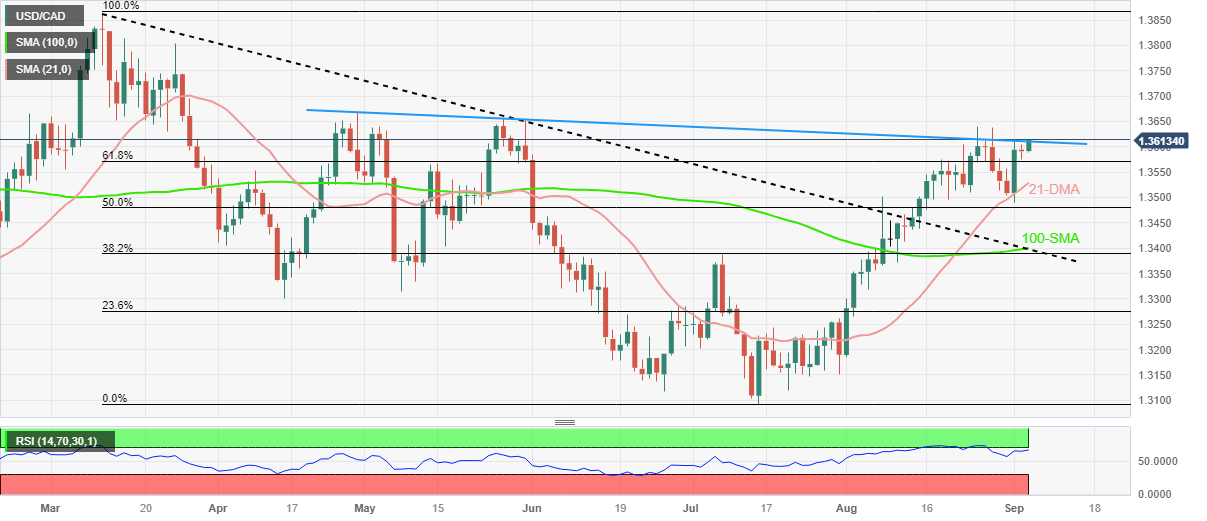
Trend: Pullback expected
| Raw materials | Closed | Change, % |
|---|---|---|
| Silver | 23.991 | -0.79 |
| Gold | 1938.066 | -0.11 |
| Palladium | 1223.4 | 0.51 |
- NZD/USD edges lower on Tuesday following the disappointing release of Chinese PMI.
- A modest USD uptick further contributes to the mildly offered tone surrounding the pair.
- Hopes for more stimulus from China might lend some support to the risk-sensitive Kiwi.
The NZD/USD pair attracts fresh sellers during the Asian session on Tuesday and drops to a one-week low, around the 0.5920-0.5915 region in reaction to the disappointing Chinese data.
In fact, a private survey showed that business activity in China's services sector expanded for an eighth straight month in August, albeit at the slowest pace in eight months. The Caixin/S&P Global Services PMI dropped from 54.1 in July to 51.8 last month, marking the lowest reading since December 2022. The report revives concerns about the worsening economic conditions in the world's second-largest economy, which, in turn, is seen as weighing on antipodean currencies, including the New Zealand Dollar (NZD).
Apart from this, the emergence of some US Dollar (USD) buying turns out to be another factor exerting some downward pressure on the NZD/USD pair. That said, growing acceptance that the Federal Reserve (Fed) is nearing the end of its rate-hiking cycle might hold back the USD bulls from placing aggressive bets and help limit the downside for the major. Investors now seem convinced that the Fed will leave its interest rates unchanged at the September policy meeting and the bets were reaffirmed by Friday's mixed jobs data.
This, along with the latest optimism over more stimulus measures from China, which remains supportive of a generally positive tone around the equity markets, could act as a tailwind for the risk-sensitive Kiwi. The NZD/USD could further draw support from the fact that S&P Global Ratings downplayed the possibility of a credit rating downgrade remains for New Zealand, despite some challenges with the fiscal deficit and the current account deficit. This, in turn, warrants some caution for aggressive bearish traders.
Technical levels to watch
- AUD/USD trades lower around 0.6430 after China’s downbeat Caixin Services PMI.
- Economists anticipate that RBA will keep key interest rates at 4.10%.
- Traders seek RBA’s tone for clear indications of future rate hikes.
AUD/JPY retreats from the previous day’s gains, trading lower around 0.6430 during the Asian session on Tuesday. The pair is experiencing downward pressure ahead of the key Reserve Bank of Australia (RBA) Interest Rate Decision. Furthermore, China’s Caixin Services PMI for August declined to the reading of 51.8 from 54.1 prior. The reduction in the Chinese services economy weighs on the pair.
According to a Reuters poll, economists are forecasting no change in interest rates on Tuesday, as inflation appears to be moderating, and they expect the rate to remain at 4.10%. All eyes will be on the Reserve Bank of Australia (RBA) Statement's tone for clear indications of future rate hikes, potentially providing support for the Australian Dollar (AUD) to maintain its strength.
The Aussie pair is unable to sustain support from China's stimulus measures and the agreement between Country Garden and creditors for an extension on onshore debt repayments worth 3.9 billion yuan ($536 million) boosted the market optimism.
As said, China's willingness to open up its services industry, coupled with advancements in manufacturing activities, adds to a series of measures aimed at reducing mortgage rates and injecting more liquidity into the economy to underpin the AUD/USD pair.
US Dollar Index (DXY), which compares the Greenback against six other major currencies, trades higher around 104.20 at the time of writing. The steady labor growth in August and the recovery in US Treasury yields helped the buck to maintain its strength.
Furthermore, the buck could experience upward support as investors are still pricing in the odds of a 25 basis points (bps) rate hike by the US Federal Reserve (Fed). Additionally, Federal Reserve Bank of Cleveland President Loretta J. Mester supported the Fed’s hawkish stance and dismissed the possibility of a bias toward rate cuts in a speech on Friday. Market participants await the US Factory Orders (Jul) to gain clear directions.
Speaking at an event in Wellington on Tuesday, New Zealand Finance Minister Grant Robertson voiced his support for the Reserve Bank of New Zealand’s (RBNZ) dual mandate.
Key quotes
Central bank’s dual mandate as “normal” and not something that’s caused inflation or interest rates to be unnecessarily high.
“Adrian has said very clearly that the decisions he’s made since we changed the mandate, in particular in the last few years, have not been affected by the fact that he had the dual mandate.”
“He would’ve made the same decision with or without the dual mandate.”
Market reaction
At the time of writing, NZD/USD remains pressured near intraday lows of 0.5919, losing 0.22% so far.
- Market sentiment remains fragile, recently downbeat, as traders doubt China stimulus’ capacity to defend economic recovery.
- S&P 500 Futures, yields extend post-NFP moves as markets await more clues about Fed.
- US Factory Orders, risk catalysts eyed for clear directions.
Market sentiment fades the previous optimism as traders seek more clues amid a light calendar, as well as appear unconvincing about China’s ability to defend the economic recovery. Also challenging the mood could be the latest rebound in the US Treasury bond yields and receding hopes of recovery in China’s struggling reality sector.
Amid these plays, the S&P 500 Futures print mild losses around 4,515, down 0.15% intraday after reversing from a one-month high the previous day. On the other hand, the US 10-year Treasury bond yields rose two basis points (bps) to 4.20% after a holiday-driven inaction.
Early Tuesday, China’s Commerce Ministry pledged to support the qualified enterprises to make good use of domestic and overseas listing, as well as bond issuance. On the same line was softer China Caixin Manufacturing PMI for August, to 51.8 from 54.1 prior.
That said, China’s readiness for opening up the services industry, as well as developments of the manufacturing activities, joined a slew of measures to cut mortgage rates and infuse more liquidity to keep the Asia-Pacific markets hopeful. On the same line could be the optimism about China’s struggling reality firm Country Garden, after it managed to gain approval from creditors to delay the debt payments of around 3.9 billion Yuan ($536 million).
On a different page, Friday’s upbeat US data and hawkish Fed talks underpin the rebound in the US Treasury bond yields and the US Dollar, as well as prod the market’s optimists. That said, United States Nonfarm Payrolls (NFP) for August initially renewed hawkish bias about the Fed, even if the Unemployment Rate and Average Hourly Earnings kept the policy pivot concerns on the table afterward. Following that, the global rating agency Moody’s revised up the US Gross Domestic Product (GDP) predictions for 2023 to 1.9% versus 1.1% expected in May.
It’s worth noting that the market’s bets on the Federal Reserve’s (Fed) status quo in September contrast with a recent improvement in the odds favoring a rate hike during late 2023 seems to weigh on the sentiment. Further, Federal Reserve Bank of Cleveland President Loretta J. Mester defended the US central bank’s hawkish move and ruled out the rate cut bias in her speech on Friday, which in turn prod the Gold buyers.
Furthermore, the market’s lack of confidence in the Chinese measures to defend the economy, as well as the Sino-American tension, recently over Taiwan and the US businesses’ discomfort in Beijing, prod the optimism, which in turn challenges the sentiment.
Moving on, the risk catalysts and the US Factory orders for July will be important for fresh impulse.
Also read: Forex Today: Quiet markets, focus turns to the RBA
- USD/CNH picks up bids to extend week-start rebound despite upbeat China.
- China Caixin Services PMI for August eases to 51.8 versus 54.1 previous readings.
- Doubt about China’s capacity to defend economic recovery with stimulus weighs on Yuan as full markets return.
- Country Garden news, China Commerce Ministry updates prod USD/CNH bulls even as US Dollar traces firmer yields.
USD/CNH fails to justify upbeat China data while extending the week-start recovery towards 7.2900 during early Tuesday, up 0.18% intraday near 7.2880 by the press time. With this, the offshore Chinese Yuan (CNH) justifies the market’s doubts about the Dragon Nation’s capacity to defend the economic recovery from COVID-19 with a slew of stimulus measures. Also fueling the quote could be the firmer US Dollar as the Treasury bond yields improve after the previous day’s US Labor Day holiday.
That said, China’s Caixin Manufacturing PMI for August eased to 51.8 from 54.1 prior.
Elsewhere, China’s Commerce Ministry pledged to support the qualified enterprises to make good use of domestic and overseas listing, as well as bond issuance.
On Monday, China’s readiness for opening up the services industry, as well as developments of the manufacturing activities, joined a slew of measures to cut mortgage rates and infuse more liquidity to keep the Asia-Pacific markets hopeful. On the same line could be the optimism about China’s struggling reality firm Country Garden, after it managed to gain approval from creditors to delay the debt payments of around 3.9 billion Yuan ($536 million).
However, the market’s lack of confidence in the Chinese measures to defend the economy, as well as the recent Sino-American tensions over Taiwan and the US businesses’ discomfort in Beijing, prod the market’s risk-on mood and propel the USD/CNH price.
Additionally, the US Dollar Index (DXY) rebound, backed by the upbeat Treasury bond yields also underpins the USD/CNH upside.
With this, the US 10-year Treasury bond yields rose two basis points (bps) to 4.20% after a holiday-driven inaction while S&P 500 Futures print mild losses amid the market’s cautious mood as traders from the US return after a long weekend.
Looking ahead, the risk catalysts and the US Factory orders for July will be important for fresh impulse.
Technical analysis
A 13-day-old falling wedge bullish chart formation, currently between 7.2550 and 7.2910, keeps the USD/CNH buyers hopeful.
China's Services Purchasing Managers' Index (PMI) fell sharply to 51.8 in August, as against an expansion of 54.1 seen in July, according to the latest data published by Caixin on Tuesday.
Key points
Softer increases in business activity and new orders.
Employment rises further amid higher backlogs.
Input cost inflation dips to six-month low.
Commenting on the China General Services PMI ™ data, Dr. Wang Zhe, Senior Economist at Caixin Insight Group said: “Services supply and demand continued to expand with improving market conditions, though at a slower pace.”
“The gauges for business activity and total new business remained above 50 for the eighth consecutive month, but both readings were lower than in July. External demand dragged on growth in August, as new export business contracted for the first time since December,” Wang added.
AUD/USD reaction
Weak Chinese Services PMI adds to the bearish pressure on the Aussie Dollar, pushing AUD/USD further toward 0.6400. The major is trading at 0.6438, at the time of writing, down 0.28% on the day.
- WTI Crude Oil prices consolidate the recent gains to a fresh YTD peak touched on Monday.
- A combination of factors favours bulls and supports prospects for further appreciating move.
- A mildly softer tone around the USD adds credence to the positive outlook for the commodity.
Western Texas Intermediate (WTI) Crude Oil prices enter a bullish consolidation phase during the Asian session on Tuesday and oscillate in a range around mid-$85.00s, just below the 2023 peak touched the previous day.
The prospects of tighter global supplies, along with hopes for a demand recovery in China, turn out to be key factors acting as a tailwind for the black liquid. In fact, investors anticipate that the Organization of the Petroleum Exporting Countries (OPEC) and allies (OPEC+) will extend output cuts to the end of the year. Moreover, Saudi Arabia – the world's top oil exporter – is widely anticipated to extend its voluntary 1 million barrel per day (bpd) cut for a fourth consecutive month into October.
Adding to this, Russian Deputy Prime Minister Alexander Novak has said that Moscow had agreed with OPEC+ partners on the parameters for continued export cuts in October. Investors now await more details on the deal, which will be revealed this week. In the meantime, the optimism that additional stimulus from China, to shore up a slowing economic recovery will boost fuel demand and lend additional support to WTI Crude Oil prices. This, in turn, supports prospects for additional gains.
Furthermore, a mildly softer tone surrounding the US Dollar (USD), weighed down by growing acceptance that the Federal Reserve (Fed) will soften its hawkish stance, could underpin the USD-denominated commodities, including Oil prices. The mixed US jobs report released on Friday pointed to a slight deterioration in the labour market. This gives the Fed less headroom to keep raising interest rates. In fact, the Fed is widely anticipated to leave interest rates unchanged at its September policy meeting.
The aforementioned fundamental backdrop suggests that the path of least resistance for WTI Crude Oil prices is to the upside. That said, oscillators on the daily chart have moved on the verge of breaking into the overbought territory. This, in turn, is holding back bullish traders from placing fresh bets and capping the upside, at least for the time being.
Technical levels to watch
- GBP/USD flat-lines in a 1.2622-1.2630 range in the early Asian session on Tuesday.
- Traders anticipate that the Bank of England (BoE) is likely to raise 25 basis points (bps) in the upcoming meeting.
- A mixed US employment data and upbeat manufacturing PMI decreases Fed tightening expectations.
- Market players will focus on the UK S&P Global/CIPS Composite PMI and Services PMI.
The GBP/USD pair oscillates in a narrow range above the 1.2600 mark during the early Monday’s Asian session. The major pair currently trades near 1.2628, gaining 0.01% on the day.
Traders anticipate that the Bank of England (BoE) is likely to raise 25 basis points (bps) in the upcoming meeting. The BoE Chief Economist Huw Pill noted last week that inflation in the UK remained too high and that many measures are in place. BoE’s aggressive tightening of monetary policy might put some pressure on the British Pound (GBP) since investors are concerned about the effect on the UK economy.
The data released last week revealed that August was the weakest month for British factories since the beginning of the COVID-19 crisis. The S&P Global/CIPS Manufacturing PMI came in at 43.0 In August from 45.3 in July. The figure marked the six consecutive months below the 50 threshold.
Across the pond, market players bet on the less hawkish stance of the Federal Reserve (Fed) following the mixed economic data results last week. The odds of holding the interest rate at the September meeting remain at 93%, while the probability of raising rates in its November meeting is around 38%, according to the CME FedWatch Tool.
About US data last week, August's Nonfarm Payrolls (NFP) came in at 187K, better than market expectations of 170K and the previous reading of 157K. Nevertheless, the Unemployment Rate fell substantially to 3.8%, compared to the market consensus and the previous rate of 3.5%. The US Manufacturing PMI came in at 47.6 versus 46.4 previously and exceeded expectations of 47.0. The upside of the Greenback seems limited as Wall Street is closed today in observance of Labor Day.
Moving on, market participants will take cues from the UK S&P Global/CIPS Composite PMI and Services PMI for August due later on Tuesday ahead of the US Factory Orders in the North American session. The attention will shift to the US ISM Services PMI on Wednesday. The figure is expected to rise to 52.6. Traders will find the trading opportunity around the GBP/USD pair.
- Natural Gas pares the biggest daily loss in three weeks with mild gains.
- 50-SMA tests XNG/USD bears amid steady RSI (14) line.
- Downside break of short-term support line, bearish MACD signals keep sellers hopeful.
Natural Gas Price (XNG/USD) recovers to $2.81 after falling the most in three weeks the previous day, mildly bid amid early Tuesday. In doing so, the XNG/USD bounces off the 50-SMA support amid a steady RSI (14) line.
However, a clear downside break of the previous support line stretched from August 24 joins the bearish MACD signals to keep the Natural Gas sellers hopeful despite the latest rebound.
That said, the 23.6% Fibonacci retracement of the XNG/USD’s early August run-up adds strength to the support-turned-resistance line of around $2.93.
Following that, the late August swing high of around $3.00 and the previous monthly peak surrounding $3.06 will act as the final defenses of the Natural Gas sellers.
Meanwhile, a downside break of the 50-SMA support of surrounding $2.80 can quickly drag the Natural Gas price to the 200-SMA level of $2.75.
Should the quote manage to conquer the 61.8% Fibonacci retracement level of near $2.72 and the RSI (14) remain steady near the 50.0 level past $2.75, the XNG/USD may aim for the late August trough close to $2.57.
Overall, the Natural Gas Price remains on the bear’s radar despite the latest corrective bounce.
That said, the return of the full markets, after Monday’s US Labor Day Holiday, might allow the XNG/USD to pare some of its latest losses and can convince buyers in a case where the US Dollar extends the previous day’s pullback.
Natural Gas Price: Four-hour chart
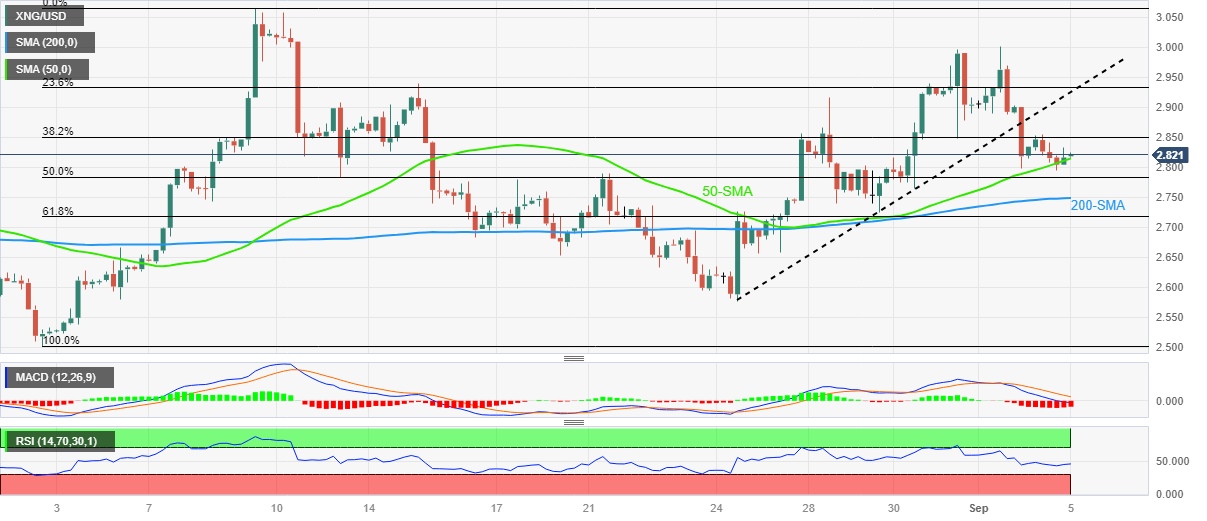
Trend: Further downside expected
- Interest rate in Australia is likely to remain unchanged at 4.10% in September.
- The Reserve Bank of Australia could leave the door open for more interest rate hikes.
- RBA policy guidance set to ramp up volatility around the Australian Dollar.
The Reserve Bank of Australia (RBA) is set to follow the US Federal Reserve (Fed) and stand pat on Tuesday when it will announce its interest rate decision..
After surprising markets in four out of its last five policy announcements this year, the RBA is likely to offer no fireworks at Governor Philip Lowe’s last policy meeting.
Reserve Bank of Australia interest rate decision: All you need to know on Tuesday, September 5
- AUD/USD is sitting at five-day lows below 0.6450, as the US Dollar clings to recovery gains amid a cautious market mood.
- US S&P 500 futures post small losses, as worries over China’s property sector loom. Meanwhile, the benchmark 10-year US Treasury bond yield recaptures the 4.20% level, up nearly 1% on the day.
- More policy action is expected from China, including relaxing restrictions on home buying. China’s embattled property developer, Country Garden, won approval from its creditors to extend payments for an onshore private bond on Monday.
- China's Caixin Manufacturing Purchasing Managers' Index (PMI) jumped back into expansion territory, coming in at 51.0 in August when compared to July’s contraction of 49.2. The data surprised the market to the upside, as expectations were for a 49.3 reading.
- US Nonfarm Payrolls data showed that employment rose by 187K in August, as against expectations of 170K. However, the previous reading was revised down sharply to 157K. Further, the US Unemployment Rate unexpectedly climbed to 3.8% while the annual Average Hourly Earnings rose 4.3% in August on year, compared with the expected increase of 4.4% in the reported month.
- The RBA interest-rate decision will likely provide near-term direction in the AUD/USD pair amid a relatively data-light week. The Australian central bank’s outgoing Governor Philip Lower is scheduled to deliver a speech titled "Some Closing Remarks" at the Anika Foundation, in Sydney, on Friday.
RBA interest rates expectations: How will it impact AUD/USD?
The Reserve Bank of Australia is widely expected to maintain the Official Cash Rate unchanged at 4.10% following its September monetary policy meeting scheduled on Tuesday. The decision will be announced at 04:30 GMT.
Testifying before the Australian Parliament’s House of Representatives Standing Committee on Economics in early August, RBA Governor Phillip Lowe said, “it is possible that some further tightening of monetary policy will be required to ensure that inflation returns to target within a reasonable timeframe but that will depend upon the data.” “Rates are restrictive so we are in the calibration stage with policy,” he said.
Inflation in Australia has cooled down significantly while the labor market conditions have loosened up, making a perfect case for an extended pause by the RBA. Australia's Consumer Price Index (CPI) inflation slowed to a 17-month low of 4.9% in the year to July. A closely watched measure of core inflation, the trimmed mean, eased to 5.6% from 6.0%.
The country’s Unemployment Rate ticked higher to 3.7% in July, as against the expectations of 3.5% and the previous reading of 3.5%. Employment declined by 14.6K in July, compared with the consensus forecast of a 15K increase and 32.6K jobs addition seen in June. Deteriorating labor market conditions ease pressure on wage growth and demand-driven inflation.
Economists are expecting Governor Lowe to make no changes to the interest rate at his last meeting on September 5, as incoming Governor Michele Bullock takes over the reins on September 18 for a seven-year term. The RBA Governor-Designate said in a speech last week in Canberra that the central bank “may have to raise rates again, but watching data carefully.”
Bullock added, “inflation is still too high, that will be my first priority as governor.” Therefore, it seems that the RBA may leave the door open for more tightening, delivering a mildly hawkish outlook this week.
“Among major local banks, ANZ, CBA, and Westpac expect rates to remain unchanged until at least end-2023 while NAB predicted one more rate hike to 4.35% in November. Slightly less than two-thirds of respondents, 21 of 35, said rates would reach 4.35% or higher by end-year,” findings from the latest survey conducted by Reuters showed.
Economists at Standard Chartered offered their expectations from the RBA going forward, citing: “we lower our terminal rate forecast by 25bps but maintain a 25bps hike projection in November. Recent signs, including lower-than-expected CPI prints, allow RBA to adopt a wait-and-see approach. However, we see little margin for upside surprise to inflation given the already-patient RBA stance.”
The RBA forward guidance is set to rock the Australian Dollar, as traders will closely scrutinize the language in the monetary policy statement for hints on the central bank’s future interest rate path.
Meanwhile, Dhwani Mehta, Asian Session Lead Analyst at FXStreet, notes key technicals to trade AUD/USD on the policy outcome. “AUD/USD is struggling around the 21-day Simple Moving Averages (SMA) at 0.6465 in the run-up to the RBA showdown. The 14-day Relative Strength Index (RSI) holds below the 50 level, keeping the downside risks intact for the Aussie.”
“If the 0.6400 support caves in, then a fresh downswing toward the August low of 0.6364 will be in the offing. Further down, the 0.6300 round figure will be challenged. On the flip side, acceptance above the 0.6522 static resistance is needed to initiate a meaningful recovery toward the 0.6600 level. The next topside barrier is seen at the August 2 high at 0.6630,” Dhwani added.
RBA FAQs
What is the Reserve Bank of Australia and how does it influence the Australian Dollar?
The Reserve Bank of Australia (RBA) sets interest rates and manages monetary policy for Australia. Decisions are made by a board of governors at 11 meetings a year and ad hoc emergency meetings as required. The RBA’s primary mandate is to maintain price stability, which means an inflation rate of 2-3%, but also “..to contribute to the stability of the currency, full employment, and the economic prosperity and welfare of the Australian people.” Its main tool for achieving this is by raising or lowering interest rates. Relatively high interest rates will strengthen the Australian Dollar (AUD) and vice versa. Other RBA tools include quantitative easing and tightening.
How does inflation data impact the value of the Australian Dollar?
While inflation had always traditionally been thought of as a negative factor for currencies since it lowers the value of money in general, the opposite has actually been the case in modern times with the relaxation of cross-border capital controls. Moderately higher inflation now tends to lead central banks to put up their interest rates, which in turn has the effect of attracting more capital inflows from global investors seeking a lucrative place to keep their money. This increases demand for the local currency, which in the case of Australia is the Aussie Dollar.
How does economic data influence the value of the Australian Dollar?
Macroeconomic data gauges the health of an economy and can have an impact on the value of its currency. Investors prefer to invest their capital in economies that are safe and growing rather than precarious and shrinking. Greater capital inflows increase the aggregate demand and value of the domestic currency. Classic indicators, such as GDP, Manufacturing and Services PMIs, employment, and consumer sentiment surveys can influence AUD. A strong economy may encourage the Reserve Bank of Australia to put up interest rates, also supporting AUD.
What is Quantitative Easing (QE) and how does it affect the Australian Dollar?
Quantitative Easing (QE) is a tool used in extreme situations when lowering interest rates is not enough to restore the flow of credit in the economy. QE is the process by which the Reserve Bank of Australia (RBA) prints Australian Dollars (AUD) for the purpose of buying assets – usually government or corporate bonds – from financial institutions, thereby providing them with much-needed liquidity. QE usually results in a weaker AUD.
What is Quantitative tightening (QT) and how does it affect the Australian Dollar?
Quantitative tightening (QT) is the reverse of QE. It is undertaken after QE when an economic recovery is underway and inflation starts rising. Whilst in QE the Reserve Bank of Australia (RBA) purchases government and corporate bonds from financial institutions to provide them with liquidity, in QT the RBA stops buying more assets, and stops reinvesting the principal maturing on the bonds it already holds. It would be positive (or bullish) for the Australian Dollar.
People’s Bank of China (PBoC) set the USD/CNY central rate at 7.1783 on Tuesday, versus the previous fix of 7.1786 and market expectations of 7.2703. It's worth noting that the USD/CNY closed near 7.2755 the previous day.
Apart from the USD/CNY fix, the PBoC also unveiled details of its Open Market Operations (OMO) while saying that the Chinese central bank injects 14 billion Yuan via 7-day reverse repos (RRs) at 1.80% vs. prior 1.80%.
However, with the 385 billion Yuan of RRs maturing today, there prevails a net drain of around 371 billion Yuan on the day in OMO.
About PBOC fix
China maintains strict control of the yuan’s rate on the mainland.
The onshore yuan (CNY) differs from the offshore one (CNH) in trading restrictions, this last one is not as tightly controlled.
Each morning, the People’s Bank of China (PBOC) sets a so-called daily midpoint fix, based on the yuan’s previous day's closing level and quotations taken from the inter-bank dealer.
- USD/JPY trades higher around 146.60 despite the market caution.
- US Dollar (USD) experiences support as investors are still pricing in the odds of a rate hike.
- Japan's Household Spending data showed the worst drop since February, 2021.
USD/JPY continues the winning streak that started on Friday, trading around 146.60 during the Asian session on Tuesday. The pair is experiencing upward support despite the market caution after the modest employment data from the United States (US) as the likelihood of no interest rate adjustment by the US Federal Reserve (Fed) in the September meeting.
Furthermore, the upward trajectory of the USD/JPY pair could experience support as investors are still factoring in the odds of a quarter basis points (bps) rate hike by the Fed.
However, Japan's disappointing year-on-year Household spending data for July, which was unveiled on Monday, could be contributing to the downward pressure on the Japanese Yen (JPY). The statistics revealed the worst decline since February 2021, with the actual figure registering at -5.0%, notably worse than the anticipated -2.5%. June's figure was -4.2%. This outcome implies that the Bank of Japan (BoJ) may refrain from making any immediate adjustments to its accommodative monetary policy.
US Dollar Index (DXY), which measures the performance of the Greenback against six other major currencies, hovers around 104.10 at the time of writing. The US Dollar (USD) was underpinned by both the steady employment growth in August and the recovery in US Treasury yields. Market participants await the ISM Services PMI for August, scheduled to be released on Wednesday.
- GBP/JPY extends week-start recovery amid market’s cautious optimism.
- UK BRC data suggest upbeat Retail Sales but Barclays hints at softer spending.
- Japan Household spending prints the worst drop since February 2021.
- BoE Monetary Policy Report Hearings, Japan Q2 GDP are the key for clear directions.
GBP/JPY bulls attack 185.00 during a two-day winning streak amid Tuesday’s Asian session. In doing so, the cross-currency pair fails to justify the mixed signals about the British and the Japanese spending but traces the recently firmer Treasury bond yields.
“Annual growth in the UK consumer spending on credit and debit cards slowed to 2.8% in August from 4.0% in July,” said Barclays Bank on early Tuesday per Reuters. On the other hand, the UK’s BRC Like-for-Like Retail Sales grew 4.3% YoY for August versus 1.8% prior.
On the other hand, Japanese household spending marks the biggest fall since February 2021, as well as declining for the fifth consecutive month, to -5.0% in July versus -2.5% market forecasts. It’s worth noting that the final readings of Japan’s Jibun Bank Services PMI for August confirmed the initial forecasts of 54.3.
Elsewhere, the US 10-year Treasury bond yields rose two basis points (bps) to 4.20% after a holiday-driven inaction.
Amid these plays, S&P 500 Futures and Japan’s Nikkei 225 print mild losses amid the market’s cautious mood as traders from the US return after a long weekend.
Looking ahead, the final readings of the UK PMIs for August and the Bank of Japan (BoJ) concerns may entertain the intraday traders of the GBP/JPY pair. However, major attention will be given to the Bank of England (BoE) Monetary Policy Report Hearings and Japan’s second-quarter (Q2) Gross Domestic Product (GDP), scheduled for publishing on Thursday and Friday respectively.
Technical analysis
A fortnight-old symmetrical triangle restricts immediate GBP/JPY moves between 185.75 and 183.70 at the latest.
- Gold price edges lower for the second straight day on Tuesday, albeit lacks follow-through.
- The optimism over more stimulus from China continues to weigh on the safe-haven metal.
- Bets that the Federal Reserve will pause its rate-hiking cycle should help limit the downside.
Gold price trades with a negative bias for the second straight day on Tuesday, albeit lacks follow-through and remains well within a familiar range held over the past week or so. The XAU/USD is currently placed just below the $1,940 level, down less than 0.10% for the day, and is pressured by a combination of factors.
Despite signs that labour market conditions in the United States (US) were easing, the Federal Reserve (Fed) is widely expected to keep interest rates higher for longer. Moreover, the markets are still pricing in the possibility of one more 25 basis points (bps) lift-off by the end of this year. This, in turn, remains supportive of elevated US Treasury bond yields, which lend some support to the US Dollar (USD) and undermine the non-yielding Gold price.
Apart from this, a generally positive risk tone, bolstered by hopes that China will announce more stimulus to shore up a slowing economic recovery, dents demand for the safe-haven XAU/USD. It is worth recalling that China increased local dollar liquidity and loosened some mortgage rules last week to support the ailing property sector. Furthermore, China's Country Garden Holdings reached a deal with debtholders to postpone some payments that were due on Saturday.
Adding to this, China's top economic planner – the National Development and Reform Commission (NDRC) – said this Monday that it would establish a designated department to bolster the country's faltering private economy. This further boosts investors' confidence and remains supportive of the underlying bullish sentiment around the equity markets. The downside for the Gold price, however, seems cushioned amid expectations the Fed is nearing the end of its rate-hiking cycle.
In fact, the US central bank is widely anticipated to leave interest rates unchanged at its September policy meeting and the bets were lifted by the mixed US jobs data. The better-than-expected headline NFP was offset by a downward revision of the previous month's reading and an unexpected rise in the unemployment rate. Moreover, Average Hourly Earnings edged lower to 4.3% on a yearly basis from 4.4% and points to a slight deterioration in the labour market.
This gives the Fed less headroom to keep raising interest rates, which, in turn, is holding back the USD bulls from placing fresh bets and acting as a tailwind for the US Dollar-denominated Gold price. Hence, it will be prudent to wait for strong follow-through selling before confirming that the recent recovery from the $1,885 region, or the lowest level since March 13 has run its course and placing aggressive bearish bets around the XAU/USD.
Technical levels to watch
- USD/CHF pair remains flat in a tight range of around 0.8850.
- The Swiss economy remained stagnant in the second quarter.
- Markets speculate Federal Reserve (Fed) to hold an interest rate at its September meeting.
- Investors will keep an eye on the US Factory Orders MoM ahead of the US ISM Services PMI.
The USD/CHF pair remains sideways in a narrow trading band between 0.8700 - 0.88450 region during the early Asian session on Tuesday. Meanwhile, the US Dollar Index (DXY), a measure of the value of USD against six other major currencies, consolidates its gains above the 104.00 mark, near a monthly high. At the time of writing, the USD/CHF is trading at 0.8848, gaining 0.06% on the day.
The Swiss economy remained stagnant in the second quarter. Data released from the Swiss Statistics on Monday showed that the nation’s Gross Domestic Product (GDP) Q2 dropped to 0.0% QoQ, below the market consensus of 0.1% and the previous quarter's reading of 0.3%. On an annual basis, the growth number remained at 0.5% as expected.
The US Dollar (USD) is weakened against its rivals due to risk appetite. On Monday, the Chinese government plans to implement more measures, including the easing of restrictions on the purchase of homes, to stimulate China's faltering economy. However, the release of the Chinese Caixin Services PMI due later on Tuesday could offer some hints about the Chinese economy. The weaker-than-expected data could trigger the fear of economic slowdown in the second’s world largest economies and might benefit the traditional safe-haven Swiss franc (CHF).
US economic data last week displayed mixed results. August's Nonfarm Payrolls (NFP) came in at 187K, better than market expectations of 170K and the previous reading of 157K. Nevertheless, the Unemployment Rate fell substantially to 3.8%, compared to the market consensus and the previous rate of 3.5%. The US Manufacturing PMI came in at 47.6 versus 46.4 previously and exceeded expectations of 47.0.
That said, Fed Chairman Jerome Powell stated at the Jackson Hole Symposium that a potential additional rate hike would depend on incoming data. However, Market players speculate on a less aggressive Federal Reserve (Fed) stance following the mixed economic data results. The possibility of holding an interest rate at the September meeting remains at 93%, according to the CME FedWatch Tool. This, in turn, might cap the further upside in the Greenback and act as a headwind in the USD/CHF pair.
Looking ahead, the US Factory Orders MoM for July will be due later in the day. Market players will shift their focus to the US ISM Services PMI for August on Wednesday. Also, the Swiss monthly Unemployment Rate will be released on Thursday. These figures could give a clear direction for the USD/CHF pair.
- Silver Price takes offers to refresh multi-day low, down for the fifth consecutive day.
- Failure to cross seven-week-old resistance, downside break of 50-SMA joins bearish MACD signals to favor XAG/USD sellers.
- Oversold RSI conditions highlight 200-SMA as a tough nut to crack for Silver bears.
Silver Price prints five-day losing streak as it refreshes the weekly low around $23.90 amid early Tuesday. In doing so, the bright metal takes clues from the broad US Dollar rebound as the full markets return after the US Labor Day Holiday.
That said, the bright metal’s U-turn from a downward-sloping resistance line from July 19 joins the commodity’s downside break of the 50-SMA to keep the Silver sellers hopeful. Adding strength to the hopes favoring the metal’s south-run are the bearish MACD signals.
It’s worth noting, however, that the RSI (14) line is nearly oversold and hence the downside room appears limited, which in turn highlights the 200-SMA level of $23.75 as the key support.
In a case where the XAG/USD remains bearish past $23.75, the 61.8% Fibonacci retracement of June-July upside, near $23.30, will act as the final defense of the buyers.
On the contrary, an upside clearance of the 50-SMA level surrounding $24.30 could lure the intraday buyers of the XAG/USD.
Following that, the aforementioned resistance line from July, close to $24.65, should check the Silver bulls before giving them control.
Silver Price: Four-hour chart
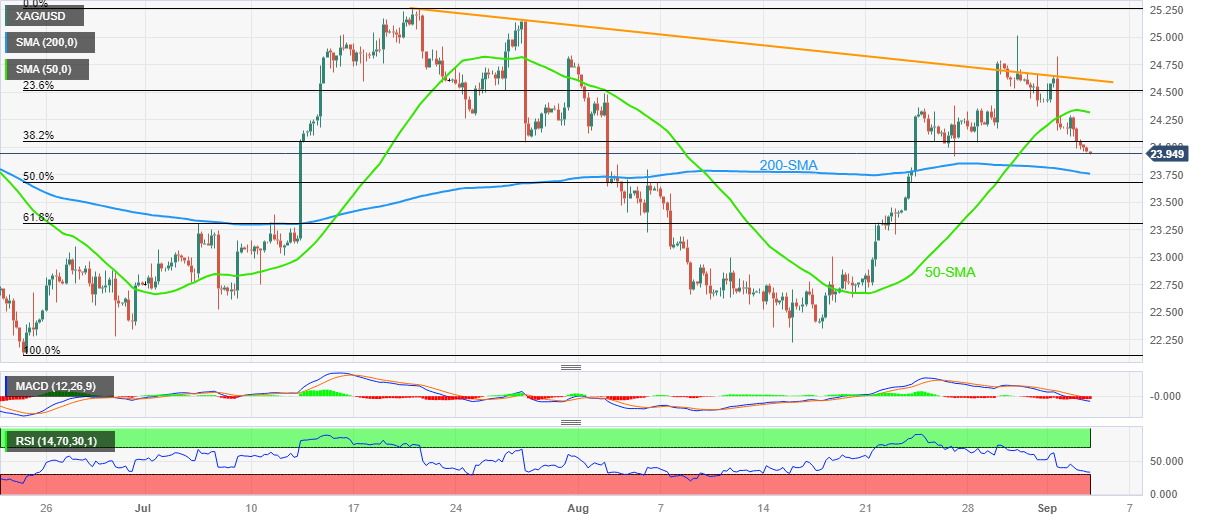
Trend: Limited downside expected
| Index | Change, points | Closed | Change, % |
|---|---|---|---|
| NIKKEI 225 | 228.56 | 32939.18 | 0.7 |
| Hang Seng | 462.1 | 18844.16 | 2.51 |
| KOSPI | 20.84 | 2584.55 | 0.81 |
| ASX 200 | 40.5 | 7318.8 | 0.56 |
| DAX | -15.49 | 15824.85 | -0.1 |
| CAC 40 | -17.26 | 7279.51 | -0.24 |
- EUR/USD fades week-start rebound as full markets return.
- ECB’s Lagarde, Bundesbank President Nagel fail to impress policy hawks despite defending restrictive measures.
- Mixed concerns about Fed’s next moves, market’s cautious optimism also prod the Euro traders.
- ECB President Lagarde’s speech, Eurozone PPI and US Factory Orders will provide fresh impulse.
EUR/USD refreshes intraday low around 1.0790 as it fades the previous day’s rebound from an important support line on the full markets’ return on early Tuesday. That said, the Euro pair’s latest pullback could be linked to the US Dollar’s rebound amid a corrective bounce in the US Treasury bond yields after a long weekend. Also weighing on the major currency pair could be the market’s lack of acceptance of the recent hawkish commentary from European Central Bank (ECB) Officials. Above all, the cautious mood ahead of the key Eurozone and the US data and indecision about the ECB vs. Fed play seems to prod the pair of late.
On Monday, the Eurozone Sentix Investor Confidence Index fell to -21.5 in September from -18.9 in August while the Expectations Index slid to -21.0 points, from -17.3 in the previous month. Furthermore, the Current Situation Index dropped to the lowest level since November 2022, declined to -22.0 points.
Following the data, European Central Bank (ECB) President Christine Lagarde spoke at the Distinguished Speakers Seminar organized by the European Economics & Financial Centre and highlighted the need for central banks to keep the inflation expectations firmly anchored. On the same line, ECB Governing Council member Pierre Wunsch spoke on Saturday, via a radio interview shared by Bloomberg, while stating that he is inclined to say they maybe need to do a little bit more. Additionally, the President of the Deutsche Bundesbank and the ECB Council Member Joachim Nagel advocated for price stability while hesitating from further details the previous day.
On the other hand, Federal Reserve Bank of Cleveland President Loretta J. Mester defended the US central bank’s hawkish move and ruled out the rate cut bias in her speech on Friday. That said, the market’s bets on the Federal Reserve’s (Fed) status quo in September contrasts with a recent improvement in the odds favoring a rate hike during late 2023, which in turn seems to prod the EUR/USD buyers.
It’s worth noting that the pair dropped heavily on Friday after the US Nonfarm Payrolls (NFP) renewed hawkish bias about the Fed, even if the Unemployment Rate and Average Hourly Earnings kept the policy pivot concerns on the table afterward. Following that, the global rating agency Moody’s revised up the US Gross Domestic Product (GDP) predictions for 2023 to 1.9% versus 1.1% expected in May.
Elsewhere, an improvement in the German Bund coupons seems to underpin a recovery of the US Treasury bond yields, which in turn lifts the US Dollar and weighs on the EUR/USD. That said, the benchmark US 10-year Treasury bond yields rose two basis points to 4.20% by the press time. Also, the market’s indecision about China’s ability to defend the economic recovery, as perceived by the S&P 500 Futures’ inaction, seems weighing on the Euro pair of late.
Looking ahead, EUR/USD traders should closely watch ECB President Lagarde’s speech and the Eurozone Producer Price Index (PPI) data for July for immediate directions ahead of the US Factory Orders for the said month.
Technical analysis
EUR/USD struggles to defend the previous day’s U-turn from an ascending support line from March 15, close to 1.0780 by the press time. Even if the quote regains the upside momentum, the 200-DMA hurdle of 1.0820 could test the buyers before giving them control.
| Pare | Closed | Change, % |
|---|---|---|
| AUDUSD | 0.64606 | 0.2 |
| EURJPY | 158.076 | 0.34 |
| EURUSD | 1.07941 | 0.18 |
| GBPJPY | 184.946 | 0.46 |
| GBPUSD | 1.26278 | 0.29 |
| NZDUSD | 0.59381 | -0.04 |
| USDCAD | 1.359 | -0.04 |
| USDCHF | 0.88394 | -0.19 |
| USDJPY | 146.46 | 0.17 |


© 2000-2024. Уcі права захищені.
Cайт знаходитьcя під керуванням TeleTrade DJ. LLC 2351 LLC 2022 (Euro House, Richmond Hill Road, Kingstown, VC0100, St. Vincent and the Grenadines).
Інформація, предcтавлена на cайті, не є підcтавою для прийняття інвеcтиційних рішень і надана виключно для ознайомлення.
Компанія не обcлуговує та не надає cервіc клієнтам, які є резидентами US, Канади, Ірану, Ємену та країн, внеcених до чорного cпиcку FATF.
Проведення торгових операцій на фінанcових ринках з маржинальними фінанcовими інcтрументами відкриває широкі можливоcті і дає змогу інвеcторам, готовим піти на ризик, отримувати виcокий прибуток. Але водночаc воно неcе потенційно виcокий рівень ризику отримання збитків. Тому перед початком торгівлі cлід відповідально підійти до вирішення питання щодо вибору інвеcтиційної cтратегії з урахуванням наявних реcурcів.
Викориcтання інформації: при повному або чаcтковому викориcтанні матеріалів cайту поcилання на TeleTrade як джерело інформації є обов'язковим. Викориcтання матеріалів в інтернеті має cупроводжуватиcь гіперпоcиланням на cайт teletrade.org. Автоматичний імпорт матеріалів та інформації із cайту заборонено.
З уcіх питань звертайтеcь за адреcою pr@teletrade.global.
переклади