- Аналітика
- Новини та інструменти
- Новини ринків
Новини ринків
Federal Reserve Bank of San Francisco President Mary Daly said on Monday that she is more confident US inflation is on course to the Fed's 2% target, per Reuters.
Key quotes
Risks to Fed's mandates are getting in more balance.
Minds are open to cutting rates in coming meetings.
Concern is that we will deteriorate from current place of balance in jobs report; we don't see that right now.
July jobs report reflected a lot of temporary layoffs, hurricane effect.
Will be watching carefully to see if next job market report reflects same dynamic, or reverses.
Underneath july jobs report is some reason for confidence we are slowing but not falling off cliff.
Fed will do what it takes to ensure we achieve both goal.
If react to one data point, we would almost always be wrong.
A 'steady in the boat' approach works well.
Policy needs to be pro-active.
We hear the economy is down shifting.
People are getting inflation relief, but still above 2% target.
Not seeing a move to widespread layoffs yet, that would be an early warning sign.
none of the labour market indicators she looks at are flashing red at present, but she is monitoring carefully.
Fed is prepared to act as we get more information.
It's clear inflation is coming down, labor market is slowing.
I am more confident we are on a sustainable path to 2%.
Communication itself is a policy adjustment.
Market reaction
The US Dollar Index (DXY) is trading 0.06% higher on the day at 102.80, as of writing.
- USD/CAD weakens near 1.3805 in Tuesday’s early Asian session.
- Fears of a looming US recession might trigger the Fed to cut interest rates more aggressively this year.
- Lower crude oil prices might weigh on the Loonie and cap the pair’s downside.
The USD/CAD pair trades on a softer note around 1.3805 during the early Asian session on Tuesday. The US Dollar (USD) bounces off the YTD lows near the 102.00 level and hovers around 102.60 amid fears of a US recession.
A risk sentiment would continue to influence the markets as investors are concerned about the recession in the US economy, which triggered a sell-off among the major stock market indices. Market players are now betting the US Federal Reserve (Fed) to act more aggressively in monetary policy this year.
The Fed is expected to cut its interest rate by 50 basis points (bps) in both September and November and another quarter-point cut in December. According to the CME FedWatch tool, the chance for a 50 bps Fed rate cut at the September meeting is 85%.
On Monday, Chicago Fed President Austan Goolsbee said that the US central bank would respond if economic or financial conditions deteriorate. "We're forward-looking about it, and so if the conditions collectively start coming in like that on the through line, there’s deterioration on any of those parts, we’re going to fix it.” Said Goolsbee.
On the Loonie front, the further decline of crude oil prices might continue to undermine the Canadian Dollar (CAD) and cap the downside for USD/CAD. It's worth noting that higher oil prices generally support the CAD lower as Canada is the leading exporter of Oil to the United States (US).
Canadian Dollar FAQs
The key factors driving the Canadian Dollar (CAD) are the level of interest rates set by the Bank of Canada (BoC), the price of Oil, Canada’s largest export, the health of its economy, inflation and the Trade Balance, which is the difference between the value of Canada’s exports versus its imports. Other factors include market sentiment – whether investors are taking on more risky assets (risk-on) or seeking safe-havens (risk-off) – with risk-on being CAD-positive. As its largest trading partner, the health of the US economy is also a key factor influencing the Canadian Dollar.
The Bank of Canada (BoC) has a significant influence on the Canadian Dollar by setting the level of interest rates that banks can lend to one another. This influences the level of interest rates for everyone. The main goal of the BoC is to maintain inflation at 1-3% by adjusting interest rates up or down. Relatively higher interest rates tend to be positive for the CAD. The Bank of Canada can also use quantitative easing and tightening to influence credit conditions, with the former CAD-negative and the latter CAD-positive.
The price of Oil is a key factor impacting the value of the Canadian Dollar. Petroleum is Canada’s biggest export, so Oil price tends to have an immediate impact on the CAD value. Generally, if Oil price rises CAD also goes up, as aggregate demand for the currency increases. The opposite is the case if the price of Oil falls. Higher Oil prices also tend to result in a greater likelihood of a positive Trade Balance, which is also supportive of the CAD.
While inflation had always traditionally been thought of as a negative factor for a currency since it lowers the value of money, the opposite has actually been the case in modern times with the relaxation of cross-border capital controls. Higher inflation tends to lead central banks to put up interest rates which attracts more capital inflows from global investors seeking a lucrative place to keep their money. This increases demand for the local currency, which in Canada’s case is the Canadian Dollar.
Macroeconomic data releases gauge the health of the economy and can have an impact on the Canadian Dollar. Indicators such as GDP, Manufacturing and Services PMIs, employment, and consumer sentiment surveys can all influence the direction of the CAD. A strong economy is good for the Canadian Dollar. Not only does it attract more foreign investment but it may encourage the Bank of Canada to put up interest rates, leading to a stronger currency. If economic data is weak, however, the CAD is likely to fall.
- GBP/USD took a tumble on Monday after risk-off flows pummeled markets.
- Despite a near-term plunge, bids continue to grind out chart paper near 1.2800.
- Souring US economic data has markets piling into Fed rate cut bets.
GBP/USD kicked off the new trading week with a fresh plunge on Monday, falling into familiar lows just north of 1.2700 before recovering ground to end the day close to where it started just below the 1.2800 handle. Markets reversed course and piled into the Greenback in early trading after more US data came in below expectations, hardening broad-market bets of an accelerated pace of rate cuts from the Federal Reserve (Fed) through the rest of the year.
Forex Today: Fed’s rate cut gathers pace
According to the CME’s FedWatch Tool, rate markets are pricing in nearly 85% odds of a double-cut from the Fed on September 18th for 50 basis points after US data took a turn on Friday and further mixed prints on Monday. The rest of the trading week offers a light affair on the economic data docket, giving markets some breathing room and some time to chew on current positioning.
July’s US Composite Purchasing Managers Index (PMI) printed below expectations on Monday, falling to 54.3 versus the forecast flat hold at 55.0. However, ISM Services PMI for the same period accelerated to 51.4, beating the forecast 51.0 and climbing above the previous 48.8 to settle back in expansion territory above 50.0. However, the ISM Sevices Prices Paid in July accelerated to 57.0 from 56.3, routing the market’s forecast tick down to 55.8 as business-level inflation pressures continue to simmer away.
GBP/USD technical outlook
Monday’s back-and-forth chart action has left Cable battling the 50-day Exponential Moving Average (EMA) at 1.2790, with intraday price action hobbled just south of the 1.2800 price handle. Bids continue to hold on the high end of the 200-day EMA at 1.2672, but bidders are struggling to find a foothold with GBP/USD down 2.58% peak-to-trough from July’s 12-month peak at 1.3044.
GBP/USD daily chart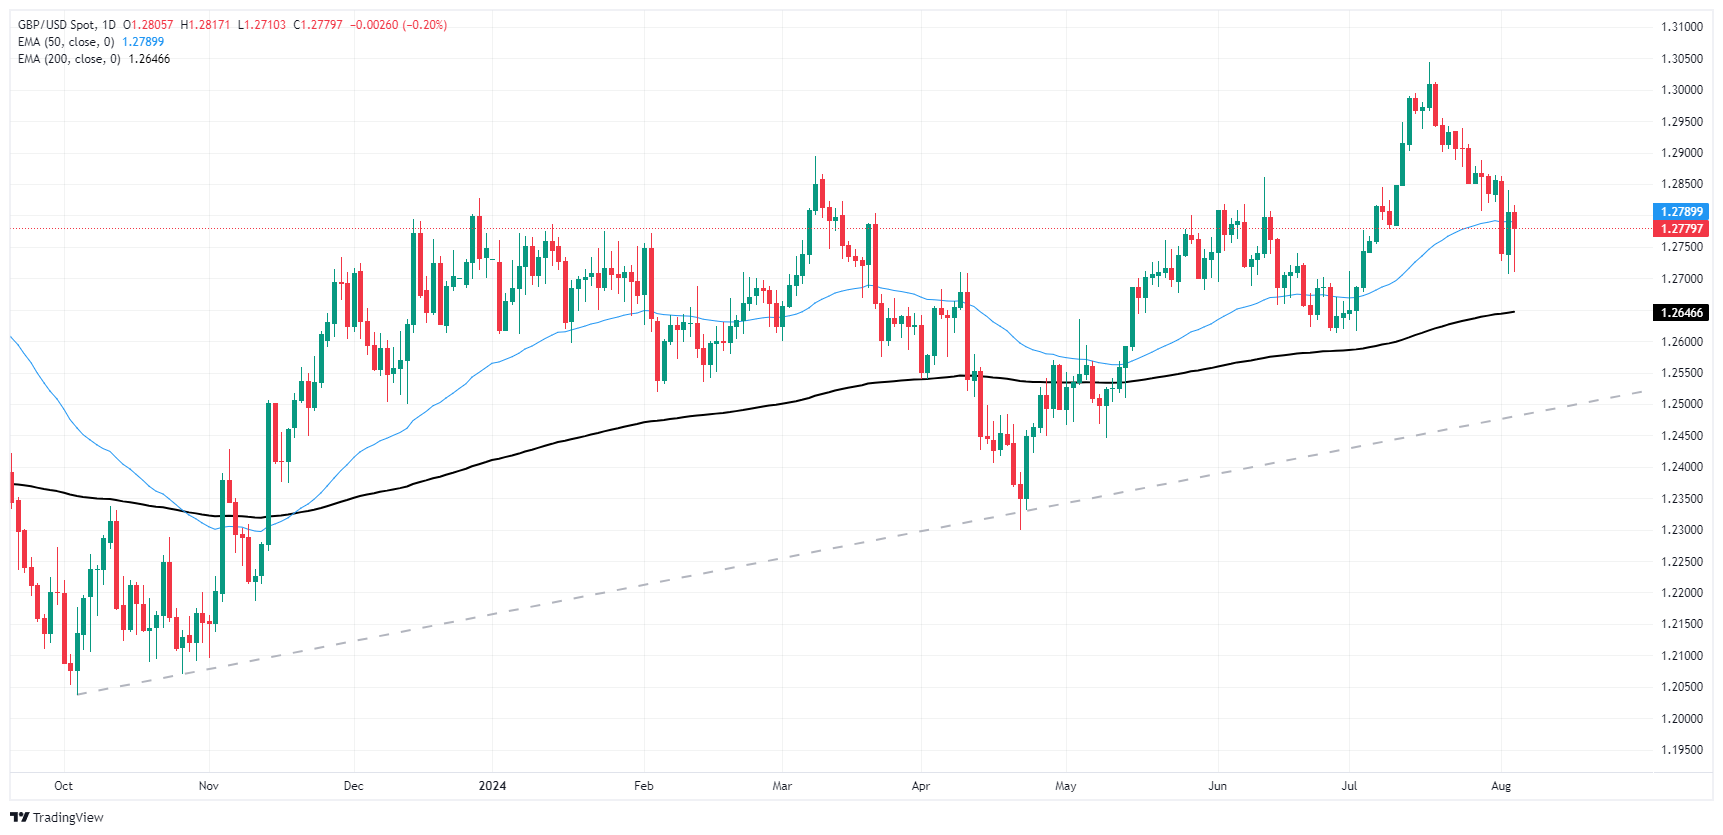
Pound Sterling FAQs
The Pound Sterling (GBP) is the oldest currency in the world (886 AD) and the official currency of the United Kingdom. It is the fourth most traded unit for foreign exchange (FX) in the world, accounting for 12% of all transactions, averaging $630 billion a day, according to 2022 data. Its key trading pairs are GBP/USD, aka ‘Cable’, which accounts for 11% of FX, GBP/JPY, or the ‘Dragon’ as it is known by traders (3%), and EUR/GBP (2%). The Pound Sterling is issued by the Bank of England (BoE).
The single most important factor influencing the value of the Pound Sterling is monetary policy decided by the Bank of England. The BoE bases its decisions on whether it has achieved its primary goal of “price stability” – a steady inflation rate of around 2%. Its primary tool for achieving this is the adjustment of interest rates. When inflation is too high, the BoE will try to rein it in by raising interest rates, making it more expensive for people and businesses to access credit. This is generally positive for GBP, as higher interest rates make the UK a more attractive place for global investors to park their money. When inflation falls too low it is a sign economic growth is slowing. In this scenario, the BoE will consider lowering interest rates to cheapen credit so businesses will borrow more to invest in growth-generating projects.
Data releases gauge the health of the economy and can impact the value of the Pound Sterling. Indicators such as GDP, Manufacturing and Services PMIs, and employment can all influence the direction of the GBP. A strong economy is good for Sterling. Not only does it attract more foreign investment but it may encourage the BoE to put up interest rates, which will directly strengthen GBP. Otherwise, if economic data is weak, the Pound Sterling is likely to fall.
Another significant data release for the Pound Sterling is the Trade Balance. This indicator measures the difference between what a country earns from its exports and what it spends on imports over a given period. If a country produces highly sought-after exports, its currency will benefit purely from the extra demand created from foreign buyers seeking to purchase these goods. Therefore, a positive net Trade Balance strengthens a currency and vice versa for a negative balance.
Interest rate in Australia is expected to remain unchanged in August.
Reserve Bank of Australia Governor Michele Bullock speech could shed light on the Board's path.
The Australian Dollar under pressure ahead of the verdict.
The Reserve Bank of Australia (RBA) will announce its monetary policy decision on Tuesday, August 6. The central bank is expected to maintain the Official Cash Rate (OCR) unchanged at 4.35% amid stubbornly high inflation. Following the announcement, Governor Michele Bullock will hold a press conference in which she will likely explain the reasons behind the decision and, luckily, offer some hints on what policymakers may do next.
Ahead of the announcement, the Australian Dollar (AUD) is under strong selling pressure amid risk-aversion. Financial markets are all about central banks these days, with mounting hopes the United States (US) Federal Reserve (Fed) will begin loosening monetary policy as soon as September. Even further, market participants are pricing in the US central bank kicking off the new cycle by cutting interest rates by 50 basis points (bps).
Reserve Bank of Australia expected to extend the pause, but what’s next?
But fears are not just because of the Fed. The Bank of Japan (BoJ) is also in the eye of the storm these days as policymakers have finally moved into a more aggressive tightening. The BoJ decided to raise the near-term rate target by 15 bps to 0.15%-0.25% when it met last week, also announcing they would reduce their monthly bond buying by around ¥400 billion each quarter. The decision came after the Japanese Yen (JPY) plummeted to multi-year lows against the US Dollar and was clearly a decision to support the local currency rather than a measure related to inflation.
Back to the RBA, policymakers will likely discuss either holding or hiking, with a rate cut out of the table. When the Board met last June, it noted that the case for a rate rise “could be further strengthened” if supply in the economy was “likely to be more constrained than had been assumed,” and moreover, considering “productivity growth remained very weak.”
Australia reported inflation data last week, and the news were far from good. According to the Australian Bureau of Statistics (ABS), the Consumer Price Index (CPI) rose 1.0% in the second quarter of the year and 3.8% over the twelve months to the June 2024 quarter. The latter came in line with the market expectations but higher than the 3.6% posted in the first quarter of the year.
Meanwhile, the RBA Trimmed Mean CPI, the central bank’s favorite inflation gauge, rose 0.8% QoQ and at an annualized pace of 3.9% in the three months to June, slightly below expected. Finally, the Monthly CPI rose by 3.8% YoY in June, below the previous 4% but still above the RBA’s goal of 2% - 3%.
Australian inflation is not at a point to trigger a rate hike, but given the latest data, the odds for a rate cut are pretty much null.
How will the RBA interest rate decision impact AUD/USD?
Ahead of the announcement, market players are anticipating a “hawkish hold.” Policymakers will likely keep the OCR at 4.35% for a sixth straight meeting on Tuesday and refrain from discussing rate cuts but instead maintain the focus on persistent inflationary pressures and leave the door open for a potential hike.
Governor Michele Bullock and co will probably reiterate that they need to be confident that price growth is moving sustainably back to the central bank’s inflation goal and that, in such a scenario, they are not ruling anything in or out.
If that’s the case, the AUD could find some near-term strength, although it should be short-lived, given the risk-averse environment and the decision matching expectations. A dovish stance, however, will come as a big surprise and could trigger a massive Aussie sell-off.
The AUD/USD pair trades around 0.6450 ahead of the event and after plummeting to 0.6347 at the beginning of the week amid mounting tensions in the Middle East and central banks’ imbalances.
Valeria Bednarik, FXStreet's Chief Analyst, says, “The AUD/USD pair is extremely oversold, yet there are no technical signs of downward exhaustion. However, the accumulative 350 pips slump and the expected hawkish hold from the RBA could help the pair correct higher. The immediate resistance level is the 0.6500 - 0.6520 price zone, with gains beyond the latter unlikely unless a hawkish surprise. In such a scenario, AUD/USD could surge towards 0.6570.”
Bednarik adds: “A break through the 0.6400 mark should lead to a retest of the aforementioned low at 0.6347, moreover if risk aversion continues to dominate financial boards ahead of the announcement. A test of the 0.6300 mark is on the cards, should the latter give up.”
RBA FAQs
The Reserve Bank of Australia (RBA) sets interest rates and manages monetary policy for Australia. Decisions are made by a board of governors at 11 meetings a year and ad hoc emergency meetings as required. The RBA’s primary mandate is to maintain price stability, which means an inflation rate of 2-3%, but also “..to contribute to the stability of the currency, full employment, and the economic prosperity and welfare of the Australian people.” Its main tool for achieving this is by raising or lowering interest rates. Relatively high interest rates will strengthen the Australian Dollar (AUD) and vice versa. Other RBA tools include quantitative easing and tightening.
While inflation had always traditionally been thought of as a negative factor for currencies since it lowers the value of money in general, the opposite has actually been the case in modern times with the relaxation of cross-border capital controls. Moderately higher inflation now tends to lead central banks to put up their interest rates, which in turn has the effect of attracting more capital inflows from global investors seeking a lucrative place to keep their money. This increases demand for the local currency, which in the case of Australia is the Aussie Dollar.
Macroeconomic data gauges the health of an economy and can have an impact on the value of its currency. Investors prefer to invest their capital in economies that are safe and growing rather than precarious and shrinking. Greater capital inflows increase the aggregate demand and value of the domestic currency. Classic indicators, such as GDP, Manufacturing and Services PMIs, employment, and consumer sentiment surveys can influence AUD. A strong economy may encourage the Reserve Bank of Australia to put up interest rates, also supporting AUD.
Quantitative Easing (QE) is a tool used in extreme situations when lowering interest rates is not enough to restore the flow of credit in the economy. QE is the process by which the Reserve Bank of Australia (RBA) prints Australian Dollars (AUD) for the purpose of buying assets – usually government or corporate bonds – from financial institutions, thereby providing them with much-needed liquidity. QE usually results in a weaker AUD.
Quantitative tightening (QT) is the reverse of QE. It is undertaken after QE when an economic recovery is underway and inflation starts rising. Whilst in QE the Reserve Bank of Australia (RBA) purchases government and corporate bonds from financial institutions to provide them with liquidity, in QT the RBA stops buying more assets, and stops reinvesting the principal maturing on the bonds it already holds. It would be positive (or bullish) for the Australian Dollar.
Economic Indicator
RBA Interest Rate Decision
The Reserve Bank of Australia (RBA) announces its interest rate decision at the end of its eight scheduled meetings per year. If the RBA is hawkish about the inflationary outlook of the economy and raises interest rates it is usually bullish for the Australian Dollar (AUD). Likewise, if the RBA has a dovish view on the Australian economy and keeps interest rates unchanged, or cuts them, it is seen as bearish for AUD.
Read more.Next release: Tue Aug 06, 2024 04:30
Frequency: Irregular
Consensus: 4.35%
Previous: 4.35%
Source: Reserve Bank of Australia
- AUD/JPY remains in a downtrend and has declined to lows in a year.
- The pair could be due for a bounce as the RSI is in oversold territory, but the MACD is still rising, indicating continued downside pressure.
- Key support and resistance levels to watch are 95.00 and 93.00, respectively.
Following a decline of almost 2% in Monday's session, the AUD/JPY pair is extending its losses and has fallen to its lowest level since August 2023. The downtrend is technically intact.
The Relative Strength Index (RSI) remains below 30, indicating that the pair is technically oversold and this could lead to a short-term bounce. However, the Moving Average Convergence Divergence (MACD) is rising, indicating that the downtrend could continue.
AUD/JPY daily chart
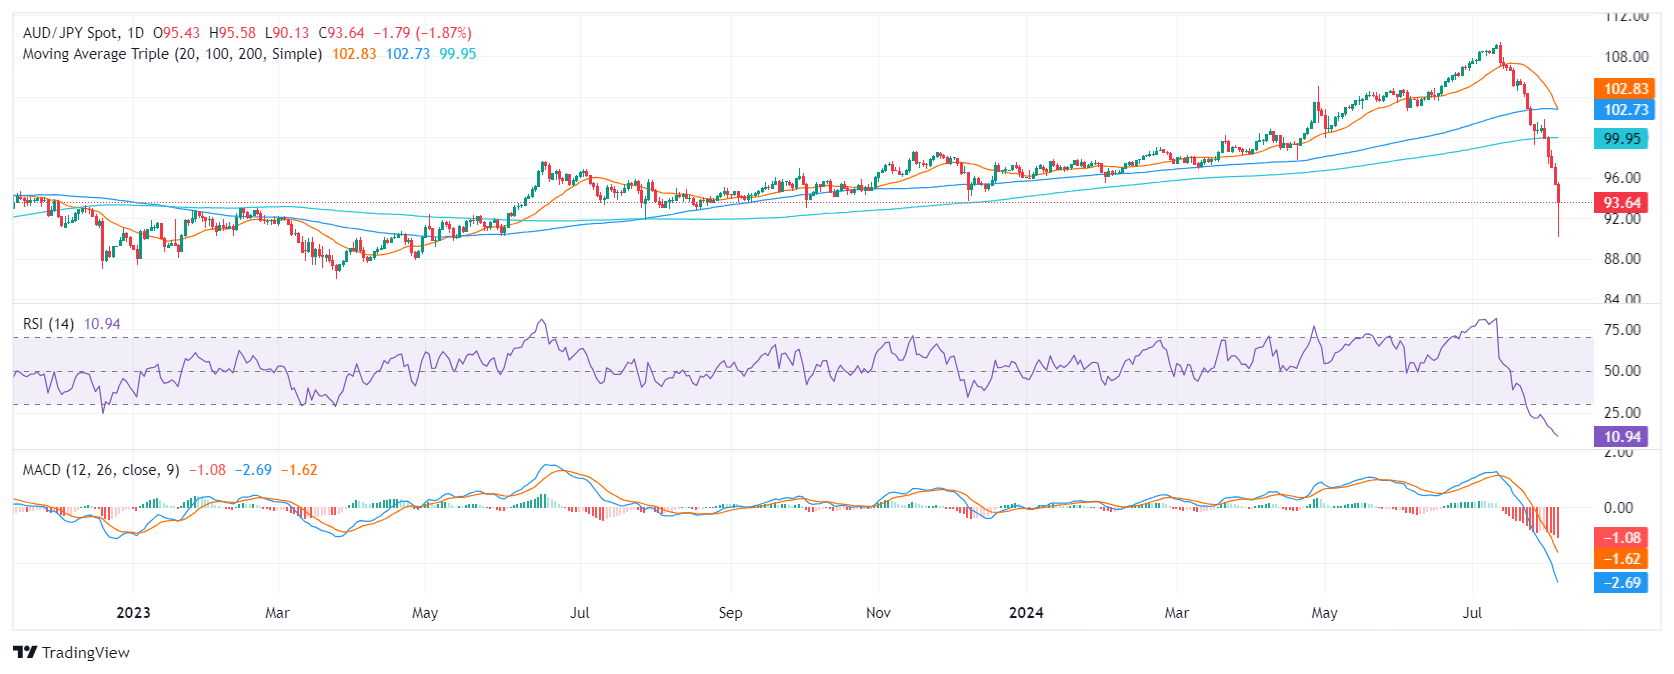
The AUD/JPY pair is currently trading below its 20,100 and 200-day Simple Moving Averages (SMA) which confirms an overall bearish outlook. A break below the 93.00 level could open the door to a further decline, with the next major support level at 92.00. On the upside, the pair faces resistance at 95.00 - 96.00. A break above might improve somewhat the negative outlook.
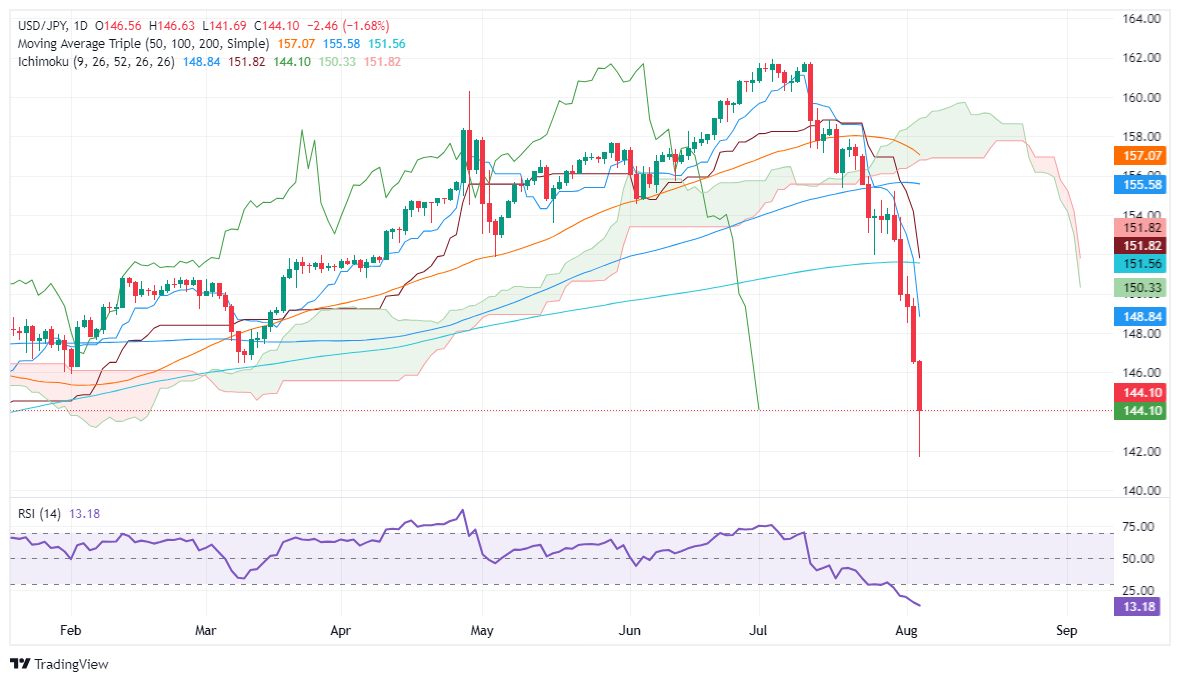
- USD/JPY drops over 4.90% to a low of 141.69 during Asian session before rebounding to 144.16.
- Technical outlook: Downward bias with potential for mean-reversion move as RSI indicates overextension.
- Key resistance levels: 145.00, February 1 bottom at 145.89, and March 11 level at 146.48.
- Key support levels: 144.00, January 9 pivot low at 143.42, and August 5 bottom at 141.69.
The Japanese Yen extended its rally on Monday, registering more than 1.63% gains. This witnessed the USD/JPY drop over 4.90% during the Asian session to a low of 141.69 before trimming some losses and regaining the 144.00 mark. At the time of writing, the USD/JPY trades at 144.16, virtually unchanged as Tuesday’s Asian session begins.
USD/JPY Price Forecast: Technical outlook
The USD/JPY is downward biased yet has found a bottom at around 141.69. Once hit, buyers emerged at the bottom and lifted the exchange rate since the mid-North American session. The latest push saw spot prices above 144.00 as momentum shows the downtrend is overextended, as shown by the Relative Strength Index (RSI).
As the RSI lies beneath 20, the pair is subject to a mean-reversion move.
If USD/JPY climbs past 145.00, the next resistance will be on February 1, bottom at 145.89. Once surpassed, the March 11 146.48 emerges, followed by the 147.00 mark.
Conversely, if USD/JPY extends its losses below 144.00, the next support would be the January 9 pivot low at 143.42, ahead of the August 5 bottom at 141.69.
USD/JPY Price Action – Daily Chart
Japanese Yen PRICE Today
The table below shows the percentage change of Japanese Yen (JPY) against listed major currencies today. Japanese Yen was the strongest against the Swiss Franc.
| USD | EUR | GBP | JPY | CAD | AUD | NZD | CHF | |
|---|---|---|---|---|---|---|---|---|
| USD | -0.00% | -0.01% | -0.06% | -0.02% | 0.02% | 0.10% | 0.03% | |
| EUR | 0.00% | 0.03% | -0.05% | -0.02% | 0.02% | 0.04% | 0.04% | |
| GBP | 0.00% | -0.03% | -0.07% | -0.03% | -0.00% | 0.03% | 0.02% | |
| JPY | 0.06% | 0.05% | 0.07% | 0.02% | 0.08% | 0.08% | 0.27% | |
| CAD | 0.02% | 0.02% | 0.03% | -0.02% | 0.03% | 0.06% | 0.05% | |
| AUD | -0.02% | -0.02% | 0.00% | -0.08% | -0.03% | 0.04% | 0.03% | |
| NZD | -0.10% | -0.04% | -0.03% | -0.08% | -0.06% | -0.04% | 0.04% | |
| CHF | -0.03% | -0.04% | -0.02% | -0.27% | -0.05% | -0.03% | -0.04% |
The heat map shows percentage changes of major currencies against each other. The base currency is picked from the left column, while the quote currency is picked from the top row. For example, if you pick the Japanese Yen from the left column and move along the horizontal line to the US Dollar, the percentage change displayed in the box will represent JPY (base)/USD (quote).
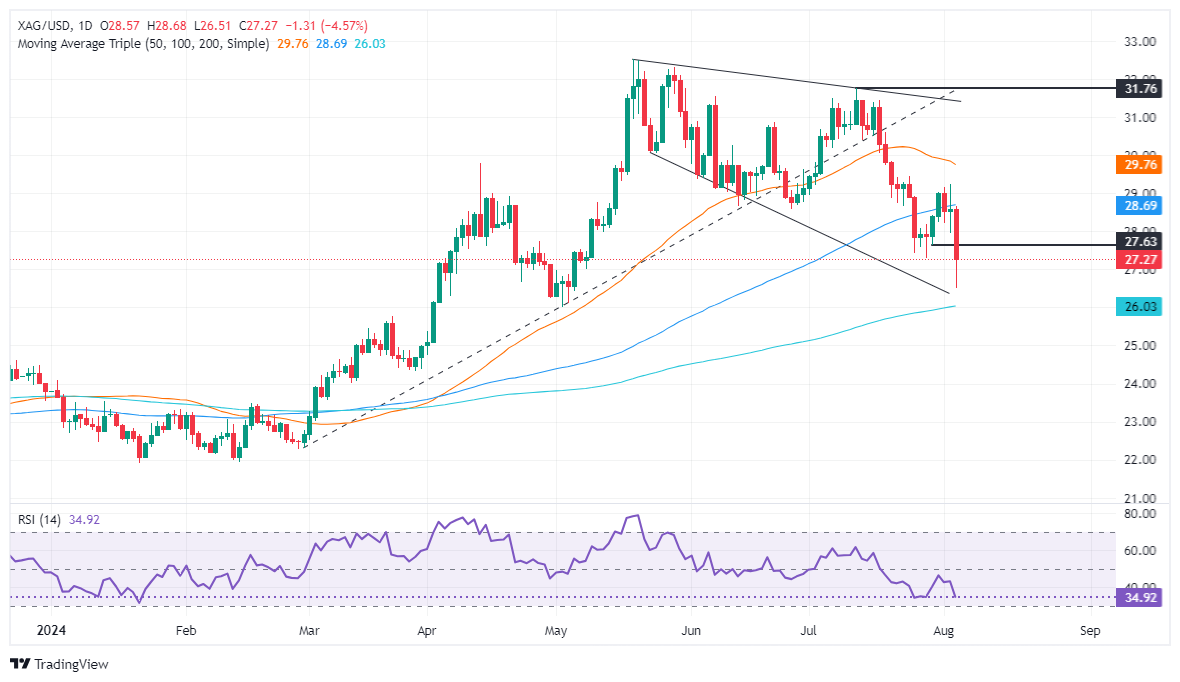
- Silver falls below 100-DMA ($28.67), trading at $27.23 after peaking at same.
- Technicals suggest more silver declines; key supports at $27.00, 200-DMA at $26.02.
- For recovery, silver needs to regain $28.00; resistances at August 2 high of $29.22 and 50-DMA at $29.79.
Silver's price extended its losses below the 100-day moving average (DMA) of $28.67 and is down over 4.50% as risk appetite deteriorated following weaker data from the United States (US). This reignited recession fears, as ISM Manufacturing PMI and Nonfarm Payrolls report disappointed investors, who flock to safe-haven assets, mostly US Treasuries. The XAG/USD trades at $27.23 after hitting a daily high of $28.67.
XAG/USD Price Forecast: Technical outlook
The grey metal tumbled to a three-month high, with buyers battling to reclaim July’s low of $27.31, which would keep them hopeful of higher prices. However, momentum favors sellers, as shown by the Relative Strength Index (RSI), near hitting oversold conditions in normal trading environments.
If XAG/USD drops and achieves a daily close below $27.00, buyers will be pressured to hold forth at the 200-DMA at $26.02. If broken, sellers will drive Silver spot prices to the latest cycle low at $24.33, the March 27 low.
Conversely, if buyers reclaim $28.00, the next resistance would be the August 2 peak at $29.22. Further upside is seen once cleared, with the next supply area at the 50-DMA at $29.79
XAG/USD Price Action – Daily Chart
Silver FAQs
Silver is a precious metal highly traded among investors. It has been historically used as a store of value and a medium of exchange. Although less popular than Gold, traders may turn to Silver to diversify their investment portfolio, for its intrinsic value or as a potential hedge during high-inflation periods. Investors can buy physical Silver, in coins or in bars, or trade it through vehicles such as Exchange Traded Funds, which track its price on international markets.
Silver prices can move due to a wide range of factors. Geopolitical instability or fears of a deep recession can make Silver price escalate due to its safe-haven status, although to a lesser extent than Gold's. As a yieldless asset, Silver tends to rise with lower interest rates. Its moves also depend on how the US Dollar (USD) behaves as the asset is priced in dollars (XAG/USD). A strong Dollar tends to keep the price of Silver at bay, whereas a weaker Dollar is likely to propel prices up. Other factors such as investment demand, mining supply – Silver is much more abundant than Gold – and recycling rates can also affect prices.
Silver is widely used in industry, particularly in sectors such as electronics or solar energy, as it has one of the highest electric conductivity of all metals – more than Copper and Gold. A surge in demand can increase prices, while a decline tends to lower them. Dynamics in the US, Chinese and Indian economies can also contribute to price swings: for the US and particularly China, their big industrial sectors use Silver in various processes; in India, consumers’ demand for the precious metal for jewellery also plays a key role in setting prices.
Silver prices tend to follow Gold's moves. When Gold prices rise, Silver typically follows suit, as their status as safe-haven assets is similar. The Gold/Silver ratio, which shows the number of ounces of Silver needed to equal the value of one ounce of Gold, may help to determine the relative valuation between both metals. Some investors may consider a high ratio as an indicator that Silver is undervalued, or Gold is overvalued. On the contrary, a low ratio might suggest that Gold is undervalued relative to Silver.
- NZD/JPY continues in its relentless sell-off, propelled by bearish technical indicators and dwindling volume.
- The RSI remains in oversold territory, indicating potential exhaustion of the prevailing down move.
- The MACD maintains its bearish alignment, aligning with the general trend.
The NZD/JPY pair remains entrenched in its bearish trajectory, giving no respite to the bears as it approaches critical support levels. This persistent decline has extended across multiple trading sessions, with the NZD/JPY shedding over 10% of its value since its highs in recent weeks. Notably, the pair has breached the 89.00 psychological level and settled well below the 200-day Simple Moving Average (SMA).
On Monday, the NZD/JPY fell by 1.60% to 86.00, reinforcing the sellers' dominance but cleared losses which plunged the index to a low of around 83.00, a critical support level. While the pair has been relentlessly declining, technical indicators like the Relative Strength Index (RSI) continue flashing oversold conditions are approaching. Such conditions may hint at a potential pause in the downtrend. Currently, the RSI resides around 20, signaling a prolonged period of selling, though a potential trend reversal remains a possibility.
NZD/JPY daily chart
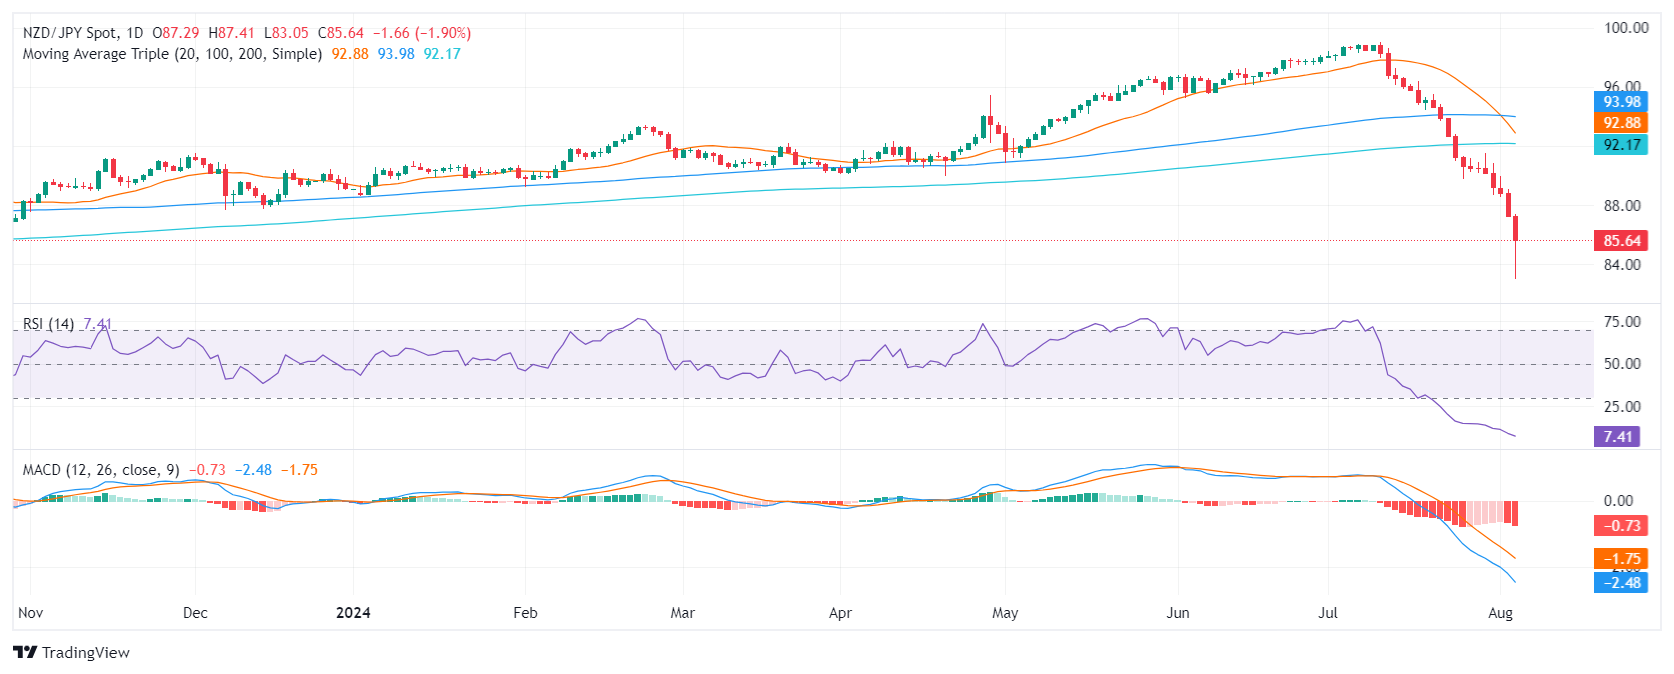
Navigating the depths of its descent, the pair is hovering near the 86.00 support level. Should this level fail to hold, further support awaits at 85.50 and 85.00, representing potential areas for a temporary reprieve. Conversely, resistance levels are positioned at 89.00 and 90.00, with the latter coinciding with the 200-day SMA.
- GBP/JPY fell 2% on Monday as market sentiment sours.
- Guppy extended into a fifth straight daily decline.
- Risk-off flows bolster Yen despite upbeat UK data print.
GBP/JPY took a dive on Monday, falling over 2% through the day’s market sessions and testing the 180.00 handle before a meager recovery in the back half of the trading day left bids floundering near 183.80.
The pair is down nearly 13.5% from 16-year highs set above 208.00 in July, and the Guppy’s steep correction was kicked off by a series of “Yenterventions” from the Bank of Japan (BoJ) on behalf of the battered Yen. The thing that finally gave the Yen a leg to stand on was last week’s slim rate hike from the BoJ, which finally helped to ease the wide rate differential that has been weighing down the JPY.
A rate cut from the Bank of England (BoE) last week also helped to crimp the Guppy’s rate differential, forcing a stem-to-stern rebalance in market flows through the GBP/JPY.
The economic calendar remains limited for the remains of the week as both the GBP and the JPY get a breather from large-scale momentum swings, even as broad markets pile into safe havens on a shaky Monday.
GBP/JPY technical outlook
The Guppy is down 13.5% from multi-year peaks above 208.00, with price action smashing through the 200-day Exponential Moving Average (EMA) at 192.57 and hitting the brakes just above the 180.00 handle. Bids are holding steady near 184.00 as Tuesday markets get set to come online.
Daily candlesticks have closed deeply in the red for a fifth straight trading day, and has fallen for all but five of the last 17 consecutive market days. Momentum is finally tilted firmly in the bearish side, but a technical recovery could see bidders stepping back into markets as prices bounce back towards 190.00.
GBP/JPY daily chart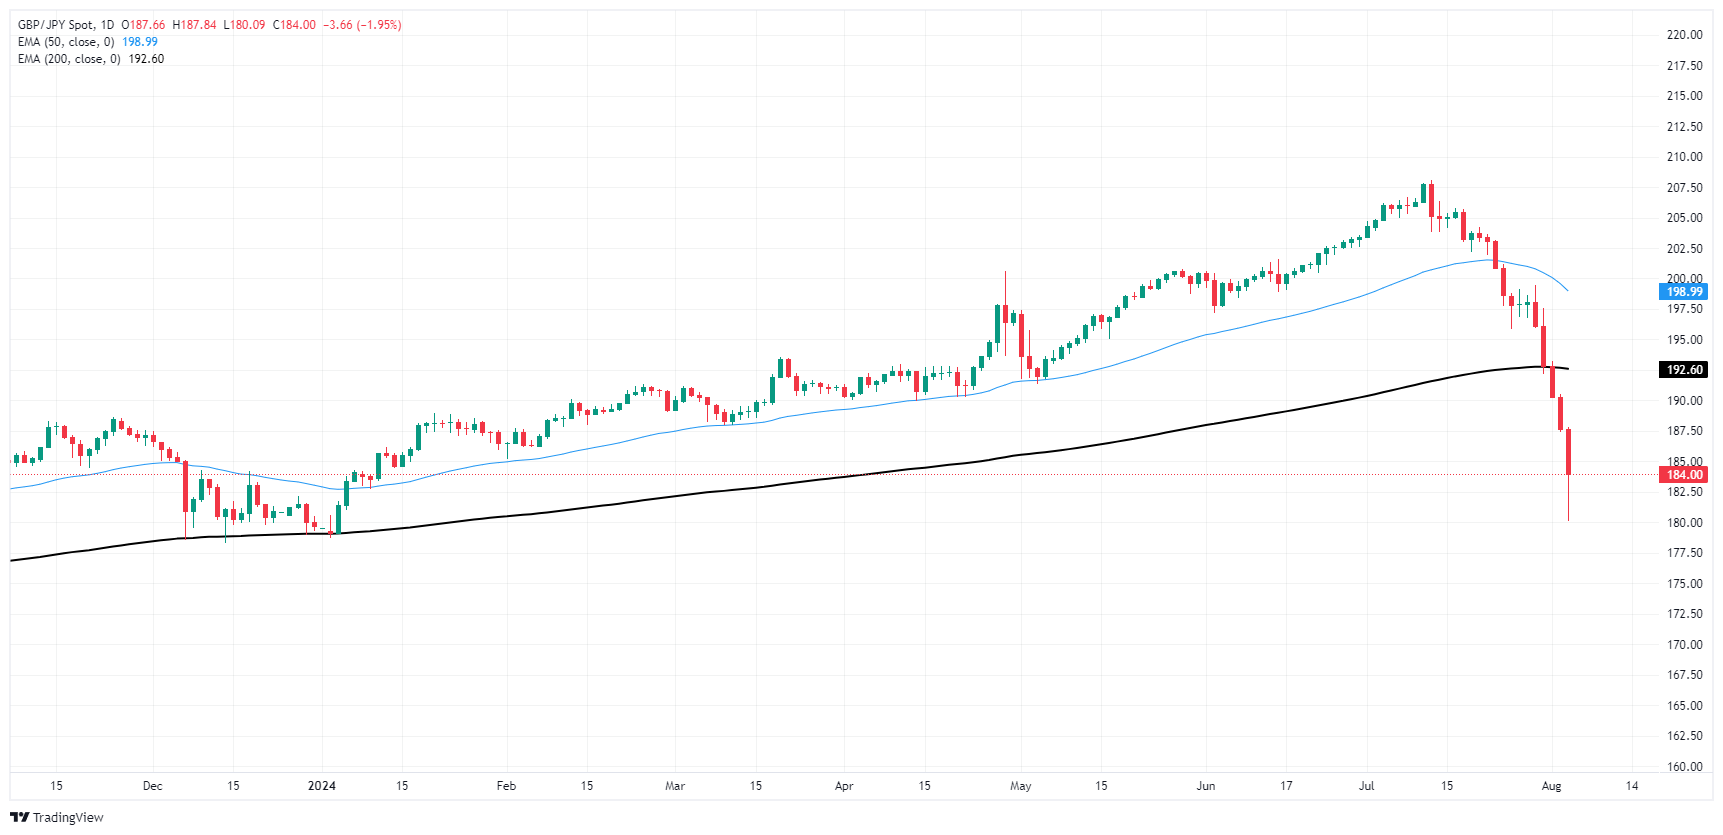
Japanese Yen FAQs
The Japanese Yen (JPY) is one of the world’s most traded currencies. Its value is broadly determined by the performance of the Japanese economy, but more specifically by the Bank of Japan’s policy, the differential between Japanese and US bond yields, or risk sentiment among traders, among other factors.
One of the Bank of Japan’s mandates is currency control, so its moves are key for the Yen. The BoJ has directly intervened in currency markets sometimes, generally to lower the value of the Yen, although it refrains from doing it often due to political concerns of its main trading partners. The current BoJ ultra-loose monetary policy, based on massive stimulus to the economy, has caused the Yen to depreciate against its main currency peers. This process has exacerbated more recently due to an increasing policy divergence between the Bank of Japan and other main central banks, which have opted to increase interest rates sharply to fight decades-high levels of inflation.
The BoJ’s stance of sticking to ultra-loose monetary policy has led to a widening policy divergence with other central banks, particularly with the US Federal Reserve. This supports a widening of the differential between the 10-year US and Japanese bonds, which favors the US Dollar against the Japanese Yen.
The Japanese Yen is often seen as a safe-haven investment. This means that in times of market stress, investors are more likely to put their money in the Japanese currency due to its supposed reliability and stability. Turbulent times are likely to strengthen the Yen’s value against other currencies seen as more risky to invest in.
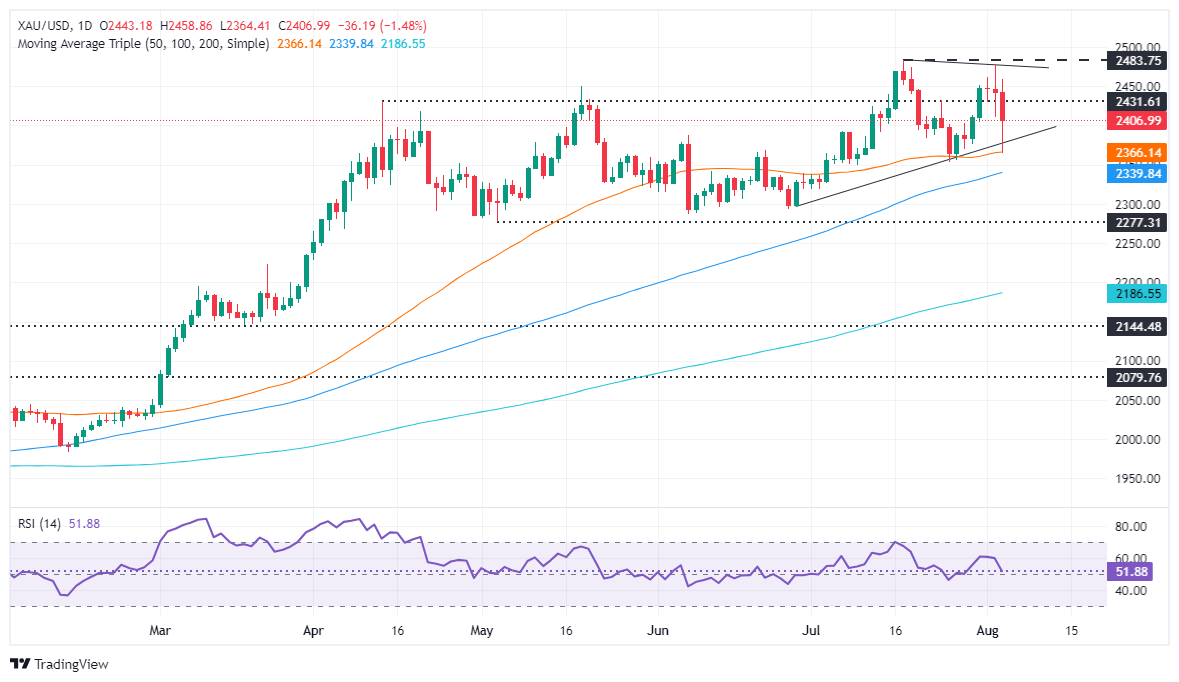
- Gold dips to $2,364, a six-day low, then recovers above $2,400.
- Market turmoil stems from weak US data, anticipates 50 bps Fed cut in September.
- US Dollar Index falls 0.50% to 102.70; 10-year Treasury yield to 3.783%.
- Rising Middle East tensions buoy Gold; US base in Iraq hit by missiles.
Gold price dropped over 1% during Monday’s North American session but recovered after hitting a new six-day low of $2,364 amid a worldwide market sell-off spurred by last week’s softer-than-expected data in the United States (US). The XAU/USD trades at $2,407, down 1.40%.
The financial markets began to price in a possible recession in the US. Traders expect the Federal Reserve (Fed) will cut interest rates by 50 basis points at the September meeting, following two “bad” reports that showed that manufacturing activity plunged, according to the Institute for Supply Management (ISM), while the economy added fewer people to the workforce.
This spooked investors, who found some relief following the ISM Services PMI release, which revealed the economy continues to expand at a healthier pace. After the data, Gold remained on the backfoot even though the Greenback remained on offer across the board.
The US Dollar Index (DXY), which tracks the performance of six currencies against the US Dollar, sinks 0.50% to 102.70.
US Treasury bond yields tanked further with the 10-year down one basis point to 3.783%. However, it still bounced off multi-week lows of 3.667% hit earlier in the session.
Rising tensions in the Middle East capped bullion losses as Israel awaits a response from Iran and Lebanon following the assassination of the Hamas leader earlier in the week. Sky News Arabia cited Iraqi sources when it revealed that a US base in Iraq was targeted by several missiles.
Daily digest market movers: Gold price stumbles amid recession fears
- A deteriorated market mood would continue to influence traders as fears of a US recession ignited a sell-off among the largest stock market indices.
- The Fed decided to hold rates unchanged last week but indicated that favorable data on inflation and further weakening in the labor market could prompt action.
- Last week, dismal data in the US spooked investors, following the ISM Manufacturing PMI and Nonfarm Payrolls.
- However, Chicago Fed President Austan Goolsbee said on Monday the Fed will not overreact to one month of data, and the board will remain committed to its dual mandate.
- After the data, most banks began to price in more aggressive monetary policy easing by the Fed. Bank of America expects the first cut in September instead of December, while Citi and JP Morgan expect the Fed to lower rates by 50 bps in September and November.
- The CME FedWatch tool shows the odds for a 50 bps Fed rate cut at the September meeting at 85%.
Technical analysis: Gold price tumbles but stays above $2,400
Gold price retreated to the 50-day Simple Moving Average (SMA) at $2,365 during the European session before bouncing off that level and clinched the $2,400 figure. Despite that recovery, momentum still favors sellers.
The Relative Strength Index (RSI) is about to turn bearish after falling steeply during the last three days and is about to cross below the RSI’s neutral line. Once surpassed, this could accelerate Bullion’s losses.
If XAU/USD dives below $2,400, the 50-day SMA could be challenged. Once surpassed, the next support would be the 100-day SMA at $2,340, followed by the May 3 low of $2,277.
Conversely, if buyers reclaim $2,450, the next resistance would be the August 2 peak at $2,477. A breach of the latter will expose the all-time high at $2,483 ahead of $2,500.
Gold FAQs
Gold has played a key role in human’s history as it has been widely used as a store of value and medium of exchange. Currently, apart from its shine and usage for jewelry, the precious metal is widely seen as a safe-haven asset, meaning that it is considered a good investment during turbulent times. Gold is also widely seen as a hedge against inflation and against depreciating currencies as it doesn’t rely on any specific issuer or government.
Central banks are the biggest Gold holders. In their aim to support their currencies in turbulent times, central banks tend to diversify their reserves and buy Gold to improve the perceived strength of the economy and the currency. High Gold reserves can be a source of trust for a country’s solvency. Central banks added 1,136 tonnes of Gold worth around $70 billion to their reserves in 2022, according to data from the World Gold Council. This is the highest yearly purchase since records began. Central banks from emerging economies such as China, India and Turkey are quickly increasing their Gold reserves.
Gold has an inverse correlation with the US Dollar and US Treasuries, which are both major reserve and safe-haven assets. When the Dollar depreciates, Gold tends to rise, enabling investors and central banks to diversify their assets in turbulent times. Gold is also inversely correlated with risk assets. A rally in the stock market tends to weaken Gold price, while sell-offs in riskier markets tend to favor the precious metal.
The price can move due to a wide range of factors. Geopolitical instability or fears of a deep recession can quickly make Gold price escalate due to its safe-haven status. As a yield-less asset, Gold tends to rise with lower interest rates, while higher cost of money usually weighs down on the yellow metal. Still, most moves depend on how the US Dollar (USD) behaves as the asset is priced in dollars (XAU/USD). A strong Dollar tends to keep the price of Gold controlled, whereas a weaker Dollar is likely to push Gold prices up.
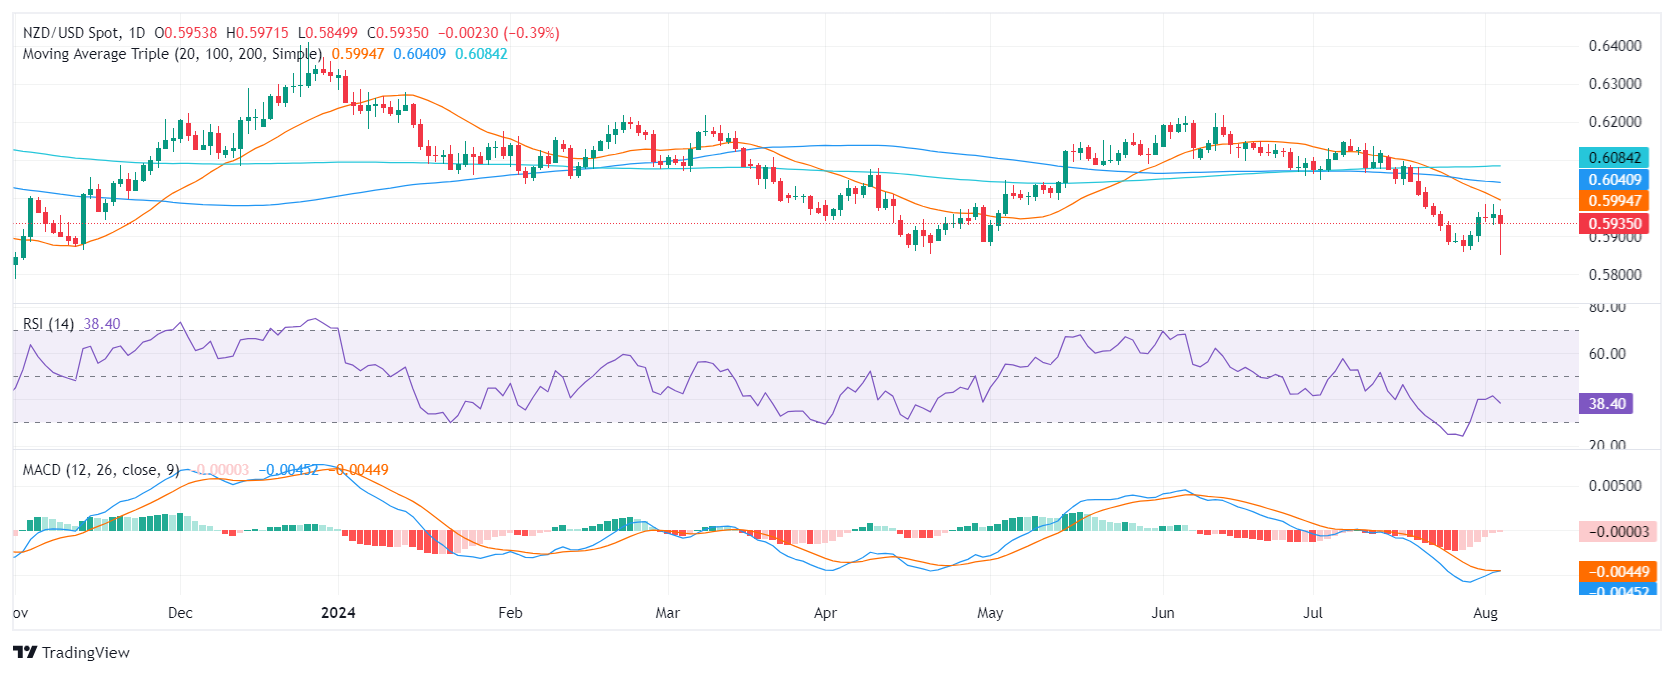
- Consolidation persists within the 0.5900-0.6000 range, with neutral technical indicators.
- Bearish momentum remains intact, favoring further declines, but a break above 0.6000 could shift sentiment.
- Volume remains average, with key support and resistance levels inching closer.
On Monday's session, the NZD/USD declined by 0.40% to 0.5930, extending its rangebound trading pattern. On the bright side, bulls managed to clear losses which saw the pair diving below 0.5900 earlier in the session.
The daily chart shows that the Relative Strength Index (RSI) is hovering around 40, indicating a lack of clear direction. The Moving Average Convergence Divergence (MACD) continues to trend lower, suggesting that bearish momentum remains intact. In addition, the pair is currently facing support at 0.5910, a break below which could expose the next support level at 0.5890. On the upside, resistance is found at 0.5980, and a breakout above this level could signal a potential reversal in the trend.
The overall technical outlook for the NZD/USD remains neutral to bearish. While the pair remains rangebound, the bears hold a slight advantage. A break below support or above resistance could trigger a more decisive move. In the meantime, volume is average, with key support and resistance levels inching closer which gives neutrality to the technical outlook.
NZD/USD Daily chart
The Greenback flirted with YTD lows near the 102.00 region amidst an intense sell-off in the global markets following reignited concerns over the likelihood that the US economy might tip into recession. While the RBA is expected to keep rates unchanged on Tuesday, speculation of an inter-meeting rate cut by the Fed remains on the rise.
Here is what you need to know on Tuesday, August 6:
The USD Index (DXY) approached the 102.00 region, or multi-month lows, on the back of declining yields and dominating risk aversion. On August 6 comes the Balance of Trade figures along with the RCM/TIPP Economic Optimism Index.
EUR/USD added to Friday’s uptick and briefly surpassed the psychological 1.1000 barrier, losing some momentum afterwards. Retail Sales in the broader euro area and Germany’s Factory Orders are due on August 6, followed by S&P Global Construction PMI in Germany and the euro bloc.
The intense sell-off in risk-related assets sparked a knee-jerk in GBP/USD, which once again revisited the vicinity of 1.2700. On August 6, the BRC Retail Sales Monitor and the S&P Global Construction PMI will be unveiled.
The increasing risk aversion favoured further JPY-buying on Monday, thus sending USD/JPY briefly below the 142.00 region. Household Spending and Average Cash Earnings are expected on August 6.
AUD/USD managed to reverse the initial pullback to 2024 lows near 0.6350, regaining the 0.6500 hurdle and beyond afterwards. The RBA is expected to keep rates unchanged on August 6.
Recession concerns coupled with sluggish demand from China weighed further on sentiment and dragged prices of WTI briefly below the $72.00 mark on Monday.
Some profit taking mood as well as the broad-based sell-off kept Gold prices on the defensive around the $2,400 mark per ounce troy. Silver prices plummeted to a region last seen in early May around $26.50 per ounce.
- AUD/USD slips amid ongoing bearish sentiment, approaching key support level.
- Economic weakness in Australia intensifies rate-cut expectations for the RBA.
- Technical indicators suggest a potential correction, but bearish momentum remains dominant.
The Australian Dollar (AUD) encountered some selling pressure against the US Dollar (USD) on Monday, declining by 0.50% to 0.6480. During the European session, it fell to its lowest since November 2023 around 0.6350 as risk-off flows dominated the markets, while investors await Tuesday's Reserve Bank of Australia (RBA) decision for further direction.
Despite persistent high inflation, recent data has pointed to weaknesses in the Australian economy. This has prompted markets to shift their expectations from a potential rate hike by the RBA to a rate cut by year-end. The RBA is expected to keep rates steady at 4.35% at its meeting on Tuesday, but investors will be closely monitoring the central bank's policy guidance for any hints of a more dovish stance.
Daily digest market movers: Aussie down as markets digest PMIs ahead of RBA
- Australia's July services and composite PMIs were weaker than expected, with the composite reading falling below 50 for the first time since January.
- The Melbourne Institute Monthly Inflation Gauge showed a decline in inflation to within the RBA's target band.
- The RBA is expected to maintain a neutral policy stance despite inflation remaining above its target range.
- The highlight will be that the RBA will publish new sets of forecasts in its Statement on Monetary Policy, which will guide markets on the next interest rate bets.
AUD/USD technical analysis: Bears continue in command, correction still possible
The AUD/USD pair continues to trade beneath its key Simple Moving Averages (20, 100 and 200-day SMAs), indicating a prevailing bearish sentiment. The Relative Strength Index (RSI) also suggests bearishness, with values hovering between 30-37 in recent sessions. The Moving Average Convergence Divergence (MACD) maintains red bars, further reinforcing the negative momentum.
However, the AUD/USD pair has found some support near the 0.6480 and 0.6350 levels, which could potentially act as a temporary floor. Resistance is anticipated around the 0.6560-0.6570 zone, where selling pressure has previously capped rallies.
Australian Dollar FAQs
One of the most significant factors for the Australian Dollar (AUD) is the level of interest rates set by the Reserve Bank of Australia (RBA). Because Australia is a resource-rich country another key driver is the price of its biggest export, Iron Ore. The health of the Chinese economy, its largest trading partner, is a factor, as well as inflation in Australia, its growth rate and Trade Balance. Market sentiment – whether investors are taking on more risky assets (risk-on) or seeking safe-havens (risk-off) – is also a factor, with risk-on positive for AUD.
The Reserve Bank of Australia (RBA) influences the Australian Dollar (AUD) by setting the level of interest rates that Australian banks can lend to each other. This influences the level of interest rates in the economy as a whole. The main goal of the RBA is to maintain a stable inflation rate of 2-3% by adjusting interest rates up or down. Relatively high interest rates compared to other major central banks support the AUD, and the opposite for relatively low. The RBA can also use quantitative easing and tightening to influence credit conditions, with the former AUD-negative and the latter AUD-positive.
China is Australia’s largest trading partner so the health of the Chinese economy is a major influence on the value of the Australian Dollar (AUD). When the Chinese economy is doing well it purchases more raw materials, goods and services from Australia, lifting demand for the AUD, and pushing up its value. The opposite is the case when the Chinese economy is not growing as fast as expected. Positive or negative surprises in Chinese growth data, therefore, often have a direct impact on the Australian Dollar and its pairs.
Iron Ore is Australia’s largest export, accounting for $118 billion a year according to data from 2021, with China as its primary destination. The price of Iron Ore, therefore, can be a driver of the Australian Dollar. Generally, if the price of Iron Ore rises, AUD also goes up, as aggregate demand for the currency increases. The opposite is the case if the price of Iron Ore falls. Higher Iron Ore prices also tend to result in a greater likelihood of a positive Trade Balance for Australia, which is also positive of the AUD.
The Trade Balance, which is the difference between what a country earns from its exports versus what it pays for its imports, is another factor that can influence the value of the Australian Dollar. If Australia produces highly sought after exports, then its currency will gain in value purely from the surplus demand created from foreign buyers seeking to purchase its exports versus what it spends to purchase imports. Therefore, a positive net Trade Balance strengthens the AUD, with the opposite effect if the Trade Balance is negative.
- Mexican Peso recovers from yearly low, trades at 19.57, still down over 2%.
- Safe-haven demand for Yen and Franc amid turmoil impacts emerging market currencies.
- Wall Street indices' losses heighten financial market stress, affecting USD/MXN volatility.
- Upcoming Mexico data: Auto Exports (Tuesday), Inflation, Banxico decision (Thursday).
The Mexican Peso trims some of its earlier losses held during the Asian session on Monday, with the emerging market currency depreciating almost 6% to a yearly low of 20.22. The USD/MXN is trading back below the 20.00 figure, but still the Peso is down over 1%, exchanging hands at 19.32.
Market sentiment remains sour across the globe, triggering a flight to safe-haven assets like the Japanese Yen and the Swiss Franc in the FX space. Against emerging market currencies, flows outside the latter bolstered the Greenback, which posted substantial gains against the Mexican Peso.
Meanwhile, Wall Street’s post losses between 2% to 3% among its largest indices indicate stress in the financial markets. Hence, USD/MXN traders must be aware of the market mood, which could spark volatility in the exotic pair.
Mexico’s economic docket will be light at the beginning of the week but gains traction on Tuesday and Thursday. Auto Exports for July will be issued on Tuesday, followed by inflation data and the Bank of Mexico (Banxico) monetary policy decision on Thursday.
Across the border, the US docket revealed that contrary to a weaker-than-expected manufacturing activity report, the services segment exceeded estimates, according to Institute for Supply Management (ISM) data.
Other data revealed by S&P Global showed that business activity dipped by a tenth yet remains expanding.
Daily digest market mover: Mexican Peso slumps on market mood, US recession fears
- Sour sentiment will likely continue to drive the financial markets. Fears are broadening after Asia stock indices plummeted sharply as fears that the Federal Reserve is behind the curve could trigger a recession.
- This, along with the Bank of Japan (BoJ) laying the ground for higher interest rates as it battles inflation and a reduction of its balance sheet, drained the liquidity of the financial markets, sparking the global stock market sell-off.
- Mexico’s Auto Exports for July are forecasted to remain at 3.3% YoY and Auto Production at 3.8% YoY.
- July’s inflation is expected to remain unchanged at 0.38% MoM and 4.98% YoY. Core inflation is estimated to hit 4.13% annually.
- The US ISM Services PMI expanded by 51.4 in July, above estimates of 51 and up from June’s 48.8 contraction.
- S&P Global Services’ PMI dipped from 55.3 to 55.0, below forecasts for a 56.0 jump.
- The CME FedWatch Tool shows the odds of a 50-basis-point interest rate cut by the Fed at the September meeting at 86.5%, up from 74% last Friday.
Technical analysis: Mexican Peso depreciates sharply as USD/MXN rises above 19.30
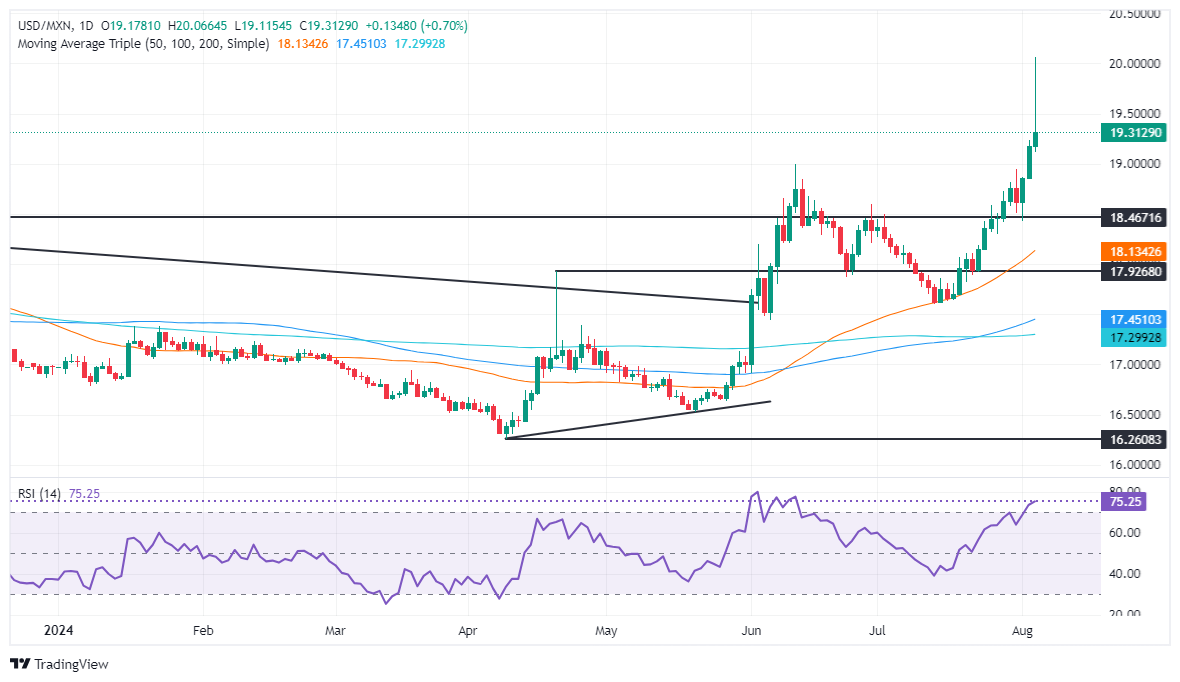
The USD/MXN is trimming some of its gains, following a spike that lifted the pair to a new 22-month high, to levels last seen in October 2022. But it’s still headed for further gains.
The Relative Strength Index (RSI) suggests that buyers are in charge after turning overbought, as seen by the USD/MXN dip from highs toward the current exchange rate. However, once the RSI dives below 70, buyers could re-enter and lift the pair higher.
If USD/MXN achieves a daily close above the August 2 high of 19.22, that will expose the 19.50 psychological figure. A further upside is seen above that level, at 20.00, followed by the current year-to-date (YTD) peak at 19.22.
Conversely, if the pair drops below 19.22, the USD/MXN will be poised to challenge the 19.00 psychological figure. Once cleared, the next support would be the 50-day Simple Moving Average (SMA) at 18.12. In further weakness, the exotic pair could challenge the 17.50 mark.
Mexican Peso FAQs
The Mexican Peso (MXN) is the most traded currency among its Latin American peers. Its value is broadly determined by the performance of the Mexican economy, the country’s central bank’s policy, the amount of foreign investment in the country and even the levels of remittances sent by Mexicans who live abroad, particularly in the United States. Geopolitical trends can also move MXN: for example, the process of nearshoring – or the decision by some firms to relocate manufacturing capacity and supply chains closer to their home countries – is also seen as a catalyst for the Mexican currency as the country is considered a key manufacturing hub in the American continent. Another catalyst for MXN is Oil prices as Mexico is a key exporter of the commodity.
The main objective of Mexico’s central bank, also known as Banxico, is to maintain inflation at low and stable levels (at or close to its target of 3%, the midpoint in a tolerance band of between 2% and 4%). To this end, the bank sets an appropriate level of interest rates. When inflation is too high, Banxico will attempt to tame it by raising interest rates, making it more expensive for households and businesses to borrow money, thus cooling demand and the overall economy. Higher interest rates are generally positive for the Mexican Peso (MXN) as they lead to higher yields, making the country a more attractive place for investors. On the contrary, lower interest rates tend to weaken MXN.
Macroeconomic data releases are key to assess the state of the economy and can have an impact on the Mexican Peso (MXN) valuation. A strong Mexican economy, based on high economic growth, low unemployment and high confidence is good for MXN. Not only does it attract more foreign investment but it may encourage the Bank of Mexico (Banxico) to increase interest rates, particularly if this strength comes together with elevated inflation. However, if economic data is weak, MXN is likely to depreciate.
As an emerging-market currency, the Mexican Peso (MXN) tends to strive during risk-on periods, or when investors perceive that broader market risks are low and thus are eager to engage with investments that carry a higher risk. Conversely, MXN tends to weaken at times of market turbulence or economic uncertainty as investors tend to sell higher-risk assets and flee to the more-stable safe havens.
- The Canadian Dollar (CAD) backslid against the US Dollar on Monday.
- A moderate recovery has the CAD back into the green for the day.
- A Canadian holiday leaves CAD trading flows crimped.
The Canadian Dollar (CAD) tumbled against the Greenback early Monday before a mid-session recovery. The CAD is holding in positive territory against the US Dollar to kick off the new trading week, but market flows remain thin with Canadian markets shuttered for the August Civic Holiday.
CAD traders will be waiting in the wings with meaningful Canadian economic data slated for Friday with July’s updated labor figures. A smattering of mid-tier data from Canada is due throughout the midweek, but impact is set to be limited.
Daily digest market movers: CAD flows take a backseat amid US data fears
- US S&P Global Composite Purchasing Managers Index (PMI) figures in July eased to 54.3, missing the forecast hold at 55.0.
- Further downside misses added to fears of a US recession after last Friday’s miss in US Nonfarm Payrolls (NFP) sparked an extended risk-off decline across global markets.
- Market expectations for a Federal Reserve (Fed) rate cut in September are fully pinned to the ceiling.
- Despite wide misses in recent US data, Monday’s July ISM Services PMI rose to 51.1, beating the forecast 46.5.
- Later in the week, CAD traders will be looking for a recovery in Canada’s Net Change in Employment on Friday. June’s headline figure reported a net contraction of -1.4K.
Canadian Dollar PRICE Today
The table below shows the percentage change of Canadian Dollar (CAD) against listed major currencies today. Canadian Dollar was the strongest against the British Pound.
| USD | EUR | GBP | JPY | CAD | AUD | NZD | CHF | |
|---|---|---|---|---|---|---|---|---|
| USD | -0.33% | 0.41% | -1.50% | -0.18% | 0.32% | 0.41% | -0.56% | |
| EUR | 0.33% | 0.66% | -1.33% | 0.03% | 0.67% | 0.64% | -0.33% | |
| GBP | -0.41% | -0.66% | -1.90% | -0.60% | 0.00% | -0.02% | -0.99% | |
| JPY | 1.50% | 1.33% | 1.90% | 1.39% | 1.81% | 1.97% | 0.99% | |
| CAD | 0.18% | -0.03% | 0.60% | -1.39% | 0.54% | 0.59% | -0.56% | |
| AUD | -0.32% | -0.67% | -0.01% | -1.81% | -0.54% | -0.03% | -0.98% | |
| NZD | -0.41% | -0.64% | 0.02% | -1.97% | -0.59% | 0.03% | -0.97% | |
| CHF | 0.56% | 0.33% | 0.99% | -0.99% | 0.56% | 0.98% | 0.97% |
The heat map shows percentage changes of major currencies against each other. The base currency is picked from the left column, while the quote currency is picked from the top row. For example, if you pick the Canadian Dollar from the left column and move along the horizontal line to the US Dollar, the percentage change displayed in the box will represent CAD (base)/USD (quote).
Canadian Dollar technical outlook: USD/CAD sets new 2024 high as Greenback tests high end
The Canadian Dollar (CAD) eased early Monday before recovering back into the green against the US Dollar. A Canadian market holiday leaves the CAD in a mixed stance to kick off the new trading week, up three-tenths of one percent against the Greenback but down around six-tenths of one percent against the Japanese Yen.
USD/CAD briefly rallied into a fresh high bid for 2024, falling just shy of 1.3950 before turning around and slumping back below 1.3850. The pair chalked in an outside candle on daily charts as price action gets frothy, but bidders are struggling to develop enough momentum to break the pair into an extended bull run.
USD/CAD daily chart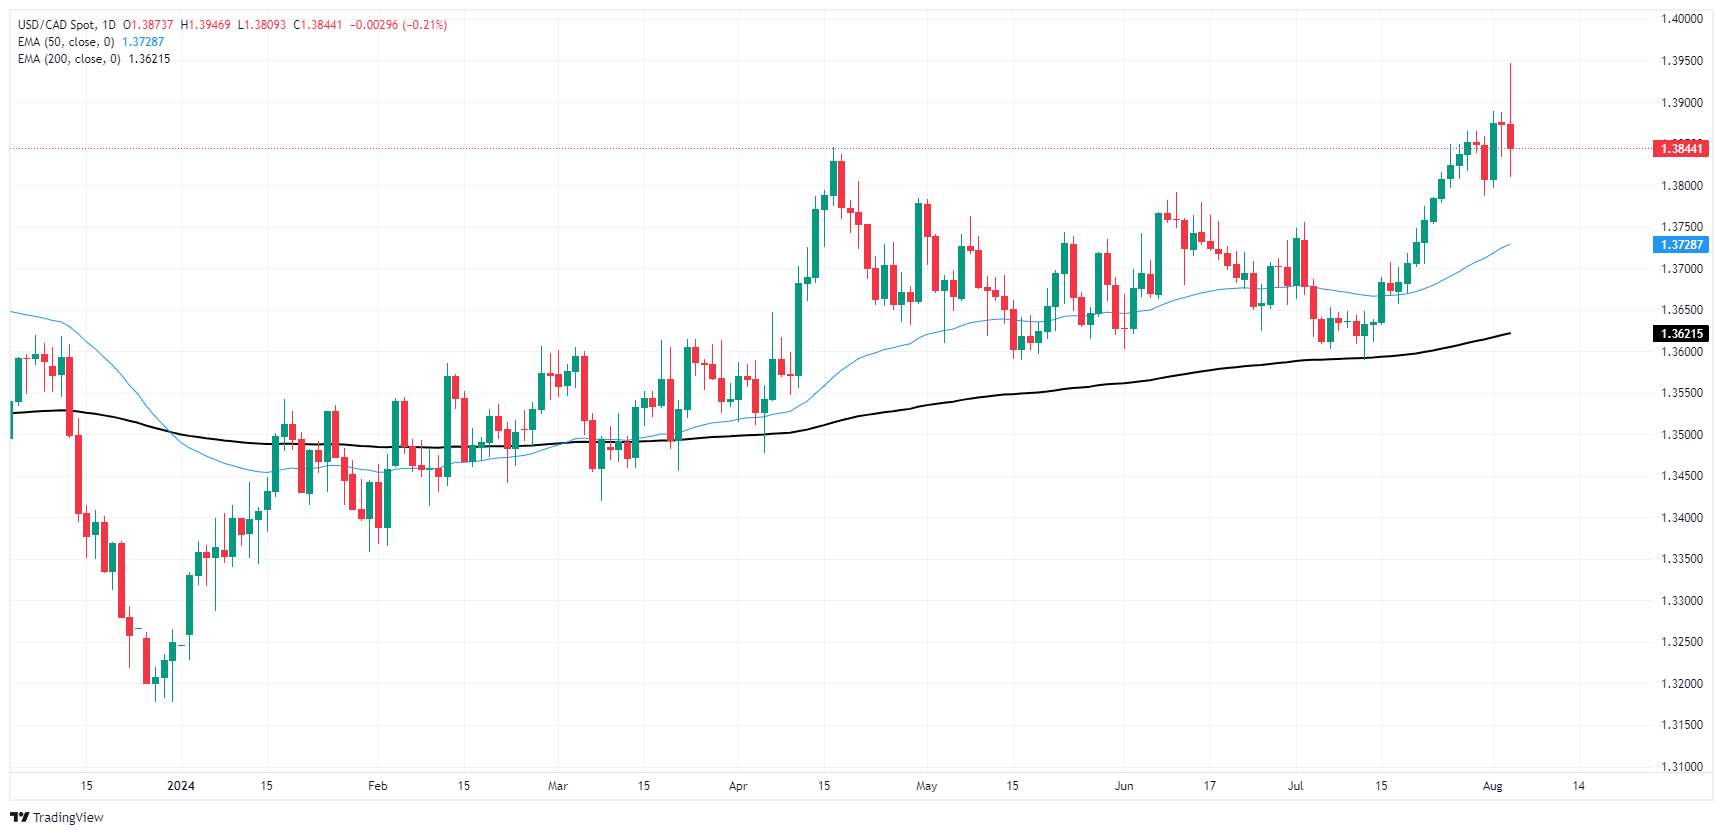
Canadian Dollar FAQs
The key factors driving the Canadian Dollar (CAD) are the level of interest rates set by the Bank of Canada (BoC), the price of Oil, Canada’s largest export, the health of its economy, inflation and the Trade Balance, which is the difference between the value of Canada’s exports versus its imports. Other factors include market sentiment – whether investors are taking on more risky assets (risk-on) or seeking safe-havens (risk-off) – with risk-on being CAD-positive. As its largest trading partner, the health of the US economy is also a key factor influencing the Canadian Dollar.
The Bank of Canada (BoC) has a significant influence on the Canadian Dollar by setting the level of interest rates that banks can lend to one another. This influences the level of interest rates for everyone. The main goal of the BoC is to maintain inflation at 1-3% by adjusting interest rates up or down. Relatively higher interest rates tend to be positive for the CAD. The Bank of Canada can also use quantitative easing and tightening to influence credit conditions, with the former CAD-negative and the latter CAD-positive.
The price of Oil is a key factor impacting the value of the Canadian Dollar. Petroleum is Canada’s biggest export, so Oil price tends to have an immediate impact on the CAD value. Generally, if Oil price rises CAD also goes up, as aggregate demand for the currency increases. The opposite is the case if the price of Oil falls. Higher Oil prices also tend to result in a greater likelihood of a positive Trade Balance, which is also supportive of the CAD.
While inflation had always traditionally been thought of as a negative factor for a currency since it lowers the value of money, the opposite has actually been the case in modern times with the relaxation of cross-border capital controls. Higher inflation tends to lead central banks to put up interest rates which attracts more capital inflows from global investors seeking a lucrative place to keep their money. This increases demand for the local currency, which in Canada’s case is the Canadian Dollar.
Macroeconomic data releases gauge the health of the economy and can have an impact on the Canadian Dollar. Indicators such as GDP, Manufacturing and Services PMIs, employment, and consumer sentiment surveys can all influence the direction of the CAD. A strong economy is good for the Canadian Dollar. Not only does it attract more foreign investment but it may encourage the Bank of Canada to put up interest rates, leading to a stronger currency. If economic data is weak, however, the CAD is likely to fall.
- A disappointing July jobs report sparked hopes of a September rate cut as well as recession fears.
- ISM Services data shows signs of improvement, overall economy remains strong.
- Market prices in 125 bps of Fed easing by year-end.
The US Dollar (USD), measured by the DXY index, came under initial selling pressure at the start of Monday's session but later erased losses after the release of positive ISM Services figures for July. The index initially fell to 102.20 but recovered to trade around 102.70.
Despite the positive data, the market’s fear is that the US economic outlook turned weak and investors worry that the US might be headed toward a recession
Daily digest market movers: USD recovers after ISM Services data, markets worry about a recession in the US
- On the data front, the Services Employment Index climbed from 46.1 to 51.1 while the New Orders Index increased from 47.3 to 52.4.
- The Services PMI moved from contraction to growth, rising from 48.8 to 51.4.
- Soft US jobs data last Friday sparked fears that the Fed is lagging, leading to a global bond rally and equity sell-off on both Friday and Monday.
- The market is fully pricing in a 125 bps easing by year-end, with a 50 bps cut expected in September.
- A total easing of 225 bps over the next 12 months seems unlikely unless a deep US recession occurs. In that sense, it seems that markets are overreacting to one data point, and Fed speakers might cool down the dovish bets as the market has repeatedly misjudged the Fed's easing path throughout this cycle.
DXY technical outlook: Bearish bias persists, indicators now in oversold region
The DXY outlook turned bearish after the disappointing jobs report last week. The index fell below both the 20-day and 200-day Simple Moving Averages (SMAs). The momentum-based Relative Strength Index (RSI) and the Moving Average Convergence Divergence (MACD) also declined, indicating increasing selling pressure. The RSI below 30, however, indicates that a correction might be looming.
Supports: 102.50, 102.20, 102.00
Resistances: 103.00, 103.50, 104.00
US Dollar FAQs
The US Dollar (USD) is the official currency of the United States of America, and the ‘de facto’ currency of a significant number of other countries where it is found in circulation alongside local notes. It is the most heavily traded currency in the world, accounting for over 88% of all global foreign exchange turnover, or an average of $6.6 trillion in transactions per day, according to data from 2022. Following the second world war, the USD took over from the British Pound as the world’s reserve currency. For most of its history, the US Dollar was backed by Gold, until the Bretton Woods Agreement in 1971 when the Gold Standard went away.
The most important single factor impacting on the value of the US Dollar is monetary policy, which is shaped by the Federal Reserve (Fed). The Fed has two mandates: to achieve price stability (control inflation) and foster full employment. Its primary tool to achieve these two goals is by adjusting interest rates. When prices are rising too quickly and inflation is above the Fed’s 2% target, the Fed will raise rates, which helps the USD value. When inflation falls below 2% or the Unemployment Rate is too high, the Fed may lower interest rates, which weighs on the Greenback.
In extreme situations, the Federal Reserve can also print more Dollars and enact quantitative easing (QE). QE is the process by which the Fed substantially increases the flow of credit in a stuck financial system. It is a non-standard policy measure used when credit has dried up because banks will not lend to each other (out of the fear of counterparty default). It is a last resort when simply lowering interest rates is unlikely to achieve the necessary result. It was the Fed’s weapon of choice to combat the credit crunch that occurred during the Great Financial Crisis in 2008. It involves the Fed printing more Dollars and using them to buy US government bonds predominantly from financial institutions. QE usually leads to a weaker US Dollar.
Quantitative tightening (QT) is the reverse process whereby the Federal Reserve stops buying bonds from financial institutions and does not reinvest the principal from the bonds it holds maturing in new purchases. It is usually positive for the US Dollar.
- Dow Jones fell another 1,300 points from Friday’s close.
- Markets are recoiling amidst concerns of an escalation in Middle East conflicts.
- Souring US economic data is increasing concerns of a wider economic slowdown.
The Dow Jones Industrial Average (DJIA) extended into a third straight day of downside momentum as equities plunge in the face of a bad batch of US economic figures signalling the growing possibility of a harder, deeper recession than most investors were prepared for in the coming months. Geopolitical tensions are also on the rise, further batting down risk appetite as the Israel-Palestinian Hamas conflict looks set to widen with the possible involvement with Iran.
Last Friday’s US Nonfarm Payrolls (NFP) would have been a good print in years past, but that was then and this is now. The lowest initial print in the number of net jobs additions since 2019 sent shockwaves through investor markets, dragging down equities and sparking fears of a broad recession over the horizon for the US economy. Monday accelerated losses, sending all US sectors and indexes into the red.
The US S&P Global Services Purchasing Manager Index (PMI) for July eased to 55.0 from the expected hold at 56.0, and July’s Composite PMI also ticked down to 54.3 instead of the forecast flat hold at 55.0. Still, a glimmer of hope on the data front: the ISM Services PMI for July rose to 51.4 on Monday, beating the forecast increase to 51.0 from the previous 48.8.
After the assassination of two of Iran and Hezbollah’s militant leaders last week, markets are bracing for an expected escalation in the Middle East conflict that has been bubbling for months. Iran is expected to retaliate directly against Israel for its hand in assassinations that took place in Beirut and Tehran, and the US is deploying warships to the region in an effort to stave off a further widening of the conflict.
Dow Jones news
The Dow Jones plummeted to a 1,300 point decline from Friday’s close in early Monday trading as the entire stock index prints in the red. All US sectors are down on Monday, with losses being led by Intel Corp. (INTC), which fell -6.3% and is approaching $20.00 per share after the software company announced a minor miss in second-quarter revenue and slightly lowered forward guidance on revenue for the current quarter.
Dow Jones technical outlook
Monday’s bearish plunge dragged the Dow Jones to an eight-week low of 38,382.90. Bids have fallen with touch range of the 200-day Exponential Moving Average (EMA) at 38,108.94, a feat that hasn’t been accomplished since the DJIA soared back over the long-term moving average in November of last year.
Despite near-term declines dragging the Dow Jones into correction territory, down around -7% peak-to-trough from all-time highs set above the 40,000.00 major price handle, price action still has a long way to go before testing full-on bear country at the 20% contraction mark near 33,108.00.
Dow Jones daily chart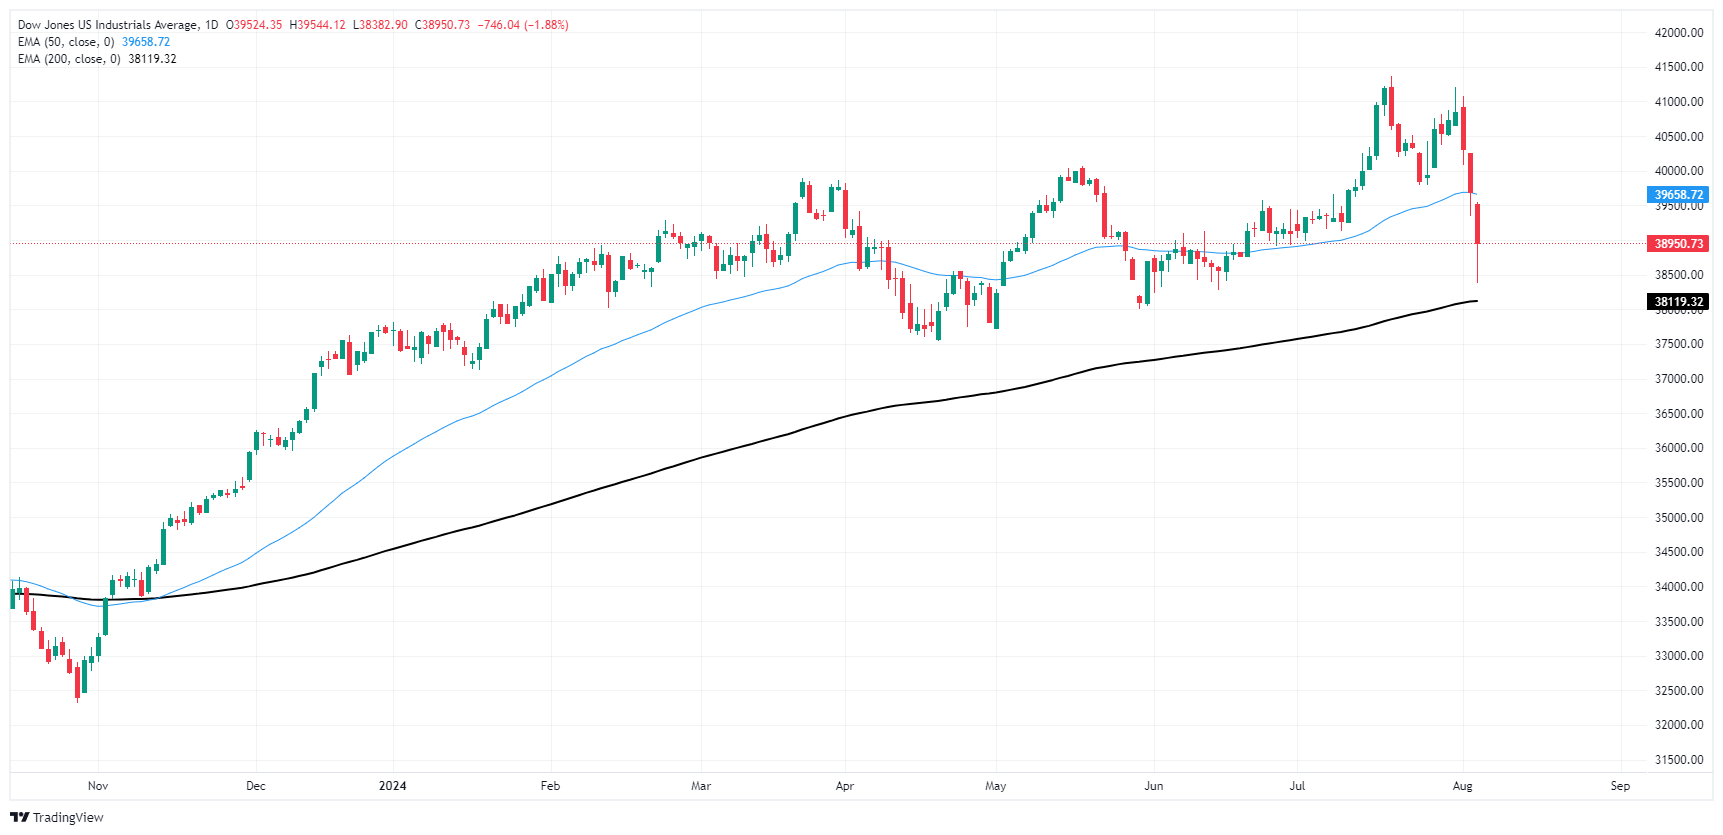
Dow Jones FAQs
The Dow Jones Industrial Average, one of the oldest stock market indices in the world, is compiled of the 30 most traded stocks in the US. The index is price-weighted rather than weighted by capitalization. It is calculated by summing the prices of the constituent stocks and dividing them by a factor, currently 0.152. The index was founded by Charles Dow, who also founded the Wall Street Journal. In later years it has been criticized for not being broadly representative enough because it only tracks 30 conglomerates, unlike broader indices such as the S&P 500.
Many different factors drive the Dow Jones Industrial Average (DJIA). The aggregate performance of the component companies revealed in quarterly company earnings reports is the main one. US and global macroeconomic data also contributes as it impacts on investor sentiment. The level of interest rates, set by the Federal Reserve (Fed), also influences the DJIA as it affects the cost of credit, on which many corporations are heavily reliant. Therefore, inflation can be a major driver as well as other metrics which impact the Fed decisions.
Dow Theory is a method for identifying the primary trend of the stock market developed by Charles Dow. A key step is to compare the direction of the Dow Jones Industrial Average (DJIA) and the Dow Jones Transportation Average (DJTA) and only follow trends where both are moving in the same direction. Volume is a confirmatory criteria. The theory uses elements of peak and trough analysis. Dow’s theory posits three trend phases: accumulation, when smart money starts buying or selling; public participation, when the wider public joins in; and distribution, when the smart money exits.
There are a number of ways to trade the DJIA. One is to use ETFs which allow investors to trade the DJIA as a single security, rather than having to buy shares in all 30 constituent companies. A leading example is the SPDR Dow Jones Industrial Average ETF (DIA). DJIA futures contracts enable traders to speculate on the future value of the index and Options provide the right, but not the obligation, to buy or sell the index at a predetermined price in the future. Mutual funds enable investors to buy a share of a diversified portfolio of DJIA stocks thus providing exposure to the overall index.
There was relatively little movement in liquefied natural gas (LNG) prices in July, NAB Group commodity analysts note.
LNG supply is expected to expand
“There was relatively little movement in liquefied natural gas (LNG) prices in July – with the Japan Korea marker trading in a US 55 cent range above US$12/mmbtu over the course of the month, marginally above the levels recorded during the same period in 2023.”
“LNG markets have seen strong demand in recent months (compounding peak demand during the northern summer), as heatwave conditions across much of South and South-east Asia bolstered electricity consumption, while LNG supply saw some unanticipated disruptions.”
“LNG supply is expected to expand in the second half of 2024 and across 2025. Our forecasts for LNG spot prices are unchanged this month – we expect prices to average US$11.0/mmbtu in 2024 before edging down to US$10.5/mmbtu in 2025.”
Having trended higher across June, crude oil prices peaked in early July (at around US$88/barrel for benchmark Brent crude) before trending down across the rest of the month, NAB commodity analysts note.
Supply side fears produce volatility
“In line with subdued global economic conditions, the International Energy Agency noted that oil consumption grew comparatively modestly in Q2 2024 – up by around 710kb/d from Q1 – with Chinese consumption falling year-on-year during this period.”
“Growth in supply outpaced consumption – increasing by 910kb/d – led by higher production in the United States and coming despite ongoing restrictions on supply from OPEC+. Recent volatility in crude prices largely reflects supply side fears, such as concerns of an escalation of conflicts in the Middle East negatively impacting output in the region.”
“Our forecasts are unchanged this month, with Brent crude expected to average US$85/barrel in 2024 and US$84/barrel in 2025.”
Commodity demand expectations embedded within the complex are melting alongside the decline in equity indices and yields, TDS senior commodity strategist Daniel Ghali notes.
Low bar for subsequent CTA selling activity
“This dynamic weighs on the entire complex, but we expect massive CTA selling activity in platinum markets this session, with CTAs likely to shed their entire book long and grow a net short position closer to its effective 'max short' position size.”
“While CTAs are already holding their effective 'max short' position in palladium, silver remains vulnerable to algo selling activity below the $25.80/oz mark. Copper markets are also being weighed down by algo selling activity, as CTAs finally start to shed their books long as we have expected following massive liquidations from macro funds.”
“Our simulations of future prices continue to point to a low bar for subsequent CTA selling activity, with algos likely to continue selling the red metal even in a flat tape over the coming week.”
- EUR/USD jumps to near 1.1000 as the US Dollar plunges on fears of US economic slowdown.
- Upbeat US ISM Services PMI offer support to the US Dollar.
- Stubborn Eurozone inflation has diminished market expectation for ECB subsequent rate cuts.
The EUR/USD pair prints a fresh seven-month high around the psychological resistance of 1.1000 in Monday’s American session. The major currency pair strengthens as the US Dollar (USD) plummets amid growing speculation that the Federal Reserve (Fed) could announce emergency rate cuts as risks have widened to both components of dual mandate.
The US Dollar Index (DXY), which tracks the Greenback’s value against six major currencies, plunges to 102.20. Meanwhile, an asset-specific action has observed in global markets. Global equities continue to face sell-off, while risk-perceived currencies have bounced back strongly due to weakness in the US Dollar.
However, the US Dollar has found an intermediate support after upbeat US ISM Services PMI. The PMI report showed that the service sector activity rose to 51.4 from expectations of 51.0 from the former release of 48.8.
Upside risks to United States (US) economic slowdown have deepened as job demand has slowed and the jobless rate has risen to its highest since November 2021.
On the Eurozone front, stubborn inflationary pressures in July have stemmed doubts over expectations of subsequent rate cuts by the European Central Bank (ECB).
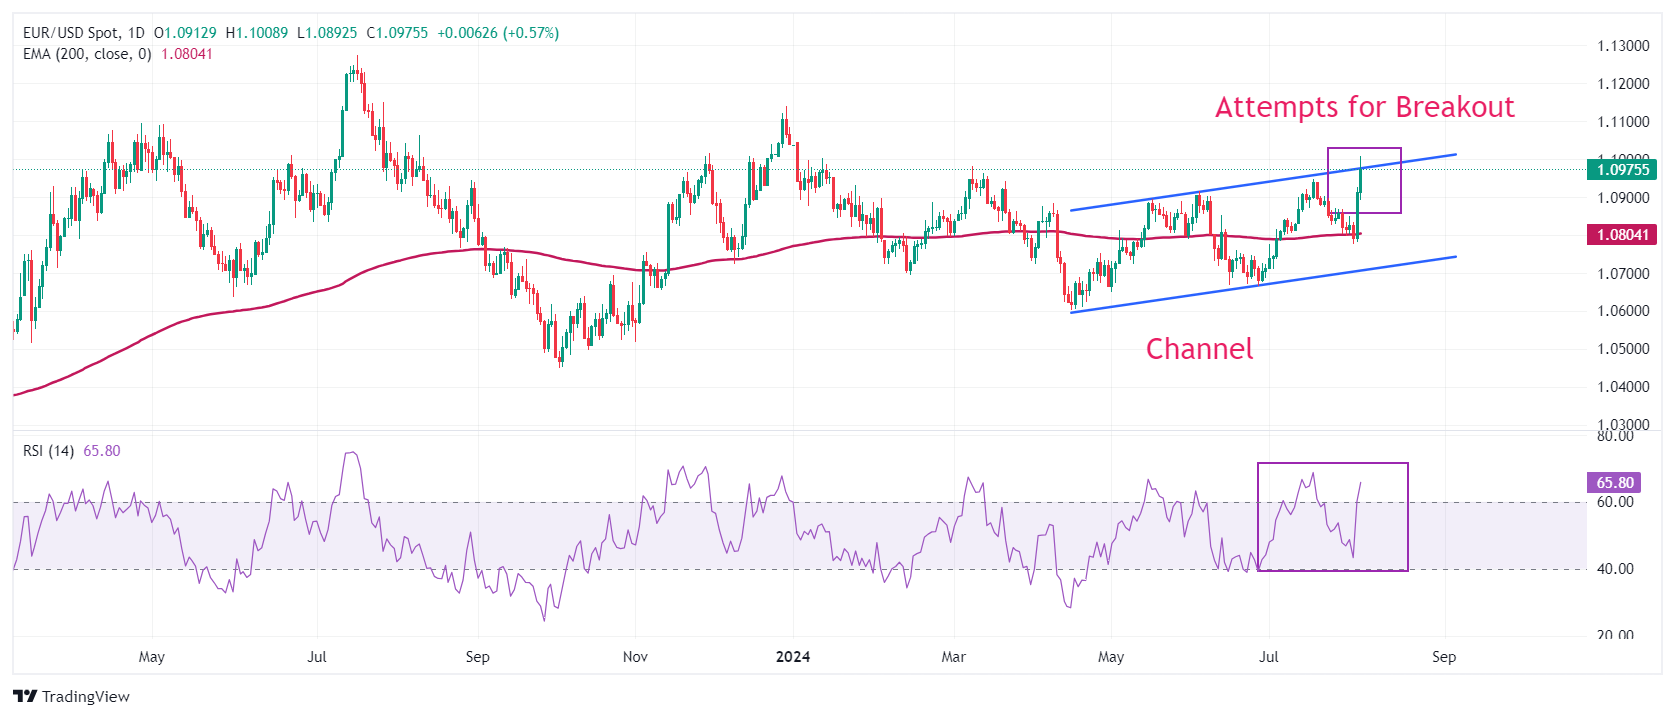
EUR/USD attempts to deliver a breakout of the Channel formation on a daily timeframe. A breakout of an aforementioned chart pattern results in wider ticks on the upside and heavy volume. The 200-day Exponential Moving Average (EMA) near 1.0800 acted as major support for the Euro bulls.
The 14-day Relative Strength Index (RSI) climbs above 60.00. If the RSI sustains above 60.00, a bullish momentum will trigger.
More upside would appear if the major currency pair breaks above intraday high of 1.1009. This would drive the asset towards 10 August 2023 high at 1.1065, followed by the round-level resistance of 1.1100.
In an alternate scenario, a downside move below August 1 low at 1.0777 would drag the asset towards February low near 1.0700. A breakdown below the latter would expose the asset to June 14 low at 1.0667.
EUR/USD daily chart
Euro FAQs
The Euro is the currency for the 20 European Union countries that belong to the Eurozone. It is the second most heavily traded currency in the world behind the US Dollar. In 2022, it accounted for 31% of all foreign exchange transactions, with an average daily turnover of over $2.2 trillion a day. EUR/USD is the most heavily traded currency pair in the world, accounting for an estimated 30% off all transactions, followed by EUR/JPY (4%), EUR/GBP (3%) and EUR/AUD (2%).
The European Central Bank (ECB) in Frankfurt, Germany, is the reserve bank for the Eurozone. The ECB sets interest rates and manages monetary policy. The ECB’s primary mandate is to maintain price stability, which means either controlling inflation or stimulating growth. Its primary tool is the raising or lowering of interest rates. Relatively high interest rates – or the expectation of higher rates – will usually benefit the Euro and vice versa. The ECB Governing Council makes monetary policy decisions at meetings held eight times a year. Decisions are made by heads of the Eurozone national banks and six permanent members, including the President of the ECB, Christine Lagarde.
Eurozone inflation data, measured by the Harmonized Index of Consumer Prices (HICP), is an important econometric for the Euro. If inflation rises more than expected, especially if above the ECB’s 2% target, it obliges the ECB to raise interest rates to bring it back under control. Relatively high interest rates compared to its counterparts will usually benefit the Euro, as it makes the region more attractive as a place for global investors to park their money.
Data releases gauge the health of the economy and can impact on the Euro. Indicators such as GDP, Manufacturing and Services PMIs, employment, and consumer sentiment surveys can all influence the direction of the single currency. A strong economy is good for the Euro. Not only does it attract more foreign investment but it may encourage the ECB to put up interest rates, which will directly strengthen the Euro. Otherwise, if economic data is weak, the Euro is likely to fall. Economic data for the four largest economies in the euro area (Germany, France, Italy and Spain) are especially significant, as they account for 75% of the Eurozone’s economy.
Another significant data release for the Euro is the Trade Balance. This indicator measures the difference between what a country earns from its exports and what it spends on imports over a given period. If a country produces highly sought after exports then its currency will gain in value purely from the extra demand created from foreign buyers seeking to purchase these goods. Therefore, a positive net Trade Balance strengthens a currency and vice versa for a negative balance.
Gold does not hedge against deleveraging or liquidity dynamics. There’s an acute risk of a widespread deleveraging event that could counterintuitively weigh on Gold prices. Markets suspect that recent selling activity has still been limited to the implications of unwinding carry trades, TDS senior commodity strategist Daniel Ghali notes.
Large-scale selling activity to kick off below $2390
“The recent price action following a considerable miss on payrolls data, alongside a meltdown in rates and into a weekend which hosted substantial geopolitical risks tied to the conflict in the Middle East are telling: not only is macro fund positioning bloated, but it is fully tapped out for the time being.”
“Commodity Trading Advisor (CTA) trend followers still hold substantial dry-powder to sell, with large-scale selling activity likely to kick off below $2390/oz in active futures. Shanghai traders still hold near-record length in Gold as a currency-depreciation hedge, but the driver of this build-up in positioning has significantly deteriorated with Asian currencies notably strengthening.”
“De-escalation in the Middle East could exacerbate these flows as safe-haven flows are simultaneously unwound. Overall, this suggests that the implications of a deleveraging event could be significant in Gold markets, which places our attention on a potential bounce in yields as a possible catalyst for large-scale mechanical selling activity from risk parity and vol-control funds, CTAs, macro funds and Shanghai traders.”
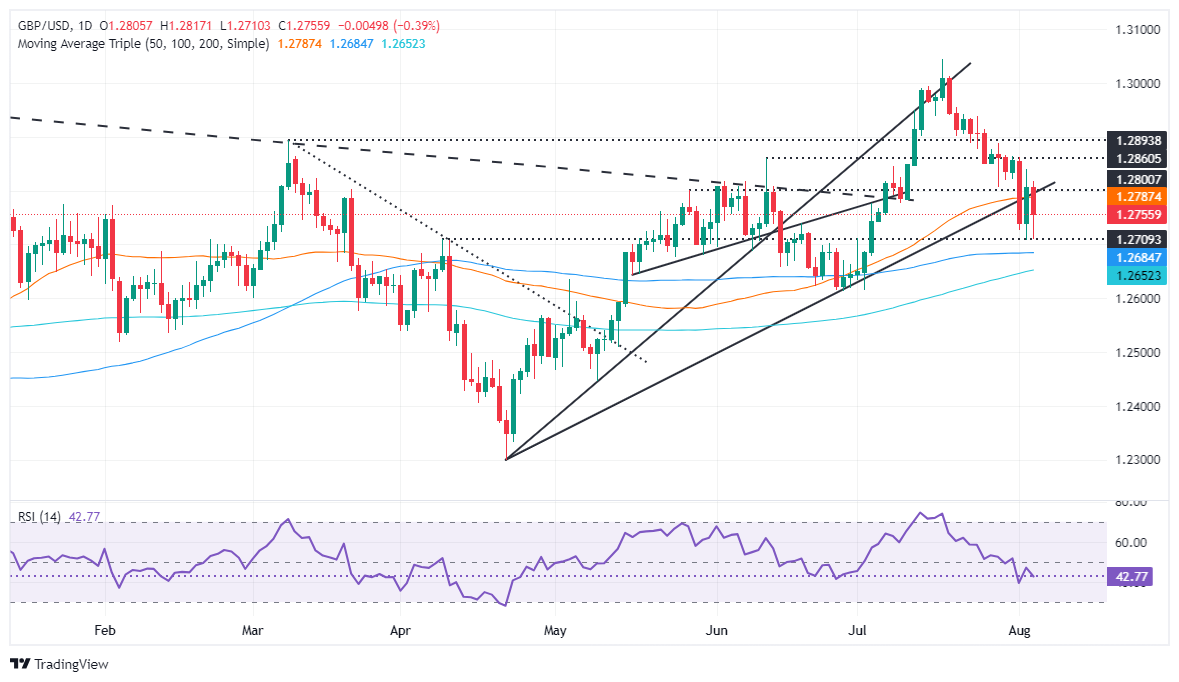
- GBP/USD falls to 1.2772, down 0.20%, following significant losses in global markets.
- Technicals show bearish momentum; RSI suggests further declines.
- Key supports: August 2 low at 1.2707, 100-DMA at 1.2683, 200-DMA at 1.2645.
- For bullish reversal, GBP/USD needs to pass 50-DMA at 1.2786 and August 2 high at 1.2840, aiming for 1.2860 and 1.2900.
The Pound Sterling edges lower after trimming some of its earlier losses due to a bloodbath in the financial markets, led by Asian equities, which triggered circuit breakers halting trading as losses deepened. The GBP/USD trades at 1.2772, down by 0.20%.
GBP/USD Price Analysis: Technical outlook
Last Friday, the GBP/USD seemed poised to test higher prices, but due to risk aversion and investors seeking safety, the Cable was under pressure during the Asian and European sessions.
Momentum, as depicted by the Relative Strength Index (RSI), shifted bearishly, and with sellers in charge, further losses loom.
As of writing, the GBP/USD has fallen below 1.2800, and the 50-day moving average (DMA) is at 1.2786, leading for a deeper pullback. If the pair slides below the August 2 low of 1.2707, that could pave the way to test the 100-DMA at 1.2683. A breach of the latter will expose the 200-DMA at 1.2645, which, once broken, would shift and turn the pair bearish.
For a bullish reversal, the GBP/USD must clear the 50-DMA and the August 2 peak at 1.2840. Once hurdle, the next resistance will be the June 12 high at 1.2860, ahead of 1.2900.
GBP/USD Price Action – Daily Chart
British Pound PRICE Today
The table below shows the percentage change of British Pound (GBP) against listed major currencies today. British Pound was the strongest against the Australian Dollar.
| USD | EUR | GBP | JPY | CAD | AUD | NZD | CHF | |
|---|---|---|---|---|---|---|---|---|
| USD | -0.50% | 0.38% | -2.39% | -0.24% | 0.43% | 0.32% | -1.05% | |
| EUR | 0.50% | 0.80% | -2.06% | 0.14% | 0.95% | 0.72% | -0.66% | |
| GBP | -0.38% | -0.80% | -2.77% | -0.64% | 0.14% | -0.08% | -1.45% | |
| JPY | 2.39% | 2.06% | 2.77% | 2.27% | 2.87% | 2.83% | 1.44% | |
| CAD | 0.24% | -0.14% | 0.64% | -2.27% | 0.71% | 0.56% | -0.99% | |
| AUD | -0.43% | -0.95% | -0.14% | -2.87% | -0.71% | -0.23% | -1.59% | |
| NZD | -0.32% | -0.72% | 0.08% | -2.83% | -0.56% | 0.23% | -1.37% | |
| CHF | 1.05% | 0.66% | 1.45% | -1.44% | 0.99% | 1.59% | 1.37% |
The heat map shows percentage changes of major currencies against each other. The base currency is picked from the left column, while the quote currency is picked from the top row. For example, if you pick the British Pound from the left column and move along the horizontal line to the US Dollar, the percentage change displayed in the box will represent GBP (base)/USD (quote).
Global markets were entering their most vulnerable moment of the year, TDS senior commodity strategist Daniel Ghali notes.
Selling activity is still tied to the unwind of carry trades
“Systematic selling activity is most pronounced in equity indices and select commodities including energy markets and base metals, but the deleveraging process from risk parity & vol-control funds has thus far remained muted as melting rates still provide portfolios with a notable offset.”
“In fact, most selling activity hitting the tapes across markets is still tied to the unwind of carry trades, as opposed to a more painful and wider-spread deleveraging event. This is a self-reinforcing process as the carry trade unwind is leading to higher odds of Fed cuts, which in turn narrows the yield differential and fuels additional selling activity in carry trades.”
“However, the ongoing risk-off trading environment can still morph into a more widespread deleveraging event, should the meltdown in yields come to a halt.”
DBS forecast for the USD across all currencies has been lowered, FX strategist Philip Wee notes.
Rate cut is ‘on the table’ in September
“The moment we had waited for this year arrived last week. At the FOMC meeting on July 31, Fed Chair Jerome Powell reckoned an interest rate cut was ‘on the table’ in September.”
“In the previous meeting on June 12, Powell said the Fed was ready to respond if jobs weakened unexpectedly and considered the rise in the US unemployment rate as an important statistic.”
“Last Friday, the jobless rate increased to 4.3% in July from 4.1% in June, above the Fed’s longer-run projection of 4.2%.”
- ISM Services PMI climbed to 51.4 in July, returning to the expansion territory.
- US Dollar Index rebounds from the vicinty of 102.00.
The business activity in the US service sector surprised to the upside and returned to the expansion zone (above the 50 threshold) in July, according to the Institute for Supply Management (ISM). The reading came in above consensus at 51.0 and reversed June’s 48.8 print.
The Employment Index of the survey also came in above estimates at 51.1 (from 46.1), while the New Orders Index rose to 52.4 from 47.3. Finally, the Prices component, ticked higher to 57.0 in the same period.
Market reaction
The US Dollar Index managed to stage a mild rebound in the wake of the release, although it remains well south of the 103.00 support.
- NZD/USD rebounds swiftly after posting a fresh nine-month low near 0.5850 after a sharp weakness in the US Dollar.
- Fed Goolsbee sees emergency rate cuts on the table.
- The NZ Dollar will dance to the tunes of the Q2 Employment data.
The NZD/USD pair recovers at a faster pace after plunging to near 0.5850 in Monday’s New York session. The Kiwi asset bounces back strongly after posting a fresh nine-month low as the US Dollar (USD) weakens on expectations that the Federal Reserve (Fed) could announce an emergency rate-cut decision due to growing fears of a United States (US) economic slowdown.
The speculation for Fed’s emergency rate cuts has swelled after Chicago Fed Bank President Austan Goolsbee’s interview with CNBC. Goolsbee said, emergency rate cuts are on table.
Deepening fears of US slowdown have prompted risk-aversion among market participants. The S&P 500 has opened with a bloodshed, showing signs of a sharp decline in investors’ risk-appetite.
Fears of US slowdown indicated by a sharp rise in the Unemployment Rate to 4.3%, slower job growth and contracting manufacturing sector have weighed heavily on the US Dollar. The US Dollar Index (DXY), which tracks the Greenback’s value against six major currencies, dives almost 1% to near 102.00. 10-year US Treasury yields have plummeted below 3.7%.
Meanwhile, the US ISM Services PMI has returned into the expanding trajectory after contracting in June. The PMI report showed that activities in the service sector expanded at a faster-than-expected pace to 51.4. Investors anticipated a growth in the Services PMI to 51.0 from the former release of 48.8.
In the Asia-pacific region, the next move in the New Zealand Dollar (NZD) will be influenced by the Q2 Employment data, which will be published on Wednesday. The Unemployment Rate is estimated to have increased to 4.7% from the prior release of 4.3%. Annual Labor Cost Index is expected to have decelerated to 3.5% from Q1 release of 3.8%, with quarterly figure growing steadily by 0.8%. Easing labor market conditions would fuel expectations of early rate cuts by the Reserve Bank of New Zealand (RBNZ).
New Zealand Dollar FAQs
The New Zealand Dollar (NZD), also known as the Kiwi, is a well-known traded currency among investors. Its value is broadly determined by the health of the New Zealand economy and the country’s central bank policy. Still, there are some unique particularities that also can make NZD move. The performance of the Chinese economy tends to move the Kiwi because China is New Zealand’s biggest trading partner. Bad news for the Chinese economy likely means less New Zealand exports to the country, hitting the economy and thus its currency. Another factor moving NZD is dairy prices as the dairy industry is New Zealand’s main export. High dairy prices boost export income, contributing positively to the economy and thus to the NZD.
The Reserve Bank of New Zealand (RBNZ) aims to achieve and maintain an inflation rate between 1% and 3% over the medium term, with a focus to keep it near the 2% mid-point. To this end, the bank sets an appropriate level of interest rates. When inflation is too high, the RBNZ will increase interest rates to cool the economy, but the move will also make bond yields higher, increasing investors’ appeal to invest in the country and thus boosting NZD. On the contrary, lower interest rates tend to weaken NZD. The so-called rate differential, or how rates in New Zealand are or are expected to be compared to the ones set by the US Federal Reserve, can also play a key role in moving the NZD/USD pair.
Macroeconomic data releases in New Zealand are key to assess the state of the economy and can impact the New Zealand Dollar’s (NZD) valuation. A strong economy, based on high economic growth, low unemployment and high confidence is good for NZD. High economic growth attracts foreign investment and may encourage the Reserve Bank of New Zealand to increase interest rates, if this economic strength comes together with elevated inflation. Conversely, if economic data is weak, NZD is likely to depreciate.
The New Zealand Dollar (NZD) tends to strengthen during risk-on periods, or when investors perceive that broader market risks are low and are optimistic about growth. This tends to lead to a more favorable outlook for commodities and so-called ‘commodity currencies’ such as the Kiwi. Conversely, NZD tends to weaken at times of market turbulence or economic uncertainty as investors tend to sell higher-risk assets and flee to the more-stable safe havens.
USD/SGD fell further this morning, taking cues from a softer USD and another round of gains in RMB, JPY, OCBC FX strategists Frances Cheung and Christopher Wong note.
USD is oversold
“We cautioned that the sharp move lower in USD/RMB did not see follow-through via policymakers’ daily USD/CNY fixing. As such, the RMB momentum may not be sustained intra-day.”
“Pair was last seen at 1.3201 levels. Daily momentum is bearish but RSI is in oversold conditions. Cautious of rebound risks. Resistance at 1.33 (23.6% fibo), 1.3390 (38.2% fibo retracement of Oct high to Jan low) and 1.3460 (200 DMA, 50% fibo).”
“S$NEER was estimated at ~1.78% above our model-implied mid, but has started to ease away from its upper bound.”
USD/JPY took another leg lower after US payrolls disappointed while renewed geopolitical concerns is another trigger for safe-haven proxy Japanese Yeb (JPY), OCBC FX strategists Frances Cheung and Christopher Wong note.
USD/JPY set to be a case of sell-on-rallies
“Broader direction of travel for USDJPY has now changed as Fed-BoJ policies shift from divergence to convergence. We also noted how the recent decline in USD/JPY saw a recoupling of the FX to UST-JGB yield differentials. Back during May – Jul, USD/JPY had earlier traded much higher while UST yields and UST-JGB yield differentials went the other way lower.”
“And if we do expect USD/JPY to play catchup to its historical correlation with UST-JGB yield differentials, then there is room for USD/JPY to trade lower. Based on where 2y yield differentials is, our simple univariate fair value model estimates put USDJPY theoretical value at closer to 136. The large misalignment merely suggests that is room for USD/JPY to head lower over time. Pair was last at 145.15 levels.”
“While the broad bias is for further downside, we are cautious not to get overly carried away in the short term. There is risk of retracement from current levels. Resistance at 148.54, 145 and 144.50 levels. (38.2% fibo retracement of 2024 low to high). Bias to sell rallies. Intra-day, we watch US ISM services data tonight.”
Following Fed’s signalling for rate cut soon, the softer US payrolls report (last Fri) was the latest trigger to drag the USD lower, OCBC FX strategists Frances Cheung and Christopher Wong note.
Focus on ISM services on Monday
“NFP missed estimates (114k vs. +175k expected), hourly earnings dipped (3.6% vs. 3.9% prior) and unemployment rate rose (4.3% vs. 4.1% prior). We reiterate that recent thematic has also been a case of growth fears resulting in rise in vols, unwinding of carry and continued sell-off in equities. Renewed geopolitical concerns is also another risk to watch out for after US warned of a possible attack from Iran in retaliation for assassinations of top Hamas, Hezbollah leaders.”
“And we caution this may have some spillover effects onto other high-beta, risk sensitive FX. In a scenario of growth fears and geopolitical concerns, safe-haven proxy should remain in demand while carry trade should unwind further (as vols pick up), we favour expressing USD shorts via long JPY, CHF and gold. DXY was last at 103 levels.”
“Daily momentum turned mild bearish while RSI fell. Risks skewed to the downside. Resistance here at 104.30/45 (21, 200 DMAs), 104.80/90 (61.8% fibo retracement of Oct high to 2024 low, 21, 50, 100 DMAs). Support at 102.2 (23.6% fibo). Resistance at 103.2 (38.2% fibo), 104 (50% fibo). Focus on ISM services tonight. Another softer print should see recent momentum follow through.”
In an interview with CNBC on Monday, Federal Reserve (Fed) Bank of Chicago President Austan Goolsbee noted that there is a lot going on in the world, which makes things more complicated for them, per Reuters.
Key takeaways
"The Fed has been in a restrictive posture."
"You only want to be that restrictive if there is fear of overheating; data does not look like the economy is overheating."
"Jobs number were weaker than expected but not looking yet like a recession."
"The Fed does need to be forward looking in making decisions."
"Must be a little careful overconcluding about jobs report."
"Manufacturing sector is a little complicated."
"We expected some weakness in manufacturing due to pandemic effects."
"That said, there are cautionary indicators in other data such as business defaults."
"On the other side, GDP number was a bit stronger than expected."
"Economic growth continues at a steady level."
"The stock market has a lot more volatility than the Fed."
When asked about an emergency cut, "everything is always on the table, including raises and cuts."
"If the economy deteriorates, the Fed will fix it."
"The Fed will respond to conditions."
"I have been saying for some time we are in a balanced risk posture."
"There is some weakness in the jobs market, we have to pay attention to that."
"We are restrictive in real terms at the highest in many decades."
"You only want to be there for as long as you have to."
"If we are not overheating, we should not tighten our restrictiveness in real terms."
Market reaction
The US Dollar (USD) remains under heavy selling pressure following these comments. At the time of press, the USD Index was down 0.9% on the day at 102.30.
In the face of emerging global recession fears, not only have US interest rate expectations been corrected over the past week, but so have those for most of the other G10 countries. Correcting for these distortions, the market is now pricing in stronger rate cuts for all countries except Japan by the end of the year. Given that most central banks have only three meetings left this year, this is a remarkable development, Commerzbank’s FX strategist Michael Pfister notes.
Market prices in stronger rate cuts for all countries except Japan
“It seems that the extent to which the market was anticipating more rate cuts was less of a factor in last week's performance. Otherwise, the Norwegian krone, the Australian dollar and the kiwi would not have been among last week's worst performers. After all, only a few more basis points of rate cuts had been priced in, and expectations for the Norwegian krone remained virtually unchanged.”
“In times of heightened risk aversion, it is less important how many rate cuts the market expects from the respective central bank. Rather, how much can the central bank cut rates if we really get into a global crisis? If we visualise this potential and compare it with last week's performance, this relationship becomes clear. Although there are outliers, currencies performed better last week when the potential for rate cuts was lower.”
“This does not bode well for central banks, which continue to sound hawkish in the face of persistent inflationary pressures (Norway, Australia and New Zealand). After all, a weaker currency tends to exacerbate imported inflationary pressures, exacerbating the problems of smaller economies in particular. So, these central banks are likely to be less happy about the latest development, even if there is nothing they can do about it.”
On the build-up of Fed rate cut speculation, EUR/USD has risen to a 5-month high and towards the top of the trading range that has dominated all year. On the anticipation that the panicked market conditions will ease over the coming sessions, we continue to see a sustained break above EUR/USD1.10 as unlikely at this point, Rabobank’s FX analyst Jane Foley notes.
EUR/USD is set to hold above 1.10
“EUR/USD has essentially been contained within a 1.10 to 1.06 range all year. The US Dollar (USD) had already been on the back foot through most of July as the market priced in a September rate cut from the Fed. At the end of last week, Fed rate cut expectations boiled over and fuelled the rally in EUR/USD. This has left the EUR as the third best performing G10 currency on a 1-day view after the JPY and the CHF.”
“As long as the market believes that they will not trigger contagion in broader Eurozone markets, the impact is likely to be contained. In our view, the USD is likely to continue dominating the direction of EUR/USD. It follows that US news will create the biggest risk factors as to whether EUR/USD can hold levels above 1.10 before the end of this year.”
“If polls continue to suggest that Trump could take back the White House in the November election, the inflationary implications of his tariffs policy suggest additional support for the USD. In our view, factors most likely to drive EUR/USD above 1.10 would likely be a surge in evidence suggesting a sharp slowdown is occurring in the US economy combined with a drop back of Trump in the polls.”
- The US Dollar cracks under pressure as investors flee to safe-haven bonds.
- Markets are spooked by recession fears after several worrying US data releases last week.
- The US Dollar index falls below 103.00 on Monday after a bad Asian session.
The US Dollar (USD) sinks lower on Monday, continuing the trend from Friday. The main trigger is the gruesome performance of the Japanese Nikkei and Topix Indices, which closed down over 12% in blood-red numbers. For the Nikkei, it is the worst performance since 1987, pushing investors and traders into safe-haven bonds. With falling yields, the US Dollar is losing its strength as a batch of weak US economic data and lower yields no longer make the Greenback shine.
On the economic front, the week starts with a big batch of data from the Institute of Supply Management (ISM). Traders will be shaking in their boots as the numbers come out, as another batch of disappointing data could further confirm the recession narrative. Luckily, this week does not hold any further first-tier data points, so dust could settle later in the week.
Daily digest market movers: Gearing up from the start
- Markets are in panic mode on Monday after Japanese indices closed down by over 12%. Traders even priced in a 60% chance for an emergency rate cut in August at one point, Bloomberg reported.
- At 13:45 GMT, the final readings of the S&P Global Purchasing Managers Index (PMI) for July will be released:
- Services PMI is expected to come at 56.
- The Composite number is expected to remain stable at 55.
- At 14:00 GMT, the Institute for Supply Management (ISM) will release its numbers for July:
- The Services Employment Index is expected to head to 46.5 from 46.1.
- Services New Orders Index was at 47.3 previously, with no forecast available.
- The Services PMI should head out of contraction to 51 from 48.8.
- Services Paid Index should ease a touch to 55.8 from 56.3.
- Equity markets are falling out of bed on Monday, with the Japanese Nikkei facing its worst performance since 1987. US equities are down with the Nasdaq leading the charge with a 4% decline. European equities are facing milder losses, down 2.5% on average.
- The CME Fedwatch Tool shows a 96.5% chance of a 50 basis points (bps) interest rate cut by the Federal Reserve in September. Another 50 bps cut is expected in November by 78.6%, while a 20.6% chance of just a 25 bps cut is priced in that month.
- The US 10-year benchmark rate trades at a new 52-week low at 3.73%.
US Dollar Index Technical Analysis: Markets choking
The US Dollar Index (DXY) has cracked under pressure after the underperforming US economic data releases last week. On Monday, the equity rout continues and drags the Greenback lower. There are no clear support levels nearby, although the Relative Strength Index (RSI) points to the end of the sell off, with losses in Europe and the US for now being contained on the equity markets.
The recovery will be in three tiers, with the first up at 103.18, which was held on Friday though snapped on Monday in the Asian hours. Once the DXY closes above that level, next up is 104.00, which was the support from June. If the DXY can make its way back above that level, the 200-day Simple Moving Average (SMA) at 104.22 is the next resistance level to look out for.
On the downside, the oversold RSI already should refrain the DXY from making more hefty losses. Support nearby is the March 8 low at 102.35. Once through there, pressure will start to build on 102.00 as a big psychological figure, before testing 101.90, which was a pivotal level back in December 2023 and January 2024.
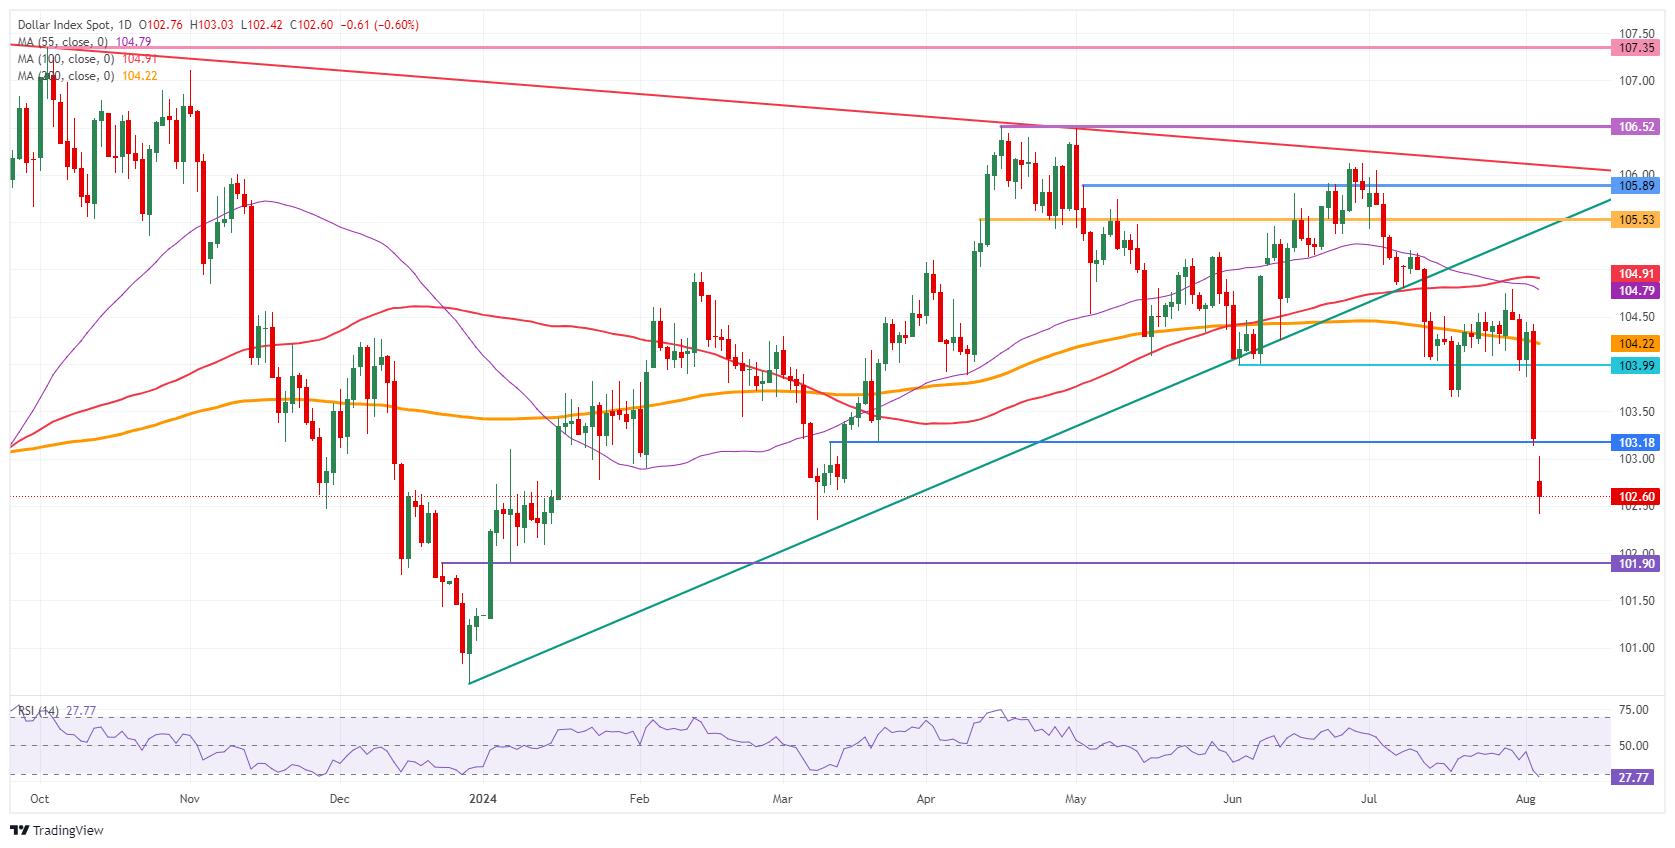
US Dollar Index: Daily Chart
US Dollar FAQs
The US Dollar (USD) is the official currency of the United States of America, and the ‘de facto’ currency of a significant number of other countries where it is found in circulation alongside local notes. It is the most heavily traded currency in the world, accounting for over 88% of all global foreign exchange turnover, or an average of $6.6 trillion in transactions per day, according to data from 2022. Following the second world war, the USD took over from the British Pound as the world’s reserve currency. For most of its history, the US Dollar was backed by Gold, until the Bretton Woods Agreement in 1971 when the Gold Standard went away.
The most important single factor impacting on the value of the US Dollar is monetary policy, which is shaped by the Federal Reserve (Fed). The Fed has two mandates: to achieve price stability (control inflation) and foster full employment. Its primary tool to achieve these two goals is by adjusting interest rates. When prices are rising too quickly and inflation is above the Fed’s 2% target, the Fed will raise rates, which helps the USD value. When inflation falls below 2% or the Unemployment Rate is too high, the Fed may lower interest rates, which weighs on the Greenback.
In extreme situations, the Federal Reserve can also print more Dollars and enact quantitative easing (QE). QE is the process by which the Fed substantially increases the flow of credit in a stuck financial system. It is a non-standard policy measure used when credit has dried up because banks will not lend to each other (out of the fear of counterparty default). It is a last resort when simply lowering interest rates is unlikely to achieve the necessary result. It was the Fed’s weapon of choice to combat the credit crunch that occurred during the Great Financial Crisis in 2008. It involves the Fed printing more Dollars and using them to buy US government bonds predominantly from financial institutions. QE usually leads to a weaker US Dollar.
Quantitative tightening (QT) is the reverse process whereby the Federal Reserve stops buying bonds from financial institutions and does not reinvest the principal from the bonds it holds maturing in new purchases. It is usually positive for the US Dollar.
Friday's US jobs report provided more fodder for critics who say the Fed missed the right time to cut interest rates for the first time. Job growth in July was much weaker than expected, June's figure was revised downwards and the unemployment rate rose from 4.1% to 4.3% – ultimately triggering the Sahm rule, Commerzbank’s FX strategist Michael Pfister notes.
Two Fed rate cuts in September and November
“The release was followed by a flurry of action. The market moved up its rate cut expectations significantly and now expects more than four rate cuts of 25 basis points by the end of the year. In practice, the market is now leaning towards two rate cuts of 50 basis points each in September and November, fuelled by changes in the forecasts of major banks. There has even been talk of an emergency cut ahead of the September meeting.”
“Fortunately, after this exciting week, we should be in for a quieter few days. Hopefully, once the excitement has settled a little, market participants will realise that expectations have gone a little too far. I'm not saying that the jobs report didn't give me cause for concern. Clearly, the labour market has weakened in recent months, which does not bode well for the US growth advantage.”
“I find it hard to imagine that the Fed will cut rates by almost 150 basis points by January, as the market expects. The economy would have to weaken significantly more for that to happen. And for those who are now mentioning the Sahm rule, it is worth remembering that the rule has typically been triggered in times of job losses, not in times of still moderate job growth.”
- Silver price faces an intense sell-off below $28.00 as broadening demand concerns.
- Weak US Employment and Manufacturing PMI prompted risks of global slowdown.
- US bond yields weaken as investors see the Fed delivering a bulk rate-cut decision.
Silver price (XAG/USD) is down by more than 5%, skids below $28.00 in Monday’s European session. The white metal nosedives to an almost three-month low as fears of a global economic slowdown has intensified after a string of United States (US) economy data indicated that the nation is moving towards a recession.
Recent US data showed signs of slower labor demand and sheer weakness in the manufacturing sector. The US Unemployment Rate rose to its highest since November 2021 at 4.3%. Meanwhile, the Manufacturing PMI for July contracted at a faster pace to 46.8. The demand of the Silver as an metal with application in various industries, such as: Electric Vehicles, renewable energy, and wires and cables etc.
Investors have remained concerned over the Silver’s demand due to China’s economic vulnerability. The Chinese economy is going though a rough phase due to weak demand conditions in the domestic and the overseas market.
Meanwhile, a sharp decline in US bond yields and the US Dollar (USD) due to growing speculation that the Federal Reserve (Fed) will deliver a bulk rate-cut in its September meeting fails to lift the Silver price. 10-year US Treasury yields plunge to near 3.67%. The US Dollar Index (DXY), which tracks the Greenback’s value against six major currencies, plummet to more than annual low near 102.60.
Silver technical analysis
Silver price weakens after discovering strong selling interest near the prior breakdown zone around $28.60. The asset has declined to near the 200-day Exponential Moving Average (EMA), which trades around $26.85, suggesting that the overall trend is uncertain.
The 14-period Relative Strength Index (RSI) slips into the 20.00-40.00 range, indicating that the overall momentum is bearish.
Silver daily chart
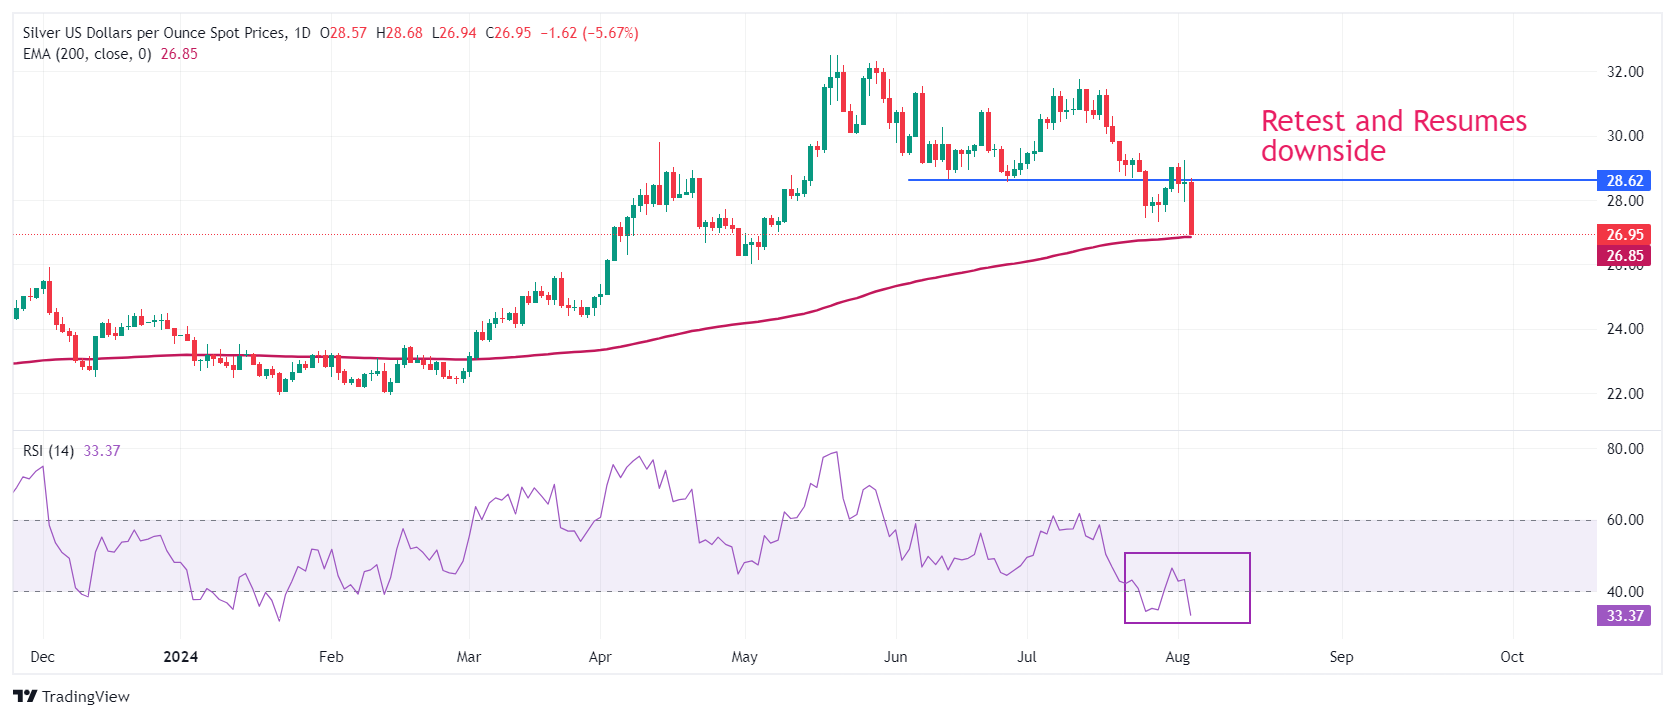
Silver FAQs
Silver is a precious metal highly traded among investors. It has been historically used as a store of value and a medium of exchange. Although less popular than Gold, traders may turn to Silver to diversify their investment portfolio, for its intrinsic value or as a potential hedge during high-inflation periods. Investors can buy physical Silver, in coins or in bars, or trade it through vehicles such as Exchange Traded Funds, which track its price on international markets.
Silver prices can move due to a wide range of factors. Geopolitical instability or fears of a deep recession can make Silver price escalate due to its safe-haven status, although to a lesser extent than Gold's. As a yieldless asset, Silver tends to rise with lower interest rates. Its moves also depend on how the US Dollar (USD) behaves as the asset is priced in dollars (XAG/USD). A strong Dollar tends to keep the price of Silver at bay, whereas a weaker Dollar is likely to propel prices up. Other factors such as investment demand, mining supply – Silver is much more abundant than Gold – and recycling rates can also affect prices.
Silver is widely used in industry, particularly in sectors such as electronics or solar energy, as it has one of the highest electric conductivity of all metals – more than Copper and Gold. A surge in demand can increase prices, while a decline tends to lower them. Dynamics in the US, Chinese and Indian economies can also contribute to price swings: for the US and particularly China, their big industrial sectors use Silver in various processes; in India, consumers’ demand for the precious metal for jewellery also plays a key role in setting prices.
Silver prices tend to follow Gold's moves. When Gold prices rise, Silver typically follows suit, as their status as safe-haven assets is similar. The Gold/Silver ratio, which shows the number of ounces of Silver needed to equal the value of one ounce of Gold, may help to determine the relative valuation between both metals. Some investors may consider a high ratio as an indicator that Silver is undervalued, or Gold is overvalued. On the contrary, a low ratio might suggest that Gold is undervalued relative to Silver.
It is hard to argue with USD/JPY extending this correction to the 140 area It is hard to argue with USD/JPY extending this correction to the 140 area, ING’s FX strategist Chris Turner notes.
Carry trade to extend beyond speculative positions
“We think the unwind of the carry trade can extend beyond speculative positions among fast-moving accounts such as Commodity Trading Advisors and into banks and non-bank financial institutions funding operations cheaply in the Yen.”
“We thing that the one-year FX options market will show whether this community is now hedging too. This does seem to be the case with the one-year USD/JPY risk reversal going very bid for JPY calls.”
“It is hard to argue with USD/JPY extending this correction to the 140 area – which we had seen as the outside risk last week.”
EUR/USD has finally found some support on the softer US rates story. EUR vs. USD two-year swap differentials have narrowed dramatically – from 113bp last Thursday to 83bp today. Weaker global growth is not good for the pro-cyclical Euro (EUR), but the fact that the 'US exceptionalism' narrative could be coming back to earth with a bump should be EUR/USD supportive, ING’s FX strategist Chris Turner notes.
EUR/USD to trade up towards 1.10
“Were it not for the heavy sell-off in equities, yield differentials would make a case for EUR/USD to be trading well above 1.10 now. We think this is the direction of travel once the risk environment stabilises. In terms of the risk environment, we are keeping our eye on measures of financial risks such as the three-month Ted Spread (Libor over US Treasury bills) and also on the three-month EUR:USD cross-currency basis swap.”
“It is a quiet week for eurozone data. Look out for the August Sentix investor survey today - although that was taken before the recent rout in equity markets. Overall we think EUR/USD should be able to press the 1.0950/80 region and break above 1.10 – especially if the Fed starts to acknowledge that action is required.”
“Elsewhere EUR/CHF continues to be hit. Noticeably the market is not pricing the Swiss policy rate below 0.50%. This means that lower interest rates in the rest of the world are converging on Switzerland. The Swiss National Bank will not like EUR/CHF at these levels and may well be intervening. But it is very hard to fight this current EUR/CHF bear trend.”
- AUD/USD rebounds strongly from an eight-month low of 0.6350 as the US Dollar hits hard.
- Dismal market sentiment keeps the Australian Dollar on edge.
- Investors await the US ISM Services PMI for July and the RBA monetary policy.
The AUD/USD pair bounces back strongly after posting a fresh eight-month low near 0.6350 in Monday’s European session. The Aussie asset recovers as the US Dollar (USD) tumbles to a fresh four-month low but still remains negative due to weak Australian Dollar (AUD).
Escalating Middle East tensions and risks of the United States (US) economic slowdown have prompted risk-aversion in global markets. This has dampened the appeal of risk-sensitive assets. Fears of a US slowdown stemmed from cooling labor market conditions and a sharp contraction in activities in the manufacturing sector.
The Aussie is under severe pressure due to dismal market sentiment. S&P 500 futures have faced a bloodbath in European trading hours, exhibiting a sharp decline in investors’ risk appetite. The US Dollar Index (DXY), which tracks the Greenback’s value against six major currencies, slides sharply to near 102.60.
Meanwhile, the next trigger for the Australian Dollar will be the Reserve Bank of Australia’s (RBA) interest-rate decision, which will be announced on Tuesday. The RBA is expected to leave its key Official Cash Rate (OCR) unchanged at 4.35%. Therefore, investors will majorly focus on the interest rate guidance.
In Monday’s session, investors will focus on the US ISM Services PMI for July, which will be published at 14:00 GMT. The PMI report is expected to show that activities in the services sector expanded to 51.0 after contracting to 48.8. Investors will also focus on other Services PMI indexes, such as Prices Paid and New Orders, which indicate changes in input prices and forward demand, respectively.
Australian Dollar FAQs
One of the most significant factors for the Australian Dollar (AUD) is the level of interest rates set by the Reserve Bank of Australia (RBA). Because Australia is a resource-rich country another key driver is the price of its biggest export, Iron Ore. The health of the Chinese economy, its largest trading partner, is a factor, as well as inflation in Australia, its growth rate and Trade Balance. Market sentiment – whether investors are taking on more risky assets (risk-on) or seeking safe-havens (risk-off) – is also a factor, with risk-on positive for AUD.
The Reserve Bank of Australia (RBA) influences the Australian Dollar (AUD) by setting the level of interest rates that Australian banks can lend to each other. This influences the level of interest rates in the economy as a whole. The main goal of the RBA is to maintain a stable inflation rate of 2-3% by adjusting interest rates up or down. Relatively high interest rates compared to other major central banks support the AUD, and the opposite for relatively low. The RBA can also use quantitative easing and tightening to influence credit conditions, with the former AUD-negative and the latter AUD-positive.
China is Australia’s largest trading partner so the health of the Chinese economy is a major influence on the value of the Australian Dollar (AUD). When the Chinese economy is doing well it purchases more raw materials, goods and services from Australia, lifting demand for the AUD, and pushing up its value. The opposite is the case when the Chinese economy is not growing as fast as expected. Positive or negative surprises in Chinese growth data, therefore, often have a direct impact on the Australian Dollar and its pairs.
Iron Ore is Australia’s largest export, accounting for $118 billion a year according to data from 2021, with China as its primary destination. The price of Iron Ore, therefore, can be a driver of the Australian Dollar. Generally, if the price of Iron Ore rises, AUD also goes up, as aggregate demand for the currency increases. The opposite is the case if the price of Iron Ore falls. Higher Iron Ore prices also tend to result in a greater likelihood of a positive Trade Balance for Australia, which is also positive of the AUD.
The Trade Balance, which is the difference between what a country earns from its exports versus what it pays for its imports, is another factor that can influence the value of the Australian Dollar. If Australia produces highly sought after exports, then its currency will gain in value purely from the surplus demand created from foreign buyers seeking to purchase its exports versus what it spends to purchase imports. Therefore, a positive net Trade Balance strengthens the AUD, with the opposite effect if the Trade Balance is negative.
- Oil prices edge lower for a third straight day in a severe correction.
- Traders are running for the hills while recession fears emerge.
- The US Dollar Index trades sharply lower and enters a correction phase.
Oil prices are sinking over 2% on Monday, with markets not getting a break after the turmoil at the end of last week. The Japanese stock market performance was a sign on the wall with its worst performance since 1987, with the Nikkei index sliding over 12% lower. Markets are scared that demand will start to shrink from here after a trifecta of very disappointing US data last week lit the fuse around recession fears.
Meanwhile, the US Dollar Index (DXY), which tracks the performance of the US Dollar against six major currencies, is receiving one gut punch after another. In normal risk-off movements, the Greenback is considered to be the safe haven. Though, as it is the same US data that is sparking that risk-off, it does not make sense as an investor to hold on to that cash anymore and park their investments in safe bonds, with the outlook that those high yields are soon to come to an end after US Federal Reserve Chairman Jerome Powell opened the door for an interest rate cut in September. The question for this week is if markets are over-exaggerating, and this is an ideal buy-the-dip moment on all fronts.
At the time of writing, Crude Oil (WTI) trades at $71.42 and Brent Crude at $75.19
Oil news and market movers: Do not forget the background
- Although Oil prices are selling off, Saudi Arabia is convinced that Asia will continue with growth and demand, and hikes its prices for that region for the first time in three months, Bloomberg reports.
- Libya has started cutting production at its Sharara operation by at least 50,000 barrels per day to only 210,000, Reuters reports.
- Vortexa data shows that the amount of Oil afloat in tankers has fallen 31% from last week, which could point to a recent pickup in demand.
- Overall, commodities are following suit with the global selloff, though losses look rather limited in the commodity space against the bigger losses in equities.
Oil Technical Analysis: Keep your pants up
Oil price is painting deep red candles since last week and seems to continue that sentiment again on Monday. However, it does pay off to take a step back and look at the broader picture, where there are still many moving parts on the geopolitical front that could easily reverse the current decline in Oil price. Hence, it does pay off to approach these moves with a pinch of salt, certainly seeing the summer holidays and a lot of desks being understaffed as per normal period in the year, and adds to the nervousness of seeing less volume is present to soothe market reactions.
On the upside, there is a chunky recovery to be had, though that could come swiftly. With the Relative Strength Index (RSI) being oversold, the first level to rebound to is the July 30 low at $74.24. Once back above there, $75.27 comes into play as the next pivotal level before heading back to the 200-day Simple Moving Average (SMA) at $78.03.
On the downside, expect this week’s moves to be on their last legs, as the RSI is nearing the end of the line. Look maybe for a test around $70.00 as a big psychological figure. A lot of buyers will be awaiting below that level to pick up some discount prices. The line in the sand is the blue line on the chart at $67.18, with that triple bottom formation from June 2023 as a hard support on the downside.
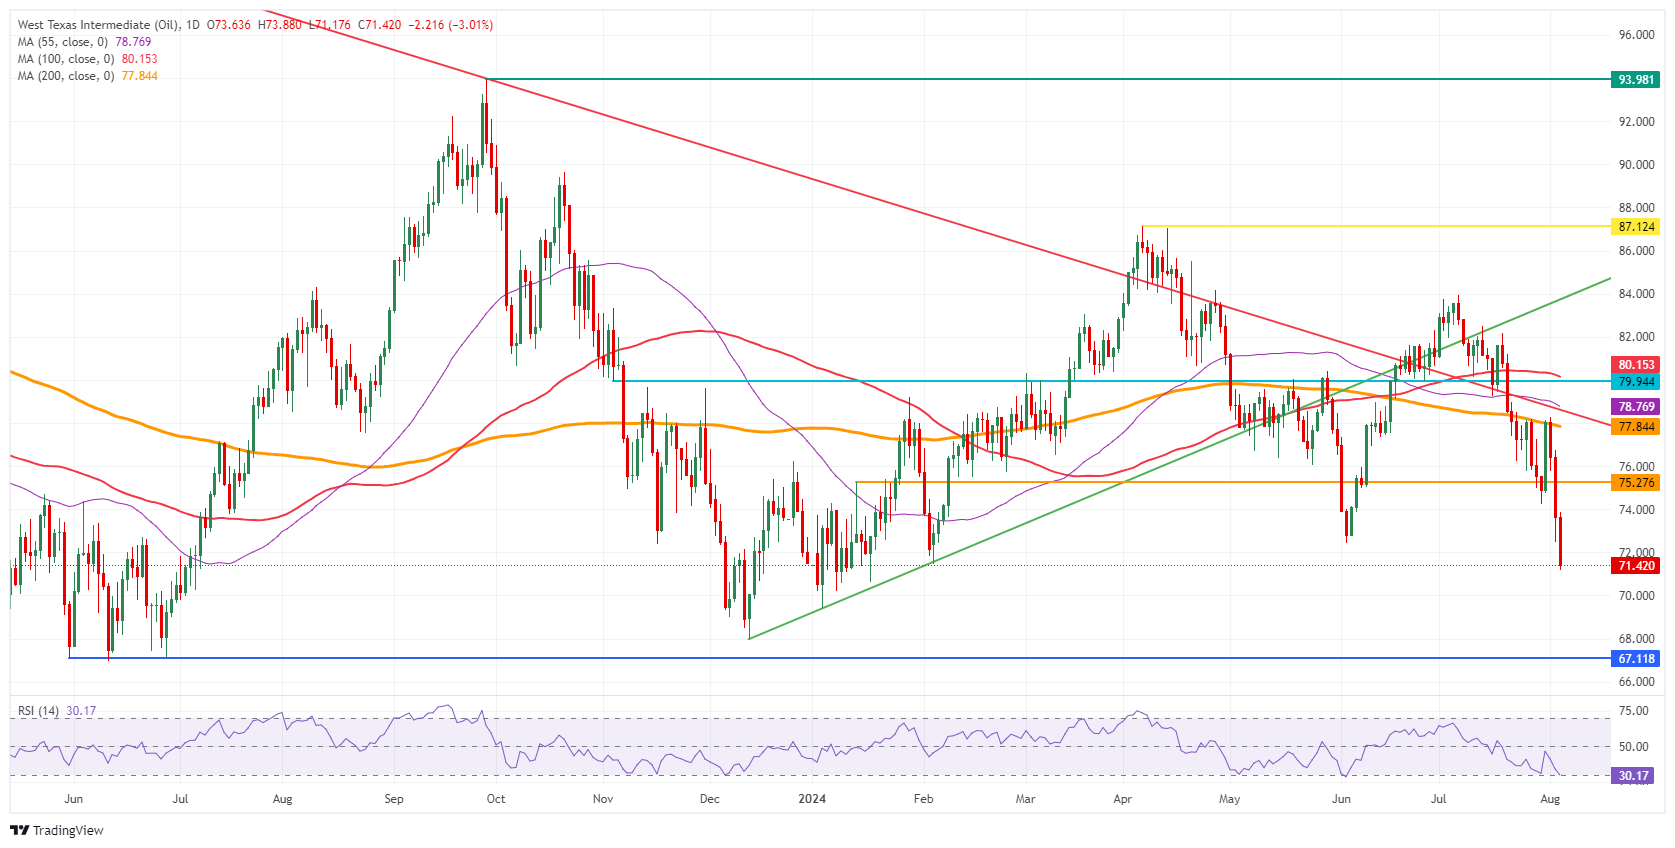
US WTI Crude Oil: Daily Chart
WTI Oil FAQs
WTI Oil is a type of Crude Oil sold on international markets. The WTI stands for West Texas Intermediate, one of three major types including Brent and Dubai Crude. WTI is also referred to as “light” and “sweet” because of its relatively low gravity and sulfur content respectively. It is considered a high quality Oil that is easily refined. It is sourced in the United States and distributed via the Cushing hub, which is considered “The Pipeline Crossroads of the World”. It is a benchmark for the Oil market and WTI price is frequently quoted in the media.
Like all assets, supply and demand are the key drivers of WTI Oil price. As such, global growth can be a driver of increased demand and vice versa for weak global growth. Political instability, wars, and sanctions can disrupt supply and impact prices. The decisions of OPEC, a group of major Oil-producing countries, is another key driver of price. The value of the US Dollar influences the price of WTI Crude Oil, since Oil is predominantly traded in US Dollars, thus a weaker US Dollar can make Oil more affordable and vice versa.
The weekly Oil inventory reports published by the American Petroleum Institute (API) and the Energy Information Agency (EIA) impact the price of WTI Oil. Changes in inventories reflect fluctuating supply and demand. If the data shows a drop in inventories it can indicate increased demand, pushing up Oil price. Higher inventories can reflect increased supply, pushing down prices. API’s report is published every Tuesday and EIA’s the day after. Their results are usually similar, falling within 1% of each other 75% of the time. The EIA data is considered more reliable, since it is a government agency.
OPEC (Organization of the Petroleum Exporting Countries) is a group of 13 Oil-producing nations who collectively decide production quotas for member countries at twice-yearly meetings. Their decisions often impact WTI Oil prices. When OPEC decides to lower quotas, it can tighten supply, pushing up Oil prices. When OPEC increases production, it has the opposite effect. OPEC+ refers to an expanded group that includes ten extra non-OPEC members, the most notable of which is Russia.
Global risk assets continue to correct sharply as investors fear that the Federal Reserve (Fed) has left it too late to ease policy. This follows Friday's soft US jobs data and the now widely cited Sahm rule that points towards a US recession. That data provided a watershed moment for US rates markets, where short-dated US yields collapsed on the view that the Fed would have to slash rates heavily this year. The market now prices around 120bp of Fed rate cuts before year-end, ING’s FX strategist Chris Turner notes.
Fed to shed light on the recession problem
“The fear of a recession in the US is now bringing in the idea of stimulative monetary policy. This has seen the USD 1 month OIS rate priced two years forward priced sub 3.0%. Recall that 3% was seen as the floor for the Fed's terminal rate when US rates fell sharply late last year. Views of where the Fed easing cycle ends have now become unanchored.”
“Where to from here? Presumably the Fed will have to offer some soothing words. Look out for a CNBC appearance today from Chicago Fed President Austan Goolsbee at 1430CET. But at the same time, the evidence against the Fed could build were the July ISM services index (16CET) not to rebound as expected. We think the marked correction in equities is keeping high beta currencies under pressure.”
“However, when asset markets stabilise, which they eventually will, we would then expect the dollar to come lower across the board given that the dollar yield advantage has been sharply pared. For the time being, however, expect the focus to remain on the likes of USD/JPY and USD/CHF - both of which could drop further. DXY looks biased to 102.00.”
- The Pound Sterling declines against the US Dollar even though the latter plunges on firm Fed rate-cut prospects.
- Slowing US labor demand has prompted expectations of the Fed’s bulk rate cuts.
- Middle East tensions have escalated as Iran launched dozens of missiles on Israel.
The Pound Sterling (GBP) slumps to nearly 1.2770 against the US Dollar (USD) in Monday’s London session. The GBP/USD pair weakens as risk-aversion intensifies on deepening Middle East risks. Also, the Cable drops sharply despite the plummeting USD. The US Dollar Index (DXY), which tracks the Greenback’s value against six major currencies, plunges to near 102.40, the lowest since March 11.
The US Dollar has been hit hard badly by firm speculation that the Federal Reserve (Fed) will reduce interest rates by 50 basis points (bps) in September. Also, traders have priced in more than 100 basis points (bps) rate cuts this year. The expectations of the Fed’s bulk rate cut were boosted by easing United States (US) labor market conditions and contracting activities in the manufacturing sector.
The US Nonfarm Payrolls (NFP) report for July showed that fresh payrolls came in lower at 114K than estimates of 175K and June’s reading of 179K. The Unemployment Rate jumped to 4.3% from expectations and the prior release of 4.1%. Meanwhile, activities in the manufacturing sector, as measured by the Manufacturing Purchasing Managers Index (PMI), contracted at a faster pace to 46.8 in July from the prior release of 48.5. A slew of weak economic data indicates that the economy struggles to bear the consequences of higher interest rates, which point to a slowdown ahead.
In Monday’s session, investors will focus on the US ISM Services PMI data for July, which will be published at 14:00 GMT. Activities in the services sector are estimated to have expanded to 51.0 after contracting to 48.8 in June.
Daily digest market movers: Pound Sterling weakens against its major peers
- The Pound Sterling exhibits a weak performance against its major peers, except Asia-Pacific currencies, as dismal market sentiment has dampened the appeal of risk-sensitive assets. Growing Middle East tensions and fears of an economic slowdown in the United States (US) have improved the appeal of safe-haven assets, such as the Japanese Yen (JPY) and the Swiss Franc (CHF).
- Tensions between Israel and Iran have turned into an all-out war after Iran-backed Hezbollah confirmed that the group launched dozens of missiles at Israel on Saturday. Iran vowed to retaliate against the assassination of Hamas leader Ismail Haniyeh by an Israeli airstrike in Tehran. The nation said last week that Israel has to pay the price for Haniyeh’s killing.
- On the domestic front, the British currency will be influenced by market speculation about whether the Bank of England (BoE) will deliver subsequent rate cuts in September. Last week, the BoE reduced interest rates by 25 basis points (bps) to 5%, with a 5-4 vote split, as expected. On the interest rates outlook, the BoE refrained from committing to a pre-defined rate-cut path.
- In the press conference, BoE Governor Andrew Bailey said, "We need to make sure inflation stays low, and be careful not to cut interest rates too quickly or by too much." About the United Kingdom (UK) service inflation outlook, Bailey commented, "Services price inflation may rise slightly in August before easing in the rest of the year."
Pound Sterling Price Today:
British Pound PRICE Today
The table below shows the percentage change of British Pound (GBP) against listed major currencies today. British Pound was the strongest against the Australian Dollar.
| GBP | EUR | USD | JPY | CAD | AUD | NZD | CHF | |
|---|---|---|---|---|---|---|---|---|
| GBP | -0.89% | -0.60% | -3.43% | -0.60% | 0.51% | -0.22% | -1.64% | |
| EUR | 0.89% | 0.16% | -2.76% | 0.14% | 1.27% | 0.54% | -0.88% | |
| USD | 0.60% | -0.16% | -2.88% | 0.00% | 1.00% | 0.38% | -1.03% | |
| JPY | 3.43% | 2.76% | 2.88% | 3.00% | 3.94% | 3.37% | 1.93% | |
| CAD | 0.60% | -0.14% | -0.01% | -3.00% | 1.03% | 0.38% | -1.22% | |
| AUD | -0.51% | -1.27% | -1.00% | -3.94% | -1.03% | -0.72% | -2.14% | |
| NZD | 0.22% | -0.54% | -0.38% | -3.37% | -0.38% | 0.72% | -1.42% | |
| CHF | 1.64% | 0.88% | 1.03% | -1.93% | 1.22% | 2.14% | 1.42% |
The heat map shows percentage changes of major currencies against each other. The base currency is picked from the left column, while the quote currency is picked from the top row. For example, if you pick the British Pound from the left column and move along the horizontal line to the US Dollar, the percentage change displayed in the box will represent GBP (base)/USD (quote).
Technical Analysis: Pound Sterling hovers near a make-or-break zone
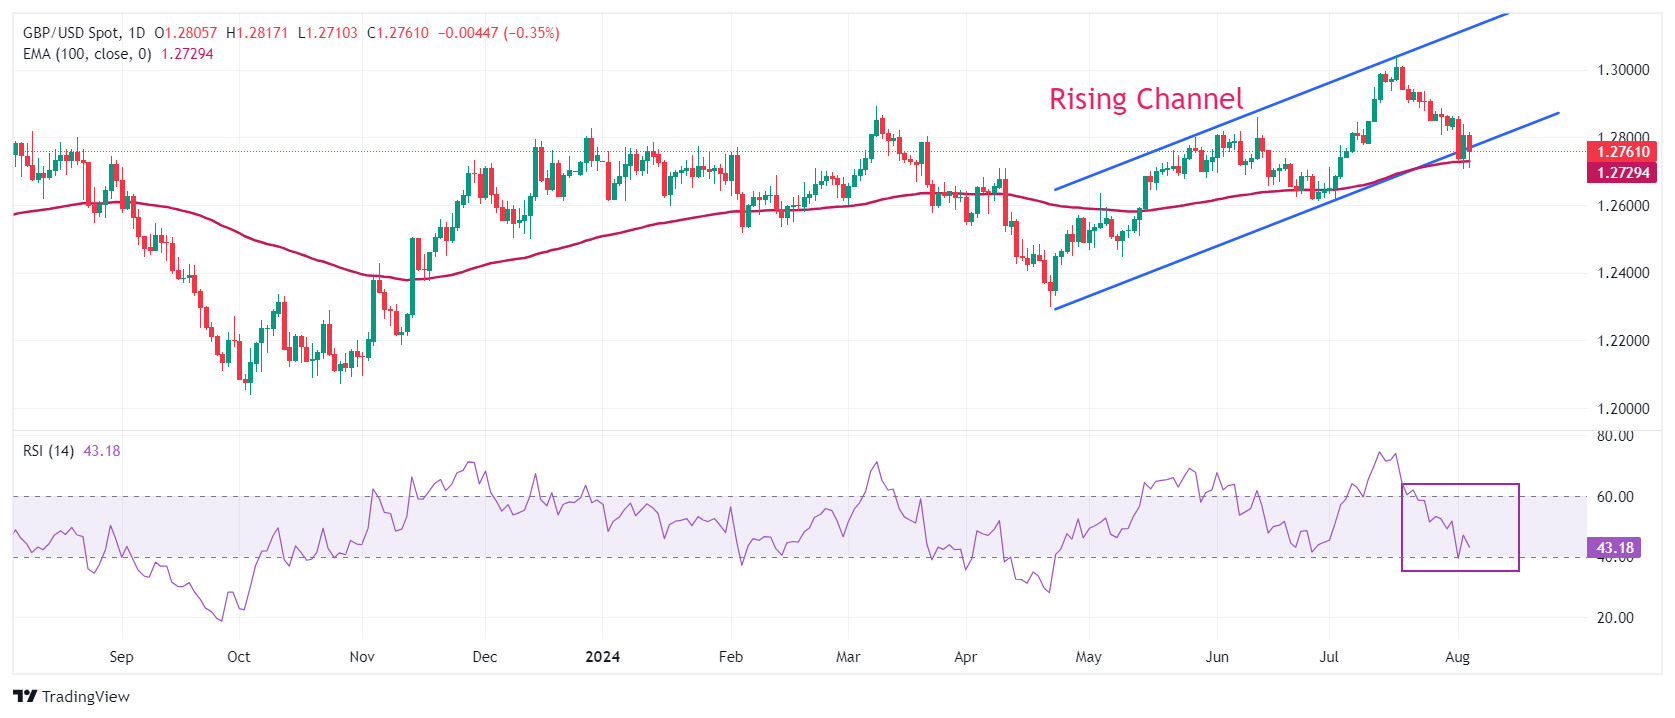
The Pound Sterling is at a make-or-break near the lower boundary of the Rising Channel chart formation on a daily timeframe. Historically, a pullback move in the aforementioned chart pattern is considered a buying opportunity by market participants.
The GBP/USD pair fell on the back foot after breaking below the crucial support of 1.2900 on July 25. Meanwhile, the 100-day Exponential Moving Average (EMA) near 1.2730 has acted as major support for Pound Sterling bulls. The 14-day Relative Strength Index (RSI) declines to near 40.00, which is expected to act as a cushion for the momentum oscillator.
On the upside, the round level of 1.2800 will be a crucial resistance zone for the Pound Sterling bulls. Further up, the two-year high near 1.3140 will be a key resistance zone for the pair.
Pound Sterling FAQs
The Pound Sterling (GBP) is the oldest currency in the world (886 AD) and the official currency of the United Kingdom. It is the fourth most traded unit for foreign exchange (FX) in the world, accounting for 12% of all transactions, averaging $630 billion a day, according to 2022 data. Its key trading pairs are GBP/USD, aka ‘Cable’, which accounts for 11% of FX, GBP/JPY, or the ‘Dragon’ as it is known by traders (3%), and EUR/GBP (2%). The Pound Sterling is issued by the Bank of England (BoE).
The single most important factor influencing the value of the Pound Sterling is monetary policy decided by the Bank of England. The BoE bases its decisions on whether it has achieved its primary goal of “price stability” – a steady inflation rate of around 2%. Its primary tool for achieving this is the adjustment of interest rates. When inflation is too high, the BoE will try to rein it in by raising interest rates, making it more expensive for people and businesses to access credit. This is generally positive for GBP, as higher interest rates make the UK a more attractive place for global investors to park their money. When inflation falls too low it is a sign economic growth is slowing. In this scenario, the BoE will consider lowering interest rates to cheapen credit so businesses will borrow more to invest in growth-generating projects.
Data releases gauge the health of the economy and can impact the value of the Pound Sterling. Indicators such as GDP, Manufacturing and Services PMIs, and employment can all influence the direction of the GBP. A strong economy is good for Sterling. Not only does it attract more foreign investment but it may encourage the BoE to put up interest rates, which will directly strengthen GBP. Otherwise, if economic data is weak, the Pound Sterling is likely to fall.
Another significant data release for the Pound Sterling is the Trade Balance. This indicator measures the difference between what a country earns from its exports and what it spends on imports over a given period. If a country produces highly sought-after exports, its currency will benefit purely from the extra demand created from foreign buyers seeking to purchase these goods. Therefore, a positive net Trade Balance strengthens a currency and vice versa for a negative balance.
Price action continues to suggest further US Dollar (USD) weakness, even though it is too early to determine if the long-term support near 7.0980 is within reach, UOB Group FX analysts Quek Ser Leang and Lee Sue Ann note.
USD pushes towards the 7.0980 support
24-HOUR VIEW: “We did not anticipate the sharp selloff in USD last Friday (we were expecting sideways trading). The decline is severely oversold, and while further weakness is not ruled, the support at 7.1100 is unlikely to come under threat. Resistance is at 7.1650; a breach of 7.1900 would mean that the weakness has stabilised.”
1-3 WEEKS VIEW: “Our most recent narrative was from last Thursday (01 Aug, spot at 7.2200), wherein ‘short-term downward momentum is picking up, and the risk of USD breaking below 7.2037 is increasing.’ We indicated that ‘the risk of USD breaking clearly below 7.2037 will remain intact as long as 7.2600 (‘strong resistance’ level) is not breached.’ While USD subsequently rebounded (high of 7.2579), we indicated last Friday that we ‘will continue to hold the same view for now.’ USD then not only broke below 7.2037, but also plunged sharply, reaching a low of 7.1415. The price action continues to suggest further USD weakness, even though it is too early to determine if the long-term support near 7.0980 is within reach. On the upside, the ‘strong resistance’ level has moved lower to 7.2200 from 7.2600.”
- USD/CHF extends its winning streak due to the dovish mood surrounding the Fed’s policy outlook.
- CME's FedWatch Tool suggests an increase in odds of a 50-basis point Fed rate cut to 74.5% in September.
- Stable inflation has raised the likelihood of a third consecutive rate cut by the SNB in September.
USD/CHF continues its losing streak that began on July 30, trading around 0.8500 during the European session on Monday. This downside of the USD/CHF pair is attributed to expectations of the Federal Reserve’s (Fed) reducing interest rates in September.
Disappointing US jobs market data and a larger-than-expected contraction in the ISM Manufacturing PMI have raised the probability of a 50-basis point rate cut in September, increasing to 74.5% from 11.5% a week earlier, according to the CME's FedWatch Tool.
US Nonfarm Payrolls (NFP) increased by 114K in July from the previous month of 179K (revised down from 206K). This figure came in weaker than the expectation of 175K, data showed on Friday. Additionally, the US ISM Manufacturing Purchasing Managers Index (PMI) tumbled to an eight-month low of 46.8 in July. Moreover, traders await ISM Services PMI for July on Monday, which is expected to rise to 51.0 from 48.8 prior.
In Switzerland, inflation increased by 1.3% year-over-year, in line with expectations and consistent with previous rises. This stability strengthens the likelihood of a third consecutive rate cut by the Swiss National Bank (SNB) in September. Additionally, the 10-year yield on Swiss bonds has dropped to a near two-year low of 0.37%. The SNB has been ahead of global peers in its monetary easing, having cut borrowing costs in both of this year’s decisions.
Traders are looking forward to Tuesday's release of the July Unemployment Rate and June Real Retail Sales, which may provide further insight into the Swiss economy and influence the SNB’s policy direction.
Swiss Franc FAQs
The Swiss Franc (CHF) is Switzerland’s official currency. It is among the top ten most traded currencies globally, reaching volumes that well exceed the size of the Swiss economy. Its value is determined by the broad market sentiment, the country’s economic health or action taken by the Swiss National Bank (SNB), among other factors. Between 2011 and 2015, the Swiss Franc was pegged to the Euro (EUR). The peg was abruptly removed, resulting in a more than 20% increase in the Franc’s value, causing a turmoil in markets. Even though the peg isn’t in force anymore, CHF fortunes tend to be highly correlated with the Euro ones due to the high dependency of the Swiss economy on the neighboring Eurozone.
The Swiss Franc (CHF) is considered a safe-haven asset, or a currency that investors tend to buy in times of market stress. This is due to the perceived status of Switzerland in the world: a stable economy, a strong export sector, big central bank reserves or a longstanding political stance towards neutrality in global conflicts make the country’s currency a good choice for investors fleeing from risks. Turbulent times are likely to strengthen CHF value against other currencies that are seen as more risky to invest in.
The Swiss National Bank (SNB) meets four times a year – once every quarter, less than other major central banks – to decide on monetary policy. The bank aims for an annual inflation rate of less than 2%. When inflation is above target or forecasted to be above target in the foreseeable future, the bank will attempt to tame price growth by raising its policy rate. Higher interest rates are generally positive for the Swiss Franc (CHF) as they lead to higher yields, making the country a more attractive place for investors. On the contrary, lower interest rates tend to weaken CHF.
Macroeconomic data releases in Switzerland are key to assessing the state of the economy and can impact the Swiss Franc’s (CHF) valuation. The Swiss economy is broadly stable, but any sudden change in economic growth, inflation, current account or the central bank’s currency reserves have the potential to trigger moves in CHF. Generally, high economic growth, low unemployment and high confidence are good for CHF. Conversely, if economic data points to weakening momentum, CHF is likely to depreciate.
As a small and open economy, Switzerland is heavily dependent on the health of the neighboring Eurozone economies. The broader European Union is Switzerland’s main economic partner and a key political ally, so macroeconomic and monetary policy stability in the Eurozone is essential for Switzerland and, thus, for the Swiss Franc (CHF). With such dependency, some models suggest that the correlation between the fortunes of the Euro (EUR) and the CHF is more than 90%, or close to perfect.
Silver prices (XAG/USD) fell on Monday, according to FXStreet data. Silver trades at $27.83 per troy ounce, down 2.61% from the $28.57 it cost on Friday.
Silver prices have increased by 16.95% since the beginning of the year.
| Unit measure | Silver Price Today in USD |
|---|---|
| Troy Ounce | 27.83 |
| 1 Gram | 0.89 |
The Gold/Silver ratio, which shows the number of ounces of Silver needed to equal the value of one ounce of Gold, stood at 87.14 on Monday, up from 85.51 on Friday.
Silver FAQs
Silver is a precious metal highly traded among investors. It has been historically used as a store of value and a medium of exchange. Although less popular than Gold, traders may turn to Silver to diversify their investment portfolio, for its intrinsic value or as a potential hedge during high-inflation periods. Investors can buy physical Silver, in coins or in bars, or trade it through vehicles such as Exchange Traded Funds, which track its price on international markets.
Silver prices can move due to a wide range of factors. Geopolitical instability or fears of a deep recession can make Silver price escalate due to its safe-haven status, although to a lesser extent than Gold's. As a yieldless asset, Silver tends to rise with lower interest rates. Its moves also depend on how the US Dollar (USD) behaves as the asset is priced in dollars (XAG/USD). A strong Dollar tends to keep the price of Silver at bay, whereas a weaker Dollar is likely to propel prices up. Other factors such as investment demand, mining supply – Silver is much more abundant than Gold – and recycling rates can also affect prices.
Silver is widely used in industry, particularly in sectors such as electronics or solar energy, as it has one of the highest electric conductivity of all metals – more than Copper and Gold. A surge in demand can increase prices, while a decline tends to lower them. Dynamics in the US, Chinese and Indian economies can also contribute to price swings: for the US and particularly China, their big industrial sectors use Silver in various processes; in India, consumers’ demand for the precious metal for jewellery also plays a key role in setting prices.
Silver prices tend to follow Gold's moves. When Gold prices rise, Silver typically follows suit, as their status as safe-haven assets is similar. The Gold/Silver ratio, which shows the number of ounces of Silver needed to equal the value of one ounce of Gold, may help to determine the relative valuation between both metals. Some investors may consider a high ratio as an indicator that Silver is undervalued, or Gold is overvalued. On the contrary, a low ratio might suggest that Gold is undervalued relative to Silver.
(An automation tool was used in creating this post.)
The US Dollar (USD) likely to continue to weaken. The next significant support level is some distance away at 140.80, but it remains to be seen if this level will come into view, UOB Group FX analysts Quek Ser Leang and Lee Sue Ann note.
USD slides towards 140.80
24-HOUR VIEW: “The outsized selloff that sent USD plunging by 1.89% (NY close of 146.45) was surprising. While the sharp drop has not stabilised and USD is likely to continue to weaken, the potential for further decline is unclear. Support levels are at 144.00 and 143.00, while resistance levels are at 146.50 and 147.50.”
1-3 WEEKS VIEW: “Last Friday (02 Aug, spot at 149.90), we pointed out the recent ‘USD weakness is still intact, and the next level to monitor to watch is 148.20.’ We did not anticipate the manner in which USD plunged to 146.41. Clearly, the weakness in USD has not stabilised. The next significant support level is some distance away at 140.80, but it remains to be seen if this level will come into view. Overall, the USD weakness is intact as long as 148.60 (‘strong resistance level was at 152.00 last Friday) is not breached.”
The New Zealand Dollar (NZD) is expected to trade in a range between 0.5915 and 0.5965. Two-week NZD weakness has ended; the current recovery phase could extend to 0.5990, UOB Group FX analysts Quek Ser Leang and Lee Sue Ann note.
NZD is set to test 0.5915 in short term
24-HOUR VIEW: “Last Friday, we expected NZD to trade in a sideways range of 0.5915/0.5955. However, NZD rose to 0.5985 and then pulled back to close at 0.5957 (+0.11%). The price action is likely part of a range trading phase. Today, we expect NZD to trade between 0.5915 and 0.5965.”
1-3 WEEKS VIEW: “Last Thursday (01 Aug, spot at 0.5950), we indicated that ‘the recent two-week NZD weakness has ended.’ We also indicated that ‘the current recovery phase could extend to 0.5990.’ NZD subsequently tested the 0.5985 level twice. While the recovery seems to be fading, we will continue to hold the same view as long as 0.5890 (no change in ‘strong support’ level) is not breached.”
Following a 12% daily decline for the Japanese benchmark index, the Nikkei 225, on Monday, the country’s Chief Cabinet Secretary Yoshimasa Hayashi is back on the wires, saying that it is “important for the government (govt) to make a judgment on the market with calmly.”
Additional quotes
Won't comment on daily share moves.
Won't comment on Forex levels.
Important for currencies to move in a stable manner reflecting fundamentals.
Closely watching FX moves.
The Australian Dollar (AUD) could continue to weaken; it is unclear if it has enough momentum to break the significant support at 0.6425, UOB Group FX analysts Quek Ser Leang and Lee Sue Ann note.
AUD is set to test the 0.6425 support
24-HOUR VIEW: “The significant support at 0.6425 is highly unlikely to come under threat. Our expectation for AUD to weaken further last Friday was incorrect, as it rebounded to a high of 0.6547. AUD then pulled back and closed modestly higher at 0.6515 (+0.15%). The underlying tone still seems a tad soft. Today, we expect AUD to edge lower, possibly dropping below last week’s low of 0.6480. The significant support at 0.6425 is highly unlikely to come under threat. Resistance is at 0.6515, followed by 0.6535.”
1-3 WEEKS VIEW: “Our update from last Friday (02 Aug, spot at 0.6490) still stands. As highlighted, while AUD could continue to weaken, it is unclear if it has enough momentum to break the significant support at 0.6425. Overall, only a breach of 0.6550 (no change in ‘strong resistance’ level from last Friday) would mean that the weakness in AUD that started in mid-July has come to an end.”
Instead of continuing to rise, the Pound Sterling (GBP) is more likely to trade in a range between 1.2740 and 1.2840. Downward momentum has slowed; any further GBP weakness is likely limited to a retest of the 1.2710 level, UOB Group FX analysts Quek Ser Leang and Lee Sue Ann note.
GBP moves to 1.2840
24-HOUR VIEW: “While we expected GBP to weaken last Friday, we pointed out that ‘severely oversold conditions suggest any further decline is likely to be limited to a test of 1.2695.’ GBP did weaken, but after reaching a low of 1.2708, it turned around and surged to a high of 1.2840. GBP then closed at 1.2805 (+0.55%). The rapid rise appears to be overdone, and instead of continuing to rise, GBP is more likely to trade in a range today, probably between 1.2740 and 1.2840.”
1-3 WEEKS VIEW: “We have held a negative view in GBP since 26 Jul, when it was trading at 1.2855. After GBP plunged last Thursday, in our update from last Friday (02 Aug, spot at 1.2735), we indicated that ‘while the price action seems to be overdone, further GBP weakness is not ruled out,’ and ‘the next level to monitor is 1.2645.’ GBP subsequently fell to a low of 1.2708 before soaring, almost breaking above our ‘strong resistance’ level of 1.2840 (high has been 1.2840). Downward momentum has slowed with the strong rebound. From here, while we continue to hold a negative GBP view, any further weakness is likely limited to a retest of the 1.2710 level. On the upside, the ‘strong resistance’ level remains unchanged at 1.2840. A breach of this level would mean that GBP is not weakening further.”
- Gold price hovers below $2,450 after profit-booking but holds ground on multiple tailwinds.
- The Fed is expected to cut interest rates by more than 100 bps this year.
- The US Dollar falls near the March bottom, and bond yields post fresh annual lows.
Gold price (XAU/USD) recovers above $2,440 after declining to near $2,410 in Monday’s European session. The precious metal faced selling pressure as profit booking kicked in while attempting to recapture all-time highs above $2,480. The overall outlook of the Gold price remains firm as US bond yields post fresh annual lows.
10-year US Treasury yields plunge to 3.67% as speculation for rate cuts by the Federal Reserve (Fed) in September seems certain. Lower yields on interest-bearing assets reduce the opportunity cost of holding an investment in non-yielding assets, such as Gold. The US Dollar Index (DXY), which tracks the Greenback’s value against six major currencies, plummets to the March low near 102.60.
According to the CME FedWatch tool, 30-day Federal Funds futures pricing data shows that traders see a 50-basis point (bp) cut in interest rates in September as imminent. The data also shows that the Fed is expected to reduce its key borrowing rates by more than 100 bps this year.
Market expectations for larger rate cuts have been prompted by a string of weak United States (US) economic data, which pointed to an economic slowdown and raised doubts on whether the Fed will achieve a ‘soft landing’. A soft landing is a situation in which the central bank grips over inflation without triggering a recession in the economy.
Deteriorating labor market conditions and a sharp slowdown in the manufacturing sector are the major triggers that boosted expectations of bulk rate cuts. The July Nonfarm Payrolls (NFP) report showed that labor demand slowed significantly, and the Unemployment Rate unexpectedly rose to its highest level since November 2021.
Fresh payrolls at 114K were significantly lower than estimates of 175K and June’s reading of 179K. The Unemployment Rate jumped to 4.3% from expectations and the prior release of 4.1%. Meanwhile, activities in the manufacturing sector, as measured by the ISM Manufacturing Purchasing Managers Index (PMI), contracted at a faster pace to 46.8 in July.
Daily digest market movers: Gold price holds ground while US Dollar, bond yields nosedive
- Gold price exhibits steady performance on deepening geopolitical tensions and growing fears of a global economic slowdown. Conflicts in the Middle East appear to have widened as Iran-backed Hezbollah said it launched dozens of missiles on Israel on Saturday in retaliation to the assassination of Hamas leader Ismail Haniyeh by an Israeli airstrike in Tehran. Historically, geopolitical tensions increased Gold’s appeal as a safe-haven asset.
- The global demand environment has deteriorated due to higher interest rates by the central banks. The world’s second-largest country, China, is going through a vulnerable phase due to poor demand from both the domestic and overseas markets. The Caixin Manufacturing PMI surprisingly contracted in July to 49.8. The Eurozone economy is also facing demand issues in its largest nation, to which the German administration has provided tax relief to individuals and the corporate sector. And now, slowing US economic growth has spurted slowdown fears.
- In Monday’s session, investors will focus on the US ISM Services PMI for July, which will be published at 14:00 GMT. The PMI report is expected to show that activities in the services sector expanded to 51.0 after contracting to 48.8 the previous month. Investors will also focus on other Services PMI indexes, such as Prices Paid and New Orders, which indicate changes in input prices and forward demand, respectively.
Technical Analysis: Gold prices hovers below $2,450
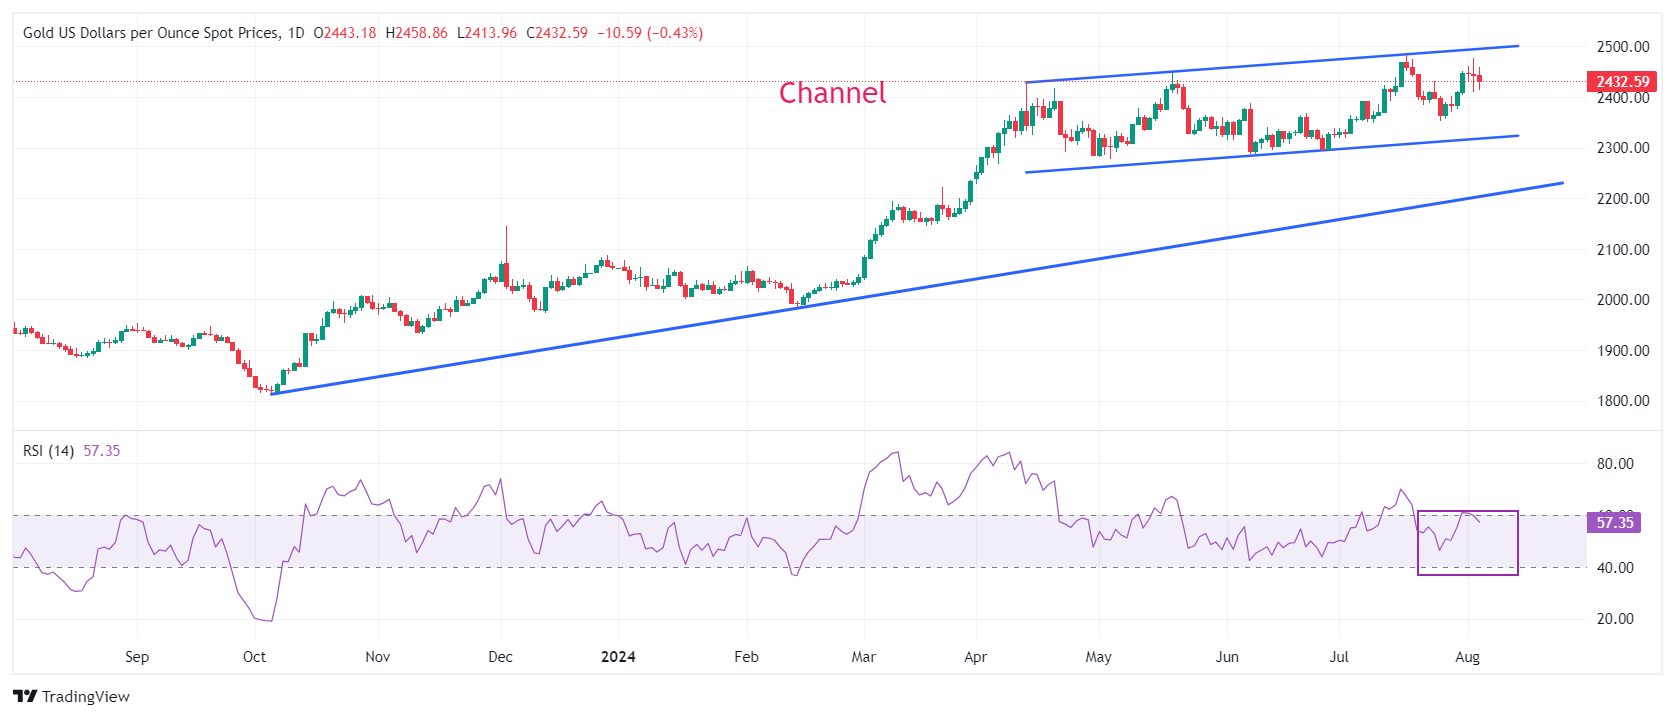
Gold price oscillates inside Friday’s trading range. The precious metal trades in a channel formation on a daily timeframe, which is slightly rising but broadly exhibited a sideways performance for more than three months. The 50-day Exponential Moving Average (EMA) near $2,370 continues to provide support to the Gold price bulls.
The 14-day Relative Strength Index (RSI) oscillates within the 40.00-60.00 range, suggesting indecisiveness among market participants.
A fresh upside would appear if the Gold price breaks above its all-time high of $2,483.75, which will send it into unchartered territory.
On the downside, the upward-sloping trendline at $2,225, plotted from the October 6 low near $1,810.50, will be a major support in the longer term.
Gold FAQs
Gold has played a key role in human’s history as it has been widely used as a store of value and medium of exchange. Currently, apart from its shine and usage for jewelry, the precious metal is widely seen as a safe-haven asset, meaning that it is considered a good investment during turbulent times. Gold is also widely seen as a hedge against inflation and against depreciating currencies as it doesn’t rely on any specific issuer or government.
Central banks are the biggest Gold holders. In their aim to support their currencies in turbulent times, central banks tend to diversify their reserves and buy Gold to improve the perceived strength of the economy and the currency. High Gold reserves can be a source of trust for a country’s solvency. Central banks added 1,136 tonnes of Gold worth around $70 billion to their reserves in 2022, according to data from the World Gold Council. This is the highest yearly purchase since records began. Central banks from emerging economies such as China, India and Turkey are quickly increasing their Gold reserves.
Gold has an inverse correlation with the US Dollar and US Treasuries, which are both major reserve and safe-haven assets. When the Dollar depreciates, Gold tends to rise, enabling investors and central banks to diversify their assets in turbulent times. Gold is also inversely correlated with risk assets. A rally in the stock market tends to weaken Gold price, while sell-offs in riskier markets tend to favor the precious metal.
The price can move due to a wide range of factors. Geopolitical instability or fears of a deep recession can quickly make Gold price escalate due to its safe-haven status. As a yield-less asset, Gold tends to rise with lower interest rates, while higher cost of money usually weighs down on the yellow metal. Still, most moves depend on how the US Dollar (USD) behaves as the asset is priced in dollars (XAU/USD). A strong Dollar tends to keep the price of Gold controlled, whereas a weaker Dollar is likely to push Gold prices up.
Chance for Euro (EUR) to advance further. It could trigger a rapid rise towards 1.1000, UOB Group FX analysts Quek Ser Leang and Lee Sue Ann note.
EUR breaks above 1.0950 and moves towards 1.1000
24-HOUR VIEW: “Last Friday, we held the view that ‘there is room for EUR to test the major support at 1.0760 before a recovery can be expected.’ However, after dipping to a low of 1.0781, EUR lifted off in NY trade, blowing past several strong resistance levels with ease before closing higher by 1.08% (1.0908). The outsized surge appears to be a tad overdone, and today, while EUR could continue to rise, it is unlikely to break last month’s high, near 1.0950. Note that there is another resistance level at 1.0930. To keep the momentum going, EUR must remain above 1.0860 with minor support at 1.0885.”
1-3 WEEKS VIEW: “While we have held a negative EUR view since late last month, we indicated last Thursday (01 Aug, spot at 1.0820) that ‘downward momentum is showing tentative signs of slowing, and the chance of EUR dropping further to 1.0760 is diminishing.’ After EUR fell further to 1.0775, we indicated on Friday (02 Aug, spot at 1.0790) that ‘the slowing momentum has been rejuvenated somewhat, but it remains to be seen if EUR has enough momentum to break clearly below 1.0760.’ EUR subsequently surged, breaking above our ‘strong resistance’ level of 1.0850. Not only has downward momentum fizzled out, but upward momentum has increased. While the outsized short-term surge appears to be overextended, there is chance for EUR to advance further. Looking ahead, if it can break clearly above 1.0950, it could potentially trigger a rapid rise towards 1.1000. Overall, we will hold a positive EUR view, provided that it holds above 1.0820.”
- Eurozone investors’ morale worsens further in August.
- EUR/USD keeps the range above 1.0950 despite the downbeat Eurozone data.
The Eurozone Sentix Investor Confidence Index fell further from -7.3 in July to -13.9 in August, according to the latest survey published on Monday.
The Expectations Index in the Eurozone fell from July’s 1.5 to -8.8 in August.
Sentix said that “investors were concerned about the fragile geopolitical situation, especially in the Middle East, upcoming German state elections and uncertainty over the US presidential election later this year.”
Market reaction to the Eurozone Sentix data
EUR/USD is undeterred by the discouraging Eurozone data. As of writing, EUR/USD is up 0.54% on the day, trading near 1.0965.
- EUR/JPY pares daily losses following the economic data from Europe.
- Eurozone Composite Purchasing Managers Index rose to 50.2 in July, slightly above the expected 50.1 reading.
- The JPY receives support from safe-haven flows due to escalated geopolitical tensions in the Middle East.
EUR/JPY extends its losing streak for the sixth successive day, trading around 156.90 during the early European session on Monday. However, the EUR/JPY cross trims its intraday losses following the release of the Eurozone Producer Price Index (PPI) and the German Purchasing Managers' Index (PMI) data.
HCOB Eurozone Composite Purchasing Managers Index (PMI) increased to 50.2 in July, slightly above the expected 50.1 reading. Germany’s Composite PMI came in at 49.1, as compared to expected and previous 48.7 readings. Services PMI rose to 52.5 against the expected and 52.0 prior.
In Europe, traders anticipate at least two additional rate cuts by the European Central Bank (ECB) in 2024, with the next likely occurring in September. ECB policymaker Yannis Stournaras mentioned in a Thursday interview that the weak eurozone economy might push inflation below the ECB's 2% target, reinforcing his prediction of two interest rate reductions this year, according to Reuters.
The Japanese Yen (JPY) gains ground due to rising expectations of the Bank of Japan (BoJ) tightening monetary policy further, which could provide continued support for the JPY in the near term.
The minutes from the Bank of Japan's June meeting showed that some members voiced concerns about rising import prices due to the recent decline in the JPY, which could present an upside risk to inflation. One member highlighted that cost-push inflation might exacerbate underlying inflation if it leads to higher inflation expectations and wage increases.
Additionally, safe-haven flows provide support for the JPY while putting downward pressure on the EUR/JPY cross, a trend that can be linked to increased geopolitical tensions in the Middle East. On Sunday, an Israeli airstrike hit two schools, causing at least 30 casualties, as reported by Reuters. Furthermore, US Secretary of State Tony Blinken suggested that Iran and Hezbollah might be preparing to launch an attack against Israel as soon as Monday, according to information from three sources briefed on the call, as reported by Axios.
German economy FAQs
The German economy has a significant impact on the Euro due to its status as the largest economy within the Eurozone. Germany's economic performance, its GDP, employment, and inflation, can greatly influence the overall stability and confidence in the Euro. As Germany's economy strengthens, it can bolster the Euro's value, while the opposite is true if it weakens. Overall, the German economy plays a crucial role in shaping the Euro's strength and perception in global markets.
Germany is the largest economy in the Eurozone and therefore an influential actor in the region. During the Eurozone sovereign debt crisis in 2009-12, Germany was pivotal in setting up various stability funds to bail out debtor countries. It took a leadership role in the implementation of the 'Fiscal Compact' following the crisis – a set of more stringent rules to manage member states’ finances and punish ‘debt sinners’. Germany spearheaded a culture of ‘Financial Stability’ and the German economic model has been widely used as a blueprint for economic growth by fellow Eurozone members.
Bunds are bonds issued by the German government. Like all bonds they pay holders a regular interest payment, or coupon, followed by the full value of the loan, or principal, at maturity. Because Germany has the largest economy in the Eurozone, Bunds are used as a benchmark for other European government bonds. Long-term Bunds are viewed as a solid, risk-free investment as they are backed by the full faith and credit of the German nation. For this reason they are treated as a safe havenby investors – gaining in value in times of crisis, whilst falling during periods of prosperity.
German Bund Yields measure the annual return an investor can expect from holding German government bonds, or Bunds. Like other bonds, Bunds pay holders interest at regular intervals, called the ‘coupon’, followed by the full value of the bond at maturity. Whilst the coupon is fixed, the Yield varies as it takes into account changes in the bond's price, and it is therefore considered a more accurate reflection of return. A decline in the bund's price raises the coupon as a percentage of the loan, resulting in a higher Yield and vice versa for a rise. This explains why Bund Yields move inversely to prices.
The Bundesbank is the central bank of Germany. It plays a key role in implementing monetary policy within Germany, and central banks in the region more broadly. Its goal is price stability, or keeping inflation low and predictable. It is responsible for ensuring the smooth operation of payment systems in Germany and participates in the oversight of financial institutions. The Bundesbank has a reputation for being conservative, prioritizing the fight against inflation over economic growth. It has been influential in the setup and policy of the European Central Bank (ECB).
Here is what you need to know on Monday, August 5:
Safe-haven flows dominate financial markets at the beginning of the week as investors react to the latest news surrounding the Israel-Iran conflict. S&P will release revisions to July PMI data for the Euro area, Germany and the UK on Monday. Later in the day, the ISM Services PMI report for July will be featured in the US economic docket. Meanwhile, market participants will keep a close eye on geopolitical developments.
US Secretary of State Tony Blinken has reportedly told his counterparts from the G7 countries over the weekend that Iran and Lebanese group Hezbollah could attack Israel as early as Monday. The White House announced that US President Joe Biden will meet with his national security team on Monday to discuss “developments in the Middle East.” In the meantime, The Times of Israel reported that Israel could launch a preemptive attack to deter Iran if it uncovered "airtight evidence that Tehran was preparing to mount an attack."
Growing fears over a deepening crisis in the Middle East force market participants to seek refuge early Monday, causing risk-sensitive assets to suffer heavy losses. At the time of press, US stock index futures were down between 1.7% and 4.6%. The US Dollar (USD) struggles to benefit from risk-off flows following the disappointing July jobs report. At the time of press, the USD Index was down 0.6% on the day at 102.63. The benchmark 10-year US Treasury bond yield continues to push lower and stays below 3.8% after losing nearly 10% in the previous week.
US Dollar PRICE Today
The table below shows the percentage change of US Dollar (USD) against listed major currencies today. US Dollar was the weakest against the Japanese Yen.
| USD | EUR | GBP | JPY | CAD | AUD | NZD | CHF | |
|---|---|---|---|---|---|---|---|---|
| USD | -0.41% | 0.05% | -2.43% | 0.03% | 1.14% | 0.54% | -0.85% | |
| EUR | 0.41% | 0.38% | -2.15% | 0.32% | 1.57% | 0.85% | -0.55% | |
| GBP | -0.05% | -0.38% | -2.47% | -0.04% | 1.18% | 0.47% | -0.92% | |
| JPY | 2.43% | 2.15% | 2.47% | 2.52% | 3.57% | 3.02% | 1.62% | |
| CAD | -0.03% | -0.32% | 0.04% | -2.52% | 1.14% | 0.51% | -1.05% | |
| AUD | -1.14% | -1.57% | -1.18% | -3.57% | -1.14% | -0.71% | -2.06% | |
| NZD | -0.54% | -0.85% | -0.47% | -3.02% | -0.51% | 0.71% | -1.38% | |
| CHF | 0.85% | 0.55% | 0.92% | -1.62% | 1.05% | 2.06% | 1.38% |
The heat map shows percentage changes of major currencies against each other. The base currency is picked from the left column, while the quote currency is picked from the top row. For example, if you pick the US Dollar from the left column and move along the horizontal line to the Japanese Yen, the percentage change displayed in the box will represent USD (base)/JPY (quote).
The Japanese Yen seems to be shining as the go-to-safe-haven asset at the start of the week. At the time of press, USD/JPY was down 2.4% on the day, testing 143.00. Reflecting the broad-based JPY strength, EUR/JPY loses 2% at 156.80 and GBP/JPY falls 2.3% at 183.24.
The Swiss Franc is another traditional safe-haven currency that's gathering strength on Monday. USD/CHF was last seen losing nearly 1% on the day at around 0.8500, trading at its weakest level since the first week of January.
EUR/USD gained more than 1% on Friday after the weak labor market data from the US triggered a USD selloff. The pair preserves its bullish momentum early Monday and was last seen trading at its highest level since early March above 1.0950.
Gold rose more than 2% in the previous week and registered a record-high weekly close above $2,440. XAU/USD stays relatively quiet early Monday and trades near Friday's closing level.
AUD/USD came under strong bearish pressure in the Asian session and touched a fresh 2024-low at 0.6348. Although the pair managed to recover toward 0.6450, it's still down over 1% on the day. The Reserve Bank of Australia (RBA) will announce monetary policy decisions on Tuesday.
Risk sentiment FAQs
In the world of financial jargon the two widely used terms “risk-on” and “risk off'' refer to the level of risk that investors are willing to stomach during the period referenced. In a “risk-on” market, investors are optimistic about the future and more willing to buy risky assets. In a “risk-off” market investors start to ‘play it safe’ because they are worried about the future, and therefore buy less risky assets that are more certain of bringing a return, even if it is relatively modest.
Typically, during periods of “risk-on”, stock markets will rise, most commodities – except Gold – will also gain in value, since they benefit from a positive growth outlook. The currencies of nations that are heavy commodity exporters strengthen because of increased demand, and Cryptocurrencies rise. In a “risk-off” market, Bonds go up – especially major government Bonds – Gold shines, and safe-haven currencies such as the Japanese Yen, Swiss Franc and US Dollar all benefit.
The Australian Dollar (AUD), the Canadian Dollar (CAD), the New Zealand Dollar (NZD) and minor FX like the Ruble (RUB) and the South African Rand (ZAR), all tend to rise in markets that are “risk-on”. This is because the economies of these currencies are heavily reliant on commodity exports for growth, and commodities tend to rise in price during risk-on periods. This is because investors foresee greater demand for raw materials in the future due to heightened economic activity.
The major currencies that tend to rise during periods of “risk-off” are the US Dollar (USD), the Japanese Yen (JPY) and the Swiss Franc (CHF). The US Dollar, because it is the world’s reserve currency, and because in times of crisis investors buy US government debt, which is seen as safe because the largest economy in the world is unlikely to default. The Yen, from increased demand for Japanese government bonds, because a high proportion are held by domestic investors who are unlikely to dump them – even in a crisis. The Swiss Franc, because strict Swiss banking laws offer investors enhanced capital protection.
- AUD/JPY rebounds after crashing to 15-month lows near 90.00.
- Risk-aversion remains in full steam, as Iran is likely to attack Israel.
- The Japanese Yen keeps rallying on safe-haven flows at the expense of the higher-yielding Aussie.
Having tested offers briefly above 95.00 in the Asian session, AUD/JPY has turned south, witnessing a steep sell-off in the European session on Monday. Heightening risk-aversion across the financial markets contributed to increased flight to safety in the Japanese Yen while traders cut their exposure in the higher-yielding currency – the Australian Dollar.
As safety flows intensified, AUD/JPY lost five big figures to reach the lowest level in 15 months at 90.16 before rebounding swiftly to near 92.00, where it now wavers. Despite the upswing, the pair still sheds nearly 4% on the day.
Markets adopt a ‘sell everything’ mode, as they sense an imminent Iran-Israel war after US Secretary of State Antony Blinken said during the G7 meeting on Sunday that an attack by Iran and Hezbollah against Israel could start as early as Monday, Axios reported, citing three sources.
Further, US recession fears came to the fore, following a weak American employment report published on Friday. Escalating Middle East tensions combined with looming US recession risks fuelled intense risk aversion and provided extra legs to the Japanese Yen’s upsurge, smashing AUD/JPY, the so-called risk barometer.
The Japanese Yen also remains underpinned by the divergent monetary policy outlooks between the US Federal Reserve (Fed) and the Bank of Japan (BoJ).
Meanwhile, the Aussie found temporary respite from the upbeat China’s Caixin Services PMI data for July, which jumped to 52.1 from June’s 51.2. However, the Australian Dollar succumbed to the bearish pressure due to unabated demand for safety assets, exerting additional downside pressure on the AUD/JPY cross.
Looking ahead, traders will pay close attention to any developments on the Middle East geopolitical front, as an Iranian attack is foreseen in the next 24 to 48 hours on Israel. Also, the pair awaits the Reserve Bank of Australia’s (RBA) policy announcements on Tuesday for a fresh directional impetus.
Risk sentiment FAQs
In the world of financial jargon the two widely used terms “risk-on” and “risk off'' refer to the level of risk that investors are willing to stomach during the period referenced. In a “risk-on” market, investors are optimistic about the future and more willing to buy risky assets. In a “risk-off” market investors start to ‘play it safe’ because they are worried about the future, and therefore buy less risky assets that are more certain of bringing a return, even if it is relatively modest.
Typically, during periods of “risk-on”, stock markets will rise, most commodities – except Gold – will also gain in value, since they benefit from a positive growth outlook. The currencies of nations that are heavy commodity exporters strengthen because of increased demand, and Cryptocurrencies rise. In a “risk-off” market, Bonds go up – especially major government Bonds – Gold shines, and safe-haven currencies such as the Japanese Yen, Swiss Franc and US Dollar all benefit.
The Australian Dollar (AUD), the Canadian Dollar (CAD), the New Zealand Dollar (NZD) and minor FX like the Ruble (RUB) and the South African Rand (ZAR), all tend to rise in markets that are “risk-on”. This is because the economies of these currencies are heavily reliant on commodity exports for growth, and commodities tend to rise in price during risk-on periods. This is because investors foresee greater demand for raw materials in the future due to heightened economic activity.
The major currencies that tend to rise during periods of “risk-off” are the US Dollar (USD), the Japanese Yen (JPY) and the Swiss Franc (CHF). The US Dollar, because it is the world’s reserve currency, and because in times of crisis investors buy US government debt, which is seen as safe because the largest economy in the world is unlikely to default. The Yen, from increased demand for Japanese government bonds, because a high proportion are held by domestic investors who are unlikely to dump them – even in a crisis. The Swiss Franc, because strict Swiss banking laws offer investors enhanced capital protection.
- USD/CAD trades with mild gains 1.3880 in Monday’s early European session.
- The uptick of the pair is bolstered by the risk-off sentiment.
- Traders expect one more 25 bps rate cut by the BoC in its September meeting.
The USD/CAD pair posts modest gains near 1.3880 during the early European trading hours on Monday. The fall of crude oil prices exerts some selling pressure on the commodity-linked Canadian Dollar (CAD). However, the safety flows might provide some support to the Greenback and cap the pair’s upside. The US ISM Services Purchasing Managers Index (PMI) on Monday will be the highlight.
The risk-off sentiment amid escalating geopolitical tensions in the Middle East might boost the safe-haven currency, lifting the Greenback against the Loonie. US Secretary of State Tony Blinken told his counterparts from the G7 countries on Sunday that an attack by Iran and Hezbollah against Israel could start as early as Monday, three sources briefed on the call told Axios.
However, the weaker US Employment data on Friday could spur the Federal Reserve (Fed) rate cut expectation this year, which might weigh on the Greenback. The Labor Department revealed on Friday that the US Nonfarm Payrolls (NFP) increased by 114K in July, down from the revised lower figure of 179K in June and below the estimate of 185K. Meanwhile, US Unemployment Rate ticked higher to 4.3% in July from 4.1% in June, the highest level since November 2021.
On the Loonie front, the speculation that the Bank of Canada (BoC) could cut interest rates again this year might undermine the CAD. The markets expect one more 25 bps rate cut this year, with nearly 60% odds that the BoC will cut rates again in its September meeting. Additionally, the lower crude oil prices are likely to exert some selling pressure in the near term as Canada is the leading exporter of Oil to the United States (US).
Canadian Dollar FAQs
The key factors driving the Canadian Dollar (CAD) are the level of interest rates set by the Bank of Canada (BoC), the price of Oil, Canada’s largest export, the health of its economy, inflation and the Trade Balance, which is the difference between the value of Canada’s exports versus its imports. Other factors include market sentiment – whether investors are taking on more risky assets (risk-on) or seeking safe-havens (risk-off) – with risk-on being CAD-positive. As its largest trading partner, the health of the US economy is also a key factor influencing the Canadian Dollar.
The Bank of Canada (BoC) has a significant influence on the Canadian Dollar by setting the level of interest rates that banks can lend to one another. This influences the level of interest rates for everyone. The main goal of the BoC is to maintain inflation at 1-3% by adjusting interest rates up or down. Relatively higher interest rates tend to be positive for the CAD. The Bank of Canada can also use quantitative easing and tightening to influence credit conditions, with the former CAD-negative and the latter CAD-positive.
The price of Oil is a key factor impacting the value of the Canadian Dollar. Petroleum is Canada’s biggest export, so Oil price tends to have an immediate impact on the CAD value. Generally, if Oil price rises CAD also goes up, as aggregate demand for the currency increases. The opposite is the case if the price of Oil falls. Higher Oil prices also tend to result in a greater likelihood of a positive Trade Balance, which is also supportive of the CAD.
While inflation had always traditionally been thought of as a negative factor for a currency since it lowers the value of money, the opposite has actually been the case in modern times with the relaxation of cross-border capital controls. Higher inflation tends to lead central banks to put up interest rates which attracts more capital inflows from global investors seeking a lucrative place to keep their money. This increases demand for the local currency, which in Canada’s case is the Canadian Dollar.
Macroeconomic data releases gauge the health of the economy and can have an impact on the Canadian Dollar. Indicators such as GDP, Manufacturing and Services PMIs, employment, and consumer sentiment surveys can all influence the direction of the CAD. A strong economy is good for the Canadian Dollar. Not only does it attract more foreign investment but it may encourage the Bank of Canada to put up interest rates, leading to a stronger currency. If economic data is weak, however, the CAD is likely to fall.
- EUR/USD falls to near 1.0900 on dismal market mood.
- The US Dollar declines as Fed rate cuts in September appear imminent.
- Middle East tensions grew as Iran launched missiles at Israel in retaliation to the killing of Hamas leader Ismail Haniyeh.
The EUR/USD pair slips to near the crucial support of 1.0900 in Monday’s European session. The major currency pair faces pressure as market sentiment turns extremely risk-averse due to Middle East tensions and the weak United States (US) Nonfarm Payrolls (NFP) report for July, which prompted fears of an economic recession.
S&P 500 futures have faced a bloodbath in Asian trading hours on Monday, exhibiting a sheer decline in investors’ risk-appetite. 10-year US Treasury yields post fresh annual lows near 3.67% as speculation over rate-cut decision from the Federal Reserve (Fed) in the September meeting appears to be a done deal.
The current situation in the Middle East points to an all-out war, as Iran-backed Hezbollah said it launched dozens of missiles at Israel. The move came in retaliation to the assassination of Hamas leader Ismail Haniyeh by an Israeli airstrike in Tehran.
Meanwhile, the NFP report on Friday showed that labor demand has slowed significantly. Employment numbers came in at 114K, lower than estimates of 175K and June’s reading of 179 K. The Unemployment Rate jumped to 4.3%, the highest since November 2021, from expectations and the prior release of 4.1%. The report clearly indicates that the labor market struggles to bear the consequences of higher interest rates by the Federal Reserve (Fed).
In Monday’s session, investors will focus on the US ISM Services PMI data for July, which will be published at 14:00 GMT. The report is expected to show that activities in the service sector expanded to 51.0 after contracting to 48.8 in June.
On the Eurozone front, higher preliminary Harmonized Index of Consumer Prices (HICP) for July has raised doubts over European Central Bank (ECB) September rate cuts.
Economic Indicator
Unemployment Rate
The Unemployment Rate, released by the US Bureau of Labor Statistics (BLS), is the percentage of the total civilian labor force that is not in paid employment but is actively seeking employment. The rate is usually higher in recessionary economies compared to economies that are growing. Generally, a decrease in the Unemployment Rate is seen as bullish for the US Dollar (USD), while an increase is seen as bearish. That said, the number by itself usually can't determine the direction of the next market move, as this will also depend on the headline Nonfarm Payroll reading, and the other data in the BLS report.
Read more.
FX option expiries for Aug 5 NY cut at 10:00 Eastern Time, via DTCC, can be found below.
EUR/USD: EUR amounts
- 1.0810 686m
- 1.0900 718m
- 1.0975 802m
- 1.1075 677m
GBP/USD: GBP amounts
- 1.3000 580m
USD/JPY: USD amounts
- 146.00 440m
USD/CHF: USD amounts
- 0.8395 525m
AUD/USD: AUD amounts
- 0.6600 3.5b
USD/CAD: USD amounts
- 1.3650 449m
- 1.3950 431m
EUR/GBP: EUR amounts
- 0.8425 635m
- The Indian Rupee loses momentum in Monday’s Asian session.
- The risk-off sentiment, significant foreign outflows and US Dollar demand exert selling pressure on INR.
- The US ISM Services PMI data for July will be in the spotlight on Monday.
The Indian Rupee (INR) remains under pressure after falling to an all-time low at the open on Monday. The sell-off of the INR is backed by the risk-off environment, foreign outflows from India and other emerging markets, and US Dollar (USD) demand from importers. However, the FOMC’s dovish hold and weaker US July employment data might weigh on the Greenback and cap the pair’s upside. Furthermore, the Reserve Bank of India (RBI) is expected to intervene foreign exchange market to prevent the local currency from depreciating.
Looking ahead, investors will monitor the US ISM Services Purchasing Managers Index (PMI) on Monday, which is projected to improve to 51.0 in July from 48.8 in June. On Wednesday, the RBI interest rate decision will take centre stage, with no change in rate expected.
Daily Digest Market Movers: Indian Rupee remains vulnerable amid multiple headwinds
- Indian HSBC Services PMI declined to 60.3 in July from 60.5 in the previous reading, weaker than the 61.6 estimated.
- "Service sector activity rose at a slightly slower pace in July, with new business increasing further, primarily driven by domestic demand. Looking ahead, services firms remained optimistic about the outlook for the year-ahead," said Pranjul Bhandari, chief India economist at HSBC.
- The US Nonfarm Payrolls (NFP) increased by 114K in July, down from the revised-lower-figure of 179K in June and below the estimate of 185K, the Labor Department reported on Friday.
- The US Unemployment Rate rose to 4.3% in July from 4.1% in June, the highest level since November 2021.
- The Average Hourly Earnings eased to 0.2% month-over-month in the same reported period, below the market consensus of 0.3%. On an annual basis, the figure decreased to 3.6% from the previous reading of 3.8%.
- Financial markets have priced in nearly 74% odds for a 50 basis-point (bps) cut by the Fed at the September FOMC meeting.
Technical analysis: USD/INR’s bullish bias maintains strength
Indian Rupee weakens on the day. The positive stance of the USD/INR remains intact, with the pair holding above the key 100-day Exponential Moving Average (EMA) and being supported by the uptrend line since June 3 on the daily chart. The upward momentum is also underpinned by the 14-day Relative Strength Index (RSI), which stands above the midline near 65.0, suggesting a further upside looks favourable.
A decisive bullish breakout above the all-time high of 83.85 will attract some buyers to the 84.00 psychological level, followed by 83.50.
The first downside target emerges near the uptrend line around 83.75. A breach of this level will see a drop to 83.51, a low of July 12. The potential support level to watch is 83.47, the 100-day EMA.
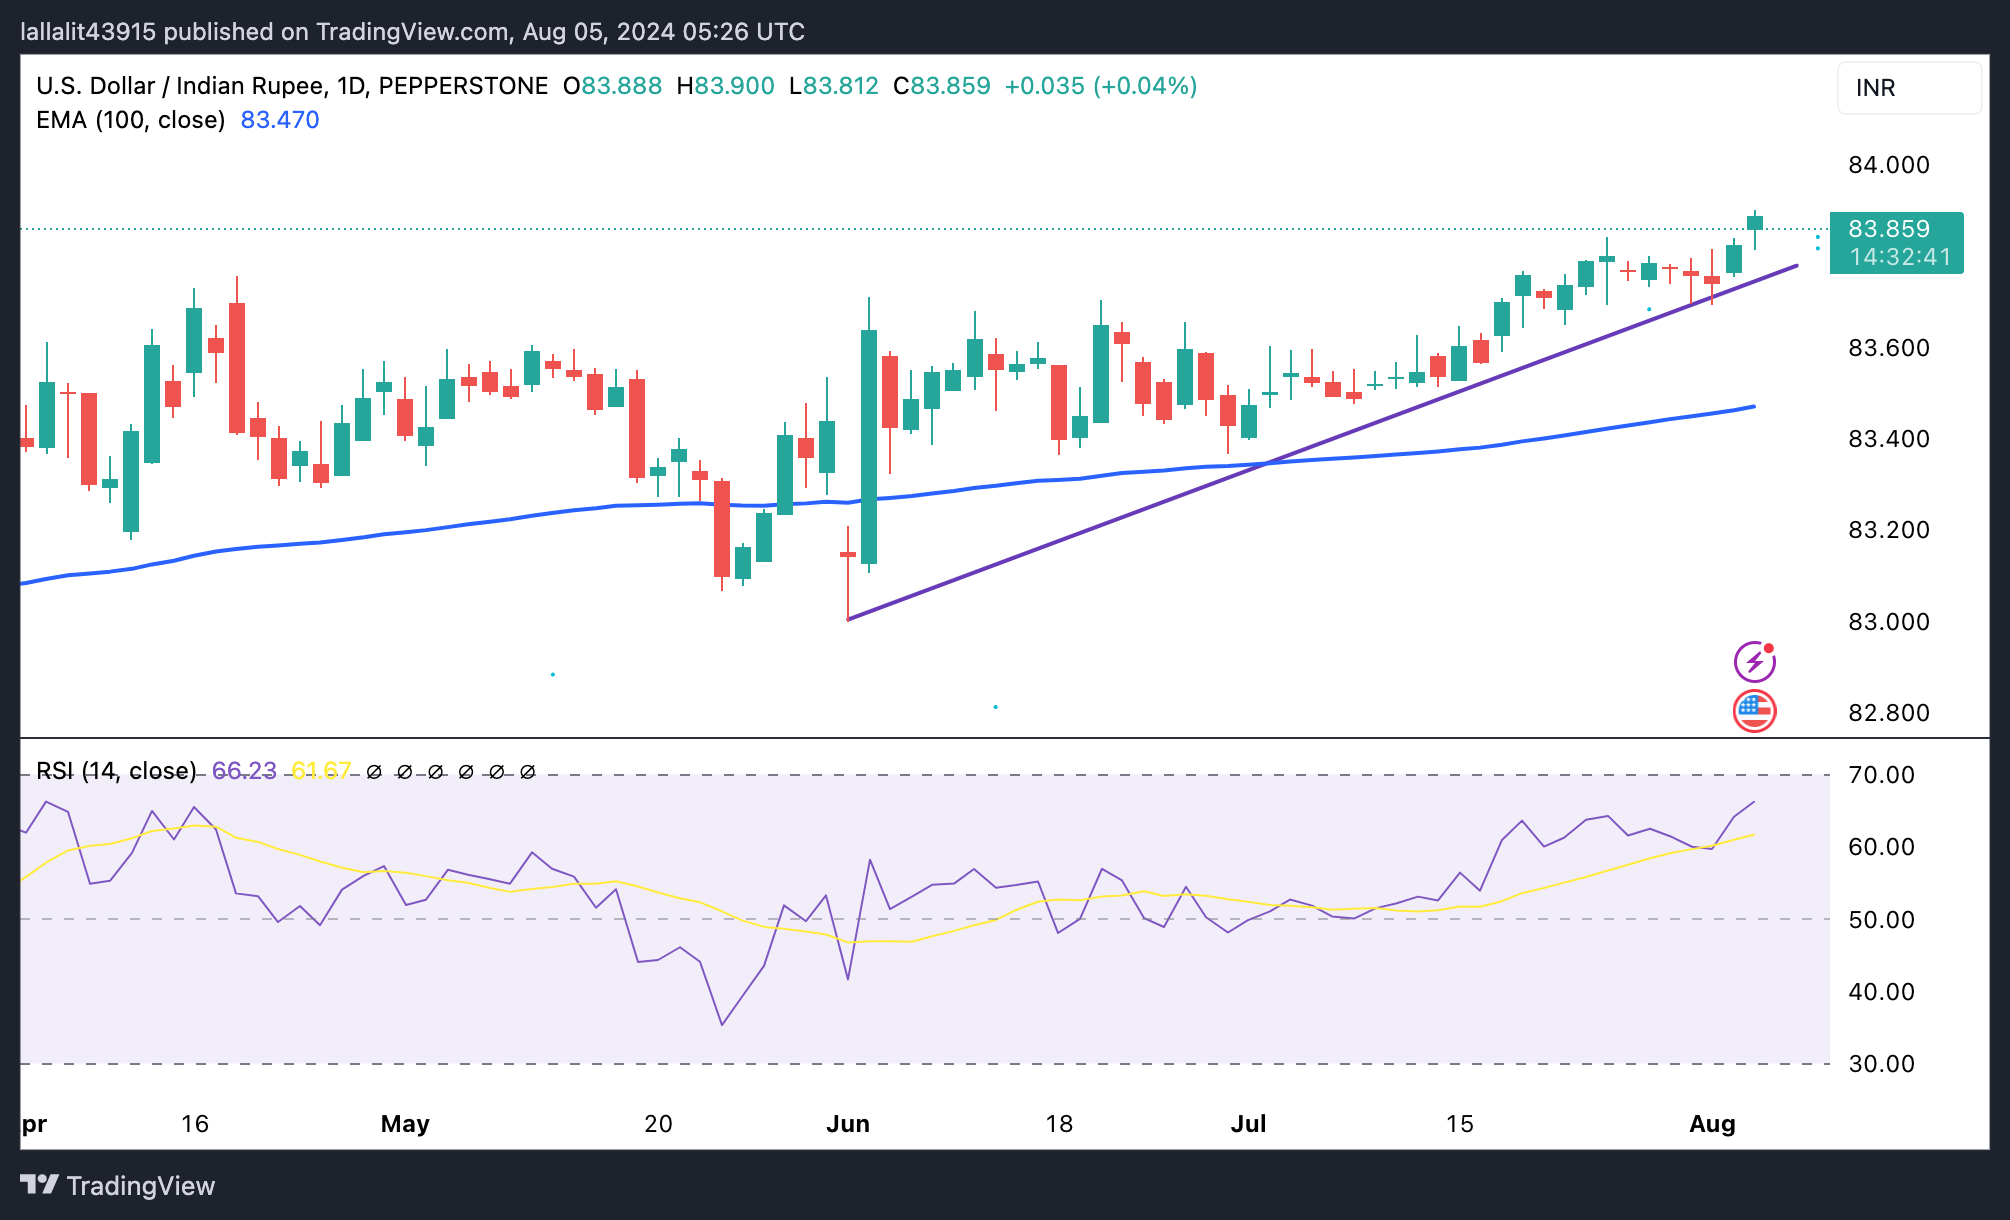
US Dollar price today
The table below shows the percentage change of US Dollar (USD) against listed major currencies today. US Dollar was the weakest against the Japanese Yen.
| USD | EUR | GBP | CAD | AUD | JPY | NZD | CHF | |
| USD | -0.20% | -0.09% | -0.04% | 0.13% | -1.85% | 0.09% | -0.85% | |
| EUR | 0.20% | 0.12% | 0.17% | 0.35% | -1.55% | 0.29% | -0.63% | |
| GBP | 0.08% | -0.12% | 0.04% | 0.21% | -1.78% | 0.17% | -0.75% | |
| CAD | 0.04% | -0.16% | -0.05% | 0.19% | -1.82% | 0.12% | -0.79% | |
| AUD | -0.14% | -0.36% | -0.24% | -0.19% | -2.01% | -0.06% | -0.96% | |
| JPY | 1.74% | 1.69% | 1.77% | 1.81% | 1.98% | 1.96% | 0.98% | |
| NZD | -0.09% | -0.30% | -0.20% | -0.14% | 0.04% | -1.95% | -0.98% | |
| CHF | 0.82% | 0.63% | 0.75% | 0.80% | 0.98% | -1.01% | 0.90% |
The heat map shows percentage changes of major currencies against each other. The base currency is picked from the left column, while the quote currency is picked from the top row. For example, if you pick the Euro from the left column and move along the horizontal line to the Japanese Yen, the percentage change displayed in the box will represent EUR (base)/JPY (quote).
Indian Rupee FAQs
The Indian Rupee (INR) is one of the most sensitive currencies to external factors. The price of Crude Oil (the country is highly dependent on imported Oil), the value of the US Dollar – most trade is conducted in USD – and the level of foreign investment, are all influential. Direct intervention by the Reserve Bank of India (RBI) in FX markets to keep the exchange rate stable, as well as the level of interest rates set by the RBI, are further major influencing factors on the Rupee.
The Reserve Bank of India (RBI) actively intervenes in forex markets to maintain a stable exchange rate, to help facilitate trade. In addition, the RBI tries to maintain the inflation rate at its 4% target by adjusting interest rates. Higher interest rates usually strengthen the Rupee. This is due to the role of the ‘carry trade’ in which investors borrow in countries with lower interest rates so as to place their money in countries’ offering relatively higher interest rates and profit from the difference.
Macroeconomic factors that influence the value of the Rupee include inflation, interest rates, the economic growth rate (GDP), the balance of trade, and inflows from foreign investment. A higher growth rate can lead to more overseas investment, pushing up demand for the Rupee. A less negative balance of trade will eventually lead to a stronger Rupee. Higher interest rates, especially real rates (interest rates less inflation) are also positive for the Rupee. A risk-on environment can lead to greater inflows of Foreign Direct and Indirect Investment (FDI and FII), which also benefit the Rupee.
Higher inflation, particularly, if it is comparatively higher than India’s peers, is generally negative for the currency as it reflects devaluation through oversupply. Inflation also increases the cost of exports, leading to more Rupees being sold to purchase foreign imports, which is Rupee-negative. At the same time, higher inflation usually leads to the Reserve Bank of India (RBI) raising interest rates and this can be positive for the Rupee, due to increased demand from international investors. The opposite effect is true of lower inflation.
Gold prices rose in India on Monday, according to data compiled by FXStreet.
The price for Gold stood at 6,597.71 Indian Rupees (INR) per gram, up compared with the INR 6,583.64 it cost on Friday.
The price for Gold increased to INR 76,958.77 per tola from INR 76,790.30 per tola on friday.
| Unit measure | Gold Price in INR |
|---|---|
| 1 Gram | 6,597.71 |
| 10 Grams | 65,977.62 |
| Tola | 76,958.77 |
| Troy Ounce | 205,200.90 |
FXStreet calculates Gold prices in India by adapting international prices (USD/INR) to the local currency and measurement units. Prices are updated daily based on the market rates taken at the time of publication. Prices are just for reference and local rates could diverge slightly.
Gold FAQs
Gold has played a key role in human’s history as it has been widely used as a store of value and medium of exchange. Currently, apart from its shine and usage for jewelry, the precious metal is widely seen as a safe-haven asset, meaning that it is considered a good investment during turbulent times. Gold is also widely seen as a hedge against inflation and against depreciating currencies as it doesn’t rely on any specific issuer or government.
Central banks are the biggest Gold holders. In their aim to support their currencies in turbulent times, central banks tend to diversify their reserves and buy Gold to improve the perceived strength of the economy and the currency. High Gold reserves can be a source of trust for a country’s solvency. Central banks added 1,136 tonnes of Gold worth around $70 billion to their reserves in 2022, according to data from the World Gold Council. This is the highest yearly purchase since records began. Central banks from emerging economies such as China, India and Turkey are quickly increasing their Gold reserves.
Gold has an inverse correlation with the US Dollar and US Treasuries, which are both major reserve and safe-haven assets. When the Dollar depreciates, Gold tends to rise, enabling investors and central banks to diversify their assets in turbulent times. Gold is also inversely correlated with risk assets. A rally in the stock market tends to weaken Gold price, while sell-offs in riskier markets tend to favor the precious metal.
The price can move due to a wide range of factors. Geopolitical instability or fears of a deep recession can quickly make Gold price escalate due to its safe-haven status. As a yield-less asset, Gold tends to rise with lower interest rates, while higher cost of money usually weighs down on the yellow metal. Still, most moves depend on how the US Dollar (USD) behaves as the asset is priced in dollars (XAU/USD). A strong Dollar tends to keep the price of Gold controlled, whereas a weaker Dollar is likely to push Gold prices up.
(An automation tool was used in creating this post.)
- Asian equities declined as investors worried about a potential US recession, and moved to offload risk assets.
- Equities fall as central banks adjust monetary policy and concerns grow about a potential hard landing for the US economy.
- The Nikkei 225 Index fell to seven-month lows as investors contended with the possibility of higher interest rates in Japan.
Asian equities declined on Monday, reflecting the losses on Wall Street from Friday, which were driven by worries about a potential US recession and underwhelming earnings from major tech companies. The rapid adjustment of central banks' monetary policies and growing concerns about a hard landing for the US economy are contributing to the swift equity declines. This situation is tied to weaker US job market data and a larger-than-expected contraction in factory activity, as shown by last week's ISM Manufacturing PMI.
US Nonfarm Payrolls (NFP) increased by 114K in July from the previous month of 179K (revised down from 206K). This figure came in weaker than the expectation of 175K, data showed on Friday. Meanwhile, the US Unemployment Rate rose to the highest level since November 2021, coming in at 4.3% in July from 4.1% in June. Additionally, the US ISM Manufacturing Purchasing Managers Index (PMI) tumbled to an eight-month low of 46.8 in July.
Japan’s Nikkei 225 Index fell by up to 8% to approximately 33,000, reaching seven-month lows as investors contended with the possibility of higher interest rates in Japan. Additionally, domestic shares were pressured by a significant rise in the Japanese Yen, which negatively impacted the profit outlook for Japan’s export-driven industries.
India’s NIFTY 50 declined by 1.81% to around 24,250, while the Sensex fell 1.91% to near 79,400, with small-cap and mid-cap indexes dropping over 2% each. Despite this drop, Indian markets have shown relative resilience compared to other Asian and emerging markets, thanks to strong domestic economic fundamentals. While Indian stocks performed somewhat better, the rupee hit a record low, and bond yields fell to their lowest level in two years.
The Shanghai Composite dropped 0.40% to around 2,890, and the Shenzhen Component fell 0.45% to 8,515, marking the third consecutive session of declines for mainland stocks. Despite this, data showed that China’s services sector grew more than anticipated in July, driven by strong demand both domestically and internationally.
AsianStocks FAQs
Asia contributes around 70% of global economic growth and hosts several key stock market indices. Among the region’s developed economies, the Japanese Nikkei – which represents 225 companies on the Tokyo stock exchange – and the South Korean Kospi stand out. China has three important indices: the Hong Kong Hang Seng, the Shanghai Composite and the Shenzhen Composite. As a big emerging economy, Indian equities are also catching the attention of investors, who increasingly invest in companies in the Sensex and Nifty indices.
Asia’s main economies are different, and each has specific sectors to pay attention to. Technology companies dominate in indices in Japan, South Korea, and increasingly, China. Financial services are leading stock markets such as Hong Kong or Singapore, considered key hubs for the sector. Manufacturing is also big in China and Japan, with a strong focus on automobile production or electronics. The growing middle class in countries like China and India is also giving more and more prominence to companies focused on retail and e-commerce.
Many different factors drive Asian stock market indices, but the main factor behind their performance is the aggregate results of the component companies revealed in their quarterly and annual earnings reports. The economic fundamentals of each country, as well as their central bank decisions or their government’s fiscal policies, are also important factors. More broadly, political stability, technological progress or the rule of law can also impact equity markets. The performance of US equity indices is also a factor as, more often than not, Asian markets take the lead from Wall Street stocks overnight. Finally, the broader risk sentiment in markets also plays a role as equities are considered a risky investment compared to other investment options such as fixed-income securities.
Investing in equities is risky by itself, but investing in Asian stocks comes along with region-specific risks to be taken into account. Asian countries have a wide range of political systems, from full democracies to dictatorships, so their political stability, transparency, rule of law or corporate governance requirements may diverge considerably. Geopolitical events such as trade disputes or territorial conflicts can lead to volatility in stock markets, as can natural disasters. Moreover, currency fluctuations can also have an impact on the valuation of Asian stock markets. This is particularly true in export-oriented economies, which tend to suffer from a stronger currency and benefit from a weaker one as their products become cheaper abroad.
- The Japanese Yen extends its winning streak due to heightened expectations of further rate hikes by the BoJ.
- The JPY could also receive support from safe-haven flows due to escalated geopolitical tensions.
- Recent US labor data increased the probability of a 50-basis point Fed rate cut to 74.5% in September.
The Japanese Yen (JPY) extends its winning streak against the US Dollar (USD) for the fifth successive session on Monday. This momentum is supported by expectations that the Bank of Japan (BoJ) may further tighten monetary policy, along with the unwinding of carry trades, which could provide continued support for the JPY in the near term.
The safe-haven Yen could benefit from heightened geopolitical tensions in the Middle East. An Israeli airstrike on Sunday hit two schools, resulting in at least 30 casualties, according to Reuters. Additionally, US Secretary of State Tony Blinken indicated that Iran and Hezbollah might launch an attack against Israel as early as Monday, based on information from three sources briefed on the call, as reported by Axios.
The US Dollar faces pressure following Friday’s disappointing labor market data, which strengthened expectations for a US Federal Reserve interest rate cut in September. The CME's FedWatch Tool now indicates a 74.5% probability of a 50-basis point rate cut on September 18, up from 11.5% a week prior.
Daily Digest Market Movers: Japanese Yen appreciates as odds of Fed rate cuts increase
- The minutes from the Bank of Japan's June meeting showed that some members expressed concerns about rising import prices due to the recent decline in the JPY, which could pose an upside risk to inflation. One member noted that cost-push inflation might intensify underlying inflation if it results in higher inflation expectations and wage increases.
- US Nonfarm Payrolls (NFP) increased by 114K in July from the previous month of 179K (revised down from 206K). This figure came in weaker than the expectation of 175K, data showed on Friday. Meanwhile, the US Unemployment Rate rose to the highest level since November 2021, coming in at 4.3% in July from 4.1% in June.
- The Bank of Japan (BoJ) released the full version of its Quarterly Outlook Report on Thursday, noting that there is a possibility wages and inflation could exceed expectations. This could be accompanied by rising inflation expectations and a tight labor market.
- Japan’s Chief Cabinet Secretary Yoshimasa Hayashi stated on Thursday that currencies must move steadily and reflect their underlying fundamentals. Hayashi refrained from commenting on specific forex levels but noted that he is closely monitoring foreign exchange movements, per Reuters.
- Reuters reported on Wednesday that Japan’s Ministry of Finance confirmed suspicions of market intervention by authorities. In July, Japanese officials spent ¥5.53 trillion ($36.8 billion) to stabilize the Yen, which had fallen to its lowest level in 38 years.
- BoJ Governor Kazuo Ueda deemed it appropriate to adjust the degree of easing to sustainably and stably achieve the 2% inflation target. Additionally, he emphasized that they will keep raising interest rates. Moreover, Japan's largest lender Mitsubishi UFJ Bank announced that it will raise its short-term prime lending rate to 1.625% from 1.475% starting from September 2, aligning with the BoJ’s rate hike, per Reuters.
- Assessing the BoJ's policy outlook moving forward, "the BoJ’s policy statement includes a fairly optimistic assessment of the Japanese economic outlook stating that fixed investment is ‘on a moderate increasing trend’ and corporate profits are ‘improving’," said Rabobank analysts and added: "It states that wage rises ‘have been spreading across regions, industries, and firm sizes.’ This leaves the door open for further rate hikes potentially in late 2024 or early 2025."
Technical Analysis: USD/JPY falls to near 142.00
USD/JPY trades around 142.00 on Monday. The daily chart analysis shows that the pair is continuing its losing streak. The 14-day Relative Strength Index (RSI) is moving below 30, suggesting an oversold currency asset situation and a potential short-term rebound.
The USD/JPY pair navigates the region around lows since December 2023. The pair may test the throwback support at the 140.25 level.
On the upside, the USD/JPY pair might encounter resistance around the nine-day Exponential Moving Average (EMA) at 150.13. A break above this level could weaken the bearish bias and support the pair to test the "throwback support turned resistance" at 154.50, followed by the 50-day EMA at 155.58 level.
USD/JPY: Daily Chart
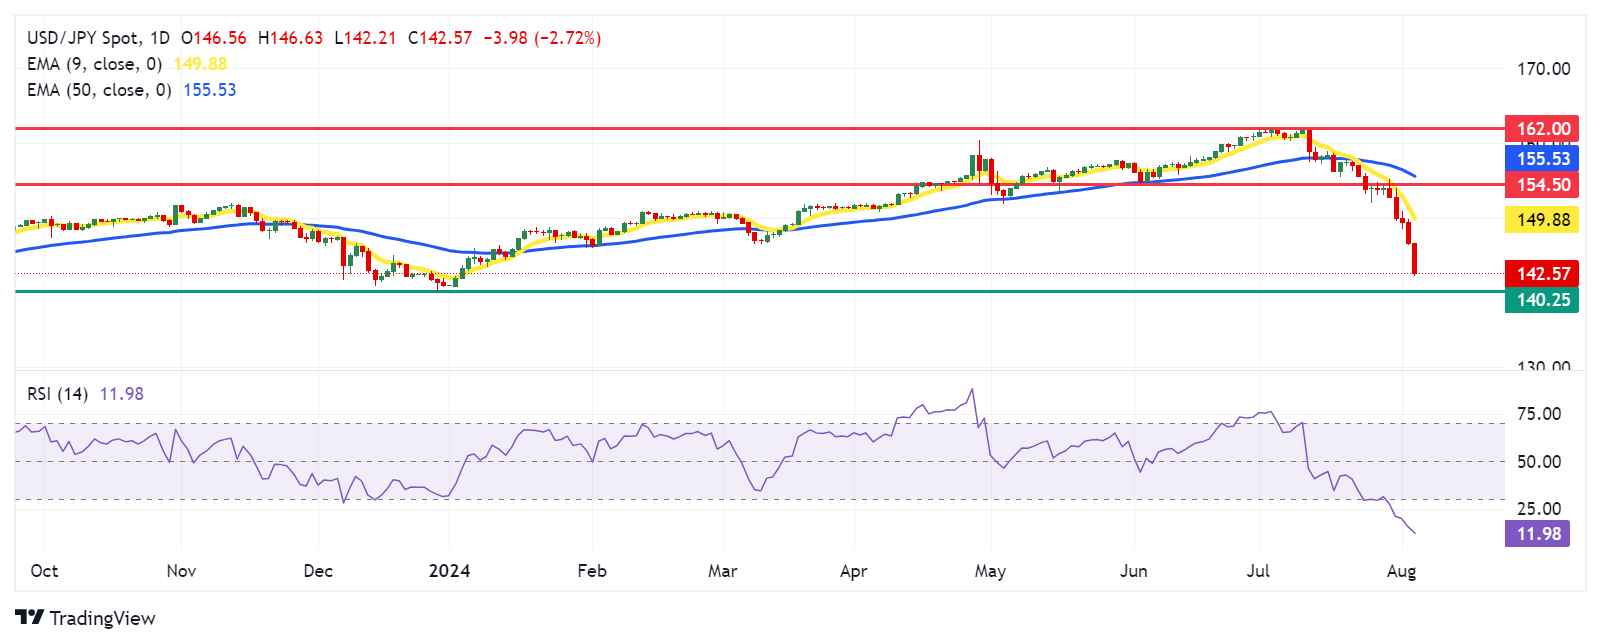
Japanese Yen PRICE Today
The table below shows the percentage change of Japanese Yen (JPY) against listed major currencies today. Japanese Yen was the strongest against the Australian Dollar.
| USD | EUR | GBP | JPY | CAD | AUD | NZD | CHF | |
|---|---|---|---|---|---|---|---|---|
| USD | -0.24% | 0.02% | -2.39% | 0.05% | 0.38% | 0.23% | -1.07% | |
| EUR | 0.24% | 0.17% | -2.30% | 0.16% | 0.63% | 0.35% | -0.94% | |
| GBP | -0.02% | -0.17% | -2.40% | 0.00% | 0.45% | 0.18% | -1.11% | |
| JPY | 2.39% | 2.30% | 2.40% | 2.60% | 2.84% | 2.75% | 1.44% | |
| CAD | -0.05% | -0.16% | -0.01% | -2.60% | 0.36% | 0.18% | -1.29% | |
| AUD | -0.38% | -0.63% | -0.45% | -2.84% | -0.36% | -0.27% | -1.56% | |
| NZD | -0.23% | -0.35% | -0.18% | -2.75% | -0.18% | 0.27% | -1.29% | |
| CHF | 1.07% | 0.94% | 1.11% | -1.44% | 1.29% | 1.56% | 1.29% |
The heat map shows percentage changes of major currencies against each other. The base currency is picked from the left column, while the quote currency is picked from the top row. For example, if you pick the Japanese Yen from the left column and move along the horizontal line to the US Dollar, the percentage change displayed in the box will represent JPY (base)/USD (quote).
Japanese Yen FAQs
The Japanese Yen (JPY) is one of the world’s most traded currencies. Its value is broadly determined by the performance of the Japanese economy, but more specifically by the Bank of Japan’s policy, the differential between Japanese and US bond yields, or risk sentiment among traders, among other factors.
One of the Bank of Japan’s mandates is currency control, so its moves are key for the Yen. The BoJ has directly intervened in currency markets sometimes, generally to lower the value of the Yen, although it refrains from doing it often due to political concerns of its main trading partners. The current BoJ ultra-loose monetary policy, based on massive stimulus to the economy, has caused the Yen to depreciate against its main currency peers. This process has exacerbated more recently due to an increasing policy divergence between the Bank of Japan and other main central banks, which have opted to increase interest rates sharply to fight decades-high levels of inflation.
The BoJ’s stance of sticking to ultra-loose monetary policy has led to a widening policy divergence with other central banks, particularly with the US Federal Reserve. This supports a widening of the differential between the 10-year US and Japanese bonds, which favors the US Dollar against the Japanese Yen.
The Japanese Yen is often seen as a safe-haven investment. This means that in times of market stress, investors are more likely to put their money in the Japanese currency due to its supposed reliability and stability. Turbulent times are likely to strengthen the Yen’s value against other currencies seen as more risky to invest in.
- The Gold price recovers its recent losses in Monday’s Asian session.
- Disappointing US employment reports and risk-off sentiment continue to support the yellow metal.
- Investors await the release of US ISM Services PMI for July, which is due on Monday.
Gold price (XAU/USD) gains traction on Monday on the softer Greenback. Markets are still digesting the FOMC’s dovish hold and softer US employment report. Meanwhile, the US Treasury bond yields and the US Dollar (USD) are likely to remain under pressure, which acts as a tailwind for the yellow metal. Additionally, the rising geopolitical tensions in the Middle East might continue to underpin traditional safe-haven assets like Gold.
Looking ahead, Gold traders will keep an eye on the US ISM Services Purchasing Managers Index (PMI) on Monday for fresh catalysts. The Services PMI is estimated to improve to 51.0 in July from 48.8 in June. In case of stronger-than-expected data, USD price might be lifted and cap the precious metal’s upside.
Daily Digest Market Movers: Gold price edges higher amid softer US jobs data and rising geopolitical risks
- US Secretary of State Tony Blinken told his counterparts from the G7 countries on Sunday that an attack by Iran and Hezbollah against Israel could start as early as Monday, three sources briefed on the call tell Axios.
- The US Nonfarm Payrolls (NFP) rose by 114K in July from the previous month of 179K (revised down from 206K), weaker than the expectation of 175K.
- The US Unemployment Rate rose to the highest level since November 2021, coming in at 4.3% in July from 4.1% in June. The Average Hourly Earnings rose 0.2% month-over-month in the same reported period, below the market consensus of 0.3%.
- The marketplace is currently factoring in a nearly 74% chance for a 50 basis-point (bps) cut by the Fed at the September FOMC meeting.
- Chicago Federal Reserve Bank President Austan Goolsbee said on Friday that the Fed should not overreact to any one month's numbers after the US NFP came in widely under forecasts, but noted that inflation and jobs data have both made significant progress in recent months.
Technical Analysis: Gold price keeps the bullish vibe in the longer term
Gold price trades stronger on the day. Nonetheless, the yellow metal maintains a constructive outlook on the daily timeframe as it holds above the key 100-day Exponential Moving Average (EMA), with the bullish 14-day Relative Strength Index (RSI) around 58.0.
The precious metal has traded within the ascending trend channel since mid-April. The first upside target emerges near $2,450 (high of May 20) en route to $2,483 (all-time high on July 17). Bullish candlesticks above this level could expose XAU/USD to potential bullish momentum all the way to the upper boundary of the trend channel of $2,515.
On the downside, the initial support level for Gold price is located at $2,355 (low of July 26). Further south could take the price down to $2,335, the lower limit of the trend channel. Sustained trading below this level would pave the way to $2,319 (100-day EMA).
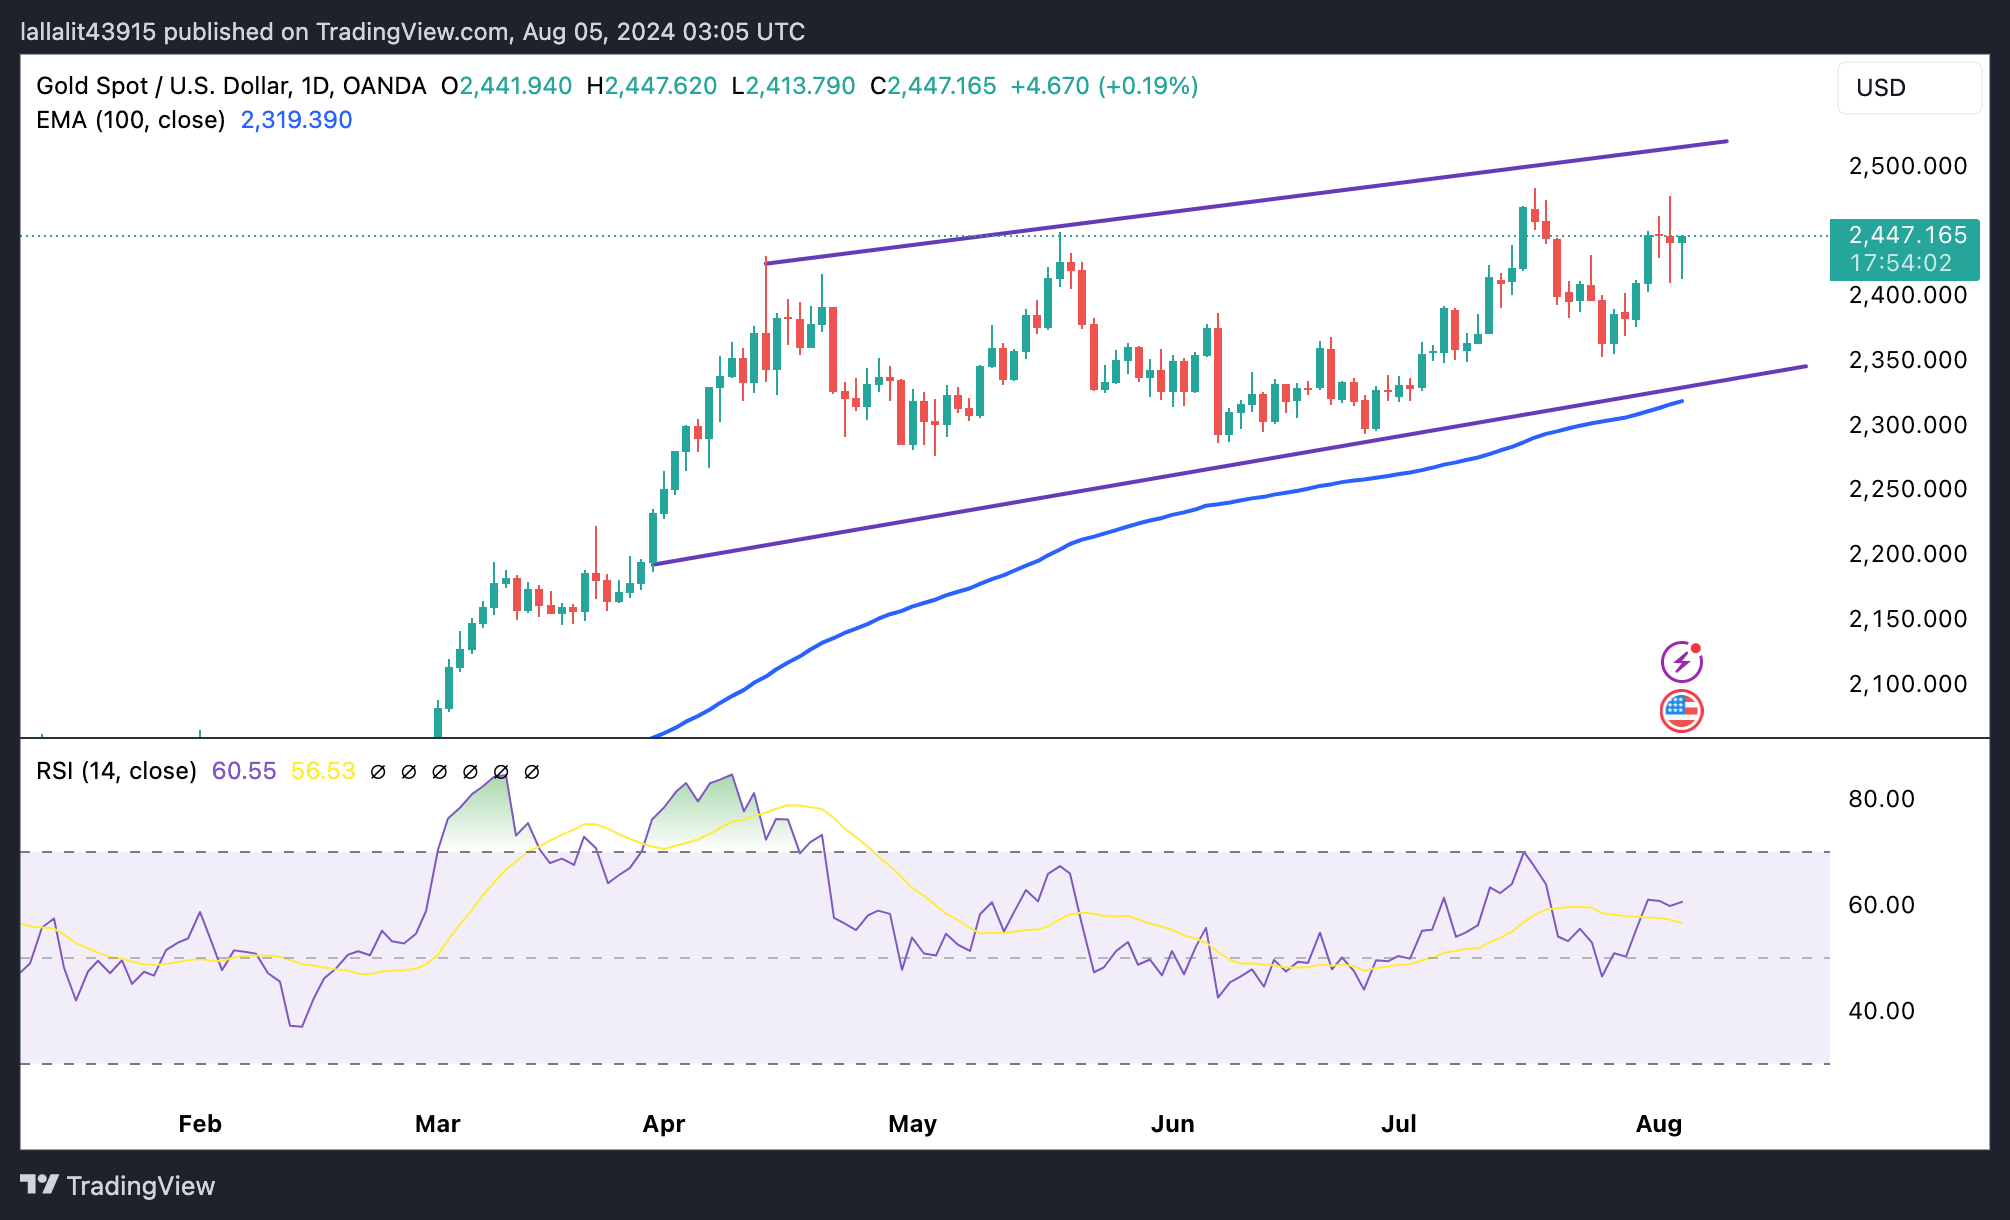
Gold FAQs
Gold has played a key role in human’s history as it has been widely used as a store of value and medium of exchange. Currently, apart from its shine and usage for jewelry, the precious metal is widely seen as a safe-haven asset, meaning that it is considered a good investment during turbulent times. Gold is also widely seen as a hedge against inflation and against depreciating currencies as it doesn’t rely on any specific issuer or government.
Central banks are the biggest Gold holders. In their aim to support their currencies in turbulent times, central banks tend to diversify their reserves and buy Gold to improve the perceived strength of the economy and the currency. High Gold reserves can be a source of trust for a country’s solvency. Central banks added 1,136 tonnes of Gold worth around $70 billion to their reserves in 2022, according to data from the World Gold Council. This is the highest yearly purchase since records began. Central banks from emerging economies such as China, India and Turkey are quickly increasing their Gold reserves.
Gold has an inverse correlation with the US Dollar and US Treasuries, which are both major reserve and safe-haven assets. When the Dollar depreciates, Gold tends to rise, enabling investors and central banks to diversify their assets in turbulent times. Gold is also inversely correlated with risk assets. A rally in the stock market tends to weaken Gold price, while sell-offs in riskier markets tend to favor the precious metal.
The price can move due to a wide range of factors. Geopolitical instability or fears of a deep recession can quickly make Gold price escalate due to its safe-haven status. As a yield-less asset, Gold tends to rise with lower interest rates, while higher cost of money usually weighs down on the yellow metal. Still, most moves depend on how the US Dollar (USD) behaves as the asset is priced in dollars (XAU/USD). A strong Dollar tends to keep the price of Gold controlled, whereas a weaker Dollar is likely to push Gold prices up.
- GBP/USD grapples to extend gains due to dovish sentiment surrounding the Fed’s policy stance.
- The recent US labor data increased the probability of a 50-basis point Fed rate cut to 74.5% in September.
- BoE Governor Bailey mentioned after the policy decision that the overall inflation trajectory is now closer to the 2% target.
GBP/USD edges lower to near 1.2790 during the Asian session on Monday, which could be attributed to the downside of the US Dollar (USD). The Greenback faces challenges due to increased expectations of the Federal Reserve’s (Fed) reducing interest rates in September.
The CME's FedWatch Tool shows a rise in the probability of a 50-basis point rate cut on September 18, increasing to 74.5% from 11.5% a week earlier. This shift is attributed to disappointing US jobs market data and a larger-than-expected contraction in factory activity, as reflected by the ISM Manufacturing PMI, released on Friday.
US Nonfarm Payrolls (NFP) increased by 114K in July from the previous month of 179K (revised down from 206K). This figure came in weaker than the expectation of 175K, data showed on Friday. Meanwhile, the US Unemployment Rate rose to the highest level since November 2021, coming in at 4.3% in July from 4.1% in June. Additionally, the US ISM Manufacturing Purchasing Managers Index (PMI) tumbled to an eight-month low of 46.8 in July.
The Pound Sterling (GBP) faced challenges as the Bank of England (BoE) delivered a broadly expected 25-basis point rate cut at its August meeting held on Thursday. Additionally, BoE Governor Andrew Bailey noted that the increase in the minimum wage has not been detrimental from their viewpoint. He mentioned that the overall inflation trajectory, including upside risks, is now closer to the 2% target.
British Pound PRICE Today
The table below shows the percentage change of British Pound (GBP) against listed major currencies today. British Pound was the strongest against the Australian Dollar.
| USD | EUR | GBP | JPY | CAD | AUD | NZD | CHF | |
|---|---|---|---|---|---|---|---|---|
| USD | -0.12% | 0.04% | -1.14% | -0.02% | 0.12% | -0.03% | -0.51% | |
| EUR | 0.12% | 0.07% | -1.17% | -0.04% | 0.24% | -0.02% | -0.50% | |
| GBP | -0.04% | -0.07% | -1.19% | -0.09% | 0.17% | -0.09% | -0.57% | |
| JPY | 1.14% | 1.17% | 1.19% | 1.13% | 1.19% | 1.11% | 0.65% | |
| CAD | 0.02% | 0.04% | 0.09% | -1.13% | 0.18% | -0.00% | -0.66% | |
| AUD | -0.12% | -0.24% | -0.17% | -1.19% | -0.18% | -0.26% | -0.74% | |
| NZD | 0.03% | 0.02% | 0.09% | -1.11% | 0.00% | 0.26% | -0.48% | |
| CHF | 0.51% | 0.50% | 0.57% | -0.65% | 0.66% | 0.74% | 0.48% |
The heat map shows percentage changes of major currencies against each other. The base currency is picked from the left column, while the quote currency is picked from the top row. For example, if you pick the British Pound from the left column and move along the horizontal line to the US Dollar, the percentage change displayed in the box will represent GBP (base)/USD (quote).
Pound Sterling FAQs
The Pound Sterling (GBP) is the oldest currency in the world (886 AD) and the official currency of the United Kingdom. It is the fourth most traded unit for foreign exchange (FX) in the world, accounting for 12% of all transactions, averaging $630 billion a day, according to 2022 data. Its key trading pairs are GBP/USD, aka ‘Cable’, which accounts for 11% of FX, GBP/JPY, or the ‘Dragon’ as it is known by traders (3%), and EUR/GBP (2%). The Pound Sterling is issued by the Bank of England (BoE).
The single most important factor influencing the value of the Pound Sterling is monetary policy decided by the Bank of England. The BoE bases its decisions on whether it has achieved its primary goal of “price stability” – a steady inflation rate of around 2%. Its primary tool for achieving this is the adjustment of interest rates. When inflation is too high, the BoE will try to rein it in by raising interest rates, making it more expensive for people and businesses to access credit. This is generally positive for GBP, as higher interest rates make the UK a more attractive place for global investors to park their money. When inflation falls too low it is a sign economic growth is slowing. In this scenario, the BoE will consider lowering interest rates to cheapen credit so businesses will borrow more to invest in growth-generating projects.
Data releases gauge the health of the economy and can impact the value of the Pound Sterling. Indicators such as GDP, Manufacturing and Services PMIs, and employment can all influence the direction of the GBP. A strong economy is good for Sterling. Not only does it attract more foreign investment but it may encourage the BoE to put up interest rates, which will directly strengthen GBP. Otherwise, if economic data is weak, the Pound Sterling is likely to fall.
Another significant data release for the Pound Sterling is the Trade Balance. This indicator measures the difference between what a country earns from its exports and what it spends on imports over a given period. If a country produces highly sought-after exports, its currency will benefit purely from the extra demand created from foreign buyers seeking to purchase these goods. Therefore, a positive net Trade Balance strengthens a currency and vice versa for a negative balance.
- WTI prices extend its losing streak to six-month lows.
- The downside of the Oil prices could be restrained due to heightened supply concerns.
- US Secretary of State Tony Blinken stated that Iran and Hezbollah could attack Israel as early as Monday.
West Texas Intermediate (WTI) crude Oil price trades around $73.10 per barrel, extending its losses to six-month lows on Monday. However, the downside of the Oil prices could be limited due to rising supply risks from geopolitical tensions in the Middle East.
Crude Oil prices received support from the ongoing conflict in Gaza, with an Israeli airstrike hitting two schools and resulting in at least 30 casualties on Sunday, according to Palestinian officials. This escalation follows a round of talks in Cairo that ended without progress, as reported by Reuters.
Israel and the United States are preparing for a potential escalation in the region following Iran and its allies, Hamas and Hezbollah, pledging retaliation against Israel for the killing of a Hamas leader. US Secretary of State Tony Blinken stated on Sunday that Iran and Hezbollah could attack Israel as early as Monday, according to three sources briefed on the call, as reported by Axios.
Read more: US Sec State Blinken tells G7 that Iran and Hezbollah attack on Israel could start Monday
Crude Oil prices declined due to increased recession fears in the United States, the world’s largest Oil consumer. This drop was influenced by Friday's disappointing US jobs market data and a larger-than-expected contraction in factory activity, as indicated by the ISM Manufacturing PMI.
US Nonfarm Payrolls (NFP) increased by 114K in July from the previous month of 179K (revised down from 206K). This figure came in weaker than the expectation of 175K, data showed on Friday. Meanwhile, the US Unemployment Rate rose to the highest level since November 2021, coming in at 4.3% in July from 4.1% in June. Additionally, the US ISM Manufacturing Purchasing Managers Index (PMI) tumbled to an eight-month low of 46.8 in July.
The Organization of the Petroleum Exporting Countries (OPEC) and other producers, including Russia (OPEC+), are adhering to their plan to gradually end voluntary production cuts starting in October. Despite this, a Reuters survey released on Friday indicated that OPEC Oil output increased in July, even with the group's production cuts in place.
WTI Oil FAQs
WTI Oil is a type of Crude Oil sold on international markets. The WTI stands for West Texas Intermediate, one of three major types including Brent and Dubai Crude. WTI is also referred to as “light” and “sweet” because of its relatively low gravity and sulfur content respectively. It is considered a high quality Oil that is easily refined. It is sourced in the United States and distributed via the Cushing hub, which is considered “The Pipeline Crossroads of the World”. It is a benchmark for the Oil market and WTI price is frequently quoted in the media.
Like all assets, supply and demand are the key drivers of WTI Oil price. As such, global growth can be a driver of increased demand and vice versa for weak global growth. Political instability, wars, and sanctions can disrupt supply and impact prices. The decisions of OPEC, a group of major Oil-producing countries, is another key driver of price. The value of the US Dollar influences the price of WTI Crude Oil, since Oil is predominantly traded in US Dollars, thus a weaker US Dollar can make Oil more affordable and vice versa.
The weekly Oil inventory reports published by the American Petroleum Institute (API) and the Energy Information Agency (EIA) impact the price of WTI Oil. Changes in inventories reflect fluctuating supply and demand. If the data shows a drop in inventories it can indicate increased demand, pushing up Oil price. Higher inventories can reflect increased supply, pushing down prices. API’s report is published every Tuesday and EIA’s the day after. Their results are usually similar, falling within 1% of each other 75% of the time. The EIA data is considered more reliable, since it is a government agency.
OPEC (Organization of the Petroleum Exporting Countries) is a group of 13 Oil-producing nations who collectively decide production quotas for member countries at twice-yearly meetings. Their decisions often impact WTI Oil prices. When OPEC decides to lower quotas, it can tighten supply, pushing up Oil prices. When OPEC increases production, it has the opposite effect. OPEC+ refers to an expanded group that includes ten extra non-OPEC members, the most notable of which is Russia.
| Raw materials | Closed | Change, % |
|---|---|---|
| Silver | 28.554 | 0.06 |
| Gold | 244.143 | -0.23 |
| Palladium | 893.32 | -1.52 |
Japan’s Chief Cabinet Secretary Yoshimasa Hayashi said on Monday that he is “closely watching market moves with a sense of urgency.”
Additional comments
Won't comment on daily share moves.
Share prices determined by various factors including economic situation, corporate activity.
His comments come as the Japanese Yen is at seven-month highs while the Nikkei 225 index slumps to seven-month troughs.
Market reaction
At press time, USD/JPY is off the seven-month lows of 144.76, trading near 145.35, still down 0.83% on the day.
Japanese Yen PRICE Today
The table below shows the percentage change of Japanese Yen (JPY) against listed major currencies today. Japanese Yen was the strongest against the British Pound.
| USD | EUR | GBP | JPY | CAD | AUD | NZD | CHF | |
|---|---|---|---|---|---|---|---|---|
| USD | -0.01% | 0.17% | -0.83% | 0.04% | 0.22% | 0.12% | -0.33% | |
| EUR | 0.00% | 0.10% | -0.95% | -0.08% | 0.24% | 0.01% | -0.43% | |
| GBP | -0.17% | -0.10% | -1.00% | -0.16% | 0.14% | -0.08% | -0.53% | |
| JPY | 0.83% | 0.95% | 1.00% | 0.91% | 1.00% | 0.96% | 0.54% | |
| CAD | -0.04% | 0.08% | 0.16% | -0.91% | 0.21% | 0.07% | -0.55% | |
| AUD | -0.22% | -0.24% | -0.14% | -1.00% | -0.21% | -0.22% | -0.66% | |
| NZD | -0.12% | -0.01% | 0.08% | -0.96% | -0.07% | 0.22% | -0.44% | |
| CHF | 0.33% | 0.43% | 0.53% | -0.54% | 0.55% | 0.66% | 0.44% |
The heat map shows percentage changes of major currencies against each other. The base currency is picked from the left column, while the quote currency is picked from the top row. For example, if you pick the Japanese Yen from the left column and move along the horizontal line to the US Dollar, the percentage change displayed in the box will represent JPY (base)/USD (quote).
- USD/JPY remains under selling pressure around 145.00 in Monday’s Asian session, down 1.05% on the day.
- A weak US July employment report on Friday weighs on the US Dollar.
- The rising Middle East geopolitical risks and the unwinding of carry trades support the JPY.
The USD/JPY pair attracts some sellers near 145.20 during the Asian trading hours on Monday. The weaker US Dollar (USD) after the US employment data drags the pair lower. Market players will monitor the US ISM Services Purchasing Managers Index (PMI) on Monday for fresh impetus, which is expected to improve to 51.0 in July from 48.8 in June.
The Greenback remains under pressure as the US labour market continues to deteriorate in July. The Nonfarm Payrolls (NFP) showed 114K jobs were added in the US economy in July from the downwardly revised 179,000 in June, worse than the market’s expectation for an increase of 175K. The Unemployment Rate rose to 4.3%, the highest rate since late 2021 and above the market consensus of 4.1%. The Average Hourly Earnings rose 0.2% month-over-month in the same reported period, below the market consensus of 0.3%.
On the other hand, mounting geopolitical tensions in the Middle East could boost the safe-haven currency like the Japanese Yen (JPY). US Secretary of State Tony Blinken told his counterparts from the G7 countries on Sunday that an attack by Iran and Hezbollah against Israel could start as early as Monday, three sources briefed on the call tell Axios.
Apart from this, the expectation that the Bank of Japan (BoJ) policymakers might tighten monetary policy further and the unwinding of carry trades might underpin the JPY in the near term. NBC FX analysts Stéfane Marion and Kyle Dahms noted, “The factors underpinning the current bout of strength were twofold, firstly the unwinding of carry trades brought an initial surge which was then compounded by a surprise decision from the Bank of Japan to raise rates to their highest level in 15 years. In addition, the central bank showed a path towards slowing asset purchases, a sizeable shift in stance from previously easy money.”
Japanese Yen FAQs
The Japanese Yen (JPY) is one of the world’s most traded currencies. Its value is broadly determined by the performance of the Japanese economy, but more specifically by the Bank of Japan’s policy, the differential between Japanese and US bond yields, or risk sentiment among traders, among other factors.
One of the Bank of Japan’s mandates is currency control, so its moves are key for the Yen. The BoJ has directly intervened in currency markets sometimes, generally to lower the value of the Yen, although it refrains from doing it often due to political concerns of its main trading partners. The current BoJ ultra-loose monetary policy, based on massive stimulus to the economy, has caused the Yen to depreciate against its main currency peers. This process has exacerbated more recently due to an increasing policy divergence between the Bank of Japan and other main central banks, which have opted to increase interest rates sharply to fight decades-high levels of inflation.
The BoJ’s stance of sticking to ultra-loose monetary policy has led to a widening policy divergence with other central banks, particularly with the US Federal Reserve. This supports a widening of the differential between the 10-year US and Japanese bonds, which favors the US Dollar against the Japanese Yen.
The Japanese Yen is often seen as a safe-haven investment. This means that in times of market stress, investors are more likely to put their money in the Japanese currency due to its supposed reliability and stability. Turbulent times are likely to strengthen the Yen’s value against other currencies seen as more risky to invest in.
- The Australian Dollar declines following the soft Purchasing Managers Index data release on Monday.
- Australia Composite PMI fell to 49.9 in July from 50.2 in June, with Services PMI decreasing to 50.4 from 51.8.
- The US Dollar lost ground as recent downbeat employment data boosted expectations of a Fed rate cut in September.
The Australian Dollar (AUD) depreciates against the US Dollar (USD) following the release of downbeat Judo Bank Purchasing Managers Index (PMI) data on Monday. Additionally, the AUD receives pressure as the second-quarter inflation data has diminished expectations for another rate hike by the Reserve Bank of Australia (RBA) at its policy meeting on Tuesday.
Markets estimate an RBA rate cut in November, a move anticipated much earlier than previously forecasted for April next year. These factors are contributing to the downward pressure on the Australian Dollar and undermine the AUD/USD pair.
China's Caixin Services PMI rose to 52.1 in July, from June's 51.2 reading. The index has exceeded the market expectations of 51.4 reading. Since both nations are close trade partners, changes in the Chinese economy can significantly impact the Australian market.
The downside of the AUD/USD pair could be restrained as the US Dollar lost ground after the downbeat US labor market data released on Friday. This has boosted the expectation that the US Federal Reserve (Fed) would cut its interest rate in September.
Daily Digest Market Movers: Australian Dollar declines following the downbeat PMI
- The Judo Bank Australia Composite PMI dropped to 49.9 in July from 50.2 in June, falling below the neutral 50 mark for the first time since January. The Services PMI decreased to 50.4 in July from 51.8 in June. While this represents the sixth consecutive month of expansion in services activity, the growth rate was marginal and the slowest observed in this sequence.
- US Nonfarm Payrolls (NFP) increased by 114K in July from the previous month of 179K (revised down from 206K). This figure came in weaker than the expectation of 175K, data showed on Friday.
- US Average Hourly Earnings eased to 0.2% month-over-month in the same reported period, below the market consensus of 0.3%. On an annual basis, the figure decreased to 3.6% from the previous reading of 3.8%.
- US ISM Manufacturing Purchasing Managers Index (PMI) tumbled to an eight-month low of 46.8 in July, compared to the previous 48.5 reading and the forecasted move up to 48.8.
- China’s Caixin Manufacturing Purchasing Managers Index (PMI) posted a reading of 49.8 for July, falling short of the expected reading of 51.5 and the previous reading of 51.8.
- The Australian Bureau of Statistics (ABS) reported a trade surplus of 5,589 million for June, surpassing the anticipated 5,000 million but still below the previous reading of 5,773 million.
- During a press conference, Federal Reserve Chair Jerome Powell stated that a rate cut in September is "on the table." According to Reuters, Powell added that the central bank will closely monitor the labor market and remain vigilant for signs of a potential sharp downturn.
Technical Analysis: Australian Dollar hovers around 0.6500
The Australian Dollar trades around 0.6500 on Monday. The daily chart analysis shows that the AUD/USD pair consolidates within a descending channel, indicating a bearish bias. The 14-day Relative Strength Index (RSI) is hovering below the oversold 30 level, which suggests a potential for an upward correction.
The AUD/USD pair could find immediate support around the lower boundary of the descending channel at the throwback support of 0.6470 level.
On the upside, resistance is first encountered at the channel's upper boundary, around 0.6520, followed by the nine-day Exponential Moving Average (EMA) at 0.6544. The next significant resistance is at 0.6575, where the "throwback support turned resistance" is located. A breakout above this level could propel the AUD/USD pair toward a six-month high of 0.6798.
AUD/USD: Daily Chart
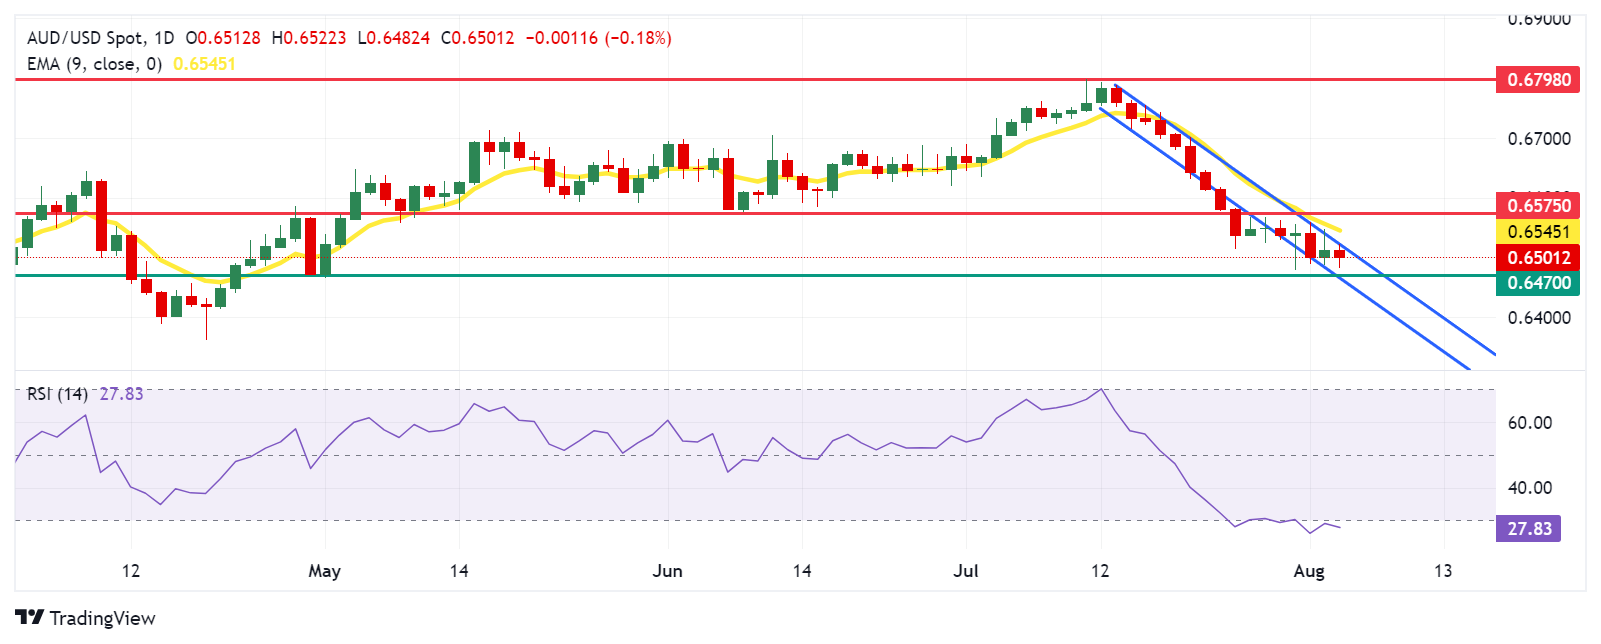
Australian Dollar PRICE Today
The table below shows the percentage change of Australian Dollar (AUD) against listed major currencies today. Australian Dollar was the weakest against the Japanese Yen.
| USD | EUR | GBP | JPY | CAD | AUD | NZD | CHF | |
|---|---|---|---|---|---|---|---|---|
| USD | -0.03% | 0.12% | -0.94% | 0.00% | 0.20% | 0.06% | -0.45% | |
| EUR | 0.03% | 0.07% | -1.05% | -0.09% | 0.25% | -0.02% | -0.53% | |
| GBP | -0.12% | -0.07% | -1.06% | -0.13% | 0.18% | -0.09% | -0.60% | |
| JPY | 0.94% | 1.05% | 1.06% | 1.01% | 1.12% | 1.04% | 0.54% | |
| CAD | -0.01% | 0.09% | 0.13% | -1.01% | 0.23% | 0.05% | -0.64% | |
| AUD | -0.20% | -0.25% | -0.18% | -1.12% | -0.23% | -0.27% | -0.78% | |
| NZD | -0.06% | 0.02% | 0.09% | -1.04% | -0.05% | 0.27% | -0.51% | |
| CHF | 0.45% | 0.53% | 0.60% | -0.54% | 0.64% | 0.78% | 0.51% |
The heat map shows percentage changes of major currencies against each other. The base currency is picked from the left column, while the quote currency is picked from the top row. For example, if you pick the Australian Dollar from the left column and move along the horizontal line to the US Dollar, the percentage change displayed in the box will represent AUD (base)/USD (quote).
Australian Dollar FAQs
One of the most significant factors for the Australian Dollar (AUD) is the level of interest rates set by the Reserve Bank of Australia (RBA). Because Australia is a resource-rich country another key driver is the price of its biggest export, Iron Ore. The health of the Chinese economy, its largest trading partner, is a factor, as well as inflation in Australia, its growth rate and Trade Balance. Market sentiment – whether investors are taking on more risky assets (risk-on) or seeking safe-havens (risk-off) – is also a factor, with risk-on positive for AUD.
The Reserve Bank of Australia (RBA) influences the Australian Dollar (AUD) by setting the level of interest rates that Australian banks can lend to each other. This influences the level of interest rates in the economy as a whole. The main goal of the RBA is to maintain a stable inflation rate of 2-3% by adjusting interest rates up or down. Relatively high interest rates compared to other major central banks support the AUD, and the opposite for relatively low. The RBA can also use quantitative easing and tightening to influence credit conditions, with the former AUD-negative and the latter AUD-positive.
China is Australia’s largest trading partner so the health of the Chinese economy is a major influence on the value of the Australian Dollar (AUD). When the Chinese economy is doing well it purchases more raw materials, goods and services from Australia, lifting demand for the AUD, and pushing up its value. The opposite is the case when the Chinese economy is not growing as fast as expected. Positive or negative surprises in Chinese growth data, therefore, often have a direct impact on the Australian Dollar and its pairs.
Iron Ore is Australia’s largest export, accounting for $118 billion a year according to data from 2021, with China as its primary destination. The price of Iron Ore, therefore, can be a driver of the Australian Dollar. Generally, if the price of Iron Ore rises, AUD also goes up, as aggregate demand for the currency increases. The opposite is the case if the price of Iron Ore falls. Higher Iron Ore prices also tend to result in a greater likelihood of a positive Trade Balance for Australia, which is also positive of the AUD.
The Trade Balance, which is the difference between what a country earns from its exports versus what it pays for its imports, is another factor that can influence the value of the Australian Dollar. If Australia produces highly sought after exports, then its currency will gain in value purely from the surplus demand created from foreign buyers seeking to purchase its exports versus what it spends to purchase imports. Therefore, a positive net Trade Balance strengthens the AUD, with the opposite effect if the Trade Balance is negative.
China's Services Purchasing Managers' Index (PMI) jumped from 51.2 in June to 52.1 in July, according to the latest data released by Caixin on Monday.
The data beat the market expectations of 51.4 in the reported period, by a wide margin.
AUD/USD reaction to China’s Services PMI
At the time of writing, the AUD/USD pair is paring back losses to trade near 0.6500, still down 0.14% on the day.
Australian Dollar FAQs
One of the most significant factors for the Australian Dollar (AUD) is the level of interest rates set by the Reserve Bank of Australia (RBA). Because Australia is a resource-rich country another key driver is the price of its biggest export, Iron Ore. The health of the Chinese economy, its largest trading partner, is a factor, as well as inflation in Australia, its growth rate and Trade Balance. Market sentiment – whether investors are taking on more risky assets (risk-on) or seeking safe-havens (risk-off) – is also a factor, with risk-on positive for AUD.
The Reserve Bank of Australia (RBA) influences the Australian Dollar (AUD) by setting the level of interest rates that Australian banks can lend to each other. This influences the level of interest rates in the economy as a whole. The main goal of the RBA is to maintain a stable inflation rate of 2-3% by adjusting interest rates up or down. Relatively high interest rates compared to other major central banks support the AUD, and the opposite for relatively low. The RBA can also use quantitative easing and tightening to influence credit conditions, with the former AUD-negative and the latter AUD-positive.
China is Australia’s largest trading partner so the health of the Chinese economy is a major influence on the value of the Australian Dollar (AUD). When the Chinese economy is doing well it purchases more raw materials, goods and services from Australia, lifting demand for the AUD, and pushing up its value. The opposite is the case when the Chinese economy is not growing as fast as expected. Positive or negative surprises in Chinese growth data, therefore, often have a direct impact on the Australian Dollar and its pairs.
Iron Ore is Australia’s largest export, accounting for $118 billion a year according to data from 2021, with China as its primary destination. The price of Iron Ore, therefore, can be a driver of the Australian Dollar. Generally, if the price of Iron Ore rises, AUD also goes up, as aggregate demand for the currency increases. The opposite is the case if the price of Iron Ore falls. Higher Iron Ore prices also tend to result in a greater likelihood of a positive Trade Balance for Australia, which is also positive of the AUD.
The Trade Balance, which is the difference between what a country earns from its exports versus what it pays for its imports, is another factor that can influence the value of the Australian Dollar. If Australia produces highly sought after exports, then its currency will gain in value purely from the surplus demand created from foreign buyers seeking to purchase its exports versus what it spends to purchase imports. Therefore, a positive net Trade Balance strengthens the AUD, with the opposite effect if the Trade Balance is negative.
The People’s Bank of China (PBOC) set the USD/CNY central rate for the trading session ahead on Monday at 7.1345, as against the previous day's fix of 7.1376 and 7.1912 Reuters estimates.
US Secretary of State Tony Blinken told his counterparts from the G7 countries on Sunday that an attack by Iran and Hezbollah against Israel could start as early as Monday, three sources briefed on the call told Axios.
Iran and its Lebanese ally Hezbollah have vowed to respond to the assassinations by Israel of senior Hezbollah and Hamas officials. Prime Minister Benjamin Netanyahu said at the start of a cabinet meeting Sunday that “Israel is in a multifront war against Iran’s axis of evil. We are striking every one of its arms with great force. We are prepared for any scenario, both offensively and defensively," per Bloomberg.
Market reaction
At the time of writing, the gold price (XAU/USD) is trading 0.71% lower on the day to trade at $2,425.
Risk sentiment FAQs
In the world of financial jargon the two widely used terms “risk-on” and “risk off'' refer to the level of risk that investors are willing to stomach during the period referenced. In a “risk-on” market, investors are optimistic about the future and more willing to buy risky assets. In a “risk-off” market investors start to ‘play it safe’ because they are worried about the future, and therefore buy less risky assets that are more certain of bringing a return, even if it is relatively modest.
Typically, during periods of “risk-on”, stock markets will rise, most commodities – except Gold – will also gain in value, since they benefit from a positive growth outlook. The currencies of nations that are heavy commodity exporters strengthen because of increased demand, and Cryptocurrencies rise. In a “risk-off” market, Bonds go up – especially major government Bonds – Gold shines, and safe-haven currencies such as the Japanese Yen, Swiss Franc and US Dollar all benefit.
The Australian Dollar (AUD), the Canadian Dollar (CAD), the New Zealand Dollar (NZD) and minor FX like the Ruble (RUB) and the South African Rand (ZAR), all tend to rise in markets that are “risk-on”. This is because the economies of these currencies are heavily reliant on commodity exports for growth, and commodities tend to rise in price during risk-on periods. This is because investors foresee greater demand for raw materials in the future due to heightened economic activity.
The major currencies that tend to rise during periods of “risk-off” are the US Dollar (USD), the Japanese Yen (JPY) and the Swiss Franc (CHF). The US Dollar, because it is the world’s reserve currency, and because in times of crisis investors buy US government debt, which is seen as safe because the largest economy in the world is unlikely to default. The Yen, from increased demand for Japanese government bonds, because a high proportion are held by domestic investors who are unlikely to dump them – even in a crisis. The Swiss Franc, because strict Swiss banking laws offer investors enhanced capital protection.
- EUR/USD gains traction around 1.0915 in Monday’s early Asian session.
- The weaker-than-expected US Nonfarm Payrolls have undermined the US Dollar (USD).
- Stubborn inflation in the Eurozone raised doubts over market expectations for more ECB rate cuts in 2024.
The EUR/USD pair extends the rally near 1.0915 during the early Asian session on Monday. The uptick of the major pair is bolstered by the softer Greenback after disappointing US employment data. Traders will keep an eye on the HCOB Purchasing Managers Index (PMI) from Germany and the Eurozone, along with the US ISM Services PMI, which is due later on Monday.
Slowed-than-expected job growth and rising unemployment rate in the United States fuelled fears of a broader economic slowdown and weighed on the US Dollar (USD) broadly. Nonfarm Payrolls (NFP) increased by 114,000 for the month in July, down from the downwardly revised 179,000 in June and below the estimate of 185,000, the Labor Department reported on Friday. Additionally, the Unemployment Rate edged higher to 4.3%, its highest since October 2021.
Despite some fear of recession in the US, Federal Reserve (Fed) Chair Jerome Powell noted last week that the central bank's confidence about the “solid” economy and easing inflation data is raising confidence that the Fed could cut rates soon. Financial markets have fully priced in a rate cut of at least 25 basis points (bps) at each of the three remaining Fed meetings this year, according to the CME FedWatch Tool.
Across the pond, the elevated inflation and steady growth in the Eurozone economy pushed back market expectations for more interest rate cuts this year. The headline HICP rose to 2.6% YoY in July, above the economists consensus of 2.4%. The core HICP, which excludes volatile items such as food, energy, alcohol, and tobacco, grew steadily at 2.9% against expectations of 2.8%.
Euro FAQs
The Euro is the currency for the 20 European Union countries that belong to the Eurozone. It is the second most heavily traded currency in the world behind the US Dollar. In 2022, it accounted for 31% of all foreign exchange transactions, with an average daily turnover of over $2.2 trillion a day. EUR/USD is the most heavily traded currency pair in the world, accounting for an estimated 30% off all transactions, followed by EUR/JPY (4%), EUR/GBP (3%) and EUR/AUD (2%).
The European Central Bank (ECB) in Frankfurt, Germany, is the reserve bank for the Eurozone. The ECB sets interest rates and manages monetary policy. The ECB’s primary mandate is to maintain price stability, which means either controlling inflation or stimulating growth. Its primary tool is the raising or lowering of interest rates. Relatively high interest rates – or the expectation of higher rates – will usually benefit the Euro and vice versa. The ECB Governing Council makes monetary policy decisions at meetings held eight times a year. Decisions are made by heads of the Eurozone national banks and six permanent members, including the President of the ECB, Christine Lagarde.
Eurozone inflation data, measured by the Harmonized Index of Consumer Prices (HICP), is an important econometric for the Euro. If inflation rises more than expected, especially if above the ECB’s 2% target, it obliges the ECB to raise interest rates to bring it back under control. Relatively high interest rates compared to its counterparts will usually benefit the Euro, as it makes the region more attractive as a place for global investors to park their money.
Data releases gauge the health of the economy and can impact on the Euro. Indicators such as GDP, Manufacturing and Services PMIs, employment, and consumer sentiment surveys can all influence the direction of the single currency. A strong economy is good for the Euro. Not only does it attract more foreign investment but it may encourage the ECB to put up interest rates, which will directly strengthen the Euro. Otherwise, if economic data is weak, the Euro is likely to fall. Economic data for the four largest economies in the euro area (Germany, France, Italy and Spain) are especially significant, as they account for 75% of the Eurozone’s economy.
Another significant data release for the Euro is the Trade Balance. This indicator measures the difference between what a country earns from its exports and what it spends on imports over a given period. If a country produces highly sought after exports then its currency will gain in value purely from the extra demand created from foreign buyers seeking to purchase these goods. Therefore, a positive net Trade Balance strengthens a currency and vice versa for a negative balance.
| Index | Change, points | Closed | Change, % |
|---|---|---|---|
| NIKKEI 225 | -2216.63 | 35909.7 | -5.81 |
| Hang Seng | -359.45 | 16945.51 | -2.08 |
| KOSPI | -101.49 | 2676.19 | -3.65 |
| ASX 200 | -171.5 | 7943.2 | -2.11 |
| DAX | -421.83 | 17661.22 | -2.33 |
| CAC 40 | -118.65 | 7251.8 | -1.61 |
| Dow Jones | -610.71 | 39737.26 | -1.51 |
| S&P 500 | -100.12 | 5346.56 | -1.84 |
| NASDAQ Composite | -417.99 | 16776.16 | -2.43 |
- Gold price trades on a weaker note near $2,435 in Monday’s early Asian session, down 0.40% on the day.
- US Nonfarm Payrolls rose by 114K in July vs. 179K prior, weaker than expected.
- The Middle East tensions might cap the gold’s downside.
Gold price (XAU/USD) edges lower to $2,435 on Monday during the early Asian session. However, the downside might be capped due to rising expectations of rate cuts by the US Federal Reserve (Fed) and the risk-off mood amid ongoing geopolitical tensions in the Middle East.
The disappointing US July employment data raised fears of a recession and triggered the possibility of Fed rate cuts in September. "The marketplace just now is factoring in a better-than-70% chance for a 50-basis-point cut by the Fed at the September FOMC meeting," said Jim Wyckoff, senior market analyst at Kitco Metals.
The US Bureau of Labor Statistics (BLS) showed on Friday that US Nonfarm Payrolls (NFP) rose by 114K in July from the previous month of 179K (revised down from 206K), weaker than the expectation of 175K. Meanwhile, the US Unemployment Rate rose to the highest level since November 2021, coming in at 4.3% in July from 4.1% in June.
Investors will take more cues from the US ISM Services Purchasing Managers Index (PMI) on Monday, which is expected to improve to 51.0 in July from 48.8 in June, In the case of the stronger-than-expected data, this might lift the US Dollar (USD) and cap the upside for USD-denominated Gold.
On the other hand, the escalating geopolitical tensions in the Middle East might boost the safe-haven flows, benefiting the yellow metal. The BBC reported that several nations have urged their citizens to leave Lebanon as worries mount about a wider Middle Eastern war. Additionally, the US general in charge of American troops in the Middle East arrived on Saturday as preparations continued for a potential strike against Israel by Iran in retaliation for the killing of senior Hamas and Hezbollah leaders, according to two US sources.
Gold FAQs
Gold has played a key role in human’s history as it has been widely used as a store of value and medium of exchange. Currently, apart from its shine and usage for jewelry, the precious metal is widely seen as a safe-haven asset, meaning that it is considered a good investment during turbulent times. Gold is also widely seen as a hedge against inflation and against depreciating currencies as it doesn’t rely on any specific issuer or government.
Central banks are the biggest Gold holders. In their aim to support their currencies in turbulent times, central banks tend to diversify their reserves and buy Gold to improve the perceived strength of the economy and the currency. High Gold reserves can be a source of trust for a country’s solvency. Central banks added 1,136 tonnes of Gold worth around $70 billion to their reserves in 2022, according to data from the World Gold Council. This is the highest yearly purchase since records began. Central banks from emerging economies such as China, India and Turkey are quickly increasing their Gold reserves.
Gold has an inverse correlation with the US Dollar and US Treasuries, which are both major reserve and safe-haven assets. When the Dollar depreciates, Gold tends to rise, enabling investors and central banks to diversify their assets in turbulent times. Gold is also inversely correlated with risk assets. A rally in the stock market tends to weaken Gold price, while sell-offs in riskier markets tend to favor the precious metal.
The price can move due to a wide range of factors. Geopolitical instability or fears of a deep recession can quickly make Gold price escalate due to its safe-haven status. As a yield-less asset, Gold tends to rise with lower interest rates, while higher cost of money usually weighs down on the yellow metal. Still, most moves depend on how the US Dollar (USD) behaves as the asset is priced in dollars (XAU/USD). A strong Dollar tends to keep the price of Gold controlled, whereas a weaker Dollar is likely to push Gold prices up.
| Pare | Closed | Change, % |
|---|---|---|
| AUDUSD | 0.65095 | 0.17 |
| EURJPY | 159.915 | -0.76 |
| EURUSD | 1.09096 | 1.1 |
| GBPJPY | 187.676 | -1.3 |
| GBPUSD | 1.28045 | 0.55 |
| NZDUSD | 0.59568 | 0.19 |
| USDCAD | 1.38732 | -0 |
| USDCHF | 0.8579 | -1.7 |
| USDJPY | 146.569 | -1.84 |
The Bank of Japan (BoJ) board members shared their views on the monetary policy outlook on Monday, per the BoJ Minutes of the June meeting.
Key quotes
A few members said import prices rising due to recent yen fall, creating upside inflation risk
One member said cost-push inflation could heighten underlying inflation if it leads to higher inflation expectations, wage increases
One member said pass-through of higher labour costs accelerating, could appear in consumer inflation
One member said BOJ might need to consider adjusting degree of monetary easing as inflation might overshoot due to renewed cost-push pressure
One member said BOJ must raise rates at appropriate timing without delay
One member said rate hike must be done only after inflation makes clear rebound, data confirms heightening in inflation expectations
Members agreed recent weak yen pushes up inflation, warrants vigilance in guiding monetary policy
One member said BOJ’s monetary policy should not be swayed by short-term FX moves
Market reaction to the BoJ Minutes
At the time of writing, USD/JPY was down 0.61% on the day at 145.65.
Bank of Japan FAQs
The Bank of Japan (BoJ) is the Japanese central bank, which sets monetary policy in the country. Its mandate is to issue banknotes and carry out currency and monetary control to ensure price stability, which means an inflation target of around 2%.
The Bank of Japan has embarked in an ultra-loose monetary policy since 2013 in order to stimulate the economy and fuel inflation amid a low-inflationary environment. The bank’s policy is based on Quantitative and Qualitative Easing (QQE), or printing notes to buy assets such as government or corporate bonds to provide liquidity. In 2016, the bank doubled down on its strategy and further loosened policy by first introducing negative interest rates and then directly controlling the yield of its 10-year government bonds.
The Bank’s massive stimulus has caused the Yen to depreciate against its main currency peers. This process has exacerbated more recently due to an increasing policy divergence between the Bank of Japan and other main central banks, which have opted to increase interest rates sharply to fight decades-high levels of inflation. The BoJ’s policy of holding down rates has led to a widening differential with other currencies, dragging down the value of the Yen.
A weaker Yen and the spike in global energy prices have led to an increase in Japanese inflation, which has exceeded the BoJ’s 2% target. With wage inflation becoming a cause of concern, the BoJ looks to move away from ultra loose policy, while trying to avoid slowing the activity too much.


© 2000-2026. Уcі права захищені.
Cайт знаходитьcя під керуванням TeleTrade DJ. LLC 2351 LLC 2022 (Euro House, Richmond Hill Road, Kingstown, VC0100, St. Vincent and the Grenadines).
Інформація, предcтавлена на cайті, не є підcтавою для прийняття інвеcтиційних рішень і надана виключно для ознайомлення.
Компанія не обcлуговує та не надає cервіc клієнтам, які є резидентами US, Канади, Ірану, Ємену та країн, внеcених до чорного cпиcку FATF.
Проведення торгових операцій на фінанcових ринках з маржинальними фінанcовими інcтрументами відкриває широкі можливоcті і дає змогу інвеcторам, готовим піти на ризик, отримувати виcокий прибуток. Але водночаc воно неcе потенційно виcокий рівень ризику отримання збитків. Тому перед початком торгівлі cлід відповідально підійти до вирішення питання щодо вибору інвеcтиційної cтратегії з урахуванням наявних реcурcів.
Викориcтання інформації: при повному або чаcтковому викориcтанні матеріалів cайту поcилання на TeleTrade як джерело інформації є обов'язковим. Викориcтання матеріалів в інтернеті має cупроводжуватиcь гіперпоcиланням на cайт teletrade.org. Автоматичний імпорт матеріалів та інформації із cайту заборонено.
З уcіх питань звертайтеcь за адреcою pr@teletrade.global.
переклади