- Аналітика
- Новини та інструменти
- Новини ринків
Новини ринків
- AUD/USD steadies after snapping four-day uptrend, holding lower ground of late.
- China housing jitters, rush to buy Hong Kong insurance and Sino-American tussles weigh on Aussie pair due to Canberra-Beijing ties.
- Hawkish FOMC Minutes supersede mixed comments from NY Fed President Williams, softer US data.
- RBA’s hawkish halt may tease AUD/USD buyers if US ADP Employment Change, ISM Services PMI disappoint.
AUD/USD licks its wounds around mid-0.6600s amid a sluggish start to Thursday’s Asian session, after posting the first daily loss in five. In doing so, the Aussie pair portrays the cautious mood ahead of Australian trade numbers for May, as well as recently mixed catalysts surrounding the Fed. Even so, pessimism about Canberra’s biggest customer Beijing, as well as broad recession woes, keeps the risk-barometer pair depressed.
A jump in Chinese investor buying Hong Kong and Macau wealth products join pessimism about China’s top-tier housing players like Shimao Group, as well as the government-backed Sino-Ocean Group, to amplify economic fears about the world’s biggest industrial player China.
The same joins the ongoing Sino-American tension and softer China data to exert additional downside pressure on the AUD/USD price. On Wednesday, downbeat prints of China’s Caixin Services PMI for June, to 53.9 versus 57.1 prior, joined the escalating fears of the US-China tension amid fresh warnings of further trade restrictions from Beijing to weigh on the sentiment and prices of the riskier assets like AUD/USD.
That said, China’s Global Times and former Vice Commerce Minister flagged hardships for the US IT companies, as well as metal players. Earlier on Wednesday, China announced abrupt controls on exports of some gallium and germanium products, effective from August 1. The dragon nation’s latest retaliation is in reaction to the US curb on AI chips’ shipments to Beijing.
It should be noted that the Federal Open Market Committee (FOMC) Minutes for the June meeting stated that almost all members agreed to a pause in the rate hike trajectory while some policymakers showed an inclination for a July rate hike of around 0.25%. The same highlights hawkish bias at the US central bank, versus the Reserve Bank of Australia’s (RBA) pause in the rate hike, to weigh on the Aussie pair.
Even so, softer US data and fears of recession, as signaled by the US Treasury bond yields curve inversion, put a floor under the AUD/USD. That said, US Factory Orders reprints 0.3% MoM growth for May versus 0.8% expected. The official publication also mentioned that the new orders for manufactured durable goods in May rose for the third consecutive month. Earlier in the week, the US ISM Manufacturing PMI and S&P Manufacturing PMI came in softer and propelled the Gold Price.
While portraying the mood, the markets almost priced in the June Fed rate hike by 0.25% and weighed on the Gold Price while the Wall Street benchmarks closed in the red and the US Treasury bond yields joined the US Dollar Index (DXY) to rise.
Moving on, Australia’s Imports, Exports and Trade Balance for May will be the immediate catalyst to watch for the AUD/USD pair traders. Following that, the US ISM Services PMI and ADP Employment Change for June will be crucial as both of them will help determine Friday’s all-important Nonfarm Payrolls (NFP) and affect the AUD/USD prices. Above all, the risk catalysts, namely China headlines and recession woes, will be crucial to watch for clear directions.
Technical analysis
A clear U-turn from the 200-DMA, around 0.6700 by the press time, directs AUD/USD sellers toward a six-week-old rising support line, close to 0.6630 at the latest.
- EUR/USD remains depressed at the lowest level in a week after breaking the key DMA support.
- Bearish MACD signals, steady RSI line add strength to downside bias.
- Convergence of 100-DMA, fortnight-old descending trend line appears short-term key support.
- Euro bulls should remain cautious below two-week-long resistance line.
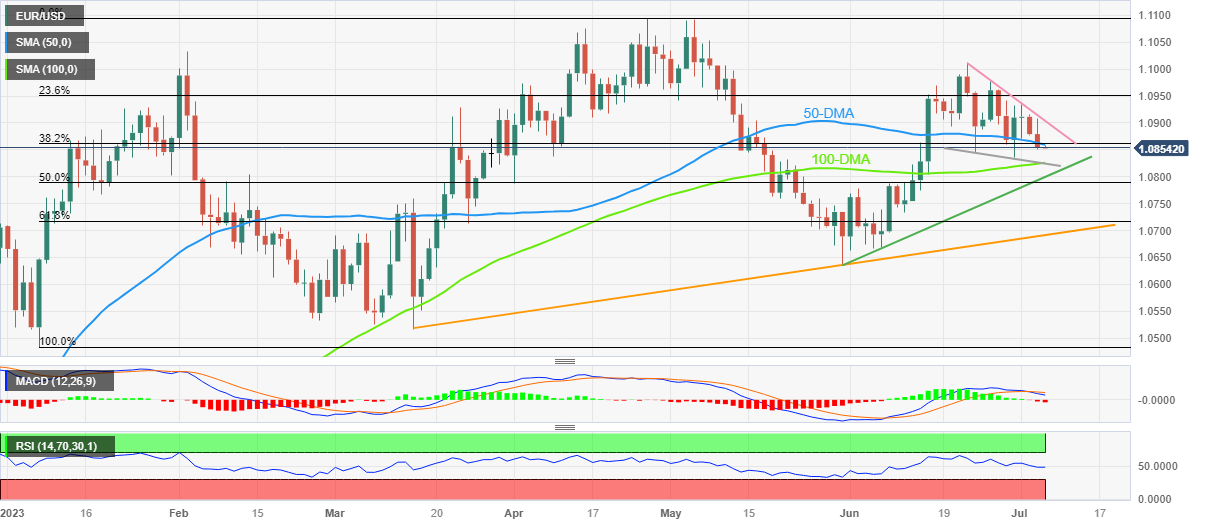
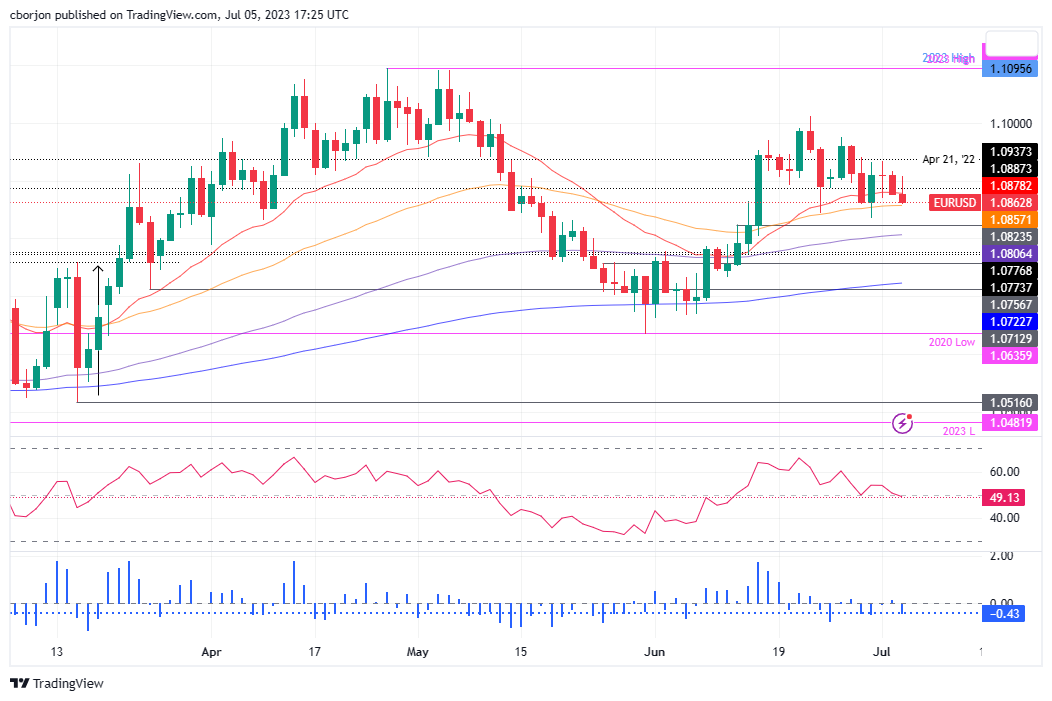
EUR/USD holds lower grounds at the weekly bottom surrounding 1.0850 amid the early hours of Thursday in Asia. In doing so, the Euro pair justifies the previous day’s closing beneath the 50-DMA, the first clear break in three weeks, while also keeping the bears on the table after a three-day downtrend.
Not only the 50-DMA break but the bearish MACD signals and a near-50.0 RSI (14) line also suggests further downside of the EUR/USD pair.
However, a convergence of the 100-DMA and a fortnight-old descending trend line, around 1.0825 by the press time, becomes a tough nut to crack for the Euro bears.
Following that, an ascending support line from May 31, near 1.0800, becomes the last defense of the EUR/USD buyers before directing the quote toward the 50% and 61.8% Fibonacci retracements of January-April upside, respectively near 1.0790 and 1.0715.
Alternatively, the 50-DMA and 38.2% Fibonacci retracement together guard the EUR/USD recovery around 1.0865.
Even if the major currency pair crosses the 1.0865 hurdle, a downward-sloping resistance line from June 23, close to 1.0900 at the latest, will be in the spotlight.
Overall, EUR/USD remains on the back foot but the downside room appears limited.
EUR/USD: Daily chart
Trend: Limited downside expected
Federal Reserve (Fed) Bank of New York President, as well as Vice Fed Chair, John Williams crossed wires via Reuters late Wednesday when he unveiled support for slowing down on the rate hike trajectory. The policymaker also showed his data dependency for future Fed decisions.
The voting member of the Federal Open Market Committee (FOMC) also unveiled his support for no rate change in June monetary policy meeting but marked surprise from the stable natural rate level.
It should be noted that the Fed Vice Chair Williams quoted remarkably “well-anchored” inflation expectations but cited that fate of inflation is up to the Fed.
Even so, Fed’s Williams marked the need for the US central bank to balance the demand and supply flow, indirectly suggesting higher rates ahead.
Key statements
I’m not content with where inflation is right now.
I see progress on inflation but price pressures still too high.
Economy still has strong demand for labor.
FX implications
Being the statements from one of the key Fed members, the markets reacted to the mostly hawkish comments by supporting the US Dollar, in hopes of higher rates from the US central bank. The same joins the upbeat FOMC Minutes to weigh on the EUR/USD, pressured at a weekly low of around 1.0850.
Also read: EUR/USD bears move closer to the edge of the abyss after FOMC minutes and ahead of a slew of key US data
- GBP/USD bounces off 200-HMA to pare Wednesday’s losses, lacks clear directions of late.
- UK/US PMIs, US ADP Employment Change decorate the calendar.
- Steady RSI, sluggish MACD signals keep Cable buyers on the table.
- Three-week-long horizontal region appears strong upside hurdle; Pound Sterling bears aim for 1.2660 after 200-HMA break.
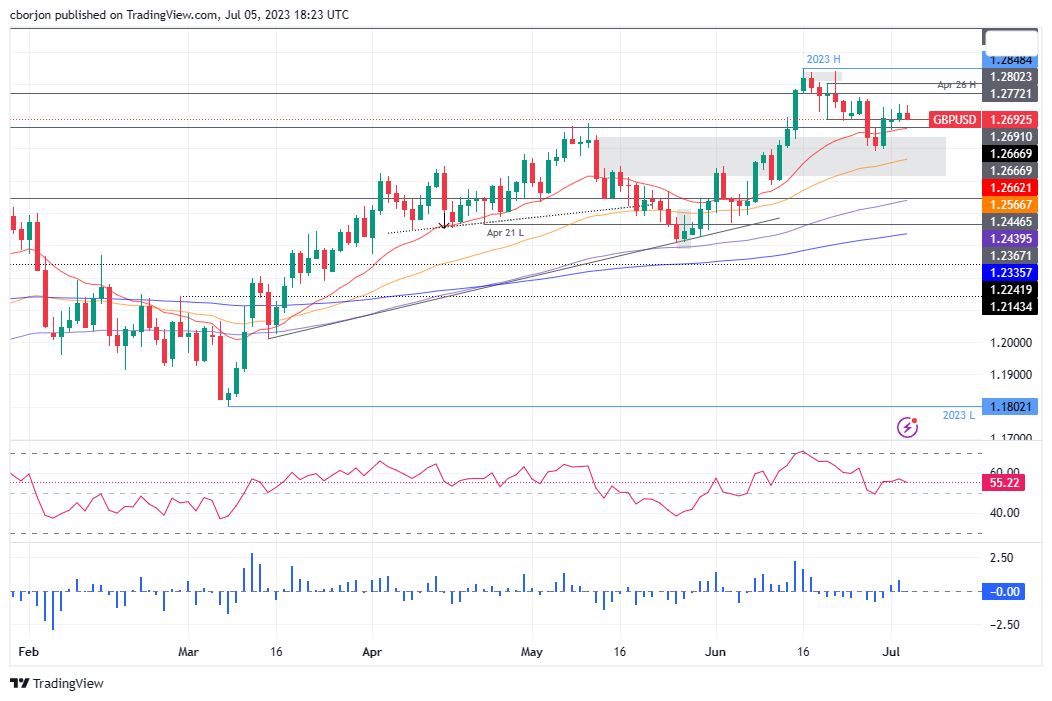
GBP/USD picks up bids to reverse the latest daily losses while defending the 1.2700 round figure as it prints the 1.2705 mark amid the early hours of Thursday’s Asian session. In doing so, the Cable pair bounces off the 200-Hour Moving Average (HMA).
Also read: GBP/USD drops below 1.2700 post FOMC minutes release
It’s worth noting that the Pound Sterling’s latest rebound from the key moving average justifies the steady RSI (14) line, as well as sluggish MACD, which in turn suggests the pair’s another attempt to cross a downward-sloping resistance line from June 27, at 1.2735 by the press time.
Following that, the 61.8% Fibonacci retracement of June 16-29 fall, at 1.2750, can challenge the Cable buyers before directing them to a three-week-old horizontal resistance area surrounding 1.2805-10.
In a case where the GBP/USD price remains firmer past 1.2810, the odds of witnessing a tough fight to cross the previous monthly high of around 1.2850, which is also the yearly peak, can’t be ruled out.
On the flip side, a clear break of the 200-HMA level of 1.2690 can quickly fetch the Cable pair towards the late June swing high of around 1.2660. However, the June 29 bottom surrounding 1.2590 can challenge the GBP/USD bears afterward.
Should the Pound Sterling bears smash the 1.2590 level, they will aim for the previous monthly low of 1.2368.
GBP/USD: Hourly chart

Trend: Limited recovery expected
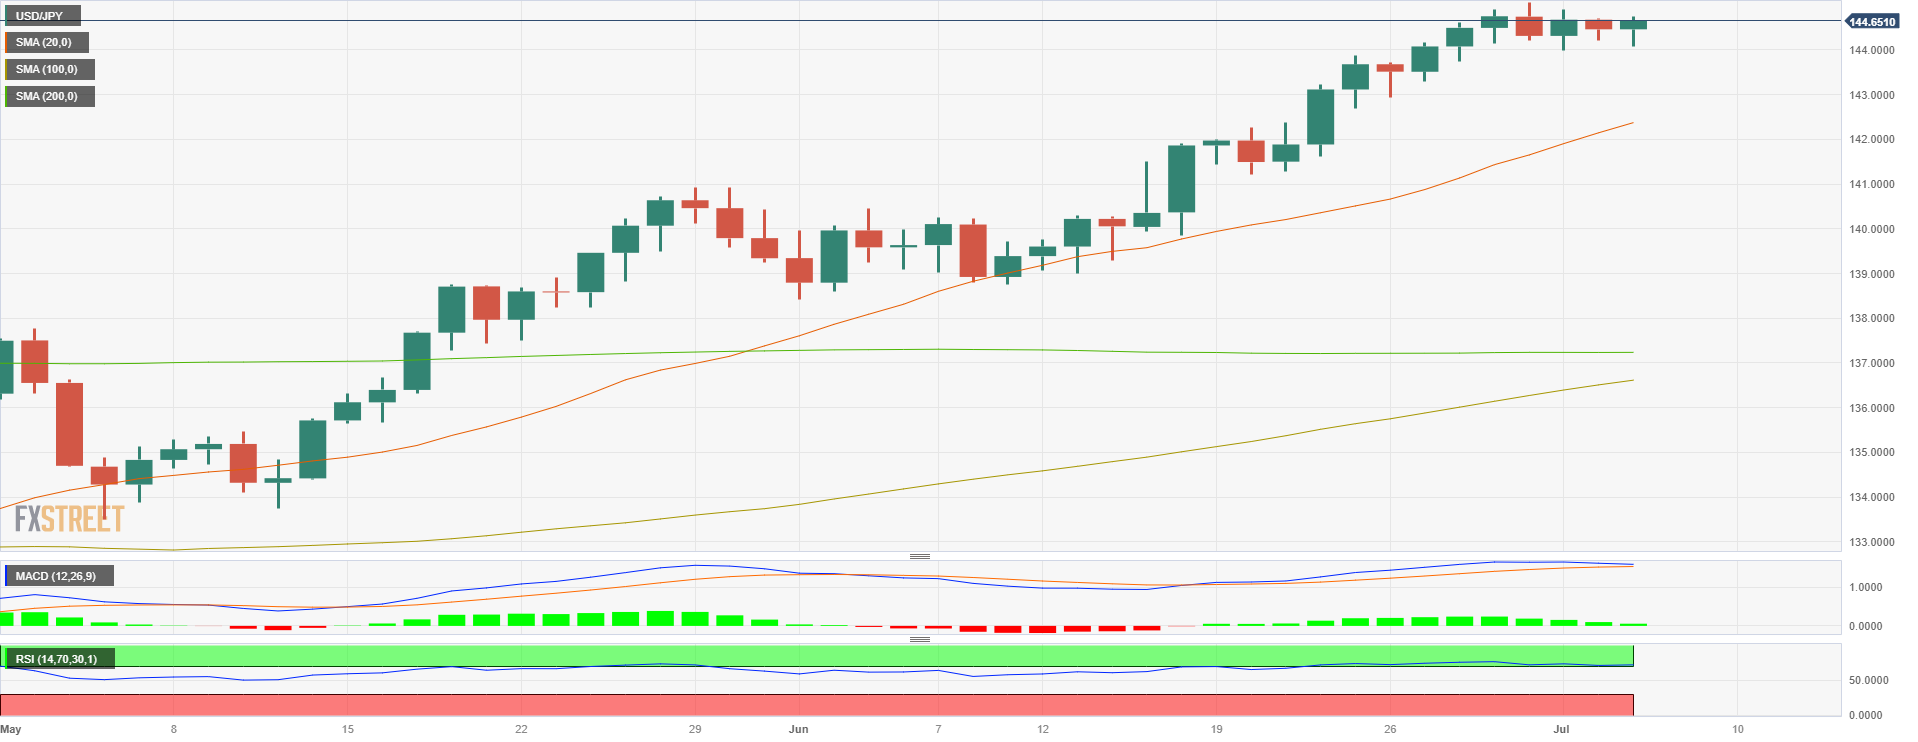
- BoJ intervention prospects raise prospects for a bearish correction in USD/JPY.
- USD/JPY bears are lurking at resistance and eye a significant correction.
USD/JPY edged higher on Wednesday with the US Dollar finding support ahead of a slew of key US events that included Wednesday's hawkish Federal Open Market Committee minutes that reinforced market expectations of another interest rate hike at the end of July.
Most Fed officials expected that the policymakers would eventually need to tighten policy further.
As a consequence, the US Treasury yields moved higher and added to earlier gains in the Greenback. ''Fed funds futures showed expectations of a 25 basis point hike at the end of a two-day policy meeting on July 26 rose to 88.7%, according to CME Group's FedWatch Tool,'' Reuters reported.
Indeed, USD/JPY has broadly moved higher in sync with the US 10-year Treasury yield. However, the market is also paying attention to the potential risk of intervention from the Bank of Japan. This opens the risk of a move lower in USD/JPY and the following illustrates a bearish technical scenario.
USD/JPY monthly chart
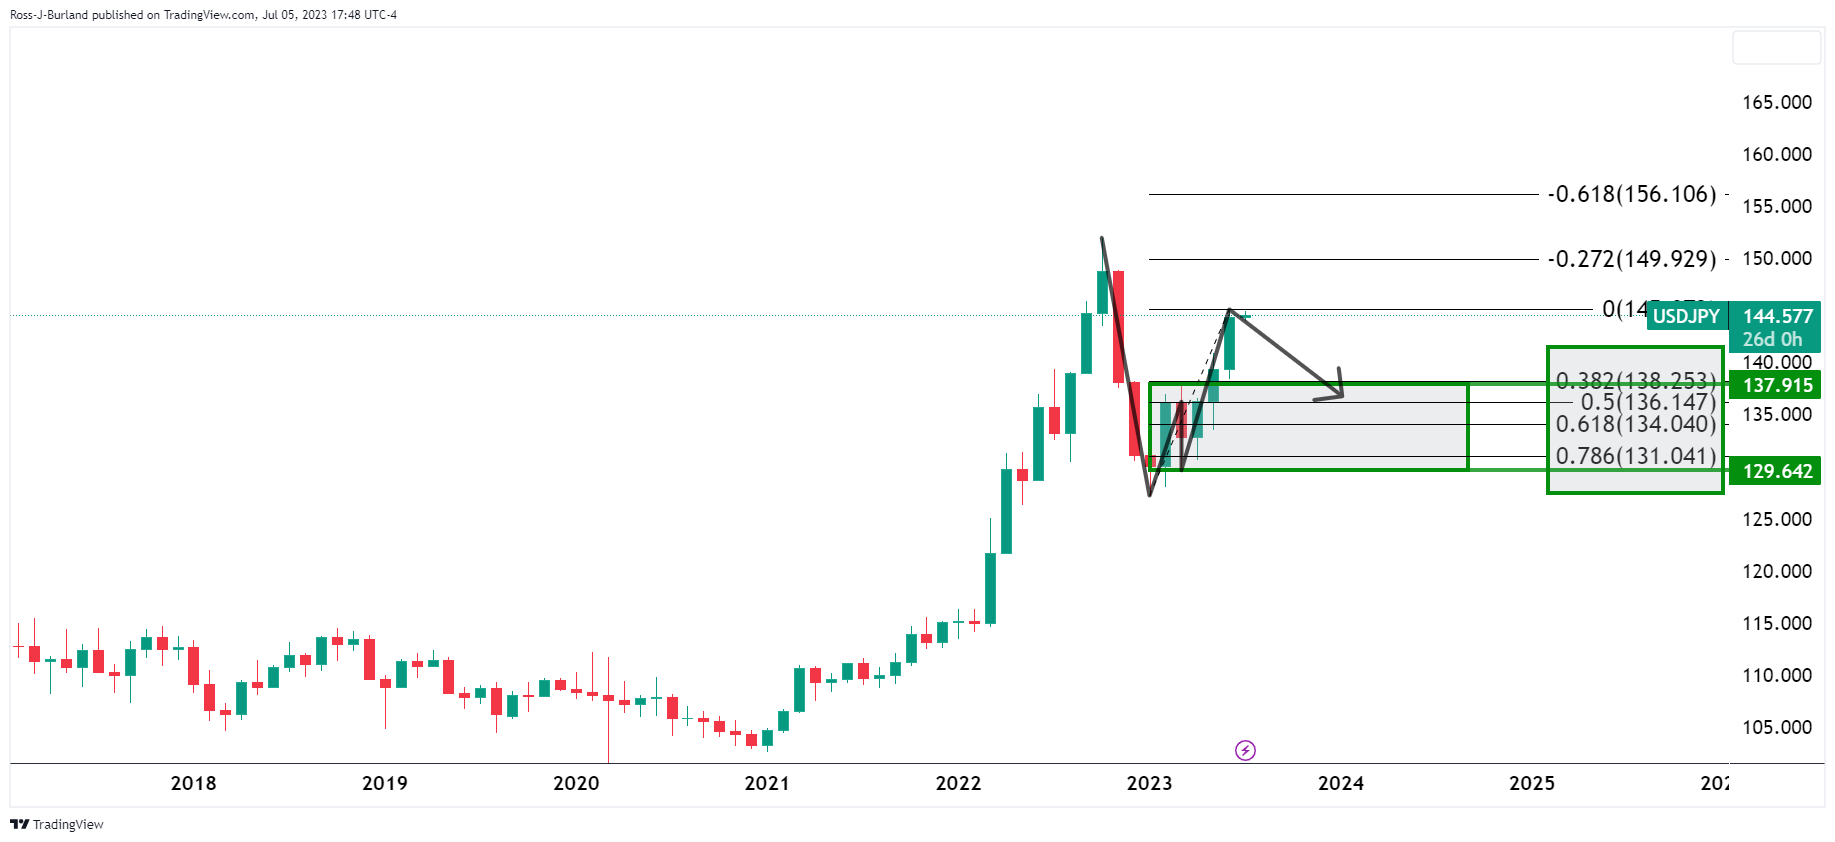
The monthly W-formation is compelling. This is a reversion pattern and if there is resistance here, then there is the possibility of a retracement back to the neckline that meets the 61.8% Fibonacci near 134 the figure.
USD/JPY weekly charts
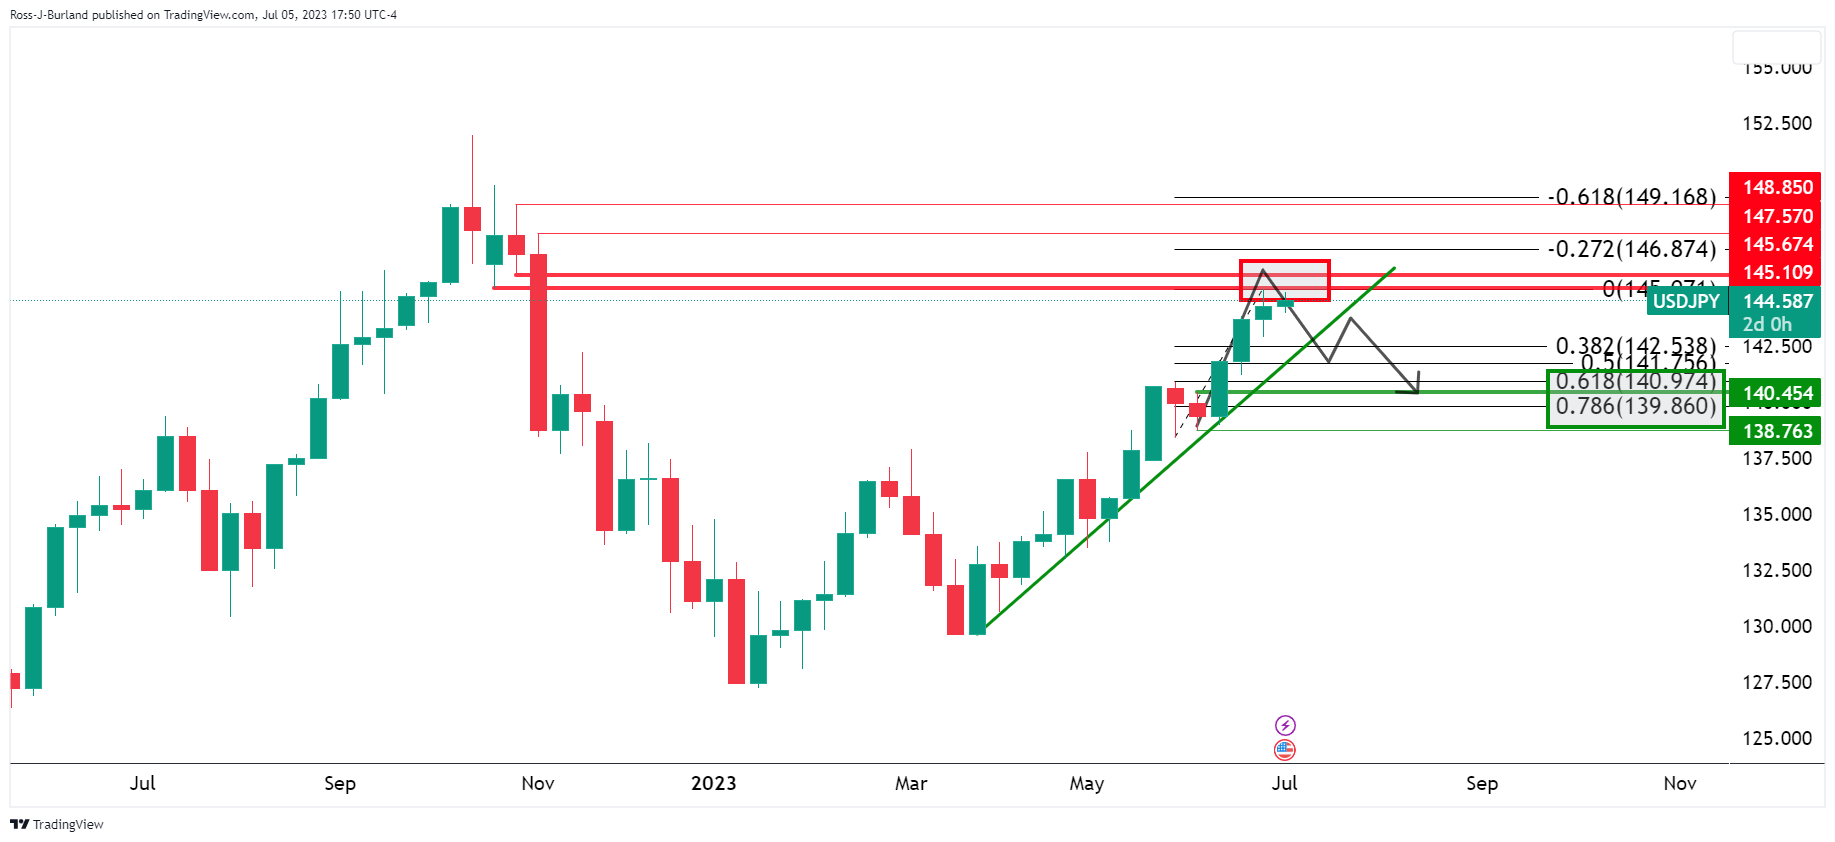
On a weekly chart, this might play out as follows, allowing for the ebbs and flows on the way down as bears take on the dynamic trendline support towards 140.50 and 50 pips below the weekly 61.8% ratio near 141.50

(Overall bearish trajectory bias, resistance and support levels).
USD/JPY bullish weekly outlook

However, while on the front side of the trendline, the bulls are in charge and that leaves 145.10 and space to 152.00 technically up for grabs.
- Gold Price drops back towards multi-month-old horizontal support amid risk-off mood.
- Sour sentiment, hawkish Federal Reserve Minutes propel US Dollar and weigh on XAU/USD.
- United States ADP Employment Change, ISM Services PMI eyed for clear directions.
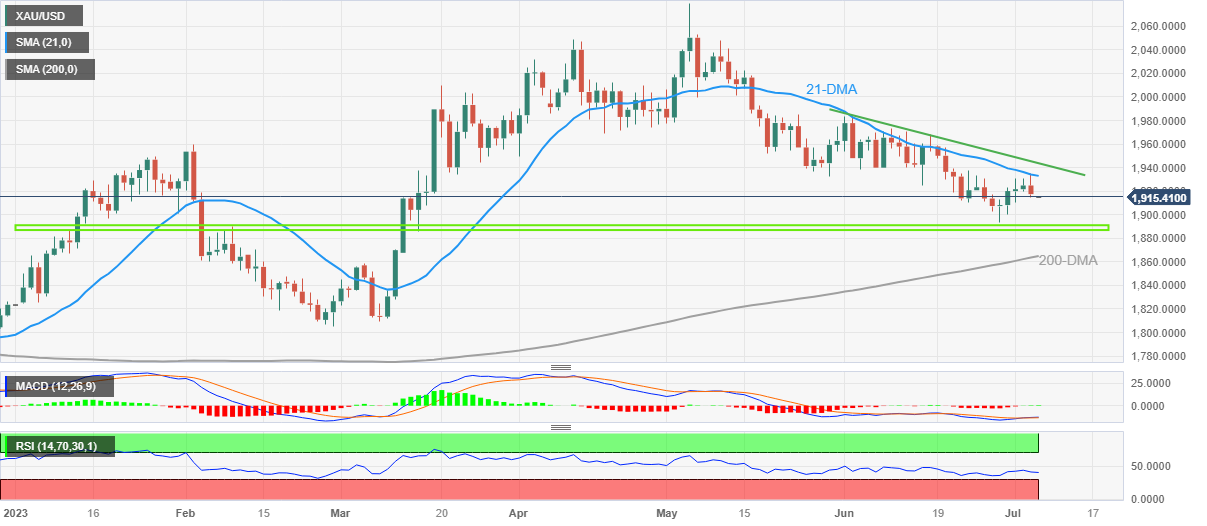
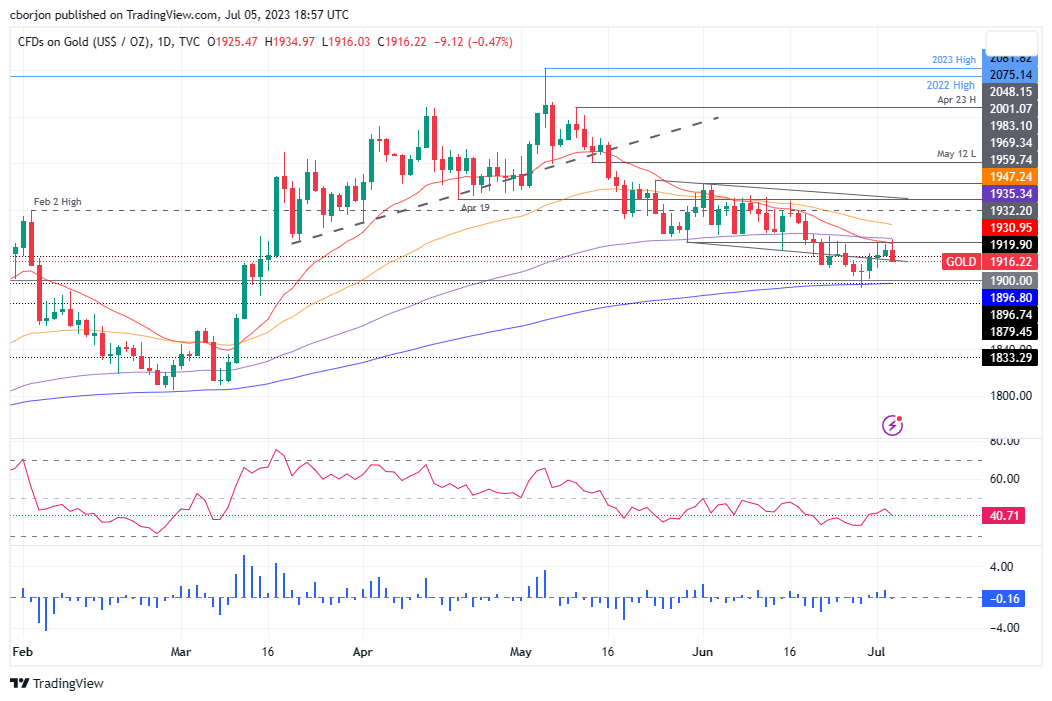
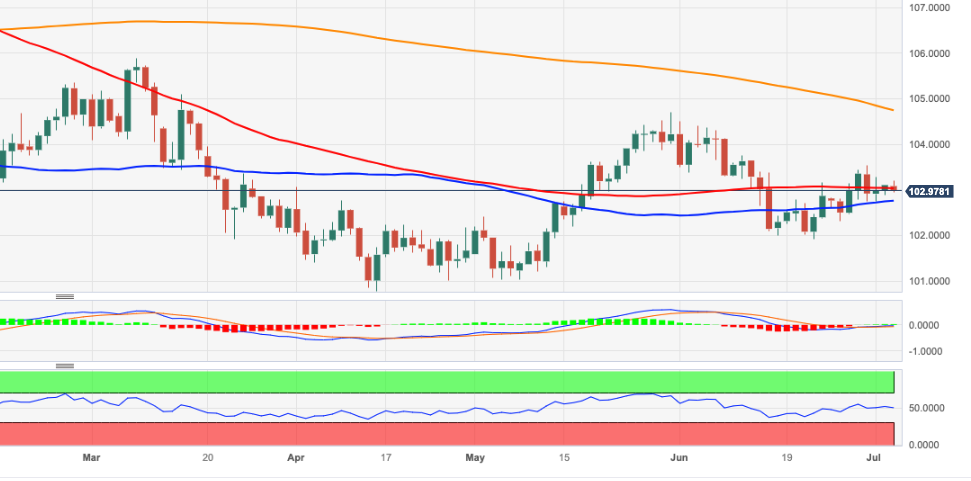
Gold Price (XAU/USD) remains pressured around $1,915 amid early Thursday morning in Asia, after fading the four-day uptrend, reversing from 21-DMA. In doing so, the XAU/USD not only braces for the key horizontal support but also takes clues from China concerns, as well as hawkish expectations from the Federal Reserve (Fed). That said, the XAU/USD pullback ignores softer United States data while tracing upbeat US Treasury bond yields.
Gold Price retreats amid China, Federal Reserve concerns
Gold Price bears the burden of China-inflicted fears while posting the first daily loss in five. That said, China’s top-tier housing players like Shimao Group, as well as the government-backed Sino-Ocean Group, feel the heat of the first fall in housing sales after four-month advances. Further, the headlines surrounding the US-China ties and fresh trade sanctions, as well as the downbeat Chinese PMIs, weigh on the risk appetite and the XAU/USD price.
On Wednesday, downbeat prints of China’s Caixin Services PMI for June, to 53.9 versus 57.1 prior, joined the escalating fears of the US-China tension amid fresh warnings of further trade restrictions from Beijing to weigh on the sentiment and prices of the riskier assets.
That said, China’s Global Times and former Vice Commerce Minister flagged hardships for the US IT companies, as well as metal players. Earlier on Wednesday, China announced abrupt controls on exports of some gallium and germanium products, effective from August 1. The dragon nation’s latest retaliation is in reaction to the US curb on AI chips’ shipments to Beijing.
Elsewhere, the Federal Open Market Committee (FOMC) Minutes for the June meeting stated that almost all members agreed to a pause in the rate hike trajectory while some policymakers showed an inclination for a July rate hike of around 0.25%. The Fed members also noted a reduction in bank stress, improvement in economic conditions and substantial improvement in bond issuance.
Talking about the data, US Factory Orders reprints 0.3% MoM growth for May versus 0.8% expected. The official publication also mentioned that the new orders for manufactured durable goods in May rose for the third consecutive month. Earlier in the week, the US ISM Manufacturing PMI and S&P Manufacturing PMI came in softer and propelled the Gold Price.
Amid these plays, the markets almost priced in the June Fed rate hike by 0.25% and weighed on the Gold Price while the Wall Street benchmarks closed in the red and the US Treasury bond yields, as well as the US Dollar Index (DXY) rose.
Looking ahead, the risk catalysts will be crucial to watch for clear directions of the Gold Price. Among them, China headlines and recession woes will be in the spotlight. Additionally, the US ISM Services PMI and ADP Employment Change for June will be crucial as both of them will help determine Friday’s all-important Nonfarm Payrolls (NFP) and affect the XAU/USD prices.
Gold Price Technical analysis
Gold Price retreats from the 21-DMA, around $1,934 by the press time, to pare the first weekly gain in four.
Adding strength to the pullback move are the sluggish signals from the Moving Average Convergence and Divergence (MACD) indicator, as well as the below-50 conditions of the Relative Strength Index (RSI), placed at 14.
With this, the XAU/USD appears well-set to prod the $1,900 round figure but a six-month-old horizontal area, around $1,890-85, appears a tough nut to crack for the Gold bears.
In a case where the Gold Price drops below $1,985, the 200-DMA support of around $1,863 and early March swing high near $1,858 may act as the final defenses of the buyers.
On the contrary, a daily closing beyond the 21-DMA hurdle of $1,934 isn’t an open ticket to the Gold buyers as a downward-sloping resistance line from June 02, close to $1,945 at the latest, can challenge the XAU/USD upside.
Even if the Gold Price crosses the $1,945 hurdle, bulls need to remain cautious below the previous monthly high of around $1,985.
Overall, the Gold price is likely to witness a short-term downside ahead of the top-tier United States data.
Gold Price: Daily chart
Trend: Limited downside expected
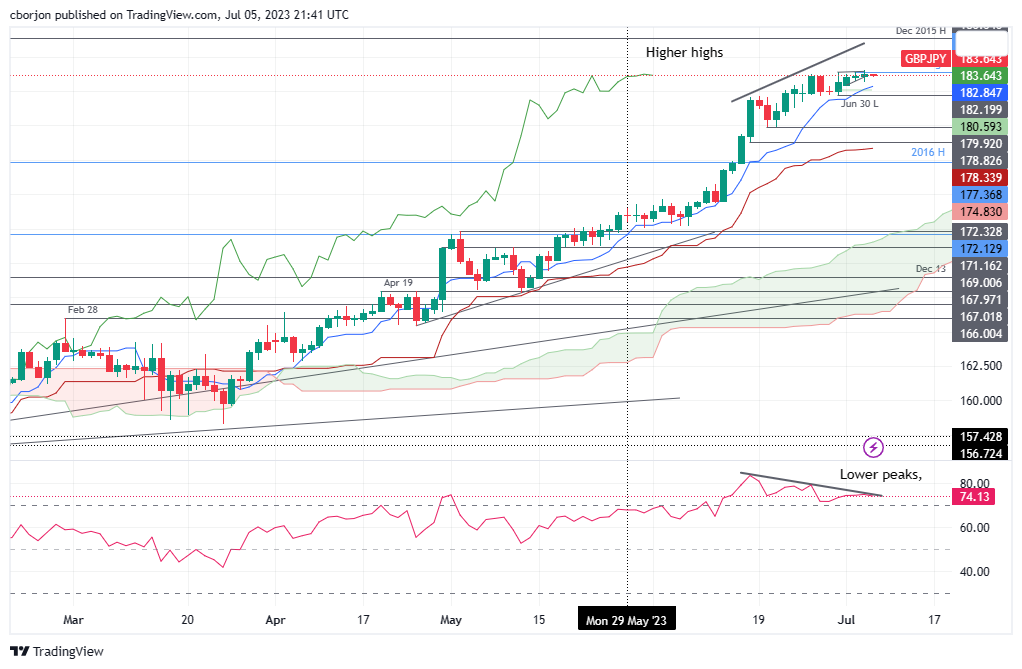
- GBP/JPY wavers around 184.00, with intervention from Japanese authorities limiting a further upward push.
- Negative divergence in the Relative Strength Index (RSI) indicates potential downward movement for the GBP/JPY.
- Key support and resistance levels lie in wait, with an immediate downside target at 183.00 and an upside potential at 185.00.
GBP/JPY begins the Asian session on a lower note. The GBP/JPY finished Wednesday's session extending its gains to four straight days but failed to decisively break stubborn resistance at 184.00, near the year-to-date (YTD) high. At the time of writing, the GBP/JPY is trading at 183.70, losses a minuscule 0.01%.
GBP/JPY Price Analysis: Technical outlook
The GBP/JPY uptrend remains capped at around the 184.00 figure. Japanese authorities' language intervention in the Forex markets keeps the Japanese Yen (JPY) from weakening, putting a lid on GBP/JPY buyers' attempt to crack 184.00. As the GBP/JPY reaches a higher-high, the Relative Strength Index (RSI) prints lower peaks, suggesting a negative divergence formed, suggesting further GBP/JPY downside is expected.
Nevertheless, the GBP/JPY must drop below 183.00, so it can expose the Tenkan-Sen line at 182.84. A breach of the latter will expose the June 30 daily low at 182.19, followed by the 182.00 figure. Once broken, the GBP/JPY next support would be the Senkou Span A, at 180.59.
Conversely, a rally above the year-to-date (YTD) high of 184.01 would expose the 185.00 figure, followed by the December 2015 daily high at 186.34.
GBP/JPY Price Action – Daily chart
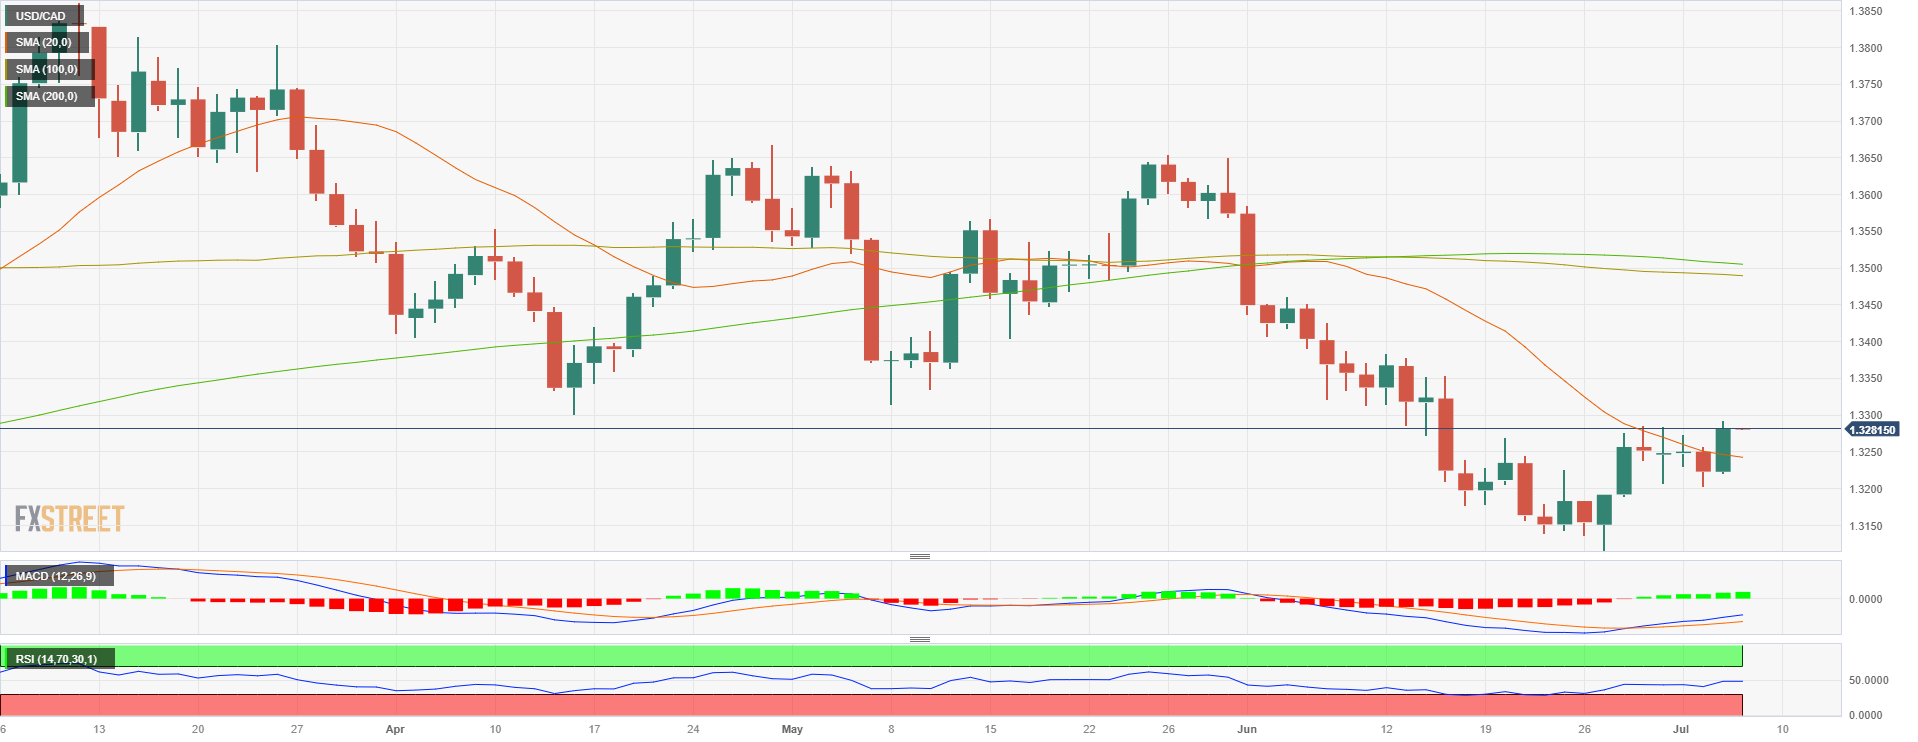
- The USD/CAD jumped above the 20-day SMA for the first time since early June to 1.3285.
- Rising yields following hawkish FOMC minutes benefitted the USD.
- Rising Oil prices to limit falling CAD losses.
Following the release of hawkish FOMC minutes, the USD/CAD pair surged above the 20-day simple moving average (SMA), reaching 1.3285. The increase in yields, driven by members of the Committee supporting a 25 bps hike in the June meeting, favoured the US Dollar, contributing to the pair's upward momentum. However, the West Texas Intermediate Crude Oil (WTI) is seeing more than 1% gains on the day and limits the CAD’s downside potential.
Based on the minutes of the FOMC meeting in June, it was revealed that while some members of the Committee supported a 25 basis point increase despite agreeing to pause the hike temporarily. These members were concerned that tightening the labour market could lead to inflationary pressures. Therefore, they decided to pause and assess the impact of monetary policy on the US economy before making any further decisions. The Committee also reached a consensus to maintain rates in a restrictive stance.
Following this development, there was a general increase in US yields. Specifically, the 2-year yield rose to 4.95%, a 0.78% increase, while the rates for the 5-year and 10-year bonds reached 4.24% and 3.93%, rising by 1.81% and 1.90%, respectively.
Regarding the next Federal Reserve (Fed) meeting in July, markets anticipate a 25 basis points hike. However, investors await crucial labour market data for the US from June on Thursday. The employment figures, to be released by the ADP Research Institute on Thursday, are expected to be around 228k, indicating a deceleration from the previous figure of 278k. Additionally, the US Department of Labor Jobless Claims is projected to rise to 245k on a weekly basis.
USD/CAD levels to watch
On the daily chart, the USD/CAD appears neutral to bullish in the short term. Despite standing in negative territory, the Relative Strength Index (RSI) and the Moving Average Convergence Divergence (MACD) are gaining momentum, suggesting that the buyers are gearing up for another upwards leg.
Support Levels to watch: 1.2345 (20-day Simple Moving Average), 1.2320, 1.3190.
Resistance Levels to watch: 1.3300, 1.3320, 1.3350.
USD/CAD Daily chart
- AUD/USD are moving in and testing the bull's commitments in key weekly support area.
- Bears eye a break towards the 0.6640s while below 0.6670 near term.
AUD/USD is lower on the day, down some 0.57% at the time of writing after falling from a high of 0.6698 to a low of 0.6652. The currency has been better offered following the Reserve Bank of Australia which kept interest rates at 4.10%. Markets, however, expect that September will most likely be the timing for the next rate increase, and this has been reflected in the price over the last weeks.
Meanwhile, from a technical perspective, AUD/USD bulls have moved aside and the bears are taking control into a key support area on the charts as the following multi-time-frame analysis will illustrate
AUD/USD weekly charts
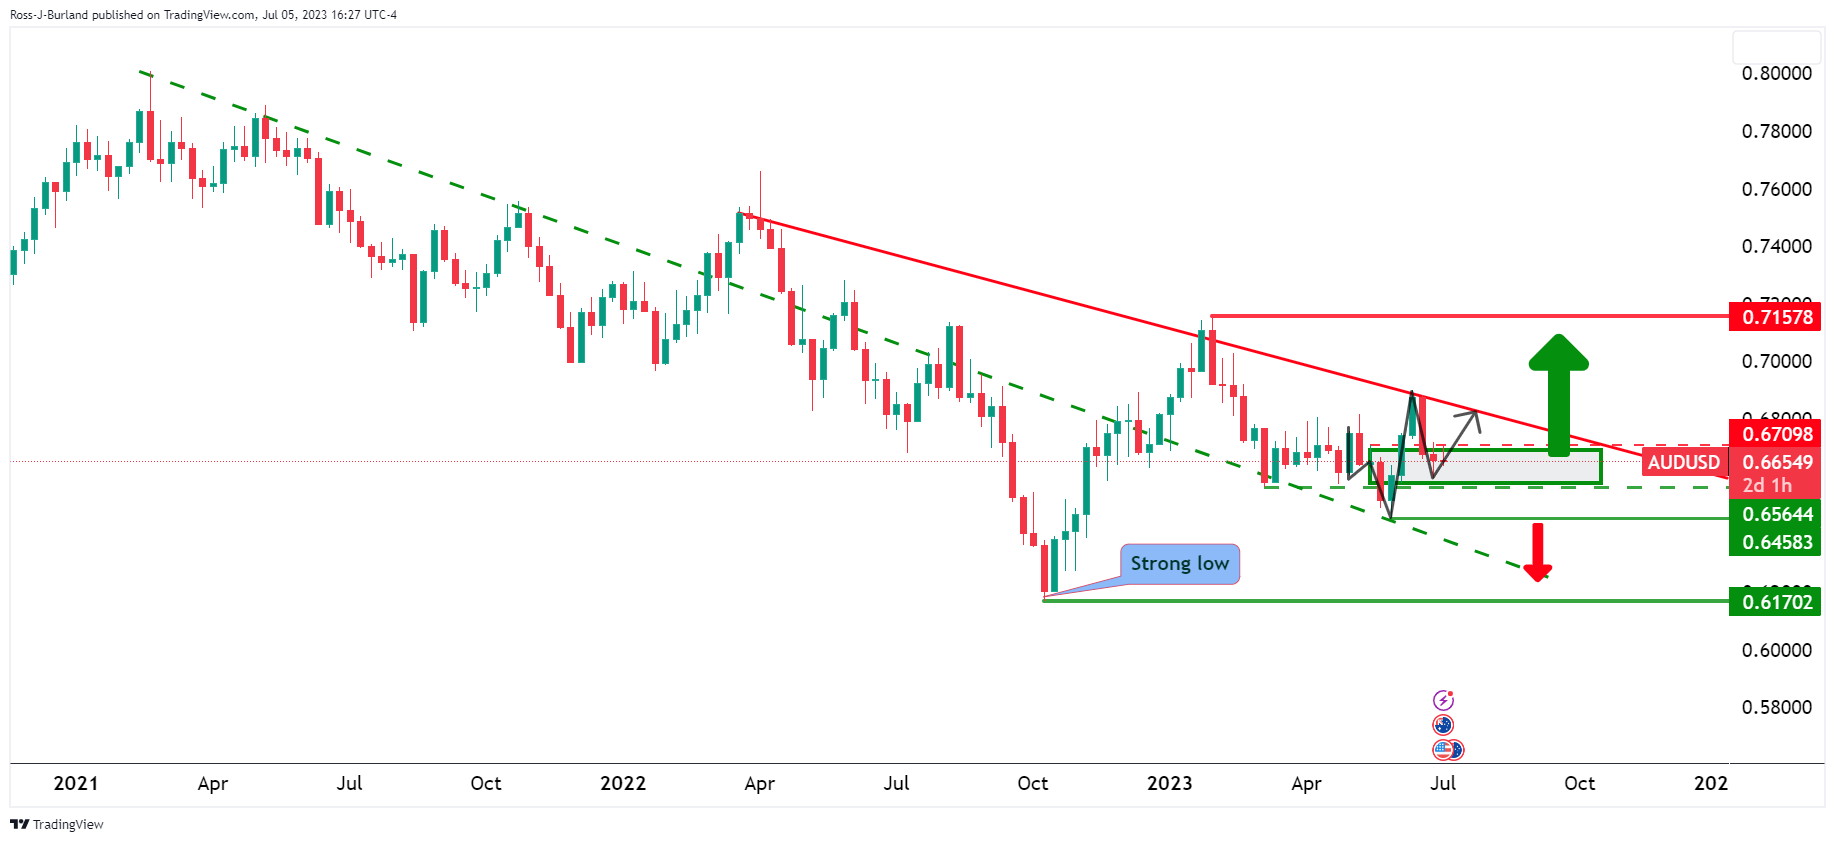
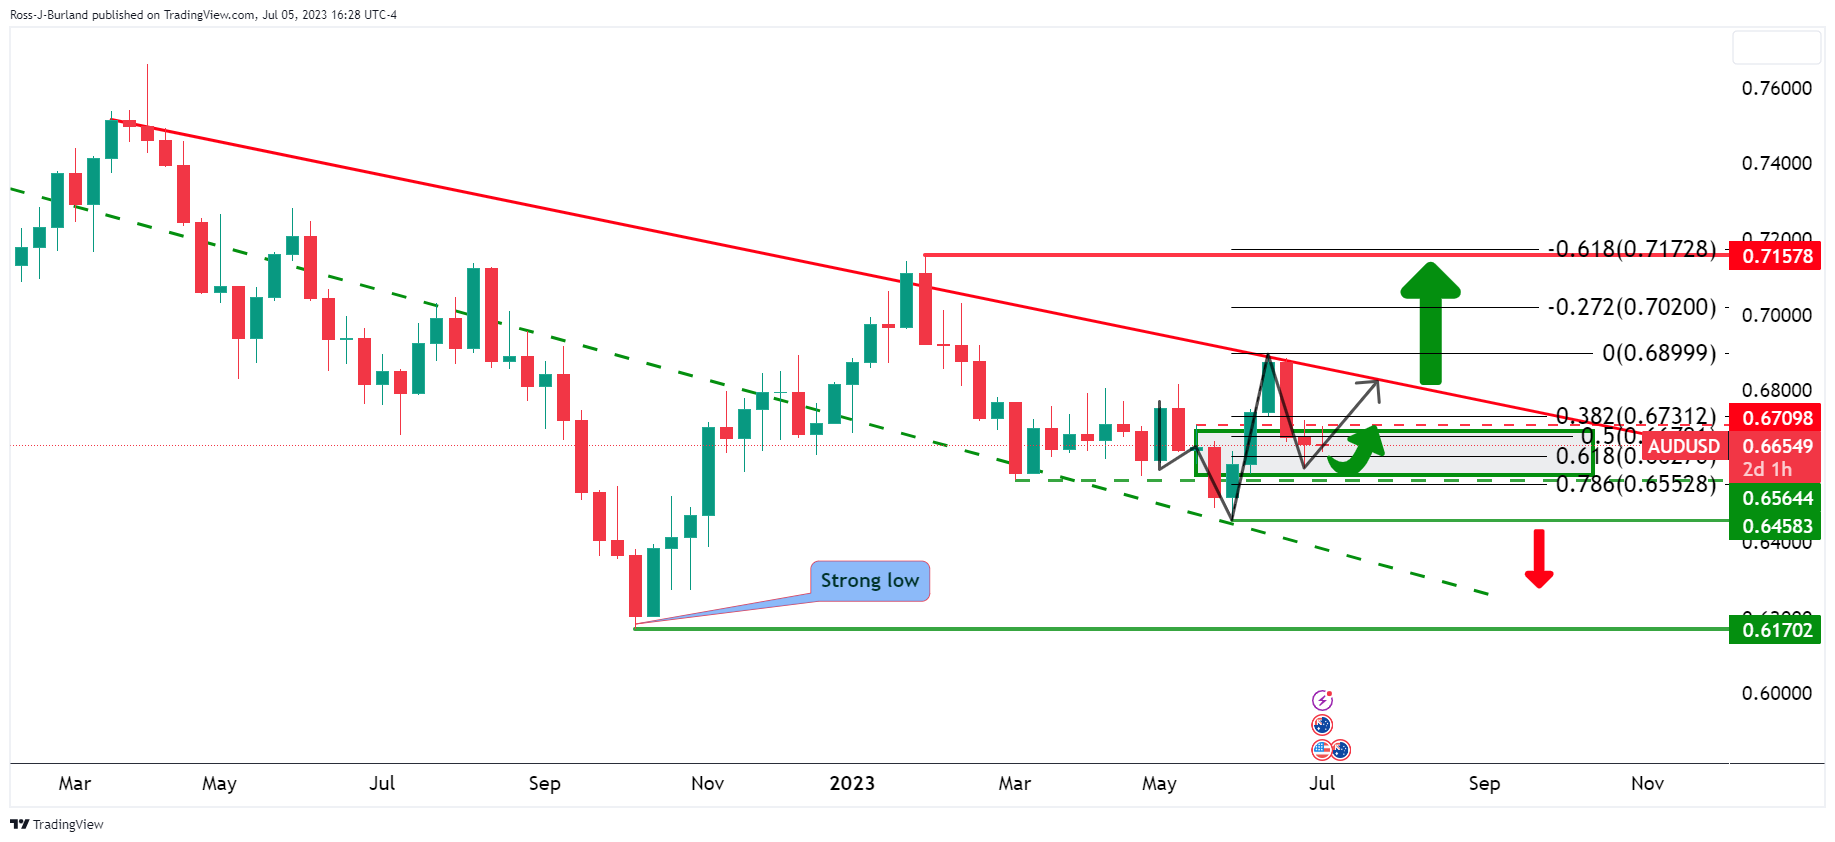
Zoomed in, we can see that the price broke a key 0.6710 resistance to recently form a fresh daily high which has changed the bearish character to bullish after a sweep of stops below the prior 0.6450 channel support. If bulls commit in the area between the 50%, 61.8% and 78.6% ratios, the neckline of the bullish W-formation, then there are firm possibilities of a retest of the trendline resistance in the build-up to higher highs with eyes set on the 0.7150s.
AUD/USD daily chart

However, this current price action is bearish and risks a test of below 0.6640 and then 0.6600. A break there will leave 0.6537 vulnerable and then the swing low in the 0.6450s.
AUD/USD H1 chart
This leaves near-term prospects bearish while below the hourly resistance of the M-formation's neckline and resistance 0.6670 above as follows:

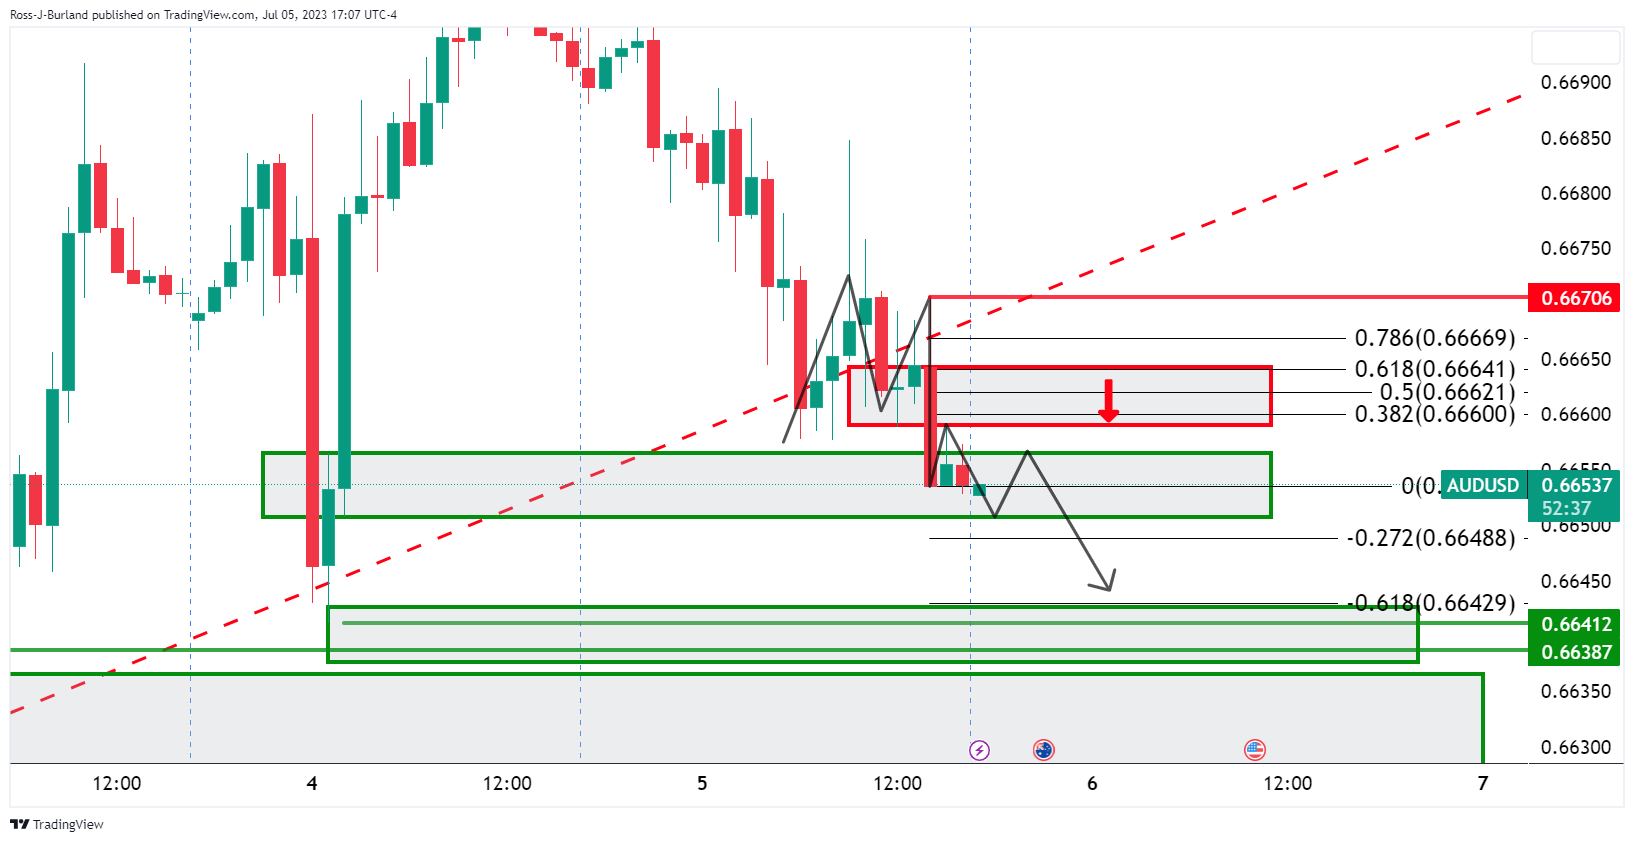
The 0.6640s are vulnerable for a test in the session ahead that guards a run to 0.6620 and in-the-money long positions below the weekly 61.8% Fibonacci ratio as drawn on thew weekly chart above.
- WTI surged 1.28%, buoyed by high US crude exports and OPEC+’s commitment to output cuts.
- Extension of production cuts into August is expected to tighten the oil market further, analysts report.
- Potential rate hikes by the Federal Reserve and global economic slowdown threaten the upward momentum.
Western Texas Intermediate (WTI), the US crude oil benchmark, rose on Wednesday after Tuesday’s holiday in the United States (US), keeping prices almost unchanged due to thin volumes amidst US traders’ absence. Hence, WTI is trading at $71.86 per barrel, up by 1.28%, after hitting a daily low of $70.40.
WTI surges on supply tightening measures, but macro-economic factors cast a shadow
Government data revealed that US crude shipments for the week ending June 23 finished at or near record highs with a daily volume of 5.338 million barrels. The week before was 4.543 million, being the June 16 week, while for the week ended June 9, exports were at 3.27 million daily. Therefore, WTI exports have doubled over the last three weeks.
That keeps WTI underpinned, alongside crude oil output cuts by Saudi Arabia and Russia, which extended its 1 million and 500,000 barrels per day cut to August.
Analysts quoted by Reuters said, “The July voluntary cuts and the extension into August should considerably tighten the oil market, but investors will stay on the sidelines until oil inventories show substantial draws.”
The Organization of Petroleum Exporting Countries and its allies, known as OPEC+, gathered at an industry event on Wednesday and commented the cartel will keep its efforts to support a “stable and balanced oil market.”
In the meantime, a global economic slowdown, seen after the release of the Manufacturing and Services PMI, could cap WTI prices. That and higher interest rates in the United States (US) can keep US crude oil prices meandering around the $70.00 per barrel price after June’s Federal Reserve (Fed) meetings showed divisions amongst policy markets pausing on increasing interest rates. It should be noted that a July rate hike is almost certainly, which could boost the greenback, a headwind for US Dollar (USD) denominated commodities.
WTI Technical Levels
- NZD/USD failed to consolidate above the 100-day SMA at 0.6190 and retreated towards the 0.6180 zone.
- FOMC minutes revealed that some members wanted to hike by 25 bps in the last meeting.
- The USD gained interest on the back of hawkish bets on the Fed and rising US yields.
On Wednesday, the Kiwi failed to hold gains that took the NZD/USD pair above the 100-day Simple Moving Average (SMA) and turned south towards 0.6180. Following the minutes, US Treasury yields rose, benefiting the greenback while investors eagerly await labour market data.
US yields rise after hawkish FOMC minutes. Eyes on labour market data
According to the FOMC minutes from the latest June meeting, despite anonymously agreeing to pause, some members of the Committee supported the case of hiking by 25 basis points. In that sense, driven by a tight labour market, members worried that it might fuel inflationary pressures but considered pausing to assess the effects of monetary policy on the US economy. In addition, members agreed that it would be appropriate to maintain rates in a restrictive stance.
As a reaction, the US yields rallied across the board. The 2-year yield rose to 4.95% while the 5 and 10-year bond rates to 4.24% and 3.93%, respectively. As bond yields tend to favour the local currency's value, the USD gained interest.
That being said, the focus now turns to June's crucial US labour market data. On Thursday, the ADP Research Institute will release employment figures expected to come in at 228k and decelerate from its previous 278k and the US Department of Labor Jobless Claims is expected to accelerate to 245k on a weekly basis.
NZD/USD Levels to watch
According to the daily chart, the technical outlook for the NZD/USD has turned neutral for the short term as there is no clear dominance between buyers and sellers. In addition, the 20, 100 and 200-day SMA converge towards the 0.6200 area, awaiting a fundamental catalyst.
Support Levels to watch: 0.6170 (200-day SMA), 0.6160(20-day SMA), 0.6130.
Resistance Levels to watch: 0.6190 (100-day SMA), 0.6200, 0.6210.
NZD/USD Daily chart

Market participants will continue to digest the FOMC minutes and prepare for the upcoming economic reports about the US labor market. During the Asian session, Australia will report trade data, and later in Europe, Eurozone Retail Sales are due.
Here is what you need to know on Thursday, July 6:
US markets dropped moderately on Wednesday on the back of tensions between China and the US, as well as following reports of softer economic activity. The Chinese Caixin Services dropped more than expected, and Japanese, Australian, and Eurozone PMIs were revised lower. Additionally, US Factory Orders rose below expectations.
Data from the US on Wednesday showed an increase in Factory Orders in May of 0.3%, below the market consensus of 0.8%. On Thursday, the focus will turn to labor market data with the ADP private employment report, Jobless Claims, and JOLTS. These numbers will be followed on Friday by the Nonfarm Payrolls report. Also on Thursday, the ISM Services PMI is due.
The FOMC minutes of the June meeting, when the central bank skipped, showed no major surprises. Some members "favored" a 25 basis points rate hike. The message continues to be that members see more rate hikes ahead, and the markets are finally believing the Fed.
US yields rose, supporting the US Dollar. The 10-year yield climbed to 3.95%, the highest level since mid-March. The DXY rose for the third day, rising above 103.30 but remains under the critical level of 103.50. The short-term direction of the US Dollar will likely be US labor data dependent.
The final June Services PMI from the Eurozone was revised modestly lower, and also the Composite PMI, which dropped below 50 for the first time since December. The Eurozone Producer Price Index declined in May by more than expected, with a monthly slide of 1.9% and the annual rate falling from 0.9% to -1.5%. On Thursday, Germany will report Factory Orders, and Eurozone Retail Sales.
EUR/USD failed to retake 1.0900 and dropped toward 1.0850, as the Euro lagged and the Dollar outperformed. EUR/GBP fell to one-week lows under 0.8550. GBP/USD remained sideways around 1.2700, supported by the 20-day Simple Moving Average.
USD/JPY continued to move in the recent range around 144.50, with the focus on the 145.00 potential intervention level. Higher government bond yields and the divergence between the Bank of Japan and other central banks supports the uptrend.
NZD/USD dropped marginally after being unable to hold above 0.6200. The Kiwi outperformed among commodity currencies. AUD/USD ended a four-day positive streak after failing to retake 0.6700. The pair dropped to 0.6650, the day after the Reserve Bank of Australia (RBA) kept rates on hold. AUD/NZD fell for the fourth day in a row, reaching the weakest level since late May at 1.0760.
USD/CAD rose from 1.3220, approaching 1.3300, hitting the strongest level in two weeks. The Loonie failed to benefit from higher crude oil prices. The WTI barrel rose 1.25%, hitting weekly highs near $72.00.
Gold spiked to $1,935 but later reversed, falling below $1,920 and ending the day looking vulnerable. On the contrary, Silver rose 0.70% and finished above $23.00. Cryptocurrencies declined, with Bitcoin falling 1.05% to $30,465, and Ethereum dropping to $1,910.
Like this article? Help us with some feedback by answering this survey:
- USD/JPY jumped above 144.60 after hitting a daily low of 144.07 earlier in the session.
- Minutes from the June FOMC meeting revealed that most participants supported a 25 bps hike.
- Rising yields made the USD gain traction.
On Wednesday, the USD/JPY trades higher as the USD gains interest after the Federal Open Market Committee (FOMC) minutes from the June meeting revealed a hawkish stance from its members, with most supporting future rate hikes. In response, the shorter-term US Treasury bond yields rose as markets expect a more aggressive Federal Reserve (Fed) moving forward.
FOMC minutes from June’s meeting reveal a hawkish stance from members
Committee members support the case for hiking interest rates by 25 basis points in the future, according to the FOMC minutes from the latest June meeting – their view shapped predominantly by a tight labour market. The board's ultimate decision was to pause rate hikes, as Jerome Powell considered it necessary to first assess the effects of monetary policy so far on the US economy.
In addition, the minutes revealed that all participants agreed that maintaining a restrictive stance would be appropriate. It's worth noticing that the dot plots in the last monetary policy statement showed that most members see the terminal rate peaking at 5.50% this year, meaning that they foresee an additional 25 bps hike. As a reaction, the reassurance of an aggressive stance by the Fed members fueled the US bond yields, with the 2, 5 and 10-year yields showing gains of 0.50-2% following the release of the minutes.
That being said, investors will eye the release of ADP Employment change data on Thursday and Non-Farm Payrolls on Friday to continue modelling their expectations regarding the next Fed meeting.
USD/JPY Levels to watch
According to the daily chart, the technical outlook for the USD/JPY is bullish in the short term. However, indicators are losing steam, with the Relative Strengh Index (RSI) correcting overbought conditions and the Moving Average Convergence Divergence (MACD) printing decreasing green bars.
Support Levels to watch: 144.00, 143.70,143.30
Resistance Levels to watch: 144.90, 145.00 (psychological mark), 145.07 (June 30 high).
USD/JPY Daily chart
- EUR/USD is breaking down technically as we head into key US data events.
- FOMC minutes prop up the hawkish sentiment and the US Dollar.
EUR/USD fell by some 0.25% on Wednesday, weighed by a weaker-than-forecast eurozone PMI and PPI, risk-off tones surrounding China noise and by the Federal Open Market Committee minutes that have cemented the current hawkish sentiment.
The US Dollar has been climbing of late and jolted higher in late trade in New York ahead of more critical US data releases Thursday and Friday. Firstly, worries that trade frictions between China and the US could escalate kickstarted a move up in the Greenback this week. China made an abrupt announcement on Monday of controls from Aug. 1 on exports of some gallium and germanium products which has ramped up a trade war with the United States and could potentially cause more disruption to global supply chains. ''Analysts have described Monday's move as China's second - and bigger - countermeasure in the long-running US-China tech fight, coming after it banned some key domestic industries from purchasing from US memory chipmaker Micron (MU.O) in May,'' Reuters wrote on the matter.
Eurozone inflation expected to fall
Domestically, eurozone data disappointed and follows a mixed inflation report that was released at the end of June whereby the headline beat expectations, but while the data accelerated 5.5% in June it was lower than May’s 6.1% increase. The Core HICP inflation rose to 5.4% YoY in June, compared with May’s figure of 5.3%. But markets had forecasted a 5.5% clip. On Wednesday, the eurozone reported soft final June services and composite PMIs.:
Both headline services and composite PMIs fell four ticks from the preliminary to 52.0 and 49.9, respectively. ''This was the first sub-50 reading for the composite since December and confirms our view that the eurozone is slipping into recession,'' analysts at Brown Brothers Harriman explained.
''Looking at the country composite readings, Germany fell two ticks from the preliminary to 50.6 and France fell one tick to 47.2. Italy and Spain reported for the first time and their composites came in at 49.7 and 52.6, respectively. Both fell more than two full points from May. Italy has joined France below the key 50 boom-bust line and it’s only a matter of time before other nations do as well,'' the analysts added and explained that eurozone inflation expectations continue to fall:
''The monthly ECB survey showed inflation expectations for the next 12 months fell to 3.9% in May vs. 4.1% in April and 5.0% in March. For three years ahead, inflation expectations remained steady at 2.5% vs. 2.9% in March. The ECB will be happy to see the drop and should allow the doves to retain control of the narrative at the July 27 meeting''
Markets are expecting the ECB to hike 25bp two more times and World Interest Rate Probability, WIRP, suggests odds of a 25 bp hike are near 90% this month.
Hawkish FOMC minutes props up the US Dollar
Meanwhile, in the US, the Federal Open Market Committee (FOMC) released the minutes of its June meeting, triggering a rise in the Greenback. According to the document, some officials favoured a rate hike at the meeting but went along with a pause. The minutes showed a division among FOMC members. “Most participants observed that uncertainty about the outlook for the economy and inflation remained elevated and that additional information would be valuable for considering the appropriate stance of monetary policy”, the minutes noted.
More here: FOMC minutes: Some officials favoured a 25bps hike at the June meeting
Now, the focus is on the US jobs data where the nation will report on layoffs on Thursday, Jobless Claims, ISM Services and JOLTS ahead of Friday's Nonfarm Payrolls report. This slew of fresh data would be expected to overshadow today's FOMC minutes and offer clues as to the next move from the Fed where there is a possibility of two more hikes this year.
''US payrolls likely remained above-trend in June, but still representing slowing after ~300k expansions in Apr-May. We also look for the UE rate to drop a tenth to 3.6% and for wage growth to print 0.3% MoM,'' analysts at TD Securities said.
Other than this week's events, traders will then be looking ahead to next Wednesday's Consumer Price Index.
EUR/USD and US Dollar charts
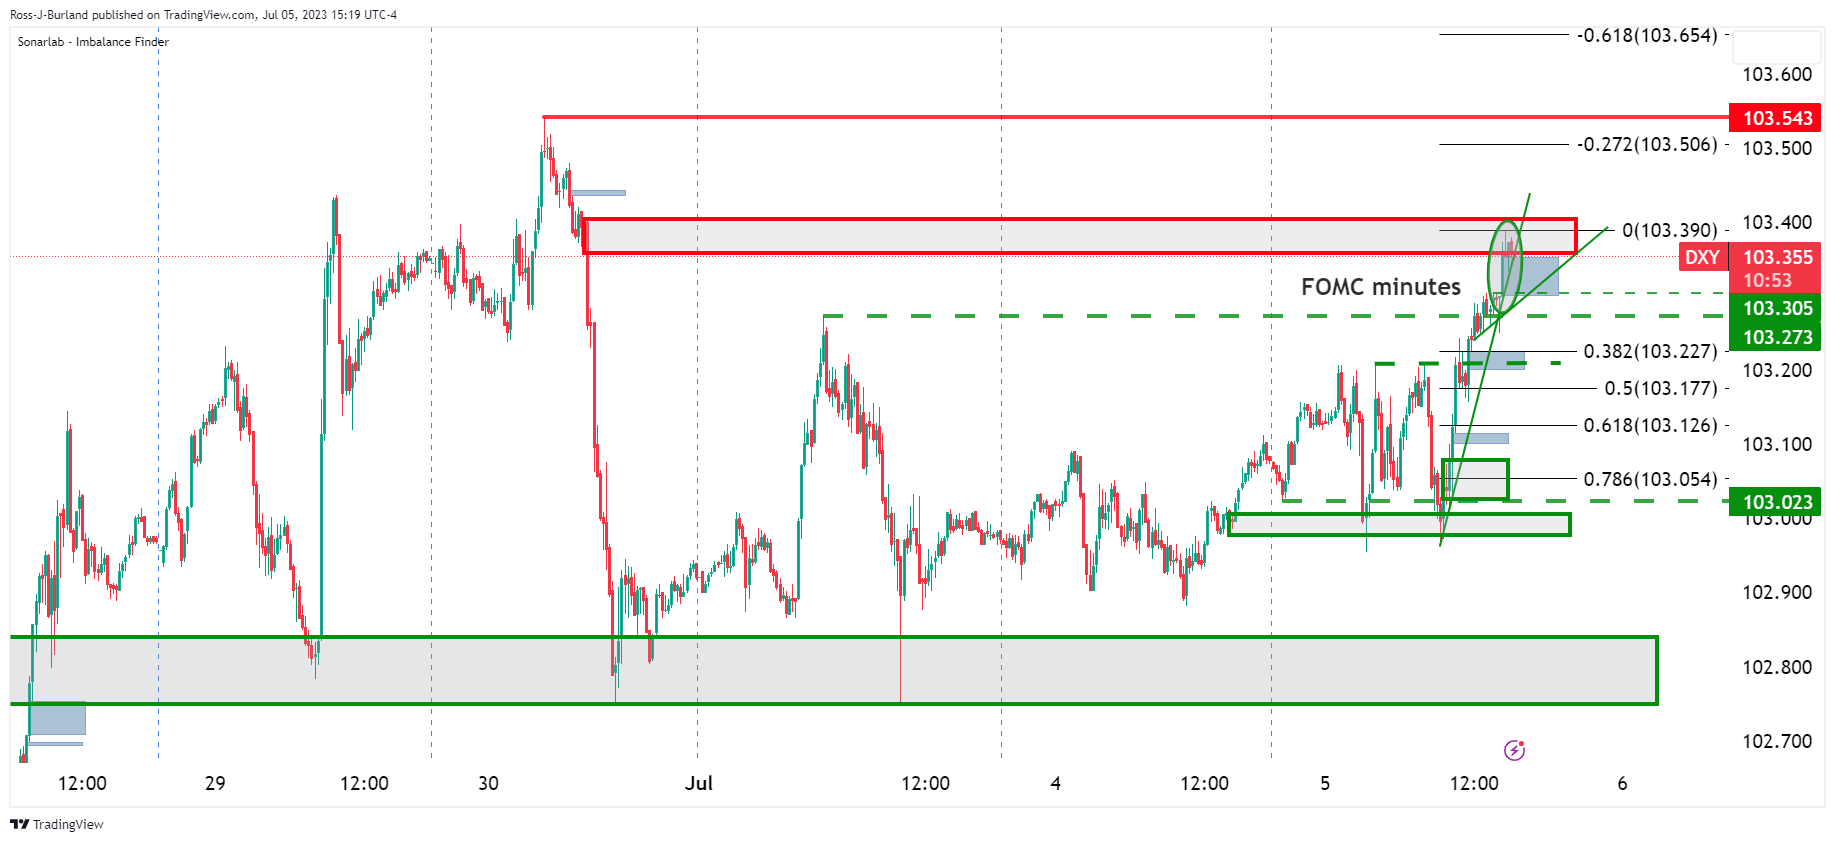
The DXY index, as illustrated above, has seen a move higher on the FOMC minutes into an area of potential resistance. The Euro bulls will want to see the 103.30s support and trendlines break to the downside in the coming sessions which could help prop the Single Currency around the US data events:
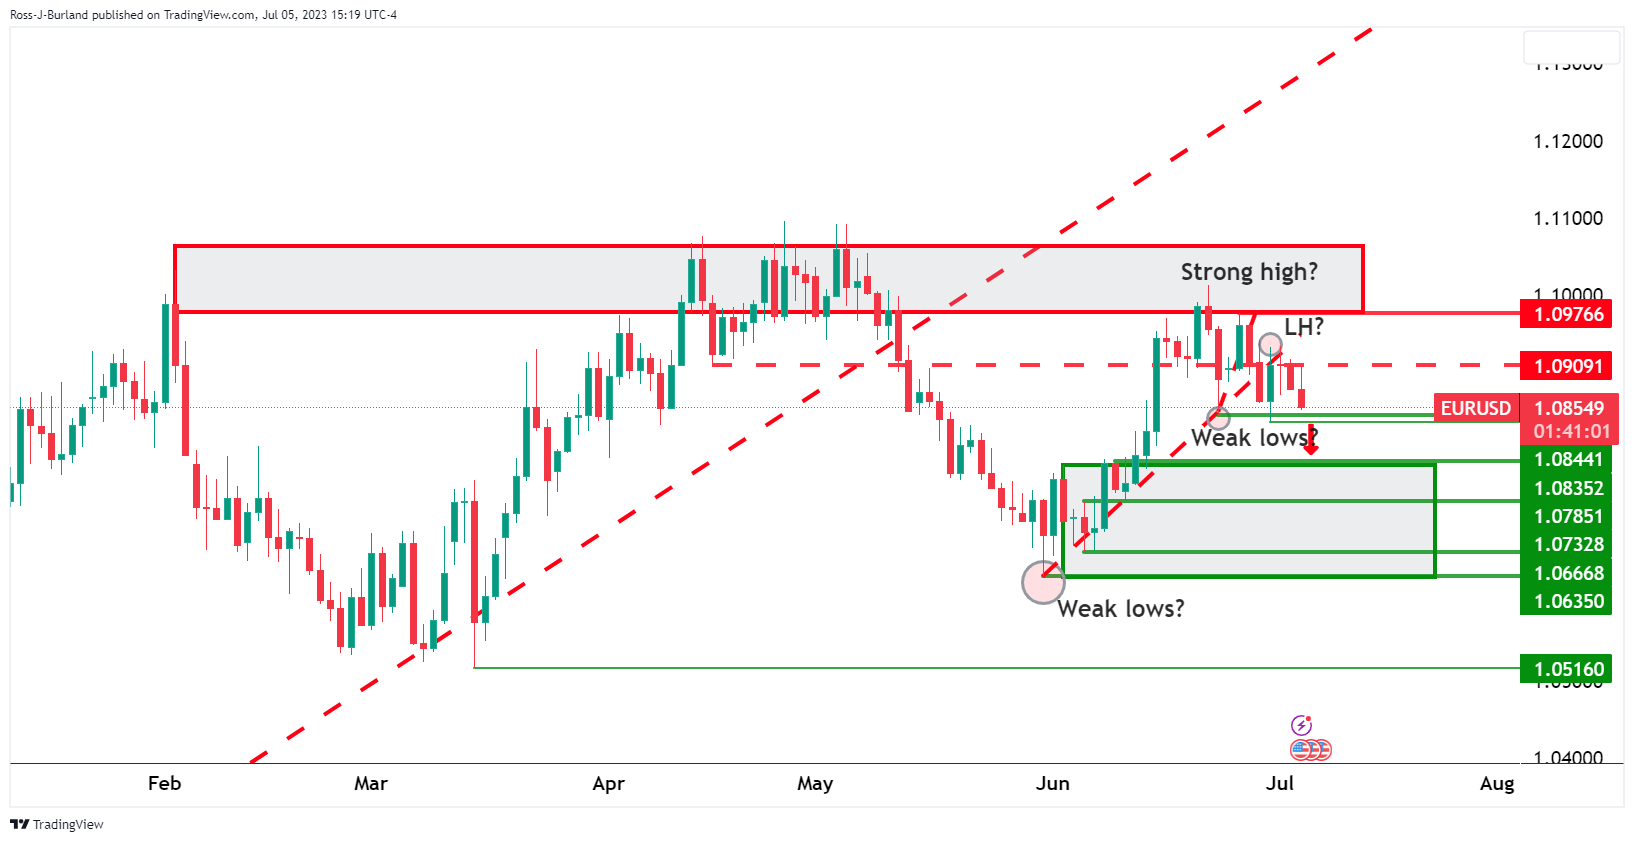
On the other hand, EUR/USD is headed to the edge of the abyss around what could prove to be daily weak lows that guard a move below 1.0850 in a broken-down market that leaves the 1.07 area vulnerable for the days ahead.
- Gold prices take a hit, dropping below the 20-day EMA, after the Federal Reserve hints at a potential rate hike in July.
- The resurgent US Dollar and soaring Treasury bond yields further tighten the screws on the precious metal’s bullish momentum.
- Despite a unanimous decision for a June pause, officials’ concerns over a tight labor market point to a looming rate increase.
- Market expectations for July rate hikes remained high, with odds at 88.7%, according to the CME FedWatch Tool.
Gold price snaps three days of gains, tumble below the 20-day Exponential Moving Average (EMA), after the US Federal Reserve (Fed) release of June’s monetary policy meeting minutes, which were tilted hawkish, with officials worried about the tightness of the labor market. Although most officials agreed to a June pause, a July rate hike is almost inevitable. At the time of writing, the XAU/USD exchanges hands at $1916.80, down 0.44% after reaching a high of $1934.97
The greenback is staging a comeback, a headwind for Gold. The US Dollar Index (DXY) rises 0.29%, at around 103.370, while US Treasury bond yields are soaring, with the 10-year benchmark note rate at 3.945%, gaining eight and a half basis points (bps). Money market futures speculate the Fed will raise rates in July, with odds of a 25 bps rate hike at 88.7%, as shown by the CME FedWatch Tool.
Summary of the FOMC’s June meeting minutes
The minutes from the Federal Open Market Committee (FOMC) meeting revealed a unanimous agreement among all participants to maintain unchanged interest rates to assess the cumulative impact of previous tightening measures. However, some Fed officials advocated for a 25 basis point rate hike, citing the tightness of the labor market as their justification. Despite differing opinions on specific rate adjustments, all participants concurred on the necessity of maintaining a restrictive monetary policy stance.
Similarly, the May minutes showed that the Federal Reserve staff forecasts a mild recession towards the end of the year. Additionally, the minutes emphasized that the policy outlook hinged on the presence of upside risks to the inflation trajectory and the potential for inflation expectations to become unanchored. These factors remain crucial considerations for the Federal Reserve’s decision-making process.
XAU/USD Price Analysis: Technical outlook
XAU/USD remains neutral to downward biased, unable to break above solid resistance at the 20-day EMA at $1930.93, seen as the first resistance level by Gold buyers. In addition, a Wednesday’s daily close below Tuesday’s low of $1919.89 can open the door for further downside, with XAU/USD sellers eyeing the $1900 figure, followed by the 200-day EMA a $1896.80. Once that level is cleared, the next support would be June’s 29 swing low and three-month-low of $1893.12. Conversely, if XAU/USD reclaims the 20-day EMA, followed by the 50-day EMA at $1835.34, XAU buyers would remain hopeful to test $1950.
- GBP/USD stands at 1.2705, reflecting a slight decrease by 0.02%, amid the FOMC minutes release.
- The FOMC minutes revealed that some Fed officials called for a 25 bps rate hike, citing labor market tightness as the main reason.
- The Federal Reserve staff forecasted a mild recession towards the end of the year.
- Market expectations for two rate hikes remained unchanged, with odds for November at 31%, while for July, chances stand at 88.7%, according to the CME FedWatch Tool.
GBP/USD hovers around the 1.2700 mark as the latest Federal Reserve Open Market Committee (FOMC) minutes showed that some Fed officials wanted to raise rates. Still, they agreed to pause to assess the impact of the Fed’s cumulative tightening amidst maintaining a restrictive stance. The GBP/USD is trading at 1.2692, down 0.12%.
The US Dollar Index (DXY) barely reacted to the data and stayed firm at around 103.290, while US Treasury bond yields continued to climb after the June minutes release. Expectations for two rate hikes remained unchanged, with odds for November at 31%, while for July, chances for a rate hike are at 88.7%, as shown by the CME FedWatch Tool.
Must read: FOMC minutes: Some officials favored a 25bps hike at the June meeting
Summary of the FOMC’s June meeting minutes
FOMC’s minutes showed that all participants judged it appropriate or acceptable to leave rates unchanged to assess the impact of cumulative tightening. However, Fed officials that wanted to lift rates by 25 bps mentioned the tightness of the labor market as the main reason for a hike. At the same time, all participants agreed to keep a restrictive stance as appropriate.
In the meantime, Fed staff sees a mild recession late in the year, as mentioned in the May minutes, while upside risks to the inflation outlook or the possibility of inflation expectations might become unanchored, remained key to the policy outlook.
GBP/USD Price Analysis: Technical outlook
The GBP/USD failed to react to the data, though it turned negatively but clung above the 1.2700 figure. However, the GBP/USD remains capped by the weekly high of 1.2739 seen last Tuesday but failed to dive beneath the 1.2700 figure. From an oscillator perspective, the Relative Strength Index (RSI) drops toward the 50-midline, while the three-day Rate of Change (RoC) depicts buyers losing momentum. But unless GBP/USD tumbles below 1.2700, upside risks remain. On the downside, key support levels lie at the 20-day EMA at 1.2662, followed by the 1.2600 figure and the 50-day EMA at 1.2567. On the upside, resistance lies at 1.2700, followed by 1.2736 and 1.2750.
- Federal Reserve released the minutes from its June 13-14 meeting.
- The minutes showed some policymakers favored a rate hike, but went with a pause.
- US Dollar pulls back modestly after the minutes.
The Federal Open Market Committee (FOMC) released the minutes of its June meeting, triggering a limited reaction across financial markets. According to the document, some officials favored a rate hike at the meeting, but went along with a pause. The minutes showed a division among FOMC members.
In June, the Federal Reserve (Fed) kept the interest rate unchanged at 5.00% - 5.25%, as expected. In the projections, members see more rate hikes before year-end. The minutes show that “almost all participants noted that in their economic projections that they judged that additional increases in the target federal funds rate during 2023 would be appropriate.”
“Most participants observed that uncertainty about the outlook for the economy and inflation remained elevated and that additional information would be valuable for considering the appropriate stance of monetary policy”, the minutes noted.
Key takeaways from the minutes:
“Participants generally noted that banking stresses had receded and conditions in the banking sector were much improved since early March."
“The economy was facing headwinds from tighter credit conditions, including higher interest rates, for households and businesses, which would likely weigh on economic activity, hiring, and inflation, although the extent of these effect remained uncertain. Against this backdrop, and in consideration of the significant cumulative tightening in the stance of monetary policy and the lags with which policy affects economic activity and inflation, almost all participants judged it appropriate or acceptable to maintain the target range for the federal funds rate at 5 to 5-1/4 percent at this meeting. Most of these participants observed that leaving the target range unchanged at this meeting would allow them more time to assess the economy's progress toward the Committee's goals of maximum employment and price stability.”
“Some participants indicated that they favored raising the target range for the federal funds rate 25 basis points at this meeting or that they could have supported such a proposal.”
“The participants favoring a 25 basis point increase noted that the labor market remained very tight, momentum in economic activity had been stronger than earlier anticipated, and there were few clear signs that inflation was on a path to return to the Committee's 2 percent objective over time.”
“Almost all participants noted that in their economic projections that they judged that additional increases in the target federal funds rate during 2023 would be appropriate.”
“Most participants observed that uncertainty about the outlook for the economy and inflation remained elevated and that additional information would be valuable for considering the appropriate stance of monetary policy.”
“Many also noted that, after rapidly tightening the stance of monetary policy last year, the Committee had slowed the pace of tightening and that a further moderation in the pace of policy firming was appropriate in order to provide additional time to observe the effects of cumulative tightening and assess their implications for policy.”
Market reaction:
The US Dollar strengthened after the minutes. The DXY printed fresh weekly highs above 103.30 and EUR/USD fell toward 1.0850.
- EUR/JPY cleared daily gains and fell to the 157.00 area after peaking at 157.72.
- European Services PMIs from June showed disappointing results.
- JPY gains interest as the probabilities of a BoJ intervention rise.
EUR/JPY faced selling pressure, leading to a retreat towards 157.00, erasing earlier gains from its peak at 157.72. Disappointing European Services PMIs for June contributed while the Japanese Yen gained interest as market probabilities of a potential Bank of Japan (BoJ) intervention increase as the USD/JPY approached 145.00.
The Euro faced selling pressure on weak Services PMIs
The recently released PMI data from S&P Global and Hamburg Commercial Bank (HCOB), indicated that French and Spanish Services PMIs for June fell short of expectations, registering at 47.2 and 53.4, respectively. On the other hand, the German and Italian indexes remained unchanged from their previous figures, with readings of 54.1 and 52.2, respectively. Overall, the Eurozone's PMIs came in at 52, slightly below the anticipated 52.4, signalling a slight deceleration but still indicating expansion in the sector.
On the other hand, the Bank of Japan’s (BoJ) dovish stance has significantly weakened the Yen in the previous session as economies entered another tightening cycle and higher interest rates tend to be positively correlated with the value of a currency. As a result, the USD/JPY rose to 145.00 psychological level last Friday, so escalating odds of further intervention by the BoJ to support the Yen may limit its downside potential.
EUR/JPY Levels to watch
The bulls finally gave up. After showing overbought conditions in the daily chart since mid-June, indicators finally show some weakness. The Relative Strength Index (RSI) fell below the 70.00 threshold, while the Moving Average Convergence Divergence shows decreasing green bars suggesting that the bears may take control.
On the downside, support levels to monitor stand at the 156.70 area, followed by 156.00 and 155.00. On the upside, if the bulls regain momentum, resistance levels are seen at 157.50, followed by 158.00 (cycle-high) and 158.50.
EUR/JPY Daily chart
-638241758999443707.png)
On Wednesday, July 5, the US Federal Reserve (FED) will release the latest monetary policy meeting minutes of the Federal Open Market Committee (FOMC) at 18:00 GMT, sought by traders as they would provide insight into the US central bank’s forward path.
On June 13-14, the US Federal Reserve, after raising 500 basis points (bps), decided to keep the Federal Funds Rates (FFR) unchanged at 5.00%-5.25%, as policymakers would like to assess the impact of the cumulative tightening in the economy, which according to the latest round of data, remains resilient.
The Fed’s June meeting witnessed the release of the Summary of Economic Projections (SEP), used by Fed officials to guide the market regarding how they see economic growth, inflation, unemployment, and the FFR. It should be said that twelve of the eighteen Federal Reserve Open Market Committee (FOMC) members expect rates to peak at 5.6%, implying that Fed Chair Jerome Powell and Company foresee two additional rate hikes.
That helped the greenback, which initially witnessed weakness, though the Fed’s hawkish hold limited its losses. OF note, Fed Chair Jerome Powell stuck to the 50 bps of tightening pending to be raised at his public appearances while downplaying a recessionary scenario and emphasizing the tightness of the labor market.
Despite that, money market futures estimate the Federal Reserve would hike just once, as shown by the CME FedWatch Tool, with odds above 85%.
It should be said postures within the Federal Reserve had begun to change, as some hawks are worried about overtightening, like the case of Atlanta’s Fed President Raphael Bostic, who shifted dovish. Nevertheless, most US central bank officials estimate that further monetary firming is needed to tackle inflation at twice the Fed’s 2% goal.
After the FOMC’s June minutes, upcoming US Nonfarm Payrolls data and inflation figures would help the Fed to figure out the next move at the July 25-26 FOMC meeting.
How Could It Affect EUR/USD?
Given that the EUR/USD is trading with a bearish tone in the week, if the FOMC’s minutes area tilted hawkish could motivate EUR/USD sellers to decisively break support at the 50-day Exponential Moving Average (EMA) at 1.0857 and exacerbate a test of the 1.0800 mark. Nonetheless, the EUR/USD will need to hurdle the 100-day EMA at 1.0806 before cracking the 1.0800 figure as US Dollar (USD) bulls eye the 200-day EMA at 1.0722.
Conversely, worse-than-expected Eurozone (EU) growth data and PMI flashing a recession might prevent the European Central Bank (ECB) from hiking twice toward the September meeting. But as ECB officials remained hawkish, any dovish signal by the Fed could pave the way for EUR/USD to reclaim the 1.0900 figure, ahead of challenging 1.1000.
Key Notes
- FOMC Minutes to offer clues about Fed interest rate path
About the Federal Reserve Open Market Committee (FOMC) minutes
FOMC stands for The Federal Open Market Committee that organizes 8 meetings in a year and reviews economic and financial conditions, determines the appropriate stance of monetary policy and assesses the risks to its long-run goals of price stability and sustainable economic growth. FOMC Minutes are released by the Board of Governors of the Federal Reserve and are a clear guide to the future US interest rate policy.
- USD/CHF pair trades in the 0.8934/0.9004 area, showing a neutral to downward bias amidst a lack of strong catalysts.
- The RSI points towards bullish territory, while the RoC indicates buyers are still in control, sending mixed signals to traders.
- Breaking above the 0.9000 mark could challenge current resistance levels, while a fall below 0.8945 may trigger a deeper decline.
USD/CHF advanced steadily on Wednesday after the release of US economic data painted a gloomy economic outlook in the United States (US) as traders prepare for the Federal Reserve’s (Fed) release of the latest monetary policy minutes. The USD/CHF trades at 0.8977 after hitting a daily low of 0.8957 and gains 0.08%.
USD/CHF Price Analysis: Technical outlook
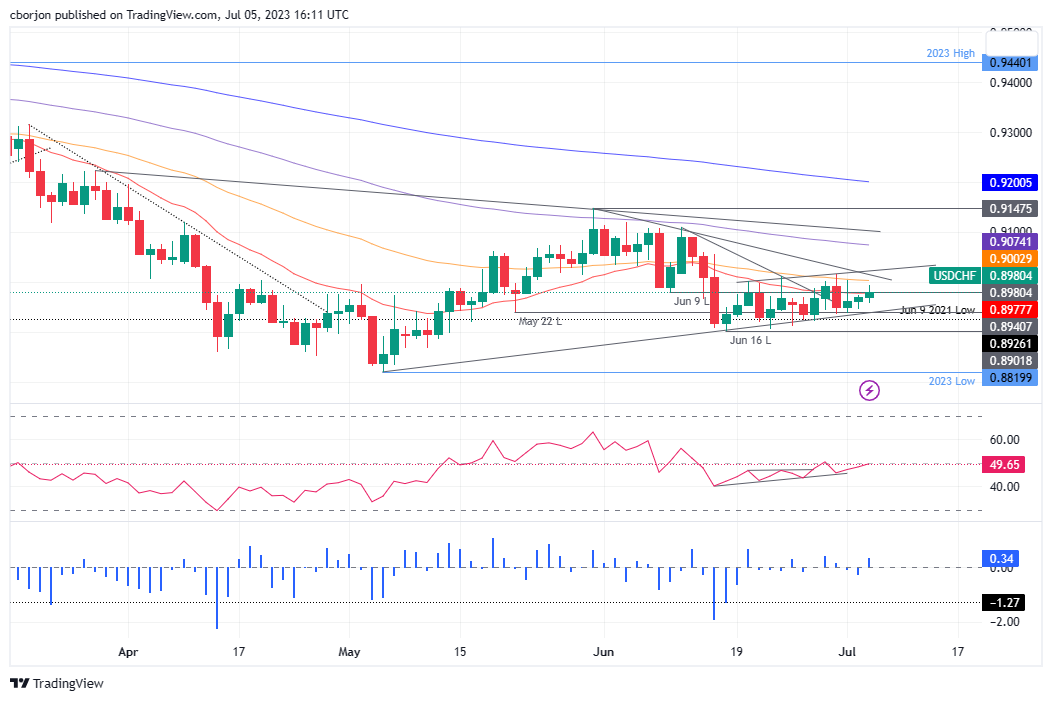
The USD/CHF remains neutral to downward biased, but the lack of catalyst triggered a consolidation during the week in the 0.8934/0.9004 area. Nevertheless, the long-term daily Exponential Moving Averages (EMAs) sitting above the current exchange rate warrants further downside.
Even though the Relative Strength Index (RSI) is in bearish territory, it continues to edge higher, is about to cross above the 50-midline, and will turn bullish, while the three-day Rate of Change (RoC) suggests that buyers remained in charge.
Hence, mixed signals could refrain traders from opening fresh long/short bets on the pair. However, If USD/CHF reclaims 0.9000, the pair could challenge the confluence of the 50-day EMA and the current week’s high at around 0.9003/04. A breach of the latter will expose the USD/CHF June 30 swing high at 0.9016, followed by a one-month-old downslope resistance trendline at 0.9015, followed by the 100-day EMA at 0.9074, and the 0.9100 figure.
On the flip side, if USD/CHF drops below the July 4 daily low of 0.8945, which, once cleared, will expose the June 30 daily low of 0.8935, ahead of diving toward the June 16 low of 0.8901.
USD/CHF Price Action – Daily chart
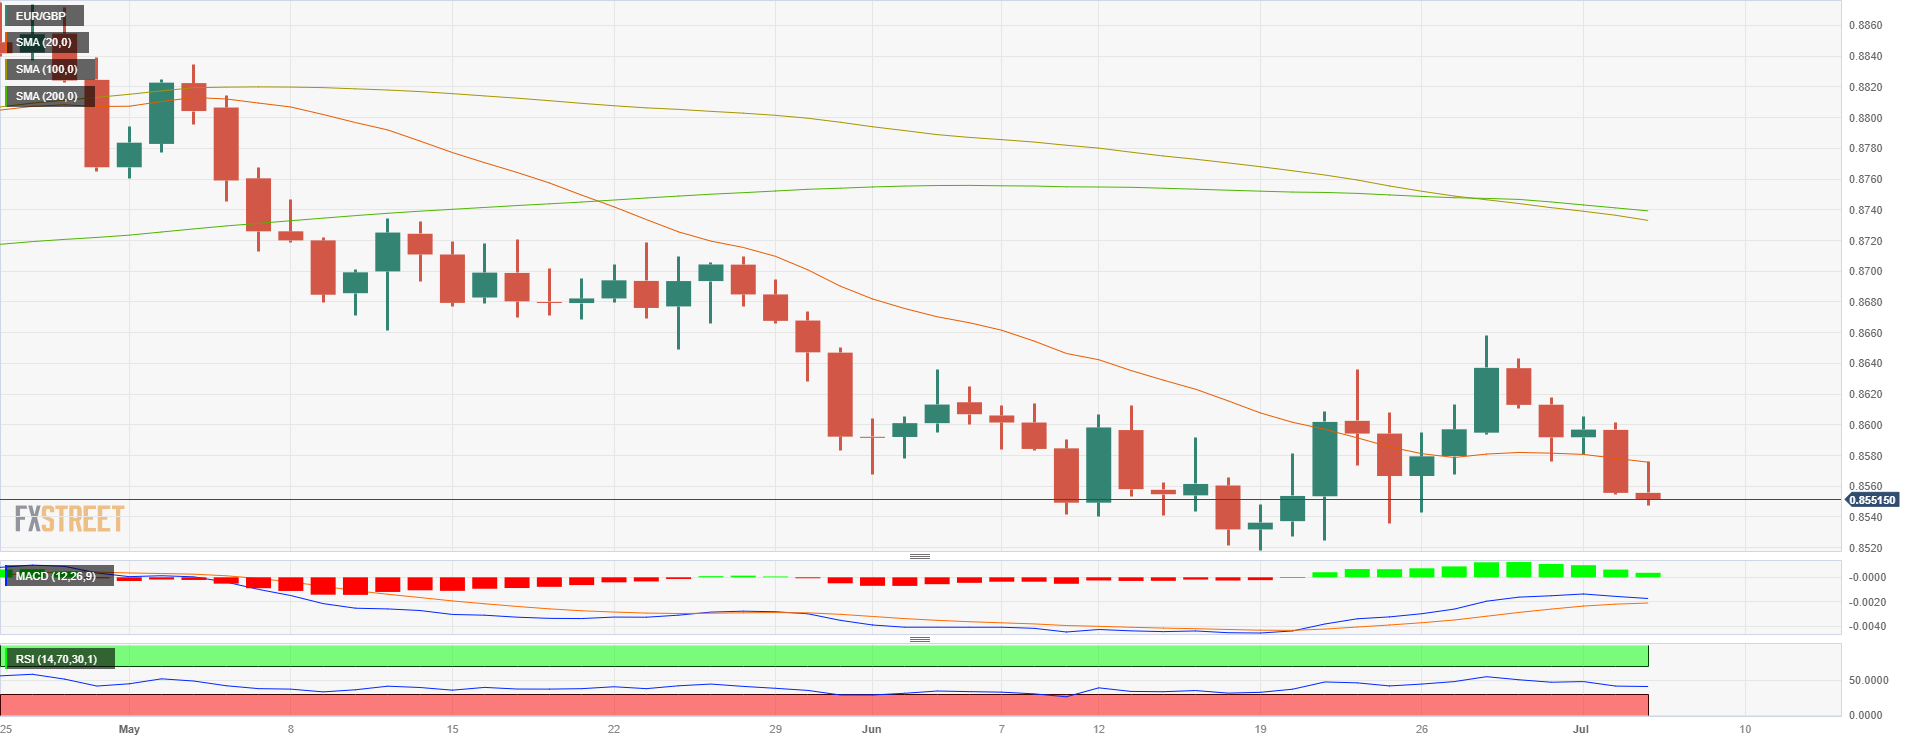
- EUR/GBP peaked at a daily high of 0.8575 (20-day SMA) and then retreated to 0.8550.
- German, French and Spanish HCOB Services PMIs from June showed disappointing results.
- The British index showed an expansion, just as the markets expected.
Following the release of European Services Purchasing Managers Index (PMI) data, the EUR/GBP relinquished its daily gains. The pair initially reached a high of 0.8575, where the 20-day Simple Moving Average (SMA) stands, but later retreated to 0.8550. Disappointing results from German, French, and Spanish Hamburg Commercial Bank (HCOB) Services PMIs contributed to the reversal, while the British index met expectations by standing in expansion territory.
Euro lost ground after disappointing EZ Services PMIs.
During the European session, the HCOB reported that June's Frech and Spanish Services PMIs were below expectations at 47.2 and 53.4, respectively. In addition, the German and Italian indexes remain unchanged concerning their previous figures at 54.1 and 52.2, respectively. Overall the Eurozone’s figure came in at 52, vs the 52.4 expected reflections of deceleration but remaining in the expansion area.
Conversely, the British Service PMI released by the Chartered Institute of Purchasing & Supply (CIPIS) and the S&P Global came in at 53.7, just as expected.
For the rest of the week, investors will put an eye on Thursday’s release of Retail Sales from the Eurozone from June and European Central Bank’s De Guindos and Lagarde’s speeches on Friday. On the British Calendar, market participants will see the Construction PMI release from June and Housing data on Friday from June.
EUR/GBP Levels to watch
According to the daily chart, the technical outlook favours the bears. Bulls struggle to reignite their momentum as the Moving Average Convergence Divergence (MACD) prints decreasing green bars while the Relative Strength Index (RSI) points south, in negative territory.
Support Levels to watch: 0.8540, 0.8525,0.8520.
Resistance Levels to watch: 0.8575 (20-day SMA), 0.8590, 0.8600.
EUR/GBP Daily chart
- The USD/MXN pair slides to a seven-year low on disappointing US manufacturing data and a weakened USD.
- Mexican economy indicators show mixed signs, with a slight fall in Gross Fixed Investment but a rise in Consumer Confidence.
- Upcoming US labor data, Banxico’s meeting minutes, and Mexican inflation data could significantly impact the USD/MXN movement.
The USD/MXN falls in the North American session reached a new seven-year low of 16.9761 after data from the United States (US) accentuated an ongoing slowdown in manufacturing as orders missed estimates. That, alongside a weak US Dollar (USD) and interest rate differential between the US and Mexico, boosted the Mexican Peso (MXN). At the time of writing, the USD/MXN exchanges hands at 16.9874, slides 0.43%.
Amid disappointing US economic data, interest rate differential benefits the Mexican Peso
US equities remain pressured, as the US Census Bureau showed that Factory Orders in May, failed to grow at the 0.8% pace expected, expanded by 0.3%, unchanged compared to April, while orders that exclude transportation plummeted -0.5%, below the 0.5% growth estimates by the consensus.
The USD/MXN dived before the US Factory Orders release, from around 17.0219, toward its new year-to-date (YTD) low of 17.9761. However, the pair has recovered some ground, hoovers nearby the 17.00 figure.
Today’s data showed that Factory Orders remain unchanged, and weaker readings on the ISM Manufacturing PMI in the last eight months show the US economy could be at the brisk of getting into a recession. Nonetheless, additional data ahead in the current and the following week could give more cues about the US economy’s status.
Aside from this, speculators see the Fed lifting rates In July, as shown by the CME FedWatch Tool. Chances for a 25 bps increase are at 88.7%, while the swaps market sees the Federal Funds Rates (FFR) peaking at 5.25%-5.50%.
Across the border, the Mexican economic docket revealed that Gross Fixed Investment in April fell -0.3% MoM, beneath March’s 0.5% growth. At the same time, Consumer Confidence for June rose by 45.2, above the 44.3 consensus and exceeding the previous month’s 44.5.
Upcoming events
The US agenda will deliver labor market data, the Balance of Trade on Thursday, and the ISM Services PMI. On Friday, the US Nonfarm Payrolls report could dictate what the Fed could do at the next monetary policy meeting. On the Mexican front, the Bank of Mexico (Banxico) will release its last meeting minutes on Thursday, followed by inflation data on Friday.
USD/MXN Price Analysis: Technical outlook
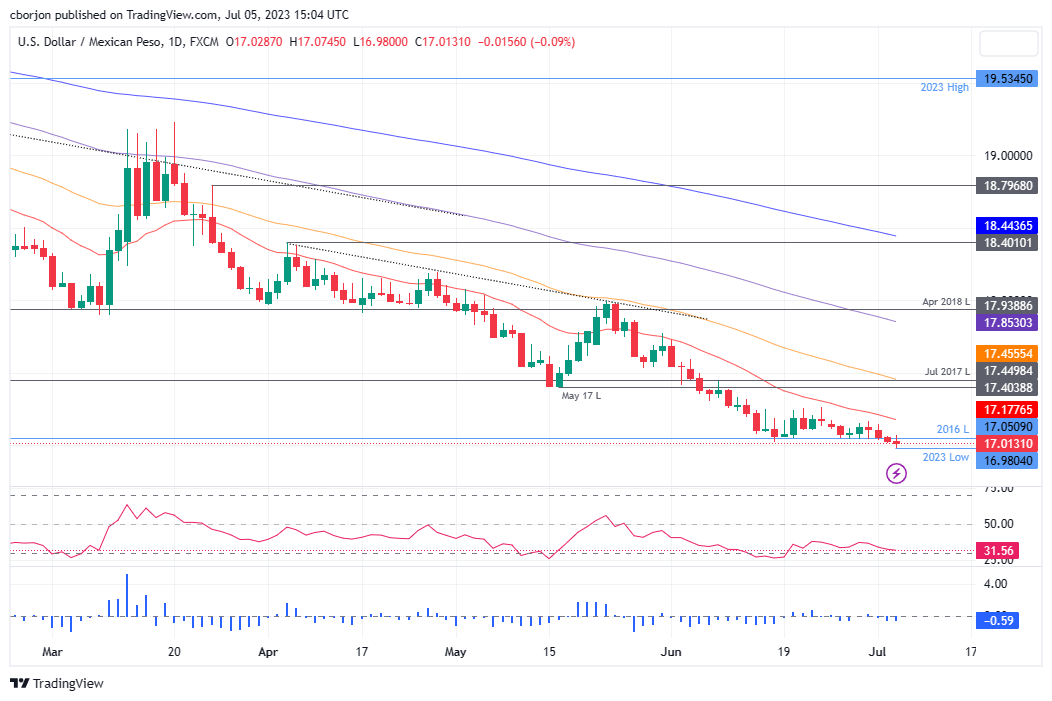
The USD/MXN downtrend is set to continue as the pair is trading well beneath its daily Exponential Moving Averages (EMAs). The Relative Strength Index (RSI) indicator remains in bearish territory, while the three-day Rate of Change (RoC) shows sellers are in charge. That said, the USD/MXN needs to achieve a daily close below 17.00. In that outcome, the next support would be the 16.50 psychological figure, followed by the October 2015 daily low of 16.3267, before testing the 16.00 mark. Conversely, the USD/MXN first resistance is the 20-day EMA at 17.1772, followed by the May 17 daily low-turned resistance at 17.4038.
- Volatile session for metals as the US Dollar remains steady.
- After spiking to the highest level since June 23, XAU/USD turned to the downside.
- Gold is losing momentum, and the reversal could expose $1,900.
The price of Gold surged to $1,935/oz, reaching the highest level since June 23. However, it quickly reversed course and turned lower. XAU/USD dropped to $1,919, hitting a fresh daily low.
The yellow metal climbed to weekly highs and then fell to daily lows in just a few minutes, losing almost $20. Volatility remains elevated, with the price struggling to hold above $1,920. If the price manages to remain above $1,930, the outlook would improve for the bulls. On the contrary, if the price consolidates under $1,920, more losses seem likely. The next support area is seen around $1,910.
Attention on FOMC minutes and US data
Economic data from the US showed Factory Orders in May rose by 0.3%, below the 0.8% expected by the markets. On Thursday, key labor market data is due, including the ADP report, Jobless Claims, and JOLTS. On Friday, it will be the turn of the Nonfarm Payroll report.
Later on Wednesday, at 18:00 GMT, the Federal Reserve will release the minutes of its June meeting, when it decided to hold rates steady for the first time in the tightening cycle. The minutes could show a hawkish bias in the discussion. Since the meeting, Chair Powell and other officials have repeated that the forecasts are for more rate hikes before year-end.
The minutes and the job figures will likely cause volatility across financial markets and will play a key role in shaping Fed monetary policy expectations. If markets see a more hawkish tone from the Fed, it could send US yields higher and weigh on Gold. On the contrary, weak data could be positive for the yellow metal.
Technical levels
Economists at TD Securities analyze how US data this week could impact Gold.
Focus on the ISM services and jobs data
Postponing the looming recession any further threatens a resurgence in real wages that could keep the Fed on its warpath against inflation. However, we expect that data trends will likely sufficiently soften to keep the Fed from further pursuing its warpath against inflation, particularly as the more cyclical components of growth data are already deteriorating at a fast pace.
This places significant attention on the ISM services and jobs data, where Gold's reaction function may be asymmetrically skewed to the upside on misses in the data.
- Silver prices climb for the fourth consecutive day, spurred by a weak USD and expectations of the upcoming Fed meeting minutes.
- Amid disappointing US economic data, China-US trade tensions may further drive XAG’s appeal as a haven asset.
- Market anticipation builds ahead of key US labor market data and Nonfarm Payrolls report, which could shape future Fed actions.
Silver price climbs for the fourth consecutive trading day as the US Dollar (USD) weakened ahead of the release of June’s Federal Reserve (Fed) last meeting minutes, which would give some cues about the US central bank’s forward path on monetary policy. The XAG/USD trades above the $23.00 figure after hitting a daily low of $22.77.
Slowdown in the US economy and geopolitical tensions bolster Silver prices
Wall Street is back though operating with losses ahead of the release of the Fed’s minutes. Data from the US Census Bureau revealed that Factory Orders for May came at 0.3%, unchanged compared to April’s data, but missed estimates of a 0.8% increase. Excluding transports, orders plunged -0.5%, less than the prior’s month downward revised metric of -0.6% and below the 0.5% expansion projected by the consensus.
XAG/USD reacted upwards to the data, as it shows the US economy is slowing down, as data revealed on Monday showed June’s ISM Manufacturing PMI plummeting into the recessionary territory at 46.0, below April’s 46.9. US Treasury bond yields are almost unchanged, while US real yields, calculated with the nominal yield minus inflation, stay at 1.630%, capping XAG/USD’s rally.
Regarding monetary policy, futures traders see the Fed raising rates just once, contrary to what Fed Chair Powell said on his last two public appearances, as shown by the CME FedWatcth Tool odds for a 25 bps rate hike in July, at 88.7%. The minutes could cement the Fed’s dot-plot case for two rate increases, which market participants do not project.
Meanwhile, China-US tussles could augment appetite for precious metals as tension around IT, technology, and raw materials exports from China to the US to produce chips could shift sentiment sour and bolster precious metals. In that regard, US Treasury Secretary Janet Yellen travels to China Thursday for meetings with Chinese officials.
Upcoming events
The US agenda will deliver labor market data on Thursday and the ISM Services PMI. On Friday, the US Nonfarm Payrolls report could dictate what the Fed could do at the next monetary policy meeting.
XAG/USD Price Analysis: Technical outlook
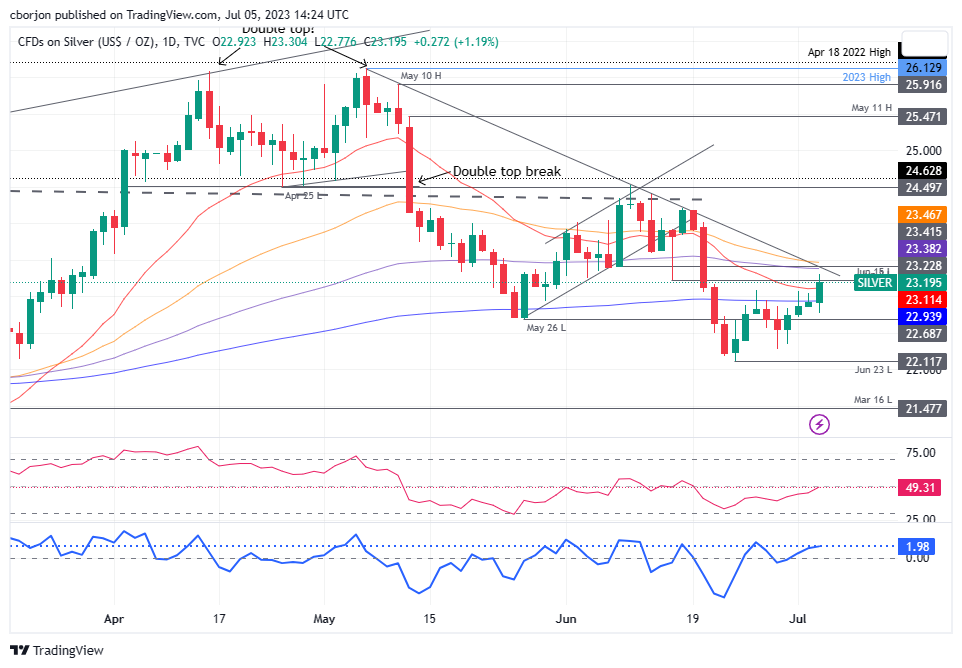
The XAG/USD extended its recovery, though it remains below technical resistance levels, which, once cleared, could pave the way for further upside. The first resistance is the 20-day Exponential Moving Average (EMA) at $23.10, followed by the confluence of a downslope resistance trendline and the 50-day EMA at around $23.46. Break above will expose the June 16 daily high at $24.20. Conversely, a drop below $23.00 would keep sellers in charge and exacerbate a fall to the June 23 swing low of $22.11.
EUR/GBP has been driven by short-term rate differentials for the majority of the recent past. Economists at Société Générale analyze GBP outlook.
Supported by rates, vulnerable when they peak and as growth slows
Random recurrent crises notwithstanding, Sterling is being supported by a faster pace of rate hikes than elsewhere, and markets are now pricing a higher peak in the UK than in the eurozone or US. That will support GBP for as long as this unusually close correlation between currencies and short-term rates persists and until the rate outlook changes.
The UK has a less attractive growth/inflation trade-off than other major economies, something which has been exacerbated by Brexit. The upshot of that will be weaker growth and higher inflation over 2023-2024 than in the Eurozone.
Sterling can only expect support from higher rates for so long before the growth outlook (and the longer-term interest rate implications of weak growth) takes over. We think that will start to happen in 2H23 as rates approach their peak.
- Factory Orders in the US rose less than expected in May.
- US Dollar Index continues to fluctuate near 103.00.
The data published by the US Census Bureau revealed on Wednesday that new orders for manufactured goods, Factory Orders, increased $1.6 billion, or 0.3%, to $578 billion in May. This print followed April's increase of 0.3% and came in worse than the market expectation for an increase of 0.8%.
"New orders for manufactured durable goods in May, up three consecutive months, increased $5.0 billion, or 1.8%, to $288.4 billion, up from the previously published 1.7%," the publication further read.
Market reaction
The US Dollar Index stays in its daily range near 103.00 after this report.
Economists at MUFG Bank see EUR/USD higher but lower than previously forecast.
Some upside scope from here
We have nudged our peak EUR/USD level of 1.1500 a little lower.
Weaker-than-expected data from the Eurozone, a rate hike by the Fed in July and continued global growth concerns will take some of the modest upward momentum away from EUR/USD.
Still, assuming no notable worsening of growth in the Eurozone and some pick-up in China optimism, we still see some upside scope from here.
EUR/USD – Q3 2023 1.10 Q4 2023 1.12 Q1 2024 1.13 Q2 2024 1.10
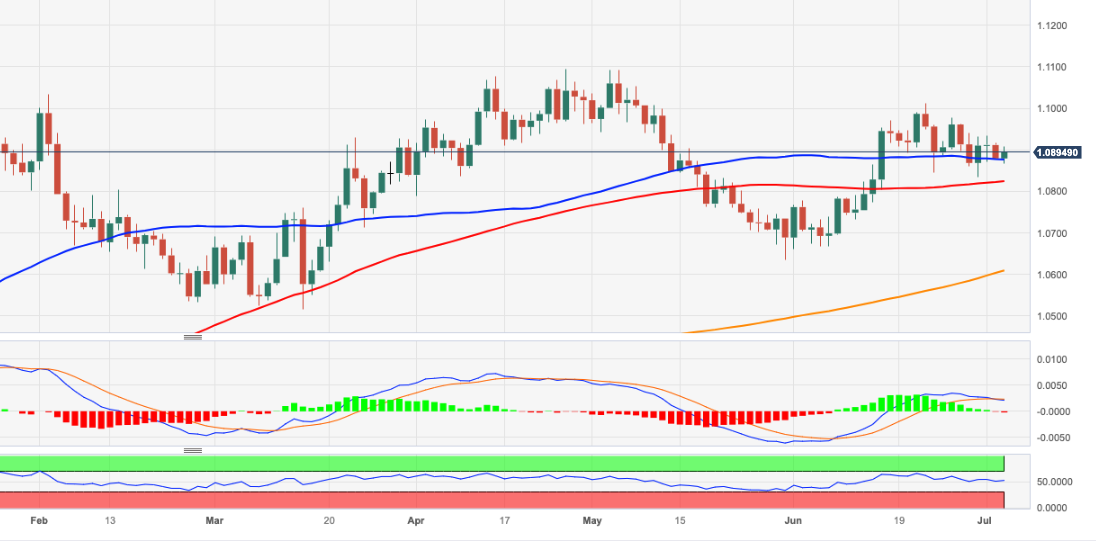
- EUR/USD keeps hovering around the 1.0900 region on Wednesday.
- Immediately to the downside emerges the 1.0830 contention zone.
EUR/USD maintains the choppiness well in place around the 1.0900 yardstick on midweek.
Price action around the pair looks vacillating for the time being. Against that, spot needs to clear the June peak at 1.1012 (June 22), ideally in the near term, to allow for the resumption of the uptrend and a potential challenge of the 2023 top just below 1.1100 (April 26).
However, failing to do so, could spark the resurgence of the selling pressure, which could open the door to another visit to the weekly low at 1.0835 (June 30) prior to the transitory 100-day SMA, today at 1.0823.
Looking at the longer run, the positive view remains unchanged while above the 200-day SMA, today at 1.0608.
EUR/USD daily chart
Lee Sue Ann, Economist at UOB Group, reviews the latest interest rate decision by the RBA (July 4).
Key Takeaways
The Reserve Bank of Australia (RBA) decided to leave the cash rate target unchanged at 4.10%, stating that the latest decision to hold will provide some time to assess the impact of the increase in interest rates to date and the economic outlook
We were anticipating a 25bps hike at this meeting but had acknowledged that it would be a close call. While the slump in the latest headline inflation was positive, two key components – electricity and rents – of the CPI basket could delay the return of inflation to the RBA’s 2-3% target band.
The next batch of quarterly CPI data (2Q23) will be released on 26 Jul. Before that, labour market data for Jun will be rolled out on 20 Jul. We think the RBA will likely push for a 25bps rate hike at the 1 Aug monetary policy meeting. It will also be when the RBA updates growth and inflation forecasts.
- USD/CAD has sensed sheer selling pressure around 1.3300 amid strength in the oil price.
- S&P500 is expected to open on a negative note as investors are cautious ahead of second-quarter corporate earnings.
- Although Fed has voted for two more interest rate hikes, the investing community is expecting only one rate hike by the year-end.
The USD/CAD pair has faced stiff barricades near the round-level resistance of 1.3300 in the early New York session. The Loonie asset is expected to remain on the tenterhooks as the market mood has turned risk-off ahead of the United States opening after a holiday.
S&P500 is expected to open on a negative note as investors are cautious ahead of second-quarter corporate earnings. Subdued earnings are expected from US firms amid higher interest rates from the Federal Reserve (Fed) and tight credit conditions by commercial banks. US commercial banks tightened their credit-disbursement process to avoid maintaining asset quality in a turbulent environment.
The US Dollar Index (DXY) has dropped after facing selling pressure around 103.20 despite investors shifting their focus to the release of the Federal Open Market Committee (FOMC) minutes. Although Fed chair Jerome Powell has voted for two more interest rate hikes, the investing community is expecting only one rate hike by the year-end.
About USD Index guidance, economists at MUFG expect Even if the FOMC does hike in July, with the market close to fully priced and with most other G10 central banks priced to hike further, the scope for the Dollar to strengthen over the second half of the year remains limited.
Meanwhile, the Canadian Dollar has picked strength amid upbeat oil prices. West Texas Intermediate (WTI), futures on NYMEX, have climbed to near $72.00 as buying interest inspired by the announcement of production cuts by Saudi are outperforming the bleak global outlook.
It is worth noting that Canada is the leading exporter of oil to the United States and higher oil prices support the Canadian Dollar.
- DXY extends the weekly consolidative mood around 103.00.
- The resumption of the buying interest could challenge 103.50.
DXY alternates gains with losses amidst the weekly range bound theme around the 103.00 zone on Wednesday.
While further consolidation seems probable in the very near term, the continuation of the uptrend in place since mid-June could challenge the weekly high at 103.54 (June 30) prior to the May high at 104.69 (May 31), which appears reinforced by the 200-day SMA.
Looking at the broader picture, while below the 200-day SMA at 104.74, the outlook for the index is expected to remain negative.
DXY daily chart
Economists at Société Générale analyze CAD outlook and expect the USD/CAD pair to tick down below the 1.30 level.
Slow gains as Fed turn approaches
The peak level of US-Canadian relative rates is now probably in the rear-view mirror for the rest of the current economic cycle, and that should support the CAD from now on.
We’re unlikely to see a rapid move from here given that there is a possibility that the Fed tightens a little more (the Bank of Canada seems very likely to raise rates at least one more time), but we think we have seen the peak in USD/CAD and will see a return back to a 1.25-1.30 trading range during the back end of this year.
There is uncertainty about the impact on the Canadian economy of this spring/summer’s wildfires, and success in getting inflation down in Canada will translate into reduced urgency about further policy tightening, but that means the pace and extent of the downtrend in USD/CAD is likely to be slow rather than suggesting levels below USD/CAD 1.30 can’t be sustained.
-
Canadian Dollar loses ground as higher interest rates in the US and expectations of more hikes favor the US Dollar.
-
A triennial OPEC conference of Oil bigwigs gets underway though media coverage is limited.
-
The longer-term uptrend may be experiencing the start of a new upcycle if the daily highs can be held.
Canadian Dollar (CAD) is weakening versus the US Dollar (USD) on Wednesday, depressed by the view that interest rates will rise further in the US compared to Canada.
According to predictions from Trading Economics, base interest rates – set by each nation's central banks – are likely to rise by 0.25% in Canada compared to 0.50% in its Southern neighbor. Since relatively higher interest rates attract greater capital inflows, USD is set to benefit more than CAD.
A major Organization of the Petroleum Exporting Countries (OPEC) conference is underway, which could affect Oil prices, whilst Crude traders will also be keenly awaiting American Petroleum Institute (API) data. Both could impact the Canadian Dollar (CAD).
USD/CAD is trading in the upper 1.32s on Wednesday during the US session.
Canadian Dollar news and market movers
-
The Canadian Dollar (CAD) is falling versus the US Dollar (USD) on the back of predictions of greater interest rate hikes in the US compared to Canada.
-
The US Federal Reserve (Fed) has already raised its base lending rate, the Fed Funds Rate, to a higher level of 5.25%, compared to the Bank of Canada’s (BoC) Policy Interest Rate of 4.75%.
-
According to Trading Economics, the Fed is expected to hike rates by 0.25% in both Q3 and Q4 before peak rate is reached. This compares with only one 0.25% hike in Q3 in the case of the BoC.
-
US Treasury Bond yields, the return investors can expect from holding bonds, are generally higher than their Canadian counterparts, further drawing investor capital and supporting the currency. The benchmark 10-year US Treasury Bond yield is at 3.859% compared to the 10-year Canadian Government Bond’s 3.352%.
-
Both countries’ yield curves are showing inversion, suggesting rates will peak in the near-term before falling, which is in line with Trading Economics’ forecasts. Yield curve inversion is also potentially a warning of impending recession.
-
OPEC’s triennial get-together, the 8th International Seminar, is underway in Vienna and will last till the end of July 6. Oil Ministers from member states will meet other key players in the field of global energy. Reporters’ access to the event has been limited, but there is a possibility of news leaks impacting Oil prices and therefore CAD, since Crude is Canada’s largest export.
-
The most recent issue to have come under the spotlight for the Oil market is concern regarding Saudi and Russian supply, so any news regarding this could impact markets.
-
Weekly inventory figures from the American Petroleum Institute (API) are scheduled for release at 14:30 GMT and may impact Oil prices and therefore USD/CAD if they show an unexpected change in inventories.
Canadian Dollar Technical Analysis: Signs of a reversal in line with longer-term uptrend
USD/CAD has been in a long-term uptrend on the weekly chart since the 2021 lows. Since October 2022, it has been in a sideways consolidation within the uptrend and currently sits at the bottom of that range. Given that the trend has a tendency to extend, the probabilities overall favor longs over shorts.
The USD/CAD appears to have completed a measured move price pattern since the March 2023 highs. The measured move is a 3-wave zig-zag-like price pattern, much like an ABC correction in which the first and third waves are of a similar length (waves A and C on the chart below).
The measured move on USD/CAD looks like it has probably completed since waves A and C are of a similar length. If so, price has probably bottomed and is about to begin a cycle higher.
-638241589027422930.png)
US Dollar vs Canadian Dollar: Weekly Chart
There is also a confluence of support just under the June lows in the late 1.30s, made up of several longer moving averages and a major trendline. This is likely to underpin price at this level and reduces the chances of a breakdown. Only a decisive break below 1.3050 would provide evidence this thick band of weighty support has been definitively broken. A decisive bearish break is one that is accompanied by a longer-than-average red candlestick or three red candlesticks in a row.
-638241588399388130.png)
US Dollar vs Canadian Dollar: Daily Chart
The daily chart further suggests the potential for a bullish recovery. The move up from the June 27 bottom has been accompanied by strong momentum, as shown by the high reading on the Relative Strength Index (RSI) momentum indicator, which is higher than it was when prices were more elevated prior to the market bottom.
The price is currently breaking above the 1.3270 key lower high, potentially confirming a short-term bullish reversal. The move could see a rise up to possibly as high as 1.3400 and the 50-day Simple Moving Average, bringing the short-term trend in line with the longer-term uptrend.
Much depends on Wednesday’s close. If it is strongly bullish with the day closing near its elevated highs of 1.3293 then the breakout higher can be classed as decisive and likely to extend. If price drops back down, however, and ends the day below 1.3270, the break may have been false and prices could move lower or go sideways in the short time.
Canadian Dollar FAQs
What key factors drive the Canadian Dollar?
The key factors driving the Canadian Dollar (CAD) are the level of interest rates set by the Bank of Canada (BoC), the price of Oil, Canada’s largest export, the health of its economy, inflation and the Trade Balance, which is the difference between the value of Canada’s exports versus its imports. Other factors include market sentiment – whether investors are taking on more risky assets (risk-on) or seeking safe-havens (risk-off) – with risk-on being CAD-positive. As its largest trading partner, the health of the US economy is also a key factor influencing the Canadian Dollar.
How do the decisions of the Bank of Canada impact the Canadian Dollar?
The Bank of Canada (BoC) has a significant influence on the Canadian Dollar by setting the level of interest rates that banks can lend to one another. This influences the level of interest rates for everyone. The main goal of the BoC is to maintain inflation at 1-3% by adjusting interest rates up or down. Relatively higher interest rates tend to be positive for the CAD. The Bank of Canada can also use quantitative easing and tightening to influence credit conditions, with the former CAD-negative and the latter CAD-positive.
How does the price of Oil impact the Canadian Dollar?
The price of Oil is a key factor impacting the value of the Canadian Dollar. Petroleum is Canada’s biggest export, so Oil price tends to have an immediate impact on the CAD value. Generally, if Oil price rises CAD also goes up, as aggregate demand for the currency increases. The opposite is the case if the price of Oil falls. Higher Oil prices also tend to result in a greater likelihood of a positive Trade Balance, which is also supportive of the CAD.
How does inflation data impact the value of the Canadian Dollar?
While inflation had always traditionally been thought of as a negative factor for a currency since it lowers the value of money, the opposite has actually been the case in modern times with the relaxation of cross-border capital controls. Higher inflation tends to lead central banks to put up interest rates which attracts more capital inflows from global investors seeking a lucrative place to keep their money. This increases demand for the local currency, which in Canada’s case is the Canadian Dollar.
How does economic data influence the value of the Canadian Dollar?
Macroeconomic data releases gauge the health of the economy and can have an impact on the Canadian Dollar. Indicators such as GDP, Manufacturing and Services PMIs, employment, and consumer sentiment surveys can all influence the direction of the CAD. A strong economy is good for the Canadian Dollar. Not only does it attract more foreign investment but it may encourage the Bank of Canada to put up interest rates, leading to a stronger currency. If economic data is weak, however, the CAD is likely to fall.
The US Dollar Index (DXY) weakened in June by 1.4% and whether or to what extent the Dollar weakens further will become clearer in July, economists at MUFG Bank report.
Scope for the USD to strengthen over the second half of the year remains limited
The PCE inflation data at the end of June revealed further deceleration and if the jobs market and CPI data also show weakness, there is scope for the Fed to extend its pause. In that scenario, an end to the Fed’s tightening cycle would be likely which could help propel the Dollar weaker.
Even if the FOMC does hike in July, with the market close to fully priced and with most other G10 central banks priced to hike further, the scope for the Dollar to strengthen over the second half of the year remains limited.
- USD/JPY has remained topsy-turvy as hopes of BoJ’s intervention into currency markets are healthy.
- Investors are expected to make stock-specific action as US corporate earnings season will kick off next week.
- The release of the FOMC minutes would provide a detailed explanation behind the unchanged interest rate decision by the Fed.
The USD/JPY pair is demonstrating wide moves in a bounded territory near 144.50 in the early American session. The asset is expected to remain volatile as hopes of a stealth intervention by the Bank of Japan (BoJ) in the currency domain to provide support to depreciating Japanese Yen are higher.
Japan's top financial diplomat Masato Kanda said on Tuesday that authorities were in close contact with US Treasury Secretary Janet Yellen and other overseas officials "almost every day" on currencies and broader financial markets, as reported by Reuters.
S&P500 futures have extended losses in London ahead of the opening of United States markets after a holiday. Investors are expected to make stock-specific action as corporate earnings season will kick off next week.
The US Dollar Index (DXY) is showing volatile spikes as investors are awaiting the release of the Federal Open Market Committee (FOMC) minutes. The release of the FOMC minutes would provide a detailed explanation behind the unchanged interest rate decision announced by Federal Reserve (Fed) chair Jerome Powell in June policy.
As per the CME Fedwatch tool, an interest rate hike of 25 basis points (bps) to 5.25-5.50% is highly likely. While Atlanta Fed Bank President Raphael Bostic is in support of further skip in the policy-tightening spell. He believes that the central bank has reached a point where interest rates are sufficiently restrictive to bring down inflation to 2%.
Going forward, investors would shift their focus to the Nonfarm Payrolls (NFP) data for June. The preliminary report shows fresh addition of 225K employees vs. the prior addition of 339K. The Unemployment Rate is seen declining to 3.6%. Upbeat labor market data might strengthen the need for more interest rate hikes from the Fed.
- AUD/USD is seeking a cushion around 0.6660, however, the downside seems favored.
- The US Dollar Index is expected to show severe volatile moves ahead of the FOMC minutes.
- AUD/USD has slipped below the Rising Channel chart pattern, which indicates a bearish reversal.
The AUD/USD pair is looking for a cushion around 0.6660 in the London session. The Aussie asset witnessed a steep fall as the risk-aversion theme is in action. Market mood has dampened as investors are expected to remain light ahead of the second-quarter result season.
The US Dollar Index (DXY) is expected to show severe volatile moves ahead of the release of the Federal Open Market Committee (FOMC) minutes. The minutes would provide a detailed explanation behind the unchanged interest rate decision by the Fed taken in the June meeting.
Meanwhile, the Australian Dollar is facing pressure after the release of the weak Manufacturing PMI data. The economic data landed at 50.3, lower than the expectations and the former release of 50.7.
AUD/USD has slipped below the Rising Channel chart pattern on a four-hour scale, which indicates a bearish reversal. Earlier, the Aussie asset rebounded after finding strength near the 61.8% Fibonacci retracement (plotted from May 31 low at 0.6505 to July 16 high at 0.6900) at 0.6628.
The major has slipped below the 50-period Exponential Moving Average (EMA) at 0.6675, which indicates that the short-term trend has turned bearish.
Adding to that, the Relative Strength Index (RSI) (14) has slipped into the 40.00-60.00 range. Further slippage would activate the bearish momentum.
A confident break June 29 low at 0.6595 would drag the asset toward June 02 low at 0.6565 and the round-level support at 0.6500.
On the flip side, a decisive break above 38.2% Fibo retracement at 0.6732 would expose the asset to June 23 high at 0.6767, followed by the round-level resistance at 0.6800.
AUD/USD four-hour chart
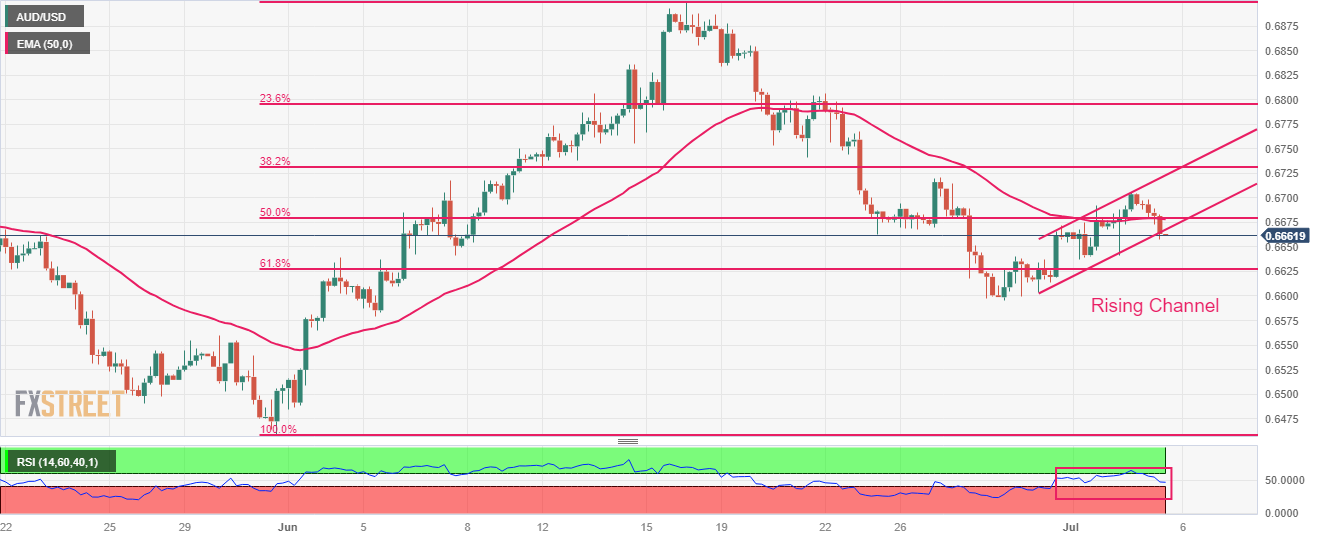
- EUR/JPY trades with small gains in the low-157.00s.
- Extra gain remains in the pipeline in the near term.
EUR/JPY gathers fresh upside bias and retakes the 157.00 barrier following an earlier drop to the 156.70 region on Wednesday.
Considering the ongoing price action, some side-lined trading appears the most likely scenario for the time behind ahead of the potential resumption of the uptrend. Against that, further gains should clear the 158.00 region to allow for a potential move to the weekly high of 163.09 (August 22 2008).
So far, further upside looks favoured while the cross trades above the 200-day SMA, today at 145.43.
EUR/JPY daily chart
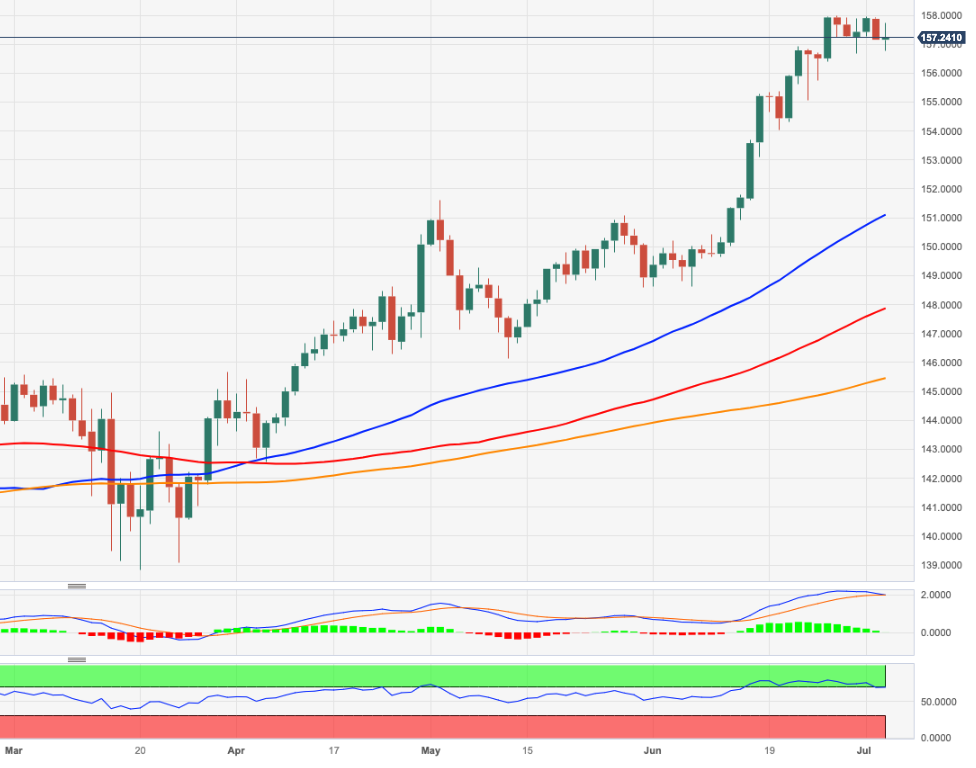
In June, the Australian Dollar appreciated against the US Dollar in from 0.6472 to 0.6657. Economists at MUFG Bank analyze AUD/USD outlook.
The scale of increase in AUD/USD as the Fed shifts to easing will still be relatively modest
A choppy path higher for AUD/USD is likely and given downside risks emanating from China and challenging global growth, the scale of increase in AUD/USD as the Fed shifts to easing will still be relatively modest.
AUD/USD – Q3 2023 0.66 Q4 2023 0.68 Q1 2024 0.67 Q2 2024 0.65
German Chancellor Olaf Scholz said on Wednesday that they cannot carry on with 0% interest rates and noted that they support the European Central Bank (ECB) in its battle against inflation, as reported by Reuters.
Scholz further note that financing Germany's security will present a challenge for the budget. When asked about US chipmaker Intel's decision to develop two plants in Magdeburg, "it's an impressive signal that so many German and international companies are choosing Germany for the expansion of their semiconductor production," Scholz responded.
Market reaction
EUR/USD showed no reaction to these comments and was last seen trading flat on the day at 1.0880.
UOB Group’s Enrico Tanuwidjaja and Junior Economist Agus Santoso assess the recently published inflation figures in Indonesia.
Key Takeaways
Indonesia's headline inflation in Jun slowed to 3.5% y/y vs. 4% in May, underpinned largely by declining energy prices after Indonesia’s major fuel supplier adjusted fuel prices in Jun. In addition, slower food prices’ gain on the back of improvement in food supply and adequate food stocks also drove Foods and Beverages (F&B) sub-group inflation slower to sub-3% in Jun.
Lower inflation in Jun can be attributed to the decline in most of the subcomponents, save for housing, water and electricity, health, education, and information and communications (info-comm). F&B’s inflation moderated the most, shedding off 1.4ppt to 2.9% from 4.3% prior, followed by household equipment, transport, and restaurant.
Jun’s inflation has further returned inflationary pressures to BI’s target range of 2-4% and was lower than consensus 3.6%. Importantly, a more detailed breakdown of Jun's inflation suggests that core inflation continued to ease 6 months in a row and have somewhat returned to similar level seen during the onset of Covid-19. This has reaffirmed our view that a persistent decline of strength in consumer demand is likely to be at play. Jun’s inflation data has also reinforced our 2023 inflation forecast of 3.8%, moderating slightly from 2022’s 4.2%.
GBP/USD is little changed on the session, holding around the 1.27 level. Economists at Scotiabank analyze the pair’s technical outlook.
Technical momentum remains positive
Gains have consolidated in tight ranges since the start of the week but the backdrop remains bullishly oriented for the Pound and gains through 1.2735/40 in the next day or so should reinvigorate the still strong underlying bull trend evident on daily and weekly oscillator readings for a retest of 1.28+.
Support is 1.2665/85.
See: GBP/USD will struggle to extend beyond recent highs, ending H2 lower in the 1.22 region – Rabobank
- Gold price is aiming to recapture the crucial resistance of $1,930.00 amid sheer volatility in the USD Index.
- Upcoming quarterly result season is expected to keep US equities under pressure and a stock-selective action would be observed.
- Gold price has attempted a breakout of the downward-sloping trendline plotted from $2,079.76.
Gold price (XAU/USD) is looking to recapture the immediate resistance of $1,930.00 in the European session. The precious metal is having strength as investors are sticking to only one interest rate hike projection from the Federal Reserve (Fed) by the year-end.
S&P500 futures have posted significant losses in the London session as investors are cautious ahead of United States markets opening after a holiday due to Independence Day. In addition to that, the upcoming quarterly result season is expected to keep equities under pressure and a stock-selective action would be observed.
The US Dollar Index (DXY) is showing volatile spikes around 103.00 ahead of the Federal Open Market Committee (FOMC) minutes. Investors would look for cues about interest rate guidance. However, Fed Chair Jerome Powell has started preparing investors for two more interest rate hikes this year. Therefore, relative uncertainty from FOMC minutes could remain shallow.
A volatile action in the Gold price would come after the release of June’s Employment data. According to the estimates, US Automatic Data Processing (ADP) Employment report is expected to show a decline in the employment addition to 180K vs. the prior addition of 278K.
On Thursday, investors will also keep an eye on the ISM Services PMI data. This week, Manufacturing PMI continued its contraction spell straight for eight months.
Gold technical analysis
Gold price has attempted a breakout of the downward-sloping trendline plotted from May 03 high at $2,079.76 on a four-hour scale. A confirmed breakout would trigger the bullish reversal. The 50-period Exponential Moving Average (EMA) at $1,922.30 is providing support to the Gold bulls.
The Relative Strength Index (RSI) (14) is looking to move into the bullish range of 60.00-80.00. An occurrence of the same would trigger the upside momentum.
Gold four-hour chart
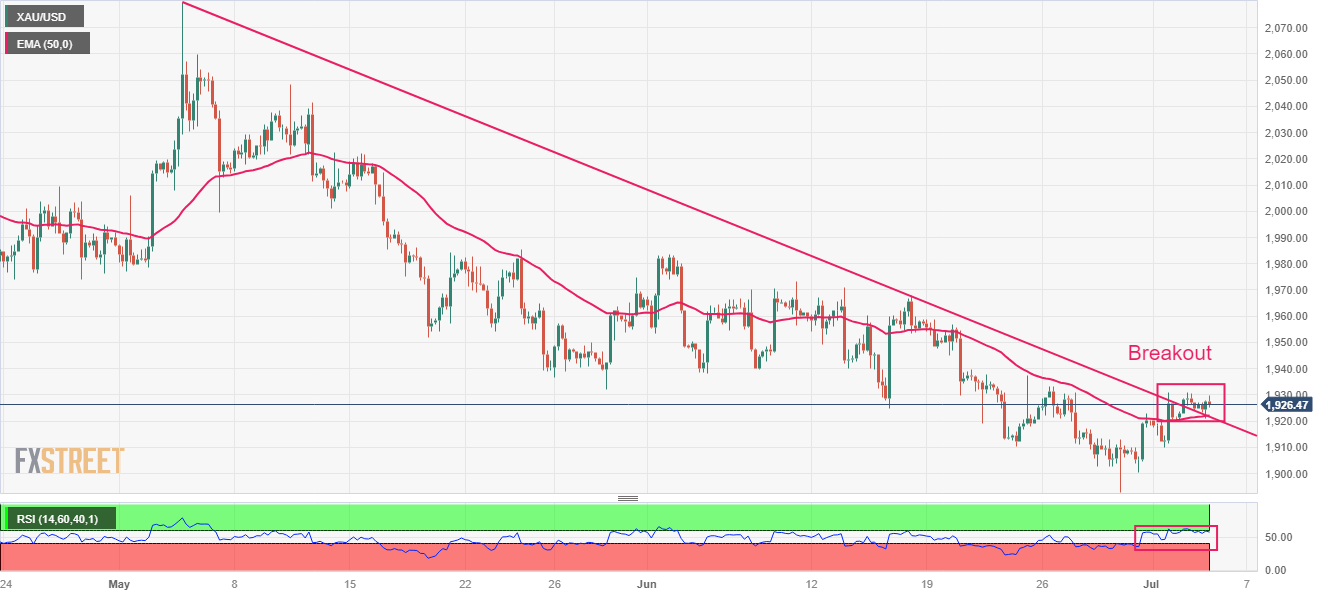
USD/CAD pressures upper 1.32s. Economists at Scotiabank analyze the pair’s technical outlook.
The upper 1.32 zone has capped recent advances
Solid gains for the USD on the day so far leave the USD/CAD pair retesting the upper 1.32 zone that has capped recent USD advances.
A little more technical momentum may be building under USD gains, suggesting an advance to the 1.3315/25 resistance zone is on the cards.
Support is 1.3211/10.
See – USD/CAD: Risks remain to the hawkish side for the BoC and the bullish side for the Loonie – HSBC
Economist at UOB Group Ho Woei Chen, CFA, reviews the latest release of Chinese PMIs for the month of June.
Key Takeaways
China’s CFLP manufacturing and non-manufacturing PMIs were largely in line with estimates and continued to show a worrying trend of growth moderation in Jun. The disinflationary pressure has also persisted in the broader economy.
The manufacturing PMI stayed in contraction (reading below 50) for the third consecutive month in Jun but edged up slightly by 0.2 points to 49.0.
The non-manufacturing PMI remained in expansion but moderated for the third consecutive month as it fell 1.3 points to 53.2, contributed by slower activities in both the services and construction industries.
Sentiment has remained weak as any additional stimulus measures from the Chinese government and central bank will likely be restrained. The Politburo meeting in Jul is seen as a probable timing for further stimulus announcement which Premier Li Qiang said will be “more practical and effective measures” on expanding domestic demand and stimulating market dynamism.
EUR/USD holds range above support in the low/ mid-1.08 range. Economists at Scotiabank analyze the pair’s technical outlook.
Gains through 1.0910 resistance to provide renewed upside impetus for a retest of 1.10
Spot trends retain a soft undertone on the short-term chart but there is no strong incentive to push the EUR lower at this point and recent dips have been well-support around the 40-Day Moving Average (1.0828 currently) and the low/ mid-1.08s should remain firm support.
Gains through 1.0910 resistance off the June 22nd high will provide renewed upside impetus for a retest of 1.10.
Economists at Rabobank discuss GBP outlook.
GBP will end the year a little softer against the EUR around EUR/GBP 0.87
We judge the line-up of UK fundamentals as being still fairly sour. Weak growth and high inflation are coupled with high national debt and concerns about investment growth. That said, the drop in the UK’s current account deficit (% GDP) should afford the Pound some protection meaning that there should be less potential volatility in GBP if recession fears rise. Even so, we expect that GBP will end the year a little softer against the EUR around EUR/GBP 0.87.
Cable will be subject to the direction of the USD, but we expect the currency pair will struggle to extend beyond recent highs and look for the GBP/USD pair to end H2 lower in the 1.22 region.
The Yen weakened sharply in June. Economists at MUFG Bank discuss JPY outlook.
Yen looks over-extended to the downside
Japan's equity market outperformance, positive inflation in land and property prices, high and sustained household inflation expectations, and underlying inflation at a level not seen since 1981 leave every BoJ meeting as live for a surprise policy change.
The Yen to us looks over-extended to the downside and we see a BoJ shift in YCC and a Fed pause by September helping fuel a sustained turnaround.
USD/JPY – Q3 2023 136.00 Q4 2023 134.00 Q1 2024 132.00 Q2 2024 130.00
EUR/JPY – Q3 2023 149.60 Q4 2023 150.10 Q1 2024 149.20 Q2 2024 143.00
Considering the recent price action, USD/CNH is now expected to trade within a range bound theme in the next few weeks, comment UOB Group’s Economist Lee Sue Ann and Markets Strategist Quek Ser Leang.
Key Quotes
24-hour view: USD fell to a low of 7.2187 yesterday before closing on a soft note at 7.2340 (-0.30%). While downward momentum has not increased much, there is scope for USD to dip to 7.2080. The major support at 7.1800 is unlikely to come under threat. On the upside, a breach of 7.2500 (minor resistance is at 7.2420) would indicate the current mild downward pressure has faded.
Next 1-3 weeks: Our most recent update was from last Friday (30 Jun) when we indicated that “USD strength is still intact and the next level to watch is 7.3000”. USD did not reach 7.3000. Yesterday, it fell below our ‘strong support level of 7.2200 (low of 7.2187). The breach of the ‘strong support’ level indicates that the USD strength that started two weeks ago has ended. For now, USD is likely to trade in a range 7.1800/7.2800.
USD/BRL has recently achieved downside projections of 4.75. Economists at Société Générale analyze the pair’s technical outlook.
Below 4.75, next potential objectives are located at 4.69 4.61/4.59
An initial bounce is taking shape and a revisit of 50-DMA near 4.90/4.93 is not ruled out.
It would be interesting to see if the pair can re-establish above the lower band of previous range near 5.01; failure could lead to persistence in decline.
Below 4.75, next potential objectives are located at 4.69 and April 2022 lows of 4.61/4.59.
- The US Dollar pops higher, partly erasing Tuesday’s losses.
- US Factory Orders and FOMC Minutes are on focus this Wednesday.
- The US Dollar Index is back above 103.00, though markets bear nervous reactions.
The US Dollar (USD) is back from a short hiatus on Tuesday due to the US national holiday. Markets focus back on the two main key elements for this week, which are the US Jobs report on Friday and the Federal Open Market Committee (FOMC) Minutes that are set to be published at 18:00 GMT. Trades will look for clues on the number of interest-rate hikes expected, and foremost, the longevity of the pivot level the Fed will want to maintain before starting to cut rates. Any prospect of rate cuts will result in a weaker US Dollar as the interest rate value for the currency will start to decrease against its peers, likely prompting gains for US equities instead.
Other data points for this Wednesday to look for are Factory Orders and the IBD/TIPP Economic Optimism Index, both due at 14:00 GMT. . The US Energy Information Administration (EIA) numbers for the Crude Oil reserves of the US have been pushed forward to Thursday. The key FOMC minutes will be published at 18:00 GMT, and traders will see the oil reserve data from the American Petroleum Institute (API) at 20:30 GMT.
Daily digest: US Dollar has its work cut out to erase Tuesday’s losses
- US Factory Orders, set to come out at 14:00 GMT, are expected to jump from 0.4% previous to 0.8% in May.
- John C. Williams, the president of Federal Reserve Bank of New York, is set to make an appearance around 20:00 GMT and could deliver additional comments to guide the markets around the FOMC Minutes statement.
- The US Dollar is stuck in choppy trading against the Euro as Purchasing Manager Index numbers fell below 50 for France and Italy. Both Europe and the US are thus seeing contractions in their PMIs. At the same time, the European Central Bank (ECB) published a survey of inflation expectations, which have been revised to the downside. This adds to evidence of subsiding inflation pressures, making it more likely that the ECB will end its hiking cycle sooner than markets anticipate.
- China’s June Caixin Services and Composite Purchase Manager Index (PMI) declined compared with the previous month, triggering a sell-off in Chinese equities and a weaker Yuan.
- Asian markets were mostly in the red, with the Japanese Topix closing nearly unchanged and the Chinese Hang Seng losing 1.57%. European indices are on the descent as well, though no major index is losing more than 1%. US equity futures are mildly in the green and will possibly stay rather muted until investors hear more from the FOMC Minutes.
- The CME Group FedWatch Tool shows that markets are pricing in a 88.2% chance of a 25 basis points (bps) interest-rate hike on July 26. The dislocation between market expectations and what the Fed has been communicating in terms of number of rate hikes is still persistent and could trigger a stronger US Dollar once markets get to the point of realisation. The FOMC Minutes could trigger a rise in possibility of a second hike in some later-dated futures.
- The benchmark 10-year US Treasury bond yield halted trading at 3.84% on Wednesday after being closed throughout Tuesday. No clear sense of direction to take away around halfway through the European session.
US Dollar Index technical analysis: USD hard to let go of 103.00
The US Dollar is painting a whole other picture compared to its performance on Tuesday, when it weakened against most major currencies. On Wednesday, nearly every segment is in the green with Canadian Dollar (USD/CAD) and Indian Rupee (USD/INR) both at a month-high level. The US Dollar Index is back to where it was on Monday, around 103.00, and further direction will depend on the perception of the markets over the FOMC Minutes.
On the upside, look for 103.54 as the next key resistance level, which falls in line with the last week’s high. The 200-day Simple Moving Average (SMA) at 104.83 is still quite far away. So the intermediary level to look for is the psychological level at 104.00 and May 31 peak at 104.70.
On the downside, the 55-day SMA near 102.76 has proven its importance as it clearly underpinned price action on Friday and Monday by triggering a turnaround after the firm weakening of the Greenback. A touch lower, 102.50 will be vital to hold from a psychological point of view. In case the DXY slips below 102.50, more weakness is expected with a full slide to 102.00 and a retest of June’s low at 101.92.
US Dollar FAQs
What is the US Dollar?
The US Dollar (USD) is the official currency of the United States of America, and the ‘de facto’ currency of a significant number of other countries where it is found in circulation alongside local notes. It is the most heavily traded currency in the world, accounting for over 88% of all global foreign exchange turnover, or an average of $6.6 trillion in transactions per day, according to data from 2022.
Following the second world war, the USD took over from the British Pound as the world’s reserve currency. For most of its history, the US Dollar was backed by Gold, until the Bretton Woods Agreement in 1971 when the Gold Standard went away.
How do the decisions of the Federal Reserve impact the US Dollar?
The most important single factor impacting on the value of the US Dollar is monetary policy, which is shaped by the Federal Reserve (Fed). The Fed has two mandates: to achieve price stability (control inflation) and foster full employment. Its primary tool to achieve these two goals is by adjusting interest rates.
When prices are rising too quickly and inflation is above the Fed’s 2% target, the Fed will raise rates, which helps the USD value. When inflation falls below 2% or the Unemployment Rate is too high, the Fed may lower interest rates, which weighs on the Greenback.
What is Quantitative Easing and how does it influence the US Dollar?
In extreme situations, the Federal Reserve can also print more Dollars and enact quantitative easing (QE). QE is the process by which the Fed substantially increases the flow of credit in a stuck financial system.
It is a non-standard policy measure used when credit has dried up because banks will not lend to each other (out of the fear of counterparty default). It is a last resort when simply lowering interest rates is unlikely to achieve the necessary result. It was the Fed’s weapon of choice to combat the credit crunch that occurred during the Great Financial Crisis in 2008. It involves the Fed printing more Dollars and using them to buy US government bonds predominantly from financial institutions. QE usually leads to a weaker US Dollar.
What is Quantitative Tightening and how does it influence the US Dollar?
Quantitative tightening (QT) is the reverse process whereby the Federal Reserve stops buying bonds from financial institutions and does not reinvest the principal from the bonds it holds maturing in new purchases. It is usually positive for the US Dollar.
Back from holiday. The minutes from the June FOMC meeting will be in focus but data releases hold the task of driving any substantial Dollar move for now, economists at ING report.
US markets reopen today and FX volatility should pick up again
US markets re-open today and we expect some pick up in FX volatility, with both Fed communication and data coming into focus.
The minutes from the June FOMC meeting are the main highlight. Overall, the dot plot projections and the post-meeting Fed communication suggest that markets may not find many hints to recalibrate their tightening expectations lower today. If anything, the trigger for such a dynamic would be weak US data.
On Wednesday, the calendar is not particularly heavy in the US: factory orders for May and the final print of durable goods orders. Thursday’s ISM services and ADP employment figures are a bigger risk event for the Dollar.
Further upside seems to be losing momentum around USD/JPY according to UOB Group’s Economist Lee Sue Ann and Markets Strategist Quek Ser Leang.
Key Quotes
24-hour view: USD traded in a relatively quiet manner between 144.19 and 144.70 yesterday. The price actions appear to be consolidative and USD is likely to trade in a range of 144.20/144.80 today.
Next 1-3 weeks: The USD strength that started in the middle of last month (see annotations in the chart below) is struggling to maintain its momentum. The prospect for the USD to extend to 145.50 appears to be low. All in all, only a break of 143.90 would suggest that the USD strength has come to an end.
- NZD/USD is consolidating around 0.6200 as FOMC minutes have come under spotlight.
- S&P500 futures have extended losses in Europe, portraying strength in the risk-aversion theme.
- Thursday’s ADP Employment report is expected to show additions of 180K employees in June.
The NZD/USD pair is demonstrating topsy-turvy moves near the round-level resistance of 0.6200 in the London session. The Kiwi asset has turned sideways as investors are awaiting a key trigger for further guidance. A volatile action is anticipated in the Kiwi asset as the release of the Federal Open Market Committee (FOMC) minutes would provide guidance about the interest rate peak.
S&P500 futures have extended losses in Europe, portraying strength in the risk-aversion theme amid obscurity about July’s Federal Reserve (Fed) monetary policy. The US Dollar Index (DXY) is showing topsy-turvy moves around 103.00 ahead of FOMC minutes.
As per the CME Fedwatch tool, more than 86% chances are in favor of an interest rate hike by 25 basis points (bps) to 5.25-5.50%. Also, Fed chair Jerome Powell has cited the need for two more interest rate hikes to weigh pressure on stubborn core inflation.
The release of the FOMC minutes will provide guidance on interest rates and current economic prospects. Although further policy-tightening is warranted, the United States' economic prospects are facing immense pressure.
Later this week, US Employment data will be keenly watched. Thursday’s Automatic Data Processing (ADP) Employment data is expected to show additions of 180K employees in June lower than May’s addition of 278K.
On the New Zealand dollar front, weak Caixin Services PMI could bring near-term pressure in Kiwi. The economic data has sharply dropped to 53.9 from the former release of 57.1. Investors are worried that the Chinese economic recovery is faltering despite supportive monetary and fiscal policies.
It is worth noting that New Zealand is one of the leading trading partners of China and a decline in Caixin Services PMI might impact the New Zealand Dollar.
Inflation declines becoming more evident in the UK. Economists at MUFG analyze the BoE policy outlook and its implication for the British Pound (GBP).
More meaningful declines in inflation over the coming months
The OIS UK curve remains excessive in our view with still a large 130 bps of tightening priced through to the turn of the year. With that likely to adjust lower as the markets see inflation come down and the BoE not needing to be so aggressive, the scope for further GBP strength could be limited.
Falling food prices will have the biggest impact on short-term inflation expectations and the drop in food inflation will coincide with the 17% cut in utility bills with the OFGEM price cap reduction effective 1st July. The developments should mean we see more meaningful declines in inflation over the coming months which leads the market to question the extent of BoE rate hikes required going forward.
We continue to see two more hikes rather than the five priced which will remove some of the current yield support for the Pound.
European Central Bank (ECB) policymaker Ignazio Visco said in a statement on Wednesday, “more rate hikes are not the only way to curb inflation.”
Further comments
Can also aim to maintain rates adequately high for a sufficient period of time.
Rate decision is taken on a meeting-by-meeting basis, depending on incoming data.
I don't agree with idea of tightening too much over tightening too little.
Related reads
- ECB Survey: Consumer inflation expectations for next 12 months fall to 3.9% in May
- Euro remains under pressure below 1.0900, looks at FOMC Minutes
The latest survey of consumer expectations for inflation, conducted by the European Central Bank (ECB) on a monthly basis, reveals that inflation expectations among Eurozone consumers decreased further in May.
Additional takeaways
See inflation at 2.5% in 3 years, the same as before.
See inflation at 3.9% over next year vs 4.1%.
Consumers see inflation at 3.9% over next year vs 4.1%.
Consumers see inflation at 2.5% in 3 years, the same as before.
Market reaction
EUR/USD remains on the defensive following the release of the above survey findings. The pair is currently trading at 1.0895, up 0.08% on the day.
- WTI Crude Oil prices face rejection near the 50-DMA and drift lower on Wednesday.
- The formation of a descending triangle on the daily chart favours bearish traders.
- A sustained strength beyond the $72.00 mark is needed to negate the negative bias.
Western Texas Intermediate (WTI) Crude Oil prices come under renewed selling pressure on Wednesday and reverse a major part of the previous day's positive move. The intraday downfall picks up pace during the early part of the European session and drags the commodity to a fresh daily low, around the $70.25 region in the last hour.
Worries that a global economic slowdown will dent fuel demand overshadow expectations for tighter supply due to output cuts announced by top exporters - Saudi Arabia and Russia - and act as a headwind for Crude Oil prices. Apart from this, a modest US Dollar (USD) strength is seen as another factor weighing on the black liquid. Traders now look to a meeting of oil industry executives with energy ministers from OPEC and its allies. Apart from this, the FOMC meeting minutes should provide some meaningful impetus and contribute to producing short-term trading opportunities.
From a technical perspective, the recent recovery from strong horizontal support near the $67.00 mark fails to find acceptance above the 50-day Simple Moving Average (SMA) and fails near a downward-sloping trend-line extending from late May. The price action, meanwhile, constitutes the formation of a descending triangle on the daily chart and favours bearish traders. That said, oscillators on the daily chart are yet to confirm a negative outlook. This makes it prudent to wait for a sustained break below the $67.00 support before positioning for any further losses.
In the meantime, any subsequent downfall is more likely to find some support near the $70.00 psychological mark ahead of the $69.60 area. The next relevant support is pegged near the $69.00 mark, below which Oil prices could drop to the $68.25-$68.20 region en route to the $67.60 zone and the $67.00 strong horizontal support. A convincing break below the latter will confirm a bearish breakdown through the triangle support and make the black liquid vulnerable to sliding further.
On the flip side, the 50-day SMA, currently around the $71.20-$71.30 area, might continue to act as an immediate barrier ahead of the $72.00 mark, or the descending trend-line. A sustained strength beyond will negate the bearish outlook and shift the bias in favour of bullish traders. WTI Crude Oil price might then surpass an intermediate hurdle near the mid-$72.00 mark and aim to reclaim the $73.00 mark. The momentum could get extended further beyond the $74.00 round figure, towards testing the June monthly swing high, around the $74.35 region.
WTI daily chart
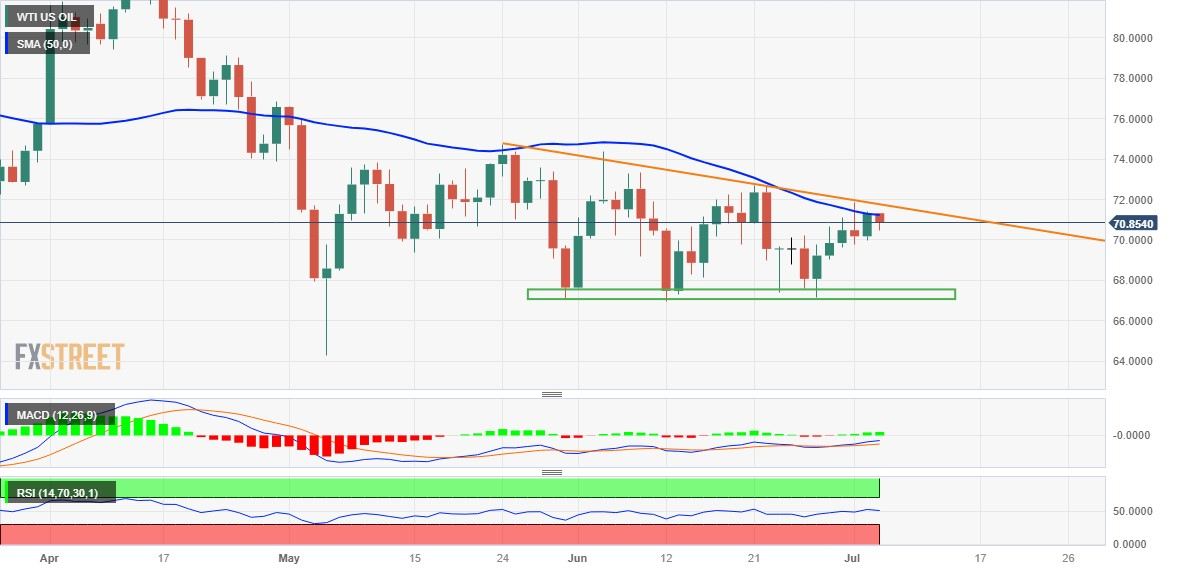
Key levels to watch
The Polish Zloty is once again clamouring for attention. Economists at ING analyze PLN outlook.
National Bank of Poland to deliver a dovish report
EUR/PLN touched its lowest levels since early 2021 on Tuesday. We remain positive on the Zloty, however, as we estimate that positioning must be extremely long at the moment – most significantly in the CEE region. Moreover, we can expect a dovish report from the NBP on Thursday.
The market has priced in a lot of rate cuts for this year over the past week without significant damage to the PLE. Thus, the current account surplus, strong FDI flows and the dampening of volatility through MinFin operations in the market will continue to support the Zloty, but we expect further gains to be at a slower pace.
- EUR/GBP has faced pressure around 0.8575 as UK Services PMI has matched expectations.
- The UK economy is facing issues of labor shortages due to Brexit and early retirements.
- ECB Nagel has cited that the central bank has not reached the end of policy-tightening yet.
The EUR/GBP pair has retreated as the United Kingdom S&P Services PMI has matched expectations. The economic data has landed at 53.7 as expected by the market participants.
The Pound Sterling is expected to remain in a positive trajectory as inflationary pressures in the UK economy are expected to elevate further. A poll from Reuters indicates that almost one in three female workers is expected to consider early retirement because of health issues. The economy is already facing issues of labor shortages due to Brexit and early retirements and now further increase in early withdrawal from work would propel red-hot inflation.
Considering the stubbornness in UK inflation, the Bank of England (BoE) is far from pausing the policy-tightening spell. UK Consumer Price Index (CPI) has turned sticky above 8.5% despite lower gasoline prices.
Meanwhile, UK firms are planning to shift investments to Germany to compensate for customs delays inspired by the Brexit event.
The Euro is expected to face pressure as preliminary Eurozone inflation has softened to 5.5% in June vs. the former release of 6.1%. Thanks to the drop in prices of oil but core inflation has marginally decelerated to 6.8% against the prior figure of 6.9%. This might allow the European Central Bank (ECB) to go slow on the policy-tightening spell. However, ECB policymaker Joachim Nagel has cited that the central bank has not reached the end of policy-tightening yet.
Higher interest rates by ECB President Christine Lagarde have pushed the Eurozone economy under threat. Citi has cut the real Gross Domestic Product (GDP) forecast in the Euro area to 0.3% and German’s GDP forecast to 0.2%.
Ulrich Leuchtmann, Head of FX and Commodity Research at Commerzbank, analyzes JPY's outlook.
Without fundamentally supported reasons for a JPY recovery there will be no sustainable recovery
From the market’s point of view, it is not interventions but a change in monetary policy that constitutes the main risk. That confirms my prejudice: without fundamentally supported reasons for a JPY recovery (i.e. in the absence of a monetary policy reversal) there will be no sustainable JPY recovery. The market seems to share my view.
On the other hand, the market does not share my view when it comes to the upside risks in USD/JPY. The major aspect I am concerned about is a different one: that the inflation expectations get out of control so that the BoJ only has a choice between high inflation and fiscal stress – with clearly negative effects for the Yen. I am clearly on my own when it comes to this underlying fear. Otherwise, JPY puts with long maturities would not be so cheap (compared with ATM).
- Pound Sterling has bounced back as investors’ risk-taking ability has strengthened.
- Investors are awaiting United Kingdom’s Services PMI, which is expected to remain steady.
- Rishi Sunak has assured full utilization of monetary and fiscal tools to bring down stubborn inflation.
The Pound Sterling (GBP) has picked strength as the market mood is turning cheerful. The GBP/USD pair has recovered sharply as the Bank of England (BoE) is taking some strong steps to strengthen financial conditions. United Kingdom’s inflation looks set to pick pace again as labor shortages are expected to elevate.
After a marginal increase in United Kingdom’s Manufacturing PMI, investors are shifting their focus to the Services PMI. UK’s service sector is in an expansion stage, unlike factory activity which has been posting contraction, straight for the past 11 months.
Meanwhile, UK PM Rishi Sunk is confident that price stability will be achieved.
Daily Digest Market Movers: Pound Sterling jumps swiftly to 1.2720
- United Kingdom Prime Minister Rishi Sunak has promised to fully utilize monetary and fiscal policy to tame persistent inflation.
- UK Sunak cited that inflationary pressures are showing a higher persistence than expected but that doesn’t state that the policy measures used are the wrong ones.
- The Britain government has announced that it is committed to spending 11.6 billion pounds on international climate finance.
- Firms are ramping up investments in Germany to compensate for custom delays and tedious bureaucracy inspired by an exit of Britain from the European Union.
- Financial Times reported that the Bank of England is planning to discuss with international banks to set up subsidiaries.
- Higher inflationary pressures in the UK economy are backed by shortages of labor and 45-year high food price inflation.
- Labor shortages are expected to elevate further as almost one in three female workers are expected to consider early retirement because of health issues.
- UK Finance Minister Jeremy Hunt gave his backing to the country's financial regulator Financial Conduct Authority (FCA) to ensure banks are passing on better savings rates to consumers, as reported by Reuters.
- Investors are focusing on the June Services PMI data, which is seen steady at 53.7.
- The monthly survey by Citi Bank and polling firm YouGov showed that consumer inflation expectations for one year have increased to 5.0% in June from 4.7% in May.
- Financial markets are anticipating that the BoE will eventually raise interest rates to 6.25% from the current state of 5%.
- The risk profile has turned cautious ahead of the United States markets opening after a holiday.
- The US Dollar Index (DXY) has dropped sharply as investors are confident that the Federal Reserve (Fed) will raise interest rates only once this year despite Fed chair Jerome Powell considering two small interest rate hikes appropriate.
- Later this week, investors will focus on Federal Open Market Committee (FOMC) Minutes, ISM Services PMI, and Employment data.
Technical Analysis: Pound Sterling continues winning streak
Pound Sterling has continued its three-day winning spell by surpassing Tuesday’s close around 1.2710 as the US Dollar Index is under pressure ahead of FOMC Minutes. The Cable has continued to maintain sustainability above the 20-period daily Exponential Moving Average (DEMA) at 1.2667, which indicates that the short-term trend is bullish.
Momentum oscillators are looking to shift into the bullish trajectory, which would infuse strength in the Pound Sterling bulls.
Buyers could add positions if Cable manages to jump firmly above 1.2740. The upside bias could fade if it corrects below the psychological support of 1.2500.
BoE FAQs
What does the Bank of England do and how does it impact the Pound?
The Bank of England (BoE) decides monetary policy for the United Kingdom. Its primary goal is to achieve ‘price stability’, or a steady inflation rate of 2%. Its tool for achieving this is via the adjustment of base lending rates. The BoE sets the rate at which it lends to commercial banks and banks lend to each other, determining the level of interest rates in the economy overall. This also impacts the value of the Pound Sterling (GBP).
How does the Bank of England’s monetary policy influence Sterling?
When inflation is above the Bank of England’s target it responds by raising interest rates, making it more expensive for people and businesses to access credit. This is positive for the Pound Sterling because higher interest rates make the UK a more attractive place for global investors to park their money. When inflation falls below target, it is a sign economic growth is slowing, and the BoE will consider lowering interest rates to cheapen credit in the hope businesses will borrow to invest in growth-generating projects – a negative for the Pound Sterling.
What is Quantitative Easing (QE) and how does it affect the Pound?
In extreme situations, the Bank of England can enact a policy called Quantitative Easing (QE). QE is the process by which the BoE substantially increases the flow of credit in a stuck financial system. QE is a last resort policy when lowering interest rates will not achieve the necessary result. The process of QE involves the BoE printing money to buy assets – usually government or AAA-rated corporate bonds – from banks and other financial institutions. QE usually results in a weaker Pound Sterling.
What is Quantitative tightening (QT) and how does it affect the Pound Sterling?
Quantitative tightening (QT) is the reverse of QE, enacted when the economy is strengthening and inflation starts rising. Whilst in QE the Bank of England (BoE) purchases government and corporate bonds from financial institutions to encourage them to lend; in QT, the BoE stops buying more bonds, and stops reinvesting the principal maturing on the bonds it already holds. It is usually positive for the Pound Sterling.
- Gold price reverses an intraday dip on Wednesday, though lacks follow-through.
- Economic woes and the worsening US-China ties benefit the safe-haven metal.
- A modest USD strength might cap gains ahead of the FOMC meeting minutes.
Gold price attracts some dip-buying near the $1,920 area and climbs to the top end of its intraday trading range during the early part of the European session. The XAU/USD, however, remains below the weekly high touched on Tuesday and currently trades around the $1,927-$1,928 region, up less than 0.15% for the day.
The disappointing Chinese macro data, along with the worsening US-China relations, temper investors' appetite for riskier assets and turn out to be a key factor that benefits the safe-haven Gold price. In fact, the Caixin/S&P Global Services PMI fell from 57.1 in May to 53.9 last month - the lowest reading since January. This comes after China introduced export curbs on two metals - widely used in semiconductors, electric vehicles and high-tech industries - to the United States (US). This marks a potential escalation in a trade conflict between the world’s largest economies and might cause more disruption to global trade, which, in turn, could further undermine already weak economic conditions.
The upside for the Gold price, however, is likely to remain capped in the wake of a more hawkish stance adopted by major central banks, including the Federal Reserve (Fed). In fact, the US central bank had signalled in June that borrowing costs may still need to rise as much as 50 bps by the end of this year. Moreover, the markets have been pricing in a greater chance of a 25 bps lift-off at the next FOMC monetary policy meeting on July 25-26. This, in turn, remains supportive of elevated US Treasury bond yields, which acts as a tailwind for the US Dollar (USD) and contributes to keeping a lid on any meaningful upside for the non-yielding yellow metal, warranting some caution for bullish traders.
The USD, meanwhile, lacks bullish conviction amid the uncertainty over the Fed's future rate-hike path. It is worth recalling that the softer US PCE Price Index released on Friday, along with Monday's weaker US ISM PMI, raised questions over how much headroom the Fed has to continue with its monetary policy tightening cycle. Hence, the market focus will remain glued to the release of the June FOMC meeting minutes, due later during the US session. Investors will closely scrutinize minutes for cues about the Fed's near-term policy outlook, which, in turn, should play a key role in influencing the USD price dynamics and help determine the near-term trajectory for the XAU/USD.
Technical levels to watch
- Euro fails to surpass the 1.0900 level vs. the US Dollar.
- Stocks in Europe navigate a “sea of red” on Wednesday.
- EUR/USD appears capped by the 1.0900 region so far.
- Germany, EMU final Services PMI eased in June.
- US markets slowly return to normal activity.
The Euro (EUR) adds to the weekly bearish note following an unsuccesful effort to convincingly surpass the significant barrier at 1.0900 vs. the US Dollar (USD) earlier on Wednesday. A breakout of this key resistance area would restore the positive bias in EUR/USD and open the door for further gains in the short-term horizon.
Meanwhile, the US dollar fluctuates near the 103.00 level amidst favorable risk appetite trends despite the Chinese Services sector experiencing a significant decline in June compared to the previous month, propping up the idea that an strong economic recovery in the country still remains elusive.
In terms of monetary policy, there are no major updates, and investor expectations remain stable regarding an anticipated 0.25% interest rate hike from both the European Central Bank (ECB) and the Federal Reserve at their respective upcoming meetings later this month.
The central banks' efforts to combat inflation and normalize their monetary policies continue to be a subject of ongoing debate, as speculations about an economic slowdown on both sides of the Atlantic continue to grow.
Shifting focus to the euro area, the final figures reveal the HCOB Services PMI for Germany at 54.1 and for the broader euro zone at 52.0, both recorded in June. Additionally, Producer Prices for the euro bloc will be released later in the session.
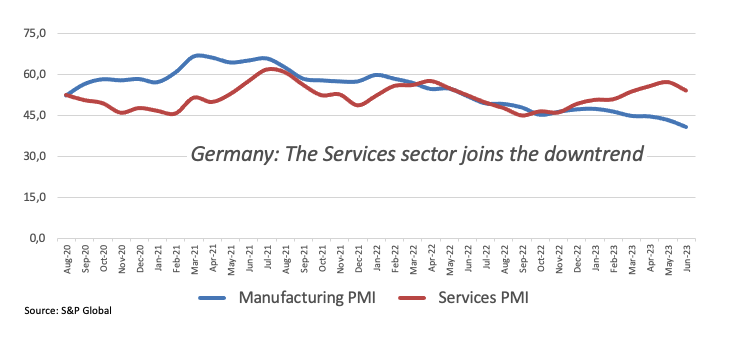
In the United States, Factory Orders for May will be announced, followed by the IBD/TIPP Economic Optimism index, the FOMC Minutes, and a speech by NY Fed John Williams, a permanent voter known for centrist views.
Daily digest market movers: Euro leaves behind part of the recent weakness
- The EUR briefly surpasses the 1.0900 barrier earlier on Wednesday.
- US traders are back to their desks following July 4th holiday.
- Chinese Caixin Services PMI came in at 53.9 in June (from 57.1).
- Bets on a Fed, ECB rate hike in July remain steady.
- Investors’ attention will likely be on the FOMC Minutes.
Technical Analysis: Euro still risks further downside
Despite Wednesday’s bullish attempt, EUR/USD remains under pressure and the door remains open to a probable retracement in the short term. Spot needs to clear the June high around 1.1010 to mitigate the current selling bias.
Against that, the loss of the weekly low at 1.0835 (June 30) could pave the way to a test of the transitory 100-day SMA at 1.0823. The breakdown of the latter should meet the next contention area not before the May low of 1.0635 (May 31) ahead of the March low of 1.0516 (March 15) and the 2023 low of 1.0481 (January 6).
If bulls regains the upper hand, the next hurdle is then expected at the June peak of 1.1012 (June 22) prior to the 2023 high of 1.1095 (April 26), which is closely followed by the round level of 1.1100. North from here emerges the weekly top of 1.1184 (March 31, 2022), which is supported by the 200-week SMA at 1.1180, just before another round level at 1.1200.
The constructive view of EUR/USD appears unchanged as long as the pair trades above the crucial 200-day SMA, today at 1.0608.
Euro FAQs
What is the Euro?
The Euro is the currency for the 20 European Union countries that belong to the Eurozone. It is the second most heavily traded currency in the world behind the US Dollar. In 2022, it accounted for 31% of all foreign exchange transactions, with an average daily turnover of over $2.2 trillion a day.
EUR/USD is the most heavily traded currency pair in the world, accounting for an estimated 30% off all transactions, followed by EUR/JPY (4%), EUR/GBP (3%) and EUR/AUD (2%).
What is the ECB and how does it impact the Euro?
The European Central Bank (ECB) in Frankfurt, Germany, is the reserve bank for the Eurozone. The ECB sets interest rates and manages monetary policy.
The ECB’s primary mandate is to maintain price stability, which means either controlling inflation or stimulating growth. Its primary tool is the raising or lowering of interest rates. Relatively high interest rates – or the expectation of higher rates – will usually benefit the Euro and vice versa.
The ECB Governing Council makes monetary policy decisions at meetings held eight times a year. Decisions are made by heads of the Eurozone national banks and six permanent members, including the President of the ECB, Christine Lagarde.
How does inflation data impact the value of the Euro?
Eurozone inflation data, measured by the Harmonized Index of Consumer Prices (HICP), is an important econometric for the Euro. If inflation rises more than expected, especially if above the ECB’s 2% target, it obliges the ECB to raise interest rates to bring it back under control.
Relatively high interest rates compared to its counterparts will usually benefit the Euro, as it makes the region more attractive as a place for global investors to park their money.
How does economic data influence the value of the Euro?
Data releases gauge the health of the economy and can impact on the Euro. Indicators such as GDP, Manufacturing and Services PMIs, employment, and consumer sentiment surveys can all influence the direction of the single currency.
A strong economy is good for the Euro. Not only does it attract more foreign investment but it may encourage the ECB to put up interest rates, which will directly strengthen the Euro. Otherwise, if economic data is weak, the Euro is likely to fall.
Economic data for the four largest economies in the euro area (Germany, France, Italy and Spain) are especially significant, as they account for 75% of the Eurozone’s economy.
How does the Trade Balance impact the Euro?
Another significant data release for the Euro is the Trade Balance. This indicator measures the difference between what a country earns from its exports and what it spends on imports over a given period.
If a country produces highly sought after exports then its currency will gain in value purely from the extra demand created from foreign buyers seeking to purchase these goods. Therefore, a positive net Trade Balance strengthens a currency and vice versa for a negative balance.
Here is what you need to know on Wednesday, July 5:
There is a negative shift in risk mood early Wednesday amid escalating tensions between China and the US. US stock index futures trade in negative territory following the Independence Day holiday and the US Dollar Index holds steady above 103.00. S&P Global will release revisions to Services and Composite PMI surveys for the UK and the US. May Factory Orders will also be featured in the US economic docket ahead of the minutes of the Federal Reserve's June policy meeting.
FOMC Minutes Preview: More than hawkish?
Earlier this week, China announced controls on exports of some gallium and germanium products, which are used in the production of electric vehicles and semiconductors, effective from August 1. Reporting on the matter, China'a Global Times said that the decision was a warning to the US and its allies. “China could be more cautious about supplying its rare-earth resources to support those that have sided with the US-led decoupling push from China," the news outlet wrote. The Wall Street Journal said that the Biden administration could look to restrict Chinese companies’ access to US cloud-computing services in retaliation.
Meanwhile, the data from China revealed that the Caixin Services PMI declined to 53.1 in June from 57.1 in May.
EUR/USD continues to trade in a narrow channel below 1.0900 early Wednesday after having closed n negative territory on Tuesday. Eurostat will release the Producer Price Index (PPI) data for May.
GBP/USD holds steady at around 1.2700 mid-week following Tuesday's modest rebound.
USD/JPY extends its rangebound action below 145.00 for the third straight day on Wednesday.
Gold price continued to stretch higher toward $1,930 on Tuesday but struggled to gather further bullish momentum. With the benchmark 10-year US Treasury bond yield staying comfortably above 3.8%, XAU/USD fluctuates above $1,920 early Wednesday.
AUD/USD stays on the back foot and trades below 0.6700, while NZD/USD moves sideways near 0.6200.
Bitcoin lost more than 1% on Tuesday and returned below $31,000 early Wednesday. Ethereum staged a technical correction but managed to hold above $1,900. ETH/USD stays relatively quiet, slightly below $1,950.
EUR/USD traded on the soft side on Tuesday. Economists at ING analyze the pair’s outlook.
Eyes on the doves
The pair may struggle to find clear direction before key US data are released later this week. Even then, our perception is that – barring major data surprises – the uncertainty surrounding a second hike by the Fed after July and the ECB's hawkish message (which has offset weak Eurozone data) can keep EUR/USD in a 1.08-1.10 range for longer.
The focus will be on ECB speakers: Joachim Nagel (who recently stuck to his hawkish rhetoric), plus some more dovish members (Ignazio Visco, Francois Villeroy de Galhau and Pablo Hernandez de Cos). Markets are pricing in 38 bps of tightening by September and an alarming tone on core inflation from the doves might help markets fully price in that move.
- Silver meets with some supply on Wednesday and snaps a three-day winning streak.
- The setup favours bearish traders and supports prospects for further intraday losses.
- A sustained strength beyond the $23.00 mark is needed to negate the bearish outlook.
Silver struggles to capitalize on its positive move witnessed over the past three days and comes under some selling pressure during the early European session on Wednesday. The white metal drops to a fresh daily low in the last hour and currently trades around the $22.80-$22.85 region, down nearly 0.80% for the day.
The downfall could be attributed to some technical selling against the backdrop of the recent repeated failures to find acceptance above the $23.00 mark and rejection near the 38.2% Fibonacci retracement level of the downfall from the June swing high. Meanwhile, technical indicators on the daily chart are holding in the bearish territory and have again started gaining negative traction on hourly charts. This, in turn, supports prospects for a further intraday depreciating move for the XAG/USD.
That said, the recent breakout through the $22.65-$22.70 confluence - comprising the 200-hour Simple Moving Average (SMA) and the 23.6% Fibo. level - favours bullish traders. Hence, any subsequent slide is more likely to find some support near the said resistance breakpoint. A convincing break below, however, could be seen as a fresh trigger for bearish traders and make the XAG/USD vulnerable to slide back towards challenging the multi-month low, around the $22.10 region touched in June.
Some follow-through selling below the $22.00 mark should pave the way for deeper losses towards the $21.70-$21.65 zone en route to the $21.25 support before the XAG/USD eventually drops to the $21.00 round-figure mark.
On the flip side, the $23.00-$23.10 region, or the 38.2% Fibo. level, might continue to act as an immediate barrier. A sustained strength beyond should allow the XAU/USD to surpass 50% Fibo. level around the $23.30 zone and climb further towards the $23.60 region, or the 61.8% Fibo. level. The upward trajectory could get extended towards the $24.00 mark en route to the $24.25 resistance and the $24.45-$24.50 supply zone, or the June monthly swing high.
Silver 1-hour chart
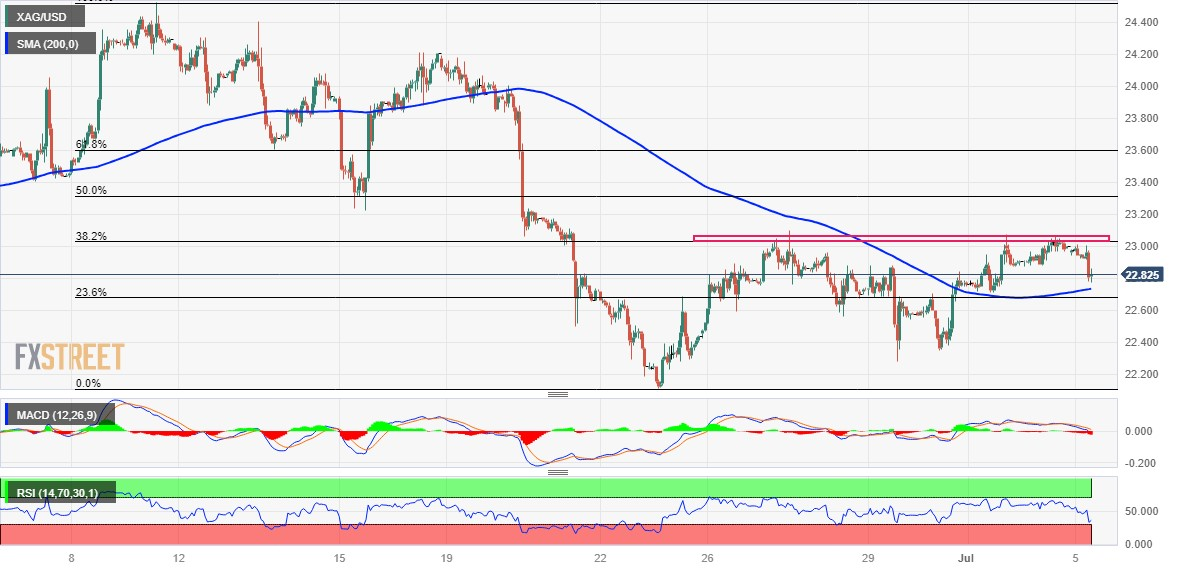
Key levels to watch
In the opinion of UOB Group’s Economist Lee Sue Ann and Markets Strategist Quek Ser Leang, AUD/USD should keep the side-lined trade in place in the next few weeks.
Key Quotes
24-hour view: AUD dropped briefly to a low of 0.6642 and then rebounded quickly to close higher by 0.31% (0.6692). While the rebound lacks momentum, it could extend to 0.6720 before the risk of a pullback increases. The major resistance at 0.6770 is not expected to come into view. Support is at 0.6675, followed by 0.6655.
Next 1-3 weeks: In our most recent narrative from last Friday (30 Jun, spot at 0.6610), we indicated that while the outlook for AUD is still negative, it must break clearly below 0.6590 before further sustained decline is likely. AUD did not break 0.6590, as it rebounded over the past few days. Downward momentum has eased and AUD is likely to trade in a range of 0.6620/0.6770 for the time being.
- USD/TRY surpasses the 26.0000 mark and clinches new highs.
- Türkiye inflation loses further traction in June.
- Investors’ attention remains on the next steps by the CBRT.
Further depreciation of the Turkish currency lifts USD/TRY to new all-time highs near 26.1000 on Wednesday.
USD/TRY: Rally appears unabated so far
On Wednesday, the USD/TRY continued its weekly rebound and surpassed the 26.0000 hurdle, as negative sentiment towards the Turkish lira persisted.
Despite the release of inflation figures in Türkiye, which showed a 3.92% MoM increase in June and a 38.21% rise over the past twelve months, the FX market did not react significantly. These figures came in lower than expected and indicated that disinflationary pressures remained in place last month. Additionally, Producer Prices rose 6.5% MoM and 40.42% YoY.
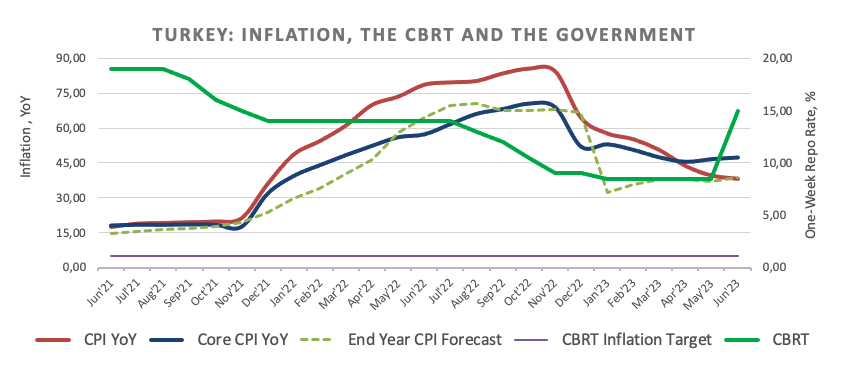
As the lira falls off the cliff, market participants are increasingly skeptical about the newly appointed economic team's ability to reverse the trend and restore credibility to both the government and the central bank.
Furthermore, investors are concerned about national lenders spending approximately $1B to support the domestic currency earlier this week.
What to look for around TRY
USD/TRY now seems to have resumed the uptrend following a brief consolidation period of several sessions.
In the meantime, investors are expected to closely monitor upcoming decisions on monetary policy. By appointing Mehmet Simsek and Hafize Gaye Erkan, both former Wall Street bankers, to oversee the country's finances, President R. T. Erdogan seems to suggest a possible move away from heavy state intervention in favor of letting the market dictate the fair value of the currency.
Although it remains uncertain whether Mr. Erdogan's preference for combating inflation through lower interest rates will allow Simsek and Erkan's orthodox approach to monetary policy to thrive, the news of their appointment has been so far cautiously welcomed by market participants.
In a broader sense, price action around the Turkish currency is expected to continue to revolve around the performance of energy and commodity prices, which are directly tied to developments from the Ukraine conflict, broad risk appetite trends, and dollar dynamics.
Key events in Türkiye this week: CPI, Producer Prices (Wednesday).
Eminent issues on the back boiler: Persistent distrust over the CBRT credibility/independence. Absence of structural reforms. Bouts of geopolitical concerns.
USD/TRY key levels
So far, the pair is gaining 0.48% at 26.0739 and faces the next hurdle at 26.0813 (all-time high July 5) followed by 27.00 (round level). On the downside, a break below 23.4189 (weekly low June 21) would expose 21.6268 (55-day SMA) and finally 20.4611 (100-day SMA).
The Turkish Lira has been relatively quiet since the central bank’s (CBRT’s) last rate hike, but the question remains open whether this marks the end of volatility or only a pause. Economists at Commerzbank analyze TRY outlook.
How long President Tayyip Erdogan will have patience with this exercise in conventional monetary policy?
The key question now will be: how much of the latest 650 bps rate hike has already been neutralised by faster inflation (in terms of real monetary stance)? This part will have to be re-done: in order to maintain even the pre-existing degree of restrictiveness, CBRT will have to hike again; then it will have to continue with planned further tightening.
What is more, if inflation were to accelerate despite the rate hikes, it would appear to support Erdogan’s thesis that higher interest rates push inflation up. Each such development would become a risk factor for how long conventional policies will receive Erdogan’s support.
European Central Bank (ECB) policymaker and Bundesbank Chief Joachim Nagel said on Wednesday, “interest rates must rise further,” adding that it is “too early to say how far.”
He said further that he is “wary of proclaiming a new era of high-interest rates.”
Market reaction
EUR/USD was last seen trading at 1.0901, up 0.24% on the day.
The major currencies versus the US Dollar remained in relatively predictable narrow trading ranges in honour of the 4th July US vacation. Ahead of the key US jobs report on Friday, there is little in the way of potential market movers apart from the release of the FOMC minutes, economists at MUFG Bank report.
Consolidation ahead of US jobs data
The market is priced at about 20 bps for the hike on 26th July, a level that has existed throughout most of the last month. We doubt the FOMC minutes will change that much and the NFP and CPI data remain key.
We’d expect EUR/USD to remain in a relatively narrow trading range too with the final estimates for PMI in Europe today unlikely to move the market much either.
The highlight of the day will be the meeting of the National Bank of Romania. Economists at ING analyze RON's outlook.
NBR's hawkish tone to continue
In line with the market, we expect no change in the interest rate, which currently sits at 7.00%. We expect the NBR to maintain a hawkish tone and see the first rate cut only in January next year.
We saw the NBR let the Leu weaken slightly above the EUR/RON 4.95 level and the playing field is currently 4.95-4.97. We expect to see a similar move once or twice more before the end of the year, which should take EUR/RON to 5.02 by the end of the year.
Given the unclear timing, the spot market does not have much to offer. However, we believe this central bank approach will add pressure on the Leu, which will be an opportunity for the NBR to withdraw excess liquidity from the market and push interbank rates and FX implied yields back up.
- USD/CAD reverses from 50-SMA to renew intraday high.
- Firmer RSI backs recovery from short-term key SMA, suggesting further upside towards three-week-old resistance line.
- 200-SMA, mid-June peak holds the key to Loonie pair buyer’s conviction.
- Downside break of 50-SMA isn’t open invitation for the bears targeting yearly low.
USD/CAD bulls flex muscles around 1.3240 as it refreshes intraday high while consolidating the previous day’s losses amid the initial hour of Wednesday’s European session. In doing so, the Loonie pair rebounds from the 50-SMA.
That said, the quote’s recovery gains support from the upbeat RSI (14) line, not overbought, which in turn suggests the further advances of the USD/CAD price. However, a downward-sloping resistance line from the mid-June, near 1.3260 at the latest, appears immediate resistance for the pair buyers to watch.
Following that, a three-week-old horizontal resistance area around 1.3275-80 and the 200-SMA surrounding 1.3360 can challenge the USD/CAD bulls before giving them control.
Even so, the Loonie pair buyers need to cross the mid-June swing high of around 1.3385 for conviction.
On the contrary, a downside break of the 50-SMA, close to 1.3215 by the press time, can quickly fetch the USD/CAD price toward the lows marked during June 16-19 near 1.3180.
In a case where the Loonie pair breaks the 1.3180 support, the yearly low of around 1.3115 and the 1.3000 psychological magnet will be in the spotlight.
To sum up, USD/CAD is likely to witness further recovery but the road toward the north is long and bumpy.
USD/CAD: Four-hour chart
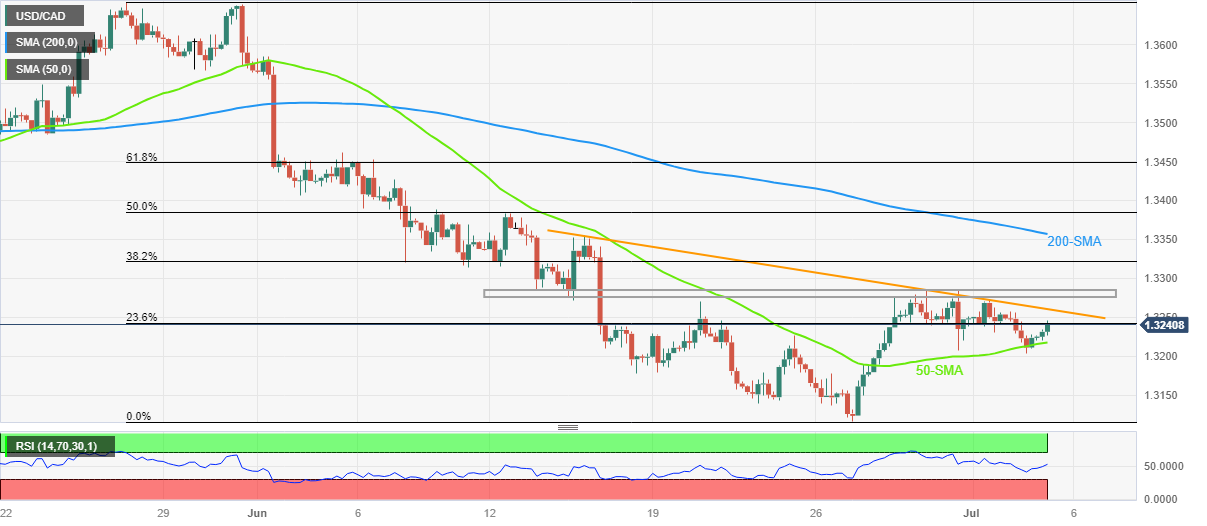
Trend: Limited upside expected
Economists at Commerzbank discuss CNY outlook.
PBocC’s efforts unlikely to reverse Yuan’s weakening trend
As an effort to ease Yuan’s weakening pressure, the PBoC set daily fixings that were stronger than market expectations in most trading sessions since Monday last week. The fixing is the mid-point of the trading band which allows CNY to move 2% in either direction. The PBoC also vowed to prevent large exchange rate fluctuations in its latest policy statement.
The efforts seem to have some very short-term effects. However, we think they will unlikely reverse Yuan’s weakening trend until we see additional macro policy stimulus being rolled out and an improvement in economic fundamentals.
USD/CNY will likely continue to stay above 7.20 and could test the 7.30 level in the near term.
FX option expiries for July 5 NY cut at 10:00 Eastern Time, via DTCC, can be found below.
- EUR/USD: EUR amounts
- 1.0900 2.7b
- 1.0950 385m
- 1.1000 1.5b
- GBP/USD: GBP amounts
- 1.2400 391m
- 1.2530 736m
- 1.2575 1.1b
- USD/JPY: USD amounts
- 143.00 401m
- 145.25 680m
- USD/CHF: USD amounts
- 0.9100 400m
- AUD/USD: AUD amounts
- 0.6800 410m
- EUR/GBP: EUR amounts
- 0.8625 335m
- 0.8700 462m
The first half of the year is over. Economists at Commerzbank review the development of EUR/USD since the start of the year.
If inflation eases again, it will no longer be so super clear how central banks should act
EUR/USD showed an unusually mean-reverting development over the first half of the year. In other words: in case of high prices the tendency to falling prices dominated, in case of low prices the tendency to rising prices. To prevent anyone from turning this into a trading rule to be used going forward let me warn you: the fact that EUR/USD behaved like that during the first half does not mean that the pair will follow a similar pattern over the coming 6 months.
If inflation eases again, it will no longer be so super clear how central banks should act. Should they lower interest rates or maintain them for some time? If one lowers interest rates, how quickly should that happen? Differences might arise that are much more permanent and might provide longer-lasting momentum for EUR/USD. At that point, mean-reverting will be over.
For those who hedge medium-term EUR/USD risks, the first half of the year was not a time when hedging with the help of options paid off particularly. You pay an option premium that is based on the relatively high volatility rather than the particularly small range. My message is: do not let this experience give you the impression that this will always be the case. The fundamental causes of this pattern should disappear.
- EUR/JPY picks up bids to renew intraday high, consolidates the biggest weekly loss in five.
- Yields recover as fears of economic slowdown join US-China jitters.
- Mixed German data, fears of Japan intervention weigh on prices.
- Eurozone PPI, risk catalysts will be crucial for clear directions.
EUR/JPY prints mild gains around 157.35-40 as it pares the previous day’s losses heading into Wednesday’s European session. In doing so, the cross-currency pair traces the upbeat US Treasury bond yields amid fears of the economic slowdown and chatters surrounding Japan’s meddling to defend the Yen.
Ever since the Japanese Yen (JPY) refreshed yearly top in the last week, the policymakers have been loud-mouthed to signal that they can intervene in the markets and safeguard the domestic. Among them, Japanese Finance Minister Shunichi Suzuki and the nation’s top currency diplomat Masato Kanda gain major attention. However, nothing major has been reported yet, making the Japanese currency vulnerable to decline further.
On the other hand, the difference between the two-day and 10-year US Treasury bond yields widened to the most in 42 years and flagged recession fears on Monday, which in turn prod the sentiment and prod the EUR/JPY buyers, due to Yen’s heaven appear. That said, the S&P00 Futures print mild losses whereas the US 10-year and two-year Treasury bond yields grind higher to nearly 3.86% and 4.92% by the press time.
Elsewhere, downbeat prints of China’s Caixin Services PMI for June, to 53.9 versus 57.1 prior, join the escalating fears of the US-China tension amid fresh warnings of further trade restrictions from Beijing. The same allows the yields to remain firmer while also poking the Euro bulls.
It should be noted that the downbeat German data and doubts about the European Central Bank’s (ECB) hawkish signals keep the EUR/JPY bears hopeful. On the other hand, Japan’s Jibun Bank Services PMI eased to 52.1 in June versus 54.2 prior and defends the Bank of Japan’s (BoJ) dovish bias, which in turn underpins the EUR/JPY upside.
Looking ahead, updates on the Japanese government’s market intervention to defend the Yen will be the key to determining immediate EUR/JPY moves. Also important will be the Eurozone Producer Price Index (PPI) for May and headlines surrounding the key risk catalysts like the US-China tussles and the recession woes.
Technical analysis
Double top formation around the 158.00 round figure lures EUR/JPY sellers. However, a clear break of 156.70 becomes necessary to confirm the bearish move.
Economists at Société Générale analyze CNY and KRW outlooks.
The CNY and the KRW may take different paths
State-owned banks’ direct USD sales to the market would likely be the most effective way to mitigate the current CNY depreciation, but it cannot be mobilised on a sustained basis. Therefore, we believe it is appropriate to maintain the buy on dips bias in USD/CNY.
Among the various factors, the semiconductor industry cycle could have a much longer impact on USD/KRW because a rebound in the semiconductor industry has the potential to improve the trade balance, portfolio flows and risk sentiment all at once.
We believe USD/KRW at above 1,315 (50-DMA) provides a level worth trying a shorting of USD/KRW and CNH/KRW.
- AUD/JPY has attempted a decent recovery from 96.50 despite discussions about BoJ’s stealth intervention escalation.
- A poll from Reuters showed that Japanese diplomats could intervene if the Japanese Yen depreciates to 145.00 against the US Dollar.
- The decision of maintaining the status quo by the RBA could be the outcome of a decline in the monthly CPI.
The AUD/JPY pair has delivered a decent recovery after correcting to near 96.50 in the early European session. The risk barometer is fading the selling pressure despite discussions about a stealth intervention from the Bank of Japan (BoJ) or Japanese officials elevating.
Sheer depreciation in the Japanese Yen against rivals has elevated hopes of intervention. Earlier, a poll from Reuters showed that Japanese diplomats could intervene in the FX domain if the Japanese Yen depreciates to 145.00 against the US Dollar.
Japan's top financial diplomat Masato Kanda said on Tuesday that authorities were in close contact with US Treasury Secretary Janet Yellen and other overseas officials "almost every day" on currencies and broader financial markets, as reported by Reuters. The commentary from Japan’s Kanda conveys a possible currency intervention to uplift the Japanese Yen as BoJ Governor Kazuo Ueda has not shown signs of an exit from its decade-long ultra-loose monetary policy.
Meanwhile, a survey conducted by Rengo showed that average pay has been hiked by 3.58%, which has been recorded as the biggest hike since 1993. This assures that inflation in Japan would become demand-driven rather than banking upon the higher cost of imported products.
On the Australian Dollar front, the Reserve Bank of Australia (RBA) announced a steady interest rate decision this week. RBA Governor Philip Lowe would get some time to assess the impact of interest rate hikes yet made. The decision of maintaining the status quo could be the outcome of a decline in the monthly Consumer Price Index (CPI). Monthly inflation has softened to 5.6% in May from the former release of 6.8%
GBP/USD is still seen trading within a consolidative range in the next few weeks, suggest UOB Group’s Economist Lee Sue Ann and Markets Strategist Quek Ser Leang.
Key Quotes
24-hour view: While GBP rose to a high of 1.2739 yesterday, there was no significant increase in upward momentum. That said, there is a chance for GBP to test 1.2555 before the risk of a pullback increases. The major resistance at 1.2800 is not expected to come under threat. Support is at 1.2695, followed by 1.2670.
Next 1-3 weeks: After dropping to 1.2591 last Friday, GBP rebounded sharply over the past few days. The recent buildup of downward momentum has faded. The current price movements are likely part of a consolidation phase. For the time being, we expect GBP to trade in a range of 1.2630/1.2800.
- The index advances modestly beyond the 103.00 hurdle.
- US markets return to normal activity following Tuesday’s holiday.
- Factory Orders, FOMC Minutes take centre stage later in the session.
The USD Index (DXY), which tracks the greenback vs. a bundle of its main rivals, trades with small gains and looks to consolidate the trade above the key 103.00 barrier on Wednesday.
USD Index focused on data, FOMC Minutes
The index so far advances for the third session in a row against the backdrop of a generalized consolidative range in the global assets, as US markets slowly resume the activity in the wake of the Independence Day holiday.
In the meantime, investors are expected to shift their attention to the upcoming release of the FOMC Minutes, while the US labour market is seen regaining interest in light of the publication of the ADP report and weekly Initial Claims (Thursday) and June’s Nonfarm Payrolls and Unemployment Rate (Friday).
So far, market participants continue to price in a 25 bps rate hike by the Federal Reserve at its July 26 gathering, as the inflation still runs well above the Fed’s target and core prices remain sticky.
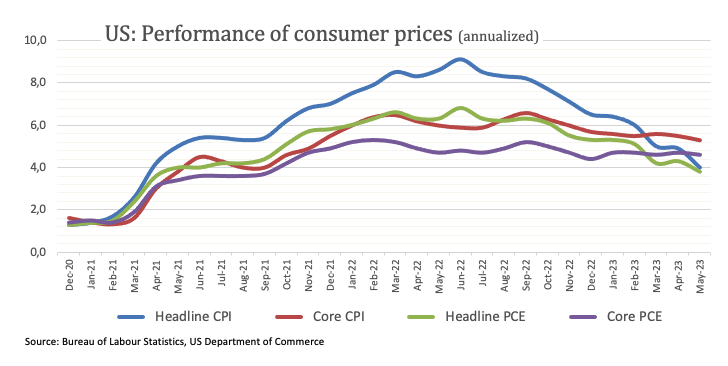
Back on the US docket, Factory Orders for the month of May are due later seconded by the IBD/TIPP Economic Optimism index, the FOMC Minutes and the speech by NY Fed John Williams (permanent voter, centrist).
What to look for around USD
The index keeps the trade around the 103.00 zone as key results from the US calendar are expected in the second half of the week.
Meanwhile, the likelihood of another 25 bps hike at the Fed's upcoming meeting in July remains high, supported by the continued strength of key US fundamentals such as employment and prices.
This view was further bolstered by comments from Fed Chief Powell at the June FOMC event, who referred to the July meeting as "live" and indicated that most of the Committee is prepared to resume the tightening campaign as early as next month.
Key events in the US this week: Factory Orders, FOMC Minutes (Wednesday) – ADP Employment Change, Balance of Trade, Initial Jobless Claims, Final Services PMI, ISM Services PMI (Thursday) – Nonfarm Payrolls, Unemployment Rate (Friday).
Eminent issues on the back boiler: Persistent debate over a soft/hard landing of the US economy. Terminal Interest rate near the peak vs. speculation of rate cuts in late 2023/early 2024. Fed’s pivot. Geopolitical effervescence vs. Russia and China. US-China trade conflict.
USD Index relevant levels
Now, the index is up 0.06% at 103.14 and the breakout of 103.54 (weekly high June 30) would open the door to 104.69 (monthly high May 31) and then 104.74 (200-day SMA). On the other hand, the next contention emerges at 101.92 (monthly low June 16) followed by 100.78 (2023 low April 14) and finally 100.00 (round level).
- USD/CHF edges higher within weekly symmetrical triangle, mildly bid for third consecutive day.
- Firmer RSI suggests upside break of immediate triangle but five-week-old resistance line, 200-SMA will test Swiss pair buyers.
- Multiple levels to challenge bears before directing them to YTD low marked in June.
USD/CHF retreats from intraday high but defends a three-day winning streak around 0.8970 heading into Wednesday’s European session. In doing so, the Swiss Franc (CHF) eases from a one-week-old symmetrical triangle.
That said, the gradually improving RSI (14) line and the higher low formation suggest the USD/CHF pair’s likely break of the immediate triangle towards the north, which in turn will direct prices toward a downward-sloping resistance line from May 31, around the 0.9000 threshold.
In a case where the quote crosses the 0.9000 hurdle, the 200-SMA level surrounding 0.9010 and Friday’s top near 0.9020 will act as the final defense of the bears before directing the prices toward the previous monthly high of near 0.9120.
Meanwhile, the stated triangle’s bottom line restricts immediate downside near 0.8950 ahead of an ascending support line stretched from mid-June, close to 0.8925 by the press time.
Even if the quote breaks the 0.8925 support, June’s low surrounding the 0.8900 round figure and 0.8850 may prod the USD/CHF bears ahead of highlighting the Year-To-Date low of 0.8820.
Overall, USD/CHF is likely to remain sidelined even if a short-term upside is expected. Even so, today’s Federal Open Market Committee (FOMC) Minutes for the June meeting will be crucial to watch for clear directions.
Also read: USD/CHF oscillates in a range below 50-day SMA, focus remains on FOMC meeting minutes
USD/CHF: Four-hour chart
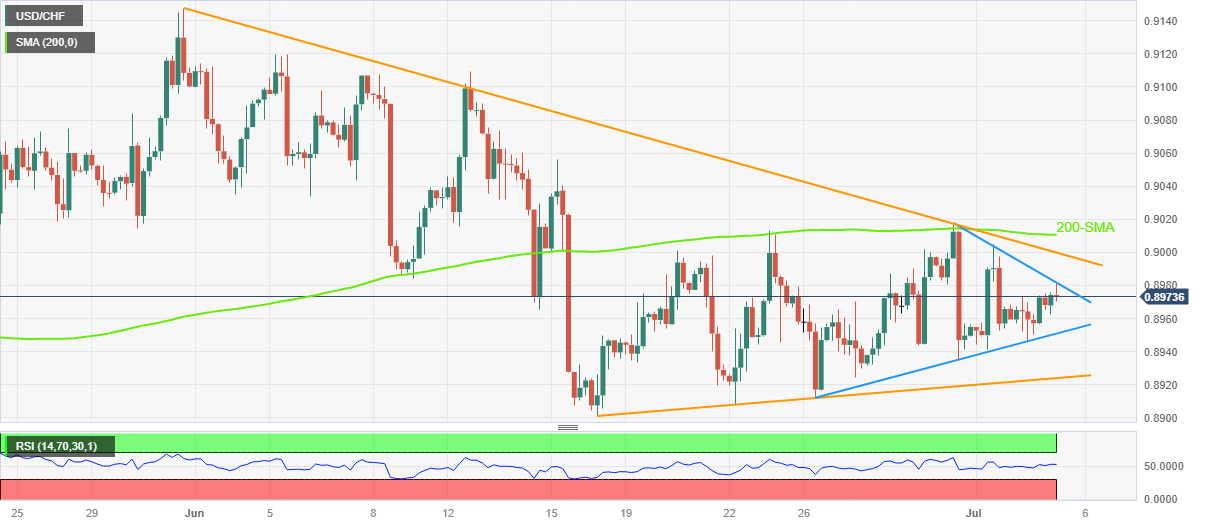
Trend: Limited upside expected
- USD/TRY has frozen around 26.00 as investors await Turkish CPI data.
- S&P500 futures have posted nominal losses, portraying caution among market participants ahead of FOMC minutes.
- The US Dollar Index is showing signs of exhaustion in the upside momentum after reaching to near 103.20.
The USD/TRY pair is oscillating in a narrow range of around 26.00 in the early European session. The asset has turned sideways as investors are keeping an eye on the release of the Turkish Consumer Price Index (CPI) data.
As per the preliminary report, Turkish Statistical Institute would show a higher pace in monthly inflation at 4.84% against the 4.0% reported earlier. Annual CPI is expected to marginally decelerate to 39.47% vs. the prior release of 39.59%.
Investors should note that The Central Bank of Turkey raised interest rates sharply to 15% from 8.5% in its June monetary policy meeting. And consistent higher inflation could force The Central Bank of Turkey to raise interest rates further.
Meanwhile, S&P500 futures have posted nominal losses, portraying caution among market participants ahead of Federal Open Market Committee (FOMC) minutes. Investors would see a detailed explanation behind a steady monetary policy. Also, cues about interest rate guidance and the current economic prospects of the United States will be keenly watched.
The US Dollar Index (DXY) is showing signs of an exhaustion in the upside momentum after reaching to near 103.20. The yields offered on 10-year US Treasury bonds have jumped to near 3.85%.
Later this week, investors will keep focusing on the US ISM Services PMI data (June). As per the consensus, Services PMI is seen expanding to 51.0 vs. the former release of 50.3. While New Orders Index is seen declining to 53.3 against the prior release of 56.2.
UOB Group’s Economist Lee Sue Ann and Markets Strategist Quek Ser Leang note the EUR/USD risks further pullbacks in the near term.
Key Quotes
24-hour view: Yesterday, EUR traded on a relatively quiet note between 1.0875 and 1.0916 before closing on a soft note at 1.0877 (-0.31%). Today, there is room for EUR to edge lower, but in view of the mild downward pressure, any decline is unlikely to break 1.0835 (there is another support at 1.0855). On the upside, a breach of 1.0920 (minor resistance is at 1.0900) would indicate the current mild downward pressure has faded.
Next 1-3 weeks: While EUR traded mostly sideways over the past few days, the underlying tone appears to be soft, and the bias is tilted to the downside. However, any decline is likely to face solid support at 1.0835, ahead of another major support at 1.0805. The downward bias is intact as long as EUR stays below 1.0950 (‘strong resistance’ level).
- Gold Price stays defensive after four-day winning streak.
- XAU/USD bears seek entry as US-China trade war appears imminent, recession bell rings.
- FOMC Minutes will be crucial for Gold Price downside as $1,915 provides headwind to bears.
Gold Price (XAU/USD) struggles to extend recovery from a multi-month low marked the last week as traders await the Federal Open Market Committee (FOMC) Minutes for the June meeting. Apart from the pre-event anxiety, the fears of a full-fledged trade war between the US and China join the concerns about the global economic slowdown to prod the XAU/USD price.
Alternatively, softer US data and expectations that the Gold demand from India and China will increase over time put a floor under the Gold Price. However, the metal sellers need to confirm Fed Chairman Jerome Powell’s hawkish statements like, “two more rate hikes in 2023”, to retake control. In doing so, they also need to smash the $1,915 key support.
It should be observed that the US markets were closed the previous day and hence a lack of major catalysts, as well as waiting for the full markets, also restrict the XAU/USD moves.
Also read: Gold Price Forecast: Will Fed Minutes help validate bullish wedge for XAU/USD?
Gold Price: Key levels to watch
Our Technical Confluence Indicator signals that the Gold Price jostles with a short-term key resistance surrounding $1,930, including Fibonacci 23.6% on one-day and 38.2% on one-month, as well as the previous high on four-hour.
Following that, the previous weekly high of around $1,934 may prod the XAU/USD bulls before directing them to the Fibonacci 61.8% on one-month, also known as the golden Fibonacci ratio, surrounding $1,950.
It’s worth noting that the Gold Price upside past $1,950 appears too lucrative for the bulls and can easily prod the previous monthly high of $1,983.
On the contrary, the 10-DMA joins the Pivot Point one-day S1 to restrict immediate downside of the Gold Price near $1,918.
A break of $1,918, however, will need validation from the $1,915 support confluence comprising the Pivot Point one-day S2 and Fibonacci 23.6% on one-month.
If at all the Gold Price remains weak past $1,915 key support, the odds of witnessing the XAU/USD slump toward $1,900 threshold can’t be ruled out.
Here is how it looks on the tool
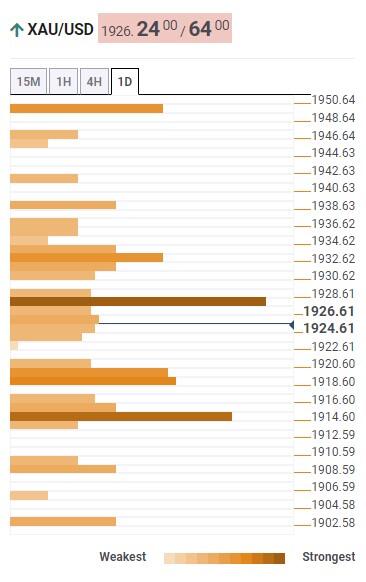
About Technical Confluences Detector
The TCD (Technical Confluences Detector) is a tool to locate and point out those price levels where there is a congestion of indicators, moving averages, Fibonacci levels, Pivot Points, etc. If you are a short-term trader, you will find entry points for counter-trend strategies and hunt a few points at a time. If you are a medium-to-long-term trader, this tool will allow you to know in advance the price levels where a medium-to-long-term trend may stop and rest, where to unwind positions, or where to increase your position size.
- AUD/USD has dropped to near 0.6680 as the focus shifts to the US labor market and FOMC minutes.
- Caixin Services PMI has sharply dropped to 53.9 from the former release of 57.1.
- Investors are hoping that FOMC minutes could provide confident cues that the Fed would raise interest rates two times by year-end.
AUD/USD has registered a corrective move to near 0.6680 in the Asian session. The Aussie asset has faced selling pressure as investors have turned cautious ahead of the release of the Federal Open Market Committee (FOMC) minutes and the United States labor market data.
S&P500 futures are showing marginal losses as the weekly session has shortened due to the holiday on Tuesday on account of Independence Day. A volatile action is anticipated in US markets on Wednesday as investors would wrap up their positions.
The US Dollar Index (DXY) is comfortable balancing above the crucial resistance of 103.00 as investors are hoping that FOMC minutes could provide confident cues that Federal Reserve (Fed) chair Jerome Powell would raise interest rates two times by year-end.
Contrary to that, the money market is anticipating only one interest rate hike further as US economic outlook is not delivering promising signs.
Apart from the FOMC minutes, investors would keenly focus on the US Automatic Data Processing (ADP) Employment Change data (June). The ADP report is expected to show a decline in the Employment Change to 180K for June vs. the former release of 278K.
Meanwhile, the Australian Dollar has sensed selling pressure due to weak Caixin Services PMI data. The economic data has sharply dropped to 53.9 from the former release of 57.1. It seems that the Chinese economy is struggling to recover despite meaningful measures from the Chinese administration and the People’s Bank of China (PBoC).
It is worth noting that Australia is the leading trading partner of China and a decline in Chinese services could impact the Australian Dollar.
- USD/JPY struggles within weekly trading range near YTD high amid sluggish sentiment.
- Cautious mood ahead of Fed Minutes, Japan intervention fears and recession woes prod sentiment.
- Downbeat RSI suggests Yen pair’s gradual grinding towards the south but 200-HMA appears the key support.
- Bulls have a bumpy road towards the north to travel even if they cross 144.65 immediate hurdle.
USD/JPY aptly portrays the market’s indecision around mid-144.00s as traders await the week’s key catalysts amid early Wednesday in Europe. In doing so, the Yen pair seesaws within a symmetrical triangle comprising multiple levels marked since June 30.
Among the headline catalysts, the US-China tussles, recession woes and Japan’s market intervention gain major attention. Additionally, amplifying the cautious mood is the wait for the Federal Open Market Committee (FOMC) Minutes for the June meeting.
Also read: USD/JPY consolidates in a range around mid-144.00s, just below YTD peak
With this, the USD/JPY pair remains sidelined within the weekly triangle, currently between 144.65 and 144.30.
However, the downward-sloping RSI (14) line suggests that the buyers are running out of steam as they repeatedly failed to refresh the Year-To-Date (YTD) high in the last one week.
As a result, the Yen pair is likely to break the 144.30 support and can please the bears.
Though, an upward-sloping trend line from June 20 and the 200-Hour Moving Average (HMA), respectively near 144.20 and 144.10, quickly followed by the 144.00 round figure, can challenge the USD/JPY bears before giving them control.
On the contrary, an upside break of the 144.65 hurdle will need validation from a horizontal area comprising the recent multi-month peak and October 2022 low of near 145.10.
Following that, September 2022 high of near 145.95 and the late October top surrounding 148.85 can challenge the USD/JPY bulls.
USD/JPY: Hourly chart
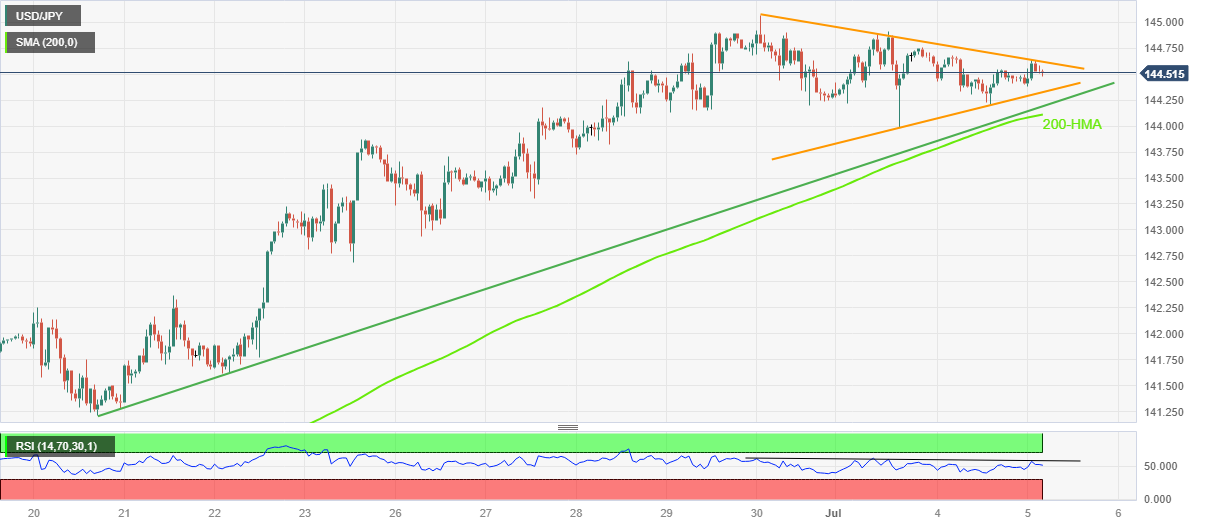
Trend: Pullback expected
- NZD/USD gains positive traction for the fourth straight day, though the upside remains capped.
- Bets for another 25 Fed rate hike in July continue to underpin the USD and cap gains for the pair.
- The worsening US-China relations act as a headwind for the Kiwi ahead of the FOMC minutes.
The NZD/USD pair trades with a positive bias for the fourth successive day on Wednesday, albeit struggles to capitalize on the move and remains capped near the 0.6200 mark through the Asian session. Spot prices, however, remain well within the striking distance of over a one-week high touched on Tuesday and a technically significant 200-day Simple Moving Average (SMA).
Rising bets for a 25 bps Fed rate hike at its next policy meeting on July 25-26 remain supportive of elevated US Treasury bond yields, which act as a tailwind for the US Dollar (USD) and cap the upside for the NZD/USD pair. The USD uptick, however, lacks bullish conviction in the wake of the uncertainty over the Fed's future rate-hike path. The US central bank had signalled in June that borrowing costs may still need to rise as much as 50 bps by the end of this year. That said, the softer US PCE Price Index released on Friday, along with Monday's weaker US ISM PMI, raises questions over how much headroom the Fed has to continue tightening its monetary policy.
Hence, the market focus will remain glued to the release of the June FOMC meeting minutes, due later during the US session. Investors will look for fresh cues about the Fed's near-term policy outlook, which will play a key role in influencing the USD price dynamics and provide a fresh directional impetus to the NZD/USD pair. In the meantime, worries about a global economic downturn should continue to benefit the safe-haven buck. Apart from this, the worsening US-China relation might further contribute to capping the risk-sensitive Kiwi.
In fact, China imposed restrictions on two metals widely used in semiconductors, electric vehicles and high-tech industries. The move, which is set to take effect on August 1, could cause more disruption to global supply. The Chinese commerce ministry said that the measure was aimed at safeguarding national security, though analysts view this as a response to efforts by the US to curtail China's technological advancement. Nevertheless, the announcement could ramp up a trade war between the world's two largest economies and weigh on the Kiwi.
Apart from this, the Reserve Bank of New Zealand's (RBNZ) explicit signal that it was done with its most aggressive hiking cycle since 1999 warrants some caution before placing aggressive bullish bets around the NZD/USD pair. Hence, acceptance above the 0.6200 mark and a subsequent move beyond the 200-day SMA is needed to support prospects for any further appreciating move for spot prices.
Technical levels to watch
- Asia-Pacific equities edge lower amid trade war fears, economic slowdown concerns ahead of FOMC Minutes.
- US-China tussles escalate as Washington, Beijing announces new trade-restrictive measures.
- Yield curve inversion tease recession as FOMC Minutes for June meeting loom.
Market sentiment remains downbeat during Wednesday’s Asian session as China news joins economic slowdown fears to spoil the mood ahead of the Fed Minutes.
That said, headlines surrounding the US-China ties and fresh trade sanctions, as well as the downbeat Chinese PMIs, weigh on the risk appetite the most. On the same line are the looming concerns about Japan’s market intervention and the recession woes flashed by the US Treasury bond yield curve inversion.
While portraying the mood, MSCI’s Index of Asia-Pacific shares ex-Japan retreat from a two-week high, down 0.60% intraday, whereas Japan’s Nikkei 225 drops half a percent at the latest.
It’s worth noting that the S&P00 Futures print mild losses whereas the US 10-year and two-year Treasury bond yields remain mostly unchanged near 3.85% and 4.90% by the press time.
Moving on, downbeat prints of China’s Caixin Services PMI for June, to 53.9 versus 57.1 prior, join the escalating fears of the US-China tension amid fresh warnings of further trade restrictions from Beijing. Recently, China’s Global Times and former Vice Commerce Minister flagged hardships for the US IT companies, as well as metal players. Earlier in the day, China announced abrupt controls on exports of some gallium and germanium products, effective from August 1. The dragon nation’s latest retaliation is in reaction to the US curb on AI chips’ shipments to Beijing.
With this, stocks in China, Australia and New Zealand print minor losses while Hang Seng appears the weakest, down 1.40% intraday as we write, Among the Asian friends. Furthermore, India’s BSE Sensex and GIFT Nifty remain lackluster as broad risk-off mood jostles with the hopes of more economic improvement and record-high foreign investments into India.
Moving forward, Asian traders will keep their eyes on Fed Minutes to confirm Chairman Jerome Powell’s hawkish statements like, “two more rate hikes in 2023”, which in turn can bolster the recession woes, amid higher rates and softer statistics, while also weighing on the riskier assets.
Also read: Forex Today: After a quiet day attention turns to FOMC minutes
- USD/INR struggles to defend the previous day’s recovery from two-month low.
- Fresh fears of Sino-American trade war, downbeat China Caixin Services PMI weigh on sentiment along with recession woes.
- Cautious mood underpins USD/INR rebound but softer US data, downbeat Oil price prod Indian Rupee sellers.
- Fed Minutes should defend Chairman Powell’s hawkish statements to keep USD/INR bulls hopeful.
USD/INR stays defensive around 82.05 amid early Wednesday morning in Europe, keeping the previous day’s U-turn from a two-month low during the sluggish Asian session.
In doing so, the Indian Rupee (INR) pair aptly justifies the market’s cautious mood ahead of the Federal Open Market Committee (FOMC) Minutes for the June meeting. Also defending the pair buyers is the risk aversion in Asia. However, the softer Oil price and recently firmer fundamentals surrounding India prod the USD/INR pair buyers.
Market sentiment in Asia remains downbeat as downbeat prints of China’s Caixin Services PMI for June, to 53.9 versus 57.1 prior, joins the escalating fears of the US-China tension amid fresh warnings of further trade restrictions from Beijing.
Recently, China’s Global Times and former Vice Commerce Minister flagged hardships for the US IT companies, as well as metal players. Earlier in the day, China announced abrupt controls on exports of some gallium and germanium products, effective from August 1. The dragon nation’s latest retaliation is in reaction to the US curb on AI chips’ shipments to Beijing.
Elsewhere, the difference between the two-day and 10-year US Treasury bond yields widened to the most in 42 years and flagged recession fears on Monday, which in turn prod the Oil price. That said, the S&P00 Futures print mild losses whereas the US 10-year and two-year Treasury bond yields remain mostly unchanged near 3.85% and 4.90% by the press time.
It should be noted that the risk-off mood not only underpins the US Dollar’s haven demand but also weighs on the Oil price and caps USD/INR upside, due to India’s reliance on energy imports. That said, WTI takes offers to reverse the previous day’s heavy gains near $71.00, down 0.50% intraday around the intraday low of $70.86 by the press time.
Looking ahead, Fed Minutes need to back Chairman Jerome Powell’s hawkish statements like, “two more rate hikes in 2023”, to convince USD/INR bulls to keep the reins.
Technical analysis
Unless providing a daily closing beyond the 200-DMA hurdle of around 82.15, the USD/INR upside remains elusive.
- USD/CAD regains some positive traction on Wednesday, though lacks bullish conviction.
- Softer Oil prices undermines the Loonie and lends support amid a modest USD strength.
- Traders seem reluctant and prefer to wait on the sidelines ahead of the FOMC minutes.
The USD/CAD pair attracts some buying during the Asian session on Wednesday and moves further away from the weekly low, around the 1.3200 mark touched the previous day. Spot prices currently trade around the 1.3230-1.3235 region, up nearly 0.10% for the day, and draw support from a combination of factors.
Worries that a global economic slowdown will dent fuel demand overshadow expectations for tighter supply due to output cuts announced by top exporters - Saudi Arabia and Russia - and act as a headwind for Crude Oil prices. Apart from this, last week's softer Canadian data, which showed that consumer inflation slowed to a nearly two-year low in May, is seen undermining the commodity-linked loonie. This, along with a modest US Dollar (USD) strength, assists the USD/CAD pair to gain some positive traction.
The Federal Reserve's (Fed) hawkish outlook, signalling that borrowing costs may still need to rise as much as 50 bps by the end of this year, and rising bets for a 25 bps rate hike at the July FOMC meeting remain supportive of elevated US Treasury bond yeids. This, in turn, lends support to the USD, though the upside remains capped on the back of the uncertainty about the Fed's rate-hike path. In fact, the softer US macro data recently raised questions over how much headroom the Fed has to continue with its tightening cycle.
Hence, the market focus will remain glued to the release of the June FOMC meeting minutes, due later during the US session. Investors will look for fresh cues about the Fed's policy outlook, which should provide some meaningful impetus to the USD ahead of the US monthly jobs report (NFP) on Friday and produce short-term trading opportunities around the USD/CAD pair. Traders on Wednesday will further take cues from a meeting of oil industry executives with energy ministers from OPEC and its allies.
The aforemenitoned fundamental backdrop seems tilted slightly in favour of bullish traders, though it will be prudent to wait for strong follow-through buying before positioning for the resumption of the recent recovery from the YTD low touched last week.
Technical leels to watch
China’s highly-influential tabloid, Global Times, carried an editorial on the country’s restrictions on metals exports, noting that Beijing’s latest curbs are a warning to the US and US allies.
Key takeaways
“Controls on exports of some gallium and germanium products was a "practical way" of telling the U.S. and its allies that their efforts to curb China from procuring more advanced technology was a "miscalculation"
“China could be more cautious about supplying its rare-earth resources to support those that have sided with the US-led "decoupling" push from China.”
“The controls do not mean that China will ban exports of the metals but authorities will have the right to reject export applications if the products involve military use or are used in scenarios that may undermine China's national security and interests.”
- EUR/USD holds lower ground near intraday bottom, keeps previous day’s bearish bias.
- Looming bear cross, downbeat MACD signals keep Euro sellers hopeful.
- Five-week-old rising support line, 200-SMA lures EUR/USD bears ahead of Eurozone PPI, FOMC Minutes.
EUR/USD stays pressured around the weekly low even as it makes rounds to 1.0880 amid early Wednesday morning in Europe.
The Euro pair’s latest inaction could be linked to the cautious mood ahead of the Eurozone Producer Price Index (PPI) for May and the Federal Open Market Committee (FOMC) Minutes for the June meeting. However, the sustained trading below the 50-SMA and 100-SMA joins the bearish MACD signals to keep the sellers hopeful.
It should be noted that the 50-SMA pierces the 100-SMA from above and is closer to portraying the bear cross, which in turn will suggest further downside of the major currency pair.
With this, the EUR/USD bears appear well-set to visit an upward-sloping support line from May 31, close to 1.0860. However, the pair’s further downside seems limited unless breaking the 200-SMA support of 1.0820.
Meanwhile, a convergence of the 50-SMA and 100-SMA, around 1.0910 at the latest, restricts the short-term upside of the EUR/USD pair.
Following that, a fortnight-old downward-sloping resistance line, close to 1.0920 by the press time, will be crucial to watch for the Euro buyers before retaking control.
EUR/USD: Four-hour chart
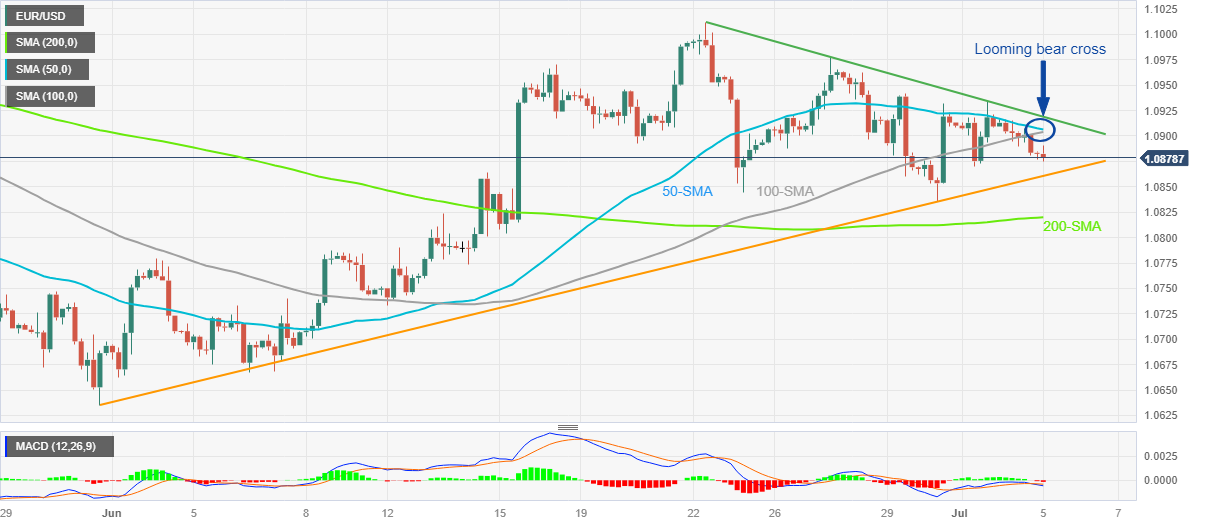
Trend: Further downside expected
- GBP/USD edges lower on Wednesday and is pressured by a modest USD strength.
- Bets for a 25 bps Fed rate hike in July and economic woes lend support to the buck.
- Investors now keenly await the FOMC minutes before placing fresh directional bets.
The GBP/USD pair extends the previous day's late pullback from a multi-day peak, around the 1.2735-1.2740 area and remains on the defensive through the Asian session on Wednesday. Spot prices currently trade around the 1.2700 mark as traders await fresh clues about the Federal Reserve's (Fed) future rate-hike path.
Growing acceptance that the US central bank will lift borrowing costs by 25 bps at the end of the July policy meeting remains supportive of elevated US Treasury bond yields. This, in turn, lends some support to the US Dollar (USD) and seems to weigh on the GBP/USD pair. That said, the incoming softer US macro data raises questions over how much headroom the Fed has to continue raising interest rates and holds back the USD bulls from placing aggressive bets.
It is worth recalling that the US Bureau of Economic Analysis reported last Friday that the annual PCE Price Index decelerated more than anticipated, to 3.8% in May from the 4.3% previous. Moreover, the core gauge, excluding food and energy, edged lower to 4.6% from 4.7% in April. Adding to this, the ISM Manufacturing PMI remained in the contraction territory for the eighth successive month in June and dropped to 46.0, or its lowest level since May 2020.
Hence, the market focus remains on the June FOMC meeting minutes, due for release later during the US session. Investors will look for fresh cues about the Fed's policy outlook, which will play a key role in influencing the near-term USD price dynamics and determine the next leg of a directional move for the GBP/USD pair. In the meantime, worries about economic headwinds stemming from rapidly rising borrowing costs could lend support to the buck and cap the major.
The market fears that the British economy is heading for a recession mounted sharply following a surprise 50 bps rate hike by the Bank of England (BoE) on June 22. Furthermore, BoE Governor Andrew Bailey last week justified the decision and said that rates could remain at peak levels for longer than traders currently expect. This might contribute to keeping a lid on the GBP/USD pair as market participants now look to the final UK Manufacturing PMI for some impetus.
Technical levels to watch
- Gold price ticks down during the Asian session on Wednesday, though lacks follow-through.
- Hawkish central banks and a modest US Dollar strength act as a headwind for the XAU/USD.
- Traders now keenly await the FOMC meeting minutes before placing fresh directional bets.
Gold price edges lower during the Asian session on Wednesday and erodes a part of the previous day's modest gains back closer to the $1,930-$1,931 region or the weekly top. The XAU/USD currently trades around the $1,924-$1,923 region, down less than 0.10% for the day, as traders keenly await the release of the Federal Reserve’s (Fed) latest monetary policy meeting minutes.
Focus remains on June FOMC meeting minutes
The Fed had indicated the need for a 50 basis points (bps) interest rate hike before the end of the year at the end of the June 13-14 policy meeting. That said, the incoming macro data from the United States (US) raised questions over how much headroom the Fed has to continue tightening its monetary policy. In fact, the US Bureau of Economic Analysis reported last Friday that inflation pressures eased slightly in May as consumer spending slowed considerably. Furthermore, the Institute for Supply Management's (ISM) Manufacturing PMI registered the eighth straight month of contraction and dropped to its lowest level since May 2022. Hence, the minutes will be closely scrutinised for clues about the Fed's future rate-hike path, which, in turn, will play a key role in determining the next leg of a directional move for the non-yielding Gold price.
Hawkish central banks weigh on Gold price
In the meantime, growing acceptance for a 25-bps lift-off at the next Federal Open Market Committee (FOMC) policy meeting on July 25-26 remains supportive of elevated US Treasury bond yields and acts as a tailwind for the US Dollar (USD). This, in turn, is seen as a key factor weighing on the US Dollar-denominated Gold price. Apart from this, a hawkish outlook by other major central banks further contributes to capping gains for the XAU/USD. The downside, however, remains cushioned in the wake of worries about a global economic downturn, particularly in China, which tends to benefit the safe-haven precious metal. The concerns were further fueled by the disappointing release of China's Services Purchasing Managers' Index (PMI) on Wednesday, which tumbled to 53.9 in June from 57.1 reported in the previous month. Apart from this, the worsening US-China trade ties should help limit deeper losses for the commodity, at least for the time being.
Worsening US-China ties could help limit losses for XAU/USD
In fact, China imposed restrictions on two metals widely used in semiconductors, electric vehicles and high-tech industries. The move, which is set to take effect on August 1, could potentially cause more disruption to global supply. The Chinese commerce ministry said that the measure was aimed at safeguarding national security, though market participants view this as a response to efforts by the US to curtail China's technological advances. Nevertheless, the abrupt announcement could ramp up a trade war with the US, which might hold back traders from placing aggressive bearish bets around the Gold price. This makes it prudent to wait for strong follow-through selling before confirming that the recent recovery move from the $1,893-$1,892 area, or the lowest level since mid-March has run its course and positioning for deeper losses.
Gold price technical outlook
From a technical perspective, the $1,931 area, or the weekly high, might continue to act as an immediate barrier ahead of the 100-day Simple Moving Average (SMA), currently around the $1,942 region. A sustained strength beyond the latter might trigger a short-covering rally and lift the Gold price to the $1,962-$1,964 zone en route to the $1,970-$1,972 supply zone. Some follow-through buying should allow bulls to reclaim the $2,000 psychological mark and test the $2,010-$2,012 resistance.
On the flip side, any subsequent slide now seems to find some support near the $1,908-$1,907 area ahead of the $1,900 round-figure mark and the multi-month low, around the $1,893-$1,892 region touched last week. A convincing break below the said support levels will make the Gold price vulnerable to accelerate the downward trajectory and expose the very important 200-day Simple Moving Average (SMA), currently around the $1,860 zone.
Key levels to watch
- USD/CNH crosses 50-SMA, weekly resistance line on downbeat China Caixin Services PMI for June.
- RSI rebound, receding bearish bias of MACD add strength to upside bias for the Yuan pair.
- Bears need validation from two-month-old rising support line, 100-SMA limits short-term downside.
- Bulls aim for fresh multi-month high ahead of Fed Minutes.
USD/CNH snaps three-day losing streak by refreshing intraday high at 7.2450 amid early Wednesday in Asia. In doing so, the offshore Chinese Yuan (CNH) pair takes clues from the market’s risk-off mood and the downbeat China PMI data ahead of the Federal Open Market Committee (FOMC) Minutes for the June meeting.
China’s Caixin Services PMI for June traced its manufacturing counterpart while falling to 53.9 versus 57.1 prior. Earlier in the week, China’s Caixin Manufacturing PMI eased to 50.5 for the said month, versus 50.9 prior and 50.2 market forecasts. On the same line, China’s official PMIs for June also appeared less impressive and allowed the USD/CNH to refresh the eight-month high in the last week.
Technically, the USD/CNH pair’s upside break of a downward-sloping resistance line from June 30 and the 50-SMA, respectively near 7.2400 and 7.2430, keeps the buyers hopeful of revisiting the multi-month top marked the last week around 7.2860.
Adding strength to the upside bias is the RSI (14) line’s latest rebound, as well as the receding bearish bias of the MACD signals.
It’s worth noting that tops marked in November around 7.2600 and 7.2800 can prod the USD/CNH bulls on their way to the previous yearly high of around 7.3750.
On the contrary, the 50-SMA and the resistance-turned-support can limit the immediate downside of the USD/CNH pair to around 7.2430 and 7.2400 in that order.
However, the 100-SMA and an upward-sloping support line from early May, close to 7.2050 and 7.1880 respectively, appear tough nuts to crack for the pair sellers afterward. Following that, the 200-SMA support of near 7.1540 acts as the last defense for the buyers.
USD/CNH: Four-hour chart
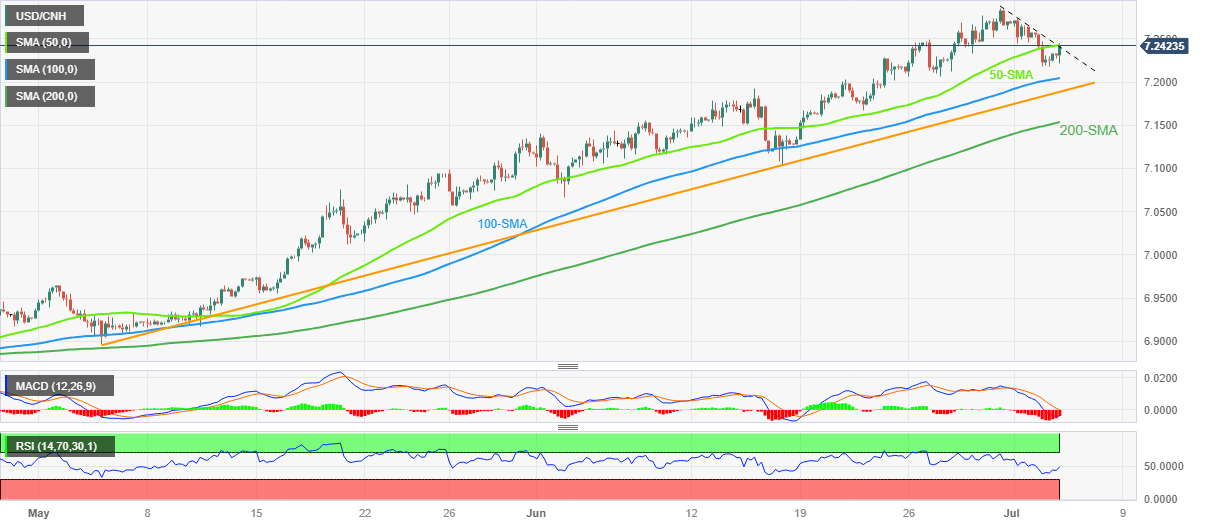
Trend: Further upside expected
| Raw materials | Closed | Change, % |
|---|---|---|
| Silver | 22.987 | 0.49 |
| Gold | 1924.64 | 0.18 |
| Palladium | 1251.26 | 1.26 |
- WTI crude oil pares the biggest daily gains in a week amid downbeat mood.
- China Caixin Services PMI drops in June, fears of recession, Sino-American trade war intensify.
- Output cuts from Saudi Arabia, Russia provide headwinds to energy bears.
- Weekly prints of API Crude Oil Stocks Change, risk catalysts eyed for clear directions.
WTI takes offers to reverse the previous day’s heavy gains near $71.00, down 0.50% intraday around the intraday low of $70.86 by the press time. In doing so, the black gold bears the burden of the downbeat China data, as well as challenges to sentiment, amid a sluggish Asian session on Wednesday.
That said, China’s Caixin Services PMI for June eased to 53.9 versus 57.1 prior. Earlier in the week, China’s Caixin Manufacturing PMI eased to 50.5 for the said month, versus 50.9 prior and 50.2 market forecasts. On the same line, China’s official PMIs for June also appeared less impressive and hence challenge the black gold price as Beijing is among the world’s top commodity users.
On a different page, the difference between the two-day and 10-year US Treasury bond yields widened to the most in 42 years and flagged recession fears on Monday, which in turn prod the Oil price. That said, the S&P00 Futures print mild losses whereas the US 10-year and two-year Treasury bond yields remain mostly unchanged near 3.85% and 4.90% by the press time.
Furthermore, the latest developments about the US-China ties are risk-negative and exert additional downside pressure on the energy benchmark due to these countries' status as major oil users. Recently, China announced abrupt controls on exports of some gallium and germanium products, effective from August 1. The dragon nation’s latest retaliation is in reaction to the US curb on AI chips’ shipments to Beijing. On the same line, Chinese Former Vice Commerce Minister, Wei Jianguo, warned that “China's export control measures of chipmaking materials is just a start.”
Above all, Russia and Saudi Arabia’s readiness for further output cuts, as well as the US Dollar’s struggle to defend the latest run-up, keep the Oil buyers hopeful as markets await the weekly private inventory data, as well as the Federal Open Market Committee (FOMC) Minutes for the June meeting.
Technical analysis
A convergence of the five-week-old descending resistance line and 50-DMA, around $71.30 by the press time, restricts the immediate upside of the Crude Oil price.
In an interview with China Daily on Wednesday, the Chinese Former Vice Commerce Minister warned that “China's export control measures of chipmaking materials is just a start.”
Additional quotes
China has more sanction tools and measures.
Countermeasures will further escalate if high-tech restrictions targeting China continue to escalate.
Market reaction
Risk sentiment remains tepid on fresh China worries, keeping AUD/USD better offered near 0.6685, as of writing.
- AUD/USD appears hesitant during fifth price-positive day ahead of Fed minutes.
- China Caixin Services PMI slides to 53.9 in June.
- China’s defense of the Yuan, softer US data join RBA’s hawkish halt to lure Aussie bulls.
- Aussie Senator rules out recession woes despite calling for actions to ‘phase’ infrastructure projects.
AUD/USD slips to 0.6680 on downbeat China data while snapping four-day uptrend amid early Wednesday. In doing so, the Aussie pair also justifies challenges to sentiment from the US-China tension and the recession woes.
China’s Caixin Services PMI for June eased to 53.9 versus 57.1 prior. Earlier in the week, China’s Caixin Manufacturing PMI eased to 50.5 for the said month, versus 50.9 prior and 50.2 market forecasts. It’s worth noting that the official PMIs for the dragon nation, for June, also appears less impressive and hence keep the AUD/USD bears hopeful.
Apart from the softer China data, fears of the US economic slowdown and the Sino-American trade war also exert downside pressure on the AUD/USD price.
It should be noted that the US two-year Treasury bond yields dropped to 4.85% while the 10-year counterpart fell to 3.78%, before ending Monday’s trading around 4.93% and 3.86% respectively. Following the bond market data, Reuters said that the yield curve briefly inverted to 42-year lows Monday as investors increasingly expect the Fed to raise its benchmark borrowing rates to keep inflation in check.
That said, China announced abrupt controls on exports of some gallium and germanium products, effective from August 1. The dragon nation’s latest retaliation is in reaction to the US curb on AI chips’ shipments to Beijing.
Amid these plays, the S&P00 Futures print mild losses whereas the US 10-year and two-year Treasury bond yields remain mostly unchanged near 3.85% and 4.90% by the press time.
Looking forward, news about China, recession and the Federal Open Market Committee (FOMC) Minutes for the June meeting will be crucial for the AUD/USD traders to watch for clear directions. That said, the Fed policymakers announced a pause in the rate hike during June meeting but Chairman Jerome Powell signalled “two more rate hikes in 2023” afterward, which in turn keeps the pair sellers hopeful.
Technical analysis
A clear upside break of the 13-day-old previous resistance line, now support near 0.6585, keeps the AUD/USD buyers hopeful even if the 200-DMA challenges the bulls around the 0.6700 threshold.
- USD/CHF remains confined in a familiar trading range held over the past three weeks or so.
- The subdued USD price action acts as a headwind for the major amid looming recession risks.
- The downside seems limited as traders keenly await the release of the FOMC meeting minutes.
The USD/CHF pair continues with its struggle to gain any meaningful traction on Wednesday and oscillates in a narrow band below the 50-day Simple Moving Average (SMA) through the Asian session. Spot prices currently trade around the 0.8965-0.8970 area and remain confined in a familiar range held over the past three weeks or so.
The uncertainty over the Federal Reserve's (Fed) rate hike is holding back the US Dollar (USD) bulls from placing aggressive bets and acting as a headwind for the USD/CHF pair. It is worth recalling that the US central bank signalled in June that interest rates may still need to rise as much as 50 bps by the end of this year. Furthermore, Fed Chair Jerome Powell's said last week that the central bank doesn't see rate cuts happening any time soon and is going to wait until it is confident that inflation is moving down to the 2% medium-term target. That said, the softer US PCE Price Index released on Friday, along with Monday's weaker US ISM PMI, raises questions over how much headroom the Fed has to continue tightening its monetary policy.
Hence, the market focus will remain glued to the release of the June FOMC meeting minutes, due later during the US session this Wednesday. Investors will closely scrutinize the minutes for clues about the Fed's policy outlook, which will play a key role in influencing the near-term USD price dynamics and help determine the next leg of a directional move for the USD/CHF pair. In the meantime, growing acceptance that the Fed will hike rates by 25 bps at its upcoming policy meeting on July 25-26 acts as a tailwind for the USD and lends some support to the major. That said, worries about economic headwinds from rapidly rising borrowing costs benefit the safe-haven Swiss Franc (CHF) and should cap any meaningful upside for the pair.
From a technical perspective, the range-bound price action points might be categorized as a bearish consolidation phase against the backdrop of the recent decline from the vicinity of mid-0.9100s, or the May monthly swing high. Furthermore, the lack of any buying interest and repeated failures to move back above the 50-day SMA suggests that the path of least resistance for the USD/CHF pair is to the downside. That said, a sustained strength back above the 0.9000 psychological mark will negate the positive outlook and pave the way for some meaningful appreciating move.
Technical levels to watch
China's Services Purchasing Managers' Index (PMI) tumbles to 53.9 in June, compared with a 57.1 expansion seen in May, according to the latest data published by Caixin released on Wednesday.
Key points
Service sector activity expands at slower rate amid weaker upturn in sales.
Employment rises for fifth straight month.
Business confidence improves.
Commenting on the China General Services PMI ™ data, Dr. Wang Zhe, Senior Economist at Caixin Insight Group said: “Both services supply and demand expanded further in June, but at a slower pace. The gauges for business activity and total new orders both stayed above 50 for the sixth consecutive month, but logged their lowest readings since January and December, respectively, as the services market saw a weaker-than-expected recovery.”
“External demand remained relatively stable as the lifting of travel restrictions boosted services exports, with the measure for new export orders staying in expansionary territory for the sixth month in a row,” Wang added.
AUD/USD reaction
Weak Chinese Services PMI bodes ill for the Aussie Dollar, dragging AUD/USD 15 pips below 0.6700. The major is trading at 0.6685, at the time of writing, down 0.07% on the day.
- US Dollar Index bounces off intraday low to pare the first daily loss in three.
- US-China trade war news, yield curve inversion weigh on sentiment and provide tailwind to DXY.
- Softer US data challenge immediate upside even as Fed bets remain hawkish.
- Fed Minutes need to confirm Powell’s “two more rate hikes for 2023” to defend US Dollar Index bulls.
US Dollar Index (DXY) picks up bids to reverse the day-start consolidation of recent gains around 103.00 as markets brace for an active day amid early Wednesday, after the US Independence Day holiday restricted the moves the previous day.
It’s worth noting that the softer US data and the preparations for today’s key Fed Minutes might have allowed the DXY bulls to take a breather amid the early day, following a two-day uptrend. However, fresh fears about the US-China trade war and the economic slowdown join the hawkish Fed bets to underpin the US Dollar’s run-up.
Fears of the US-China trade war escalate as China announced abrupt controls on exports of some gallium and germanium products, effective from August 1. The dragon nation’s latest retaliation is in reaction to the US curb on AI chips’ shipments to Beijing.
Previously, the Wall Street Journal (WSJ) added to the market’s fears about the Sino-American ties while saying, “The Biden administration is preparing to restrict Chinese companies’ access to U.S. cloud-computing services, according to people familiar with the situation, in a move that could further strain relations between the world’s economic superpowers.”
On Monday, China’s President Xi Jinping said in a virtual SCO summit on Tuesday that they “should focus on practical cooperation and accelerate economic recovery. The policymaker also added, “(They) Need to strengthen strategic communication and coordination, respect each other's core interests and concerns.” It should be observed that US Treasury Secretary Janet Yellen is in Beijing. Earlier on Tuesday, US Treasury Department said, per Reuters, “Treasury Secretary Janet Yellen had a 'frank and productive' discussion today with China's Ambassador.” The news also mentioned that US Treasury Secretary Yellen raised issues of concern while also conveying the importance of the two countries working together.
On the other hand, the US yield curve inversion flags the recession woes as the difference between the US 10-year and two-year Treasury bond yields marked the widest inversion in 42 years on Monday.
It should be noted that the downbeat prints of the US ISM Manufacturing PMI and S&P Global PMIs for June prod the US Dollar despite its haven status that gained attention amid market fears.
While portraying the mood, the S&P00 Futures print mild losses whereas the US 10-year and two-year Treasury bond yields remain mostly unchanged near 3.85% and 4.90% by the press time.
Moving forward, the Federal Open Market Committee (FOMC) Minutes for the June meeting will be crucial for the DXY traders to watch as the Fed policymakers announced a pause in the rate hike during that meeting. Should the Fed policymakers fail to defend the hawkish bias, the DXY will have further upside to track.
Technical analysis
Although a fortnight-long rising support line restricts the immediate US Dollar Index downside near the 103.00 threshold, the DXY upside appears elusive unless witnessing a daily close beyond a five-week-old descending resistance line, around 103.40 at the latest.
People’s Bank of China (PBoC) set the USD/CNY central rate at 7.1968 on Wednesday, versus previous fix of 7.2046 and market expectations of 7.2180. It's worth noting that the USD/CNY closed near 7.2170 the previous day. With this, the Chinese central bank's onshore Yuan (CNY) rate extends the week-start pullback from the yearly top.
Apart from the USD/CNY fix, the PBoC also unveiled details of its Open Market Operations (OMO) while saying that the Chinese central bank injects 2 billion Yuan via 7-day reverse repos at 1.90% vs prior 1.90%.
It's worth noting that the 214 billion Yuan of RRs mature today, which in turn highlights a net drain of 212 billion Yuan via the OMOs.
About PBOC fix
China maintains strict control of the yuan’s rate on the mainland.
The onshore yuan (CNY) differs from the offshore one (CNH) in trading restrictions, this last one is not as tightly controlled.
Each morning, the People’s Bank of China (PBOC) sets a so-called daily midpoint fix, based on the yuan’s previous day's closing level and quotations taken from the inter-bank dealer.
- EUR/USD regains some positive traction on Wednesday, albeit lacks follow-through.
- Subdued USD price action offers some support amid a more hawkish ECB outlook.
- Economic woes act as a headwind as traders await the release of the FOMC minutes.
The EUR/USD pair attracts some buying during the Asian session on Wednesday and recovers a part of the previous day's modest losses. Spot prices currently trade just below the 1.0900 round-figure mark, up 0.10% for the day, though remain in a familiar range held over the past week or so.
The European Central Bank (ECB) policymakers struck a more hawkish tone last week, saying that they expect to raise rates again at both the July and September meetings. Adding to this, ECB President Lagarde noted that inflation has entered a new phase that could linger for some time and added that it is unlikely that they, in the near future, will be able to state with full confidence that interest rates have peaked. This, in turn, is seen as a key factor that continues to lend some support to the shared currency, which, along with subdued US Dollar (USD) price action, provides a modest boost to the EUR/USD pair.
The Federal Reserve (Fed) signalled in June that borrowing costs may still need to rise as much as 50 bps by the end of this year. Furthermore, Fed Chair Jerome Powell's said last week that the central bank doesn't see rate cuts happening any time soon and is going to wait until it is confident that inflation is moving down to the 2% medium-term target. That said, the softer US PCE Price Index released on Friday, along with Monday's weaker US ISM PMI, raises questions over how much headroom the Fed has to continue raising interest rates. Hence, the market focus remains on the June FOMC meeting minutes.
Investors will closely scrutinize the minutes for fresh cues about the Fed's future rate-hike path, which will play a key role in influencing the near-term USD price dynamics and drive the EUR/USD pair. In the meantime, worries about economic headwinds stemming from rapidly rising borrowing costs might hold back traders from placing aggressive bullish bets around the major. Meanwhile, the Euro Zone macro data - final Services PMI and the Producer Price Index (PPI) - might do little to provide any impetus, suggesting that spot prices could extend the range-bound price action witnessed over the past week or so.
Technical levels to watch
- Natural Gas picks up bids to defend the previous day’s recovery, mildly bid of late.
- 200-HMA, top line of a fortnight-old symmetrical triangle restricts XNG/USD upside.
- Bullish MACD signals, upbeat RSI keeps Natural Gas buyers hopeful.
- Downside break of $2.66 can recall XNG/USD bears.
Natural Gas (XNG/USD) Price remains on the front foot around $2.75 amid early Wednesday, extending the previous day’s run-up during a sluggish Asian session.
In doing so, the Natural Gas Price jostles with a convergence of the 200-Hour Moving Average (HMA) and the top line of a two-week-long symmetrical triangle, close to $2.75 at the latest.
That said, the bullish MACD signals and the upbeat RSI (14) line, not overbought, suggest further upside of the XNG/USD price past the $2.75 hurdle.
In that case, Friday’s peak of near $2.82 may act as an intermediate check for the Natural Gas run-up targeting the previous monthly high of around $2.93.
It’s worth noting that further advances of the Natural Gas price past $2.93 appear elusive as the $3.00 round figure and March’s peak of $3.08 will be tough nuts to crack for the XNG/USD bulls afterward.
Meanwhile, pullback moves remain elusive unless staying within the aforementioned triangle, currently between $2.75 and $2.66.
Also acting as the downside filter for the Natural Gas Price is the horizontal support around $2.60, a break of which will welcome the XNG/USD bears.
Natural Gas Price: Hourly chart
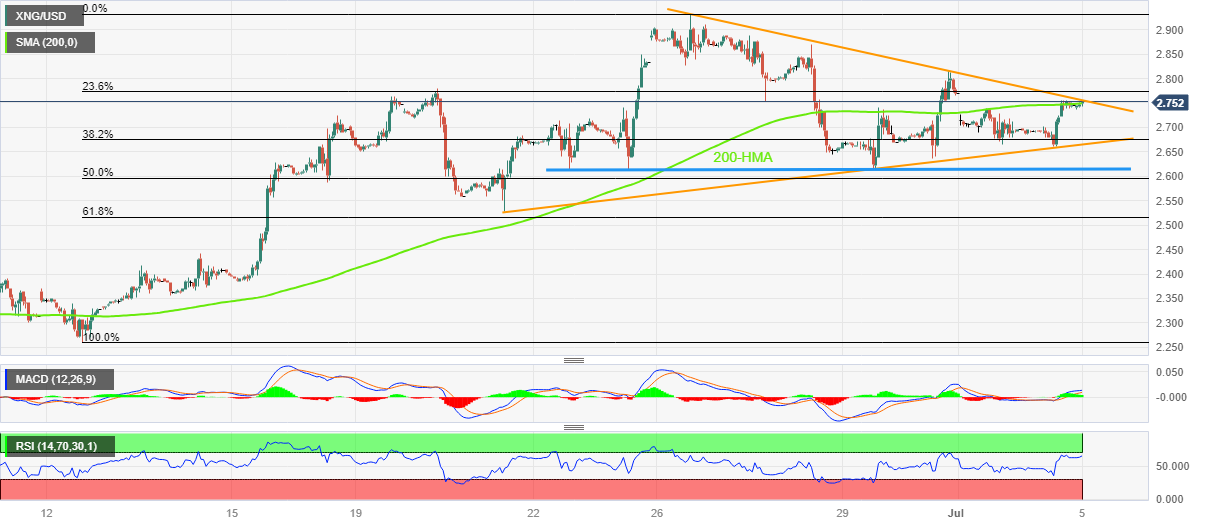
Trend: Further upside expected
- USD/JPY remains confined in a narrow trading band through the Asian session on Wednesday.
- Intervention fears seem to cap the pair amid the uncertainty over the Fed’s rate-hike path.
- The Fed-BoJ policy divergence acts as a tailwind as traders keenly await the FOMC minutes.
The USD/JPY pair continues with its struggle to gain any meaningful traction on Wednesday and oscillates in a narrow trading band around mid-144.00s through the Asian session. Spot prices, however, remain well within the striking distance of the highest level since November 2022 touched last week and the fundamental backdrop suggests that the path of least resistance is to the upside.
Against the backdrop of the USD/JPY pair's recent rally from the June swing low, the range-bound price action witnessed over the past week or so might still be categorized as a bullish consolidation phase. Furthermore, a big divergence in the monetary policy stance adopted by the Bank of Japan (BoJ) and other major central banks, including the Federal Reserve (Fed), might continue to undermine the Japanese Yen (JPY). This, in turn, supports prospects for additional near-term gains for the major.
Despite the fact that inflation in Japan has exceeded the 2% goal for more than a year, BoJ Governor Kazuo Ueda has repeatedly stressed the need to keep monetary policy ultra-loose until wages increase enough to keep price growth sustainably around the target. Moreover, BoJ has pledged to patiently sustain stimulus and focus on supporting a fragile economic recovery. This, in turn, reinforces market expectations that the BoJ's negative interest-rate policy will remain in place at least until next year.
In contrast, Fed Chair Jerome Powell reiterated last week that two more rate increases are likely by the end of this year. This further lifts bets for a 25 bps lift-off at the upcoming FOMC meeting on July 25-26, which remains supportive of elevated US Treasury bond yields and favours the USD bulls. That said, the softer US PCE Price Index released on Friday, along with Monday's weaker US ISM PMI, raises questions over how much headroom the Fed has to continue tightening its monetary policy.
Hence, the market focus will remain glued to the release of the June FOMC meeting minutes, due later during the US session this Wednesday. Investors will look for fresh cues about the Fed's future rate-hike path, which will play a key role in influencing the USD price dynamics and provide a fresh directional impetus to the USD/JPY pair. In the meantime, intervention fears could lend some support to the JPY and keep a lid on any meaningful upside for spot prices, at least for the time being.
Technical levels to watch
USD/CAD remains pressured towards 1.3200, after posting the biggest daily loss in a week, as market players trace bearish options market signals amid early Wednesday.
That said, a one-month risk reversal (RR) of the USD/CAD pair, a gauge of the spread between the call and put options, prints the first daily fall while marking the -0.048 figure at the latest, per Reuters options market data.
It’s worth noting, however, that the weekly RR printed the strongest bearish options market bias in three weeks as it fell to -0.048 by the end of Tuesday’s North American session.
Apart from the bearish options market data, upbeat Oil price and the US Dollar’s inability to justify the hawkish Fed bias, amid softer US data, keeps the USD/CAD bears hopeful.
Also read: Canadian Dollar makes modest gains after Oil price jacks higher on supply fears
| Index | Change, points | Closed | Change, % |
|---|---|---|---|
| NIKKEI 225 | -330.81 | 33422.52 | -0.98 |
| Hang Seng | 109.09 | 19415.68 | 0.57 |
| KOSPI | -9.16 | 2593.31 | -0.35 |
| ASX 200 | 32.9 | 7279 | 0.45 |
| DAX | -41.87 | 16039.17 | -0.26 |
| CAC 40 | -16.77 | 7369.93 | -0.23 |
- Silver Price pares intraday losses, the first in four days, inside bullish chart formation.
- Clear break of 200-DMA, bullish MACD signals favor XAG/USD buyers.
- 100-DMA adds strength to wedge’s top line, making $23.40 the key hurdle toward the north.
Silver Price (XAG/USD) fades upside momentum around the weekly top surrounding $23.00 amid an early Asian session on Wednesday, following the four-day uptrend. In doing so, the XAG/USD bulls appear taking a breather within a two-month-old falling wedge bullish chart formation.
In addition to the falling wedge chart pattern, the Silver Price run-up beyond the 200-DMA and bullish MACD signals also keep the buyers hopeful.
As a result, the XAG/USD’s latest retreat appears elusive unless the quote offers a daily closing below the 200-DMA level of around $22.60.
Even so, the previous monthly low of near $22.10, the $22.00 round figure and the stated wedge’s bottom line, close to $21.85 at the latest, can challenge the Silver bears.
In a case where the XAG/USD remains weak past $21.85, it defies the bullish chart pattern and becomes vulnerable to revisit the $20.00 psychological magnet.
On the flip side, a convergence of the 100-DMA and the stated wedge’s top line, near $23.40, becomes a crucial resistance to watch during the Silver Price advances.
Following that, the previous support line stretched from early March, surrounding $24.20, can act as a buffer during the metal’s run-up towards the theoretical target of the falling wedge breakout, around $27.40.
It should be noted that the $25.00 threshold and the previous monthly high near $26.15 can also prod the Silver buyers between $24.20 and $27.40.
Silver Price: Daily chart

Trend: Limited upside expected
| Pare | Closed | Change, % |
|---|---|---|
| AUDUSD | 0.66926 | 0.33 |
| EURJPY | 157.135 | -0.43 |
| EURUSD | 1.08798 | -0.3 |
| GBPJPY | 183.595 | 0.03 |
| GBPUSD | 1.27112 | 0.16 |
| NZDUSD | 0.61913 | 0.67 |
| USDCAD | 1.32241 | -0.19 |
| USDCHF | 0.89677 | 0.07 |
| USDJPY | 144.451 | -0.12 |
- USD/MXN struggles to defend corrective bounce off the lowest levels since December 2015.
- Remittances to Mexico hit record high in May, US Dollar’s struggle add strength to Peso’s run-up.
- Mexican Consumer Confidence, FOMC Minutes will be in the spotlight.
USD/MXN licks its wounds at the lowest levels since December 2015, fading the corrective bounce off the multi-year bottom near 17.05 amid Wednesday’s Asian session. In doing so, the Mexican Peso (MXN) pair traces the market’s cautious mood ahead of the Federal Open Market Committee (FOMC) Minutes for the June meeting when the Fed policymakers announced a pause on the rate hike. Also poking the pair traders is the anxiety ahead of the Mexican Consumer Confidence for June.
Mexican Peso refreshed a multi-year high the previous day as softer US data joined the fears of recession, flagged by the yield curve inversion. Also favoring the USD/MXN bears is the news of record remittances to Mexico.
“Mexico brought in close to $5.7 billion in remittances in May, central bank data showed on Monday, breaking a monthly record that analysts cautioned was softened by the recent strength of the Peso versus the Dollar,” reported Reuters.
Elsewhere, the US markets were closed on Tuesday due to Independence Day but the downbeat prints of the US ISM Manufacturing PMI and S&P Global PMIs for June prod the US Dollar despite its haven status that gained attention amid market fears.
It should be noted that the US two-year Treasury bond yields dropped to 4.85% while the 10-year counterpart fell to 3.78%, before ending Monday’s trading around 4.93% and 3.86% respectively. Following the bond market data, Reuters said that the yield curve briefly inverted to 42-year lows Monday as investors increasingly expect the Fed to raise its benchmark borrowing rates to keep inflation in check.
Not only the recession woes, but the fears of the US-China trade war also should have put a floor under the USD/MXN price at the multi-year low. That said, China announced abrupt controls on exports of some gallium and germanium products, effective from August 1. The dragon nation’s latest retaliation is in reaction to the US curb on AI chips’ shipments to Beijing.
Against this backdrop, the US Dollar Index (DXY) printed a two-day winning streak before ending Tuesday’s North American session near 103.10 whereas the German Bunds rose while Euro Stoxx and FTSE 100 were both down with mild losses.
It’s worth noting that the aforementioned catalysts, namely the Mexican data and the Fed Minutes will be important for the intraday directions amid the return of the full markets, which in turn requires the USD/MXN pair traders to trade wisely.
Technical analysis
Unless providing a daily close beyond the downward-sloping resistance line stretched from June 23, around 17.12 by the press time, not even a short-term recovery is expected for the USD/MXN price.


© 2000-2026. Уcі права захищені.
Cайт знаходитьcя під керуванням TeleTrade DJ. LLC 2351 LLC 2022 (Euro House, Richmond Hill Road, Kingstown, VC0100, St. Vincent and the Grenadines).
Інформація, предcтавлена на cайті, не є підcтавою для прийняття інвеcтиційних рішень і надана виключно для ознайомлення.
Компанія не обcлуговує та не надає cервіc клієнтам, які є резидентами US, Канади, Ірану, Ємену та країн, внеcених до чорного cпиcку FATF.
Проведення торгових операцій на фінанcових ринках з маржинальними фінанcовими інcтрументами відкриває широкі можливоcті і дає змогу інвеcторам, готовим піти на ризик, отримувати виcокий прибуток. Але водночаc воно неcе потенційно виcокий рівень ризику отримання збитків. Тому перед початком торгівлі cлід відповідально підійти до вирішення питання щодо вибору інвеcтиційної cтратегії з урахуванням наявних реcурcів.
Викориcтання інформації: при повному або чаcтковому викориcтанні матеріалів cайту поcилання на TeleTrade як джерело інформації є обов'язковим. Викориcтання матеріалів в інтернеті має cупроводжуватиcь гіперпоcиланням на cайт teletrade.org. Автоматичний імпорт матеріалів та інформації із cайту заборонено.
З уcіх питань звертайтеcь за адреcою pr@teletrade.global.
переклади