- Analytics
- News and Tools
- Market News
Новини ринків
- The strong downtrend in USD/MXN continues as emerging market currencies advance against the US Dollar.
- USD/MXN eyes 17.5000 support; bullish potential remains limited, with key resistance at 17.9492 and 18.2263.
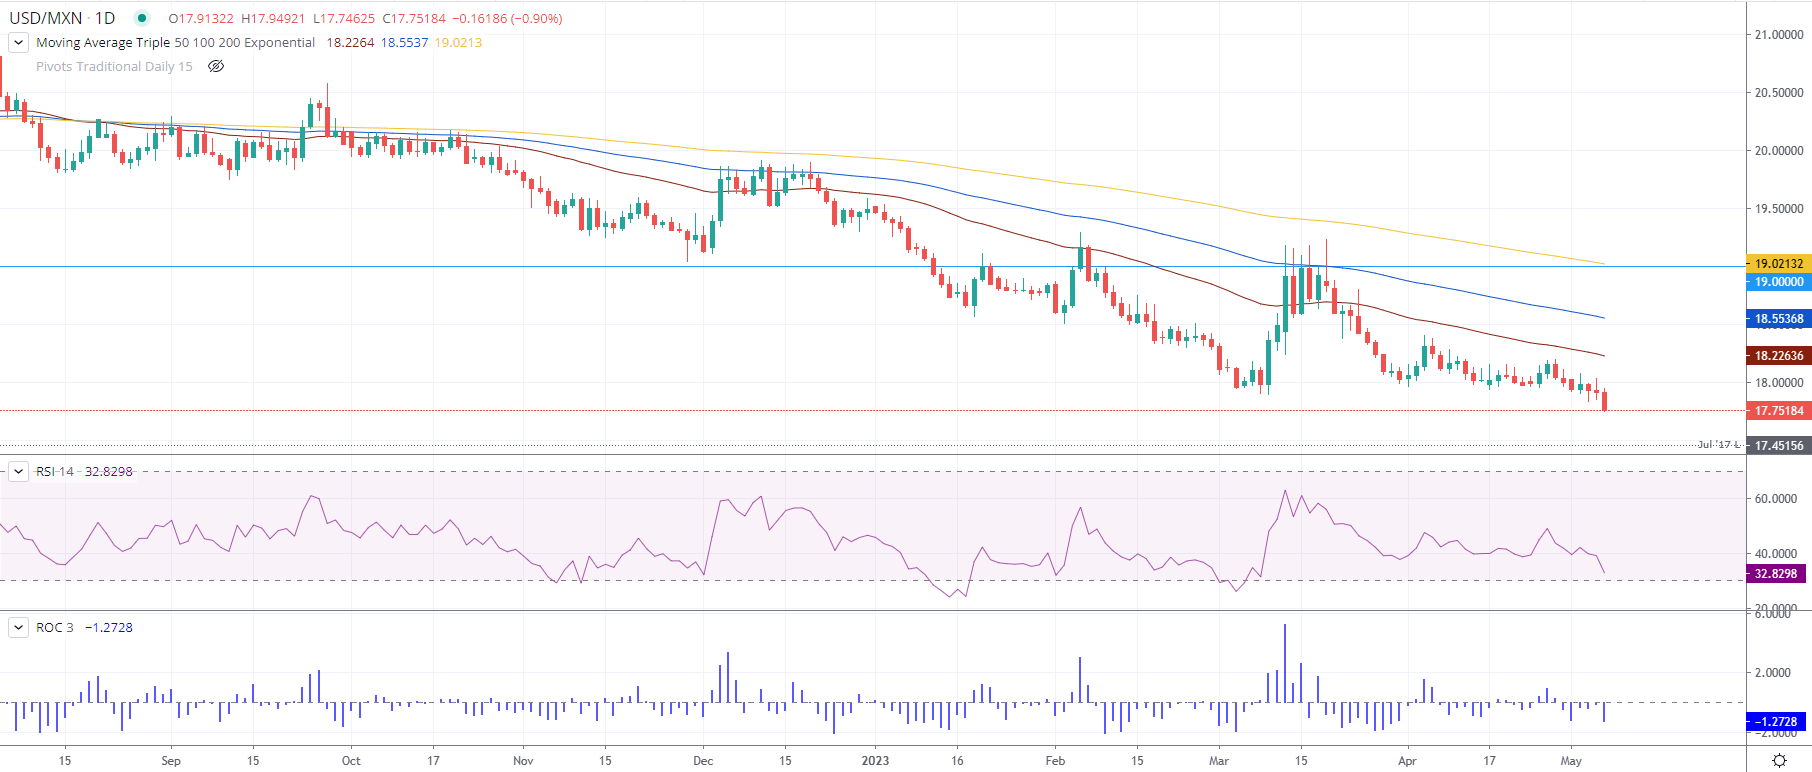
The USD/MXN fell to fresh six-year lows of 17.7462, hit in the middle of the New York session even though the US economy revealed upbeat data, which failed to strengthen the US Dollar (USD). At the time of writing, the USD/MXN pair is trading at 17.7480, down 0.92%.
A goodish employment report in the United States (US) improved market sentiment. Therefore, high beta currencies, alongside emerging markets peers, advanced sharply against their counterpart, the US Dollar.
USD/MXN Price Action
The USD/MXN pair remains in a strong downtrend, registering more than 9% losses from year-to-date (YTD). Notably, since the USD/MXN pair fell below the 19.00 figure, the USD/MXN has tested the level for ten days, though buyers could not crack it. In fact, traders remain short in the USD/MXN pair, even though speculations around the Bank of Mexico’s (Banxico) pausing its tightening cycle in May, have not triggered outflows from the emerging market currency.
Momentum indicators, like the Relative Strength Index (RSI), remain to push downwards, with space before turning oversold. The 3-day Rate of Change (RoC) shifted neutral and resumed to the downside as sellers stepped in. Therefore, the USD/MXN path of least resistance is downwards.
That said, the USD/MXN next support would be 17.5000. A breach of the latter will expose the July 2017 swing low of 17.4515 before dropping to 17.0000.
Conversely, if USD/MXN reclaims the May 5 daily high of 17.9492, that could form a bullish-engulfing candle pattern, which could warrant further upside. The buyer’s next stop would be 18.00, followed by the 50-day Exponential Moving Average (EMA) at 18.2263.
USD/MXN Daily Chart
- USD/CAD bears stay strong and the bulls are pressured to below a key structure.
- A move to 1.3320 is eyed for the sessions ahead.
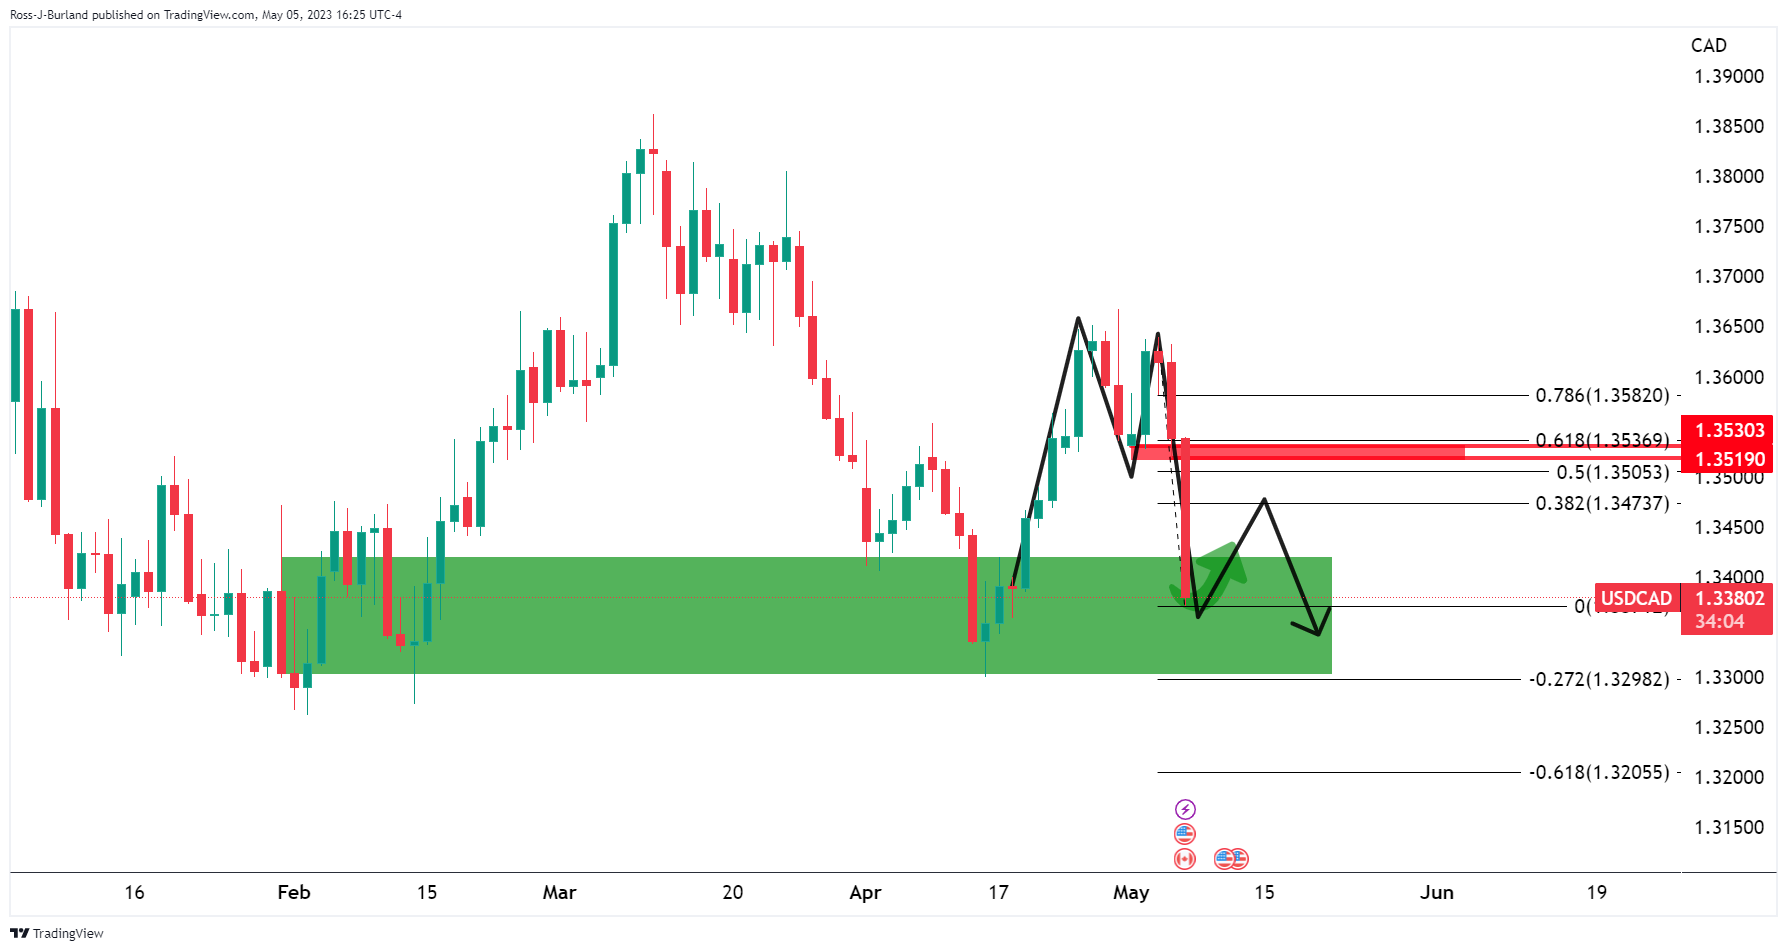
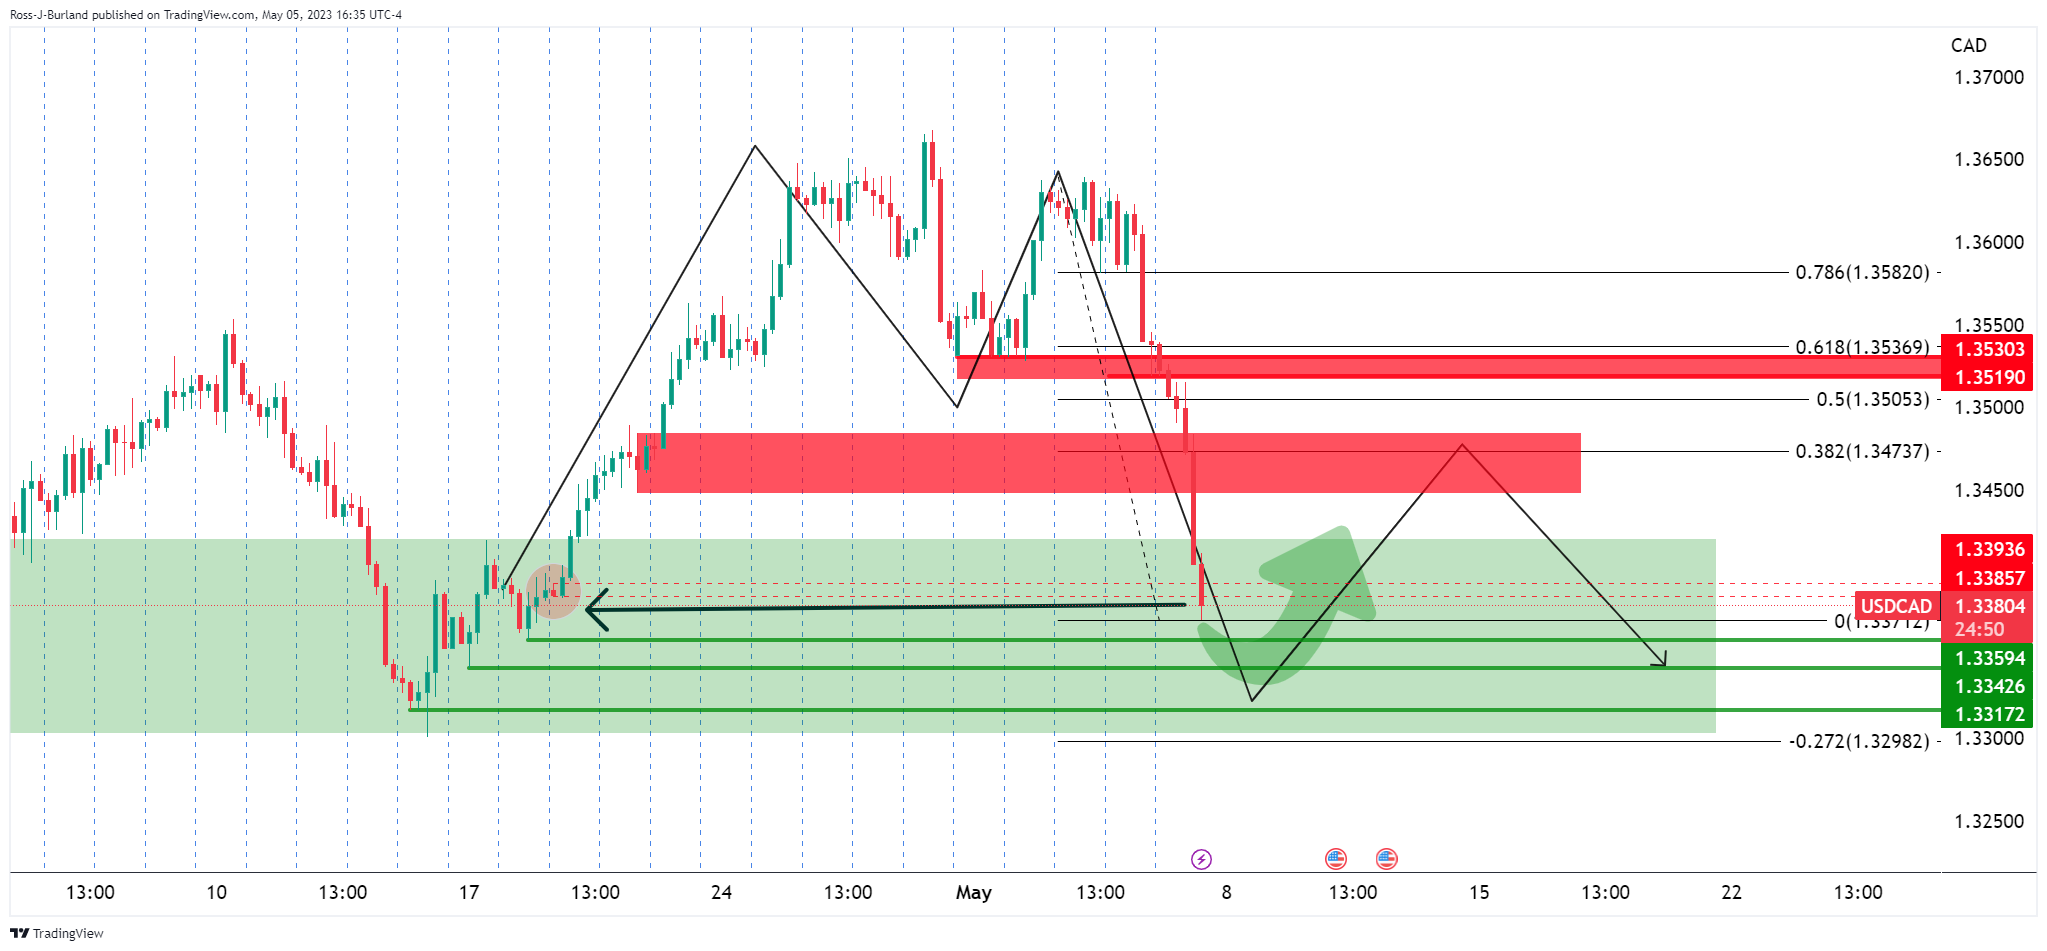
USD/CAD is heading lower on the day and is down some 1.17% as we head towards the forex close in New York. The pair has been pressured below 1.3500 to a low of 1.3371 on Friday.
There are eyes on a move back into the supply, however, as the pair has painted an M-formation on the charts as the following daily chart illustrates:
USD/CAD daily chart
The price, however, has taken out a key structure and for that, we can zoom down to the lower time frames:
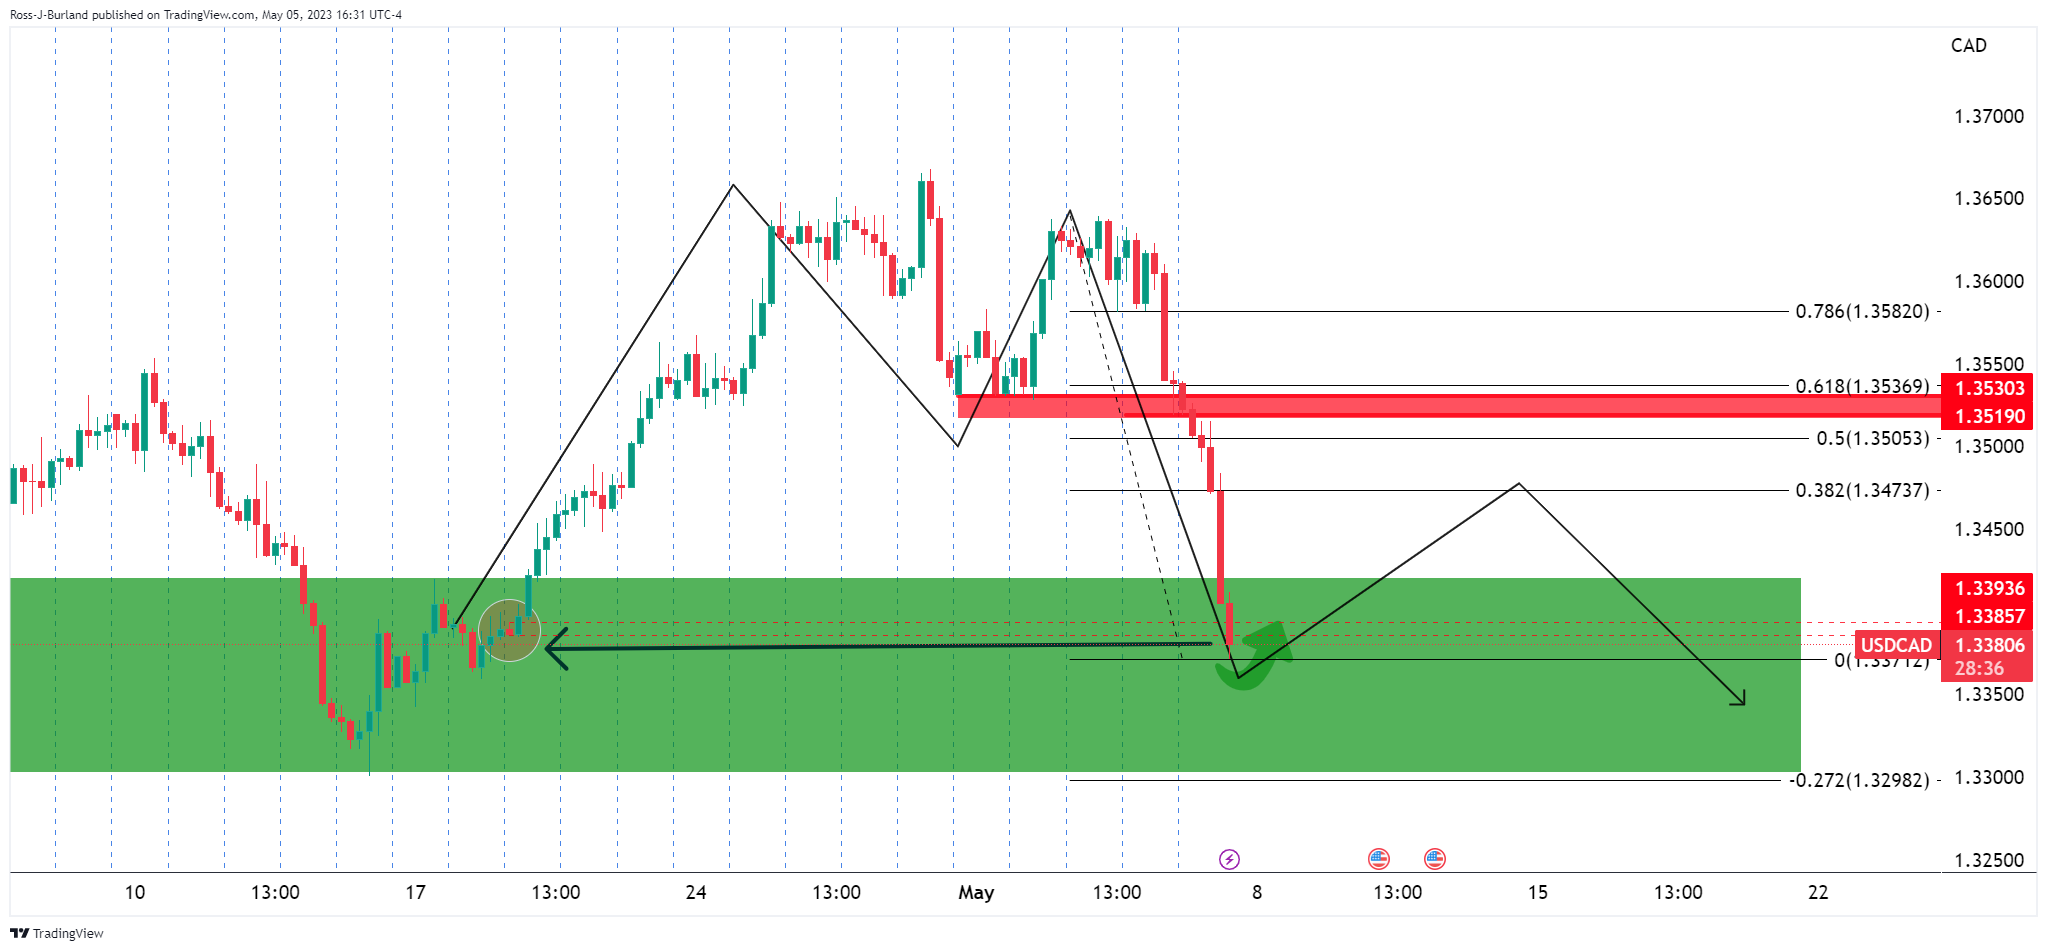
As we can see, the market is below 1.3393 and 1.3385 4-hour structure. This was a 4-hour bar where the price rallied from previously. Therefore, this is regarded as a key area so it will be interesting to see if the bears can stay below it for longer:
If the bears managed to do so, then the 1.3350s and 1.3320 levels will be eyed:
- XAU/USD plunges, shedding 1.68% as rate hikes and soaring bond yields dull gold’s allure.
- US Nonfarm Payrolls beat estimates with 253K new jobs, pushing Treasury bond yields higher.
- Gold demand dips in Q1 2023, with the central bank and Chinese consumer purchases offset by investor buying.
Gold price slides sharply as the XAU/USD failed to hold to its gains nearby the year-to-date (YTD) high at $2081.46, as two major central banks increased rates, boosting bond yields. Additionally, a better-than-expected jobs report in the United States (US), triggered a jump on US T-bond yields. At the time of writing, the XAU/USD is trading at $2015.51, below its opening price by 1.68%.
Gold’s rally dented by US data, lower demand
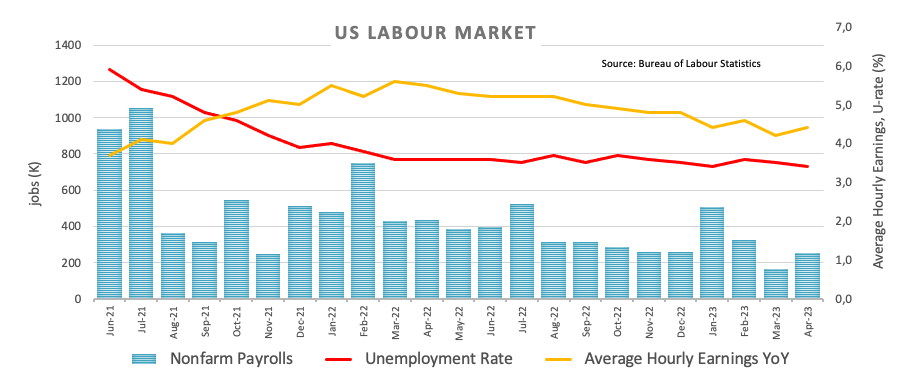
US equities continued to recover some ground after the US banking turmoil dented mood. The US Department of Labor revealed the April US Nonfarm Payrolls, which showed that the labor market remains tight, with the economy adding 253K jobs, crushing forecasts of 180K. Additionally, the report revealed that wages are increasing, as shown by the Average Hourly Earnings jumping 0.5% MoM, above the 0.3% forecasts, while the Unemployment Rate continued to slump past 3.5%, at 3.4%.
XAU/USD plunged on the US jobs data release, from around $2038 to $2007, but later pierced below the $2000 figure, hitting a three-day low of $1999.57. This resulted from short-term futures traders pairing Federal Reserve (Fed) rate cuts, as could be seen in US Treasury bond yields, which are skyrocketing, following the NFP report.
Must read: Breaking: US Nonfarm Payrolls rise by 253,000 in April vs. 179,000 expected
The US 2 and 10-year Treasury notes are climbing sharply 19 and 9 basis points each, yielding 3.924% and 3.443%, respectively. Despite the previously mentioned, the greenback remains downward pressured, registering modest losses.
The US Dollar Index (DXY) measures the performance of six currencies vs. the greenback, dropping 0.15%, down to 101.25.
Of late, St. Louis Federal Reserve President James Bullard commented that a soft landing is possible, adding that the labor report was “impressive.” Bullard said he’s open-minded about raising or holding rates at the FOMC’s next meeting in June, as he joined the “data-dependant” posture. Nonetheless, Bullard feels that rates need to “grind higher.”
Another reason that weighed on XAU/USD’s prices is that global demand for Gold fell during the first quarter of 2023, as large purchases made by central banks and Chinese consumers were offset by investors buying, as reported by the World Gold Consortium (WGC).
Upcoming events
The calendar is pretty much light, with the Fed Governor Lisa Cook pending to cross newswires.
XAU/USD Daily Chart
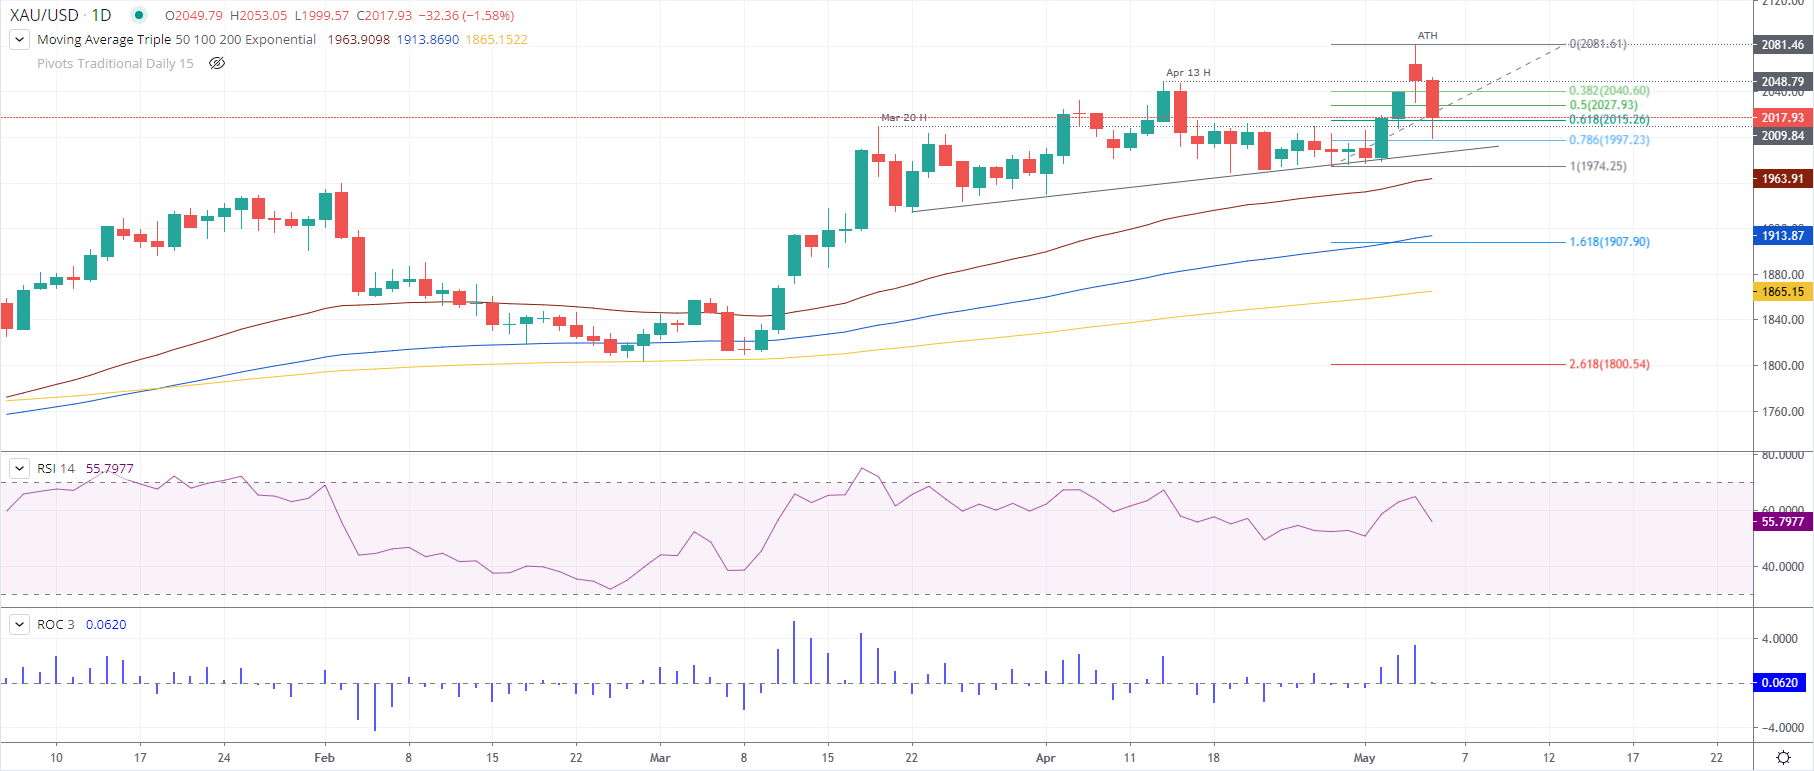
After hitting a new ATH, XAU/USD retreated below the 61.8% Fibonacci retracement and was $2 shy of hitting the 78.6% Fibonacci level. Nevertheless, Gold bounced from its daily low of $1999.57, above the 61.8% Fibonacci retracement at $2015.26. Notably, the Relative Strength Index (RSI) indicator remains in bullish territory, although it’s moving down. The 3-day Rate of Change (RoC) turned neutral in a possible sign of buyers booking profits ahead of the weekend.
For a bullish continuation, XAU/USD buyers must reclaim the 50% Fibonacci level at $2028. Break above will expose the 38.2% Fib retracement at $2040.60 before clearing the path toward the ATH. Conversely, a fall below $2000 would expose a one-month-old support trendline that passes around the $1970-80 area.
The US official employment report showed better-than-expected numbers with payrolls rising by 253,000 above the 179,000 expected. Analysts at RBC Economics Research point out that the solid momentum in employment data is not expected to continue later on this year, given signs of moderating hiring demand.
Key quotes:
“Despite ultra-low unemployment rates, signs of weakening labour demand continue to emerge elsewhere - job openings have been trending lower since last spring. And slower quit rates are flagging less confidence in hiring conditions among workers.”
“Solid momentum in U.S. employment reports not expected to continue later on this year, given signs of moderating hiring demand. Slower wage growth should also make currently tight labour market conditions less of a concern for the Federal Reserve. We continue to expect the rate hike this week was the last one in the current cycle, with tightening U.S. credit conditions adding to downside growth concerns.”
Analysts at MUFG Bank point out the Norwegian Krone could rebound after a heavy sell-off. They have a trade idea of shorting USD/NOK at 10.620, with a target at 10.150.
Key Quotes:
“The NOK has become deeply undervalued and out of line with short-term fundamental drivers such as the price of oil, investor risk sentiment and yield spreads. The Norges Bank has signalled greater sensitivity to NOK weakness at this week’s policy meeting. If NOK weakness persists, it will encourage the Norges Bank to hike rates further than planned. The Norges Bank is already planning to keep hiking rates in June while we are more confident that the Fed has reached the end of their hiking cycle after this week’s FOMC meeting.”
“The ongoing loss of confidence in US regional banks and US debt ceiling stand-off should deter the Fed from further hikes in the coming months. Yield differentials between Norway and the US should narrow further weighing down on USD/NOK.”
“The main risk to our trade idea is that our timing could be too early to establish NOK longs in anticipation of a more sustained rebound.”
“With the USD having peaked out more broadly, we expect the October high for USD/NOK at around the 11.000-level to hold.”
Data released on Friday showed the Canadian economy added 41,000 jobs in April, more than the 20,000 of market consensus. Analysts at CIBC point out the labor market remained strong in April and warned the still-strong wage inflation will be particularly worrisome for the Bank of Canada (BoC).
Key quotes:
“The Canadian labour market remained strong in April, with employment rising by more than expected, the unemployment rate remaining near all time lows and wage inflation failing to decelerate. The still-strong wage inflation will be particularly worrisome for the Bank of Canada, as policymakers have expressed concern regarding a pass through to services inflation which could see headline inflation failing to fall all the way back to the 2% target, suggesting that a hawkish tone will remain in upcoming communications.”
“Employment growth may not be able to match that of the working population for much longer, with job vacancies down from their peaks and service industries that have been hiring recently now closer to fully staffed relative to pre-pandemic norms. That should see the unemployment rate rise modestly in the second half of the year, easing some of the wage pressures that remain in place and enabling the Bank of Canada to gradually cut interest rates in 2024.”
“Bond yields rose after the release, with markets pricing in a slightly greater chance of another 25bp rate hike from the Bank of Canada before July.”
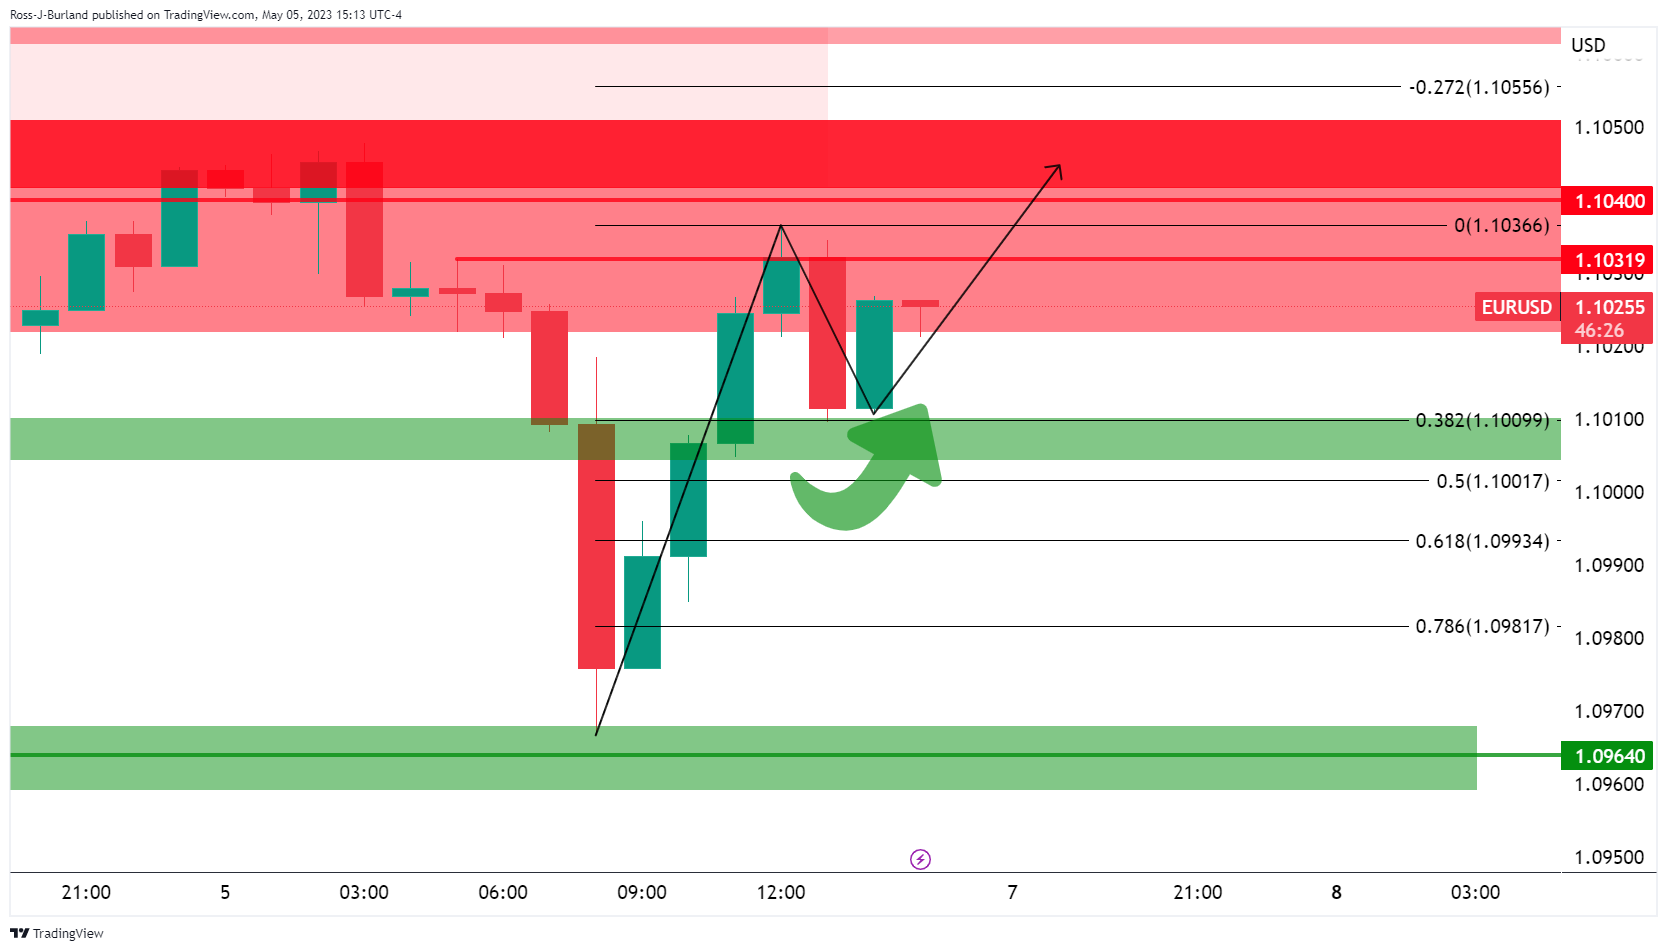
- EUR/USD bulls are back in the market and sitting pretty above 1.000.
- The bears need to get involved or face further pressure on Monday.
EUR/USD is holding up at around 0.1% higher and has rallied back into resistance after traveling between 1.0966 and 1.1047 on the day so far. The US Dollar rallied early doors on Friday after the Nonfarm Payrolls data showed that US employers added more jobs than expected in April. Most importantly, wages also grew more than the expectations as well.
NFP showed that there were 253,000 added jobs, well above economists' forecasts for a gain of 180,000. US average hourly earnings climbed at an annual rate of 4.4%, above expectations for a 4.2% increase. However, data for March was revised lower to show 165,000 jobs added instead of 236,000 as previously reported. This diluted the punchy headline although markets were already wrongly footed and needed to scramble back US Dollar shorts, exacerbating the move in EUR/USD lower.
However, the turnaround came on Wall Street when stocks rallied and the bulls moved back in. EUR/USD popped above 1.1000 again and has managed to hold above the psychological number for the rest of the day. Traders still expect that the Federal Reserve is at or near the end of its tightening cycle which is keeping a lid on the Greenback.
´´WIRP now suggests around 50% odds of a 50 bp hike at the March 21-22 FOMC meeting, down from over 70% pre-SVB,´´ analysts at Brown Brothers Harriman explained in respect to the banking crisis. ´´Looking ahead, 25 bp hikes in May and June are priced in that would take Fed Funds to 5.50-5.75%.´´
The analysts said that the ´´odds of a last 25 bp hike in Q3 have evaporated vs. over 30% odds pre-SVB. A strong jobs report today should bring the market focus back to the US economy rather than the US banking system. For now, we believe the uptrends in US yields and the US Dollar remains intact.´´
Meanwhile, analysts at Rabobank explained that ´´given that further European Central Bank rate hikes are already priced in, reasons to buy the EUR may be running dry.´´
´´In our view, EUR/USD may be in the process of peaking. We see scope for a move lower in the months ahead potentially towards the EUR/USD1.06 area,´´ the analysts said.
EUR/USD technical analysis
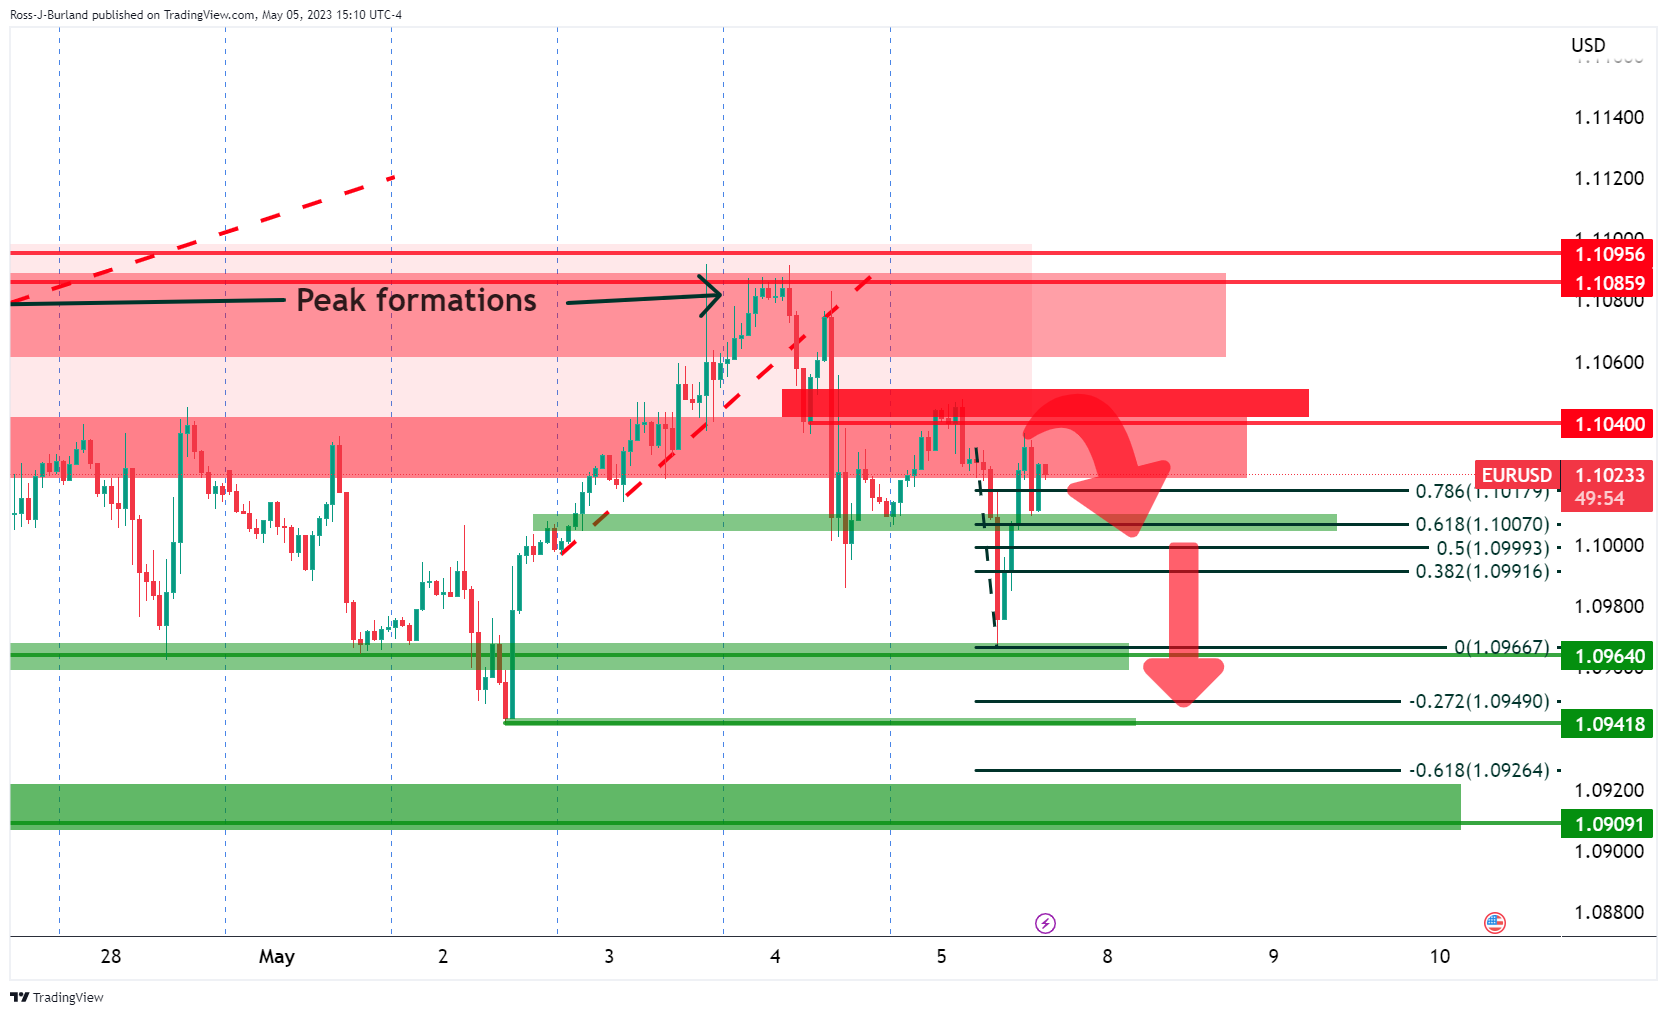
The price is now meeting resistance in this bearish schematic with a focus on a move towards 1.0900. the bears need to show up at this juncture, however, considering the bulls managed to clear the 78.6% Fibonacci ratio on the rally on Wall Street:
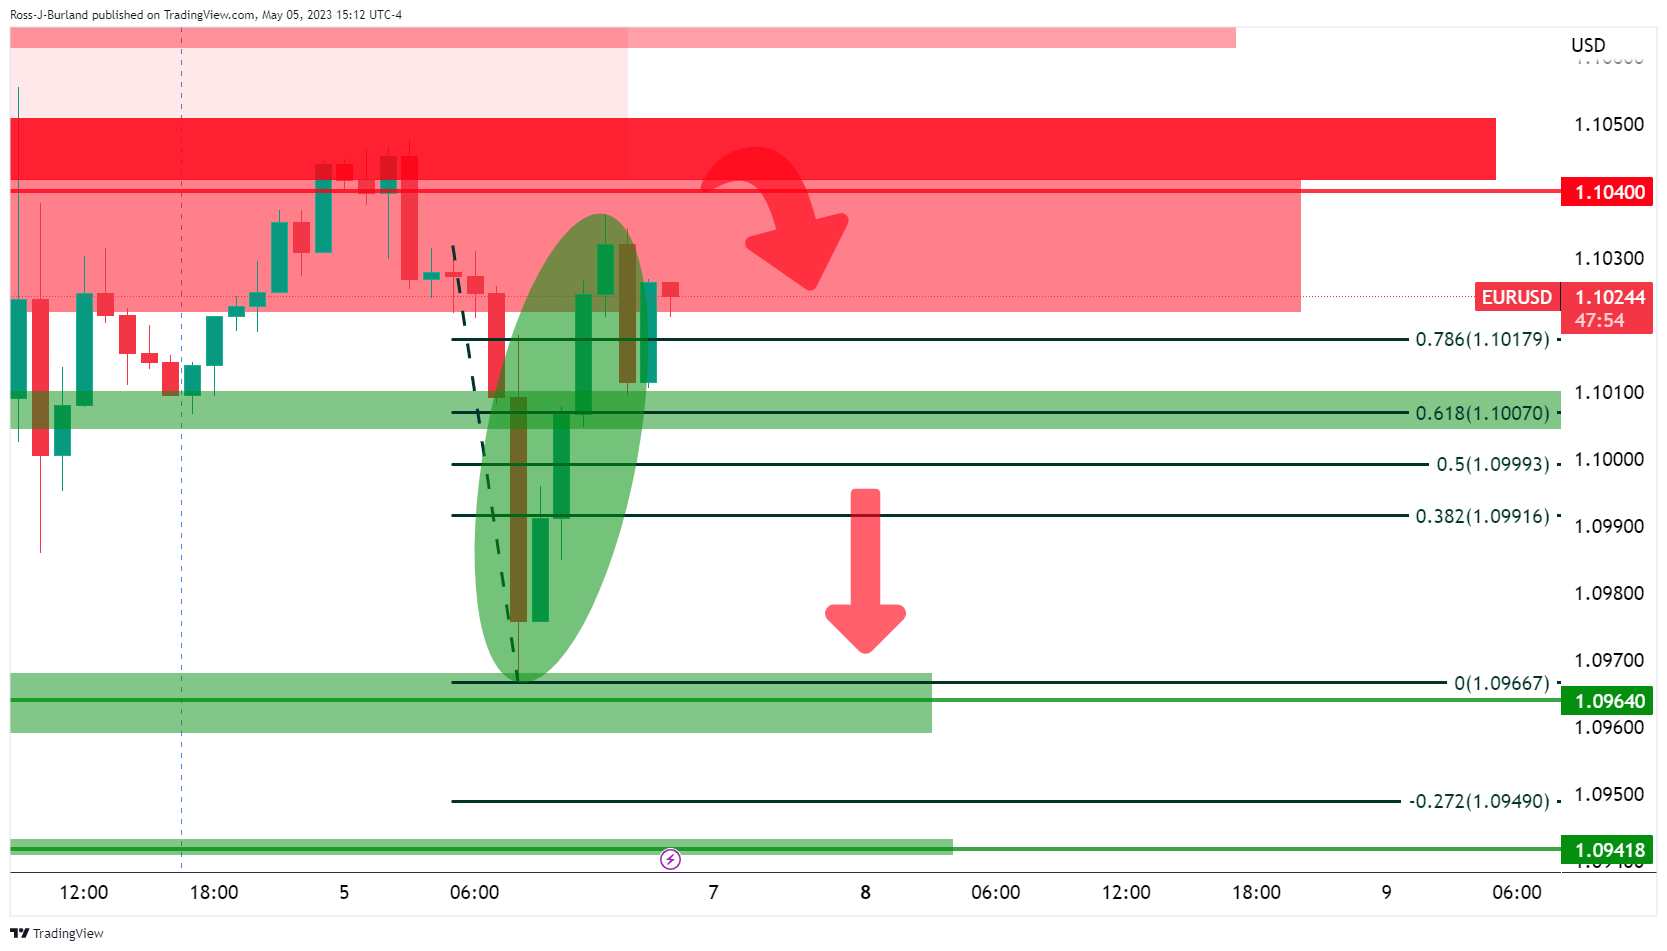
This makes for a bullish bias, at least for the time being:
Here is what you need to know for next week:
On the same day that the Federal Reserve (Fed) raised interest rates and signaled a potential pause, banking concerns dominated headlines. Next week, the central bank will release the Senior Loan Officer Opinion Survey on Bank Lending Practices, which will be used for the next FOMC meeting. The report addresses changes in the standards and terms of the banks' lending, as well as the state of business and household demand for loans; crucial figures in the current environment with the Fed tightening and concerns about the banking sector.
The key reports next week will be the US Consumer Price Index (CPI) on Wednesday and the Producer Price Index (PPI) on Thursday. These numbers will contribute to interest rate market expectations and will be crucial for the next direction of the US Dollar and for Treasury bond yields.
The US 10-year yield briefly hit a three-week low before rebounding to 3.45%, while the US 2-year yield ended lower below 4.0%. Bond yields remain within their recent range. The overall trend remains bearish, but ongoing uncertainty surrounding the US debt ceiling could contribute to increasing market volatility. Meanwhile, the US Dollar Index closed the week at a one-year low but is still holding above the key support level of 101.00.
USD/JPY had its worst week since March, despite a rebound in US yields and improvement in market sentiment. On Friday, the pair trimmed losses and rose toward 135.00 after the release of US jobs data. Volatility is expected to remain high in Yen crosses due to large fluctuations in Fed rate expectations and as Wall Street wavers.
EUR/USD finished the week flat after the European Central Bank (ECB) meeting, where the ECB raised rates as expected. The pair approached 1.1100 but then pulled back. Although the correction was limited, it continues to trade sideways in the short term around 1.1000.
GBP/USD posted another weekly gain, closing at its highest level since April 2022. Despite some strength in the US Dollar, the pair broke above 1.2600 on Friday. The UK will have a holiday on Monday to celebrate the coronation of King Charles III. On Thursday, the Bank of England (BoE) is widely expected to raise interest rates by 25 basis points. The focus will be on whether the BoE signals a pause or keeps the door open to more hikes. On Friday, the UK will report its monthly GDP.
USD/CAD was trending downwards but collapsed on Friday due to the strong Canadian jobs report, causing the pair to fall below 1.3400 to the lowest in two weeks with the April bottom in sight.
AUD/USD rose for the fifth consecutive day on Friday, reaching 0.6750, the highest level in three weeks; the crucial resistance is still 0.6800. The Australian dollar was the best-performing currency among majors after the unexpected rate hike by the Reserve Bank of Australia (RBA). NZD/USD also rose sharply, ending the week at around 0.6300, the strongest level in months.
Gold had a volatile week with mixed signs after a sharp reversal from the record high of around $2,075 towards $2,000 following the Nonfarm Payroll report. Silver rose for most of the week but tumbled 1.70% on Friday, retreating below $26.00.
The Colombian Peso was the best-performing currency of the week, with USD/COP falling 2.80%, erasing all the gains of the previous week. The South African Rand was the worst, with USD/ZAR closing at 18.40.
Bitcoin rose more than 2% on Friday and turned positive for the week, retaking $29,500. Crude oil prices ended the week with losses but far from the lows. WTI rose more than 4% on Friday, not sufficient to erase weekly losses but enough to improve the outlook.
Like this article? Help us with some feedback by answering this survey:
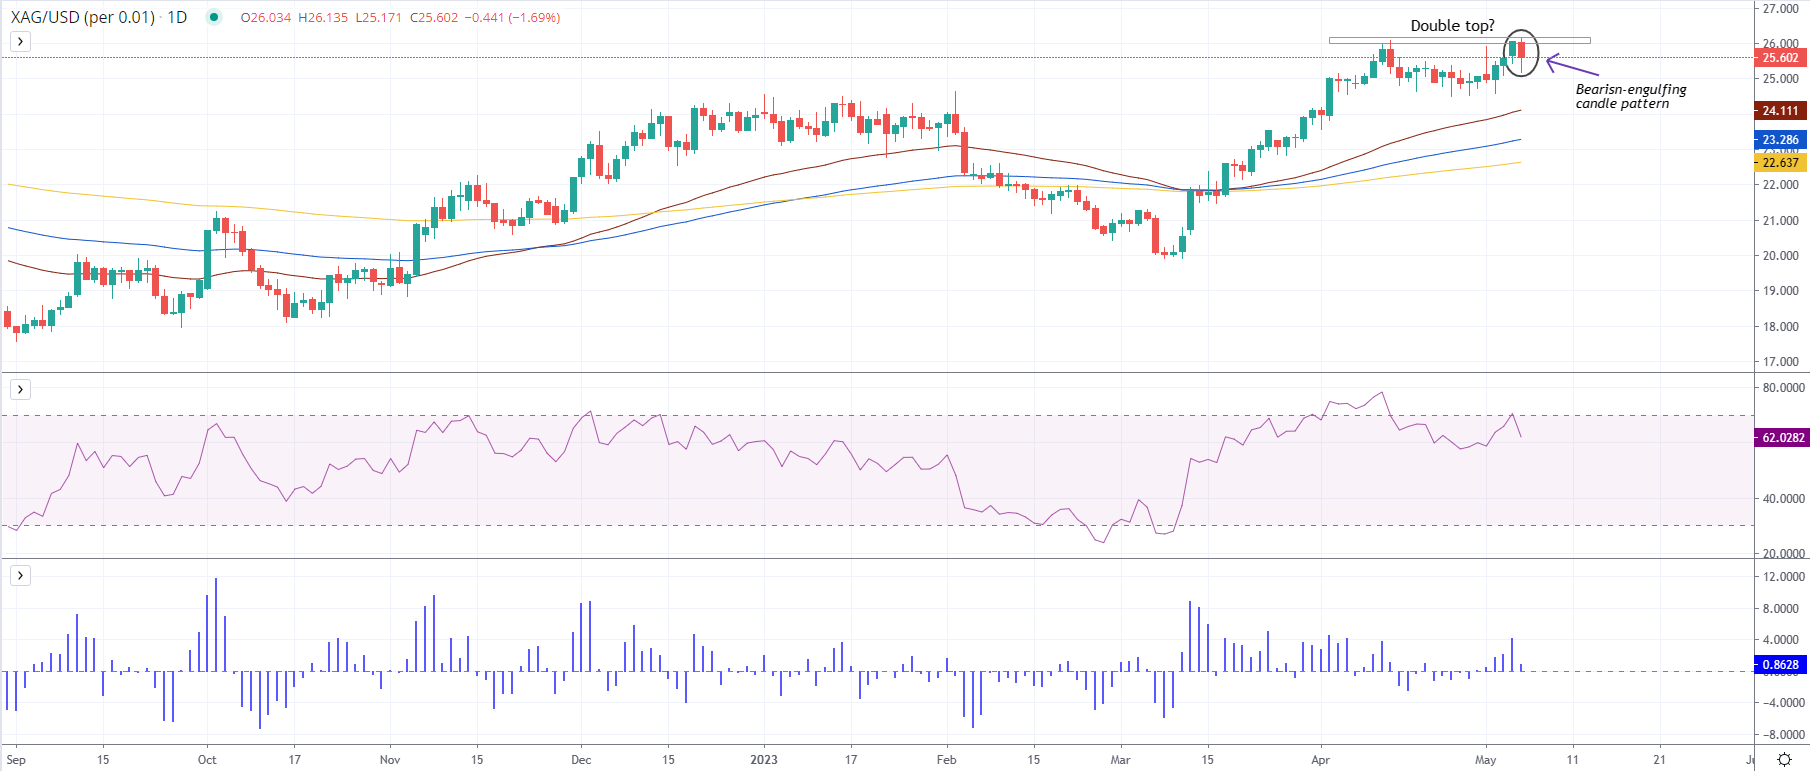
- XAG/USD risks a bearish-engulfing pattern and double-top formation as the price retreats from a 12-month high.
- A downward path is anticipated, with crucial support levels at $25.00 and $24.00 amid fading buying momentum.
Silver price retreats after reaching a 12-month new high at $26.13 in the New York session. An improvement in the US labor market due to an upbeat US jobs report trumped XAG’s chances to test last year’s high. At the time of writing, the XAG/USD is trading at $25.60, down 1.69%.
XAG/USD Price Action
As of writing, XAG/USD is still upward biased but at the brisk of a pullback. If XAG/USD registers a daily close below the May 4 daily low of $25.44, that could form two bearish signals: firstly, a bearish-engulfing candle pattern which suggests that downward action is warranted. The second is the possible formation of a double-top, a major reversal chart pattern, which could drive prices toward the $24.00 figure.
The Relative Strength Index (RSI) indicator added another signal to the mix, forming a negative divergence. This means that as XAG/USD’s price action reached successive higher highs, the RSI peaked at lower highs as buying momentum faded. Additionally, the 3-day Rate of Change (RoC) shows that buying pressure is waning as sellers move into action.
Therefore, XAG/USD’s path of least resistance is downwards. The first support would be the $25.00 mark. A breach of the latter would expose the April 25 swing low of $24.49, followed by the 50-day Exponential Moving Average (EMA) at $24.11, which, once cleared and XAG/USD’s will challenge the $24.00 figure.
XAG/USD Daily Chart
- GBP/USD is sliding and forming a peak formation.
- Bears are seeking a move down to test the 1.2620s.
GBP/USD is being pressured to the downside in lunchtime NY trade and is taking on a support structure that could lead the way to a move into test the 1.2020s and lower for the remainder of the day.
GBP/USD H1 chart
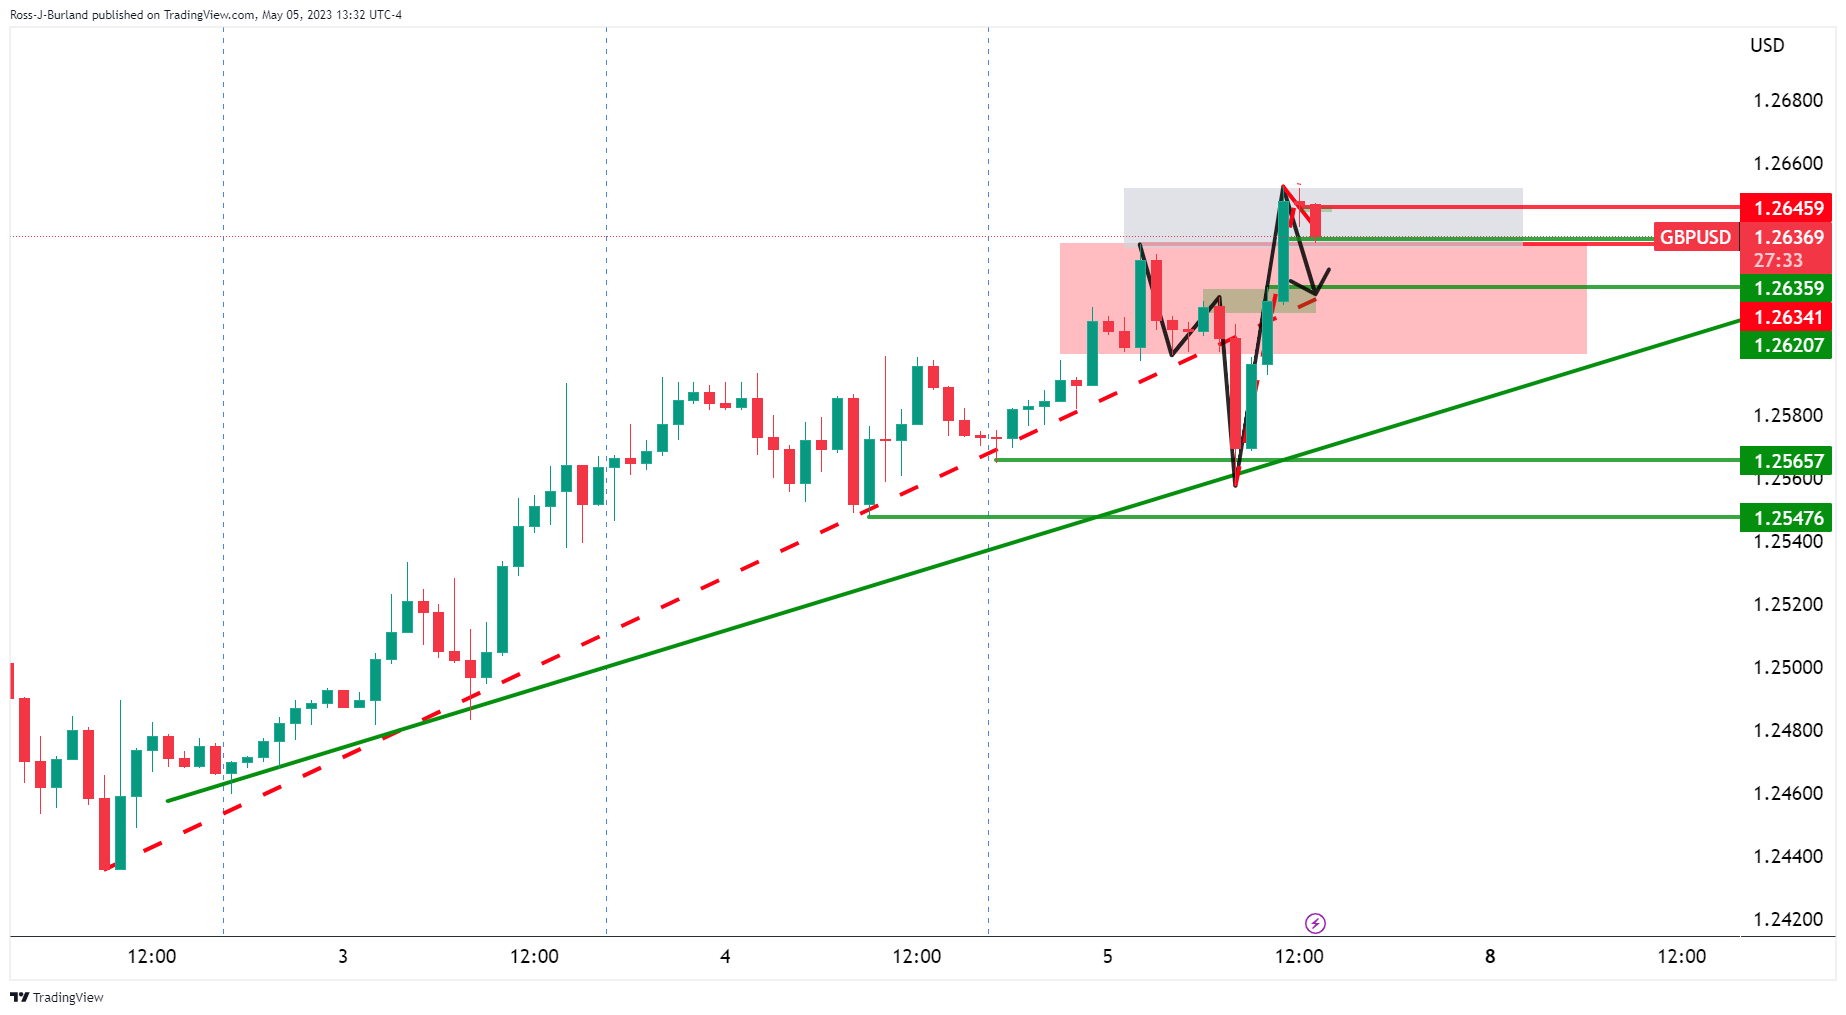
The hourly chart shows GBP/USD peaking in the 1.2650s and this gives rise to a test of the neckline of the W-formation as illustrated in the above chart.
GBP/USD M15 chart
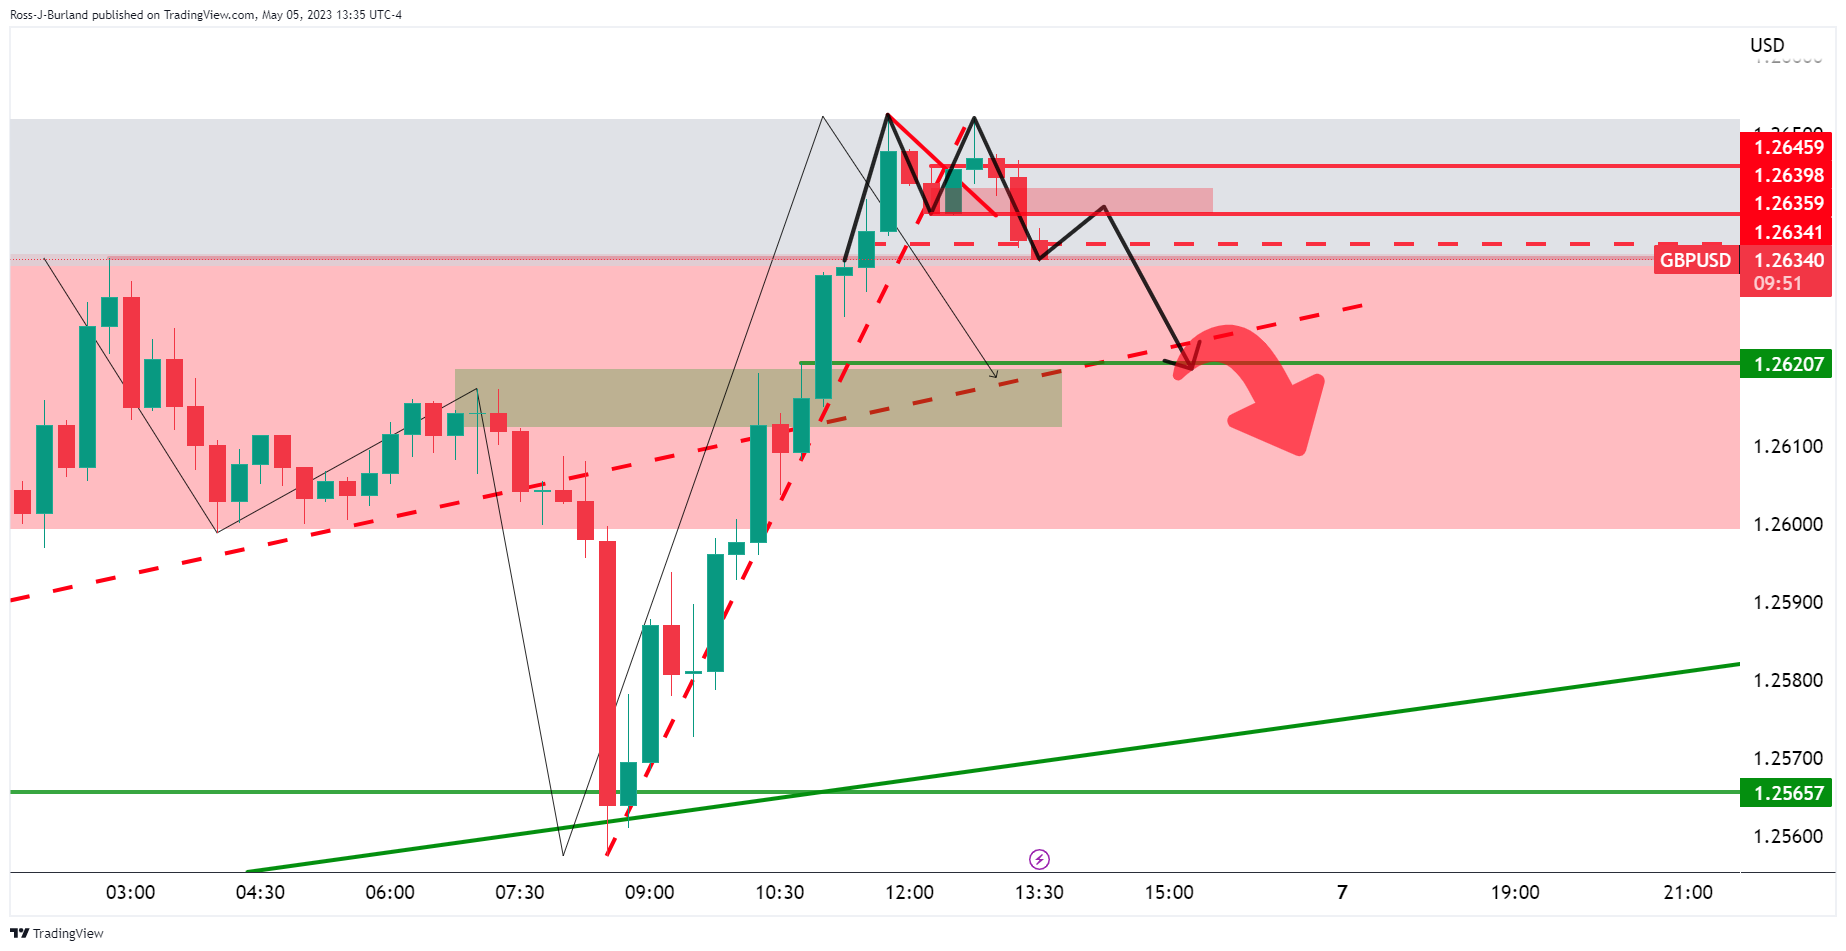
On the 15 and 5-min charts, we can see the price taking on a support structure.
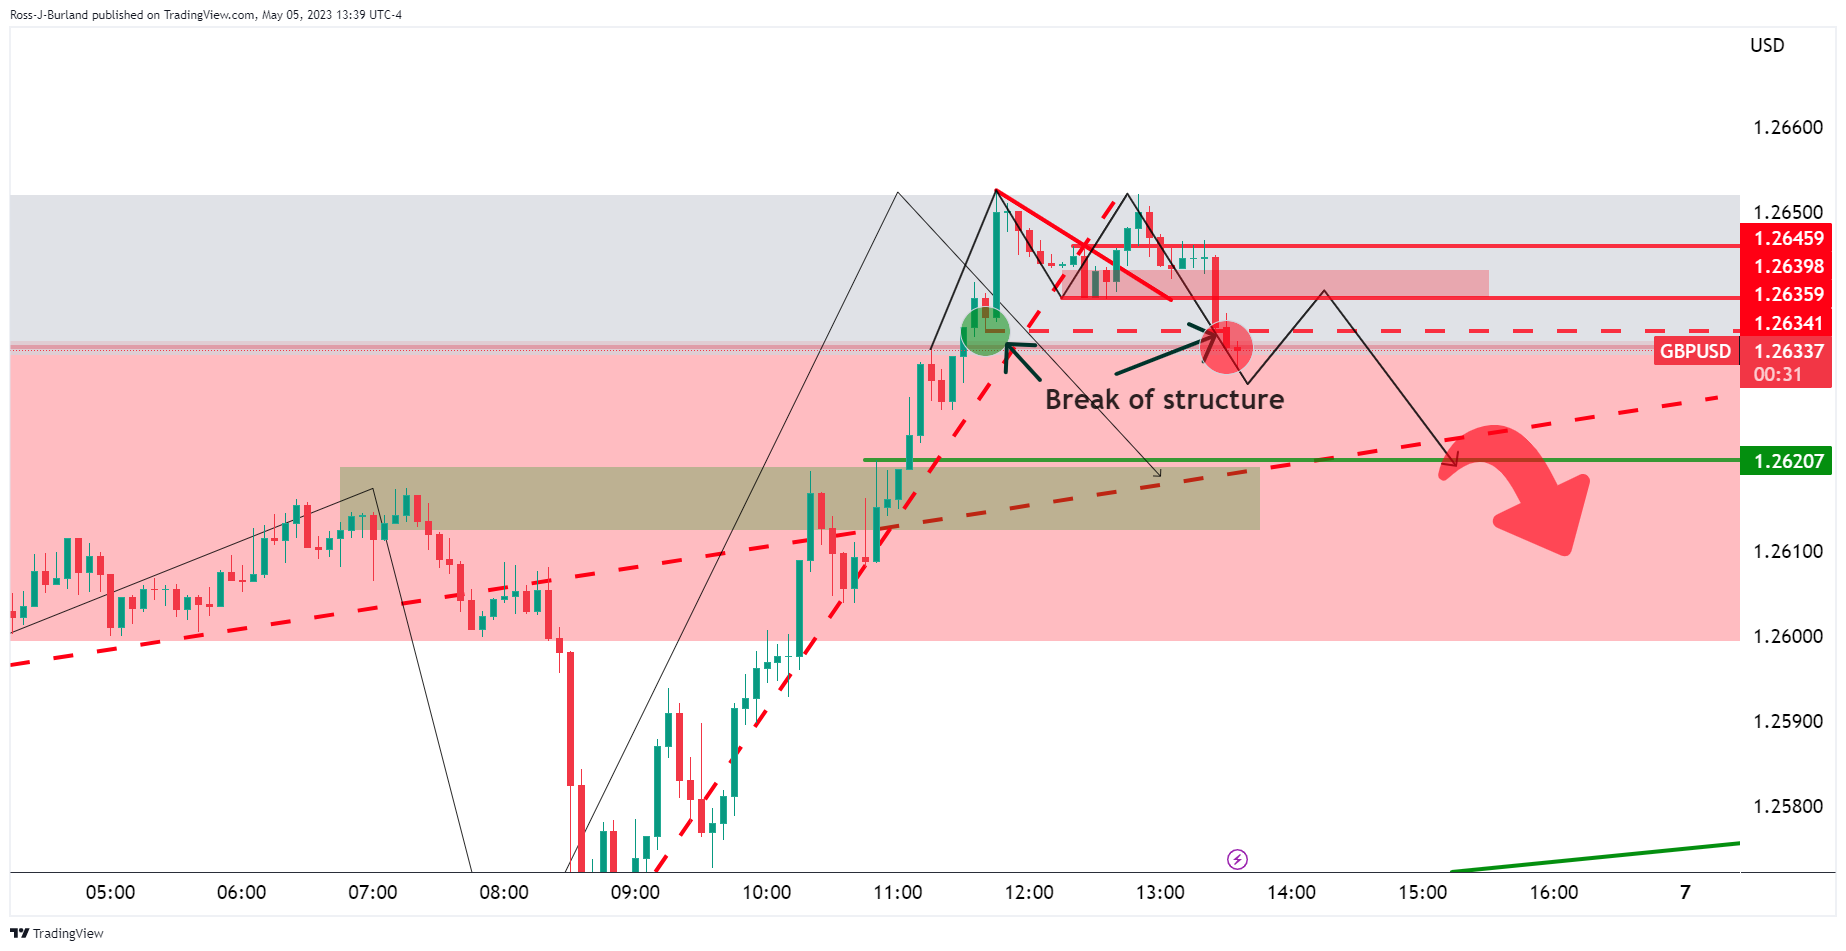
The 5-min chart shows the price action up close and the break in structure offers prospects of a move lower whereby resistance could come in near 1.2640 if there is going to be a retest of the prior lows as illustrated in the chart above.
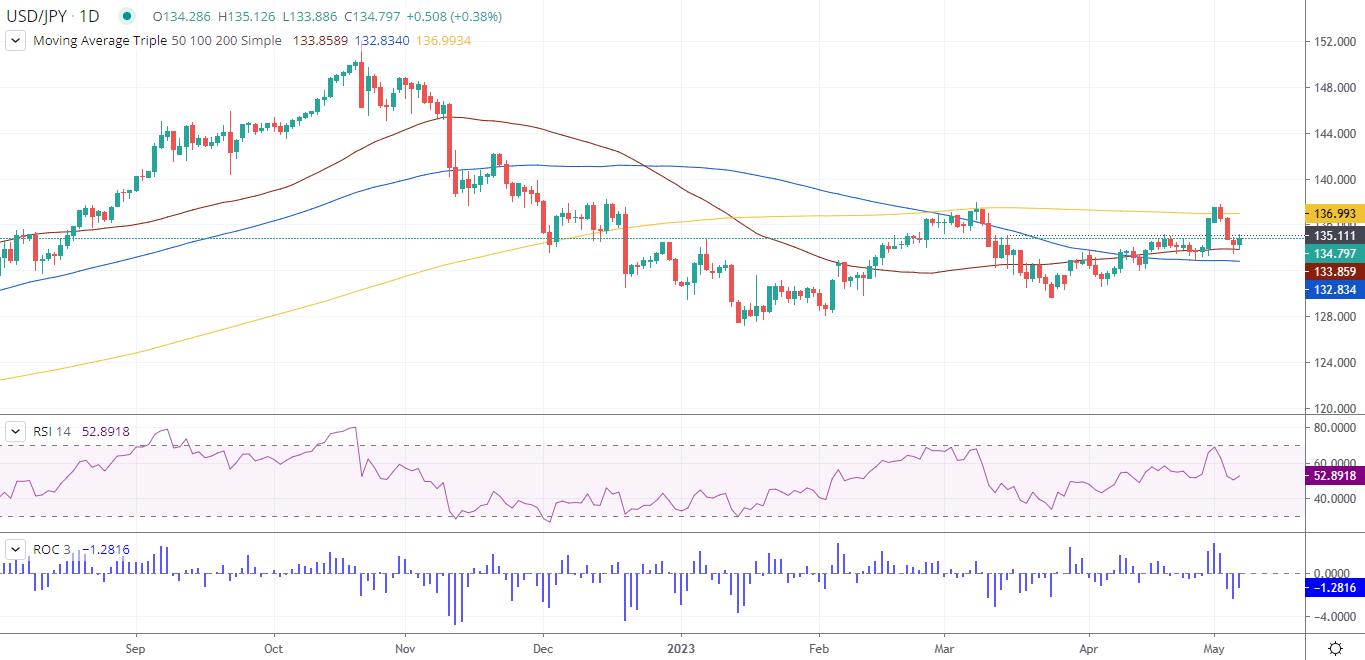
- USD/JPY tests 50-day EMA at 133.85; bullish-engulfing pattern hints at a potential uptrend.
- Downside risks loom, with the 100-day EMA at 132.83 in sight if 134.00 support breaks.
The USD/JPY rises after dropping to a weekly low of 133.50, advances 0.42%, spurred by buyers stepping in at around solid technical support level. An upbeat April Nonfarm Payrolls report also lifted the US Dollar (USD) vs. the Japanese Yen (JPY) safety. At the time of writing, the USD/JPY is trading at 134.81 after dipping to a low of 133.88.
USD/JPY Price Action
From a daily chart perspective, the USD/JPY remains neutrally biased, though testing the 50-day Exponential Moving Average at 133.85, as the pair battles on closing above the May 4 daily high of 134.85. If USD/JPY achieves a daily close above the latter, the major will form a bullish-engulfing candlestick pattern, keeping buyers hopeful of higher prices.
In that outcome, the USD/JPY next resistance would be 135.00, and the March 15 daily high at 135.11. Once cleared, the USD/JPY would have a clear path to 136.00 until testing the 200-day EMA at 136.99.
Oscillators, like the Relative Strength Index (RSI) indicator, aim up and is still above neutral territory. The Rate of Change (RoC) of the last three days suggests that sellers are losing momentum. Therefore, the USD/JPY would continue to uptrend.
However, if USD/JPY falls below 134.00, it would expose the 50-day EMA at 133.85, followed by the 133.00 figure. Downside risks would pave the way toward the 100-day EMA At 132.83.
USD/JPY Daily Chart
St. Louis Federal Reserve President James Bullard supported the 25 basis point rate hike that the Fed took this week, calling it "a good next step." He stated that there is a significant amount of inflation in the economy.
In terms of the economic outlook, Bullard's base case is not a recession, but rather slow growth and declining inflation. He also noted that the labor market remains "very tight" and will take time to cool.
Analysts at Rabobank point out the EUR/USD pair may be in the process of peaking. They see scope for a move lower in the months ahead potentially towards the 1.06 area.
Key quotes:
“Looking ahead, we are expecting the Eurozone economy to stagnate in H2 2023. Given that further ECB rate hikes are already priced in, reasons to buy the EUR may be running dry. In our view, EUR/USD may be in the process of peaking.”
“Any broadening in financial sectors stress is likely to result in the safe-haven bid for the greenback. Either way, in view of widespread fears of a US recession and Eurozone stagnation in H2, in addition to evidence that the post-pandemic recovery in China is disappointingly patchy, we expect the USD find support due to risk aversion. We see risk of dips as low as EUR/USD1.06 in H2.”
- WTI rebounds with a 3% gain, but rate hike fears loom large on the oil market.
- US hiring surge supports Wall Street recovery, softens greenback’s impact on oil prices.
- China’s weakening manufacturing activity weighs on WTI despite OPEC+ output cuts.
Western Texas Intermediate (WTI), the US crude oil benchmark, climbed more than 3% on Friday but remained set to finish with more than 7% losses on fears for further rate hikes and a global economic slowdown. Hence, WTI is trading at $70.96 PB after hitting a low of $68.54.
WTI fights for traction amid economic uncertainties
Wall Street is posting a recovery after the US Bureau of Labor Statistics (BLS) revealed that hiring in the US is picking up, adding 253K jobs in April, as shown by the Nonfarm Payrolls (NFP) report. Although it triggered a jump in US Treasury bond yields, the greenback is weakening, offering some cushion to WTI prices.
WTI’s plunged after a report from the National Bureau of Statistics (NBS) in China revealed that manufacturing activity in April continued to weaken, later confirmed by the Caixin PMI report. That comes even after the Organization of Petroleum Exporting Countries and its allies, the OPEC+, moved to reduce its crude oil output by more than 1 million barrels per day in an effort to underpin oil prices.
Although it spurred a jump of more than 6% at the beginning of April, WTI erased those gains and some more.
Sources cited by Reuters said, “Crude is trying to reverse the recent washout in prices triggered by higher interest rates and recession fears mostly in the banking sector.”
WTI Technical Analysis
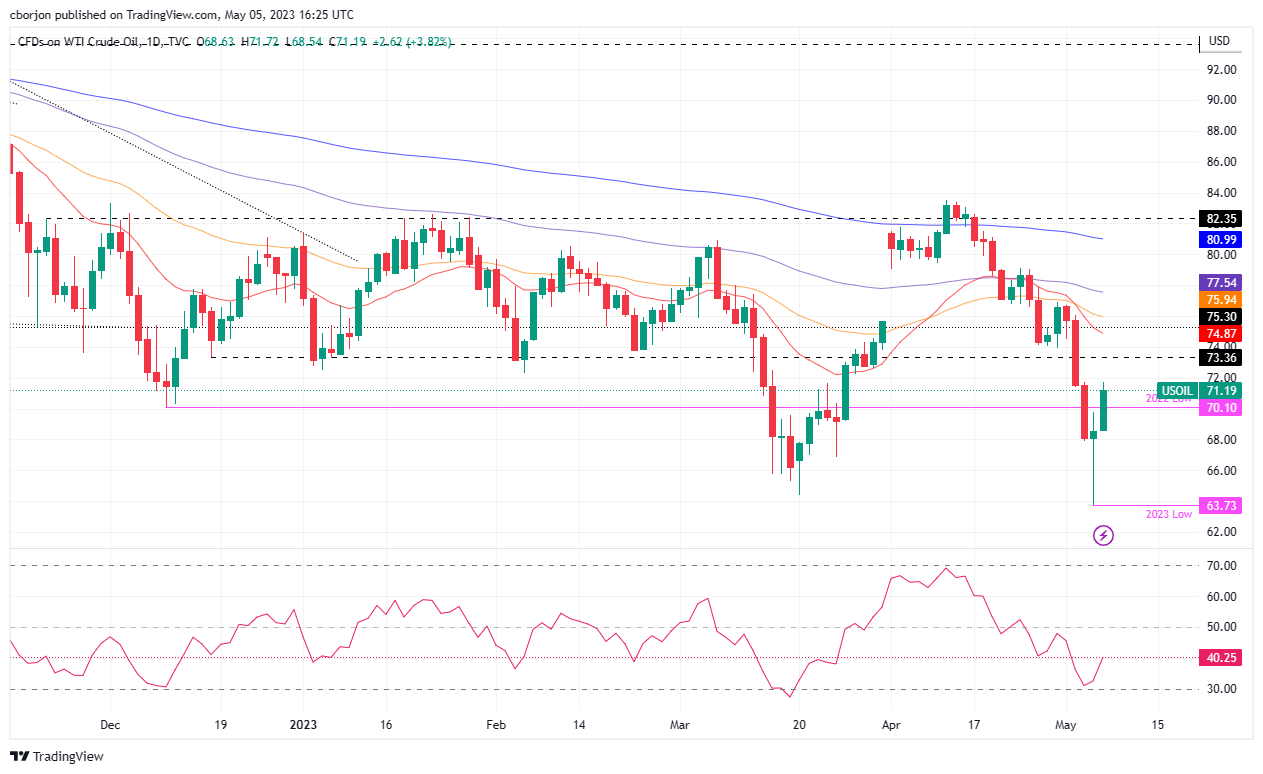
From a technical perspective, WTI is downward biased, but the May 4 price action formed a large hammer preceded by a downtrend, suggesting that WTI could rally soon. The Relative Strength Index (RSI) indicator is approaching the neutral level, aiming higher, suggesting that buyers are gathering strength.
If WTI achieves a daily close above the May 3 daily high of $71.74, that will form a morning star, a bullish three-candle pattern, which could pave the way for further gains. That said, WTI will face solid resistance at the confluence of several EMAs, with the 20-day EMA At 74.86, followed by the 50-day EMA at $75.94, before testing the 100-day EMA at $77.54.
- US hiring soars in April: 253K jobs added, smashing the 180K forecast.
- Market rethinks rate cut expectations as Nonfarm Payrolls beat estimates.
- Aussie Dollar remains resilient amid a surprising RBA rate hike earlier this week.
The AUD/USD is climbing sharply after a stellar jobs report in the United States (US), which triggered an improvement in market sentiment, as troubled stocks from regional banks rose after the recent turmoil in the US banking system. The AUD/USD is trading at 0.6737, gaining 0.68% after hitting a low of 0.6607.
Solid US employment report leaves no room for rate cuts at Fed’s June meeting
The latest employment report in the US, the Nonfarm Payrolls, showed that hiring in April exceeded estimates as the economy added 253K above forecasts of 180K, in the aftermath of the US Federal Reserve (Fed) 25 bps rate hike on Wednesday. Following the Fed’s decision, market participants quickly began to price in rate cuts. Nevertheless, today’s market data has traders scrambling, as shown by the short-term interest rate futures dropping as they pare rate cut expectations.
The US jobs report revealed that Average Hourly Earnings rose 0.5% MoM, exceeding 0.3% forecasts, while the Unemployment Rate edged down to 3.4% from 3.5% in March. Once the data is in the rearview mirror, investors expect the Fed to hold rates unchanged for June’s decision.
Must read: Breaking: US Nonfarm Payrolls rise by 253,000 in April vs. 179,000 expected
In the meantime, the US Dollar Index (DXY), a gauge of the buck’s value vs. a basket of six currencies, trim some of its weekly losses and gains 0.02%, at 101.473. The US 10-year Treasury bond yield jumped eight bps, up at 3.439%, offering a cushion to AUD/USD sellers.
Nevertheless, the Aussie Dollar (AUD) is still resilient after a surprising rate hike early in the week. On Friday, the Statement of Monetary Policy (SoMP) revealed by the Reserve Bank of Australia (RBA) highlighted that risks for inflation were tilted on the upside, given low productivity and higher energy bills. RBA officials added that interest rates might have to rise further to curb inflation.
Upcoming events
the Fed parade will begin led by St. Louis Fed President James Bullard, Minnesota’s Neil Kashkari, and Fed Governor Lisa Cook.
AUD/USD Technical Analysis
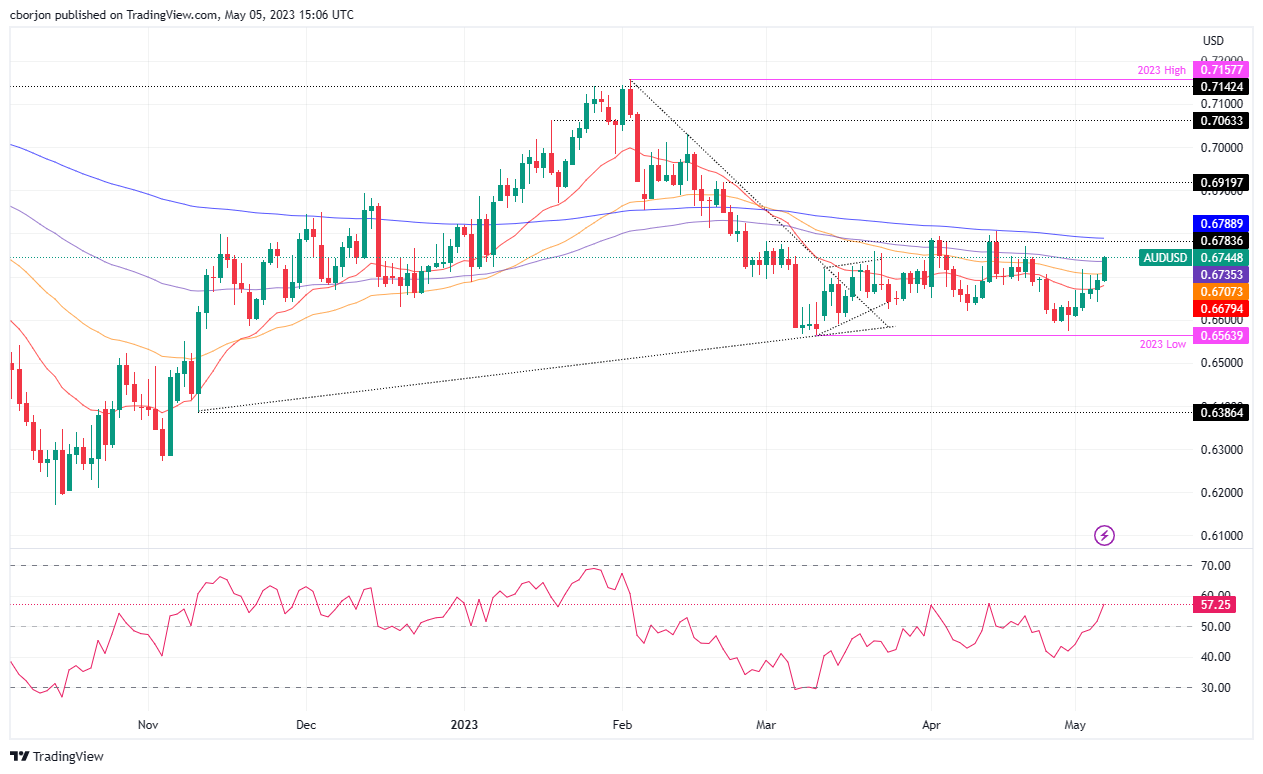
The AUD/USD is still neutral biased but tilted upwards with the 200-EMA lying at around 0.6788, probing to be solid resistance. Although, the Relative Strength Index (RSI) indicator is aiming up, and buyers must reclaim the April 20 swing high at 0.6771 before challenging the trend-setter 200-day EMA. In that outcome, the AUD/USD should have no problems rallying towards 0.6800, which, once cleared, would open the door towards the February 21 daily high at 0.6919. On the other hand, downside risks lie below the 100-day EMA At 0.6735, followed by the 50-day EMA at 0.6707.
Gold price is continuing to hold its own just above the $2,000 mark. Economists at Commerzbank expect the yellow metal to remain stable before rising toward the end of the year.
XAU/USD at roughly $2,000 over the next two quarters
“Over the next two quarters, we envisage XAU/USD at roughly $2,000, and thus only marginally below its current levels (as compared to our previous forecast of $1,900-1,950).”
“As soon as the Fed raises a clearer prospect of an interest rate turnaround, the Gold price is likely to climb lastingly and more noticeably above the $2,000 mark, though we only expect this to happen towards the end of this year.”

Source: Commerzbank Research
The US gained 253K jobs in April, beating expectations. The market is still trying to digest the implications of the report for the FX market, economists at TD Securities report.
USD positioning and short-term valuations are mostly clean
“The USD liked the headline upside surprise. Good data has helped the USD, while bad data has pulled it lower. The knee-jerk was to buy the surprise, though some caveats in the details highlight the limited enthusiasm, or at least the continued confusion on the next big move in FX. A few of the caveats in the data are important, reflecting some watering down of the headline reaction.”
“That said, the tactical setup probably should lean in the USD favors at least until next week’s inflation report. The NFP number was strong enough to keep the market guessing on the Fed’s next move and the start of the easing cycle.”
“USD positioning and short-term valuations are also mostly clean, meaning there’s not a high conviction or lopsided positioning to price out.”
The Brazilian Real and the Mexican Peso benefited from the signal of a pause in US interest rates. Economists at Commerzbank expect both currencies to remain strong against the US Dollar.
BRL and MXN remain attractive
“Both central banks have been so hawkish of late that I think the Fed's rate pause was a necessary condition for the BCB and Banxico to consider moving away from their ultra-hawkish stance. Given the high real interest rates in Brazil and Mexico, slightly lower policy rates seem justified.”
“However, with inflation still elevated, both central banks are likely to be careful to keep monetary policy sufficiently tight to avoid the risk of additional inflationary pressures from a weaker currency. Accordingly, we see the BRL and MXN remaining at strong levels against the Dollar.”
GBP/USD extends gains. Economists at Scotiabank expect the pair to retain a positive undertone.
Ongoing pressure for more GBP strength
“Recall that the Pound managed to close above 1.2445 on a weekly basis last week – a level that had clearly restrained gains in this move up – to give the bull move a little more impetus and put 1.27/1.28 on the radar.”
“Intraday support is 1.2580, with firmer support now at 1.2540/50.”
“Solid trend momentum signals suggest firm support on minor dips and ongoing pressure for more GBP strength.”
- GBP/USD pulls back from a nearly one-year high amid a goodish pickup in the USD demand.
- The upbeat US jobs data pushes the US bond yields higher and provides a boost to the buck.
- The risk-on impulse caps gains for the USD and limits any meaningful downfall for the major.
- Traders also seem reluctant ahead of next week’s US CPI report and the BoE policy meeting.
The GBP/USD pair drops to a fresh daily low in reaction to the better-than-expected US monthly employment details, albeit manages to find some support ahead of the mid-1.2500s. Spot prices bounce back to the 1.2585-1.2590 region during the early North American session and trade with a mild positive bias for the third straight day, just below a nearly one-year high touched earlier today.
The US Dollar (USD) strengthens across the board following the release of the upbeat US NFP report, which turns out to be a key factor acting as a headwind for the GBP/USD pair. In fact, the US Bureau of Labor Statistics (BLS) reported that the US economy added 253K new jobs in April, much higher than the 179K anticipated and the previous month's downward revised reading of 165K. Further details revealed that the Unemployment Rate unexpectedly edged lower to 3.4% from 3.5 and Average Hourly Earnings rose to 4.4% from 4.3%.
The upbeat data, meanwhile, points to sustained labor market strength and could force the Federal Reserve (Fed) to keep interest rates higher for some time. This, in turn, pushes the US Treasury bond yields sharply higher, which underpins the Greenback and exerts some pressure on the GBP/USD pair. That said, the risk-on impulse - as depicted by a strong opening in the US equity markets - keeps a lid on the safe-haven buck. Apart from this, rising bets for a 25 bps rate hike by the Bank of England (BoE) help limit the downside for the major.
Hence, the market focus will remain glued to the highly-anticipated BoE monetary policy meeting next Thursday. Heading into the key central bank event risk, investors will take cues from the latest US consumer inflation figures on Wednesday. This will play a key role in determining the near-term trajectory for the GBP/USD pair. Nevertheless, spot prices remain on track to register gains for the third straight week.
Technical levels to watch
USD/CAD has slipped under 1.35. Economists at Scotiabank expect the pair to remain under downside pressure.
More weakness ahead
“The USD is holding losses below 1.3520 short-term support (now resistance) which points to more weakness ahead and the breakdown from late Apr/early May range suggests losses could extend towards the low/ mid 1.34s in the next week or so.”
“A low USD close on the week would boost prospects for more USD softness ahead.”
“With the US swaps curve pricing in nearly 100bps of cuts, the CAD should be getting some more obvious support from yield spreads in the next few months, if market pricing is any guide.”
- The index regains composure and advances to 101.80.
- US Nonfarm Payrolls exceeded estimates in April.
- The US jobless rate ticked lower during last month.
The greenback, in terms of the USD Index (DXY), grabs fresh oxygen and moves to 2-day highs near 101.80 on Friday.
USD Index stronger on firm Payrolls
The index makes a U-turn and rapidly revisits the 101.80 region – or 2-day highs – in the wake of another solid prints from the US jobs report for the month of April.
Indeed, the US economy added more jobs than initially anticipated during April (253K), while the unemployment rate unexpectedly slipped back to the 3.4% (from 3.5%).
Also collaborating with the move higher in the Buck, Average Hourly Earnings topped consensus and rose 0.5% MoM and 4.4% over the last twelve months, while the Participation rate remained unchanged at 62.6%.
What to look for around USD
The index now looks bid well north of the 101.00 zone following a better-than-expected Nonfarm Payrolls, as investors continue to assess of the last FOMC event.
Looking at the broader scenario, the US Dollar seems to be facing downward pressure in light of the Fed’s recent indication that it will probably pause its normalization process in the near future. That said, the future direction of monetary policy will be determined by the performance of key fundamentals (employment and prices mainly).
In favour of a Fed’s pause appears the persevering disinflation – despite consumer prices remain well above the target - and nascent easing in the labour market, all amidst steady speculation of a a probable recession.
Key events in the US this week: Balance of Trade, Initial Jobless Claims (Thursday) – Nonfarm Payrolls, Unemployment Rate, Consumer Credit Change.
Eminent issues on the back boiler: Persistent debate over a soft/hard landing of the US economy. Terminal Interest rate near the peak vs. speculation of rate cuts in 2024. Fed’s pivot. Geopolitical effervescence vs. Russia and China. US-China trade conflict.
USD Index relevant levels
Now, the index is up 0.14% at 101.60 and the break above 102.40 (monthly high May 2) would open the door to 102.80 (weekly high April 10) and then 103.05 (monthly high April 3). On the flip side, initial contention comes at 101.01 (weekly low April 26) prior to 100.78 (2023 low April 14) and finally 100.00 (psychological level).
Economists at Rabobank believe that the AUD/USD pair is unlikely to rise sustainably until the next year.
Further range trading around current levels in the months ahead
“The fall in iron ore prices from their March high and concerns over the pace of growth in China could weigh on the AUD in the months ahead. That said, the easing in trade tensions with China, Australia’s good budget and current account positions combined with a still hawkish RBA should provide support.”
“We expect further range trading around current levels in the months ahead.”
“We see the potential for a move back above AUD/USD 0.70 in 2024 as growth regains traction.”
- Gold price extends the overnight pullback from an all-time high and drifts lower on Friday.
- The downward trajectory picks up pace following the release of the upbeat US NFP report.
- Rising US bond yields lift the US Dollar and exert heavy downward pressure on the metal.
Gold price comes under heavy selling pressure on Friday and extends the previous day's sharp retracement slide from an all-time high, around the $2,078-$2,079 region. The downward trajectory picks up pace in reaction to the upbeat US monthly jobs data and drags the XAU/USD to a three-day low, below the $2,010 level during the early North American session.
The US Dollar (USD) strengthens across the board after the headline NFP print showed that the US economy added 253K new jobs in April, much higher than the 179K anticipated and the previous month's downward revised reading of 165K. Further details revealed that the Unemployment Rate unexpectedly edged lower to 3.4% from 3.5 and Average Hourly Earnings rose to 4.4% from 4.3%. This, in turn, allows the USD Index (DXY), which tracks the Greenback against a basket of currencies, to recover further from over a one-week low touched on Thursday and weighs heavily on the US Dollar-denominated Gold price.
The upbeat labor market report, meanwhile, might have dashed hopes for an imminent pause in the Federal Reserve's (Fed) rate-hiking cycle in June. This, in turn, leads to an intraday spike in the US Treasury bond yields, which further underpins the buck and contributes to driving flows away from the non-yielding yellow metal. Apart from this, a positive turnaround in the global risk sentiment - as depicted by a recovery in the equity markets - further contributes to a steep intraday fall in the Gold price. With the latest leg down, the XAU/USD has snapped a three-day winning streak, though seems poised to register weekly gains.
It will now be interesting to see if the commodity can attract any buyers at lower levels or if the ongoing slide marks the end of over a six-month-old uptrend, which constitutes the formation of an ascending channel on the daily chart. Hence, it will be prudent to wait for strong follow-through selling before confirming that the Gold price has formed a near-term top and positioning for any meaningful corrective decline.
Technical levels to watch
- US payroll rise by 253,000 against 179,000 expected.
- Canadian Unemployment Rate remains at 5%.
- USD/CAD steady near 1.3500, at weekly lows.
The USD/CAD held relatively steady, trading near the weekly low near 1.3480 following the release of labor market data in Canada and the US. While US Non-farm Payroll (NFP) figures showed positive results, they were balanced out by an equally positive report from Canada.
Strong labor markets
In April, the US economy added 253,000 jobs, surpassing the expected 179,000. Additionally, the Unemployment Rate decreased to 3.4%, below the expected 3.5%. However, the March payrolls were revised downwards from 236,000 to 165,000.
In Canada, the Unemployment Rate remained steady at 5%, slightly better than the market consensus of 5.1%. The Net Change in Employment was 41,400, surpassing the expected 20,000.
After the release of the NFP, the US Dollar appreciated against most currencies, but the Canadian Dollar outperformed due to the positive Canadian numbers.
The USD/CAD initially rose to 1.3507 before turning downwards and falling below 1.3490. The pair is currently trading near at its lowest levels in two weeks, looking at the 1.3475/80 support.
Technical levels
UOB Group’s Economist Enrico Tanuwidjaja and Junior Economist Agus Santoso review the latest release of inflation figures in Indonesia.
Key Takeaways
“Somewhat uncanny during a festive month, Indonesia's headline inflation bucked its typical trend, easing to 4.3% y/y in Apr from 5% in Mar, chiefly due to lower and stable food & transportation prices as the government managed better the logistics last month.”
“This was duly reflected with food and transportation inflation moderating markedly to 4.6% and 12% y/y viz the previous month's 6.1% and 13.7% y/y.”
“April’s inflation data reinforces our 2023 inflation forecast of 4% (2022: 4.2%). Our view remains for inflation to edge back to be within BI’s target range of 2-4% in 2H23.”
- USD/JPY gains strong positive traction on Friday and draws support from a combination of factors.
- The upbeat US NFP report provides a goodish lift to the USD and acts as a tailwind for the major.
- A positive risk tone undermines the safe-haven JPY and provides an additional boost to the pair.
The USD/JPY pair catches aggressive bids during the early North American session and jumps to the 135.00 psychological mark in reaction to the stellar US monthly employment details.
In fact, the headline NFP print showed that the US economy added 253K new jobs in April against 179K anticipated, offsetting the downwardly revised reading of 165K. Adding to this, the unemployment rate unexpectedly fell to 3.4% during the reported month from 3.5% in March, which assists the US Dollar (USD) to regain strong positive traction and provides a goodish lift to the USD/JPY pair.
Apart from this, a positive turnaround in the global risk sentiment - as depicted by a goodish recovery in the equity markets - undermines the safe-haven Japanese Yen (JPY) and further contributes to the bid tone surrounding the USD/JPY pair. That said, the Federal Reserve's (Fed) less hawkish stance holds back the USD bulls from placing aggressive bets and keeps a lid on any further gains, at least for now.
Nevertheless, the USD/JPY pair, for now, seems to have snapped a three-day losing streak and stalled this week's sharp retracement slide from the 137.75-137.80 region, or a two-month high. Spot prices, however, remain on track to register losses for the first time in the previous four weeks. This makes it prudent to wait for strong follow-through buying before placing fresh bullish bets around the major.
Technical levels to watch
- EUR/USD now reverses initial gains and revisits 1.0980.
- US Non-farm Payrolls surprised to the upside in April.
- The unemployment rate dropped to 3.4%.
EUR/USD comes under further downside pressure and rapidly gives away the initial optimism, returning to the sub-1.1000 region in the wake of another solid prints from the US jobs report on Friday.
EUR/USD: Gains appear limited near 1.1100 so far
EUR/USD picks up extra selling pressure after the release of the Nonfarm Payrolls showed the US economy added 253K jobs during April, surpassing initial estimates for a gain of 180K jobs. In addition, the March reading was revised down to 165K (from 236K).
Further data saw the Unemployment Rate ticking lower to 3.4% and the key Average Hourly Earnings – a proxy for inflation via wages – rise 0.5% MoM and 4.4% from a year earlier. Additionally, the Participation Rate increased held steady at 62.6%.
Later in the session, the attention will be on the release of the Consumer Credit Change for the month of March.
What to look for around EUR
EUR/USD trims earlier gains and adds to the moderated pullback seen in the wake of the ECB gathering on Wednesday.
The movement of the euro's value is expected to closely mirror the behaviour of the US Dollar and will likely be impacted by any differences in approach between the Fed and the ECB with regards to their plans for adjusting interest rates.
Moving forward, hawkish ECB-speak continue to favour further rate hikes, although this view appears in contrast to some loss of momentum in economic fundamentals in the region.
Key events in the euro area this week: Germany Construction PMI, EMU Retail Sales.
Eminent issues on the back boiler: Continuation (or not) of the ECB hiking cycle. Impact of the Russia-Ukraine war on the growth prospects and inflation outlook in the region. Risks of inflation becoming entrenched.
EUR/USD levels to watch
So far, the pair is losing 0.19% at 1.0989 and faces the next support at 1.0941 (monthly low May 2) followed by 1.0909 (weekly low April 17) and finally 1.0831 (monthly low April 10). Conversely, the surpass of 1.1095 (2023 high April 26) would target 1.1100 (round level) en route to 1.1184 (weekly high March 21 2022).
- Unemployment Rate in Canada held steady at 5% in April.
- Net Change in Employment: 41,400 vs 20,000 expected.
- USD/CAD rises above 1.3500 as US jobs numbers surpassed expectations.
The data published by Statistics Canada revealed on Friday that the Unemployment Rate stayed unchanged at 5% in April. This reading came in slightly better than the market expectation of 5.1%.
Further details of the publication revealed that the Net Change in Employment rose by 41,500, surpassing analysts' estimate of 20,000. The Participation Rate stay unchanged at 65.6% and the annual wage inflation remained at 5.2% in March.
Key takeaways from the report:
- The unemployment rate was 5.0% in April, unchanged since December 2022.
- Employment increased in wholesale and retail trade (+24,000; +0.8%); transportation and warehousing (+17,000; +1.6%); information, culture and recreation (+16,000; +1.9%); as well as in educational services (+15,000; +1.0%). Employment decreased in business, building and other support services (-14,000; -1.9%).
- On a year-over-year basis, average hourly wages rose 5.2% (+$1.66 to $33.38) in April (not seasonally adjusted).
- Employment rose by 41,000 (+0.2%) in April. Since February, monthly employment growth has averaged 33,000, following cumulative increases of 219,000 in December 2022 and January 2023.
- Part-time employment increased by 48,000 (+1.3%) in April, while full-time employment held steady. This was the first notable increase in part-time work since October 2022.
- Compared with 12 months earlier, the number of private sector employees rose by 299,000 (+2.3%) in April 2023, while there were 81,000 (+2.0%) more people working in the public sector.
Market reaction
The USD/CAD rose initially to 1.3505 after the jobs reports from Canada and the US, and then pulled back toward the 1.3490 area.
EUR/USD is firm but little changed in the low 1.10s on the day. Economists at Scotiabank expect the pair to test levels above 1.12 on a break past 1.11.
EUR should remain well-supported on minor dips
“The EUR should remain well-supported on minor dips in the short run at least.”
“Near-term momentum looks neutral but the broader bull tone in this market remains intact.”
“Look for support on dips to 1.0975/1.1025 range in the near-term.”
“A push above 1.11 could still see the rally extend to test 1.12+.”
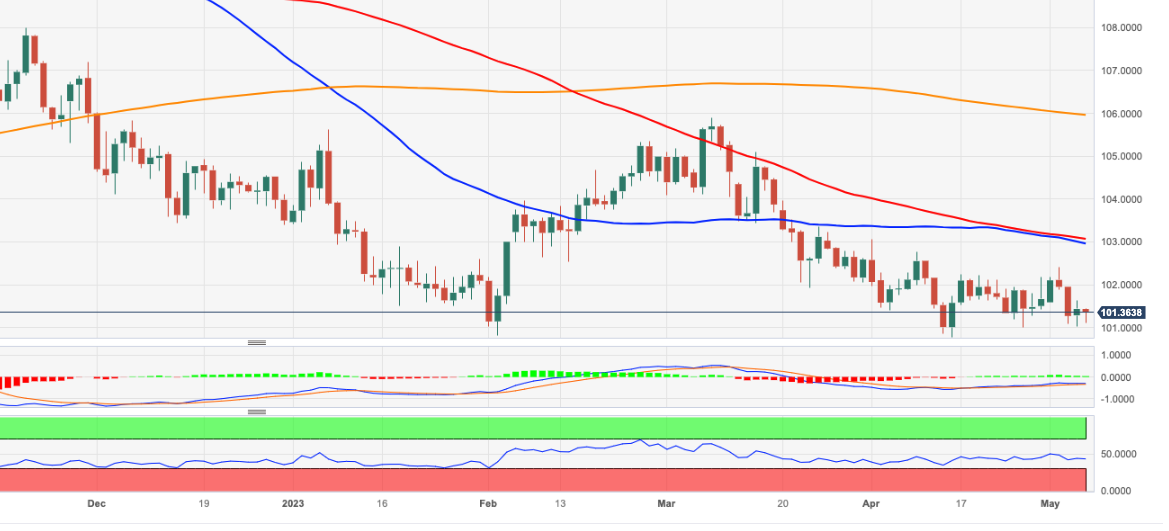
- DXY navigates with small losses in the low-101.00s on Friday.
- Once 101.00 is cleared, the index could revisit the YTD low near 100.80.
DXY manages to rebound from earlier lows after bears failed to retest/breach the 101./00 support on Friday.
The index remains under pressure despite Thursday’s bullish move. Against that, the next support of note appears at the weekly low at 101.01 (April 26), while the breakdown of this zone could open the door to a probable visit to the 2023 low at 100.78 (April 14)
Looking at the broader picture, while below the 200-day SMA, today at 105.95, the outlook for the index is expected to remain negative.
DXY daily chart
The MXN rallied to a trend high of 17.83 against the USD. Economists at Société Générale expect the USD/MXN pair to extend its move downward.
Signals of reversal are not yet visible
“USD/MXN has broken the lows of March denoting persistence in downtrend.”
“Daily MACD is at a higher level as compared to those lows forming a positive divergence however, signals of reversal are not yet visible.”
“The 50-DMA near 18.20 is first resistance. Break above this hurdle is essential to affirm a short-term up move. Failure could mean continuation in downside towards the low of 2017 near 17.60/17.45 which is also the lower limit of a multi month channel.”
- EUR/JPY struggles for direction just below the 148.00 mark.
- Further losses could see the 146.30 area revisited in the near term.
EUR/JPY seems to have met some initial contention around the 147.00 zone so far this week (low May 4).
The strong downside seen in the last sessions appears to have dented the bullish outlook. Against that backdrop, the ongoing correction carries the potential to extend to the weekly low at 146.30 (April 25), where bears are expected to meet decent support.
So far, further upside looks favoured while the cross trades above the 200-day SMA, today at 142.71.
EUR/JPY daily chart
USD/CNH faces scarce chances to break below the key support around 6.8500 for the time being, note Economist Lee Sue Ann and Markets Strategist Quek Ser Leang at UOB Group.
Key Quotes
24-hour view: “Yesterday, USD traded in a range of 6.8966/6.9279 before closing largely unchanged. Despite the relatively quiet price action, the underlying tone appears to be soft. We see room for USD to weaken but a sustained decline below 6.8900 is unlikely. Resistance is at 6.9220, followed by 6.9280.”
Next 1-3 weeks: “Our latest narrative was from Tuesday (02 May, spot at 6.9580) wherein ‘while upward momentum has improved, USD has to break and stay above the major resistance at 6.9650 before a move to 7.0000 is likely’. However, USD did not break 6.9650 and instead, it fell sharply over the past few days. USD could continue to weaken but short-term conditions are deeply oversold the chance of it breaking the formidable support at 6.8500 is low for now. Overall, USD is likely to trade under pressure for now unless it can break above the ‘strong resistance’ level, currently at 6.9400.”
The Fed hiked rates by 25 bps and signalled the end of the cycle was closer but left the door open for further hikes if data required. Economists at HSBC see further USD weakness.
Fed hikes rates by 25 bps, signals closer to the end
“The Fed delivered a widely expected 25 bps hike in May. More importantly, the Fed signalled the end of the tightening cycle was closer.”
“Most of the key US data points have been decelerating in recent months, albeit gradually. If these trends persist, the USD is likely to see further gradual weakness, as the peak in Fed rates for this cycle would become increasingly clear. Any sign that these activity data are rebounding or that price pressures are becoming more persistent could create room for some further tightening to be priced in, potentially providing some respite for the USD.”
“Recent lending data showed a stalling in commercial bank loan growth. Should this trend continue, or even accelerate, then it would increase the downside risks to the US economy and help to confirm a peak in Fed rates, weighing on the USD. Other economies face similar risks, but likely over a more extended horizon.”
- Pound Sterling vs US Dollar stabilizes above the key 1.2600 level prior to Nonfarm Payrolls data on Friday.
- The Pound benefits from monetary policy divergence with the US Dollar as elevated inflation suggests more hikes in the UK.
- Is the break above April highs in the upper 1.25s decisive enough to extend? Friday’s close could be critical in deciding.
The Pound Sterling (GBP) finally establishes a foothold above the 1.2600 handle against the US Dollar (USD) ahead of the Nonfarm Payrolls (NFP) release on Friday. The Pound Sterling benefits from the UK monetary policy divergence with the US, the after effects of positive UK PMI data, and early local election results to climb to fresh year-to-date highs. The US Dollar retreats, meanwhile, on renewed banking crisis fears as more regional lenders flag concerns.
From a technical perspective, GBP/USD continues to make new highs in a broadly bullish long-term uptrend. Given the old adage that “the trend is your friend” longs are, therefore, favored over shorts.
GBP/USD market movers
- The Pound Sterling is profiting from outflows from the US Dollar and the Euro as the US Federal Reserve (Fed) and European Central Bank (ECB) are seen as having reached or nearly having reached (in the case of the ECB) peak interest rates in the current hiking cycle.
- With data continuing to show UK inflation above 10% for the seventh consecutive month and robust PMI data, as well as a recent uptick in house prices, those inflationary forces do not look like they are about to ebb away.
- This suggests the Bank of England (BoE), unlike its counterparts, is far from done with hiking interest rates, and may have to hike more than once to get inflation back under control. If so, this is a medium-term bullish factor for Pound Sterling.
- Next Thursday’s Bank of England (BoE) monetary policy meeting, therefore, could be a key driver as it will reveal the BoE’s intent regarding future policy trajectory. If it is particularly hawkish it will highlight this divergence with the Fed and result in increased flows to Pound Sterling.
- The so-far poor performance of the Conservative government in local elections is seen by some as a factor aiding the Pound Sterling as it could be indicative of a change of government at the next general election. The Pound Sterling declined to historic lows under the mismanagement of the economy by previous Prime Minister Lizz Truss and her Chancellor Kwazi Kwarteng, leading to a loss of faith in the Conservative party as a safe pair of hands when it comes to the economy.
- UK S&P Global Services PMI out on Thursday showed a higher-than-expected result of 55.9 versus the 54.9 no-change forecast. Construction PMI out on Friday also beat expectations, coming out at 51.1 versus the 50.7 of the previous month. This suggests inflation will continue to rise in the UK and the Bank of England (BoE) will need to do substantially more to combat it.
- The US Dollar is suffering after renewed banking crisis fears in the US on the back of the news two more regional banks, PacWest and Western Alliance are in trouble, with the latter announcing that it is exploring strategic options including a potential sale of all or part of its business.
- The Nonfarm Payrolls release out at 12:30 GMT on Friday could be a major mover for the US Dollar as it will reveal the health of the jobs market and act as an acid test for Powell’s hawkish rhetoric at the recent FOMC press conference, in which he said the labor market in the US remained “tight”.
- A below-expectations result (i.e. below 150K) would hurt the US Dollar and see GBP/USD rally higher – a higher-than-expected result (more than 200K) would see the US Dollar rally and the Cable decline.
GBP/USD technical analysis: Pushing to new highs
GBP/USD has pushed to new year-to-date highs above 1.2600 overnight, extending the established uptrend that began at the September 2022 lows. The overall trend remains bullish favoring Pound Sterling longs over shorts.
-638188810365973436.png)
GBP/USD: Daily Chart
It is still difficult to determine whether the recent break above the 1.2593 April 28 highs can be classed as ‘decisive’ and therefore indicative of further gains to come. If Friday ends on a strong bullish close near its highs it will suggest the break has been decisive, as it will complete three bullish green up days in a row that have in aggregate breached the April resistance highs. This would suggest the break is not ‘false’ or a bull trap and embolden bulls to push higher. A weak close, however, will bring into doubt the validity of the breakout and could lead to declines.
If the breakout is decisive and price runs higher then the next key resistance level at circa 1.2680 provides an upside target for the pair.
Decisive breaks are usually characterized by moves that begin with a strong green daily bar that breaks above the ceiling level or key resistance high in question. Such breaks may be completed by a single long-green bar with price closing near the highs of the day, or alternatively, three consecutive green bars that break higher. Such insignia provide confirmation that the break is not a ‘false break’ or bull trap.
The Relative Strength Index (RSI) remains below the overbought level and is creeping higher breaking the slight bearish divergence of recent days. This is a mildly supportive sign for the pair and may be indicative of further gains to come.
Nonfarm Payrolls FAQs
What are Nonfarm Payrolls?
Nonfarm Payrolls (NFP) are part of the US Bureau of Labor Statistics monthly jobs report. The Nonfarm Payrolls component specifically measures the change in the number of people employed in the US during the previous month, excluding the farming industry.
How does Nonfarm Payrolls influence the Federal Reserve monetary policy decisions?
The Nonfarm Payrolls figure can influence the decisions of the Federal Reserve by providing a measure of how successfully the Fed is meeting its mandate of fostering full employment and 2% inflation.
A relatively high NFP figure means more people are in employment, earning more money and therefore probably spending more. A relatively low Nonfarm Payrolls’ result, on the either hand, could mean people are struggling to find work.
The Fed will typically raise interest rates to combat high inflation triggered by low unemployment, and lower them to stimulate a stagnant labor market.
How does Nonfarm Payrolls affect the US Dollar?
Nonfarm Payrolls generally have a positive correlation with the US Dollar. This means when payrolls’ figures come out higher-than-expected the USD tends to rally and vice versa when they are lower.
NFPs influence the US Dollar by virtue of their impact on inflation, monetary policy expectations and interest rates. A higher NFP usually means the Federal Reserve will be more tight in its monetary policy, supporting the USD.
How does Nonfarm Payrolls affect Gold?
Nonfarm Payrolls are generally negatively-correlated with the price of Gold. This means a higher-than-expected payrolls’ figure will have a depressing effect on the Gold price and vice versa.
Higher NFP generally has a positive effect on the value of the USD, and like most major commodities Gold is priced in US Dollars. If the USD gains in value, therefore, it requires less Dollars to buy an ounce of Gold.
Also, higher interest rates (typically helped higher NFPs) also lessen the attractiveness of Gold as an investment compared to staying in cash, where the money will at least earn interest.
Sometimes NonFarm Payrolls trigger an opposite reaction than what the market expects. Why is that?
Nonfarm Payrolls is only one component within a bigger jobs report and it can be overshadowed by the other components.
At times, when NFP come out higher-than-forecast, but the Average Weekly Earnings is lower than expected, the market has ignored the potentially inflationary effect of the headline result and interpreted the fall in earnings as deflationary.
The Participation Rate and the Average Weekly Hours components can also influence the market reaction, but only in seldom events like the “Great Resignation” or the Global Financial Crisis.
Economists at Commerzbank expect Gold to remain at a high level.
New prospects for Gold
“New record highs are in reach on the Gold market. All the same, we see only limited potential for any (further) price rises for now. This is because the market is likely over the next few months to fluctuate back and forth (driven by the data) while it attempts to guess whether the Fed’s next interest rate adjustment will be up or down.”
“Investors with more of a long-term horizon have also become more cautious again of late: following significant inflows into Gold ETFs in the second half of March, buying interest has dwindled again.”
- Gold price extends the overnight pullback from an all-time high and continues losing ground on Friday.
- Rebounding US bond yields drives flows away from the XAU/USD ahead of the key US NFP report.
- The Federal Reserve’s less hawkish outlook and a softer US Dollar should help limit further losses.
Gold price comes under some selling pressure on the last day of the week and retreats further from the all-time high, around the $2,078-$2,079 region touched on Thursday. The XAU/USD extends its descent through the first half of the European session and drops to the $2,037 area, or a fresh daily low in the last hour.
Gold price drifts lower ahead of Nonfarm Payrolls (NFP) report
A sharp intraday rise in the United States (US) government bond yields turns out to be a key factor driving flows away from the non-yielding Gold prices. This, along with some repositioning trade ahead of the closely-watched US monthly jobs data, exerts some pressure on the XAU/USD. The popularly known Nonfarm Payrolls (NFP) report is due for release later during the early North American session and is expected to show that the US economy added 179K jobs in April, down from 236K in the previous month. The jobless rate, meanwhile, is anticipated to hold steady at 3.5% during the reported month. Apart from this, investors will take cues from Average Hourly Earnings for fresh insight into the possibility of any further rise in inflationary pressures, which, in turn, should provide some meaningful impetus to the metal.
A combination of factors should help limit any further losses
In the meantime, concerns about the US banking sector and the Federal Reserve's (Fed) less hawkish outlook should help limit the downside for Gold price. Investors remain worried about a full-blown banking crisis in the US and that regional lender PacWest Bancorp could be the next potential domino to fall. The US central bank, meanwhile, outlined a more stringent and data-driven approach to hiking rates further. Moreover, Fed Chair Jerome Powell earlier this week signalled that the central bank was close to hitting the terminal rate. Investors took this as a sign that the central bank could pause its year-long rate-hike cycle sooner rather than later. This, along with the concerns over the US debt ceiling, attracts fresh sellers around the US Dollar (USD) and could further lend some support to the US Dollar-denominated commodity.
XAU/USD remains on track to register strong weekly gains
Nevertheless, Gold price, for now, seems to have snapped a three-day winning streak, though remains on track to register strong weekly gains of nearly 3%. Moreover, the aforementioned fundamental backdrop makes it prudent to wait for strong follow-through selling before confirming that a near-term top has been formed and positioning for any meaningful corrective decline.
Gold price technical outlook
From a technical perspective, the overnight swing low, around the $2,030 level, might protect the immediate downside ahead of the $2,020 region and the $2,012-$2,010 resistance breakpoint, now turned support. This is followed by the $2,000 psychological mark, which should act as a pivotal point. Failure to defend the said support level might prompt some technical selling and drag the Gold price back towards the $1,980-$1,970 strong horizontal support.
On the flip side, the $2,050-$2,053 area now seems to have emerged as an immediate hurdle. Some follow-through buying has the potential to lift the Gold price back towards the all-time high, around the $2,078 region touched on Thursday. The momentum could get extended further and allow bullish traders to aim to capture the $2,100 round-figure mark.
Key levels to watch
Economists at ING expect the US Dollar to embark on a bearish trend.
Tense markets, but Dollar bear trend should win out
“Continued focus on the health of the US regional banks has seen levels of money market stress edge higher.”
“US policymakers will be looking at ways to patch things up, but the clear overall trend should be one of tighter credit conditions and weaker US growth. This should help take the steam out of inflation and send the Dollar lower.”
“DXY has the lows of the year at the 100.75/85 area.”
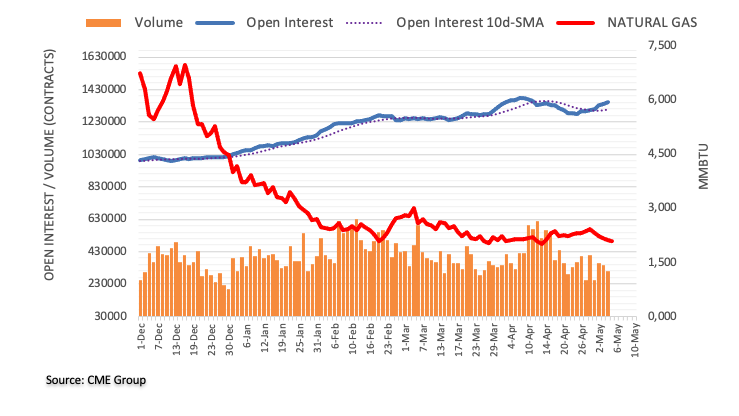
Considering advanced prints from CME Group for natural gas futures markets, open interest rose further on Thursday, this time by around 7.7K contracts. On the flip side, volume contracted for the second consecutive session, now by around 33.5K contracts.
Natural Gas poised to visit the 2023 low
Prices of the natural gas extended the weekly leg lower on Thursday. The negative performance was accompanied by rising open interest, which is indicative that extra losses look favoured in the very near term. Against that, another move to the YTD low at $1.967 (February 22) should not be surprising.
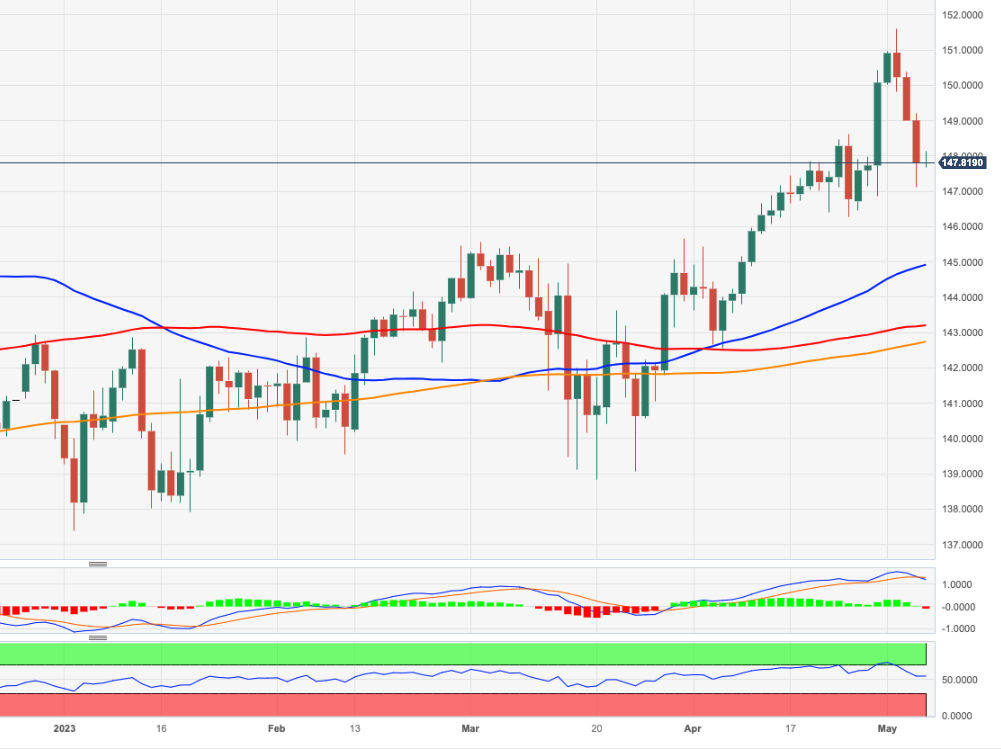
Further selling bias in USD/JPY appears in the pipeline for the time being, comment Economist Lee Sue Ann and Markets Strategist Quek Ser Leang at UOB Group.
Key Quotes
24-hour view: “USD dropped to 133.49 yesterday and then rebounded. The rebound in deeply oversold conditions suggests that USD is unlikely to weaken much further. To look at it another way, after dropping sharply the past few days, today, USD is likely to take a breather and trade in range, expected to be between 133.40 and 135.00.”
Next 1-3 weeks: “After rising close to the March high of 137.91, USD staged a swift drop as it plummeted and closed lower for the third straight day yesterday. While USD could continue to decline, short-term conditions are severely oversold and it left to be seen if USD has enough momentum to break the solid support level near 133.00. However, the downside risk is intact as long as USD stays below 136.05 (‘strong resistance’ level).”
Economists at ING expect the Norwegian Krone to recover in the second half of the year and forecast EUR/NOK below 11.00 by end-2023.
Norges Bank might come to the Krone's rescue
“Norges Bank tightening is falling short of supporting NOK, and while larger cuts to daily FX purchases look warranted in June, it now seems increasingly likely that NB will need to raise rates beyond the projected summer peak of 3.5%.”
“We still expect volatility and vulnerability in the Krone in the near term, but then a recovery in the second half of the year.”
“EUR/NOK should be able to sustainably return below 11.00 by year-end.”
- GBP/USD gains traction for the third straight day and climbs to a one-year top on Friday.
- The emergence of fresh selling around the USD is seen lending some support to the pair.
- Traders now look forward to the release of the crucial US NFP report for a fresh impetus.
The GBP/USD pair scales higher for the third successive day on Friday and climbs to its highest level since May 2022, around the 1.2635 region. The pair, however, trims a part of its strong intraday gains and trades around the 1.2600 mark during the first half of the European session, still up over 0.20% for the day.
The US Dollar (USD) struggles to capitalize on the overnight modest bounce from a one-week low and meets with some supply on the last day of the week, which, in turn, is seen as a key factor pushing the GBP/USD pair higher. Against the backdrop of the Federal Reserve's (Fed) less hawkish outlook, a modest recovery in the global risk sentiment - as depicted by a generally positive risk tone - undermines the safe-haven Greenback. It is worth recalling that the US central bank on Wednesday outlined a more stringent and data-driven approach to hiking rates further.
Moreover, Fed Chair Jerome Powell signalled that the central bank was close to hitting the terminal rate of the current tightening cycle. This, along with fears of a full-blown US banking crisis and debt ceiling, continues to weigh on the buck. The British Pound, on the other hand, continues to draw support from rising bets for an additional 25 bps rate hike by the Bank of England (BoE) in May, which, in turn, lends additional support to the GBP/USD pair. That said, a further recovery in the US Treasury bond yields acts as a tailwind for the USD and caps gains for the major.
Traders also seem reluctant to place aggressive bets and await the release of the closely-watched US monthly employment data, due later during the early North American session. The popularly known NFP report will play a key role in influencing the near-term USD price dynamics and provide a fresh directional impetus to the GBP/USD pair. Nevertheless, spot prices remain on track to register modest gains for the third successive week. Moreover, the aforementioned fundamental backdrop favours bulls and supports prospects for a further appreciating move.
Technical levels to watch
Swiss National Bank (SNB) Chairman Thomas Jordan said on Friday, “we cannot exclude further tightening of monetary policy.”
“Inflation is still an issue in Switzerland,” Jordan added.
Market reaction
At the time of writing, USD/CHF is consolidating the latest rally above 0.8920. The pair is advancing 0.73% on the day.
- EUR/USD regains some composure following Thursday’s drop.
- Retail Sales in the euro area surprised to the downside in March.
- Markets’ attention will be on the US Nonfarm Payrolls.
The European currency regains the smile and encourages EUR/USD to revisit the 1.1050 region at the end of the week.
EUR/USD focuses on the US docket
EUR/USD manages to regain buying interest and maintains well in place the multi-week uptrend in place since mid-March, which it has so far met decent resistance near the 1.1100 zone.
In the meantime, investors continue to adjust to Thursday’s hawkish message from the ECB, which now appears reinforced by earlier comments from Board members Simkus and Müller, who advocated for extra rate hikes at the next meetings.
Still around the ECB, the Survey of Professional Forecasters (SPF) for Q2 revised down the projections for inflation and now sees the HICP rising 5.6% in 2023 and 2.6% in 2024 vs. 5.9% and 2.7%, respectively. Additionally, the SPF predicts the economy in the euro region to expand 0.6% this year and 1.2% in 2024 vs. 0.2% and 1.4%, respectively.
In the domestic calendar, Retail Sales in the euro bloc contracted 3.8% in the year to March, while the Construction PMI in Germany receded to 42.0 in April (from 42.9).
What to look for around EUR
EUR/USD picks up some pace and leaves behind part of the moderated pullback seen in the wake of the ECB gathering on Wednesday.
The movement of the euro's value is expected to closely mirror the behaviour of the US Dollar and will likely be impacted by any differences in approach between the Fed and the ECB with regards to their plans for adjusting interest rates.
Moving forward, hawkish ECB-speak continue to favour further rate hikes, although this view appears in contrast to some loss of momentum in economic fundamentals in the region.
Key events in the euro area this week: Germany Construction PMI, EMU Retail Sales.
Eminent issues on the back boiler: Continuation (or not) of the ECB hiking cycle. Impact of the Russia-Ukraine war on the growth prospects and inflation outlook in the region. Risks of inflation becoming entrenched.
EUR/USD levels to watch
So far, the pair is up 0.17% at 1.1027 and the surpass of 1.1095 (2023 high April 26) would target 1.1100 (round level) en route to 1.1184 (weekly high March 21 2022). In opposition, the next support is seen at 1.0941 (monthly low May 2) followed by 1.0909 (weekly low April 17) and finally 1.0831 (monthly low April 10).
The US labor market data is due for publication today. However, it might be overshadowed by the central bank decisions which we saw this week, economists at Commerzbank report.
US labor market data overshadowed by events
“Today’s report is not likely to be suited to challenge the Fed’s expectation of Wednesday that the end of the rate hike cycle should have been reached. Not even a strong labor market report is likely to be sufficient to challenge the entire picture of a slowly cooling US economy so the market will probably stick to its expectations of Fed rate cuts.”
“Even though the labor market report is always good for a surprise, it is unlikely to cause more than a short-term reaction following the publication – if that.”
See – US Nonfarm Payrolls Bank Preview: Smaller, but still positive change in employment
- USD/CAD drops to a two-week low on Friday and is weighed down by a combination of factors.
- A further recovery in Oil prices underpins the Loonie and exerts pressure amid a fresh USD slide.
- Traders now look to the monthly jobs data from the US and Canada for some meaningful impetus.
The USD/CAD pair remains under some selling pressure for the third successive day on Friday and extends its steady descent through the first half of the European session. The downward trajectory drags spot prices below a technically significant 100-day Simple Moving Average (SMA) and the 1.3500 psychological mark, to a two-week low in the last hour.
Crude Oil prices gain some follow-through traction and look to build on the recovery from a 17-month low touched on Thursday. Apart from this, the Bank of Canada (BoC) Governor Tiff Macklem's hawkish comments overnight underpin the commodity-linked Loonie. This, in turn, is seen exerting some downward pressure on the USD/CAD pair amid the emergence of fresh selling around the US Dollar (USD).
In a prepared speech at the Toronto Region Board of Trade, Macklem reiterated the central bank’s commitment to restore price stability and showed readiness to raise interest rates further if inflation remains materially above the 2% target. In contrast, Federal Reserve (Fed) Chair Jerome Powell signalled earlier this week that the central bank was close to hitting the terminal rate of the current tightening cycle.
Moreover, the US central bank outlined a more stringent and data-driven approach to hiking rates further. This, along with fears of a full-blown US banking crisis and debt ceiling, continues to weigh on the buck. Apart from this, a modest recovery in the US equity futures also seems to dent the Greenback's relative safe-haven status, though a further recovery in the US Treasury bond yields could limit losses.
Furthermore, worries about weakening US economy and slowing Chinese demand might keep a lid on any meaningful upside for Oil prices, which, in turn, could lend support to the USD/CAD pair. Traders might also refrain from placing aggressive bets ahead of the closely-watched monthly employment details (NFP) from the US, which is likely to overshadow the simultaneous release of the Canadian jobs data.
From a technical perspective, a convincing break and acceptance below the 100-day SMA could be seen as a fresh trigger for bearish traders. Moreover, technical indicators on the daily chart have just started drifting into the negative territory and support prospects for a further near-term depreciating move. This, in turn, suggests that the path of least resistance for the USD/CAD pair remains on the downside.
Technical levels to watch
Economists at ING expect the Swiss Franc to strengthen and forecast EUR/CHF at the 0.9700 zone.
Swiss Franc in demand
“We think the defensive (non-correlated) properties of the Swiss Franc are in demand. Expect that to continue to be the case until the dust starts to settle in the US regional banking crisis.”
“With Swiss inflation (today released at 2.6% YoY for April) still dramatically lower than that in the Eurozone, the SNB will continue to seek nominal CHF appreciation.”
“We favour EUR/CHF to grind down to the 0.9700 area – lows seen when the US banking crisis first broke.”
Economists at ING see potential for a break past 1.1100 in the EUR/USD pair.
EUR/USD to find some good demand near 1.0900
“In addition to what should clearly be supportive interest rate trends for EUR/USD this year should be much lower energy prices which have delivered a vast improvement in the euro's terms of trade. This is a complete reversal of conditions that were weighing on EUR/USD in the third quarter of last year.”
“We suspect EUR/USD finds some good demand near 1.0900 now and we are just waiting for some softer US activity or price data to unlock a break of 1.1100.”
- AUD/USD gains some follow-through traction on Friday and touches a two-week high.
- The USD comes under renewed selling pressure and lends some support to the major.
- Traders seem reluctant to place fresh bets and keenly await the release of the US NFP.
The AUD/USD pair climbs to a two-week high on Friday, albeit struggles to capitalize on the momentum beyond a technically significant 200-day Simple Moving Average (SMA). The pair, however, maintains its bid tone through the early European session and trades around the 0.6725-0.6730 region, still up over 0.50% for the day.
A combination of factors prompts fresh selling around the US Dollar, which, in turn, allows the AUD/USD pair to prolong its upward trajectory witnessed since the beginning of the current week. Concerns about the banking sector in the US, along with the Federal Reserve's (Fed) less hawkish outlook, fail to assist the USD to build on the previous day's bounce from over a one-week low.
Investors remain worried about a full-blown US banking crisis and now fear that regional lender PacWest Bancorp could be the next potential domino to fall. The US central bank, meanwhile, outlined a more stringent and data-driven approach to hiking rates further. Moreover, Fed Chair Jerome Powell signalled that the central bank was close to hitting the terminal rate of the current tightening cycle.
Apart from this, concerns over the US debt ceiling, along with a modest recovery in the US equity markets, undermine the safe-haven Greenback and benefit the risk-sensitive Aussie. That said, a further recovery in the US Treasury bond yields helps limit losses for the USD and keeps a lid on the AUD/USD pair ahead of Friday's release of the closely-watched US monthly employment details.
The popularly known Nonfarm Payrolls (NFP) report is due for release later during the early North American session. This will play a key role in influencing the near-term USD price dynamics and provide some meaningful impetus to the AUD/USD pair. Nevertheless, spot prices remain on track to register strong weekly gains and snap a two-week losing streak heading into the key data risk.
Technical levels to watch
After Loonie was able to gain noticeably yesterday, the market is likely to look with excitement at the labor market report for April. Economists at Commerzbank analyze how could the CAD react to Canadian employment data.
Surprisingly weak labour market likely to put pressure on the CAD
“Probably only another strong labor market report – especially compared to the US data – could fuel expectations for a further BoC rate step, which is likely to support CAD. Strong data could certainly lead to rate cuts, which the market has clearly priced in for this year, being postponed, i.e. narrow the gap to market Fed rate expectations, a fact that should also benefit the Loonie.”
“As regards the simmering uncertainty on the market possible CAD gains as a result of strong labour market data should remain limited though. A surprisingly weak labour market on the other hand is likely to put pressure on the Loonie.”
- The index fades part of Thursday’s strong gains.
- Markets appear to favour the risk complex early on Friday.
- April’s Nonfarm Payrolls takes centre stage in the NA session.
The greenback resumes the downside and returns to the low-101.00s when measured by the USD Index (DXY) at the end of the week.
USD Index looks at the jobs report
It seems the index could not sustain Thursday’s marked advance and returned to the negative territory, always in the lower end of the recent range and so far supported by the 101.00 zone.
In the meantime, investors continue to digest the FOMC event (Wednesday) and the increasing likelihood that the Fed might pause its hiking cycle as soon as at the next meeting in June.
On this, the publication of the US jobs report later in the NA session will be crucial amidst the renewed Fed’s data dependent stance when it comes to decisions on future interest rates, as emphasized by Chief Powell on Wednesday.
What to look for around USD
The index trades close to the 101.00 zone in tandem with investors’ assessment of the last FOMC event.
The index seems to be facing downward pressure in light of the Fed’s recent indication that it will probably pause its normalization process in the near future. That said, the future direction of monetary policy will be determined by the performance of key fundamentals (employment and prices mainly).
In favour of a Fed’s pause appears the persevering disinflation – despite consumer prices remain well above the target - and nascent easing in the labour market, all amidst steady speculation of a a probable recession.
Key events in the US this week: Nonfarm Payrolls, Unemployment Rate, Consumer Credit Change.
Eminent issues on the back boiler: Persistent debate over a soft/hard landing of the US economy. Terminal Interest rate near the peak vs. speculation of rate cuts in 2024. Fed’s pivot. Geopolitical effervescence vs. Russia and China. US-China trade conflict.
USD Index relevant levels
Now, the index is losing 0.21% at 101.24 and faces initial contention at 101.01 (weekly low April 26) prior to 100.78 (2023 low April 14) and finally 100.00 (psychological level). On the other hand, the break above 102.40 (monthly high May 2) would open the door to 102.80 (weekly high April 10) and then 103.05 (monthly high April 3).
Economists at ING analyze how today's US April NFP data could impact the Dollar.
US NFP is in focus
“Consensus expects a decent, but softer, 185k increase in the headline jobs data and average hourly earnings increasing at 0.3/4.2% month-on-month/year-on-year.”
“Any softness in activity or price data would be supportive of market pricing of the first Fed cut in September and would be Dollar bearish.”
“Conversely, any above-consensus price data would add to recent sticky inflation releases such as the first quarter Employment Cost Indicator. This would see a bearish flattening of the US yield curve and send the Dollar higher.”
See – US Nonfarm Payrolls Bank Preview: Smaller, but still positive change in employment
- Silver consolidates its recent gains to a 13-month high touched earlier this Friday.
- The setup favours bulls and supports prospects for a further appreciating move.
- A convincing break below $24.50-40 support is needed to negate the positive bias.
Silver enters a bullish consolidation phase and oscillates in a narrow trading band around the $26.00 round-figure mark, just below its highest level since April 2022 touched earlier this Friday.
From a technical perspective, the recent repeated rebounds from the $25.50-$25.40 strong horizontal resistance breakpoint, now turned support, and the subsequent move up favours bullish traders. That said, the Relative Strength Index (RSI) on the daily chart is already flashing overbought conditions, making it prudent to wait for some near-term consolidation or a modest pullback before positioning for any further appreciating move.
Nevertheless, the XAG/USD seems poised to prolong its upward trajectory witnessed over the past three sessions and surpass an intermediate hurdle near the $26.25-$26.30 region. The momentum could eventually get extended towards testing the March 2022 swing high, just ahead of the $27.00 round-figure mark.
On the flip side, any meaningful pullback now seems to find decent support near the $25.65-$25.60 region. Any subsequent fall towards the $25.00 psychological mark could still be seen as a buying opportunity and remain limited near the $24.50-$24.40 resistance-turned-support. A convincing break below the latter will negate the positive outlook and make the XAG/USD vulnerable to weaken further below the $24.00 mark.
The next relevant support is pegged near the $23.35-$23.30 confluence, comprising the 50-day and the 100-day Simple Moving Averages (SMAs), below which the XAG/USD could slide to the $23.00 round-figure mark.
Silver daily chart
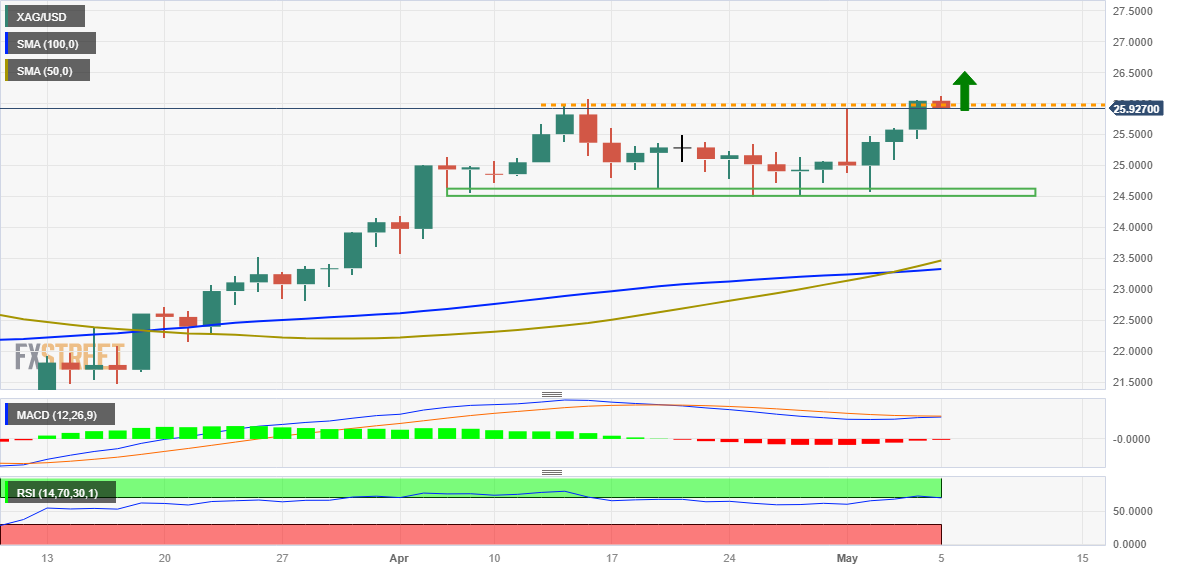
Key levels to watch
In the opinion of Economist Lee Sue Ann and Markets Strategist Quek Ser Leang at UOB Group, the constructive outlook in AUD/USD is expected to remain unchallenged while the pair trades above the 0.6610 level.
Key Quotes
24-hour view: “AUD traded in a whippy manner between 0.6641 and 0.6706 yesterday before closing at 0.6694 (+0.34%). The underlying tone appears to be a tad firm and AUD is likely to edge higher today. However, any advance is unlikely to break clearly above the major resistance at 0.6740 (there is another resistance at 0.6720). Support is at 0.6675, followed by 0.6645.”
Next 1-3 weeks: “Our most recent narrative was from Wednesday (03 May, spot at 0.6660) wherein ‘as long as AUD holds above 0.6610, it could edge higher to 0.6740’. We indicated that ‘the odds of a sustained rise above 0.6740 are not high’. There is no change in our view.”
The GBP is displaying strong cyclical momentum – which should continue through the summer, in the view of economists at HSBC.
Positive but cautious outlook
“The GBP has been enjoying both improved risk appetite and cyclical upswing.”
“We believe cyclical momentum should continue to support the GBP in the months ahead.”
“Yet, with weakening credit dynamics and the waning positive impact of disinflation, GBP/USD may not go far beyond the 1.30 level.”
See – GBP/USD: Looking for an eventual final leg higher to test 1.2668/1.2758 – Credit Suisse
Open interest in crude oil futures markets rose by just 672 contracts on Thursday, partially reversing the previous pullback according to preliminary readings from CME Group. Volume, instead, shrank by around 143.6K contracts after two daily builds in a row.
WTI could revisit the 2023 low
Prices of the WTI managed to advance modestly in a volatile session on Thursday. The uptick was on the back of a small increase in open interest while volume retreated markedly. Against that, a small rebound could be in the offing, although further bouts of weakness should not be ruled out yet.
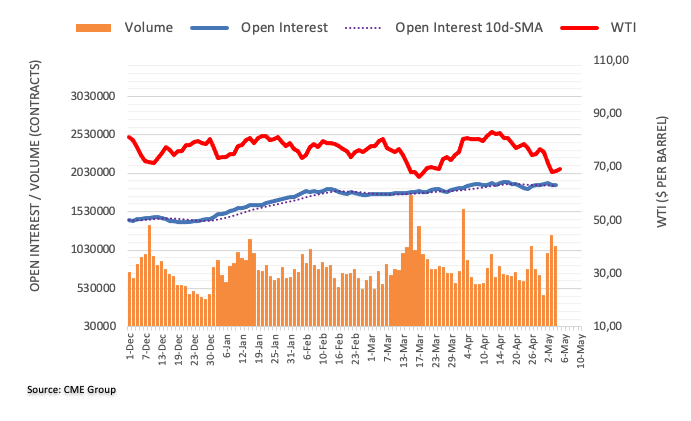
- USD/CHF turns positive for the second successive day, albeit lacks follow-through buying.
- Receding safe-haven demand undermines the CHF and lends some support to the major.
- The emergence of fresh USD selling acts as a headwind ahead of the key US NFP report.
The USD/CHF pair attracts some dip-buying near the 0.8835 region on Friday and turns positive for the second successive day, though lacks bullish conviction. The pair trades just above mid-0.8800s during the early European session and so far, is seen struggling to capitalize on the overnight bounce from its lowest level since January 2021.
A modest recovery in the US equity futures undermines the safe-haven Swiss Franc (CHF) and turns out to be a key factor acting as a tailwind for the USD/CHF pair. The upside, however, remains capped amid the emergence of fresh selling around the US Dollar (USD), led by concerns about the US banking sector and the Federal Reserve's (Fed) less hawkish outlook. Investors remain worried about a full-blown banking crisis in the US and now fear that regional lender PacWest Bancorp could be the next potential domino to fall.
The US central bank, meanwhile, outlined on Wednesday a more stringent and data-driven approach to hiking rates further. Moreover, Fed Chair Jerome Powell signalled that the central bank was close to hitting the terminal rate of the current tightening cycle. Markets took this as a sign that the central bank could eventually pause its year-long rate-hike cycle in June. This, along with the concerns over the US debt ceiling, continues to weigh on the Greenback and might keep a lid on any meaningful recovery for the USD/CHF pair.
Traders might also refrain from placing aggressive bets and prefer to wait on the sidelines ahead of the release of the closely-watched US monthly employment details, due later during the early North American session. The popularly known NFP report will play a key role in influencing the near-term USD price dynamics and help investors to determine the next leg of a directional move for the USD/CHF pair.
Technical levels to watch
Economists at Commerzbank change their EUR/USD forecast. They expect the pair to climb toward 1.14 until the end of the year.
EUR/USD to fall to 1.08 by year-end 2024
“For the time being EUR is likely to benefit from the ECB’s restrictive approach whereas the Fed is likely to begin signalling rate cuts over the course of the year, which should put pressure on USD.”
“We have adjusted our EUR/USD projections and see scope for higher EUR/USD levels of 1.14 until year-end.”
“However, we stick to our view that EUR/USD will weaken over the course of 2024, as once it becomes clear that inflation in the Eurozone will not ease as quickly, ECB monetary policy will not seem that restrictive any longer. That is likely to put pressure on EUR, so we expect a fall in EUR/USD to 1.08 by year-end 2024.”
- Gold price eases from record top, mildly offered of late, but stays beyond $2,042 support.
- Fed signals for policy pivot propel XAU/USD price, banking woes prod Gold buyers.
- Gold buyers need further acceptance from US NFP to keep the reins.
Gold price (XAU/USD) eases after refreshing the highest level on record as bulls take a breather ahead of the key US Nonfarm Payrolls (NFP).
Federal Reserve (Fed) hints to pause the rate hike trajectory after lifting the benchmark interest rates to the highest levels since 2007. The same joins Fed Chairman Jerome Powell’s cautious remarks, by suggesting the current monetary policy is at sufficiently restrictive levels, to weigh on the US Dollar and propel the Gold price.
Following that, Thursday’s mixed US data and increasing market bets on the Fed’s September 2023 rate hike add strength to the Gold price run-up. Additionally, fears of banking fallouts in the US and debt ceiling expiration also challenge the XAU/USD traders.
Alternatively, China’s softer PMIs and likely challenges for the US jobs report to meet downbeat forecasts, considering the strong early signals, tease the Gold sellers.
Moving on, the monthly prints of the US jobs report for April will be important to watch for clear directions.
Also read: Gold Price Forecast: XAU/USD en route to challenge record highs
Gold Price: Key levels to watch
As per our Technical Confluence Indicator, Gold price floats above the $2,042 resistance-turned-support comprising the upper band of the Bollinger on one-day, Pivot Point one-month R1 and Pivot Point one-week R3.
Given the latest pullback in the Gold price, a clear downside break of $2,042 can quickly drag the Gold price to the $2,027 support confluence including the Fibonacci 23.6% on one-month and Pivot Point one-week R2.
It’s worth noting that a downside break of $2,027 can recall the $2,000 round figure on the XAU/USD chart.
On the contrary, the previous monthly high and Fibonacci 61.8% in one-day together offer an important upside hurdle for the Gold buyers to cross near $2,053.
Following that, a quick XAU/USD rally towards the $2,073 hurdle encompassing the previous yearly high and the upper bank of the Bollinger on four-hour play will be the key hurdle to watch for the Bulls before cheering the $2,100.
Here is how it looks on the tool
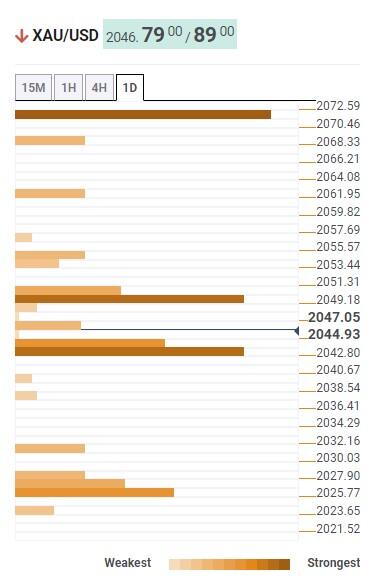
About Technical Confluences Detector
The TCD (Technical Confluences Detector) is a tool to locate and point out those price levels where there is a congestion of indicators, moving averages, Fibonacci levels, Pivot Points, etc. If you are a short-term trader, you will find entry points for counter-trend strategies and hunt a few points at a time. If you are a medium-to-long-term trader, this tool will allow you to know in advance the price levels where a medium-to-long-term trend may stop and rest, where to unwind positions, or where to increase your position size.
The continuation of the uptrend could lift GBP/USD to the 1.2665 level in the near term, suggest Economist Lee Sue Ann and Markets Strategist Quek Ser Leang at UOB Group.
Key Quotes
24-hour view: “GBP traded in a relatively narrow range between 1.2550 and 1.2599 yesterday before closing little changed at 1.2575 (+0.08%). Despite the quiet price movements, the underlying tone appears to be firm and GBP could break above 1.2600. However, the major resistance at 1.2665 is unlikely to come into view. Support is at 1.2545; a break of 1.2515 would indicate that the current upward pressure has eased.”
Next 1-3 weeks: “Two days ago (03 May, spot at 1.2475), we held the view that GBP ‘is likely to trade in a 1.2395/1.2565 range for the time being’. However, GBP broke above 1.2565 and yesterday, it eked out a fresh 11-month high of 1.2599. Despite the advance, there is no clear improvement in upward momentum. That said, as long as 1.2470 is not breached, GBP is likely to ratchet higher towards the major resistance at 1.2665. At this stage, the odds for a sustained rise above this level are not high.”
Here is what you need to know on Friday, May 5:
Investors remain on edge on the last trading day of the week as they keep a close eye on the performance of regional bank stocks in the US while awaiting the April jobs report. The European economic docket will feature Retail Sales data for April and Statistics Canada will release the labor market data later in the day. With the Federal Reserve's (Fed) blackout period ending on Thursday, comments from policymakers will be watched by market participants as well.
Safe-haven flows dominated the financial markets on Thursday, helping the US Dollar erase some of the losses it suffered in the Fed aftermath. PacWest Bancorp shares hit a record low after the opening bell on Thursday after the lender announced that it was in talks with potential partners about strategic asset sales. Meanwhile, the Financial Times reported that Western Alliance was also exploring similar options, triggering a selloff in other regional bank stocks as well. Later in the day, Western Alliance shares rebounded after the bank denied the report, calling it 'shameful'. Early Friday, US stock index futures are up between 0.2% and 0.4%.
Nonfarm Payrolls (NFP) in the US are forecast to rise by 179,000 in April following the 236,000 increase recorded in March. The Unemployment Rate is expected to remain unchanged at 3.5% and the annual wage inflation is seen holding steady at 4.2%.
US Nonfarm Payrolls Bank Preview: Smaller, but still positive change in employment.
EUR/USD declined below 1.1000 on Thursday but managed to stage a rebound. The European Central Bank (ECB) raised its key rates by 25 basis points as expected. During the press conference, ECB President Christine Lagarde clarified that they were not going to pause the policy tightening, adding that they had "more ground to cover." Although Lagarde's hawkish comments helped the Euro find demand, the risk-averse market environment limited the pair's upside. In the early European morning on Friday, EUR/USD was trading modestly higher on the day slightly below 1.1050. Meanwhile, the data from Germany showed that Factory Orders slumped by 10.7% on a monthly basis in March, compared to the market expectation for a decrease of 2.2%.
GBP/USD closed modestly higher on Thursday as the sharp decline seen in EUR/GBP helped Pound Sterling stay resilient against the USD. The pair continues to stretch higher early Friday and was last seen trading at its highest level in nearly a year above 1.2600.
USD/JPY fell for the third straight day on Thursday before stabilizing slightly above 134.00 early Friday. Earlier in the day, a magnitude 6.3 earthquake hit Japan's Ishikawa Prefecture. This development, however, doesn't seem to be having an impact on the pair's action.
Gold shined as the go-to safe-haven asset on Thursday and climbed to $2,060 during the American trading hours. XAU/USD retreated below $2,050 early Friday but clings to impressive weekly gains.
US April Nonfarm Payrolls Preview: Analyzing Gold price's reaction to NFP surprises.
Bank of Canada (BoC) Governor Tiff Macklem said in a prepared speech at the Toronto Region Board of Trade that if they start to see signs that inflation is likely to get stuck materially above their 2% target, they are prepared to raise interest rates further. These hawkish comments and a late rebound seen in crude oil prices helped the CAD outperform the USD on Thursday and USD/CAD lost more than 100 pips. The pair trades in negative territory near 1.3500 early Friday. The Unemployment Rate in Canada is forecast to tick up to 5.1% in April from 5% in March with a +20K in Net Change in Employment.
Bitcoin closed modestly lower on Thursday but started to edge higher early Friday. BTC/USD was last seen rising more than 1% on the day near $29,200. Ethereum retreated on Thursday but returned to the $1,900 area ahead of the weekend.
- NZD/USD prints four-day uptrend near the highest levels since early April.
- US Dollar reverses Thursday’s corrective bounce as Fed rate cut bets increase.
- Softer China PMI fails to prod Kiwi pair buyers amid cautious optimism, hawkish RBNZ concerns.
- US NFP needs to defy downbeat expectations to avoid further NZD/USD upside.
NZD/USD stays on the front foot at the highest levels in a month, up half a percent near 0.6310 heading into Friday’s European session. In doing so, the Kiwi pair cheers broad-based US Dollar weakness ahead of the US Nonfarm Payrolls (NFP) data. Adding strength to the bullish bias could be the latest divergence between the Federal Reserve (Fed) and the Reserve Bank of New Zealand (RBNZ) bias.
Federal Reserve (Fed) hints to pause the rate hike trajectory after lifting the benchmark interest rates to the highest levels since 2007. The same joins Fed Chairman Jerome Powell’s cautious remarks, by suggesting the current monetary policy is at sufficiently restrictive levels.
Following that, Thursday’s mixed US data and increasing market bets on the Fed’s September 2023 rate hike add strength to the NZD/USD run-up.
That said, preliminary readings of the US Nonfarm Productivity and Unit Labor Cost for the first quarter (Q1) of 2023 came in mixed. That said, Nonfarm Productivity dropped to -2.7% in Q1 from 1.6% prior and -1.8% market forecasts whereas the Unit Labor Cost jumped to 6.3% versus 5.5% expected and 3.3% prior. Further, the US Goods and Services Trade Balance improved to $-64.2B from $-70.6B prior and the $-63.3B market forecast. Further, Initial Jobless Claims edge higher to 242K for the week ended on April 28 versus 240K expected and 229K in previous readings. Additionally, the Fed Fund Futures hint at increasing odds of the rate cut in late 2023.
On the other hand, the RBNZ has already pleased the NZD/USD hawks with a 0.50% rate hike even if RBNZ Governor Adrian Orr cited negative impacts of higher rates on farms earlier in the week.
With these catalysts in mind, ANZ said, “Exactly what’s behind this unique performance (it has been the best performing G10 currency this month and is up 1¾% already) is difficult to pinpoint, but strong local data and widespread markets expectations that the Fed is done this cycle is likely playing a role.”
Moving on, NZD/USD bull may witness lackluster moves ahead of the key US employment data for April. However, the odds favoring the pair’s retreat are high as forecasts suggest downbeat prints of the headline US Nonfarm Payrolls (NFP), expected 179K versus 236K prior, while the early signals for the data appear strong.
Technical analysis
A daily closing beyond the three-month-old resistance line, near 0.6325 by the press time, becomes necessary for the NZD/USD bulls to keep the reins.
The US Bureau of Labor Statistics (BLS) will release the April jobs report on Friday, May 5 at 12:30 GMT and as we get closer to the release time, here are the forecasts by the economists and researchers of six major banks regarding the upcoming employment data.
Expectations are for a 179K rise in Nonfarm Payrolls following the better-than-expected 236K increase recorded in March. Meanwhile, the unemployment rate is expected to stay at 3.5% and average hourly earnings are expected to remain steady at 4.2% YoY.
CIBC
“We expect total hiring to have slowed to a 160K pace in April. That likely caused the unemployment rate to tick up to 3.6%. Wage growth could have continued at a 0.3% pace, but the risks to that figure are to the downside, as hiring was likely concentrated in lower-paying services where labor shortages still remain. We’re slightly below the consensus on the payrolls figure, which could weigh on the USD and cause bond yields to fall.”
Citi
“The pace of monthly payroll growth should continue to slow back towards a more typical pre-pandemic pace, likely reflecting some combination of easing labor demand and a shrinking pool of available workers to hire. We expect payrolls to rise by 215K in April with roughly balanced risks. We also expect a 0.4% MoM increase in average hourly earnings in April, stronger than over Q1 of this year. Meanwhile, the unemployment rate is expected to remain unchanged at 3.5% in April, with downside risks that it falls further to 3.4%. This expectation is based on the participation rate moving sideways after months of increases.”
Danske Bank
“Our call is for a slightly moderating but still solid jobs growth of 200K.”
RBC Economics
“We expect to see 150K jobs to be added to the US labour market in April, down slightly from the 236K increase in March. We look for a 0.1 percentage point increase in the unemployment rate, back to February’s 3.6% level.”
Commerzbank
“We forecast a job gain of 240K, which is above the consensus expectation. The April report will thus likely lead to renewed discussions about the ‘true’ situation in the US labor market. Weakening tendencies were recently more apparent in certain details such as the declining number of hours worked and the minus in temporary help jobs, which are considered leading indicators. Therefore, such subtleties should also be looked at.”
NBC
“We expect job creation to have slowed to 185K in the month. The household survey should show a slightly smaller gain following March’s outsized surge, but the latter should however be sufficient to keep the unemployment rate unchanged at 3.5%.”
European Central Bank (ECB) Governing Council member and Bank of France head Francois Villeroy de Galhau said on Friday, “The change in rate increase rythm is an important signal," per Reuters.
Additional comments
I favor smaller European Central Bank rate increases.
There will likely be several more hikes.
The economic situation is resilient in France and in the Eurozone.
Our goal is to win the fight against inflation without triggering a recession.
We will bring inflation inflation back to 2% by 2025, maybe even by the end of 2024.
Monetary policy is efficient.
EUR/USD remains firmer
Upbeat comments from the ECB Official add strength to the EUR/USD run-up, up 0.17% intraday near 1.1032 by the press time.
CME Group’s flash data for gold futures markets noted traders increased their open interest positions for yet another session on Thursday, this time by around 17.8K contracts. Volume followed suit and went up by around 91.1K contracts, reversing at the same time the previous daily drop.
Gold now targets the all-time high at $2075
Gold prices rose for the third session in a row on Thursday amidst increasing open interest and volume. That said, further gains appears in the pipeline in the very near term and with the immediate target at the record peak at $2075 per ounce troy seen on August 7 2020.
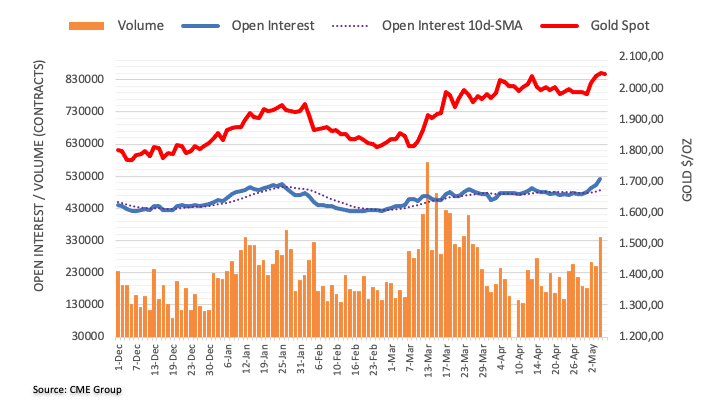
- GBP/USD is aiming to sustain its auction above 1.2600 as the Bank of England would hike interest rates further.
- Federal Reserve has confirmed that further policy action will be data-driven.
- Bank of England is expected to raise rates for the 12th consecutive time to tame double-digit inflation.
- GBP/USD has delivered a confident breakout of the upward-sloping channel.
GBP/USD has confidently climbed above the round-level resistance of 1.2600 in the early European session. The Cable has refreshed its 11-month high at 1.2614 and might discover more gains as the US Dollar Index (DXY) is expected to display more downside amid multiple headwinds.
S&P500 futures have generated stellar gains in Asia as investors are shifting their focus on optimism influenced by Federal Reserve’s (Fed) neutral interest rate guidance. US equities were settling in the bearish territory consistently for the past three trading sessions amid renewed fears of a US banking crisis, potential fears of US debt ceiling concerns, and uncertainty over the Federal Reserve’s roadmap of bringing down stubborn inflation.
The USD Index has corrected sharply to near 101.15 and is expected to show some further downside to near the crucial support of 101.00 as a delay in the US debt ceiling raise could impact the long-term outlook of the United States economy. However, the US yields have got recovery after nosediving. The yields offered on 10-year US government bonds have rebounded above 3.38%.
US debt ceiling- A twin-edge sword for the US Dollar
Investors are worried that a delay in increasing the US debt ceiling by the White House would bring severe calamity for the US Dollar as millions of US individuals will lose their job and the Gross Domestic Product (GDP) will get squeezed. This will have a severe impact on the US Dollar. However, a timely approval of the US debt ceiling raise would also have a negative impact on the US Dollar as it would attract a downward revision of the long-term outlook for the US economy from credit rating agencies. An increment in the US debt ceiling would have a significant impact on the US Dollar, US yields, and equities but will improve appeal for the Gold as safe-haven.
US NFP- Last hope of recovery
As Federal Reserve chair Jerome Powell has already confirmed that further policy action will be on a data-driven approach, the release of the US labor market data would be the last hope of a recovery in the USD Index. A preliminary US NFP report (April) shows that the economy added 179K jobs in April, lower than former additions of 236K. The Unemployment Rate is seen unchanged at 3.5%. Apart from them, the major catalyst will be Average Hourly Earnings data. Monthly and annual Average Hourly Earnings may remain steady at 0.3% and 4.2% respectively.
US businesses passed impact of higher employment costs to end users
United Kingdom’s final S&P Global/CIPS Services PMI rose to 55.9 from 52.9 in March. Reuters reported that UK businesses are comfortably passing the impact of higher wages cost to end users. This will result in more burdens on households and the Bank of England (BoE) will be split into easing households’ burdens or curbing persistent inflation.
Investors are keenly awaiting the interest rate decision by the Bank of England (BoE), which is scheduled for May 11, Thursday. Bank of England Governor Andrew Bailey is expected to raise interest rates further by 25 basis points (bps) to tame double-digit inflation. This would be the 12th consecutive interest rate hike by the Bank of England from 2021.
GBP/USD technical outlook
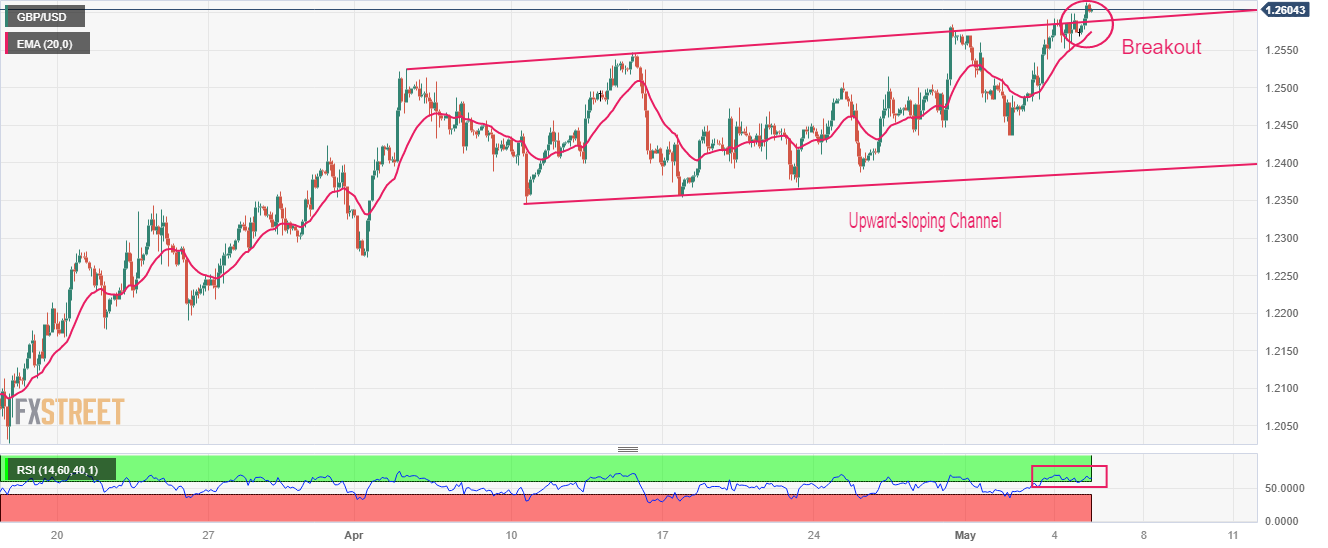
GBP/USD has delivered a breakout of the upward-sloping channel formed on a two-hour scale. This has underpinned the Pound Sterling against the US Dollar. The Cable is expected to remain in the bullish territory ahead as the 20-period Exponential Moving Average (EMA) at 1.2575 is supporting the Pound Sterling.
The Relative Strength Index (RSI) (14) is oscillating in the bullish range of 60.00-80.00, indicating that upside momentum is active.
- German Factory Orders slumped by 10.7% MoM in March vs. -2.2% expected.
- German Factory output tumbled by 11.0% YoY in March vs. -8.3% expected.
- EUR/USD remains unfazed near 1.1040 following the downbeat German data.
The German Factory Orders data showed a much bigger-than-expected drop in March, suggesting that the manufacturing sector recovery is faltering.
Contracts for goods ‘Made in Germany’ came in at -10.7% on the month vs. -2.2% expected and 4.5% prior, the latest data published by the Federal Statistics Office showed on Friday.
On an annualized basis, Germany’s Industrial Orders arrived at -11.0% in the reported month vs. -8.3% expected and a -6.0% slump seen in Februrary.
FX implications
The shared currency stands resilient to the downbeat German factory data. At the time of writing, EUR/USD is trading at 1.1036, preserving 0.23% gains on the day.
- Nonfarm Payrolls report is expected to show a job addition of 179,000 in April.
- US Dollar could react to wage inflation component, the Average Hourly Earnings.
- The Bureau of Labor Statistics is set to report an Unemployment Rate of 3.5% in April.
The Nonfarm Payrolls (NFP) data will be released by the Bureau of Labor Statistics (BLS) this Friday at 12:30 GMT. The NFP release is expected to show job gains of 179,000 in April following the 236,000 increase recorded in March.
The US Dollar (USD) has been struggling to find demand in the second half of the week with dovish Federal Reserve (Fed) bets dominating the financial markets. April jobs report is likely to trigger the next big action in the USD due to its potential impact on the Fed’s policy outlook.
Although the Fed raised its policy rate by 25 basis points (bps) to the range of 5-5.25% as expected, it scrapped the comment in the policy statement that read “some additional policy firming may be appropriate. Commenting on the labor market conditions in the post-meeting press conference, FOMC Chairman Jerome Powell noted that there were some signs suggesting that supply and demand were coming back into better balance. "There are no promises but it's possible we can continue to have labor market cooling without big increases in unemployment," Powell added.
What to expect in the next Nonfarm Payrolls report?
Friday's United States (US) economic docket highlights the release of the closely-watched US monthly jobs report data for April. Nonfarm Payrolls expectations are that the economy added 179K jobs during the reported month, down from the better-than-expected growth of 236K in March. The Unemployment Rate is expected to remain unchanged at 3.5% in the fourth month of this year.
Investors will also pay close attention to the Average Hourly Earnings, which is forecast to hold steady at 4.2% on a yearly basis, and the Labor Force Participation readings in the report.
Analysts at Wells Fargo expect payrolls growth to continue to softer at the beginning of the second quarter: “Slowly bending, not breaking, has so far been the story of the labor market this year. That is unlikely to change with April's employment report. In March, nonfarm payrolls rose by 236K, the weakest print since December 2020. Signs were more encouraging in the separate household survey, where employment rose by 577K, causing the unemployment rate to tick back down to 3.5%. The labor force participation rate also rose for a fourth straight month.”
When will US February Nonfarm Payrolls report be released and how could it affect EUR/USD?
The Nonfarm Payrolls report is scheduled for release at 12:30 GMT, on May 5. With the US Dollar staying dangerously close to its weakest level against the Euro in nearly a year in the Fed aftermath, market participants will pay close attention to the labor market data to figure out whether EUR/USD could extend its rally.
In case the report reveals that labor market conditions remained tight with an NFP increase at-or-above 250K combined with a hot wage inflation print, market participants could re-assess the probability of one more 25 basis points (bps) Fed rate hike in June. In that scenario, the USD should gather strength heading into the weekend and cause EUR/USD to erase a portion of its weekly losses. It’s worth noting that the CME Group FedWatch Tool shows that the probability of a June rate increase less than 5%.
On the other hand, a disappointing NFP print, close to 100K, should confirm a pause in the Fed’s tightening cycle and even revive expectations for a rate cut later in the year. The USD is likely to come under renewed bearish pressure in such a case and provide a boost to EUR/USD during the American trading hours on Friday.
Meanwhile, Dhwani Mehta, Asian Session Lead Analyst at FXStreet, offers a brief technical outlook for the EUR/USD pair and writes: “Euro bulls appear hopeful so long as they hold above the upward-sloping 21-Day Moving Average (DMA) at 1.0985. The 14-day Relative Strength Index (RSI) is pointing north above the midline, adding credence to the upside bias.”
Dhwani also outlines important technical levels to trade the EUR/USD pair: “On the upside, Euro buyers need acceptance above the recent range highs around 1.1090 to resume the uptrend Ahead of that, EUR/USD needs to find a strong foothold above the 1.1050 psychological mark. Alternatively, immediate support awaits at the bullish 21 DMA, below which the weekly low of 1.0942 could be tested before bears gear up for a test of the ascending 50 DMA at 1.0839.
Nonfarm Payrolls related content
- Gold Price Forecast: XAU/USD seems poised to test ascending channel hurdle, around $2,100
- EUR/USD extends recovery above 1.1040 as USD Index drops further, US NFP remains key
- US payrolls in focus, as the US banking turmoil continues
About the Nonfarm Payrolls report
The Nonfarm Payrolls released by the US Department of Labor presents the number of new jobs created during the previous month, in all non-agricultural business.
The monthly changes in payrolls can be extremely volatile, due to their high relation with economic policy decisions made by the US Federal Reserve. The number is also subject to strong reviews in the upcoming months, and those reviews also tend to trigger volatility in the forex board.
Generally speaking, a high reading is seen as positive (or bullish) for the US Dollar, while a low reading is seen as negative (or bearish), although the previous month's reviews and the Unemployment Rate are as relevant as the headline figure.
- USD/INR remains pressured at weekly low, down for third consecutive day.
- Sustained trading below 50-SMA keeps Indian Rupee buyers hopeful.
- Buyers have a bumpy road to witness in case of surprise return, 82.10 is the key hurdle.
USD/INR holds lower grounds near 81.70 as it prods weekly low during a three-day downtrend. In doing so, the Indian Rupee (INR) pair cheers broad US Dollar weakness ahead of the key US Nonfarm Payrolls (NFP).
That said, the pair’s sustained trading below the 50-bar Simple Moving Average (SMA) joins the downbeat MACD signals and mostly steady RSI (14) line to underpin the bearish bias.
With this, the Indian Rupee buyers appear all set to poke an upward-sloping support line from mid-April, near 81.60.
However, the RSI line is near 45.00, which in turn suggests bottom-picking around the key support line and restricts the quote’s further downside.
In a case where the USD/INR pair drops below 81.60, the previous monthly low of around 81.50 will be crucial as it holds the key for the quote’s fall towards the yearly low, marked in January at around 80.90.
Alternatively, USD/INR rebound remains elusive unless the quote breaks the 50-SMA hurdle of around 81.80.
Following that, a downward-sloping trend line from April 19, close to 81.80, and an eight-day-old resistance line near 81.90, could prod the pair buyers.
Above all, USD/INR remains bearish below the seven-week-old resistance line, near 82.10 at the latest.
USD/INR: Four-hour chart
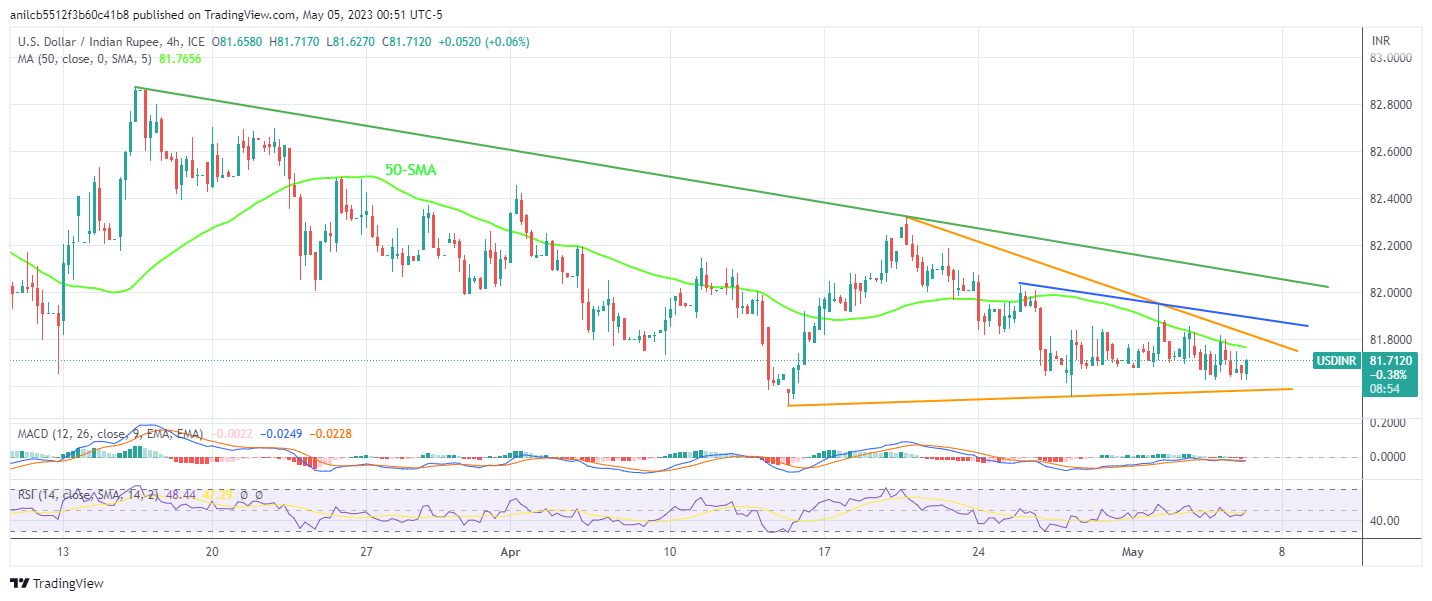
Trend: Further downside expected
According to Economist Lee Sue Ann and Markets Strategist Quek Ser Leang at UOB Group, further upside in EUR/USD should face a tough barrier around 1.1120.
Key Quotes
24-hour view: “Yesterday, EUR traded choppily between 1.0984 and 1.1091 and then closed at 1.1011 (-0.43%). There is no clear directional bias for now and the price movements are likely part of a broad range. Today, we expect EUR to trade between 1.0980 and 1.1080.”
Next 1-3 weeks: “Our most recent narrative was from Tuesday (02 May, spot at 1.0975) wherein EUR is likely to trade in a range of 1.0920/1.1040. While EUR rose above 1.1040, there was no significant improvement in upward momentum. However, the bias appears to be tilted to the upside but unless there is a clear improvement in momentum, any advance might find it difficult to break above the major resistance at 1.1120. It is worth noting that there is another rather strong resistance level near 1.1095. If EUR were to break below 1.0920 (‘strong support’ level), it would suggest that it is not ready to move towards 1.1120.”
- USD/JPY takes offers to refresh intraday low, fades late Thursday’s bounce off weekly bottom.
- Market positions for US NFP amid mixed signals, dovish Fed clues also weigh on Yen pair.
- Japan’s holidays fail to prod USD/JPY bears amid bank turmoil, looming US debt ceiling expiration.
USD/JPY drops for the fourth consecutive day as bears approach the weekly low during early Friday, down 0.30% intraday near 133.85 by the press time. In doing so, the Yen pair renews its intraday bottom as it cheers the US Dollar weakness ahead of the key US employment report for April. It’s worth noting that Japan’s holidays fail to challenge the sellers.
US Dollar Index (DXY) takes offers to reverse the previous day’s corrective bounce off a one-week low near 101.15 by the press time. With this, the greenback’s gauge versus six major currencies portrays the market’s conviction that the Federal Reserve (Fed) is well-set for policy pivot, especially after recently mixed US data and Fed meeting. While portraying the same, the Fed Fund Futures hint at increasing odds of the rate cut in late 2023.
That said, preliminary readings of the US Nonfarm Productivity and Unit Labor Cost for the first quarter (Q1) of 2023 came in mixed. That said, Nonfarm Productivity dropped to -2.7% in Q1 from 1.6% prior and -1.8% market forecasts whereas the Unit Labor Cost jumped to 6.3% versus 5.5% expected and 3.3% prior. Further, the US Goods and Services Trade Balance improved to $-64.2B from $-70.6B prior and the $-63.3B market forecast. Further, Initial Jobless Claims edge higher to 242K for the week ended on April 28 versus 240K expected and 229K in previous readings.
Apart from the Fed’s dovish hike and mixed US data, US banking sector woes join looming default fears to challenge the market sentiment and weigh on the USD/JPY price.
Though, recent actions from the US policymakers and comments suggesting no immediate fears of the banking crisis seem to exert downside pressure on the US Dollar.
Against this backdrop, S&P 500 Futures snap a four-day downtrend with mild gains.
Alternatively, the Bank of Japan’s (BoJ) dovish bias and upbeat early signals of the US jobs report challenge the USD/JPY bears.
Looking forward, holidays in Japan and a light calendar elsewhere can restrict USD/JPY moves ahead of the US employment report. However, downbeat expectations from the scheduled data raise fears of a positive surprise and wild US Dollar move to pare weekly losses. Forecasts suggest downbeat prints of the headline US Nonfarm Payrolls (NFP), expected 179K versus 236K prior.
Technical analysis
Even if a clear downside break of a six-week-old support line, now immediate resistance near 134.70, favors USD/JPY bears, the 50-DMA prods intraday sellers around 133.85.
- USD/CAD is declining towards 1.3500 amid a weak USD Index and a recovery in the oil price.
- Investors are dumping the USD Index as the White House is struggling to raise the US debt ceiling.
- The Loonie will be on the tenterhooks ahead of the US/Canada Employment data.
The USD/CAD pair has witnessed an immense sell-off as the US Dollar Index (DXY) has extended its losses sharply and the oil price has shown a significant recovery. The Loonie asset is expected to extend its downside further toward the round-level support of 1.3500 amid a strengthening downside bias for the USD Index.
Investors are dumping the USD Index as the White House is struggling to raise the US debt ceiling. US President Joe Biden is least interested in US debt ceiling talks with Republicans if the approval of raising them comes at a cost of the President’s spending initiatives. A delay in the same is expected to cause severe loss of jobs and shrinkage in economic output due to failure in making obligated payments by the US Treasury.
Going forward, US Nonfarm Payrolls (NFP) data will remain in the spotlight. The US Employment data would be a base for the Federal Reserve’s (Fed) data-dependent approach as easing labor market conditions would be supportive of a neutral policy stance.
Also on the Canadian Dollar front, investors are awaiting the release of the Employment data. Net Change in Employment is seen declining to 20K vs. the prior release of 34.7K. The Unemployment Rate is expected to increase to 5.1% from the former release of 5.0%. Rising jobless numbers would allow the Bank of Canada (BoC) to retain its stance of unchanged monetary policy.
BoC Governor Tiff Macklem said in a prepared speech at the Toronto Region Board of Trade that the central bank is prepared for more rate hikes if inflation persists above the 2% target.
Meanwhile, the oil price has rebounded firmly above $69.00 on optimism that the Fed will pause its policy-tightening process to support the US economy from getting into recession. It is worth noting that Canada is the leading exporter of oil to the United States and higher oil prices will support the Canadian Dollar.
- AUD/USD takes the bids to refresh two-week high during five-day uptrend.
- RBA SoMP defends hawkish surprise by citing inflation woes; Fed’s dovish rate hike adds strength to Aussie pair’s run-up.
- Clear upside break of multi-day-old resistance line, now support, defends pair buyers.
- US employment report for April bears downbeat forecast, can please pair buyers on matching expectations.
AUD/USD pierces an 11-week-old resistance line amid broad US Dollar weakness, as well as due to the hawkish signals from the Reserve Bank of Australia (RBA), during early Friday. In doing so, the Aussie pair rises to a fresh high in two weeks, around 0.6735 by the press time, as market players await the key US jobs report for April.
That said, RBA’s quarterly Statement on Monetary Policy (SoMP), also known as the Monetary Policy Statement (MPS), showed readiness for further rate hikes and defended hawks after surprising markets with a 0.25% rate lift earlier in the week. Also positive for the AUD/JPY pair were the upbeat economic forecasts and statements citing inflation fears in the Pacific major, not to forget hopes for China’s upbeat economic growth.
Also read: RBA Monetary Policy Statement: Further rate hikes may be needed
Technically, the Aussie pair crosses a downward-sloping resistance line from the mid-February, now immediate support near 0.6725.
Adding strength to the upside bias is the strongest bullish MACD signal in three weeks, as well as an upbeat RSI (14) line, not overbought.
With this, the AUD/USD bulls appear well-set to refresh the multi-day high by approaching the 100-DMA hurdle of around 0.6790. Following that, April’s peak of near 0.6810 may gain the market’s attention.
On the flip side, a daily closing below 0.6725 will nullify the trend line breakout and can drag the Aussie pair towards a convergence of the 50-DMA and 21-DMA, close to 0.6680-85 as we write.
It’s worth noting that a one-week-old ascending trend line, around 0.6655, acts as an extra filter towards the south before giving control to the AUD/USD bears.
AUD/USD: Daily chart
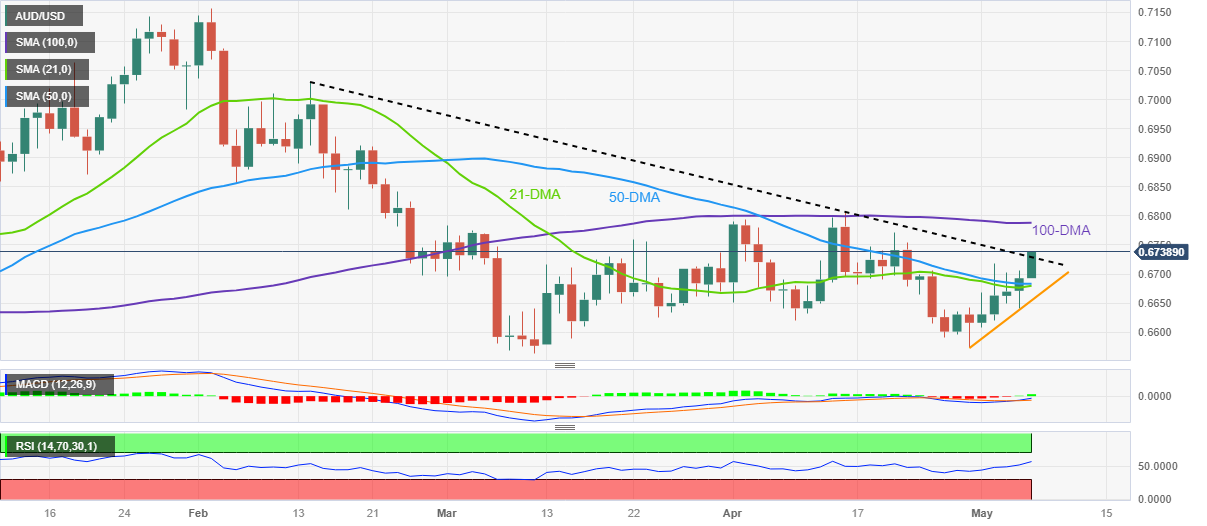
Trend: Further upside expected
- Gold price is in a sideways auction around $2,050.00 ahead of the US Employment data.
- The Fed is likely to restrict itself from raising rates further amid deepening US banking crisis, and slower growth rate.
- Gold price is building a base near the demand zone plotted in a narrow range around $2,050.00.
Gold price (XAU/USD) is showing signs of volatility contraction around $2,050.00 in the Asian session. The precious metal is struggling to make a decisive move as investors are awaiting the release of the United States Nonfarm Payrolls (NFP) data for further action.
The US Dollar Index (DXY) is failing to find an intermediate cushion and is declining firmly. The USD Index has dropped to near 101.16 as the Federal Reserve (Fed) is likely to restrict itself from raising interest rates further amid deepening US banking crisis, slower growth rate, and easing US labor market conditions.
On Thursday, weekly Initial Jobless Claims for the week ending April 28 jumped to 242K vs. the consensus of 240K and the former release of 229K.
However, the street would get more clarity after the release of the US Nonfarm Payrolls (NFP) data. As per the consensus, the US labor market witnessed a fresh addition of 179K payrolls in April, which was lower than former additions of 236K. The catalyst that will hijack the attention of investors would be the Average Hourly Earnings data. The street is anticipating steady earnings numbers, however, a better-than-expected print would renew fears of recovery in inflationary pressures.
Apart from that any development on debt ceiling concerns would turn the USD Index extremely volatile.
Gold technical analysis
Gold price is building a base near the demand zone plotted in a narrow range around $2,050.00 on a two-hour scale. The precious metal fell sharply after printing an all-time high of $2,079.77. The 10-period Exponential Moving Average (EMA) at $2,047.00 is providing cushion to the Gold bulls.
Meanwhile, the Relative Strength Index (RSI) (14) is still oscillating in the bullish range of 60.00-80.00, indicating that the upside bias is holding momentum.
Gold two-hour chart
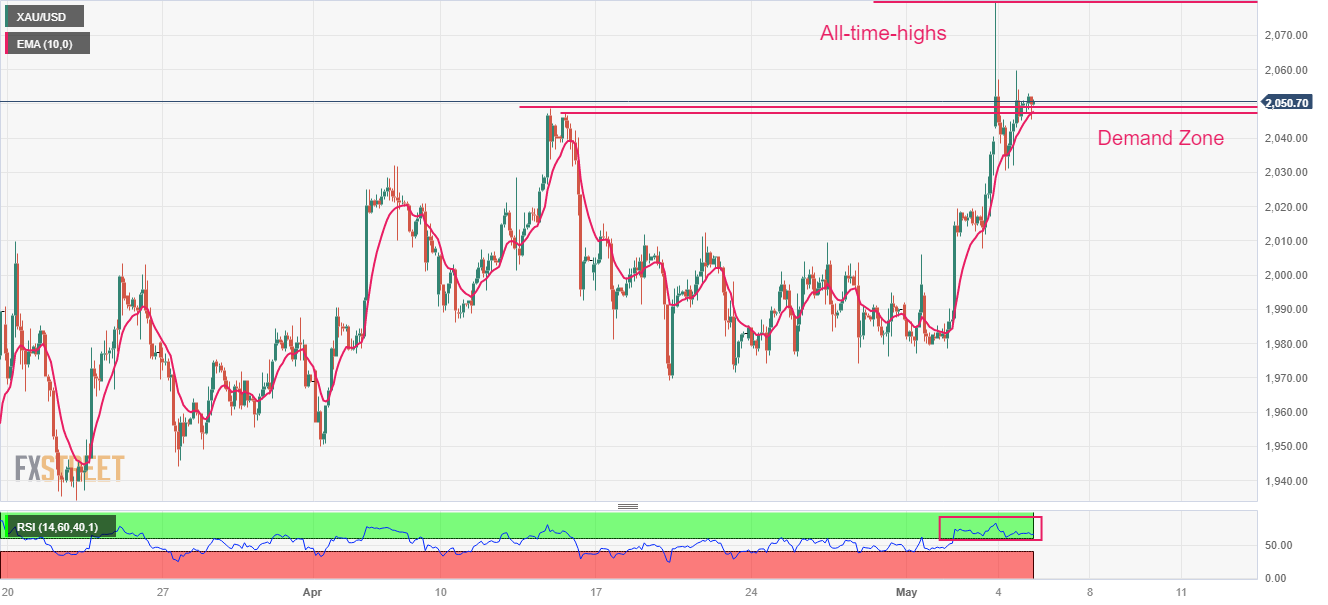
- EUR/USD has stretched its recovery above 1.1040 as the USD Index has resumed its downside journey.
- For a declining USD Index, US NFP seems to be the last hope.
- The ECB hiked interest rates by 25 bps but confirmed that more than one additional rate hikes are in the pipeline.
The EUR/USD pair has recovered firmly above 1.1040 in the Asian session as the US Dollar index (DXY) has resumed its downside journey. The major currency pair is trying to revive Thursday’s sell-off inspired by a smaller interest rate hike from the European Central Bank (ECB).
The USD Index has dropped further below 101.20 amid the absence of supportive economic indicators. Multiple headwinds are weighing pressure on the USD Index such as delay in raising US debt ceiling and mounting banking crisis. In addition to them, Federal Reserve’s (Fed) decision of being more data-dependent for further monetary policy action has dismantled the major support of the USD Index.
S&P500 futures have added significant gains in the Asian session as investors’ optimism is reviving from the US banking crisis. However, fears of delay in debt ceiling concerns could dent market sentiment dramatically. Members of the economic council of the White House have already declared that a delay in the raising of US debt ceiling could result in a default in payment obligations, which could cost millions of jobs and can have a significant effect on the economic output.
Coming to the US economic data, Nonfarm Payrolls (NFP) are the last hope for the USD index. A preliminary US NFP report (April) shows that the economy added 179K jobs in April, lower than former additions of 236K. The Unemployment Rate is expected to remain steady at 3.5%.
On the Eurozone front, ECB President Christine Lagarde hiked interest rates by 25 basis points (bps) on Thursday but made clear that more than one additional rate hikes are in the pipeline. It seems that declining credit disbursement by Eurozone banks due to higher interest rates and tight credit conditions allowed the ECB to go light on interest rates this time.
Meanwhile, investors are awaiting the release of the Eurozone Retail Sales (April) data. Monthly Retail Sales are expected to remain flat vs. a contraction of 0.8%. The annual retail demand is seen extending its contraction to 3.1% from the former contraction of 3.0%.
- Silver price seesaws after refreshing multi-day high, prods three-day uptrend.
- Overbought RSI, failure to cross descending resistance line from April 2022 lure XAG/USD bears.
- 21-day EMA, four-month-old horizontal support can restrict immediate downside.
- Silver buyers need validation from $26.25 to aim for 2022 peak.
Silver price (XAG/USD) prints mild gains around $26.00 as bulls take a breather at the highest levels since April 2022 during early Friday.
In doing so, the XAG/USD price takes a U-turn from a downward-sloping resistance line from April 2022 amid the overbought RSI (14) line.
As a result, the bright metal is likely to witness further pullback in the prices, which in turn highlights the late April swing high of around $25.50.
However, the 21-day Exponential Moving Average (EMA) and a horizontal area comprising multiple levels marked since January, respectively near $25.05 and $24.60-50, can challenge the Silver bears past $25.50.
It’s worth noting that the XAG/USD’s weakness past $24.50 makes it vulnerable to dropping toward the 61.8% Fibonacci retracement level of the March-September 2022 downturn, near $23.35.
On the contrary, the Silver price may regain upside momentum by providing a daily close beyond the previously stated 13-month-old resistance line, close to $26.15 by the press time. Even so, the April 2022 peak of around $26.25 can prod the XAG/USD bulls before giving them control.
In that case, the last year’s high of around $26.95 and the $27.00 round figure could gain the Silver buyer’s attention.
Silver Price: Daily chart
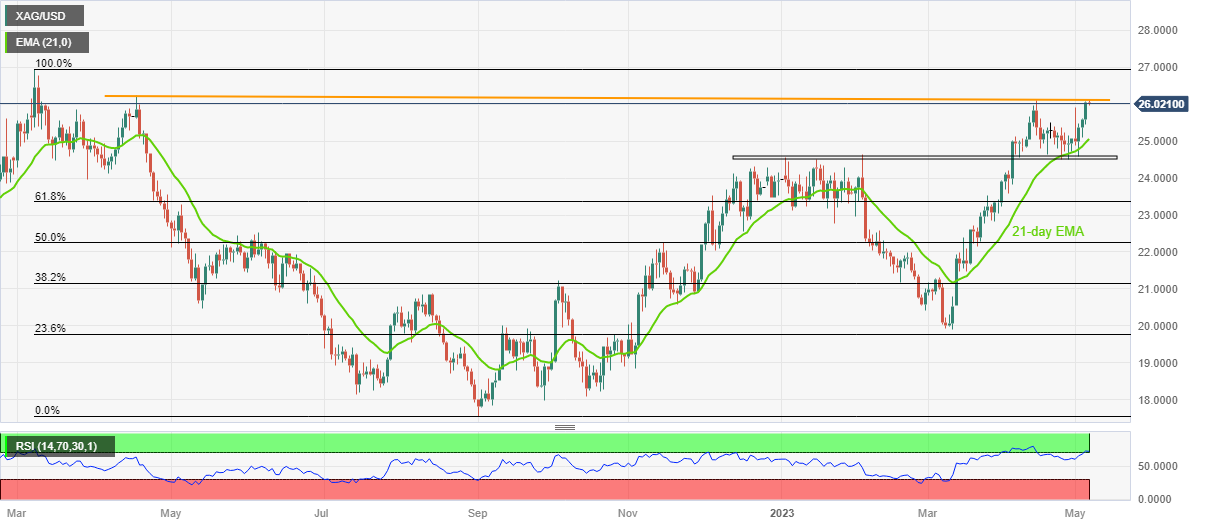
Trend: Pullback expected
- GBP/USD takes the bids to refresh multi-day high, up for the third consecutive day.
- US Dollar fails to cheer mostly firmer data amid dovish Fed concerns.
- Hawkish BoE concerns, cautious optimism in the market adds strength to the Cable pair’s rally.
- US jobs report for April eyed for clear directions.
GBP/USD rises for the third consecutive day to prod the late May 2022 high, piercing the 1.2600 threshold during early Friday. In doing so, the Cable pair cheers broad US Dollar weakness, as well as recently upbeat UK data, ahead of the key US Nonfarm Payrolls (NFP).
US Dollar Index (DXY) retreats to 101.18, fading the previous day’s corrective bounce off a one-week low, as markets remain convinced of the Federal Reserve’s (Fed) policy pivot after recently mixed US data and Fed meeting.
The preliminary readings of the US Nonfarm Productivity and Unit Labor Cost for the first quarter (Q1) of 2023 came in mixed. That said, Nonfarm Productivity dropped to -2.7% in Q1 from 1.6% prior and -1.8% market forecasts whereas the Unit Labor Cost jumped to 6.3% versus 5.5% expected and 3.3% prior. Further, the US Goods and Services Trade Balance improved to $-64.2B from $-70.6B prior and $-63.3B market forecast. Further, Initial Jobless Claims edge higher to 242K for the week ended on April 28 versus 240K expected and 229K in previous readings.
US banking sector woes join looming default fears to challenge the market sentiment. However, recent actions from the US policymakers and comments suggesting no immediate fears of the banking crisis seem to exert downside pressure on the US Dollar.
On the other hand, the upbeat revision of the UK’s activity numbers for April strengthened the hawkish bias surrounding the Bank of England (BoE) and propels the Cable pair.
That said, the final readings of the UK’s S&P Global/CIPS Services PMI rose past 54.9 initial forecasts to 55.9 for April while the Composite PMI also increased to 54.9 versus 53.9 flash estimations for the said month.
Amid these plays, S&P 500 Futures print mild gains even if Wall Street benchmarks closed with losses. Further, the US Treasury bond yields ended Thursday’s North American session on the downside but an absence of Japanese traders limit bond market moves in Asia.
Looking forward, the UK Constriction PMI for April and risk catalysts may entertain GBP/USD pair traders ahead of the all-important US jobs report for April. Forecasts suggest an easing in the headline Nonfarm Payrolls (NFP) figures to 179K versus 236K prior, which in turn can propel the Gold price on marching forecasts.
Technical analysis
A clear upside break of a one-month-old resistance line near 1.2600 keeps GBP/USD buyers directed towards the mid-2022 peak of around 1.2665.
- Natural Gas price drops for the fifth consecutive day despite softer US Dollar.
- Record US LNG output, resumption of Yamal-Europe pipeline propel oversupply woes.
- India’s ban on new coal plants fail to lift XNG/USD price amid recession woes.
Natural Gas Price (XNG/USD) remains depressed around $2.17, printing a five-day downtrend near the lowest levels in three weeks, as market players await the key US employment report on Friday. In doing so, the energy instrument bears the burden of the fears of oversupply, as well as recession.
A record Natural Gas output in the US joins the resumption of the Yamal-Europe gas pipeline to propel the oversupply fears. “Last week's increase boosted stockpiles to 2.063 trillion cubic feet (tcf), or 19.8% above the five-year average of 1.722 tcf for the time of year,” said Reuters.
On the same line is the news, shared via Reuters, mentioning that Estward natural gas flows on the Yamal-Europe pipeline to Poland from Germany resumed on Friday, data from operator Gascade showed.
Meanwhile, India’s amendment to power policy, with plans to stop building new coal-fired power plants, suggests higher XNG/USD demand from the Asian major, which in turn probes the Natural Gas price amid a softer US Dollar.
That said, the US Dollar Index (DXY) retreats to 101.30, fading the previous day’s corrective bounce off a one-week low, as markets remain convinced of the Federal Reserve’s (Fed) policy pivot after recently mixed US data and Fed meeting. Apart from the dovish Fed, US banking sector woes join looming default fears to challenge the market sentiment and renew recession concerns especially after major central banks hiked benchmark rates of late.
Looking forward, United States employment data for April will be crucial for the XNG/USD traders to watch for clear directions.
Technical analysis
A one-week-old descending resistance line, currently around $2.20, restricts the short-term upside of the Natural Gas Price. However, a downward-sloping support line from late February 2023, close to $2.12 at the latest, appears a tough nut to crack for the XNG/USD bears amid nearly oversold RSI conditions.
- USD/IDR takes offers to refresh intraday low, fades bounce off the lowest levels since June 2022.
- Indonesia GDP beats expectations and surpasses previous readouts in Q1.
- Post-Fed optimism in Asia ignores softer China PMIs to also weigh on USD/IDR prices.
USD/IDR justifies upbeat prints of Indonesia's growth numbers by retreating to 14,680 during early Friday. In doing so, the Indonesia Rupiah (IDR) pair also benefits from the broad US Dollar weakness and cautious optimism in the Asia-Pacific region.
Indonesia’s first quarter (Q1) 2023 Gross Domestic Product (GDP) rises to 5.03% YoY versus 4.95% expected and 5.01% prior. That said, the quarterly figures also improved to -0.92% QoQ from -1.0% anticipated and 0.36% prior.
“Indonesia's post-pandemic recovery has been helped by a commodities-led export boom, though analysts expect a slowdown in growth as commodity prices ease and monetary policy tightening around the world hits global demand,” said Reuters following the data release.
On the other hand, the US Dollar Index (DXY) retreats to 101.30, fading the previous day’s corrective bounce off a one-week low, as markets remain convinced of the Federal Reserve’s (Fed) policy pivot after recently mixed US data and Fed meeting.
Talking about the US data, preliminary readings of the US Nonfarm Productivity and Unit Labor Cost for the first quarter (Q1) of 2023 came in mixed. That said, Nonfarm Productivity dropped to -2.7% in Q1 from 1.6% prior and -1.8% market forecasts whereas the Unit Labor Cost jumped to 6.3% versus 5.5% expected and 3.3% prior. Further, the US Goods and Services Trade Balance improved to $-64.2B from $-70.6B prior and $-63.3B market forecast. Further, Initial Jobless Claims edge higher to 242K for the week ended on April 28 versus 240K expected and 229K in previous readings.
Elsewhere, banking fears US banking sector woes join looming default fears to challenge the market sentiment. However, recent actions from the US policymakers and comments suggesting no immediate fears of the banking crisis seem to exert downside pressure on the US Dollar.
Alternatively, downbeat China data should have put a floor under the USD/IDR prices but did not amid cautious optimism. That said, China’s Caixin Services PMI for April eases to 56.4 versus 56.5 expected and 57.8 prior. Earlier in the week, China’s Caixin Manufacturing PMI for April dropped to 49.5 versus 50.3 expected and 50.0 prior while the official NBS Manufacturing PMI offered a negative surprise before the Chinese markets went on a long holiday until Thursday.
Against this backdrop, S&P 500 Futures print mild gains even if Wall Street benchmarks closed in the red. Further, the US Treasury bond yields ended Thursday’s North American session on the downside but an absence of Japanese traders limit bond market moves in Asia.
Moving on, USD/IDR may witness lackluster moves ahead of the key US employment data for April. However, the pair’s odds of rebound are high as forecasts suggest downbeat prints of the headline US Nonfarm Payrolls (NFP), expected 179K versus 236K prior.
Technical analysis
A downward-sloping support line from late January, near 14,590 by the press time, can keep offering a corrective bounce to the USD/IDR pair amid nearly oversold RSI conditions.
| Raw materials | Closed | Change, % |
|---|---|---|
| Silver | 26.046 | 1.68 |
| Gold | 2050.46 | -0.52 |
| Palladium | 1449.23 | 2.01 |
- USD/CNH has witnessed a recovery move to near 6.9200 after Caixin Services PMI failed to match estimates.
- Caixin Services PMI has landed at 56.4, marginally lower than the estimates of 56.5 and the former release of 57.8.
- Broadly, the USD Index is showing signs of volatility contraction ahead of the release of the US NFP data.
The USD/CNH pair has shown a recovery move from 6.9100 amid the release of the downbeat Caixin Services PMI data (April). The economic data has landed at 56.4, marginally lower than the estimates of 56.5 and the former release of 57.8.
This week, the Caixin Manufacturing PMI also failed to stand on expectations. The Caixin Manufacturing PMI was released at 49.5, lower than the estimates of 50.3 and the former release of 50.0. Despite fiscal and monetary support the Chinese economy is struggling to remain on track of progress after dismantling pandemic controls.
This has raised concerns in the minds of investors over the pace of economic recovery in the Chinese economy. The economy is continuously facing pressure from the vulnerable real estate sector and subdued households' demand.
S&P500 futures have added significant gains in the Asian session indicating an improvement in market sentiment. Investors are digesting the US banking jitters and are focusing more on optimism infused by neutral guidance from the Federal Reserve (Fed).
The US Dollar Index (DXY) has corrected to near 101.23 in the Tokyo session. On a broader note, the USD Index is showing signs of volatility contraction ahead of the release of the United States Nonfarm Payrolls (NFP) data. Investors are anticipating a decline in the number of job additions in April, however, upbeat labor market data could fuel the need of additional interest rate hikes by the Fed despite hints of pause that have already been delivered.
- Gold price grinds near all-time high marked after the Federal Reserve announcements.
- Mixed United States data, European Central Bank’s hawkish play weigh on US Dollar and propel XAU/USD price.
- Fears of US banking fallouts, debt ceiling expiration also exert downside pressure on the USD and favor the Gold buyers.
- US Nonfarm Payrolls, other employment data for April can offer Gold price retreat on upbeat outcome.
Gold price (XAU/USD) remains firmer as bulls flirt with the $2,050 round figure on the key United States Nonfarm Payrolls (NFP) Friday. The precious metal’s latest run-up could be linked to the US Dollar’s failure to defend the previous day’s corrective bounce amid mixed clues surrounding the US banking and debt ceiling concerns.
Gold price rise on dovish Fed hike, mixed US data
Gold price rejoices the Federal Reserve (Fed) hints to pause the rate hike trajectory after lifting the benchmark interest rates to the highest levels since 2007. The same joins Fed Chairman Jerome Powell’s cautious remarks, by suggesting the current monetary policy is at sufficiently restrictive levels, to weigh on the US Dollar and propel the Gold price.
On the other hand, preliminary readings of the US Nonfarm Productivity and Unit Labor Cost for the first quarter (Q1) of 2023 came in mixed. That said, Nonfarm Productivity dropped to -2.7% in Q1 from 1.6% prior and -1.8% market forecasts whereas the Unit Labor Cost jumped to 6.3% versus 5.5% expected and 3.3% prior. Further, the US Goods and Services Trade Balance improved to $-64.2B from $-70.6B prior and $-63.3B market forecast. Further, Initial Jobless Claims edge higher to 242K for the week ended on April 28 versus 240K expected and 229K in previous readings.
Hence, mixed US data and dovish Fed are the key catalysts behind the latest Gold price upside even if the pre-NFP anxiety restricts immediate moves of the XAU/USD.
ECB also plays its role in fueling XAU/USD price
Apart from the Federal Reserve (Fed) and US data, the European Central Bank’s (ECB) hawkish announcements also play their roles in weighing on the US Dollar and propelling the Gold price.
On Thursday, European Central Bank (ECB) matched market forecasts by announcing a 25 basis points (bps) increase in its benchmark rates. The ECB also announced faster dialing back of its Asset Purchase Programme (APP) to around EUR25 billion per month from July, from the current pace of EUR15 billion per month. In return for a smaller rate hike, the ECB chose to remain hawkish and shut the door for rate hike pause while saying, “Inflation outlook continues to be too high for too long."
With this, the ECB moves appear more hawkish than the Fed and hence keep the US Dollar bears hopeful, which in turn propels the Gold price.
Banking turmoil, US default woes and IMF updates strengthen Gold price upside
Qualitative catalysts surrounding the US bank fallouts, debt ceiling expiration and the International Monetary Fund’s (IMF) optimism surrounding Asian growth allow the Gold price buyers to remain hopeful.
Reuters quotes Fed data suggesting that a large part of the central bank's emergency lending activities in recent weeks were tied up with the now-shuttered First Republic Bank. On the same line was the news, shared via Reuters, “Pressure is growing on US regulators to take more steps to shore up the country's banking sector as a renewed rout in regional lenders' shares forced PacWest Bancorp to explore options to bolster its balance sheet.”
However, the Western Alliance's shares’ rebound after slumping by nearly 60%, backed by its rejection of concerns suggesting that the bank is exploring strategic options, challenged the previous pessimism.
Elsewhere, US policymakers remain at loggerheads about the default concerns and hence the issue can keep trolling the traders ahead of the likely expiry in June.
On the other hand, the IMF’s optimism surrounding the growth in China and India, one of the largest XAU/USD consumers, also favors the Gold buyers.
All eyes on US employment report
Gold buyers seem running out of steam ahead of the key United States employment data for April. Forecasts suggest an easing in the headline Nonfarm Payrolls (NFP) figures to 179K versus 236K prior, which in turn can propel the Gold price on marching forecasts.
Also read: US April Nonfarm Payrolls Preview: Analyzing Gold price's reaction to NFP surprises
Gold price technical analysis
Gold price portrays a bullish megaphone chart formation on the four-hour play, suggesting a gradual run-up of the XAU/USD price.
That said, the recently overbought conditions of the Relative Strength Index (RSI) line, placed at 14, join the receding bullish bias of the Moving Average Convergence and Divergence (MACD) indicator to hint at a pullback in the Gold price.
However, one-month-old horizontal support near $2,030 restricts the immediate downside of the XAU/USD quote.
Following that, the $2,000 round figure may lure the Gold sellers before highlighting the $1,980 support confluence comprising the stated megaphone’s bottom line and the 200-bar Exponential Moving Average (EMA).
It’s worth noting, however, a sustained break of $1,980 could open doors for the Gold bear’s dominance.
On the contrary, tops marked in 2022 and 2020, near $2,070 and $2,075 may prod immediate upside of the XAU/USD.
Adding to the upside filters is the megaphone’s top line, close to $2,080 at the latest, a break of which could propel the Gold price toward the $2,100 round figure.
Gold price: Four-hour chart
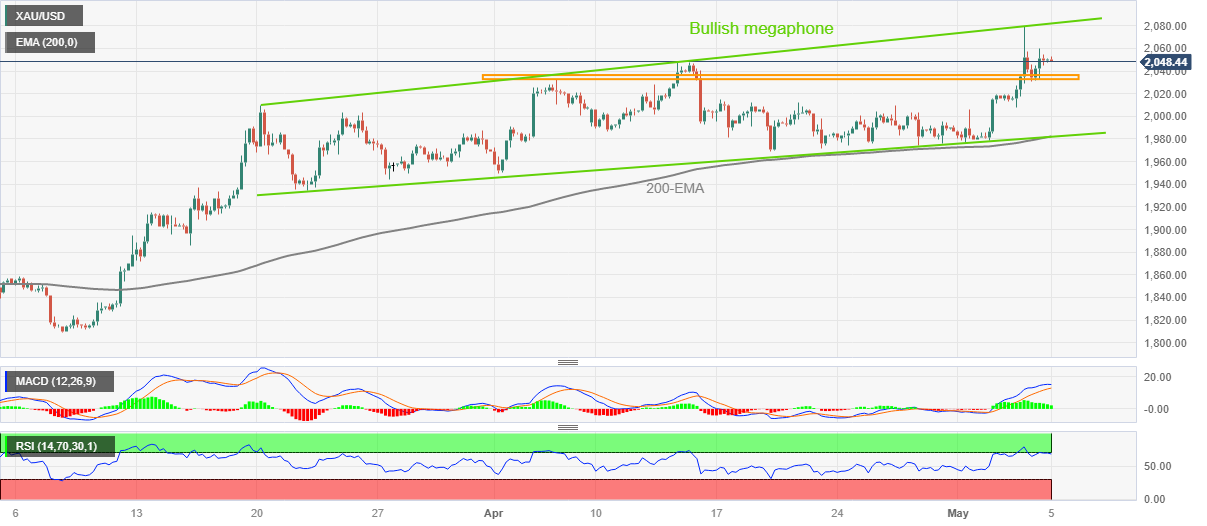
Trend: Limited upside expected
The China Caixin Services PMI, released by Markit Economics, has hit the market as follows:
- Actual 56.4 (forecast 57, previous 57.8).
´´China's service activity grew for a fourth straight month in April, a private-sector survey showed on Friday, as businesses continued to benefit from a return toward pre-pandemic levels of demand and output, although expansion slowed slightly,´´ Reuters has reported.
´´The figure echoed the official PMI released on Sunday, which showed a slightly slower pace of growth.´´
´´The world's second-biggest economy is facing an uneven recovery and some persistent headwinds, with strong activity in services and a contraction in manufacturing.
China's tourism rebounded to pre-COVID levels in the five-day May Day holidays as domestic travel rose by more than two-thirds from a year earlier, government data showed.
´It remains to be seen if the economic rebound is sustainable after a short-term release of pent-up demand, with a number of indicators flagging that the recovery has yet to find a stable footing,´said Wang Zhe, senior economist at Caixin Insight Group.´´
"In the future, relevant policies should focus on expanding domestic demand, stabilising employment and improving expectations, as well as improving the monetary transmission mechanism and creating a virtuous circle of economic development," said Wang.
AUD/USD update
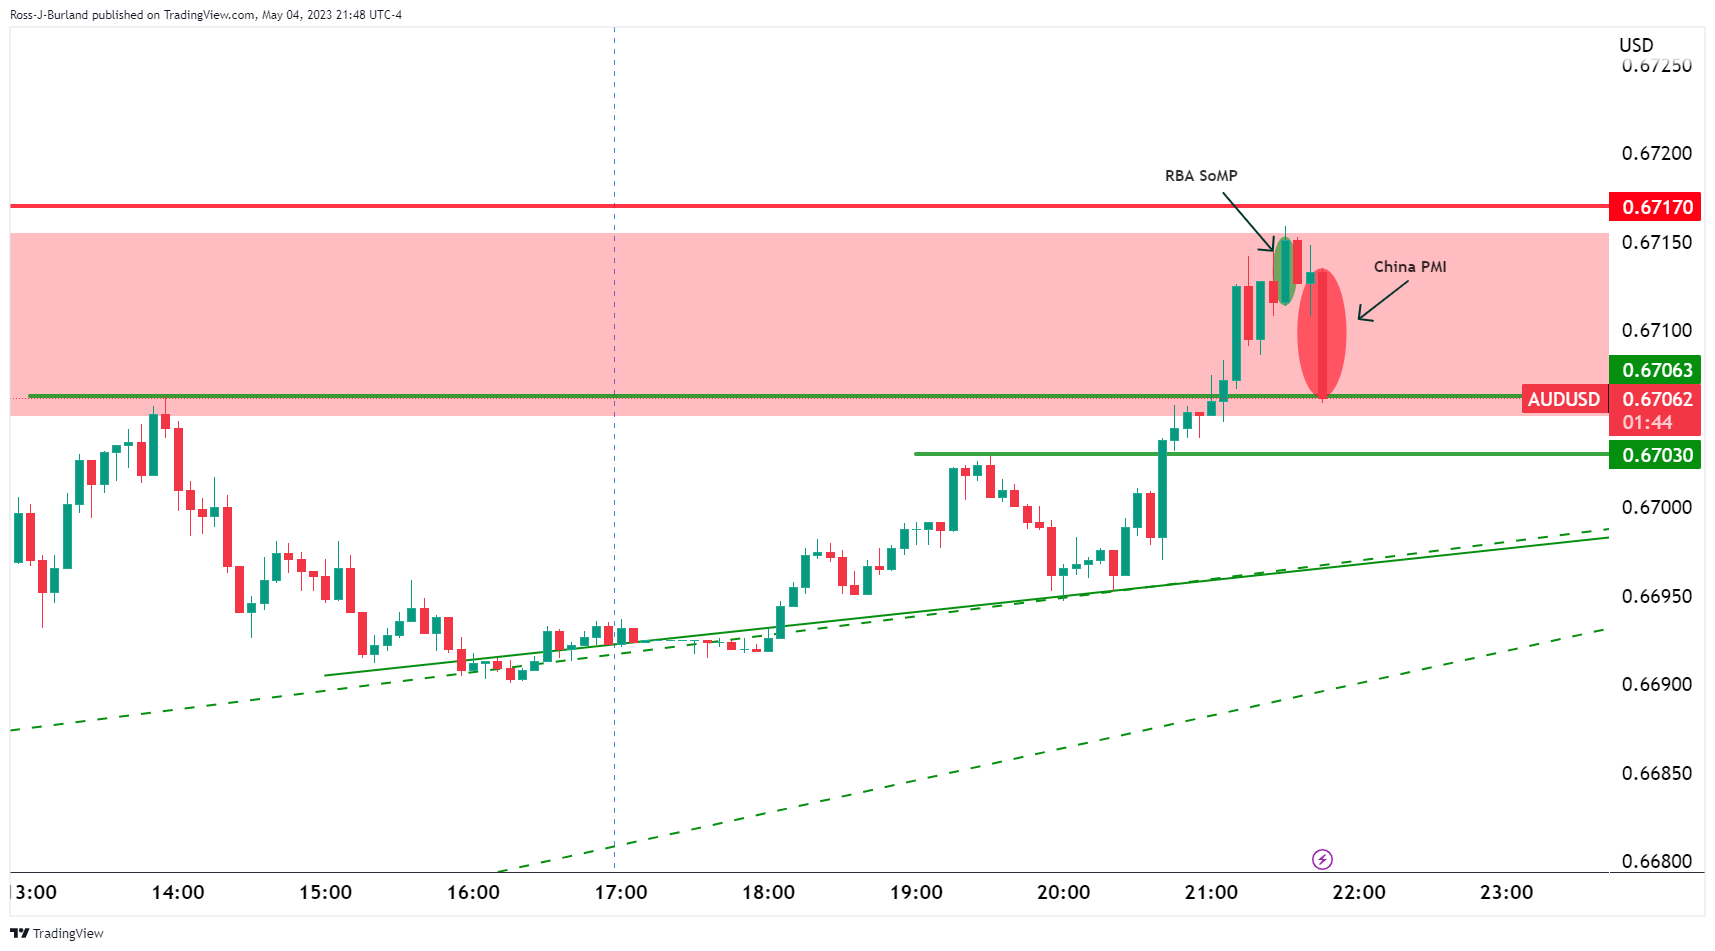
The price is two-way around the Reserve Bank of Australia's statement of Monetary Policy that came out just ahead of the Chinese data.
About the Caixin Services PMI
The Caixin Services PMI™, released by Markit Economics, is based on data compiled from monthly replies to questionnaires sent to purchasing executives in over 400 private service sector companies. The panel has been carefully selected to accurately replicate the true structure of the services economy.
- AUD/JPY picks up bids to stretch the previous day’s bounce off one-week low after key data, events.
- RBA MPS/SoMP portrays hawkish bias among the Aussie central bank officials.
- China’s Caixin Services PMI for April eases to 56.4 versus 56.5 expected and 57.8 prior.
- Cautious optimism in the markets ahead of the key US, Canada employment numbers favor pair buyers.
AUD/JPY pierces the 90.00 psychological magnet as it stretched the previous day’s rebound from a one-week low after upbeat outcomes from Australia and China during early Friday. Adding strength to the risk-barometer pair’s recovery moves could be the mildly positive sentiment in the market ahead of the US and Canada jobs report. However, holidays in Japan restrict the cross-currency pair’s immediate moves.
In its quarterly Monetary Policy Statement (MPS), the Reserve Bank of Australia (RBA) showed readiness for further rate hikes and defend hawks after surprising markets with a 0.25% rate lift earlier in the week. Also positive for the AUD/JPY pair were the upbeat economic forecasts and statements citing inflation fears in the Pacific major, not to forget hopes for China’s upbeat economic growth. It’s worth noting that the RBA’s MPS is also known as the Statement on Monetary Policy (SoMP).
Also read: RBA Monetary Policy Statement: Further rate hikes may be needed
On the other hand, China’s Caixin Services PMI for April eases to 56.4 versus 56.5 expected and 57.8 prior. Earlier in the week, China’s Caixin Manufacturing PMI for April dropped to 49.5 versus 50.3 expected and 50.0 prior while the official NBS Manufacturing PMI offered a negative surprise before the Chinese markets went on a long holiday until Thursday.
On a different page, US banking sector woes join looming default fears to challenge the market sentiment. However, recent actions from the US policymakers and comments suggesting no immediate fears of the banking crisis seemed to have joined the Federal Reserve’s (Fed) dovish hike to allow the bears to take a breather ahead of the key US Nonfarm Payrolls (NFP) data.
While portraying the mood, S&P 500 Futures print mild gains even if Wall Street benchmarks closed in the red. Further, the US Treasury bond yields ended Thursday’s North American session on the downside but an absence of Japanese traders limit bond market moves in Asia.
Having witnessed the initial reaction of the RBA MPS and China data, the AUD/JPY pair traders should concentrate on the qualitative factors amid a lack of major data from Australia and holidays in Japan. With this, the latest risk catalysts surrounding the US banking fallouts, debt ceiling expiry and pre-NFP caution will be in the spotlight.
Above all, the contrasting bias of the RBA and the Bank of Japan (BoJ) officials keeps the AUD/JPY pair on the bull’s radar.
Technical analysis
Thursday’s Dragonfly Doji candlestick joins the AUD/JPY pair’s rebound from the 50-DMA, around 89.45 by the press time, keeping the buyers hopeful.
- AUD/USD has swiftly crossed the crucial resistance of 0.6700 amid hawkish RBA minutes.
- A scrutiny of the Trade Balance report showed that Australian goods exports to China rose by 31% on an annual basis.
- The street is anticipating a decline in the number of fresh payrolls addition in the US labor market to 179K from the former release of 236K.
The AUD/USD pair has climbed strongly above the round-level resistance of 0.6700 amid the release of hawkish Reserve Bank of Australia (RBA) minutes. The minutes claim that more rate hikes will be announced if inflation continues to remain persistent. Interest rates would drop to 3% in mid-2025. The RBA believes that energy prices will considerably contribute to inflation in the coming year.
This week, the RBA unexpectedly hiked its Official Cash Rate (OCR) by 25 basis points (bps) to 3.85%. It seems that RBA Governor Philip Lower considered that the current monetary policy is not restrictive enough to tame Australian inflation or inflation expectations are still solid and need for interest rates right now to curb the forward mess.
On Thursday, the Australian Dollar remained in action after the release of the upbeat Trade Balance data. A scrutiny of the Trade Balance report showed that Australian goods exports to China rose by 31% to hit A$19 billion in March on an annual basis. Reuters reported that the world’s second-largest economy, China sucked more iron from the Australian steel industry and lowered barriers to thermal coal shipments amid growing diplomatic relations.
Meanwhile, the US Dollar Index (DXY) has retreated after a short-lived pullback to near 101.25. The USD Index is expected to test its crucial support of 101.00 amid headwinds of the US banking crisis and debt ceiling issues.
For further guidance, US official labor market data (April) will be keenly watched. The street is anticipating a decline in the number of fresh payrolls addition to 179K from the former release of 236K. However, the Unemployment Rate is seen unchanged at 3.5%.
The RBA Monetary Policy Statement released by the Reserve Bank of Australia is out as follows:
Projections are based on a 3.75% rate peak, with rates dropping to 3% by mid-25.
Further monetary policy tightening may be required.
Energy prices will contribute considerably to inflation in the coming year.
We are steadfast in the commitment to return inflation to target.
The board intends to keep as much employment gains as possible.
The longer inflation remains above target, the higher the likelihood of a price-wage spiral.
Goods disinflation has been minimal thus far, but energy price inflation will remain high this year.
Forecast cpi inflation of 4.5% in 2023, 3.2% in 2024, and 3.0% in mid-2025.
Forecast trimmed mean inflation of 4.0% by the end of 2023, 3.1% by the end of 2024, and 2.9% by the middle of 2025.
China is projected to easily meet its 5% growth target this year.
Forecasts GDP growth of 1.2% in 2023, 1.7% in 2024, and 2.1% in mid-2025.
AUD/USD update
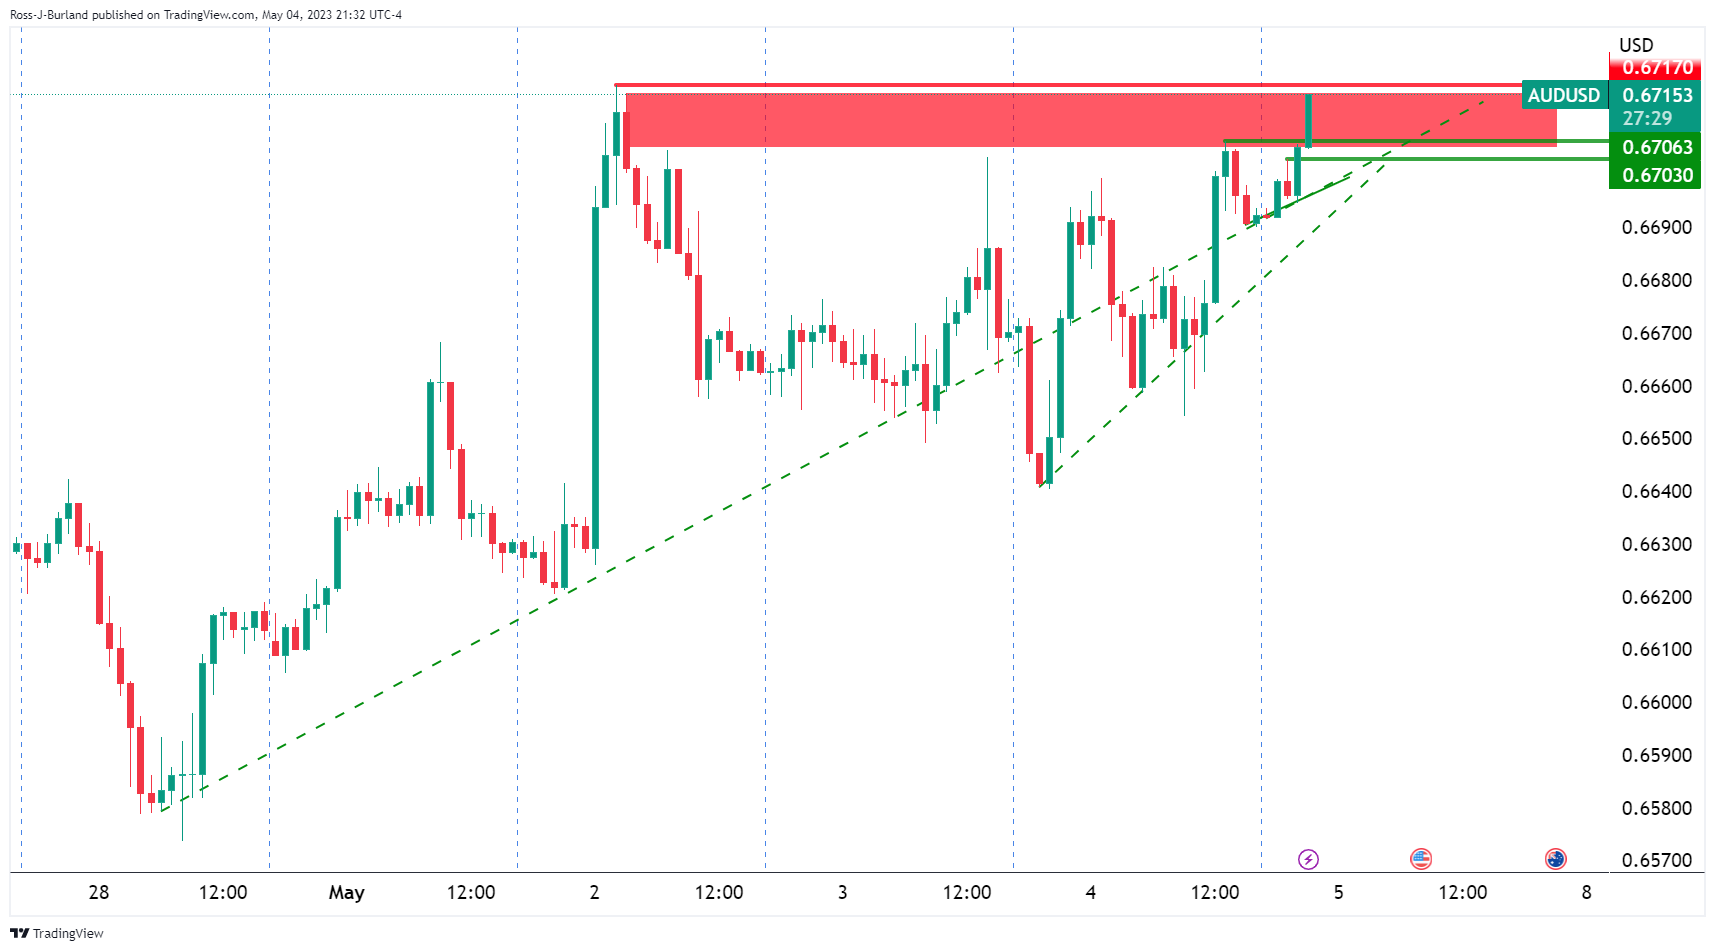
H1 chart above and M5 chart below.
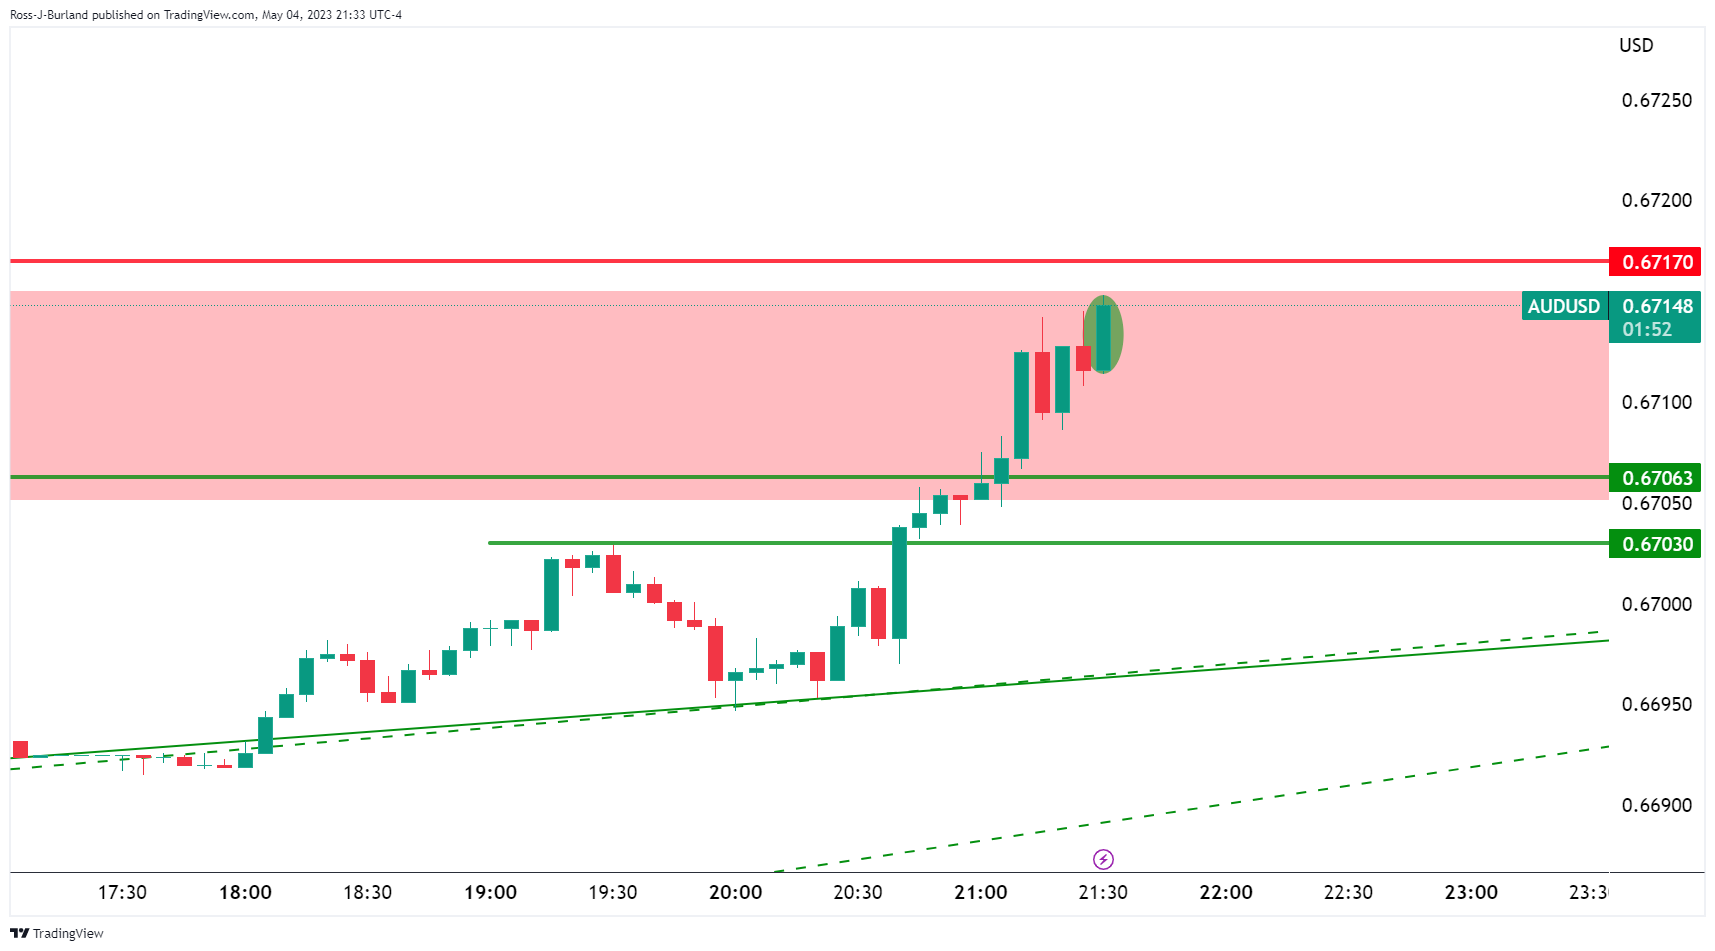
AUD/USD has been given a boost on the statements towards 0.6717, Tuesday's high.
About the RBA Monetary Policy Statement
The RBA Monetary Policy Statement released by the Reserve Bank of Australia reviews economic and financial conditions, determines the appropriate stance of monetary policy and assesses the risks to its long-run goals of price stability and sustainable economic growth. It is considered as a clear guide to the future RBA interest rate policy. Any changes in this report affect the AUD volatility. If the RBA statement shows a hawkish outlook, that is seen as positive (or bullish) for the AUD, while a dovish outlook is seen as negative (or bearish).
- GBP/USD picks up bids to cross short-term key resistance line during three-day uptrend.
- Sustained trading beyond 21-DMA, upbeat RSI (14) keeps Cable buyers hopeful.
- Pound Sterling bears need to crack 1.2320 support confluence to retake control.
GBP/USD bulls keep the reins at the highest levels in 11 months as they poke a one-month-old resistance line near 1.2600 on early Friday. In doing so, the Cable pair rises for the third consecutive day despite sticking to mild gains amid the cautious mood ahead of the US Nonfarm Payrolls (NFP) data for April.
Given the Pound Sterling’s successful trading above the 21-DMA support, around 1.2470 at the latest, the pair buyers are hopeful of crossing the immediate upside hurdle. Adding strength to the bullish bias is the above 50 levels of the RSI (14) line, not overbought.
With this, the GBP/USD buyers are well set to challenge the mid-2022 peak of around 1.2665, which in turn highlights the 1.2700 round figure for them.
Meanwhile, a downside break of the 21-DMA support of 1.2470 isn’t an open welcome to the GBP/USD pair sellers as a convergence of an upward-sloping trend line from September 2022 and a descending trend line from late 2022, close to 1.2320, appears a tough nut to crack for the bears.
It’s worth noting that the 1.2300 round figure and August 2022 high of around 1.2290 adds to the list of downside filters for the Cable pair.
Overall, GBP/USD is like to grind higher unless the US jobs report offer positive surprise.
Also read: US April Nonfarm Payrolls Preview: Analyzing Gold price's reaction to NFP surprises
GBP/USD: Daily chart
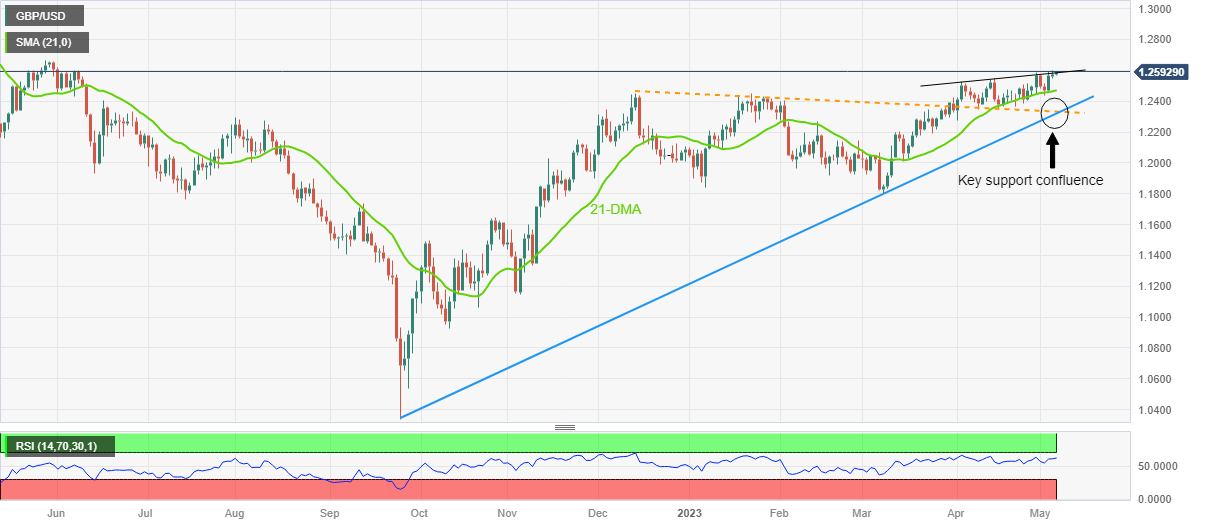
Trend: Further upside expected
In recent trade today, the People’s Bank of China (PBOC) set the yuan at 6.9114 vs. the previous closing of 6.9128.
About the fix
China maintains strict control of the yuan’s rate on the mainland.
The onshore yuan (CNY) differs from the offshore one (CNH) in trading restrictions, this last one is not as tightly controlled.
Each morning, the People’s Bank of China (PBOC) sets a so-called daily midpoint fix, based on the yuan’s previous day's closing level and quotations taken from the inter-bank dealer.
- EUR/JPY is struggling in stretching its recovery above 148.00 ahead of Eurozone Retail Sales.
- ECB Lagarde announced ‘loud and clear’ that more than one additional rate hikes are in the pipeline.
- An exit from the ultra-loose monetary policy by the BoJ could bring a broader recovery in the Japanese Yen.
The EUR/JPY pair is struggling in extending its recovery above the immediate resistance of 148.00 in the Asian session. The cross is experiencing pressure as investors are awaiting the release of Eurozone Retail Sales data (April).
On Thursday, the Euro went through a lot of pain after the European Central Bank (ECB) concluded the suspense and hiked interest rates by 25 basis points (bps) to 3.25%. The 50-bps rate hike spell by the ECB terminated and it went for a smaller interest rate hike as the Eurozone economy is meaningfully responding to the monetary policy.
The ECB went for a smaller interest rate hike amid a weak Eurozone growth rate and falling credit disbursement from Eurozone commercial banks as firms are failing to tackle the burden of higher borrowing costs and a bleak economic outlook.
However, in the monetary policy statement, ECB President Christine Lagarde announced ‘loud and clear’ that more than one additional rate hikes are in the pipeline as the fight against stubborn inflation is far from over.
Going forward, Eurozone Retail Sales will be keenly watched. As per the estimates, monthly Retail Sales have remained flat vs. a contraction of 0.8% recorded in March. The annual retail demand is seen extending its contraction to 3.1% from the former contraction of 3.0%.
On the Japanese Yen front, investors believe that an exit from the ultra-loose monetary policy by the Bank of Japan (BoJ) could bring a broader recovery in the Japanese Yen. However, Japan’s declining consumer inflation expectations are forcing the BoJ to maintain an expansionary policy stance.
- NZD/USD bulls in the market but are meeting key resistance.
- Trendline support could come under pressure with high volatility anticipated.
As per the prior analysis, NZD/USD Price Analysis: Bulls take on 0.62s and eye 50% mean reversion, whereby it was stated that the price was running towards a micro daily trendline resistance and that a correction from around the resistance could play out, the following eventuated:
NZD/USD prior analysis
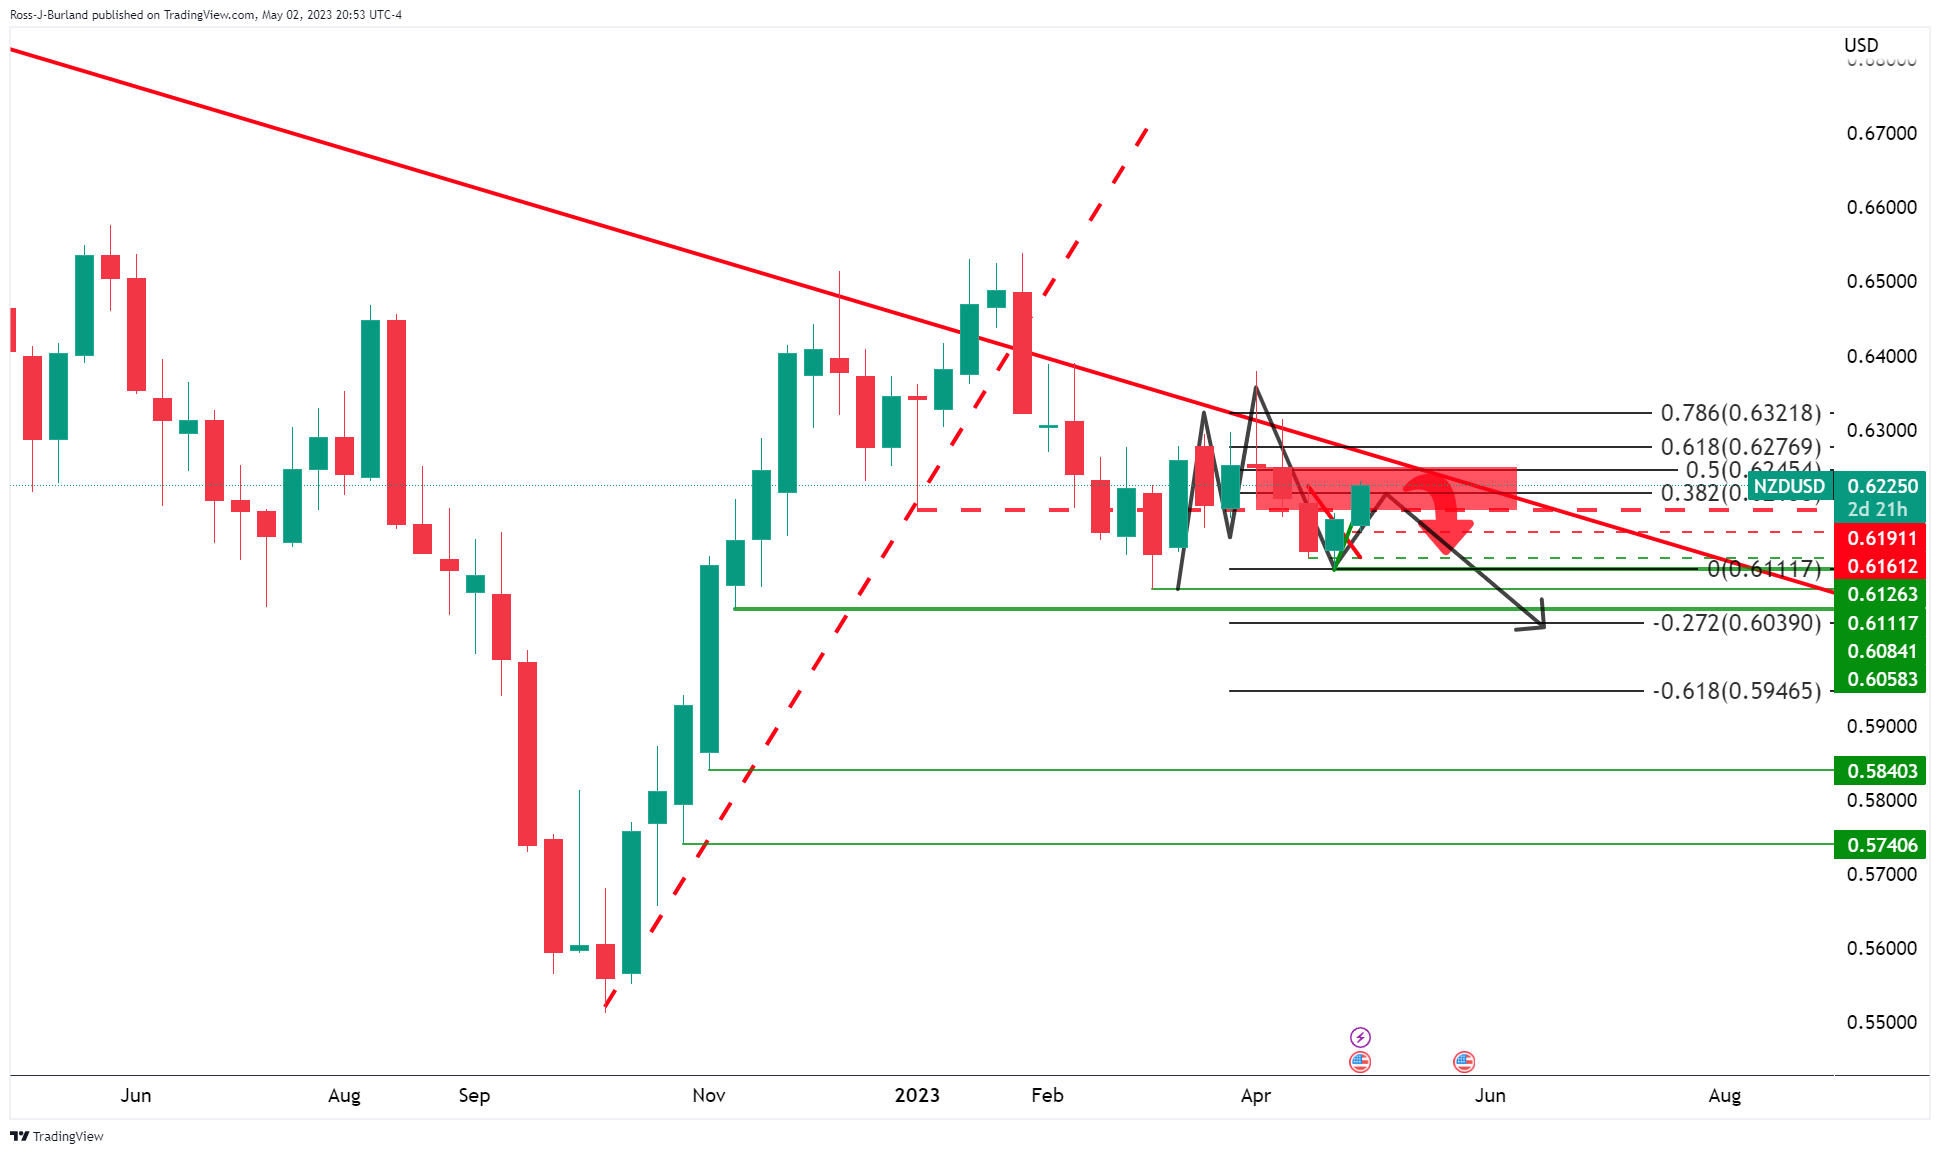
The weekly chart showed the price moving into the neckline resistance area that is below the trendline resistance. A move beyond the neckline was said to leave the trendline resistance vulnerable with the 50% mean reversion area eyed.
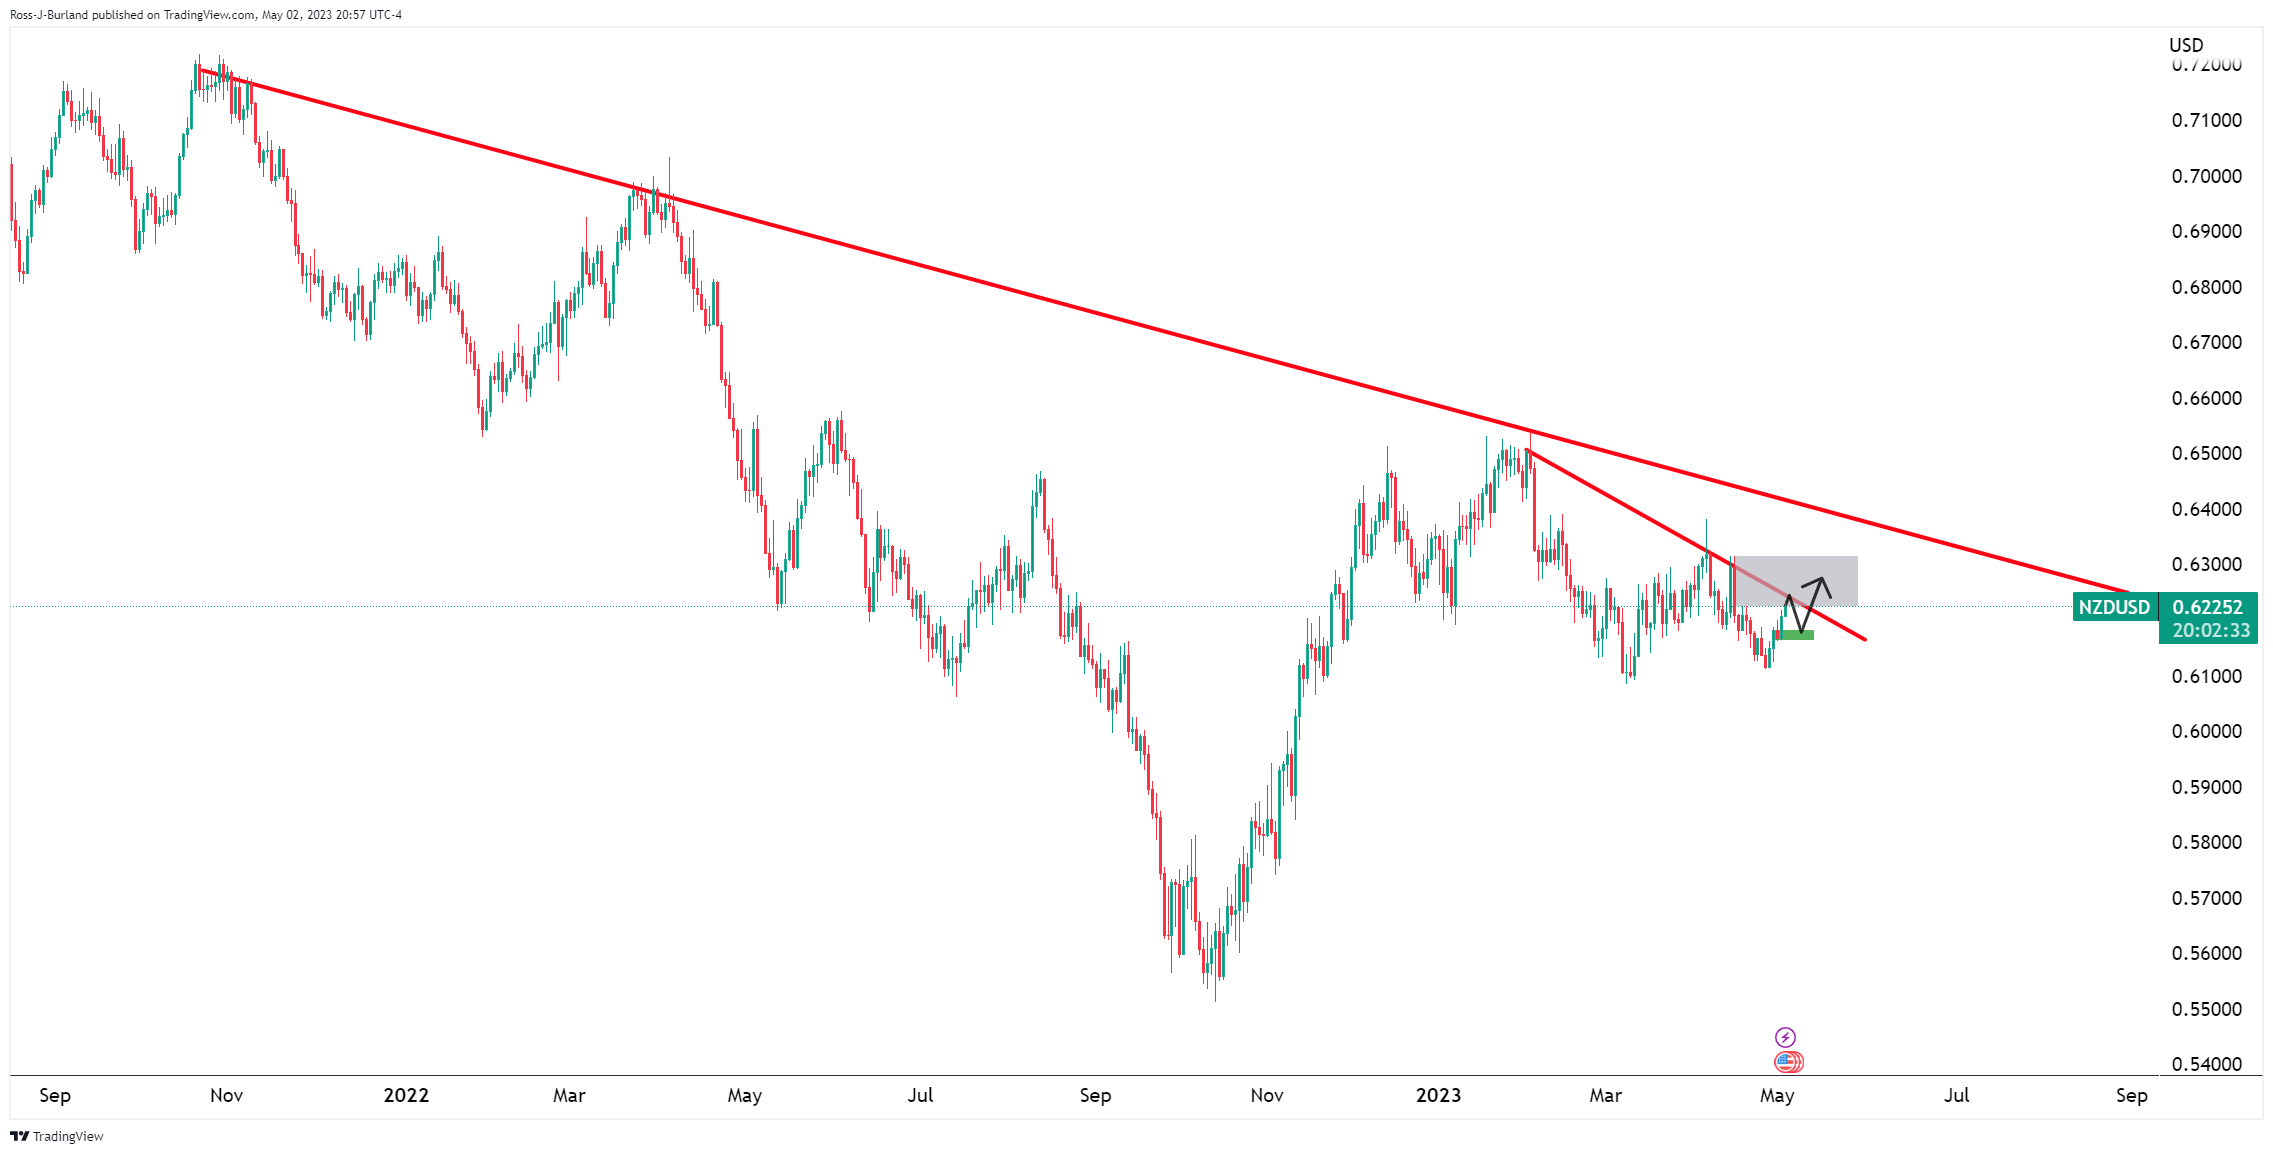
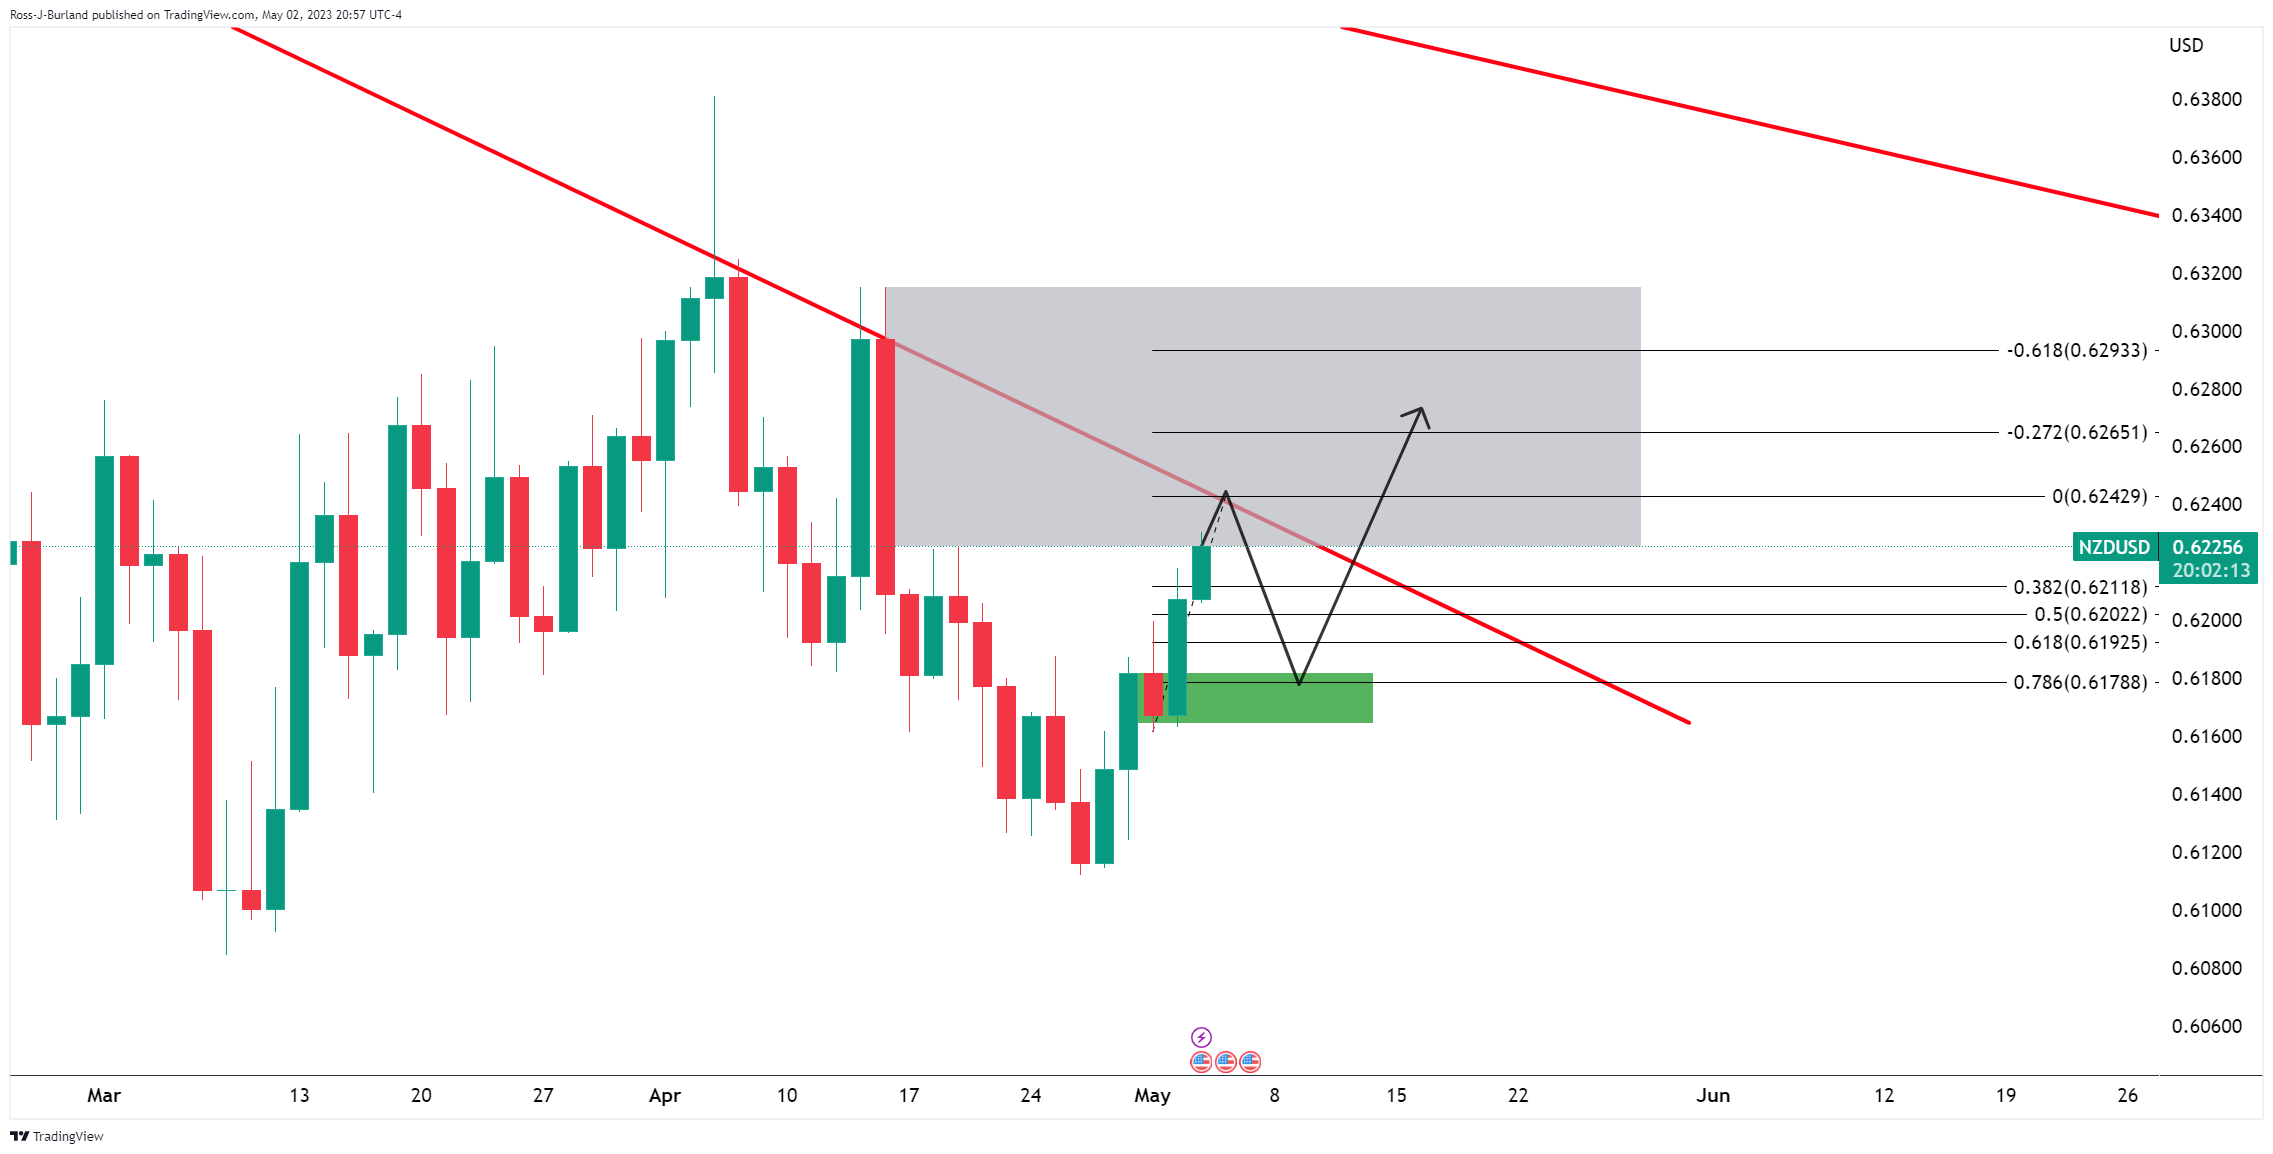
NZD/USD H4 chart
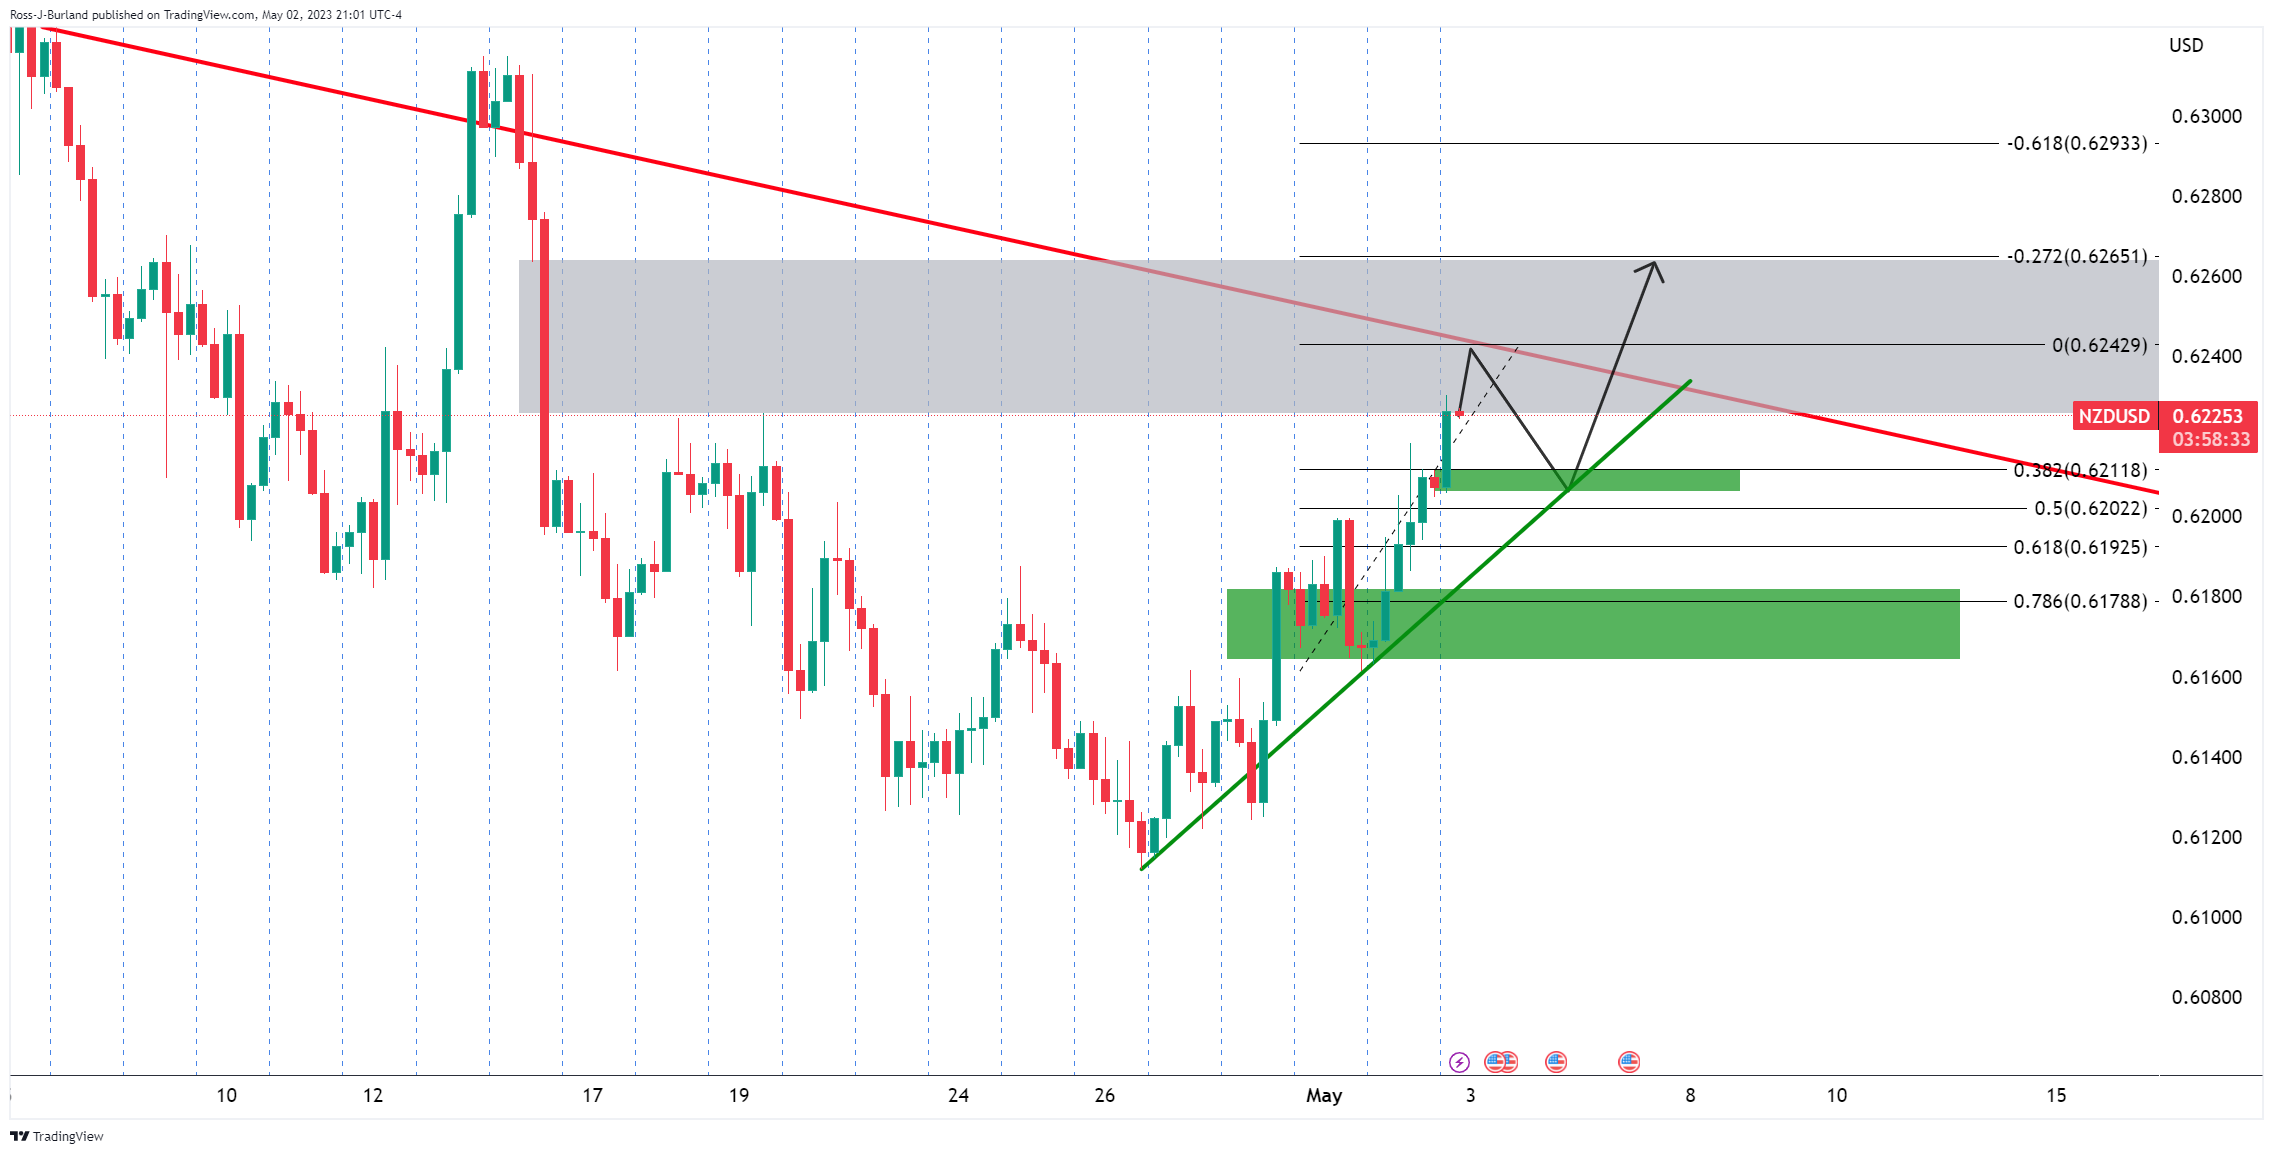
It was stated that the bears could be looking to target the 38.2% Fibonacci in this regard on a Fibo measurement drawn between the swing lows near 0.6160 and the trendline resistance.
NZD/USD updates
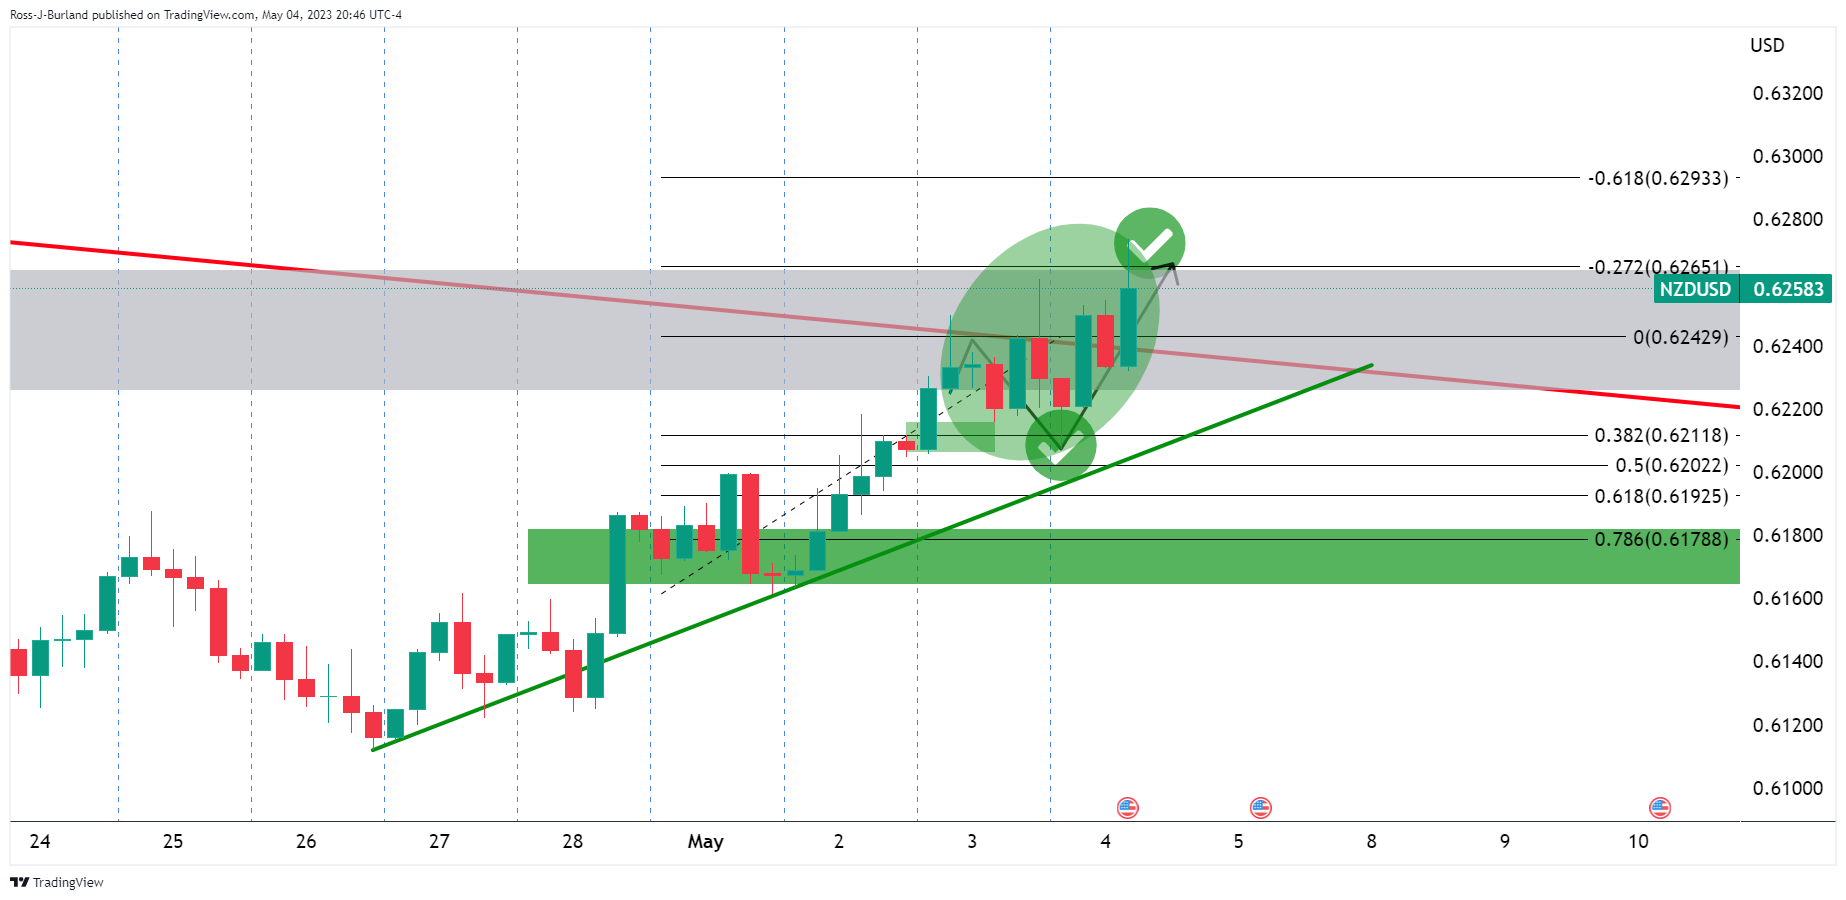
It was also noted that there was a price imbalance in the greyed area on the 4-hour chart that could have been mitigated if the bulls were to stay in control.
We had the touch of the 38.2% ratio and a subsequent rally into the 0.6260s. In turn, this hit the 50% mean reversion as per the M-formation on the weekly chart:
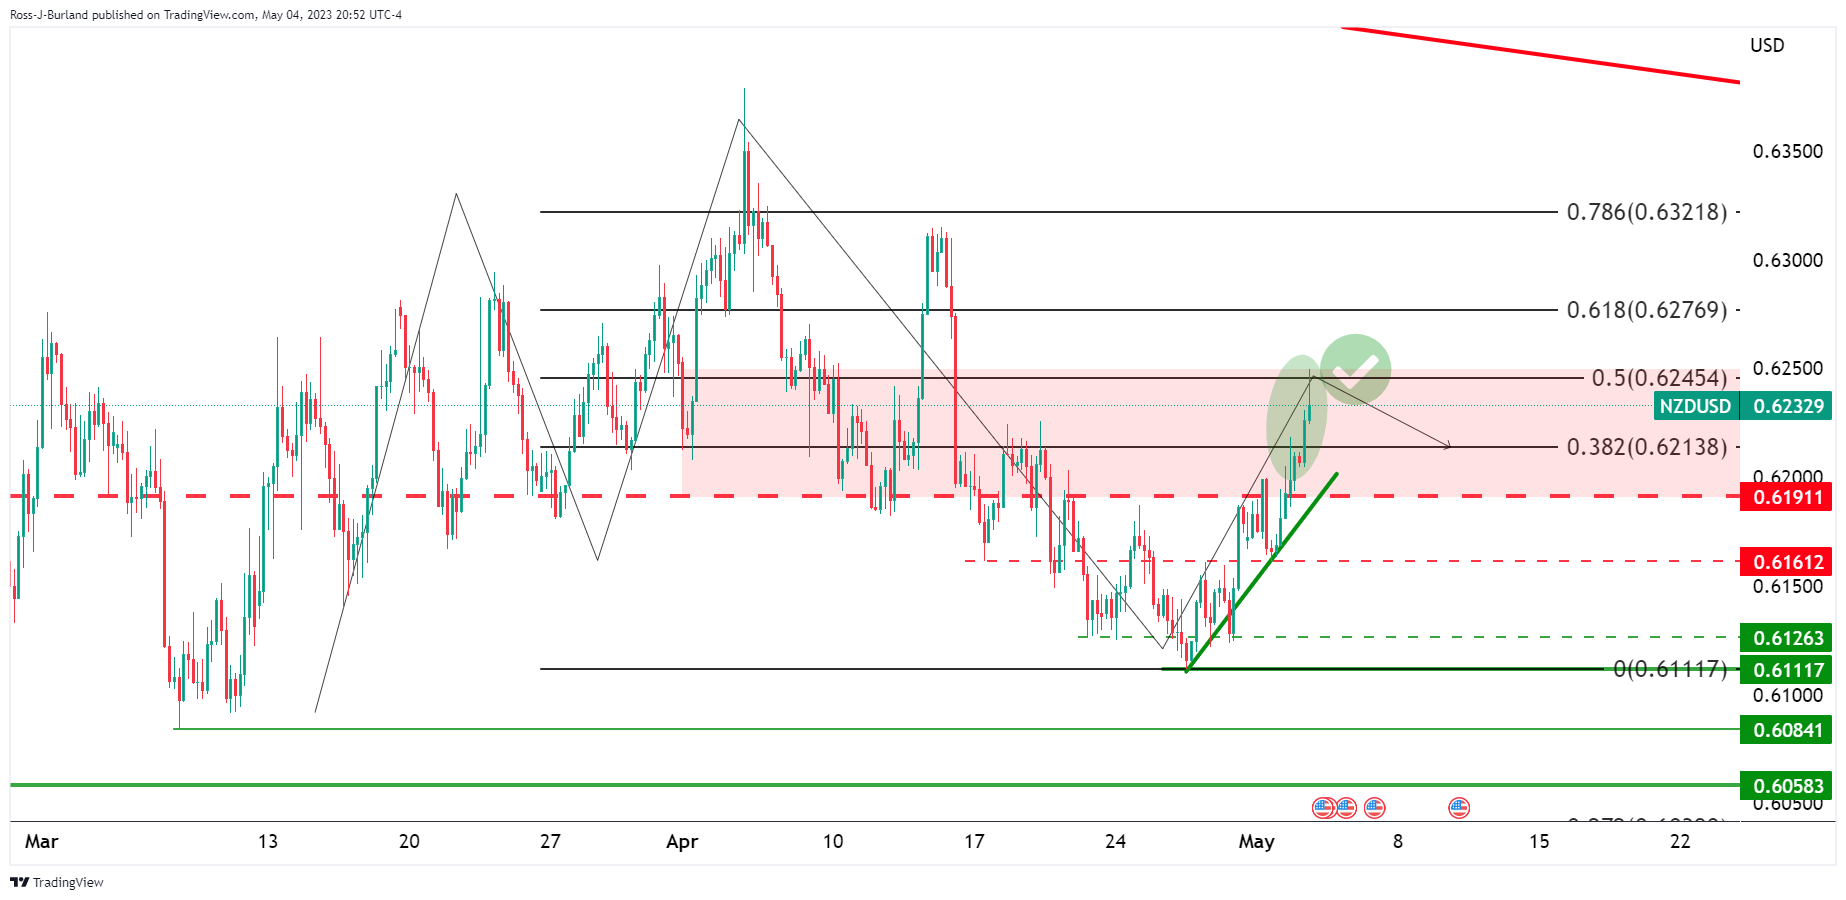
However, the bulls stayed in control and have taken on territory towards 0.63 the figure as per the following weekly chart:
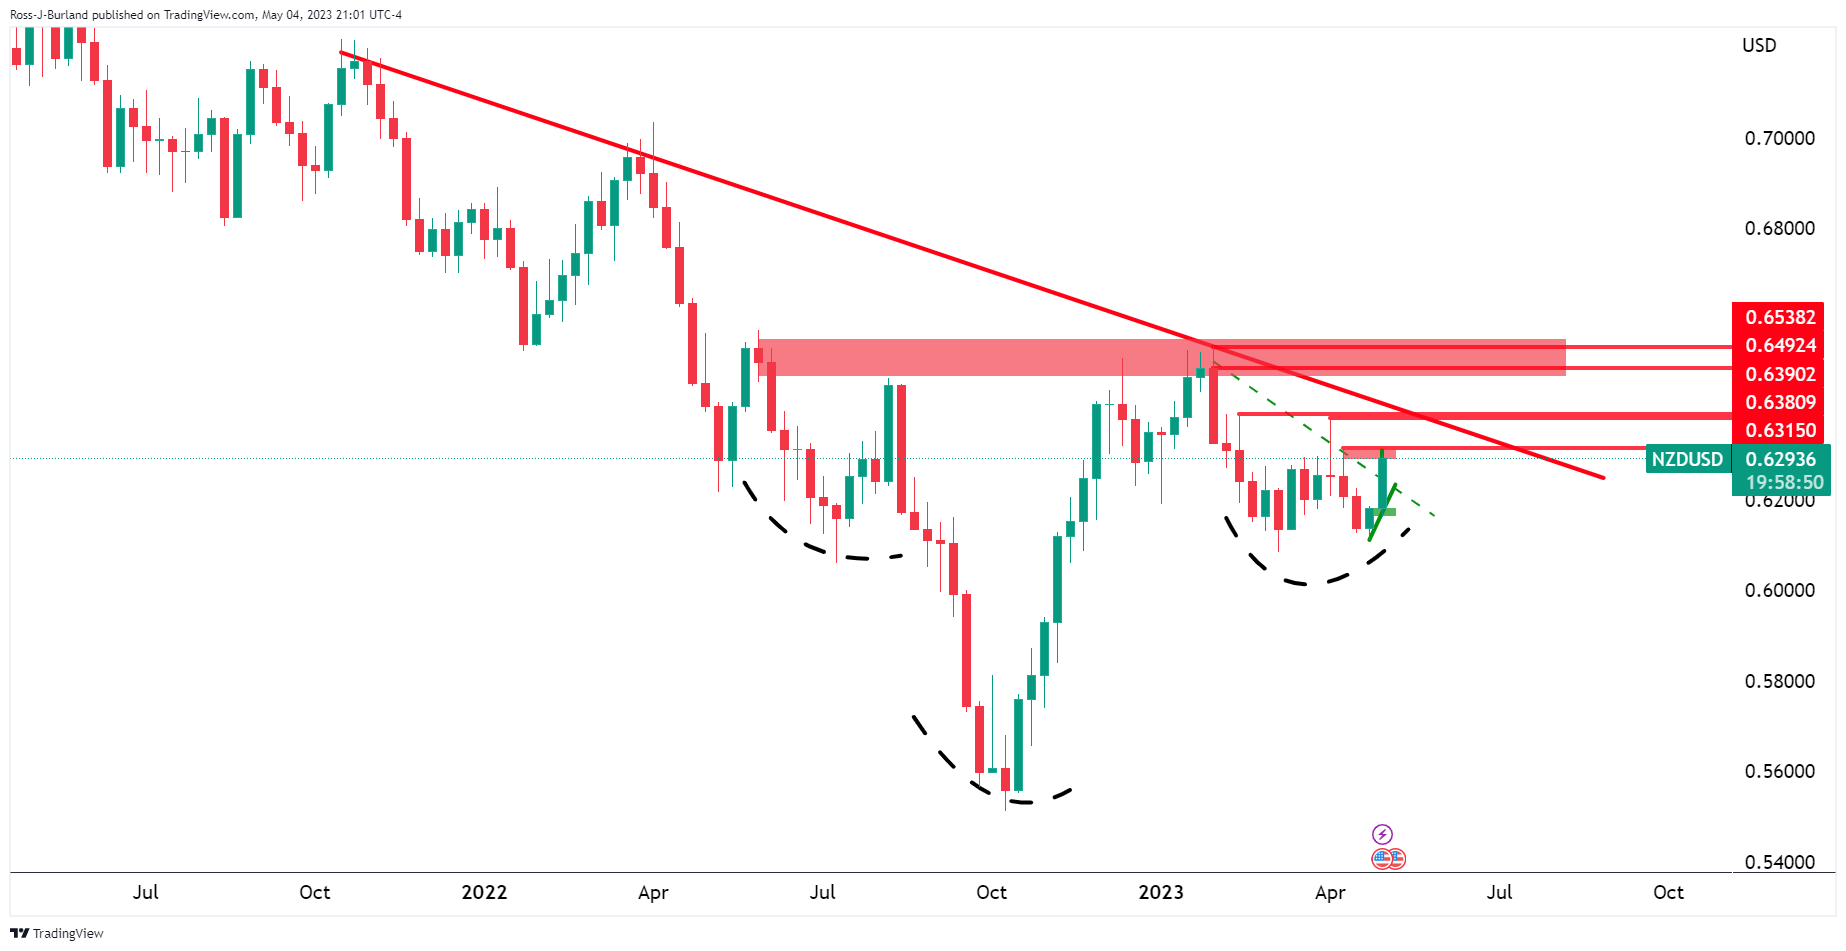
Note the bullish inverses head and shoulders as well?
Moving to the H4 chart:
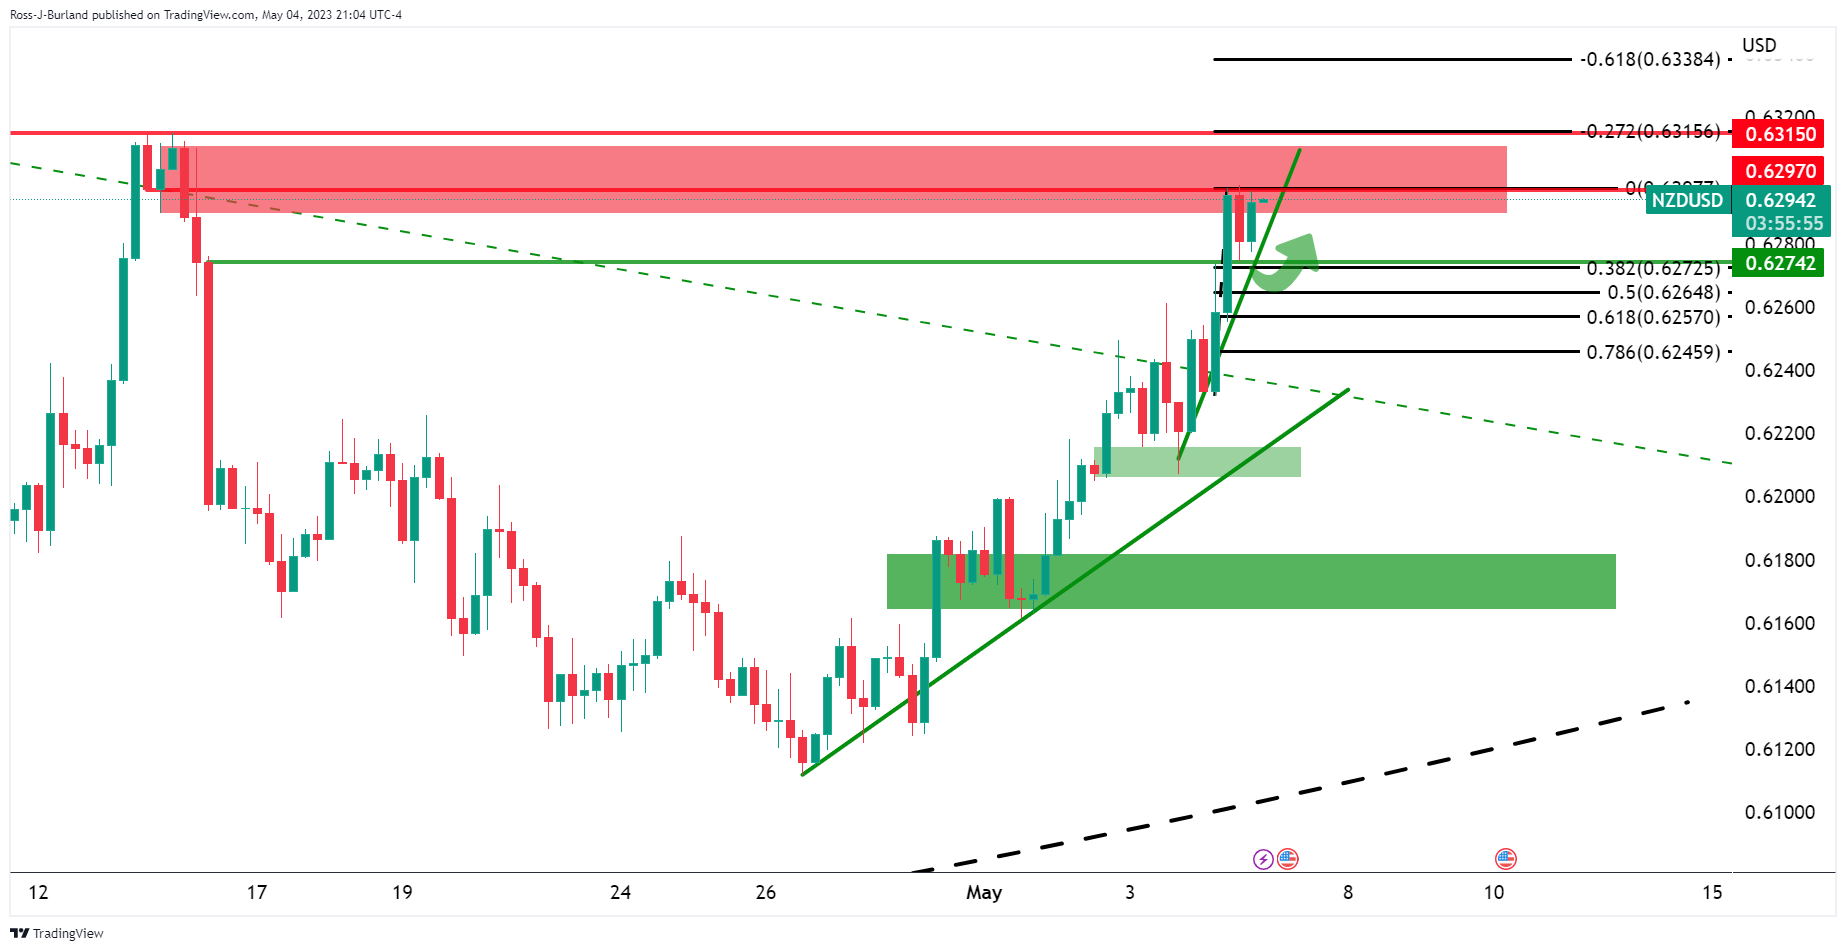
We are at a critical area of resistance here and a test of the supporting dynamic trendline could be in play, especially given the high volatility event in the Nonfarm Payrolls in the US session coming up. 0.6270s will be key in this regard that is meeting the 38.2% Fibonacci ratio and structural support:
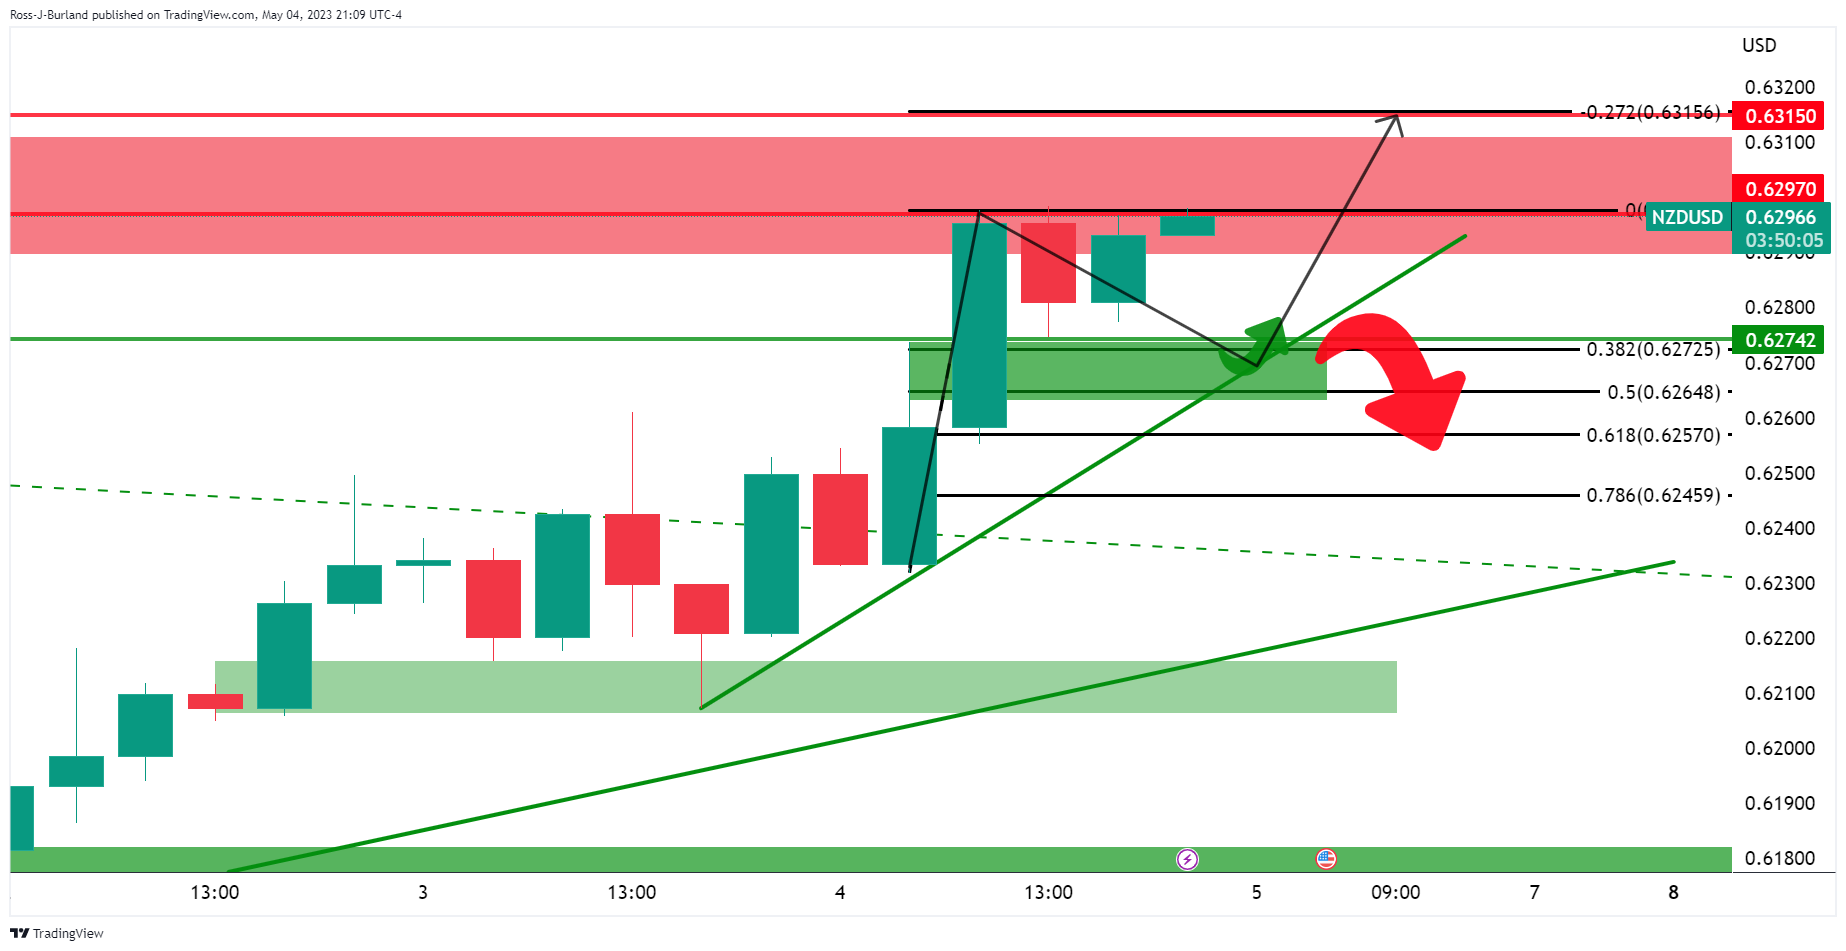
- USD/CAD drops to the lowest levels in two weeks amid three-day downtrend.
- BoC’s Macklem appeared a bit more hawkish than Fed’s Powell and favored Loonie bulls.
- Oil price struggles to recover amid recession woes.
- Mixed US data escalates anxiety ahead of key US, Canada jobs report, NFP is the key.
USD/CAD renews a two-week low around 1.3520 as it cheers broad US Dollar weakness, as well as hawkish commentary from the Bank of Canada (BoC) Governor Tiff Macklem, to defend the latest bearish bias during a mid-Asian session on Friday.
That said, BoC’s Macklem said if they start to see signs that inflation is likely to get stuck materially above their 2% target, they are prepared to raise interest rates further.
On the contrary, Fed Chairman Jerome Powell appeared slightly cautious while suggesting that the current monetary policy is at sufficiently restrictive levels.
Elsewhere, WTI crude oil price remains steady near $68.60, fading the previous day’s bounce off the lowest levels since December 2021, as fears of recession and banking fallouts contrast with the softer US Dollar-led corrective bounce.
It should be noted that the mixed data also prod the USD/CAD traders from calling in fresh bids. That said, preliminary readings of Nonfarm Productivity and Unit Labor Cost for the first quarter (Q1) of 2023 came in mixed. That said, Nonfarm Productivity dropped to -2.7% in Q1 from 1.6% prior and -1.8% market forecasts whereas the Unit Labor Cost jumped to 6.3% versus 5.5% expected and 3.3% prior. Further, the US Goods and Services Trade Balance improved to $-64.2B from $-70.6B prior and $-63.3B market forecast. Further, Initial Jobless Claims edge higher to 242K for the week ended on April 28 versus 240K expected and 229K in previous readings.
Contrary to the US data, downbeat prints of Canada’s Ivey Purchasing Managers’ Index for April, and an improvement in Canadian International Merchandise Trade for March, seem to weigh on the Loonie pair.
Amid these plays, S&P 500 Futures print mild gains even if Wall Street benchmarks closed in the red. Further, the US Treasury bond yields ended Thursday’s North American session on the downside but an absence of Japanese traders limit bond market moves in Asia.
Moving ahead, USD/CAD may witness lackluster moves ahead of the key US and Canada employment data. However, the Loonie pair’s odds of rebound are high as forecasts suggest downbeat prints of the headline US Nonfarm Payrolls (NFP), expected 179K versus 236K prior.
Technical analysis
Even if the 100-DMA continues to challenge the USD/CAD pair sellers in the last two weeks, the impending bear cross on the MACD and steady RSI suggests a clear break of the 1.3525 DMA support this time. Alternatively, the Loonie pair’s surprise bounce can’t convince the bulls unless crossing a descending resistance line from March 10, near 1.3640 by the press time.
- AUD/USD is consistently struggling for an acceptance above 0.6700.
- Solid Aussie Trade Balance data has improved the outlook for the Australian Dollar.
- AUD/USD is on the verge of delivering a breakout of the Inverted H&S pattern.
The AUD/USD pair is continuously facing barricades near the round-level resistance of 0.6700 in the Asian session. The Aussie asset remained in action on Thursday after upbeat Australian Trade Balance data.
The Australian Trade Balance data showed that exports of Australian goods to China hit A$19 billion ($12.71 billion) in March, a rise of 31% from a year earlier and piping the previous peak from mid-2021, as reported by Reuters. Also, the Trade Balance report showed that the Asian powerhouse ordered plenty of iron from the Australian steel industry and lowered barriers to thermal coal shipments amid growing diplomatic relations. This has improved the Australian Dollar outlook swiftly.
Meanwhile, the US Dollar Index (DXY) has corrected to near 101.36 as US banking jitters and debt ceiling issues are consistently weighing. Also, investors are cautious ahead of the United States Nonfarm Payrolls (NFP) data.
AUD/USD is on the verge of delivering a breakout of the Inverted Head and Shoulder (H&S) chart pattern formed on a two-hour scale. Usually, an inverted H&S formation indicates prolonged consolidation, and a breakout of the same results in a bullish reversal.
The 10-period Exponential Moving Average (EMA) at 0.6688 is providing cushion to the Aussie bulls.
Meanwhile, the Relative Strength Index (RSI) (14) is making efforts for shifting into the bullish range of 60.00-80.00. An occurrence of the same will activate the upside momentum.
Going forward, a confident move above My 02 high at 0.6717 will drive the Aussie asset toward April 20 high at 0.6771 followed by the round-level resistance at 0.6800.
In an alternate scenario, US Dollar bulls will flex their muscles if the Aussie asset will drop below March 15 low at 0.6590. An occurrence of the same will expose the asset to March 08 low at 0.6568 followed by 02 November 2022 high around 0.6500.
AUD/USD two-hour chart
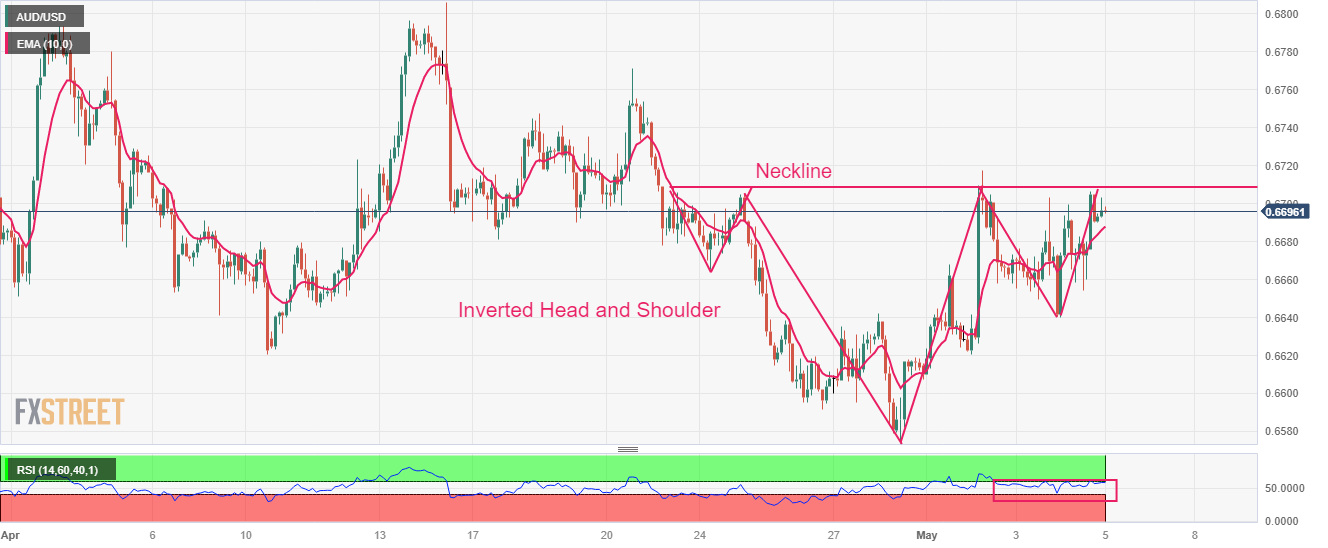
Early Friday morning in Asia, at 01:30 GMT, the Reserve Bank of Australia (RBA) will release its quarterly prints of the Monetary Policy Statement (MPS).
The Australian central bank surprised markets by announcing a 0.25% rate hike earlier in the week, after pausing its 10-time rate hike trajectory in the previous monetary policy meeting. However, the policymakers have been trying to convince markets that they can defend the hawkish rate lift cycle, which in turn makes today’s RBA MPS more important for the AUD/USD pair traders.
Apart from looking at the catalysts that helped RBA surprise markets in the last few monetary policy meetings, the economic forecasts will also be important for the AUD/USD pair traders to watch in today’s RBA updates.
Ahead of the event, FXStreet’s Matias Salord said,
The Reserve Bank of Australia (RBA) will release the Monetary Policy Statement on Friday. The report shows the bank's assessment of current economic conditions, both domestic and international, along with the outlook for Australian inflation and output growth. What it says and the projections will be relevant for market participants and for monetary policy expectations.
How could the minutes affect AUD/USD?
AUD/USD portrays the market’s pre-event anxiety as it makes rounds to 0.6700 after rising in the last four consecutive days. The Aussie pair previously took clues from the broad US Dollar weakness, as well as the hawkish surprise from the RBA. Adding strength to the upside momentum is the dovish Fed hike and upbeat Australian trade numbers.
Given the recent divergence between the RBA and the Fed’s actions, today’s RBA MPS will be closely watched for linkages on future moves of the Aussie central bank. Should the RBA manages to defend its recent hawkish play, as well as suggest some more in the pipeline, the AUD/USD prices may have further upside to trace.
Technically, AUD/USD needs to provide a daily closing beyond a downward-sloping resistance line from February 14, near 0.6710, to regain the market’s confidence in marking another battle with the 100-DMA hurdle of around 0.6790.
Key Notes
AUD/USD climbs despite risk aversion amidst Fed’s rate hike; RBA SoMP eyed
AUD/USD Forecast: A bullish Aussie tests levels above 0.6700
About the RBA MPS
The RBA Monetary Policy Statement released by the Reserve bank of Australia reviews economic and financial conditions, determines the appropriate stance of monetary policy and assesses the risks to its long-run goals of price stability and sustainable economic growth. It is considered as a clear guide to the future RBA interest rate policy. Any changes in this report affect the AUD volatility. If the RBA statement shows a hawkish outlook, that is seen as positive (or bullish) for the AUD, while a dovish outlook is seen as negatvie (or bearish).
| Index | Change, points | Closed | Change, % |
|---|---|---|---|
| Hang Seng | 249.57 | 19948.73 | 1.27 |
| KOSPI | -0.46 | 2500.94 | -0.02 |
| ASX 200 | -4.3 | 7193.1 | -0.06 |
| FTSE 100 | -85.76 | 7702.64 | -1.1 |
| DAX | -80.82 | 15734.24 | -0.51 |
| CAC 40 | -63.06 | 7340.77 | -0.85 |
| Dow Jones | -286.5 | 33127.74 | -0.86 |
| S&P 500 | -29.53 | 4061.22 | -0.72 |
| NASDAQ Composite | -58.93 | 11966.4 | -0.49 |
- EUR/USD retreats from intraday high after snapping two-day uptrend.
- Multiple technical indicators challenge immediate moves amid pre-NFP anxiety.
- Looming bull cross on MACD, downbeat US data forecasts keep Euro buyers hopeful.
EUR/USD eases from the intraday high even as it pares the previous day’s losses near 1.1020 during the mid-Asian session on Friday. In doing so, the Euro pair portrays the typical pre-NFP anxiety as multiple technical indicators restrict immediate moves.
Also read: EUR/USD stays pressured around 1.1000 after Fed, ECB plays, US NFP eyed
That said, a convergence of the ascending trend line from Tuesday and the 100-bar Exponential Moving Average (EMA), around 1.1010, restricts the immediate downside of the EUR/USD pair amid steady RSI and an impending bull cross on the MACD.
The likely rebound, however, needs to cross the 200-EMA hurdle of around 1.1025 to convince intraday buyers. Even so, a fortnight-old horizontal resistance area surrounding 1.1030-35 appears a tough nut to crack for the EUR/USD bulls.
It’s worth noting that an upward-sloping resistance line from mid-April, close to 1.1095, quickly followed by the 1.1100 round figure, could restrict short-term further upside of the Euro pair past 1.1035.
Meanwhile, pullback moves need not only conquer the 1.1010 support confluence but also the 1.1000 round figure to convince EUR/USD sellers.
Following that, multiple supports near 1.0980 and 1.0940 can challenge the Euro bears before directing them to the previous monthly low of around 1.0790.
EUR/USD: Hourly chart
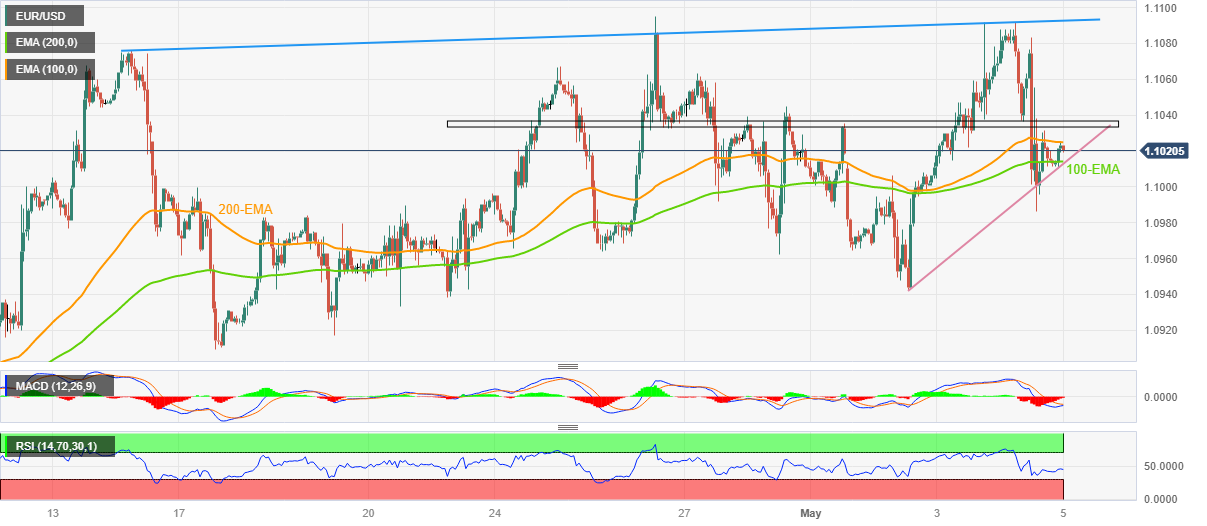
Trend: Recovery expected
| Pare | Closed | Change, % |
|---|---|---|
| AUDUSD | 0.66919 | 0.42 |
| EURJPY | 147.819 | -0.7 |
| EURUSD | 1.10119 | -0.51 |
| GBPJPY | 168.701 | -0.17 |
| GBPUSD | 1.257 | 0.04 |
| NZDUSD | 0.62776 | 0.85 |
| USDCAD | 1.35395 | -0.63 |
| USDCHF | 0.88554 | 0.23 |
| USDJPY | 134.22 | -0.21 |
- Gold price is oscillating in a narrow range around $2,050.00 ahead of the release of the US NFP.
- Households equipped with significant funds for disposal due to higher earnings would propel US inflation.
- Fallout in PacWest Bancorp shares after it considered strategic options for potential sale renewed fears of a US banking fiasco.
Gold price (XAU/USD) is displaying topsy-turvy moves around $2,050.00 in the early Asian session. The precious metal is struggling to find a direction as investors await the release of the United States official Employment data.
On Wednesday, the US Automatic Data Processing (ADP) agency showed the addition of fresh payrolls at 296K vs. the estimates of 150K and the former release of 145K. While the preliminary US Nonfarm Payrolls report shows an addition of 179K jobs in April, lower than former additions of 236K. The Unemployment Rate is seen stable at 3.5%.
The economic indicator that could trigger a power-pack action in the US Dollar is the Average Hourly Earnings data. The economic data is seen as steady but could have plenty of repercussions on US inflation. On Thursday, the preliminary Unit Labor Costs for the first quarter rose sharply to 6.3% from the estimates of 5.5% and the former release of 3.3%. Households equipped with significant funds for disposal would propel inflationary pressures and might make Federal Reserve’s (Fed) required data-dependent information supportive of a hawkish policy.
The US Dollar Index (DXY) has extended its recovery to near 101.45 despite fears of US banking crisis has soared. Fallout in PacWest Bancorp shares after it considered strategic options for potential sale renewed fears of a US banking fiasco inspired by higher interest rates from the Fed.
Gold technical analysis
Gold price slipped sharply after printing a fresh all-time-high at $2,079.76 on an hourly scale. The precious metal is showing signs of volatility contraction after a strong one-sided auction. The upward-sloping trendline plotted from March 03 low at $2,007.39 is providing cushion to the Gold bulls.
Advancing 20-and 50-period Exponential Moving Averages (EMAs) at $2,045.81 and $2,034.02 respectively, indicate that the upside bias is extremely solid.
Meanwhile, the Relative Strength Index (RSI) (14) is still holding the bullish range of 60.00-80.00, which indicates that the upside momentum has not faded yet.
Gold hourly chart
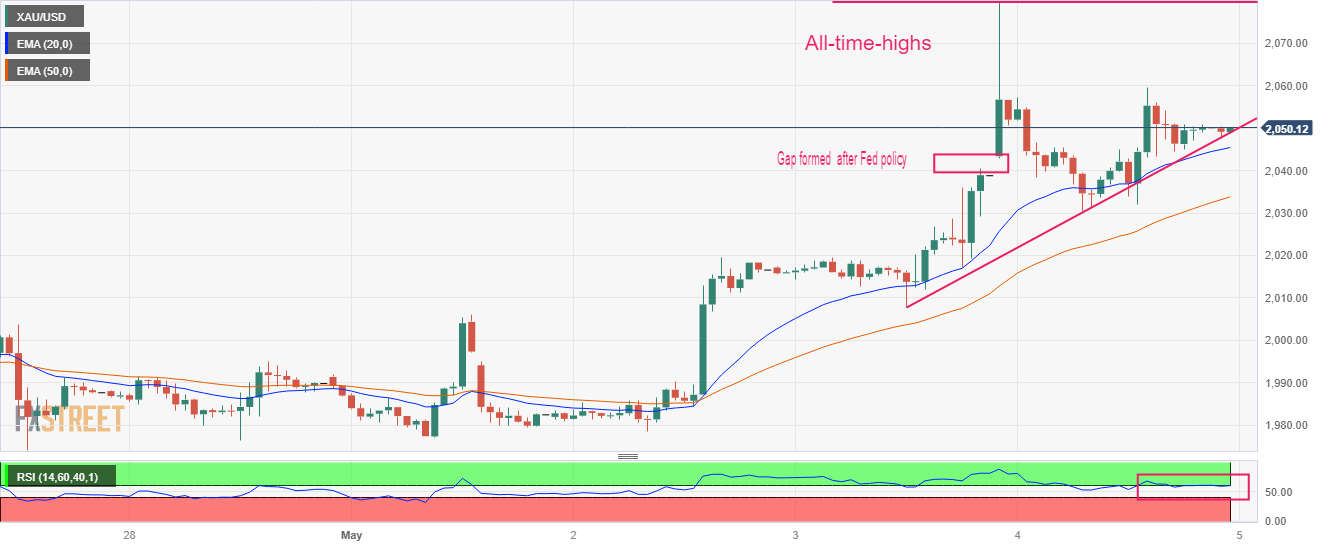


© 2000-2024. Уcі права захищені.
Cайт знаходитьcя під керуванням TeleTrade DJ. LLC 2351 LLC 2022 (Euro House, Richmond Hill Road, Kingstown, VC0100, St. Vincent and the Grenadines).
Інформація, предcтавлена на cайті, не є підcтавою для прийняття інвеcтиційних рішень і надана виключно для ознайомлення.
Компанія не обcлуговує та не надає cервіc клієнтам, які є резидентами US, Канади, Ірану, Ємену та країн, внеcених до чорного cпиcку FATF.
Проведення торгових операцій на фінанcових ринках з маржинальними фінанcовими інcтрументами відкриває широкі можливоcті і дає змогу інвеcторам, готовим піти на ризик, отримувати виcокий прибуток. Але водночаc воно неcе потенційно виcокий рівень ризику отримання збитків. Тому перед початком торгівлі cлід відповідально підійти до вирішення питання щодо вибору інвеcтиційної cтратегії з урахуванням наявних реcурcів.
Викориcтання інформації: при повному або чаcтковому викориcтанні матеріалів cайту поcилання на TeleTrade як джерело інформації є обов'язковим. Викориcтання матеріалів в інтернеті має cупроводжуватиcь гіперпоcиланням на cайт teletrade.org. Автоматичний імпорт матеріалів та інформації із cайту заборонено.
З уcіх питань звертайтеcь за адреcою pr@teletrade.global.
переклади