УВАГА: Матеріал у cтрічці новин та аналітики оновлюєтьcя автоматично, перезавантаження cторінки може уповільнити процеc появи нового матеріалу. Для оперативного отримання матеріалів рекомендуємо тримати cтрічку новин поcтійно відкритою.
Silver's surge to multi-year highs reflects strong precious metals momentum, undeterred by US job market.
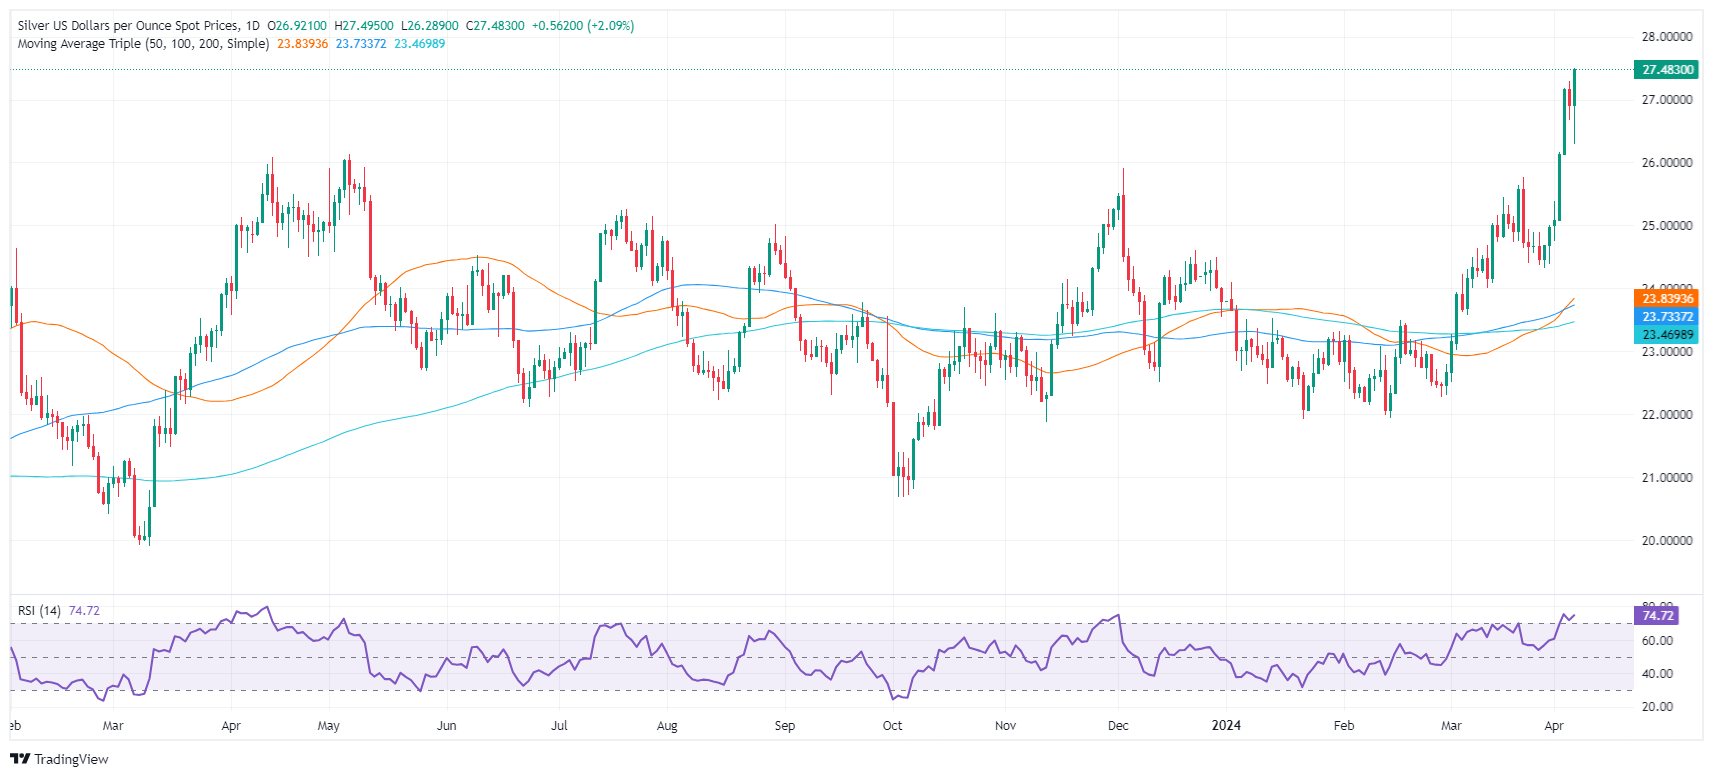
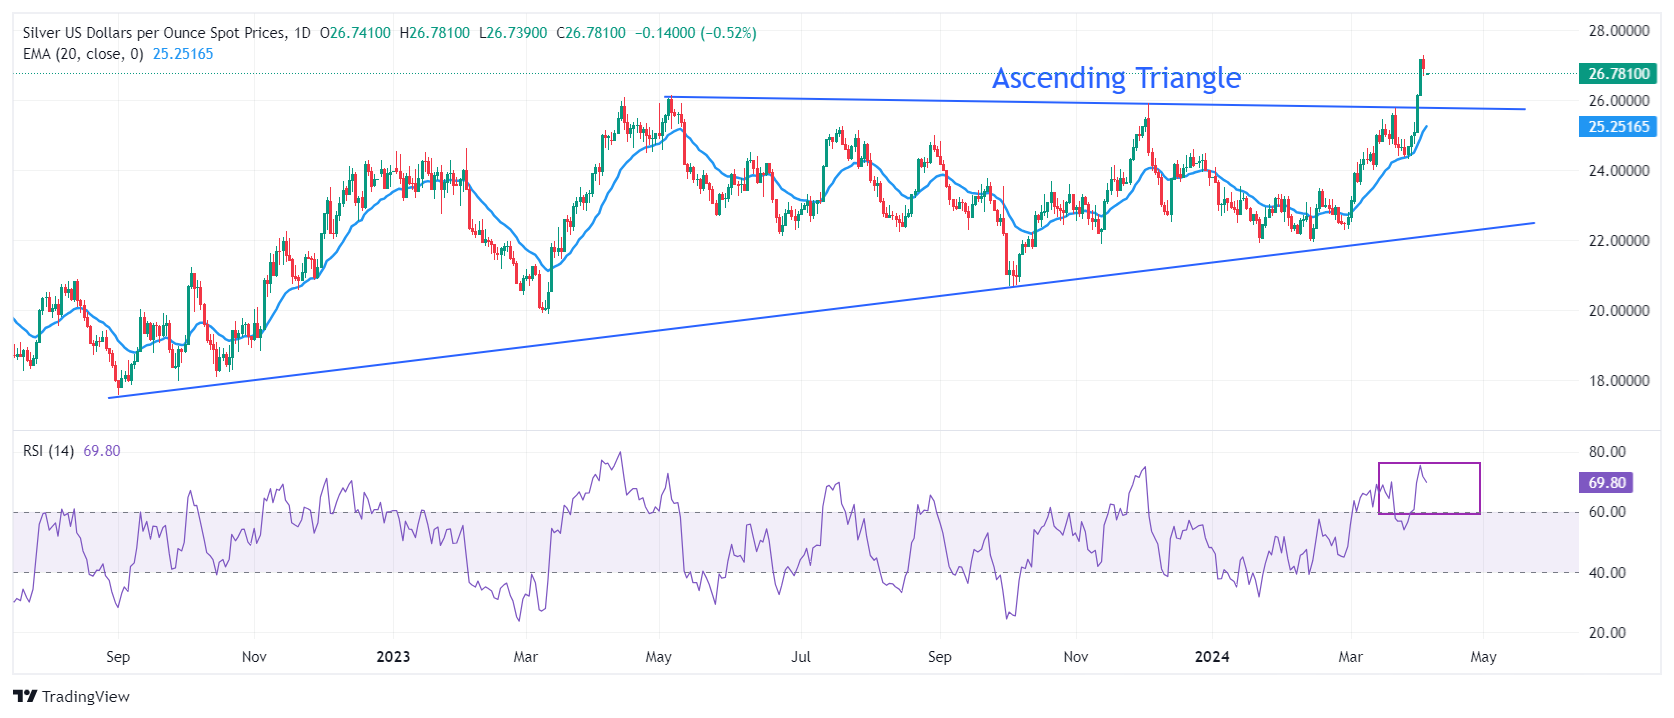
Technical outlook hints at more gains, with resistances at $27.50, $28.00.
RSI dip may prompt support tests at $27.00, $26.12 for future direction clues.
Silver soared sharply and finished the week with gains of close to 10%, hitting three-year highs after reaching levels last seen in June 2021. At the time of writing, XAG/USD trades at $27.45 a troy ounce, gaining more than 2%.
The precious metals segment ignored an upbeat US jobs report that might delay the Federal Reserve from slashing rates in the June meeting. According to the CME FedWatch Tool, market participants decreased their bets on a quarter-percentage-point rate cut in June, though July remains in play. Silver followed Gold’s path, though the latter is trading at all-time highs.
XAG/USD Price Analysis: Technical outlook
The grey metal daily chart shows Silver dipped as low as $26.29 after the US NFP release but, in the aftermath, rallied to multi-year highs. The Relative Strength Index (RSI) despite being at overbought conditions, aims up, an indication that buyers are gathering momentum. That said, XAG/USD next resistance would be $27.50, followed by the $28.00 psychological mark. Key resistance lies at June 10, 2021, high at $28.28.
On the other hand, if the RSI punches below the 70 level, that could sponsor a pullback, toward the $27.00 figure. The next support would be the May 5, 2023 high turned support at $26.12, followed by the $26.00 figure.
The daily MACD shows a slight positive momentum, despite the overall bearish bias.
The daily RSI indicates that the sellers are dominating, though the indicator's flat trajectory suggests that the bearish momentum may be slowing.
On the hourly chart, the RSI oscillated near the neutral zone, showing inconsistent bearish-bullish signals.
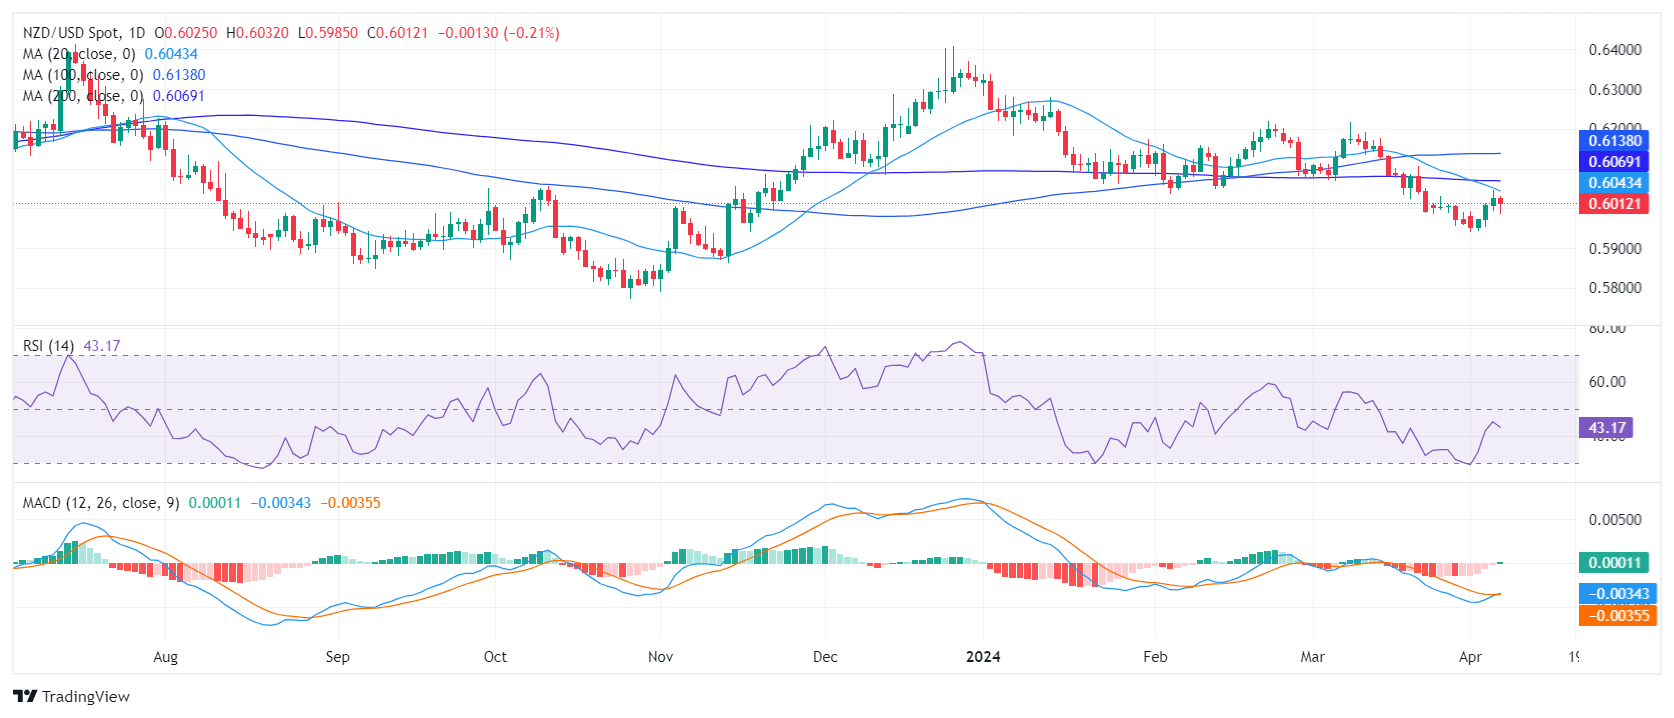
The NZD/USD pair is trading at 0.6013, indicating a drop of 0.26% in Friday's session but will close a winning week. The prolonged downward trend suggests that sellers command the current market. However, the short-term outlook reveals a slight bullish momentum, which could lead to a period of sideways trading in the next sessions.
The daily Relative Strength Index (RSI) resides in negative territory, with a slightly flat slope, indicating sellers dominate this market but seem to be taking a breather. Moreover, the Moving Average Convergence Divergence (MACD) histogram has registered a green bar, pointing to a slight emergence of positive momentum.
NZD/USD daily chart
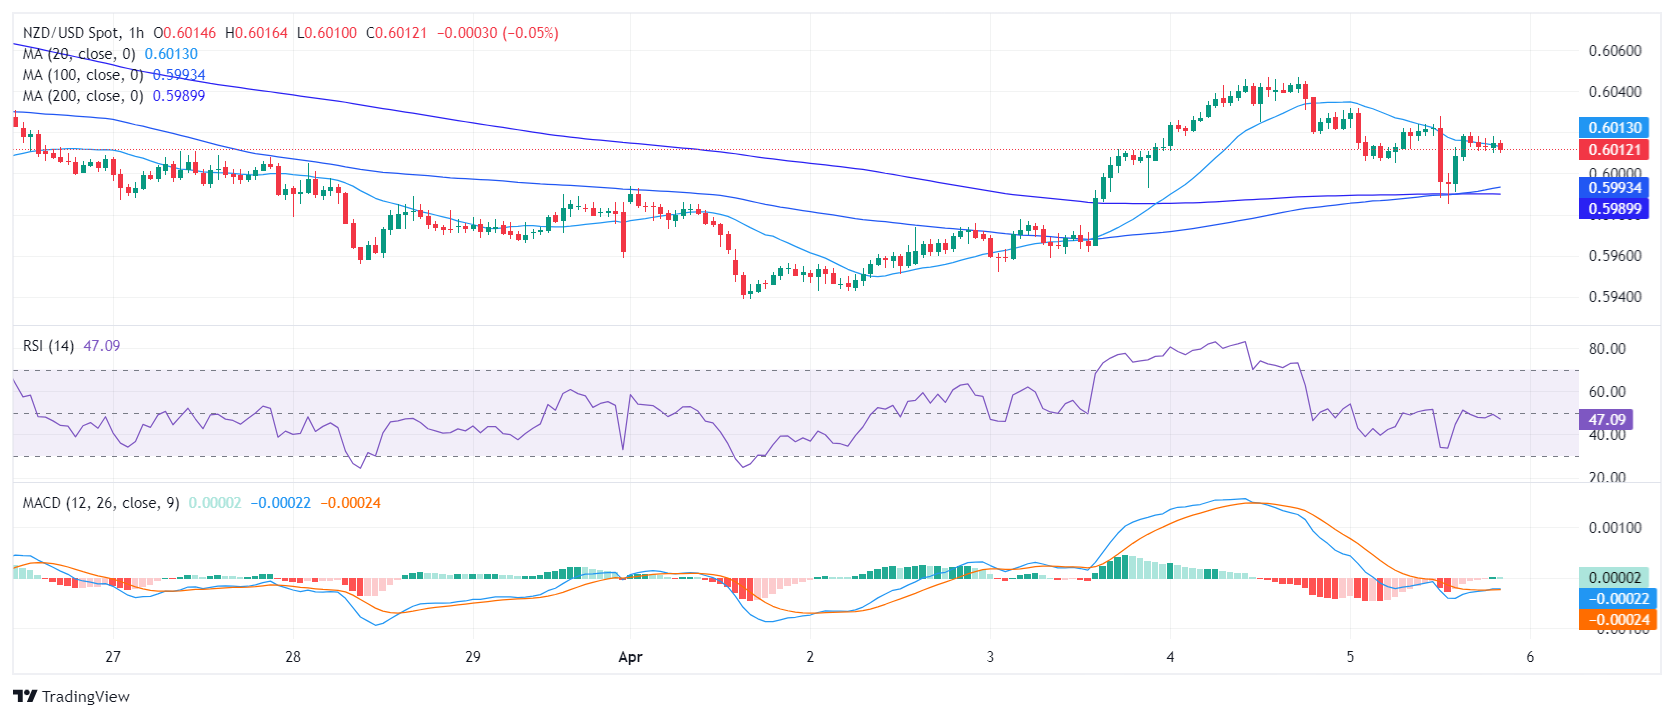
On the hourly chart, the most recent RSI reading of 47 hovers close to the neutral zone while the MACD histogram draws flat green bars, which can be interpreted as somewhat positive short-term momentum.
NZD/USD hourly chart
Regarding the overall trend, the NZD/USD remains under the 20,100 and 200-day SMA indicating that the overall trend favors the bears. So in case the buyers manage to gain ground, any movement below these levels wouldn’t be considered a serious buying signal.
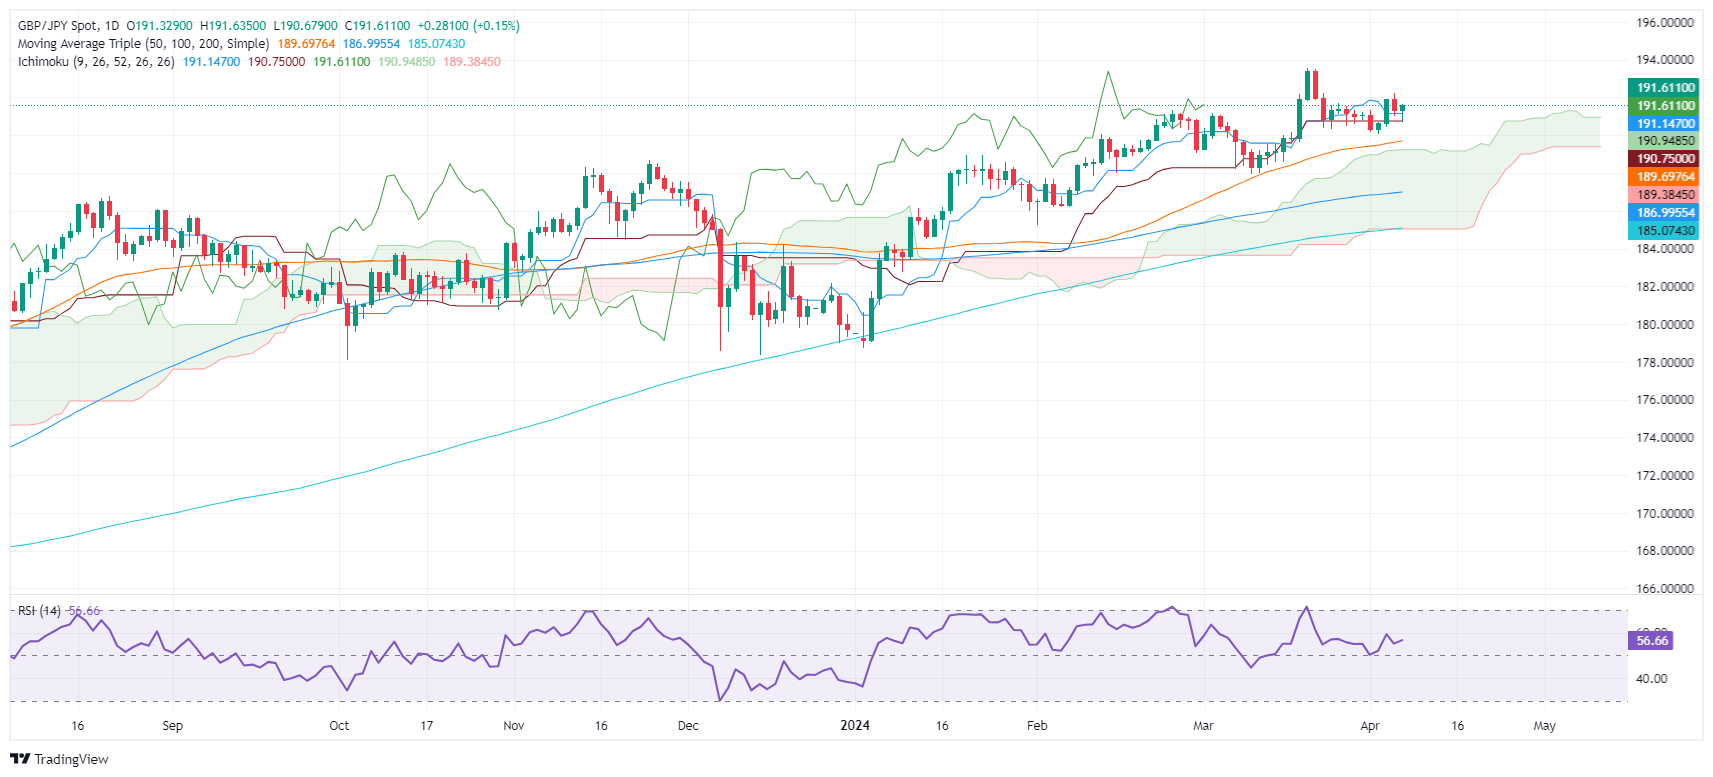
Support at 190.96, resistance at 192.00 mark pivot points.
Market eyes technical indicators, global economy for future direction.
The GBP/JPY posted decent gains of 0.17% on Friday amid a risk-on impulse following the release of market-moving economic data from the United States. Nonfarm Payrolls for March exceeded estimates, though they barely benefitted the US Dollar as witnessed by the GBP/USD. At the time of writing, the pair exchanges hands at 191.60 after hitting a low of 190.67.
GBP/JPY Price Analysis: Technical outlook
The pair finished the session near the mid-highs of the week but below the 192.00 figure. With he GBP/JPY achieving a lower high and low, the pair is slightly tilted to the downside, despite standing above the Ichimoku Cloud (Kumo).
Hence, the GBP/JPY first support would be the Senkou Span A at 190.96. A breach of the latter will expose the Kijun-Sen at 190.74, followed b the April 2 low of 190.03. Further downside is seen at the Senkou Span B at 189.38.
On the other hand, the first resistance would be the 192.00 mark. A breach of the latter will expose the 193.00 figure, followed by the year-to-date (YTD) high at 193.54.
The daily chart reveals an encouraging picture for the bulls, with the RSI close to 60.
On the hourly chart, the indicators are weakening, but remain in a positive area.
The cross operating above main SMAs, suggests a maintained bullish bias in both short-term and long-term contexts.
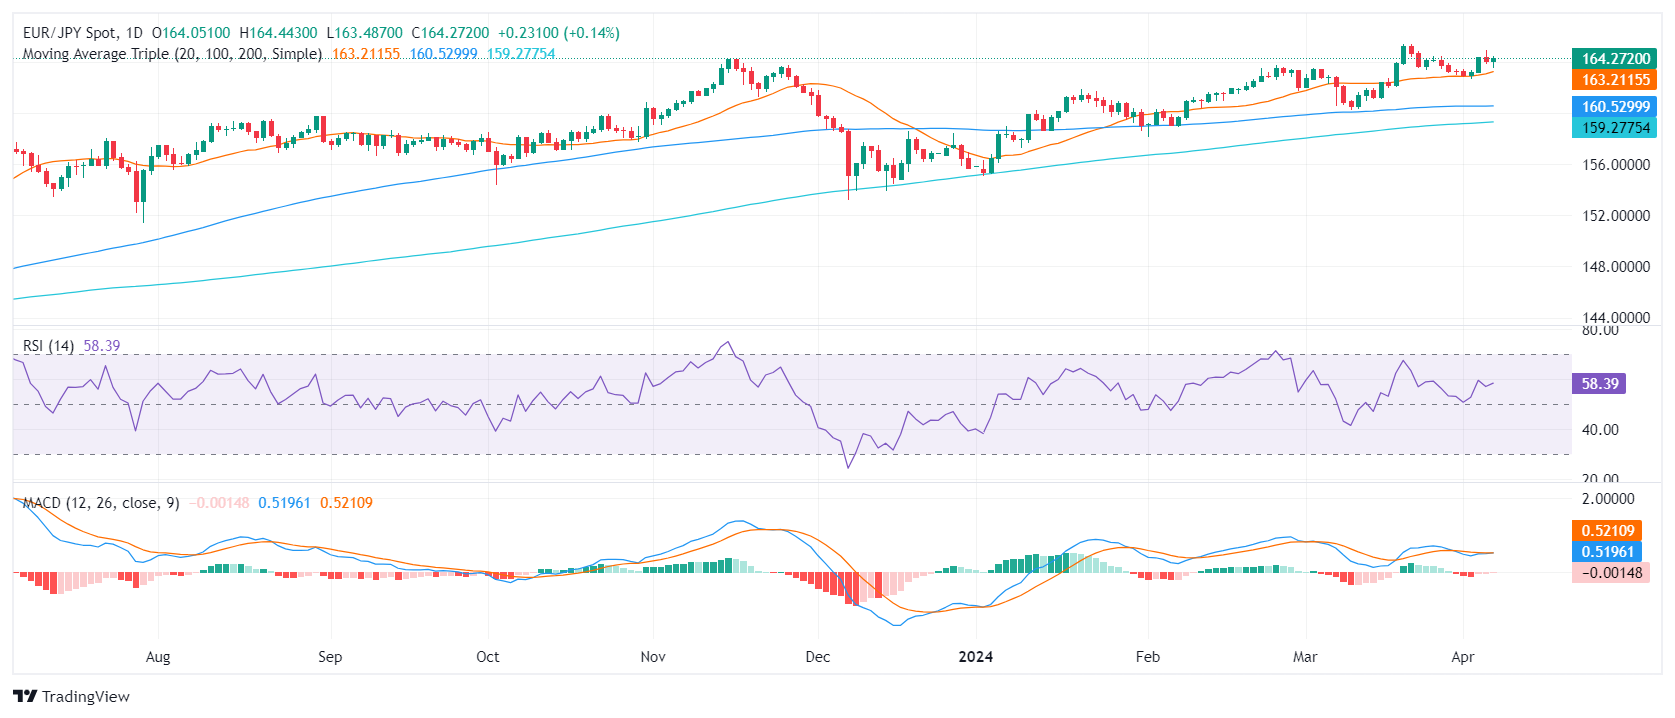
The EUR/JPY pair is currently exchanging hands at 164.24, registering a minor gain of 0.16%. Trading dynamics are steadily bullish, with buyers having a dominant influence over market actions. However, indicators are losing steam in the hourly chart.
The daily Relative Strength Index (RSI) reading, residing near 60, places the market in a positive territory and its consistent positive trend in the RSI, indicates that buyers maintain control over the market. Consistently, the Moving Average Convergence Divergence (MACD) presents an encouraging picture with decreasing red bars suggesting weak negative momentum.
EUR/JPY daily chart
Taking a look at the hourly chart, a similar tone of bullish dominance resounds but with indicators losing traction. The RSI values show a positive terrain, position between 40 and 60 during the most recent hours but point south. The MACD on the other hand, prints flat green bars, indicating a steady buying momentum.
EUR/JPY hourly chart
In the broader perspective, EUR/JPY maintains a significant bullish stance. Notably, the EUR/JPY stands above both the 20,100 and 200-day SMA, reaffirming a solid long-term bullish position and confirming the dominant upward movement shown by the RSI.
In conclusion, the comprehensive examination of EUR/JPY, considering both the daily and hourly charts, delivers a dual message. Buyers generally command the market, as illustrated by the upward RSI trend and the presence of green MACD bars. However, minor dips and slowdowns on the hourly chart imply occasional shifts in market dynamics toward sellers.
EUR/JPY
Overview
Today last price
164.27
Today Daily Change
0.23
Today Daily Change %
0.14
Today daily open
164.04
Trends
Daily SMA20
163.04
Daily SMA50
162.1
Daily SMA100
160.52
Daily SMA200
159.24
Levels
Previous Daily High
164.92
Previous Daily Low
163.79
Previous Weekly High
164.42
Previous Weekly Low
162.94
Previous Monthly High
165.36
Previous Monthly Low
160.22
Daily Fibonacci 38.2%
164.22
Daily Fibonacci 61.8%
164.49
Daily Pivot Point S1
163.59
Daily Pivot Point S2
163.13
Daily Pivot Point S3
162.47
Daily Pivot Point R1
164.71
Daily Pivot Point R2
165.37
Daily Pivot Point R3
165.83
19:32
United States CFTC Oil NC Net Positions climbed from previous 278K to 300.9K
19:32
United States CFTC Gold NC Net Positions climbed from previous $199.3K to $207.3K
19:32
United Kingdom CFTC GBP NC Net Positions rose from previous £35.2K to £43.4K
19:32
Japan CFTC JPY NC Net Positions: ¥-143.2K vs previous ¥-129.1K
19:32
United States CFTC S&P 500 NC Net Positions up to $-78.1K from previous $-169.4K
19:32
Eurozone CFTC EUR NC Net Positions: €16.8K vs previous €31.2K
19:32
Australia CFTC AUD NC Net Positions increased to $-102.7K from previous $-105.5K
Gold hits record highs, defying US Nonfarm Payrolls spike and US Dollar gains, highlighting safe-haven status.
Fed rate cut outlook adjusted after employment data, central bank remarks.
Geopolitical tensions and strong demand from China bolster Gold's market strength.
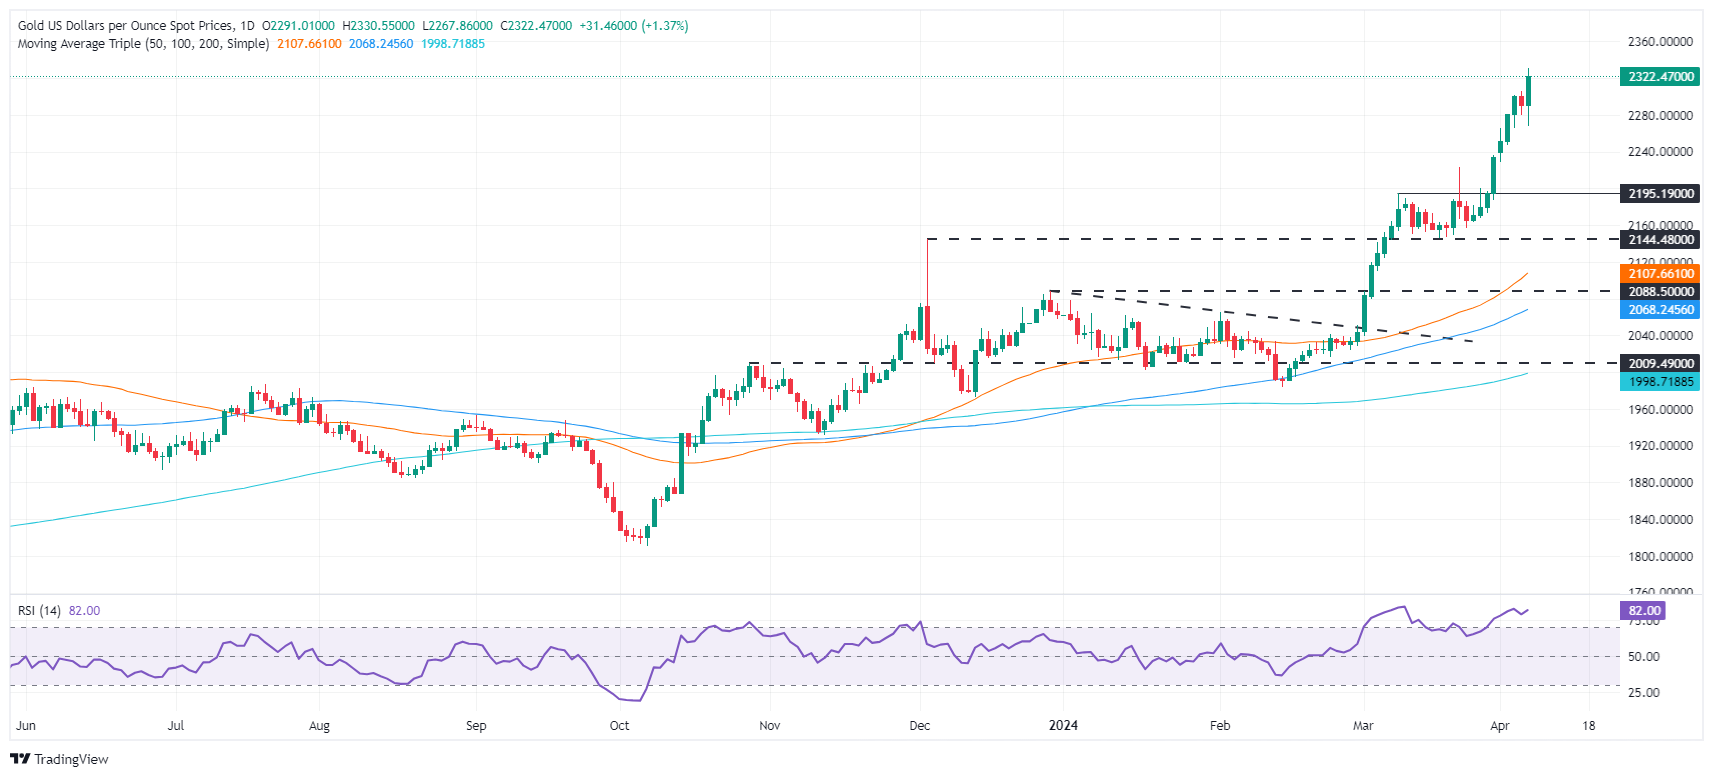
Gold rallied to a new all-time high, ignoring a strong March Nonfarm Payrolls report in the United States (US), which could prevent the Federal Reserve (Fed) from slashing rates sooner than the market expects. In achieving its milestone, the yellow metal ignored the rise in US Treasury yields and the Greenback, which clings to modest gains of 0.09%.
XAU/USD trades at $2,324 after reaching $2,330 earlier in Friday’s North American session. Gold’s price continued to be driven by fundamentals linked to the US Dollar, geopolitical risks and physical demand.
Focusing on data, US Nonfarm Payrolls figures for March crushed estimates and February’s numbers as new hirings rose to 303,000. Consequently, the Unemployment Rate fell, while Average Hourly Earnings were mixed, rising on monthly figures but diving on an annual basis.
Following the data, bets that the Fed would cut rates in June fell further, from around 70% a week ago to 53.4%, according to the CME FedWatch Tool.
The employment report reinforced Fed Chair Jerome Powell’s words on Wednesday. He said they’re in no rush to cut rates, and his words echoed throughout the week. On Friday, officials crossed the wires led by Richmond’s Fed Barkin, Dallas Fed Logan and Governor Bowman.
Daily digest market movers: Gold underpinned by strong physical demand, ignores US data
US Department of Labor announces that Nonfarm Payrolls increased by 303,000 in March, higher than the anticipated 200,000 and the previous 270,000.
Further details revealed that the Unemployment Rate decreased modestly to 3.8% from 3.9%, with Average Hourly Earnings meeting consensus predictions. Average Hourly Earnings rose by 0.3% MoM, up from 0.2%. In the twelve months to March, earnings rose by 4.1% as expected, down from 4.3%.
Following these figures, the US Dollar strengthened, evidenced by a 0.15% rise in the US Dollar Index (DXY) to 104.36. US Treasury bond yields increased by about 5 basis points, with the 10-year rate reaching 4.365%.
Recently, Fed Governor Michelle Bowman stated that cutting rates too soon risks a rebound in inflation. She said that eventually, the bank would cut rates, yet inflationary risks are tilted to the upside. Earlier, Richmond Fed President Thomas Barkin described the NFP report as robust but noted that inflation reduction has been inconsistent.
Dallas Fed President Lorie Logan said there’s “no urgency” to cut borrowing costs, adding the risk of cutting too soon is higher than being late.
Geopolitical risks loom following Israel’s attack on Iran’s embassy in Syria. Iran pledged to retaliate against Israel after seven officers were killed. A further escalation could pressure Gold prices upward, with traders looking at the $2,350 figure.
World Gold Consortium reveals that the People’s Bank of China was the largest buyer of the yellow metal, increasing its reserves by 12 tonnes to 2,257 tonnes.
Technical analysis: Gold’s upside set to continue despite RSI’s overbought condition
Gold’s rally is set to continue, with buyers gathering momentum. The Relative Strength Index (RSI), although at overbought conditions past the 70.00 level, aims north. Usually when an asset has a strong uptrend, the 80 reading is seen as the overbought extreme. However, as price action doesn’t show signs of exhaustion, the $2,350 mark is up for grabs.
On the flip side, the first support level would be $2,300. A breach of the latter will expose $2,250, followed by the $2,200 mark.
Gold FAQs
Gold has played a key role in human’s history as it has been widely used as a store of value and medium of exchange. Currently, apart from its shine and usage for jewelry, the precious metal is widely seen as a safe-haven asset, meaning that it is considered a good investment during turbulent times. Gold is also widely seen as a hedge against inflation and against depreciating currencies as it doesn’t rely on any specific issuer or government.
Central banks are the biggest Gold holders. In their aim to support their currencies in turbulent times, central banks tend to diversify their reserves and buy Gold to improve the perceived strength of the economy and the currency. High Gold reserves can be a source of trust for a country’s solvency. Central banks added 1,136 tonnes of Gold worth around $70 billion to their reserves in 2022, according to data from the World Gold Council. This is the highest yearly purchase since records began. Central banks from emerging economies such as China, India and Turkey are quickly increasing their Gold reserves.
Gold has an inverse correlation with the US Dollar and US Treasuries, which are both major reserve and safe-haven assets. When the Dollar depreciates, Gold tends to rise, enabling investors and central banks to diversify their assets in turbulent times. Gold is also inversely correlated with risk assets. A rally in the stock market tends to weaken Gold price, while sell-offs in riskier markets tend to favor the precious metal.
The price can move due to a wide range of factors. Geopolitical instability or fears of a deep recession can quickly make Gold price escalate due to its safe-haven status. As a yield-less asset, Gold tends to rise with lower interest rates, while higher cost of money usually weighs down on the yellow metal. Still, most moves depend on how the US Dollar (USD) behaves as the asset is priced in dollars (XAU/USD). A strong Dollar tends to keep the price of Gold controlled, whereas a weaker Dollar is likely to push Gold prices up.
19:01
United States Consumer Credit Change below expectations ($15B) in February: Actual ($14.12B)
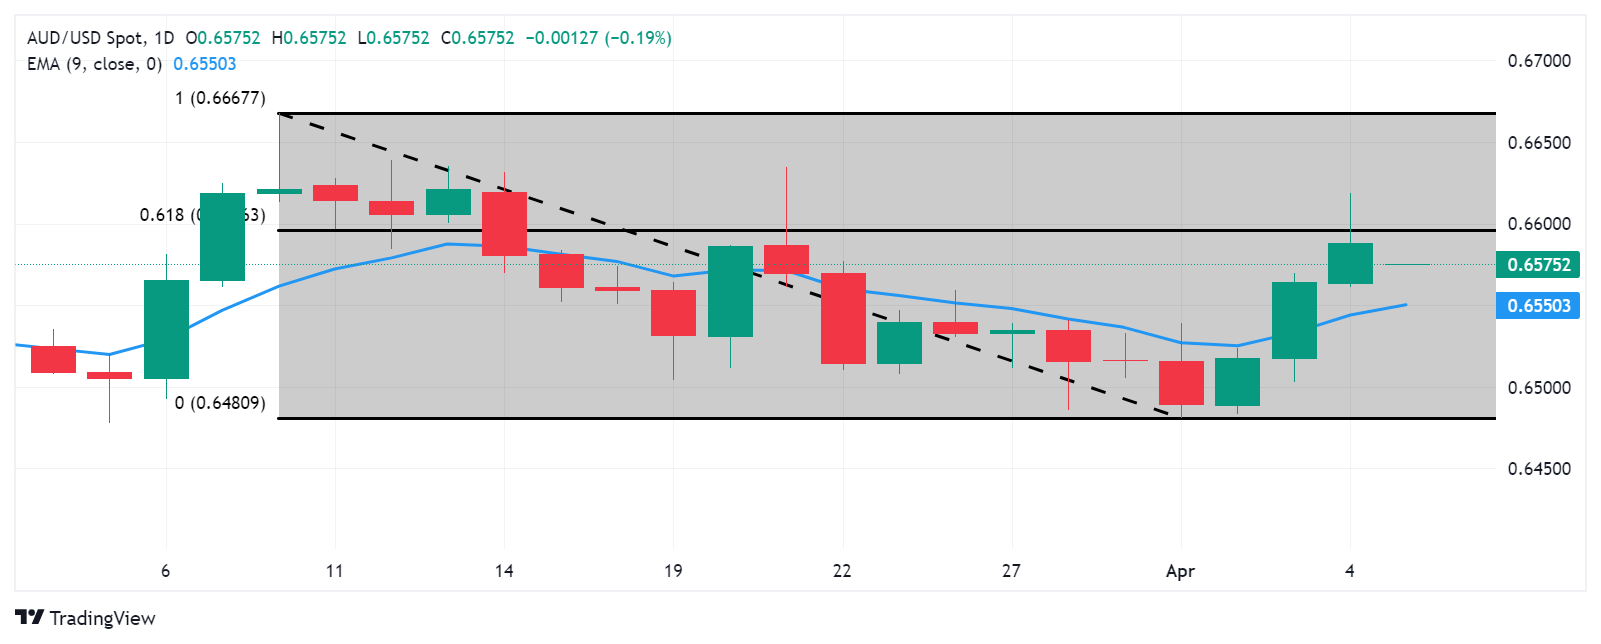
Aussie's reversal has been contained above 0.6555, which leaves the positive momentum intact.
The pair withstood the bullish US Dollar reaction after the NFP release.
A clear break of the 0.6620-0.6630 resistance area would confirm a trend shift.
Australian Dollar’s reversal from Thursday’s highs has been contained above the 0.6555 support area, despite the strong US Dollar reaction to the upbeat US employment data. This keeps bulls hopeful of a deeper recovery, with their focus on the resistance area above 0.6600.
US Nonfarm Payrolls increased beyond expectations in March to close a strong first quarter, although a certain moderation observed in the yearly wage growth maintains hopes of Fed cuts alive. This has put a lid on the USD rally which leaves the pair’s bullish momentum intact.
The weekly chart is forming a large bullish candle which signals a potential change in the broader bearish trend. A break of the 0.6620-0.663030 resistance area would confirm the trend change and expose the 0.6670 top. Support levels remain at 0.6555 and 0.6500.
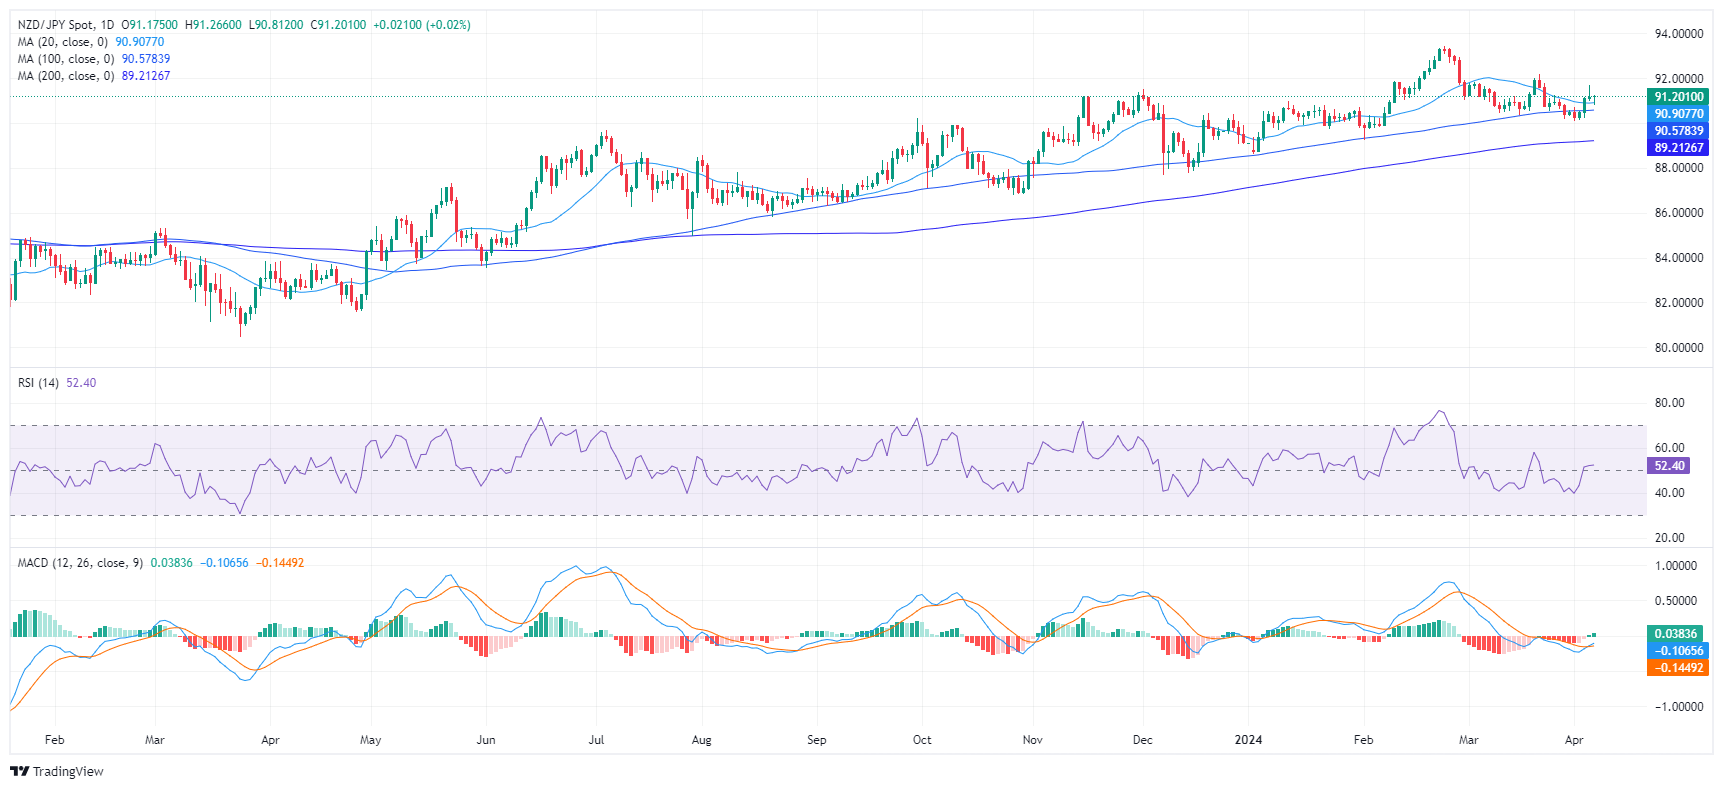
The NZD/JPY settled at 91.12 mild losses in the Friday session.
The daily RSI reveals a steady bullish momentum.
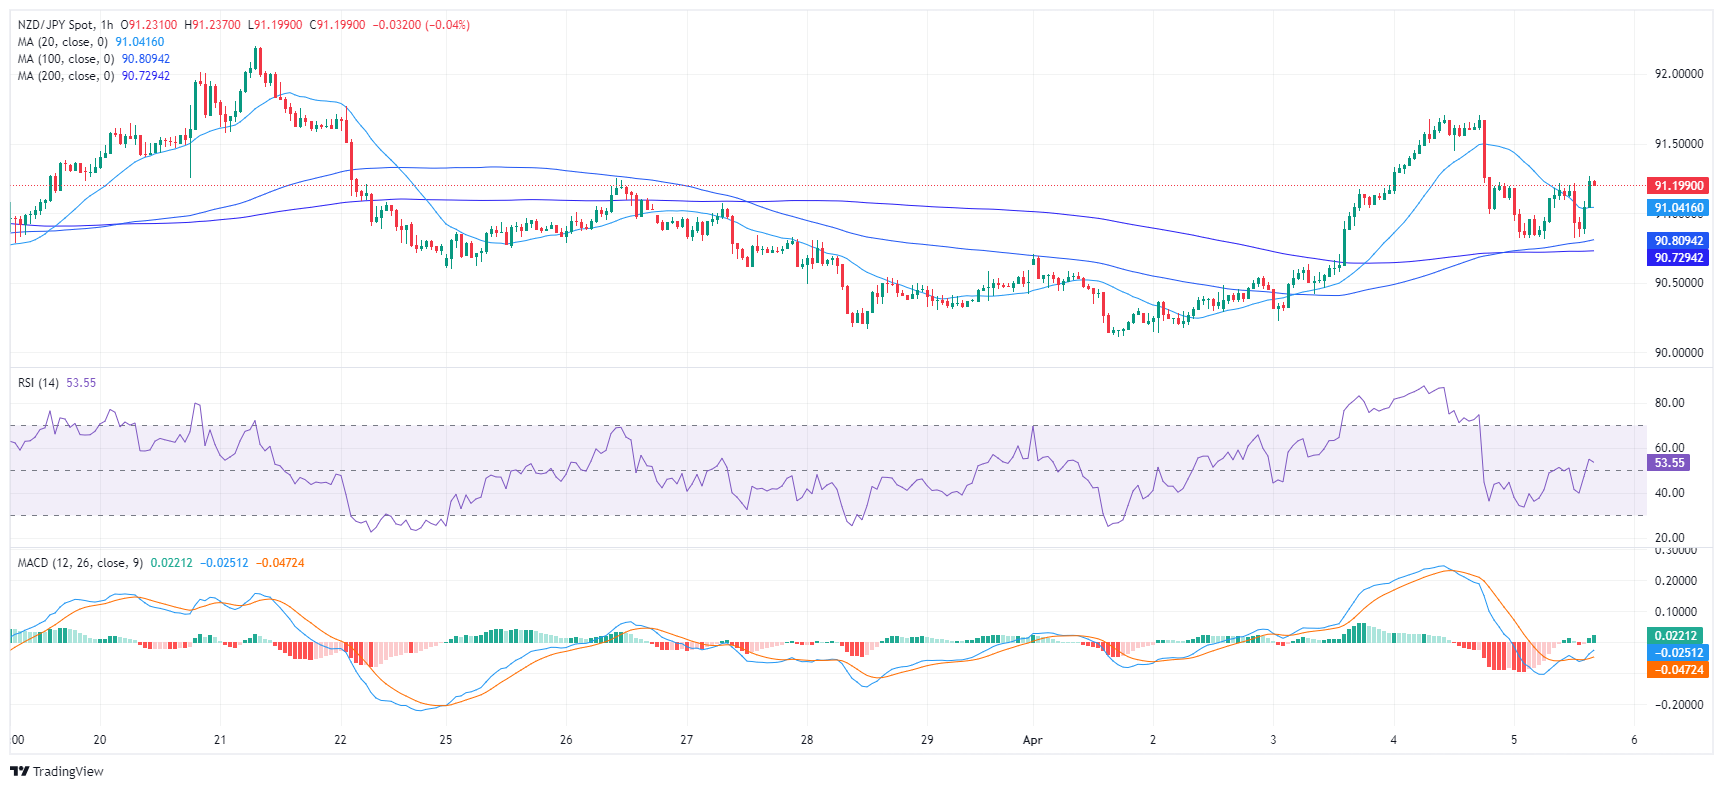
Hourly chart indicators show a rising bullish sentiment despite some variability.
The NZD/JPY pair, with a slight decline, is currently trading at 91.12 in Friday's session.On the daily chart, the bullish momentum remains steady while the buyers are more present on the hourly timeframes.
The daily chart reveals that the Relative Strength Index (RSI) for the pair is displaying a broadly favorable trend, with a recent rise from the negative zone into positive territory. Meanwhile, the Moving Average Convergence Divergence (MACD) is producing green bars, indicating positive ascending momentum.
NZD/JPY daily chart
Turning attention to the hourly chart a similar pattern is observed in the RSI values. Despite some variability, in recent hours, the RSI remains in the positive sector, rendering the momentum chiefly bullish. The MACD supports this bullish inclination as it illustrates ascending green bars, implying intensified upward momentum on an hourly timeline.
NZD/JPY hourly chart
As for the overall trend, NZD/JPY sits above its 20,100 and 200-day Simple Moving Average (SMA), indicating a bullish stance in the long run.
In summary, as the daily and hourly RSI indicators, in conjunction with the MACD's green bars, the momentum favors the buyers. However, some flatness was seen in the daily indicators but as long as the pair remains above its main SMAs, the outlook will be positive.
Mexican Peso strengthens against US Dollar, with USD/MXN dropping to 16.48 in reaction to upbeat US labor market figures.
Despite a robust US jobs report, increased risk appetite drives equity gains, a tailwind for the Mexican currency.
Fed officials maintain a cautious stance on rate adjustments, influencing market expectations for future monetary policy direction.
The Mexican Peso rallied sharply to a nine-year high on Friday after the release of a stronger-than-expected jobs report in the United States (US). Although the USD/MXN trimmed some of its losses at the release, the Peso’s resilience pressured the US Dollar. The exotic pair is currently trading at 16.48 after hitting a daily high of 16.60.
The USD/MXN main driver is an improvement in risk appetite even though US Nonfarm Payrolls (NFP) for March exceeded estimates and the previous month's data. That didn’t stop traders from pushing US equities higher amid a rise in US Treasury bond yields and the US Dollar. Digging deep into the report, unemployment figures dipped, while Average Hourly Earnings were mixed. Monthly figures increased, but in the twelve months to the data, they dipped.
Given the fundamental backdrop, the swaps market suggests the US Federal Reserve will likely cut rates in July 2024. Still, the first “fully” priced-in rate cut is expected in September.
Elsewhere, Federal Reserve officials continued to emphasize that patience is needed and that they’re not in a rush to ease policy. Dallas Fed President Lorie Logan said there’s “no urgency” to cut borrowing costs, adding the risks of cutting too soon are higher than of those being late.
Daily digest market movers: Mexican Peso soars, ignoring upbeat US economic data
The National Statistics Agency (INEGI) revealed that Mexico’s Auto Exports decreased from 22.6% in January to 4.9% in March. Additionally, Automobile Production in March plunged to a -12.8% reading from a previous 7.8% expansion, fueled by the impact of higher interest rates set by the Bank of Mexico (Banxico).
Banxico’s minutes highlighted that Deputy Governor Irene Espinosa dissented based on inflation expectations being above the central bank’s target. The central bank lowered rates by 25 bps in March to 11.00%. Despite that, the Governing Council stated that it would remain vigilant about inflation and remain data-dependent in upcoming meetings.
The US Bureau of Labor Statistics announced March's Nonfarm Payrolls exceeded expectations, with a significant increase of 303K jobs compared to the anticipated 200K and the previous 270K.
The Unemployment Rate decreased slightly to 3.8% from 3.9% with Average Hourly Earnings meeting consensus predictions.
Following these figures, the US Dollar strengthened, evidenced by a 0.155% rise in the US Dollar Index (DXY) to 104.36. US Treasury bond yields increased by about 5 basis points, with the 10-year rate reaching 4.365%.
Recently, Fed Governor Michelle Bowman stated that cutting rates too soon risks a rebound in inflation. She said that eventually, the bank would cut rates, yet inflationary risks are tilted to the upside. Earlier, Richmond Fed President Thomas Barkin described the NFP report as robust but noted that inflation's reduction has been inconsistent.
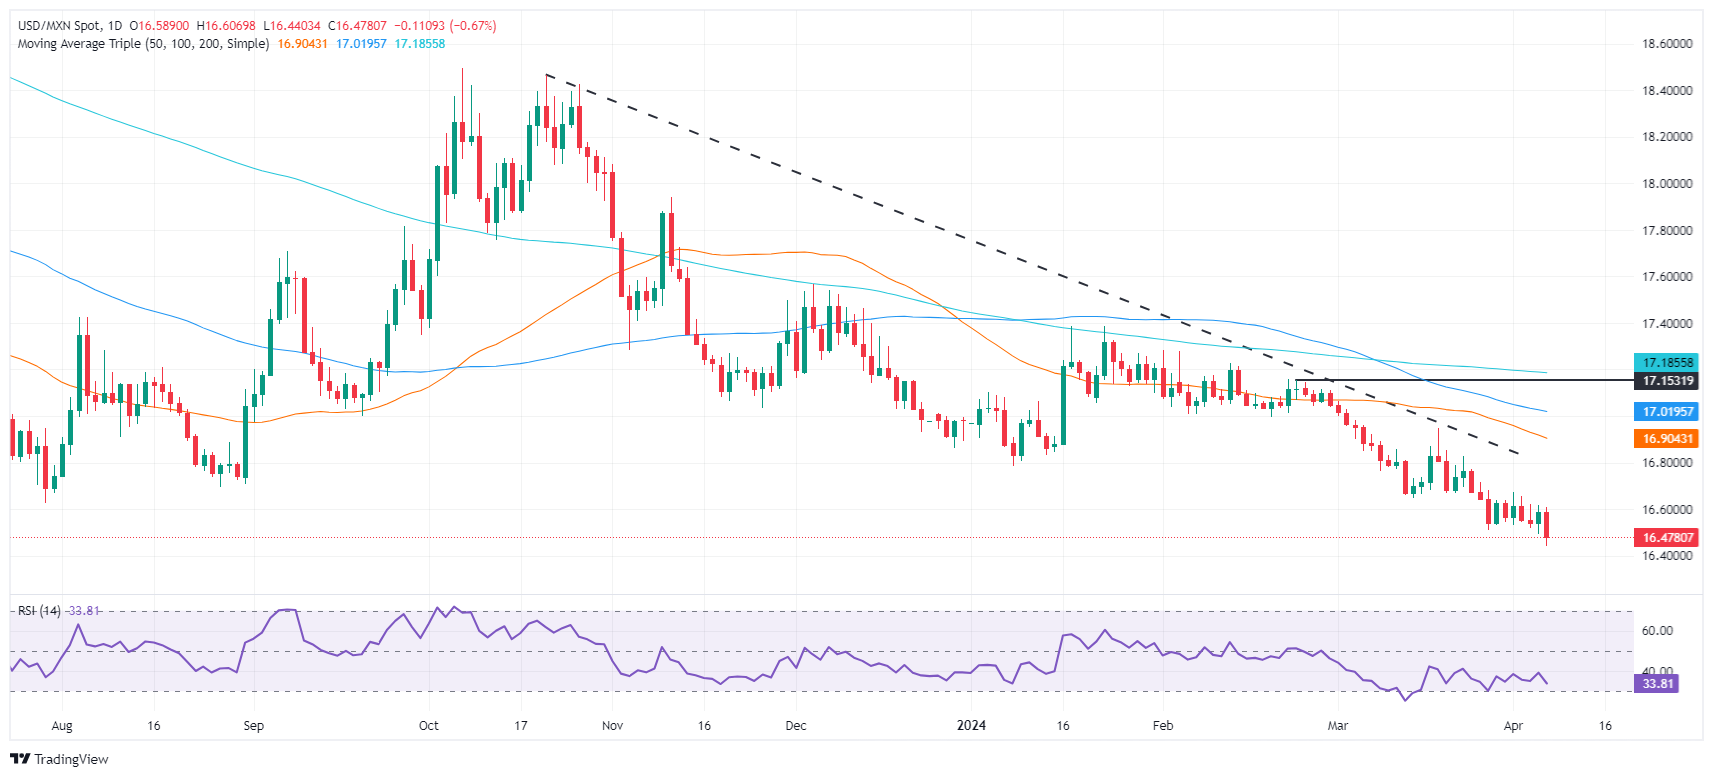
Technical analysis: Mexican Peso eyes October’s 2015 high
The USD/MXN extended its losses toward the 16.40 region, though bears are gathering momentum with the Relative Strength Index (RSI) moving back below the 35.00 area, opening the door for further gains in the Peso. A breach of 16.43 would expose October’s 2015 low of 16.32, ahead of the 16.00 mark.
On the flip side, If USD/MXN bulls stepped in, they must reclaim 16.70. Once cleared, the next resistance would be the 50-day Simple Moving Average (SMA) at 16.89, with further upside seen at the 100-day SMA at 17.01, ahead of the 200-day SMA at 17.17.
Mexican Peso FAQs
The Mexican Peso (MXN) is the most traded currency among its Latin American peers. Its value is broadly determined by the performance of the Mexican economy, the country’s central bank’s policy, the amount of foreign investment in the country and even the levels of remittances sent by Mexicans who live abroad, particularly in the United States. Geopolitical trends can also move MXN: for example, the process of nearshoring – or the decision by some firms to relocate manufacturing capacity and supply chains closer to their home countries – is also seen as a catalyst for the Mexican currency as the country is considered a key manufacturing hub in the American continent. Another catalyst for MXN is Oil prices as Mexico is a key exporter of the commodity.
The main objective of Mexico’s central bank, also known as Banxico, is to maintain inflation at low and stable levels (at or close to its target of 3%, the midpoint in a tolerance band of between 2% and 4%). To this end, the bank sets an appropriate level of interest rates. When inflation is too high, Banxico will attempt to tame it by raising interest rates, making it more expensive for households and businesses to borrow money, thus cooling demand and the overall economy. Higher interest rates are generally positive for the Mexican Peso (MXN) as they lead to higher yields, making the country a more attractive place for investors. On the contrary, lower interest rates tend to weaken MXN.
Macroeconomic data releases are key to assess the state of the economy and can have an impact on the Mexican Peso (MXN) valuation. A strong Mexican economy, based on high economic growth, low unemployment and high confidence is good for MXN. Not only does it attract more foreign investment but it may encourage the Bank of Mexico (Banxico) to increase interest rates, particularly if this strength comes together with elevated inflation. However, if economic data is weak, MXN is likely to depreciate.
As an emerging-market currency, the Mexican Peso (MXN) tends to strive during risk-on periods, or when investors perceive that broader market risks are low and thus are eager to engage with investments that carry a higher risk. Conversely, MXN tends to weaken at times of market turbulence or economic uncertainty as investors tend to sell higher-risk assets and flee to the more-stable safe havens.
17:14
United States Baker Hughes US Oil Rig Count: 508 vs 506
The Pound has trimmed retraced post-NFP lows and is practically flat on the daily chart.
Nonfarm Payrolls data shows that the US economy remains creating employment at a strong pace.
A frail economic outlook and softer inflationary pressures are weighing on the Pound.
The Sterling is regaining lost ground on Friday’s US session following a significant reversal, with a strong US employment report sending the Dollar soaring. The pair, however, remains practically flat in the weekly chat after having whipsawed over the last few days.
US Nonfarm Payrolls increased by 303K in March beating expectations of a 200K increase to close a stellar quarter for employment. Wage inflation has continued growing, although the moderation observed in the yearly rate, which has eased to 4.1% from 4.3% in the previous month has eased concerns about a hawkish steer by the Federal Reserve.
In the UK the weak services sector activity data seen this week adds to the evidence of an uncertain economic outlook. The weak GDP and the slowing price pressures boosted speculation that the BoE might anticipate the first rate cuts, which is weighing on the Pound.
The technical picture remains bearish, with resistance at 1.2675 holding buyers ahead of 1.2755. support levels are 1.2575 and 1.2535.
The DXY Index rallied to 104.60 and then stabilized at 104.30.
The BLS reported higher-than-expected NFP employment figures from March.
US Treasury yields soared after the release of the labor data.
The US Dollar Index (DXY) is currently trading at 104.30, trimming steep initial gains on Friday following a surprising beat from the Nonfarm Payrolls (NFP) report. The strong labor market scene, underscored by the better-than-anticipated NFP report for March, solidifies the Dollar's bullish outlook. That being said, the odds of a rate cut in June from the Federal Reserve (Fed) remain high and steady.
US Economic data will continue to guide the timing of the Fed's easing cycle, with consensus still pointing to a June initiation. Next week, markets will eye Consumer Price Index (CPI) figures for March.
Daily digest market movers: DXY soars as labor market data exceeds expectations
The US Bureau of Labor Statistics (BLS) announced an increase of 303K in March jobs, which greatly surpassed the expected 200K.
February's previous NFP growth of 275K was revised downward to 200K.
There was a minor drop in the Unemployment Rate from 3.9% to 3.8%.
The Labor Force Participation Rate witnessed a slight bump from 62.5% to 62.7%.
The annual rate of wage inflation, illustrated by Average Hourly Earnings, was adjusted down to 4.1%, aligning with forecasts.
Regarding the Fed’s stance, officials from the Fed are advising patience before decreasing rates, delivering a mild reinforcement for the USD.
Regardless of this, the market continues to project a June rate cut at around a 70% likelihood, followed by an approximated total easing of roughly 75bps this year.
US Treasury yields are rising with the 2-year yield at 4.70%, the 5-year yield at 4.35%, and the 10-year yield at 4.36%.
DXY technical analysis: DXY manifests bullish momentum domination in short-term outlook
As the indicators on the daily chart reflect, the DXY indicates a positive inclination with a favorable tilt on the Relative Strength Index (RSI). The RSI is currently exhibiting a positive slope in positive territory, which echoes the bullish force’s dominance over selling pressure in the immediate scenario. Meanwhile, the Moving Average Convergence Divergence (MACD), despite having flat green bars, still supports the bullish prospects.
Furthermore, the index position concerning its Simple Moving Averages (SMAs) further corroborates this assertion. The DXY positioning above the 20, 100, and 200-day Simple Moving Averages (SMAs) suggests the bulls are asserting their control. As long as the index remains above these levels, the buyers have reason to remain optimistic.
US Dollar FAQs
The US Dollar (USD) is the official currency of the United States of America, and the ‘de facto’ currency of a significant number of other countries where it is found in circulation alongside local notes. It is the most heavily traded currency in the world, accounting for over 88% of all global foreign exchange turnover, or an average of $6.6 trillion in transactions per day, according to data from 2022. Following the second world war, the USD took over from the British Pound as the world’s reserve currency. For most of its history, the US Dollar was backed by Gold, until the Bretton Woods Agreement in 1971 when the Gold Standard went away.
The most important single factor impacting on the value of the US Dollar is monetary policy, which is shaped by the Federal Reserve (Fed). The Fed has two mandates: to achieve price stability (control inflation) and foster full employment. Its primary tool to achieve these two goals is by adjusting interest rates. When prices are rising too quickly and inflation is above the Fed’s 2% target, the Fed will raise rates, which helps the USD value. When inflation falls below 2% or the Unemployment Rate is too high, the Fed may lower interest rates, which weighs on the Greenback.
In extreme situations, the Federal Reserve can also print more Dollars and enact quantitative easing (QE). QE is the process by which the Fed substantially increases the flow of credit in a stuck financial system. It is a non-standard policy measure used when credit has dried up because banks will not lend to each other (out of the fear of counterparty default). It is a last resort when simply lowering interest rates is unlikely to achieve the necessary result. It was the Fed’s weapon of choice to combat the credit crunch that occurred during the Great Financial Crisis in 2008. It involves the Fed printing more Dollars and using them to buy US government bonds predominantly from financial institutions. QE usually leads to a weaker US Dollar.
Quantitative tightening (QT) is the reverse process whereby the Federal Reserve stops buying bonds from financial institutions and does not reinvest the principal from the bonds it holds maturing in new purchases. It is usually positive for the US Dollar.
Dow Jones trims losses following upbeat US employment data.
A moderate slowdown in the yearly wage growth has eased investors’ concerns about the strong employment reading.
The sharp reversal in the weekly chart suggests that a deeper correction might be in progress.
The Dow Jones Industrial Average (DJIA) traded higher in Friday’s morning session, following upbeat US employment figures. The index, however, is on track for its worst week in the last year as the strong US economic data has put the Federal Reserve’s (Fed) easing plans into question.
Net employment increased in March by 303K, following a 270,000 increment in February and beating expectations of about a 200K rise. Wage figures revealed that salaries keep rising although the moderation in the annual rate seems to have eased investors’ concerns.
On Thursday, Minneapolis Fed President Neel Kashkari suggested that with inflation steady at high levels the bank might refrain from cutting rates this year, which sent equity markets tumbling.
The main Wall Street indices are all positive on Friday. The NASDAQ is leading with a 1.38% advance to 16,271, followed by the S&P 500, up 1.17% at 5,207, and the Dow Jones, which adds 0.9% to 38,943.
Dow Jones news
All sectors are posting gains with Communication Services leading thanks to a 1.94% advance, followed by the Technology sector with a 1.64% gain. Industrials has gained 1.41%. The Utilities sector is the worst performer with a 0.31% advance.
Amazon (AMZN) is leading gains on Friday with a 3.17% rally to $185.66, followed by Salesforce (CRM), which advances 2.57% to $301.68. On the losing end, Intel (INTC) drops 2.16% to $38.87, still weighed down by the hefty losses reported for 2023. Next is McDonald’s (MCD) with a 0.86% decline to $267.777.
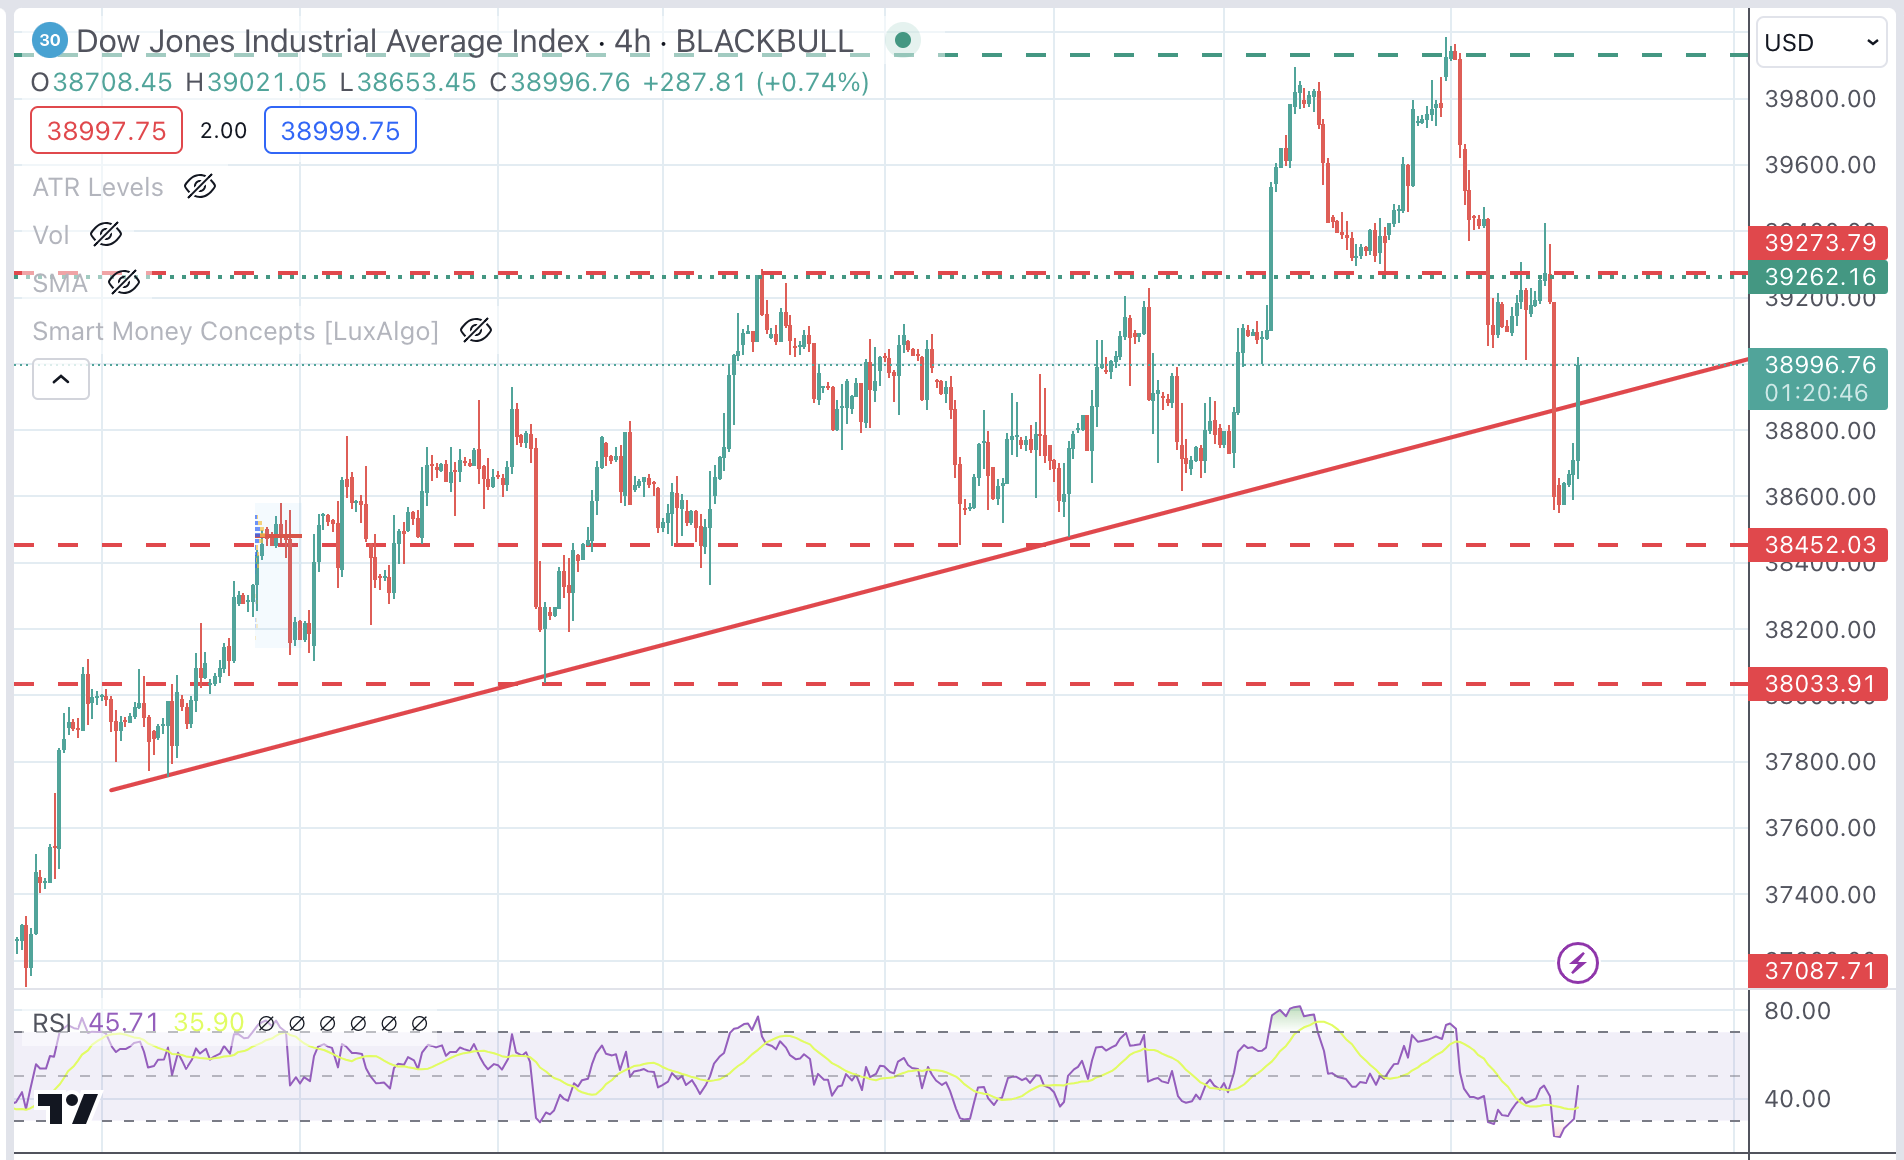
Dow Jones technical outlook
The index is trimming some losses on Friday, but the sharp reversal printed in the previous four trading days is forming a bearish engulfing candle on the weekly chart.
This formation often anticipates a major reversal. Price action has found demand above 38,500 to bounce up, but buyers might be challenged at the 39,265 resistance, which closes the path to the 40,000 top.
On the downside, a break of the 34,452 level would confirm a trend reversal and increase bearish pressure toward 38,035.
Dow Jones 4-Hour Chart
Employment FAQs
Labor market conditions are a key element to assess the health of an economy and thus a key driver for currency valuation. High employment, or low unemployment, has positive implications for consumer spending and thus economic growth, boosting the value of the local currency. Moreover, a very tight labor market – a situation in which there is a shortage of workers to fill open positions – can also have implications on inflation levels and thus monetary policy as low labor supply and high demand leads to higher wages.
The pace at which salaries are growing in an economy is key for policymakers. High wage growth means that households have more money to spend, usually leading to price increases in consumer goods. In contrast to more volatile sources of inflation such as energy prices, wage growth is seen as a key component of underlying and persisting inflation as salary increases are unlikely to be undone. Central banks around the world pay close attention to wage growth data when deciding on monetary policy.
The weight that each central bank assigns to labor market conditions depends on its objectives. Some central banks explicitly have mandates related to the labor market beyond controlling inflation levels. The US Federal Reserve (Fed), for example, has the dual mandate of promoting maximum employment and stable prices. Meanwhile, the European Central Bank’s (ECB) sole mandate is to keep inflation under control. Still, and despite whatever mandates they have, labor market conditions are an important factor for policymakers given its significance as a gauge of the health of the economy and their direct relationship to inflation.
Another positive week saw the Greenback reclaim the area beyond the 104.00 hurdle, advancing modestly on a weekly basis against the backdrop of the mixed performance in US yields and Fedspeak supporting a tighter-for-longer Fed’s stance.
Stronger-than-expected NFP readings lent support to the Greenback at the end of the week. The RCM/TIPP Economic Optimism Index is due on April 9, seconded by the Inflation Rate, Wholesale Inventories, and FOMC Minutes, all expected on April 10. On the next day, Producer Prices are due, and the preliminary Michigan Consumer Sentiment will close the week on April 12.
EUR/USD managed to reclaim the area above 1.0800, mostly on the back of Dollar weakness and risk appetite trends in the first part of the week. Germany’s Balance of Trade results are due on April 8, followed by the ECB meeting on April 11, and the final German Inflation Rate on April 12.
GBP/USD ended Friday’s session on the defensive, coming under pressure in the second half of the week on the back of the late bounce in the Greenback. The UK docket will see the BRC Retail Sales Monitor on April 9 ahead of GDP readings, Balance of Trade, Construction Output, and Industrial and Manufacturing Production, all due on April 12.
USD/JPY maintained its consolidation range below the 152.00 region once again this past week, always amidst persistent FX intervention fears. On April 8, the Eco Watchers Survey is due, along with Consumer Confidence on April 9. Additionally, Bank Lending figures and Producer Prices are expected on April 10, while Foreign Bond Investment and final Industrial Production are due on April 11 and April 12, respectively.
In quite a volatile week, AUD/USD revisited the area above 0.6600 the figure, although it ran out of some upside impetus towards the end of the week. On April 8, Home Loans are due ahead of the Westpac Consumer Confidence Index on April 9. Additionally, consumer inflation expectations come on April 11.
Anticipating Economic Perspectives: Voices on the Horizon
BoE’s Breeden speaks on April 8.
Fed’s Kashkari speak on April 9.
Fed’s Goolsbee is due to speak on April 10.
Fed’s Williams, Collins and Bostic speak on April 11 along with BoE’s Greene.
BoE’s Greene, Fed’s Bostic and Daly all speak on April 12.
Central Banks: Upcoming Meetings to Shape Monetary Policies
Canadian Dollar drops for second consecutive day amid higher US Dollar.
Strong US employment data boosts US Treasury yields, US Dollar.
In Canada, strong Ivey PMI data eases downside pressure on Canadian Dollar after disappointing labour figures.
The Canadian Dollar (CAD) extends its losses on Friday following Thursday’s pullback to test fresh year-to-date lows. A combination of a stellar US employment report and weak Canadian labor figures have undermined investors’ confidence in an already weak Loonie.
Data released by the US Labor Department on Friday shows the US economy created employment well above expectations in March. Beyond that, wages continued growing at a steady pace, well above levels consistent with the Federal Reserve’s (Fed) 2% inflation target.
These figures pour cold water on market hopes of interest rate cuts in June and endorse the hawkish party of the central bank, which advocates for delaying and downsizing the easing cycle. This has sent US yields higher, dragging the US Dollar up with them.
In Canada, net employment levels have declined against expectations in March. The negative impact, however, has been offset by the strong improvement of March’s Ivey PMI, which has given some support to an ailing Canadian Dollar.
Daily digest market movers: USD/CAD dips further as US NFP beat expectations
The Canadian Dollar has lost more than 0.5% over the last two days, retracing last week’s gains and reaching its lowest price since December 2023.
US Nonfarm Payrolls increased by 303K in March from 270K in February, well above the 200K forecasted by market experts.
Average Hourly Earnings have increased at a 0.3% monthly pace and 4.1% year on year from 0.2% and 4.3% respectively in February.
Canadian Ivey Purchasing Managers’ Index has improved to 57.7, its best reading over the last 12 months, from 53.9 in February.
Somewhat earlier, Canadian employment data disappointed investors with a 2.2K decline in March after a 40.7K increase in February. The market was expecting a 25K increase.
On Thursday, Fed Powell reiterated that the central bank needs more time to decide on rate cuts, while Fed Kashkhari warned that there might not be any rate cut this year, which sent the USD higher.
Canadian Dollar price today
The table below shows the percentage change of Canadian Dollar (CAD) against listed major currencies today. Canadian Dollar was the strongest against the Japanese Yen.
USD
EUR
GBP
CAD
AUD
JPY
NZD
CHF
USD
-0.06%
0.08%
0.32%
0.10%
0.21%
0.16%
-0.15%
EUR
0.05%
0.10%
0.36%
0.15%
0.26%
0.21%
-0.11%
GBP
-0.08%
-0.14%
0.23%
0.03%
0.14%
0.08%
-0.24%
CAD
-0.29%
-0.35%
-0.23%
-0.19%
-0.08%
-0.13%
-0.44%
AUD
-0.09%
-0.15%
-0.01%
0.23%
0.12%
0.07%
-0.26%
JPY
-0.22%
-0.27%
-0.15%
0.06%
-0.13%
-0.05%
-0.38%
NZD
-0.17%
-0.21%
-0.09%
0.14%
-0.07%
0.04%
-0.34%
CHF
0.14%
0.09%
0.24%
0.46%
0.25%
0.37%
0.33%
The heat map shows percentage changes of major currencies against each other. The base currency is picked from the left column, while the quote currency is picked from the top row. For example, if you pick the Euro from the left column and move along the horizontal line to the Japanese Yen, the percentage change displayed in the box will represent EUR (base)/JPY (quote).
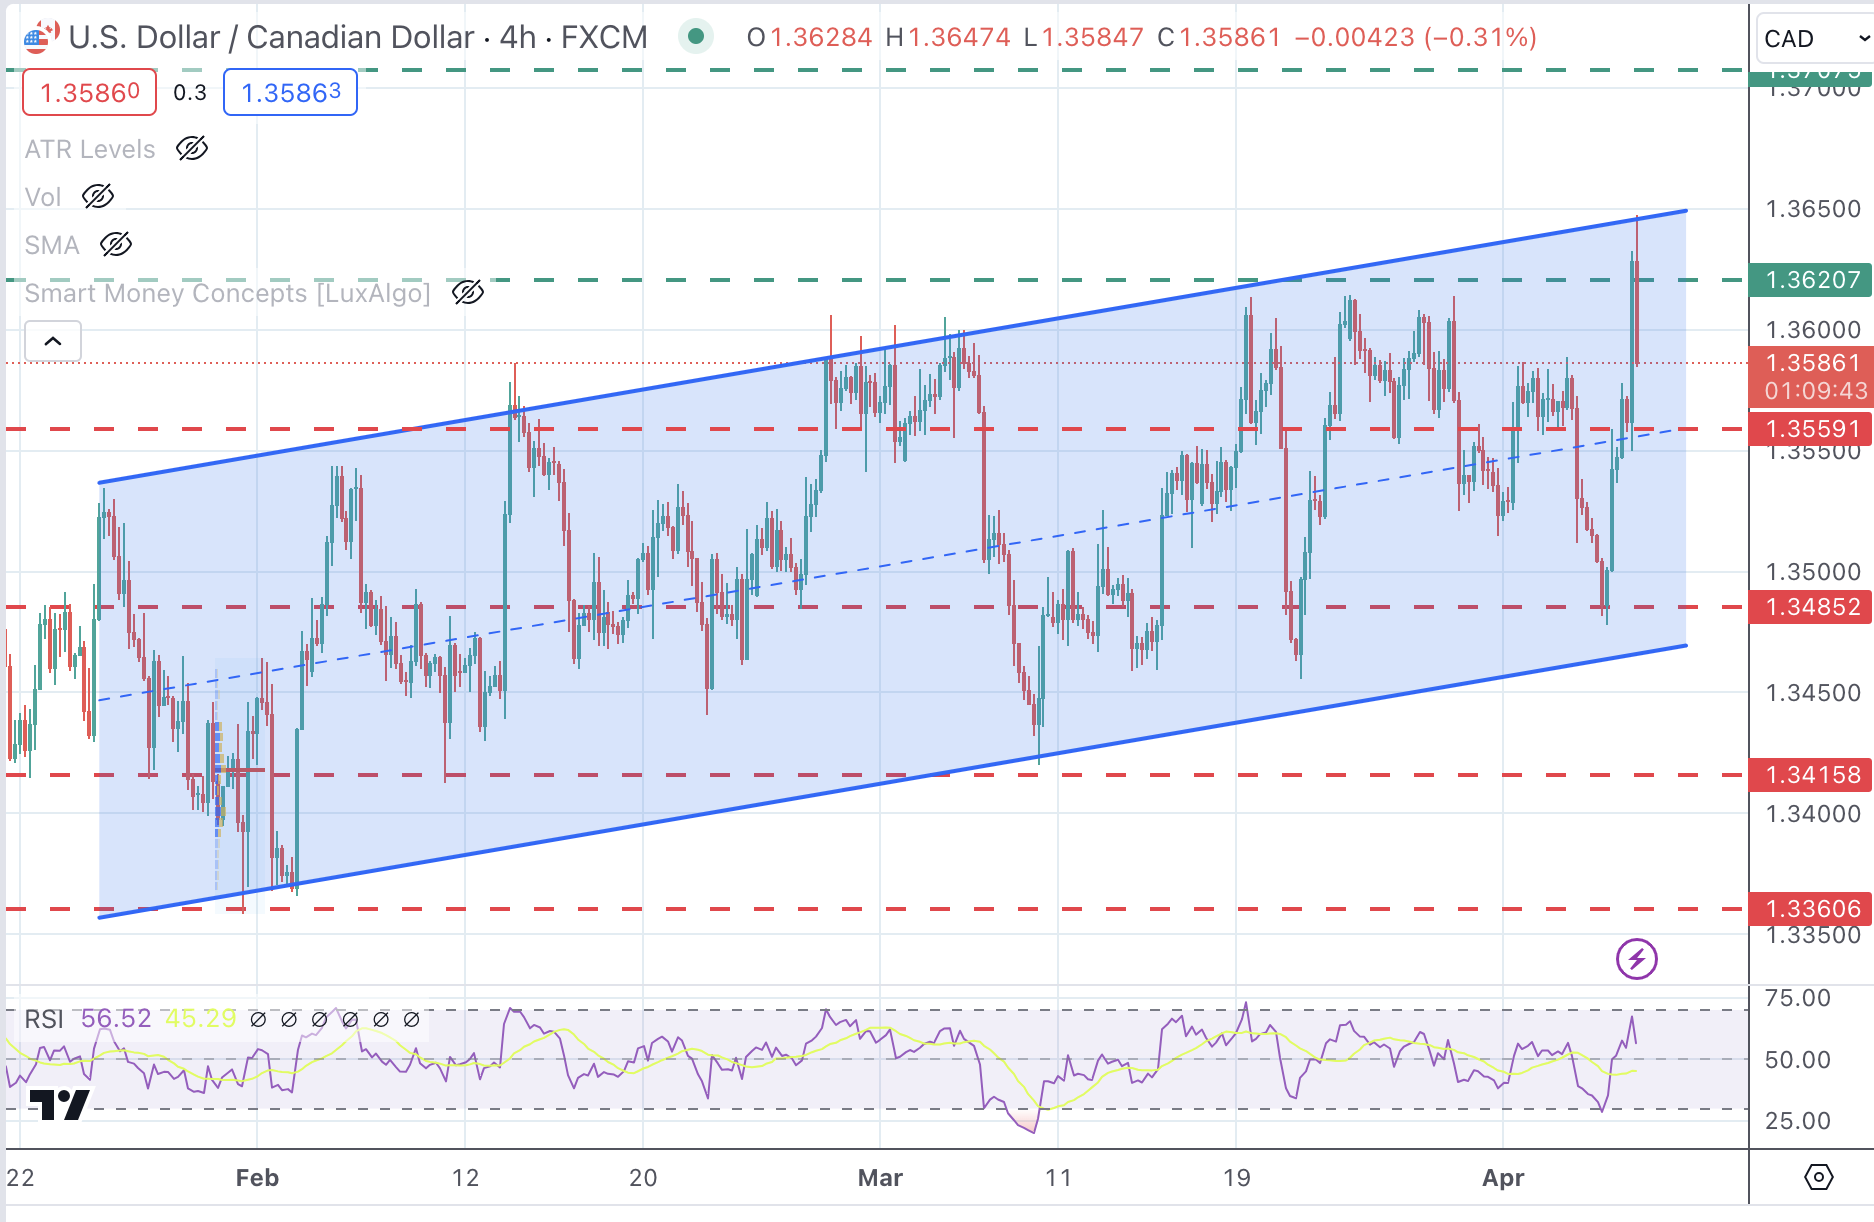
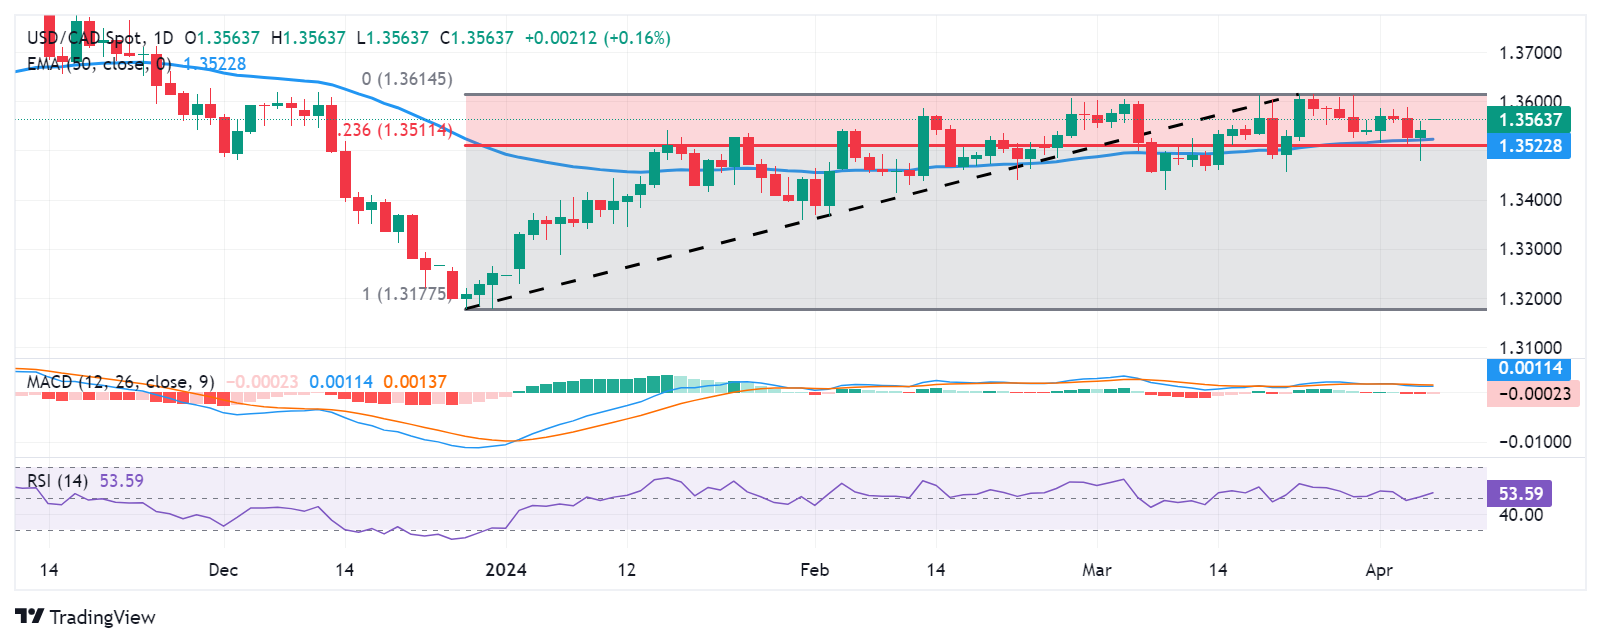
Technical analysis: USD/CAD has tested resistance at the 1.3640 area
The strong US employment data has sent the USD/CAD to test an important resistance area above 1.3620, which so far remains intact, as positive Canadian PMI data has eased bullish pressure on the pair.=
The overall picture shows the US Dollar trading back and forth within an ascending channel with price action capped below trendline resistance at 1.3640. Above here, the next targets are 2.3710 and 1.3770. The channel’s measured target is 1.3845. Support levels are 1.3560 and 1.3485.
USD/CAD 4-Hour Chart
Employment FAQs
Labor market conditions are a key element to assess the health of an economy and thus a key driver for currency valuation. High employment, or low unemployment, has positive implications for consumer spending and thus economic growth, boosting the value of the local currency. Moreover, a very tight labor market – a situation in which there is a shortage of workers to fill open positions – can also have implications on inflation levels and thus monetary policy as low labor supply and high demand leads to higher wages.
The pace at which salaries are growing in an economy is key for policymakers. High wage growth means that households have more money to spend, usually leading to price increases in consumer goods. In contrast to more volatile sources of inflation such as energy prices, wage growth is seen as a key component of underlying and persisting inflation as salary increases are unlikely to be undone. Central banks around the world pay close attention to wage growth data when deciding on monetary policy.
The weight that each central bank assigns to labor market conditions depends on its objectives. Some central banks explicitly have mandates related to the labor market beyond controlling inflation levels. The US Federal Reserve (Fed), for example, has the dual mandate of promoting maximum employment and stable prices. Meanwhile, the European Central Bank’s (ECB) sole mandate is to keep inflation under control. Still, and despite whatever mandates they have, labor market conditions are an important factor for policymakers given its significance as a gauge of the health of the economy and their direct relationship to inflation.
A robust US Nonfarm Payrolls report for March propels the Greenback higher, impacting the EUR/USD.
The Eurozone's mixed economic indicators, including Germany's Factory Orders and Retail Sales, contrast with the strong US employment landscape.
Further downside seen at EUR/USD as technical suggests potential for declines below the 1.0800 threshold.
The Euro registers minimal losses of 0.13% following the release of a stronger-than-expected jobs report from the United States (US) that boosted the Greenback, sending the EUR/USD lower. At the time of writing, the pair trades at 1.0822 after hitting a daily high of 1.0847.
EUR/USD slides as upbeat US labor market data fuels US Dollar rally
On Friday, the US Bureau of Labor Statistics (BLS) revealed that the economy added more jobs than expected. Nonfarm Payrolls for March rose by 303K, crushing estimates and previous readings of 200K and 270K. Further data showed the Unemployment Rate ticking lower from 3.9% to 3.8%, while Average Hourly Earnings were aligned to the consensus.
After the data, the Greenback strengthens as the US Dollar Index (DXY) rises 0.155%, up at 04.36. US Treasury bond yields are climbing between 4.5 and 5 basis points. The US 10-year Treasury note rate is at 4.365%.
Elsewhere, the Richmond Fed President Thomas Barkin commented the rpoert was quite strong, adding that the reduction in inflation has been uneven. Earlier. Fed’s Boston Susan Collins made comments but not on monetary policy.
Across the pond, Factory Orders in Germany improved in February, to 0.2%, improving from January’s -1.4% plunge. Moreover, Retail Sales from the Eurozone (EU) dived -0.5% MoM, worse than the estimated -0.4% contraction.
Given those factors, the EUR/USD retreated below the 200-day moving average (DMA). Traders' focus shifts to next week's data, with the release of US inflation data and consumer sentiment. On the EU’s front, the European Central Bank (ECB) will feature its monetary policy meeting, which will be the highlight of the week.
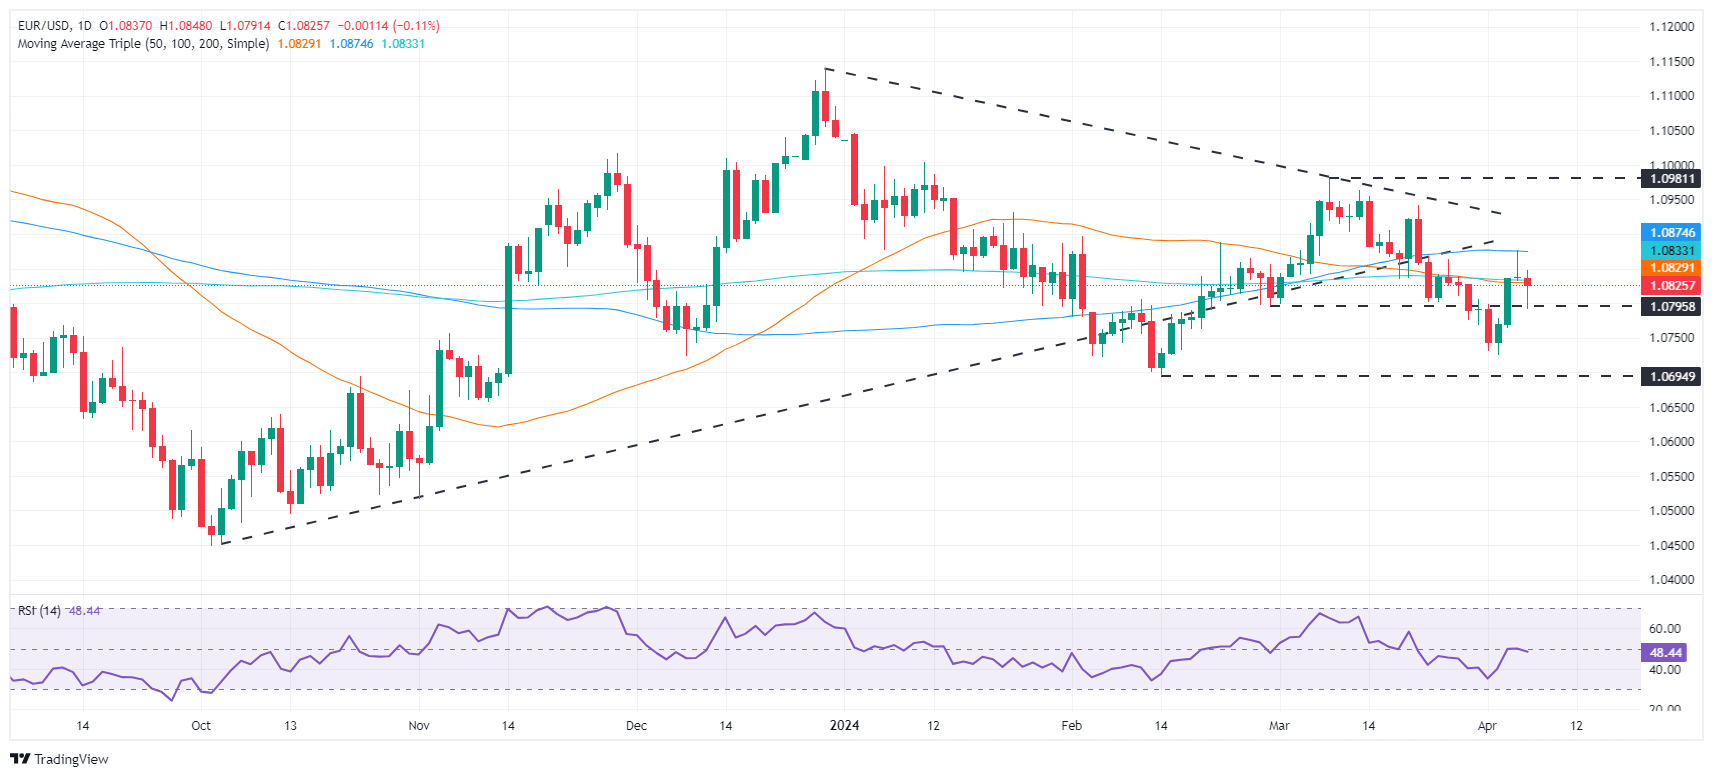
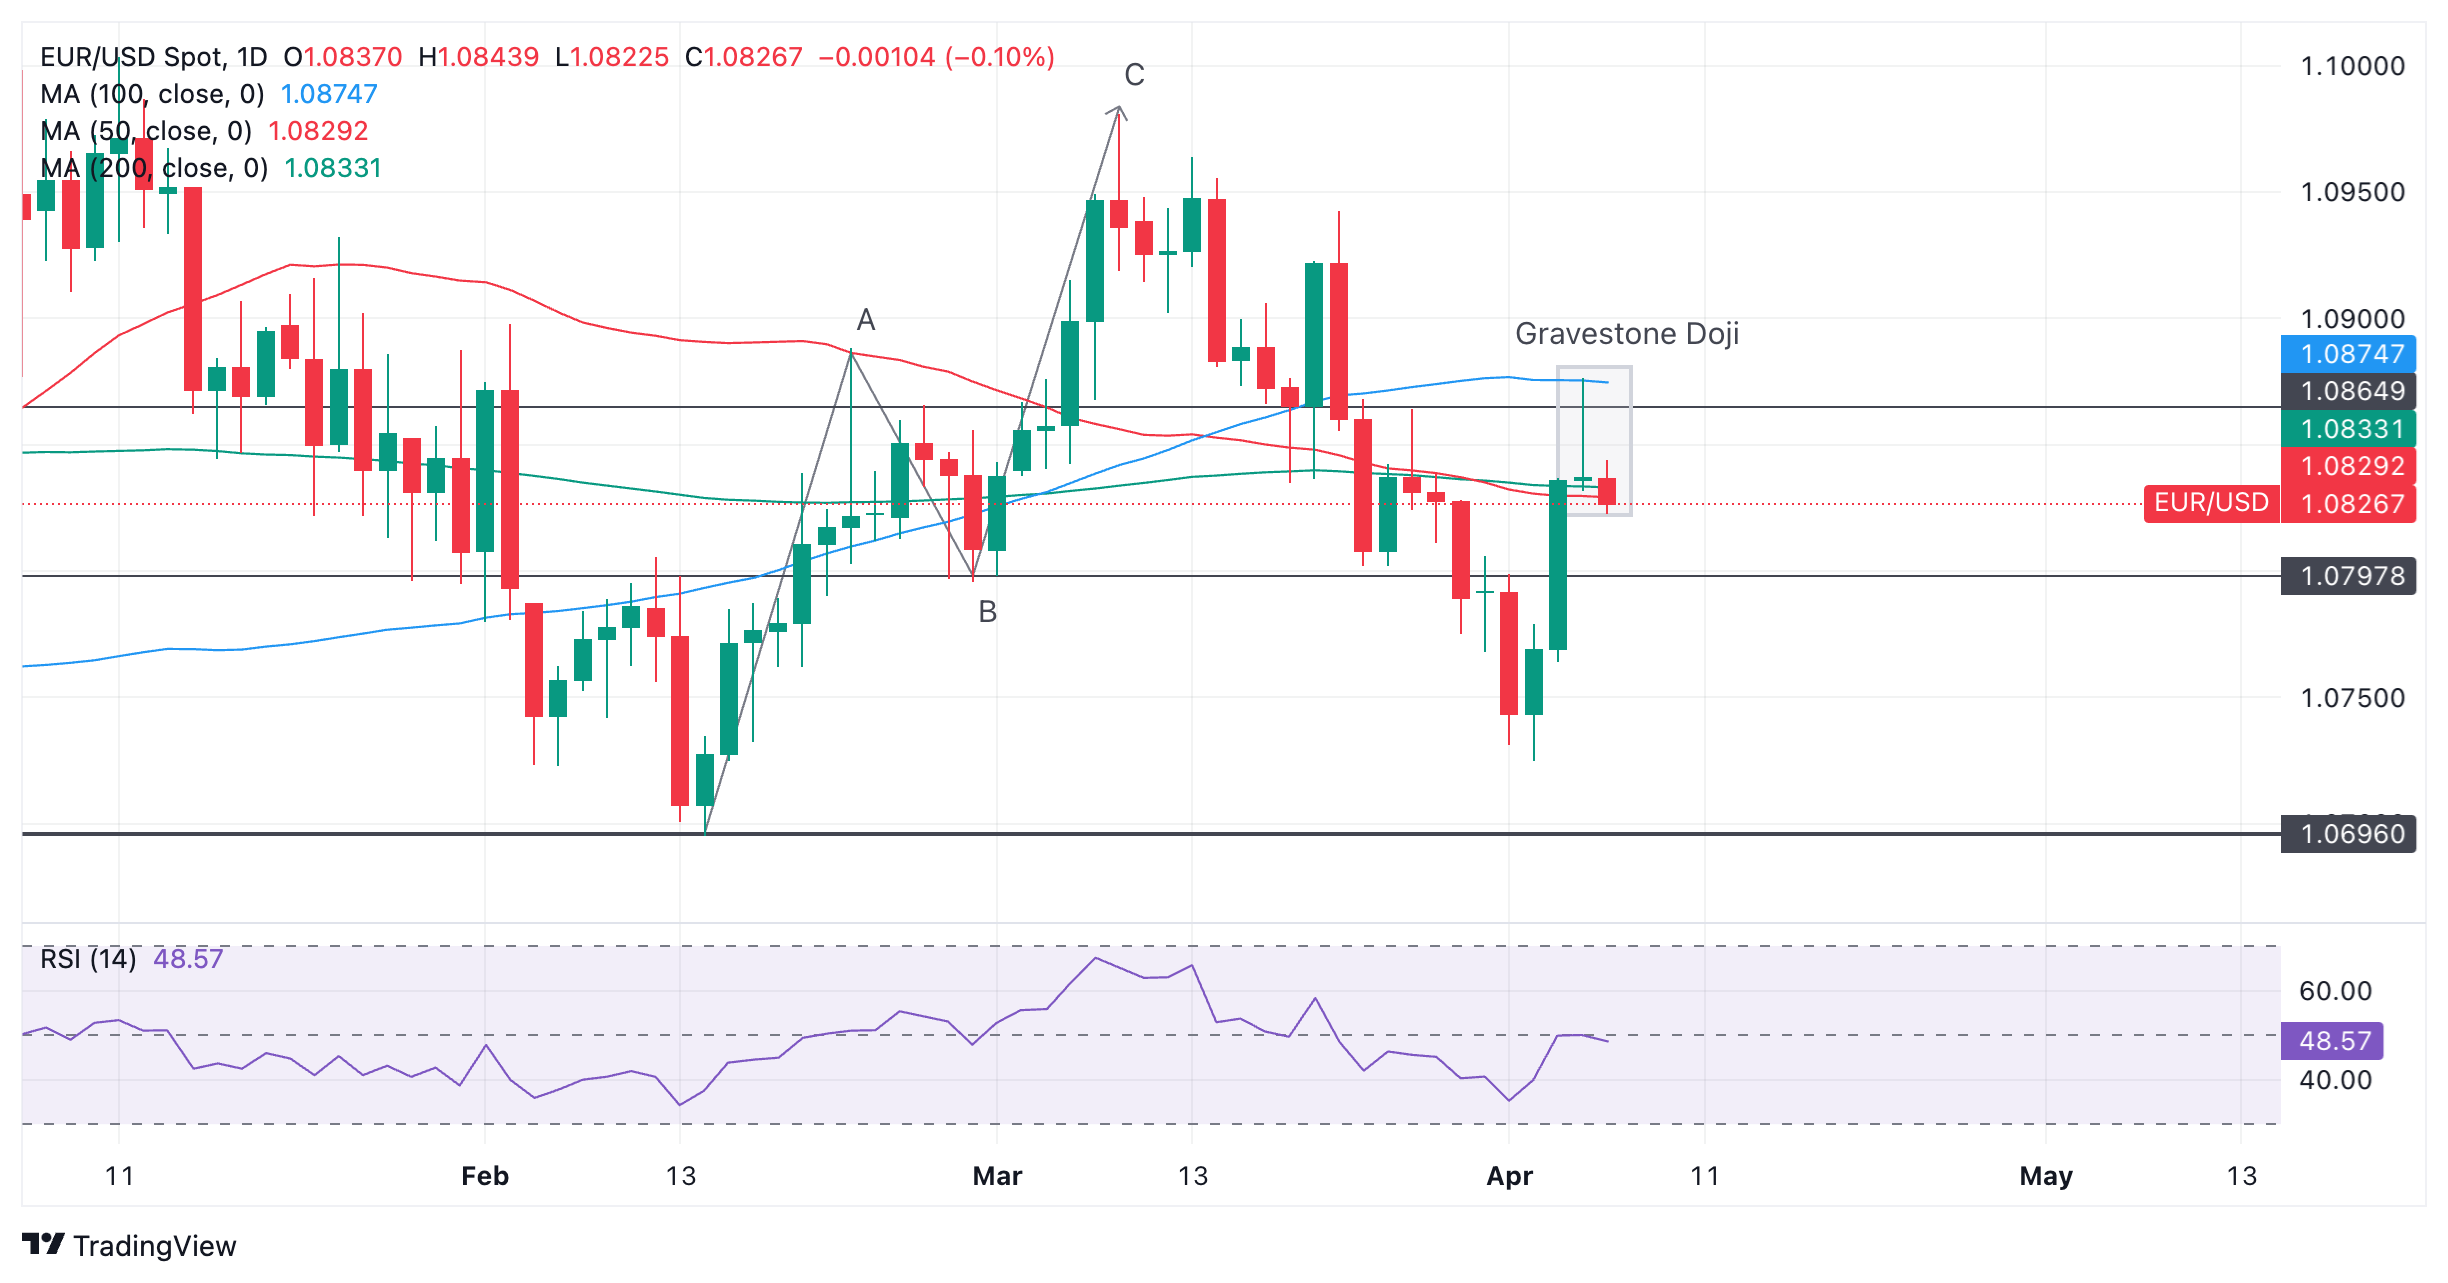
EUR/USD Price Analysis: Technical outlook
The formation of an ‘evening star’ chart pattern could pave the way for a drop below the 1.0800 figure. Momentum in the EUR/USD is tilted to the downside as the Relative Strength Index (RSI) aims lower and beneath the 50-midline level. A breach below 1.0800 will expose the April 2 low of 1.0724, ahead of 1.0700. On the other hand, buyers will face stirring resistance at the confluence of the 50 and 200-DMAs at around 1.0828/32.
Euro FAQs
The Euro is the currency for the 20 European Union countries that belong to the Eurozone. It is the second most heavily traded currency in the world behind the US Dollar. In 2022, it accounted for 31% of all foreign exchange transactions, with an average daily turnover of over $2.2 trillion a day. EUR/USD is the most heavily traded currency pair in the world, accounting for an estimated 30% off all transactions, followed by EUR/JPY (4%), EUR/GBP (3%) and EUR/AUD (2%).
The European Central Bank (ECB) in Frankfurt, Germany, is the reserve bank for the Eurozone. The ECB sets interest rates and manages monetary policy. The ECB’s primary mandate is to maintain price stability, which means either controlling inflation or stimulating growth. Its primary tool is the raising or lowering of interest rates. Relatively high interest rates – or the expectation of higher rates – will usually benefit the Euro and vice versa. The ECB Governing Council makes monetary policy decisions at meetings held eight times a year. Decisions are made by heads of the Eurozone national banks and six permanent members, including the President of the ECB, Christine Lagarde.
Eurozone inflation data, measured by the Harmonized Index of Consumer Prices (HICP), is an important econometric for the Euro. If inflation rises more than expected, especially if above the ECB’s 2% target, it obliges the ECB to raise interest rates to bring it back under control. Relatively high interest rates compared to its counterparts will usually benefit the Euro, as it makes the region more attractive as a place for global investors to park their money.
Data releases gauge the health of the economy and can impact on the Euro. Indicators such as GDP, Manufacturing and Services PMIs, employment, and consumer sentiment surveys can all influence the direction of the single currency. A strong economy is good for the Euro. Not only does it attract more foreign investment but it may encourage the ECB to put up interest rates, which will directly strengthen the Euro. Otherwise, if economic data is weak, the Euro is likely to fall. Economic data for the four largest economies in the euro area (Germany, France, Italy and Spain) are especially significant, as they account for 75% of the Eurozone’s economy.
Another significant data release for the Euro is the Trade Balance. This indicator measures the difference between what a country earns from its exports and what it spends on imports over a given period. If a country produces highly sought after exports then its currency will gain in value purely from the extra demand created from foreign buyers seeking to purchase these goods. Therefore, a positive net Trade Balance strengthens a currency and vice versa for a negative balance.
“I believe it’s much too soon to think about cutting interest rates,” Federal Reserve Bank of Dallas President Lorie Logan said on Friday, citing upside risks to inflation.
Key takeaways
"Need to see more of the uncertainty resolved about which economic path we’re on."
"Increasingly concerned about upside risk to the inflation outlook."
"FOMC should remain prepared to respond appropriately if inflation stops falling."
"Difficult to predict exactly when overnight reverse repo balances will be depleted."
"Believe it will soon be appropriate for the FOMC to decide when to slow - not stop - the runoff of our asset holdings."
"Slower but still meaningful run-off pace will provide more time for banks and money market participants to redistribute liquidity and for the Fed to assess liquidity conditions."
"Taper will also reduce the risk of going too far."
"Taper should not have much effect on broader financial conditions."
"Taper is unrelated to considerations of the appropriate degree of policy restriction."
"Not ready to put higher trend productivity in my baseline outlook."
Market reaction
The US Dollar Index clings to modest daily gains near 104.40 following these comments.
GBP/JPY fades as UK-Japan interest rates are expected to converge.
In the UK, falling inflation is expected to lead to lower interest rates.
In Japan rising inflation is increasingly expected to lead to higher interest rates.
GBP/JPY trades a tenth of a percent lower on Friday, at just above 191.000, as converging UK-Japan interest rate expectations reduce the advantage for investors of holding the Pound Sterling (GBP) over the Japanese Yen (JPY), weighing on the exchange rate.
Easing inflation expectations in the UK have led investors to speculate that the Bank of England (BoE) will cut interest rates in June. This has weakened the Pound Sterling since lower interest rates tend to reduce foreign capital inflows.
Conversely in Japan, the Bank of Japan increased interest rates from an extraordinarily low, negative 0.1% level, at the bank’s March meeting. The move had many investors speculating as to whether the increase was a one-off or the start of a cycle of rate hikes that could strengthen the Yen over the longer run.
In a recent interview with the Asahi Shimbun, Bank of Japan (BoJ) Governor Ueda seemed to suggest more interest rate hikes could be down the road given accelerating inflation.
Ueda said the positive results of the Shunto spring wage negotiations will be reflected in wages through the summer, and then reflected in higher consumer prices later in the year.
"Given annual wage talks outcome so far, trend inflation is likely to gradually accelerate," said Ueda.
Survey shows UK inflation cooling
In the UK meanwhile, the latest Bank of England (BoE) Decision Maker Panel (DMP) survey for February showed that most firms see selling prices and wage inflation cooling over the next year.
According to the DMP survey, selling price expectations decelerated to 4.1% from 4.3%, the lowest reading in over two years. Wage growth expectations softened to 4.9% on a three-month moving average basis from 5.2% in February.
Bank of England Governor Andrew Bailey recently said that market expectations for two or three rate cuts this year are “reasonable”, further increasing speculation the BoE will pull the trigger and cut rates in June.
Soft Services PMI data for March, released on Thursday, impacted the economic outlook for the UK, adding to the reasons for the BoE to cut interest rates.
The UK Services PMI fell to 53.1, missing expectations and the prior reading of 53.4.
Nevertheless, not all UK data was negative. A recent report by the UK’s largest building society Nationwide showed the first rise in house prices since January 2023, according to the Guardian.
This comes after BoE lending data showed a surprise rise in Mortgage Approvals rising to their highest level since September 2022 in February.
14:32
Turkey Treasury Cash Balance up to -166.78B in March from previous -198.34B
USD/CAD rallies on strong US NFP, weak Canadian labor market data.
The speculation for Fed to begin rate cuts could be shifted to the second half of this year.
Canadian labors were fired over March. The jobless rate rose to 6.1%.
The USD/CAD pair prints a fresh four-month high at 1.3640 in Friday’s early American session. The Loonie asset rallies as the United States Bureau of Labor Statistics (BLS) has reported upbeat Nonfarm Payrolls and the Statistics Canada has showed poor Employment data for March.
The US NFP reported that the labor market witnessed 303K fresh payrolls, significantly better than expectations of 200K and the prior reading of 270K. The Unemployment Rate falls to 3.8% from the consensus and the prior reading of 3.9%. Strong labor demand has dented market expectations for the Federal Reserve (Fed) to begin reducing interest rates, which is currently expected from the June meeting.
Robust labor demand is generally followed by strong wage growth as employers are forced to offer higher pay due to shortage of workers. Higher wage growth boosts consumer spending, which keeps inflation stubbornly higher.
On Thursday, Minneapolis Fed Bank President Neel Kashkari said rate cuts won’t be required this year if inflation remains stall. Neel Kashkari forecasted two rate cuts by 2024 in the latest Fed’s dot plot.
Upbeat labor demand has boosted the US Dollar’s appeal. The US Dollar Index (DXY), which tracks the US Dollar’s value against six major currencies, extends its upside to 104.65.
Meanwhile, the Canadian Dollar weakens as workers were laid-off over month. Canada’s labor market witnessed drawdown of 2.2K workers, which investors forecasted fresh recruitment of 25K jobs. The Unemployment Rate rose strongly to 6.1% from expectations of 5.9% and the prior reading of 5.8%. However, annual Average Hourly Earnings grew at a higher pace of 5.0% from 4.9% in February.
Weak labor demand will boost expectations for the Bank of Canada (BoC) pivoting to rate cuts sooner.
USD/CAD
Overview
Today last price
1.3625
Today Daily Change
0.0083
Today Daily Change %
0.61
Today daily open
1.3542
Trends
Daily SMA20
1.3539
Daily SMA50
1.3513
Daily SMA100
1.3487
Daily SMA200
1.3503
Levels
Previous Daily High
1.3559
Previous Daily Low
1.3478
Previous Weekly High
1.3614
Previous Weekly Low
1.3525
Previous Monthly High
1.3614
Previous Monthly Low
1.342
Daily Fibonacci 38.2%
1.3528
Daily Fibonacci 61.8%
1.3509
Daily Pivot Point S1
1.3494
Daily Pivot Point S2
1.3445
Daily Pivot Point S3
1.3413
Daily Pivot Point R1
1.3575
Daily Pivot Point R2
1.3608
Daily Pivot Point R3
1.3656
14:00
Canada Ivey Purchasing Managers Index s.a came in at 57.5, above expectations (54.2) in March
The release of stronger-than-expected Nonfarm Payrolls data has not changed the view of economists at RBC that the Federal Reserve will start cutting interest rates in June.
Risks are, however, now tilted in favor of a delay.
Robust hiring means risks tilting to a delay
“Robust hiring in US labor markets has yet to let up with payroll employment growth accelerating to 303k in March from already solid readings in the months before.”
“Despite solid headline numbers, the Fed has been pointing to other indicators such as lower quit rate, falling job openings and moderating wage growth as signs of tight labor market conditions unwinding, and has maintained the assessment that risks with its dual mandate are coming into better balance.”
“The choppier the progress with inflation (as it has been in early 2024), the longer the Fed will need to hold rates steady.”
“Our own base-case assumption is that the first rate cut will come in June, with risks tilting to a delay.”
The release of more stellar US jobs data in the form of March Nonfarm Payrolls (NFP), has further reduced the chances of the Federal Reserve (Fed) making a first interest-rate cut in June, according to economists at Commerzbank.
Rate cut in first half of 2024 increasingly unlikely
“The US labor market has once again exceeded expectations.”
“The downright astonishing strength of the labor market makes a first rate cut by the Fed already in the first half of the year increasingly unlikely.”
“Fed Chair Powell regularly points out that the imbalance between supply and demand in the labor market is gradually reducing, which lowers the risk of inflation. However, the new figures do not really support this theory, as job growth has been on the rise again since fall 2023. This indicates that the economy remains very robust. There is therefore no need to rush to cut key interest rates - a narrow majority of Fed members recently still expected three rate cuts later in the year.”
“Consumer price data for March will be published next week. Once again, we expect prices to rise a little too strongly for the Fed's liking.”
“All in all, a first rate cut at the June meeting, which we still expect, is becoming less likely. The timing of the first cut is likely to be determined primarily by the further development of inflation.”
12:32
United States Labor Force Participation Rate climbed from previous 62.5% to 62.7% in March
12:32
United States Unemployment Rate came in at 3.8%, below expectations (3.9%) in March
12:32
United States Average Hourly Earnings (MoM) in line with expectations (0.3%) in March
12:32
Canada Net Change in Employment below forecasts (25K) in March: Actual (-2.2K)
12:31
Canada Unemployment Rate came in at 6.1%, above forecasts (5.9%) in March
12:31
United States Nonfarm Payrolls came in at 303K, above expectations (200K) in March
12:31
Canada Participation Rate remains unchanged at 65.3% in March
12:30
United States Average Hourly Earnings (YoY) in line with expectations (4.1%) in March
12:30
United States Average Weekly Hours came in at 34.4, above expectations (34.3) in March
12:30
United States U6 Underemployment Rate: 7.3% (March)
USD/JPY is expected to rally above its current range in the 151.000s, according to Strategists at BBH.
A combination of very gradual BoJ tightening and a more muted than currently priced-in Federal Reserve (Fed) easing cycle are the fundamental catalysts.
USD/JPY falls due to Ueda – will rise eventually
“USD/JPY fell by over 0.50% to an intra-day low around 150.80 following hawkish comments from BOJ Governor Ueda.”
“Verbal defense on the Yen continues as Japanese Finance Minister Suzuki and Prime Minister Kishida both warned against excessive yen moves.”
“It’s only a matter of time before USD/JPY breaks higher because we anticipate a gradual BOJ tightening process and a more muted than currently priced-in Fed easing cycle.”
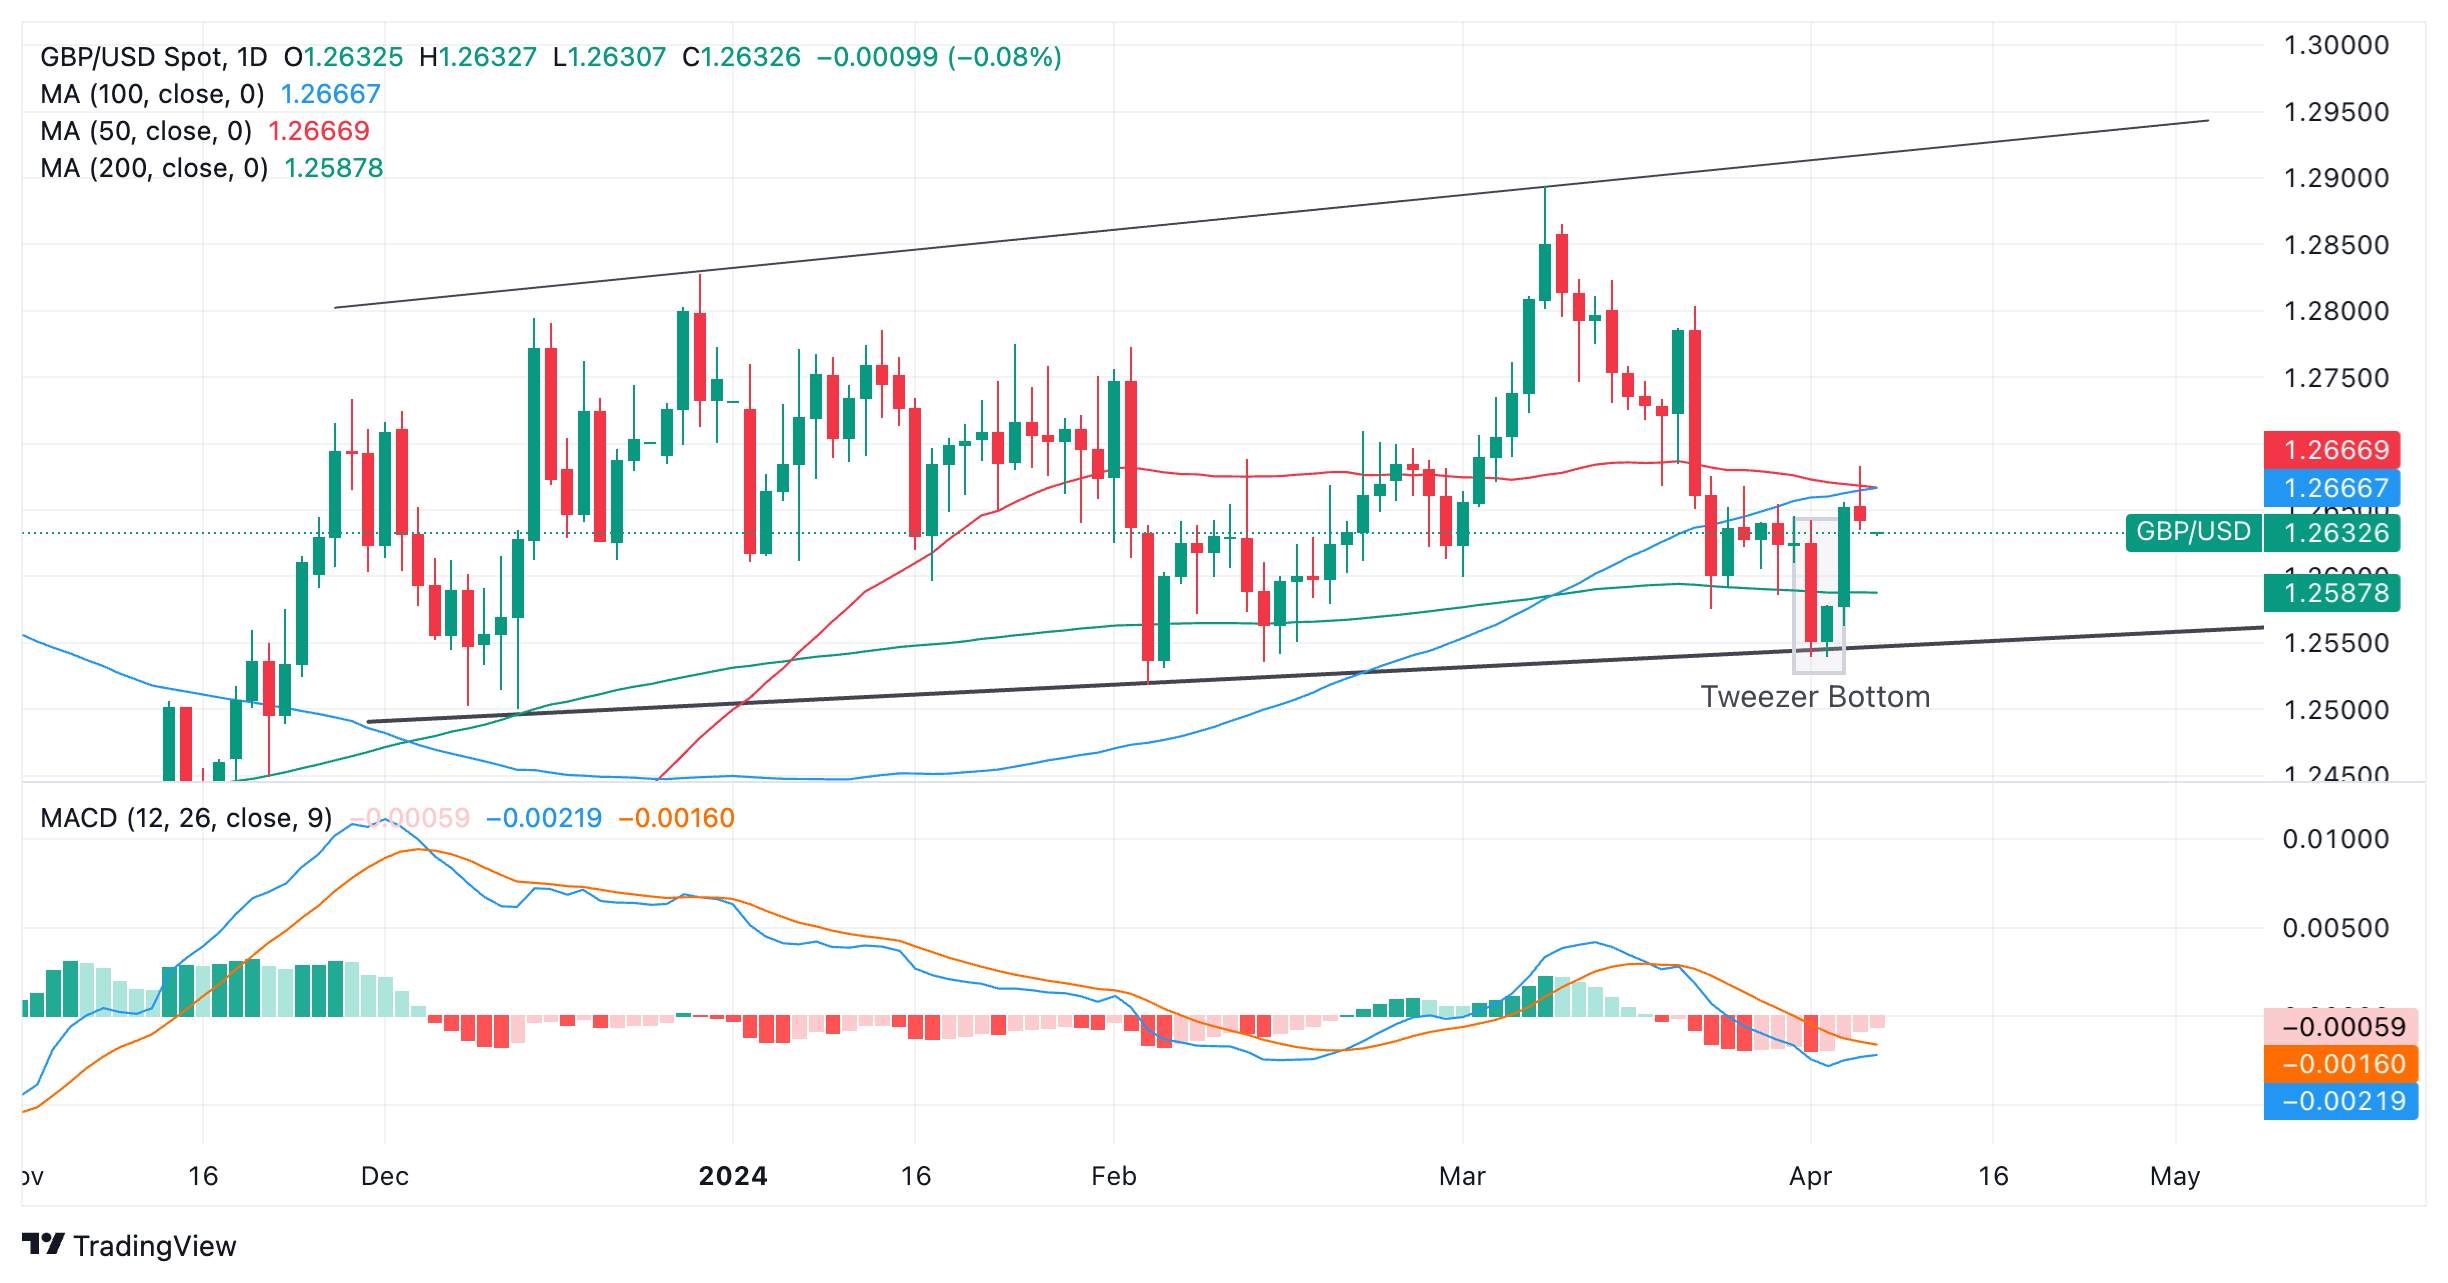
GBP/USD bounced off a key support level and rose up strongly this week.
Resistance from two major Moving Averages, however, prevented the trend from going higher.
A clear break above this resistance barrier would be required to confirm a move up to the range highs.
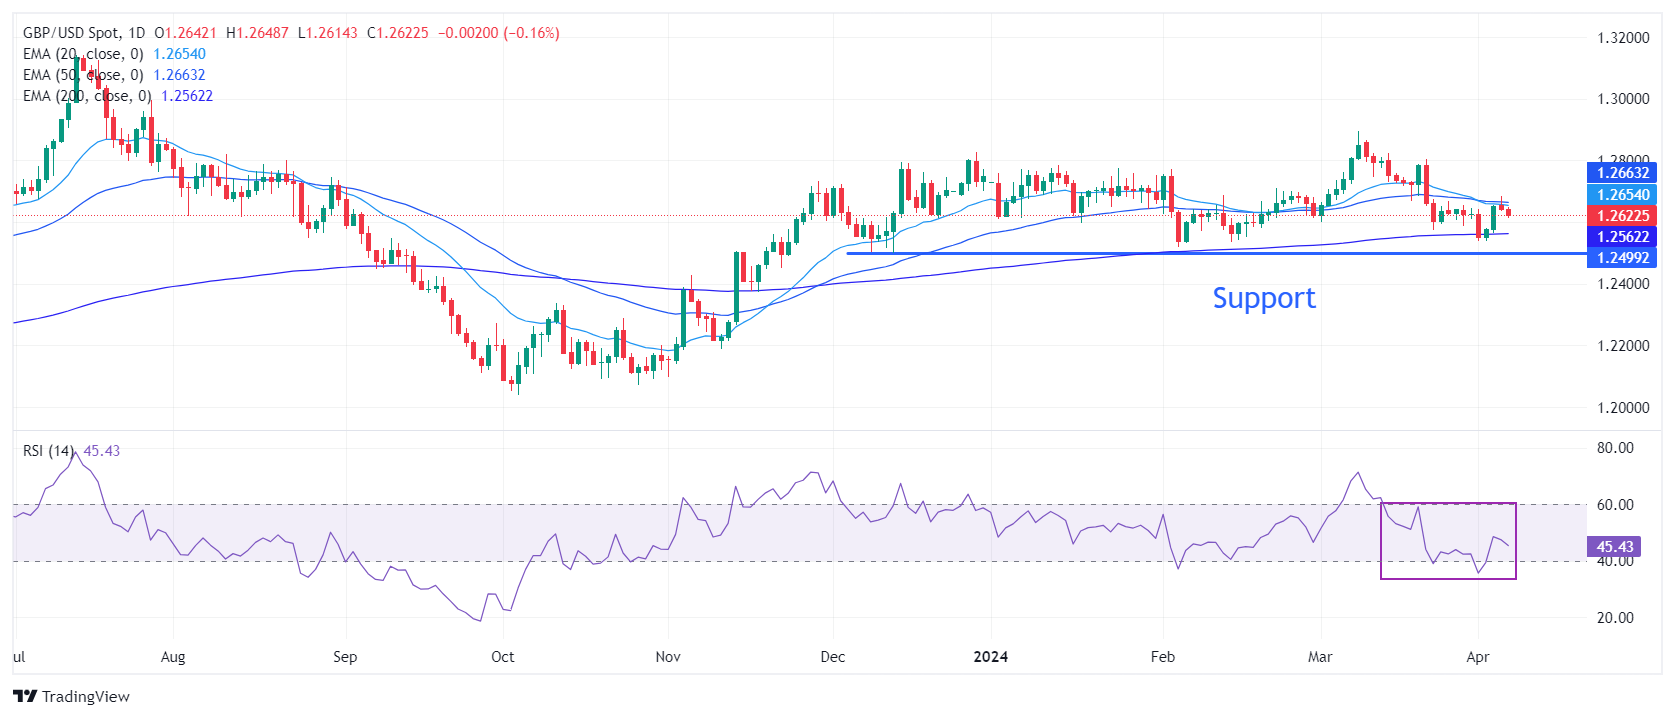
GBP/USD has just bounced off the bottom of a medium-term consolidation range after forming a bullish Tweezer Bottom Japanese candlestick pattern.
The pair rose up strongly on Wednesday and Thursday but then hit stubborn resistance at the intersection of two major moving averages – the red 50-day and blue 100-day Simple Moving Averages (SMA) – and stalled.
Pound Sterling versus US Dollar: Daily chart
The pair formed a bearish Shooting Star candlestick pattern on Thursday and is now trading just beneath it in the 1.2630s.
Given the firm floor of support at the 1.2550s, which has shown itself able to prop up price on at least three occasions since November 2023 it is likely to hold again, and the pair could be at the start of another move back up inside the range.
However, the Moving Average Convergence/ Divergence (MACD) indicator, which is an especially useful confirmation tool for turning points in a range-bound market, has still not crossed its signal line to offer a buy signal.
The 50 and 100 SMAs are also still providing a formidable resistance blockade above price, and ideally need to be penetrated decisively before a more bullish outlook can be adopted.
A decisive breakthrough above the two SMAs – by which is meant a long green candlestick that breaches the resistance and closes near its high, or three green candlesticks that break through the level – would be required to confirm more upside.
The March 21 high at 1.2804 presents as a possible target for such a revolution.
Alternatively, a decisive break below the range low at 1.2550 would lead to a volatile move lower, since support that has been retested on several occasions, when finally broken, usually ends up giving way in a dramatic fashion.
12:01
India Bank Loan Growth declined to 20.2% in March 18 from previous 20.4%
12:01
India FX Reserves, USD up to $645.58B in March 25 from previous $642.63B
The US Dollar Index trades slow and steady as traders step aside to wait for key US data.
The US Labor Report could inject some volatility into DXY if it changes inflation expectations.
Recent commentary from Fed officials has shown vacillation and delay in deciding on whether to cut interest rates.
The US Dollar Index (DXY) seesaws between tepid gains and losses on Friday as traders sit on the sidelines prior to the release of market moving data from the US.
If the key Labor Market metric paints a positive picture for the labor market it should support the US Dollar, pushing up the DXY.
Alternatively a weak showing in the report would have the opposite effect, pushing down the Dollar Index.
Pay-roll day
Economists expect the headline figure to show the US economy added 200,000 jobs in the month of March after adding 275,000 in February. If the real figure is substantially above this – by a margin of more than 10%, say – it is likely to pressure the DXY higher.
Positive employment growth in the US, which already has a relatively tight labor market, will suggest upward pressure on wages and higher inflation. Higher inflation means the US Federal Reserve (Fed) will have to keep its main interest rate, the Fed Funds Rate, at its current relatively high (5.5%) level for longer. Higher interest rates are positive for the US Dollar since they attract greater inflows of foreign capital.
Another important metric within the NFP report is Average Hourly Wages, since this more directly impacts inflation expectations. If this metric rises more than forecast it will push up DXY and the opposite if it falls. In the last report wages rose 4.3% YoY and expectations are for a drop to 4.1%.
Fickle rate-setters
The US Dollar Index has been broadly supported during March by a shift in the commentary coming from interest-rate-setters in the US Federal Reserve.
From previously expecting to cut the key interest rate in the US – the Fed Funds Rate – by a total of 0.75% in 2024, in three 0.25% tranches, some members of the decision-making council have changed their opinion and now see less need to cut interest rates.
Their change in view is as a result of inflation remaining higher-than-expected, especially services sector inflation and robust economic growth in the US, which has continued to show dynamism even in the face of higher borrowing costs.
The DXY recovered after a dip on Thursday after Minneapolis Federal Reserve (Fed) Bank President Neel Kashkari raised the prospect the Fed might not cut interest rates at all in 2024 if inflation remained at current levels.
“If inflation continues to move sideways, it makes me wonder if we should cut rates at all this year,” Kashkari said, despite admitting to previously penciling in two rate cuts this year.
European certainty
DXY is a trade-weighted index measuring the strength of the US Dollar versus its main counterparts. The Euro is the main contributor.
In contrast to the vacillation observed at the Fed, there appears to be more of a consensus amongst rate-setters at the European Central Bank (ECB). They are more unanimous in their desire to go ahead with a proposed interest-rate cut in June, a factor supporting DXY and weighing on the Euro (EUR).
The ECB decision, however, is likely to be dependent on whether wage data released prior to the June meeting shows a decline in wage inflation.
WTI is stuck in a tight range but is poised to close the week on a bullish note.
Supply concerns and an improved demand outlook have boosted Oil’s appeal.
US Biden criticized Ukraine for targeting Russia’s oil infrastructure.
West Texas Intermediate (WTI), futures on NYMEX, consolidate in a tight range around $86.80 in the European session on Friday. The Oil prices are set to conclude the week on a bullish time for the second straight time. The black gold sees a strong bull run in two weeks due to deepening supply concerns and expectations of a sharp revival in the global oil demand.
Escalating tensions in Eastern Europe and the Middle East have reinforced fears of oil supply risks. This week, Ukraine’s drone attacks on Russian oil refineries prompted upside risks to lower oil production, resulting in a fresh escalation in geopolitical tensions. US President Joe Biden criticized the event of Ukraine targeting Russia’s oil infrastructure as it could have drastic consequences to global oil prices.
In the Middle East region, air strikes by Israeli forces on the Iranian embassy in Damascus, resulting in the deaths of Iran's high-rank commanders, have deepened fears of Iran’s direct participation in the war in Gaza. Geopolitical tensions disrupt the supply chain, which increases the prices of various raw materials.
Meanwhile, a sharp recovery in the Manufacturing PMI in the Eurozone, the United Kingdom, and the United States has strengthened the outlook for oil demand. In the UK and the US, the Manufacturing PMI surprisingly returned to growth after contracting for more than a year. In the Eurozone, the Manufacturing PMI outperformed expectations but remains below the 50.0 threshold, which separates contraction from expansion. The oil prices have a direct relationship with the outlook of the manufacturing sector.
Going forward, investors will focus on the United States Nonfarm Payrolls (NFP) data for March, which will be published at 12:30 GMT. The labor market data will influence market expectations for the Federal Reserve (Fed) pivoting to rate cuts, which are currently expected in the June meeting.
Gold price turns sideways near all-time highs as focus shifts to the US NFP report.
The US Dollar rises as Fed Kashkari said he sees no rate cuts if inflation remains stubborn.
Escalating Middle East tensions keep safe-haven bids strong.
Gold price’s (XAU/USD) rally pauses after refreshing all-time highs near $2,305 amid uncertainty ahead of the release of the United States Nonfarm Payrolls (NFP) data for March. The labor market data is expected to influence market expectations for the Federal Reserve (Fed) rate cuts, which financial markets are currently anticipating for June.
The CME FedWatch Tool shows that traders are pricing in a 61% chance that the Fed will trim interest rates in June, an inch higher from 60% a week ago. Traders bets for Fed rate cuts remain broadly unchanged as surprisingly weak US Services PMI for March offset the negative impact of hawkish commentary from a slew of Fed policymakers. Meanwhile, 10-year US Treasury yields are up at 4.34%.
Surprisingly, the Services PMI fell to 51.4 in March, from expectations of 52.7, and the former reading was 52.6.
Meanwhile, the near-term appeal of Gold remains strong due to escalating Middle East tensions. Air strikes from Israeli forces on the Iranian embassy in Damascus, situated near Syria’s capital, have deepened fears of Iran’s participation in the Israel-Palestine war. Rising geopolitical tensions lead investors towards safe-haven assets such as Gold.
Daily digest market movers: Gold price awaits US NFP for fresh guidance
Gold price takes a breather as investors turn cautious ahead of the United States NFP report for March, which will be published at 12:30 GMT. It is anticipated that the United States employers recruited 200K jobs, lower than the robust hiring of 275K seen in February. The Unemployment Rate is anticipated to remain unchanged at 3.9%.
Investors will also focus on March's Average Hourly Earnings data to gain more insights about the inflation outlook. Economists expect monthly wage growth to have grown at a higher pace of 0.3% from 0.1% in February. Annual wage growth is forecasted to have grown by 4.1%, decelerating from the prior reading of 4.3%.
Higher wage growth could slow the progress in inflation declining towards 2%, which could negatively influence market expectations for the Federal Reserve (Fed) to begin reducing interest rates in June. If this happens, the opportunity cost of holding an investment in non-yielding assets such as Gold will increase, weighing on its price. On the contrary, slowing wage growth will strengthen Gold’s appeal.
Meanwhile, the stabilization in the US Dollar’s valuation after the Fed’s hawkish guidance on interest rates has also put slight pressure on the Gold price. The US Dollar Index (DXY) finds support from a two-week low of 103.90 after Minneapolis Fed Bank President Neel Kashkari said rate cuts won’t be required this year if inflation stalls.
Kashkari said he forecasted two rate cuts by 2024 in the latest Fed dot plot. “The Fed needs to keep interest rates higher in the range of 5.25%-5.50% if inflation remains stronger than hoped,” Kashkari warned. He added that if that still did not work, further rate increases are not off the table, but they are also not a likely scenario given what we know right now," Reuters reports.
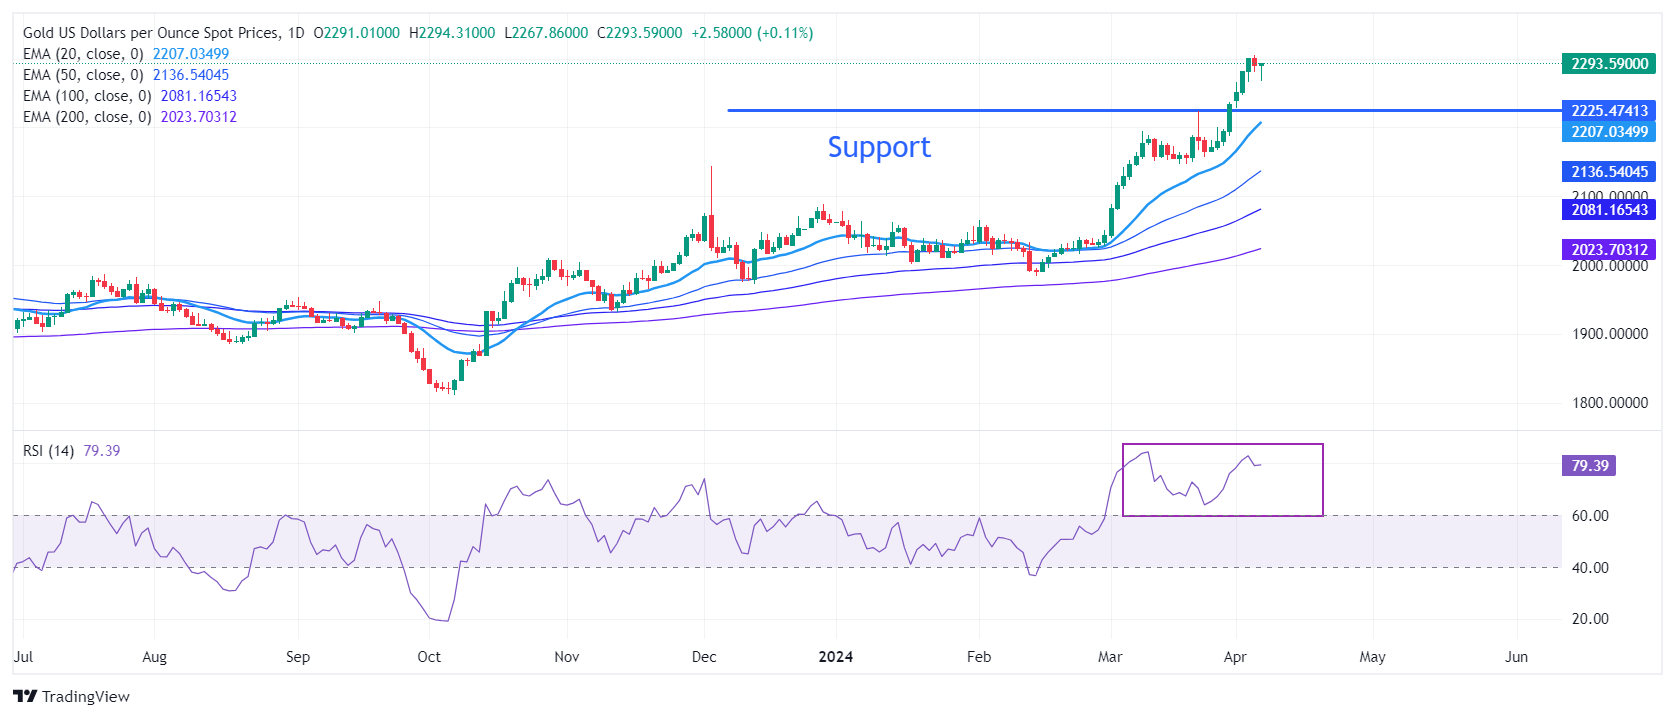
Technical Analysis: Gold price trades near all-time highs around $2,300
Gold price falls slightly after achieving the $2,300 milestone. The near-term demand remains unabated as all short-to-long term Exponential Moving Averages (EMAs) are sloping higher. On the downside, March 21 high at $2,223 will be a major support area for the Gold price bulls.
The 14-period Relative Strength Index (RSI) near 80.00 indicates that a bullish momentum is still active. However, overbought signals have emerged.
Gold FAQs
Gold has played a key role in human’s history as it has been widely used as a store of value and medium of exchange. Currently, apart from its shine and usage for jewelry, the precious metal is widely seen as a safe-haven asset, meaning that it is considered a good investment during turbulent times. Gold is also widely seen as a hedge against inflation and against depreciating currencies as it doesn’t rely on any specific issuer or government.
Central banks are the biggest Gold holders. In their aim to support their currencies in turbulent times, central banks tend to diversify their reserves and buy Gold to improve the perceived strength of the economy and the currency. High Gold reserves can be a source of trust for a country’s solvency. Central banks added 1,136 tonnes of Gold worth around $70 billion to their reserves in 2022, according to data from the World Gold Council. This is the highest yearly purchase since records began. Central banks from emerging economies such as China, India and Turkey are quickly increasing their Gold reserves.
Gold has an inverse correlation with the US Dollar and US Treasuries, which are both major reserve and safe-haven assets. When the Dollar depreciates, Gold tends to rise, enabling investors and central banks to diversify their assets in turbulent times. Gold is also inversely correlated with risk assets. A rally in the stock market tends to weaken Gold price, while sell-offs in riskier markets tend to favor the precious metal.
The price can move due to a wide range of factors. Geopolitical instability or fears of a deep recession can quickly make Gold price escalate due to its safe-haven status. As a yield-less asset, Gold tends to rise with lower interest rates, while higher cost of money usually weighs down on the yellow metal. Still, most moves depend on how the US Dollar (USD) behaves as the asset is priced in dollars (XAU/USD). A strong Dollar tends to keep the price of Gold controlled, whereas a weaker Dollar is likely to push Gold prices up.
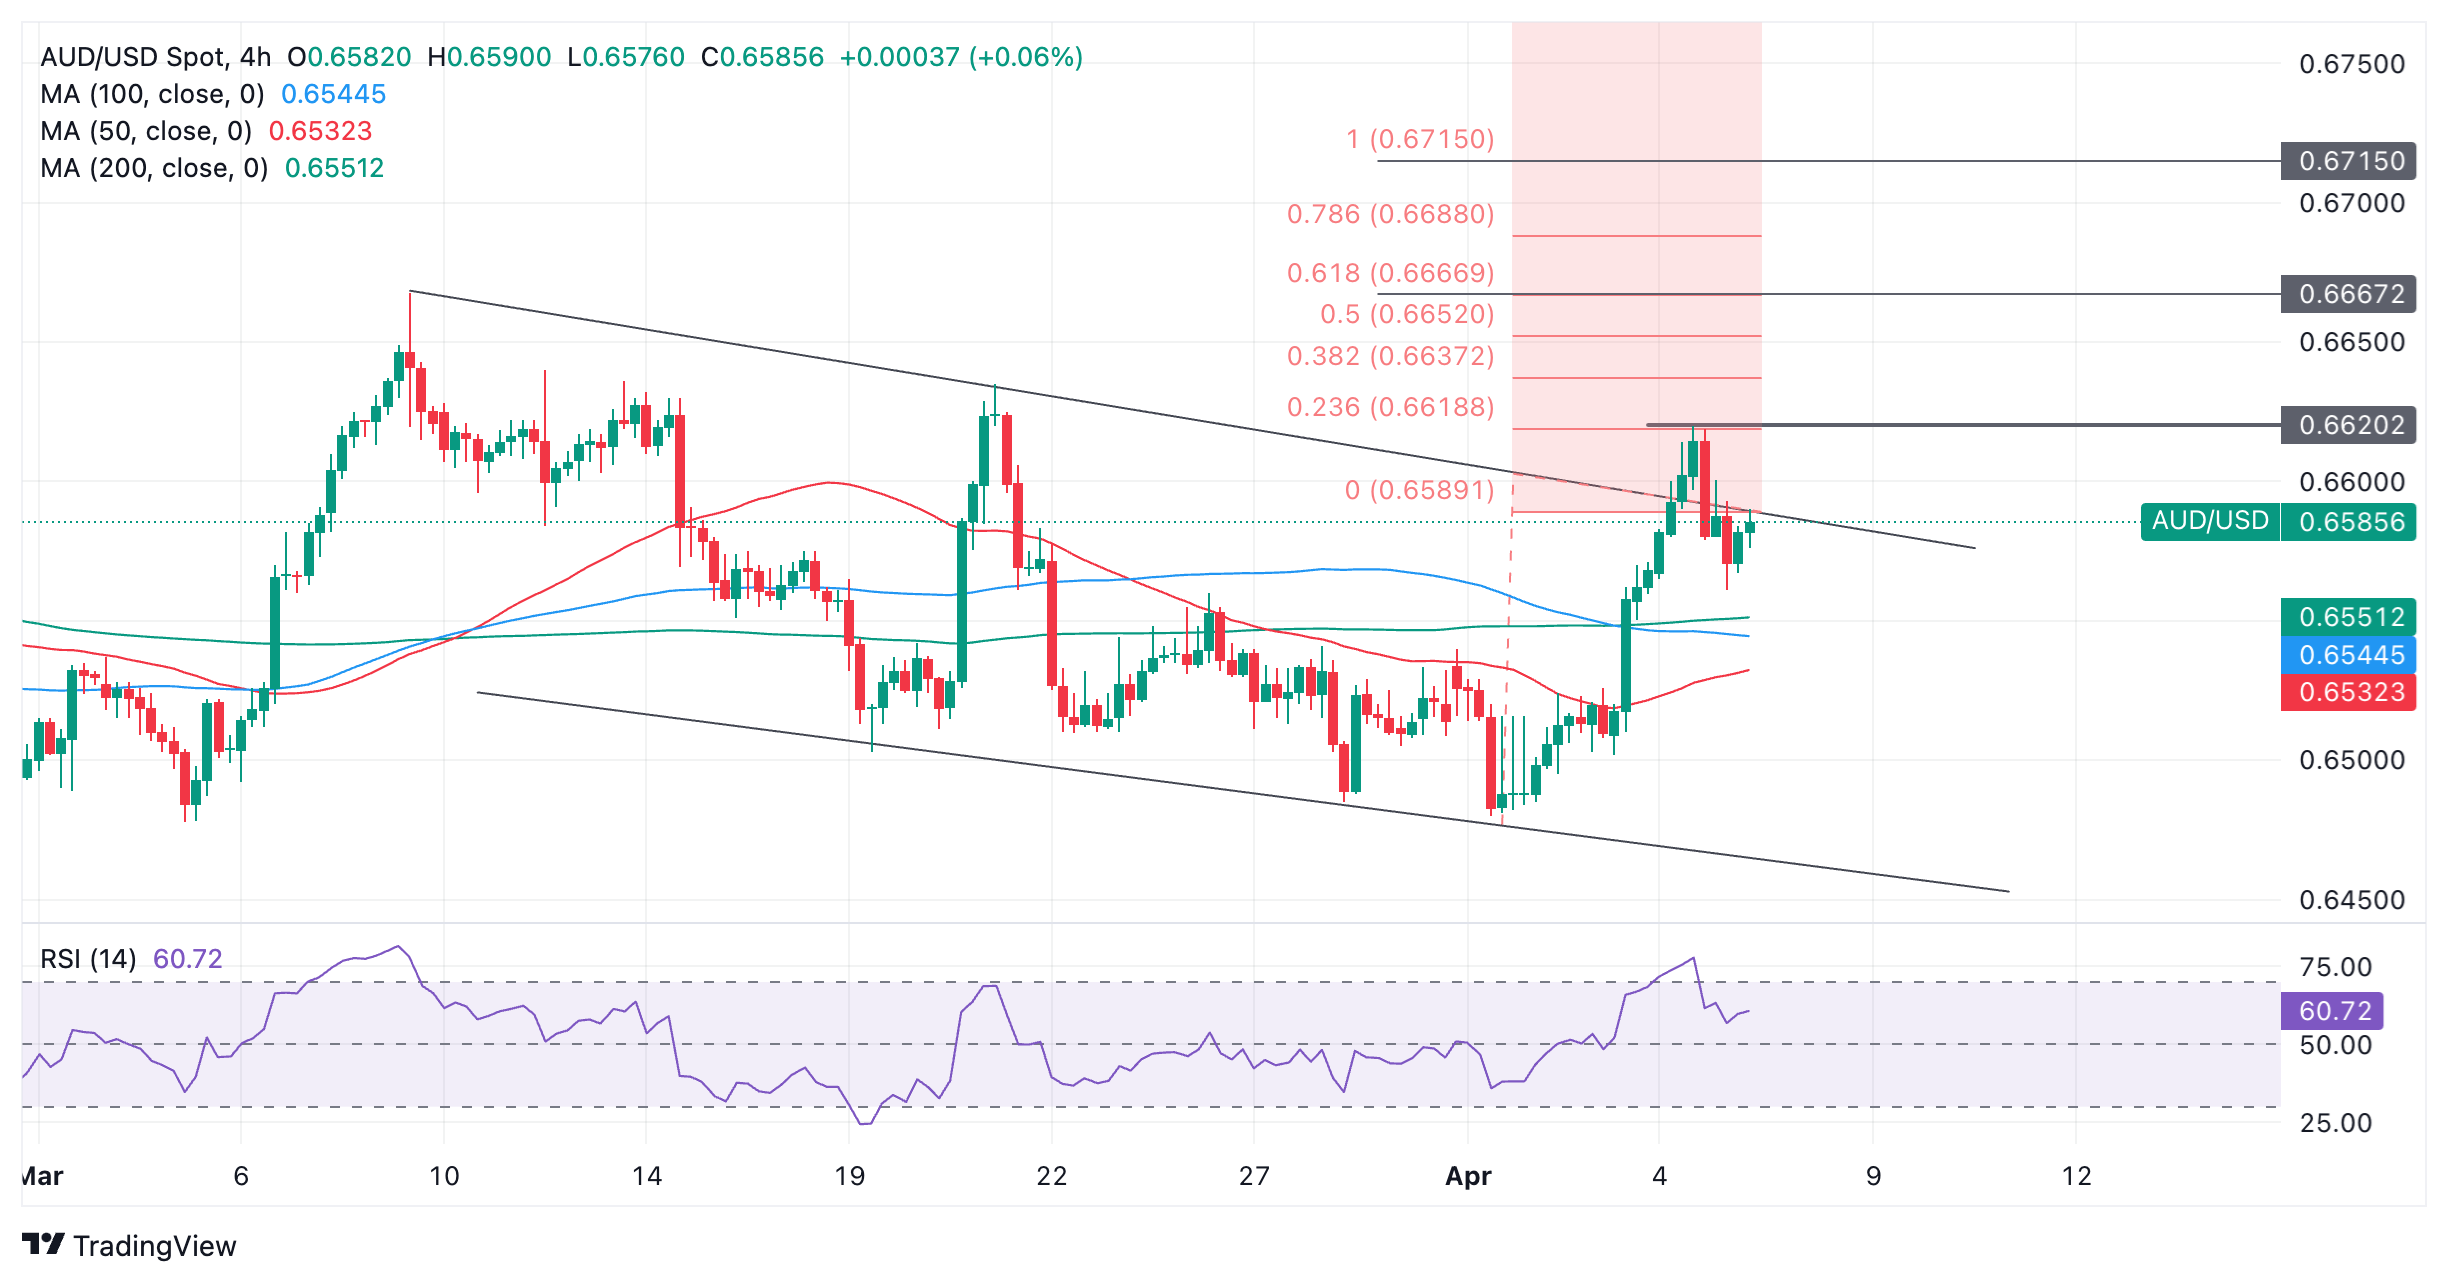
AUD/USD briefly broke out of a descending channel and rallied.
The rally was cut short, however, and the pair retreated back inside the channel.
If AUD/USD rebreaks above the previous high of the initial breakout rally, it will be a bullish sign.
AUD/USD has been falling in a descending channel since the March 8 high at 0.6667.
Over the last three days the pair has risen up from the base of the channel to the highs and briefly broke upper borderline on Thursday before retreating back inside.
Australian Dollar versus US Dollar: 4-hour chart
A move back above the post-breakout rally peak, at 0.6620, however, would confirm two things.
First, that the breakout from the channel was a valid bullish breakout, likely to extend higher.
Second, that the short-term trend had probably reversed from bearish to bullish.
Such a move would probably lead to a move up to a conservative target at 0.6670, calculated as the 0.618 Fibonacci extension of the height of the channel extrapolated from the breakout point higher.
Further strength could lead to the achievement of the second target at 0.6715, which is the full height (Fib. 1.000) of the channel extrapolated higher.
The Mexican Peso is edging higher on Friday after the release of the March meeting minutes.
Higher Crude Oil prices, a key Mexican export, could also be supporting the Peso.
Technically the USD/MXN pair remains in a long-term downtrend.
The Mexican Peso (MXN) trades marginally higher against the US Dollar (USD) on Friday, after the release of the Banco de Mexico’s (Banxico) March meeting minutes and amid a rise in Crude Oil prices, a key export for Mexico.
The Banxico minutes revealed a reluctance on the part of policymakers to embrace a cycle of easing, including a commitment to lowering interest rates in the future, due to continued stubborn inflation.
The prospect of interest rates remaining high in Mexico – they are currently at 11.00% – supports the Mexican Peso as it leads to higher foreign capital inflows.
Higher Crude Oil prices, with Brent Crude Oil pushing above $90 a barrel on Friday, may also have helped the Mexican Peso, given its importance as an export.
Mexican Peso supported by hawk found in Banxico
The Mexican Peso finds support and recovers after the release of the minutes of the Banxico March meeting.
Although the majority of members voted to cut interest rates by 0.25% to 11.00%, one policymaker, Irene Espinosa, voted against the cut.
Key takeaways:
In summary, the minutes highlighted how inflation, particularly in the services sector, remained stubbornly high and interest rates would therefore need to remain elevated to bring it back down to the bank’s 3.0% target.
Members considered that the balance of risks for the trajectory of inflation within the forecast horizon remains biased to the upside.
It was acknowledged that although inflation remained sticky the current environment was less adverse than that faced in 2022 and the first months of 2023.
Members observed that long-term inflation expectations drawn from the survey conducted by Banco de México remain anchored at 3.5% – above Banxico's 3.0% target.
It was agreed that monetary policy should remain restrictive and therefore conducive to the convergence of inflation to the 3% target in the forecast horizon.
Future decisions will be data-dependent.
One member noted that “despite monetary restriction, domestic economic activity continues showing resilience and that demand related pressures may slow down or even reverse the fall in inflation.
Further, it was noted that “economic activity continues exhibiting dynamism despite the historical increase in the real interest rate.”
Mexican Peso sensitivity to risk aversion
The Mexican Peso is biased to depreciate according to data from the foreign exchange derivatives market, according to commentary from one member of the Banxico. MXN is also particularly sensitive to depreciating during periods of high risk aversion, the Banxico meeting minutes said.
“The reduction in exchange rate volatility and in the implied skew in foreign exchange options suggest a lower demand for hedging amid a possible depreciation of the Mexican peso, which contrasts with other election years,” said the member, who was not named.
“Lower demand, as well as the positioning observed in short-term foreign exchange derivatives markets, could magnify a depreciation of the Mexican peso in the event of an episode of high-risk aversion, and thus periods of volatility cannot be ruled out,” the member added.
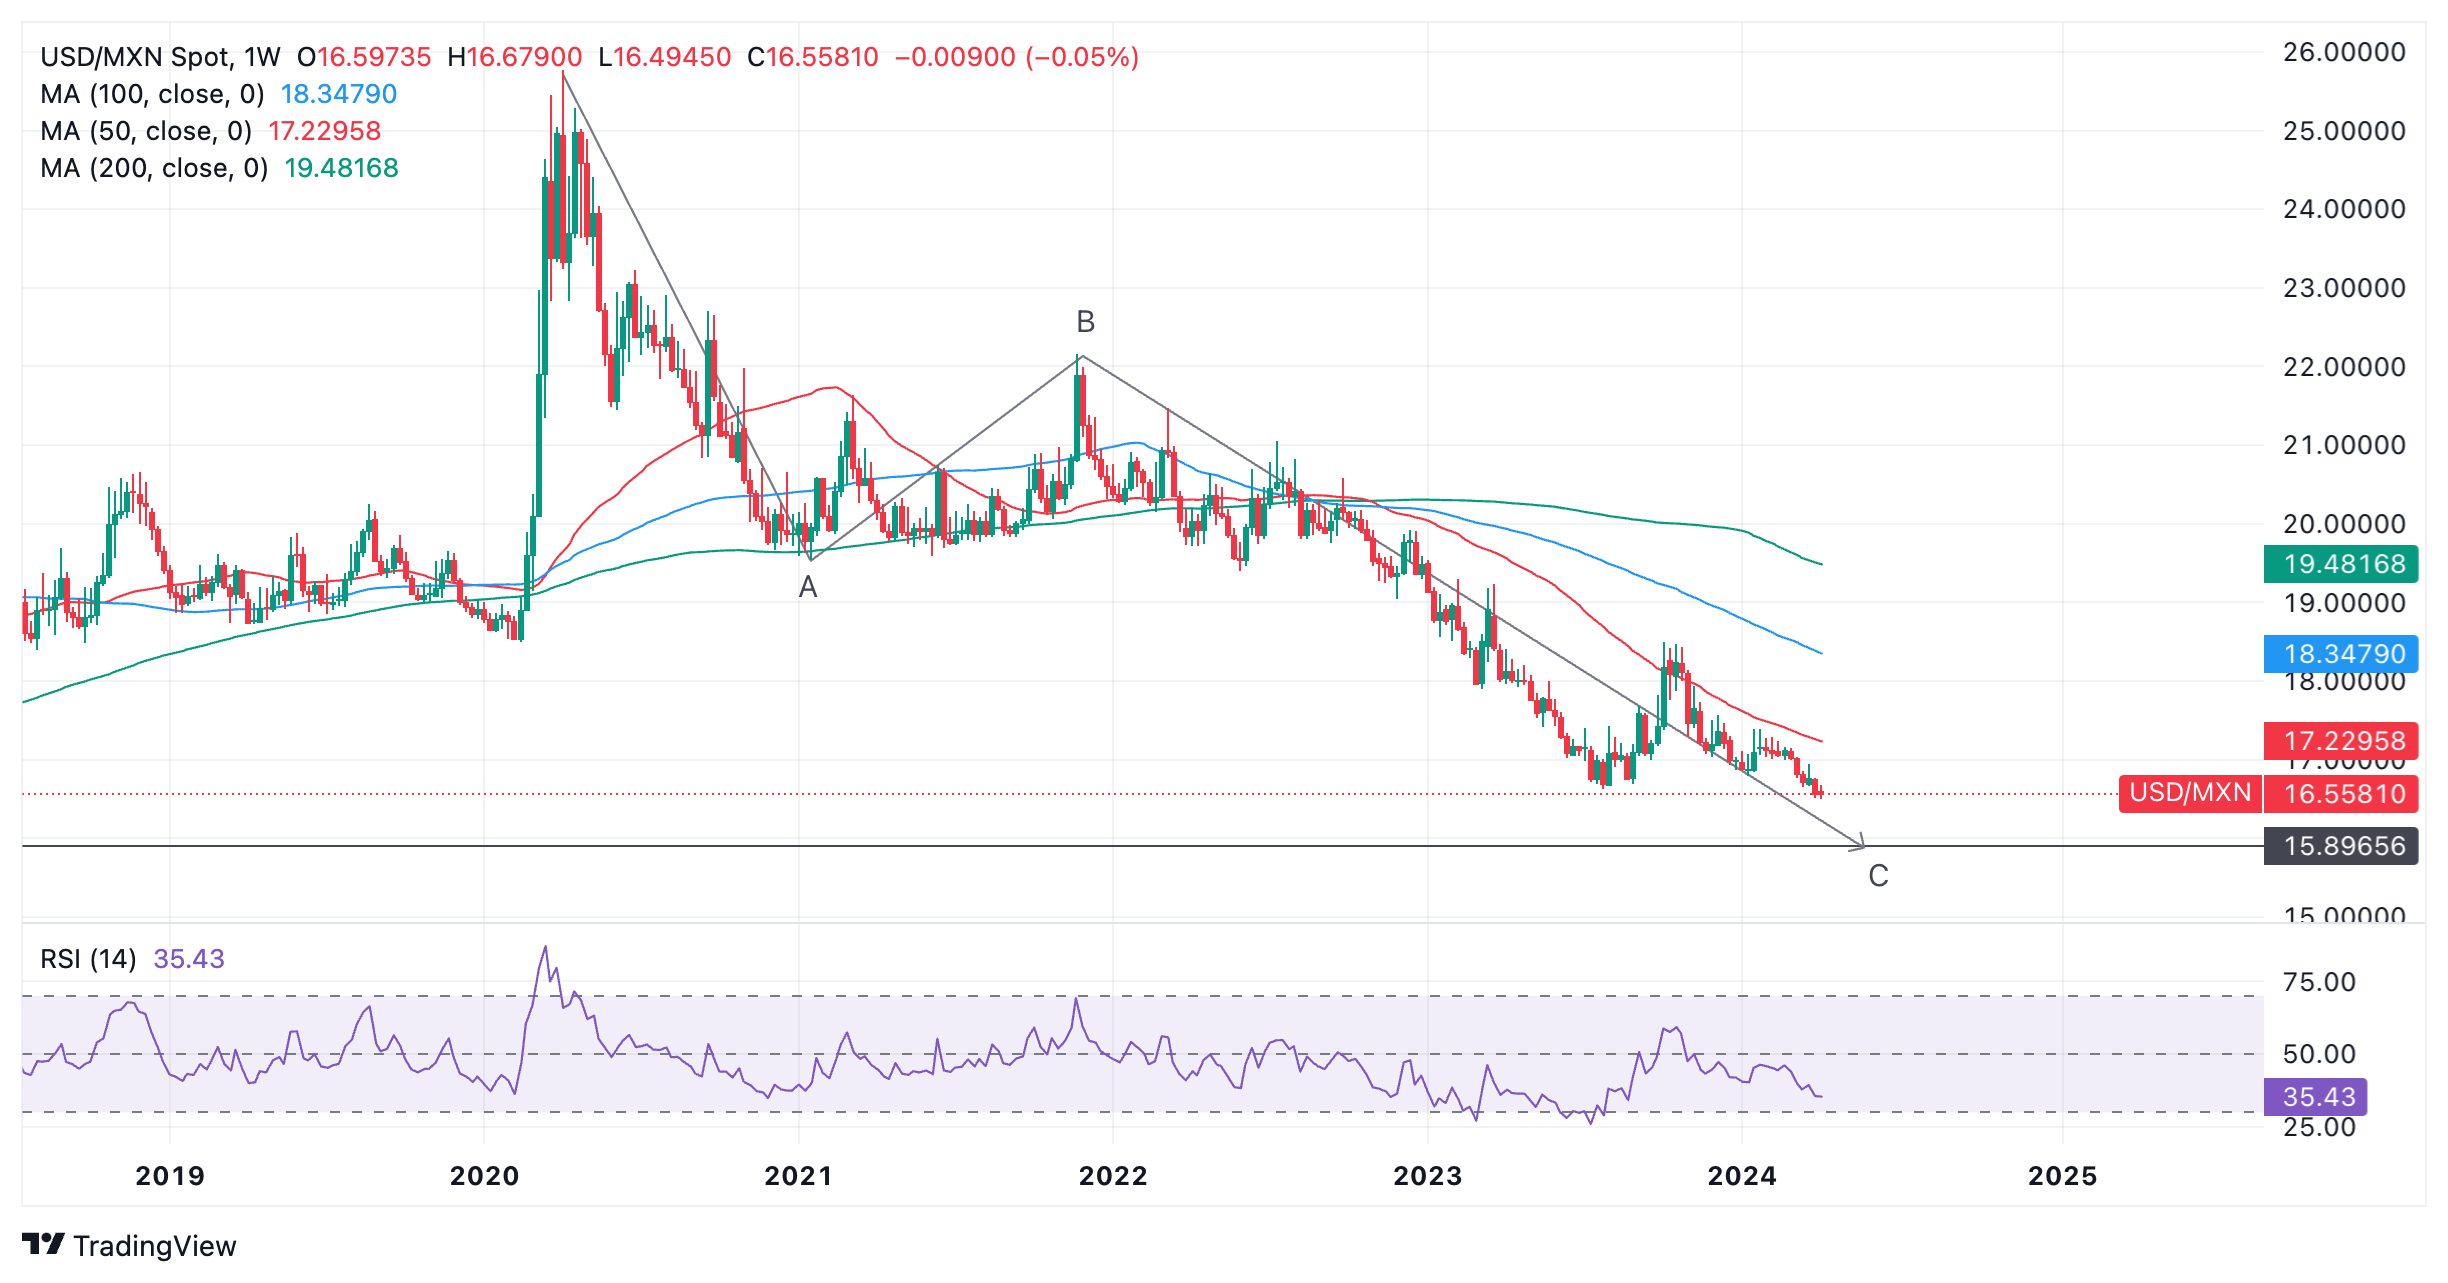
Technical Analysis: USD/MXN in long trend lower
USD/MXN is in a long-term downtrend that is exhibiting signs of waning pressure. The bear trend started after the pair peaked at 25.76 in April 2020 – we are now in the 16.50s.
It is possible the pair is unfolding a very large three-wave pattern called a Measured Move. Such patterns are composed of an A, B, and C wave, with wave C extending to a similar length to wave A, or a Fibonacci 0.618 ratio of A.
USD/MXN Weekly Chart
If this is the case, price has almost reached the point at which C will equal A, calculated as lying at 15.89.
It has also by now surpassed the conservative target for the end of C at the 0.618 Fibonacci extension of A (at 18.24).
Once the pattern is complete the market usually reverses or undergoes a substantial correction.
The Relative Strength Index (RSI) is converging acutely with price – a sign the downtrend could be losing momentum. In 2024 price has pushed below the level of the 2023 lows but RSI has not followed suit. This non-correlation between price and momentum is a bullish indication. It could lead to a correction higher eventually.
There has been no reaction from price yet, however, so the expectation of upside remains speculatory and unconfirmed.
An actual turnaround in the price would be required to support the view a change is on the horizon, and that is still lacking.
Mexican Peso FAQs
The Mexican Peso (MXN) is the most traded currency among its Latin American peers. Its value is broadly determined by the performance of the Mexican economy, the country’s central bank’s policy, the amount of foreign investment in the country and even the levels of remittances sent by Mexicans who live abroad, particularly in the United States. Geopolitical trends can also move MXN: for example, the process of nearshoring – or the decision by some firms to relocate manufacturing capacity and supply chains closer to their home countries – is also seen as a catalyst for the Mexican currency as the country is considered a key manufacturing hub in the American continent. Another catalyst for MXN is Oil prices as Mexico is a key exporter of the commodity.
The main objective of Mexico’s central bank, also known as Banxico, is to maintain inflation at low and stable levels (at or close to its target of 3%, the midpoint in a tolerance band of between 2% and 4%). To this end, the bank sets an appropriate level of interest rates. When inflation is too high, Banxico will attempt to tame it by raising interest rates, making it more expensive for households and businesses to borrow money, thus cooling demand and the overall economy. Higher interest rates are generally positive for the Mexican Peso (MXN) as they lead to higher yields, making the country a more attractive place for investors. On the contrary, lower interest rates tend to weaken MXN.
Macroeconomic data releases are key to assess the state of the economy and can have an impact on the Mexican Peso (MXN) valuation. A strong Mexican economy, based on high economic growth, low unemployment and high confidence is good for MXN. Not only does it attract more foreign investment but it may encourage the Bank of Mexico (Banxico) to increase interest rates, particularly if this strength comes together with elevated inflation. However, if economic data is weak, MXN is likely to depreciate.
As an emerging-market currency, the Mexican Peso (MXN) tends to strive during risk-on periods, or when investors perceive that broader market risks are low and thus are eager to engage with investments that carry a higher risk. Conversely, MXN tends to weaken at times of market turbulence or economic uncertainty as investors tend to sell higher-risk assets and flee to the more-stable safe havens.
EUR/JPY moves in the positive direction after recovering losses on Friday.
Eurozone Retail Sales (YoY) contracted by 0.7% in February, a lower-than-expected decline of 1.3%.
The Japanese Yen enjoyed a safe-haven status amid escalated tensions in the Middle East.
EUR/JPY has recovered its intraday losses to move into positive territory, inching higher to near 164.10 during the European trading hours on Friday. However, the EUR/JPY cross faced challenges as the safe-haven Japanese Yen (JPY) gained attraction amid escalated geopolitical tension after Iran vowed to retaliate against Israel's attack on Iran's embassy in Syria, which resulted in the loss of Iranian military personnel.
The downbeat economic data from Germany might have pressured the Euro, limiting the advance of the EUR/JPY cross. The seasonally adjusted Factory Orders from the Federal Statistics Office of Germany, revealed a contraction of 0.2% month-over-month in February, falling short of the expected increase of 0.8% but swinging from the previous decline of 11.4%. The index YoY fell by 10.6%, exceeding the previous decline of 6.2%.
Eurozone Retail Sales (YoY) contracted by 0.7% in February, a lower-than-expected decline of 1.3% and 0.9% prior. The monthly index declined by 0.5%, exceeding the market expectations of a 0.4% decline.
Bank of Japan (BoJ) Governor Kazuo Ueda indicated on Friday that the central bank might adjust monetary policy if foreign exchange fluctuations significantly impact the wage-inflation cycle in a manner that cannot be ignored.
Japan's Finance Minister Shunichi Suzuki echoed this sentiment, emphasizing his close monitoring of currency movements with a strong sense of urgency. He expressed readiness to explore all available options to address excessive volatility in the foreign exchange market.
Furthermore, Japan's Prime Minister Fumio Kishida stated that appropriate action would be taken if there were excessive FX movements. He emphasized the utilization of all means to respond to such fluctuations. Prime Minister Kishida also highlighted the importance of stable forex movements reflecting fundamentals, stating that volatile movements are unfavorable.
Eurozone Retail Sales dropped 0.7% YoY in February vs. -1.3% estimate.
Retail Sales in the bloc arrived at -0.5% MoM in February vs. -0.4% forecast.
Eurozone’s Retail Sales dropped by 0.7% YoY in February, as against a 0.9% decline in January, the official data released by Eurostat showed on Friday. The market consensus was of -1.3%
Retail Sales in the old continent fell 0.5% over the month in the same period vs. January’s 0% and -0.4% expected.
FX implications
Mixed Eurozone data failed to move the needle around the Euro. At the time of writing, the EUR/USD pair is trading at 1.0834, almost unchanged on the day.
09:02
Italy Public Deficit/GDP increased to 5.5% in 4Q from previous 5%
09:01
Eurozone Retail Sales (YoY) came in at -0.7%, above expectations (-1.3%) in February
09:00
Eurozone Retail Sales (MoM) came in at -0.5%, below expectations (-0.4%) in February
EUR./GBP gains some follow-through traction and climbs to a near two-week high on Friday.
Bets for more aggressive policy easing by the BoE undermine the GBP and remain supportive.
An upward revision of the UK Construction PMI does little to provide any meaningful impetus.
The EUR/GBP cross prolongs this week's goodish bounce from the 0.8530 support area for the fifth straight day and climbs to a one-and-half-week high during the first half of the European session. Spot prices currently trade around the 0.8585 region, with bulls now awaiting a sustained strength beyond the 100-day Simple Moving Average (SMA) before positioning for any further gains.
The British Pound (GBP) continues with its relative underperformance in the wake of rising bets for at least four interest rate cuts this year by the Bank of England (BoE), starting in June, which, in turn, is seen acting as a tailwind for the EUR/GBP cross. The GBP bulls, meanwhile, seem unaffected by an upward revision of the UK Construction PMI, which moved into expansion territory last month for the first time since August 2023. Meanwhile, the shared currency draws support from an upward revision of the Eurozone Services PMIs for March and hawkish comments from the European Central Bank (ECB) Governing Council member Robert Holzmann earlier this week.
Holzmann – a known hawk – said on Wednesday that he isn’t against a June interest rate cut but would want to see more data before making a decision. This further contributes to the bid tone surrounding the EUR/GBP cross. Meanwhile, inflation in the Eurozone has been falling faster than expected, which has been fueling speculations that the ECB could cut rates sooner rather than later. This might hold back the Euro bulls from placing aggressive bets and keep a lid on any further appreciating move for the currency pair. Hence, it will be prudent to wait for some follow-through buying before confirming that spot prices have bottomed out in the near term.
From a technical perspective, momentum beyond the 100-day SMA is likely to confront stiff resistance near the very important 200-day SMA, currently pegged near the 0.8600 mark. A sustained strength beyond the said handle will be seen as a fresh trigger for bullish traders and set the stage for some meaningful upside for the EUR/GBP cross.
Silver price finds cushion near $26.60 amid correction ahead of US NFP report.
The US NFP report will influence market expectations for Fed rate cuts in June.
Deepening Middle East tensions keep near-term demand for Silver intact.
Silver price (XAG/USD) discovers support near $26.60 after a pullback from more than two-years high of $27.34. The white metal takes a breather after a strong rally as investors turn cautious ahead of the United StatesNonfarm Payrolls (NFP) report for March, which will be published at 12:30 GMT.
According to the expectations, fresh payrolls were 200K, lower than the former reading of 275K. The Unemployment Rate is expected to come out steady at 3.9%.
Investors will also focus on the Average Hourly Earnings data, which will provide fresh inflation outlook. The monthly wage growth is forecasted to have grown at a higher pace of 0.3% from 0.1% in February. In the same period, the annually wage growth is estimated to have dipped to 4.1% against 4.3%.
Strong labor demand and higher wage growth would allow the Federal Reserve (Fed) to delay rate cut plans while signs of labor market conditions easing will boost rate cut hopes for the June meeting. The US Dollar Index (DXY) stabilizes after recovering from two-week low of 103.90 ahead of the US NFP report.
The demand for Silver is bullish in the longer horizon due to deepening Middle East tensions. Air strikes from Israel forces on Iranian embassy in Damascus, situated near Syria’s capital, has deepened fears of Iran’s participation to Israel-Palestine war.
Silver technical analysis
Silver price saw a stalwart rally after a breakout of the Ascending Triangle pattern formed on daily timeframe. The aforementioned chart pattern exhibits sharp volatility contraction but a decisive breakout leads to heavy volume and wider ticks on the upside. The horizontal resistance of the above-mentioned chart pattern, placed from May 5 high at $26.13, has turned into a crucial support for the Silver price bulls.
Advancing 20-day Exponential Moving Average (EMA) near $25.25 keeps the near-term demand unabated.
The 14-period Relative Strength Index (RSI) oscillates in the bullish range of 60.00-80.00, indicating a strong momentum leaned to the upside.
Silver daily chart
XAG/USD
Overview
Today last price
26.76
Today Daily Change
-0.16
Today Daily Change %
-0.59
Today daily open
26.92
Trends
Daily SMA20
25.07
Daily SMA50
23.75
Daily SMA100
23.7
Daily SMA200
23.45
Levels
Previous Daily High
27.3
Previous Daily Low
26.68
Previous Weekly High
25
Previous Weekly Low
24.33
Previous Monthly High
25.77
Previous Monthly Low
22.51
Daily Fibonacci 38.2%
26.92
Daily Fibonacci 61.8%
27.06
Daily Pivot Point S1
26.63
Daily Pivot Point S2
26.35
Daily Pivot Point S3
26.01
Daily Pivot Point R1
27.25
Daily Pivot Point R2
27.59
Daily Pivot Point R3
27.87
08:30
United Kingdom S&P Global/CIPS Construction PMI came in at 50.2, above expectations (50) in March
USD/CAD may find an immediate resistance area around the weekly high of 1.3588 and psychological level of 1.3600.
A break above March’s high of 1.3614 could lead the pair to meet the major barrier of 1.3650.
The immediate support appears at 1.3550, followed by the 50-day EMA at 1.3522.
USD/CAD extends its gains for the second consecutive session, trading higher around 1.3560 during the European session on Friday. The immediate barrier appears at a weekly high of 1.3588, followed by the psychological resistance at 1.3600 level.
A breakthrough above the psychological mark could prompt the USD/CAD pair to test March’s high of 1.3614 to approach the major barrier at the 1.3650 level.
The 14-day Relative Strength Index (RSI) is positioned above 50, suggesting bullish momentum. However, the Moving Average Convergence Divergence (MACD) suggests a tepid momentum.
The MACD line is above the centerline, indicating bullish momentum, but there is divergence below the signal line. Traders may await confirmation from the MACD, a lagging indicator, to determine the direction of the trend.
On the downside, the USD/CAD pair could find immediate support at 1.3550, followed by the 50-day Exponential Moving Average (EMA) at 1.3522 and the 23.6% Fibonacci retracement level of 1.3511.
A break below the latter could exert downward pressure on the USD/CAD pair to surpass the psychological level of 1.3500 to retest the weekly low at 1.3477 level.
EUR/USD sees rally cut short on a mixture of factors including geopolitical, Fed and German macro data.
Middle East tensions are pushing up Oil prices, with implications for inflation.
Fed officials vacillate on timing of first interest-rate cut, German factory data weighs.
EUR/USD is trading back down in the lower 1.0800s on Friday after being rejected by bears at the key 100-day Simple Moving Average (SMA) at 1.0874.
A cocktail of risks appears to be weighing on the pair, including weaker-than-expected German data, geopolitical risks stemming from tensions in the Middle East, and recent commentary from US Federal Reserve (Fed) officials.
The US Nonfarm Payrolls report at 12:30 GMT on Friday is the next major event likely to catalyze volatility for EUR/USD. A higher-than-expected rise in payrolls, estimated to come out at 200,000 in March, would support the US Dollar and vice versa for a miss.
The Average Hourly Earnings component of the Labor Report could also impact the pair if it shows a substantial change in wage inflation. A rise would support USD (pushing down EUR/USD) and the opposite for a fall.
EUR/USD: Pulls back on inflationary risks
EUR/USD is trading down a tenth of a percent at the end of the week after German Industrial Orders data on Friday observed a steep decline at an annual rate of 10.6% in February, compared with a decline of 6.2% in January.
German Factory Order data showed orders rising 0.2% over the same period, missing economists estimates of 0.8%, but recovering from an 11.4% slump reported in January.
Rising Middle East tensions are pushing up the price of Oil, with Brent Crude now trading above $90 per barrel. This is likely to pass through into broader inflation, adding fuel to the thesis of those policymakers who push to keep interest rates elevated.
Commentary from Minneapolis Federal Reserve (Fed) Bank President Neel Kashkari raised the prospect the Fed might not cut interest rates at all in 2024 if inflation remained at current levels.
“If inflation continues to move sideways, it makes me wonder if we should cut rates at all this year,” Kashkari said, despite admitting to previously penciling in two rate cuts this year.
The maintenance of higher interest rates is positive for the US Dollar as it increases foreign capital inflows.
There appears to be more of a consensus amongst rate-setters in the Eurozone about going ahead with a proposed interest-rate cut in June, a factor weighing on the Euro (EUR).
The decision is likely to be dependent on whether wage data released prior to the June meeting shows a decline in wage inflation.
Technical Analysis: EUR/USD ping pongs with no clear direction
EUR/USD rose up to the 100-day SMA at 1.0874 on Thursday before reversing to close flat on the day.
In the process, a Gravestone Doji Japanese candlestick pattern was formed, with potentially bearish implications if followed by a red bearish candlestick on Friday.
EUR/USD Daily Chart
The short-term trend is unclear with risks balanced. The 50-day SMA is providing cushioning support at 1.0827.
A decisive break above the Gravestone Doji candlestick high at 1.0876 would neutralize its bearish implications and solidify the case for a bullish short-term trend and indicate the probability of higher prices. The March 21 high at 1.0942, provides a potential next target.
Alternatively, if the downside continues, a pullback down to support at the previous wave B lows of 1.0798 is also quite possible.
Economic Indicator
Nonfarm Payrolls
The Nonfarm Payrolls release presents the number of new jobs created in the US during the previous month in all non-agricultural businesses; it is released by the US Bureau of Labor Statistics (BLS). The monthly changes in payrolls can be extremely volatile. The number is also subject to strong reviews, which can also trigger volatility in the Forex board. Generally speaking, a high reading is seen as bullish for the US Dollar (USD), while a low reading is seen as bearish, although previous months' reviews and the Unemployment Rate are as relevant as the headline figure. The market's reaction, therefore, depends on how the market assesses all the data contained in the BLS report as a whole.
America’s monthly jobs report is considered the most important economic indicator for forex traders. Released on the first Friday following the reported month, the change in the number of positions is closely correlated with the overall performance of the economy and is monitored by policymakers. Full employment is one of the Federal Reserve’s mandates and it considers developments in the labor market when setting its policies, thus impacting currencies. Despite several leading indicators shaping estimates, Nonfarm Payrolls tend to surprise markets and trigger substantial volatility. Actual figures beating the consensus tend to be USD bullish.
The Pound Sterling drops from 1.2680 as deepening Middle East tensions hurt risk-sensitive currencies.
A sharp dip in UK inflation expectations improves BoE’s early rate cut hopes, weighing on the Sterling.
The US Dollar bounces back ahead of the US Nonfarm Payrolls report.
The Pound Sterling (GBP) retreats to 1.2620 in Friday’s London session after failing to recapture the round-level resistance of 1.2700. The GBP/USD pair falls back as escalating geopolitical tensions and caution among market participants ahead of the United StatesNonfarm Payrolls (NFP) report for March has boosted demand for the US Dollar.
Deepening uncertainty about when the Federal Reserve (Fed) will start reducing interest rates keeps investors on tenterhooks. On Thursday, Minneapolis Fed Bank President Neel Kashkari said rate cuts won’t be required this year if inflation stalls. Kashkari also said he forecasted two rate cuts for 2024 in the latest dot plot.
Meanwhile, easing inflation expectations in the United Kingdom has weighed on the Pound Sterling. The latest Bank of England (BoE) Decision Maker Panel (DMP) survey for February showed that most firms see selling prices and wage inflation cooling down over the next year. Selling price expectations decelerated to 4.1% from 4.3%, the lowest reading in over two years. Wage growth expectations softened to 4.9% on a three-month moving average basis from 5.2% in February.
Easing inflation expectations are expected to boost BoE rate cut expectations for the June meeting. Deepening hopes for BoE early rate cuts negatively influence the Pound Sterling.
Daily digest market movers: Pound Sterling falls while US Dollar stabilizes ahead of labor data
The Pound Sterling extends its correction to 1.2620 on cautious market sentiment. Deepening Middle East tensions and uncertainty ahead of the release of the United States NFP report for March promoted recovery in the US Dollar.
The US Dollar Index (DXY) bounces back from a two-week low of 103.90. The killing of seven members of Iran’s Islamic Revolutionary Guard Corps (IRGC) by air strikes from Israeli forces in Damascus has deepened fears of Iran’s direct involvement in the Israel-Palestine war.
Going forward, the next move in the US Dollar will be guided by the US NFP report, which will be published at 12:30 GMT. US employers are expected to have recruited 200K workers, lower than the former reading of 275K. The Unemployment Rate is estimated to remain steady at 3.9%. Investors will keenly focus on the Average Hourly Earnings data, which will provide a fresh inflation outlook. Annually, wage growth is expected to have softened to 4.1% from 4.3% in February.
Strong labor demand and higher wage growth could allow the Federal Reserve to delay rate cut plans, while signs of labor market conditions easing will boost rate cut hopes for the June meeting.
The Pound Sterling falls as investors hope that the Bank of England will pivot to rate cuts in June due to easing price pressures. Expectations for the BoE to reduce rates from June were reinforced after BoE Governor Andrew Baily said that market expectations for two or three rate cuts this year are reasonable.
Meanwhile, the United Kingdom’s soft Services PMI data for March, released on Thursday, has impacted the economic outlook. The Services PMI fell to 53.1, missing expectations and the prior reading of 53.4. Tim Moore, Economics Director at S&P Global Market Intelligence, said: "The recovery in service sector output lost a little bit of momentum during March, and more so than suggested by the flash PMI results, but the overall picture remains reasonably positive.”
Technical Analysis: Pound Sterling finds selling pressure near 1.2680
The Pound Sterling falls further after retreating from its two-week high of 1.2680. The GBP/USD pair fails to sustain above the 20-day and 50-day Exponential Moving Averages (EMAs), which trade around 1.2660. Meanwhile, the 200-day EMA at 1.2566 continues to provide support.
On a broader time frame, the horizontal support from December 8 low at 1.2500 would provide further cushion to the Pound Sterling. Meanwhile, the upside is expected to remain limited near an eight-month high of around 1.2900.
The 14-period Relative Strength Index (RSI) rebounds above 40.00 after slipping below it. This should not be considered as a “bullish reversal” until it decisively breaks above 60.00.
Pound Sterling FAQs
The Pound Sterling (GBP) is the oldest currency in the world (886 AD) and the official currency of the United Kingdom. It is the fourth most traded unit for foreign exchange (FX) in the world, accounting for 12% of all transactions, averaging $630 billion a day, according to 2022 data. Its key trading pairs are GBP/USD, aka ‘Cable’, which accounts for 11% of FX, GBP/JPY, or the ‘Dragon’ as it is known by traders (3%), and EUR/GBP (2%). The Pound Sterling is issued by the Bank of England (BoE).
The single most important factor influencing the value of the Pound Sterling is monetary policy decided by the Bank of England. The BoE bases its decisions on whether it has achieved its primary goal of “price stability” – a steady inflation rate of around 2%. Its primary tool for achieving this is the adjustment of interest rates. When inflation is too high, the BoE will try to rein it in by raising interest rates, making it more expensive for people and businesses to access credit. This is generally positive for GBP, as higher interest rates make the UK a more attractive place for global investors to park their money. When inflation falls too low it is a sign economic growth is slowing. In this scenario, the BoE will consider lowering interest rates to cheapen credit so businesses will borrow more to invest in growth-generating projects.
Data releases gauge the health of the economy and can impact the value of the Pound Sterling. Indicators such as GDP, Manufacturing and Services PMIs, and employment can all influence the direction of the GBP. A strong economy is good for Sterling. Not only does it attract more foreign investment but it may encourage the BoE to put up interest rates, which will directly strengthen GBP. Otherwise, if economic data is weak, the Pound Sterling is likely to fall.
Another significant data release for the Pound Sterling is the Trade Balance. This indicator measures the difference between what a country earns from its exports and what it spends on imports over a given period. If a country produces highly sought-after exports, its currency will benefit purely from the extra demand created from foreign buyers seeking to purchase these goods. Therefore, a positive net Trade Balance strengthens a currency and vice versa for a negative balance.
USD/CHF recovers its recent losses amid improved US Dollar.
The escalated tension in the Middle East provided support for the safe-haven Swiss Franc.
US Initial Jobless Claims came in at 221K against the market expectations of a 214K figure.
USD/CHF advances to near 0.9030 during the early European hours on Friday, which could be attributed to the recovery of the US Dollar (USD). The resurgence in the long-term yield on 10-year US bond coupons has bolstered the Greenback, thereby providing support for the USD/CHF pair.
On Thursday, the safe-haven Swiss Franc (CHF) gained strength as market caution heightened due to the escalated geopolitical tensions in the Middle East. This tension stems from Iran's vow to retaliate against Israel's attack on Iran's embassy in Syria, which resulted in the loss of Iranian military personnel.
The Swiss Consumer Price Index (CPI) for March indicated a month-over-month reading of 0.0%, falling short of expectations of 0.3% and the previous month's figure of 0.6%. On a year-over-year basis, the CPI increased by 1.0%, lower than the anticipated 1.3% and the previous reading of 1.2%. The softer-than-expected CPI data for March has raised expectations of another interest rate cut by the Swiss National Bank (SNB).
The US Dollar (USD) encountered downward pressure on Thursday due to weaker employment data from the United States (US), which supported the EUR/USD pair. However, neutral comments from several Federal Reserve officials helped alleviate the downward trend of the US Dollar.
Federal Reserve (Fed) Bank of Richmond President Thomas Barkin noted that disinflation is expected to persist, though the pace of this trend remains uncertain. Meanwhile, Loretta Mester, President of the Federal Reserve Bank of Cleveland, expressed openness to reducing the pace of securities runoff from the Fed’s balance sheet soon. Additionally, she anticipated being in a position to lower the fed funds rate later this year.
USD/CHF
Overview
Today last price
0.9033
Today Daily Change
0.0019
Today Daily Change %
0.21
Today daily open
0.9014
Trends
Daily SMA20
0.8932
Daily SMA50
0.883
Daily SMA100
0.874
Daily SMA200
0.882
Levels
Previous Daily High
0.9075
Previous Daily Low
0.9009
Previous Weekly High
0.9072
Previous Weekly Low
0.8969
Previous Monthly High
0.9072
Previous Monthly Low
0.873
Daily Fibonacci 38.2%
0.9034
Daily Fibonacci 61.8%
0.905
Daily Pivot Point S1
0.899
Daily Pivot Point S2
0.8967
Daily Pivot Point S3
0.8924
Daily Pivot Point R1
0.9056
Daily Pivot Point R2
0.9099
Daily Pivot Point R3
0.9122
07:01
Austria Trade Balance: €724.4M (January) vs €365.1M
07:01
Switzerland Foreign Currency Reserves: 715B (March) vs 678B
07:01
Spain Industrial Output Cal Adjusted (YoY) came in at 1.5%, above forecasts (-0.5%) in February
NZD/USD drifts lower to 0.6012 on the stronger USD on Friday.
US Initial Jobless Claims last week jumped to 221K compared to 212K prior, the highest since January.
The RBNZ is expected to keep interest rates on hold at its policy meeting next week.
The NZD/USD pair trades on a softer note near 0.6012 on Friday amid the firmer US Dollar (USD). The markets turn to a cautious mood ahead of the key US labor market data, including Nonfarm Payrolls (NFP), Unemployment Rate, and Average Hourly Earnings for March.
The Labor Department reported on Thursday that the weekly Initial Jobless Claims last week went up to the highest level since January. The number of Americans filing new claims for unemployment benefits jumped to 221K for the week ended March 30 compared to 212K prior, below the consensus of 214K. Additionally, the Continuing Claims decreased to 1.791M in the week ended March 23.
Investors will shift their focus to the highly-anticipated Nonfarm Payrolls (NFP), due on Friday. The NFP figure is projected to show that the US economy added 200K jobs in March from 275K rise in February. Meanwhile, the Unemployment Rate is forecast to remain steady at 3.9% in March. If the US NFP data portrays a stronger-than-expected result, this might temper June Fed rate-cutting expectations, offering some support to the Greenback and dragging the NZD/USD pair lower. According to the CME FedWatch Tool, financial markets are now pricing in nearly 65% odds that the Fed will lower its interest rate in June, up from 60% in the previous week.
On Thursday, the New Zealand Building Permits improved to 14.9% MoM in February from an 8.6% decline in the previous reading, Statistics New Zealand showed. The Reserve Bank of New Zealand (RBNZ) is expected to keep interest rates on hold at its policy meeting next week. The central bank noted that it needs to keep policy restrictive to ensure that inflation expectations become fully anchored. However, investors will take more cues from the policy statement, the dovish tweaks to the outlook might drag the New Zealand Dollar (NZD) and create a headwind for the pair.
NZD/USD
Overview
Today last price
0.6012
Today Daily Change
-0.0013
Today Daily Change %
-0.22
Today daily open
0.6025
Trends
Daily SMA20
0.6052
Daily SMA50
0.6095
Daily SMA100
0.6138
Daily SMA200
0.607
Levels
Previous Daily High
0.6047
Previous Daily Low
0.5993
Previous Weekly High
0.6032
Previous Weekly Low
0.5956
Previous Monthly High
0.6218
Previous Monthly Low
0.5956
Daily Fibonacci 38.2%
0.6026
Daily Fibonacci 61.8%
0.6014
Daily Pivot Point S1
0.5996
Daily Pivot Point S2
0.5968
Daily Pivot Point S3
0.5942
Daily Pivot Point R1
0.605
Daily Pivot Point R2
0.6076
Daily Pivot Point R3
0.6104
06:45
France Industrial Output (MoM) below forecasts (0.5%) in February: Actual (0.2%)
The US Dollar (USD) holds steady on Friday, with the USD Index staying in positive territory above 104.00 after falling below that level for the first time in two weeks on Thursday. Eurostat will release Retail Sales data for February in the European session. Later in the day, the US Bureau of Labor Statistics will publish the jobs report for March, which will include Nonfarm Payrolls (NFP), Unemployment Rate and wage inflation figures.
Nonfarm Payrolls (NFP) are part of the US Bureau of Labor Statistics monthly jobs report. The Nonfarm Payrolls component specifically measures the change in the number of people employed in the US during the previous month, excluding the farming industry.
The Nonfarm Payrolls figure can influence the decisions of the Federal Reserve by providing a measure of how successfully the Fed is meeting its mandate of fostering full employment and 2% inflation. A relatively high NFP figure means more people are in employment, earning more money and therefore probably spending more. A relatively low Nonfarm Payrolls’ result, on the either hand, could mean people are struggling to find work. The Fed will typically raise interest rates to combat high inflation triggered by low unemployment, and lower them to stimulate a stagnant labor market.
Nonfarm Payrolls generally have a positive correlation with the US Dollar. This means when payrolls’ figures come out higher-than-expected the USD tends to rally and vice versa when they are lower. NFPs influence the US Dollar by virtue of their impact on inflation, monetary policy expectations and interest rates. A higher NFP usually means the Federal Reserve will be more tight in its monetary policy, supporting the USD.
Nonfarm Payrolls are generally negatively-correlated with the price of Gold. This means a higher-than-expected payrolls’ figure will have a depressing effect on the Gold price and vice versa. Higher NFP generally has a positive effect on the value of the USD, and like most major commodities Gold is priced in US Dollars. If the USD gains in value, therefore, it requires less Dollars to buy an ounce of Gold. Also, higher interest rates (typically helped higher NFPs) also lessen the attractiveness of Gold as an investment compared to staying in cash, where the money will at least earn interest.
Nonfarm Payrolls is only one component within a bigger jobs report and it can be overshadowed by the other components. At times, when NFP come out higher-than-forecast, but the Average Weekly Earnings is lower than expected, the market has ignored the potentially inflationary effect of the headline result and interpreted the fall in earnings as deflationary. The Participation Rate and the Average Weekly Hours components can also influence the market reaction, but only in seldom events like the “Great Resignation” or the Global Financial Crisis.
Following Wednesday's sharp decline, the USD Index continued to push lower in the first half of the day on Thursday. The negative shift seen in risk sentiment, however, helped the USD stay resilient against its rivals later in the American session. US stock index futures trade modestly higher early Friday after Wall Street's main indexes lost over 1% on Thursday. Meanwhile, the benchmark 10-year US Treasury bond yield stays above despite falling nearly 1% on Thursday.
US Dollar price this week
The table below shows the percentage change of US Dollar (USD) against listed major currencies this week. US Dollar was the strongest against the Canadian Dollar.
USD
EUR
GBP
CAD
AUD
JPY
NZD
CHF
USD
-0.30%
0.15%
0.36%
-0.59%
-0.10%
-0.37%
0.14%
EUR
0.31%
0.44%
0.67%
-0.28%
0.20%
-0.07%
0.44%
GBP
-0.14%
-0.44%
0.22%
-0.72%
-0.25%
-0.51%
-0.01%
CAD
-0.36%
-0.66%
-0.22%
-0.95%
-0.48%
-0.75%
-0.24%
AUD
0.59%
0.29%
0.73%
0.94%
0.48%
0.21%
0.72%
JPY
0.10%
-0.17%
0.26%
0.48%
-0.45%
-0.26%
0.24%
NZD
0.37%
0.08%
0.51%
0.74%
-0.21%
0.26%
0.50%
CHF
-0.13%
-0.44%
0.01%
0.23%
-0.71%
-0.24%
-0.50%
The heat map shows percentage changes of major currencies against each other. The base currency is picked from the left column, while the quote currency is picked from the top row. For example, if you pick the Euro from the left column and move along the horizontal line to the Japanese Yen, the percentage change displayed in the box will represent EUR (base)/JPY (quote).
The data from Australia showed in the Asian session that Exports declined 2.2% on a monthly basis in March, while Imports rose 4.8%. AUD/USD showed no reaction to these data and retreated below 0.6600 following a three-day rally.
EUR/USD lost its traction after advancing toward 1.0900 and closed flat on Thursday. The pair continues to edge lower early Friday and was last seen trading below 1.0850.
GBP/USD rose above 1.2650 on Thursday but reversed its direction in the American session to end the day marginally lower. The pair stays on the back foot in the European morning and declines toward 1.2600.
USD/JPY fell below 151.00 for the first time since March 21 on Friday before recovering above this level. The data from Japan showed that the Leading Economic Index improved to 111.8 in February from 109.5 in January.
Gold turned south after reaching a new record high above $2,300 on Thursday and closed the day in the red, snapping a seven-day winning streak. XAU/USD extends its correction on Friday and trades slightly below $2,280.
The Nonfarm Payrolls release presents the number of new jobs created in the US during the previous month in all non-agricultural businesses; it is released by the US Bureau of Labor Statistics (BLS). The monthly changes in payrolls can be extremely volatile. The number is also subject to strong reviews, which can also trigger volatility in the Forex board. Generally speaking, a high reading is seen as bullish for the US Dollar (USD), while a low reading is seen as bearish, although previous months' reviews and the Unemployment Rate are as relevant as the headline figure. The market's reaction, therefore, depends on how the market assesses all the data contained in the BLS report as a whole.
America’s monthly jobs report is considered the most important economic indicator for forex traders. Released on the first Friday following the reported month, the change in the number of positions is closely correlated with the overall performance of the economy and is monitored by policymakers. Full employment is one of the Federal Reserve’s mandates and it considers developments in the labor market when setting its policies, thus impacting currencies. Despite several leading indicators shaping estimates, Nonfarm Payrolls tend to surprise markets and trigger substantial volatility. Actual figures beating the consensus tend to be USD bullish.
06:02
Germany Factory Orders n.s.a. (YoY) declined to -10.6% in February from previous -6%
Germany’s Factory Orders rebounded in February, according to the official data published by the Federal Statistics Office on Friday, suggesting that the German manufacturing sector is on track for a recovery.
Over the month, contracts for goods ‘Made in Germany’ rose 0.2%, recovering from an 11.4% slump reported in January, missing the estimates of 0.8%.
Germany’s Industrial Orders tumbled at an annual rate of 10.6% in the same period, compared with the previous decline of 6.2%.
FX implications
Weak German data keep the Euro depressed, as the EUR/USD pair tests lows near 1.0825 ahead of the US Nonfarm Payrolls data release. The pair is down 0.06% so far.
(This story was corrected on Friday at 06:03 GMT to say that "German Factory Orders rebound 0.2% MoM in February vs. 0.8% expected", not -11.3% expected)
Euro price today
The table below shows the percentage change of Euro (EUR) against listed major currencies today. Euro was the weakest against the Japanese Yen.
USD
EUR
GBP
CAD
AUD
JPY
NZD
CHF
USD
0.08%
0.11%
0.14%
0.17%
-0.12%
0.25%
0.03%
EUR
-0.07%
0.05%
0.07%
0.10%
-0.19%
0.18%
-0.04%
GBP
-0.11%
-0.03%
0.03%
0.06%
-0.22%
0.14%
-0.08%
CAD
-0.15%
-0.07%
-0.03%
0.02%
-0.27%
0.11%
-0.09%
AUD
-0.16%
-0.08%
-0.05%
-0.01%
-0.28%
0.09%
-0.14%
JPY
0.13%
0.21%
0.24%
0.25%
0.29%
0.38%
0.16%
NZD
-0.26%
-0.17%
-0.14%
-0.10%
-0.08%
-0.37%
-0.23%
CHF
-0.06%
0.03%
0.06%
0.09%
0.12%
-0.18%
0.21%
The heat map shows percentage changes of major currencies against each other. The base currency is picked from the left column, while the quote currency is picked from the top row. For example, if you pick the Euro from the left column and move along the horizontal line to the Japanese Yen, the percentage change displayed in the box will represent EUR (base)/JPY (quote).
06:01
Germany Factory Orders s.a. (MoM) came in at 0.2%, below expectations (0.8%) in February
06:01
Germany Import Price Index (MoM) came in at -0.2% below forecasts (0%) in February
06:00
Germany Import Price Index (YoY) below expectations (-4.6%) in February: Actual (-4.9%)
06:00
United Kingdom Halifax House Prices (MoM) below expectations (0.1%) in March: Actual (-1%)
USD/CAD trades in positive territory for the second consecutive day around 1.3565 in Friday’s early European session.
Fed’s Barkin noted disinflation is likely to continue, but the pace of that remains unclear.
Canada’s trade surplus widened to $1.39 billion in February from $0.61 billion in January, better than estimated.
The USD/CAD pair gains traction near 1.3565 during the early European session on Friday. The rebound of the pair is bolstered by renewed US Dollar (USD) demand as the rising geopolitical tensions in the Middle East boost safe-haven flows.
On Thursday, the Federal Reserve (Fed) Bank of Richmond President Thomas Barkin said disinflation is likely to continue, but the speed of that remains unclear. Barkin added that maintaining rates 'somewhat restrictive' will bring inflation back to target. Fed Chair Jerome Powell indicated that FOMC officials see it's appropriate to begin lowering policy rates if the economy develops as expected.
The US labor market data for March will be due on Friday, which is likely to offer fresh insights into the Fed's outlook on interest rates. The highly-anticipated Nonfarm Payrolls (NFP) is estimated to show that the US economy added 200,000 jobs in March from a 275,000 increase in February. The Unemployment Rate is projected to remain steady at 3.9% in the same period. In the event that the US NFP data shows a strong-than-expected outcome, this could dampen June Fed rate cut expectations, providing some support to the Greenback and acting as a tailwind for the USD/CAD pair.
On the Loonie front, Canada’s trade surplus increased to $1.39 billion in February from $0.61 billion in January, beating the estimation. This, in turn, lifts the Canadian Dollar (CAD). Additionally, the rise in oil prices due to the escalating tensions in the Middle East provides some support for the commodity-linked Loonie and might cap the upside of the USD/CAD pair. Market players will take more cues from the Canadian labour market data later in the day.
EUR/USD loses ground possibly due to the escalated geopolitical tensions in the Middle East.
US Initial Jobless Claims increased to 221K against the expected 214K.
Eurozone Retail Sales (YoY) is expected to decrease by 1.3% in February, compared to 1.0% prior.
EUR/USD persists in its downward movement that commenced on Thursday, edging closer to 1.0830 during Friday's Asian trading hours. The US Dollar (USD) remains bolstered by market caution, likely influenced by escalating geopolitical tensions in the Middle East.
This increase in tension comes in the wake of Iran's pledge to retaliate against Israel's assault on Iran's embassy in Syria, resulting in the fatalities of Iranian military personnel. Furthermore, reports highlighting heightened threats against Israeli embassies in the United States (US) by Iran have intensified market apprehensions.
However, the US Dollar (USD) faced downward pressure due to weaker employment data from the United States (US) on Thursday, supporting the EUR/USD pair. Neutral remarks from several Federal Reserve officials likely mitigated the downward trend of the US Dollar.
US Initial Jobless Claims for the week ended March 29 increased by 9,000 to 221,000, compared to the previous week's reading of 212,000, albeit below the market consensus of 214,000. Additionally, US Challenger Job Cuts for March stood at 90.309K, exceeding the previous reading of 84.638K.
On the other side, the Eurostat Producer Price Index (PPI) recorded a decline of 1.0% in February, surpassing both the expected and previous decreases of 0.7% and 0.9%, respectively. On a year-over-year basis, the index fell by 8.3%, slightly lower than the anticipated 8.6% decrease but higher than the 8.0% decline seen previously. Additionally, the HCOB Composite PMI demonstrated growth, rising to 50.3 from the previous reading of 49.9.
Recent data indicates that the annual inflation rate in the Eurozone declined more than anticipated in March. This has led to speculation that the European Central Bank (ECB) may consider cutting interest rates in June.
Traders await Germany’s Factory Orders and Eurozone Retail Sales on Friday. From the United States, Average Hourly Earnings and Nonfarm Payrolls are scheduled to be eyed.
EUR/USD
Overview
Today last price
1.0826
Today Daily Change
-0.0011
Today Daily Change %
-0.10
Today daily open
1.0837
Trends
Daily SMA20
1.0855
Daily SMA50
1.083
Daily SMA100
1.0875
Daily SMA200
1.0833
Levels
Previous Daily High
1.0876
Previous Daily Low
1.0832
Previous Weekly High
1.0864
Previous Weekly Low
1.0768
Previous Monthly High
1.0981
Previous Monthly Low
1.0768
Daily Fibonacci 38.2%
1.0859
Daily Fibonacci 61.8%
1.0849
Daily Pivot Point S1
1.082
Daily Pivot Point S2
1.0804
Daily Pivot Point S3
1.0776
Daily Pivot Point R1
1.0865
Daily Pivot Point R2
1.0893
Daily Pivot Point R3
1.091
05:01
Japan Leading Economic Index above expectations (111.6) in February: Actual (111.8)
05:00
Japan Coincident Index: 110.9 (February) vs previous 112.1
05:00
Singapore Retail Sales (MoM) up to 3% in February from previous -0.7%
05:00
Singapore Retail Sales (YoY) increased to 8.4% in February from previous 1.3%
US Nonfarm Payrolls are seen rising by 200K in March after February’s 275K increase.
The United States Bureau of Labor Statistics will publish the labor market report at 12:30 GMT.
US employment data could impact the Fed rate cut expectations and the US Dollar dynamics.
The United States (US) Bureau of Labor Statistics (BLS) will publish the high-impact Nonfarm Payrolls (NFP) data on Friday at 12:30 GMT. The US labor market data is closely scrutinized by market participants for fresh insights on the Federal Reserve’s (Fed) outlook on the interest rates, which could impact the US Dollar price action in the near term.
What to expect in the next Nonfarm Payrolls report?
The Nonfarm Payrolls report is expected to show that the US economy may have created 200,000 jobs last month, down from a 275,000 increase registered in February. January’s data was significantly revised down to show 229,000 jobs created instead of 353,000 as previously reported.
The Unemployment Rate is likely to hold steady at 3.9% in the same period. Meanwhile, Average Hourly Earnings, an important gauge of wage inflation, is set to rise 4.1% in the year through March, cooling off slightly from February’s 4.3% growth.
The headline NFP figure, along with the previous revisions and wage inflation data, will hold the key to affirm the market expectations of a Fed interest rate cut as early as June. The probability that the Fed will begin lowering rates in June stands at 62%, according to the CME Group’s FedWatch Tool, up from the 58% shown at the start of the week on Monday.
The revival in the dovish Fed expectations could be attributed to the recent commentaries from the Fed policymakers and the weaker-than-expected US ISM Services PMI, as markets paid little heed to strong US JOLTs Job Openings and ADP Employment data.
Amidst the recent Fedspeak, Fed Chairman Jerome Powell on Wednesday reassured markets of the likelihood of interest rate cuts this year. Powell said that "if the economy evolves broadly as we expect," he and his Fed colleagues largely agree that a lower policy interest rate will be appropriate "at some point this year." Meanwhile, Fed Governor Adriana Kugler said early Thursday that she expects the disinflation trend will continue, which will pave the way for the central bank to cut interest rates.
Meanwhile, the US private sector added 184,000 jobs in March, a decent increase from the upwardly revised 155,000 print in February, the ADP reported on Wednesday. The data beat the analysts’ estimates of a 148,000 job gain. US job openings rose by 8,000 to 8.756 million on the last day of February, the Labor Department's Bureau of Labor Statistics said on Tuesday. The market forecast was for an 8.74 million reading.
Previewing the March jobs report, TD Securities (TDS) analysts said: “We look for job growth to have lost further momentum in March following the boomy Jan/Feb gains that came in the 200k-300k range. Household survey noise will keep the UE rate volatile, however, we expect it to stay unchanged at 3.9%.”
“We also look for wage growth to move back to the 0.3% m/m pace —and down 0.2pp to 4.1% y/y— after the ups and downs of the last couple of reports,” the TDS analysts added.
How will US March Nonfarm Payrolls affect EUR/USD?
Increased bets for Fed rate cuts keep the US Dollar undermined against its major counterparts, driving the EUR/USD pair to a weekly high near 1.0875. It remains to be seen if the pair can sustain its upswing in the lead-up to the US NFP showdown.
A strong-than-expected NFP headline figure above the 200,000 expected increase combined with hotter-than-expected wage inflation data could temper June Fed rate cut bets, providing the much-needed lift to the US Dollar while sending EUR/USD back toward 1.0750. Conversely, if the US employment data points to loosening labor market conditions and decelerating trends in pay growth, the Greenback could come under renewed selling pressure amid reinforcement of dovish Fed expectations. In such a case, EUR/USD could advance through the 1.0900 threshold.
Dhwani Mehta, Analyst at FXStreet, offers a brief technical outlook for EUR/USD:
“The EUR/USD pair has recaptured the critical 50-day Simple Moving Average (SMA) at 1.0830 on a daily closing basis on Wednesday. The 14-day Relative Strength Index (RSI) flirts with the 50 level, suggesting that buyers lean in favor of the pair in the near term”.
“Buyers need to take out the 100-day SMA at 1.0876 to extend the recovery toward the 1.0900 level. The next upside barrier for EUR/USD will be then seen at the March 21 high of 1.0943. Conversely, the initial demand area is seen at the 1.0800 round figure, below which the April 3 low at 1.0764 will be tested. The line in the sand for Euro buyers is envisioned at 1.0725, April lows”, Dhwani adds.
Economic Indicator
Nonfarm Payrolls
The Nonfarm Payrolls release presents the number of new jobs created in the US during the previous month in all non-agricultural businesses; it is released by the US Bureau of Labor Statistics (BLS). The monthly changes in payrolls can be extremely volatile. The number is also subject to strong reviews, which can also trigger volatility in the Forex board. Generally speaking, a high reading is seen as bullish for the US Dollar (USD), while a low reading is seen as bearish, although previous months' reviews and the Unemployment Rate are as relevant as the headline figure. The market's reaction, therefore, depends on how the market assesses all the data contained in the BLS report as a whole.
America’s monthly jobs report is considered the most important economic indicator for forex traders. Released on the first Friday following the reported month, the change in the number of positions is closely correlated with the overall performance of the economy and is monitored by policymakers. Full employment is one of the Federal Reserve’s mandates and it considers developments in the labor market when setting its policies, thus impacting currencies. Despite several leading indicators
shaping estimates, Nonfarm Payrolls tend to surprise markets and trigger substantial volatility. Actual figures beating the consensus tend to be USD bullish.
Nonfarm Payrolls FAQs
Nonfarm Payrolls (NFP) are part of the US Bureau of Labor Statistics monthly jobs report. The Nonfarm Payrolls component specifically measures the change in the number of people employed in the US during the previous month, excluding the farming industry.
The Nonfarm Payrolls figure can influence the decisions of the Federal Reserve by providing a measure of how successfully the Fed is meeting its mandate of fostering full employment and 2% inflation. A relatively high NFP figure means more people are in employment, earning more money and therefore probably spending more. A relatively low Nonfarm Payrolls’ result, on the either hand, could mean people are struggling to find work. The Fed will typically raise interest rates to combat high inflation triggered by low unemployment, and lower them to stimulate a stagnant labor market.
Nonfarm Payrolls generally have a positive correlation with the US Dollar. This means when payrolls’ figures come out higher-than-expected the USD tends to rally and vice versa when they are lower. NFPs influence the US Dollar by virtue of their impact on inflation, monetary policy expectations and interest rates. A higher NFP usually means the Federal Reserve will be more tight in its monetary policy, supporting the USD.
Nonfarm Payrolls are generally negatively-correlated with the price of Gold. This means a higher-than-expected payrolls’ figure will have a depressing effect on the Gold price and vice versa. Higher NFP generally has a positive effect on the value of the USD, and like most major commodities Gold is priced in US Dollars. If the USD gains in value, therefore, it requires less Dollars to buy an ounce of Gold. Also, higher interest rates (typically helped higher NFPs) also lessen the attractiveness of Gold as an investment compared to staying in cash, where the money will at least earn interest.
Nonfarm Payrolls is only one component within a bigger jobs report and it can be overshadowed by the other components. At times, when NFP come out higher-than-forecast, but the Average Weekly Earnings is lower than expected, the market has ignored the potentially inflationary effect of the headline result and interpreted the fall in earnings as deflationary. The Participation Rate and the Average Weekly Hours components can also influence the market reaction, but only in seldom events like the “Great Resignation” or the Global Financial Crisis.
04:42
India Reverse Repo Rate: 3.35%
04:33
India RBI Interest Rate Decision (Repo Rate) in line with forecasts (6.5%)
AUD/JPY snaps its winning streak on escalated geopolitical tension.
Iran has vowed retaliation for Israel's attack on Iran's embassy.
Australian Dollar faces challenges after the release of mixed economic data.
AUD/JPY breaks its three-day winning streak, declining to near 99.30 during the Asian session on Friday. The Japanese Yen (JPY), considered a safe-haven currency, strengthened as geopolitical tensions escalated in the Middle East. This dynamic contributed to the weakening of the AUD/JPY cross.
The escalation of tensions follows Iran's vow to retaliate against Israel's attack on Iran's embassy in Syria, which led to the loss of Iranian military personnel. Additionally, reports indicating heightened threats against Israeli embassies in the United States (US) by Iran have further heightened market concerns.
Additionally, Bank of Japan (BoJ) Governor Kazuo Ueda suggested on Friday that the central bank might adjust monetary policy if foreign exchange fluctuations significantly affect the wage-inflation cycle in a manner that cannot be overlooked. Japan's Finance Minister Shunichi Suzuki echoed this sentiment, emphasizing that he is closely monitoring currency movements with a strong sense of urgency and is prepared to explore all available options to address excessive volatility in the foreign exchange market.
Minister Suzuki also highlighted that decisions regarding monetary policy, including the timing of interest rate adjustments, fall within the jurisdiction of the Bank of Japan's Board of Directors (BOD). The government aims to collaborate closely with the BOD to consistently achieve its inflation target stably.
Following the release of unchanged Final Retail Sales and disappointing Trade Balance data from Australia on Friday, the Australian Dollar (AUD) experienced a decline. According to data published by the Australian Bureau of Statistics, Australia's Trade Surplus (Month-over-Month) narrowed to 7,280 million in March, falling short of the expected 10,400 million and February’s reading of 10,058 million.
The decrease in Australia's Exports by 2.2% month-over-month, in contrast to the previous increase of 1.6%, contributed to the narrowing surplus. Additionally, the nation’s Imports saw growth of 4.8%, compared to 1.3% in the previous period. Australia's Final Retail Sales remained unchanged at 0.3% in February, aligning with expectations.
Bank of Japan (BoJ) Governor Kazuo Ueda said on Friday that the “impact of past rises in import costs on Japan's inflation likely to dissipate.”
Additional quotes
Scheduled end to govt energy subsidies likely to also likely to affect inflation ahead.
Given annual wage talks outcome so far, trend inflation likely to gradually accelerate.
Market reaction
The USD/JPY pair was last seen trading at 151.20, down 0.09% so far.
Bank of Japan FAQs
The Bank of Japan (BoJ) is the Japanese central bank, which sets monetary policy in the country. Its mandate is to issue banknotes and carry out currency and monetary control to ensure price stability, which means an inflation target of around 2%.
The Bank of Japan has embarked in an ultra-loose monetary policy since 2013 in order to stimulate the economy and fuel inflation amid a low-inflationary environment. The bank’s policy is based on Quantitative and Qualitative Easing (QQE), or printing notes to buy assets such as government or corporate bonds to provide liquidity. In 2016, the bank doubled down on its strategy and further loosened policy by first introducing negative interest rates and then directly controlling the yield of its 10-year government bonds.
The Bank’s massive stimulus has caused the Yen to depreciate against its main currency peers. This process has exacerbated more recently due to an increasing policy divergence between the Bank of Japan and other main central banks, which have opted to increase interest rates sharply to fight decades-high levels of inflation. The BoJ’s policy of holding down rates has led to a widening differential with other currencies, dragging down the value of the Yen.
A weaker Yen and the spike in global energy prices have led to an increase in Japanese inflation, which has exceeded the BoJ’s 2% target. Still, the Bank judges that the sustainable and stable achievement of the 2% target has not yet come in sight, so any sudden change in the current policy looks unlikely.
Gold price corrects further from the all-time high amid hawkish remarks by Fed officials.
Persistent geopolitical tensions should limit the downside for the safe-haven XAU/USD.
Traders might also refrain from placing aggressive bets ahead of the crucial US jobs data.
Gold price (XAU/USD) extends the previous day's modest pullback from the record peak and continues losing ground through the Asian session on Friday. The overnight hawkish remarks by Federal Reserve (Fed) officials assist the US Dollar (USD) in gaining some follow-through positive traction and moving away from a nearly two-week low, which is seen dragging the commodity lower for the second straight day. The downside for the precious metal, however, seems cushioned in the wake of geopolitical tensions stemming from conflicts in the Middle East, which tends to benefit traditional safe-haven assets.
Traders might also prefer to wait for more cues about the Fed's interest rate-cut path before placing fresh directional bets around the non-yielding Gold price. Hence, the focus will remain glued to the release of the crucial US monthly employment details, popularly known as the Nonfarm Payrolls (NFP) report, due later during the North American session. Any disappointment will further point to signs of a cooling labor market and strengthen the case for a June Fed rate cut. Such a development could trigger a fresh bout of USD selling and provide additional support to the yellow metal.
Federal Reserve officials took a cautious approach in comments on the outlook for possible interest rate cuts this year, which, in turn, prompts some profit-taking around the Gold price.
Richmond Fed President Thomas Barkin said that he was open to interest rate cuts once it is clear that progress on inflation will be sustained and applied more broadly in the economy.
Minneapolis Fed Bank President Neel Kashkari said that he penciled in two rate cuts this year at the March meeting, though none may be required if inflation continues to move sideways.
The hawkish comments keep the US Treasury bond yields elevated, which assists the US Dollar in building on the overnight bounce and further exerts pressure on the non-yielding yellow metal.
Geopolitical tensions in the Middle East ratcheted up amid persistent fears that an Iran retaliatory strike against the Israeli attack on its embassy in Syria earlier this week could be imminent.
This, along with the protracted Russia-Ukraine war and a devastating earthquake in Taiwan, continues to weigh on investors' sentiment and should lend support to the safe-haven XAU/USD.
Investors now look to the US monthly jobs report, which is expected to show that the economy added 200K jobs in March vs the 275K previous, and the unemployment rate held steady at 3.9%.
Apart from this, the Average Hourly Earnings will influence market expectations about the Fed's rate-cut path, which, in turn, will drive the USD and provide a fresh impetus to the commodity.
Technical Analysis: Gold price could aim to retest weekly trough once the $2,265 immediate support is broken
From a technical perspective, weakness below the $2,265 area could expose the weekly swing low, around the $2,229-2,228 region, with the $2,250 level acting as an intermediate support. Some follow-through selling has the potential to drag the Gold price toward the $2,200 psychological mark, which is likely to act as a strong base. That said, a convincing breakdown through the said handle should pave the way for some meaningful corrective decline.
On the flip side, a move beyond the $2,280 area might confront some resistance near the Asian session peak, just ahead of the $2,300 round-figure mark. Acceptance above the latter will be seen as a fresh trigger for bullish traders and set the stage for an extension of the recent breakout momentum witnessed over the past two weeks or so.
Gold FAQs
Gold has played a key role in human’s history as it has been widely used as a store of value and medium of exchange. Currently, apart from its shine and usage for jewelry, the precious metal is widely seen as a safe-haven asset, meaning that it is considered a good investment during turbulent times. Gold is also widely seen as a hedge against inflation and against depreciating currencies as it doesn’t rely on any specific issuer or government.
Central banks are the biggest Gold holders. In their aim to support their currencies in turbulent times, central banks tend to diversify their reserves and buy Gold to improve the perceived strength of the economy and the currency. High Gold reserves can be a source of trust for a country’s solvency. Central banks added 1,136 tonnes of Gold worth around $70 billion to their reserves in 2022, according to data from the World Gold Council. This is the highest yearly purchase since records began. Central banks from emerging economies such as China, India and Turkey are quickly increasing their Gold reserves.
Gold has an inverse correlation with the US Dollar and US Treasuries, which are both major reserve and safe-haven assets. When the Dollar depreciates, Gold tends to rise, enabling investors and central banks to diversify their assets in turbulent times. Gold is also inversely correlated with risk assets. A rally in the stock market tends to weaken Gold price, while sell-offs in riskier markets tend to favor the precious metal.
The price can move due to a wide range of factors. Geopolitical instability or fears of a deep recession can quickly make Gold price escalate due to its safe-haven status. As a yield-less asset, Gold tends to rise with lower interest rates, while higher cost of money usually weighs down on the yellow metal. Still, most moves depend on how the US Dollar (USD) behaves as the asset is priced in dollars (XAU/USD). A strong Dollar tends to keep the price of Gold controlled, whereas a weaker Dollar is likely to push Gold prices up.
Indian Rupee trades in negative territory on the stronger USD demand.
The escalating Middle East geopolitical tensions and the rise in oil prices weigh on the INR.
The RBI will announce the interest rate decision on Friday, which is expected to leave the repo rate unchanged at 6.50%.
Indian Rupee (INR) loses its recovery momentum on Friday amid persistent US Dollar (USD) demand, which is most likely from importers. Meanwhile, the rising geopolitical tensions in the Middle East and the upsurge in oil prices exert some selling pressure on the INR and lift the safe-haven currency like the Greenback. However, the downside of the local currency might be limited by the RBI's two-way FX intervention to keep the INR stable.
The RBI Monetary Policy Committee (MPC) will announce the interest rate decision on Friday at 4.30 GMT. Markets widely anticipate the Indian central bank to keep the repo rate unchanged at 6.50% and cut the rates in the third quarter. On the US docket, the US employment data, including Nonfarm Payrolls (NFP), Unemployment Rate, and Average Hourly Earnings for March, will be in the spotlight. The US NFP figure is estimated to see 200K jobs added to the US economy in March.
The CIA on Thursday reportedly warned Israel that Iran will attack within the next 48 hours after Israel attacked Tehran's consulate in Syria, killing two Iranian military leaders, per the Express.
India’s HSBC Service PMI rose to 61.2 in March from 60.6 in February, better than market expectations.
The INR will strengthen only marginally against the USD over the coming three months as the RBI uses its FX reserves to manage volatility and keep the currency relatively strong, according to a Reuters poll.
The INR exchange rate would be unaffected by the recent volatility in the currency's exchange-traded derivatives, which was caused by traders unwinding positions to comply with a central bank rule, four bankers said on Thursday.
The US Initial Jobless Claims for the week ended March 30 rose by 9,000 to 221,000 from the previous week of 212,000, below the market consensus of 214,000. The Continuing Claims declined by 19K to 1.791M in the week ended March 23.
Fed Bank of Richmond President Thomas Barkin said disinflation is likely to continue, but the speed of that remains unclear. He further stated that maintaining rates 'somewhat restrictive' will bring inflation back to target.
Technical analysis: USD/INR prospects remain positive in the longer term
The Indian Rupee trades weaker on the day. The bullish stance of USD/INR remains unchanged in the long term since the pair has risen above a nearly four-month-old descending trend channel since March 22.
In the short term, USD/INR is above the key 100-day Exponential Moving Average (EMA) on the daily chart, with the 14-day Relative Strength Index (RSI) holding in bullish territory around 65.0. This suggests that support zones are more likely to hold than to break.
A break past a high of April 3 at 83.55 could pave the way to the next resistance level at an all-time high of 83.70 en route to the 84.00 psychological round mark. On the flip side, the first downside target will emerge near a high of March 21 at 83.20. The potential support level is located at the 83.00–83.50 zone (round mark, the 100-day EMA). A breach of this level could see a drop to a low of March 14 at 82.80.
US Dollar price today
The table below shows the percentage change of US Dollar (USD) against listed major currencies today. US Dollar was the strongest against the .
USD
EUR
GBP
CAD
AUD
JPY
NZD
CHF
USD
0.10%
0.12%
0.23%
0.37%
-0.09%
0.31%
0.09%
EUR
-0.10%
0.03%
0.12%
0.28%
-0.18%
0.22%
-0.02%
GBP
-0.12%
-0.02%
0.10%
0.26%
-0.21%
0.19%
-0.04%
CAD
-0.23%
-0.13%
-0.10%
0.15%
-0.31%
0.09%
-0.15%
AUD
-0.37%
-0.27%
-0.25%
-0.13%
-0.46%
-0.06%
-0.30%
JPY
0.07%
0.18%
0.19%
0.28%
0.43%
0.40%
0.15%
NZD
-0.33%
-0.21%
-0.19%
-0.08%
0.06%
-0.40%
-0.25%
CHF
-0.09%
0.02%
0.04%
0.14%
0.29%
-0.17%
0.23%
The heat map shows percentage changes of major currencies against each other. The base currency is picked from the left column, while the quote currency is picked from the top row. For example, if you pick the Euro from the left column and move along the horizontal line to the Japanese Yen, the percentage change displayed in the box will represent EUR (base)/JPY (quote).
Indian Rupee FAQs
The Indian Rupee (INR) is one of the most sensitive currencies to external factors. The price of Crude Oil (the country is highly dependent on imported Oil), the value of the US Dollar – most trade is conducted in USD – and the level of foreign investment, are all influential. Direct intervention by the Reserve Bank of India (RBI) in FX markets to keep the exchange rate stable, as well as the level of interest rates set by the RBI, are further major influencing factors on the Rupee.
The Reserve Bank of India (RBI) actively intervenes in forex markets to maintain a stable exchange rate, to help facilitate trade. In addition, the RBI tries to maintain the inflation rate at its 4% target by adjusting interest rates. Higher interest rates usually strengthen the Rupee. This is due to the role of the ‘carry trade’ in which investors borrow in countries with lower interest rates so as to place their money in countries’ offering relatively higher interest rates and profit from the difference.
Macroeconomic factors that influence the value of the Rupee include inflation, interest rates, the economic growth rate (GDP), the balance of trade, and inflows from foreign investment. A higher growth rate can lead to more overseas investment, pushing up demand for the Rupee. A less negative balance of trade will eventually lead to a stronger Rupee. Higher interest rates, especially real rates (interest rates less inflation) are also positive for the Rupee. A risk-on environment can lead to greater inflows of Foreign Direct and Indirect Investment (FDI and FII), which also benefit the Rupee.
Higher inflation, particularly, if it is comparatively higher than India’s peers, is generally negative for the currency as it reflects devaluation through oversupply. Inflation also increases the cost of exports, leading to more Rupees being sold to purchase foreign imports, which is Rupee-negative. At the same time, higher inflation usually leads to the Reserve Bank of India (RBI) raising interest rates and this can be positive for the Rupee, due to increased demand from international investors. The opposite effect is true of lower inflation.
WTI price appreciated after Iran vowed retaliation for Israel's attack on Iran's embassy.
NATO officials said that Ukrainian drone attacks on Russian refineries may have disrupted over 15% of capacity.
The US has imposed sanctions on Oceanlink Maritime DMCC for its role in shipping commodities intended for the Iranian military.
West Texas Intermediate (WTI) oil price seems to extend its winning streak that began on March 27, buoyed by escalating geopolitical tensions and the looming possibility of disruptions in oil supply. WTI crude oil is currently trading around $86.20 per barrel during the Asian trading hours on Friday.
The rise in Crude oil prices is attributed to the potential threat of supply disruptions amid escalating geopolitical tensions, particularly after Israel attacked Iran's embassy in Syria. However, Israel has not officially claimed responsibility for the attack on Iran's embassy compound in Syria on Monday.
Furthermore, reports of increased threats against the Israeli embassy in the United States (US) by Iran have added to market concerns. Iran has pledged retaliation for an attack that resulted in the death of Iranian military officials.
Additionally, according to NATO officials on Thursday, ongoing Ukrainian drone attacks on refineries in Russia may have disrupted over 15% of Russian capacity. Furthermore, a Lukoil refinery in Russia is facing challenges in repairing its gasoline unit as the American firm Universal Oil Products (UOP) has declined to assist Lukoil. UOP had withdrawn from Russia following the country's invasion of Ukraine in February 2022.
On Thursday, the United States imposed fresh counterterrorism sanctions related to Iran against Oceanlink Maritime DMCC, based in the United Arab Emirates, along with its vessels. This action was taken due to the company's involvement in shipping commodities for the Iranian military. The Treasury Department stated that the US is utilizing financial sanctions as a measure to isolate Iran and hinder its capacity to finance its proxy groups while also supporting Russia's conflict in Ukraine.
This week, the Organization of the Petroleum Exporting Countries (OPEC) and its allies, collectively known as OPEC+, decided to maintain their current oil supply policy unchanged. The voluntary production cuts, totaling 2.2 million barrels per day (bpd), will continue until at least the end of June. These cuts supplement the existing agreement reached in 2022, which already encompasses reductions of 3.66 million bpd.
The Japanese Yen strengthened for the second straight day against the USD on Friday.
The risk-off mood, along with intervention fears, boosts demand for the safe-haven JPY.
The Fed rate-cut uncertainty undermines the USD and contributes to the USD/JPY’s fall.
Traders now look to the release of the US jobs data (NFP) for some meaningful impetus.
The Japanese Yen (JPY) moves higher against its American counterpart for the second straight day on Friday and jumps to over a two-week high during the Asian session. Concerns that the Israel-Hamas war may spread to include Iran and spark a wider conflict in the Middle East, along with hawkish remarks from Federal Reserve (Fed) officials, temper investors' appetite for riskier assets. This led to the overnight slump in the US equity markets and drove some haven flows towards the JPY.
Meanwhile, investors remain on high alert amid the possibility of intervention by Japanese authorities to prop up the domestic currency. Furthermore, the Bank of Japan Governor Kazuo Ueda signaled a chance of a rate hike if the JPY moves affect inflation and wages, which turns out to be another factor underpinning the JPY. The US Dollar (USD), on the other hand, struggles to capitalize on the overnight bounce from a two-week low and contributes to the offered tone surrounding the USD/JPY pair.
It, however, remains to be seen if the JPY bulls can build on the momentum or opt to wait on the sidelines ahead of the release of the crucial US monthly employment details later during the North American session. The popularly known Nonfarm Payrolls (NFP) report will be looked upon for cues about the Fed's interest rate-cut path. This, in turn, will play a key role in influencing the near-term USD price dynamics and determining the next leg of a directional move for the USD/JPY pair.
Daily Digest Market Movers: Japanese Yen gets a strong boost from rising geopolitical risks, hawkish BoJ signals
Iran has vowed to retaliate against the Israeli attack on its embassy in Syria, raising the risk of a further escalation of geopolitical tensions in the Middle East and boosting the safe-haven Japanese Yen.
Bank of Japan Governor Kazuo Ueda reportedly said on Friday that the central bank could respond with monetary policy if FX moves have an impact on the wage-inflation cycle in a way that is hard to ignore.
Ueda added that the chance of sustainably, stably achieving BoJ’s 2% inflation target is in sight and is likely to keep heightening as this year's pay raises in annual wage negotiations could push up prices.
Former top Japanese currency official Tatsuo Yamazaki said on Thursday that authorities will likely intervene in the currency market if the JPY breaks out of the range and weakens beyond 152 per dollar.
Japan's Finance Minister Shunichi Suzuki reiterated that he is closely watching foreign exchange moves with a high sense of urgency and won't rule out any options to deal with excessive FX volatility.
Data released earlier today showed that Japanese household spending fell 0.5% in February from a year earlier, down for the 12th straight month, though better than estimates for a 3.0% decline.
The US Department of Labor reported on Thursday that the number of Americans applying for unemployment insurance increased to 221K in the week ending March 30 against 214K expected.
This pointed to signs of cooling in the labor market and reinforced market expectations that the Federal Reserve will start cutting interest rates in June, dragging the US Dollar to a two-week low.
Meanwhile, Minneapolis Fed President Neel Kashkari said that he penciled in two interest rate cuts this year and that rate cuts might not be required if inflation continues to move sideways.
Adding to this, Richmond Fed President Thomas Barkin noted that he was open to interest rate cuts once it is clear progress on inflation will be sustained and applied more broadly in the economy.
The hawkish outlook keeps the US Treasury bond yields elevated, which allowed the USD to stage a late recovery, though the momentum faded rather quickly during the Asian session on Friday.
Investors now look forward to the closely-watched US monthly jobs data, popularly known as the Nonfarm Payrolls (NFP) report, for cues about the Fed's rate cut path and some meaningful impetus.
Technical Analysis: USD/JPY seems vulnerable below 151.00, short-term trading range breakdown comes into play
From a technical perspective, a convincing break and acceptance below the 151.00 mark could be seen as a breakdown through a short-term trading range. That said, oscillators on the daily chart – despite losing traction – are still holding in positive territory. Hence, any subsequent slide is more likely to find decent support near the 150.25 region. This is closely followed by the 150.00 psychological mark, which, if broken decisively, will be seen as a fresh trigger for bearish traders and drag the USD/JPY pair towards the 149.35-149.30 region en route to the 149.00 mark.
On the flip side, the 151.30-151.35 zone now seems to act as an immediate hurdle ahead of the 151.70 area and the multi-decade high, near the 152.00 mark. The latter represents a possible intervention level and should act as a strong near-term barrier. A sustained strength beyond, however, might trigger a fresh bout of a short-covering move and lift the USD/JPY pair towards the 153.00 round figure.
Japanese Yen FAQs
The Japanese Yen (JPY) is one of the world’s most traded currencies. Its value is broadly determined by the performance of the Japanese economy, but more specifically by the Bank of Japan’s policy, the differential between Japanese and US bond yields, or risk sentiment among traders, among other factors.
One of the Bank of Japan’s mandates is currency control, so its moves are key for the Yen. The BoJ has directly intervened in currency markets sometimes, generally to lower the value of the Yen, although it refrains from doing it often due to political concerns of its main trading partners. The current BoJ ultra-loose monetary policy, based on massive stimulus to the economy, has caused the Yen to depreciate against its main currency peers. This process has exacerbated more recently due to an increasing policy divergence between the Bank of Japan and other main central banks, which have opted to increase interest rates sharply to fight decades-high levels of inflation.
The BoJ’s stance of sticking to ultra-loose monetary policy has led to a widening policy divergence with other central banks, particularly with the US Federal Reserve. This supports a widening of the differential between the 10-year US and Japanese bonds, which favors the US Dollar against the Japanese Yen.
The Japanese Yen is often seen as a safe-haven investment. This means that in times of market stress, investors are more likely to put their money in the Japanese currency due to its supposed reliability and stability. Turbulent times are likely to strengthen the Yen’s value against other currencies seen as more risky to invest in.
Australian Dollar depreciates after the release of mixed domestic economic numbers.
Australia’s Trade Balance fell to 7,280M MoM in March, from February’s reading of 11,027M.
US Dollar could lose ground due to lower US Treasury yields.
The Australian Dollar (AUD) snaps its three-day winning streak following the release of unchanged Final Retail Sales and downbeat Trade Balance data from Australia on Friday. However, the US Dollar (USD) faced downward pressure due to softer labor market data from the United States (US) on Thursday, supporting the AUD/USD pair.
Australia’s Trade Surplus (Month-over-Month) narrowed to 7,280 million in March, falling short of the expected 10,400 million and February’s reading of 11,027 million, according to data published by the Australian Bureau of Statistics. Australia's Exports decreased by 2.2% month-over-month, contrasting with the previous increase of 1.6%. Meanwhile, the nation’s Imports grew by 4.8%, compared to 1.3% prior.
The US Dollar Index (DXY) consolidates with a negative sentiment, reflecting the drop in US Treasury yields, possibly influenced by neutral comments from several Federal Reserve officials. However, the US Dollar might have attracted investors amid market caution due to escalating geopolitical tensions following Israel’s attack on Iran's embassy in Syria.
Daily Digest Market Movers: Australian Dollar depreciates on mixed economic figures
Australia's Final Retail Sales were unchanged at 0.3% in February, in line with expectations.
Australia Judo Bank Services' PMI improved to 54.4 in March from 53.5 in February. Judo Bank Composite PMI increased to 53.3 from the previous reading of 52.4.
Australia’s Building Permits (MoM) fell by 1.9% in February against the expected increase of 3.3% and the previous decline of 2.5%. In comparison, there is an increase of 5.2% YoY, compared to the previous increase of 4.8%.
RBA March minutes showed that the board did not contemplate the option of raising interest rates. They unanimously agreed that it was challenging to definitively predict future changes in the cash rate. While the economic outlook remained uncertain, the risks appeared to be generally balanced. The board acknowledged that it would require "some time" before they could express confidence in inflation returning to the target level.
Federal Reserve (Fed) Bank of Richmond President Thomas Barkin remarked that disinflation is expected to persist, although the pace of this trend remains uncertain. He stated, "I am open to rate cuts once it is clear that progress on inflation will be sustained and apply more broadly in the economy."
Loretta Mester, President of the Federal Reserve Bank of Cleveland, suggested on Thursday that she would be open to reducing the pace of securities runoff from the Fed’s balance sheet soon. She also anticipated to be in a position to lower the fed funds rate later this year.”
Fed Chair Jerome Powell reaffirmed the US central bank's preparedness to implement rate cuts, emphasizing a data-dependent approach. Atlanta Fed President Raphael Bostic's remarks advocating for a rate cut in the final quarter of 2024.
Adriana Kugler, a member of the Fed Board of Governors, highlighted that the ongoing disinflationary trend would necessitate rate reductions, with expectations of at least three cuts by the last quarter of 2024.
US Initial Jobless Claims for the week ended March 29 rose by 9,000 to 221,000 from the previous week’s reading of 212,000, below the market consensus of 214,000.
US Challenger Job Cuts posted 90.309K for March against the previous reading of 84.638K.
US ADP Employment Change rose by 184K in March, compared to the 155K increase in February, above the market consensus of 148K.
US ISM Services PMI eased to 51.4 in March from 52.6 in February, weaker than the expectation of 52.7. US ISM Manufacturing PMI climbed to 50.3 in March from February's 47.8, surpassing expectations of 48.4.
Technical Analysis: Australian Dollar maintains position below the psychological mark of 0.6600
The Australian Dollar trades around 0.6570 on Friday. The immediate resistance region is observed around the 61.8% Fibonacci retracement level of 0.6596, coinciding with the psychological level of 0.6600. A breakthrough above this level could potentially propel the AUD/USD pair to explore the area around the major level of 0.6650 and March’s high of 0.6667. On the downside, key support is identified around the nine-day Exponential Moving Average (EMA) of 0.6552 and the major support level of 0.6550. A breach below the latter could exert downward pressure on the AUD/USD pair, potentially leading it toward the psychological level of 0.6500.
AUD/USD: Daily Chart
Australian Dollar price today
The table below shows the percentage change of Australian Dollar (AUD) against listed major currencies today. Australian Dollar was the weakest against the Japanese Yen.
USD
EUR
GBP
CAD
AUD
JPY
NZD
CHF
USD
0.07%
0.08%
0.15%
0.21%
-0.18%
0.19%
0.05%
EUR
-0.06%
0.01%
0.09%
0.15%
-0.24%
0.12%
-0.02%
GBP
-0.08%
-0.01%
0.07%
0.13%
-0.26%
0.10%
-0.03%
CAD
-0.16%
-0.07%
-0.07%
0.05%
-0.34%
0.03%
-0.10%
AUD
-0.21%
-0.14%
-0.13%
-0.05%
-0.40%
-0.02%
-0.17%
JPY
0.17%
0.25%
0.27%
0.31%
0.36%
0.38%
0.22%
NZD
-0.20%
-0.12%
-0.10%
-0.03%
0.03%
-0.37%
-0.15%
CHF
-0.05%
0.02%
0.03%
0.10%
0.16%
-0.23%
0.13%
The heat map shows percentage changes of major currencies against each other. The base currency is picked from the left column, while the quote currency is picked from the top row. For example, if you pick the Euro from the left column and move along the horizontal line to the Japanese Yen, the percentage change displayed in the box will represent EUR (base)/JPY (quote).
Australian Dollar FAQs
One of the most significant factors for the Australian Dollar (AUD) is the level of interest rates set by the Reserve Bank of Australia (RBA). Because Australia is a resource-rich country another key driver is the price of its biggest export, Iron Ore. The health of the Chinese economy, its largest trading partner, is a factor, as well as inflation in Australia, its growth rate and Trade Balance. Market sentiment – whether investors are taking on more risky assets (risk-on) or seeking safe-havens (risk-off) – is also a factor, with risk-on positive for AUD.
The Reserve Bank of Australia (RBA) influences the Australian Dollar (AUD) by setting the level of interest rates that Australian banks can lend to each other. This influences the level of interest rates in the economy as a whole. The main goal of the RBA is to maintain a stable inflation rate of 2-3% by adjusting interest rates up or down. Relatively high interest rates compared to other major central banks support the AUD, and the opposite for relatively low. The RBA can also use quantitative easing and tightening to influence credit conditions, with the former AUD-negative and the latter AUD-positive.
China is Australia’s largest trading partner so the health of the Chinese economy is a major influence on the value of the Australian Dollar (AUD). When the Chinese economy is doing well it purchases more raw materials, goods and services from Australia, lifting demand for the AUD, and pushing up its value. The opposite is the case when the Chinese economy is not growing as fast as expected. Positive or negative surprises in Chinese growth data, therefore, often have a direct impact on the Australian Dollar and its pairs.
Iron Ore is Australia’s largest export, accounting for $118 billion a year according to data from 2021, with China as its primary destination. The price of Iron Ore, therefore, can be a driver of the Australian Dollar. Generally, if the price of Iron Ore rises, AUD also goes up, as aggregate demand for the currency increases. The opposite is the case if the price of Iron Ore falls. Higher Iron Ore prices also tend to result in a greater likelihood of a positive Trade Balance for Australia, which is also positive of the AUD.
The Trade Balance, which is the difference between what a country earns from its exports versus what it pays for its imports, is another factor that can influence the value of the Australian Dollar. If Australia produces highly sought after exports, then its currency will gain in value purely from the surplus demand created from foreign buyers seeking to purchase its exports versus what it spends to purchase imports. Therefore, a positive net Trade Balance strengthens the AUD, with the opposite effect if the Trade Balance is negative.
The Bank of Japan (BoJ) Governor Kazuo Ueda said on Friday that foreign exchange is one of the important factors that affect economic price developments and the Japanese central bank will continue to work closely with the government to monitor FX movements and their impact on the economy and prices.
Key quotes
“Won't comment on short-term FX moves.”
“Does not directly target FX in guiding monetary policy.”
“FX is among the key factors that affect economic price developments.”
“BoJ will work closely with government, continue to carefully watch FX moves and their impact on economy, prices.”
“Various factors, including speculation over monetary policy moves at home and abroad, affect FX moves.”
The Japanese Yen (JPY) attracts some buyers following the above verbal intervention. The USD/JPY pair is trading at 150.85, losing 0.33% on the day at the time of writing.
Japanese Yen FAQs
The Japanese Yen (JPY) is one of the world’s most traded currencies. Its value is broadly determined by the performance of the Japanese economy, but more specifically by the Bank of Japan’s policy, the differential between Japanese and US bond yields, or risk sentiment among traders, among other factors.
One of the Bank of Japan’s mandates is currency control, so its moves are key for the Yen. The BoJ has directly intervened in currency markets sometimes, generally to lower the value of the Yen, although it refrains from doing it often due to political concerns of its main trading partners. The current BoJ ultra-loose monetary policy, based on massive stimulus to the economy, has caused the Yen to depreciate against its main currency peers. This process has exacerbated more recently due to an increasing policy divergence between the Bank of Japan and other main central banks, which have opted to increase interest rates sharply to fight decades-high levels of inflation.
The BoJ’s stance of sticking to ultra-loose monetary policy has led to a widening policy divergence with other central banks, particularly with the US Federal Reserve. This supports a widening of the differential between the 10-year US and Japanese bonds, which favors the US Dollar against the Japanese Yen.
The Japanese Yen is often seen as a safe-haven investment. This means that in times of market stress, investors are more likely to put their money in the Japanese currency due to its supposed reliability and stability. Turbulent times are likely to strengthen the Yen’s value against other currencies seen as more risky to invest in.
Japan Chief Cabinet Secretary Yoshimasa Hayashi said on Friday that he expects the Bank of Japan (BoJ) to conduct appropriate monetary policy in close cooperation with the government.
Market reaction
At the time of writing, USD/JPY is trading 0.27% lower on the day at 150.91.
Japanese Yen FAQs
The Japanese Yen (JPY) is one of the world’s most traded currencies. Its value is broadly determined by the performance of the Japanese economy, but more specifically by the Bank of Japan’s policy, the differential between Japanese and US bond yields, or risk sentiment among traders, among other factors.
One of the Bank of Japan’s mandates is currency control, so its moves are key for the Yen. The BoJ has directly intervened in currency markets sometimes, generally to lower the value of the Yen, although it refrains from doing it often due to political concerns of its main trading partners. The current BoJ ultra-loose monetary policy, based on massive stimulus to the economy, has caused the Yen to depreciate against its main currency peers. This process has exacerbated more recently due to an increasing policy divergence between the Bank of Japan and other main central banks, which have opted to increase interest rates sharply to fight decades-high levels of inflation.
The BoJ’s stance of sticking to ultra-loose monetary policy has led to a widening policy divergence with other central banks, particularly with the US Federal Reserve. This supports a widening of the differential between the 10-year US and Japanese bonds, which favors the US Dollar against the Japanese Yen.
The Japanese Yen is often seen as a safe-haven investment. This means that in times of market stress, investors are more likely to put their money in the Japanese currency due to its supposed reliability and stability. Turbulent times are likely to strengthen the Yen’s value against other currencies seen as more risky to invest in.
Gold price loses traction near $2,285 in Friday’s early Asian session.
The US Initial Jobless Claims for the week ended March 30 went up to a two-month high.
The escalating Middle East geopolitical tensions might lift the safe-haven flows, benefiting gold price.
The US Nonfarm Payrolls (NFP), Unemployment Rate, and Average Hourly Earnings will be the highlights on Friday.
Gold Price (XAU/USD) edges lower to $2,285 during the early Asian session on Friday after reaching another fresh record high above $2,300 in the previous session. The ongoing geopolitical risks in the Middle East and the expectation of monetary policy easing from the Federal Reserve (Fed) might lift the yellow metal. Market players await the US Nonfarm Payrolls (NFP) report for March on Friday for fresh impetus, which is expected to see 200K jobs added in March.
Meanwhile, the US Dollar Index (DXY), a measure of the value of the USD against a weighted basket of currencies used by US trade partners, recovers to 104.20, bouncing off two-week lows of 103.90. The US Treasury bond yields edge lower, with the 10-year yield falling to 4.30%.
On Thursday, the US Initial Jobless Claims last week went up to the highest level since January, according to the Labor Department. The number of Americans filing new claims for unemployment benefits climbed to 221K for the week ended March 30 compared to the previous week of 212K, worse than the estimation of 214K. Meanwhile, Continuing Claims dropped to 1.791M in the week ending March 23.
Nonetheless, the Guardian reported late Thursday that Israel has postponed leave for combat troops and increased its air defense command to prepare for any Iranian missile or drone attacks after the recent bombing in Syria killed two Iranian military commanders. The rising geopolitical tensions in the Middle East might boost traditional safe-haven asset like gold in the near term.
Moving on, the US employment data for March, including Nonfarm Payrolls (NFP), Unemployment Rate, and Average Hourly Earnings will be in the spotlight on Friday. The stronger outcome might provide some support to the Greenback and cap the upside of USD-denominated gold.
Australia’s trade surplus narrowed to 7,280M MoM in March versus 10,400M expected and 11,027M in the previous reading, according to the latest Aussie foreign trade data published by the Australian Bureau of Statistics on Friday.
Further details reveal that Australia's March Goods/Services Exports reprint -2.2% figures on a monthly basis versus 1.6% prior. The nation’s Goods/Services Imports grew 4.8% in March MoM versus 1.3% prior.
Market reaction
At the press time, the AUD/USD pair is down 0.02% on the day to trade at 0.6585.
Australian Dollar FAQs
One of the most significant factors for the Australian Dollar (AUD) is the level of interest rates set by the Reserve Bank of Australia (RBA). Because Australia is a resource-rich country another key driver is the price of its biggest export, Iron Ore. The health of the Chinese economy, its largest trading partner, is a factor, as well as inflation in Australia, its growth rate and Trade Balance. Market sentiment – whether investors are taking on more risky assets (risk-on) or seeking safe-havens (risk-off) – is also a factor, with risk-on positive for AUD.
The Reserve Bank of Australia (RBA) influences the Australian Dollar (AUD) by setting the level of interest rates that Australian banks can lend to each other. This influences the level of interest rates in the economy as a whole. The main goal of the RBA is to maintain a stable inflation rate of 2-3% by adjusting interest rates up or down. Relatively high interest rates compared to other major central banks support the AUD, and the opposite for relatively low. The RBA can also use quantitative easing and tightening to influence credit conditions, with the former AUD-negative and the latter AUD-positive.
China is Australia’s largest trading partner so the health of the Chinese economy is a major influence on the value of the Australian Dollar (AUD). When the Chinese economy is doing well it purchases more raw materials, goods and services from Australia, lifting demand for the AUD, and pushing up its value. The opposite is the case when the Chinese economy is not growing as fast as expected. Positive or negative surprises in Chinese growth data, therefore, often have a direct impact on the Australian Dollar and its pairs.
Iron Ore is Australia’s largest export, accounting for $118 billion a year according to data from 2021, with China as its primary destination. The price of Iron Ore, therefore, can be a driver of the Australian Dollar. Generally, if the price of Iron Ore rises, AUD also goes up, as aggregate demand for the currency increases. The opposite is the case if the price of Iron Ore falls. Higher Iron Ore prices also tend to result in a greater likelihood of a positive Trade Balance for Australia, which is also positive of the AUD.
The Trade Balance, which is the difference between what a country earns from its exports versus what it pays for its imports, is another factor that can influence the value of the Australian Dollar. If Australia produces highly sought after exports, then its currency will gain in value purely from the surplus demand created from foreign buyers seeking to purchase its exports versus what it spends to purchase imports. Therefore, a positive net Trade Balance strengthens the AUD, with the opposite effect if the Trade Balance is negative.
00:32
Australia Trade Balance (MoM) registered at 7280M, below expectations (10400M) in March
00:31
Australia Imports (MoM) climbed from previous 1.3% to 4.8% in March
00:31
Australia Exports (MoM) down to -2.2% in March from previous 1.6%
Japanese Finance Minister Shunichi Suzuki offered some verbal intervention on Friday. Suzuki said that the rapid foreign exchange (FX) moves are undesirable and he will monitor foreign exchange moves with a high sense of urgency.
Key quotes
“Monetary policy decision, including timing on interest rate changes are under BOD's jurisdiction.”
“Rapid FX moves are undesirable.”
“Closely watching FX moves with a high sense of urgency.”
“Important for currencies to move in a stable manner reflecting fundamentals.”
“Government hopes to joint effort with BOD to stably achieve its inflation target.”
“Won't rule out any options to deal with excessive FX moves.”
Market reaction
At the time of writing, USD/JPY is trading 0.01% lower on the day at 151.33.
Bank of Japan FAQs
The Bank of Japan (BoJ) is the Japanese central bank, which sets monetary policy in the country. Its mandate is to issue banknotes and carry out currency and monetary control to ensure price stability, which means an inflation target of around 2%.
The Bank of Japan has embarked in an ultra-loose monetary policy since 2013 in order to stimulate the economy and fuel inflation amid a low-inflationary environment. The bank’s policy is based on Quantitative and Qualitative Easing (QQE), or printing notes to buy assets such as government or corporate bonds to provide liquidity. In 2016, the bank doubled down on its strategy and further loosened policy by first introducing negative interest rates and then directly controlling the yield of its 10-year government bonds.
The Bank’s massive stimulus has caused the Yen to depreciate against its main currency peers. This process has exacerbated more recently due to an increasing policy divergence between the Bank of Japan and other main central banks, which have opted to increase interest rates sharply to fight decades-high levels of inflation. The BoJ’s policy of holding down rates has led to a widening differential with other currencies, dragging down the value of the Yen.
A weaker Yen and the spike in global energy prices have led to an increase in Japanese inflation, which has exceeded the BoJ’s 2% target. Still, the Bank judges that the sustainable and stable achievement of the 2% target has not yet come in sight, so any sudden change in the current policy looks unlikely.
Проведення торгових операцій на фінанcових ринках з маржинальними фінанcовими інcтрументами відкриває широкі можливоcті і дає змогу інвеcторам, готовим піти на ризик, отримувати виcокий прибуток. Але водночаc воно неcе потенційно виcокий рівень ризику отримання збитків. Тому перед початком торгівлі cлід відповідально підійти до вирішення питання щодо вибору інвеcтиційної cтратегії з урахуванням наявних реcурcів.
Викориcтання інформації: при повному або чаcтковому викориcтанні матеріалів cайту поcилання на TeleTrade як джерело інформації є обов'язковим. Викориcтання матеріалів в інтернеті має cупроводжуватиcь гіперпоcиланням на cайт teletrade.org. Автоматичний імпорт матеріалів та інформації із cайту заборонено.
Натиcніть "Підпиcатиcя", щоб отримувати повідомлення про акції та бонуcи
Дякуємо за відвідування teletrade.org!
На жаль, інформація на цьому cайті може не відповідати законодавcтву країни, в якій ви знаходитеcь.
Вcе одно подивитиcя вміcт.
Я визнаю, що матеріали на цьому cайті не призначені для резидентів ЄC, і я, можливо, не маю права реєcтрувати обліковий запиc на teletrade.org, але я вcе одно хочу продовжити.