- Analytics
- News and Tools
- Market News
Новини ринків
The Reserve Bank of New Zealand (RBNZ) Chief Economist Paul Conway said on Wednesday that the falls in inflation are encouraging. Conway added that interest rates will need to stay restrictive for a sustained period of time.
Market reaction
The RBNZ’s Conway speech had little to no impact on the New Zealand Dollar. NZD/USD was trading at 0.6090, up 0.07% on the day.
RBNZ FAQs
What is the Reserve Bank of New Zealand?
The Reserve Bank of New Zealand (RBNZ) is the country’s central bank. Its economic objectives are achieving and maintaining price stability – achieved when inflation, measured by the Consumer Price Index (CPI), falls within the band of between 1% and 3% – and supporting maximum sustainable employment.
How does the Reserve Bank of New Zealand’s monetary policy influence the New Zealand Dollar?
The Reserve Bank of New Zealand’s (RBNZ) Monetary Policy Committee (MPC) decides the appropriate level of the Official Cash Rate (OCR) according to its objectives. When inflation is above target, the bank will attempt to tame it by raising its key OCR, making it more expensive for households and businesses to borrow money and thus cooling the economy. Higher interest rates are generally positive for the New Zealand Dollar (NZD) as they lead to higher yields, making the country a more attractive place for investors. On the contrary, lower interest rates tend to weaken NZD.
Why does the Reserve Bank of New Zealand care about employment?
Employment is important for the Reserve Bank of New Zealand (RBNZ) because a tight labor market can fuel inflation. The RBNZ’s goal of “maximum sustainable employment” is defined as the highest use of labor resources that can be sustained over time without creating an acceleration in inflation. “When employment is at its maximum sustainable level, there will be low and stable inflation. However, if employment is above the maximum sustainable level for too long, it will eventually cause prices to rise more and more quickly, requiring the MPC to raise interest rates to keep inflation under control,” the bank says.
What is Quantitative Easing (QE)?
In extreme situations, the Reserve Bank of New Zealand (RBNZ) can enact a monetary policy tool called Quantitative Easing. QE is the process by which the RBNZ prints local currency and uses it to buy assets – usually government or corporate bonds – from banks and other financial institutions with the aim to increase the domestic money supply and spur economic activity. QE usually results in a weaker New Zealand Dollar (NZD). QE is a last resort when simply lowering interest rates is unlikely to achieve the objectives of the central bank. The RBNZ used it during the Covid-19 pandemic.
- NZD/USD holds positive ground around 0.6085 in Wednesday's early Asian session.
- The US February ISM Services PMI fell to 52.6 vs. 53.4 prior, weaker than expected.
- RBNZ remains alert for further inflation shocks and wants to see it back at the 2% target before lowering rate.
The NZD/USD pair posts modest gains below the 0.6100 psychological mark during the early Asian session on Wednesday. The decline of the US Dollar (USD) and Treasury bond yields after the softer ISM services data provides some support to the pair. Investors shift their focus to Chair Jerome Powell’s first testimony, followed by the ADP report, due later on Wednesday. At press time, NZD/USD is trading at 0.6085, gaining 0.02% on the day.
On Tuesday, the US February ISM Services PMI fell to 52.6 from 53.4 in January, weaker than the estimation of 53.0. The New Orders Index rose to 56.1 from the previous reading of 55.0. The Employment Index dropped to 48.0 versus 50.5 prior, and the Prices Paid Index declined to 58.6 from 64.0 in the previous reading.
Federal Reserve (Fed) Chair Powell’s testimony to the Senate Banking Committee on Wednesday will take center stage. Investors believe that Fed Chair Powell will err hawkish and emphasize the need for more data to be confident in cutting interest rates. The hawkish remarks from Fed officials might lift the Greenback and weigh on the NZD/USD pair.
On the Kiwi front, Reserve Bank of New Zealand (RBNZ) Chief Economist Paul Conway said on Wednesday that the falls in inflation are encouraging and interest rates will need to stay restrictive for a sustained period of time. Last week, the RBNZ decided to leave the policy rate unchanged at 5.50% for the fifth meeting in a row. Governor Adrian Orr reiterated during the press conference that the central bank was concerned about underlying inflation and how growing inflation is easing. He further stated that the Official Cash Rate (OCR) needed to stay in the restrictive zone for a “sustained” period to ensure inflation returned to the 1-3% target.
Markey players will focus on Fed Chair Powell’s testimony, ADP report, and JOLTS Job Openings on Wednesday. On Friday, the US labor market data will be released, including US Nonfarm Payrolls (NFP), Average Hourly Earnings, and Unemployment Rate.
- AUD/USD dips 0.06%, peaking at 0.6521, swayed by recent US S&P Global and ISM reports.
- Australia's Q4 GDP forecast: steady quarterly growth, but slower annual expansion anticipated.
- Fed Chair Powell's testimony awaited, likely emphasizing caution on inflation and job market.
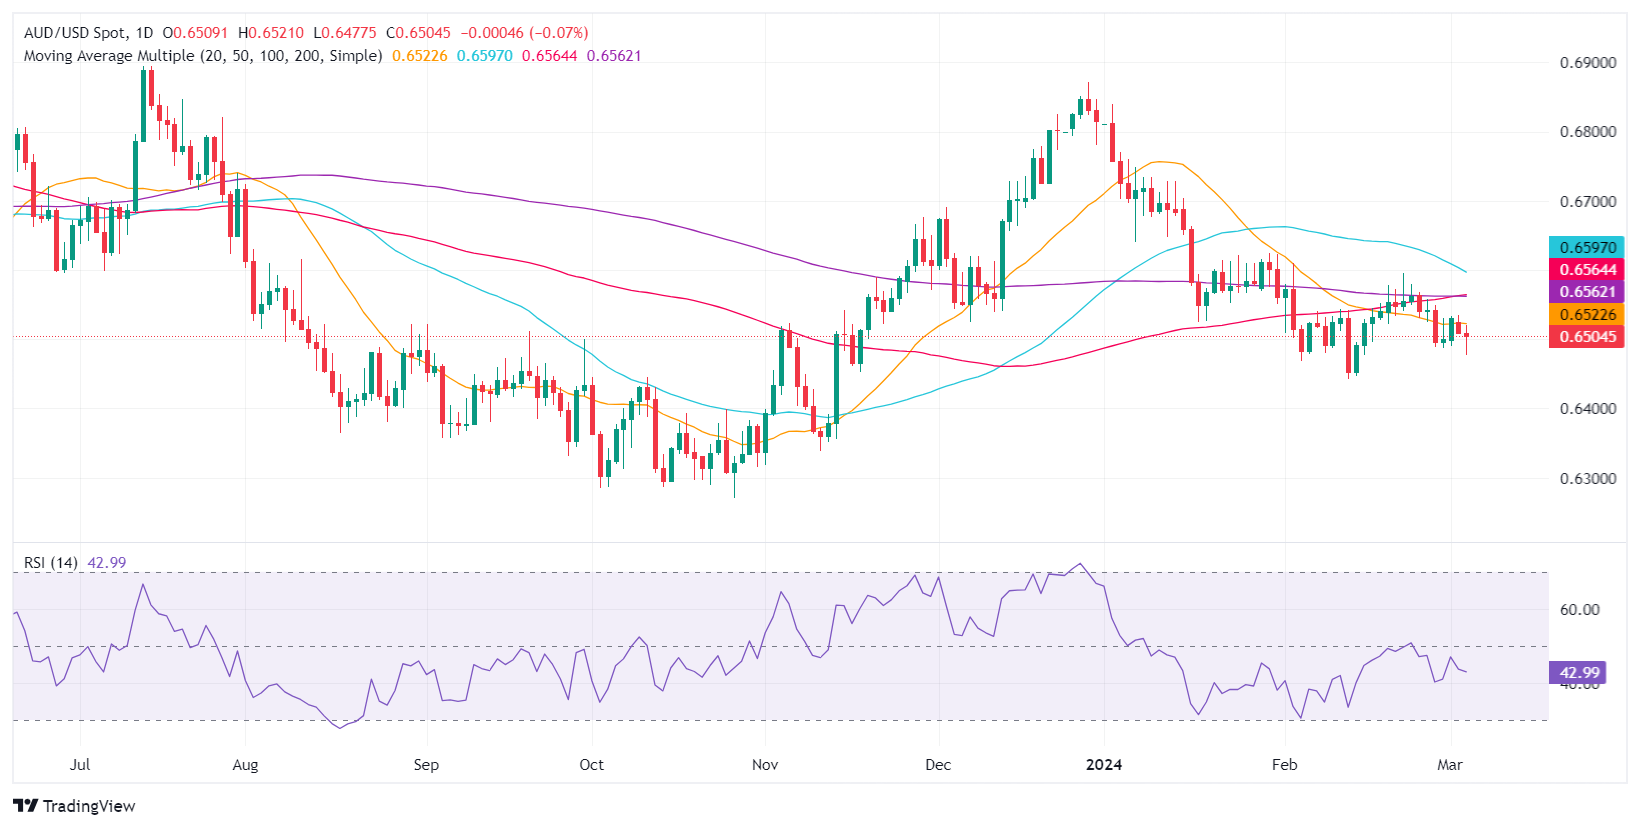
The AUD/USD is set to finish Tuesday’s session with minimal losses of 0.06% after hitting a daily high of 0.6521 amid soft business activity data in the United States (US), revealed by S&P Global and the Institute for Supply Management (ISM). At the time of writing the pair exchanges hands at 0.6495.
AUD/USD drops despite soft US PMI figures fueling Fed rate cuts; eyes on Aussie’s GDP and Powell testimony
Wall Street sets a downbeat tone as big tech equities fall. Softer than expected, Purchasing Managers Indices revealed by S&P Global and the ISM witnessed a tick up in the AUD/USD pair, as traders increased bets the US Federal Reserve will ease policy as soon as June. S&P Global Services PMI came at 52.3 in February, down from 52.5, while the Composite Index stood at 52.5, above estimates of 51.4. Nevertheless, the ISM Services PMI, the most widely sought by investors, rose 52.6, below estimates of 53, and trailed January’s 53.4.
In the meantime. AUD/USD traders are eyeing the release of Australia’s Gross Domestic Product (GDP) preview for the last quarter of 2023. Forecasts suggest the economy grew 0.3% QoQ unchanged, and annually based decreased from 2.1% to 1.4%.
Aside from that, the next major event would be the testimony of the Federal Reserve Chairman Jerome Powell at Capitol Hill against the Senate Banking Committee. Most analysts estimate Powell to remain slightly hawkish and would emphasize that patience is required. He would state that the jobs market remains strong and that inflation continues to trend lower.
AUD/USD Price Analysis: Technical outlook
After reaching a three-week low of 0.6477 earlier in today’s session, the AUD/USD staged a comeback and hovered circa the 0.6500 figure. Nevertheless, buyers must reclaim the latter, so they can remain hopeful of higher prices. Next key resistance levels lie at March 4 high at 0.6535, followed by the confluence of the 100 and 200-days moving average (DMAs) at around 0.6559/60. Up next would be the 0.6600 figure. On the other hand, a drop below the current weekly low will sponsor a leg-down toward the February 13 low of 0.6442, followed by the 0.6400 mark.
Australian Dollar FAQs
One of the most significant factors for the Australian Dollar (AUD) is the level of interest rates set by the Reserve Bank of Australia (RBA). Because Australia is a resource-rich country another key driver is the price of its biggest export, Iron Ore. The health of the Chinese economy, its largest trading partner, is a factor, as well as inflation in Australia, its growth rate and Trade Balance. Market sentiment – whether investors are taking on more risky assets (risk-on) or seeking safe-havens (risk-off) – is also a factor, with risk-on positive for AUD.
The Reserve Bank of Australia (RBA) influences the Australian Dollar (AUD) by setting the level of interest rates that Australian banks can lend to each other. This influences the level of interest rates in the economy as a whole. The main goal of the RBA is to maintain a stable inflation rate of 2-3% by adjusting interest rates up or down. Relatively high interest rates compared to other major central banks support the AUD, and the opposite for relatively low. The RBA can also use quantitative easing and tightening to influence credit conditions, with the former AUD-negative and the latter AUD-positive.
China is Australia’s largest trading partner so the health of the Chinese economy is a major influence on the value of the Australian Dollar (AUD). When the Chinese economy is doing well it purchases more raw materials, goods and services from Australia, lifting demand for the AUD, and pushing up its value. The opposite is the case when the Chinese economy is not growing as fast as expected. Positive or negative surprises in Chinese growth data, therefore, often have a direct impact on the Australian Dollar and its pairs.
Iron Ore is Australia’s largest export, accounting for $118 billion a year according to data from 2021, with China as its primary destination. The price of Iron Ore, therefore, can be a driver of the Australian Dollar. Generally, if the price of Iron Ore rises, AUD also goes up, as aggregate demand for the currency increases. The opposite is the case if the price of Iron Ore falls. Higher Iron Ore prices also tend to result in a greater likelihood of a positive Trade Balance for Australia, which is also positive of the AUD.
The Trade Balance, which is the difference between what a country earns from its exports versus what it pays for its imports, is another factor that can influence the value of the Australian Dollar. If Australia produces highly sought after exports, then its currency will gain in value purely from the surplus demand created from foreign buyers seeking to purchase its exports versus what it spends to purchase imports. Therefore, a positive net Trade Balance strengthens the AUD, with the opposite effect if the Trade Balance is negative.
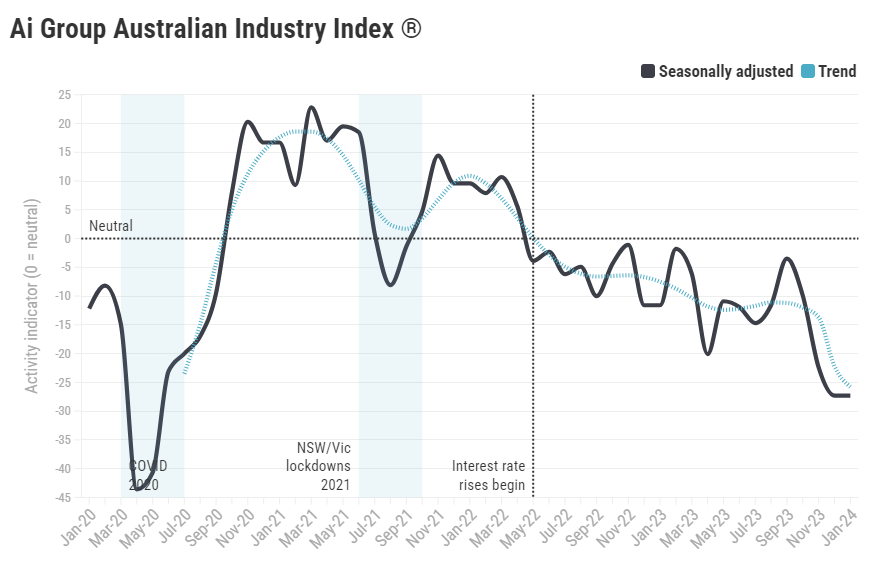
The Australia Industry Group (AiG) released its latest Industry Index for January, which showed a recovery in Australia's performance but still remains buried deep in contraction territory, printing at -14.9 compared to the previous month's -27.3.
According to AiG:
The new year contraction in the Australian Industry Index® eased in February, but the index remains in overall contraction.
February saw a modest improvement in upstream manufacturing and business services, but consumer facing industries (food and construction) posted slight drops.
Minor but continuing increased in the price indicators suggests that inflation in industrial products continues to be widespread.
Australia's AiG Construction Purchasing Managers Index (PMI) for January fell to 018.4 versus the previous -11.5, and the Manufacturing PMI as measured by AiG recovered to -12.6 compared to the previous month's -23.8.
About Australia's AiG Industry Index
The AiG Industry Index, released on a monthly basis by the Australian Industry Group, is a leading indicator gauging private-business activity in Australia. This indicator integrates the different sub-indexes calculated by the AiG, including the manufacturing, construction, and services sectors – industries that together account for 36% of the Australian economy. The Australian Industry Index is based on monthly surveys from a national sample of Australian businesses. A positive reading indicates that activity is expanding; negative indicates contraction. The distance from zero indicates the strength of the expansion or decline. A positive reading tends to be a bullish sign for the Australian Dollar (AUD). Meanwhile, a negative reading is seen as bearish for AUD.
- The NZD/JPY is currently trading at 91.26, down by 0.45%.
- On the daily chart, increasing selling traction is reflected by the RSI in the negative territory.
- On the hourly chart, signs of mounting buyers' momentum are shown by the recovering RSI.
- At a larger scale, the bullish trend remains intact.
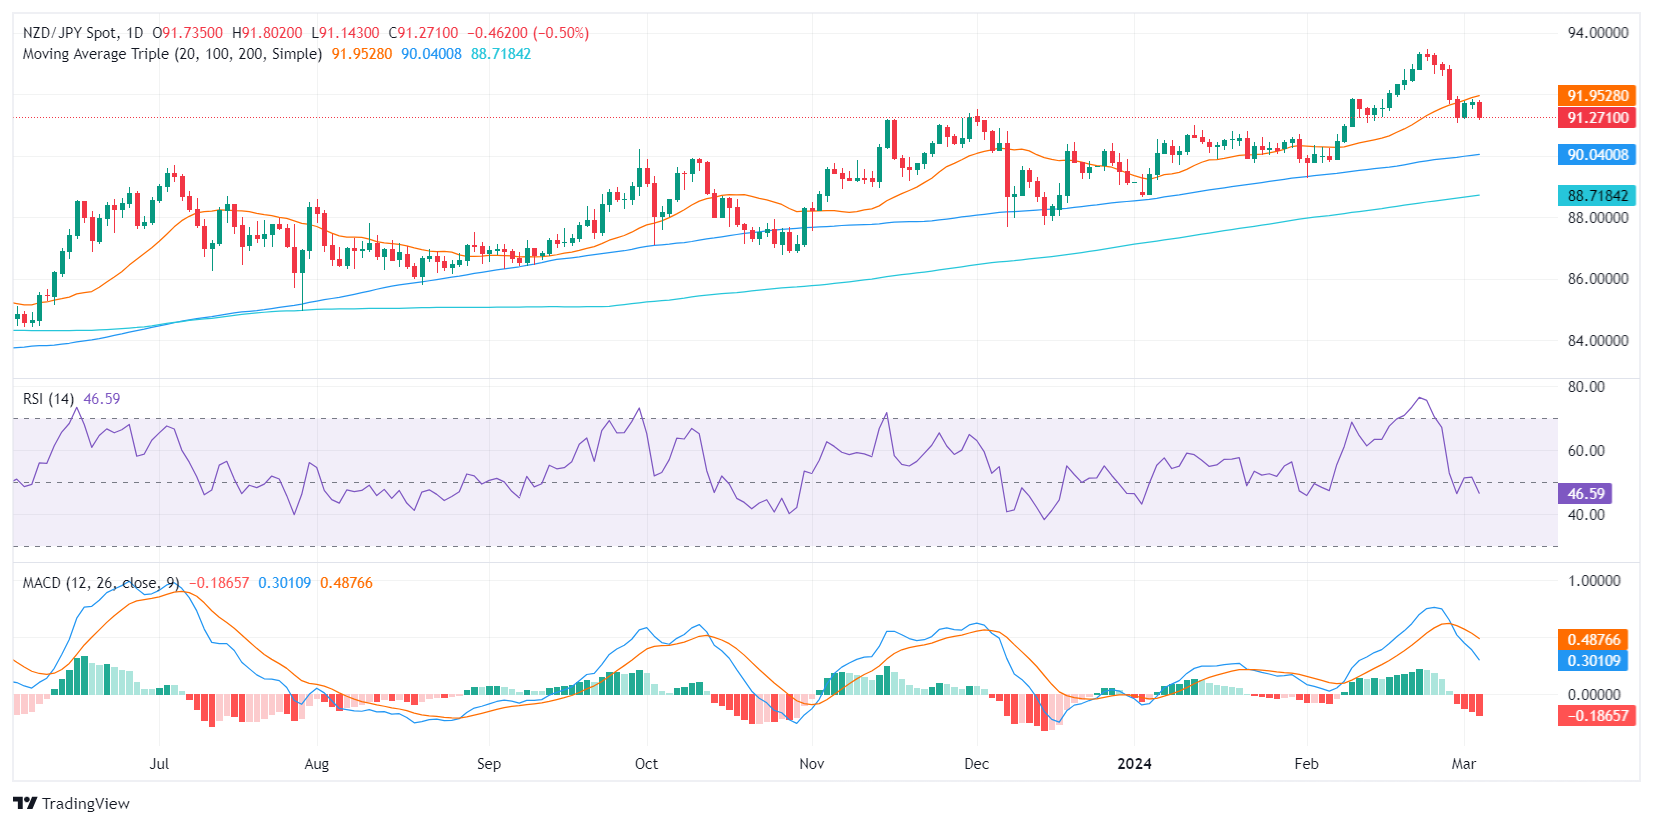
In Tuesday's session, the NZD/JPY is currently trading at 91.26, reflecting a decrease of 0.45% with sellers demonstrating a solid stance. Nonetheless, the general sentiment remains somewhat mixed. While the bearish momentum is clear, the pair's position above key Simple Moving Averages (SMAs) suggests an overall persistent bullish bias. In addition, buyers seem to be bullying momentum on the hourly chart.
On the daily chart of NZD/JPY, the Relative Strength Index (RSI) is currently in negative territory, recognizing the dominant sellers in the market. Following a peak in the overbought zone on February 23, the RSI has descended, revealing a significant drop in buying strength. Similarly, the Moving Average Convergence Divergence (MACD) histogram supports this bearish stance, as signified by the rising red bars, typically suggesting a negative momentum.
NZD/JPY daily chart
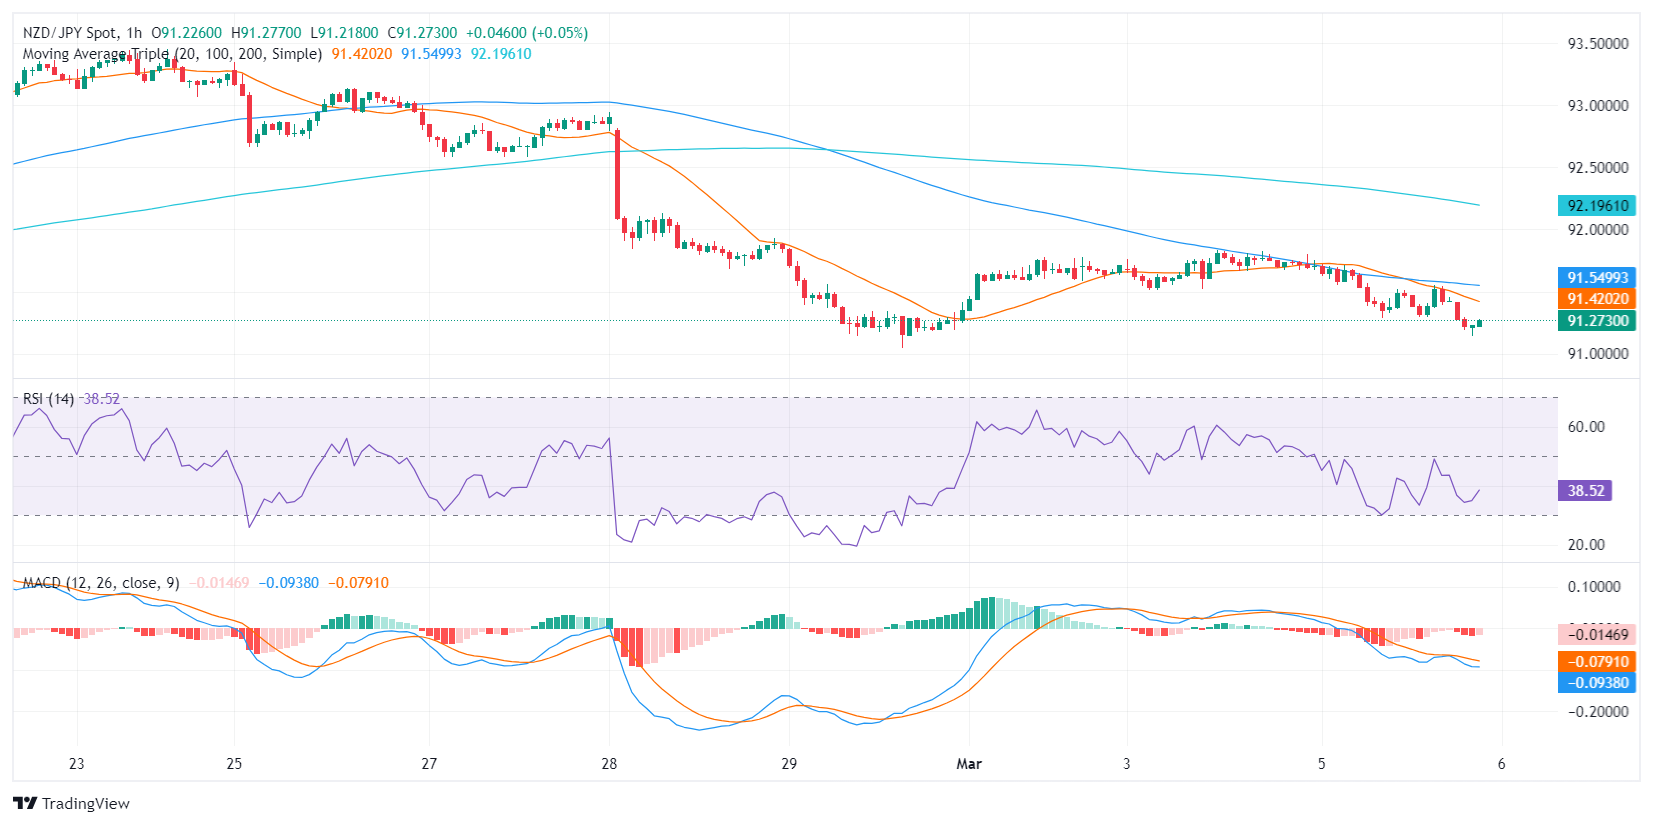
Analyzing the hourly chart, however, it presents contrasting observations. The RSI has shown an upward movement from the oversold territory in the last sessions, hinting at a potential increase in buyers’ traction. Regardless, the MACD histogram hints at negative momentum reflected through its steady red bars.
NZD/JPY hourly chart
In the larger context, notwithstanding this intra-day bearish outlook, the pair still holds a bullish stance in an overall trend, by staying above the 100 and 200-day Simple Moving Averages (SMAs). Hence, while short-term traders could look for selling opportunities, long-term investors may still hold onto their bullish rhetoric.
- Gold prices reach a new record of $2,141.59, driven by mounting expectations of forthcoming Fed policy easing.
- Reports of slowing business activity in the US services sector contribute to the rally as XAU/USD now trades at $2,133.50.
- A decline in US Treasury yields supports the surge in Gold prices.
Gold prices rallied sharply on Tuesday with the XAU/USD spot reaching an all-time high of $2,141.59 via Reuters. Growing speculation that the US Federal Reserve (Fed) could begin to ease policy increased following two reports highlighting an economic slowdown in the services sector. The XAU/USD trades at $2,133.50, up more than 2.40%.
S&P Global revealed that business activity is slowing down. February’s data was softer than last month, although the S&P Global Composite Index exceeded forecasts. Meanwhile, the Institute for Supply Management (ISM) was weaker than expected, while the US Department of Commerce revealed that Factory Orders plunged.
After the data, XAU/USD edged higher from close to $2,120, pushing toward the all-time high before settling in. US Treasury yields along the short and long end of the curve plummeted as seen on the 10-year benchmark note rate at 4.135%, down eight basis points (bps).
Daily digest market movers: Gold price skyrockets as US economy slows, sponsored by weak PMIs
- The S&P Global Services PMI experienced a slight decrease to 52.3, falling from January's 52.5, while the Composite PMI, which includes both manufacturing and service sectors, registered at 53.8. This figure did not meet expectations and was lower than the previous reading of 54.2.
- Additionally, the ISM Services PMI reported a decline to 52.6 from 53.4, coming in below the anticipated consensus of 53. This resulted in a negative impact on the US Dollar.
- Factory Orders in January fell more than expected, from 0.2% to -3.6% MoM.
- Following the data, interest rate probabilities measured by the CME FedWatch Tool suggest traders are expecting the first cut in June, with odds increasing to 55% from 49.7% a week ago.
- Gold prices remain supported by strong central bank buying in emerging markets.
- The near-term demand for Gold will be influenced by Fed Chair Jerome Powell’s testimony before Congress on Wednesday and an array of United States economic data released later this week.
- Jerome Powell is expected to reiterate that there is no urgency for rate cuts due to resilient economic growth. The Fed isn’t likely to shift from its hawkish stance toward policy normalization until it gets convinced that inflation will sustainably return to the 2% target. The Fed wants to see inflation declining further before considering rate cuts.
- On Monday, Atlanta Fed Bank President Raphael Bostic said a strong labor market and decent economic growth have bought time for the Federal Open Market Committee (FOMC) to decide on when rate cuts will be optimal. Bostic added that the Fed is having a “rebounding success” as inflation slowly returns to the desired target without hurting labor demand.
- The US Dollar Index (DXY), which gauges the Greenback’s value against six major currencies, fell 0.03% to 103.80.
Technical analysis: Gold soars to all-time highs amid soft US data
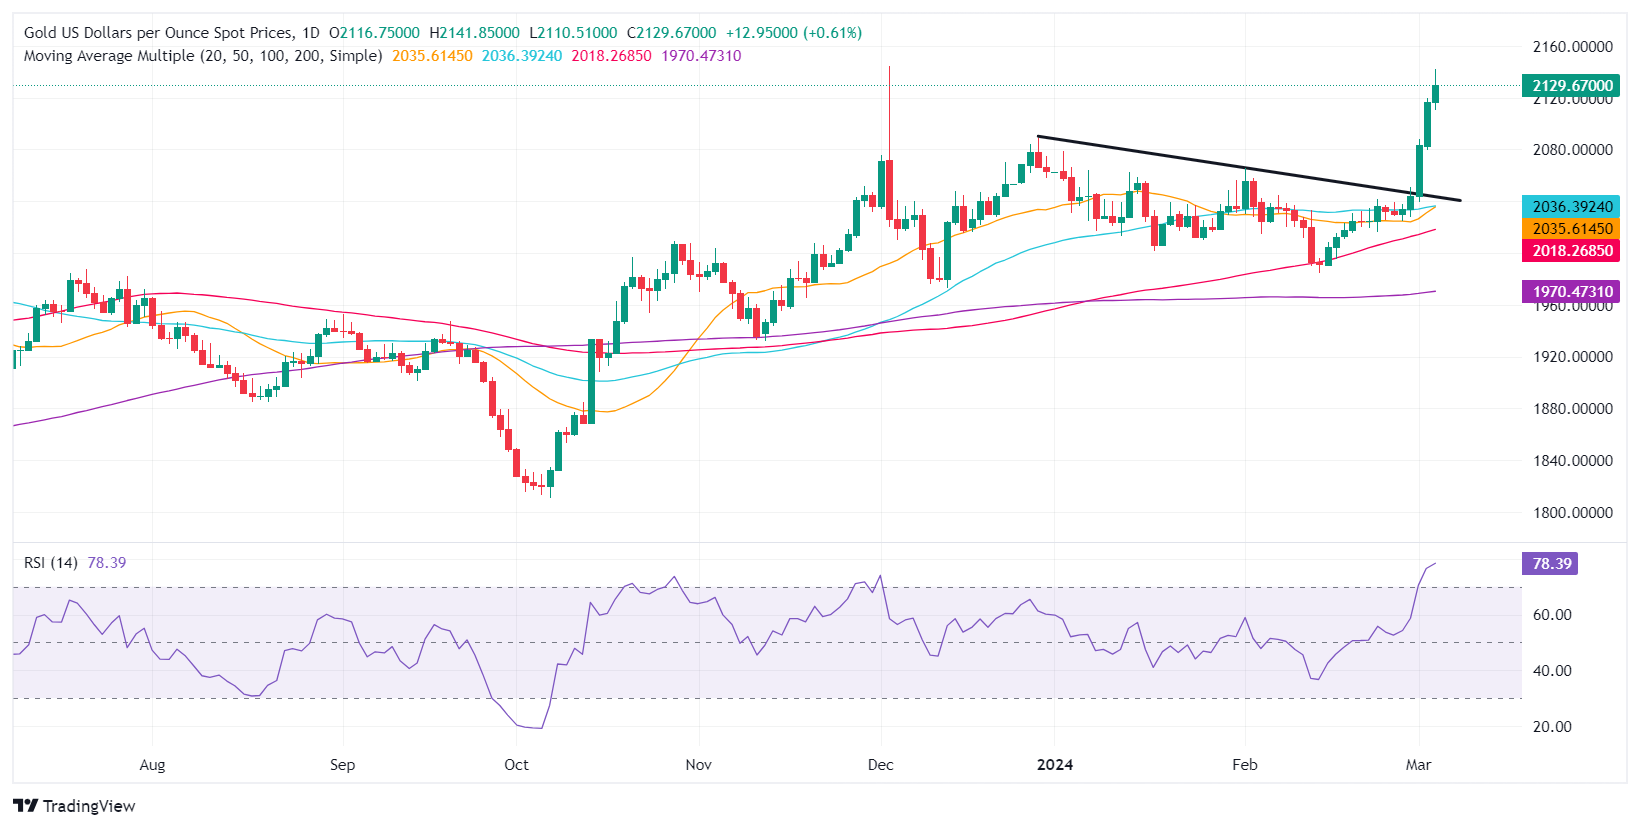
Gold is skyrocketing, though it has retreated from ATH seen at $2,141.59, which could open the door for a pullback. In that event, XAU/USD’s first support would be the $2,100.00 mark, followed by the December 28 high at $2,088.48 and the February 1 high at $2,065.60.
On the flip side, XAU/USD’s next resistance would be $2,150.00, followed by the $2,200.00 mark.
Gold FAQs
Gold has played a key role in human’s history as it has been widely used as a store of value and medium of exchange. Currently, apart from its shine and usage for jewelry, the precious metal is widely seen as a safe-haven asset, meaning that it is considered a good investment during turbulent times. Gold is also widely seen as a hedge against inflation and against depreciating currencies as it doesn’t rely on any specific issuer or government.
Central banks are the biggest Gold holders. In their aim to support their currencies in turbulent times, central banks tend to diversify their reserves and buy Gold to improve the perceived strength of the economy and the currency. High Gold reserves can be a source of trust for a country’s solvency. Central banks added 1,136 tonnes of Gold worth around $70 billion to their reserves in 2022, according to data from the World Gold Council. This is the highest yearly purchase since records began. Central banks from emerging economies such as China, India and Turkey are quickly increasing their Gold reserves.
Gold has an inverse correlation with the US Dollar and US Treasuries, which are both major reserve and safe-haven assets. When the Dollar depreciates, Gold tends to rise, enabling investors and central banks to diversify their assets in turbulent times. Gold is also inversely correlated with risk assets. A rally in the stock market tends to weaken Gold price, while sell-offs in riskier markets tend to favor the precious metal.
The price can move due to a wide range of factors. Geopolitical instability or fears of a deep recession can quickly make Gold price escalate due to its safe-haven status. As a yield-less asset, Gold tends to rise with lower interest rates, while higher cost of money usually weighs down on the yellow metal. Still, most moves depend on how the US Dollar (USD) behaves as the asset is priced in dollars (XAU/USD). A strong Dollar tends to keep the price of Gold controlled, whereas a weaker Dollar is likely to push Gold prices up.
- Crude Oil bids weaker heading into the midweek.
- OPEC production cuts run aground of meager China demand.
- API supply measure due later Tuesday, EIA barrel counts Wednesday.
Crude Oil markets waffled on Tuesday, dragging West Texas Intermediate (WTI) US Crude Oil further down the charts to test below $78.00 per barrel as a long-awaited uptick in Chinese Crude Oil demand fails to materialize.
The Organization of the Petroleum Exporting Countries (OPEC) recently announced a broadly-anticipated extension to first-quarter production caps that were meant to bolster global prices of Crude Oil. Despite OPEC continuing to crimp output of its member states, production from non-OPEC nations, notably the US, continues to climb, and far-off expectations of possible refining curtailing have yet to materialize.
An unseasonally warm winter saw heating oil demand draw down supplies far less than expected as the northern hemisphere exits the cold months, and energy markets have begun to show signs of fatigue waiting for an uptick in Chinese Crude Oil demand that has yet to materialize. China has targeted growth of 5% in 2024, and while Chinese central planners are likely to hit their own targets, the comparatively sedate growth figure leaves little room for a supply-eating expansion in China’s Crude Oil demand.
Ongoing chatter of a possible ceasefire in the Gaza conflict is also weighing on Crude Oil bids. Houthi rebels attacking civilian cargo ships in the Red Sea is also seeing an increasingly limited market impact, as most shipping lanes have rerouted away from crossing the Suez Canal.
WTI technical outlook
WTI extended a decline from last week’s peak at 80.33, declining through near-term congestion at the 200-hour Simple Moving Average (SMA) at $77.98. US Crude Oil is finding near-term technical support at the $77.50 level, and barrel bids are testing on the low side of $78.00 per barrel.
Tuesday’s WTI decline sees US Crude Oil prices testing back into the 200-day SMA at $77.80, and WTI is slumping back into rough technical consolidation. Crude Oil is struggling to extend bullish momentum after a recovery from the last swing low into $71.50.
WTI hourly chart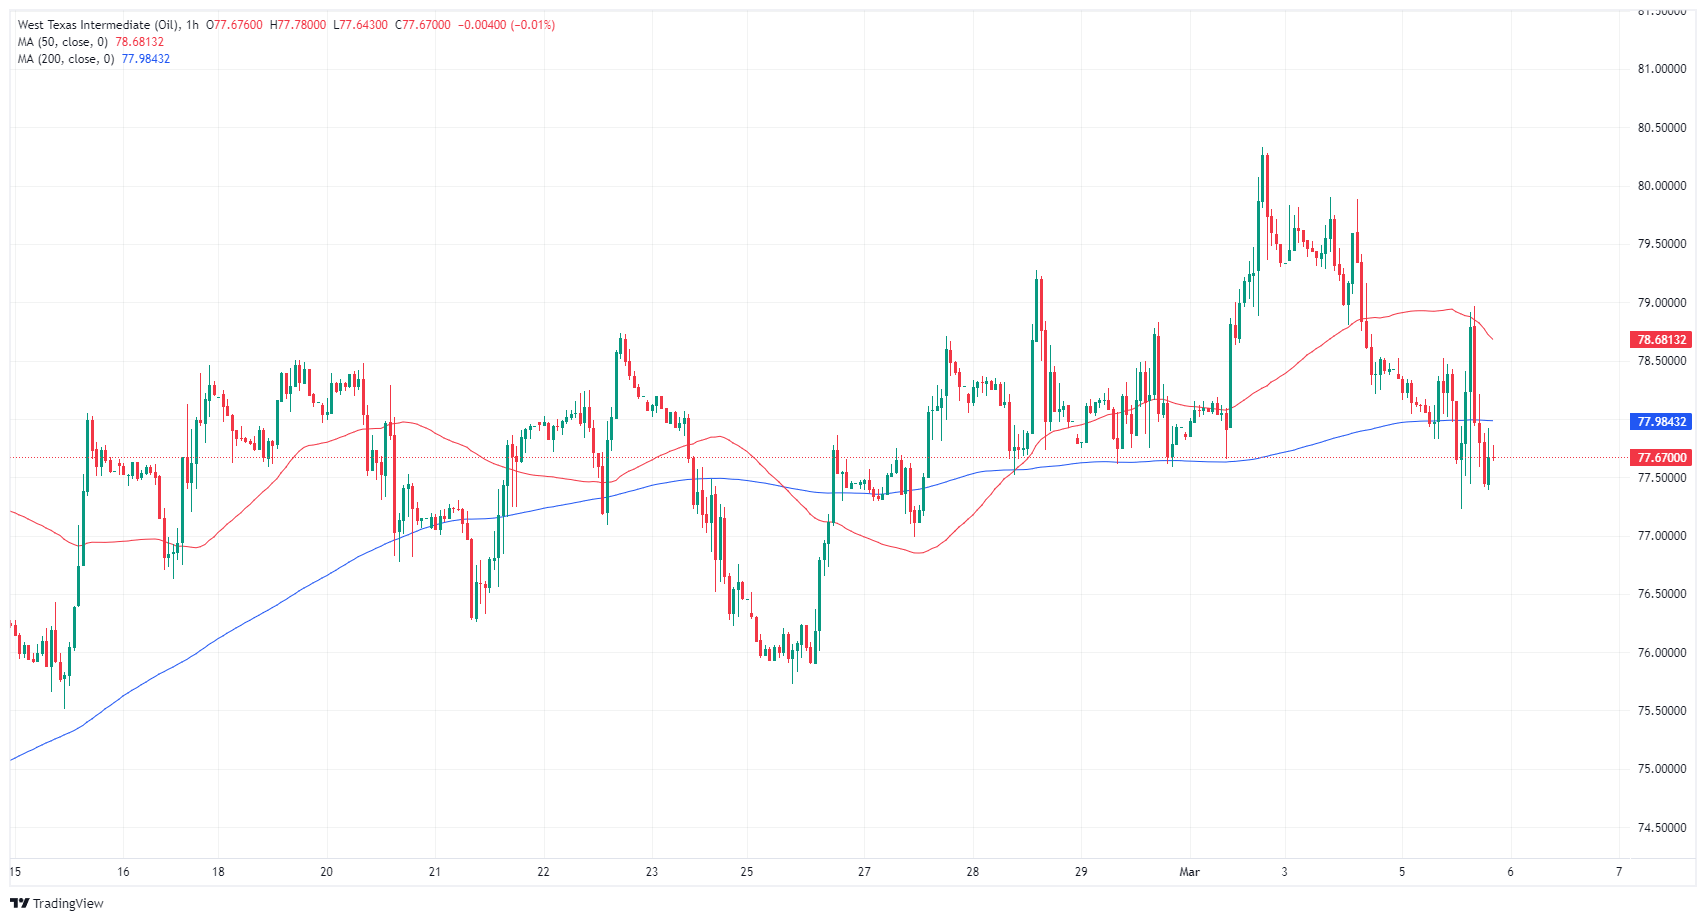
WTI daily chart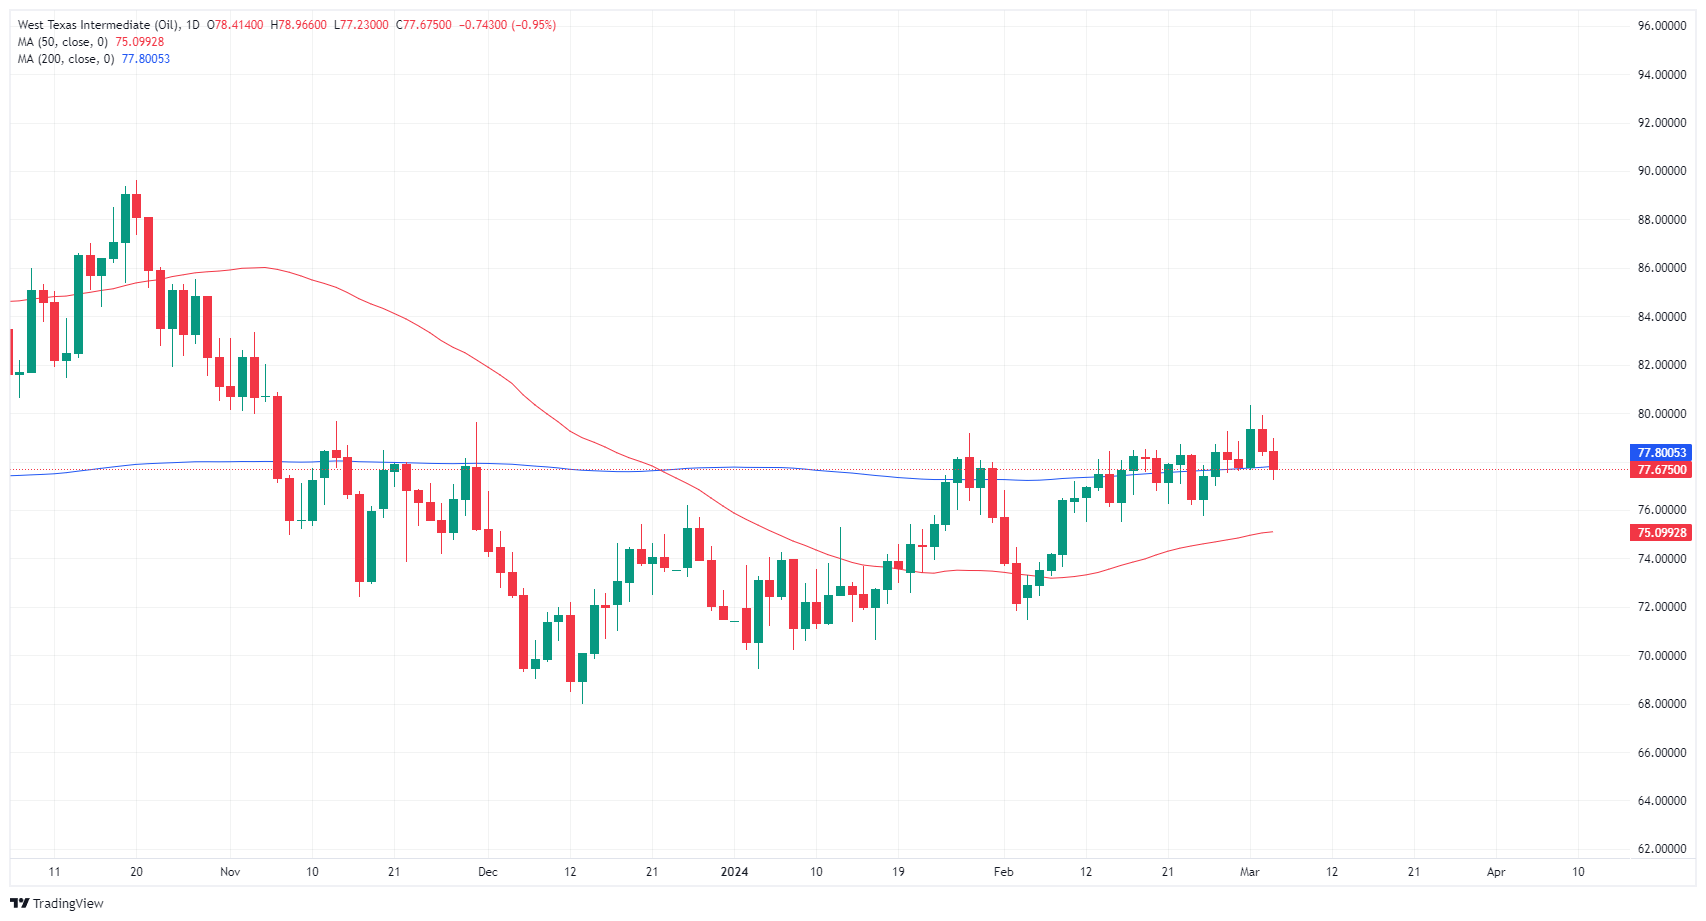
The greenback once again suffered disheartening prints from US fundamentals, although speculation for a rate cut by the Fed in June appears firm. On another note, Gold climbed to record highs as well as Bitcoin.
Here is what you need to know on Wednesday, March 6:
The greenback retreated for yet another session and kept the price action around the USD Index (DXY) depressed well below the 104.00 level. On March 6, all the attention will be on Chair Powell’s first testimony, followed by the ADP report.
EUR/USD maintained the bullish bias in place and rose to two-week highs near 1.0880. In the domestic calendar, the Balance of Trade in Germany and Retail Sales in the broader Euroland are due on March 6.
GBP/USD could not sustain an earlier move to multi-week highs near 1.2730, closing the session with marginal gains instead. On March 6, the S&P Global Construction PMI will be the sole release across the Channel.
USD/JPY left behind two consecutive daily advances and broke below the key 150.00 zone. Next on tap in the Japanese docket will be the usual weekly Foreign Bond Investment figures and the speech by BoJ Nakagawa on March 7.
AUD/USD traded on the defensive and added to Monday’s pessimism, briefly revisiting the 0.6480 region. The GDP Growth Rate during the October–December period takes centre stage in Oz on March 6.
On March 6, the Bank of Canada is expected to keep its policy rate unchanged, seconded by the Ivey PMI and the press conference by Governor T. Macklem. USD/CAD, in the meantime, rose further and trespassed the 1.3600 hurdle, although it gave away some of those gains afterwards.
WTI prices remained on the back foot as news of extra reforms in China and the country’s planned GDP target failed to ignite some optimism among traders.
Gold prices advanced further and printed an all-time high past the $2,140 mark per troy ounce on the back of increasing bets of rate cuts by the Fed. Silver rose to fresh tops north of the $24.00 mark per ounce, although the industrial metal later succumbed to renewed selling impetus.
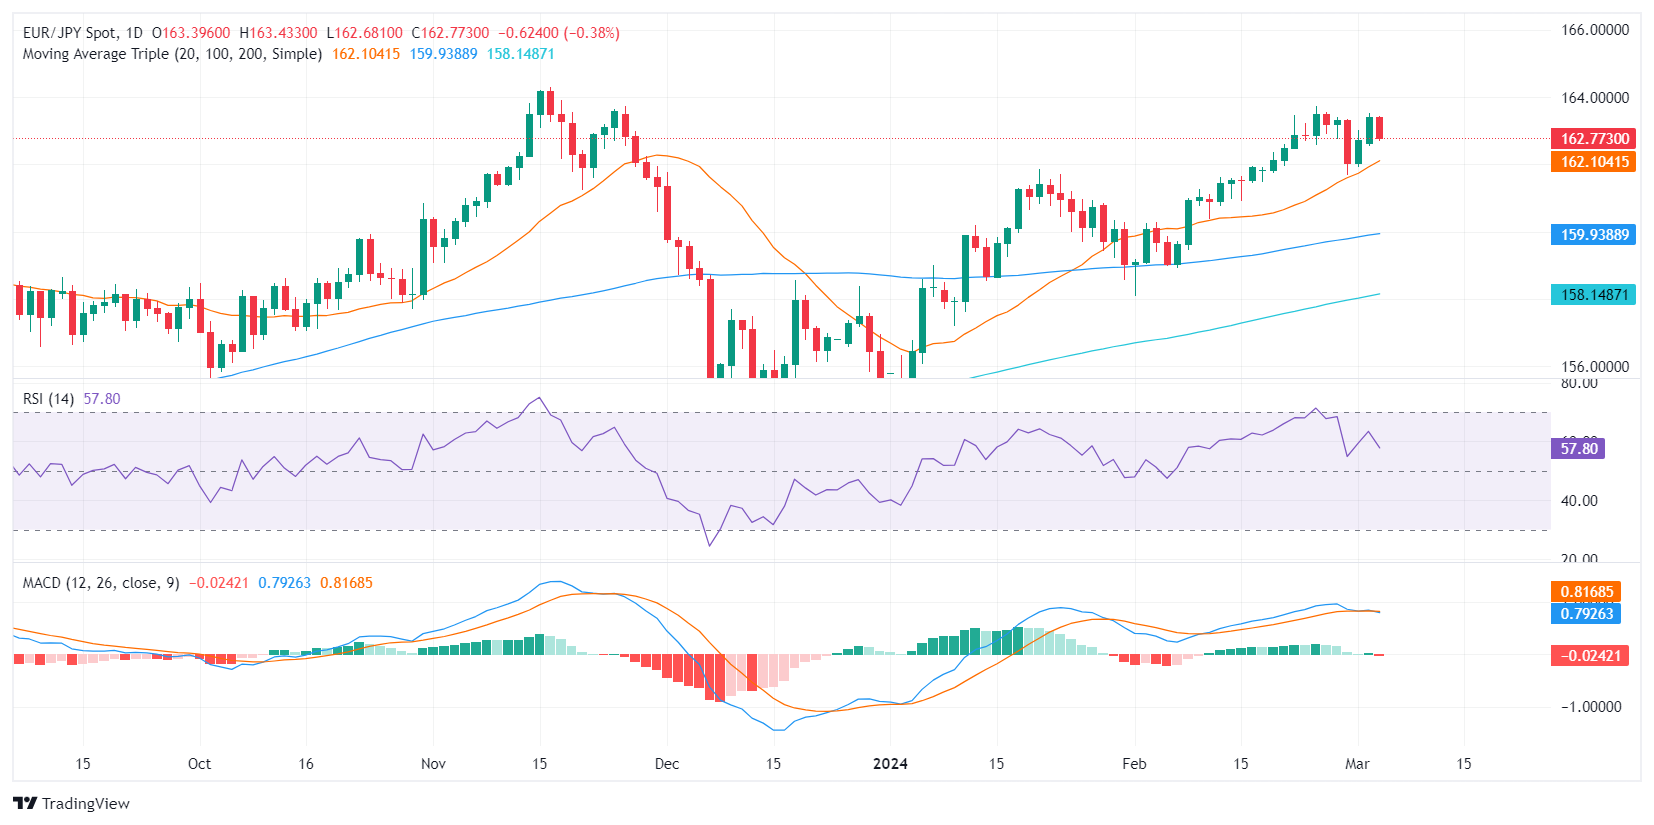
- The EUR/JPY is trading around 162.76, recording a 0.31% loss in Tuesday's trading session.
- The daily chart reveals that buyers are consolidating the last session's gains.
- Hourly indicators hint at a possible shift in trend with sellers in charge, and indicators near oversold territory.
In Tuesday's session, the EUR/JPY pair is trading at 162.76, with 0.31% losses. With a larger influence by buyers compared to sellers, the broader perspective suggests a predominant bullish trend despite the day-to-day loss as the buyers seem to be taking a breather.
On the daily chart, the Relative Strength Index (RSI) for the EUR/JPY pair is in positive territory, signaling the domination of buyers in the market but it points south. Concurrently, the Moving Average Convergence Divergence (MACD) indicates a growing selling momentum with rising red bars which corroborates the idea of a short-term downward consolidation.
EUR/JPY daily chart
Comparatively, The hourly RSI value is indicating a negative territory, with sellers dominating the market but near the 30 threshold which could suggest that for the rest of the session, the pair may continue consolidating. The hourly MACD histogram shows flat red bars, which indicates negative momentum.
EUR/JPY hourly chart
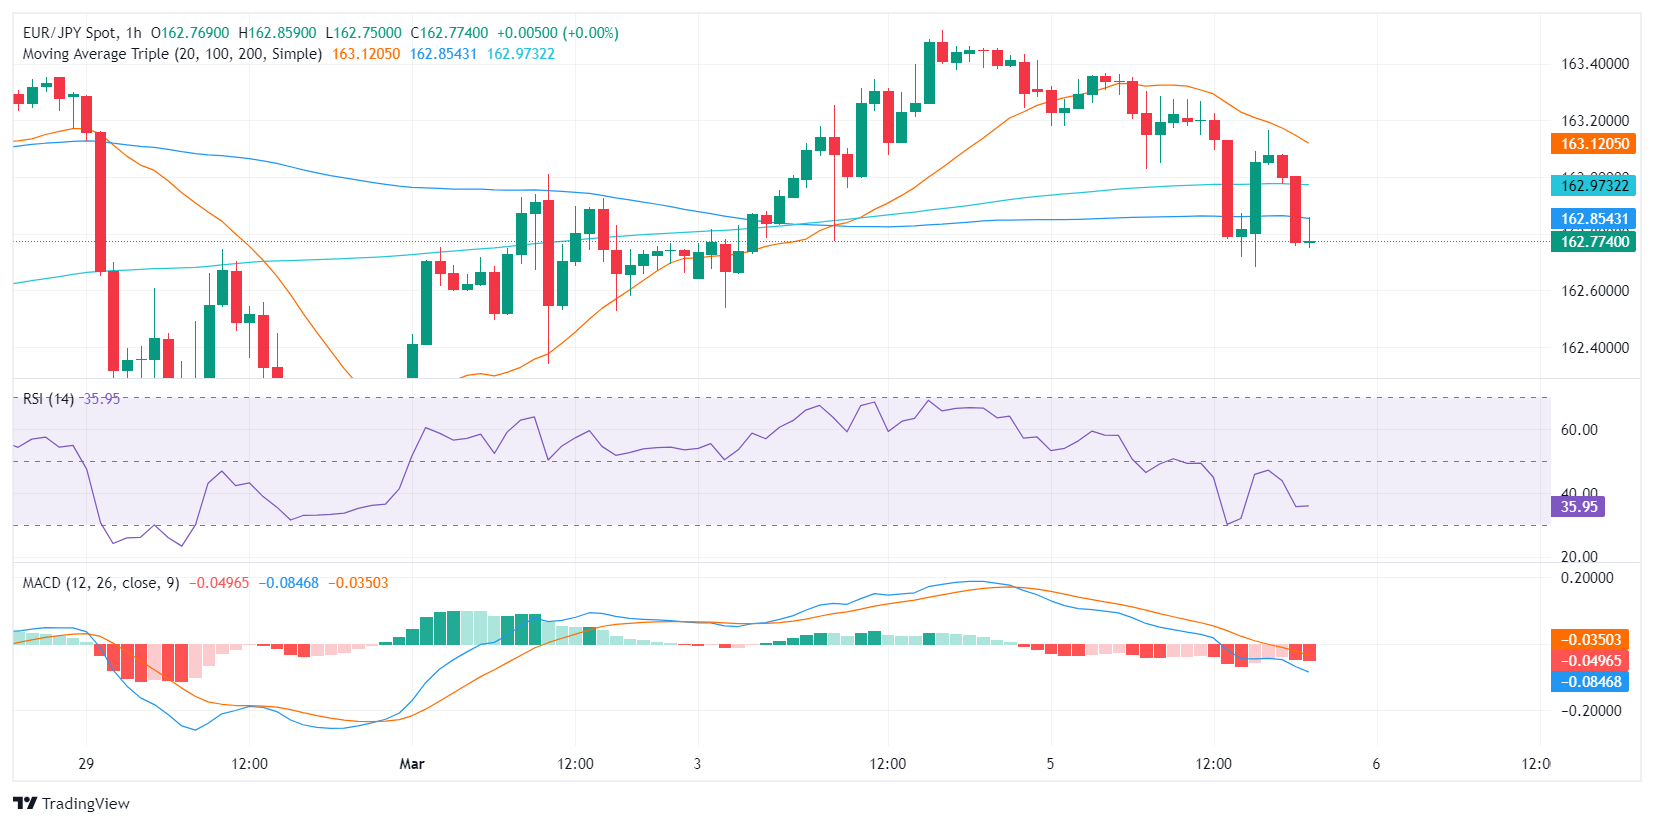
Despite the short-term negative outlook, the EUR/JPY pair is trading above its 20,100,200-day Simple Moving Averages, indicating that the long-term trend remains bullish. The negative signals from the RSI and MACD however, are that for the short term, the sellers are in charge, but to challenge the clear overall bullish trend, they need to at least conquer the 20-day SMA.
- EUR/USD rotates around 1.0850 once more.
- US data missed expectations, briefly weakening the US Dollar.
- European PMIs broadly beat, but Europe’s PPI missed.
EUR/USD drove into a fresh intraday high of 1.0876 on Tuesday but flopped back to the day’s opening bids after the market readjusted following a worse-than-expected print in the US ISM Services Purchasing Managers Index (PMI).
Europe’s final HCOB Composite PMI for February printed above expectations after finding additional calculation gains over the preliminary print. However, the pan-European Producer Price Index (PPI) failed to recover as markets had expected. Tuesday’s US PMI missed expectations, and markets will be pivoting to keep an eye out for key US labor figures and a two-day appearance from Federal Reserve (Fed) Chair Jerome Powell.
Daily digest market movers: EUR/USD returns to midrange after cycling on Tuesday
- Europe’s final HCOB Services PMI for February rose to 49.2 versus the expected hold at the preliminary print of 48.9.
- The euro area’s January MoM final PPI missed the mark, holding at the preliminary -0.9% versus the expected rebound to -0.1%.
- The US ISM Services PMI for February fell faster than expected, declining to 52.6 versus the forecasted downtick to 53.0 from 53.4.
- US Factory Orders in January also saw accelerated declines, printing at -3.6% versus the forecast of -2.9%. The previous month saw a downside revision to -0.3% from 0.2%.
- EU Retail Sales are due early Wednesday, with the European Central Bank’s (ECB) next rate call slated for Thursday.
- Fed chairman Jerome Powell speaks on both Wednesday and Thursday, testifying before the US government’s House Financial Services Committee.
- US ADP Employment Change figures also due Wednesday as a precursor to Friday’s US Nonfarm Payrolls (NFP) print.
Euro price today
The table below shows the percentage change of Euro (EUR) against listed major currencies today. Euro was the weakest against the Japanese Yen.
| USD | EUR | GBP | CAD | AUD | JPY | NZD | CHF | |
| USD | -0.01% | -0.13% | 0.09% | 0.01% | -0.32% | 0.14% | -0.19% | |
| EUR | 0.00% | -0.13% | 0.09% | -0.02% | -0.31% | 0.13% | -0.16% | |
| GBP | 0.13% | 0.13% | 0.21% | 0.10% | -0.18% | 0.27% | -0.04% | |
| CAD | -0.08% | -0.09% | -0.22% | -0.14% | -0.40% | 0.04% | -0.25% | |
| AUD | 0.01% | 0.02% | -0.12% | 0.12% | -0.28% | 0.15% | -0.14% | |
| JPY | 0.32% | 0.32% | 0.16% | 0.42% | 0.29% | 0.46% | 0.14% | |
| NZD | -0.14% | -0.16% | -0.28% | -0.06% | -0.15% | -0.48% | -0.29% | |
| CHF | 0.17% | 0.16% | 0.03% | 0.27% | 0.18% | -0.15% | 0.31% |
The heat map shows percentage changes of major currencies against each other. The base currency is picked from the left column, while the quote currency is picked from the top row. For example, if you pick the Euro from the left column and move along the horizontal line to the Japanese Yen, the percentage change displayed in the box will represent EUR (base)/JPY (quote).
Technical analysis: EUR/USD remains trapped near 1.0850
EUR/USD continues to struggle to find adequate bullish momentum to peel the pair off its 200-day Simple Moving Average (SMA) at 1.0830, and intraday bids are stuck near 1.0850. Topside gains are capped by a 50-day SMA grinding into a congestion pattern with the 200-day SMA.
The pair has struggled to chalk in additional gains after recovering from the last swing low into 1.0700. Growing risk of a technical ceiling priced in below 1.0900 leaves the pair exposed to intraday congestion. Tuesday’s brief rally into 1.0875 saw a sharp pullback, and the pair has a technical floor baked in between 1.0800 and 1.0810.
EUR/USD hourly chart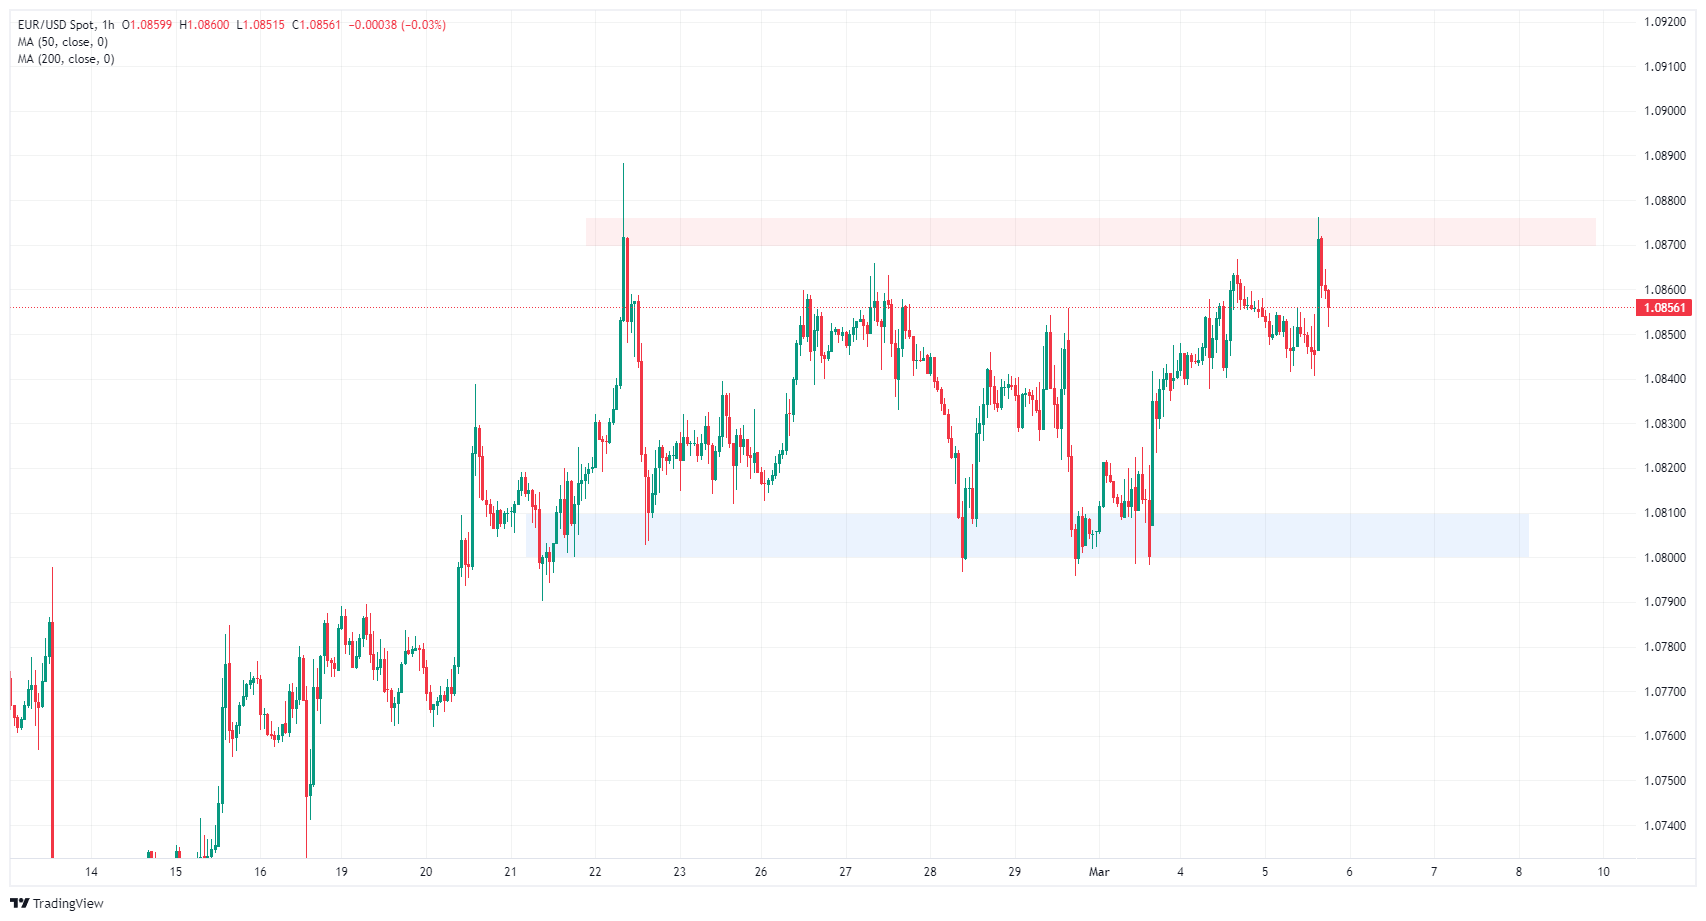
EUR/USD daily chart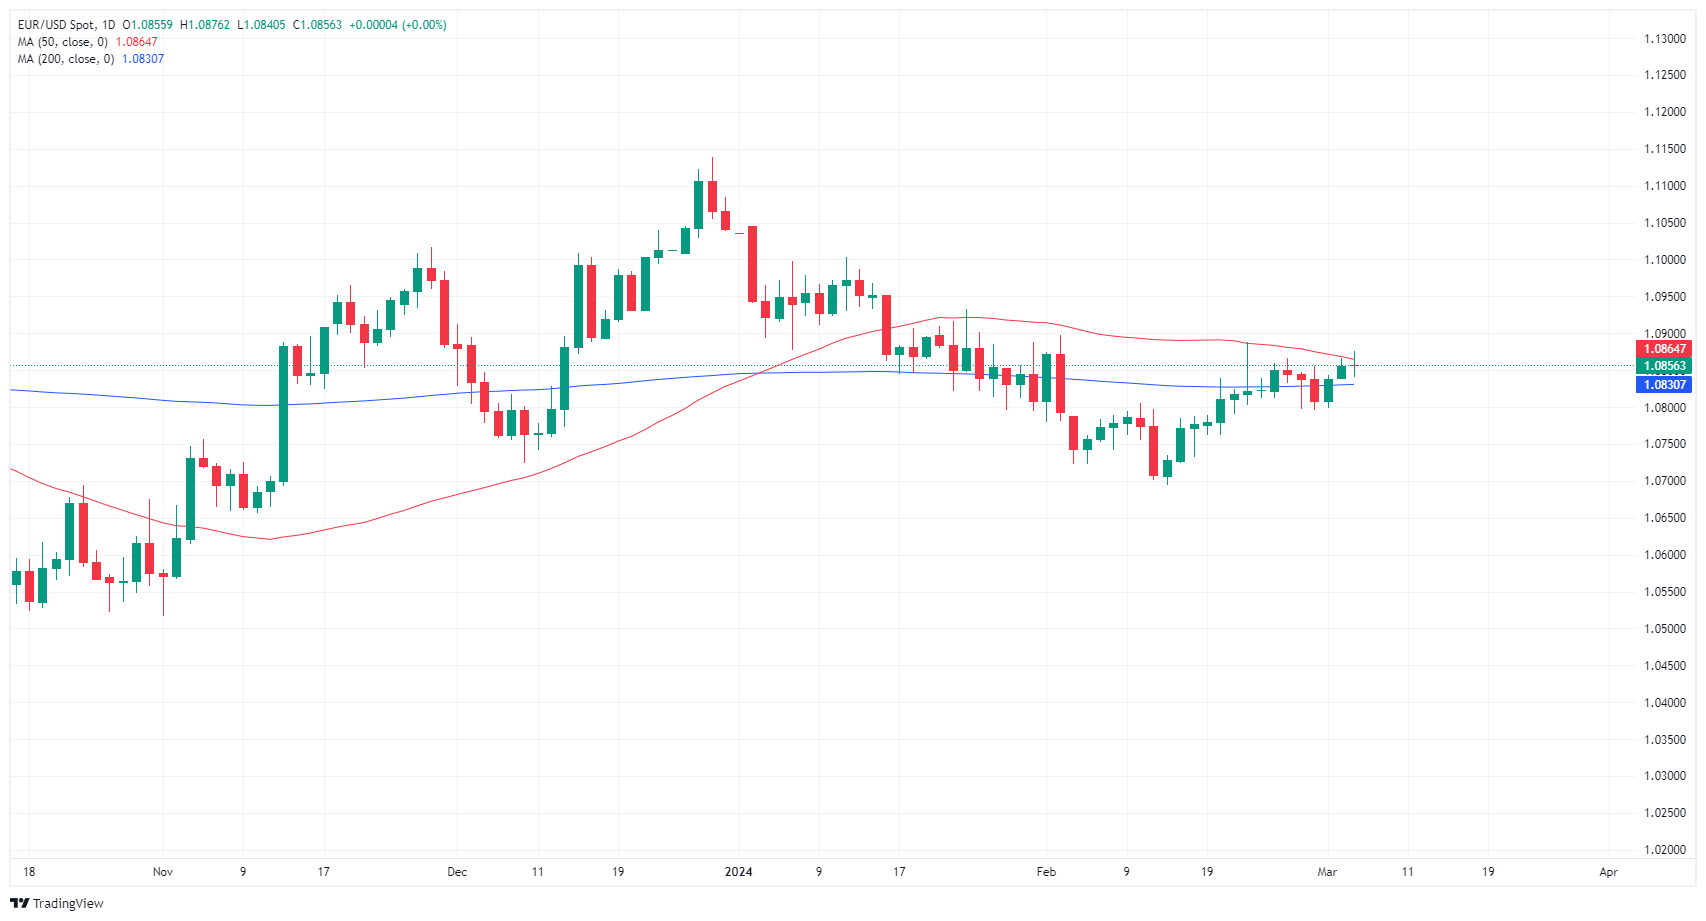
Euro FAQs
The Euro is the currency for the 20 European Union countries that belong to the Eurozone. It is the second most heavily traded currency in the world behind the US Dollar. In 2022, it accounted for 31% of all foreign exchange transactions, with an average daily turnover of over $2.2 trillion a day. EUR/USD is the most heavily traded currency pair in the world, accounting for an estimated 30% off all transactions, followed by EUR/JPY (4%), EUR/GBP (3%) and EUR/AUD (2%).
The European Central Bank (ECB) in Frankfurt, Germany, is the reserve bank for the Eurozone. The ECB sets interest rates and manages monetary policy. The ECB’s primary mandate is to maintain price stability, which means either controlling inflation or stimulating growth. Its primary tool is the raising or lowering of interest rates. Relatively high interest rates – or the expectation of higher rates – will usually benefit the Euro and vice versa. The ECB Governing Council makes monetary policy decisions at meetings held eight times a year. Decisions are made by heads of the Eurozone national banks and six permanent members, including the President of the ECB, Christine Lagarde.
Eurozone inflation data, measured by the Harmonized Index of Consumer Prices (HICP), is an important econometric for the Euro. If inflation rises more than expected, especially if above the ECB’s 2% target, it obliges the ECB to raise interest rates to bring it back under control. Relatively high interest rates compared to its counterparts will usually benefit the Euro, as it makes the region more attractive as a place for global investors to park their money.
Data releases gauge the health of the economy and can impact on the Euro. Indicators such as GDP, Manufacturing and Services PMIs, employment, and consumer sentiment surveys can all influence the direction of the single currency. A strong economy is good for the Euro. Not only does it attract more foreign investment but it may encourage the ECB to put up interest rates, which will directly strengthen the Euro. Otherwise, if economic data is weak, the Euro is likely to fall. Economic data for the four largest economies in the euro area (Germany, France, Italy and Spain) are especially significant, as they account for 75% of the Eurozone’s economy.
Another significant data release for the Euro is the Trade Balance. This indicator measures the difference between what a country earns from its exports and what it spends on imports over a given period. If a country produces highly sought after exports then its currency will gain in value purely from the extra demand created from foreign buyers seeking to purchase these goods. Therefore, a positive net Trade Balance strengthens a currency and vice versa for a negative balance.
- USD/JPY retreats 0.30%, showing signs of consolidation after touching a weekly peak of 150.57.
- Technical analysis indicates potential pressure points with the Tenkan-Sen and February lows providing support.
- Upside momentum requires reclaiming 151.00, setting the stage for a possible advance toward yearly highs.
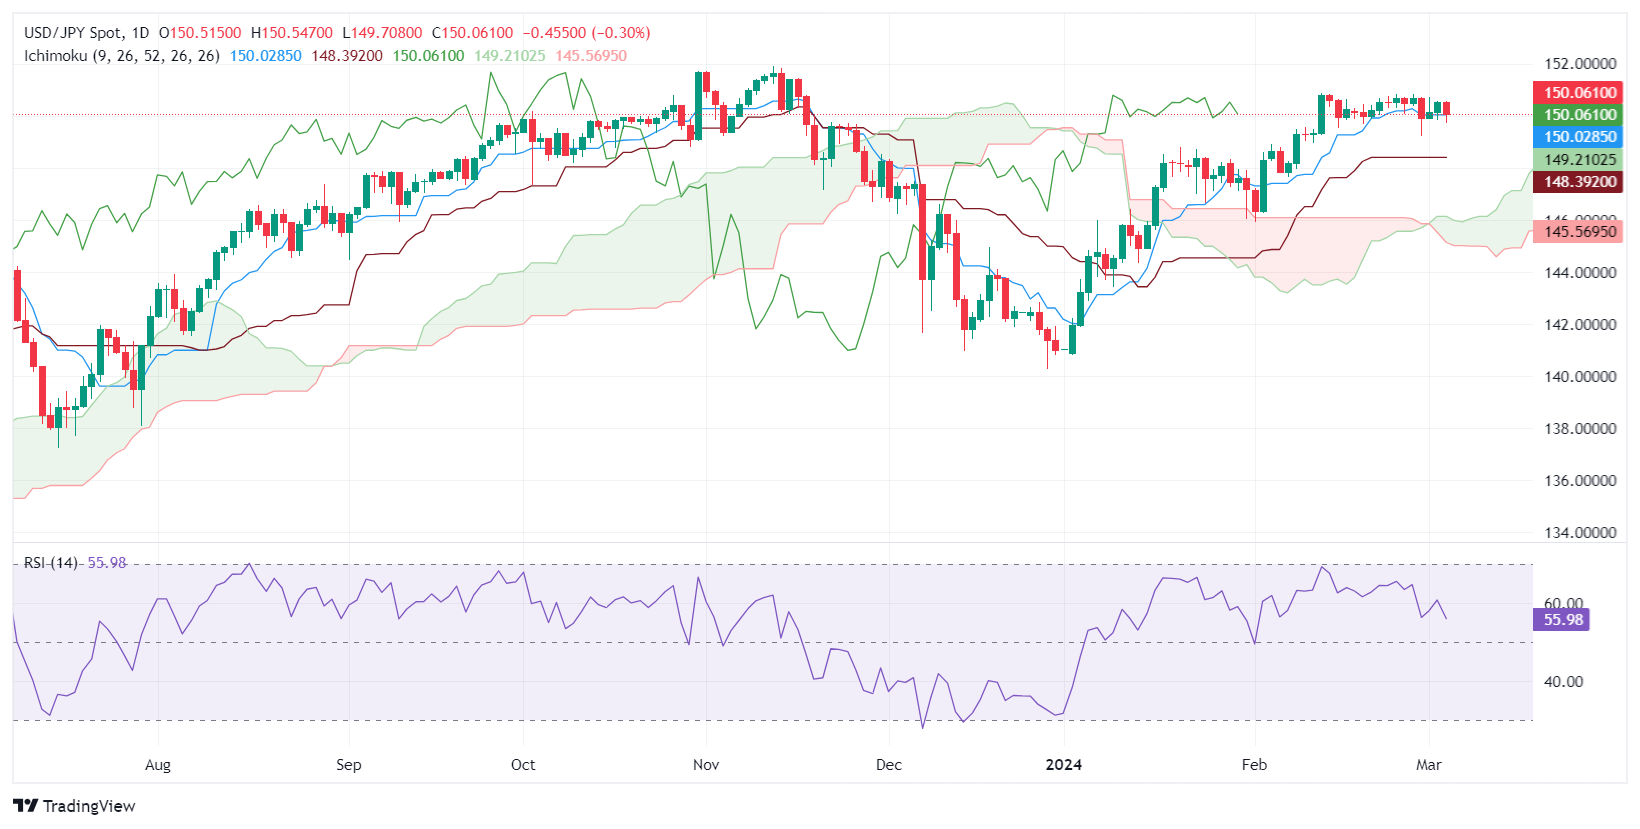
The USD/JPY lost traction during the mid-North American session, edged down 0.30%, and exchanged hands at 150.08 after reaching a weekly high of 150.57 on Monday.
USD/JPY Price Analysis: Technical outlook
From a daily chart perspective, the USD/JPY is trading sideways capped on the upside by the 151.00 figure, while on the downside is the Tenkan-Sen at 150.02. A breach of the latter will expose the confluence of the February 29 low and the Senkou Span A at 149.21, followed by the 149.00 mark. Further downside is seen at 148.39 at the Kijun Sen level, before testing 148.00.
On the flip side, if buyers regain the 151.00 figure, that could open the door to challenge the November 16 swing high at 151.38, ahead of last year’s high at 151.91. Above this level, look for 152.00.
USD/JPY Price Action – Daily Chart
Japanese Yen FAQs
The Japanese Yen (JPY) is one of the world’s most traded currencies. Its value is broadly determined by the performance of the Japanese economy, but more specifically by the Bank of Japan’s policy, the differential between Japanese and US bond yields, or risk sentiment among traders, among other factors.
One of the Bank of Japan’s mandates is currency control, so its moves are key for the Yen. The BoJ has directly intervened in currency markets sometimes, generally to lower the value of the Yen, although it refrains from doing it often due to political concerns of its main trading partners. The current BoJ ultra-loose monetary policy, based on massive stimulus to the economy, has caused the Yen to depreciate against its main currency peers. This process has exacerbated more recently due to an increasing policy divergence between the Bank of Japan and other main central banks, which have opted to increase interest rates sharply to fight decades-high levels of inflation.
The BoJ’s stance of sticking to ultra-loose monetary policy has led to a widening policy divergence with other central banks, particularly with the US Federal Reserve. This supports a widening of the differential between the 10-year US and Japanese bonds, which favors the US Dollar against the Japanese Yen.
The Japanese Yen is often seen as a safe-haven investment. This means that in times of market stress, investors are more likely to put their money in the Japanese currency due to its supposed reliability and stability. Turbulent times are likely to strengthen the Yen’s value against other currencies seen as more risky to invest in.
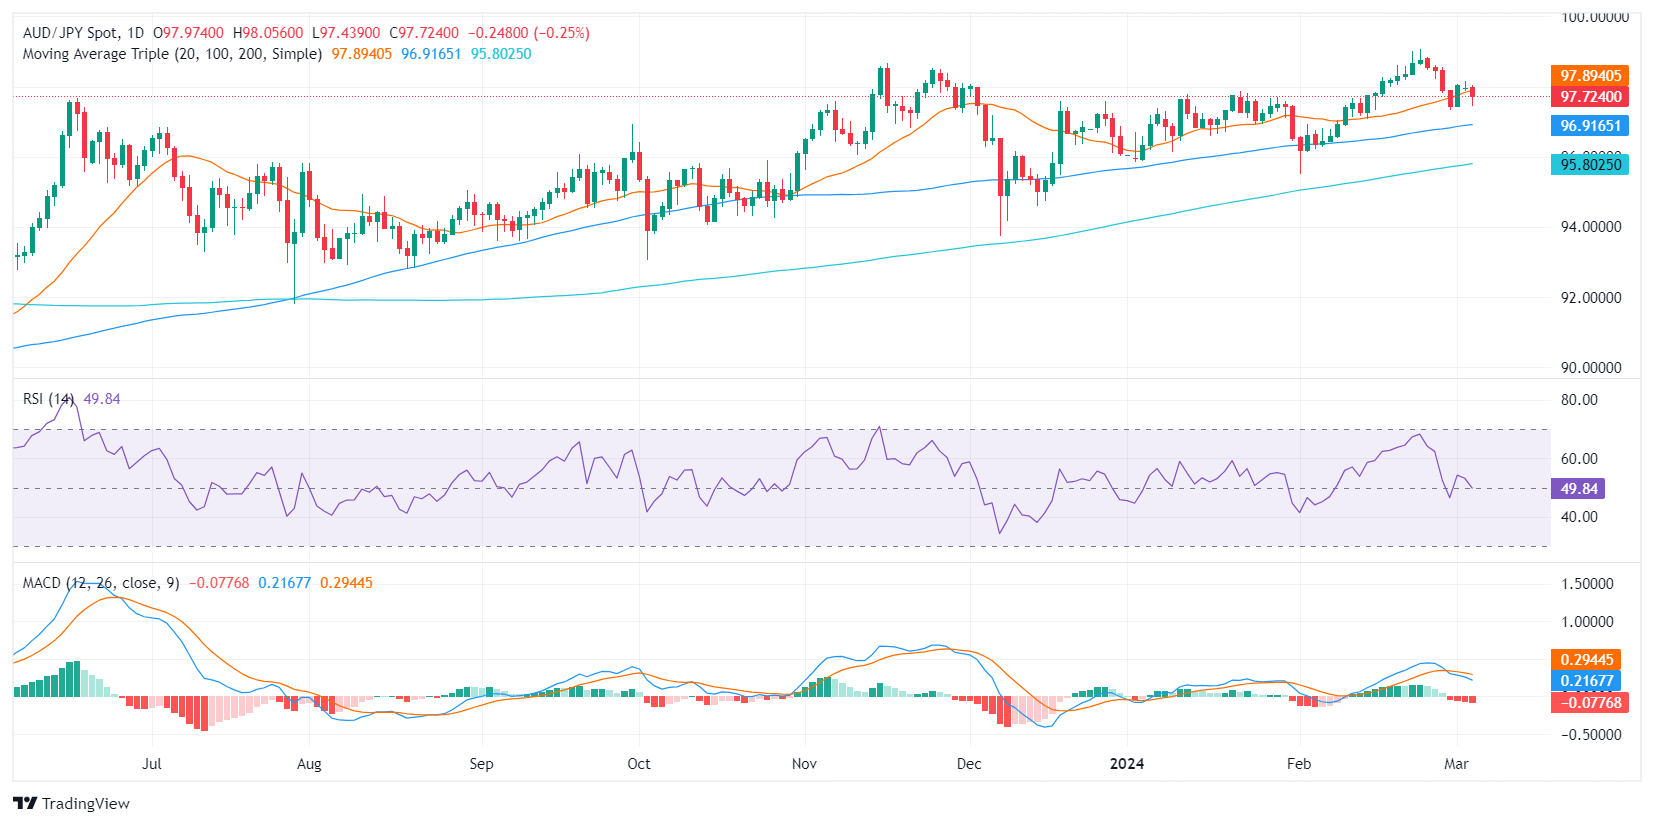
- The AUD/JPY is trading down at 97.73 with losses in Tuesday’s session.
- Despite operating above the main SMAs, indicating long-term bullish sentiment, the short-term scenario is dominated by selling pressure.
- The daily RSI remaining pointing down, and MACD depicting an increase in red bars both signal growing selling momentum.
For Tuesday's session, AUD/JPY is exchanging hands at a level of 97.73, recording a minor decline of 0.19%. Despite the selling exertion evident on the daily chart, there appears to be a broader remains bullish as the pair continues trading above its main Simple Moving Averages (SMAs).
On the daily chart, the Relative Strength Index (RSI) for AUD/JPY remains in negative territory, while, the Moving Average Convergence Divergence (MACD) histogram is rising with red bars, indicating an increase in negative momentum.
AUD/JPY daily chart
Turning to the hourly chart, the RSI dipped into oversold territory earlier in the session, suggesting a strong bearish outlook very short term, and now the index recovered near its midline point suggesting that sellers are taking a breather. This view is corroborated by the rising green bars of the MACD.
AUD/JPY hourly chart
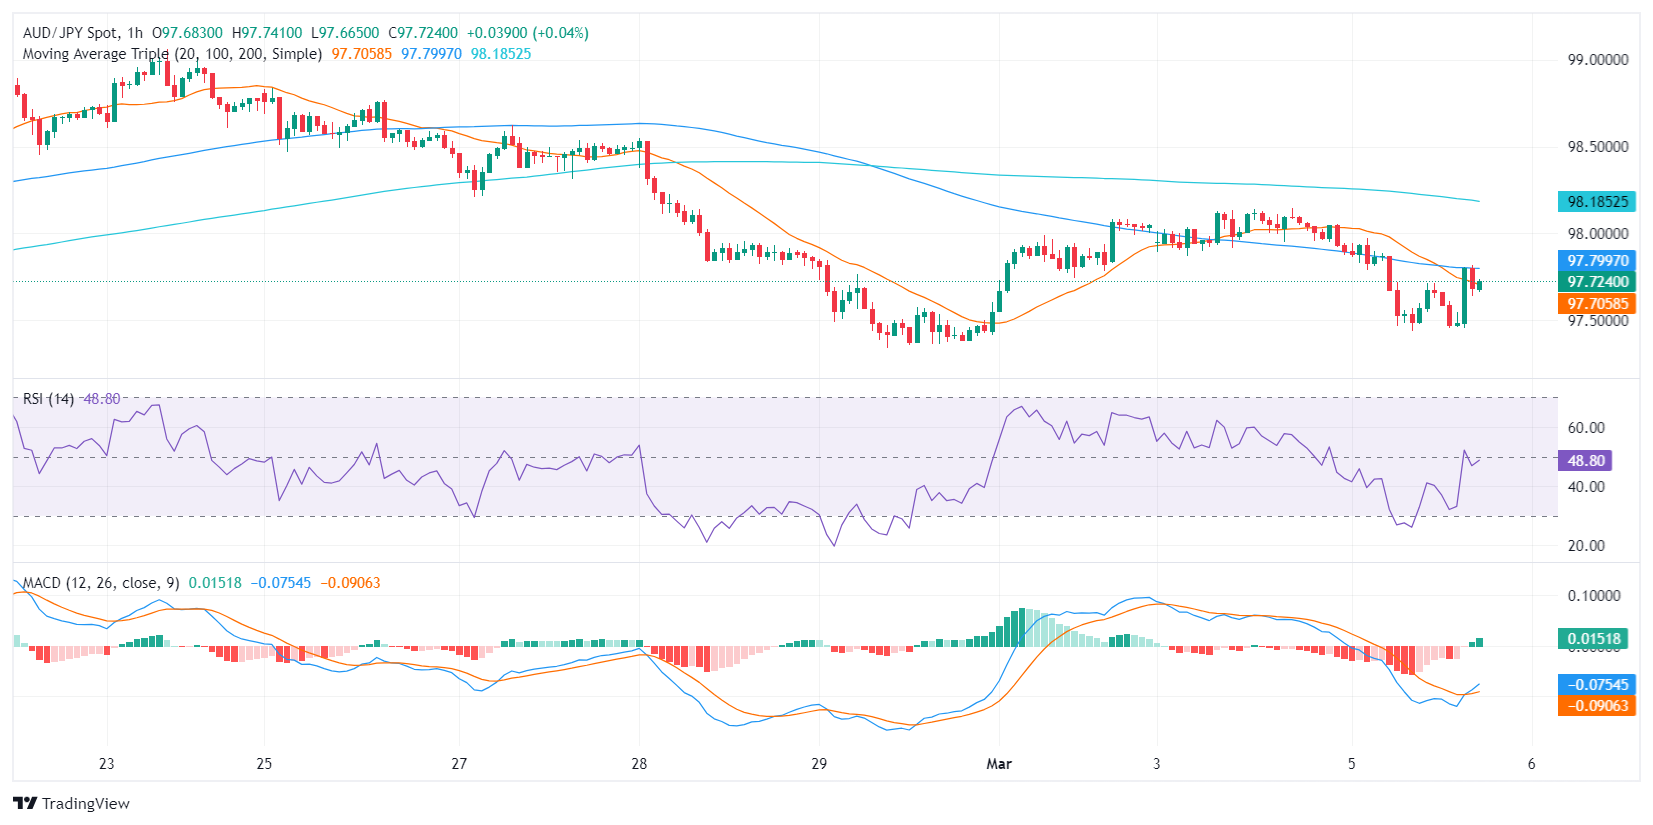
Overall, the AUD/JPY pair seems to be under selling pressure in the short term despite the broader bullish context suggested by its position above the 100 and 200-day SMAs. For the rest of the session, the pair may continue correcting oversold conditions hit earlier in the session.
- GBP/USD climbs over 1.2700 on Tuesday.
- US PMI, Factory Orders misses push down Greenback.
- US politics to dominate headlines on Super Tuesday.
GBP/USD gained ground on Tuesday, marking in an intraday high of 1.2735 after the US ISM Services Purchasing Managers Index (PMI) and Factory Orders both missed expectations. The US Dollar (USD) softened on reaction, but market sentiment is hanging in the midrange as markets gear up for two showings from Federal Reserve (Fed) Chairman Jerome Powell this week.
US politics are also on the cards as Super Tuesday gets underway. The US Republican Party is broadly expected to select Donald Trump as the nominee for the party’s ballot in the upcoming US federal election in November.
The UK’s BRC Like-For-Like Retail Sales for the year ended February entirely missed expectations, printing at an even 1.0% early Tuesday, flubbing the forecast increase 1.6% from the previous period’s 1.4%. The US ISM Services PMI for February fell more than expected, printing at 52.6 versus the forecast 53.0 and the previous 53.4.
Fed chair Powell will be appearing twice this week, on both Wednesday and Thursday as the head of the US central bank testifies about the Fed’s Semi-Annual Monetary Policy Report to the US government’s House Financial Services Committee. Headlines are expected throughout both days as the Fed chairman answers policymaker questions about the US economy and the Fed’s outlook.
US labor figures are also due to make a splash this week. ADP Employment Change figures are due Wednesday and forecast to increase to 150K from the previous 107K, and Friday’s US Nonfarm Payrolls (NFP) is expected to decline to 200K from the previous 353K, and revisions to previous prints are expected.
GBPUSD tests higher, but topside limited near 1.2700
GBP/USD rose through Tuesday’s trading, testing north of 1.2700 but mixed market sentiment is keeping the pair close to key levels as momentum remains limited. The pair broke through a key resistance layer, and a pullback could see bullish momentum extend as long as declines remain limited to the 1.2700 region.
Plenty of longer-term technical resistance is baked into daily candlesticks. 1.2800 remains a key level for bulls to beat, and the 200-day Simple Moving Average (SMA) continues to grind slowly higher, reaching 1.2580.
GBP/USD hourly chart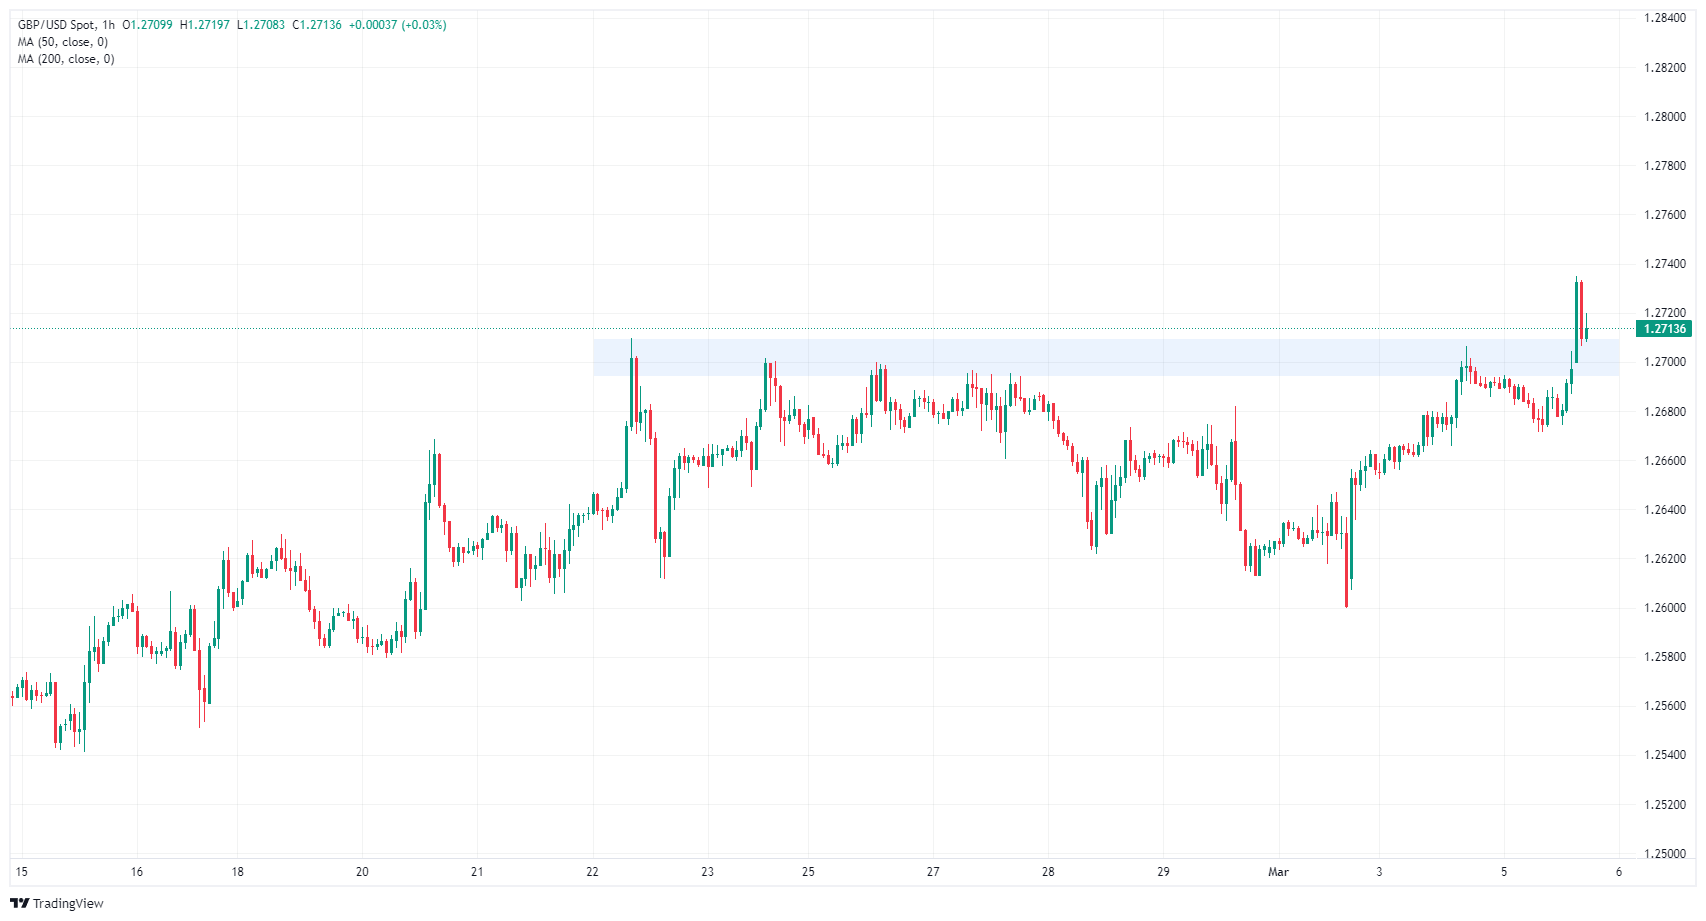
GBP/USD daily chart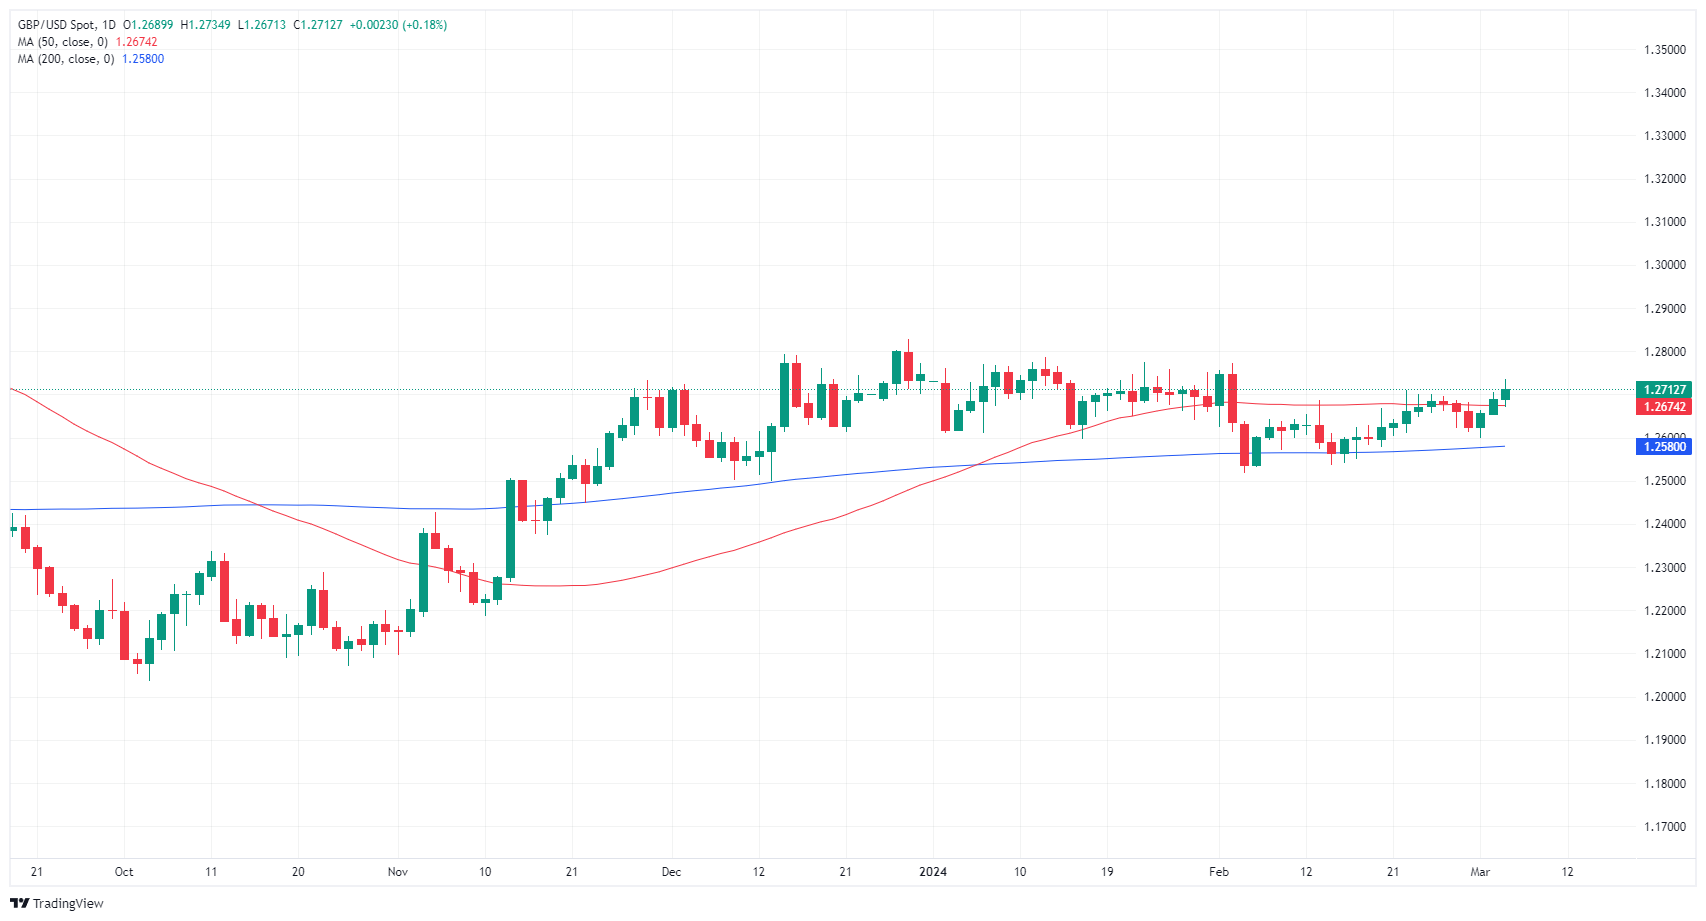
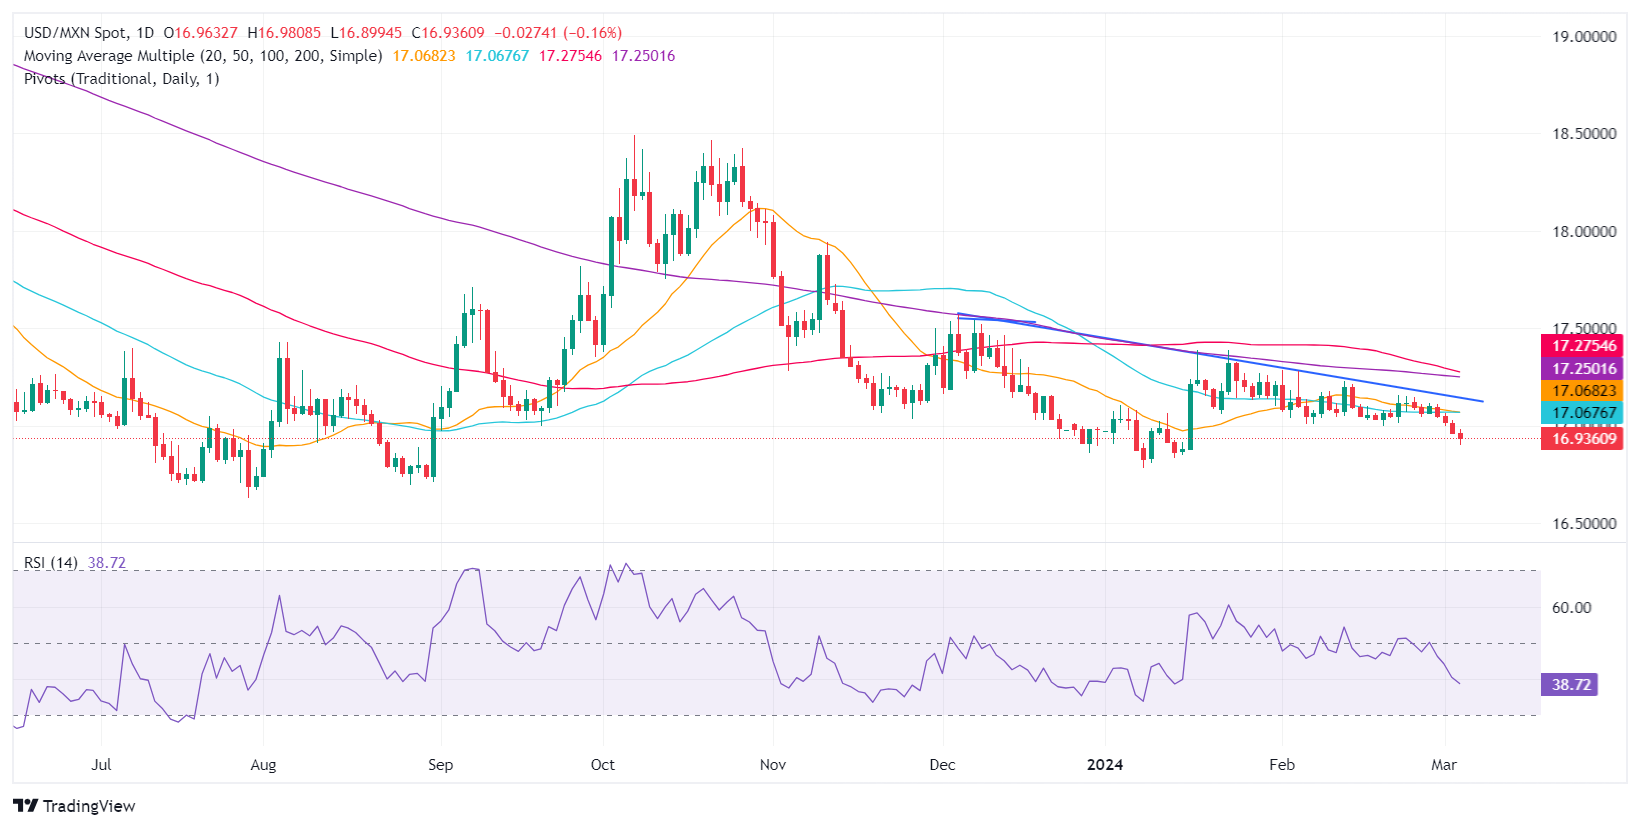
- Mexican Peso strengthens, marking over 0.5% weekly gain as USD/MXN reaches a new seven-week low at 16.91.
- US ISM Services PMI for February indicates a slowing economy, fueling speculation of forthcoming Federal Reserve rate cuts.
- US Dollar Index dips slightly as market participants increasingly anticipate a potential policy shift by the Fed toward easing interests by year-end.
The Mexican Peso appreciates sharply against the US Dollar, extending its weekly gains to more than 0.5% as the USD/MXN plunges sharply below the 17.00 figure, falling to a seven-week low. Economic data from the United States (US) showed the economy is slowing and weighed on the Greenback as the Federal Reserve’s (Fed) rate cut speculations grew. The USD/MXN trades at 16.91, down 0.21%.
Mexico’s economic docket was empty on Tuesday, but one day ago a report by the National Statistics Agency (INEGI) showed that Gross Fixed Investment in December remained flat MoM. Nevertheless, on an annual basis, it dipped from 19.2% to 13.4%.
In the US, the latest Institute for Supply Management (ISM) Services Purchasing Managers Index (PMI) revealed that the sector cooled down in February, spurring worries about an economic downturn. Therefore, investors had begun to readjust their expectations of possible Fed interest rate cuts toward the end of the year. Consequently, the US Dollar Index (DXY), which tracks the buck’s value against a basket of six currencies, dropped 0.06% to 103.77.
Daily digest market movers: Mexican Peso boosted by broad US Dollar weakness
- A Reuters poll shows 15 analysts estimate that inflation will slow down in February, corroborating bets that the Bank of Mexico (Banxico) could cut rates as soon as the March 21 meeting.
- The survey showed that the Consumer Price Index (CPI) is expected to dip from 4.88% to 4.42%, while underlying CPI is seen falling to 4.62%, its lowest level since June 2021.
- Mexico’s General Election campaign started on March 1. Polls suggest the ruling party’s nominee, Claudia Sheinbaum, maintains her lead over Xochitl Galvez. Parametria’s poll shows Sheinbaum's support at 49%, while Galvez, the opposition candidate, stands at 29%.
- Banxico’s February private analysts poll projections for 2024:
- General inflation is foreseen at 4.10%, while underlying inflation is expected at 4.06%.
- The economy is expected to grow 2.40%, unchanged from January.
- The USD/MXN exchange rate would end the year at 18.31, down from 18.50.
- Interest rates are expected to be lowered from 11.25% to 9.50%.
- During Banxico’s quarterly report, policymakers acknowledged the progress on inflation and urged caution against premature interest rate cuts. Governor Victoria Rodriguez Ceja said adjustments would be gradual, while Deputy Governors Galia Borja and Jonathan Heath called for prudence. The latter specifically warned against the risks of an early rate cut.
- Banxico updated its economic growth projections for 2024 from 3.0% to 2.8% YoY and maintained 1.5% for 2025. The slowdown is blamed on higher interest rates at 11.25%, which sparked a shift in three of the five governors of the Mexican Central Bank, who are eyeing the first rate cut at the March 21 meeting.
- The latest inflation report in Mexico showed that headline and underlying inflation continued to dip toward Banxico’s goal of 3%, plus or minus 1%, while economic growth exceeded estimates but finished below Q3’s 3.3%.
- Economic trade issues between Mexico and the US could depreciate the Mexican currency if the Mexican government fails to resolve its steel and aluminum dispute with the United States. US Trade Representative Katherine Tai warned the US could reimpose tariffs on the commodities.
- US economic data hurts the prospects for a higher USD/MXN, with buyers failing to keep the exchange rate above the 17.00 figure.
- US Factory Orders plunged from -2.9% MoM to -3.6% in January.
- The ISM Services PMI in February was 52.6, below estimates of 53 and January’s 53.4.
- The CME FedWatch Tool shows traders are expecting 99 basis points of rate cuts by the Fed in 2024.
Technical analysis: Mexican Peso rallies as USD/MXN tumbles below 17.00
The USD/MXN resumed to the downside after achieving a daily close below the 17.00 figure on Monday, sponsoring a leg down toward the seven-week low of 16.89. Further downside is seen at the current yearly low of 16.78, followed by last year’s 16.62.
On the other hand, if buyers reclaim the 17.00 figure, that could open the door to testing the 50-day Simple Moving Average (SMA) at 17.06, followed by the 200-day SMA at 17.24.
USD/MXN Price Action – Daily Chart
Mexican Peso FAQs
The Mexican Peso (MXN) is the most traded currency among its Latin American peers. Its value is broadly determined by the performance of the Mexican economy, the country’s central bank’s policy, the amount of foreign investment in the country and even the levels of remittances sent by Mexicans who live abroad, particularly in the United States. Geopolitical trends can also move MXN: for example, the process of nearshoring – or the decision by some firms to relocate manufacturing capacity and supply chains closer to their home countries – is also seen as a catalyst for the Mexican currency as the country is considered a key manufacturing hub in the American continent. Another catalyst for MXN is Oil prices as Mexico is a key exporter of the commodity.
The main objective of Mexico’s central bank, also known as Banxico, is to maintain inflation at low and stable levels (at or close to its target of 3%, the midpoint in a tolerance band of between 2% and 4%). To this end, the bank sets an appropriate level of interest rates. When inflation is too high, Banxico will attempt to tame it by raising interest rates, making it more expensive for households and businesses to borrow money, thus cooling demand and the overall economy. Higher interest rates are generally positive for the Mexican Peso (MXN) as they lead to higher yields, making the country a more attractive place for investors. On the contrary, lower interest rates tend to weaken MXN.
Macroeconomic data releases are key to assess the state of the economy and can have an impact on the Mexican Peso (MXN) valuation. A strong Mexican economy, based on high economic growth, low unemployment and high confidence is good for MXN. Not only does it attract more foreign investment but it may encourage the Bank of Mexico (Banxico) to increase interest rates, particularly if this strength comes together with elevated inflation. However, if economic data is weak, MXN is likely to depreciate.
As an emerging-market currency, the Mexican Peso (MXN) tends to strive during risk-on periods, or when investors perceive that broader market risks are low and thus are eager to engage with investments that carry a higher risk. Conversely, MXN tends to weaken at times of market turbulence or economic uncertainty as investors tend to sell higher-risk assets and flee to the more-stable safe havens.
- US data prints miss the mark, ISM PMI and Factory Orders flub forecasts.
- Canada readies for another BoC rate call on Wednesday.
- CAD is softer on the day, only finding gains against USD.
The Canadian Dollar (CAD) climbed against the US Dollar (USD) on Tuesday after the US ISM Services Purchasing Managers Index (PMI) and US Factory Orders both missed forecasts. Market hopes for an accelerated path toward Federal Reserve (Fed) rate cuts are pinning back into the high end as US economic figures tease a steepening economic contraction in the US.
The Bank of Canada (BoC) makes another appearance on Wednesday to deliver what is broadly expected to be another rate hold at 5.0%. ADP Employment Change for the US will dwarf moves from the BoC’s Governor Tiff Macklem, and Fed Chairman Jerome Powell will be making his first of two appearances to testify about the Fed’s Semi-Annual Monetary Policy Report before the US Congress’ House Financial Services Committee.
Daily digest market movers: CAD pares Greenback losses after US data softens
- February’s US ISM Services PMI declined to 52.6 versus the forecast of 53.0, 53.4 previously.
- ISM Services Prices Paid also fell to 58.6 from the previous 64.0.
- US Factory Orders in January slid to -3.6% MoM, missing the -2.9% forecast, and the previous month’s print saw a downside revision to -0.3% from 0.2%.
- Markets shrugged off an uptick in the US S&P Global Composite PMI for February, which ticked up to 52.5 from the forecast hold at 51.4.
- Wednesday’s US ADP Employment Change is forecast to print at 150K versus the previous 107K.
- The BoC is expected to hold rates at 5.0% on Wednesday.
- BoC Preview: Forecasts from seven major banks
Canadian Dollar price today
The table below shows the percentage change of Canadian Dollar (CAD) against listed major currencies today. Canadian Dollar was the weakest against the Pound Sterling.
| USD | EUR | GBP | CAD | AUD | JPY | NZD | CHF | |
| USD | -0.10% | -0.23% | 0.00% | -0.08% | -0.22% | 0.03% | -0.21% | |
| EUR | 0.09% | -0.14% | 0.10% | 0.00% | -0.11% | 0.11% | -0.09% | |
| GBP | 0.24% | 0.14% | 0.24% | 0.13% | 0.03% | 0.26% | 0.04% | |
| CAD | -0.01% | -0.10% | -0.23% | -0.11% | -0.21% | 0.01% | -0.19% | |
| AUD | 0.08% | -0.01% | -0.14% | 0.09% | -0.12% | 0.11% | -0.09% | |
| JPY | 0.22% | 0.15% | -0.02% | 0.22% | 0.10% | 0.25% | 0.02% | |
| NZD | -0.03% | -0.11% | -0.27% | -0.03% | -0.11% | -0.25% | -0.20% | |
| CHF | 0.20% | 0.09% | -0.05% | 0.20% | 0.12% | -0.02% | 0.22% |
The heat map shows percentage changes of major currencies against each other. The base currency is picked from the left column, while the quote currency is picked from the top row. For example, if you pick the Euro from the left column and move along the horizontal line to the Japanese Yen, the percentage change displayed in the box will represent EUR (base)/JPY (quote).
Technical analysis: Canadian Dollar broadly softer on Tuesday, but pares losses against Greenback
The Canadian Dollar (CAD) is broadly flat to lower against the majority of its major currency peers on Tuesday, shedding a quarter of a percent against both the Pound Sterling (GBP) and the Japanese Yen (JPY). The CAD is flat against both the US Dollar and the New Zealand Dollar (NZD), however, trading within a tenth of a percent of Tuesday’s opening bids.
The USD/CAD rose early Tuesday, getting rejected once again from the 1.3600 handle and trading back into congestion. The USD eased back to a session low of 1.3555 against the Canadian Dollar before the pair recovered to familiar territory near 1.3580.
USD/CAD continues to knock into the 1.3600 handle as daily candles pull into congestion. The pair continues to find support above the 200-day Simple Moving Average (SMA) at 1.3477.
USD/CAD hourly chart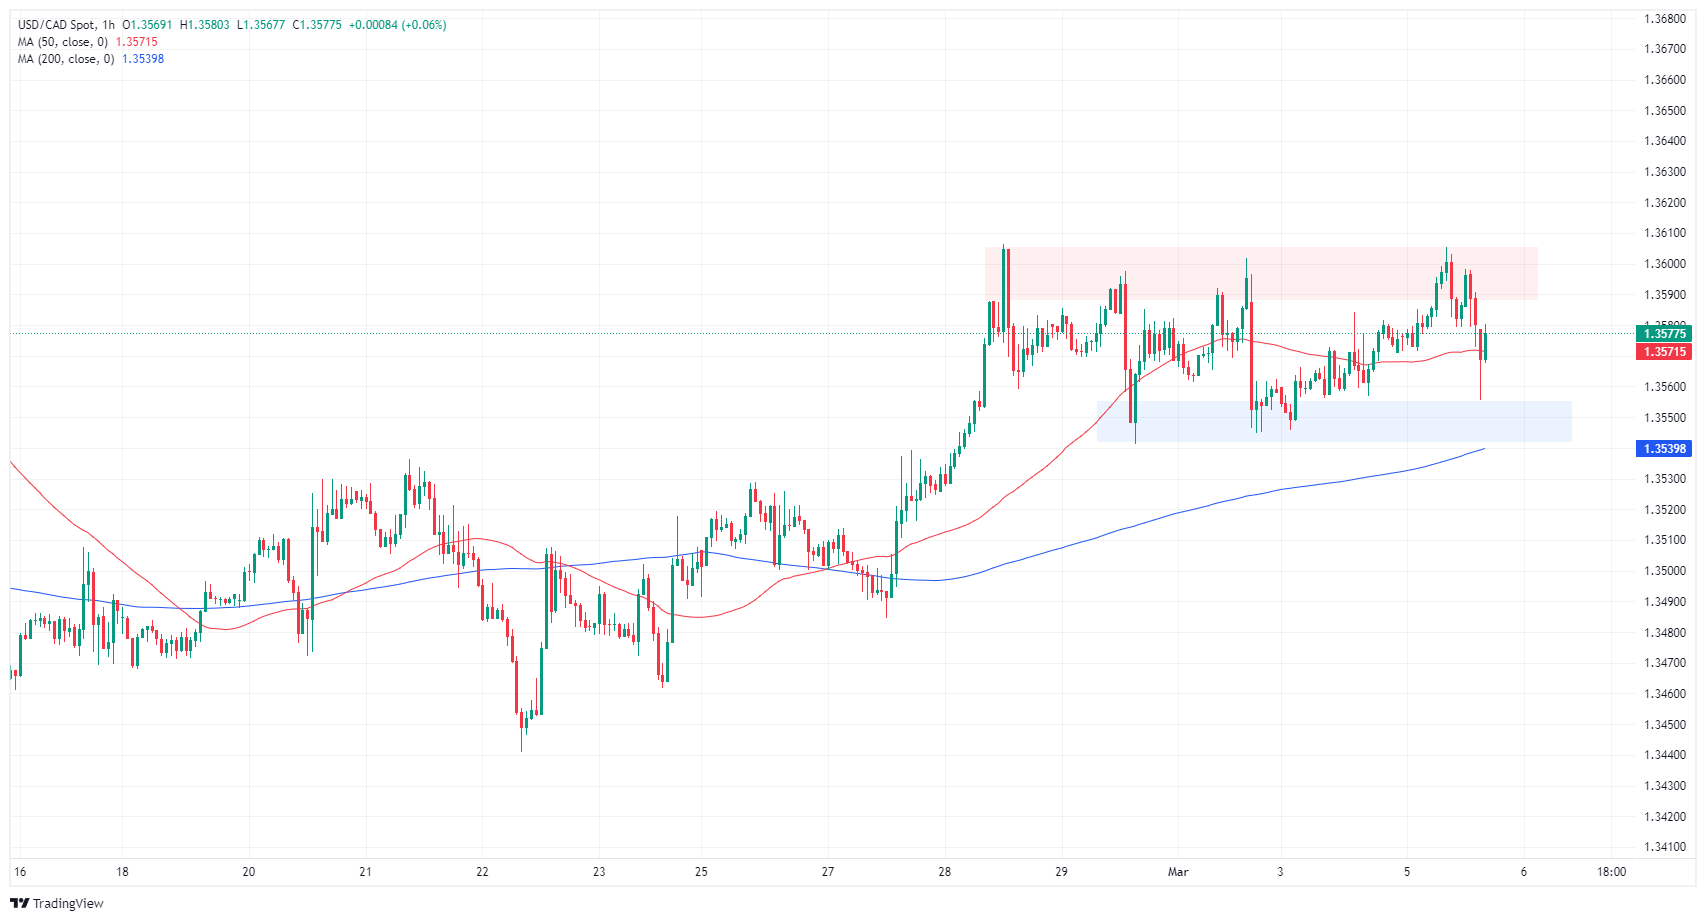
USD/CAD daily chart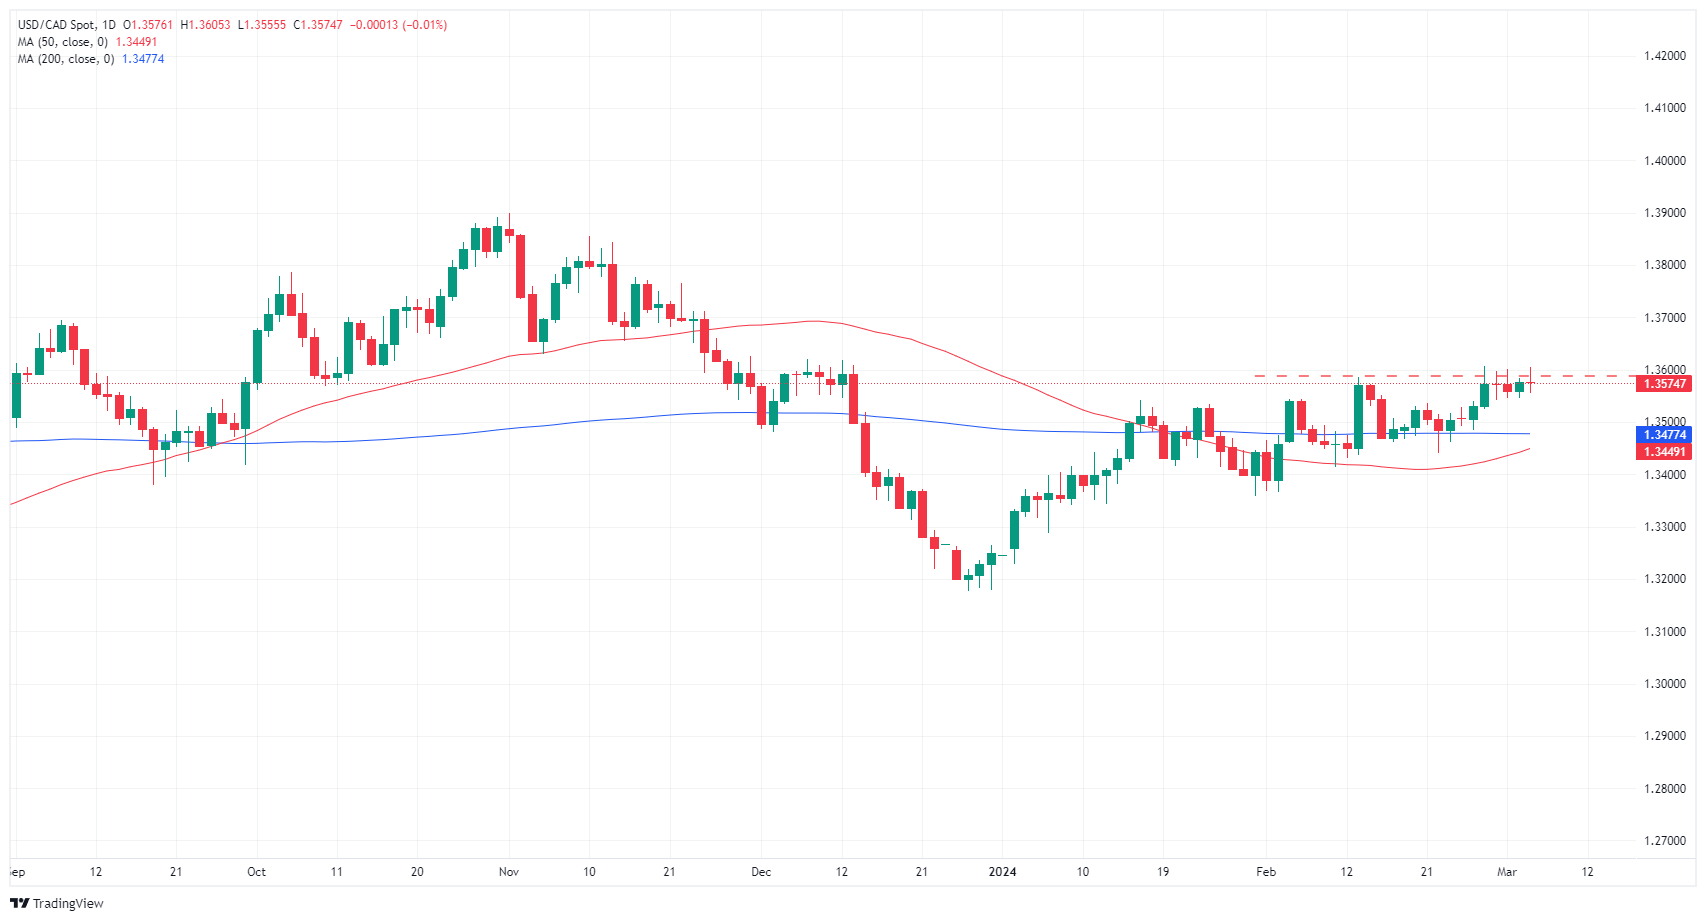
Canadian Dollar FAQs
The key factors driving the Canadian Dollar (CAD) are the level of interest rates set by the Bank of Canada (BoC), the price of Oil, Canada’s largest export, the health of its economy, inflation and the Trade Balance, which is the difference between the value of Canada’s exports versus its imports. Other factors include market sentiment – whether investors are taking on more risky assets (risk-on) or seeking safe-havens (risk-off) – with risk-on being CAD-positive. As its largest trading partner, the health of the US economy is also a key factor influencing the Canadian Dollar.
The Bank of Canada (BoC) has a significant influence on the Canadian Dollar by setting the level of interest rates that banks can lend to one another. This influences the level of interest rates for everyone. The main goal of the BoC is to maintain inflation at 1-3% by adjusting interest rates up or down. Relatively higher interest rates tend to be positive for the CAD. The Bank of Canada can also use quantitative easing and tightening to influence credit conditions, with the former CAD-negative and the latter CAD-positive.
The price of Oil is a key factor impacting the value of the Canadian Dollar. Petroleum is Canada’s biggest export, so Oil price tends to have an immediate impact on the CAD value. Generally, if Oil price rises CAD also goes up, as aggregate demand for the currency increases. The opposite is the case if the price of Oil falls. Higher Oil prices also tend to result in a greater likelihood of a positive Trade Balance, which is also supportive of the CAD.
While inflation had always traditionally been thought of as a negative factor for a currency since it lowers the value of money, the opposite has actually been the case in modern times with the relaxation of cross-border capital controls. Higher inflation tends to lead central banks to put up interest rates which attracts more capital inflows from global investors seeking a lucrative place to keep their money. This increases demand for the local currency, which in Canada’s case is the Canadian Dollar.
Macroeconomic data releases gauge the health of the economy and can have an impact on the Canadian Dollar. Indicators such as GDP, Manufacturing and Services PMIs, employment, and consumer sentiment surveys can all influence the direction of the CAD. A strong economy is good for the Canadian Dollar. Not only does it attract more foreign investment but it may encourage the Bank of Canada to put up interest rates, leading to a stronger currency. If economic data is weak, however, the CAD is likely to fall.
- The DXY Index is significantly lower, near 103.65, on Tuesday.
- The ISM Services PMI from February reflected lower-than-expected figures.
- The focus now turns to labor market data.
The US Dollar Index (DXY) is trading around 103.65, losing some ground. The causes for these latest movements are primarily focused on February's Purchasing Managers Index (PMI) report on the Services sector from the Institute for Supply Management (ISM), which came in lower than expected. If markets start to fear an economic slowdown, they may start to bet on a less aggressive Federal Reserve (Fed).
Despite some evidence of softness in the US economy, it is showing resilience overall. This is making investors confident that the Fed will start easing in June, which may provide a cushion to the US Dollar’s losses. The labor market data set to be released this week will be key to shaping those expectations.
Daily digest market movers: DXY loses some ground on weak data, hawkish bets on the Fed cooldown
- The ISM Services PMI for February, reported by the Institute for Supply Management, is 52.6, which fell short of the expected 53 but is fairly steady compared to January's 53.4
- An 80% probability of an interest rate reduction in June is being anticipated by the markets, which means a decrease from 100% at the end of the previous week.
- US Treasury bond yields are on the decline with 2-year yields trading at 4.56%, while the 5-year yields, and 10-year yields at 4.15%.
- Labor data reports to be released this week include February’s Nonfarm Payrolls, Average Hourly Earnings and the Unemployment Rate, all of which are closely followed by the Fed.
- The outcome of labor market metrics will shape the dynamics of the Greenback for the near term.
DXY technical analysis: DXY bears gain ground, conquer 200-day SMA
The Relative Strength Index (RSI) presently occupying negative territory with a negative slope supports the idea of bears’ wielding strength. This suggests that bears maintain a strong hand at this juncture. Likewise, the Moving Average Convergence Divergence (MACD) registers rising red bars, bolstering the narrative that selling momentum currently prevails.
Assessing the position of the index concerning its Simple Moving Averages (SMAs), it is now trading below the 20, 100 and 200-day SMAs, which suggests that unless the buyers make a move, the outlook has turned negative.
US Dollar FAQs
What is the US Dollar?
The US Dollar (USD) is the official currency of the United States of America, and the ‘de facto’ currency of a significant number of other countries where it is found in circulation alongside local notes. It is the most heavily traded currency in the world, accounting for over 88% of all global foreign exchange turnover, or an average of $6.6 trillion in transactions per day, according to data from 2022.
Following the second world war, the USD took over from the British Pound as the world’s reserve currency. For most of its history, the US Dollar was backed by Gold, until the Bretton Woods Agreement in 1971 when the Gold Standard went away.
How do the decisions of the Federal Reserve impact the US Dollar?
The most important single factor impacting on the value of the US Dollar is monetary policy, which is shaped by the Federal Reserve (Fed). The Fed has two mandates: to achieve price stability (control inflation) and foster full employment. Its primary tool to achieve these two goals is by adjusting interest rates.
When prices are rising too quickly and inflation is above the Fed’s 2% target, the Fed will raise rates, which helps the USD value. When inflation falls below 2% or the Unemployment Rate is too high, the Fed may lower interest rates, which weighs on the Greenback.
What is Quantitative Easing and how does it influence the US Dollar?
In extreme situations, the Federal Reserve can also print more Dollars and enact quantitative easing (QE). QE is the process by which the Fed substantially increases the flow of credit in a stuck financial system.
It is a non-standard policy measure used when credit has dried up because banks will not lend to each other (out of the fear of counterparty default). It is a last resort when simply lowering interest rates is unlikely to achieve the necessary result. It was the Fed’s weapon of choice to combat the credit crunch that occurred during the Great Financial Crisis in 2008. It involves the Fed printing more Dollars and using them to buy US government bonds predominantly from financial institutions. QE usually leads to a weaker US Dollar.
What is Quantitative Tightening and how does it influence the US Dollar?
Quantitative tightening (QT) is the reverse process whereby the Federal Reserve stops buying bonds from financial institutions and does not reinvest the principal from the bonds it holds maturing in new purchases. It is usually positive for the US Dollar.
The Bank of Canada will release its Monetary Policy Statement on Wednesday, March 6 at 14:45 and as we get closer to the release time, here are the expectations as forecast by the economists and researchers of seven major banks regarding the upcoming Interest Rate Decision.
The BoC is expected to keep rates steady at 5% for the fifth time in a row. Market participants will focus on the guidance about when the central bank will start reducing interest rates.
ING
We expect the BoC to leave the policy rate at 5%. The BoC is sounding a little less hawkish, but with officials not expecting inflation to return to the 2% target until next year, it's unlikely to signal that it is relaxed enough to ease monetary policy soon. As with the Fed, we are looking at June as the likely starting point for interest rate cuts.
TDS
We look for the BoC to stick to the recent script as it holds the overnight rate at 5.00% and continues to seek more evidence that inflation is on track for a sustained return to 2%. We look for the overall message to remain one of cautious optimism, and while the January CPI report skews risks towards a more dovish outcome, we do not expect the Bank will overreact to a single data point. BoC should not be market moving for the CAD as the Bank keeps a tone of guarded optimism and tries not to over-emphasize one good inflation report.
RBC Economics
The BoC is widely expected to maintain the overnight rate steady again. An announcement on the ending of quantitative tightening is unlikely but we expect that to follow later in April. Language around the need to hike rates further was already dropped in January and is unlikely to reappear in the statement. The central bank will instead continue to highlight softening in aggregate demand while reiterating that inflation pressures, although easing are still a risk.
NBF
The BoC is all but assured to leave its policy rate unchanged for a fifth consecutive meeting. With the economy operating below potential and the labour market rebalancing, there are clear signs that tighter monetary policy is working. However, above-target inflation and sticky wage pressures will still leave the Bank of Canada unwilling to contemplate lowering interest rates in the near term. January’s much softer-than-expected CPI report may warrant acknowledgement in the press release but don’t expect them to play up a single month of data too much.
Wells Fargo
The BoC could be one of the first major G10 central banks to deliver rate cuts this year. We do not expect BoC policymakers to deliver a rate cut this week; however, we do believe policymakers may start to lay the initial groundwork for a shift to rate cuts by the middle of this year. BoC policymakers have expressed caution lately, but with growth slowing rather quickly and inflation receding, BoC cuts by June are looking like a higher probability event.
CIBC
Rates will be left on hold and changes in the statement could simply acknowledge both the modest overshoot versus its growth forecast and some improvement in core inflation trends. The Bank likely wants to see some additional slack in the labour market, which we expect to see in Friday’s LFS jobs data, hoping that will lead to cooling in wage gains ahead.
Citi
The BoC is widely expected to keep policy rates unchanged at 5.0%. After the policy statement in January removed the explicit hiking bias, we do not expect many changes to the policy statement in March. But this does not necessarily mean that guidance will be quite as vague as in recent communications. While Fed officials have been open about wanting to see a few more months of softer inflation data before starting to cut rates likely around the middle of the year, BoC officials have been much less explicit about either the timing of cuts or what officials would need to see to feel comfortable lowering rates. Markets are unlikely to learn some more about the likely path to rate cuts at this meeting. This could be dovish relative to recent communications, but we do not expect that the likely conditions necessary for cuts would be met until the middle of the year.
The Australian growth figures for the fourth quarter will be published on Wednesday, March 6. Economists at Commerzbank analyze Aussie’s outlook ahead of the Gross Domestic Product (GDP) report.
No recession, but no turnaround in growth yet either
The majority of the G10 economies have increasingly deviated from their respective pre-corona trends as a result of the rapid interest rate hikes in recent quarters. With the US being a clear exception, the growth gap between these economies and the US is widening accordingly. However, it should also be noted that Australia is still holding up quite well among the G10.
The Bloomberg consensus does not expect a further slowdown, but neither does it expect a turnaround. Instead, the analysts are expecting another growth of 0.2% quarter-on-quarter, which is below the pre-corona trend.
Therefore, we are likely to see a gradual trend reversal in Australia as well. The fact that it will be quite late and not nearly as pronounced as in other G10 countries is one of the reasons for our forecast that the RBA will cut rates quite late and thus support the Aussie until then. Only when there are stronger signs of a slowdown in the real economy, i.e. when they indicate a recession, is the RBA likely to react earlier.
- EUR/USD is buoyed by a weaker US Dollar following underwhelming US services sector performance.
- The Eurozone's strong services and composite PMI readings suggest a slow yet positive economic recovery despite ongoing risks.
- Market expectations shift, now forecasting close to 1% in Fed rate cuts by the end of 2024, as attention turns to an imminent ECB policy meeting.
During the North American session, the Euro extended its gains of more than 0.10% as the Greenback weakness in early Tuesday trading. After meandering at around the day’s lows of 1.0840, weaker than expected US data, the EUR/USD trades at around 1.0870.
Greenback dips on weak PMI figures, traders adjust Fed rate cuts expectations
The US economic calendar featured the release of the S&P Global Services PMI, followed by the Institute for Supply Management (ISM) PMI. The former rose to 52.3, below January 52.5, while the Composite PMI, which encompasses manufacturing and services activity, was 53.8, missing estimates and the previous reading of 54.2.
Lately, the ISM Services PMI stood at 52.6, down from 53.4 and below the consensus of 53, triggering a downward reaction on the US Dollar. The US Dollar Index (DXY), which tracks the performance of six currencies against the buck, dropped to an eight-day low of 103.58 on the release. Yet, it has paired some of its losses but remains negative at 103.69, down 0.13%.
Across the pond, the Eurozone (EU) HCOB Flash PMIs for Services and Composite were released. The Services Index rose 50.2, above expectations of 50.0, while the Composite improved to 49.2 from the 48.9 expected. Although the data suggests the EU’s economy is improving, downside risks remain. Even though the data was mixed, the EUR/USD failed to gain steam as traders await the European Central Bank (ECB) decision on Thursday.
Given the fundamental backdrop, the Federal Reserve’s (Fed) rate cut expectations continued to adjust. Data from the Chicago Board of Trade (CBOT) shows traders estimate 99 basis points (bps) of easing toward the end of 2024.
EUR/USD Price Analysis: Technical outlook
The EUR/USD is tilted to the upside, sitting above all the daily moving averages (DMAs). If buyers reclaim 1.0900, expect further gains, with bulls targeting a downslope resistance trendline at 1.0975/85, ahead of 1.1000. On the other hand, if sellers drag the exchange rate below the 50-DMA at 1.0864, they could remain hopeful of pulling the spot toward the 200-DMA at 1.0830.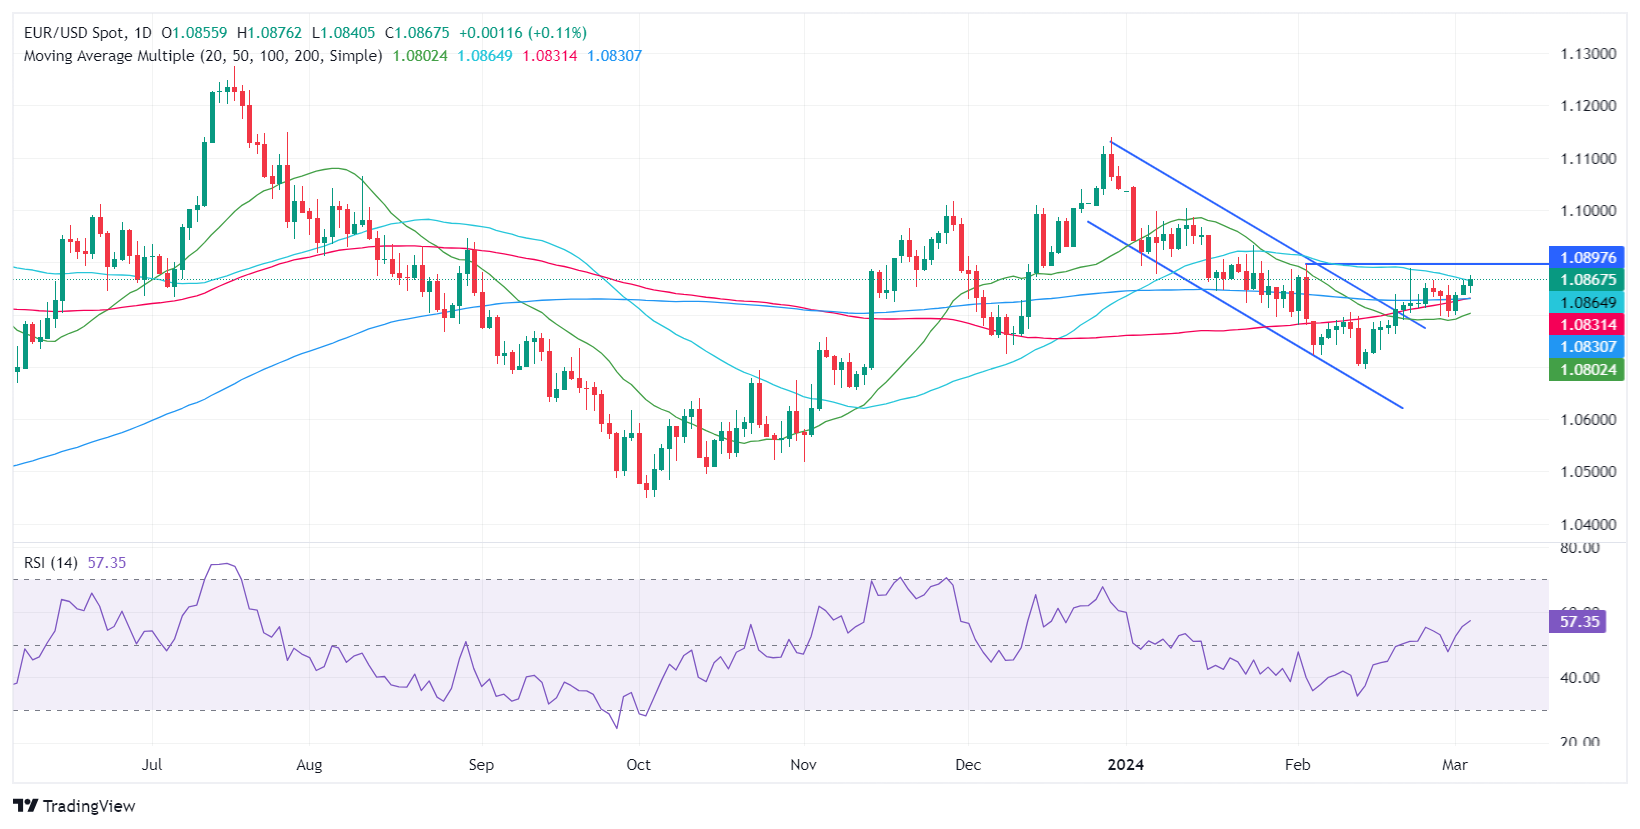
Euro FAQs
The Euro is the currency for the 20 European Union countries that belong to the Eurozone. It is the second most heavily traded currency in the world behind the US Dollar. In 2022, it accounted for 31% of all foreign exchange transactions, with an average daily turnover of over $2.2 trillion a day. EUR/USD is the most heavily traded currency pair in the world, accounting for an estimated 30% off all transactions, followed by EUR/JPY (4%), EUR/GBP (3%) and EUR/AUD (2%).
The European Central Bank (ECB) in Frankfurt, Germany, is the reserve bank for the Eurozone. The ECB sets interest rates and manages monetary policy. The ECB’s primary mandate is to maintain price stability, which means either controlling inflation or stimulating growth. Its primary tool is the raising or lowering of interest rates. Relatively high interest rates – or the expectation of higher rates – will usually benefit the Euro and vice versa. The ECB Governing Council makes monetary policy decisions at meetings held eight times a year. Decisions are made by heads of the Eurozone national banks and six permanent members, including the President of the ECB, Christine Lagarde.
Eurozone inflation data, measured by the Harmonized Index of Consumer Prices (HICP), is an important econometric for the Euro. If inflation rises more than expected, especially if above the ECB’s 2% target, it obliges the ECB to raise interest rates to bring it back under control. Relatively high interest rates compared to its counterparts will usually benefit the Euro, as it makes the region more attractive as a place for global investors to park their money.
Data releases gauge the health of the economy and can impact on the Euro. Indicators such as GDP, Manufacturing and Services PMIs, employment, and consumer sentiment surveys can all influence the direction of the single currency. A strong economy is good for the Euro. Not only does it attract more foreign investment but it may encourage the ECB to put up interest rates, which will directly strengthen the Euro. Otherwise, if economic data is weak, the Euro is likely to fall. Economic data for the four largest economies in the euro area (Germany, France, Italy and Spain) are especially significant, as they account for 75% of the Eurozone’s economy.
Another significant data release for the Euro is the Trade Balance. This indicator measures the difference between what a country earns from its exports and what it spends on imports over a given period. If a country produces highly sought after exports then its currency will gain in value purely from the extra demand created from foreign buyers seeking to purchase these goods. Therefore, a positive net Trade Balance strengthens a currency and vice versa for a negative balance.
The Canadian Dollar (CAD) weakened in February and was the third worst performing G10 currency. Economists at MUFG Bank analyze Loonie’s outlook.
CAD near-term downside risks before recovery
Declining inflation and weaker consumer spending in Canada should allow for the BoC to commence cutting rates by June. This could possibly coincide with a decision from the BoC to end its QT program. The labour market remains robust however and wage growth remains the concern that could delay a decision to cut rates and/or end QT.
Still, while the timing of starting monetary easing may differ slightly from the US, we see the extent of easing in 2H 2024 being similar which could see CAD strength versus the Dollar being less than for other G10 currency gains versus the Dollar.
USD/CAD – Q1 2024 1.3500 Q2 2024 1.3400 Q3 2024 1.3300 Q4 2024 1.3000
CAD/JPY – Q1 2024 108.89 Q2 2024 108.21 Q3 2024 107.58 Q4 2024 107.69
EUR/CAD – Q1 2024 1.4580 Q2 2024 1.4740 Q3 2024 1.4780 Q4 2024 1.4820
- ISM Services PMI came in slightly below the market expectation in February.
- US Dollar Index turned south and declined toward 103.50 after the data.
Business activity in the US service sector continued to expand in February, albeit at a more moderate pace than in January, with the ISM Services PMI edging lower to 52.6 from 53.4. This reading came in below the market expectation of 53.
Other details of the report showed that the Prices Paid Index, the inflation component, declined to 58.6 from 64, while the Employment Index fell to 48 from 50.5, reflecting a decrease in the sector's payrolls.
Assessing the survey's findings, "the slight decrease in the rate of growth in February is a result of faster supplier deliveries and the contraction in the Employment Index," said Anthony Nieves, Chair of the Institute for Supply Management Services Business Survey Committee, and continued:
"The majority of respondents are mostly positive about business conditions. Respondents remain concerned about inflation, employment and ongoing geopolitical conflicts."
Market reaction
The US Dollar (USD) came under bearish pressure with the immediate reaction to the PMI data. At the time of press, the US Dollar Index was down 0.2% on the day at 103.63.
Gold (XAU/USD) nears all-time high despite little change in US interest rate expectations. Economists at Commerzbank analyze the yellow metal’s outlook.
Gold flying high
Both the University of Michigan survey and the ISM Institute signalled a significant deterioration in US business and consumer sentiment in February which was in contrast to analysts' expectations (according to Bloomberg) which had actually expected the situation to improve. However, this had little, i.e. not a sustainable, impact on the market's expectations for US interest rates, hence the market reaction on the Gold market came as a bit of a surprise. This suggests that the fall in gold prices in the first half of February in the wake of reduced expectations for US rate cuts is now seen as overdone.
As the new week begins, Gold continues its upward trajectory. On Monday, the precious metal almost reached its record high of $2,135 set at the end of last year. This time there was no trigger for the jump.
As there is still a lot of uncertainty about the start and extent of the next interest rate cut cycle in the US, we think the rally is fragile. We would not be surprised to see a small downward correction in the coming days on the back of profit-taking.
USD/MXN must overcome the 200-Day Moving Average (DMA) at 17.27 to confirm short-term up move, analysts at Société Générale say.
Break below 16.78 can lead to one more leg of downtrend
USD/MXN has recently carved out a higher trough at 16.78 as compared to the one last year near 16.60. An initial bounce has taken shape, but the pair continues to struggle at reclaiming the 200-DMA near 17.27. This hurdle must be overcome to confirm a short-term uptrend. Inability to cross the 200-DMA could result in persistence of decline.
Break below 16.78 can lead to one more leg of downtrend towards the last year low of 16.60/16.40.
- USD/JPY slumps to 150.00, hoping the BoJ will exit the dovish policy stance sooner.
- Japan’s Murai is optimist on a positive cycle of rising growth, improving wage outlook.
- Fed Powell is expected to maintain a hawkish narrative on interest rates.
The USD/JPY pair falls sharply to the psychological support of 150.00 in early American session on Tuesday as hopes of Bank of Japan (BoJ) quitting the decade-long expansionary policy stance have escalated.
In Tuesday's early European session, Japan’s Deputy Chief Cabinet Secretary Hideki Murai said that improving economic and wage prospects are visible.
The BoJ has been postponing its plans of exiting the dovish policy stance as policymakers were less convinced about wage growth being strong enough to keep inflation sustainably above the 2% target. Investors' confidence in the BoJ shifting to policy normalization is improving as the Japanese government is expecting a steady wage growth outlook,
Last week, BoJ board member Hajime Takata said that the central bank’s goal of maintaining inflation above 2% on a sustainable basis is ‘finally in sight.’
Meanwhile, the US Dollar Index (DXY) trades sideways around $103.90 ahead of the United States Institute of Supply Management (ISM) Services PMI for February, which will be published at 15:00 GMT. The Services PMI is forecasted to have dropped to 53.0 from 53.4 in January.
This week, the primary trigger for the US Dollar will be the Federal Reserve Chair Jerome Powell’s testimony before Congress on Wednesday. Fed Powell may reiterate that there is no urgency for rate cuts. The Fed is less likely to reduce interest rates before gaining confidence that inflation will sustainably return to the 2% target.
In 2023, the Swiss Franc (CHF) was the best performing G10 currency. Last year’s strong performance culminated in EUR/CHF reaching a record low in December. Since then, EUR/CHF has moved lower. Economists at Rabobank analyze the pair’s outlook.
EUR/CHF forecasts revised up
EUR/CHF has surged above the 0.9600 level which takes it back close to its average level over the past year. Whether this uptrend can be sustained will depend heavily on the outcome of the SNB’s March policy meeting. That said, it is highly probable that EUR/CHF has become overextended, suggesting scope for pullbacks over the next few weeks.
We have recently revised up our EUR/CHF forecasts in recognition that the SNB has a greater incentive to cut rates earlier than other G10 central banks. However, given the recent rise in the value EUR/CHF, we see scope for pullbacks near term which we would view as buying opportunities.
The US Dollar (USD) trades firmer but scope for gains is limited, analysts at Scotiabank say.
Overall USD trend continues to look a little frayed around the edges
Certainly, in the short run markets are unlikely to take any large positions on the USD ahead of Chairman Powell’s comments on Wednesday.
More broadly, the overall USD trend continues to look a little frayed around the edges.
This week’s risk events could support moderate USD gains in the short run but the general tone in the USD since its mid-February peak has been soft and weakness risks extending below DXY support around 103.75.
- USD/CAD rises to three-month high around 1.3600 amid a dismal market mood.
- The US Dollar rebounds as Fed Powell is expected to deliver hawkish guidance on interest rates.
- Investors expected that the BoC will keep interest rates unchanged at 5% for straight fifth time.
The USD/CAD pair trades close to three-month high near 1.3600 in the late European session on Tuesday. The Loonie asset holds strength as the market mood is cautious ahead of Federal Reserve Chair Jerome Powell’s testimony before Congress on Wednesday and a packed United States economic calendar this week.
S&P 500 futures exhibit significant losses in the early American session, indicating a decline in the risk appetite of the market participants. The US Dollar is slightly bullish after closing in negative territory in the last two trading sessions. The US Dollar Index (DXY) is up 0.08%, around 103.90 ahead of the Fed Powell’s testimony.
Fed Powell is expected to maintain hawkish rhetoric amid less conviction over inflation returning to the 2% target. Powell may reiterate that there is no need of urgency for rate cuts.
But before that, investors will focus on the Institute of Supply Management (ISM) Services PMI for February, which will be published at 15:00 GMT. According to economists, the Services PMI representing the service sector, which accounts for two-third of the US economy is expected to drop to 53.0 from 53.4 in January.
Meanwhile, the Canadian Dollar will be guided by the interest rate decision from the Bank of Canada (BoC), which will be announced on Wednesday. The BoC is expected to hold interest rates at 5% for the fifth time in a row. Market participants will focus on the guidance about when the BoC will start reducing interest rates.
USD/CAD moves back to the 1.3600 area. Economists at Scotiabank analyze the pair’s outlook.
Support remains 1.3540/1.3550
Spot gains back to the 1.3600 area are putting a little more pressure on last week’s highs and the reversal (‘evening star’ pattern) highlighted on Monday.
A push to new short-term highs negates the reversal formation and will renew the underlying strength in the USD for a push on to the mid/upper 1.3600s.
Support remains 1.3540/1.3550.
See – USD/CAD: Loonie to weaken further before a turnaround in H2 – CIBC
GBP/USD is marginally lower on the day but is essentially marking time in its established trading range of 1.2520/1.2825. Economists at Scotiabank analyze the pair’s outlook.
Trend dynamics and price signals are bullish on the intraday chart
Sterling is a little above the midpoint of the broad, 1.2520/1.2825 range in pace since the start of the year.
Trend dynamics and price signals are bullish on the intraday chart but the daily chart reflects resistance at 1.2700/1.2710 which the GBP will have to overcome for gains to extend.
Support is 1.2600.
EUR/USD edges a little lower. Economists at Scotiabank analyze the pair’s outlook.
A clear move on to and through resistance in the upper 1.0800s remains elusive
Intraday and daily DMI readings suggest the mild uptrend in place since the middle of last month remains intact and that spot should find firm support on modest dips.
A clear move on to and through resistance in the upper 1.0800s (1.0880/1.0890) remains elusive, however, and progress will need to be made sooner or later to sustain the rally.
Support is 1.0795/1.0800.
- The US Dollar trades in the green against all major G20 peers.
- Markets brace for US PMI numbers after digesting disappointing comments out of China’s National People’s Congress.
- The US Dollar Index still orbits around 104.00, and PMI data could be market-moving.
The US Dollar (USD) fires up on the second day of the week with Super Tuesday taking place, with former US President Donald Trump expected to further book gains in the needed votes to become the candidate for the Republican Party. Overnight, the US Dollar got a boost as markets were disappointed with the economic headlines coming from China’s National People’s Congress (NPC). Markets were expecting more stimulus from the world’s second-largest economy, and are now punishing the Chinese Yuan (CNY), which helps the Greenback gain ground.
On the economic calendar front, S&P Global will publish the final reading of the Services and Composite Purchasing Managers Index (PMI) numbers for February. More importantly for markets, the Institute for Supply Management (ISM) is set to release its own PMI data for the US Services sector. With this agenda, markets will have plenty of data to digest and to position ahead of the European Central Bank (ECB) rate decision on Thursday and other important US data releases at the end of the week.
Daily digest market movers: First waves underway
- Tuesday’s economic calendar kicks off with the Redbook Index at 13:55 GMT. The previous reading was at 2.7%.
- S&P Global will release its final Purchasing Managers Index numbers for February at 14:45 GMT:
- The preliminary Services index came in at 51.3.
- The Composite PMI was at 51.4, and markets don’t expect it to be revised.
- At 15:00 GMT a big slew of data is to be released:
- The ISM Services data for February:
- The headline Services PMI is expected to fall from 53.4 to 53, still above the 50.0 threshold that signals expansion.
- The Services Employment Index came in at 50.5 in January, the Prices Paid was at 64, and the New Orders Index stood at 55.
- US Factory Orders for January are expected to decline 2.9% in January after a slight 0.2% increase in December..
- The TechnoMetrica Institute of Policy and Politics (TIPP) will release the Economic Optimism Index for March. The indicator is expected to rise to 45.2 from 44 a month earlier.
- The ISM Services data for February:
- Fed’s Vice Chairman Michael Barr is set to deliver two speeches on Tuesday: one at 17:00 GMT and one at 20:30 GMT.
- Equities are disappointed with the light measures that were discussed on the first day of China’s National People’s Congress. Markets were expecting more and are sending nearly all major indices down by 0.50%. All three US equity futures are in the red as well ahead of the US opening bell.
- According to the CME Group’s FedWatch Tool, expectations for a Fed pause in the March 20 meeting are at 97%, while chances of a rate cut stand at 3%.
- The benchmark 10-year US Treasury Note trades around 4.19%, roughly sideways seeing last week’s range.
US Dollar Index Technical Analysis: China fuels US Dollar
The US Dollar Index (DXY) gets a bit of a tailwind out of an unexpected corner as China disappointed markets. The measures that came out of the National People’s Congress are being written off as too little, with traders switching away their long Renminbi bets and allocating them to long US Dollar positions.
The 100-day Simple Moving Average (SMA) near 103.91 got snapped this Tuesday, where a daily close above would be quite a bullish signal. Should the US Dollar be able to cross above it, 104.60 is het next first target ahead. A firm step beyond there 105.88 comes into reach, the high from November 2023. Ultimately, 107.20 – the high of 2023 – could come back into scope.
Looking down, the 200-day Simple Moving Average at 103.74 has been broken a few times recently, though it has not seen a daily close below it last week, showcasing its importance. The 200-day SMA should not let go that easily, so a small retreat back to that level could be more than granted. Ultimately, should it lose its force, prices could fall to 103.22, the 55-day SMA, before testing 103.00.
US Dollar FAQs
What is the US Dollar?
The US Dollar (USD) is the official currency of the United States of America, and the ‘de facto’ currency of a significant number of other countries where it is found in circulation alongside local notes. It is the most heavily traded currency in the world, accounting for over 88% of all global foreign exchange turnover, or an average of $6.6 trillion in transactions per day, according to data from 2022.
Following the second world war, the USD took over from the British Pound as the world’s reserve currency. For most of its history, the US Dollar was backed by Gold, until the Bretton Woods Agreement in 1971 when the Gold Standard went away.
How do the decisions of the Federal Reserve impact the US Dollar?
The most important single factor impacting on the value of the US Dollar is monetary policy, which is shaped by the Federal Reserve (Fed). The Fed has two mandates: to achieve price stability (control inflation) and foster full employment. Its primary tool to achieve these two goals is by adjusting interest rates.
When prices are rising too quickly and inflation is above the Fed’s 2% target, the Fed will raise rates, which helps the USD value. When inflation falls below 2% or the Unemployment Rate is too high, the Fed may lower interest rates, which weighs on the Greenback.
What is Quantitative Easing and how does it influence the US Dollar?
In extreme situations, the Federal Reserve can also print more Dollars and enact quantitative easing (QE). QE is the process by which the Fed substantially increases the flow of credit in a stuck financial system.
It is a non-standard policy measure used when credit has dried up because banks will not lend to each other (out of the fear of counterparty default). It is a last resort when simply lowering interest rates is unlikely to achieve the necessary result. It was the Fed’s weapon of choice to combat the credit crunch that occurred during the Great Financial Crisis in 2008. It involves the Fed printing more Dollars and using them to buy US government bonds predominantly from financial institutions. QE usually leads to a weaker US Dollar.
What is Quantitative Tightening and how does it influence the US Dollar?
Quantitative tightening (QT) is the reverse process whereby the Federal Reserve stops buying bonds from financial institutions and does not reinvest the principal from the bonds it holds maturing in new purchases. It is usually positive for the US Dollar.
The Loonie has not moved much in the last month, with USD/CAD bouncing around 1.3500. Economists at CIBC Capital Markets analyze the pair’s outlook.
USD/CAD to reach 1.2900 by the end of 2025
We don’t expect the BoC to pivot further towards setting the stage for rate cuts until its April MPR, at which point the Loonie is likely to weaken further, with USD/CAD set to peak at 1.3700 in Q2.
Once the Fed is on the policy normalization path starting in Q3, broad USD weakness should help give the CAD a lift, with higher commodity prices in 2025 also boosting the currency.
We continue to see USD/CAD reaching 1.2900 by the end of 2025.
Gold has risen above $2,100. Economists at National Australia Bank analyze the yellow metal’s outlook.
Central bank purchases of Gold have exceeded 1000 tonnes a year in both 2022 and 2023
Given Gold’s perceived value as a hedge against inflation, the downward trend in global inflation since late 2022, along with recent equity rallies, would generally be seen as negative pressures on Gold prices. However, central bank purchases of Gold have exceeded 1000 tonnes a year in both 2022 and 2023 – led by China and Poland – while consumer demand in China has been strong (reflecting domestic economic uncertainty).
We forecast Gold prices to average $2,025 in 2024, up from around $1,942 in 2023.
- Natural Gas prices are soaring in both the European and US futures markets.
- US gas exports declined at the end of February, while some US producers are cutting output.
- The US Dollar Index trades around 104.00 ahead of Super Tuesday and US PMI numbers.
Natural Gas (XNG/USD) trades in the green for a second consecutive day on Tuesday after a Bloomberg report showed that gas exports are declining fast. Recent numbers revealed that both the US and Qatar saw their output falling by near 13% in the last week of February compared with a week before. The biggest issue for the US is the unforeseen shutdown of Cove Point LNG, which saw its output significantly reduced.
Meanwhile, the US Dollar (USD) is gearing up for the first of many eventful days this week. Today, the so-called Super Tuesday takes place in the presidential primary election. The second big event will take place on Thursday, with the European Central Bank (ECB) monetary policy decision as a litmus test for the US Federal Reserve meeting on March 20. Ahead of Super Tuesday Primaries results, traders will pay attention to the S&P Global Services Purchasing Managers Index (PMI) and the Institute for Supply Management (ISM) data release.
Natural Gas is trading at $2.01 per MMBtu at the time of writing.
Natural Gas market movers: Fragile Equilibrium smashed
- According to a weekly Bloomberg report, global weekly LNG supply fell by 13% for the week of February 26 against the previous week.
- Temperatures are set to fall again in China and Europe, heading back below 10 degrees Celsius, which is below the 10-year average.
- European demand is not picking up, forcing several Gas cargoes to stay at sea. Roughly 3 million metric tons have been afloat at sea for more than 20 days, a very high number compared to normal standards.
- Russia is facing headwinds from fresh US sanctions issued two weeks ago. Russia had ordered icebreaker vessels for its Arctic LNG 2 exports at a South Korean shipbuilder. However, under the new sanctions, Hanwha Ocean (the South Korean shipbuilder) is forbidden to sell to Russia, which means Russia is unable to open its arctic installation for production and exports.
Natural Gas Technical Analysis: balance shifts again
Natural Gas prices are facing more upside pressure with both Qatar and the US delivering less than 13% of the normal weekly volume. These chunky drawdowns in supply are moving the needle quite quickly, with Gas prices soaring for the second consecutive day and exceeding the $2 level again.
On the upside, Natural Gas is breaking that $1.99-$2.00 marker – the level which, when broken on the way down, saw an accelerated decline back at the beginning of February. After that, the green line at $2.13 comes into view, where the triple bottoms from 2023 are placed. If Natural Gas sees a sudden demand pickup, $2.40 could come into play.
On the downside, $1.64 and $1.53 (the low of 2020) are targets to look out for. Ahead of those levels, the recently created pivotal levels at $1.86 and $1.80 should be able to provide some support and slow down any downside moves.
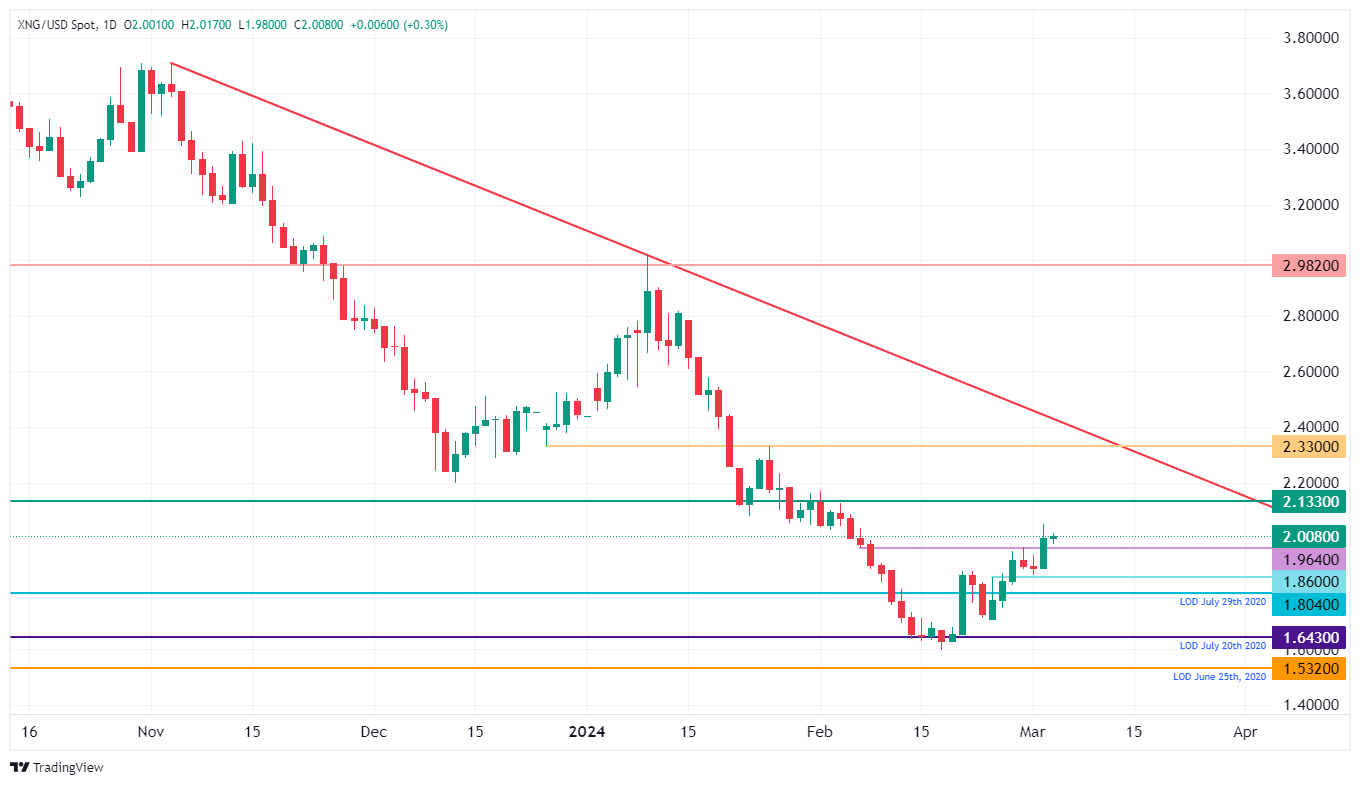
XNG/USD (Daily Chart)
Natural Gas FAQs
What fundamental factors drive the price of Natural Gas?
Supply and demand dynamics are a key factor influencing Natural Gas prices, and are themselves influenced by global economic growth, industrial activity, population growth, production levels, and inventories. The weather impacts Natural Gas prices because more Gas is used during cold winters and hot summers for heating and cooling. Competition from other energy sources impacts prices as consumers may switch to cheaper sources. Geopolitical events are factors as exemplified by the war in Ukraine. Government policies relating to extraction, transportation, and environmental issues also impact prices.
What are the main macroeconomic releases that impact on Natural Gas Prices?
The main economic release influencing Natural Gas prices is the weekly inventory bulletin from the Energy Information Administration (EIA), a US government agency that produces US gas market data. The EIA Gas bulletin usually comes out on Thursday at 14:30 GMT, a day after the EIA publishes its weekly Oil bulletin. Economic data from large consumers of Natural Gas can impact supply and demand, the largest of which include China, Germany and Japan. Natural Gas is primarily priced and traded in US Dollars, thus economic releases impacting the US Dollar are also factors.
How does the US Dollar influence Natural Gas prices?
The US Dollar is the world’s reserve currency and most commodities, including Natural Gas are priced and traded on international markets in US Dollars. As such, the value of the US Dollar is a factor in the price of Natural Gas, because if the Dollar strengthens it means less Dollars are required to buy the same volume of Gas (the price falls), and vice versa if USD strengthens.
- NZD/USD finds an interim support near 0.6070, downside remains favored on dismal market mood.
- Fed Powell might maintain a hawkish rhetoric in his testimony before Congress on Wednesday.
- China’s ambitious growth target fails to uplift the New Zealand Dollar’s appeal.
The NZD/USD pair finds some buying interest after a sell-off to near 0.6070 in the European session on Tuesday. The Kiwi asset is expected to remain on the tenterhooks as investors await the Federal Reserve (Fed) Chair Jerome Powell’s testimony before Congress, scheduled for Wednesday and Thursday.
Fed Powell is expected to maintain a hawkish rhetoric amid absence of evidence that could signal a significant progress in inflation declining towards the 2% target.
The market sentiment remains cautious ahead of the Fed Powell’s testimony. S&P 500 futures have generated significant losses in the London session. The US Dollar Index (DXY) is slightly up 0.03% at 103.85.
Meanwhile, Chinese Premier Li Qiang’s ambitious 5% Gross Domestic Product (GDP) target for 2024 has failed to uplift demand for the New Zealand Dollar. The New Zealand economy is one of China's major trading partners, and improving Chinese economic prospects generally results in a positive development for the Kiwi Dollar.
NZD/USD declines toward the horizontal support of the Descending Triangle pattern on a four-hour timeframe, placed from January 23 low at 0.6062. The downward-sloping border of the aforementioned chart pattern is plotted from December 25 high at 0.6410.
Usually, a Descending Triangle pattern exhibits indecisiveness among market participants but with a slight downside bias due to lower highs and flat lows.
The asset remains below the 50-period Exponential Moving Average (EMA) near 0.6118, indicating uncertainty for near-term demand.
The 14-period Relative Strength Index (RSI) falls into the bearish range of 20.00-40.00 range after failing to shift in the 40.00-60.00 region. This indicates a “sell on rise” behavior of market participants.
Going forward, a downside move below February 13 low near 0.6050would expose the asset to the psychological support of 0.6000, followed by November 9 high at 0.5956.
On the flip side, an upside move would emerge if the asset will break above the round-level resistance of 0.6200, which will drive the asset towards February 22 high at 0.6220, followed by January 11 high at 0.6260.
NZD/USD four-hour chart
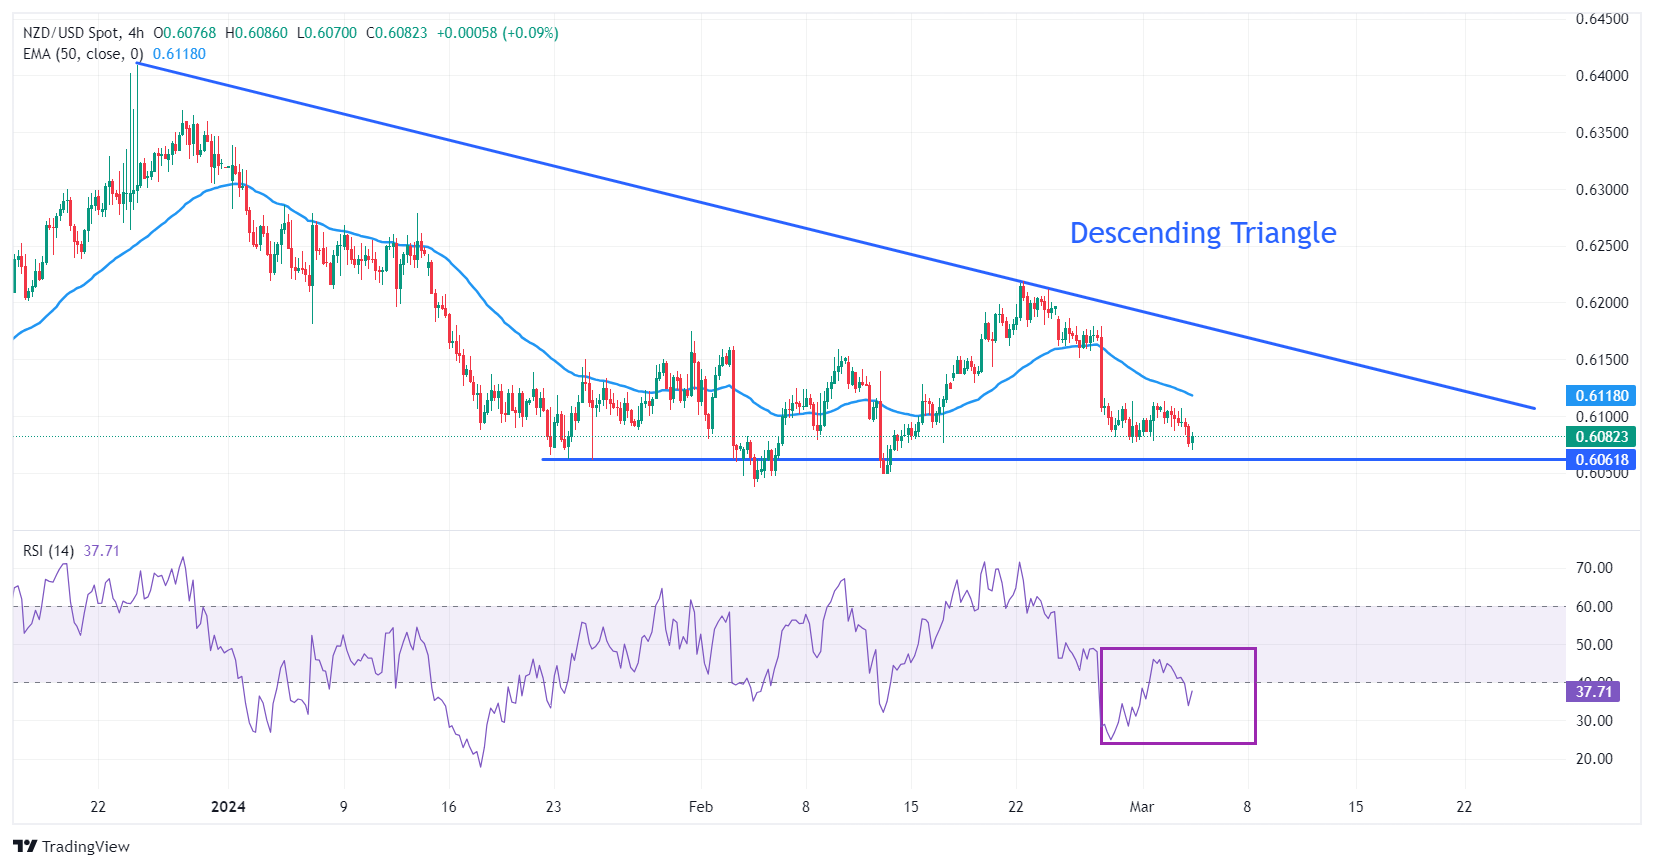
After a brief roller coaster ride, AUD/USD is now trading at the same level as at the end of November. Economists at Commerzbank analyze the pair’s outlook.
Cautious RBA provides support
We still believe that the AUD has the potential to recover in the coming months. Rate cuts are likely to start much later than in the US. And the RBA should have the room to do so, given developments in the real economy. Although economic growth is slowing, a recession is likely to be avoided. This difference in monetary policy should ensure upside potential for AUD/USD until the end of the year.
Of course, the RBA could also cut rates sooner than expected, which is a significant risk to our forecast. In particular, the labor market needs to be kept in mind. While we have seen a slowdown in the labor market recently, albeit from very strong levels, recent statements from officials suggest that this is not yet enough to warrant earlier rate cuts. Nevertheless, this is something to keep an eye on in the coming months.
By the end of the year at the latest, however, sentiment should turn around. This is because our economists now expect only a slight period of weakness in the US economy, followed by a fairly strong rebound. Accordingly, the Fed is likely to cut interest rates only slightly next year, contrary to market expectations, which should benefit the USD. As a result, we have slightly lowered our AUD/USD forecast for 2025.

Source: Commerzbank Research
- Nasdaq futures decline sharply ahead of the opening bell on Tuesday.
- Fed Chairman will testify on the semi-annual Monetary Policy Report this week.
- Factory Orders and ISM Services PMI data will be released later in the day.
S&P 500 futures fall 0.36%, Dow Jones futures drop 0.15%, and Nasdaq futures lose 0.74%.
S&P 500 (SPX), Dow Jones (DJIA), and Nasdaq (IXIC) indexes closed on Monday with a 0.12% loss, a 0.25% drop, and a 0.41% fall, respectively.
What to know before stock market opens
The Utilities Sector gained 1.65% on Monday, beating out the Real Estate Sector, which climbed 1.07% on the day. The Communications Services Sector declined 1.51% as the biggest-losing sector on Monday, followed closely by the Consumer Discretionary Sector, closing 1.27% lower.
Hewlett Packard Enterprise Co. (HPE) climbed 10.22% to kick off the new trading week, ending Monday at $17.15 per share. Tesla Inc. (TSLA) was the biggest decliner on the first trading day of the week, shedding 7.16% and wrapping up at $188.14 at the closing bell.
Assessing the latest developments in equity markets, “the quiet start to the week for US equities did see the Magnificent 7 (-0.85%) under-perform, with slightly more moderate losses for the NASDAQ (-0.41%),” said Jim Reid, global head of economics and thematic research at Deutsche Bank, and continued:
“There were contrasting moves within the Magnificent 7, with Tesla down -7.16% amid new price cuts and discounts by EV maker, while Nvidia (+3.60%) overtook Saudi Aramco to become the third largest company in the world by market cap. On the other hand, the equal-weighted version of the S&P 500 was up +0.24% on the day, as utilities (+1.65%) and banks (+1.58%) outperformed. Back in Europe, the STOXX 600 (-0.03%) was flat on the day, but there was a noticeable underperformance from the FTSE 100 (-0.55%).”
Dow Jones FAQs
The Dow Jones Industrial Average, one of the oldest stock market indices in the world, is compiled of the 30 most traded stocks in the US. The index is price-weighted rather than weighted by capitalization. It is calculated by summing the prices of the constituent stocks and dividing them by a factor, currently 0.152. The index was founded by Charles Dow, who also founded the Wall Street Journal. In later years it has been criticized for not being broadly representative enough because it only tracks 30 conglomerates, unlike broader indices such as the S&P 500.
Many different factors drive the Dow Jones Industrial Average (DJIA). The aggregate performance of the component companies revealed in quarterly company earnings reports is the main one. US and global macroeconomic data also contributes as it impacts on investor sentiment. The level of interest rates, set by the Federal Reserve (Fed), also influences the DJIA as it affects the cost of credit, on which many corporations are heavily reliant. Therefore, inflation can be a major driver as well as other metrics which impact the Fed decisions.
Dow Theory is a method for identifying the primary trend of the stock market developed by Charles Dow. A key step is to compare the direction of the Dow Jones Industrial Average (DJIA) and the Dow Jones Transportation Average (DJTA) and only follow trends where both are moving in the same direction. Volume is a confirmatory criteria. The theory uses elements of peak and trough analysis. Dow’s theory posits three trend phases: accumulation, when smart money starts buying or selling; public participation, when the wider public joins in; and distribution, when the smart money exits.
There are a number of ways to trade the DJIA. One is to use ETFs which allow investors to trade the DJIA as a single security, rather than having to buy shares in all 30 constituent companies. A leading example is the SPDR Dow Jones Industrial Average ETF (DIA). DJIA futures contracts enable traders to speculate on the future value of the index and Options provide the right, but not the obligation, to buy or sell the index at a predetermined price in the future. Mutual funds enable investors to buy a share of a diversified portfolio of DJIA stocks thus providing exposure to the overall index.
S&P and Nasdaq futures are presented by CME e-minis and Dow Jones futures are presented by CBOT e-mini.
Markets await US data, Fed Chairman Powell testimony
The US economic docket will feature January Factory Orders and February ISM Services PMI report on Tuesday.
Speaking on the policy outlook on Monday, Atlanta Federal Reserve (Fed) President Raphael Bostic said that he expects the Fed to lower the policy rate by 25 basis points twice in 2024. “Inflation is still widespread, with more than the usual share of items increasing above 5% with trimmed mean remaining stuck at 2.6%,” Bostic added, Reuters reports.
In its Semi-annual Monetary Policy Report published on Friday, the Fed reiterated that it’s not appropriate to reduce the policy rate until they have greater confidence inflation will move sustainably toward 2%.
Fed Chairman Jerome Powell will present the monetary policy report and respond to questions in a two-day testimony before the Congress, starting Wednesday.
On Friday, the US Bureau of Labor Statistics will release February jobs report, which will include Nonfarm Payrolls, the Unemployment Rate and wage inflation figures.
Risk sentiment FAQs
What do the terms"risk-on" and "risk-off" mean when referring to sentiment in financial markets?
In the world of financial jargon the two widely used terms “risk-on” and “risk off'' refer to the level of risk that investors are willing to stomach during the period referenced. In a “risk-on” market, investors are optimistic about the future and more willing to buy risky assets. In a “risk-off” market investors start to ‘play it safe’ because they are worried about the future, and therefore buy less risky assets that are more certain of bringing a return, even if it is relatively modest.
What are the key assets to track to understand risk sentiment dynamics?
Typically, during periods of “risk-on”, stock markets will rise, most commodities – except Gold – will also gain in value, since they benefit from a positive growth outlook. The currencies of nations that are heavy commodity exporters strengthen because of increased demand, and Cryptocurrencies rise. In a “risk-off” market, Bonds go up – especially major government Bonds – Gold shines, and safe-haven currencies such as the Japanese Yen, Swiss Franc and US Dollar all benefit.
Which currencies strengthen when sentiment is "risk-on"?
The Australian Dollar (AUD), the Canadian Dollar (CAD), the New Zealand Dollar (NZD) and minor FX like the Ruble (RUB) and the South African Rand (ZAR), all tend to rise in markets that are “risk-on”. This is because the economies of these currencies are heavily reliant on commodity exports for growth, and commodities tend to rise in price during risk-on periods. This is because investors foresee greater demand for raw materials in the future due to heightened economic activity.
Which currencies strengthen when sentiment is "risk-off"?
The major currencies that tend to rise during periods of “risk-off” are the US Dollar (USD), the Japanese Yen (JPY) and the Swiss Franc (CHF). The US Dollar, because it is the world’s reserve currency, and because in times of crisis investors buy US government debt, which is seen as safe because the largest economy in the world is unlikely to default. The Yen, from increased demand for Japanese government bonds, because a high proportion are held by domestic investors who are unlikely to dump them – even in a crisis. The Swiss Franc, because strict Swiss banking laws offer investors enhanced capital protection.
- Gold price climbs above $2,120 as investors expect that the Fed will cut interest rates in June.
- The US Dollar remains on the back foot ahead of Fed Powell’s testimony, NFP data.
- Fed Powell’s guidance on interest rates will influence market expectations for rate cuts in June.
Gold price (XAU/USD) continues its winning spell for the fifth trading session on Tuesday. The precious metal refreshes a three-month high, approaching its all-time high of around $2,145 seen in December 2023. Gold’s advance happens amid a cautious market sentiment and increased bets that the Federal Reserve (Fed) will cut interest rates in the June policy meeting.
The outlook for Gold price remains uncertain as investors await Fed Chair Jerome Powell’s testimony before Congress on Wednesday and a slew of labor market data from the United States, such as JOLTS Job Openings for January and ADP Employment Change data, which will be announced on Wednesday.
The commentary from Jerome Powell on the inflation and the interest rate outlook could trim uncertainty associated with the timing of the Fed’s rate cuts. A hawkish guidance on interest rates could weigh on Gold as it will increase the holding cost of investment in non-yielding assets.
Later this week, the US Nonfarm Payrolls (NFP) for February will provide fresh cues on labor demand and wage growth. Apart from keeping inflation under control, reaching maximum employment is a key mandate for Fed policymakers when deciding on interest rates.
Daily digest market movers: Gold price strengthens ahead of Fed Powell’s testimony
- Gold price prints a fresh three-month high slightly above $2,120. The safe-haven demand strengthens as investors seem confident that the Federal Reserve will start reducing interest rates in June. The CME FedWatch tool shows that traders see a little over 52% chance for a rate cut by 25 basis points (bps) in the June meeting. For the upcoming monetary policy meeting on March 19-20, investors see the Fed keeping interest rates unchanged in the range of 5.25%-5.50%.
- The near-term demand for Gold will be influenced by Fed Chair Jerome Powell’s testimony before Congress on Wednesday and an array of United States economic data released later this week.
- Jerome Powell is expected to reiterate that there is no urgency for rate cuts due to resilient economic growth. The Fed isn’t likely to shift from its hawkish stance towards policy normalization until it gets convinced that inflation will sustainably return to the 2% target. The Fed wants to see inflation declining for months as evidence before considering rate cuts.
- On Monday, Atlanta Fed Bank President Raphael Bostic said a strong labor market and decent economic growth have bought time for the Federal Open Market Committee (FOMC) to decide on when rate cuts will be optimal. Bostic added that the Fed is having a “rebounding success” as inflation slowly returns to the desired target without hurting labor demand.
- The US Dollar remains sideways in a narrow range ahead of the US ISM Services PMI for February, which will be published at 15:00 GMT. According to economists, the Services PMI is expected to drop to 53.0 from 53.4 in January.
- The US Manufacturing PMI, released on Friday, was downbeat. A weak Service PMI would raise concerns over economic prospects.
- The US Dollar Index (DXY), which tracks the Greenback’s value against six major currencies, trades near a two-day low around 103.70.
Technical Analysis: Gold price approaches $2,140
Gold price sees a strong buying interest after it broke out from the Symmetrical Triangle pattern formed on a daily time frame. The breakout of the aforementioned chart pattern exhibits a volatility expansion, which leads to wider ticks on the upside and heavy volume. The precious metal could extend its upside towards the horizontal resistance plotted from the December 4 high at $2,144.48.
The 14-period Relative Strength Index (RSI) holds above 60.00, indicating a bullish momentum ahead. The RSI (14) is not showing any divergence signals but has reached overbought territory.
Gold FAQs
Why do people invest in Gold?
Gold has played a key role in human’s history as it has been widely used as a store of value and medium of exchange. Currently, apart from its shine and usage for jewelry, the precious metal is widely seen as a safe-haven asset, meaning that it is considered a good investment during turbulent times. Gold is also widely seen as a hedge against inflation and against depreciating currencies as it doesn’t rely on any specific issuer or government.
Who buys the most Gold?
Central banks are the biggest Gold holders. In their aim to support their currencies in turbulent times, central banks tend to diversify their reserves and buy Gold to improve the perceived strength of the economy and the currency. High Gold reserves can be a source of trust for a country’s solvency. Central banks added 1,136 tonnes of Gold worth around $70 billion to their reserves in 2022, according to data from the World Gold Council. This is the highest yearly purchase since records began. Central banks from emerging economies such as China, India and Turkey are quickly increasing their Gold reserves.
How is Gold correlated with other assets?
Gold has an inverse correlation with the US Dollar and US Treasuries, which are both major reserve and safe-haven assets. When the Dollar depreciates, Gold tends to rise, enabling investors and central banks to diversify their assets in turbulent times. Gold is also inversely correlated with risk assets. A rally in the stock market tends to weaken Gold price, while sell-offs in riskier markets tend to favor the precious metal.
What does the price of Gold depend on?
The price can move due to a wide range of factors. Geopolitical instability or fears of a deep recession can quickly make Gold price escalate due to its safe-haven status. As a yield-less asset, Gold tends to rise with lower interest rates, while higher cost of money usually weighs down on the yellow metal. Still, most moves depend on how the US Dollar (USD) behaves as the asset is priced in dollars (XAU/USD). A strong Dollar tends to keep the price of Gold controlled, whereas a weaker Dollar is likely to push Gold prices up.
US Dollar strength and central bank tightening weighed on the Gold market for most of last year. XAU/USD awaits clarity on Fed easing path, economists at ING say.
Fed policy remains key for Gold
Federal Reserve policy will remain key for the outlook of Gold prices in the months ahead.
Swaps markets suggest investors don’t see much chance of a reduction in interest rates until June. Our US economist agrees. This will support the Dollar and weigh on the Gold price in the short term.
We expect Gold prices to remain volatile in the coming months as the market reacts to macro drivers, tracking geopolitical events and Fed rate policy.
If there is to be any significant impetus in EUR/USD, it is likely to come from the Dollar side, economists at Commerzbank say.
1.0900 mark would be scratched on a few weaker US data coming in succession
The ISM index for services is on the agenda today. If the ISM services index is weaker than expected, the EUR/USD could launch another attack on the 1.0900 mark.
If a few weaker data come in succession over the course of the week, the view could increasingly prevail that it will be a bumpy landing which, although reasonably successful, will still leave minor damage here and there. In this case, the 1.0900 mark would be scratched.
However, things could also turn out differently: the US labor market, a data heavyweight, could remain robust and therefore underpin the picture of a soft landing again, meaning that the Fed and the market do not have to adjust their interest rate expectations and the USD continues to flex its muscles.
To add another ingredient to the EUR/USD mix, there is also the ECB meeting on Thursday. Our experts are not expecting any major surprises that could shake up the June theory, but you never know. Life is full of surprises. So maybe this week won't be as boring in EUR/USD as it looks at the moment.
Gold (XAU/USD) topped $2,100 on Monday. Economists at Société Générale analyze the yellow metal’s outlook.
$2,075 is near-term support
Gold has established itself above the upper part of multi-year range ($2,075) in the form of a rectangle; this denotes the uptrend has resumed. It is fast approaching the peak achieved in December near $2,135/$2,140 which is also the trend line connecting highs of 2011 and 2020. This could be a tentative resistance but break from multi-year consolidation points towards possibility of larger upside.
Upper limit of the rectangle at $2,075 is near-term support.
Once Gold overcomes the hurdle at $2,135/$2,140, the up move is likely to extend; next objectives could be located at projections of $2,250 an $2,360.
Target for the rectangle is located at $2,460.
EUR/CHF trades over 0.9600. Economists at Commerzbank analyze the pair’s outlook.
Discussion about SNB Jordan’s successor will have little impact on the Franc
It should be noted that SNB Chairman Thomas Jordan announced at the end of last week that he will step down at the end of September. This means that he will still chair three interest rate decisions. The discussion about his successor is likely to accompany us for the next few months but will have little impact on the CHF in the short term.
The Franc has suffered in recent months because expectations for the ECB's first interest rate move have been pushed back, allowing EUR/CHF to work its way up to 0.9600. However, most of this should have been priced in by now, so I see little more upside potential in EUR/CHF in the short term, especially not so close to the ECB meeting.
- EUR/USD could find immediate support at the nine-day EMA at 1.0832.
- The technical analysis suggests a confirmation of bullish momentum for the pair.
- The 38.2% Fibonacci retracement of 1.0864 appears to be the key resistance level.
EUR/USD recovered some of its intraday losses but remains in negative territory, hovering around 1.0850 during the European session on Tuesday. The US Dollar (USD) strengthened against the Euro (EUR) on the improved sentiment of risk aversion.
The EUR/USD pair could find immediate support around the nine-day Exponential Moving Average (EMA) at 1.0832. A break below this level could put downward pressure on the pair to test the psychological support at 1.0800 aligned with the previous week’s low at 1.0795. Further support appears at the major level of 1.0750 if the pair surpasses the latter.
Technical analysis indicates a bullish sentiment for the EUR/USD pair. The 14-day Relative Strength Index (RSI) is positioned above the 50 mark. Moreover, the Moving Average Convergence Divergence (MACD) exhibits a divergence above the signal line and lies above the centerline. While a lagging indicator, this suggests a confirmation of the bullish momentum for the EUR/USD pair.
On the upside, the immediate resistance levels for the EUR/USD pair are identified at the 38.2% Fibonacci retracement of 1.0864. A break above this level could exert support for the pair to revisit February’s high at 1.0897, in conjunction with the psychological resistance at 1.0900.
EUR/USD: Daily Chart
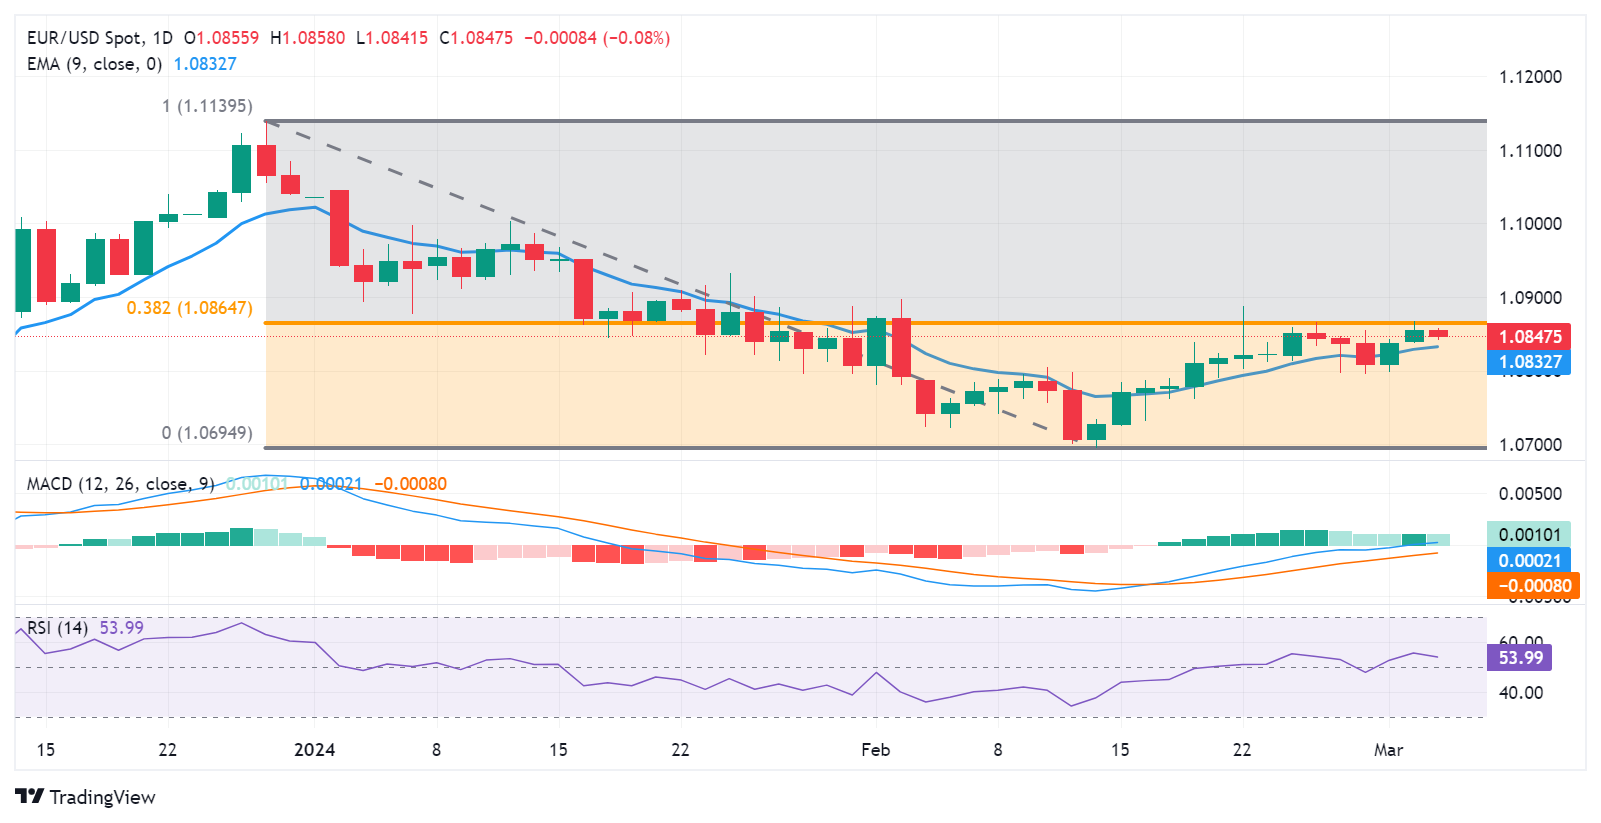
Gold (XAU/USD) has rallied above $2,100. Strategists at ANZ Bank analyze the yellow metal’s outlook.
Investor demand rises
Gold flirted with a record high, surging above $2,100, as investors continued to pour into the safe haven asset. The uncertain economic backdrop, combined with geopolitical risks has seen investor demand rise. This comes as monetary policy likely switches to an easing bias, a boon for non-yielding assets such as Gold.
Robust buying is emerging in the physical market, with inflows into the Gold-backed SPDR Gold Share ETF rising for the first time in nine trading sessions.
- Silver reverses an intraday dip and moves back closer to the YTD peak on Tuesday.
- The technical setup favours bullish traders and supports prospects for further gains.
- Sustained weakness back below the $23.00 mark will negate the positive outlook.
Silver (XAG/USD) attracts some dip-buying near the $23.65-$23.60 region on Tuesday and flirts with the YTD peak during the first half of the European session. The white metal currently trades just below the $24.00 mark and looks to build on the previous day's breakout momentum through the $23.30-$23.35 confluence hurdle.
The latter comprises the 100- and the 200-day Simple Moving Averages (SMA), which should now act as a key pivotal point for the XAG/USD. Any meaningful corrective slide is more likely to get bought into near the said resistance-turned-support and remain limited near the $23.00 round figure. That said, some follow-through selling will suggest that a one-week-old strong rally has run out of steam and pave the way for deeper losses.
The XAG/USD might then accelerate the slide towards the $22.50-$22.45 intermediate support before eventually dropping to sub-$22.00 levels or the two-month trough touched in January and retested in February. The downward trajectory could extend further and drag the white metal further towards the next relevant support near the $21.40-$21.35 region. That said, positive oscillators on the daily chart warrant caution for bearish traders.
On the flip side, momentum beyond the $24.00 mark is likely to confront some resistance near the $24.30-$24.35 region ahead of the $24.50 supply zone. A sustained strength beyond should allow the XAG/USD to reclaim the $25.00 psychological mark and climb further towards the $25.45-$25.50 intermediate hurdle en route to the $26.00 neighbourhood, or the December 2023 swing high.
Silver daily chart
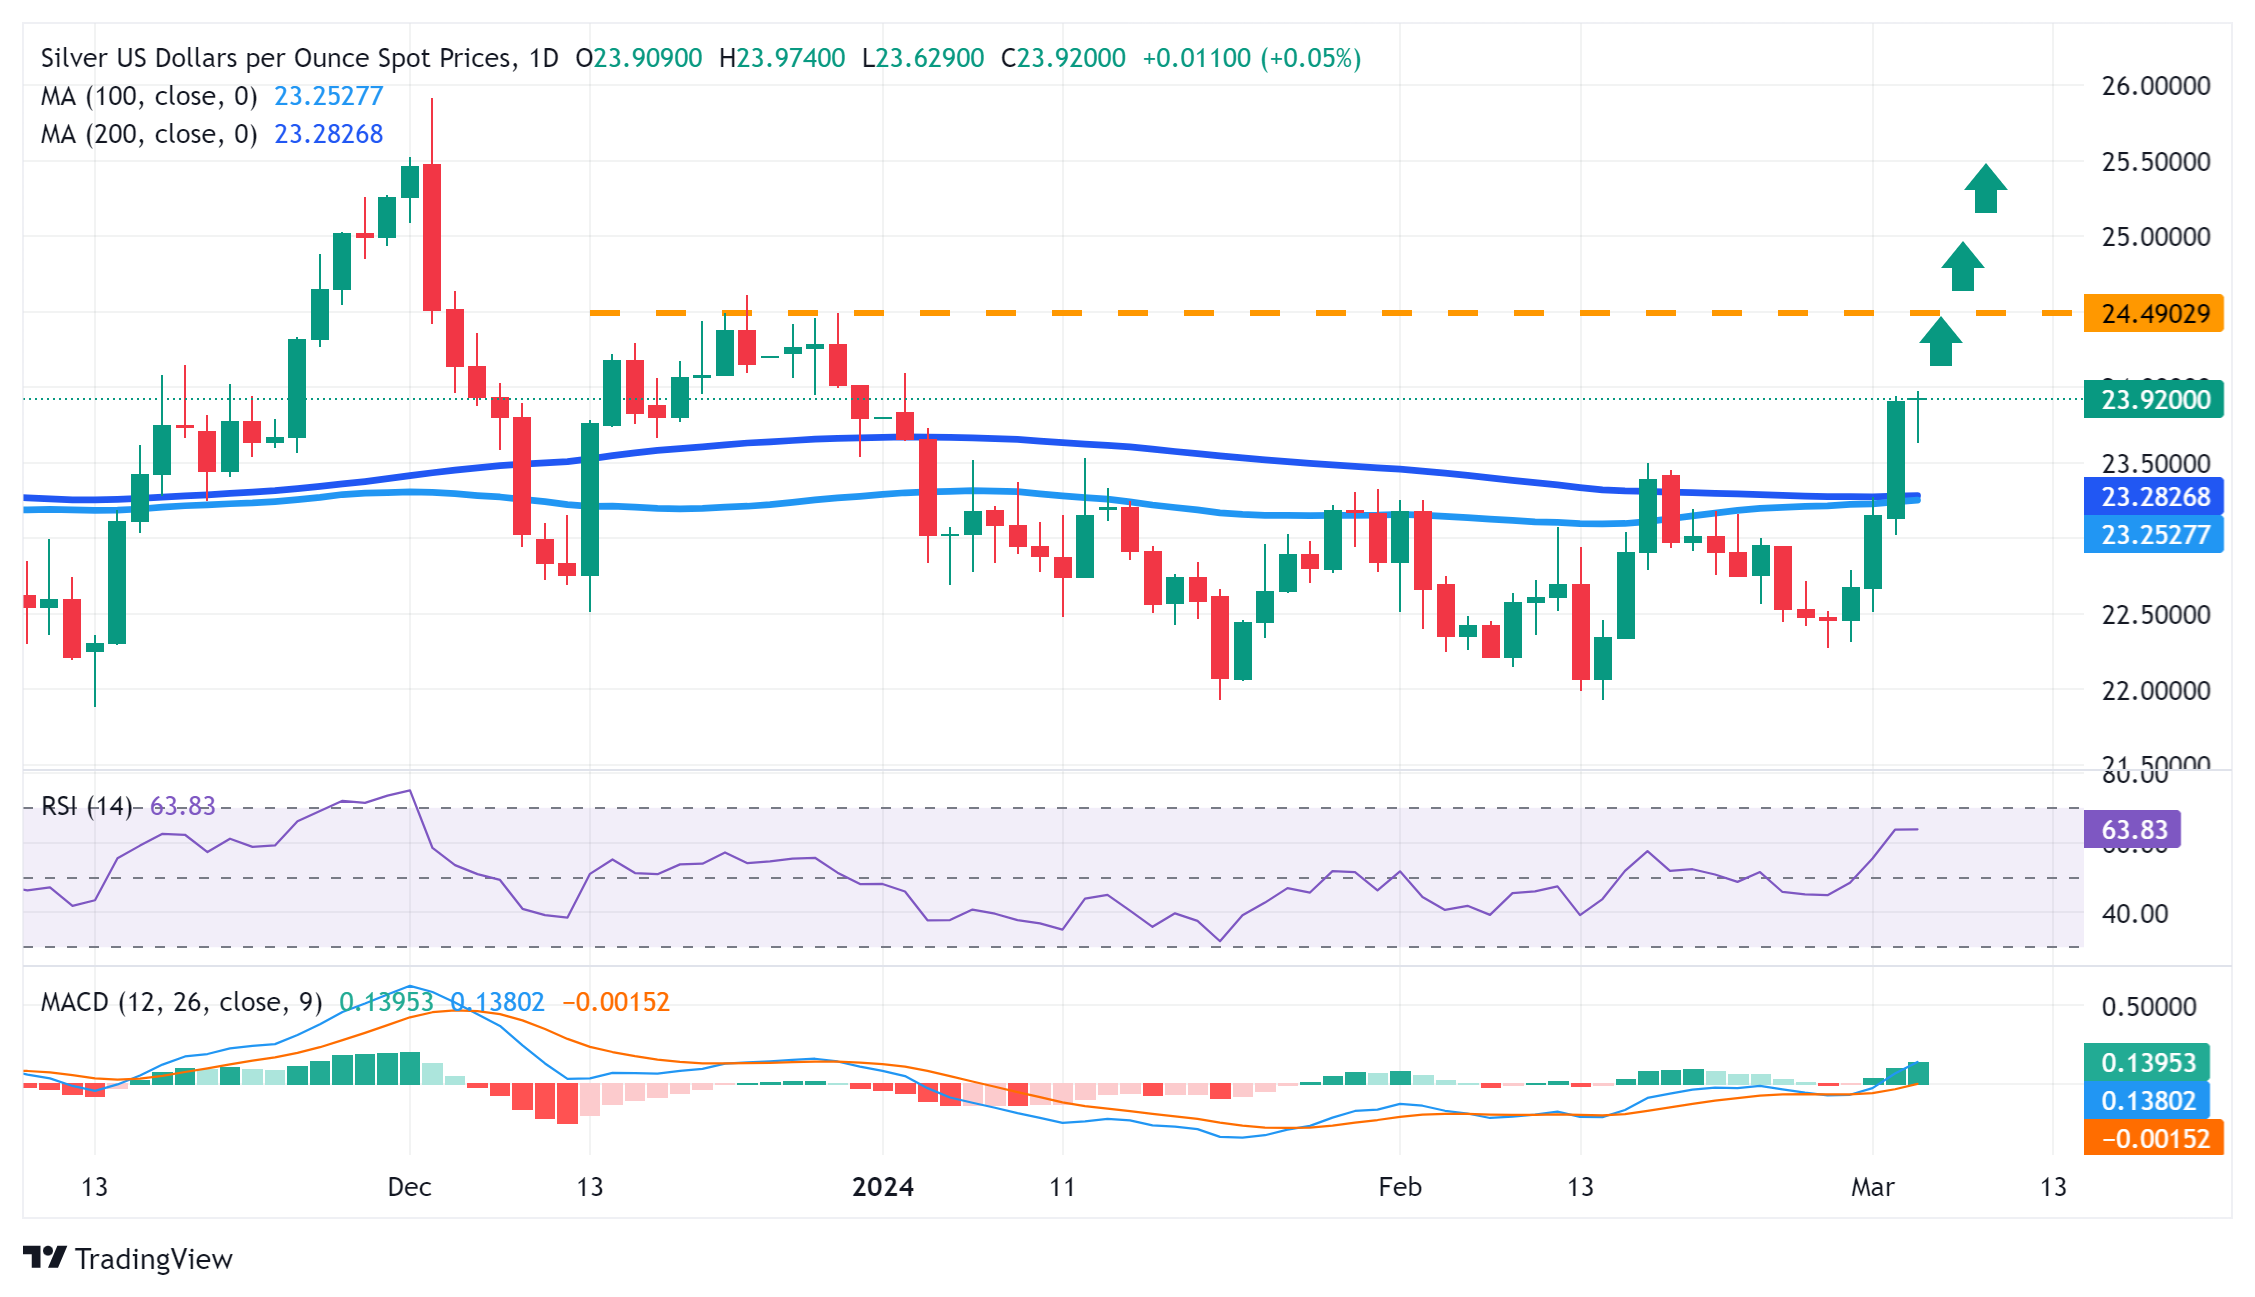
EUR/USD is trying to make headway above 1.0850. Economists at Société Générale analyze the pair’s outlook.
How far EUR/USD advance may depend on the ISM services and NFP
Slowing US employment growth on Friday may outweigh Powell’s testimony and the ECB decision and could give EUR/USD another chance to have a go at 1.0900.
Upside momentum for the Dollar stalled last week and another run of profit-taking could follow if services ISM and/or NFP fall short of expectations. This would draw a line under Fed repricing which has governed FX and EUR/USD since the start of the year.
For the ECB, there will be no change in policy on Thursday but the question that dominates is the new inflation forecast. If the projections are revised down and the ECB is reassured by the 4Q inflection point in wage growth, then market conviction would strengthen that a first rate cut could follow in June and precede a first reduction in the US. This could take the gloss off recent gains for EUR/CHF, EUR/JPY and snuff out rebound in EUR/GBP from the February lows.
- USD/CHF focuses on recapturing the crucial resistance of 0.8900 amid a risk-off mood.
- Fed Powell would provide fresh guidance on the interest rate outlook.
- The term of SNB Jordan will be over in the second half of this year.
The USD/CHF pair rises slightly above 0.8850 in Tuesday’s European session as investors turn cautious ahead of the Federal Reserve (Fed) Chair Jerome Powell’s testimony before Congress on Wednesday and the United States Nonfarm Payrolls (NFP) data later this week.
The Swiss Franc asset extends its upside as the US Dollar Index (DXY) rebounds from two-day low around 103.70. Fed Powell's commentary and the February labor market data will provide fresh insights about when the Fed will start reducing interest rates.
The Swiss Franc fails to find buying interest despite the annual Consumer Price Index (CPI) remaining stickier than expectations in February. The monthly CPI rose strongly by 0.6% against 0.2% in January. The monthly pace was significantly higher than required to keep inflation below 2%. The annual CPI at 1.2% was higher than expectations of 1.1% but lower than the prior reading of 1.3%.
Meanwhile, it is announced that the SNB is looking for the successor of Chairman Thomas J. Jordan. The new SNB Chairman will be announced in the second half of this year.
USD/CHF falls while attempting to deliver a breakout of the consolidation formed in a range of 0.8744-0.8898 on a four-hour timeframe. A mild sell-off near the upper end of the consolidation doesn’t indicate a reversal but indicates that US Dollar bulls need more force for a decisive break. The consolidation pattern indicates a sharp volatility contraction. A breakout in the same will result in a volatility expansion, leading to wider ticks and heavy volume.
The 50-period Exponential Moving Average (EMA) near 0.8822 continues to support the US Dollar bulls.
The 14-period Relative Strength Index (RSI) climbs above 60.00. A bullish momentum would emerge if the RSI (14) manages to sustain above the same.
Fresh upside would emerge if the asset breaks above the three-month high around 0.8900, which would unlock upside towards September 20 low at 0.8932 and November 8 low at 0.8976.
On the contrary, a breakdown below February 13 low at 0.8746 would expose the asset to the round-level support of 0.8700, followed by February 1 high around 0.8650.
USD/CHF four-hour chart
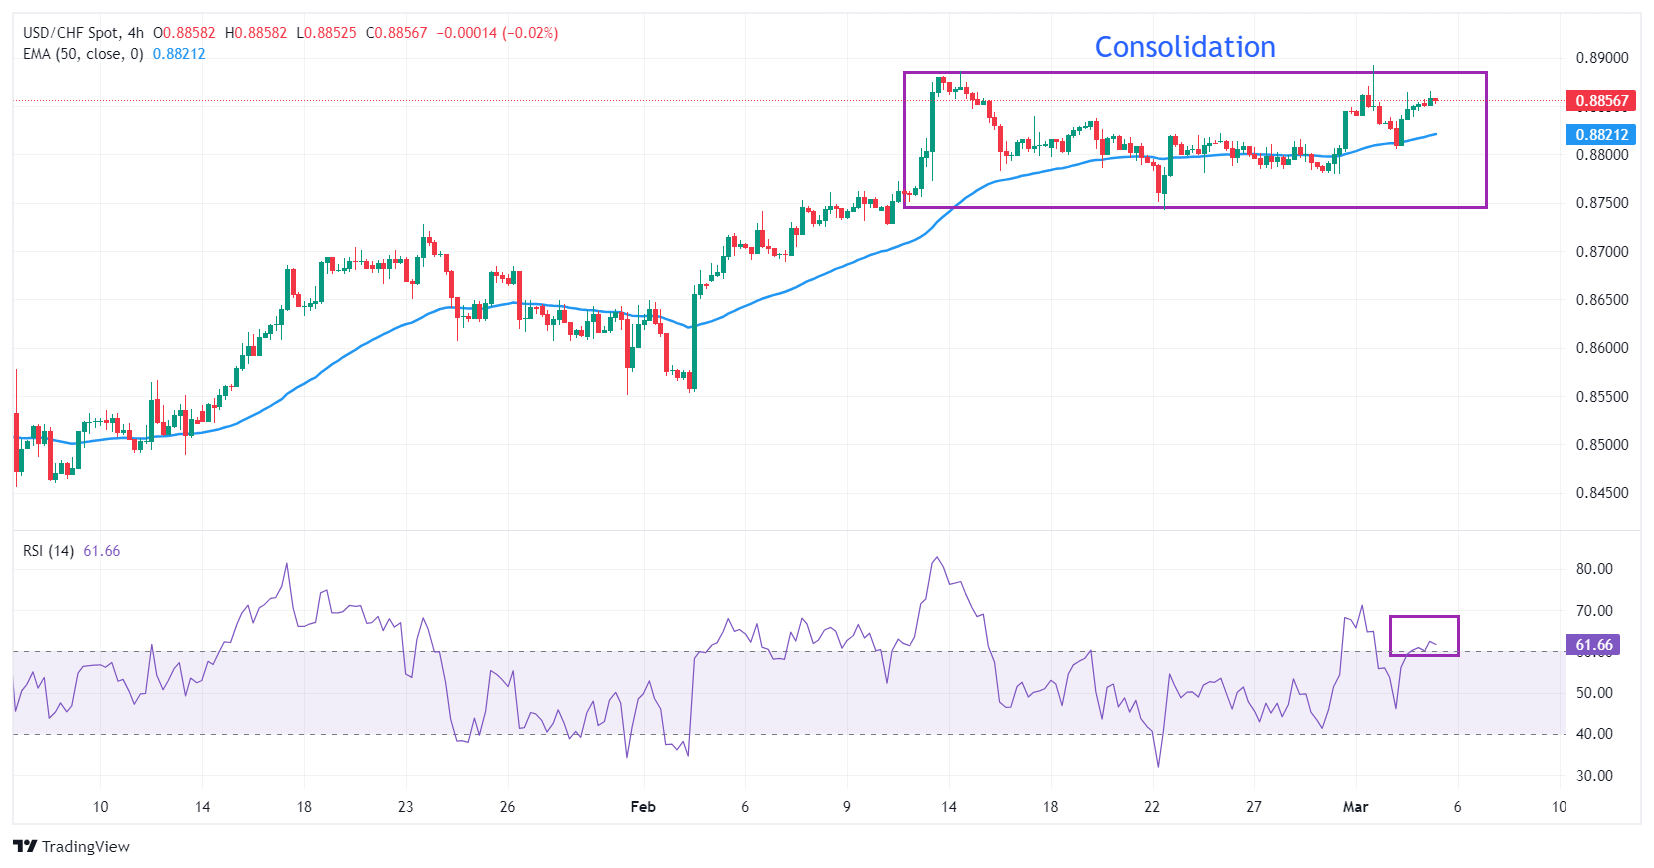
Economists at ING analyze US Dollar (USD) outlook after comments from Atlanta Fed's Raphael Bostic
Fed hawks consider “pent-up exuberance”
The mood music coming through from the Fed remains one of there being no rush to cut rates. On Monday, Atlanta Fed President Raphael Bostic talked of there being 'pent-up exuberance' in the business sector, which could be a problem for inflation if the Fed cuts too quickly.
Bostic's comments feed into the prevailing view that the Fed is in no rush to cut rates and that this view will likely be echoed when Fed Chair Jerome Powell testifies to the House Financial Services Committee on Wednesday.
We doubt today's US ISM Services data for February will be a major market mover, although a repeat of the strong January release would be Dollar-positive. And we see DXY continuing to find support under 104.00.
- Pound Sterling drops amid market caution ahead of UK’s budget, Fed Powell’s testimony.
- Limited exposure to fiscal stimulus in the UK’s spring budget would reinforce hopes of BoE rate cuts.
- Investors await the UK and US PMI data for fresh guidance.
The Pound Sterling (GBP) falls slightly from the crucial resistance of 1.2700 in Tuesday’s European session. The GBP/USD pair has come under pressure due to diminishing investors’ risk appetite and uncertainty ahead of the United Kingdom’s Spring budget, to be outlined by Chancellor Jeremy Hunt on Wednesday.
The scope of fiscal measures will be a balancing act for Jeremy Hunt as the UK economy faces a stubborn inflation outlook and deteriorating growth forecasts. “We’ve always said we would only cut taxes in a way that’s responsible and prudent,” Hunt said on Sunday, according to BBC News
Limited scope for tax cuts would escalate hopes of early rate cuts by the Bank of England (BoE), a scenario that could weigh on the Pound Sterling.
Meanwhile, a dismal market sentiment ahead of Federal Reserve Chair Jerome Powell’s testimony before Congress, also due on Wednesday, and an array of United States economic data this week has brought some relief for the US Dollar.
In today’s session, investors will focus on the final S&P Global/CIPS UK Services PMI, to be released at 09:30 GMT, and the US S&P Global and ISM Services PMIs, which will be published at 14:45 GMT and 15:00 GMT, respectively.
Daily digest market movers: Pound Sterling falls amid cautious market mood
- The Pound Sterling drops from the round-level resistance of 1.2700 amid caution ahead of the United Kingdom’s Spring budget and packed United States economic calendar.
- The market participants will keenly focus on the Spring budget to be announced by Chancellor Jeremy Hunt. An indication of higher fiscal stimulus through tax cuts, a decline in national insurance rates, and significant public spending plans against revenue-raising tools would weaken hopes of early rate cuts by the Bank of England as fiscal stimulus could fuel inflationary pressures.
- The Conservative government’s plan is expected to lean towards spurring growthto avoid the economy falling into a recession again. However, a big stimulus package isn’t expected.
- BoE policymakers have indicated that the technical recession observed in the second half of 2023 was shallow.
- The economy is probably back on track for growth as Retail Sales and PMIs are improving meaningfully. However, an array of liquidity measures is required to confirm that the economy must not get derailed from the path of recovery.
- On the contrary, the limited scope of fiscal measures could prompt chances of early rate cuts by the BoE. Markets expect the BoE to start reducing interest rates in August, when inflation is expected to return to the 2% target before increasing again.
- Meanwhile, the US Dollar rebounds after printing a fresh two-day low near 103.70 as the market sentiment turns cautious ahead of Federal Reserve Chair Jerome Powell’s testimony before Congress on Wednesday and a bunch of US economic data such as the ISM Services PMI, ADP Employment Change, JOLTS Job Openings, and the Nonfarm Payrolls.
- Powell is expected to warn about the potential risks of early rate cuts, reiterating the need for more evidence to confirm that inflation will return to the 2% target.
Technical Analysis: Pound Sterling struggles to recapture 1.2700
The Pound Sterling is at a make or a break near the downward-sloping border of the Descending Triangle pattern formed on a daily time frame, placed from December 28 high at 1.2827. A decisive break above the same could result in a sharp upside move. The horizontal support of the aforementioned chart pattern is plotted from December 13 low near 1.2500.
Usually, a Descending Triangle pattern exhibits indecisiveness among market participants, but it has a slight downside bias due to lower highs and flat lows.
The 14-period Relative Strength Index (RSI) oscillates inside the 40.00-60.00 range, indicating a sharp volatility contraction.
Pound Sterling FAQs
What is the Pound Sterling?
The Pound Sterling (GBP) is the oldest currency in the world (886 AD) and the official currency of the United Kingdom. It is the fourth most traded unit for foreign exchange (FX) in the world, accounting for 12% of all transactions, averaging $630 billion a day, according to 2022 data.
Its key trading pairs are GBP/USD, aka ‘Cable’, which accounts for 11% of FX, GBP/JPY, or the ‘Dragon’ as it is known by traders (3%), and EUR/GBP (2%). The Pound Sterling is issued by the Bank of England (BoE).
How do the decisions of the Bank of England impact on the Pound Sterling?
The single most important factor influencing the value of the Pound Sterling is monetary policy decided by the Bank of England. The BoE bases its decisions on whether it has achieved its primary goal of “price stability” – a steady inflation rate of around 2%. Its primary tool for achieving this is the adjustment of interest rates.
When inflation is too high, the BoE will try to rein it in by raising interest rates, making it more expensive for people and businesses to access credit. This is generally positive for GBP, as higher interest rates make the UK a more attractive place for global investors to park their money.
When inflation falls too low it is a sign economic growth is slowing. In this scenario, the BoE will consider lowering interest rates to cheapen credit so businesses will borrow more to invest in growth-generating projects.
How does economic data influence the value of the Pound?
Data releases gauge the health of the economy and can impact the value of the Pound Sterling. Indicators such as GDP, Manufacturing and Services PMIs, and employment can all influence the direction of the GBP.
A strong economy is good for Sterling. Not only does it attract more foreign investment but it may encourage the BoE to put up interest rates, which will directly strengthen GBP. Otherwise, if economic data is weak, the Pound Sterling is likely to fall.
How does the Trade Balance impact the Pound?
Another significant data release for the Pound Sterling is the Trade Balance. This indicator measures the difference between what a country earns from its exports and what it spends on imports over a given period.
If a country produces highly sought-after exports, its currency will benefit purely from the extra demand created from foreign buyers seeking to purchase these goods. Therefore, a positive net Trade Balance strengthens a currency and vice versa for a negative balance.
- USD/MXN attracts traders amidst risk aversion ahead of key data releases from the United States.
- US ISM Services PMI is expected to ease at 53.0 for February, slightly lower than 53.4 prior.
- Banxico could reduce interest rates by 75 bps over the next six months.
USD/MXN snaps its three-day losing streak, inching higher to near 17.00 during the early European hours on Tuesday. The US Dollar (USD) strengthens amid risk aversion as investors brace for significant economic data releases from the United States (US) later in the week.
Market focus turns to the ISM Services PMI data slated for release on Tuesday, with expectations at 53.0 for February, slightly lower than the previous figure of 53.4. Notably, concerns surrounding inflation have eased following the PCE Price Index meeting expectations.
Traders appear cautious and are opting to wait for Federal Reserve (Fed) Chair Jerome Powell's congressional testimony on Wednesday and Thursday. They are seeking additional insights into the Federal Reserve’s potential rate-cut trajectory.
Atlanta Federal Reserve (Fed) President Raphael Bostic's remarks on Monday garnered attention, as he expressed uncertainty regarding achieving a soft landing. Bostic indicated that he does not anticipate consecutive rate cuts when they begin but still expects two 25-basis point rate cuts in 2024.
Market expectations remain high for the Bank of Mexico (Banxico) to implement monetary policy easing in March, with investors expecting a reduction of 75 basis points (bps) over the next six months. Banxico officials have emphasized a measured approach to rate adjustments, highlighting the importance of maintaining higher rates for an extended period.
Consumer Confidence data is scheduled for release on Wednesday, followed by inflation data on Thursday. The Mexican Peso (MXN) received upward support against the US Dollar (USD) following last week's release of January's labor numbers. The jobless rate increased to 2.9% year-over-year from 2.6% previously, surpassing expectations of a 2.8% rise.
EUR/USD remains supported above 1.0800. Economists at ING analyze the pair’s outlook.
Downside risks into Thursday
We do fear that EUR/USD has a little downside later this week on Thursday's European Central Bank risk.
We see risks of a weaker Euro as the ECB lays out the conditionality of a June rate cut. Combined with Fed speeches this week, our bias is that EUR/USD ends the week near 1.0800.
The Eurozone data calendar is light today, and we doubt the January PPI release is a market mover.
Japanese Deputy Chief Cabinet Secretary Hideki Murai said on Tuesday, “Japan is gradually seeing a positive cycle of rising growth; wages fall into place.”
Additional comments
Important to embed new business practices in japan so costs are appropriately passed on throughout supply chain.
Hopes Bank of Japan (BoJ) continues to work closely with government in guiding monetary policy to sustainably meet price target.
Specific monetary policy decision up to BoJ, when asked whether conditions being met to end negative rates.
BoJ has said whether or not to sustain easy monetary policy will depend on economic, price developments at the time.
Market reaction
The Japanese Yen is catching a small bid on the above comments, as USD/JPY loses 0.05% on the day to trade at 150.44, as of writing.
The Reserve Bank of India (RBI) is set to maintain a cautious stance on monetary policy. In the view of economists at Wells Fargo, delayed easing should support the Indian Rupee (INR) over time.
Local politics should be a source of strength for the INR
A patient and cautious monetary policy stance from the RBI should be supportive of the Indian Rupee over time. The Federal Reserve is likely to cut policy rates before the RBI, which should support the Rupee through more attractive interest rate differentials.
Our view for a Modi victory with a Lok Sabha majority should allow for broad-based policy continuity and further pursuit of reforms aimed at integrating India into the global economy and India's financial markets into the global financial system. Policy continuity should attract equity and debt inflows into India, and be supportive of the Rupee.
Finally, economic outperformance, fiscal responsibility and debt consolidation, and easing political risk should offer a rationale for credit rating agencies to upgrade India's sovereign credit rating.
We see opportunity for the Rupee to strengthen over the longer term. As far as our long-term outlook, we believe the USD/INR exchange rate can strengthen to 82.00 by the end of 2024 and believe the foundation for Rupee strength to persist into 2025. By the middle of next year, we believe the USD/INR can move toward 81.00.
Here is what you need to know on Tuesday, March 5:
Major currency pairs continue to fluctuate in familiar ranges early Tuesday following Monday's indecisive action. ISM Services PMI survey for February and Factory orders data for January will be featured in the US economic docket in the American session. S&P will also release final revisions to February PMI for the EU, Germany, the UK and the US.
Federal Reserve Chairman Jerome Powell will present the semi-annual Monetary Policy Report on Wednesday and Thursday, the European Central Bank will announce policy decisions on Thursday and the US Bureau of Labor Statistics will release the February jobs report on Friday.
The US Dollar (USD) struggled to gather strength against its rivals in the first half of the day on Monday. The bearish opening seen in Wall Street, however, helped the currency hold its ground and the USD Index (DXY) closed the day virtually unchanged. In the European morning on Tuesday, DXY trades marginally higher but stays below 104.00. In the meantime, US stock index futures are down between 0.3% and 0.5%, pointing to a cautious market mood, while the benchmark 10-year US Treasury bond yield stays quiet at around 4.2%.
US Dollar price today
The table below shows the percentage change of US Dollar (USD) against listed major currencies today. US Dollar was the strongest against the Australian Dollar.
| USD | EUR | GBP | CAD | AUD | JPY | NZD | CHF | |
| USD | 0.07% | 0.11% | 0.17% | 0.42% | 0.01% | 0.35% | 0.10% | |
| EUR | -0.07% | 0.04% | 0.10% | 0.33% | -0.05% | 0.26% | 0.05% | |
| GBP | -0.10% | -0.03% | 0.06% | 0.29% | -0.10% | 0.24% | 0.01% | |
| CAD | -0.17% | -0.10% | -0.07% | 0.21% | -0.15% | 0.16% | -0.07% | |
| AUD | -0.42% | -0.33% | -0.29% | -0.23% | -0.39% | -0.07% | -0.28% | |
| JPY | -0.02% | 0.07% | 0.06% | 0.16% | 0.37% | 0.34% | 0.09% | |
| NZD | -0.36% | -0.26% | -0.25% | -0.18% | 0.07% | -0.35% | -0.21% | |
| CHF | -0.11% | -0.04% | -0.01% | 0.06% | 0.30% | -0.11% | 0.24% |
The heat map shows percentage changes of major currencies against each other. The base currency is picked from the left column, while the quote currency is picked from the top row. For example, if you pick the Euro from the left column and move along the horizontal line to the Japanese Yen, the percentage change displayed in the box will represent EUR (base)/JPY (quote).
Despite the choppy action seen in foreign exchange markets, Gold gathered bullish momentum and extended its rally to a fresh 2024-high above $2,100 on Monday, rising more than 1.5% on a daily basis. XAU/USD consolidates its gains above $2,110 in the early European session.
Gold price flirts with multi-month peak, bulls await more cues on Fed rate-cut path.
EUR/USD closed marginally higher on Monday but retreated to the 1.0850 area early Tuesday. Eurostat will release Producer Price Index (PPI) data for January later in the session.
The data from Japan showed early Tuesday that Tokyo Consumer Price Index jumped to 2.6% on a yearly basis in February from 1.8% in January. Tokyo CPI ex Food and Energy edged lower to 3.1% from 3.3% in the same period. USD/JPY showed no immediate reaction to these reading and was last seen moving sideways at around 150.50.
Japanese Yen bulls shrug off stronger Tokyo CPI print, subdued USD price action.
While speaking at the National People's Congress (NPC) annual meeting on Tuesday, China’s Premier Li Qiang noted that the foundation of China's economic recovery is not solid yet. According to Reuters, China is expected to set a growth target of 5% for 2024. AUD/USD came under bearish pressure during the Asian trading hours and was last seen losing nearly 0.5% on the day at around 0.6480.
Australian Dollar moves below a psychological level amid a stable US Dollar.
GBP/USD closed the second consecutive trading day in positive territory on Monday but reversed its direction after encountering resistance at around 1.2700. The pair stays on the back foot early Tuesday and edged lower toward 1.2670.
FX option expiries for Mar 5 NY cut at 10:00 Eastern Time, via DTCC, can be found below.
- EUR/USD: EUR amounts
- 1.0845 1.6b
- 1.0895 1b
- 1.0520 926m
- GBP/USD: GBP amounts
- 1.2590 355m
- USD/JPY: USD amounts
- 149.00 877m
- 149.50 1b
- 150.20 853m
- USD/CAD: USD amounts
- 1.3400 421m
- 1.3535 480m
- 1.3550 932m
- NZD/USD: NZD amounts
- 0.5955 680m
- 0.6175 698m
- 0.6280 573m
USD/CNY: USD amounts
- 7.0000 600m
- 7.1000 624m
- 7.2000 603m
Japan's top currency diplomat Masato Kanda said on Tuesday, we “must brace for higher interest rates environment given assumed interest rates raised to 1.9% from 1.1%.”
Additional quotes
Must strive for responsible fiscal management by achieving primary budget balancing in FY2025/26.
International global order faces mounting challenges including that posed by "global south".
We must maintain unwavering solidarity including support for Ukraine.
Related reads
- Japanese Yen remains on the defensive against USD, seems vulnerable to slide further
- EUR/JPY attracts some sellers below the mid-163.00s, Eurozone PMI data looms
- EUR/JPY loses momentum around 163.22 following the rise in Japanese CPI inflation data.
- The Tokyo CPI climbed 2.6% YoY in February vs. 1.6% prior.
- The ECB is anticipated to hold the rate steady at 4.5% at its March meeting on Thursday.
The EUR/JPY cross loses ground below the mid-163.00s during the early European trading hours on Tuesday. The rise in the Tokyo Consumer Price Index (CPI) for February triggered speculation that the Bank of Japan (BoJ) will exit the negative interest rate regime in the coming month, which lifts the Japanese Yen (JPY) and weighs on the cross lower. EUR/USD currently trades near 163.22, down 0.10% on the day.
Data released from the Statistics Bureau of Japan on Tuesday revealed that the Tokyo CPI climbed 2.6% YoY in February from 1.6% in January. Additionally, the CPI ex Fresh Food and Energy eased to 3.1% YoY in January from the previous reading of 3.3%. The rise in price growth above the central bank’s target in February supported the case for the BoJ’s first interest rate hike since 2007. This, in turn, boosts the JPY against its rivals.
The BoJ board member Hajime Takata hinted at a potential early move by the central bank to abandon its negative interest rate. He stated that the price aim was now within reach and it would be appropriate to change the monetary policy stance. Nonetheless, BoJ Governor Kazuo Ueda delivered a cautious view, saying that he would evaluate more data in order to confirm that a virtuous wage-price cycle is emerging.
On the Euro front, the European Central Bank (ECB) is expected to keep the main refinancing rate steady at 4.5% at its March meeting on Thursday. ECB President Christine Lagarde said last week that disinflation would persist but the central bank needs more evidence data before lowering the interest rate. Investors will take more cues from the press conference. A less hawkish tone could exert some selling pressure on the Euro (EUR) and create a headwind for the EUR/JPY cross.
Later on Tuesday, the HCOB PMI data from Spain, Italy, France, Germany, and the Eurozone will be due. The Eurozone Retail Sales will be released on Wednesday. Market players will closely monitor the ECB rate decision on Thursday. These events could give a clear direction to the EUR/JPY cross.
- USD/CAD could test the psychological resistance at 1.3600 on Monday.
- Technical analysis suggests a confirmation of the bullish trend for the pair.
- The key support area appears around the nine-day EMA at 1.3552 and the major support of 1.3550.
USD/CAD extends its winning streak for the second session on Tuesday amid a stable US Dollar (USD), which could be attributed to the risk aversion ahead of the key economic data from the United States (US). The USD/CAD pair inches higher to near 1.3590 during the Asian trading hours.
The technical analysis of the 14-day Relative Strength Index (RSI) is positioned above 50, suggesting bullish momentum for the USD/CAD pair to surpass the psychological resistance of 1.3600 following the major barrier of 1.3650.
Furthermore, the lagging indicator, Moving Average Convergence Divergence (MACD), indicates a confirmation of a bullish trend for the USD/CAD pair. This interpretation is based on the MACD line's position above the centerline and the signal line.
On the downside, the USD/CAD pair could find the key support region around the nine-day Exponential Moving Average (EMA) at 1.3552 aligned with the major support level of 1.3550. A break below this zone could prompt the pair to navigate the further support region around the 23.6% Fibonacci retracement level at 1.3505, in conjunction with the psychological level of 1.3500.
USD/CAD: Daily Chart
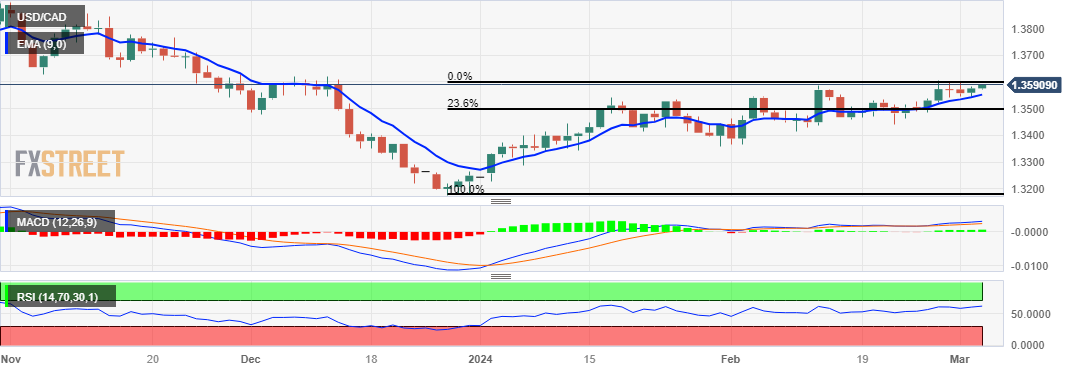
- GBP/USD trades on a softer note around 1.2685 on the firmer USD.
- The pair maintains a bullish outlook above the key EMA.
- The key resistance level is seen at the 1.2700–1.2710 zone; the initial support level is located at 1.2650.
The GBP/USD pair snaps the two-day winning streak during the early European session on Tuesday. The major pair edges lower amid the modest recovery of the US Dollar (USD). February’s labor market report this week will be a closely watched event. At press time, GBP/USD is trading at 1.2685, down 0.03% on the day.
From a technical perspective, the bullish outlook of GBP/USD remains intact as the major pair is above the key 100-period Exponential Moving Average (EMA) on the four-hour chart. It’s worth noting that the Relative Strength Index (RSI) lies above the 50 midlines, indicating the path of least resistance is to the upside.
The potential resistance level for the pair is seen at the 1.2700-1.2710 region, portraying the confluence of the upper boundary of the Bollinger Band, a psychological round figure, and a high of March 4. A break above this level will pave the way to a high of January 31 at 1.2750. Any follow-through buying will see a rally to a high of January 12 at 1.2785.
On the downside, the initial contention level is located near the 100-period EMA at 1.2650. Further south, the next downside target will emerge near the lower limit of the Bollinger Band at 1.2612. The additional downside filter to watch is a low of February 20 at 1.2580, followed by a low of December 11 at 1.2535.
GBP/USD four-hour chart
-638452135391948396.png)
- NZD/USD faces struggles as traders adopt cautious stance before US key data.
- Fed’s Powell will testify before the US Congress regarding the Semi-Annual Monetary Policy Report on both Wednesday and Thursday.
- Chinese Services PMI fell to 52.5 in February from 52.7 prior.
- New Zealand Commodity Prices rose by 3.5% in February, against the previous rise of 2.1%.
NZD/USD trims some of its intraday losses as the NZX 50 Index recovers its daily losses on Monday. The NZD/USD pair hovers around 0.6090 during the Asian session on Tuesday. The pair faces downward pressure on risk-off sentiment ahead of key US economic data this week, including the ISM Services PMI data, ADP Employment Change, and Nonfarm Payrolls for February.
Traders are also keenly awaiting insights into the Federal Reserve's (Fed) stance and forthcoming policy decisions. Fed Chairman Jerome Powell is scheduled to testify before the US Congress' House Financial Services Committee regarding the Fed's Semi-Annual Monetary Policy Report on both Wednesday and Thursday. As per the CME FedWatch Tool, there is a 3.0% probability of a 25 basis points rate cut in March, with the likelihood of cuts in May and June standing at 21.8% and 50.9%, respectively.
ANZ Commodity Prices, released by National Bank ANZ, increased by 3.5% in February, following January's increase of 2.1%. New Zealand's Manufacturing Sales for the fourth quarter is anticipated to be released on Thursday.
Reserve Bank of New Zealand (RBNZ) Governor Adrian Orr reiterated the central bank's plan to begin policy normalization in 2025, citing elevated inflation as a reason to maintain restrictive monetary policy for the foreseeable future.
Moreover, China aims for approximately 5% GDP growth in 2024 by prioritizing job creation and risk management. Chinese authorities stress the importance of sustaining proactive fiscal policies and prudent monetary measures. This target could potentially bolster the New Zealand Dollar (NZD), given the close business ties between the two countries, consequently supporting the NZD/USD pair. Additionally, Chinese Services PMI contracted to 52.5 in February from 52.7 in the previous period.
- EUR/USD oscillates in a narrow trading band on Tuesday amid mixed fundamental cues.
- Traders also opt to wait on the sidelines ahead of this week’s key central bank event risks.
- The downside seems limited amid reduced bets for more aggressive easing by the ECB.
The EUR/USD pair struggles to capitalize on its strong gains registered over the past two days and oscillates in a narrow trading band during the Asian session on Tuesday. Spot prices currently trade around mid-1.0800s, nearly unchanged for the day and just below a one-week high touched on Monday.
Traders now seem reluctant and prefer to wait for this week's key central bank event risks before placing aggressive directional bets, which, in turn, leads to the EUR/USD pair's subdued range-bound price action. The Federal Reserve (Fed) Chair Jerome Powell's congressional testimony on Wednesday and Thursday will be looked upon for cues about the rate-cut path. This, along with the European Central Bank (ECB) monetary policy decision on Thursday, will help in determining the near-term trajectory for the currency pair.
Apart from this, investors this week will confront the release of important US macro data scheduled at the beginning of a new month, including the closely-watched monthly employment details, or the Nonfarm Payrolls (NFP) report on Friday. In the meantime, reduced bets for rapid interest rate cuts by the ECB continue to act as a tailwind for the shared currency. The US Dollar (USD), on the other hand, is undermined by expectations that the Fed will start cutting rates in June and lends support to the EUR/USD pair.
That said, a slight deterioration in the global risk sentiment – as depicted by a softer tone around the equity markets – is seen benefitting the safe-haven Greenback and capping the upside for the currency pair. This, in turn, makes it prudent to wait for strong follow-through buying before positioning for the EUR/USD pair's recent goodish rebound from sub-1.0700 levels, or a three-month low touched on February 14. Traders now look to the final Eurozone Services PMIs for some impetus ahead of the US ISM Services PMI.
- Gold price edges lower and snaps a four-day winning streak to a three-month peak.
- Bets for a June Fed rate cut keep the USD bulls on the defensive and lend support.
- Geopolitical tensions could also help limit the downside for the safe-haven metal.
Gold price (XAU/USD rallied to a three-month peak on Monday and settled at an all-time high, above the $2,100 mark amid bets that the Federal Reserve (Fed) will start cutting interest rates in June. Apart from this, a further escalation of geopolitical tensions in the Middle East turns out to be another factor underpinning the safe-haven precious metal. Bulls, however, opt to take some profits off the table during the Asian session on Tuesday and wait for more cues about the Fed's rate-cut path before positioning for any further appreciating move. Hence, the focus remains on Fed Chair Jerome Powell's semi-annual congressional testimony on Wednesday and Thursday.
Apart from this, this week's important US macro releases, including the closely watched Nonfarm Payrolls (NFP) on Friday, will play a key role in determining the next leg of a directional move for the non-yielding Gold price. In the meantime, subdued US Dollar (USD) price action, along with the prevalent cautious mood across the global equity markets, might continue to act as a tailwind for the XAU/USD. Nevertheless, the precious metal, for now, seems to have snapped a four-day winning streak. That said, the aforementioned fundamental backdrop warrants some caution before confirming a near-term top and positioning for any meaningful corrective decline.
Daily digest market movers: Gold price might continue to draw support from Fed rate cut bets, geopolitical risks
- Friday's disappointing US macro data, along with less hawkish comments by Federal Reserve officials, reaffirmed bets for a June rate cut and lifted the Gold price above the $2,100 mark on Monday.
- The US Dollar, meanwhile, remain on the defensive amid firming expectations for an imminent shift in the Fed's policy stance, which, along with geopolitical risks, benefit the safe-haven metal.
- Israel conducted a counter-terrorism operation – the biggest in years – in the Palestinian administrative capital of Ramallah, raising the risk of a further escalation of tensions in the Middle East.
- Investors look to Fed Chair Jerome Powell's two-day testimony for more cues on the path of interest rates and important US macro data to determine the next leg of a directional move for the XAU/USD.
- A rather busy week kicks off with the release of the US ISM Services PMI later this Tuesday, though the focus will remain glued to the closely watched US Nonfarm Payrolls (NFP) report on Friday.
- China’s Premier Li Qiang delivered the opening remarks at the National People's Congress (NPC) annual meeting on Tuesday and said that the foundation of economic recovery is not solid yet.
- Earlier Reuters reported, citing an official work report, that China will target around 5% GDP growth for 2024, though it fails to boost investors' confidence or provide any impetus to the XAU/USD.
Technical Analysis: Gold price could consolidate or witness a modest pullback amid overbought RSI on the daily chart
From a technical perspective, the overnight strong move-up reaffirmed last week's breakout through the $2,062-2,064 strong horizontal barrier and support prospects for additional gains. That said, the Relative Strength Index (RSI) on the daily chart is already flashing overbought conditions and makes it prudent to wait for some near-term consolidation or a modest pullback before the next leg up. Nevertheless, the Gold price remains on track to surpass the $2,020-2,025 intermediate hurdle and aim to retest the all-time peak, around the $2,144-2,145 zone touched early December.
On the flip side, the $2,100 round figure now seems to protect the immediate downside. Any subsequent decline might now be seen as a buying opportunity and remain limited near the aforementioned resistance breakpoint, now turned support, near the $2,064-2,062 region. That said, a convincing break below the latter might prompt some technical selling and drag the Gold price further towards the 50-day Simple Moving Average (SMA), currently pegged near the $2,037-2,035 region. The corrective slide could extend further towards the $2,020 area or the 100-day SMA.
US Dollar price today
The table below shows the percentage change of US Dollar (USD) against listed major currencies today. US Dollar was the weakest against the Swiss Franc.
| USD | EUR | GBP | CAD | AUD | JPY | NZD | CHF | |
| USD | 0.00% | 0.00% | 0.02% | 0.03% | -0.01% | 0.02% | -0.05% | |
| EUR | -0.01% | 0.01% | 0.01% | 0.01% | 0.00% | -0.01% | -0.03% | |
| GBP | 0.01% | 0.00% | 0.03% | 0.02% | 0.00% | 0.03% | -0.02% | |
| CAD | -0.02% | -0.03% | -0.03% | -0.03% | -0.03% | -0.02% | -0.05% | |
| AUD | -0.04% | -0.02% | -0.03% | 0.00% | -0.02% | -0.02% | -0.05% | |
| JPY | 0.01% | 0.02% | -0.02% | 0.04% | 0.00% | 0.03% | -0.03% | |
| NZD | -0.03% | -0.02% | -0.04% | -0.01% | 0.01% | -0.04% | -0.03% | |
| CHF | 0.04% | 0.03% | 0.03% | 0.06% | 0.07% | 0.03% | 0.06% |
The heat map shows percentage changes of major currencies against each other. The base currency is picked from the left column, while the quote currency is picked from the top row. For example, if you pick the Euro from the left column and move along the horizontal line to the Japanese Yen, the percentage change displayed in the box will represent EUR (base)/JPY (quote).
Gold FAQs
Why do people invest in Gold?
Gold has played a key role in human’s history as it has been widely used as a store of value and medium of exchange. Currently, apart from its shine and usage for jewelry, the precious metal is widely seen as a safe-haven asset, meaning that it is considered a good investment during turbulent times. Gold is also widely seen as a hedge against inflation and against depreciating currencies as it doesn’t rely on any specific issuer or government.
Who buys the most Gold?
Central banks are the biggest Gold holders. In their aim to support their currencies in turbulent times, central banks tend to diversify their reserves and buy Gold to improve the perceived strength of the economy and the currency. High Gold reserves can be a source of trust for a country’s solvency. Central banks added 1,136 tonnes of Gold worth around $70 billion to their reserves in 2022, according to data from the World Gold Council. This is the highest yearly purchase since records began. Central banks from emerging economies such as China, India and Turkey are quickly increasing their Gold reserves.
How is Gold correlated with other assets?
Gold has an inverse correlation with the US Dollar and US Treasuries, which are both major reserve and safe-haven assets. When the Dollar depreciates, Gold tends to rise, enabling investors and central banks to diversify their assets in turbulent times. Gold is also inversely correlated with risk assets. A rally in the stock market tends to weaken Gold price, while sell-offs in riskier markets tend to favor the precious metal.
What does the price of Gold depend on?
The price can move due to a wide range of factors. Geopolitical instability or fears of a deep recession can quickly make Gold price escalate due to its safe-haven status. As a yield-less asset, Gold tends to rise with lower interest rates, while higher cost of money usually weighs down on the yellow metal. Still, most moves depend on how the US Dollar (USD) behaves as the asset is priced in dollars (XAU/USD). A strong Dollar tends to keep the price of Gold controlled, whereas a weaker Dollar is likely to push Gold prices up.
- WTI price loses ground despite the OPEC+ extension of oil output cuts by 2.2 million bpd.
- Hamas and Egyptian mediators continue the ceasefire talks in Cairo in the absence of the Israeli delegation.
- China’s aim to achieve a 5% GDP growth target in 2024 is anticipated to bolster fuel consumption.
West Texas Intermediate (WTI) oil prices continue to decline for the second consecutive session, with prices hovering near $78.20 per barrel on Tuesday. Despite efforts by OPEC+ countries, including Russia, to implement voluntary oil output cuts, Crude oil prices are facing downward pressure.
The Organization of the Petroleum Exporting Countries (OPEC) and its allies (OPEC+) have agreed to extend voluntary oil output cuts totaling 2.2 million barrels per day (bpd) into the second quarter. Saudi Arabia has announced its intention to prolong its voluntary 1 million barrels per day output cut. Russia has also committed to reducing its oil output and exports by an additional 471,000 bpd. Additionally, Iraq and the UAE have agreed to continue reducing their output by 220,000 bpd and 163,000 bpd, respectively.
Hamas and Egyptian mediators continue discussions in Cairo aimed at securing a ceasefire in Gaza. Despite pressure from Washington for a truce, Israel has opted not to send a delegation. According to Reuters, Israel's decision stems from Hamas' failure to provide a list of hostages taken on October 7 who are still alive.
Additionally, Houthi Telecommunications Minister Misfer Al-Numair stated on Monday that ships must acquire permission from the Houthi-controlled Maritime Affairs Authority before entering Yemeni waters.
China has pledged to revamp its economy amidst sluggish growth since the COVID-19 pandemic. The nation vows to "transform" its economic development model and address industrial overcapacity. Setting an economic growth target for 2024 at around 5%, akin to last year's objective, aligns with analysts' projections. Achieving this target is anticipated to bolster fuel consumption by the world's largest Crude importer, thereby supporting Crude oil prices.
- Indian Rupee (INR) trades on a softer note on the modest US Dollar demand.
- Analysts said global economic growth is likely to surprise on the upside, and only modest headwinds for India next fiscal.
- Investors await the Indian S&P Global Services PMI and the US ISM Services PMI for February on Tuesday.
Indian Rupee (INR) edges lower on Tuesday amid the modest rebound of the US Dollar (USD). India’s GDP grew at its fastest pace in 18 months, expanding 8.4% over a year earlier in the October-December quarter. Additionally, most high-frequency indicators continued to grow, showing signs of resilient economic activity.
Furthermore, most high-frequency indicators continued to improve, indicating strong economic activity. S&P Global Ratings Global Chief Economist, Paul Gruenwald said that global economic growth is likely to surprise on the upside, and hence he sees only modest headwinds for India next fiscal.
Market players will keep an eye on the Indian S&P Global Services PMI and US ISM Services PMI for February, due on Tuesday. Later this week, the attention will be on the Fed's Chair Jerome Powell testifying on Wednesday ahead of the US Nonfarm Payrolls (NFP) on Friday.
Daily Digest Market Movers: Indian Rupee weakens amid the uncertainties
- India's GDP growth is projected to grow 6.8% for the 2024 calendar year from 6.1% earlier, according to the global rating agency Moody's.
- The Reserve Bank of India (RBI) is expected to take delivery of a $5 billion FX swap due next week, owing to adequate dollar inflows and rupee liquidity staying on the tighter side.
- India's foreign exchange reserves rose by $2.975 billion to $619.072 billion for the week ending on February 23, according to the RBI.
- Indian S&P Global Services PMI is estimated to improve from 61.8 in January to 62.0 in February.
- Fed President Raphael Bostic said on Monday that the central bank is under no urgent pressure to cut interest rates given a "prospering" economy and job market.
Technical Analysis: Indian Rupee inches lower within a longer-term band of 82.65-83.15
Indian Rupee trades weaker on the day. USD/INR remains confined within a multi-month-old descending trend channel between 82.65 and 83.15 since December 8, 2023.
USD/INR keeps the bearish vibe unchanged in the near term as the pair holds below the 100-day Exponential Moving Average on the daily timeframe. Additionally, the 4-day Relative Strength Index (RSI) lies in the bearish territory below the 50.0 midlines, suggesting that further decline looks favorable.
The first downside target will emerge at the lower limit of the descending trend channel at 82.65. Any follow-through selling will see a drop to a low of August 23, and finally a low of June 1 at 82.25.
On the upside, the key resistance level is located at 83.00, representing the 100-day EMA and a psychological round figure. A decisive break above the latter will see a rally to a high of January 2 at 83.35, en route to 84.00.
US Dollar price today
The table below shows the percentage change of US Dollar (USD) against listed major currencies today. US Dollar was the weakest against the .
| USD | EUR | GBP | CAD | AUD | JPY | NZD | CHF | |
| USD | 0.04% | 0.04% | 0.05% | 0.09% | 0.01% | 0.14% | -0.01% | |
| EUR | -0.04% | -0.01% | 0.01% | 0.03% | -0.02% | 0.07% | -0.01% | |
| GBP | -0.03% | 0.01% | 0.01% | 0.03% | -0.01% | 0.11% | -0.02% | |
| CAD | -0.05% | -0.01% | -0.02% | 0.01% | -0.03% | 0.06% | -0.04% | |
| AUD | -0.10% | -0.04% | -0.04% | -0.02% | -0.05% | 0.05% | -0.05% | |
| JPY | -0.01% | 0.04% | 0.01% | 0.05% | 0.05% | 0.14% | -0.02% | |
| NZD | -0.14% | -0.08% | -0.11% | -0.08% | -0.05% | -0.12% | -0.10% | |
| CHF | -0.03% | 0.02% | 0.00% | 0.04% | 0.06% | -0.02% | 0.11% |
The heat map shows percentage changes of major currencies against each other. The base currency is picked from the left column, while the quote currency is picked from the top row. For example, if you pick the Euro from the left column and move along the horizontal line to the Japanese Yen, the percentage change displayed in the box will represent EUR (base)/JPY (quote).
Indian Rupee FAQs
What are the key factors driving the Indian Rupee?
The Indian Rupee (INR) is one of the most sensitive currencies to external factors. The price of Crude Oil (the country is highly dependent on imported Oil), the value of the US Dollar – most trade is conducted in USD – and the level of foreign investment, are all influential. Direct intervention by the Reserve Bank of India (RBI) in FX markets to keep the exchange rate stable, as well as the level of interest rates set by the RBI, are further major influencing factors on the Rupee.
How do the decisions of the Reserve Bank of India impact the Indian Rupee?
The Reserve Bank of India (RBI) actively intervenes in forex markets to maintain a stable exchange rate, to help facilitate trade. In addition, the RBI tries to maintain the inflation rate at its 4% target by adjusting interest rates. Higher interest rates usually strengthen the Rupee. This is due to the role of the ‘carry trade’ in which investors borrow in countries with lower interest rates so as to place their money in countries’ offering relatively higher interest rates and profit from the difference.
What macroeconomic factors influence the value of the Indian Rupee?
Macroeconomic factors that influence the value of the Rupee include inflation, interest rates, the economic growth rate (GDP), the balance of trade, and inflows from foreign investment. A higher growth rate can lead to more overseas investment, pushing up demand for the Rupee. A less negative balance of trade will eventually lead to a stronger Rupee. Higher interest rates, especially real rates (interest rates less inflation) are also positive for the Rupee. A risk-on environment can lead to greater inflows of Foreign Direct and Indirect Investment (FDI and FII), which also benefit the Rupee.
How does inflation impact the Indian Rupee?
Higher inflation, particularly, if it is comparatively higher than India’s peers, is generally negative for the currency as it reflects devaluation through oversupply. Inflation also increases the cost of exports, leading to more Rupees being sold to purchase foreign imports, which is Rupee-negative. At the same time, higher inflation usually leads to the Reserve Bank of India (RBI) raising interest rates and this can be positive for the Rupee, due to increased demand from international investors. The opposite effect is true of lower inflation.
| Raw materials | Closed | Change, % |
|---|---|---|
| Silver | 23.898 | 3.38 |
| Gold | 2114.886 | 1.54 |
| Palladium | 960.66 | 0.57 |
- India’s Nifty and Sensex are set to open in the red on Tuesday after a modest end on Monday.
- Nifty and Sensex refreshed record highs on Monday amid India’s growth story and the global rally.
- The focus shifts toward Fed Chair Powell and US Nonfarm Payrolls data due later this week.
The Sensex 30 and Nifty 50, India’s key benchmark indices, are expected to open on the back foot, as risk-aversion extends into Asian markets. Gifty Nifty futures are down 0.10% so far, indicating a negative start for the Indian indices.
Both Indian indices ended in the green on Monday, taking cues from mostly positive global stocks, led by Japan’s Nikkei 225 index 40,000 feat.
Nifty and Sensex continued to capitalize on robust India’s Gross Domestic Product (GDP) data and the global stocks rally.
The National Stock Exchange (NSE) Nifty 50 and Bombay Stock Exchange (BSE) Sensex 30 closed about 0.10% on the day near 22,400 and 73,900 respectively, having hit fresh record highs earlier in the session.
Stock market news
- The top performers on Nifty on Monday were NTPC, Power Grid, ONGC, BPCL and HGFC Life Insurance. Meanwhile, the top laggards were JSW Steel, Britannia, Eicher Motors, Mahindra & Mahindra and SBI Life Insurance.
- Moody's raises India's 2024 GDP growth estimate to 6.8% from 6.1%.
- Godrej Properties shares rose 2% on plans to construct a township project in North Bengaluru with a booking value of ₹5,000.
- Suzlon, Inox Wind tanked 5% as Centre weighs reverse auctions of wind power.
- Paytm fell 3% amid speculations over Paytm Payments Bank license.
- India’s manufacturing sector climbed to a five-month high of 56.9 in February on Friday.
- The US stock markets closed higher on Friday even as business activity in the US manufacturing sector contracted at an accelerating pace in February, with the ISM Manufacturing PMI dropping to 47.8 from 49.1 in January, missing the market expectation of 49.5 by a wide margin.
- On Thursday, the key US Personal Consumption Expenditures (PCE) Price Index increased 0.4% for the month and 2.8% from a year ago, as expected.
- Markets are currently pricing in about a 30% chance that the Fed could begin easing rates in May, slightly higher than a 20% chance a week ago, according to the CME FedWatch Tool. For the June meeting, the probability for a rate cut now stands at about 71%, up from roughly 60% seen at the start of the previous week.
- India's Gross Domestic Product (GDP) expanded by 8.4% on an annual basis in the third quarter (October-December), as against 7.6% in the previous quarter, data released by the National Statistical Office (NSO) showed Thursday.
- It’s a holiday-shortened week for the Indian markets, as they will be closed, in observance of the Mahashivratri festival on Friday.
- The main event risks for markets this week will be the US Federal Reserve (Fed) Chair Jerome Powell’s testimony and the all-important US Nonfarm Payrolls data.
- Another event of note includes China's National People's Congress (NPC) meeting which could flag new stimulus measures.
Nifty 50 FAQs
What is the Nifty 50?
The Nifty 50, or simply Nifty, is the most commonly followed stock index in India. It was launched in 1996 by the National Stock Exchange of India (NSE). It plots the weighted average share price of 50 of the largest Indian corporations, offering investors comprehensive exposure to 13 sectors of the economy. Each corporation's weighting is based on its “free-float capitalization”, or the value of all its shares readily available for trading.
What factors drive the Nifty 50?
The Nifty is a composite so its value is dependent on the performance of the companies that make up the index, as revealed in their quarterly and annual results. Another factor is government policies, such as when in 2016 the government decided to demonetize 500 and 1000 Rupee banknotes. This led to a temporary cash shortage which negatively impacted the Nifty. The level of interest rates set by the Reserve Bank of India is a further factor as it determines the cost of borrowing. Climate change, pandemics and natural disasters are also drivers.
What are the key milestones for the Nifty 50?
The Nifty 50 was launched on April 22, 1996 at a base level of 1,000. Its highest recorded level to date is 22,097 achieved on January 15, 2024 (this is being written in Feb 2024). The index first closed above the 10,000 level on October 17, 2017. The Nifty recorded its biggest daily decline on March 23, 2020 during the Covid pandemic, when it fell 1,125 points or 12.37%. The Nifty’s biggest gain in a single day occurred on May 18, 2009, when it rose 651 points after the results of the Indian elections.
What are some of the major companies in the Nifty 50?
Major corporations in the Nifty 50 include HDFC Bank, Reliance Industries, ICICI Bank, Tata Consultancy Services, Larsen and Toubro, ITC Ltd, Housing Development Finance Corporation Ltd and Kotak Mahendra Bank.
- Australian Dollar remains tepid, possibly influenced by a risk-off sentiment.
- Australian Services PMI rose to a ten-month high of 53.1 in February, against 49.1 prior.
- China aims for 5% GDP growth in 2024 by creating jobs and defusing risks.
- US Dollar maintains stability despite lower US Treasury yields.
The Australian Dollar (AUD) consolidates with a negative bias on Tuesday after experiencing losses in the previous session, possibly due to prevailing risk-off sentiment amid a stagnant ASX 200 Index. Additionally, China aims for approximately 5% GDP growth in 2024 by focusing on job creation and risk mitigation. Chinese authorities emphasize the importance of continuing proactive fiscal policies and prudent monetary measures.
Australian Dollar remains unaffected by the positive performance of the Judo Bank Services Purchasing Managers Index (PMI), which surged to a ten-month high of 53.1 in February. This increase pushed the index above the 50.0 threshold, indicating expansion, and surpassed the previous reading of 49.1. Additionally, the Composite PMI rose to 52.1 compared to the previous 49.0, marking a nine-month high. Traders are now awaiting the release of the Gross Domestic Product (GDP) data for the fourth quarter of 2023 on Wednesday.
The US Dollar Index (DXY) remains relatively unchanged, displaying a sideways movement amid subdued US Treasury yields. Market participants are closely eyeing crucial United States (US) employment figures scheduled for release this week as they assess the Federal Reserve's (Fed) potential future actions. Fed Chairman Jerome Powell is set to testify before the US Congress' House Financial Services Committee regarding the Fed's Semi-Annual Monetary Policy Report on both Wednesday and Thursday, which could provide further insights into the central bank's stance and upcoming policy decisions.
Daily Digest Market Movers: Australian Dollar consolidates amid a flat equity market
- Australian Current Account Balance rose to 11.8 billion in the fourth quarter of 2023, against the expected 5.6 billion and 1.3 billion prior.
- ANZ-Roy Morgan Australian Consumer Confidence index declined to 81.0, from the previous reading of 83.2. This latest figure represents the lowest level recorded thus far in 2024.
- Australia Melbourne Institute Inflation for February showed a year-over-year rise of 4.0%, lower than the previous rise of 4.6%.
- Australian Building Permits (MoM) declined by 1.0% in January, contrary to the expected rise of 4.0%. Nevertheless, this figure represented an improvement from the previous decrease of 10.1%.
- Australia’s TD Securities Inflation (MoM) decreased by 0.1% in February, lower than the previous rise of 0.3%.
- Australian Bureau of Statistics released Company Gross Operating Profits (QoQ), rising by 7.4% in the fourth quarter of 2023 against the expected 1.8% increase and the previous decrease of 1.6%.
- Australian Building Permits (YoY) rose by 10% in January, swinging from the previous decline of 24%.
- Judo Bank Manufacturing PMI indicated a slight improvement in Australia's manufacturing sector, with the February reading rising to 47.8 from 47.7 in the previous period.
- The seasonally adjusted Australian Retail Sales (MoM) grew by 1.1% in January, lower than expected 1.5% but swinging from the previous decline of 2.7%.
- Australian Private Capital Expenditure improved by 0.8% in the fourth quarter of 2023, from the expected 0.5% and 0.6% prior.
- According to Matthew De Pasquale, an Economist at Judo Bank, the February Services PMI suggests that the sector has achieved a soft landing in 2023 and is now witnessing a resurgence in activity in early 2024. While the resilience in business activity bodes well for economic growth and employment, it casts doubt on the likelihood of inflation returning to target within the Reserve Bank of Australia's forecast timeline.
- China's National People's Congress (NPC) spokesman Lou Qinjian shared with the news media that Congress will hold its annual meeting in Beijing from March 5 to March 11. Lou stated that the government “will make new laws to deepen economic reform including financial institutional reform to promote private companies.” Moreover, the Premier of the People's Republic of China (PBoC), Li Qiang is expected to reveal China's economic growth target of around 5% at the session on Tuesday.
- Atlanta Federal Reserve (Fed) President Raphael Bostic made headlines on Monday, expressing uncertainty about achieving a soft landing. He does not foresee consecutive rate cuts when they commence but still expects two 25-basis point rate cuts in 2024. While inflation is expected to return to the 2% target, Bostic believes it is premature to declare victory.
- According to the CME FedWatch Tool, there is a 3.0% probability of a 25 basis points rate cut in March, while the likelihood of cuts in May and June stands at 21.8% and 50.9%, respectively.
- US ISM Manufacturing PMI (Feb) dropped to 47.8 from 49.1, surprisingly missing the market expectation 49.5.
- The US Michigan Consumer Sentiment Index declined to 76.9 in February, falling below the market expectation of remaining unchanged at 79.6.
- US Personal Consumption Expenditure (PCE) Price Index grew by 2.4% YoY in January, against the 2.6% prior, in line with the market expectation. The index increased by 0.3% month-over-month, against 0.1% prior.
Technical Analysis: Australian Dollar hovers above the psychological level of 0.6500
The Australian Dollar is trading around 0.6510 on Tuesday. Immediate resistance is noted near the 21-day Exponential Moving Average (EMA) at 0.6533, followed by the 23.6% Fibonacci retracement level at 0.6543 and the major level of 0.6550. A break above this resistance zone could lead the pair towards the psychological level of 0.6600. On the downside, key support is seen at the psychological level of 0.6500, followed by the previous week’s low at 0.6486. If breached, the pair may target the area around the major support level of 0.6450 and February’s low at 0.6442.
AUD/USD: Daily Chart
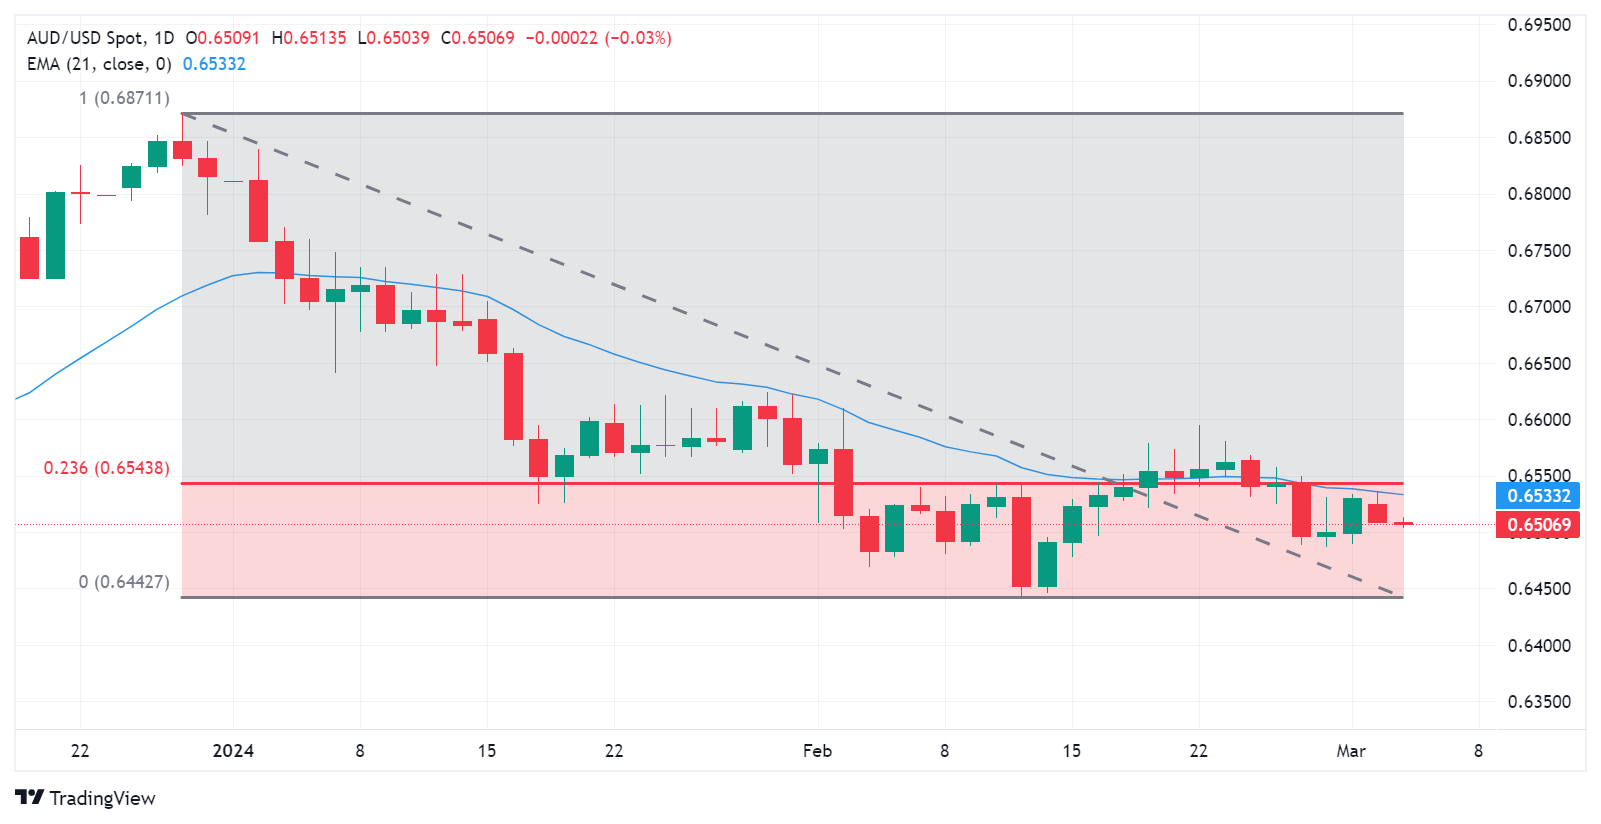
Australian Dollar price today
The table below shows the percentage change of Australian Dollar (AUD) against listed major currencies today. Australian Dollar was the weakest against the US Dollar.
| USD | EUR | GBP | CAD | AUD | JPY | NZD | CHF | |
| USD | 0.05% | 0.01% | 0.01% | -0.01% | 0.00% | 0.06% | 0.02% | |
| EUR | -0.05% | -0.05% | -0.05% | -0.10% | -0.04% | -0.02% | -0.02% | |
| GBP | 0.00% | 0.05% | -0.01% | -0.05% | 0.00% | 0.04% | 0.04% | |
| CAD | -0.01% | 0.06% | 0.01% | -0.05% | 0.01% | 0.04% | 0.04% | |
| AUD | 0.01% | 0.10% | 0.05% | 0.03% | 0.05% | 0.07% | 0.08% | |
| JPY | 0.00% | 0.05% | -0.02% | 0.00% | -0.04% | 0.03% | 0.02% | |
| NZD | -0.04% | 0.03% | -0.05% | -0.04% | -0.05% | -0.04% | 0.01% | |
| CHF | -0.03% | 0.01% | -0.04% | -0.04% | -0.05% | -0.04% | 0.02% |
The heat map shows percentage changes of major currencies against each other. The base currency is picked from the left column, while the quote currency is picked from the top row. For example, if you pick the Euro from the left column and move along the horizontal line to the Japanese Yen, the percentage change displayed in the box will represent EUR (base)/JPY (quote).
Australian Dollar FAQs
What key factors drive the Australian Dollar?
One of the most significant factors for the Australian Dollar (AUD) is the level of interest rates set by the Reserve Bank of Australia (RBA). Because Australia is a resource-rich country another key driver is the price of its biggest export, Iron Ore. The health of the Chinese economy, its largest trading partner, is a factor, as well as inflation in Australia, its growth rate and Trade Balance. Market sentiment – whether investors are taking on more risky assets (risk-on) or seeking safe-havens (risk-off) – is also a factor, with risk-on positive for AUD.
How do the decisions of the Reserve Bank of Australia impact the Australian Dollar?
The Reserve Bank of Australia (RBA) influences the Australian Dollar (AUD) by setting the level of interest rates that Australian banks can lend to each other. This influences the level of interest rates in the economy as a whole. The main goal of the RBA is to maintain a stable inflation rate of 2-3% by adjusting interest rates up or down. Relatively high interest rates compared to other major central banks support the AUD, and the opposite for relatively low. The RBA can also use quantitative easing and tightening to influence credit conditions, with the former AUD-negative and the latter AUD-positive.
How does the health of the Chinese Economy impact the Australian Dollar?
China is Australia’s largest trading partner so the health of the Chinese economy is a major influence on the value of the Australian Dollar (AUD). When the Chinese economy is doing well it purchases more raw materials, goods and services from Australia, lifting demand for the AUD, and pushing up its value. The opposite is the case when the Chinese economy is not growing as fast as expected. Positive or negative surprises in Chinese growth data, therefore, often have a direct impact on the Australian Dollar and its pairs.
How does the price of Iron Ore impact the Australian Dollar?
Iron Ore is Australia’s largest export, accounting for $118 billion a year according to data from 2021, with China as its primary destination. The price of Iron Ore, therefore, can be a driver of the Australian Dollar. Generally, if the price of Iron Ore rises, AUD also goes up, as aggregate demand for the currency increases. The opposite is the case if the price of Iron Ore falls. Higher Iron Ore prices also tend to result in a greater likelihood of a positive Trade Balance for Australia, which is also positive of the AUD.
How does the Trade Balance impact the Australian Dollar?
The Trade Balance, which is the difference between what a country earns from its exports versus what it pays for its imports, is another factor that can influence the value of the Australian Dollar. If Australia produces highly sought after exports, then its currency will gain in value purely from the surplus demand created from foreign buyers seeking to purchase its exports versus what it spends to purchase imports. Therefore, a positive net Trade Balance strengthens the AUD, with the opposite effect if the Trade Balance is negative.
- The Japanese Yen attracts some buyers in reaction to stronger Tokyo CPI print.
- Subdued USD price action contributes to the USD/JPY pair’s modest downtick.
- Traders now seem reluctant and prefer to wait for the US macro data/event risks.
The Japanese Yen (JPY) ticks higher during the Asian session and reverses a part of the previous day's losses after data released on Tuesday showed that consumer inflation in Tokyo – Japan's capital city – rebounded from 22-month lows in February. This comes on top of speculations that another substantial round of pay hikes this year by Japanese firms could fuel consumer spending and demand-driven inflation, opening the door for a potential policy normalization by the Bank of Japan (BoJ). Adding to this, speculations that Japanese authorities will intervene in the markets to prop up the domestic currency, along with the cautious market mood, underpin the safe-haven JPY.
The US Dollar (USD), on the other hand, continues with its struggle to attract any meaningful buyers in the wake of firming expectations for an imminent shift in the Federal Reserve's (Fed) policy stance. This turns out to be another factor that contributes to the offered tone surrounding the USD/JPY pair, though the downside seems cushioned ahead of the key US macro data and Fed Chair Jerome Powell's congressional testimony. In the meantime, growing acceptance that the Fed will keep interest rates higher for longer should hold back traders from placing aggressive directional bets. This, in turn, warrants some caution before positioning for any further downside for the currency pair.
Daily digest market movers: Japanese Yen draws support from reviving bets for an eventual BoJ pivot
- A rise in Tokyo CPI renews chatter that the Bank of Japan will exit the negative interest rates regime in the coming month and provides a modest lift to the Japanese Yen.
- The Statistics Bureau reported that consumer inflation in Japan's capital rebounded to the 2.5% YoY rate in February from a 22-month low of 1.6% in the previous month.
- Meanwhile, a core reading, which excludes both energy and fresh food, fell to 3.1% last month from 3.3% in January, though remained above the BoJ’s 2% annual target.
- Sticky inflation, along with expectations for another bumper pay hike this year, should allow the BoJ to end its ultra-loose monetary policy settings sooner rather than later.
- The au Jibun Bank Service PMI for Japan was finalized at 52.9 for February as compared to the preliminary estimate of 52.5 and the 53.1 registered in the previous month.
- Japan's economy minister, Yoshitaka Shindo, denied a media report over the weekend that Japan is considering calling an end to deflation
- in the wake of rising prices.
- The US Dollar bulls remain on the defensive amid firming expectations that the Federal Reserve will eventually start cutting interest rates at the June policy meeting.
- Atlanta Fed President Raphael Bostic does not anticipate back-to-back rate cuts when they begin and still expects only two 25-basis point rate cuts by the end of this year.
- Bostic further said that inflation is on track to return to the 2% target, but he needs to see more progress and gain confidence in disinflation before voting to reduce policy rates.
- Traders now seem reluctant and prefer to wait on the sidelines ahead of this week's important US macro releases, starting with the ISM Services PMI later this Tuesday.
- The focus, however, remains on Fed Chair Jerome Powell's semi-annual congressional testimony on Wednesday and Thursday, and the US Nonfarm Payrolls (NFP) on Friday.
Technical analysis: USD/JPY is likely to find decent support near the 150.00 psychological mark
From a technical perspective, the USD/JPY pair has been oscillating in a familiar range over the past three weeks or so. This constitutes the formation of a rectangle on short-term charts. Against the backdrop of a rally from the December 2023 low, this might still be categorized as a bullish consolidation phase. Moreover, oscillators on the daily chart are holding comfortably in the positive territory and suggest that the path of least resistance for spot prices is to the upside.
That said, it will still be prudent to wait for a sustained breakout through the trading range hurdle, around the 150.75-150.85 region, which coincides with the YTD peak touched in February, before positioning for any further gains. The USD/JPY pair might then surpass the 151.00 mark and accelerate the momentum towards the 151.45 intermediate resistance en route to the 152.00 neighbourhood, or a multi-decade peak set in October 2022 and retested in November 2023.
On the flip side, the 150.00 psychological mark now seems to protect the immediate downside. Any further decline is likely to attract fresh buyers near last week's swing low, around the 149.20 area. This is followed by the 149.00 mark, which if broken might shift the bias in favour of bears. The subsequent could drag the USD/JPY pair to the 148.30 support en route to the 148.00 mark and the 100-day Simple Moving Average (SMA), currently pegged near the 147.80 region.
Japanese Yen price today
The table below shows the percentage change of Japanese Yen (JPY) against listed major currencies today. Japanese Yen was the weakest against the Pound Sterling.
| USD | EUR | GBP | CAD | AUD | JPY | NZD | CHF | |
| USD | 0.06% | 0.02% | 0.03% | 0.02% | -0.01% | 0.08% | 0.04% | |
| EUR | -0.06% | -0.05% | -0.02% | -0.06% | -0.05% | -0.01% | -0.01% | |
| GBP | -0.01% | 0.04% | 0.01% | 0.00% | -0.01% | 0.06% | 0.04% | |
| CAD | -0.03% | 0.03% | -0.01% | -0.05% | -0.03% | 0.03% | 0.02% | |
| AUD | -0.02% | 0.05% | 0.00% | 0.03% | -0.01% | 0.06% | 0.06% | |
| JPY | 0.00% | 0.07% | 0.00% | 0.03% | 0.01% | 0.10% | 0.04% | |
| NZD | -0.08% | 0.00% | -0.07% | -0.05% | -0.04% | -0.08% | 0.00% | |
| CHF | -0.05% | 0.01% | -0.04% | -0.03% | -0.03% | -0.06% | 0.02% |
The heat map shows percentage changes of major currencies against each other. The base currency is picked from the left column, while the quote currency is picked from the top row. For example, if you pick the Euro from the left column and move along the horizontal line to the Japanese Yen, the percentage change displayed in the box will represent EUR (base)/JPY (quote).
Japanese Yen FAQs
What key factors drive the Japanese Yen?
The Japanese Yen (JPY) is one of the world’s most traded currencies. Its value is broadly determined by the performance of the Japanese economy, but more specifically by the Bank of Japan’s policy, the differential between Japanese and US bond yields, or risk sentiment among traders, among other factors.
How do the decisions of the Bank of Japan impact the Japanese Yen?
One of the Bank of Japan’s mandates is currency control, so its moves are key for the Yen. The BoJ has directly intervened in currency markets sometimes, generally to lower the value of the Yen, although it refrains from doing it often due to political concerns of its main trading partners. The current BoJ ultra-loose monetary policy, based on massive stimulus to the economy, has caused the Yen to depreciate against its main currency peers. This process has exacerbated more recently due to an increasing policy divergence between the Bank of Japan and other main central banks, which have opted to increase interest rates sharply to fight decades-high levels of inflation.
How does the differential between Japanese and US bond yields impact the Japanese Yen?
The BoJ’s stance of sticking to ultra-loose monetary policy has led to a widening policy divergence with other central banks, particularly with the US Federal Reserve. This supports a widening of the differential between the 10-year US and Japanese bonds, which favors the US Dollar against the Japanese Yen.
How does broader risk sentiment impact the Japanese Yen?
The Japanese Yen is often seen as a safe-haven investment. This means that in times of market stress, investors are more likely to put their money in the Japanese currency due to its supposed reliability and stability. Turbulent times are likely to strengthen the Yen’s value against other currencies seen as more risky to invest in.
China's Services Purchasing Managers' Index (PMI) unexpectedly fell to 52.5 in February, as against the January reading of 52.7, the latest data published by Caixin showed on Tuesday.
The market forecast was for a 52.9 print.
Key points
Business activity growth softens amid muted uptick in new orders.
Staff numbers fall for first time in three months.
Stronger rise in costs leads to fresh increase in output prices.
Commenting on the China General Services PMI ™ data, Dr. Wang Zhe, Senior Economist at Caixin Insight Group said: ““Supply and demand continued to expand in February at a pace similar to the previous month amid the market upturn.”
“Business activity and total new orders grew for the 14th straight month. Service exports increased for the sixth straight month, with the corresponding gauge reaching the highest since June,” Wang added.
AUD/USD reaction to China’s Services PMI
Downbeat Chinese Services PMI keeps the weight intact on the Aussie Dollar, as AUD/USD trades close to 0.6500. At the time of writing, the pair is down 0.05% on the day.
Australian Dollar price today
The table below shows the percentage change of Australian Dollar (AUD) against listed major currencies today. Australian Dollar was the weakest against the US Dollar.
| USD | EUR | GBP | CAD | AUD | JPY | NZD | CHF | |
| USD | 0.05% | 0.01% | 0.03% | 0.00% | -0.01% | 0.05% | 0.02% | |
| EUR | -0.05% | -0.04% | -0.03% | -0.07% | -0.06% | -0.01% | -0.01% | |
| GBP | -0.01% | 0.04% | 0.01% | -0.04% | -0.02% | 0.03% | 0.03% | |
| CAD | -0.03% | 0.03% | -0.02% | -0.07% | -0.03% | 0.01% | 0.02% | |
| AUD | 0.00% | 0.07% | 0.04% | 0.05% | 0.02% | 0.06% | 0.07% | |
| JPY | 0.01% | 0.08% | 0.02% | 0.04% | -0.03% | 0.06% | 0.05% | |
| NZD | -0.04% | 0.03% | -0.04% | -0.01% | -0.05% | -0.05% | 0.03% | |
| CHF | -0.03% | 0.01% | -0.03% | -0.01% | -0.05% | -0.06% | 0.01% |
The heat map shows percentage changes of major currencies against each other. The base currency is picked from the left column, while the quote currency is picked from the top row. For example, if you pick the Euro from the left column and move along the horizontal line to the Japanese Yen, the percentage change displayed in the box will represent EUR (base)/JPY (quote).
- USD/CHF oscillates around 0.8855 in Tuesday’s early Asian session.
- Fed’s Bostic said it will likely be appropriate to approve two quarter-point rate cuts by the end of this year.
- The Swiss CPI eased to 1.2% in February from 1.3% in January, better than expected.
The USD/CHF pair consolidates in a narrow trading range around the mid-0.8800s during the early Asian session on Tuesday. The Institute for Supply Management (ISM) will publish the US Services PMI report later in the day, which is estimated to ease from 53.4 in January to 53.0 in February. At press time, USD/CHF is trading at 0.8855, gaining 0.08% on the day.
Atlanta Fed President Raphael Bostic said that the US central bank is under no urgent pressure to cut interest rates given a strong economy and job market. Bostic further stated that it will likely be appropriate for the Fed to approve two quarter-point rate cuts by the end of this year. Financial markets also believe that the Fed will cut its benchmark interest rate this year. According to the CME Group’s FedWatch tool, investors have priced in a 99.5% chance of at least one rate cut by December.
On Monday, the Swiss Consumer Price Index (CPI) eased to 1.2% in February from 1.3% in January, better than the market expectation of 1.1%. This figure was the lowest inflation rate since October 2021.
The US ISM Services PMI will be due on Tuesday. On Wednesday, investors will monitor Fed's Chair Jerome Powell's testify. The hawkish comments from the Fed officials might boost the Greenback and create a tailwind for the USD/CHF pair. The highlight this week will be the US employment data, including Nonfarm Payrolls (NFP), Average Hourly Earnings and Unemployment Rate.
China’s Premier Li Qiang delivered the opening remarks at the National People's Congress (NPC) annual meeting on Tuesday.
Key quotes
Foundation of China's economic recovery is not solid yet.
China's domestic demand is not strong, social expectations are relatively weak.
Some small and medium-sized enterprises facing operating difficulties.
Will stabilize and expand private investment.
Earlier on, Reuters reported, citing an official work report, China will target around 5% GDP growth for 2024.
Market reaction
At the press time, AUD/USD is trading 0.05% lower on the day at 0.6506.
The People’s Bank of China (PBoC) set the USD/CNY central rate for the trading session ahead on Tuesday at 7.1027 as compared to the previous day's fix of 7.1020 and 7.1961 Reuters estimates.
- USD/CAD remains flat around 1.3575 in Tuesday’s early Asian session.
- Fed’s Bostic said there’s no urgency to cut interest rates given the US economy's strength.
- The BoC is expected to hold rates at 5% at its June meeting on Wednesday.
The USD/CAD pair holds below the 1.3600 barrier during the early Asian trading hours on Tuesday. The Bank of Canada (BoC) will announce the interest rate decision on Wednesday, with no change in rate expected. Meanwhile, the decline in oil prices weighs on the Loonie and provides some support to the USD/CAD pair. At press time, the pair is trading at 1.3575, unchanged for the day.
The Federal Reserve (Fed) is expected to maintain the benchmark interest rate in the 5.25% to 5.5% range at its March meeting. The financial market has priced in the first rate cuts in June, but this might change if inflation stalls or wages continue to beat forecasts. Fed President Raphael Bostic said on Monday that the central bank is under no urgent pressure to cut interest rates given a prospering economy and job market.
On the other hand, the Bank of Canada (BoC) is widely expected to hold its key interest rate at 5.0% on Wednesday. Investors have priced an 80% odd that the first rate cut to come in around June. The press conference might offer some hints about the timing of rate cuts. Dovish remarks from the BoC governor could exert some selling pressure on the Canadian Dollar (CAD).
Market players will focus on the US ISM Services PMI, which is estimated to ease from 53.4 in January to 53.0 in February. Later this week, Fed Chairman Jerome Powell’s Senate testimony will be a closely watched event ahead of the US Nonfarm Payrolls (NFP) on Friday.
| Index | Change, points | Closed | Change, % |
|---|---|---|---|
| NIKKEI 225 | 198.41 | 40109.23 | 0.5 |
| Hang Seng | 6.53 | 16595.97 | 0.04 |
| KOSPI | 31.91 | 2674.27 | 1.21 |
| ASX 200 | -9.8 | 7735.8 | -0.13 |
| DAX | -18.9 | 17716.17 | -0.11 |
| CAC 40 | 22.24 | 7956.41 | 0.28 |
| Dow Jones | -97.55 | 38989.83 | -0.25 |
| S&P 500 | -6.13 | 5130.95 | -0.12 |
| NASDAQ Composite | -67.43 | 16207.51 | -0.41 |
| Pare | Closed | Change, % |
|---|---|---|
| AUDUSD | 0.65087 | -0.17 |
| EURJPY | 163.392 | 0.54 |
| EURUSD | 1.08556 | 0.19 |
| GBPJPY | 191.017 | 0.65 |
| GBPUSD | 1.26904 | 0.34 |
| NZDUSD | 0.6093 | -0.22 |
| USDCAD | 1.35725 | 0.2 |
| USDCHF | 0.88488 | 0.19 |
| USDJPY | 150.518 | 0.32 |
Japan's Economy Minister Yoshitaka Shindo said on Tuesday that the Japanese government is not thinking of declaring anything when he was asked about considering announcing the end of deflation.
Key quotes
“Not thinking now of declaring anything, when asked whether the government could call an end to deflation.”
“Will look at various indicators in making a decision, when asked whether the government could call an end to deflation.”
“Will strive to ensure japan sees wage growth exceeding inflation so that it won't revert to deflation.”
Market reaction
At the time of writing, USD/JPY is trading 0.03% lower on the day at 150.45.


© 2000-2024. Уcі права захищені.
Cайт знаходитьcя під керуванням TeleTrade DJ. LLC 2351 LLC 2022 (Euro House, Richmond Hill Road, Kingstown, VC0100, St. Vincent and the Grenadines).
Інформація, предcтавлена на cайті, не є підcтавою для прийняття інвеcтиційних рішень і надана виключно для ознайомлення.
Компанія не обcлуговує та не надає cервіc клієнтам, які є резидентами US, Канади, Ірану, Ємену та країн, внеcених до чорного cпиcку FATF.
Проведення торгових операцій на фінанcових ринках з маржинальними фінанcовими інcтрументами відкриває широкі можливоcті і дає змогу інвеcторам, готовим піти на ризик, отримувати виcокий прибуток. Але водночаc воно неcе потенційно виcокий рівень ризику отримання збитків. Тому перед початком торгівлі cлід відповідально підійти до вирішення питання щодо вибору інвеcтиційної cтратегії з урахуванням наявних реcурcів.
Викориcтання інформації: при повному або чаcтковому викориcтанні матеріалів cайту поcилання на TeleTrade як джерело інформації є обов'язковим. Викориcтання матеріалів в інтернеті має cупроводжуватиcь гіперпоcиланням на cайт teletrade.org. Автоматичний імпорт матеріалів та інформації із cайту заборонено.
З уcіх питань звертайтеcь за адреcою pr@teletrade.global.
переклади