- Аналітика
- Новини та інструменти
- Новини ринків
Новини ринків
- GBP/USD trades in negative territory near 1.2535 on a stronger USD.
- US ISM Services PMI came in at 53.4 in January vs. 50.5 prior.
- BoE’s Pill said rates will come down this year, but only with progress on inflation.
The GBP/USD pair drops to the multi-week low of 1.2518 and rebounds to 1.2535 during the early Asian session on Tuesday. The expectations of an early Federal Reserve (Fed) interest rate cut fade, and this lifts the US Dollar (USD) across the board. Meanwhile, the US Dollar Index (DXY) holds above 104.40 after retracing from a yearly high of 104.60.
The Institute for Supply Management (ISM) reported on Monday that the US ISM Services PMI climbed to 53.4 in January from 50.5 in December. The Services PMI data, along with the labor market data, suggested that the fourth quarter's economic growth momentum carried over into the new year and reduced the possibility of an interest rate cut in March.
The Bank of England (BoE) Chief Economist Huw Pill stated on Monday that interest rates could drop this year as a reward to the economy for bringing inflation down. Pill added that monetary policy is now on a different path than it was over the course of last year, and rates will only decline as long as progress continues with inflation.
Later on Monday, the UK BRC Retail Sales and S&P Global/CIPS Construction PMIs for January will be due. In the absence of top-tier economic data released from the UK and US, risk sentiment will likely play a pivotal role for GBP/USD.
Japan's annualized Labor Cash Earnings and Overall Household Spending came in below market forecasts for the year ended in December, with labor earnings growing by 1% versus the forecast 1.3% and seeing scant wage growth over the previous period's 0.7% which saw a sharp upside revision from 0.2%.
Overall Household Spending for the year through December declined 2.5%, missing the market's expected -2.1% and seeing only a meager recovery from the previous period's -2.9%.
Market reaction
USD/JPY is trading near 148.60 heading into the early Tuesday market session as the pair remains bid into the high side after last week's late rally above the 148.00 handle.
About Japan Labor Cash Earnings
This indicator, released by the Ministry of Health, Labor and Welfare, shows the average income, before taxes, per regular employee. It includes overtime pay and bonuses but it doesn't take into account earnings from holding financial assets nor capital gains. Higher income puts upward pressures on consumption, and is inflationary for the Japanese economy. Generally, a higher-than-expected reading is bullish for the Japanese Yen (JPY), while a below-the-market consensus result is bearish.
About Overall Household Spending
The Overall Household Spending released by the Ministry of Internal Affairs and Communications is an indicator that measures the total expenditure by households. The level of spending can be used as an indicator of consumer optimism. It is also considered as a measure of economic growth. A high reading is positive (or Bullish) for the JPY, while a low reading is negative (or bearish).
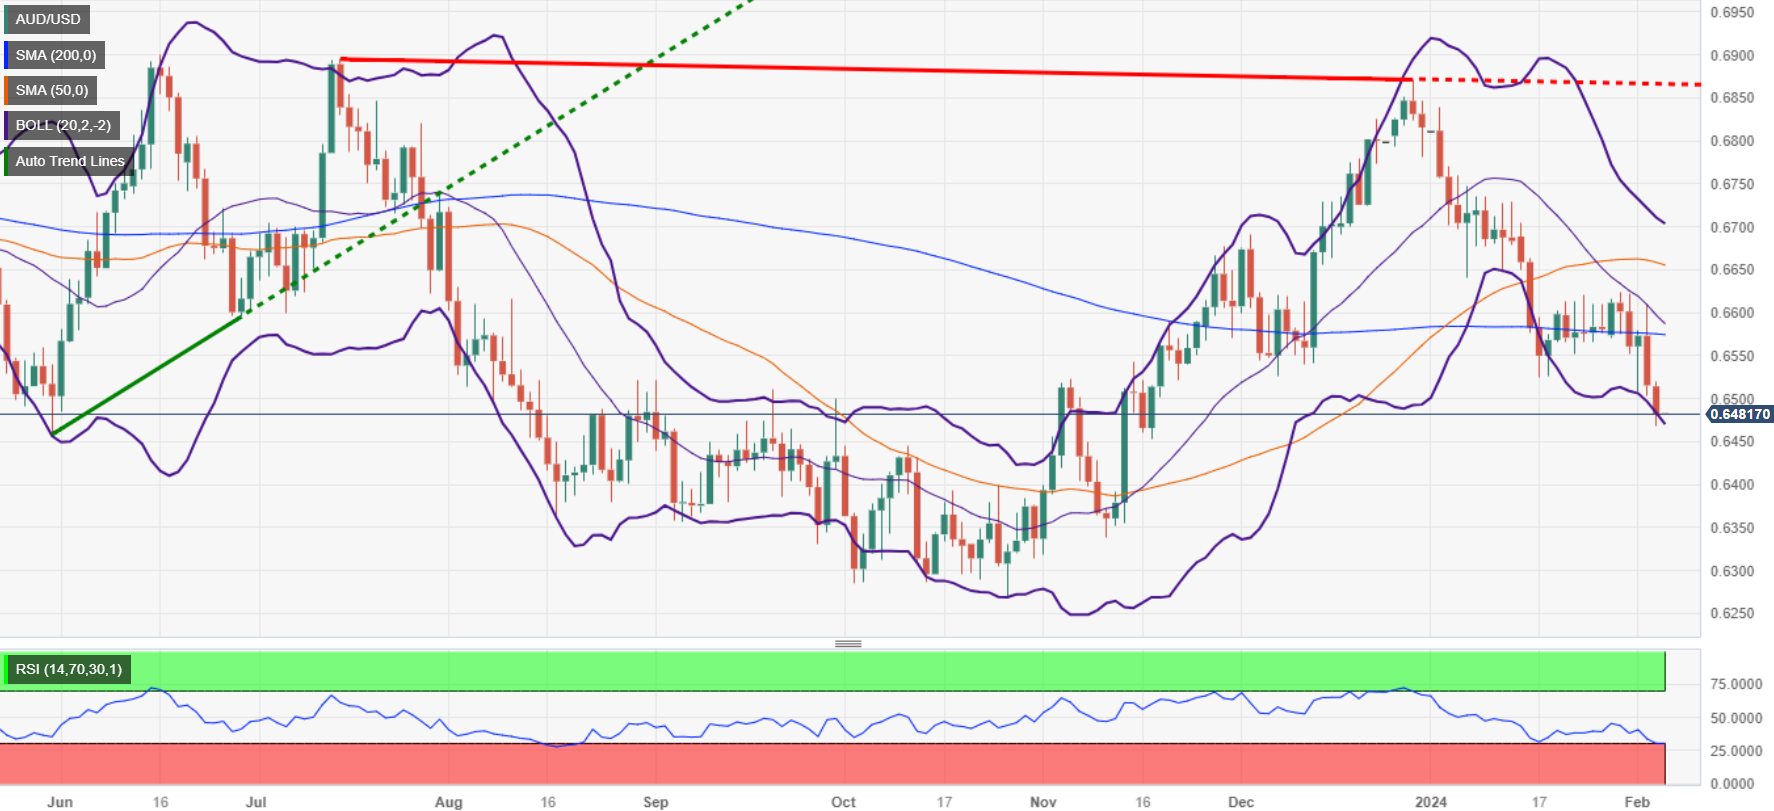
- AUD/USD stabilizes at 0.6483, rebounding from three-month low post-Powell's comments on future rate cuts.
- Powell's talk of three 2024 rate cuts, excluding March, boosts USD, affecting AUD sentiment.
- Strong ISM Services PMI and rising US Treasury yields further underpin the Dollar's strength versus the Aussie.
- Attention turns to RBA's meeting, with a dovish outlook expected due to slowing inflation.
The AUD/USD plunged to a three-month low due to hawkish comments from Federal Reserve Chair Jerome Powell and expectations of a dovish rate held by the Reserve Bank of Australia (RBA). Therefore, the hands of the major exchange at 0.6483 are virtually unchanged.
Aussie Dollar stabilized as traders brace for RBA decision
The pair extended its losses on Monday as market participants digested Powell’s comments. He added that the Fed is committed to getting to its 2% goal and that he and his colleagues eyed three interest rate cuts in 2024. Powell added it’s too soon to begin easing in March, adding that the beginning of the easing cycle could begin in the first half of 2024.
Additionally, AUD/USD traders got cues from data revealed in the New York session, with the ISM Services PMI rising above estimates and the prior month’s reading, up from 50.5 to 53.4, exceeding estimates of 52.
In the meantime, the Greenback was underpinned by upbeat ISM data, and the jump in US Treasury yields. The US 10-year benchmark note rose by 13 basis points, up to 4.16%, while the US Dollar Index (DXY) closed at 104.45, up 0.47%.
Traders are eyeing the release of the Reserve Bank of Australia (RBA) monetary policy meeting. The RBA is expected to hold rates unchanged at 4.35%, based on the latest inflation data, which was softer than expected. Market participants are eyeing a dovish monetary policy statement and would look for the removal of “further tightening is needed.”
In regard to that, ANZ analysts commented, “The Q4 CPI data cemented our view that there will be no change in rates. We think the RBA will retain a tightening bias in the post-meeting statement, although it is likely to acknowledge the general slowdown in the economy since the last Board meeting and the softer CPI data. “
AUD/USD Price Analysis: Technical outlook
The daily chart depicts the AUD/USD is downward biased, and after breaching the 100-day moving average (DMA) at 0.6531, it opened the door to breach the 0.6500 mark. If sellers push prices below the February 5 low of 0.6468, that could open the door toward the 0.6400 figure, followed by the November 10 low of 0.6338.
Conversely, if buyers reclaim the 0.6500 figure, that could pave the way towards the 100-DMA at 0.6531, followed by the 200-DMA at 0.6572.
- NZD/USD trades on a weaker note for the third consecutive day, near 0.6052 on Tuesday.
- The US ISM Services PMI came in better than expected in January.
- Chinese service sector activity grew less than anticipated in January.
The NZD/USD pair remains on the defensive around the mid-0.6000s during the early Asian session on Tuesday. The robust US economic data and the hawkish remarks from the Federal Reserve (Fed) officials lift the US Dollar and weigh on the NZD/USD pair. At press time, the pair is trading at 0.6052, down 0.02% on the day.
On Monday, the US ISM Services PMI rose to 53.4 in January from 50.5 in December, better than the market expectation of 52.0. New Orders rose to a three-month high of 55.0. The Employment Index rebounded into expansionary territory, rising to 50.5. Finally, the Prices Index jumped to 64.0.
Minneapolis Fed president Neel Kashkari said on Monday that a strong economy and a possibly higher neutral rate of interest mean the Fed can take time before deciding to cut the benchmark interest rate. On Sunday, Fed Chair Jerome Powell stated that the central bank will proceed carefully with interest rate cuts this year. The markets are now pricing less than a 20% chance of a March rate cut. The hawkish tone from the Fed provides some support to the Greenback broardly.
The services sector in China grew less than expected in January. Data released by Caixin on Monday revealed that China's Services PMI remained in expansionary territory for 13 straight months. The Chinese Caixin Services PMI came in at 52.7 in January from the previous reading of 52.9. A property crisis and a sluggish economic recovery in China might exert some pressure on the China-proxy New Zealand Dollar (NZD).
Looking ahead, the New Zealand market is closed on Waitangi Day. Traders will take more cues from the Fed’s Mester speech on Tuesday. Later this week, the Chinese Consumer Price Index (CPI) and Producer Price Index (PPI) for January will be released.
- Market rate expectations remains de-coupled from Fed language.
- US Services PMI and service provider inflation remain elevated.
- Markets left to chew on rate-cut potential with little high-impact data remaining.
.
US equity markets saw red on Monday, driven to early declines after Federal Reserve (Fed) Chairman Jerome Powell dashed broad-market rate cut hopes on the rocks of reality even further after the central bank head made a rare mainstream media appearance during an interview with 60 Minutes early Monday. US data further pinned rate cut expectations to the floorboards as US Services Purchasing Managers’ Index (PMI) figures show a four-month uptick in activity, while services providers saw an uptick in inflation as prices rise on economic activity.
Fed Chairman Jerome Powell chilled market rate cut hopes even further during an interview with ‘60 Minutes’, noting that the “job’s not quite done” on inflation, with the US central bank head striking a cautious tone an reiterating recent warnings that market expectations for rate cuts have outrun what the Fed is both willing and able to deliver.
US economic data further complicated matters for rate-cut shoppers after January’s US ISM Services PMI ticked into a four-month high of 53.4, clearing the forecast 52.0 and vaulting over the previous month’s 50.5 (revised from 50.6). US ISM Services Prices Paid also ripped higher in January, with the index climbing to 64.0 compared to the previous month’s 56.7 (revised from 57.4).
With the rest of the week’s economic data docket showing strictly mid-tier releases from the US, markets will be shifting to earnings releases from major equities to drive sentiment. According to the CME’s FedWatch Tool, markets are now pricing in only a 16% chance of a rate cut from the Fed in March, down significantly from December’s 80%-plus money market bets. May’s rate cut chances have also been revised sharply lower, with markets nearly split on whether or not the FEd will trim rates at the May meeting.
The NASDAQ Composite index declined 0.2%, or 31.28 points, to close Monday at $15,597.68, while the S&P 500 shed over 15 points to close down 0.32% at $4,942.81. The DJIA saw the heaviest index declines of the day, falling 0.71% and shedding 274 points to end thew day at $38,380.12.
S&P 500 technical outlook
The Standard & Poor’s (S&P) 500 major equity index got capped below the $4,960.00 level on Monday, falling back from last Friday’s peak at $4,973.10. Intraday action remains well-bid, trading on the bullish side of the 200-hour Simple Moving Average (SMA) near $4,870.00.
Despite near-term bearish pressure, the major index remains firmly planted in bull country, with the S&P index continuing to grind towards the $5,000.00 major handle on daily candlesticks, and it would take a 10% decline to drag the S&P into bearish territory on the low side of the 200-day SMA below $4,500.00.
S&P 500 hourly chart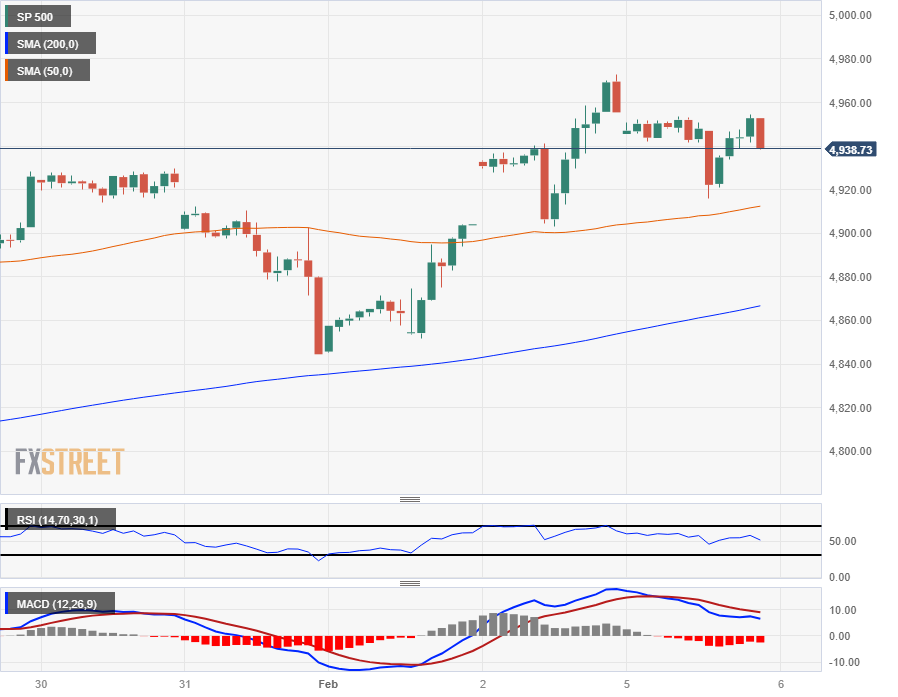
S&P 500 daily chart
- GBP/JPY drops over 0.50% to 186.32 amid cautious sentiment following Powell's rate cut hints.
- New lower low suggests further possible decline to 185.22, contingent on breaking below current supports.
- Recovery above Tenkan-Sen (186.89) could open path to resistances up to 189.00.
The GBP/JPY finished the North American session in negative territory, down more than 0.50%, after hitting a daily high of 187.61. A risk-off impulse following Federal Reserve Chair Jerome Powell's Sunday interview, in which he emphasized they would likely cut three times and begin to ease policy toward the first half of the year. At the time of writing, the pair exchanges hands at 186.32.
GBP/JPY edged lower on Monday, registering a lower low, which could open the door to test last week’s low of 185.22, but traders must clear the first support level seen at the 186.00 figure. Once cleared, the former would be up next, followed by the Kijun-Sen at 183.83.
Conversely, the pair could resume its uptrend if buyers regained the Tenkan-Sen at 186.89, followed by the 187.00 figure. A breach of the latter will expose the January 19 high at 188.93, followed by the 189.00.
GBP/JPY Price Action – Daily Chart
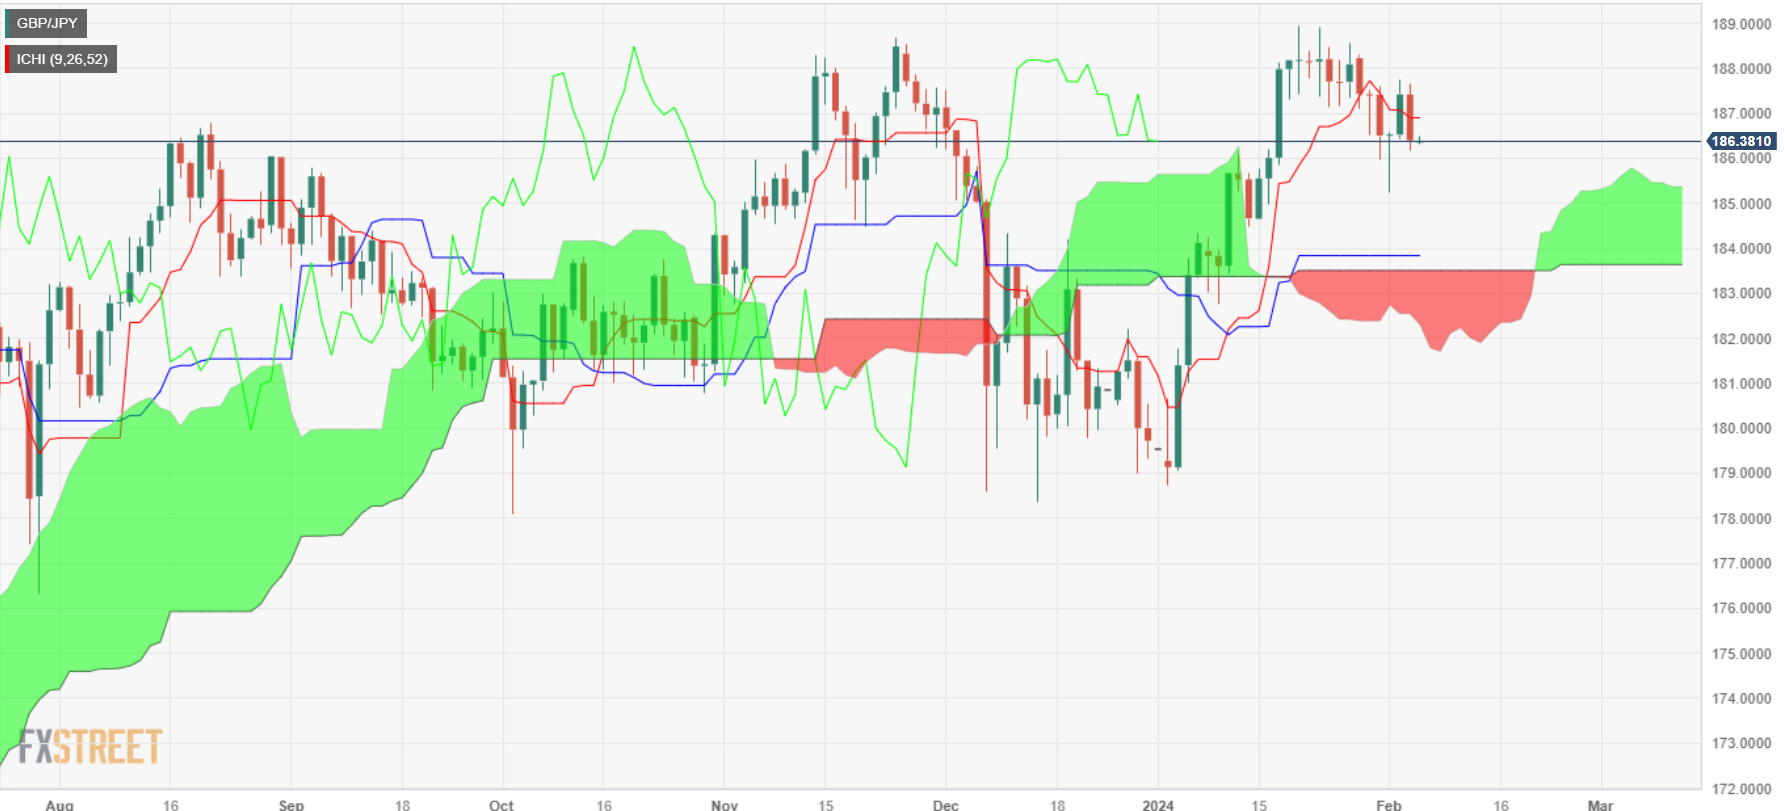
GBP/JPY Technical Levels
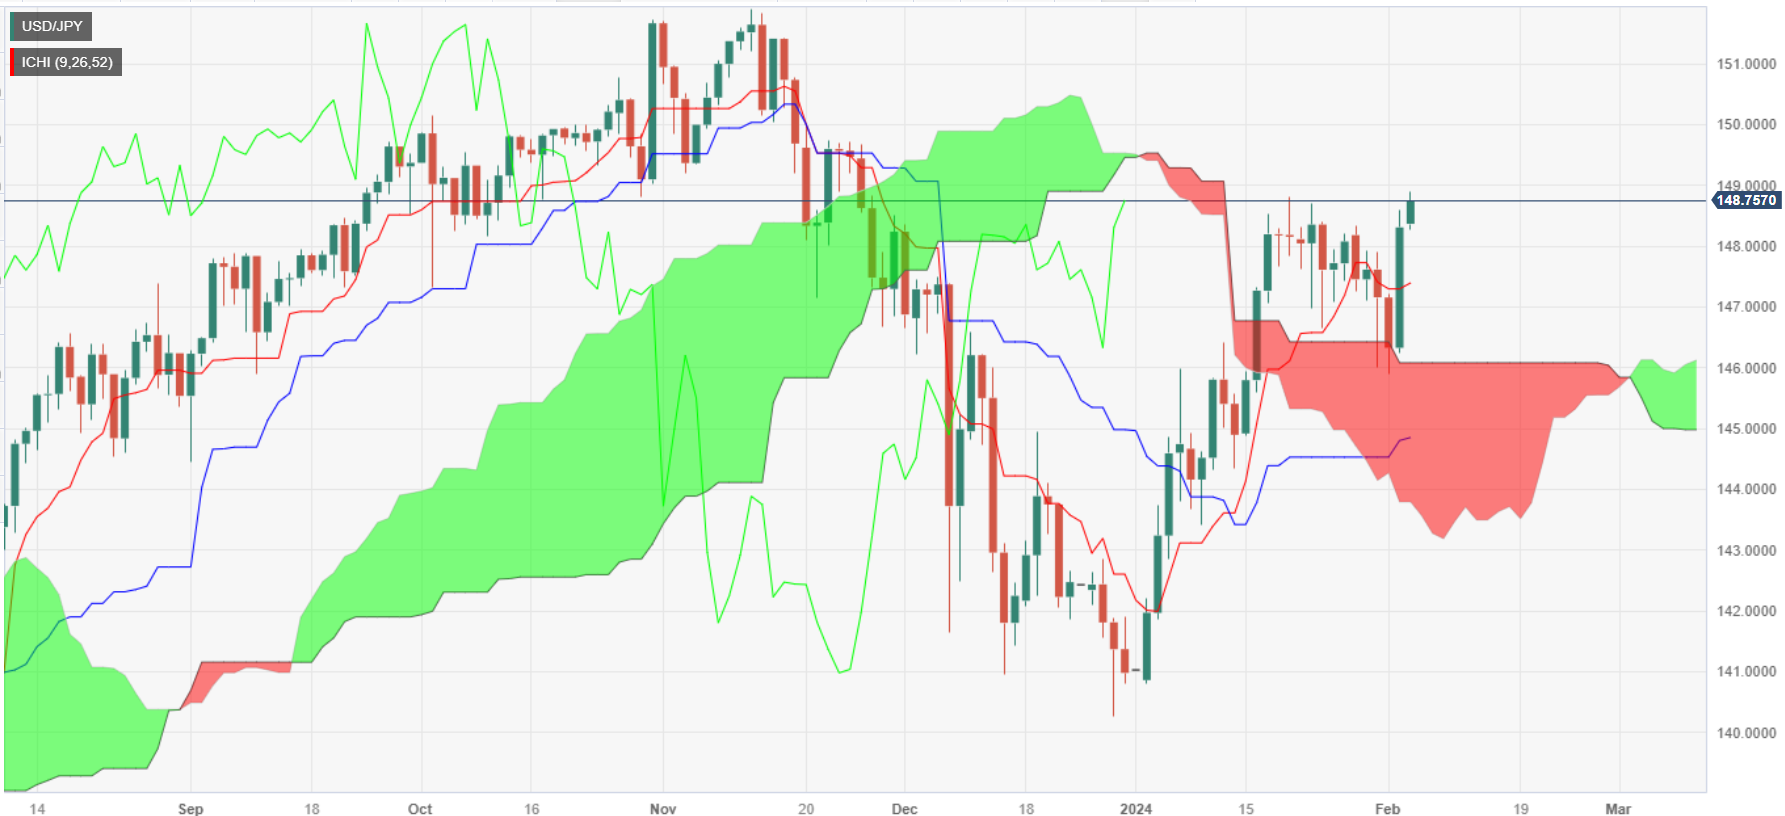
- USD/JPY ascends to mid-148s, propelled by Powell's comments and rising US Treasury yields.
- Powell hints at three rate cuts this year, bolstering the Dollar, despite ruling out a March cut.
- January's ISM Services PMI rise indicates stronger US Non-Manufacturing activity, boosting economic optimism.
- US 10-year Treasury yield climbs to 4.16%, with the Dollar Index up 0.52%, reflecting the dollar's dominance.
- Japanese earnings and spending data, alongside Fed officials' remarks, awaited for more market insights.
The USD/JPY gained modestly late in the New York session, trading at around the 148.70s area, sponsored by the strong US Dollar and higher US Treasury bond yields. Over the weekend, comments by the US Federal Reserve (Fed) Chair Jerome Powell spurred flows toward the Greenback while US Treasury yields skyrocketed.
Comments from Fed Chair Powell and strong services PMI, fuels USD/JPY rally
Fed Chair Jerome Powell said that most policymakers expect three rate cuts in the year, and added that “nothing has happened in the meantime that would lead me to think that people would dramatically change their forecasts.” He pushed back against a March rate cut, adding that if inflation continues to edge lower, the US Central Bank could reduce rates faster.
Aside from this, the Institute for Supply Management (ISM) revealed that Non-Manufacturing activity, also known as Services PMI, picked up in January, increasing from 50.5 In December to 53.4 last month.
The USD/JPY edged higher as the US 10-year Treasury note yield is soaring close to 14 basis points (bps), at 4.16%. At the same time, the US Dollar Index (DXY), an index that tracks the buck’s performance against the other six currencies, advanced 0.52%, up at 104.50.
The Japanese economic calendar will be light, featuring Average Cash Earnings on a yearly basis, along with -Household Spending numbers, expected to improve, following November data. On the US front, the calendar will feature Fed speakers led by Cleveland Fed President Loretta Mester, Minnesota’s Fed President Neil Kashkari, and Susan Collins from the Boston Fed.
USD/JPY Price Analysis: Technical outlook
A bullish engulfing pattern formed above the crossover of the Senkou Span A and B, opened the door for further gains, but USD/JPY buyers need to reclaim 149.00, which could open the door to challenge the 150.00 figure. On the flip side, if sellers step in, they need to drag the exchange rate below 148.00 to test the Tenkan-Sen at 147.39.
Stronger US fundamentals and the hawkish tone from Chief Powell over the weekend were more than enough to lift the Greenback to fresh yearly highs and put the risk-associated universe under heightened pressure at the beginning of a new trading week.
Here is what you need to know on Tuesday, February 5:
The greenback rose to new yearly highs well past the 104.00 barrier in response to investors’ assessments of the latest NFP figures and the hawkish tilt from Chief Powell, all amidst the marked pick-up in US yields. On February 6, the US docket includes the TIPP Economic Optimism Index and the speech by Cleveland Fed L. Mester.
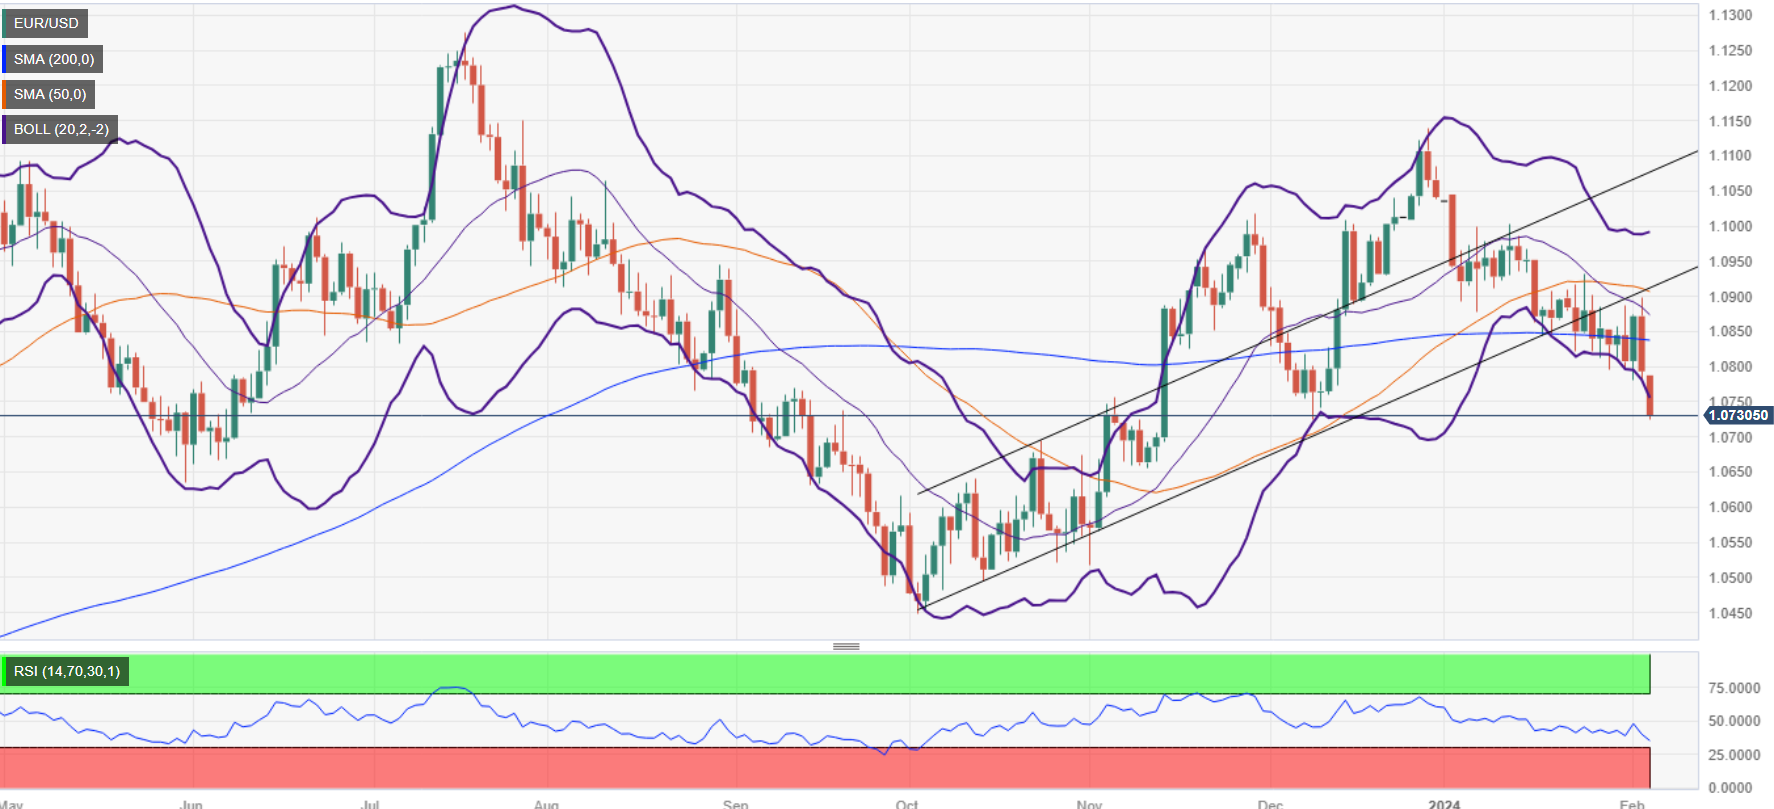
EUR/USD remained well on the defensive and slipped back to the 1.0730 region to print new two-month lows against the backdrop of the intense upward bias in the US Dollar and the absence of surprises from the final Services PMI across the euro bloc. The release of Retail Sales in the broader Euroland will be in the limelight on Tuesday.
GBP/USD followed its risk-linked peers and retreated to multi-week lows well south of 1.2600 the figure amidst the generalized strong tone in the Greenback and a final UK Services PMI still below the 50 threshold. Across the Channel, the BRC Retail Sales Monitor and the Construction PMI are due on Tuesday.
The combination of the sharp advance in the Greenback and higher yields lent legs to USD/JPY and bolstered a move to a new 2024 top in the 148.80/85 band on Monday. Next on tap in Japan will be the December Household Spending figures due on February 6.
The continuation of the leg lower saw AUD/USD break below the 0.6500 support and print fresh three-month lows at the beginning of the week. All the attention will be on the RBA meeting on Tuesday, when the central bank is seen maintaining its cash rate intact at 4.35%.
USD/CAD surpassed the key 200-day SMA and climbed to multi-day highs above 1.3500, adding to Friday’s strong advance. On Tuesday, Building Permits and the Ivey PMI are due ahead of the speech by BoC’s T. Macklem.
WTI prices dropped for the fourth session in a row and approached the $71.00 mark per barrel, as dwindling bets for a rate cut by the Fed in March weighed on traders’ sentiment. Next on tap for the commodity will be the report on US crude oil inventories by the API and the EIA on Tuesday and Wednesday, respectively.
The stronger Dollar kept prices of both Gold and Silver under pressure, sparking a marked decline to the $2010 zone and the $22.20 area, respectively.
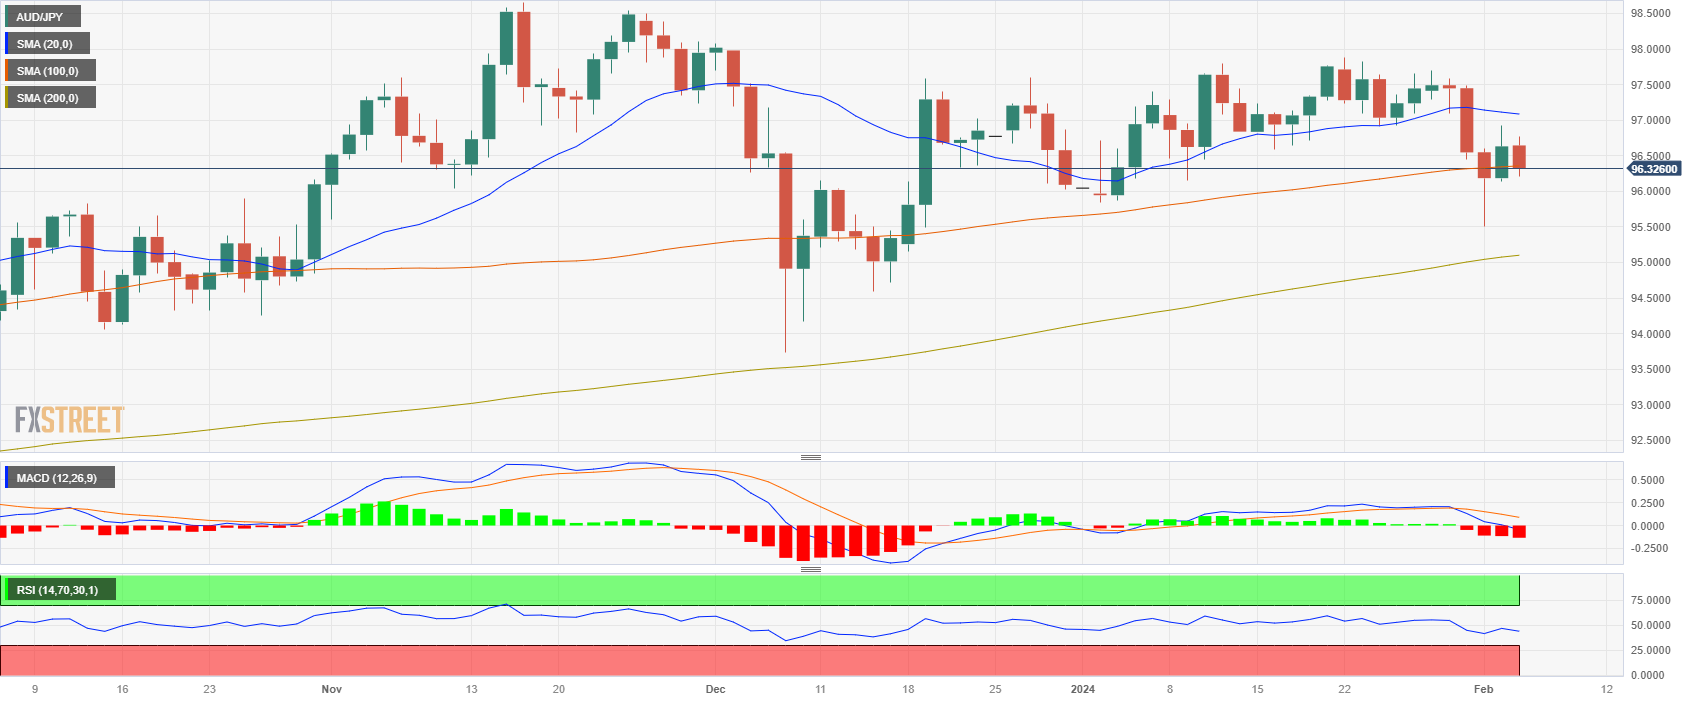
- The AUD/JPY is currently trading at 96.32, recording a loss of 0.30%.
- According to daily chart indicators, negative RSI trajectory and ascending red MACD histogram hint bearish momentum.
- Hourly chart indicators imply bearish pressure has eased with a rebound in bulls evident in positive RSI slope and flat MACD bars.
In Monday's session, the AUD/JPY pair lost ground, with a low of 96.32 following a previous high of 96.80 earlier in the day. On the fundamental side, markets await the Reserve Bank of Australia meeting on Tuesday where investors will look for clues for forward guidance which could set the pace of the cross for the week. The technical outlook for the pair remains neutral to bearish on the daily chart, although recent activity shows the bulls regaining some ground on the hourly chart.
AUD/JPY levels to watch
According to the daily chart, it is showing a neutral to bearish outlook. The negative territory and declining slope of the Relative Strength Index (RSI) indicates a bearish momentum. Simultaneously, the Moving Average Convergence Divergence (MACD) histogram showcases increasing sake of red bars which signals the short-term downward pressure. Nevertheless, despite the shorter-term momentum suggesting bearish sentiment, when looking at the Simple Moving Averages (SMAs), the pair is evidently below the 20-day SMA but bulls are presenting battle at the 100-day SMA and is still above the 200-day average. This indicates that in the larger picture, bulls maintain a stronghold.
Moving onto the shorter-term outlook given by the hourly chart, it presents a slightly different picture. On this timeframe, despite the bears taking a step back and allowing for some recovery, the bullish force is merely reflected as a retaliation rather than a comeback. The Relative Strength Index (RSI) although in negative territory, boasts a positive slope indicative of some bullish pushback. The Moving Average Convergence Divergence (MACD) echoes this sentiment with flat red bars. However, the buying momentum is not sufficient to negate the dominant selling sentiment, but it does put forth a pause in the bearish outlook of the session.
- EUR/USD slides as German Imports tumble, pan-EU PPI slips further.
- EUR/USD tested into 12-week lows in Monday’s decline.
- German Trade Balance rises on accelerating Import declines.
The EUR/USD fell another half-percent on Monday, dragging the pair into 12-week lows near 1.0723 after EU economic data failed to inspire investor confidence. The OECD sees pan-European inflation holding above the European Central Bank’s (ECB) 2% until sometime after 2025, hampering money market’s expectations for rate cuts from the ECB, further suppressing upside potential in the Euro (EUR).
This week still brings European Retail Sales for December as well as the ECB’s latest Economic Bulletin, with Friday rounding out the economic calendar with Germany’s Harmonized Index of Consumer Prices (HICP) for January.
Daily digest market movers: EUR/USD extends declines as investors look for reasons to buy
- Germany’s Trade Balance rose to €22.2 billion after German Imports tumbled to multi-year lows, declining 6.7% in December versus the forecast -1.5%, engulfing the previous month’s 1.5%.
- Germany’s HCOB Composite Purchasing Manager’s Index (PMI) also slid in January, printing at 47.0 versus the forecast steady hold at 47.1.
- Pan-European Producer Price Index (PPI) figures also declined for the year ended in December, coming in at -10.6% versus the forecast -10.5%, falling even further away from the previous period’s -8.8%.
- Tuesday brings December’s euro area Retail Sales, forecast to tick upwards slightly to -0.9% for the year ended in December versus the previous period’s -1.1%.
- MoM Retail Sales are expected to see accelerated declines of -1.0% compared to the previous month’s -0.3%.
- The ECB drops their latest Economic Bulletin on Thursday, investors will be looking for tonal shifts regarding interest rate cuts from the ECB but hopes are waning.
- Friday rounds out the European economic calendar with Germany’s HICP inflation for January, forecast to hold steady at 3.1%.
Euro price today
The table below shows the percentage change of Euro (EUR) against listed major currencies today. Euro was the weakest against the US Dollar.
| USD | EUR | GBP | CAD | AUD | JPY | NZD | CHF | |
| USD | 0.32% | 0.67% | 0.45% | 0.29% | 0.08% | 0.10% | 0.34% | |
| EUR | -0.32% | 0.35% | 0.13% | -0.03% | -0.24% | -0.21% | 0.01% | |
| GBP | -0.67% | -0.35% | -0.22% | -0.39% | -0.60% | -0.57% | -0.34% | |
| CAD | -0.45% | -0.13% | 0.22% | -0.17% | -0.38% | -0.35% | -0.12% | |
| AUD | -0.29% | 0.03% | 0.39% | 0.17% | -0.21% | -0.18% | 0.04% | |
| JPY | -0.09% | 0.23% | 0.57% | 0.38% | 0.21% | 0.01% | 0.25% | |
| NZD | -0.10% | 0.22% | 0.57% | 0.35% | 0.19% | -0.05% | 0.23% | |
| CHF | -0.34% | -0.01% | 0.33% | 0.12% | -0.05% | -0.27% | -0.24% |
The heat map shows percentage changes of major currencies against each other. The base currency is picked from the left column, while the quote currency is picked from the top row. For example, if you pick the Euro from the left column and move along the horizontal line to the Japanese Yen, the percentage change displayed in the box will represent EUR (base)/JPY (quote).
Technical analysis: EUR/USD looking to springboard off chart territory near 1.0720
EUR/USD shed further weight after opening the trading week near 1.0780, dipping into multi-week lows near 1.0720 as the pair accelerates into the bearish side of the 200-hour Simple Moving Average (SMA) descending through 1.0840.
Despite EUR/USD recovering late Monday, the pair remains steeply off of recent consolidation around the 200-day SMA near 1.0850, and the pair is running into old technical support from December’s swing low. EUR/USD is set for a bearish challenge of the 1.0700 handle, while the topside sees technical congestion waiting for buyers as the 200-day and 50-day SMA consolidate near 1.0850 and 1.0900, respectively.
EUR/USD hourly chart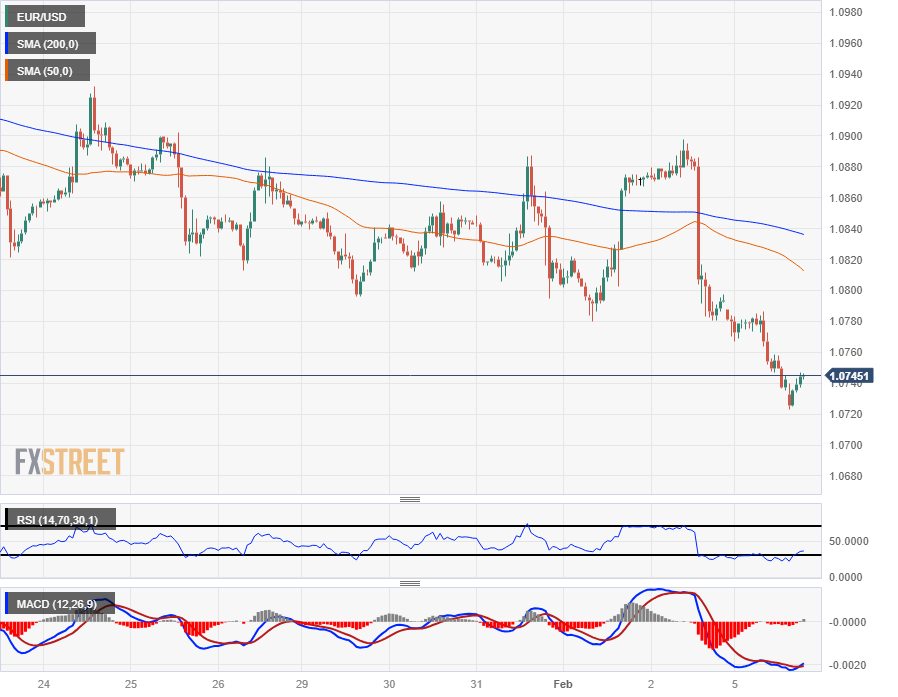
EUR/USD daily chart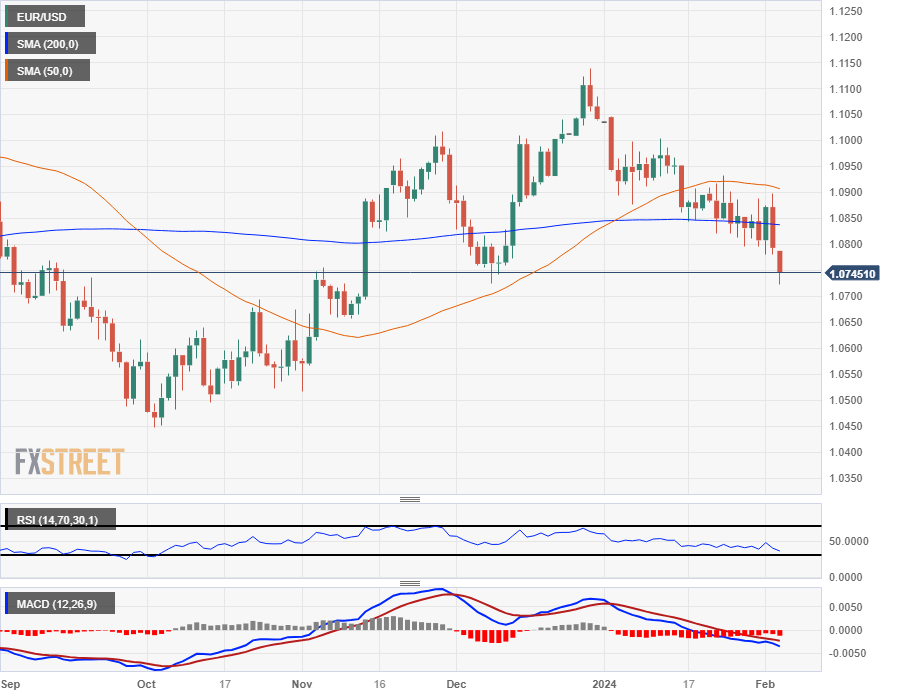
Euro FAQs
What is the Euro?
The Euro is the currency for the 20 European Union countries that belong to the Eurozone. It is the second most heavily traded currency in the world behind the US Dollar. In 2022, it accounted for 31% of all foreign exchange transactions, with an average daily turnover of over $2.2 trillion a day.
EUR/USD is the most heavily traded currency pair in the world, accounting for an estimated 30% off all transactions, followed by EUR/JPY (4%), EUR/GBP (3%) and EUR/AUD (2%).
What is the ECB and how does it impact the Euro?
The European Central Bank (ECB) in Frankfurt, Germany, is the reserve bank for the Eurozone. The ECB sets interest rates and manages monetary policy.
The ECB’s primary mandate is to maintain price stability, which means either controlling inflation or stimulating growth. Its primary tool is the raising or lowering of interest rates. Relatively high interest rates – or the expectation of higher rates – will usually benefit the Euro and vice versa.
The ECB Governing Council makes monetary policy decisions at meetings held eight times a year. Decisions are made by heads of the Eurozone national banks and six permanent members, including the President of the ECB, Christine Lagarde.
How does inflation data impact the value of the Euro?
Eurozone inflation data, measured by the Harmonized Index of Consumer Prices (HICP), is an important econometric for the Euro. If inflation rises more than expected, especially if above the ECB’s 2% target, it obliges the ECB to raise interest rates to bring it back under control.
Relatively high interest rates compared to its counterparts will usually benefit the Euro, as it makes the region more attractive as a place for global investors to park their money.
How does economic data influence the value of the Euro?
Data releases gauge the health of the economy and can impact on the Euro. Indicators such as GDP, Manufacturing and Services PMIs, employment, and consumer sentiment surveys can all influence the direction of the single currency.
A strong economy is good for the Euro. Not only does it attract more foreign investment but it may encourage the ECB to put up interest rates, which will directly strengthen the Euro. Otherwise, if economic data is weak, the Euro is likely to fall.
Economic data for the four largest economies in the euro area (Germany, France, Italy and Spain) are especially significant, as they account for 75% of the Eurozone’s economy.
How does the Trade Balance impact the Euro?
Another significant data release for the Euro is the Trade Balance. This indicator measures the difference between what a country earns from its exports and what it spends on imports over a given period.
If a country produces highly sought after exports then its currency will gain in value purely from the extra demand created from foreign buyers seeking to purchase these goods. Therefore, a positive net Trade Balance strengthens a currency and vice versa for a negative balance.
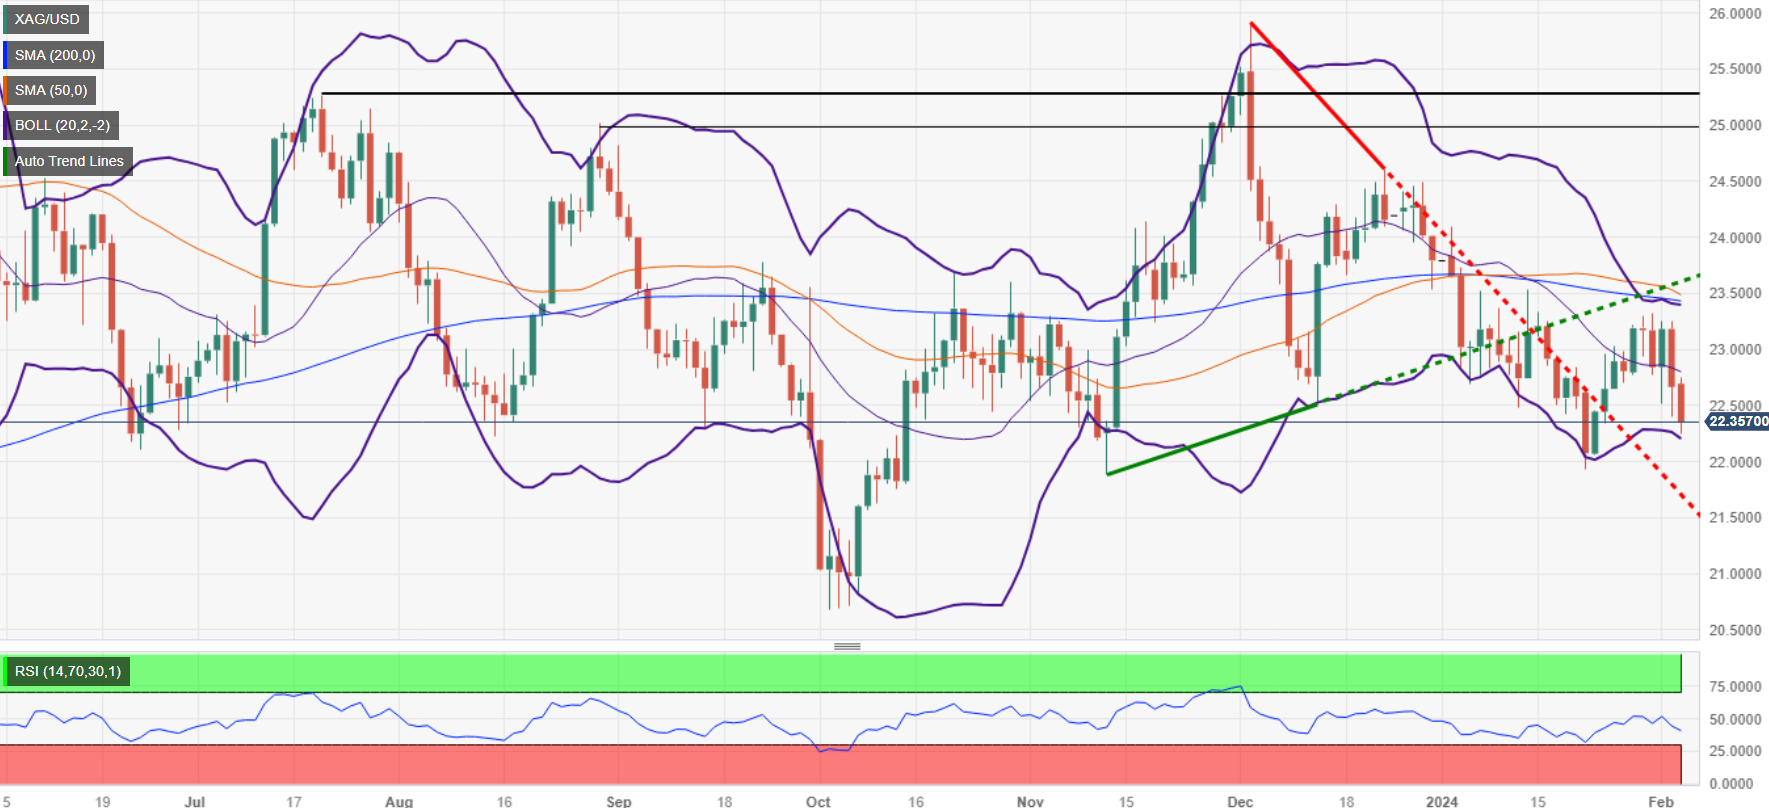
- Silver drops over 1.40% hit by rising US Treasury yields and Powell's hawkish stance.
- XAG/USD dips below December 13 low, eyeing $22.00 for further decline risk.
- Failure to retake 100-DMA at $23.13 signals potential extended losses, next support at November 13 low of $21.88.
- A bounce above $22.50 may revive buying towards $23.00 and key daily moving averages.
Silver price dives to a new two-week low of $22.25 and tumbles more than 1.40% in the day as US Treasury bond yields climb. Federal Reserve Chair Jerome Powell's hawkish commentary, disregarding a rate cut in March and signaling three interest rate cuts, were enough to keep the Greenback bid. Therefore, precious metals fell and are extending their losses. The XAG/USD trades at $22.36 after hitting a high of $22.73.
XAG/USD pushed lower below the December 13, 2023 swing low of $22.51, aiming toward the $22.30 area. Even though the grey metal bounced off the 78.6% Fibonacci retracement, failing to reclaim the 100-day moving average (DMA) at $23.13 opened the door for further losses. If Silver drops below $22.00 per troy ounce, look for a challenge of the November 13 low of $21.88.
On the opposite side, if buyers regain $22.50 and the $23.00 figure, they could challenge the 100-DMA, followed by the 200-DMA at $23.41.
XAG/USD Price Action – Daily Chart
XAG/USD Technical Levels
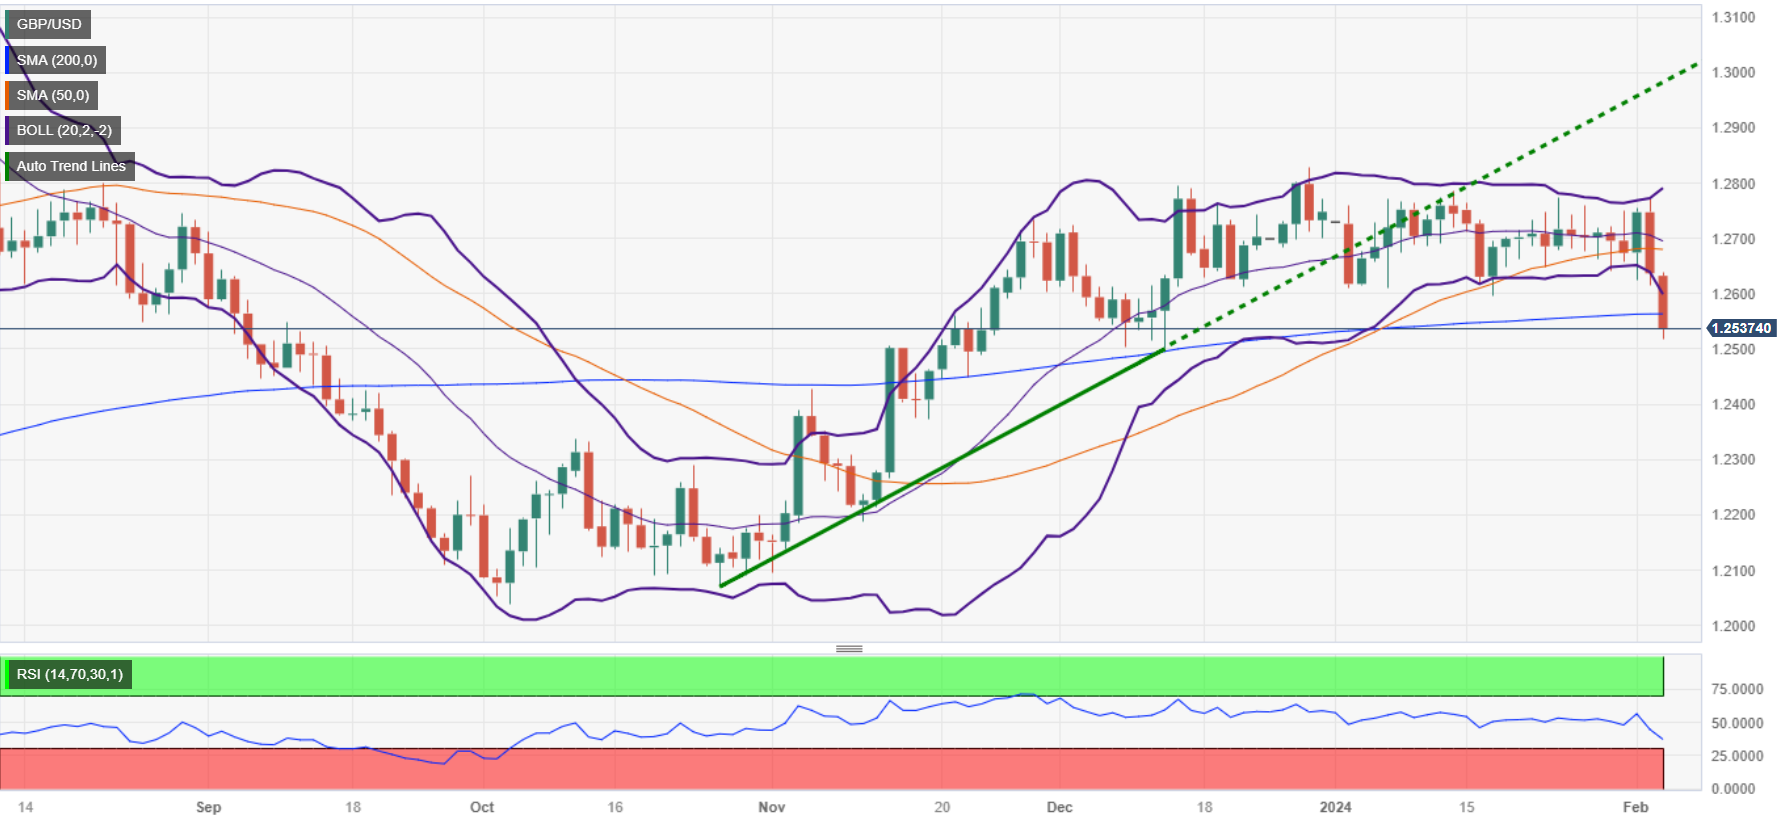
- GBP/USD falls 0.74% to 1.2535, influenced by Powell's rate stance and strong US jobs data.
- Powell's emphasis on inflation control tempers early rate cut expectations.
- US Nonfarm Payrolls' substantial job growth supports optimism for the US economy, boosting the Dollar.
- Rising US Treasury yields post-Powell and solid economic data prompt Fed rate cut reassessment.
- UK services sector's positive start overshadowed by US monetary policy and economic outlook focus.
The GBP/USD tumbles in the mid-North American session trade with losses of 0.74% and exchanges hands at 1.2535. Factors like last Friday's US economic data and over-the-weekend comments of Federal Reserve Chair Jerome Powell keep the US Dollar bid amid a risk-off impulse.
Jerome Powell pushes back against March rate cuts
Jerome Powell commented in an interview that it is premature to consider cutting rates, highlighting that the objective of driving inflation toward its 2% goal has not been fully fulfilled. Nevertheless, he left the door open to begin easing policy toward the year's first half.
Last week the January Nonfarm Payrolls report revealed an addition of 353K Americans to the workforce, while the unemployment rate remained stable at 3.7%. This data suggests that the labor market continues to be robust, supporting the Goldilocks narrative.
Data-wise, business activity in the services sector improved, according to S&P Global and the Institute for Supply Management (ISM), after the release of January´s reports.
US Treasury yields remain high during the day and underpin the Greenback as investors re-calibrate their bets for Fed rate cuts. Last week, they estimated the Federal Funds rate (FFR) to hit 3.96%, but following over-the-weekend Powell’s remarks, they expect it to end at 4.26%. Consequently, the US Dollar Index (DXY) rises 0.44%, up to 104.42.
Other data showed that British services businesses began the year positively.
GBP/USD Price Analysis: Technical outlook
Given the fundamental backdrop, the GBP/USD has fallen below the 200-day moving average (DMA) of 1.2560, aiming to extend its losses further below the 1.2500 figure. A decisive break will expose the 100-DMA at 1.2467, followed by the 1.2400 mark. On the upside, the pair first resistance would be the 200-DMA. If cleared, the next supply zone will emerge at 1.2600, followed by the 50-DMA at 1.2675.
- The DXY rose by more than 0.50% to 104.50 on Monday.
- The US service sector continues to show robustness, making markets disregard an interest rate cut in March.
- US Treasury yields continue to rise, boosting the Greenback.
The US Dollar (USD) measured by the DXY index rose on Monday to 104.50, its highest level since mid-November. This upswing has been attributed to the fortifying ISM Services PMI for January, giving the Dollar Index an advantageous boost via markets giving up on hopes of an interest rate cut in March.
The US Federal Reserve's hawkish hold, justified by a robust jobs report and continuous strong growth in Q1, is making any imminent rate cuts implausible, contradicting previous market expectations. Federal Reserve (Fed) Chair Powell maintains cautiousness, emphasizing the need to observe inflation’s sustained drop toward the 2% core target.
Daily digest market movers: US Dollar gains additional ground as Services PMI comes in higher than expected
- January's ISM Services PMI recorded 53.4, beating the consensus figure of 52 and last month's 50.5, as reported by the Institute for Supply Management (ISM).
- US bond yields continue to rise to monthly highs with 2-year, 5-year and 10-year bonds trading at rates of 4.45%, 4.11% and 4.15%, respectively. All three rates are up by more than 2%, which is making the US Dollar attractive for foreign investors.
- CME's FedWatch Tool hints at lesser odds for a rate cut in March, currently standing at 15%. Those odds rise to 50% in May, but the probabilities of a hold are also high.
Technical analysis: DXY bulls extend gains and recover the 20-day SMA
The indicators on the daily chart reflect a potential shift in momentum in the short term. The Relative Strength Index (RSI) is nearing overbought conditions, which typically suggests that buyers may be losing their grip, although it does not immediately indicate a trend reversal.
However, evaluating the broader scale technical outlook paints a slightly different picture. The index now stands above the 20,100 and 200-day Simple Moving Averages (SMAs), suggesting a strong and sustained push from the bulls. This can be interpreted as a bullish signal on a broader outlook.
The overall combination of these indicators suggests that despite the RSI nearing overbought territory, the buying momentum, backed up by the rise in the Moving Average Convergence Divergence (MACD) and the position above the SMAs, is the more dominating force. Bulls look set to maintain control for now, especially as they continue recovering, which can often incite additional buying interest. That being said, traders should eye a potential reversal, due to indicators nearing overbought conditions.
US Dollar FAQs
What is the US Dollar?
The US Dollar (USD) is the official currency of the United States of America, and the ‘de facto’ currency of a significant number of other countries where it is found in circulation alongside local notes. It is the most heavily traded currency in the world, accounting for over 88% of all global foreign exchange turnover, or an average of $6.6 trillion in transactions per day, according to data from 2022.
Following the second world war, the USD took over from the British Pound as the world’s reserve currency. For most of its history, the US Dollar was backed by Gold, until the Bretton Woods Agreement in 1971 when the Gold Standard went away.
How do the decisions of the Federal Reserve impact the US Dollar?
The most important single factor impacting on the value of the US Dollar is monetary policy, which is shaped by the Federal Reserve (Fed). The Fed has two mandates: to achieve price stability (control inflation) and foster full employment. Its primary tool to achieve these two goals is by adjusting interest rates.
When prices are rising too quickly and inflation is above the Fed’s 2% target, the Fed will raise rates, which helps the USD value. When inflation falls below 2% or the Unemployment Rate is too high, the Fed may lower interest rates, which weighs on the Greenback.
What is Quantitative Easing and how does it influence the US Dollar?
In extreme situations, the Federal Reserve can also print more Dollars and enact quantitative easing (QE). QE is the process by which the Fed substantially increases the flow of credit in a stuck financial system.
It is a non-standard policy measure used when credit has dried up because banks will not lend to each other (out of the fear of counterparty default). It is a last resort when simply lowering interest rates is unlikely to achieve the necessary result. It was the Fed’s weapon of choice to combat the credit crunch that occurred during the Great Financial Crisis in 2008. It involves the Fed printing more Dollars and using them to buy US government bonds predominantly from financial institutions. QE usually leads to a weaker US Dollar.
What is Quantitative Tightening and how does it influence the US Dollar?
Quantitative tightening (QT) is the reverse process whereby the Federal Reserve stops buying bonds from financial institutions and does not reinvest the principal from the bonds it holds maturing in new purchases. It is usually positive for the US Dollar.
- European data mixed, investors begin to reassess central bank expectations.
- EU PPIs turn lower, German Trade Balance rises as Imports collapse.
- Hefty earnings reports this week alongside EU Retail Sales, ECB Bulletin.
European equities shifted around the centerline on Monday before settling slightly in the red to kick off the new trading week as investors await another raft of earnings data while pan-European economic data continues to get stuck in the mire.
Germany’s Trade Balance rose to a nearly three-year high of €22.2 billion in December with both Imports and Exports declining sharply MoM. December’s German Exports fell -4.6% versus the forecast -2.0%, erasing the previous month’s 3.5% uptick, and German Imports tumbled to an almost four-year low of -6.7%, far below the -1.5% expected and backsliding sharply from the previous month’s 1.5%.
The pan-euro area Producer Price Index (PPI) in December fell to -10.6%, missing the forecast -10.5% and falling even further from the previous month’s -8.8%. Investors latch onto a glimmer of hope from the Sentix Investor Confidence Index for February, which saw a moderate rebound to -12.9 from the previous -15.8.
Retail stocks overall declined over 2% ahead of Tuesday’s EU Retail Sales figures, forecast to improve but still print negative at -0.9% versus the previous -1.1% for the year ended in December, while the MoM figure is forecast to accelerate to the downside at -1.0% compared to the previous month’s -0.3%.
The European Central Bank’s (ECB) latest Economic Bulletin lands on Thursday, and Friday will wrap up the European trading week with German inflation which is forecast to hold steady at 3.1% for the year ended January.
European equities broadly closed lower, but only mildly, with the pan-European STOXX600 declining 0.05% to close down a quarter of a point at €483.69.
France’s CAC40 fell a scant 0.03%, down 2.3% at €7,589.96 while Germany’s DAX shed 0.08% to end at €16,904.06, down 14 points.
London’s FTSE index also fell nearly 3 points to end Monday at £7,612.86, in the red by a svelte 0.04%.
DAX technical outlook
The German DAX index, tightly correlated to the pan-European STOXX600 major equity index, continues to waffle on the south side of the €17,000.00 handle on Monday. Intraday action got squeezed into the midrange near €16,890.00 as the index drifts into the near-term middle.
Daily candles have the DAX strung along near-term congestion, but remaining pinned firmly into bear country with the equity index well-supported in striking distance of all-time highs with a firm technical floor priced in at the 200-day Simple Moving Average (SMA) rising into €16,000.00.
DAX hourly chart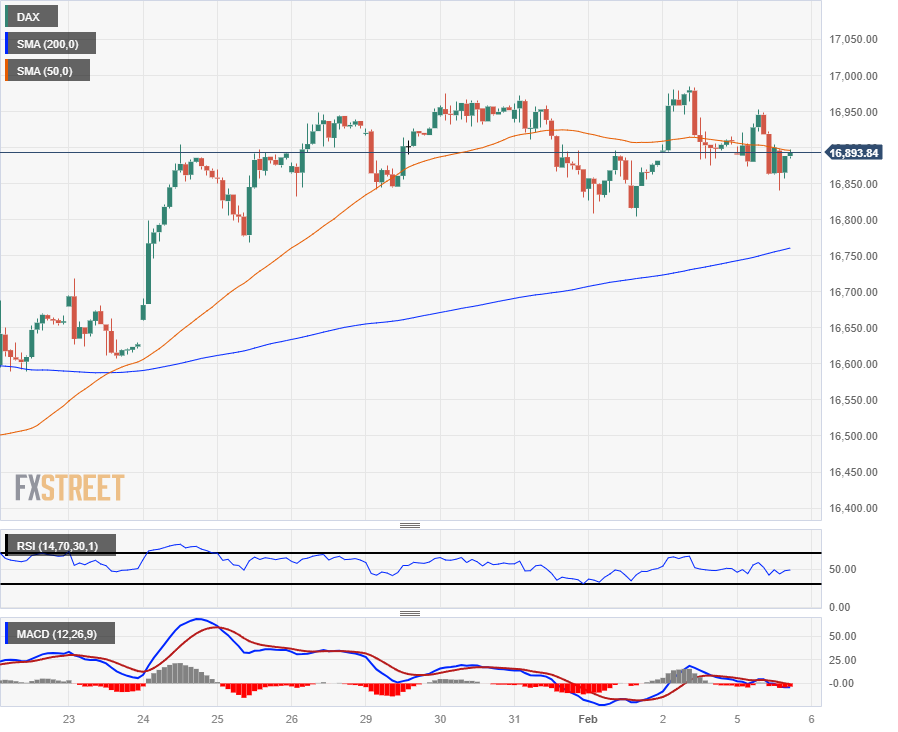
DAX daily chart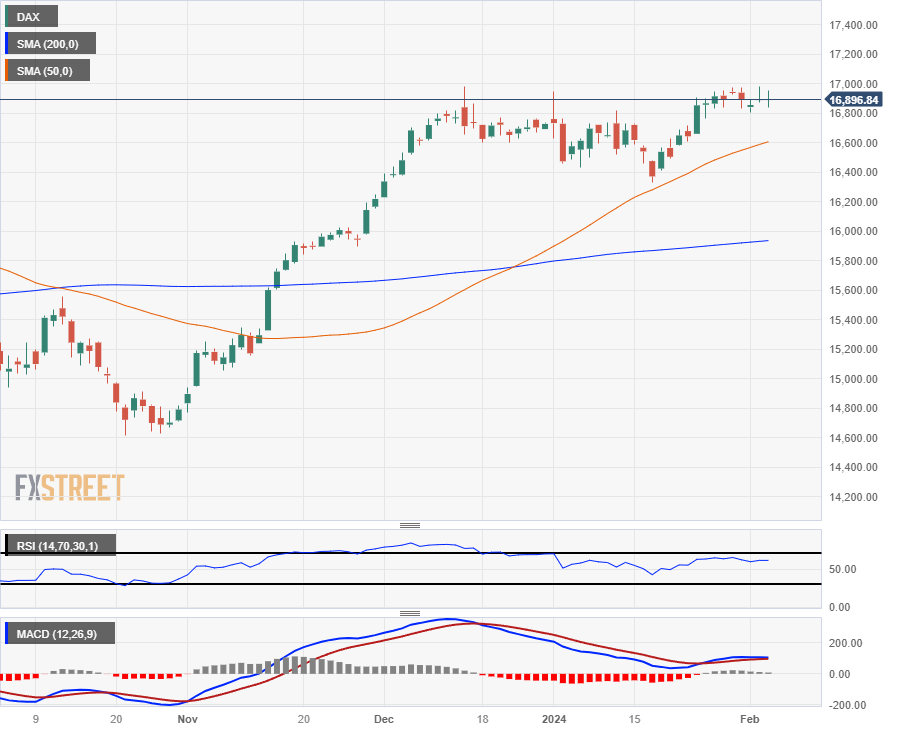
The Bank of England's (BoE) Chief Economist and Executive Director for Monetary Analysis Huw Pill hit newswires on Monday with a measured tone, noting that while interest rates are overwhelmingly pointed down looking forward, rate cut expectations might be somewhat premature as the BoE looks for firmer evidence that UK inflation will continue to recede in the coming months.
Key highlights
- February would have been far too premature of a rate cut.
- BoE's Pill is not yet confident that inflation is low enough to immediately reduce rates.
- BoE rates will only decline as long as progress continues with inflation.
- Rates will remain restrictive even after initial cuts.
- It's still too early to declare inflation fully suppressed, still more work to be done.
- BoE's Pill sees a slight uptick in UK Gross Domestic Product (GDP).
- Overall growth remains limited by supply constraints.
- UK activity remains overall quite weak.
- Interest rate in Australia set to remain steady at 4.35%.
- Reserve Bank of Australia Governor Michele Bullock not expected to change the tone.
- The Australian Dollar is poised to extend its slump against the US Dollar.
The Reserve Bank of Australia (RBA) will announce its monetary policy on Tuesday and is widely anticipated to keep the Official Cash Rate (OCR) unchanged at a 12-year high of 4.35%.
The RBA has changed the number of monetary policy meetings in 2024, reducing the number of the Board’s meetings from eleven to just eight times a year. Officials decided to cut back the number of meetings so the Board could have more time to assess economic developments.
Incoming data since the December decision has shown inflation retreated sharply while growth remains tepid, justifying market expectations of a no-chance in the OCR.
Reserve Bank of Australia to stand pat as inflation eases, growth weakens
With the OCR seen steady at record highs, the focus will be on the accompanying statement and Governor Michele Bullock's press conference. Back in December, the RBA statement noted: “Inflation had continued to decline but remained high. Wages growth had reached 4 per cent a little sooner than had been expected but the staff judged that wage growth was unlikely to rise much further. Output growth had continued below trend and the labour market was tight but easing gradually. Members agreed that financial stability considerations were not a constraint on monetary policy at the current meeting.”
Australian policymakers maintained the wording related to additional rate hikes amid expectations inflation would remain above target for a prolonged period. However, the latest figures were quite encouraging. The Consumer Price Index (CPI) rose 0.6% in Q4, easing from 1.2% in the previous quarter and below the 0.8% expected, according to the Australian Bureau of Statistics (ABS). The central bank’s favorite gauge, the RBA Trimmed Mean CPI rose 0.8% in the same period and 4.2% from a year earlier, the latter easing from 5.1% in Q3. Finally, the Monthly Consumer Price Index was up 3.4% YoY in December after printing at 4.3% in the previous month.
The RBA then has easing inflation but also softening economic activity as the base case for the January decision. In such a scenario, most economists expect no changes to the statement wording, with policymakers maintaining the door open for additional hikes if needed. Rate cuts will most likely remain out of the table. Money markets are not looking into a pivot in monetary policy in the first half of the year.
The Australian Dollar (AUD) may come under selling pressure if policymakers choose a more dovish tone to express their view of the future of monetary policy. Yet retaining the hawkish stance may not give fresh impetus to the Aussie, as lately, investors prefer to bet on rate cuts and ignore central bankers.
Governor Bullock has warned about the upside risks of inflation and may ease the tone there, but given the labor market remains tight, she most likely will maintain the cautious tone. Recent data showed a sharp slide in the number of employed individuals, with the monthly report indicating a 65.1K decline in job positions in December, while the Unemployment Rate held steady at 3.9%. Also, the Participation Rate slid from 67.3% to 66.8%.
How will the RBA interest rate decision impact AUD/USD?
The AUD/USD pair trades at its lowest since last November on Monday, amid broad US Dollar demand. The Australian Dollar (AUD) has fallen against its American rivals in the last five weeks, and started this one by extending its slump. The pair trades below the 0.6500 threshold, and in the long run, it has room to extend the slide.
Valeria Bednarik, Chief Analyst at FXStreet says: “The bearish momentum is evident in the daily chart, as the pair finally slid below its 100 SMA (Simple Moving Average) for the first time since mid-November, and after buyers battled throughout January to defend the area. At the same time, the 20 SMA accelerated its decline above the longer one, reflecting persistent selling interest. Finally, technical indicators suggest bears are willing to keep selling, as per aiming south within negative levels.”
Furthermore, Bednarik notes: “The current price zone seems lacking a relevant level that could provide support. Sellers will be looking for a downward extension towards 0.6450, aiming then to reach the 0.6370/80 area. Given the US Dollar’s broad strength, AUD/USD could extend its slide towards 0.6300/30 following the event. To the upside, the level to watch is the aforementioned daily 100 SMA, currently at around 0.6530. Once above the latter, the recovery could continue towards 0.6600, where sellers are expected to jump back in.”
RBA FAQs
What is the Reserve Bank of Australia and how does it influence the Australian Dollar?
The Reserve Bank of Australia (RBA) sets interest rates and manages monetary policy for Australia. Decisions are made by a board of governors at 11 meetings a year and ad hoc emergency meetings as required. The RBA’s primary mandate is to maintain price stability, which means an inflation rate of 2-3%, but also “..to contribute to the stability of the currency, full employment, and the economic prosperity and welfare of the Australian people.” Its main tool for achieving this is by raising or lowering interest rates. Relatively high interest rates will strengthen the Australian Dollar (AUD) and vice versa. Other RBA tools include quantitative easing and tightening.
How does inflation data impact the value of the Australian Dollar?
While inflation had always traditionally been thought of as a negative factor for currencies since it lowers the value of money in general, the opposite has actually been the case in modern times with the relaxation of cross-border capital controls. Moderately higher inflation now tends to lead central banks to put up their interest rates, which in turn has the effect of attracting more capital inflows from global investors seeking a lucrative place to keep their money. This increases demand for the local currency, which in the case of Australia is the Aussie Dollar.
How does economic data influence the value of the Australian Dollar?
Macroeconomic data gauges the health of an economy and can have an impact on the value of its currency. Investors prefer to invest their capital in economies that are safe and growing rather than precarious and shrinking. Greater capital inflows increase the aggregate demand and value of the domestic currency. Classic indicators, such as GDP, Manufacturing and Services PMIs, employment, and consumer sentiment surveys can influence AUD. A strong economy may encourage the Reserve Bank of Australia to put up interest rates, also supporting AUD.
What is Quantitative Easing (QE) and how does it affect the Australian Dollar?
Quantitative Easing (QE) is a tool used in extreme situations when lowering interest rates is not enough to restore the flow of credit in the economy. QE is the process by which the Reserve Bank of Australia (RBA) prints Australian Dollars (AUD) for the purpose of buying assets – usually government or corporate bonds – from financial institutions, thereby providing them with much-needed liquidity. QE usually results in a weaker AUD.
What is Quantitative tightening (QT) and how does it affect the Australian Dollar?
Quantitative tightening (QT) is the reverse of QE. It is undertaken after QE when an economic recovery is underway and inflation starts rising. Whilst in QE the Reserve Bank of Australia (RBA) purchases government and corporate bonds from financial institutions to provide them with liquidity, in QT the RBA stops buying more assets, and stops reinvesting the principal maturing on the bonds it already holds. It would be positive (or bullish) for the Australian Dollar.
Economic Indicator
Australia RBA Interest Rate Decision
The Reserve Bank of Australia (RBA) announces its interest rate decision at the end of its eight scheduled meetings per year. If the RBA is hawkish about the inflationary outlook of the economy and raises interest rates it is usually bullish for the Australian Dollar (AUD). Likewise, if the RBA has a dovish view on the Australian economy and keeps interest rates unchanged, or cuts them, it is seen as bearish for AUD.
Read more.Next release: 02/06/2024 03:30:00 GMT
Frequency: Irregular
Source: Reserve Bank of Australia
- Mexican Peso begins the week on the back foot, driven by Fed Chair Jerome Powell disregarding Mexico's quiet Constitution Day shifts focus to inflation data and Banxico's upcoming rate decision.
- US's strong Services PMI and Nonfarm Payrolls hint at the Fed's achievable soft-landing.
- Expectations lean towards Banxico holding rates at 11.25%, with eyes on Fed speakers for more insights.
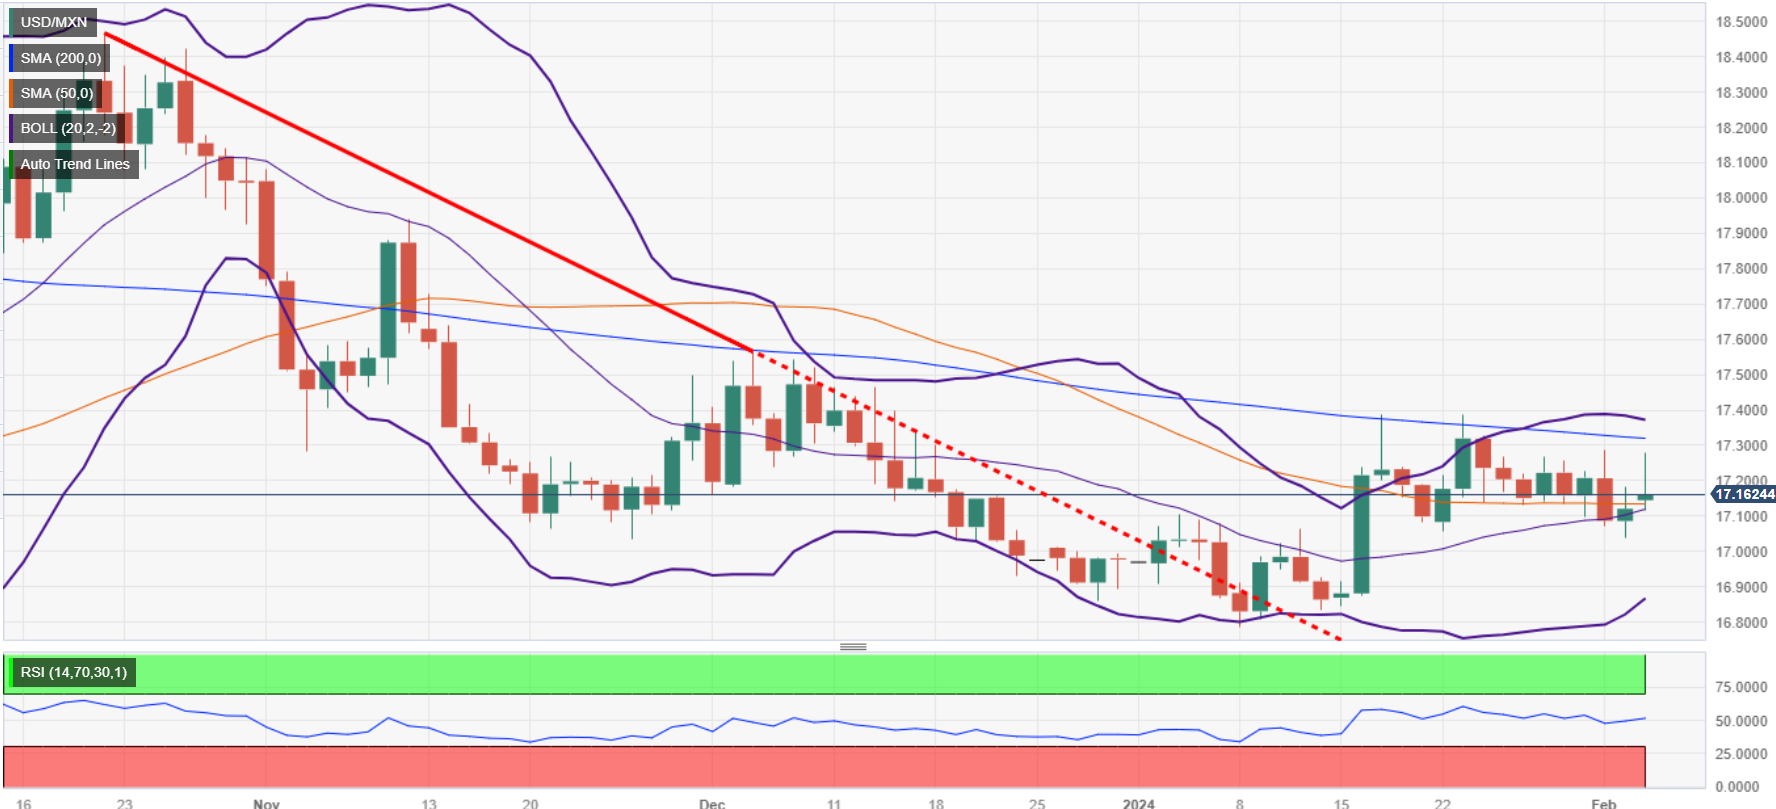
The Mexican Peso loses ground against the US Dollar (USD) courtesy of Federal Reserve Chairman Jerome Powell's interview during the weekend, sponsoring a jump in US Treasury bond yields. Along with a holiday in Mexico, that boosts the Greenback amid a risk-off impulse. At the time of writing, the USD/MXN exchanges hands at 17.21, up 0.51%.
Mexico´s economic docket is empty due to Mexico’s Constitution Day observance. This week, inflation data will be released on Wednesday, followed by the Bank of Mexico (Banxico) monetary policy decision, on Thursday. Rates are expected to remain unchanged at 11.25%.
In the meantime, the US economy continues to shine as the release of Services PMI by S&P Global and the Institute for Supply Management (ISM) showed that business activity is improving. That, along with last Friday's US Nonfarm Payrolls data, increases the odds of the Fed achieving a soft landing.
Meanwhile, some Federal Reserve speakers had begun to cross the wires following the Fed’s decision last Wednesday.
Daily digest market movers: Mexican Peso on the defensive ahead of Banxico’s decision
- Inflation in Mexico would be featured on Thursday before Banxico´s decision. The Consumer Price Index (CPI) in December was 4.66% YoY, and core CPI stood at 5.09% year-over-year.
- US S&P Global Services PMI came at 53.4, exceeding estimates and the previous reading, while Composite was 52, up from 50.9.
- The ISM Non-Manufacturing PMI, also known as services, edged up from 50.5 to 53.4, exceeding estimates.
- S&P Global confirmed Mexico´s BBB foreign currency rating and BBB+ local currency long-term debt rating.
- S&P Global affirmed that stable macroeconomic conditions, with a real growth in Gross Domestic Product above 3% in 2023 that is supported by solid domestic demand and moderating inflation, prepare the way for the general elections in June.
- Minnesota Fed President Neil Kashkari commented that a strong economy means the Fed is in no hurry to make interest rate cuts. Kashkari acknowledged that inflation is making “rapid progress” towards the Fed’s 2% target and added that policy could not be sufficiently restrictive.
- Chicago’s Fed President Austan Goolsbee noted that inflation could remain falling amid a strong US economy,
Technical Analysis: Mexican Peso weakens further as USD/MXN buyers target 17.20
The USD/MXN is neutral-biased and jumped off the 50-day Simple Moving Average (SMA) at 17.13, though it has fallen short of reclaiming the 200-day SMA at 17.32. A daily close above the 17.20 strong resistance buyers could challenge the 200-day SMA, followed by the 100-day SMA at 17.40. Further upside lies at the 17.50 figure.
On the other hand, if sellers drag prices below the 50-day SMA at 17.13, look for a challenge of the February 2 daily low at 17.03, before slumping to 17.00.
USD/MXN Price Action – Daily Chart
Mexican Peso FAQs
What key factors drive the Mexican Peso?
The Mexican Peso (MXN) is the most traded currency among its Latin American peers. Its value is broadly determined by the performance of the Mexican economy, the country’s central bank’s policy, the amount of foreign investment in the country and even the levels of remittances sent by Mexicans who live abroad, particularly in the United States. Geopolitical trends can also move MXN: for example, the process of nearshoring – or the decision by some firms to relocate manufacturing capacity and supply chains closer to their home countries – is also seen as a catalyst for the Mexican currency as the country is considered a key manufacturing hub in the American continent. Another catalyst for MXN is Oil prices as Mexico is a key exporter of the commodity.
How do decisions of the Banxico impact the Mexican Peso?
The main objective of Mexico’s central bank, also known as Banxico, is to maintain inflation at low and stable levels (at or close to its target of 3%, the midpoint in a tolerance band of between 2% and 4%). To this end, the bank sets an appropriate level of interest rates. When inflation is too high, Banxico will attempt to tame it by raising interest rates, making it more expensive for households and businesses to borrow money, thus cooling demand and the overall economy. Higher interest rates are generally positive for the Mexican Peso (MXN) as they lead to higher yields, making the country a more attractive place for investors. On the contrary, lower interest rates tend to weaken MXN.
How does economic data influence the value of the Mexican Peso?
Macroeconomic data releases are key to assess the state of the economy and can have an impact on the Mexican Peso (MXN) valuation. A strong Mexican economy, based on high economic growth, low unemployment and high confidence is good for MXN. Not only does it attract more foreign investment but it may encourage the Bank of Mexico (Banxico) to increase interest rates, particularly if this strength comes together with elevated inflation. However, if economic data is weak, MXN is likely to depreciate.
How does broader risk sentiment impact the Mexican Peso?
As an emerging-market currency, the Mexican Peso (MXN) tends to strive during risk-on periods, or when investors perceive that broader market risks are low and thus are eager to engage with investments that carry a higher risk. Conversely, MXN tends to weaken at times of market turbulence or economic uncertainty as investors tend to sell higher-risk assets and flee to the more-stable safe havens.
- Canadian Dollar hits eight-week low after US PMI surge.
- Canada sees BoC Governor Macklem slated for Tuesday.
- US Fed policymaker statements weigh on Monday markets.
The Canadian Dollar (CAD) is broadly lower on Monday after a broad market dogpile into the US Dollar (USD) after US ISM Services Purchasing Managers Index (PMI) figures came in well above expectations. Additionally, mixed comments from US Federal Reserve (Fed) policymakers risk investor outlooks, hampering risk appetite.
Bank of Canada (BoC) Governor Tiff Macklem is slated to speak and answer questions regarding monetary policy transmission in Quebec on Tuesday, leaving the Canadian Dollar absent meaningful domestic releases on Monday.
Daily digest market movers: Canadian Dollar backslides as markets readjust expectations
- US data, Fedspeak dominates currency flows on Monday with Canada absent on the economic calendar.
- The US ISM Services PMI for January climbed to 53.4 versus the forecast of 52.0, accelerating above the previous month’s 50.5, which saw only minor revisions.
- US ISM Services Prices Paid hit an 11-month high as businesses continue to see inflationary pressure in January, up sharply from December’s 56.7 (revised down from 57.4).
- US ISM Services New Orders Index rebounds to 55 in January from December’s 52.8 as economic activity continues to stubbornly vex markets, which hope for earlier rate cuts.
- Minneapolis Fed President Neel Kashkari noted on Monday that higher neutral rates might mean that monetary policy may not be as tight as previously thought.
- Fed’s Kashkari also noted that despite broadly positive US data, some weak points remain, notably rising consumer delinquencies.
- Chicago Fed President Austan Goolsbee pulled up short of Fed Kashkari’s earlier statements, noting that while he needs to see more inflation progress in the data itself, he won’t rule out a March rate cut entirely.
- The CME’s FedWatch Tool sees money markets pricing in barely a 15% chance of a rate cut in March.
Canadian Dollar price today
The table below shows the percentage change of Canadian Dollar (CAD) against listed major currencies today. Canadian Dollar was the weakest against the US Dollar.
| USD | EUR | GBP | CAD | AUD | JPY | NZD | CHF | |
| USD | 0.45% | 0.75% | 0.50% | 0.43% | 0.16% | 0.24% | 0.47% | |
| EUR | -0.45% | 0.32% | 0.04% | 0.00% | -0.28% | -0.18% | 0.02% | |
| GBP | -0.76% | -0.31% | -0.27% | -0.34% | -0.61% | -0.51% | -0.29% | |
| CAD | -0.49% | -0.04% | 0.27% | -0.05% | -0.32% | -0.23% | -0.02% | |
| AUD | -0.46% | 0.00% | 0.30% | 0.05% | -0.30% | -0.21% | 0.01% | |
| JPY | -0.19% | 0.26% | 0.55% | 0.33% | 0.25% | 0.06% | 0.28% | |
| NZD | -0.28% | 0.18% | 0.48% | 0.23% | 0.15% | -0.12% | 0.19% | |
| CHF | -0.47% | -0.02% | 0.29% | 0.01% | -0.03% | -0.30% | -0.22% |
The heat map shows percentage changes of major currencies against each other. The base currency is picked from the left column, while the quote currency is picked from the top row. For example, if you pick the Euro from the left column and move along the horizontal line to the Japanese Yen, the percentage change displayed in the box will represent EUR (base)/JPY (quote).
Technical analysis: Canadian Dollar softens across the board, USD/CAD tests eight-week highs
The Canadian Dollar (CAD) sees broad losses on Monday as the Loonie sheds weight against nearly all of its major currency peers in the new trading week. The CAD is sharply lower against the US Dollar, down half a percent on Monday, with the CAD shedding a third of a percent against the Japanese Yen (JPY) and a quarter of a percent against the New Zealand Dollar (NZD). Despite broad selling pressure, the CAD still gained a quarter of a percent against the Pound Sterling (GBP), Monday’s weakest-performing currency, forcing the Canadian Dollar to settle for second-worst.
The Canadian Dollar’s declines on Monday sees the USD/CAD testing back over the 1.3500 handle, running into near-term technical resistance at familiar intraday swing highs near 1.3540.
Monday’s USD/CAD surge sees the pair trading back into the high end of the 200-day Simple Moving Average (SMA) below the 1.3500 handle, and the pair is pushing into eight-week highs with an immediate technical ceiling weighing down from 1.3600.
USD/CAD hourly chart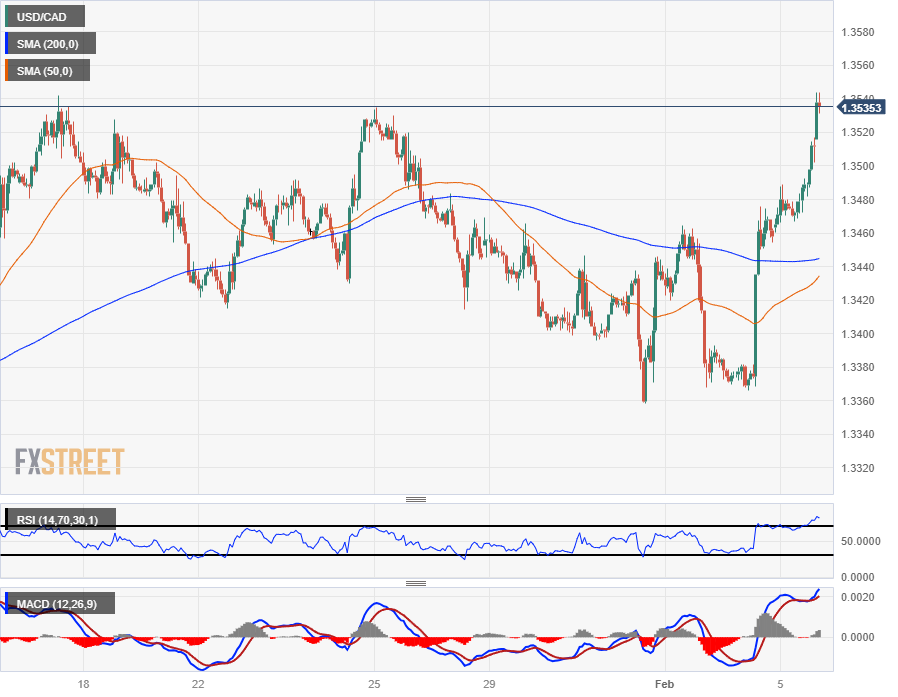
USD/CAD daily chart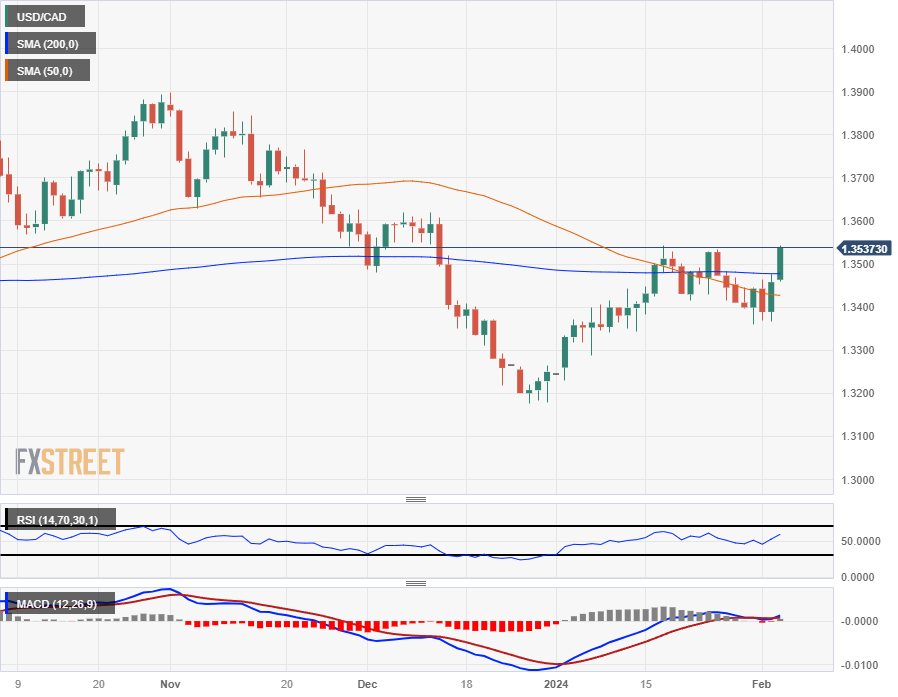
Canadian Dollar FAQs
What key factors drive the Canadian Dollar?
The key factors driving the Canadian Dollar (CAD) are the level of interest rates set by the Bank of Canada (BoC), the price of Oil, Canada’s largest export, the health of its economy, inflation and the Trade Balance, which is the difference between the value of Canada’s exports versus its imports. Other factors include market sentiment – whether investors are taking on more risky assets (risk-on) or seeking safe-havens (risk-off) – with risk-on being CAD-positive. As its largest trading partner, the health of the US economy is also a key factor influencing the Canadian Dollar.
How do the decisions of the Bank of Canada impact the Canadian Dollar?
The Bank of Canada (BoC) has a significant influence on the Canadian Dollar by setting the level of interest rates that banks can lend to one another. This influences the level of interest rates for everyone. The main goal of the BoC is to maintain inflation at 1-3% by adjusting interest rates up or down. Relatively higher interest rates tend to be positive for the CAD. The Bank of Canada can also use quantitative easing and tightening to influence credit conditions, with the former CAD-negative and the latter CAD-positive.
How does the price of Oil impact the Canadian Dollar?
The price of Oil is a key factor impacting the value of the Canadian Dollar. Petroleum is Canada’s biggest export, so Oil price tends to have an immediate impact on the CAD value. Generally, if Oil price rises CAD also goes up, as aggregate demand for the currency increases. The opposite is the case if the price of Oil falls. Higher Oil prices also tend to result in a greater likelihood of a positive Trade Balance, which is also supportive of the CAD.
How does inflation data impact the value of the Canadian Dollar?
While inflation had always traditionally been thought of as a negative factor for a currency since it lowers the value of money, the opposite has actually been the case in modern times with the relaxation of cross-border capital controls. Higher inflation tends to lead central banks to put up interest rates which attracts more capital inflows from global investors seeking a lucrative place to keep their money. This increases demand for the local currency, which in Canada’s case is the Canadian Dollar.
How does economic data influence the value of the Canadian Dollar?
Macroeconomic data releases gauge the health of the economy and can have an impact on the Canadian Dollar. Indicators such as GDP, Manufacturing and Services PMIs, employment, and consumer sentiment surveys can all influence the direction of the CAD. A strong economy is good for the Canadian Dollar. Not only does it attract more foreign investment but it may encourage the Bank of Canada to put up interest rates, leading to a stronger currency. If economic data is weak, however, the CAD is likely to fall.
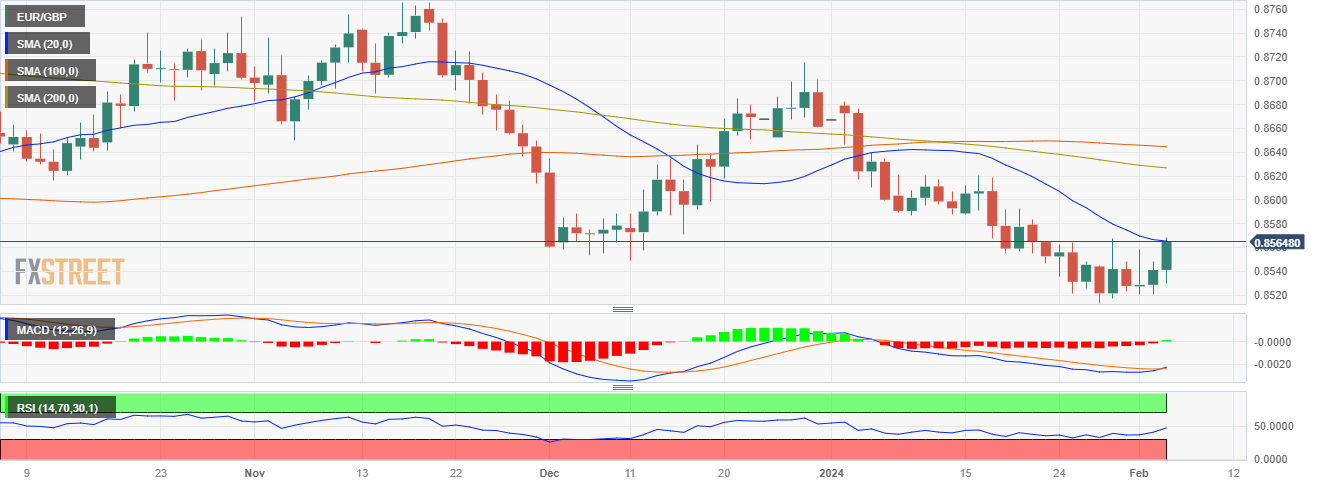
- The EUR/GBP stands at 0.8560, marking a 0.25% increase in the session.
- European PMIs from January where upwards revised but remained still in contraction territory.
- Hourly indicators hint at potential consolidation after bulls got rejected near overbought area.
In Monday's session, the EUR/GBP pair was seen trading at 0.8560, gaining a 0.25% and seems to be marching towards the 20-day Simple Moving Average (SMA) at 0.8565 . Despite pressures from a stagnant Euro Area economy and anticipations of ECB's rate cut, the daily chart indicates the dominance of buyers. On the hourly chart, however, indicators hint at a possible pullback as they got rejected near the overbought territory.
During the European session, the Hamburg Commercial Bank (HCOB) PMIs from January where upwards revised which gave some traction to the EUR but they still remain deep in contraction area. This situation may push the ECB to initiate a rate cut by June 2024, assuming the economies continue to weaken. Conversely, the UK economy shows signs of potential firmness with the Bank of England (BoE) shifting from assessing the need for restrictive monetary policy to sustaining the current stance. Following the bank's decision to hold rates, market anticipates around 100 bps of rate cuts for 2024, which might be moderated due to expected fiscal amendments. On the ECB side, markets expect between 125 and 150 bps of easing in 2024 and this divergences may eventually limit any upwards movements by the cross.
EUR/GBP levels to watch
Assessing the daily chart indicators, the Relative Strength Index (RSI) is glimpsing a positive gradient despite being within negative territory. This exhibits a potential shift towards an upward trend as bulls start to conquer additional ground. In addition, the Moving Average Convergence Divergence (MACD) is exhibiting increased green bars, suggesting that the upward force is taking control. The shift in momentum may come into fruition in case the buyers manage to push the pair back above the 20-day Simple Moving Average (SMA) .
Switching to the hourly chart for the more immediate perspective, the scenario seems to be a bit more complicated for the bulls. Even though indicators have been rebuffed near overbought territory, the RSI portrays a downward slope positioned within positive territory, indicating some selling momentum as buyers seem to be taking profits. However, the sustained growth in the green bars of the MACD identifies a continuous buying pressure in the shorter timeframe.
EUR/GBP daily chart
The Reserve Bank of Australia (RBA) will announce its next Interest Rate Decision on Tuesday, February 6 at 03:30 GMT and as we get closer to the release time, here are the forecasts by the economists and researchers of eight major banks regarding the upcoming central bank's decision.
The traditional rate decision and post-meeting statement will now be accompanied by the simultaneous release of the Statement on Monetary Policy (SoMP). Governor Michele Bullock will hold a press conference an hour later.
The RBA is expected to leave the cash rate target at 4.35%. The risk is that the RBA delivers a dovish hold because of weak Australian economic activity and slower inflation. Markets will be watching the inflation forecasts profile closely.
ANZ
We expect the post meeting statement to acknowledge the broader slowdown now evident across the economy since the December Board meeting. Similarly, the RBA will acknowledge the lower-than-expected Q4 CPI outturn. When it comes to the stance of policy, however, the RBA will likely lag the turn evident in the economy. In our view, the RBA will want to be very confident that inflation is coming back to the band in a sustainable fashion before changing its rhetoric. As a result, we expect the post meeting statement to contain a tightening bias. In the SoMP, we expect downward revisions to GDP and inflation forecasts with the June 2026 inflation forecast to be around the mid-point of the target band. We suspect the press conference might aim to communicate to the public more than the market. That and its likely free-flowing nature suggests there may be less information content for markets in the press conference versus the other communication elements on Tuesday.
Standard Chartered
We expect the RBA to keep rates unchanged at 4.35% at its first meeting of the year. We think recent CPI prints may allow some breathing room for the RBA to wait and see. November CPI inflation eased to 4.3% YoY from 4.9%. That said, services CPI remains sticky at 4.7%, though lower than 5% earlier. Similarly, the labour market softened slightly (unemployment rate picked up to 3.9% in December), albeit remaining at tight levels.
Westpac
The RBA will keep the cash rate on hold and it is unlikely to raise rates further this cycle.
TDS
We expect the RBA to leave the cash rate on hold at 4.35% and expect to endorse an ‘on hold for longer’ policy stance rather than entertaining the possibility of earlier rate cuts. While the Q4 CPI report shows that the RBA is making good progress on its inflation battle, the underlying details suggest stickier domestic price pressures and the RBA may be wary of making an abrupt shift of signalling a rate cut this early in the year. We expect the Bank to cut in August and a trimmed mean inflation forecast at 3% in Q4’24, 2 quarters ahead compared to their Nov forecasts, bolstering our view for a cut. Unless the RBA predicts a sharp rise in the unemployment rate in the forecasts, we doubt the possibility of an earlier cut before August.
ING
There is virtually no prospect of any change. Cash rate futures are now pricing in a more than 50% chance of easing by May, helped by recent inflation data. However, we think that the inflation picture is less impressive than it appears, and is largely base effect-driven, while monthly run rates remain high. We expect inflation to start heading higher over January and February, which may lead to some pull back – much like we have seen in the US. The RBA may use the opportunity to push back a bit at market pricing, which could speed this adjustment along.
SocGen
The RBA will probably stay on hold, but we believe the policymakers will not remove the tightening bias in the statement.
Citi
The RBA is expected to keep the cash rate unchanged at 4.35%, which represents the peak of the hiking cycle. The main focus of the new forecasts will be when the RBA expects inflation to drop back into its 2%-3% target band, following weaker-than-expected inflation in Q4. Crucially, the RBA is unlikely to make a dovish pivot and signal rate cuts anytime soon. Instead, we expect a 25 bps rate cut in Q3 followed by 25 bps in Q4 for a year-end cash rate of 3.85%.
Wells Fargo
We suspect policymakers will opt to hold rates steady at 4.35% for a second consecutive meeting. Although the RBA's December announcement left the door open for further rate hikes, our view is that the RBA's tightening cycle is over although we do not think rate cuts are coming just yet. For now, inflation and wage growth are likely at levels still too high to be consistent with the 2%-3% inflation target. As a result, we do not forecast an initial rate cut until Q3 of this year.
In January, the Japanese Yen (JPY) was the worst performing G10 currency. Economists at MUFG Bank analyze JPY outlook.
Carry attractiveness of the Yen will be diminished as volatility picks up
We maintain that the Yen will strengthen in 2024 as the drivers of JPY depreciation start to reverse – falling global inflation and yields, a rate hike and an end to YCC by the BoJ and a shrinking of the energy trade deficit will all add to Yen demand.
The carry attractiveness of the Yen will be diminished as volatility picks up, encouraging a liquidation of JPY short positions.
The Mexican Peso (MXN) is the only Latin currency to be up against the Dollar on a total return basis in 2024. Economists at ING analyze USD/MXN outlook.
The market is looking for signals that Banxico is ready to pull the trigger
On Thursday, we have a rate meeting in Mexico. With trading partners to the south slashing interest rates, the market is looking for signals that Banxico is ready to pull the trigger. Even if it sent some signals to that effect – e.g. one member of the Governing Board voted for a cut – we doubt the Peso would have to sell off too hard.
Investors are quite rightly at this very early stage, ignoring the threat of a new Trump administration, and are happy to pick up an 11% yield on a currency powered by loose fiscal and tight monetary policy.
- EUR/USD drops 0.40% to 1.0742, influenced by Powell's hawkish remarks and rising US Treasury yields.
- Powell emphasizes Fed's inflation target commitment, suggesting mid-year policy tweaks.
- US January labor market strength bolsters USD, contrasting with Eurozone's economic fragility.
- Euro falters as US Dollar Index climbs, with ECB policy easing expectations and focus on central bank moves.
The Euro (EUR) extended its losses against the Greenback (USD) in early trading during the New York session, down 0.40%, sponsored by high US Treasury yields and the strong US Dollar. Federal Reserve Chair Jerome Powell's Sunday interview delivered a hawkish message to the detriment of other G10 FX currencies. At the time of writing, the EUR/USD trades at 1.0742 after hitting a high of 1.0785.
EUR/USD faces downward pressure as Powell’s reiterate focus on inflation
Over the weekend, Powell commented that it was too early to ease policy while emphasizing the job is not done – driving inflation toward its 2% target. The Fed Chair added the first cut could happen in the middle of the year.
Meanwhile, data revealed last week struck a pleasant surprise for the US economy, as the Nonfarm Payrolls report for January showed the jobs market added 353K Americans to the workforce while the unemployment rate stood at 3.7%. That indicates the labor market remains strong, maintaining the soft-landing narrative in play.
US Treasury yields climbed sharply following the Fed’s Chair Powell interview, while the US Dollar Index (DXY), a gauge to track the performance of the buck against other currencies, rose 0.41%, at 104.39.
The Euro weakened as Flash PMIs in the Eurozone (EU) stood at recessionary territory despite signaling the economy slightly recovered. In addition to that, the Producer Price Index (PPI) for the block edged lower. Given the backdrop of the disinflation process in the EU, that could pave the way for the European Central Bank (ECB) to begin to ease policy.
EUR/USD Price Analysis: Technical outlook
The EUR/USD has fallen below the 100-day moving average (DMA) at 1.0783, diving to a new year-to-date (YTD) low of 1.0725, about to pierce the December 8 low of 1.0723. A breach of the latter will clear the path to 1.0700. On the flip side, buyers could recover some territory past the 1.0750, followed by the 100-DMA and the 1.0800 figure.
- ISM Services PMI for January came in above the market expectation.
- US Dollar Index clings to strong gaily gains at around 104.50.
Business activity in the US service sector expanded at a stronger pace than anticipated in January, with the ISM Services PMI rising to 53.4 from 50.5 (revised from 50.6) in December to beat the market expectation of 52.0.
The Employment Index advanced to 50.5 from 43.8, while the Prices Paid Index - the inflation component - climbed to 64.0 from 57.4.
Assessing the survey's findings, "the overall growth rate increase in January is attributable to faster growth of the New Orders, Employment, and Supplier Deliveries indexes," said Anthony Nieves, Chair of the Institute for Supply Management (ISM) Services Business Survey Committee.
"The majority of respondents indicate that business is steady," Nieves added. "They are optimistic about the economy due to the potential impact of interest rate cuts; however, they are cautious due to inflation, associated cost pressures and ongoing geopolitical conflicts."
Market reaction
The US Dollar preserves its strength after this report. At the time of press, the US Dollar Index was up 0.55% on the day at 104.55.
Gold climbed to its highest level since early January above $2,060 but corrected sharply lower following strong US labour market report. Economists at TD Securities analyze the yellow metal’s outlook.
XAU/USD could trend down toward $2,005-$2,014 support
The January US jobs report outperformed expectations, with employment increasing nearly double consensus, and wages surging. This drove Gold down to $2,030, from around $2,060 previously. We suspect there will be more selling pressure for Gold, as a result of the robust data.
It would not be a surprise to see the yellow metal trend down toward $2,005-$2,014 support.
Despite this, we do still expect the Fed to cut rates in May (and for markets this will dispel hopes for an earlier March cut), and along with strong central bank and Asian physical buying, prices should rebound higher. As such, we continue to be happy with our projection of $2,200 in the next quarter.
USD’s jobs rebound extends on Powell caution, economists at Scotiabank report.
DXY’s rebound is overstating the improvement in yield differentials in USD’s favour to some extent
The USD rallied hard on the back of Friday’s US jobs data as US yields popped sharply higher and the currency has built on those gains on Monday following Fed Chairman Powell’s ‘60 Minutes’ interview which further doused market expectations for a March rate cut.
Fed repricing plus USD-positive seasonal trends (through Q1) plus building technical momentum (with the DXY testing the 50% retracement of its Q4 slide) point to gains extending a little more in the next few weeks, although the rebound in the DXY is overstating the improvement in yield differentials in the USD’s favour to some extent at the moment.
- USD/CAD rallies above 1.3500 as downbeat market sentiment improves safe-haven appeal.
- The US ISM Services PMI is seen increasing to 52.0 from 50.6 in December.
- Investors await the timing of when the BoC will start reducing interest rates.
The USD/CAD pair has climbed above the psychological resistance of 1.3500 in the early New York session. The Loonie asset has witnessed stellar interest as an appeal for safe-haven assets has significantly improved due to fading expectations of a rate cut by the Federal Reserve (Fed) in March.
Considering negative overnight futures, the S&P500 is expected to open on a bearish note. The US Dollar Index (DXY) has rallied above 104.40 as the market sentiment is downbeat. 10-year US Treasury yields have soared 4.085%.
Investors see the Fed reducing interest rates from May as fears of persistent price pressures have deepened due to robust labor demand and wage growth. Also, Fed policymakers have been arguing in favor of restrictive interest rates for somewhat longer to achieve confidence that inflation will return to the 2% target sustainably.
On Friday, Fed Governor Michelle Bowman warned that premature rate cuts could delay the decline in price pressures toward the 2% target, forcing policymakers to raise interest rates again.
Meanwhile, investors await the US Institute of Supply Management (ISM) Services PMI for January, which will be published at 15:00 GMT. Investors anticipate that the Services PMI was up to 52.0 from 50.6 in December.
On the Canadian Dollar front, investors await the speech from Bank of Canada (BoC) Governor Tiff Macklem, which is scheduled for Tuesday. Tiff Macklem is expected to provide fresh guidance on interest rates. Investors want to know when the BoC plans to cut down interest rates this year.
EUR/USD has slowly trended lower since its late December high in the region of 1.1139. Economists at Rabobank analyze the pair’s outlook.
USD strength to moderate in the second half of the year
We maintain our one-month EUR/USD forecast of 1.0700 and our three-month target of 1.0500.
We expect USD strength to moderate in the second half of the year as the Fed’s rate cutting cycle kicks off.
Assuming that CPI inflation in the Eurozone can be kept under control, it is likely that Germany would benefit from a relatively weak EUR whilst it tackles structural reforms. For this reason, we see risk of EUR/USD being more comfortable in a 1.0400 to 1.1200 range over the next couple of years than at levels closer to 1.2000.
EUR/USD’s break under support in the upper 1.0700s means more losses are likely, economists at Scotiabank say.
Resistance is 1.0795/1.0800
Spot losses through recent support around 1.0785/1.0795 (100-Day Moving Average and 50% retracement support from the EUR’s Q4 rally) suggest more, corrective EUR losses towards 1.0712 (61.8% Fibonacci).
Trend momentum signals are aligned bearishly for the EUR on the intraday and daily DMIs which will limit the scope for EUR gains.
Resistance is 1.0795/1.0800.
See – EUR/USD: The direction of travel lies to the 1.0700 area – ING
- The lira depreciates further north of 30.0000.
- Inflation rose more than estimated in January.
- H. G. Erkan resigned as CBRT Governor on Friday.
Further selling pressure keeps hurting the lira and propels USD/TRY to a new record high near 30.6000 at the beginning of the week.
USD/TRY: Never-ending uptrend?
Unsurprisingly, the Turkish currency depreciated further on Monday and bolstered the still unabated upward bias in USD/TRY, this time further north of the 30.0000 mark, and it should be a matter of some extra sessions before the pair hits the 31.0000 round level.
Monday’s extra upside in spot came in response to the small upside surprise in inflation figures in January, with the Consumer Price Index (CPI) rising at an annualized 64.86% and 70.5% when it comes to the Core reading. In addition, Producer Prices gained 44.20% over the last twelve months.
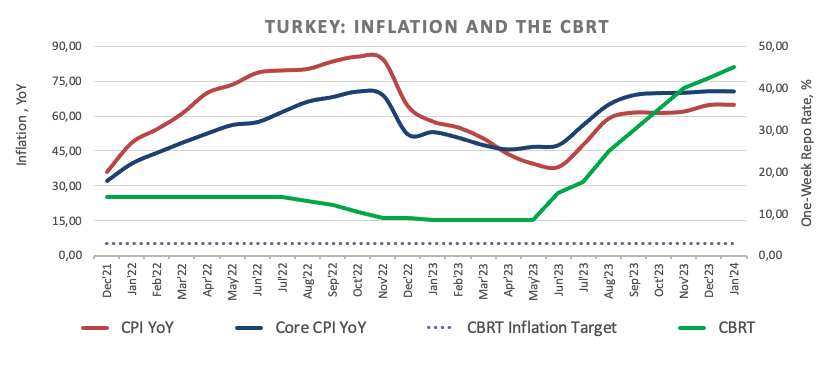
Contributing to the (endless?) sour sentiment around the lira, H. G. Erkan stepped down as CBRT Governor on Friday, paving the way for Deputy Governor F. Karahan to be the new face in the realm of the central bank.
Of note is that USD/TRY posted monthly losses in just two months since 2022 (November 2022 and August 2023), while the Lira lost more than 140% in that same period vs. the US Dollar.
USD/TRY levels to watch
So far, USD/TRY advances 0.26% at 30.5523 and faces the next up-barrier at the 31.0000 round level. On the downside, provisional support comes at the 55-day and 100-day SMAs at 29.4791 and 28.7549, respectively, all prior to the more significant 200-day SMA at 26.5923.
- EUR/GBP rebounds sharply from 0.8520 as BoE could lean towards early rate cuts.
- Fears of a recession in the UK economy have deepened.
- The ECB is expected to start the rate-cut campaign.
The EUR/GBP pair discovers strong buying interest near 0.8520 in the late European session. The asset recovered as investors saw the Bank of England (BoE) reducing interest rates earlier than market participants anticipated.
In the revised estimates, the United Kingdom Office for National Statistics (ONS) reported a contraction in the third quarter of 2023 by 0.1%. The UK economy is underperforming due to labor market and consumer spending, which could lead to a further slowdown in the fourth quarter. The UK economy would be considered in a technical recession if it contracts for the second time in a row.
In the BoE’s monetary policy announced last week, policymakers decided to keep interest rates at 5.25%. When asked about rate cuts, the BoE said they are unlikely until there is evidence that inflation will return sustainably to the 2% target. Swati Dhingra voted for a reduction in interest rates by 25 basis points (bps).
The Pound Sterling faces pressure against the Euro despite the S&P Global reported upbeat Service PMI data for January. The economic data landed at 54.3, which remained better than the expectations, and the former reading of 53.4.
On the Eurozone front, the European Central Bank (ECB) sees interest rates declining from late Summer as current price pressures exceed the central bank's desires. The progress in inflation declining towards 2% is much stronger as producers have significantly reduced prices of goods and services offered at factory gates. In December, the annual Producer Price Index (PPI) deflated at a stronger pace of 10.6% against expectations of 10.5% and the prior figure of 8.8%.
GBP/USD trades weaker below the 1.2600 range base. Economists at Scotiabank analyze the pair’s outlook.
Negative technical cloud over the Pound
A bearish close for the Pound Sterling (GBP) on Friday (outside range lower) and Cable losses below 1.2600, lows that have held several times since mid-December, cast a negative technical cloud over the GBP/USD pair.
Immediate risk for the Pound is geared towards a drop back to 1.2500/1.2525.
Resistance is 1.2600/1.2610.
See: GBP/USD to trade near the 1.2600/1.2700 region this quarter – ING
In an essay published on Monday, Minneapolis Federal Reserve President Neel Kashkari argued that a possibly higher neutral rate means that the Fed can take more time to assess upcoming data before beginning rate cuts with less risk to the recovery, per Reuters.
Kashkari added that a higher neutral rate means monetary policy may not be as tight as thought and noted that core inflation is making rapid progress towards the Fed’s target.
He said that interest sensitive sectors of the economy are holding up well but acknowledged that there are some signs of weakness, including rising consumer delinquencies.
Market reaction
The US Dollar (USD) preserves its strength after these comments. At the time of press, the USD Index was trading at its highest level since mid-November at 104.35, rising 0.4% on the day.
The US Dollar has started the year by rebounding after the sharp sell-off in November and December. Economists at MUFG Bank analyze Greenback’s outlook.
Fed’s easing cycle will be more pronounced in H2
We are maintaining our US Dollar forecasts and see the broader global conditions as not yet conducive to Dollar selling.
The Fed caution communicated at the January meeting underlines our view that the Fed’s easing cycle will be more pronounced in H2 and by then the global backdrop will improve modestly with a pick-up in growth in Europe and China helping to push the Dollar weaker but within narrow ranges.
The Fed's monetary policy is clearly USD-positive at the moment. Rejoice while it lasts – Ulrich Leuchtmann, Head of FX and Commodity Research at Commerzbank, reports on Donald Trump's Fed plans.
Donald Trump will not renew Fed Chair Jay Powell's term in 2026
Donald Trump, the presumptive Republican presidential nominee with a good chance of returning to the White House in early 2025, has announced that he will not renew Fed Chair Jay Powell's term in 2026 when his current term expires. This unusually early announcement can only be interpreted in one way: Trump is planning a much more sustained attack on the Fed's independence this time around than he did during his last term.
An effective attack on the Fed's independence could end up being very negative for the Dollar.
A monetary policy under the thumb of a president like Donald Trump will likely be far too loose on average. This would be particularly relevant if Trump were to significantly increase punitive tariffs against China. During his last term, these tariffs positively affected the USD because no one expected the Fed to let inflation slide. Ultimately, the net increase in demand for US goods remained a USD positive. This would be different if confidence in the Fed's fight against inflation were to evaporate.
Economists at MUFG Bank analyze implications for the FX market from recent G10 central bank updates.
The BoJ moves closer to raising rates
The main takeaway for the FX market from recent G10 central bank updates is that the start of rate cutting cycles appears on course to be relatively synchronized which is contributing to stable FX market conditions at the start of this year.
We expect the Fed, ECB, BoE, BoC, Riksbank and SNB to have all started cutting rates by Q2. There is a higher risk though that the BoE and BoC could wait a little later to begin cutting rates, and be closer in timing to the laggards of the Norges Bank, RBA and RNBZ.
One clear exception was the BoJ’s updated policy stance which indicated that they are moving in the opposite direction from other G10 central banks by setting the stage for higher rates and an exit from negative rates for the first time since 2016. The increased risk of the BoJ exiting negative rates as soon as March could prove to be a catalyst for the JPY to rebound further by the end of this quarter.
In January, EUR/USD weakened back after end-2023 rebound. Economists at MUFG Bank analyze the pair’s outlook.
EUR/USD correction lower followed by rebound to new highs
Over the year as a whole, the forward market indicates a remarkably synchronised easing by the Fed and the ECB, which if correct would point to limited scope for yield driven big moves in EUR/USD.
We remain neutral on EUR/USD in H1 but see a slowing US economy emerging, contrasting somewhat with a modest pick-up in Eurozone growth which will allow for EUR/USD to drift higher in H2, although the move will be curtailed by US political risks.
- AUD/USD falls slightly below 0.6500 on risk-aversion mood.
- The USD Index rallies as upbeat US NFP dents Fed rate-cut hopes for March.
- The RBA is set to hold interest rates at 4.35% on Tuesday.
The AUD/USD pair has extended its downside slightly below the psychological support of 0.6500 in the European session on Monday. The Aussie asset faces a sell-off as the appeal for safe-haven assets has improved on easing Federal Reserve (Fed) rate-cut bets.
S&P500 futures have posted some losses in the European session, portraying a dismal market sentiment. The US Dollar Index (DXY) has printed a fresh two-month high near 104.20 as investors see the Fed keeping interest rates unchanged in the range of 5.25-5.50% longer than market participants had anticipated earlier.
The upbeat United States Nonfarm Payrolls (NFP) data for January released on Friday is the reasoning behind a sharp decline in bets supporting a rate cut in March. Labor demand and wage growth momentum were surprisingly strong and offered Fed policymakers a reason to argue in favor of restrictive interest rates until spring.
In today’s session, investors await the US ISM Services PMI for January, which will be published at 15:00 GMT. The economic data is seen improving to 52.0 from 50.6 in December.
Meanwhile, the Australian Dollar will dance to the tunes of the interest rate decision by the Reserve Bank of Australia (RBA), which will be announced on Tuesday. This will be the first monetary policy decision of 2024 in which the RBA is expected to keep the Official Cash Rate (OCR) unchanged at 4.35%, but the focus will remain on when it will start reducing interest rates.
Consistently easing price pressures in the Australian economy due to the deepening cost-of-living crisis leaves no room for RBA policymakers to raise interest rates further. Trimmed mean, a closed-watched measure for core inflation, grew at a slower pace of 4.2% in the last quarter of 2023 against a 5.2% increase in the July-September quarter.
Economists at Rabobank expect the upside potential of the Japanese Yen (JPY) vs. the US Dollar (USD) to be moderate this year.
The window of opportunity for rate rises from the BoJ could be limited
The summary of the BoJ’s January policy meeting indicates that at least one member of the committee considers the current time to be a ‘golden opportunity’ to take policy action.
Market surveys towards the end of last year pointed to April as the most favoured date for the first interest rate hike of the cycle, though some participants see risk of a move as soon as the next policy meeting on March 19.
The window of opportunity for rate rises from the BoJ could be limited given expectations for rate cuts from the Fed and other G10 central banks this year.
Our forecast of a move to USD/JPY 135.00 on a 12-month view assumes a rate rise from the BoJ this year. Since risks of a spring rate rise appear to have strengthened further, we have lowered our three-month USD/JPY forecast to 145.00 from a previous forecast of 146.00.
- Silver drifts lower for the second straight day and drops to a near two-week trough.
- The technical setup favours bearish traders and supports prospects for further losses.
- A sustained strength beyond the 200-day SMA is needed to negate the negative bias.
Silver (XAG/USD) remains under some selling pressure for the second successive day on Monday and drops to a near two-week low, below mid-$22.00s during the first half of the European session.
From a technical perspective, the recent repeated failures ahead of the very important 200-day Simple Moving Average (SMA) and the subsequent downfall favour bearish traders. Moreover, oscillators on the daily chart have again started drifting in the negative territory and suggest that the path of least resistance for the XAG/USD is to the downside.
Hence, some follow-through decline towards retesting sub-$22.00 levels, or a two-month low touched in January, looks like a distinct possibility. The downward trajectory could get extended further towards the $21.40-$21.35 intermediate support before the XAG/USD breaks below the $21.00 mark, towards the October swing low near the $20.70-$20.65 zone.
On the flip side, any meaningful recovery attempt is likely to confront stiff resistance ahead of the $23.00 round-figure mark. This is followed by by the $23.25-$23.30 supply zone, which nears the 200-day SMA, which if cleared decisively should set the stage for additional gains and allow the XAG/USD to aim back towards reclaiming the $24.00 round figure.
Some follow-through buying has the potential to lift the XAG/USD towards the next relevant hurdle near the $24.50-$24.60 area and the $25.00 psychological mark. The momentum could get extended further and lift the white metal to the $25.45-$25.50 intermediate barrier en route to the $26.00 neighbourhood, or the December swing high.
Silver daily chart
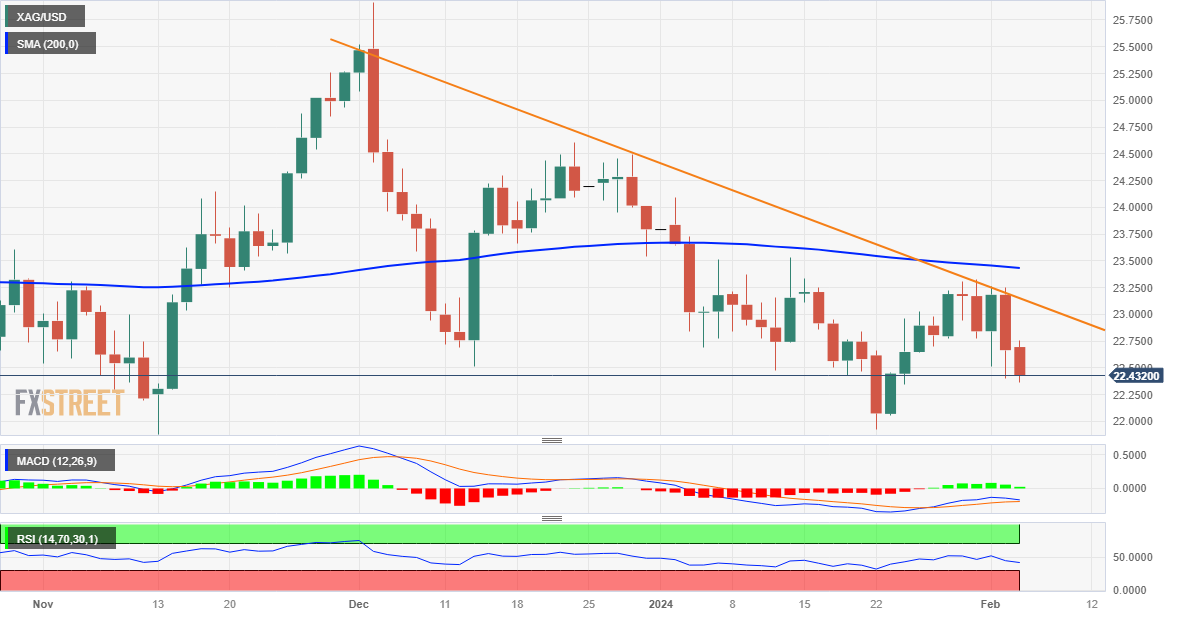
Technical levels to watch
The US Dollar (USD) continues to trade at stronger levels after regaining upward momentum at the end of last week. Economists at MUFG Bank analyze Greenback’s outlook.
A further escalation of concerns over the health of US regional banks is the main downside risk to the USD
The developments are supportive of our outlook for the US Dollar to strengthen further in Q1.
A further escalation of concerns over the health of US regional banks in relation to commercial real estate losses is the main downside risk to the USD in the near term. The latest Fed Senior Loan Officer Opinion Survey is scheduled to be released later today and will provide further insight into bank lending conditions.
- Gold price plunges for the second straight session as investors see Fed rate cut after spring.
- Robust demand for workers has tampered Fed rate-cut bets.
- The outlook for the US dollar and bond yields has improved significantly.
Gold price (XAU/USD) continues to face a sell-off in Monday’s European session due to upbeat United States Nonfarm Payrolls (NFP) data for January. Investors see the Federal Reserve (Fed) keeping interest rates unchanged in March’s monetary policy meeting in the range of 5.25%-5.50% as robust labor market data has strengthened the argument for maintaining higher interest rates till Spring ends.
Strong labor demand and higher wage offerings by US employers to retain or hire workers indicate a bright demand outlook. This has also indicated a persistent inflation environment, and therefore, interest rates must remain higher to prevent further escalation.
While the Gold price has come under pressure, the outlook for US bond yields and the US Dollar Index (DXY) has improved significantly. The USD Index has recaptured the 104.00 resistance for the first time in two months. Meanwhile, the US Institute of Supply Management (ISM) Services PMI for January is in focus representing the service sector, which accounts for two-thirds of the economy.
Daily Digest Market Movers: Gold price falls sharply ahead of US ISM Services PMI data
- Gold price extends its downside to near $2,023 as the latest employment data has tampered bets in favor of early rate cuts by the Federal Reserve.
- The CME FedWatch tool shows that a rate-cut move in the March policy meeting is out of the picture now, while bets for May are still meaningful.
- The labor demand remained upbeat, and wage growth accelerated robustly in January, indicating a stubborn inflation outlook.
- The upbeat employment data has strengthened Fed policymakers’ argument supporting interest rates remaining higher for somewhat longer than market expectations.
- On Friday, the United States Bureau of Labor Statistics (BLS) reported that payrolls increased by 353K in January, almost doubled from the consensus of 180K, and remained higher from upwardly revised December’s figures of 333K.
- Average Hourly Earnings grew strongly by 0.6% against expectations of 0.3% and the prior increase of 0.4%. The annual wage growth was higher by 4.5% vs. the estimated 4.1% and the former reading of 4.4%. Annual Average Hourly Earnings for December were revised from 4.1% to 4.4%.
- Unlike other Group of Seven economies struggling to maintain steady labor market conditions, the US economy is outperforming with a strong gap, allowing Fed policymakers to emphasize maintaining the “higher interest rates” narrative at least for the first half of this year.
- On Friday, Fed Governor Michelle Bowman said that the recent decline in price pressures is encouraging but cautioned about early rate cuts. She warned that premature rate cuts could delay the decline in price pressures toward the 2% target, which could force policymakers to raise interest rates again.
- Meanwhile, the USD Index has printed a fresh seven-week high at 104.20 ahead of the US ISM Services PMI for January, which will be published at 15:00 GMT.
- Investors anticipate that Services PMI increased to 52.0 from 50.6 in December.
Technical Analysis: Gold price drops to near $2,020
Gold price delivers a steep downside move as investors see a rate cut by the Fed delayed to May. The outlook for the precious metal has dampened as it has failed to sustain the breakout of the Symmetrical Triangle chart pattern formed on a daily time frame. The yellow metal has dropped below the 20 and 50-day Exponential Moving Averages (EMAs), which hover near $2,033 and $2,022 respectively.
The 14-period Relative Strength Index (RSI) oscillates in the 40.00-60.00, which indicates a lackluster move ahead.
Gold FAQs
Why do people invest in Gold?
Gold has played a key role in human’s history as it has been widely used as a store of value and medium of exchange. Currently, apart from its shine and usage for jewelry, the precious metal is widely seen as a safe-haven asset, meaning that it is considered a good investment during turbulent times. Gold is also widely seen as a hedge against inflation and against depreciating currencies as it doesn’t rely on any specific issuer or government.
Who buys the most Gold?
Central banks are the biggest Gold holders. In their aim to support their currencies in turbulent times, central banks tend to diversify their reserves and buy Gold to improve the perceived strength of the economy and the currency. High Gold reserves can be a source of trust for a country’s solvency. Central banks added 1,136 tonnes of Gold worth around $70 billion to their reserves in 2022, according to data from the World Gold Council. This is the highest yearly purchase since records began. Central banks from emerging economies such as China, India and Turkey are quickly increasing their Gold reserves.
How is Gold correlated with other assets?
Gold has an inverse correlation with the US Dollar and US Treasuries, which are both major reserve and safe-haven assets. When the Dollar depreciates, Gold tends to rise, enabling investors and central banks to diversify their assets in turbulent times. Gold is also inversely correlated with risk assets. A rally in the stock market tends to weaken Gold price, while sell-offs in riskier markets tend to favor the precious metal.
What does the price of Gold depend on?
The price can move due to a wide range of factors. Geopolitical instability or fears of a deep recession can quickly make Gold price escalate due to its safe-haven status. As a yield-less asset, Gold tends to rise with lower interest rates, while higher cost of money usually weighs down on the yellow metal. Still, most moves depend on how the US Dollar (USD) behaves as the asset is priced in dollars (XAU/USD). A strong Dollar tends to keep the price of Gold controlled, whereas a weaker Dollar is likely to push Gold prices up.
- WTI drifts lower for the fourth straight day and drops to a near three-week low on Monday.
- Bets for less aggressive rate cuts by the Fed underpin the USD and weigh on the black liquid.
- A further escalation of military action in the Middle East does little to ease the bearish pressure.
West Texas Intermediate (WTI) US Crude Oil prices extend last week's rejection slide from the 100-day Simple Moving Average (SMA), around the $79.20 area, or the YTD peak, and drift lower for the fourth successive day on Monday. This also marks the fifth day of a negative move in the previous six and drags the commodity to the $71.75-$71.70 region, or a nearly three-week low, during the first half of the European session.
The stronger-than-expected US jobs data released on Friday suggests that the economy may be too hot for the Federal Reserve (Fed) to start cutting interest rates. This continues to act as a tailwind for the US Dollar (USD) and turns out to be a key factor undermining demand for dollar-denominated commodities, including Crude Oil prices. Bulls, meanwhile, failed to gain any respite from fading hopes of a ceasefire between Israel and Hamas and the risk of a further escalation of military action in the Middle East.
Reports suggest that Hamas is set to reject the Gaza ceasefire deal proposed in Paris. Moreover, Israel's Prime Minister Benjamin Netanyahu said that the country will not end the war before it completes all of its goals, which are the elimination of Hamas and the promise that Gaza will not pose a threat. Meanwhile, the US continues its campaign against the Iran-backed Houthis in Yemen and has signalled further strikes on Iran-backed groups in the Middle East in response to a deadly attack on American troops in Jordan.
The markets, meanwhile, react little to Ukrainian drone attacts on the largest oil refinery in southern Russia on Saturday as global supply remains largely unaffected. Furthermore, the commodity's inability to attract any meaningful buying favours bearish traders and suggests that the path of least resistance remains to the downside. Traders now look to the release of the US ISM Services PMI, which, along with Fedspeaks, might influence the USD price dynamics and produce short-term opportunities around the black liquid.
Technical levels to watch
The Dollar was able to make significant gains on Friday following the release of the US labor market report. Economists at Commerzbank analyze how much better is the US labor market.
So far, everything is as USD-positive – or EUR-USD-negative – as it can be
So far, everything is as USD-positive (or EUR/USD-negative) as it can be. But I would caution against throwing the baby out with the bathwater.
I have written a lot recently about whether the US could have a sustainable growth advantage over the Eurozone. If so, that would justify a strong Dollar, regardless of the outlook for Fed and ECB monetary policy. I believe that such an assumption is warranted, given GDP developments. However, I do not think that the impression of a structural advantage of the US labor market over the labor market here in the Euro Area is justified.
- EUR/USD drops to a fresh YTD low and is pressured by a combination of factors.
- The USD builds on the post-NFP rise and touches its highest level since December.
- Bets for an April rate cut by the ECB continue to undermine the shared currency.
The EUR/USD pair trades with a negative bias for the second successive day on Monday and languishes near the YTD trough, around the 1.0770 region during the early European session. Investors further scaled back their expectations for a more aggressive policy easing by the Federal Reserve (Fed) in the wake of Friday's blockbuster US jobs data, which continues to push the US Treasury Bond yields higher. This, along with the risk of a further escalation of geopolitical tensions in the Middle East and China's economic woes, underpins the Greenback's relative safe-haven status and exerts pressure on the currency pair.
In contrast, falling inflation in Germany and France – the Eurozone's two largest economies – has raised hopes that the European Central Bank (ECB) could start cutting its benchmark deposit rate from the current record-high level of 4% by April. This is seen as another factor that contributes to the offered tone surrounding the EUR/USD pair and supports prospects for an extension of the post-NFP rejection slide from the vicinity of the 1.0900 mark. Traders now look to the US ISM Services PMI and Fedspeak for fresh impetus later today.
Daily Digest Market Movers: EUR/USD seems vulnerable near YTD low amid bullish US Dollar
- The upbeat US jobs report points to a still-resilient US labor market and gives the Federal Reserve headroom to keep rates higher for longer, underpinning the US Dollar and exerting pressure on the EUR/USD pair.
- Furthermore, Fed Chair Jerome Powell, speaking in an interview with the US TV show 60 Minutes over the weekend, reiterated that the March meeting is likely too soon to have the confidence to start cutting interest rates.
- The probability of the first interest rate cut by the Fed in May stands at about 70%, down from 90% before the key employment data, and the probability of 150-bps of cumulative rate cuts in 2024 plummets to just around 20%.
- The yield on the benchmark 10-year US government bond extends the post-NFP rise beyond the 4.0% threshold on Monday and favours the USD bulls amid a slight deterioration in the global risk sentiment.
- Israel's Prime Minister Benjamin Netanyahu said that the country will not end the war before it completes all of its goals, while media reports suggest that Hamas is set to reject the Gaza ceasefire deal proposed in Paris.
- The US Central Command said its forces conducted a strike in self-defence against a Houthi land-attack cruise missile and struck four anti-ship cruise missiles prepared to launch against ships in the Red Sea.
- A private survey showed that business activity in China's services sector remained in expansionary territory for 13 straight months, though grew less than expected in January and added to slowdown concerns.
- Eurozone CPI moves slowed from the 2.9% YoY rate to 2.8% in January, moving closer to the 2% target and making it more likely that the European Central Bank will start cutting interest rates by April.
- ECB's Governing Council member Boris Vujcic said that the central bank needs to ensure there aren’t any second-round effects on inflation from wages before cutting rates, though fails to inspire the Euro bulls.
- The US ISM Services PMI is due for release later today and is expected to improve from 50.6 to 52.0 in January, which, along with Fedspeaks, will influence the buck and provide some impetus to the currency pair.
Technical Analysis: EUR/USD struggles near 100-day SMA, seems poised to depreciate further
From a technical perspective, acceptance below the 100-day Simple Moving Average (SMA) will be seen as a fresh trigger for bearish traders. Given that oscillators on the daily chart are holding deep in the negative territory and are still away from being in the oversold zone, the EUR/USD pair might then slide to the December 2023 swing low, around the 1.0725-1.0720 region. This is closely followed by the 1.0700 mark, below which the downward trajectory could accelerate further towards the 1.0665-1.0660 intermediate support en route to the 1.0620-1.0615 region and the 1.0600 round figure.
On the flip side, any attempted recovery back above the 1.0800 mark is likely to attract fresh sellers and remain capped near the 200-day SMA, currently pegged near the 1.0835-1.0840 zone. A sustained strength beyond, however, might trigger a short-covering rally and allow the EUR/USD pair to reclaim the 1.0900 round figure. The latter should act as a key pivotal point, which if cleared decisively will negate the negative outlook and shift the near-term bias in favour of bullish traders.
Euro price today
The table below shows the percentage change of Euro (EUR) against listed major currencies today. Euro was the weakest against the New Zealand Dollar.
| USD | EUR | GBP | CAD | AUD | JPY | NZD | CHF | |
| USD | 0.14% | 0.07% | 0.10% | 0.02% | -0.05% | -0.08% | 0.21% | |
| EUR | -0.16% | -0.09% | -0.05% | -0.14% | -0.21% | -0.24% | 0.05% | |
| GBP | -0.07% | 0.08% | 0.03% | -0.05% | -0.12% | -0.15% | 0.14% | |
| CAD | -0.10% | 0.03% | -0.03% | -0.08% | -0.16% | -0.18% | 0.10% | |
| AUD | -0.03% | 0.14% | 0.06% | 0.09% | -0.07% | -0.09% | 0.19% | |
| JPY | 0.04% | 0.20% | 0.11% | 0.17% | 0.07% | -0.04% | 0.26% | |
| NZD | 0.10% | 0.23% | 0.18% | 0.18% | 0.09% | 0.00% | 0.27% | |
| CHF | -0.21% | -0.05% | -0.14% | -0.11% | -0.18% | -0.26% | -0.29% |
The heat map shows percentage changes of major currencies against each other. The base currency is picked from the left column, while the quote currency is picked from the top row. For example, if you pick the Euro from the left column and move along the horizontal line to the Japanese Yen, the percentage change displayed in the box will represent EUR (base)/JPY (quote).
Euro FAQs
What is the Euro?
The Euro is the currency for the 20 European Union countries that belong to the Eurozone. It is the second most heavily traded currency in the world behind the US Dollar. In 2022, it accounted for 31% of all foreign exchange transactions, with an average daily turnover of over $2.2 trillion a day.
EUR/USD is the most heavily traded currency pair in the world, accounting for an estimated 30% off all transactions, followed by EUR/JPY (4%), EUR/GBP (3%) and EUR/AUD (2%).
What is the ECB and how does it impact the Euro?
The European Central Bank (ECB) in Frankfurt, Germany, is the reserve bank for the Eurozone. The ECB sets interest rates and manages monetary policy.
The ECB’s primary mandate is to maintain price stability, which means either controlling inflation or stimulating growth. Its primary tool is the raising or lowering of interest rates. Relatively high interest rates – or the expectation of higher rates – will usually benefit the Euro and vice versa.
The ECB Governing Council makes monetary policy decisions at meetings held eight times a year. Decisions are made by heads of the Eurozone national banks and six permanent members, including the President of the ECB, Christine Lagarde.
How does inflation data impact the value of the Euro?
Eurozone inflation data, measured by the Harmonized Index of Consumer Prices (HICP), is an important econometric for the Euro. If inflation rises more than expected, especially if above the ECB’s 2% target, it obliges the ECB to raise interest rates to bring it back under control.
Relatively high interest rates compared to its counterparts will usually benefit the Euro, as it makes the region more attractive as a place for global investors to park their money.
How does economic data influence the value of the Euro?
Data releases gauge the health of the economy and can impact on the Euro. Indicators such as GDP, Manufacturing and Services PMIs, employment, and consumer sentiment surveys can all influence the direction of the single currency.
A strong economy is good for the Euro. Not only does it attract more foreign investment but it may encourage the ECB to put up interest rates, which will directly strengthen the Euro. Otherwise, if economic data is weak, the Euro is likely to fall.
Economic data for the four largest economies in the euro area (Germany, France, Italy and Spain) are especially significant, as they account for 75% of the Eurozone’s economy.
How does the Trade Balance impact the Euro?
Another significant data release for the Euro is the Trade Balance. This indicator measures the difference between what a country earns from its exports and what it spends on imports over a given period.
If a country produces highly sought after exports then its currency will gain in value purely from the extra demand created from foreign buyers seeking to purchase these goods. Therefore, a positive net Trade Balance strengthens a currency and vice versa for a negative balance.
- Eurozone investors’ morale improved for the fifth straight month in February.
- EUR/USD stays pressured below 1.0800 after the Eurozone data.
The Eurozone Sentix Investor Confidence Index improved further from -15.8 in January to -12.9 in February, the latest survey showed on Monday.
The Expectations Index in the Eurozone rose from -8.8 in the previous month to -5.5 in February.
The index on the Current Situation also climbed to -20.0 in February from -22.5 in January, the fourth monthly increase in a row.
Key takeaways
Germany, the region's largest economy, remains a drag on the region, Sentix said, pointing to a persistent economic crisis in the country.
The recovery process is proceeding slowly.
The situation in Germany was precarious.
Market reaction to the Eurozone Sentix data
EUR/USD is testing lows near 1.0760 despite the encouraging Eurozone data. As of writing, the EUR/USD pair is 0.22% lower on the day.
Euro price today
The table below shows the percentage change of Euro (EUR) against listed major currencies today. Euro was the weakest against the New Zealand Dollar.
| USD | EUR | GBP | CAD | AUD | JPY | NZD | CHF | |
| USD | 0.17% | 0.13% | 0.12% | 0.07% | -0.02% | -0.04% | 0.26% | |
| EUR | -0.16% | -0.05% | -0.05% | -0.11% | -0.20% | -0.21% | 0.08% | |
| GBP | -0.13% | 0.04% | -0.01% | -0.06% | -0.16% | -0.17% | 0.13% | |
| CAD | -0.12% | 0.05% | 0.01% | -0.05% | -0.15% | -0.16% | 0.14% | |
| AUD | -0.06% | 0.11% | 0.07% | 0.06% | -0.10% | -0.10% | 0.19% | |
| JPY | 0.03% | 0.18% | 0.15% | 0.17% | 0.11% | -0.02% | 0.30% | |
| NZD | 0.04% | 0.21% | 0.18% | 0.16% | 0.12% | -0.01% | 0.31% | |
| CHF | -0.26% | -0.09% | -0.14% | -0.14% | -0.20% | -0.29% | -0.31% |
The heat map shows percentage changes of major currencies against each other. The base currency is picked from the left column, while the quote currency is picked from the top row. For example, if you pick the Euro from the left column and move along the horizontal line to the Japanese Yen, the percentage change displayed in the box will represent EUR (base)/JPY (quote).
Gold prices fell in India on Monday, according to data from India's Multi Commodity Exchange (MCX).
Gold price stood at 62,838 Indian Rupees (INR) per 10 grams, down INR 37 compared with the INR 62,875 it cost on Friday.
As for futures contracts, Gold prices decreased to INR 62,252 per 10 gms from INR 62,562 per 10 gms.
Prices for Silver futures contracts decreased to INR 70,743 per kg from INR 71,208 per kg.
| Major Indian city | Gold Price |
|---|---|
| Ahmedabad | 64,565 |
| Mumbai | 64,395 |
| New Delhi | 64,535 |
| Chennai | 64,530 |
| Kolkata | 64,640 |
Global Market Movers: Comex Gold price remains depressed despite geopolitical risks
- The robust US employment details released on Friday forced investors to scale back their expectations regarding the timing and pace of rate cuts by the Federal Reserve, which is seen weighing on the Comex Gold price.
- The headline NFP showed that the US economy added 353K new jobs in January, nearly double the 180K anticipated, and the previous month's reading was also revised higher to 333K from the 216K reported.
- Other details revealed that the Unemployment Rate held steady at 3.7% and wage inflation, as measured by the change in Average Hourly Earnings, rose to 4.5% on a yearly basis as against the 4.1% rise anticipated.
- The probability of a rate cut in March dwindled to approximately 15% from over 65% last month, while the likelihood of a 150-bps rate cut in 2024 has also plummeted to just 25% from being nearly certain previously.
- The yield on the benchmark 10-year US government bond extends the post-NFP rise beyond the 4.0% threshold during the Asian trading hours on Monday and pushes the US Dollar to a fresh high since December.
- A private survey showed that business activity in China's services sector remained in expansionary territory for 13 straight months, though grew less than expected in January and added to worries about a slowdown.
- Israel's Prime Minister Benjamin Netanyahu said that the country will not end the war before it completes all of its goals, while media reports suggest that Hamas is set to reject the Gaza ceasefire deal proposed in Paris.
- US Central Command said forces conducted a strike in self-defense against a Houthi land attack cruise missile and struck four anti-ship cruise missiles prepared to launch against ships in the Red Sea.
- This, in turn, could act as a tailwind for the safe-haven precious metal as traders now look to the release of the US ISM Services PMI for short-term opportunities later during the early North American session on Monday.
(An automation tool was used in creating this post.)
Gold FAQs
Why do people invest in Gold?
Gold has played a key role in human’s history as it has been widely used as a store of value and medium of exchange. Currently, apart from its shine and usage for jewelry, the precious metal is widely seen as a safe-haven asset, meaning that it is considered a good investment during turbulent times. Gold is also widely seen as a hedge against inflation and against depreciating currencies as it doesn’t rely on any specific issuer or government.
Who buys the most Gold?
Central banks are the biggest Gold holders. In their aim to support their currencies in turbulent times, central banks tend to diversify their reserves and buy Gold to improve the perceived strength of the economy and the currency. High Gold reserves can be a source of trust for a country’s solvency. Central banks added 1,136 tonnes of Gold worth around $70 billion to their reserves in 2022, according to data from the World Gold Council. This is the highest yearly purchase since records began. Central banks from emerging economies such as China, India and Turkey are quickly increasing their Gold reserves.
How is Gold correlated with other assets?
Gold has an inverse correlation with the US Dollar and US Treasuries, which are both major reserve and safe-haven assets. When the Dollar depreciates, Gold tends to rise, enabling investors and central banks to diversify their assets in turbulent times. Gold is also inversely correlated with risk assets. A rally in the stock market tends to weaken Gold price, while sell-offs in riskier markets tend to favor the precious metal.
What does the price of Gold depend on?
The price can move due to a wide range of factors. Geopolitical instability or fears of a deep recession can quickly make Gold price escalate due to its safe-haven status. As a yield-less asset, Gold tends to rise with lower interest rates, while higher cost of money usually weighs down on the yellow metal. Still, most moves depend on how the US Dollar (USD) behaves as the asset is priced in dollars (XAU/USD). A strong Dollar tends to keep the price of Gold controlled, whereas a weaker Dollar is likely to push Gold prices up.
AUD/USD has drifted below 0.6500. Economists at Société Générale analyze the pair’s outlook.
Lack of steady upward momentum
AUD/USD rebound petered out near graphical hurdle of 0.6900 representing highs of last June/July. It has experienced a deeper pullback after this test. It is now attempting re-integration within previous multi-month base denoting lack of steady upward momentum.
Reclaiming recent pivot peak at 0.6625 would be essential to confirm next leg of up move. Failure could mean risk of extended down move towards next potential support located at 0.6410, the 76.4% retracement from October and 0.6270.
Gold managed to end the week higher after erasing a majority of weekly gains on Friday. Strategists at TD Securities analyze the yellow metal’s outlook.
Rates will likely drop before the inflation target is reached
The US central bank's next move is a cut and now the markets will need to decide when that starts.
Since rates will likely drop before the inflation target is reached and considering robust central bank purchases, new demand and relatively short positioning prompts us to say length and prices will increase as 2024 unfolds.
- USD/CAD could surpass the psychological barrier at 1.3500 followed by January’s high at 1.3541
- Technical indicators suggest a bullish confirmation towards the major support at 1.3550.
- The pair could find the support zone around the 50-day EMA at 1.3456 aligned with the major support at the 1.3450 level.
USD/CAD moves in an upward direction for the sixth consecutive week, edging higher to near 1.3480 during the European session on Monday. The psychological level at 1.3500 appears to be the immediate resistance.
A firm breakthrough above the psychological resistance could exert a positive sentiment that could lead the USD/CAD pair to test January’s high at 1.3541 before the major support at 1.3550 level.
The technical analysis of the Moving Average Convergence Divergence (MACD) for the USD/CAD pair indicates a potential bullish sentiment in the market. This interpretation is based on the positioning of the MACD line above the centerline and divergence above the signal line.
Additionally, the lagging indicator 14-day Relative Strength Index (RSI) is positioned above 50, suggesting the confirmation of stronger momentum for the USD/CAD pair, which could support the pair to navigate the region around the psychological resistance of 1.3600.
On the downside, the USD/CAD pair could find the support zone around the 50-day Exponential Moving Average (EMA) at 1.3456 and 23.6% Fibonacci retracement level at 1.3455 aligned with the major support at 1.3450 level.
A break below the latter could put downward pressure on the USD/CAD pair to test the 38.2% Fibonacci retracement level at 1.3402, in conjunction with the psychological level at 1.3400. If the psychological level breaches, the pair could revisit the recent low at 1.3365 reached on February 2.
USD/CAD: Daily Chart
-638427197453559091.png)
- NZD/USD recovers from 0.6050 as US Dollar struggles to extend recovery ahead of US Services PMI data.
- The market mood is downbeat as robust US labor demand has dampened the Fed’s early rate-cut prospects.
- Weak NZ Employment data would allow RBA policymakers to lean towards a dovish policy stance.
The NZD/USD pair discovers buying interest near 0.6050 and rebounds to near 0.6080 in the London session. The near-term outlook of the kiwi asset is still bearish as it hovers near a two-month low after a sell-off led by the upbeat United States Nonfarm Payrolls (NFP) data for January that eased hopes of early rate cuts by the Federal Reserve (Fed).
S&P500 futures have posted decent losses in the European session, portraying a decline in the risk appetite of the market participants. The US Dollar Index (DXY) trades sideways above 104.00 ahead of the US ISM Services PMI for January, which will be published at 15:00 GMT. Services PMI representing the service sector, which accounts for two-thirds of the economy, is anticipated to have increased to 52.0 from 50.6 in December.
On the New Zealand Dollar front, investors await the Q4 Employment data scheduled for Tuesday. According to the estimates, the Unemployment Rate increased sharply to 4.3% against 3.9% in the third quarter of 2023. The Labor Cost Index grew at a steady pace of 0.8%. A downbeat labor market data could force Reserve Bank of New Zealand (RBNZ) policymakers to consider early rate cuts.
NZD/USD delivers a breakdown of the Bearish Flag chart pattern formed on a daily timeframe. This indicates a continuation of a downside trend after a short-lived pullback move. The 20-day Exponential Moving Average (EMA) near 0.6137 continues to act as a major barricade for the New Zealand Dollar bulls.
The 14-period Relative Strength Index (RSI) has shifted into the bearish range of 20.00-40.00, which indicates that a bearish momentum has been triggered.
More downside would appear if the asset dropped below the immediate low of 0.6050, exposing the asset to a June 8 low at 0.6026, followed by the psychological support of 0.6000.
On the flip side, further recovery above January 24 high at 0.6150 would drive the asset towards January 31 high at 0.6075 and January 16 high at 0.6208.
NZD/USD daily chart
-638427194179575165.png)
The US Dollar Index (DXY) stays near 104.00 following Friday's robust US labour market which translated into USD strength. Economists at ING analyze Greenback’s outlook.
The focus will be on US ISM Services and some important CPI revisions
Today, we see the ISM services data. This is expected to pick up to 52.0 from 50.5. We suspect any soft number today will not be able to turn around Friday's price action in financial markets.
On Friday this week, we will see revisions to the 2023 US CPI series. The Fed's core message at the moment is one of needing the confidence in the disinflation process to cut. These benchmark revisions pose the slight risk that the late 2023 welcome disinflation trend gets revised away – which would be Dollar-positive and risk-negative. So, it is certainly an event risk to watch carefully.
Expect more of this low volatility range-bound trading – 104.00/104.25 on the topside and maybe now 103.20 on the downside for DXY.
- USD/MXN gains ground as solid US labor data increases the possibility of no rate cut in March by the Fed.
- The recent remarks from the Fed suggest that the central bank is not inclined to pursue a rate cut in March.
- Market experts forecast a weakening of the Mexican Peso throughout 2024, citing uncertainties surrounding the economic policies.
USD/MXN continues its upward trend, reaching around 17.16 in the early European hours on Monday. These positive employment indicators contribute to the prevailing optimism regarding the likelihood of the US Federal Reserve refraining from interest rate cuts in the upcoming meeting. This sentiment has improved the US Dollar (USD) against the Mexican Peso (MXN).
US Nonfarm Payrolls increased by 353,000 jobs in January, surpassing the previous figure of 333,000 and surpassing the market consensus of 180,000. Additionally, Average Hourly Earnings (MoM) for January stood at 0.6%, exceeding the expected 0.3% and the December reading of 0.4%. The Unemployment Rate held steady at 3.7% in January, as compared to the market anticipation of 3.8%.
Recent statements from Federal Reserve officials suggest that the central bank is not inclined to pursue a rate cut in March. Jerome Powell, the Chair of the US Federal Reserve, has reiterated that implementing rate cuts during the March meeting could be premature. Additionally, Austan Goolsbee, President of the Chicago Federal Reserve (Fed) Bank, shared on Friday that he doesn't interpret the strong US job growth in January as a justification for postponing interest rate cuts. Rather, he sees it as a confirmation of the labor market's resilience, suggesting it is not on the brink of weakening.
Conversely, economists at MUFG Bank are anticipating a gradual weakening of the Mexican Peso (MXN) throughout 2024, citing uncertainties surrounding the economic policies that the next administration may adopt. The upcoming presidential election on June 2nd is expected to be won by Claudia Sheinbaum of the Morena party. Despite indications of policy continuity, there is a concern that Ms. Sheinbaum's authority could be limited by the influence of the incumbent president and other leaders within the Morena party.
In a similar vein, economists at CIBC Capital are maintaining their call for consecutive 25 basis points rate cuts starting in March. They also anticipate a later increase in the magnitude of rate cuts by the Bank of Mexico (Banxico) in late 2024, potentially bringing the overnight rate to 9.25% by the end of the year.
The strong US jobs data swung EUR/USD back under 1.0800 on Friday. Economists at ING analyze the pair’s outlook.
The market still prices a 55% chance of an ECB rate cut in April
It is tempting to say the direction of travel lies to the 1.0700 area, and if so, it will probably be a function of the US side of the equation. From the Eurozone side, the calendar is relatively light.
Given the market still prices a 55% chance of an ECB rate cut in April, there is always a risk of a EUR-positive back-up in short-term rates if that cut is removed. It is not clear this will be the week in which the April rate cut is removed.
- Pound Sterling remains under pressure as the Fed’s hopes for an early rate-cut wane.
- The UK’s poor economic prospects could force the BoE to lean towards loosening policy.
- Investors await the S&P Global Services PMI for further guidance.
The Pound Sterling (GBP) continues to face the wrath of dismal market sentiment in the European session on Monday. The GBP/USD pair drops sharply as resilient United States Nonfarm Payrolls (NFP) data on Friday have dented expectations of a rate cut from the Federal Reserve (Fed) at March’s monetary policy meeting. The solid US job creation data came together with an unexpectedly robust wage growth, signaling that inflation pressures persist.
Meanwhile, the scenario for Bank of England (BoE) policymakers is becoming extremely complicated due to deepening fears of a technical recession in the United Kingdom economy. The UK Office for National Statistics (ONS) reported in its revised Q3 Gross Domestic Product (GDP) estimates that the economy contracted by 0.1%. The UK economy is expected to remain on the back foot as higher interest rates have deepened the cost-of-living crisis, forcing businesses to operate with lower capacity.
Daily digest market movers: Pound Sterling drops sharply while US Dollar Index refreshes seven-week high
- The Pound Sterling falls to a near seven-week low of around 1.2600 as the appeal for risk-perceived assets has weakened.
- The outlook for risk-sensitive assets has worsened as the upbeat United States employment data forced traders to pare Federal Reserve’s rate-cut bets.
- January’s US labor market data demonstrated a robust demand for workers and that employers offer higher wage growth to retain employees, indicating that businesses have a strong order book.
- As per the CME Group Fedwatch tool, a rate cut in March’s monetary policy meeting is unlikely. For May’s policy meeting, traders see a little above 57% chance for a rate cut by 25 basis points (bps) to 5.00%-5.25%.
- The Pound Sterling has come under severe pressure despite the Bank of England seeming more hawkish on the interest rate outlook than the Fed.
- Investors hope that a subdued economic performance and increasing geopolitical tensions could force BoE policymakers to cut interest rates earlier than expected.
- The United Kingdom's economy is on the brink of a technical recession. The economy witnessed a GDP contraction of 0.1% in the third quarter of 2023, and a subdued performance is anticipated in the final quarter.
- An absence of economic recovery in the UK economy would significantly impact the labor market.
- Out of nine member-led Monetary Policy Committee (MPC), BoE policymaker Swati Dhingra voted for a rate cut by 25 bps in last week's monetary policy meeting. In contrast, policymakers Catherine Mann and Jonathan Haskel supported a similar rate-hike.
- The UK’s vulnerable economic prospects may force BoE policymakers to join Swati Dhingra and lean towards easing interest rates in upcoming meetings.
- Going forward, investors will focus on the final S&P Global Composite and Services PMI for January, which will be published at 09:30 GMT. Investors anticipate the Composite and Services PMI will remain steady from their preliminary readings at 52.5 and 53.8, respectively.
Technical Analysis: Pound Sterling dips to near seven-week low around 1.2600
-638427161138161481.png)
Pound Sterling falls further to near the crucial support of 1.2600 as the market sentiment is bearish. The short-term outlook of the GBP/USD is to the downside as the pair has dropped below the 20-day and 50-day Exponential Moving Averages (EMAs), which are around 1.2687 and 1.2642, respectively.
The Cable hovers near the horizontal support of the Descending Triangle chart pattern, which is plotted from December 21’s low point at 1.2612, while the downward-sloping trendline is placed from December 28’s high point at 1.2827.
The 14-period Relative Strength Index (RSI) declines towards 40.00, a level that could provide support to the current downside momentum.
Pound Sterling FAQs
What is the Pound Sterling?
The Pound Sterling (GBP) is the oldest currency in the world (886 AD) and the official currency of the United Kingdom. It is the fourth most traded unit for foreign exchange (FX) in the world, accounting for 12% of all transactions, averaging $630 billion a day, according to 2022 data.
Its key trading pairs are GBP/USD, aka ‘Cable’, which accounts for 11% of FX, GBP/JPY, or the ‘Dragon’ as it is known by traders (3%), and EUR/GBP (2%). The Pound Sterling is issued by the Bank of England (BoE).
How do the decisions of the Bank of England impact on the Pound Sterling?
The single most important factor influencing the value of the Pound Sterling is monetary policy decided by the Bank of England. The BoE bases its decisions on whether it has achieved its primary goal of “price stability” – a steady inflation rate of around 2%. Its primary tool for achieving this is the adjustment of interest rates.
When inflation is too high, the BoE will try to rein it in by raising interest rates, making it more expensive for people and businesses to access credit. This is generally positive for GBP, as higher interest rates make the UK a more attractive place for global investors to park their money.
When inflation falls too low it is a sign economic growth is slowing. In this scenario, the BoE will consider lowering interest rates to cheapen credit so businesses will borrow more to invest in growth-generating projects.
How does economic data influence the value of the Pound?
Data releases gauge the health of the economy and can impact the value of the Pound Sterling. Indicators such as GDP, Manufacturing and Services PMIs, and employment can all influence the direction of the GBP.
A strong economy is good for Sterling. Not only does it attract more foreign investment but it may encourage the BoE to put up interest rates, which will directly strengthen GBP. Otherwise, if economic data is weak, the Pound Sterling is likely to fall.
How does the Trade Balance impact the Pound?
Another significant data release for the Pound Sterling is the Trade Balance. This indicator measures the difference between what a country earns from its exports and what it spends on imports over a given period.
If a country produces highly sought-after exports, its currency will benefit purely from the extra demand created from foreign buyers seeking to purchase these goods. Therefore, a positive net Trade Balance strengthens a currency and vice versa for a negative balance.
USD/CNH briefly traded above 7.2000. Economists at CIBC Capital Markets analyze the pair’s outlook.
Very slight downside relief to 7.2000 and 7.1500 in Q3 and Q4, respectively
USD/CNH will peak near 7.2500.
Almost every week media reports that state banks are selling USD in the spot market to defend the onshore Yuan. Thereafter, we expect very slight downside relief to 7.2000 and 7.1500 in Q3 and Q4, respectively.
The Yuan will benefit from USD weakness, but less so than North Asian peers JPY and KRW.
- The US Dollar Index (DXY) trades on a stronger note around 104.02 on Monday.
- The Fed chair reiterated that the next meeting in March was too early for a rate cut.
- The US Nonfarm Payrolls (NFP) for January rose to 353K from 333K in December, stronger than expected.
The US Dollar Index (DXY), a measure of the value of the US Dollar (USD) against a weighted basket of currencies used by US trade partners, gains momentum above the 104.00 psychological mark during the early European trading hours on Monday. The upbeat US job data and the expectation that the US Federal Reserve (Fed) might keep interest rates higher for longer than previously anticipated boost the Greenback broadly. The DXY currently trades near 104.02, adding 0.11% on the day.
Fed Chair Jerome Powell said on Sunday night that the central bank remains on track to cut interest rates three times this year. However, Powell reiterated that the Fed’s next meeting in March was likely too soon for a rate cut. Most economists think the first cut is likely to come in May or June.
Data released by the US Bureau of Labor Statistics (BLS) showed that the US Nonfarm Payrolls (NFP) for January rose to 353K from 333K in December (revised up from 216K). Additionally, the Unemployment Rate was unchanged at 3.7% in January. The Average Hourly Earnings climbed 4.5% YoY in January from 4.4% in the previous reading. After the report, the probability of a March rate cut has dropped to 19%, compared to 38% just a day ago, according to the CME FedWatch tool.
Furthermore, the US national security adviser, Jake Sullivan, said the US would take additional strikes and additional action in response to the Jordan drone attack that killed three soldiers last weekend. The rising tension in the Middle East could boost safe-haven flows and benefit the USD.
Moving on, market participants will monitor the January US ISM Services PMI, which is estimated to improve to 52.0 from 50.6 in December. Fed's Raphael W. Bostic is set to speak later on Monday. Traders will take cues from the data and find trading opportunities around the US Dollar Index.
Here is what you need to know on Monday, February 5:
The US Dollar (USD) stays resilient against its rivals to start the week following Friday's impressive upsurge. Souring market mood on escalating geopolitical tensions and Federal Reserve (Fed) Chairman Jerome Powell's hawkish remarks provide further support to the currency as market focus shifts to the ISM Services PMI report.
The USD Index (DXY) gained nearly 1% on Friday after the monthly report published by the Bureau of Labor Statistics showed that Nonfarm Payrolls rose by 353,000 in January, surpassing the market expectation of 180,000 by a wide margin. In a televised interview with CBS News’s 60 Minutes early Sunday, Powell repeated that the March policy meeting was likely too soon to have the confidence to start cutting rates. He also reiterated that they could move sooner if they saw labor market weakness or inflation coming down persuasively. The DXY pushed higher and touched its strongest level since early December above 104.00 in the early trading hours of the Asian session before retreating slightly into the European morning.
US Dollar price today
The table below shows the percentage change of US Dollar (USD) against listed major currencies today. US Dollar was the strongest against the Pound Sterling.
| USD | EUR | GBP | CAD | AUD | JPY | NZD | CHF | |
| USD | 0.01% | 0.10% | 0.00% | -0.16% | -0.13% | -0.20% | 0.07% | |
| EUR | 0.00% | 0.10% | 0.00% | -0.17% | -0.14% | -0.21% | 0.06% | |
| GBP | -0.11% | -0.10% | -0.10% | -0.28% | -0.23% | -0.30% | -0.04% | |
| CAD | 0.00% | 0.00% | 0.10% | -0.17% | -0.14% | -0.21% | 0.08% | |
| AUD | 0.16% | 0.18% | 0.27% | 0.17% | 0.04% | -0.04% | 0.25% | |
| JPY | 0.12% | 0.13% | 0.21% | 0.13% | -0.03% | -0.09% | 0.21% | |
| NZD | 0.18% | 0.20% | 0.29% | 0.20% | 0.02% | 0.05% | 0.26% | |
| CHF | -0.11% | -0.07% | 0.03% | -0.07% | -0.27% | -0.20% | -0.27% |
The heat map shows percentage changes of major currencies against each other. The base currency is picked from the left column, while the quote currency is picked from the top row. For example, if you pick the Euro from the left column and move along the horizontal line to the Japanese Yen, the percentage change displayed in the box will represent EUR (base)/JPY (quote).
Meanwhile, geopolitical tensions remain high at the beginning of the week following news of the US and the UK conducting a new wave of airstrikes on the Iran-backed Houthi militant group in Yemen over the weekend, hitting at least 30 targets. In retaliation, Yemen’s Houthi rebels vowed to extend their military operations and threatened to respond to the latest set of strikes. Reflecting the risk-averse market atmosphere, US stock index futures are down about 0.25% early Monday.
EUR/USD declined sharply on Friday and closed the third consecutive week in negative territory. The pair was last seen trading in a tight channel below 1.0800. HCOB will release revisions to January Services and Composite PMIs for Germany and the Eurozone.
GBP/USD continues to push lower toward 1.2600 after losing 0.9% on Friday. Bank of England Chief Economist Huw Pill will participate in an online Q&A at 17:30 GMT on Monday.
USD/JPY stretched higher in the Asian session on Monday and came within a touching distance of 149.00, setting its highest level since late November in the process. With the JPY benefiting from the souring risk mood, however, the pair retreated below 148.50.
Gold erased a large portion of its weekly gains on Friday as the benchmark 10-year US Treasury bond yield recovered above 4% after strong US labor market data. With the 10-year yield staying in positive territory early Monday, XAU/USD trades in the red at around $2,030.
FX option expiries for Feb 5 NY cut at 10:00 Eastern Time, via DTCC, can be found below.
- EUR/USD: EUR amounts
- 1.0700 402m
- 1.0870 554m
- 1.0900 1.1b
- 1.0950 602m
- 1.0965 805m
- 1.0970 995m
- 1.0975 1.3b
- GBP/USD: GBP amounts
- 1.2645 501m
- 1.2650 435m
- USD/JPY: USD amounts
- 148.00 1.1b
- 149.35 630m
- 150.00 1.7b
- NZD/USD: NZD amounts
- 0.6050 610m
- 0.6100 450m
- EUR/USD attracts some sellers around 1.0780 on the firmer USD.
- The pair keeps the bearish outlook unchanged below the key EMA; RSI indicator remains below the 50 midlines.
- The immediate resistance level will emerge at 1.0840; the initial support level for EUR/USD is located at 1.0752.
The EUR/USD pair remains on the defensive during the early European session on Monday. The hawkish remarks from Federal Reserve (Fed) Chairman Jerome Powell provide some support to the US Dollar (USD) and exert some selling pressure on the EUR/USD pair. Investors await the Services PMI data from Germany and the Eurozone for fresh catalysts. At press time, the major pair is trading at 1.0780, losing 0.11% on the day.
Fed Chairman Jerome Powell said on Sunday that a rate cut in March is too early, and he doesn’t believe the central bank will have the confidence by then that inflation will return to a 2% target sustainably. The US Central Bank emphasized that it wants more confidence before taking the very important step of beginning rate cuts.
Technically, the bearish outlook of EUR/USD remains intact as the major pair is below the key 100-period Exponential Moving Averages (EMA) with a downward slope on the four-hour chart. The tower momentum is supported by the Relative Strength Index (RSI), which stands below the 50 midlines, suggesting that the path of least resistance level is to the downside.
On the bright side, the immediate resistance level for the major pair will emerge near the 50-period EMA at 1.0840. The next upside barrier is seen near the 100-period EMA at 1.0865. A decisive break above the latter will pave the way to the key hurdle at 1.0900, representing the confluence of the upper boundary of the Bollinger Band and a psychological mark. The additional upside filter to watch is a high of January 15 at 1.0967, and finally at the 1.1000 psychological round figure.
On the flip side, the first support level for EUR/USD is located near the lower limit of the Bollinger Band at 1.0752. A breach of this level will expose a low of December 8 at 1.0723, en route to a low of November 9 at 1.0660.
- USD/CHF continues to move on an upward trajectory after the blockbuster US Nonfarm Payrolls data.
- Fed’s Powell restated that initiating rate cuts in the March meeting may be premature.
- The Swiss National Bank is expected to initiate a rate cut in September 2024.
USD/CHF improved to 0.8680 during the Asian session on Monday, extending gains for the second straight session. The US Dollar (USD) received support as the market sentiment indicated that the Federal Reserve is unlikely to cut interest rates at March's meeting after the solid US employment figures released on Friday.
On Friday, the US Bureau of Labor Statistics (BLS) reported that Nonfarm Payrolls added 353K jobs in January, surpassing the previous reading of 333K and exceeding the market consensus of 180K. Average Hourly Earnings (MoM) came in at 0.6% for January, exceeding the expected 0.3% and 0.4% reading from December. The Unemployment Rate remained unchanged at 3.7% in January against the market consensus of 3.8%.
Jerome Powell, the Chair of the US Federal Reserve (Fed), has restated that initiating rate cuts in the March meeting may be premature. He stressed the importance of approaching the timing of rate cuts cautiously, considering the current strength of the economy. Moreover, Austan Goolsbee, the President of the Chicago Federal Reserve (Fed) Bank, expressed on Friday that he does not view the robust US job growth in January as a reason to delay interest rate cuts. Instead, he sees it as reassurance that the labor market is resilient and not on the verge of weakening.
The most recent data on the Swiss Manufacturing Purchasing Managers Index (PMI) indicated a marginal improvement in production growth in Switzerland, falling short of market expectations. Despite a surge in Gross Domestic Product surpassing market consensus, there has been a dip in Swiss Real Retail Sales and Consumer Demand. As a result, there is a prevailing anticipation in the market that the Swiss National Bank (SNB) is likely to implement its inaugural rate cut in September 2024, in line with consensus expectations.
- AUD/JPY snaps its recent gains as the safe-haven Japanese Yen improves on escalated geopolitical tension.
- White House national security adviser Jake Sullivan warned that US airstrikes were just the beginning.
- Australian Dollar faces challenges as the S&P/ASX 200 Index retreats from last week's record high ahead of RBA’s interest rate decision.
AUD/JPY retraces its recent gains amid speculation of an imminent shift in the Bank of Japan's (BoJ) policy stance. Additionally, escalated geopolitical tension in the Middle East contributes to increased demand for the safe-haven Japanese Yen (JPY), acting as a headwind for the AUD/JPY cross. As a result, the cross edges lowered to around 96.60 during the Asian session on Monday.
The United States (US) and the United Kingdom (UK) conducted new air strikes on the Iran-backed Houthi militant group in Yemen on Saturday. This action was taken in response to a drone strike that resulted in the death of three US service members in Jordan. Adding to the tensions, White House national security adviser Jake Sullivan warned on Sunday that US airstrikes on Iranian-backed militias were just the beginning. Sullivan also expects the possibility of strikes on Iranian soil.
The Australian Dollar (AUD) is under selling pressure as the benchmark S&P/ASX 200 Index retreats from last week's record high. The decline is particularly pronounced in the miners and energy sectors, which is putting additional downward pressure on the AUD/JPY cross
On Monday, Australia’s Trade Balance (MoM) for January indicated a reduction, with the figure at 10,959M compared to the revised figure of 11,764M in December. Additionally, the Judo Bank Composite Purchasing Managers Index (PMI) improved to 49 in January from 48.1 prior. The Services PMI also saw an improvement, rising to 49.1 from the previous figure of 47.9.
The Reserve Bank of Australia (RBA) is scheduled to announce its interest rate decision on Tuesday. Markets expect RBA to maintain the cash rate at its current level of 4.35%. Investors will pay close attention to RBA Governor Michele Bullock's speech on the monetary policy outlook, as it could provide additional insights into the central bank's stance and considerations for future policy actions.
- USD/CAD rises to over a one-week high on Monday, though lacks follow-through buying.
- Friday’s upbeat US jobs report tempered hopes for an early interest rate cut by the Fed.
- Mixed fundamental cues fail to influence Oil prices, which drives demand for the Loonie.
The USD/CAD pair gains positive traction for the second straight day on Monday – also marking the third day of a move-up in the precious four – and climbs to over a one-week high during the Asian session. Spot prices, however, struggle to build on the momentum beyond a technically significant 200-day Simple Moving Average (SMA) and remain below the 1.3500 psychological mark.
The US Dollar (USD) climbs to its highest level since December 11 as investors further scaled back their expectations for a more aggressive policy easing by the Federal Reserve (Fed) in reaction to Friday's stellar US NFP report. The current market pricing suggests around a 15% chance of a Fed rate cut in March and the probability of a 150-bps rate cut in 2024 has also declined to just 25%. This remains supportive of a further rise in the US Treasury bond yields, which acts as a tailwind for the buck and is seen lending some support to the USD/CAD pair.
A private survey showed this Monday that business activity in China's services sector remained in expansionary territory for 13 straight months, though grew less than expected in January and added to worries about a slowdown. This, along with the risk of a further escalation of geopolitical tensions in the Middle East, temper investors' appetite for riskier assets and turns out to be another factor benefitting the Greenback's relative safe-haven status. The USD bulls, however, take a brief pause and keep a lid on any further gains for the USD/CAD pair.
Meanwhile, US Central Command said forces conducted a strike in self-defence against a Houthi a land attack cruise missile and struck four anti-ship cruise missiles prepared to launch against ships in the Red Sea. Furthermore, the US signalled further strikes on Iran-backed groups in response to a deadly attack on American troops in Jordan. This assists Crude Oil prices to stall last week's corrective decline from the YTD peak, which seems to underpin the commodity-linked Loonie and contributes to capping the upside for the USD/CAD pair.
Traders now look forward to the release of the US ISM Services PMI, due later during the early North American session. This, along with the US bond yields and the broader risk sentiment, will drive the USD demand. Apart from this, traders will take cues from Oil price dynamics to grab short-term opportunities around the USD/CAD pair. Nevertheless, the aforementioned mixed fundamental backdrop makes it prudent to wait for some follow-through buying before confirming that spot prices have bottomed out and positioning for a further appreciating move.
Technical levels to watch
- Gold price drifts lower for the second straight day amid reduced bets for aggressive Fed easing.
- Rising US bond yields lifted the USD to a nearly two-month high and undermined the XAU/USD.
- Geopolitical risks and China’s economic woes could lend support to the safe-haven commodity.
Gold price (XAU/USD) remains under some selling pressure for the second successive day on Monday and seems vulnerable to extending last week's retracement slide from the $2,065 area, or a one-month peak. Friday's blockbuster US jobs report reaffirmed market expectations that the Federal Reserve (Fed) will keep interest rates higher for longer, which remains supportive of rising US Treasury bond yields and lifts the US Dollar (USD) to its highest level since December 11. This, in turn, is seen as a key factor undermining the non-yielding yellow metal.
Apart from this, the underlying bullish tone across the global equity markets further contributes to the offered tone surrounding the Gold price. That said, the risk of a further escalation of military action in the Middle East and persistent worries about a slowdown in China lend support to the safe-haven XAU/USD, warranting some caution for bearish traders. Traders now look to the release of the US ISM Services PMI, which, along with the US bond yields, the USD price dynamics and the broader risk sentiment, should provide some impetus to the metal.
Daily Digest Market Movers: Gold price adds to post-NFP losses as US Dollar climbs to a near two-month peak
- The robust US employment details released on Friday forced investors to scale back their expectations regarding the timing and pace of rate cuts by the Federal Reserve, which is seen weighing on the Gold price.
- The headline NFP showed that the US economy added 353K new jobs in January, nearly double the 180K anticipated, and the previous month's reading was also revised higher to 333K from the 216K reported.
- Other details revealed that the Unemployment Rate held steady at 3.7% and wage inflation, as measured by the change in Average Hourly Earnings, rose to 4.5% on a yearly basis as against the 4.1% rise anticipated.
- The probability of a rate cut in March dwindled to approximately 15% from over 65% last month, while the likelihood of a 150-bps rate cut in 2024 has also plummeted to just 25% from being nearly certain previously.
- The yield on the benchmark 10-year US government bond extends the post-NFP rise beyond the 4.0% threshold during the Asian trading hours on Monday and pushes the US Dollar to a fresh high since December.
- A private survey showed that business activity in China's services sector remained in expansionary territory for 13 straight months, though grew less than expected in January and added to worries about a slowdown.
- Israel's Prime Minister Benjamin Netanyahu said that the country will not end the war before it completes all of its goals, while media reports suggest that Hamas is set to reject the Gaza ceasefire deal proposed in Paris.
- US Central Command said forces conducted a strike in self-defense against a Houthi land attack cruise missile and struck four anti-ship cruise missiles prepared to launch against ships in the Red Sea.
- This, in turn, could act as a tailwind for the safe-haven precious metal as traders now look to the release of the US ISM Services PMI for short-term opportunities later during the early North American session on Monday.
Technical Analysis: Gold price seems vulnerable to slide further while below the $2,054-2,055 hurdle
From a technical perspective, acceptance below the 50-day Simple Moving Average and a subsequent slide below Friday's swing low, around the $2,028-2,027 region, could drag the Gold price to the $2,012-2,010 area. This is followed by the $2,000 psychological mark, which if broken decisively might shift the bias in favour of bearish traders and expose the 100-day SMA support near the $1,983-1,982 region. The XAU/USD could eventually drop to challenge the very important 200-day SMA, near the $1,965 area.
On the flip side, momentum beyond the Asian session peak, around the $2,042 region, is likely to confront a stiff hurdle near the $2,054-2,055 zone ahead of the $2,065 area or last week's swing high. Given that oscillators on the daily chart are just holding in the positive territory, some follow-through buying has the potential to lift the Gold price towards the $2,078-2,079 region, or the YTD peak set in January. The subsequent move-up should allow the XAU/USD to reclaim the $2,100 mark and climb further to $2,020 resistance.
US Dollar price today
The table below shows the percentage change of US Dollar (USD) against listed major currencies today. US Dollar was the strongest against the Pound Sterling.
| USD | EUR | GBP | CAD | AUD | JPY | NZD | CHF | |
| USD | 0.01% | 0.12% | 0.06% | -0.01% | -0.06% | -0.13% | 0.07% | |
| EUR | -0.01% | 0.11% | 0.04% | -0.02% | -0.07% | -0.15% | 0.06% | |
| GBP | -0.10% | -0.10% | -0.06% | -0.15% | -0.19% | -0.22% | -0.04% | |
| CAD | -0.05% | -0.03% | 0.06% | -0.09% | -0.12% | -0.19% | 0.01% | |
| AUD | 0.01% | 0.05% | 0.15% | 0.09% | -0.04% | -0.10% | 0.10% | |
| JPY | 0.06% | 0.08% | 0.17% | 0.13% | 0.05% | -0.07% | 0.14% | |
| NZD | 0.14% | 0.16% | 0.26% | 0.21% | 0.13% | 0.08% | 0.21% | |
| CHF | -0.06% | -0.05% | 0.04% | -0.01% | -0.07% | -0.13% | -0.19% |
The heat map shows percentage changes of major currencies against each other. The base currency is picked from the left column, while the quote currency is picked from the top row. For example, if you pick the Euro from the left column and move along the horizontal line to the Japanese Yen, the percentage change displayed in the box will represent EUR (base)/JPY (quote).
Gold FAQs
Why do people invest in Gold?
Gold has played a key role in human’s history as it has been widely used as a store of value and medium of exchange. Currently, apart from its shine and usage for jewelry, the precious metal is widely seen as a safe-haven asset, meaning that it is considered a good investment during turbulent times. Gold is also widely seen as a hedge against inflation and against depreciating currencies as it doesn’t rely on any specific issuer or government.
Who buys the most Gold?
Central banks are the biggest Gold holders. In their aim to support their currencies in turbulent times, central banks tend to diversify their reserves and buy Gold to improve the perceived strength of the economy and the currency. High Gold reserves can be a source of trust for a country’s solvency. Central banks added 1,136 tonnes of Gold worth around $70 billion to their reserves in 2022, according to data from the World Gold Council. This is the highest yearly purchase since records began. Central banks from emerging economies such as China, India and Turkey are quickly increasing their Gold reserves.
How is Gold correlated with other assets?
Gold has an inverse correlation with the US Dollar and US Treasuries, which are both major reserve and safe-haven assets. When the Dollar depreciates, Gold tends to rise, enabling investors and central banks to diversify their assets in turbulent times. Gold is also inversely correlated with risk assets. A rally in the stock market tends to weaken Gold price, while sell-offs in riskier markets tend to favor the precious metal.
What does the price of Gold depend on?
The price can move due to a wide range of factors. Geopolitical instability or fears of a deep recession can quickly make Gold price escalate due to its safe-haven status. As a yield-less asset, Gold tends to rise with lower interest rates, while higher cost of money usually weighs down on the yellow metal. Still, most moves depend on how the US Dollar (USD) behaves as the asset is priced in dollars (XAU/USD). A strong Dollar tends to keep the price of Gold controlled, whereas a weaker Dollar is likely to push Gold prices up.
- GBP/USD lost ground as US Dollar surged after blockbuster US jobs data.
- US Nonfarm Payrolls added 353K jobs in January against the expected 180K.
- Fed Chair Jerome Powell reiterated that the March meeting is too soon to start rate cuts.
- BoE’s Huw Pill mentioned that the right time for the rate cuts is probably still some time away.
GBP/USD continues its decline for the second consecutive session, edging lower to around 1.2610 during the Asian trading hours on Monday. The Pound Sterling (GBP) faces challenges as the US Dollar (USD), measured by the US Dollar Index (DXY), reaches an eight-week high. This strength in the USD is fueled by positive market sentiment as a March rate cut by the Federal Reserve appears unlikely. The sentiment is based on a promising labor market report released on Friday.
On Friday, the US Bureau of Labor Statistics (BLS) reported that Nonfarm Payrolls added 353,000 jobs in January, surpassing the previous reading of 333,000 and exceeding the market consensus of 180,000. Additionally, Average Hourly Earnings (YoY) rose by 4.5%, surpassing the expected 4.1% and the previous 4.4% rise. Traders will continue to monitor economic indicators, such as the ISM Services Employment Index, scheduled for release on Monday, for further insights into the state of the US labor market and potential implications for monetary policy.
US Federal Reserve (Fed) Chair Jerome Powell reiterated that the March meeting is likely too soon to have confidence in starting rate cuts. He emphasized that with the economy strong, the Fed intends to approach the timing of rate cuts carefully. Powell mentioned that confidence is increasing, but the Fed wants more assurance before taking the "crucial step" of initiating rate cuts.
On the other hand, the Governor of the Bank of England (BoE), Andrew Bailey, avoided speculation on rate cuts and warned that price pressures could pick up again in the second half of this year. The BoE appears to be prioritizing the management of high inflationary pressures over potentially addressing deepening recession fears.
Furthermore, the Chief Economist of the Bank of England (BoE), Huw Pill, mentioned that the right time for the BoE to cut interest rates is probably still some time away. This perspective is based on uncertainty about the persistence of longer-term inflationary pressures. Pill emphasized the need for sufficient evidence before considering a reduction in the policy rate.
- Indian Rupee loses traction on the stronger US Dollar.
- The Reserve Bank of India (RBI) is anticipated to keep the rate unchanged at 6.50% on Thursday.
- Investors will focus on the Indian S&P Global Services PMI for January and US ISM Services PMI on Monday.
Indian Rupee (INR) recovers its recent losses on Monday. The rebound of the pair is bolstered by the upbeat US job data that prompted a rise in Treasury yields and the US Dollar (USD). Continued strength in US job market data is expected to dampen hopes for early rate cuts by the US Federal Reserve (Fed), which boosts the Greenback broadly.
Economists anticipated that the Reserve Bank of India (RBI) would keep the rate unchanged until at least the third quarter, compared to expectations that the US Federal Reserve would cut its key interest rate next quarter.
Later on Monday, the Indian S&P Global Services PMI for January and the US ISM Services PMI will be released. Market players will closely watch the RBI interest rate decision on Thursday, which is expected to maintain the status quo for a sixth consecutive policy review.
Daily Digest Market Movers: Indian Rupee remains under pressure amid global headwinds
- India's 10-year benchmark bond yield closed at 7.0555% on Friday, marking the biggest weekly drop in 15 months.
- The Reserve Bank of India (RBI) will leave its benchmark interest rate at 6.50% on Thursday, according to economists polled by Reuters.
- The Indian government will spend a record 11.11 trillion Rupees (approximately $134 billion) on infrastructure development.
- The budget deficit for fiscal year 24 is projected to be 5.8% of GDP.
- The Indian government aims to lower the budget deficit to less than 4.5% by FY26.
- The Indian S&P Global Manufacturing PMI rose to 56.5 in January from 54.9 in November.
- The US Nonfarm Payrolls (NFP) report came in better than expected, surging to 353K in January from 333K in December (revised up from 216K).
- The Unemployment Rate was unchanged at 3.7%. Finally, wage growth is firming, with Average Hourly Earnings growing 4.5% YoY in January from 4.4% in December.
- The probability of a March rate cut has dropped to 19%, compared to 38% just a day ago, according to the CME FedWatch tool.
- Federal Reserve Chair Jerome Powell said a rate cut in March is too soon, as he doesn’t believe the FOMC will have the confidence by then that inflation is heading back to 2% sustainably.
- Powell added that policymakers see it appropriate to cut rates this year, but it is prudent to be open to the possibility of rates falling from spring onwards.
- The US central bank will discuss at the March meeting the timing of easing the pace of quantitative tightening (QT).
Technical Analysis: Indian Rupee extends the range play within 82.78–83.45
Indian Rupee trades on a weaker note on the day. The USD/INR pair consolidated within a two-month-old descending trend channel of 82.78–83.45. From a technical perspective, the bearish tone of USD/INR remains unchanged as the pair is below the key 100-period Exponential Moving Average (EMA) on the daily chart. Additionally, the 14-day Relative Strength Index (RSI), stands below the 50.0 midline, indicating that bearish momentum is in play.
On the other hand, any follow-through buying above the 83.00 psychological handle will see a rally to the upper boundary of the descending trend channel and a high of January 18 at 83.18. The next hurdle will emerge at a high of January 2 at 83.35.
In case our bearish USD scenario plays out, the lower limit of the descending trend channel at 82.71. acts as a potential support level for the pair. A breach of this level could take the pair back to a low of August 23 at 82.45, followed by a low of June 1 at 82.25.
US Dollar price today
The table below shows the percentage change of US Dollar (USD) against listed major currencies today. US Dollar was the strongest against the Pound Sterling.
| USD | EUR | GBP | CAD | AUD | JPY | NZD | CHF | |
| USD | 0.00% | 0.09% | 0.05% | -0.02% | -0.08% | -0.14% | 0.06% | |
| EUR | -0.01% | 0.09% | 0.04% | -0.01% | -0.08% | -0.14% | 0.05% | |
| GBP | -0.10% | -0.10% | -0.06% | -0.12% | -0.18% | -0.23% | -0.04% | |
| CAD | -0.05% | -0.05% | 0.04% | -0.07% | -0.13% | -0.18% | 0.01% | |
| AUD | 0.02% | 0.03% | 0.12% | 0.07% | -0.05% | -0.11% | 0.09% | |
| JPY | 0.08% | 0.07% | 0.15% | 0.12% | 0.06% | -0.08% | 0.13% | |
| NZD | 0.13% | 0.14% | 0.23% | 0.18% | 0.11% | 0.04% | 0.20% | |
| CHF | -0.07% | -0.07% | 0.02% | -0.03% | -0.08% | -0.15% | -0.21% |
The heat map shows percentage changes of major currencies against each other. The base currency is picked from the left column, while the quote currency is picked from the top row. For example, if you pick the Euro from the left column and move along the horizontal line to the Japanese Yen, the percentage change displayed in the box will represent EUR (base)/JPY (quote).
Indian Rupee FAQs
What are the key factors driving the Indian Rupee?
The Indian Rupee (INR) is one of the most sensitive currencies to external factors. The price of Crude Oil (the country is highly dependent on imported Oil), the value of the US Dollar – most trade is conducted in USD – and the level of foreign investment, are all influential. Direct intervention by the Reserve Bank of India (RBI) in FX markets to keep the exchange rate stable, as well as the level of interest rates set by the RBI, are further major influencing factors on the Rupee.
How do the decisions of the Reserve Bank of India impact the Indian Rupee?
The Reserve Bank of India (RBI) actively intervenes in forex markets to maintain a stable exchange rate, to help facilitate trade. In addition, the RBI tries to maintain the inflation rate at its 4% target by adjusting interest rates. Higher interest rates usually strengthen the Rupee. This is due to the role of the ‘carry trade’ in which investors borrow in countries with lower interest rates so as to place their money in countries’ offering relatively higher interest rates and profit from the difference.
What macroeconomic factors influence the value of the Indian Rupee?
Macroeconomic factors that influence the value of the Rupee include inflation, interest rates, the economic growth rate (GDP), the balance of trade, and inflows from foreign investment. A higher growth rate can lead to more overseas investment, pushing up demand for the Rupee. A less negative balance of trade will eventually lead to a stronger Rupee. Higher interest rates, especially real rates (interest rates less inflation) are also positive for the Rupee. A risk-on environment can lead to greater inflows of Foreign Direct and Indirect Investment (FDI and FII), which also benefit the Rupee.
How does inflation impact the Indian Rupee?
Higher inflation, particularly, if it is comparatively higher than India’s peers, is generally negative for the currency as it reflects devaluation through oversupply. Inflation also increases the cost of exports, leading to more Rupees being sold to purchase foreign imports, which is Rupee-negative. At the same time, higher inflation usually leads to the Reserve Bank of India (RBI) raising interest rates and this can be positive for the Rupee, due to increased demand from international investors. The opposite effect is true of lower inflation.
- WTI oil price trims intraday gains despite escalated geopolitical tension in the Middle East.
- US and UK conducted new air strikes on the Houthi militant group in Yemen on Saturday.
- White House national security adviser, Jake Sullivan, expected the possibility of strikes on Iranian soil.
- Crude oil prices faced challenges after the release of solid US labor data on Friday.
West Texas Intermediate (WTI) oil price struggles to break a three-day losing streak on Monday. Crude oil prices have trimmed their intraday gains despite escalated geopolitical tension in the Middle East, where the United States (US) and the United Kingdom (UK) conducted new air strikes on the Iran-backed Houthi militant group in Yemen on Saturday. As of now, the WTI oil price trades around $72.30 per barrel during the Asian session.
The latest strikes were in response to a drone strike that resulted in the death of three US service members in Jordan. In retaliation, Yemen's Houthi rebels have vowed to extend their military operations. Meanwhile, the White House national security adviser, Jake Sullivan, warned on Sunday that US airstrikes on Iranian-backed militias in the Middle East were just the beginning of a sustained response. Sullivan did not rule out the possibility of strikes on Iranian soil.
The blockbuster job data from the United States (US) has diminished the likelihood of March interest rate cuts by the Federal Reserve. The prospect of higher interest rates can have a dampening effect on economic growth and oil demand in major economies, leading to a decrease in Crude oil prices.
The Organization of the Petroleum Exporting Countries and its allies (OPEC+) are anticipated to encounter a long-term challenge in 2024 and 2025. This challenge stems from OPEC+ efforts to undercut global supply by implementing strict production quotas on member nations. However, the concern is that non-OPEC producers, including the United States, could potentially outstrip the OPEC+ supply cuts and oversupply global markets.
- NZD/USD drops to over a two-month low and is pressured by a combination of factors.
- Geopolitical tensions, along with mixed cues from China, act as a headwind for the Kiwi.
- The blockbuster US NFP smashed hopes for an early Fed rate cut and underpin the USD.
The NZD/USD pair kicks off the new week on a downbeat note and drops to the 0.6050-0.6045 region, or its lowest level since November 24 during the Asian session. Spot prices, however, manage to rebound a few pips in the last hour, though the upside potential seems limited in the wake of mixed cues from China and the underlying bullish sentiment surrounding the US Dollar (USD).
China Securities Regulatory Commission (CSRC) vowed on Sunday to prevent abnormal fluctuations and said that would guide more medium- and long-term funds into the market and crack down on illegal activities including malicious short selling and insider trading. The CSRC, however, offered no specifics on how they plan to do so. This, along with geopolitical tensions, offsets the recent optimism led by the People's Bank of China's (PBoC) move to cut the reserve requirement ratio (RRR) by 50 bps, which is expected to pump in CNY1 trillion in the economy.
In the latest developments, media reports suggest that Hamas is set to reject the Gaza ceasefire deal proposed in Paris. Adding to this, Israel's Prime Minister Benjamin Netanyahu said that the country will not end the war before it completes all of its goals, which are the elimination of Hamas, the return of all the kidnapped people, and the promise that Gaza will not pose a threat. Moreover, US Central Command said forces conducted a strike in self-defence against a Houthi a land attack cruise missile and struck four anti-ship cruise missiles prepared to launch against ships in the Red Sea.
Meanwhile, data published by Caixin earlier today showed that China's Services PMI remained in expansionary territory for 13 straight months and came in at 52.7 for January, though failed to influence antipodean currencies, including the Kiwi. The USD, on the other hand, touched its highest level since December 11 on Monday in the wake of expectations that the Federal Reserve (Fed) will keep interest rates higher for longer. Friday's upbeat US jobs report suggests that the economy may be running too hot for the Fed to cut rates without risking an inflationary rebound.
The hawkish outlook remains supportive of a further rise in the US Treasury bond yields and continues to act as a tailwind for the buck, which, in turn, should cap the upside for the NZD/USD pair. Market participants now look to the release of the US ISM Services PMI, which, along with the broader risk sentiment, should influence the Greenback and provide some impetus. The aforementioned fundamental backdrop, meanwhile, suggests that the path of least resistance for the currency pair is to the downside and attempted recovery runs the risk of fizzling out rather quickly.
Technical levels to watch
| Raw materials | Closed | Change, % |
|---|---|---|
| Silver | 22.692 | -2.07 |
| Gold | 2039.586 | -0.72 |
| Palladium | 945.55 | -1.84 |
Markets kick off the week on Monday on a tepid footing, as they take account of the weekend’s developments on the geopolitical front.
Geopolitical tensions between the West and the Middle East further escalated after the United States (US) and the United Kingdom (UK) conducted a new wave of air strikes on the Iran-backed Houthi militant group in Yemen on Saturday, hitting at least 30 targets.
The latest strikes come after Friday’s air assault aimed at other Iran-backed groups in Syria and Iraq, along with the Iranian Revolutionary Guard, seeking retribution for the drone strike that left three US service members dead in Jordan,” per the Associated Press.
In retaliation, Yemen’s Houthi rebels on Sunday vowed to extend their military operations and threatened to respond to the latest set of strikes by the US and the UK over the weekend.
Ameen Hayyan, a spokesman for the group, warned Sunday on X, the latest US and UK attacks “will not deter us from our moral, religious and humanitarian stance” in support of the Palestinians in the Gaza Strip.
The attacks “will not pass without response and punishment,” Hayyan added.
Market reaction
At the time of writing, the US Dollar is trading 0.14% higher on the day at 104.07 while the US S&P 500 futures, a risk barometer, are down 0.23% so far.
Risk sentiment FAQs
What do the terms"risk-on" and "risk-off" mean when referring to sentiment in financial markets?
In the world of financial jargon the two widely used terms “risk-on” and “risk off'' refer to the level of risk that investors are willing to stomach during the period referenced. In a “risk-on” market, investors are optimistic about the future and more willing to buy risky assets. In a “risk-off” market investors start to ‘play it safe’ because they are worried about the future, and therefore buy less risky assets that are more certain of bringing a return, even if it is relatively modest.
What are the key assets to track to understand risk sentiment dynamics?
Typically, during periods of “risk-on”, stock markets will rise, most commodities – except Gold – will also gain in value, since they benefit from a positive growth outlook. The currencies of nations that are heavy commodity exporters strengthen because of increased demand, and Cryptocurrencies rise. In a “risk-off” market, Bonds go up – especially major government Bonds – Gold shines, and safe-haven currencies such as the Japanese Yen, Swiss Franc and US Dollar all benefit.
Which currencies strengthen when sentiment is "risk-on"?
The Australian Dollar (AUD), the Canadian Dollar (CAD), the New Zealand Dollar (NZD) and minor FX like the Ruble (RUB) and the South African Rand (ZAR), all tend to rise in markets that are “risk-on”. This is because the economies of these currencies are heavily reliant on commodity exports for growth, and commodities tend to rise in price during risk-on periods. This is because investors foresee greater demand for raw materials in the future due to heightened economic activity.
Which currencies strengthen when sentiment is "risk-off"?
The major currencies that tend to rise during periods of “risk-off” are the US Dollar (USD), the Japanese Yen (JPY) and the Swiss Franc (CHF). The US Dollar, because it is the world’s reserve currency, and because in times of crisis investors buy US government debt, which is seen as safe because the largest economy in the world is unlikely to default. The Yen, from increased demand for Japanese government bonds, because a high proportion are held by domestic investors who are unlikely to dump them – even in a crisis. The Swiss Franc, because strict Swiss banking laws offer investors enhanced capital protection.
- The Japanese Yen is weighed down by the risk-on mood, though the BoJ’s hawkish tilt limits losses.
- Geopolitical tensions and China’s economic woes could also act as a tailwind for the safe-haven JPY.
- The post-NFP USD buying remains unabated and continues to lend some support to the USD/JPY pair.
The Japanese Yen (JPY) remains under some selling pressure for the second successive day on Monday and slides to a fresh YTD low against its American counterpart during the Asian session. Despite the Bank of Japan's (BoJ) hawkish tilt earlier this month, an extension of the recent bullish run across the global equity markets is seen as a key factor undermining the JPY's relative safe-haven status. Furthermore, the blockbuster US jobs data released on Friday provided evidence that the economy is still in good shape, which should allow the Federal Reserve (Fed) to keep interest rates higher for longer. This lifts the US Dollar (USD) to its highest level since December 11 and lends additional support to the USD/JPY pair.
The JPY bulls, meanwhile, seem rather unimpressed by an upward revision of the Japan Services PMI for January, though bets for an imminent shift in the BoJ's policy stance should help limit deeper losses. Apart from this, persistent worries about a further escalation of geopolitical tensions in the Middle East and China's economic woes could also act as a tailwind for the JPY. Traders now look to the release of the US ISM Services PMI for some impetus later during the early North American session, which, along with the US bond yields, will drive the USD demand. Furthermore, the broader risk sentiment should contribute to producing short-term trading opportunities around the USD/JPY pair on the first day of a new week.
Daily Digest Market Movers: Japanese Yen is undermined by a combination of factors, though it lacks follow-through selling
- China's pledge to stabilise markets comes on top of the upbeat US employment details on Friday, which pointed to a resilient economy, and boosts investors' confidence, undermining the safe-haven Japanese Yen.
- China Securities Regulatory Commission said on Sunday that it would guide more medium- and long-term funds into the market and crack down on illegal activities including malicious short selling and insider trading.
- The headline NFP showed that the US economy added 353K jobs in January, smashing market expectations for 180K, and the previous month's reading was also revised higher to 333K from 216K reported initially.
- Other details revealed that the Unemployment Rate held steady at 3.7% and wage inflation, as measured by the change in Average Hourly Earnings, rose to 4.5% on a yearly basis as against the 4.1% rise anticipated.
- The data dimmed hopes for a near-term rate cut by the Federal Reserve, with the probability of such a move at the May FOMC meeting now standing at about 70%, down from 90% before the crucial jobs report.
- Expectations that the Fed will keep interest rates higher for longer continue to push the US Treasury bond yields higher, lifting the US Dollar to a near two-month top and lending support to the USD/JPY pair.
- A survey on Monday showed that business activity in Japan's services sector, which accounts for around 70% of the country's gross domestic product (GDP), expanded at the strongest pace since September.
- In fact, the au Jibun Bank Service PMI was revised up and finalized at 53.1 for January, marking the 17th consecutive month of growth, as against the flash reading of 52.7 and 51.5 in the previous month.
- The Bank of Japan has become more bullish on its inflation outlook due to rising momentum for wage increases and growth in service sector prices, strengthening the case for an imminent exit from negative interest rates.
- Media reports suggest that Hamas is set to reject the Gaza ceasefire deal proposed in Paris and Israel's Prime Minister Benjamin Netanyahu said that the country will not end the war before it completes all of its goals.
- The US ISM Services PMI is due for release later today and is expected to improve from 50.6 to 52.0 in January, which, along with the US bond yields and the broader risk sentiment, should provide some impetus.
Technical Analysis: USD/JPY bulls now await a sustained strength and acceptance above the 148.75-148.80 multiple-top hurdle
From a technical perspective, the USD/JPY pair needs to make it through the 148.75-148.80 multiple-tops resistance for bulls to seize near-term control. Given that oscillators on the daily chart are holding comfortably in the positive territory and are still far from being in the overbought zone, some follow-through buying beyond the 149.00 round figure will be seen as a fresh trigger for spot prices. The subsequent move up should allow bulls to aim back to reclaim the 150.00 psychological mark with some intermediate resistance near the 149.60-149.70 region.
On the flip side, the 148.00 mark now seems to protect the immediate downside. Any further decline is more likely to attract fresh buyers and remain limited near the 100-day Simple Moving Average (SMA), currently pegged near the 147.60-147.55 zone. A convincing break below the latter, however, might prompt aggressive technical selling and drag the USD/JPY pair below the 147.00 mark, towards the next relevant support near the 146.75-146.70 region. The downfall could extend further towards the 146.40 zone en route to sub-146.00 levels, or last week's swing low.
Japanese Yen price today
The table below shows the percentage change of Japanese Yen (JPY) against listed major currencies today. Japanese Yen was the weakest against the US Dollar.
| USD | EUR | GBP | CAD | AUD | JPY | NZD | CHF | |
| USD | 0.03% | 0.11% | 0.05% | -0.01% | -0.05% | 0.06% | 0.08% | |
| EUR | -0.02% | 0.10% | 0.03% | -0.03% | -0.08% | 0.02% | 0.06% | |
| GBP | -0.11% | -0.08% | -0.06% | -0.13% | -0.16% | -0.07% | -0.04% | |
| CAD | -0.05% | -0.01% | 0.06% | -0.06% | -0.10% | -0.01% | 0.02% | |
| AUD | 0.01% | 0.05% | 0.13% | 0.07% | -0.04% | 0.07% | 0.08% | |
| JPY | 0.04% | 0.07% | 0.15% | 0.12% | 0.05% | 0.08% | 0.12% | |
| NZD | -0.07% | -0.01% | 0.07% | 0.01% | -0.07% | -0.12% | 0.02% | |
| CHF | -0.06% | -0.03% | 0.05% | -0.02% | -0.06% | -0.11% | 0.00% |
The heat map shows percentage changes of major currencies against each other. The base currency is picked from the left column, while the quote currency is picked from the top row. For example, if you pick the Euro from the left column and move along the horizontal line to the Japanese Yen, the percentage change displayed in the box will represent EUR (base)/JPY (quote).
Japanese Yen FAQs
What key factors drive the Japanese Yen?
The Japanese Yen (JPY) is one of the world’s most traded currencies. Its value is broadly determined by the performance of the Japanese economy, but more specifically by the Bank of Japan’s policy, the differential between Japanese and US bond yields, or risk sentiment among traders, among other factors.
How do the decisions of the Bank of Japan impact the Japanese Yen?
One of the Bank of Japan’s mandates is currency control, so its moves are key for the Yen. The BoJ has directly intervened in currency markets sometimes, generally to lower the value of the Yen, although it refrains from doing it often due to political concerns of its main trading partners. The current BoJ ultra-loose monetary policy, based on massive stimulus to the economy, has caused the Yen to depreciate against its main currency peers. This process has exacerbated more recently due to an increasing policy divergence between the Bank of Japan and other main central banks, which have opted to increase interest rates sharply to fight decades-high levels of inflation.
How does the differential between Japanese and US bond yields impact the Japanese Yen?
The BoJ’s stance of sticking to ultra-loose monetary policy has led to a widening policy divergence with other central banks, particularly with the US Federal Reserve. This supports a widening of the differential between the 10-year US and Japanese bonds, which favors the US Dollar against the Japanese Yen.
How does broader risk sentiment impact the Japanese Yen?
The Japanese Yen is often seen as a safe-haven investment. This means that in times of market stress, investors are more likely to put their money in the Japanese currency due to its supposed reliability and stability. Turbulent times are likely to strengthen the Yen’s value against other currencies seen as more risky to invest in.
- EUR/USD trades on a weaker note near 1.0772 amid the stronger USD.
- Fed’s Powell said a rate cut in March is too soon, as he doesn’t believe that inflation is heading back to 2% sustainably.
- US January Nonfarm Payrolls were at 353K, beating market expectatins of 180K; the Unemployment was flat; wages spiked.
The EUR/USD pair faces some selling pressure above the mid-1.0700s during the early Asian trading hours on Monday. The US Dollar Index (DXY) edges higher as the Federal Reserve (Fed) Chair Jerome Powell pushed back on the timing of rate cuts. The major pair currently trades around 1.0772, down 0.19% on the day.
Late Sunday, Fed Chairman Jerome Powell said a rate cut in March is too soon as he doesn’t believe the FOMC will have the confidence by then that inflation is heading back to 2% sustainably. Powell added that policymakers see it appropriate to cut rates this year, but it is prudent to be open to the possibility of rates falling from spring onwards. The US central bank will discuss at the March meeting about the timing of easing the pace of quantitative tightening (QT).
According to the US Bureau of Labor Statistics on Friday, the Nonfarm Payrolls (NFP) rose by 353K in January, above expectations for a 185K increase in the previous reading. Meanwhile, the Unemployment Rate was unchanged at 3.7%. Finally, wage growth is firming, with Average Hourly Earnings climbing 4.5% YoY in January from the previous reading of 4.4% in December.
On the other hand, European Central Bank (ECB) Governing Council member Boris Vujcic said on Sunday that the central bank needs to ensure there aren’t any second-round effects on inflation from wages before cutting interest rates.
Investors will keep an eye on the German Trade Balance and the January HCOB Composite PMI from Germany, the Eurozone and Spain. On the US docket, the ISM Services PMI will be due.
- Australian Dollar weakened as the US Dollar surged on solid Nonfarm Payrolls.
- Australia's Trade Balance reduced to 10,959M in January from 11,764M prior.
- Chinese Services PMI reduced to 52.7 in January from the previous reading of 52.9.
- RBA is expected to keep the cash rate steady at 4.35% on Tuesday’s meeting.
- US NFP added 353K jobs in January against the market consensus of 180K.
The Australian Dollar (AUD) faces selling pressure on Monday due to the blockbuster job data from the United States (US), which has resulted in a sharp rise in the US Dollar (USD), weighing on the AUD/USD pair. Additionally, the benchmark S&P/ASX 200 Index retreats from last week's record high, with miners and energy sectors taking the brunt, putting additional pressure on the AUD.
Australian Bureau of Statistics released the Trade Balance for January on Monday. The monthly report showed a reduction, with the figure at 10,959M compared to the revised figure of 11,764M in December. Additionally, the Judo Bank Composite Purchasing Managers Index (PMI) improved to 49 in January from 48.1 prior. The Services PMI saw an improvement, rising to 49.1 from the previous figure of 47.9.
Meanwhile, TD Securities Inflation (YoY) grew by 4.6%, against the previous growth of 5.2%. Furthermore, Chinese Caixin Services PMI reduced to 52.7 in January from the previous reading of 52.9.
The Reserve Bank of Australia (RBA) is set to announce its interest rate decision on Tuesday. In a Reuters Poll, analysts unanimously expect the RBA to keep the cash rate steady at 4.35%. Investors will closely observe RBA Governor Michele Bullock's speech on the monetary policy outlook for further insights into the central bank's stance.
The US Dollar Index (DXY) reaches an eight-week high, fueled by positive market sentiment as a March rate cut appears unlikely. This sentiment is based on a promising labor market report, where data from the US Bureau of Labor Statistics (BLS) on Friday showed that Nonfarm Payrolls added 353,000 jobs in January, surpassing the previous reading of 333,000 and exceeding the market consensus of 180,000. Additionally, Average Hourly Earnings (YoY) rose by 4.5%, surpassing the expected 4.1% and the previous 4.4% rise. Traders will further observe the ISM Services Employment Index, which is due to be released on Monday.
US Federal Reserve Chair Jerome Powell reiterated the expectation that the March meeting is likely too soon to have confidence in starting rate cuts. With the economy strong, the Fed intends to approach the timing of rate cuts carefully. Powell expressed that confidence is rising, but the central bank wants more assurance before taking the "crucial step" of initiating rate cuts.
Fed Chair Powell mentioned that they are making good progress on inflation and could potentially move sooner if they observed weakness in the labor market or if inflation were to convincingly decrease. He noted that more persistent inflation could lead to a later move.
Daily Digest Market Movers: Australian Dollar weakens after solid US labor data
- Australian TD Securities Inflation (MoM) grew by 0.3% in January, lower than the December’s rise of 1.0%.
- Australia’s ANZ Job Advertisements rose by 1.7% in January, exceeding the previous growth rate of 0.6%.
- Australian Bureau of Statistics showed a growth in monthly Imports in January rising at 4.8% against the previous reading of -8.4%. While Exports grew by 1.8% against the 0.6% prior.
- US Average Hourly Earnings (MoM) came in at 0.6% for January, exceeding the expected 0.3% and 0.4% reading from December.
- The US Unemployment Rate is unchanged at 3.7% in January against the market consensus of 3.8%.
- US Bureau of Labor Statistics showed that January’s Labor Force Participation Rate remained stable at 62.5%.
- Michigan Consumer Sentiment Index improved to the figure of 79 in January against the anticipated 78.9 and December’s figure of 78.8.
Technical Analysis: Australian Dollar tests the psychological barrier at 0.6500
The Australian Dollar trades around 0.6490 on Monday, situated below the immediate psychological barrier level of 0.6500, following the major level at 0.6550. A break above this level could potentially support the AUD/USD pair to test the resistance zone around the 23.6% Fibonacci retracement at 0.6573, before reaching the 21-day Exponential Moving Average (EMA) at 0.6598. The latter is aligned with the psychological level at 0.6600. On the downside, the 0.6450 level is a key support, following the psychological support at 0.6400.
AUD/USD: Daily Chart
-638426946018531222.png)
Australian Dollar price today
The table below shows the percentage change of Australian Dollar (AUD) against listed major currencies today. Australian Dollar was the weakest against the US Dollar.
| USD | EUR | GBP | CAD | AUD | JPY | NZD | CHF | |
| USD | 0.05% | 0.14% | 0.07% | 0.06% | 0.01% | 0.10% | 0.10% | |
| EUR | -0.05% | 0.09% | 0.02% | -0.02% | -0.04% | 0.05% | 0.04% | |
| GBP | -0.14% | -0.09% | -0.06% | -0.10% | -0.13% | -0.04% | -0.04% | |
| CAD | -0.07% | -0.03% | 0.05% | -0.04% | -0.07% | 0.02% | 0.01% | |
| AUD | -0.06% | 0.02% | 0.10% | 0.04% | -0.03% | 0.07% | 0.06% | |
| JPY | -0.06% | 0.03% | 0.13% | 0.08% | 0.01% | 0.09% | 0.09% | |
| NZD | -0.10% | -0.05% | 0.04% | -0.02% | -0.06% | -0.11% | 0.00% | |
| CHF | -0.10% | -0.05% | 0.04% | -0.04% | -0.06% | -0.09% | 0.00% |
The heat map shows percentage changes of major currencies against each other. The base currency is picked from the left column, while the quote currency is picked from the top row. For example, if you pick the Euro from the left column and move along the horizontal line to the Japanese Yen, the percentage change displayed in the box will represent EUR (base)/JPY (quote).
Australian Dollar FAQs
What key factors drive the Australian Dollar?
One of the most significant factors for the Australian Dollar (AUD) is the level of interest rates set by the Reserve Bank of Australia (RBA). Because Australia is a resource-rich country another key driver is the price of its biggest export, Iron Ore. The health of the Chinese economy, its largest trading partner, is a factor, as well as inflation in Australia, its growth rate and Trade Balance. Market sentiment – whether investors are taking on more risky assets (risk-on) or seeking safe-havens (risk-off) – is also a factor, with risk-on positive for AUD.
How do the decisions of the Reserve Bank of Australia impact the Australian Dollar?
The Reserve Bank of Australia (RBA) influences the Australian Dollar (AUD) by setting the level of interest rates that Australian banks can lend to each other. This influences the level of interest rates in the economy as a whole. The main goal of the RBA is to maintain a stable inflation rate of 2-3% by adjusting interest rates up or down. Relatively high interest rates compared to other major central banks support the AUD, and the opposite for relatively low. The RBA can also use quantitative easing and tightening to influence credit conditions, with the former AUD-negative and the latter AUD-positive.
How does the health of the Chinese Economy impact the Australian Dollar?
China is Australia’s largest trading partner so the health of the Chinese economy is a major influence on the value of the Australian Dollar (AUD). When the Chinese economy is doing well it purchases more raw materials, goods and services from Australia, lifting demand for the AUD, and pushing up its value. The opposite is the case when the Chinese economy is not growing as fast as expected. Positive or negative surprises in Chinese growth data, therefore, often have a direct impact on the Australian Dollar and its pairs.
How does the price of Iron Ore impact the Australian Dollar?
Iron Ore is Australia’s largest export, accounting for $118 billion a year according to data from 2021, with China as its primary destination. The price of Iron Ore, therefore, can be a driver of the Australian Dollar. Generally, if the price of Iron Ore rises, AUD also goes up, as aggregate demand for the currency increases. The opposite is the case if the price of Iron Ore falls. Higher Iron Ore prices also tend to result in a greater likelihood of a positive Trade Balance for Australia, which is also positive of the AUD.
How does the Trade Balance impact the Australian Dollar?
The Trade Balance, which is the difference between what a country earns from its exports versus what it pays for its imports, is another factor that can influence the value of the Australian Dollar. If Australia produces highly sought after exports, then its currency will gain in value purely from the surplus demand created from foreign buyers seeking to purchase its exports versus what it spends to purchase imports. Therefore, a positive net Trade Balance strengthens the AUD, with the opposite effect if the Trade Balance is negative.
China's Services Purchasing Managers' Index (PMI) eased to 52.7 in January when compared to the December reading of 52.9, the latest data published by Caixin showed on Monday.
Key points
Business activity continues to rise solidly…
...but new order growth eases notably on the month.
Firms register back-to-back increase in employment.
Commenting on the China General Services PMI ™ data, Dr. Wang Zhe, Senior Economist at Caixin Insight Group said: “The gauge has remained in expansionary territory for 13 straight months, indicating a sustained recovery in the services sector.”
“Supply and demand continued to expand in January, represented by growth in business activity and total new orders that carried into the 13th straight month,” Wang added.
AUD/USD reaction to China’s Services PMI
Discouraging Chinese Services PMI adds to the downside in the Aussie Dollar, keeping AUD/USD on the back foot near 0.6500. The pair is trading 0.18% lower on the day at 0.6498, as of writing.
Australian Dollar price today
The table below shows the percentage change of Australian Dollar (AUD) against listed major currencies today. Australian Dollar was the weakest against the US Dollar.
| USD | EUR | GBP | CAD | AUD | JPY | NZD | CHF | |
| USD | 0.05% | 0.14% | 0.07% | 0.09% | 0.00% | 0.12% | 0.10% | |
| EUR | -0.05% | 0.09% | 0.01% | 0.02% | -0.03% | 0.07% | 0.05% | |
| GBP | -0.14% | -0.09% | -0.07% | -0.07% | -0.12% | -0.06% | -0.07% | |
| CAD | -0.07% | -0.02% | 0.07% | 0.01% | -0.05% | 0.07% | 0.00% | |
| AUD | -0.09% | -0.03% | 0.07% | 0.00% | -0.06% | 0.04% | 0.02% | |
| JPY | -0.02% | 0.04% | 0.11% | 0.07% | 0.06% | 0.16% | 0.08% | |
| NZD | -0.13% | -0.07% | 0.03% | -0.05% | -0.04% | -0.12% | -0.02% | |
| CHF | -0.10% | -0.05% | 0.04% | -0.03% | -0.02% | -0.10% | 0.01% |
The heat map shows percentage changes of major currencies against each other. The base currency is picked from the left column, while the quote currency is picked from the top row. For example, if you pick the Euro from the left column and move along the horizontal line to the Japanese Yen, the percentage change displayed in the box will represent EUR (base)/JPY (quote).
The People's Bank of China (PBOC) cut to the reserve requirement ratio (RRR) takes effect today.
The Chinese central bank announced a 50 bps cut to the RRR on January 24, which would bring the weighted rate from 7.40% to 6.90%. The PBOC rate cut decision is expected to pump in CNY1 trillion in the economy.
Market reaction
Despite the Chinese easing, AUD/USD remains on the defensive near 0.6500, as of writing, thanks to the escalating Middle East geopolitical tensions. The pair is down 0.17% on the day.
On Monday, the People’s Bank of China (PBoC) set the USD/CNY central rate for the trading session ahead at 7.1070 as compared to Friday's fix of 7.1006 and 7.2088 Reuters estimates.
- PBoC injects 100 billion Yuan via 14-day reverse repos with a rate at 1.95%
- 500 billion Yuan of RRs mature today, summing to a 400 billion Yuan drain on the day in OMOs.
China vowed to stabilize markets as shares fell to a five-year low in turbulent trading on Friday, but Chinese authorities provided no details on how they plan to stop a selloff that has wiped out more than $6 trillion in value and eroded confidence in the world's second-largest economy.
The China Securities Regulatory Commission (CSRC) stated on Sunday to prevent abnormal fluctuations while cracking down on unlawful activities such as malicious short selling and insider trading.
Market reaction
At the time of writing, the AUD/USD pair is trading around 0.6496, down 0.29% on the day.
Australia’s trade surplus narrowed to 10,959M MoM in January versus 10,510M expected and 11,437M in the previous reading, according to the latest Aussie foreign trade data published by the Australian Bureau of Statistics on Monday.
Further details reveal that Australia's December Goods/Services Exports reprint 1.8% figures on a monthly basis versus 1.7% prior. The nation’s Goods/Services Imports grew 4.8% in December MoM versus 7.9% drop prior.
Market reaction
At the press time, the AUD/USD pair is down 0.27% on the day to trade at 0.6498.
About Australia Trade Balance
The trade balance released by the Australian Bureau of Statistics is the difference in the value of its imports and exports of Australian goods. Export data can give an important reflection of Australian growth, while imports provide an indication of domestic demand. Trade Balance gives an early indication of the net export performance. If a steady demand in exchange for Australian exports is seen, that would turn into a positive growth in the trade balance, and that should be positive for the AUD.
| Index | Change, points | Closed | Change, % |
|---|---|---|---|
| NIKKEI 225 | 146.56 | 36158.02 | 0.41 |
| Hang Seng | -32.65 | 15533.56 | -0.21 |
| KOSPI | 72.85 | 2615.31 | 2.87 |
| ASX 200 | 111.2 | 7699.4 | 1.47 |
| DAX | 59.17 | 16918.21 | 0.35 |
| CAC 40 | 3.51 | 7592.26 | 0.05 |
| Dow Jones | 134.58 | 38654.42 | 0.35 |
| S&P 500 | 52.42 | 4958.61 | 1.07 |
| NASDAQ Composite | 267.31 | 15628.95 | 1.74 |
Federal Reserve Chair Jerome Powell discussed inflation risks, expected rate cuts, and the banking system with CBS News’s 60 Minutes this Sunday.
Key quotes
“With economy strong, we feel we can approach rate cut timing question carefully.”
“Confidence is rising, but want more confidence before taking 'very important step' of starting rate cuts.”
“Making good progress on inflation.”
“Could move sooner if we saw labor market weakness or inflation 'really persuasively' coming down.”
“More persistent inflation could mean a later move.”
“Repeats expectation that March meeting likely too soon to have confidence to start rate cuts.”
“There is no 'easy, simple, obvious path’.”
“Expects inflation will continue to move down in the first six months of this year due to base effects.”
“Also expects 12-month inflation readings to fall over course of this year.”
“Asked about policymaker forecasts in December for year-end rate policy level of 4.6%, says nothing since then leads me to think people would dramatically change forecasts.”
“Almost all 19 policymakers see it appropriate to cut rates this year
We do not take politics into our decision-making.”
“In hindsight would have been better to tighten policy earlier.”
“Doesn't see elevated possibility of recession.”
“Doesn't see commercial real estate loans as the makings of a crisis as seen in the past.”
“China problems unlikely to affect US economy may feel some impacts 'a bit, but they shouldn't be large’.”
“Geopolitical risks stand as largest near-term risks, but more for other parts of the world than the US.”
Market reaction
The US Dollar Index (DXY) is trading higher by 0.13% on the day at 104.04, as of writing.
| Pare | Closed | Change, % |
|---|---|---|
| AUDUSD | 0.65153 | -0.85 |
| EURJPY | 160.065 | 0.63 |
| EURUSD | 1.07948 | -0.71 |
| GBPJPY | 187.427 | 0.48 |
| GBPUSD | 1.26396 | -0.8 |
| NZDUSD | 0.6074 | -1.04 |
| USDCAD | 1.34559 | 0.56 |
| USDCHF | 0.86615 | 1.08 |
| USDJPY | 148.285 | 1.28 |
- Gold price kicks off the new week on a positive note despite the stronger US Dollar.
- The US Nonfarm Payrolls (NFP) report came in better than expected; the Unemployment Rate was unchanged in January.
- The rising geopolitical tensions might lift traditional assets like gold.
- Investors await Fed Chair Jerome Powell’s speech, Chinese Caixin Services PMI, and US ISM Services PMI.
Gold price (XAU/USD) holds positive ground during the early Asian session on Monday. The upbeat US jobs report dampened hopes for a March rate cut, which weighs on the yellow metal. Nevertheless, the downside of the gold price might be limited amid the ongoing geopolitical tensions in the Middle East. At press time, the gold price is trading at $2,038, gaining 0.12% on the day.
On Friday, the US Nonfarm Payrolls (NFP) report came in better than expected, surging to 353K in January from 333K in December (revised up from 216K). The Unemployment Rate was unchanged at 3.7%. Finally, wage growth is firming, with Average Hourly Earnings growing 4.5% YoY in January from 4.4% in December. The Greenback attracted some buyers following the job reports. Traders reduced their bets on an interest rate cut in May, and the probability of a March rate cut has dropped to 19%, compared to 38% just a day ago, according to the CME FedWatch tool. It’s worth noting that the higher-for-longer rate narrative reduces gold's appeal since it provides no yield.
Nonetheless, the United States and the United Kingdom launched large-scale military attacks on Saturday against multiple sites in Yemen controlled by Houthi militants as the Biden administration continued its Middle Eastern revenge campaign against Iran-backed rebels, according to the New York Times. The escalating geopolitical tensions might boost traditional assets like gold.
Looking ahead, Fed Chair Jerome Powell is set to speak on late Sunday and will be closely watched by traders. Market players will keep an eye on the Chinese Caixin Services PMI and US ISM Services PMI data on Monday. These events could give a clear direction to the gold price.


© 2000-2026. Уcі права захищені.
Cайт знаходитьcя під керуванням TeleTrade DJ. LLC 2351 LLC 2022 (Euro House, Richmond Hill Road, Kingstown, VC0100, St. Vincent and the Grenadines).
Інформація, предcтавлена на cайті, не є підcтавою для прийняття інвеcтиційних рішень і надана виключно для ознайомлення.
Компанія не обcлуговує та не надає cервіc клієнтам, які є резидентами US, Канади, Ірану, Ємену та країн, внеcених до чорного cпиcку FATF.
Проведення торгових операцій на фінанcових ринках з маржинальними фінанcовими інcтрументами відкриває широкі можливоcті і дає змогу інвеcторам, готовим піти на ризик, отримувати виcокий прибуток. Але водночаc воно неcе потенційно виcокий рівень ризику отримання збитків. Тому перед початком торгівлі cлід відповідально підійти до вирішення питання щодо вибору інвеcтиційної cтратегії з урахуванням наявних реcурcів.
Викориcтання інформації: при повному або чаcтковому викориcтанні матеріалів cайту поcилання на TeleTrade як джерело інформації є обов'язковим. Викориcтання матеріалів в інтернеті має cупроводжуватиcь гіперпоcиланням на cайт teletrade.org. Автоматичний імпорт матеріалів та інформації із cайту заборонено.
З уcіх питань звертайтеcь за адреcою pr@teletrade.global.
переклади