- Аналітика
- Новини та інструменти
- Новини ринків
Новини ринків
- EUR/USD whipped in hectic Friday action following Eurozone inflation, US labor data.
- European inflation continues to hamper the ECB, while US jobs data beat the street.
- EUR/USD wraps up the week near 1.0940.
The EUR/USD fell to a three-week low on Friday after European inflation rebounded higher in December, with the Eurozone Harmonized Index of Consumer Prices (HICP) for the year ended December climbing to 2.9% versus November’s YoY 2.4%. Markets were expecting a print of 3.0%, but higher inflation of any amount reduces the chances of the European Central Bank (ECB) cutting interest rates to reduce borrowing and lending costs.
After an inflation-fueled decline, the EUR/USD promptly rallied to a three-day high at the 1.1000 handle after US Nonfarm Payrolls (NFP) handily beat the street, adding 216K net new jobs to the US labor market in December versus the forecast 170K. US Average Hourly Earnings also climbed to 4.1% for the year through December, beating the forecast downtick to 3.9% and pushing slightly above November’s YoY 4.0% print.
US NFP surge hampers rate cut hopes
A firming-up US labor market threw cold water on market expectations of rate cuts, with the Federal Reserve (Fed) less likely to rush to cut rates as long as the US domestic economy continues to push towards stable growth and avert a potential recession in 2024. Money markets were pricing in a 90% chance of a rate cut from the Fed as soon as the US central bank’s meeting in March, but the NFP beat has sent those odds tumbling to around 60%.
Despite the firm labour beat, the US ISM Services Purchasing Managers’ Index (PMI) for December declined much further than expected, printing at 50.6 versus the forecast 52.6 and extending a slide from November’s 52.7 to close at a seven-month low.
Data revisions are also plaguing official labor figures, with the November NFP getting steeply revised lower from 199K to 173K, and October’s NFP print seeing further revisions down to 105K from 150K.
Next week kicks off with European Retail Sales as well as a slew of confidence and sentiment readings across consumers, manufacturers, and industrial sector participants. US data will remain thin until next Thursday’s US Consumer Price Index (CPI), with the headline annualized US CPI expected to tick upwards from 3.1% to 3.2%.
EUR/USD Technical Outlook
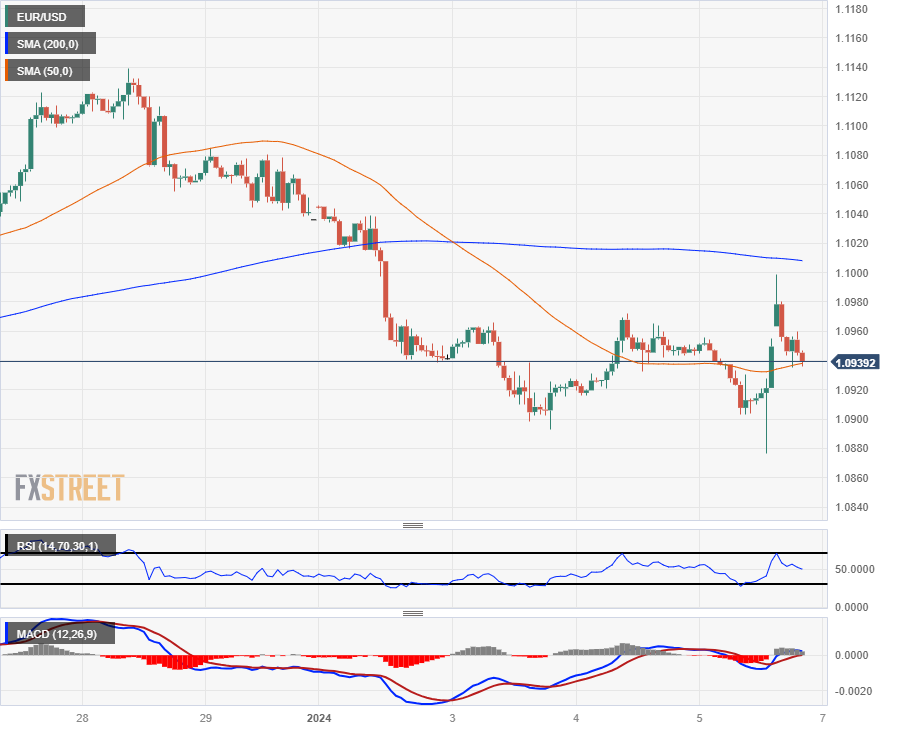
Despite the EUR/USD’s late break higher on Friday, the pair remains capped underneath the 200-hour Simple Moving Average (SMA) just above the 1.1000 major handle, with the EUR/USD bidding into the consolidation zone between the 200-hour SMA and the 50-hour SMA near 1.0940 as the back half of the trading week’s action drifts back into median prices.
Monday’s early decline from the 1.1040 region saw the EUR/USD weaken before grinding flat heading through Wednesday’s trading, and 1.0900 is baked in as a near-term technical barrier for further downside.
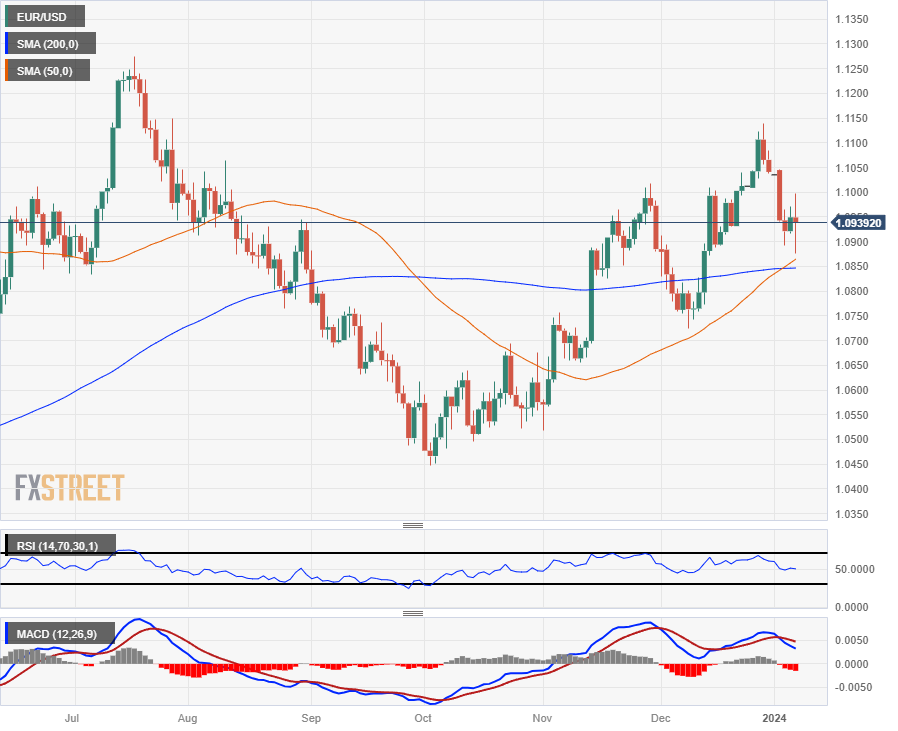
Daily candlesticks have the EUR/USD consolidating just above a bullish cross of the 50-day and 200-day SMAs near 1.0850, and bidders will be looking to capitalize on the technical confluence to gather momentum for another run at December’s peak near 1.1140.
EUR/USD Hourly Chart
EUR/USD Daily Chart
EUR/USD Technical Levels
- The NZD/JPY rose to 90.30, seeing 0.25% gains.
- Daily chart indicators hint at sustained buying momentum; RSI in positive territory alongside a rising MACD histogram.
- Four_hour_chart indicators flattened and suggested consolidation of upward movements.
In Friday's session, the NZD/JPY pair traded up to a high of 90.50, its highest since early December, and then consolidated towards 90.30, marking a gain of 0.25%. Bulls are seemingly gaining ground in the daily chart as it portrays a bullish outlook. Meanwhile, the four-hour indicators seem to be consolidating the upward movement, suggesting a pause in the dominant buying activity.
The indicators on the daily chart reflect a substantial buying momentum. The Relative Strength Index (RSI) is in positive territory with an upward inclination, signifying increasing buyer strength. Advancing green bars of the Moving Average Convergence Divergence (MACD) complement this positive outlook, further indicating a growing uptrend. Complementing this bullish prognosis is the pair's position above all of the Simple Moving Averages (SMAs) - 20, 100, and 200-day periods, which corroborates that the uptrend is under the solid control of the bulls in a broader context.
Switching to a shorter time frame, the four-hour chart paints a more consolidated image of the market. Although the Relative Strength Index (RSI) remains in positive territory, it has leveled off to a steady flat position, indicating that the buying momentum might be taking a pause. Concurrently, the green bars in the Moving Average Convergence Divergence (MACD) continue to rise, suggesting an ongoing but slowing upward trajectory. This mix of signals on the shorter time frame suggests that while the upward momentum still holds, the market might be taking a breather before making the next move.
NZD/JPY technical levels
NZD/JPY daily chart
-638400875077520141.png)
- AUD/JPY sees slight 0.24% increase, maintaining position near Ichimoku Cloud, signaling potential market shifts.
- For continued upward trajectory, the pair needs to breach December's high of 97.59, eyeing 98.00 and last year's peak at 98.58.
- Downside risks include support levels at 96.83, Tenkan-Sen at 96.71, and possible retreat to 95.90.
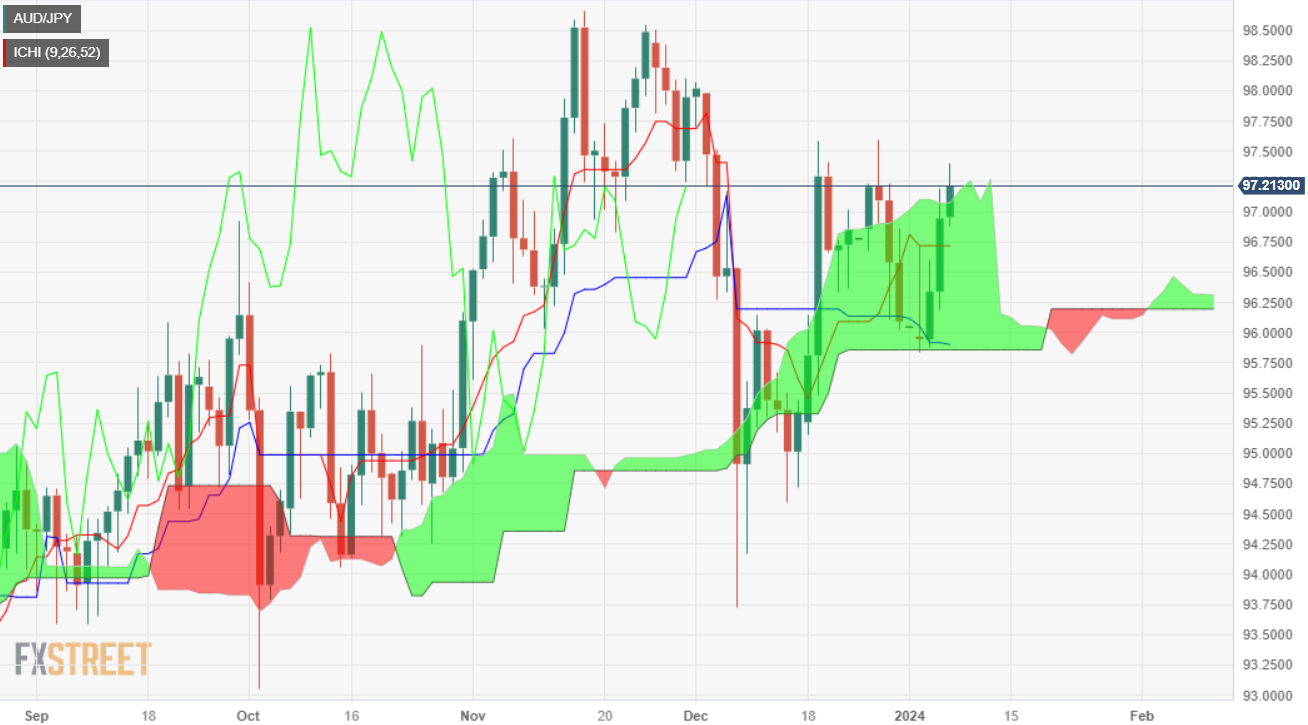
The AUD/JPY is set to finish the week with gains of close to 1.20%, though it remains at the brisk of getting back inside the Ichimoku Cloud (Kumo), which could pave the way for a pullback. At the time of writing, the pair trades at 97.20, posting modest gains of 0.24% after hitting a daily low of 96.83.
The cross rallied above the Kumo, opening the door for further upside, with buyers leaning on the top, with first support at 97.07. If buyers would like to drive prices higher, they need to reclaim December’s high of 97.59, which, once cleared, could pave the path toward 98.00. Once surpassed, up next would be last year’s high at 98.58.
On a bearish resumption, AUD/JPY sellers must drag prices below 97.00, toward the first support level seen at the November 21 low of 96.83. Once surpassed, the Tenkan-Sen would be up next at 96,71, followed by 96.18, January’s 4 swing low. If bulls could not cap the downtrend, the pair could retrace the current week’s gains and open the door for additional losses below the Kijun-Sen at 95.90.
AUD/JPY Price Action – Daily Chart
AUD/JPY Technical Levels
- USD/JPY touched 146.00 in the pre-NFP market runup before slumping back.
- Yen set for another significant down week, falling a full percent against most major currencies.
- Broad-base JPY selling to dominate market themes as Yen pairs rebalance recent losses.
The USD/JPY spiked to a near-term high at the 146.00 handle early Friday in the broad-market run-up to the US Nonfarm Payrolls release, which surged above market forecasts and sent the US Dollar (USD) back down against the Japanese Yen (JPY) as markets weighed odds of Federal Reserve (Fed) rate cuts in the face of a still-firm US labor market.
US Average Hourly Earnings for the year ended in December climbed to 4.1% compared to November’s 4.0% print, climbing over the market forecast of a slight decline to 3.9%, and the NFP showed the US added 216K net jobs to the economy in December, well above the market’s expected print of 170K. December’s NFP print came in at a three-month high, though revisions can be expected in the coming months with November’s final print getting revised down from 199K and October seeing a second set of revisions bringing the total down from 150K to 105K.
See More: US Nonfarm Payrolls rise by 216,000 in December vs. 170,000 expected
With the US labor market continuing to show more strength than investors were expecting or hoping for, odds of a sooner rather than later rate cut from the Fed are diminishing, and money markets are now pricing in a 60% chance of a March rate cut, compared to around 90% as recently as December.
Next week kicks off with a fresh reading of Japan’s Tokyo Consumer Price Index (CPI), and investors will be keeping a close watch on Japan inflation figures as markets continue to look for signs of the Bank of Japan (BoJ) getting pushed out of its deeply-entrenched hyper easy monetary policy hole.
Japan’s Tokyo CPI last printed at 2.6% for the year ended December, a 12-month low after headline inflation in Japan reached 4.4% in January of 2023. Despite the rapid and steady decline in inflation, the BoJ has taken a widely opposite stance of most major central banks, and is overwhelmingly concerned about inflation falling too fast, too far below the BoJ’s target of 2%, with the Japanese central bank worried about inflation lagging below their minimum target some time in 2025.
Core Tokyo CPI (headline inflation less Fresh Food prices) is forecast to slip from 2.3% to 2.1% for the year through December.
USD/JPY Technical Outlook
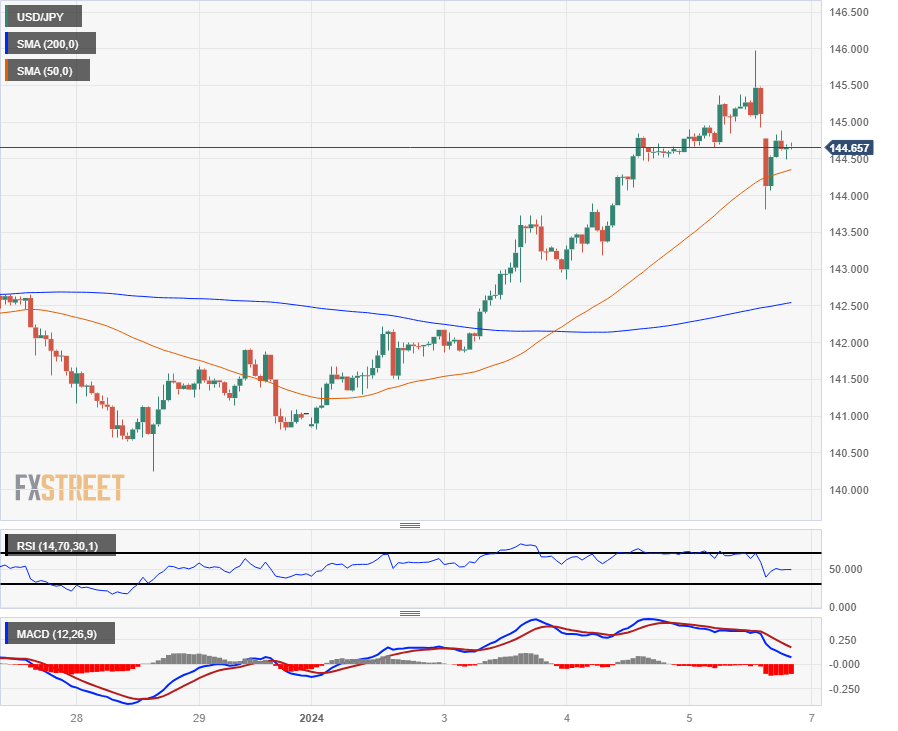
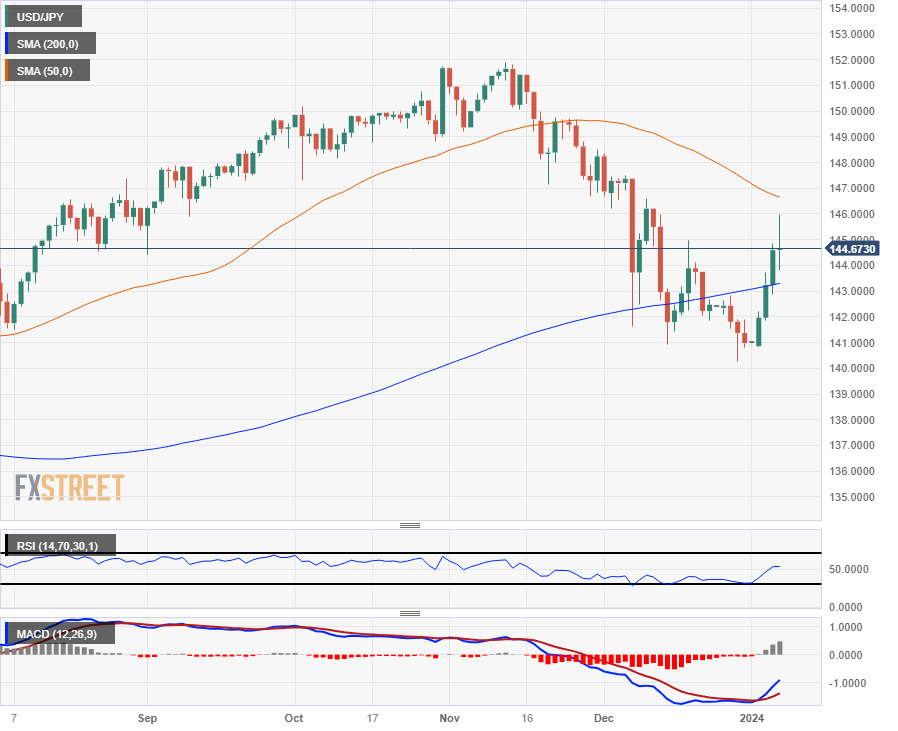
Friday made a mess of the USD/JPY intraday charts after the post-NFP plunge, tapping 146.00 and dipping below 144.00 before settling the day close to where it started near 144.50.
Steady Yen selling has seen the USD/JPY climb through the first week of 2024, and the pair is up a little over 3% from December’s swing low of 140.25.
The USD/JPY closed in the green for three straight trading days this week, rebounding into the top side of the 200-day Simple Moving Average (SMA) as technical indicators lift from oversold conditions. The pair remains down nearly 5% from November’s peak bids near 151.90, and USD/JPY bulls will find an immediate technical ceiling at the 50-day SMA descending through 147.00.
USD/JPY Hourly Chart
USD/JPY Daily Chart
USD/JPY Technical Levels
- EUR/JPY sees minimal gains in a risk-off environment, influenced by contrasting US economic reports and JPY dynamics.
- Potential downward pressure could lead to tests of Kijun-Sen at 157.52 and Senkou Span B, with further support at 157.03.
- For upward momentum, buyers need to break above 159.00, targeting Ichimoku Cloud bottom at 159.32 and 160.00 resistance.
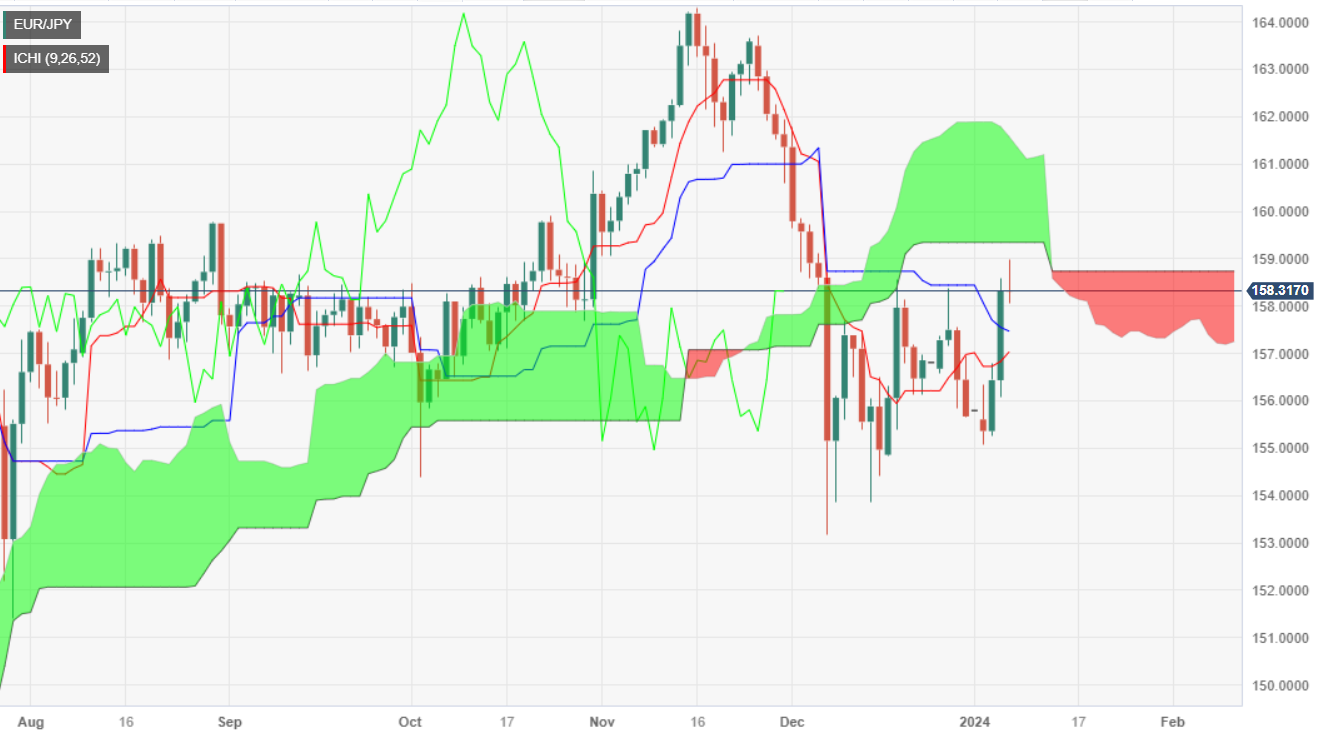
The EUR/JPY clings to minuscule gains of 0.01% late in Friday trading, courtesy of a risk-off impulse amid mixed economic data from the United States (US). Consequently, the Japanese Yen (JPY) gained some ground against the US Dollar (USD), as seen by the USD/JPY, trimming some of its losses, which underpinned the cross-pair. At the time of writing, the pair is trading at 158.33 after seesawing within the 158.07/99 range.
During the last three days, the EUR/JPY has managed to rise above the 158.00 figure, but failure to reclaim 159.00 leaves the pair exposed to selling pressure. If sellers step in, they could drive prices toward the Kijun-Sen at 157.52, ahead of testing the Senkou Span B at 157.52. A breach of the latter will expose the Senkou Span A, followed by the Tenkan-Sen at 157.03.
If buyers emerge at current levels, they must regain 159.00 so they can test the bottom of the Ichimoku Cloud (Kumo) at 159.32. The next supply zone would be the 160.00 handle, followed by the top of the Kumo at around 161.35/55.
EUR/JPY Price Action - Daily Chart
EUR/JPY Technical Levels
- The NZD/USD trend upwards, trading near the 0.6250 level.
- Following mixed economic data, market dovish expectations for the Federal Reserve policy intensified
- Next week, the US will report inflation data.
In Friday's session, the New Zealand Dollar (NZD) advanced against the US Dollar (USD), trading at a comfortable level of 0.6250, seeing firm gains. The pair may be probably consolidating the last session's losses as strong labor market data may push the Federal Reserve (Fed) to take a less aggressive stance. Meanwhile, markets remain stubborn, betting on earlier rate cuts.
In December, economic indicators presented a mixed picture in the US. The ISM Services PMI recorded a figure of 50.6, falling short of the expected 52.6 and marking a decline from the previous month's 52.7. On the labor front, December's Nonfarm Payrolls report outperformed expectations with the creation of 216,000 jobs, significantly higher than the consensus estimate of 170,000 and the previous month's 173,000 jobs. Average Hourly Earnings increased by 0.4% month-on-month, exceeding the forecasted 0.3% and mirroring the previous month's growth rate, while the Unemployment Rate remained unchanged at 3.7%, slightly better than the anticipated 3.8%. Altogether, these events suggest a mixed economic outlook with a slowdown in the services sector potentially balanced by a robust labor market and wage growth.
Meanwhile, markets rushed to adjust their dovish bets on the Fed due to the soft service sector figures but seem to be ignoring the upside risks that present the strong labor market figures. As for now, according to the CME FedWatch tool, the odds of a cut in March have risen to 70%, and the probabilities of an additional cut in May are still high. Next week, the US Consumer Price Index (CPI) is due, which may provide further guidance to investors regarding the next Fed decisions.
NZD/USD levels to watch
The daily chart indicators reflect a neutral to practically bullish momentum for the pair. The Relative Strength Index (RSI), residing in positive territory, is ascending, indicating an upward momentum. Nevertheless, the Moving Average Convergence Divergence (MACD) shows flat red bars, suggesting a minor bearish control in the near term.
On the other hand, from a wider perspective, the pair's stance above the 20, 100, and 200-day Simple Moving Averages (SMAs) indicates a predominant bullish force. This signals that despite minor fluctuations, the overall buying momentum outweighs the selling in the broader market scenario.
Considering these factors, the dominating force seen in the pair right now is in favor of the buyers, marking a more bullish-oriented short-term technical outlook. This is supported by the RSI's positive trajectory and the pair's position in relation to the SMAs despite the near-neutral indication signaled by the MACD.
NZD/USD daily chart
-638400808333407709.png)
- European equity indexes closed broadly lower on Friday after EU inflation rebounded.
- The end of EU energy subsidies bodes poorly for ECB rate cut expectations.
- US jobs data likewise firms up US economic backdrop, reducing odds of Fed cuts.
European equity indexes shed weight on Friday, plunging on a rebound in Eurozone inflation figures while the US’ Nonfarm Payrolls (NFP) solidly steamrolled forecasts, adding the most jobs since October while markets were expecting a slight fallback in the headline jobs figure.
The European Harmonized Index of Consumer Prices (HICP) rose to 2.9% for the year ended December, slightly less than the market forecast of 3.0% but still a healthy rebound from the previous period’s 2.4%. Annualized Core HICP ticked lower to 3.4% in December, down slightly from November’s YoY 3.6% and missing the forecast 3.5%, highlighting how much of Eurozone inflation is being driven by rising energy prices. EU subsidies meant to cap energy volatility are expiring, and the added price growth will plague EU inflation looking forward, making it more difficult for the European Central Bank (ECB) to cut interest rates.
See More: Euro area HICP inflation rises to 2.9% in December vs. 3% expected
European equities plunged to near-term lows after headline EU inflation ticked higher, sending the German DAX index to a four-week low of €16,434. European indexes recovered from early Friday’s inflation plunge before getting yanked lower again by US NFP figures that thoroughly trounced expectations.
Friday’s NFP print showed the US added 216K net job additions to the American employment landscape, easily clearing the median market forecast of 170K, and stepping over November’s revised print of 173K (revised down from 199K). Investors will also note that October’s NFP print saw further revisions, declining to 105K from the previous 150K).
Germany’s DAX ended the week at €16,594.21, down a little over 23 points to end Friday down 0.14%, while the French CAC 40 fell nearly 30 points to close down 0.4% at €7,420.69. The pan-European STOXX600 fell 1.3 points to end at €476.38, down around a quarter of a percent. London’s FTSE index also slid four-tenths of one percent to close down 33.46 points at £7,689.61.
DAX Technical Outlook
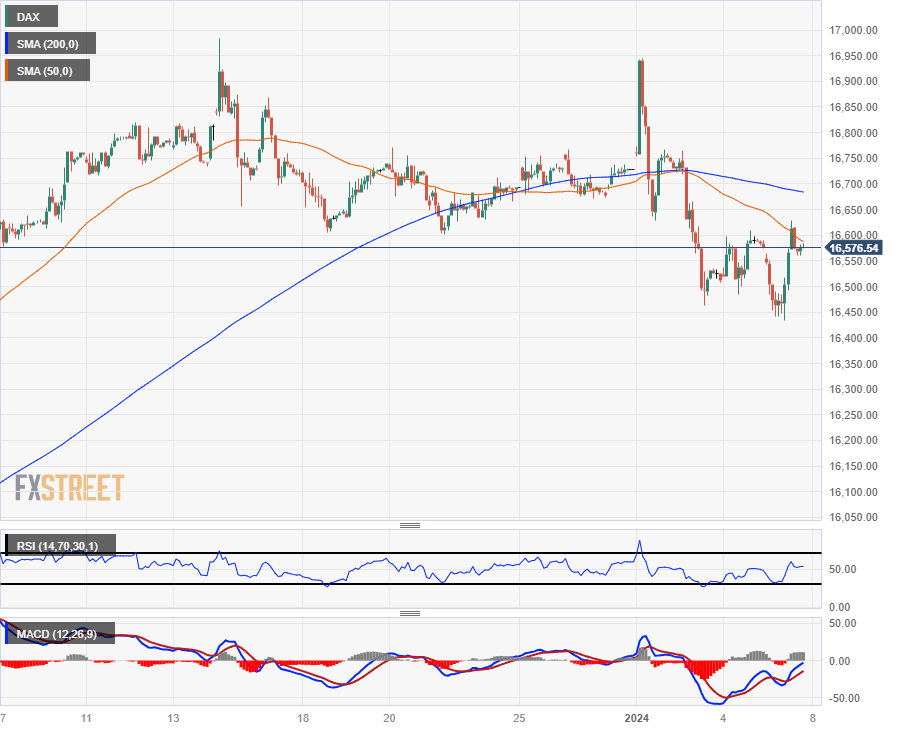
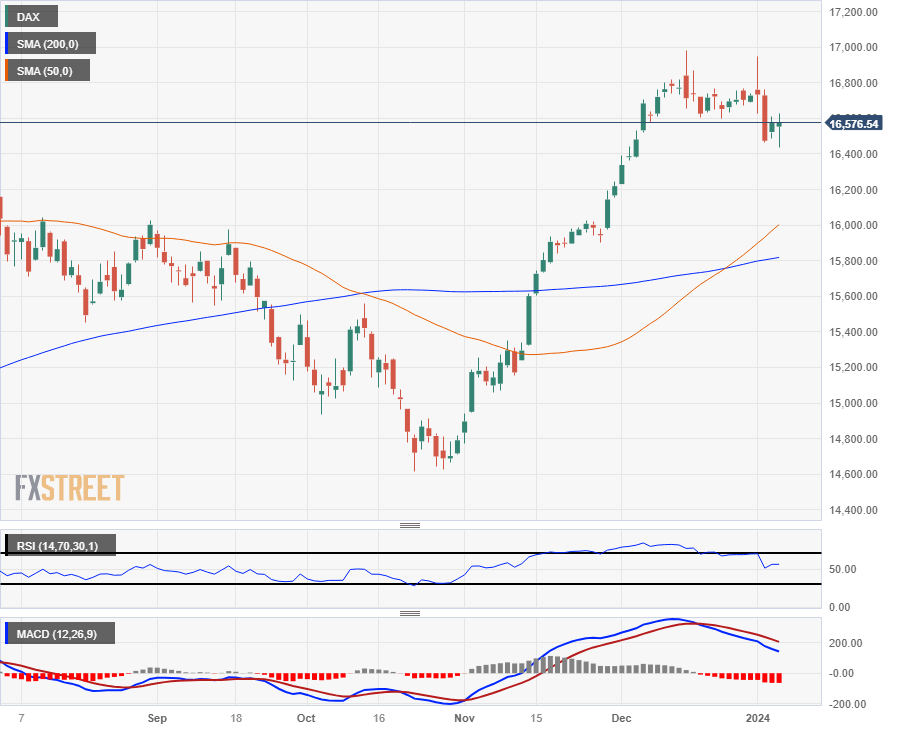
The German DAX 40 major equity index fell on Friday, and efforts by stock traders to bolster stocks back from the day’s lows saw a late break back below the €16,600 level heading into the Friday closing bell.
The DAX kicked off 2024 with an early rally into €16,950 as investors keep an eye turned to the major 17,000 handle, but the equity index continues to get dragged below the 200-hour Simple Moving Average (SMA) near €16,700.
Despite near-term congestion and a bearish lean to technical indicators on the daily candlesticks, the DAX remains well-bid from late 2023’s lows, up nearly 13.5% from late October’s bottom near €14,620.
DAX Hourly Chart
DAX Daily Chart
DAX Technical Levels
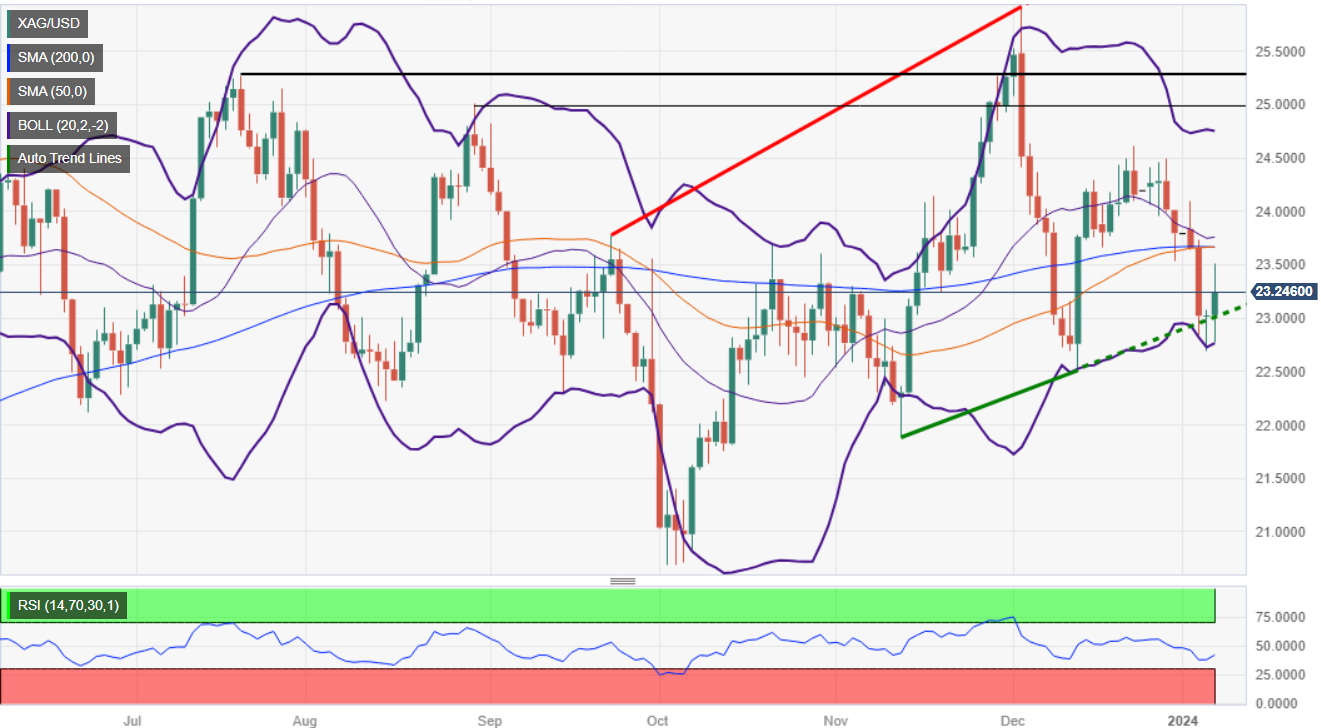
- Silver advances 0.63% to $23.12, reacting to US employment strength and factory orders, countered by slowing business activity.
- XAG/USD's potential bullish push towards $24.00 contingent on reclaiming the 100-DMA at $23.30.
- Downside risks loom if Silver falls below $23.00, with targets at January 4 low of $22.69 and December 13 low of $22.51.
Silver price edged higher on Friday, though it retreated after hitting a two-day high of $23.51 after the release of mixed data from the US. A stronger-than-expected jobs report and a jump in factory orders suggest the economy remains robust. Nevertheless, business activity slowed sharply, approaching recessionary levels. At the time of writing, XAG/USD is trading at $23.12, gaining 0.63%.
The XAG/USD daily chart portrays the grey metal as neutral-biased. The 50, 100, and 200-day moving averages (DMAs) are flat, suggesting there’s indecision among traders. If buyers reclaim the 100-DMA at $23.30, that could pave the way for challenging the confluence of the 50 and 200-DMAs around $23.65. A decisive break would expose the $24.00 figure.
On the other hand, if XAG/USD sellers step in and drag prices from around current levels below $23.00, that would exacerbate a test of the January 4 low of $22.69. Once surpassed, sellers could challenge December’s 13 low of $22.51.
XAG/USD Price Action – Daily Chart
XAG/USD Key Technical Levels
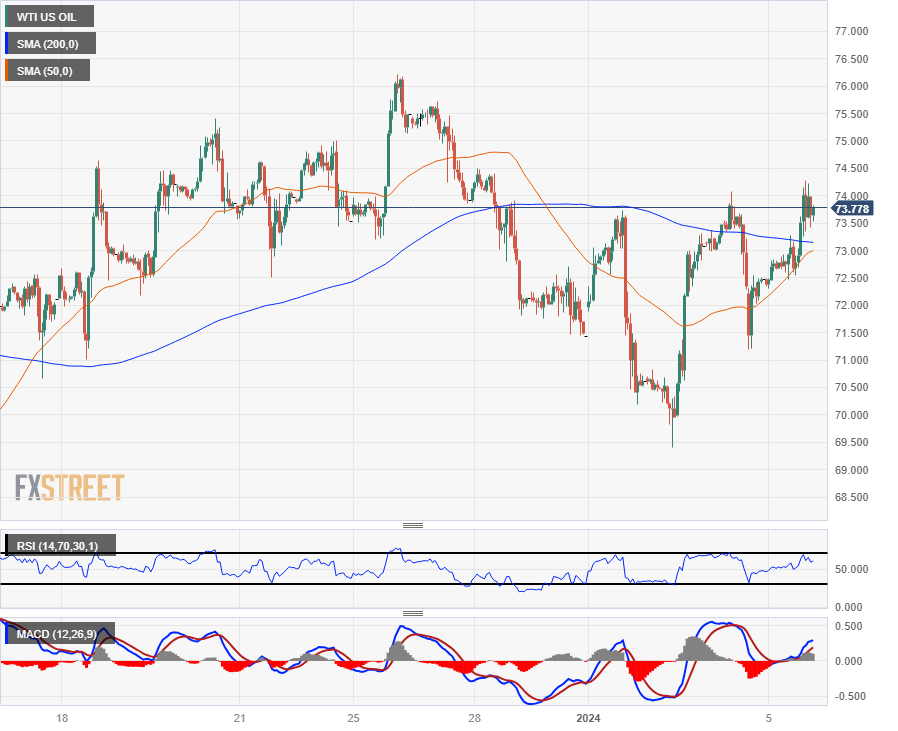
- Crude Oil markets bumped on continued threat of Middle East conflict spillover.
- Cargo ships are beign diverted from the Red Sea for the foreseeable future.
- Record buildup in US fuel stocks capping upside potential in Crude Oil.
West Texas Intermediate (WTI) US Crude Oil rose again on Friday, tapping 74.27 as Middle East tensions continue to weigh on energy markets.
Logistics and shipping companies continue to divert cargo ships away from the Suez Canal to avoid Houthi rebel-infested waters off the coast of Yemen, sending Europe-Aisa connecting shipping lanes around the African continent.
A US-led coalition of naval warships is struggling to secure the waterways of Yemeni shores as Iran-backed Houthi rebels continue to target civilian ships passing through the region, and the arrival of an Iranian warship has complicated matters as Iran plays chicken with coalition naval forces.
The ongoing Israel-Hamas conflict rages on, threatening to spill over into neighboring countries. While Israel and Palestine are not key players in Crude Oil markets, several nations surrounding the Gaza region are viewed as critical participants.
Iran is reportedly withholding further Crude shipments to China according to reporting by Reuters, citing unnamed sources within the oil industry.
In a bid to seek higher prices for their Crude Oil exports to China, Iran is allegedly suspending shipments to the world’s largest oil importer until China agrees to pay higher prices for Iranian barrels.
The move comes shortly after China front-loaded a significant portion of their anticipated Crude Oil demand for the year after enjoying a $10 billion discount on Crude Oil imports through the first three quarters of 2023 by specifically importing from sanction-plagued Iran. Iran, in a bid to bolster their government finances, is closing the discount gap that China sees on Iranian Crude Oil imports, leaving Chinese refiners in a tough spot where they have to choose between paying full price on the global market or accepting a reduced discount margin on Iranian barrels.
WTI Technical Outlook
Friday’s upside drive in WTI brings US Crude Oil back over the 200-hour Simple Moving Average (SMA) to test territory north of $74.00, but technical pressures are hardening the key price handle.
US Crude Oil has climbed over 6% from the weekly low near $69.41 as WTI bidders continue to gather steam for repeated attempts at pushing into fresh highs, but so far topside momentum remains limited as clunky markets continue to grapple with the charts.
Daily candlesticks have WTI snared beneath the 200-day SMA at the $78.00 handle, capped by technical resistance from a bearish crossover of the 50-day and 200-day SMAs, and the near-term technical ceiling currently sits at the $76.00 price level at December’s swing high.
WTI Hourly Chart
WTI Daily Chart
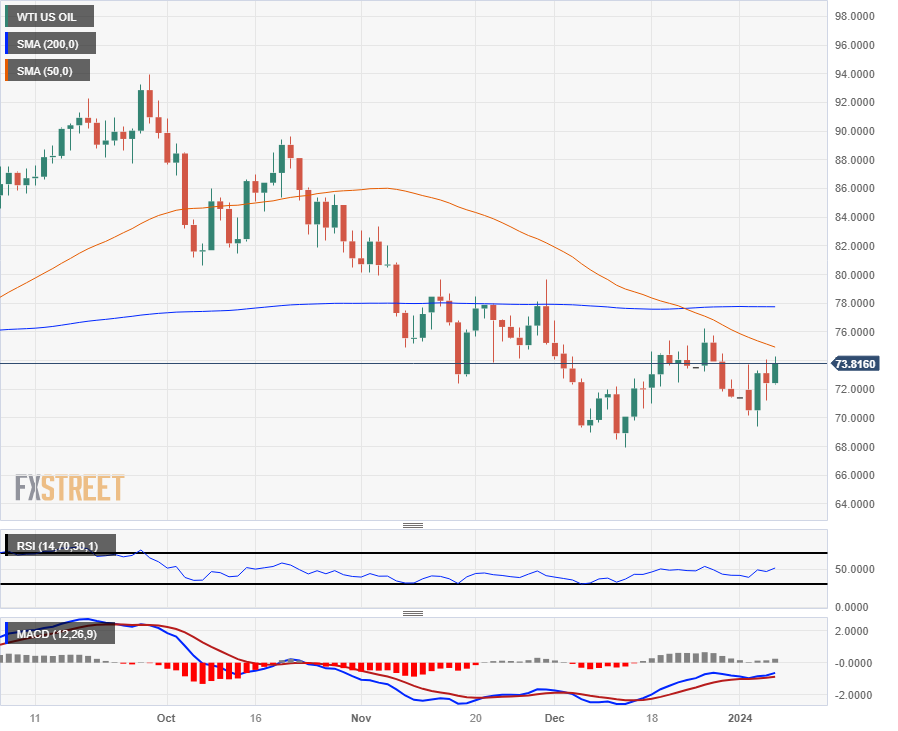
WTI Technical Levels
- The XAU/USD experiences minor losses, trading around the $2,040 level.
- US December reports reveal ISM Services PMI dropping to 50.6, while NFPs exceeded expectations.
- Market participants recalibrate Fed expectations following inconsistent economic data.
In the Friday trading session, the XAU/USD metal witnessed a downward trend, trading around the $2,040 level after jumping near $2,060. The metal showed volatility following the release of mixed US economic data, triggering which saw a strong US labor market but a weak Service sector. However, the markets rushed to re-adjust their dovish bets on the Federal Reserve (Fed) and are now betting on higher odds of a sooner beginning of the easing cycle.
In December, the US labor market showed robust performance as evidenced by the Nonfarm Payrolls report, which exceeded expectations by adding 216,000 jobs. This figure not only surpassed the consensus prediction of 170,000 jobs but also improved significantly from the previous month's addition of 173,000 jobs. Additionally, the Average Hourly Earnings witnessed a monthly increase of 0.4%, surpassing the consensus forecast of 0.3% and equalling the rate of the previous month, while the Unemployment Rate for the month remained stable at 3.7%, which was slightly lower than the anticipated 3.8%.
On the negative side, the Institute for Supply Management (ISM) Services PMI for December recorded a decline to 50.6, against a market expectation of 52.6, underperforming the previous figure of 52.7, which triggered a decline in the US Dollar, potentially limiting the downside for the metal for the rest of the session.
Elsewhere, US bond yields are on an upward trend which is pushing down the metal. The 2-year rate is trading at 4.40%, while the 5-year and 10-year yields jumped back above 4%. That being said, the upside for the yields may be limited as, according to the CME FedWatch Tool, markets are now betting on earlier rate cuts from the Fed. Specifically, the odds of a 25 bps cut in March rose to 70%. It will all come down to the incoming data, and next week, the US will release Consumer Price Index (CPI) figures from December, which may add volatility to the metal.
XAU/USD levels to watch
Reflecting upon the key indicators in the daily chart, the technical scenario illustrates an equilibrium between the buying and selling momentum. The Relative Strength Index (RSI) remains flat, indicating a balance in the buying and selling pressures, yet its location in the positive territory suggests an upper hand for the buyers.
The Moving Average Convergence Divergence (MACD) shows flat red bars, which typically signal a seller's momentum. However, the flatness points to stalling momentum rather than a dominant bearish attitude.
Considering the position of the metal in relation to the Simple Moving Averages (SMAs), it stands above the 20,100,200-day SMAs which implies a commanding bullish stance in the larger time frames.
XAU/USD daily chart
-638400757938131659.png)
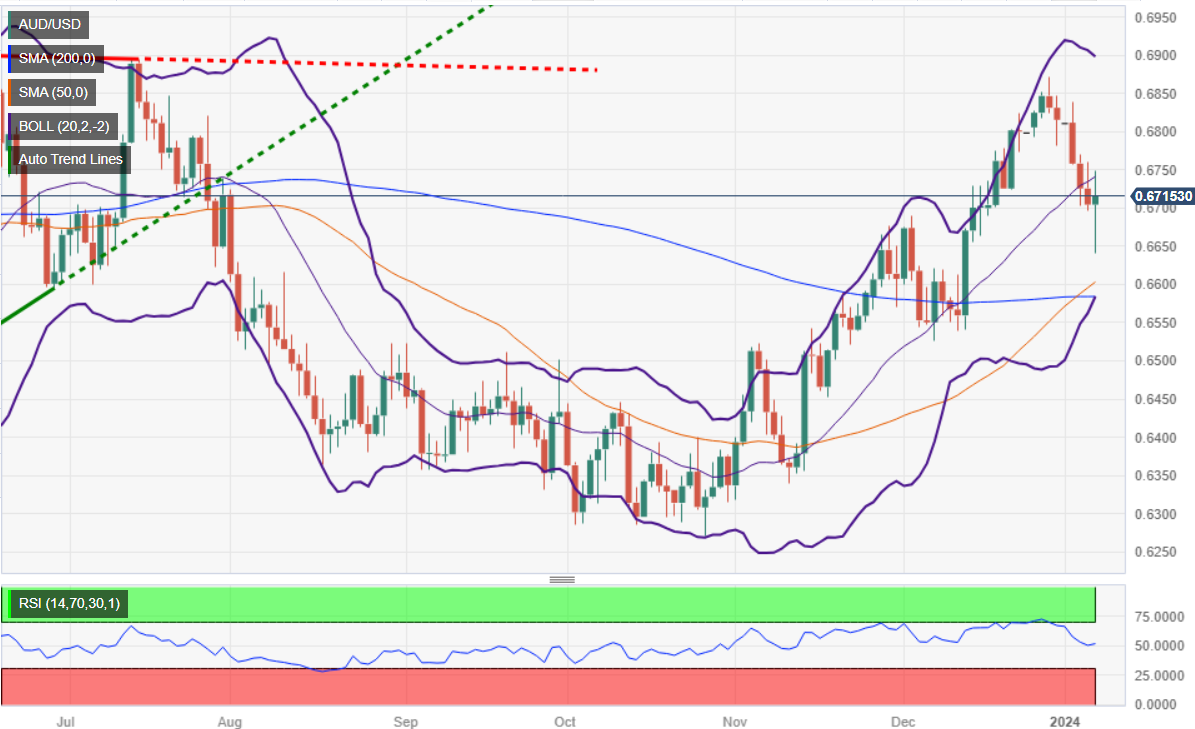
- AUD/USD shows marginal gains in volatile session, reacting to US job strength and services sector deceleration.
- Solid US Nonfarm Payrolls and a decline in Services PMI create a mixed economic landscape, impacting currency dynamics.
- Traders eye upcoming US inflation data and Australian Retail Sales for further directional cues in the week ahead.
The AUD/USD is almost flat during the North American session, after mixed economic data from the United States (US) keeps the Greenback seesawing between gains and losses. A solid employment report in the US and weaker business activity in the services sector keep investors scratching their heads about the economy's outlook. The pair, post minuscule gains of 0.11%, trades at 0.6711.
AUD/USD remains afloat above 0.6700 amid mixed US economic data
The Institute for Supply Management (ISM) revealed the services sector slowed in December, as the Services PMI slid from 50.7 to 43.3, the lowest since May 2023. Today’s reading, along with the Manufacturing PMI revealed earlier this week, suggests the economy is slowing faster than foreseen, with both readings in recessionary territory.
Earlier, the US Department of Labor (DoL) disclosed the US economy created 216K jobs, as illustrated by December’s Nonfarm Payrolls data, while the Unemployment Rate cooled from 3.8% to 3.7%. According to Average Hourly Earnings, wages rose to 4.1% YoY from 3.9%.
In the meantime, the AUD/USD reversed its earlier gains post US NFP and ISM Services PMI release, which witnessed the pair hitting a daily high of 0.6748, before retreating somewhat toward the 0.6710 region.
Ahead of the next week, the US economic docket will feature December’s inflation data. On the Australian front, traders would be looking for Retail Sales.
AUD/USD Price Analysis: Technical outlook
After dropping toward 0.6640, AUD/USD buyers moved in, lifting the pair shy of testing the 0.6750 area before reversing its course. If the pair closes around current exchange rates, that would form a large doji, meaning that traders remain uncertain about the pair's direction. For a bullish resumption, buyers must reclaim 0.6750, which would expose the 0.6800 figure. On the downside, if sellers drag prices below the 0.6700 figure, that could pave the way to test the confluence of the 50-200-day moving averages (DMA), at 0.6582/92.
- The Pound Sterling climbed over the Greenback after markets surged in the NFP aftermath.
- US jobs additions easily cleared expectations, but revisions loom ahead.
- US data dominates Friday, UK looks ahead to GDP and output figures next Friday.
The GBP/USD climbed into a new high for the year at 1.2771 after markets broadly went risk-on after the US Nonfarm Payroll (NFP) data release surged above median forecasts, adding 216K new jobs in December. The NFP print handily trounced market expectations of 170K. Still, November saw a steep revision from 199K to 173K, with even further revisions to October’s already-revised 150K, bringing it down to just 105K.
Despite revisions continuing to plague key datasets, markets surged on the NFP forecast-beater, pushing the US Dollar broadly lower and sending the Pound Sterling to a new 2024 high.
US Average Hourly Earnings for the year through December also beat expectations, climbing from 4.0% to 4.1% versus the forecast tick down to 3.9%, and the US Unemployment Rate also beat the street, holding steady at 3.7% against the forecast increase to 3.8%.
See More: US Nonfarm Payrolls rise by 216,000 in December vs. 170,000 expected
Earlier Friday, UK Halifax Housing Prices rebounded for the annualized fourth quarter, climbing 1.7% after the previous quarter’s -0.8% backslide (revised up slightly from -1.0%). UK data was strictly low-impact and barely moved the needle as markets were bracing for NFP at the time.
Coming up next week will be BRC Like-For-Like Retail Sales on Tuesday, and then a clear data docket from the UK until next Friday’s Manufacturing & Industrial Production, as well as UK GDP figures.
US data will again feature heavily next week, with US Consumer Price Index (CPI) figures for December printing on Thursday, as well as Producer Price Index (PPI) and the Michigan Consumer Sentiment Index for January both printing on Friday.
Pound Sterling price this week
The table below shows the percentage change of Pound Sterling (GBP) against listed major currencies this week. Pound Sterling was the strongest against the Japanese Yen.
| USD | EUR | GBP | CAD | AUD | JPY | NZD | CHF | |
| USD | 0.94% | 0.04% | 0.66% | 1.44% | 2.51% | 1.12% | 0.94% | |
| EUR | -0.80% | -0.74% | -0.14% | 0.65% | 1.57% | 0.34% | 0.09% | |
| GBP | -0.06% | 0.74% | 0.63% | 1.38% | 2.54% | 1.08% | 0.82% | |
| CAD | -0.66% | 0.10% | -0.45% | 0.76% | 1.85% | 0.45% | 0.25% | |
| AUD | -1.46% | -0.66% | -1.42% | -0.80% | 0.90% | -0.34% | -0.57% | |
| JPY | -2.55% | -1.57% | -2.45% | -1.67% | -0.90% | -1.24% | -1.67% | |
| NZD | -1.14% | -0.34% | -1.09% | -0.47% | 0.32% | 1.23% | -0.24% | |
| CHF | -0.88% | -0.09% | -0.83% | -0.19% | 0.58% | 1.62% | 0.27% |
The heat map shows percentage changes of major currencies against each other. The base currency is picked from the left column, while the quote currency is picked from the top row. For example, if you pick the Euro from the left column and move along the horizontal line to the Japanese Yen, the percentage change displayed in the box will represent EUR (base)/JPY (quote).
GBP/USD Technical Outlook
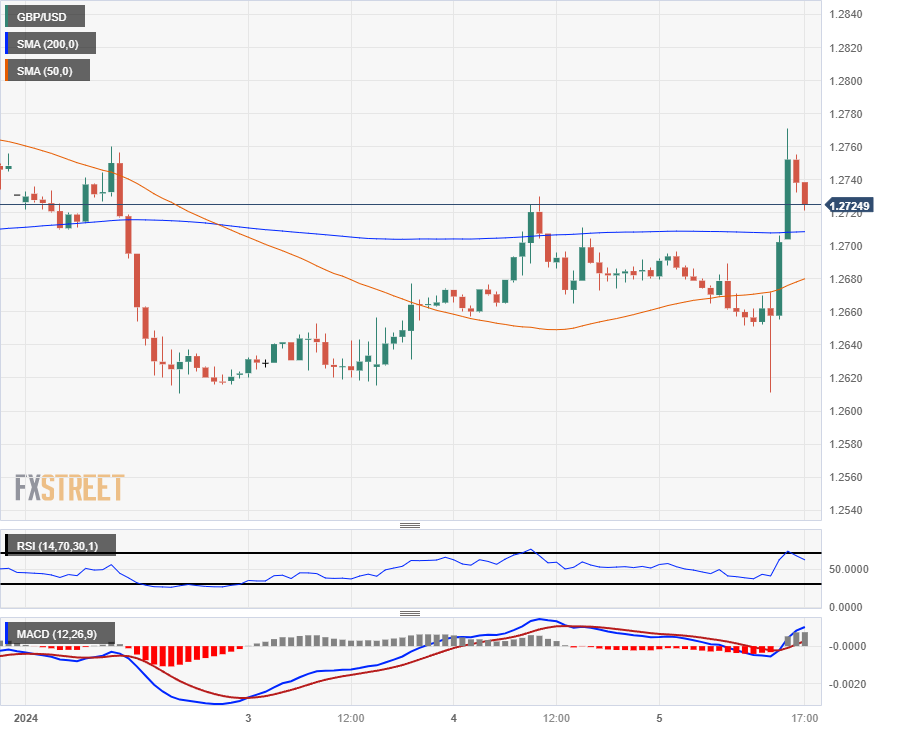
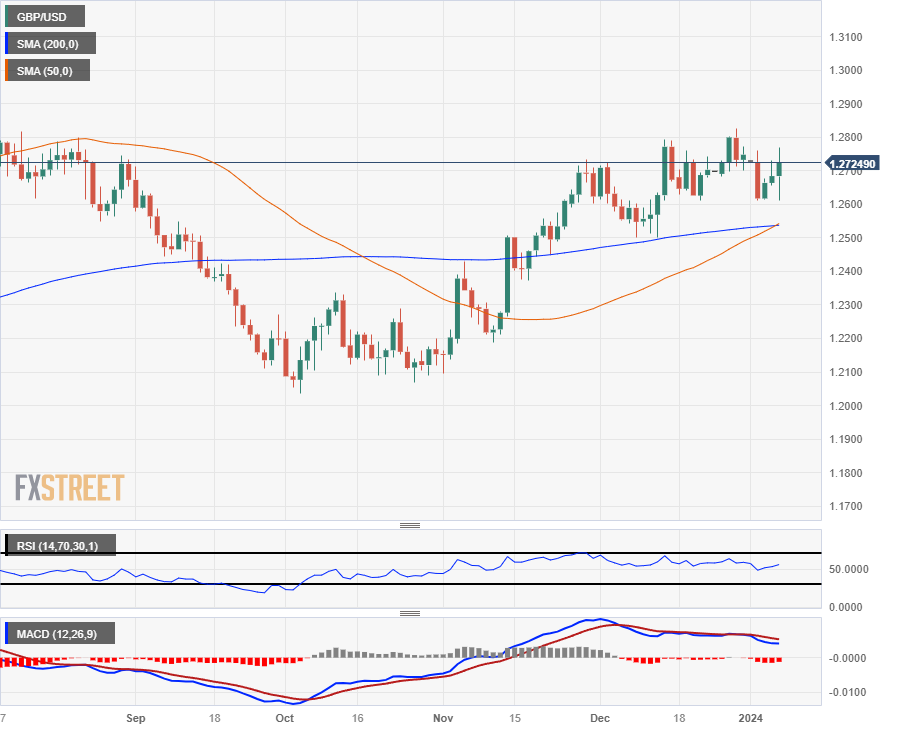
It’s been a down-then-up week for the Pound Sterling, kicking off 2024 with broad gains against the majority of the GBP’s major currency peers. As markets wind down towards the Friday closing bell, the Poun Sterling finds itself up over two and a half percent against the Yen this week, with a 1.4% gain against the Aussie and 1.1% against the Kiwi as the Antipodeans slump.
The only contender taking wind out of the GBP’s sails was the US Dollar itself, keeping mostly flat on the week and strapping the GBP/USD to a tight range around the 1.2700 handle.
GBP/USD bids remain constrained within easy reach of the 200-day Simple Moving Average (SMA), and a rough near-term consolidation range is baking into the daily candlesticks.
GBP/USD Hourly Chart
GBP/USD Daily Chart
GBP/USD Technical Levels
- The Canadian Dollar is etching in a broad range on NFP Friday.
- Canada jobs additions crumble, US jobs easily beat the street.
- Despite weak labor figures, Canadian wage pressures persist.
The Canadian Dollar (CAD) slumped to a new low for the week against the US Dollar (USD) before surging to a three-day high as markets whipsaw after a bumper US Nonfarm Payrolls (NFP) report crushes market forecasts.
Canada saw a hamstrung labor market add fewer jobs than the margin of error on the figure itself, coupled with persistent wage growth that accelerated to a two-year high.
Daily digest market movers: Canadian Dollar churns, investors grapple with NFP print
- US Nonfarm Payrolls are dominating the headlines, adding 216K net new jobs to the US employment landscape in December compared to the 160K forecast.
- Despite the beat, revisions continue to plague the data, dragging November’s 199K down to 173K and October’s 150K getting revised even further lower to 105K.
- Average Hourly Earnings in the US ticked up slightly from 4% to 4.1% for the year ended December, and the US Unemployment Rate also held steady at 3.7% in December, where market forecasts expected a tick upwards to 3.8%.
- Despite the overall upshot in US data, the US ISM Services Purchasing Managers’ Index (PMI) in December broadly missed expectations, printing at a stunted 50.6 versus the forecast decline from 52.7 to 52.6.
- On the Canadian side, the Unemployment Rate held flat at 5.8%, snubbing the forecast 5.9%.
- Canadian Average Hourly Wages growth surged from 5.0% to 5.7% in December, a two-year high.
- Forecasts for Canadian Net Change in Employment completely missed the mark, with Canada adding a paltry 0.1K new jobs in December versus the forecast decline from 24.9K to 13.5K.
- Canadian December Ivey PMIs remain upbeat in the seasonally-adjusted figure, moving from 54.7 to 56.3, but cyclical factors are doing a lot of the heavy lifting, with the non-seasonally adjusted PMI slipping from 53.2 into contractionary territory at 43.7, a 12-month low.
Canadian Dollar price today
The table below shows the percentage change of Canadian Dollar (CAD) against listed major currencies today. Canadian Dollar was the strongest against the US Dollar.
| USD | EUR | GBP | CAD | AUD | JPY | NZD | CHF | |
| USD | -0.16% | -0.47% | -0.21% | -0.33% | -0.25% | -0.45% | -0.31% | |
| EUR | 0.17% | -0.28% | 0.00% | -0.15% | -0.07% | -0.26% | -0.13% | |
| GBP | 0.49% | 0.33% | 0.31% | 0.16% | 0.24% | 0.04% | 0.18% | |
| CAD | 0.19% | 0.02% | -0.29% | -0.14% | -0.08% | -0.27% | -0.13% | |
| AUD | 0.33% | 0.16% | -0.15% | 0.11% | 0.06% | -0.13% | 0.01% | |
| JPY | 0.27% | 0.13% | -0.18% | 0.11% | -0.04% | -0.18% | -0.03% | |
| NZD | 0.48% | 0.30% | -0.01% | 0.24% | 0.13% | 0.19% | 0.15% | |
| CHF | 0.30% | 0.15% | -0.16% | 0.13% | -0.01% | 0.05% | -0.15% |
The heat map shows percentage changes of major currencies against each other. The base currency is picked from the left column, while the quote currency is picked from the top row. For example, if you pick the Euro from the left column and move along the horizontal line to the Japanese Yen, the percentage change displayed in the box will represent EUR (base)/JPY (quote).
Technical Analysis: All that effort just to push the Canadian Dollar in a circle, USD/CAD returns to midrange
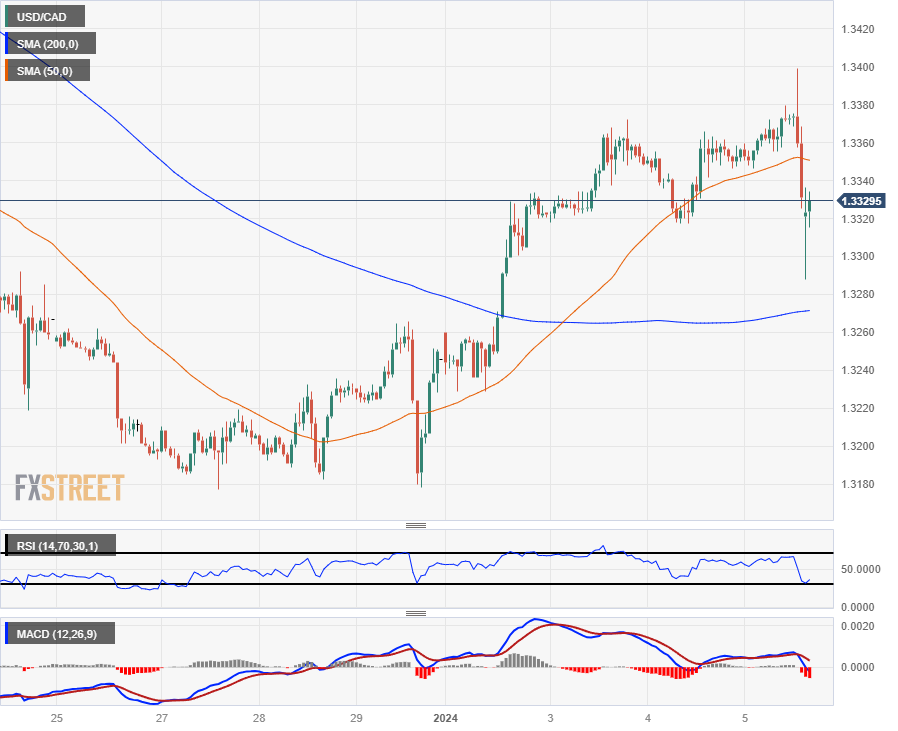
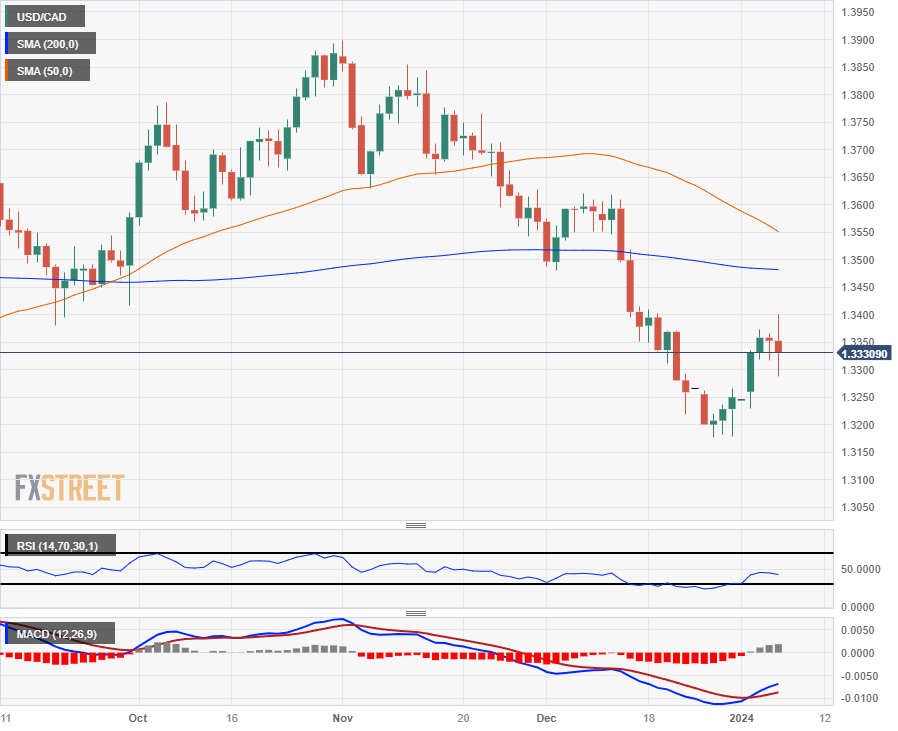
It’s a fundamentals-driven day for the Canadian Dollar, with NFP sparking an initial surge in the USD/CAD towards 1.3400 following the jobs release, however, markets quickly reversed course to plunge into 1.3290 before settling back into familiar territory near 1.3330.
Despite the US Dollar broadly falling against most of major currencies heading into the weekly close, the CAD is struggling to draw interest, underperforming most of its peers, gaining a fifth of a percent against the Greenback.
With the USD/CAD pushing into the middle on Friday, the pair is at risk of a pause on the daily candlesticks, hung out to dry in no man’s land below the 200-day Simple Moving Average (SMA) at the 1.3500 handle while the 50-day SMA accelerates into a downside crossover of the longer moving average.
USD/CAD Hourly Chart
USD/CAD Daily Chart
Canadian Dollar FAQs
What key factors drive the Canadian Dollar?
The key factors driving the Canadian Dollar (CAD) are the level of interest rates set by the Bank of Canada (BoC), the price of Oil, Canada’s largest export, the health of its economy, inflation and the Trade Balance, which is the difference between the value of Canada’s exports versus its imports. Other factors include market sentiment – whether investors are taking on more risky assets (risk-on) or seeking safe-havens (risk-off) – with risk-on being CAD-positive. As its largest trading partner, the health of the US economy is also a key factor influencing the Canadian Dollar.
How do the decisions of the Bank of Canada impact the Canadian Dollar?
The Bank of Canada (BoC) has a significant influence on the Canadian Dollar by setting the level of interest rates that banks can lend to one another. This influences the level of interest rates for everyone. The main goal of the BoC is to maintain inflation at 1-3% by adjusting interest rates up or down. Relatively higher interest rates tend to be positive for the CAD. The Bank of Canada can also use quantitative easing and tightening to influence credit conditions, with the former CAD-negative and the latter CAD-positive.
How does the price of Oil impact the Canadian Dollar?
The price of Oil is a key factor impacting the value of the Canadian Dollar. Petroleum is Canada’s biggest export, so Oil price tends to have an immediate impact on the CAD value. Generally, if Oil price rises CAD also goes up, as aggregate demand for the currency increases. The opposite is the case if the price of Oil falls. Higher Oil prices also tend to result in a greater likelihood of a positive Trade Balance, which is also supportive of the CAD.
How does inflation data impact the value of the Canadian Dollar?
While inflation had always traditionally been thought of as a negative factor for a currency since it lowers the value of money, the opposite has actually been the case in modern times with the relaxation of cross-border capital controls. Higher inflation tends to lead central banks to put up interest rates which attracts more capital inflows from global investors seeking a lucrative place to keep their money. This increases demand for the local currency, which in Canada’s case is the Canadian Dollar.
How does economic data influence the value of the Canadian Dollar?
Macroeconomic data releases gauge the health of the economy and can have an impact on the Canadian Dollar. Indicators such as GDP, Manufacturing and Services PMIs, employment, and consumer sentiment surveys can all influence the direction of the CAD. A strong economy is good for the Canadian Dollar. Not only does it attract more foreign investment but it may encourage the Bank of Canada to put up interest rates, leading to a stronger currency. If economic data is weak, however, the CAD is likely to fall.
- DXY Index retreats after the latest string of US data, holds onto weekly gains
- United States NFP from December were higher than expected, as well as Average Hourly Earnings, while Unemployment Rate stood at 3.7%.
- The Services ISM PMI from the same month disappointed.
The US Dollar (USD), represented by the Dollar Index, is currently trading just above 102.00, showing a downtick of 0.30% due to the markets adjusting dovish bets post the release of December’s Nonfarm Payrolls (NFP) and the ISM PMIs.
From indications in the last 2023 Federal Reserve meeting, a dovish stance was apparent. The Fed expressed comfort with cooling inflation and projected no rate hikes until 2024, suggesting 75 bps of easing. As for now, market predictions hint towards a rate cut in March followed by another in May, and such a position signals a bearish climate for the US Dollar, as lower interest rates might drive liquid capital to higher yield markets.
Daily digest market movers: US Dollar under downward pressure despite strong NFP, ISM PMI weighs
- The ISM Services PMI for December came in at 50.6, missing the consensus of 52.6 and lower than the previous figure of 52.7.
- December's Average Hourly Earnings saw a monthly increase of 0.4%, outpacing the consensus of 0.3% and matching the previous figure.
- December Unemployment Rate remained steady at 3.7%, lower than the 3.8% expected.
- The Nonfarm Payrolls report surpassed expectations with the addition of 216,000 jobs, beating the 170,000 job consensus and the previous 173,000 figure.
- Despite the strong labor figures, markets seem to be weighting in more poor ISM figures and rushed to bet on a less aggressive Fed.
- Fed predictions suggest no hike is anticipated for the January meeting, with only a 15% probability of a rate cut. The market consensus now points toward the likelihood of rate cuts in both March and May of 2024, with the odds of the easing cycle starting in the third month at 70%.
Technical Analysis: DXY index seller’s momentum resumes as bulls give up
The Relative Strength Index (RSI) is charting a negative slope in the negative territory, suggesting a bearish trend prevalent in the DXY. Selling momentum seems to have a stronger hold, reflecting the downward drift of the RSI.
The Moving Average Convergence Divergence (MACD) is showing rising red bars, implying that negative momentum is gradually escalating, further reinforcing the bearish outlook.
In regards to the Simple Moving Averages (SMAs), the index is struggling around the 20-day SMA and is still below the longer-term 100, and 200-day SMAs. indicating that on the broader context, the sellers are comfortably in command.
In conclusion, the indicators on the daily chart reflect a dominant bearish force in the short term, amplified by the repeated indication of the bulls losing ground and failing to hold the traction gained in the last session. This suggests there may be more downward movements on the horizon.
Support levels: 101.80, 101.70, 101.50.
Resistance levels: 102.15 (20-day SMA), 102.50, 103.00.
US Dollar FAQs
What is the US Dollar?
The US Dollar (USD) is the official currency of the United States of America, and the ‘de facto’ currency of a significant number of other countries where it is found in circulation alongside local notes. It is the most heavily traded currency in the world, accounting for over 88% of all global foreign exchange turnover, or an average of $6.6 trillion in transactions per day, according to data from 2022.
Following the second world war, the USD took over from the British Pound as the world’s reserve currency. For most of its history, the US Dollar was backed by Gold, until the Bretton Woods Agreement in 1971 when the Gold Standard went away.
How do the decisions of the Federal Reserve impact the US Dollar?
The most important single factor impacting on the value of the US Dollar is monetary policy, which is shaped by the Federal Reserve (Fed). The Fed has two mandates: to achieve price stability (control inflation) and foster full employment. Its primary tool to achieve these two goals is by adjusting interest rates.
When prices are rising too quickly and inflation is above the Fed’s 2% target, the Fed will raise rates, which helps the USD value. When inflation falls below 2% or the Unemployment Rate is too high, the Fed may lower interest rates, which weighs on the Greenback.
What is Quantitative Easing and how does it influence the US Dollar?
In extreme situations, the Federal Reserve can also print more Dollars and enact quantitative easing (QE). QE is the process by which the Fed substantially increases the flow of credit in a stuck financial system.
It is a non-standard policy measure used when credit has dried up because banks will not lend to each other (out of the fear of counterparty default). It is a last resort when simply lowering interest rates is unlikely to achieve the necessary result. It was the Fed’s weapon of choice to combat the credit crunch that occurred during the Great Financial Crisis in 2008. It involves the Fed printing more Dollars and using them to buy US government bonds predominantly from financial institutions. QE usually leads to a weaker US Dollar.
What is Quantitative Tightening and how does it influence the US Dollar?
Quantitative tightening (QT) is the reverse process whereby the Federal Reserve stops buying bonds from financial institutions and does not reinvest the principal from the bonds it holds maturing in new purchases. It is usually positive for the US Dollar.
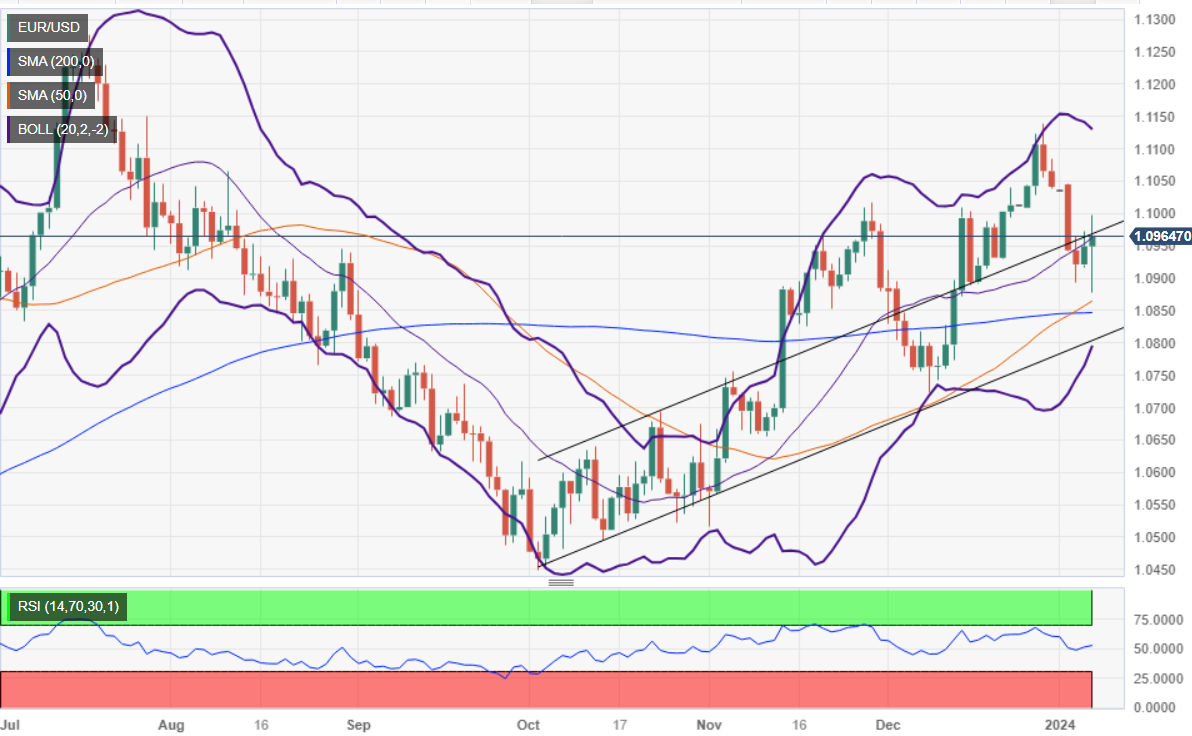
- EUR/USD climbs to 1.0960, buoyed by solid US jobs report and sharp slowdown in ISM Services PMI.
- Eurozone inflation eases, sparking speculation about potential ECB rate adjustments and impacting EUR/USD dynamics.
- Pair's retreat to 1.0970 area follows profit-booking post-surge, as markets digest varied economic indicators.
The EUR/USD rallied to a three-day high on Friday after the latest US jobs data announced by the US Bureau of Labor Statistics (BLS) was solid, sponsoring a dive to a new three-week low at 1.0876. Recently, the ISM Services PMI in December slowed sharply, clinging to expansionary territory, sponsoring a leg-up in the major, which is posting gains of more than 0.30%.
EUR/USD rallied towards 1.0998 after the release of the ISM Services PMI
The US Bureau of Labor Statistics (BLS) revealed the economy added 216K, as depicted by December’s Nonfarm Payrolls data, while the Unemployment Rate cooled from 3.8% to 3.7%. Digging a little deep in the data, Average Hourly Earnings rose to 4.1% YoY from 3.9%. After the data, the EUR/USD climbed to 1.0960.
Lately, the Institute for Supply Management (ISM) revealed that the Non-Manufacturing PMI cooled from 52.7 to 50.6, its lowest reading since May 2023, blamed by a drop in a measure of employment plummeting to its lowest level in 3 and a half years. The ISM Services Employment Index dropped from 50.7 to 43.3. That sponsored the EUR/USD most recent leg-up towards its daily high of 1.0998, but traders booked profits, with the pair retreating toward the 1.0970 area.
In the meantime, during the European session, inflation in the Eurozone (EU) jumped 2.9%, less than expectations of 3%. Core inflation decelerated from 3.6% to 3.4%, as estimated by analysts. The major dropped on speculations that the European Central Bank (ECB) would run out of excuses not to lower rates.
Next week’s economic calendar in the US will feature inflation data on the consumer and the producer side, along with the Initial Jobless Claims for the week ending on January 6.
EUR/USD Price Analysis: Technical outlook
The EUR/USD accelerated during the day but fell short of piercing the 1.1000 figure, sponsoring a pullback toward the 1.0960 area. The emergence of a golden cross suggests the pair is on a correction that could resume with the major testing the 1.1000 mark, followed by a test of a downslope resistance trendline drawn from April 2021 highs of 1,2260s, at around 1.1050. If cleared, buyers could lift the exchange rate to 1.1100. On the other hand, if sellers return, they could drag prices toward the 1.0900 figure, followed by the current year’s low of 1.0876.
Factory Orders in the US economy expanded by 2.6% in November from a month earlier, reported the US Census Bureau. The reading came in above prior expectations and reversed October’s 3.4% decline (revised from -3.6%).
Market reaction
The USD Index (DXY) extends its corrective decline, as investors keep digesting the recently published Nonfarm Payrolls. The steep pullback forces the index to breach the key 102.00 support.
According to US Treasury Secretary Yellen, she stated that the pessimism regarding the economy had been proven unwarranted.
She noted that certain surveys were starting to indicate increased optimism among Americans.
Yellen described the current situation as a "soft landing", indicating that there was no substantial impact on energy prices from the disruptions in Red Sea shipping.
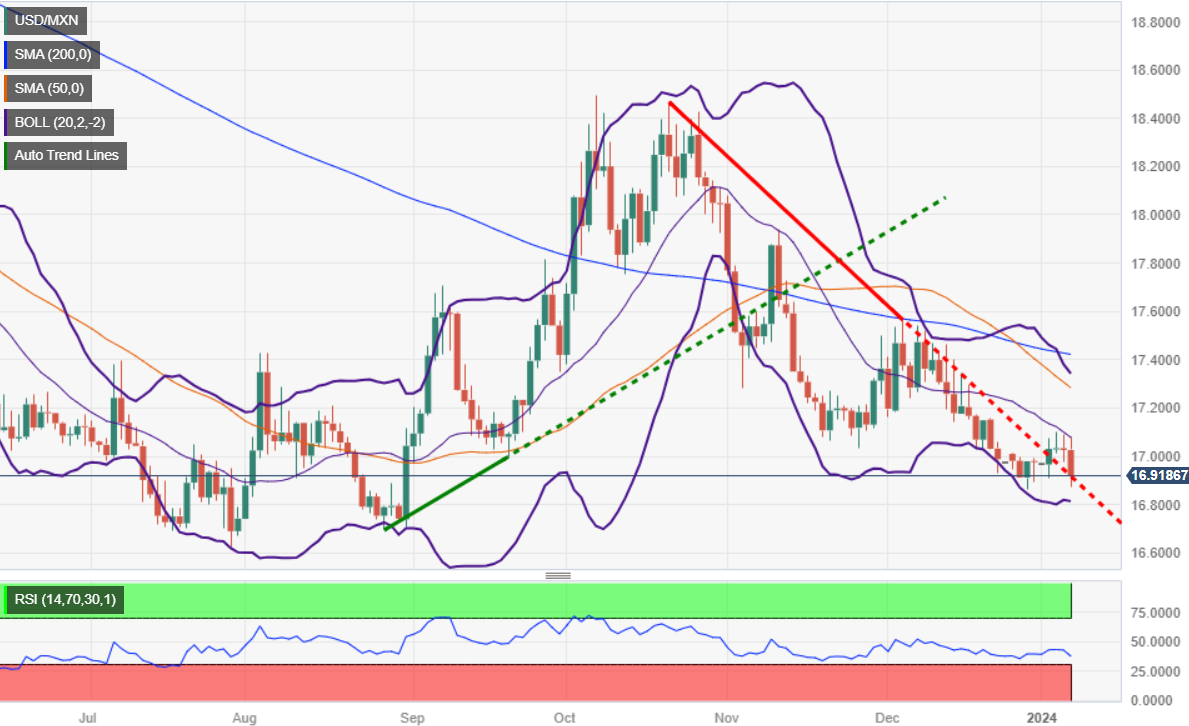
- Mexican Peso gains against USD, with USD/MXN falling to 16.93 after US jobs data shows higher-than-expected employment growth.
- Banxico's recent minutes highlight ongoing inflation challenges, affirming the need for stable interest rates.
- US Treasury yields rise as market expectations for Fed rate cuts in 2024 adjust to 135 basis points.
The Mexican Peso (MXN) stages a comeback and registers a new three-day high against the US Dollar (USD) after the US Bureau of Labor Statistics (BLS) revealed the economy in the United States (US) added more jobs than expected in December. Even though the USD/MXN initial reaction witnessed the pair hitting a daily high of 17.07, it quickly reversed, tumbling below the 17.00 figure. At the time of writing, the exotic pair is exchanging hands at 16.93, posting losses of 0.45% on the day.
Mexico’s economic docket is absent on Friday, but the release of the latest Bank of Mexico (Banxico) minutes on Thursday suggested the inflationary scenario in the country poses challenges, which is why it sees it necessary to maintain rates at current levels “for a certain time.”
Aside from this, the December US Nonfarm Payrolls report triggered reactions in the financial markets, with traders expecting just 135 basis points (bps) of rate cuts by the US Federal Reserve (Fed) throughout 2024, lower than the 150 bps estimated at the beginning of the week. Therefore, the US 10-year Treasury bond yield climbed above 4% for the third time in the week.
Daily digest market movers: Mexican Peso remains firm extending its gains against the US Dollar
- US Nonfarm Payrolls in December increased by 216K, exceeding forecasts of 170K, though figures from November were downwardly revised from 199K to 173K.
- The Unemployment Rate edged lower from 3.8% to 3.7%, while Average Hourly Earnings YoY rose from 3.9% to 4.1%.
- Most analysts see the December US employment report maintaining a goldilocks scenario, as the Greenback dives after printing a new three-week high at 103.10, as shown by the US Dollar Index (DXY). At the time of writing, the DXY sits at 102.45 almost flat.
- Banxico’s latest meeting minutes suggest the central bank could begin taking into consideration easing monetary policy, but with a cautious approach. Four members of the Governing Council expressed the need to be careful when evaluating or communicating rate cuts. On the other hand, one member said they could begin discussing rate cuts.
- Most of Mexico’s central bank members expressed that inflation’s outlook continues to pose challenges.
- At its December meeting, Banxico kept rates unchanged at 11.25%.
- The Federal Reserve’s latest meeting minutes indicated that most officials believe interest rates are approaching or have reached their peak. However, they noted uncertainty regarding the duration for which the restrictive policy should be sustained. Despite observing some improvements in inflation, they acknowledged that core services prices remain high. It was also mentioned that some policymakers might favor maintaining the current interest rates longer than initially expected.
- On Tuesday, Mexico’s S&P Global Manufacturing PMI for December came out at 52.0, below November’s 52.5, suggesting the economy is slowing down amid Banxico’s tightening cycle.
- On Wednesday, Business Confidence in Mexico improved to 54.6 from 54.0 in November, although it failed to underpin the Mexican Peso, which remained weak during the session.
Technical analysis: Mexican Peso buyers moved in after US jobs report as USD/MXN dives
The USD/MXN resumed its downtrend on Friday and plunged below 17.00. It accelerated its pace to test December’s lowest point seen at 16.86, which, if cleared, could pave the way to challenge last year's cycle low of 16.62.
On the flip side, if sentiment shifts bullish on the US Dollar, the exotic pair could reclaim the 17.00 figure, followed by the 17.05 mark. A breach of the latter will expose the 17.20 figure, followed by the convergence of the 50, 100, and 200-day Simple Moving Averages (SMAs) at the 17.31/42 area.
Also read: Mexican Peso Price Annual Forecast: Which factor would impact most in 2024, economics or politics?
USD/MXN Price Action - Daily Chart
Mexican Peso FAQs
What key factors drive the Mexican Peso?
The Mexican Peso (MXN) is the most traded currency among its Latin American peers. Its value is broadly determined by the performance of the Mexican economy, the country’s central bank’s policy, the amount of foreign investment in the country and even the levels of remittances sent by Mexicans who live abroad, particularly in the United States. Geopolitical trends can also move MXN: for example, the process of nearshoring – or the decision by some firms to relocate manufacturing capacity and supply chains closer to their home countries – is also seen as a catalyst for the Mexican currency as the country is considered a key manufacturing hub in the American continent. Another catalyst for MXN is Oil prices as Mexico is a key exporter of the commodity.
How do decisions of the Banxico impact the Mexican Peso?
The main objective of Mexico’s central bank, also known as Banxico, is to maintain inflation at low and stable levels (at or close to its target of 3%, the midpoint in a tolerance band of between 2% and 4%). To this end, the bank sets an appropriate level of interest rates. When inflation is too high, Banxico will attempt to tame it by raising interest rates, making it more expensive for households and businesses to borrow money, thus cooling demand and the overall economy. Higher interest rates are generally positive for the Mexican Peso (MXN) as they lead to higher yields, making the country a more attractive place for investors. On the contrary, lower interest rates tend to weaken MXN.
How does economic data influence the value of the Mexican Peso?
Macroeconomic data releases are key to assess the state of the economy and can have an impact on the Mexican Peso (MXN) valuation. A strong Mexican economy, based on high economic growth, low unemployment and high confidence is good for MXN. Not only does it attract more foreign investment but it may encourage the Bank of Mexico (Banxico) to increase interest rates, particularly if this strength comes together with elevated inflation. However, if economic data is weak, MXN is likely to depreciate.
How does broader risk sentiment impact the Mexican Peso?
As an emerging-market currency, the Mexican Peso (MXN) tends to strive during risk-on periods, or when investors perceive that broader market risks are low and thus are eager to engage with investments that carry a higher risk. Conversely, MXN tends to weaken at times of market turbulence or economic uncertainty as investors tend to sell higher-risk assets and flee to the more-stable safe havens.
- US ISM Services PMI for December came in below the market expectation.
- US Dollar Index stays deep in negative territory near 102.00.
Business activity in the US service sector continued to expand in December, albeit at a softer pace than November, with the ISM Services PMI declining to 50.6 from 52.7. This reading came in below the market expectation of 52.6.
Further details of the survey showed that the Prices Paid Index, the inflation component, edged slightly lower to 57.4 from 58.3, while the Employment Index dropped sharply to 43.3 from 50.7. Finally, the New Orders Index retreated to 52.8 from 55.5.
Commenting on the data, “the services sector had a slight uptick in growth in November, attributed to the increase in business activity and slight employment growth," said Anthony Nieves, Chair of the Institute for Supply Management (ISM) Services Business Survey Committee. "Respondents’ comments vary by both company and industry. There is continuing concern about inflation, interest rates and geopolitical events. Rising labor costs and labor constraints remain employment-related challenges."
Market reaction
The US Dollar Index continued to push lower after this data and was last seen losing 0.4% on the day at 102.00.
- Silver price recovers US NFP-inspired losses as US Dollar turns volatile.
- All components of the US NFP such as: labor demand, jobless rate and labor cost were surprisingly upbeat.
- 10-year US Treasury yields cling to gains around 4.06%.
Silver price (XAG/USD) rebounds after a sharp sell-off from $22.70 despite the United States Bureau of Labor Statistics (BLS) has reported an upbeat Nonfarm Payrolls (NFP) data for December. Number of jobs created in December were 216K, higher than the expectations of 170K and revised former reading of 173K.
The Unemployment Rate remains unchanged at 3.7% while market participants anticipated it higher at 3.8%. Wages are surprisingly accelerated to 4.1% as investors projected annual Average Hourly Earnings slowing to 3.9% against 4.0% growth earlier. Monthly wages grew at a steady pace of 0.4% against expectations of 0.3%.
Each parameter of the US NFP report has remained stronger than expectations, which has lightened bets in favour of rate cuts by the Federal Reserve (Fed) from March. As per the CME Fedwatch tool, chances of a rate cut decision in March monetary policy meeting have dropped sharply to 51% from 62% after the release of the official US employment data.
The S&P500 is expected to open on a flat-to-negative note considering overnight futures. The US Dollar Index (DXY) has fallen sharply after failing to sustain recovery to three-week high of 103.00 while 10-year US Treasury yields remain higher at 4.06%.
Silver technical analysis
Silver price has been in the bearish trajectory after a breakdown of the Head and Shoulder chart pattern formed on a four-hour scale. The Relative Strength index (RSI) (14) has shifted into the bearish range of 20.00-40.00, which indicates that a bearish momentum is intact.
Silver four-hour chart
-638400615928220686.png)
According to Statistics Canada, the Employment Change, that is the number of people currently employed, increased by a meagre 0.1K in the last month of 2023, coming in short of initial estimates.
Additionally, the Unemployment Rate held steady at 5.8%, Average Hourly Wages rose at an annualized 5.7% and Full Time employed individuals shrank by 23.5K. Finally, Part Time Employment Change increased by 23.6K people and the Participation Rate receded a tad to 65.4% (from 65.6%)
Market reaction
USD/CAD rose to a new two-week high just below the 1.3400 mark, also boosted by the firmer-than-expected US Nonfarm Payrolls (+216K).
- AUD/USD drops sharply below 0.6700 as investors turn cautious ahead of US labor market data.
- An upbeat US NFP report would impact higher prospects for early rate cuts by the Fed.
- The Australian Dollar will dance to the tunes of the monthly Retail Sales data.
The AUD/USD pair has witnessed a steep fall as investors have rushed towards safe-haven assets to safeguard themselves against escalating volatility ahead of the United States Nonfarm Payrolls (NFP) data, which will be published at 13:30 GMT. The Aussie asset has dropped below the crucial support of 0.6700 in the early New York session.
S&P500 futures have generated losses in the European session, portraying a dismal market mood. The US Dollar Index (DXY) has printed a fresh three-week high at 102.70. 10-year US Treasury yields have jumped to near 4.04%.
The release of the US NFP data is expected to trigger sheer volatility in the FX domain. Analysts at TD Securities TD Securities analysts said that they expect a steady 150,000–200,000 growth in payrolls for the third straight month. As per their forecasts the Unemployment Rate will rebound by a tenth after unexpectedly dropping to 3.7% in November. Wage growth likely printed 0.3% m/m.”
It is likely that an upbeat labor market report will challenge the narrative of ‘rate cuts by the Federal Reserve (Fed) from March’. The chances of an interest rate reduction from March have dropped recently as Fed policymakers have been emphasizing on keeping interest rates higher for a longer period.
On the Australian Dollar front, investors will focus on monthly Retail Sales for November, which will be published on Tuesday. As per the estimates, the consumer spending grew by 1.2% after contracting 0.2% in October. This may allow Reserve Bank of Australia (RBA) policymakers to stay with argument of keeping interest rates elevated for longer.
- The Swiss Franc trades flat against the Euro after inflation data shows a decline in some metrics but a rise in others.
- Annual inflation falls whilst price growth accelerated on a monthly basis.
- The overall trend for EUR/CHF remains bearish with the possibility of a correction higher in the short-term.
The Swiss Franc (CHF) traded flat against the Euro (EUR) on Friday after Eurozone inflation data painted a mixed picture in December. Whilst inflation came out below forecast on a year-on-year basis, it rose month-on-month.
European Central Bank (ECB) President Christine Lagarde adopted a hawkish stance at the last ECB meeting, saying inflation pressures remained too high for the Governing Council to consider cutting interest rates. The policy echoes that adopted by the Swiss National Bank (SNB), whose Chairperson Thomas Jordan also sidestepped questions about rate cuts during his press conference on the same day.
Lower interest rates are negative for a currency as they reduce foreign capital inflows.
Daily digest market movers: Swiss Franc trades flat versus Euro after mixed HICP data
- The Swiss Franc trades flat against the Euro at the end of the week, after mixed inflation data from the Eurozone.
- The Harmonized Index of Consumer Prices (HICP), the ECB’s preferred gauge of inflation, came out at 2.9% in December on a year-on-year basis.
- This was lower than the 3.0% estimated by economists but higher than the previous year’s 2.4%.
- Core HICP also undershot expectations, registering a 3.4% gain versus the 3.5% expected and 3.6% previous.
- On a month-on-month basis, however, Core HICP showed a rise of 0.4% against the 0.6% decline in November.
- Headline HICP rose by 0.2% MoM after registering a 0.6% decline in November.
- The so-called factory gate prices, which are measured by the Producer Price Index, showed a 0.3% decline in December on month, when a fall of 0.1% had been forecast. This was also lower than the 0.3% gain of November.
Swiss Franc technical analysis: EUR/CHF in firm downtrend but with risks of a correction higher
EUR/CHF – the number of Swiss Francs that one Euro can buy – shows a small recovery this week despite the overall bearish tenor of the chart.
The pair is arguably in a downtrend on all major time frames – long, intermediate and short-term charts. This overall bearish bias pushes the odds in favor of more downside in the future.
-638400549780240167.png)
Euro vs Swiss Franc: Weekly Chart
If EUR/CHF breaks below the 0.9254 lows it will likely continue falling to the next support level at the 0.9200 round number. A break below that will then usher in further weakness to 0.9100.
Several factors have emerged, however, which suggest the possibility of a correction higher happening first.
The pair has reached the oversold zone on the Relative Strength Index (RSI) which classically means short-holders should not add to their positions. If RSI exits oversold, rising back above 30, it will be a sign the pair will rise and for traders to buy.
Secondly, the pair has reached the lower trendline of a descending channel. This is likely to provide technical support to price and could be the springboard for a recovery back up towards the upper channel line at roughly 0.9500.
Nevertheless, the pair is below its three major Simple Moving Averages – the 50, 100 and 200 and continues making lower lows and lower highs, which suggests any recovery may be short lived before the dominant downtrend resumes.
Swiss Franc FAQs
What key factors drive the Swiss Franc?
The Swiss Franc (CHF) is Switzerland’s official currency. It is among the top ten most traded currencies globally, reaching volumes that well exceed the size of the Swiss economy. Its value is determined by the broad market sentiment, the country’s economic health or action taken by the Swiss National Bank (SNB), among other factors. Between 2011 and 2015, the Swiss Franc was pegged to the Euro (EUR). The peg was abruptly removed, resulting in a more than 20% increase in the Franc’s value, causing a turmoil in markets. Even though the peg isn’t in force anymore, CHF fortunes tend to be highly correlated with the Euro ones due to the high dependency of the Swiss economy on the neighboring Eurozone.
Why is the Swiss Franc considered a safe-haven currency?
The Swiss Franc (CHF) is considered a safe-haven asset, or a currency that investors tend to buy in times of market stress. This is due to the perceived status of Switzerland in the world: a stable economy, a strong export sector, big central bank reserves or a longstanding political stance towards neutrality in global conflicts make the country’s currency a good choice for investors fleeing from risks. Turbulent times are likely to strengthen CHF value against other currencies that are seen as more risky to invest in.
How do decisions of the Swiss National Bank impact the Swiss Franc?
The Swiss National Bank (SNB) meets four times a year – once every quarter, less than other major central banks – to decide on monetary policy. The bank aims for an annual inflation rate of less than 2%. When inflation is above target or forecasted to be above target in the foreseeable future, the bank will attempt to tame price growth by raising its policy rate. Higher interest rates are generally positive for the Swiss Franc (CHF) as they lead to higher yields, making the country a more attractive place for investors. On the contrary, lower interest rates tend to weaken CHF.
How does economic data influence the value of the Swiss Franc?
Macroeconomic data releases in Switzerland are key to assessing the state of the economy and can impact the Swiss Franc’s (CHF) valuation. The Swiss economy is broadly stable, but any sudden change in economic growth, inflation, current account or the central bank’s currency reserves have the potential to trigger moves in CHF. Generally, high economic growth, low unemployment and high confidence are good for CHF. Conversely, if economic data points to weakening momentum, CHF is likely to depreciate.
How does the Eurozone monetary policy affect the Swiss Franc?
As a small and open economy, Switzerland is heavily dependent on the health of the neighboring Eurozone economies. The broader European Union is Switzerland’s main economic partner and a key political ally, so macroeconomic and monetary policy stability in the Eurozone is essential for Switzerland and, thus, for the Swiss Franc (CHF). With such dependency, some models suggest that the correlation between the fortunes of the Euro (EUR) and the CHF is more than 90%, or close to perfect.
- USD/CAD has climbed to near 1.3380 as investors turn anxious ahead of US labor market data.
- The Unemployment Rate in the US and Canada in December is seen at 3.8% and 5.9% respectively.
- A decisive break above 23.6% Fibo retracement has improved appeal for the Loonie asset.
The USD/CAD pair prints a fresh two-week high near 1.3380 in the London session. The Loonie asset has witnessed a decent buying interest due to a sharp recovery in the US Dollar Index (DXY) amid cautious market mood ahead of the United States Nonfarm Payrolls (NFP) report.
As per the estimates, investors see 170K jobs being created in December against overall hiring of 199K in November. The Unemployment Rate is seen marginally higher at 3.8% vs. the former reading of 3.7%. The upbeat ADP Employment data, released on Thursday, has set a positive undertone for the labor growth.
An upbeat US NFP report is expected to trim prospects of rate cuts by the Federal Reserve (Fed) from March, knowing that higher job growth will keep the last leg of underlying inflation sticky ahead.
Meanwhile, the Canadian Dollar will also dance to the tunes of its domestic labor market data, which will be published at 13:30 GMT. Canada’s jobless rate is seen higher at 5.9% vs. the prior reading of 5.8%.
USD/CAD has climbed above the 23.6% Fibonacci retracement (plotted from 1 November 2023 high at 1.3900 to 27 December 2023 low at 1.3177) at 1.3350. Upward-sloping 50-period Exponential Moving Average (EMA), which trades around 1.3310 will continue to provide support to the US Dollar bulls.
The Relative Strength Index (RSI) (14) has shifted into the upside range of 60.00-80.00, which indicates that a bullish momentum has been triggered
Fresh buying would appear if the Loonie asset corrects marginally to the 23.6% Fibo retracement, which is around 1.3350. This will drive the asset towards December 18 high at 1.3410, followed by 38.2% Fibo retracement at 1.3453.
On the flip side, downside bias could stem if the pair drops below December 28 low of 1.3180. This would expose the asset to July 25 low near 1.3150, followed by July 13 low around 1.3193.
USD/CAD four-hour chart
-638400485168576155.png)
- Gold price faces pressure as investors focus on US labor market data.
- The Unemployment Rate is expected to remain within the Fed’s long-term projection of 3.8%.
- Robust US economic prospects may trim prospects of a Fed rate cut in March.
Gold price (XAU/USD) oscillates in a tight range around $2,040 as investors await the United States Nonfarm Payrolls (NFP) data for fresh cues. Other employment-related economic indicators such as ADP Employment Change and weekly jobless claims data, released on Thursday, outperformed expectations and have set a higher base for the official employment data. Market participants still anticipate moderate job gains, below 200K, as the pace of frequent job change by individuals has slowed due to easing labor demand.
Market participants have turned cautious about near-term demand for bullions as prospects in favour of rate cuts by the Federal Reserve (Fed) from March are gradually unwinding. Unlike other members of the Group of Seven economies that are struggling with high interest rates, the US economy is performing well on all parameters. This strength could allow the Fed to leave interest-rate cuts for the second quarter of this year.
Daily Digest Market Movers: Gold price remains sideways ahead of US NFP data
- Gold price trades back and forth slightly above $2,040 as investors await the United States official Employment data for December, which will be published at 13:30 GMT.
- US employers are expected to have hired 170K individuals against 199K in November. The Unemployment Rate is seen slightly higher at 3.8% vs. 3.7% recorded earlier, which is in-line with Federal Reserve’s projection for this year.
- Investors will keenly focus on the Average Hourly Earnings data, which has been a key catalyst to higher price pressures in the US economy. These are forecast to grow at a slower pace of 0.3% after rising 0.4% in November. Annual wage data is estimated to have softened slightly to 3.9% from prior growth of 4.0%.
- Soft labor demand and easing price pressure would elevate prospects of a dovish interest rate decision by the Fed from March. If the economic data turns out hotter-than-projected, Fed policymakers will get an argument in favour of keeping interest rates high for a longer period.
- As per the CME FedWatch tool, chances of an interest rate cut in March have dropped to 62.5%.
- Market participants are reconsidering bets supporting a rate-cut campaign from March as robust economic prospects for the US economy could imbed inflationary pressures above 2%.
- This week, the US ISM reported a strong rebound in Manufacturing PMI as firms remain optimistic about lower borrowing costs this year.
- Apart from the US NFP report, investors will focus on the ISM Services PMI, which will be published at 15:00 GMT. The Services PMI represents the service sector, which accounts for two-third of the US economy. It is seen slightly down at 52.6 against November’s reading of 52.7.
- Meanwhile, the US Dollar Index has printed a fresh three-week high near 102.80 as investor risk-appetite is easing swiftly. 10-year US Treasury Bond yields have climbed above 4% amid a cautious market mood.
Technical Analysis: Gold price trades inside previous day’s trading range
Gold price remains subdued in the European session as investors turn anxious ahead of the US labor market data. The downside in the precious metal seems restricted for now as the 20-day Exponential Moving Average (EMA) around $2,040 will continue to provide a cushion while the upside seems capped amid fading appeal for non-yielding assets.
The yellow metal trades inside Thursday’s trading range but a volatile action is highly anticipated after the release of the US economic data.
Gold FAQs
Why do people invest in Gold?
Gold has played a key role in human’s history as it has been widely used as a store of value and medium of exchange. Currently, apart from its shine and usage for jewelry, the precious metal is widely seen as a safe-haven asset, meaning that it is considered a good investment during turbulent times. Gold is also widely seen as a hedge against inflation and against depreciating currencies as it doesn’t rely on any specific issuer or government.
Who buys the most Gold?
Central banks are the biggest Gold holders. In their aim to support their currencies in turbulent times, central banks tend to diversify their reserves and buy Gold to improve the perceived strength of the economy and the currency. High Gold reserves can be a source of trust for a country’s solvency. Central banks added 1,136 tonnes of Gold worth around $70 billion to their reserves in 2022, according to data from the World Gold Council. This is the highest yearly purchase since records began. Central banks from emerging economies such as China, India and Turkey are quickly increasing their Gold reserves.
How is Gold correlated with other assets?
Gold has an inverse correlation with the US Dollar and US Treasuries, which are both major reserve and safe-haven assets. When the Dollar depreciates, Gold tends to rise, enabling investors and central banks to diversify their assets in turbulent times. Gold is also inversely correlated with risk assets. A rally in the stock market tends to weaken Gold price, while sell-offs in riskier markets tend to favor the precious metal.
What does the price of Gold depend on?
The price can move due to a wide range of factors. Geopolitical instability or fears of a deep recession can quickly make Gold price escalate due to its safe-haven status. As a yield-less asset, Gold tends to rise with lower interest rates, while higher cost of money usually weighs down on the yellow metal. Still, most moves depend on how the US Dollar (USD) behaves as the asset is priced in dollars (XAU/USD). A strong Dollar tends to keep the price of Gold controlled, whereas a weaker Dollar is likely to push Gold prices up.
- Annual HICP inflation in the Euro area climbed to 2.9% in December.
- EUR/USD stays in negative territory slightly above 1.0900.
Inflation in the Euro area, as measured by the change in the Harmonized Index of Consumer Prices, rose to 2.9% on a yearly basis in December from 2.4% in November. This reading came in slightly below the market expectation of 3%. On a monthly basis, HICP rose 0.2% as forecast.
The Core HICP, which excludes prices of volatile items such as energy and food, increased 0.4% in December but edged lower to 3.4% from 3.6% on a yearly basis.
Market reaction
EUR/USD stays on the back foot after the data and was last seen losing 0.3% on the day at 1.0910.
- EUR/GBP loses ground on weaker-than-expected November Sales data from Germany.
- German Retail Sales YoY and MoM declined by 2.4% and 2.5%, respectively.
- Improved UK credit and housing data might have supported the British Pound.
EUR/GBP has almost retraced its recent profits, losing ground near 0.8610 during the European session Friday. The Euro (EUR) lost ground against the British Pound (GBP) as German Retail Sales data for November revealed a drop in November sales of the German retail sector.
German Retail Sales (YoY) declined by 2.4% against the expected fall of 0.5% and 0.1% decline previously. The monthly sales dropped by 2.5% against the expected decline of 0.1%, swinging from the previous growth of 1.1%. Investors are expected to keep a close eye on the upcoming release of the preliminary Harmonized Index of Consumer Prices (HICP) data from the European Monetary Union. The anticipation is that the inflation data might show an increase, attributed to base effects. This could provide European Central Bank (ECB) policymakers with room to favor maintaining higher interest rates for an extended period.
The Pound Sterling (GBP) gained ground possibly on the recent credit and housing data released from the United Kingdom (UK). On Thursday, UK Consumer Credit showed that individuals’ borrowing rose to £2.005B in November from the previous £1.411B (Revised from £1.289B). On Friday, Halifax House Prices (MoM) for December rose by 1.1% from the previous growth of 0.6%.
The gloomy economic outlook in the United Kingdom could weigh on the British Pound (GBP). The Institute of Directors Economic Confidence Index survey adds weight to this concern, highlighting a continued decline in optimism among British directors about the country's economic prospects in the next 12 months. Corporate executives in the UK requested the Bank of England (BoE) to quickly lower interest rates, seeking support for the struggling economy.
- Silver meets with a fresh supply following an intraday uptick to the $23.20 area on Friday.
- The technical setup favours bearish traders and supports prospects for a further downfall.
- Any attempted recovery move might continue to attract fresh sellers and remain capped.
Silver (XAG/USD) struggles to capitalize on its modest intraday gains to the $23.20 region and retreats to the lower end of its daily range during the early part of the European session. The white metal currently trades around the $23.00 mark and for now, seems to have stalled its modest recovery from a three-week low touched on Thursday.
From a technical perspective, the recent sustained break below the very important 200-day Simple Moving Average (SMA) and a subsequent break through the $23.30 confluence was seen as a fresh trigger for bearish traders. Moreover, bearish oscillators on the daily chart are far from being in the oversold territory and suggest that the path of least resistance for the XAG/USD is to the downside.
That said, any further decline is more likely to find some support near the multi-week trough, around the $22.70 region set the previous day. Some follow-through selling, however, will reaffirm the negative bias and drag the XAG/USD further towards the December monthly swing low, around the mid-$22.00s, en route to the next relevant support near the $22.25 region and the $22.00 mark.
On the flip side, the aforementioned confluence support breakpoint around the $23.30 area, comprising the 100-day SMA and a multi-month-old ascending trend-line, might now act as an immediate strong barrier. Any further recovery could attract fresh sellers near the $23.55 zone and remain capped near the $23.80 horizontal barrier, which if cleared could lift the XAG/USD to the $24.00 mark.
Some follow-through buying will suggest that the recent corrective decline from the $24.60 region has run its course and push the XAG/USD further towards the $24.60 area (December 22 high). Bulls might eventually aim back towards reclaiming the $25.00 psychological mark.
Silver daily chart
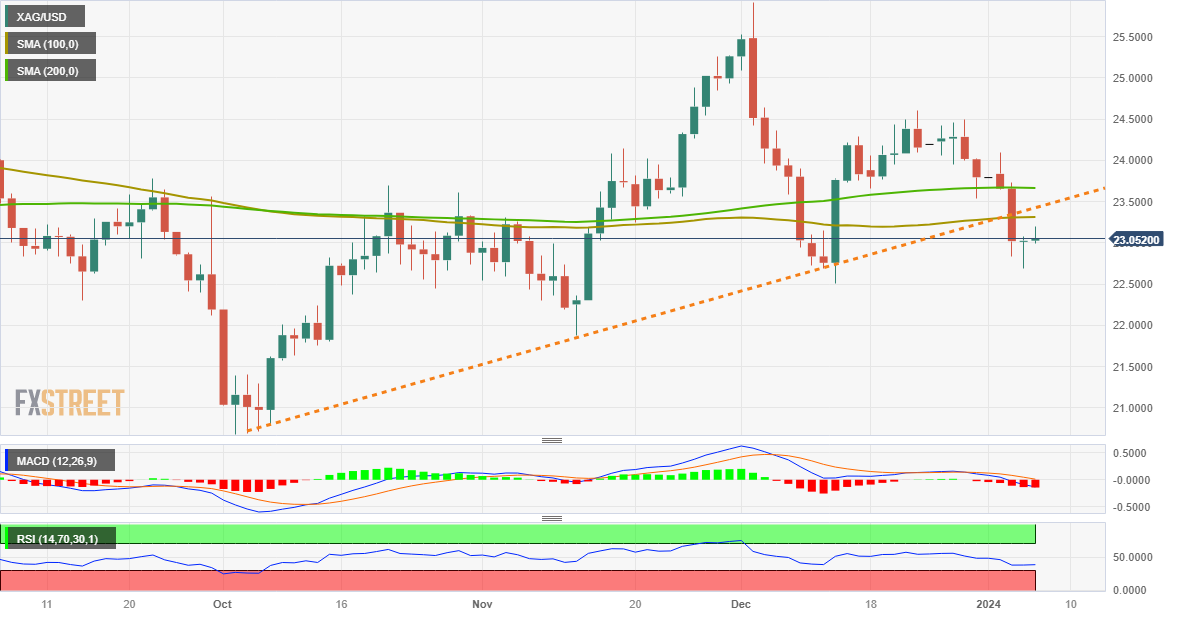
Technical levels to watch
FX option expiries for January 5 NY cut at 10:00 Eastern Time, via DTCC, can be found below.
- EUR/USD: EUR amounts
- 1.0870 411m
- 1.0900 558m
- 1.0940 954m
- 1.1075 1.8b
- USD/JPY: USD amounts
- 140.00 366m
- 141.00 554m
- 142.00 474m
- 143.00 670m
- 143.80 490m
- AUD/USD: AUD amounts
- 0.6600 453m
- 0.6775 409m
- USD/CAD: USD amounts
- 1.3300 630m
- USD/CHF: USD amounts
- 0.8750 471m
- 0.8935 421m
- EUR/USD retreats from 1.0950 amid caution ahead of US labor market data.
- The Eurozone HICP data is seen higher due to base effects.
- Eurozone bulls may find interest after further correction to near 1.0880.
The EUR/USD pair resumes its downside journey after a less-confident pullback to near 1.0950 in the early European session. The major currency pair faces selling pressure as the market mood has turned downbeat ahead of the United States labor market data.
S&P500 futures remain subdued in the Asian session, portraying caution among market participants ahead of crucial economic data.
The US Dollar Index (DXY) has rebounded to near 102.60 as prospects of interest rate reduction from the Federal Reserve (Fed) in March have dropped. Market participants are reconsidering expectations of rate cuts considering strong economic prospects of the US economy.
On the Eurozone front, investors await the preliminary Harmonized Index of Consumer Prices (HICP) data for December, which will be published at 10:00 GMT. The inflation data is seen higher due to base effects as it will allow European Central Bank (ECB) policymakers to favour higher interest rates for a longer period.
EUR/USD trades in a Rising Channel chart pattern on a four-hour scale in which each pullback is considered as a selling opportunity by the market participants. The asset is declining towards the lower portion of the aforementioned chart pattern. The major has corrected to near the 200-period Exponential Moving Average (EMA), which trades around 1.0913.
The Relative Strength Index (RSI) (14) has slipped into the bearish range of 20.00-40.00. A recovery move is highly likely as the broader appeal is upbeat and lower RSI (14) would be considered as oversold.
Fresh buying opportunity would emerge if the asset will correct further to the lower portion of Rising Channel around 1.0878. This would drive the asset towards December 20 low at 1.0930, followed by January 4 high at 1.0972.
On the flip side, downside would appear if the asset will drop below November 17 low at 1.0825. If the asset drops below the same, it will drop further to September 12 high at 1.0770 and December 8 low at 1.0728.
EUR/USD four-hour chart
-638400398551391379.png)
Gold prices fell in India on Friday, according to data from India's Multi Commodity Exchange (MCX).
Gold price stood at 62,395 Indian Rupees (INR) per 10 grams, down INR 171 compared with the INR 62,566 it costed on Thursday.
As for futures contracts, Gold prices decreased to INR 62,611 per 10 gms from INR 62,768 per 10 gms.
Prices for Silver futures contracts decreased to INR 72,389 per kg from INR 72,430 per kg.
| Major Indian city | Gold Price |
|---|---|
| Ahmedabad | 64,570 |
| Mumbai | 64,380 |
| New Delhi | 64,455 |
| Chennai | 64,540 |
| Kolkata | 64,540 |
Global Market Movers: Comex Gold price extends the range play ahead of the US NFP report
- Geopolitical risks, along with China's economic woes, continue to weigh on investors' sentiment and offer some support to the safe-haven Comex Gold price on Friday.
- The benchmark 10-year US Treasury yield holds steady near 4.0% amid reduced bets for multiple rate cuts by the Federal Reserve and caps the XAU/USD.
- Traders trimmed expectations on the number of rate cuts by the Fed in 2024 to four from six on Wednesday following the release of the upbeat US macro data.
- The Automatic Data Processing (ADP) reported on Thursday that US private-sector employers added 164K jobs in December as against 115K expected.
- Adding to this, a report published by the US Department of Labor (DOL) showed that Weekly Jobless Claims fell more than expected, to 202K last week.
- The US Dollar bulls, meanwhile, seem reluctant to place aggressive bets and prefer to wait for the release of the closely-watched official US monthly jobs data.
- The popularly known Nonfarm Payrolls (NFP) report is expected to show that the economy added 170K new jobs in December vs 199K in the previous month.
- The unemployment rate is anticipated to edge higher to 3.8% from 3.7%, while Average Hourly Earnings growth is seen easing to 3.9% YoY rate from 4.0% in November.
- The crucial employment figures could guide the Fed's near-term policy outlook, which will influence the USD and provide a fresh impetus to the non-yielding metal.
(An automation tool was used in creating this post.)
Gold FAQs
Why do people invest in Gold?
Gold has played a key role in human’s history as it has been widely used as a store of value and medium of exchange. Currently, apart from its shine and usage for jewelry, the precious metal is widely seen as a safe-haven asset, meaning that it is considered a good investment during turbulent times. Gold is also widely seen as a hedge against inflation and against depreciating currencies as it doesn’t rely on any specific issuer or government.
Who buys the most Gold?
Central banks are the biggest Gold holders. In their aim to support their currencies in turbulent times, central banks tend to diversify their reserves and buy Gold to improve the perceived strength of the economy and the currency. High Gold reserves can be a source of trust for a country’s solvency. Central banks added 1,136 tonnes of Gold worth around $70 billion to their reserves in 2022, according to data from the World Gold Council. This is the highest yearly purchase since records began. Central banks from emerging economies such as China, India and Turkey are quickly increasing their Gold reserves.
How is Gold correlated with other assets?
Gold has an inverse correlation with the US Dollar and US Treasuries, which are both major reserve and safe-haven assets. When the Dollar depreciates, Gold tends to rise, enabling investors and central banks to diversify their assets in turbulent times. Gold is also inversely correlated with risk assets. A rally in the stock market tends to weaken Gold price, while sell-offs in riskier markets tend to favor the precious metal.
What does the price of Gold depend on?
The price can move due to a wide range of factors. Geopolitical instability or fears of a deep recession can quickly make Gold price escalate due to its safe-haven status. As a yield-less asset, Gold tends to rise with lower interest rates, while higher cost of money usually weighs down on the yellow metal. Still, most moves depend on how the US Dollar (USD) behaves as the asset is priced in dollars (XAU/USD). A strong Dollar tends to keep the price of Gold controlled, whereas a weaker Dollar is likely to push Gold prices up.
- USD/MXN moves sideways amid improved US Dollar.
- US ADP Employment Change improved to 164K from 101K prior.
- US Initial Jobless Claims reduced to 202K from the previous 220K.
- The upbeat US bond yields reinforce the strength of the Greenback.
USD/MXN moves sideways after posting losses in the previous session, hovering near 17.01 during the European session on Friday. However, the US Dollar (USD) improves to near 102.60, recovering its recent losses with the help of improved US bond yields. Additionally, the better-than-expected labor data from the United States (US) underpinned the Greenback and limited its losses on Thursday.
At the time of writing, the 2-year and 10-year yields on US bond coupons stand lower at 4.39% and 4.01%, respectively. Moreover, ADP Employment Change added new jobs of 164K, more than the previous figure of 101K and the market's expectation of 115K. Additionally, Initial Jobless Claims for the week ending on December 29 reduced the number of claims of unemployment benefits to 202K from the previous 220K, exceeding the anticipated 216K.
Traders eagerly await the release of additional data from the US employment market to gain more cues on the nation's economic scenario. The spotlight is on key indicators such as Average Hourly Earnings and Nonfarm Payrolls (NFP) data for December.
On the other side, the recent moderate data might offer some relief to the Bank of Mexico (Banxico) by potentially reducing the pressure for an immediate interest rate reduction. With no data releases from Mexico this week, traders are looking ahead to next week's Consumer Confidence and Headline Inflation data for December. These forthcoming releases are expected to be pivotal in shaping market expectations and influencing Banxico's decisions regarding monetary policy.
- The Pound Sterling falls back as investors shift their focus to the US Nonfarm Payrolls data.
- While the UK manufacturing sector continues to face pressure, the services sector outperformed in December, according to PMI figures.
- The US Dollar Index recovers swiftly, fueled by upbeat US data.
The Pound Sterling (GBP) struggles for a firm footing on Friday, trading at around 1.2670 against the US Dollar in the early European session, as markets’ risk appetite gets sapped amid the uncertainty ahead of critical US economic data. The GBP/USD pair faces a sharp sell-off as the US Dollar recovers and investors see tough decisions ahead for Bank of England (BoE) policymakers, who are stuck between deepening recession risks in the UK economy and high underlying inflation.
The likelihood of a technical recession in the UK economy is high as it contracted in the third quarter and a stagnant performance is anticipated for the final quarter. Also, recent PMI data signaled that the manufacturing sector continues to face pain due to high interest rates.
Further action in the GBP/USD pair will be guided by the Nonfarm Payrolls data of the United States for December, which will be published at 13:30 GMT. The outlook for the GBP/USD pair could improve if the data showed that the US labor market is cooling further, although employment-related indicators such as ADP, job openings and jobless claims have come in better than expected.
Daily Digest Market Movers: Waiting for Nonfarm Payrolls
- The Pound Sterling has dropped to near 1.2670 against the US Dollar after correcting from a two-day high of 1.2730 amid caution ahead of the crucial United States official Employment data for December.
- Investors see moderate job gains in December. As per the consensus, US employers are expected to have added 170K workers against the 199K jobs created in November.
- The Unemployment Rate is seen edging up to 3.8% versus the former reading of 3.7% as labor market conditions have cooled down.
- Investors will also watch the pay growth data, which has been a major driver of inflation in the US economy.
- Investors anticipate Average Hourly Earnings to grow at a slower 0.3% pace in December against 0.4% in November on a monthly basis. The annual wage growth is seen decelerating to 3.9% against the prior reading of 4.0%.
- Bets in favour of a rate cut by the Federal Reserve in March are likely to escalate if labor market conditions soften more than projected.
- The US Dollar Index (DXY) has rebounded after discovering support near 102.20, supported by recent upbeat labor market data and as investors rush back to safe-haven assets ahead of US labor market data.
- Meanwhile, the Pound Sterling remains on the back foot as investors anticipate a mild recession in the United Kingdom. The country’s economy shrank by 0.1% in the third quarter of 2023.
- Bank of England policymakers remain on a balancing act as an early rate cut decision to skirt a recession could fuel inflationary pressures.
- While the UK’s manufacturing sector continues to remain in a contraction phase due to tough conditions in the domestic and overseas markets, the Services PMI – which gauges activity in the services sector – expanded at the fastest pace since June.
- S&P Global reported on Thursday that the Services PMI rose to 53.4 in December against expectations of 52.7 and the former reading of 50.9.
- A significant rise in client demand on hopes of lower borrowing costs and economic recovery in 2024 accelerated growth in service activities, S&P Global said.
Technical Analysis: Pound Sterling drops to near 1.2670
-638400379782658870.png)
The Pound Sterling falls sharply after failing to extend recovery above the crucial resistance of 1.2720. The GBP/USD pair is expected to find intermediate support near 1.2625, but this will result in a head and shoulder chart pattern formation on an intraday timeframe. A breakdown of the pattern would result in a fresh downside move towards the three-week low of 1.2500.
Broader strength in the GBP/USD pair has started fading as it is struggling to sustain above the 20-day Exponential Moving Average (EMA) at 1.2660. Momentum oscillators indicate a sideways performance ahead.
Pound Sterling FAQs
What is the Pound Sterling?
The Pound Sterling (GBP) is the oldest currency in the world (886 AD) and the official currency of the United Kingdom. It is the fourth most traded unit for foreign exchange (FX) in the world, accounting for 12% of all transactions, averaging $630 billion a day, according to 2022 data.
Its key trading pairs are GBP/USD, aka ‘Cable’, which accounts for 11% of FX, GBP/JPY, or the ‘Dragon’ as it is known by traders (3%), and EUR/GBP (2%). The Pound Sterling is issued by the Bank of England (BoE).
How do the decisions of the Bank of England impact on the Pound Sterling?
The single most important factor influencing the value of the Pound Sterling is monetary policy decided by the Bank of England. The BoE bases its decisions on whether it has achieved its primary goal of “price stability” – a steady inflation rate of around 2%. Its primary tool for achieving this is the adjustment of interest rates.
When inflation is too high, the BoE will try to rein it in by raising interest rates, making it more expensive for people and businesses to access credit. This is generally positive for GBP, as higher interest rates make the UK a more attractive place for global investors to park their money.
When inflation falls too low it is a sign economic growth is slowing. In this scenario, the BoE will consider lowering interest rates to cheapen credit so businesses will borrow more to invest in growth-generating projects.
How does economic data influence the value of the Pound?
Data releases gauge the health of the economy and can impact the value of the Pound Sterling. Indicators such as GDP, Manufacturing and Services PMIs, and employment can all influence the direction of the GBP.
A strong economy is good for Sterling. Not only does it attract more foreign investment but it may encourage the BoE to put up interest rates, which will directly strengthen GBP. Otherwise, if economic data is weak, the Pound Sterling is likely to fall.
How does the Trade Balance impact the Pound?
Another significant data release for the Pound Sterling is the Trade Balance. This indicator measures the difference between what a country earns from its exports and what it spends on imports over a given period.
If a country produces highly sought-after exports, its currency will benefit purely from the extra demand created from foreign buyers seeking to purchase these goods. Therefore, a positive net Trade Balance strengthens a currency and vice versa for a negative balance.
- NZD/USD consolidates post-recent losses ahead of US Nonfarm Payrolls data.
- The pair could surpass 0.6250 to test seven-day EMA at 0.6261.
- MACD suggests a shift toward bearish market sentiment.
NZD/USD moves sideways with a negative bias, hovering around 0.6230 during the early European trading hours on Friday. The technical indicator 14-day Relative Strength Index (RSI) is positioned above the 50 level, signaling a strong sentiment. This suggests that the NZD/USD pair could approach the 0.6250 major followed by the seven-day Exponential Moving Average (EMA) at 0.6261.
A breakthrough above the major level could influence the bulls of the NZD/USD pair to approach the psychological region around 0.6300 level followed by the weekly high at 0.6329 and the major resistance at 0.6350 level.
On the downside, the NZD/USD pair could find immediate support at the 0.6200 psychological level. A break below the latter could put pressure on the pair to navigate the 38.2% Fibonacci retracement at 0.6167 level followed by the major support at 0.6150 level.
The technical analysis points toward a potential shift in sentiment for the NZD/USD pair. The placement of the Moving Average Convergence Divergence (MACD) line above the centerline, along with divergence below the signal line, signals a possible move toward a bearish sentiment. Traders are likely to keep a close eye on this lagging indicator and may await further confirmation before making trading decisions.
NZD/USD: Daily Chart:
-638400376294621660.png)
Here is what you need to know on Friday, January 5:
Following Thursday's indecisive action, the US Dollar (USD) started to gather strength against its major rivals early Friday. Eurostat will release the December Harmonized Index of Consumer Prices data, the European Central Bank's (ECB) preferred gauge of inflation, for the Euro area. Later in the day, December jobs report, which will include Nonfarm Payrolls and wage inflation figures, and ISM Services PMI will be featured in the US economic docket.
US NFP Forecast: Nonfarm Payrolls expected to grow below 200K in December for third straight month.
The data from the US showed on Thursday that employment in the private sector rose by 164,000 in December, surpassing the market expectation for an increase of 115,000. Additionally, the Department of Labor reported that there were 202,000 first time applications for unemployment benefits in the week ending December 30, down from 220,000 in the previous week. The benchmark 10-year US Treasury bond yield climbed above 4% after these data and the USD Index erased earlier losses to close the day virtually unchanged. Early Friday, the 10-year yield holds steady above 4% and the USD Index clings to modest gains above 102.50.
US Dollar price this week
The table below shows the percentage change of US Dollar (USD) against listed major currencies this week. US Dollar was the strongest against the Japanese Yen.
| USD | EUR | GBP | CAD | AUD | JPY | NZD | CHF | |
| USD | 1.16% | 0.49% | 0.89% | 1.79% | 2.92% | 1.56% | 1.28% | |
| EUR | -1.01% | -0.51% | -0.12% | 0.80% | 1.78% | 0.58% | 0.20% | |
| GBP | -0.50% | 0.51% | 0.42% | 1.28% | 2.52% | 1.08% | 0.70% | |
| CAD | -0.90% | 0.09% | -0.23% | 0.87% | 2.03% | 0.65% | 0.32% | |
| AUD | -1.81% | -0.78% | -1.30% | -0.90% | 0.98% | -0.21% | -0.57% | |
| JPY | -2.99% | -1.78% | -2.48% | -1.87% | -0.97% | -1.21% | -1.82% | |
| NZD | -1.60% | -0.58% | -1.10% | -0.69% | 0.23% | 1.22% | -0.36% | |
| CHF | -1.21% | -0.20% | -0.71% | -0.29% | 0.61% | 1.71% | 0.38% |
The heat map shows percentage changes of major currencies against each other. The base currency is picked from the left column, while the quote currency is picked from the top row. For example, if you pick the Euro from the left column and move along the horizontal line to the Japanese Yen, the percentage change displayed in the box will represent EUR (base)/JPY (quote).
EUR/USD registered small gains on Thursday but failed to gather recovery momentum during the Asian trading hours on Friday. At the time of press, the pair was trading in negative territory below 1.0950. Germany's Destatis reported early Friday that Retail Sales declined by 2.5% on a monthly basis in November, following the 1.1% increase recorded in October. Annual HICP inflation in the Euro area is forecast to rise to 3% from 2.4% in November.
GBP/USD climbed above 1.2700 on Thursday but retraced its daily rally in the American session to close below 1.2700. The pair stays on the back foot early Friday and retreats toward 1.2650.
The data from Japan showed that the Consumer Confidence Index improved to 37.2 in December from 36.1 in November. Other data revealed that the Jibun Bank Services PMI was 51.5 in December, slightly below the flash estimate of 52. USD/JPY extended its uptrend and climbed above 145.00 for the first time in three weeks on Friday.
Gold lost its traction after testing $2,050 on Thursday and retreated to the $2,040 area. With the 10-year yield clinging to its weekly gains, XAU/USD finds it difficult to stage a rebound early Friday.
- USD/CHF continues to gain mild profits as the US Dollar retraces its recent losses.
- The prevailing risk-off mood, driven by expected sluggish global growth, supports the Greenback.
- Traders await pivotal Swiss Inflation and Real Retail Sales data to gain further impetus on the economic scenario.
USD/CHF extends its gains on the second consecutive session on improved US Dollar (USD), which could be attributed to the risk-off mood due to the expected sluggish global growth at the end of 2024. The US Dollar Index (DXY) cheers on the improvement in US Treasury yields. Moreover, on Thursday, the upbeat labor data from the United States (US) supported the buck to limit its losses. The USD/CHF pair trades near 0.8500 during the Asian session on Friday.
The employment landscape in the US for December showcased a notable upswing, with the ADP Employment Change revealing a substantial addition of 164K new positions, exceeding both the previous figure of 101K and the market's expectation of 115K. Furthermore, Initial Jobless Claims for the week ending on December 29 displayed a reduction in claims of unemployment benefits, decreasing to 202K from the previous 220K, surpassing the anticipated 216K. The market is on edge as traders eagerly await the release of further data from the US employment market. The focus is particularly on crucial indicators like Average Hourly Earnings and Nonfarm Payrolls (NFP) data for December.
On the other side, the Swiss Franc (CHF) appears to have experienced a limitation in losses, a trend that could be attributed to intervention in the foreign exchange market by the Swiss National Bank (SNB). Furthermore, the release of the SVME Manufacturing Purchasing Managers Index (PMI) for December on Wednesday showed an improvement, with the figure rising to 43 from the previous 42.1. The positive shift in business conditions within the manufacturing sector might be influencing the buying sentiment surrounding the Swiss Franc (CHF).
Traders await pivotal data releases from Switzerland, including the Consumer Price Index and Real Retail Sales, which are scheduled to be unveiled on Monday. These releases can serve as important indicators of Swiss economic health and may influence market sentiments, guiding trading decisions in the USD/CHF pair.
- US Nonfarm Payrolls are forecast to rise by 170K in December after November’s 199K increase.
- The US jobs report could influence the market pricing of the Fed rate outlook and the US Dollar valuation.
- The United States employment data will be released by the Bureau of Labor Statistics at 13:30 GMT.
The high-impact Nonfarm Payrolls (NFP) data from the United States (US) will be published by the Bureau of Labor Statistics (BLS) on Friday at 13:30 GMT.
What to expect in the next Nonfarm Payrolls report?
The US labor market report is expected to show that the economy created 170,000 jobs in the last month of 2023, down from a job addition of 199,000 in November. The Unemployment Rate is seen ticking up to 3.8%. A closely-watched measure of wage inflation, Average Hourly Earnings, is forecast to retreat to 3.9% in the year through December, a tad down from the 4% increase registered in November.
The US labor market data is crucial to the US Federal Reserve (Fed) interest rate outlook for 2024, and thus it could have a significant impact on the US Dollar (USD) valuation.
Amidst cooling inflation in the US, markets price in that the Fed is done with its tightening cycle, expecting interest rate cuts as early as March. The probability for a March Fed rate cut currently stands about 65%, according to CME Group’s FedWatch Tool.
Fed rate cut bets rose substantially after the Fed’s revised Summary of Economic Projections (SEP) showed in December that policymakers forecasted a total of 75 basis points reduction in the policy rate. Moreover, Fed Chairman Jerome Powell acknowledged that officials have started to talk about when it will be appropriate to cut the policy rate. Powell further added that they are very focused on “not making the mistake of keeping rates too high too long.” Regarding the labor market conditions, “job gains have moderated but remain strong and the unemployment rate remains low," the Fed said in the policy statement.
On a hawkish note, Chicago Fed President Austan Goolsbee and Cleveland Fed President Loretta Mester both argued in late December that the markets have gotten ahead of themselves on likely interest rate cuts. These comments, however, did little to nothing to alter the expectations of a March rate reduction.
Previewing December jobs report, TD Securities analysts said that they expect a steady 150,000–200,000 growth in Nonfarm Payrolls for the third straight month and added:
“We anticipate continued weakness in the information/tech and finance sectors, while government jobs likely stayed perky. We also look for the Unemployment Rate to rebound by a tenth after unexpectedly dropping to 3.7% in Nov. Wage growth likely printed 0.3% m/m.”
Meanwhile, private sector employment in the US rose by 164,000 in December and annual pay was up 5.4%, data published by Automatic Data Processing (ADP) showed on Thursday.
How will US November Nonfarm Payrolls affect EUR/USD?
The Nonfarm Payrolls, a significant indicator of the US labor market, will be published at 13:30 GMT. EUR/USD gained more than 1% in December and touched its highest level since July at 1.1140 before staging a technical correction to begin 2024. The US employment data could trigger a big reaction and help investors determine the next directional bias for the main currency pair.
An encouraging NFP headline print, between 200,000 and 250,000, combined with an elevated wage inflation reading could prompt investors to reassess Fed rate cut bets, adding legs to the ongoing US Dollar recovery while weighing on EUR/USD. Conversely, the USD could come under renewed selling pressure should the data disappoint and affirm dovish Fed prospects. Given the market positioning, however, a USD sell-off on a weak NFP figure could remain short-lived.
Eren Sengezer, Analyst at FXStreet, offers a brief technical outlook for EUR/USD:
“EUR/USD faces immediate support at 1.0930-1.0920, where the Fibonacci 50% retracement level of the latest uptrend and the 200-day Simple Moving Average (SMA) are located. In case the pair starts using that area as resistance, technical sellers could remain interested. In this scenario, 1.0880 (Fibonacci 61.8% retracement) and 1.0830 (static level) could be set as the next bearish targets.
On the upside, 1.0970-1.0980 (100-day SMA, Fibonacci 38.2% retracement) aligns as immediate resistance ahead of 1.1020-1.1030 (20-day SMA, Fibonacci 23.6% retracement) and 1.1120 (end-point of the latest uptrend).”
Economic Indicator
United States Nonfarm Payrolls
The Nonfarm Payrolls release presents the number of new jobs created in the US during the previous month in all non-agricultural businesses; it is released by the US Bureau of Labor Statistics (BLS). The monthly changes in payrolls can be extremely volatile. The number is also subject to strong reviews, which can also trigger volatility in the Forex board. Generally speaking, a high reading is seen as bullish for the US Dollar (USD), while a low reading is seen as bearish, although previous months' reviews and the Unemployment Rate are as relevant as the headline figure. The market's reaction, therefore, depends on how the market assesses all the data contained in the BLS report as a whole.
Read more.Next release: 01/05/2024 13:30:00 GMT
Frequency: Monthly
Source: US Bureau of Labor Statistics
Why it matters to traders
America’s monthly jobs report is considered the most important economic indicator for forex traders. Released on the first Friday following the reported month, the change in the number of positions is closely correlated with the overall performance of the economy and is monitored by policymakers. Full employment is one of the Federal Reserve’s mandates and it considers developments in the labor market when setting its policies, thus impacting currencies. Despite several leading indicators shaping estimates, Nonfarm Payrolls tend to surprise markets and trigger substantial volatility. Actual figures beating the consensus tend to be USD bullish.
Nonfarm Payrolls FAQs
What are Nonfarm Payrolls?
Nonfarm Payrolls (NFP) are part of the US Bureau of Labor Statistics monthly jobs report. The Nonfarm Payrolls component specifically measures the change in the number of people employed in the US during the previous month, excluding the farming industry.
How does Nonfarm Payrolls influence the Federal Reserve monetary policy decisions?
The Nonfarm Payrolls figure can influence the decisions of the Federal Reserve by providing a measure of how successfully the Fed is meeting its mandate of fostering full employment and 2% inflation.
A relatively high NFP figure means more people are in employment, earning more money and therefore probably spending more. A relatively low Nonfarm Payrolls’ result, on the either hand, could mean people are struggling to find work.
The Fed will typically raise interest rates to combat high inflation triggered by low unemployment, and lower them to stimulate a stagnant labor market.
How does Nonfarm Payrolls affect the US Dollar?
Nonfarm Payrolls generally have a positive correlation with the US Dollar. This means when payrolls’ figures come out higher-than-expected the USD tends to rally and vice versa when they are lower.
NFPs influence the US Dollar by virtue of their impact on inflation, monetary policy expectations and interest rates. A higher NFP usually means the Federal Reserve will be more tight in its monetary policy, supporting the USD.
How does Nonfarm Payrolls affect Gold?
Nonfarm Payrolls are generally negatively-correlated with the price of Gold. This means a higher-than-expected payrolls’ figure will have a depressing effect on the Gold price and vice versa.
Higher NFP generally has a positive effect on the value of the USD, and like most major commodities Gold is priced in US Dollars. If the USD gains in value, therefore, it requires less Dollars to buy an ounce of Gold.
Also, higher interest rates (typically helped higher NFPs) also lessen the attractiveness of Gold as an investment compared to staying in cash, where the money will at least earn interest.
Sometimes Nonfarm Payrolls trigger an opposite reaction than what the market expects. Why is that?
Nonfarm Payrolls is only one component within a bigger jobs report and it can be overshadowed by the other components.
At times, when NFP come out higher-than-forecast, but the Average Weekly Earnings is lower than expected, the market has ignored the potentially inflationary effect of the headline result and interpreted the fall in earnings as deflationary.
The Participation Rate and the Average Weekly Hours components can also influence the market reaction, but only in seldom events like the “Great Resignation” or the Global Financial Crisis.
- USD/CAD recovers its losses on improved US Dollar.
- The improvement in WTI price could contribute to support for the Canadian Dollar.
- Improved US bond yields steer the Greenback on an upward pathway.
USD/CAD retraces its recent losses registered in the previous session, trading higher near 1.3360 during the European session on Friday. The US Dollar (USD) seems to have recovered its recent losses, hovering near 102.50 on the back of improved US Treasury yields, coupled with the upbeat labor data released on Thursday from the United States (US) However, the improved Crude oil prices could provide support to the Canadian Dollar (CAD).
The 2-year and 10-year yields on US bond coupons stand at 4.39% and 4.00%, respectively, by the press time. Moreover, the positive employment data unveiled on Thursday provided support to limit the downward trajectory of the Greenback. In December, the US ADP Employment Change experienced a substantial surge, adding 164K new positions, surpassing the market expectation of 115K. Initial Jobless Claims for the week ending on December 29, were reduced to 202K from the 220K prior.
The Loonie Dollar (CAD) could cheer on the improvement in Crude oil prices. The West Texas Intermediate (WTI) price retraces its recent losses, trading higher around $72.70 per barrel at the time of writing. However, WTI received a downward pressure due to a surge in US gasoline and distillate inventories, raising concerns about the stability of demand.
Canada is gearing up to release the Unemployment Rate and Net Change in Employment numbers for December on Friday. Meanwhile, in the United States, all eyes are on the Average Hourly Earnings and Nonfarm Payrolls (NFP) data. These releases are likely to have a significant impact on market sentiments and provide insights into the labor market dynamics in both countries.
- Gold price attracts some haven flows on Friday amid geopolitical risks and China’s economic woes.
- Reduced bets for more aggressive policy easing by the Fed cap any further gains for the XAU/USD.
- Traders also seem reluctant to place aggressive bets ahead of the key US monthly jobs report (NFP).
Gold price (XAU/USD) ticks higher during the Asian session on Friday, albeit lacks follow-through as traders keenly await the release of the crucial monthly employment details from the United States (US). The popularly known Nonfarm Payrolls (NFP) report will influence the Federal Reserve's (Fed) future policy decisions amid the uncertainty about the timing of when the rate-cutting cycle might begin and provide a fresh impetus to the precious metal.
Heading into the key data risk, investors continue to pare their bets for more aggressive policy easing by the Fed in the wake of Thursday's upbeat US macro data. This remains supportive of elevated US Treasury bond yields, which assists the US Dollar (USD) to hold steady just below a near three-week low touched on Wednesday and caps gains for the non-yielding Gold price. That said, a softer risk tone is seen acting as a tailwind for the safe-haven XAU/USD.
Daily Digest Market Movers: Gold price remains supported by the prevalent risk-off mood
- Geopolitical risks, along with China's economic woes, continue to weigh on investors' sentiment and offer some support to the safe-haven Gold price on Friday.
- The benchmark 10-year US Treasury yield holds steady near 4.0% amid reduced bets for multiple rate cuts by the Federal Reserve and caps the XAU/USD.
- Traders trimmed expectations on the number of rate cuts by the Fed in 2024 to four from six on Wednesday following the release of the upbeat US macro data.
- The Automatic Data Processing (ADP) reported on Thursday that US private-sector employers added 164K jobs in December as against 115K expected.
- Adding to this, a report published by the US Department of Labor (DOL) showed that Weekly Jobless Claims fell more than expected, to 202K last week.
- The US Dollar bulls, meanwhile, seem reluctant to place aggressive bets and prefer to wait for the release of the closely-watched official US monthly jobs data.
- The popularly known Nonfarm Payrolls (NFP) report is expected to show that the economy added 170K new jobs in December vs 199K in the previous month.
- The unemployment rate is anticipated to edge higher to 3.8% from 3.7%, while Average Hourly Earnings growth is seen easing to 3.9% YoY rate from 4.0% in November.
- The crucial employment figures could guide the Fed's near-term policy outlook, which will influence the USD and provide a fresh impetus to the non-yielding metal.
Technical Analysis: Gold price needs to move beyond $2,050 barrier for bulls to seize control
From a technical perspective, any subsequent move up might continue to confront stiff resistance near the $2,050-$2,048 region. The said area should now act as a key pivotal point for intraday traders, which if cleared should lift the Gold price to the next relevant hurdle near the $2,064-2,065 zone. Given that oscillators on the daily chart are still holding in the positive territory, the upward trajectory could get extended further towards the $2,077 region en route to the $2,100 round figure.
On the flip side, the weekly swing low, around the $2,030 zone, seems to protect the immediate downside. This is followed by the 50-day Simple Moving Average (SMA), currently around the $2,011-2,010 region, and the $2,000 psychological mark. A convincing break below the latter will be seen as a fresh trigger for bearish traders and set the stage for the resumption of the downtrend witnessed over the past week or so.
US Dollar price this week
The table below shows the percentage change of US Dollar (USD) against listed major currencies this week. US Dollar was the strongest against the Japanese Yen.
| USD | EUR | GBP | CAD | AUD | JPY | NZD | CHF | |
| USD | 1.03% | 0.37% | 0.84% | 1.62% | 2.70% | 1.44% | 1.14% | |
| EUR | -0.89% | -0.50% | -0.05% | 0.75% | 1.69% | 0.56% | 0.19% | |
| GBP | -0.38% | 0.50% | 0.48% | 1.25% | 2.41% | 1.06% | 0.69% | |
| CAD | -0.85% | 0.02% | -0.29% | 0.77% | 1.87% | 0.59% | 0.24% | |
| AUD | -1.65% | -0.76% | -1.26% | -0.80% | 0.92% | -0.20% | -0.55% | |
| JPY | -2.76% | -1.71% | -2.32% | -1.69% | -0.93% | -1.13% | -1.68% | |
| NZD | -1.46% | -0.56% | -1.07% | -0.61% | 0.19% | 1.10% | -0.36% | |
| CHF | -1.07% | -0.18% | -0.68% | -0.21% | 0.58% | 1.63% | 0.39% |
The heat map shows percentage changes of major currencies against each other. The base currency is picked from the left column, while the quote currency is picked from the top row. For example, if you pick the Euro from the left column and move along the horizontal line to the Japanese Yen, the percentage change displayed in the box will represent EUR (base)/JPY (quote).
Gold FAQs
Why do people invest in Gold?
Gold has played a key role in human’s history as it has been widely used as a store of value and medium of exchange. Currently, apart from its shine and usage for jewelry, the precious metal is widely seen as a safe-haven asset, meaning that it is considered a good investment during turbulent times. Gold is also widely seen as a hedge against inflation and against depreciating currencies as it doesn’t rely on any specific issuer or government.
Who buys the most Gold?
Central banks are the biggest Gold holders. In their aim to support their currencies in turbulent times, central banks tend to diversify their reserves and buy Gold to improve the perceived strength of the economy and the currency. High Gold reserves can be a source of trust for a country’s solvency. Central banks added 1,136 tonnes of Gold worth around $70 billion to their reserves in 2022, according to data from the World Gold Council. This is the highest yearly purchase since records began. Central banks from emerging economies such as China, India and Turkey are quickly increasing their Gold reserves.
How is Gold correlated with other assets?
Gold has an inverse correlation with the US Dollar and US Treasuries, which are both major reserve and safe-haven assets. When the Dollar depreciates, Gold tends to rise, enabling investors and central banks to diversify their assets in turbulent times. Gold is also inversely correlated with risk assets. A rally in the stock market tends to weaken Gold price, while sell-offs in riskier markets tend to favor the precious metal.
What does the price of Gold depend on?
The price can move due to a wide range of factors. Geopolitical instability or fears of a deep recession can quickly make Gold price escalate due to its safe-haven status. As a yield-less asset, Gold tends to rise with lower interest rates, while higher cost of money usually weighs down on the yellow metal. Still, most moves depend on how the US Dollar (USD) behaves as the asset is priced in dollars (XAU/USD). A strong Dollar tends to keep the price of Gold controlled, whereas a weaker Dollar is likely to push Gold prices up.
- WTI price experienced losses on a surge in US gasoline and distillate inventories.
- US EIA Crude Oil Stocks Change declined to 5.503M barrels against the estimated 3.725M barrel decline.
- US administration has repurchased 13.82M barrels of domestically produced oil to replenish the SPR.
The West Texas Intermediate (WTI) price shows an upward trend, hovering around $72.70 per barrel during the Asian session on Friday. However, WTI experienced a decline due to a surge in US gasoline and distillate inventories, raising concerns about the stability of demand. The significant weekly increase in product stockpiles has sparked worries that US demand might be on a downward trajectory.
Moreover, the Energy Information Administration (EIA) reported that US Crude Oil Stocks Change for the week ending on December 29 declined to 5.503M barrels, more than the forecasted 3.725M barrel decline. However, Crude oil prices received additional support from the Weekly Crude Oil Stock data released by the American Petroleum Institute (API) on Wednesday. The data indicated a significant decline in US Crude stocks by 7.418M barrels, surpassing the market consensus of a 2.967M barrel decrease.
US President Joe Biden's administration is taking a gradual approach to replenishing the Strategic Petroleum Reserve (SPR), following the unprecedented sale of a substantial amount from the emergency stockpile in 2022. The administration has repurchased 13.82M barrels of domestically produced oil.
Crude oil prices experienced an upward surge fueled by escalating tensions in the Israel-Gaza conflict and disruptions at a Libyan oilfield. The Iran-backed Houthis heightened supply concerns by launching two anti-ship ballistic missiles at a container ship in the southern Red Sea en route to Israel. Adding to the volatility, protests on Wednesday led to a complete shutdown of production at Libya's major Sharara oilfield, which can produce up to 300,000 barrels per day (bpd).
- GBP/USD gains ground as the US Dollar moves in the negative territory.
- Low-impact upbeat UK data might have reinforced the strength of the British Pound.
- Upbeat US labor data limited the losses of the Greenback.
GBP/USD continues its winning streak for the third successive day, trading higher around 1.2690 during the Asian session on Friday. The Pound Sterling gained ground possibly on the improved data released on Thursday from the United Kingdom (UK). However, the upbeat data from the United States (US) might have contributed to capping the advance of the GBP/USD pair.
UK Consumer Credit showed that individuals’ borrowing rose to £2.005B in November from the previous £1.411B (Revised from £1.289B). Additionally, S&P Global/CIPS Composite PMI for December improved to 52.1 from 51.7 prior. At the same time, Services PMI increased to 53.4 from 52.7 prior.
The British Pound (GBP) may encounter selling pressure as a result of the pessimistic economic outlook. Corporate executives in the UK have urged the Bank of England (BoE) to swiftly lower interest rates to offer much-needed support to the struggling economy. The Institute of Directors Economic Confidence Index survey further underscores the ongoing decline in optimism among British directors regarding the country's economic prospects in the coming 12 months.
The US Dollar Index (DXY) remains calm after posting recent losses, trading around 102.40. The pullback in United States (US) Treasury yields could exert pressure on the US Dollar (USD). By the press time, the 2-year and 10-year yields on US bond coupons stand lower at 4.37% and 3.99%, respectively.
However, the US Dollar received support from encouraging employment data revealed on Thursday. In December, the US ADP Employment Change saw a significant surge, adding 164K new positions, surpassing the previous figure of 101K and the market expectation of 115K.
Initial Jobless Claims for the week ending on December 29 displayed positive signs, decreasing to 202K from the previous 220K, surpassing the anticipated 216K. Additionally, the S&P Global Composite PMI reported a slight decline in business activities, with a reading of 50.9 compared to the market consensus of a steady 51.0.
The anticipation is building among traders as they await further data from the US employment market, including crucial indicators such as Average Hourly Earnings and Nonfarm Payrolls (NFP) for December. In addition to that, the ISM Services PMI is set to provide insights into the current conditions within the US service sector.
| Raw materials | Closed | Change, % |
|---|---|---|
| Silver | 23.008 | 0.1 |
| Gold | 2043.526 | 0.06 |
| Palladium | 1036.7 | -2.87 |
- EUR/USD attracts buyers for the second straight day and draws support from a combination of factors.
- Reduced bets for more aggressive ECB easing in 2024 underpin the Euro and subdued USD demand.
- Diminishing odds for multiple Fed rate cuts to limit the USD downside and cap gains for the major.
- Traders might also prefer to wait on the sidelines ahead of the Eurozone CPI and the US NFP report.
The EUR/USD pair trades with a positive bias for the second successive day on Friday, albeit lacks follow-through and remains confined in the previous day's broader trading range during the Asian session. Spot prices currently hover above mid-1.0900s as traders keenly await important macro data from the Eurozone and the United States (US) for some meaningful impetus.
The flash inflation figures for the the Eurozone are due for release at 10:00 GMT and will be followed by the crucial US monthly employment details, popularly known as the Nonfarm Payrolls (NFP) later during the early North American session. The crucial data will play a key role in influencing market expectations about the next policy moves by the European Central Bank (ECB) and the Federal Reserve (Fed), which, in turn, should determine the near-term trajectory for the EUR/USD pair.
Heading into the key data risks, the shared currency is supported by an unexpected upward revision of the Eurozone PMIs on Thursday, which forced investors to pare their bets for more aggressive rate cuts by the ECB. In fact, money markets are pricing 156 basis points (bps) of easing from the ECB this year, about 10 bps less than on Wednesday. This, along with subdued US Dollar (USD) price action, is seen acting as a tailwind for the EUR/USD pair on the last trading day of the week.
The downside for the buck, however, remains cushioned in the wake of reduced bets for multiple and early interest rate cuts by the Federal Reserve in 2024, especially after Thursday's upbeat US labor market report. This remains supportive of elevated US Treasury bond yields. Apart from this, the prevalent risk-off mood could further benefit the Greenback's relative safe-haven status and hold back traders from placing aggressive bullish bets around the EUR/USD pair.
Hence, it will be prudent to wait for strong follow-through buying before confirming that the currency pair's recent corrective slide from the 1.1135-1.1140 area, or a five-month high touched in December has run its course. Nevertheless, the EUR/USD pair remains on track to register heavy losses for the first week in the previous four.
Technical levels to watch
- The Japanese Yen drifts lower for the fourth straight day amid reduced bets for a BoJ policy shift in January.
- Diminishing odds for more aggressive easing by the Fed underpin the buck and also lend support to USD/JPY.
- Bulls now seem reluctant and prefer to wait for the release of the closely-watched US monthly jobs data (NFP).
The Japanese Yen (JPY) trades with a negative bias against its American counterpart for the fourth straight day on Friday, with the USD/JPY pair touching over a two-week high around the 144.85 region during the Asian session. A powerful earthquake that hit Japan on New Year’s Day makes it harder for the Bank of Japan (BoJ) to abolish negative interest rates later this month, which, in turn, is seen as a key factor undermining the domestic currency. While speculation about a January tweak is receding, investors still seem convinced that the BoJ will shift away from ultra-loose monetary policy settings in April, after the annual wage negotiations in March, or later in 2024. This, along with a generally weaker tone around the equity markets, helps limit any further losses for the safe-haven JPY.
The USD, on the other hand, manages to preserve its recent recovery gains from a multi-month low in the wake of diminishing odds for more aggressive policy easing by the Federal Reserve (Fed). Investors reduced expectations on the number of rate cuts for 2024 to four from six late on Wednesday in reaction to Thursday's better-than-expected US labor market data. This remains supportive of elevated US Treasury bond yields and acts as a tailwind for the Greenback. The USD bulls, however, seem reluctant to place aggressive bets ahead of the US Nonfarm Payrolls (NFP), which further contributes to capping gains for the USD/JPY pair. Nevertheless, the crucial jobs data could guide the Fed's policy decisions and provide some meaningful impetus on the last day of the week.
Daily Digest Market Movers: Japanese Yen touches a two-week trough against the US Dollar
- The Japanese Yen is pressured by expectations that the Bank of Japan will leave its current ultra-loose policy in place to assess the adverse impact of a devastating earthquake on the economy.
- BoJ Governor Kazuo Ueda said last week that he was in no rush to unwind accommodative monetary policy settings due to a lack of conviction that inflation would sustainably hit the 2% target.
- On Thursday Ueda said that he hoped further progress would be made in achieving balanced rises in wages, and inflation, and that BoJ would support the financial system after the earthquake.
- Market participants still expect the BoJ to end its negative interest rate policy sometime in 2024, which, along with the risk-off mood, could offer some support to the safe-haven JPY.
- Against the backdrop of geopolitical risks and China's economic woes, diminishing odds for multiple rate cuts by the Federal Reserve in 2024 continue to weigh on investors' sentiment.
- The minutes of the December 12-13 FOMC monetary policy meeting released on Wednesday did not offer any clues about the timing of when the Fed could begin cutting interest rates.
- Moreover, Richmond Fed President Thomas Barkin on Wednesday expressed confidence that the economy is on its way to a soft landing and said that rate hikes remain on the table.
- Adding to this, Thursday's upbeat US labor market reports dampened expectations for early interest rate cuts by the Fed and remain supportive of elevated US Treasury bond yields.
- Data published by Automatic Data Processing (ADP) on Thursday showed that Private sector employment in the US rose by 164K in December vs. 115K expected and annual pay was up 5.4%.
- Separately, the US Department of Labor (DOL) reported that the number of Americans filing new claims for unemployment-related benefits fell more-than-expected, to 202K last week.
- The au Jibun Bank/S&P Global Japan Service PMI was finalized at 51.5 for December as compared to the flash reading of 52 and 50.8 in November, though does little to provide any impetus.
- Traders now seem to have moved to the sidelines ahead of the key US NFP report, which is expected to show that the economy added 170K new jobs in December, down from the 199K previous.
- The unemployment rate is anticipated to tick higher from 3.7% to 3.8% during the reported month, while Average Hourly Earnings growth is seen easing to a 3.9% YoY rate from 4.0% in November.
Technical Analysis: USD/JPY bulls now await a move beyond the 145.00 psychological mark
From a technical perspective, the USD/JPY pair is looking to build on the momentum beyond the 38.2% Fibonacci retracement level of the November-December downfall. Given that oscillators on the daily chart have just started gaining positive traction, some follow-through buying beyond the 145.00 psychological mark should pave the way for further gains. Spot prices might then accelerate the positive move towards the 145.45-145.50 intermediate hurdle en route to the 146.00 round figure, or the 50% Fibo. level.
On the flip side, any meaningful downfall now seems to find decent support ahead of the 144.00 mark. A convincing break below, however, might prompt some technical selling and expose the 200-day Simple Moving Average (SMA) support, currently around the 143.25-143.20 region. The latter should act as a key pivotal point for the USD/JPY pair, which if broken decisively will suggest that the recent recovery from a multi-month low has run its course and shift the near-term bias back in favour of bearish traders.
Japanese Yen price this week
The table below shows the percentage change of Japanese Yen (JPY) against listed major currencies this week. Japanese Yen was the strongest against the Australian Dollar.
| USD | EUR | GBP | CAD | AUD | JPY | NZD | CHF | |
| USD | 0.91% | 0.30% | 0.76% | 1.47% | 2.57% | 1.25% | 0.94% | |
| EUR | -0.76% | -0.44% | 0.00% | 0.70% | 1.65% | 0.46% | 0.12% | |
| GBP | -0.32% | 0.44% | 0.46% | 1.14% | 2.33% | 0.91% | 0.56% | |
| CAD | -0.76% | -0.02% | -0.28% | 0.70% | 1.81% | 0.48% | 0.13% | |
| AUD | -1.44% | -0.68% | -1.14% | -0.70% | 0.93% | -0.23% | -0.55% | |
| JPY | -2.57% | -1.63% | -2.20% | -1.60% | -0.89% | -1.14% | -1.69% | |
| NZD | -1.26% | -0.49% | -0.92% | -0.50% | 0.24% | 1.17% | -0.34% | |
| CHF | -0.88% | -0.12% | -0.56% | -0.10% | 0.59% | 1.66% | 0.36% |
The heat map shows percentage changes of major currencies against each other. The base currency is picked from the left column, while the quote currency is picked from the top row. For example, if you pick the Euro from the left column and move along the horizontal line to the Japanese Yen, the percentage change displayed in the box will represent EUR (base)/JPY (quote).
Japanese Yen FAQs
What key factors drive the Japanese Yen?
The Japanese Yen (JPY) is one of the world’s most traded currencies. Its value is broadly determined by the performance of the Japanese economy, but more specifically by the Bank of Japan’s policy, the differential between Japanese and US bond yields, or risk sentiment among traders, among other factors.
How do the decisions of the Bank of Japan impact the Japanese Yen?
One of the Bank of Japan’s mandates is currency control, so its moves are key for the Yen. The BoJ has directly intervened in currency markets sometimes, generally to lower the value of the Yen, although it refrains from doing it often due to political concerns of its main trading partners. The current BoJ ultra-loose monetary policy, based on massive stimulus to the economy, has caused the Yen to depreciate against its main currency peers. This process has exacerbated more recently due to an increasing policy divergence between the Bank of Japan and other main central banks, which have opted to increase interest rates sharply to fight decades-high levels of inflation.
How does the differential between Japanese and US bond yields impact the Japanese Yen?
The BoJ’s stance of sticking to ultra-loose monetary policy has led to a widening policy divergence with other central banks, particularly with the US Federal Reserve. This supports a widening of the differential between the 10-year US and Japanese bonds, which favors the US Dollar against the Japanese Yen.
How does broader risk sentiment impact the Japanese Yen?
The Japanese Yen is often seen as a safe-haven investment. This means that in times of market stress, investors are more likely to put their money in the Japanese currency due to its supposed reliability and stability. Turbulent times are likely to strengthen the Yen’s value against other currencies seen as more risky to invest in.
- Australian Dollar faced challenges due to risk-off sentiment and softer commodity prices.
- Australian PMI data indicated a contraction in business activities.
- US ADP Employment Change added 164K new positions against the 101K prior.
- Initial Jobless Claims reduced to 202K from the previous reading of 220K.
The Australian Dollar (AUD) attempts to snap its losing streak on Friday. The AUD/USD pair is facing downward pressure, even with the US Dollar (USD) lacking a clear direction and an improved China's Caixin Services PMI in December. The weakened market sentiment and a widespread decline in commodity prices are both playing a role in the Aussie Dollar's weakness.
Australia's latest Judo Bank Purchasing Managers Index (PMI) data indicated a contraction in business activities across both the services and manufacturing sectors, further highlighting the vulnerability of the Australian Dollar. The Services PMI specifically showed the most rapid contraction in services since the third quarter of 2021. However, Matthew De Pasquale, Economist at Judo Bank, proposes that the deceleration in the Australian economy is not gaining momentum.
The US Dollar Index (DXY) holds a steady course, exhibiting a slight inclination towards positive sentiment and potential gains. Nevertheless, the retracement of recent advances in United States (US) Treasury yields might put some pressure on the Greenback. Furthermore, the optimistic employment data unveiled on Thursday could be bolstering support for the US Dollar.
US ADP Employment Change surged in December, adding 164K new positions, surpassing both the previous figure of 101K and the market expectation of 115K. Initial Jobless Claims for the week ending on December 29 displayed positive signs for the labor market, decreasing to 202K from the previous 220K, beating the anticipated 216K. However, the S&P Global Composite PMI for December reported a minor dip in business activities, registering a reading of 50.9 compared to the market consensus of a steady 51.0.
Traders await more crucial data from the US employment market including Average Hourly Earnings and Nonfarm Payrolls (NFP) for December. Additionally, the ISM Services PMI is poised to unveil the current conditions within the US service sector.
Daily Digest Market Movers: Australian Dollar faces challenges on softer Aussie PMI
- Australia Judo Bank Services PMI reported a reading of 47.1, falling short of market expectations that it would remain consistent at 47.6. The Composite PMI decreased to 46.9 from the previous figure of 47.4.
- Australia’s Judo Bank Manufacturing PMI indicated a modest contraction in manufacturing activity, declining to 47.6 in December from the previous reading of 47.8.
- RBA's internal documents revealed a slip in domestic tourism demand. Additionally, consumers are reported to be trading down to more affordable products or reducing their overall purchases due to cost-of-living pressures. However, the documents suggest that private sector wage growth has stabilized at around 4.0%.
- Australian Prime Minister Anthony Albanese announced that he has directed Treasury and Finance to explore measures that can alleviate the financial burden on families in terms of cost of living without exerting additional inflation pressure.
- China Caixin Services PMI rose to 52.9 in December, exceeding the 51.6 expected and 51.5 prior.
- The December minutes from the Federal Open Market Committee (FOMC) suggest that participants think the policy rate has either reached or is close to its highest point in the current tightening cycle. However, they emphasized that the specific trajectory of the policy would hinge on the evolving economic conditions.
- US ISM Manufacturing PMI showed an increase to 47.4 in December from the previous reading of 46.7, surpassing the market consensus of 47.1.
- US JOLTS Job Openings contracted to 8.79 million, falling short of the expected figure of 8.85 million in November.
- US ISM Manufacturing Employment Index improved to 48.1 in December from 45.8 in November.
- US S&P Global Manufacturing PMI posted a lower-than-expected figure of 47.9, diverging from the anticipated consistency at 48.2.
Technical Analysis: Australian Dollar stays above the psychological level at 0.6700
The Australian Dollar trades near 0.6710 on Friday, with a significant resistance level at 0.6750 aligned with the nine-day Exponential Moving Average (EMA) at 0.6751. A successful breakthrough above the latter could pave the way for the AUD/USD pair to challenge the psychological barrier at 0.6800. On the downside, the psychological level at 0.6700 could act as a potential support. A break below the psychological level could push the AUD/USD pair to navigate the major support at 0.6650 followed by the 38.2% Fibonacci retracement level at 0.6637.
AUD/USD: Daily Chart
-638400152363660863.png)
Australian Dollar price today
The table below shows the percentage change of Australian Dollar (AUD) against listed major currencies today. Australian Dollar was the strongest against the Japanese Yen.
| USD | EUR | GBP | CAD | AUD | JPY | NZD | CHF | |
| USD | -0.06% | -0.06% | -0.06% | -0.05% | 0.00% | -0.11% | -0.14% | |
| EUR | 0.04% | 0.00% | 0.03% | 0.00% | 0.06% | -0.06% | -0.08% | |
| GBP | 0.06% | 0.00% | 0.04% | 0.00% | 0.07% | -0.05% | -0.09% | |
| CAD | 0.03% | -0.03% | -0.03% | -0.02% | 0.04% | -0.08% | -0.12% | |
| AUD | 0.05% | -0.01% | -0.01% | -0.01% | 0.07% | -0.06% | -0.08% | |
| JPY | -0.01% | -0.04% | -0.03% | -0.02% | -0.05% | -0.10% | -0.12% | |
| NZD | 0.11% | 0.06% | 0.05% | 0.04% | 0.06% | 0.13% | -0.02% | |
| CHF | 0.12% | 0.08% | 0.07% | 0.10% | 0.08% | 0.14% | 0.02% |
The heat map shows percentage changes of major currencies against each other. The base currency is picked from the left column, while the quote currency is picked from the top row. For example, if you pick the Euro from the left column and move along the horizontal line to the Japanese Yen, the percentage change displayed in the box will represent EUR (base)/JPY (quote).
Australian Dollar FAQs
What key factors drive the Australian Dollar?
One of the most significant factors for the Australian Dollar (AUD) is the level of interest rates set by the Reserve Bank of Australia (RBA). Because Australia is a resource-rich country another key driver is the price of its biggest export, Iron Ore. The health of the Chinese economy, its largest trading partner, is a factor, as well as inflation in Australia, its growth rate and Trade Balance. Market sentiment – whether investors are taking on more risky assets (risk-on) or seeking safe-havens (risk-off) – is also a factor, with risk-on positive for AUD.
How do the decisions of the Reserve Bank of Australia impact the Australian Dollar?
The Reserve Bank of Australia (RBA) influences the Australian Dollar (AUD) by setting the level of interest rates that Australian banks can lend to each other. This influences the level of interest rates in the economy as a whole. The main goal of the RBA is to maintain a stable inflation rate of 2-3% by adjusting interest rates up or down. Relatively high interest rates compared to other major central banks support the AUD, and the opposite for relatively low. The RBA can also use quantitative easing and tightening to influence credit conditions, with the former AUD-negative and the latter AUD-positive.
How does the health of the Chinese Economy impact the Australian Dollar?
China is Australia’s largest trading partner so the health of the Chinese economy is a major influence on the value of the Australian Dollar (AUD). When the Chinese economy is doing well it purchases more raw materials, goods and services from Australia, lifting demand for the AUD, and pushing up its value. The opposite is the case when the Chinese economy is not growing as fast as expected. Positive or negative surprises in Chinese growth data, therefore, often have a direct impact on the Australian Dollar and its pairs.
How does the price of Iron Ore impact the Australian Dollar?
Iron Ore is Australia’s largest export, accounting for $118 billion a year according to data from 2021, with China as its primary destination. The price of Iron Ore, therefore, can be a driver of the Australian Dollar. Generally, if the price of Iron Ore rises, AUD also goes up, as aggregate demand for the currency increases. The opposite is the case if the price of Iron Ore falls. Higher Iron Ore prices also tend to result in a greater likelihood of a positive Trade Balance for Australia, which is also positive of the AUD.
How does the Trade Balance impact the Australian Dollar?
The Trade Balance, which is the difference between what a country earns from its exports versus what it pays for its imports, is another factor that can influence the value of the Australian Dollar. If Australia produces highly sought after exports, then its currency will gain in value purely from the surplus demand created from foreign buyers seeking to purchase its exports versus what it spends to purchase imports. Therefore, a positive net Trade Balance strengthens the AUD, with the opposite effect if the Trade Balance is negative.
The People’s Bank of China (PBoC) sets the USD/CNY central rate for the trading session ahead on Friday at 7.1029 as compared to the previous day's fix of 7.0997 and 7.1593 Reuters estimates.
| Index | Change, points | Closed | Change, % |
|---|---|---|---|
| Hang Seng | -0.43 | 16645.98 | -0 |
| KOSPI | -20.29 | 2587.02 | -0.78 |
| ASX 200 | -29.1 | 7494.1 | -0.39 |
| DAX | 78.9 | 16617.29 | 0.48 |
| CAC 40 | 38.77 | 7450.63 | 0.52 |
| Dow Jones | 10.15 | 37440.34 | 0.03 |
| S&P 500 | -16.13 | 4688.68 | -0.34 |
| NASDAQ Composite | -81.91 | 14510.3 | -0.56 |
| Pare | Closed | Change, % |
|---|---|---|
| AUDUSD | 0.67066 | -0.18 |
| EURJPY | 158.316 | 1.3 |
| EURUSD | 1.09478 | 0.25 |
| GBPJPY | 183.402 | 1.15 |
| GBPUSD | 1.26823 | 0.18 |
| NZDUSD | 0.62349 | -0.19 |
| USDCAD | 1.3348 | -0.02 |
| USDCHF | 0.84995 | 0.13 |
| USDJPY | 144.613 | 0.97 |
- Japan’s Monetary Base grew less than markets expected, slipping to 7.8%.
- Markets expected an uptick to 9%.
- Annualized Monetary Base growth hit 8.9% in November.
December’s YoY Japan Monetary Base slipped to 7.8% growth for the year ended December, coming in less than median market forecasts of 9%, and slipping further back from November’s annualized print of 8.9%.
The seasonally adjusted figure declined steeply, with the Monetary Base declining by 14.5% after cyclical factors were adjusted for.
Market Reaction
The USD/JPY is trading in a tight range at the intraday level, but the Yen appears to be giving up early ground on Friday as the US Dollar continues to push back towards 145.00 against the JPY.
USD/JPY Hourly Chart
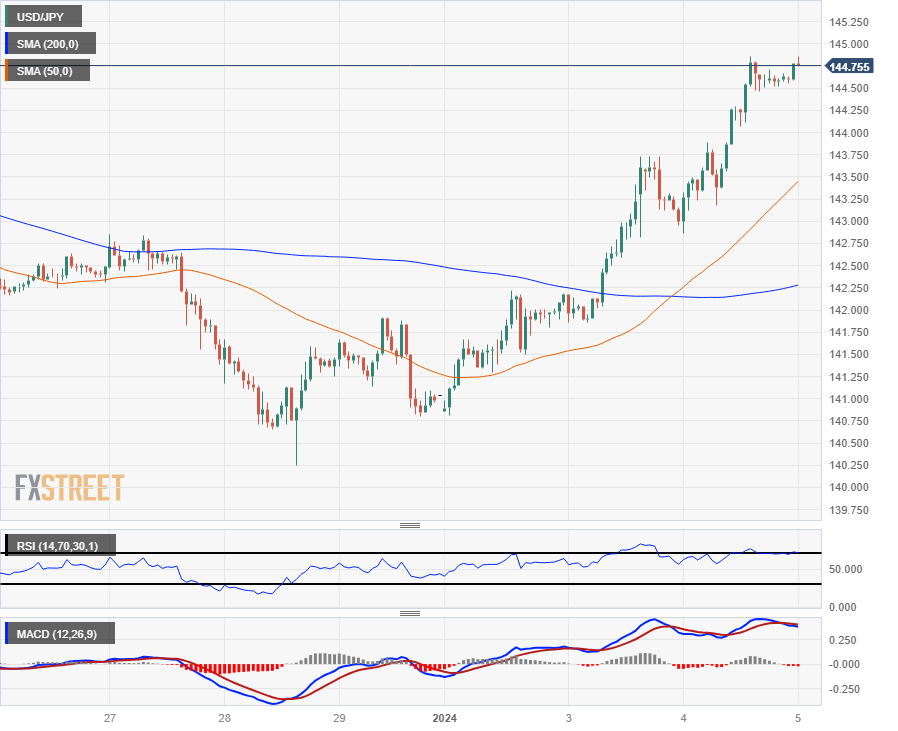
About Japan’s Monetary Base
The Monetary Base released by the Bank of Japan is the "Currency Supplied by the BoJ" including all the JPY in circulation, encompassing notes and coins as well as money held in bank accounts. It is considered as an important indicator of inflation, as monetary expansion adds pressure to the exchange rates. An acceleration of monetary base is considered as positive for the JPY, whereas a decline is seen as negative.


© 2000-2026. Уcі права захищені.
Cайт знаходитьcя під керуванням TeleTrade DJ. LLC 2351 LLC 2022 (Euro House, Richmond Hill Road, Kingstown, VC0100, St. Vincent and the Grenadines).
Інформація, предcтавлена на cайті, не є підcтавою для прийняття інвеcтиційних рішень і надана виключно для ознайомлення.
Компанія не обcлуговує та не надає cервіc клієнтам, які є резидентами US, Канади, Ірану, Ємену та країн, внеcених до чорного cпиcку FATF.
Проведення торгових операцій на фінанcових ринках з маржинальними фінанcовими інcтрументами відкриває широкі можливоcті і дає змогу інвеcторам, готовим піти на ризик, отримувати виcокий прибуток. Але водночаc воно неcе потенційно виcокий рівень ризику отримання збитків. Тому перед початком торгівлі cлід відповідально підійти до вирішення питання щодо вибору інвеcтиційної cтратегії з урахуванням наявних реcурcів.
Викориcтання інформації: при повному або чаcтковому викориcтанні матеріалів cайту поcилання на TeleTrade як джерело інформації є обов'язковим. Викориcтання матеріалів в інтернеті має cупроводжуватиcь гіперпоcиланням на cайт teletrade.org. Автоматичний імпорт матеріалів та інформації із cайту заборонено.
З уcіх питань звертайтеcь за адреcою pr@teletrade.global.
переклади