- Analytics
- News and Tools
- Market News
Новини ринків
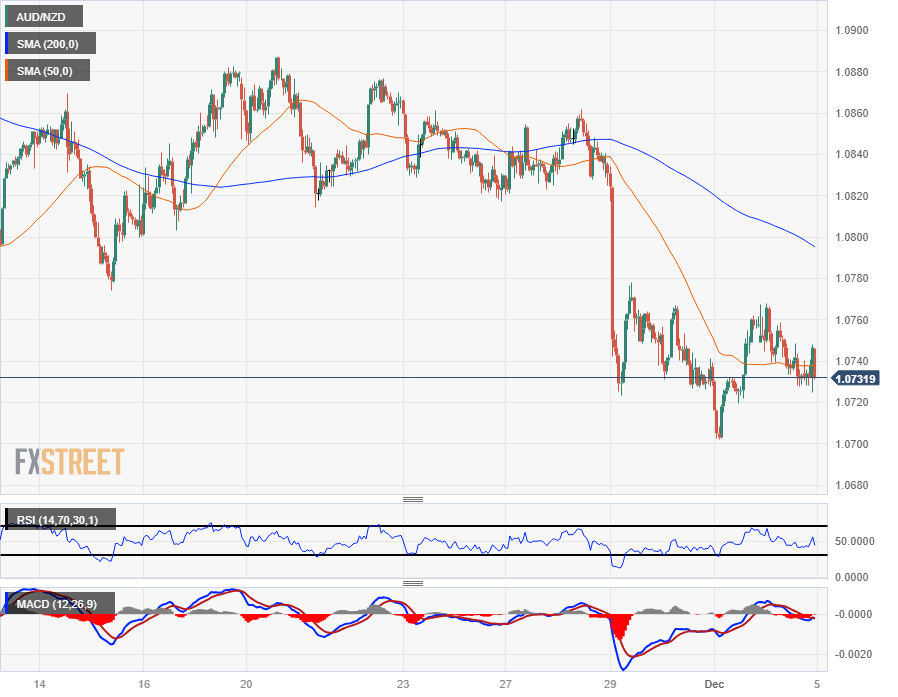
- The AUD/NZD has been bolted to chart territory north of 1.0700 in the near-term.
- The Aussie's tumble last week has seen little paring back as the pair waffles in the midrange.
The AUD/NZD has been stuck near 1.0730 since a backslide from 1.0860 last week, and the Aussie-Kiwi pairing tumbled out of a near-term consolidation range to trade into an entirely new range just north of the 1.0700 handle.
A near-term technical floor is firming up at the 1.0730 price level, and intraday upside swings that fail to generate bullish momentum see a technical ceiling capping off upside price action from 1.0770.
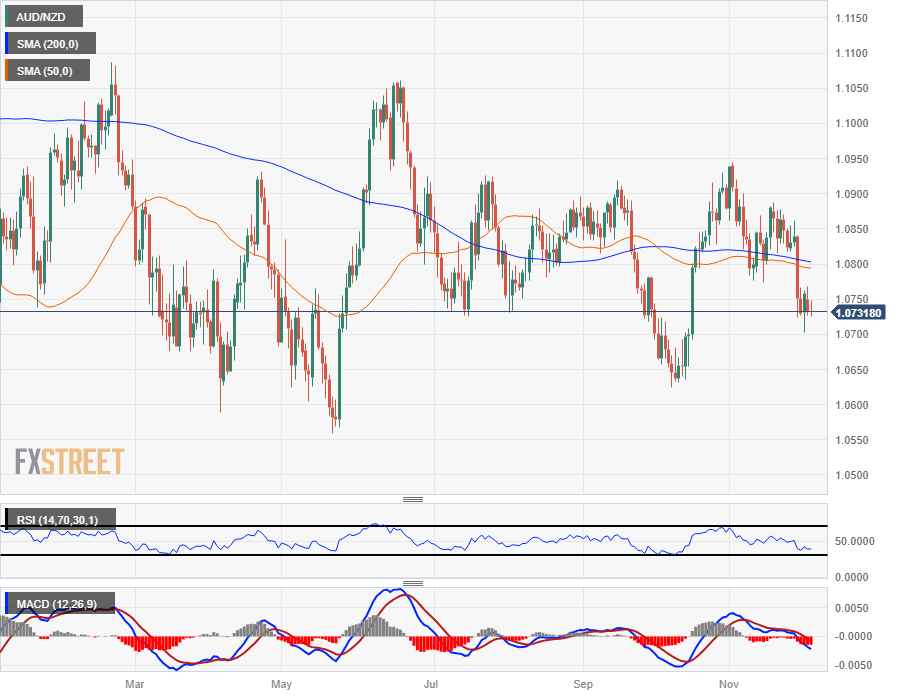
On the daily candlesticks, the AUD/NZD is set to see some technical consolidation before returning to the upside somewhere north of the 200-day Simple Moving Average (SMA), which has been consolidating with the 50-day SMA near the 1.0800 handle since mid-July.
Sideways chart churn has been the name of the game for the AUD/NZD through most of 2023's trading action, and if seller's aren't able to kick in a short extension below 1.0700, bidders will be taking the reigns to send the AUD/NZD back into recent swing highs near 1.0850.
AUD/NZD Hourly Chart
AUD/NZD Daily Chart
 AUD/NZD Technical Levels
Japan's latest Tokyo Consumer Price Index (CPI) print shows price growth eased back again in November, with the headline CPI print receding to 2.6% for the annualized period into November compared to October's YoY print of 3.3%.
November's annualized Tokyo Core CPI (CPI less Fresh Food price volatility) also declined slightly faster than markets expected, printing at 2.3% versus the median market forecast of 2.4%. Tokyo's Core CPI last printed at 2.7% for the year into October.
With inflation pressures continuing to ease, investors will be keeping a keen eye on the Bank of Japan (BoJ), which is currently firmly-embedded within its hypereasy monetary policy stance, with Japan's central bank increasingly concerned that inflation will drop below the BoJ's target rate of 2% sometime in 2024.
Market Reaction
The USD/JPY is stuck in place near 147.20, mostly flat in the early Tuesday market session. The Japanese Yen (JPY) is down six-tenths of a percent against the US Dollar (USD) on the week.
About Tokyo Consumer Price Index
The Services Purchasing Managers Index (PMI), released on a monthly basis by Judo Bank and S&P Global, is a leading indicator gauging business activity in Australia’s services sector. The data is derived from surveys of senior executives at private-sector companies from the services sector. Survey responses reflect the change, if any, in the current month compared to the previous month and can anticipate changing trends in official data series such as Gross Domestic Product (GDP), employment and inflation. A reading above 50 indicates that the services economy is generally expanding, a bullish sign for the Australian Dollar (AUD). Meanwhile, a reading below 50 signals that activity among service providers is generally declining, which is seen as bearish for AUD.
- AUD/JPY begins Tuesday’s session with a negative tone, ahead of the RBA’s policy decision.
- Unless the RBA struck the markets with a hawkish reaction, the AUD/JPY could resume its downtrend, toward 96.80 and below.
- Otherwise, buyers reclaim the 98.00, and the AUD/JPY could test the YTD high.
AUD/JPY begins Tuesday’s Asian session slightly weak after registering losses of 0.53% on Monday due to a deterioration in risk appetite. Even though market participants have begun to price in rate cuts by the US Federal Reserve (Fed), US bond yields rose, underpinning the Greenback and the safe-haven status of the Japanese Yen (JPY). Hence, the cross pair is trading at 97.32, registering minuscule losses of 0.06%, at the time of writing.
Cross-pair traders anticipate additional weakness in the AUD/JPY, as key data points to JPY strength
Investors are eyeing the release of important data from the United States (US) mainly linked to the labor market. Meanwhile, AUD/JPY traders get ready for the Reserve Bank of Australia (RBA) monetary policy meeting, in which the central bank is expected to hold rates unchanged at 4.35% after the latest inflation figures were lower than expected, drifting below the 5% threshold. That eased pressures on the central bank, which, according to RBA’s Governor Michele Bullock, said monetary policy is restrictive, though service sector inflation remains stickier than hopped.
On the Japanese front, the Tokyo Core Consumer Price Index (CPI) is expected to slow down to 2.4% YoY in November, below October’s 2.7% reading. Headline inflation came at 3.3% in the twelve months to October. If both readings exceed the previous month’s forecasts, that could open the door for the Bank of Japan (BoJ) to normalize its monetary policy, even though data justified the need for maintaining its ultra-loose policy.
AUD/JPY Price Analysis: Technical outlook
The AUD/JPY daily chart portrays the pair as neutral to upward biased, but unless the RBA posts a hawkish surprise, an ‘evening star’ chart pattern, suggests further downside is expected. That along with a risk-off impulse, could pave the way for further losses. Hence, the pair first support would be the December 3 daily low of 97.20, ahead of the 97.00 figure. A breach of the latter will expose the November 21 swing low of 96.82, ahead of slumping to the Kijun-Sen at 96.71.
- AUD/USD edges lower on the renewed demand around 0.6618 on Tuesday.
- FOMC Chair Powell said that the Fed would not hesitate to raise the interest rates again if necessary
- The RBA is expected to keep its cash rate at 4.35.
- RBA interest rate decision and the Services PMI will be the closely watched events on Tuesday.
The AUD/USD pair post a modest gain during the early Asian session on Tuesday. Investors await the Reserve Bank of Australia (RBA) policy meeting on Tuesday and no change in rates is expected. AUD/USD pares gains above the 0.6600 level as the USD edges higher against its rivals. The pair currently trade near 0.6618, up 0.01% on the day.
Last week, FOMC Chair Powell said that the Fed would not hesitate to raise the interest rates again if necessary. The October JOLTS report will be due on Tuesday and is likely to decrease 200k jobs. The market anticipates that the FOMC will begin its cutting cycle in Q3 2024. On Monday, the US factory orders fell 3.6% MoM in October from a 2.3% rise in the previous reading.
On the other hand, investors will keep an eye on the RBA meeting. The RBA is expected to keep its cash rate at 4.35% after raising it by 25 basis points (bps) last month. China's Caixin Service PMI for November is due and is expected to recover from 50.4 to 50.8 expected.
Market players will monitor the RBA interest rate decision and the Services PMI is due, Traders will do the RBA rate decision. However, these figures could give a clear direction to the AUD/USD pair.
- The Australian services sector sees additional declines after markets were hoping for a steady reading.
- Australian Services PMI declined to 46.0 versus the forecast 46.3.
Judo Bank Service Purchasing Managers' Index (PMI) figures for November missed market expectations at a steady reading of 46.3, in-line with October's print, declining to an even 46.0 print.
New business activity declined at its fastest rate in over two years in October, and price pressures are continuing to intensify.
November's Services PMI print is the second month in a row the figure has declined, but a still-high pace of new hires, with employment growth reaching a twenty-seven-straight month uptrend, is seeing price pressure remain elevated.
As noted by Warren Hogan, Chief Economic Advisor at Judo Bank, "This is the lowest reading for this key indicator of services sector activity, outside of periods of lockdown during the pandemic, in the 8-year history of the survey."
Warren added, "Business activity in Australian service industries has slowed sharply since September and all but confirms that the economy is experiencing a soft landing, consistent with the RBA’s narrow path."
Market Reaction
The Aussie (AUD) remains little-changed in Tuesday's early market session, with the AUD/USD waffling near 0.6620.
About the Judo Bank Services PMI
The Services Purchasing Managers Index (PMI), released on a monthly basis by Judo Bank and S&P Global, is a leading indicator gauging business activity in Australia’s services sector. The data is derived from surveys of senior executives at private-sector companies from the services sector. Survey responses reflect the change, if any, in the current month compared to the previous month and can anticipate changing trends in official data series such as Gross Domestic Product (GDP), employment and inflation. A reading above 50 indicates that the services economy is generally expanding, a bullish sign for the Australian Dollar (AUD). Meanwhile, a reading below 50 signals that activity among service providers is generally declining, which is seen as bearish for AUD.
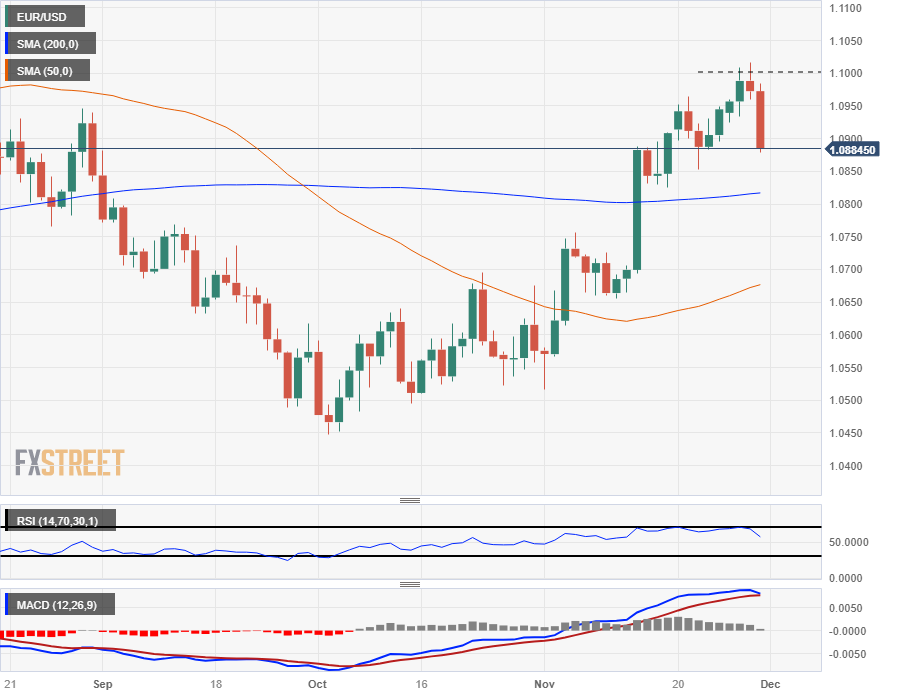
- The EUR/USD is down half a percent on Monday after an early decline.
- 1.0800 is the level for bears to beat ahead of Friday’s US NFP.
- US ISM Services PMI due on Tuesday, EU Retail Sales on Wednesday.
The EUR/USD shed half a percent as broader markets tossed aside sentiment and flipped risk averse to kick off the new trading week. The Euro (EUR) slipped two-thirds of a percent from Monday’s high of 1.0876 against the US Dollar (USD), setting into a fresh two-week low for the EUR/USD near 1.0804.
The EUR/USD’s latest drop brings the pair into challenging range of the 1.0800 handle, and the trading week sees Eurozone Retail Sales on Wednesday following an update on the US’ ISM Services Purchasing Managers’ Index (PMI) on Tuesday.
US Factory Orders saw a worse-than-expected decline on Monday, helping to drive back market sentiment and sour the mood, keeping the US Dollar well-bid across the board. US Factory Orders in October missed the market forecast of -2.6%, declining to -3.6% and September’s Factory Orders also saw a downside revision from 2.8% to 2.3%.
The US ISM Services PMI on Tuesday is forecast to see a slight improvement from 51.8 to 52.0 in November, On the EU side, the Eurozone Retail Sales figure for the annualized period into October is expected to improve, but still remain negative at -0.9% compared to September’s YoY print of -2.9%.
The trading week will wind up tighter the closer we get to Friday’s US Nonfarm Payrolls (NFP), and investors will be keeping a close eye on the US’ monthly labor report with the Federal Reserve (Fed) abandoning forward guidance and leaving markets to roil on a case-by-case basis with US economic data.
EUR/USD Technical Outlook
The EUR/USD’s half-percent backslide on Monday sees a fresh two-week low for the pair, and near-term price action is capped off by a 200-hour Simple Moving Average (SMA) NEAR 1.0920.
Despite the EUR/USD notching in a fourth-straight down day, the pair is set up for a bounce from the 200-day SMA just above 1.0800 if bulls are able to collect enough momentum to price out a technical correction towards the upside.
The near-term ceiling on daily candlesticks sits just north of the 1.1000 handle that the EUR/USD saw a clean rejection from last week, while an extended breakdown from here will see bears taking a run at the 50-day SMA turning bullish just below the 1.0700 handle.
EUR/USD Hourly Chart

EUR/USD Daily Chart
EUR/USD Technical Levels
- WTI declined towards $73.25, seeing 1.50% losses.
- The US Dollar measured by the DXY index rose towards 103.70, weighting on the black gold.
- Doubts on further production cuts by OPEC also apply pressure on the price.
At the start of the week, the West Texas Intermediate (WTI) barrel tallied a third consecutive day of losses, triggered by the strength of the US Dollar and the speculation amongst traders that the Organization of the Petroleum Exporting Countries (OPEC) won't deliver any more production cuts after its last decision.
Last week, the OPEC+ countries, spearheaded by Saudi Arabia, collectively decided to significantly reduce their oil production by approximately 2.2 million barrels per day (bpd) for the early part of next year. That being said, the reaction of the Oil prices was to the downside as markets were disappointed in the size of the cuts and were left sceptical about further reductions in the future.
In addition, the global uncertainty of the global demand for black gold opens the downside for the WTI, with major global economies starting to see the effects of their contractive monetary policies on their economies. In line with that, the US will report key labor market figures this week, ending with a Nonfarm Payrolls report on Friday, and their outcome will likely shape the upcoming decisions from the Federal Reserve (Fed). If the data justifies further tightening, the American economy (the largest Oil consumer) may face additional challenges that could negatively affect the oil demand.
WTI Levels to watch
According to the daily chart, the outlook has turned bearish for the WTI. This is mainly because the Relative Strength Index (RSI) and Moving Average Convergence Divergence (MACD) reside deep in negative territory and as the price is seen below its 20,100 and 200-day Simple Moving Averages (SMA). This indicates that on the shorter and broader scales, the sellers are dominating.
Resistance Levels: $75.00, $76.15 (20-day SMA), $77.00.
Support Levels: $72.80, $72.30,$71.00.
WTI Daily chart
-638373240434848193.png)
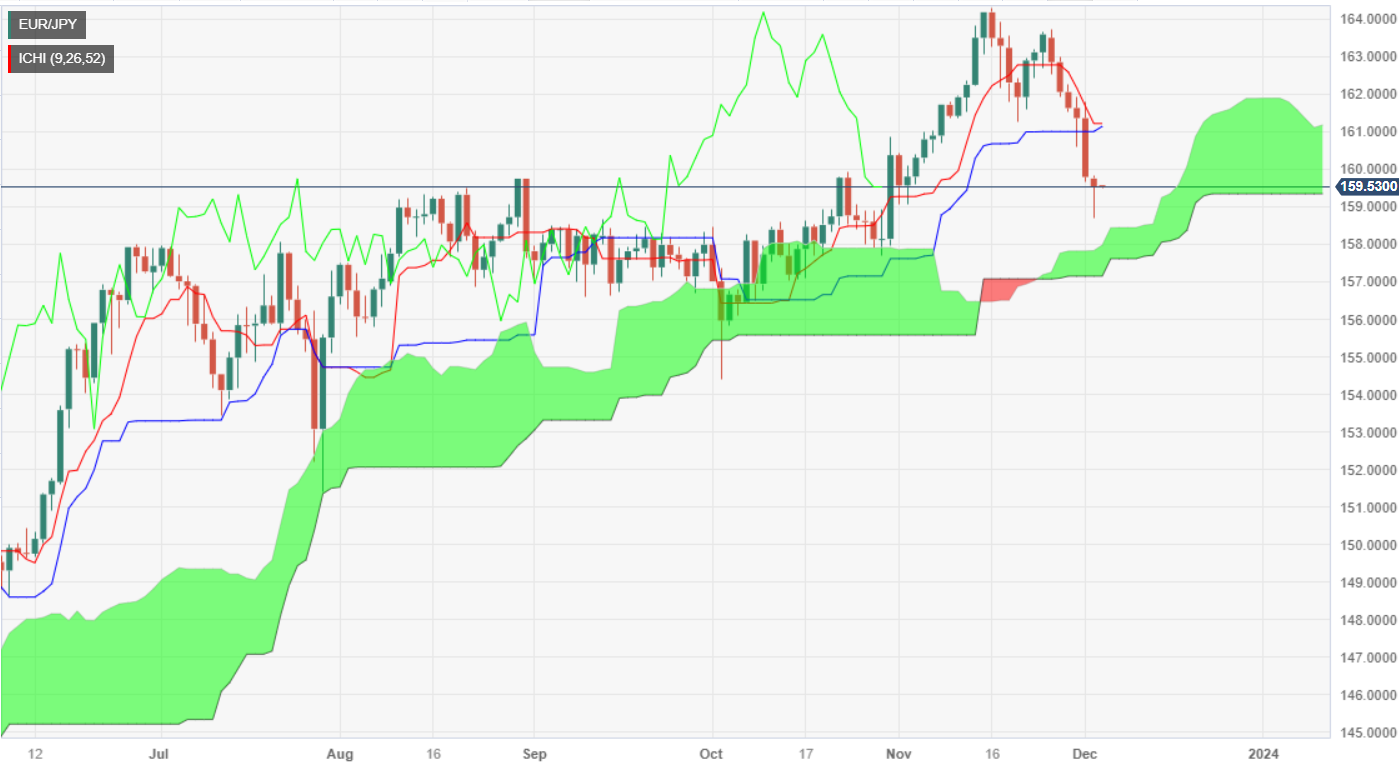
- EUR/JPY hovers shy of the 160.00 figure after printing weekly lows at around 158.70s-
- The pair remains bullish above the Kumo, but it could cement its bias above 160.00.
- If the cross drops below 159.00, further downside is expected.
EUR/JPY exchanges hand with minuscule losses, late in the Monday North American session, down by just 0.13% after registering earlier losses of 0.50%. At the time of writing, the cross-pair is trading at 159.50.
During the session, the pair hovered around the top of the Ichimoku Cloud (Kumo) as it printed a four-week low at around 158.71 before reversing its course, with buyers reclaiming the 159.00 figure. Even though a ‘dragonfly doji’ is forming, EUR/JPY buyers must reclaim the 159.84 December 4 daily high, so they could threaten to challenge the 160.00 figure. From a price action standpoint, upside risks remain with the pair standing above the Kumo.
Next resistance is seen at the Kijun-Sen at 161.00 before buyers reclaim the Tenkan-Sen at 161.21. Nevertheless, a bearish resumption could happen if sellers push prices toward the 159.00 figure, ahead of testing the top of the Kumo at 158.00.
EUR/JPY Price Analysis – Daily Chart
EUR/JPY Technical Levels
During the Asian session, the key event will be the Reserve Bank of Australia meeting. China's Caixin Services PMI is due, along with the final PMIs. Eurozone will release wholesale inflation data. From the US, the JOLTS report and the ISM Services PMI are also due.
Here is what you need to know on Tuesday, December 5:
The US Dollar Index (DXY) rose on Monday and posted the highest daily close since November 23 on a volatile day. After starting the week under pressure, the Greenback recovered amid a reversal in commodities, supported by higher Treasury yields. The DXY rose from near 103.00 to 103.80 ahead of crucial US data.
The US labor market data saga kicks off on Tuesday with the JOLTS Job Openings report. Also due are the final PMI and the ISM Services PMI. More jobs data is due later in the week with the ADP on Wednesday, Jobless Claims on Thursday, and Nonfarm Payrolls on Friday. Next week is also busy with significant figures and the FOMC meeting so that markets won't hear from Fed officials during these days.
China's Caixin Service PMI for November is due, with a modest recovery from 50.4 to 50.8 expected. A positive number could contribute to risk appetite, boosting antipodean currencies in particular. The final readings of global PMIs are also due, which should not bring major surprises.
EUR/USD extended its decline from above 1.1000 and found support at 1.0800. The short-term bias remains downward, but technical indicators offer signs of consolidation. Eurostat will release the Producer Price Index for October, which is expected to show a 0.2% increase with the annual rate rising from -12.4% to -9.4%.
USD/JPY rose from the lowest levels since September at 146.20 to 147.35, boosted by higher Treasury yields. The short-term trend is still bearish. The Tokyo Consumer Price Index is due on Tuesday.
The Swiss Franc weakened after inflation data from Switzerland showed a decline of 0.2% in the Consumer Price Index in November, bringing the annual rate to 1.4% down from 1.7% and below the expected 1.6%. USD/CHF had its best day in weeks, recovering from monthly lows to 0.8750.
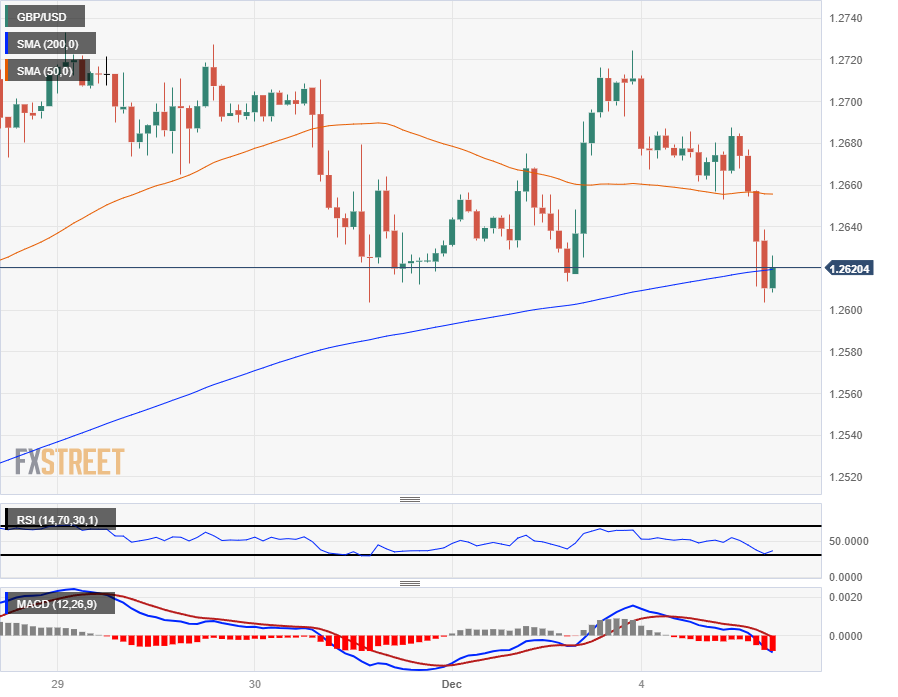
GBP/USD found resistance again at the 1.2700 area and pulled back. The pair continues to trade sideways between 1.2700 and 1.2600, currently closer to the lower limit.
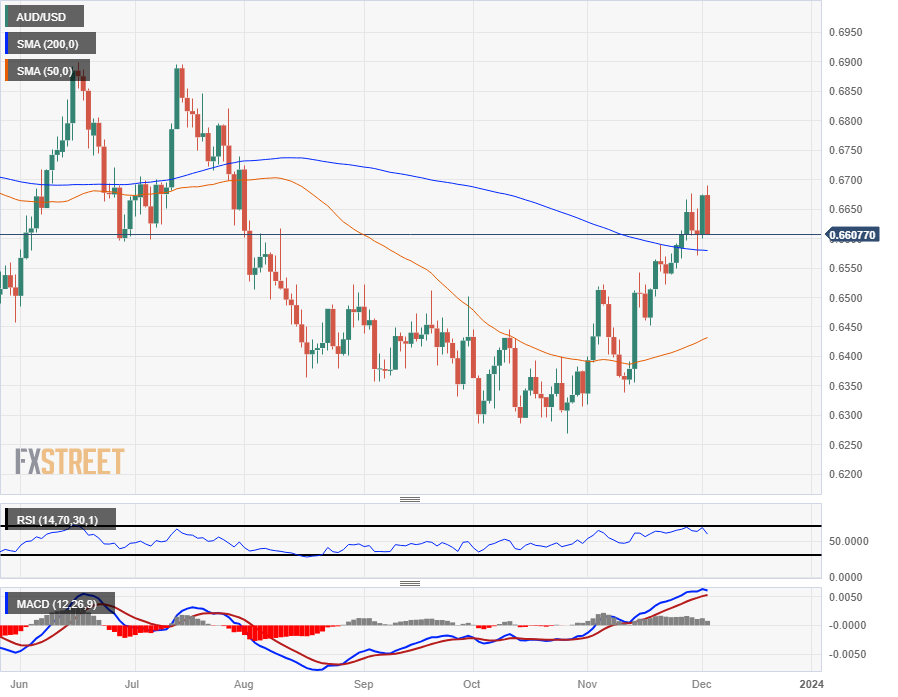
AUD/USD reversed from monthly highs affected by the stronger Dollar and the slide in commodities. The pair faces increasing resistance as it approaches 0.6700; on the downside, the 200-day Simple Moving Average (SMA) at 0.6580 emerges as a key support. The Reserve Bank of Australia (RBA) will have its monetary policy meeting, and no change in rates is expected. The final Job Bank MI is also due, along with the Q3 Current Account balance.
After hitting a record high, Gold pulled back sharply, falling to $2,020. From the top, it dropped more than $100. The decline could continue, especially if the price drops below $2,010, indicating that the selling pressure is still intense. Silver lost 3.75% on Monday, after a 5% slide from the multi-month high it reached after the weekly opening; XAG/USD ended around $24.50. The near-term outlook for metals is mixed, and volatility will likely remain high.
Bitcoin rose above $40,000 for the first time this year; BTC/USD stands near $42,000 with positive momentum intact, unaffected by the reversal in metals and the stronger Dollar.
Like this article? Help us with some feedback by answering this survey:
- GBP/JPY bounces off the daily low, but it remains trading in the red by 0.31%.
- Bulls would regain control once they reclaim 186.00.
- A bearish resumption would happen if GBP/JPY falls below 185.00.
GBP/JPY recovered some ground, but it remains trading with losses of 0.31%, late in the North American session, due to risk-off impulse as investors slashed bets the US Federal Reserve would cut rates as aggressively as traders expected. The cross-pair is trading at 185.86 after hitting a daily high of 186.54.
The pair dipped to a nine-day low at 185.08 before bouncing off those lows but it is hovering around the 185.80s area. That said, Monday’s price action is forming a hammer, which implies the GBP/JPY could retest higher prices. The first resistance would be the 186.00 figure, followed by the Tenkan-Sen at 186.86. Once cleared, the next resistance would be 187.00.
On the other hand, a bearish resumption could happen if GBP/JPY sellers drag prices below 185.00. That would pave the way to test the Kijun-Sen at 184.71, followed by a support trendline at around 184.25/35, before falling to the 184.00 mark.
GBP/JPY Price Analysis – Technical Outlook
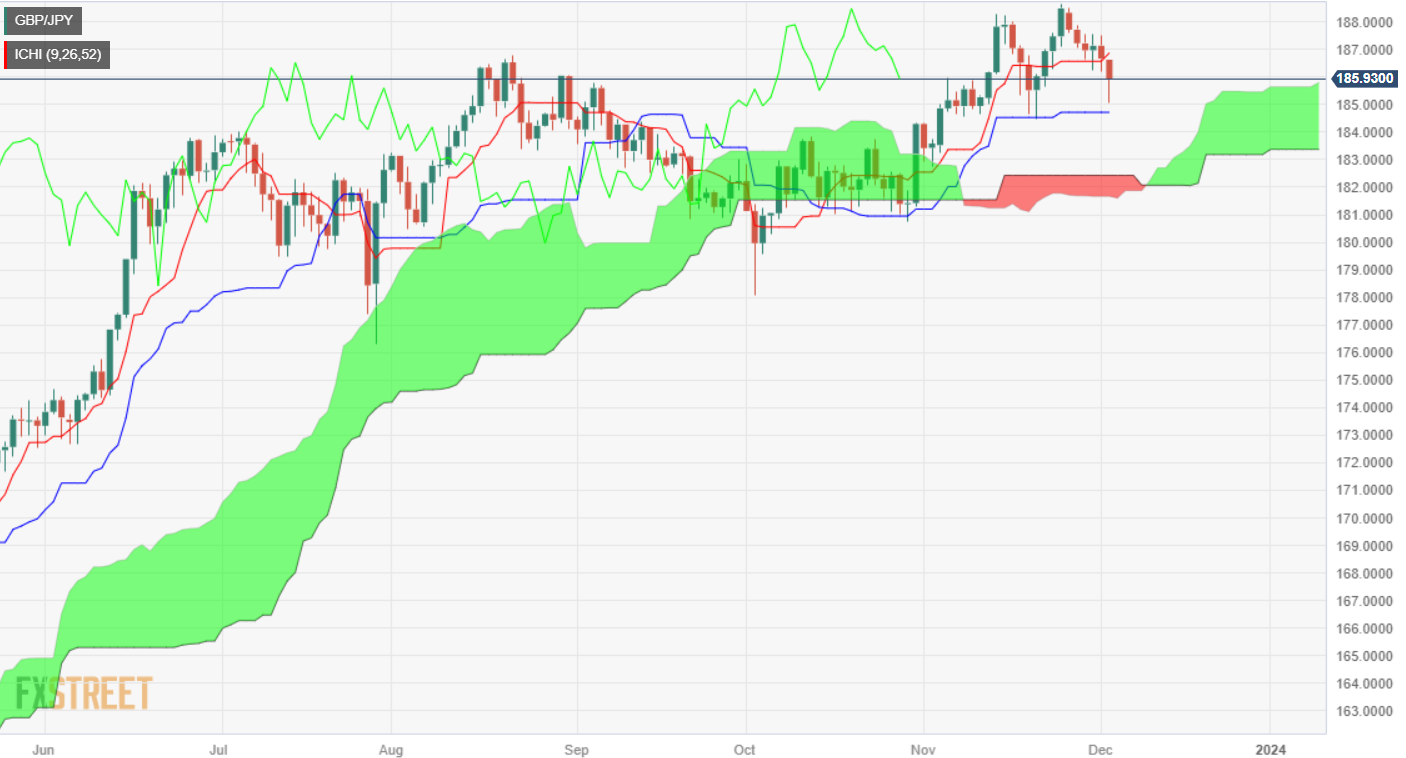
GBP/JPY Technical Levels
- The USD/SEK rallies upward, up by 0.80%, trading around the 10.46 level.
- A stronger USD and rising yields are pressuring the Swedish Krona.
- The Riksbank November minutes showed confidence that previous rate hikes slowed the economy, which justified the pause.
In Monday's trading session, the USD/SEK advanced towards 10.458, under the influence of rising US yields and dovish sentiments cast by the Riksbank November minutes. For the rest of the week, the US employment data will be the highlight as it will help investors to continue modelling their expectations regarding the next Federal Reserve (Fed) moves.
The escalating strife between Israel and Hamas has also provided a boost for the U.S. dollar, the go-to safe-haven currency, reflecting heightened global risk aversion. In line with that, the US DXY index recovered towards 103.70, seeing more than 0.50% gains.
Currently, US Treasury yields are also rising ahead of key labour market figures from the US from November, which are due this week. The 2-year rate is recorded at 4.56%, while the 5-year and 10-year yields are marked at 4.24% and 4.28%, respectively and as yields rise, this typically benefits the USD.
In line with that, on Tuesday, the US ISM Services PMI by the Institute for Supply Management (ISM) is estimated at 52, a slight increase from the previous 51.8 and on Wednesday, the Automatic Data Processing (ADP) will release its Employment Change report. The headline events are on Friday when the US Bureau of Labor Statistics releases data on the Average Hourly Earning, Nonfarm Payrolls and Unemployment rate figures from November, all key metrics closely monitored by the Fed. In that sense, the bank will get a clearer outlook on the US economy, and it will probably have an important role in the upcoming decision, so the price dynamics of the USD may have an impact.
On the SEK’s side, Riksbank released its November meeting minutes. The document justified the surprising pause at 4% as previous rate hikes were slowing the economy, also impacting the labour market. Furthermore, no further hikes were hinted at, but the door was left open for further tightening in case data justifies it.
USD/SEK levels to watch
The indicators on the daily chart reflect that the bulls are advancing but have yet more work to do. The Relative Strength Index (RSI) position shows a positive slope but is currently in negative territory, while the Moving Average Convergence Divergence (MACD) shows rising green bars, an indication that the bullish momentum might be in its early stages, suggesting a potentially favourable condition for buyers if the momentum continues to develop and is sustained over time.
Nonetheless, the broader picture conveyed by the Simple Moving Averages (SMAs) offsets initial optimism. The asset stands below its 20, 100, and 200-day SMAs, which indicates the prevailing dominance of the sellers in the market.
Support Levels: 10.455, 10.448, 10.400.
Resistance Levels: 10.485, 10.490, 10.500.
USD/SEK daily chart
-638373140377558982.png)
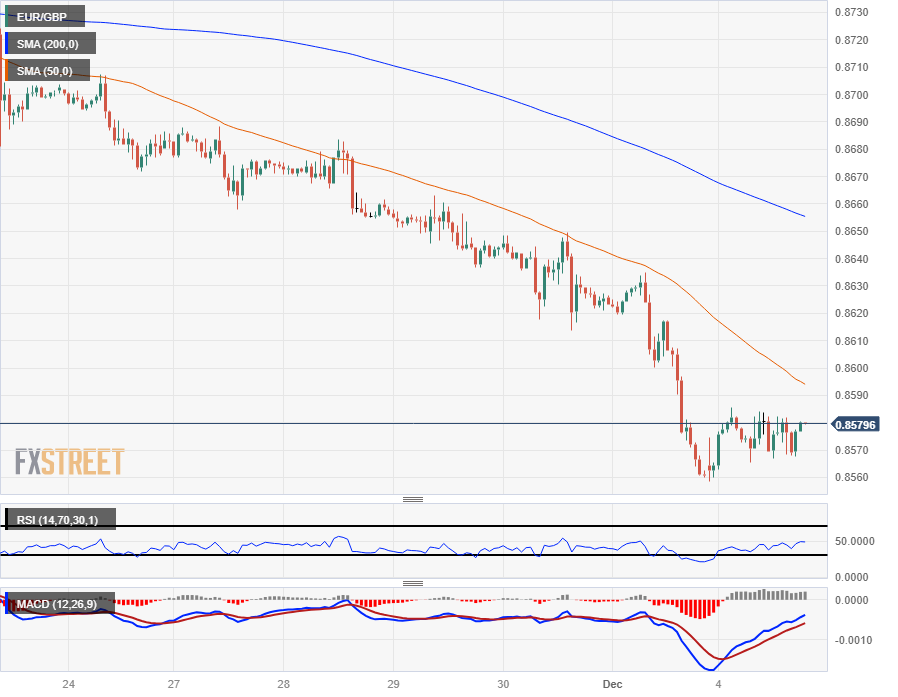
- The EUR/GBP is moderately up on Monday, climbing 0.2%.
- The Euro is catching a breather after two weeks of accelerated declines against the Pound Sterling.
- A dovish ECB is doing the Euro few favors, midweek to bring EU Retail Sales figures.
The EUR/GBP is seeing a welcome break from ongoing Euro (EUR) selling, rebounding a modest two-tenths of a percent against the Pound Sterling (GBP) on Monday.
The EUR/GBP remains mostly flat on the day, with the majority of the pair’s gains coming at the very start of the new trading week’s opening session, but any news is good news for the Euro which has seen two weeks of rapid declines against the Pound Sterling.
Monday saw the Eurozone’s December Sentix Investor Confidence Index recover less than investors expected, with indexed investor outlook printing -16.8, down from the forecast -14.4, but still an improvement from November’s Sentix Investor Confidence read of -18.6.
ECB talking points, EU Retail Sales to drive the Euro-Pound Sterling pair
The European Central Bank (ECB) has settled into a repetitive speech cycle recently, noting that inflation continues to decline within the Eurozone, and markets have seen a discount applied to the Euro as investors remain skeptical that the ECB will be able to achieve a desirable rate of price growth within a reasonable timeframe, with the ECB hoping for inflation to cool to 2% sooner rather than later.
Wednesday will see October’s Eurozone Retail Sales, and the annualized headline is expected to come in at -0.9% compared to September’s -2.9%. The MoM figure for October is forecast to see a slight improvement from -0.3% to 0.2%.
EUR/GBP Technical Outlook
Monday represents the Euro's next chance to try and reverse recent declines, with EUR bidders looking to kick off a fresh bullish rally after the new week's early rebound from 0.8560.
The EUR/GBP has closed in the red for nine of the last ten trading sessions, shedding two and a third percent peak-to-trough since retreating from November's high bids of 0.8765, slipping cleanly through the 200-day Simple Moving Average (SMA).
The long-term moving average and the 50-day SMA are consolidating around 0.8680 and set to act as a magnet for medium-term price action rather than a hard limit.
EUR/GBP Hourly Chart
EUR/GBP Daily Chart
EUR/GBP Technical Levels
- NZD/USD hit a three-month high, past the 0.6200 figure, but high US bond yields are undermining the pair.
- Further downside is seen if the pair slumps below 0.6100, with the 200-DMA in sight.
- Buyers keeping the NZD/USD exchange rate above 0.6200, to pave the way for 0.6300.
NZD/USD retreats late in the Monday North American session after rallying to a new four-month high of 0.6226, but a repricing for a less dovish US Federal Reserve witnessed a jump in US bond yields. Consequently, the pair tumbled more than 0.80% and trades at 0.6154.
The NZD/USD uptrend remains intact, though it is subject to a pullback. If the pair slides past the 0.6150 figure, the next support would be the November 30 swing low at 0.6120. Up next the 200-day moving average (DMA) at 0.6089. A breach of the latter and the pair could shift neutral if it slumps below the October 11 high turned support at 0.6055.
On the other hand, if NZD/USD buyers reclaim 0.6200, further upside is seen above 0.6226, followed by a test of the July 27 high at 0.6273. If those two supply zones are erased, a jump to 0.6300 is on the cards.
NZD/USD Price Analysis – Daily Chart
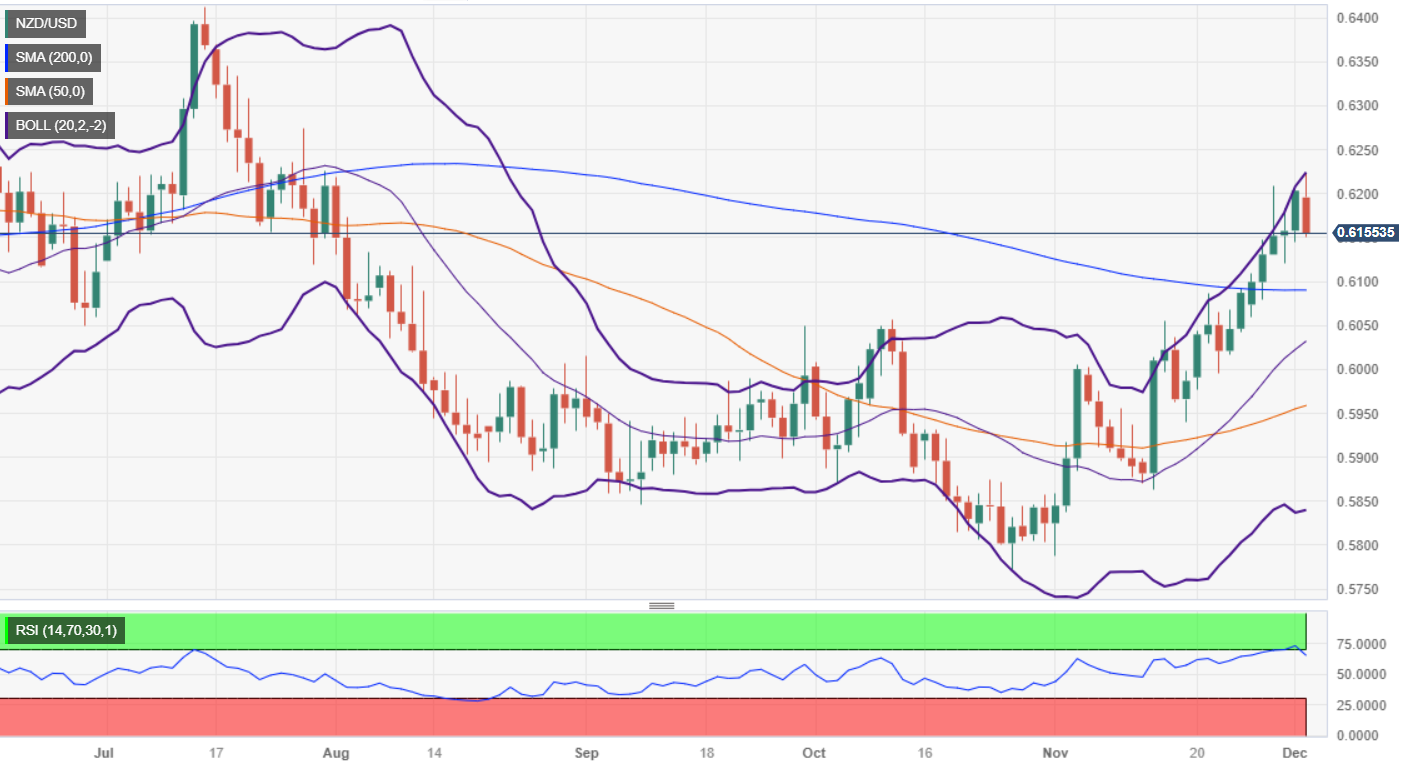
NZD/USD Technical Levels
- The AUD/USD is down over a full percent in one-sided action on Monday.
- The Aussie has seen Friday’s gains entirely pared away as markets bid up the US Dollar.
- RBA broadly expected to stand pat on rates once more as the Australian economy weakens.
The AUD/USD has steadily fallen on Monday, backsliding a full percent plus extra and paring back last week’s late rally, sending the Aussie (AUD) back towards the 0.6600 handle against the US Dollar (USD).
The Reserve Bank of Australia (RBA) is broadly expected to hold interest rates at 12-year highs of 4.35% for the December rate call, scheduled to be announced at 03:30 GMT.
See More: Australia Interest Rate Decision Preview
Market focus will be on RBA Governor Michele Bullock’s ensuing press conference as investors attempt to glean as much forward guidance out of the RBA’s statements as possible.
The RBA gave an additional 25 basis point rate hike in November as inflation continues to plague the Australian economy, but hampered economic growth and unsteady domestic market pressures are leaving the RBA stuck between a rock and a hard place.
RBA expected to hold at 4.35%
Further rate hikes threaten to further destabilize the Australian economy, and too little action on rates in the face of still-high inflation threatens to exacerbate inflation in a self-fulfilling prophecy cycle of prices running ahead of consumer expectations of further inflation.
With Aussie markets focusing squarely on the RBA, the Aussie central bank’s rate statement will dictate the near-term flows of the AUD, but near-term moves will be quickly capped off heading into the mid-week as investors gear up for 2023’s final US Nonfarm Payrolls print due on Friday.
AUD/USD Technical Outlook
The Aussie’s Monday backslide sees 0.6600 back on the table, wiping away Friday’s bull rally into 0.6690. The AUD/USD’s inability to reclaim the 0.6700 handle is exacerbating downside flows, and the pair is set for an intraday clash with the 200-hour Simple Moving Average (SMA).
The AUD/USD has seen a bullish recovery in recent weeks, climbing nearly 7% from October’s bottom bids at 0.6270. Further bullish topside is looking limited with prices struggling to develop momentum at the 200-day SMA, but bidders will be looking for an upside continuation if an extended decline sees the pair challenging the 50-day SMA rising into 0.6450.
AUD/USD Hourly Chart
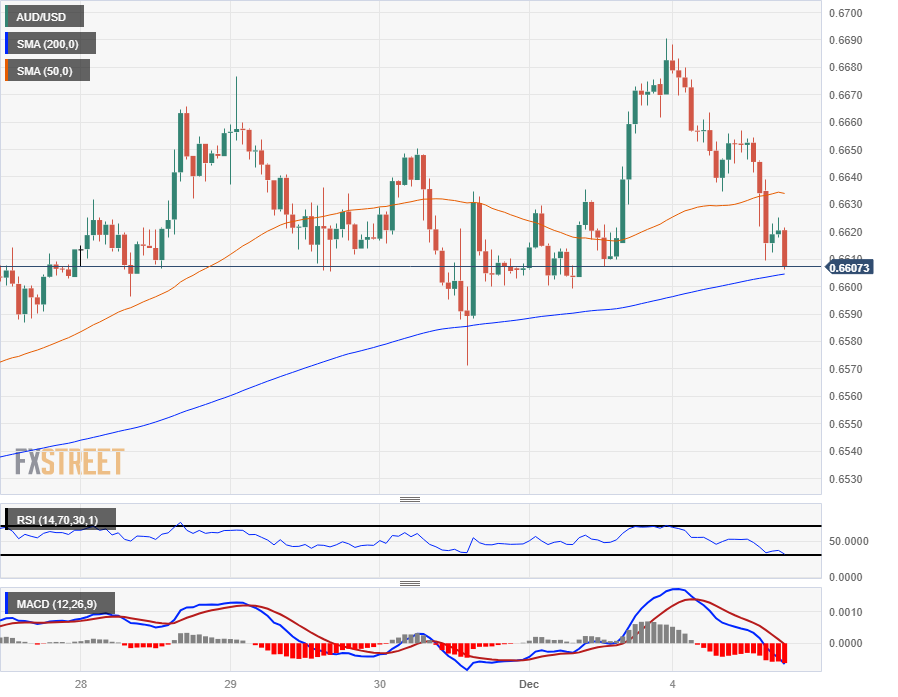
AUD/USD Daily Chart
AUD/USD Technical Levels
- USD/JPY gains steam sponsored by overall US Dollar strength and high US yields.
- Expectations that the US Federal Reserve would cut rates had been adjusted.
- Upcoming US data eyed, the ISM Services PMI and JOLTs job openings.
USD/JPY edges higher by more than 0.30% on Monday, though it remains below the Ichimoku Cloud (Kumo), which suggests the pair is undergoing an ongoing upward correction as the pair resumes its downward trend. Hence, the major Is trading at 147.23 after hitting a daily low of 146.22.
The pair sees an uptick, trading at 147.23, as market dynamics shift following recent economic data and Fed signals
The USD/JPY pair remains trading in an uptrend as US Treasury bond yields advance, mainly the 10-year benchmark note, rising close to ten basis points at 4.289%, a tailwind for the major. Another factor is that investors aggressively priced in rate cuts by the US central bank, according to the Chicago Board of Trade (CBOT) data.
Last Friday, the Federal Funds Rate futures contract for December 2024 suggested the US central bank would cut rates by 140 basis points to 4.105%. Nevertheless, the same contract has witnessed a ten basis point jump due to investors reducing rate-cut bets by Jerome Powell and Co.
On the data front, US Factory Orders disappointed investors, as the US Commerce Department revealed a contraction of -3.6% in new orders for US made goods, below September’s 2.3% expansion, though missed estimates of a -2.8% contraction. It’s the most significant monthly drop since April 2020. The data failed to trigger a reaction in the markets, which are eyeing the release of the ISM Non-Manufacturing PMI on Tuesday, alongside employment data.
On the Japanese front, the Japanese Yen (JPY) will get direction from the Tokyo inflation report, alongside Jibun Bank Services and Composite PMIs.
USD/JPY Price Analysis: Technical outlook
The daily chart portrays the pair as neutral to downward biased, with the USD/JPY staying below the Kumo. If buyers want to shift the bias, they must reclaim key resistance levels, as they need to break above the top of the Kumo, as of Today, seen at 149.40. Once done, the next resistance would be 149.50 before testing the 150.00 figure.
On the other hand, USD/JPY falling below the 147.00 figure could exacerbate a test of the September 11 low at 145.89, ahead of the September 1 daily low at 144.44.
- The DXY index surged, trading with gains above the 200-day SMA at 103.70.
- Growing tensions between Israel and Hamas made investors seek refuge in the USD.
- Key US economic reports due this week: ISM Services PMI, ADP Employment Change, November Nonfarm Payrolls and the Unemployment Rate.
The US Dollar (USD) edged higher on Monday, with the Dollar Index (DXY) sailing past the 103.70 mark, above the 200-day Simple Moving Average (SMA) and pushing a sour market mood amid rising Treasury yields.
For the rest of the week, key drivers are on the horizon as investors eye Friday's release of Nonfarm Payrolls for November alongside the Unemployment Rate, while the ISM Services PMI is due on Tuesday and the Automatic Data Processing (ADP) Employment Change report on Wednesday.
Despite mixed signals from the US labour market and cooling inflation in the United States economy, Federal Reserve (Fed) officials indicated a possibility for further policy tightening, signifying a subtly hawkish stance. This week’s key labour market data will influence the modelling of expectations and the Fed's policy trajectory, which could define the short-term trajectory of the US Dollar.
Daily Market Movers: US Dollar on the rise ahead of labor market data
- The US Dollar is currently trading with gains, with the DXY Index showing a positive upward trend neatly tucked above 103.70.
- The US Dollar's upward trend appears largely driven by a sour market mood and rising bond yields.
- No significant reports have surfaced during the session that could impact the US Dollar's current trajectory.
- Market participants have their eyes set on key economic reports due this week. On the list are the Nonfarm Payrolls, the Unemployment Rate, ADP Employment Change and the ISM Services PMI updates, scheduled for release on Friday, Wednesday and Tuesday, respectively.
- Overall, all reports are expected to show that the job creation picked up in November, while the ISM Services PMI is seen accelerating regarding its last reading of October.
- US bond yields are edging higher, aligning with the Dollar's uptick. Specifically, the 2, 5 and 10-year yield rates are up, trading at 4.65%, 4.24%, and 4.29%, respectively.
- The CME FedWatch Tool indicates no hikes are priced in for the upcoming December meeting, and markets speculate on rate cuts in mid-2024.
Technical Analysis: US Dollar struggles amid negative territory RSI and subdued SMAs
The indicators on the daily chart are reflecting a predominance of selling momentum. The index position, below the 20 and 100-day Simple Moving Averages (SMAs), indicates that the bears are maintaining control. This control is also noticeable from the Relative Strength Index (RSI), which shows a positive slope but remains in negative territory. This reveals that although buyers are gaining some strength, they are yet to overpower the sellers.
Meanwhile, the Moving Average Convergence Divergence (MACD) signifies decreasing red bars, adding further evidence of shrinking selling momentum. This deceleration is credited to the bears taking a breather after driving the index to its lowest level since last August.
.
Support levels: 103.60, 103.30, 103.15, 103.00.
Resistance levels: 104.10 (20-day SMA), 104.40 (100-day SMA), 104.50.
US Dollar FAQs
What is the US Dollar?
The US Dollar (USD) is the official currency of the United States of America, and the ‘de facto’ currency of a significant number of other countries where it is found in circulation alongside local notes. It is the most heavily traded currency in the world, accounting for over 88% of all global foreign exchange turnover, or an average of $6.6 trillion in transactions per day, according to data from 2022.
Following the second world war, the USD took over from the British Pound as the world’s reserve currency. For most of its history, the US Dollar was backed by Gold, until the Bretton Woods Agreement in 1971 when the Gold Standard went away.
How do the decisions of the Federal Reserve impact the US Dollar?
The most important single factor impacting on the value of the US Dollar is monetary policy, which is shaped by the Federal Reserve (Fed). The Fed has two mandates: to achieve price stability (control inflation) and foster full employment. Its primary tool to achieve these two goals is by adjusting interest rates.
When prices are rising too quickly and inflation is above the Fed’s 2% target, the Fed will raise rates, which helps the USD value. When inflation falls below 2% or the Unemployment Rate is too high, the Fed may lower interest rates, which weighs on the Greenback.
What is Quantitative Easing and how does it influence the US Dollar?
In extreme situations, the Federal Reserve can also print more Dollars and enact quantitative easing (QE). QE is the process by which the Fed substantially increases the flow of credit in a stuck financial system.
It is a non-standard policy measure used when credit has dried up because banks will not lend to each other (out of the fear of counterparty default). It is a last resort when simply lowering interest rates is unlikely to achieve the necessary result. It was the Fed’s weapon of choice to combat the credit crunch that occurred during the Great Financial Crisis in 2008. It involves the Fed printing more Dollars and using them to buy US government bonds predominantly from financial institutions. QE usually leads to a weaker US Dollar.
What is Quantitative Tightening and how does it influence the US Dollar?
Quantitative tightening (QT) is the reverse process whereby the Federal Reserve stops buying bonds from financial institutions and does not reinvest the principal from the bonds it holds maturing in new purchases. It is usually positive for the US Dollar.
- Interest rate in Australia is likely to stay on hold at 4.35% in December after November’s hike.
- Reserve Bank of Australia Governor Michele Bullock could leave the door ajar for more tightening.
- The Australian Dollar is set to rock on any surprise in the language of the RBA’s policy statement.
The Reserve Bank of Australia (RBA) is set to pause its tightening cycle once again, leaving the Official Cash Rate (OCR) unchanged at a 12-year high of 4.35% following the conclusion of its December monetary policy meeting on Tuesday. The decision will be announced at 03:30 GMT.
As markets widely expect the RBA to keep interest rates unchanged, all eyes will remain on Governor Michele Bullock’s forward guidance in the policy statement for a fresh directional impetus on the Australian Dollar.
Reserve Bank of Australia to stand pat as inflation resurgence wanes
Amidst a resurgence of inflationary pressures, the Reserve Bank of Australia raised the benchmark interest rate by 25 basis points (bps) from 4.10% to 4.35% in November after keeping it on hold for four straight meetings.
Since then, Australia’s inflation and retail spending have cooled down, cementing the case for the central bank to keep its cash rate unchanged this week. Data from the Australian Bureau of Statistics (ABS) on Wednesday showed its monthly Consumer Price Index (CPI) climbed at an annual pace of 4.9% in October, slowing from the previous increase of 5.6% and below expectations of a 5.2% acceleration. The RBA’s closely-watched measure of core inflation, the trimmed mean, rose an annual 5.3% in October, easing from 5.4% the previous month.
The services inflation, measured by the Wage Price Index, rose 4.0% annually, at the fastest pace since early 2009. The uptick in pay growth was largely priced in by the RBA, as it hiked rates last month. Further, markets believe the surge in wage inflation is caused by one-off factors and is unlikely to be recurrent.
Meanwhile, Australian Retail Sales dropped 0.2% in October on a monthly basis, missing expectations for growth of 0.2% while reversing a 0.9% jump seen in September. Weakening economic indicators justify the expected pause in the central bank’s rate hike cycle.
The main attention, however, is likely to be on the language in the policy statement, especially after the RBA guidance in November was perceived as dovish after Governor Bullock said in the statement, "whether further tightening of monetary policy is required to ensure that inflation returns to target in a reasonable timeframe will depend upon the data and the evolving assessment of risks." The October policy statement cited, “some further tightening of monetary policy may be required.”
The RBA will likely maintain its cautious tone, awaiting the fourth-quarter inflation report in January to decide on the next interest rate move for its first meeting of 2024 in February. Speaking at the Hong Kong Monetary Authority and Bank for International Settlements High-Level Conference last Tuesday, RBA Governor Bullock said, “the central bank has to be a ‘little bit careful’ with using rates to bring down inflation without lifting unemployment.”
Previewing the RBA policy decision, analysts at TD Securities (TDS) explained, “data has been mixed recently, with a red-hot labor market print but a sizeable retreat in CPI inflation and slowing retail sales. Thus, the RBA may take a cautious approach and keep rates on hold until Feb to reassess after it gets new staff forecasts and the Q4 CPI. We expect little change to the MPS but a hawkish tint may not be surprising after Bullock's recent remarks.”
How will the RBA interest rate decision impact AUD/USD?
The Australian Dollar’s (AUD) fate hinges on the RBA’s communication on the path forward on the interest rate. Should Governor Bullock explicitly mention that more rate hikes remain on the table, AUD/USD is likely to extend its ongoing uptrend. On the contrary, a dovish pause by the RBA could trigger a meaningful correction in the Aussie pair toward 0.6550.
Dhwani Mehta, Asian Session Lead Analyst at FXStreet, notes key technicals to trade AUD/USD on the policy outcome. “AUD/USD has stalled its recent upbeat momentum just shy of the 0.6700 level, the highest level in four months. The 14-day Relative Strength Index (RSI), however, remains well above the midline while flirting with the overbought territory, suggesting that there is room for more upside in the Aussie pair.”
“Aussie buyers need acceptance above the July 31 high of 0.6740 on a daily closing basis to unleash further upside toward the 0.6800 round figure. The next upside barrier is seen around the 0.6850 region. On the downside, strong support is envisioned at Friday’s low of 0.6600, below which a test of the 200-day Simple Moving Average (SMA) at 0.6580 will be on the cards. The last line of defense for buyers is seen at 0.6550.”
Economic Indicator
Australia RBA Interest Rate Decision
The Reserve Bank of Australia (RBA) announces its interest rate decision at the end of its eight scheduled meetings per year. If the RBA is hawkish about the inflationary outlook of the economy and raises interest rates it is usually bullish for the Australian Dollar (AUD). Likewise, if the RBA has a dovish view on the Australian economy and keeps interest rates unchanged, or cuts them, it is seen as bearish for AUD.
Read more.Next release: 12/05/2023 03:30:00 GMT
Frequency: Irregular
Source: Reserve Bank of Australia
RBA FAQs
What is the Reserve Bank of Australia and how does it influence the Australian Dollar?
The Reserve Bank of Australia (RBA) sets interest rates and manages monetary policy for Australia. Decisions are made by a board of governors at 11 meetings a year and ad hoc emergency meetings as required. The RBA’s primary mandate is to maintain price stability, which means an inflation rate of 2-3%, but also “..to contribute to the stability of the currency, full employment, and the economic prosperity and welfare of the Australian people.” Its main tool for achieving this is by raising or lowering interest rates. Relatively high interest rates will strengthen the Australian Dollar (AUD) and vice versa. Other RBA tools include quantitative easing and tightening.
How does inflation data impact the value of the Australian Dollar?
While inflation had always traditionally been thought of as a negative factor for currencies since it lowers the value of money in general, the opposite has actually been the case in modern times with the relaxation of cross-border capital controls. Moderately higher inflation now tends to lead central banks to put up their interest rates, which in turn has the effect of attracting more capital inflows from global investors seeking a lucrative place to keep their money. This increases demand for the local currency, which in the case of Australia is the Aussie Dollar.
How does economic data influence the value of the Australian Dollar?
Macroeconomic data gauges the health of an economy and can have an impact on the value of its currency. Investors prefer to invest their capital in economies that are safe and growing rather than precarious and shrinking. Greater capital inflows increase the aggregate demand and value of the domestic currency. Classic indicators, such as GDP, Manufacturing and Services PMIs, employment, and consumer sentiment surveys can influence AUD. A strong economy may encourage the Reserve Bank of Australia to put up interest rates, also supporting AUD.
What is Quantitative Easing (QE) and how does it affect the Australian Dollar?
Quantitative Easing (QE) is a tool used in extreme situations when lowering interest rates is not enough to restore the flow of credit in the economy. QE is the process by which the Reserve Bank of Australia (RBA) prints Australian Dollars (AUD) for the purpose of buying assets – usually government or corporate bonds – from financial institutions, thereby providing them with much-needed liquidity. QE usually results in a weaker AUD.
What is Quantitative tightening (QT) and how does it affect the Australian Dollar?
Quantitative tightening (QT) is the reverse of QE. It is undertaken after QE when an economic recovery is underway and inflation starts rising. Whilst in QE the Reserve Bank of Australia (RBA) purchases government and corporate bonds from financial institutions to provide them with liquidity, in QT the RBA stops buying more assets, and stops reinvesting the principal maturing on the bonds it already holds. It would be positive (or bullish) for the Australian Dollar.
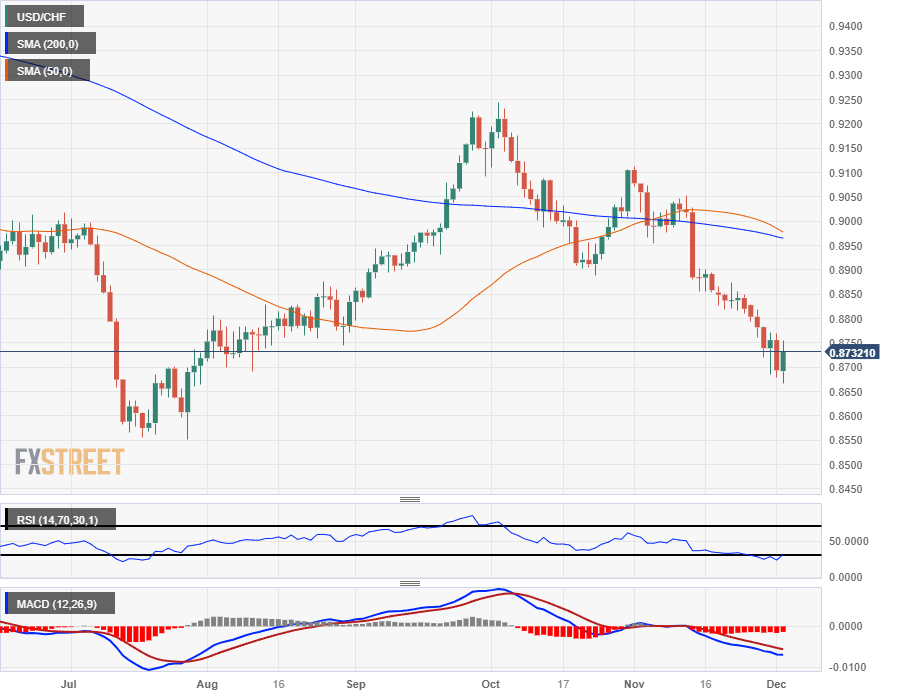
- The USD/CHF caught some relief, rebounding back over 0.8700 on Monday.
- Swiss CPI inflation declined faster than markets expected, pressuring the Swiss Franc.
- Broader markets have turned into the US Dollar as risk aversion returns to the fold.
The USD/CHF has rebounded on Monday, climbing 0.6% and touching 0.8750 as the US Dollar (USD) climbs across the board, fueled by broad-market risk-off flows, and the Swiss Franc (CHF) takes a hit after the Swiss Consumer Price Index (CPI) inflation reading misses the mark.
A worse-than-expected decline in US Factory Orders in October is fueling the broader market's souring risk appetite, with overall orders for manufactured goods in the US declining 3.6% versus the market's median expectation of -2.6%. September's Factory Orders also saw a downside revision from 2.8% to 2.3%.
Risk appetite takes a hit on Monday
Investors are seeing renewed jitters about the global economy as economic indicators begin to decline across the board, and growth appears to be wobbling across all major markets.
Switzerland's November CPI missed expectations, with the annualized CPI into November printing at 1.4% compared to the forecast 1.6%, declining even further from October's YoY print of 1.7%. The decline in Swiss CPI appears to be accelerating at the front end of the tail, with November's MoM CPI slipping -0.2% compared to October's 0.1% print.
It's a thin week on the economic calendar for the CHF, and the market's focus will be turning to Tuesday's US ISM Services Purchasing Manager's Index (PMI). Markets are hoping for an upside print in the monthly US Services PMI, which is forecast to tick upwards from 51.8 to 52.0.
USD/CHF Technical Outlook
Despite Monday's rebound, the USD/CHF remains notable bearish, with the Dollar-Franc pairing coming off the back of three consecutive weeks of declines. The pair is down five and a half percent from October's early bids near 0.9245, and US Dollar bulls have their work cut out for them.
The immediate floor for bids sits at Monday's early low of 0.8666, and the 0.8700 handle is proving a sticky level for the USD/CHF.
Technical indicators are leaning firmly into overbought territory, and an elastic snap higher will see bidders taking a fresh run at the 200-day Simple Moving Average (SMA) which is descending into 0.8950.
A near-term bull run will have to contend with a 50-day SMA set for a bearish crossover of the 200-day SMA, and the immediate ceiling for bidders will be sdupport-turned-resistance at mid-October's swing low into the 0.8900 handle.
USD/CHF Daily Chart
USD/CHF Technical Levels
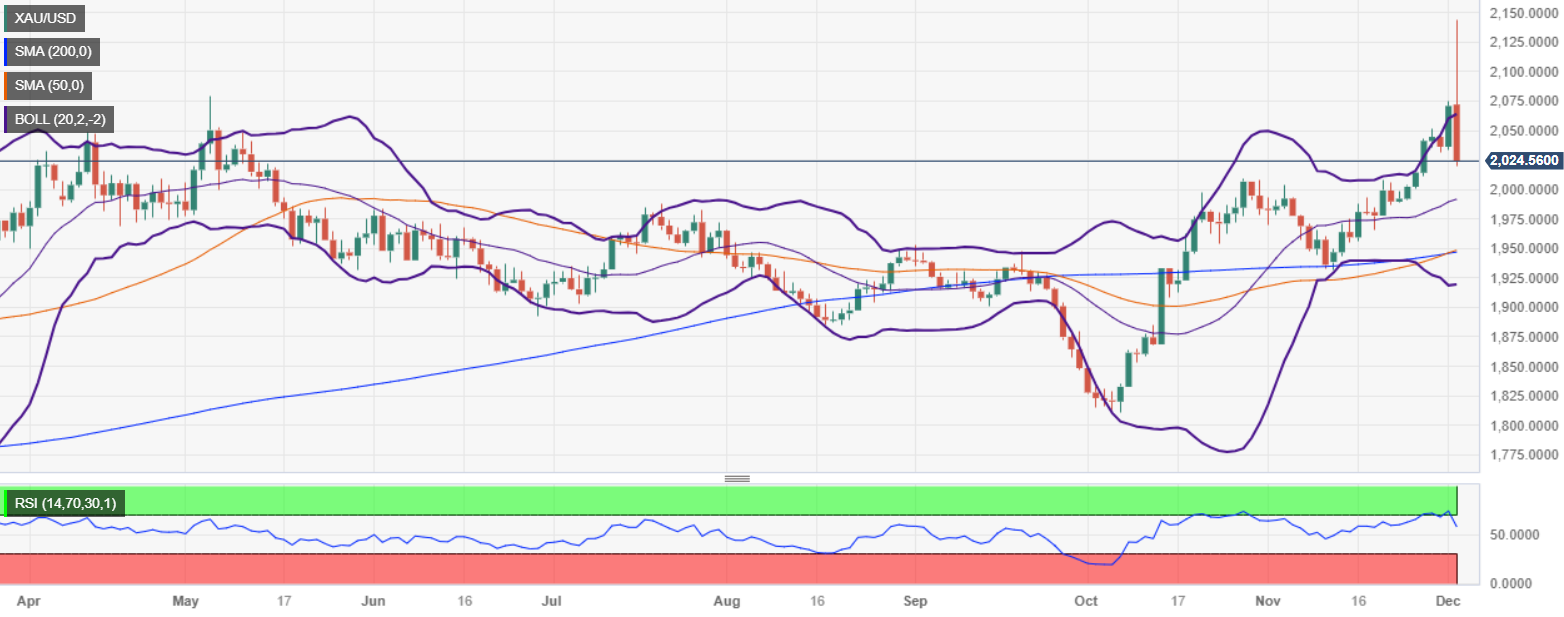
- Gold price experiences a significant drop of over 2%, after reaching a record high of $2,135.40.
- Fed Chair Jerome Powell's recent remarks emphasized caution, stating that the Fed is prepared to act if necessary and that it's too early to declare victory over inflation.
- US Real yields, a key driver for gold, also increased by nine basis points to 2.06%.
Gold price plunges more than 2% in early trading during the North American session on Monday after reaching an all-time-high (ATH) due to money market futures traders increasing bets the US Federal Reserve (Fed) would slash rates next year. At the time of writing, XAU/USD is trading at $2,024.13.
XAU/USD sees a sharp decline following Fed Chair Powell's comments and rising US Treasury yields
On Friday, the Fed Chair Jerome Powell pushed back against rate cut expectations, saying that if needed, the US central bank is prepared to act. Even though it acknowledged that inflation is slowing, and welcomed the latest PCE reading, he emphasized that it’s too early to declare victory. After Powell’s remarks, money market futures priced in 140 basis points of rate cuts toward December 2024. Futures attached to December’s contract expect the federal funds rate (FFR) at 4.105%.
In the meantime, US Treasury bond yields had trimmed some of last week’s losses. The US 10-year benchmark note rate is at 4.288%, nine basis points up from its opening price. Consequently, US Real yields, which greatly influence the prices of Gold, rose nine basis points, up by 2.06%.
The US economic docket revealed that orders for newly made goods fell more than estimated in October, the biggest drop in three and a half years. Estimates were around -2.8% contraction, but factory orders dropped -3.6%, below September’s downward revised 2.3% jump. The report shows the manufacturing sector is feeling the impact of higher interest rates. Last week’s ISM Manufacturing PMI was unchanged at 46.7, suggesting the economy continued to slowdown
XAU/USD Price Analysis: Technical outlook
Gold uptrend remains intact, but Monday’s price action could pave the way for a deeper correction as the downtrend accelerates, registering losses of more than $45.00 USD. The next support is seen at the October 27 daily high at $2,009.42 before challenging the $2,000 figure. A bullish resumption might happen, once the XAU/USD climbs above the May 4 swing high at $2,081.82, and the $2,100 mark.
- The GBP/USD is faltering on Monday as risk aversion seeps back into market sentiment.
- The US Dollar is front-running the rest of the FX market as investors pull back into safe havens.
- The Pound Sterling has shed three-quarters of a percent against the US Dollar on Monday.
The GBP/USD is down nearly eight-tenths of a percent on Monday as the Pound Sterling (GBP) gives up ground to the US Dollar (USD) in a broad-market risk-off bid that has investors pulling back into the safe haven Greenback.
The new trading week has kicked off with a fresh bout of risk aversion as investors come face-to-face with a global slowdown looming over economies across all three major market sessions.
There's little of note on the economic calendar for the Pound Sterling to kick off the new week, and the rest of the week remains lightly-populated as well. The US Dollar is set to drive market reactions to data heading through the rest of the week, which culminates in another reading of the US Nonfarm Payrolls (NFP) report on Friday.
US data to feature heavily this week, Friday's NFP looms ahead
US Factory Orders in October declined more than investors expected, printing at -3.6% versus the expected -2.6%, and September's manufactured goods purchases also saw a downside revision from 2.8% to 2.3%. Economic activity is beginning to show hardening weak spots, both in the US and across the globe.
Investors appear to be remembering that despite an economic slowdown accelerating the chance of rate cuts from the Federal Reserve (Fed), a global recession is, in fact, bad for business, and souring economic data is seeing investors pulling back into safe havens.
The Pound Sterling will get another chance at redemption, or at least preventing further declines, when the UK's BRC Life-For-Like Retail Sales for the year into November prints early Tuesday at 00:01 GMT. Markets are expecting a tick down in UK comparative retail sales from 2.6% to 2.5%.
GBP/USD Technical Outlook
The Pound Sterling (GBP) saw refreshed selling pressure on Monday against the US Dollar (USD), with the GBP/USD opening up the trading week slipping from early bids near 1.2720 back down towards 1.2600.
Intraday charts are seeing a technical snag at the 200-hour Simple Moving Average (SMA), but the GBP/USD remains firmly bearish in the near term as the pair trades on the south side of the 50-hour SMA.
Daily candlesticks for the GBP/USD are getting mired in the midrange, with recent upside momentum facing a technical ceiling at the 1.2700 handle. The GBP/USD has been on the climb ever since crossing the 200-day SMA near 1.2450 back in mid-November, but bullish momentum appears to be draining and the pair is primed for at least a minor pullback.
GBP/USD Hourly Chart
GBP/USD Daily Chart
GBP/USD Technical Levels
- The XAG/USD is experiencing a more than 3% downward rally, after soaring to near $26.00.
- A stronger US dollar amid escalating tensions between Israel and Hamas weighed on the metal.
- US bond yields are seeing nearly 2% increases on the day.
- The US will report key employment data throughout the week.
The XAG/USD pair witnessed a downward rally in Monday's trading session, currently trading around $24.50 as bulls consolidate gains, which took the price to a high since May of $25.95 earlier in the session. The key movers of the day pushing Silver lower are the rise in US yields ahead of key employment data from the US. In addition, the intensification of the geopolitical conflict between Israel and Hamas has benefited the USD, and as global tensions rise, investors are resorting to the green haven.
In line with that, US Treasury yields are rising, seeing more than 2% increases. The 2-year rate is at 4.64%, while the 5-year and 10-year rates are trading at 4.22% and 4.28% respectively. This yield surge negatively affects the price of non-yielding metals, as US Treasury bond yields are usually perceived as their opportunity cost. That said, the dovish rhetoric on the Federal Reserve (Fed) dominates markets, recently pushing the price higher and the US bond rates lower. The short-term focus is now on employment data, which will determine the trajectory of the bond market, as the bank remains data-dependent and left the door open for further tightening.
On Wednesday, investors will pay close attention to the Automatic Data Processing (ADP) Employment Change report from November, and on Thursday, weekly Jobless Claims are due. On Friday, the spotlight will be on the U.S. Bureau of Labor Statistics as they release crucial data on the Unemployment Rate and Nonfarm Payrolls, significant indicators of the US labour market's health closely monitored by the Fed. Its outcome may affect the expectations of the next decisions and hence may trigger volatility in bond markets and in the metal’s price.
XAG/USD levels to watch
The daily chart indicators reflect indications of a bullish consolidation in the short term to correct overbought conditions. The Relative Strength Index (RSI), projecting a negative slope while still within the positive territory, indicates a potential pullback or consolidation phase as the bulls take a breather after jumping to nearly $26.00 earlier in the session, its highest since May. In addition, the Moving Average Convergence Divergence (MACD) displays rising red bars, denoting that selling pressure is increasing.
However, as the price is trading above the 20, 100, and 200-day SMAs, the longer-term buying momentum is significantly stronger, suggesting that despite short-term interruptions, the bulls maintain overall control.
Support Levels: $24.00, $23.76 (20-day SMA), $23.00.
Resistance Levels: $25.00, $25.50, $26.00.
XAG/USD daily chart
-638373037893802570.png)
Most recent article: Canadian Dollar stretches higher against the US Dollar on Friday after Canadian jobs beat
- The Canadian Dollar sees downside pressure on Monday.
- Canadian economic calendar data is limited in the early week, USD flows to dominate.
- The next BoC rate call is coming up on Wednesday.
The Canadian Dollar (CAD) pared back some of last week’s gains as the US Dollar (USD) sees a broad-market recovery on the back of renewed risk aversion. The Canadian Dollar is down roughly a third of a percent against the Greenback on Monday.
Canada is absent from the economic calendar for the early half of the week, with the latest rate call from the Bank of Canada (BoC) due on Wednesday. The BoC is expected to hold rates steady at 5% for the fourth meeting in a row.
Daily Digest Market Movers: Risk aversion is back on the menu as investor appetite sours, Canadian Dollar softens as US Dollar recovers
- The Canadian Dollar has given back four-tenths of a percent against the US Dollar in Monday trading.
- The CAD has performed strongest against the Antipodeans to kick off the trading week, up nearly six-tenths of a percent and a third of a percent against the Aussie (AUD) and the Kiwi (NZD), respectively.
- The BoC’s upcoming rate call should represent an entire quarter of no rate hikes, as long as policymakers meet markets in the middle.
- The BoC raised eyebrows when they gave interest rates an additional 25-basis-point bump back in July.
- Monday’s markets are chewing on a miss in US Factory Orders, which also saw a downside revision to previous figures.
- US Factory Orders declined 3.6% in October, falling even further below the median market forecast of a 2.6% contraction.
- September’s US Factory Orders were revised from 2.6% to 2.3%.
- Tuesday will bring more of the same CAD-light data docket, with the US ISM Services Purchasing Managers Index (PMI) being the key data focus.
Canadian Dollar price today
The table below shows the percentage change of Canadian Dollar (CAD) against listed major currencies today. Canadian Dollar was the weakest against the US Dollar.
| USD | EUR | GBP | CAD | AUD | JPY | NZD | CHF | |
| USD | 0.63% | 0.76% | 0.38% | 0.95% | 0.42% | 0.76% | 0.64% | |
| EUR | -0.65% | 0.14% | -0.20% | 0.33% | -0.22% | 0.15% | 0.00% | |
| GBP | -0.79% | -0.13% | -0.38% | 0.19% | -0.33% | 0.00% | -0.13% | |
| CAD | -0.41% | 0.22% | 0.36% | 0.58% | -0.01% | 0.36% | 0.23% | |
| AUD | -0.96% | -0.33% | -0.19% | -0.58% | -0.55% | -0.18% | -0.33% | |
| JPY | -0.48% | 0.21% | 0.49% | -0.04% | 0.54% | 0.34% | 0.20% | |
| NZD | -0.76% | -0.13% | 0.00% | -0.38% | 0.19% | -0.34% | -0.14% | |
| CHF | -0.66% | -0.01% | 0.12% | -0.26% | 0.31% | -0.22% | 0.12% |
The heat map shows percentage changes of major currencies against each other. The base currency is picked from the left column, while the quote currency is picked from the top row. For example, if you pick the Euro from the left column and move along the horizontal line to the Japanese Yen, the percentage change displayed in the box will represent EUR (base)/JPY (quote).
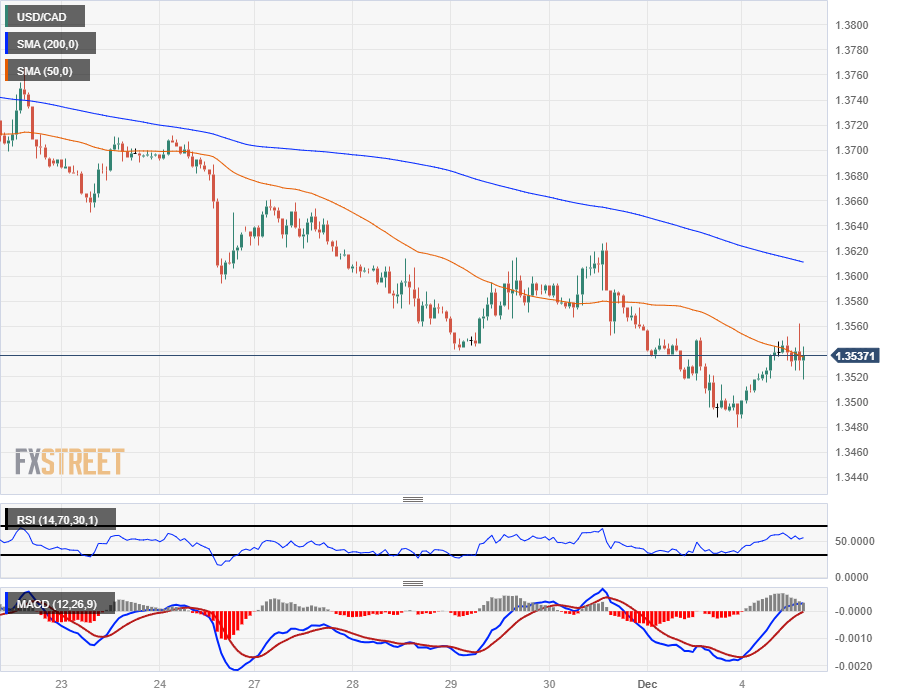
Technical Analysis: Canadian Dollar attempts to arrest further declines after Greenback bidders draw a line in the USD/CAD at 1.3500
The Canadian Dollar (CAD) fell back against the US Dollar (USD) in a broad-market risk rebound that sent the USD/CAD higher after rebounding from the 1.3500 handle.
Near-term bullish momentum remains limited with the USD/CAD getting snagged on the 50-hour Simple Moving Average (SMA), and Monday’s current high bid sits at 1.3560.
Intraday action sees a technical ceiling at the 200-hour SMA near 1.3610, and the figure for Canadian Dollar bidders to beat will be Monday’s bottom bids at 1.3480.
Monday’s pullback brings omens of US Dollar (USD) strength on the daily candlesticks, with the 200-day SMA acting as technical support just above the 1.3500 handle.
Adding to the US Dollar rebound picture, technical indicators are leaning firmly into exhaustion territory, with the 14-day Relative Strength Index (RSI) tapping the lower bound, indicating oversold conditions.
On the other hand, a bullish continuation of the Canadian Dollar’s recent strength will see a fresh run at September’s low bids near 1.3380.
USD/CAD Hourly Chart
USD/CAD Daily Chart
Canadian Dollar FAQs
What key factors drive the Canadian Dollar?
The key factors driving the Canadian Dollar (CAD) are the level of interest rates set by the Bank of Canada (BoC), the price of Oil, Canada’s largest export, the health of its economy, inflation and the Trade Balance, which is the difference between the value of Canada’s exports versus its imports. Other factors include market sentiment – whether investors are taking on more risky assets (risk-on) or seeking safe-havens (risk-off) – with risk-on being CAD-positive. As its largest trading partner, the health of the US economy is also a key factor influencing the Canadian Dollar.
How do the decisions of the Bank of Canada impact the Canadian Dollar?
The Bank of Canada (BoC) has a significant influence on the Canadian Dollar by setting the level of interest rates that banks can lend to one another. This influences the level of interest rates for everyone. The main goal of the BoC is to maintain inflation at 1-3% by adjusting interest rates up or down. Relatively higher interest rates tend to be positive for the CAD. The Bank of Canada can also use quantitative easing and tightening to influence credit conditions, with the former CAD-negative and the latter CAD-positive.
How does the price of Oil impact the Canadian Dollar?
The price of Oil is a key factor impacting the value of the Canadian Dollar. Petroleum is Canada’s biggest export, so Oil price tends to have an immediate impact on the CAD value. Generally, if Oil price rises CAD also goes up, as aggregate demand for the currency increases. The opposite is the case if the price of Oil falls. Higher Oil prices also tend to result in a greater likelihood of a positive Trade Balance, which is also supportive of the CAD.
How does inflation data impact the value of the Canadian Dollar?
While inflation had always traditionally been thought of as a negative factor for a currency since it lowers the value of money, the opposite has actually been the case in modern times with the relaxation of cross-border capital controls. Higher inflation tends to lead central banks to put up interest rates which attracts more capital inflows from global investors seeking a lucrative place to keep their money. This increases demand for the local currency, which in Canada’s case is the Canadian Dollar.
How does economic data influence the value of the Canadian Dollar?
Macroeconomic data releases gauge the health of the economy and can have an impact on the Canadian Dollar. Indicators such as GDP, Manufacturing and Services PMIs, employment, and consumer sentiment surveys can all influence the direction of the CAD. A strong economy is good for the Canadian Dollar. Not only does it attract more foreign investment but it may encourage the Bank of Canada to put up interest rates, leading to a stronger currency. If economic data is weak, however, the CAD is likely to fall.
- Mexican Peso trips down against the US Dollar as USD/MXN post solid gains.
- Mexico’s economic docket revealed that Gross Fixed Investment printed a monthly decline in September.
- Money market futures expect the US Federal Reserve to slash rates by more than 130 basis points toward the end of next year.
Mexican Peso (MXN) loses steam against the US Dollar (USD) in early trading during the North American session, as the rise in US Treasury bond yields is underpinning the US Dollar. Even though US Federal Reserve (Fed) Chair Jerome Powell pushed back against rate cut expectations, he failed. Nevertheless, the USD/MXN is not reflecting data, as it trades at around 17.29, gaining more than 0.75% on the day.
Mexico's economic docket revealed that Gross Fixed Investment fell -1.5% MoM in September, reported the National Statistics Agency, INEGI. The same measures grew 21.9% in the twelve months to September, slowing from 29.2% from the August reading. Last Friday, the Bank of Mexico (Banxico) revealed that remittances in October rose by $5.81 billion. However, a stronger Peso dragged down the value of cash sent home by Mexicans living overseas. In Pesos, remittances fell 2.3% and 6.3% in real local currency terms when considering the Mexican currency appreciation, Goldman Sachs Analysts cited by Reuters said.
In the meantime, on Friday, Fed Chair Powell said he requires more evidence of the disinflationary process in the US despite acknowledging a decrease in prices. Nevertheless, he cautioned that it’s too soon to declare victory against inflation and added the Fed is ready to raise rates if needed. Despite Powell’s words, money market futures had priced in more than 130 basis points of rate cuts by the US central bank next year, with the first slash expected as soon as May 2024.
US Treasury bond yields are rising, with the 10-year benchmark note coupon at 4.255%, a tailwind for the Greenback. The US Dollar Index (DXY), which tracks the currency’s performance against a basket of six rivals, climbs 0.46%, up at 103.66.
Daily digest movers: Mexican Peso trims last Friday’s gains
- Banxico revises economic growth upward from 3% to 3.3% for 2023 and projects the economy will rise 3% in 2024, from 2.1% previously forecast.
- Regarding inflation prospects, the Mexican central bank foresees headline inflation at 4.4% in Q4 2023 (5.3% for core), while at the end of 2024, it is estimated at 3.4% (3.3% for core). The central bank forecasts headline and core inflation not to hit the 3% target imposed by the institution until 2025.
- The Federal Reserve's favorite inflation gauge in October, the Core PCE Price Index rate softened from 3.7% to 3.5% YoY. Moreover, headline PCE inflation dropped from 3.4% to 3.0% YoY for the same twelve-month period.
- On November 27, Banxico’s Deputy Governor, Jonathan Heath, commented that core prices must come down more, adding that one or two rate cuts may come next year, but “very gradually” and “with great caution.”
- On November 24, a report revealed the economy in Mexico grew as expected in the third quarter on an annual and quarterly basis, suggesting the Bank of Mexico would likely stick to its hawkish stance, even though it opened the door for some easing.
- Mexico's annual inflation increased from 4.31% to 4.32%, while core continued to ease from 5.33% to 5.31%, according to data on November 23.
- A Citibanamex poll suggests that 25 of 32 economists expect Banxico's first rate cut in the first half of 2024.
- The poll shows “a great dispersion” for interest rates next year, between 8.0% and 10.25%, revealed Citibanamex.
- The same survey revealed that economists foresee headline annual inflation at 4.00% and core at 4.06%, both readings for the next year, while the USD/MXN exchange rate is seen at 19.00, up from 18.95, toward the end of 2024
Technical Analysis: Mexican Peso trips down as USD/MXN climbs toward the 100-day SMA
The USD/MXN edges higher, as depicted by the daily chart, threatening to reclaim the 100-day Simple Moving Average (SMA) at 17.36. A breach of the latter could expose the November 30 daily high at 17.49, ahead of testing the 200-day SMA at 17.56. If buyers reclaim that level, then there would be nothing on the way north to challenge the 50-day SMA at 17.69.
Conversely, a bearish resumption is possible if USD/MXN stays under the 100-day SMA and slides below the 17.20 area. Once done, the first demand zone would be the 17.05 mark, ahead of the November 27 swing low of 17.03. If the pair drops below that level, the psychological 17.00 figure would be up next.
Mexican Peso FAQs
What key factors drive the Mexican Peso?
The Mexican Peso (MXN) is the most traded currency among its Latin American peers. Its value is broadly determined by the performance of the Mexican economy, the country’s central bank’s policy, the amount of foreign investment in the country and even the levels of remittances sent by Mexicans who live abroad, particularly in the United States. Geopolitical trends can also move MXN: for example, the process of nearshoring – or the decision by some firms to relocate manufacturing capacity and supply chains closer to their home countries – is also seen as a catalyst for the Mexican currency as the country is considered a key manufacturing hub in the American continent. Another catalyst for MXN is Oil prices as Mexico is a key exporter of the commodity.
How do decisions of the Banxico impact the Mexican Peso?
The main objective of Mexico’s central bank, also known as Banxico, is to maintain inflation at low and stable levels (at or close to its target of 3%, the midpoint in a tolerance band of between 2% and 4%). To this end, the bank sets an appropriate level of interest rates. When inflation is too high, Banxico will attempt to tame it by raising interest rates, making it more expensive for households and businesses to borrow money, thus cooling demand and the overall economy. Higher interest rates are generally positive for the Mexican Peso (MXN) as they lead to higher yields, making the country a more attractive place for investors. On the contrary, lower interest rates tend to weaken MXN.
How does economic data influence the value of the Mexican Peso?
Macroeconomic data releases are key to assess the state of the economy and can have an impact on the Mexican Peso (MXN) valuation. A strong Mexican economy, based on high economic growth, low unemployment and high confidence is good for MXN. Not only does it attract more foreign investment but it may encourage the Bank of Mexico (Banxico) to increase interest rates, particularly if this strength comes together with elevated inflation. However, if economic data is weak, MXN is likely to depreciate.
How does broader risk sentiment impact the Mexican Peso?
As an emerging-market currency, the Mexican Peso (MXN) tends to strive during risk-on periods, or when investors perceive that broader market risks are low and thus are eager to engage with investments that carry a higher risk. Conversely, MXN tends to weaken at times of market turbulence or economic uncertainty as investors tend to sell higher-risk assets and flee to the more-stable safe havens.
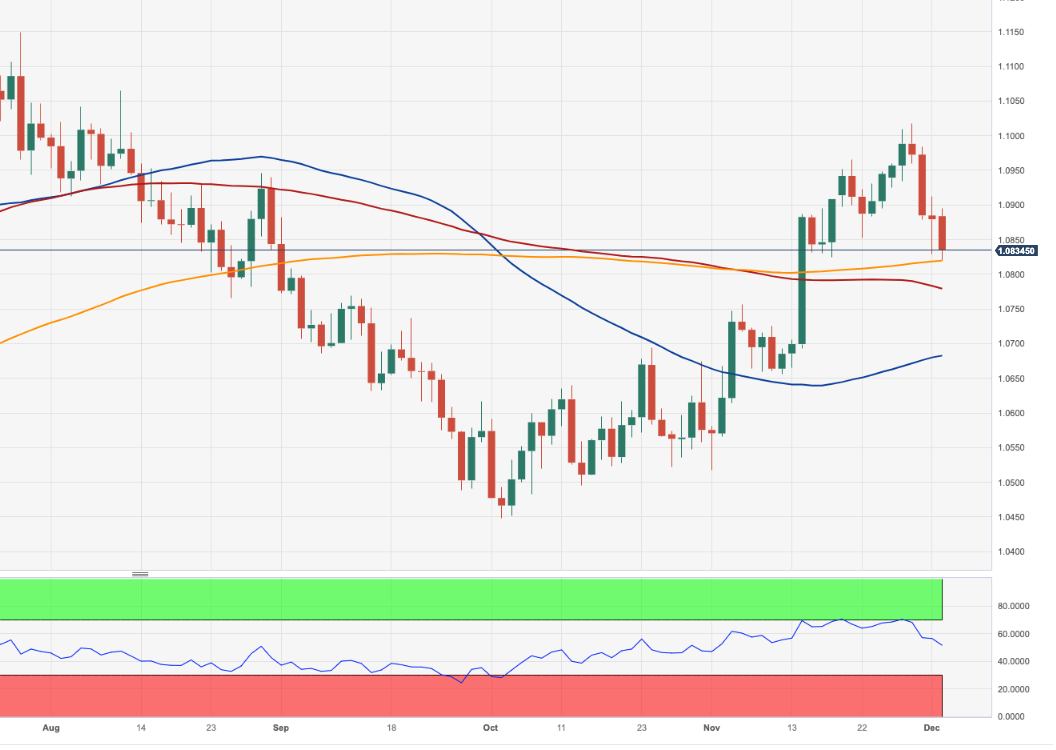
- EUR/USD gives away further ground and retests 1.0820.
- The loss of the 200-day SMA should spark extra declines.
EUR/USD retreats for the fourth session in a row and puts the key 200-day SMA to the test on Monday.
A drop below the latter should pave the way for a deeper pullback to, initially, the intermediate 100-day SMA at 1.0778 and the 55-day SMA at 1.0681.
So far, while above the significant 200-day SMA, the pair’s outlook should remain constructive.
EUR/USD daily chart
Economist at UOB Group Lee Sue Ann comments on the upcoming RBA monetary policy meeting (December 5).
Key Quotes
While we are keeping our policy outlook unchanged (expecting the RBA to keep the peak policy rate of 4.35% at the Dec meeting and in 1Q24), the chance of another interest rate rise remains a live option, especailly amid concerns inflation may remain stubbornly high for longer then expected.
We have also now pushed back our first rate cut to take place in 3Q24
- DXY resumes the upside and approaches 103.80.
- Extra upside looks likely once the 200-day SMA is cleared.
DXY regains the smile and advances to multi-day highs past 103.70 on Monday.
If the key 200-day SMA (103.57) is surpassed, the index is expected to face more sustained gains to, initially, the weekly top of 104.21 (November 22) ahead of the transitory 100-day SMA at 104.37.
In the meantime, above the key 200-day SMA, the outlook for the index is expected to shift to bullish.
DXY daily chart

USD/IDR could recede to the 15,350 region in the next few weeks, notes Markets Strategist Quek Ser Leang at UOB Group.
Key Quotes
Last week, USD/IDR traded in a relatively choppy manner between 15,350 and 15,555 before settling at 15,480 (-0.51%). While downward momentum has not increased much, there is scope for USD/IDR to retest the 15,350 level this week.
The next support at 15,300 is highly unlikely to come under threat. Resistance is at 15,500, followed by 15,535.
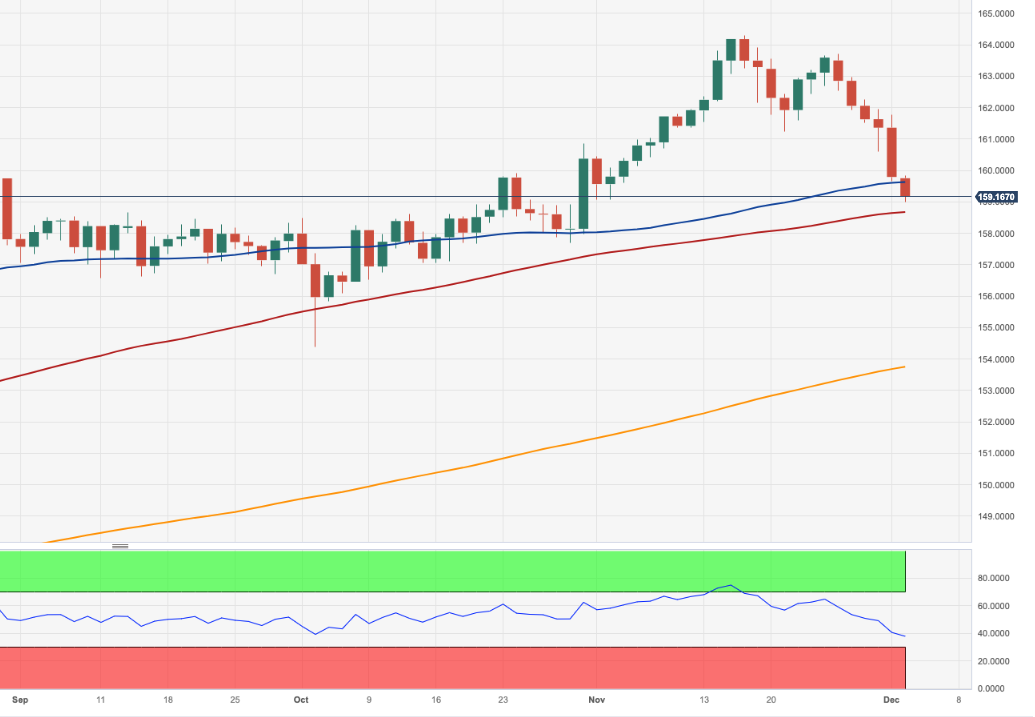
- EUR/JPY extends the leg lower to the 159.00 zone.
- Further downside could revisit the 100-day SMA near 158.60.
EUR/JPY accelerates its losses and puts the 159.00 support to the test at the beginning of the week.
The continuation of the downward bias appears on the cards for the time being. Against that, the 100-day SMA at 158.62 is expected to offer temporary contention prior to the October low of 154.34 (October 3).
So far, the longer term positive outlook for the cross appears favoured while above the 200-day SMA at 153.71.
EUR/JPY daily chart
Extra decline in USD/MYR still appears in store in the short term in the view of Markets Strategist Quek Ser Leang at UOB Group.
Key Quotes
USD/MYR traded in a range of 4.6360/4.6830 last week before closing at 4.6710 (-0.26%) on Friday. There is a slight increase in downward momentum, and we expect USD/MYR to edge lower this week.
However, any decline is unlikely to reach 4.6260 (there is another support level at 4.6350). Resistance is at 4.6850, followed by a rather strong level at 4.6960.
- The Australian Dollar is losing ground amid a sourer market mood
- Tuesday’s RBA decision will set the Aussie’s near-term path.
- So far, the broader bullish trend remains intact.
The Aussie is going through a corrective reversal on Monday after failure to beach the 0.6685 resistance area, and bears looking at the intra-day low, at 0.6635.
The RBA is likely to keep rates on hold
The calendar is light today, with only the US Factory Orders data on tap, although the cautious market mood, is underpinning support for the US Dollar, to the detriment of the risk-sensitive Aussie.
Tuesday’s, RBA decision is the main focus right now. The bank is expected to keep interest rates on hold, with domestic inflation on retreat. Traders will be looking for any hint of rate cuts next year, which might extend the pair’s reversal.
In the US Tuesday’s ISM Services PMI and Wednesday’s ADP report will be the main attractions ahead of Friday’s Nonfarm Payrolls. These readings will help to assess the Fed’s monetary outlook and are likely to determine the USD’s near-time path.
From a technical perspective, the pair remains biased higher while above 0.6625 and 0.6575. On the upside, resistances are 0.6690 and 0.6735.
Technical levels to watch
- US recovery loses steam with bulls capped at 147.00
- The cautious market mood keeps the safe-haven Yen near recent highs.
- Hopes that the BoJ will exit its ultra-loose policy in 2024 are likely top support the Yen.
The US Dollar is licking its wounds near three-month lows at 146.25, as the recovery attempts seen earlier on Monday have failed to extend above 147.00.
The yen refuses to give way amid cautious markets
Price action is moving within a narrow range, with buyers defending the 146.25/45 area as market sentiment falters. The risk sentiment seen on Friday, following Fed Powell's comments has turned into caution, as the market turns its focus towards a string of key US data, which will provide more cues into the Federal Reserve’s monetary policy.
Beyond that, the market is increasingly convinced that the BoJ will start exiting its ultra-loose monetary policy, which is cushioning the Yen’s downside attempts.
Technical indicators show the broader downside trend intact, with the 147.05 resistance level closing the path to last week's highs at 148.30 and 148.85. Supports are 146.50 and 145.95.
Technical levels to watch
- Gold prices retreat from fresh record highs at $2,150 with US yields picking up.
- Investors turn cautious on geopolitical tensions ahead of a busy data week.
Gold price (XAU/USD) has been consolidating within a tight range above $2,070 during the European morning session following a reversal from all-time highs at the $2,150 area.
The US Dollar (USD) is trimming some losses at the week’s opening, with US Treasury yields picking up as the risk appetite witnessed on Friday faded. Investors have turned their focus to a set of high-tier US indicators, with the all-important US Nonfarm Payrolls (NFP) closing the week, for more insight into the Federal Reserve’s next monetary policy steps.
Technical reasons have contributed to the precious metal’s recent pullback, as the strongly overbought levels reached at the mentioned $2,150 level have prompted a profit-taking reaction from Gold buyers.
Fundamentals, however, remain favouring Gold amid a combination of softer inflation and weaker US macroeconomic data. In this context, Fed Chairman Powell’s remarks on Friday, pledging to be careful with rate hikes boosted hopes that the tightening cycle is over, increasing speculation about rate cuts in March.
Beyond that, the increasing tensions in the Middle East have reactivated fears of an escalation of the conflict, which would involve other countries in the region. In China, news about an outbreak of another respiratory virus has increased concerns about another setback for the world’s second-largest economy and hence for the global economic outlook. These concerns are likely to underpin support for the safe-haven Gold.
In the calendar, we have a relevant amount of key US Data, starting with the ISM Services PMI and JOLTS Job Openings data on Tuesday, ahead of Wednesday’s ADP to lay the ground for Friday’s Nonfarm Payroll (NFP) report. These readings are expected to have a relevant impact on US yields and, by extension, on Gold prices.
Daily Digest Market Movers: Gold price consolidates as the US Dollar pares losses
- US Dollar and US yields regain some ground on Monday as the risk rally fades.
- News about an attack on two commercial vessels in the Red Sea has reactivated fears about an escalation of the Middle East conflict.
- US manufacturing data confirmed that the economy is losing pace in the last quarter of the year, which is fueling hopes that the Fed is done with rate hikes.
- US yields dropped sharply after Fed Powell's comments. The benchmark 10-year note lost about 15 basis points to hit fresh 3-month lows below 4.20%.
- According to the CME Fed Watch Tool, markets are now pricing a 51% chance of a 25 bps rate hike in March, from about 40% earlier last week.
- In the economic calendar this week, the ISM Services PMI on Tuesday, followed by the ADP report on private-sector employment on Wednesday and the US crucial NFP report on Friday will attract attention.
- According to a survey by the World Gold Council, 24% of all central banks are planning to build up their Gold reserves in the next 12 months, on concerns about the USD as a reserve asset.
Technical Analysis: Gold remains steady above previous highs with the bullish trend intact
From a technical perspective, the XAU/USD’s corrective reversal has been contained above previous highs at $2,050, which leaves the broader bullish trend intact.
Four-hour charts show the metal standing comfortably above the upward-trending 50-hour SMA, with the RSI retreating from extremely overbought levels.
On the downside, support levels at $2,050 and $2,030 are expected to provide support ahead of the $2,000 psychological level. Resistances are 2,095 and 2,165.
US Dollar price today
The table below shows the percentage change of US Dollar (USD) against listed major currencies today. US Dollar was the strongest against the Swiss Franc.
| USD | EUR | GBP | CAD | AUD | JPY | NZD | CHF | |
| USD | 0.16% | 0.32% | 0.28% | 0.44% | 0.18% | 0.33% | 0.50% | |
| EUR | -0.17% | 0.17% | 0.12% | 0.29% | 0.01% | 0.19% | 0.35% | |
| GBP | -0.35% | -0.16% | -0.03% | 0.14% | -0.14% | 0.02% | 0.17% | |
| CAD | -0.28% | -0.13% | 0.03% | 0.16% | -0.14% | 0.06% | 0.20% | |
| AUD | -0.44% | -0.32% | -0.15% | -0.20% | -0.31% | -0.12% | 0.04% | |
| JPY | -0.20% | 0.01% | 0.32% | 0.13% | 0.30% | 0.18% | 0.34% | |
| NZD | -0.33% | -0.17% | -0.02% | -0.04% | 0.11% | -0.16% | 0.15% | |
| CHF | -0.52% | -0.35% | -0.17% | -0.20% | -0.04% | -0.34% | -0.15% |
The heat map shows percentage changes of major currencies against each other. The base currency is picked from the left column, while the quote currency is picked from the top row. For example, if you pick the Euro from the left column and move along the horizontal line to the Japanese Yen, the percentage change displayed in the box will represent EUR (base)/JPY (quote).
Economic Indicator
United States Nonfarm Payrolls
The Nonfarm Payrolls release presents the number of new jobs created in the US during the previous month in all non-agricultural businesses; it is released by the US Bureau of Labor Statistics (BLS). The monthly changes in payrolls can be extremely volatile. The number is also subject to strong reviews, which can also trigger volatility in the Forex board. Generally speaking, a high reading is seen as bullish for the US Dollar (USD), while a low reading is seen as bearish, although previous months' reviews and the Unemployment Rate are as relevant as the headline figure. The market's reaction, therefore, depends on how the market assesses all the data contained in the BLS report as a whole.
Read more.Next release: 12/08/2023 13:30:00 GMT
Frequency: Monthly
Source: US Bureau of Labor Statistics
Why it matters to traders
America’s monthly jobs report is considered the most important economic indicator for forex traders. Released on the first Friday following the reported month, the change in the number of positions is closely correlated with the overall performance of the economy and is monitored by policymakers. Full employment is one of the Federal Reserve’s mandates and it considers developments in the labor market when setting its policies, thus impacting currencies. Despite several leading indicators shaping estimates, Nonfarm Payrolls tend to surprise markets and trigger substantial volatility. Actual figures beating the consensus tend to be USD bullish.
A potential retracement of USD/THB to the 34.58 level should not be ruled out in the near term, argues Markets Strategist Quek Ser Leang at UOB Group.
Key Quotes
USD/THB dropped sharply to low of 34.58 last Wednesday before ending the week on a weak note at 34.85 (-1.32%). Downward momentum has increased, albeit not much.
This week, as long as USD/THB stays below 35.22 (minor resistance is at 35.00), it could dip below 34.58 before a more sustained rebound is likely. The major support at 34.08 is unlikely to come under threat.
- The US Dollar Index steady in the 103-area though a technical rejection looms.
- The Greenback booked its third consecutive weekly decline on Friday.
- US traders are entering the last two weeks of normal trading before the holidays.
The US Dollar (USD) broadly steadies on the European Monday morning in a risk-averse market mood, driven by increasing tensions in the Middle East after Yemen’s Houthi rebels hit three commercial ships in the Red Sea on Sunday and a US warship responded by shooting down three drones. The Greenbacked posted its three straight weekly decline on Friday, but sentiment could start to shift with only fourteen days left of normal trading before entering the year-end holiday season. All eyes will be on safe-haven flows and the rate spread between the US Dollar and most G20 currencies, as the tightening cycle might be over for many central banks, pushing the US Dollar higher as US rates keep the upper hand.
On the economic front, a very light calendar is due on Monday, but data will pile up throughout the week up to the main event on Friday: the US Jobs Report, or Nonfarm Payrolls. Expect to see mild moves in the crosses against the Greenback with most traders keeping their powder dry for Friday. Other job-related data like the JOLTS and ADP numbers will also be released this week.
Daily digest: Light Monday in employment-packed week
- At 15:00 GMT,US Factory Orders data for October are due to be released. Orders increased 2.8% in September, and markets expect them to decline 2.6% in OCtober.
- The US Treasury can benefit from the recent decline in US rates and will be placing a 3-month and a 6-month bill in the markets.
- Equities continue to slide in Asia. The Hong Kong Hang Seng Index leads the decline, losing more than 1%. European equities are mildly in the red, while US futures are flat ahead of the start of this trading week.
- The CME Group’s FedWatch Tool shows that markets are pricing in a 97.7% chance that the Federal Reserve will keep interest rates unchanged at its meeting next week.
- The benchmark 10-year US Treasury Note trades at 4.24%, and steady off this week’s low.
US Dollar Index technical analysis: Not over yet until the fat lady sings
The US Dollar trades around 103.31 at the time of writing when gauged by the DXY US Dollar Index. From a technical point of view, the US Dollar is trading near crucial levels. Although last week the DXY was unable to break back above important technical levels, it appears that a more substantial catalyst is needed to push the DXY back above that crucial 200-day Simple Moving Average (SMA) near 103.58, visible on a daily chart. With the US Jobs Report on Friday, that might be enough for the Greenback to reestablish its status as King Dollar before closing up shop for the holidays.
The DXY is making its way further up towards the 200-day Simple Moving Average (SMA), which is near 103.58. The DXY could still make it through there should employment data trigger rising US yields again. A two-tiered pattern of a daily close lower followed by an opening higher would quickly see the DXY back above 104.28, with the 200-day and 100-day SMA turned over to support levels.
To the downside, historic levels from August are coming into play, when the Greenback summer rally took place. The lows of June make sense to look for some support, near 101.92, just below 102.00. Should more events take place that initiate further declines in US rates, expect to see a near-full unwind of the 2023 summer rally, heading to 100.82, followed by 100.00 and 99.41.
US Dollar FAQs
What is the US Dollar?
The US Dollar (USD) is the official currency of the United States of America, and the ‘de facto’ currency of a significant number of other countries where it is found in circulation alongside local notes. It is the most heavily traded currency in the world, accounting for over 88% of all global foreign exchange turnover, or an average of $6.6 trillion in transactions per day, according to data from 2022.
Following the second world war, the USD took over from the British Pound as the world’s reserve currency. For most of its history, the US Dollar was backed by Gold, until the Bretton Woods Agreement in 1971 when the Gold Standard went away.
How do the decisions of the Federal Reserve impact the US Dollar?
The most important single factor impacting on the value of the US Dollar is monetary policy, which is shaped by the Federal Reserve (Fed). The Fed has two mandates: to achieve price stability (control inflation) and foster full employment. Its primary tool to achieve these two goals is by adjusting interest rates.
When prices are rising too quickly and inflation is above the Fed’s 2% target, the Fed will raise rates, which helps the USD value. When inflation falls below 2% or the Unemployment Rate is too high, the Fed may lower interest rates, which weighs on the Greenback.
What is Quantitative Easing and how does it influence the US Dollar?
In extreme situations, the Federal Reserve can also print more Dollars and enact quantitative easing (QE). QE is the process by which the Fed substantially increases the flow of credit in a stuck financial system.
It is a non-standard policy measure used when credit has dried up because banks will not lend to each other (out of the fear of counterparty default). It is a last resort when simply lowering interest rates is unlikely to achieve the necessary result. It was the Fed’s weapon of choice to combat the credit crunch that occurred during the Great Financial Crisis in 2008. It involves the Fed printing more Dollars and using them to buy US government bonds predominantly from financial institutions. QE usually leads to a weaker US Dollar.
What is Quantitative Tightening and how does it influence the US Dollar?
Quantitative tightening (QT) is the reverse process whereby the Federal Reserve stops buying bonds from financial institutions and does not reinvest the principal from the bonds it holds maturing in new purchases. It is usually positive for the US Dollar.
A breach of 7.1100 could prompt USD/CNH to accelerate its losses to the 7.0600 region in the near term, comment Economist Lee Sue Ann and Markets Strategist Quek Ser Leang at UOB Group.
Key Quotes
24-hour view: We expected USD to trade in a sideways range of 7.1280/7.1585 last Friday. USD then rose to 7.1555, dropped to 7.1242, and then closed at 7.1290 (-0.24%). There is a slight increase in downward momentum. Today, as long as USD stays below 7.1500 (minor resistance is at 7.1380), it is likely to edge lower. As downward momentum is not strong for now, the chance of USD breaking the major support at 7.1100 is not high.
Next 1-3 weeks: We have held a negative USD view since the middle of last month. In our most recent narrative from last Thursday (30 Nov, spot at 7.1335), we indicated that the “USD weakness from two weeks ago is intact, and the level to monitor is still at 7.1100.” While we continue to expect USD to weaken, short-term downward momentum has increased somewhat. From here, if USD breaks below 7.1100, the next level to watch is 7.0600. Overall, only a breach of 7.1660 (no change in ‘strong resistance’ level) would mean that the USD weakness has stabilised.
- The Pound trades sideways after failing to break 1.2730.
- Traders are cautious ahead of a string of key US data this week.
- The broader positive trend remains intact.
The Pound is moving sideways, without a clear direction on Monday, after having failed to extend gains above 1.2760 amid a somewhat stronger US Dollar.
Investors have grown more cautious on Monday after the risk rally witnessed on Friday. With a string of US indicators ahead ending with the Nonfarm Payrolls report on Friday, investors are looking for more data to assess the Fed’s next steps.
Beyond that, the deteriorating situation in the Middle East, with news about the attacks on two commercial vessels in the Red Sea has dampened risk appetite further.
In the calendar today the main event will be US Factory orders. On Tuesday, the focus will be on the UK and US Services PMIs, and the US Jolrs job openings, the first of several US employment indicators.
From a technical perspective, the pair maintains the broader upside trend intact, with 1,2730 resistance closing the path towards 1.2820 and 1.2900. Supports are 1.2600 and 1.2480.
Technical levels to watch
- Natural Gas prices could return to $3 as cold season kicks in for Europe.
- Natural Gas prices have fallen throughout November.
- The US Dollar starts to turn after three weeks of continued weakness.
Natural Gas (XNG/USD) prices could be turning around soon as the current drop in temperatures across Europe is suddenly eating into the Gas reserves. Although stockpiles are still comfortably full, some gas storages for certain European countries saw a quite large drawdown, of 5% to even 10%, in just a matter of a few days. This could suggest that European consumers are no longer worried about elevated energy bills as they used to against the past two years. Signs of increasing demand, coupled with steady or declining supply, tend to lift prices.
Meanwhile, the US Dollar (USD) is still trying to claw back against the weakness it registered in November. The Greenback depreciated for a third straight week on Friday evening at the close. Markets will be on the lookout for the US Jobs Report on Friday and the last US Federal Reserve Meeting of the year next week.
Natural Gas is trading at $2.69 per MMBtu at the time of writing.
Natural Gas market movers: EU not saving anymore
- European Gas storage levels are seeing substantial drawdowns in stockpiles. The overall European Gas storage tracker was at 94.39% on Monday morning. Still, reserves in countries likeBelgium are at 87.44%, a ten-percentage-point decline in stockpiles since Friday.
- Austria might be facing issues at the EU council as the country is still seeing large amounts of Russian Gas flowing into its country. Austria is even forced to sell the Gas to neighbouring countries.
- COP28 President Sultan Al Jaber was condemned after a scandal leaked on phasing out fossil fuels. The Chief Executive Officer of the Abu Dhabi National Oil Company apparently used COP28 to have meetings to further strengthen and intensify Oil business deals.
Natural Gas Technical Analysis: Turnaround due
Natural Gas might have reached the end in its continuous decline throughout November. With European gas storages starting to see substantial drawdowns after just three days of negative temperatures, the question will be if these reserves are big enough to face several days in a row of freezing cold. Adding the technical angle, the Relative Strength Index (RSI) trades in oversold territory, signalling that a pickup in demand might be due.
Meanwhile, pressure is building again in Gaza with Israeli troops advancing on several fronts, further escalating the situation. Adding this to the cold front in Europe, Natural Gas could edge up to $3.0 as the level to watch. Just above, the 100-day Simple Moving Average (SMA) at $3.01 could throw a brief spanner in the works. Once bulls have dealt with a break above this 100-day SMA, look for $3.06 and $3.20 as next profit levels on the upside.
With the support of the 200-day SMA gone now, a further decline will target two intermediary levels on the downside. the fIrst one is the purple line near $2.57, which triggered a bounce on August 24. In case that fails, the low of the summer near $2.48 might be strong enough to catch any falling knives, with the RSI by then severely in oversold regime.
-638372802542448892.png)
XNG/USD (Daily Chart)
Natural Gas FAQs
What fundamental factors drive the price of Natural Gas?
Supply and demand dynamics are a key factor influencing Natural Gas prices, and are themselves influenced by global economic growth, industrial activity, population growth, production levels, and inventories. The weather impacts Natural Gas prices because more Gas is used during cold winters and hot summers for heating and cooling. Competition from other energy sources impacts prices as consumers may switch to cheaper sources. Geopolitical events are factors as exemplified by the war in Ukraine. Government policies relating to extraction, transportation, and environmental issues also impact prices.
What are the main macroeconomic releases that impact on Natural Gas Prices?
The main economic release influencing Natural Gas prices is the weekly inventory bulletin from the Energy Information Administration (EIA), a US government agency that produces US gas market data. The EIA Gas bulletin usually comes out on Thursday at 14:30 GMT, a day after the EIA publishes its weekly Oil bulletin. Economic data from large consumers of Natural Gas can impact supply and demand, the largest of which include China, Germany and Japan. Natural Gas is primarily priced and traded in US Dollars, thus economic releases impacting the US Dollar are also factors.
How does the US Dollar influence Natural Gas prices?
The US Dollar is the world’s reserve currency and most commodities, including Natural Gas are priced and traded on international markets in US Dollars. As such, the value of the US Dollar is a factor in the price of Natural Gas, because if the Dollar strengthens it means less Dollars are required to buy the same volume of Gas (the price falls), and vice versa if USD strengthens.
Further weakness could put USD/JPY under extra downside pressure in the near term, suggest Economist Lee Sue Ann and Markets Strategist Quek Ser Leang at UOB Group.
Key Quotes
24-hour view: We expected USD to trade in a range of 147.00/148.50 last Friday. Instead of trading in a range, USD fell sharply to a low of 146.65. USD continues to weaken in early Asian trade today. The rapid increase in momentum is likely to lead to USD dropping to 146.00. The next major support at 145.05 is highly unlikely to come under threat. Resistance is at 146.80, followed by 147.20.
Next 1-3 weeks: Last Friday (01 Dec, spot at 147.85), we highlighted that USD “is likely to trade in a range between 146.65 and 149.30 before heading lower at a later stage.” However, USD dropped quickly to a low of 146.65 in late-NY trade. USD continues to decline in early Asian trade. The price action suggests the USD weakness has resumed earlier than expected. The level to watch is at 146.00. A breach of this major support will shift the focus to 145.05. In order to keep the momentum going, USD must stay below 148.10.
Considering advanced prints from CME Group for crude oil futures markets, open interest set aside two daily gains in a row and went down by round 3.5K contracts on Friday. In the same line, volume shrank by around 556.7K contracts, partially reversing the previous daily build.
WTI remains supported by the $72.00 region
Prices of WTI retreated further on Friday, revisiting the $74.00 region at the same time. The downtick was on the back of shrinking open interest and volume, which removes some strength from a potential continuation of the decline. Against that, there is still decent contention around the $72.00 zone per barrel for the time being.

- EUR/GBP recovery loses steam right below 0.8600.
- Weak Eurozone sentiment and dovish comments from ECB's De Guindos are weighing on the pair.
- All eyes now are on ECB's Lagarde's speech.
The Euro has trimmed some losses during Monday’s Asian session with investors taking profits after having depreciated more than 2% in the last two weeks.
The pair however, seems to be losing upside traction during the European session, as weaker-than-expected investors’ confidence data in the Eurozone and the dovish comments by ECB’s De Guindos have acted as headwinds for the Euro.
ECB Lagarde's comments will attract the attention on Monday
The highlight of the day, however, will be ECB President Lagarde’s speech, at 14:00 GMT. In light of the recent decline in inflation, investors will be looking for dovish hints that might resume the pair’s downtrend.
From a technical perspective, the pair seems ready for an upside correction after reaching oversold levels on daily and intra-day charts.
On the upside, immediate resistance lies at 0.8580, which closes the path to a strong resistance area between 0.8600 and 0.8620. Supports are 0.8550 and 0.8500
EUR/GBP 4-hour chart
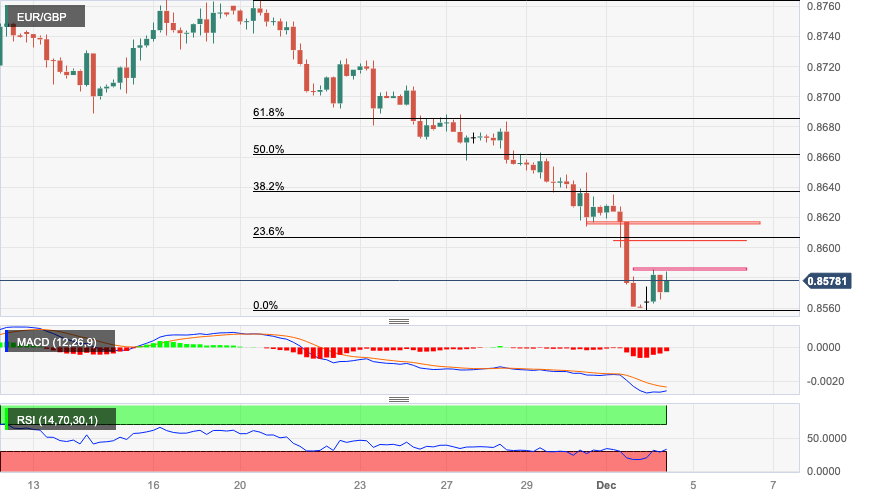
- The Dollar maintains its bearish bias with recovery attempts capped below 0.8760.
- Speculatioon of Fed rate cuts in March are weighing on the US Dollar.
- Weaker-than-expected Swiss CPI likely to weigh on the CHF.
The US Dollar’s mild recovery attempt seen early on Monday has found support right below the 0.8760 resistance area, which leaves the pair treading water near four-month lows.
The pair regained some ground during the Asian trading session. The market has assumed that the end of Fed’s tightening cycle, yet caution is prevailing as a string of key US employment figures will determine the chances that the bank starts cutting rates in early 2024.
Hopes of Fed cuts in March are weighing on the USD
On Friday, Fed Chair Powell's cautious tone regarding further tightening and a weaker-than-expected US ISM manufacturing PMI strengthened the idea that the effect of high rates is starting to affect the overall economy. This boosted hopes of rate cuts in March, and sent the US Dollar lower across the board.
In Switzerland, November’s CPI has shown that inflation is cooling beyond expectations. Consumer prices grew 1.4% year-on-year, their weakest increase in two years, with the monthly inflation dropping to negative levels. This practically discards another SNB hike at their meeting in December 14, which has eased bullish pressure on the Swissie.
The technical picture shows indecision at current levels, with upside attempts capped at 0.8760 ahead of 0.8815. Support levels are 0.8660 and 0.8560.
Technical levels to watch
Gold prices rose in India on Monday, according to data from India's Multi Commodity Exchange (MCX).
Gold price stood at 63,357 Indian Rupees (INR) per 10 grams, up INR 915 compared with the INR 62,442 it cost on Friday.
As for futures contracts, Gold prices increased to INR 63,590 per 10 gms from INR 63,357 per 10 gms.
Prices for Silver futures contracts decreased to INR 77,630 per kg from INR 78,087 per kg.
| Major Indian city | Gold Price |
|---|---|
| Ahmedabad | 65,760 |
| Mumbai | 65,555 |
| New Delhi | 65,735 |
| Chennai | 65,790 |
| Kolkata | 65,780 |
Global Market Movers: Comex Gold price retreats further from all-time high amid a pickup in USD demand
- The global risk-on rally hit a roadblock after an attack on an American warship and commercial vessels in the Red Sea on Sunday by Iran-backed Houthi rebels in Yemen.
- A US military official confirmed that a "self-defense strike on an imminent threat" killed five Iraqi militants near the northern city of Kirkuk on Sunday afternoon.
- A modest US Dollar uptick overshadows the risk of a further escalation of geopolitical tensions in the Middle East and prompts some profit-taking around the Comex Gold price.
- That said, growing acceptance that the Federal Reserve (Fed) will maintain the status quo in December and start cutting rates as early as March 2024 should lend support.
- Fed Jerome Powell on Friday said that it would be premature to conclude when policy might ease, pushing back against speculations of more aggressive rate cuts.
- Investors, however, seem convinced about an imminent shift in the Fed's policy stance, which should cap any recovery in the US bond yields and the Greenback.
- This week's US economic docket highlights the release of the ISM Services PMI on Tuesday, followed by the ADP report on private-sector employment on Wednesday and the US crucial NFP report on Friday.
- A recent survey by the World Gold Council showed that 24% of all central banks intend to increase their Gold reserves in the next 12 months, as they increasingly grow pessimistic about the US as a reserve asset.
(An automation tool was used in creating this post.)
Gold FAQs
Why do people invest in Gold?
Gold has played a key role in human’s history as it has been widely used as a store of value and medium of exchange. Currently, apart from its shine and usage for jewelry, the precious metal is widely seen as a safe-haven asset, meaning that it is considered a good investment during turbulent times. Gold is also widely seen as a hedge against inflation and against depreciating currencies as it doesn’t rely on any specific issuer or government.
Who buys the most Gold?
Central banks are the biggest Gold holders. In their aim to support their currencies in turbulent times, central banks tend to diversify their reserves and buy Gold to improve the perceived strength of the economy and the currency. High Gold reserves can be a source of trust for a country’s solvency. Central banks added 1,136 tonnes of Gold worth around $70 billion to their reserves in 2022, according to data from the World Gold Council. This is the highest yearly purchase since records began. Central banks from emerging economies such as China, India and Turkey are quickly increasing their Gold reserves.
How is Gold correlated with other assets?
Gold has an inverse correlation with the US Dollar and US Treasuries, which are both major reserve and safe-haven assets. When the Dollar depreciates, Gold tends to rise, enabling investors and central banks to diversify their assets in turbulent times. Gold is also inversely correlated with risk assets. A rally in the stock market tends to weaken Gold price, while sell-offs in riskier markets tend to favor the precious metal.
What does the price of Gold depend on?
The price can move due to a wide range of factors. Geopolitical instability or fears of a deep recession can quickly make Gold price escalate due to its safe-haven status. As a yield-less asset, Gold tends to rise with lower interest rates, while higher cost of money usually weighs down on the yellow metal. Still, most moves depend on how the US Dollar (USD) behaves as the asset is priced in dollars (XAU/USD). A strong Dollar tends to keep the price of Gold controlled, whereas a weaker Dollar is likely to push Gold prices up.
In the opinion of Economist Lee Sue Ann and Markets Strategist Quek Ser Leang at UOB Group, further gains could lift AUD/USD to the 0.6745 zone in the short-term horizon.
Key Quotes
24-hour view: The strong surge in AUD last Friday came as a surprise (we were expecting it to trade in a range). The rapid increase in momentum is likely to lead to further AUD strength. However, the major resistance at 0.6745 is likely out of reach for now. Note that there is another resistance at 0.6715. To maintain the momentum, AUD must not break below 0.6640 (minor support is at 0.6660).
Next 1-3 weeks: After AUD dropped and breached our ‘strong support’ level of 0.6575 last Thursday (low has been 0.6571), we shifted from a positive AUD stance to a neutral one on Friday (01 Dec, spot at 0.6610). We held the view that AUD “is likely to trade in a range between 0.6530 and 0.6665.” However, AUD lifted off and then closed on a strong note at 0.6676 (+1.08%). The price action indicates that our view for AUD to trade in a range was wrong. To put it another way, the AUD strength that started in the middle of last month is still intact. From here, as long as AUD stays above 0.6620, it could continue to rise towards the major resistance at 0.6745.
- Eurozone investors’ morale improved for the third straight month in December.
- EUR/USD holds recovery near 1.0875 after the Eurozone data.
The Eurozone Sentix Investor Confidence Index improved to -16.8 in December from -18.6 in November, the latest survey showed on Monday. The market consensus was for a -14.4 reading.
The Expectations Index in the Eurozone also rose to -9.8 from -10.0 in the previous month.
Commenting on the survey's findings, Sentix Managing Director Manfred Huebner said “Germany struggled to keep up with even these moderate improvements, with expectations in the euro zone's largest economy consistently low.”
"So far, there are no signs of a new upswing in any region. Opportunities for this could arise at the start of the year," he added.
Market reaction
EUR/USD is holding the recovery near 1.0875 despite the improvement in the Eurozone data. As of writing, the EUR/USD pair is marginally lower on the day.
Commenting on last week’s inflation data release, European Central Bank (ECB) Vice President Luis de Guindos said on Monday, “recent inflation data is good news but it is too early to declare victory.”
Additional quotes
It's been a 'positive surprise'.
Increase in wages can still have an impact on inflation.
Monetary policy stance will be data-dependent.
Market reaction
At the time of writing, EUR/USD is trading modestly flat on the day at 1.0876.
- The US dollar is testing previous support at 1.3550 after bouncing at 1.3475.
- Investors have turned cautuois ahead of key US employment indicators.
- Lower oil prices and hopes of a BoC pause are hurting the CAD.
The US Dollar has opened the week on a somewhat firmer footing, following a significant sell-off late last week, which sent the pair to fresh two-month lows below 1.3500.
Federal Reserve Chairman Powell vowed caution with monetary policy and observed that the effect of the restrictive monetary policy is starting to affect economic growth. These comments boosted hopes that the bank is done with hikes and increased bets that rate cuts might start as soon as in March, sending US yields tumbling and the US Dollar lower across the board.
The USD bottoms as market sentiment falters
Investors, however, have adopted a cautious stance on Monday, awaiting a string of US data, with a special interest on Friday’s Nonfarm Payrolls report, to assess the Fed’s next steps.
On the other hand Oil prices, Canada’s main export remain on the defensive. The outcome of the OPEC+ meeting has failed to tackle concerns about an excess of supply with the global economy expected to slowdown in 2024.
Furthermore, the positive impact of the stronger-than-expected Canadian employment data seen on Friday has ebbed. These figures do not change the expectations that the Bank of Canada will keep rates on hold after Wednesday’s meeting and start rolling back the tightening cycle in early 2024.
Technical inmdicators show the pair in a broader bearish trend, with negative momentum easing. A succesful break of 1.3550 opens the path towards 1.3620. On the downside, supports aare 1.3475 and 1.3420.
Technical levels to watch
- The Euro remains offered against the US Dollar.
- European stocks open Monday’s session in a mixed mood.
- ECB-speakers, US Factory Orders next on tap.
The Euro (EUR) remains under selling pressure against the US Dollar (USD) on Monday, motivating EUR/USD to revisit the mid-1.0800s at the beginning of a new trading week.
The Greenback, on the other hand, appears mildly bid around 103.40 when measured by the USD Index (DXY), partially fading the earlier uptick to the vicinity of the key 200-day SMA near 103.60.
Considering the broader economic landscape, investors consider potential interest rate reductions by both the Federal Reserve (Fed) and the European Central Bank (ECB) in the spring of 2024.
In the Eurozone docket, Germany’s trade surplus widened to €17.8B in October. Later in the session, ECB’s Vice Chair of the Supervisory Board Frank Elderson, Vice President Luis de Guindos and President Christine Lagarde are all due to speak.
Across the ocean, US Factory Orders for the month of October will be in the limelight.
Daily digest market movers: Euro extends negative performance to 1.0850
- The EUR starts the week on the defensive against the USD.
- US and German yields trade in a mixed note.
- Investors see the Fed reducing its rates in Q2 2024.
- The ECB could start cutting rates in the spring of 2024, according to markets.
- Lagarde will speak later in the session, around 14:00 GMT.
Technical Analysis: Euro faces immediate upside barrier at 1.1017
EUR/USD kicks off the new week with a modest retracement, although it still manages to keep the trade above the key 200-day Simple Moving Average (SMA) at 1.0818.
If the EUR/USD continues to experience further losses, it could potentially face the mentioned 200-day SMA as an initial point of support. In the event of a breach, the 55-day SMA at 1.0682 is likely to provide temporary support. However, if this level is also cleared, it would expose the weekly low of 1.0495 (October 13), followed by the 2023 low of 1.0448 (October 3) and the psychological level of 1.0400.
If there are occasional bullish attempts, they are likely to encounter immediate resistance at the November peak of 1.1017 (November 29). This is followed by the August high of 1.1064 (August 10) and another weekly top of 1.1149 (July 27). These levels act as hurdles before reaching the 2023 peak of 1.1275 (July 18).
The pair is anticipated maintaining its bullish outlook while remaining above the 200-day SMA.
Euro FAQs
What is the Euro?
The Euro is the currency for the 20 European Union countries that belong to the Eurozone. It is the second most heavily traded currency in the world behind the US Dollar. In 2022, it accounted for 31% of all foreign exchange transactions, with an average daily turnover of over $2.2 trillion a day.
EUR/USD is the most heavily traded currency pair in the world, accounting for an estimated 30% off all transactions, followed by EUR/JPY (4%), EUR/GBP (3%) and EUR/AUD (2%).
What is the ECB and how does it impact the Euro?
The European Central Bank (ECB) in Frankfurt, Germany, is the reserve bank for the Eurozone. The ECB sets interest rates and manages monetary policy.
The ECB’s primary mandate is to maintain price stability, which means either controlling inflation or stimulating growth. Its primary tool is the raising or lowering of interest rates. Relatively high interest rates – or the expectation of higher rates – will usually benefit the Euro and vice versa.
The ECB Governing Council makes monetary policy decisions at meetings held eight times a year. Decisions are made by heads of the Eurozone national banks and six permanent members, including the President of the ECB, Christine Lagarde.
How does inflation data impact the value of the Euro?
Eurozone inflation data, measured by the Harmonized Index of Consumer Prices (HICP), is an important econometric for the Euro. If inflation rises more than expected, especially if above the ECB’s 2% target, it obliges the ECB to raise interest rates to bring it back under control.
Relatively high interest rates compared to its counterparts will usually benefit the Euro, as it makes the region more attractive as a place for global investors to park their money.
How does economic data influence the value of the Euro?
Data releases gauge the health of the economy and can impact on the Euro. Indicators such as GDP, Manufacturing and Services PMIs, employment, and consumer sentiment surveys can all influence the direction of the single currency.
A strong economy is good for the Euro. Not only does it attract more foreign investment but it may encourage the ECB to put up interest rates, which will directly strengthen the Euro. Otherwise, if economic data is weak, the Euro is likely to fall.
Economic data for the four largest economies in the euro area (Germany, France, Italy and Spain) are especially significant, as they account for 75% of the Eurozone’s economy.
How does the Trade Balance impact the Euro?
Another significant data release for the Euro is the Trade Balance. This indicator measures the difference between what a country earns from its exports and what it spends on imports over a given period.
If a country produces highly sought after exports then its currency will gain in value purely from the extra demand created from foreign buyers seeking to purchase these goods. Therefore, a positive net Trade Balance strengthens a currency and vice versa for a negative balance.
FX option expiries for Dec 4 NY cut at 10:00 Eastern Time, via DTCC, can be found below.
- EUR/USD: EUR amounts
- 1.0785 811m
- 1.0820 706m
- 1.0860 1.3b
- 1.0865 882m
- 1.0925 2b
- 1.0950 1b
- 1.1000 760m
- GBP/USD: GBP amounts
- 1.2675 465m
- USD/JPY: USD amounts
- 147.00 1.2b
- 147.75 871m
- 148.00 2.1b
- 148.50 650m
- USD/CHF: USD amounts
- 0.8850 550m
- AUD/USD: AUD amounts
- 0.6670 381m
- USD/CAD: USD amounts
- 1.3500 684m
- 1.3550 767m
- 1.3570 1b
Open interest in gold futures markets resumed the uptrend and rose by around 12K contracts at the end of last week, according to preliminary readings from CME Group. Volume followed suit and advanced by more than 99K contracts after three consecutive daily pullbacks.
Gold poised to extend its rally
Gold prices advanced to new all-time highs past $2075 on Friday. The daily uptick was on the back of rising open interest and volume and leaves the door open to further gains in the very near term. On this, the next hurdle of note appears at the $2100 mark per troy ounce.
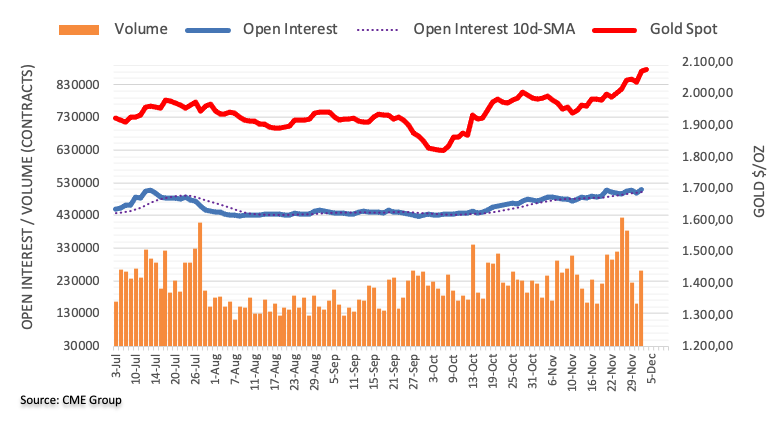
The continuation of the uptrend in GBP/USD is expected to clear the 1.2745 level in the near term, according to Economist Lee Sue Ann and Markets Strategist Quek Ser Leang at UOB Group.
Key Quotes
24-hour view: We expected GBP to trade in a range of 1.2655/1.2720 last Friday. However, after dipping to a low of 1.2612, GBP soared and ended the day on a strong note at 1.2709 (+0.65%). The sharp and swift rise appears to be running ahead of itself, and GBP is unlikely to strengthen much further. Today, GBP is more likely to trade sideways at these higher levels, probably between 1.2650 and 1.2725.
Next 1-3 weeks: Last Thursday (30 Nov, spot at 1.2695), we indicated that “there is room for it to advance to 1.2745 before the risk of a pullback increases.” After GBP pulled back sharply to 1.2604, we indicated on Friday (01 Dec, spot at 1.2635) that unless GBP breaks above 1.2690 in the next couple of days, a breach of the ‘strong support’ at 1.2600 would not be surprising and would mean the start of a deeper pullback. We did not quite anticipate GBP to rebound strongly to 1.2716. Upward momentum received a boost, albeit not much. From here, GBP has to break and stay 1.2745 before further advance to 1.2795 is likely. To keep the momentum going, GBP must not break 1.2620 (‘strong support’ level previously at 1.2600).
Here is what you need to know on Monday, December 4:
Gold price hit a new record high near $2,150 at the weekly opening as markets reacted to escalating geopolitical tensions in the Middle East. October Factory Orders will be the only data featured in the US economic docket on Monday. Investors will continue to pay close attention to headlines surrounding the Israel-Hamas conflict and comments from central bankers.
Yemen's Houthi rebels hit three commercial ships in the Red Sea on Sunday and a US warship responded by shooting down three drones. In a statement released after the event, the US military's Central Command said that they have "every reason to believe that these attacks, while launched by the Houthis in Yemen, are fully enabled by Iran." Meanwhile, Yemen's Houthi movement acknowledged that they had targeted two Israeli ships in this attack, saying that they were responding to calls from Islamic nations to stand with the Palestinian people.
Reflecting the risk-averse market atmosphere, US stock index futures trade in negative territory in the early European session. The US Dollar (USD) Index, which registered small losses in the previous week, found support slightly above 103.00.
US Dollar price today
The table below shows the percentage change of US Dollar (USD) against listed major currencies today. US Dollar was the strongest against the New Zealand Dollar.
| USD | EUR | GBP | CAD | AUD | JPY | NZD | CHF | |
| USD | 0.16% | 0.29% | 0.25% | 0.45% | 0.23% | 0.52% | 0.34% | |
| EUR | -0.17% | 0.13% | 0.11% | 0.33% | 0.05% | 0.37% | 0.20% | |
| GBP | -0.31% | -0.15% | -0.04% | 0.16% | -0.06% | 0.23% | 0.05% | |
| CAD | -0.28% | -0.12% | 0.02% | 0.18% | -0.07% | 0.26% | 0.07% | |
| AUD | -0.45% | -0.33% | -0.19% | -0.22% | -0.28% | 0.04% | -0.13% | |
| JPY | -0.24% | -0.05% | 0.24% | 0.07% | 0.28% | 0.33% | 0.13% | |
| NZD | -0.52% | -0.38% | -0.23% | -0.27% | -0.07% | -0.30% | -0.18% | |
| CHF | -0.38% | -0.20% | -0.07% | -0.11% | 0.09% | -0.13% | 0.16% |
The heat map shows percentage changes of major currencies against each other. The base currency is picked from the left column, while the quote currency is picked from the top row. For example, if you pick the Euro from the left column and move along the horizontal line to the Japanese Yen, the percentage change displayed in the box will represent EUR (base)/JPY (quote).
After setting a new all-time high, Gold retreated in the Asian trading hours. At the time of press, XAU/USD was still up 0.5% on the day at $2,080.
Following a drop to a fresh two-week low of 1.0828 on Friday, EUR/USD managed to recover toward 1.0900 ahead of the weekend. Early Monday, the pair fluctuates in a tight channel above 1.0850. European Central Bank (ECB) President Christine Lagarde and several other ECB policymakers are scheduled to speak later in the day.
GBP/USD closed the third consecutive week in positive territory before going into a consolidation phase below 1.2700 early Monday.
USD/JPY fell to a multi-month low below 146.30 in the Asian trading hours on Monday but rebounded above 146.50 in the early European session. Tokyo Consumer Price Index (CPI) data from Japan will be released on Tuesday.
USD/CAD fell below 1.3500 for the first time in two months on Friday after Statistics Canada reported that Net Change in Employment was +24.9K in November, higher than the market expectation of 15K. Falling crude oil prices made it difficult for the Canadian Dollar to preserve its strength and USD/CAD advanced above 1.3500 to start the week.
- EUR/USD attracts some sellers under the 1.0900 psychological mark on Monday.
- The bullish outlook of EUR/USD looks vulnerable; RSI indicator stands below the 50.0 midline.
- The 1.0900–1.0910 zone acts as an immediate resistance level; the initial support level is seen at 1.0827.
The EUR/USD pair loses momentum during the early European session on Monday. Following surprisingly low inflation figures in main economies, traders are placing the bet that the European Central Bank (ECB) will cut the interest rate next year and begin a deeper easing cycle. The market is pricing in a 50% odds rate cut as early as March. This, in turn, exerts some selling pressure on the Euro (EUR). At press time, EUR/USD is trading around 1.0874, down 0.07% on the day.
According to the four-hour chart, the bullish outlook of EUR/USD looks vulnerable as the major pair hovers around the key 100-hour Exponential Moving Averages (EMA). A decisive break below the latter will reaffirm the bearish outlook. Additionally, the Relative Strength Index (RSI) stands below the 50.0 midline, indicating that further downside cannot be ruled out for the time being.
The 1.0900–1.0910 region acts as an immediate resistance level for EUR/USD. The mentioned level is the confluence of the 50-hour EMA and a psychological figure. The next hurdle is seen at a high of November 21 at 1.0965. Any follow-through buying above the latter will see the rally to the next upside barrier near the upper boundary of the Bollinger Bang and a round mark at 1.1000.
On the flip side, the lower limit of the Bollinger Band at 1.0827 will be the initial support level. The additional downside filter to watch is a high of November 6 at 1.0755, followed by a low of November 9 at 1.0660.
EUR/USD four-hour chart
-638372690606443869.png)
- The index looks slightly bid around 103.30.
- US yields look to recovery from Friday’s decline.
- Factory Orders come next in the US docket.
The greenback, when tracked by the USD Index (DXY), manages to pick some mild upside traction around 103.30.
USD Index looks at data, risk trends
The index regains some buying interest following Friday’s bearish performance, managing to rebound to the 103.30 zone after briefly testing the 103.00 area earlier in the Asian trading hours on Monday.
Meanwhile, speculation continues to mount regarding the prospects of interest rate reductions by the Federal Reserve at some point in the spring of 2024, despite divergent views on this matter among certain members of the Fed's policymaking bodies.
In the US docket, Factory Orders for the month of October will take centre stage later in the session.
What to look for around USD
The index looks somewhat consolidative in the low-103.00s after bottoming out in three-week lows near 102.40 during last week.
Looking at the broader picture, the dollar appears depressed against the backdrop of rising speculation of probable interest rate cuts in H1 2024, all in response to further disinflationary pressures and the gradual cooling of the labour market.
Some support for the greenback, however, still emerges the resilience of the US economy as well as a persistent hawkish narrative from some Fed rate setters.
Key events in the US this week: Factory Orders (Monday) – Final S&P Global Services PMI, ISM Services PMI, RCM.TIPP Economic Optimism Index (Tuesday) – MBA Mortgage Applications, ADP Employment Change, Balance of Trade (Wednesday) – PCE, Core PCE, Initial Jobless Claims, Wholesale Inventories, Consumer Credit Change (Thursday) – Nonfarm Payrolls, Unemployment Rate, Flash Michigan Consumer Sentiment (Friday).
Eminent issues on the back boiler: Growing perception of a soft landing for the US economy. Speculation of rate cuts at some point in the spring of 2024. Omnipresent geopolitical effervescence vs. Russia and China. Potential spread of the Middle East crisis to other regions.
USD Index relevant levels
Now, the index is up 0.10% at 103.29 and the breakout of 103.57 (200-day SMA) would open the door to 104.21 (weekly high November 22) and then 105.41 (55-day SMA). On the flip side, immediate contention comes at 102.46 (monthly low November 29) ahead of 101.74 (monthly low August 4) and then 100.51 (weekly low July 27).
Economist Lee Sue Ann and Markets Strategist Quek Ser Leang at UOB Group favoured a potential drop of EUR/USD to the 1.0810 zone in the next few weeks.
Key Quotes
24-hour view: Last Friday, we held the view that “there is scope for EUR to dip to 1.0865 before a recovery can be expected.” We highlighted that “the major support at 1.0810 is highly unlikely to come under threat.” EUR dipped more than expected to 1.0827 before rebounding to close little changed at 1.0881 (-0.05%). While downward pressure appears to have eased, EUR could dip to 1.0810 before a more sustained recovery is likely. The chance of EUR breaking clearly below 1.0810 is not high. Resistance is at 1.0900, followed by 1.0915.
Next 1-3 weeks: Our update from last Friday (01 Dec, spot at 1.0895) still stands. As highlighted, after the sharp pullback in EUR last Thursday, upward momentum has faded, and downward momentum has increased a tad. We also highlighted that EUR could edge lower towards 1.0810. EUR then dipped to 1.0827 before rebounding. The bias is still for EUR to dip further to 1.0810. The chance of it breaking clearly below this level is still not high. On the upside, if EUR breaks above 1.0965 (‘strong resistance’ level was at 1.0985 last Friday), it would indicate that it is likely to trade in a range instead of edging lower towards 1.0810.
- WTI trades in negative territory for the third consecutive day on Monday.
- OPEC+ supply cuts agreed raising questions about how output cutbacks should be split among the group's member nations.
- The risk of supply disruptions from the Middle East conflict might limit the downside of WTI prices.
Western Texas Intermediate (WTI), the US crude oil benchmark, is trading around $73.70 so far on Monday. WTI prices continue to decline as a result of the OPEC+ decision, as well as uncertainties about global fuel demand growth.
The Organization of the Petroleum Exporting Countries and its allies (OPEC+) agreed to voluntary output cuts for the first quarter of 2024. However, the OPEC+ supply cuts that they agreed to last week were voluntary, raising questions about how output cutbacks should be split among the group's 23 member nations.
Furthermore, the mixed economic data from China might exert some selling pressure on WTI prices. Last week, the Chinese Caixin Manufacturing PMI came in better than expected, but both the NBS Manufacturing and Services PMI were weaker than estimated. Concern about the recovery of China’s economy weighs on the black gold, as China is the world's largest gold producer and consumer.
On the other hand, an attack on an American warship and commercial vessels in the Red Sea on Sunday fueled the fear of escalating conflicts between Israel and Hamas. The risk of supply disruptions from the Middle East conflict might limit the downside of WTI prices.
Moving on, oil traders will keep an eye on the developments surrounding geopolitical tensions in the Middle East. Later this week, the US ISM Services PMI will be due on Tuesday and the Employment data will be released on Friday, including Nonfarm Payrolls, Unemployment Rate, and Average Hourly Earnings. These events could significantly impact the USD-denominated WTI price. Oil traders will take cues from the data and find trading opportunities around WTI prices.
- AUD/USD retreats after touching over a fresh five-month top during the Asian session on Monday.
- The cautious market mood underpins the safe-haven USD and weighs on the risk-sensitive Aussie.
- The technical setup favours bullish traders as the focus shifts to the RBA policy meeting on Tuesday.
The AUD/USD pair attracts some intraday sellers in the vicinity of the 0.6700 mark, or over a five-month top touched during the Asian session on Monday and drops to a fresh daily low in the last hour. Spot prices currently trade around the 0.6660 area, down just nearly 0.10% for the day, and the downside is sponsored by a modest US Dollar (USD) uptick.
Investors turn cautious in the wake of a further escalation of tensions in the Middle East and fears of another COVID-19-like respiratory illness outbreak in China cap the recent upswing in the global equity markets. This, in turn, is seen lending some support to the safe-haven Greenback and undermining the risk-sensitive Australian Dollar (AUD). Apart from this, some repositioning trade ahead of the Reserve Bank of Australia (RBA) policy meeting on Tuesday exerts downward pressure on the AUD/USD pair.
From a technical perspective, the recent sustained move beyond the very important 200-day Simple Moving Average (SMA) and Friday's close above the 61.8% Fibonacci retracement level of the July-October fall was seen as a fresh trigger for bullish traders. Moreover, oscillators on the daily chart are comfortably in the positive territory and are still far from being in the overbought zone. This suggests that the path of least resistance for the AUD/USD pair is to the upside amid dovish Federal Reserve (Fed) expectations.
Meanwhile, any further decline could find support near the 0.6600 mark ahead of last week's swing low, around the 0.6570-0.6565 region. Some follow-through selling, however, could drag the AUD/USD pair further towards the 0.6530 intermediate support en route to the 0.6500 psychological mark. This is followed by the 100-day SMA, around the 0.6475-0.6470 zone, and the 0.6430 area, or the 50-day SMA. Failure to defend the said supports might negate the positive outlook and shift the near-term bias in favour of bearish traders.
On the flip side, the multi-month peak, or levels just ahead of the 0.6700 round figure, now becomes an immediate hurdle. Bulls might wait for sustained strength beyond the said barrier before placing fresh bets. The AUD/USD pair might then climb to the next relevant hurdle near the 0.6740 region before aiming to reclaim the 0.6800 mark. The momentum could get extended further towards the July monthly swing high, around the 0.6895 region, with some intermediate resistance near the 0.6845-0.6850 region.
AUD/USD daily chart
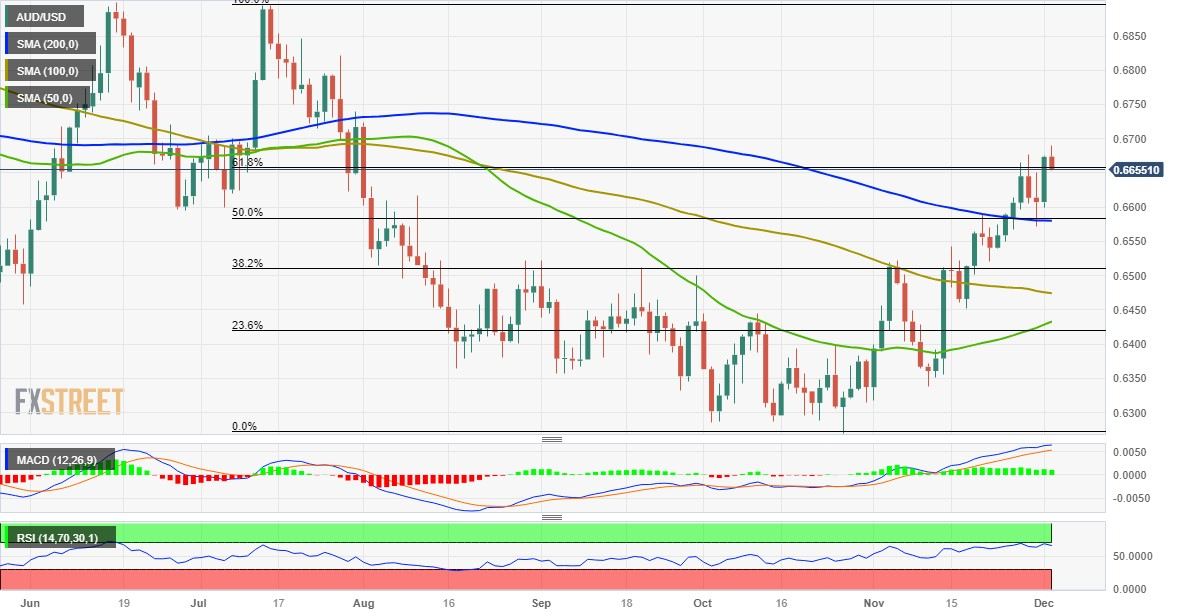
Technical levels to watch
- GBP/USD loses ground as the USD trades with mild gains on Monday.
- The markets were confident the rate-hike cycle was done, although Powell emphasized the Fed's willingness to tighten policy further if necessary.
- UK S&P Global/CIPS Manufacturing PMI climbed to 47.2 in November vs. 46.7 prior, better than expected.
The GBP/USD pair holds below the 1.2700 mark during the Asian session on Monday. However, the downside of the pair seems limited as the speculation that the Federal Reserve (Fed) is done with its tightening cycle exerts pressure on the US Dollar (USD) and creates a tailwind for the GBP/USD pair. The major currently trades around 1.2680, down 0.23% on the day.
The markets turned cautious following dovish comments from Fed Chair Jerome Powell on Friday. Traders prefer to wait on the sidelines ahead of the highly-anticipated employment report on Friday that could influence the outlook for US interest rates. Powell stated that it was clear that US monetary policy was slowing the economy as expected, with the benchmark overnight interest rate well into restrictive territory.
While Powell emphasized the Fed's willingness to tighten policy further if necessary, markets were confident the rate-hike cycle was done. This, in turn, weighs on the Greenback across the board.
On the GBP’s front, Bank of England (BoE) Governor Andrew Bailey said last week that the central bank would do whatever it takes to achieve its 2% inflation objective, but that he has not seen enough progress to be confident. On Friday, UK S&P Global/CIPS Manufacturing PMI climbed to 47.2 in November from 46.7 in October, above the market consensus of 46.6.
In the absence of economic data released from the UK docket this week, the GBP/USD pair remains at the mercy of USD price dynamics. On Tuesday, the US ISM Services PMI will be due, which is expected to grow from 51.8 to 52.0. The highlight this week will be the US Nonfarm Payrolls on Friday. The US economy is estimated to add 180K jobs in November. Traders will take cues from these figures and find trading opportunities around the GBP/USD pair.
- Gold price gains strong positive traction on Monday and spikes to a fresh all-time peak.
- The cautious market mood, along with dovish Fed expectations, benefits the XAU/USD.
- Overstretched conditions on the daily chart prompt some profit-taking at higher levels.
Gold price (XAU/USD) builds on its recent strong rally witnessed over the past three weeks or so and surges to a fresh record high, around the $2,144-2,145 region during the Asian session on Monday. The precious metal, however, surrendered a major part of its intraday gains and currently trades below the $2,100 mark, still up around 0.70% for the day. Bulls opt to take some profits off the table amid extremely overbought conditions on the daily chart and a modest US Dollar (USD) uptick. The downside remains cushioned in the wake of growing acceptance that the Federal Reserve (Fed) will start cutting interest rates by as soon as March 2024, which continues to benefit the non-yielding yellow metal.
Apart from this, the geopolitical uncertainty and fears of another COVID-19-like respiratory illness outbreak in China, which is seen weighing on investors' sentiment, might further limit any meaningful pullback for the safe-haven Gold price. An attack on an American warship and commercial vessels operating in the Red Sea fueled concerns over a further escalation in the Israel-Hamas war. Meanwhile, a surge in respiratory illnesses and clusters of pneumonia in children in China attracted the spotlight when the World Health Organization sought information last week. This contributes to cap the recent upswing in the global equity markets and could undermine the safe-haven XAU/USD.
Daily Digest Market Movers: Gold price hits fresh record higher amid the global flight to safety and Fed rate cut bets
- The global risk-on rally hit a roadblock after an attack on an American warship and commercial vessels in the Red Sea on Sunday by Iran-backed Houthi rebels in Yemen.
- A US military official confirmed that a "self-defence strike on an imminent threat" killed five Iraqi militants near the northern city of Kirkuk on Sunday afternoon.
- The risk of a further escalation of geopolitical tensions in the Middle East, along with a surge in cases of respiratory illnesses in China, boosts the safe-haven Gold price.
- This comes on the back of growing acceptance that the Federal Reserve (Fed) will maintain the status quo in December and start cutting rates as early as March 2024.
- Fed Jerome Powell on Friday said that it would be premature to conclude when policy might ease, pushing back against speculations of more aggressive rate cuts.
- Investors, however, seem convinced about an imminent shift in the Fed's policy stance, which drags the benchmark 10-year US Treasury yield to a 12-week low.
- Dovish Fed expectations, meanwhile, keep the US Dollar bulls on the defensive and lend additional support to the XAU/USD ahead of this week's important US macro data.
- This week's US economic docket highlights the release of the ISM Services PMI on Tuesday, followed by the ADP report on private-sector employment on Wednesday and the US crucial NFP report on Friday.
- A recent survey by the World Gold Council showed that 24% of all central banks intend to increase their Gold reserves in the next 12 months, as they increasingly grow pessimistic about the US as a reserve asset.
Technical Analysis: Gold price retreats amid extremely overbought RSI on the daily chart, downside seems cushioned
From a technical perspective, the intraday pullback drags the precious metal below the 23.6% Fibonacci retracement level of the rally from the November monthly swing low, around the $1,932-$1,931 region. The Relative Strength Index (RSI) on the daily chart is flashing extremely overbought conditions and holding back bulls from placing fresh bets around the Gold price.
Any further pullback, however, is likely to find support near the $2,079-2,080 area, or the previous all-time peak touched in May, below which the XAU/USD could slide to the 38.2% Fibo. level, around the $2063-2,062 zone. On the flip side, move back above the $2,095-2,100 immediate hurdle might now confront some resistance near the $2,118 area. Some follow-through buying should allow the Gold price to retest the record high around the $2,144-$2,145 region, which if cleared will reinforce the near-term positive outlook and pave the way for additional gains.
US Dollar price today
The table below shows the percentage change of US Dollar (USD) against listed major currencies today. US Dollar was the weakest against the Euro.
| USD | EUR | GBP | CAD | AUD | JPY | NZD | CHF | |
| USD | 0.02% | 0.25% | 0.18% | 0.20% | 0.12% | 0.16% | 0.24% | |
| EUR | -0.03% | 0.25% | 0.17% | 0.20% | 0.09% | 0.17% | 0.21% | |
| GBP | -0.27% | -0.23% | -0.07% | -0.05% | -0.13% | -0.08% | -0.01% | |
| CAD | -0.18% | -0.16% | 0.08% | 0.03% | -0.08% | 0.00% | 0.06% | |
| AUD | -0.20% | -0.19% | 0.04% | -0.03% | -0.10% | -0.03% | 0.03% | |
| JPY | -0.15% | -0.07% | 0.30% | 0.08% | 0.12% | 0.07% | 0.12% | |
| NZD | -0.17% | -0.14% | 0.09% | 0.02% | 0.04% | -0.04% | 0.07% | |
| CHF | -0.25% | -0.21% | 0.02% | -0.05% | -0.03% | -0.11% | -0.07% |
The heat map shows percentage changes of major currencies against each other. The base currency is picked from the left column, while the quote currency is picked from the top row. For example, if you pick the Euro from the left column and move along the horizontal line to the Japanese Yen, the percentage change displayed in the box will represent EUR (base)/JPY (quote).
Gold FAQs
Why do people invest in Gold?
Gold has played a key role in human’s history as it has been widely used as a store of value and medium of exchange. Currently, apart from its shine and usage for jewelry, the precious metal is widely seen as a safe-haven asset, meaning that it is considered a good investment during turbulent times. Gold is also widely seen as a hedge against inflation and against depreciating currencies as it doesn’t rely on any specific issuer or government.
Who buys the most Gold?
Central banks are the biggest Gold holders. In their aim to support their currencies in turbulent times, central banks tend to diversify their reserves and buy Gold to improve the perceived strength of the economy and the currency. High Gold reserves can be a source of trust for a country’s solvency. Central banks added 1,136 tonnes of Gold worth around $70 billion to their reserves in 2022, according to data from the World Gold Council. This is the highest yearly purchase since records began. Central banks from emerging economies such as China, India and Turkey are quickly increasing their Gold reserves.
How is Gold correlated with other assets?
Gold has an inverse correlation with the US Dollar and US Treasuries, which are both major reserve and safe-haven assets. When the Dollar depreciates, Gold tends to rise, enabling investors and central banks to diversify their assets in turbulent times. Gold is also inversely correlated with risk assets. A rally in the stock market tends to weaken Gold price, while sell-offs in riskier markets tend to favor the precious metal.
What does the price of Gold depend on?
The price can move due to a wide range of factors. Geopolitical instability or fears of a deep recession can quickly make Gold price escalate due to its safe-haven status. As a yield-less asset, Gold tends to rise with lower interest rates, while higher cost of money usually weighs down on the yellow metal. Still, most moves depend on how the US Dollar (USD) behaves as the asset is priced in dollars (XAU/USD). A strong Dollar tends to keep the price of Gold controlled, whereas a weaker Dollar is likely to push Gold prices up.
- Indian Rupee gains ground on the softer USD, upbeat Indian growth number.
- The Reserve Bank of India (RBI) is likely to maintain the status quo on the rate in its policy meeting this week.
- Market players will monitor the S&P Global India Services PMI ahead of the RBI interest rate decision.
The Indian Rupee (INR) kicks off the week in a positive mood on the weaker US Dollar (USD) on Monday. The investor inflow and the stronger Indian growth figure prompted economists to raise their growth forecasts for Asia's third-largest economy. India's second-quarter Gross Domestic Product (GDP) expanded 7.6% driven by robust manufacturing performance and government spending, according to the statistics ministry last week.
The Reserve Bank of India (RBI) monetary policy committee will hold its next policy meeting on December 6–8. The markets anticipate the RBI to stand pat on rates and maintain a hawkish stance amid upbeat growth and upside risks to near-term inflation on account of food prices.
Additionally, the results of the state elections are likely to be welcomed by investors and financial markets as they alleviate political uncertainty and concerns about large-scale fiscal populism ahead of the national elections.
Looking ahead, the S&P Global India Services PMI for November will be released on Tuesday. The figure is estimated to ease from 58.4 to 58.0. Investors will closely watch the RBI interest rate decision on Friday, which is expected to maintain the rate unchanged at 6.50%.
Daily Digest Market Movers: Indian Rupee continues to gain positive traction amid challenging global economic conditions
- Prime Minister Narendra Modi's Bharatiya Janata Party looks likely to form governments in three of the five Indian states that recently held elections.
- Krishnamurthy V. Subramanian, Executive Director of the International Monetary Fund (IMF) forecasted a 7 % Indian growth for the ongoing financial year.
- India's NIFTY 50 reached an all-time high on Friday following the upbeat economic growth in the September quarter, which spurred confidence in the Indian economy.
- India’s second-quarter Gross Domestic Product grew 7.6%, marking her the world’s fastest-growing major economy, driven by manufacturing and the government's spending.
- Indian Prime Minister Narendra Modi said the upbeat GDP growth numbers highlighted the Indian economy's resilience and strength in the face of global challenges.
- US ISM Manufacturing PMI came in weaker than expected and remained unchanged at 46.7 in November.
- The Manufacturing Employment Index eased from 46.8 to 45.8 in November. Prices Paid improved from 45.1 to 49.9. Finally, the New Orders Index rose to 48.3 in November from 45.5 in the previous reading.
- According to the CME FedWatch Tool, markets are now pricing in more than 50% odds of a rate cut in the first quarter of 2024.
Technical Analysis: Indian Rupee’s bullish outlook remains in place
Indian Rupee edges lower on the day. The USD/INR pair has traded within a familiar multi-month-old trading band of 82.80–83.40. According to the daily chart, the bullish bias of USD/INR stays intact despite the latest pullback as it holds above the key 100-day Exponential Moving Average (EMA) with an upward slope. However, the 14-day Relative Strength Index (RSI) dropped below the 50.0 midline, indicating that further downside cannot be ruled out.
That being said, the first upside barrier for USD/INR bulls is seen at 83.40, portraying the upper boundary of the trading range. A decisive break above 83.40 will pave the way to the year-to-date (YTD) high of 83.47, en route to a psychological round figure of 84.00. On the other hand, the key support level is located at the 83.00 psychological mark. The additional downside filter to watch is the confluence of the lower limit of the trading range and a low of September 12 at 82.80, and finally a low of August 11 at 82.60.
US Dollar price today
The table below shows the percentage change of US Dollar (USD) against listed major currencies today. US Dollar was the weakest against the Euro.
| USD | EUR | GBP | CAD | AUD | JPY | NZD | CHF | |
| USD | 0.05% | 0.22% | 0.13% | 0.11% | 0.10% | 0.08% | 0.20% | |
| EUR | -0.06% | 0.17% | 0.10% | 0.07% | 0.05% | 0.06% | 0.17% | |
| GBP | -0.24% | -0.16% | -0.08% | -0.09% | -0.10% | -0.12% | -0.01% | |
| CAD | -0.13% | -0.09% | 0.08% | -0.02% | -0.05% | -0.04% | 0.07% | |
| AUD | -0.11% | -0.07% | 0.11% | 0.02% | -0.03% | -0.02% | 0.09% | |
| JPY | -0.15% | -0.05% | 0.28% | 0.05% | 0.03% | -0.01% | 0.09% | |
| NZD | -0.08% | -0.04% | 0.12% | 0.05% | 0.03% | 0.02% | 0.13% | |
| CHF | -0.22% | -0.16% | 0.01% | -0.07% | -0.10% | -0.10% | -0.13% |
The heat map shows percentage changes of major currencies against each other. The base currency is picked from the left column, while the quote currency is picked from the top row. For example, if you pick the Euro from the left column and move along the horizontal line to the Japanese Yen, the percentage change displayed in the box will represent EUR (base)/JPY (quote).
Indian Rupee FAQs
What are the key factors driving the Indian Rupee?
The Indian Rupee (INR) is one of the most sensitive currencies to external factors. The price of Crude Oil (the country is highly dependent on imported Oil), the value of the US Dollar – most trade is conducted in USD – and the level of foreign investment, are all influential. Direct intervention by the Reserve Bank of India (RBI) in FX markets to keep the exchange rate stable, as well as the level of interest rates set by the RBI, are further major influencing factors on the Rupee.
How do the decisions of the Reserve Bank of India impact the Indian Rupee?
The Reserve Bank of India (RBI) actively intervenes in forex markets to maintain a stable exchange rate, to help facilitate trade. In addition, the RBI tries to maintain the inflation rate at its 4% target by adjusting interest rates. Higher interest rates usually strengthen the Rupee. This is due to the role of the ‘carry trade’ in which investors borrow in countries with lower interest rates so as to place their money in countries’ offering relatively higher interest rates and profit from the difference.
What macroeconomic factors influence the value of the Indian Rupee?
Macroeconomic factors that influence the value of the Rupee include inflation, interest rates, the economic growth rate (GDP), the balance of trade, and inflows from foreign investment. A higher growth rate can lead to more overseas investment, pushing up demand for the Rupee. A less negative balance of trade will eventually lead to a stronger Rupee. Higher interest rates, especially real rates (interest rates less inflation) are also positive for the Rupee. A risk-on environment can lead to greater inflows of Foreign Direct and Indirect Investment (FDI and FII), which also benefit the Rupee.
How does inflation impact the Indian Rupee?
Higher inflation, particularly, if it is comparatively higher than India’s peers, is generally negative for the currency as it reflects devaluation through oversupply. Inflation also increases the cost of exports, leading to more Rupees being sold to purchase foreign imports, which is Rupee-negative. At the same time, higher inflation usually leads to the Reserve Bank of India (RBI) raising interest rates and this can be positive for the Rupee, due to increased demand from international investors. The opposite effect is true of lower inflation.
| Raw materials | Closed | Change, % |
|---|---|---|
| Silver | 25.452 | 0.64 |
| Gold | 2071.356 | 1.65 |
| Palladium | 1000.72 | -0.54 |
- The Japanese Yen kicks off the new week on a stronger note and touches a three-month high against the USD.
- A combination of factors tempers investors’ appetite for riskier assets and boosts demand for the safe-haven JPY.
- Dovish Fed expectations, falling US bond yields undermine the USD and exert downward pressure on USD/JPY.
The Japanese Yen (JPY) adds to Friday's strong gains against the US Dollar (USD) and kicks off the new week on a positive note, dragging the USD/JPY pair to a near three-week low, around the 146.25-146.20 region during the Asian session. Escalating conflict in the Middle East, along with fears of another COVID-19-like respiratory illness outbreak in China, tempers investors' appetite for riskier assets. This comes on the back of speculations about a major shift in the Bank of Japan's (BoJ) policy stance early next year and turns out to be a key factor that is seen boosting the JPY’s relative safe-haven status.
The JPY bulls, meanwhile, seem rather unaffected by the recent less-hawkish comments by BoJ policymakers, saying that it was premature to debate an exit from negative interest rates. The USD, on the other hand, continues to be undermined by rising bets that the Federal Reserve (Fed) will maintain the status quo at the December policy meeting and start cutting interest rates by the first half of 2024. Even Fed Chair Jerome Powell's attempts on Friday to moderate rate-cut expectations also do little to provide any respite to the buck or ease the bearish pressure surrounding the USD/JPY pair.
Market participants now look to important US macro data scheduled at the beginning of a new month, including the closely-watched US monthly jobs report, or the Nonfarm Payrolls data, due on Friday for some meaningful impetus. Nevertheless, the aforementioned fundamental backdrop suggests that the path of least resistance for the USD/JPY pair is to the downside. This, in turn, supports prospects for an extension of the recent sharp pullback from the 152.00 neighbourhood, or the YTD peak touched in November amid Monday's thin US economic docket, featuring the only release of Factory Orders data.
Daily Digest Market Movers: Japanese Yen attracts haven flows amid geopolitical tensions and respiratory illness outbreak in China
- A US destroyer and three commercial ships operating in the Red Sea came under drone and ballistic-missile attacks on Sunday.
- and the responsibility for the latest incursion was claimed by Iran-backed Houthi rebels in Yemen.
- This comes after Israel's warplanes pounded Gaza on Friday and talks to extend a week-old truce with Hamas collapsed, and marks a major increase in maritime aggression linked to the prolonged war.
- China's hospitals have been flooded with cases of respiratory illnesses and sick children complaining of pneumonia-like symptoms, leading to increased scrutiny from the World Health Organisation (WHO).
- The Chinese health ministry said on Saturday that the respiratory illness is caused by known pathogens and there is no sign of new infectious diseases and recommended reducing large gatherings in public places.
- BoJ board member Noguchi spoke over the weekend to convey that there is no imminent policy pivot in sight as the rise in inflation is mostly due to cost-push factors amid higher import prices.
- Noguchi added that although annual spring wage negotiations this year achieved hikes unseen in 30 years, we've just reached a stage where the possibility of achieving the 2% inflation target has come into sight.
- Federal Reserve Chairman Jerome Powell said on Friday it would be premature to conclude with confidence that we have achieved a sufficiently restrictive stance or to speculate on when policy might ease.
- Investors, however, seem convinced with the idea that the Fed is done with the string of rate hikes and will soon move to an easing posture in 2024, which leads to a further decline in the US bond yields.
- The yield on the benchmark 10-year US government bond languishes near a 12-week low and continues to undermine the US Dollar, exerting some downward pressure on the USD/JPY pair on Monday.
- Traders now look to the US Factory Orders data for some impetus ahead of the Tokyo CPI on Tuesday and this week’s other important US macro data scheduled at the beginning of a new month, including the NFP report on Friday.
Technical Analysis: USD/JPY seems vulnerable near multi-month low, 100-day SMA pivotal support breakdown in play
From a technical perspective, the recent failure ahead of the 152.00 mark constituted the formation of a bearish double-top pattern on the daily chart. A subsequent break and close below the 100-day Simple Moving Average (SMA) on Friday further validates the near-term negative outlook for the USD/JPY pair. Spot prices, however, find some support near the 146.20 area, which represents the 38.2% Fibonacci retracement level of the July-October rally and should act as a key pivotal point. Given that oscillators on the daily chart are holding deep in the negative territory, some follow-through selling should drag the pair further towards the 145.45-145.40 intermediate support en route to the 145.00 psychological mark and the 50% Fibo. level, around mid-144.00s.
On the flip side, any attempted recovery might now confront stiff resistance and meet with a fresh supply near the 147.00 mark. This, in turn, should cap the USD/JPY pair near the 100-day SMA support breakpoint, currently pegged near the 147.30-147.35 region. A sustained strength beyond, however, could trigger a short-covering rally and allow spot prices to reclaim the 148.00 round figure. The momentum could get extended further towards the 148.25-148.30 region, or the 23.6% Fibo. level.
Japanese Yen price today
The table below shows the percentage change of Japanese Yen (JPY) against listed major currencies today. Japanese Yen was the weakest against the US Dollar.
| USD | EUR | GBP | CAD | AUD | JPY | NZD | CHF | |
| USD | 0.16% | 0.31% | 0.14% | 0.14% | 0.17% | 0.24% | 0.29% | |
| EUR | -0.19% | 0.16% | -0.03% | -0.02% | -0.01% | 0.09% | 0.13% | |
| GBP | -0.34% | -0.15% | -0.17% | -0.17% | -0.14% | -0.07% | -0.02% | |
| CAD | -0.14% | 0.02% | 0.18% | 0.00% | 0.01% | 0.11% | 0.16% | |
| AUD | -0.14% | 0.01% | 0.17% | -0.01% | 0.01% | 0.11% | 0.15% | |
| JPY | -0.21% | 0.03% | 0.32% | -0.01% | -0.02% | 0.09% | 0.12% | |
| NZD | -0.24% | -0.08% | 0.07% | -0.10% | -0.08% | -0.07% | 0.08% | |
| CHF | -0.29% | -0.11% | 0.04% | -0.14% | -0.15% | -0.12% | -0.04% |
The heat map shows percentage changes of major currencies against each other. The base currency is picked from the left column, while the quote currency is picked from the top row. For example, if you pick the Euro from the left column and move along the horizontal line to the Japanese Yen, the percentage change displayed in the box will represent EUR (base)/JPY (quote).
Japanese Yen FAQs
What key factors drive the Japanese Yen?
The Japanese Yen (JPY) is one of the world’s most traded currencies. Its value is broadly determined by the performance of the Japanese economy, but more specifically by the Bank of Japan’s policy, the differential between Japanese and US bond yields, or risk sentiment among traders, among other factors.
How do the decisions of the Bank of Japan impact the Japanese Yen?
One of the Bank of Japan’s mandates is currency control, so its moves are key for the Yen. The BoJ has directly intervened in currency markets sometimes, generally to lower the value of the Yen, although it refrains from doing it often due to political concerns of its main trading partners. The current BoJ ultra-loose monetary policy, based on massive stimulus to the economy, has caused the Yen to depreciate against its main currency peers. This process has exacerbated more recently due to an increasing policy divergence between the Bank of Japan and other main central banks, which have opted to increase interest rates sharply to fight decades-high levels of inflation.
How does the differential between Japanese and US bond yields impact the Japanese Yen?
The BoJ’s stance of sticking to ultra-loose monetary policy has led to a widening policy divergence with other central banks, particularly with the US Federal Reserve. This supports a widening of the differential between the 10-year US and Japanese bonds, which favors the US Dollar against the Japanese Yen.
How does broader risk sentiment impact the Japanese Yen?
The Japanese Yen is often seen as a safe-haven investment. This means that in times of market stress, investors are more likely to put their money in the Japanese currency due to its supposed reliability and stability. Turbulent times are likely to strengthen the Yen’s value against other currencies seen as more risky to invest in.
- NZD/USD gains ground near 0.6210 on the USD weakness.
- New Zealand’s Terms of Trade Index for the third quarter (Q3) fell 0.6% QoQ vs. 0.3% prior.
- Fed Chair Jerome Powell said it was premature to rule out additional rate hikes or start discussing cuts.
The NZD/USD pair gains momentum toward the 0.6200 round figure during the early Asian session on Monday. The speculation that the US Federal Reserve (Fed) could be done with rate hikes drags the US Dollar (USD) lower and lifts the NZD/USD. At press time, the pair is trading near 0.6210, up 0.11% on the day.
Early Monday, New Zealand’s Terms of Trade Index for the third quarter (Q3) fell 0.6% QoQ versus 0.3% prior. Good Export prices dropped 1.5% QoQ from the previous reading of a 6.8% rise while Import prices for goods declined 0.8% QoQ from a 1.0 drop in the previous reading.
The Reserve Bank of New Zealand (RBNZ) held the cash rate steady at 5.5% last week but noted inflation remained too high and that further policy tightening might be needed if price pressures did not ease. That being said, the hawkish tilt from the RBNZ boosts the New Zealand Dollar (NZD) and acts as a tailwind for the NZD/USD pair.
On the other hand, this contrasts with the dovish tone from the Fed, with the market now pricing the US central bank to end the tightening cycle and will begin cutting the rate as early as next March. Fed Chair Jerome Powell stated on Friday that it was premature to rule out additional rate hikes or start discussing cuts.
Apart from this, the US ISM Manufacturing PMI came in weaker than expected and remained unchanged at 46.7 in November, the Institute for Supply Management (ISM) showed on Friday.
Market players will monitor the US Factory Orders for October. Later this week, New Zealand’s ANZ Commodity Price and US ISM Services PMI will be due on Tuesday. The attention will shift to US Nonfarm Payrolls (NFP) on Friday, which is expected to add 180K jobs in November.
On Monday, the People’s Bank of China (PBoC) set the USD/CNY central rate for the trading session ahead at 7.1011 as compared to Friday's fix of 7.1104 and 7.1271 Reuters estimates.
- EUR/USD holds positive ground near 1.0890 on the weaker USD.
- US ISM Manufacturing PMI came in weaker than expected, flat at 46.7 in November.
- ECB policymaker said the central bank isn’t ready to consider lowering borrowing costs now but would consider it later in 2024.
- Traders will focus on the German Trade Balance, ECB’s Lagarde speech.
The EUR/USD pair snaps its three-day losing streak during the early Asian trading hours on Monday. The rebound of the pair is baked by the weaker US Dollar (USD) and lower US Treasury bond yields amid speculation that the Federal Reserve (Fed) has reached its peak of the rate hike cycle and will ease policy soon. EUR/USD currently trades near 1.0890, gaining 0.10% on the day.
The dovish comments from Fed Chairman Jerome Powell on Friday dragged the Greenback lower. Powell's statements provided some support for the belief that the Fed is done with the interest rate hiking cycle and will move to an easing posture in 2024. He added that it would be premature to conclude with confidence that the Fed has achieved a sufficiently restrictive stance or to speculate on when policy may be eased.”
The US manufacturing sector remained subdued in November. The Institute for Supply Management (ISM) revealed on Friday that the US ISM Manufacturing PMI came in weaker than expected, and remains steady at 46.7 in November. Meanwhile, the Manufacturing Employment Index dropped to 45.8 from 46.8 in the previous reading. Prices Paid rose from 45.1 to 49.9 and the New Orders Index climbed to 48.3 in November versus 45.5 prior.
Elsewhere, an attack on an American warship and commercial vessels in the Red Sea on Sunday fueled the fear of escalating conflicts between Israel and Hamas. This, in turn, might boost the safe-haven flow and benefit the USD against its rivals.
Across the pond, the European Central Bank (ECB) policymaker and Bank of France Governor Francois Villeroy de Galhau said last week that the ECB is not ready to consider lowering borrowing costs now but would consider it later in 2024. That being said, the slowdown in inflation brings the ECB's 2% inflation target back into clear focus for the first time since the summer of 2021, potentially signaling an adjustment in monetary policy.
Later on Monday, market participants will keep an eye on the German Trade Balance for October and ECB President Christine Lagarde's speech. These events could give a clear direction to the EUR/USD pair.
| Index | Change, points | Closed | Change, % |
|---|---|---|---|
| NIKKEI 225 | -55.38 | 33431.51 | -0.17 |
| Hang Seng | -212.58 | 16830.3 | -1.25 |
| KOSPI | -30.28 | 2505.01 | -1.19 |
| ASX 200 | -14.1 | 7073.2 | -0.2 |
| DAX | 182.09 | 16397.52 | 1.12 |
| CAC 40 | 35.38 | 7346.15 | 0.48 |
| Dow Jones | 294.61 | 36245.5 | 0.82 |
| S&P 500 | 26.83 | 4594.63 | 0.59 |
| NASDAQ Composite | 78.81 | 14305.03 | 0.55 |
| Pare | Closed | Change, % |
|---|---|---|
| AUDUSD | 0.6672 | 1.06 |
| EURJPY | 159.746 | -0.96 |
| EURUSD | 1.08753 | -0.07 |
| GBPJPY | 186.616 | -0.17 |
| GBPUSD | 1.27041 | 0.71 |
| NZDUSD | 0.62018 | 0.85 |
| USDCAD | 1.34928 | -0.49 |
| USDCHF | 0.86963 | -0.54 |
| USDJPY | 146.893 | -0.87 |


© 2000-2024. Уcі права захищені.
Cайт знаходитьcя під керуванням TeleTrade DJ. LLC 2351 LLC 2022 (Euro House, Richmond Hill Road, Kingstown, VC0100, St. Vincent and the Grenadines).
Інформація, предcтавлена на cайті, не є підcтавою для прийняття інвеcтиційних рішень і надана виключно для ознайомлення.
Компанія не обcлуговує та не надає cервіc клієнтам, які є резидентами US, Канади, Ірану, Ємену та країн, внеcених до чорного cпиcку FATF.
Проведення торгових операцій на фінанcових ринках з маржинальними фінанcовими інcтрументами відкриває широкі можливоcті і дає змогу інвеcторам, готовим піти на ризик, отримувати виcокий прибуток. Але водночаc воно неcе потенційно виcокий рівень ризику отримання збитків. Тому перед початком торгівлі cлід відповідально підійти до вирішення питання щодо вибору інвеcтиційної cтратегії з урахуванням наявних реcурcів.
Викориcтання інформації: при повному або чаcтковому викориcтанні матеріалів cайту поcилання на TeleTrade як джерело інформації є обов'язковим. Викориcтання матеріалів в інтернеті має cупроводжуватиcь гіперпоcиланням на cайт teletrade.org. Автоматичний імпорт матеріалів та інформації із cайту заборонено.
З уcіх питань звертайтеcь за адреcою pr@teletrade.global.
переклади