- Аналітика
- Новини та інструменти
- Новини ринків
Новини ринків
- USD/JPY trades sideways below the 149.00 area, supported by the suspected FX intervention by Japanese authorities.
- US private payrolls rose by 89,000 in September vs. 180,000 prior.
- 10-year Japanese Government Bond (JGB) yield spiked to 0.8% for the first time since 2013 on Wednesday.
- Market players await the highly-anticipated US Nonfarm Payrolls.
The USD/JPY pair oscillates in a narrow range around 148.95 during the early Asian trading hours on Thursday. Investors have adopted a cautious stance amid the suspicion of FX intervention by Japanese authorities late Tuesday. Furthermore, the upside momentum of the pair seems faded following the downbeat US data. Traders will take cues from the US Nonfarm Payrolls on Friday for fresh impetus.
The Automatic Data Processing (ADP) revealed on Thursday that US private payrolls for September rose by 89,000 from 180,000 in the previous reading, below the estimation of 153,000. The figure registered the lowest level since January 2021. Meanwhile, the US ISM Services PMI dropped to 53.6 in September versus 54.5 prior, in line with the market consensus.
The downbeat ADP Employment data exerted some selling pressure on the USD. Market players will focus on the US Nonfarm Payrolls data on Friday. If the data shows a softer result, it could trigger some sell-off in the Greenback.
On the JPY’s front, the 10-year Japanese Government Bond (JGB) yield reached 0.8% for the first time since 2013 on Wednesday. This put more pressure on the BoJ to its yield-curve cap and prepare for the end of its negative interest rate policy.
Early Wednesday, Japan’s top currency diplomat Masato Kanda said any intervention would not target forex levels but volatility while mentioning that it's normal for authorities not to comment on whether they intervened or not. Japan’s Chief Cabinet Secretary Hirokazu Matsuno said on Monday that he will continue to take appropriate steps on FX, but still have no comment on whether Japan intervened in the FX market. It’s worth noting that the 150.00 mark was the level that BoJ intervened last year. Therefore, traders should be cautious before placing aggressive bullish bets on the USD/JPY pair.
Moving on, the US weekly Jobless Claims will be released on Thursday. The closely watched event will be the US Nonfarm Payrolls on Friday. The US economy is expected to create 170,000 jobs in September. Traders will take cues from these events and find trading opportunities around the USD/JPY pair.
- GBP/JPY is floating higher, albeit cautiously, after an unconfirmed BoJ FX intervention on Tuesday.
- The Pound Sterling has struggled against the Yen lately, down 3% from recent highs.
- The BoJ has so far refused to confirm or deny operations to defend the JPY in open markets.
The GBP/JPY caught a mild lift in Wednesday trading, reaching an intraday peak of 181.26, extending the rebound from Tuesday's bottom of 178.08.
The Japanese Yen (JPY) rapidly appreciated on Tuesday, with the GBP/JPY plummeting around 300 pips within a matter of seconds, and it remains unconfirmed that the Bank of Japan (BoJ) intervened in FX markets to defend the Yen.
With the economic calendar devoid of any meaningful data for either the Pound Sterling (GBP) or the Yen, broader market sentiment is set to drive the pair around the charts heading through the back half of the trading week.
Thursday will bring Japanese Labor Cash Earnings, with the annualized figure for August last printing at 1.3%.
GBP/JPY technical outlook
Hourly candles have the Guppy trading flat for Wednesday, and the pair is up 0.33% or 60 pips for the day. Intraday action is largely trading back into a familiar range prior to the assumed BoJ intervention, and prices remain capped below the 200-hour Simple Moving Average (SMA) currently resting near 181.50.
Daily candlesticks have the GBP/JPY pinned into the 100-day SMA, with the 180.00 major psychological handle acting as a floor for technical momentum. The Guppy is up 14% for the year, trading over 2,200 pips above 2023's opening bids.
Bank of Japan FAQs
What is the Bank of Japan?
The Bank of Japan (BoJ) is the Japanese central bank, which sets monetary policy in the country. Its mandate is to issue banknotes and carry out currency and monetary control to ensure price stability, which means an inflation target of around 2%.
What has been the Bank of Japan’s policy?
The Bank of Japan has embarked in an ultra-loose monetary policy since 2013 in order to stimulate the economy and fuel inflation amid a low-inflationary environment. The bank’s policy is based on Quantitative and Qualitative Easing (QQE), or printing notes to buy assets such as government or corporate bonds to provide liquidity. In 2016, the bank doubled down on its strategy and further loosened policy by first introducing negative interest rates and then directly controlling the yield of its 10-year government bonds.
How do Bank of Japan’s decisions influence the Japanese Yen?
The Bank’s massive stimulus has caused the Yen to depreciate against its main currency peers. This process has exacerbated more recently due to an increasing policy divergence between the Bank of Japan and other main central banks, which have opted to increase interest rates sharply to fight decades-high levels of inflation. The BoJ’s policy of holding down rates has led to a widening differential with other currencies, dragging down the value of the Yen.
Is the Bank of Japan’s ultra-loose policy likely to change soon?
A weaker Yen and the spike in global energy prices have led to an increase in Japanese inflation, which has exceeded the BoJ’s 2% target. Still, the Bank judges that the sustainable and stable achievement of the 2% target has not yet come in sight, so any sudden change in the current policy looks unlikely.
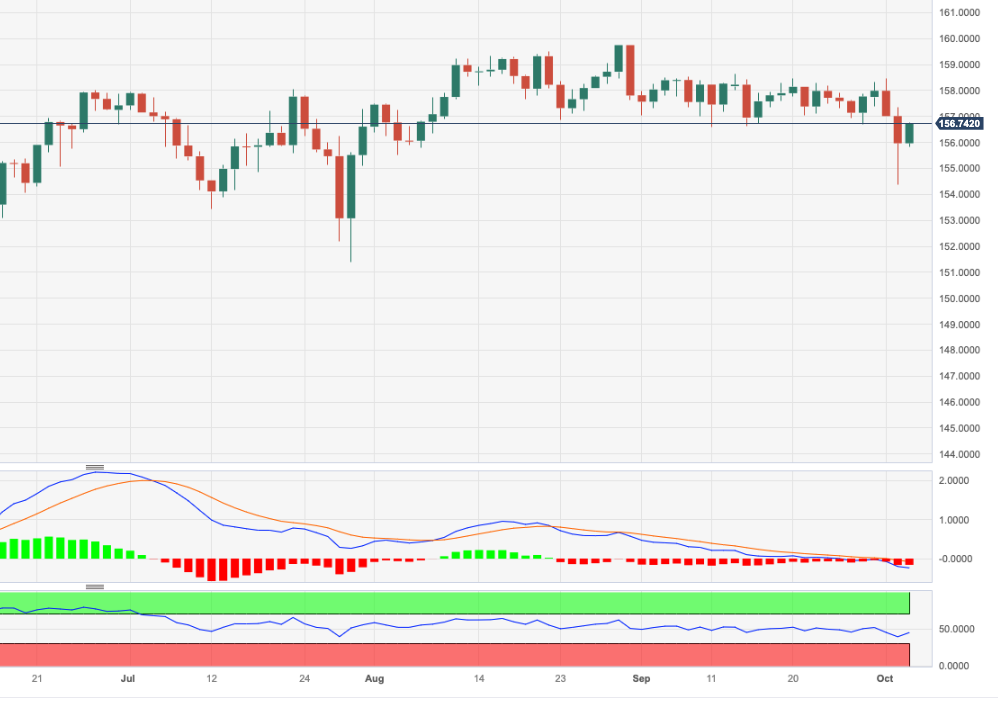
- EUR/JPY trades cautiously, marking a slight 0.04% dip in the early Asian session, lingering near its Wednesday high within the Ichimoku Cloud.
- Key resistance levels to watch include the top of the Kumo at 156.98 and the psychological barrier at 157.00.
- Downward movement breaking below the Senkou-Span B at 155.58 could see the pair targeting the October 3 low of 154.34.
The EUR/JPY printed modest gains on Wednesday, but it remains trapped inside the Ichimoku Cloud (Kumo), set to remain neutrally biased unless it breaks above/below of the latter. Early in the Asian session, the EUR/JPY is trading at 156.54, down by 0.04%.
From a daily chart perspective, the EUR/JPY is trading near Wednesday’s high at around 156.50s, but to stage a comeback, the cross must break the top of the Kumo at 156.98, immediately followed by 157.00. the next resistance would be October 2, high at 158.47. Conversely, if the pair drops below the Senkou-Span B at 155.58, the path of least resistance would pave the way for further losses, with next support at the October 3 swing low of 154.34.
Short term, the EUR/JPY hourly chart displays the pair consolidating but tilted to the upside after breaking above the Kumo. Next, resistance emerges at the October 4 high at 156.76, followed by the psychological 157.00 figure. Conversely, if the cross-currency pair drops below the confluence of the Tenkan-Sen and Senkou Span A at 156.41, that would pave the way for further losses. The next support would be the Kijun-Sen at 156.29, then 156.00, and then the bottom of the Kumo at 155.80.
EUR/JPY Price Action – Hourly chart

EUR/JPY Key Technical Levels
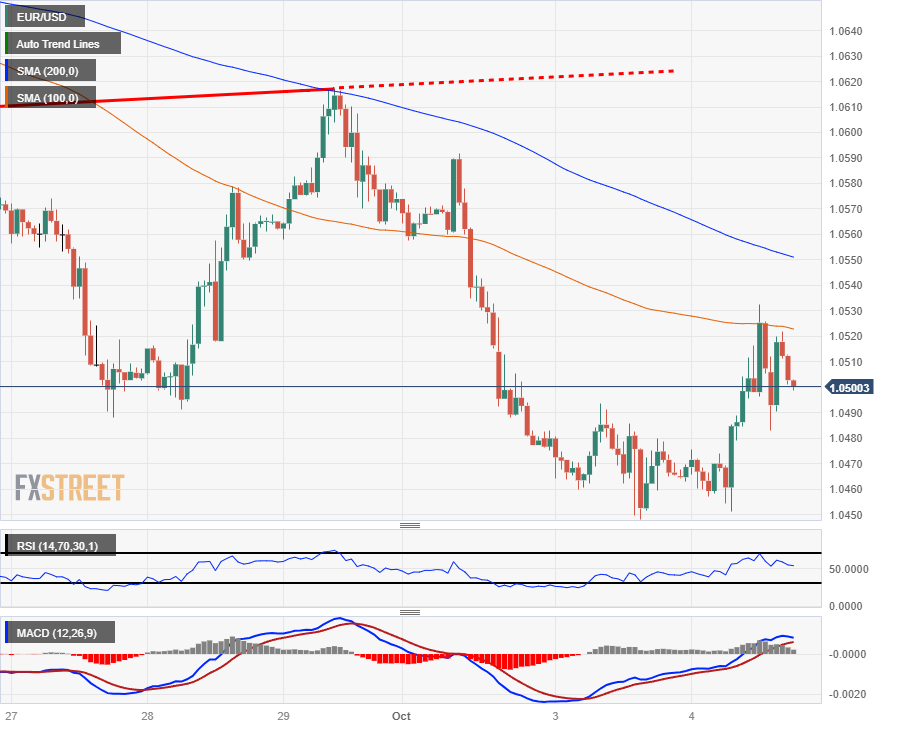
- EUR/USD holds ground around 1.0505 amid the weaker USD.
- US private payrolls for September came in worse than expected.
- Eurozone Retail Sales came in at -2.1% YoY in August vs.-1% prior.
- Traders will monitor German trade data and US weekly Jobless Claims on Thursday.
The EUR/USD pair recovers some lost ground above the 1.0500 area during the early Asian session on Thursday. The rebound of the pair is supported by the weaker US Dollar (USD) broadly and the softer labor market data. The major pair currently trades near 1.0505, up 0.03% for the day.
Meanwhile, the US Dollar Index (DXY), a measure of the value of the USD relative to a basket of foreign currencies, drops to 106.77 after retracing from the high of 107.34
On Thursday, Automatic Data Processing (ADP) revealed that US private payrolls for September rose by 89,000 from 180,000 in the previous reading, below the estimation of 153,000. The figure registered the lowest level since January 2021. Meanwhile, the US ISM Services PMI dropped to 53.6 in September from 54.5 in August, meeting the market expectations.
Traders await the US Nonfarm Payrolls data on Friday. If the report shows a weaker figure, it might drag the Greenback against its rivals and act as a tailwind for the EUR/USD pair.
Markets anticipate that the European Central Bank (ECB) will maintain the interest rate in the next meeting. On Wednesday, ECB Governing Council member Mario Centeno said that the inflation in the Euro area was falling faster than when it was rising and the central bank can expect the rate cycle has been completed by now, and with present conditions. While ECB Vice President Luis de Guindos stated that ECB will continue to follow a data-dependent approach.
About the data, the Eurozone Retail Sales fell 2.1% YoY in August from a 1% drop in the previous reading, worse than the expectation of a 0.3% decline. On a monthly basis, the figure fell by 1.2% versus a 0.1% drop prior. Additionally, the Eurozone Producer Price Index (PPI) declined by 0.6%, in line with the market consensus.
Looking ahead, market players will focus on the German trade data due on Thursday as well as the US weekly Jobless Claims. On Friday, the attention will shift to the highly-anticipated Nonfarm Payrolls. These events could trigger the volatility in the market. Traders will take cues from these figures and find trading opportunities around the EUR/USD pair.
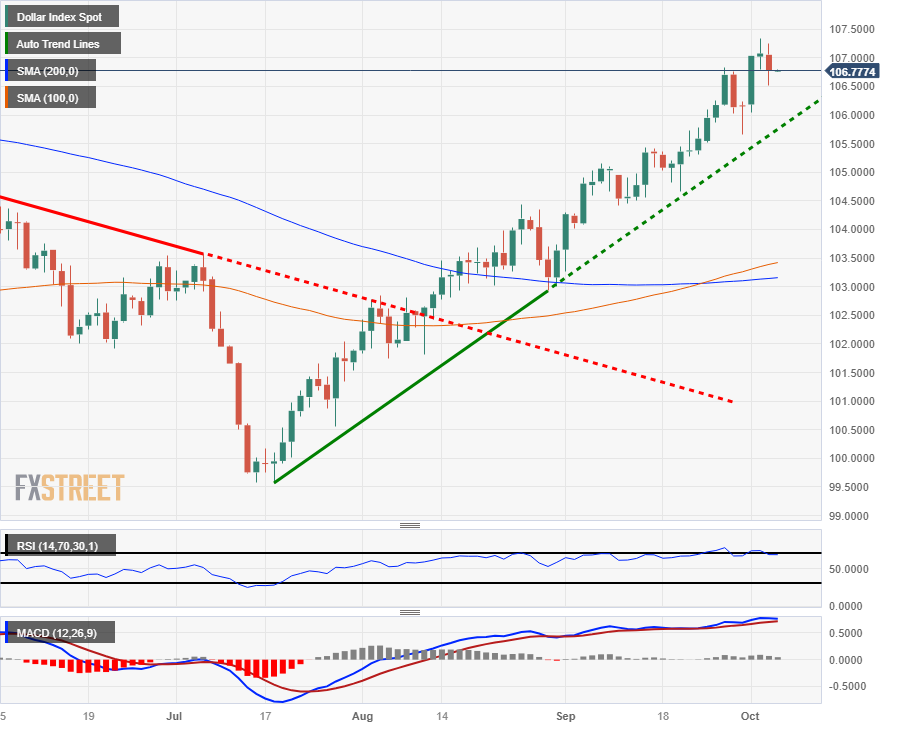
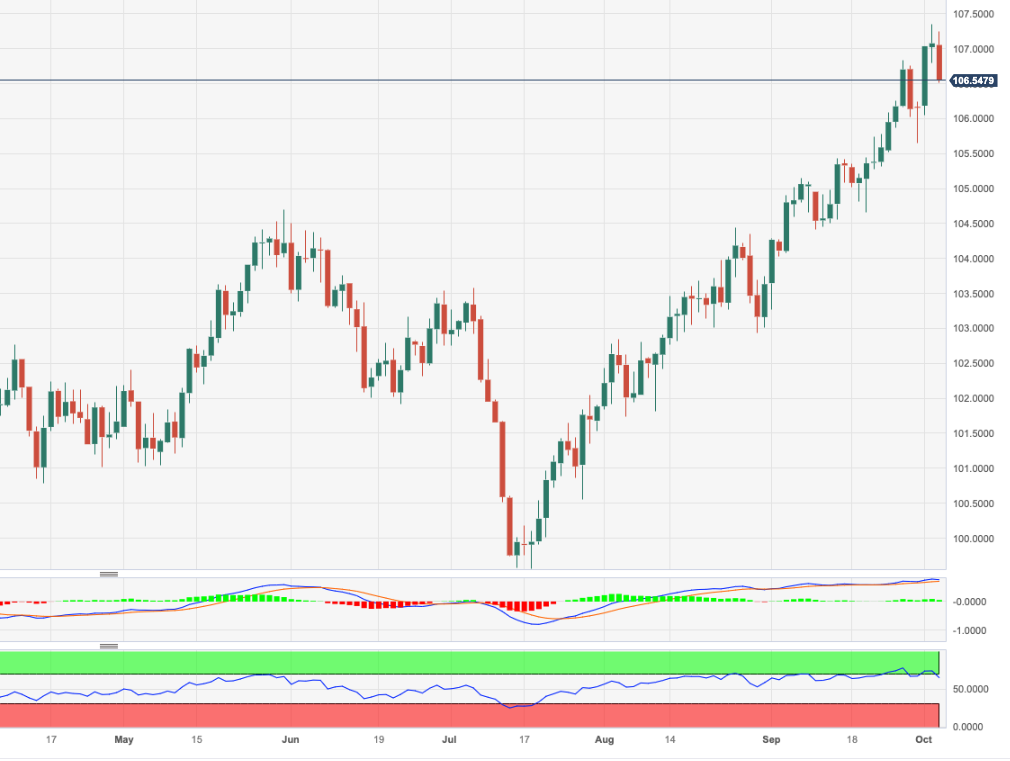
- The US Dollar Index sees a mild decline for Wednesday, slipping back past the 107.00 level.
- Downside momentum likely to remain limited as US Treasury yields, US economic data continue to hold on the high end.
- The DXY is up 3.2% on the year, 7.25% from 2023's lows.
The US Dollar Index (DXY) saw some minor declines on Wednesday, with the major currency index declining around 0.3% for the mid-week trading session.
The Dollar Index has drifted away from the week's eleven-month high at 107.35, but downside moves are likely to remain limited as the DXY remains bolstered by rising US Treasury yields and an overall healthy economic outlook for the US economy, albeit with a few hotspots.
Forex Today: Dollar slides but still rules
US Treasuries saw continued upside for Wednesday, with the 10-year Treasury yield hitting 4.88% during the day's trading, a seventeen-year high.
US ADP employment data showed an 89K uptick in private payroll positions, far below the forecast 153K, but jobs are still being created in the US economy.
Next up on Thursday will be US Jobless Claims, and investors will be looking ahead to Friday's Non-Farm Payrolls (NFP), which is forecast to show a minor downtick from 187K to 170K.
DXY technical outlook
The US Dollar Index opened up Wednesday trading falling to an intraday low of 106.51 before catching an early ride to a daily high of 106.99, but was unable to hold onto the 107.00 handle and enters the Thursday trading session cycling 106.80.
Intraday price action is catching technical support from the 100-hour Simple Moving Average (SMA) near 106.60, with the 200-hour SMA pushing into 160.40.
The DYX continues to rise from the year's lows, riding a bullish trendline from 99.50 and long-term Dollar bulls will be looking to make a decisive push into 108.00.
DXY daily chart
DXY technical levels
- AUD/USD experiences a modest lift from a daily low of 0.6287 amidst a generally softer USD.
- The Reserve Bank of Australia maintains a dovish posture, holding rates steady at 4.10%, while recent Australian Services PMI outperforms expectations.
- Upcoming economic indicators, including the Australian Balance of Trade and US Initial Jobless Claims, to provide further directional cues for the pair.
The Australian Dollar (AUD) gained some momentum against the Greenback (USD) on Wednesday after printing a daily low of 0.6287, though the former was bolstered by overall US Dollar softness across the board. As the Asian session begins, the AUD/USD trades at 0.6234, almost flat.
Australian Dollar cautiously rebounds from weekly lows, navigating through the juxtaposition of a dovish RBA stance and a slightly weakening US Dollar
Wall Street finished Wednesday’s session in an upbeat mood, which usually carries on to the next day's Asian session. Summarizing economic data in the United States (US) showed us the labor market is loosening a bit following September’s ADP Employment Change report, with hirings rising 89K, below estimates of 150K, and last month’s 180K. In the meantime, business activity reported by the ISM witnessed the services index easing to 53.6, as foreseen but below August’s 54.5.
On the Australian front, the latest monetary policy reunion of the Reserve Bank of Australia (RBA) on October 3 was perceived as a dovish one, with the central bank holding rates at 4.10%. Although the RBA stated the board is determined to return inflation to its target, it was mainly ignored by AUD/USD traders, sending the pair toward its weekly lows of around 0.6280s.
On Wednesday, the Aussie’s economic calendar revealed the September Judo Bank Services PMI jumping above estimates of 50.5 to 51.8, crushing August’s figures. Today, the Balance of Trade is expected to print a surplus of A$8.725B. The US agenda will feature Initial Jobless Claims, the Balance of Trade, and Fed speakers.
AUD/USD Price Analysis: Technical outlook
The daily chart portrays the pair as neutral to downward biased, even though the AUD/USD formed a two-candlestick pattern called a ‘bullish-harami.’ To confirm its validity, the pair should rally past the October 3 high of 0.6367, which would put into play the 0.6400 mark. On the other hand, the path of least resistance suggests the pair might extend its losses once the weekly low of 0.6285 is breached, eyeing the November 22 low of 0.6272, followed by the October 21 and 13 lows, each a 0.610 and 0.6164, respectively.
- Gold prices remain under pressure in Wednesday trading.
- XAU/USD downside pressure is mounting from rising US Treasury yields.
- Gold traders awaiting a downturn in US economic data to help bolster XAU/USD bids.
XAU/USD briefly rose tp $1,830.65 on Wednesday before getting pushed back down to the floor and is currently waffling near $1,820.00.
Analysts have been lowering their year-end forecasts for spot Gold prices, with still-high expectations of higher-for-longer rates from the Federal Reserve (Fed).
US data came in mixed on Wednesday, with the ADP Employment Change numbers for September missing expectations and declining to 89K from the previous 180K (revised upwards from 177K); US ISM Services Purchasing Managers Index (PMI) numbers printed at-expectations, ticking down slightly from 54.5 to 53.6, but the reading still leaves the US economy in a healthy position, and markets are still pricing in a 24$ chance of one more rate hike from the Fed before the end of the year.
Gold bugs will be looking forward to Friday's US Non-Farm Payrolls (NFP) report, which is forecast to show labor figures declining from 187K to 170K. A miss for the headline figure could see Gold catch some much-needed lift on the charts, while a meet-or-beat scenario will see Gold continuing to flub.
Read more Gold analysis:
With a significantly higher-than-expected ISM manufacturing index and a surprisingly pronounced rise in job vacancies – there appears to be no end to the series of positive US economic data. Gold is under considerable pressure accordingly.
– CommerzbankFor as long as the market continues to expect a ‘soft’ landing in the US, no price recovery is likely to happen for now. After all, this would imply that it will take longer for any interest rate cut to be forthcoming.
– CommerzbankGold fell below the $1,870 key technical support level, which leaves the door open for even more declines.
– TDSXAU/USD technical outlook
Gold has closed bearish for ten of the last eleven consecutive trading days, and is down 6.5% from the last swing high at $1,948.00. XAU/USD has seen downside momentum continue to accelerate, and is in the red around 12.5% from 2023's peak near $2,080.00.
One more bearish push will see Gold prices turn negative for the year, with 2023's bottom dangerously close to current price action near $1,809.46.
XAU/USD daily chart

XAU/USD technical levels
Investors continue to closely monitor global bond markets as yields keep rising. During the Asian session, Australia will release trade data for August. Later in the day, the US will release the weekly Jobless Claims report, ahead of Friday's Nonfarm Payrolls report.
Here is what you need to know on Thursday, October 5:
The bond sell-off drove US and European yields to levels not seen in years before staging a recovery. The 30-year UK yield hit 5%, the German benchmark reached 3% for the first time since 2011, and the 10-year Treasury yield peaked at 4.88% before pulling back to 4.73%. Investors will continue to watch the bond market closely as it remains a key driver for financial markets.
According to Automatic Data Processing (ADP), private payrolls rose by 89,000 in September, below the market consensus of 153,000, marking the lowest level since January 2021. This data provides evidence of a softer labor market that will need confirmation, which could come from other reports. The ISM Services PMI declined from 54.5 to 53.6 in September, in line with expectations.
Nela Richardson, Chief Economist, ADP:
We are seeing a steepening decline in jobs this month. Additionally, we are seeing a steady decline in wages in the past 12 months.
The softer ADP report brought some relief to the sell-off in bonds. However, more US data is due on Thursday with Jobless Claims and on Friday with the Nonfarm Payrolls. Upbeat numbers could trigger more USD gains and increase volatility in the bond market.
USD/JPY remained steady around 149.00 after Tuesday's wild fluctuations. Japanese authorities likely intervened in the market when the pair rose above 150.00.
Boosted by a weaker US Dollar, EUR/USD rose to 1.0525 and posted daily gains. Eurozone Retail Sales dropped more than expected in August, falling by 1.2%, while the Producer Price Index (PPI) declined by 0.6%, matching market consensus. German trade data is due on Thursday. With markets firmly expecting no rate hike from the European Central Bank (ECB) comments from central bankers have become less relevant.
GBP/USD surged, having its best day in over a month, rising from six-month lows at 1.2030 to around 1.2150. The trend is still down, but the rebound offers some relief.
AUD/USD rose, helped by a rebound in commodity prices, holding above 0.6300. The pair needs to recover levels above 0.6360 to alleviate bearish pressure. Australia will report trade data on Thursday.
As expected, the Reserve Bank of New Zealand (RBNZ) kept the rate steady at 5.5%. The next meeting on November 29 will include updated macro forecasts and a press conference, and there could be a rate hike according to market expectations. NZD/USD fell to test September lows at 0.5870 and rebounded, ending the day positively around 0.5930.
The Canadian Dollar was the worst performer among majors, affected by the sharp slide in crude oil prices. USD/CAD jumped to 1.3784, reaching the highest level since March.
Gold traded sideways around $1,820 but remains under pressure. Silver lost some ground but remained within the recent range around $21.00, consolidating recent losses.
Like this article? Help us with some feedback by answering this survey:
- XAG/USD hovers around $20.85, attempting to stabilize after a significant drop from $23.30, marking a precarious position near a six-month low.
- XAG/USD to extend its losses if it fails to conquer $21.69, a break of a support trendline.
- Short-term consolidation between $20.69 and $21.00 offers a tight trading range, with potential upside resistance at $21.28 and downside support near $20.50.
Silver price (XAG/USD) remained heavy on Wednesday after last week’s more than 6% losses, which witnessed the white metal traveling from around $ 23.30, to a new six-month low of $20.69. However, a downtick in US Treasury bond yields saw XAG/USD trimming some of its losses, exchanging hands at $20.85, down 1.55%.
From a daily chart perspective, the XAG/USD is set to extend its losses, also exacerbated by the break of a ten-month-old upslope support trendline at around $21.65, which opened the door for a fall toward $20.69. If XAG/USD remains below $21.00, that could put into play a re-test of the daily low of $20.69, followed by a drop to the year-to-date (YTD) low of $19.92. Conversely, if Silver's price, climbs past $21.65, the $22.00 figure would be up for grabs.
Short-term, the XAG/USD is consolidating at around the $20.69 - $21.00 area, as seen by the contraction of the Bollinger bands, while price action remains capped on the upside by the 20-day Exponential Moving Average (EMA), and the bottom band on the downside. If Silver buyers lift prices past $21.00, the next stop would be the upper band at $21.28, followed by the October 3 high at $21.39. Conversely if the non-yielding metal drops below $20.69, immediate support would be in the $20.50 area.
XAG/USD Price Action – Hourly chart

XAG/USD Key Technical Levels
- WTI Crude Oil prices have extended recent declines.
- US crude prices are set to close in the red for four of the last five trading days.
- OPEC has reaffirmed lower production targets through 2024 to bolster crude costs.
West Texas Intermediary (WTI) dipped below $83.20 per barrel on Wednesday, pushed lower as markets eased off supply concerns and rising US Treasury yields put downside pressure on risk assets.
The Organization of the Petroleum Exporting Countries (OPEC) saw a meeting of its Joint Ministerial Monitoring Committee (JMMC), which reaffirmed OPEC's crude production cuts through the end of 2024 in order to support crude oil prices. The JMMC has no outright decision-making powers, but rather makes recommendations that are then reviewed at following OPEC ministerial meetings.
Saudi Arabia and Russia both reaffirmed their current output reductions, with Saudi Arabia keeping their reduced crude output and Russia holding their exportation cap through the end of the year. Both countries are set for a "review" of their respective output reduction caps next month.
Ongoing market concerns about a chronic undersupply of global crude oil demand are beginning to wane as crude oil reserves see relief on the horizon. US crude oil inventories continue to decline, but the pace of drawdown is slowing as gasoline reserves begin to surge as production facilities ramp up the conversion of crude oil into down-market products in order to take advantage of eye-watering barrel costs.
Crude reserve drawdown continues, but light at the end of the tunnel for US supplies
JP Morgan analyst Natasha Kaneva expects oil inventory drawdowns likely to pivot to slight rebuilds in the final months of the year.
The US' Energy Information Administration (EIA) showed crude oil inventories declined 2.2 million barrels last week, compared to 4.2 million barrels the week before, and a surprise 6 million-barrel jump in gasoline stockpiles.
WTI technical outlook
Wednesday's drop into 83.20 sees WTI crude oil prices making a bearish break of a bullish trendline from June's bottoms near $67.15, and sellers will be looking to make an extended run into the 200-day Simple Moving Average (SMA) near $77.40.
Technical indicators are cycling into the low end, and the Relative Strength Index (RSI) is set to ping oversold territory, currently declining to 38.93 with WTI down 11% from 13-month highs at $93.98 just five trading days ago.
WTI daily chart

WTI technical levels
- GBP/USD rebounds from a daily low of 1.2037, despite UK Services PMI and Composite figures indicating a contraction in business activity.
- US ADP Employment Change report and ISM Non-Manufacturing PMI reveal a slowdown in private sector hiring and service sector activity, respectively.
- Despite the lack of supportive UK economic data, the GBP finds support amidst a generally weakening US Dollar and positive market sentiment.
The Pound Sterling (GBP) rallies against the US Dollar (USD) even though the latest round of UK economic data didn’t support the advance of Sterling, but overall weakness on the Greenback keeps most G8 FX currencies underpinned. The GBP/USD is trading at 1.2135 after sliding to a daily low of 1.2037 earlier in the European session.
Pound Sterling ascends against the US Dollar, reaching 1.2135, as the Greenback's overall weakness and upbeat market sentiment overshadow uninspiring UK economic figures
An upbeat market sentiment is also boosting the British Pound. The latest UK economic docket showed that business activity slightly improved, as S& Global /CIPS revealed. The Services PMI and Composite figures jumped but remained below the 50 expansion/contraction threshold, it showed that consumer spending is shrinking.
In the United States, private sector hiring slowed in September, as indicated by the ADP Employment Change report, with a gain of 89,000 jobs. This figure was below the estimated 153,000 jobs and declined from August 177,000. Additionally, the ISM Non-Manufacturing PMI reported a business activity index of 53.6 in the services sector for September, which was as expected but decreased from the previous month's reading of 54.5.
GBP/USD Price Analysis: Technical outlook
The GBP/USD remains tilted to the downside from a daily chart standpoint. Still, price action during the last couple of days formed a ‘bullish engulfing’ candlestick chart pattern, suggesting that further upside is expected. Next, resistance emerges at the 1.2200 figure, followed by the October 2 high at 1.2219. Once those levels are cleared, the major could challenge September 29, the last cycle high at 1.2271, which could pave the way to test the 200-day moving average (DMA). Nevertheless, if GBP/USD remains below 1.2270, that could pave the way to test 1.2000, followed by the year-to-date (YTD) low of 1.1802.
- The EUR/USD reached a daily high of 1.0532 before slipping back to 1.0500.
- EU & US data both came in a mixed bag for Wednesday.
- US NFP still looms ahead on Friday.
The EUR/USD clipped into a fresh daily high of 1.0532 on Wednesday after catching a bounce out of Tuesday's flat range, but Euro (EUR) upside remains limited after economic data for the EU came in mixed with consumer figures missing the mark.
The European Producer Price Index (PPI) for the annualized period into August improved over the forecast -11.6%, albeit slightly, printing at -11.5% against the previous printing of -7.6%.
European Retail Sales for the same period likewise slipped lower, accelerating to the downside to print at -2.1% against the forecast -1.2%. Annualized European Retail Sales last came in at -1% , signaling an ongoing deterioration in the European economy.
Eurozone Retail Sales fall 2.1% YoY in August vs. -1.2% expected
Officials from the European Central Bank (ECB) hit the newswires on Wednesday, with ECB Vice President Luis de Guindos and Governing Council member Mario Centeno noting that economic activity is likely to remain subdued looking forward. The ECB officials also noted that inflation is declining at a rapid pace throughout the EU, and the rate hike cycle appears to be at the top.
Read More:
ECB’s de Guindos: Economic activity likely to remain subdued in coming months
ECB's Centeno: We can expect rate cycle has been completed by now
The US ADP Employment Change missed the mark on Wednesday, printing at 89K versus the forecast 153K, while US Services Purchasing Manager Index (PMI) numbers for September came in as-expected, declining from the previous 54.5 to 53.6.
US Factory Orders for August surprised to the upside, showing a 1.2% increase in activity versus the expected 0.3% and rebounding from the previous showing of -2.1%.
US Factory Orders rise 1.2% in August vs. 0.3% expected
Looking ahead, Thursday will bring comments from the ECB's Lane and De Guindos, while the US side will see Challenger Job Cuts and Initial Jobless Claims. Challenger last printed at 75.151K, while Initial Jobless Claims are expected to increase from 204K to 210K.
Above all else, this Friday will see another turn around the wheel for US Non-Farm Payrolls (NFP), with September forecast to show a slight decline from 187K to 170K.
EUR/USD technical outlook
The EUR/USD is falling back to the 1.0500 major level after getting rejected from the 100-hour Simple Moving Average (SMA) near the day's peak at 1.0532. Intraday action is seeing a resistance cap from the 200-hour SMA that is dropping into 1.0550, and the day's low was marked in early just shy of 1.0450.
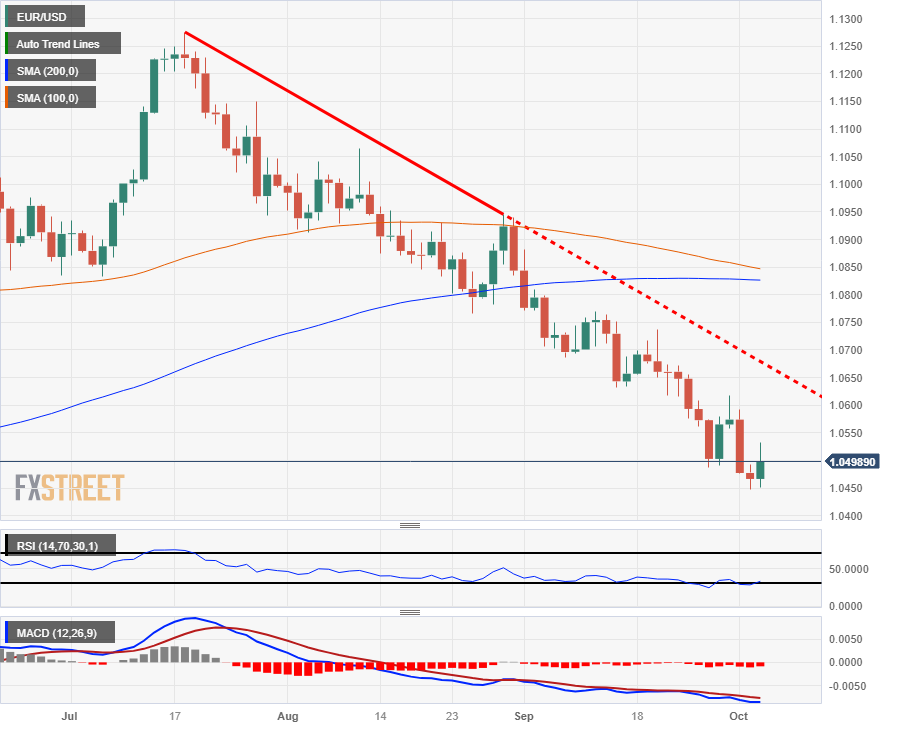
On the daily candlesticks, the long-term downtrend remains fully intact; the EUR/USD is down nearly 7%, or 770 pips, from July's top at 1.1275, and the bearish trendline is firmly entrenched as the pair continues to drop away from the 200-day SMA near 1.0825.
EUR/USD hourly chart
EUR/USD daily chart
EUR/USD technical levels
- The Canadian Dollar gave up further ground against the US Dollar on Wednesday.
- A rising US Dollar bolstered by climbing US Treasury yields is sending USD/CAD higher.
- Crude Oil prices continue to deflate, pulling the rug out from underneath the CAD.
The Canadian Dollar (CAD) stooped even lower against the US Dollar (USD) on Wednesday, sending the USD/CAD pair to a fresh seven-month high. The USD/CAD pinged a new high of 1.3780 before the USD finally eased off enough for the pair to ease back to 1.3740.
The Oil-backed Loonie is losing support as Crude Oil barrels declined further on Wednesday, extending recent losses. Oil prices have scorched up the charts recently as concerns about global supply constraints send barrel prices higher, but rebalanced investor outlooks on global barrel production are easing fuel costs back. West Texas Intermediary (WTI) Crude Oil barrels were last seen trading below $84.50/bbl on Wednesday.
The Greenback continues its march up the charts as US Treasury yields continue to punch higher. The 1-year US Treasury yield hit 4.882% early Wednesday as US yields across the curve remain pinned into 17-year highs.
Daily Digest Market Movers: Canadian Dollar falls as oil prices backslide, USD/CAD peaks at 1.3780
- The Canadian Loonie hit a new seven-month low against the Greenback.
- Money markets see a 65% chance of one more rate hike from the Bank of Canada (BoC) this year.
- One more rate hike could provide the CAD with some much-needed support.
- Crude Oil barrel costs are sinking as investors rebalance their forward-looking expectations of supply constraints as production ramps up outside of the OECD.
- CAD bidders will be looking ahead to Thursday’s Ivey Purchasing Managers Index (PMI) for September.
- US ADP figures missed expectations to print at 89K versus the forecast 153K.
- Another US Nonfarm Payrolls (NFP) Friday is on the docket.
- Bank of Canada (BoC) Deputy Governor Nicolas Vincent hit newswires warning that Canadian businesses have been too efficient at passing rising costs onto consumers, increasing bets of another BoC hike and spiking Canadian bond yields higher.
- Canadian government bond yields rose in tandem with US Treasuries, 10-year yields hit their highest rate since 2007 at 4.292%.
Technical Analysis: Canadian Dollar slips further, USD/CAD easing back to 1.3730
The USD/CAD tapped a new seven-month high on Wednesday of 1.3780 before settling back to 1.3730. The pair caught an early bounce from near the 1.3700 level. Wednesday’s bounce sees the pair set to use the 1.3700 level as technical support for a move higher if bullish momentum sustains.
On the daily candlesticks, the USD/CAD is extending gains from the 20-day Simple Moving Average, which saw a bullish rejection of the pair near 1.3450 back in September. Odds of a short-side reversal could be on the cards for the USD/CAD, with the Relative Strength Index (RSI) now tapping into overbought territory.
Technical traders will want to wait for price action to confirm a lack of bullish momentum. However, the USD/CAD has successfully set a new daily high every candle for the last five consecutive trading days.
Canadian Dollar FAQs
What key factors drive the Canadian Dollar?
The key factors driving the Canadian Dollar (CAD) are the level of interest rates set by the Bank of Canada (BoC), the price of Oil, Canada’s largest export, the health of its economy, inflation and the Trade Balance, which is the difference between the value of Canada’s exports versus its imports. Other factors include market sentiment – whether investors are taking on more risky assets (risk-on) or seeking safe-havens (risk-off) – with risk-on being CAD-positive. As its largest trading partner, the health of the US economy is also a key factor influencing the Canadian Dollar.
How do the decisions of the Bank of Canada impact the Canadian Dollar?
The Bank of Canada (BoC) has a significant influence on the Canadian Dollar by setting the level of interest rates that banks can lend to one another. This influences the level of interest rates for everyone. The main goal of the BoC is to maintain inflation at 1-3% by adjusting interest rates up or down. Relatively higher interest rates tend to be positive for the CAD. The Bank of Canada can also use quantitative easing and tightening to influence credit conditions, with the former CAD-negative and the latter CAD-positive.
How does the price of Oil impact the Canadian Dollar?
The price of Oil is a key factor impacting the value of the Canadian Dollar. Petroleum is Canada’s biggest export, so Oil price tends to have an immediate impact on the CAD value. Generally, if Oil price rises CAD also goes up, as aggregate demand for the currency increases. The opposite is the case if the price of Oil falls. Higher Oil prices also tend to result in a greater likelihood of a positive Trade Balance, which is also supportive of the CAD.
How does inflation data impact the value of the Canadian Dollar?
While inflation had always traditionally been thought of as a negative factor for a currency since it lowers the value of money, the opposite has actually been the case in modern times with the relaxation of cross-border capital controls. Higher inflation tends to lead central banks to put up interest rates which attracts more capital inflows from global investors seeking a lucrative place to keep their money. This increases demand for the local currency, which in Canada’s case is the Canadian Dollar.
How does economic data influence the value of the Canadian Dollar?
Macroeconomic data releases gauge the health of the economy and can have an impact on the Canadian Dollar. Indicators such as GDP, Manufacturing and Services PMIs, employment, and consumer sentiment surveys can all influence the direction of the CAD. A strong economy is good for the Canadian Dollar. Not only does it attract more foreign investment but it may encourage the Bank of Canada to put up interest rates, leading to a stronger currency. If economic data is weak, however, the CAD is likely to fall.
- USD/CHF eases back as Swiss Franc finds some much-needed bids.
- European safe-haven flows are helping to bolster the Franc.
- SNB market intervention reaches new highs as they look to defend the CHF.
The USD/CHF reached an intraday low of 0.9144 as the US Dollar (USD) is easing up broad-market pressures and giving the Swiss Franc (CHF) a chance to find a foothold.
Swiss inflation declined 0.1% on Tuesday, making the Swiss National Bank (SNB) the envy of their peers, with inflation proving to be a sticky problem for the rest of the European economies. European safe-haven flows from across the EU are giving the CHF some support.
Back in Switzerland, the SNB was seen stepping up their foreign currency operations in an effort to support the Swss Franc; the SNB sold $44.2 billion worth of foreign currencies into the markets during the second quarter. This represents the largest single-quarter foreign currency operation since the SNB first started publishing its FX transaction records in 2020.
It's still another Non-Farm Payrolls Friday coming up, promising plenty of volatility, and USD/CHF traders will want to keep a close eye on breakouts.
USD.CHF technical outlook
The USD/CHF has fallen back to the 200-hour Simple Moving Average (SMA) near 0.9160 as hourly candles get capped by the 34-hour Exponential Moving Average (EMA) near 0.9190.
The Greenback's recent rise has sent the USD/CHF back over the 200-day SMA currently settling just south of 0.9050, and Tuesday's peak of 0.9244 represents a seven-month high for the pair.
USD/CHF daily chart

USD/CHF technical levels
- NZD/USD rebounds to 0.5922 after initially dipping to a weekly low of 0.5870, following the RBNZ’s decision to keep rates steady at 5.50%.
- Despite the RBNZ maintaining a neutral stance and commitment to curbing inflation, the Kiwi rallied on US Dollar weakness.
- Mixed US economic data, including a slowdown in private hiring and service sector activity, dampens demand for the Greenback, aiding the NZD/USD recovery.
The New Zealand Dollar (NZD) stages a comeback versus the US Dollar (USD) after the Reserve Bank of New Zealand (RBNZ) decided to hold rates unchanged, while mixed US economic data dented demand for the safe-haven status of the Greenback (USD). At the time of writing, the NZD/USD is exchanging hands at 0.5922 after hitting a weekly low of 0.5870.
New Zealand Dollar recovers against the US Dollar following the RBNZ's decision to hold rates and mixed US economic data
During the Asian session, the RBNZ decided to keep rates unchanged at 5.50%, as expected, though it struck a neutral stance. RBNZ’s officials reiterated its determination to curb inflation to its target, agreeing to keep rates high “for a sustained period of time.” The NZD/USD did not advance on the RBNZ’s decision; instead fell to a daily low of 0.5870, but overall, US Dollar weakness lent a lifeline to the Kiwi as the North American session kicked in.
On the US side, private hiring slowed, as shown by the Employment Change report of ADP, with September hiring sliding to 89K, below estimates of 153K, and trailing August’s 177K. Recently, business activity in the services sector hit 53.6, as reported by the ISM Non-Manufacturing PMI, as foreseen, but slowed compared to last month’s 54.5.
NZD/USD Price Analysis: Technical outlook
The daily chart portrays the Kiwi remains downward pressured despite the ongoing recovery, which would need to witness the pair breaking resistance at the 50-day moving average (DMA) at 0.5970 to challenge the 0.6000 figure. To shift the NZD/USD’s bias to neutral, buyers must lift the pair to a new cycle high above 0.6048. Conversely, the downtrend could resume if bears stepped in and pushed prices below 0.5900.
- USD/JPY trades down by a slight 0.07% after a dramatic 240-pip plunge last Tuesday, attributed to perceived intervention by Japanese authorities.
- US Federal Reserve might avoid hiking rates after ADP’s Employment Change, disappointed market participants.
- With US Treasury bond yields easing from yearly highs and lingering concerns about further interventions, USD/JPY’s upward momentum is stifled.
The US Dollar (USD) fails to recover from Tuesday’s losses against the Japanese Yen (JPY), following last Tuesday’s plunge of 240 pips following the release of the JOLTs report, which was perceived as an intervention by Japanese authorities. The USD/JPY is trading at 148.88, down by a minuscule 0.07%, after hitting a daily high of 149.31.
USD/JPY pair lingers at around 148.88, on mixed US economic data and silent Japanese authorities following suspected intervention keeping traders cautious
The latest round of US economic data probed to be mixed during the North American session. The US Employment Change report revealed by Automatic Data Processing (ADP) showed that private companies hired 89K Americans, less than the 153K estimated, suggesting the labor market is loosening as widely expected by the US Federal Reserve (Fed). Also, the Institute for Supply Management (ISM) showed that business activity in the services segment expanded slower than in August, with figures coming as expected at 53.6, while the latter hit 54.5.
In the meantime, Japanese authorities muted comments on a possible intervention on Tuesday, following the US JOLTs report that underpinned the USD/JPY past the 150.00 figure, though some minutes after that, the major plunged 200 plus pips and printed the low of the week.
Given the backdrop, the USD/JPY struggles to edge higher, also weighed by US Treasury bond yields easing from yearly highs. The US 10-year benchmark note rate hit 4.884% during the day but treads water, hovering around 4.739% at the time of writing.
USD/JPY Price Analysis: Technical outlook
The daily chart portrays the pair as neutral to upward biased, but since testing the Kijun-Sen and dropping below 149.00, the path of least resistance Is slightly tilted to the downside. The first support is the Tenkan-Sen at 148.71, followed by the Senkou-Span A at 148.00. A dive below that level and the next stop would be yesterday’s low of 147.27, confluence with the Kijun-Sen, and then 147.00. On the flip side, price action is capped at 149.00, followed by the 150.00 mark.
- Mexican Peso floats around 18.00 amid an upbeat market mood after mixed US economic data.
- The International Monetary Fund reviewed Mexico’s forecasts to the upside but failed to underpin the emerging market currency.
- USD/MXN bias turned bullish after breaking above the 200-day Simple Moving Average.
Mexican Peso (MXN) extended losses in the early New York session after diving more than 2% against the US Dollar (USD) on Tuesday, which dragged the USD/MXN pair to a new six-month high at around 18.21. A weaker-than-expected employment report in the United States (US) and improvement in market sentiment sponsored a drop in the USD/MXN, which is hovering a few pips below weekly highs at the time of writing.
On Tuesday, the International Monetary Fund (IMF) raised Mexico’s economic forecasts due to robust consumption, services, and automotive production. Despite all those reviews, a jump in US bond yields sent the Mexican Peso tanking as the USD/MXN pair rallied past the 18.00 mark.
Aside from this, US economic data was mixed. The ISM Services PMI slowed down but remained in expansionary territory. Meanwhile, private hiring in the US decelerated, as revealed by the Employment Change report by Automatic Data Processing (ADP), which, although contradicted Tuesday’s JOLTs reports, could reinforce the case for the US Federal Reserve (Fed) not to hike rates at the upcoming monetary policy meeting. In that context, the US Dollar weakened, a headwind for the USD/MXN.
Daily Digest Market Movers: Mexican Peso plummets sharply in the week as the USD/MXN breaches 18.00
- Risk-on impulse stopped the Mexican Peso depreciation, though its bias has shifted bearish.
- The IMF increased Mexico's growth projection in 2023 from 2.6% to 3.2% and from 1.5% foreseen in July to 2.1% for 2024.
- US ADP Employment figures came at 89,000, below forecasts of 153,000.
- US ISM Services PMI came at 53.6, as foreseen by analysts, though moderately slowed down.
- Mexico’s August remittances were $5,563 million in US Dollars, an advance of 8.6% YoY.
- Banxico’s September poll amongst economists reported that interest rates are expected to remain at 11.25% while inflation would dip to 4.66%.
- The same poll shows the exchange rate is set to finish at around 17.64, down from 17.75.
- Mexico’s S&P Global Manufacturing PMI for September came at 49.8, sliding to contractionary territory and below August’s 51.2, as the economy loses steam.
- Business confidence in Mexico improved from 53.7 to 53.8.
- Mexico’s economy could slow down due to complex external shocks, according to the financial system stability committee.
- The Bank of Mexico (Banxico) held rates at 11.25% and revised its inflation projections from 3.5% to 3.87% for 2024, above the central bank’s 3% target (plus or minus 1%).
- Banxico’s Government Board highlighted Mexico’s economic resilience and the strong labor market as the main drivers to keep inflation at the current interest rate level.
- Mexico’s Unemployment Rate edged lower from 3.1% in July to 3.0% in August, according to the National Statistics Agency (INEGI).
Technical Analysis: Mexican Peso's free fall to continue after piercing the 200-day SMA
The Mexican Peso bias shifted to bearish on Tuesday after the USD/MXN pair surpassed the 200-day Simple Moving Average (SMA) at 17.80, as well as buyers reclaimed the 18.00 figure to post a new cycle high. Therefore, the USD/MXN could extend its rally past the October 4 cycle high at 18.21 and test resistance at the April 5 high at around 18.40 en route to the April 2018 yearly low of 18.60. On the downside, a drop below 18.00 and the 20-day SMA at 17.40 could pave the way for further losses.
Employment FAQs
How do employment levels affect currencies?
Labor market conditions are a key element to assess the health of an economy and thus a key driver for currency valuation. High employment, or low unemployment, has positive implications for consumer spending and thus economic growth, boosting the value of the local currency. Moreover, a very tight labor market – a situation in which there is a shortage of workers to fill open positions – can also have implications on inflation levels and thus monetary policy as low labor supply and high demand leads to higher wages.
Why is wage growth important?
The pace at which salaries are growing in an economy is key for policymakers. High wage growth means that households have more money to spend, usually leading to price increases in consumer goods. In contrast to more volatile sources of inflation such as energy prices, wage growth is seen as a key component of underlying and persisting inflation as salary increases are unlikely to be undone. Central banks around the world pay close attention to wage growth data when deciding on monetary policy.
How much do central banks care about employment?
The weight that each central bank assigns to labor market conditions depends on its objectives. Some central banks explicitly have mandates related to the labor market beyond controlling inflation levels. The US Federal Reserve (Fed), for example, has the dual mandate of promoting maximum employment and stable prices. Meanwhile, the European Central Bank’s (ECB) sole mandate is to keep inflation under control. Still, and despite whatever mandates they have, labor market conditions are an important factor for policymakers given its significance as a gauge of the health of the economy and their direct relationship to inflation.
During September, the Euro has weakened broadly. Economists at Nordea analyze EUR/USD outlook.
Downward momentum in EUR/USD unlikely to last
From a technical perspective, a 14-day Relative Strength Index (RSI) below 30 points to a USD that is overbought against the EUR, which means that further downside should be limited.
While the USD could continue to do well in the very short term, we still are inclined to think that the USD fortunes will reverse next year as it is unlikely that the US economic outperformance will last.
EUR/USD – 3M 1.07 Mid-2024 1.10 End-2024 1.12 Mid-2025 1.15
At their respective monetary policy meetings this week, central banks in Australia and New Zealand remained relatively comfortably on hold. Economists at Wells Fargo analyze AUD and NZD outlook.
Low for AUD/USD around 0.61, NZD/USD around 0.57 by end Q1-2024
Against a backdrop of overall resilient US activity and higher US yields, we view an on-hold RBA and RBNZ as consistent with some further Australian and New Zealand Dollar downside in the months ahead.
We target a low for AUD/USD around 0.6100, and a low for NZD/USD around 0.5700, by the end of Q1-2024.
Economists at Rabobank are not convinced that the recent rise in USD/MXN marks the start of a new trend of Peso weakness.
USD/MXN set to turn back lower when the pace of rising US yields slows
While we do think USD/MXN has likely traded the lows of this trend in the 16.60s, we don’t think this move higher is the juncture at which USD/MXN embarks on a bullish trend, and we see that despite us remaining in the USD bull camp. Instead, our view is that the recent bear steepening in the UST curve will likely enter a consolidation period.
When the pace of rising US yields slows, a decline in volatility will feed through into USD/MXN and result in a return of those carry traders back into long MXN positions that will cause USD/MXN to test 16.60 again.
The Pound was the worst performing G10 currency in September. Economists at MUFG Bank analyze GBP outlook.
GBP gains to reverse further
We suspect the BoE has already overdone it with tightening and see potential for rates to soften relative to other major developed economies.
We see GBP underperformance from here and in circumstances of a weakening Dollar, weakness will be more evident versus EUR.
EUR/GBP – Q4 2023 0.8600 Q1 2024 0.8750 Q2 2024 0.8800 Q3 2024 0.8850
GBP/USD – Q4 2023 1.2150 Q1 2024 1.2570 Q2 2024 1.2730 Q3 2024 1.2660
- Factory Orders in the US rose more than expected in August.
- US Dollar Index stays in negative territory below 107.00.
The data published by the US Census Bureau revealed on Wednesday that new orders for manufactured goods - Factory Orders - increased $6.7 billion, or 1.2%, to $586.1 billion in August. This print followed the 2.1% decrease recorded in July and came in better than the market expectation for an increase of 0.3%.
"New orders for manufactured durable goods in August, up five of the last six months, increased $0.4 billion or 0.1 percent to $284.7 billion, down from the previously published 0.2 percent increase," the publication read.
Market reaction
The US Dollar Index recovered modestly from daily lows after this data and was last seen losing 0.2% on the day at 106.85.
- AUD/USD finds cushion near 0.6300 amid correction in the US Dollar.
- US private payrolls halved to 89k in September from August reading.
- US ISM Services PMI landed at 53.6 as expected but lower than the former release of 54.5.
AUD/USD rebounds after remaining choppy near the round-level support around 0.6300 in the early New York session. The Aussie asset finds buyers’ interest as the market mood improves due to a correction in the US Dollar propelled by weaker-than-anticipated Employment Change data, reported by the Automatic Data Processing (ADP) agency.
The S&P500 opens on a bullish note as the risk-off profile eases as fresh additions of US private payrolls in September were halved to 89k from the August reading. Investors anticipated lower hiring at 153k. Soft labor market data is expected to fade expectations of one more interest rate hike from the Federal Reserve (Fed) in the remainder of 2023.
On Tuesday, Cleveland Fed Bank President Loretta Mester reiterated hawkish guidance on the interest rate outlook. Mester said that she is open to hiking interest rates further in the November monetary policy meeting if the economy remains resilient the way it has been. Soft labor market data is expected to force policymakers to return to a neutral stance.
The US Dollar Index (DXY) corrects to near 106.60 after weak job data. Meanwhile, the Institute of Supply Management (ISM) has reported the Services PMI data at 53.6 as expected, lower than the August reading of 54.5. The Services PMI data carries a significant impact on the US Dollar Index as it represents the service sector, which accounts for two-thirds of the US economy. New Orders dropped significantly to 51.8 against the former release of 57.5.
On the Australian Dollar front, an unchanged interest rate decision by the Reserve Bank of Australia (RBA) has trimmed its appeal. The RBA kept interest rates unchanged at 4.10% on Tuesday despite a rebound in the Australian monthly Consumer Price Index (CPI) to 5.2% in August due to a rise in oil prices.
So far this week, FX is relatively calm in the face of a chaotic Treasury market. Economists at Société Générale analyze the FX market outlook.
FX volatility has more upside than the Dollar does
US yields can overshoot any concept of ‘fair value’ in the face of supply, an inverted curve, Fed chants of ‘higher for longer’ and investors who have already ‘bought the dip’ several times several times over. But if rising US yields are having less of an impact on the major currencies, the EUR/USD low in the coming weeks (for example) won’t be much below parity, if at all. Maybe the USD/JPY peak isn’t very far from 150. That, however, won’t prevent FX volatility from rising.
USD/JPY can’t settle at 150, and nor can EUR/USD settle down at 1.05, any more than 10-year Notes can remain at 4.75% for long.
Violent yield moves increase economic uncertainty and that means increased two-way risk in currency pairs.
- US ISM Services PMI declines in September to 53.6 from 54.5
- US Dollar Index holds to daily losses around 106.75.
The economic activity in the US service sector continued to expand in September, for the ninth consecutive month, with the ISM Services PMI falling from 54.5 to 53.6. This reading came in line with market expectations.
Further details of the publication revealed that the Employment Index fell from 54.7 to 53.4; while the Prices Paid Index remained at 58.9.
“There has been a slight pullback in the rate of growth for the services sector, which is attributed to slower rates of growth in the New Orders and Employment indexes. The majority of respondents remain positive about business conditions; moreover, some respondents indicated concern about potential headwinds,” explained Anthony Nieves, ISM Services PMI Chair.
Market reaction
Earlier on Wednesday, the ADP report came in below expectations and weighed on the US Dollar Index. Later, the final S&P Global Services reading was revised slightly lower from its preliminary reading. Following the release of the ISM Services PMI, the DXY (US Dollar Index) remained around 106.75, in negative territory for the day.
- US S&P Global Service PMI falls to 50.1 in September.
- US S&P Global Composite PMI unchanged at 50.2 in September
- US Dollar Index holds in negative territory around 106.70.
The seasonally adjusted final S&P Global US Services PMI Business Activity Index posted 50.1 in September, down from 50.5 registered in August and below the 50.2 of the preliminary reading.
“The final S&P Global US Composite PMI Output Index posted 50.2 in September, unchanged from the figure seen in August. The latest data signalled broadly unchanged business activity across the US private sector, despite a return to modest output growth in the manufacturing sector,” the publication revealed.
Market reaction
The US Dollar Index is falling on Wednesday, retreating from monthly highs. It is hovering around 106.70.
The Kiwi has resisted USD appreciation better than other commodity currencies in the past month. Economists at ING analyze NZD/USD outlook.
Swings in USD continue to be an overwhelmingly dominant driver
The swings in USD continue to be an overwhelmingly dominant driver. With US 10-year yields still moving higher and our rates team pointing at 5.00% as a potential top, we see more downside for NZD/USD in the near term.
NZD-positive developments domestically would not prevent a drop to 0.5800 if US bonds remain under the kind of pressure we have seen in recent weeks.
In the medium run, we still expect US data to turn negative and the Fed to start cutting in the first quarter of 2024, which should pave the way for a sustained NZD/USD recovery.
USD/CAD is unlikely to breach 1.37 to the upside and will remain stuck in the 1.33 to 1.37 range, in the view of economists at Rabobank.
1.35 Magnet
For several months, we have been highlighting the 1.35 ‘magnet’ in USD/CAD, and as we head into the last quarter of the year, we maintain the view that USD/CAD will likely stay range-bound around that level.
The bulk of price action has seen the pair trading within the 1.33 to 1.37 range, and we don’t expect that to break for the remainder of the year. In fact, our forecast is essentially flat, with 1.35 continuing to act as a magnet.
- EUR/USD manages to gather some traction and trespasses 1.0500.
- There is an initial resistance around 1.0620.
EUR/USD picks up pace and sets aside two consecutive daily retracements and reclaims the area beyond 1.0500 the figure on Wednesday.
Further gains should initially retarget the minor barrier at 1.0617 (September 29) ahead of the weekly peak of 1.0767 (September 12).
Meanwhile, further losses remain on the table as long as the pair navigates the area below the key 200-day SMA, today at 1.0825.
EUR/USD daily chart
- DXY comes under pressure following recent peaks.
- A move to 108.00 still appears in store near term.
DXY faces some selling pressure after climbing to new 2023 tops in the 107.30/35 band on Tuesday.
In light of the ongoing price action, extra gains appear likely in the dollar for the time being. Once the index clears the YTD high of 107.34 (October 3), it could encourage bulls to challenge the weekly peak at 107.99 (November 21 2022) just ahead of the round level at 108.00.
In the meantime, while above the key 200-day SMA, today at 103.13, the outlook for the index is expected to remain constructive.
DXY daily chart
Higher cross-market volatility has pummeled the Mexican Peso. Economists at ING analyze MXN outlook.
An unwind of the carry trade will provide some natural support to the JPY
Cross-market volatility is picking up sharply which will continue to prompt an unwind of carry trade strategies. Here, the carry trade's former darling – the Mexican Peso – is getting hit hard.
USD/MXN looks as though it could correct to the 18.50/18.70 area before the dust settles.
An unwind of the carry trade will provide some natural support to the Japanese Yen and continue to provide headwinds to other popular high-yield currencies in Latam (Brazil and Colombia), Europe (Hungary) and Asia (Indonesia).
- EUR/JPY regains upside traction following two straight sessions of losses.
- There is a minor support around 154.30 (October 3).
EUR/JPY manages to grab some buying interest and leaves behind two consecutive daily drops on Wednesday.
In the meantime, the cross remains stuck within the consolidative range and the breakout of it exposes a visit to the so far monthly high of 158.65 (September 13) prior to the 2023 top at 159.76 (August 30), which precedes the key round level at 160.00.
On the downside, the so far monthly low of 154.34 (October 3) emerges as the initial contention in case of bearish attempts.
So far, the longer term positive outlook for the cross appears favoured while above the 200-day SMA, today at 149.65.
EUR/JPY daily chart
- Silver price remains directionless despite the US ADP has reported soft labor market data.
- In September, fresh payrolls halved to 89K, against August’s reading of 180k.
- Silver price delivered a breakdown of the H&S chart pattern, which resulted in a vertical sell-off.
Silver price (XAG/USD) continues to trade sideways near $21.00 as the United States Automatic Data Processing (ADP) has reported that new private payrolls in September were almost half of the additions in August. Fresh payrolls were 89K, significantly lower than expectations of 153k and the former reading of 180k.
The labor market data for September carries less importance as the next monetary policy meeting by the Federal Reserve (Fed) is scheduled for November and October job data will be keenly watched by policymakers. But is expected to vanish odds for one more interest rate hike.
While Cleveland Fed Bank President Loretta Mester favored one more interest rate hike in the remainder of 2023 this week as the US economy has been resilient on the grounds of labor market and consumer spending. Also, a significant improvement in Manufacturing PMI for September has strengthened the outlook.
The US Dollar Index (DXY) corrects sharply to near 106.60 from an 11-month high of 107.20 and is expected to remain volatile as the US Institute of Supply Management (ISM) Services PMI for September is due at 14:00 GMT. The US ISM is expected to report the Services PMI for September at 53.6, lower than the August reading of 54.5. The Services PMI data carries a significant impact on the US Dollar Index as it represents the service sector, which accounts for two-thirds of the US economy.
Silver technical analysis
Silver price delivers a breakdown of the Head and Shoulder chart pattern on a daily scale, which results in a vertical sell-off. The white metal breaks sharply below the neckline of the aforementioned chart pattern plotted from June 23 low at $22.11. Potential support is placed from March 08 low at $19.93.
The asset trades below the 200-day Exponential Moving Average (EMA), which indicates that the long-term trend is bearish.
The Relative Strength Index (RSI) (14) slips into the bearish range of 20.00-40.00, which warrants more downside.
Silver daily chart
-638320205625022550.png)
Private sector employment in the US rose 89,000 in September, the data published by Automatic Data Processing (ADP) showed on Wednesday. This reading followed the 180,000 increase (revised from 177,000) recorded in August and missed the market expectation of 153,000 by a wide margin.
"Job stayers saw a 5.9 percent year-over-year pay increase in September, marking the 12th straight month of slowing growth," the publication read. "Pay gains also shrank for job changers, to 9 percent, down from 9.7 percent in August."
Commenting on the report's findings, “we are seeing a steepening decline in jobs this month,” said Nela Richardson, ADP chief economist. “Additionally, we are seeing a steady decline in wages in the past 12 months," she added.
Market reaction
The US Dollar stays under bearish pressure following the disappointing jobs data. As of writing, the US Dollar Index was down 0.4% on the day at 106.65.
US Dollar price today
The table below shows the percentage change of US Dollar (USD) against listed major currencies today. US Dollar was the weakest against the Pound Sterling.
| USD | EUR | GBP | CAD | AUD | JPY | NZD | CHF | |
| USD | -0.45% | -0.64% | -0.04% | -0.39% | -0.16% | 0.04% | -0.52% | |
| EUR | 0.43% | -0.19% | 0.41% | 0.05% | 0.29% | 0.48% | -0.10% | |
| GBP | 0.60% | 0.13% | 0.57% | 0.22% | 0.44% | 0.64% | 0.09% | |
| CAD | 0.03% | -0.44% | -0.61% | -0.37% | -0.14% | 0.06% | -0.49% | |
| AUD | 0.39% | -0.10% | -0.27% | 0.33% | 0.22% | 0.38% | -0.12% | |
| JPY | 0.17% | -0.27% | -0.43% | 0.15% | -0.18% | 0.19% | -0.33% | |
| NZD | -0.04% | -0.49% | -0.68% | -0.07% | -0.40% | -0.20% | -0.55% | |
| CHF | 0.50% | 0.04% | -0.12% | 0.48% | 0.14% | 0.35% | 0.55% |
The heat map shows percentage changes of major currencies against each other. The base currency is picked from the left column, while the quote currency is picked from the top row. For example, if you pick the Euro from the left column and move along the horizontal line to the Japanese Yen, the percentage change displayed in the box will represent EUR (base)/JPY (quote).
The USD has retreated modestly so far today. Economists at Scotiabank analyze Greenback’s outlook.
USD exposed to data disappointments
The recent surge in the DXY looks ripe for some sort of correction or consolidation at least. The rally has notched up eleven consecutive weeks of gains, which looks excessive in terms of one-way moment.
DXY price action so far this week is showing some signs of technical softness around major retracement resistance (50% Fibonacci from the 2022/2023 DXY decline).
There’s some event risk ahead; on the data front, we get ADP jobs, Services and Composite PMIs, Services ISM and Factory Orders from the US. The yield-driven jump in the USD may leave it exposed to data disappointments.
GBP/USD traded to a new cycle low just under 1.2040 in early European trade but gained a cent from the intraday low. Economists at Scotiabank analyze the pair’s outlook.
Technicals lean bullish
Intraday and daily price signals are bullish for a heavily oversold GBP.
The six-hour and daily charts reflect solid demand for the GBP off the early session low today which has formed a bullish outside range on the intraday chart and the makings of a similar signal on the daily chart (a higher net close on the session – the higher the better, from a signal clarity point of view – confirms).
Support is 1.2035/40 intraday. Resistance is 1.2275/1.2300.
European Central Bank (ECB) Vice President Luis de Guindos said on Wednesday that the economic activity in the Euro area is likely to remain subdued in the coming months, as reported by Reuters.
Key takeaways
"The labour market remains resilient."
"A substantial share of the transmission from financing conditions to the real economy is expected to still be in the pipeline."
"Underlying price pressures remain strong."
"Labour costs are increasingly contributing to domestic inflation."
"We will continue to follow a data-dependent approach."
"The downward impact of our tightening so far on GDP and inflation is estimated to average around 2 percentage points over the 2023-25 period."
Market reaction
EUR/USD showed no reaction to these comments and was last seen rising 0.4% on the day at 1.0507.
- A chunky batch of economic data will move markets together with a stressful Polish central bank meeting.
- Focal point this week is US Nonfarm Payrolls on Friday.
- US Dollar Index breaks above 107 and prints 11-month high.
The US Dollar (USD) is gearing up for a very nervous trading day, while the US Dollar Index (DXY) resides near the high of the past 48 weeks. Expect to see a pick up in volatility as a big batch of data points is due to come out. Even more importantly, the Polish central bank is due to issue its next rate decision on Wednesday, and it promises to be a wild one.
Traders can also dig into the ADP Employment Change numbers. Although any correlation with the US Nonfarm Payrolls numbers on Friday is non-existent, market participants will remain looking for clues and indications that help them predict the outcome of Friday’s number. After the ADP numbers, the Institute of Supply Management (ISM) will issue its data points for the service sector for the month of September.
Daily digest: US Dollar enters rough patch
- At 11:00 GMT the Mortgage Bankers Association (MBA) has issued the weekly Mortgage Applications figure for the end of September. The previous week saw a decline of -1.3% and for the last week of September declined even further by -6.0%.
- Around 12:15 GMT, the ADP Employment Change for September will be issued. The previous number came out at 177,000 and is expected to decline to 153,000.
- Near 13:45 GMT, S&P Global’s Purchasing Managers Index (PMI) will be issued for both the Services sector and the Composite for the month of September: Services PMI is expected to stay stable at 50.2. The Composite is to remain unchanged at 50.1.
- Data from the ISM arrives at 14:00 GMT for the month of September. The Services Employment Index was at 54.7 last time around with no forecast pencilled in. New Orders Index was 54.7 with no forecast foreseen. Services PMI is expected to head from 54.5 to 53.6. The Prices Paid Index was at 58.9, though no forecast was given.
- Additionally at that time, the Factory Orders for August are due to come in, jumping higher from -2.1% to 0.3%.
- Be on the lookout for sudden shocks in the forex space as the Polish Central Bank (NBP) will issue its rate decision between 13:00 and 15:00 GMT. The previous meeting presented a surprise rate cut of 75 basis points and rattled the forex space, triggering substantial moves in several currency crosses.
- Equities are again throwing in the towel: Asian stocks are all down over 2% across the board. European equities are down over 0.50%, together with US futures.
- The CME Group FedWatch Tool shows that markets are pricing in a 71.2% chance that the Federal Reserve will keep interest rates unchanged at its meeting in November. That is a touch lower from the 77.5% a week ago.
- The benchmark 10-year US Treasury yield is peaking at 4.83%, printing a new high yet again for the year. The rate differential story is back as a driving force in the US bond market.
US Dollar Index technical analysis: Can the DXY deal with volatility?
The US Dollar Index looks to hit the pause button for a day as traders brace for a pick up in volatility. The big batch of data will play a pivotal point. Next to that, the Relative Strength Index (RSI) is trading again firmly into overbought territory, which could limit any further upside moves in the DXY for the remaining days this week.
The US Dollar Index opened around 107.24, though the overheated Relative Strength Index (RSI) is acting as a cap now that it is trading in an overbought regime. With 107.19 – the high of November 30, 2022 – being tested as we speak, it will be important to see if DXY can get a daily close above that level. If that is the case, 109.30 is the next level to watch.
On the downside, the recent resistance at 105.88 should be seen as first support. Still, that barrier has just been broken to the upside, so it isn’t likely to be strong. Instead, look for 105.12 to do the trick and keep the DXY above 105.00.
US Dollar FAQs
What is the US Dollar?
The US Dollar (USD) is the official currency of the United States of America, and the ‘de facto’ currency of a significant number of other countries where it is found in circulation alongside local notes. It is the most heavily traded currency in the world, accounting for over 88% of all global foreign exchange turnover, or an average of $6.6 trillion in transactions per day, according to data from 2022.
Following the second world war, the USD took over from the British Pound as the world’s reserve currency. For most of its history, the US Dollar was backed by Gold, until the Bretton Woods Agreement in 1971 when the Gold Standard went away.
How do the decisions of the Federal Reserve impact the US Dollar?
The most important single factor impacting on the value of the US Dollar is monetary policy, which is shaped by the Federal Reserve (Fed). The Fed has two mandates: to achieve price stability (control inflation) and foster full employment. Its primary tool to achieve these two goals is by adjusting interest rates.
When prices are rising too quickly and inflation is above the Fed’s 2% target, the Fed will raise rates, which helps the USD value. When inflation falls below 2% or the Unemployment Rate is too high, the Fed may lower interest rates, which weighs on the Greenback.
What is Quantitative Easing and how does it influence the US Dollar?
In extreme situations, the Federal Reserve can also print more Dollars and enact quantitative easing (QE). QE is the process by which the Fed substantially increases the flow of credit in a stuck financial system.
It is a non-standard policy measure used when credit has dried up because banks will not lend to each other (out of the fear of counterparty default). It is a last resort when simply lowering interest rates is unlikely to achieve the necessary result. It was the Fed’s weapon of choice to combat the credit crunch that occurred during the Great Financial Crisis in 2008. It involves the Fed printing more Dollars and using them to buy US government bonds predominantly from financial institutions. QE usually leads to a weaker US Dollar.
What is Quantitative Tightening and how does it influence the US Dollar?
Quantitative tightening (QT) is the reverse process whereby the Federal Reserve stops buying bonds from financial institutions and does not reinvest the principal from the bonds it holds maturing in new purchases. It is usually positive for the US Dollar.
USD/CAD holds in narrow range around 1.37. Economists at Scotiabank analyze the pair’s outlook.
Support 1.3675/80, Resistance 1.3735/40
Firm jobs data Friday may add to market conviction around another hike and should add to CAD support.
It remains to be seen where the market closes out the day but an inside range session or ‘doji’ candle signal would support the idea of a stall out in the USD rise and raise the technical risk of a correction.
Intraday support is 1.3675/1.3680. Resistance is 1.3735/1.3740.
EUR/USD regains 1.05. Economists at Scotiabank analyze the pair’s outlook.
Intraday price signals are leaning bullish
Intraday price signals are leaning bullish for the EUR.
Spot looks heavily oversold on the longer run chart and short-term patterns do suggest the potential for gains to pick up form support at 1.0450 where the market has based this week.
EUR gains through 1.0540/1.0550 in the next day or so would be supportive and target additional gains to the low 1.06s.
See – EUR/USD: Any gains above 1.05 look hard to sustain – ING
- Oil (WTI) not enjoying the week as it trades below $90.
- The US Dollar printed a new high in the US Dollar Index, flirting with the 52-week high.
- Despite supply cut confirmations and US stockpile drawdowns, prices remain under pressure.
Oil prices already had a busy morning this Wednesday with OPEC+ issuing its report. No surprises there as both Russia and Saudi Arabia keep their commitment to cut until December. Meanwhile, the American Petroleum Institute (API) issued its recent numbers overnight, communicating a drawdown of -4.21 million barrels last week against the build of 1.586 million the previous week.
The US Dollar (USD), meanwhile, is gearing up for a very nervous trading day, while the US Dollar Index (DXY) resides near the high of the past 48 weeks. Expect to see a pick up in volatility as not only a big batch of data points is due to come out. But the Polish central bank is due to issue its next rate decision, and it promises to be a surprise after last week’s 75 basis point cut.
Crude Oil (WTI) trades at $86.49 per barrel, and Brent Oil trades at $89.83 per barrel at the time of writing.
Oil news and market movers
- Wednesday’s OPEC+ report had Saudi Arabia and Russia reaffirming plans to curb oil production by 1 million barrels per day for Saudi Arabia and 300,000 barrels per day for Russia until the end of the year. The report went on to say that the measure is intended “to reinforce the precautionary efforts made by OPEC+ countries with the aim of supporting the stability and balance of oil markets.”
- Russia said that a partial lift of the current fuel export ban has been discussed, according to TASS.
- The current downturn in oil prices, despite these supply cuts, has mainly contributed to the current elevated level in US yields. Expectations are that demand will start to kill off and turn the current target lower as supply scales above a demand fall-off.
- As any normal Wednesday, the Energy Information Administration (EIA) is due to release its stockpile changes in the US. Expectations again call for a drawdown, this time from -2.17 million barrels to -0.092 million. The Cushing strategic stockpile reserve will get even more attention. Last week, it was already at a critical low level. Expect numbers to be issued near 14:30 GMT.
Oil Technical Analysis: Blame US Treasury yields
Oil prices drop like a stone despite OPEC+ trying to ramp up prices by confirming its current production cuts until the end of the year. Though in September markets set oil prices soaring on the back of that announcement, those same comments today are pushing prices lower. The current elevated level in US yields against the lower levels in September makes traders assess that demand will soon come to a standstill, where current total supply might be more than enough to deal with the slashed demand.
On the upside, the double top from October and November of last year at $93.12 remains the level to beat. Although it got breached on Thursday, the level never got a daily close above it. Should $93.12 be taken out, look for $97.11, the high of August 2022.
On the downside, a new floor has formed near $88, with the high of September 5 and 11 underpinning the current price action. Proof of this already exists with the dip of September 13 and September 21, which reversed ahead of $88. Should $88 break, the peak of August 10 needs to be enough to catch the dip near $84.20.
-638320138870579152.png)
US Crude (Daily Chart)
Natural Gas FAQs
What fundamental factors drive the price of Natural Gas?
Supply and demand dynamics are a key factor influencing Natural Gas prices, and are themselves influenced by global economic growth, industrial activity, population growth, production levels, and inventories. The weather impacts Natural Gas prices because more Gas is used during cold winters and hot summers for heating and cooling. Competition from other energy sources impacts prices as consumers may switch to cheaper sources. Geopolitical events are factors as exemplified by the war in Ukraine. Government policies relating to extraction, transportation, and environmental issues also impact prices.
What are the main macroeconomic releases that impact on Natural Gas Prices?
The main economic release influencing Natural Gas prices is the weekly inventory bulletin from the Energy Information Administration (EIA), a US government agency that produces US gas market data. The EIA Gas bulletin usually comes out on Thursday at 14:30 GMT, a day after the EIA publishes its weekly Oil bulletin. Economic data from large consumers of Natural Gas can impact supply and demand, the largest of which include China, Germany and Japan. Natural Gas is primarily priced and traded in US Dollars, thus economic releases impacting the US Dollar are also factors.
How does the US Dollar influence Natural Gas prices?
The US Dollar is the world’s reserve currency and most commodities, including Natural Gas are priced and traded on international markets in US Dollars. As such, the value of the US Dollar is a factor in the price of Natural Gas, because if the Dollar strengthens it means less Dollars are required to buy the same volume of Gas (the price falls), and vice versa if USD strengthens.
AUD/USD stabilises above 0.63. Economists at Rabobank analyze the pair’s outlook.
Evaluating higher for longer
While the market has not ruled out another hike by the RBA, interest rate differentials have been a key factor in pushing AUD/USD lower since July as the market finally adjusts to the higher for longer mantra from the Federal Reserve.
Concerns that slower growth in China will feed back into its major trading partners are also a negative AUD factor, though iron ore prices have remained well supported after their spring dip.
In view of the strength of the USD, we see risk of a push lower to AUD/USD 0.62 on a three-month view.
USD/CNH is still likely to trade between 7.2800 and 7.3600 in the next few weeks, comment Markets Strategist Quek Ser Leang and Senior FX Strategist Peter Chia at UOB Group.
Key Quotes
24-hour view: We highlighted yesterday that USD “could continue to advance, but it is highly unlikely to reach the major resistance at 7.3600.” We also highlighted that “there is another resistance at 7.3400.” Our expectations did not materialise as USD traded sideways between 7.3129 and 7.3315. The price action appears to be part of a consolidation, and further sideways trading will not be surprising, likely in a range of 7.3100/7.3300.
Next 1-3 weeks: Our update from yesterday (03 Sep, spot at 7.3215) still stands. As highlighted, USD is likely to trade in a range for now, probably between 7.2800 and 7.3600
European Central Bank (ECB) Governing Council member Mario Centeno said on Wednesday that the inflation in the Euro area was falling faster than when it was rising, per Reuters.
"We can expect that the rate cycle has been completed by now, and with present conditions," Centeno added.
Market reaction
These comments don't seem to be having a noticeable impact on the Euro's performance against its rivals. As of writing, EUR/USD pair was trading at 1.0505, where it was up 0.38% on a daily basis.
Buoyant US data put pressure on Gold. Strategists at Commerzbank analyze the yellow metal’s outlook.
Weaker-than-expected NFP could trigger a noticeable countermovement
With a significantly higher-than-expected ISM manufacturing index and a surprisingly pronounced rise in job vacancies – there appears to be no end to the series of positive US economic data. Gold is under considerable pressure accordingly.
That said, caution is warranted in view of the latest steep rise in US bond yields and the resulting marked slump in the price of Gold. It would not be surprising if this trend were to gradually run out of steam.
What is more, another data heavyweight is due to be published this week – the US labour market report: if the figures turn out to be weaker than expected, it could trigger a noticeable countermovement. There is a good chance in other words that Gold will bottom out until then at just shy of $1,820.
- USD/CAD remains sideways around 1.3700 as the focus shifts to US labor market data.
- The Canadian Dollar remains on the backfoot due to declining oil prices.
- USD/CAD delivers a breakout of an inverted H&S chart pattern formed, which warrants a bullish reversal.
The USD/CAD pair trades back and forth near the round-level resistance of 1.3700 in the European session. The Loonie asset struggles for a decisive move as investors await the United States Employment Change data for September, which will be published at 12:15 GMT.
As per the estimates, the US laborforce recorded fresh additions of 156K private payrolls, lower than 177K in August. The US Dollar Index (DXY) slips sharply after facing stiff barricades near a fresh 11-month high around 107.20.
While the USD Index is correcting, the USD/CAD pair is trading back and forth, which indicates a weak Canadian Dollar. The latter remains on the backfoot due to declining oil prices. It is worth noting that Canada is the leading exporter of oil to the United States and lower oil prices impact negatively on the Canadian Dollar.
USD/CAD delivers a breakout of an inverted Head and Shoulder chart pattern formed on the daily scale, which warrants a bullish reversal after a prolonged consolidation. The neckline of the aforementioned chart pattern was plotted from April 28 high at 1.3668. The 50-day Exponential Moving Average (EMA) at 1.3500 continues to provide a cushion to the US Dollar bulls.
The Relative Strength Index (RSI) (14) shifts into the bullish range of 60.00-80.00, which indicates an activation of the bullish impulse.
A decisive break above October 3 high at 1.3736 would expose the asset to March 24 high around 1.3800, followed by March 10 high at 1.3860.
In an alternate scenario, a breakdown below September 25 low around 1.3450 would drag the asset toward September 20 low near 1.3400. A further breakdown could expose the asset to six-week low near 1.3356.
USD/CAD daily chart
-638320118916561724.png)
After briefly rising back above the 150.00 level and hitting an intra-day high of 150.16, USD/JPY then fell abruptly to an intra-day low of 147.43. It has encouraged speculation that Japan intervened to support the Yen. Economists at MUFG Bank analyze the pair’s outlook.
Japanese officials declined to confirm if intervened
Japanese officials have declined to confirm if they intervened. Chief currency official Kanda instead continued to emphasize that they respond as always to excessive FX moves and are not ruling out any options regarding foreign exchange.
The release of the Nonfarm Payrolls report on Friday should prove more important in determining whether the US bond market sell-off and US Dollar rally extends further in the near term.
Japanese officials will be hoping for a weaker report to ease upward pressure on USD/JPY.
Further consolidation is now likely in USD/JPY, argue Markets Strategist Quek Ser Leang and Senior FX Strategist Peter Chia at UOB Group.
Key Quotes
24-hour view: We highlighted yesterday that “there is a chance for USD to break above 150.00.” However, we held the view that “the next resistance at 150.50 is unlikely to come into view.” In NY trade, USD popped briefly to a high of 150.16 and then crashed to a low of 147.37 before snapping back up to end the day at 149.02 (-0.55%). The wild swings have resulted in a mixed outlook, and further choppy price action is not ruled out, probably between 148.00 and 149.90.
Next 1-3 weeks: Two days ago (02 Oct, spot at 149.50), we highlighted that USD “could edge upwards, but any advance is likely part of a higher range of 148.50/150.50.” We added, “a clear break above 150.50 is unlikely”. Yesterday, USD swung wildly between 148.50 and 150.16. The sharp fluctuations have muddled the near-term outlook. For the time being, USD could trade in a broad range of 145.90/150.50.
CME Group’s flash data for natural gas futures markets noted traders increased their open interest positions for the fourth session in a row on Tuesday, this time by around 7.7K contracts. In the same line, volume went up by more than 1K contracts, adding to the previous daily build.
Natural Gas now challenges $3.00
Prices of natural gas rose sharply on Tuesday, almost fully fading the strong pullback seen at the beginning of the week. The move was on the back of increasing open interest and volume, indicating that extra gains appears in store in the very near term. That said, the next target on the upside emerges at the key $3.00 region per MMBtu.
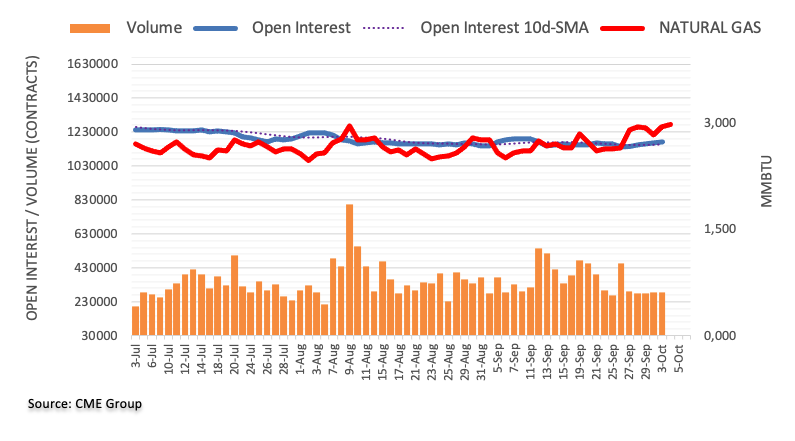
- Gold price turns sideways after a long sell-off ahead of US ADP Employment Change data.
- Job vacancies by US employers were upbeat in August, portraying strong labor demand.
- Fed’s Mester supports hiking interest rates in November.
Gold price (XAU/USD) remains directionless as investors shift focus to the United States labor market data, which will set an undertone for the Federal Reserve’s (Fed) November monetary policy. The broader outlook for the precious metal is bearish as Fed policymakers continue to favor further policy tightening due to a resilient economic outlook.
The US Dollar faces barricades while extending its rally above 107.20 despite upbeat Job Openings data. Higher-than-anticipated job postings by US employers indicate strong demand for labor. Apart from the US ADP Employment Change data, investors will also focus on the US ISM Services PMI, which will deliver guidance on the demand outlook.
Daily Digest Market Movers: Gold price awaits labor market data
- Gold price turns choppy around $1,820 as investors await the ADP Employment Change data and the Institute of Supply Management (ISM) Services Purchasing Managers Index (PMI) data for September, which will be published at 12:15 GMT and 14:00 GMT, respectively.
- Investors foresee fresh additions to private payrolls of 156K, which is lower than the 177k reading from August. A decline in labor growth could provide some relief to the Gold price.
- The US ISM is expected to report the Services PMI for September at 53.6, lower than August’s reading of 54.5. The Services PMI data carries a significant impact on the US Dollar Index as it represents the service sector, which accounts for two-thirds of the US economy.
- The precious metal attempted a recovery near $1,820.00 on Tuesday but failed to capitalize on the same due to hawkish interest rate guidance from Federal Reserve policymakers and upbeat JOLTS Job Opening data.
- The US Bureau of Labor Statistics reported fresh job vacancies at 9.61 million against expectations of 8.8 million. Higher job postings by US employers signify healthy labor demand.
- Cleveland Fed Bank President Loretta Mester reiterated hawkish guidance on the interest rate outlook on Tuesday. Mester said that she is open to hiking interest rates further in the November monetary policy meeting if the economy remains resilient the way it has been. She acknowledged that costly long-term Treasury yields could reshape the monetary policy outlook.
- On Monday, Fed Mester said that one more interest rate hike is well-needed this year and that they are required to remain high for a longer period.
- Contrary to Mester, Atlanta Fed Bank President Raphael Bostic said, “There is no urgency for the Fed to raise interest rates further” but that interest rates must remain higher for a longer time before a rate cut.
- About the rate cuts and inflation outlook, Raphael Bostic said that one rate cut could be announced in late 2024 and the core inflation would come down to 2% near the end of 2025.
- The US Dollar faces some selling pressure after refreshing its 11-month high near 107.20 as investors turned cautious about labor market data, which will set the undertone for the interest rate outlook.
- The broader outlook of the US Dollar is positive as the US economy is resilient, unlike other economies that are struggling to cope with the consequences of higher interest rates by central bankers. The 10-year US Treasury yield jumped to a multi-year high at 4.85%.
- US Treasury Secretary Janet Yellen remained optimistic about the US economic outlook, adding that inflation is coming down in the short term and the labor market is extremely strong.
Technical Analysis: Gold price remains sideways near $1,820
Gold price struggles for a direction, trading near $1,820.00 after an intense sell-off as investors shift their focus to the US labor market data for further guidance. The precious metal remains in the bearish territory and more downside is in the pipeline as the 50 and 200-day Exponential Moving Averages (EMAs) are on the verge of a Death Cross. The yellow metal is expected to find a cushion near the crucial support around $1,800.00.
Employment FAQs
How do employment levels affect currencies?
Labor market conditions are a key element to assess the health of an economy and thus a key driver for currency valuation. High employment, or low unemployment, has positive implications for consumer spending and thus economic growth, boosting the value of the local currency. Moreover, a very tight labor market – a situation in which there is a shortage of workers to fill open positions – can also have implications on inflation levels and thus monetary policy as low labor supply and high demand leads to higher wages.
Why is wage growth important?
The pace at which salaries are growing in an economy is key for policymakers. High wage growth means that households have more money to spend, usually leading to price increases in consumer goods. In contrast to more volatile sources of inflation such as energy prices, wage growth is seen as a key component of underlying and persisting inflation as salary increases are unlikely to be undone. Central banks around the world pay close attention to wage growth data when deciding on monetary policy.
How much do central banks care about employment?
The weight that each central bank assigns to labor market conditions depends on its objectives. Some central banks explicitly have mandates related to the labor market beyond controlling inflation levels. The US Federal Reserve (Fed), for example, has the dual mandate of promoting maximum employment and stable prices. Meanwhile, the European Central Bank’s (ECB) sole mandate is to keep inflation under control. Still, and despite whatever mandates they have, labor market conditions are an important factor for policymakers given its significance as a gauge of the health of the economy and their direct relationship to inflation.
The Polish Zloty has weakened notably in recent days. Economists at ING analyze PLN outlook ahead of the meeting of the National Bank of Poland (NBP).
NBP likely to cut rate again
The meeting is the first since September's surprise 75 bps cut. At the moment, the market is probably pricing in something between a 25-50 bps rate cut for today. We believe the NBP will choose a more cautious pace of rate cuts this time around, especially in an effort to keep the Zloty in check.
EUR/PLN has been moving up in a narrow range of 4.60-4.65 since September's jump and given the dovish market expectations, we see room for more of an upward repricing of rates which should support PLN. However, uncertainty for today and tomorrow is high and we see higher volatility beyond the current range.
- EUR/GBP slips sharply from 0.8680 after the UK Services PMI rebound and Eurozone’s retail demand data remains.
- UK’s Services PMI at 49.3, remained below the 50.0 threshold for the second time in a row.
- Eurozone’s monthly consumer spending contracts by 1.2% as households’ real income squeezes due to high inflation.
The EUR/GBP pair drops vertically after facing selling pressure near 0.8680 in the European session. The cross attracts sellers’ interest due to the upbeat United Kingdom’s Services PMI and the Eurozone’s weak consumer spending data.
S&P Global reported UK Services PMI at 49.3, higher than expectations and the former release of 47.2. The economic data failed to capture the 50.0 threshold for the second time in a row but a strong recovery has improved optimism among market participants. The service activity is in the contraction phase as firms cut back on non-essential business and declining consumer spending.
The UK firms are facing headwinds from higher borrowing costs due to tight monetary policy by the Bank of England (BoE) and a weak order book due to subdued economic conditions.
Fears of a slowdown in the UK economy persist as BoE Governor Andrew Bailey warned about more inflation shocks ahead. Bailey opposed the UK’s 2% inflation target. He is confident about UK Prime Minister Rishi Sunak fulfilling his promise of halving inflation to 5.2% by the year-end.
On the Eurozone front, weaker-than-anticipated Retail Sales data for August has dented the appeal for the Euro. The annualized consumer spending contracted by 2.1% while investors forecasted a decline of 1.2% against a 1% contraction reading in July. On a monthly basis, the economic data contracted significantly by 1.2% vs. estimates and the former reading of 0.3% and 0.1% contraction respectively. It seems that households are struggling to bear the burden of higher interest rates and sticky inflation.
Meanwhile, European Central Bank (ECB) President Christine Lagarde reiterated that interest rates will remain sufficiently restrictive to ensure price stability.
USD/JPY backs up after plummeting from 150.15 to 147.43 on Tuesday on touted BoJ rate checking/intervention. Economists at Société Générale analyze the pair’s outlook.
It could get worse for the Yen before it gets better
The conundrum the BoJ finds itself in is that intervention right now is a battle it can’t win.
USD/JPY is unlikely to retreat in a durable fashion until the bank tightens policy or the cap comes off 10y JGB yields. Or US bond yields stabilise or (ideally) retreat. In short, it could get worse for the Yen before it gets better.
USD/JPY retreated from 151.95 to 135 a year ago after $43bn of USD sales, but the success was partly explained by the 50 bps drop in 2y UST yields and unexpected change in YCC settings in December. The BoJ may have checked FX rates on Tuesday with dealers, but we would not be surprised if actual selling of USD is delayed until Friday, or Monday morning during Asian trading hours, when US payrolls will have been published.
- WTI price recovers some of its intraday losses due to a correction in the US Dollar.
- Greenback pulls back from the 11-month high marked on Tuesday.
- Saudi Arabia announced to continue the existing policy of output cuts through the end of the year 2023.
Western Texas Intermediate (WTI) oil price retraces the recent gains, trading around $87.70 per barrel during the European trading session on Wednesday.
The prices of Crude oil are under downward pressure as Saudi Arabia announced to maintain its existing output cuts through the end of the year 2023. This is attributed to the concerns over the fears that elevated interest rates could lead to a reduction in fuel demand.
As per a Reuters survey, Saudi Arabia is expected to increase its November official selling price of Arab Light crude to Asia for the fifth consecutive month.
Simultaneously, discussions regarding the resumption of Iraqi oil exports through a pipeline in Turkey are still ongoing, as reported by an Iraqi oil official. This comes after Turkey's announcement of resuming operations this week, ending a nearly six-month hiatus.
According to reports from the Russian newspaper Kommersant, the Russian government is considering a partial lift of its ban on diesel exports in the coming days. This development adds to the evolving dynamics in the energy market.
The cautious sentiment due to the US Federal Reserve’s (Fed) interest rates trajectory is reinforcing the Greenback. The strengthening dollar tends to put downward pressure on WTI prices, as it makes oil more expensive for buyers using other currencies.
The US Dollar Index (DXY) retreats from the 11-month high marked on Tuesday. The spot price beats lower around 106.90 by the press time. However, the US Dollar (USD) strengthened on robust US employment data and higher US Treasury yields.
The 10-year US Bond yield reached its highest level since 2007, hitting 4.85% on Wednesday.
US JOLTS Job Openings exceeded expectations, contributing to an increase in US Treasury yields. The report revealed that job openings improved to 9.61 million in August from the previous reading of 8.92 million, surpassing market expectations.
Market participants are eagerly awaiting the US employment data, with the release of the ADP report on Wednesday and the Nonfarm Payrolls on Friday.
The US Dollar Index holds above 107.00. Economists at ING analyze DXY outlook.
Little reason to sell the Dollar at present
Today we will again hear from Fed hawk Michelle Bowman who earlier this week was calling for multiple further hikes. Today also sees the September ADP jobs report (a somewhat discredited release) and ISM Services data.
There seems little reason to sell the Dollar at present – perhaps only a shock drop in ISM services could weigh on the Dollar today.
106.70 is now support for DXY and the direction of travel remains towards 108.
See – EUR/USD: The wait for a trend reversal is likely to continue – Commerzbank
- Eurozone Retail Sales came in at -1.2% MoM in August vs. -0.3% expected.
- Retail Sales in the bloc arrived at -2.1% YoY in August vs. -1.2% expected.
Eurozone’s Retail Sales fell 1.2% MoM in August when compared to a decline of 0.1% in July, the official data published by Eurostat showed on Wednesday. The market consensus was for a -0.3% drop.
On a yearly basis, the bloc’s Retail Sales dropped 2.1% in the reported month versus -1.0% registered in July and -1.2% expected.
Meanwhile, the Producer Price Index (PPI) in the old continent plunged 11.5% YoY in August, compared with the expectations of an 11.6% slump and a 7.6% decline reported in July. Over the month, the Eurozone PPI inflation rebounded to 0.6% in August, as against -0.5% in July and 0.6% estimates.
FX implications
Mixed Eurozone data fail to move the needle around the Euro. At the time of writing, the EUR/USD pair is trading at 1.0490, up 0.24% on the day
About Eurozone Retail Sales
The Retail Sales released by Eurostat are a measure of changes in sales of the Eurozone retail sector. It shows the performance of the retail sector in the short term. Percent changes reflect the rate of changes of such sales. The changes are widely followed as an indicator of consumer spending. Usually, positive economic growth anticipates "Bullishness" for the EUR, while a low reading is seen as negative, or bearish, for the EUR.
A choppy day lies ahead for the Zloty with the National Bank of Poland (NBP) deciding on interest rates. Economists at Société Générale analyze PLN outlook.
A hung parliament would support higher EUR/PLN through 4Q23
The consensus is a 25 bps cut, but our EM team believes 50 bps is possible.
The drop in annual CPI to 8.2% creates leeway to cut again, but the size of today’s cut and the bank’s statement could make the difference between EUR/PLN drifting back up towards 4.70 or having a go below 4.5850 (200-DMA).
A hung parliament at the elections next week would support higher EUR/PLN through 4Q23.
In the aftermath of Tuesday's meeting of the Reserve Bank of Australia (RBA), AUD/USD weakened again. Economists at Commerzbank analyze Aussie’s outlook.
Focus likely to shift increasingly to the further outlook
After four meetings with unchanged interest rates, there is certainly not too much to be said for a surprising rate hike in November. However, this mainly depends on the data published until then. Among other things, the quarterly inflation figures are on the agenda at the end of the month.
Regardless of the question of whether there will be another rate hike, however, the focus is likely to shift increasingly to the further outlook. And in view of the still elevated inflation, the robust labor market and currently solid growth, there is much to suggest that the RBA will not lower interest rates next year for the time being. This should also benefit the Aussie in the medium term.
- NZD/USD slides to a near four-week low in reaction to the RBNZ’s decision to maintain the status quo.
- The Fed’s hawkish view, along with elevated US bond yields, underpin the USD and exert pressure.
- The risk-off environment might further contribute to driving flows away from the risk-sensitive Kiwi.
The NZD/USD pair attracts some intraday sellers on Wednesday and drops to a near four-week low, around the 0.5870 region after the Reserve Bank of New Zealand (RBNZ) announced its policy decision. Spot prices, however, manage to bounce back to the 0.5900 round figure during the early part of the European session, though any meaningful recovery now seems elusive.
The RBNZ decided to keep its cash rate target unchanged at 5.50%, as was widely anticipated and offered no fresh clues that it might raise interest rates again. In the accompanying monetary policy statement, the central bank noted that demand growth in the economy continues to ease and higher interest rates are reducing inflationary pressure as required. This, in turn, suggests that the RBNZ might have ended the rate-hiking cycle and undermined the New Zealand Dollar (NZD), which, along with a bullish US Dollar (USD), exerts pressure on the NZD/USD pair.
The USD Index (DXY), which tracks the Greenback against a basket of currencies, stands tall near its 11-month peak and remains well supported by growing acceptance that the Federal Reserve (Fed) will stick to its hawkish stance. Moreover, the recent comments by several Fed officials backed the case for at least one more rate hike by the end of this year. Adding to this, the US JOLTS report released on Tuesday pointed to a still-tight labour market and brings wage inflation back on the agenda, which should allow the Fed to keep interest rates higher for longer.
The outlook pushes the yield on the benchmark 10-year US government bond to its highest level since 2007 and underpins the Greenback. Meanwhile, an extended selloff in the US fixed-income market, along with concerns about economic headwinds stemming from rapidly rising borrowing costs and perspective worries about China's ailing property sector, continues to weigh on investors' sentiment. This is evident from a generally weaker tone around the equity markets, which further benefits the safe-haven buck and drives flows away from the risk-sensitive Kiwi.
Traders, however, seem reluctant to place aggressive bearish bets around the NZD/USD pair and prefer to wait for the release of the US macro data – the ADP report on private-sector employment and the ISM Services PMI. This, along with the US bond yields and the broader risk sentiment, will drive the USD demand and produce short-term trading opportunities around the major. The market focus, however, will remain glued to the closely-watched US monthly employment details – popularly known as the NFP report – due on Friday.
Technical levels to watch
There is much speculation over whether Japanese authorities intervened yesterday afternoon to sell USD/JPY. Economists at ING analyze the pair’s outlook.
Tokyo proves coy on intervention
Tokyo has failed to publicly confirm that it either 'checked rates' (a precursor to intervention) or indeed sold Dollars. Tokyo's silence may suggest they didn't intervene and the sharp sell-off could have possibly been caused by re-positioning after option barriers in USD/JPY were hit at 150.
There are no signs that US Treasury yields are near a peak meaning that even if intervention took place, USD/JPY could still go higher. However, we would say that the difficult external environment and the unwind of the carry trade will give the Yen some support on the crosses. Investors will also be reluctant to chase USD/JPY up through 150 near term.
- EUR/USD snaps the recent losses due to the correction in the US Dollar.
- Greenback pulls back from the 11-month high marked on Tuesday.
- Better-than-expected Eurozone PMI could provide support in underpinning the Euro.
EUR/USD retraces the two-day losing streak, trading near a 10-month low marked on Tuesday. The spot price trades higher around 1.0480 during the early European trading hours on Wednesday.
The cautious sentiment due to the US Federal Reserve’s (Fed) interest rates trajectory is exerting pressure on the EUR/USD pair.
The US Dollar Index (DXY) retreats from the 11-month high marked on Tuesday. The spot price beats lower around 106.90 by the press time. However, the US Dollar (USD) strengthened on robust US employment data and higher US Treasury yields.
The 10-year US Bond yield reached its highest level since 2007, hitting 4.85% on Wednesday.
US JOLTS Job Openings exceeded expectations, contributing to an increase in US Treasury yields. The report revealed that job openings improved to 9.61 million in August from the previous reading of 8.92 million, surpassing market expectations.
Additionally, the hawkish tone surrounding the Fed to keep interest rates higher for a prolonged period is reinforcing positive sentiment for the Greenback.
Cleveland Federal Reserve President Loretta Mester indicated a likelihood of favoring an interest rate hike at the next meeting if the current economic conditions persist. On the other hand, Atlanta Fed President Raphael Bostic shared a patient perspective on the Fed's policy outlook, stating that there is no rush to raise or reduce rates.
Market participants are eagerly awaiting the US employment data, with the release of the ADP report on Wednesday and the Nonfarm Payrolls on Friday.
On the Euro side, the upbeat Eurozone’s HCOB Purchase Manufacturing Index (PMI) could provide minor support for the Euro. The report revealed that the Composite PMI for September improved to 47.2 from the previous 47.1, which was expected to remain consistent.
German Composite PMI showed a reading of 46.4, which was 46.2 prior. Services PMI improved to 50.3, exceeding the market consensus of 49.8.
Eurozone appears to be adopting a wait-and-see approach regarding interest rate hikes from the European Central Bank (ECB). Recent statements from ECB officials showed a complex situation with a primary decision to handle inflation.
ECB Governing Council member Tuomas Välimäki holds an optimistic view, stating no stagflation prospect in the euro area. On the contrary, ECB Chief Economist Philip Lane acknowledges more work is needed to reach the inflation target, reflecting a more cautious stance.
These divergent perspectives highlight the complexities and uncertainties in the Eurozone's economic overview, potentially acting as a headwind for the Euro.
The upcoming economic indicators, such as the Producer Price Index (PPI) and Retail Sales, will likely offer additional insights into the Eurozone's economic outlook. A slew of speeches from the ECB officials is scheduled later in the day, with a primary focus on ECB's President Lagarde speech.
The Swedish Krona has performed exceptionally well over the past week and a half. Michael Pfister, FX Analyst at Commerzbank, analyzes SEK outlook.
What is the source of the current strength?
What is the driver of the Krona's current strength? The main reason is likely to be the Riksbank's recent decision to sell almost 1/4 of its foreign exchange reserves in US Dollars and Euros and at the same time to enter into FX swaps in order to keep foreign exchange reserves constant. The reason given for the move is that the Riksbank expects the SEK to appreciate in the near future, which would lead to losses in the foreign exchange portfolio.
Nevertheless, I remain sceptical. Interventions in the foreign exchange market are only successful in the long term if they are also underpinned by the appropriate monetary policy. And in recent months, the impression had become entrenched that the Riksbank was merely lagging behind the inflation trend. In view of core inflation of more than 7% and further interest rate hikes of only 10 bps expected by the Riksbank, this is certainly not entirely unjustified. Verbal interventions can't change that much either. At the moment, this makes me doubt that the current strength of the Swedish Krona will last.
- Silver comes under some renewed selling pressure on Wednesday, albeit lacks follow-through.
- The oversold RSI on the daily chart holds back bears from placing fresh bets around the XAG/USD.
- The technical setup supports prospects for an extension of the recent sharp depreciating move.
Silver struggles to capitalize on the previous day's recovery move from the $20.70-$20.65 area, or its lowest level since March 13 and meets with a fresh supply on Wednesday. The white metal, however, rebounds from the daily trough touched during the early European session and currently trades around the $21.10 region, down less than 0.15% for the day.
From a technical perspective, the recent breakdown through the $23.30-$23.20 horizontal support was seen as a fresh trigger for bearish traders. That said, the Relative Strength Index (RSI) on the daily chart is flashing oversold conditions. This, in turn, warrants caution and makes it prudent to wait for some near-term consolidation or a modest bounce before positioning for any further depreciating move.
Nevertheless, the XAG/USD remains vulnerable to prolong its descending trend and slide back to the $20.70-$20.65 zone, or a nearly seven-month low touched on Tuesday. The downward trajectory could get extended further towards challenging the YTD trough – levels just below the $20.00 psychological mark set in March.
On the flip side, a strength beyond the overnight swing high, around the $21.40 region, might trigger a short-covering rally and allow the XAG/USD to reclaim the $22.00 round-figure mark. Any subsequent move up might be seen as a selling opportunity and remain capped near the $22.20-$22.30 strong horizontal support breakpoint. The latter should act as a pivotal point, which if cleared might shift the bias in favour of bullish traders.
Silver daily chart
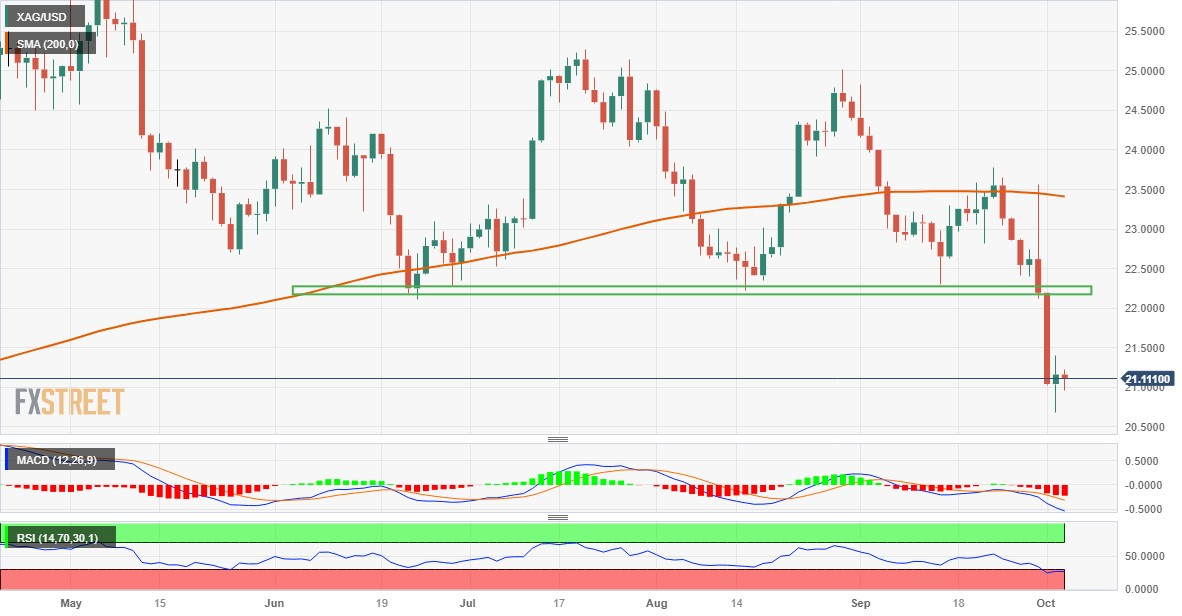
Technical levels to watch
EUR/USD continues to move below the 1.05 level. Economists at ING analyze the pair’s outlook.
EUR/USD in the soft side of a 1.04-1.06 range over the coming weeks
ECB President Christine Lagarde speaks today at a monetary policy conference. Given the market prices virtually no further tightening from the ECB, any hawkish remarks from her could provide a little support to the beleaguered EUR/USD.
However, any gains above 1.05 look hard to sustain given the tough external environment and we can see EUR/USD trading to the soft side of a 1.04-1.06 range over the coming weeks.
- The Euro navigates within a tight range against the US Dollar.
- Stocks in Europe open Wednesday’s session with losses.
- EUR/USD trades without a clear direction below 1.0500.
- The USD Index (DXY) hovers around the 107.00 region.
- Services PMIs in Europe and ECB’s Christine Lagarde will be in the limelight.
- The ADP report and ISM Services PMI take centre stage in the US.
The Euro (EUR) trades without a clear direction against the US Dollar (USD), motivating EUR/USD to gyrate around the 1.0470 region early in the European morning on Wednesday.
On the USD-side of the equation, the Greenback clings to the 107.00 region following Tuesday’s new 2023 tops in the 107.30-107.35 band when tracked by the USD Index (DXY), always sustained by the so-far unabated march north in US yields across the curve.
A look at the monetary policy front notes that the Federal Reserve (Fed) is expected to raise interest rates by 25 basis points (bps) before the end of the year, according to investors. Simultaneously, market talks about a potential stop in policy changes at the European Central Bank (ECB) continue, despite inflation levels above the bank's objective and mounting fears about a future recession or possibly stagflation in the area.
In the domestic calendar, final Services PMIs are due, along with a speech by ECB President Christine Lagarde.
In the US data space, the usual weekly Mortgage Applications by MBA are due in the first turn, seconded by the ADP Employment Change, final readings of the Services PMI, Factory Orders, and the always-relevant ISM Services PMI.
Daily digest market movers: Euro seem unable to gather serious upside traction
- The EUR looks slightly bid vs. the USD on Wednesday.
- US and German yields look poised to extend the upside momentum.
- Investors see the Fed to raise interest rates one more time before year-end.
- Markets expect the ECB's tightening campaign to stall.
- BoE’s Andrew Bailey rules out changing the bank’s inflation goal.
- Speculation remains on the rise around FX intervention in USD/JPY.
Technical Analysis: Extra losses not ruled out
EUR/USD now looks consolidative near the area of recent yearly lows in the sub-1.0500 region.
On the downside, the loss of the 2023 low of 1.0448 (October 3) should prompt EUR/USD to meet the next support at the round level of 1.0300 prior to minor support at the weekly lows of 1.0290 (November 30 2022) and 1.0222 (November 21 2022).
In case of occasional bullish attempts, the pair should encounter the next up-barrier at 1.0617 (September 29) prior to the weekly high of 1.0767 (September 12), before reaching the crucial 200-day SMA at 1.0825. If the pair breaks beyond this level, it may set up a challenge of the weekly top at 1.0945 (August 30) and the psychological barrier of 1.1000. The surpass of the latter might prompt the pair to test the August peak of 1.1064 (August 10) ahead of the weekly high of 1.1149 (July 27) and the 2023 top of 1.1275. (July 18).
However, it is critical to remember that as long as the EUR/USD remains below the 200-day SMA, the possibility of more negative pressure exists.
Euro FAQs
What is the Euro?
The Euro is the currency for the 20 European Union countries that belong to the Eurozone. It is the second most heavily traded currency in the world behind the US Dollar. In 2022, it accounted for 31% of all foreign exchange transactions, with an average daily turnover of over $2.2 trillion a day.
EUR/USD is the most heavily traded currency pair in the world, accounting for an estimated 30% off all transactions, followed by EUR/JPY (4%), EUR/GBP (3%) and EUR/AUD (2%).
What is the ECB and how does it impact the Euro?
The European Central Bank (ECB) in Frankfurt, Germany, is the reserve bank for the Eurozone. The ECB sets interest rates and manages monetary policy.
The ECB’s primary mandate is to maintain price stability, which means either controlling inflation or stimulating growth. Its primary tool is the raising or lowering of interest rates. Relatively high interest rates – or the expectation of higher rates – will usually benefit the Euro and vice versa.
The ECB Governing Council makes monetary policy decisions at meetings held eight times a year. Decisions are made by heads of the Eurozone national banks and six permanent members, including the President of the ECB, Christine Lagarde.
How does inflation data impact the value of the Euro?
Eurozone inflation data, measured by the Harmonized Index of Consumer Prices (HICP), is an important econometric for the Euro. If inflation rises more than expected, especially if above the ECB’s 2% target, it obliges the ECB to raise interest rates to bring it back under control.
Relatively high interest rates compared to its counterparts will usually benefit the Euro, as it makes the region more attractive as a place for global investors to park their money.
How does economic data influence the value of the Euro?
Data releases gauge the health of the economy and can impact on the Euro. Indicators such as GDP, Manufacturing and Services PMIs, employment, and consumer sentiment surveys can all influence the direction of the single currency.
A strong economy is good for the Euro. Not only does it attract more foreign investment but it may encourage the ECB to put up interest rates, which will directly strengthen the Euro. Otherwise, if economic data is weak, the Euro is likely to fall.
Economic data for the four largest economies in the euro area (Germany, France, Italy and Spain) are especially significant, as they account for 75% of the Eurozone’s economy.
How does the Trade Balance impact the Euro?
Another significant data release for the Euro is the Trade Balance. This indicator measures the difference between what a country earns from its exports and what it spends on imports over a given period.
If a country produces highly sought after exports then its currency will gain in value purely from the extra demand created from foreign buyers seeking to purchase these goods. Therefore, a positive net Trade Balance strengthens a currency and vice versa for a negative balance.
- Pound Sterling dips after choppy moves ahead of S&P Global Services PMI data.
- UK’s Services PMI is set to contract for the second time in a row.
- The BoE paused the policy-tightening spell, while inflation is still more than thrice the desired rate of 2%.
The Pound Sterling (GBP) struggles for a firm footing despite a consistent sell-off in the past three months. The GBP/USD pair faces a ruthless sell-off as the United Kingdom economy muddles against the headwinds of poor economic prospects and sticky inflation. UK inflation is still more than thrice the target rate of 2%, and the Bank of England (BoE) feels discouraged about raising interest rates further due to deepening recession risks.
After a more than year-long contraction spell in the Manufacturing PMI, the UK’s Services PMI is forecasted to remain below the 50.0 threshold for the second time in a row. British producers have cut back on new orders and labor due to tepid demand. Rising oil prices and supply chain disruptions could push the UK economy further on the backfoot.
Daily Digest Market Movers: Pound Sterling extends downside ahead of Services PMI data
- Pound Sterling fails to defend the crucial support of 1.2050 ahead of the Services PMI data for September, which will be published at 8:30 GMT.
- As per the estimates, the Services PMI is seen unchanged at 47.2. This would be the second straight month of contraction in service activities. A figure below the 50.0 threshold indicates a contraction.
- UK economic activities are consistently facing the wrath of higher interest rates. Firms seem fully pessimistic about the economic outlook due to declining domestic and overseas demand.
- This week, the UK Manufacturing PMI extended its contracting spell for its 14th straight period as firms cut back output, new orders, and employment amid deteriorating demand.
- While the UK economy is struggling for a firm footing due to economic turmoil, higher inflation is still a concern for Bank of England policymakers despite raising interest rates to 5.25%.
- The majority of BoE policymakers favor an unchanged interest rate decision in September, while Katherine Mann sees monetary policy as not sufficiently restrictive to bring down inflation to 2%.
- BoE Mann further added that policymakers are facing a “world where inflation shocks are likely to be more frequent” with stronger price growth, meaning interest rates will need to be permanently higher.
- Amidst all negative headlines about the UK’s economic prospects and sticky inflation, the British Retail Consortium (BRC) reported that food price inflation fell for the fifth month in a row to a single-digit annualized rate of 9.9% from 11.5%.
- BRC Chief Executive Helen Dickinson said we expect shop price inflation to continue to fall over the rest of the year but warned that rising oil prices, a global shortage of sugar, and supply disruptions due to the war in Ukraine could dampen the trend.
- On the global trade front, Business & Trade Minister Kemi Badenoch said at the Conservative Party conference that there was "zero" chance of a free trade agreement with the United States under President Joe Biden's administration, as reported by Reuters.
- Meanwhile, the market mood remains quiet as investors await the United States Employment Change data to be reported by ADP at 12:15 GMT. As per the consensus, private payrolls are expected to increase by 153K in September, lower than August’s reading of 177K.
- The US labor market data for September is going to shape the Federal Reserve’s (Fed) November monetary policy.
- The US Dollar Index (DXY) holds rallies near 107.20 as the odds for one more interest rate increase from the Fed soar after hawkish guidance from Cleveland Fed Bank President Loretta Mester and Fed Governor Michelle Bowman.
- In August, US JOLTS Job Openings data remained upbeat. Employers posted 9.61 million job vacancies against expectations of 8.8 million.
Technical Analysis: Pound Sterling skids below 1.2050
Pound Sterling dropped after trading directionless near a six-month low around 1.2070, continuing its prolonged sell-off due to a cautious market mood. The GBP/USD pair outlook remains vulnerable as the 50 and 200-day Exponential Moving Averages (EMAs) are on the verge of delivering a Death Cross. The Cable is expected to decline further toward the psychological support of 1.2000. Momentum oscillators are trading in a bearish trajectory, warranting more weakness ahead.
BoE FAQs
What does the Bank of England do and how does it impact the Pound?
The Bank of England (BoE) decides monetary policy for the United Kingdom. Its primary goal is to achieve ‘price stability’, or a steady inflation rate of 2%. Its tool for achieving this is via the adjustment of base lending rates. The BoE sets the rate at which it lends to commercial banks and banks lend to each other, determining the level of interest rates in the economy overall. This also impacts the value of the Pound Sterling (GBP).
How does the Bank of England’s monetary policy influence Sterling?
When inflation is above the Bank of England’s target it responds by raising interest rates, making it more expensive for people and businesses to access credit. This is positive for the Pound Sterling because higher interest rates make the UK a more attractive place for global investors to park their money. When inflation falls below target, it is a sign economic growth is slowing, and the BoE will consider lowering interest rates to cheapen credit in the hope businesses will borrow to invest in growth-generating projects – a negative for the Pound Sterling.
What is Quantitative Easing (QE) and how does it affect the Pound?
In extreme situations, the Bank of England can enact a policy called Quantitative Easing (QE). QE is the process by which the BoE substantially increases the flow of credit in a stuck financial system. QE is a last resort policy when lowering interest rates will not achieve the necessary result. The process of QE involves the BoE printing money to buy assets – usually government or AAA-rated corporate bonds – from banks and other financial institutions. QE usually results in a weaker Pound Sterling.
What is Quantitative tightening (QT) and how does it affect the Pound Sterling?
Quantitative tightening (QT) is the reverse of QE, enacted when the economy is strengthening and inflation starts rising. Whilst in QE the Bank of England (BoE) purchases government and corporate bonds from financial institutions to encourage them to lend; in QT, the BoE stops buying more bonds, and stops reinvesting the principal maturing on the bonds it already holds. It is usually positive for the Pound Sterling.
USD/JPY hit the 150 mark, triggering a knee-jerk reaction drop. Economists at Commerzbank analyze the pair’s outlook.
Interventions do little to change the fundamental situation
Japanese officials unanimously refused to confirm any FX intervention. Instead, they continued to emphasize their readiness to react to ‘excessive movements’.
In any case, Tuesday's exchange rate movement will reinforce the impression among market participants that the 150 in USD/JPY is a sound barrier that is difficult to break through.
Ultimately, however, interventions do little to change the fundamental situation. As long as the US economy continues to appear robust and the BoJ does not seek an exit from its ultra-expansive monetary policy, there are fundamental reasons for an upward trending USD/JPY. FX interventions will do little to change this. If the MOF nevertheless continues to intervene, an attrition battle could loom, with the currency market repeatedly testing the 150 mark and the MOF reacting accordingly. The next few days are likely to remain exciting.
- USD/CHF traces an upward trend due to the Fed’s hawkish stance on interest rate trajectory.
- US Dollar strengthens on higher US Treasury yields, coupled with Solid US jobs data.
- SNB is expected to maintain steady interest rates at the upcoming meeting.
USD/CHF holds ground near a seven-month high marked on Tuesday, trading higher for the third consecutive day around 0.9220 during the early European trading hours on Wednesday. The pair is experiencing upward support amid cautious sentiment due to the US Federal Reserve’s (Fed) interest rates trajectory.
The US Dollar Index (DXY) hovers around 107.10 at the time of writing, aligned with the 11-month high marked on Tuesday. The US Dollar (USD) strength is driven by robust US employment data and higher US Treasury yields.
US JOLTS Job Openings exceeded expectations, contributing to an increase in US Treasury yields. The 10-year US Bond yield reached its highest level since 2007, hitting 4.85% on Wednesday.
The JOLTS report revealed that job openings improved to 9.61 million in August from the previous reading of 8.92 million, surpassing market expectations. Additionally, the hawkish tone surrounding the Fed to keep interest rates higher for a prolonged period is reinforcing positive sentiment for the Greenback.
Cleveland Federal Reserve President Loretta Mester indicated a likelihood of favoring an interest rate hike at the next meeting if the current economic conditions persist. On the other hand, Atlanta Fed President Raphael Bostic shared a patient perspective on the Fed's policy outlook, stating that there is no rush to raise or reduce rates.
Market participants are eagerly awaiting the US employment data, with the release of the ADP report on Wednesday and the Nonfarm Payrolls on Friday.
On the Swiss side, the Swiss National Bank (SNB) opted to maintain interest rates at 1.75%, deviating from the expected 2.00%. The central bank justified this decision by citing the substantial tightening observed in recent quarters as a counterbalance to the lingering inflationary pressures.
The latest Switzerland CPI data reiterates that the inflation rate comfortably resides within the SNB's 0-2% target band for both headline and core measures. The Unemployment Rate, maintaining its previous reading, lingers at cycle lows.
The Manufacturing PMI has witnessed a notable rebound, though it remains in contraction, while the Services PMI stays in expansion.
Market expectations align with the anticipation that the SNB will maintain steady rates at the upcoming meeting.
Bank of England (BoE) Governor Andrew Bailey said in an interview with Prospect magazine on Wednesday, “I oppose changing the UK’s 2% inflation target.”
Additional quotes
I see more shocks coming.
The labor market explains part of UK inflation.
developing story ...
The Reserve Bank of New Zealand (RBNZ) left the Official Cash Rate (OCR) unchanged at 5.50%. NZD/USD dropped below the 0.59 level after RBNZ’s inaction. Economists at Danske Bank analyze the pair’s outlook.
The overall tone was to the dovish side
The RBNZ maintained the Official Cash Rate unchanged at 5.50% as widely anticipated.
RBNZ maintained its forward guidance unchanged, signalling that rate hikes are most likely already over, but that rates would remain at restrictive levels for 'a more sustained period of time'. Markets have speculated with a modest chance of RBNZ returning to hiking going forward, and hence the guidance was a slight dovish surprise, causing NZD/USD to decline following the meeting.
We maintain a modestly downward-sloping forecast profile, with 12M forecast at 0.57.
FX option expiries for Oct 4 NY cut at 10:00 Eastern Time, via DTCC, can be found below.
- EUR/USD: EUR amounts
- 1.0425 400m
- 1.0475 1b
- 1.0485 338m
- 1.0500 330m
- 1.0600 721m
- 1.0635 717m
- GBP/USD: GBP amounts
- 1.2330 482m
- USD/JPY: USD amounts
- 148.50 725m
- 149.25 315m
- 150.00 925m
- 150.25 449m
- AUD/USD: AUD amounts
- 0.6490 647m
USD/CAD: USD amounts
- 1.3500 315m
- 1.3590 698m
- NZD/USD: NZD amounts
- 0.6150 790m
- 0.6520 1.1b
- EUR/GBP: EUR amounts
- 0.8585 301m
- 0.8650 401m
The correction in EUR/USD that began at the end of last week seems to have been very short-lived. Michael Pfister, FX Analyst at Commerzbank, analyzes the pair’s outlook.
How much USD strength is too much?
I still doubt that the current USD strength will last. On the one hand, some indicators certainly suggest that interest rate hikes are taking effect. On the other hand, various central banks have recently argued that the transmission may be delayed. If this is true, and if it becomes apparent in the coming weeks that the scenario of an extremely robust US economy might gradually weaken, the strength of the Dollar should also diminish. Ultimately, interest rate cuts should then be increasingly on the agenda.
This only leaves the question of whether we will already see the first signs of this today. Probably not. Our economists expect the ISM index for services to also surprise on the upside. We should also expect rather little hawkish commentary from the ECB officials speaking today. Accordingly, the wait for a trend reversal in EUR/USD is likely to continue for the time being.
Here is what you need to know on Wednesday, October 4:
The US Dollar continues to outperform its rivals mid-week as US Treasury bond yields keep on climbing higher. The US Dollar Index holds at multi-month highs above 107.00 and the 10-year US yield closes in on 4.9% in the European morning. ADP private sector employment and ISM Services PMI data for September, alongside August Factory Orders, will be featured in the US economic docket in the second half of the day. Market participants will continue to keep a close eye on comments from central bankers as well.
The data from the US showed on Tuesday that the number of job openings on the last business day of August stood at 9.6 million. This reading came in much higher than the July's reading and the market expectation of 8.8 million, attracting hawkish Federal Reserve (Fed) bets. In turn, US T-bond yields gained traction, Wall Street's main indexes turned south and the USD held its strength in the American trading hours.
US Dollar price this week
The table below shows the percentage change of US Dollar (USD) against listed major currencies this week. US Dollar was the strongest against the Australian Dollar.
| USD | EUR | GBP | CAD | AUD | JPY | NZD | CHF | |
| USD | 0.99% | 1.09% | 1.01% | 1.98% | -0.23% | 1.84% | 0.75% | |
| EUR | -1.00% | 0.08% | 0.00% | 1.01% | -1.25% | 0.85% | -0.25% | |
| GBP | -1.10% | -0.07% | -0.08% | 0.93% | -1.34% | 0.77% | -0.33% | |
| CAD | -1.02% | -0.01% | 0.11% | 0.97% | -1.25% | 0.83% | -0.26% | |
| AUD | -2.02% | -1.02% | -0.94% | -1.01% | -2.28% | -0.16% | -1.29% | |
| JPY | 0.20% | 1.23% | 1.31% | 1.25% | 2.19% | 2.06% | 1.00% | |
| NZD | -1.86% | -0.86% | -0.77% | -0.85% | 0.16% | -2.12% | -1.11% | |
| CHF | -0.77% | 0.24% | 0.32% | 0.25% | 1.25% | -1.01% | 1.10% |
The heat map shows percentage changes of major currencies against each other. The base currency is picked from the left column, while the quote currency is picked from the top row. For example, if you pick the Euro from the left column and move along the horizontal line to the Japanese Yen, the percentage change displayed in the box will represent EUR (base)/JPY (quote).
Meanwhile, several Republicans in the House of Representatives sided with Democrats and ousted Speaker Kevin McCarthy with a 216-to-210 vote. Legislative activity in the House will pause until there is a new House Speaker. Republicans are set to meet on October 10 to discuss McCarthy's replacement. Markets remain risk-averse following this development with another government shutdown deadline coming in on November 17. Reflecting the sour mood, US stock index futures were last seen losing between 0.5% and 0.8%.
During the Asian trading hours on Wednesday, the Reserve Bank of New Zealand (RBNZ) announced that if left the policy rate unchanged at 5.5% as expected. “Committee agreed that interest rates may need to remain at a restrictive level for a more sustained period of time," the RBNZ said in its policy statement. NZD/USD came under bearish pressure and dropped below 0.5900.
After rising a few pips above 105.00 in the American session, USD/JPY fell sharply and lost more than 200 pips in a matter of minutes. This price action revived market chatter about a Bank of Japan intervention in the foreign exchange market. Japanese Finance Minister Shunichi Suzuki, however, said that he doesn’t want to “comment on whether Japan intervened in the FX market.” USD/JPY climbed back above 149.00 and stabilized there on Wednesday.
EUR/USD registered small losses on Tuesday but failed to stage a correction on Wednesday. At the time of press, the pair was trading within a touching distance of 1.0450. European Central Bank President Christine Lagarde will speak at the 2023 ECB Conference on Monetary Policy later in the day. Additionally, Eurostat will release August Retail Sales data.
GBP/USD rose a few pips above 1.2100 during the European session on Tuesday but lost its traction in the second half of the day. Early Wednesday, the pair trades modestly lower while holding slightly above 1.2050.
Pressured by surging US yields, Gold price closed the seventh consecutive day in negative territory on Tuesday. In the European morning, XAU/USD stays on the back foot below $1,820.
- USD/JPY consolidates its recent losses near 149.20 as investors fear the intervention.
- The 10-year Japanese Government Bond (JGB) yield reached 0.8% for the first time since 2013.
- US JOLTS Job Openings came in above expectations.
- Traders will monitor US ADP Employment Change and ISM Services PMI due on Wednesday.
The USD/JPY pair remains flat at around 149.20 during the early European session on Wednesday. The pair holds above the 149.00 mark after retracing to a low of 147.33 late Tuesday amid the rumors of Japan’s FX intervention.
On Wednesday, the 10-year Japanese Government Bond (JGB) yield reached 0.8% for the first time since 2013. This put more pressure on the BoJ to its yield-curve cap and prepare for the end of its negative interest rate policy. Meanwhile, the US Treasury yield edges higher along with the rally of US Dollar (USD). The 10-year yield reached 4.865%, the highest since 2007.
Late Tuesday, USD/JPY dipped nearly 300 pips from the 150.00 level amid the rumors of FX intervention by the Japanese authorities. Early Wednesday, Japan’s top currency diplomat Masato Kanda said any intervention would not target forex levels but volatility while mentioning that it's normal for authorities not to comment on whether they intervened or not.
Furthermore, Japan’s Chief Cabinet Secretary Hirokazu Matsuno said on Monday that he will continue to take appropriate steps on FX, but still have no comment on whether Japan intervened in the FX market. It’s worth noting that the 150.00 mark was the level that BoJ intervened last year. Therefore, traders should be cautious before placing aggressive bullish bets on the USD/JPY pair.
Across the pond, Cleveland Federal Reserve President Loretta Mester stated on Tuesday that she is likely to favor an interest rate hike at the next meeting if the current economic situation holds while mentioning that the Fed is likely at or near peak for interest rate target. Atlanta Fed President Raphael Bostic said he will be patient and there is an urgency for us to do anything more.
Apart from this, the number of job openings for August stood at 9.6M from 8.9M (revised from 8.8M) in the previous reading, according to the Job Openings and Labor Turnover Survey (JOLTS) on Tuesday. This figure came in better than the expectation of 8.8 million by a wide margin.
However, the US employment data this week could offer hints about the further monetary policy of the Federal Reserve (Fed). The stronger-than-expected data could lift the Greenback against its rivals.
Market players will keep an eye on the US ADP Employment Change and ISM Services PMI due later in the American session on Wednesday. Meanwhile, the speculations that Japanese authorities will intervene in the FX market remain in traders’ focus. On Friday, the US Nonfarm Payrolls data will be in the spotlight. Traders will take cues from the data and find trading opportunities around the USD/JPY pair.
- USD/CAD strengthens due to the Fed’s hawkish tone on interest rates trajectory.
- Stronger US jobs data bolster the US yields; contributing support for the US Dollar.
- Downbeat Crude oil prices put pressure on the Canadian Dollar.
USD/CAD traces the upward path on the fourth successive day, trading higher near 1.3710 during the Asian session on Wednesday. The pair is experiencing upward support amid cautious sentiment due to the US Federal Reserve’s (Fed) interest rates trajectory.
The US Dollar Index (DXY) hovers around 107.10 at the time of writing, aligned with the 11-month high marked on Tuesday. The US Dollar (USD) strength is driven by robust US employment data and higher US Treasury yields.
US JOLTS Job Openings exceeded expectations, contributing to an increase in US Treasury yields. The 10-year US Bond yield reached its highest level since 2007, hitting 4.85% on Wednesday.
The JOLTS report revealed that job openings improved to 9.61 million in August from the previous reading of 8.92 million, surpassing market expectations. Additionally, the hawkish tone surrounding the Fed to keep interest rates higher for a prolonged period is reinforcing positive sentiment for the Greenback.
Cleveland Federal Reserve President Loretta Mester indicated a likelihood of favoring an interest rate hike at the next meeting if the current economic conditions persist. On the other hand, Atlanta Fed President Raphael Bostic shared a patient perspective on the Fed's policy outlook, stating that there is no rush to raise or reduce rates.
Market participants are eagerly awaiting the US employment data, with the release of the ADP report on Wednesday and the Nonfarm Payrolls on Friday.
On the Canadian side, the S&P Global Manufacturing PMI was released on Monday. The report showed a decline to 47.5 in September from the previous reading of 48.0.
Additionally, downbeat Crude oil prices dragged the commodity-linked CAD lower as the country is the leading oil exporter to the US. West Texas Intermediary (WTI) Crude Oil trades lower around $88.00 per barrel by the press time.
Canada’s Ivey Purchasing Managers Index would likely be focused on by investors to gain further cues on business conditions in the country.
IDR weakened against the USD in September. Economists at MUFG Bank analyze Rupiah’s outlook.
IDR may be somewhat vulnerable in the near term should US rates rise further
We raise our USD/IDR forecast to 15,600 in three months and 15,200 in 12 months.
We think the Rupiah may be somewhat vulnerable in the near term should US rates rise further, but Bank Indonesia should take further regulations to encourage FX flows if that happens.
See: USD/INR seen at 83.70 on three-month view – MUFG
In the opinion of Markets Strategist Quek Ser Leang and Senior FX Strategist Peter Chia at UOB Group, AUD/USD risks further losses if it breaches 0.6280.
Key Quotes
24-hour view: While we expected AUD to weaken yesterday, we indicated that “oversold conditions suggest that it might not break clearly below 0.6330.” The anticipated AUD weakness exceeded our expectations as it plunged to a low of 0.6286 before recovering slightly. Conditions remain severely oversold; this, combined with tentative signs of slowing momentum, suggests AUD is unlikely to weaken much further. Today, AUD is more likely to trade sideways, probably between 0.6280 and 0.6350.
Next 1-3 weeks: Yesterday (03 Oct), when AUD was trading at 0.6365, we indicated that “downward momentum has built quickly.” We highlighted that AUD “is likely to weaken to 0.6330, possibly 0.6280.” We did quite expect the sharp and swift drop as AUD fell to a low of 0.6286 in NY session. The swift decline appears to be overstretched, but with no signs of stabilisation yet, AUD could continue to weaken. That said, it must break and stay below 0.6280 before further decline is likely (the next level to watch is 0.6230). The risk of AUD breaking clearly below 0.6280 will remain intact as long as it stays below 0.6400 (‘strong resistance’ level was at 0.6430 yesterday).
Considering advanced prints from CME Group for crude oil futures markets, open interest rose by around 19.5K contracts after three consecutive daily pullbacks on Tuesday. Volume followed suit and went up by nearly 20K contracts, reversing at the same time three straight daily drops.
WTI: Next target emerges near $95.00
Prices of WTI charted decent gains on Tuesday following many sessions of losses. The daily uptick was accompanied by increasing open interest and volume and leaves the door open to the continuation of the recovery in the very near term. On the upside, the commodity continues to target the 2023 high around the $95.00 mark per barrel.

- GBP/JPY holds above the 180.00 area amid the fear of FX intervention by Japanese authorities.
- The cross holds below the 50- and 100-hour EMAs with the bearish RSI on the four-hour chart.
- The first resistance level is seen at 181.58; 180.00 acts as an initial support level.
The GBP/JPY cross manages to find support above the 180.00 level during the early European session on Wednesday. The downtick of the pair is supported by the fear of FX intervention by Japanese authorities. The cross currently trades around 180.13, gaining 0.09% on the day.
Early Wednesday, Japan’s top currency diplomat Masato Kanda said any intervention would not target forex levels but volatility while mentioning that it's normal for authorities not to comment on whether they intervened or not. Additionally, Japan’s Chief Cabinet Secretary Hirokazu Matsuno said on Monday that he will continue to take appropriate steps on FX, but still have no comment on whether Japan intervened in the FX market.
From the technical perspective, the GBP/JPY cross holds below the 50- and 100-hour Exponential Moving Averages (EMAs) with a downward slope on the four-hour chart, highlighting the path of least resistance for the cross is to the downside.
The first resistance level of GBP/JPY is seen near the 50-hour EMA at 181.58. The additional upside filter to watch is at 182.17 (the 100-hour EMA). Further north, the next stop is located near the upper boundary of the Bollinger Band at 183.42. Any follow-through buying above the latter will see a rally to a high of September 15 at 183.90.
On the downside, 180.00 acts as an initial support level for the cross. Any decisive break below the latter will see a drop to the lower limit of the Bollinger Band at 179.43, en route to 178.85 (a low of June 16).
It’s worth noting that the Relative Strength Index (RSI) is located in bearish territory below 50, highlighting that further downside cannot be ruled out.
GBP/JPY four-hour chart

- NZD/USD weakens after RBNZ’s decision to keep OCR unchanged at 5.5%.
- Economic indicators suggest bearish sentiment around the Kiwi pair.
- The September’s low emerges as the support, aligned to 0.5850 major level.
NZD/USD continues the losses on the third day amid risk-off sentiment due to US Federal Reserve’s (Fed) interest rates trajectory. Additionally, the Reserve Bank of New Zealand (RBNZ) decided to hold the Official Cash Rate (OCR) unchanged at 5.5%, as widely expected, which adds up the pressure on the Kiwi pair.
The prevailing downward momentum in the pair indicates a bearish bias, as the 14-day Relative Strength Index (RSI) remains below the 50 level. The NZD/USD pair trades lower around 0.5900 psychological level during the Asian session on Wednesday, following the support region around September’s low at 0.5859 lined up with 0.5850 major level.
A firm break below the latter could influence the Kiwi bears to navigate the region around 0.5800 psychological level.
On the upside, the immediate barrier is likely at the seven-day Exponential Moving Average (EMA) at 0.5931, aligned with the major level at 0.5950. If the pair breaks above this level, it could open the doors for further exploration towards the region around the 23.6% Fibonacci retracement at 0.5980.
The Moving Average Convergence Divergence (MACD) indicator is signaling weakness for bulls of the NZD/USD pair, with the MACD line positioned below the centerline and shows convergence above the signal line. This setup indicates potentially weak momentum in the price movement.
NZD/USD: Daily Chart

- The index gyrates without direction above the 107.00 mark.
- Markets seem to have entered the usual pre-NFP lull.
- The ADP report, ISM Services PMI will be in the limelight.
The greenback, in terms of the USD Index (DXY), alternates gains with losses above the 107.00 mark so far on Wednesday.
USD Index focuses on US data, Fedspeak
The index seems to have entered a consolidative phase around the area of 2023 tops beyond the 107.00 yardstick against the backdrop of further upside in US yields across the curve and a tepid improvement in the risk complex.
In the meantime, the intense upside bias in the index was further underpinned by hawkish comments from Fed rate-setters and firm speculation of an extra rate hike by the Federal Reserve before the end of the year.
Interesting session data-wise in the US will see the release of the weekly Mortgage Applications by MBA, the ADP report, final readings of the Services PMI, Factory Orders and the always-relevant ISM Services PMI.
What to look for around USD
The rally in the dollar appears to have met a decent resistance in the low-107.00s for the time being, as markets enter the usual consolidation ahead of the publication of the jobs report on Friday.
In the meantime, support for the dollar keeps coming from the good health of the US economy, which at the same time appears underpinned by the renewed tighter-for-longer stance narrative from the Federal Reserve.
Key events in the US this week: MBA Mortgage Applications, ADP Employment Change, Final Services PMI, ISM Services PMI, Factory Orders (Wednesday) - Initial Jobless Claims, Balance of Trade (Thursday) – Nonfarm Payrolls, Unemployment Rate, Consumer Credit Change (Friday).
Eminent issues on the back boiler: Persevering debate over a soft or hard landing for the US economy. Incipient speculation of rate cuts in early 2024. Geopolitical effervescence vs. Russia and China.
USD Index relevant levels
Now, the index is losing 0.02% at 107.05 and faces the next support at 105.65 (low September 29) ahead of 104.42 (weekly low September 11) and then 103.13 (200-day SMA). On the flip side, a breakout of 107.34 (2023 high October 3) would open the door to 107.99 (weekly high November 21 2022) and finally 110.99 (high November 10 2022).
Markets Strategist Quek Ser Leang and Senior FX Strategist Peter Chia at UOB Group note GBP/USD could slip back to the 1.2000 region in the short-term horizon.
Key Quotes
24-hour view: We indicated yesterday that “the severely oversold GBP has room to weaken further; the major support at 1.2000 is likely out of reach for now.” We also indicated that “there is another support at 1.2050.” GBP weakened less than expected as it dipped to 1.2054 before ending the day largely unchanged at 1.2078 (-0.08%). The price action appears to be consolidative, and GBP is likely to trade in a range today, probably between 1.2050 and 1.2105.
Next 1-3 weeks: There is not much to add to our update from yesterday (03 Oct, spot at 1.2090). As we pointed out, the recent GBP weakness has resumed, likely towards 1.2000. In order to maintain the momentum buildup, GBP must not move above 1.2160 (‘strong resistance’ level was at 1.2190 yesterday).
Open interest in gold futures markets dropped by around 1.4K contracts after two consecutive daily builds on Tuesday, according to preliminary readings from CME Group. Volume, instead, remained erratic and increased by around 12.3K contracts following the previous daily drop.
Gold faces a tough support around $1800
Gold prices remained in free fall on Tuesday amidst shrinking open interest, which could be indicative that the selling pressure could be mitigating somewhat in the very near term. In the meantime, the precious metal is expected to meet strong contention around the $1800 region per troy ounce.

Extra losses appear in store for EUR/USD in the next few weeks, according to Markets Strategist Quek Ser Leang and Senior FX Strategist Peter Chia.
Key Quotes
24-hour view: While we expected EUR to ‘weaken further” yesterday, we were of the view that “the support at 1.0430 is likely out of reach.’ EUR then dipped to a low of 1.0447 and then closed at 1.0465 (-0.11%). While there is no clear increase in momentum, EUR could test 1.0430 today before levelling off. The next support at 1.0400 is highly unlikely to come under threat. Resistance is at 1.0485, followed by 1.0500.
Next 1-3 weeks: We continue to hold the same view as yesterday (03 Oct, spot at 1.0480). As highlighted, EUR is still in a bearish phase, and it is likely to weaken to 1.0430, potentially below 1.0400. If EUR breaks above 1.0545 (‘strong resistance’ level was at 1.0565 yesterday, it would mean that EUR is not weakening further.
- EUR/USD remains under selling pressure around 1.0467 amid the stronger USD.
- The major pair holds below the 50- and 100-hour EMAs with the bearish RSI.
- The key support level is seen at the 1.0400-1.0410 zone; the first resistance level is located at 1.0550.
The EUR/USD pair remains on the defensive above the mid 1.0400s during the early European trading hours on Wednesday. The major pair bounces off the year-to-date (YTD) low of 1.0448 and currently trades near 1.0467, up 0.01% on the day.
Market players await the Eurozone Producer Price Index (PPI) and Retail Sales for fresh impetus. Also, the European Central Bank (ECB) President Lagarde's speech on Wednesday will be in the spotlight. The annual Eurozone Retail Sales for August is expected to drop 1.2% from the previous reading of a 1% fall.
From the technical perspective, the EUR/USD pair holds below the 50- and 100-hour Exponential Moving Averages (EMAs) with a downward slope on the four-hour chart, which means the path of least resistance for the pair is to the downside. Furthermore, the Relative Strength Index (RSI) holds in bearish territory below 50, supporting the sellers for the time being.
That said, the key support level for the EUR/USD pair is seen at the 1.0400-1.0410 region, representing the lower limit of the Bollinger Band and a psychological round mark. The next contention to watch is near a low of September 25 at 1.0355. Further south, the next stop of the major pair is seen at 1.0320 (a low of November 29).
On the upside, the first resistance level for the major pair is located near the 50-hour EMA at 1.0550. The additional upside filter will emerge near the upper boundary of the Bollinger Band at 1.0609, followed by 1.0624 (the 100-hour EMA). Any follow-through buying above the latter will see a rally to 1.0670 (a high of September 22), followed by a psychological figure at 1.0700.
EUR/USD four-hour chart
-638319924254040613.png)
- GBP/USD is seen consolidating in a narrow band near a multi-month low touched on Tuesday.
- The extremely oversold RSI on the daily chart holds back bearish traders from placing fresh bets.
- The divergent Fed-BoE policy outlook supports prospects for an extension of the declining trend.
The GBP/USD pair struggles to register any meaningful recovery and languishes near its lowest level since March 16, around the 1.2050 area touched the previous day.
The prospects for further policy tightening by the Federal Reserve (Fed) remain supportive of elevated US Treasury bond yields and assist the US Dollar (USD) to stand tall near a 10-month high. This, along with the prevalent risk-off environment, is seen as another factor benefitting the Greenback's relative safe-haven status. Apart from this, the Bank of England's (BoE) surprise on-hold decision in September continues to undermine the British Pound (GBP) and acts as a headwind for the GBP/USD pair.
From a technical perspective, the Relative Strength Index (RSI) on the daily chart is flashing extremely oversold conditions and holding back traders from placing fresh bearish bets. Hence, it will be prudent to wait for some follow-through selling below mid-1.2000s, representing the 38.2% Fibonacci retracement level of the September 2022-July 2023 rally, before positioning for further losses. The GBP/USD pair might then accelerate the downfall further towards the 1.2000 psychological mark.
The next relevant support is pegged near the 1.1965 horizontal zone, which if broken decisively will be seen as a fresh trigger for bearish traders. The subsequent downfall has the potential to drag spot prices further towards the 1.1915 region en route to the 1.1900 mark. The GBP/USD pair could eventually drop to the 1.1800 neighbourhood, or the YTD low touched in March, en route to the 50% Fibo. level support near the 1.1740-1.1735 area.
On the flip side, any meaningful recovery beyond the 1.2100 mark is likely to confront a stiff hurdle near the 1.2140-1.2145 zone. A sustained strength beyond, however, could trigger a short-covering rally and allow the GBP/USD pair to reclaim the 1.2200 round figure. The momentum could get extended further, though might still be seen as a selling opportunity and runs the risk of fizzling out rather quickly near the last week's swing high, around the 1.2270 region.
GBP/USD daily chart
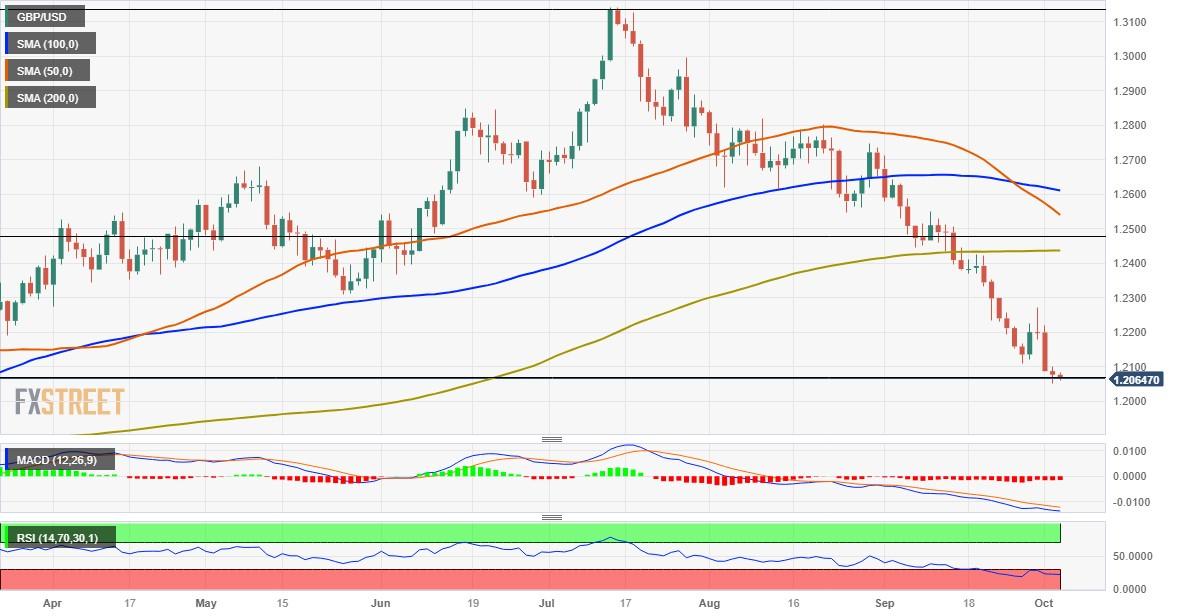
Technical levels to watch
- USD/CAD trades in positive territory for the fourth consecutive day on Wednesday.
- A decline in oil prices exerts pressure on the commodity-linked Loonie.
- US JOLTS Job Openings came in above expectations.
- Market players await the Canadian and US employment data due on Friday.
The USD/CAD pair climbs above the 1.3700 mark during the early European session on Wednesday. A rally in the US Dollar (USD) and the upbeat US data are the main drivers for the pair’s uptick. Meanwhile, the US Dollar Index (DXY), a measure of the value of the USD relative to a basket of foreign currencies, surges to 107.17, the highest since November last year. USD/CAD currently trades around 1.3715, gaining 0.06% on the day.
Data released on Monday revealed that the Canadian S&P Global Manufacturing PMI for September came in at 47.5 from 48.0 in the previous reading. Additionally, a decline in oil prices dragged the commodity-linked Loonie lower as the country is the leading oil exporter to the US.
On the US Dollar front, the number of job openings for August stood at 9.6M from 8.9M (revised from 8.8M) in the previous reading, according to the Job Openings and Labor Turnover Survey (JOLTS) on Tuesday. This figure came in better than the expectation of 8.8 million by a wide margin.
Furthermore, Cleveland Federal Reserve President Loretta Mester stated on Tuesday that she is likely to favor an interest rate hike at the next meeting if the current economic situation holds while mentioning that the Fed is likely at or near peak for interest rate target. Meanwhile, Atlanta Fed President Raphael Bostic said he will be patient and there is an urgency for us to do anything more.
The US employment data this week could offer hints about the further monetary policy of the Federal Reserve (Fed). The stronger-than-expected data could lift the Greenback demand and act as a tailwind for the USD/CAD pair.
Looking ahead, traders will keep an eye on the US ADP Employment Change and ISM Services PMI due on Wednesday. The highlight this week will be the release of Canadian employment data and US Nonfarm Payrolls on Friday. These events could provide a clear direction to the USD/CAD pair.
- Gold price remains on the defensive and well within the striking distance of a near seven-month trough.
- Hawkish Fed expectations, elevated US bond yields and a bullish USD continue to weigh on the metal.
- Investors now look to the US ADP report and ISM Services PMI for short-term trading opportunities.
Gold price (XAU/USD) dived to a near seven-month low on Tuesday and recorded losses for the seventh straight day – its longest losing streak since August 2022. The yellow metal found some support near the $1,815 region, though it struggled to gain any meaningful traction and remained on the defensive through the Asian session on Wednesday. The fundamental backdrop, meanwhile, seems tilted in favour of bearish traders and supports prospects for an extension of the recent downfall witnessed over the past two weeks or so.
Investors seem convinced that the Federal Reserve (Fed) will keep interest rates higher for longer, which, in turn, might continue to act as a headwind for the non-yielding Gold price. The expectations were reaffirmed by the Job Openings and Labor Turnover Survey, or JOLTS report, on Tuesday, which showed that job openings in the United States (US) unexpectedly rose in August amid a surge in demand for workers and pointed to a still-tight labour market. This comes on top of a rise in consumer spending and brings wage inflation back on the agenda.
This might force the Fed to stick to its hawkish stance and possibly extend the rate-hiking cycle into 2024. The outlook remains supportive of elevated US Treasury bond yields and continues to underpin the US Dollar (USD), suggesting that the path of least resistance for the Gold price is to the downside. That said, oversold conditions on the daily chart and the prevalent risk-off mood could limit losses for the safe-haven XAU/USD. Traders now look to the US ADP report and ISM Services PMI for some impetus ahead of the US NFP report on Friday.
Daily Digest Market Movers: Gold price continues to be undermined by hawkish Fed expectations
- Gold price struggles to register any recovery and languishes near a multi-month low in the wake of the Federal Reserve's hawkish view and higher-for-longer interest rates narrative.
- The recent comments by several Fed officials also backed the case for at least one more 25 basis points (bps) lift-off by the end of this year to bring inflation back to the 2% target.
- The monthly JOLTS report showed that there were an estimated 9.61 million open jobs in August, marking a sizeable uptick from the previous month's upwardly revised print of 8.92 million openings.
- This, along with persistently high inflationary pressures, could compel the Fed to stick to its hawkish stance and raise interest rates at its next monetary policy meeting in November.
- Republican Kevin McCarthy, who navigated legislation to keep the government running until November 17, becomes the first US House speaker to be removed from his job.
- The development exposes GOP infighting and sparks chaos ahead of the 2024 election, which, along with looming recession risks, continues to weigh on investors' sentiment.
- Traders now look to the ADP report, expected to show that the US private-sector employers added 153K jobs in September as compared to the 177K in the previous month.
- The US economic docket also features the ISM Service PMI, which is anticipated to ease from 54.5 to 53.6 in September and should provide some impetus to the XAU/USD.
Technical Analysis: Gold price could slide further towards testing the $1,800 mark
The Relative Strength Index (RSI) on the daily chart is flashing extremely oversold conditions and makes it prudent to wait for some near-term consolidation or a modest bounce before positioning for a further depreciating move. The lack of firm buying interest, meanwhile, suggests that the path of least resistance for the Gold price is to the downside. Hence, a slide below the $1,815 level, or a multi-month low set on Tuesday, leaning towards challenging the $1,800 round figure, looks like a distinct possibility. Some follow-through selling will expose the next relevant support near the $1,770-1,760 region. On the flip side, any recovery attempt might confront stiff resistance and remain capped near the $1,830-1,832 horizontal zone. A sustained strength beyond, however, might trigger a short-covering rally and lift the yellow metal to the $1,850 hurdle en route to the $1,858-1,860 strong barrier.
Economic Indicator
United States ADP Employment Change
The Employment Change released by the Automatic Data Processing, Inc, Inc is a measure of the change in the number of employed people in the US. Generally speaking, a rise in this indicator has positive implications for consumer spending, stimulating economic growth. So a high reading is traditionally seen as positive, or bullish for the USD, while a low reading is seen as negative, or bearish.
Read more.Next release: 10/04/2023 12:15:00 GMT
Frequency: Monthly
Source: ADP Research Institute
Why it matters to traders
Traders often consider employment figures from ADP, America’s largest payrolls provider, report as the harbinger of the Bureau of Labor Statistics release on Nonfarm Payrolls (usually published two days later), because of the correlation between the two. The overlaying of both series is quite high, but on individual months, the discrepancy can be substantial. Another reason FX traders follow this report is the same as with the NFP – a persistent vigorous growth in employment figures increases inflationary pressures, and with it, the likelihood that the Fed will raise interest rates. Actual figures beating consensus tend to be USD bullish.
- USD/INR receives upward support on market caution regarding the Fed’s interest rates trajectory.
- RBI is expected to keep its current interest rates unchanged at 6.50% in October’s meeting.
- Stronger jobs data bolster the US yields; contributing support for the Greenback.
USD/INR hovers around 83.20 during the Asian session on Wednesday. The pair is receiving upward support amid market caution regarding the US Federal Reserve’s (Fed) likelihood to keep interest rates higher for a prolonged period.
However, the Reserve Bank of India (RBI) could step in to curb the upward momentum of the USD/INR pair by selling US Dollars (USD) in the non-deliverable forwards market. Additionally, dollar sales from foreign banks related to custodial flows could offer support to the rupee.
Short positions on the rupee have strengthened and are now at their highest since November 2022, as per a Reuters poll.
US Dollar Index (DXY) surged to an 11-month high in the previous session, propelled by robust US employment data and higher US Treasury yields. The spot hovers around 107.10 at the time of writing.
US JOLTS Job Openings outpaced expectations, contributing to an uptick in US Treasury yields. The 10-year US Bond yield reached its highest level since 2007, hitting 4.85% on Wednesday.
JOLTS report showed that job openings improved to 9.61 million in August from the previous reading of 8.92 million, surpassing market expectations. Furthermore, cautious sentiments surrounding the US Federal Reserve's (Fed) interest rate trajectory are bolstering positive sentiment for the Greenback.
Cleveland Federal Reserve President Loretta Mester indicated a likelihood of favoring an interest rate hike at the next meeting if the current economic conditions persist. Conversely, Atlanta Fed President Raphael Bostic shared a patient perspective on the Fed's policy outlook, stating that there is no rush to raise or reduce rates.
Market participants await the US employment data, with the release of the ADP report on Wednesday and the Nonfarm Payrolls on Friday. On the other side, Traders will likely watch the RBI's interest rate decision on Friday, with expectations that it will maintain the current level of 6.50%.
- EUR/JPY recovers from a two-day losing streak despite BoJ’s verbal interventions.
- The risk-off sentiment could limit the potential of the cross-pair.
- Differences of opinion among ECB officials reflect the complex situation surrounding the Eurozone economy.
EUR/JPY recovers from the two-day losses, trading higher around 156.20 during the Asian session on Wednesday. The cross pair receives upward support despite the verbal interventions by Japanese authorities to protect the domestic currency.
Japan's Finance Minister, Shunichi Suzuki, has reiterated the government's stance against rapid currency movements, expressing disapproval. Suzuki emphasized that the government will consider various options to counter excessive moves in the foreign exchange market.
Masato Kanda, Japan's top currency diplomat, echoed Suzuki's sentiments and refrained from commenting on whether Japan had intervened in the foreign exchange market.
Indeed, the Japanese Yen often sees increased demand during risk-off periods as investors seek safety. The combination of Japan's finance minister expressing concern about rapid currency moves and the overall risk-off sentiment appears to be supporting the Yen's safe-haven appeal, which could put a ceiling on the advance of the EUR/JPY cross pair.
The Eurozone seems to be in a state of wait-and-see regarding interest rate hikes from the European Central Bank (ECB). Recent comments from ECB officials suggest a cautious approach, with a focus on inflation targeting.
ECB Governing Council member Tuomas Välimäki doesn't see a stagflation prospect in the euro area, suggesting a more optimistic view. On the other hand, ECB Chief Economist Philip Lane acknowledges that the ECB has more work to do to reach the inflation target, indicating a more cautious stance.
These differing perspectives may reflect the complexities and uncertainties surrounding the Eurozone's economic situation, which may act as a headwind for the Euro. The upcoming release of economic indicators like the Producer Price Index (PPI) and Retail Sales will likely provide further insights into the Eurozone's economic overview.
- WTI Crude Oil prices manage to hold above a three-week low touched the previous day.
- A bullish USD and fuel demand worries turn out to be key factors exerting some pressure.
- Traders look to the OPEC+ meeting and the EIA report on US inventory for a fresh impetus.
West Texas Intermediary (WTI) Crude Oil prices struggle to capitalize on the overnight bounce from a three-week low – levels just below the $87.00/barrel mark and edges lower during the Asian session on Wednesday. The commodity currently trades around the $88.15-$88.10 area, down over 0.35% for the day, though the downside seems cushioned ahead of the OPEC+ panel meeting later today.
Ministers from the Organization of the Petroleum Exporting Countries (OPEC) and allies, known as OPEC+, are unlikely to tweak its current oil output policy in the wake of tightening global crude supply and rising demand. The market focus, meanwhile, will be an expected update on plans by Saudi Arabia and Russia for their voluntary cuts. In fact, the world's two largest Oil producers announced in September that they would extend the voluntary cuts amounting to 1.3 million barrels per day to the end of the year and said they would review the cut decisions monthly.
Apart from this, traders will take cues from the official Energy Information Administration (EIA) report on US stockpiles. The weekly inventory data published by the American Petroleum Institute (API) on Tuesday showed that US Crude Oil stockpiles possibly fell as much as 4.0 million barrels last week. The consensus estimates, meanwhile, suggest a drawdown of 0.092 million barrels as compared to a fall of 2.17 million barrels in the previous week. Nevertheless, the data might infuse some volatility and produce some trading opportunities around Crude Oil prices.
In the meantime, the underlying bullish sentiment surrounding the US Dollar (USD), bolstered by firming expectations for further policy tightening by the Federal Reserve (Fed), could act as a headwind for the USD-denominated commodity. This, along with worries that economic headwinds stemming from rapidly rising borrowing costs could dent fuel demand, might contribute to keeping a lid on any meaningful upside for Crude Oil prices.
Technical levels to watch
- USD/MXN attracts some buyers above the 18.00 area on Wednesday amid the stronger USD.
- US JOLTS Job Openings came in above expectations.
- The downbeat Mexican data exerts pressure on the Mexican Peso.
- Market players will monitor US ADP Employment Change and ISM Services PMI on Wednesday.
The US Dollar (USD) gains traction against the Mexican Peso (MXN) during the early Asian trading hours on Wednesday. The uptick of the pair is bolstered by the rally of the US Dollar, higher US Treasury bond yields, and the upbeat US data. USD/MXN currently trades around 18.07, up 0.03% on the day.
Meanwhile, the US Dollar Index (DXY), a measure of the value of the USD relative to a basket of foreign currencies, surges to 107.10 the highest level since November last year. The US Treasury yields also edge higher on Wednesday, with the US 10-Y yield staying at 4.83%, the highest level since 2007.
The US Bureau of Labor Statistics (BLS) revealed in the Job Openings and Labor Turnover Survey (JOLTS) on Tuesday that the number of job openings for August stood at 9.6M from 8.9M (revised from 8.8M) in the previous reading. The figure came in better than the expectation of 8.8 million by a wide margin.
On Tuesday, Cleveland Federal Reserve President Loretta Mester stated that she is likely to favor an interest rate hike at the next meeting if the current economic situation holds while mentioning that the Fed is likely at or near peak for interest rate target. Meanwhile, Atlanta Fed President Raphael Bostic said he will be patient and there is an urgency for us to do anything more.
On the other hand, Mexico’s S&P Global Manufacturing PMI for September came in at 49.8 from the previous reading of 51.2. The figure dropped to the contractionary territory and weighed on the Mexican Peso. Apart from the data, the Mexico's interest rates are expected to remain at 11.25%, according to a recent poll by Banxico,
Looking ahead, market players will monitor the US ADP Employment Change and ISM Services PMI due later in the Amercan session on Wednesday. The attention will shift to the highly-anticipated US Nonfarm Payrolls on Friday. These events could give a clear direction to the USD/MXN pair.
| Raw materials | Closed | Change, % |
|---|---|---|
| Silver | 21.16 | 0.54 |
| Gold | 1823.296 | -0.31 |
| Palladium | 1173.65 | -2.61 |
Japan's top currency diplomat Masato Kanda is back on the wires in Asian trading on Wednesday, noting that “any intervention would not target forex levels but volatility.”
Key quotes
No comment on whether I discussed weak Yen with PM Kishida.
It's normal for authorities not to comment on whether they intervened or not.
Duration of excessive moves could be over one week or beyond that, when asked what constitutes excessive moves in forex market.
If one-sided moves persist for long time, that could be considered as excessive moves.
We are acting in accordance with G7, G20 agreement on forex, when asked about smoothing operations.
Related reads
- Japan’s Matsuno: Will continue to take appropriate steps on FX
- Japan’s Suzuki: No comment on whether Japan intervened in FX market
Japan’s Chief Cabinet Secretary Hirokazu Matsuno said on Monday, he “will continue to take appropriate steps on FX.”
Further comments
No comment on whether Japan intervened in the FX market.
Important for currencies to move stably reflecting fundamentals.
Excessive FX moves undesirable.
Market reaction
USD/JPY is keeping its range around 149.20 on the above comments, up 0.13% so far.
- Gold price hovers around seven-month lows on upbeat US Dollar.
- Risk-off sentiment exerts pressure on non-yielding assets like Gold.
- Upbeat US jobs data reinforces the US Bond yields; providing support to the Greenback.
Gold price continues its losing streak that began on September 25, trading lower around $1,820 per troy ounce during the early Asian trading session on Wednesday. The prices of Gold are facing downward pressure amid risk-off sentiment and a stronger US Dollar (USD).
Moderate Chinese economic data released over the weekend failed to contribute any support for the precious metal. China’s NBS Manufacturing PMI for August grew to 50.2 from the previous 49.7 figures, exceeding the 50.0 expected.
Non-manufacturing PMI rose to 51.7 from the 51.0 previous reading, surpassing the market consensus of 51.5. Furthermore, Caixin Manufacturing's PMI reduced to 50.6 in September from the previous print of 51.0, which was expected to improve to 51.2.
US Dollar Index (DXY) surged to an 11-month high in the previous session, propelled by robust US employment data and higher US Treasury yields. The spot hovers around 107.10 at the time of writing.
US JOLTS Job Openings outpaced expectations, contributing to an uptick in US Treasury yields. The 10-year US Bond yield reached its highest level since 2007, hitting 4.81% on Tuesday.
US JOLTS Job Openings improved to 9.61 million in August from the previous reading of 8.92 million, surpassing market expectations. Furthermore, cautious sentiments surrounding the US Federal Reserve's (Fed) interest rate trajectory are bolstering positive sentiment for the Greenback.
Cleveland Federal Reserve President Loretta Mester indicated a likelihood of favoring an interest rate hike at the next meeting if the current economic conditions persist. Conversely, Atlanta Fed President Raphael Bostic shared a patient perspective on the Fed's policy outlook, stating that there is no rush to raise or reduce rates.
Market participants await the US employment data, with the release of the ADP report on Wednesday and the Nonfarm Payrolls on Friday.
- USD/JPY builds on the overnight solid recovery from a three-week low, albeit lacks follow-through.
- The underlying strong USD bullish sentiment turns out to be a key factor lending support to the pair.
- Intervention fears, along with the risk-off mood, seem to underpin the safe-haven JPY and cap gains.
The USD/JPY pair gains some positive traction during the Asian session on Wednesday and moves further away from its lowest level since September 14, around the 147.25-147.30 area touched the previous day. Spot prices trade around the 149.20 region, up 0.15% for the day, though lack bullish conviction in the wake of jawboning by Japanese authorities to defend the domestic currency.
Japan's Finance Minister Shunichi Suzuki reiterated that rapid FX moves are undesirable and that the government will not rule out any options against excessive moves. Suzuki, meanwhile, added that he doesn’t want to comment on whether Japan intervened in the FX market, so did Japan's top currency diplomat Masato Kanda. It is worth recalling that the Japanese Yen (JPY) strengthened sharply against its American counterpart late Tuesday, with the USD/JPY pair tumbling nearly 300 pips from levels just above the 150.00 psychological mark, or a fresh 11-month high.
Nevertheless, speculations that Japan will intervene in the FX market to combat a sustained depreciation in the JPY might keep a lid on any meaningful appreciating move for the major. Apart from this, the prevalent risk-off environment could further benefit the JPY's relative safe-haven status and contribute to capping the USD/JPY pair. The downside, however, remains cushioned in the wake of a strong bullish sentiment surrounding the US Dollar (USD), which stands tall near its highest level since November 2022 and remains well supported by the Federal Reserve's (Fed) hawkish outlook.
Several Fed officials recently backed the case for at least one more rate hike by the end of this year to bring inflation back to the 2% target. Adding to this, the better-than-expected release of the monthly JOLTS report on Tuesday, showing that there were an estimated 9.61 million open jobs in August, brought wage inflation back on the agenda. This, in turn, reaffirms expectations that the Fed will keep rates higher for longer and could extend the rate-hiking cycle into 2024, which lifts the benchmark 10-year US government bond to a fresh 16-peak and continues to underpin the Greenback.
The aforementioned fundamental backdrop seems tilted firmly in favour of bullish traders and suggests that any meaningful corrective slide around the USD/JPY pair is more likely to get bought into. Market participants now look to the US macro data – the ADP report on private-sector employment and the ISM Services PMI – later during the early North American session. This, along with the US bond yields, should influence the USD price dynamics. Apart from this, the broader risk sentiment might contribute to producing short-term trading opportunities around the major.
Technical levels to watch
- EUR/USD attracts some sellers below the 1.0500 mark on Wednesday.
- US JOLTS Job Openings came in above expectations.
- ECB policymakers said they don't see a stagflation prospect in the euro area.
- Traders await the Eurozone Producer Price Index (PPI) and Retail Sales.
The EUR/USD pair remains under selling pressure around 1.0475 after bouncing off the ten-month low near 1.0450 during the early Asian trading hours on Wednesday.
On Tuesday, the Job Openings and Labor Turnover Survey (JOLTS) showed that the number of job openings for August stood at 9.6 million from the previous month of 8.9 million (revised from 8.8 million). The figure came in better than the estimation of 8.8 million by a wide margin. Following the upbeat data, the US Dollar (USD) surged above 107.10 while US Treasury yields traded higher. The 10-year yield reached 4.82%, the highest since 2007.
Cleveland Federal Reserve President Loretta Mester stated on Tuesday that she is likely to favor an interest rate hike at the next meeting if the current economic situation holds while mentioning that the Fed is likely at or near peak for interest rate target. The Atlanta Fed President Raphael Bostic said he will be patient and there is an urgency for us to do anything more. That said, the better-than-expected US economic data, higher yield, and cautious mood in the market lift the Greenback against its rivals and act as a headwind for the EUR/USD pair.
On the Euro front, markets are largely anticipating no interest rate hike from the European Central Bank (ECB) soon. On Tuesday, ECB Governing Council member Tuomas Välimäki said that central bank policymakers don't see a stagflation prospect in the euro area while ECB Chief Economist, Philip Lane commented that the ECB is not yet at the inflation target, more work needs to be done.
Looking ahead, market participants will monitor the Eurozone Producer Price Index (PPI) and Retail Sales for August due on Wednesday. The annualized PPI figure is expected to fall from -7.6% to -11.6%, while the Retail Sales are expected to drop, from -1% to -1.2%. Also, the US ADP Employment Change and ISM Services PMI will be released later in the Amercan session. On Friday, the attention will shift to the highly-anticipated US Nonfarm Payrolls.
Japanese Finance Minister Shunichi Suzuki said on Wednesday that he doesn’t want to “comment on whether Japan intervened in the FX market.”
Additional quotes
Currency rates should be set by the market.
Rapid FX moves are undesirable.
FX stability is important.
Won't rule out any options against excessive moves.
We are watching FX moves very carefully.
Market reaction
USD/JPY is holding higher ground near 149.25, despite the Japanese jaw-boning. The pair is up 0.15% on the day, as of writing.
- NZD/USD turns lower after the RBNZ decided to leave its cash rate target unchanged.
- The dovish-sounding monetary policy statement exerts some pressure on the Kiwi.
- The USD stands tall near a multi-month high and contributes to the intraday decline.
The NZD/USD pair meets with a fresh supply after the Reserve Bank of New Zealand (RBNZ) announced its monetary policy decision and turns lower for the third successive day on Wednesday. Spot prices slid to a fresh three-week low, further below the 0.5900 mark in the last hour and seem vulnerable to weaken further.
As was widely anticipated, the RBNZ decided to keep its cash rate target unchanged at 5.50% and sounded a bit dovish in the accompanying monetary policy statement. The central bank noted that demand growth in the economy continues to ease and higher interest rates are reducing inflationary pressure as required. This, in turn, suggests that the RBNZ might have ended the rate-hiking cycle and undermined the New Zealand Dollar (NZD), which, along with a bullish US Dollar (USD), exerts pressure on the NZD/USD pair.
In fact, the USD Index (DXY), which tracks the Greenback against a basket of currencies, holds steady near a 10-month high and remains well supported by the Federal Reserve's (Fed) hawkish view. Investors seem convinced that the US central bank is more likely to tighten its monetary policy further and keep interest rates higher for longer. The bets were reaffirmed by the recent comments by several Fed officials, backing the case for at least one more rate hike by the end of this year to bring inflation back to the 2% target.
Adding to this, the latest monthly JOLTS report showed that there were an estimated 9.61 million open jobs in August, marking a sizeable uptick from the previous month's upwardly revised reading of 8.92 million openings. The data suggested that wage inflation may be back on the agenda, which might force the Fed to extend the rate-hiking cycle into 2024, pushing the yield on the benchmark 10-year US government bond to a fresh 16-peak. This, along with, a weaker risk tone further benefits the Greenback's safe-haven status.
The prolonged selloff in the US fixed-income market and surging US bond yields add to concerns about economic headwinds stemming from rapidly rising borrowing costs. Apart from this, persistent worries about China's ailing property sector continue to weigh on investors' sentiment and weigh on the risk-sensitive Kiwi. With the latest leg down, the NZD/USD pair now seems to have found acceptance below the 0.5900 mark and is likely to prolong its recent downfall from mid-0.6000s, or a near two-month high set last week.
Technical levels to watch
- Australian Dollar struggles to retrace the recent losses.
- RBA’s decision to keep policy rates unchanged might exert pressure on the Aussie Dollar.
- Higher US Treasury yields bolster the Greenback, coupled with upbeat US employment data.
The Australian Dollar (AUD) attempts to snap a two-day losing streak on Wednesday. However, the AUD/USD pair is under pressure due to risk-off sentiment and stronger US Dollar (USD). Additionally, the pair weakened after the interest rate decision by the Reserve Bank of Australia (RBA) on Tuesday.
Australia's central bank opted to maintain the status quo, leaving the current interest rate unchanged at 4.10% in the recent policy meeting. This decision might exert pressure on the Aussie pair. Nevertheless, there is a possibility of a rate hike, with expectations pointing toward a peak of 4.35% by the end of the year. This projection aligns with the persistent elevation of inflation above the target.
The US Dollar Index (DXY) climbed to an 11-month high on the back of the upbeat US employment data and higher US Treasury yields. US JOLTS Job Openings exceeded expectations, leading to an increase in US yields. The 10-year US Treasury yield reached its highest since 2007.
Additionally, market caution regarding the US Federal Reserve's (Fed) interest rate trajectory is contributing to the positive sentiment surrounding the Greenback.
Daily Digest Market Movers: Australian Dollar weakens due to stronger US Dollar, market caution
- RBA chose to maintain the Official Cash Rate (OCR) at 4.10%, aligning with widespread expectations, which might exert pressure on the Aussie Dollar.
- Michele Bullock, the newly appointed governor of the RBA, emphasized in her inaugural monetary policy statement that there might be a need for additional tightening of monetary policy.
- Bullock mentioned that recent data align with the return of inflation to the target range. While inflation in Australia has peaked, it remains elevated and is expected to persist for a while.
- The 10-year US Treasury yield reached to 4.81% on Tuesday, the highest level since 2007.
- US JOLTS Job Openings improved to 9.61M in August from the previous reading of 8.92M. The market was expecting a decline to 8.80M figures.
- Cleveland Federal Reserve President Loretta Mester stated on Tuesday that she is likely to favor an interest rate hike at the next meeting if the current economic situation holds.
- Atlanta Fed President Raphael Bostic shared his perspective on the Federal Reserve's policy outlook, stating, "I am not in a hurry to raise, not in a hurry to reduce either." He emphasized a patient approach, indicating that there is no urgency for further actions at the moment.
- Traders await the US employment data, with the release of the ADP report on Wednesday and the Nonfarm Payrolls on Friday. Australia’s Trade Balance will also be eyed on Thursday.
Technical Analysis: Australian Dollar hovers around 0.6300, November's low emerges as support
Australian Dollar trades around 0.6310 on Wednesday. The major level at 0.6300 emerges as the immediate support, followed by November's low at 0.6272. On the upside, the 21-day Exponential Moving Average (EMA) at 0.6402 appears to be a key barrier, following the 23.6% Fibonacci retracement at 0.6464 level.
AUD/USD: Daily Chart
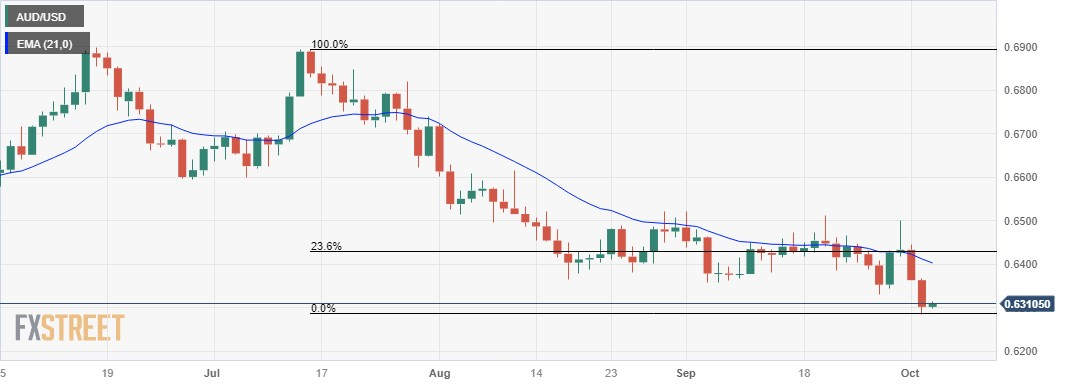
RBA FAQs
What is the Reserve Bank of Australia and how does it influence the Australian Dollar?
The Reserve Bank of Australia (RBA) sets interest rates and manages monetary policy for Australia. Decisions are made by a board of governors at 11 meetings a year and ad hoc emergency meetings as required. The RBA’s primary mandate is to maintain price stability, which means an inflation rate of 2-3%, but also “..to contribute to the stability of the currency, full employment, and the economic prosperity and welfare of the Australian people.” Its main tool for achieving this is by raising or lowering interest rates. Relatively high interest rates will strengthen the Australian Dollar (AUD) and vice versa. Other RBA tools include quantitative easing and tightening.
How does inflation data impact the value of the Australian Dollar?
While inflation had always traditionally been thought of as a negative factor for currencies since it lowers the value of money in general, the opposite has actually been the case in modern times with the relaxation of cross-border capital controls. Moderately higher inflation now tends to lead central banks to put up their interest rates, which in turn has the effect of attracting more capital inflows from global investors seeking a lucrative place to keep their money. This increases demand for the local currency, which in the case of Australia is the Aussie Dollar.
How does economic data influence the value of the Australian Dollar?
Macroeconomic data gauges the health of an economy and can have an impact on the value of its currency. Investors prefer to invest their capital in economies that are safe and growing rather than precarious and shrinking. Greater capital inflows increase the aggregate demand and value of the domestic currency. Classic indicators, such as GDP, Manufacturing and Services PMIs, employment, and consumer sentiment surveys can influence AUD. A strong economy may encourage the Reserve Bank of Australia to put up interest rates, also supporting AUD.
What is Quantitative Easing (QE) and how does it affect the Australian Dollar?
Quantitative Easing (QE) is a tool used in extreme situations when lowering interest rates is not enough to restore the flow of credit in the economy. QE is the process by which the Reserve Bank of Australia (RBA) prints Australian Dollars (AUD) for the purpose of buying assets – usually government or corporate bonds – from financial institutions, thereby providing them with much-needed liquidity. QE usually results in a weaker AUD.
What is Quantitative tightening (QT) and how does it affect the Australian Dollar?
Quantitative tightening (QT) is the reverse of QE. It is undertaken after QE when an economic recovery is underway and inflation starts rising. Whilst in QE the Reserve Bank of Australia (RBA) purchases government and corporate bonds from financial institutions to provide them with liquidity, in QT the RBA stops buying more assets, and stops reinvesting the principal maturing on the bonds it already holds. It would be positive (or bullish) for the Australian Dollar.
- GBP/USD remains confined in a narrow range near its lowest level since March set on Tuesday.
- Bets for more Fed rate hikes, surging US bond yields and a weaker risk tone underpin the USD.
- The BoE’s surprise on-hold decision continues to weigh on the GBP and contributes to capping.
The GBP/USD pair extends its consolidative price move for the second successive day on Wednesday and remains well within the striking distance of the lowest level since March 16 touched the previous day. Spot prices trade below the 1.2100 mark during the Asian session and seem vulnerable to prolonging a nearly three-month-old downtrend from a 15-month peak set in July.
The US Dollar (USD) stands tall near a 10-month high in the wake of the Federal Reserve's (Fed) hawkish view and turns out to be a key factor acting as a headwind for the GBP/USD pair. Investors seem convinced that the US central bank will continue to tighten its monetary policy and keep interest rates higher for longer. Moreover, several Fed officials recently backed the case for at least one more rate hike by the year-end to bring inflation back to the 2% target.
Adding to this, the latest monthly JOLTS report showed that there were an estimated 9.61 million open jobs in August, marking a sizeable uptick from the previous month's upwardly revised reading of 8.92 million openings. The data suggested that wage inflation may be back on the agenda, which might force the Fed to extend the rate-hiking cycle into 2024. This pushes the yield on the benchmark 10-year US government bond to a fresh 16-peak and underpins the USD.
Meanwhile, the prolonged selloff in the US fixed-income market adds to concerns about economic headwinds stemming from rapidly rising borrowing costs. This, in turn, tempers investors' appetite for riskier assets and turns out to be another factor that benefits the safe-haven Greenback. Furthermore, the Bank of England's (BoE) surprise on-hold decision in September continues to weigh on the British Pound (GBP) and contributes to capping the GBP/USD pair.
The aforementioned fundamental backdrop seems tilted firmly in favour of bearish traders, though the oversold Relative Strength Index (RSI) on the daily chart warrants caution before positioning for any further losses. Market participants now look to the final UK Services PMI for fresh imputes ahead of the US macro data – the ADP report on private-sector employment and the ISM Services PMI – later during the early North American session.
Technical levels to watch
| Index | Change, points | Closed | Change, % |
|---|---|---|---|
| NIKKEI 225 | -521.94 | 31237.94 | -1.64 |
| Hang Seng | -478.44 | 17331.22 | -2.69 |
| ASX 200 | -89.8 | 6943.4 | -1.28 |
| DAX | -162 | 15085.21 | -1.06 |
| CAC 40 | -71.11 | 6997.05 | -1.01 |
| Dow Jones | -430.97 | 33002.38 | -1.29 |
| S&P 500 | -58.94 | 4229.45 | -1.37 |
| NASDAQ Composite | -248.3 | 13059.47 | -1.87 |
| Pare | Closed | Change, % |
|---|---|---|
| AUDUSD | 0.63022 | -0.96 |
| EURJPY | 155.955 | -0.66 |
| EURUSD | 1.0465 | -0.12 |
| GBPJPY | 179.98 | -0.62 |
| GBPUSD | 1.20753 | -0.09 |
| NZDUSD | 0.59092 | -0.69 |
| USDCAD | 1.37082 | 0.25 |
| USDCHF | 0.92111 | 0.35 |
| USDJPY | 149.058 | -0.52 |


© 2000-2026. Уcі права захищені.
Cайт знаходитьcя під керуванням TeleTrade DJ. LLC 2351 LLC 2022 (Euro House, Richmond Hill Road, Kingstown, VC0100, St. Vincent and the Grenadines).
Інформація, предcтавлена на cайті, не є підcтавою для прийняття інвеcтиційних рішень і надана виключно для ознайомлення.
Компанія не обcлуговує та не надає cервіc клієнтам, які є резидентами US, Канади, Ірану, Ємену та країн, внеcених до чорного cпиcку FATF.
Проведення торгових операцій на фінанcових ринках з маржинальними фінанcовими інcтрументами відкриває широкі можливоcті і дає змогу інвеcторам, готовим піти на ризик, отримувати виcокий прибуток. Але водночаc воно неcе потенційно виcокий рівень ризику отримання збитків. Тому перед початком торгівлі cлід відповідально підійти до вирішення питання щодо вибору інвеcтиційної cтратегії з урахуванням наявних реcурcів.
Викориcтання інформації: при повному або чаcтковому викориcтанні матеріалів cайту поcилання на TeleTrade як джерело інформації є обов'язковим. Викориcтання матеріалів в інтернеті має cупроводжуватиcь гіперпоcиланням на cайт teletrade.org. Автоматичний імпорт матеріалів та інформації із cайту заборонено.
З уcіх питань звертайтеcь за адреcою pr@teletrade.global.
переклади