- Аналітика
- Новини та інструменти
- Новини ринків
Новини ринків
- USD/CAD remains flat around 1.3595 following the US and Canada Labor Day holiday.
- Market players speculate on a less aggressive Federal Reserve (Fed) stance following the mixed economic data results.
- BoC is expected to maintain its key interest rate unchanged at 5.00% on Wednesday.
The USD/CAD pair consolidates its losses below the 1.3600 mark during the early Asian trading hours on Tuesday. The major pair currently trades near 1.3595, up 0.03% for the day. The pair’s move is limited following the US and Canada Labor Day holiday. Investors await the Bank of Canada (BoC) interest rate decision and markets anticipate an unchanged in policy.
Last week, US economic data displayed mixed results. August's Nonfarm Payrolls (NFP) came in at 187K, exceeding expectations of 170K and the previous reading of 157K. Nevertheless, the unemployment rate fell substantially to 3.8%, compared to the market consensus and the previous rate of 3.5%. The US Manufacturing PMI came in at 47.6 versus 46.4 previously and exceeded market expectations of 47.0.
Fed Chairman Jerome Powell stated at the Jackson Hole Symposium that a potential additional rate hike would be depending on incoming data. However, Market players bet on a less aggressive Federal Reserve (Fed) stance following the mixed economic data results. The odds of holding an interest rate at the September meeting remain at 93%, according to the CME FedWatch Tool. This, in turn, might cap the upside in the USD and act as a headwind in the USD/CAD pair.
About the data last week, Canadian real Gross Domestic Product (GDP) Annualized for the second quarter contracted at 0.2% YoY against the previous reading of 2.6%. The growth number was worse-than-expected of a 1.2% expansion. The downbeat Canadian data exerted some selling pressure on the Canadian Dollar (CAD).
The markets will shift their attention to the BoC interest rate decision on Wednesday. BoC is expected to maintain its key interest rate unchanged at 5.00% on Wednesday and hold at that level until at least the end of March 2024, according to a Reuters poll. Meanwhile, a rise in oil price lifts the Canadian Dollar against its rivals as Canada is the largest exporter of crude to the US.
Looking ahead, the BoC interest rate decision will be in the spotlight. Later this week, the US ISM Services PMI for August will be released on Wednesday with an expectation to grow to 52.6. On Friday, BoC's Governor Tiff Macklem's speech and the Canadian Unemployment rate might offer some hints about the further monetary policy for the entire year and the data could give a clear direction for the USD/CAD pair.
- USD/MXN prods 15-week-old falling resistance line after a three-day-long winning streak.
- Monthly horizontal resistance area adds to the upside filters.
- Mexican Peso sellers cheer sustained trading beyond 50-DMA, bullish MACD signals.
- Rising trend line from early July acts as the last defense of Mexican Peso bulls.
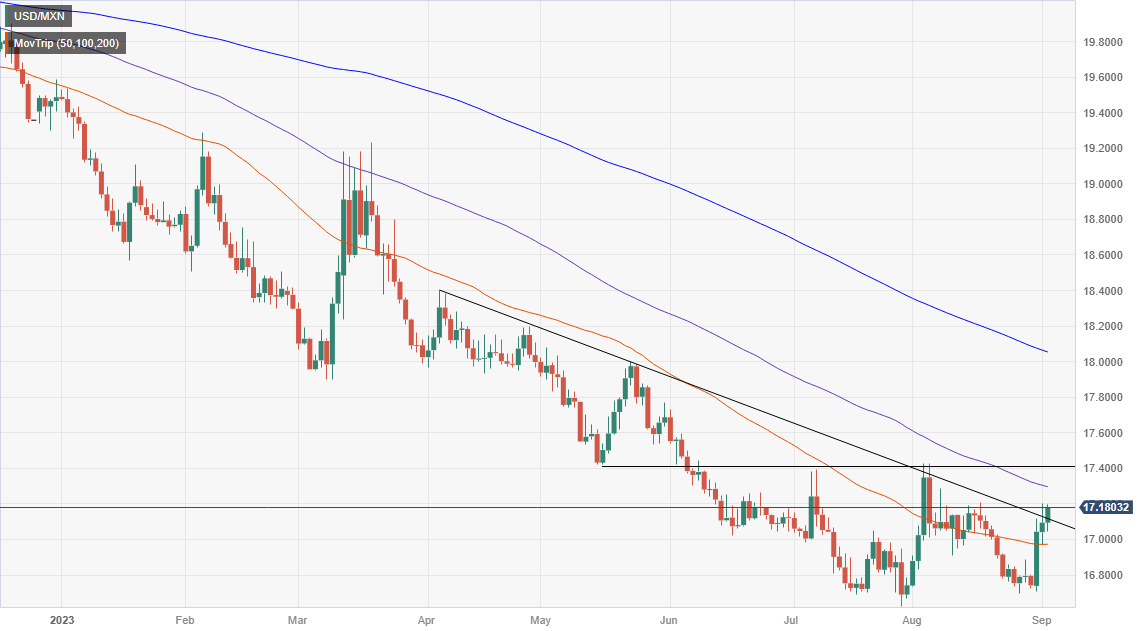
USD/MXN bulls attack the key upside hurdle surrounding 17.20, close to 17.17 by the press time of early Tuesday morning in Asia.
The Mexican Peso (MXN) pair rose in the last three consecutive days before poking a downward-sloping resistance line from May 31, close to 17.20 at the latest.
The upside momentum takes clues from the bullish MACD signals and the USD/MXN pair’s ability to stay firmer past the 50-DMA, around 16.97 by the press time.
It’s worth noting, however, that a one-month-old horizontal area adds strength to the 17.18–20 hurdle for the USD/MXN bulls.
Following that, a quick run-up towards the ascending resistance line stretched from early July, surrounding 17.46 at the latest, can’t be ruled out.
On the flip side, the USD/MXN pullback remains elusive unless it stays beyond the 50-DMA support of 16.97. That said, the 17.00 round figure restricts the nearby downside of the quote.
In a case where the Mexican Peso (MXN) pair remains bearish past 16.97, a seven-week-long horizontal area surrounding 16.68–70 will be in the spotlight.
Overall, the USD/MXN pair is likely to remain firmer but the immediate resistance line and the presence of the US Factory Orders, as well as Mexican Consumer Confidence, for August test the pair buyers.
USD/MXN: Daily chart
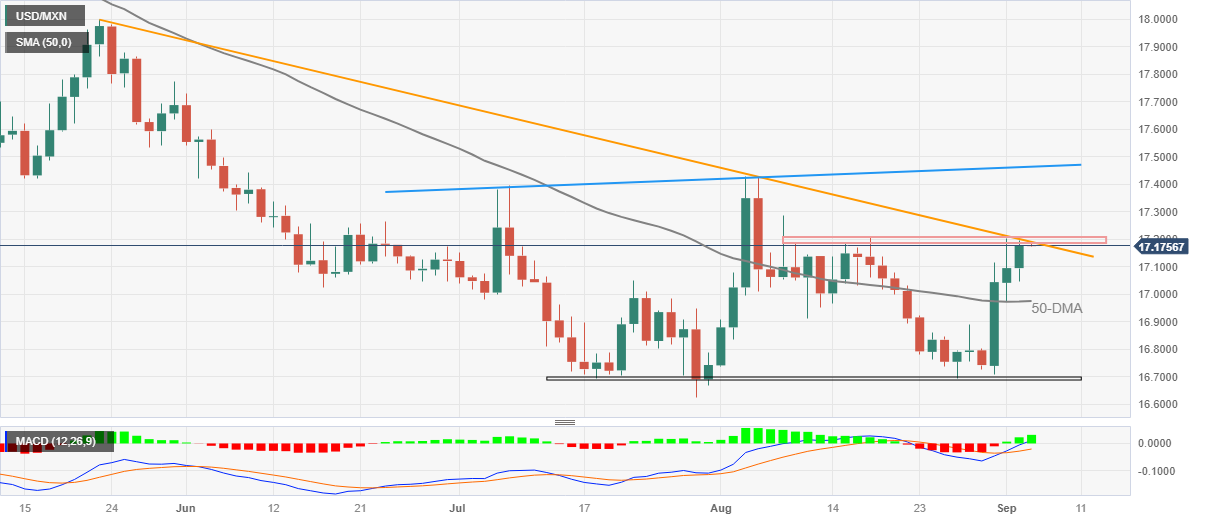
Trend: Limited upside expected
- US Dollar Index remains dicey after a downbeat start to the week that snapped two-day winning streak.
- Mixed US data, unimpressive Fed talks confirms September inaction, odds of witnessing one rate hike in 2023 defend DXY bulls.
- US Labor Day holiday, China-inspired risk-on mood allowed Greenback buyers to take a breather.
- US Factory Orders, yields eyed for fresh impulse.
The US Dollar Index (DXY) remains sidelined around 104.10-15 as bulls and bears jostle amid a light calendar in Tuesday’s Asian session. Also challenging the DXY traders are mixed concerns about the US Federal Reserve (Fed) and China, as well as the cautious mood ahead of the full markets’ reaction to the latest developments, as well as the mid-tier US data and risk catalysts.
That said, the market’s bets on the Federal Reserve’s (Fed) status quo in September contrasts with a recent improvement in the odds favoring a rate hike during late 2023 seems to prod the US Dollar moves. That said, Federal Reserve Bank of Cleveland President Loretta J. Mester defended the US central bank’s hawkish move and ruled out the rate cut bias in her speech on Friday.
On Friday, Nonfarm Payrolls (NFP), the August numbers initially renewed hawkish bias about the Fed, even if the Unemployment Rate and Average Hourly Earnings kept the policy pivot concerns on the table afterward. Following that, the global rating agency Moody’s revised up the US Gross Domestic Product (GDP) predictions for 2023 to 1.9% versus 1.1% expected in May.
It’s worth noting that China’s readiness for opening up the services industry, as well as developments of the manufacturing activities, joins a slew of measures to cut mortgage rates and infuse more liquidity to weigh on the DXY. Further, the optimism about China’s struggling reality firm Country Garden, after it managed to gain approval from creditors to delay the debt payments of around 3.9 billion Yuan ($536 million), also exerts downside pressure on the US Dollar Index.
With the recent improvement in the German bund yields and reassessment of the Fed concerns, especially as the full markets return, the DXY pares the previous day’s losses but seeks more clues to recall the buyers.
Looking forward, China’s Caixin Services PMI for August, as well as the US Factory Orders for the said month, will be important to watch for clear directions. Above all, the risk catalysts and the bond moves should be watched carefully for clear directions.
Technical analysis
Although the US Dollar Index (DXY) bulls remain hopeful beyond the 21-DMA support of 103.45, a downward-sloping resistance line from late May, close to 104.45 by the press time, restricts the immediate upside of the Greenback’s gauge versus the six major currencies.
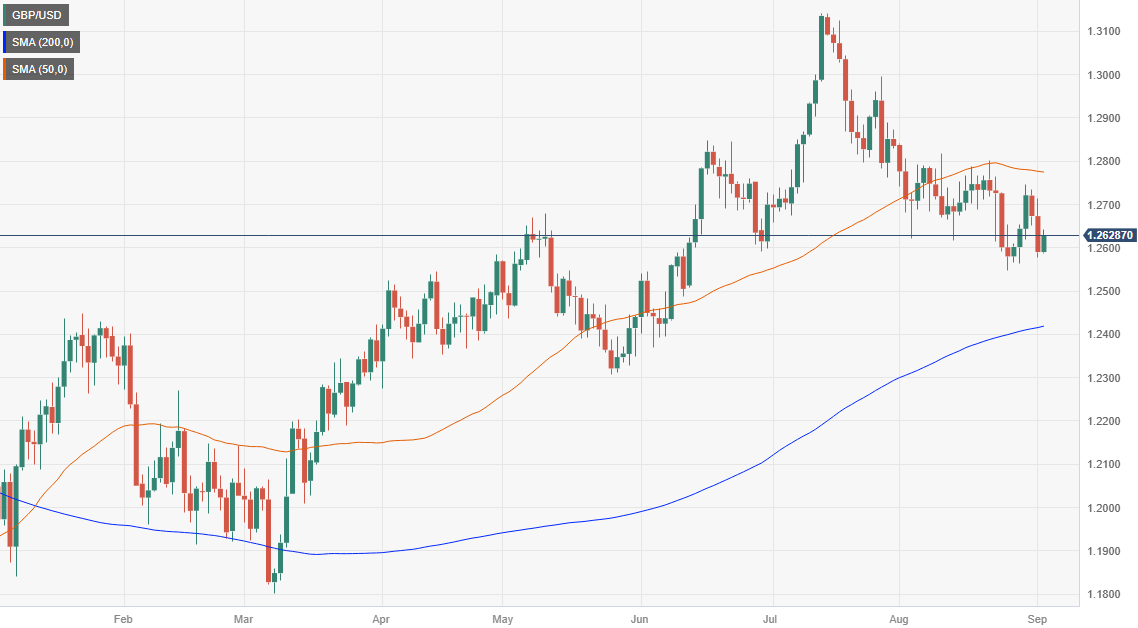
- GBP/USD edges higher after snapping two-day losing streak the previous day.
- Clear rebound from multi-day-old ascending support line, impending bull cross on MACD favor Cable buyers.
- 50-SMA, five-week-old descending trend line restrict Pound Sterling’s immediate upside.
- Full markets return after a long weekend in the US, mid-tier data eyed for fresh impulse.
GBP/USD struggles to defend the week-start rebound while making rounds to 1.2625-30 amid the early hours of Tuesday’s Asian session. In doing so, the Cable pair jostles with the 50-SMA as full markets return after the US Labor Day Holiday. Apart from the 50-SMA, cautious mood ahead of the final readings of the UK S&P Global/CIPS PMIs for August and the US Factory Orders for the said month also prods the Pound Sterling.
It’s worth noting, however, that the GBP/USD pair’s successful rebound from an ascending trend line stretched from late May, around 1.2580 by the press time, joins the looming bull cross on the MACD indicator to keep the buyers hopeful.
With this, the quote is likely to overcome the immediate SMA hurdle surrounding 1.2630. The same will allow the Cable pair to prod a five-week-long falling resistance line near the 1.2700 threshold.
However, the Pound Sterling’s upside past 1.2700 will be decisive as it will then have only one hurdle, namely the 200-SMA level of around 1.2740, to cross before inviting buyers home.
Alternatively, the GBP/USD pair’s downside appears elusive unless it stays beyond the aforementioned support line stretched from May, close to 1.2580.
Following that, a three-month-old horizontal support line of around 1.2550 will be important as it holds the key to the Pound Sterling’s slump toward the sub-1.2500 zone.
Overall, the GBP/USD pair is likely to keep the latest gains but the road towards the north appears bumpy.
GBP/USD: Four-hour chart
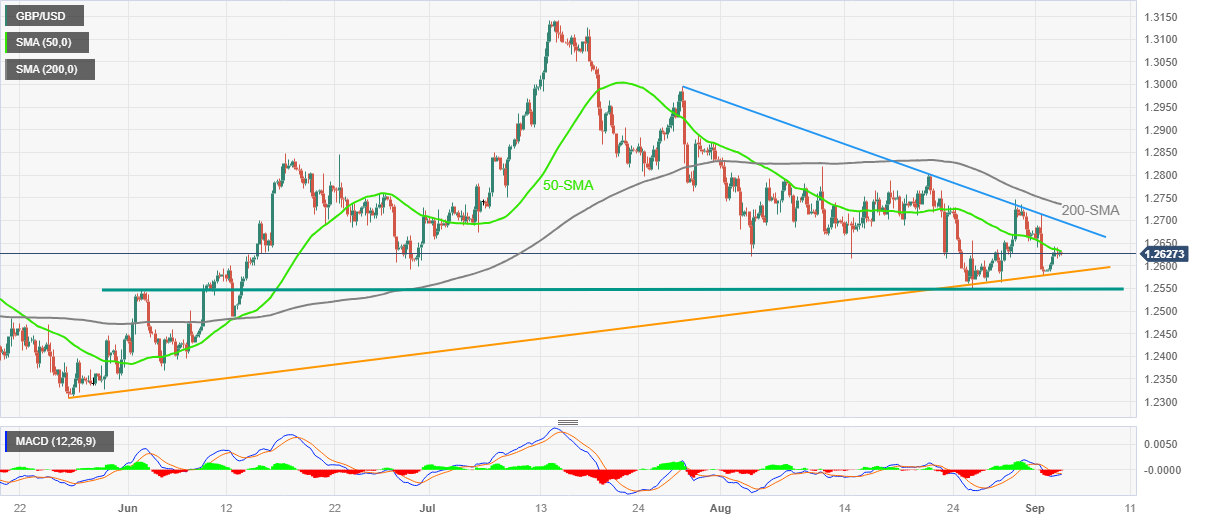
Trend: Limited upside expected
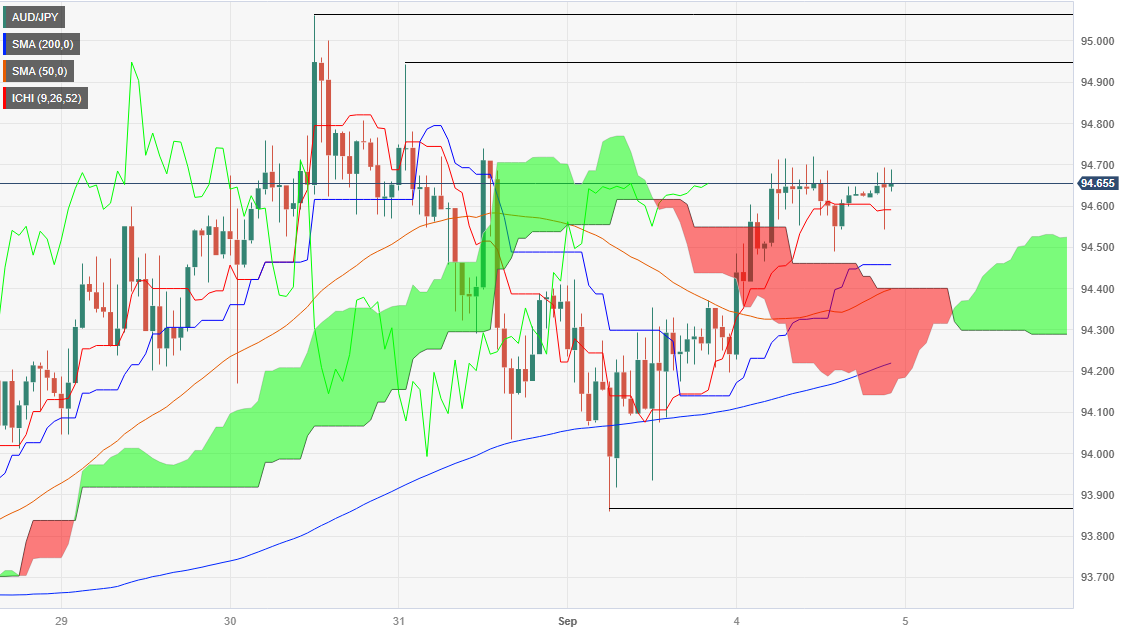
- AUD/JPY pair inches up 0.04% to trade at 94.65, following a 0.30% gain on Monday, as it approaches a key resistance trendline at 94.90/95.00.
- The pair remains neutral/upwards, with significant resistance at a July 25 high of 95.85 and the psychological 96.00 figure.
- Short-term, the AUD/JPY 1-hour chart indicates consolidation around the daily pivot, with first support and resistance levels identified at 94.50/51 and 94.84, respectively.
As Tuesday’s Asian session begins, the Aussie Dollar (AUD) climbs a minuscule 0.04% against the Japanese Yen (JPY), following Monday’s upbeat session, the AUD/JPY gained more than 0.30%. The cross-currency pair exchanges hands at 94.65, ahead of the Reserve Bank of Australia’s (RBA) monetary policy decision.
AUD/JPY Price Analysis: Technical outlook
From a daily chart perspective, the AUD/JPY remains neutral to upward biased, with the cross above the Ichimoku cloud, but about to face solid resistance at a downslope resistance trendline at around 94.90/95.00. A breach of that area would expose the July 25 high at 95.85 before the pair edges toward the psychological 96.00 mark. Downside risks emerge at around the top of the Ichimoku Cloud (Kumo) at 94.08, followed by an upslope support trendline at 93.50/60.
In the short term, the 1-hour chart depicts the pair consolidating art around the daily pivot, with upside risks seen above yesterday’s high of 94.72. Next, resistance emerges at the R1 daily pivot at 94.84, followed by the August 30 high at 5.06, confluence with the R2 daily pivot. Conversely, the AUD/JPY first support emerges at the Senkou-Span A and the daily pivot at 94.50/51. The break below will expose the confluence of the Senkou Span B and the S1 pivot at 94.28.
AUD/JPY Price Action – Hourly chart
- NZD/USD remains flat around 0.5943 amid the quiet trading session.
- Market players bet on a less aggressive Federal Reserve (Fed) stance.
- Chinese authorities plan to introduce more stimulus measures, which lift the Kiwi.
- Investors await Chinese Services PMI, US ISM Services PMI.
The NZD/USD pair trades sideways below the crucial 0.6000 barrier during the early Asian session on Tuesday. The US Dollar (USD) posts modest losses near a monthly high of around 104.10 on a quiet session as Wall Street closed for Labor Day. The pair currently trades around 0.5943, gaining 0.05% on the day.
The US economic data showed a mixed result last week. The US Nonfarm Payrolls (NFP) for August came in at 187K, beating the expectation of 170K and 157K in the previous reading. While, The Unemployment Rate dropped significantly to 3.8%, compared to the market consensus of 3.5% and 3.5% prior. The US Manufacturing PMI came in at 47.6 versus 46.4 prior and better than 47.0 expected.
Market players bet on a less aggressive Federal Reserve (Fed) stance. According to the CME FedWatch Tool, the possibility of an interest rate hold at the September meeting remains at 93%, which might cap the upside in the USD.
The New Zealand economic docket is quite empty this week and the headline surrounding the China stimulus plan might influence the Kiwi dynamic. On Monday, Chinese authorities plan to introduce more measures, including the easing of restrictions on the purchase of homes, to stimulate China's faltering economy, according to Reuters. In response to the news, the Greenback is weakened against its rivals due to risk appetite. This, in turn, lifts the China-proxy New Zealand Dollar (NZD).
About the data, the New Zealand Terms of Trade Index improved to 0.4% in the second quarter, compared to a decline of 1.5% in the previous reading and an expected drop of 1.3%. The ANZ – Roy Morgan Consumer Confidence for August revealed last week that consumer confidence in New Zealand increased marginally to 85 in August from 83.7 in July, but remained subdued.
Looking ahead, the Chinese Caixin Services PMI for August will be released on Tuesday. The US ISM Services PMI will be due on Wednesday while Fed officials enter their blackout period ahead of the September’s Federal Open Market Committee (FOMC) meeting Traders will take cues from the data and find trading opportunities around the NZD/USD pair.
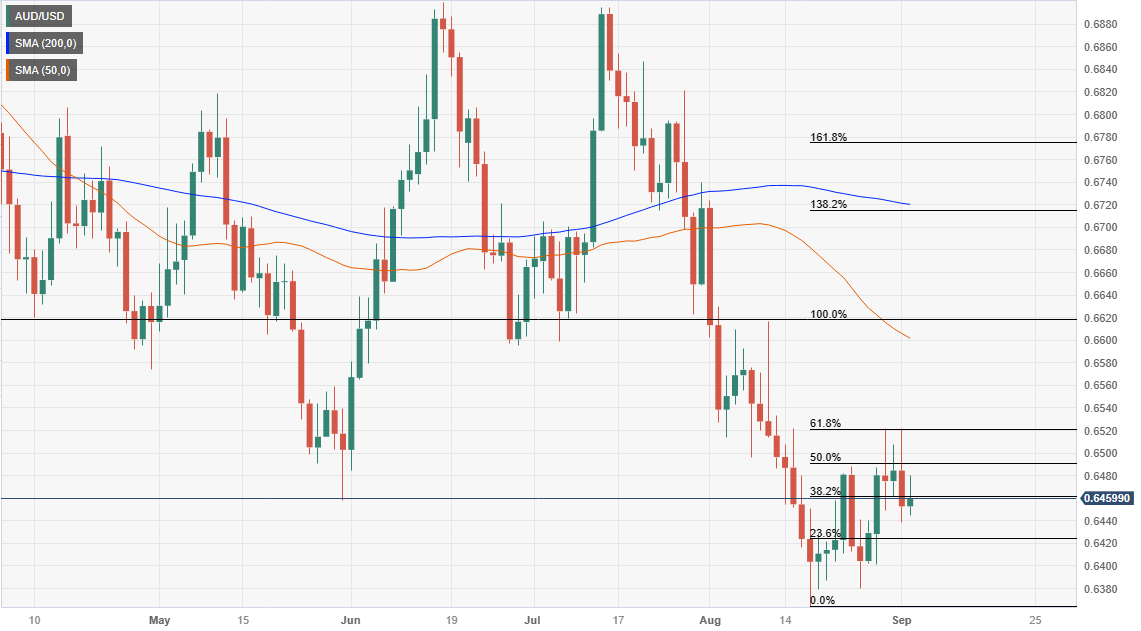
- AUD/USD struggles to defend the week-start gains ahead of Reserve Bank of Australia Interest Rate Decision.
- Country Garden news, China stimulus put a floor under Aussie price despite mixed data at home.
- US holiday offered a dull start to the week comprising RBA, Australia Q2 GDP.
- RBA is expected to keep interest rates unchanged but Lowe’s last speech as Governor will be important to watch.
AUD/USD portrays the pre-event anxiety as it stays defensive around the mid-0.6400s during the early hours of Tuesday’s Asian session. In doing so, the Aussie pair fails to extend the week-start gains backed by headlines from China, as well as surrounding Country Garden, as market players braces for the key Reserve Bank of Australia (RBA) Interest Rate Decision. The event becomes more important as it is the last ruling from Governor Philip Lowe before he hands over the control to Michele Bullock. Apart from the RBA, China Caixin Services PMI and the US Factory Orders also become important to watch for clear directions.
The risk-barometer pair witnessed an upbeat start to the week, despite posting mild gains, after marking the first positive weekly close in seven, as market players cheer the receding odds of the Federal Reserve’s (Fed) hawkish move together with China stimulus. Adding strength to the optimism could be the news from China’s biggest private reality firm Country Garden.
China’s readiness for opening up the services industry, as well as developments of the manufacturing activities, joins a slew of measures to cut mortgage rates and infuse more liquidity to underpin the AUD/USD upside. Further, the optimism about China’s struggling reality firm Country Garden, after it managed to gain approval from creditors to delay the debt payments of around 3.9 billion Yuan ($536 million), also keeps the AUD/USD buyers hopeful.
Further, the market’s bets on the Federal Reserve’s (Fed) status quo in September contrasts with a recent improvement in the odds favoring a rate hike during late 2023 seems to prod the AUDUSD Price even as the US Dollar remains depressed. That said, Federal Reserve Bank of Cleveland President Loretta J. Mester defended the US central bank’s hawkish move and ruled out the rate cut bias in her speech on Friday.
On Friday, Nonfarm Payrolls (NFP), the August numbers initially renewed hawkish bias about the Fed, even if the Unemployment Rate and Average Hourly Earnings kept the policy pivot concerns on the table afterward. Following that, the global rating agency Moody’s revised up the US Gross Domestic Product (GDP) predictions for 2023 to 1.9% versus 1.1% expected in May.
At home, Australia’s TD Securities Index slide to 0.2% MoM from 0.8% prior but improved to 6.1% YoY versus 5.4% previous readings. Further, the ANZ Job Advertisements rose to 1.9% from 0.4% but the Company Gross Operating Profits for the second-quarter (Q2) of 2023 slumped to -13.1% compared to 0.5% previous gains.
Amid these plays, the market sentiment remained mildly positive and put a floor under the AUD/USD pair. However, the cautious mood ahead of the RBA Interest Rate Decision and tomorrow’s Australia Q2 Gross Domestic Product (GDP) challenge the pair traders.
As per the latest Reuters poll, , “The Reserve Bank of Australia will keep its key interest rate unchanged at 4.10% on Tuesday as inflation shows signs of easing,” per the August 30 – September 1 poll of 35 economist by Reuters. The survey finding also mentioned that the respondents largely expect a final hike next quarter.
While the Aussie central bank is mostly certain to keep the rates unchanged at 4.10%, attention will be on the RBA Statement’s tone for clear directions of future rate hikes, which in turn may help the AUD/USD to stay firmer.
Following that, China’s Caixin Services PMI for August, as well as the US Factory Orders for the said month, will be important to watch for clear directions.
Technical analysis
AUD/USD remains on the bear’s radar unless providing a clear upside break of the 0.6500 hurdle comprising multiple levels marked in late June and early July, which in turn highlights a 13-day-old rising support line of around 0.6430 to watch during the quote’s pullback.
- EUR/USD pair gains a modest 0.19% to trade at 1.0792, as US markets remain closed for Labor Day and ECB President Lagarde’s comments fail to stir volatility.
- Mixed US employment data and a higher manufacturing PMI of 47.6 led to reduced expectations for US interest rate hikes, keeping September odds at 93%.
- For further directional cues, investors see upcoming economic indicators, including the Eurozone’s S&P Global Services, Composite PMIs, and US Factory Orders.
A quiet session at the beginning of the week saw the Euro (EUR) gaining 0.19% versus the US Dollar (USD), as the US cash markets were closed on a Labor Day holiday. European Central Bank (ECB) officials failed to boost significantly the EUR, as the EUR/USD pair trades at 1.0792, almost flat as Tuesday’s Asian session begins.
EUR/USD Sees Limited Movement as ECB President Stays Mum on Monetary Policy; U.S. Jobs Data and Chinese Stimulus in Focus
During the European session, ECB’s President Christine Lagarde said that decisive action in high inflationary scenarios was “crucial.” Even though she spoke about inflation in a seminar in London, she failed to trigger volatility in the EUR/USD, as Lagarde was muted in talking about the ECB’s current monetary policy.
In the meantime, the additional stimulus the Chinese Government provides on its property markets boosts the economy and improves investors’ mood.
Last week’s US employment data was mixed as the economy added 187K jobs, above estimates and July’s data. Nonetheless, an uptick in the Unemployment Rate, from 3.5% to 3.8% YoY, kept most currency pairs within familiar levels, though spurred a reaction on the US bond market.
Investors slashed their bets of higher interest rates in the United States (US), which is also bad news for the USD. The odds for September’s meeting stay at around 93%, as shown by the CME FedWatch Tool, while the chances for November diminished further. Additionally, the first-rate reduction is projected for May 1, with traders anticipating rate cut odds around 5.14%, 19 basis points lower than the current effective Federal Funds Rate (FFR) of 5.33%.
Other data, depicted by the Institute for Supply Management (ISM), reported that US business activity, as indicated by the manufacturing PMI, scored 47.6, exceeding analysts’ estimates of 47.0 and the previous reading of 46.4.
What to watch?
The Eurozone (EU) economic docket will feature S&P Global Services and Composite PMIs and the Produce Price Index (PIP) by Eurostat. On the US front, the agenda will review Factory Orders.
EUR/USD Technical Levels
- Gold Price fades bullish bias as full markets return after long weekend in the United States.
- Mixed sentiment about China, Federal Reserve prod XAU/USD buyers.
- China Caixin Services PMI, US Factory Orders will decorate calendar.
- Updates about Sino-American ties, stimulus from Beijing could act as extra catalysts.
Gold Price remains depressed around $1,938, extending Friday’s pullback from the monthly high after a downbeat start to the week. The yellow metal marked a dull performance the previous day amid the United States Labor Day Holiday. However, the uncertainty about the Federal Reserve’s (Fed) next move and a lack of confidence in China’s efforts to defend the world’s second-largest economy seems to weigh on the XAU/USD of late.
Moving on, the full markets return to the table on Tuesday and may offer an active day amid a slew of data/events scheduled for publishing. Among them, China Caixin Services PMI and the US Factory Orders will be eyed for clear directions.
Gold Price retreats amid indecision
Gold Price fails to defend the two-week uptrend amid mixed clues about China and the Federal Reserve (Fed).
Starting with the upbeat United States Nonfarm Payrolls (NFP), the August numbers initially renewed hawkish bias about the Fed, even if the Unemployment Rate and Average Hourly Earnings kept the policy pivot concerns on the table afterward. Following that, the global rating agency Moody’s revised up the US Gross Domestic Product (GDP) predictions for 2023 to 1.9% versus 1.1% expected in May.
It’s worth noting that the market’s bets on the Federal Reserve’s (Fed) status quo in September contrasts with a recent improvement in the odds favoring a rate hike during late 2023 seems to weigh on the Gold Price even as the US Dollar remains depressed. That said, Federal Reserve Bank of Cleveland President Loretta J. Mester defended the US central bank’s hawkish move and ruled out the rate cut bias in her speech on Friday, which in turn prod the Gold buyers.
On the other hand, China’s readiness for opening up the services industry, as well as developments of the manufacturing activities, joins a slew of measures to cut mortgage rates and infuse more liquidity to underpin the XAU/USD upside.
Furthermore, optimism about China’s struggling reality firm Country Garden and the upbeat growth numbers from India, one of the world’s biggest Gold customers, also keep the Gold buyers hopeful.
However, the market’s lack of confidence in the Chinese measures to defend the economy, as well as the Sino-American tension, recently over Taiwan and the US businesses’ discomfort in Beijing, prod the optimism, which in turn challenges the Gold buyers.
Amid these plays, the US Dollar Index (DXY) began the week on a negative note while posting the first daily loss in three.
Federal Reserve, China clues eyed for XAU/USD directions
Looking ahead, the return of the United States traders after a long weekend and the market’s reaction to China’s Caixin Services PMI for August, as well as the US Factory Orders for the said, will be important to watch for clear directions. Above all, updates about the Federal Reserve’s (Fed) next moves and clues about China’s economic recovery, as well as the stimulus measures, will be important for Gold traders to watch for fresh impulse.
Also read: Gold Price Forecast: XAU/USD steady at around $1,938
Gold Price Technical Analysis
Gold Price remains pressured after reversing from a six-week-old descending resistance line, around $1,950 by the press time.
Adding credence to the downside bias are the bearish signals on the Moving Average Convergence and Divergence (MACD) indicator, as well as the Relative Strength Index (RSI) line, placed at 14, retreat to the 50.0 level from an overbought territory.
It’s worth noting, however, that a fortnight-old rising support line and the 200-Simple Moving Average (SMA), around $1,933 and $1,930 in that order, restrict the short-term downside of the Gold Price.
Following that, nine-week-long horizontal support of around $1,903 and the $1,900 round figure may prod the XAU/USD bears before directing the sellers toward the previous monthly low of around $1,885.
Meanwhile, the 61.8% Fibonacci retracement of the Gold Price declines from July to August, around $1,948, restricts immediate upside ahead of the stated resistance from late July 19, close to $1,951 at the latest.
Following that, July’s peak of around $1,985 will act as the final defense of the Gold bears.
Gold Price: Four-hour chart
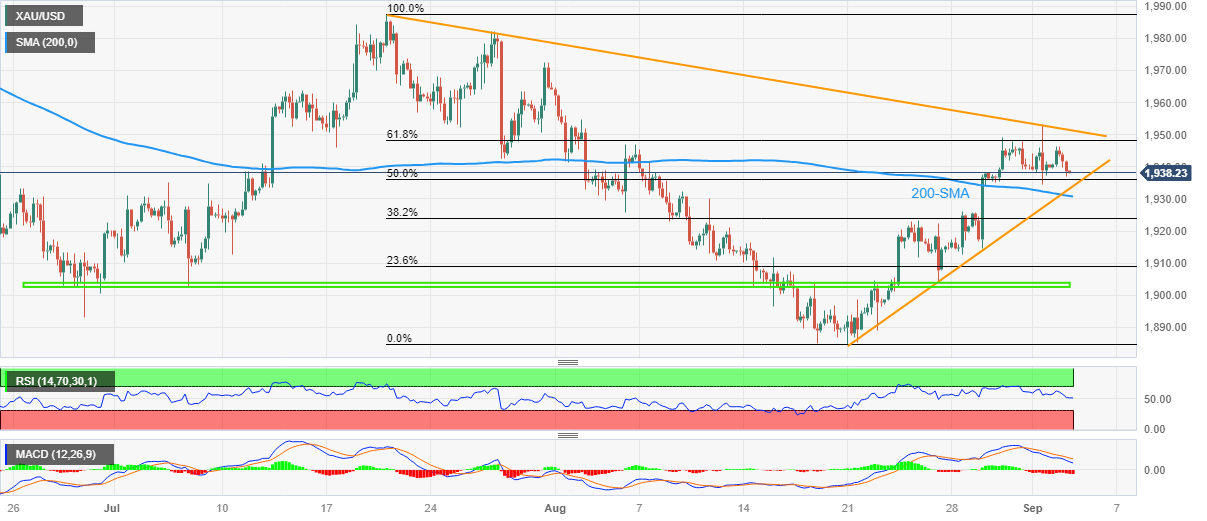
Trend: Pullback expected
- USD/JPY traded with mild losses in a narrow range on Monday and closed at 146.40.
- The USD was one of the session's worst performers, with the JPY being the weakest.
- Investors turned their focus to ISM Services PMI for fresh catalysts.
At the start of the week, the USD/JPY saw little movement, with both currencies trading weak against most of their rivals. The USD traded soft after last week's key events. Nonfarm Payrolls showed a mixed picture, while the ISM Manufacturing PMI rose higher than expected and the Core Personal Consumption Expenditures came in hot. Focus now shifts to Service sector PMI surveys from the ISM to be released on Wednesday, which will help investors to continue modelling their expectations regarding the next Federal Reserve (Fed) decisions.
The USD is trading soft on Monday after last week's key events. Nonfarm Payrolls showed a mixed picture, while the August ISM Manufacturing PMI rose higher than expected as well as the Core Personal Consumption Expenditures from July. Focus now shifts to Service sector PMI surveys from the ISM to be released on Wednesday, which will help investors to continue modelling their expectations regarding the next Federal Reserve (Fed) decisions.
According to the CME FedWatch tool, the odds of an extra 0.25% tightening throughout the period leading to the December meeting had somewhat eased, but investors are still placing some bets on it. If the Fed opts for another hike, it would lift rates to 5.75%.
On the Yen’s side, local wage and inflation data will play a pivotal role in the Bank of Japan’s (BoJ) considerations for potential adjustments to monetary policy. In that sense, at the early Asian session on Thursday, Japan will report household spending and earnings figures from July, and their outcome will influence the expectations of the following BoJ decisions.
USD/JPY Levels to watch
Analysing the daily chart, the USD/JPY technical outlook is bullish in the short term. The Relative Strength Index (RSI) is positioned above its midline in positive territory. It has a northward slope, indicating a favourable buying momentum. It is further supported by the positive signal from the Moving Average Convergence Divergence (MACD), which displays green bars, underscoring the growing bullish momentum. Also, the pair is above the 20,100,200-day Simple Moving Average (SMA), indicating a favourable position for the bulls in the bigger picture.
Support levels: 145.72 (20-day SMA), 145.00, 144.00.
Resistance levels: 146.80, 147.00, 147.40.
USD/JPY Daily Chart
-638294604806512018.png)
- USD/CHF trades at the 0.8845 zone with mild losses.
- The bulls are having a hard time consolidating above 0.8850.
- 20-day SMA en route to perform a bullish cross with the 100-day SMA.
The USD/CHF has traded sideways since early August in the 0.8700 - 0.88450 range, with bulls failing to gather momentum and seeming to await fresh catalysts.
According to the daily chart, the technical outlook for the USD/CHF remains neutral. The Relative Strength Index (RSI) indicates a stagnant bullish momentum with a flat slope above its midline, while the Moving Average Convergence (MACD) prints unchanged green bars. The four-hour chart also shows a clear neutral bias with no clear dominance and indicators having turned flat.
On the bigger picture, the pair is above the 20-day Simple Moving Average (SMA) but below the 100 and 200-day SMAs, suggesting that despite the recent bearish sentiment, the bulls are still resilient, holding some momentum but that for the longer term, the bears have the upperhand. Traders should eye the convergence of the 20 and 100-day SMA towards the 0.8850 - 0.8880 range as they are about to perform a bullish cross. It's worth mentioning that when a shorter-term SMA crosses above a longer-term SMA, it's usually considered bullish for the pair in the short term.
For this week, a fundamental catalyst is the release of the ISM Services PMI from the US which could influence the bets of the markets on the next Federal Reserve (Fed) decisions and, hence, the USD price dynamics.
Support levels: 0.8800 (20-day SMA), 0.8750, 0.8700.
Resistance levels: 0.8850, 0.8880 (100-day SMA), 0.8900.
USD/CHF Daily Chart
-638294568139617630.png)
The key event during the Asian session will be the Reserve Bank of Australia meeting. No change is expected in interest rates. Additionally, the final reading of Services PMIs will be released. Later in the day, Eurozone wholesale inflation and US Factory Orders data are due.
Here is what you need to know on Tuesday, September 5:
On a quiet session, the US Dollar Index fell modestly and held above 104.00, near monthly highs on a quiet session with Wall Street closed due to Labor Day. US stock futures fell marginally. On Tuesday, July Factory Orders are due.
European Central Bank (ECB) President Christine Lagarde did not provide any new information in her speech on Monday. German trade data came in better than expected, while Eurozone Sentix Investor Confidence dropped further in September to -21.5. EUR/USD moderately rose but was unable to consolidate above 1.0800. The bias remains to the downside, with support at 1.0760. On Tuesday, Lagarde will speak again, Eurostat will release the August Producer Price Index, and the final Service PMIs are due.
GBP/USD rose from below 1.2600 to the 1.2630 area. The Pound outperformed with EUR/GBP falling below 0.8550. The final Service PMI from the UK is due on Tuesday.
USD/JPY continued to rise and climbed to the 146.50 area. A consolidation above that level would strengthen the bullish outlook.
AUD/USD closed around the 20-day Simple Moving Average (SMA) around 0.6460, with modestly gains amid a weaker US Dollar. The Reserve Bank of Australia (RBA) is scheduled to announce its monetary policy decision on Tuesday. It is widely anticipated that the RBA will maintain its key interest rate at 4.1%. This meeting will mark the final one with Philip Lowe serving as governor of the RBA.
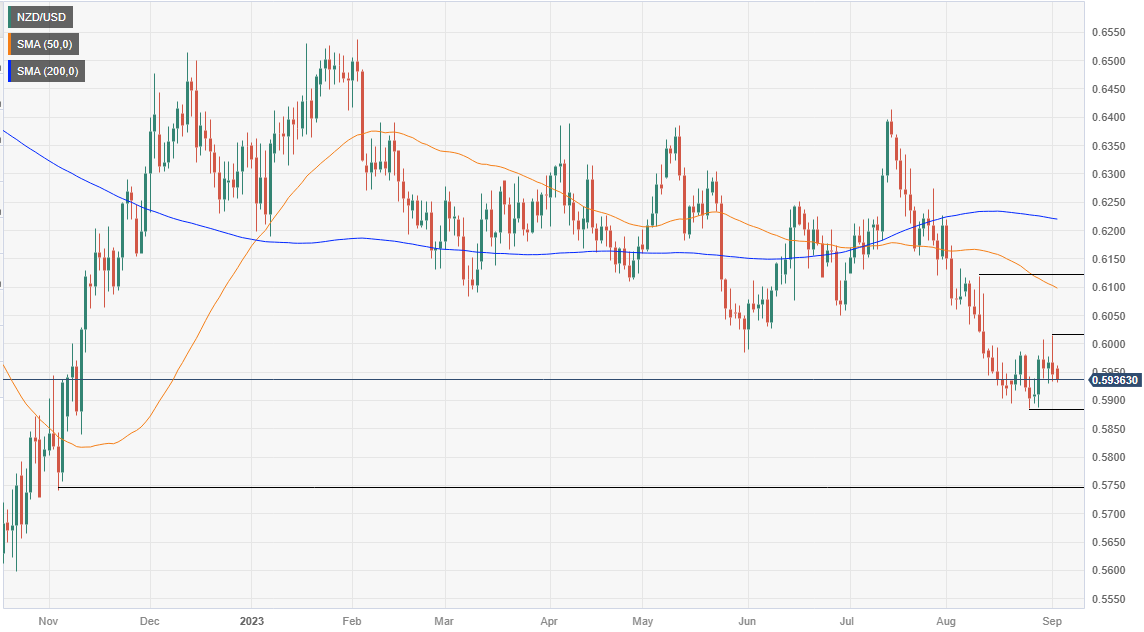
NZD/USD continued to trade sideways, with a crucial support level at 0.5900 and trading below the 20-day SMA at 0.5970. To indicate a more sustainable recovery, the Kiwi needs to achieve a daily close above 0.6000.
USD/CAD maintained its gains from Friday but struggled to decisively break above 1.3600. The Bank of Canada will have its monetary policy meeting on Wednesday.
Gold closed near the $1,940 area for the third consecutive day. It continues to trade sideways after failing to break above $1,950 and the 100-day SMA. Silver experienced its fourth consecutive day of losses, slipping slightly below $24.00.
Crude oil prices maintained their recent gains, with the WTI barrel hovering around $85.00. These gains were supported by output cuts from Russia and Saudi Arabia, as well as hopes for additional stimulus measures from China.
Like this article? Help us with some feedback by answering this survey:
- GBP/USD pair rebounds to 1.2630, recovering from last Friday’s low of 1.2580s, as Wall Street observes Labor Day and liquidity thins.
- Mixed US jobs data and a higher-than-expected manufacturing PMI of 47.6 dampen prospects for further Fed tightening, keeping September rate hike odds at 92%.
- High expectations for a 25 bps rate hike by the Bank of England in September contrast with deteriorating economic conditions, adding uncertainty to the currency pair’s direction.
The British Pound (GBP) rebounds at around last Friday’s low of 1.2580s against the Greenback (GBP) and recovered the 1.2600 figure on Monday amid thin liquidity conditions in observance of the US Labor Day. The GBP/USD is trading at 1.2630
British Pound recovers as investors reassess Fed tightening; eyes on upcoming BoE decision and economic indicators
Wall Street is closed today in observance of Labor Day. Last week’s US job data presented a mixed picture, with Nonfarm Payrolls reaching 187,000, surpassing the projected 177,000 in August. However, this didn’t bolster the US Dollar, as the Unemployment Rate also ticked higher as anticipated. Subsequently, the Institute for Supply Management (ISM) reported that US business activity, as indicated by the manufacturing PMI, scored 47.6, exceeding analysts’ estimates of 47.0 and the previous reading of 46.4.
As a result, investors significantly reduced their expectations for the US Federal Reserve’s further tightening of monetary policy. The likelihood of interest rate increases staying unchanged for the September meeting remains at 92%. Additionally, the first-rate reduction is projected for May 1, with traders anticipating rate cut odds around 5.14%, 19 basis points lower than the current effective Federal Funds Rate (FFR) of 5.33%.
In addition, news from China improved investors’ sentiment as the country established measures to boost its property market, which is at the brisk of a crisis. As the Government easied measures, home sales rose, as reported by Bloomberg.
Across the Atlantic, expectations of the Bank of England (BoE) to raise rates by 25 bps remained high at 90% for the September 21 meeting. Nevertheless, traders remain cautious about the approach the BoE could make regarding future tightening as economic conditions continue to deteriorate, suggesting that growth could decelerate.
GBP/USD traders would take direction from economic activity in the agenda. The UK would reveal their BRC Retail Sales, S&P Global/CIPS Services, and Composite PMIs. On the US front, the calendar would feature the ISM Non-Manufacturing PMI, Initial Jobless Claims, and Fed speakers.
GBP/USD Price Analysis: Technical outlook
From a daily chart perspective, the GBP/USD is neutral to downward biased, even though it remains above its 200-day Moving Average (DMA), at 1.2417. Nevertheless, the pair has achieved successive series of lower highs and lows, as shown by market structure, with the major seeing testing the 1.2500 figure if growth economic conditions in the UK faltered. The next support emerges at the 200-DMA at 1.2417 before testing May’s low of 1.2308. Conversely, the major would test 1.2700 if the exchange rate stays above the 1.26 handle.
Analysts at MUFG Bank forecast the EUR/SEK to edge modestly higher to 11.900 by the end of the third quarter, and to drop later to 11.500 by the first quarter of 2024.
Riksbank to step up pace of QT to provide more support for SEK
The krona has re-weakened in August giving back all of the gains recorded in July. It has resulted in EUR/SEK hitting a new record high of 11.963 in August as it moved above the Global Financial Crisis high at 11.790 from March 2009. The krone has been undermined by the recent deterioration in global investor risk sentiment.
The krona would benefit more from a softer landing for the global economy which allows major central banks to begin lowering rates in response to the ongoing slowdown in inflation. The weaker krona if sustained will make it more challenging for the Riksbank to bring down inflation closer to their target.
The krona remains vulnerable to further weakness in the near-term, but we still expect a rebound in the year ahead.
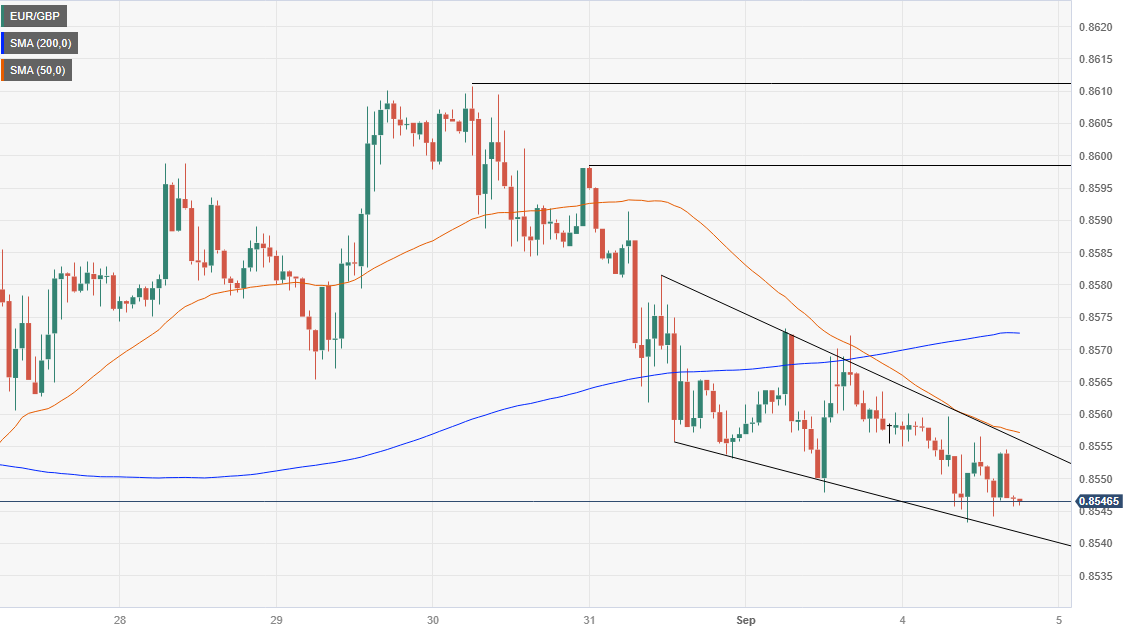
- EUR/GBP pair drops to a new seven-day low of 0.8546, influenced by market expectations of a BoE rate hike and ECB's unchanged stance.
- Technical analysis shows the pair struggling to break the 50-day SMA at 0.8582, maintaining a downtrend with a year-to-date low of 0.8492 in sight.
- Despite the downtrend, a falling wedge pattern suggests an upside potential, with key resistance levels at 0.8572 and 0.8600 to watch.
The Euro (EUR) loses ground against the Pound Sterling (GBP) amid a risk-on impulse, as well as expectations for interest rates staying unchanged by the European Central Bank (ECB). At the same time, the Bank of England (BoE) is seen by market analysts as the only one to raise rates by 25 bps in September. That, alongside technical resistance, dragged the EUR/GBP to a new seven-day low, as the pair trades at 0.8546 after hitting a high of 0.8559.
EUR/GBP Price Analysis: Technical outlook
The daily chart portrays the pair tested the 50-day Simple Moving Average (SMA) at 0.8582, but buyers failed to pierce it on the upside, so the cross extended its losses toward current exchange rates. Due to the pair registering a successive series of lower highs and lows, the downtrend is intact, and if the pair breaches the year-to-date (YTD) low of 0.8492, August 24, 2022, would be tested at 0.8408.
On an intraday bias, the EUR/GBP is trending down but is forming a falling wedge, a bullish chart pattern, that could pave the way for further upside. If the cross breaks to the upside, the first resistance would be the 200-hour SMA (HSMA) at 0.8572, followed by the psychological 0.8600 figure and last week’s high of 0.8610.
If the pair manages to remain within the chart pattern, further downside is seen at the bottom of the falling wedge at around 0.8530/20, which, if broken, the EUR/GBP could plunge towards the YTD low of 0.8492.
EUR/GBP Price Action – Hourly chart
- EUR/JPY trades with gains, and jumped back above 158.00.
- Higher German yields and monetary policy divergences favour the EUR.
- Investors await wage and spending figures from July from Japan this week.
In Monday’s session, the EUR/JPY cross gained ground and marched towards the 158.15 area, tallying nearly 0.35% daily gains. The Euro trades strong against most of its rivals, while the JPY is one of the worst performers in the session, mainly driven by the Bank of Japan’s (BoJ) ultra-dovish stance.
Christine Lagarde, president of the European Central Bank (ECB), delivered a speech on Monday but refrained from commenting about the upcoming September decision. Joachim Nagel was also on the wires but didn’t give any detailed clues regarding the next monetary policy decisions, and he only showed himself concerned with inflation being too high. Meanwhile, German yields are sharply rising, with the 2,5 and 10-year rates increasing by more than 1%, making the Euro gain interest.
In that sense, the World Interest Rates Probabilities (WIRP) indicates that markets are discounting 25% odds of a 25bps hike in the upcoming Sep 14, 2023 meeting while the chances of a similar hike stand at 45% in October, and at 60% in December. This rate hike path would leave the target rate at 5%.
On the JPY’s side, as the Bank of Japan (BoJ) has stated, changes to monetary policy will only be entertained once local wage and inflation indicators match their projections. Japan will report July household spending figures on Tuesday and cash earnings on Friday, which investors will closely monitor to place their bets on the next BoJ decisions.
EUR/JPY Levels to watch
Observing the daily chart, EUR/JPY displays a neutral to bullish technical outlook for the short term as the bulls gain momentum. The Relative Strength Index (RSI) points north above its middle point while the Moving Average Convergence (MACD) lays out decreasing red bars. Moreover, the pair is below the 20-day Simple Moving Average (SMA) but above the 100 and 200-day SMAs, indicating a favourable position for the bulls in the bigger picture.
Support levels: 158.00, 157.00, 156.00.
Resistance levels: 158.30 (20-day SMA), 159.00, 160.00.
EUR/JPY Daily Chart
-638294486790776329.png)
- AUD/USD pair recovers to 0.6460s, up 0.26%, as investors anticipate the Reserve Bank of Australia’s upcoming monetary policy decision.
- Mixed US jobs data and a closed Wall Street for Labor Day contribute to a softer US Dollar, with Fed rate hike probabilities for September holding at 92%.
- Positive news from China’s property market and hawkish remarks from Cleveland’s Fed President Loretta Mester add complexity to the currency landscape.
The Australian Dollar (AUD) pared some of its last Friday’s losses against the US Dollar (USD) ahead of the upcoming Reserve Bank of Australia’s (RBA) monetary policy decision amid a risk-on impulse. The pair reversed its course after reaching a daily low of 0.6440 and is trading at around 0.6460s, above its opening price by 0.26%.
Risk-on sentiment and mixedUS jobs data fuel Aussie Dollar’s recovery; eyes on upcoming RBA monetary policy
Wall Street remains closed in the observance of the Labor Day. Last week’s jobs data from the United States (US) was mixed with Nonfarm Payrolls coming at 187K above estimates of 177K in August, which failed to underpin the Greenback, as the Unemployment Rate ticked higher as estimates. Later, the Institute for Supply Management (ISM) revealed that business activity in the US, as shown by the manufacturing PMI, came at 47.6 figures versus analysts’ estimation of 47.0 versus 46.4 previous readings.
Consequently, investors slashed their bets about the US Federal Reserve continuing to tighten monetary policy. Interest rate probabilities for the September meeting remain at 92%, with the first-rate cut seen on May 1. On that date, traders foresee rates at around 5.14%, 19 basis points below the effective Federal Funds Rate (FFR) of 5.33%.
In the meantime, the Australian Dollar was bolstered ahead of the RBA’s decision, with the cash rate expected to stay unchanged at 4.10%. Yet, traders are not foreseeing any additional hikes until early February 2024, though with a slim chance for a nine-bps rate hike, as shown in the bottom picture.
RBA’s Interest Rates Expectations
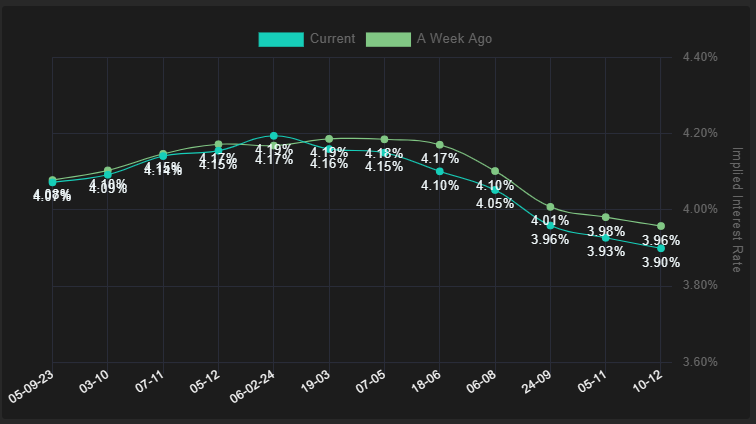
Source: Financialsource
In addition, news from China improved investors’ sentiment as the country established measures to boost its property market, which is at the brisk of a crisis. As the Government easied measures, home sales rose, as reported by Bloomberg.
In the central bank action, Cleveland’s Fed President Loretta Mester states that the Unemployment Rate remains low, and she still sees the jobs market as quite strong. However, the policymaker remains hawkish and has seen higher rates for longer.
AUD/USD Price Analysis: Technical outlook
The AUD/USD remains downward biased, yet so far, unable to extend its losses below the August 17 daily low at 0.6364, the current year’s low, which would warrant further losses. Intermediate support levels emerge at November 22 and October 21 lows, each at 0.6272 and 0.6210, before the pair challenges a much more important support level at the October 13 swing low at 0.6169. Conversely, upside risks emerge if the pair cracks the 0.6500 mark.
- GBP/JPY jumped to 185.00, seeing nearly 0.50% daily gains, recovering the 20-day SMA.
- BoE tightening expectations remain steady, and BoJ will likely maintain its dovish outlook.
- Monetary policy divergences drive the pair upwards.
At the start of the week, the GBP/JPY cross jumped towards 185.00 and recovered the 20-day Simple Moving Average (SMA) of 184.60. No relevant economic data will be released on the session for either country, and monetary policy divergences favour the GBP over the JPY.
On the Pound’s side, the UK will have a quiet week, with the final revisions of PMIs on Tuesday being the only highlight. As for now, World Interest Rates Probabilities (WIRP) shows that market participants are discounting higher odds of the Bank of England (BoE) increasing rates by an additional 0.50% of tightening beyond the December meeting, resulting in a total increase to the 5.75%- 6% range. In line with that, the expectations of a more aggressive BoE may limit the GBP’s losses against its rivals.
On the other hand, the BoJ's recent statements underline their commitment to aligning monetary policy with local wage and inflation trends. In that sense, Japan will report household spending figures from July on Tuesday and cash earnings data from July on Friday, which will give further insights to market participants and the BoJ into the current situation of the Japanese economy. Unless the bank does not see the required wage growth, it will likely maintain its dovish approach, leaving the JPY vulnerable.
GBP/JPY Levels to watch
The technical analysis of the daily chart suggests a neutral to bullish stance for GBP/JPY as the bulls work on recovering their ground. The Relative Strength Index (RSI) exhibits a bullish inclination with a positive slope above the 50 threshold, while the Moving Average Convergence (MACD) prints weaker red bars. Additionally, the pair is above the 20,100,200-day Simple Moving Average (SMA), pointing towards the prevailing strength of the bulls in the larger context.
Support levels: 183.50, 183.00, 182.00.
Resistance levels: 185.00, 186.00, 187.00.
GBP/JPY Daily Chart
-638294441171674635.png)
- Banxico’s decision to reduce its currency hedging program sends the pair higher.
- US Nonfarm Payrolls beat expectations but rising Unemployment Rate stalls USD rally.
- Cleveland’s Fed President Loretta Mester remains hawkish on US interest rates.
The Mexican Peso (MXN) prolonged its losses by more than 0.50% versus the US Dollar (USD) after the Bank of Mexico (Banxico) decided to slash its hedging program due to stabilizing the USD/MXN exchange rate amid geopolitical and Covid-19 uncertainty. Hence, the pair trades at 17.1792 after hitting a daily low of 17.0430.
Mexican Peso weakens further after the Bank of Mexico’s decision to cut hedging, despite mixed US employment figures
Last week’s news that Banxico would reduce its currency hedging program sent the USD/MXN pair into a tailspin, as the program was designed to tame volatility, seen by traders as an exit signal from its long positions. On August 31, the USD/MXN posted more than 1.70% gains after Banxico’s decision.
On Friday, the latest US employment figures revealed the US Nonfarm Payrolls (NFP) rose to 187K in August versus 170K expected and 157K prior (revised). Nevertheless, the Unemployment Rate rising to 3.8% from the 3.5% market forecasts and previous readings stalled the Greenback rally, as the data was seen as a justification for the Fed to keep interest rates unchanged at the September meeting.
Other data The US ISM Manufacturing PMI also impressed the US Dollar buyers with the 47.6 figures versus analysts’ estimation of 47.0 versus 46.4 previous readings.
In the central bank action, Cleveland’s Fed President Loretta Mester states that the Unemployment Rate remains low, and she still sees the jobs market as quite strong. However, the policymaker remains hawkish and has seen higher rates for longer.
On the Mexican front, Banxico’s Governor Victoria Rodriguez Ceja took off from the table rate cuts, as she added, “The outlook ahead continues to be complex and uncertain. It’s important to remember that disinflation periods are not linear.”
Upcoming data will see the release of Mexican inflation figures for August, and the US ISM Non-Manufacturing PMI will give direction to the USD/MXN pair. Nevertheless, expect further Mexican Peso weakness after Banxico’s hedge cuts.
USD/MXN Price Analysis: Technical outlook
The USD/MXN is consolidating, with the pair unable to crack to new year-to-date (YTD) lows while reversing its course, threatening to edge higher if it reclaims a mult-month downslope resistance trendline and the 50-day Moving Average (DMA) at around 17.20/17.2900. If that area is reclaimed, look for buyers to test the May 17 daily low turned resistance at 17.4038, seen as a crucial level to overcome, before testing the confluence of the 200-DMA and the psychological 18.0000 figure. On the downside, risks emerge below the confluence of the 20 and 50-DMA at around 16.98/96.
- WTI found support at $85.32 and then settled around $85.50.
- Investors continue to asses the US’s August NFPs released on Friday.
- OPEC expected to extend its voluntary production cuts.
The West Texas Intermediate (WTI) barrel cleared daily losses and traded neutral in the $85.50 - $86.00 zone near multi-month highs, benefited by a softer USD. The Greenback is trading weak against most of its rivals while investors digest Friday’s Nonfarm Payroll (NFP) figures. No relevant economic data will be released during the session, and the focus will shift to Wednesday’s ISM Services PMI figures from August.
NFPs revealed that headline employment grew, but so did the unemployment rate, and wage inflation measured by the Average Hourly Earnings decelerated. Signs of the labour market cooling may ease the pressure on the Federal Reserve (Fed) to continue hiking, and markets started to price in a less aggressive stance for the remainder of the year. As for now, the CME FedWatch tool indicates that the odds of a pause in September remain high while the probabilities of a hike in November and December decreased to nearly 35%, and those dovish bets explain the USD weakness. Interest rates and Oil prices tend to be negatively correlated, so as the Fed approaches the end of its tightening cycle, the WTI may gain further traction.
In addition, the Organization of the Petroleum Exporting Countries (OPEC) and its allies, including Russia, are expected to extend their voluntary production cuts into October, which could contribute to a tighter global supply. Oil prices may get an additional boost.
WTI Levels to watch
Based on the daily chart assessment, a bullish outlook is noted for WTI in the near future. The Relative Strength Index (RSI) resides above its midline in the positive territory near the overbought threshold. It is further validated by the green bars on the Moving Average Convergence Divergence (MACD), indicating a robust bullish momentum. Moreover, the pair is above the 20,100,200-day Simple Moving Average (SMA), pointing towards the prevailing strength of the bulls in the larger context.
Support levels: $85.30, $84.00, $83.00.
Resistance levels: $87.00, $88.00, $89.00
WTI Daily Chart
-638294399089740976.png)
- China’s measures to boost its property market initially lifted investor sentiment.
- Traders price in a less aggressive Federal Reserve; first-rate cut expected in May.
- The upcoming week features sparse New Zealand economic data but includes the RBA monetary policy meeting.
The New Zealand Dollar (NZD) losses some traction against the Greenback (USD) on thin liquidity conditions due to the observance of Labor Day in the United States (US). Even though China’s measures to boost its economy and a risk-on impulse, the pair is under stress after hitting a daily high of 0.5961. The NZD/USD is trading at 0.5935, down 0.04%.
The NZD lost ground despite positive news from China and the Fed’s less aggressive outlook
Price action remains subdued as volume remains scarce. Overnight news from China improved investors’ mood as the country established measures to boost its property market, which is at the brisk of a crisis. As the Government easied measures, home sales rose, as reported by Bloomberg.
Aside from this, traders have begun to price in a less aggressive Federal Reserve (Fed) in the US. Interest rate probabilities for the September meeting remain at 92%, with the first-rate cut seen on May 1, as shown by the bottom picture. On that date, traders foresee rates at around 5.14%, 19 basis points below the effective Federal Funds Rate (FFR) of 5.33%.
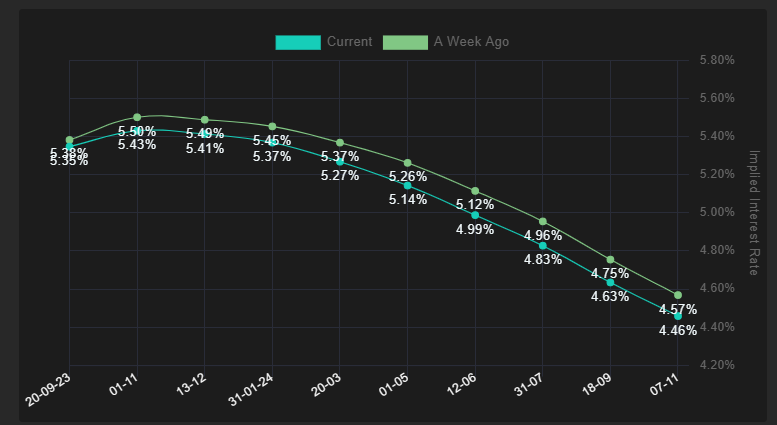
Source: Financialsource
The latest round of US data witnessed Nonfarm Payrolls for August at 187K above estimates, which warranted a US Dollar upside in other conditions. Still, it wasn’t the case as the Unemployment Rate rose by 3.8% YoY, above estimates of 3.5%. Analysts at TDS Securities noted, “We think this week’s labor-market and consumer prices data should be judged as positive news by Fed officials, and we continue to view July as the last hike of the Fed’s tightening cycle.”
In the week ahead, the New Zealand economic docket is empty, except for the Global Dairy Trade Price Index release. Nevertheless, one of its largest trading partners, Australia, has scheduled the Reserve Bank of Australia’s (RBA) monetary policy meeting, in which the central bank is expected to keep rates unchanged. In that outcome, the NZD/USD could continue to resume lower unless an upbeat market mood keeps flows going toward riskier assets.
On the US front, a slew of Fed officials would keep traders entertained before policymakers enter their blackout period ahead of September’s monetary policy meeting.
NZD/USD Price Analysis: Technical outlook
From a technical standpoint, the NZD/USD is downward biased, but in the short-term, it’s sideways, in the middle of the August 25-September 1 swing low/high at 0.5886-0.6015, waiting for a clear direction to resume a larger correction. However, if the pair tumbles below 0.5900, expected sellers to pile up and drive prices toward the year-to-date (YTD) low of 0.5886, with further downside seen at the November 3 low of 0.5740. Conversely, a rally to 0.6000 could pave the way for an upward correction, with the 50-day Moving Average (DMA) targeted at 0.6098.
- Silver price corrects further as the US Dollar remains firm due to stable job growth.
- Fed Mester that demand and supply in the labor market is coming into a better balance.
- Silver price demonstrates a Broadening Triangle chart formation.
Silver price (XAG/USD) extends its correction to near the crucial support of $24.00 even though investors hope that the Federal Reserve (Fed) is done with hiking interest rates. The white metal remained offered from Thursday but the broader trend is still positive as the tight United States labor market starts cooling down.
S&P500 futures remain lackluster as US markets are closed on account of Labor Day. Due to the extended weekend, weak volume is expected in the FX domain too. Also, the market mood is quiet due to an extended weekend.
The US Dollar Index (DXY) looks set to extend recovery above the immediate resistance of 104.20 as job growth remains solid in August.
Cleveland Fed Bank President Loretta Mester said on Friday that demand and supply in the labor market is coming into a better balance but the job market is still strong. She further added that while job growth has slowed and job openings are down, the Unemployment Rate is low.
Also, US Manufacturing PMI for August increased to 47.6 from 46.4 in July but remained below the 50.0 mark, which itself shows a contraction in activities. After factory activities, investors shift focus to the Services PMI for August, which will be published on Wednesday.
Silver technical analysis
Silver price demonstrates a Broadening Triangle chart formation on a two-hour scale. The downside is supported near the horizontal resistance plotted from August 25 low around $23.92. A declining 20-period Exponential Moving Average (EMA) indicates that the mid-term trend is bearish. The Relative Strength Index (RSI) (14) shifts into the bearish range of 20.00-40.00, which indicates that a bearish impulse is already active.
Silver two-hour chart
-638294339190992924.png)
Analysts at MUFG Bank forecast the USD/INR at 82.70 by the end of the third quarter and at 81.50 by the end of the first quarter of next year. They have a neutral view of the Indian Ruppe in the short term.
Neutral on INR near-term
We recently turned neutral on INR, and further raise our USD/INR forecast to 82.700 in 3m and 81.000 in 12m with our global team now calling for a shallower and delayed path for US dollar weakness.
There are some headwinds for INR in the nearterm, with inflation spiking more than we initially anticipated in July, albeit mainly driven by food prices so far.
The RBI should remain hawkish for longer. We still expect the next move to be a rate cut but see this happening in June 2024 at the earliest.
The structural reforms over the past decade put India in a good place to benefit from FDI flows, in part to tap the domestic market, but also in line with broader trends to diversify companies’ supply chains.
- EUR/USD makes a U-turn and regains the 1.0800 zone.
- Further decline could revisit the August low near 1.0760
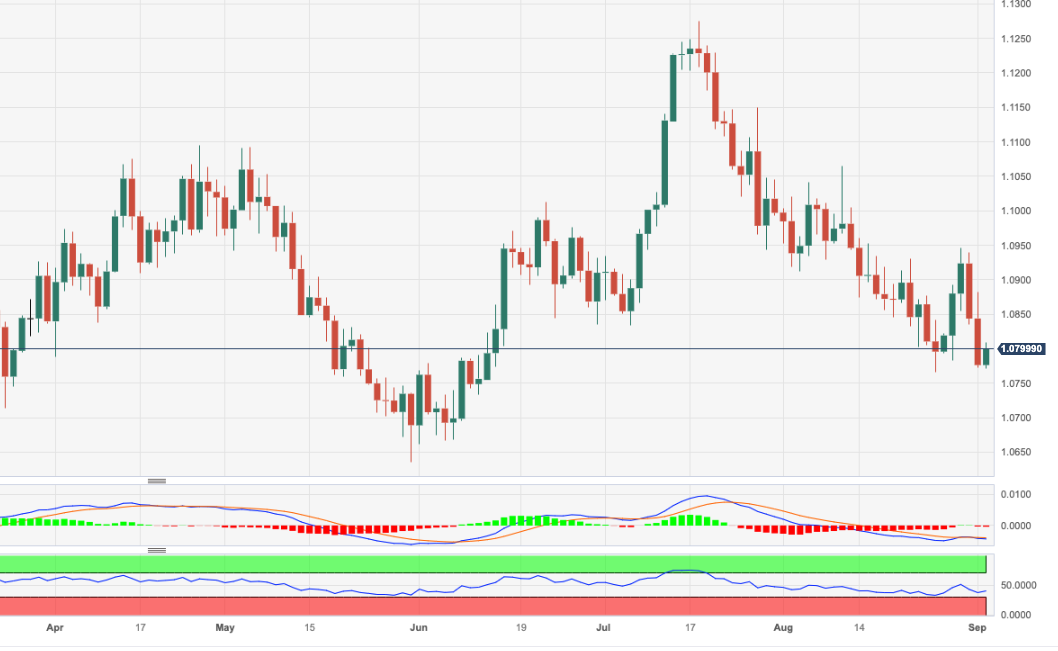
EUR/USD manages to pick up some traction and reclaims the area above 1.0800 the figure at the beginning of the week.
The sharp retracement seen in the latter part of last week seems to have shifted the attention to the downside. Against that, the next contention area aligns at the August low of 1.0765 (August 25) prior to the May low of 1.0635 (May 31).
In the meantime, further losses remain in the pipeline while below the key 200-day SMA, today at 1.0817.
EUR/USD daily chart
- USD/JPY prepares for a fresh rally amid strength in the US Dollar Index.
- The US Dollar remains firm US Dollar due to steady labor growth in August despite higher interest rates by the Fed.
- USD/JPY has been consolidating in a narrow range of 145.58-147.38 for the past three weeks.
The USD/JPY pair gathers strength to extend the V-shape recovery above the immediate resistance of 146.50. The asset remains solid due to a firmer US Dollar amid steady labor growth in August despite higher interest rates by the Federal Reserve (Fed).
The market mood remained majorly quiet on Monday due to an extended weekend in the US on account of Labor Day. The US Dollar Index (DXY) corrects gradually to near 104.00 from the four-day high of 104.20 as investors await the ISM Services PMI for August, which will be published on Wednesday.
Meanwhile, hopes that the Fed will keep interest rates unchanged in the remaining year rose as labor market conditions cool down further. The Unemployment Rate rose and wage growth slowed in August.
USD/JPY has been consolidating in a narrow range of 145.58-147.38 for the past three weeks. The asset is demonstrating a volatility contraction and is expected to deliver a decisive action after a consolidation break.
The asset continues to find support from the upward-sloping 20-day Exponential Moving Average (EMA), which trades around 145.31. Also, advancing 50-EMA indicates that the short-term trend is extremely bullish. Potential resistance is plotted from 21 October 2022 high at around 152.00.
The Relative Strength Index (RSI) (14) aims to stabilize into the bullish range of 60.00-40.00. An occurrence of the same will activate the upside momentum.
Going forward, a decisive break above August 29 high at 147.38 will expose the asset to the psychological resistance of 150.00, followed by 21 October 2022 high at around 152.00.
In an alternate scenario, a breakdown below September 1 low at 144.44 would drag the asset toward the 50-DEMA around 143.50 and July 21 high around 142.00.
USD/JPY daily chart
-638294319240410186.png)
"It will be critical for central banks to keep inflation expectations firmly anchored while these relative price changes play out," Christine Lagarde, President of the European Central Bank (ECB), said on Monday.
"It is exactly when people are paying most attention that central banks should deliver their key communication to ensure that those expectations remain firmly anchored," she added while speaking at the Distinguished Speakers Seminar organised by the European Economics & Financial Centre.
Market reaction
These comments failed to trigger a noticeable market reaction and EUR/USD was last seen trading in positive territory near 1.0800.
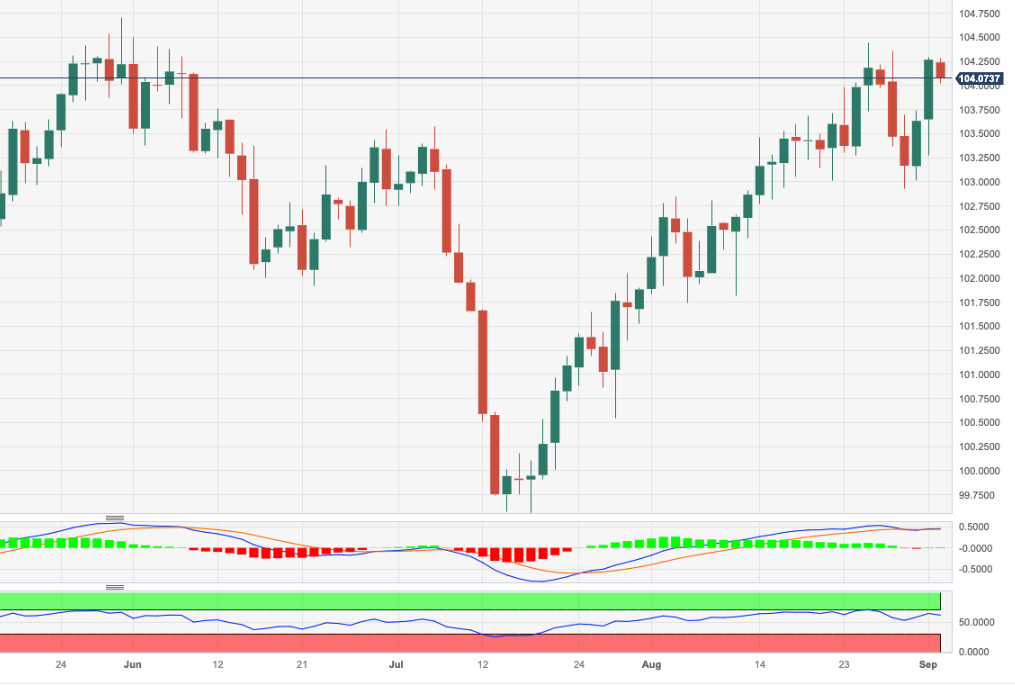
- DXY gives away part of the recent two-day advance on Monday.
- Bulls continue to target the 104.50 region in the near term.
DXY partially surrenders the sharp uptick seen in the second half of last week and challenges the key 104.00 neighbourhood on Monday.
If bulls regain the upper hand, the index should shift its focus to another visit to the monthly peak of 104.44 (August 25) just before the May top of 104.69 (May 31). The breakout of this level could prompt a probable test of the 2023 high at 105.88 (March 8) to re-emerge on the horizon.
While above the key 200-day SMA, today at 103.04, the outlook for the index is expected to remain constructive.
DXY daily chart
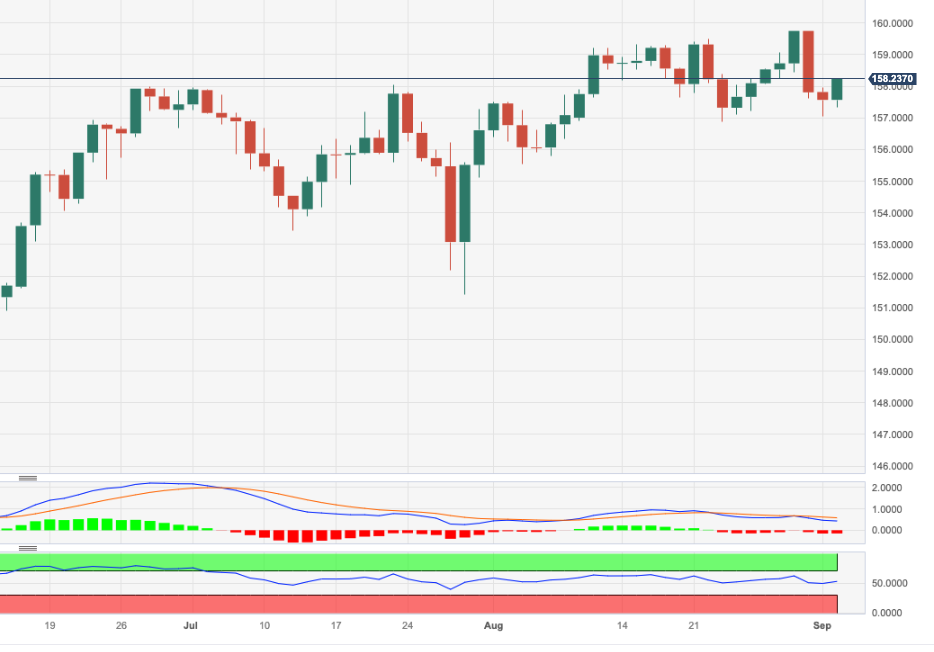
- EUR/JPY sets aside two daily pullbacks in a row and retests 158.00.
- There seems to be a decent contention area around 157.00.
EUR/JPY regains some upside traction and reverses two straight sessions of losses at the beginning of the week.
The continuation of the uptrend could see the cross challenging the recent 2023 peak at near 159.76 (August 30) ahead of the key round level at 160.00. The surpass of the latter should not see any resistance level of note until the 2008 high at 169.96 (July 23).
In the meantime, the resumption of the selling pressure is expected to meet initial support at the weekly low around 157.00 (September 1), an area reinforced by the temporary 55-day SMA.
So far, the longer term positive outlook for the cross appears favoured while above the 200-day SMA, today at 148.05.
EUR/JPY daily chart
There is still scope for USD/IDR to keep navigating within a 15,185-15,300 range for the time being, suggests Markets Strategist Quek Ser Leang at UOB Group.
Key Quotes
Last week, we expected USD/IDR to trade sideways between 15,240 and 15,340. However, it traded in a lower range of 15,210/15.298.
There is no clear increase in downward momentum and we continue to expect USD/IDR to trade sideways, probably between 15,185 and 15,300.
- USD/CAD remains sideways around 1.3600 as the US and Canadian markets will remain closed on Monday on account of Labor Day.
- The US Dollar maintains its bullish mainstay as job growth remained steady in August.
- The BoC is expected to keep interest rates unchanged at 5% on Wednesday.
The USD/CAD pair remains sideways after a vertical rally near the round-level resistance of 1.3600 in the late European session. The Loonie asset is expected to remain lackluster on Monday as the US and Canadian markets will remain closed on account of Labor Day.
S&P500 futures generate some gains in Europe, portraying strength in the risk-appetite theme. The US Dollar Index (DXY) faces nominal selling pressure near a four-day high at 104.20 while the upside is still favored as investors remain cautious that the Federal Reserve (Fed) will keep interest rates higher for a longer period.
The US Dollar maintains its bullish mainstay as hiring momentum remained steady in August despite restrictive interest rate policy by the Fed. As per the US Nonfarm Payrolls (NFP) report, the job market witnessed a fresh addition of 187K new employees, which was higher than expectations of 170K and July's reading of 157K. However, the higher Unemployment Rate and slower wage growth boost hopes of the Fed announcing a pause in its current tightening spell.
Meanwhile, oil prices turn sideways after a massive rally near $85.50 as Saudi Arabia is expected to extend supply cut by one million barrels per day from October. In an already shrinking oil market, tight supply expectations keep oil prices on fire.
It is worth noting that Canada is the leading exporter of oil to the United States and higher oil prices will support the Canadian Dollar.
This week, the major trigger will be the interest rate decision by the Bank of Canada (BoC), which will be announced on Wednesday. BoC Governor Tiff Macklem is expected to keep interest rates unchanged at 5% as job growth remains slow.
Markets Strategist Quek Ser Leang at UOB Group expects USD/MYR to extend the current side-lined trading in the next few sessions.
Key Quotes
Last week, we highlighted that USD/MYR “could continue to trade in a range this week, likely between 4.6200 and 4.6700.” USD/MYR then traded in a narrower range of 4.6270/4.6540.
The quiet price actions offer no fresh clues, and we continue to expect USD/MYR to trade in a range, likely between 4.6250 and 4.6660.
- US Dollar price action expected to head sideways at the start of the week.
- No real outliers or data points to monitor at the start of the week.
- The US Dollar Index is likely to hold above 104.00.
The US Dollar (USD) steadies on Monday, in a mixed bag against most major currencies. No real outliers to notice as US traders are enjoying the US Labor Day bank holiday. Expect low volumes this Monday as several futures markets are closed.
The focal point this week will be on Wednesday, when the Institute of Supply Management (ISM) will publish the key Services Purchasing Managers Index (PMI) survey for August. Additionally, nearly eight central bank speakers are due to make an appearance and might guide the market towards the next US Federal Reserve meeting on September 20.
Daily digest: US Dollar steadies while enjoying a break
- A very calm calendar ahead with US markets closed for the US Labor Day holiday.
- Germany July Machinery orders fell 11% on a yearly basis.
- Italy is set to prepare for raising its 2023 budget deficit targets, according to Reuters.
- Chinese president Xi Jinping will not attend the G-20 summit in India after reports that Chinese banks are distributing billions of loans to Russia.
- China issues more stimulus measures, which makes the property stocks gauge jump 2.8%.
- Markets will be on edge to hear if the biggest property developer of China, Country Garden, can afford its bond payments, which are already in an extended grace period. Non-payment would trigger a default.
- A similar picture to Friday unfolds in the equity markets with the Japanese Topix index closes at +1.02%. The Hong Kong Hang Seng is about to close higher after its emergency close on Friday due to a typhoon. The index caught up, jumping 2.50% near its closing bell. European equities are trading higher over 0.50% and US equity futures are mildly in the green.
- The CME Group’s FedWatch Tool shows that markets are pricing in a 93% chance that the Federal Reserve will keep interest rates unchanged at its meeting in September.
- The benchmark 10-year US Treasury bond yield trades at 4.18% and will not move this Monday as bond markets are closed for US Labor Day.
- US Dollar Index technical analysis: left or right
- The US Dollar is steady, with no real outliers to report on this Monday. Volumes are usually lower on Mondays, and even more today with the US markets closed for US Labor Day. No big moves to takeaway for the US Dollar Index (DXY), which looks to be consolidating above 104.00.
In case pace picks up again on Tuesday in the same direction asFriday, a surge towards 104.00 is likely. In this region, 104.35 (the peak of August 29) is an ideal candidate for a double top. Should the Greenback go on a tear, expect a test at 104.47 – the six-month high. From there, 104.70 from May 31 will be the next target.
On the downside, the summer rally of the DXY will be the key element to track for any change in sentiment. That is the 200-day Simple Moving Average (SMA) at 103.06, which could bring substantially more weakness once the DXY starts trading further below it. The double belt of support at 102.42, with both the 100-day and the 55-day SMA, are the last lines of defence before the US Dollar sees substantial and longer-term depreciation.
US Dollar FAQs
What is the US Dollar?
The US Dollar (USD) is the official currency of the United States of America, and the ‘de facto’ currency of a significant number of other countries where it is found in circulation alongside local notes. It is the most heavily traded currency in the world, accounting for over 88% of all global foreign exchange turnover, or an average of $6.6 trillion in transactions per day, according to data from 2022.
Following the second world war, the USD took over from the British Pound as the world’s reserve currency. For most of its history, the US Dollar was backed by Gold, until the Bretton Woods Agreement in 1971 when the Gold Standard went away.
How do the decisions of the Federal Reserve impact the US Dollar?
The most important single factor impacting on the value of the US Dollar is monetary policy, which is shaped by the Federal Reserve (Fed). The Fed has two mandates: to achieve price stability (control inflation) and foster full employment. Its primary tool to achieve these two goals is by adjusting interest rates.
When prices are rising too quickly and inflation is above the Fed’s 2% target, the Fed will raise rates, which helps the USD value. When inflation falls below 2% or the Unemployment Rate is too high, the Fed may lower interest rates, which weighs on the Greenback.
What is Quantitative Easing and how does it influence the US Dollar?
In extreme situations, the Federal Reserve can also print more Dollars and enact quantitative easing (QE). QE is the process by which the Fed substantially increases the flow of credit in a stuck financial system.
It is a non-standard policy measure used when credit has dried up because banks will not lend to each other (out of the fear of counterparty default). It is a last resort when simply lowering interest rates is unlikely to achieve the necessary result. It was the Fed’s weapon of choice to combat the credit crunch that occurred during the Great Financial Crisis in 2008. It involves the Fed printing more Dollars and using them to buy US government bonds predominantly from financial institutions. QE usually leads to a weaker US Dollar.
What is Quantitative Tightening and how does it influence the US Dollar?
Quantitative tightening (QT) is the reverse process whereby the Federal Reserve stops buying bonds from financial institutions and does not reinvest the principal from the bonds it holds maturing in new purchases. It is usually positive for the US Dollar.
"Dollar consolidates gains, bonds maintain losses after break-out in oil prices overshadowed the rise in US unemployment rate to 3.8% in August," note analysts at Société Générale.
US markets are closed today
"Decline in payrolls growth confirms labour market loosening, cements Fed pause. US markets are closed today."
"Week ahead: ECB’s Lagarde speaks today, ECB inflation expectations tomorrow and US ISM services on Wednesday. RBA and BoC forecast to keep rates on hold Tuesday/Wednesday. SG house view: Chile CB to cut 100bp tomorrow and Poland to launch easing cycle on Wednesday with a 25bp cut to 6.50%. CPI from Mexico, Chile, Hungary also on agenda."
"China: existing home sales in Beijing jumped 100% to 1,200 units on Saturday from a week before according to Security Journal following lower minimum down payment and easing mortgage restrictions."
Analysts at Rabobank assess the latest CFTC Commitment of Traders report:
Forecasters are confident BoC rates will remain on hold this week
"USD net long positions decreased slightly. This was driven by an increase in short positions. Lower than anticipated JOLTS printed on Tuesday and may act as support for the Fed to pause future rate hikes."
"EUR net long positions have decreased. This was driven by an increase in short positions as the market evaluates recent weak Eurozone economic data and doubts spread as to the ability of the ECB to hike rates further."
"GBP net speculators’ long positions increased for the third consecutive week. This was driven by an increase in long positions. The market continues to price in further BoE rate hikes."
"JPY net short positions have increased for the second consecutive week. This was driven by a contraction in long positions, and an increase in short positions, given shifting expectations that the BoJ may not prove more dovish than previously thought."
"CHF net shorts have fallen for the fourth consecutive week. Short positions decreased slightly as the SNB remains hawkish."
"CAD net shorts have increased slightly. This was driven by a contraction in long positions. Surveys suggest forecasters are confident that BoC rates will remain on hold this week."
"AUD net short positions have increased for the second consecutive week. This was driven by an increase in short positions and has driven the volume of short positions to an all-time high. Weak Chinese data is impacting the AUD, although Australian fundamentals are holding up relatively well."
Analysts at TD Securities thinks that the Reserve Bank of Australia will leave its policy rate unchanged following the September policy meeting.
Governor Lowe's last RBA meeting
We expect the RBA to leave the cash rate unchanged at 4.1% (cons: 4.1%) at the September meeting after the encouraging July CPI print. The economic data hasn't provided much impetus for the RBA to restart its hiking cycle since the Bank transited to a fine-tuning phase in this cycle, emphasising that the Board will take decision month-by-month based on incoming data.
"July CPI inflation continued to decelerate to 4.8% y/y while the job losses of -14.6k in July cements the case for another pause from the Bank. As such, we doubt there will be any distinct shift in the RBA's messaging at the September meeting and expect Governor Lowe's last RBA meeting to go without much fanfare."
- Natural Gas takes a small step back as US markets close due to the Labor Day Holiday.
- The US Dollar weakens slightly after Friday’s knee-jerk reaction on Nonfarm Payrolls data.
- Support at $2.80 likely to hold before the rally picks up again.
Natural Gas falls slightly in European trading hours as US markets are closed for Labor Day. Substantial declines aren’t expected as European gas supply is under pressure. Over the weekend, supply from three Norwegian gas fields was halted, sending Norwegian gas exports to the EU to its lowest level since 2015.
Meanwhile, the US Dollar trades mixed after a US Jobs report that delivered a knee-jerk reaction. The US Dollar Index first weakened on the initial headlines, and reversed an hour later as markets digested the report’s content, which pointed to still strong labour market conditions. With the US on holiday, no big moves are expected in either Natural Gas futures or in the Greenback.
At the time of writing, Natural Gas is trading at $2.844 per MMBtu.
Natural Gas news and market movers
- The European Natural Gas price jumped 5.3% due to surprise outages in Norway.
- The risk of strikes inAustralia remains high, an outcome that could hit Natural Gas supply going forward.
- Japan’s spot power price climbed 5.5% for the week as bad weather hurts the solar-power supply and puts higher pressure on LNG supplies. Reports of regional costs soaring on LNG supply are being factored into the price as well.
- Further unplanned curbs in Norway are projected due to unforeseen maintenance at the Aasta Hansteen field. The Dvalin field is also impacted, while planned works at Oseberg are being extended due to unforeseen delays.
Natural Gas Technical Analysis: steady during US holiday
Natural Gas was on a tear last week, together with Crude Oil prices. Though the European bloc has its gas stockpiles filled up over more than 90%, it looks like it will need to scramble for any further needs..
On the upside, $3 is the level to watch after the double top formation from Friday and Thursday. Just above there, the 200-day Simple Moving Average (SMA) is present as a cap and has not been tested in the past few months. Keep an eye on $3.03 before targeting $3.18 and testing the upper side of the trend channel.
On the downside, the trend channel has done a massive job underpinning the price action. Aside from one small false break, ample support was provided near $2.71. The 55-daySMA needs to give that much needed support at $2.71 ahead of the ascending trend channel at $2.63. Any falling knives can still be caught by the 100-day SMA near $2.58.
-638294212984860896.png)
Natural Gas FAQs
What fundamental factors drive the price of Natural Gas?
Supply and demand dynamics are a key factor influencing Natural Gas prices, and are themselves influenced by global economic growth, industrial activity, population growth, production levels, and inventories. The weather impacts Natural Gas prices because more Gas is used during cold winters and hot summers for heating and cooling. Competition from other energy sources impacts prices as consumers may switch to cheaper sources. Geopolitical events are factors as exemplified by the war in Ukraine. Government policies relating to extraction, transportation, and environmental issues also impact prices.
What are the main macroeconomic releases that impact on Natural Gas Prices?
The main economic release influencing Natural Gas prices is the weekly inventory bulletin from the Energy Information Administration (EIA), a US government agency that produces US gas market data. The EIA Gas bulletin usually comes out on Thursday at 14:30 GMT, a day after the EIA publishes its weekly Oil bulletin. Economic data from large consumers of Natural Gas can impact supply and demand, the largest of which include China, Germany and Japan. Natural Gas is primarily priced and traded in US Dollars, thus economic releases impacting the US Dollar are also factors.
How does the US Dollar influence Natural Gas prices?
The US Dollar is the world’s reserve currency and most commodities, including Natural Gas are priced and traded on international markets in US Dollars. As such, the value of the US Dollar is a factor in the price of Natural Gas, because if the Dollar strengthens it means less Dollars are required to buy the same volume of Gas (the price falls), and vice versa if USD strengthens.
According to Markets Strategist Quek Ser Leang at UOB Group, USD/THB is now seen trading within the 34.90-35.35 range.
Key Quotes
After USD/THB dropped sharply to 34.84 and rebounded, we highlighted last Monday (28 Aug, spot at 35.23) that “despite the drop to 34.84, there is no significant increase in downward momentum” and we expected USD/THB to trade in a range between 34.88 and 35.52. Our view was not wrong, even though USD/THB traded in a narrower range than expected (34.89/35.29).
The price movements offer no fresh clues, and we continue to expect USD/THB to trade in a range, likely between 34.90 and 35.35. Looking ahead, if USD/THB breaks clearly above 35.35, it could lead to a sustained advance.
- AUD/USD trades inside Friday’s range as investors sidelined ahead of the RBA policy.
- The US Dollar remains sideways as the US markets will remain closed on account of Labor Day.
- Price action from the AUD/USD pair in a four-hour time frame suggests a Bearish Flag formation.
The AUD/USD pair auctioned inside Friday’s trading range of 0.6438-0.6522 on Monday as investors await the interest rate decision by the Reserve Bank of Australia (RBA) for its September monetary policy, which will be announced on Tuesday.
According to a Reuters poll, RBA Governor Philip Lowe will keep interest rates unchanged at 4.10% but will keep doors open for more hikes.
Meanwhile, the US Dollar Index (DXY) turns sideways after a rally to near 104.20 inspired by steady hiring momentum recorded for August. The United States Nonfarm Payrolls (NFP) report showed that 187K new employees were recruited in August, which was higher than expectations of 170K and July's reading of 157K. The Unemployment Rate rose sharply to 3.8% against the consensus and the prior release of 3.5%.
Price action from the AUD/USD pair in a four-hour time frame suggests a Bearish Flag chart pattern formation, which indicates a consolidation in which inventory is transferred from the institutional investors to the retail participants after a vertical sell-off move. A declining 200-period Exponential Moving Average (EMA) indicates that the long-term trend is bearish.
The Relative Strength Index (RSI) (14) trades in a 40.00-60.00 range, which indicates that investors await a fresh trigger.
A fresh downside would appear if the Aussie asset dropped below August 17 low around 0.6360. This would expose the asset to the round-level support of 0.6300 followed by 03 November 2022 low at 0.6272.
On the contrary, a recovery move above August 15 high around 0.6522 will drive the asset to August 9 high at 0.6571. Breach of the latter will drive the asset towards August 10 high at 0.6616.
AUD/USD two-hour chart
-638294181901276808.png)
- Gold price juggles below the $1,950.00 resistance as the focus shifts to the US Services PMI.
- US markets will remain closed on Monday on account of Labor Day.
- Cooling labor market conditions boost the Fed’s hopes of a soft landing.
Gold price (XAU/USD) traded back and forth from the past four trading sessions even though cooling labor market conditions boosted the Federal Reserve’s (Fed) soft landing hopes. A softening job market could mean that the Fed’s interest rate hike in July was the last one in the current policy tightening spell. The precious metal remains calm, but a power-pack action is expected after the release of the Services PMI data on Wednesday.
US markets will remain closed on Monday on account of the Labor Day holiday, so a lackluster performance is widely anticipated due to thin trading conditions. Going forward, investors hope that both price and the US Dollar can deliver gains as strength in the US Dollar would shift from the Fed’s tight policy to the vulnerable economic outlook of other G7 economies.
Daily Digest Market Movers: Gold price awaits Services PMI for further action
- Gold price trades sideways below the $1,950.00 resistance even as cooling labor market conditions boost the Federal Reserve’s soft landing hopes.
- The precious metal delivered a volatile action after Friday’s Nonfarm Payrolls report for August but remains above the crucial support of $1,940.00.
- US employers added 187K new payrolls in August, higher than expectations of 170K and July's reading of 157K. The Unemployment Rate rose sharply to 3.8% against the consensus and the prior release of 3.5%.
- Cleveland Fed Bank President Loretta Mester said on Friday that demand and supply in the labor market is coming into a better balance but the job market is still strong. She further added that while job growth has slowed and job openings are down, the Unemployment Rate is low.
- Wage growth slowed in August as employees appear to be shifting their focus towards staying at one job rather than switching frequently.
- Average Hourly Earnings expanded at 0.2% on a monthly basis, a slower pace than the expected 0.3%. In July, earnings grew by 0.4%. On an annual basis, earnings growth decelerated to 4.3% against the consensus and the former print of 4.4%.
- Slower wage growth might cut the real income of households and weigh on consumer spending momentum. In July, both the headline and core monthly Personal Consumption Expenditure (PCE) Price Index grew at a steady pace.
- Investors hope that the US labor market will continue to cool down due to hefty interest rate hikes, prompting the Fed to keep interest rates unchanged for the remainder of the year.
- As per the CME Group Fedwatch Tool, as much as 93% of chances are in favor of steady interest rates in the September meeting. For the November meeting, the chances of an unchanged interest rate decision have increased to 62%.
- The US manufacturing sector seems to be stabilizing, but the PMI came in below the 50.0 mark, signaling a contraction in activity. The PMI increased to 47.6 in August from July’s reading of 46.4. The index has remained below the 50.0 threshold for 10 consecutive months.
- The US Dollar Index declined from a four-day high of 104.30 even though a cooling labor market boosted Fed pause bets.
- While the majority of economies are experiencing a vulnerable real estate sector, the US Commerce Department said on Friday that construction spending rose 0.7% as outlays on single-home projects rose due to limited supply.
- Investors should note that US markets will remain closed on Monday on account of Labor Day.
- This week, investors will keep focus on the ISM Services PMI for August, which will be published on Wednesday at 14:00 GMT. The PMI is expected to be broadly steady at 52.6.
- Developing economies could face the wrath of higher interest rates for a longer period as IMF First Deputy Managing Director Gita Gopinath expects that interest rates will remain higher for a quite long time.
- IMF Gopinath warned that external conditions had become more challenging for emerging markets due to rising geopolitical fragmentation, tightening financial conditions, and the growing costs of climate change.
Technical Analysis: Gold price trades sideways below $1,950
Gold price continued to auction in the $1,934-$1,949 range for the past four trading sessions after a significant recovery. The precious metal stabilizes above the 20- and 50-day Exponential Moving Averages (EMAs), which indicates that the medium-trend has turned positive. The Relative Strength Index (RSI) (14) hovers around 60.0, A decisive break above this level will likely activate the bullish impulse.
Fed FAQs
What does the Federal Reserve do, how does it impact the US Dollar?
Monetary policy in the US is shaped by the Federal Reserve (Fed). The Fed has two mandates: to achieve price stability and foster full employment. Its primary tool to achieve these goals is by adjusting interest rates.
When prices are rising too quickly and inflation is above the Fed’s 2% target, it raises interest rates, increasing borrowing costs throughout the economy. This results in a stronger US Dollar (USD) as it makes the US a more attractive place for international investors to park their money.
When inflation falls below 2% or the Unemployment Rate is too high, the Fed may lower interest rates to encourage borrowing, which weighs on the Greenback.
How often does the Fed hold monetary policy meetings?
The Federal Reserve (Fed) holds eight policy meetings a year, where the Federal Open Market Committee (FOMC) assesses economic conditions and makes monetary policy decisions.
The FOMC is attended by twelve Fed officials – the seven members of the Board of Governors, the president of the Federal Reserve Bank of New York, and four of the remaining eleven regional Reserve Bank presidents, who serve one-year terms on a rotating basis.
What is Quantitative Easing (QE) and how does it impact USD?
In extreme situations, the Federal Reserve may resort to a policy named Quantitative Easing (QE). QE is the process by which the Fed substantially increases the flow of credit in a stuck financial system.
It is a non-standard policy measure used during crises or when inflation is extremely low. It was the Fed’s weapon of choice during the Great Financial Crisis in 2008. It involves the Fed printing more Dollars and using them to buy high grade bonds from financial institutions. QE usually weakens the US Dollar.
What is Quantitative Tightening (QT) and how does it impact the US Dollar?
Quantitative tightening (QT) is the reverse process of QE, whereby the Federal Reserve stops buying bonds from financial institutions and does not reinvest the principal from the bonds it holds maturing, to purchase new bonds. It is usually positive for the value of the US Dollar.
- EUR/GBP trades lower around 0.8550 due to weak data from Eurozone and Germany.
- ECB President Lagarde will deliver a speech during a press conference on Monday.
- Traders seem cautious about hawkish expectations amid gloomy economic scenario in the UK.
EUR/GBP trades lower around 0.8550 during the European session on Monday, struggling to hold ground after the releases of disappointing data from the Eurozone and Germany. As said, Germany’s Trade Balance for July reduced to €15.9B compared to the expected €18.0B, which was €18.7B in the previous month. Along with this, Eurozone’s Sentix Investor Confidence (Sep) showed a decline of 21.5 from the previous 18.9 decline.
Furthermore, the cross pair is facing downward pressure as investors exercise caution, fearing that additional monetary tightening by the European Central Bank (ECB) could potentially push the Eurozone's economy into a recession.
Traders await the ECB President Christine Lagarde’s speech during the press conference scheduled for later in the day. During this conference, Lagarde may provide insight into the ECB's assessment of both the present and future condition of the Eurozone's economy.
ECB Governing Council member, Pierre Wunsch emphasized prevailing inflation as a factor for supporting the necessity of further tightening of monetary policy. During a radio interview broadcast by Bloomberg on Saturday, Pierre stated "I'm leaning towards the idea that we might need to take further action."
Conversely, EUR/GBP traders seem to adopt a cautious stance, given the challenging economic conditions prevailing in the United Kingdom (UK). The hawkish expectations raise concerns over the potential negative impact on the UK economy due to the further rise in interest rates during the Bank of England's (BoE) September meeting.
- EUR/JPY attracts fresh buyers on the first day of a new week and snaps a two-day losing streak.
- The BoJ’s dovish stance, along with a positive risk tone, undermines the JPY and lends support.
- Expectations that the ECB will pause its rate-hiking cycle hold back bulls from placing fresh bets.
The EUR/JPY cross regains positive traction on the first day of a new week and for now, seems to have stalled a two-day-old corrective decline from the 159.75 region, or its highest level since August 2008 touched last Wednesday. The buying interest picks up pace during the early part of the European session and lifts spot prices to a fresh daily peak, further beyond the 158.00 mark in the last hour.
The Japanese Yen (JPY) continues with its relative underperformance in the wake of a more dovish stance adopted by the Bank of Japan (BoJ) and turns out to be a key factor pushing the EUR/JPY cross higher. It is worth mentioning that the BoJ is the only central bank in the world to maintain negative interest rates and is widely expected to stick to its ultra-easy monetary policy settings. Moreover, the recent remarks by BoJ officials ensure that the Japanese central bank will maintain the status quo until next summer.
Apart from this, a generally positive tone around the equity markets, bolstered by the optimism over more stimulus measures from China, is seen as another factor weighing on the safe-haven JPY. China's top economic planner – the National Development and Reform Commission (NDRC) – said this Monday that it would establish a designated department to bolster the country's faltering private economy. This comes on the back of recent policy packages to boost China's ailing private businesses and lift the market sentiment.
The shared currency, on the other hand, draws some support from the emergence of some US Dollar (USD) selling, though lacks bullish conviction in the wake of the uncertainty over further policy tightening by the European Central Bank (ECB). In fact, a slew of ECB policymakers last week kept the door open for more interest rate hikes in 2023. That said, market participants have been scaling back their expectations for an imminent interest rate hike in the wake of signs of easing underlying inflation in the Euro Zone.
The preliminary data released by the European Union’s statistics agency Eurostat last Thursday showed that the annual Eurozone Harmonised Index of Consumer Prices (HICP) rose 5.3% in August, matching the pace seen in July. That said, the Core HICP inflation, which excludes more volatile energy, food, alcohol and tobacco prices and is closely watched by ECB policymakers, edged lower to 5.3% YoY in August from 5.5% in the previous month. This, along with looming recession risks, might cap gains for the EUR/JPY cross.
The market worries were further fueled by Monday's release of the Euro Zone Sentix Investor Confidence Index, which fell to -21.5 in September from -18.9 in the previous month. The Expectations Index also dropped to -21.0 points, from -17.3 in August. Moreover, the Current Situation Index registered its lowest reading since November 2022 and declined to -22.0 points for the current month. This, in turn, warrants some caution before traders start positioning for the resumption of the EUR/JPY pair's prior well-established uptrend.
Technical levels to watch
- Eurozone investors’ morale deteriorated in September amid German economic woes.
- EUR/USD pares back gains below 1.1000 on the downbeat Eurozone data.
The Eurozone Sentix Investor Confidence Index fell to -21.5 in September from -18.9 in August.
The Expectations Index in the Eurozone also dropped to -21.0 points, from -17.3 in the previous month.
The Current Situation Index declined to -22.0 points, its lowest level since November 2022.
Commenting on the survey's findings, Sentix Managing Director Manfred Huebner said that "the situation in Germany remains particularly precarious. Here we are measuring the weakest situation ... since July 2020, when the economy was slowed by the first coronavirus lockdown.”
"Germany is also weighing heavily on the economy in the Eurozone as a whole ... The tipping point of a global recession is less distant than one might think,” Huebner said.
Market reaction
EUR/USD is paring back gains below 1.0800 in response to the downbeat Eurozone data. As of writing, the EUR/USD pair is trading at 1.0790, up 0.17% on the day.
- USD/CHF trades lower around 0.8830 in the face of disappointing Swiss GDP.
- US and China trade tension could favor the safe-haven Swiss Franc (CHF).
- US weak employment data exerted pressure on the US Dollar (USD); traders seek more cues on Fed policy.
USD/CHF snaps the two-day winning streak, trading lower around 0.8830 during the early trading hours in the European session on Monday. The Swiss Franc (CHF) is experiencing upward support despite Switzerland’s downbeat Gross Domestic Product (GDP) (QoQ) for the second quarter.
The Swiss GDP declined to 0.0% against the market consensus of 0.1%, which was reported at 0.3% in the previous quarter. Additionally, the modest data from the United States (US) is exerting downward pressure on the USD/CHF pair, as it reinforces the likelihood of no interest rate adjustment by the US Federal Reserve (Fed) in the September meeting.
Furthermore, the renewed trade tensions between the US and China could potentially favor the traditional safe-haven Swiss Franc (CHF) and pose a challenge for the USD/CHF pair. On Sunday, US Commerce Secretary Gina Raimondo emphasized that there are "legitimate concerns" regarding Chinese investments in the United States. Raimondo also underscored the necessity of taking robust measures to safeguard the nation's national security.
During the China International Fair for Trade in Services (CIFTIS) in Beijing, Chinese President Xi Jinping announced that China would promote the integrated growth of high-end manufacturing and modern service industries, as reported by Reuters.
However, the downward trajectory of the USD/CHF pair may be restrained as investors are still factoring in the probability of a quarter basis points (bps) rate hike by the Fed. This anticipation continues to provide support for the USD/CHF pair, curbing its potential losses.
US Dollar Index (DXY), which measures the performance of the Greenback against six other major currencies, retreating from the recent gains. Spot prices are beating lower around 104.10 at the time of writing. As mentioned earlier, the US downbeat employment data weighed on the greenback. Even so, the improved yields on US Treasury bonds exerted upward support to the US Dollar (USD), which closed the previous week at 4.18%.
US Nonfarm Payrolls data showed improvement in August, with a reading of 187,000, higher than the market consensus of 170,000 and the previous reading of 157,000. Average Hourly Earnings (Aug) declined to the rate of 4.3%, which was anticipated to remain consistent at 4.4% prior.
- Silver edges lower for the fourth successive day and touches a one-week low on Monday.
- The mixed oscillators on hourly/daily charts warrant caution before placing directional bets.
- A sustained move beyond the $25.00 mark will be seen as a fresh trigger for bullish traders.
Silver remains on the defensive for the fourth successive day on Monday and drops to a one-week low during the early part of the European session, though manages to hold above the $24.00 round-figure mark.
The downtick could be attributed to some technical selling after last week's repeated failures to break through a descending trend line extending from over a one-year high, around the $26.10-$26.15 region touched in May. That said, mixed oscillators on hourly/daily charts warrant some caution before placing bearish bets around the XAG/USD and positioning for any further decline.
Hence, any subsequent fall is more likely to find some support near the 200-period Simple Moving Average (SMA) on the 4-hour chart, currently pegged around the $23.80 region. Some follow-through selling, however, should pave the way for a fall towards the $23.55 region, which is closely followed by the 200-day SMA, near the $23.40 region. The latter should act as a pivotal point for the XAG/USD.
A convincing break below will be seen as a fresh trigger for bearish traders and expose the $23.00 round figure. The downward trajectory could get extended further and drag the XAG/USD towards strong horizontal support near the $22.20-$22.10 region.
On the flip side, the $24.30-$24.35 area now seems to act as an immediate hurdle ahead of the aforementioned descending trend-line resistance, currently around the $24.75 region. This is followed by the $25.00 psychological mark and July monthly swing high, around the $25.25 region. A sustained strength beyond should allow the XAG/USD to make a fresh attempt to conquer the $26.00 mark.
Silver daily chart
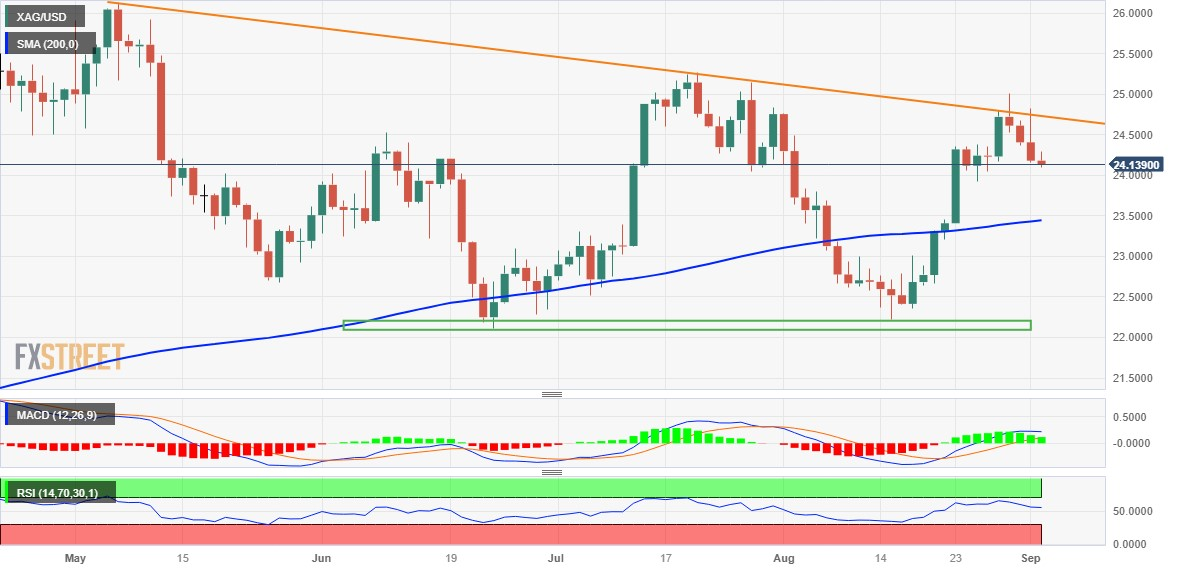
Technical levels to watch
- The Euro rebounds from the 1.0770 region vs. the US Dollar.
- Stocks in Europe kick off the week on a positive note.
- EUR/USD has so far been supported around 1.0770.
- The bullish view in USD Index (DXY) looks limited near 104.50.
- German yields add to Friday’s advance at the beginning of the week.
- US markets will be closed on Monday due to Labor Day holiday.
- Germany’s trade surplus shrank to €15.9B in July.
- The EMU Sentix Index is due later in the region.
- The ECB’s Christine Lagarde speaks later in the session.
The Euro (EUR) regains some upside traction vs. the US Dollar (USD) and encourages EUR/USD to reclaim the area above the key 1.0800 the figure at the beginning of the week.
On the other hand, the Greenback meets some downside pressure and slips back to the 104.00 region when tracked by the USD Index (DXY), as investors continue to assess Friday’s mixed results from the US jobs report (+187K jobs).
In the meantime, bets on the Fed’s pause of its hiking campaign for the rest of the year remain firm amidst incipient speculation of interest rate cuts not before March 2024. From the ECB, uncertainty keeps running high around the potential decision on rates beyond the summer amidst market chatter around stagflation.
From the speculative community, net longs in the single currency shrank to levels last seen in early July during the week ended on August 29, according to the CFTC positioning report.
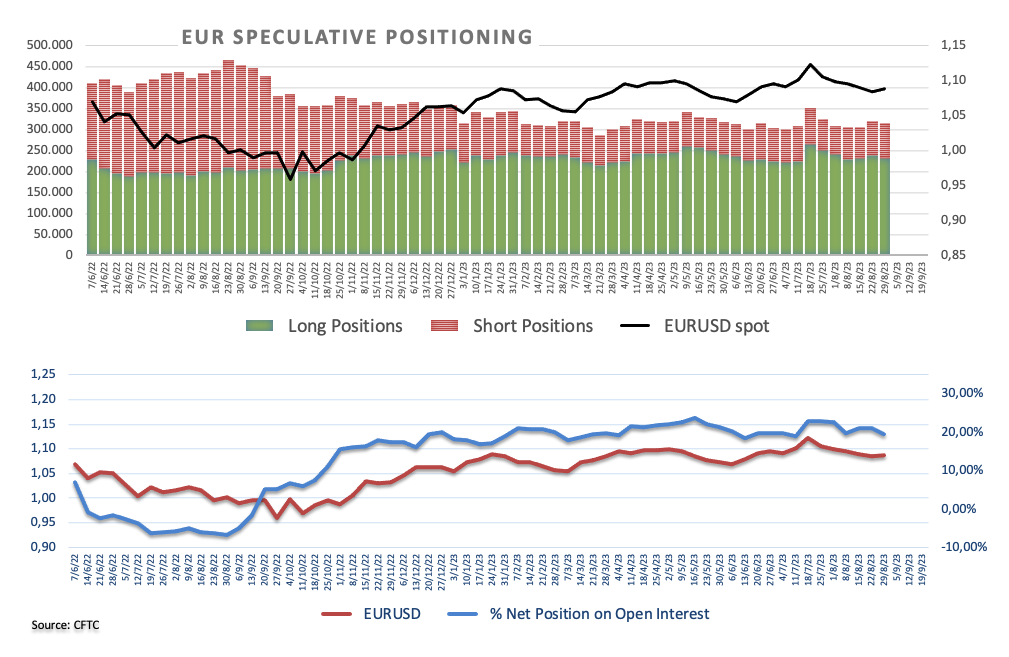
While US markets will be closed on Monday, the euro calendar saw the German trade surplus diminish to €15.9B in July, while the Investor Confidence gauged by the Sentix index for the current month is due later in the European morning. In addition, ECB President Christine Lagarde and Board members Fabio Panetta, Philip Lane, and Frank Elderson will also speak on Monday.
Daily digest market movers: Euro gathers traction amidst Dollar weakness
- The EUR manages to regain ground lost vs. the USD.
- Trading conditions are expected to remain thin due to the US holiday.
- Investors’ attention should shift to ECB-speak later on Monday.
- Lower inflation, cooling labour market support the Fed’s pause on rates.
- Markets expect the Fed to keep rates unchanged in the next few months.
Technical Analysis: Euro faces the next up-barrier at the 200-day SMA
EUR/USD picks up some pace and manages to retest the 1.0800 region, just ahead of the key 200-day SMA (1.0817).
Further recovery in EUR/USD is now expected to target the critical 200-day SMA at 1.0817. North from here, bulls should meet the the weekly top of 1.0945 (August 30) ahead of the interim 55-day SMA at 1.0961 and prior to the psychological 1.1000 barrier and the August top at 1.1064 (August 10). Once the latter is cleared, spot could challenge the weekly peak at 1.1149 (July 27). If the pair surpasses this region, it could alleviate some of the downward pressure and potentially visit the 2023 peak of 1.1275 (July 18). Further up comes the 2022 high at 1.1495 (February 10), which is closely followed by the round level of 1.1500.
The resumption of the downward bias could motivate the pair to initially revisit the August low of 1.0765 (August 25). The breach of the latter exposes the May low of 1.0635 (May 31) prior to the March low of 1.0516 (March 15) and the 2023 low at 1.0481 (January 6).
Furthermore, sustained losses are likely in EUR/USD once the 200-day SMA is breached in a convincing fashion.
Euro FAQs
What is the Euro?
The Euro is the currency for the 20 European Union countries that belong to the Eurozone. It is the second most heavily traded currency in the world behind the US Dollar. In 2022, it accounted for 31% of all foreign exchange transactions, with an average daily turnover of over $2.2 trillion a day.
EUR/USD is the most heavily traded currency pair in the world, accounting for an estimated 30% off all transactions, followed by EUR/JPY (4%), EUR/GBP (3%) and EUR/AUD (2%).
What is the ECB and how does it impact the Euro?
The European Central Bank (ECB) in Frankfurt, Germany, is the reserve bank for the Eurozone. The ECB sets interest rates and manages monetary policy.
The ECB’s primary mandate is to maintain price stability, which means either controlling inflation or stimulating growth. Its primary tool is the raising or lowering of interest rates. Relatively high interest rates – or the expectation of higher rates – will usually benefit the Euro and vice versa.
The ECB Governing Council makes monetary policy decisions at meetings held eight times a year. Decisions are made by heads of the Eurozone national banks and six permanent members, including the President of the ECB, Christine Lagarde.
How does inflation data impact the value of the Euro?
Eurozone inflation data, measured by the Harmonized Index of Consumer Prices (HICP), is an important econometric for the Euro. If inflation rises more than expected, especially if above the ECB’s 2% target, it obliges the ECB to raise interest rates to bring it back under control.
Relatively high interest rates compared to its counterparts will usually benefit the Euro, as it makes the region more attractive as a place for global investors to park their money.
How does economic data influence the value of the Euro?
Data releases gauge the health of the economy and can impact on the Euro. Indicators such as GDP, Manufacturing and Services PMIs, employment, and consumer sentiment surveys can all influence the direction of the single currency.
A strong economy is good for the Euro. Not only does it attract more foreign investment but it may encourage the ECB to put up interest rates, which will directly strengthen the Euro. Otherwise, if economic data is weak, the Euro is likely to fall.
Economic data for the four largest economies in the euro area (Germany, France, Italy and Spain) are especially significant, as they account for 75% of the Eurozone’s economy.
How does the Trade Balance impact the Euro?
Another significant data release for the Euro is the Trade Balance. This indicator measures the difference between what a country earns from its exports and what it spends on imports over a given period.
If a country produces highly sought after exports then its currency will gain in value purely from the extra demand created from foreign buyers seeking to purchase these goods. Therefore, a positive net Trade Balance strengthens a currency and vice versa for a negative balance.
- Pound Sterling attempts recovery from below 1.2600 but still remains fragile as factory activities weaken further.
- UK factory activities dropped to 43.0, the lowest reading in the past 39 months.
- The BoE is expected to raise interest rates consecutive for the 15th time this month.
The Pound Sterling (GBP) strives for a meaningful recovery after an intense sell-off, which was propelled by deepening recession risks. The recovery attempt by the GBP/USD pair seems delicate as UK factory activities face the wrath of higher interest rates by the Bank of England (BoE). Britain firms have shifted their focus on stabilizing margins and easing cost pressures by cutting inventories and the labor force. Going forward, transferring the benefit of easing cost pressures from firms to the end-consumer might ease inflationary pressures on households.
In spite of deepening recession fears, the BoE cannot pause the policy tightening spell as the core Consumer Price Index (CPI) is pretty close to its all-time peak of 7.1%, and the decline in the headline inflation is lower in comparison with the softening pace of energy prices. Meanwhile, UK FM Jeremy Hunt is confident that UK inflation will halve from January levels near 10% by year-end.
Daily Digest Market Movers: Pound Sterling licks wounds after vulnerable PMI data
- Pound Sterling discovers intermediate cushion after a vertical sell-off move below the round-level support of 1.2600 as investors shift focus to the interest rate outlook.
- Investors keep guessing about the interest rate decision from the Bank of England to be taken this month as higher interest rates dampen the economic outlook.
- S&P Global reported on Friday that UK factory PMI for August dropped to 43.0 vs. July’s reading of 45.3. The reading was above the estimates of 42.5 but was the lowest one in more than three years.
- UK’s Manufacturing PMI remained below the 50.0 threshold for the 13th month in a row, denoting de-growth in activity as firms operate on leaner capacity and in an efficient manner to avoid cost pressures.
- Rob Dobson, director at S&P Global Market Intelligence, said output and new orders in the factory sector contracted at rates rarely seen outside of crisis periods, and companies were being forced into defensive action.
- UK firms are cutting purchasing inputs and their laborforce to stabilize margins and control costs.
- S&P Global Manufacturing report stated that input costs eased at the quickest pace since January, which would ease inflation in upcoming months as firms might pass on the benefit of low input costs to end consumers.
- In spite of the deepening risk of a recession, the BoE is expected to raise interest rates further as core inflation is so close to its all-time peak of 7.1%.
- The BoE is expected to raise interest rates by 25 basis points (bps) to 5.50% at its September monetary policy meeting. This would be the 15th straight interest rate hike by the central bank.
- UK Finance Minister Jeremy Hunt said over the weekend that the administration is on track to bring down inflation to almost 5% by year-end.
- UK authority’s focus on halving inflation is expected to disappoint members of the ruling Conservative Party who lobbied heavily for tax cuts before elections.
- The market mood remains cautious as the US Dollar keeps attracting funds after stable hiring momentum offset a higher jobless rate in August.
- The US Bureau of Labor Statistics reported that the Unemployment Rate for August jumped sharply to 3.8% against estimates and the former release of 3.5%. Fresh Nonfarm Payrolls (NFP) were 187K, higher than expectations of 170K and July's reading of 157K.
- Wage growth continues to expand but at a slower growth rate. Average Hourly Earnings expanded at a slower pace of 0.2% than the expected pace of 0.3%. Slower wage growth could ease consumer spending momentum and some heat in inflationary pressures.
- In spite of the restrictive monetary policy by the Federal Reserve (Fed), the Manufacturing PMI reported by the Institute of Supply Management (ISM) increased to 47.6 last month from 46.4 in July. However, factory PMI remained below the 50.0 mark, which itself shows a contraction in activities.
Technical Analysis: Pound Sterling attempts to recapture 1.2600
Pound Sterling attempts to recapture the round-level resistance of 1.2600 as the US Dollar faces a gradual correction. The Cable witnessed an intense sell-off on Friday after a breakdown of two-day consolidation formed in the 1.2648-1.2745 range. The Cable is consistently failing to sustain above the 20 and 50-day Exponential Moving Averages (EMAs), which indicates that investors are considering pullbacks as a selling opportunity.
BoE FAQs
What does the Bank of England do and how does it impact the Pound?
The Bank of England (BoE) decides monetary policy for the United Kingdom. Its primary goal is to achieve ‘price stability’, or a steady inflation rate of 2%. Its tool for achieving this is via the adjustment of base lending rates. The BoE sets the rate at which it lends to commercial banks and banks lend to each other, determining the level of interest rates in the economy overall. This also impacts the value of the Pound Sterling (GBP).
How does the Bank of England’s monetary policy influence Sterling?
When inflation is above the Bank of England’s target it responds by raising interest rates, making it more expensive for people and businesses to access credit. This is positive for the Pound Sterling because higher interest rates make the UK a more attractive place for global investors to park their money. When inflation falls below target, it is a sign economic growth is slowing, and the BoE will consider lowering interest rates to cheapen credit in the hope businesses will borrow to invest in growth-generating projects – a negative for the Pound Sterling.
What is Quantitative Easing (QE) and how does it affect the Pound?
In extreme situations, the Bank of England can enact a policy called Quantitative Easing (QE). QE is the process by which the BoE substantially increases the flow of credit in a stuck financial system. QE is a last resort policy when lowering interest rates will not achieve the necessary result. The process of QE involves the BoE printing money to buy assets – usually government or AAA-rated corporate bonds – from banks and other financial institutions. QE usually results in a weaker Pound Sterling.
What is Quantitative tightening (QT) and how does it affect the Pound Sterling?
Quantitative tightening (QT) is the reverse of QE, enacted when the economy is strengthening and inflation starts rising. Whilst in QE the Bank of England (BoE) purchases government and corporate bonds from financial institutions to encourage them to lend; in QT, the BoE stops buying more bonds, and stops reinvesting the principal maturing on the bonds it already holds. It is usually positive for the Pound Sterling.
FX option expiries for Sept 4 NY cut at 10:00 Eastern Time, via DTCC, can be found below.
- EUR/USD: EUR amounts
- 1.0700 990m
- 1.0810 530m
- 1.0925 1.5b
- GBP/USD: GBP amounts
- 1.2600 361m
- USD/JPY: USD amounts
- 145.50 693m
- USD/CAD: USD amounts
- 1.3580 840m
- NZD/USD: NZD amounts
- 0.5955 741m
Further downside in USD/CNH appears likely on a breach of 7.2390, argue Economist Lee Sue Ann and Markets Strategist Quek Ser Leang at UOB Group.
Key Quotes
24-hour view: USD fell briefly to 7.2392 last Friday before rebounding strongly to end the day largely unchanged at 7.2715 (-0.05%). The price movements did not result in any significant increase in momentum. Today, USD is likely to trade sideways, probably in a range of 7.2460/7.2860.
Next 1-3 weeks: Our latest narrative was from 24 Aug (spot at 7.2840), wherein USD is likely to trade in a range of 7.2500/7.3300 for the time being. Last Friday (01 Sep), USD fell below 7.2500 (low of 7.2392) before rebounding to close at 7.2715 (-0.05%). Despite no significant increase in downward momentum, the breach of 7.2500 has slightly increased the downside risk. However, USD must break and stay below 7.2390 before a sustained decline is likely. The chance of USD breaking clearly below 7.2390 will remain intact as long as USD stays below 7.3000 in the next few days.
- EUR/SEK extends its upside around 11.8875 for the four straight days.
- The cross trades within the ascending trend-channel on the four-hour chart; the RSI stands in bullish territory above 50.
- The initial support level is located at 11.8650; a high of September 1 at 11.9240 acts as an immediate resistance level.
The EUR/SEK cross trades in positive territory for the fourth consecutive day. The cross currently trades near 11.8875, losing 0.15% on the day. Market players await the European Central Bank (ECB) President Lagarde's Speech later in the day and will find a clear direction around the cross.
Last week, Riksbank Governor Erik Thedeen stated that the Swedish Krona's (SEK) weakness is unjustified. The policymaker added that the Swedish Krona is very far from a country with a collapsing currency due to several factors.
From the technical perspective, EUR/SEK trades within the ascending trend-channel since the middle of July on the four-hour chart. Additionally, the cross holds above the 50- and 100-hour Exponential Moving Average (EMAs), which means the further upside looks favorable for the time being. Furthermore, the Relative Strength Index (RSI) stands in bullish territory above 50, indicating the path of least resistance seems is to the upside for now.
The initial support level for the cross is located near the lower limit of the ascending trend-channel at 11.8650. The next contention level will emerge at 11.8418 (100-hour EMA). The additional downside filter is located at 11.7375 (a low of August 15).
On the upside, a high of September 1 at 11.9240 acts as an immediate resistance level for the cross. The next upside stop to watch is 11.9500 (a high of July 7). The key barrier for EUR/SEK is located at 11.9625, representing a Year-To-Date (YTD) high. Any meaningful follow-through buying above the latter will see a rally to the next critical area at 12.0000. The mentioned level portrays a psychological round figure and the upper boundary of the ascending trend-channel.
EUR/SEK four-hour chart
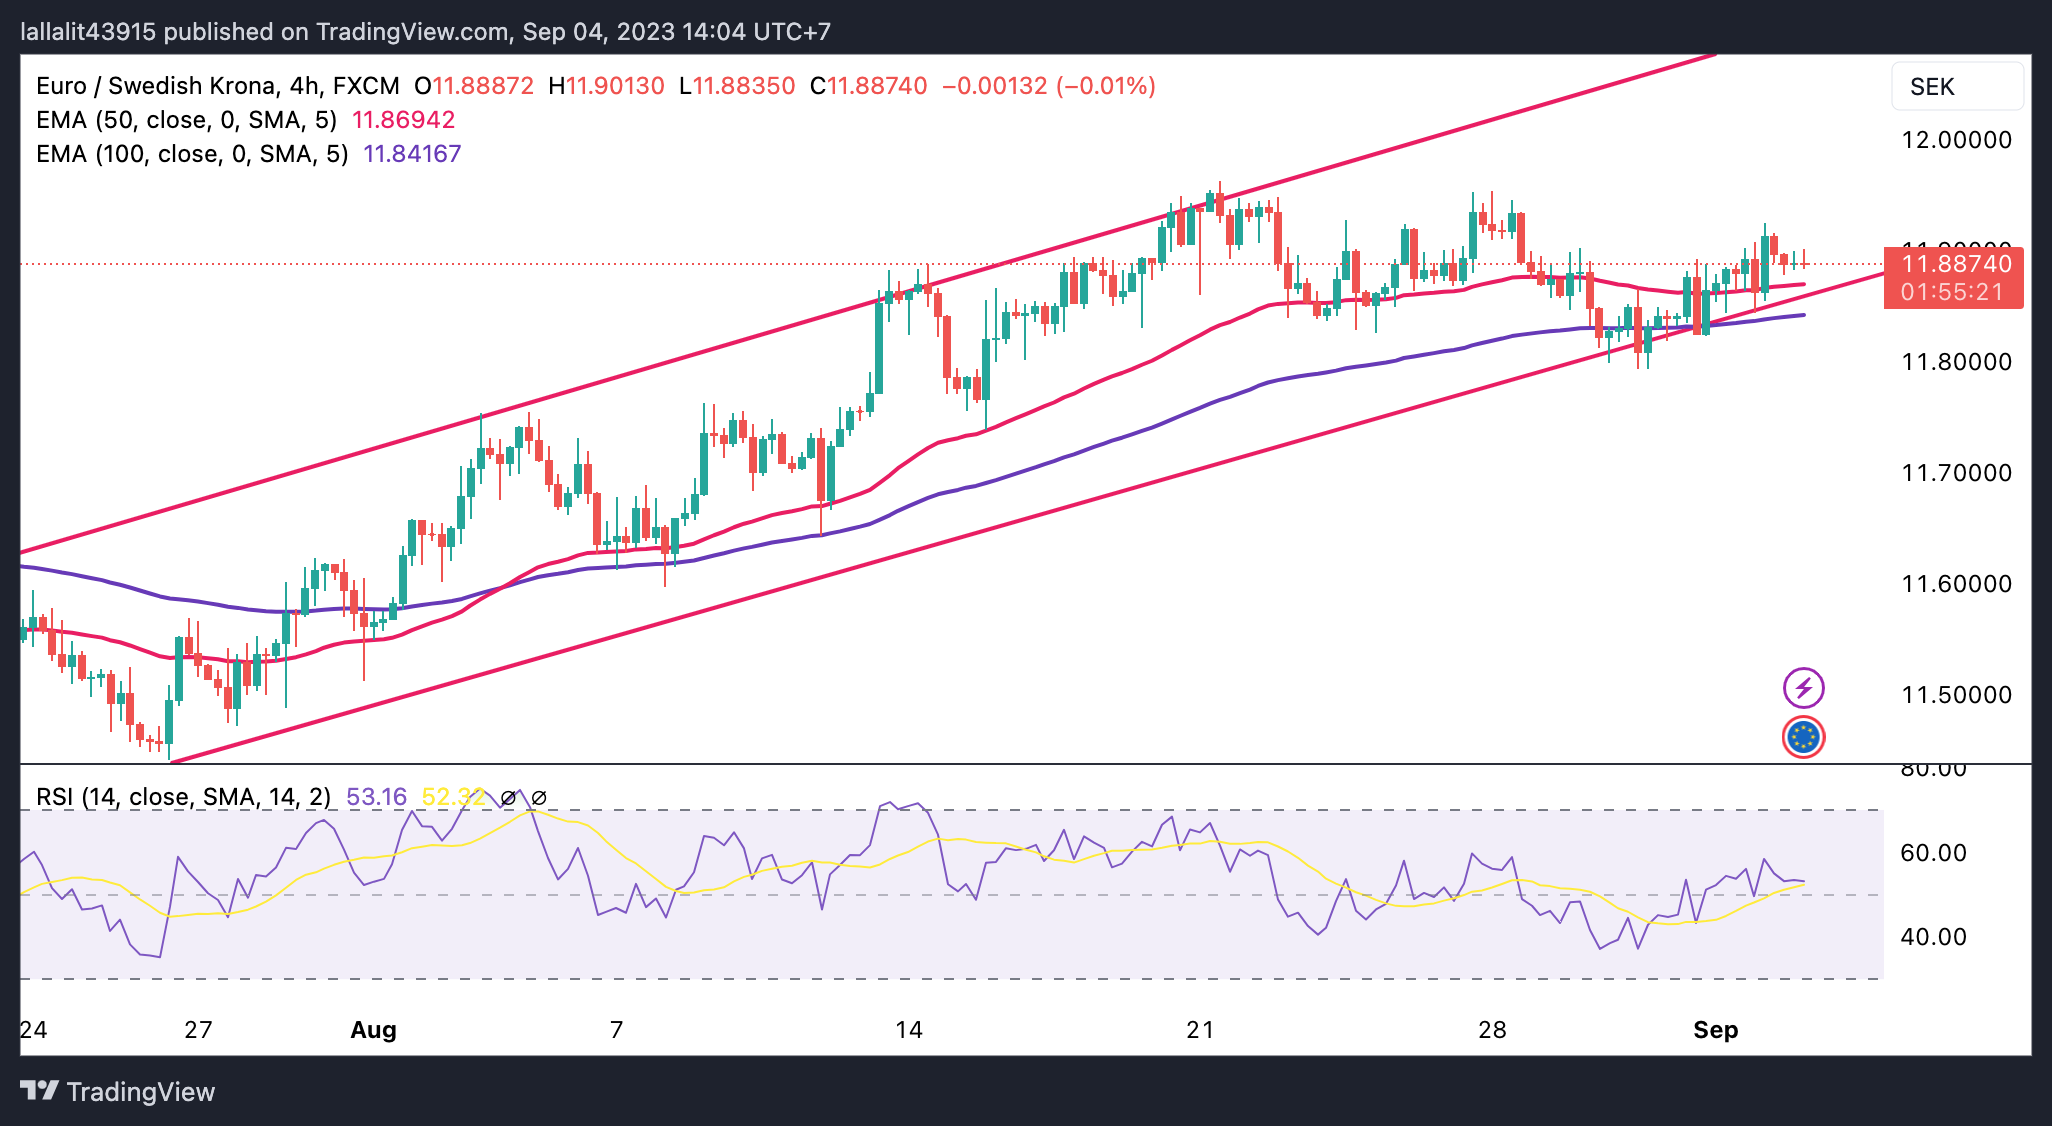
- The index meets some selling pressure near recent tops.
- US markets will be closed on Monday due to Labor Day holiday.
- Markets continue to digest Friday’s Payrolls (+187K).
The USD Index (DXY), which gauges the greenback vs. its main rival competitors, faces some downside pressure around recent peaks near 104.30.
USD Index looks at Fed, risk trends
The index now comes under some tepid selling pressure following two consecutive daily advances, including a move back above the key 104.00 barrier in the second half of last week.
In the meantime, market participants continue to digest Friday’s Nonfarm Payrolls, where the US economy created more jobs than initially estimated (187K jobs), although the jobless rate ticked higher to 3.8% and wage inflation seems to have cooled somewhat during last month.
Back to the Fed, investors continue to favour unchanged interest rates for the remainder of the year, particularly following the recent results from the jobs report as well as other key US fundamentals.
There will be no activity in the US markets on Monday due to the Labor Day holiday, while Factory Orders, ISM Services PMI and weekly Initial Claims are expected to be in the limelight later in the week.
What to look for around USD
The recent strong recovery in the index seems to have met some initial up barrier around the 104.30 region so far.
In the meantime, support for the dollar keeps coming from the good health of the US economy, which seems to have reignited the narrative around the tighter-for-longer stance from the Federal Reserve.
Running on the opposite side of the road, the idea that the dollar could face headwinds in response to the data-dependent stance from the Fed against the current backdrop of persistent disinflation and cooling of the labour market appears to have regained some traction as of late.
Key events in the US this week: Factory Orders (Tuesday) – MBA Mortgage Applications, Balance of Trade, Final S&P Global Services PMI, ISM Services PMI, Fed Beige Book (Wednesday) – Initial Jobless Claims (Thursday) – Wholesale Inventories, Consumer Credit Change (Friday).
Eminent issues on the back boiler: Persistent debate over a soft or hard landing for the US economy. Incipient speculation of rate cuts in H1 2024. Geopolitical effervescence vs. Russia and China.
USD Index relevant levels
Now, the index is losing 0.12% at 104.13 and the breach of 103.04 (200-day SMA) would open the door to 102.93 (weekly low August 30) and then 102.42 (55-day SMA). On the upside, there is an initial hurdle at 104.44 (monthly high August 25) ahead of 104.69 (monthly high May 31) and finally 105.88 (2023 high March 8).
- NZD/USD holds ground above 0.5950 after the US moderate economic data.
- Investors still price in a 25bps rate hike by the Fed, underpinning the US Dollar (USD).
- Market optimism due to China’s measures, providing support to the Aussie pair.
NZD/USD snaps the previous session’s losses, holding grounds above 0.5950 during the Asian session on Monday. The moderate data from the United States (US) provides support in underpinning the pair as it reinforces the possibility of no interest rate change by the US Federal Reserve (Fed) at the September meeting.
However, investors are still factoring in the possibility of a 25 basis point (bps) interest rate hike by the Fed. This expectation continues to pose a challenge for the AUD/USD pair, restraining its potential gains.
As said, the US Nonfarm Payrolls report showed 187,000 new jobs were added, higher than the market consensus of 170,000. In the month of July, 157,000 new jobs were added. Average Hourly Earnings (Aug) fell to the rate of 4.3%, which was anticipated to remain consistent at 4.4% prior.
China's recent actions to boost local dollar liquidity along with relaxing certain mortgage regulations have initiated market optimism, lending support to economic growth. This could boost investors’ confidence and underpin the Kiwi pair as New Zealand is a close trading partner of the world’s second-largest economy.
Additionally, China's leading economic authority, the National Development and Reform Commission (NDRC), has announced plans to create a dedicated department aimed at revitalizing the country's struggling private sector.
US Dollar Index (DXY), which measures the performance of the Greenback against six other major currencies, retreating from the recent gains. Spot prices are trading around 104.10 at the time of writing. However, the improved yields on US Treasury bonds provided support to the buck, which closed at 4.18% on Friday. Market participants seek further cues regarding the upcoming Fed’s policy decision as robust US Nonfarm Payrolls data raised concerns around the inflation scenario.
Here is what you need to know on Monday, September 4:
There is a positive shift in risk mood at the beginning of the week, as reflected by the impressive gains recorded in major Asian equity indexes on Monday. The European economic docket will feature Sentix Investor Confidence data for September and European Central Bank President Christine Lagarde will be delivering a speech in the early American session. Nevertheless, trading action is likely to remain subdued in the second half of the day, as markets in the US and Canada will be closed in observance of the Labor Day holiday.
In the late American session on Friday, the US Dollar gathered strength against its major rivals. Following the sharp decline seen in the first half of the week, the US Dollar Index (DXY) closed the week virtually unchanged above 104.00. In the European morning, DXY trades modestly lower on the day.
Nonfarm Payrolls in the US rose 187,000 in August, the US Bureau of Labor Statistics announced on Friday. Although this reading surpassed the market expectation of 170,000, the downward revision to the July print - from 187,000 to 157,000, made it difficult for the USD to gather strength against its rivals with the immediate reaction. Other details of the report revealed that the Unemployment Rate climbed to 3.8% from 3.5% as the Labor Force Participation Rate improved to 62.8% from 62.6%.
US Dollar price in the last 7 days
The table below shows the percentage change of US Dollar (USD) against listed major currencies in the last 7 days. US Dollar was the weakest against the Australian Dollar.
| USD | EUR | GBP | CAD | AUD | JPY | NZD | CHF | |
| USD | 0.05% | -0.21% | -0.08% | -0.90% | -0.25% | -0.76% | -0.04% | |
| EUR | -0.06% | -0.27% | -0.12% | -0.96% | -0.31% | -0.82% | -0.12% | |
| GBP | 0.21% | 0.26% | 0.14% | -0.69% | -0.04% | -0.57% | 0.14% | |
| CAD | 0.06% | 0.09% | -0.15% | -0.84% | -0.19% | -0.72% | 0.00% | |
| AUD | 0.90% | 0.94% | 0.69% | 0.83% | 0.64% | 0.12% | 0.84% | |
| JPY | 0.25% | 0.32% | 0.06% | 0.19% | -0.64% | -0.50% | 0.19% | |
| NZD | 0.76% | 0.81% | 0.55% | 0.68% | -0.14% | 0.51% | 0.70% | |
| CHF | 0.07% | 0.12% | -0.15% | 0.00% | -0.85% | -0.19% | -0.72% |
The heat map shows percentage changes of major currencies against each other. The base currency is picked from the left column, while the quote currency is picked from the top row. For example, if you pick the Euro from the left column and move along the horizontal line to the Japanese Yen, the percentage change displayed in the box will represent EUR (base)/JPY (quote).
Following the decision by the People's Bank of China to lower the foreign exchange reserve requirement ratio to boost onshore US Dollar liquidity ahead of the weekend, news of troubled Chinese real-estate developer Country Garden winning approval from creditors to extend payments for an onshore private bond helped market mood improve early Monday. Hong Kong's Hang Seng gained more than 2% on the first trading day of the week and the Shanghai Composite rose nearly 1.5%.
EUR/USD lost more than 50 pips on Friday and closed the week in negative territory below 1.0800. The pair holds its ground early Monday and recovers toward 1.0800. Earlier in the day, the data from Germany showed that the country's trade surplus narrowed to €15.9 billion in July from €18.7 billion in June.
GBP/USD registered strong gains in the first half of the week but erased them all in a two-day slide ahead of the weekend. The pair clings to modest daily gains above 1.2600 in the European morning on Monday.
AUD/USD benefited from improving risk mood and started to climb toward 0.6500 on Monday. In the Asian trading hours on Tuesday, the Reserve Bank of Australia (RBA) will announce monetary policy decisions. The RBA is widely expected to leave its key interest rate unchanged at 4.1%.
Gold struggled to preserve its bullish momentum on Friday but ended up posting gains for the second consecutive week. XAU/USD holds steady above $1,940 on Monday.
USD/JPY rallied on surging US yields on Friday and stabilized above 146.00 at the beginning of the week.
- USD/CAD pares the biggest daily gain in a month as market consolidates Friday’s moves amid US Labor Day holiday.
- Bearish MACD signals, failure to cross key resistance line lure Loonie sellers.
- Intraday sellers eyed Golden Fibonacci Ratio ahead of the key DMAs.
- Bulls need validation from multiple technical, fundamental catalysts.
USD/CAD clings to mild losses around 1.3585 heading into Monday’s European session as market players consolidate Friday’s heavy gains amid a sluggish start to the week’s trading.
In doing so, the Loonie pair aptly portrays the USD/CAD pair trader’s cautious mood ahead of the Bank of Canada (BoC) Interest Rate Decision, as well as the Canadian employment data for August.
Technically, the bearish MACD signals join the USD/CAD pair’s U-turn from a downward-sloping resistance line from late April, around 1.3610 at the latest, keeping the Loonie pair sellers hopeful.
However, a daily closing beneath the 61.8% Fibonacci retracement of its March–July downside, near 1.3570, becomes necessary to convince intraday sellers of the USD/CAD. It’s worth noting that the stated Fibonacci retracement is also known as the Golden Fibonacci ratio.
Following that, the 21-DMA and 200-DMA, respectively near 1.3520 and 1.3465, will act as the final defense of the USD/CAD buyers.
Meanwhile, a daily closing beyond the aforementioned resistance line stretched from April, close to 1.3610 at the latest, could convince the USD/CAD bulls to prod the previous monthly high of around 1.3640.
In a case where the Loonie pair buyers keep the reins, the tops marked in May and April, close to 1.3655 and 1.3670, could act as additional upside filters before directing the prices toward the yearly top marked in March around 1.3860.
USD/CAD: Daily chart
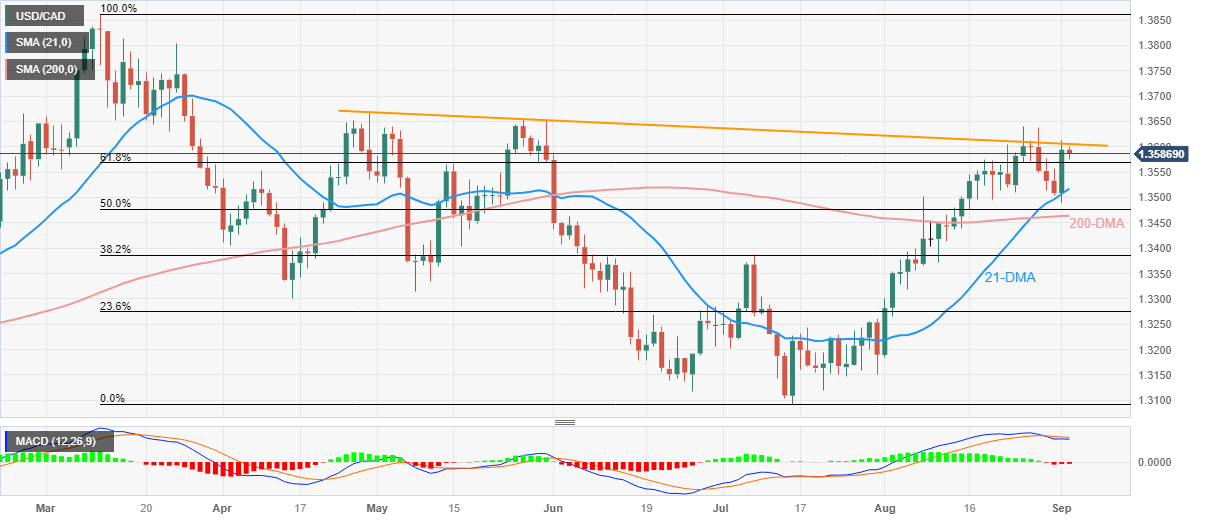
Trend: Pullback expected
In the view of Economist Lee Sue Ann and Markets Strategist Quek Ser Leang at UOB Group, the upside pressure in USD/JPY now seems to have lost some traction.
Key Quotes
24-hour view: Last Friday, USD fell sharply, but briefly to 144.43 and then rebounded strongly to close at 146.23 (+0.48%). While USD could rebound further, any advance is likely part of higher trading of 145.40/146.80. In other words, USD is unlikely to break clearly above 146.80.
Next 1-3 weeks: Our latest narrative was from last Thursday (30 Aug, spot at 146.00). At that time, we were of the view that USD “is likely to trade in a range between 144.50 and 147.20.” On Friday, USD dropped briefly to 144.43, and then rebounded strongly. The price actions reinforce our view, and we continue to expect USD to trade in a range between 144.50 and 147.20.
- Gold Price stays firmer at the highest level in a month amid sluggish start to the week.
- Receding hawkish Fed bias, China stimulus and sustained trading past key support keep XAU/USD buyers hopeful.
- Downbeat yields, cautious optimism in Asia add strength to the Gold Price.
- Sino-American tension, lack of major data/events prod XAU/USD buyers.
Gold Price (XAU/USD) remains on the front foot as bulls prod the early August swing high while keeping the reins past the $1,936-38 support confluence. In doing so, the precious metal cheers the US Dollar’s retreat amid fears about the Federal Reserve’s (Fed) policy pivot, especially after witnessing mostly downbeat figures in the last few days. With this, the US Dollar Index (DXY) snaps a two-day winning streak with mild losses to around 104.15.
Apart from the softer US Dollar, China’s multiple measures to defend the world’s second-largest economy also propelled the XAU/USD price, due to the Dragon Nation’s status as one of the world’s biggest Gold customers. Among the latest actions, the government’s establishment of a special cell to promote the private economy and opening up barriers for the services industry gained major attention. Previously, China's central bank, namely the People's Bank of China (PBoC), announced a heavy cut to its foreign exchange reserve requirement ratio (FX RRR) to 4% from 6.0% effective from September 15. Additionally, a slew of China banks cut interest rates on Yuan deposits to ease the pressure from lower mortgage rates announced previously.
Elsewhere, the downbeat performance of the US Treasury bond yields in the last two weeks also underpin the Gold Price rebound, especially when the XAU/USD stays firmer beyond the key technical support.
Moving on, the holiday-shortened week may test the Gold buyers, together with the US-China tension. However, the US ISM Services PMI and China inflation data, as well as stimulus announcements from Beijing, may entertain the bullion traders.
Also read: Gold Price Forecast: XAU/USD attempts another run to take out 100 DMA at $1,954
Gold Price: Key levels to watch
Our Technical Confluence indicator suggests that the Gold Price floats firmly beyond the $1,936-38 support confluence comprising the Fibonacci 61.8% on one-month, 5-DMA and the lower band of the Bollinger on the four-hour (4H) play.
Also restricting the short-term downside of the XAU/USD is the $1,942 level that encompasses the Fibonacci 38.2% on one-day, as well as the middle band of the Bollinger on the hourly and 4H formations.
It’s worth noting, however, that the Gold Price weakness past $1,936 will need validation from $1,932 to convince the sellers. That said, the stated support confluence includes the 50-DMA and Pivot Point one-day S1.
Alternatively, the previous monthly high of around $1,967 appears luring the XAU/USD buyers during the commodity’s further advances. Following that, an area comprising multiple hurdles marked during May and July, around $1,985, will be in the spotlight.
Overall, the Gold Price has fewer barriers toward the north but the US data and China news can test the bulls.
Here is how it looks on the tool

About Technical Confluences Detector
The TCD (Technical Confluences Detector) is a tool to locate and point out those price levels where there is a congestion of indicators, moving averages, Fibonacci levels, Pivot Points, etc. If you are a short-term trader, you will find entry points for counter-trend strategies and hunt a few points at a time. If you are a medium-to-long-term trader, this tool will allow you to know in advance the price levels where a medium-to-long-term trend may stop and rest, where to unwind positions, or where to increase your position size.
- GBP/USD attracts some buyers above the 1.2600 mark in the early European session.
- US Nonfarm Payrolls (NFP) for August came in better the expected; Manufacturing PMI rose to 47.6 vs. 46.4 prior.
- UK S&P Global/CIPS Manufacturing PMI came in at 43.0 In August from 45.3 in July.
- Investors await the US ISM Services PMI for August for fresh impetus.
The GBP/USD pair recovers some recent losses and holds above the 1.2600 mark during the early European session on Monday. The major pair currently trades around 1.2612, gaining 0.17% on the day.
Markets remain subdued due to the Labor Day holiday in the US after a busy week of economic data released. The US Bureau of Labor Statistics revealed on Friday that the US Nonfarm Payrolls (NFP) for August came in at 187K, beating the expectations of 170K and 157K in the previous reading. The Unemployment Rate dropped significantly to 3.8%, compared to the market consensus of 3.5% and 3.5% prior. The monthly Average Hourly Earnings rose by 0.2%, against the estimation of 0.3%. Finally, the US Manufacturing PMI came in at 47.6 versus 46.4 prior and better than 47.0 expected.
Market participants speculate that the Federal Reserve (Fed) might end its cycle of monetary tightening. According to the CME FedWatch tool, the markets have priced in the fact that the Fed will not raise interest rates at its September meeting, and the probability of raising rates in November and December dropped to nearly 35%. Despite posting the lowest weekly gain since the beginning of July, the US Dollar (USD) trades in positive territory for the sixth consecutive week.
On the Pound Sterling front, the data released on Friday indicated that August was the weakest month for British factories since the beginning of the COVID-19 crisis, with orders plunging substantially due to rising interest rates. The S&P Global/CIPS Manufacturing PMI came in at 43.0 In August from 45.3 in July. The figure marked the six consecutive months below the 50 threshold. However, traders anticipate the odds of a 25 basis points (bps) rate hike in the upcoming meeting.
The BoE Chief Economist Huw Pill noted last week that inflation in the United Kingdom remains too high and added that there are several measures in the pipeline. The aggressive tightening of monetary policy by the BoE exerts some pressure on the British Pound considering investors fear the negative impact on the UK economy.
In the absence of the top-tier economic data release from the UK docket and the US holiday. Investors will digest last week’s data ahead of the US ISM Services PMI for August. The figure is expected to rise to 52.6. Investors will take cues from the data and find opportunities around the GBP/USD pair.
Considering advanced prints from CME Group for natural gas futures markets, open interest dropped for the third session in a row on Friday, now by around 1.4K contracts. In the same direction, volume resumed the downtrend and shrank by nearly 90K contracts.
Natural Gas: Interim contention emerges around $2.650
Prices of natural gas yielded no clear direction on Friday against the backdrop of dwindling open interest and volume. That said, the commodity could face some near-term consolidation while appears supported by the provisional 55-day SMA around the $2.650 region per MMBtu.
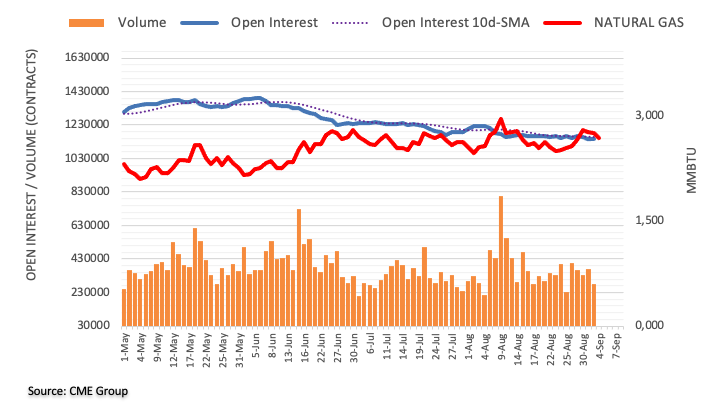
AUD/USD is now expected to trade within the 0.6390-0.6525 range in the next few weeks, according to Economist Lee Sue Ann and Markets Strategist Quek Ser Leang at UOB Group.
Key Quotes
24-hour view: AUD popped briefly to a high of 0.6522 in NY trade last Friday before falling back down to end the day at 0.6450 (-0.54%). Despite the sharp drop, downward momentum has not improved much. That said, AUD could edge lower today, but it unlikely to break the strong support at 0.6420. Resistance is at 0.6465, followed by 0.6480.
Next 1-3 weeks: Our latest update was from last Thursday (31 Aug, spot at 0.6480). At that time, we were of the view that “if AUD breaks and stays above 0.6500, the focus will shift to 0.6550.” While AUD broke above 0.6500, it did not close above 0.6500. On Friday, AUD fell by 0.54% (0.6450). Upward pressure appears to have eased, and AUD is unlikely to strengthen. For now, AUD is more likely to trade in a range of 0.6390/0.6525.
CME Group’s flash data for crude oil futures markets noted traders added around 14.5K contracts to their open interest positions on Friday. Volume followed suit and increased for the fourth straight session, this time by more than 130K contracts.
WTI: Immediate up barrier now emerges at $90.00
The rally in WTI seems to have met a solid initial resistance around the $85.00 mark per barrel. Friday’s gains in the commodity came in response to rising open interest and volume and leave the door open to the continuation of the current uptrend. Against that, the immediate target emerges at the round level of $90.00 per barrel.
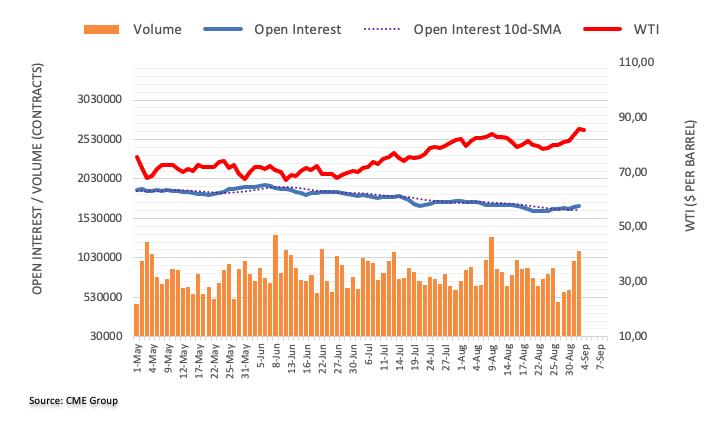
Economist Lee Sue Ann and Markets Strategist Quek Ser Leang at UOB Group suggest GBP/USD is predicted to meet a tough support around 1.2545 ahead of 1.2500.
Key Quotes
24-hour view: After rising briefly to a high of 1.2712 last Friday, it plunged to a low of 1.2578 before closing on a weak note at 1.2590 (-0.65%). Unsurprisingly, the sharp drop has resulted in an increase in downward momentum. Today, GBP is likely to weaken further, but oversold conditions suggest it might not be able to break clearly below 1.2545 (next support is at 1.2500). Resistance is at 1.2620, followed by 1.2645.
Next 1-3 weeks: In our most recent narrative from last Thursday (31 Aug, spot at 1.2715), we held the view that “there is a chance for GBP to rise to 1.2800, with a lower possibility of reaching 1.2845.” Our view was invalidated quickly, as GBP plunged on Friday and took out our ‘strong support’ level at 1.2630. The risk appears to have shifted to the downside. However, as downward momentum is only beginning to build, any weakness is likely to face solid support at 1.2500 (there is another strong support at 1.2545). Resistance-wise, if GBP breaks above 1.2680, it would mean that the buildup in momentum has faded.
Open interest in gold futures markets shrank for the second session in a row on Friday, now by nearly 2K contracts according to preliminary readings from CME Group. Volume, instead, went up by around 29.4K contracts following two consecutive daily builds.
Gold faces initial resistance near $1950
Gold’s inconclusive price action came on the back of shrinking open interest and rising volume on Friday. Against that, the precious metal could attempt some consolidation in the very near term and with occasional bullish attempts so far capped by the $1950 region per troy ounce, and area also coincident with the interim 100-day SMA.
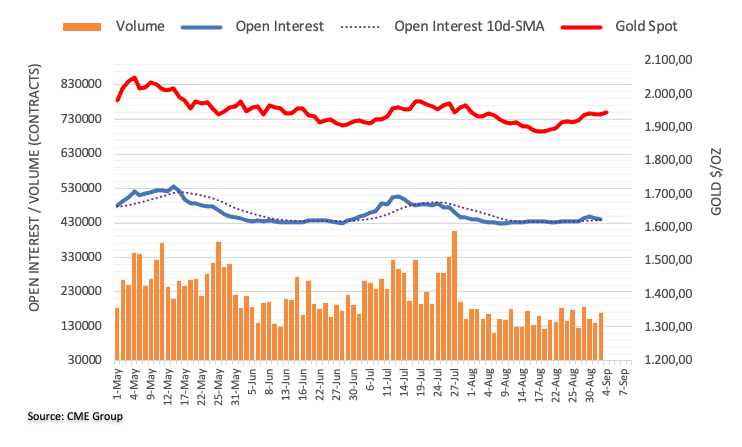
- USD/JPY fades the previous day’s rebound from three-week low.
- Cautious optimism in Asia, upbeat Japan data and BoJ bias weigh on Yen pair.
- Mixed US data pushes back expectations of Fed’s rate hike in September.
- Moody’s revises up 2023 US growth forecasts but keeps 2024 GDP outlook intact.
USD/JPY stays defensive around 146.10-15 heading into Monday’s European session after witnessing a sluggish start to the key week comprising Japan growth numbers and the US ISM Services PMI. The Yen pair’s latest inaction could be linked to the US Labor Day holiday, as well as mixed clues about the US Federal Reserve (Fed) and the Bank of Japan (BoJ).
Earlier in the day, Japan Monetary Base data for August suggests an increase in liquidity with 1.2% YoY growth versus -1.3% prior. The same joins the market’s hawkish expectations from the BoJ to defend the Japanese Yen (JPY) buyers despite the cautious optimism in the market and inactive bond markets, due to the US holiday.
Elsewhere, market sentiment remains positive as China stimulus joins increasing hopes of witnessing no more rate hikes from the US Federal Reserve (Fed).
China’s government established a special cell to promote the private economy and open up barriers for the services industry and bolstered the sentiment early Monday, following a slew of measures to defend the world’s second-largest economy. On Friday, the People's Bank of China’s (PBoC), heavy cut to its foreign exchange reserve requirement ratio (FX RRR) to 4% from 6.0% effective from September 15 gained major attention. On the same line a slew of China banks cut interest rates on Yuan deposits to ease the pressure from lower mortgage rates announced previously. Additionally, Reuters cited four people familiar with the matter to report that China is likely to step up action to revive the country’s property sector.
On the other hand, the receding odds of the Federal Reserve’s (Fed) hawkish moves in the future, mainly after Friday’s mixed US jobs report for August, also underpins the market’s optimism and weigh on the USD/JPY price.
Talking about the US data, US Nonfarm Payrolls (NFP) rose to 187K in August versus 170K expected and 157K prior (revised) even as the Unemployment Rate marked an uptick to 3.8% from 3.5% market forecasts and previous readings. Further, the Average Hourly Earnings also eased to 0.2% and 4.3% compared to 0.4% and 4.4% respective priors. Additionally, the US ISM Manufacturing PMI also impressed the US Dollar buyers with the 47.6 figures versus analysts’ estimation of 47.0 versus 46.4 previous readings. Following the data, Federal Reserve Bank of Cleveland President Loretta J. Mester advocated for hawkish monetary policy and allowed the Greenback to remain firmer the previous day.
Meanwhile, the US-China tension and upward revision of the US growth forecasts for 2023 by the global rating agency Moody’s prods the USD/JPY bears amid a sluggish session.
While portraying the mood, the US Dollar Index (DXY) snaps a two-day winning streak with mild losses to around 104.15 whereas the S&P 500 Futures print mild gains of late. It’s worth noting that the benchmark US 10-year Treasury bond yields dropped in the last two consecutive weeks after rising to the highest levels since 2007, to 4.18% at the latest.
Moving on, the US market’s holiday may restrict the USD/JPY performance on Monday but Japan’s second-quarter (Q2) Gross Domestic Product (GDP) and the US ISM Services PMI will be important to watch for clear directions.
Technical analysis
USD/JPY pullback remains elusive unless providing a daily close below the 144.60–50 support zone comprising multiple levels marked in the late June and early July. On the contrary, the Yen pair’s recovery can aim for one more battle with the two-month-old ascending resistance line, close to 147.00 by the press time.
Further decline could see EUR/USD revisiting the 1.0720 region in the next few weeks, note Economist Lee Sue Ann and Markets Strategist Quek Ser Leang at UOB Group.
Key Quotes
24-hour view: In NY trade last Friday, EUR rose briefly to 1.0881 before plummeting to a low of 1.0769. While approaching oversold levels, the decline is likely to break below last month’s low near 1.0765. In view of the oversold conditions, the next support at 1.0720 is unlikely to come into view. On the upside, if EUR breaks above 1.0825 (minor resistance is at 1.0800), it would indicate that the weakness in EUR has stabilised.
Next 1-3 weeks: We left off last Thursday (31 Aug, spot at 1.0930) where we indicated that if EUR “breaks and holds above 1.0955, the next level to watch is 1.1000.” Not only did EUR not break above 1.0955, but it also plummeted to a low of 1.0739 on Friday. After the sharp decline, downward momentum appears to be building, albeit tentatively. In the next few days, as long as EUR stays below 1.0860, it could edge lower to 1.0720. EUR must break and stay below 1.0720 before a sustained decline is likely. Looking ahead, the next significant support below 1.0720 is at 1.0635.
- USD/RUB trades with modest gains around 96.40 amid the Russian Ruble weakness.
- Russia's Manufacturing PMI for August came in better than expected; the Unemployment Rate declined to 3.0% from 3.1%.
- US Nonfarm Payrolls for August were better than estimated.
USD/RUB extends its upside during the early European session on Monday. The pair currently trades near 96.40, unchanged for the day. The pair trades in positive territory for the third consecutive week amid the Russian Ruble's depreciation.
According to data published last week, Russia's S&P Global Manufacturing PMI for August came in at 52.7 versus the market consensus of 52.1. The figure climbed the highest in three months. Earlier, the Unemployment Rate for July declined to 3.0% from 3.1% in June and 3.2% market expectation.
Apart from this, Finance Minister Anton Siluanov forecast that the Russian economy is expected to grow by at least 2.5% in 2023, with inflation hovering around 6%. He also said that he would work with the Central Bank to take all necessary actions to bring inflation down to the appropriate level. It’s worth noting that the Bank of Russia hiked the interest rate by 350 basis points (bps) to 12% on August 15 to halt the ruble's slide amid the the turmoil in Ukraine war.
On the other hand, Nonfarm Payrolls (NFP) for August in the US came in at 187K, exceeding the estimate of 170K and July's reading of 157K. The Unemployment Rate decreased considerably to 3.8%, compared to the market's estimate of 3.5% and the previous reading of 3.5%. The monthly Average Hourly Earnings increased by 0.2% instead of 0.3%.
Following the Nonfarm Payrolls report, the US Dollar (USD) fell across the board as traders expect the Federal Reserve to end the tightening cycle. However, the Greenback reversed its course after the US PMI data. The Manufacturing PMI improved to 47.6 versus 46.4 prior and better than the market estimation of 47.0.
Market players will take cues from the US Service PMI data due later this week and find opportunities around USD/RUB. The data could offer hints about the path of further interest rate decisions by the Federal Reserve (Fed)
- USD/CHF prints the first daily loss in three within one-month-old rising trend channel.
- Cautious mood ahead of Swiss Q2 GDP, US Labor Day holiday allows traders to pare recent moves.
- Buyers remains hopeful unless breaking 0.8700; June’s low acts as additional upside filter.
USD/CHF bulls take a breather ahead of the key Swiss Q2 GDP heading into Monday’s European session. In doing so, the Swiss Franc (CHF) pair prints the first daily loss in three despite staying within a one-month-old bullish trend channel.
That said, not only an upward-sloping bullish trend channel from early August but the bullish MACD signals and the upbeat RSI (14) line also keeps the USD/CHF pair buyers hopeful ahead of the Swiss second-quarter (Q2) Gross Domestic Product (GDP), expected 0.1% QoQ versus 0.3% prior.
It’s worth noting that an ascending trend line from last Wednesday, close to 0.8815 by the press time, quickly followed by the 0.8800 round figure, restricts the short-term USD/CHF downside.
Following that, a convergence of the 200-SMA and the bottom line of the stated bullish channel, close to 0.8755, will challenge the Swiss Franc (CHF) pair’s further downside.
Above all, the USD/CHF pair buyers remain hopeful unless they witness a clear downside break of the previous resistance line stretched from early June, close to 0.8700 at the latest.
On the flip side, the aforementioned channel’s top line surrounding 0.8890 precedes June’s bottom of around the 0.8900 threshold, to check the USD/CHF bulls.
USD/CHF: Four-hour chart
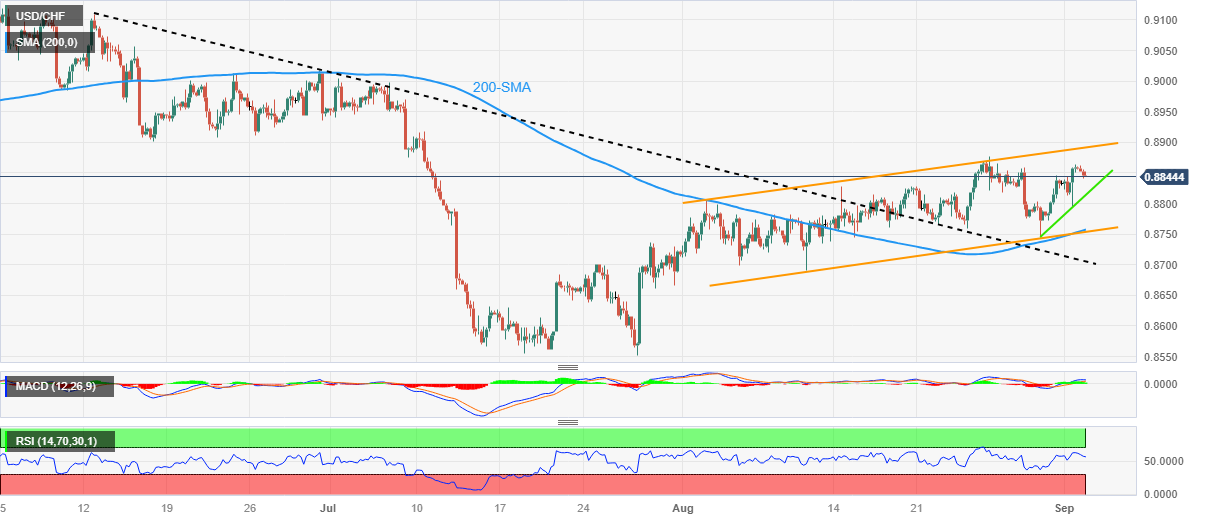
Trend: Bullish
- AUD/USD consolidates above 0.6450 after the US mixed employment data.
- Investors turn cautious on the expected 25 bps rate hike by the Fed, following the moderate employment figures.
- Aussie traders anticipate that the RBA will extend the rate pause for a second successive month.
AUD/USD recovers from the previous session’s losses, trading higher around 0.6460 during the Asian session on Monday. The pair experienced downward pressure due to mixed employment data from the United States (US) released on Friday. The moderate figures reinforce the possibility of no interest rate change by the US Federal Reserve (Fed) at the September meeting.
The US Nonfarm Payrolls report for August printed the reading of 187K, compared to the market consensus of 170K. The data reported 157K figure in the month of July. Average Hourly Earnings (Aug) declined to the rate of 4.3%, which was expected to remain consistent at 4.4% from the previous reading.
However, investors are still factoring in a 25 basis points (bps) rate hike by the US Federal Reserve (Fed), which acts as a headwind for the AUD/USD pair and limits the gains of the pair.
Market participants will watch the Reserve Bank of Australia (RBA) monetary policy meeting on Tuesday. The RBA is expected to extend the rate pause for the second consecutive month and defy the expected rate hike of a quarter basis points as the cost pressure in the country is easing.
US Dollar (USD), which measures the performance of the Greenback against six other major currencies, hovers around 104.20. Additionally, the improved US Treasury yields provided support to the buck, which closed at 4.18% on Friday. Market participants await additional guidance from the Fed regarding its upcoming policy decision as robust US Nonfarm Payrolls data raised the concerns around inflation outlook.
- Asia-Pacific shares edge higher on China stimulus despite light calendar.
- Hang Seng rallies as Country Garden wins creditors approval for delayed bond coupon payment.
- Mixed updates about US-China ties, US Labor Day holiday restricts market moves.
- Risk catalysts eyed for clear directions, China inflation will be crucial to watch.
The risk appetite improves in Asia during a sluggish start to the week elsewhere as China defends the region’s bulls whereas the US Labor Day holiday allows policy hawks to take a breather. Further, the risk-positive news about China’s struggling real-estate plays Country Garden also underpins the cautious optimism even as the Sino-US headlines prod bulls.
While portraying the mood, the MSCI’s index of Asia-Pacific shares outside Japan rises to the highest level in a month, up 1.20% intraday at the latest, whereas Japan’s Nikkei 0.50% on a day by the press time.
It’s worth noting that Hong Kong’s Hang Seng resumes trading after a long weekend, due to the off on Friday, while posting more than a 2.0% jump on a day as Country Garden gains the creditor’s approval for onshore bond payment’s delay.
China’s government established a special cell to promote the private economy and open up barriers for the services industry and bolstered the sentiment early Monday, following a slew of measures to defend the world’s second-largest economy.
Among the major moves, the People's Bank of China’s (PBoC), heavy cut to its foreign exchange reserve requirement ratio (FX RRR) to 4% from 6.0% effective from September 15 gained major attention. On the same line a slew of China banks cut interest rates on Yuan deposits to ease the pressure from lower mortgage rates announced previously. Additionally, Reuters cited four people familiar with the matter to report that China is likely to step up action to revive the country’s property sector.
Alternatively, the US-China tension, mainly due to the concerns that American businesses are less comfortable in Beijing, as well as US President Joe Biden’s readiness to restore ties with Taiwan, prods the market’s optimism amid a sluggish session.
Elsewhere, the disappointing prints of Australia’s Company Gross Operating Profits for Q2 2023 and Japan’s upbeat Monetary Base for August underpins the upbeat performance of Australia’s ASX and Japan’s Nikkei 225, mainly backed by Chinese equities. It’s worth noting that shares in New Zealand buck the trend with minor losses as New Zealand’s Terms of Trade Index improves in Q2 2023.
Above all, the receding odds of the Federal Reserve’s (Fed) hawkish moves in the future join China measures to keep the Asia-Pacific buyers hopeful, especially amid the US Labor Day holiday.
On a broader front, the US Dollar Index (DXY) snaps a two-day winning streak with mild losses to around 104.15 whereas the S&P 500 Futures print mild gains. It’s worth noting that the benchmark US 10-year Treasury bond yields dropped in the last two consecutive weeks after rising to the highest levels since 2007, to 4.18% at the latest.
Also read: Forex Today: The Dollar doesn't give up
- USD/CAD oscillates in a narrow band below the 1.3600 mark on Monday.
- The technical setup favours bulls and supports prospects for further gains.
- A convincing break below the 200-day SMA will negate the positive bias.
The USD/CAD pair struggles to capitalize on Friday's solid recovery from levels just below the 1.3500 psychological mark or a two-week low and kicks off the new week on a subdued note. Spot prices remain below the 1.3600 round figure through the Asian session, though the near-term bias seems tilted in favour of bullish traders and suggests that the path of least resistance is to the upside.
Bets that the Federal Reserve (Fed) will leave interest rates unchanged at its September policy meeting, along with a positive risk tone, weigh on the safe-haven US Dollar (USD) and act as a headwind for the USD/CAD pair. Market participants, however, seem convinced that the Fed will keep rates higher for longer and have been pricing in the possibility of one more 25 bps lift-off by the end of this year. This remains supportive of elevated US Treasury bond yields and should help limit the downside for the buck.
Moreover, growing worries about a deeper global economic downturn overshadow the optimism led by more stimulus measures from China and support prospects for a further near-term appreciating move for the Greenback. The Canadian Dollar (CAD), on the other hand, is weighed down by Friday's data, showing the economy contracted during the second quarter. This, along with a modest pullback in Crude Oil prices, could undermine the commodity-linked Loonie and lend support to the USD/CAD pair.
From a technical perspective, the recent breakout through the 200-day Simple Moving Average (SMA) and the emergence of fresh buying on Friday favours bullish traders. Moreover, oscillators on the daily chart are holding comfortably in the positive territory and have also eased a bit from the overbought zone. This further adds credence to the near-term positive outlook for the USD/CAD pair, though it will still be prudent to wait for acceptance above the 1.3600 round-figure mark before positioning for further gains.
The next relevant hurdle is pegged near the 1.3635-1.3640 area, or the multi-month peak touched in August. Some follow-through buying has the potential to lift the USD/CAD pair to the 1.3700 mark en route to the 1.3740-1.3745 resistance zone. The momentum could get extended further towards the 1.3800 round figure, above which spot prices could climb to the YTD peak, around the 1.3860 area touched in March.
On the flip side, any meaningful slide is more likely to find decent support near the 1.3555-1.3550 area. a subsequent slide could be seen as a buying opportunity near the 1.3500 mark and remain limited near the 1.3460-1.3455 region, or the 200-day SMA. The latter should act as a pivotal point, which if broken decisively would shift the bias in favour of bearish traders and make the USD/CAD pair vulnerable. Spot prices might then fall to the 1.3400 mark en route to the next relevant support near the 1.3370 area.
USD/CAD daily chart
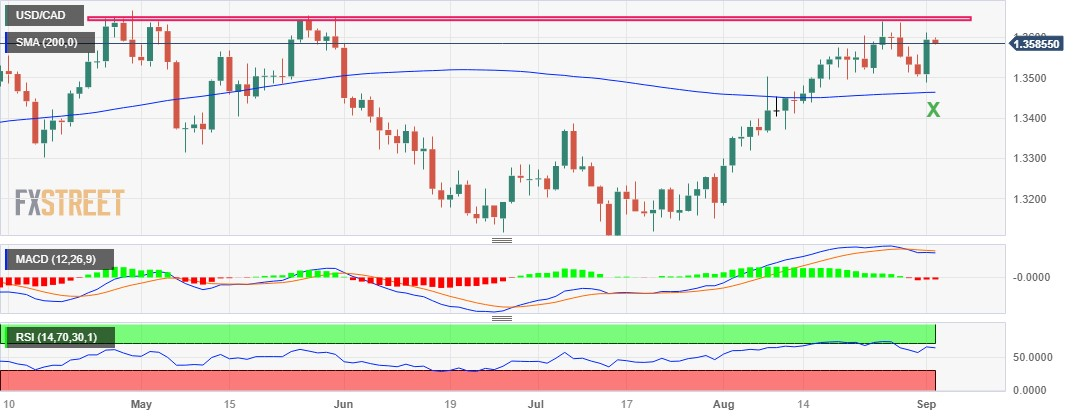
Technical levels to watch
- EUR/USD hovers around 1.0780 amid the thin trading volume due to the US holiday.
- European Central Bank (ECB) Governor Pierre Wunsch said it's too early to talk about ending hikes entirely.
- US Nonfarm Payrolls for August came in at 187K better than the estimation of 170K and July's reading of 157K.
The EUR/USD pair remains on the defensive above the mid-1.0700s during the Asian session on Monday. The major currently trades near 1.0782, gaining 0.05% for the day.
On Saturday, Belgian Central Bank Governor and European Central Bank (ECB) Governing Council member Pierre Wunsch said that the central bank could do a little bit more. He added that ECB will have to pause the policy at some point but it's too early to talk about ending hikes entirely. Additionally, ECB policymaker, Francois Villeroy de Galhau said that they are very close to a peak in interest rates, but still a long way from considering rate cut.
On the US Dollar front, the US Nonfarm Payrolls (NFP) for August came in at 187K, better than the estimation of 170Kand the July's reading of 157K, the US Bureau of Labor Statistics showed on Friday. Meanwhile, the Unemployment Rate fell significantly to 3.8%, compared to the market estimate of 3.5% and the prior data of 3.5%. The monthly Average Hourly Earnings rose by 0.2%, against the expectation of 0.3%. Finally, the US Manufacturing PMI came in at 47.6 versus 46.4 prior and better than the market consensus of 47.0.
Market players believe that the Federal Reserve (Fed) is likely to end its tightening cycle. According to the CME FedWatch tool, markets have priced in that the Fed will not hike rates in its September meeting and the possibility of raising rates in November and December declined to almost 35%. Despite registering its lowest weekly gain since early July, the US Dollar (USD) trades in positive territory for the sixth straight week.
The US market is closed for the Labor Day holiday. Market participants will keep an eye on the German Trade Balance for July, the Eurozone Sentix Investor Confidence for September, and German Buba President Joachim Nagel’s speech ahead of the ECB's President Lagarde Speech. Traders will take cues from the statement and find the trading opportunities around the EUR/USD pair.
- Gold price regains positive traction and remains within the striking distance of a one-month top.
- Expectations that the Federal Reserve is down with its rate-hiking cycle underpin the XAU/USD.
- A positive risk tone might hold back bulls from placing aggressive bets and cap any further gains.
Gold price attracts fresh buying on the first day of a new week and steadily climbs back above the $1,945 level during the Asian session. The XAU/USD remains well within the striking distance of a one-month high, around the $1,952-$1,953 region touched on Friday and seems poised to build on its recent goodish rebound from over a five-month trough, around the $1,885 zone touched in August.
The mixed monthly jobs report released from the United States (US) on Friday ensured that the Federal Reserve (Fed) will leave interest rates unchanged at its September policy meeting, which, in turn, is seen benefitting the non-yielding Gold price. In fact, the headline NFP showed that the US economy added 187K jobs in August, higher than market expectations. That said, the previous month's reading was revised down from 187K to 157K. Furthermore, the unemployment rate climbed to 3.8% from 3.5% in July and Average Hourly Earnings edged lower to 4.3% on a yearly basis from 4.4%. The data points to a slight deterioration in the labour market and gives the Fed less headroom to keep raising interest rates.
The outlook fails to assist the US Dollar (USD) to capitalize on its strong gains registered over the past two trading days and turns out to be another factor lending support to the Gold price. A softer buck tends to underpin demand for US Dollar-denominated commodities, including the XAU/USD. The downside for the USD, however, remains cushioned as the markets are still pricing in the possibility of one more 25 basis points (bps) Fed rate hike move by the end of this year. This remains supportive of elevated US Treasury bond yields and continues to act as a tailwind for the Greenback. Apart from this, a generally positive tone around the equity markets might contribute to capping gains for the safe-haven precious metal.
Expectations that the Fed is nearing the end of its rate-hiking cycle, along with the optimism over more supportive measures from China to shore up economic growth, continue to boost investors' confidence. In fact, China's top economic planner – the National Development and Reform Commission (NDRC) – said this Monday that it would establish a designated department to bolster the country's faltering private economy. This comes after China increased local dollar liquidity and loosened some mortgage rules last week. In the absence of any relevant market-moving economic releases and a bank holiday in the US, the risk-on flow might hold back traders from placing aggressive bullish bets around the Gold price, at least for now.
Technical levels to watch
- AUD/JPY gains traction around 94.50 ahead of Australia’s key events.
- The Reserve Bank of Australia (RBA) is expected to keep its key interest rate unchanged at 4.10% on Tuesday.
- Japanese policymakers said that there is no indication of intervention in the market to shore up the weak yen.
- Investors will closely watch the RBA Interest Rate Decision, Gross Domestic Product (GDP) for Q2.
The AUD/JPY cross snaps the two-day losing streak during the Asian session on Monday. The cross currently trades near 94.51, up 0.17% on the day. The Reserve Bank of Australia (RBA) monetary policy meeting and the Gross Domestic Product (GDP) due on Tuesday and Wednesday could trigger volatility in the market.
The Australian Labour government will introduce legislation to close "loopholes" in workplace law on Monday, which is opposed by business organizations who are concerned about increased expenses as a result. This, in turn, might encourage employers to pay more and can foster inflation higher.
About the data, the latest data from the University of Melbourne showed that Australian annual TD Securities Inflation for August surged 6.1% versus 5.4% in the previous month. On a monthly basis, the figure rose 0.2% versus 0.8% prior.
The RBA is expected to keep its key interest rate unchanged at 4.10% on Tuesday’s meeting as inflation shows signs of easing, according to a Reuters poll. However, market players anticipate that the central bank will maintain its hawkish stance and might hike rates further later this year.
On the other hand, the Japanese Monetary Base data for August revealed a rise of 1.2% YoY compared to the previous reading of a 1.3% drop. On Friday, Japanese Finance Minister Shunichi Suzuki stated that although sudden fluctuations in currencies are undesirable, there is no visible indication of intervention in the market to shore up the weak yen. However, the policymaker will closely watch the currency move, according to Reuters. The Bank of Japan (BOJ) maintains its loose monetary policy, while shifting away from yield curve control. BoJ Board member Toyoaki Nakamura said last week that policymakers need more time to transition to monetary tightening. That said, the monetary policy gap between Australia and Japan is still the factor behind the yen's weakness.
In the absence of top-tier economic data release from Japan, the AUD/JPY cross continues to be at the mercy of AUD price dynamics. The key event this week will be the Reserve Bank of Australia (RBA) Interest Rate Decision. Also, the Australian Gross Domestic Product (GDP) for the second quarter will be due on Wednesday. Traders will take cues from these data and find trading opportunities around the AUD/JPY cross.
- USD/JPY trades lower around 146.10, struggling to extend gains.
- MACD suggests that recent momentum is tepid as lies below the signal line.
- 147.00 psychological level emerges as the key resistance aligned to the previous week’s high.
USD/JPY struggles to extend the previous session’s gains, trading lower around 146.10 during the Asian session on Monday. The pair moves in sideways as traders adopt a cautious stance on monetary policy decision by the US Federal Reserve (Fed), following the mixed employment data from the United States (US) released on Friday.
The Moving Average Convergence Divergence (MACD) line remains above the centerline but lies below the signal line, which indicates that recent momentum is tepid.
The pair could face a challenge around 147.00 psychological level, followed by the area around the previous week’s high at 147.37.
On the flip side, the 14-day Exponential Moving Average (EMA) at 145.67 could act as immediate support, following the 21-day EMA at 145.19.
A firm break below the latter could inspire the USD/JPY sellers to navigate the region around 23.6% Fibonacci retracement at 144.98, following the 38.2% Fibonacci retracement at 143.50.
In the short term, the USD/JPY pair remains to be bullish as long as the 14-day Relative Strength Index (RSI) stays above 50.
USD/JPY: Daily Chart
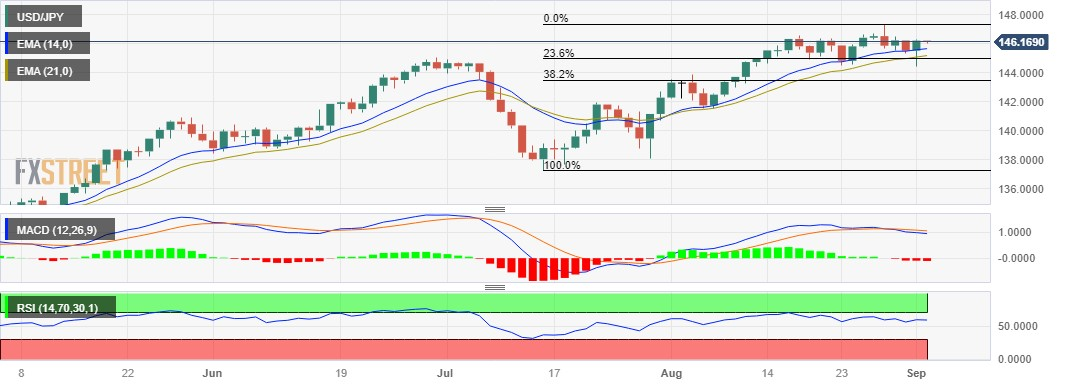
- USD/INR snaps two-day losing streak amid sluggish Asian session.
- China’s Xi advocates opening of services industry, appoints special cell to promote private economy.
- US-China tension, US Labor Day Holiday prods market sentiment and Indian Rupee moves.
USD/INR bears relinquish controls after ruling in the last two consecutive days, despite lacking momentum around 82.65–70 amid early Monday. In doing so, the Indian Rupee (INR) pair takes clues from the Asian market optimism, mainly driven by China, as well as the US Dollar’s retreat amid the US Labor Day holiday.
Markets in Asia cheer China’s readiness for multiple measures to defend the world’s second-largest economy. Among the latest actions, the government’s establishment of a special cell to promote the private economy and opening up barriers for the services industry gained major attention.
In the last week, China's central bank, namely the People's Bank of China (PBoC), announced a heavy cut to its foreign exchange reserve requirement ratio (FX RRR) to 4% from 6.0% effective from September 15.
That said, a slew of China banks cut interest rates on Yuan deposits to ease the pressure from lower mortgage rates announced previously. Among them, ICBC, China Industrial Bank, Agricultural Bank of China and Bank of China (BoC) gained major attention. Additionally, Reuters cited four people familiar with the matter to report that China is likely to step up action to revive the country’s property sector.
It’s worth noting, however, that the US-China tension, mainly due to the concerns that American businesses are less comfortable in Beijing, as well as US President Joe Biden’s readiness to restore ties with Taiwan, prod the market’s optimism and the USD/INR losses. Furthermore, an absence of major market moves due to the US holiday and a light calendar in Asia also restricts the Indian Rupee (INR) pair’s latest moves.
Even so, India’s second quarter (Q2) Gross Domestic Product (GDP) offered a positive surprise the previous week by rising to 7.8% YoY from 6.1% previous readings and 7.7% market forecasts, which in turn weighs on the USD/INR price.
On the other hand, a downward revision to the Q2 US GDP growth and softer PMIs contrasted with the upbeat prints of inflation clues and mostly impressive employment statistics. With this, the US Dollar managed to close on the positive side for the seventh consecutive week despite marking the lowest weekly gain since early July.
US Nonfarm Payrolls (NFP) rose to 187K in August versus 170K expected and 157K prior (revised) even as the Unemployment Rate marked an uptick to 3.8% from 3.5% market forecasts and previous readings. Further, the Average Hourly Earnings also eased to 0.2% and 4.3% compared to 0.4% and 4.4% respective priors. Additionally, the US ISM Manufacturing PMI also impressed the US Dollar buyers with the 47.6 figures versus analysts’ estimation of 47.0 versus 46.4 previous readings. Following the data, Federal Reserve Bank of Cleveland President Loretta J. Mester advocated for hawkish monetary policy and allowed the Greenback to remain firmer the previous day.
Amid these plays, the US Dollar Index (DXY) snaps a two-day winning streak with mild losses to around 104.15 whereas the S&P 500 Futures print mild losses and stocks in the Asia-Pacific zone edge higher of late. It’s worth noting that the benchmark US 10-year Treasury bond yields dropped in the last two consecutive weeks after rising to the highest levels since 2007, to 4.18% at the latest.
Looking forward, a light calendar and the US holiday may allow the USD/INR bears to keep the reins. However, headlines about China and the US Federal Reserve, as well as the US ISM Services PMI, will be the key for clear directions.
Technical analysis
USD/INR remains pressured between the 21-day Simple Moving Average (SMA) and the 50-SMA, respectively around 82.90 and 82.50 by the press time.
- NZD/USD regains positive traction on Monday and is supported by subdued USD price action.
- The upbeat market mood undermines the safe-haven buck and benefits the risk-sensitive Kiwi.
- Bets that the Fed will keep rates higher for longer help limit the USD losses and cap the major.
The NZD/USD pair attracts fresh buying on the first day of a new week and stalls Friday's retracement slide from the 0.6015 area, or its highest level since August 11. Spot prices trade around the 0.5950-0.5955 region during the Asian session, up nearly 0.20% for the day, and draw support from a subdued US Dollar (USD) price action.
The mixed US monthly jobs report released on Friday ensures that the Fed will leave rates unchanged at its September meeting and fails to assist the USD to capitalize on last week's strong move up back closer to the August monthly swing high. Apart from this, the optimism over more supportive measures from China to shore up economic growth boosts investors' confidence and benefits antipodean currencies, including the New Zealand Dollar (NZD).
In fact, China's top economic planner – the National Development and Reform Commission (NDRC) – said that it would establish a designated department to bolster the country's faltering private economy. This comes after China increased local dollar liquidity and loosened some mortgage rules last week, which remains supportive of a positive tone around the equity markets. The upbeat mood further undermines the safe-haven buck and benefits the risk-sensitive Kiwi.
The upside for the NZD/USD pair, however, seems limited, warranting some caution for bullish traders and before positioning for any meaningful appreciating move in the near term. The markets seem convinced that the Fed will keep interest rates higher for longer and are still pricing in the possibility of one more 25 bps lift-off by the end of this year. The hawkish outlook continues to act as a tailwind for the Greenback and should keep a lid on any further gains for the major.
In the absence of any relevant market-moving economic releases and a bank holiday in the US, the aforementioned fundamental backdrop makes it prudent to wait for strong follow-through buying to confirm that the NZD/USD pair has bottomed out.
Technical levels to watch
- Natural Gas begins Monday’s trading with a downside gap after two-week uptrend.
- Slightly upbeat US Natural Gas production, fears of slower China economy and US holiday allow XNG/USD to pare recent gains.
- Bears remain off the table amid geopolitical, environmental fears suggesting supply crunch.
- Risk catalysts eyed for fresh impulse amid US Labor Day Holiday.
Natural Gas Price (XNG/USD) began Monday’s trading with a downside gap and printed the biggest daily loss in three weeks so far even as the energy instrument recently bounced off its intraday low to $2.82 amid the market’s indecision.
In doing so, the XNG/USD fails to justify the price-positive headlines from the energy industry, mainly surrounding the supply and demand forces, amid the market’s consolidation as the US traders cheer the Labor Day holiday.
Reuters conveyed the latest US Energy Information Administration (EIA) data to suggest a 4.0% jump in the Gas output versus a slump in the number of rigs drilling for gas, to an average of 121 in August 2023 from a peak of 159 in April 2023, per Reuters. With this, the XNG/USD traders cheer the US Dollar’s positioning for this week’s US ISM Services PMI, especially when the US-China tension escalates and China braces for more privatization of the economy, per the latest comments from China President Xi Jinping.
Further, the fears of natural calamities roiling the gas supplies and allowing the XNG/USD to remain firmer also put a floor under the Natural Gas price.
The reason for the XNG/USD positioning could be linked to the US Dollar’s sustained run-up, as well as the headlines suggesting higher Gas inventories, to around 132 billion cubic feet versus the prior ten-year seasonal average on Aug. 25.
Moving on, the supply–demand scenario keeps the XNG/USD buyers hopeful despite the latest pullback. As a result, headlines about China and other risk catalysts will be important for fresh impulse.
Technical Analysis
Friday’s Gravestone Doji candlestick on the daily chart keeps the Natural Gas price pressured towards the 100-day Exponential Moving Average (EMA) support of around $2.76 unless the quote stays firmer past the previous day’s top of $3.00.
- EUR/GBP trades around 0.8560 due to the traders’ caution on ECB policy.
- Investors await ECB Lagarde’s speech, seeking further cues on the economic outlook.
- ECB member Pierre Wunsch emphasizes the persistence of inflation and additional tightening of monetary policy.
EUR/GBP hovers around 0.8560 during the Asian session on Monday, struggling to hold ground due to the possibility of an interest rate hike by the European Central Bank (ECB). The cross pair is under downward pressure as investors exercise caution, fearing that additional monetary tightening by the ECB could potentially tip the Eurozone's economy into a recession.
Traders await the press conference of ECB President Christine Lagarde, which is due on Monday. Lagarde may detail how the ECB observes the current and future state of the Eurozone’s economic scenario. The policymaker may provide indications of the ECB's monetary policy decision.
Additionally, the member of the ECB Governing Council, Pierre Wunsch points to ongoing inflation as a factor for advocating the necessity of further tightening of monetary policy. Pierre stated "I'm leaning towards the idea that we might need to take further action," during a radio interview broadcast by Bloomberg on Saturday. At first, the policymaker mentioned the diminishing price pressures but then asserted that the ECB's 2% target rate would not be reached until 2025 due to persistent inflation.
Conversely, EUR/GBP traders are exercising caution due to the challenging economic situation in the United Kingdom (UK) amid the hawkish outlook regarding a potential 25 basis point (bps) interest rate hike at the Bank of England's (BoE) September meeting.
During the weekend, UK Finance Minister Jeremy Hunt told to Reuters, “We are on track to halve inflation this year and by sticking to our plan we will ease the pressure on families and businesses alike." Hunt also mentioned on BBC that he expects a brief uptick in inflation in September but anticipates it to subsequently decline to around 5.0%, in line with the Bank of England's (BoE) projections.
Market participants will monitor British policymakers’ return to the Parliament after a vacation, and they may express optimism regarding Friday's revised economic data, which revealed a quicker post-pandemic recovery for the UK economy than previously thought.
| Raw materials | Closed | Change, % |
|---|---|---|
| Silver | 24.173 | -1.03 |
| Gold | 1939.846 | -0.01 |
| Palladium | 1219.4 | -0.66 |
- Silver Price prints mild gains while snapping three-day losing streak.
- Upbeat oscillators, clear rebound from 10-EMA favor XAG/USD buyers.
- Sellers remain off the table beyond $23.75 while Silver price upside remains elusive below $24.80.
Silver Price (XAG/USD) picks up bids to defend the week-start rebound above the $24.00 amid early Monday in Asia. In doing so, the XAG/USD prints the first daily gain in four while reversing from the 10-day Exponential Moving Average (EMA).
Apart from the Silver Price rebound from the 10-EMA, the bullish MACD signals and the upbeat RSI (14) line, not overbought, also underpins the Silver Price recovery to $24.25 by the press time.
However, a convergence of the commodity’s 23.6% Fibonacci retracement of the March–May upside and a four-month-old downward-sloping trend line, close to $24.75–80 at the latest, appears the key for the XAG/USD bulls to cross to retake control.
Following that, the Silver Price run-up towards the previous monthly high of around $25.00 and July’s peak of $25.30 will be in the spotlight.
Meanwhile, a downside break of the 10-EMA level of $24.10, needs validation from the $24.00 round figure to convince the intraday sellers of the Silver.
Even so, the 50-EMA and 38.2% Fibonacci retracement together offer a tough nut to crack for the Silver bears around $23.75.
To sum up, the XAG/USD is likely to portray a corrective bounce amid the US Labor Day Holiday.
Silver Price: Daily chart
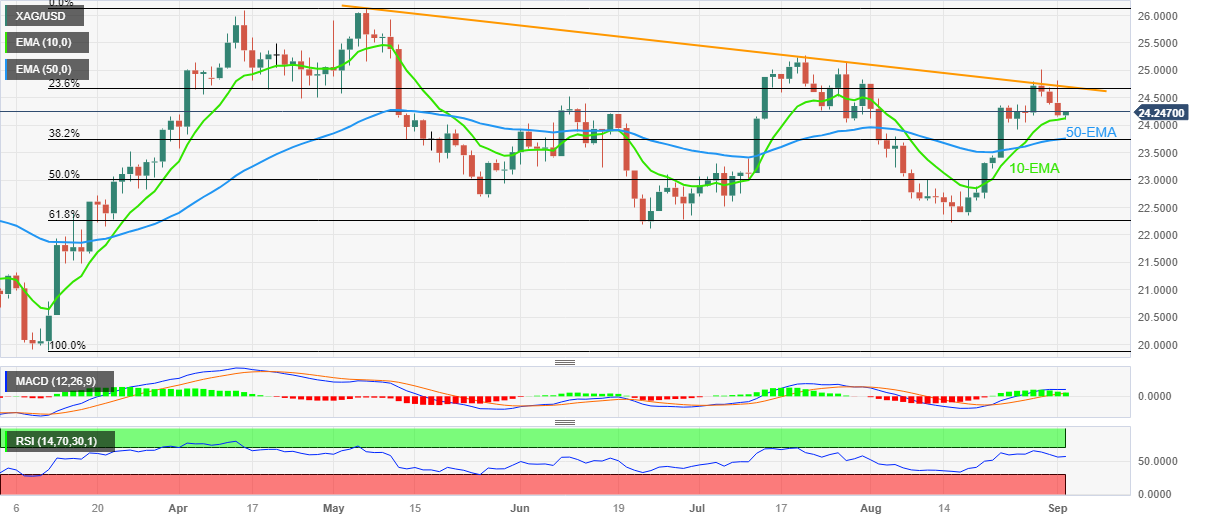
Trend: Limited recovery expected
- GBP/USD edges higher during the Asian session on Monday amid subdued USD demand.
- The uncertainty over the Fed's rate-hike path is seen as a key factor undermining the USD.
- The lack of any meaningful buying warrants some caution for aggressive bullish traders.
The GBP/USD pair edges higher on the first day of a new week, albeit lacks follow-through buying or build on its modest intraday gains around the 1.2600 round-figure mark.
The mixed US monthly jobs report released on Friday ensures that the Fed will leave rates unchanged at its September meeting and fails to assist the USD to capitalize on last week's strong move up back closer to the August monthly swing high. In contrast, the Bank of England (BoE) is anticipated to continue with its policy tightening cycle to combat high inflation, which turns out to be another factor acting as a tailwind for the GBP/USD pair. It is worth recalling that BoE Deputy Governor Ben Broadbent had said that policy rates may well have to remain in restrictive territory for some time as the knock-on effects of the surge in prices were unlikely to fade away rapidly.
Adding to this, BoE Chief Economist Huw Pill noted last Thursday that inflation in the UK remains "too high" and added that there is a lot of policy in the pipeline to come through. That said, the lack of buying interest warrants some caution before placing fresh bullish bets around the GBP/USD pair and positioning for any meaningful appreciating move. The markets are still pricing in the possibility of one more 25 bps Fed rate hike by the end of this year. This remains supportive of elevated US Treasury bond yields, which, in turn, is seen underpinning the Greenback and capping the upside for the major in the wake of growing concerns about a deeper global economic downturn.
Traders also seem reluctant in the absence of any relevant market-moving economic releases from the UK and a bank holiday in the US. Nevertheless, the GBP/USD pair, for now, seems to have snapped a two-day losing streak, though remains well within the striking distance of its lowest level since June 13, around the 1.2550-1.2545 region touched in August. The said area should now act as a pivotal point and help determine the next leg of a directional move for the major.
Technical levels to watch
- GBP/JPY stays defensive after two-day losing streak, bounces off one-week low.
- UK FinMin Hunt expects slower inflation despite September’s blip, challenging BoE rate hikes.
- Japan Monetary Base expands in August, suggesting need for hawkish BoJ.
- BoE Monetary Policy Report Hearings, Japan Q2 2023 GDP will be important for fresh impulse.
GBP/JPY floats above 184.00 while struggling to defend the early-day rebound from a one-week low during Monday’s Asian session. In doing so, the cross-currency pair justifies the mixed headlines about the UK and Japan amid sluggish markets due to the US Labor Day holiday.
“We are on track to halve inflation this year and by sticking to our plan we will ease the pressure on families and businesses alike," said UK Finance Minister Jeremy Hunt during the weekend per Reuters. The policymaker, however, also told the BBC that he thinks of witnessing a blip in inflation in September but also anticipated the fall in inflation to around 5.0% as per the Bank of England (BoE) forecasts.
The same joins the recently downbeat concerns about the BoE’s rate hike and prod the GBP/JPY rebound. However, Friday’s revised British economic data joins the sticky inflation in the UK to keep the buyers hopeful.
On the other hand, the recent Japan Monetary Base data for August suggests an increase in liquidity with 1.2% YoY growth versus -1.3% prior. The same joins the market’s hawkish expectations from the Bank of Japan (BoJ) to defend the Japanese Yen (JPY) buyers despite the cautious optimism in the market and inactive bond markets, due to the US holiday.
It’s worth observing that the BoJ policymakers have been defending the ultra-easy monetary policy and putting a floor under the GBP/JPY price, especially when the BoE Officials are hawkish.
Amid these plays, the benchmark US 10-year Treasury bond yields dropped in the last two consecutive weeks after rising to the highest levels since 2007, to 4.18% at the latest. Further, the Wall Street benchmarks also improved in the recent few days, despite Friday’s sluggish closing, while the S&P 500 Futures printed mild gains by the press time.
Moving on, BoE Monetary Policy Report Hearings and Japan’s second-quarter (Q2) Gross Domestic Product (GDP) will be crucial for clear directions. Should the Japanese growth data improve and the BoE policymakers sound cautious, the GBP/JPY may witness the bear’s dominance.
Technical analysis
GBP/JPY stays beneath the 21-DMA hurdle, around 184.50, despite the latest rebound, which in turn joins the bearish signals to direct the sellers toward the 50-DMA support of 183.00.
- WTI prices are bolstered by the falling crude oil inventories, oil production cut by Russia and Saudi Arabia.
- The concerns about the economic slowdown in China might limit the further upside in WTI.
- Oil traders will monitor the Chinese Caixin Services PMI, the US ISM Services PMI due later this week.
Western Texas Intermediate (WTI), the US crude oil benchmark, is trading around the $85.20 mark so far on Monday. The falling crude oil inventories and the expectations of oil production cut by Saudi Arabia and OPEC+ boost WTI prices near the Year-To-Date (YTD) high of $85.52.
Higher WTI prices are also supported by a substantial drop in US crude oil stocks. The Energy Information Administration (EIA) reported last week that crude oil stockpiles fell by 10.584 million barrels in the week ending August 25, above expectations of a -3.267 million barrel decrease.
Furthermore, according to Reuters, Russia's Deputy Prime Minister Alexander Novak said that the nation agreed with OPEC+ to limit oil output and would unveil the new parameters later this week. Nonetheless, Russia is expected to cut its oil exports by 500,000 barrels per day in August and 300,000 barrels per day in September. While Saudi Arabia is anticipated to prolong its voluntary oil cut of 1 million barrels per day into October for the third month in a row. In response to the news, WTI prices reached a YTD high on Friday.
On the other hand, Moody’s stated on Friday that the Global rating agency expects China’s economy to grow at the same rate of 5.0% in 2023 as expected earlier. However, the global rating company also downwardly revised its 2024 GDP for China to 4.0% from 4.5%, according to Reuters. The concerns about the economic slowdown in China might limit the WTI's upside potential as China is the world's largest oil importer.
Moving on, oil traders await the Chinese Caixin Services PMI for August and the US ISM Services PMI due on Tuesday and Wednesday, respectively. Also, traders will take cues from the EIA Crude Oil Stocks Change data for the week ending September 1 due on Wednesday. These events could significantly impact the USD-denominated WTI price. Oil traders will take cues from the data and find trading opportunities around the WTI price.
- USD/CAD trades higher around 1.3590 after data releases from both countries last week.
- Canadian disappointing GDP data may influence the upcoming BoC's policy decision.
- Saudi Arabia is expected to extend its oil output cut, supporting the Canadian Dollar.
USD/CAD trades higher around 1.3590, extending gains on the second day during the Asian session on Monday. The Canadian Dollar (CAD) is experiencing downward support against the US Dollar (USD), which is attributed to the data releases from the United States (US) and Canada.
As said, Canada’s Gross Domestic Product (GDP) unexpectedly contracted at the rate of 0.2% annually in the second quarter, against the expected growth of 1.2%. The growth figure was 2.6% in the first quarter. S&P Global Manufacturing PMI report for August showed a reduction, with a reading of 48, compared to the market expectations of 49.2 and from 49.6 prior.
The USD/CAD pair faced downward pressure due to data figures that fell below expectations. The Bank of Canada (BoC) is set to announce its monetary policy decision this Wednesday, and the disappointing GDP figure may impact the anticipated 25 basis point (bps) rate hike by the BoC.
However, the improved prices of US crude oil might have limited the gains of the Loonie pair. The Western Texas Intermediate (WTI) price rose to a new year-to-date (YTD) high of $85.57, following the expected supply cuts of 1 million barrels per day (bpd) by Saudi Arabia in October. Additionally, Russia agrees with the Organization of the Petroleum Exporting Countries (OPEC) and its allies on the decision.
On the other hand, the US Nonfarm Payrolls (Aug) report showed improvement in job creation. The data reported a 187K figure, higher than the expected reading of 170K. The data reported 157K figure in the month of July. ISM Manufacturing PMI rose to 47.6, from the previous reading of 46.4. The market consensus was 47.
The robust jobs and manufacturing data support the Greenback which gauges the performance of the US Dollar (USD) against the six other major currencies. Spot treads waters around 104.20 at the time of writing. However, market participants seek further indications from the US Federal Reserve (Fed) on the policy decision in the upcoming meeting.
- AUD/USD regains positive traction on Monday, albeit lacks follow-through buying.
- Bets for one more Fed rate hike in 2023 cap the pair ahead of the RBA on Tuesday.
- The formation of a bearish flag on hourly charts warrants caution for bullish traders.
The AUD/USD pair attracts some dip-buying near the 0.6440 area or a four-day low touched during the Asian session on Monday and stalls last week's modest pullback from the 0.6520 region, or its highest level since August 11. Spot prices currently trade near the 0.6465 zone, up just over 0.10% for the day, and draw support from subdued US Dollar (USD) price action.
The mixed US monthly employment details released on Friday ensure that the Fed will leave rates unchanged at its September meeting and fails to assist the USD to capitalize on Friday's strong move up closer to the August monthly swing high. This, in turn, is seen as a key factor acting as a tailwind for the AUD/USD pair. The markets, however, are still pricing in the possibility of one more 25 bps lift-off by the end of this year. This might hold back traders from placing aggressive bearish bets around the USD and keep a lid on the major ahead of the Reserve Bank of Australia (RBA) monetary policy meeting on Tuesday.
From a technical perspective, the AUD/USD pair's recent bounce from the 0.6365 area, or the YTD low touched in August, has been along an upward-sloping channel. Against the backdrop of a sharp downfall from the double-top resistance near the 0.6900 mark, this constitutes the formation of a bearish flag pattern on hourly charts. Moreover, oscillators on the daily chart - though have managed to recover from lower levels - are still holding in the negative territory. This suggests that the path of least resistance for spot prices is to the downside and any subsequent move up might still be seen as an opportunity for bearish traders.
Meanwhile, the 200-hour Simple Moving Average (SMA), currently pegged around the mid-0.6400s, is likely to act as a pivotal point for intraday traders. Acceptance below will expose the trend-channel support near the 0.6400 mark, which if broken decisively will mark a fresh breakdown and pave the way for deeper losses. The AUD/USD pair might then accelerate the slide back towards the YTD low, around the 0.6365 region, before eventually dropping to the 0.6300 round figure.
On the flip side, the 0.6500 psychological mark now seems to act as an immediate hurdle ahead of the top end of the aforementioned channel, around the 0.6520-0.6525 region. A convincing breakthrough will negate the bearish setup and prompt an aggressive short-covering move. The AUD/USD pair might then aim to reclaim the 0.6500 round figure. Some follow-through buying beyond and testing the 0.6510-0.6515 resistance zone might shift the bias in favour of bullish traders and pave the way for a further near-term positive move towards the 0.6700 mark en route to the next relevant hurdle near the 0.6725-0.6730 area.
ADU/USD 1-hour chart
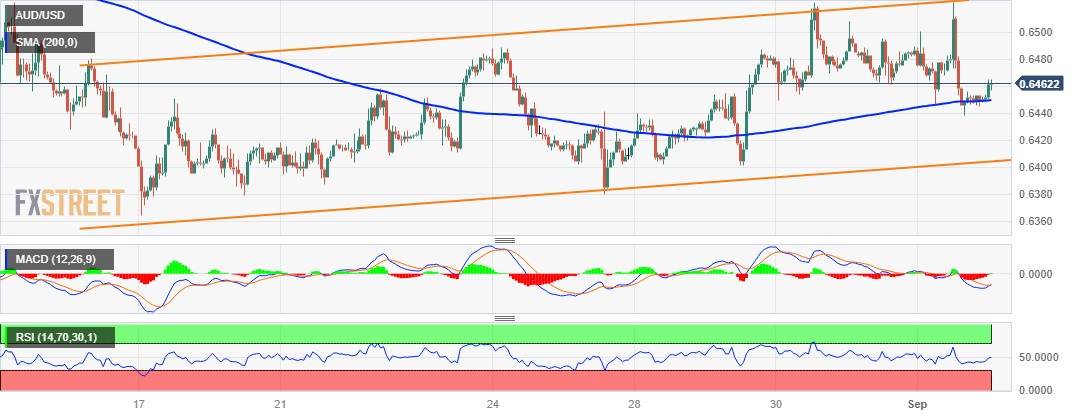
Technical levels to watch
- Gold Price jostles with key upside hurdle after two-week uptrend.
- United States employment, inflation clues defend US Dollar but activity, growth numbers prod Federal Reserve hawks and Greenback bulls.
- China stimulus, sustained trading beyond the EMA confluence also favor XAU/USD bulls.
- More data, risk catalysts eyed for clear directions of the Gold Price.
Gold Price (XAU/USD) remains mildly bid while picking up bids to reverse the previous day’s pullback from a one-month high amid early Monday. That said, the US Dollar’s retreat amid the US Labor Day Holiday joins the mixedUS–China news to underpin the XAU/USD upside around $1,941 of late. It’s worth noting that Friday’s United States data prod the Gold buyers after the metal refreshed the monthly top. Even so, a lack of hawkish bias about the Federal Reserve (Fed) joins China's stimulus to keep the bullion buyers hopeful, especially when the technical details are favorable to the upside move.
Gold Price edge higher as US Dollar bulls struggle, China announces stimulus
Gold Price remains on the buyer’s radar as the US Dollar buyers appear running out of steam after seven consecutive weekly gains. Adding strength to the bullish bias about the XAU/USD are stimulus measures from one of the world’s biggest Gold customers, namely China.
Looking back, a downward revision to the Q2 US GDP growth and softer PMIs contrasted with the upbeat prints of inflation clues and mostly impressive employment statistics. With this, the US Dollar managed to close on the positive side for the seventh consecutive week despite marking the lowest weekly gain since early July.
On Friday, the headline US Nonfarm Payrolls (NFP) rose to 187K in August versus 170K expected and 157K prior (revised) even as the Unemployment Rate marked an uptick to 3.8% from 3.5% market forecasts and previous readings. Further, the Average Hourly Earnings also eased to 0.2% and 4.3% compared to 0.4% and 4.4% respective priors. Additionally, the US ISM Manufacturing PMI also impressed the US Dollar buyers with the 47.6 figures versus analysts’ estimation of 47.0 versus 46.4 previous readings.
Following the data, Federal Reserve Bank of Cleveland President Loretta J. Mester downplayed the increase in the Unemployment Rate to 3.8% by stating that the level "is still low." The policymaker termed the US job market as strong despite recent rebalancing as she spoke at an event in Germany. About inflation, Fed’s Mester acknowledged that progress has been made but noted it remains elevated.
On the other hand, China’s Caixin Manufacturing PMI for August rose to 51.0 versus 49.3 market forecasts and 49.2 previous readings. On the same line, China’s official NBS Manufacturing PMI for August rose to 49.7 versus 49.4 expected and 49.3 previous readings. However, the Non-Manufacturing PMI came in as 51.0 compared to 51.5 prior readouts and market forecasts of 51.1.
Also, China's central bank, namely the People's Bank of China (PBoC), announced a heavy cut to its foreign exchange reserve requirement ratio (FX RRR) to 4% from 6.0% effective from September 15.
That said, a slew of China banks cut interest rates on Yuan deposits to ease the pressure from lower mortgage rates announced previously. Among them, ICBC, China Industrial Bank, Agricultural Bank of China and Bank of China (BoC) gained major attention.
Additionally, Reuters cited four people familiar with the matter to report that China is likely to step up action to revive the country’s property sector.
Recently, the global rating agency Moody’s cuts its economic growth forecasts for China, as well as revised up the US Gross Domestic Product (GDP) predictions in its latest report while the news about the US-China tension and Beijing’s readiness for more stimulus entertained the Gold traders.
It should be observed that the decline in the benchmark US 10-year Treasury bond yields has been inversely related to the Gold Price in the fortnight. That said, the key bond coupons rose to the highest levels since 2007 before retreating in the last two weeks to 4.18%.
Further, the Wall Street benchmarks also improved in the recent few days, despite Friday’s sluggish closing, which in turn allowed the Gold buyers to keep the reins.
Even so, the US Dollar Index (DXY) managed to post a seven-week uptrend and challenged the XAU/USD upside.
XAU/USD bulls need more clues about Fed policy pivot to keep the reins
Although the US Dollar’s struggle to defend the latest gains joins the China-inspired optimism to underpin the Gold Price upside, traders need more clues to defend the XAU/USD buyers as the sentiment remains fragile. That said, the S&P 500 Futures printed mild losses by the press time and the equity buyers have also lost some of the grounds in the last few days.
As a result, this week’s China inflation data and the US ISM Services PMI will be crucial for Gold traders to watch for clear directions.
Also read: Gold Price Weekly Forecast: $1,950 stands in the way of an extended uptrend
Gold Price Technical Analysis
Gold Price prods a four-month-old descending resistance line surrounding $1,950 while defending the previous week’s sustained trading beyond the 50-day and 100-day Exponential Moving Averages (EMAs).
That said, the bullish signals on the Moving Average Convergence and Divergence (MACD) indicator, as well as an upbeat Relative Strength Index (RSI) line, placed at 14, keep the XAU/USD hopeful of crossing the immediate upside hurdle.
Following that, the Gold Price can quickly rise to a horizontal resistance area comprising multiple levels marked since late May, around $1,985, ahead of targeting the $2,000 round figure.
Meanwhile, a convergence of the 100 and 50 EMA, near $1,930 at the latest, puts a floor under the XAU/USD.
Even if the Gold Price drops below $1,930, a convergence of the 200-EMA and 61.8% Fibonacci retracement of the bullion’s February-May upside, close to $1,908, quickly followed by the $1,900 threshold, will test the bears before giving them control.
It’s worth noting that the previous monthly low of around $1,885 also acts as a downside filter for the XAU/USD.
Gold Price: Daily chart
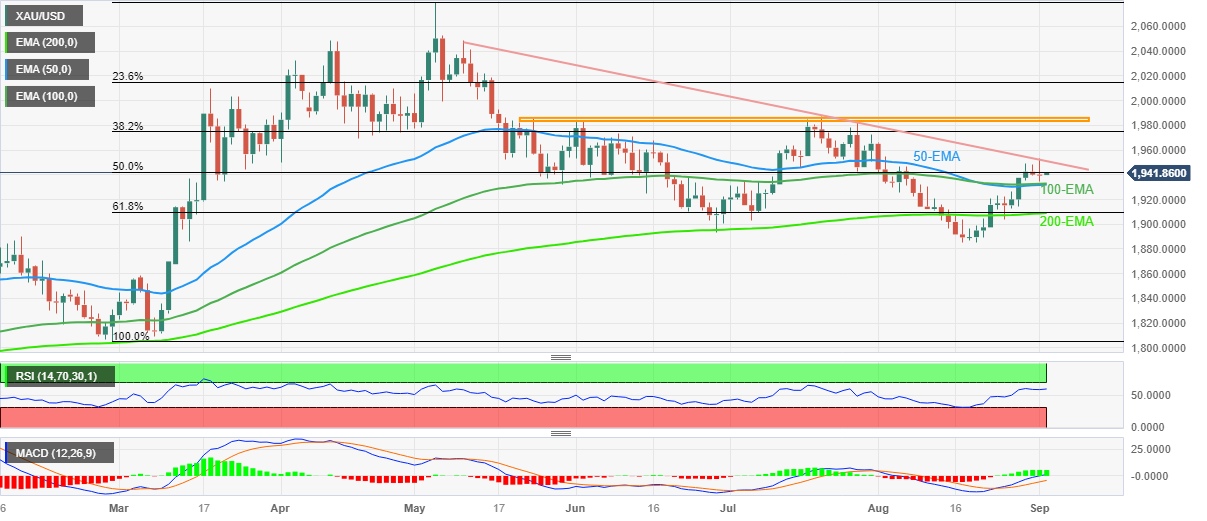
Trend: Further upside expected
People’s Bank of China (PBoC) set the USD/CNY central rate at 7.1786 on Monday, versus the previous fix of 7.1788 and market expectations of 7.2795. It's worth noting that the USD/CNY closed near 7.2675 the previous day.
About PBOC fix
China maintains strict control of the yuan’s rate on the mainland.
The onshore yuan (CNY) differs from the offshore one (CNH) in trading restrictions, this last one is not as tightly controlled.
Each morning, the People’s Bank of China (PBOC) sets a so-called daily midpoint fix, based on the yuan’s previous day's closing level and quotations taken from the inter-bank dealer.
Global rating agency Moody’s cuts its economic growth forecasts for China, as well as revised up the US Gross Domestic Product (GDP) predictions in its latest report, published late Friday.
"We have raised our growth forecast for the United States' economy to 1.9% in 2023 from 1.1% in our May outlook, acknowledging the strong underlying economic momentum," Moody's said in a report per Reuters.
The rating giant also flagged hardships for the Federal Reserve (Fed) in defending the 2.0% inflation target should the current economic transition prevail while keeping the 1.0% US growth forecasts for 2024.
On the other hand, Moody’s expects China’s economy to grow at the same rate of 5.0% in 2023 as expected earlier. However, the global rating company also downwardly revised its 2024 GDP for China to 4.0% from 4.5%.
In doing so, Moody’s cites low consumer confidence as holding back household spending while adding that the economic and policy uncertainty will continue to weigh on business decisions.
Also read: AUD/USD ignores Aussie government’s push for more wages near 0.6450, focus on RBA, Australia GDP
- USD/MXN snaps two-day winning streak by reversing from the highest level in a fortnight.
- US Labor Day Holiday, mixed sentiment allow Mexican Peso to regain upside momentum.
- Mexico Headline Inflation for August, US ISM Services PMI eyed for clear directions.
USD/MXN reverses from a two-week high, as well as snaps a two-day winning streak, while declining to 17.05 during the early hours of Monday’s Asian session. In doing so, the Mexican Peso (MXN) pair justifies the market’s doubts about the Federal Reserve’s (Fed) ability to lift the rates further while also suggesting the hawkish bias about the Mexican central bank, namely the Banxico.
The US Dollar barely managed to post a positive weekly close after a downbeat start as a downward revision to the Q2 US GDP growth and softer PMIs prod the DXY bulls initially before the upbeat prints of inflation clues and mostly impressive employment statistics.
On Friday, the headline US Nonfarm Payrolls (NFP) rose to 187K in August versus 170K expected and 157K prior (revised) even as the Unemployment Rate marked an uptick to 3.8% from 3.5% market forecasts and previous readings. Further, the Average Hourly Earnings also eased to 0.2% and 4.3% compared to 0.4% and 4.4% respective priors. Additionally, the US ISM Manufacturing PMI also impressed the US Dollar buyers with the 47.6 figures versus analysts’ estimation of 47.0 versus 46.4 previous readings.
It’s worth noting that Federal Reserve Bank of Cleveland President Loretta J. Mester downplayed the increase in the Unemployment Rate to 3.8% by stating that the level "is still low." The policymaker termed the US job market as strong despite recent rebalancing as she spoke at an event in Germany. About inflation, Fed’s Mester acknowledged that progress has been made but noted it remains elevated.
Even so, the latest readings on the interest rate futures, suggest a nearly 90% chance of the Federal Reserve’s (Fed) inaction in September, as well as the receding odds of witnessing one more rate hike in 2024, which in turn prods the US Dollar amid the US holiday.
On the other hand, the Officials at the Banxico appear hawkish and hence this week’s Mexican Headline Inflation for August, up for publishing on Thursday, as well as Wednesday’s US ISM Services PMI, become crucial for the pair traders to watch.
It should be noted that China stimulus and the US-China tension are extra filters, apart from the mixed US data, that challenge the USD/MXN moves.
While portraying the mood, the benchmark US 10-year Treasury bond yields have been declining in the last two consecutive weeks after rising to the highest levels since 2007, to 4.18% at the latest. Further, the Wall Street benchmarks also improved in the recent few days, despite Friday’s sluggish closing, while the S&P 500 Futures printed mild losses by the press time.
Looking ahead, a light calendar and the US holiday may allow the USD/MXN to consolidate the previous weekly losses.
Technical analysis
Although a downward-sloping resistance line from late May, around 17.20 by the press time, caps the USD/MXN pair’s immediate upside, the sellers need validation from a convergence of the 50-DMA and 21-DMA, close to 16.98–97 to retake control.
- USD/CHF consolidates in a narrow trading band around 0.8850 on Monday.
- US Nonfarm Payrolls for August came in at 187,000, exceeding the estimate of 170,000.
- The renewed trade war tension between the US-China might benefit the Swiss Franc.
- Investors will monitor the Swiss Gross Domestic Product (GDP), the US ISM Services PMI.
The USD/CHF pair remains confined between 0.8852-0.8862 range during the early Asian trading hours on Monday. Meanwhile, the US Dollar Index (DXY), a measure of the value of USD against six other major currencies, holds above the 104.00 mark, while the US bond yields have a volatile session following the US economic data. The 2-year yield currently trades around 4.87% after falling to a three-week low of 4.76% and the 10-year bonds trade near 4.18%. At the time of writing, the USD/CHF is trading at 0.8855, losing 0.02% on the day.
Data released on Friday showed that Nonfarm Payrolls (NFP) for August in the US came in at 187,000, exceeding the estimate of 170,000 and July's reading of 157,000. The Unemployment Rate decreased considerably to 3.8%, compared to the market's estimate of 3.5% and the previous reading of 3.5%. The monthly Average Hourly Earnings increased by 0.2% instead of 0.3%. The US Dollar (USD) weakened across the board following the data released as traders anticipate that the Federal Reserve is likely to end the tightening cycle.
However, the Greenback reversed its direction after the US PMI data. That said, the US Manufacturing PMI came in at 47.6 versus 46.4 previously and above market expectations of 47.0.
On the other hand, the Swiss Real Retail Sales YoY for July came in at -2.2% versus 1.8% prior, the Swiss Federal Statistical Office reported last week. Additionally, the KOF Leading Indicator for August came in at 91.1 versus 92.01 prior and below the market consensus of 91.5. Finally, the ZEW Survey of Expectation for the same period fell to -38.6 from -32.6 the previous month and missed the expectation of -31.3. The weaker-than-expected Swiss data dragged the Swiss Franc (CHF) lower against its rivals.
However, The renewed trade war tension between the US and China might benefit the traditional safe-haven CHF and act as a headwind for USD/CHF. US Commerce Secretary Raimondo said that China is making the situation more difficult. He added that a lack of a predictable environment and a fair playing field are the primary drivers affecting US business in China. On the weekend, Chinese President Xi Jinping stated at the China International Fair for Trade in Services (CIFTIS) in Beijing that China will encourage the integrated development of high-end manufacturing and modern service industries, according to Reuters.
Looking ahead, market players will closely watch the Swiss Gross Domestic Product (GDP) for the second quarter. The quarterly and annual growth number is expected to grow 0.1% and 0.5%, respectively. On the US docket, the US ISM Services PMI for August will be released on Wednesday. These figures could give a clear direction for the USD/CHF pair.
- USD/JPY consolidates Friday's solid bounce from a multi-week low amid subdued USD demand.
- The divergent Fed-BoJ stance continues to act as a tailwind for the pair and favours bullish traders.
- Intervention fears seem to be the only factor keeping a lid on any meaningful upside for the major.
The USD/JPY pair struggles to capitalize on Friday's solid recovery from the 144.45 area, or its lowest level since August 11 and kicks off the new week on a subdued note. Spot prices, however, manage to hold above the 146.00 mark through the first half of the European session and the fundamental backdrop remains tilted in favour of bullish traders.
The US Dollar (USD) consolidates the post-NFP strong move up back closer to the August monthly swing high and turns out to be a key factor that continues to act as a tailwind for the USD/JPY pair. The closely-watched US monthly employment details showed that the economy added 187K jobs in August, higher than market expectations and the previous month's downwardly revised reading of 157K. Adding to this, the jobless rate climbed to 3.8% from 3.5% in July and Average Hourly Earnings edged lower to 4.3% on a yearly basis from 4.4%. The data pointed to a slight deterioration in the labour market and ensures that the Fed will leave rates unchanged at its September meeting, though the markets are still pricing in the possibility of one more 25 bps lift-off by the end of this year. This remains supportive of elevated US Treasury bond yields and is seen underpinning the Greenback.
The Japanese Yen (JPY), on the other hand, is weighed down by the fact that the Bank of Japan (BoJ) has shown no signs of an imminent change in its super-easy monetary policy stance. In fact, BoJ board member Toyoaki Nakamura indicated last week that it was premature to tighten monetary policy as recent increases in inflation were mostly driven by higher import costs rather than wage gains. Moreover, BoJ Governor Kazuo Ueda had said that the underlying inflation remains a bit below the 2% target, ensuring the status quo until next summer. This marks a big divergence in comparison to other major central banks, including the Fed, and suggests that the path of least resistance for the USD/JPY pair is to the upside. That said, fears that Japanese authorities might intervene in the markets to prop up the domestic currency seem to keep a lid on any further gains for the major.
Moving ahead, there isn't any relevant market-moving economic data due for release on Monday and the US banks will be closed in observance of Labor Day, supporting prospects for some near-term consolidation for the USD//JPY pair. Nevertheless, the aforementioned fundamental backdrop favours bullish traders. Hence, any meaningful dip might still be seen as a buying opportunity and is more likely to remain limited, at least for the time being.
Technical levels to watch
- EUR/USD holds lower grounds after breaking key support line, approaches multi-day-old descending trend line support.
- Downbeat oscillators suggest limited room towards the south, highlighting 1.0750 as the key support.
- Euro pair’s recovery remains elusive below 1.0920 resistance confluence.
- ECB President Christine Lagarde’s speech will entertain traders amid US holiday.
EUR/USD remains on the back foot around 1.0780–75 after breaking the key support line stretched from March, now immediate resistance around 1.0780 during early Monday morning in Asia.
It’s worth noting that a downside break of an ascending trend line from mid-March joins the bearish MACD signals to keep the Euro sellers hopeful.
However, the US Labor Market Holiday joins the nearly oversold RSI (14) line to allow the EUR/USD to take a breather.
Even so, a daily closing beneath a descending support line from late June, close to 1.0750, becomes necessary for the Euro seller’s conviction. Apart from the stated support line, a speech from European Central Bank (ECB) President Christine Lagarde may also challenge the EUR/USD bears as the policymaker sounded hawkish in her latest speech.
In a case where the EUR/USD sellers keep the reins past 1.0750, the May 31 low of around 1.0635 will lure the bears.
On the flip side, a daily closing beyond the support-turned-resistance line stretched from mid-March, close to 1.0780 by the press time, becomes necessary for the intraday buyers.
Following that, the 1.0850 hurdle may gain the market’s attention ahead of a convergence of the 100-DMA and a five-week-old falling resistance line, close to 1.0920.
Also read: EUR/USD: US holiday to restrict Euro moves, further downside hinges on 1.0750 break and ECB’s Lagarde
EUR/USD: Daily chart
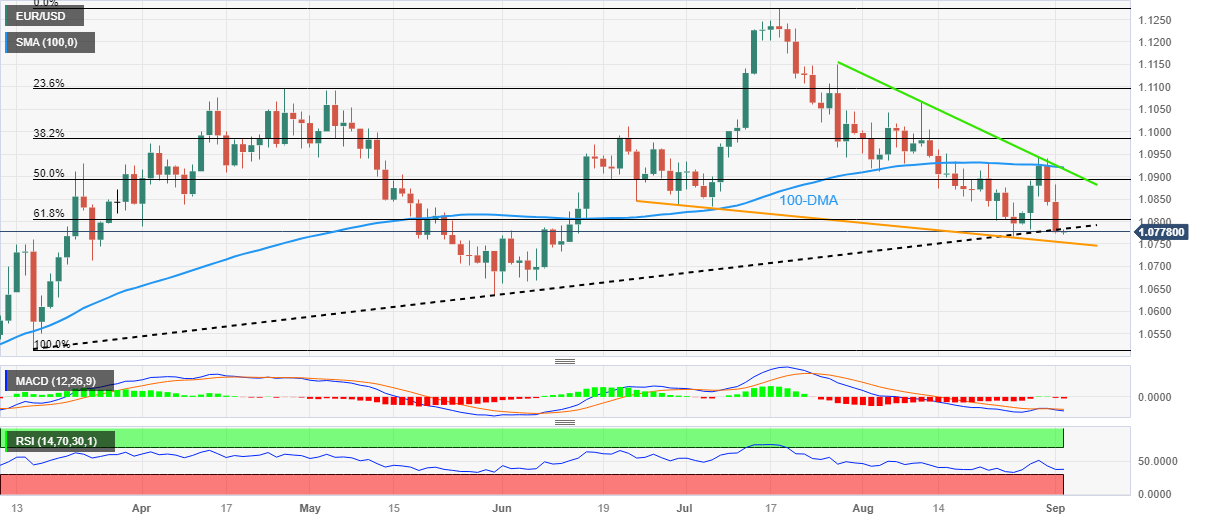
Trend: Bearish
| Index | Change, points | Closed | Change, % |
|---|---|---|---|
| NIKKEI 225 | 91.28 | 32710.62 | 0.28 |
| KOSPI | 7.44 | 2563.71 | 0.29 |
| ASX 200 | -27 | 7278.3 | -0.37 |
| DAX | -106.74 | 15840.34 | -0.67 |
| CAC 40 | -19.93 | 7296.77 | -0.27 |
| Dow Jones | 115.8 | 34837.71 | 0.33 |
| S&P 500 | 8.11 | 4515.77 | 0.18 |
| NASDAQ Composite | -3.16 | 14031.81 | -0.02 |
- US Dollar Index struggles for clear directions after seven-week uptrend.
- Labor Day Holiday restricts market moves amid a light calendar, mixed sentiment.
- Upbeat US jobs report teases policy hawks even as Fed inaction in September is mostly priced in.
- China stimulus, Sino-American jitters and inflation clues eyed for clear directions.
US Dollar Index (DXY) seesaws around 104.25-30 during a sluggish start of the week’s trading, mainly due to the US Labor Day Holiday and a light calendar in Asia. Even so, the Greenback’s gauge versus the six major currencies defend the seven-week uptrend by staying on the way to an important technical resistance, mainly after Friday’s heavy rebound.
Although a downward revision to the Q2 US GDP growth and softer PMIs prod the DXY bulls, the upbeat prints of inflation clues and mostly impressive employment statistics allowed the US Dollar to close on the positive side for the seventh consecutive week despite marking the lowest weekly gain since early July.
On Friday, the headlines US Nonfarm Payrolls (NFP) rose to 187K in August versus 170K expected and 157K prior (revised) even as the Unemployment Rate marking an uptick to 3.8% from 3.5% market forecasts and previous readings. Further, the Average Hourly Earnings also eased to 0.2% and 4.3% compared to 0.4% and 4.4% respective priors. Additionaly, the US ISM Manufacturing PMI also impressed the US Dollar buyers with the 47.6 figures versus analysts’ estimation of 47.0 versus 46.4 previous readings.
Following the data, Federal Reserve Bank of Cleveland President Loretta J. Mester downplayed the increase in the Unemployment Rate to 3.8% by stating that the level "is still low." The policymaker termed US job market as strong despite recent rebalancing as she spoke at an event in Germany. About inflation, Fed’s Mester acknowledged that progress has been made but noted it remains elevated.
It’s worth noting, however, that China stimulus and the US-China tension are extra filters, apart from the mixed US data, that challenges the DXY moves.
China President Xi Jinping showed readiness for more collaboration with the international players of the services industry after US Commerce Secretary Gina Raimondo warned China as she returned from her trip to Beijing. On the same line, US President Joe Biden also crossed wires during the weekend while showing his disappointment with Chinese President Xi Jinping’s decision to remain absent from the summit of G20 leaders in India.
Elsewhere, China's central bank, namely the People's Bank of China (PBoC), announced a heavy cut to its foreign exchange reserve requirement ratio (FX RRR) to 4% from 6.0% effective from September 15. That said, a slew of China banks cut interest rates on Yuan deposits to ease the pressure from lower mortgage rates announced previously. Among them, ICBC, China Industrial Bank, Agricultural Bank of China and Bank of China (BoC) gained major attention. Additionally, Reuters cited four people familiar with the matter to report that China is likely to step up action to revive the country’s property sector.
Against this backdrop, , the benchmark US 10-year Treasury bond yields have been declining in the last two consecutive weeks after rising to the highest levels since 2007, to 4.18% at the latest. Further, the Wall Street benchmarks also improved in the recent few days, despite Friday’s sluggish closing, while the S&P 500 Futures print mild losses by the press time.
Moving on, a light calendar and the US holiday may allow the DXY bulls to take a breather but the risk catalysts and Wednesday’s US ISM Services PMI will be the key to watch for clear directions.
Technical analysis
A three-month-old descending resistance line, currently around 104.50, appears the key upside hurdle for the US Dollar Index (DXY) bulls.
“The Reserve Bank of Australia will keep its key interest rate unchanged at 4.10% on Tuesday as inflation shows signs of easing,” per the August 30 – September 1 poll of 35 economist by Reuters.
The survey finding also mentioned that the respondents largely expect a final hike next quarter.
Of the 21 economists who are expecting at least one more rate hike, two are expecting a move on Tuesday, while the rest are expecting it to come next quarter, likely after the next detailed quarterly inflation data is released in November reported Reuters.
The poll also cites expectations of witnessing a rate hike in November as Michele Bullock becomes the RBA Governor after the mid-September but also states the rates to remain unchanged at 4.35% through end-March 2024 afterward.
Also read: AUD/USD ignores Aussie government’s push for more wages near 0.6450, focus on RBA, Australia GDP
| Pare | Closed | Change, % |
|---|---|---|
| AUDUSD | 0.64486 | -0.55 |
| EURJPY | 157.574 | -0.12 |
| EURUSD | 1.07731 | -0.64 |
| GBPJPY | 184.109 | -0.17 |
| GBPUSD | 1.25872 | -0.69 |
| NZDUSD | 0.59417 | -0.41 |
| USDCAD | 1.35918 | 0.62 |
| USDCHF | 0.88578 | 0.28 |
| USDJPY | 146.265 | 0.52 |
- NZD/USD remains on the defensive around 0.5956 after retracing from 0.6015.
- US Nonfarm Payrolls came in at 187,000, better than 170,000 expected.
- New Zealand Terms of Trade Index Q2 improved to 0.4% versus a 1.5% drop in the previous reading.
The NZD/USD pair consolidates its recent losses below the 0.6000 barrier during the early Asian session on Monday. The pair currently trades near 0.5956, gaining 0.17% on the day. The Kiwi (NZD) is weakened against the US Dollar (USD) following Friday’s upbeat US economic data and the headlines surrounding the US-China trade war tension.
The US Bureau of Labor Statistics reported on Friday that Nonfarm Payrolls (NFP) for August came in at 187,000, better than the estimation of 170,000 and July's reading of 157,000. The Unemployment Rate fell significantly to 3.8%, compared to the market estimate of 3.5% and the prior data of 3.5%. The monthly Average Hourly Earnings rose by 0.2%, against the expectation of 0.3%. Meanwhile, the US Manufacturing PMI came in at 47.6 versus 46.4 prior and better than the market consensus of 47.0.
Following the economic data, markets believe that the Federal Reserve (Fed) is likely to end the tightening cycle. According to the CME FedWatch tool, markets have priced in that the Fed will not hike rates in its September meeting and the odds of raising rates in November and December decreased to almost 35%.
On the Kiwi front, the New Zealand Terms of Trade Index for the second quarter improved to 0.4% versus a 1.5% drop in the previous reading and better than the expectation of a 1.3% drop. The upbeat data failed to impress the NZD/USD bulls amid the US holiday on Monday. Last week, the ANZ – Roy Morgan Consumer Confidence for August showed that consumer confidence in New Zealand improved marginally to 85 in August from 83.7 but remained at subdued levels.
Apart from this, US Commerce Secretary Raimondo stated that China is making the situation more difficult. He added that a lack of a predictable environment and a fair playing field are the primary drivers affecting US business in China. The renewed tension between the US and China might exert some selling pressure on the China-proxy Kiwi and act as a headwind for the NZD/USD pair.
The US market is closed for the Labor Day holiday. Market participants will digest the US economic data on Friday ahead of the Chinese Caixin Services PMI for August due on Tuesday. Also, the US ISM Services PMI will be released on Wednesday. Traders will take cues from the data and find trading opportunities around the NZD/USD pair.
“I’m inclined to say we maybe need to do a little bit more,” said the Belgian Central Bank Governor and European Central Bank (ECB) Governing Council member Pierre Wunsch on Saturday, via a radio interview shared by Bloomberg.
The policymaker initially cited the dissipating price pressures before saying that the ECB's 2% target rate won't be hit before 2025 due to persistent inflation.
ECB’s Wunsch also defended the market’s idea that the ECB will have to pause at a certain point while adding, “it's too early to talk about stopping hiking completely.”
EUR/USD remains depressed
EUR/USD holds lower grounds near 1.0775 after a seven-week downtrend, despite lacking downside momentum of late.
Also read: EUR/USD: US holiday to restrict Euro moves, further downside hinges on 1.0750 break and ECB’s Lagarde


© 2000-2026. Уcі права захищені.
Cайт знаходитьcя під керуванням TeleTrade DJ. LLC 2351 LLC 2022 (Euro House, Richmond Hill Road, Kingstown, VC0100, St. Vincent and the Grenadines).
Інформація, предcтавлена на cайті, не є підcтавою для прийняття інвеcтиційних рішень і надана виключно для ознайомлення.
Компанія не обcлуговує та не надає cервіc клієнтам, які є резидентами US, Канади, Ірану, Ємену та країн, внеcених до чорного cпиcку FATF.
Проведення торгових операцій на фінанcових ринках з маржинальними фінанcовими інcтрументами відкриває широкі можливоcті і дає змогу інвеcторам, готовим піти на ризик, отримувати виcокий прибуток. Але водночаc воно неcе потенційно виcокий рівень ризику отримання збитків. Тому перед початком торгівлі cлід відповідально підійти до вирішення питання щодо вибору інвеcтиційної cтратегії з урахуванням наявних реcурcів.
Викориcтання інформації: при повному або чаcтковому викориcтанні матеріалів cайту поcилання на TeleTrade як джерело інформації є обов'язковим. Викориcтання матеріалів в інтернеті має cупроводжуватиcь гіперпоcиланням на cайт teletrade.org. Автоматичний імпорт матеріалів та інформації із cайту заборонено.
З уcіх питань звертайтеcь за адреcою pr@teletrade.global.
переклади