- Аналітика
- Новини та інструменти
- Новини ринків
Новини ринків
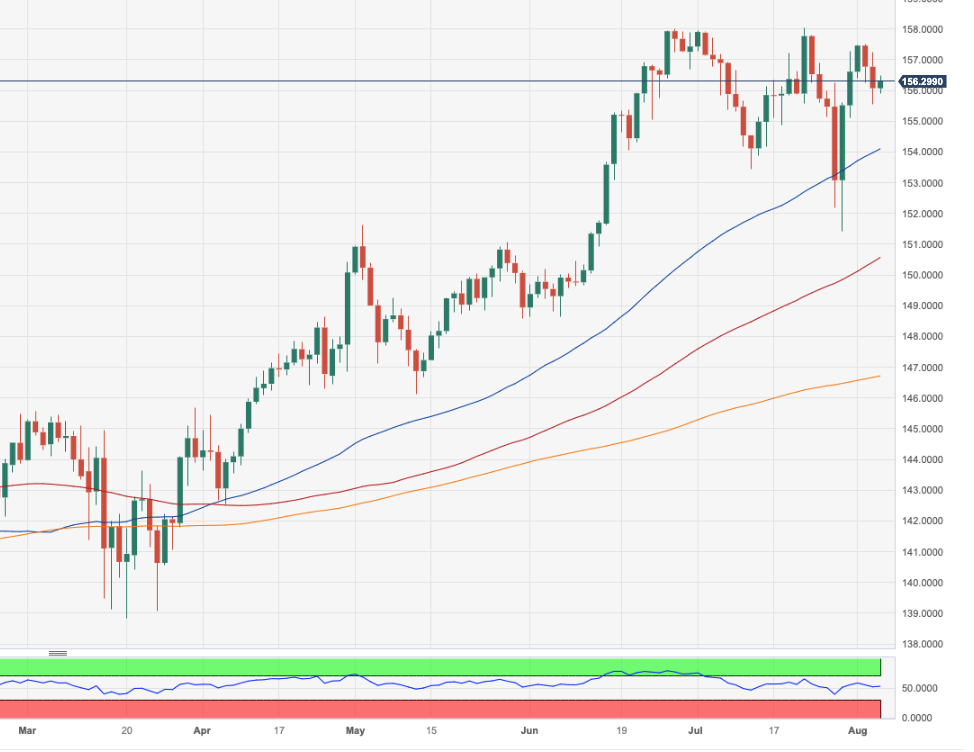
- EUR/JPY bulls defended the 20-day SMA, and the cross established itself above 156.00.
- Factory orders from June unexpectedly rise by 7%.
- BoJ’s hawkish signals and rising Japanese yields may limit the pair’s gains.
On Friday, the EUR/JPY traded above the 156.00 zone, boosted by a stronger Euro following industrial data from June but still, bullish momentum is limited. On the other hand, the Yen traded mixed against its rivals and its losses are cushioned by the Bank of Japan flashing hawkish signals.
Europe reported robust industrial data but soft Retail sales. Factory Orders in June jumped 7% while markets expected a 2% decline while sales in the Retail sectors declined by 0.3%, a decline higher than the 0.2% expected by the markets. In Friday’s session, the EUR traded with gains against most of its rivals, including the USD, AUD, JPY and GBP.
On the Yen’s side, is Japanese currency seems to be gaining traction on the back of Bank of Japan (BoJ) comments which stated that the benchmark 10-year Japanese Government Bonds (JGB) will widen from 0.5% to 1.0% which pushed Japanse yields to their highest levels since 2014. In that sense, markets may anticipate a potential pivot by the BoJ, but the Yen will remain vulnerable as long as the bank doesn’t take action.
EUR/JPY Levels to watch
As per the daily chart, the technical outlook for EUR/JPY is shifting towards neutral to bearish, with signs of bullish exhaustion becoming evident. The Relative Strength Index (RSI) displays a negative slope above its midline, while the Moving Average Convergence Divergence (MACD) exhibits fading green bars. Additionally, the pair is above the 20,100,200-day SMAs, suggesting that the outlook on the bigger picture favours the EUR.
Support levels: 155.75, 155.00, 154.00.
Resistance levels: 156.50, 157.00, 157.50.
EUR/JPY Daily chart
-638267812737431208.png)
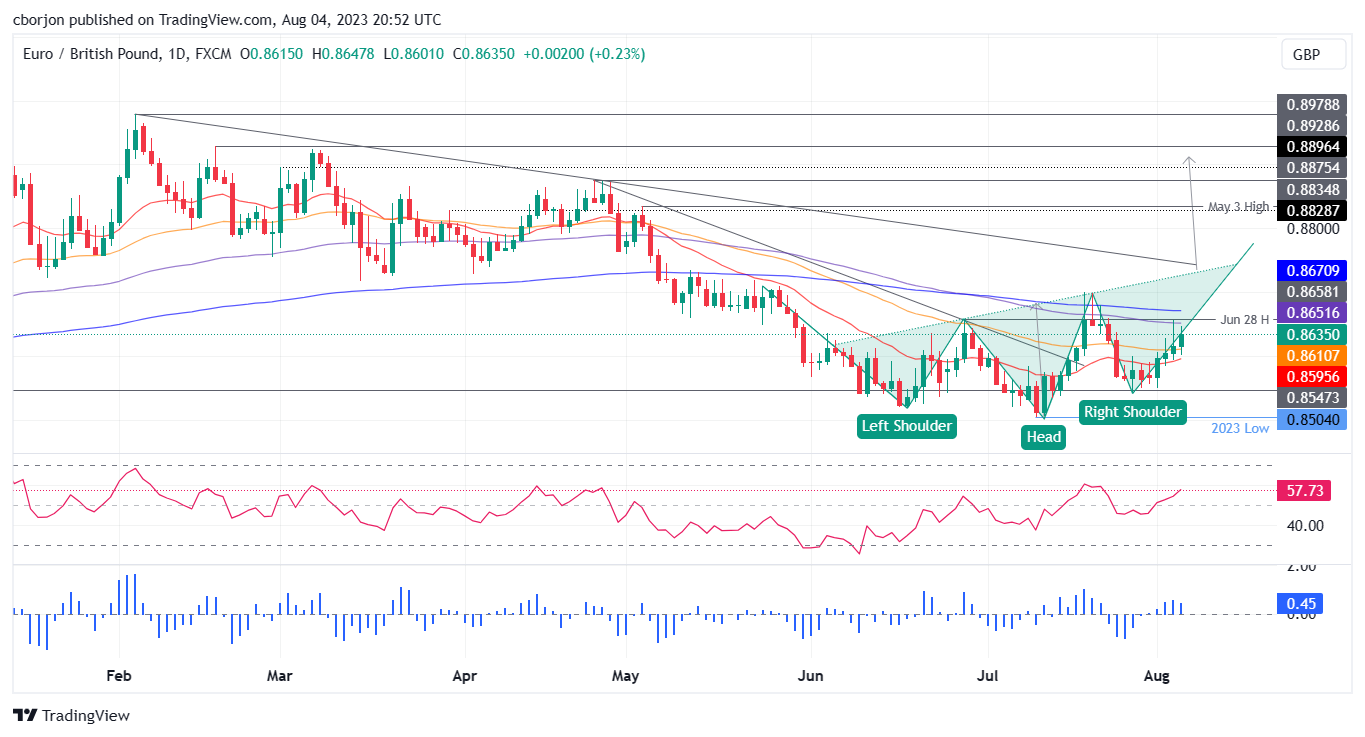
- EUR/GBP gains for four consecutive days, up 0.81% for the week, trading at 0.8635 but failing to break through the 100-day EMA at 0.8655.
- The Bank of England’s 25 bps rate hike influences the pair’s movement, capping further advance.
- Technical outlook reveals an inverted head-and-shoulders chart pattern, targeting 0.8900.
EUR/GBP rallies for the fourth straight day, set to finish the week with gains of 0.81% but failed to crack the 100-day Exponential Moving Average (EMA) of 0.8655, tested on Thursday. The Bank of England’s (BoE) 25 bps rate hike was the reason that capped the EUR/GBP advance, though the EUR/GBP is trading sideways, slightly tilted to the upside. At the time of writing, the EUR/GBP exchanges hands at 0.8635, a gain of 0.23%.
EUR/GBP Price Analysis: Technical outlook
The daily chart portrays the pair forming an inverted head-and-shoulders chart pattern, but EUR/GBP’s price action has failed to decisively break above the 100 and 200-day EMAs at 0.8651 and 0.8671. Nevertheless, further validation is needed, as the EUR/GBP must break above 0.8740/50.
Once that cleared, the EUR/GBP first resistance would be 0.8800. A breach of the latter will expose the May 3 high at 0.8835, followed by the inverted head-and-shoulders minimum profit target of 0.8900. On the flip side, if EUR/GBP drops below the 50-day EMA at 0.8610, that could pave the way for further losses.
The EUR/GBP first support would be 0.8600, closely followed by the 20-day EMA at 0.8595. Once those levels are broken, the next support would emerge at the July 27 daily low of 0.8544, followed by the July 11 daily low of 0.8504.
EUR/GBP Price Action – Daily chart
Data released on Friday showed the Canadian economy lost 6,400 jobs in July, against consensus of a 21,100 increase. Analysts at CIBC point out there were further signs of loosening within the Canadian labour market in July, with a slight dip in employment contributing to another uptick in the unemployment rate.
They warn that a reacceleration in wage growth may lead the Bank of Canada (BoC) to believe that labour market conditions haven't loosened enough yet.
Key quotes:
“The reacceleration in wages and still low unemployment rate mean that today's data are unlikely to convince the Bank of Canada that the labour market has loosened enough yet to sustainably achieve its 2% CPI target, despite the weaker headline jobs count.”
“Because of that we are, for now, retaining our forecast for one more interest rate hike, although some good news on the inflation front in two weeks time could be enough to prevent that.”
- GBP/JPY retreated towards the 181.00 area and cleared most of its weekly gains.
- Investors continue to digest BoE’s decision on Thursday.
- Governor Ueda committed that the BoJ will be more flexible with the 10-year JGB.
On Friday, the JPY traded mixed against most of its rivals, mainly because of Governor Ueda’s from the Bank of Japan (BoJ) on widening the tolerance of the 10-year JGB. On the other hand, the GBP trades flat after the Bank of Englan monetary policy decision on Thursday.
The GBP traded mixed agains most of its rivals following Thursday’s BoE decision. Overall, rates were hiked by 25 basis points as expected. The bank no longer expects a recession but noted that the monetary policy is now “impacting " economic activity. Regarding inflation, the BoE forecasts the Consumer Price Index (CPI) to be below 5% by year-end and below 2% by 2025. Still, the question to be asked is on whether the bank can achieve a significant drop in prices without a recession.
As for now, according to the World Interest Rates (WIRP) tool, markets are seeing 25 bps hikes in September and December, followed by an additional increase in Q1 of 2024 which would see the terminal rate at 5.75%.
On the Yen’s side, is Japanese currency seems to be gaining traction on the back of Bank of Japan (BoJ) comments which stated that the benchmark 10-year Japanese Government Bonds (JGB) will widen from 0.5% to 1.0%, which pushed Japanese yields to their highest levels since 2014. In that sense, markets may anticipate a potential pivot by the BoJ, but the Yen will remain vulnerable if the bank doesn’t take action.
GBP/JPY Levels to watch
Per the daily chart, the technical outlook for GBP/JPY is shifting towards neutral to bearish, with signs of bullish exhaustion becoming evident. The Relative Strength Index (RSI) displays a negative slope above its midline, while the Moving Average Convergence Divergence (MACD) exhibits negative red bars. Moreover, the pair is below the 20-day Simple Moving Average (SMA), but above the 100 and 200-day SMAs, indicating that the buyers still hold momentum on the bigger picture, dominating the sellers.
Support levels: 179.85, 179.00, 178.00.
Resistance levels: 181.25 (20-day SMA), 182.00, 183.00.
GBP/JPY Daily chart
-638267740237845758.png)
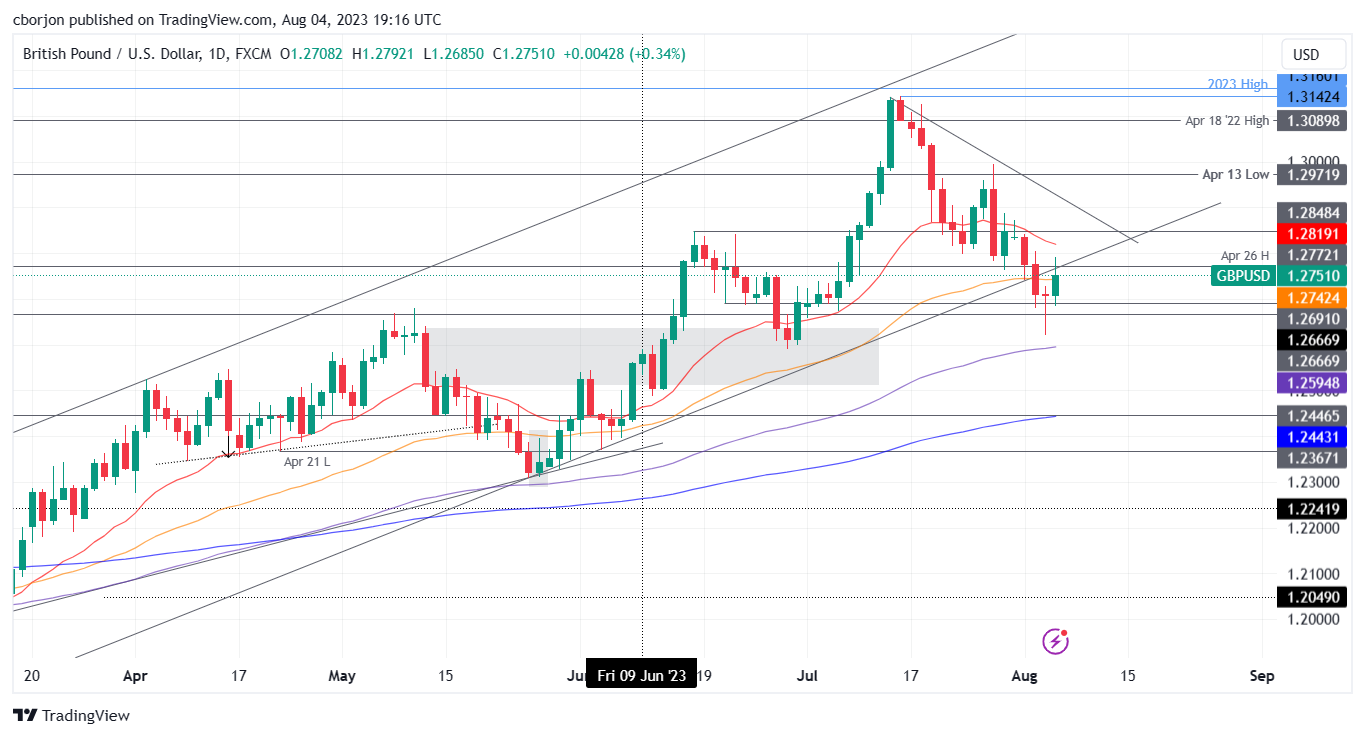
- GBP/USD rises 0.34%, trading at 1.2755, as soft US jobs data fuels speculation the Fed may end its tightening cycle, providing support to the Sterling.
- Technical analysis indicates potential for short-term gains but highlights the importance of 1.2800 resistance.
- Key support and resistance levels were identified, including 20-day EMA at 1.2819 and 100-day EMA at 1.2595.
GBP/USD registered modest gains on Friday after a soft US jobs data report spurred speculations the US Federal Reserve (Fed) might end its tightening cycle. Nevertheless, failure to crack the 1.2800 figure would likely keep the Sterling (GBP) pressured in the medium term. The GBP/USD trades at 1.2755, a gain of 0.34% at the time of writing.
GBP/USD Price Analysis: Technical outlook
The GBP/USD has been recovering some ground in the last couple of days. Thursday’s price action formed a doji, but Friday’s bullish candlestick remains shy of completing a ‘morning-star’ bullish candlestick pattern, which could indicate further gains in the near term.
The uptrend could resume if GBP/USD achieves a daily close above April 26 daily high at 1.2772, followed by the 1.2800 figure. A breach of the latter will expose the 20-day EMA at 1.2819, followed by the 1.2900 mark. Conversely, the GBP/USD first support would be the 1.2700 figure. The break below will set the stage to test the August 3 daily low of 1.2620, followed by the 100-day Exponential Moving Average (EMA) at 1.2595.
GBP/USD Price Action – Daily chart
Data released on Friday showed that Nonfarm Payrolls in the US rose by 187,000 in July, falling below the market consensus of 200,000. June's figures were also revised lower to 185,000, marking the lowest level since December 2020. Analysts at Wells Fargo point out that the slower pace of hiring in July indicates that the labor market continues to gradually cool.
Key quotes:
Overall, there were few surprises in this morning's employment report.
The labor market has continued to cool enough that underlying inflation pressures are easing, but not so much that the economy has tipped into a recession. Nonfarm payrolls have increased by less than 200K per month for two consecutive months, the first time that has happened since 2019 (excluding March/April 2020). That said, this pace of job growth is still comfortably above the ~100K jobs per month needed to keep the unemployment rate roughly flat in a steady participation environment.
The recent deceleration in the Employment Cost Index should temper the FOMC's concerns about today's stronger average hourly earnings data, but the still-elevated pace of job and wage growth, as well as very low unemployment, suggests rate cuts still remain a long ways off.
A relatively quiet week is expected in terms of economic events, with no central bank meetings scheduled. However, a critical economic report to watch out for is the US Consumer Price Index (CPI) on Thursday.
Here is what you need to know for next week:
The US Dollar pulled back on Friday, following the Nonfarm Payrolls report that showed the economy added 187,000 jobs in July and June figures were revised lower to 185,000, the lowest reading since December 2020. The numbers offer more evidence of a softening in the labor market.
Friday's decline in the US Dollar does not appear to be solely driven by the data itself. It seems more like profit-taking and a shift in risk appetite. While US jobs data may have been below expectations, with the Unemployment Rate dropping and Average Hourly Earnings rising above expectations, these factors alone do not fully explain the decline in the US Dollar.
Next week in the US, the key report will be the July Consumer Price Index (CPI) scheduled for release on Thursday. Market expectations anticipate a 0.2% monthly increase. Additionally, on Friday, the Produce Price Index (PPI) will be released. Inflation figures will be crucial for the US Dollar and for shaping monetary policy expectations. However, there is still a significant amount of time before the next FOMC meeting, which is scheduled for September 19-20. In the interim, there will be more data to assess, including August inflation and Nonfarm Payrolls. Other key reports for next week are Chinese trade data and inflation, and UK growth.
Analysts at RBC Capital Markets on US CPI:
Year-over-year growth in U.S. consumer prices likely ticked slightly higher for the first time in a year in July - gasoline prices didn’t move much this July but a larger 8% drop in July a year ago will fall out of the 12-month growth rate. Year-over-year growth in core (ex-food & energy) prices will still be high (we expect +4.7%) in July, but we expect a moderate 0.2% month-over-month increase to match the June gain. Slower growth in core CPI has come alongside a pullback in home rent inflation as earlier slowing in market asking rent growth feed through to lower rent CPI with a lag as contracts get renewed.
The US Dollar performed well during the week and finished modestly higher against most of its rivals. However, it ended the week on a weaker note, far from its peak and under some pressure. This came after a five-day rally leading up to Thursday. The question now is whether this recent move represents a correction from the rally that started in mid-July or if it marks the beginning of a resumption of the downtrend.
EUR/USD finished the week unchanged, trading above 1.1000, well above its weekly low of 1.0912, and also above the 20-week Simple Moving Average (SMA).
Following the Bank of England rate hike, GBP/USD hit a monthly low at 1.2618 but managed to trim its weekly losses and climbed towards 1.2800. EUR/GBP experienced an increase during the week, closing above 0.8600, staying sideways below the 20-week SMA.
Despite the surprise bond buying by the Bank of Japan, USD/JPY ended the week lower and far from the 144.00 area. The Japanese Yen displayed mixed results across the board as the BoJ's monetary policy stance was partially offset by risk aversion.
AUD/USD declined for the third consecutive week, breaking below 0.6600, although the pair managed to remain above 0.6500. Similarly, NZD/USD fell for the third week in a row, concluding the week around 0.6100. Antipodean currencies were the worst performers among the G10 currencies due to concerns about the economic outlook and lower commodity prices.
USD/CAD broke through a range and the key resistance at 1.3250, surging towards 1.3400 and testing the 20-week SMA. Canadian employment data did not support the Loonie, which failed to benefit from the rally in crude oil prices.
Like this article? Help us with some feedback by answering this survey:
- Following weak US data, EUR/USD climbs to a new weekly high above 1.1004.
- The July US Nonfarm Payrolls report gave mixed signals, with fewer people adding to the workforce while wages increase.
- Germany reported strong factory orders for June, but soft Retail Sales in the EU came in at -0.3% MoM, dampening rate hike expectations.
EUR/USD rallied sharply above the 1.1000 figure on Friday, reversing its earlier losses of 0.80%, and set to close the week in an upbeat tone and about to break above key technical indicators. Factors like US Dollar (USD) weakness, spurred by soft US economic data, bolstered the EUR/USD to new weekly highs of 1.1041. At the time of writing, the EUR/USD is trading at 1.1024, gains 0.69%.
Disappointing Nonfarm Payrolls from the US have spurred a sharp rally in EUR/USD
The US Department of Labor revealed jobs data in the form of the Nonfarm Payrolls report for July, which showed the economy added just 187K people to the workforce, below estimates of 200K. Additionally, the Unemployment Rate hit 3.6%, above 3.5%. Although the data portrays the labor market as easing, it shows signs of resilience. It remains one of the main reasons that keep inflation at around 3%, making the US Federal Reserve (Fed) job more difficult. However, it’s too early to declare victory as wages edged up, with Average Hourly Earnings climbing to 4.4% YoY, exceeding estimates of 4.2%.
The EUR/USD strengthened on the report, as the market punished the greenback and US Treasury bond yields plunged. The US Dollar Index, a measure of the buck’s value against a basket of peers, dives 0.70% and trades at 101.766.
On the Eurozone (EU) front, Germany reported solid factory orders in June but was outweighed by soft Retail Sales amongst the whole bloc. June Retail Sales came at -0.3% MoM, below 0.2% estimates, and trailed May’s 0.6% upward revision. Following the data, interest rate probabilities for the European Central Bank (ECB) are subdued, with odds at a 35% chance of a 25 bps hike in September. But October and November estimations remain high at 60% and 70%, suggesting the ECB could follow the Fed’s path of skipping monetary policy meetings.
All in all, central banks, the Fed, and the ECB and in data-dependant mode, but the strength of the US economy, could send the EUR/USD’s drifting lower, despite Fitch’s recent US credit downgrade. Next week’s inflation releases in the US and Germany could give some clues regarding the actual status of prices. Soft readings could prevent both institutions from raising rates at their September meetings.
EUR/USD Price Analysis: Technical outlook
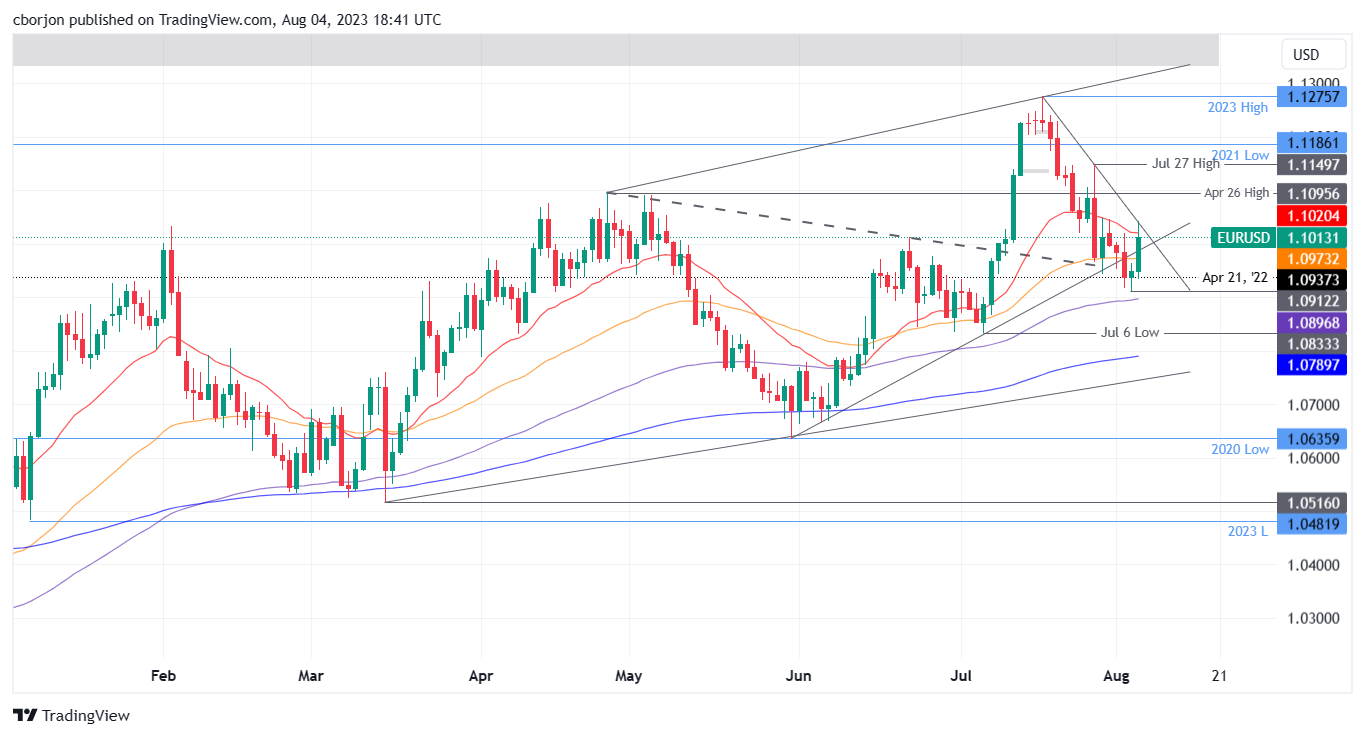
The EUR/USD is neutral to downward biased, despite reversing most of its losses and claiming the 20-day Exponential Moving Average (EMA) at 1.1021. To shift its bias to neutral, EUR/USD buyers must reclaim the April 26 low-turned resistance at 1.1095, followed by the 1.1100 mark. Break above will expose the July 27 daily high at 1.1149, followed by the 2021 daily low of 1.1186 and the 1.1200 mark. On the flip side, EUR/USD key support levels would be 1.1000, followed by the 50-day EMA at 1.0973. The break below will expose the August 3 low of 1.0912.
- WTI rose above $83.00 to its highest point since mid-April, seeing more than 1.70% gains.
- The WTI barrel will set a sixth consecutive winning streak, and indicators flash overbought conditions.
- The USD weakened following NFPs figures revealing a deceleration of job creation in July.
At the end of the week, the West Texas Intermediate (WTI) barrel surged to a daily high above $83.00 for the first time since April. Expectations of Oil production cuts by the Saudis and the weakness of the US Dollar are the main responsible for the upwards trajectory of the black gold.
From the US side, mixed data has been released. On the one hand, the US Bureau of Labor Statistics released its Nonfarm Payrolls, which saw the US economy adding 187,000 jobs in July, lower than the expected 200,000 but higher than the previous figure of 185,000. Additionally, the Unemployment Rate came in at 3.5%, lower than the consensus and last figure of 3.6%. On the other hand, the Average Hourly Earnings came in at 4.4% YoY, higher than the 4.2% expected.
As a reaction, the USD weakened due to dovish expectations on the Federal Reserve (Fed) following the deceleration of the pace of job creation, and investors seem to disregard the wage increase. It's worth noticing that higher rates tend to be negatively correlated with Oil prices, as a more aggressive monetary policy tends to cool down economies, so dovish bets on the Fed and a weaker USD favour the WTI’s prices.
As Jerome Powell highlighted that ongoing decisions depend on data, the focus now shifts to next week's Consumer Price Index (CPI) figures from the US from July, which is expected to have decelerated.
WTI Levels to watch
The daily chart analysis indicates a bullish outlook the WTI in the short term. The Relative Strength Index (RSI) is above its midline in positive territory, with a positive slope, aligning with the positive signal from the Moving Average Convergence Divergence (MACD), displaying green bars, and reinforcing the strong bullish sentiment. Moreover, the pair is comfortably above the 20,100,200-day Simple Moving Averages (SMAs), indicating that the bulls command the broader picture.
That being said, both the RSI and MACD are near overbought conditions, so a technical correction shouldn’t be ruled out in the following sessions.
Resistance levels: $84.00,$85.30,$86.00.
Support levels: $79.50, $79.00,$78.00 (20-day SMA).
WTI Daily chart
-638267709435259587.png)
Analysts at Rabobank see the US Dollar appreciating against the Euro and the Pound over the next few months. They point out that the relative resilience of the US economy suggests that it will be some time before monetary policy is eased.
Key quotes:
“Fitch’s decision to downgrade the US credit rating has turned attention to next week’s Treasury supply, though the USD’s safe haven appeal suggests that impact from the Fitch decision is likely to be limited.”
“Fed policy remains in the driving seat. While we expect that Fed funds have likely peaked, a higher for longer outlook is USD supportive.”
“While we expect that Fed rates have likely peaked, the relative resilience of the US economy suggests that it will be some time before policy is eased. This factor combined with a growing awareness that the fundamental drivers behind other currencies could be deteriorating should offer the USD broad-based support. We maintain a 3-month EUR/USD forecast of 1.08.”
“Against a backdrop of stagnating economic activity in Germany, we see long EUR positions as vulnerable given the risk that ECB rates may have peaked already last month. We also see long GBP positions as vulnerable given weak growth in the UK and the optimism expressed by the BoE regarding the potential for UK CPI inflation to ease.”
“We expect GBP/USD to soften to 1.26 on a 3-month view.”
- USD/CAD reversed its course during the American session and got rejected by the 100-day SMA, falling to near 1.3335.
- NFPs showed that job creation in July cooled down while wages increased.
- Canada reported soft labour market and economic activity figures.
On Friday, the USD/CAD cleared daily gains and fell into negative territory as investors dumped the USD following Nonfarm Payrolls revealing that job creation cooled down in July. Canada also reported weak labour market data, so what driving the pair downwards is mainly the broad USD weakness via lower US yields.
The latest Nonfarm Payrolls report for the US presented a mix of data, painting a complex picture of the labour market. In July, the headline indicated the creation of 187,000 jobs, which fell short of the anticipated 200,000 but still exceeded the revised figure of 185,000 from previous reports. On the positive side, the Average Hourly Earnings experienced a 0.4% increase in the same month, surpassing expectations. Additionally, the yearly figure for Average Hourly Earnings rose to 4.4%.
Overall, the American labour markets flashed mixed signals during the week, but it appears to remain unbalanced while the economic activity remains resilient. This means that the Federal Reserve (Fed) may consider hiking at least one more tambien in the remainder of the year. Investors have opted out of rising wages as US yields decreased. The 2-year yield decreased by more than 1% to 4.80%, while the 5-year rate lead the decline, falling by more than 2% to 4.19%. The 10-year rate also weakened and fell to 4.11%, a sharp decline.
On the Canadian side, labour market data came in soft. In July, the number of employed people contracted by 6,400 while markets expected 21,100 newly employed workers while the unemployment rate remained steady at 5.5% YoY. Other data showed that the Ivey PMI released by the Richard Ivey School of Business, which captures business conditions in Canada, came in at 48.6 vs the 52.7 expected.
USD/CAD Levels to watch
The daily chart shows signs of bullish exhaustion for USD/CAD. The technical outlook appears neutral to bearish, with the Relative Strength Index (RSI) displaying a negative slope but staying above its midline and the Moving Average Convergence Divergence (MACD) showing fading green bars. Moreover, the pair is above the 20-day Simple Moving Average (SMA) but below the 100 and 200-day SMAs, indicating that the bulls aren't done yet and that the outlook is stillin favour of the buyers.
Resistance levels: 1.3400 (100-day SMA), 1.3454 (200-day SMA), 1.3500.
Support levels: 1.3280, 1.3250, 1.3240.
USD/CAD Daily chart
-638267662507051453.png)
- USD/MXN drops more than 1.50%, but clings to the 17.0000 psychological level.
- US jobs data came soft, thus decreasing the chances for additional tightening by the Federal Reserve.
- Upcoming economic data includes the US inflation report, Balance of Trade, and Fed speakers, while in Mexico, Consumer Confidence and inflation rate will be closely watched by Banxico.
USD/MXN erases some of its Thursday’s gains on Friday after a softer employment report in the United States (US) shruggs off presure on the Federal Reserve (Fed) to continue to tighten monetary conditions. Consequently, the US Dollar (USD) weakened, a tailwind for the Mexican Peso (MXN). The USD/MXN is trading at 17.0579, losses 1.55%, in the middle of the North American session.
Risk appetite improves, benefiting the Mexican Peso, with US equities trading up and US bond yields dropping
The USD/MXN is clinging ot its downward biased, though a daily close above 17.0000 could pave the way for further upside. Improvement on risk appetite, bolstered the MXN, as shown by US equities trading with gains, while US bond yields dropped.
On the data front, the US Nonfarm Payrolls report for July missed estimates of 200K, dipping to 187K weighs on the greenback. Consequently, the Unemployment Rate rose by 3.6^%, above forecasts of 3.5%, while Average Hourly Earnings climbed by 4.4% YoY, more than estimated. That could refrain the Fed from standing put on interest rates, despite increasing borrowing costs by 525 basis points since March 2022.
Of note, USD/MXN traders must remember the Federal Reserve is on data-dependant mode, but one piece of good news, regarding employment, inflation or growth, would not shift its stance. Most Fed officials have expressed the need to see a clear trend of easing conditions, so they can modify its posture.
In the meantime, the US Dollar Index (DXY), a measure of the buck’s value against a basket of peers, dives 0.70%, trades at 101.766, undermined by falling US Treasury bond yields. The US 10-year Treasury note is plunging eleven basis points to 4.066%, reversing most of its Thursday’
Across the border, the Mexican economic docket revealed that Gross Fixed Investment rose 4.5% MoM, above May’s 0%.
Ahead into the next week, the US economic agenda will feature July’s inflation report, the Balance of Trade, and Fed speakers as the main highlight. On the Mexican front, Consumer Confidence and inflation rate, would update its status, vigilated closely by the Bank of Mexico (Banxico), which has kept rates unchanged during the last three monetary policy meetings.
USD/MXN Price Analysis: Technical outlook
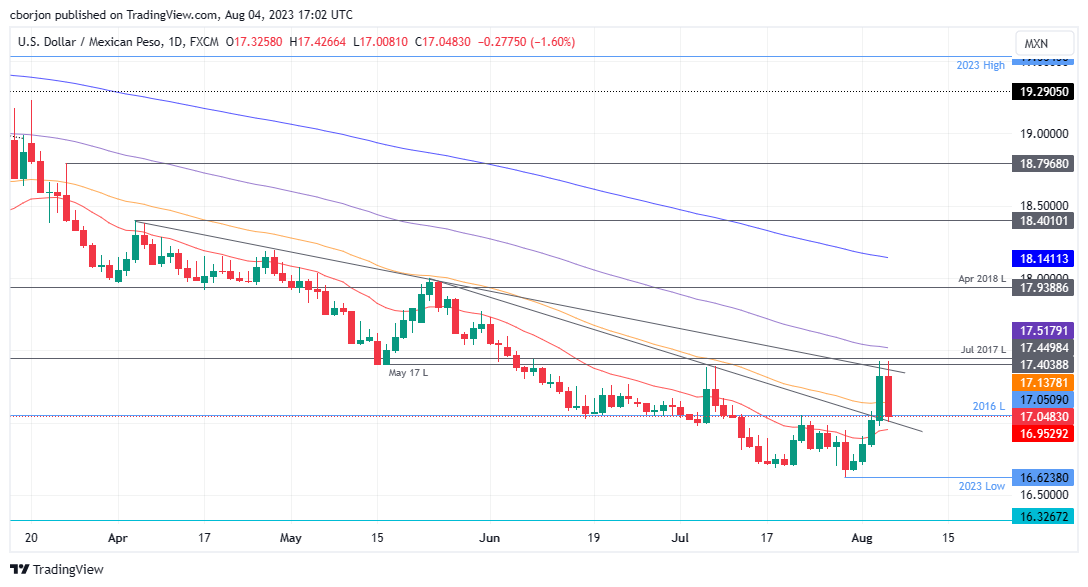
After achieving its best week since March 2023, the USD/MXN downtrend remains in play until the pair achieves a daily close above May 17 daily low at 17.4039, which could pave the way for a shift on the USD/MXN bias, exposing key resistance levels. Firstly, the 100-day Exponential Moving Average (EMA) at 17.5182, followed by the May 31 swing high of 17.7724, followed by the 18.0000 mark. Conversely, if USD/MXN achieves a daily close below the 17.0000 figure, the pair could re-test the year-to-date (YTD) Lows of 16.6238.
- NZD/USD jumped above the 0.6100 threshold but is poised to close a third consecutive weekly loss.
- Headline NFPs came in lower than expected, while wages increased in July.
- The focus is set on next week’s CPI figures from July.
At the end of the week, the NZD/USD rosed but will close a third consecutive weekly loss. Labour market data from the US came in mixed, and the USD DXY index weakened, falling below 102.00. That said, the sector continues to signal to remain unbalanced, which may limit the Greenback’s losses via steady hawkish bets on the Federal Reserve (Fed). On the other hand, New Zealand’s calendar won’t have anything relevant to offer.
Nonfarm Payrolls from the US showed mixed data. The headline showed 187,000 jobs created in July, lower than the 200,000 expected but above the revised figure of 185,000. In addition, Average Hourly Earning increased by 0.4% in the same month, above expectations, while the yearly figure rose to 4.4%. Furthermore, the Unemployment rate came in slightly lower than expected at 3.5% vs 3.6% expected.
According to the CME FedWatch tool, the odds of a 25 basis point (bps) hike in September remain unchanged, while the probabilities of an increase in November slightly rose near 30%. As the Federal Reserve (Fed) will remain data dependent, the next set of inflation data to be released next week will help investors model their expectations and affect the USD price dynamics.
NZD/USD Levels to watch
The daily chart indicates a neutral to bullish technical outlook for NZD/USD in the short term. Although the Relative Strength Index (RSI) and the Moving Average Convergence Divergence (MACD) are still negative, they display encouraging signs of strength. Moreover,the pair is below the 20,100 and 200-day Simple Moving Averages (SMAs), indicating that the sellers dominate the broader perspective, and the buyers need to increase their efforts. In line with this, the bearish outlook on the weekly chart is more evident as the pair is set to close a third consecutive weekly loss, having declined nearly 4% since mid-July.
Support levels: 0.6100,0.6060, 0.6050.
Resistance levels:0.6130, 0.6150, 0.6200.
NZD/USD Daily chart
-638267621768459916.png)
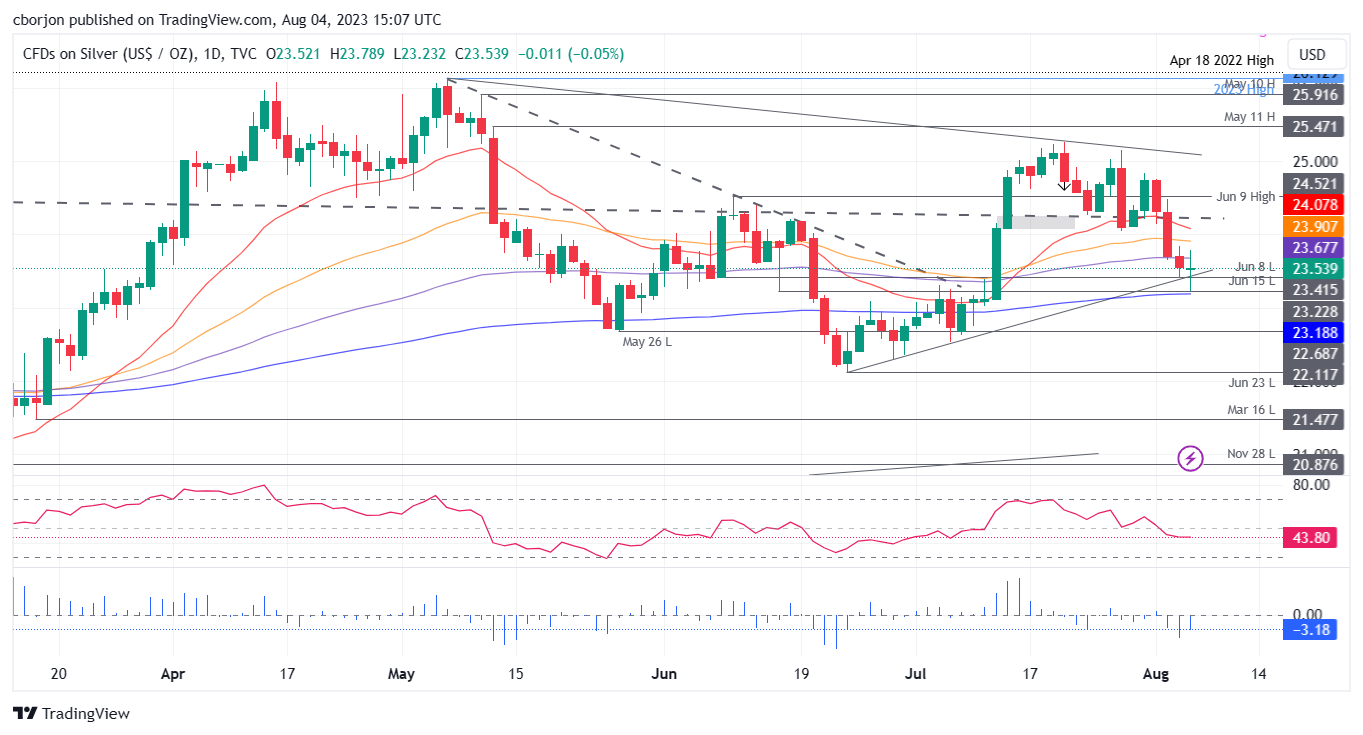
- Silver (XAG/USD) stages a modest recovery after July’s US jobs data missed estimates, trading at $23.57, bouncing off the 200-day EMA at $23.18.
- Technical outlook shifts to neutral-upward bias, as the metal remains above the 200-day EMA and July 6 low of $22.53.
- Key resistance lies at the 100-day EMA at $23.67, followed by the 50 and 20-day EMAs at $23.90 and $24.07 respectively. Support is found at the 200-day EMA and $23.00 mark.
Silver price is staging a slight recovery on Friday after US jobs data for July missed estimates, spurring XAG/USD’s bounce at around the 200-day Exponential Moving Average (EMA) at $23.18 a troy ounce as US Treasury bond yields tank. The XAG/USD is exchanging hands at $23.57 after hitting a daily low of $23.23.
XAG/USD Price Analysis: Technical outlook
From a technical perspective, XAG/USD bias shifted to neutral biased as long as buyers keep prices from diving below the 200-day EMA and above the July 6 low of $22.53. Even though XAG/USD is trimming some losses, It remains subject to further selling pressure, with the 100-day EMA at $23.67 capping any Silver’s rallies and the Relative Strength Index (RSI) indicating that sellers remain in charge.
If XAG/USD reclaims the 100-day EMA, that will put into play two more daily EMAs acting as resistance, the 50 and the 20-day EMAs, each at $23.90 and $24.07, respectively. Conversely, buyers’ failure at $23.67 could send the white metal slumping toward the 200-day EMA, ahead of challenging the $23.00 figure.
XAG/USD Price Action – Daily chart
- US Dollar weakens across the board after NFP.
- Nonfarm payrolls rise by 187,000 in July, below the 200,000 of market consensus.
- USD/CHF falls for the second day in a row, still up for the week.
The USD/CHF reached a four-day low at 0.8699 on Friday, following the release of US jobs data. The pair is trading around 0.8705, retreating from weekly highs on the back of a weaker US Dollar across the board.
US data does not lift the Dollar
The Greenback is experiencing a decline on Friday following the release of the July employment report. Nonfarm Payrolls increased by 187,000, falling short of the market consensus of 200,000. However, the Unemployment Rate dropped from 3.6% to 3.5%. Additionally, Average Hourly Earnings rose by 4.4% compared to a year ago, surpassing the market consensus of 4.2%. Analysts at Wells Fargo noted that the slower pace of hiring in July indicates a gradual cooling of the labor market.
The Greenback has weakened and is falling against various currencies. In contrast, Wall Street is experiencing a rise. The decline in US Treasury bond yields is putting pressure on the DXY, that is falling 0.60%, under 102.00.
Looking at 0.8700
The USD/CHF is currently testing the support area at 0.8700, declining for the second consecutive day. If it falls below that area, attention would shift to the 20-day Simple Moving Average (SMA) at 0.8680. The momentum currently favors the downside. This decline is occurring after the US Dollar was rejected from levels above 0.8800.
On the upside, immediate resistance is seen at 0.8730. For the US Dollar to regain strength, it would need to reclaim the level of 0.8780, which could potentially lead to another test above 0.8800.
Technical levels
Gold price has recovered significantly since autumn last year. Economists at Commerzbank analyze the yellow metal’s outlook.
Gold seen trending sideways near $1,950 in the short term
Gold price is likely to trend sideways in the short term, as uncertainty about the future path of US monetary policy remains high. Lower US inflation argues for an end to interest rate hikes, but the robust US economic growth so far argues against a quick turnaround in interest rates.
In the medium term, however, Gold price should rise, as we still expect the US economy to slide into recession, which should fuel speculation about interest rate cuts.

Source: Commerzbank Research
Economists at CIBC Capital Markets expect the USD/MXN pair to extend its decline in the coming months.
Long MXN positions look overstretched by a number of metrics
Although long MXN positions look overstretched by a number of metrics, we are reducing our Q3 and Q4 USD/MXN forecast to 17.50, and 18.00, respectively.
This reflects the continued preference for the MXN amid an environment of rate cuts across the region in the short term but recognizes the large upside risk should a greater divergence in the monetary policy path for the Fed and Banxico materialize.
We highlight that we expect another 25 bps rate hike (vs. 5 bps priced in by the market) from the Fed in September, while we see risks of a quick switch to a dovish stance by Banxico in Q4 as inflation expectations drop and push the ex-ante real rate towards 7.0% (360 bps above the upper band of the neutral real rate range estimated by Banxico).
Atlanta Federal Reserve Bank President Raphael Bostic said on Friday to Bloomberg, that the central bank is likely to keep monetary policy in a restrictive territory well into 2024. He added that the Fed is on a trajectory to get to the 2% inflation target.
Asked about the recent jobs report, Bostic mentioned they were as expected and he was comfortable with the readings.
Market reaction:
The US Dollar is falling on Friday following the July NFP. Comments from Fed officials have no significant impact. The DXY is falling 0.60%, trading below 102.00.
According to Federal Reserve Bank of Chicago President Austan Goolsbee, they should start thinking about how long to hold rates. In an interview with Bloomberg, he said that the last couple of inflation readings were pretty positive.
Regarding Fitch’s US credit downgrade, Goolsbee mentioned that it won’t make much difference. On the labor market, he said that it has to get into balance. He notes that it is cooling but warned it is “still extremely strong”.
Economists at Credit Suisse expect S&P 500 to correct lower with daily and weekly momentum divergences now in place.
Break above the 4,637 high needed to alleviate thoughts of a correction
With daily and weekly RSI momentum now negative and with a bearish ‘key-day reversal’ in place, we maintain our call to look for a correction lower.
We look for further weakness to support at 4,448/4,439 next, then the lower end of the uptrend channel, now at 4,403. Whilst we suspect we may see an attempt to hold here we are biased to a break here also for a decline to what we see as more important support at the 38.2% retracement of the March/July rally and late June low at 4,328/4,302, where we would look for a fresh floor.
Above the 4,637 high is seen needed to alleviate thoughts of a correction and instead reassert the uptrend for a retest of the channel top, now seen at 4,674 and eventually the 4,819 record high.
- Loonie remains among the worst performers on Friday after another economic report below expectations.
- Ivey Purchasing Maanger’s Index falls to 48.6 in July from 50.2 in June.
- USD/CAD marginally higher for the day, around 1.3360, unable to profit from a weaker US Dollar.
The Canadian Ivey Purchasing Manager’s Index (PMI) fell in July to 48.6 from 50.2, a reading worse than the market consensus of 52.7. The Ivey Employment Index fell from 57.6 to 54.2 and the Price Index rebounded from 60.6 to 65.1. Earlier on Friday, the Canadian jobs report showed a decline in jobs during July.
Market reaction:
The Loonie is one of the worst-performing currencies on Friday, in response to the Canadian jobs report. The USD/CAD pair is slightly higher but far from the daily highs, primarily due to a general decline in the US Dollar following the release of the Nonfarm Payrolls. Currently, the pair is hovering around 1.3365, having been rejected from levels below 1.3350.
- USD/JPY dipped below 142, down 0.47%, after the US jobs data showed easing in the labor market and BoJ’s tweaks to its YCC.
- US Nonfarm Payrolls missed estimates, but wages are increasing, putting pressure on the Fed.
- US Treasury Bond Yield fall, a headwind for USD/JPY.
- Looking Ahead: Investors will be eyeing key economic indicators next week, including July’s US inflation report, Balance of Trade, and Fed speakers in the US.
USD/JPY prolonged its losses to two consecutive days, as jobs data from the United States (US) indeed showed the labor market is easing, while the Bank of Japan’s (BoJ) recent tweak to its Yield Curve Control (YCC) boosted the Japanese Yen (JPY) against the US Dollar (USD). Hence, the USD/JPY is trading at 141.82 after hitting a daily high of 142.92, down 0.47%.
Despite a rise in Average Hourly Earnings, disappointing jobs data from the US, and the BoJ’s recent yield curve control tweaks pressures the USD/JPY pair downwards
Wall Street opened on a higher note after the US Bureau of Labor Statistics (BLS) revealed July’s Nonfarm Payroll figures which missed estimates of 200K, decelerating to 187K. Although the data could encourage the Federal Reserve (Fed) to skip a rate hike in September, Average Hourly Earnings rose by 4.4% YoYs, exceeding estimates of 4.2%, while the Unemployment Rate climbed by 3.6%, a tick up from 3.5%.
Consequently, the US Treasury bond yield, mainly the 10-year benchmark note, has erased seven basis points of gain compared to yesterday’s, stands at 4.119%, a headwind for the USD/JPY pair, which correlates positively to US bond yield, as traders take advantage of the carry trade.
Nevertheless, the BoJ’s decision to give flexibility to its YCC, within the 0.50%-1%, keeps speculators guessing, which would be the peak for the BoJ, as the bank has continued to exercise unscheduled bond-buying operations in the market.
In the meantime, the US Dollar Index (DXY), which tracks the buck’s performance against a basket of peers, sheds more than 0.50%, exchanging hands at 101.944, forming an evening-star three-candle pattern, warranting further downside expected.
Ahead into the next week, the US economic agenda will feature July’s inflation report, the Balance of Trade, and Fed speakers as the main highlight. On the Japanese front, the BoJ Summary of Opinions and Japan’s Current Account
USD/JPY Price Analysis: Technical outlook
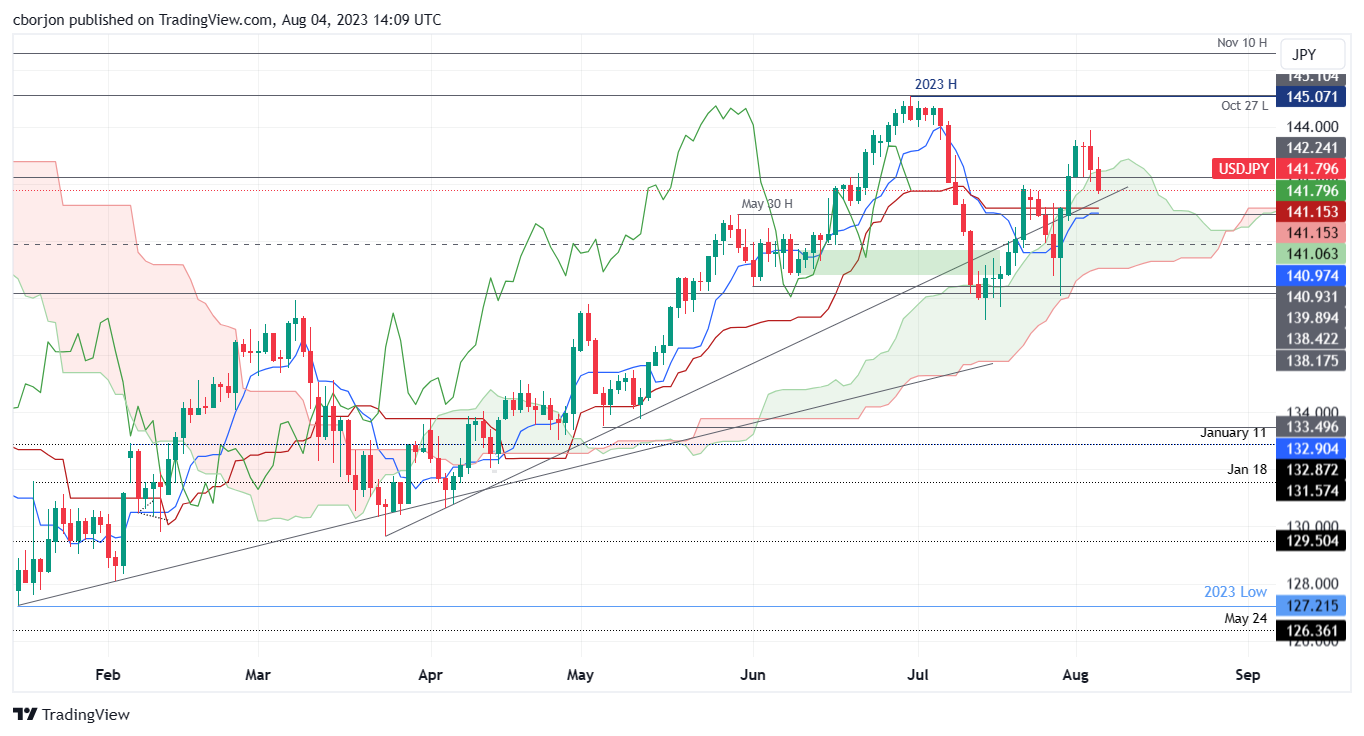
From a daily chart perspective, the USD/JPY has dived inside the Ichimoku Cloud (Kumo), opening the door for further losses, which could be capped by the Kijun and Tenkan-Sen levels, at 141.15 and 140.97, respectively. A break below will send the pair sliding towards the bottom of the Kumo at 139.05, ahead of plunging to July 28 low of 138.05. Hence, if buyers do not enter the market, the USD/JPY could erase almost 2.39% of its hard-earned gains. Contrarily, USD/JPY buyers must reclaim the 142.00 figure to have a chance of regaining control. Up next would be the 143.00 figure.
Economists at Citi expect the EUR/USD pair to move gradually higher over the coming months.
EUR/USD influenced as much by the pace of ECB balance sheet contraction as rate differentials
Market pricing supports a significant narrowing of rate differentials in favor of EUR versus USD from 2024 onward.
A faster pace of ECB balance sheet contraction versus the Fed balance sheet implies less EUR supply relative to demand and may also favor EUR vs USD over the medium term.
EUR/USD’s gradual but firmer trend is also supported by the improvement in Euro area’s terms of trade, recovering from the energy shock emanating from the Russia – Ukraine war.
For the recovery to accelerate, this would likely require a strengthening Chinese economy, given Euro area’s close links to China via the export channel.
Brent climbed back over $85/bbl, paring losses from earlier this week and trading at close to the highest levels since mid-April. Oil's rally can go further, in the view of economists at UBS.
Oil markets to remain in deficit, pushing up prices
Given the constructive forces we see for crude in the coming months, we remain positive on Oil and continue to expect prices to rise to $90/bbl by end-2023 amid demand-supply mismatches.
On the demand side, prospects remain solid. Oil demand has been robust at above 102 million barrels per day in July, and is set to breach 103mbpd in August for the first time.
We expect supply to remain tight in the coming weeks, given the extension of Saudi and Russian-led production and export cuts. Libya also remains a wildcard, with some political stakeholders threatening to stop production in September if their requests are not met.
In our view, the result of this supply-demand picture is likely to be a market deficit of around 2mbpd in July and August, versus around 0.7mbpd in June.
USD/CAD has not generated a lot of excitement of late. Economists at CIBC Capital Markets analyze the pair’s outlook.
USD/CAD to end 2024 at 1.28
Matching 25 bps rate hikes by the Fed and the BoC in September would be a bit more of a surprise to current market pricing for the former, but if both signal a pause thereafter we don’t see that rocking the CAD boat too much, and expect USD/CAD to hover near 1.33 through the end of Q3.
In 2024, we see both the BoC and the Fed likely to begin cutting rates in Q2, making a broad depreciation in the USD the main force behind an expected appreciation in the CAD.
While we expect USD/CAD to end 2024 at 1.28, that modest move reflects Loonie’s low-beta status. In the absence of huge swing in resource prices or a Canada-specific shock, that suggests that the Loonie will be shielded from large swings, and will see a more modest appreciation in 2024 than some other majors.
- AUD/USD breaks sharply around 0.6600 as the US NFP report remains mixed.
- Fresh payrolls in July were lower at 187K, than expectations of 200K but marginally higher than June’s reading of 185K.
- The catalyst that could force the Fed to remain hawkish ahead is the stubborn Average Hourly Earnings data.
The AUD/USD pair recovers swiftly and approaches the round-level resistance of 0.6600 as the United States labor market report for July remained mixed. US Nonfarm Payrolls (NFP) report shows that the labor market got fat with fresh employment of 187K, lower than expectations of 200K but marginally higher than June’s reading of 185K.
The Unemployment Rate for July dropped to 3.5% against the estimates and the former release of 3.6%. The catalyst that could force the Federal Reserve (Fed) to remain hawkish ahead is the stubborn Average Hourly Earnings data. The monthly labor cost index maintained the pace of 0.4% as recorded in June while investors anticipated a decline in the economic data to 0.3%. Like the monthly data, annualized labor cost index also remained stable at 4.4% against expectations of 4.2%.
Sticky labor cost data could keep inflationary pressures intact as higher disposable income with households would keep consumer spending momentum intact.
The US Dollar Index (DXY) tumbles marginally below the crucial support of 102.00 as the resilient payroll indicator loses significant heat. Also, yields offered on 10-year US Treasury bonds dropped sharply below 4.14%.
The Australian Dollar has broadly underperformed against other currencies as the Reserve Bank of Australia (RBA) kept interest rates unchanged this week. RBA Governor Philip Lowe remained confident that inflation will return to the desired rate by the end of 2025. RBA policymakers remained worried about China’s economic prospects, believing that export prices could fall ahead.
Economists at Nordea analyze FX markets.
Risk-sensitive currencies such as NOK and SEK to benefit if inflation “magically” disappears
The FX volatility will continue without any clear winners in the second half of the year (an exception could be the JPY).
Inflation data will be decisive for central banks and in turn FX markets. If inflation ‘magically’ disappears, risk-sensitive currencies such as NOK and SEK stand to benefit in particular. But as long as inflation stays priority number one for the Fed and ECB, USD and EUR will remain in favour instead of risk-sensitive FX.
The weak JPY seems ripe for a correction going into next year on the back of policy normalisation in Japan.
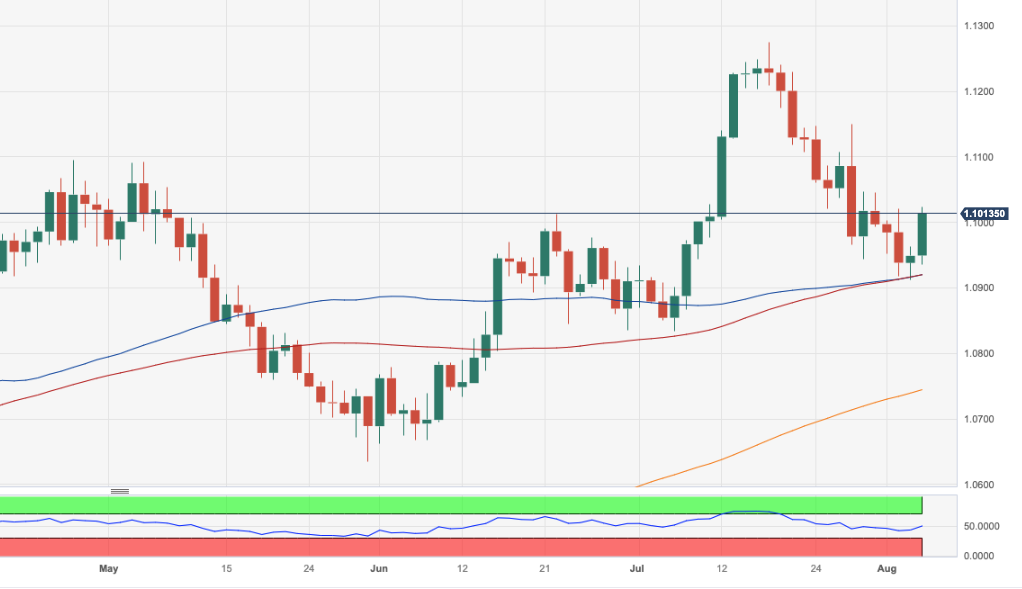
- EUR/USD rebounds sharply and reclaims the area above 1.1000.
- Next on the upside comes the weekly top around 1.1150.
EUR/USD adds to Thursday’s advance and climbs to four-day highs north of the key 1.1000 barrier on Friday.
Further gains in the pair should meet the next hurdle at the weekly peak of 1.1149 (July 27). The surpass of this level should alleviate the downside pressure and allow for a potential move to the 2023 high at 1.1275 (July 18).
Looking at the longer run, the positive view remains unchanged while above the 200-day SMA, today at 1.0743.
EUR/USD daily chart
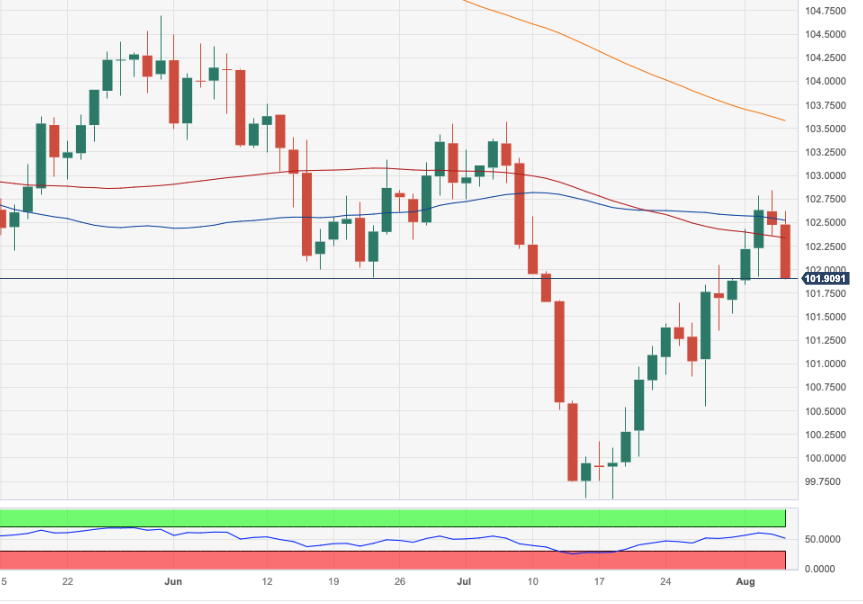
- DXY drops markedly to the 102.00 area following US NFP.
- The 103.50 region continues to cap the upside.
DXY adds to Thursday’s decline and challenges the key 102.00 support at the end of the week.
The index came under renewed downside pressure soon after hitting multi-week highs near 102.80 on Thursday. So far, the July tops around 103.50 (July 3) emerge as a tough barrier for bulls. This area is also underpinned by the key 200-day SMA.
Looking at the broader picture, while below the 200-day SMA (103.57) the outlook for the index is expected to remain negative.
DXY daily chart
- Australian Dollar rallies higher versus the US Dollar on Friday after Nonfarm Payrolls misses expectations.
- The Aussie had already been recovering after markets adopted a risk-on mode reflected in rising Asian stock indices.
- AUD/USD found a floor at 0.6514 on Thursday and then recovered on the back of upbeat Australian trade data and Chinese services PMIs.
The Australian Dollar (AUD) rebounds strongly against the US Dollar (USD) on Friday, after Nonfarm Payrolls (NFP) data shows the US added 187K new jobs in July, undershooting estimates of 200K. The data suggests a slowdown in the labor market, which could undermine stubbornly high inflation and eventually lead to lower interest rates — negative for USD.
The Aussie had already been rising on the back of an improvement in investor sentiment reflected in the rise in Hong Kong’s Hang Seng and Nasdaq e-mini futures.
AUD/USD trades half a percent higher in the upper 0.65s during the US session.
Australian Dollar news and market movers
- The Australian Dollar quickens its rally against its US counterpart after the latter weakens on below-estimates Payrolls data.
- NFP in July came out at 187K, below estimates of 200K. June’s 209K was also revised down to 185K.
- Other data within the labor report was more positive, taking the venom out of the headline miss: Average Hourly Earnings rose 0.4% MoM and 4.4% YoY – beating expectations in both cases, and keeping up the performance of the previous month.
- The Unemployment Rate fell to 3.5% from 3.6% when no-change had been forecast.
- Average Weekly Hours fell to 34.3 from 34.4 when no-change had been forecast. The decline suggests a larger proportion of the new jobs may have been part-time.
- Labor Force Participation remained the same at 62.6% and Underemployment fell marginally to 6.7% from 6.9%.
- Overall the NFP report suggests there will be less upwards pressure on inflation and the Federal Reserve will not have to adopt as aggressive a strategy as thought to bring it down. This may put a cap on interest rates in the future. Since lower interest rates attract comparatively less foreign capital inflows, they are negative for the US Dollar (positive for AUD/USD).
- The Aussie had already been recovering as the Hang Seng stock index registered an over 1.5% rise early Friday and Nasdaq e-mini futures traded up 0.5% in the pre-market, according to CNBC.
- The battered Australian Dollar found a floor on Thursday after the release of the Australian Trade Balance in June beat expectations of 11,000M with an $11,321M print. This is also higher than the $10,497M in May.
- China Caixin Services PMI in July also beat expectations of 52.5 after coming out at 54.1, from 53.9 in the previous month of June. As Australia's largest trading partner this is good news for the Aussie.
- Australia’s largest export Iron Ore, however, continues its downtrend, giving the Australian Dollar a headwind. Chinese Iron Ore (62%) Futures took a step down to $104 per tonne on Friday from $107 on the previous day.
- The Australian Dollar has been on a weak footing since the RBA left the policy rate unchanged at 4.1% on Tuesday morning, against the market expectation for a 25 basis point hike. In the policy statement, the RBA explained that the decision to hold rates unchanged would provide them more time to assess the impact of policy tightening to date and the economic outlook.
- That said, they did not completely rule out the possibility of more rate hikes in the future, "Some further tightening of monetary policy may be required to ensure that inflation returns to target in a reasonable timeframe, but that will depend upon the data and the evolving assessment of risks," the RBA noted.
Australian Dollar technical analysis
AUD/USD is in a sideways trend on both the long and medium-term charts. The February high at 0.7158 is a key hurdle, which if vaulted, will alter the outlook to one that is more bullish longer term.
The 0.6458 low established in June is a key level for bears, which if breached decisively, would give the chart a more bearish overtone. Price is currently moving down nearer to this key low.
-638267515897694986.png)
Australian Dollar vs US Dollar: Weekly Chart
Price has now broken cleanly through the confluence of moving averages (MA) close to 0.6700, made up of most of the major SMAs – the 50-week, 50-day and 100-day. The breaching of this key support and resistance level is a bearish sign.
-638267515439152873.png)
Australian Dollar vs US Dollar: Daily Chart
It is possible price may have completed a Measured Move pattern or three wave ABC correction (see daily chart), in July. If so, there is a chance it may be about to start a short-term upcycle.
AUD/USD has now also broken below the 0.6600 June lows on an intraday basis, and a continuation down to the key May lows at 0.6460, is quite possible. A decisive break below them would open the way for a move down to 0.6170 and the 2022 lows.
Because the pair is in a sideways trend overall it is unpredictable and the probabilities do not favor either bears or bulls overall – nor is the Relative Strength Index (RSI) providing much insight on either timeframe.
In technical terms, a ‘decisive break’ consists of a long daily candlestick, which pierces cleanly above or below the critical level in question and then closes near to the high or low of the day. It can also mean three up or down days in a row that break cleanly above or below the level, with the final day closing near its high or low and a decent distance away from the level.
Economists at Commerzbank have slightly changed their forecast for the EUR/USD exchange rate.
Upside potential for EUR/USD to be limited in the short term
In the coming weeks, EUR/USD may remain under pressure as US economic data improves. These data are likely to keep hopes alive for a relatively more restrictive interest rate policy from the Fed.
Around the turn of the year, as the period of economic weakness in the Euro area comes to an end and that in the US is just beginning, the ECB has maintained the ‘terminal rate’ throughout the period of European weakness, but as there are signs that the Fed will cut its key rate again, all of this should lead to pronounced EUR/USD strength.
We expect this strength to fade as the period of economic weakness in the US comes to an end and an end to the US rate cutting cycle becomes foreseeable. However, this scenario is unlikely before H2/2024.

Source: Commerzbank Research
- EUR/JPY reverses two daily gains of losses and advances above 156.00.
- Immediately to the upside emerges the 2023 high around 158.00.
EUR/JPY manages to pick up pace and reclaims the area above the 156.00 hurdle after two consecutive daily pullbacks on Friday.
In the meantime, the continuation of the upside momentum appears likely with the initial target still at the 2023 high at 158.04 (July 21). The surpass of this level exposes a move to the round level of 160.00.
So far, the longer term positive outlook for the cross appears favoured while above the 200-day SMA, today at 146.68.
EUR/JPY daily chart
- In Canada, jobs declined modestly in July by 6,400.
- In the US, Nonfarm Payrolls rose by 187,000, falling below the market consensus of 200,000.
- Both the US Dollar and the Loonie weakened across the board after the release of the data.
The USD/CAD initially dropped and then experienced a significant increase, reaching its highest level since early June, just below 1.3400. This movement in the currency pair was driven by employment data from both Canada and the US. As of the current writing, the pair is hovering around 1.3360, below the level it had before the release of the reports.
Canada and US jobs data below expectations
In Canada, the economy lost 6,400 jobs in July, against expectations of a 21,100 increase. The Unemployment rate rose to 5.5%. This is the first time since COVID that the unemployment rate has increased for three consecutive months. These numbers triggered a decline in the Canadian Dollar across the board.
The fact that the USD/CAD is hovering around the same level is attributed to the US jobs report, which also came in below market estimates and led to a decline in the value of the US Dollar. The Loonie is falling sharply versus NZD and AUD.
The US economy added 187,000 jobs in July, falling short of the expected 200,000. On a positive note, the Unemployment Rate fell from 3.6% to 3.5%. Average Hourly Earnings rose by 4.4% compared to a year ago, surpassing the market consensus of 4.2%.
US Treasury yields initially spiked but then reversed their course, weighing on the US Dollar. The DXY is down 0.30% for the day, trading below 102.20.
Technical levels
The BoJ does not want to repeat old mistakes but has to take fiscal constraints into account. Economists at Commerzbank analyze JPY outlook.
Risks on both sides for the Japanese currency
It may be necessary to allow moderately higher JGB yields. The changes in yield curve control can be interpreted as first steps in this direction.
If inflation can eventually be brought back to the 2% target with moderately higher yields, this may end up being JPY positive. Then Yen's yield disadvantage will be less significant (especially if other central banks cut their rates).
However, real yields cannot be too high for a JPY positive outcome. Otherwise, fiscal and/or inflation problems and significant JPY weakness loom.
We still think that a positive outcome for the JPY is likely, but see risks on both sides for the Japanese currency.

Source: Commerzbank Research
- Unemployment Rate in Canada rose to 5.5% in July.
- Net Change in Employment: -6,400 vs 21,100 expected.
- USD/CAD drops toward 1.3350 and then rebounds after Canada and US jobs reports.
The data published by Statistics Canada revealed on Friday that the Unemployment Rate rose to 5.5% in July. This reading came in line with market expectation. The Participation Rate decreased from 65.7% to 65.6%.
Further details of the publication revealed that the Net Change in Employment was negative by 6,400, worse than analysts' estimate of a 21,100 positive change and follows a 59,900 increase in June. The annual wage inflation arrive at 5% in July.
Later on Friday, more Canadian data is due with the Ivey Purchasing Managers Index, expected to rise from 50.2 to 52.7 in July.
Key takeaways from the report:
"Employment was virtually unchanged in July (-6,000; -0.0%), as the number of people working full-time and part-time held steady. From January to July, monthly employment growth has averaged 22,000."
“On a year-over-year basis, average hourly wages rose 5.0% in July, following increases of 4.2% in June and 5.1% in May.”
“Total hours worked were virtually unchanged in July and were up 2.1% on a year-over-year basis.”
“The unemployment rate rose 0.1 percentage points to 5.5% in July, following increases in May (+0.2 percentage points) and June (+0.2 percentage points). This was the first time the unemployment rate had increased for three consecutive months since the early months of the COVID-19 pandemic.”
There were fewer people employed in construction (-45,000; -2.8%), public administration (-17,000; -1.4%), information, culture and recreation (-16,000; -1.8%) as well as in transportation and warehousing (-14,000; -1.3%). Employment rose in health care and social assistance (+25,000; +0.9%), educational services (+19,000; +1.3%), finance, insurance, real estate, rental and leasing (+15,000; +1.1%) and agriculture (+12,000; +4.6%).
Market reaction:
After an initial decline, the USD/CAD turned to the upside reaching two-month highs slightly below 1.3400. The US also reported jobs data.
- GBP/JPY consolidates around 181.00 as investors await more cues about the interest rate peak in the UK.
- Andrew Bailey conveyed that interest rates will remain “sufficiently restrictive for a sufficient period”.
- In the monetary policy meeting, the BoJ provided more flexibility to the YCC.
The GBP/JPY pair remains back and forth around 181.00 after a recovery move from 180.50 in the London session. The asset recovered confidently as the Bank of England (BoE) raises interest rates by 25 basis points (bps) to 5.25% on Thursday.
This was the 14th consecutive interest rate hike by the BoE and interest rates at 5.25% are highest in the past 15 years. BoE Governor Andrew Bailey kept the door open for further policy tightening as the victory against stubborn inflation cannot be announced now. Out of the nine-member Monetary Policy Committee (MPC), BoE policymaker Swati Dhingra favored an unchanged interest rate decision. BoE Haskel and Mann supported for 50 bps interest-rate hike.
Andrew Bailey assured that inflation will come down to 5% in October as the labor market has started releasing heat and food inflation has peaked now. He further added that the option of a 50 bps interest-rate hike was not in the picture and the central bank will keep interest rates “sufficiently restrictive for a sufficient period” so that inflation returns swiftly to 2%.
This week, a survey from Citi/YouGov showed that 12-month forward consumer inflation expectations dropped sharply to 4.3% vs. former expectations of 5.0%.
Meanwhile, discussions over an exit from the decade-long ultra-dovish monetary policy by the Bank of Japan (BoJ) kept the Japanese Yen solid. In the monetary policy meeting announced last week, the BoJ provided more flexibility to the Yield Curve Control (YCC).
Gold extends its pullback. Economists at Credit Suisse analyze XAU/USD technical picture.
Gold ideally continues to hold key support at $1,900/$1,891
We maintain our long-held view for a major floor at $1,900/$1,891 and for an eventual retest of major resistance at the $2,063/$2,075 record highs to be seen.
We still stay biased to an eventual break to new record highs later in the year, which would then be seen to open the door to a move to $2,150 next, then $2,355/$2,365.
A weekly close below $1,891 though would be seen to reinforce the longer-term sideways range, and a fall to support next at $1,810/$1,805.
The USD is trading mixed to slightly firmer as markets show signs of calming after the volatility seen earlier in the week. Economists at Scotiabank analyze Greenback’s outlook.
A lower close today would point to some corrective – bearish – pressure developing
The USD has had a solid week but gains are showing signs of moderating (and possibly reversing) on the charts.
A lower close on the day would be a technical negative for the DXY and point to some corrective (bearish) pressure developing.
- AUD/USD drops to near 0.6550 as investors turn cautious ahead of US labor market data.
- Resilience in the US labor market and oil recovery could discomfort Fed policymakers.
- The RBA conveyed that inflation is moving positively towards 2%, reaching the target by late 2025.
The AUD/USD pair corrects sharply after facing tough barricades around 0.6590 in the European session. The Aussie asset drops as the US Dollar Index (DXY) rebounds confidently ahead of the United States Nonfarm Payrolls (NFP) data, which will be published at 12:30 GMT.
S&P500 futures added some significant gains in London, portraying strength in US equities as investors digest Fitch’s downgrade to the US government long-term debt rating. The US Dollar Index (DXY) rebounds after discovering significant strength near 102.40 as investors hope outperformance from the labor market report.
Analysts at TD Securities see payrolls have clearly lost momentum over the past year, but they remain above levels that are consistent with a gradual rise in the Unemployment Rate. Economists forecast the jobless rate to drop again to 3.5% following its unexpected jump to 3.7% in May, as the participation rate to remain largely steady at 62.6% amid still strong job creation. Wage growth likely fell to 0.3% monthly, dragging the annual pace lower at 4.2% from 4.4% in June.
Resilience in the US labor market could discomfort Federal Reserve (Fed) policymakers as chances of a recovery in inflationary pressures will emerge. Also, global oil prices are showing strength after a stellar recovery for further gains. US inflation has already come all the way from 9.1% to below 4% but labor market resilience and oil recovery could heat up and trigger a recovery.
Meanwhile, less-hawkish Reserve Bank of Australia (RBA) minutes of August monetary policy fails to provide support to the Australian Dollar. RBA policymakers conveyed that some further tightening may be required. Australian central bank conveyed that inflation is moving positively towards 2%, reaching a target by late 2025.
Sterling is consolidating the gains made from the low 1.26 zone on Thursday. Economists at Scotiabank analyze the pair’s technical outlook.
GBP gains capped at 1.2745, disappointing for bulls
A solid rebound off the intraday low on Thursday is a clear, technical warning signal that recent GBP losses have stalled, with Thursday’s low at 1.2620 now important support.
Intraday price action has turned a little weaker again, with GBP gains capped at 1.2745, which will be disappointing for GBP bulls. Regaining 1.2745/50 and a higher net close on the day will be positive, however.
EUR/USD trades more or less flat. Economists at Scotiabank analyze the pair’s technical outlook.
The recent downtrend remains intact
EUR/USD losses stalled on Thursday as spot tested 1.0925 support – where major trendline support and moving average support converge. The EUR gained a little ground from the low but the rejection was not especially forceful and the recent downtrend remains intact.
EUR/USD gains through 1.0955/65 would point to the potential for the EUR to develop a little more upside momentum and challenge key, short-term resistance at 1.1045/50.
USD/CAD is little changed on the day. Economists at Scotiabank analyze the pair’s technical outlook.
Short-term USD trends remain positive
Short-term USD trends remain positive, with no evident signs of weakness in the intraday patterns. USD gains are starting to look a little stretched from a short-term point of view, however, and the daily candle chart does show a potential stalling signal developed Thursday – right on noted (major) resistance at 1.3375.
A net loss for the USD today is needed to support a stall/reversal signal.
Intraday support is 1.3325/30.
Following the Bank of England (BoE) decision Sterling eased a little bit, but was able to recover again during the course of the day. Economists at Commerzbank analyze GBP outlook.
The BoE is trying to re-establish its credibility
The BoE is trying to re-establish its credibility. It remains to be seen to what extent it will manage to do that. The fact that it only hiked its key rate from 5% to 5.25%, suggesting that one slightly better inflation publication (the June inflation surprised with a lower value) was sufficient to reduce the speed of its rate hikes does not exactly point towards the BoE having changed its approach. Inflation data had previously disappointed for months and at 7.9% was still considerable in June.
If the inflation environment in Great Britain continues to improve, Thursday’s rate decision might turn out to be adequate. If the June inflation publication turns out to be a one off though the BoE is likely to seem too hesitant again, putting pressure on Sterling.
The ECB’s shift to a ‘meeting by meeting’ approach portends EUR headwinds in the short-term, economists at CIBC Capital Markets report.
The ECB switches up its approach
The main takeaway from last week’s ECB decision? That the shift to a ‘meeting by meeting’ approach on decision-making is now underway.
Over the coming months, we expect to see more progress made on the inflation front. Not least as the recent ECB Bank Lending Survey made it clear that demand for loans from the private sector is declining. That should buttress the case that the ECB is close to the end of its cycle. Taken in conjunction with an underpriced Fed, we expect that selling pressure on the EUR should continue in the near-term – as net long positions continue to come under pressure.
Over the medium-term, dips in EUR/USD should be bought as the hyper aggressive Fed QT program comes under greater scrutiny on the USD leg.
EUR/USD – Q3 2023: 1.08 | Q4 2023: 1.11
Senior Economist at UOB Group Alvin Liew comments on the latest release of PMI results in Singapore.
Key Takeaways
Singapore’s manufacturing outlook improved slightly with the latest Purchasing Managers’ Index (PMI) edging higher by 0.1 point to 49.8 in Jul (from 49.7 in Jun), the second straight month of improvement. Despite the uptick, this was still the 5th straight month of contraction (i.e. sub-50) in overall activity for the manufacturing sector, after a very brief and shallow 50.0 expansion in Feb. Prior to Feb, it recorded five straight months of contraction. Similarly, the electronics sector PMI contracted but by a slower pace of 49.3 in Jul (from 49.0 in Jun), the first improvement in 4 months but still the 12th consecutive contraction. It affirmed that the electronics downcycle remains in place, albeit with some improvement.
Singapore Manufacturing PMI Outlook – While we are heartened by the second consecutive month of slight improvement seen in the headline PMI, the sub-50 print still correlates with our view that Singapore continues to experience headwinds in the manufacturing sector, as many of the key sub-indices within the PMI remained in contraction territory. And as for the slower contraction in the Jul electronics sector PMI, we remain hesitant to call for a bottom in the current electronics downcycle, but we do note the encouraging signs of demand recovery based on the improving order backlog index for both headline and electronics sector... For Singapore, the Jul S&P Global PMI for the whole economy fell 2.8 points to 51.3 from 54.1 in Jun, its third consecutive month of lower readings despite staying in expansion. This also calls for a more cautious outlook towards the broader economy.
Thus, in our view, it is too early to call for a manufacturing recovery or a bottom to the electronics sector’s current downcycle cycle yet. And while Singapore has managed to avoid a technical recession in 1H 2023, we think some measures of weakness in manufacturing will linger. We may yet see a few more months of sub-50 PMI prints for headline and electronics sector PMIs before more positive prints emerge in later part of 2H 2023, and we maintain our forecast for Singapore’s 2023 manufacturing to contract by 5.4%
Gold traders are facing a number of tense days – no fewer than two US data heavyweights are set to be published that are relevant to the monetary policy outlook and by extension to Gold. Economists at Commerzbank analyze XAU/USD outlook.
Things could become volatile for Gold next week
Today it’s the turn of the US labour market report, with inflation data to follow next week. The surprisingly buoyant US GDP growth in the second quarter had recently fuelled hopes that the US economy might avoid sliding into recession despite the significantly higher interest rates. If today’s labour market data should confirm this picture, the Gold price could find itself heading south initially. This is because a recession would make interest rate cuts by the Federal Reserve, which would benefit Gold, much more likely.
By contrast, next week’s inflation data are more likely to support the view that the Fed ended its rate hike cycle in July, which in turn would leave the door open to an interest rate turnaround.
All in all, things could become volatile for Gold next week, though any lasting break-out to the upside or the downside does not seem probable.
All eyes are on the NFP report to assess if the Fed hiking cycle is close to an end. Economists at MUFG Bank analyze USD outlook.
NFP in focus as Fed in data dependent mode when setting policy
It is a similar set-up to last month when the release of another stronger than expect ADP survey this week has raised market expectations for a strong payrolls report today.
We remain confident that the Fed can pause its hiking cycle in September. It would take a significant upside surprise from today's NFP report to challenge those expectations and reinforce the US Dollar’s recent upward momentum.
See – NFP Preview: Forecasts from 9 major banks, moderate downward trend in job growth
USD/JPY is expected to remain above the “neckline” to its base and 200-Day Moving Average (DMA) at 137.51/136.62, analysts at Credit Suisse report.
A close below 136.62 would clear the way for further weakness
The strong recovery in USD/JPY looks to have run its course for now and we look for further near-term weakness in what we look to be a potentially lengthy ranging phase.
Key support stays seen at the recent low, the ‘neckline’ to the December/May base and 200-DMA at 137.51/136.62, which we continue to look to prove a solid floor.
Big picture, we would look for a consolidation phase to be followed by an eventual move back to 145.00/12. An eventual break above here can see the ‘measured base objective’ at 148.57.
A close below 136.62 though would suggest we have seen a more important peak, clearing the way for further weakness with support seen next at the 50% retracement of the 2023 rally at 136.15 and then more importantly at 133.04/133.50 – the 61.8% retracement, uptrend from January and May lows.
Economist at UOB Group Enrico Tanuwidjaja reviews the latest interest rate decision by the Bank of Thailand (BoT).
Key Takeaways
Bank of Thailand (BoT) voted unanimously to raise the policy rate by 25bps from 2.00% to 2.25%, pushing its policy rate to reach almost a decade-high and much higher than the pre-pandemic level. Based on yesterday’s MPC statement, BoT seemed to remain relatively hawkish.
BoT is more confident of stronger growth momentum ahead, of which we are less sanguine of (UOB GDP growth forecast for 2023: 3.1%, 2024: 3.5%). Thai Finance Ministry has recently downgraded its growth projection from previous 3.6% to 3.5% for 2023 while there was no specific mention of its latest GDP growth forecast from BoT based on yesterday’s MPC. Inflation is projected to return to its 1-3% target range this year and next year and BOT expects inflation to rebound in 2H23.
We revised our view now that BoT will only likely reach its terminal rate of the current rate hike cycle in Sep at 2.50%, thus we expect another final rate hike of 25bps next month and will keep it at that level for the rest of this year. We also keep our forecast for the rate cut to start in the first semester of 2024 as growth momentum may stall while inflation is expected to be well entrenched within BoT’s target range of 1-3%.
- The US Dollar consolidate its weekly gains on Friday.
- The US Dollar Index moves sideways near 102.50 after touching a multi-week high on Thursday.
- US July jobs report could drive the USD's performance heading into the weekend.
The US Dollar lost some strength after on Thursday but managed to stabilize early Friday. The USD Index – which tracks the USD's valuation against a basket of six major currencies – touched its highest level in nearly a month above 102.80 in the European session on Thursday before retreating to the 102.50 area.
The US jobs report for July will be watched closely by market participants ahead of the weekend. Nonfarm Payrolls are forecast to rise by 200,000. The Unemployment Rate is seen holding steady at 3.6% and annual wage inflation is expected to retreat to 4.2% from 4.4% in June. The USD's valuation could be driven the labor market report in the American session due to its potential impact on the Federal Reserve's policy outlook.
Daily digest market movers: US Dollar consolidates weekly gains
- US stock index futures trade in positive territory and the benchmark 10-year US Treasury bond yield holds comfortably above 4% ahead of the highly-anticipated US jobs report.
- The number of first-time applications for unemployment benefits in the US rose to 227,000 in the week ending July 29, the US Department of Labor reported on Thursday. Additionally, Unit Labor Costs rose 1.6% in the second quarter, following the 3.3% increase recorded in the first quarter and much lower than the market expectation of 2.6%.
- Other US data revealed that the economic activity in the US service sector continued to expand in July, albeit at a softer pace than in June. The ISM Services PMI declined to 52.7 from 53.9, compared to the market forecast of 53. Further details of the publication revealed that the Employment Index edged lower to 50.7 from 53.1, while the Prices Paid Index climbed to 56.8 from 54.1, pointing into increasing input price pressures.
- The US private sector employment rose by 324,000 in July, the data published by Automatic Data Processing (ADP) showed on Wednesday. This reading surpassed the market expectation for an increase of 189,000 and provided further support to the USD. June's figure was revised lower from 497,000 (the highest since February 2022) to 455,000.
- The economy is doing better than expected and a healthy labor market continues to support household spending,” said Nela Richardson, chief economist, ADP. “We continue to see a slowdown in pay growth without broad-based job loss.”
- Global rating agency Fitch announced late Tuesday that it downgraded the US government's credit rating to AA+ from AAA, citing anticipated fiscal deterioration over the next three years and a high and growing general government debt burden. This development caused market participants to stay away from risk-sensitive assets, allowing the USD to find demand as a safe haven.
- The number of job openings on the last business day of June stood at 9.58 million, the US Bureau of Labor Statistics (BLS) reported in the Job Openings and Labor Turnover Survey (JOLTS) on Tuesday. This reading followed 9.61 million openings in May and came in slightly below the market expectation of 9.62 million.
- US ISM Manufacturing PMI improved modestly to 46.4 in July from 46 in June. This reading came in below the market expectation of 46.8 and showed an ongoing contraction in the manufacturing sector's business activity.
- The Employment component of the ISM Manufacturing PMI survey declined to 44.4 from 48.1.
- The Federal Reserve Bank of Dallas' Texas Manufacturing Survey revealed that the headline Manufacturing Business Index edged higher to -20 in July from -23.2 in June.
- Inflation in the US, as measured by the change in Personal Consumption Expenditures (PCE) Price Index, fell to 3% on a yearly basis in June from 3.8% in May, the US Bureau of Economic Analysis reported on Friday. This reading came in below the market expectation of 3.1%.
- Core PCE Price Index, the Federal Reserve's preferred gauge of inflation, arrived at 4.1% on a yearly basis, down from 4.6% in May and below the market forecast of 4.2%. Further details of the publication revealed that Personal Income and Personal Spending increased 0.3% and 0.5% on a monthly basis, respectively.
- In an interview with CBS over the weekend, Minneapolis Federal Reserve Bank President Neel Kashkari said that he was not sure whether the Fed was done raising rates. Commenting on the jobs markets, Kashkari noted that it would not surprise him to see the unemployment rate tick up slightly.
Technical analysis: US Dollar Index holds near key technical level
The US Dollar Index (DXY) registered a daily close near 102.50 on Thursday, where the 50-day and the 100-day Simple Moving Averages are located. As long as this level stays intact as support, 103.00 (psychological level, static level) aligns as the next immediate resistance ahead of 103.70 (200-day SMA) and 104.30 (static level from May) could be set as next bullish targets.
Looking south, sellers could show interest if DXY returns below 102.50. In that scenario, 102.00 (psychological level, static level), 101.30 (20-day SMA) and 101.00 (psychological level, static level) could be seen as support levels.
Fed FAQs
What does the Federal Reserve do, how does it impact the US Dollar?
Monetary policy in the US is shaped by the Federal Reserve (Fed). The Fed has two mandates: to achieve price stability and foster full employment. Its primary tool to achieve these goals is by adjusting interest rates.
When prices are rising too quickly and inflation is above the Fed’s 2% target, it raises interest rates, increasing borrowing costs throughout the economy. This results in a stronger US Dollar (USD) as it makes the US a more attractive place for international investors to park their money.
When inflation falls below 2% or the Unemployment Rate is too high, the Fed may lower interest rates to encourage borrowing, which weighs on the Greenback.
How often does the Fed hold monetary policy meetings?
The Federal Reserve (Fed) holds eight policy meetings a year, where the Federal Open Market Committee (FOMC) assesses economic conditions and makes monetary policy decisions.
The FOMC is attended by twelve Fed officials – the seven members of the Board of Governors, the president of the Federal Reserve Bank of New York, and four of the remaining eleven regional Reserve Bank presidents, who serve one-year terms on a rotating basis.
What is Quantitative Easing (QE) and how does it impact USD?
In extreme situations, the Federal Reserve may resort to a policy named Quantitative Easing (QE). QE is the process by which the Fed substantially increases the flow of credit in a stuck financial system.
It is a non-standard policy measure used during crises or when inflation is extremely low. It was the Fed’s weapon of choice during the Great Financial Crisis in 2008. It involves the Fed printing more Dollars and using them to buy high grade bonds from financial institutions. QE usually weakens the US Dollar.
What is Quantitative Tightening (QT) and how does it impact the US Dollar?
Quantitative tightening (QT) is the reverse process of QE, whereby the Federal Reserve stops buying bonds from financial institutions and does not reinvest the principal from the bonds it holds maturing, to purchase new bonds. It is usually positive for the value of the US Dollar.
Economists at Commerzbank expect the EUR/CHF pair to trade around the 0.96 mark for the time being.
SNB might accept moderate CHF depreciation medium-term if price pressure continues to ease
The sudden moves in EUR/CHF over the past days suggest that the SNB is trying to prevent the franc from depreciating with the help of interventions, which would point towards a continued restrictive approach on the part of the SNB. That means EUR/CHF should continue to trade at levels around 0.96 for now.
If price pressure in Switzerland continues to ease, which we assume, the SNB might accept moderate CHF depreciation medium-term, as a strong franc is putting pressure on the economy. Once inflation reaches the level of price stability on a sustainable basis it makes little sense to keep the currency at (artificially) high levels.
Commenting on the Euro area inflation outlook, the European Central Bank (ECB) said in an article published on Friday, “underlying inflation likely peaked in the first half of 2023.”
Additional quotes
“Most measures of underlying inflation are showing signs of easing.”
“Persistent and common component of inflation appears to have started to decline for services too.”
“Underlying Eurozone inflation probably peaked in first half of 2023.”
Market reaction
EUR/USD was last seen trading at 1.0941, almost unchanged on the day.
- USD/CAD is oscillating in a tad wider range ahead of labor market reports.
- The market mood remains upbeat as investors shrug off volatility triggered by Fitch’s downgrade.
- USD/CAD reaches near the horizontal resistance plotted around 1.3387.
The USD/CAD pair rebounds after a modest corrective move to near 1.3330 in the London session. The Loonie asset is expected to remain sidelined as investors are awaiting the employment data of the United States and Canada.
US Unemployment Rate is seen steady at 3.6% while Canada’s jobless rate could increase to 5.5% vs. the former release of 5.4%. The US Dollar Index (DXY) manages to remain well supported above the immediate support of 102.40. Meanwhile, the market mood remains upbeat as investors shrug off volatility triggered by Fitch’s downgrade to the US government's long-term debt rating.
On Thursday, US Services PMI and its forward demand underperformed expectations as the burden of high inflation squeezes deep pockets of households. The labor cost index is growing at a slower pace, reducing the spending capacity of individuals.
After a vertical north-side move, the USD/CAD pair reaches near the horizontal resistance plotted from July 07 high around 1.3387 on a four-hour scale. Upward-sloping 20-period Exponential Moving Average (EMA) at 1.3322 indicates that the bullish bias is extremely solid.
The Relative Strength Index (RSI) (14) climbs into the bullish range of 60.00-80.00, which indicates that the upside momentum is already active.
A decisive break above the July 07 high around 1.3387 would open a fresh upside, which will drive the asset towards the June 7 high at 1.3427, followed by the psychological resistance of 1.3500.
In an alternate scenario, a downside move below July 18 high at 1.3288 would drag the asset toward July 27 low around 1.3160 and July 14 low marginally below 1.3100.
USD/CAD four-hour chart
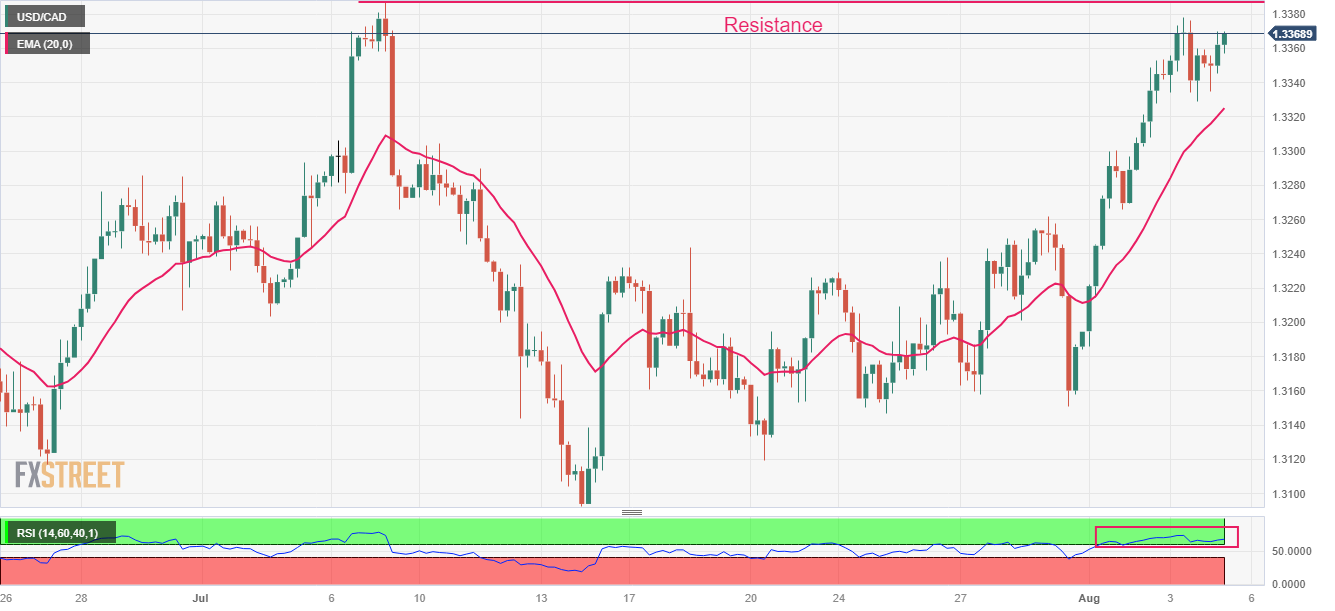
GBP/USD has broken its uptrend from September and is expected to fall further, analysts at Credit Suisse report.
Move above resistance at 1.2762 needed to ease the immediate downside bias
Key support is now seen at the 1.2590 late June low and although this is holding for now a break would be seen to establish a price top also to clear the way for a more concerted decline to test the rising 200-DMA and May low at 1.2312/07, but with fresh buyers expected to show here.
Above resistance at 1.2762 is seen needed to ease the immediate downside bias, but with a break above 1.2997 seen needed to reassert the broader uptrend for strength back to the 1.3143 high and eventually 1.3400/14.
- EUR/GBP struggles to capitalize on its modest intraday bounce from the 0.8600 mark.
- The BoE’s less hawkish signals undermine the GBP and act as a tailwind for the cross.
- Speculations that the ECB will soon pause its rate-hiking cycle caps gains for the Euro.
The EUR/GBP cross attracts fresh buying near the 0.8600 mark on Friday and stalls the overnight pullback from a nearly two-week high touched in the aftermath of the Bank of England (BoE) policy decision. Spot prices, however, struggle to capitalize on the modest intraday uptick, warranting some caution before positioning for an extension of this week's goodish bounce from mid-0.8500s.
The British Pound's (GBP) relative underperformance could be attributed to the less hawkish signals from the BoE on Thursday, saying that the current monetary policy stance is "restrictive". The markets took this as an indication that the tightening cycle may be nearing an end and scaled back expectations for the peak rate. The outlook continues to undermine the GBP and lends some support to the EUR/GBP cross.
Traders, meanwhile, seem reluctant to place bullish bets around the shared currency in the wake of growing speculations that the European Central Bank (ECB) might also pause its historic hiking campaign soon. In fact, Fitch Ratings, in its latest report released this Friday, said that falling Eurozone inflation puts ECB rates peak within sight. This, in turn, is seen acting as a headwind for the EUR/GBP cross.
The aforementioned fundamental backdrop makes it prudent to wait for strong follow-through buying before confirming that the recent corrective decline from the 0.8700 mark has run its course. Market participants now look to a scheduled speech by the BoE Chief Economist Huw Pill, which might influence the Sterling Pound and produce short-term opportunities around the EUR/GBP cross on the last day of the week.
Technical levels to watch
USD/CNH is seen trading within the 7.1300-7.2450 range in the next few weeks, argue Markets Strategist Quek Ser Leang and Senior FX Strategist Peter Chia at UOB Group.
Key Quotes
24-hour view: We expected USD to trade in a range between 7.1830 and 7.2180 yesterday. USD then traded in a range of 7.1712/7.2074. The underlying tone has softened, and USD is likely to edge lower to 7.1500 today. The major support at 7.1300 is unlikely to come under threat. On the upside, if USD breaks above 7.2020 (minor resistance is at 7.1850), it would mean the current mild downward pressure has faded.
Next 1-3 weeks: There is not much to add to our update from Wednesday (02 Aug, spot at 7.1800). As highlighted, the current price actions are likely part of a consolidation phase. For the time being, USD is likely to trade in a range of 7.1300/7.2450.
- Eurozone Retail Sales came in at -0.3% MoM in June vs. 0.2% expected.
- Retail Sales in the bloc arrived at -1.4% YoY in June vs. -1.7% expected.
According to the official data released by Eurostat on Friday, Eurozone’s Retail Sales came in at -0.3% MoM in June versus 0.2% expected and 0.6% previous.
On a yearly basis, the bloc’s Retail Sales dropped 1.4% in June versus -2.4% booked in May and -1.7% expected.
FX implications
The Euro is little affected by the mixed Eurozone consumer spending data. At the time of writing, the major is trading at 1.0940, down 0.05% on the day
About Eurozone Retail Sales
The Retail Sales released by Eurostat are a measure of changes in sales of the Eurozone retail sector. It shows the performance of the retail sector in the short term. Percent changes reflect the rate of changes of such sales. The changes are widely followed as an indicator of consumer spending. Usually, positive economic growth anticipates "Bullishness" for the EUR, while a low reading is seen as negative, or bearish, for the EUR.
Today’s US jobs data release may well keep the volatility in long-dated US bond yields elevated. Such volatility remains relevant for FX, but implications of payrolls for Fed pricing are what matters most for the Dollar beyond the very short term, economists at ING report.
Time to re-focus on Fed pricing?
Markets enter today’s NFP release pricing with very little chance of any further hikes (8 bps) and placing the first rate cut in May 2024. This market positioning leaves non-negligible room for repricing in either direction (pricing in a hike before year-end, bringing forward the first cut), so out-of-consensus NFP prints should trigger sizeable directional moves in USD crosses.
Incidentally, elevated volatility in longer-dated yields should see that part of the curve move quite sharply after the release, and continue to be a factor for FX today. Still, once the fiscal and bond supply factors dissipate, hard data are what investors will be left with, and what can dictate moves beyond the very near term.
See – NFP Preview: Forecasts from 9 major banks, moderate downward trend in job growth
- Gold price remains directionless as US NFP release to set the undertone for Fed policy.
- Thursday’s United States economic calendar failed to trigger action in the Gold price.
- The market mood turns positive as investors digest Fitch’s downgrade of the US government long-term debt rating.
Gold price (XAU/USD) trades back and forth as investors are sidelined ahead of the United States Nonfarm Payrolls (NFP) report. The precious metal struggles to deliver a decisive move as the labor market report will set a fresh undertone for the Federal Reserve’s (Fed) September monetary policy. Preliminary consensus is in favor of further resilience in the labor market despite aggressive rate-tightening by the central bank and tight credit conditions.
Thursday’s economic calendar failed to trigger action in the Gold price despite the US Services PMI underperforming in July and the labor cost index growing at a slower pace in the April-June quarter. US factory activities are already in a contracting phase, therefore, resilience in the labor market seldom is a holding hand with the US Dollar and a restrictive measure for the Gold price.
Daily Digest Market Movers: Gold price awaits US NFP
- Gold price extends consolidation as investors await US labor market data for further guidance.
- The precious metal failed to find a decisive move despite the US Services PMI delivering an underperformance and the labor cost index softening further on Thursday.
- US Services PMI for July remained lower at 52.7 against expectations of 53.0 and June’s reading of 53.9. Also, new orders at 55.0 remained surprisingly lower than an upwardly revised consensus of 55.6 and the former release of 55.5.
- Crucial support for higher inflation in the US economy continues to be the rising labor cost index, but significantly weak growth in the wage cost index in the April-June quarter eases consumer inflation expectations.
- Q2 Unit Labor Costs grew at a pace of 1.6% vs. investors’ expectations of 2.6% and a Q1 figure of 3.3% as the context of quick job change starts fading.
- Monthly Factory Orders for June turned out surprisingly higher at 2.3% than upwardly revised expectations of 2.2% and May’s print of 0.4%.
- The US economic calendar remains full of crucial events this week, but the show-stopper is the NFP report, which will be published at 12:30 GMT.
- Wednesday’s July ADP Employment Change report set a positive undertone for the crucial NFP report. The ADP reported that the US labor market added fresh 324K new jobs to payrolls in July versus expectations of 189K.
- About NFP expectations, TD Securities expects payrolls to stay strong in July, registering a 260K gain, and also to reflect a reacceleration from June's 209K print. Economists at TD Securities look for the unemployment rate to drop to 3.5%, as job creation in the household survey will print a similar gain to that of the establishment survey.
- Also, Average Hourly Earnings will be of utmost importance. Per estimates, monthly wage data should grow at a pace of 0.3%, slower than the 0.4% recorded for June. Annual data is seen declining to 4.2%.
- Gold price remains directionless as Fed policymakers deliver mixed interest rate guidance. Chicago Fed Bank President Austan Goolsbee favors further policy tightening despite easing inflationary pressures. Atlanta Fed Bank President Raphael Bostic thinks an interest rate hike in September is no longer required.
- Meanwhile, Richmond Federal Reserve President Thomas Barkin said on Thursday that June’s inflation print was a good read. The Fed policymaker refrained from delivering guidance over policy action.
- The US Dollar Index looks lost in the 102.40-102.80 range as the focus shifts to labor market data.
- The market mood turns positive as investors digest Fitch’s downgrade of the US government's long-term debt rating.
- US Secretary of State Blinken: I have not received a response yet from China's Foreign Minister Wang Yi on the invite to Washington. Blinken expects to have an opportunity to meet.
Technical Analysis: Gold price juggles above $1,930
Gold price oscillates in a narrow range above the crucial support of $1,930.00 as investors await US NFP for further guidance. The precious metal is exposed to the further downside amid a breakdown of the Head and Shoulders chart pattern on a smaller time frame. The yellow metal trades below the 20 and 50-day Exponential Moving Averages (EMAs), which portrays a bearish trend.
Fed FAQs
What does the Federal Reserve do, how does it impact the US Dollar?
Monetary policy in the US is shaped by the Federal Reserve (Fed). The Fed has two mandates: to achieve price stability and foster full employment. Its primary tool to achieve these goals is by adjusting interest rates.
When prices are rising too quickly and inflation is above the Fed’s 2% target, it raises interest rates, increasing borrowing costs throughout the economy. This results in a stronger US Dollar (USD) as it makes the US a more attractive place for international investors to park their money.
When inflation falls below 2% or the Unemployment Rate is too high, the Fed may lower interest rates to encourage borrowing, which weighs on the Greenback.
How often does the Fed hold monetary policy meetings?
The Federal Reserve (Fed) holds eight policy meetings a year, where the Federal Open Market Committee (FOMC) assesses economic conditions and makes monetary policy decisions.
The FOMC is attended by twelve Fed officials – the seven members of the Board of Governors, the president of the Federal Reserve Bank of New York, and four of the remaining eleven regional Reserve Bank presidents, who serve one-year terms on a rotating basis.
What is Quantitative Easing (QE) and how does it impact USD?
In extreme situations, the Federal Reserve may resort to a policy named Quantitative Easing (QE). QE is the process by which the Fed substantially increases the flow of credit in a stuck financial system.
It is a non-standard policy measure used during crises or when inflation is extremely low. It was the Fed’s weapon of choice during the Great Financial Crisis in 2008. It involves the Fed printing more Dollars and using them to buy high grade bonds from financial institutions. QE usually weakens the US Dollar.
What is Quantitative Tightening (QT) and how does it impact the US Dollar?
Quantitative tightening (QT) is the reverse process of QE, whereby the Federal Reserve stops buying bonds from financial institutions and does not reinvest the principal from the bonds it holds maturing, to purchase new bonds. It is usually positive for the value of the US Dollar.
- GBP/JPY struggles to capitalize on its modest intraday gains on Friday.
- The BoE’s hawkish signals turn out to be a key factor capping the upside.
- The BoJ’s dovish stance and a positive risk tone should help limit losses.
The GBP/JPY cross surrenders a major part of its modest intraday gains and retreats to the 181.15-181.20 region during the early part of the European session on Friday. Spot prices, however, manage to hold above the weekly low touched on Thursday.
The Bank of England (BoE), as was widely anticipated, raised its key interest rate by 25 bps to a 15-year peak level of 5.25% on Thursday, though signalled that the tightening cycle may be nearing an end. The UK central bank called its current monetary policy stance "restrictive", forcing investors to scale back expectations for the peak rate. This, in turn, holds back traders from placing aggressive bullish bets around the British Pound and turns out to be a key factor capping the upside for the GBP/JPY cross.
The downside, however, seems limited, at least for the time being, in the wake of a more dovish stance adopted by the Bank of Japan (BoJ) and a positive risk tone, which tends to undermine the safe-haven Japanese Yen (JPY). In fact, the Japanese central bank last week took steps to make its Yield Curve Control (YCC) policy flexible, fueling speculations about an imminent shift away from the ultra-loose monetary policy. The BoJ, however, moved quickly to dampen speculation about an early end to the negative rate policy.
Furthermore, BoJ Governor Kazuo Ueda reiterates that the central bank won't hesitate to ease policy further and that more time was needed to sustainably achieve the 2% inflation target. Adding to this, the minutes from the BoJ policy meeting showed that members agreed to maintain the current easy monetary policy. This, in turn, should act as a tailwind for the GBP/JPY cross and limit the downside.
The aforementioned fundamental backdrop, meanwhile, suggests that the path of least resistance for spot prices is to the upside, suggesting that any subsequent slide is more likely to get bought into. This makes it prudent to wait for strong follow-through selling before confirming
that the recent strong rally of nearly 700 pips from a six-week low touched last Friday has run its course.
In the absence of any relevant market-moving economic releases from the UK, traders on Friday will take cues from the BoE Chief Economist Huw Pill's scheduled speech. Apart from this, the broader risk sentiment might influence demand for the safe-haven JPY and contribute to producing short-term trading opportunities around the GBP/JPY cross on the last day of the week.
Technical levels to watch
EUR/USD has extended its rejection of key resistance from the 61.8% retracement of the 2021/2022 fall at 1.1275 for a decline to the 1.0912/1.0833 support cluster. Economists at Credit Suisse analyze the pair’s technical outlook.
Break below 1.0833 would warn of a more important reversal lower
The 1.0912/1.0833 support cluster – the rising 55-DMA, uptrend from last September and early July lows – needs to hold to suggest weakness is corrective ahead of strength back to 1.1152 and then a retest of 1.1275/77.
Below 1.0833 would warn of a more important reversal lower to suggest weakness can extend further yet to test the 200-DMA, currently at 1.0740, where we would expect fresh buyers to show at first.
Above resistance at 1.1055 is needed to ease the pressure off the 1.0912/1.0833 support but with a break above 1.1152 seen needed to open the door to a retest of 1.1275/77.
Fitch Ratings said in its latest report, “falling Eurozone inflation puts ECB rates peak within sight.”
Additional takeaways
“Expect inflation in the Eurozone will fall to around 4.0% by year-end.”
“ECB will probably not need to raise its near-term inflation forecasts further in September.”
Market reaction
EUR/USD remains unfazed by the above report findings, keeping its range at around 1.0950 ahead of the US Nonfarm Payrolls data release.
- Euro trades in a vacillating fashion vs. the US Dollar.
- Stocks in Europe open Friday’s session with decent gains.
- EUR/USD hovers around the mid-1.0900s amidst investors’ prudence.
- The USD Index (DXY) gyrates around 102.50 amidst steady yields.
- Retail Sales in the euro area come next on the domestic docket.
The Euro (EUR) has been trading without a clear direction against the US Dollar (USD), causing EUR/USD to remain within a narrow trading range around 1.0950 towards the end of the week.
A similar situation is observed with the USD Index (DXY), which is maintaining its trade in the mid-102.00s. This is happening due to the lack of a definite trend in US yields, even after the recent climb to the highest levels in nine months across various parts of the yield curve.
Meanwhile, investors are anticipated to pay close attention to the release of the Nonfarm Payrolls report for July. The report is expected to show an increase of around 200K jobs. This interest comes as the Federal Reserve has recently emphasized its reliance on economic data for its decisions, as highlighted during its event on July 26.
Currently, there is a lot of speculation that the Fed's rate hike in July might have been its last for the foreseeable future. Additionally, the possibility of the European Central Bank (ECB) implementing further tightening measures beyond the summer seems to be losing momentum.
In terms of US economic data, the focus later in the North American session will be on the July Nonfarm Payrolls report and the Unemployment Rate.
Daily digest market movers: Euro looks cautious ahead of key US data
- The EUR maintains the trade in the lower end of the range vs. the USD.
- The upside bias in the USD Index seems to be taking a breather.
- CME Group’s FedWatch Tool sees no rate hikes by the Fed in H2 2023.
- Speculation that the Fed might have ended its hiking cycle runs high.
- Markets’ attention remain on the US labour market on Friday.
Technical Analysis: Euro looks supported near 1.0900
EUR/USD seems to have met some decent contention just above the 1.0900 yardstick, an area coincident with the transitory 55-day and 100-day SMAs.
The loss of the 1.0920 region, where the provisional 55-day and 100-day SMAs converge, leaves EUR/USD vulnerable to a probable drop to the July low of 1.0833 (July 6) ahead of the key 200-day SMA at 1.0742 and the May low of 1.0635 (May 31). South from here emerges the March low of 1.0516 (March 15) before the 2023 low of 1.0481 (January 6).
On the other hand, occasional bullish attempts could motivate the pair to initially dispute the weekly top at 1.1149 (July 27). Above this level the downside pressure could mitigate somewhat and could encourage the pair to test the 2023 high at 1.1275 (July 18). Once this level is cleared, there are no resistance levels of significance until the 2022 peak of 1.1495 (February 10), which is closely followed by the round level of 1.1500.
Furthermore, the constructive view of EUR/USD appears unchanged as long as the pair trades above the key 200-day SMA.
Euro FAQs
What is the Euro?
The Euro is the currency for the 20 European Union countries that belong to the Eurozone. It is the second most heavily traded currency in the world behind the US Dollar. In 2022, it accounted for 31% of all foreign exchange transactions, with an average daily turnover of over $2.2 trillion a day.
EUR/USD is the most heavily traded currency pair in the world, accounting for an estimated 30% off all transactions, followed by EUR/JPY (4%), EUR/GBP (3%) and EUR/AUD (2%).
What is the ECB and how does it impact the Euro?
The European Central Bank (ECB) in Frankfurt, Germany, is the reserve bank for the Eurozone. The ECB sets interest rates and manages monetary policy.
The ECB’s primary mandate is to maintain price stability, which means either controlling inflation or stimulating growth. Its primary tool is the raising or lowering of interest rates. Relatively high interest rates – or the expectation of higher rates – will usually benefit the Euro and vice versa.
The ECB Governing Council makes monetary policy decisions at meetings held eight times a year. Decisions are made by heads of the Eurozone national banks and six permanent members, including the President of the ECB, Christine Lagarde.
How does inflation data impact the value of the Euro?
Eurozone inflation data, measured by the Harmonized Index of Consumer Prices (HICP), is an important econometric for the Euro. If inflation rises more than expected, especially if above the ECB’s 2% target, it obliges the ECB to raise interest rates to bring it back under control.
Relatively high interest rates compared to its counterparts will usually benefit the Euro, as it makes the region more attractive as a place for global investors to park their money.
How does economic data influence the value of the Euro?
Data releases gauge the health of the economy and can impact on the Euro. Indicators such as GDP, Manufacturing and Services PMIs, employment, and consumer sentiment surveys can all influence the direction of the single currency.
A strong economy is good for the Euro. Not only does it attract more foreign investment but it may encourage the ECB to put up interest rates, which will directly strengthen the Euro. Otherwise, if economic data is weak, the Euro is likely to fall.
Economic data for the four largest economies in the euro area (Germany, France, Italy and Spain) are especially significant, as they account for 75% of the Eurozone’s economy.
How does the Trade Balance impact the Euro?
Another significant data release for the Euro is the Trade Balance. This indicator measures the difference between what a country earns from its exports and what it spends on imports over a given period.
If a country produces highly sought after exports then its currency will gain in value purely from the extra demand created from foreign buyers seeking to purchase these goods. Therefore, a positive net Trade Balance strengthens a currency and vice versa for a negative balance.
The US Dollar Index (DXY) has recovered further than expected but is still capped below its 200-Day Moving Average (DMA). Economists at Credit Suisse analyze DXY's technical outlook.
Risk to turn lower again on a break below 100.55
The DXY has recovered strongly, reversing its prior break of the key 100.82/78 lows. Whilst this throws a question mark over the bear trend and large bearish continuation pattern, only a close above the 200-DMA and July high at 103.57/66 would be seen to turn the trend neutral again, with resistance then seen next at 105.38.
Below support at 100.55 is needed to see the risk turn lower again for a fall back to the 99.58/50 lows, then a test of support at the 61.8% retracement of the 2021/2022 bull trend and 200-week average at 98.98/98.28.
- USD/CHF regains some positive traction and reverses a major part of the overnight slide.
- A positive risk tone undermines the safe-haven CHF and lends support amid a bullish USD.
- Traders keenly await the crucial US NFP report before placing aggressive directional bets.
The USD/CHF pair attracts some dip-buying near the 0.8730 area on Friday and builds on its steady intraday ascent through the early part of the European session. Spot prices climb to the 0.8760-0.8765 zone, or a fresh daily high in the last hour, reversing a major part of the previous day's slide from the 0.8800 mark, or the vicinity of a three-week high touched on Wednesday.
A generally positive tone around the equity markets is seen undermining the safe-haven Swiss Franc (CHF), which, along with a modest US Dollar (USD) uptick, is seen acting as a tailwind for the USD/CHF pair. In fact, the USD Index (DXY), which tracks the Greenback against a basket of currencies, trades just below its highest level since July 7 and remains well supported by the prospects for further policy tightening by the Federal Reserve (Fed).
Market participants now seem convinced that the US central bank will have enough headroom to raise interest rates further. The expectations were reaffirmed by the incoming US macro data, which continues to point to a resilient economy and should allow the Fed to stick to its hawkish stance. This keeps the yield on the benchmark 10-year US government bond elevated just below its highest level since October 2022 and lends support to the Greenback.
The USD/CHF pair, however, still needs to break through and find acceptance above the 0.8800 mark, which coincides with the 200-period Simple Moving Average (SMA) on the 4-hour chart, before bulls start positioning for any further appreciating move. Spot prices might then prolong the recent goodish recovery over around 250 pips witnessed over the past week or so, from mid-0.8500s, or the lowest level since January 2015.
Market participants now look to Friday's key release of the closely-watched US monthly employment details, due later during the early North American session. The popularly known NFP report will influence market expectations about the Fed's future rate hike path, which, in turn, should play a key role in driving the USD demand. Apart from this, the broader risk sentiment might provide some impetus to the USD/CHF pair on the last day of the week.
Technical levels to watch
Elisabeth Andreae, FX Analyst at Commerzbank, analyzes CAD outlook ahead of the Canadian labour market due at 12:30 GMT.
USD/CAD and general market sentiment are likely to depend mainly on the result of NFP
If the Canadian labour market report supports the impression of a soft landing for the economy, as expected, the Canadian data should not provide much momentum for the CAD exchange rates.
A surprisingly strong labour market report will buoy the Bank of Canada’s rate hike expectations somewhat, thus supporting the Loonie a little.
USD/CAD and general market sentiment are likely to depend mainly on the result of the US equivalent. If it involves major surprises, very weak US data might fuel increasing fears of a recession, thus leading to heightened risk aversion, CAD is going to fare worse than the usually favoured USD. Things will not look much better in case of a surprisingly strong US labour market report if this fuels rate hike expectations on the market.
See:
-
Canada Employment Preview: Forecasts from five major banks, further rise in the job count
-
NFP Preview: Forecasts from 9 major banks, moderate downward trend in job growth
The EUR/USD decline stalled around 1.0910 on Thursday. Economists at ING analyze the pair’s outlook.
EUR/USD moves will entirely be determined by US jobs data
With the Eurozone calendar being very light, EUR/USD moves will entirely be determined by US jobs data and any more swings in treasury yields today.
Any sub-consensus read should see a return to 1.100+ levels, while stronger-than-expected numbers would drag the pair to the next key supports at 1.0900 and 1.0850.
See – NFP Preview: Forecasts from 9 major banks, moderate downward trend in job growth
- The index alternates gains with losses in the mid-102.00s.
- US yields poised to extend the recent rally on Friday.
- US Nonfarm Payrolls takes centre stage across the pond.
The greenback, in terms of the USD Index (DXY), still appears under pressure around the 102.50 region at the end of the week.
USD Index looks at key data
The index continues to face some selling pressure following Thursday’s advance to multi-week tops above 102.80, always amidst the persistent cautiousness ahead of the release of crucial data in the US docket.
Indeed, the greenback’s price action so far falls in line with the generalized side-line trading seen in the global markets ahead of US Nonfarm Payrolls due later in the NA session.
In the meantime, US yields trade without a clear direction in the wake of the opening bell in the old continent, following Thursday’s advance to multi-month highs in the 10-year/30-year segment.
In the US data space, the economy is expected to have created around 200K jobs in July according to Nonfarm Payrolls figures, while the jobless rate is seen holding steady at 3.6% in the same period.
What to look for around USD
The index now seems to have met some decent hurdle around 102.80 ahead of the publication of the US jobs report for the month of July.
So far, the dollar has resumed the multi-day rally on the back of the strong loss of momentum in the risk-associated universe. This pronounced uptick in the dollar, however, could face extra headwinds in response to the data-dependent stance from the Fed against the current backdrop of persistent disinflation and cooling of the labour market.
Furthermore, speculation that the July hike might have been the last of the current hiking cycle is also expected to keep the buck under some pressure for the time being.
Key events in the US this week: Nonfarm Payrolls, Unemployment Rate (Friday).
Eminent issues on the back boiler: Persistent debate over a soft or hard landing for the US economy. Terminal Interest rate near the peak vs. speculation of rate cuts in late 2023 or early 2024. Geopolitical effervescence vs. Russia and China. US-China trade conflict.
USD Index relevant levels
Now, the index is gaining 0.04% at 102.52 and the breakout of 102.84 (weekly high August 3) would open the door to 103.54 (weekly high June 30) and finally 103.57 (200-day SMA). On the other hand, immediate contention emerges at 100.55 (weekly low July 27) prior to 100.00 (psychological level) and then 99.57 (2023 low July 13).
Economists at ANZ Bank note that the 0.60 mark is a key level to watch on the NZD/USD pair.
USD strength is again weighing on the Kiwi
USD strength is again weighing on the Kiwi, as are lower milk prices and AUD weakness in the wake of the Reserve Bank of Australia's decision to keep policy on hold this week.
Our forecasts call for a gradual firming from here, but if 0.60 were to break, that could bring on a wave of bearish sentiment.
- Silver remains under some selling pressure for the fourth straight day on Friday.
- The technical setup favours bears and supports prospects for a further downfall.
- A sustained strength back above the $24.00 mark might negate the negative bias.
Silver comes under some renewed selling pressure during the early European session on Friday and drops to over a three-week low in the last hour. The white metal currently trades around the $23.40 area, down for the fourth straight day, and seems vulnerable to prolonging its downward trajectory witnessed over the past two weeks or so.
The negative outlook is reinforced by the fact that technical indicators on the daily chart have been drifting lower and are still far from being in the oversold territory. Bearish traders, however, might still wait for a sustained break and acceptance below the $23.35 area, or the 61.8% Fibonacci retracement level of the June-July rally, before positioning for any further losses.
The XAG/USD might then accelerate the slide towards challenging the very important 200-day Simple Moving Average (SMA), currently pegged around the $23.00 mark. The downward trajectory could get extended and make silver vulnerable to retest the multi-month low, around the $22.15-$22.10 area touched in June, before eventually breaking below the $22.00 mark.
On the flip side, the 50% Fibo. level, around the $23.70 area, now seems to act as an immediate hurdle. Any subsequent move up is likely to attract fresh sellers and remain capped near the $24.00-$24.10 confluence support breakpoint, turned resistance. The said area comprises the 100-day SMA and the 38.2% Fibo. level, which should act as a pivotal point.
A sustained strength beyond might trigger a short-covering rally and lift the XAG/USD back towards the 23.6% Fibo. level, around $24.45-$24.50 supply zone. Some follow-through buying has the potential to lift Siver towards the $24.75 intermediate hurdle en route to the $25.00 psychological mark and the next relevant barrier near the $25.25 supply zone.
Silver daily chart
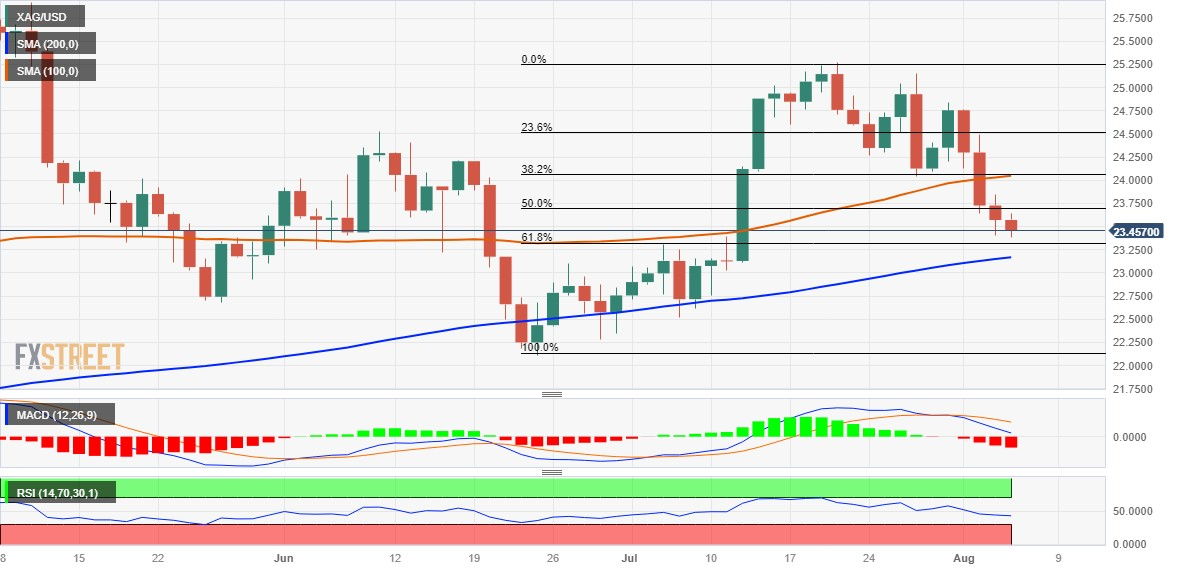
Technical levels to watch
A potential advance to 145.00 in USD/JPY seems to be losing traction, comment Markets Strategist Quek Ser Leang and Senior FX Strategist Peter Chia at UOB Group.
Key Quotes
24-hour view: Yesterday, we held the view that USD “could edge higher, but any advance is expected to face solid resistance at 144.00”. USD then rose to 143.89 before staging a surprisingly sharp pullback (low was 142.05). The price actions appear to be part of a broad trading range. Today, we expect USD to trade between 142.00 and 143.50
Next 1-3 weeks: Our latest narrative was from two days ago (02 Aug, spot at 143.10) wherein, “while USD could continue to rise, it remains to be seen if there is enough momentum to carry it to June’s high near 145.00.” Yesterday, USD rose to a fresh 1-month high of 143.89 and then dropped close to our ‘strong support’ level of 142.00 (low of 142.05). Upward momentum is beginning to deteriorate, and the chance of USD rising to 145.00 is decreasing. A breach of the ‘strong support’ level would suggests USD could trade in a broad range for a period of time.
- EUR/USD remains on the defensive near 1.0945, losing 0.02% for the day.
- Germany's Factory Orders rose 3.0% YoY compared to -4.4% prior.
- Traders await the US Nonfarm Payrolls, Unemployment Rate and Average Hourly Earnings data.
The EUR/USD pair struggles to gain and remains on the defensive below the 1.1000 barrier heading into the early European session. Markets turn cautious ahead of top-tier economic data from the US. The major pair currently trades around 1.0945, down 0.02% for the day.
The European Central Bank raised interest rates by 25 basis points (bps) to 4.25% last week. ECB President Christine Lagarde stated that the central bank will move towards achieving a medium-term inflation target of 2%. Additionally, ECB board member Fabio Panetta supported higher interest rates for longer and added that Inflation risks are balanced and economic activity is weak.
The latest data from the Deutsche Bundesbank showed that Germany's Factory Orders rose 3.0% YoY compared to -4.4% prior, while the monthly figure increase was 7.0% compared to 6.2% previously and -2.0% market expectations.
Additionally, the Eurozone Producer Price Index (PPI) for June fell to its lowest level in three years on Thursday. The figure dropped -3.4% YoY vs -3.1% expected and -1.6% prior. The bloc's HCOB Composite PMI fell from 48.9 to 48.6. While the services PMI for July declined from 51.1 to 50.9.
On the US Dollar front, the data released by the US on Thursday revealed that Initial Jobless Claims rose to 227,000 for the week ending July 29. The Unit Labour Costs Q2 increased by 1.6%, below the anticipated 2.6%, and Q1 was revised from 4.2% to 3.2%. In June, Factory Orders rose by 2.3%, as expected. The ISM Services PMI decreased from 53.9 to 52.7, below the market consensus of 53.
However, traders will also take cues from the US wage inflation and employment release on Friday. The upbeat data could convince the Federal Reserve (Fed) to hike additional rates for the entire year. This, in turn, benefits the Greenback and acts as a headwind for EUR/USD.
Moving on, market participants will focus on the top-tier data due later in the American session. The US Nonfarm Payrolls are expected to create 180,000 jobs in July. Also, the Unemployment Rate and Average Hourly Earnings will be released on Friday. The Unemployment Rate is expected to remain at 3.6%, and Average Hourly Earnings YoY are expected to increase by 4.2%. Market participants find trading opportunities around the EUR/USD pair.
Considering advanced prints from CME Group for natural gas futures markets, open interest rose for the fourth consecutive session on Thursday, now by just 202 contracts. Volume, instead, shrank by around 42.3K contracts after two consecutive daily builds.
Natural Gas: Decent support emerges around $2.50
Thursday’s marked uptick in prices of natural gas was accompanied by a small increase in open interest, which seems to support the view that further gains appear on the table for the commodity in the very near term. In the meantime, the $2.50 region per MMBtu continues to emerge as a solid contention zone for the time being.
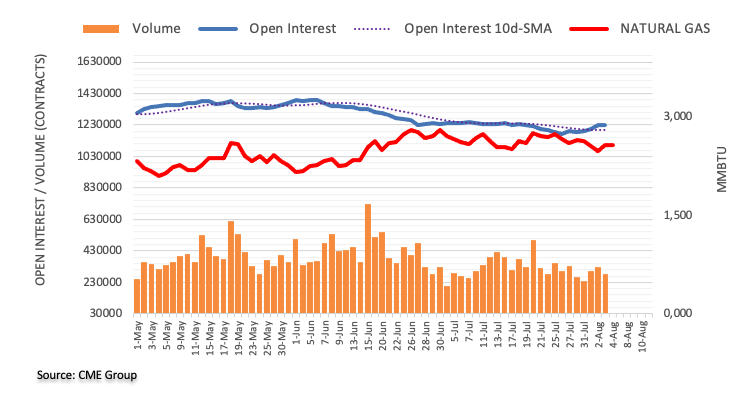
- NZD/USD retreats from intraday high, reversing previous day’s rebound from five-week low.
- Doji candlestick at multi-day low, below-50.0 RSI conditions put a floor under Kiwi price.
- Bulls have a long and bumpy road ahead, two-month-old previous support line guards immediate upside.
- US NFP bears downbeat forecasts but early signals make it interesting for Greenback buyers.
NZD/USD trims intraday gains around 0.6085 amid the initial European session on Friday as markets brace for the US employment report for July.
Also read: NZD/USD clings to modest recovery gains, struggles to capitalize on move beyond 0.6100
That said, the Kiwi pair recovered from the lowest level since June 29 the previous day but lacked follow-through, which in turn portrayed a Doji candlestick on the Daily timeframe, suggesting a reversal in the bearish trend established since mid-July.
Adding strength to the hopes of recovery is the RSI (14) line as it suggests bottom-picking by being below 50.0. Further, the position of the Doji candlestick at the multi-day low also increases the strength of the rebound.
However, the support-turned-resistance line from May 31 joins the bearish MACD signals to challenge the NZD/USD buyers around 0.6135.
Even if the quote rises past 0.6135 previous support line, a three-week-old descending resistance line, close to 0.6180, followed by the 200-DMA hurdle of 0.6230, will challenge the Kiwi bulls.
Above all, a four-month-old horizontal area surrounding 0.6390 appears a tough nut to crack for NZD/USD buyers.
On the contrary, the June 29 swing low of around 0.6050 will precede the lows marked during late May and early June, surrounding 0.6030, to challenge the short-term downside of the NZD/USD pair.
In a case where the Kiwi pair remains bearish past 0.6030, the 0.6000 psychological magnet and the yearly low marked in May around 0.5985 will be in the spotlight.
NZD/USD: Daily chart

Trend: Limited recovery expected
A week already quite rich in data publications has a final highlight on offer today in the shape of the US labor market report. Economists at Commerzbank analyze how USD could react to employment data.
USD might ease in an initial reaction
Following the ADP data on Wednesday, which came in well above expectations, there is a risk that the market has raised its expectations for today’s labor market report – and will end up being disappointed. That means USD might ease in an initial reaction.
As long as the data is not disastrously bad today, USD is likely to continue finding support against the background of a reasonably solid economic development and a tight labor market. Certainly, until the next data highlight is due next week in the form of the July inflation data.
See – NFP Preview: Forecasts from 9 major banks, moderate downward trend in job growth
In the opinion of Markets Strategist Quek Ser Leang and Senior FX Strategist Peter Chia at UOB Group, AUD/USD could still depreciate further and revisit the YTD low around 0.6460.
Key Quotes
24-hour view: After AUD plunged sharply to 0.6528 on Wednesday, we highlighted yesterday that “there is a chance for AUD to dip below 0.6500.” Our expectations did not materialise as AUD dipped to 0.6514 before recovering. Oversold conditions, coupled with early signs of slowing momentum, suggest low downside risk. Today, AUD is likely to trade in a range, probably between 0.6530 and 0.6595.
Next 1-3 weeks: We continue to hold the same view as yesterday (03 Aug, spot at 0.6535). As highlighted, while the AUD weakness that started early last week is severely oversold, AUD could weaken further to the year’s low near 0.6460. Overall, only a breach of 0.6620 (‘strong resistance’ was at 0.6635 yesterday) would indicate that AUD is not weakening further.
- Pound Sterling aims to continue recovery as the BoE eyes further policy-tightening.
- Andrew Bailey assured that inflation in the United Kingdom will soften to 5% in October.
- One-year forward UK consumer inflation expectations and wage growth slow down swiftly.
The Pound Sterling (GBP) attempts to sustain above 1.2700, capitalizing on the recovery move, as the market mood starts reviving and the Bank of England (BoE) delivers a hawkish interest rate decision. The GBP/USD pair eyes more gains as the BoE raises interest rates by 25 basis points (bps) to 5.25%, the highest in the past 15 years. The central bank leaves the door open for further policy tightening as inflation is extremely far from the desired rate of 2%.
Andrew Bailey assured that inflation in the United Kingdom will soften to 5% in October as food inflation appeared to be peaking now. While stubborn service inflation could keep persistence in inflation ahead. Meanwhile, an aggressive rate-tightening cycle by the central bank deepens fears of recession as the housing sector and factory activities would face more heat.
Daily Digest Market Movers: Pound Sterling capitalizes on hawkish BoE policy
- Pound Sterling manages to sustain above 1.2700 after a decent recovery as the risk appetite of market participants improves and Bank of England Governor Andrew Bailey leaves the door open for further policy tightening.
- On Thursday, the BoE raised interest rates by 25 bps to 5.25% to build more pressure on stubborn inflation. This was the 14th consecutive interest-rate hike.
- Out of the nine-member Monetary Policy Committee (MPC), BoE policymaker Swati Dhingra favored a steady interest rate policy. BoE's Haskel and Mann supported a 50 bps interest rate hike.
- Andrew Bailey said that the option of a 50 bps interest-rate hike was not in the picture and the central bank will keep interest rates “sufficiently restrictive for a sufficient period” so that inflation returns swiftly to 2%.
- In his support, BoE Deputy Governor Ben Broadbent said keeping relatively high rates over an extended period was the key to cutting inflation.
- Regarding the inflation outlook, Andrew Bailey is of the view that inflation will come down to 5% by October.
- UK Finance Minister Jeremy Hunt said it is encouraging that the BoE thinks UK PM Rishi Sunak will meet his pledge to halve inflation.
- Also, a survey from Citi/YouGov showed that 12-month forward consumer inflation expectations dropped sharply to 4.3% vs. former expectations of 5.0%.
- Major catalysts behind elevated United Kingdom inflation are labor shortages and sticky food inflation.
- Andrew Bailey is of the view that food and drink inflation appears to have peaked while continued strength in services price inflation may suggest that high inflation will persist.
- Decision Maker Panel survey conducted on July 7-21 showed that prices charged and wage distribution by businesses would slow down ahead. One-year forward wage growth is seen decreasing to 5.0% in July from 5.3% in June.
- Risk-aversion theme loses strength as investors digest Fitch’s downgrade to the United States government's long-term debt rating.
- The US Dollar Index (DXY) witnesses correction after facing stiff barricades around 102.80 as investors remain cautious ahead of the US Nonfarm Payrolls (NFP) data.
- On Thursday, the US Dollar delivered a power-pack action as the Services PMI failed to match expectations and labor cost growth eased beyond expectations.
- While Factor Orders outperformed expectations and May’s reading, indicating a recovery in Manufacturing PMI.
- Regarding Federal Reserve (Fed) interest rate guidance, Atlanta Fed Bank President Raphael Bostic thinks an interest rate hike in September is no longer required.
Technical Analysis: Pound Sterling forms Hammer candlestick pattern
Pound Sterling bounces back swiftly after sensing decent buying interest near the round-level support of 1.2600. The Cable forms a Hammer candlestick pattern on Thursday that signifies strong interest from buyers considering the asset a value bet. The major still trades below the 20 and 50-day Exponential Moving Averages (EMAs), which indicates that the short and medium-term trend is bearish. The Cable struggles to return to the Rising Channel chart pattern formed on the daily chart.
Pound Sterling FAQs
What is the Pound Sterling?
The Pound Sterling (GBP) is the oldest currency in the world (886 AD) and the official currency of the United Kingdom. It is the fourth most traded unit for foreign exchange (FX) in the world, accounting for 12% of all transactions, averaging $630 billion a day, according to 2022 data.
Its key trading pairs are GBP/USD, aka ‘Cable’, which accounts for 11% of FX, GBP/JPY, or the ‘Dragon’ as it is known by traders (3%), and EUR/GBP (2%). The Pound Sterling is issued by the Bank of England (BoE).
How do the decisions of the Bank of England impact on the Pound Sterling?
The single most important factor influencing the value of the Pound Sterling is monetary policy decided by the Bank of England. The BoE bases its decisions on whether it has achieved its primary goal of “price stability” – a steady inflation rate of around 2%. Its primary tool for achieving this is the adjustment of interest rates.
When inflation is too high, the BoE will try to rein it in by raising interest rates, making it more expensive for people and businesses to access credit. This is generally positive for GBP, as higher interest rates make the UK a more attractive place for global investors to park their money.
When inflation falls too low it is a sign economic growth is slowing. In this scenario, the BoE will consider lowering interest rates to cheapen credit so businesses will borrow more to invest in growth-generating projects.
How does economic data influence the value of the Pound?
Data releases gauge the health of the economy and can impact the value of the Pound Sterling. Indicators such as GDP, Manufacturing and Services PMIs, and employment can all influence the direction of the GBP.
A strong economy is good for Sterling. Not only does it attract more foreign investment but it may encourage the BoE to put up interest rates, which will directly strengthen GBP. Otherwise, if economic data is weak, the Pound Sterling is likely to fall.
How does the Trade Balance impact the Pound?
Another significant data release for the Pound Sterling is the Trade Balance. This indicator measures the difference between what a country earns from its exports and what it spends on imports over a given period.
If a country produces highly sought-after exports, its currency will benefit purely from the extra demand created from foreign buyers seeking to purchase these goods. Therefore, a positive net Trade Balance strengthens a currency and vice versa for a negative balance.
Open interest in crude oil futures markets resumed the uptrend and went up by around 8.7K contracts on Thursday, leaving behind the previous daily pullback according to preliminary readings from CME Group. In the same direction, volume increased for the third straight session, no by around 33.3K contracts.
WTI keeps the target at the 2023 peak above $83.00
Prices of WTI rebounded sharply and regained the area above the $81.00 mark on Thursday. The bounce on the commodity was on the back of increasing open interest and volume and leaves the door open to the continuation of the strong uptrend in place since late June. Immediately to the upside emerges the YTD high at $83.49 (April 12).
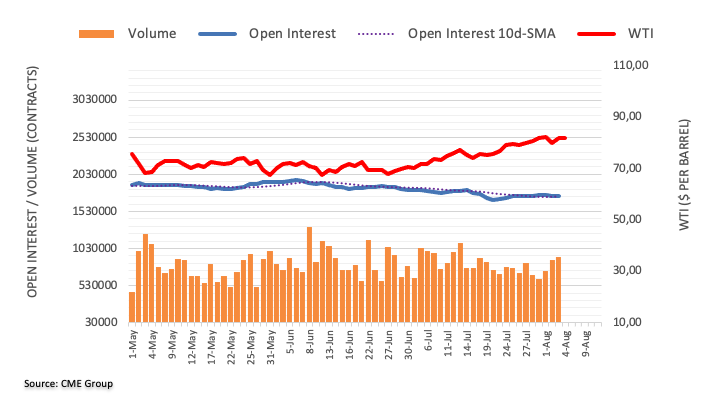
Canada’s employment data for July will be reported by Statistics Canada on Friday, August 4 at 12:30 GMT and as we get closer to the release time, here are forecasts from economists and researchers at five major banks regarding the upcoming jobs figures.
The North American economy is expected to have added 21.1K jobs vs. 59.9k in June, while the Unemployment Rate is expected to increase to 5.5% against the former release of 5.4%.
TDS
We look for the labour market to add just 20K jobs in July as the unemployment rate holds at 5.4% and wage growth for permanent workers firms to 4.2% YoY. Our forecast would see the 6m trend slow to just 27K from 48K in June, falling below neutral levels of job creation for the first time since late 2022, which follows the recent moderation in job vacancies as well as a pullback in hiring intentions. This should help labour market conditions move closer to balance, although it will still take several months of below-trend job growth to get there.
RBC Economics
We expect a 25K uptick in new jobs in July. Still, surging population growth means that won’t be enough to absorb all new labour market entrants. The unemployment rate edged up 0.2 percentage points in each of May and June and we look for another tick higher in July. Total job postings have also been trending lower. And slower wage growth in recent months has been consistent with signs that the surge of excess demand for workers in the economy has weakened. We see softening job markets keeping the BoC on the sidelines with no additional interest rate increases this year. Still, central banks in Canada and abroad won’t hesitate to hike interest rates further if needed to put inflation back in target range.
NBF
Although vigorous, job creation in July may not have been sufficient to bring down the unemployment rate, as an expected gain of 25K jobs may have been entirely offset by a further sharp increase in the labour force. According to this scenario, and assuming that the participation rate remains unchanged at 65.7%, the unemployment rate should stay put at 5.4%.
CIBC
While employment growth resumed in June, it failed to keep up with the surge in working age population – a trend that we expect will have continued in July. The 25K increase in job count we expect wouldn’t quite keep up with projected labour force growth, and as a result would see the unemployment rate rise to 5.5%. With job vacancy rates continuing to edge lower, it is clear that demand for labour is easing at the same time that the supply of potential workers is rising quickly. While wage growth could rebound slightly after decelerating more than expected in the prior month, it should still remain well below the 5.4% peak seen towards the end of last year.
Citi
We expect a 45K increase in employment in July, a strong increase reflecting the continued upside to employment figures due to substantial population growth. This would continue a bounce-back of employment from a modest decline in May. Another large increase in employment should keep the unemployment rate unchanged at 5.4%, a still very low level but somewhat higher than the lows reached earlier this year. Wage growth has also slowed somewhat, although this is partly due to unfavorable base effects in June and a rebound to 4.0% is expected in July. The BoC may not see this labor market backdrop as encouraging for reaching the 2% core CPI target if further loosening does not occur over the coming months, particularly if wage growth remains around 4-5%. However, a July employment report in line with expectations, with a higher unemployment rate and softer wage growth compared to a few months ago, is likely to be mostly inconclusive for the outcome of the BoC’s September meeting.
Further losses now appear on the table for GBP/USD in the short-term horizon, according to Markets Strategist Quek Ser Leang and Senior FX Strategist Peter Chia at UOB Group.
Key Quotes
24-hour view: After GBP fell sharply to 1.2680 on Wednesday, we highlighted yesterday that “While severely oversold, there appears to be enough momentum for GBP to dip below 1.2680.” We added, “The major support at 1.2645 is likely out of reach today.” However, GBP plummeted to 1.2620 in London trade, then snapped back up to close largely unchanged in NY (1.2709, -0.09%). Downward momentum has slowed, and this combined with still overbought conditions, suggests GBP is unlikely to weaken further. Today, GBP is more likely to trade sideways in a range of 1.2670/1.2770.
Next 1-3 weeks: We turned negative in GBP last Friday (28 Jul, spot at 1.2800). In our update from yesterday (03 Aug, spot at 1.2725), we held the view that GBP “is likely to weaken further.” We indicated that “the next level to aim for is 1.2640, followed by 1.2580.” GBP broke below 1.2640 in London trade (low was 1.2620). While downward momentum has eased somewhat with the bounce from the low, there is a chance for GBP to drop to 1.2580. Overall, only a breach of 1.2805 (‘strong resistance’ level was at 1.2830) would indicate that the downside risk has faded.
CME Group’s flash data for gold futures markets noted traders scaled back their open interest positions by around 3.7K contracts on Thursday, resuming the downside following Wednesday’s small uptick. Volume followed suit and reversed two daily builds in a row and went down by nearly 30K contracts.
Gold faces the next support around $1900
Gold prices charted an irresolute session on Thursday amidst shrinking open interest and volume. That said, the near-term price action now appears unclear, while extra decline expected to meet the next contention area at the $1900 zone per troy ounce.
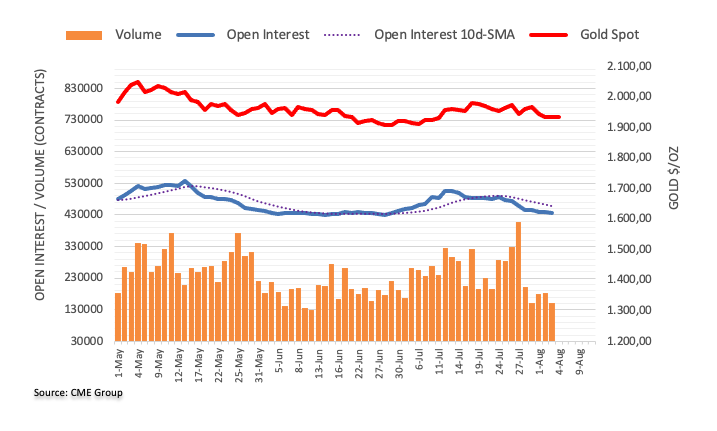
- EUR/JPY stays pressured after two-day losing streak, lacks clear directions of late.
- German Factory Orders post notable growth in June, crosses market forecasts and prior readings.
- Pullback in global Treasury bond yields from multi-day peaks weigh on prices amid cautious optimism.
- Looming divergence between ECB and BoJ monetary policy keeps sellers hopeful ahead of Eurozone Retail Sales.
EUR/JPY remains sidelined around 156.00 as it pays little heed to the German Factory Orders data amid early Friday morning in Europe. In doing so, the cross-currency pair struggles for clear directions amid downbeats yields and mixed concerns about the European Central Bank (ECB) and the Bank of Japan (BoJ).
Germany’s Factory Orders grew 3.0% YoY versus -4.4% prior while the monthly growth came out as 7.0% from 6.2% previous readings and -2.0% market forecasts.
That said, Thursday’s softer prints of the Eurozone Producer Price Index (PPI) for June, the lowest in three years, with -3.4% YoY figures versus -3.1% expected and -1.6% prior (revised), weighed on the EUR/JPY price the previous day. On the same line were the final readings of the bloc’s HCOB Composite PMI and Services PMI for July deteriorated while the same activity numbers for Germany improved from the initial forecasts for the said month.
Furthermore, the mixed comments from European Central Bank (ECB) board member Fabio Panetta also weighed on the pair as he supported high interest rates for a longer time via a webinar. The policymaker, however, also added, “Inflation risks are balanced and economic activity is weak.”
It should be noted that the Bank of Japan’s (BoJ) two unscheduled bond-buying programs and the decision-makers’ defense of the easy-money policy flags fears of the BoJ’s exit from the record low interest rate and/or a tweak to the Yield Curve Control (YCC) policy.
Elsewhere, top-tier Treasury bond yields retreat from the multi-month high marked the previous day and exert downside pressure on the EUR/JPY price, which in turn stops the quote from cheering the German data.
Looking forward, Eurozone Retail Sales for June, expected -1.7% YoY versus -2.9% prior, will be important to watch for intraday directions of the pair. Above all, the likely monetary policy divergence between the ECB and the BoJ keeps the EUR/JPY bears hopeful.
Technical analysis
Bullish megaphone trend-widening formation keeps EUR/JPY buyers hopeful despite the latest U-turn from the pattern’s top line, close to 157.60 at the latest. That said, the 50-DMA level of 154.50 can restrict the immediate downside of the pair ahead of directing it to the stated megaphone’s bottom line of around 152.70.
Here is what you need to know on Friday, August 4:
The US Dollar stays relatively quiet early Friday as the USD Index holds steady at around 102.50 after snapping a five-day winning streak on Thursday. Retail Sales data for June will be featured in the European economic docket on Friday. Later in the day, July jobs report from the US, which will include Nonfarm Payrolls and wage inflation data, will be watched closely by market participants. Statistics Canada will also release the labor market data.
Following a bearish opening on Thursday, Wall Street's main indexes managed to stage a rebound and closed the day with small losses. In addition to the modest improvement seen in market mood, mixed macroeconomic data releases from the US caused the USD rally to lose steam. Early Friday, US stock index futures trade in positive territory, pointing to an upbeat tone.
US Nonfarm Payrolls Forecast: July NFP release expected to show steady job market.
Factory Orders in the US rose 2.3% in June while the weekly Initial Jobless Claims came in at 227,000 for the week ending July 29, matching the market expectation. The ISM Services PMI edged lower in July but held above 50, while the Employment Index component of the survey retreated to 50.7 from 53.1, highlighting a loss of momentum in the service sector's job growth.
EUR/USD staged a rebound after falling toward on Thursday and stabilized at around 1.0950 early Friday. The data from Germany showed earlier in the day that Factory Orders increase 7% in June, much better than the market forecast for a 2% contraction.
GBP/USD touched its lowest level in over a month at 1.2622 on Thursday before recovering back above 1.2700. The Bank of England (BoE) raised its policy rate by 25 basis points (bps) to 5.25% as expected. In the post-meeting press conference, BoE Governor Andrew Bailey refrained from committing to additional rate hike and caused Pound Sterling to weaken against its rivals during the European trading hours on Thursday.
The Reserve Bank of Australia (RBA) lowered inflation and growth forecasts in its quarterly Monetary Policy Statement (MPS) published on Friday. Further tightening of the policy could provide some insurance against upside inflation risks, the RBA noted in its publication. Meanwhile, China’s Commerce Ministry announced on Friday that the country will lift the anti-dumping and anti-subsidy tariff on barley imports from Australia, effective August 5. AUD/USD edged higher following these developments and was last seen trading in positive territory above 0.6550.
USD/JPY turned south and lost nearly 100 pips on Thursday. The pair holds steady above 142.50 early Friday.
Despite the renewed US Dollar weakness on Thursday, XAU/USD struggled to gain traction as the benchmark 10-year US Treasury bond yield continued to push higher above 4.1%. Gold price moves sideways slightly above $1,930 in the European morning.
Bitcoin holds steady above $29,000 after moving sideways in a narrow channel on Thursday. Ethereum remains directionless while fluctuating between $1,800 and $1,850.
- Gold price remains confined in a narrow range around the $1,930 level.
- The upbeat data could convince the Federal Reserve (Fed) to hike additional rates.
- The renewed tensions between the US-China might benefit gold, a traditional safe-haven asset.
- All eyes are on the US Nonfarm Payrolls, Unemployment Rate data due later in the day.
The gold price oscillates around $1,935 heading into the early European session on Friday. Market participants await the US Nonfarm Payrolls figure due later in the American session.
The top-tier data from the US on Thursday showed that the Initial Jobless Claims increased to 227,000 for the week ended July 29, matching market consensus. Meanwhile, the ISM Service PMI for July dropped to 52.7 from 53.9 prior and was worse than expected at 53. Unit Labor Costs from Q2 increased to 1.6%, lower than the 2.6% expected.
Gold traders will take cues from the US wage inflation and employment release on Friday. The stronger-than-expected report could convince the Federal Reserve (Fed) to hike additional rates for the entire year. This, in turn, benefits the Greenback and acts as a headwind for XAU/USD. It’s worth noting that gold is sensitive to rising interest rates as they raise the opportunity cost of holding non-yielding bullion.
Furthermore, the US House committee said on Thursday that President Joe Biden needs to limit outbound US investment in China, particularly in key industries that might undermine national security. Biden may impose further outbound investment restrictions on China in the coming weeks, Reuters sources said. The escalating tensions between the US-China might exert some pressure on the US Dollar and benefit gold, a traditional safe-haven asset.
Looking ahead, all eyes are on the US Nonfarm Payrolls data due later in the day. The US economy is expected to have created 180,000 jobs in July. Also, the Unemployment Rate and Average Hourly Earnings will be released on Friday. The Unemployment Rate is expected to remain at 3.6%, and Average Hourly Earnings YoY are expected to increase by 4.2%. Market participants find trading opportunities around the gold price.
Markets Strategist Quek Ser Leang and Senior FX Strategist Peter Chia at UOB Group note there is scope for EUR/USD to retreat to the 1.0860 zone in the near term.
Key Quotes
24-hour view: We held the view yesterday that EUR “could drop to 1.0900 before stabilisation is likely.” In London trade, EUR dropped to 1.0910 and then rebounded to close little changed in NY (1.0944, +0.07%). EUR appears to have moved into a consolidation phase, and it is likely to trade in a range of 1.0920/1.0985 today.
Next 1-3 weeks: Our update from yesterday (03 Aug, spot at 1.0940) still stands. As highlighted, after EUR broke below the strong support at 1.0920 on Wednesday (02 Aug), there was a boost in momentum. This boost in momentum is likely to lead to EUR weakening further to 1.0865. On the upside, if EUR breaks above the ‘strong resistance’ level at 1.1020 (no change in level), it would indicate that the EUR weakness that began in the middle of last week has stabilised.
The German Factory Orders data showed a solid improvement in June, suggesting that the manufacturing sector recovery is extending for the second straight month.
Contracts for goods ‘Made in Germany’ jumped 7.0% on the month vs. -2.0% expected and 6.2% previous figure, the latest data published by the Federal Statistics Office showed on Friday.
On an annual basis, the German Industrial Orders increased by 3.0% in the reported month, as against the 4.4% decline seen in May.
FX implications
The shared currency is unable to find any positive impetus from the strong German factory data. At the time of writing, EUR/USD is trading at 1.0955, holding 0.10% gains on the day.
USD/INR continued to trade within a tight range between 82.00 and 82.80 in July. Economists at MUFG Bank analyze the pair’s outlook.
Positive view on INR
The good news on the food inflation front is that there has been meaningful progress in the monsoon and Kharif crop sowing in recent weeks, although rainfall distribution continues to be uneven. If these trends are sustained, food inflation could start to normalise over the next few months.
Most growth indicators remained resilient, with industrial production rising 5.2% YoY.
The flow picture also remains supportive for the INR, with a manageable current account deficit of around 1.5% of GDP, together with continued pick-up in portfolio flows thus far.
We expect FDI to reverse its soft patch recently, and External Commercial Borrowing flows should also improve in the coming months.
USD/INR – Q3 2023 81.50 Q4 2023 80.50 Q1 2024 79.50 Q2 2024 79.00
- WTI crude oil stays defensive after bouncing off one-week low.
- Overbought RSI, receding bullish bias of MACD prod energy bulls below eight-month-old horizontal resistance.
- Black gold stays on buyer’s radar unless breaking 200-DMA.
WTI crude oil traders struggle for clear directions, treading water around $81.50 heading into Friday’s European session. In doing so, the black gold fails to extend the previous day’s rebound from an upward-sloping support line from June 27.
That said, overbought RSI and looming bear cross on the MACD challenge buyers of the energy benchmark as it seesaws below the key upside hudle, namely a horizontal area comprising multiple tops marked since December 2022, close to $83.30-40.
It’s worth noting that the weekly high surrounding $82.20 and the early 2023 peak of around $82.70-80 act as immediate upside hurdles for the WTI crude oil price.
In a case where the commodity price rises past $83.40, the $90.00 round figure may prod the bulls before directing them to the tops registered in October and November 2022, close to $92.65 and $92.95 in that order.
On the flip side, a daily closing beneath the aforementioned support line stretched from late June, close to $79.80 at the latest, will challenge the weekly low of around $78.50.
However, the Oil bears remain off the table unless witnessing a daily closing beneath the 200-DMA support of around $76.40.
Overall, WTI crude oil losses upside momentum but the bears are far from taking control.
WTI crude oil: Daily chart
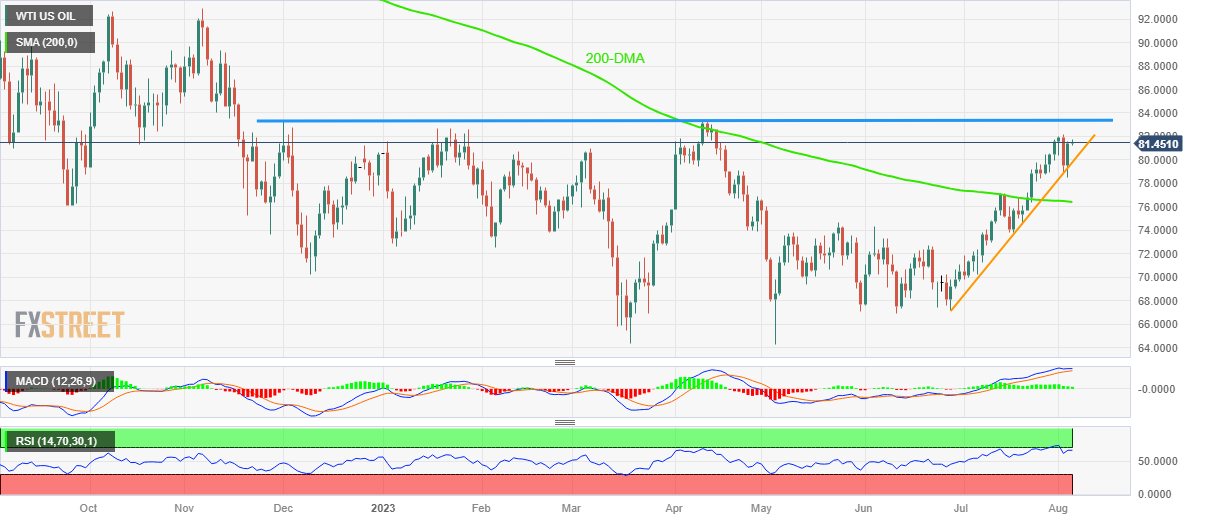
Trend: Pullback expected
FX option expiries for Aug 4 NY cut at 10:00 Eastern Time, via DTCC, can be found below.
- EUR/USD: EUR amounts
- 1.0950 795m
- 1.0975 511m
- 1.1000 781m
- 1.1035 485m
- 1.1050 401m
- 1.1075 798m
- 1.1100 388m
- 1.1150 441m
- GBP/USD: GBP amounts
- 1.2600 447m
- 1.2700 891m
- USD/JPY: USD amounts
- 141.00 402m
- 142.00 1.2b
- 143.00 900m
- 144.00 360m
- 145.00 944m
- AUD/USD: AUD amounts
- 0.6600 628m
- 0.6800 381m
- 0.6900 717m
- USD/CAD: USD amounts
- 1.3200 1b
- 1.3270 382m
- 1.3300 2b
- 1.3325 591m
- 1.3400 1.3b
- EUR/GBP: EUR amounts
- 0.8575 741m
- US Nonfarm Payrolls are forecast to rise 200K in July vs. 209K seen in June.
- The headline NFP and Average Hourly Earnings are key to the Fed’s rate hike outlook.
- US Unemployment Rate is expected to hold steady at 3.6%.
Following the releases of significant US employment data this week, market participants await the all-important US Nonfarm Payrolls report due this Friday, which could influence the US Federal Reserve (Fed) decision on whether to raise the policy rate again this year.
Private sector employment in the US increased by 324,000 in July, Automatic Data Procession reported on Wednesday. This reading surpassed the market expectation of 324,000 by a wide margin. “The economy is doing better than expected and a healthy labor market continues to support household spending,” said Nela Richardson, chief economist at ADP. In response to the upbeat data, the benchmark 10-year US Treasury bond yield climbed to its highest level since November above 4.1% midweek and the US Dollar Index, which gauges the USD valuation against a basket of six major currencies, advanced to its highest level in nearly a month above 102.50.
Earlier in the week, the US Bureau of Labor Statistics announced that the number of job openings on the last business day of June declined to 9.58 million from 9.61 million in May. Meanwhile, the Employment Index of the ISM Manufacturing PMI survey declined to 44.4 in July from 48.1, showing an ongoing decline in the number of manufacturing jobs.
What to expect in the next Nonfarm Payrolls report?
Markets expect Nonfarm Payrolls to rise 200,000 in July following the weaker-than-forecast increase of 209,000 recorded in June. The Unemployment Rate is anticipated to remain unchanged at 3.6%, while annual wage inflation, as measured by the change in Average Hourly Earnings, is seen edging lower to 4.2% from 4.4%.
The Fed raised its policy rate to the range of 5.25-5.5% following the July meeting. In the post-meeting press conference, Fed Chairman Jerome Powell acknowledged that they were observing sings of labor supply and demand coming into better balance. Powell, however, reiterated that the labor demand was still substantially exceeding supply. Nevertheless, Powell refrained from confirming one more rate increase later in the year and said that they will continue to closely watch jobs and inflation data.
Markets are currently pricing in a nearly-30% probability that the Fed will hike the policy rate one more time before the end of the year. In case there is a significant upside surprise to the NFP in July, a reading at or above 250,000, hawkish Fed bets could dominate the action and help the USD outperform its rivals. If a strong NFP figure is accompanied by a high wage inflation, the USD rally could gather further steam ahead of the weekend. On the other hand, a disappointing NFP print between 100K and 150K could highlight loosening conditions in the labor market and hurt the USD.
Analysts at TD Securities expect an upbeat NFP reading:
“We look for payrolls to stay strong in July, registering a 260k gain, and also reflecting a reacceleration from June's 209k print. We also look for the unemployment rate to drop again by a tenth to 3.5%, as we are assuming job creation in the household survey will print a similar gain to that of the establishment survey. Average hourly earnings likely advanced 0.3% m/m, with the y/y measure likely dropping to a still-elevated 4.2%.”
When will US June Jobs Report data be released and how could it affect EUR/USD?
Nonfarm Payrolls number, part of the US jobs report, will be released at 12:30 GMT on August 4. EUR/USD has been staying under persistent bearish pressure since touching its highest level since February 2022 at 1.1277 on July 18. The labor market data could influence the USD’s valuation and trigger the next big action in the pair.
As explained above, stronger-than-expected NFP numbers and hot wage inflation data could strengthen expectations of one more Fed hike this year and force EUR/USD to stay on the back foot. Especially after the European Central Bank adopted a cautious stance regarding further policy tightening in the face of growing signs of a slowdown in economic activity.
Alternatively, EUR/USD could stage a rebound if the jobs report unveils a noticeable cooldown in the US labor market in July, causing market participants to lean toward a no-change in the Fed policy.
FXStreet Analyst Eren Sengezer shares his view on EUR/USD short-term technical outlook heading into the jobs report.
“EUR/USD stays dangerously close to 1.0900, where the Fibonacci 61.8% retracement of the June - mid-July uptrend is reinforced by the 50-day and the 100-day Simple Moving Averages. Meanwhile, the Relative Strength Index (RSI) indicator stays below 50, reflecting the lack of buyer interest.”
“A daily close below 1.0900 could open the door for an extended slide toward 1.0830 (static level), 1.0750 (200-day SMA) and 1.0700 (static level, beginning point of the uptrend). Looking north, the pair needs to rise above 1.1000 (static level, psychological level) and start using that level as support in order to stage a consistent recovery toward 1.1080 (20-day SMA) and 1.1150 (static level).”
NonFarm Payrolls FAQs
What are Nonfarm Payrolls?
Nonfarm Payrolls (NFP) are part of the US Bureau of Labor Statistics monthly jobs report. The Nonfarm Payrolls component specifically measures the change in the number of people employed in the US during the previous month, excluding the farming industry.
How does Nonfarm Payrolls influence the Federal Reserve monetary policy decisions?
The Nonfarm Payrolls figure can influence the decisions of the Federal Reserve by providing a measure of how successfully the Fed is meeting its mandate of fostering full employment and 2% inflation.
A relatively high NFP figure means more people are in employment, earning more money and therefore probably spending more. A relatively low Nonfarm Payrolls’ result, on the either hand, could mean people are struggling to find work.
The Fed will typically raise interest rates to combat high inflation triggered by low unemployment, and lower them to stimulate a stagnant labor market.
How does Nonfarm Payrolls affect the US Dollar?
Nonfarm Payrolls generally have a positive correlation with the US Dollar. This means when payrolls’ figures come out higher-than-expected the USD tends to rally and vice versa when they are lower.
NFPs influence the US Dollar by virtue of their impact on inflation, monetary policy expectations and interest rates. A higher NFP usually means the Federal Reserve will be more tight in its monetary policy, supporting the USD.
How does Nonfarm Payrolls affect Gold?
Nonfarm Payrolls are generally negatively-correlated with the price of Gold. This means a higher-than-expected payrolls’ figure will have a depressing effect on the Gold price and vice versa.
Higher NFP generally has a positive effect on the value of the USD, and like most major commodities Gold is priced in US Dollars. If the USD gains in value, therefore, it requires less Dollars to buy an ounce of Gold.
Also, higher interest rates (typically helped higher NFPs) also lessen the attractiveness of Gold as an investment compared to staying in cash, where the money will at least earn interest.
Sometimes Nonfarm Payrolls trigger an opposite reaction than what the market expects. Why is that?
Nonfarm Payrolls is only one component within a bigger jobs report and it can be overshadowed by the other components.
At times, when NFP come out higher-than-forecast, but the Average Weekly Earnings is lower than expected, the market has ignored the potentially inflationary effect of the headline result and interpreted the fall in earnings as deflationary.
The Participation Rate and the Average Weekly Hours components can also influence the market reaction, but only in seldom events like the “Great Resignation” or the Global Financial Crisis.
- USD/CAD holds above the 1.3350 mark ahead of top-tier employment data from the US and Canada.
- US Initial Jobless Claims rose to 227K last week, as expected; the ISM Service PMI (Jul) fell to 52.7 from 53.9 prior.
- Market participants will watch the Canadian Employment Change, US Nonfarm Payrolls.
The USD/CAD pair consolidates its recent gains heading into the early European session on Friday. The major currently trades near 1.3355, gaining 0.02% for the day. Market players await employment data from the US and Canada for fresh impetus.
Data released from the US on Thursday showed mixed readings. That said, the US Initial Jobless Claims increased to 227,000 for the week ended July 29, matching expectations. At the same time, the ISM Service PMI for July dropped to 52.7 from 53.9 prior and was worse than expected at 53. Additionally, Unit Labor Costs from Q2 increased to 1.6%, lower than the 2.6% expected. Investors will take more cues from US wage inflation and US employment data later in the day. The upbeat data could convince the Federal Reserve (Fed) to hike additional rates this year, which benefits the US Dollar and acts as a tailwind for the USD/CAD pair.
On the Canadian Dollar front, investors await the Canadian Employment Change on Friday as it could offer hints into the strength of domestic activity and the direction of the BoC's monetary policy. Earlier this week, the S&P Global Canada Manufacturing PMI rose to 49.6 versus 48.8 prior and was better than expected at 48.9. Meanwhile, the rebound in oil prices has underpinned the Loonie since Canada is the largest oil exporter to the United States.
Moving on, market participants will keep an eye on the Canadian Employment Change and Nonfarm Payrolls. The US economy is expected to have created 180,000 jobs in July. While economists forecast that the Canadian economy will create 21,100 jobs. The data will be critical for determining a clear movement for the USD/CAD pair.
According to the one-hour chart, the further upside appears favorable for USD/CAD as the Relative Strength Index (RSI) stands in the bullish territory above 50. The immediate resistance level is seen at 1.3378 (High of August 3), and the initial support level appears at 1.3328 (Low of August 3), followed by 1.3300 (a psychological round mark).
- AUD/USD attracts some buying on Friday and recovers further from a two-month low.
- The RBA’s hawkish SOMP benefits the Aussie and lends support amid a softer USD.
- Bets for more Fed rate hikes limit the USD losses and cap the pair ahead of the NFP.
The AUD/USD pair builds on the previous day's modest bounce from the 0.6515 area, or over a two-month low, and gains some follow-through positive traction for the second successive day on Friday. Spot prices, however, retreat a few pips from a two-day high touched during the Asian session and currently trade around the 0.6565-0.6570 region, up over 0.25% for the day.
The US Dollar (USD) remains on the defensive below its highest level since July 7 touched on Thursday, which, along with a positive tone around the US equity futures, benefits the risk-sensitive Aussie. This, along with the Reserve Bank of Australia's hawkish quarterly Statement on Monetary Policy (SOMP), indicating that interest rates may still need to go higher, lends some support to the AUD/USD pair. Adding to this, Commerce Ministry announced that the country will lift the anti-dumping and anti-subsidy tariff on barley imports from Australia, which turns out to be another factor acting as a tailwind for the major.
The downside for the USD, however, remains cushioned in the wake of rising bets for further policy tightening by the Federal Reserve (Fed). In fact, the incoming stronger US macro data continues to point to an extremely resilient economy, which should allow the Fed to keep interest rates higher for longer. This had led to the recent rise in the US Treasury bond yields. It is worth recalling that the yield on the benchmark 10-year US government bond shot to its highest level since October on Thursday, This, in turn, acts as a tailwind for the Greenback and keeps a lid on any meaningful appreciating move for the AUD/USD pair.
Traders also seem reluctant to place aggressive directional bets and prefer to wait on the sidelines ahead of the release of the closely-watched US monthly employment details later during the early North American session. The popularly known NFP report will influence expectations about the Fed's future rate-hike path, which will play a key role in driving the USD demand and help determine the near-term trajectory for the AUD/USD pair. This further makes it prudent to wait for strong follow-through buying before confirming that the pair's three-week-old downtrend from the 0.6900 mark has run its course.
Technical levels to watch
- EUR/GBP holds lower grounds near intraday low, printing the first daily loss in four.
- BoE announces 0.25% rate hike, matches market forecasts but policymakers appear divided.
- Mixed Euro data, ECB bias prod buyers from cheering BoE’s unimpressive performance.
- German Factory Orders, Eurozone Retail Sales eyed ahead of a speech from BoE’s Pill for clear directions.
EUR/GBP drops 0.12% intraday as it reports the first daily loss, so far, in four days around 0.8600 heading into Friday’s European session. In doing so, the cross-currency pair extends late Thursday’s U-turn from a two-week high as market players await the key catalysts from Eurozone and the UK.
Thursday’s softer prints of the Eurozone Producer Price Index (PPI) for June, the lowest in three years, with -3.4% YoY figures versus -3.1% expected and -1.6% prior (revised), weighed on the EUR/GBP price initially ahead of the Bank of England (BoE) Interest Rate Decision.
Also contributing to the quote’s weakness could be the final readings of the bloc’s HCOB Composite PMI and Services PMI for July deteriorated while the same activity numbers for Germany improved from the initial forecasts for the said month.
It’s worth noting that the mixed comments from European Central Bank (ECB) board member Fabio Panetta also weighed on the pair as he supported high interest rates for a longer time via a webinar. The policymaker, however, also added, “Inflation risks are balanced and economic activity is weak.”
On the other hand, the Bank of England (BoE) matched market forecasts by lifting the benchmark interest rates to the highest level in 15 years with a 0.25% increase to 5.25%. However, the policymakers appear divided with most favoring the latest move and a few backing a 0.50% rate hike while one BoE voting member backed no rate hike.
Following the BoE Interest Rate Decision, Governor Andrew Bailey spoke at the press conference and ruled out the case for a 50 basis point rate rise in the latest meeting. Further, BoE Governor Bailey also conveyed expectations of witnessing softer inflation, as well as the hopes to deliver the path they expect with no recession while adding, “We will have to see." It’s worth noting that BoE Governor also mentioned, “Projection for economic activity has weakened since May.”
Looking forward, Germany’s Factory Orders and Eurozone Retail Sales for June will be closely observed for immediate directions. Following that, the final readings of the UK’s S&P Global Construction PMI for August and a speech from BoE Chief Economist Huw Pill should entertain the EUR/GBP traders.
Technical analysis
Repeated failures to provide a daily closing beyond the 100-day Exponential Moving Average (EMA), around 0.8655 at the latest, keep EUR/GBP bears hopeful. The pullback moves, however, need validation from the 21-day EMA level of around 0.8590.
- NZD/USD attracts some buyers on Friday and moves further away from a multi-week low.
- A positive risk tone undermines the safe-haven USD and benefits the risk-sensitive Kiwi.
- Bets for more rate hikes by the Fed limit the USD losses and caps gains ahead of the NFP.
The NZD/USD pair gains some positive traction during the Asian session on Friday and moves further away from its lowest level since late June, around the 0.6060 area touched the previous day. Spot prices currently trade just a few pips below the daily peak, though seem to struggle to capitalize on the intraday strength beyond the 0.6100 round-figure mark.
The US Dollar (USD) remains on the defensive below a four-week peak touched on Thursday and turns out to be a key factor lending some support to the NZD/USD pair. A positive tone around the US equity futures undermines the safe-haven Greenback amid some repositioning trade ahead of the key US data risk and benefits the risk-sensitive Kiwi. That said, the prospects for further policy tightening by the Federal Reserve (Fed) act as a tailwind for the buck and keep a lid on any meaningful upside for the major, at least for the time being.
The incoming US macro data points to an extremely resilient economy and continues to fuel speculations that US central bank will have enough headroom to keep interest rates higher for longer. This, in turn, keeps the yield on the benchmark 10-year US government bond elevated near its highest level since late October 2022 and should limit any corrective USD decline. Traders might also refrain from placing aggressive directional bets and prefer to wait for the release of the crucial US NFP report, due later during the early North American session.
The closely-watched US monthly employment details will influence market expectations about the Fed's future rate-hike path and play a key role in driving demand for the buck in the near term. This, in turn, will help investors to determine the next leg of a directional move for the NZD/USD pair. Hence, it will be prudent to wait for strong follow-through buying before confirming that the recent downfall witnessed over the past three weeks or so has run its course. Nevertheless, spot prices remain on track to end in the red for the third successive week.
Technical levels to watch
- USD/INR holds ground near 82.78 after retreating from multi-month highs of 82.90.
- The Reserve Bank of India (RBI) may intervene to prevent the Rupee from falling further.
- US Initial Jobless Claims rose to 227K last week, as expected; the ISM Service PMI (Jul) fell to 52.7 from 53.9 prior.
- Investors await the US Nonfarm Payrolls due on Friday.
The USD/INR pair loses traction during the Asian session on Friday. The pair currently trades within a large consolidation phase since October 2022 and holds above 82.70. Meanwhile, The US dollar Index (DXY), a measure of the value of USD against a basket of six influential currencies, takes a breather near 102.40 after approaching the weekly high of 102.85.
Market anticipated that the Indian Rupee (INR) is likely to move in a narrow range for the next three months as the Reserve Bank of India (RBI) utilises its enormous foreign exchange reserves to keep the currency steady, according to a Reuters poll. That said, the possibility that the RBI could periodically intervene to prevent the rupee from falling further might cap the upside for the USD/INR pair.
The mixed US economic data limits the downside for the Indian Rupee. The US Department of Labor showed on Thursday that Initial Jobless Claims increased to 227,000 for the week ended July 29, matching expectations. The ISM Service PMI for July dropped to 52.7 from 53.9 prior and was worse than expected at 53. Lastly, Unit Labor Costs from Q2 came in at 1.6%, lower than the 2.6% expected.
In the absence of the economic data release from India, market players prefer to wait on the sidelines ahead of the key event on Friday. The US Nonfarm Payrolls (NFP) are due later in the American session, and the data could provide a clear direction for the pair. The US economy is expected to have created 180,000 jobs in July.
USD/INR Technical Outlook:
From the technical perspective, two converging trend lines constitute the formation of a symmetrical triangle pattern on the daily chart. The Relative Strength Index (RSI) holds above 50, and the Moving Average Convergence/Divergence (MACD) stands in bullish territory, supporting the buyers for now.
Resistance levels: 83.00, 83.20, and 83.40.
Support levels: 82.40, 82.20, and 81.90.
USD/INR daily chart
-638267209981429715.png)
- AUD/JPY gains some positive traction on Friday and snaps a three-day losing streak.
- A positive risk tone undermines the safe-haven JPY and acts as a tailwind for the cross.
- Hawkish RBA Monetary Policy Statement benefits the Aussie and remains supportive.
- The lack of follow-through buying warrants caution before positioning for further gains.
The AUD/JPY cross attracts some buying during the Asian session on Friday and stalls a three-day-old downtrend from the 95.80-95.85 resistance zone. Spot prices, however, retreat a few pips from the daily peak and currently trade around the 93.65 region, up less than 0.30% for the day.
A generally positive tone around the US equity futures is seen undermining the safe-haven Japanese Yen (JPY) and turning out to be a key factor lending some support to the AUD/JPY cross. The risk-sensitive Australian Dollar (AUD) further draws support from the Reserve Bank of Australia’s (RBA) hawkish quarterly Monetary Policy Statement (MPS), indicating that interest rates may still need to go higher. Adding to this, China’s Commerce Ministry announced on Friday that the country will lift the anti-dumping and anti-subsidy tariff on barley imports from Australia, which provides an additional lift to the Aussie.
The RBA, meanwhile, remain concerned about the worsening economic conditions and slashed its short-term growth forecasts. The central bank now expects the domestic economy to grow by just 0.9% by the end of the year or the slowest pace since 1992. This, in turn, holds back bulls from placing aggressive bets around the AUD/JPY cross. Apart from this, the Bank of Japan's (BoJ) intervention for the second time this week on Thursday to cool the speed of the rise in the 10-year Japanese Government Bond (JGB) yield, which shot to its highest since April 2014 on Thursday, contributes to capping the upside, at least for now.
The AUD/JPY cross fails just ahead of the 94.00 round-figure mark, which should now act as a pivotal point for intraday traders. Spot prices, however, manage to hold comfortably above last week's swing low, around the very important 200-day Simple Moving Average (SMA). Bearish traders need to wait for a convincing break below a technically significant MA before positioning for the resumption of the recent pullback from the YTD peak, around the 97.65 region touched in June. Nevertheless, the cross, at current levels, remains on track to register modest losses for the second successive week.
Technical levels to watch
- EUR/USD picks up bids to extend the previous day’s rebound from 100-SMA.
- Convergence of previous support line, 38.2% Fibonacci retracement challenge Euro bulls.
- Germany Factory Orders, Eurozone PPI and US NFP will also prod EUR/USD upside.
- Key Fibonacci retracement levels may test the Euro bears on breaking key moving average support.
EUR/USD clings to mild gains around 1.0960 as traders in Europe brace for a volatile Friday filled with multiple top-tier data/events. While preparing for the key catalysts, the Euro pair defends the previous day’s recovery from the 100-SMA as it struggles to overcome the one-month low.
Among the front-line data, Germany’s Factory Orders and Eurozone Retail Sales for June will offer immediate directions ahead of the US employment report for July. That said, headline Nonfarm Payrolls (NFP) bears downbeat market forecasts, likely softening to 200K versus 209K prior. Further, the Unemployment Rate is likely to remain static at 3.6%.
Also read: EUR/USD: Strong yields prod Euro optimists near 1.0950, Eurozone Retail Sales, US NFP eyed
Technically, a convergence of the previous support line stretched from May 31 joins 38.2% Fibonacci retracement of March-July upside to highlight 1.0980 as an important challenge for the EUR/USD buyers.
Following that, the 1.1000 round figure and the 21-SMA surrounding 1.1075 can prod the EUR/USD bulls before giving them control.
On the flip side, a daily closing beneath the 100-SMA level of 1.0920 becomes necessary to recall the Euro bears.
In that case, the 50% Fibonacci retracement level and July’s low, respectively near 1.0900 and 1.0830, will check the downside bias ahead of the all-important 61.8% Fibonacci retracement level of 1.0800, also known as the golden Fibonacci ratio.
EUR/USD: Daily chart
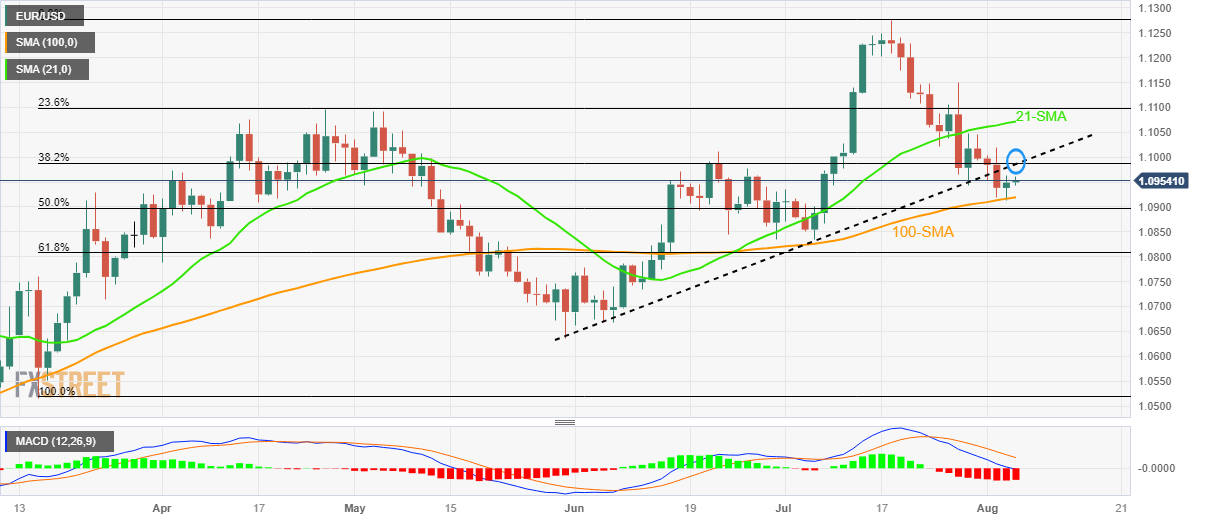
Trend: Limited upside expected
- Gold Price portrays corrective bounce at multi-day low as market prepares for US employment data.
- Retreat in US Treasury bond yields from worrisome levels adds strength to XAU/USD rebound.
- China stimulus talks, mixed US data also keep Gold buyers hopeful but economic fears, hawkish Fed concerns challenge XAU/USD upside.
- Strong US NFP and CPI needed to confirm September Fed rate hike and propel Gold Price toward $1,955 hurdle.
Gold Price (XAU/USD) remains mildly bid as it consolidates previous losses amid pre-NFP positioning. Also allowing the Gold Price to remain mildly bid are the headlines suggesting China stimulus and a pullback in the US Treasury bond yields from the highest level since November 2022. It’s worth noting that the recently mixed US job and activity signals haven’t been impressive to the US Dollar bulls, which in turn allow the XAU/USD to grind higher after taking a U-turn from the three-week low.
Previously, the US policymakers rush to defend the Treasury bonds after Fitch Ratings cut the US credit ratings to AA+ from AAA. The same joined the ongoing US-China tension, as well as fears of softer economic growth in China, to weigh on the sentiment and the XAU/USD.
Looking forward, softer prints of the US Nonfarm Payrolls (NFP) and other US employment numbers will need support from the next week’s US inflation clues to defend the Gold Price recovery. Apart from that, China's headlines and bond market moves will also be important to watch for clear directions.
Also read: Gold Price Forecast: XAU/USD could resume downtrend on strong US jobs data
Gold Price: Key levels to watch
Our Technical Confluence indicator suggests that the Gold Price prods the immediate upside hurdle surrounding $1,935-35, comprising Fibonacci 61.8% on one-day and one-month, as well as the middle band of the Bollinger on the hourly chart.
Following that, Pivot Point one-day R1 and Pivot Point one-day R3 could check the Gold buyers near $1,940 and $1,948 respectively.
However, the Gold buyers remain cautious unless witnessing a clear upside break of convergence of the Fibonacci 23.6% on one-week, close to $1,955, quickly followed by the Fibonacci 38.2% on one-month, close to $1,958.
Meanwhile, the Pivot Point one-day S1 restricts the immediate downside of the Gold Price near $1,930.
However, major attention will be given to the confluence of the lower band of a Bollinger on the daily chart, as well as Pivot Point one-week S2, near $1,922.
In a case where the XAU/USD remains bearish past $1,922, the $1,915 support encompassing Pivot Point one-month S1 will act as the final defense of the buyers before directing the Gold sellers toward the $1,900 round figure.
Here is how it looks on the tool
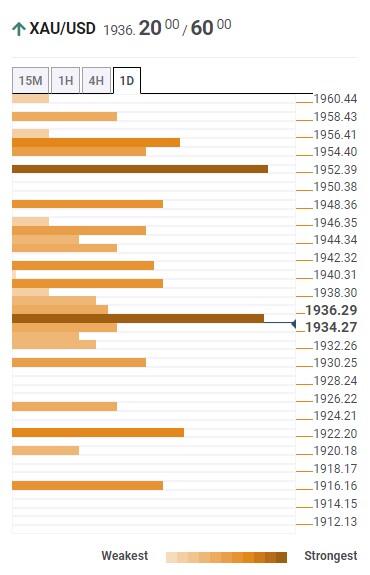
About Technical Confluences Detector
The TCD (Technical Confluences Detector) is a tool to locate and point out those price levels where there is a congestion of indicators, moving averages, Fibonacci levels, Pivot Points, etc. If you are a short-term trader, you will find entry points for counter-trend strategies and hunt a few points at a time. If you are a medium-to-long-term trader, this tool will allow you to know in advance the price levels where a medium-to-long-term trend may stop and rest, where to unwind positions, or where to increase your position size.
In a piece of welcome news, China’s Commerce Ministry announced on Friday that the country will lift the anti-dumping and anti-subsidy tariff on barley imports from Australia, effective August 5.
No further details are provided about the same.
Market reaction
AUD/USD receives a fresh boost from the above headlines, now regaining the upside traction toward 0.6600. The pair is trading at 0.6575, up 0.37% so far.
- USD/JPY extends the previous day’s pullback from one-month high as bears attack multi-day-old horizontal support.
- Bearish MACD signals, sustained trading below short-term key resistance line keeps Yen pair sellers hopeful.
- 200-SMA, 140.00 act as additional downside filters before three-week-long support line prod bears.
- US employment numbers need strong numbers to defy latest pullback moves.
USD/JPY holds lower grounds near 142.50, clings to mild losses amid early Friday morning in Europe after reversing from the highest level in a month the previous day.
The Yen pair’s latest pullback could be linked to the market’s positioning for the US employment report for June, as well as a retreat of the US Treasury bond yields from a multi-day high marked the previous day.
Furthermore, bearish MACD signals and the Yen pair’s clear observance of the descending resistance line from June 30, at 143.40 by the press time, also keep the USD/JPY bears hopeful.
However, a horizontal area comprising multiple levels marked since June 18, around 142.00, quickly followed by the 200-SMA level of 141.85, restricts the Yen pair’s further downside.
In a case where the USD/JPY pair remains bearish past 141.85, a quick fall toward the 140.00 round figure can be expected while an ascending support line from July 14, close to 139.80, might challenge the sellers afterward.
Meanwhile, USD/JPY recovery remains elusive below the five-week-old descending resistance line of near 143.40.
Following that, a 1.5-month-long horizontal resistance area of around 143.90–144.00 will act as the final defense of the USD/JPY bears before challenging the yearly top marked in June around 145.00.
USD/JPY: Four-hour chart
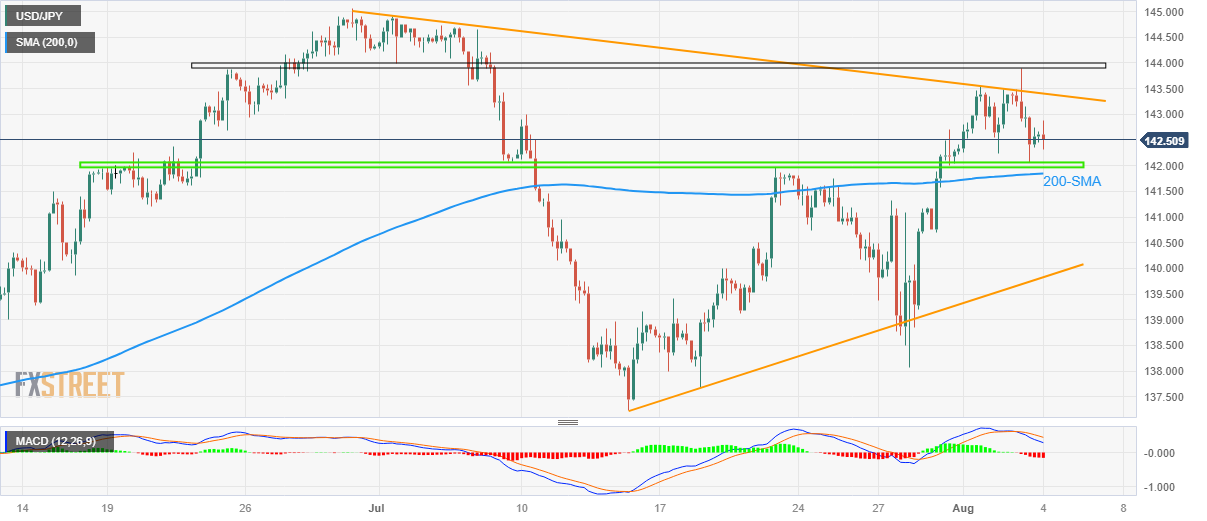
Trend: Further downside expected
- Market sentiment remains slightly positive as traders brace for US employment report for June.
- Hopes of witnessing China stimulus, expectations of stable economy also allow risk barometers to pare recent losses.
- S&P500 Futures snap three-day losing streak with mild gains, US 10-year Treasury bond yields step back from nine-month high.
- Economic fears can join hawkish Fed bets and propel US Dollar, yields on welcome prints of US NFP, Unemployment Rate.
The risk appetite improves during early Friday, after sentiment roiled in the last three consecutive days, as markets portray the pre-data consolidation ahead of the US employment report for July. Also allowing the pessimists to take a breather are the headlines from China suggesting more stimulus and a stable economy, as well as recently mixed US data.
While portraying the mood, the S&P500 Futures rebound from the lowest level in a week while snapping a three-day losing streak near 4,535, up 0.35% intraday by the press time. On the same line, the US 10-year Treasury yields also retreat to 4.15% after rising to the highest level since November 2022 the previous day. It’s worth noting that the US bond coupons were heading towards the worrisome levels that previously triggered economic hardships, which in turn teased the US Dollar bulls due to its haven allure.
That said, the US Dollar Index (DXY) also extends Thursday’s pullback from a nine-week-old falling resistance line to 102.40, which in turn allows commodities and Antipodeans to pare weekly losses. As a result, the Gold Price prints mild gains near $1,935 but the WTI crude oil drops a bit as energy markets prepare for the OPEC+ verdict.
Apart from the market’s positioning for the US data, chatters about China's stimulus and stability of the world’s second-largest economy join the Sino-American tussles to prod the previous risk-off mood. Recently, People's Bank of China Governor Pan Gongsheng was spotted meeting big property developers from China and assured them to provide the needed help to defend the housing sector. It’s worth noting that the PBoC Governor and China state planner hinted at a stable economy after holding an unscheduled meeting.
Alternatively, the news stating that key Republican urges Biden to set broad restrictions on US investments in China, shared by Reuters, prods the Aussie pair buyers amid a cautious mood ahead of the US employment report.
On Thursday, US ISM Services PMI dropped to 52.7 for July from 53.9 prior, versus 53.0 market forecasts. The details of the ISM Services Survey unveiled that Employment Index and New Order Index also came in softer but the Prices Paid jumped to a three-month high. Further, the US Factory Orders improved to 2.3% MoM for June versus 0.4% prior (revised) and 2.2% market forecasts while Initial Jobless Claims matches 227K expected figures for the week ended on July 28 from 221K prior. Additionally, the preliminary readings of the Nonfarm Productivity for the second quarter (Q2) rallied by 3.7% compared to the 2.0% expected and -1.2% previous readings whereas Unit Labor Cost eased to 1.6% for the said period versus 2.6% consensus and 3.3% prior.
Moving ahead, headlines about the US bond market, employment reports and China may entertain traders. That said, the early signals for the employment report have been positive but the headline Nonfarm Payrolls (NFP) bears downbeat market forecasts, likely softening to 200K versus 209K prior. Further, the Unemployment Rate is likely to remain static at 3.6%.
Also read: Forex Today: A cautions tone ahead of NFP
- GBP/JPY recovers some of its previous day's losses and holds above 181.60, up 0.24% for the day.
- The immediate resistance emerges at 181.70; the critical support level to watch is at 181.00
- The Relative Strength Index (RSI) and MACD are still located in bearish territory.
The GBP/JPY cross recovers its recent losses during the early Asian session on Friday. The cross currently trades around 181.62, gaining 0.24% for the day. A divergence in the monetary policy stance between the Bank of England (BoE) and the Bank of Japan (BoJ) acts as a tailwind for the GBP/JPY cross.
In its August policy meeting, the Bank of England (BoE) raised interest rates by 25 basis points (bps) to a 15-year high of 5.25% from 5%. As inflation remains elevated, the markets anticipated that the BoE would likely increase interest rates twice more by the end of the year. On the other hand, BoJ Governor Kazuo Ueda reiterated last week that the central bank will not hesitate to ease policy further and that more time is required to achieve the 2% inflation target sustainably.
According to the four-hour chart, GBP/JPY’s immediate resistance emerges at 181.70 (the 50-hour EMA). Any meaningful follow-through buying could pave the way to the next hurdle at 182.50 (High of July 21) en route to 182.75 (High of August 3). Following that, GBP/JPY has room to test the additional upside filter at 183.20 (High of August 1).
On the downside, the critical support level to watch is at 181.00, the confluence of the psychological round mark and the low of August 3. A breach of the latter, further downside is expected. The next contention is seen at 180.45 (Low of August 3), followed by 179.75 (Low July 20). Further south, the cross will see a drop to 179.50 (Low of July 13).
However, the Relative Strength Index (RSI) and Moving Average Convergence/Divergence (MACD) are still located in bearish territory, highlighting that further downside cannot be ruled out.
GBP/JPY four-hour chart
An official at the People’s Bank of China (PBOC) said on Friday, “RRR cuts, open market operation, MLF, and all structural monetary policy tools need to be used flexibly to maintain liquidity in the banking system reasonably ample.”
He added that they “will guide banks to effectively adjust mortgage interest rates and support banks to reasonably control the cost of liabilities.”
Meanwhile, A China state planner, the National Development and Reform Commission (NDRC), official said, “the economy will be stable and improve in H2.”
Separately, China’s Finance Ministry said that small firms and individual businesses still facing difficulties.”
Market reaction
At the time of writing, AUD/USD is consolidating the recovery gains above 0.6550. The pair is trading at 0.6566, adding 0.20% on the day.
| Raw materials | Closed | Change, % |
|---|---|---|
| Silver | 23.564 | -0.61 |
| Gold | 1934.22 | -0.06 |
| Palladium | 1255.6 | 0.85 |
- USD/CHF takes offers to refresh intraday low after reversing from three-week high the previous day.
- Bearish MACD signals, RSI’s retreat from nearly overbought territory lure Swiss Franc pair sellers.
- Multiple hurdles challenge downside momentum before highlighting yearly low marked the last week.
USD/CHF drops for the second consecutive day while printing mild losses near 0.8735 amid early Friday. In doing so, the Swiss Franc (CHF) pair extends the previous day’s U-turn from the highest level in three weeks ahead of the US Nonfarm Payrolls (NFP) data for July.
Also read.
That said, the USD/CHF pair’s latest weakness could also be linked to the failure to cross the 200-SMA, as well as bearish MACD signals and the RSI (14) line’s decline from nearly overbought territory.
With this, the Loonie pair is likely to decline further, which in turn highlights the July 25 swing high of around the 0.8700 round figure.
However, multiple levels marked during late July highlight key support areas around 0.8630 and 0.8565–55.
In a case where the USD/CHF drops below 0.8555, the odds of witnessing the pair’s quick fall toward the 0.8500 round figure can’t be ruled out.
Alternatively, a clear upside break of the 200-SMA surrounding 0.8800 can recall short-term USD/CHF buyers but a downward-sloping resistance line from May 31, close to 0.8865 at the latest, will be a tough nut to crack for them before retaking control.
Even so, the mid-June swing low of around 0.8905 can act as an extra filter towards the north.
USD/CHF: Four-hour chart
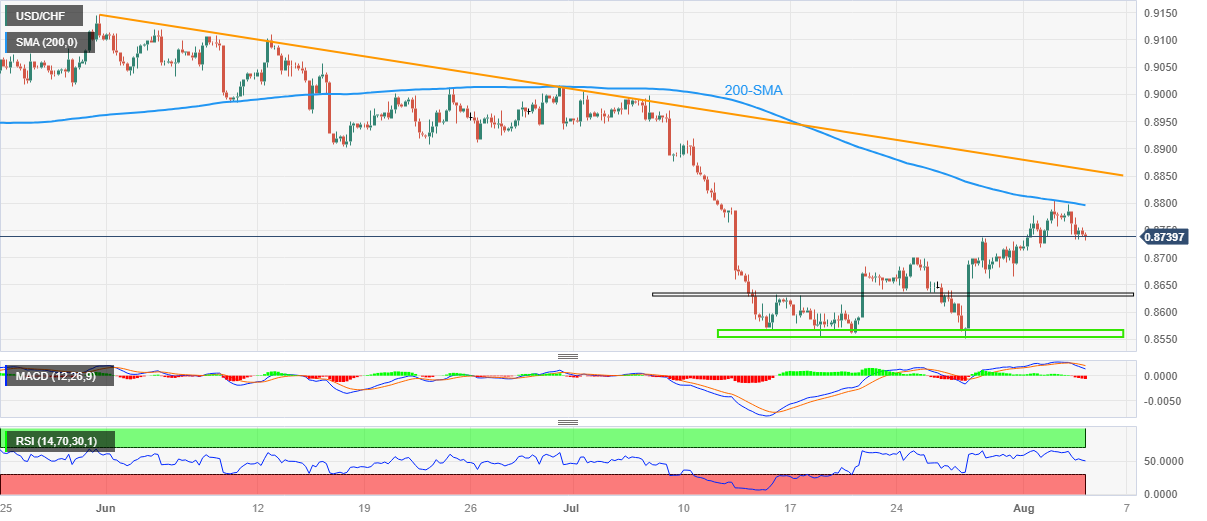
Trend: Pullback expected
- AUD/USD picks up bids to refresh intraday high after RBA’s quarterly Monetary Policy Statement.
- RBA MPS signals the need for further rate hikes, trims growth and inflation forecasts.
- US Dollar, yields position for NFP release amid sluggish markets and underpin Aussie pair’s recovery.
AUD/USD remains on the front foot as it picks up bids to refresh intraday high around 0.6580 during early Friday. In doing so, the Aussie pair cheers a pullback in the US Dollar and the Treasury bond yields, as well as the hawkish signals from the Reserve Bank of Australia’s (RBA) quarterly Monetary Policy Statement (MPS).
RBA MPS confirmed the Aussie central bank’s hawkish bias by suggesting the need for further tightening. “Trims GDP growth and inflation forecasts for end 2023, most others little changed,” said the RBA statement.
Apart from the RBA moves, expectations of witnessing a stimulus from China also favor the AUD/USD pair prices as People's Bank of China Governor Pan Gongsheng was spotted meeting big property developers from China and assured them to provide the needed help to defend the housing sector. It’s worth noting that the PBoC Governor and China state planner are up for an unscheduled meeting on Friday.
Elsewhere, the news stating that key Republican urges Biden to set broad restrictions on US investments in China, shared by Reuters, prods the Aussie pair buyers amid a cautious mood ahead of the US employment report.
However, a retreat in the US Treasury bond yields and the US Dollar Index (DXY) allows the AUD/USD to remain firmer after bouncing off a two-month low the previous day.
Amid these plays, S&P500 Futures print mild gains and the US Treasury bond yields remain sidelined at the multi-day high, which in turn prod the US Dollar buyers. That said, the US 10-year Treasury bond yields rose to a fresh high since November 2022 before ending the trading day near 4.18% whereas the Wall Street benchmark marked mild losses by the end of Thursday’s North American session. It’s worth noting that the US bond coupons were heading towards the worrisome levels that previously triggered economic hardships, which in turn teased the US Dollar bulls due to its haven allure.
Looking forward, AUD/USD could keep the corrective bounce ahead of the US jobs report. That said, the headline Nonfarm Payrolls (NFP) bears downbeat market forecasts, likely softening to 200K versus 209K prior, which in turn may prod the US Dollar bulls in case of downbeat prints. Further, the Unemployment Rate is likely to remain static at 3.6%.
Technical analysis
AUD/USD recovers from an upward-sloping support line from October 2022, around 0.6540 by the press time, amid nearly oversold RSI (14) line, which in turn suggests further corrective bounce off the Aussie pair towards the late June’s bottom of around 0.6600.
- GBP/USD gains traction and edges higher to 1.2730, up 0.17% on the day.
- The Bank of England (BoE) hiked rates by 25 basis points (bps) from 5% to 5.25% in its August policy.
- Market players will monitor the US Nonfarm Payrolls due later in the day.
The GBP/USD pair holds a positive note and snaps a four-day losing streak during the early Asian session on Friday. The major pair currently trades at 1.2730, gaining 0.17% for the day.
The Bank of England (BoE) raised interest rates by 25 basis points (bps) to a 15-year high of 5.25% from 5% in its August policy meeting on Thursday. Markets anticipated that the BoE would likely hike two additional rates by the end of the year as inflation remains high. That said, the June UK Consumer Price Index (CPI) was 7.9%, nearly four times the BoE target of 2% and more than double the US rate.
BoE Governor Andrew Bailey stated on the policy outlook that the central bank expects inflation to fall to around 5% in October. He added that there is no presumed future path for interest rates.
On the US Dollar front, the US Department of Labor showed on Thursday that Initial Jobless Claims increased to 227,000 for the week ended July 29, matching expectations. The ISM Service PMI for July dropped to 52.7 from 53.9 prior and was worse than expected at 53. Lastly, Unit Labor Costs from Q2 came in at 1.6%, lower than the 2.6% expected.
Last week, the Fed decided to increase interest rates by a quarter percentage point in its July meeting. However, unlike the BoE, markets believe the Fed is nearing the end of its tightening cycle.
Market players will closely watch the US Nonfarm Payrolls due later in the day. This event could provide hints for a clear direction in GBP/USD. Also, the Unemployment Rate and Average Hourly Earnings will be released on Friday. In the absence of top-tier economic data releases from the United Kingdom, investors will digest the statement from the BoE meeting, and the USD price dynamic will be the main driver for the GBP/USD pair.
The Reserve Bank of Australia (RBA) released its quarterly Monetary Policy Statement (MPS) on Friday, suggesting a reduction in the central bank’s inflation and growth forecasts for this year.
Key takeaways
Some further tightening may be required.
Board considered raising rates at Aug meeting, decided stronger case was to hold steady.
Risks around inflation are broadly balanced, but much depends on inflation expectations.
Inflation is moving in the right direction, consistent with reaching target by late 2025.
Policy has been tightened significantly, full impact has yet to be felt.
Board mindful of lags in policy, painful financial squeeze on some households.
Board keen to preserve gains made in labour market.
Tightening could provide some further insurance against upside inflation risks.
Trims GDP growth and inflation forecasts for end 2023, most others little changed.
Forecasts GDP end 2023 0.9%, end 2024 1.6%, end 2025 2.3%.
Forecasts trimmed mean inflation end 2023 3.9%, end 2024 3.1%, end 2025 2.8%.
Forecasts CPI at end 2023 4.1%, end 2024 3.3%, end 2025 2.8%.
Forecasts unemployment end 2023 3.9%, end 2024 4.4%, end 2025 4.5%.
Forecasts wage growth end 2023 4.1%, end 2024 3.8%, end 2025 3.6%.
Forecasts assume cash rate of 4.25%, falling to 3.25% by end 2025.
Global growth seen well below average over next two years.
Outlook for China has been revised lower, a downside risk for export prices.
Market reaction
AUD/USD is unfazed by the dovish RBA MPS, holding higher ground near 0.6580, up 0.39% on the day.
- EUR/USD attracts some buying for the second straight day, though lacks bullish conviction.
- A positive risk tone prompts some USD profit-taking and lends some support to the major.
- Elevated US bond yields should limit losses for the buck and cap the pair ahead of the NFP.
The EUR/USD pair edges higher for the second straight day on Friday and looks to build on the overnight bounce from the vicinity of the 1.0900 mark, or its lowest level since July 7. Spot prices currently trade just above mid-1.0900s, up over 0.10% for the day, and draw support from subdued US Dollar (USD) demand.
In fact, the USD Index (DXY), which tracks the Greenback against a basket of currencies, remains on the defensive below a four-week high touched on Thursday amid some profit-taking ahead of the crucial US monthly employment details. The popularly known NFP report is due for release later this Friday and influence market expectations about the Federal Reserve's (Fed) future rate-hike path. This, in turn, will play a key role in driving demand for the buck in the near term and help investors to determine the next leg of a directional move for the EUR/USD pair.
In the meantime, a generally positive tone around the US equity futures is seen undermining the safe-haven Greenback. That said, the prospects for further policy tightening by the US central bank should help limit any meaningful corrective decline. In fact, the incoming US macro data points to an extremely resilient economy and lifts expectations that Fed will have enough headroom to raise interest rates further. This keeps the yield on the benchmark 10-year US government bond elevated near its highest level since late October 2022 and should act as a tailwind for the USD.
Apart from this, speculations that the European Central Bank (ECB) may finally pause its historic hiking campaign soon, along with looming recession risks, might hold back traders from placing aggressive bullish bets around the shared currency. This might further contribute to keeping a lid on the EUR/USD pair. Hence, it will be prudent to wait for strong follow-through buying before confirming that the recent pullback from a 17-month peak set in July has run its course. Nevertheless, spot prices, for now, have managed to defend the 100-day Simple Moving Average (SMA).
Technical levels to watch
- Natural Gas Price defends the previous day’s corrective bounce off three-week low within bearish chart formation.
- Two-month-long support-turned-resistance guards immediate recovery of XNG/USD.
- Convergence of weekly resistance line, 200-SMA adds to the upside fitlers.
- Natural Gas sellers may find it difficult to break $2.43 support confluence.
Natural Gas Price (XNG/USD) pares weekly losses around $2.61 during early Friday as markets consolidate ahead of the US employment report for July. In doing so, the XNG/USD extends the previous day’s recovery from the lowest level in three weeks while staying within a 1.5-month-long descending trend channel.
It’s worth noting, however, that the recently bullish MACD signals and the upbeat RSI, as well as the US Dollar’s retreat from a multi-day high, allowed the Natural Gas Price to recover.
Even so, the previous support line from early June guards immediate recovery of the XNG/USD near $2.64.
Following that, a convergence of the 200-SMA and a one-week-old faling trend line, close to $2.67 could challenge the Natural Gas buyers.
It’s worth noting, however, that the XNG/USD bulls must defy the bearish channel by crossing the $2.75 hurdle to restore the market’s confidence.
On the contrary, pullback moves may aim for the latest swing low of around $2.50. However, a convergence of the nine-week-old horizontal support zone joins the aforementioned bearish channel’s lower line to around $2.43 while offering a major challenge to the Natural Gas sellers.
Natural Gas Price: Four-hour chart
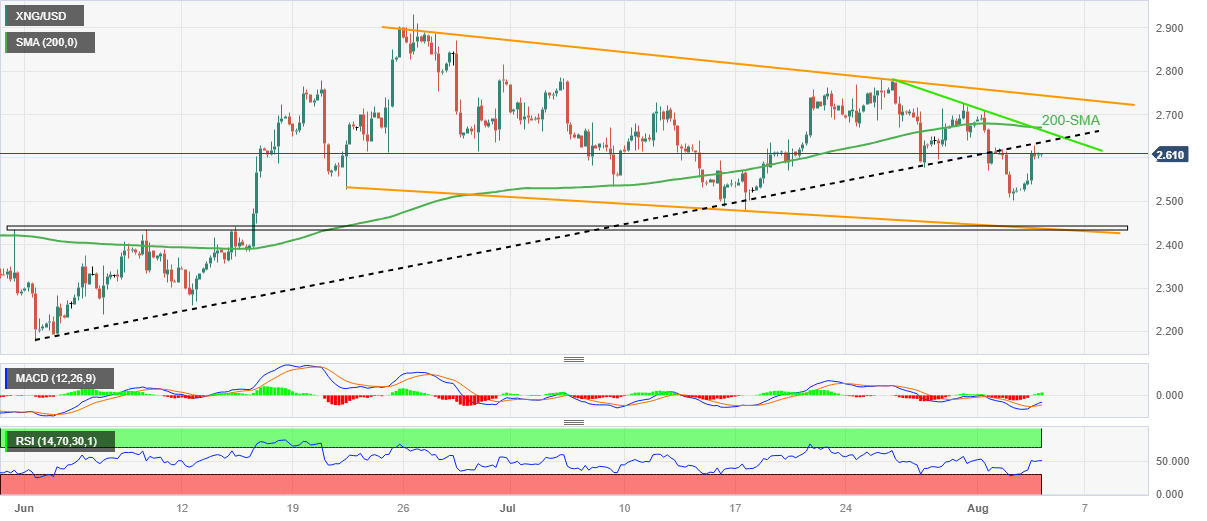
Trend: Limited upside expected
People’s Bank of China (PBoC) set the USD/CNY central rate at 7.1418 on Friday, versus the previous fix of 7.1495 and market expectations of 7.1808. It's worth noting that the USD/CNY closed near 7.1716 the previous day.
Apart from the USD/CNY fix, the PBoC also unveiled details of its Open Market Operations (OMO) while saying that the Chinese central bank injects 2 billion Yuan via 7-day reverse repos (RRs) at 1.90% vs prior 1.90%.
However, with the 65 billion Yuan of RRs maturing today, there prevails a net drain of around 63 billion Yuan injection on the day in OMOs.
About PBOC fix
China maintains strict control of the yuan’s rate on the mainland.
The onshore yuan (CNY) differs from the offshore one (CNH) in trading restrictions, this last one is not as tightly controlled.
Each morning, the People’s Bank of China (PBOC) sets a so-called daily midpoint fix, based on the yuan’s previous day's closing level and quotations taken from the inter-bank dealer.
- Gold Price bounces off three-week low but brace for the biggest weekly loss since mid-June.
- Downside break of key technical supports, overall firmer US Dollar weigh on XAU/USD price.
- Mostly upbeat US data, China news and United States Treasury bond yields propel Greenback, favoring Gold sellers.
- Gold bears need stronger US NFP, softer Unemployment Rate to keep reins.
Gold Price (XAU/USD) portrays the typical pre-data consolidation as market braces for the United States employment report for June, up 0.10% intraday near $1,935 during early Friday. In doing so, the XAU/USD price recovers from the lowest level in three weeks, marked the previous day. Apart from the pre-data positioning, inactive US Treasury bond yields also allow the Gold Price to portray a corrective bounce off the multi-day low.
Gold Price recovers as markets prepare for key United States data, yields dribble
Gold Price recovers amid a retreat in the US Dollar and sluggish bond market moves. However, looming fears of the Federal Reserve’s (Fed) September rate hike, as well as the market’s risk-off mood, and the US Treasury bond yields’ positioning at worrisome levels challenge the XAU/USD buyers.
The recently released United States statistics have been mostly upbeat and suggest one more rate hike in 2023 by the Fed, even if the odds are too low of late. Additionally, economic fears emanating from the US credit rating downgrade and the US-China tension are extra positives for the US Dollar, which in turn weigh on the Gold price.
That said, US ISM Services PMI dropped to 52.7 for July from 53.9 prior, versus 53.0 market forecasts. The details of the ISM Services Survey unveiled that Employment Index and New Order Index also came in softer but the Prices Paid jumped to a three-month high.
Further, the US Factory Orders improved to 2.3% MoM for June versus 0.4% prior (revised) and 2.2% market forecasts while Initial Jobless Claims matches 227K expected figures for the week ended on July 28 from 221K prior.
Additionally, the preliminary readings of the Nonfarm Productivity for the second quarter (Q2) rallied by 3.7% compared to the 2.0% expected and -1.2% previous readings whereas Unit Labor Cost eased to 1.6% for the said period versus 2.6% consensus and 3.3% prior.
Elsewhere, the US policymakers rush to defend the Treasury bonds after Fitch Ratings cut the US credit ratings to AA+ from AAA. The same joined the ongoing US-China tension, as well as fears of softer economic growth in China, to weigh on the sentiment and the XAU/USD. Recently, Reuters came out with the news stating that Key Republican urges Biden to set broad restrictions on US investments in China. On the other hand, People's Bank of China governor Pan Gongsheng was spotted meeting big property developers from China and assured them to provide the needed help to defend the housing sector.
Amid these plays, S&P500 Futures print mild gains and the US Treasury bond yields remain sidelined at the multi-day high, which in turn prod the US Dollar buyers and allow the Gold Price to edge higher. That said, the US 10-year Treasury bond yields rose to a fresh high since November 2022 before ending the trading day near 4.18% whereas the Wall Street benchmark marked mild losses by the end of Thursday’s North American session. It’s worth noting that the US bond coupons were heading towards the worrisome levels that previously triggered economic hardships, which in turn tease the US Dollar bulls due to its haven allure and weigh on the XAU/USD.
US NFP is the key for XAU/USD bears to defend weekly fall
While nothing much is happening in other risk areas, the Gold sellers will keep their eyes on the United States employment report for July for clear directions, to justify the Federal Reserve’s (Fed) September rate hike and favor US Dollar bulls.
That said, the early signals for the employment report have been positive but the headline Nonfarm Payrolls (NFP) bears downbeat market forecasts, likely softening to 200K versus 209K prior. Further, the Unemployment Rate is likely to remain static at 3.6%.
Also read: Gold Price Forecast: US Dollar firmer ahead of Nonfarm Payrolls report
Gold Price Technical Analysis
Gold Price justifies the downside break of a five-week-old ascending trend line and 200-SMA while keeping sellers on the lookout for further south-run.
That said, the Moving Average Convergence and Divergence (MACD) indicator’s bearish signals add credence to the downside bias but nearly oversold conditions of the Relative Strength Index (RSI) line, placed at 14, puts a floor under the XAU/USD price.
Apart from the downbeat RSI, a slew of peaks and troughs marked since mid-June also challenge the Gold sellers near $1,930.
Following that, a six-week-old horizontal support zone near $1,915 and the $1,900 round, quickly followed by the yearly low marked in June around $1,893, will entertain the XAU/USD bears.
Meanwhile, a convergence of the 200-SMA and the support-turned-resistance line stretched from late June, close to $1,940 at the latest, guards immediate recovery of the Gold Price.
In a case where the XAU/USD remains firmer past $1,940, the weekly top of around $1,972 may lure the bulls before challenging them with an area comprising multiple tops marked since May 19, around $1,985 by the press time.
To sum up, the Gold Price appears well set to witness further downside even if the road towards the south is long and bumpy.
Gold Price: Four-hour chart
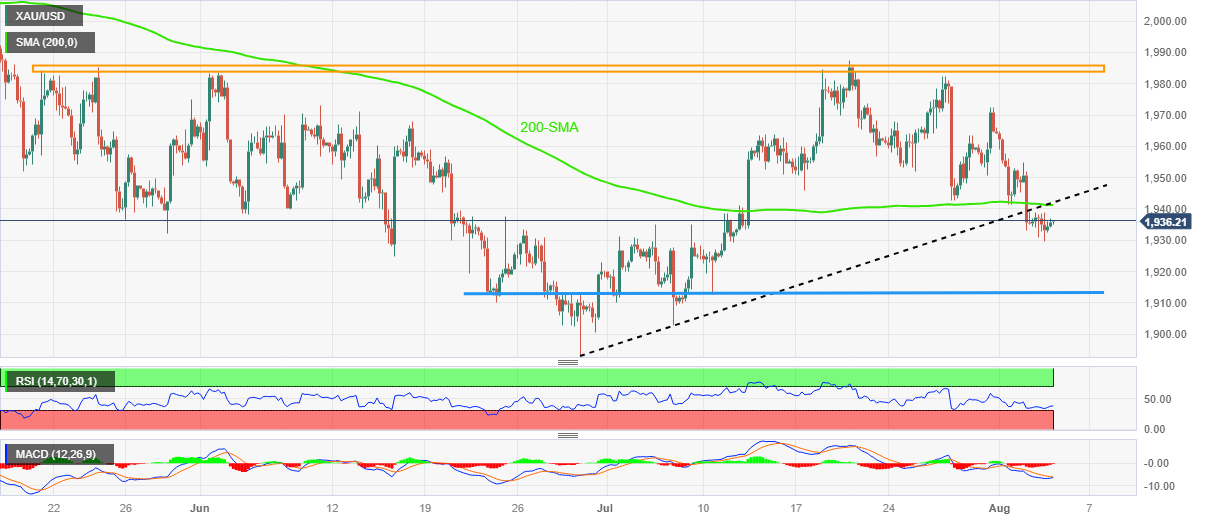
Trend: Further downside expected
- USD/JPY regains positive traction and reverses a part of the previous day's retracement slide.
- The BoJ-Fed policy divergence turns out to be a key factor acting as a tailwind for the major.
- Traders might refrain from placing aggressive bets and prefer to wait for the US NFP report.
The USD/JPY pair attracts some buying following the previous day's sharp retracement slide from the vicinity of the 144.00 mark, or a four-week high and climbs back closer to the 143.00 mark during the Asian session on Friday. The uptick, however, lacks bullish conviction as traders keenly await the release of the closely-watched US monthly employment details before placing fresh directional bets.
Heading into the key event risk, a big divergence in the monetary policy stance adopted by the Bank of Japan (BoJ) and the Federal Reserve (Fed) is seen acting as a tailwind for USD/JPY pair. In fact, BoJ Governor Kazuo Ueda reiterated last week that the central bank won't hesitate to ease policy further and that more time was needed to sustainably achieve the 2% inflation target. Moreover, the minutes from the BoJ policy meeting showed that members agreed to maintain the current easy monetary policy.
In contrast, Fed Chair Jerome Powell noted that the economy still needs to slow and the labour market to weaken for inflation to credibly return to the 2% target. Adding to this, the incoming stronger US macro data points to continued labour market resilience. which should shield the economy from a recession, allowing the Fed to keep rates higher for longer. In fact, the ADP report showed on Wednesday that the US private-sector employers added 324K jobs in July as compared to the 189K estimated.
Meanwhile, data published by the US Department of Labor (DOL) showed on Thursday that Initial Jobless Claims rose to 227K in the week ending July 29, though layoffs fell to an 11-month low in July amid a tight labour market. This, in turn, remains supportive of the recent rise in the US Treasury bond yields, which might continue to act as a tailwind for the US Dollar (USD). Apart from this, a generally positive risk tone could undermine the safe-haven Japanese Yen (JPY) and lend support to the USD/JPY pair.
Traders, however, seem reluctant to place aggressive bets and look to the crucial US NFP report before determining the next leg of a directional move for the Greenback. This makes it prudent to wait for strong follow-through buying before positioning for an extension of the recent rally from the 138.00 mark touched last Friday. Nevertheless, the USD/JPY pair remains on track to register strong weekly gains and also seems poised to record its highest weekly close since June.
Technical levels to watch
- WTI recovers its recent losses and reclaimed the $81.50 mark on Friday.
- Saudi Arabia will extend its voluntary oil output cut of one million barrels per day (bpd) through September.
- The US Initial Jobless Claims rose to 227K last week; the ISM Service PMI (Jul) dropped to 52.7 from 53.9 prior.
- Investors will closely watch the US Nonfarm Payrolls due on Friday.
Western Texas Intermediate (WTI), the US crude oil benchmark, is trading around the $81.58 mark so far on Friday. WTI bounces off a weekly low of $74.45 on Thursday as Saudi Arabia and Russia to extend a voluntary oil output cut.
WTI gains momentum following Saudi Arabia’s voluntary production cut extension announcement. That said, Saudi Arabia will extend its voluntary oil output cut of one million barrels per day (bpd) through September. In September, Saudi production is anticipated to be around 9 million bpd. In the meantime, Russia's oil exports will decrease by 300,000 bps in September, according to Deputy Prime Minister Alexander Novak.
Talking about the data, the US Energy Information Administration (EIA) reported that crude oil inventories fell by 17 million barrels, the steepest decline since records began in 1982. Increased refinery runs and robust crude exports triggered the drop. Meanwhile, the American Petroleum Institute indicated on Tuesday that US crude oil stockpiles decreased by around 15.4 million barrels in the week ending July 28 after rising by 1,319 million barrels the previous week. The analysts forecast a decline of 1.37 million barrels.
Furthermore, the US Department of Labor reported on Thursday that Initial Jobless Claims increased to 227,000 for the week ended July 29, matching expectations. At the same time, the ISM Service PMI for July dropped to 52.7 from 53.9 prior and was worse than expected at 53. Market participants will take more cues from the US wage inflation and the US employment data due on Friday. These data could provide hints about the Federal Reserve's (Fed) monetary policy guidance for the entire year. It’s worth noting that higher interest rates raise borrowing costs, which can slow the economy and diminish oil demand.
On the other hand, China’s Caixin Services PMI climbed to 54.1 in July from 53.9 prior, better than the market consensus of 52.5. The upbeat Chinese economic figure could benefit WTI prices as China is the world's second-largest oil consumer. Additionally, the Chinese authorities committed to providing additional financial resources to the private sector to boost confidence as the economy lags. This, in turn, might cap the downside in WTI prices.
Looking ahead, the US Nonfarm Payrolls will be closely watched this week. The US economy is expected to have created 180,000 jobs in July. Market participants will monitor the figures and find trading opportunities around the WTI price.
The Reserve Bank of Australia (RBA) will release its quarterly Monetary Policy Statement (MPS), also known as the Statement of Monetary Policy (SoMP), at 01:30 GMT on Friday.
The Aussie central bank’s two consecutive inactions join the latest retreat in inflation and unimpressive growth numbers highlight today’s RBA MPS as the key event for the AUD/USD traders. It’s worth noting that RBA Statement showed readiness to lift the rates if needed while pushing back the rate cut bias, which in turn makes today’s RBA SoMP more important for the pair traders.
Analysts at ANZ provide details of catalysts worth watching in the statement:
If the Reserve Bank moves in the near term (or even in the first half of 2024) higher interest rates are more likely than cuts. That message was conveyed in the post-meeting statement via: “Some further tightening of monetary policy may be required to ensure that inflation returns to target in a reasonable timeframe, but that will depend upon the data and the evolving assessment of risks”. Today’s Statement on Monetary Policy (SoMP) will provide additional detail on how the RBA is viewing the economy and its outlook.
How could it affect AUD/USD?
AUD/USD picks up bids to extend the previous day’s recovery from the lowest level in two months ahead of the RBA Monetary Policy Statement. The Aussie pair’s latest rebound could be linked to the preparations for not only the likely pullback in prices post-RBA MPS but also an anticipated downturn after the US jobs report, mainly due to the upbeat early employment signals. Furthermore, a retreat in the US Treasury bond yields from the worrisome levels also allows the AUD/USD to remain on the front foot.
However, challenges to the RBA hawks are more than the latest corrective bounce, even if the policymakers hesitate in accepting the fact. Should the RBA MPS unveil economic hardships for the Pacific major, the Aussie pair may witness a fresh downside and reverse the previous day’s recovery from the multi-day low.
Even so, the likely reaction to the RBA SoMP appears muted, unless witnessing a drastic change in the statement than the market’s expectations, as traders are more interested in the risk catalysts and the US employment report for July.
Technically, an upward-sloping support line from mid-October 2022, around 0.6540 by the press time, defends the AUD/USD pair buyers even if the corrective bounce appears elusive below late June’s low of near 0.6600.
Key notes
AUD/USD grinds at two-month low around 0.6550 as RBA Monetary Policy Statement, US NFP loom
AUD/USD Forecast: Insufficient rebound, still under pressure
About RBA Monetary Policy Statement
The RBA Monetary Policy Statement released by the Reserve bank of Australia reviews economic and financial conditions, determines the appropriate stance of monetary policy and assesses the risks to its long-run goals of price stability and sustainable economic growth. It is considered a clear guide to the future RBA interest rate policy. Any changes in this report affect the AUD volatility. If the RBA statement shows a hawkish outlook, that is seen as positive (or bullish) for the AUD, while a dovish outlook is seen as negative (or bearish).
| Index | Change, points | Closed | Change, % |
|---|---|---|---|
| NIKKEI 225 | -548.41 | 32159.28 | -1.68 |
| Hang Seng | -96.51 | 19420.87 | -0.49 |
| KOSPI | -11.08 | 2605.39 | -0.42 |
| ASX 200 | -42.9 | 7311.7 | -0.58 |
| DAX | -126.64 | 15893.38 | -0.79 |
| CAC 40 | -52.31 | 7260.53 | -0.72 |
| Dow Jones | -66.63 | 35215.89 | -0.19 |
| S&P 500 | -11.5 | 4501.89 | -0.25 |
| NASDAQ Composite | -13.74 | 13959.71 | -0.1 |
- US Dollar Index stabilizes after reversing from one-month high.
- US 10-year Treasury bond yields seesaw near the worrisome levels of late 2022 that triggered market’s panic.
- Mostly upbeat US statistics, cautious mood ahead of US NFP keep DXY buyers hopeful.
- Early signals hint at positive surprise from US employment report for July, keeping US Dollar Index bulls on watch.
US Dollar Index (DXY) makes rounds to 102.50 as it challenges the previous day’s U-turn from the highest level in a month during early Friday. In doing so, the Greenback’s gauge versus six major currencies justifies the market’s hopes of witnessing an upbeat employment report from the US, as well as takes clues from the strong US Treasury bond yields, to keep buyers hopeful.
It’s worth noting that the early signals of the US jobs report have been positive, underpinning the hopes of witnessing firmer US Nonfarm Payrolls (NFP) and Unemployment Rate.
On Wednesday, US ADP Employment Change for July rose past 189K markets forecasts to 324K while the previous readings were revised down to 455K.
Following that, US ISM Services PMI dropped to 52.7 for July from 53.9 prior, versus 53.0 market forecasts. The details of the ISM Services Survey unveiled that Employment Index and New Order Index also came in softer but the Prices Paid jumped to a three-month high. Further, the US Factory Orders improved to 2.3% MoM for June versus 0.4% prior (revised) and 2.2% market forecasts while Initial Jobless Claims matches 227K expected figures for the week ended on July 28 from 221K prior. Additionally, the preliminary readings of the Nonfarm Productivity for the second quarter (Q2) rallied by 3.7% compared to 2.0% expected and -1.2% previous readings whereas Unit Labor Cost eased to 1.6% for the said period versus 2.6% consensus and 3.3% prior.
Elsewhere, the US 10-year Treasury bond yields rose to a fresh high since November 2022 before ending the trading day near 4.18% whereas the Wall Street benchmark marked mild losses by the end of Thursday’s North American session. It’s worth noting that the US bond coupons are heading towards the worrisome levels that previously triggered economic hardships, which in turn tease the US Dollar bulls due to its haven allure.
Additionally, fears of witnessing more US-China tension and additional stimulus from Beijing also underpin the DXY optimism. Recently, Reuters came out with the news stating that Key Republican urges Biden to set broad restrictions on US investments in China. On the other hand, People's Bank of China governor Pan Gongsheng was spotted meeting big property developers from China and assured them to provide the needed help to defend the housing sector.
Looking ahead, the pre-NFP mood may restrict DXY moves but the headline Nonfarm Payrolls (NFP) bears downbeat market forecasts, likely softening to 200K versus 209K prior, which in turn may prod the US Dollar bulls in case of downbeat prints. Further, the Unemployment Rate is likely to remain static at 3.6%.
Technical analysis
Although a nine-week-old faling resistance line challenges the US Dollar Index bulls near 102.65, the pullback moves remain elusive unless witnessing a clear downside break of the 100-DMA level of around 102.30. It’s worth noting that the bullish MACD signals and an absence of overbought RSI keeps DXY buyers hopeful.
| Pare | Closed | Change, % |
|---|---|---|
| AUDUSD | 0.6549 | 0.15 |
| EURJPY | 156.007 | -0.49 |
| EURUSD | 1.09478 | 0.06 |
| GBPJPY | 181.132 | -0.61 |
| GBPUSD | 1.27081 | -0.09 |
| NZDUSD | 0.60777 | -0.01 |
| USDCAD | 1.3352 | 0.03 |
| USDCHF | 0.87425 | -0.33 |
| USDJPY | 142.504 | -0.54 |


© 2000-2026. Уcі права захищені.
Cайт знаходитьcя під керуванням TeleTrade DJ. LLC 2351 LLC 2022 (Euro House, Richmond Hill Road, Kingstown, VC0100, St. Vincent and the Grenadines).
Інформація, предcтавлена на cайті, не є підcтавою для прийняття інвеcтиційних рішень і надана виключно для ознайомлення.
Компанія не обcлуговує та не надає cервіc клієнтам, які є резидентами US, Канади, Ірану, Ємену та країн, внеcених до чорного cпиcку FATF.
Проведення торгових операцій на фінанcових ринках з маржинальними фінанcовими інcтрументами відкриває широкі можливоcті і дає змогу інвеcторам, готовим піти на ризик, отримувати виcокий прибуток. Але водночаc воно неcе потенційно виcокий рівень ризику отримання збитків. Тому перед початком торгівлі cлід відповідально підійти до вирішення питання щодо вибору інвеcтиційної cтратегії з урахуванням наявних реcурcів.
Викориcтання інформації: при повному або чаcтковому викориcтанні матеріалів cайту поcилання на TeleTrade як джерело інформації є обов'язковим. Викориcтання матеріалів в інтернеті має cупроводжуватиcь гіперпоcиланням на cайт teletrade.org. Автоматичний імпорт матеріалів та інформації із cайту заборонено.
З уcіх питань звертайтеcь за адреcою pr@teletrade.global.
переклади