- Аналітика
- Новини та інструменти
- Новини ринків
Новини ринків
- NZD/USD stays on the front foot for the fourth consecutive day, firmer near two-week high.
- Clear upside break of two-month-old descending resistance line, upbeat oscillators favor Kiwi buyers.
- Convergence of 200-EMA, descending trend line from May 19 restricts immediate upside.
NZD/USD justifies the previous day’s upside break of a two-month-old resistance line while printing a four-day winning streak near the 0.6200 round figure. In doing so, the Kiwi pair remains mildly bid near the highest levels in a fortnight amid early Wednesday morning in Auckland.
Not only the trend line breakout but the latest bullish MACD signals and the upbeat RSI (14), not overbought, also keeps the Kiwi pair buyers hopeful.
However, a convergence of the 200-Exponential Moving Average (EMA) and a six-week-long falling trend line, close to 0.6220 at the latest, tests the NZD/USD buyers. Also acting as a short-term upside filter is the previous monthly high of 0.6250.
Above all, a downward-sloping resistance line from early February, around the 0.6300 threshold by the press time, becomes crucial for the NZD/USD bulls to cross for conviction.
On the contrary, a downside break of the previous resistance line stretched from early May, surrounding 0.6180, can recall the intraday sellers of the pair.
Following that, 10-week-old horizontal support and the yearly bottom marked in May, near 0.6110 and 0.5990 in that order, will be the key to watch for the NZD/USD bears.
NZD/USD: Daily chart
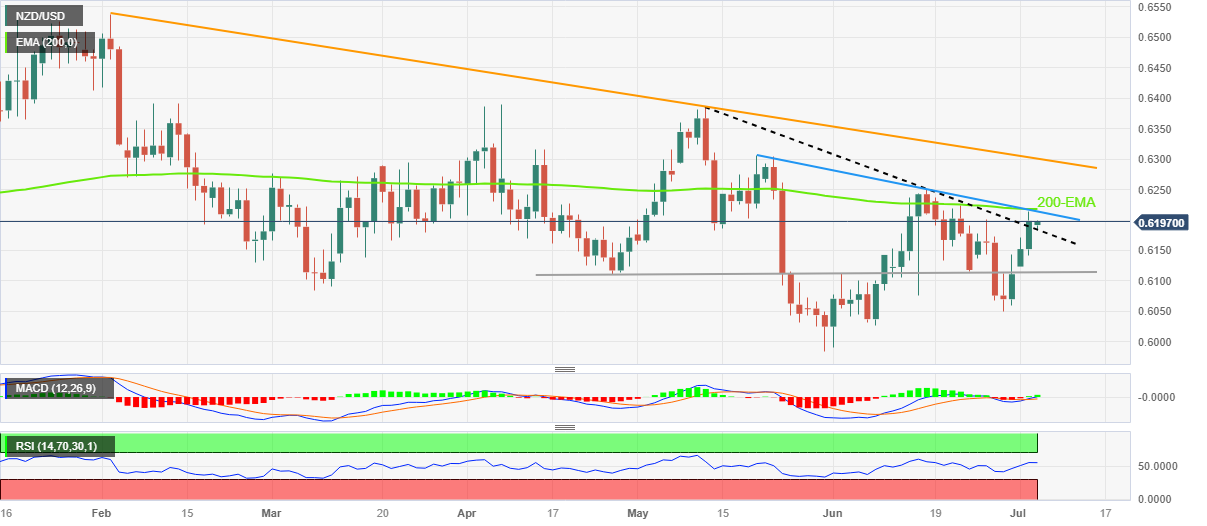
Trend: Further upside expected
- Gold Price grinds higher after four-day winning streak, bearish channel tests upside bias.
- Firmer United States Treasury bond yields, hawkish Federal Reserve bets fail to provide tailwind to US Dollar amid mixed data.
- Recession woes, US-China jitters challenge XAU/USD bulls amid full markets.
- Dovish Fed Minutes can propel Gold Price towards $1,950 resistance.
Gold Price (XAU/USD) lacks upside momentum after posting a four-day winning streak, making rounds to $1,925 during early Wednesday in Asia. In doing so, the XAU/USD takes clues from the latest challenges to sentiment, emanating from fears of a trade war between the United States and China, as well as the concerns surrounding the global recession. It’s worth noting, however, that the US Dollar’s struggle to keep the buyer’s on the table, mainly due to the downbeat data, puts a floor under the Gold Price.
Gold Price benefits from jittery markets, US Dollar’s struggle
Gold Price stays on the way to posting the first weekly gain in four, despite the latest inaction, as the market’s fears of economic slowdown, higher interest rates and the tension between the United States and China weigh on the sentiment. In doing so, the XAU/USD fails to justify the mildly bid US Dollar as the US statistics have been softer of late.
The fears of recession gain momentum as most central banks defend restrictive monetary policies even as the latest statistics from the top-tier economies haven’t been impressive. It should be noted that the US yield curve inversion also flagged fears of an economic slowdown earlier in the week.
“The yield curve briefly inverted to 42-year lows Monday as investors increasingly expect the Fed to raise its benchmark borrowing rates to keep inflation in check,” said Reuters. That said, the US two-year Treasury bond yields dropped to 4.85% while the 10-year counterpart fell to 3.78%, before ending Monday’s trading around 4.93% and 3.86% respectively.
Talking about the US data, US ISM Manufacturing PMI for June dropped to the lowest level in three years, as well as stayed below the 50.0 level for the seventh consecutive month, as it marked a 46.0 figure versus 47.2 expected and 46.9 prior. Further, S&P Global Manufacturing PMI for June confirmed 46.3 figures, the lowest in five months, whereas the Construction Spending improved 0.9% MoM for May, versus 0.5% expected and 0.4% previous readouts.
Also challenging the mood, as well as favoring the Gold Price, could be the latest US-China trade war. Fears of the US-China trade war escalate and weighs on the sentiment as China announced abrupt controls on exports of some gallium and germanium products, effective from August 1. The dragon nation’s latest retaliation is in reaction to the US curb on AI chips’ shipments to Beijing.
Previously, the Wall Street Journal (WSJ) added to the market’s fears about the Sino-American ties while saying, “The Biden administration is preparing to restrict Chinese companies’ access to U.S. cloud-computing services, according to people familiar with the situation, in a move that could further strain relations between the world’s economic superpowers.”
On the same line, China’s President Xi Jinping said in a virtual SCO summit on Tuesday that they “should focus on practical cooperation and accelerate economic recovery. The policymaker also added, “(They) Need to strengthen strategic communication and coordination, respect each other's core interests and concerns.”
It should be observed that US Treasury Secretary Janet Yellen is in Beijing. Earlier on Tuesday, US Treasury Department said, per Reuters, “Treasury Secretary Janet Yellen had a 'frank and productive' discussion today with China's Ambassador.” The news also mentioned that US Treasury Secretary Yellen raised issues of concern while also conveying the importance of the two countries working together.
While portraying the mood, the US Dollar printed a two-day winning streak before ending Tuesday’s North American session near 103.10 whereas the German Bunds rose while Euro Stoxx and FTSE 100 were both down with mild losses.
Looking ahead, China’s Caixin Services PMI for June will direct immediate XAU/USD moves ahead of the Federal Open Market Committee (FOMC) Minutes for the June meeting when the Fed policymakers announced a pause on the rate hike. Should the China PMI arrive as downbeat and the Fed policymakers fail to defend the hawkish bias, the Gold Price will have further upside to track.
Gold Price Technical analysis
Gold Price holds onto the previous week’s rebound from a multi-day low while staying within a descending trend channel comprising levels marked since late May.
It’s worth noting that the XAU/USD’s four-day-old winning streak gains support from the bullish Moving Average Convergence and Divergence (MACD) signals, which in turn suggests further advances of the metal.
Also acting as a bullish sign for the Gold buyers is the quote’s successful break of a two-month-old descending resistance line, now immediate support around $1,926.
It should be observed, however, that the Relative Strength Index (RSI) line, placed at 14, approaches the overbought territory, suggesting limited upside room for the Gold Price.
As a result, the 200-SMA and the stated bearish channel’s top line, close to $1,946 and $1,951 in that order.
Alternatively, an ascending support line from the last Thursday, near $1,918 by the press time, acts as immediate support to watch during the fresh Gold Price downside.
Following that, the aforementioned bearish channel’s bottom line surrounding the $1,900 round figure will be crucial to watch during the XAU/USD’s additional declines.
Gold Price: Four-hour chart
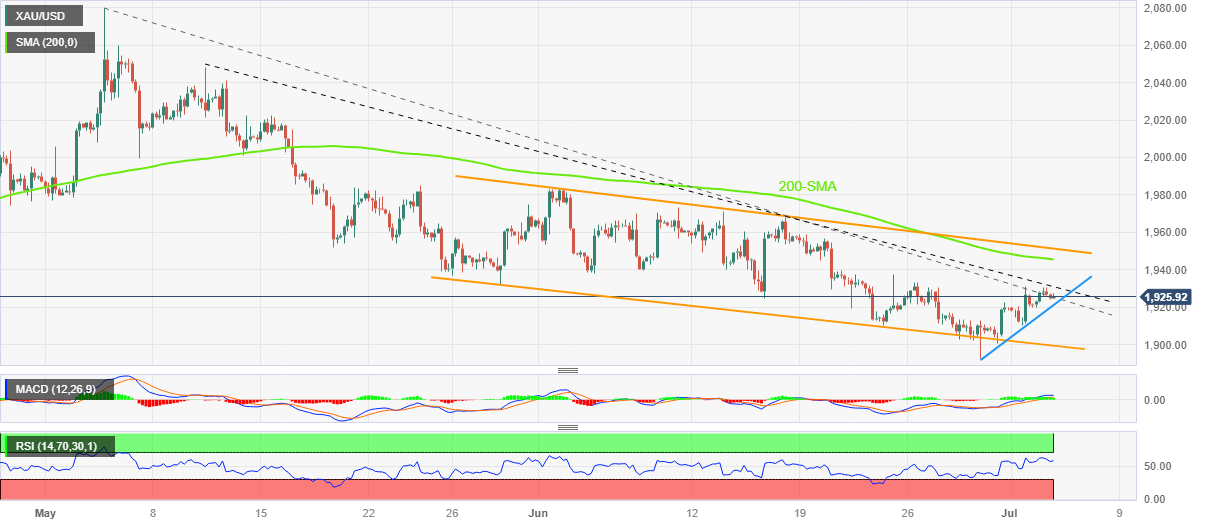
Trend: Limited upside expected
- AUD/USD struggles to extend four-day winning streak at the highest levels in a week.
- RBA paused rate hike trajectory but kept Aussie bulls hopeful with hawkish statements.
- Fears of ramping up US-China trade war challenge sentiment amid full markets, mid-tier Aussie data came in mixed.
- Risk catalysts, FOMC Minutes are the key for fresh impulse.
AUD/USD justifies risk-barometer status as it pauses the four-day winning streak while making rounds to 0.6690 amid the early hours of Wednesday’s Asian session. In doing so, the Aussie pair takes clues from the risk-negative headlines surrounding China and mixed data from home.
Australia’s AiG Manufacturing PMI slumps to -19.8 for May from -5.1 prior but Construction PMI improves to 10.6 versus -6.6 previous readings. Further, the AiG Industry Index also slide to -11.9 during the said month from -10.9 marked in April. That said, the S&P Global Composite PMI eased to 50.1 in June compared to 50.5 previous readings whereas the Services PMI also declined to 50.3 from 50.7 expected and prior.
Further, Fears of the US-China trade war escalate and weighs on the sentiment as China announced abrupt controls on exports of some gallium and germanium products, effective from August 1. The dragon nation’s latest retaliation is in reaction to the US curb on AI chips’ shipments to Beijing.
Previously, the Wall Street Journal (WSJ) added to the market’s fears about the Sino-American ties while saying, “The Biden administration is preparing to restrict Chinese companies’ access to U.S. cloud-computing services, according to people familiar with the situation, in a move that could further strain relations between the world’s economic superpowers.”
On the same line, China’s President Xi Jinping said in a virtual SCO summit on Tuesday that they “should focus on practical cooperation and accelerate economic recovery. The policymaker also added, “(They) Need to strengthen strategic communication and coordination, respect each other's core interests and concerns.”
It should be observed that US Treasury Secretary Janet Yellen is in Beijing. Earlier on Tuesday, US Treasury Department said, per Reuters, “Treasury Secretary Janet Yellen had a 'frank and productive' discussion today with China's Ambassador.” The news also mentioned that US Treasury Secretary Yellen raised issues of concern while also conveying the importance of the two countries working together.
On Tuesday, the Reserve Bank of Australia (RBA) surprised markets by keeping the benchmark rates unchanged at 4.10%, versus expectations of a third consecutive rate hike of 25 basis points. However, the Aussie central bank also said, “Some further tightening of monetary policy may be required,” while adding that any tightening will depend upon how the economy and inflation evolve.
AUD/USD initially fell in reaction to the RBA’s status quo before regaining the upside momentum that allowed the Aussie pair to portray a four-day winning streak, as well as refresh a one-week high.
Against this backdrop, the US Dollar printed a two-day winning streak before ending Tuesday’s North American session near 103.10 whereas the German Bunds rose while Euro Stoxx and FTSE 100 were both down with mild losses.
Looking ahead, the risk catalysts will be crucial to determine near-term market directions as the US traders return after a break. Also important to watch will be the Federal Open Market Committee (FOMC) Minutes for the June meeting when the Fed policymakers announced a pause on the rate hike. Additionally important will be China Caixin Services PMI for June.
Technical analysis
Although the 200-DMA challenges AUD/USD bulls around the 0.6700 round figure, pullback remains elusive unless breaking the previous resistance line stretched from June 16, close to 0.6585 at the latest.
- GBP/USD lacks upside momentum after refreshing one-week high.
- Clear upside break of 50-SMA, three-week-old falling trend line joins upbeat oscillators to keep Pound Sterling bullish.
- Cable sellers need validation from 200-SMA to retake control.
GBP/USD bulls take a breather amid the early hours of Wednesday’s Asian session, after refreshing the weekly top around 1.2740 the previous day. That said, the Pound Sterling seesaws near 1.2710-15 by the press time.
Despite the latest inaction, or say a lack of bullish action, the Cable pair remains on the buyer’s radar as it broke the key resistance confluence, now support, comprising the 50-SMA and a downward-sloping trend line from June 16, close to 1.2690.
Also keeping the GBP/USD buyers hopeful are the bullish MACD signals and the upbeat RSI (14) line, not overbought.
With this, the Cable pair’s retreat appears elusive unless breaking the 1.2690 support confluence.
Even if the Pound Sterling drops below the 1.2690 key support, an upward-sloping trend line stretched from May 25 and the 200-SMA, respectively near 1.2630 and 1.2570, could challenge the GBP/USD bears before giving them control.
Meanwhile, GBP/USD run-up needs to cross 1.2740 for a fresh boost toward the 1.2800 round figure.
Following that, the latest multi-month peak marked in June around 1.2850 will be in the spotlight.
Should the RSI (14) line fail to stop the bulls around 1.2850, as it is rushing towards the overbought territory, then the GBP/USD upside may aim for the 61.8% Fibonacci Extension (FE) of its late May to June 29 moves, near 1.2925.
GBP/USD: Four-hour chart

Trend: Further upside expected
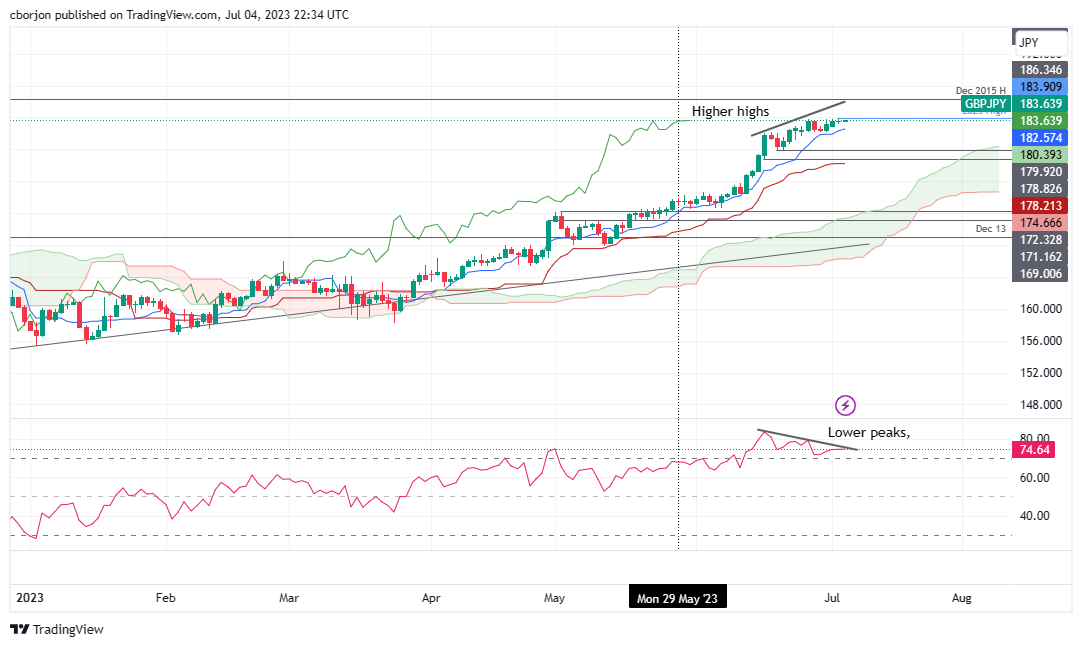
- GBP/JPY struggles to break the 184.00 mark amid potential Japanese FX intervention, ending Tuesday with near flatline movement.
- Negative divergence in RSI suggests a potential for a pullback, with the Tenkan-Sen line inching closer to price action.
- Key levels to watch include resistance at 186.34 and several support levels leading down to the Kijun-Sen line at 178.21.
GBP/JPY consolidates at around the 183.60s area after hitting a year-to-date (YTD) high of 183.90, shy of hitting the 184.00 mark. On Tuesday, the GBP/JPY finished the session around 183.59, nearby its open price, forming a doji. That said, GBP/JPY is set to trade sideways unless a catalyst spurs a break to eigh-year highs or a correction gets underway. As the Asian session commences, the GBP/JPY trades at 153.65, almost flat.
GBP/JPY Price Analysis: Technical outlook
The GBP/JPY remains upward biased, though of late, the pair has struggled to get to new YTD highs, as threats of Japan’s government intervention in the FX markets keep traders on their toes. The Relative Strength Index (RSI) indicator remains at overbought levels, printing lower peaks, while the GBP/JPY registers higher highs. That means a negative divergence surfaced, which could pave the way for a pullback.
Additionally, the Tenkan-Sen line is getting close to price action, opening the door for a fall below the latte, which could spur a GBP/JPY sell signal, opening the door for a pullback toward the Senkou Span A line at 180.39 before slumping toward the June 20 daily low of 179.92. Break below will expose a test of the June 16 low of 178.82, slightly above the Kijun-Sen line at 178.21.
Conversely, if the GBP/JPY cracks the 184.00 mark, the first resistance appears at December’s 2015 high of 186.34, followed by the 190.00 figure.
GBP/JPY Price Action – Daily chart
- EUR/USD holds lower grounds after snapping two-day winning streak.
- Downbeat German data raised doubt about hawkish ECB talks and weighed Euro amid quiet session.
- US Dollar managed to remain steady, mildly bid, on mixed sentiment.
- Eurozone PPI for June, FOMC Minutes will be crucial for immediate directions.
EUR/USD remains pressured near 1.0880 as it braces for further downside amid fears of upbeat US Dollar and softer Euro prices amid early Wednesday. Adding strength to the Euro pair’s downside performance could be the fears of softer German export data, as well as mixed sentiment. It’s worth noting that the US Dollar’s failure to justify the previous day’s US holiday allow the Euro pair to remain firmer despite witnessing a lackluster day.
That said, the global markets were mostly inactive amid the US Independence Day holiday. Adding strength to the market’s indecision were mixed concerns about the US-China ties and a light calendar elsewhere. Further, the downbeat German data and comparatively more hawkish Fed signals than from the European Central Bank (ECB) keep the EUR/USD bears hopeful.
It’s worth noting that Germany’s Exports improved to -0.1% MoM in May, from -0.5% expected and 0.7% prior but the Imports came in as 1.7% versus -1.7% prior and 3.1% expected. As a result, Germany’s Seasonally Adjusted Trade Balance dropped to €14.4B from €18.4B versus €17B.
Talking about the risks, anxiety surrounding the US-China ties escalates and weighs on the sentiment as US Treasury Secretary Janet Yellen is in Beijing. Earlier on Tuesday, US Treasury Department said, per Reuters, “Treasury Secretary Janet Yellen had a 'frank and productive' discussion today with China's Ambassador.” The news also mentioned that US Treasury Secretary Yellen raised issues of concern while also conveying the importance of the two countries working together.
It’s worth noting, however, that the Wall Street Journal (WSJ) added to the market’s cautious mood about the Sino-American ties. The WSJ stated, “The Biden administration is preparing to restrict Chinese companies’ access to U.S. cloud-computing services, according to people familiar with the situation, in a move that could further strain relations between the world’s economic superpowers.”
On the same line, China’s President Xi Jinping said in a virtual SCO summit on Tuesday that they “should focus on practical cooperation and accelerate economic recovery. The policymaker also added, “(They) Need to strengthen strategic communication and coordination, respect each other's core interests and concerns.”
It’s worth observing that China announced abrupt controls on exports of some gallium and germanium products, effective from August 1, which in turn has ramped up a trade war with the United States. The same could potentially cause more disruption to global supply chains, reported Reuters. That said, China’s latest retaliation is in reaction to the US curb on AI chips’ shipments to Beijing.
Amid these plays, the US Dollar printed two-day winning streak before ending Tuesday’s North American session near 103.10 whereas the German Bunds rose while Euro Stoxx and FTSE 100 were both down with mild losses.
Moving on, EUR/USD may witness further downside amid return of the full markets and the looming risk-off mood. However, major attention will be given to the Eurozone Producer Price Index (PPI) for May and the Federal Open Market Committee (FOMC) Minutes.
Technical analysis
Monday’s bearish Doji candlestick and a failure to cross a fortnight-old descending resistance line, around 1.0910 by the press time, keep EUR/USD vulnerable to decline further. However, the 50-DMA and 100-DMA, respectively near 1.0865 and 1.0820, appear tough nuts to crack for the Euro bears.
China announced abrupt controls on exports of some gallium and germanium products, effective from August 1, which in turn has ramped up a trade war with the United States. The same could potentially cause more disruption to global supply chains, reported Reuters.
“Chinese industry players also fear that curbs on rare earth exports could follow,” the news added.
The news quotes Peter Arkell, chairman of the Global Mining Association of China, saying "China has hit the American trade restrictions where it hurts."
The Commerce Ministry will meet with major producers of the metals on Thursday to discuss the export restrictions, four people familiar with the matter told Reuters.
China’s latest retaliation is in reaction to the US curb on AI chips’ shipments to Beijing. On the same line is the news from the Wall Street Journal (WSJ) that the Biden administration is preparing to restrict Chinese companies’ access to U.S. cloud-computing services.
Key details
One US semiconductor wafer manufacturer said on Tuesday it was applying for export permits, while a China-based germanium producer said buyer enquiries had come in as prices surged.
The eight gallium and six germanium products cited are also used in other high-tech industries.
Some in the metals industry said they feared China could follow with new restrictions on rare earth exports, after curbing shipments 12 years ago in a dispute with Japan.
AUD/USD grinds higher
The news fails to gain any major immediate directions amid the US holiday but can weigh on the sentiment during the full markets.
Also read: Forex Today: After a quiet day attention turns to FOMC minutes
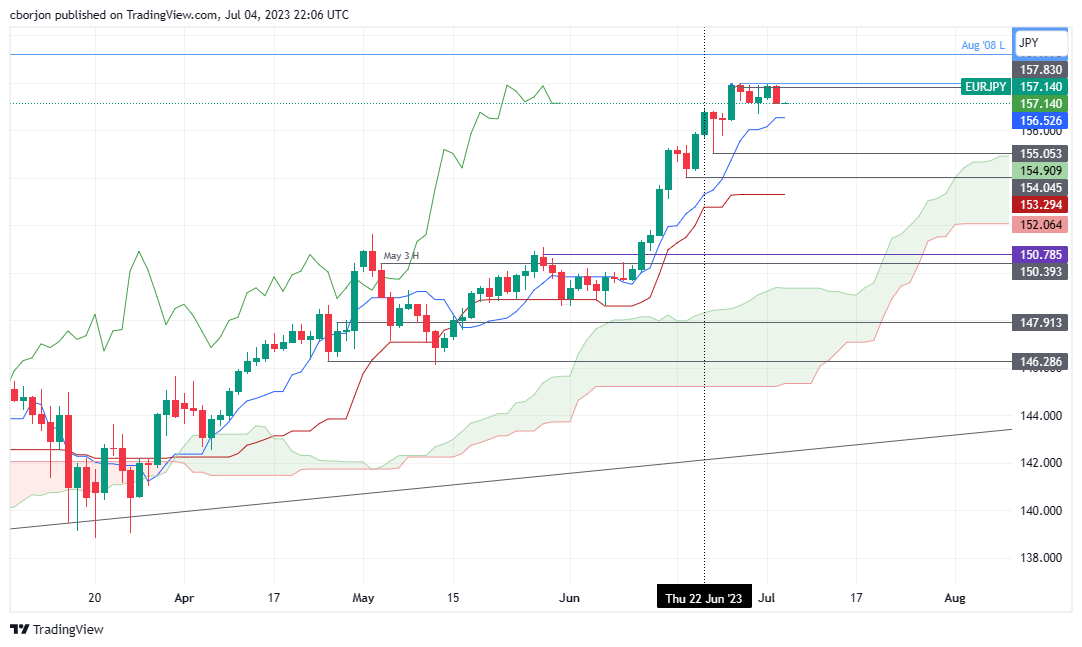
- EUR/JPY retreats from YTD highs following the Japanese Finance Minister’s intervention threats, ending Tuesday’s session down by 0.47%.
- The pair maintains its uptrend but struggles to break decisively above the 158.00 mark, raising concerns about further downside potential.
- Key supports and resistances lie at 156.52 and 157.99, respectively, with further levels determined by market reactions.
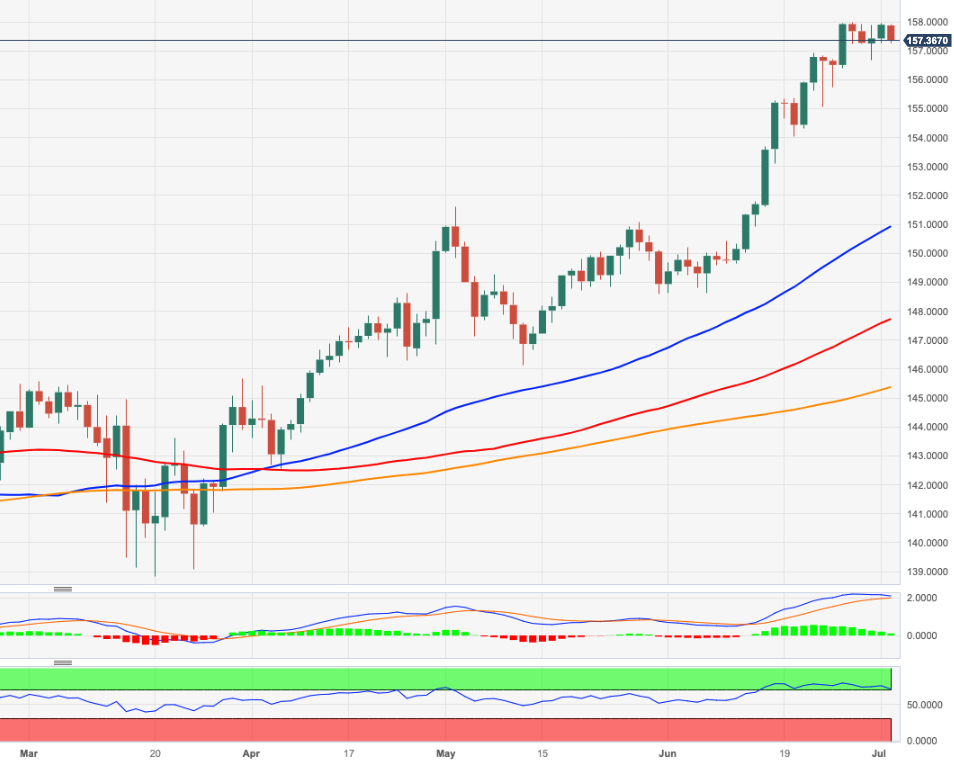
EUR/JPY retreats from year-to-date (YTD) highs of 157.99 and falls toward the 157.10s area on the Japanese Minister of Finance’s threats to intervene in the Forex markets. That bolstered the Japanese Yen (JPY); hence, the EUR/JPY finished Tuesday’s session with losses of 0.47%. As Wednesday’s Asian session begins, the EUR/JPY exchanges hands at 157.15, printing minuscule gains of 0.02%.
EUR/JPY Price Analysis: Technical outlook
The EUR/JPY uptrend remains intact, though the cross-currency pair cannot break above the 158.00 figure decisively. A couple of days ago, the EUR/JPY dipped to 156.67 before re-testing the 158.00 figure, though the pair peaked at around 157.90. After that, the EUR/JPY extended its losses toward the daily low of 157.11 but remained well above the first support level, the 157.00 mark.
If EUR/JPY tumbles below the figure, the next support would be the Tenkan-Sen line at 156.52. A breach of the latter will clear the path toward the confluence of the June 23 daily low and the Senkou Span A at 155.05/154.90, followed by the June 20 daily low of 154.04.
Conversely, if EUR/JPY resumes its uptrend, the first resistance would be the year-to-date (YTD) high of 157.99, followed by the August 2008 swing low turned resistance at 159.21.
EUR/JPY Price Action – Daily chart
- GBP/USD advances in choppy trading, leveraging previous economic data and US market closure for Independence Day.
- US and UK economic indicators suggest continuing challenges, with manufacturing activity in both nations signaling recession.
- Interest rate hikes from the Fed and BoE loom large, potentially favoring GBP in the short term but posing risks for long-term stability.
GBP/USD marched higher amid a choppy trading session, as Wall Street remained closed in observance of the Independence Day of the United States (US). The absence of economic data in the UK and the US left traders leaning on last Monday’s data and the latest week’s upbeat news about the US economy. At the time of writing, the GBP/USD trades at 1.2715 after hitting a daily low of 1.2681.
Pound Sterling strength faces challenges on economic data, interest rates expectations
A risk-on impulse underpinned the GBP/USD throughout Tuesday’s dull trading session. The greenback remained pressured, though printed gains of 0.09%, as shown by the US Dollar Index (DXY), which measures the American Dollar (USD) value against a basket of six currencies at 103.063.
The US/UK economic dockets kicked off the week on Monday with PMI releases. The US ISM Manufacturing PMI June report plunged sharply, showing that manufacturing activity remained in recessionary territory for the eighth straight month. On the same tone, UK’s S&P Global/CIPS Manufacturing PMI for the same period dropped from May 47.1 to 46.5, the lowest through in the year and one of the weakest level since the 2008-09 financial crisis.
Last week’s US economic data was mixed, as the Federal Reserve’s (Fed) preferred inflation gauge, the Core PCE, softened a tick, a sign welcomed by the US central bank. Nevertheless, Durable Good Orders are rising, Consumer Confidence is improving, and the Gross Domestic Product (GDP) for Q1 is crushing the latest report, suggesting the Fed still has work to do.
Market participants expect a 25 bps rate hike, as the CME FedWatch Tool shows, with odds at 87.4%. Regarding the Bank of England (BoE), money market futures odds for a 50 bps interest rate increase are at 73.41%, according to Refinitiv.
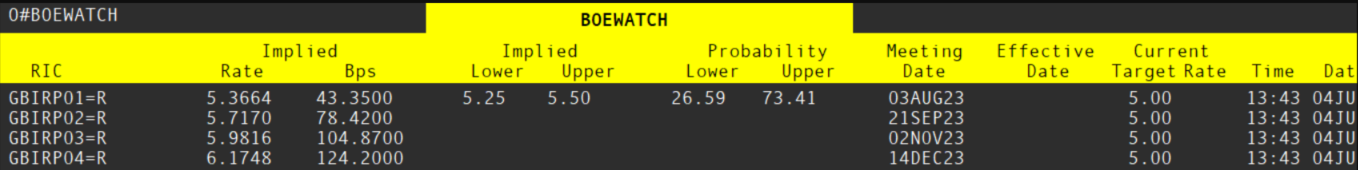
Source: Refinitiv
Given the backdrop, the GBP/USD would trade volatile, as the interest rate differential could favor the Pound Sterling (GBP). Based on that premise, the GBP/USD could hit 1.3000. Nonetheless, due to the market’s reaction to UK CPI data and the BoE 50 bps rate hike, higher rates could tip the UK economy into a recession, weakening the GBP in the medium to long term.
GBP/USD Price Analysis: Technical outlook
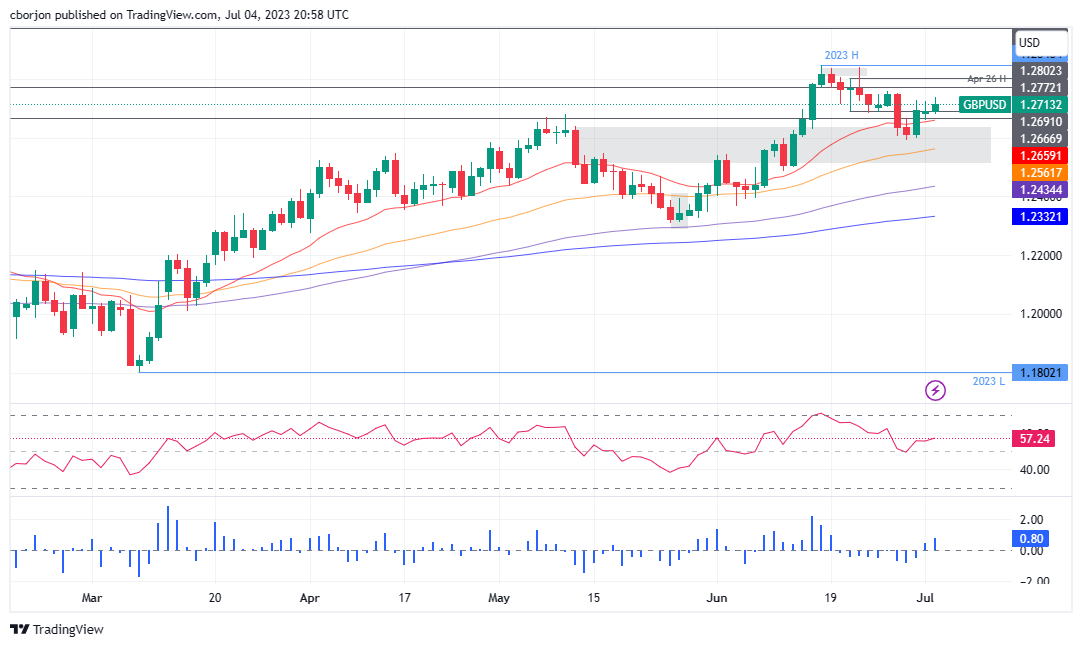
The GBP/USD uptrend remains intact after briefly piercing below the 20-day Exponential Moving Average during the last five trading days. As of writing, the GBP/USD exchange rate sits above the 20-day EMA at 1.2659, acting as dynamic support during the last three trading days, with the major bouncing toward the current spot price.
For the GBP/USD to extend its gains, the pair must reclaim the June 27 daily high of 1.2759, so the major could threaten 1.2800. Once broken, the year-to-date (YTD) high of 1.2848 would be up for grabs. If Pound Sterling (GBP) buyers gather strength, they can challenge 1.2900, followed by 1.3000. Conversely, the GBP/USD first support would be 1.2700. A breach of the latter will expose the confluence of a solid support area, with the 20-day EMA and the May 10 daily high, each at 1.2659/79, respectively, followed by June’s 29 swing low of 1.2591.
During the Asian session, Australian activity data is due, as well as the Chinese Caixin Services PMI. The final European PMI readings are also due, along with the Eurozone Producer Price Index. Later in the day, the Federal Reserve will release the minutes of its latest meeting.
Here is what you need to know on Wednesday, July 5:
On a quiet day due to a holiday in the US, the US dollar posted mixed results. Commodity currencies were the top performers. Markets await new information, and volatility is set to pick up on Wednesday with the release of the FOMC minutes. Then, the focus will turn to US labor market data with the ADP report, JOLTS, and Jobless Claims on Thursday, and on Friday, with the Nonfarm Payrolls report.
The US Dollar Index rose above 103.00, boosted only by the decline of the EUR/USD, which fell under 1.0900. The Euro was the worst performer among majors. On Wednesday, the final reading of June PMIs is due in the Eurozone, as well as the June Producer Price Index (PPI).
GBP/USD rose modestly and held above 1.2700 while EUR/GBP resumed its decline, falling toward 0.8550 and posting the lowest close in two weeks.
USD/JPY moved sideways around 144.50 in a tight range. The Yen benefited from a modest decline in European stocks and as European bond yields pulled back moderately.
AUD/USD recovered on Tuesday after a slide that followed the Reserve Bank of Australia's (RBA) decision to keep rates unchanged. The pair bottomed at 0.6641 and then rebounded, reaching levels above 0.6700. On Wednesday, the AIG Manufacturing Index is due, as well as the final Global Services PMI.
TD Securities on RBA:
We retain our call for the RBA to hike in August. However, calls beyond that will be more data dependent and based on today's Statement suggest an upside surprise in inflation will be required to bring the RBA back to the hiking table after that. At this stage the risk to our 4.85% call is that the tightening cycle is drawn out rather than the RBA calling it a day on rate hikes.
The kiwi was among the top performers, with AUD/NZD hitting one-month lows after the RBA decision, falling below 1.0800. NZD/USD rose for the third consecutive day and posted the strongest daily close in two weeks, slightly below 0.6200 and above key daily simple moving averages.
USD/CAD dropped on Tuesday but found support above 1.3200. The weaker dollar and a recovery in crude oil prices after Saudi Arabia and Russia's output cut favored the Loonie.
Metals rose modestly on Tuesday, with Gold testing levels above $1,930 but again failing to hold above and pulling back. Silver continues to be limited by the $23.00 area.
Like this article? Help us with some feedback by answering this survey:
- USD/JPY experienced minor losses due to threats of Japanese Forex intervention and US Independence Day trading lull.
- Technical indicators suggest the potential for a pullback, with the RSI nearing the overbought threshold and a negative RoC.
- If USD/JPY retraces, key supports stand at 144.00 and 143.11, while a rally could target the November highs and beyond.
USD/JPY trades with minuscule losses amidst verbal intervention by Japanese authorities, as week as choppy trading, with traders in the United States (US) out for the US Independence Day holiday. The USD/JPY is exchanging hands at 144.48 after hitting a daily high of 144.70.
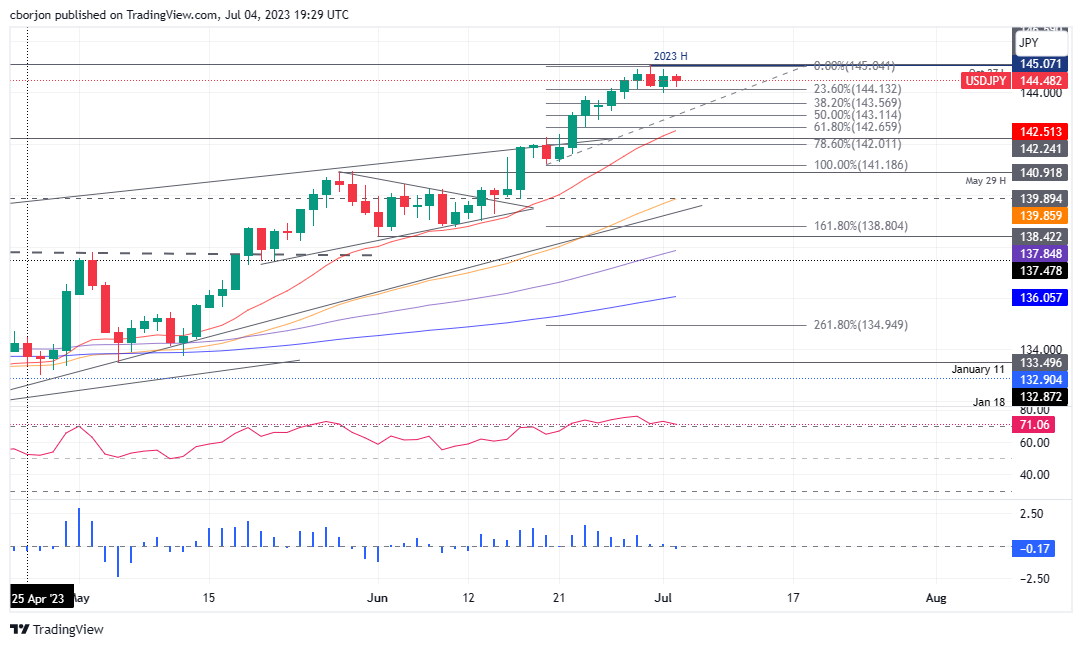
USD/JPY Price Analysis: Technical outlook
The USD/JPY remains upward biased even though it cannot edge towards a new year-to-date (YTD) high of 145.07 amidst threats from Japanese authorities of steepening into the Forex markets. It should be said the Relative Strength Index (RSI) remains at overbought conditions, about to cross below the 70 levels, which could open the door for a deeper pullback.
Furthermore, the three-day Rate of Change (RoC) portrays that selling pressure is fading as it turned negative, suggesting that further downside is possible.
If USD/JPY retraces, the first support will be the 144.00 figure. A breach of the latter will expose the 38.2% Fibonacci retracement at 146.57, drawn from the lows of June 28 toward the YTD high. Once cleared, the 50% Fibo retracement will be up next at 143.11, followed by the confluence of the 20-day Exponential Moving Average (EMA) and the 61.8% golden ratio at 142.51/65.
Conversely, if USD/JPY rallies to new YTD highs above 145.00, the next resistance would be the November 10 high at 146.59, followed by the November 1 daily high at 148.82 and 2022 high at 151.94.
USD/JPY Price Action – Daily chart
- Gold price remains firm around $1920s, supported by falling US Treasury bond yields.
- Resilient US economic data justifies Fed’s tightening stance, but lower inflation numbers weigh on the greenback.
- Market awaits upcoming US economic data and FOMC meeting minutes for further direction on gold prices.
Gold price stays firm at around $1920s, after hitting a daily low of $1919.89 in a subdued trading session, as the European markets closed, while Wall Street stays shut off in the observance of US Independence Day. Falling US Treasury bond yields lent a lifeline to XAU/USD traders, eyeing to recover the $1950 area, though data from the United States (US) could increase demand for the greenback, a headwind for XAU’s prices.
Subdued trading and US economic data to determine XAU/USD’s path
Risk appetite improved throughout the overnight session amidst the lack of economic data, with the Reserve Bank of Australia’s (RBA) monetary policy decision being the highlight. The RBA’s kept rates unchanged, though opened the door for further tightening if needed. Aside from this, US economic data revealed during the last couple of weeks have shown the US economy’s resilience amidst 500 basis points of tightening by the Federal Reserve (Fed). June’s Durable Good Orders, Consumer Confidence, and Q1’s Gross Domestic Product (GDP) figure, improving with the latter almost doubling GDP preliminary reading of 1.1%, justified the Fed’s stance to lift rates.
However, inflation data, notably the Fed’s preferred gauge for inflation, the PCE and Core PCE numbers in June, edged lower. That weighed on the greenback, as the US Dollar Index (DXY), which tracks the buck’s performance vs. a basket of peers, dropped 0.42% on the data release but so far trimmed some of those losses, exchanging hands at 103.010, gains 0.03% on Tuesday.
US Treasury bond yields lacked the strength to rise further as investors brace for a Fed 25 basis point (bps) interest rate hike in July, as shown by the CME FedWatch Tool. Nonetheless, market participants remain reluctant to believe that Fed Chair Jerome Powell and his colleagues would increase the Federal Funds Rate (FFR) toward the 5.50%-5.75% range.
XAU/USD traders would get more cues about the non-yielding metal direction as the US economic agenda will remain busy. On Wednesday, Factory Orders and the latest FOMC meeting minutes would shed some light on the US central bank path. For Thursday and Friday, the ISM Services PMI and labor market data could increase volatility in the yellow metal. Upbeat figures will increase speculations for not just one but the two rate hikes mentioned by Powell at his latest public appearance.
XAU/USD Price Analysis: Technical outlook
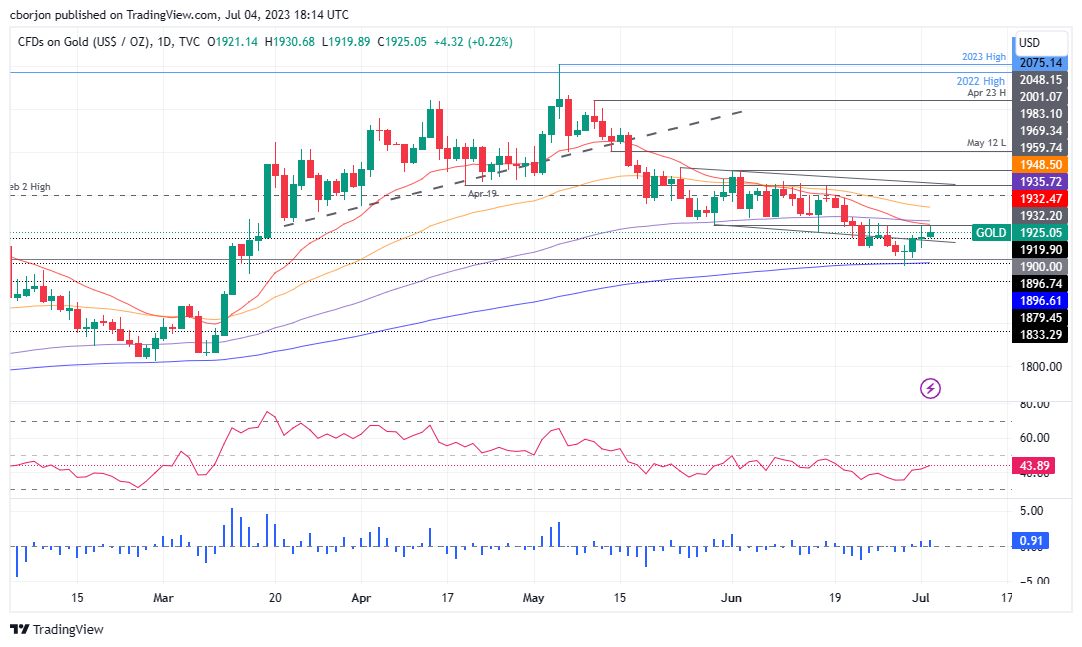
XAU/USD is neutral to downward biased, capped on the upside by the 20-day Exponential Moving Average (EMA) at $1932.48, which also intersects with the May 30 daily low of $1932.20. If XAU/USD would resume upwards, buyers must reclaim the previously-mentioned area in order to challenge the 50-day EMA at $1948.51, ahead of testing $1950. Conversely, if XAU/USD stays below the strong supply area around the $1932 region, sellers could drag prices toward the 200-day EMA at $1896.61, as the Relative Strength Index (RSI) remains at bearish territory.
- USD/MXN falls to fresh YTD lows of 17.0156, with MXN benefiting from thin trading volumes due to US Independence Day celebrations.
- Despite robust US data – including firm Durable Good Orders, Consumer Confidence, and Q1 GDP reports – a weaker-than-expected inflation report and ISM Manufacturing PMI dampen greenback appeal.
- Mexican economic indicators show promise, with improving business activity and record-breaking remittances;
- Banxico's private poll suggests a USD/MXN exchange rate of around 18.33 by year-end.
USD/MXN tumbles to fresh year-to-date (YTD) lows of 17.0156, as Mexican Peso (MXN) bulls take advantage of thin volumes as traders in the United States (US) remain absent on observance of Independence Day. The USD/MXN is trading at 17.0196, losses 0.23% after hitting a daily high n the overnight session of 17.0623.
Risk appetite and sturdy US economic data overwhelmed by weak inflation report, pushing USD/MXN lower
A risk-on mood keeps investors buying the emerging market currency; hence the USD/MXN is pressured. Tuesday’s lack of economic releases keeps USD/MXN traders leaning into the latest US economic releases, which painted an uncertain economic outlook in the US. Solid than-expected data, with Durable Good Orders exceeding estimates, an Improvement in Consumer Confidence, and an outstanding Gross Domestic Product (GDP) report for Q1, showed the US economy’s resilience. Solid housing data further supported that, while the Federal Reserve (Fed) Chair Jerome Powell emphasized the US central bank foresees at least two additional rate increases.
However, last Friday’s inflation report, the PCE and Core PCE sought by the Fed as its preferred gauge for inflation, edging lower, and a weak ISM Manufacturing PMI for June, pressured the greenback, as traders speculations for two rate increases, diminished.
The US Dollar Index (DXY), which tracks the buck’s value against a basket of six currencies, regained positive territory, up at 103.012, gains 0.04%.
On the Mexican front, the latest jobs report in Mexico was shrugged off by the Mexican Peso, as the USD/MXN pair threatened to break support at 17.00. In the meantime, business activity improved, as shown by the S&P Global Manufacturing PMI, at 50.90, exceeding May’s 50.50.
The latest tranche of data from Mexico showed that remittances broke a monthly record, while a Bank of Mexico (Banxico) private poll showed an upward revision by most private analysts, the USD/MXN exchange rate will end the year at around 18.33.
USD/MXN Price Analysis: Technical outlook
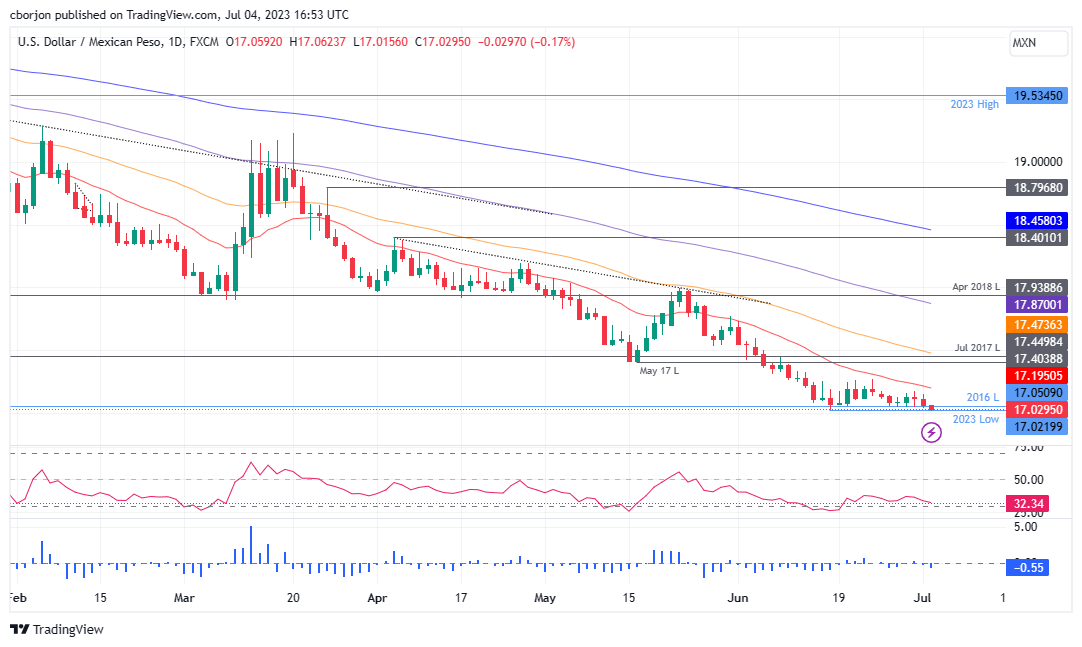
From a technical perspective, the USD/MXN remains neutral to downward biased, threatening to extend its losses below the psychological 17.00 figure. In that event, the following support levels would emerge at the 16.50 area, followed by the October 2015 low of 16.3267, and then the 16.00 figure. Conversely, the USD/MXN must reclaim the 20-day Exponential Moving Average (EMA) at 17.1942 to have a chance to turn bullish. Yet, after conquering the 20-day EMA, the next resistance would be the May 17 swing low at 17.4038. A breach of the latter could turn the pair neutral bullish and pave the way for further upside.
- NZD/USD advances with support from RBA’s hawkish hold and weakness in the US dollar during the US holiday session.
- Uncertain economic outlook in the US amid mixed economic data and recession fears increases the likelihood of rate hikes.
- New Zealand’s QSBO improves in Q2 but highlights weakening demand and labor challenges.
NZD/USD advances in a subdued North American session as traders from the United States (US) remain on holiday in observance of Independence Day. However, the NZD/USD got lifted by the Reserve Bank of Australia’s (RBA) hawkish hold and the greenback’s soft tone. The NZD/USD exchanges hands at 0.6197 after hitting a daily low of 0.6140, up by 0.75%.
NZD/USD benefits from RBA’s hawkish hold, eyes US data and RBNZ next week’s decision
Global equities are trading upbeat on thin liquidity conditions as the US cash markets remain closed. The latest round of US economic data has painted an uncertain economic outlook after Durable Good Orders, Retails Sales, and Gross Domestic Product (GDP) for Q1 final reading justified the Federal Reserve’s (Fed) need for higher rates. Nevertheless, a soft read on the Fed’s preferred gauge for inflation revealed on Friday, alongside a contractionary June’s ISM Manufacturing PMI, increased the likelihood of a hard landing as recession fears increased.
Meanwhile, during the Asian session, the New Zealand Institute of Economic Research (NZIER) quarterly survey of business opinion (QSBO) improved in Q2 to -63.0% vs. -66.0 prior. The report highlighted demand is weakening while capacity utilization declined among builders and manufacturers. Regarding employment, firms revealed difficulties in finding labor, especially unskilled workers.
That, alongside the Reserve Bank of Australia’s (RBA) June monetary policy decision to keep rates unchanged but tilted hawkish, opened the door for additional tightening, and underpinned the New Zealand Dollar (NZD) against the US Dollar (USD).
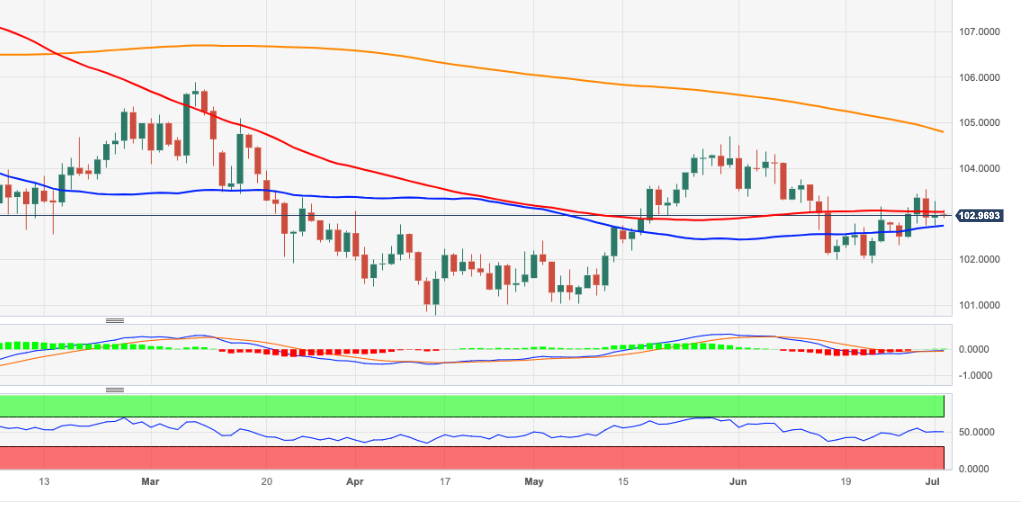
The US Dollar Index (DXY), which tracks the buck’s value against a basket of peers, erased some of its Monday’s gains and is down 0.02%, at 102.941. In the short term of the curve, US Treasury bond yields are rising, while 20s and 30s print minuscule losses.
Upcoming events
The New Zealand economic docket is light throughout the week. Still, it will get some traction until next week’s Reserve Bank of New Zealand (RBNZ) monetary policy decision, which is expected to keep rates unchanged. On the US front, NZD/USD traders will get cues from the latest FOMC minutes, Fed speakers, and labor market data.
NZD/USD Price Analysis: Technical outlook
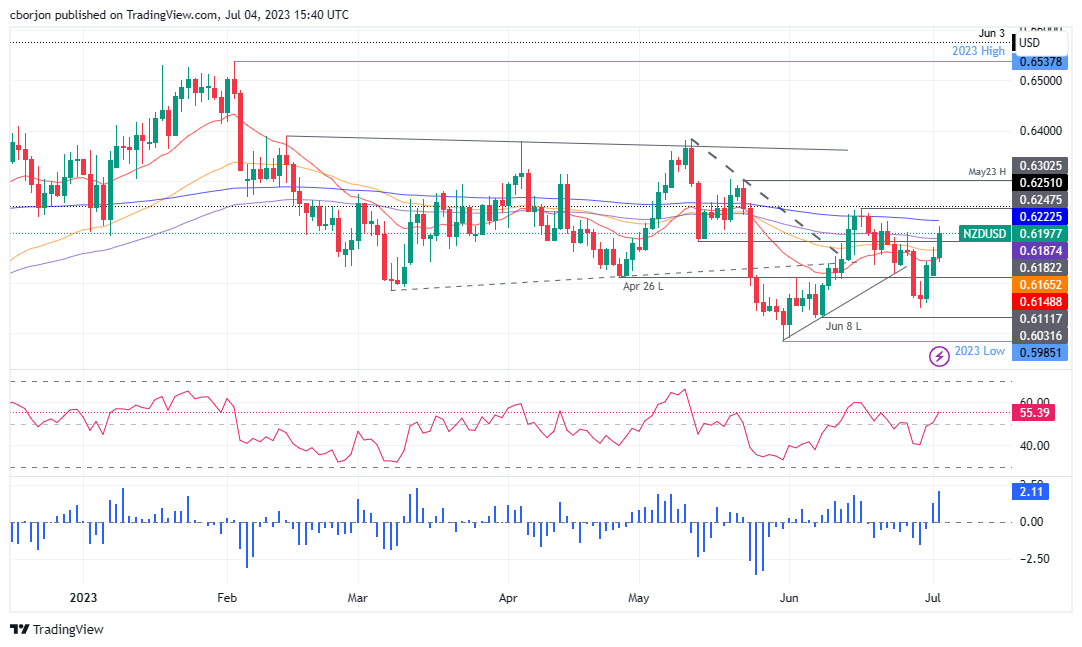
In the near term, the NZD/USD remains neutral to downward biased, as the 200-day Exponential Moving Average (EMA) at 0.6225 is putting a lid on the pair’s advance. In addition, a three advancing soldiers chart pattern suggests buyers gathered strong momentum, reinforced by the Relative Strength Index (RSI) getting to the bullish territory. If NZD/USD climbs past the 200-day EMA, that will expose the June 16 high of 0.6247, followed by the 0.6300 figure. Conversely, if NZD/USD drops below 0.6200, that could open the door for further downside, eyeing the 100-day EMA at 0.6187 and the 50-day EMA at 0.6165.
-
Canadian Dollar trades slightly higher supported by Oil price rises on supply fears.
-
Canadian Manufacturing PMI comes out lower than expected in June though the response from price action is limited.
-
Traders are in two minds about the outlook for monetary policy from the Bank of Canada as GDP continues to grow but inflation falls.
Canadian Dollar rises versus the US Dollar on Tuesday during the US session on the back of higher Oil prices, Canada’s largest export, amidst fears of supply cuts by Saudi Arabia and Russia.
The Canadian Manufacturing PMI data release, which came out a few hours ago, was lower than expected and continues to show contraction but has had a limited impact on the exchange rate.
USD/CAD is trading in the lower 1.32s on Tuesday during the US session.
Canadian Dollar news and market movers
-
The Canadian Dollar is trading up by about 0.25% due to rising Oil prices. Whilst a muted outlook for global growth had weighed on Oil prices, fears of supply cuts by Saudi Arabia and Russia outweighed them.
-
The Bank of Canada (BoC) hiked rates by 0.25%, raising its Policy Interest Rate to 4.75% at its last meeting after a five-month pause. In its statement, the BoC gave increased consumer spending and higher-than-expected economic growth as the primary causes.
-
Canadian GDP in May rose by 0.4% after the economy flatlined in April, increasing expectations of more BoC rate hikes.
-
Core Inflation in May, however, fell to a lower-than-expected 3.7% versus the 3.9% forecast and 4.1% previous, reducing expectations the BoC will hike interest rates at its July 12 meeting.
-
The BoC’s inflation target is between 1-3%, so with Core inflation at 3.7%, it is not now as far off the upper threshold as previously.
-
The S&P Global Manufacturing PMI survey for June came out at 48.8, which was below the 49.6 forecast and the 49 previously. Despite the lower result, USD/CAD was little affected.
Canadian Dollar Technical Analysis: USD/CAD could reverse in line with longer-term uptrend
USD/CAD is in a long-term uptrend on the weekly chart since the 2021 lows. It has been consolidating in a broad sideways range since October 2022 and currently sits at the bottom of that range. Given that the trend has a tendency to extend the probability, therefore, favors longs over shorts.
The USD/CAD appears to have completed a measured move price pattern since the March 2023 highs. The measured move is a 3-wave zig-zag-like price pattern, much like an ABC correction in which the first and third waves are of a similar length (waves A and C on the chart below).
The measured move that has formed on USD/CAD looks like it has probably completed since waves A and C are of almost the same length. If so, it suggests the price has probably bottomed and is about to begin a cycle higher.
-638240812559553418.png)
US Dollar vs Canadian Dollar: Weekly Chart
There is also a confluence of support just under the June lows in the late 1.30s, made up of several longer moving averages and a major trendline. This is likely to underpin price at this level and reduces the chances of a breakdown. Only a decisive break below 1.3050 would provide evidence this thick band of weighty support has been definitively broken. A decisive bearish break is one that is accompanied by a longer-than-average red candlestick or three red candlesticks in a row.
-638240813117353216.png)
US Dollar vs Canadian Dollar: Daily Chart
The daily chart further suggests the potential for a bullish recovery. The move up from the June 27 bottom has been accompanied by strong momentum, as shown by the high reading on the Relative Strength Index (RSI) momentum indicator, which is higher than it was when prices were more elevated prior to the market bottom.
A decisive break above the 1.3270 key lower high would provide evidence of a short-term reversal. This move would likely see a rise up to possibly as high as 1.3400 and the 50-day Simple Moving Average. This would also see the short-term trend rise in line with the longer-term uptrend.
Canadian Dollar FAQs
What key factors drive the Canadian Dollar?
The key factors driving the Canadian Dollar (CAD) are the level of interest rates set by the Bank of Canada (BoC), the price of Oil, Canada’s largest exports, the health of its economy, inflation and the Trade Balance, which is the difference between the value of Canada’s exports versus its imports. Other factors include market sentiment – whether investors are taking on more risky assets (risk-on) or seeking safe-havens (risk-off) – with risk-on being CAD-positive. As its largest trading partner, the health of the US economy is also a key factor influencing the Canadian Dollar.
How do the decisions of the Bank of Canada impact the Canadian Dollar?
The Bank of Canada (BoC) has a significant influence on the Canadian Dollar by setting the level of interest rates that banks can lend to one another. This influences the level of interest rates for everyone. The main goal of the BoC is to maintain inflation at 1-3% by adjusting interest rates up or down. Relatively higher interest rates tend to be positive for the CAD. The Bank of Canada can also use quantitative easing and tightening to influence credit conditions, with the former CAD-negative and the latter CAD-positive.
How does the price of Oil impact the Canadian Dollar?
The price of Oil is a key factor impacting the value of the Canadian Dollar. Petroleum is Canada’s biggest export, so Oil price tends to have an immediate impact on the CAD value. Generally, if Oil price rises CAD also goes up, as aggregate demand for the currency increases. The opposite is the case if the price of Oil falls. Higher Oil prices also tend to result in a greater likelihood of a positive Trade Balance, which is also supportive of the CAD.
How does inflation data impact the value of the Canadian Dollar?
While inflation had always traditionally been thought of as a negative factor for a currency since it lowers the value of money, the opposite has actually been the case in modern times with the relaxation of cross-border capital controls. Higher inflation tends to lead central banks to put up interest rates which attracts more capital inflows from global investors seeking a lucrative place to keep their money. This increases demand for the local currency, which in Canada’s case is the Canadian Dollar.
How does economic data influence the value of the Canadian Dollar?
Macroeconomic data releases gauge the health of the economy and can have an impact on the Canadian Dollar. Indicators such as GDP, Manufacturing and Services PMIs, employment, and consumer sentiment surveys can all influence the direction of the CAD. A strong economy is good for the Canadian Dollar. Not only does it attract more foreign investment but it may encourage the Bank of Canada to put up interest rates, leading to a stronger currency. If economic data is weak, however, the CAD is likely to fall.
The Mexican Peso continued its appreciation path in June. Economists at MUFG Bank revise their MXN call to stronger levels as compared to their former forecasts.
Sharp MXN weakening unlikely in the near term
We keep our outlook for a moderate MXN weakening in the coming quarters influenced by concerns over a global economic slowdown amid an environment where Central Banks in the advanced economies have been struggling to curb inflationary pressures.
A slowdown in the US especially might curtail USD inflows into Mexico. And on the local side, fear of AMLO’s nationalistic policies might affect business confidence, especially in the energy sector. But we don´t expect a sharp MXN weakening in the near term.
USD/MXN – Q3 2023 17.20 Q4 2023 17.30 Q1 2024 17.40 Q2 2024 17.50
Since the start of the year when EUR/CHF peaked just above parity, the Franc has been on a bullish trend. Economists at Société Générale analyze CHF outlook.
The 0.97 region should now be a bottom
The 0.97 region should now be a bottom, and we expect very slow EUR/CHF gains.
In a context where the market digested the banking sector stress and inflation is expected to return below 2% this year, the CHF now looks toppish.
See: It is too early for higher EUR/CHF rates – Commerzbank
British Prime Minister Rishi Sunak said on Tuesday that inflation in the UK is proving to be more persistent than expected but added that they are using the right tools to battle it.
"Whether that's monetary policy, responsible fiscal policy or supply side reform, that's the right toolkit that you need to deploy bringing inflation down," Sunak explained, per Reuters.
Market reaction
GBP/USD extends its recovery following these comments and the pair was last seen trading at 1.2735, where it was up 0.35% on a daily basis.
The Gold price has been under pressure for some weeks. Strategists at Commerzbank analyze XAU/USD outlook.
Declining investor interest
Declining investor interest can be seen from the marked fall in gold ETF holdings since the beginning of June.
The picture is similar as far as speculative financial investors are concerned: they have likewise reduced their net long positions considerably of late.
The withdrawal of investors has thus contributed to the price weakness in recent weeks.
See – Gold Price Forecast: XAU/USD unlikely to enjoy big gains for a while yet – TDS
Economists at OCBC Bank discuss policymakers’ readiness to act on JPY’s weakness.
If USD/JPY trades volatile by another 2-3 JPY intra-day, then authorities could really act
If USD/JPY trades volatile by another 2-3 JPY intra-day, then authorities could really act. That said, such activities (jawboning, etc.) probably only serve to slow the pace of USD/JPY upticks especially if the uptrend remains intact.
A reversal in the trend would require market dynamics to change (i.e. USD to turn or yield differentials to narrow, etc.).
Kit Juckes, Chief Global FX Strategist at Société Générale, analyzes the EUR/USD outlook.
EUR/USD is back where it was in 2015, after the Draghi devaluation
The 2-year rate spread between the Eurozone and the US is smaller today than it was when EUR/USD was at 1.25 17 years ago. EUR/USD is back where it was in 2015, after the Draghi devaluation.
The market can see the ECB normalise policy but is concerned about economic weakness. It can see the Fed tighten but having failed to see the US tightening cause a recession yet, will soon have stopped worrying that one will ever arrive. You don’t need to read your children a lot of fairy tales to know how that plays out.
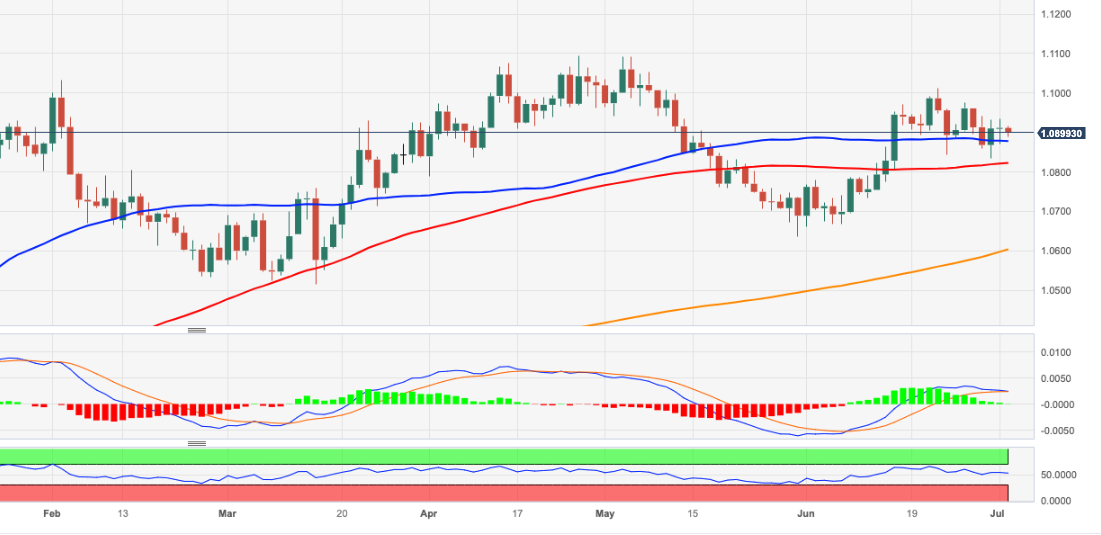
- EUR/USD remains stuck within a tight range near 1.0900.
- The continuation of the upside initially targets the June top.
EUR/USD navigates within a narrow range around the 1.0900 zone on the back of reduced trade conditions in response to the US Independence Day holiday.
Price action around the pair looks vacillating for the time being. Against that, spot needs to clear the June peak at 1.1012 (June 22), ideally in the near term, to allow for the resumption of the uptrend and a potential challenge of the 2023 top just below 1.1100 (April 26).
Looking at the longer run, the positive view remains unchanged while above the 200-day SMA, today at 1.0602.
EUR/USD daily chart
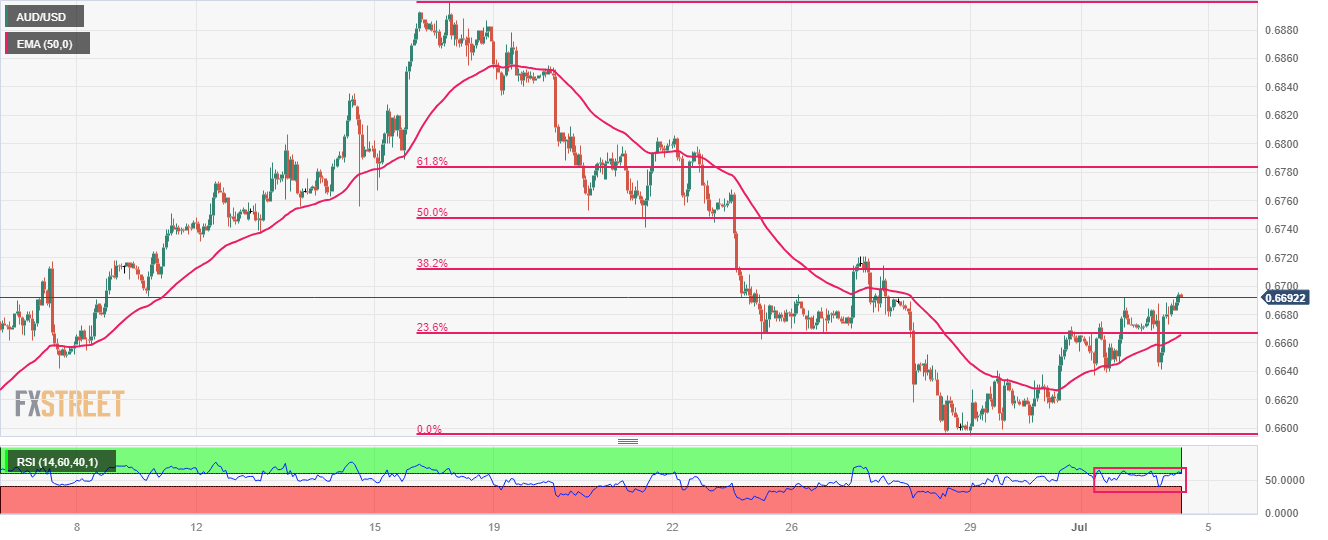
- AUD/USD is aiming to recapture the immediate resistance of 0.6700 amid a decline in the USD Index.
- RBA Lowe kept interest rates unchanged but warned that some further tightening is appropriate.
- AUD/USD has climbed above the 23.6% Fibonacci retracement at 0.6667.
The AUD/USD pair is looking to extend its upside journey toward the round-level resistance of 0.6700 in the European session. The Aussie asset showed a V-shape recovery from 0.6640 as investors have recovered losses inspired by a steady monetary policy announcement by the Reserve Bank of Australia (RBA).
S&P500 futures have posted moderate losses in London, portraying a quiet market mood as the weekly session has shortened due to the holiday on Tuesday on account of Independence Day. The US Dollar Index (DXY) is showing signs of volatility contraction as investors are awaiting the release of the United States Employment data for further guidance.
RBA Governor Philip Lowe kept interest rates unchanged but warned that some further tightening of monetary policy is appropriate. The decision of maintaining the status quo must have been supported by softening of Australian inflation to 5.8% due to lower gasoline prices.
AUD/USD has climbed above the 23.6% Fibonacci retracement (placed from June 16 high at 0.6900 to June 25 low at 0.6595) at 0.6667 on an hourly scale. The 50-period Exponential Moving Average (EMA) at 0.6663 is consistently providing support to the Australian Dollar bulls.
Meanwhile, the Relative Strength Index (RSI) (14) is gathering strength to jump into the bullish range of 60.00-80.00. An occurrence of the same would strengthen Aussie bulls.
A decisive break above 38.2% Fibo retracement at 0.6712 would expose the asset to June 23 high at 0.6767, followed by the round-level resistance at 0.6800.
On the flip side, a confident break June 29 low at 0.6595 would drag the asset toward June 02 low at 0.6565 and the round-level support at 0.6500.
AUD/USD hourly chart
The Riksbank still has further to go, in the view of economists at TD Securities.
Inflation and the Krona key in shaping the next couple of rate decisions
As the dust settles on last week's Riksbank decision, we now see the Bank delivering one final 25 bps hike to a 4.00% terminal rate in September.
We believe the Riksbank will settle with just one more hike in this tightening cycle. Constructive inflation and wage developments, combined with Swedish households being particularly interest rate sensitive, argues for a more cautious approach to policy setting. Adopting a high-for-long approach, we expect the Bank to refrain from cutting rates until September 2024.
Risks are skewed to the upside though, with inflation and the Krona being particularly key in shaping the next couple of rate decisions.
Over the last week, USD/BRL depreciated 0.1%. Economists at Rabobank analyze the pair’s outlook.
A market repricing of Fed cuts this year could erode BRL gains
The BRL and other EM currencies still enjoy gains from local domestic rates held in restrictive territory and from the high spread over global interest rates. But, a market repricing of Fed cuts this year could erode BRL gains.
For now, the market expectation of a reversal of the US tightening cycle and a more benign view of the fiscal framework still lead the BRL to post gains.
As appreciation drivers prevail in the short term, we now see the USD/BRL trading at 5.05 by end-2023 and 5.15 by end-2024.
- DXY navigates an inconclusive range around the 103.00 area.
- Further advances could retarget recent tops in the mid-103.00s.
DXY exchanges ups and downs around the 103.00 neighbourhood amidst a generalized range bound theme in the global markets.
There is room for further gains in the very near term, with the immediate up-barrier at the weekly high at 103.54 (June 30). The breakout of this level could open the door to a move to the May high at 104.69 (May 31), which appears reinforced by the 200-day SMA, today at 104.79.
Looking at the broader picture, while below the 200-day SMA the outlook for the index is expected to remain negative.
DXY daily chart
- EUR/GBP has slipped sharply to near 0.8570 as the BoE is set to raise interest rates further.
- Headline inflation in the UK is sticky above 8.7% as higher costs of services have faded the impact of lower gasoline prices.
- ECB Lagarde has conveyed that the current monetary policy is not sufficiently restrictive to bring inflation to 2%.
The EUR/GBP pair has faced selling pressure and has dropped to near 0.8570 in the London session. The cross is under pressure as stubborn United Kingdom inflation is supporting more interest rate hikes from the Bank of England (BoE).
Headline inflation in the UK is sticky above 8.7% as higher cost of services and food prices have faded the impact of lower gasoline prices. Core inflation that doesn’t include volatile oil and food prices has refreshed its recent highs at 7.1%. UK’s labor market conditions are extremely tight due to the Brexit event and early retirements by individuals.
This week, the UK Manufacturing PMI landed at 46.5, which remained better than expectations at 46.2. UK’s Manufacturing PMI has been contracting straight for eleven months. A figure below 50.0 is considered a general contraction. Going forward, investors would await Services PMI, which will release on Wednesday. The economic data is seen steady at 53.7.
Meanwhile, a monthly survey by Citi Bank and polling firm YouGov showed that consumer inflation expectations in the UK region for one year have increased to 5.0% in June from 4.7% in May.
On the Eurozone front, investors are awaiting the release of the Retail Sales data (May). Monthly economic data has seen an expansion of 0.2% vs. a stagnant performance reported earlier.
More interest rates from the European Central Bank (ECB) are widely anticipated. ECB President Christine Lagarde has conveyed that the current monetary policy is not sufficiently restrictive to bring inflation to 2%.
Having failed to retest its spring low in June, the US Dollar Index (DXY) has been edging higher in the past couple of weeks. Economists at Rabobank analyze USD outlook.
Fears of slower levels of global growth should prevent heavy selling pressure on the greenback
It has been our view for some time that USD strength would peak around the middle of this year and then lose some ground as the market looked ahead to Fed rate cuts in 2024. That said, fears of slower levels of global growth should prevent heavy selling pressure on the greenback.
If the market maintains its scepticism about the chances of tightening beyond July, the DXY is likely to continue to steer away from its spring low.
- EUR/JPY reverses two daily advances in a row.
- Further upside remains in store in the short term.
EUR/JPY comes under some selling pressure soon after another failed attempt to test the 158.00 yardstick on Tuesday.
Considering the ongoing price action, some side-lined trading appears the most likely scenario for the time behind ahead of the potential resumption of the uptrend. Against that, further gains should meet the next hurdle of significance not before the weekly high of 163.09 (August 22 2008).
The ongoing overbought conditions of the cross, however, are indicative that a deeper knee-jerk should not be ruled out at some point in the short-term horizon.
So far, further upside looks favoured while the cross trades above the 200-day SMA, today at 145.34.
EUR/JPY daily chart
- USD/CAD has dropped to near 1.3200 as the focus has shifted to labor market data.
- S&P500 futures are showing choppy moves as investors are hoping volatile quarterly result season.
- USD/CAD has dropped sharply to near the lower segment of the consolidation formed in a range of 1.3207-1.3288.
The USD/CAD pair has delivered a breakdown of the consolidation formed in a range of 1.3230-1.3265 in the European session. The Lonnie asset is struggling to find its feet as the market mood is quite cautious ahead of the United States/Canada Employment data.
S&P500 futures are showing choppy moves as investors are hoping volatile quarterly result season due to higher interest rates from the Federal Reserve (Fed). The US Dollar Index (DXY) is demonstrating non-directional performance as United States markets will remain closed on account of Independence Day.
The Canadian Dollar will dance to the tunes of the Employment data. Canada’s Employment data will be keenly watched to get cues about interest rate guidance for Bank of Canada (BoC) policy.
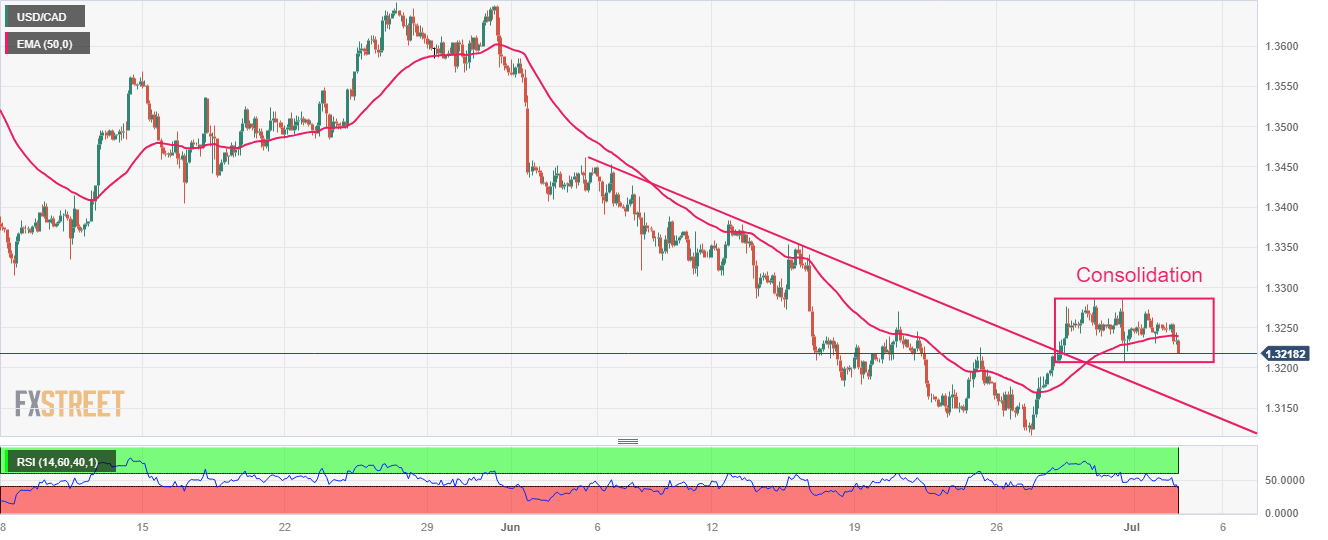
USD/CAD has dropped sharply to near the lower segment of the consolidation formed in a range of 1.3207-1.3288 on a two-hour scale. The Loonie asset is maintaining the breakout of the downward-sloping trendline plotted from June 05 high at 1.3462.
The major has dropped below the 20-period Exponential Moving Average (EMA) at 1.3241, which indicates that the short-term trend is bearish.
Meanwhile, the Relative Strength Index (RSI) (14) is oscillating in the 40.00-60.00 range. The downside momentum would activate if the momentum oscillator would drop into the 20.00-40.00 range.
Going forward, a decisive move above June 07 low at 1.3321 would drive the asset to June 12 high at 1.3384 and June 06 high at 1.3452.
On the flip side, a downside move below June 16 low at 1.3177 could expose the asset to June 22 low at 1.3139 followed by the round-level support at 1.3100.
USD/CAD two-hour chart
AUD/USD has retracted some of the gains made in June and is approaching potential support of 0.6560/0.6510, the 76.4% retracement of that bounce. Economists at Société Générale analyze the pair’s technical outlook.
Break above 0.6720 is essential for confirming a larger up-move
Daily MACD has been posting positive divergence denoting receding downward momentum. A bounce is expected however break above the high formed last week at 0.6720 is essential for confirming a larger up-move.
If AUD/USD fails to defend 0.6560/0.6510, there would be risk of one more down leg towards May low of 0.6450 and projections of 0.6200/0.6170.
President Erdoğan’s personal preference for low interest rates has caused severe damage to the Turkish economy. Economists at Danske Bank discuss TRY's outlook.
Fixing the economy with only bad options on the table
President Erdoğan’s new economic team has started monetary policy normalisation. However, reversing the course without causing more pain is all but easy, as imbalances in the economy have been building up for a while.
We expect the CBRT to gradually hike the policy rate to 25%, but at a pace insufficient to bring the real rate into the positive territory, particularly as recent TRY depreciation is expected to fuel inflation going forward.
Credit demand is expected to remain elevated, maintaining pressure on current account and Lira.
This week’s US data releases will be instrumental in informing market expectations regarding the risk of further Fed tightening. Economists at Rabobank analyze USD outlook.
Stronger-than-expected data could boost the prospect of another Fed rate hike beyond July
While today will be a quiet session due to the US July 4 holiday, the slew of US economic data due before the end of the week will likely bring more clarity as to the need for additional Fed policy tightening beyond this month. In particular, the US Labour data on Friday will shine fresh light onto the relative tightness of the labour market.
While stronger-than-expected data could boost the prospect of another Fed rate hike beyond July and underpin the USD near-term, the likelihood that the US economy will be slowing into year-end will continue to colour the outlook for the greenback.
Economists at ANZ Bank discuss Gold (XAU/USD) outlook.
USD resuming its downtrend will be another tailwind
The probability of the US Federal Reserve pausing in the next meeting has risen, but strong economic activity will keep it hawkish in the short term. This could see the Gold price consolidating.
Still, the Fed is likely to end its hiking cycle in H2 2023, which is structural support in the medium and long term. The prospect of the USD resuming its downtrend will be another tailwind.
What will the ECB’s and Fed’s next monetary policy steps look like? Economists at Commerzbank discuss monetary policy decisions and how could impact the EUR/USD pair.
EUR/USD is likely to remain stuck in a sideways move
The ECB is likely to leave its key rate unchanged at peak levels for a long time, according to our economists. There are doubts though amongst market participants whether the ECB will stick to its restrictive approach next year too, which is why EUR is struggling to stand its ground against USD at present.
There is also uncertainty regarding US monetary policy. Our economists expect rate cuts next year, as the US economy is likely to cool notably. But there is no clear indication so far, instead, the US economy has turned out to be quite robust. It, therefore, does not come as a surprise that the market remains cautious about betting on significantly lower USD prices.
We are likely to require more clarity about inflation and economic developments to move EUR/USD into one direction or the other. At present, the uncertainty is dominating though and as a result, EUR/USD is likely to remain stuck in a sideways move.
- The US Dollar nudges lower against almost every major pair.
- No economic data or Fed comments are expected.
- The US Dollar Index cracks below 103.00 and could eke out more losses if the US Dollar remains sold.
The US Dollar (USD) is officially on holiday, though it is traded and quoted in other parts and countries of the world. The US bond and equity market is closed and US futures are expected to trade at very low volumes. A thin market is an ideal moment for some investors, funds or central banks to make a move, and this happened this morning with the Chinese Yuan, which booked substantial gains against the Greenback. The correction pushes the USD/CNY pair to a month low, and drags South Korean Won (KRW) alongside it.
On the datafront, nothing out of the US as most events are pushed forward to later this week. Expect to see traders keep their powder dry for Friday with the US jobs report coming out. On Tuesday, all focus will be on the next-best-thing, which is Canada publishing its Manufacturing Purchasing Managers Index (PMI). The reading, which will be published at 13:30 GMT, is expected to increase slightly to 49.6 from 49.
Daily digest: US Dollar in the ropes
- Geopolitical tensions flare up as Yellen is set to fly to China soon. On Monday, China restricted exports of two key components for making chips, and the US is looking into restricting access to cloud computing for China. The tug-of-war between China and the US looks to be far from over.
- The United States is enjoying Independence Day. Both the Bond market and equity trading floors are closed.
- The US Dollar hit monthly lows against the Chinese Yuan (USD/CNY), the South Korean Won (USD/KRW), the New Zealand Dollar (USD/NZD), the Norwegian Krone (USD/NOK) and the Australian Dollar (USD/AUD).
- Mixed picture in equity markets as Japan is firmly in the red, losing 0.62%, while the Chinese Hang Seng is up 0.60% for the day. Europe registers mild gains, but no real rallies to notice. US futures are flat and are hardly moving as volume is low due to the holiday in the US.
- The CME Group FedWatch Tool shows that markets are pricing in a 87.4% chance of a 25 basis points (bps) interest-rate hike on July 26. The dislocation between market expectations and what the Fed has been communicating in terms of number of rate hikes is still persistent and could trigger a stronger US Dollar once markets get to the point of realisation.
- The benchmark 10-year US Treasury bond yield halted trading at 3.85% on Monday night and will not start trading again until the opening of the Asian session on Wednesday.
US Dollar Index technical analysis: USD to say goodbye to 103.00?
The US Dollar is lower this morning as US traders are enjoying a day off, while Asian markets are using their absence to appreciate local currencies. The Chinese Yuan is gaining substantially against the Greenback, while in the past few days or weeks even, the Chinese coin was in a losing streak against the US Dollar. With only two or three very small gains for the US Dollar on an overall downbeat day, it looks that the DXY index will make more losses today depending on technical support levels that either hold or break.
On the upside, look for 103.54 as the next key resistance level, which falls in line with the high of last week. The 200-day Simple Moving Average (SMA) at 104.94 is still quite far away. So the intermediary level to look for is the psychological level at 104.00 and May 31 peak at 104.70.
On the downside, the 55-day SMA near 102.74 has proven its importance as it clearly underpinned price action on Friday and Monday by triggering a turnaround after the firm weakening of the Greenback. A touch lower, 102.50 will be vital to hold from a psychological point of view. In case the DXY slips below 102.50, more weakness is expected with a full slide to 102.00 and a retest of June’s low at 101.92.
US Dollar FAQs
What is the US Dollar?
The US Dollar (USD) is the official currency of the United States of America, and the ‘de facto’ currency of a significant number of other countries where it is found in circulation alongside local notes. It is the most heavily traded currency in the world, accounting for over 88% of all global foreign exchange turnover, or an average of $6.6 trillion in transactions per day, according to data from 2022.
Following the second world war, the USD took over from the British Pound as the world’s reserve currency. For most of its history, the US Dollar was backed by Gold, until the Bretton Woods Agreement in 1971 when the Gold Standard went away.
How do the decisions of the Federal Reserve impact the US Dollar?
The most important single factor impacting on the value of the US Dollar is monetary policy, which is shaped by the Federal Reserve (Fed). The Fed has two mandates: to achieve price stability (control inflation) and foster full employment. Its primary tool to achieve these two goals is by adjusting interest rates.
When prices are rising too quickly and inflation is above the Fed’s 2% target, the Fed will raise rates, which helps the USD value. When inflation falls below 2% or the Unemployment Rate is too high, the Fed may lower interest rates, which weighs on the Greenback.
What is Quantitative Easing and how does it influence the US Dollar?
In extreme situations, the Federal Reserve can also print more Dollars and enact quantitative easing (QE). QE is the process by which the Fed substantially increases the flow of credit in a stuck financial system.
It is a non-standard policy measure used when credit has dried up because banks will not lend to each other (out of the fear of counterparty default). It is a last resort when simply lowering interest rates is unlikely to achieve the necessary result. It was the Fed’s weapon of choice to combat the credit crunch that occurred during the Great Financial Crisis in 2008. It involves the Fed printing more Dollars and using them to buy US government bonds predominantly from financial institutions. QE usually leads to a weaker US Dollar.
What is Quantitative Tightening and how does it influence the US Dollar?
Quantitative tightening (QT) is the reverse process whereby the Federal Reserve stops buying bonds from financial institutions and does not reinvest the principal from the bonds it holds maturing in new purchases. It is usually positive for the US Dollar.
- Gold price has jumped to $1,930.00 amid mixed views about Fed’s interest rate guidance.
- Investors would keep an eye on the FOMC minutes and the US Employment data.
- Gold price has rebounded from near the 61.8% Fibonacci retracement at $1,909.55.
Gold price (XAU/USD) has climbed to near $1,930.00 in the European session. The precious metal has delivered a stellar rally despite investors are anticipating a small interest rate hike by the Federal Reserve (Fed) in its July monetary policy.
S&P500 futures are holding nominal losses in London amid caution among investors ahead of second-quarter result season. The risk profile is quiet as investors are expected to deliver irrational moves once United States companies would start disclosing quarterly performance.
The US Dollar Index (DXY) is showing choppy moves around 103.00 amid mixed views about July’s interest rate decision. Fed chair Jerome Powell has already cleared that two small interest rate hikes are appropriate by year-end. While Atlanta Fed Bank President Raphael Bostic stated last week that the central bank has reached a point where interest rates are sufficiently restrictive to bring down inflation to 2%.
Going forward, investors would keep an eye on Federal Open Market Committee (FOMC) minutes. The minutes will provide a detailed explanation behind a steady interest rate policy announcement. Apart from that, cues about further interest rates and economic prospects will be keenly watched.
In addition to FOMC minutes, investors would await Automatic Data Processing (ADP) Employment data. As per the estimates, the US economy added 180K fresh payrolls in June lower than the addition of 278K made in May.
Gold technical analysis
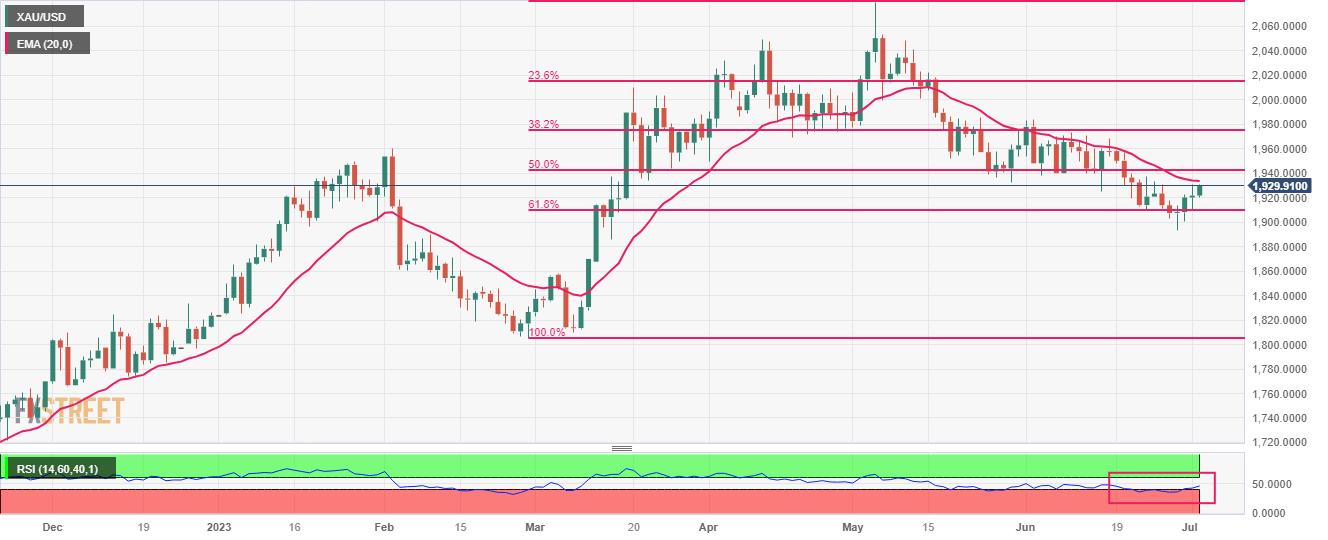
Gold price has rebounded from near the 61.8% Fibonacci retracement (plotted from February 28 low at $1,804.76 to May 03 high at $2,079.76) at $1,909.55 on a daily scale. The 20-period daily Exponential Moving Average (EMA) at $1,933.54 is still acting as a barricade for the Gold bulls.
Meanwhile, the Relative Strength Index (RSI) (14) has jumped into the 40.00-60.00 range from the bearish range of 20.00-40.00, which indicates that the downside momentum has faded. Investors should note that the downside bias is still solid
Gold daily chart
The Reserve Bank of Australia (RBA) kept rates unchanged. Economists at ING analyze AUD/USD outlook.
A hawkish ‘skip’ by the RBA
The statement clearly leaves the door open for more tightening if required and reiterates a strictly data-dependent approach to further monetary policy decisions.
With a September rate hike almost fully priced in, we expect the pair to be almost entirely driven by external factors (Fed, US data, Chinese sentiment): for now, the upside looks somewhat limited, although the room for a rally later in the year should emerge.
EUR/SEK is flying higher to 11.80. Economists at Société Générale analyze Krona's outlook.
Riksbank’s room for manoeuvre is limited
The Swedish CPI is finally coming back from double-digit territory, but is still the highest in G10 and very far away from the 2% target. Worryingly, the decline is more attributable to lower energy prices than core inflation.
Riksbank’s room for manoeuvre is also limited by households’ very high leverage, with Swedish residential prices plunging 20% this year, and a real estate crisis threatening the economy.
With both the ECB and BoE affirming their hawkish stances, and the surprise 50 bps hike from the Norges bank, the SEK still looks very vulnerable.
- AUD/USD has shown recovery as the focus has shifted to US labor market data.
- RBA decided to keep interest rates steady as inflation has decelerated sharply to 5.8%.
- The US Dollar Index has turned sideways around 103.00 as investors are awaiting the release of the US labor market data.
The AUD/USD pair has delivered a V-shape recovery after dropping to near 0.6640 in the London session. The Aussie asset has recovered its entire losses inspired by an unchanged interest rate decision by the Reserve Bank of Australia (RBA).
S&P500 futures have posted marginal losses in Europe. US equities ended with nominal gains on Monday as shortened week due to a holiday on Tuesday on account of Independence Day has sidelined investors. The overall market mood is quiet ahead of the quarter result season which is expected to remain volatile due to higher interest rates by the Federal Reserve (Fed).
The US Dollar Index (DXY) has turned sideways around 103.00 as investors are awaiting the release of the United States labor market data for further guidance. As per the estimates, US Automatic Data Processing (ADP) private employment report is expected to disclose the addition of fresh 180K employees, lower than the former addition of 278K. The yields offered on 10-year US Treasury bonds have jumped to near 3.88%.
Meanwhile, the Australian Dollar has recovered some gains despite RBA Governor Philip Lowe maintaining the status quo. The street was mixed as one school of thought was favoring one more rate hike knowing the fact that Australian inflation is far from the desired rate of 2%.
While the other school believed that a steady monetary policy would be better as monthly inflation has sharply softened to 5.8% and the central bank would get some time to assess monetary policy conditions.
- USD/JPY continues with its struggle to make it through 145.00 and edges lower on Tuesday.
- Intervention fears lend some support to the JPY and seem to be a key factor exerting pressure.
- The Fed-BoJ policy divergence should lend support ahead of the FOMC minutes on Wednesday.
The USD/JPY pair comes under some selling pressure on Tuesday and reverses a major part of the previous day's positive move back closer to the 145.00 psychological mark. Spot prices remain depressed through the first half of the European session and currently trade just below mid-144.00s, down 0.15% for the day.
Speculations for a potential intervention by the Japanese government to curb any further sharp decline in the domestic currency turn out to be a key factor acting as a headwind for the USD/JPY pair. In fact, Japan's Finance Minister Shunichi Suzuki warned last week that the government will take appropriate steps should the Japanese Yen (JPY) weaken excessively. Adding to this, Japan’s top financial diplomat Masato Kanda said Tuesday that authorities were in close contact with US Treasury Secretary Janet Yellen and communicating with various countries over currencies.
Apart from this, worries about a global economic downturn further benefits the safe-haven JPY, which, along with subdued US Dollar (USD) price action, contributes to the mildly offered tone surrounding the USD/JPY pair. That said, a big divergence in the monetary policy stance adopted by the Bank of Japan (BoJ) and the Federal Reserve (Fed) helps limit the downside. In fact, market participants seem convinced that the BoJ will focus on supporting a fragile economic recovery and stick to its ultra-ease monetary policy settings amid a view that inflation will slow later this year.
In contrast, the US central bank signalled in June that borrowing costs may still need to rise as much as 50 bps by the end of this year and the outlook was reinforced by Fed Chair Jerome Powell's last week. This, in turn, triggers a sharp intraday rise in the US Treasury bond yields and lends some support to the USD. That said, the softer US PCE Price Index released on Friday, along with Monday's weaker US ISM PMI, raises questions over how much headroom the Fed has to continue tightening its monetary policy, which, in turn, is holding back the USD bulls from placing aggressive bets.
Traders also seem reluctant in the wake of relatively thin trading volumes on the back of the Independence Day holiday in the US and ahead of this week's key releases. The minutes of the June FOMC meeting are due on Wednesday and will be closely scrutinized for clues about the future rate-hike path. Apart from this, the US monthly jobs data - popularly known as the NFP report on Friday - will influence the USD and provide a fresh directional impetus to the USD/JPY pair. The fundamental backdrop, meanwhile, suggests that the path of least resistance for spot prices is to the upside.
Technical levels to watch
Economists at Rabobank analyze GBP outlook.
Positioning could be looking a little stretched
Speculators’ net GBP longs are now at their highest level since July 2014. For a currency like the Pound which still suffers from a weak line up of economic fundamentals, positioning could be looking a little stretched.
In the second half of June, GBP lost ground against both the USD and the EUR, suggesting a reluctance on the part of investors to continue to build GBP longs. Despite widespread expectations about the potential extent of BoE rate hikes in the month ahead, in our view, GBP’s upside will be limited by concerns that tighter monetary policy also enhances growth risks. As demonstrated on several occasions last year, BoE rate hikes do not always lift the Pound.
“Risks of the global economic crisis are on the rise,” Russian President Vladimir Putin said while speaking at a virtual meeting of the Shanghai Cooperation Organization (SCO) on Tuesday.
Additional comments
“Potential for conflicts is rising.”
“Russia will stand up against sanctions and provocations.“
“We plan to boost ties with Shanghai Cooperation Organization.“
“Russia supports the transition to settlements in local currencies.”
“One of the key SCO tasks is to support security.”
Market reaction
Putin’s warning has little to no impact on risk sentiment. The US S&P 500 futures, a risk barometer, is trading with a 0.12% gain on the day.
- Euro alternates gains with losses around 1.0900 vs. the US Dollar.
- Stocks in Europe starts Tuesday’s session slightly bid.
- EUR/USD finds a comfort zone around the 1.0900 so far this week.
- Trade balance figures in Germany missed expectations in May.
- US markets are closed due to the Independence Day holiday.
The Euro (EUR) is currently showing signs of being slightly undervalued after a session earlier this week that did not yield any clear results. Despite this, the EUR/USD pair has not been able to break through the critical level of 1.0900 this week, due to the general lack of direction in risk appetite trends.
Meanwhile, the US Dollar (USD) is experiencing small gains, hovering around the 103.00 mark when measured by the USD Index (DXY), in a market environment characterized by low trading activity and volatility.
As far as monetary policy is concerned, there is no significant news, and investor expectations remain steady regarding an expected 0.25% interest rate hike by both the European Central Bank (ECB) and the Federal Reserve at their upcoming meetings later this month.
The central banks' efforts to combat inflation and normalize their monetary policies continue to be a topic of ongoing debate, amid growing speculation about an economic slowdown on both sides of the Atlantic.
On the domestic front, Germany's trade surplus decreased to €14.4B in May, with exports declining by 0.1% MoM and imports increasing by 1.7% MoM. Meanwhile, Spain's unemployment rate decreased by 50.3K individuals in the past month.
On Tuesday, there is no significant news from the US, but the release of the FOMC Minutes on Wednesday is expected to attract considerable attention.
Daily digest market movers: Euro remains under mild downside pressure
- The EUR fails to gather convincing upside traction so far on Tuesday.
- The inactivity in the US markets should keep trading conditions depressed.
- Australia’s RBA kept the OCR unchanged at 4.10%.
- Investors continue to price in a Fed, ECB hike in July.
- FOMC Minutes and Nonfarm Payrolls are next of note in the docket.
Technical Analysis: Euro could slip back to 1.0830
EUR/USD appears under pressure and risks a potential deeper pullback in case the bears retail control. That said, the loss of the weekly low at 1.0835 (June 30) could open the door to a test of the interim 100-day SMA at 1.0821. The breakdown of the latter should meet the next contention area not before the May low of 1.0635 (May 31) ahead of the March low of 1.0516 (March 15) and the 2023 low of 1.0481 (January 6).
If bulls regains the upper hand, the next hurdle is then expected at the June peak of 1.1012 (June 22) prior to the 2023 high of 1.1095 (April 26), which is closely followed by the round level of 1.1100. North from here emerges the weekly top of 1.1184 (March 31, 2022), which is supported by the 200-week SMA at 1.1180, just before another round level at 1.1200.
The constructive view of EUR/USD appears unchanged as long as the pair trades above the crucial 200-day SMA, today at 1.0602.
Euro FAQs
What is the Euro?
The Euro is the currency for the 20 European Union countries that belong to the Eurozone. It is the second most heavily traded currency in the world behind the US Dollar. In 2022, it accounted for 31% of all foreign exchange transactions, with an average daily turnover of over $2.2 trillion a day.
EUR/USD is the most heavily traded currency pair in the world, accounting for an estimated 30% off all transactions, followed by EUR/JPY (4%), EUR/GBP (3%) and EUR/AUD (2%).
What is the ECB and how does it impact the Euro?
The European Central Bank (ECB) in Frankfurt, Germany, is the reserve bank for the Eurozone. The ECB sets interest rates and manages monetary policy.
The ECB’s primary mandate is to maintain price stability, which means either controlling inflation or stimulating growth. Its primary tool is the raising or lowering of interest rates. Relatively high interest rates – or the expectation of higher rates – will usually benefit the Euro and vice versa.
The ECB Governing Council makes monetary policy decisions at meetings held eight times a year. Decisions are made by heads of the Eurozone national banks and six permanent members, including the President of the ECB, Christine Lagarde.
How does inflation data impact the value of the Euro?
Eurozone inflation data, measured by the Harmonized Index of Consumer Prices (HICP), is an important econometric for the Euro. If inflation rises more than expected, especially if above the ECB’s 2% target, it obliges the ECB to raise interest rates to bring it back under control.
Relatively high interest rates compared to its counterparts will usually benefit the Euro, as it makes the region more attractive as a place for global investors to park their money.
How does economic data influence the value of the Euro?
Data releases gauge the health of the economy and can impact on the Euro. Indicators such as GDP, Manufacturing and Services PMIs, employment, and consumer sentiment surveys can all influence the direction of the single currency.
A strong economy is good for the Euro. Not only does it attract more foreign investment but it may encourage the ECB to put up interest rates, which will directly strengthen the Euro. Otherwise, if economic data is weak, the Euro is likely to fall.
Economic data for the four largest economies in the euro area (Germany, France, Italy and Spain) are especially significant, as they account for 75% of the Eurozone’s economy.
How does the Trade Balance impact the Euro?
Another significant data release for the Euro is the Trade Balance. This indicator measures the difference between what a country earns from its exports and what it spends on imports over a given period.
If a country produces highly sought after exports then its currency will gain in value purely from the extra demand created from foreign buyers seeking to purchase these goods. Therefore, a positive net Trade Balance strengthens a currency and vice versa for a negative balance.
- Pound Sterling is displaying back-and-forth turns as households are facing the burden of high inflation.
- Inflation in the United Kingdom is sticky due to the tight labor market and 45-year high food inflation.
- After a slightly higher Manufacturing PMI, investors are shifting their focus toward Services PMI.
The Pound Sterling (GBP) is demonstrating choppy moves around 1.2700 as investors are awaiting key Service PMI numbers after better-than-expected Manufacturing PMI data. The GBP/USD pair is non-directional as the market mood is broadly quiet due to the Independence Day holiday in the United States. Investors would keep their entire focus on interest rate guidance from Bank of England (BoE) policymakers.
The economic outlook for the United Kingdom is still solid as demand from households is upbeat despite higher interest rates by the Bank of England. While problems or BoE policymakers and the UK government are galloping as inflation looks extremely sticky above 8.5% and tight monetary policy is failing to do the expected job.
Daily Digest Market Movers: Pound Sterling remains sideways around 1.2700
- Pound Sterling finds strength as United Kingdom’s economic prospects are improving despite higher interest rates from the Bank of England.
- UK’s S&P Manufacturing PMI for June landed at 46.5, higher than the consensus and the former release of 46.2.
- Manufacturing PMI has been broadly contracting straight for the past 11 months. A figure below 50.0 is considered a generation contraction.
- Later this week, investors will focus on the June Services PMI data. The economic data is seen steady at 53.7.
- The Bank of England warned commercial banks on Monday that they may be underestimating their exposure to private equity and to commodity markets at a time when rising interest rates could squeeze liquidity in the market, as reported by Reuters.
- The monthly survey by Citi Bank and polling firm YouGov showed that consumer inflation expectations for one year have increased to 5.0% in June from 4.7% in May.
- This must be the outcome of stubborn inflation, which is reluctant to ditch the territory above 8.5%. Thanks to elevated food price inflation and tight labor market conditions that are keeping inflation higher.
- BoE Governor Andrew Bailey is consistently supporting further interest rate hikes as the UK economy is dealing with more persistent inflation.
- Contrary, BoE policymaker Silvana Tenreyro is opposing further increases in interest rates as risks having to make a sharp U-turn if it tightens policy anymore.
- Market mood is quite cautious as investors have been sidelined ahead of the second-quarter result season.
- The US Dollar Index (DXY) is broadly under pressure as the United States Manufacturing PMI continued contraction straight for eight months.
- US factory activities landed at 46.0, significantly lower than the expectations of 47.2 and the former release of 46.9. Contrary to the US PMI data, New Orders Index jumped to 45.6, higher than the consensus of 44.0 and the prior release of 42.6.
- Later this week, investors will focus on the Federal Open Market Committee (FOMC) minutes and the employment data to be released by the US Automatic Data Processing (ADP).
- US ADP private employment report is expected to disclose the addition of fresh 180K employees, lower than the former addition of 278K.
Technical Analysis: Pound Sterling eyes lower portion of the Rising Channel pattern
Pound Sterling is correcting toward the lower portion of the Rising Channel chart pattern in which pullback moves are considered as buying opportunities by the market participants. The Cable is holding the 20-period daily Exponential Moving Average (EMA), which indicates that the upside momentum is extremely solid.
Buyers could add positions if Cable corrects further to 1.2570 as a bargain buy opportunity would emerge. While upside bias could fade if it extends correction below the psychological support of 1.2500.
Pound Sterling FAQs
What is the Pound Sterling?
The Pound Sterling (GBP) is the oldest currency in the world (886 AD) and the official currency of the United Kingdom. It is the fourth most traded unit for foreign exchange (FX) in the world, accounting for 12% of all transactions, averaging $630 billion a day, according to 2022 data.
Its key trading pairs are GBP/USD, aka ‘Cable’, which accounts for 11% of FX, GBP/JPY, or the ‘Dragon’ as it is known by traders (3%), and EUR/GBP (2%). The Pound Sterling is issued by the Bank of England (BoE).
How do the decisions of the Bank of England impact on the Pound Sterling?
The single most important factor influencing the value of the Pound Sterling is monetary policy decided by the Bank of England. The BoE bases its decisions on whether it has achieved its primary goal of “price stability” – a steady inflation rate of around 2%. Its primary tool for achieving this is the adjustment of interest rates.
When inflation is too high, the BoE will try to rein it in by raising interest rates, making it more expensive for people and businesses to access credit. This is generally positive for GBP, as higher interest rates make the UK a more attractive place for global investors to park their money.
When inflation falls too low it is a sign economic growth is slowing. In this scenario, the BoE will consider lowering interest rates to cheapen credit so businesses will borrow more to invest in growth-generating projects.
How does economic data influence the value of the Pound?
Data releases gauge the health of the economy and can impact the value of the Pound Sterling. Indicators such as GDP, Manufacturing and Services PMIs, and employment can all influence the direction of the GBP.
A strong economy is good for Sterling. Not only does it attract more foreign investment but it may encourage the BoE to put up interest rates, which will directly strengthen GBP. Otherwise, if economic data is weak, the Pound Sterling is likely to fall.
How does the Trade Balance impact the Pound?
Another significant data release for the Pound Sterling is the Trade Balance. This indicator measures the difference between what a country earns from its exports and what it spends on imports over a given period.
If a country produces highly sought-after exports, its currency will benefit purely from the extra demand created from foreign buyers seeking to purchase these goods. Therefore, a positive net Trade Balance strengthens a currency and vice versa for a negative balance.
It should be a quiet day in FX today due to the US national holiday, but things will get hectic again from tomorrow, economists at ING report.
National holiday today, but volatility to pick up tomorrow
US bond and equity markets are closed and there are no data releases, so expect another quiet day in FX.
USD-crosses volatility will pick up again tomorrow when the focus will shift to FOMC minutes.
See – EUR/USD: Reluctance to take the pair sustainably above the benchmark 1.10 level – ING
- NZD/USD scales higher for the third straight day and climbs to a one-week high on Tuesday.
- The uncertainty over the Fed’s rate-hike path undermines the USD and lends some support.
- The divergent Fed-RBNZ policy outlook to cap gains ahead of FOMC minutes on Wednesday.
The NZD/USD pair gains positive traction for the third successive day on Tuesday and climbs to a one-week high during the early part of the European session. Spot prices currently trade around the 0.6170, up 0.30% for the day, and might look to build on the recent bounce from the 0.6050 area, or a three-week low touched last Thursday.
The US Dollar (USD) struggles to gain any meaningful traction in the wake of the uncertainty over the Federal Reserve's (Fed) rate-hike path and turns out to be a key factor acting as a tailwind for the NZD/USD pair. It is worth recalling that the US central bank had indicated in June that borrowing costs may still need to rise as much as 50 bps by the end of this year and the outlook was reinforced by Fed Chair Jerome Powell last week. That said, the softer US PCE Price Index released on Friday, along with Monday's weaker US ISM PMI, raises questions over how much headroom the Fed has to continue tightening its monetary policy and keep the USD bulls on the defensive.
The markets, however, are still pricing in a greater chance of a 25 bps lift-off at the next FOMC policy meeting on July 25-26. This, in turn, remains supportive of elevated US Treasury bond yields, which, along with worries about a global economic downturn, lends some support to the safe-haven Greenback and could cap gains for the risk-sensitive Kiwi. Apart from this, the Reserve Bank of New Zealand's (RBNZ) explicit signal that it was done with its most aggressive hiking cycle since 1999 might further contribute to keeping a lid on the NZD/USD pair and warrants some caution before positioning for any meaningful appreciating move in the near term.
Traders might also prefer to wait on the sidelines ahead of this week's releases of the June FOMC meeting minutes, due on Wednesday, which will be scrutinized for cues about the Fed's policy outlook. Apart from this, the closely-watched US monthly employment details - popularly known as the NFP - will influence the USD and determine the near-term trajectory for the NZD/USD pair. In the meantime, relatively thin trading volumes, on the back of the Independence Day holiday in the US might hold back bulls from placing gresh bets.
Technical levels to watch
In a virtual SCO summit on Tuesday, China’s President Xi Jinping said that they “should focus on practical cooperation and accelerate economic recovery.
Additional takeaways
“Need to strengthen strategic communication and coordination, respect each other's core interests and concerns.“
“Need to formulate foreign policies independently.”
“China willing to work with all parties to implement global security initiatives.”
“China is against decoupling and severing supply chain.”
Related reads
- US Treasury Secretary Yellen had a 'frank and productive' discussion with China's ambassador
- USD/CNY: Forecasts raised to 7.30 in Q3 and 7.40 in Q4 – SocGen
Here is what you need to know on Tuesday, July 4:
The Reserve Bank of Australia (RBA) went against the market expectation and left its policy rate unchanged following the July policy meeting. Meanwhile, the US Dollar holds its ground early Tuesday after having weakened against its rivals following the disappointing ISM Manufacturing PMI survey on Monday. There won't be any high-impact data releases and trading action is likely to stay subdued with US stock and bond markets remaining closed in observance of the Independence Day holiday.
The RBA announced early Tuesday that it held the Official Cash Rate (OCR) unchanged at 4.10%. The latest Reuters poll showed there was a near split among economists, with 16 of 31 forecasting another 25 bps rate hike to 4.35%. In its policy statement, the RBA reiterated that "some further tightening of the monetary policy may be required" and explained that any tightening will depend on how the economy and inflation evolve. With the initial reaction, AUD/USD lost nearly 50 pips and dropped below 0.6650 before staging a rebound. At the time of press, the pair was trading flat on the day near 0.6670.
The economic activity in the US manufacturing sector continued to contract at an accelerating pace in June, the ISM Manufacturing PMI survey revealed on Monday. The headline ISM Manufacturing PMI fell to 46 from 46.9 in May and came in weaker than the market expectation of 47.2. Further details of the publication revealed that the Employment Index fell to 48.1 and the inflation component, Prices Paid Index, dropped to 41.8 from 44.2. The US Dollar Index erased its daily gains after this data and went into a consolidation phase near 103.00.
EUR/USD failed to make a decisive move in either direction on Monday. Early Tuesday, the pair continues to fluctuate in a tight channel at around 1.0900.
GBP/USD extends its sideways grind near 1.2700 for the second straight day on Tuesday.
Crude oil prices edged higher on Monday after Saudi Arabia said that it will extend the voluntary oil output cut of one million barrels per day by one more month to include August. After rising toward $72, the barrel of West Texas Intermediate retreated toward $70 area with the disappointing US ISM PMI report reviving concerns over the demand outlook.
USD/CAD holds steady above 1.3200 on Tuesday. Later in the day, the Bank of Canada will release the Business Outlook Survey for the second quarter.
USD/JPY moves up and down in a narrow channel below 145.00 on Tuesday. Japanese Finance Minister Shunichi Suzuki said earlier in the day that he is “keeping in close contact with the US at the vice-ministerial level on FX.” Similarly, "We are exchanging views with and communicating with authorities in other countries including our ally the United States not only on currencies, financial markets but various other issues," Japan's top currency diplomat Masato Kanda told reporters.
Gold staged a rebound amid retreating US yields on Monday and closed the day modestly higher. XAU/USD stays in positive territory above $1,920 early Tuesday.
Bitcoin gathered bullish momentum and climbed to $31,000 area before staging a technical correction early Tuesday. Ethereum rose above $1,900 on Monday and seems to have stabilized there in the European morning.
The RBA left the cash rate on hold at 4.10% at today's Board meeting. Economists at TD Securities analyze the AUD outlook.
0.66 to be firm support heading into US NFP
It is tough to be an AUD bull these days and today's pause makes an even harder case to buy the AUD.
We expect AUD/USD to face strong support at 0.66 before NFP.
We expect payrolls to remain above-trend, registering a firm 240K gain (cons. 225K) which should keep the USD well-supported. A much larger surprise may prove to be the fatal blow for AUD/USD to break below 0.66, revisiting first the YTD low of 0.65.
Economists at ING analyze EUR/USD outlook.
Sticking to 1.09 for now
EUR/USD appears to have found an anchor around 1.0900, which likely signals some reluctance for markets to take the pair sustainably above the benchmark 1.10 level, given uncertainty about the Fed’s tightening peak, but still mirroring the support offered by the very hawkish ECB messaging.
The only speech by ECB officials scheduled today is one by Joachim Nagel, who already delivered some hawkish remarks yesterday, saying the tightening cycle has still some way to go given upside risks to the risk outlook.
- Silver attracts some buyers for the third straight day, though remains below $23.00.
- The technical setup favours bullish traders and supports prospects for further gains.
- A convincing break below the $22.70-65 confluence will negate the positive outlook.
Silver trades with a mild positive bias for the third successive day on Tuesday, albeit lacks follow-through and remains below the $23.00 mark through the early European session.
From a technical perspective, the recent breakout through the $22.65-$22.70 confluence - comprising the 200-hour Simple Moving Average (SMA) and the 23.6% Fibonacci retracement level of the downfall from the June swing high - favours bullish traders. Moreover, oscillators on hourly charts are holding in the positive territory and are still far from being in the overbought zone, supporting prospects for some meaningful appreciating move for the XAG/USD.
That said, technical indicators on the daily chart - though have been recovering from lower levels - are yet to confirm the positive outlook and warrant some caution. This makes it prudent to wait for sustaiend strength and acceptance beyond the $23.00 mark, nearing the 38.2% Fibo. level, before placing fresh bullish bets. This is followed by the $23.30 area, or the 50% Fibo., which if cleared decisively might trigger a fresh bout of a short-covering around the XAG/USD.
The subsequent move up has the potential to lift the white metal beyond the $23.60 intermediate hurdle, or the 61.8% Fibo. level, towards reclaiming the $24.00 round-figure mark. The upward trajectory could get extended further towards the $24.25 resistance en route to the $24.45-$24.50 supply zone, or the June monthly swing high.
On the flip side, the $22.70-$22.65 confluence resistance breakpoint now seems to protect the immediate downside. A convincing break below will be seen as a fresh trigger for bearish traders and drag the XAG/USD back towards the multi-month low, around the $22.10 region touched in June. Some follow-through selling below the $22.00 mark should pave the way for deeper losses towards the $21.70-$21.65 zone en route to the $21.25 support and the $21.00 mark.
Silver 1-hour chart
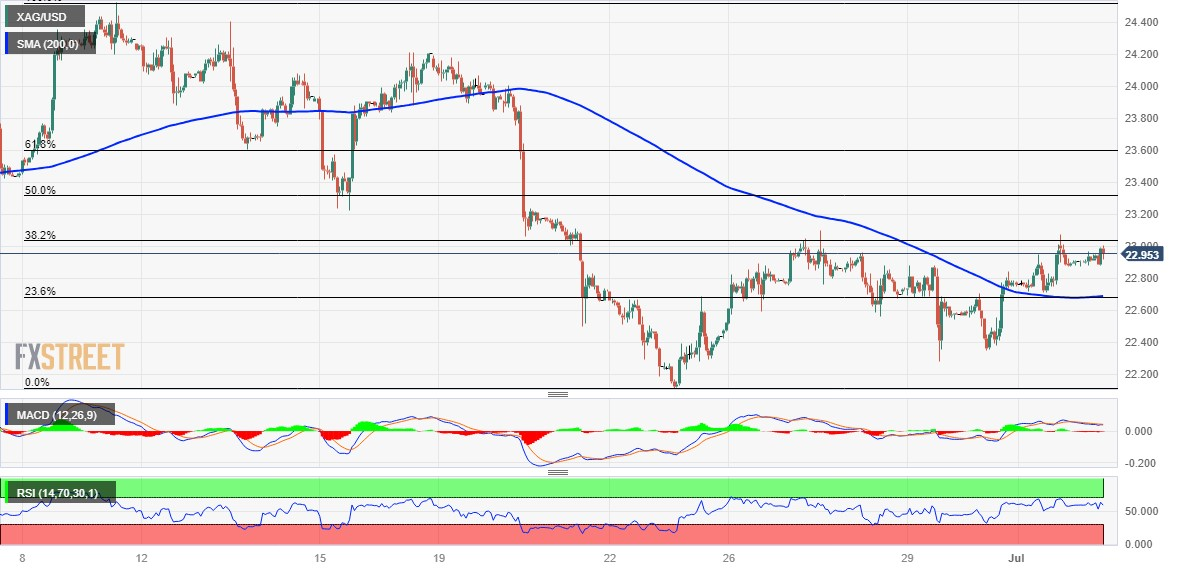
Key levels to watch
Economists at Commerzbank discuss the SNB policy outlook and its implications for the Swiss Franc (CHF).
Inflation in Switzerland: target reached?
For some months now price data in Switzerland has been moving in the right direction, as was the case again in June. Does that mean that the subject of inflation is over in Switzerland? Of course, it is still too early for that, as the SNB repeated frequently there is the risk of second-round effects. Wages might rise further thus fuelling inflation once again.
The SNB itself expects only a short-term decline in inflation rates. According to SNB projections consumer price inflation will be above the target corridor again next year.
As a result, the SNB is likely to remain vigilant and a continued hawkish approach seems likely. In this context, it will continue to prefer a strong Franc. It is therefore too early for higher EUR/CHF rates.
- The index hovers around the 103.00 region on Tuesday.
- US markets are closed due to the Independence Day holiday.
- Next salient event in the US docket will be the FOMC Minutes.
The greenback, when tracked by the USD Index (DXY), navigates within a tight range in the wake of the opening bell in Euroland on turnaround Tuesday.
USD Index looks cautious ahead of key releases
The index maintains the trade around Monday’s closing levels near the 103.00 yardstick against the backdrop of reduced trade conditions and scarce volatility due to the US Independence Day holiday.
Looking at the broader picture, the index continues to monitor developments around the potential next steps by the Federal Reserve in the next months vs. the persistent resilience observed in US key fundamentals.
So far, and according to CME Group’s FedWatch Tool, the probability of a 25 bps rate hike at the July 26 meeting is close to 90%.
In the US data space, the week is expected to be dominated by releases from the labour market (ADP report, weekly Initial Claims and Nonfarm Payrolls) as well as by the FOMC Minutes and the ISM Services PMI.
What to look for around USD
The index keeps the trade around the 103.00 hurdle amidst the inactivity in the US markets on Tuesday.
Meanwhile, the likelihood of another 25 bps hike at the Fed's upcoming meeting in July remains high, supported by the continued strength of key US fundamentals such as employment and prices.
This view was further bolstered by comments from Fed Chief Powell at the June FOMC event, who referred to the July meeting as "live" and indicated that most of the Committee is prepared to resume the tightening campaign as early as next month.
Key events in the US this week: Factory Orders, FOMC Minutes (Wednesday) – ADP Employment Change, Balance of Trade, Initial Jobless Claims, Final Services PMI, ISM Services PMI (Thursday) – Nonfarm Payrolls, Unemployment Rate (Friday).
Eminent issues on the back boiler: Persistent debate over a soft/hard landing of the US economy. Terminal Interest rate near the peak vs. speculation of rate cuts in late 2023/early 2024. Fed’s pivot. Geopolitical effervescence vs. Russia and China. US-China trade conflict.
USD Index relevant levels
Now, the index is up 0.01% at 102.98 and the breakout of 103.54 (weekly high June 30) would open the door to 104.69 (monthly high May 31) and then 104.79 (200-day SMA). On the other hand, the next contention emerges at 101.92 (monthly low June 16) followed by 100.78 (2023 low April 14) and finally 100.00 (round level).
Considering advanced prints from CME Group for natural gas futures markets, open interest resumed the uptrend and rose by around 6.6K contracts at the beginning of the week. On the other hand, volume reversed the previous daily build and dropped by around 123.2K contracts.
Natural Gas: Next hurdle emerges at $3.00
Prices of natural gas retreated modestly on Monday on the back of increasing open interest. That said, further retracements appear on the cards in the very near term, while the resumption of the uptrend is expected to meet a tough barrier at the March top around the $3.00 mark per MMBtu (March 3).
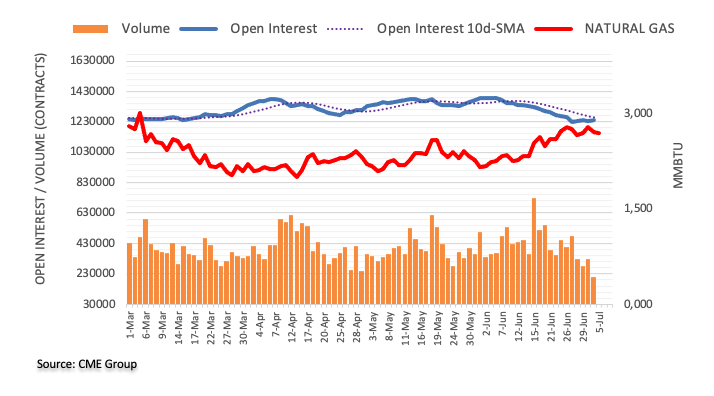
Economists at Société Générale analyze AUD outlook after the RBA decided to keep the cash rate unchanged at 4.10%
AUD outlook tied to industrial metals
The statement reiterates that ‘some further tightening may be required to ensure that inflation returns to target in a reasonable timeframe, but that will depend upon how the economy and inflation evolve’. In theory, this leaves the door open for another increase to 4.35%, which is also our base case.
The hawkish RBA bias can only support the AUD if the downtrend in industrial metals subsides, or the Fed starts cutting interest rates. The anaemic global manufacturing backdrop does not fill us with confidence that AUD/USD will attempt to return above 0.69-0.70 soon.
The mood should improve towards the latter part of the year if markets revert to pricing in rates cuts in the US.
Foreign trade data for May on Thursday and US NFP on Friday should set the direction for the currency in the near term.
Economists at Nomura expect EUR/GBP to advance nicely toward 0.88 and possibly 0.90 by the end of the year.
UK CPI could surprise on the downside in the second half of the year
The markets have shifted away from trading based on rate spreads, which would suggest a strengthening of the GBP, and are now more focused on growth expectations. Global surveys have been disappointing recently, leading to the underperformance of high-beta currencies.
The market is currently pricing in 121 bps of BoE policy rate hikes by the end of the year, which contrasts with our forecast of 75 bps.
Our leading indicators suggest that the UK CPI could surprise on the downside in the second half of the year.
Taking into account the overpriced rate hikes and the possibility of a downside surprise in UK CPI, we believe that EUR/GBP is likely to gradually move higher, reaching levels around 0.88 or even 0.90 by the end of the year.
The Lira adjusted sharply lower against the US Dollar in June by just over 20%. Economists at MUFG Bank analyze USD/TRY outlook.
Important for policymakers in Türkiye to regain credibility amongst foreign investors
It is now important for policymakers in Türkiye to regain credibility amongst foreign investors who have sharply cut back exposure to Türkiye. It will take time to regain investor confidence given fears that the policy reversal could prove short-lived given it will involve a painful adjustment for the economy, and President Erdogan is a long-time advocate of lower rates.
Under the leadership of new Governor Erkan, the CBRT raised the policy rate by 6.50 percentage points. While it was a step in the right direction, the size of the rate hike disappointed expectations and has placed more pressure on the Lira to adjust lower. We expect further similar sized hikes in July and August to lift the policy rate closer to inflation which remained elevated at 39% in May.
USD/TRY – Q3 2023 28.00 Q4 2023 29.00 Q1 2024 30.00 Q2 2024 30.00
- USD/CAD takes offers to refresh intraday low as European session begins with firmer Oil price.
- Supply crunch fears, US Dollar’s failure to stay firmer keep WTI on the front foot.
- US Dollar Index fades late Monday’s rebound as market sentiment dwindles.
- Bank of Canada Business Outlook Survey, Canada S&P Global Manufacturing PMI for June will be crucial for intraday directions.
USD/CAD slides to 1.3235 as the Loonie pair traders flex muscles to overcome the three-day-old inaction amid the early hours of the European session on Tuesday, after witnessing inactive Asian hours.
The Loonie pair’s latest losses could be linked to an uptick in Canada’s main export item, as well as a retreat in the US Dollar Index (DXY).
That said, WTI crude oil prints mild gains around $70.30 as it justifies the latest announcements from Saudi Arabia and Russia suggesting more supply cuts. Adding strength to the energy benchmark could be the hopes of increasing Oil demand from the US and China as both these economies are trying to overcome differences of late.
On the other hand, the DXY renews its intraday low near 102.90, down 0.07% on a day, as European traders react to the previous day’s downbeat US ISM Manufacturing PMI for June. That said, the private activity gauge dropped to the lowest level in three years, as well as stayed below the 50.0 level for the seventh consecutive month, as it marked a 46.0 figure versus 47.2 expected and 46.9 prior. Further, S&P Global Manufacturing PMI for June confirmed 46.3 figure, the lowest in five months, whereas the Construction Spending improved 0.9% MoM for May, versus 0.5% expected and 0.4% previous readouts.
It should be noted that the US holiday also allows the USD/CAD pair to print losses amid the market’s positioning for the key Canadian data/events. That said, Bank of Canada’s (BoC) Business Outlook Survey and June’s readings of S&P Global Manufacturing PMI appear crucial to watch for clear directions.
Meanwhile, the US Treasury bond yields curve inversion flagged fears of recession and join the anxiety about the Sino-American ties, as US Treasury Secretary Janet Yellen is in Beijing for diplomatic talks, to roil the sentiment and put a floor under the USD/CAD price.
Technical analysis
Multiple Doji candlesticks, portrayed in the last three days, suggest the USD/CAD pair’s inaction within the 21-DMA and 10-DMA, respectively around 1.3260 and 1.3210 in that order.
- USD/CHF has fallen back from 0.8970 as the USD Index has retreated.
- S&P500 futures have posted nominal losses as investors have turned cautious amid the holiday in the US.
- An inflation figure below 2% would allow the SNB to pause the policy-tightening spell.
The USD/CHF pair has witnessed extreme selling pressure after a less-confident pullback to near 0.8970 in the early London session. The Swiss Franc asset has retreated following the footprints of the US Dollar Index (DXY). The USD Index has dropped sharply as investors have shifted their focus toward the release of the United States Employment data.
S&P500 futures have posted nominal losses in Europe as investors have turned cautious amid the holiday in the United States. US markets will be closed on account of Independence Day. The USD Index has come under pressure as economic prospects in the US economy are going through a rough phase.
US Factory activity has dropped sharply as firms are facing issues while tapping for credit from regional banks due to tight conditions for loans. The US Institute of Supply Management (ISM) reported that Manufacturing PMI has extended its contraction straight for eight months. A figure below 50.0 is considered a general contraction in economic activities. The economic data landed at 46.0, significantly lower than the expectations of 47.2 and the former release of 46.9.
Going forward, Federal Open Market Committee (FOMC) minutes will be in focus. The minutes will provide a detailed explanation of steady interest rate policy and views about interest rate guidance.
Apart from that, US Automatic Data Processing (ADP) Employment data will be keenly watched. A decline in payrolls is expected to be 180K for June vs. the former release of 278K.
Meanwhile, the appeal for the Swiss Franc has been trimmed as the monthly Consumer Price Index (CPI) accelerated at a pace of 0.1% lower than the pace observed last month at 0.3%. Annualized CPI has decelerated to 1.7% vs. expectations of 1.8%. A figure below 2% would allow the Swiss National Bank (SNB) to pause further policy tightening.
The deluge of US Dollars over the past few years has contributed to the development of China’s domestic FX market. Economists at ANZ Bank gauge USD inflows.
Federal Reserve set to keep interest rate “higher for longer”
We have established an indicator to capture USD flows to China’s onshore FX market, which shows net USD50bn of outflows in recent months. This has increased both USD liquidity tightness and CNY depreciation risk.
Recent USD outflows are mainly due to corporate actions. Higher USD funding costs prompt corporates to repay rather than roll over USD-denominated debt. At the same time, cheaper RMB funding costs also reduces the need to sell more USD.
We do not expect a turnaround in USD flows in the near term. Corporates will continue to deleverage as the US Federal Reserve is set to keep interest rate ‘higher for longer’.
Open interest in crude oil futures markets dropped for the fifth consecutive session on Monday, this time by around 6.2K contracts according to preliminary readings from CME Group. Volume followed suit and shrank by nearly 161K contracts, setting aside the previous daily build.
WTI still targets weekly lows near $73.00
WTI prices started the week on the back foot and returned to the $70.00 zone following an earlier move to the vicinity of $72.00. The daily pullback was accompanied by shrinking open interest and volume and leaves the door open to the resumption of the recovery in the very near term and with the immediate hurdle at the weekly high near the $73.00 mark per barrel (June 21).
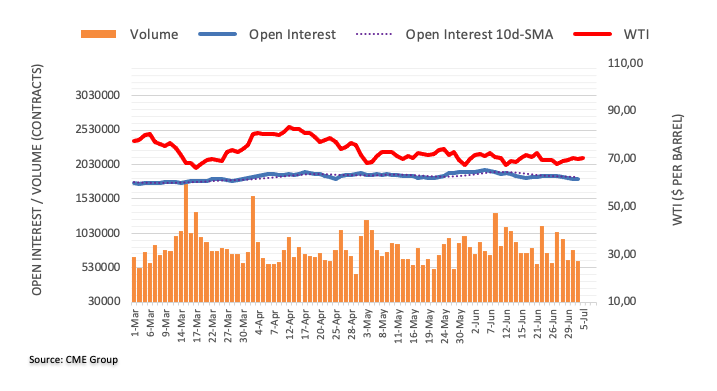
The Reserve Bank of Australia (RBA) has decided not to hike rates. AUD reacted negatively to the decision. Economists at Commerzbank analyze the Aussie outlook.
RBA takes another break
The RBA has once again taken a break in the rate hike cycle and left its key rate unchanged at 4.10%. However, the RBA seemed quite hawkish in its statement. According to the RBA, a further tightening of monetary policy might become necessary. However, in Australia too much depends on future data publications.
So overall it was a hawkish pause in Australia. That is likely to limit a down move in AUD against USD as the US central bank has also taken a break in the rate hike cycle and a Fed rate hike in July is far from being a fait accompli.
Economists at Société Générale analyze CNY outlook and forecast weakness ahead.
CNY likely to weaken
Market enthusiasm about China’s reopening did not last long. Even some of the more resilient indicators failed to mask the country’s structural problems. The market has shrugged off the technical recovery and is more focused on structural challenges. Under these circumstances, the CNY is likely to weaken. We have raised our USD/CNY forecasts to 7.30 in 3Q, 7.40 in 4Q and in 1Q24.
Meanwhile, the PBoC does not seem too concerned about the currency weakness. The underwhelming growth outlook and rising expectations of further monetary easing could maintain downward pressure on the CNY for some time yet.
- USD/TRY remains sidelined near all-time high, snaps three-day downtrend of late.
- Hopes of higher Turkish inflation leading to higher rates from CBRT tease Turkish Lira bears amid sluggish markets.
- Lack of strong rate hikes from CBRT failed to inspire Turkish Lira bulls amid broadly firmer US fundamentals.
- Hawkish signals from CBRT may trigger much-awaited pullback but the US holiday can limit the moves.
USD/TRY snaps a three-day downtrend even as the bulls struggle to print major gains around 25.93 heading into Tuesday’s European session. In doing so, the Turkish Lira (TRY) pair takes clues from the broad US Dollar recovery, as well as justifies fears of easing Turkish inflation, amid the lackluster markets due to the US holiday.
US Dollar Index (DXY) remains mildly bid near 103.00, after struggling the previous day, as downbeat sentiment joins hawkish Fed bets.
That said, the US yield curve inversion flags recession woes as an inversion between the US 10-year and two-year Treasury bond yields jumped to a fresh high since 1981 the previous day. “The yield curve briefly inverted to 42-year lows Monday as investors increasingly expect the Fed to raise its benchmark borrowing rates to keep inflation in check,” said Reuters. That said, the US two-year Treasury bond yields dropped to 4.85% while the 10-year counterpart fell to 3.78%, before ending Monday’s trading around 4.93% and 3.86% respectively.
On a different page, fears of the US-China tussle renew even as US Treasury Secretary Janet Yellen is in Beijing to restore the Sino-American business ties. The reason could be linked to the Wall Street Journal (WSJ) news suggesting “The Biden administration is preparing to restrict Chinese companies’ access to U.S. cloud-computing services, according to people familiar with the situation, in a move that could further strain relations between the world’s economic superpowers.”
Elsewhere, the downbeat US data fails to tame the hawkish Fed bets and challenge the Gold buyers despite the sluggish markets. On Monday, US ISM Manufacturing PMI for June dropped to the lowest level in three years, as well as stayed below the 50.0 level for the seventh consecutive month, as it marked a 46.0 figure versus 47.2 expected and 46.9 prior. Further, S&P Global Manufacturing PMI for June confirmed 46.3 figure, the lowest in five months, whereas the Construction Spending improved 0.9% MoM for May, versus 0.5% expected and 0.4% previous readouts.
At home, the Central Bank of the Republic of Türkiye (CBRT) hiked rates for the first time since August 2021, to 15% from 8.5% versus the 21% expected. However, the lesser-than-expected rate hike disappointed the Turkish Lira (TRY) buyers. That said, The CBRT reiterated its commitment to the 5% inflation target and did not rule out additional monetary tightening measures to achieve this target. However, the USD/TRY refreshed a record high of 24.61 following the CBRT announcements.
Moving on, Turkish Consumer Price Index (CPI) and Producer Price Index ((PPI) for June, scheduled for Wednesday, will be crucial for the Turkish Lira pair traders to watch for short-term directions. Also important will be Wednesday’s Fed minutes and Friday’s US jobs report for June.
Technical analysis
Despite posting the first daily gains in four, the lower-low formation keeps the USD/TRY bears hopeful. However, the Turkish Lira (TRY) sellers need daily closing beyond the latest peak of around 26.09 to keep buyers on the board.
CME Group’s flash data for gold futures markets noted traders increased their open interest positions for the third session in a row on Monday, this time by more than 8K contracts. Volume, instead, shrank for the second straight session, now by around 23.7K contracts.
Gold now targets the 100-day SMA
Prices of the troy ounce of gold extended the rebound from last week’s lows in the sub-$1900 region at the beginning of the week. The decent advance was on the back of rising open interest, which is indicative that further upside remains on the table for the time being. In the meantime, extra gains should meet temporary resistance at the 100-day SMA, today at $1945.
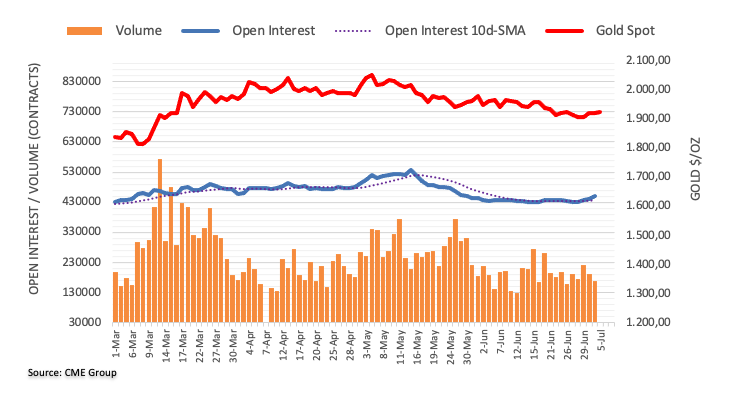
- Oil prices are holding an auction near $70.00 as Saudi has announced fresh supply cuts.
- The announcement of production cuts is making efforts to trim the impact of weak global macro cues.
- Investors would get more clarity about the Fed’s interest rate guidance from the release of the FOMC minutes.
West Texas Intermediate (WTI), futures on NYMEX, are holding their auction near the round-level support of $70.00 in the early London session. The oil price has turned sideways as fresh supply cuts announcements by Saudi Arabia are giving a tough fight to deepening fears about a bleak global outlook.
Saudi Arabia's Ministry for Energy announced it would be extending its production cut for crude for an extra month, as reported by Newswires. Usually, the decision to production cuts follows the need of bringing stability in the oil price.
The announcement of production cuts is making efforts to trim the impact of weak global macro cues. On Monday, the United States Institute of Supply Management (ISM) reported that the spell of contraction in Manufacturing PMI has extended to eight months. Investors should be aware that a figure below 50.0 is considered a contraction.
The economic data landed at 46.0, significantly lower than the expectations of 47.2 and the former release of 46.9. Contrary to the US PMI data, New Orders Index jumped to 45.6, higher than the consensus of 44.0 and the prior release of 42.6. This indicates that oil demand is extremely weak and more interest rates by the Federal Reserve (Fed) would put more pressure on black gold.
Investors would get more clarity about the Fed’s interest rate guidance from the release of the Federal Open Market Committee (FOMC) minutes, which will release on Wednesday.
The US Dollar Index (DXY) has rebounded to nearly 103.10 ahead of the US Employment data, which will release on Thursday. Automatic Data Processing (ADP) is expected to show a decline in the Employment Change to 180K for June vs. the former release of 278K.
- EUR/JPY takes offers to print the first daily loss in three, stays near the highest levels since September 2008.
- Japan authorities keep showing readiness to defend Yen but haven’t acted of late.
- Recession woes, US-China jitters and downbeat EU/German PMIs are extra negatives for cross-currency pair.
EUR/JPY prints the first daily loss in three while refreshing the intraday low around 157.55 heading into Tuesday’s European session. In doing so, the cross-currency pair justifies the market’s cautious mood, as well as the chatters about Japan’s meddling in the markets to defend the Yen (JPY).
Market sentiment remains mostly downbeat of late as fears of the US-China tussle renew even as US Treasury Secretary Janet Yellen is in Beijing to restore the Sino-American business ties. The reason could be linked to the Wall Street Journal (WSJ) news suggesting “The Biden administration is preparing to restrict Chinese companies’ access to U.S. cloud-computing services, according to people familiar with the situation, in a move that could further strain relations between the world’s economic superpowers.”
Additionally weighing on the market sentiment, as well as on the EUR/JPY price, could be the fears of recession flagged by an inversion between the US 10-year and two-year Treasury bond yields as it jumped to a fresh high since 1981 the previous day. “The yield curve briefly inverted to 42-year lows Monday as investors increasingly expect the Fed to raise its benchmark borrowing rates to keep inflation in check,” said Reuters. That said, the US two-year Treasury bond yields dropped to 4.85% while the 10-year counterpart fell to 3.78%, before ending Monday’s trading around 4.93% and 3.86% respectively.
Softer European and German statistics also add strength to the bearish bias surrounding the EUR/JPY pair. On Monday, the final readings of June’s German HCOB Manufacturing PMI and the same manufacturing gauge for the Eurozone came in softer-than-expected respective figures of 41.0 and 43.6 to 40.6 and 43.4.
Even so, European Central Bank (ECB) policymaker Joachim Nagel said that monetary policy signals are clearly pointing in the direction of further tightening. The policymaker also added that they will have "a way to go" with regard to additional rate increases, per Reuters.
On the other hand, Japanese Finance Minister Shunichi Suzuki said on Tuesday, he is “keeping in close contact with the US at the vice-ministerial level on FX.” Earlier in the day, the nation’s top currency diplomat Masato Kanda said that he is communicating with various countries including the US over currencies, per Reuters.
Against this backdrop, S&P500 Futures retreated even as Wall Street managed to post minor gains.
Moving on, German trade numbers for May and the aforementioned risk catalysts will be important for the immediate EUR/JPY direction.
Technical analysis
A confirmation of a one-week-old bearish triangle becomes necessary to convince EUR/JPY sellers to take the risk of entering a short-term position. As a result, 157.30 appears short-term key support.
Economist at UOB Group Lee Sue Ann expects the Bank Negara Malaysia to keep its policy rate unchanged at this week’s event.
Key Quotes
Although the May monetary policy statement indicated that BNM continues to leave the door open for further rate hikes, we think the odds for another hike is diminishing as external downside risks linger or escalate, growth momentum moderates, and consumption drivers slow weighed by prospects of higher costs amid adjustments in domestic subsidy policies.
- EUR/USD has dropped to near 1.0900 amid a cautious market mood.
- S&P earnings could be full of surprises as overall demand is strong in conjunction with higher interest rates by the Fed.
- US Manufacturing PMI has contracted straight for eight months.
The EUR/USD pair has corrected to near the round-level cushion of 1.0900 in the late Asian session. The major currency pair has faced some pressure as the market mood has turned cautious amid the holiday in the United States due to Independence Day.
S&P500 futures are showing choppy moves in late Tokyo as investors have sidelined ahead of the quarterly result season. Earnings could be full of surprises as overall demand is strong in conjunction with higher interest rates by the Federal Reserve (Fed).
The US Dollar Index (DXY) has climbed to near 103.00 as investors have started ignoring weak US Manufacturing PMI and are focusing on the release of the Federal Open Market Committee (FOMC) minutes. On Monday, the US ISM reported that Manufacturing PMI was contracted straight for eight months as a figure below 50.0 is considered a general contraction. The economic data landed at 46.0, significantly lower than the expectations of 47.2 and the former release of 46.9.
Contrary to the US PMI data, New Orders Index jumped to 45.6, higher than the consensus of 44.0 and the prior release of 42.6.
Meanwhile, the Euro bulls are facing some challenges as the preliminary headline Harmonized Index of Consumer Prices (HICP) for June has softened to 5.5% in June vs. the prior release of 6.1%. This is the seventh decline in price pressures in the past eight months. However, core inflation that excludes volatile oil and food prices decelerated marginally to 6.8% vs. 6.9% released earlier.
European Central Bank (ECB) President Christine Lagarde has already conveyed that the interest rate policy is not sufficiently restrictive to bring inflation to 2%.
Going forward, investors will keep focusing on the Eurozone Retail Sales data, which will release on Thursday. Monthly Retail Sales data is seen at 0.2% vs. a stagnant figure.
- Gold Price picks up bids to print four-day uptrend despite posting minor gains of late.
- US Independence Day holiday directs traders toward XAU/USD amid recession woes, mixed concerns about Sino-American ties.
- Softer US data fails to tame hawkish Fed bets and challenge Gold buyers near the key resistances.
Gold Price (XAU/USD) stays on the front foot for the fourth consecutive day despite lacking upside momentum around $1,923 heading into Tuesday’s European session. In doing so, the XAU/USD portrays the market’s inaction amid the US holidays and a light calendar elsewhere.
However, concerns about the global economic slowdown and the US-China ties help the traders to remain active. Also favoring the market momentum was the recent inaction by the Reserve Bank of Australia (RBA) as defied broad consensus of announcing a third consecutive 25 basis points of a rate hike.
The inversion between the US 10-year and two-year Treasury bond yields jumped to a fresh high since 1981 and renewed recession woes. “The yield curve briefly inverted to 42-year lows Monday as investors increasingly expect the Fed to raise its benchmark borrowing rates to keep inflation in check,” said Reuters after the US two-year Treasury bond yields dropped to 4.85% while the 10-year counterpart fell to 3.78%. It’s worth noting that both these benchmark yields ended Monday’s trading around 4.93% and 3.86% respectively.
Elsewhere, anxiety surrounding the US-China ties escalates and provides tailwind to the Gold Price as US Treasury Secretary Janet Yellen is in Beijing. Earlier in the day, US Treasury Department said, per Reuters, “Treasury Secretary Janet Yellen had a 'frank and productive' discussion today with China's Ambassador.” The news also mentioned that US Treasury Secretary Yellen raised issues of concern while also conveying the importance of the two countries working together.
On the same line are headlines from the Wall Street Journal (WSJ) stating, “The Biden administration is preparing to restrict Chinese companies’ access to U.S. cloud-computing services, according to people familiar with the situation, in a move that could further strain relations between the world’s economic superpowers.”
It’s worth observing that the downbeat US data fails to tame the hawkish Fed bets and challenge the Gold buyers despite the sluggish markets. On Monday, US ISM Manufacturing PMI for June dropped to the lowest level in three years, as well as stayed below the 50.0 level for the seventh consecutive month, as it marked 46.0 figure versus 47.2 expected and 46.9 prior. Further, S&P Global Manufacturing PMI for June confirmed 46.3 figure, the lowest in five months, whereas the Construction Spending improved 0.9% MoM for May, versus 0.5% expected and 0.4% previous readouts.
While portraying the mood, S&P500 Futures retreated even as Wall Street managed to post minor gains.
Looking forward, the risk catalysts for clear directions amid the US holiday and light calendar elsewhere.
Gold Price Technical Analysis
Despite failing to cross a fortnight-old descending resistance line, near $1,930 at the latest, the Gold Price remains well above the $1,917 support confluence comprising the 200-Hour Moving Average (HMA) and a four-day-old rising support line, which in turn keeps the XAU/USD bulls hopeful of poking the stated resistance line for one more time.
It should be observed that the 50% Fibonacci retracement of the quote’s weakness between June 16 and 29, adds strength to the $1,930 resistance comprising the previously mentioned falling trend line.
Following that, a quick jump towards the 61.8% Fibonacci retracement, also known as the golden Fibonacci ratio, near $1,940, can’t be ruled out.
However, a convergence of the 100-DMA and a downward-sloping resistance line from early June on the daily chart, around $1,945, appears a tough nut to crack for the Gold buyers afterward.
Meanwhile, a downside break of the $1,917 support confluence will need validation from the 23.6% Fibonacci retracement level of around $1,910 before directing the Gold bears toward the previous monthly low, also the lowest level since March, around $1,893.
Gold Price: Hourly chart
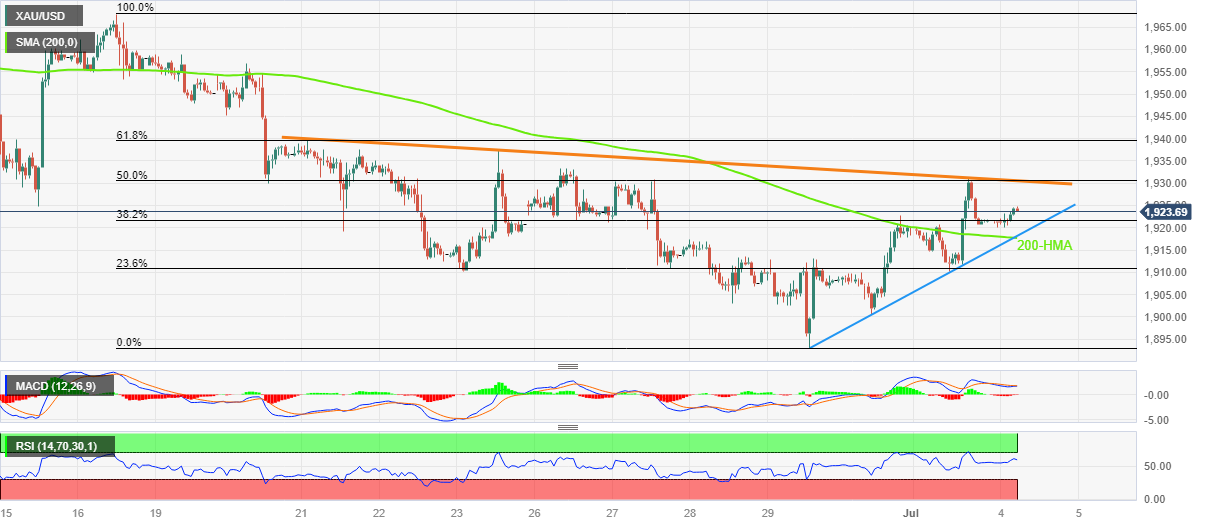
Trend: Limited upside expected
- AUD/NZD has displayed a vertical fall as RBA left interest rates unchanged.
- The recent decline in monthly CPI to 5.8% provided strength to RBA policymakers to maintain the status quo.
- NZ inflation is not showing signs of easing while the economic outlook has dampened extremely.
The AUD/NZD pair has witnessed an intense sell-off to near the round-level support of 1.0800 as the Reserve Bank of Australia (RBA) has left interest rates unchanged at 4.10%. As per the expectations, investors were mixed between a steady interest rate decision and a small hike of 25 basis points (bps) to 4.35%.
It looks like the recent decline in the monthly Consumer Price Index (CPI) provided strength to RBA policymakers to maintain the status quo. Investors should note that Australia’s monthly CPI softened heavily to 5.6% in May from a prior pace of 6.8%. A sheer decline in gasoline prices released severe heat from red-hot inflation in Australia and provided a luxury to RBA Governor Philip Lowe to remain light on monetary policy.
Meanwhile, labor market conditions in Australia are still solid amid an overall upbeat demand. The Unemployment Rate dropped to 3.6% in May vs. the former figure of 3.7%.
No doubt, price pressures in the Australian region are far from the desired rate of 2%, a steady interest rate policy would buy some time for RBA policymakers to assess interest rate hikes yet made in achieving price stability. Investors should understand that further rate hikes cannot be ruled out. Financial markets are anticipating that RBA’s Official Cash Rate (OCR) would peak around 4.6%.
On the New Zealand Dollar front, inflation is not showing signs of easing while the economic outlook has dampened extremely. The Reserve Bank of New Zealand (RBNZ) has already pushed its OCR to 5.50% and more rate hikes are in the pipeline.
- Asia-Pacific markets remain mildly positive amid softer US data, hopes of Sino-American ties.
- Yield curve inversion renews recession fears and weigh on market’s optimism amid US holiday.
- Australia’s ASX rises half a percent on RBA’s surprise status quo.
- Japan intervention, inflation fears from South Korea also prod Asian equity buyers.
Market sentiment in the Asia-Pacific region remains slightly upbeat during early Tuesday as traders juggle between the recession woes and the Reserve Bank of Australia’s (RBA) inaction. Also restricting the trading sentiment could be the mixed concerns about the Sino-American ties, as well as the US holiday.
Amid these plays, MSCI’s index of the Asia-Pacific shares outside Japan rises 0.30% whereas Japan’s Nikkei 225 bucks the trend with a 0.90% intraday fall, so far, to 33,461 heading into Tuesday’s European session.
It’s worth noting that Australian equities recently witnessed a boost from the Reserve Bank of Australia’s (RBA) no rate hike decision, which in turn propels the benchmark ASX to an intraday high of near 7,285, up half a percent by the press time. That said, Australia’s 10-year Treasury bond yields dropped nearly 45 basis points (bps) to 3.97% after the RBA announcements.
On a border front, S&P500 Futures retreated even as Wall Street managed to post minor gains whereas US two-year Treasury bond yields rose to 4.93% while the 10-year counterpart printed mild gains around 3.86% by the end of Monday’s North American trading session.
It’s worth noting that the Chinese stocks are mildly positive as US Treasury Secretary Janet Yellen is in Beijing for diplomatic talks whereas South Korea’s KOSPI drops 0.30% intraday as the Bank of Korea (BoK) flagged inflation woes earlier in the day.
Elsewhere, New Zealand’s NZX50 traces its Aussie counterpart while posting nearly 0.30% intraday gains but Indian equities remain lackluster around the record tops after an upbeat day.
It should be observed that the hawkish bias surrounding the US Federal Reserve (Fed) ignores recently downbeat US data but manages to check the equity bears of late.
Moving on, share traders should pay attention to the risk catalysts for clear directions amid the US holiday and light calendar elsewhere.
Also read: Forex Today: Dollar weakens after data, attention turns to RBA
- AUD/JPY comes under intense selling pressure in reaction to the RBA’s surprise pause.
- Speculation fears lend some support to the JPY and contribute to the intraday slide.
- The BoJ’s dovish stance acts as a headwind for the JPY and helps limit further losses.
The AUD/JPY cross attracts heavy selling near the 96.70 area, or over a one-week high touched earlier this Tuesday and drops to a fresh daily low after the Reserve Bank of Australia (RBA) announced its policy decision. Spot prices currently trade just above the 96.00 round-figure mark and for now, seem to have snapped a three-day winning streak.
The Australian Dollar (AUD) weakens across the board after the RBA board members decided to leave the Official Cash Rate (OCR) unchanged at 4.10%. This seems to have disappointed a fraction of market participants anticipating another 25 bps lift-off, which, in turn, is seen as a key factor weighing on the AUD/JPY cross. Furthermore, worries about a global economic downturn, particularly in China, further contribute to the offered tone surrounding the risk-sensitive Aussie.
The Japanese Yen (JPY), on the other hand, draws some support from speculations that authorities will intervene in the markets to stem any further weakness in the domestic currency. In fact, Japan's Finance Minister Shunichi Suzuki warned last week that the government will take appropriate steps should the Japanese Yen (JPY) weaken excessively. Suzuki added this Tuesday that the government is keeping in close contact with the US at the vice-ministerial level on FX.
That said, a big divergence in the monetary policy stance adopted by the Bank of Japan (BoJ) and other major central banks might cap the JPY, which, in turn, could limit losses for the AUD/JPY cross. Investors seem convinced that the BoJ will stick to its ultra-ease monetary policy stance
in the wake of a view that inflation will slow later this year. Moreover, the BoJ has pledged to patiently sustain stimulus and focus on supporting a fragile economic recovery.
The aforementioned mixed fundamental backdrop makes it prudent to wait for strong follow-through selling before traders start positioning for the resumption of the AUD/JPY pair's recent pullback from its highest level since September 2022. Bullish traders, meanwhile, might now wait for a sustained strength beyond the 96.70-96.80 horizontal barrier before placing fresh bets and a possible move back towards challenging the 97.55-97.65 supply zone, or the YTD peak.
Technical levels to watch
- AUD/USD takes offers to reverse early-day gains, prod three-day uptrend, after RBA’s dovish surprise.
- RBA stays away from rate hike after two consecutive hawkish surprises, keeps benchmark rate unchanged at 4.10%.
- Yield curve inversion renews recession fears and exerts additional downside pressure on Aussie pair.
- Updates about US-China ties will be important for intraday directions amid US holiday, Treasury Secretary Yellen’s Beijing visit.
AUD/USD aptly portrays the market’s disappointment with the Reserve Bank of Australia’s (RBA) no rate hike decision on early Tuesday as it slumped nearly 40 pips within a minute of the Interest Rate Decision to 0.6644, pressured around 0.6650 at the latest.
After offering two consecutive hawkish surprises, the Aussie central bank unveils a dovish surprise while keeping the benchmark interest rate unchanged at 4.10%, versus market expectations of rolling out the third rate lift of 25 basis points (bps).
Also read: RBA: Any tightening will depend upon how the economy and inflation evolve
Not only the RBA-inflicted disappointment but the looming recession woes, signaled via the inversion of the US Treasury bond yields curve, also weigh on the AUD/USD prices. That said, the inversion between the US 10-year and two-year Treasury bond yields jumped to a fresh high since 1981 and renewed recession woes. “The yield curve briefly inverted to 42-year lows Monday as investors increasingly expect the Fed to raise its benchmark borrowing rates to keep inflation in check,” said Reuters after the US two-year Treasury bond yields dropped to 4.85% while the 10-year counterpart fell to 3.78%. It’s worth noting that both these benchmark yields ended Monday’s trading around 4.93% and 3.86% respectively.
It should be noted, however, that the downbeat US data and the holiday in the world’s largest economy, the US, prod the AUD/USD pair sellers. On Monday, US ISM Manufacturing PMI for June dropped to the lowest level in three years, as well as stayed below the 50.0 level for the seventh consecutive month, as it marked 46.0 figure versus 47.2 expected and 46.9 prior. Further, S&P Global Manufacturing PMI for June confirmed 46.3 figure, the lowest in five months, whereas the Construction Spending improved 0.9% MoM for May, versus 0.5% expected and 0.4% previous readouts.
Furthermore, anxiety surrounding the US-China ties escalates and weighs on the AUD/USD price as US Treasury Secretary Janet Yellen is in Beijing. Earlier in the day, US Treasury Department said, per Reuters, “Treasury Secretary Janet Yellen had a 'frank and productive' discussion today with China's Ambassador.” The news also mentioned that US Treasury Secretary Yellen raised issues of concern while also conveying the importance of the two countries working together.
Against this backdrop, S&P500 Futures retreated even as Wall Street managed to post minor gains whereas US two-year Treasury bond yields rose to 4.93% while the 10-year counterpart printed mild gains around 3.86% by the end of Monday’s North American trading session.
Having witnessed the initial market reaction to the RBA’s status quo, the AUD/USD pair traders should pay attention to the risk catalysts for clear directions amid the US holiday and light calendar elsewhere.
Technical analysis
A clear upside break of the 0.6690-95 resistance confluence comprising the 100 and 200 Exponential Moving Averages (EMAs), quickly followed by the 0.6700 round figure, becomes necessary for the AUD/USD bulls to keep the reins. Meanwhile, the Aussie pair sellers need validation from a 12-day-old descending resistance line, now support around 0.6810.
Following are the key headlines from the Reserve Bank of Australia’s (RBA) July monetary policy statement, via Reuters, as presented by Governor Phillip Lowe.
Board remains resolute in its determination to return inflation to target.
Some further tightening of monetary policy may be required.
Higher interest rates are working to establish a more sustainable balance between supply and demand in the economy.
Board is still expecting the economy to grow as inflation returns to the 2–3 per cent target range.
In light of this and the uncertainty surrounding the economic outlook, the board decided to hold interest rates steady this month.
This will provide some time to assess the impact of the increase in interest rates to date and the economic outlook.
Any tightening will depend upon how the economy and inflation evolve.
Inflation is still too high and will remain so for some time yet.
Board’s priority is to return inflation to target within a reasonable timeframe.
A significant source of uncertainty continues to be the outlook for household consumption.
Board remains alert to the risk that expectations of ongoing high inflation will contribute to larger increases in both prices and wage.
-
AUD/USD nosedives 40 pips to 0.6650 on RBA inaction
About RBA rate decision
RBA Interest Rate Decision is announced by the Reserve Bank of Australia. If the RBA is hawkish about the inflationary outlook of the economy and rises the interest rates it is positive, or bullish, for the AUD. Likewise, if the RBA has a dovish view on the Australian economy and keeps the ongoing interest rate, or cuts the interest rate it is seen as negative, or bearish.
At its July policy meeting, the Reserve Bank of Australia (RBA) board members decided to leave the Official Cash Rate (OCR) unchanged at 4.10%, disappointing the markets.
The latest Reuters poll showed there was a near split among economists with 16 of 31 foressing another 25 bps rate hike to 4.35% at the July 4 meeting. The remaining 15 expected a pause.
The Australian central bank raised interest rates by 25 bps in May and June, delivering two consecutive hawkish surprises.
AUD/USD reaction
In a knee-jerk reaction to the RBA decision, the AUD/USD pair dropped over 40 pips to test 0.6650. The pair is down 0.25% on the day.
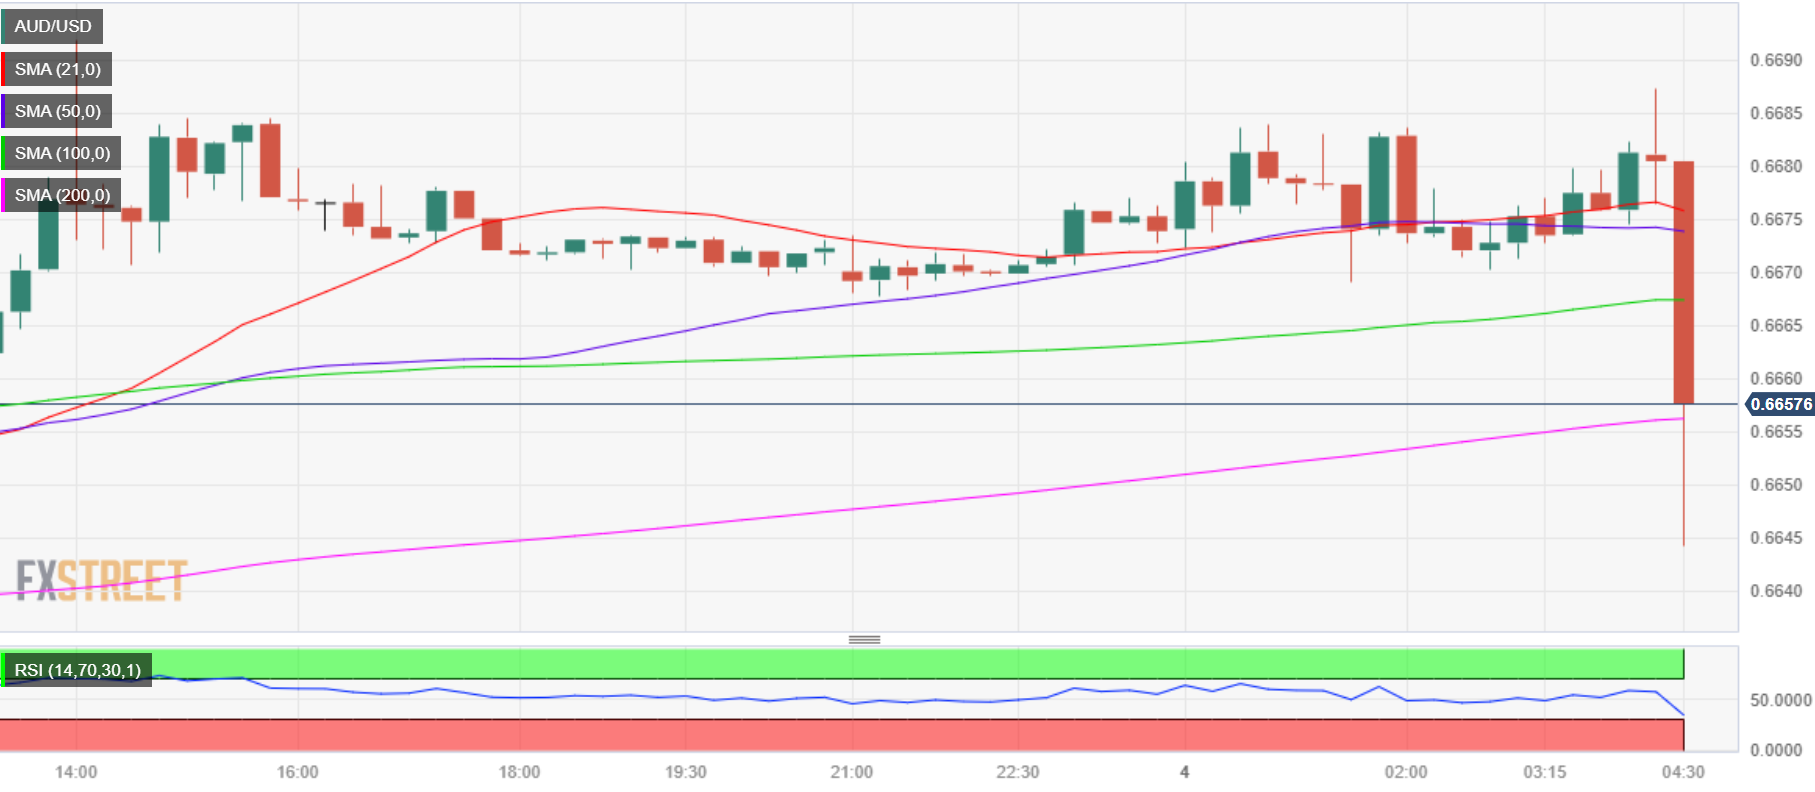
AUD/USD: 15-minutes chart
About RBA rate decision
RBA Interest Rate Decision is announced by the Reserve Bank of Australia. If the RBA is hawkish about the inflationary outlook of the economy and rises the interest rates it is positive, or bullish, for the AUD. Likewise, if the RBA has a dovish view on the Australian economy and keeps the ongoing interest rate, or cuts the interest rate it is seen as negative, or bearish.
- NZD/USD trades with a positive bias for the third successive day, though lacks follow-through.
- A big divergence in the Fed-RBNZ policy outlook continues to act as a headwind for the major.
- Traders might also refrain from placing fresh bets ahead of this week’s key releases from the US.
The NZD/USD pair attracts some buyers for the third successive day on Tuesday and holds steady above mid-0.6100s through the Asian session. Spot prices, however, remain well within the previous day's broader trading range, warranting some caution before positioning for an extension of the recent bounce from a three-week low touched last Thursday.
The US Dollar (USD) struggles to gain any meaningful traction in the wake of the uncertainty over the Federal Reserve's future rate-hike path and turns out to be a key factor lending support to the NZD/USD pair. It is worth recalling that the US central bank has signalled in June that borrowing costs may still need to rise as much as 50 bps by the end of this year and the outlook was reinforced by Fed Chair Jerome Powell last week. That said, the incoming US macro data has been fueling speculations that the central bank will soften its hawkish stance, sooner rather than later, which keeps the USD bulls on the defensive.
In fact, the US Bureau of Economic Analysis reported on Friday that the annual PCE Price Index decelerated to 3.8% in May from the 4.3% previous and the core gauge ticked lower to 4.6% from 4.7% in April. Adding to this, the ISM Manufacturing PMI remained in contraction territory for the eighth straight month in June and fell to its lowest level since May 2020. The markets, however, are still pricing in a 25 bps lift-off at the July FOMC meeting. This markets a big divergence as compared to the Reserve Bank of New Zealand's (RBNZ) dovish shift, signalling that it was done with its most aggressive hiking cycle since 1999.
The aforementioned fundamental backdrop makes it prudent to wait for strong follow-through selling before placing fresh bullish bets around the NZD/USD pair ahead of this week's important releases. The minutes of the June FOMC meeting are due on Wednesday and will be scrutinized for cues about the Fed's future rate-hike path. This will be followed by the US monthly jobs data - popularly known as the Nonfarm Payrolls (NFP) on Friday, which should influence the USD. In the meantime, traders might prefer to wait on the sidelines amid relatively thin trading on the back of the Independence Day holiday in the US.
Technical levels to watch
- USD/CAD remains sidelined between 21-DMA and 10-DMA, fades bounce off intraday low recently.
- Multiple Doji candlestick portrays the Loonie trader’s indecision near the lowest levels since September 2022.
- Bullish MACD signals, higher low formation suggest buyers flexing muscles.
- Sellers need validation from 1.3165; buyers may wait for 1.3340 breakout for conviction.
USD/CAD stays defensive for the fourth consecutive day around 1.3250 heading into Tuesday’s European session.
The Loonie pair’s latest inaction could be linked to the US Independence Day holiday and the cautious mood ahead of the key Canadian catalysts. That said, Bank of Canada’s (BoC) Business Outlook Survey and June’s readings of S&P Global Manufacturing PMI appear crucial to watch for clear directions.
That said, multiple Doji candlestick portrays the Loonie pair’s inaction within the 21-DMA and 10-DMA, respectively around 1.3260 and 1.3210 in that order.
However, the recent higher lows and bullish MACD signals suggest the USD/CAD pair’s recovery past the 1.3260 hurdle comprising the 21-DMA.
Even so, the previous support line from November 15, 2022, around 1.3340 at the latest, becomes crucial to convince the Loonie pair buyers.
On the flip side, a daily closing beneath the 10-DMA support of 1.3210 will need validation from the 1.3200 round figure and the latest multi-month low around 1.3165, marked the last week, to renew the bearish bias about the Loonie pair.
Following that, the 1.3000 psychological magnet and September 2022 low near 1.2965 will be in the spotlight.
USD/CAD: Daily chart
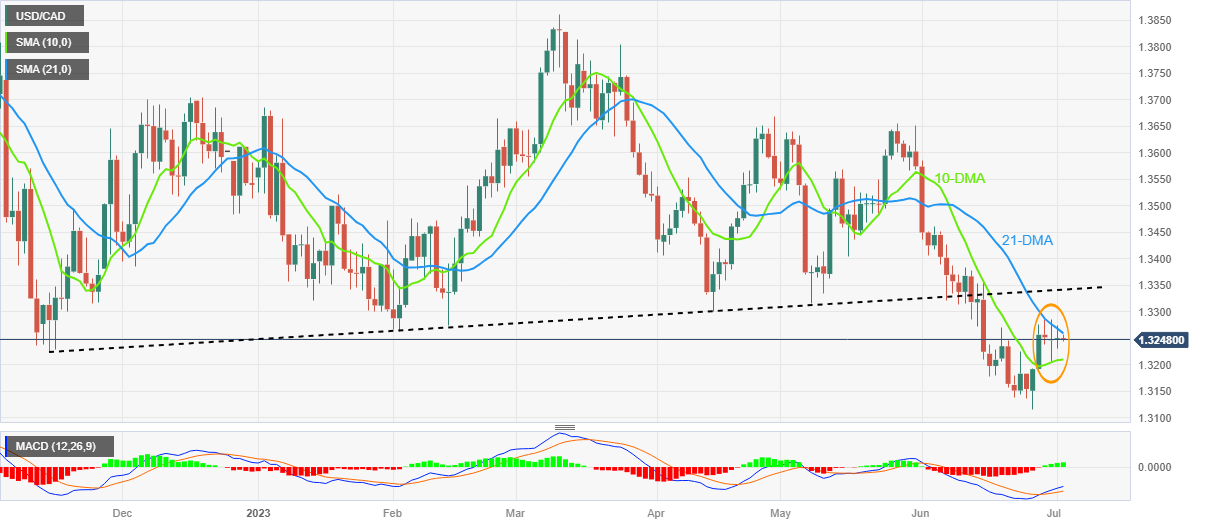
Trend: Builds upside momentum
- USD/INR remains under some selling pressure for the second successive day on Tuesday.
- The recent breakdown through the 82.15 confluence supports prospects for further losses.
- A sustained strength beyond last week’s swing high is needed to negate the bearish outlook.
The USD/INR pair struggles to capitalize on the previous day's bounce from the 81.75 area, or a two-month low and meets with a fresh supply during the Asian session on Tuesday. Spot prices currently trade just below the 82.00 mark, down 0.10% for the day, and seem vulnerable to slide further amid subdued US Dollar (USD) price action.
The recent breakdown through the 82.15 confluence - comprising the very important 200-day Simple Moving Average (SMA) and an upward sloping trend-line extending from November 2022 - validates the negative outlook for the USD/INR pair. Moreover, technical indicators on the daily chart are holding in the bearish territory and are still far from being in the oversold zone. This, in turn, supports prospects for an extension of the recent downfall from the vicinity of the 83.00 round figure mark.
Some follow-through selling below the overnight swing low, around the 81.75 region, will reaffirm the bearish bias and make the USD/INR pair vulnerable to accelerate the slide towards the next relevant support near the 81.50 zone. The downward trajectory could get extended further towards testing sub-81.00 levels or the YTD low touched in January.
On the flip side, the 82.15 confluence support breakpoint might now act as an immediate strong resistance ahead of last week's swing high, around the 82.25 region. A sustained strength beyond the latter might shift the bias in favour of bullish traders and lift the USD/INR pair back towards the 82.70-82.75 intermediate hurdle. Spot prices might then make a fresh attempt to conquer the 83.00 round-figure mark.
USD/INR daily chart
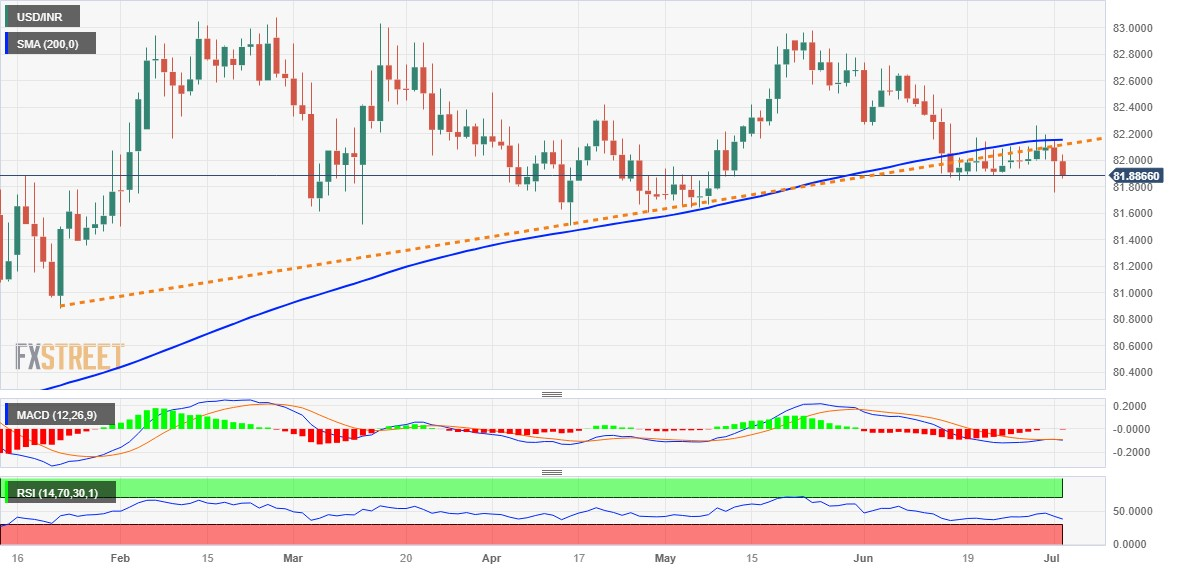
Key levels to watch
- USD/JPY stays pressured within four-day-old trading range near the highest levels since November 2022.
- Yield curve inversion renews recession fears, allowing US Dollar to lick data-inflicted wounds.
- Japan policymakers show readiness to intervene into money markets to defend Yen.
- Risk catalysts are the key, sluggish session likely amid US holiday.
USD/JPY fades the previous day’s recovery moves around 144.60 amid early Tuesday morning in Europe, suggesting the market’s cautious mood amid the US Independence Day holiday and mixed sentiment.
It’s worth noting that the Yen pair’s latest downbeat performance could be linked to the fears of Japan’s market intervention to defend the domestic currency as it seesaws around the highest levels in eight months. Also challenging the USD/JPY buyers are the fears of recession signaled via the US Treasury bond yields inversion.
Recently, Japanese Finance Minister Shunichi Suzuki said on Tuesday, he is “keeping in close contact with the US at the vice-ministerial level on FX.” Earlier in the day, the nation’s top currency diplomat Masato Kanda said that he is communicating with various countries including the US over currencies, per Reuters.
Elsewhere, the inversion between the US 10-year and two-year Treasury bond yields jumped to a fresh high since 1981 and renewed recession woes. “The yield curve briefly inverted to 42-year lows Monday as investors increasingly expect the Fed to raise its benchmark borrowing rates to keep inflation in check,” said Reuters after the US two-year Treasury bond yields dropped to 4.85% while the 10-year counterpart fell to 3.78%. It’s worth noting that both these benchmark yields ended Monday’s trading around 4.93% and 3.86% respectively.
On the other hand, downbeat US data prod US Dollar bulls but sour sentiment allows the greenback to grind higher amid the holiday moves. On Monday, US ISM Manufacturing PMI for June dropped to the lowest level in three years, as well as stayed below the 50.0 level for the seventh consecutive month, as it marked 46.0 figure versus 47.2 expected and 46.9 prior. Further, S&P Global Manufacturing PMI for June confirmed 46.3 figure, the lowest in five months, whereas the Construction Spending improved 0.9% MoM for May, versus 0.5% expected and 0.4% previous readouts.
Against this backdrop, S&P500 Futures retreat even as Wall Street managed to post minor gains.
Moving on, the US holiday will restrict immediate USD/JPY moves but the fears of market intervention can check the bullish bias despite hawkish Fed bets, favoring a 0.25% rate hike in July.
Technical analysis
USD/JPY bulls are running out of steam as the lower-high formation around the multi-day peak joins the overbought RSI, as well as a downside break of a three-week-old rising support line, now immediate resistance near 144.70.
RBA monetary policy decision – Overview
The Reserve Bank of Australia (RBA) is scheduled to announce its monetary policy decision this Tuesday, July 4, at 04:30 GMT and is expected to raise the cash rate by 25 bps to 4.35%. The markets, however, remain divided over the possibility that the central bank might keep its monetary policy unchanged. As Matías Salord, News Reporter at FXStreet explains:” The economic data still allows the RBA to raise rates further, and that is the main argument for a hike. At the same time, the central bank could pause at this meeting and resume the hike cycle later, which is what the interest rate market is indicating.” Hence, the focus will also be on the accompanying monetary policy statement, which will be closely scrutinized for fresh cues about the future rate-hike path.
Analysts at TD Securities offer a brief preview of the event and write: “Another line-ball call with cons. expecting no hike and OIS market pricing in ~50% prob of a 25 bps hike. Contrary to cons., we expect the RBA to hike. The labour market is too tight, upside retail sales beat for May, rebound in domestic housing prices in June and elevated household savings provides room for the RBA to continue its hike to return inflation back to target.”
How could the RBA decision affect AUD/USD?
Heading into the key central bank event risk, the AUD/USD pair is seen trading just below the one-week high touched on Monday and draws support from subdued US Dollar (USD) price action. Theoretically, a hawkish 25 bps RBA rate hike should provide a fresh boost to the Australian Dollar (AUD), though worries about economic headwinds stemming from rapidly rising borrowing costs should cap any meaningful upside.
In contrast, a dovish tilt will be enough to prompt aggressive selling around the growth-sensitive Aussie against the backdrop of worries about a global economic downturn. This, in turn, suggests that the path of least resistance for the AUD/USD pair is to the downside. Hence, any intraday positive move might still be seen as a selling opportunity and runs the risk of fizzling out rather quickly.
Key quotes
• Reserve Bank of Australia Preview: A close call, with AUD/USD vulnerable
• RBA Preview: Banks split between a pause and 25 bps hike after softer inflation
• AUD/USD Price Analysis: Further recovery hinges of 0.6700 breakout and RBA Interest Rate Decision
About the RBA interest rate decision
RBA Interest Rate Decision is announced by the Reserve Bank of Australia. If the RBA is hawkish about the inflationary outlook of the economy and rises the interest rates it is positive, or bullish, for the AUD. Likewise, if the RBA has a dovish view of the Australian economy and keeps the ongoing interest rate, or cuts the interest rate it is seen as negative, or bearish.
- GBP/JPY trades with a mild negative bias through the Asian session on Tuesday.
- Intervention fears lend some support to the JPY and exert pressure on the cross.
- The fundamental and technical setup still seems tilted in favour of bullish traders.
The GBP/JPY cross struggles to capitalize on its gains recorded over the past two days and edges lower during the Asian session on Tuesday. Spot prices currently trade around mid-183.00s and remain well within the striking distance of the highest level since December 2015 touched last Friday.
Speculations that Japanese authorities will intervene in the markets to stem any further weakness in the domestic currency act as a headwind for the GBP/JPY cross. That said, a big divergence in the monetary policy stance adopted by the Bank of Japan (BoJ) and other major central banks continues to undermine the Japanese Yen (JPY). This, in turn, lends some support to the cross and warrants some caution before positioning for any meaningful corrective decline.
Furthermore, the lack of selling suggests that the strong rally witnessed since late March is still far from being over and supports prospects for an extension of the well-established uptrend. Hence, the recent range-bound price action might still be categorized as a consolidation phase. That said, technical indicators on the daily chart are still flashing overbought conditions and holding back bullish traders from placing fresh bets around the GBP/JPY cross.
The aforementioned technical setup makes it prudent to wait for some near-term consolidation or a modest pullback before positioning for any further gains. In the meantime, the multi-year peak, just ahead of the 184.00 round figure, might now act as an immediate resistance. A sustained strength beyond has the potential to lift the GBP/JPY cross towards the next relevant hurdle near the 184.60 region en route to the 185.00 psychological mark.
On the flip side, the 183.00 round figure is likely to protect the immediate downside. Any subsequent decline might be seen as a buying opportunity and remain limited near the 182.60-182.55 horizontal support. That said, some follow-through selling could drag spot prices further towards the 182.10-182.00 area, which if broken decisively could pave the way for a slide towards the 180.55-180.50 area with some intermediate support near the 181.00 mark.
GBP/JPY 4-hour chart
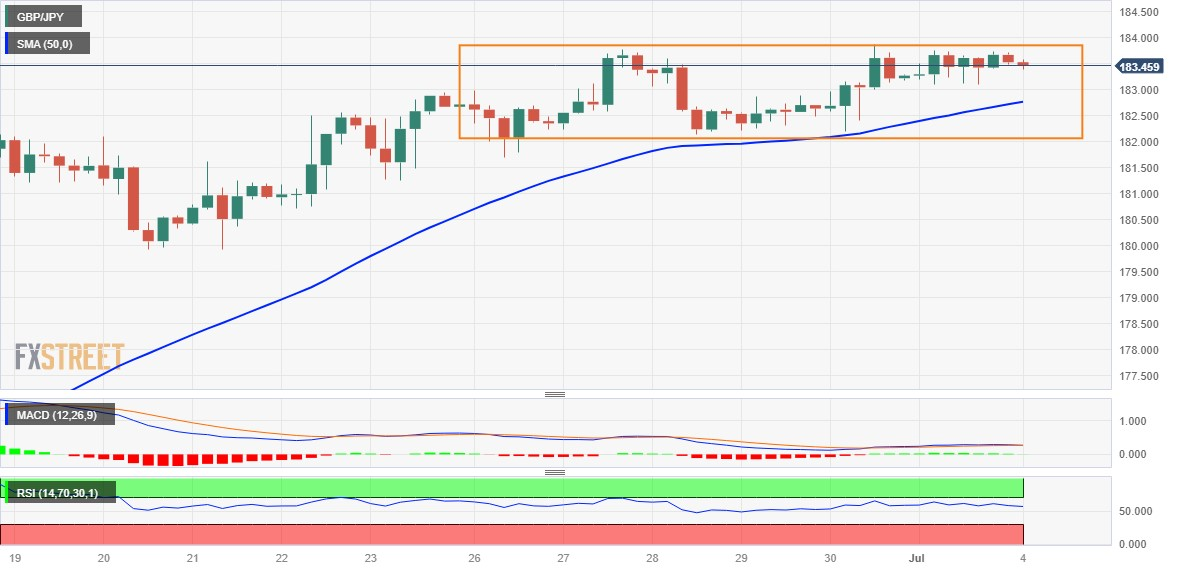
Key levels to watch
Japanese Finance Minister Shunichi Suzuki said on Tuesday, he is “keeping in close contact with the US at the vice-ministerial level on FX.”
He said that he doesn't have anything to add beyond what he has already said previously on recent Yen declines.
Market reaction
USD/JPY is off the lows but posts small losses near 144.60, as of writing.
| Raw materials | Closed | Change, % |
|---|---|---|
| Silver | 22.897 | 0.58 |
| Gold | 1921.38 | 0.14 |
| Palladium | 1245.3 | 1.54 |
- EUR/USD renews intraday low after an unimpressive week-start, lures bears amid sluggish session.
- Monday’s Doji candlestick, looming bear cross on MACD direct Euro sellers towards five-week-old rising support line.
- Seven-day-long falling trend line guards immediate recovery; 50-DMA acts as additional downside filters.
EUR/USD takes offers to refresh the intraday low near 1.0905 as it justifies the previous day’s bearish candlestick formation, as well as downbeat MACD signals, during a sluggish Tuesday morning due to the US Independence Day holiday.
Also read: EUR/USD floats above 1.0870-65 support confluence as softer US data prods hawkish Fed bias
That said, the Euro pair portrayed an indecisive closing the previous day while reversing from 1.0934, after an upbeat start of the week, which in turn marked a bearish Doji candlestick on the daily chart, suggesting a reversal of Friday’s recovery.
Additionally favoring the EUR/USD bears is the quote’s sustained trading below a downward-sloping resistance line from June 22, close to 1.0920 at the latest.
It’s worth noting that the impending bear cross on the MACD indicator adds strength to the downside bias surrounding the Euro pair.
With this, the EUR/USD price appears well-set to prod a five-week-old rising support line, near 1.0870. However, the 50-DMA acts as an extra filter toward the south and challenges the EUR/USD bears near 1.0865.
In a case where the EUR/USD remains bearish past 1.0865, Friday’s bottom of 1.0835 can act as the final defense of the Euro bulls.
On the flip side, a daily closing beyond the 1.0920 resistance can trigger a run-up toward the 1.1000 psychological magnet before directing the bulls toward the previous monthly high of around 1.1015.
It should be noted that the EUR/USD pair’s rise past 1.1015 enables it to challenge the yearly peak of 1.1095.
EUR/USD: Daily chart
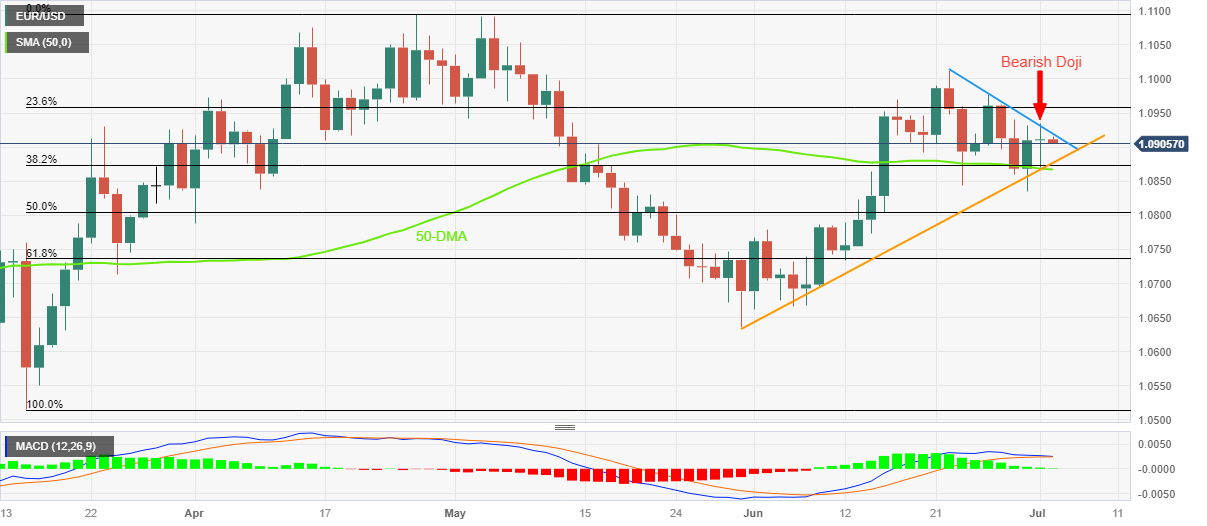
Trend: Further downside expected
- Gold price lacks any firm intrada direction and oscillates in a narrow band on Tuesday.
- Subdued US Dollar price action and economic woes lend some support to the XAU/USD.
- Hawkish central banks continue to act as a headwind and cap gains for the yellow metal.
Gold price struggles to gain any meaningful traction on Tuesday and oscillates in a narrow trading band, around the $1,920 level through the Asian session. The XAU/USD, meanwhile, now seems to have found acceptance above the 200-hour Simple Moving Average (SMA) for the first time since June 16 and might look to build on the recent recovery from the $1,893 area, or a three-and-half-month low touched last Thursday.
Economic woes lend some support to safe-haven XAU/USD
The incoming weaker economic data from the United States (US) cast doubts about the need for further policy tightening by the Federal Reserve (Fed), which keeps the US Dollar (USD) bulls on the defensive and lends support to the Gold price. It is worth recalling that the US Bureau of Economic Analysis reported on Friday that the annual PCE Price Index decelerated to 3.8% in May from the 4.3% previous and the core gauge ticked down to 4.6% from 4.7% in April.
Furthermore, the Institute for Supply Management's (ISM) Manufacturing PMI dropped to the lowest level since May 2020 and came in at 46.0 for June. This marks the eighth straight month of contraction, which adds to worries about a global economic downturn and further seems to benefit the safe-haven Gold price. Despite the supporting factors, the XAU/USD remains below the one-week high touched on Monday, warranting caution before placing aggressive bullish bets.
Traders await this week’s key releases from United States
Given that the US markets will be closed in observance of Independence Day, relatively thin liquidity is holding back traders on the sidelines ahead of this week's key releases from the US. The minutes of the June Federal Open Market Committee (FOMC)meeting are due on Wednesday, which will be closely scrutinized for cues about the Fed's future rate-hike path. This will be followed by the US monthly jobs data - popularly known as the Nonfarm Payrolls (NFP) on Friday.
Hawkish central banks should act as a headwind for Gold price
in the meantime, bets for a 25 basis points (bps) rate hike at the next FOMC meeting on July 25-26, along with a more hawkish outlook adopted by major central banks, might continue to act as a headwind for the non-yielding Gold price. Apart from this, the recent risk-on rally across the global equity markets should further contribute to capping the upside for the safe-haven precious metal. This makes it prudent to wait for strong follow-through buying before confirming that the XAU/USD has formed a near-term bottom and positioning for any meaningful appreciating move.
Gold price technical outlook
From a technical perspective, the overnight swing high, around the $1,931 area now seems to act as an immediate hurdle. This is closely followed by the 100-day Simple Moving Average (SMA), currently around the $1,942 region, which if cleared decisively might trigger a short-covering rally. The Gold price might then accelerate the recovery towards the $1,962-$1,964 hurdle en route to the $1,970-$1,972 supply zone. Some follow-through buying should allow bulls to reclaim the $2,000 psychological mark and test the $2,010-$2,012 resistance.
On the flip side, immediate support is pegged near the $1,908-$1,907 area ahead of the $1,900 round-figure mark and the multi-month low, around the $1,893-$1,892 region touched last week. A convincing break below will make the Gold price vulnerable to accelerate the downward trajectory and expose the very important 200-day Simple Moving Average (SMA), currently around the $1,860 zone.
Key levels to watch
- GBP/USD struggles for clear directions after a slightly downbeat daily performance.
- Fears of recession, US-China tussles put a floor under US Dollar, weigh on Pound Sterling.
- Softer US data versus comparatively more hawkish BoE concerns than Federal Reserve keeps Cable buyers hopeful.
- US holiday will restrict intraday moves, PMIs, Fed Minutes and US NFP in focus.
GBP/USD treads water around 1.2700 as it struggles to justify the hawkish bias about the Bank of England (BoE), as well as fails to cheer the recently downbeat US data, amid sluggish markets on Tuesday. That said, the US holidays and mixed clues about the central banks’ next moves join the fresh fears of recession to restrict the immediate moves of the Pound Sterling.
US yields curve inversion renews fears of economic slowdown as the difference between the two-year US bond coupons and 10-year counterpart marked the deepest inversion since 1981 on Monday. “The yield curve briefly inverted to 42-year lows Monday as investors increasingly expect the Fed to raise its benchmark borrowing rates to keep inflation in check,” said Reuters.
Not only the fears of US recession but downbeat US data and concerns about the Sino-American tension also challenge the hawkish Fed bets and should have favored the GBP/USD buyers. However, US holidays and the risk-off mood allow the Cable pair to consolidate the recent losses ahead of the top-tier data/events.
That said, the interest rate futures suggest an 85% probability of witnessing 25 basis points (bps) of a Fed rate hike in July, as well as back the chances of BoE’s 0.50% rate hike in August. On the same line, Reuters said, “Futures markets had reflected rate cuts at the Fed's September meeting as recently as May, and are now projecting that the first cuts will come in January.” The market's hawkish mood could be linked to the last week’s central bankers’ comments at the European Central Bank (ECB) Forum in Sintra.
It should be noted that US ISM Manufacturing PMI for June dropped to the lowest level in three years, as well as stayed below the 50.0 level for the seventh consecutive month, as it marked 46.0 figure versus 47.2 expected and 46.9 prior. Further details reveal that the ISM Manufacturing Employment Index slid to a three-month low of 48.1 in June from 51.4 previous readings but the New Orders Index improved to 45.6 from 42.6 marked in May and 44.0 market forecasts. Additionally, the ISM Manufacturing Prices Pair nosedived to the lowest since April 2020, to 41.8, during the said month from 44.2 previous readings. On a different page, S&P Global Manufacturing PMI for June confirmed 46.3 figure, the lowest in five months, whereas the Construction Spending improved 0.9% MoM for May, versus 0.5% expected and 0.4% previous readouts.
Against this backdrop, S&P500 Futures remain inactive after a mildly positive Wall Street performance. That said, the Treasury bond yields remain sidelined after an upbeat week-start move.
Looking ahead, the US Independence Day holiday will offer the GBP/USD pair a lackluster trading day ahead.
Technical analysis
A U-turn from the 12-day-old resistance line, around 1.2715 by the press time, joins downbeat oscillators to suggest the GBP/USD pair’s further downside.
- USD/CHF takes offers to reverse the week-start gains, mildly offered of late.
- Convergence of 100 and 200-EMA restricts immediate upside within three-week-old bullish channel.
- Ascending support line from June 26 restricts immediate downside.
USD/CHF holds lower ground near 0.8960 as it reverses the week-start rebound amid a sluggish Asian session on Tuesday. In doing so, the Swiss Franc (CHF) pair remains pressured below a convergence of the 100 and 200 Exponential Moving Averages (EMA).
Adding strength to the downside bias are the bearish MACD signals and steady RSI (14) line.
However, a one-week-old rising support line, near 0.8945 by the press time, restricts the immediate downside of the USD/CHF pair.
Following that, the aforementioned three-week-old rising trend channel’s bottom line, close to 0.8920 at the latest, holds the key to the pair’s further downside.
In a case where the Swiss Franc pair defies the bullish chart formation by breaking the 0.8920 support, the previous monthly low of around 0.8910 may act as an extra filter toward the south before directing the USD/CHF bears to the yearly low marked in May ear 0.8820.
On the contrary, a clear upside break of the 100 and 200 EMAs, around 0.8970, could quickly propel the USD/CHF price to the 0.9000 psychological magnet. However, the aforementioned bullish channel’s top line, close to 0.9020 as we write, can prod the pair buyers afterward.
Overall, USD/CHF is likely to improve gradually but the short-term pullback can’t be ruled out.
USD/CHF: Hourly chart

Trend: Limited downside expected
- USD/CAD continues with its struggle to gain any meaningful traction on Tuesday.
- Softer Crude Oil prices undermine the Loonie and lend some support to the pair.
- Subdued USD price action acts as a headwind ahead of this week’s key releases.
The USD/CAD pair extends its sideways consolidative price move on Tuesday and remains confined in a familiar trading range, around mid-1.3200s through the Asian session.
The Canadian Dollar (CAD) is weighed down by last week's softer domestic data, showing that consumer inflation slowed to a nearly two-year low in May. This weakens the case for another interest rate hike by the Bank of Canada (BoC) in July. Apart from this, a downtick in Crude Oil prices further undermines the commodity-linked Loonie and acts as a tailwind for the USD/CAD pair, though subdued US Dollar (USD) demand continues to cap the upside. This, in turn, warrants some caution before placing aggressive bets around the major and positioning for a firm near-term direction.
Despite supply woes from cuts for August by top exporters Saudi Arabia and Russia, Crude Oil prices remain on the defensive amid worries that a global economic downturn will dent fuel demand. It is worth recalling that Saudi Arabia said on Monday that it would extend its voluntary cut of one million bpd from output to August. Adding to this, Russia’s Deputy Prime Minister Alexander Novak announced that the country will also reduce its oil exports by 500,000 bpd in August. The news did provide a modest lift to the black liquid, though the immediate market reaction fades rather quickly.
The USD, on the other hand, continues with its struggle to gain any meaningful traction in the wake of the uncertainty over the Federal Reserve's (Fed) Rate hike path. It is worth recalling that the US central bank has signalled in June that borrowing costs may still need to rise as much as 50 bps by the end of this year and the outlook was reinforced by Fed Chair Jerome Powell last week. That said, the incoming US macro data has been fueling speculations that the central bank will soften its hawkish stance, sooner rather than later, which keeps the USD bulls on the defensive and caps the USD/CAD pair.
Traders also seem reluctant to place aggressive bets in the wake of the Independence Day holiday in the US and ahead of this week's important releases. The FOMC meeting minutes, due on Wednesday, will be scrutinized for fresh cues about the future rate-hike path, which will play a key role in driving the USD demand. The focus will then shift to the monthly employment details from the US and Canada, scheduled on Friday. This, along with Oil price dynamics, should help determine the next leg of a directional move for the USD/CAD pair.
Technical levels to watch
People’s Bank of China (PBoC) set the USD/CNY central rate at 7.2046 on Tuesday, versus previous fix of 7.2157 and market expectations of 7.2386. It's worth noting that the USD/CNY closed near 7.2450 the previous day. With this, the Chinese central bank's onshore Yuan (CNY) rate extends the previous day's retreat from the yearly top.
Apart from the USD/CNY fix, the PBoC also unveiled details of its Open Market Operations (OMO) while saying that the Chinese central bank injects 2 billion Yuan via 7-day reverse repos at 1.90% vs prior 1.90%.
It's worth noting that the 219 billion Yuan of RRs mature today, which in turn highlights a net drain of 217 billion Yuan via the OMOs.
About PBOC fix
China maintains strict control of the yuan’s rate on the mainland.
The onshore yuan (CNY) differs from the offshore one (CNH) in trading restrictions, this last one is not as tightly controlled.
Each morning, the People’s Bank of China (PBOC) sets a so-called daily midpoint fix, based on the yuan’s previous day's closing level and quotations taken from the inter-bank dealer.
- US Dollar Index holds lower grounds near 103.00 after unimpressive week-start.
- US ISM Manufacturing PMI joins downbeat PCE inflation, softer spending to prod hawkish Fed bets.
- US Independence Day holiday restricts DXY moves, key PMIs, Fed Minutes and NFP eyed.
US Dollar Index (DXY) remains on the back foot around 102.95, fading the late Monday’s corrective bounce, as markets seek fresh clues amid early Tuesday. In doing so, the greenback’s gauge versus six major currencies justifies the traders’ lack of confidence in the hawkish Fed bets amid recently downbeat US data. It’s worth noting that the US Independence Day holiday limits the DXY moves of late.
While extending Friday’s data disappointment, US ISM Manufacturing PMI for June dropped to the lowest level in three years, as well as stayed below the 50.0 level for the seventh consecutive month, as it marked 46.0 figure versus 47.2 expected and 46.9 prior. Further details reveal that the ISM Manufacturing Employment Index slid to a three-month low of 48.1 in June from 51.4 previous readings but the New Orders Index improved to 45.6 from 42.6 marked in May and 44.0 maket forecasts. Additionally, the ISM Manufacturing Prices Pair nosedived to the lowest since April 2020, to 41.8, during the said month from 44.2 previous readings. On a different page, S&P Global Manufacturing PMI for June confirmed 46.3 figure, the lowest in five months, whereas the Construction Spending improved 0.9% MoM for May, versus 0.5% expected and 0.4% previous readouts.
During the last week, the US Gross Domestic Product (GDP) and Durable Goods Orders improved but failed to gain support from the Fed’s preferred inflation gauge, namely the US Personal Consumption Expenditure (PCE) Price Index. Additionally, personal spending also eased and hence challenged the hawkish Fed bias, as well as the DXY bulls.
That said, the interest rate futures suggest 85% probability of witnessing 25 basis points (bps) of Fed rate hike in July. On the same line, Reuters said, “Futures markets had reflected rate cuts at the Fed's September meeting as recently as May, and are now projecting that the first cuts will come in January.” The market's hawkish Fed bets could be linked to the last week’s hawkish comments from the Federal Reserve Officials at the European Central Bank (ECB) Forum in Sintra.
Elsewhere, news that US Treasury Secretary Yellen had a 'frank and productive' discussion today with China's ambassador join the hopes of more easing from the People’s Bank of China (PBoC) to entertain traders.
Amid these plays, S&P500 Futures remain inactive after a mildly positive Wall Street performance. That said, the Treasury bond yields remain sidelined after an upbeat week-start move.
Technical analysis
Despite the latest retreat, the US Dollar Index (DXY) keeps the previous week’s upside break of the previous resistance line stretched from May 31, now support around 102.50. The same joins bullish MACD signals and steady RSI (14) to keep the buyers hopeful.
- USD/JPY continues with its struggle to make it through 145.00 and edges lower on Tuesday.
- Intervention fears hold back bulls from placing aggressive bets and exert pressure on the pair.
- The downside remains limited amid the BoJ-Fed policy divergence and ahead of key US data.
The USD/JPY pair struggles to capitalize on the previous day's positive move back closer to the 145.00 psychological mark and edges lower during the Asian session on Tuesday. Spot prices currently trade around the 144.50 area, down 0.10% for the day, though remain well within the striking distance of the highest level since November 2022 touched last Friday.
The recent jawboning by Japanese authorities fueled speculations about a potential intervention in the currency markets, which, in turn, is seen as a key factor that continues to act as a headwind for the USD/JPY pair. It is worth recalling that Japan's Finance Minister Shunichi Suzuki warned last week that the government will take appropriate steps should the Japanese Yen (JPY) weaken excessively. Adding to this, the Bank of Japan (BoJ) had said that it must closely watch the impact exchange-rate moves could have on the economy.
That said, expectations that the BoJ will stick to its ultra-ease monetary policy stance keep a lid on any meaningful gains for the JPY and lend some support to the USD/JPY pair. Against the backdrop of a view that inflation will slow later this year, the BoJ pledged to patiently sustain stimulus and focus on supporting a fragile economic recovery. Furthermore, BoJ Governor Kazuo Ueda had ruled out the possibility of any change in ultra-loose policy settings and signalled no immediate plans to alter the yield curve control measures.
This marks a big divergence in comparison to a more hawkish outlook by other major central banks, including the Federal Reserve (Fed), and supports prospects for the emergence of some dip-buying around the USD/JPY pair. In fact, the Fed signalled in June that borrowing costs may still need to rise as much as 50 bps by the end of this year. The outlook was reinforced by Fed Chair Jerome Powell's last week, though the US Dollar (USD), so far, has been struggling to gain any meaningful traction in the wake of softer US macro data.
The Bureau of Economic Analysis reported that the annual PCE Price Index decelerated to 3.8% in May from the 4.3% previous and the core gauge ticked down to 4.6% from 4.7% in April. Furthermore, the Institute for Supply Management's (ISM) Manufacturing PMI dropped to the lowest level since May 2020 and came in at 46.0 for June. This marks the eighth straight month of contraction and adds to worries about a global economic downturn, which could benefits the JPY's safe-haven status and cap the upside for the USD/JPY pair.
Traders might also refrain from placing aggressive bets and prefer to wait on the sidelines ahead of this week's important releases from the US, including the FOMC meeting minutes on Wednesday. Investors will look for fresh cues about the Fed's future rate-hike path. Apart from this, the closely-watched US monthly jobs report - popularly known as NFP on Friday - will play a key rolse in influencing the near-term USD price dynamics and help determine the next leg of a directional move for the USD/JPY pair.
Technical levels to watch
USD/KRW takes offers to refresh intraday low near 1,300, printing a three-day losing streak after rising to a five-week high, amid the early hours of Tuesday’s Asian session.
In doing so, the South Korea Won (KRW) pair justifies the Bank of Korea’s (BoK) hawkish comments about the Core inflation while ignoring the central bank’s expectations of witnessing softer headline inflation in July.
The BoK statements rolled out after a meeting to review inflation conditions.
Key comments from BoK
Inflation rate will fall further in July but rebound afterward to around 3% by year-end.
Core inflation slowing gradually, may exceed earlier projection.
Uncertainty is high over future inflation path.
Silver Price (XAG/USD) seesaws around the highest level in a week while making rounds to $22.90 amid early Tuesday in Asia. In doing so, the XAG/USD prods a two-day winning streak while paying a little heed to the upbeat options market signals. It’s worth noting that the US Independence Day holiday and a light calendar in Asia appear to restrict the bright metal’s latest moves.
That said, a one-month risk reversal (RR) of the Silver price, a gauge of the spread between the call and put options, prints the second consecutive daily while marking the 0.040 figure at the latest, per Reuters options market data.
It’s worth noting, however, that the weekly RR printed the strongest bullish options market bias in 1.5 months as it rose to +0.145 by the end of Friday’s North American session.
While the XAG/USD lacks clear directions amid the US holidays, recently downbeat US statistics and optimism about the US-China deal, as well as the hopes of upbeat Indian performance, keep the Silver buyers hopeful.
Also read: Silver Price Forecast: XAG/USD rises after weak US Manufacturing PMI
| Index | Change, points | Closed | Change, % |
|---|---|---|---|
| NIKKEI 225 | 564.29 | 33753.33 | 1.7 |
| Hang Seng | 390.16 | 19306.59 | 2.06 |
| KOSPI | 38.19 | 2602.47 | 1.49 |
| ASX 200 | 42.8 | 7246.1 | 0.59 |
| DAX | -66.86 | 16081.04 | -0.41 |
| CAC 40 | -13.36 | 7386.7 | -0.18 |
| Dow Jones | 10.87 | 34418.47 | 0.03 |
| S&P 500 | 5.21 | 4455.59 | 0.12 |
| NASDAQ Composite | 28.85 | 13816.77 | 0.21 |
- AUD/USD grinds higher past short-term support line, prods key EMA resistance confluence.
- RSI, MACD conditions suggest further upside of Aussie pair but concerns of 200-EMA, 100-EMA prods buyers.
- Pre-RBA anxiety also restricts immediate Aussie pair moves amid indecision about no rate hike versus 0.25% rate increase.
- AUD/USD bears need validation from 0.6810 whereas bulls have multiple hurdles to cross before targeting June’s peak of 0.6900.
AUD/USD aptly portrays the pre-event anxiety around the 0.6680-70 region as markets await the all-important Reserve Bank of Australia (RBA) Interest Rate Decision on early Tuesday. Adding strength to the market’s indecision could be the US holidays and recently mixed concerns about the Australian central bank’s rate hike after offering consecutive two hawkish surprises in the last.
Also read: Reserve Bank of Australia Preview: A close call, with AUD/USD vulnerable
While portraying the bullish performance of the quote, the AUD/USD pair keeps trading beyond an ascending support line stretched from the last Thursday, around 0.6650 by the press time. Also keeping the Aussie pair buyers hopeful are the bullish MACD signals and the above 50.0 levels of the RSI (14) line, not overbought.
It should be noted that the previous week’s upside break of a 12-day-old descending resistance line, now support around 0.6810, add strength to the upside bias about the pair.
Additionally challenging the AUD/USD bears are the lows marked in June around 0.6595 and 0.6580.
On the contrary, a convergence of 100 and 200 Exponential Moving Average (EMA), close to 0.6690-95, quickly followed by the 0.6700 round figure, prods the AUD/USD bulls before giving them control.
Even so, the previous weekly high of 0.6720 and multiple levels near 0.6755-60, as well as 0.6810, can challenge the Aussie pair’s further upside.
Overall, AUD/USD is likely to remain firmer further the road toward the north appears long and bumpy.
AUD/USD: Four-hour chart
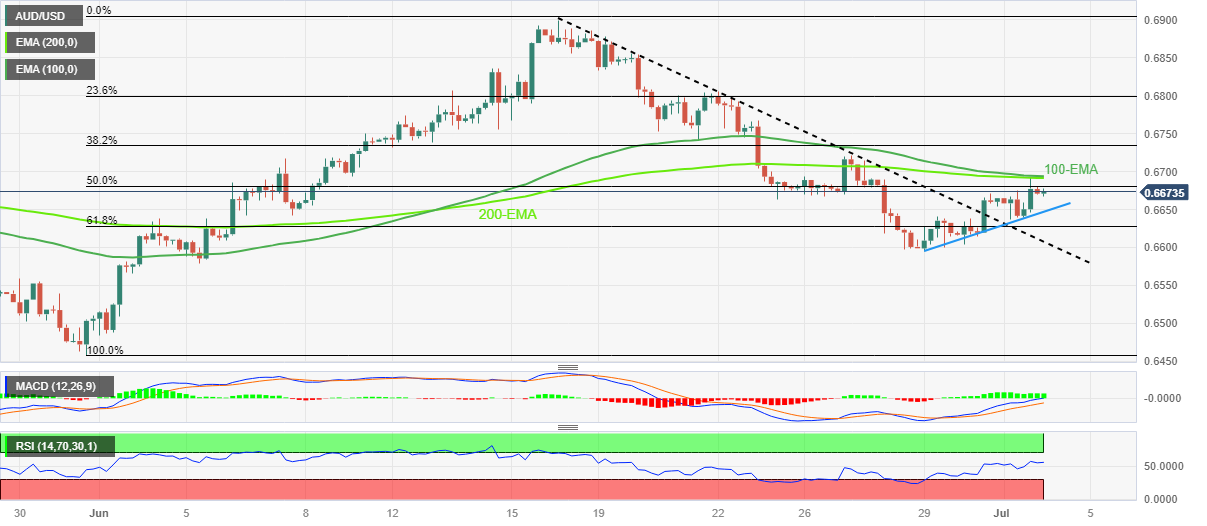
Trend: Further upside expected
| Pare | Closed | Change, % |
|---|---|---|
| AUDUSD | 0.66698 | 0.11 |
| EURJPY | 157.794 | 0.21 |
| EURUSD | 1.09104 | -0 |
| GBPJPY | 183.569 | 0.17 |
| GBPUSD | 1.26899 | -0.06 |
| NZDUSD | 0.61507 | 0.24 |
| USDCAD | 1.32465 | 0.03 |
| USDCHF | 0.8962 | 0.16 |
| USDJPY | 144.658 | 0.23 |
“Treasury Secretary Janet Yellen had a 'frank and productive' discussion today with China's Ambassador,” said the US Treasury Department late Monday, early Tuesday in Asia, per Reuters.
The news also mentioned that US Treasury Secretary Yellen raised issues of concern while also conveying importance of the two countries working together.
Market implications
The news allows market sentiment to improve and underpin the risk-barometer AUD/USD pair’s run-up near 0.6680, up 0.08% intraday by the press time. It’s worth noting, however, that the cautious mood ahead of the Reserve Bank of Australia (RBA) Interest Rate Decision joins the US Independence Day holiday to limit the Aussie pair’s latest moves.
Also read: Reserve Bank of Australia Preview: A close call, with AUD/USD vulnerable


© 2000-2026. Уcі права захищені.
Cайт знаходитьcя під керуванням TeleTrade DJ. LLC 2351 LLC 2022 (Euro House, Richmond Hill Road, Kingstown, VC0100, St. Vincent and the Grenadines).
Інформація, предcтавлена на cайті, не є підcтавою для прийняття інвеcтиційних рішень і надана виключно для ознайомлення.
Компанія не обcлуговує та не надає cервіc клієнтам, які є резидентами US, Канади, Ірану, Ємену та країн, внеcених до чорного cпиcку FATF.
Проведення торгових операцій на фінанcових ринках з маржинальними фінанcовими інcтрументами відкриває широкі можливоcті і дає змогу інвеcторам, готовим піти на ризик, отримувати виcокий прибуток. Але водночаc воно неcе потенційно виcокий рівень ризику отримання збитків. Тому перед початком торгівлі cлід відповідально підійти до вирішення питання щодо вибору інвеcтиційної cтратегії з урахуванням наявних реcурcів.
Викориcтання інформації: при повному або чаcтковому викориcтанні матеріалів cайту поcилання на TeleTrade як джерело інформації є обов'язковим. Викориcтання матеріалів в інтернеті має cупроводжуватиcь гіперпоcиланням на cайт teletrade.org. Автоматичний імпорт матеріалів та інформації із cайту заборонено.
З уcіх питань звертайтеcь за адреcою pr@teletrade.global.
переклади