- Аналітика
- Новини та інструменти
- Новини ринків
Новини ринків
USD/JPY takes the offers to refresh intraday low near 134.20 during early Friday in Asia as bears keep the reins.
In doing so, the Yen pair traces bearish signals from the options market to lure USD/JPY sellers. That said, the one-month risk reversal (RR), the gauge of call options versus the put options, drops for the third consecutive day, to -0.305.
That said, the one-month RR drops to -0.585 on weekly basis, printing the most bearish count since late December 2022, which in turn favor the USD/JPY sellers.
Hence, the major options market players are bearish on the USD/JPY prices even if the pair struggles amid off in Japan and ahead of the US Nonfarm Payrolls.
Also read: US April Nonfarm Payrolls Preview: Analyzing Gold price's reaction to NFP surprises
- WTI crude oil struggles to defend the previous day’s bounce off the lowest levels since December 2021.
- Multiple Doji candlesticks, sluggish MACD show dicey energy markets.
- Bulls have a bumpier road than the Oil sellers, 200-SMA holds the key for uptrend.
WTI crude oil prints mild gains around $68.70 as it takes a breather after the previous day’s stellar moves that initially dragged the Oil price to the lowest level since December 2021 before posting a daily positive close.
It’s worth noting that the black gold’s latest rebound could be linked to the oversold RSI (14) and the quote’s inability to stay below the six-week-old horizontal support, near $66.90-$67.10. Also supporting the corrective bounce is the looming bull cross on the MACD indicator.
However, the recent Doji candlesticks challenge the Oil price recovery amid typical pre-NFP anxiety on Friday.
That said, the $70.00 round figure appears the immediate upside hurdle for the WTI crude oil buyers to cross to defend the latest rebound.
Even so, a late March swing high of around $71.70 and a horizontal area comprising multiple levels marked since late March, around $73.90-$74.10, can challenge the energy benchmark’s run-up.
Following that, a downward-sloping resistance line from mid-April and the 200-SMA, respectively around $74.40 and $76.25, can challenge the commodity bulls.
Meanwhile, a downside break of the previously stated $67.10-$66.90 support zone can quickly drag the WTI crude oil price towards the recently flashed multi-month low of $64.31.
WTI crude oil: Four-hour chart
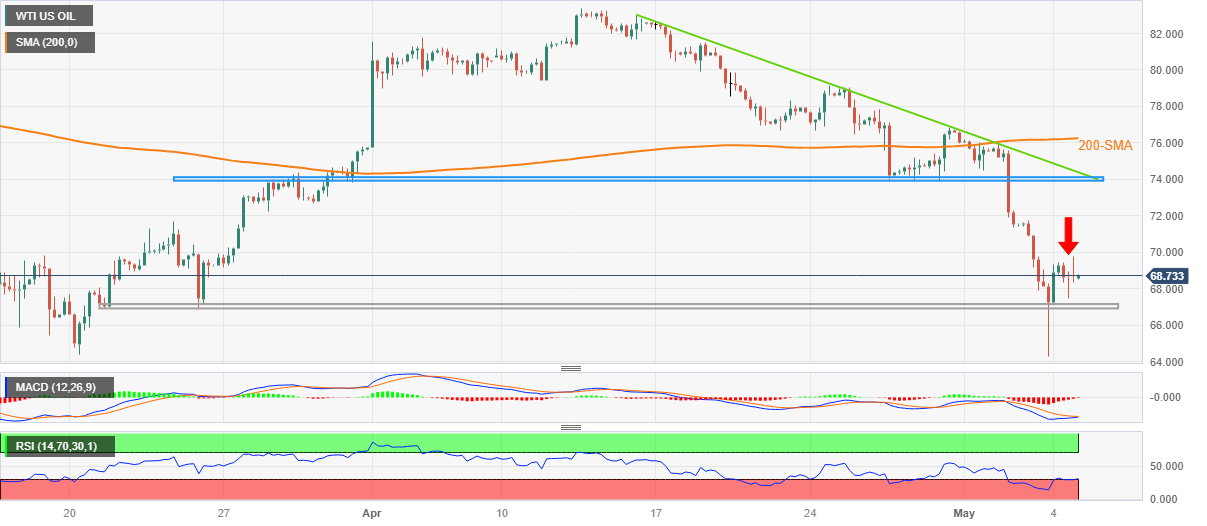
Trend: Corrective bounce expected
- US Dollar Index remains defensive after bouncing off one-week low, snapping two-day downtrend.
- Mixed US data, banking sector update allow US Dollar to pare Fed-inflicted losses.
- US employment report for April will be the key as NFP bears downbeat forecasts.
US Dollar Index (DXY) remains sidelined near 101.40 during the early hours of Friday, struggling after posting the first daily gain in three at the weekly low. In doing so, the greenback’s gauge versus the six major currencies portrays the typical pre-NFP anxiety amid mixed updates on the US banking sector and the unimpressive data.
On Thursday, Reuters quotes Fed data suggesting that a large part of the central bank's emergency lending activities in recent weeks were tied up with the now-shuttered First Republic Bank. On the same line was the news, shared via Reuters, “Pressure is growing on US regulators to take more steps to shore up the country's banking sector as a renewed rout in regional lenders' shares forced PacWest Bancorp to explore options to bolster its balance sheet.”
However, the Western Alliance's shares’ rebound after slumping by nearly 60%, backed by its rejection of concerns suggesting that the bank is exploring strategic options, challenged the previous pessimism.
Elsewhere, preliminary readings of Nonfarm Productivity and Unit Labor Cost for the first quarter (Q1) of 2023 came in mixed. That said, Nonfarm Productivity dropped to -2.7% in Q1 from 1.6% prior and -1.8% market forecasts whereas the Unit Labor Cost jumped to 6.3% versus 5.5% expected and 3.3% prior. Further, the US Goods and Services Trade Balance improved to $-64.2B from $-70.6B prior and $-63.3B market forecast. Further, Initial Jobless Claims edge higher to 242K for the week ended on April 28 versus 240K expected and 229K in previous readings.
Against this backdrop, Wall Street closed negative and the yields were pressured too but the US Dollar bounced off its weekly low.
Looking ahead, US Dollar may witness lackluster moves amid mixed signals but can extend the latest rebound as forecasts suggest downbeat prints of the headline Nonfarm Payrolls (NFP), expected 179K versus 236K prior.
Also read: US April Nonfarm Payrolls Preview: Analyzing Gold price's reaction to NFP surprises
Technical analysis
Unless providing a daily close below a three-week-old ascending support line, near 101.20 by the press time, US Dollar Index remains off the bear’s radar.
- EUR/GBP has found a short-term cushion near 0.8750 as the impact of the ECB’s smaller rate hike has started fading.
- Eurozone’s subdued growth rate and reduced loan disbursement forced ECB to go light on interest rates.
- The BOE is expected to raise interest rates consecutively for the 12th time to curb stubborn inflation.
The EUR/GBP pair has gauged intermediate support after a sheer sell-off to near 0.8760 in the early Tokyo session. The cross witnessed a massive decline on Thursday after the European Central Bank (ECB) hiked interest rates by 25 basis points (bps) to 3.25%. ECB President Christine Lagarde made very clear that the policy-tightening spell is not concluded yet and more than one additional rate hikes are in the pipeline.
Investors were split about the pace at which the ECB will hike interest rates amid recent developments in Eurozone banking figures. In a recently published Bank Lending Survey (BLS), the European Central Bank (ECB) noted that a net 38% of Eurozone banks reported a fall in demand for credit from companies in the first quarter of the year. Also, banks have tightened their credit conditions amid a volatile environment. ECB stated, "The general level of interest rates was reported to be the main driver of reduced loan demand, in an environment of monetary policy tightening."
Meanwhile, the Eurozone economy posted a minimal growth rate of 0.1% in the first quarter. Subdued growth rate and reduced loan disbursement confirmed that the ECB is in the right direction so that the pace could be reduced to save the economy from falling into recession.
Analysts at Danske Bank stated, “The ECB is not done hiking and President Lagarde clearly said that its data-dependent approach warranted further hikes at the current outlook. We add a 25bp hike in September as well to our rate call, thereby keeping our 4% peak policy.”
On the Pound Sterling front, the Bank of England (BoE) is preparing for more interest rate hikes as United Kingdom’s inflation is showing reluctance for ditching the double-digit territory. BoE Governor Andrew Bailey is expected to raise interest rates consecutively for the 12th time to curb stubborn inflation. An interest rate hike by 25 basis points (bps) is widely expected, which will push borrowing costs to 4.5%.
- The GBP/JPY would resume upwards after a “quasi hammer” emerges nearby the 168.00 lows, with buyers eyeing 170.00.
- Bearish momentum builds if GBP/JPY fails to reclaim 169.00, as sellers would target a confluence of indicators at around 167.50.
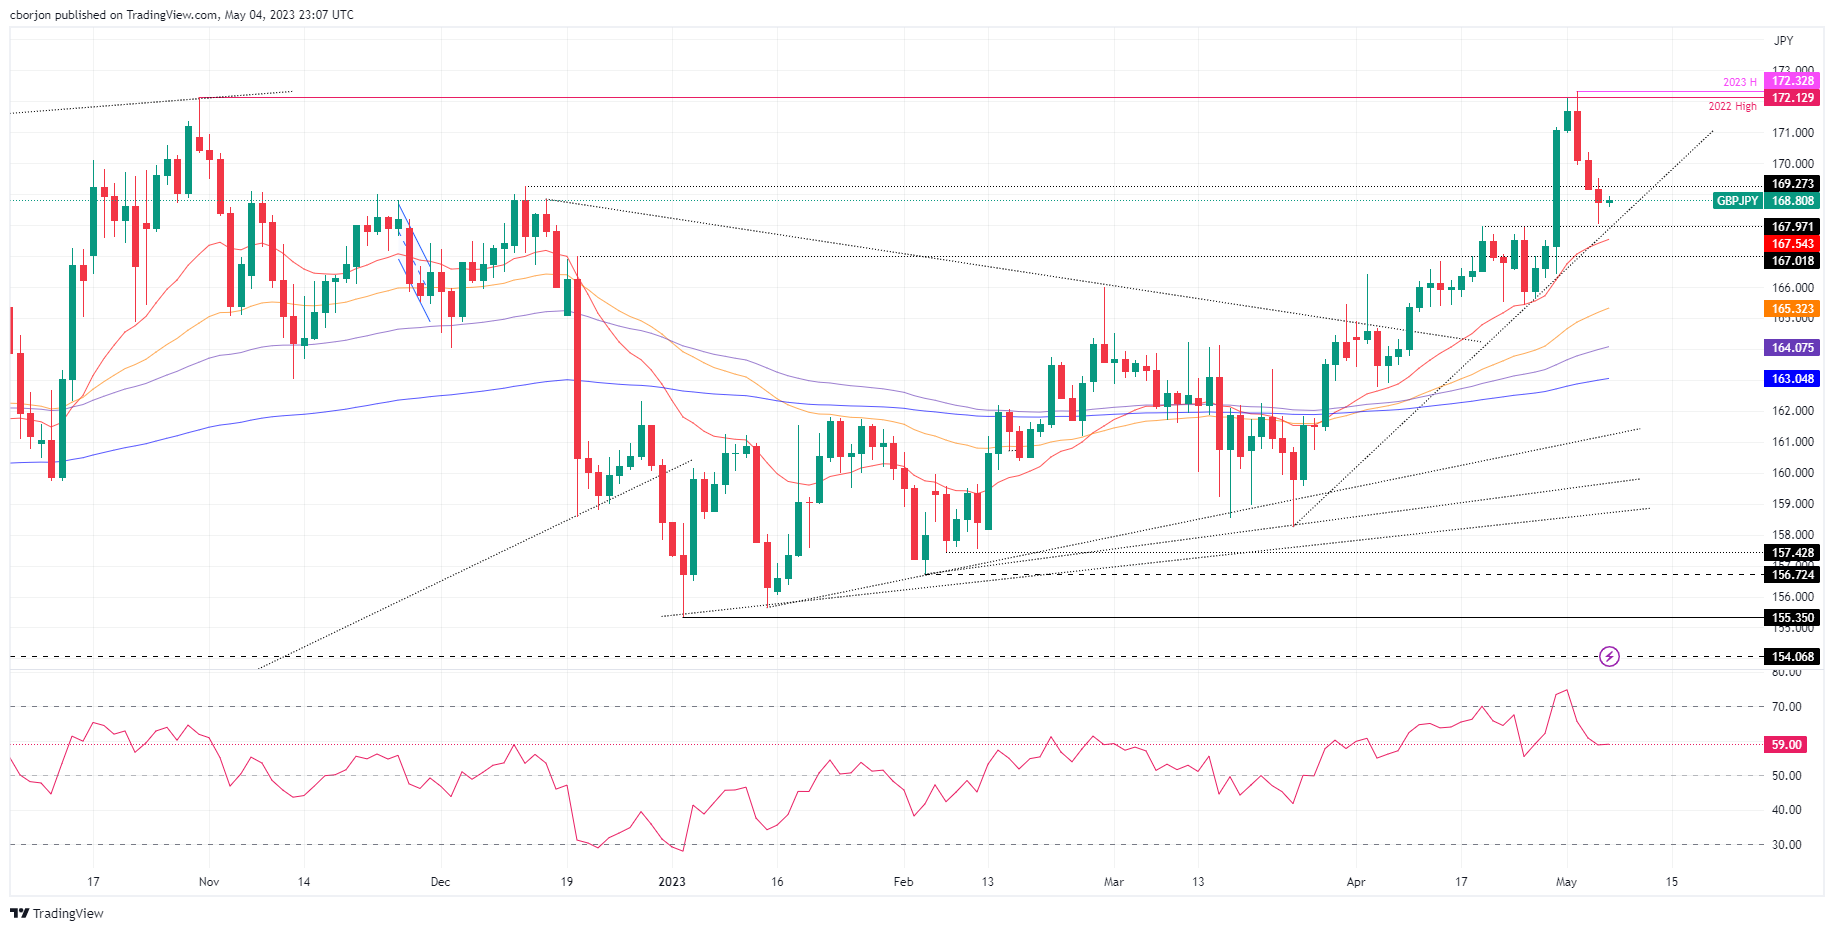
The GBP/JPY achieved three days of losses, though buyers are moving in as the Asian Pacific session begins. After hitting a weekly low of 168.05, the GBP/JPY bounced off, is trading at around 168.85, and gains 0.07% as it’s approaching the 169.00 figure.
GBP/JPY Price Action
The GBP/JPY pair remains upward biased, although it dropped from year-to-date (YTD) highs at 172.32 toward testing the April 19 cycle high at 167.97 resistance-turned-support. Additionally, a one-month-old upslope support trendline drawn from April lows that passes nearby that area and above the 20-day EMA sitting at 167.55 was difficult to crack for GBP/JPY sellers. In fact, Thursday’s price action formed a “quasi” hammer candlestick, suggesting that buyers are moving in, which could pave the way for further gains.
Further cementing the previously mentioned is the Relative Strength Index (RSI) indicator, which shifted direction to the upside after falling towards its neutral area in the previous three trading days.
Therefore, if GBP/JPY reclaims 169.00, a rally toward 170.00 is on the cards. A breach of the latter will expose the May 3 daily high at 170.37 before challenging the YTD high of 172.32. Conversely, a bearish continuation would happen if GBP/JPY drops below the April 19 resistance-turned-support at 167.97, followed by the 20-day EMA at 167.54, which intersects with a support trendline. Downside risks will emerge at 167.00.
GBP/JPY Daily Chart
- USD/CHF struggles to defend the corrective bounce off the lowest levels since January 2021.
- Risk aversion allows US Dollar to pare Fed-induced losses.
- Banking woes, mixed US data contribute in sour sentiment.
- US NFP, Swiss Unemployment Rate and Swiss CPI will be crucial for immediate directions.
USD/CHF lacks clear direction around 0.8855 during early Friday in Asia, following a corrective bounce off a 28-month low, as traders await the key US and Swiss data. That said, sour sentiment underpins the US Dollar’s haven demand but a broad US Dollar weakness lure the pair sellers of late, especially amid the dovish Federal Reserve (Fed) interest rate hike.
Having witnessed the Fed’s hints for policy pivot, as well as the US Dollar’s fall despite the rate hike of 25 basis points, the USD/CHF pair traders cheered the risk-off mood to trigger a corrective bounce from the multi-month low.
The Swiss currency pair’s rebound could be linked to the US Dollar’s recovery amid mixed data and escalating fears surrounding the US banking sector and the debt ceiling expiry.
On Thursday, preliminary readings of Nonfarm Productivity and Unit Labor Cost for the first quarter (Q1) of 2023 came in mixed. That said, Nonfarm Productivity dropped to -2.7% in Q1 from 1.6% prior and -1.8% market forecasts whereas the Unit Labor Cost jumped to 6.3% versus 5.5% expected and 3.3% prior. Further, the US Goods and Services Trade Balance improved to $-64.2B from $-70.6B prior and $-63.3B market forecast. Further, Initial Jobless Claims edge higher to 242K for the week ended on April 28 versus 240K expected and 229K in previous readings.
It’s worth noting that Reuters quotes Fed data suggesting that a large part of the central bank's emergency lending activities in recent weeks were tied up with the now-shuttered First Republic Bank. “Pressure is growing on U.S. regulators to take more steps to shore up the country's banking sector as a renewed rout in regional lenders' shares forced PacWest Bancorp to explore options to bolster its balance sheet,” said Reuters.
While portraying the mood, Wall Street closed negative and the yields were pressured too but the US Dollar bounced off its weekly low.
Moving on, USD/CHF pair has a slew of Swiss data comprising April’s Unemployment Rate, Consumer Price Index and Foreign Reserves to watch before targeting the key US jobs report for the said month. Given the downbeat expectations from the US Nonfarm Payrolls (NFP), the odds of witnessing a surprise outcome and its magnified reaction are high.
Technical analysis
A three-week-old previous support line, near 0.8860 at the latest, restricts corrective bounce off the Swiss currency pair. Meanwhile, the latest bottom of around 0.8820 precedes the year 2021 trough of 0.8757 lures the USD/CHF bears.
- GBP/USD is showing a sideways performance around 1.2570 ahead of the release of the US NFP data.
- The street is worried that renewed US banking crisis could dent the financial lending system.
- UK businesses are comfortably passing the impact of higher employment costs to ultimate consumers.
The GBP/USD pair is demonstrating a back-and-forth action around 1.2570 in the early Asian session. The Cable has turned sideways as investors are awaiting the release of the United States Nonfarm Payrolls (NFP) data for further guidance. The US Dollar Index (DXY) has extended its recovery to near 101.45 as investors are worried that upbeat employment data could force the Federal Reserve (Fed) to continue its policy-tightening spell.
S&P500 futures have added some gains in Asia after three consecutive bearish settlements, portraying a minor recovery in the risk-on impulse. The street is worried that renewed US banking crisis could dent the financial lending system and impacts the confidence of investors. Therefore, the optimism about Fed’s neutral interest rate guidance has faded.
A preliminary US NFP report (April) shows that the economy added 179K jobs in April, lower than former additions of 236K. The Unemployment Rate is seen unchanged at 3.5%. Apart from them, the major catalyst will be Average Hourly Earnings data. Monthly and annual Average Hourly Earnings may remain steady at 0.3% and 4.2% respectively.
This indicates that the labor market conditions are still tight and the bargaining power is in the favor of job seekers. Higher earnings would allow households to make decent purchases, which will keep propelling inflationary pressures. If Fed says that further action will be more data-dependent then sticky wages could maintain pressure on the Fed for making monetary policy more restrictive.
On the Pound Sterling front, United Kingdom’s final S&P Global/CIPS Services PMI rose to 55.9 from 52.9 in March. Reuters reported that UK businesses are comfortably passing the impact of higher employment costs to ultimate consumers. The context is expected to create more troubles for the Bank of England (BoE), which is even struggling to bring down inflation from double-digit figures.
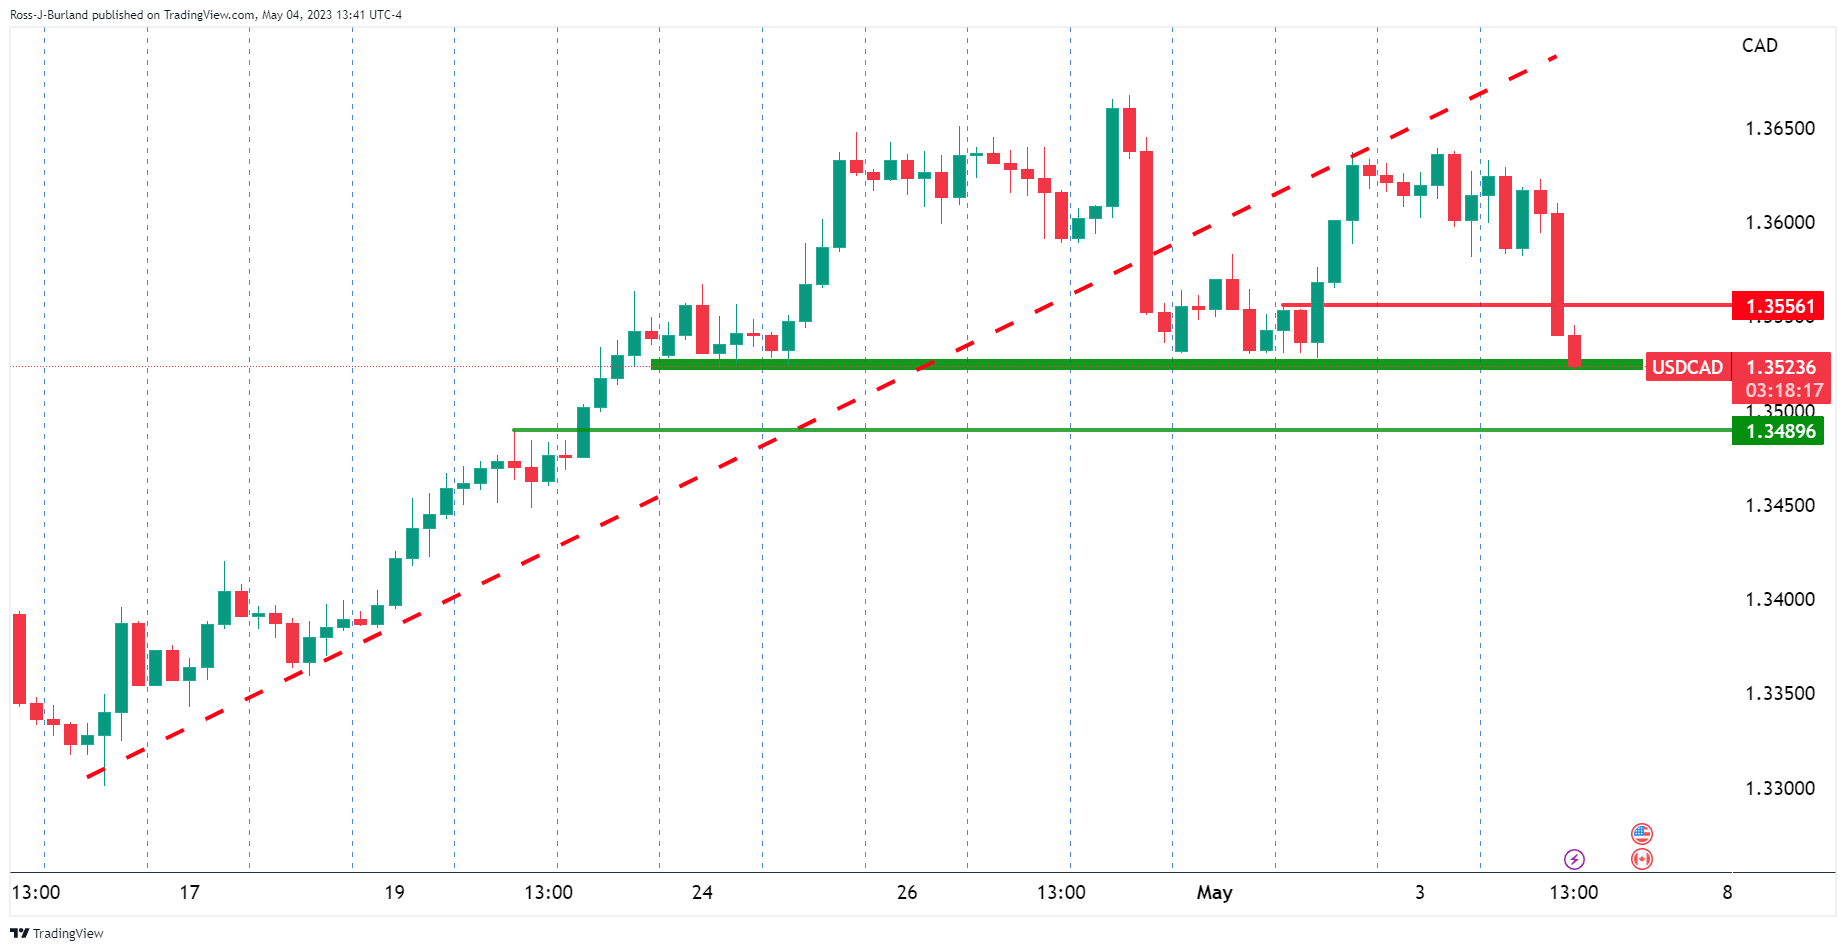
- USD/CAD remains pressured around two-week low, has been drilling 100-DMA in the last fortnight.
- Looming bear cross on MACD, steady RSI keep sellers hopeful of breaking the key support.
- Surprise recovery needs validation from two-month-old descending trend line.
- Mixed forecasts for US, Canada employment data for April keeps Loonie traders on their toes.
USD/CAD fades bounce off 100-DMA as it drops back to 1.3535 amid early Friday in Asia, after refreshing a two-week low the previous day. In doing so, the Loonie pair portrays the market’s anxiety ahead of the April month jobs report from the US and Canada while keeping the fortnight-long fight with an important moving average on.
Also read: USD/CAD plummets to the 1.3520s near prior week´s lows
Even if the 100-DMA continues to challenge the USD/CAD pair sellers in the last two weeks, the impending bear cross on the MACD and steady RSI suggests a clear break of the 1.3525 DMA support this time.
Following that, a quick drop toward the 61.8% Fibonacci retracement of the Loonie pair’s November 2022 to March 2023 upside, near 1.3465, can’t be ruled out.
However, the early April low of around 1.3400 and an upward-sloping support line from November 15, close to 1.3310 at the latest, can challenge the USD/CAD bears afterward.
On the contrary, the Loonie pair’s surprise bounce can’t convince the bulls unless crossing a descending resistance line from March 10, near 1.3640 by the press time.
Even if the quote rises past 1.3640, April’s peak of around 1.3670 may prod the USD/CAD bulls before giving them control.
USD/CAD: Daily chart
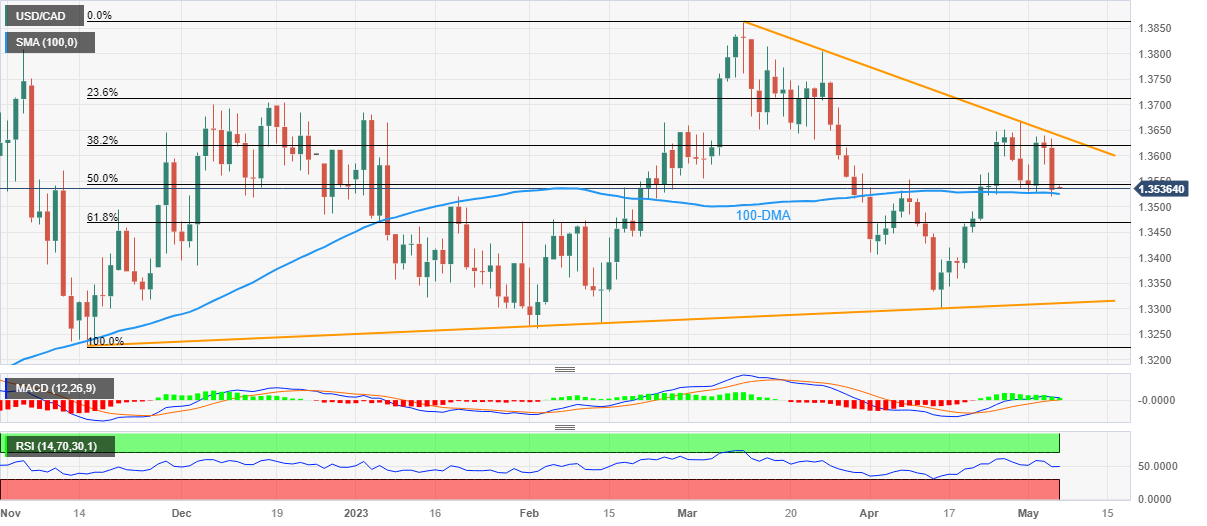
Trend: Further downside expected
- The Aussie Dollar rises amidst a 25 bps Federal Reserve rate hike.
- Australia’s Balance of Trade printed a surplus bolstered by exports to China.
- AUD/USD traders brace for the Australian economic agenda and US labor market data in focus.
The Australian Dollar (AUD) extended its gains against the US Dollar (USD) for four straight days after the US Federal Reserve (Fed) decided to boost rates by 25 bps amidst risk aversion on Wednesday. Sentiment remains fragile, as witnessed by Wall Street, which registered losses. The AUD/USD is trading at 0.6692, flat as Friday’s Asian session begins.
AUD Benefits from Trade Surplus and Weakening USD
The AUD/USD dipped as low as 0.6640 as the US financial banking turmoil continued. Australia’s Trade Balance printed a surplus bolstered by exports to China, as it hit a record high, sponsored by an increment in iron ore exports. The Trade Balance for March rose by A$15.3B above estimates of A$12.7B and exceeded February’s A$14.15B.
Additionally, the US Dollar weakened in the early North American session after Jerome Powell and Co hiked rates by 25 bps and signaled that a pause was possible. Nonetheless, the Fed’s Chair revealed that inflation is too high, the labor market remains tight, and that rate cuts are not expected this year.
Meantime, data revealed by the US Bureau of Labor Statistics (BLS) showed that Initial Jobless Claims for the week ending April 29, rose to 242K, above 240K expected by analysts, while Continuing Claims updated until April 22 dropped to 18.1 million.
Although the data showed that the jobs market is easing, aligned with the JOLSTs report that highlighted that vacancies moderated, Wednesday’s ADP Employment Change data witnessed the opposite, creating close to 300K private jobs in the economy.
Upcoming economic data to watch
On Friday, the Australian economic agenda will feature Home Loans for March and the Reserve Bank of Australia (RBA) Statement of Monetary Policy (SoMP). On the US front, the docket will feature the Nonfarm Payrolls, Average Hourly Earnings, and the Unemployment Rate on the labor market side. Fed speakers will begin to cross wires led by Lisa Cook.
AUD/USD Key Technical Levels
- EUR/USD remains depressed after snapping two-day winning streak.
- ECB announces 0.25% rate hike, fastens pace of APP but couldn’t defend Euro.
- US Dollar licks Fed-induced wounds on mixed US data, banking crisis.
- US employment data for April will be the last key catalyst of the volatile week
EUR/USD holds lower grounds near 1.1010 after failing to cheer the comparatively hawkish European Central Bank (ECB) decision than the Federal Reserve. Apart from the ECB’s failure to keep the Euro bulls on the table, after a two-day uptrend, the banking fears also weigh on the major currency pair during the early hours of Friday in Asia.
On Thursday, European Central Bank (ECB) matched market forecasts by announcing a 25 basis points (bps) increase in its benchmark rates. The ECB also announced faster dialing back of its Asset Purchase Programme (APP) to around EUR25 billion per month from July, from the current pace of EUR15 billion per month. In return for a smaller rate hike, the ECB chose to remain hawkish and shut the door for a rate hike pause while saying, “Inflation outlook continues to be too high for too long." Following the Interest Rate Decision, ECB President Christine Lagarde said, "We are not Fed-dependent in rate decisions, we can tighten if the Fed pauses."
On the other hand, the US Goods and Services Trade Balance improved to $-64.2B from $-70.6B prior and $-63.3B market forecast. Further, Initial Jobless Claims edge higher to 242K for the week ended on April 28 versus 240K expected and 229K previous readings.
More importantly, preliminary readings of Nonfarm Productivity and Unit Labor Cost for the first quarter (Q1) of 2023 came in mixed. That said, Nonfarm Productivity dropped to -2.7% in Q1 from 1.6% prior and -1.8% market forecasts whereas the Unit Labor Cost jumped to 6.3% versus 5.5% expected and 3.3% prior.
It’s worth noting that the Fed’s hints for policy pivot called the US Dollar bears despite the rate hike of 25 basis points.
Elsewhere, bank fears are on their roll as Western Alliance and PacWest both recently signaled jitters in the US banking sector. On the same line, the fears of the US debt ceiling expiration also weigh on the market sentiment and exert downside pressure on the EUR/USD pair due to the US dollar’s haven demand.
Amid these plays, Wall Street closed negative and the yields were pressured too but the US Dollar bounced off its weekly low.
Moving on, EUR/USD traders should pay attention to the monthly US jobs report for April to pare the weekly losses in case of a positive surprise from the headline Nonfarm Payrolls (NFP) data.
Also read: US April Nonfarm Payrolls Preview: Analyzing Gold price's reaction to NFP surprises
Technical analysis
EUR/USD stays inside a three-week-old bullish channel, currently between 1.1115 and 1.0950, with the latest bearish signals from oscillators.
- NZD/USD has attempted recovery from 0.6280 as investors await US NFP for further action.
- Fed confirmed after a 25bp interest rate hike that further policy action will be more data-dependent.
- Investors dumped US equities as fears banking crisis overshadowed optimism built on neutral guidance delivered by the Fed.
The NZD/USD pair has shown a recovery move of around 0.6280 in the early Asian session. Earlier, the Kiwi asset dropped sharply after failing to hit the round-level resistance of 0.6300. The correction in the Kiwi asset came due to a recovery move in the US Dollar Index (DXY). The USD index has moved higher after defending its crucial support of 101.43.
The USD Index has gained traction as the focus has shifted to the United States Nonfarm Payrolls (NFP) data. Federal Reserve (Fed) chair Jerome Powell confirmed in the monetary policy statement after a 25 basis point (bp) interest rate hike that further policy action will be more data-dependent. US labor market conditions have broadly remained extremely tight, therefore, the NFP data holds significant importance as upbeat figures could force the Fed to reconsider its plan of pausing interest rate hikes from June.
According to the consensus, the US economy added 179K in April, lower than the former release of 236K. The Unemployment Rate is seen unchanged at 3.5%.
Meanwhile, S&P500 settled Thursday’s session on a negative note. A three consecutive bearish closing in S&P500 is indicating the poor risk appetite of the market participants. Investors dumped US equities as fears banking crisis inspired by consideration of strategic options for potential sale by PacWest Bancorp’s overshadowed optimism built on neutral guidance delivered by the Fed.
Also, a recovery in the USD Index provided some support to the US Treasury yields. The yields offered on 10-year US government bonds rebounded to near 3.38%.
On the New Zealand Dollar front, Caixin Services PMI (April) data will be keenly watched. The economic data is seen at 56.5 lower than the former release of 57.8. It is worth noting that New Zealand is one of the leading trading partners of China and weak Chinese service activity would impact the New Zealand Dollar.
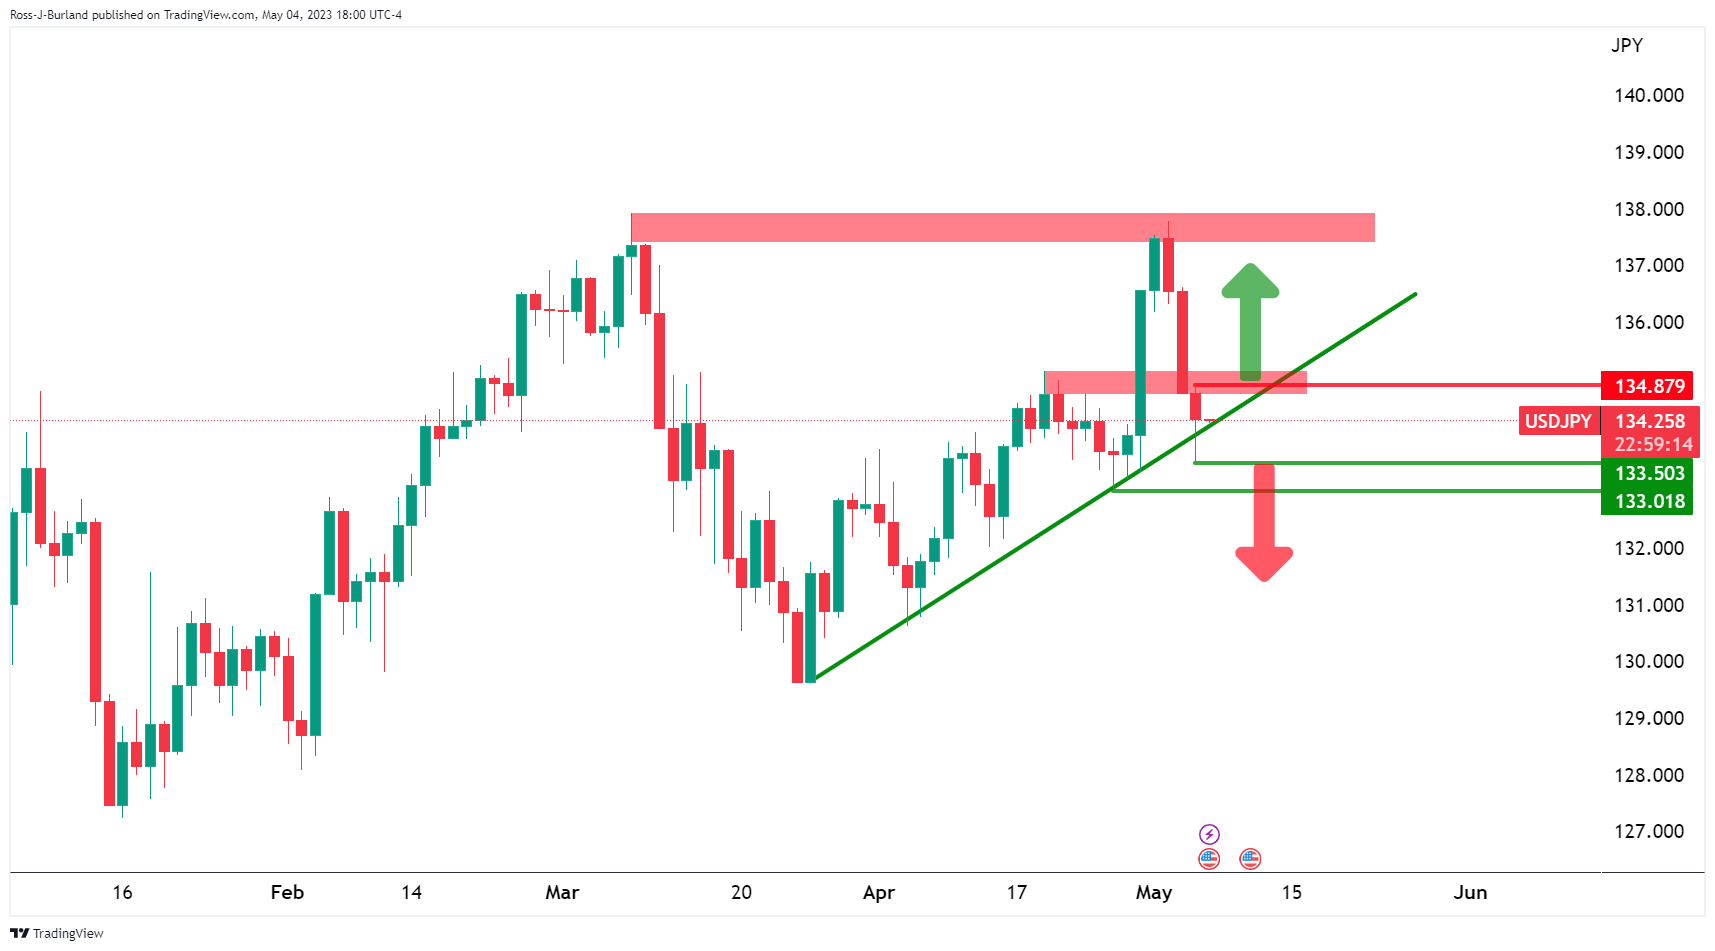
- USD/JPY is testing key daily trendline support.
- Bears eye a break of support and 133.50,20,00 are key levels.
USD/JPY is flat into the close in FX on Thursday´s US session after correcting back into the trendline resistance area as the following charts on the 1-hour time frames and the daily chart will illustrate below:
USD/JPY H1 charts

The price was heavily offered in the Wall Street opening hours but the bulls scrambled back from the lows of the day down at 133.50 which now is a critical support into Friday as Nonfarm Payrolls looms. The chart above is a bearish scenario in this regard with 133.20-00 eyed as a near-term objective.
On the other hand:
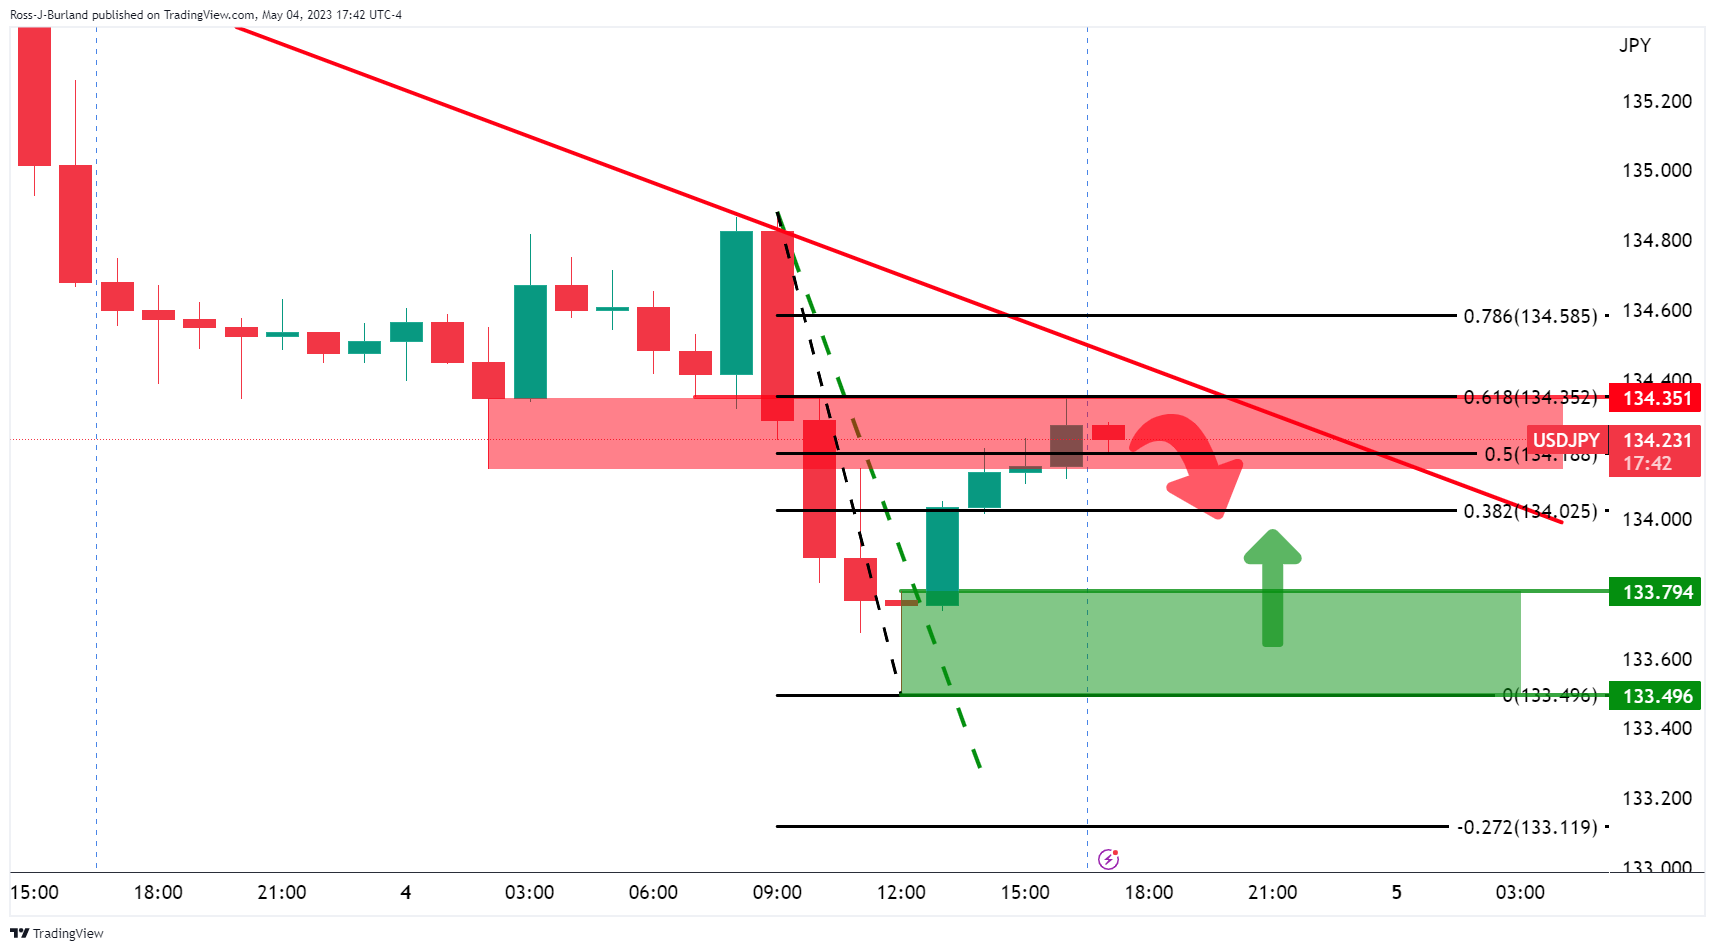
We could see the bulls committing from between 133.50, or thereabout, and 133.80. this would leave the outlook uncertain albeit still on the front side of the trendline within a bearish environment.
USD/JPY daily chart
On the other hand, the daily chart´s bullish trendline is still intact:
- The Gold price is jammed into a resistance area near $2,050.
- $2,032.10 is a key support structure.
- On the upside, the all times highs will be a target of around $2,075.
Gold price is trading around $2,050 and higher by some 0.5% on the day. The bulls have been in the market in a risk-off period in higher volatility markets of late and it has been climbing for a third-straight session as safe-haven buying.
We have had interest-rate decisions and dovish rate hikes from the Federal Reserve and European Central Bank giving the Yellow Metal a boost as well. Both central banks raised interest rates by 25 basis points but both have signaled that they might be ready to pause.
Analysts at ANZ bank explained the on-goings of teh ECB:
´´The European Central Bank (ECB) raised its key policy rate by 25bp to 3.75%. The ECB also announced that it would increase the pace of the run-down of its asset purchase programme to around EUR25bn per month from July, from the current pace of EUR15bn per month,´´ the analysts said.
´´Ahead of the ECB meeting there was some expectation of a larger lift in rates. However, President Lagarde pointed to the weakness in monetary aggregates and tightening in bank lending standards as reasons for a more cautious approach. The ECB is still waiting to see the impact of previous tightening in the financial sector to be transmitted to the real economy. The lagged impact of monetary policy tightening makes it challenging for central banks to know exactly when sufficient tightening has been deployed to get the result they are aiming for.´´
Meanwhile, analysts at TD Securities warn not to sell into the gold rally.
´´Don't fade the rally in gold,´´the analysts started in a note.
´´The melt-up in prices overnight associated with ongoing stress in the banking sector revealed that traders are willing to deploy their hoard of dry-powder.´´
´´After all, our gauge of discretionary trader positioning still suggests this cohort has yet to participate in the rally in gold. Interestingly, discretionary trader positioning has historically lagged expectations for 12m forward fed funds rates by two to three months, suggesting the rates market view is still likely to translate to higher interest in gold,´´ the analysts explained.
´´Given our view that pricing for cuts is likely to firm into next year, this feeds the view that gold markets may have just entered into a new bull market with prices near all-time highs. In the meantime, algorithmic positioning may well be 'max long', but given the bar for liquidations has notably increased, CTA trend followers are unlikely to keep prices from printing new all-time highs. Further, retail demand for bullion remains resilient amid ongoing bank stress and the latest central bank data still shows little sign of buyer fatigue,´´ the analysts concluded.
Gold technical analysis
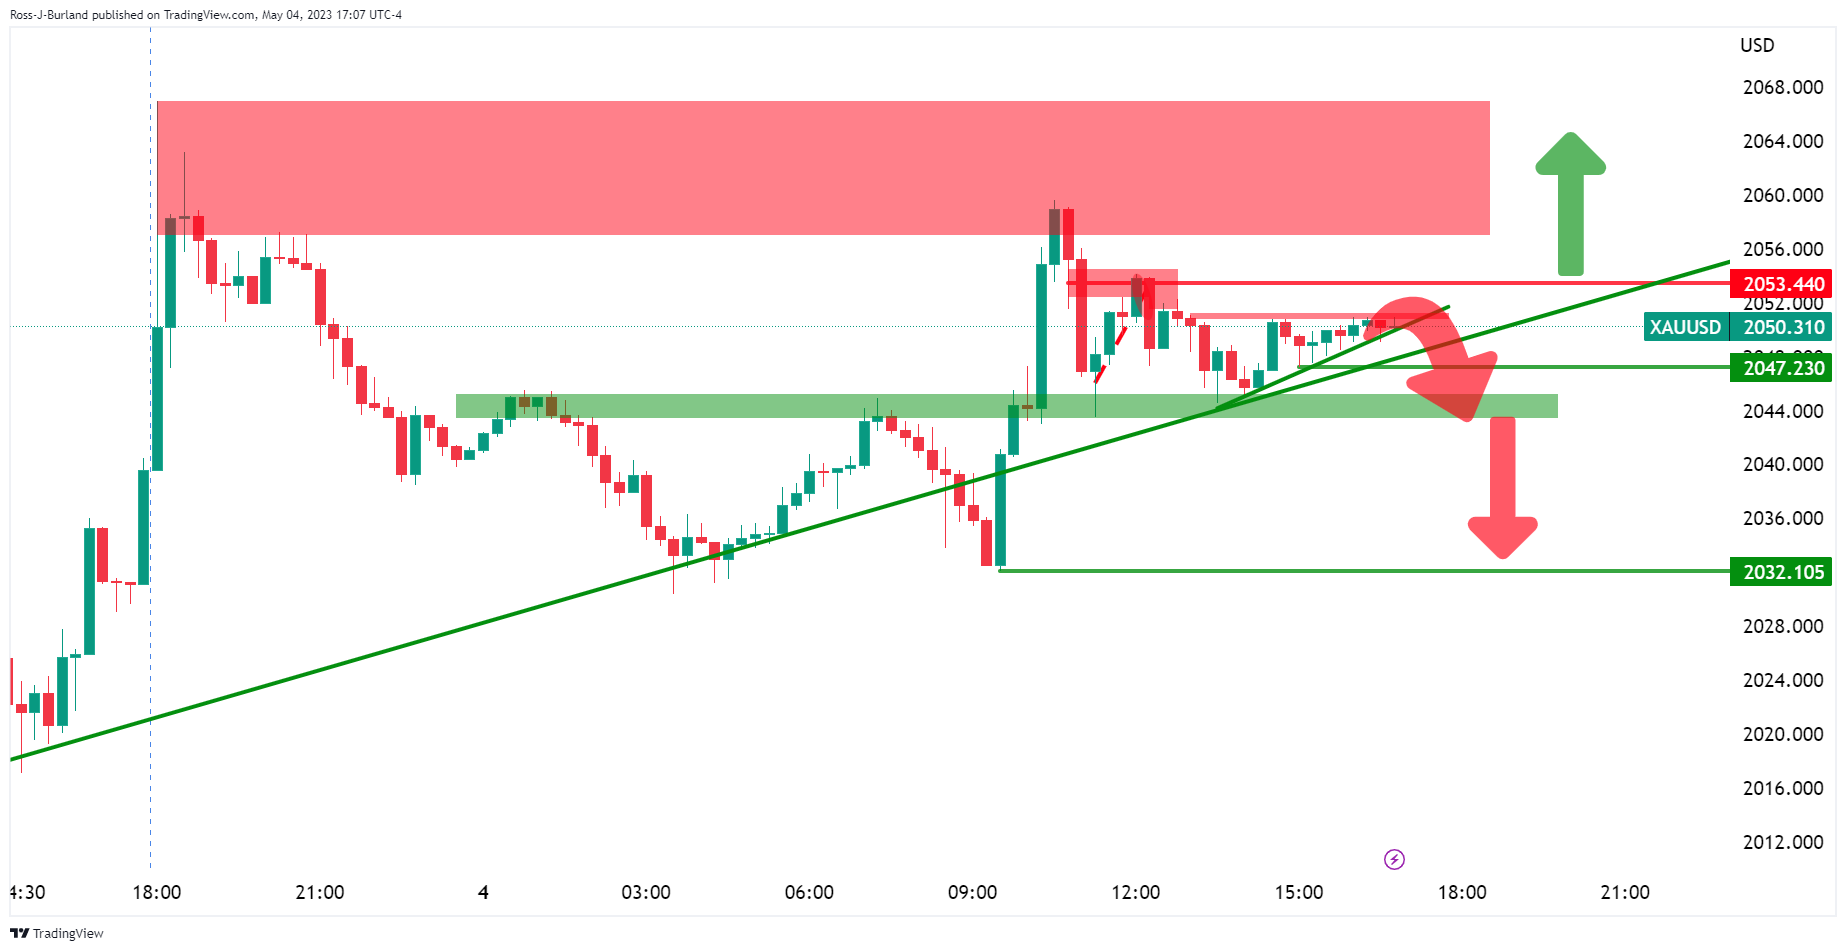
The price is jammed into a resistance area near $2,050 and supported by the micro trendline that rides the $40.00s. A break of the $47.00s opens the risk of a move to test $2,032.10 support structure. On the upside, the all times highs will be a target around $2,075.%
During the Asian session, the Reserve Bank of Australia will release its Monetary Policy Statement. Australia will also report Home Loans data, while China will release the Caixin Services PMI. The key event of the day will be the US employment report. The jobs number could be critical for the US Dollar that weakened on Thursday, even amid risk aversion.
Here is what you need to know on Friday, May 5:
Wall Street dropped again on the back of banking concerns, and US bond yields hit fresh monthly lows amid expectations of rate cuts from the Federal Reserve during the second half of the year. Although the US Dollar Index (DXY) rose modestly boosted by the decline in EUR/USD, the Greenback lost ground against most of its rivals, not helped by risk aversion.
Economic data from the US showed a 6.3% advance (annualized rate) in Unit Labor Costs (ULC) during the first quarter and an increase in Initial Jobless Claims to 242K. On Friday, the key report will be the Nonfarm Payrolls report. Market consensus points to an increase of 179K and the Unemployment Rate to stay at 3.5%.
Analysts at Wells Fargo:
Although ULCs are more volatile than other measures of labor costs, their continued menacing pace adds to last week's Employment Cost Index in dampening the nascent optimism that wage pressures are beginning to ease in a meaningful way. Inflation's road back to 2% continues to look long as a result.
The European Central Bank (ECB) raised its key interest rates by 25 basis points, marking a slowdown from the previous 50 basis points hikes. The central bank is expected to continue hiking rates in the future. Following the ECB event, the Euro lost ground against the US dollar, with EUR/USD dropping below 1.1000. The pair then rebounded but finished far from the key 1.1100 area.
EUR/GBP posted its lowest daily close in a month, near 0.8750. Meanwhile, GBP/USD rose marginally but was still unable to break above 1.2600, although it closed at its highest level since June 2022.
USD/CHF rose modestly, boosted by the slide of the Euro after the ECB, and settled around 0.8850. On Friday, Switzerland will report consumer inflation.
The Japanese Yen was among the top performers, boosted by risk aversion and lower US yields. USD/JPY trimmed losses late on Thursday, rebounding above 134.00.
AUD/USD rose for the fourth consecutive day but was struggling to retake 0.6700. The Reserve Bank of Australia (RBA) will release the Monetary Policy Statement on Friday.
NZD/USD jumped on Thursday, approaching 0.6300. The Kiwi is among the biggest gainers of the week.
USD/CAD dropped sharply to weekly lows at 1.3515 before consolidating at 1.3540. Canada will release crucial jobs data on Friday with a net change in employment expected to slow to 20K.
After surging earlier on Thursday, Gold pulled back and ended around $2,050 as it continues to look at all-time highs. Silver had the highest close in a year above $26.00. Cryptocurrencies rose, with BTC/USD gaining 1.3%. Crude oil prices finished flat after extreme volatility during the Asian session.
Like this article? Help us with some feedback by answering this survey:
- GBP/USD bulls are eyeing a break towards 1.2660.
- Bears need to get below the 1.2570s.
GBP/USD was trading in a narrower range of around 50 pips on Thursday having hit an 11-month high the prior day after the Federal Reserve raised rates but signaled an end to its tightening cycle is in sight. The technicals are left bullish, however, while on the front side of the weekly dynamic support line as the following will illustrate:
GB/USD weekly chart

We have a resistance at 1.2600 that the bulls need to overcome that will open the way to 1.2660. There are prospects of a strong move up from there which makes the midpoint of the 1.26s potentially stubborn resistance.
GBP/USD H4 chart

The 4-hour time frame is compelling. A break of trendline support will be key and the 1.2570s are key in this regard. A break of the 1.2550s opens the risk of a deeper move lower for the days ahead. Nonfarm Payrolls will be a critical event on Friday and next week´s opening balance could be what counts, setting the tone for the week ahead after the NFP volatility.
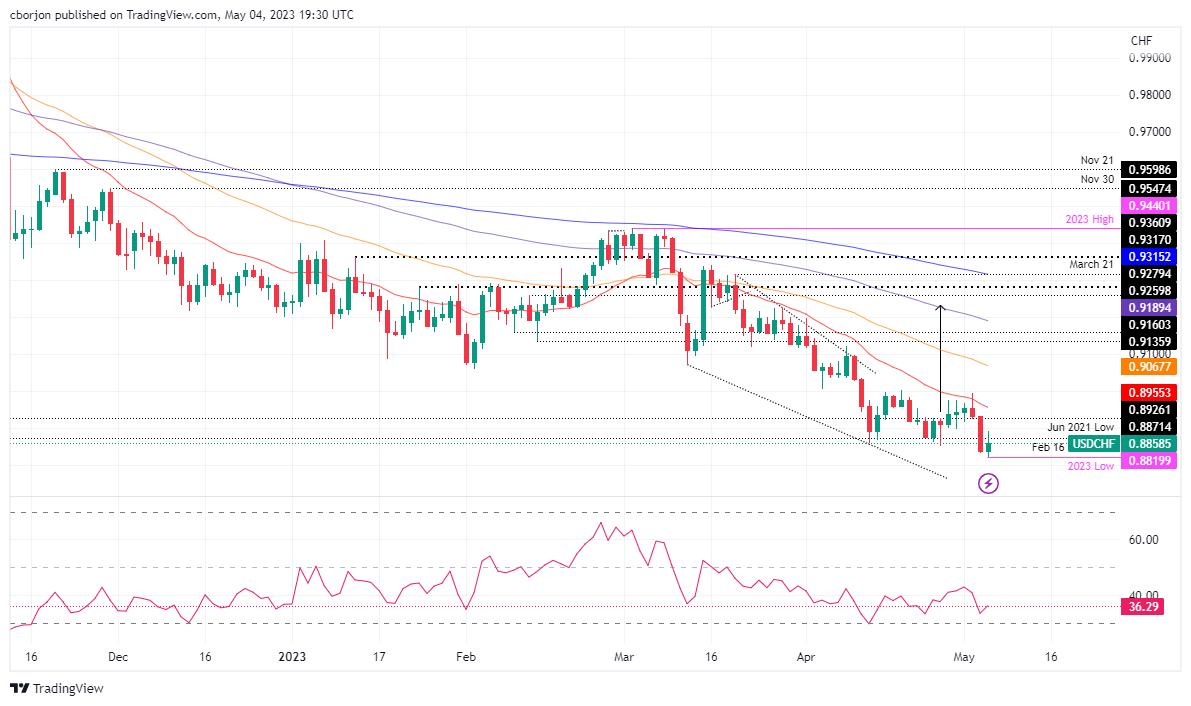
- USD/CHF may be headed for an upward correction despite touching new lows.
- If buyers reclaim the 20-Day EMA at 0.8955, further upside is expected in the USD/CHF pair.
- USD/CHF at a brisk of falling towards 0.8800, once it falls beneath 0.8819.
The Swiss Franc (CHF) strengthened to a new high of the year against the US Dollar (USD), as the USD/CHF dropped towards 0.8819, the year-to-date (YTD) low, as risk aversion hit the markets. Nevertheless, the USD shrugged off its earlier losses, and the USD/CHF pair reversed its course, holding gains. At the time of writing, the USD/CHF is trading at 0.8858 and has gained 0.20%.
USD/CHF Price Action
Although the pair touched new lows, and the USD/CHF price action fell to a lower low, technically speaking, the USD/CHF might be headed for an upward correction. The Relative Strength Index (RSI) indicator is in bearish territory, though it has printed a series of successive higher troughs on each USD/CHF’s lower low. Therefore, a positive divergence is emerging, which could pave the way for further upside.
For that outcome to happen, USD/CHF buyers must reclaim the 20-day EMA at 0.8955. Once cleared, the pair must rally above the May 2 high, at around 0.9000. A decisive break of the figure would expose another resistance level at the 50-day EMA at 0.9067 before buyers can claim 0.9100.
Conversely, if USD/CHF collapses below 0.8819, a fall towards 0.8800 is on the cards.
USD/CHF Daily Chart
- Silver price pierces the $26.00 figure but fails to crack the YTD high of $26.08.
- A dovish perceived Federal Reserve underpinned the white metal.
- XAG/USD remains in a solid uptrend despite overbought RSI readings; a pullback is possible.
Silver price rallied but remained shy of cracking the previous year-to-date (YTD) high of $26.08, with XAG remaining supported by buyers keeping the white metal trading nearby the $26.00 figure. Data from the US flashed the labor market is easing amidst the ongoing US banking turmoil, which weighed on market sentiment. The XAG/USD is trading at $25.96 a troy ounce, up 1.40%.
Silver price nears YTD highs as Fed policy boosts uptrend, but overbought RSI signals potential pullback
The rise in the precious metals segment was sparked by traders seeking safety, amidst an ongoing deterioration in the United States (US) economy, alongside falling US Treasury bond yields. Reflection of the latter is investors seemed to price in rate cuts by the Federal Reserve in 2023.
On Wednesday, the Fed increased rates to the 5.00% - 5.25% area, 25 bps up from its March meeting level. It signaled that it would be data-dependent while removing “hawkish” language from its monetary policy statement.
Even though the Fed’s decision was perceived as dovish, when Fed Chair Jerome Powell was asked about rate cuts, he said, “Would not be appropriate to cut rates, given our view that inflation will take some time to come down.”
In the meantime, the labor market continued to ease, as shown by Initial Jobless Claims for the week ending on April 29, jumping above the estimated 240K and coming at 242K. Continuing Claims edged down by 38K, to 1.81 million, in the week ending on April 22.
In other data, the US Balance of Trade deficit narrowed in March as Exports increased, as the US Commerce Department reported.
Ahead of the week, the US economic calendar will include the Nonfarm Payrolls for April, which is expected to show 180K jobs added to the economy - less than the previous month’s 236K. The report will also include the Average Hourly Earnings, which are expected to remain at 0.3% MoM, and the Unemployment Rate, which is predicted to be 3.6%.
XAG/USD Technical Analysis
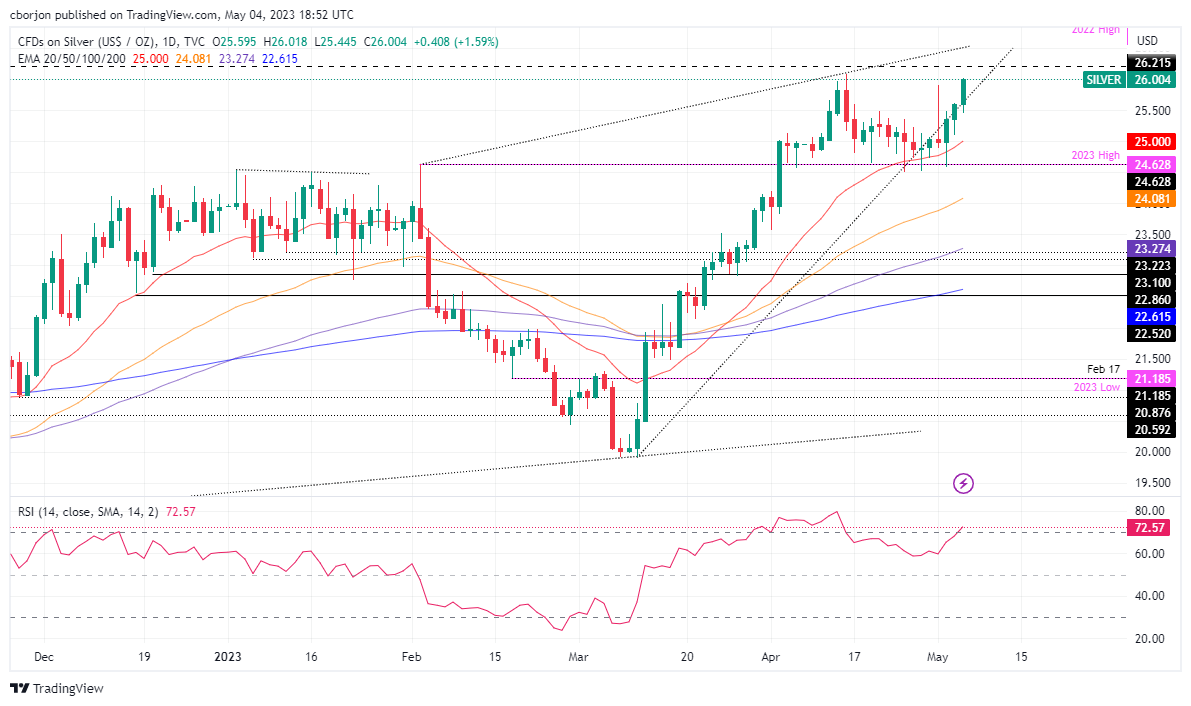
The XAG/USD remains in a solid uptrend, despite falling to crack $26.08, the YTD high. However, the high readings of the Relative Strength Index (RSI) indicator in the overbought territory could refrain Silver traders from opening new positions, as price action looks overextended. That could pave the way for a mean reversion toward the 20-day EMA, which intersects with the $25.00 figure, as buyers take a respite to lift XAG/USD to higher prices.
- EUR/USD bears are engaging again but the support could be solid ahead of Nonfarm Payrolls.
- EUR/USD 1.0980s are key for the day ahead.
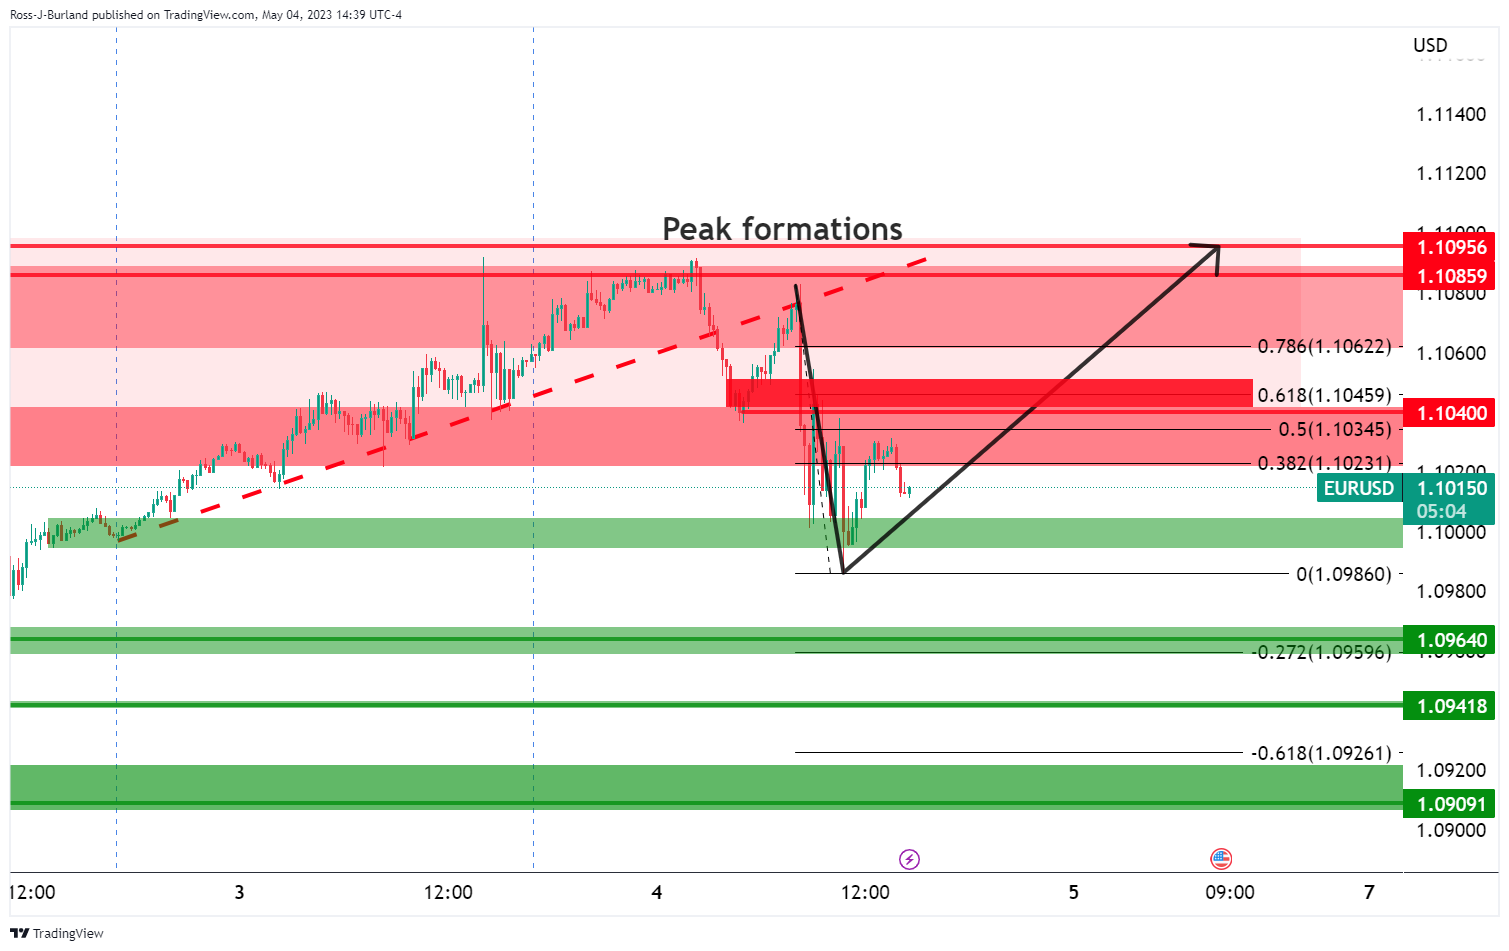
The bias remains bearish with low-hanging fruit for the bears to pick off on a break below 1.1000 with eyes on the 1.0950s. However, should the bulls commit at the current support, the market could easily turn higher to the 1.1050s as a key resistance area that guards the recent highs near 1.1100:
EUR/USD was giving back some of its overnight gains after the European Central Bank eased the pace of its rate hikes, enabling the bears a free lunch from the top of the peak formation as the following technical analysis will illustrate:
EUR/USD H1 charts
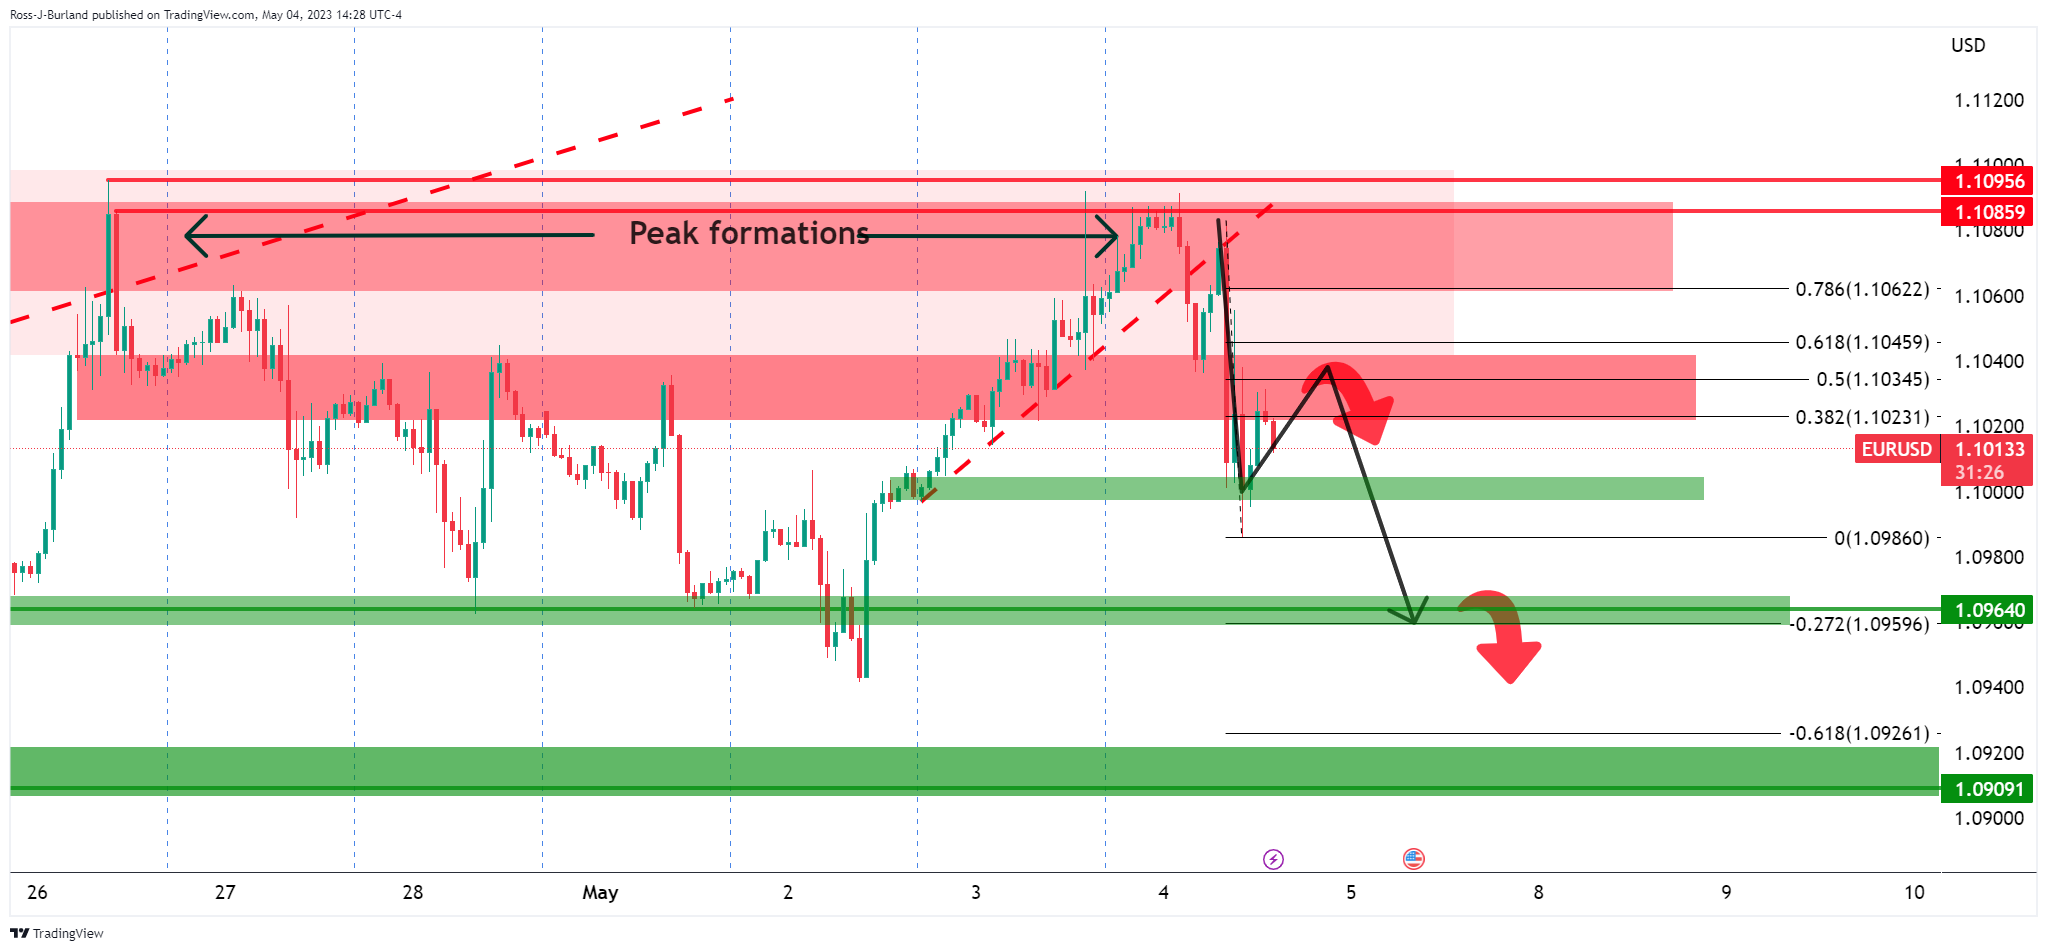
EUR/USD met resistance in a 38.2% Fibonacci and a 50% mean reversion at the height of the correction following the slide from the ECB outcome.
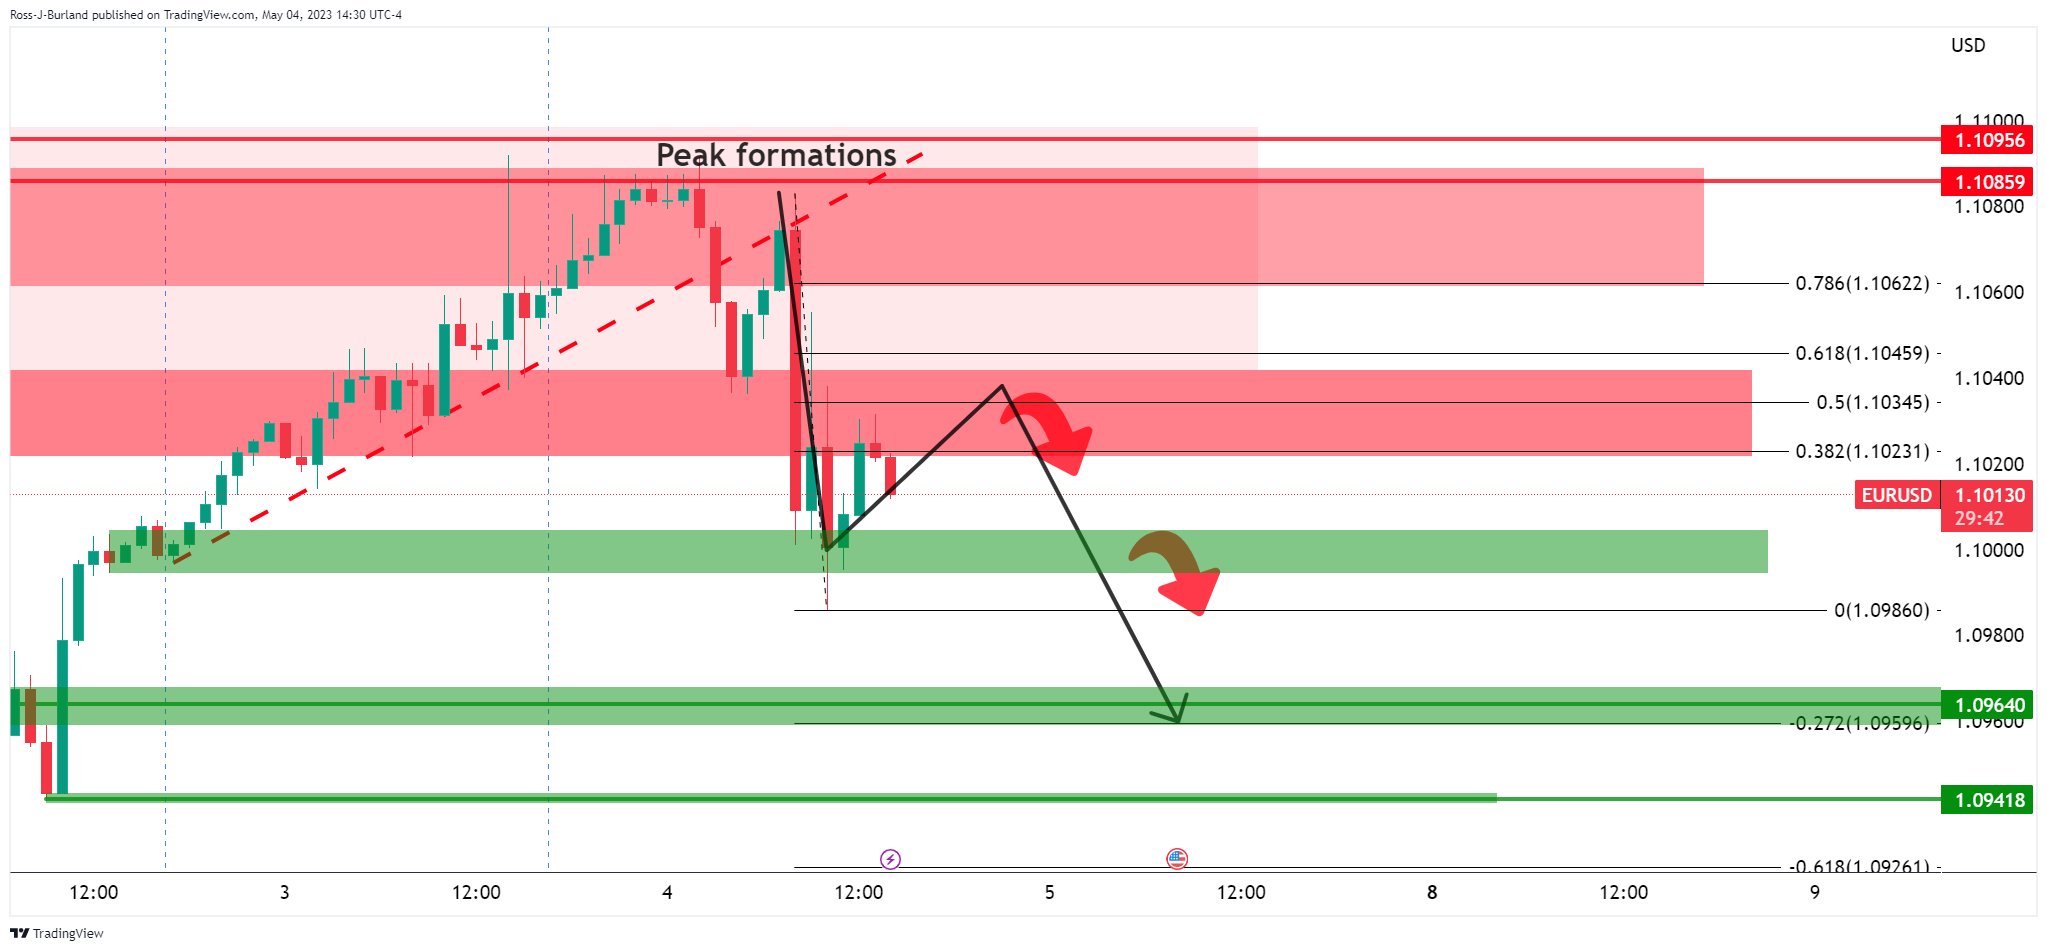
The bias remains bearish with low-hanging fruit for the bears to pick off on a break below 1.1000 and 1.0980 with eyes on the 1.0950s. However, should the bulls commit at the current support, the market could easily turn higher to the 1.1050s as a key resistance area that guards the recent highs near 1.1100:
EUR/USD M15 chart
- US Dollar Index is trading sideways, with EMAs acting as resistance.
- The RSI indicator suggests bearish momentum may be losing steam for the DXY.
- USD buyers reclaiming 102.500 would pave the way to challenge 103.000; otherwise, the DXY could retest YTD lows.
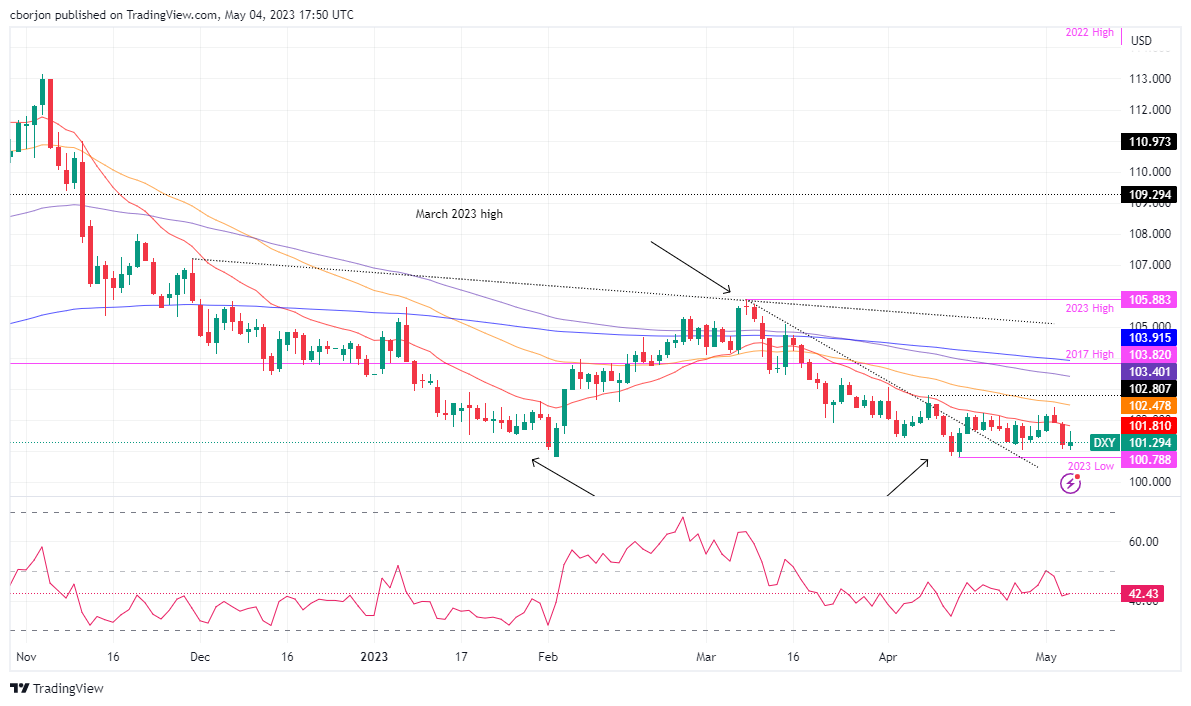
The US Dollar Index (DXY), a gauge that measures the value of six peers against the American Dollar (USD), prints minuscule gains of 0.06% as risk aversion takes hold due to the US banking system turmoil, and also on a dovish rate hike by the Fed on Wednesday. At the time of writing, the DXY exchanges hand at 101.298 after hitting a low of 101.027.
DXY Price Action
The US Dollar Index continues to be trading sideways after bottoming at around 100.788 in April 14, capped on the upside by the 20 and 50-day Exponential Moving Average (EMA), which are acting as a dynamic resistance, each at 101.808 and 102.477, respectively.
The Relative Strength Index (RSI) indicator stays at bearish territory though it has not reached a lower trough, as price action has done it. So, it suggests that sellers are losing momentum.
If DXY buyers want to shift the bias to neutral, they must reclaim the 20 and 50-day EMAs, meaning that the DXY needs to be above 102.477. Once cleared, the next resistance would be the April 10 daily high at 102.807 before challenging 103.000. The uptrend will extend if buyers crack the 100-day EMA at 103.400.
Conversely, if the DXY drops below the May 4 daily low of 101.027, it would immediately expose the YTD low of 100.788 before challenging the 100.000 mark.
DXY Daily Chart
- USD/CAD drops into last week´s lows as CAD gets a boost from BoC chatter.
- If support holds, then the 1.3550s come into focus in a correction.
USD/CAD is falling as the market price in the Bank of Canada and Federal Reserve interest rate outlooks. At the time of writing, USD/CAD is trading in the 1.3520s after falling from a high of 1.3632.
In recent trade, the Bank of Canada´s Tiff Macklem stated, ´´ If we see signs inflation stuck materially above 2%, we could hike again.´´ When compared to the dovish statement from the Federal Reserve on Wednesday, this gives the CAD the edge and we are seeing USD/CAD as a consequence, despite the heavy drop in the price of oil.
Meanwhile, the attention will turn to the labour market reports from both the US and Canada. ´´US payrolls likely slowed for a third consecutive month to a still firm pace in April, though the slowest since 2020,´´ analysts at TD Securities said, adding, ´´we also look for the UE rate to rise to 3.6%, and wage growth to print 0.3% MoM.´As for In Canada, the analysts said that they look for a 15k print, well below the 6m trend and the weakest since September 2022. This should see the UE rate edging higher to 5.1% as wage growth cools to 4.7% YoY.´´
The data will be critical for both the US and Canada with the Federal Reserve data dependant after the Federal Open Market Committee raised the target range for the fed funds rate by 25bp to 5.00-5.25%, as widely expected. However, the accompanying statement saw changes from the March statement, with the most important being the removal of the line “the Committee anticipates that some additional policy firming may be appropriate,” signaling that further rate rises will no longer be the default choice at coming meetings.
USD/CAD technical analysis
USD/CAD is testing support in the 1.3520s and last week´s lows. a break here gives way to a move into the 1.3490s for the foreseeable future. However, a correction would be anticipated imminently.
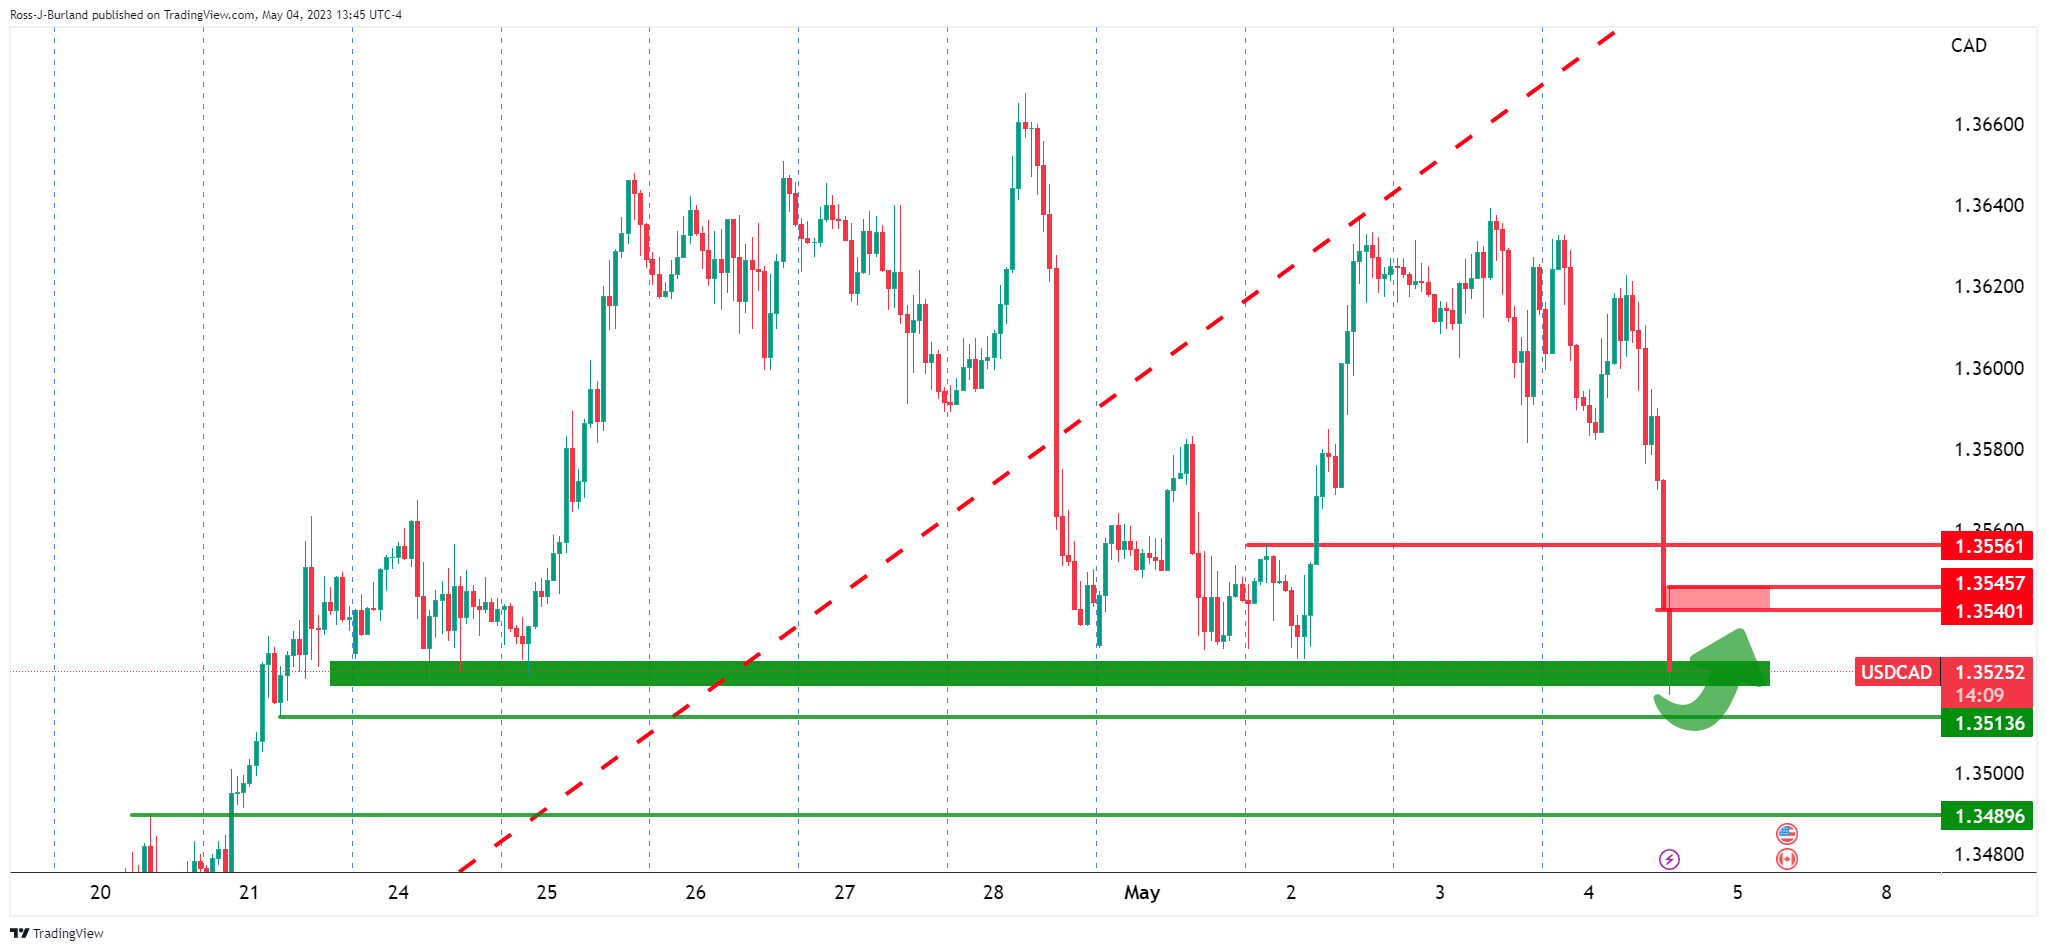
The hourly chart shows the price heading into the support area and if this were to see a deceleration then a reasonable upside target would be the 1.3550s in a correction.
The Bank of Canada´s Governor Tiff Macklem said in a prepared speech at the Toronto Region Board of Trade that if they start to see signs that inflation is likely to get stuck materially above their 2% target, they are prepared to raise interest rates further. The BoC decided to pause interest rate hikes in March.
Key quotes from the speech:
“We’re forecasting inflation to fall quickly to about 3% this summer and to reach the 2% target near the end of 2024. The projected decline from 3% to 2% is both slower and more uncertain. With growth anticipated to be weak through the rest of the year before picking up gradually next year, we expect services price inflation to ease and overall inflation to converge on the 2% target. But several things still have to happen for services price inflation to moderate in line with our forecast, and we are watching these closely.”
“Last month, Governing Council decided to hold its policy rate steady at 4½% as we assess whether monetary policy is restrictive enough to return inflation to the 2% target. We know that monetary policy works with a delay, and the effects of the tightening we’ve undertaken to date have not yet fully worked their way through the economy. If we start to see signs that inflation is likely to get stuck materially above our 2% target, we are prepared to raise rates further.”
“At the same time, the financial system needs to adjust to higher interest rates. This underscores the importance of sound risk management in financial institutions and vigilant supervision to identify and manage risks as the economy slows and the cost of funding adjusts to higher interest rates.”
Market reaction:
The USD/CAD is trading at weekly lows, under 1.3530 on Thursday, with the Canadian dollar outperforming during the American session.
- XAU/USD hits new ATH high as Fed signals pause, though profit-taking weighed on Gold price.
- The labor market eases as US Initial Jobless Claims rise to 242K, but Continuing Claims fall to 1.81 M.
- XAU/USD Price Analysis: It could dip below $2050 with sellers eyeing $2000; otherwise, buyers could challenge the ATH.
Gold price remains trading in positive territory after hitting a new all-time high (ATH) at around $2081.82. Some profit-taking, risk aversion, and another central bank increasing rates dragged XAU/USD price towards the $2050 area. At the time of writing, XAU/USD exchanges hands at $205.92, holding to gains of 0.40%.
XAU/USD clings to its earlier gains, though at brisk of losing $2050
The financial turmoil around the US banking system continues, as PacWest and Western Alliance Bank are under solid selling pressure, which triggered flows towards safety. Therefore, XAU/USD continues to hold its ground, despite recent US Dollar (USD) strength.
The economic agenda in the United States (US) revealed that unemployment claims for the week ending on April 29 jumped to 242K, exceeding estimates of 240K, a report cheered by US Federal Reserve (Fed) officials. Continuing claims, which include citizens receiving unemployment benefits for a week or more, fell by 38K, to 1.81 million, in the week ending on April 22.
The XAU/USD reached its new ATH high after the Fed increased rates above the 5% threshold and signaled that it would be data-dependent, opening the door for a pause. However, Fed Chair Jerome Powell reiterated that inflation remains high and that the labor market is tight. He kept the chances for additional tightening on the table and pushed back against cutting rates amidst inflation levels, twice the Fed’s goal.
On Thursday, the US Dollar Index (DXY), which measures the value of six currencies against the buck, fluctuates between gains and losses at 101.340, influenced by US Treasury bond yields. The US 10-year Treasury bond yield is losing eight bps, down to 3.315%, a tailwind for XAU/USD’s price.
What to watch?
On Friday, the US economic docket will feature the US Nonfarm Payrolls report for April, expected at 180K, less than the prior’s month 236K jobs added to the economy. Additionally, Average Hourly Earnings are expected to remain unchanged at 0.3% MoM, while the Unemployment Rate is foreseen at 3.6%.
XAU/USD Technical Analysis
From a daily chart perspective, the XAU/USD is still upward biased, though Thursday’s price action opens the door for a mean reversion move. If XAU/USD’s Thursday daily candle closes beneath $2050, that will exacerbate a correction. Initially, XAU/USD could fall towards $2030.50, May 4 low, followed by the March 20 swing high, which turned support at $2009.75. A breach of the latter will expose the $2000 figure.
Conversely, a bullish continuation could happen if XAU/USD buyers hold prices above $2050 as they eye the $2100 barrier.
Citing four sources familiar with the matter, Reuters reported on Thursday that all European Central Bank (ECB) policymakers but one, Robert Holzmann, agreed to slowing down the pace of rate increases at May policy meeting.
Policymakers reportedly wanted forward guidance for more rate hikes ahead. According to the sources, some ECB policymakers except two or three more rate increases.
Market reaction
EUR/USD struggled to stage a rebound following this headline. As of writing, EUR/USD pair was down 0.35% on a daily basis at 1.1020.
On Thursday, the European Central Bank (ECB) raised its key interest rates by 25 basis points. Analysts at Danske Bank were expecting a 50 basis points hike. They pointed out that the central bank is not done hiking, and President Lagarde clearly stated that its data-dependent approach warranted further hikes based on the current outlook.
Key quotes:
“The inflation assessment was broadly unchanged with ‘inflation outlook continues to be too high for too long’. Against this background, we assess that the bank lending survey has ‘spooked’ the GC members to slow the pace to 25bp.”
“The ECB is not done hiking and President Lagarde clearly said that its data dependent approach warranted further hikes at the current outlook. We add a 25bp hike in September as well to our rate call, thereby keeping our 4% peak policy.”
“Lagarde repeated several times that it is a journey and not the destination and hence an open mind to the rate decisions is kept. With our current inflation and growth assessment we warrant that this tightening cycle will be slightly longer but still end around the 4% level.”
- WTI grinds higher after hitting a new YTD low at around $63.00.
- Global central bank tightening puts stress on oil prices with recession fears and lower demand potential.
- WTI Price Analysis: Analysis suggests relief for buyers with a rally above $70 but a potential fall to $60 is on the cards.
Western Texas Intermediate (WTI), the US crude oil price, had shrugged off a $6.00 fall during the Asian session and is trading above its opening price. Two major central banks’ decisions weighed WTI’s price, though buyers moved in and lifted prices. At the time of writing, WTI is exchanging hands at $68.72 PB, gains almost 1%.
Oil prices pressured by a global economic slowdown looming
Sentiment is still sour, blamed on the US regional bank turmoil. Further losses in the segment keep the US financial markets under stress, though a lending hand from the US Federal Reserve (Fed) could calm investors.
On Wednesday, the Fed hiked rates by 25 bps and signaled it’s ready to hold rates at the 5.00%-5.25% range. Nevertheless, Powell and Co. emphasized that inflation is elevated, the jobs market remains tight, and the Fed is ready to act if needed.
WTi reacted negatively, finishing Wednesday’s session with more than 4.50% losses. During the Asian session, risk aversion weighed on oil prices as WTI plunged to its year-to-date (YTD) low of $63.73 before bouncing off those levels.
Another factor that weighed on WTI price was that manufacturing activity in China slid, according to Caixin Global. China’s Manufacturing PMI slumped into contractionary territory, falling to 49.5 from 50 in March, and 51.6 in February, signaling that the largest Asian economy is slowing down.
Of late, the European Central Bank (ECB) increased its interest rates to 3.75%, slowing its pace of 50 bps of tightening to 25. However, the ECB’s President Christine Lagarde reiterated that the central bank is not pausing, just slowing the rhythm of tightening.
Meanwhile, given that the Organization of Petroleum Export Countries and its allies (OPEC+) began to cut its output in May, it served as a cushion for the US crude oil benchmark to stay afloat above the $60.00 mark.
Regarding US stockpiles, inventories shrank as reported by official data released by the US Energy Information Administration (EIA) on Wednesday, falling just one million barrels last week.
WTI Technical Analysis
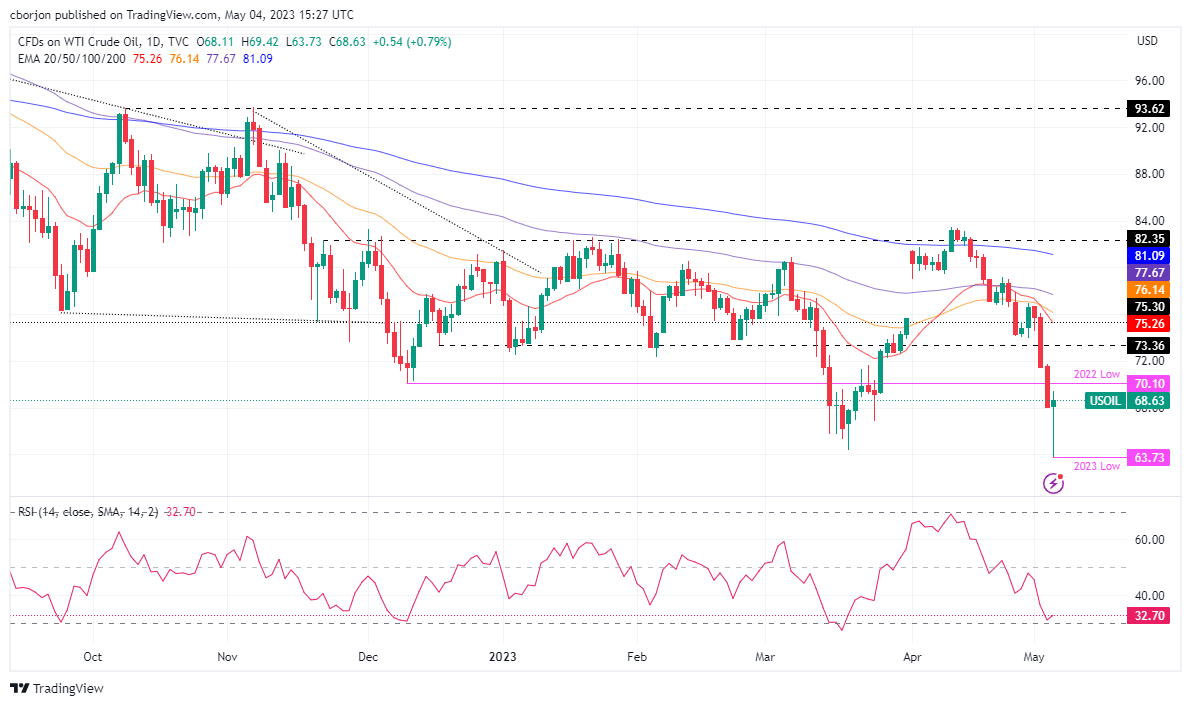
WTI is in a downtrend, and despite recovering from its earlier losses, the $60.00 mark is eyed by sellers. Unless WTI buyers reclaim last year’s low of $70.10 PB, further downside is expected. WTI’s first support would be the March 24 low of $66.86, followed by its prior’s YTD low of $64.41. Conversely, a rally above $70.00 could offer buyers a respite, though downside risks remain as it remains below $75.00.
- US yields hit fresh weekly lows due to risk aversion.
- Japanese yen benefits from falling equity prices in the US amid banking concerns.
- USD/JPY drops for the third consecutive day, below the 20-day SMA.
The USD/JPY has broken lower and tumbled to 133.79, reaching its lowest level in six days. The pair remains under pressure amid risk aversion, with US regional banks taking a hit.
Although the US Dollar experienced a modest rebound following US Q1 productivity report, it quickly faded after Wall Street's opening bell. US stocks are falling again, with regional banks tumbling. Wednesday's Federal Reserve rate hike seems like old news already.
The deterioration in market sentiment is driving demand toward Treasury bonds. The US 10-year yield is at 3.33%, while the 2-year is at 3.79%, both at one-month lows.
The context of lower US yields and risk aversion is boosting the Japanese yen across the board during the American session, pushing USD/JPY down, extending weekly losses.
The pair is falling for the third consecutive day. From Tuesday's top, it lost almost 400 pips. The price is testing levels below 134.00 and under the 20-day Simple Moving Average (SMA). The next strong support area is seen around 133.50. A recovery above 135.00 would alleviate the bearish pressure.
Technical levels
Economists at Credit Suisse discuss GBP outlook and expect Cable to extend its gains.
Break below support at 1.2344 to warn of a deeper setback
“We still see scope for one final leg higher to our core target at 1.2668/1.2758 – the May 2022 high, 61.8% retracement of the 2021/2022 fall and long-term downtrend from May 2021. Our bias would then be to look for an important top here.”
“Below support at 1.2344 stays seen needed to mark a minor top to warn of a deeper setback to the 55-DMA and price support at 1.2255/1.2190, but with this ideally holding.”
Brent Crude Oil is under heavy pressure after recently rejecting key resistance levels, suggesting a resumption of the downtrend is likely, with next supports at $65.72 and $63.02, analysts at Credit Suisse report.
Key resistance at $86.41/89.37 still expected to cap
“With medium-term momentum still negative and short-term momentum crossing back into outright bearish territory, we look for a break below current year-to-date low at $70.12 imminently, which would open up a move to the major cluster of supports between $65.72 and $63.02 next.”
“Key resistance at the 200-DMA and key highs at $86.41/89.37 is still expected to cap should the market stabilize and turn back higher, but even this is not our base case.”
The European Central Bank (ECB) downshifted to a 25 bps hike as expected. The EUR/USD pair came off a bit on the announcement. Economists at TD Securities expect the 1.0950 mark to provide solid support.
Positioning squeeze but remain firm dip buyers
“Ultimately, we think the EUR reaction boils down mostly to disappointed positioning. Markets had to reprice some lingering expectations of a 50 bps hike.”
“We continue to look for a break of 1.10 and would look to buy short-term dips towards 1.0950.”
EUR/CHF has turned back lower over the past couple of days within its broad ~0.9700- 1.0101 range. Economists at Credit Suisse expect further weakness in EUR/CHF.
Renewed phase of risk-off
“Weekly MACD momentum is turning freshly lower back into negative territory. This, along with our risk-off stance, leaves us biased towards further CHF appreciation.”
“We believe a range breakdown below 0.9712/00 is likely in due course, which would open up a move to 0.9559 next and potentially the 0.9411 low.”
“Key resistance at the range top at 1.0101 is expected to cap.”
- Canada Ivey PMI retreats less than expected in April.
- USD/CAD moves toward daily lows after data.
The Ivey Purchasing Managers Index (PMI), which measures the month-to-month variation in economic activity in Canada, dropped to 56.8 (seasonally adjusted) in April from 58.2 in March. However, this was a smaller drop than the market had expected, with the consensus forecast at 54.8.
The Employment Index also edged lower to 55.8 from 60.3, and the Prices Index fell to 59.0 from 62.0.
Market reaction
Following the release of the data, USD/CAD initially moved towards daily lows but later largely ignored the figures. The pair was last seen trading modestly higher on the day at 1.3615. Bank of Canada Governor Macklem is set to deliver a speech later on Thursday.
- GBP/USD is seen consolidating its recent gains to the highest level since June 2022.
- A modest USD recovery from over one-week low acts as a headwind for the pair.
- The downside seems limited, warranting some caution before placing bearish bets.
The GBP/USD pair enters a bullish consolidation and oscillates in a narrow trading range just below its highest level since June 2022 touched this Thursday. The pair holds steady just above the mid-1.2500s through the early North American session, awaiting a fresh catalyst before the next leg of a directional move.
In the meantime, a modest US Dollar (USD) recovery from over one-week low acts as a headwind and keeps the GBP/USD pair below the 1.2600 round-figure mark. Signs of stress at another US regional bank, PacWest Bancorp, sparks fears of a full-blown banking crisis in the US, which, along with looming recession risks, temper investors' appetite for riskier assets. This is evident from a generally weaker tone around the equity markets and helps revive demand for the safe-haven Greenback.
The USD bulls, however, seem reluctant to place aggressive bets in the wake of the Federal Reserve's (Fed) less hawkish outlook. It is worth recalling that the US central bank raised interest rates by 25 bps on Wednesday and opened the door for a possible pause in June. Apart from this, concerns over the US debt ceiling continue to act as a headwind for the US Treasury bond yields, which should further contribute to keeping a lid on the buck and limiting the downside for the GBP/USD pair, at least for now.
On the economic data front, the US Initial Weekly Jobless Claims rose more than expected, to 242K during the week ending April 29 from the previous week’s 229K (revised from 230K) and fails to provide any meaningful impetus. Traders now seem to have moved to the sidelines and keenly await the closely-watched US monthly jobs data on Friday. The popularly known NFP report will play a key role in influencing the USD price dynamics and determine the near-term trajectory for the GBP/USD pair.
Technical levels to watch
The GBP/USD pair eeks out marginal gains to a new cycle high. Economists at Scotiabank expect Cable to enjoy further gains.
Support aligns at 1.2475/1.2525
“New cycle highs, however marginal today, keep the broader backdrop for Cable positive.”
“Last week’s firm close through 1.2445/50 remains a key feature of the GBP charts from my point of view and suggest topside pressure continues to develop (towards 1.27/1.28) even if gains remain very slow.”
“GBP/USD support is 1.2475/1.2525.”
See: GBP/USD could trade up to 1.2650/2750 – ING
Christine Lagarde, President of the European Central Bank (ECB), is delivering her remarks on the policy outlook and responding to questions from the press following the Governing Council's decision to hike key rates by 25 basis points in May.
Key takeaways
"Saving a little bit of optionality on APP reinvestment."
"The ultimate goal is to reduce APP bond holdings to zero."
"Rate hiking is a journey, we are not there yet."
"Data dependency is not forward guidance."
"We had lengthy debates about core inflation."
"We are particularly concerned about food inflation."
"We are not Fed-dependent in rate decisions, we can tighten if the Fed pauses."
"We are not making any commitment to cut rates at any point in time."
About ECB's press conference
Following the ECB´s monetary policy decisions, the ECB President delivers a prepared statement and responds to questions from the press on the policy outlook. Her comments may influence the volatility of EUR and determine a short-term positive or negative trend. Her hawkish view is considered as positive, or bullish for the EUR, whereas her dovish view is considered as negative, or bearish.
- EUR/USD loses some ground and revisits 1.1000.
- ECB President Christine Lagarde said inflation pressures remain strong.
- Many board members suggested a 50-basis-points interest-rate raise.
EUR/USD accelerates the corrective decline and probed the boundaries of the key 1.1000 level on Thursday, where solid contention appears to have emerged.
EUR/USD: Gains remain capped by 1.1100 so far
EUR/USD comes under pressure and faces some increased volatility as President Lagarde’s press conference is under way on Thursday.
So far, the pair probed once again the boundaries of the 1.1100 barrier just to give away all those gains and poke with the 1.1000 neighbourhood, managing to stage a rebound afterwards.
At her press conference, Lagarde argued that price pressures remain strong, while services prices are pushed up by pent up demand amidst a strong growth in the sector and in contrast with a worsening outlook for manufacturers.
Lagarde also noted that there are still significant upside risks to inflation, which remain bolstered by energy and supply bottlenecks, while wage pressure has gathered further traction as of late.
Lagarde reiterated that the bank maintains a meeting-by-meeting approach when it comes to decide on the next moves on rates as well as the performance of inflation and key fundamentals.
At the Q&A session, Lagarde stressed that all participants agreed that more tightening was needed, while many of them even leant towards a 50 bps hike. She added the bank still has further work to do in terms of reaching a sufficiently restrictive stance.
EUR/USD levels to watch
So far, the pair is down 0.17% at 1.1040 and faces the next support at 1.0941 (monthly low May 2) followed by 1.0909 (weekly low April 17) and finally 1.0831 (monthly low April 10). On the other hand, the surpass of 1.1095 (2023 high April 26) would target 1.1100 (round level) en route to 1.1184 (weekly high March 21 2022).
USD is narrowly mixed versus majors as markets digest the FOMC decision. Economists at Scotiabank expect the US Dollar Index (DXY) to remain stable.
Fed outcome largely in line with market expectations
“The overall outcome was largely in line with market expectations and priced in; as such, the USD is likely to remain soft but, on the basis of current interest rate differentials, it looks close to fair value in broad terms at this point.”
“If a further, major decline is unlikely at this point, a significant rebound is unlikely.”
“Range trading, with a soft bias appears likely for the DXY in the near-term.”
Christine Lagarde, President of the European Central Bank (ECB), is delivering her remarks on the policy outlook and responding to questions from the press following the Governing Council's decision to hike key rates by 25 basis points in May.
Key takeaways
"Some ECB governors thought 50 bps hike was appropriate."
"Nobody advocated unchanged rates."
"There was a very strong consensus."
"I don't have a numerical estimate for sufficiently restrictive."
"We are not yet seeing the complete impact desired to get to target."
About ECB's press conference
Following the ECB´s monetary policy decisions, the ECB President delivers a prepared statement and responds to questions from the press on the policy outlook. Her comments may influence the volatility of EUR and determine a short-term positive or negative trend. Her hawkish view is considered as positive, or bullish for the EUR, whereas her dovish view is considered as negative, or bearish.
- NZD/USD climbs to a multi-week high on Thursday, albeit struggles to capitalize on the move.
- A goodish USD bounce, along with a softer risk tone cap the upside for the risk-sensitive Kiwi.
- The fundamental backdrop favours bulls and supports prospects for further near-term gains.
The NZD/USD pair prolongs its uptrend for the third successive day on Thursday, also marking the fifth day of a positive move in the previous six, and climbs to a nearly three-week high. The pair maintains its strong bid tone, around the 0.6260-0.6265 area through the early North American session, with bulls looking to build on the momentum beyond a technically significant 200-day Simple Moving Average (SMA).
The New Zealand Dollar (NZD) continues to draw support from the upbeat domestic jobs data released on Wednesday, which backs the case for further interest rate hikes by the Reserve Bank of New Zealand (RBNZ). Adding to this, hawkish remarks by RBNZ Deputy Governor Christian Hawkesby, saying that the underlying economy has strength and New Zealand banks are well-positioned to support customers, act as a tailwind for the NZD/USD pair. That said, a goodish US Dollar (USD) recovery from over a one-week low touched earlier this Thursday keeps a lid on any further gains, at least for the time being.
Signs of stress at another US regional bank, PacWest Bancorp, sparks fears of a full-blown banking crisis in the US. Apart from this, looming recession risks temper investors' appetite for riskier assets. this is evident from a generally weaker tone around the equity markets, which helps revive demand for the safe-haven Greenback. That said, the Federal Reserve's (Fed) less hawkish outlook might hold back the USD bulls from placing aggressive bets and continue to lend some support to the NZD/USD pair. As was widely expected, the US central bank on Wednesday opened the door for a possible pause in June.
In fact, Fed Chair Jerome Powell, speaking at the post-meeting press conference, signalled that the US central bank was close to hitting the terminal rate of the current hiking cycle. Furthermore, data released this Thursday showed that the US Initial Weekly Jobless Claims rose more than expected, to 242K during the week ending April 29 from the previous week’s 229K (revised from 230K). This, in turn, suggests that the path of least resistance for the USD is to the downside and supports prospects for a further near-term appreciating move for the NZD/USD pair ahead of the US monthly jobs report (NFP) on Friday.
Technical levels to watch
Economists at Credit Suisse discuss S&P 500 outlook. They expect the index to move downward.
Move above 4195 to clear the way for a test of 4312/4325
“S&P 500 has retested and again rejected key resistance from the 4195 YTD high and with daily RSI and MACD momentum having turned lower, we think the broader risk is shifting towards a ‘risk off’ phase.”
“Below support from the recent low and 63-day average at 4054/49 is needed to confirm a near-term top for a fall to test the 200-day average, now at 3968. Indeed, a close below 4049 this Friday would also see a bearish “reversal week” established.”
“Above 4195 though would be seen to clear the way for a test of the summer 2022 high and 61.8% retracement of the entire 2022 fall at 4312/4325. We look for this to then prove a much tougher barrier and for a fresh top to be found here for a turn lower in the broader range later in Q2.”
Christine Lagarde, President of the European Central Bank (ECB), is delivering her remarks on the policy outlook and responding to questions from the press following the Governing Council's decision to hike key rates by 25 basis points in May.
Key takeaways
"Mood in the meeting was determined."
"We were attentive to Bank Lending Survey."
"There were a variety of views expressed, everybody agreed that raising rates was needed."
"Not pausing, we have more ground to cover."
About ECB's press conference
Following the ECB´s monetary policy decisions, the ECB President delivers a prepared statement and responds to questions from the press on the policy outlook. Her comments may influence the volatility of EUR and determine a short-term positive or negative trend. Her hawkish view is considered as positive, or bullish for the EUR, whereas her dovish view is considered as negative, or bearish.
Christine Lagarde, President of the European Central Bank (ECB), is delivering her remarks on the policy outlook and responding to questions from the press following the Governing Council's decision to hike key rates by 25 basis points in May.
Key takeaways
"Resilince of labour market could lead to higher growth."
"There are still significant upside risks to inflation."
"Recent wage deals added to upside risks."
"The Euro area banking sector has proved resilient."
"Higher pay growth or profit margins could increase inflation."
"According to a recent survey, bank lending may continue to decline."
About ECB's press conference
Following the ECB´s monetary policy decisions, the ECB President delivers a prepared statement and responds to questions from the press on the policy outlook. Her comments may influence the volatility of EUR and determine a short-term positive or negative trend. Her hawkish view is considered as positive, or bullish for the EUR, whereas her dovish view is considered as negative, or bearish.
- US Goods and Services Trade Balance came in at -$64.2 billion in March.
The goods and services deficit was $64.2 billion in March, down $6.4 billion from $70.6 billion in February, the US Bureau of Economic Analysis revealed on Thursday. This reading came in slightly above the market expectation for a deficit of $63.3 billion.
Key takeaways from the report:
March exports were $256.2 billion, $5.3 billion more than February exports. March imports were $320.4 billion, $1.1 billion less than February imports.
The March decrease in the goods and services deficit reflected a decrease in the goods deficit of $6.4 billion to $86.6 billion and a decrease in the services surplus of less than $0.1 billion to $22.4 billion.
Year-to-date, the goods and services deficit decreased $77.6 billion, or 27.6 percent, from the same period in 2022. Exports increased $61.4 billion or 8.7 percent. Imports decreased $16.2 billion or 1.6 percent.
Exports of goods increased $5.2 billion to $174.3 billion in March.
Imports of goods decreased $1.2 billion to $260.9 billion in March.
Exports of services increased $0.1 billion to $81.8 billion in March.
Imports of services increased $0.1 billion to $59.5 billion in March.
The deficit with China decreased $2.3 billion to $22.9 billion in March. Exports increased $1.3 billion to $14.4 billion and imports decreased $0.9 billion to $37.3 billion.
Christine Lagarde, President of the European Central Bank (ECB), is delivering her remarks on the policy outlook and responding to questions from the press following the Governing Council's decision to hike key rates by 25 basis points in May.
Key takeaways
"Domestic demand, consumption, remained weak."
"We see divergence among sectors of the economy."
"Manufacturing prospects are worsening."
Government should roll back energy support measures."
"Price pressure remain strong."
"Services prices pushed up also by pent up demand."
"Wage pressures have strengthened further."
"Some firms also increased profit margins."
"Longer term inflation expectations warrant monitoring."
About ECB's press conference
Following the ECB´s monetary policy decisions, the ECB President delivers a prepared statement and responds to questions from the press on the policy outlook. Her comments may influence the volatility of EUR and determine a short-term positive or negative trend. Her hawkish view is considered as positive, or bullish for the EUR, whereas her dovish view is considered as negative, or bearish.
- Unit Labor Costs in the US increased at a stronger pace than expected in Q1.
- US Dollar Index turns positive after the report rising above 101.50.
“Unit labor costs (ULC) in the nonfarm business sector increased 6.3% in the first quarter of 2023, reflecting a 3.4% increase in hourly compensation and a 2.7% decrease in productivity. Unit labor costs increased 5.8% over the last four quarters”, the US Bureau of Labor Statistics (BLS) reported on Thursday. The increase in ULC was higher than the 5.5% increase expected.
“Nonfarm business sector labor productivity decreased 2.7% in the first quarter of 2023, the US Bureau of Labor Statistics reported today, as output increased 0.2% and hours worked increased 3.0%. From the same quarter a year ago, nonfarm business sector labor productivity decreased 0.9%, reflecting a 1.3% increase in output and a 2.3% increase in hours worked.”
“The 0.9% productivity decline is the first time the four-quarter change series has remained negative for five consecutive quarters; this series begins in the first quarter of 1948.”
Market reaction
The US Dollar rose across the board after the report. The DXY climbed above 101.50 while EUR/USD tumbled toward 1.1020 as traders await European Central Bank President Lagarde press conference.
- Initial Jobless Claims in the US advanced by 13,000 in the week ending April 29.
- Continuing Jobless Claims declined by 38,000 in the week ending April 22.
- US Dollar Index rises after economic reports.
Initial Jobless claims totaled 242,000 in the week ending April 29, the weekly data published by the US Department of Labor (DOL) showed on Thursday. The print follows the previous week’s 229,000 (revised from 230,000) and came in above market expectations of 240,000.
“The 4-week moving average was 239,250, an increase of 3,500 from the previous week's revised average. The previous week's average was revised down by 250 from 236,000 to 235,750.”
Continuing Claims decreased by 38,000 in the week ended April 22 to 1.805 million, below the 1.863 million of market consensus. It is the lowest level in three weeks.
“The 4-week moving average was 1,828,250, a decrease of 4,500 from the previous week's revised average. The previous week's average was revised down by 3,750 from 1,836,500 to 1,832,750.”
On Friday, the US official employment report is due with market expectations pointing to an increase in payrolls of 179,000. ADP surprised on Wednesday with higher-than-expected figures.
Market reaction
The US Dollar rose following the release of Jobless Claims and Labor Cost figures. Market participants focus on the European Central Bank which has just announced a 25 basis points rate hike. The EUR/USD is falling, trading at daily lows near 1.1020.
- EUR/USD keeps the trade within the daily range near 1.1040.
- ECB matched consensus and raised rates by 25 bps.
- Investors now shift their attention to Lagarde’s press conference.
Some disappointment emerges after the ECB’s interest rate decision and relegates EUR/USD to trade around the 1.1050/40 band on Thursday.
EUR/USD shifts the focus to Lagarde
EUR/USD maintains the inconclusive bias after the well-anticipated rate hike by the ECB.
Indeed, the central bank raised the interest rate on the main refinancing operations, the interest rate on the marginal lending facility and the deposit facility to 3.75%, 4.00% and 3.25%, respectively.
The ECB stressed that underlying inflation remains strong despite the loss of momentum seen in past months. In addition, the lags and strength of transmission of past rate raises to the real economy remain uncertain.
The ECB also noted that future decisions will make rates sufficiently restrictive.
Moving forward, market participants will now closely follow the usual press conference by Chairwoman Lagarde and the subsequent Q&A session.
EUR/USD levels to watch
So far, the pair is down 0.17% at 1.1040 and faces the next support at 1.0941 (monthly low May 2) followed by 1.0909 (weekly low April 17) and finally 1.0831 (monthly low April 10). On the other hand, the surpass of 1.1095 (2023 high April 26) would target 1.1100 (round level) en route to 1.1184 (weekly high March 21 2022).
- EUR/GBP drifts lower for the second straight day and retreats further from the weekly top.
- The ECB’s 25 bps rate hike fails to impress the Euro bulls or lend any support to the cross.
- Investors now look to ECB President Lagarde's comments for some meaningful impetus.
The EUR/GBP cross extends the overnight retracement slide from the 0.8835 region, or the weekly low and remains under some selling pressure for the second successive day on Thursday. The cross remains on the defensive below the 0.8800 mark through the mid-European session and moves little after the European Central Bank (ECB) announced its policy decision.
As was widely expected, the ECB raises its benchmark interest rates by 25 bps at the end of the May monetary policy meeting and noted that the inflation outlook continues to be too high for too long. In the accompanying policy statement, the central bank reiterated that it stands ready to adjust all of its instruments within its mandate to ensure that inflation returns to its 2% target over the medium term. In the absence of any hawkish surprise, the outlook fails to impress the Euro bulls and exerts downward pressure on the EUR/GBP cross.
The British Pound, on the other hand, continues to draw support from rising bets for another 25 bps rate hike by the Bank of England (BoE). This is seen as another factor weighing on the EUR/GBP cross, though the downside remains cushioned. Traders seem reluctant to place aggressive bets and prefer to wait for ECB President Christine Lagarde's comments at the post-meeting press conference. Investors will look for fresh cues about the future rate-hike path, which will drive the shared currency and provide a fresh impetus to the cross.
Technical levels to watch
The European Central Bank (ECB) announced on Thursday that it raised its key rates by 25 basis points (bps) following the May policy meeting, as expected.
With this decision, the interest rate on the main refinancing operations and the interest rates on the marginal lending facility and the deposit facility will be increased to 3.75%, 4% and 3.25%, respectively.
Follow our live coverage of the market reaction to the ECB's policy announcements.
Key takeaways from policy statement
"Inflation outlook continues to be too high for too long."
"Overall, incoming information broadly supports assessment of medium-term inflation outlook that ECB formed at its previous meeting."
"ECB's future decisions will ensure that policy rates will be brought to levels sufficiently restrictive to achieve a timely return of inflation to 2% medium-term target and will be kept at those levels for as long as necessary."
"ECB's policy rate decisions will continue to be based on its assessment of inflation outlook in light of incoming economic and financial data, dynamics of underlying inflation, and strength of monetary policy transmission."
"Interest rates remain ECB’s primary tool for setting monetary policy stance."
"In line with these principles, ECB expects to discontinue reinvestments under APP as of July 2023."
"The APP portfolio is declining at a measured and predictable pace, as the Eurosystem does not reinvest all of the principal payments from maturing securities."
"The decline will amount to €15 billion per month on average until the end of June 2023."
Market reaction
EUR/USD came under modest bearish pressure and declined to the 1.1050 area with the initial reaction to the ECB's policy announcements.
EUR/USD’s rally is clearly slowing but economists at Credit Suisse still see scope for one final leg higher to the 1.1185/1.1275 zone.
Move below support at 1.0963 to mark a near-term top
“EUR/USD uptrend is clearly slowing with strength again essentially capped at the shallow uptrend channel from the beginning of January. We would still though not rule out one final leg higher to our 1.1185/1.1275 core target – the 61.8% retracement and March 2022 high. Our bias would then be to look for an important top here.”
“Below support at 1.0963 is now needed to mark a near-term top for a test of the April low and 55-DMA at 1.0806/1.0788, which ideally holds on a closing basis. Below though would warn of a potentially more important downturn and a test of support at 1.0540/1.0483.”
Gold is still stalling in a range from just ahead of pivotal resistance from its $2,070 and $2,075 record highs. But economists at Credit Suisse stay biased towards an eventual move to new record highs.
Initial support is seen at $1,969
“With short-term momentum decisively rolling over after previously showing a bearish divergence, we look for the $2,070/2,075 highs to remain a formidable barrier.”
“Support is seen at $1,969 initially, beneath which would confirm a deeper pullback to $1,950/34, which includes the 55-DMA, which we would look to hold if reached.”
“Post the current ranging phase, we believe the market will eventually move to new record highs, supported by lower US Real Yields. Above $2,075 on a weekly closing basis would be seen to mark a significant break higher, opening up a move to our first core upside objective at $2,330/2,360.”
- EUR/USD’s upside falters just ahead of 1.1100 once again.
- A sustainable advance seems likely once 1.1100 is cleared.
EUR/USD keeps the march north well in place and always with the immediate target at the 1.1100 barrier so far on Thursday.
Further recovery appears on the table for the time being. The surpass of with the 2023 high at 1.1095 (April 26) should encourage the pair to rapidly leave behind the round level at 1.1100 before embarking on a potential visit to the weekly high at 1.1184 (March 21 2022)
Looking at the longer run, the constructive view remains unchanged while above the 200-day SMA, today at 1.0429.
EUR/USD daily chart
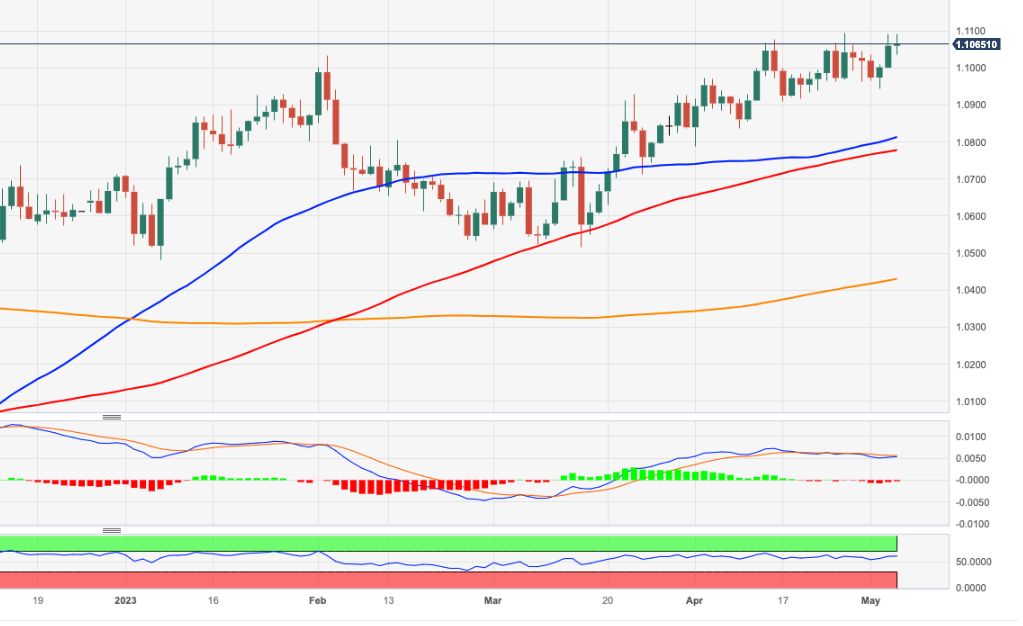
- DXY trades within a tight range in the low-101.00s.
- The loss of 101.00 could expose a move to the YTD low.
DXY exchanges ups and downs in the low-101.00s following the FOMC event on Thursday.
The continuation of the ongoing decline faces the next support of note at the weekly low at 101.01 (April 26). The loss of this region could pave the way for a deeper move to the 2023 low at 100.78 (April 14).
Looking at the broader picture, while below the 200-day SMA, today at 105.97, the outlook for the index is expected to remain negative.
DXY daily chart
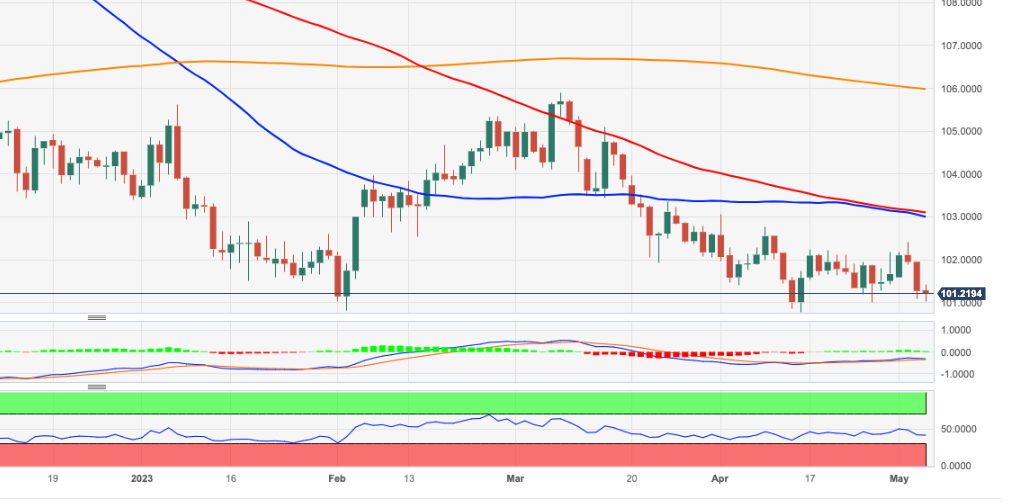
EUR/USD is capped near 1.11 again ahead of the ECB policy decision. Economists at Scotiabank explain what is needed to lift the pair through 1.11.
Support aligns at 1.1000/10
“A clear message from President Lagarde that more hikes are coming should underpin the EUR but a strongly hawkish message might be needed to push EUR/USD through 1.11 and on to the 1.12 area at the moment.”
“Support is 1.1000/10 ahead of 1.0940/50.”
See: There is a risk that the hawkish ECB sends EUR/USD through 1.1100 – ING
Kit Juckes, Chief Global FX Strategist at Société Générale, expects the EUR/USD pair to advance nicely.
EUR/USD will fall a bit on a knee-jerk reaction to 25 bps move
“EUR/USD will fall a bit on a knee-jerk reaction to 25 bps move today but it’s basically a coin-toss between a ’hawkish 25’ and a ‘dovish 50’.”
“It’s what the market thinks happens next that really matters. And that depends on the data. So far, we’ve seen some softness in recent European figures (PMI revisions and German trade, today) and that’s stalling Euro gains.”
“We don’t think the Eurozone has the same issues as the US and data should reflect that in the coming weeks, dragging EUR/USD slowly higher.”
- EUR/JPY extends losses for the third session in a row.
- The continuation of the leg lower could revisit the 146.30 region.
EUR/JPY’s selling pressure gathers further pace and forces the cross to break below the 149.00 support.
The underlying bullish outlook appears somewhat dented for the time being. Against that backdrop, the ongoing correction carries the potential to extend to the weekly low at 146.30 (April 25), where bears could struggle to push harder.
So far, further upside looks favoured while the cross trades above the 200-day SMA, today at 142.66.
EUR/JPY daily chart
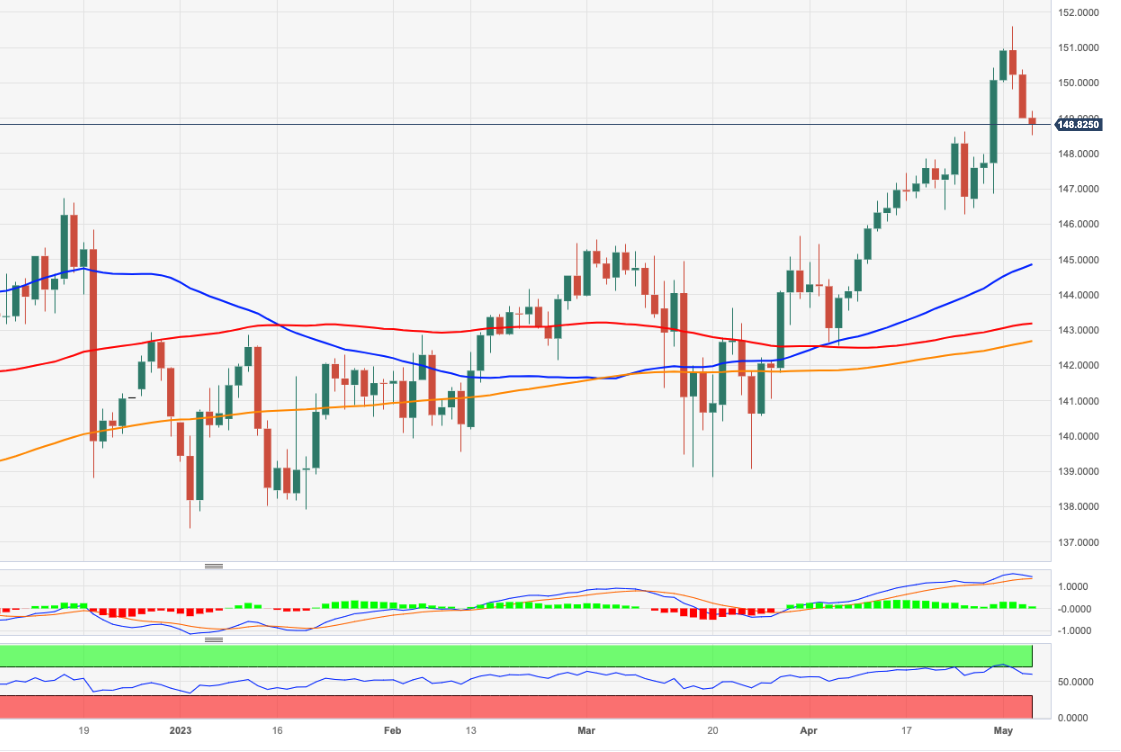
ECB monetary policy decision – Overview
The European Central Bank (ECB) is scheduled to announce its monetary policy decision this Thursday, May 5, at 12:15 GMT, which will be followed by the post-meeting press conference at 12:45 GMT. The ECB is widely expected to raise its borrowing rates for a seventh meeting in a row, though market participants are divided over the size of the increase. Nevertheless, a majority of the market participants anticipate that the ECB will slow the hiking pace and announce a smaller 25-bps move as compared to the 50-bps lift-off in March. This is likely to create more ambiguity for the July meeting. Hence, investors will scrutinize the accompanying monetary policy statement and ECB President Christine Lagarde's comments for fresh cues about the future rate-hike path.
How could it affect EUR/USD?
Heading into the key central bank event risk, the EUR/USD pair retreats from the vicinity of the 1.1100 round figure amid a modest US Dollar (USD) bounce from over a one-week low. A 25 bps rate hike by the ECB, with no forward guidance or a dovish shift, could weigh on the Euro and pave the way for some meaningful downside for the major.
Conversely, a hawkish 50 bps lift-off, though seems unlikely, could raise contagion fears stemming from the US banking crisis. This, in turn, will fuel speculations for an earlier ECB rate cut, which, in turn, should attract fresh sellers around the shared currency, warranting some caution for bullish traders and before positioning for any further gains.
Eren Sengezer, European Session Lead Analyst at FXStreet, outlines important technical levels to trade the major and writes: “EUR/USD faces initial resistance at 1.1100 (psychological level, static level, mid-point of the ascending regression channel). Once the pair rises above that level and confirms it as support, it could target 1.1160 (static level from March 2022) and 1.1200 (psychological level, static level).”
“On the downside, 1.1050 (former resistance, static level) aligns as interim support before 1.1025 (lower-limit of the ascending regression channel, 50-period Simple Moving Average (SMA)) and 1.1000 (100-period SMA; psychological level),” Eren adds further.
Key Notes
• European Central Bank Preview: Lagarde set to lift the Euro in two out of three scenarios
• ECB Preview: 25bps is not the same as 50bps
• EUR/USD Forecast: ECB-Fed policy divergence could lift Euro
About the ECB interest rate decision
ECB Interest Rate Decision is announced by the European Central Bank. Usually, if the ECB is hawkish about the inflationary outlook of the economy and rises the interest rates it is positive, or bullish, for the EUR. Likewise, if the ECB has a dovish view on the European economy and keeps the ongoing interest rate, or cuts the interest rate it is seen as negative, or bearish.
Economists at TD Securities are biased to further EUR/USD upside.
Lurch higher may be dependent on the interplay between the ECB and NFP
“A lurch higher in the EUR/USD pair may be dependent on the interplay between the ECB and US NFP. All told, we think the ECB has some leeway to credibly sound more hawkish, which means there may be more fluidity around the terminal rate.”
“1.1120/1.1200 is the key resistance area, and we think it is likely we test this near-term.”
- USD/CAD attracts some dip-buying on Thursday, albeit struggles to capitalize on the move.
- A modest USD bounce from over a one-week low is seen lending some support to the major.
- A solid intraday recovery in Oil prices underpins the Loonie and caps the upside for the pair.
The USD/CAD pair bounces off the 1.3580 area for the second successive day on Thursday, albeit struggles to capitalize on the move and remains depressed through the first half of the European session. The pair is currently placed around the 1.3600 mark and is influenced by a combination of diverging forces.
The US Dollar (USD) stages a modest recovery from over a one-week low and turns out to be a key factor lending some support to the USD/CAD pair. The prevalent cautious mood around the equity markets - amid looming recession risks - helps revive demand for the safe-haven Greenback. That said, an intraday turnaround in Crude Oil prices, following the early slump to the lowest level since December 2021, underpins the commodity-linked Loonie and acts as a headwind for the major.
Apart from this, the Federal Reserve's (Fed) less hawkish outlook is holding back the USD bulls from placing aggressive bets and keeping a lid on the USD/CAD pair. It is worth recalling that the US central bank, as was widely expected, raised interest rates by 25 bps and opened the door for a possible pause in June at the end of a two-day monetary policy meeting on Wednesday. In the post-meeting presser, Powell signalled that the Fed was close to hitting the terminal rate of the current hiking cycle.
This, along with concerns over the US debt ceiling and renewed fears of a full-blown banking crisis, keeps the US Treasury bond yields depressed and should cap any meaningful upside for the Greenback, at least for the time being. Hence, it will be prudent to wait for strong follow-through buying before placing fresh bullish bets and positioning for an extension of this week's goodish rebound from the 100-day Simple Moving Average (SMA) support near the 1.3530-1.3525 region.
Market participants now look to the release of the usual Weekly Initial Jobless Claims data from the US, due later during the early North American session. This, along with the US bond yields and the broader risk sentiment, will drive the USD demand and provide some impetus to the USD/CAD pair. Traders will further take cues from Oil price dynamics to grab short-term opportunities ahead of the Bank of Canada (BoC) Governor Tiff Macklem's scheduled speech later this Thursday.
The focus, however, will remain glued to the closely-watched US monthly jobs data, popularly known as the NFP report on Friday. The data will influence the USD, which, along with the simultaneous release of Canadian monthly employment details, will help investors to determine the next leg of a directional move for the USD/CAD pair.
Technical levels to watch
EUR/USD remains close to the highs of the year. Economists at ING analyze the pair’s outlook ahead of the European Central Bank (ECB) meeting.
Positioning is probably the biggest headwind to EUR/USD
“Today should see a 25 bps ECB hike and it is now probably stretched positioning which is the biggest headwind to further EUR/USD gains.”
“There is a risk that the hawkish ECB sends EUR/USD through 1.1100 today, but a) long positioning is quite stretched and b) a hawkish ECB is priced. This warns that EUR/USD could hang around this 1.10 area a little longer – particularly were the US equity sell-off to gain momentum.”
Economists at Société Générale discuss the European Central Bbank (ECB) interest rate decision and its implications for the EUR/USD pair.
Hawkish 25 bps or dovish 50 bps?
“Our house call was for the ECB to hike by 50 bps, but the combo of below-forecast 1Q GDP growth (0.1% QoQ), a decline in core inflation to 5.6% in April (services up 0.1pp), tightening in ECB bank lending conditions and lower demand for loans tilted the scales in favour of a (hawkish) 25 bps.”
“Guidance in the statement and by President Lagarde that the tightening cycle is not over in theory should be conducive to the EUR/USD overcoming the April high of 1.1095 and having a go at 1.11 when the large option expiry rolls off and delta hedging flows subside.”
“Upside for rates could be limited if investors opt for the safety of govies and receiving in swaps in the face of banking and debt ceiling jitters in the US.”
- AUD/USD attracts some intraday selling near the 0.6700 mark, though lacks follow-through.
- A modest USD bounce from over a one-week low is seen acting as a headwind for the major.
- The Fed’s less hawkish outlook keeps the US bond yields depressed and might cap the USD.
The AUD/USD pair struggles to capitalize on its modest intraday uptick and attracts some selling near the 0.6700 round-figure mark on Thursday. Spot prices, however, manage to hold above the daily low through the first half of the European session and currently trade with a mild negative bias, just above mid-0.6600s.
As investors look past the better-than-expected release of the Australian trade balance data, a modest US Dollar (USD) bounces from over a one-week low turns out to be a key factor exerting some downward pressure on the AUD/USD pair. Looming recession risks continue to weigh on investors' sentiment, which is evident from the prevalent cautious mood around the equity markets and lends some support to the safe-haven buck. That said, any meaningful USD recovery seems elusive in the wake of the Federal Reserve's (Fed) less hawkish outlook.
It is worth recalling that the US central bank, as was widely expected, raised interest rates by 25 bps and opened the door for a possible pause in June at the end of a two-day monetary policy meeting on Wednesday. In the post-meeting presser, Powell signalled that the Fed was close to hitting the terminal rate of the current hiking cycle. This, along with concerns over the US debt ceiling and renewed fears of a full-blown banking crisis, keeps the US Treasury bond yields depressed and might hold back the USD bulls from placing aggressive bets.
The Australian Dollar (AUD), on the other hand, might continue to draw support from the Reserve Bank of Australia's (RBA) surprise 25 rate hike earlier this week. Moreover, the Australian central bank indicated that some further tightening of monetary policy may be required to ensure that inflation returns to target in a reasonable timeframe. This, in turn, should act as a tailwind for the AUD/USD pair and limit the downside, making it prudent to wait for strong follow-through selling before positioning for any further depreciating move.
Market participants now look to the release of the usual Weekly Initial Jobless Claims data from the US, due later during the early North American session. This, along with the US bond yields and the broader risk sentiment, will influence the USD price dynamics and provide some impetus to the AUD/USD pair. The focus, however, will remain glued to the closely-watched US monthly employment details, popularly known as the NFP report on Friday. This will drive the USD demand and determine the near-term trajectory for the major.
Technical levels to watch
The US Dollar Index (DXY) has seen some modest weakness – now down around 0.5% on the week. Economists at ING expect the greenback to stay on the back foot.
DXY year low is around 100.75/80
“In the US, there will again be focus on the initial jobless claims numbers and whether any substantial rise (Dollar bearish) signals some easing in US labour supply.”
“Overall expect DXY to stay soft – unless we start to see any dislocation in US money markets again such as a sharp widening in the Euro cross-currency basis swap or a much higher FRA-OIS money market spread.”
“The DXY year low is around 100.75/80, below which 100 beckons.”
Economists at Danske Bank make no changes to their Fed call, see no rate cuts this year and expect EUR/USD to fall to 1.06 in six months.
A hawkish 50 bps hike from the ECB could still drive EUR/USD higher in the near-term
“For now, we stick to our view that the Fed will maintain rates unchanged for the remainder of the year.”
“With markets pricing around 72 bps worth of cuts for the rest of the year, if we are right in our call, relative rates should add broad support to the USD in H2. Combined with relative terms of trade, growth differentials and relative unit labour cost, we expect EUR/USD to head lower towards 1.06 in 6M. That said, a hawkish 50 bps hike from the ECB today could still drive the cross higher in the near-term.”
- Christine Lagarde to hold key press conference on Thursday.
- European Central Bank expected to raise interest rates by 25 basis points, but 50 bps not out of question.
- Q&A section of speech will be important to determine ECB hawkish or dovish tone.
Christine Lagarde, President of the European Central Bank (ECB), will hold a press conference on Thursday, May 4 at 12:45 GMT, 30 minutes after the publication of the ECB monetary policy decision statement. The ECB is expected to raise interest rates by 25 basis points, but the possibility of a 50-bps rate hike is not out of the table.
You can follow the ECB press conference, with Christine Lagarde’s speech, in the following video:
The Q&A session by Christine Lagarde will be key to shaping the market reaction. The expected 25 basis point rate hike could be accompanied by hawkish remarks from the ECB president, while a surprising 50-bps raise might come with some dovish comments by Lagarde. Matías Salord, Senior Analyst at FXStreet, details both scenarios:
There could be a hawkish 25 bps hike or a dovish 50 bps hike. A new rate hike decision will likely be unanimous, but policymakers will probably differ on the magnitude. (...) A 50 bps hike should boost the Euro sharply across the board, while a 25 bps hike could have a mixed impact, depending on what the statement says. The net outcome will depend on the size of the hike and also on what the ECB sees going forward. A cautious hawkish explicit forward guidance seems a likely scenario, which should keep the Euro supported in the short term. A more cautious approach, on the contrary, could weaken the common currency.
The ECB has been raising interest rates in the past months, since the summer of 2022, lifting the main operations rate from 0% to the current 3.5%. In the previous press conference in March, Lagarde notoriously wore an owl pin on her jacket, a metaphor as a way to distance herself from both the hawkish or dovish camps.
How Lagarde and her colleagues on the policy board operate this time around will be crucial to the market reaction, particularly for the Euro.
About Christine Lagarde
Christine Lagarde was born in 1956 in Paris, France. Graduated from Paris West University Nanterre La Défense and became President of the European Central Bank in November 1st 2019. Prior to that, she served as Chairman and Managing Director of the International Monetary Fund between 2011 and 2019. Lagarde previously held various senior ministerial posts in the Government of France: she was Minister of the Economy, Finance and Industry (2007–2011), Minister of Agriculture and Fishing (2007) and Minister of Commerce (2005–2007).
- USD/JPY reverses an intraday dip to the weekly low amid a modest USD recovery.
- The Fed’s less hawkish outlook to cap the buck and act as a headwind for the pair.
- US banking jitters could benefit the safe-haven JPY and warrant caution for bulls.
The USD/JPY pair attracts some buying near the 134.15 area, or the weekly low touched this Thursday and climbs to the top end of its daily range during the early European session. The pair is currently placed around the 134.65-134.70 region and for now, seems to have stalled its retracement slide from a nearly two-month high touched on Tuesday.
The US Dollar (USD) stages a modest recovery from over a one-week low and turns out to be a key factor lending some support to the USD/JPY pair. The modest USD bounce, meanwhile, lacks any obvious fundamental catalyst and is more likely to remain capped amid the Federal Reserve's (Fed) less hawkish outlook. In fact, the US central bank, as was widely anticipated, raised interest rates by 25 bps and opened the door for a possible pause in June.
In the post-meeting presser, Powell signalled that the Fed was close to hitting the terminal rate of the current hiking cycle, though did not explicitly confirm a pause. Powell also warned that US economic growth was cooling and noted that credit conditions were likely to tighten further in the wake of growing pressure on banks. This, along with concerns over the US debt ceiling, drags the US Treasury bond yields lower and acts as a headwind for the USD.
Apart from this, looming recession risks continue to weigh on investors' sentiment, which could benefit the JPY's relative safe-haven status and contribute to capping the USD/JPY pair, at least for the time being. The downside, meanwhile, remains cushioned amid a more dovish stance adopted by the BoJ, leaving its ultra-loose monetary policy settings unchanged and making no tweaks to its yield curve control (YCC) by a unanimous vote last week.
The aforementioned mixed fundamental backdrop makes it prudent to wait for strong follow-through buying before confirming that the USD/JPY pair has formed a near-term bottom and positioning for any meaningful appreciating move. Traders might also refrain from placing aggressive directional bets and prefer to wait on the sidelines ahead of the release of the closely-watched US monthly jobs data, popularly known as the NFP report on Friday.
In the meantime, the US Weekly Initial Jobless Claims data might provide some impetus later during the early North North American session on Thursday. This, along with the US bond yields, could influence the USD price dynamics. Apart from this, the post-European Central Bank (ECB) volatility in the markets will drive demand for the safe-haven JPY and contribute to producing short-term trading opportunities around the USD/JPY pair.
Technical levels to watch
GBP/USD is trading closer to 1.26. Economists at ING believe that the pair could inch higher to 1.2650/2750.
EUR/GBP to remain steady near 0.800
“It seems that the view that European banks, including the UK, are better regulated than those in the US is providing some insulation to European currencies. This is also helping to keep expectations alive (expectations with which we disagree) that the Bank of England can hike rates two to three more times this year. Our latest views are that the BoE may not push back against these expectations next week – which would see Sterling hang onto recent gains.”
“Expect EUR/GBP to remain steady (slight upside bias) near 0.8800, while GBP/USD could trade up to 1.2650/2750 – should EUR/USD manage to break through 1.1100 with momentum.”
- Silver once again fails ahead of the $26.00 mark and turns lower on Thursday.
- Positive oscillators support prospects for the emergence of some dip-buying.
- A break below the $25.50-40 area is needed to negate the positive outlook.
Silver attracts some sellers following an early uptick to the $26.00 neighbourhood and extends its intraday descent through the early European session on Thursday. The white metal drops to a fresh daily low, around the $25.45 region in the last hour and for now, seems to have snapped a two-day winning streak back closer to over a two-week high touched on Monday.
From a technical perspective, the recent repeated failures near the $26.00 round figure could be seen as the first sign of possible bullish exhaustion. The XAG/USD, however, has been showing resilience near the $25.50-$25.40 strong horizontal resistance breakpoint, now turned support. The said area coincides with the 23.6% Fibonacci retracement level of the March-April rally and should act as a key pivotal point.
Meanwhile, oscillators on the daily chart are holding comfortably in the positive territory. This further makes it prudent to wait for strong follow-through selling below the aforementioned support before confirming that the XAG/USD has formed a near-term top and positioning for any meaningful corrective decline. The white metal might then weaken below the $24.00 mark and test 38.2% Fibo. level, around the $23.70 area.
The downward trajectory could get extended further towards the $23.35-$23.30 confluence, comprising the 50-day and the 100-day Simple Moving Averages (SMAs), en route to the $23.00 mark, or the 50% Fibo. level.
On the flip side, bulls might now wait for a move beyond the $26.00 round figure and a one-year high touched in April before placing fresh bets. The subsequent move up has the potential to lift the XAG/USD towards the $26.25-$26.30 region en route to the March 2022 swing high, just ahead of the $27.00 round-figure mark.
Silver daily chart
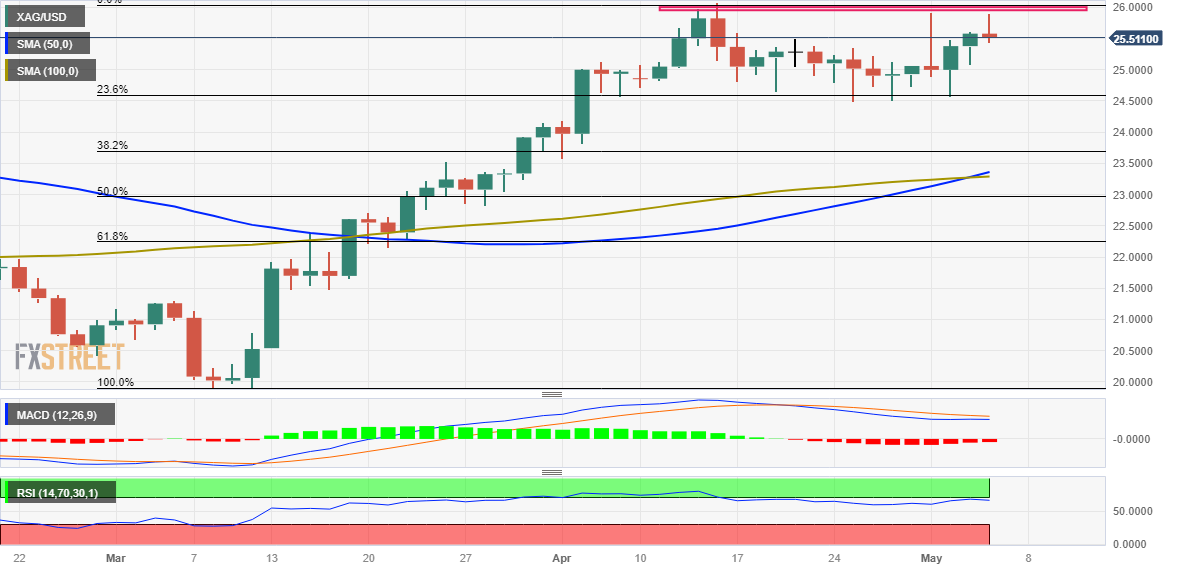
Key levels to watch
- EUR/USD gives away initial gains to the vicinity of 1.1100.
- The ECB is expected to hike rates by 25 bps later on Thursday.
- Germany, EMU final Services PMI remain firm in April.
EUR/USD now erodes part of the recent upbeat tone and retreats to the mid-1.1000s following an earlier fruitless attempt to test 1.1100 the figure in the wake of the opening bell in Euroland on Thursday.
EUR/USD now looks at ECB, Lagarde
EUR/USD so far fails to advance for the third consecutive session on Thursday and comes under pressure near 1.1050 prior to the key ECB event due later in the session.
On this, the central bank is seen hiking the policy rate by 25 bps, although a larger rate raise (50 bps?) is not completely off the table, as per hawkish messages from rate setters and the persistently elevated inflation.
In the meantime, the German 10-year Bund yields set aside two sessions in a row with losses and attempt a mild rebound to the proximity of the 2.30% area.
In the euro calendar, final Services PMIs in Germany and the euro area came at 56.0 and 56.2, respectively, for the month of April. In the US, Balance of Trade results are due seconded by usual weekly Jobless Claims.
What to look for around EUR
EUR/USD’s upside momentum keeps gathering pace and now shifts the attention to the 2023 high near 1.1100 the figure amidst persistent dollar weakness and prudence ahead of the ECB meeting.
Meanwhile, price action around the single currency should continue to closely follow dollar dynamics, as well as the Fed-ECB divergence when it comes to the banks’ intentions regarding the potential next moves in interest rates.
Moving forward, hawkish ECB-speak continue to favour further rate hikes, although this view appears in contrast to some loss of momentum in economic fundamentals in the region.
Key events in the euro area this week: Germany Final Services PMI, EMU Final Services PMI, ECB Meeting, ECB Lagarde press conference (Thursday) – Germany Construction PMI, EMU Retail Sales.
Eminent issues on the back boiler: Continuation (or not) of the ECB hiking cycle. Impact of the Russia-Ukraine war on the growth prospects and inflation outlook in the region. Risks of inflation becoming entrenched.
EUR/USD levels to watch
So far, the pair is down 0.05% at 1.1054 and faces the next support at 1.0941 (monthly low May 2) followed by 1.0909 (weekly low April 17) and finally 1.0831 (monthly low April 10). On the other hand, the surpass of 1.1095 (2023 high April 26) would target 1.1100 (round level) en route to 1.1184 (weekly high March 21 2022).
FX option expiries for May 4 NY cut at 10:00 Eastern Time, via DTCC, can be found below.
- EUR/USD: EUR amounts
- 1.0920-25 851m
- 1.0940-50 3.58b
- 1.0965-85 1.57b
- 1.1000 1.34b
- 1.1015 301m
- 1.1050-55 757m
- 1.1075 1.32b
- 1.1100 1.19b
- GBP/USD: GBP amounts
- 1.2480-1.2500 459m
- USD/JPY: USD amounts
- 133.00 263m
- 133.77-80 418m
- 135.00-05 400m
- 135.50 276m
- USD/CHF: USD amounts
- 0.8940 251m
- AUD/USD: AUD amounts
- 0.6515-20 355m
- 0.6680 257m
- 0.6725-35 535m
- 0.6740-50 438m
- NZD/USD: NZD amounts
- 0.6250 230m
- USD/CAD: USD amounts
- 1.3590 560m
- 1.3625-35 1.39b
- 1.3665 284m
Economists at Commerzbank discuss the European Central Bank (ECB) interest rate decision and its implications for the EUR/USD pair.
Current EUR/USD levels are fundamentally justified
“We believe that the market's expectations of a rate hike of almost 75 bps are too optimistic. As a result, sooner or later a correction will be necessary and the Euro is unlikely to escape unscathed. Nevertheless, we believe that the current EUR/USD levels are fundamentally justified.”
“For the Euro, it does not matter whether the interest rate peak is 25 bps higher or lower. The key point is that the ECB is likely to maintain this level of interest rates on the back of higher inflation. Today's ECB meeting is unlikely to change this view, even if the ECB cannot avoid the start of discussions about an end to the rate hike cycle. And especially as long as the immediate factors of uncertainty are primarily of a US nature (debt ceiling, stress in the financial sector), any setback in EUR/USD should remain limited.”
- Gold price eases from record top, mildly offered of late, but stays beyond $2,025 key level.
- Fed signals for policy pivot propel XAU/USD price while banking woes trim bullish momentum strength.
- Gold buyers need further acceptance from US NFP to keep the reins.
Gold price (XAU/USD) eases after refreshing the highest level on record as bulls take a breather ahead of the key European Central Bank (ECB) monetary policy meeting on early Thursday, as well as await Friday’s US Nonfarm Payrolls (NFP).
That said, the Federal Reserve’s (Fed) indirect efforts of turning down the hawks, despite announcing a 0.25% rate hike, appear the major force behind the Gold Price upside. On the same line could be the US Dollar’s downtrend amid fears that banking woes and debt ceiling expiration may push back the rate hike concerns, especially when the policymakers omitted to mention of the need for further rate increases. Furthermore, the International Monetary Fund’s (IMF) optimism for Asia, the leading XAU/USD consumer, adds strength to the Gold price upside.
On the other hand, China’s softer PMIs and likely challenges for the ECB’s rate hike, which in turn can help the US Dollar, seemed to have prodded the XAU/USD buyers after it refreshed the all-time high with the $2,080 figure.
Moving on, ECB’s action will be the key recent statistics from the bloc and Bank Lending Survey (BLS) challenge the heavy rate lifts. Following that, the monthly prints of the US jobs report for April will be important to watch for clear directions.
Also read: Gold Price Forecast: XAU/USD hit record high on US banking jitters and potential Fed pause
Gold Price: Key levels to watch
As per our Technical Confluence Indicator, Gold price stays well above the $2,025 resistance-turned-support comprising Pivot Point one-week R2 and Fibonacci 23.6% on one month. The same joins the softer US Dollar to keep the XAU/USD bulls hopeful.
Even if the Gold price breaks the $2,025 support, the $2,011 confluence level could act as the last defense of the XAU/USD buyers. The mentioned level encompasses Fibonacci 38.2% on one month.
Following that, the $2,000 may act as an additional check for the Gold sellers before giving them control.
On the flip side, a convergence of Pivot Point one month R1 and one week R3 highlights $2,043 as a short-term key upside hurdle.
Should the Gold price remains firmer past $2,043, the previous monthly high and upper band of the Bollinger on four-hour play can challenge the Gold buyers.
It’s worth noting that the XAU/USD run-up beyond $2,043 may pause at the $2,063 level including Pivot Point one-day R2 and upper band of the Bollinger on hourly play, a break of which could challenge the all-time high surrounding $2,080.
Here is how it looks on the tool

About Technical Confluences Detector
The TCD (Technical Confluences Detector) is a tool to locate and point out those price levels where there is a congestion of indicators, moving averages, Fibonacci levels, Pivot Points, etc. If you are a short-term trader, you will find entry points for counter-trend strategies and hunt a few points at a time. If you are a medium-to-long-term trader, this tool will allow you to know in advance the price levels where a medium-to-long-term trend may stop and rest, where to unwind positions, or where to increase your position size.
Economist Lee Sue Ann at UOB Group reviews the last RBA gathering, where the central bank lifted the OCR to 3.85% (from 3.60%).
Key Takeaways
“The Reserve Bank of Australia (RBA) decided to increase the cash rate target by 25bps to 3.85%. Today’s decision, which follows the RBA’s decision to hold its benchmark policy rate steady at 3.60% in the Apr meeting; came as a surprise, and against consensus as well as our forecast for policy to remain unchanged.”
“The RBA said that some further tightening of monetary policy may be required to ensure that inflation returns to target in a reasonable timeframe. In justifying today’s increase, the RBA added that although inflation in Australia has passed its peak, at 7 per cent, it is still too high and will be some time yet before it is back in the target range.”
“Nonetheless, we think this is the last hike of this cycle... The RBA will also be releasing its quarterly Statement on Monetary Policy Statement (SoMP), due for release this Fri (5 May).”
- The index trades close to the 101.00 region on Thursday.
- Investors shift their attention to the ECB meeting.
- Weekly Claims, Balance of Trade next of note in the docket.
The USD Index (DXY), which gauges the greenback vs. a basket of its main competitors, alternates gains with losses near the 101.00 neighbourhood on Thursday.
USD Index now looks to data
The index trades without a clear direction in the lower end of the weekly range near the 101.00 mark, as investors continue to adjust to the Fed’s dovish hike on Wednesday.
On the latter, the Federal Reserve matched previous estimates and raised interest rates by 25 bps to 5.00%-5.25% at its meeting on Wednesday and also suggested that the end of its hiking cycle could be near. In addition, the Committee stressed that future decisions on interest rates will depend on data and the assessment of monetary policy will be on the meeting-by-meeting approach.
Speaking about central banks, the ECB meets later in the European afternoon and is also expected to tighten its policy stance by 25 bps, although the main divergence with the Fed resides in the ECB’s intentions to extend the hiking cycle to the June and July gatherings.
The irresolute price action in the dollar, in the meantime, comes amidst a so far tepid bounce in US yields across the curve following a couple of sessions with marked losses.
In the data space, usual Initial Jobless Claims are due along with Balance of Trade figures.
What to look for around USD
The index puts the 101.00 zone to the test pari passu with investors’ assessment of the last FOMC event.
Looking at the broader picture, the index now appears under pressure after the Federal Reserve signaled a most likely pause in its normalization process, while economic fundamentals will now rule the direction of the future moves of the monetary policy.
In favour of a Fed’s pause appears the persevering disinflation – despite consumer prices remain well above the target - and nascent easing in the labour market, all amidst steady speculation of a a probable recession.
Key events in the US this week: Balance of Trade, Initial Jobless Claims (Thursday) – Nonfarm Payrolls, Unemployment Rate, Consumer Credit Change.
Eminent issues on the back boiler: Persistent debate over a soft/hard landing of the US economy. Terminal Interest rate near the peak vs. speculation of rate cuts in 2024. Fed’s pivot. Geopolitical effervescence vs. Russia and China. US-China trade conflict.
USD Index relevant levels
Now, the index is gaining 0.02% at 101.24 and a break above 102.80 (weekly high April 10) would open the door to 103.05 (monthly high April 3) and then 103.09 (100-day SMA). On the other hand, immediate support aligns at 101.01 (weekly low April 26) prior to 100.78 (2023 low April 14) and finally 100.00 (psychological level).
Economists at TD Securities are biased to further USD/JPY downside.
Upcoming NFP report to sort of seal the deal for USD/JPY
“Note that USD/JPY's variability has become more closely synced with 10y rate spreads and in particular USTs. And like the receiving bias in the market, we expect that positioning for duration is asymmetric at this point in the cycle.”
“We place a lot of emphasis on the upcoming NFP report to sort of seal the deal for USD/JPY. There, we look for a slowing in job creation to 150K with an edge higher in the unemployment rate to 3.6%. We think a realization of our forecast on payrolls could help to deepen the stake that the market has on USD shorts. That likely means that USD/JPY may have more room to run to the downside.”
- GBP/USD touches its highest level since June 2022, albeit lacks any follow-through.
- Looming recession risks lend some support to the Greenback and act as a headwind.
- Declining US bond yields and the Fed’s less hawkish outlook to cap gains for the USD.
The GBP/USD pair struggles to capitalize on its modest intraday uptick and retreats from the vicinity of the 1.2600 mark, or its highest level since June 2022 touched this Thursday. Spot prices drop back closer to the daily low during the early European session and currently trade just above mid-1.2500s, nearly unchanged for the day.
The US Dollar (USD) recovers a part of its intraday losses to over a one-week low and turns out to be a key factor that acts as a headwind for the GBP/USD pair. Looming recession risks continue to weigh on investors' sentiment, which is evident from the prevalent cautious mood around the equity markets and lends some support to the safe-haven buck. That said, any meaningful USD recovery seems elusive amid a further decline in the US Treasury bond yields and the Federal Reserve's (Fed) less hawkish outlook.
It is worth recalling that the US central bank, as was widely anticipated, raised interest rates by 25 bps and opened the door for a possible pause in June at the end of a two-day policy meeting on Wednesday. In the post-meeting presser, Powell signalled that the Fed was close to hitting the terminal rate of the current hiking cycle. This, along with concerns over the US debt ceiling and renewed fears of a full-blown banking crisis, continues to drag the US bond yields lower and should keep a lid on the attempted USD bounce.
Apart from this, rising bets for another 25 bps rate hike by the Bank of England (BoE) might continue to underpin the British Pound and contribute to limiting the downside for the GBP/USD pair. Traders, however, might refrain from placing aggressive directional bets and prefer to move to the sidelines ahead of the closely-watched US monthly employment details, popularly known as the NFP report on Friday. This will influence the near-term USD price dynamics and provide a fresh directional impetus to the pair.
In the meantime, traders on Thursday will take cues from the Weekly Initial Jobless Claims data from the US, due later during the early North American session. Apart from this, the broader risk sentiment and the US bond yields will drive the USD demand. This, along with the post-European Central Bank (ECB) decision volatility in the markets, should allow traders to grab short-term opportunities around the GBP/USD pair.
Open interest in natural gas futures markets extended the uptrend for yet another session on Wednesday, this time increasing by around 10.7K contracts according to preliminary readings from CME Group. On the other hand, volume kept the choppiness in place and went down by nearly 16K contracts.
Natural Gas moves closer to $2.00
Prices of the natural gas extended the weekly leg lower on Wednesday amidst rising open interest. Against that, the likelihood of further decline remains on the cards and always with the immediate target at the $2.00 mark per MMBtu.
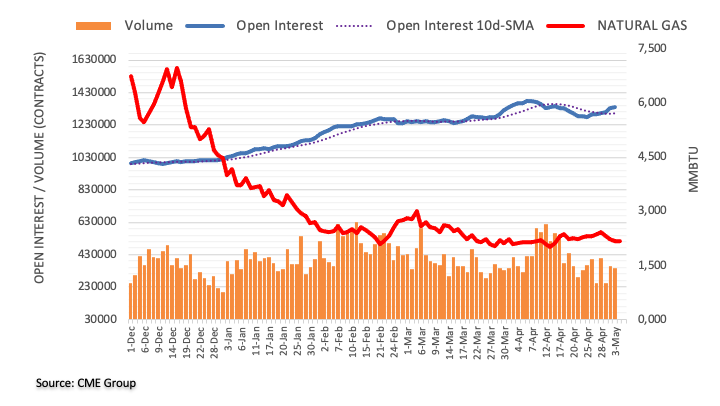
CME Group’s flash data for crude oil futures markets noted traders reduced their open interest positions by around 26.5K contracts after five consecutive daily builds on Wednesday. On the flip side, volume rose for the second session in a row, this time by around 238.3K contracts.
WTI: A temporary bounce in the offing?
Wednesday’s marked retracement in prices of the barrel of the WTI was on the back of shrinking open interest, suggesting that a sustained move lower appears not favoured in the very near term. That said, the commodity could attempt a “technical” bounce in light of the current oversold condition. Immediate resistance levels appear at $70.00 ahead of the 55- and 100-day SMAs at $75.72 and $76.68, respectively.
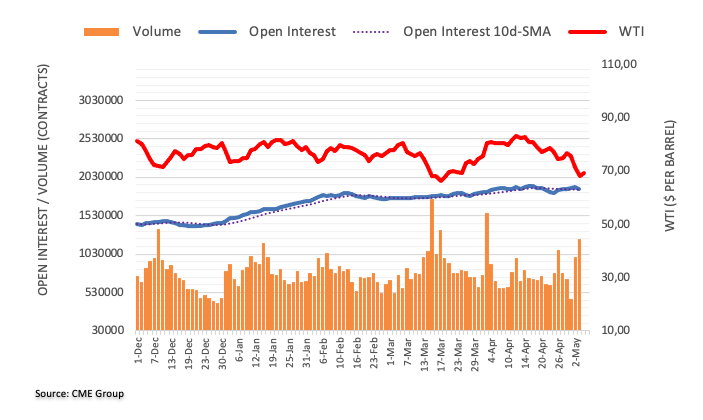
Economists at Commerzbank discuss the Reserve Bank of India (RBI) policy and USD/INR outlook.
RBI is in a wait-and-see mode
“RBI is in a wait-and-see mode. They left rates unchanged at 6.50% in April. They are likely to stay neutral-to-hawkish near term and rule out a rate cut anytime soon. They would need to be convinced of a notable moderation in core inflation in order to consider rate cuts.”
“For USD/INR, it has held within the 81-83 range so far this year and holding just below the 82 level. It appears RBI is content to see a relatively stable INR for now.”
Economists at TD Securities discuss the European Central Bank (ECB) interest rate decision and their implications for the EUR/USD pair.
Hawkish (35%)
“The GC decides to get one last 50 bps hike in. While data is generally moving in the right direction, strong services inflation and general concern about sustained labour market pressure on prices remain top of mind. Guidance remains largely as in March, with the ECB not committing to further hikes, and remaining fully data dependent. There is no update on H2 APP reduction. EUR/USD +1.0%.”
Base Case (45%)
“The ECB hikes 25 bps because inflation is still too high, labour markets strong, and the region avoided a severe recession this past winter. The passing of peak banking system stress allows the GC to re-introduce forward guidance, with an intention to hike again in June. The pace of the H2 reduction in the APP is deferred until June (though there are risks the ECB foreshadows an acceleration). EUR/USD +0.15%.”
Dovish (20%)
“The GC decides to hike 25 bps, but due to the ongoing risk backdrop, refrains from any material changes to forward guidance, leaving data in the driving seat going forward. This means that more hikes are entirely possible, but that the GC isn't comfortable signalling the precise amount at this point. No changes to APP/TLTROs at this point. EUR/USD -0.75%.”
- USD/MXN fades late Wednesday’s corrective bounce off the lowest levels since September 2017.
- Failure to extend corrective bounce beyond 18.04-05 support-turned-resistance keeps Mexican Peso buyers hopeful.
- 11-month-old descending trend channel, downward-sloping resistance line from April 2020 portray pair bear’s dominance.
- Nearly oversold RSI (14) hints at corrective bounce before poking 2017 low.
USD/MXN holds lower grounds at the intraday bottom of 17.88 heading into Thursday’s key European session. In doing so, the Mexican Peso (MXN) pair remains pressured at the multi-month low marked late Wednesday, after a corrective bounce.
That said, the USD/MXN pair dropped to the lowest levels since September 2017 as it broke horizontal support comprising multiple levels marked from August 2017, close to 18.04-05.
The bearish bias also takes clues from the downward-sloping trend channel from June 2022 and a 25-month-old descending resistance line.
It’s worth noting, however, that the below 50 levels of the RSI (14) hints at the corrective bounce in the Mexican Peso prices. The same could gain attention on staying beyond the aforementioned 18.04-05 support-turned-resistance.
Should the quote cross the 18.05 hurdle, the early 2020 bottom surrounding 18.55 will be in the spotlight before directing the USD/MXN buyers toward the multi-month-old resistance line near 18.95, quickly followed by the stated bearish channel’s top line, close to 19.25 at the latest.
Alternatively, the bottom line of the previously stated descending trend channel, near 17.55, can act as immediate support for the USD/MXN bears to watch.
Following that, the year 2017 bottom of around 17.44 will be crucial as the RSI (14) might have turned oversold, suggesting a short-term rebound.
Mexican Peso price: Weekly chart
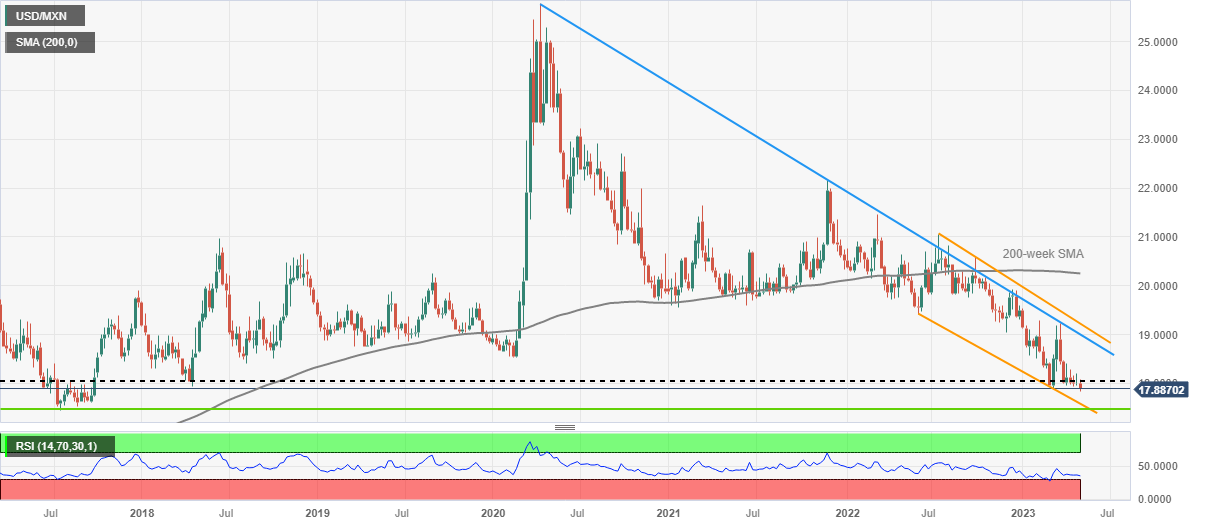
Trend: Limited downside expected
- NZD/USD has sensed some pressure after retesting the critical resistance of 0.6250.
- US Treasury would default in addressing payment obligations if the White House fails to raise the debt ceiling in time.
- The consensus for official US NFP data says an addition of fresh 179K jobs in April lower than the former release of 236K.
The NZD/USD pair has retested the potential resistance of 0.6250 in the early European session. The Kiwi asset is expected to stretch its upside further as the US Dollar Index (DXY) might show more weakness amid the absence of supportive indicators.
S&P500 futures have added significant gains in the Asian session, signaling that investors have digested US banking jitters and are cheering a consideration of a pause in the policy-tightening spell by the Federal Reserve (Fed). The USD Index is consolidating near the critical support of 101.07 and is prone to further downside amid rising concerns over US debt ceiling saga.
Investors are worried that a delay in raising the US debt ceiling by the White House will significantly impact the economic output and labor market as US Treasury would default in addressing payment obligations.
The Federal Reserve (Fed) hiked interest rates by 25 basis points (bps) and cited that further action will be more data-dependent. Therefore, investors are shifting their focus towards the United States Nonfarm Payrolls (NFP) data, which will release on Friday. On Wednesday, the US Automatic Data Processing (ADP) agency reported an addition of fresh 296K jobs in April vs. the estimates of 150K and the former release of 145K. Upbeat US ADP data indicates tight labor market conditions in the US economy.
However, the consensus for official US Employment data depicts the addition of fresh 179K jobs in April, lower than the former release of 236K. The Unemployment Rate is seen unchanged at 3.5%.
On the New Zealand Dollar front, the Kiwi focused least on the downbeat Caixin Manufacturing PMI data. The economic data has landed at 49.5, lower than the estimates of 50.3 and the former release of 50.0.
It is worth noting that New Zealand is one of the leading trading partners of China and weak Chinese manufacturing PMI would impact the New Zealand Dollar outlook.
Here is what you need to know on Thursday, May 4:
The US Dollar stays under persistent selling pressure following the US Federal Reserve's (Fed) rate decision and Chairman Jerome Powell's comments on the policy outlook. The European Central Bank (ECB) will announce its policy decisions later in the day and the US economic docket will feature the weekly Initial Jobless Claims report alongside March Trade Balance and Unit Labor Costs data for the first quarter.
The Fed raised its policy rate by 25 basis points (bps) to the range of 5-5.25% as expected after its May policy meeting. In the policy statement, the Fed stopped using the language saying that "some additional policy firming may be appropriate in order to attain a stance of monetary policy that is sufficiently restrictive to return inflation to 2% over time." The dovish change in the Fed's tone triggered a sharp decline in the US Treasury bond yields and caused the US Dollar Index (DXY) to extend its daily slide late Wednesday.
Although FOMC Chairman Jerome Powell refrained from confirming a pause in the tightening cycle in June and said that they were not forecasting a rate cut this year, these comments did little to nothing to change the market perception. After having lost 0.7% on Wednesday, the DXY continues to edge lower early Thursday and stays within a touching distance of 101.00.
The ECB is forecast to raise its key rates by 25 bps later in the day. Investors will want to see whether the ECB will confirm one more rate hike at the next meeting. Ahead of this important event, EUR/USD continues to stretch higher toward 1.1100 in the European morning.
ECB Preview: 25bps is not the same as 50bps.
GBP/USD gained 100 pips on Wednesday and erased Monday's and Tuesday's losses. The pair clings to small daily gains early Thursday and trades slightly below 1.2600.
In the early Asian session, Gold price reached an all-time high of $2,080 before retreating below $2,050 by the European morning. The benchmark 10-year US Treasury bond yield stages a modest rebound after having lost nearly 7% in the last two days, limiting XAU/USD's upside for the time being.
USD/JPY fell nearly 200 pips on Wednesday and retraced the majority of the bullish rally witnessed toward the end of the previous week. The pair stays relatively quiet early Thursday and fluctuate near 134.50.
Bitcoin continues to edge higher after having registered modest gains following the Fed event late Wednesday. At the time of press, BTC/USD was trading near $29,200. Ethereum gained nearly 2% for the second straight day on Wednesday and seems to have stabilized slightly above $1,900 early Thursday.
Considering advanced prints from CME Group for gold futures markets, open interest rose for the fourth consecutive session on Wednesday, this time by around 11.1K contracts. Volume, instead, kept the erratic activity well in place and shrank by around 13.8K contracts, partially reversing the previous daily build.
Gold: Next target at the all-time high
Gold prices extended the recovery further north of the $2000 mark on Wednesday. The strong advance was amidst rising open interest and left the door open to a potential test of the all-time peak at $2075 recorded on August 7 2020.
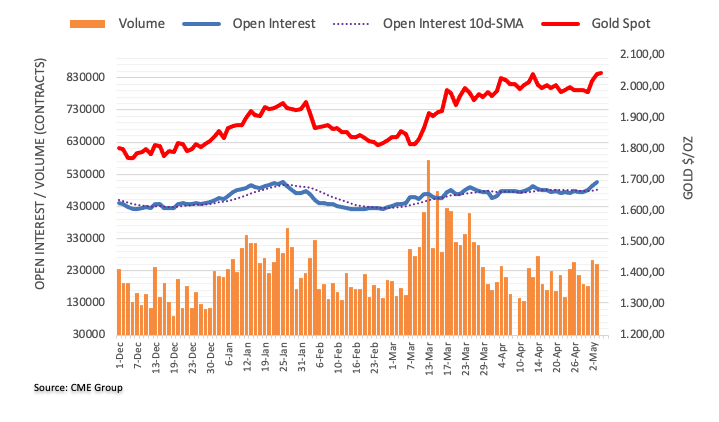
- EUR/USD is marching towards 1.1100 as the USD Index is facing multiple headwinds.
- Federal Reserve has changed its policy stance guidance to neutral after hiking rates consecutively by 25 bps to 5.00-5.25%.
- A decline in credit disposal from European banks could force the European Central Bank to announce a smaller rate hike.
- EUR/USD is on the verge of delivering a breakout of the Ascending Triangle.
EUR/USD has shifted its auction comfortably above the critical resistance of 1.0800 in the early European session. The major currency pair is expected to extend its upside journey towards the round-level resistance of 1.1100 as the Federal Reserve (Fed) has changed its policy stance guidance to neutral after hiking rates consecutively by 25 basis points (bps) to 5.00-5.25%. However, the road to reaching the terminal rate for the European Central Bank (ECB) is far from over.
S&P500 futures have added decent gains in the Asian session, portraying a meaningful recovery in the risk appetite of investors. US equities were heavily dumped by investors on Wednesday amid uncertainty over the Fed’s roadmap of arresting sticky inflation. Also, a bloodbath in PacWest Bancorp renewed fears of a US banking crisis. Bloomberg reported that PacWest Bancorp is considering strategic options, including a potential sale.
The US Dollar Index (DXY) is defending the immediate support of 101.07, however, the absence of recovery signs is strengthening the downside bias. Federal Reserve’s change of language to ‘monetary action will be data dependent’ from ‘some appropriate tightening would be required’ has trimmed expectations of further policy-tightening dramatically.
US debt ceiling saga
There is no denying the fact that a shift in policy stance by the Federal Reserve has weighed heavily on the US Dollar. It is highly anticipated that the policy-tightening spell by the Federal Reserve is paused for now considering the mounting banking crisis and deepening fears of a US recession.
Apart from that, catalysts that have capped the upside in the USD Index are renewed US banking woes and debt ceiling concerns.
A few days back, US President Joe Biden denied negotiations on raising the US debt ceiling with Republicans as they were supporting it at the cost of the President’s spending initiatives. The White House is not ready to make negotiations, however, repercussions of delay in US debt ceiling talks are haunting the USD Index.
US Treasury has already confirmed that it will run out of funds in early June, which would result in a default on payment obligations. According to an analysis by the White House Council of Economic Advisers, a protracted default on U.S. payment obligations could result in the loss of 8.3 million jobs and a 6.1% reduction in economic output, as reported by Reuters.
To avoid such circumstances, the White House could come sooner on the table for negotiations otherwise it would cost severe damage to the US economy.
European Central Bank to lift interest rates further
The street is awaiting the announcement of the interest rate decision by the European Central Bank to understand how swift policymakers are looking to tame stubborn Eurozone inflation. Investors are divided over the pace of the interest rate hike as the growth rate in the Eurozone economy has squeezed sharply. Reuters reported that a decline in credit disposal from European banks and softening inflation is bolstering the case of a smaller interest rate hike announcement from European Central Bank President Christine Lagarde. However, European Central Bank Governing Council Member Isabel Schnabel said last week that a 50 bps interest rate hike is on the cards.
EUR/USD technical outlook
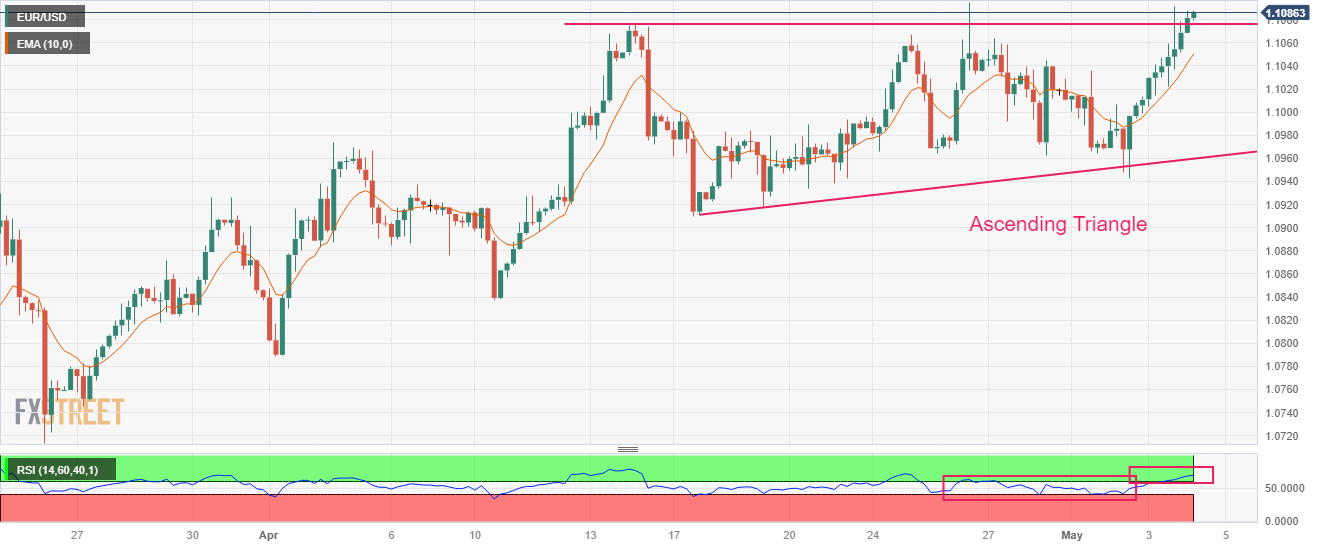
EUR/USD is on the verge of delivering a breakout of the Ascending Triangle chart pattern formed on a four-hour scale. The upward-sloping trendline of the chart pattern is plotted from April 17 low at 1.0910 while the horizontal resistance is placed from April 14 high at 1.1076.
Advancing 10-period Exponential Moving Average (EMA) at 1.1050 is diverged from the shared currency pair, indicating a sheer strength in the Euro bulls.
The Relative Strength Index has shifted into the bullish range of 60.00-80.00, which conveys that more gains are in the pipeline.
- Asia-Pacific shares remain firmer as Fed hints at policy pivot.
- Upbeat Aussie trade numbers, off in Japan and softer China Caixin Manufacturing PMI check equity buyers.
- Oil price recovers after falling to the lowest since December 2021.
- Banking woes worsen in US as PacWest Bancorp teases asset sale.
Asia-Pacific markets edge higher on early Thursday as equity buyers cheer Fed’s dovish rate hike amid mixed concerns at home. Adding strength to the recovery moves could be the recently firmer S&P500 Futures and the consolidation ahead of another key event, namely the European Central Bank (ECB) monetary policy meeting.
While portraying the mood, MSCI’s index of Asia-Pacific shares outside Japan prints 0.60% intraday gains while off in Japan limits the market moves. Additionally portraying the cautious optimism are mixed plays surrounding the US stock futures and the recently firmer price of Oil, as well as banking woes in the West.
Fed’s 0.25% rate hike fails to inspire currency hawks as the omission of statements supporting further rate hikes and higher importance to the data dependency favor market bears. The same joins upbeat Australian trade numbers and the Bank of Japan’s (BoJ) defense of easy money policy, as well as China’s downbeat PMIs, to keep the equity buyers hopeful.
On the contrary, PacWest Bancorp teased an asset sale late Wednesday and propelled the market’s banking woes. Further, the White House statements suggesting debt limit default could cost 8.3 million job losses also weigh on the sentiment.
It’s worth noting that the WTI crude oil’s recovery to $69.00 joins hawkish hopes from the ECB and the Hong Kong central bank’s rate hike to challenge the market’s recent optimism.
As a result, stocks in Australia and South Korea print mild losses while those from New Zealand and China lead the bulls. That said, Indian equities are also firmer whereas S&P00 Futures snap a three-day downtrend while printing 0.25% intraday gains near 4,120 at the latest.
Also read: Forex Today: Dollar slides as Fed delivers as expected
Lee Sue Ann, Economist at UOB Group, comments on the upcoming ECB gathering.
Key Takeaways
“We are pencilling in a 25bps hike at the May meeting, on the ECB’s willingness to put out fires in banking woes, as well as fresh forecasts confirming that it probably does not think the fight against inflation is over.”
“Further out, even if the ECB were to continue hiking, we think it would be prudent to move in clips of 25bps.”
- AUD/USD stays firmer for third consecutive day while piercing 21-DMA.
- Australia trade numbers for March came in firmer, Fed signals halt to rate hike trajectory.
- Looming bull cross on MACD, steady RSI (14) suggests further grinding towards the north.
- Descending resistance line from mid-February restricts immediate upside, Aussie bears remain cautious beyond 0.6565.
AUD/USD picks up bids to prod intraday high surrounding 0.6695 heading into Thursday’s European session as bulls cheer strong Australia’s trade numbers and the Federal Reserve’s (Fed) dovish rate hike. In doing so, the Aussie pair ignores downbeat China data, fears surrounding the US banking sector fallout and debt ceiling expiry.
Australia’s headline Trade Balance rose to 15,269M in April versus 12,650M market forecast and 13,870 prior. Further, Exports and Imports also improved to 4.0% and 2.0% versus -3.0% and -9.0% respective priors.
On the other hand, China’s Caixin Manufacturing PMI for April drops to 49.5 versus 50.3 expected and 50.0 prior. Earlier in the week, the NBS Manufacturing PMI for the dragon nation offered a negative surprise before the Chinese markets went on a long holiday until Thursday.
With more positives than negatives, the AUD/USD pair manages to cross the 21-DMA hurdle, now immediate support around 0.6675. The upside momentum also takes clues from the impending bull cross on the MACD and firmer RSI (14) line, near 50 level.
However, the quote needs to provide a daily closing beyond a downward-sloping resistance line from February 14, near 0.6710, to regain the market’s confidence in marking another battle with the 100-DMA hurdle of around 0.6790.
On the flip side, a surprise pullback of the AUD/USD price can aim for 0.6630 before poking the 0.6600 round figure.
Following that, a horizontal area comprising multiple levels marked since November 2022, around 0.6565-75, will be crucial for the bears to conquer to keep the reins.
AUD/USD: Daily chart

Trend: Further upside expected
- USD/INR bears prod three-week-old ascending support line, drops for the second consecutive day.
- Indian Rupee buyers keep the reins amid talks of RBI’s US Dollar buying, Fed’s dovish rate hike.
- Market sentiment remains sluggish as banking crisis debt ceiling expiry woes escalate.
- Second-tier data eyed ahead of Friday’s US NFP.
USD/INR remains on the back foot for the second consecutive day, mildly offered near 81.70 heading into Thursday’s European session. In doing so, the Indian Rupee pair benefits from the Federal Reserve’s (Fed) signals of a halt in the monetary policy tightening. However, the Reserve Bank of India’s (RBI) Open Market Operations (OMO), as well as indirect Dollar moves via Indian companies, seem to challenge the INR pair as it drills short-term key support.
Federal Reserve (Fed) announced a 25 basis points (bps) rate hike on Wednesday and propelled the benchmark rate to the highest since 2007. Following that rate announcements, Fed Chairman Jerome Powell also ruled out banking woes to praise the economic soundness. However, the omission of statements supporting further rate hikes and higher importance to the data dependency drowned the US Dollar despite the key central bank’s hawkish move.
On the other hand, downbeat Oil prices also allowed the USD/INR bears to keep the reins as the WTI benchmark dropped to the lowest levels since December 2021 before recently recovering to $69.00.
Furthermore, PacWest Bancorp teased an asset sale late Wednesday and propelled the market’s banking woes and weighed on the US Dollar, via indirect challenges to further rate hikes. Additionally, the White House statements suggesting debt limit default could cost 8.3 million job losses also weigh on the sentiment and the US Dollar.
On the same line could be the heavy inflow of funds into Indian equities. “Foreigners are buyers of $1.5 billion of Indian equities in the last three sessions,” per Reuters. Also, a 13-year high of India’s S&P Global Services PMI for April exerts downside pressure on the USD/INR price.
It’s worth mentioning that Reuters quote anonymous traders to state that the RBI has been buying dollars via public sector banks to keep the pair narrow range, which in turn should prod the USD/INR bears. On the same line could be the recent rebound in the Oil price.
Moving on, USD/INR traders should pay attention to the risk catalysts and second-tier US data ahead of Friday’s key US Nonfarm Payrolls (NFP) for clear directions.
Technical analysis
A three-week-old ascending support line joins the 200-DMA to restrict the short-term USD/INR downside near 81.65-60. That said, recovery moves need validation from the 21-DMA hurdle of around 81.90.
- USD/CAD has slipped sharply below 1.3600 as the oil price has recovered sharply.
- Fed Powell cited that the central bank will be more data-dependent for further action.
- Headwinds of the US debt ceiling issue and banking jitters are weighing heavily on the USD Index.
The USD/CAD pair has slipped below the round-level support of 1.3600 after failing to sustain above the crucial resistance of 1.3620 in the Asian session. The Loonie asset has sensed pressure amid strength in the Canadian Dollar as oil prices have strongly rebounded after refreshing the annual low of $63.60.
Earlier, oil prices witnessed a bloodbath due to soaring fears of a global economic slowdown as major central banks are tightening their monetary policy further to arrest sticky inflation. The oil was heavily sold after the Fed hiked rates by 25 basis points (bps) but managed to recover some gains as US central bank opted for a neutral stance on interest rate guidance.
It is worth noting that Canada is the leading exporter of oil to the US and a rebound in oil prices will support the Canadian Dollar.
S&P500 futures have shown some recovery in the Asian session as investors are cheering the changed language on rate guidance. Fed chair Jerome Powell cited that the central bank will be more data-dependent for further action. The updated language from ‘some hikes would be appropriate’ is acting as music to the ears of investors.
The US Dollar Index (DXY) is making efforts for defending the crucial support of 101.07 despite critical headwinds of the debt ceiling issue and banking jitters.
Going forward, the US labor market data (April) will remain in the spotlight. Considering the consensus, the US economy added 179K jobs vs. the prior addition of 236K. The jobless rate is seen unchanged at 3.5%.
On the Canadian Dollar front, investors are awaiting the release of the Canadian Employment data. The net change in Employment is seen at 20K higher than the former addition of 34.7K. The Unemployment Rate is expected to increase to 5.1%.
- Natural Gas price picks up bids to refresh intraday high, bounced off three-week low.
- Fed’s dovish hike weighs on US Dollar, allows XNG/USD to remain firmer.
- Steady RSI suggests further recovery from one-month-old ascending support line.
- 21-DMA guards immediate upside, seven-week-long resistance line is the key hurdle.
Natural Gas (XNG/USD) Price remains firmer around $2.27 as the commodity buyers cheer the first daily gains in four during early Thursday.
The energy instrument’s latest rebound from the lowest levels in three weeks could be linked to the US Federal Reserve’s (Fed) hints of a pause in the rate hike trajectory, despite announcing a 0.25% increase in the benchmark rates the previous day.
Adding strength to the XNG/USD rebound could be the ascending trend line from early April, around $2.20 by the press time, as well as the steady RSI (14) line.
It’s worth noting, however, that the 21-DMA hurdle of around $2.35 restricts immediate upside of the Natural Gas price, a break of which could please short-term XNG/USD buyers.
Even so, a downward-sloping resistance line from mid-March, close to $2.45 at the latest, appears a tough nut to crack for the Natural Gas buyers before retaking control.
Meanwhile, a downside break of the aforementioned one-month-old support line, close to $2.20, can quickly drag the XNG/USD quote towards a broad support line stretched from late February, around $2.12.
If at all, the Natural Gas price drops below $2.12, the $2.00 psychological magnet will gain the market’s attention.
Natural Gas Price: Daily chart

Trend: Bearish
- Gold price has corrected to near $2,040.00 after printing a fresh all-time high at $2,079.76.
- The USD Index is holding losses amid various headwinds such as renewed US banking crisis and debt ceiling issues.
- US President Joe Biden is not interested in raising the debt ceiling at the cost of the President’s spending initiatives.
Gold price has retreated sharply to near $2,040.00 in the Asian session after printing all-time highs of $2,079.76. The precious metal has corrected swiftly as profit-booking kicked in after solid gains inspired by changed language on interest rate guidance from the Federal Reserve (Fed) after hiking critical rates by consecutive 25 basis points (bps) to 5.00-5.25%.
The USD Index is making efforts to defend its immediate support of 101.07, however, the downside seems favored due to various headwinds. US banking jitters have renewed as Bloomberg reported that PacWest Bancorp is considering strategic options, including a potential sale.
While fears of debt ceiling issues are accelerating as US President Joe Biden is not interested in raising the debt ceiling in negotiations with Republicans at the cost of the President’s spending initiatives.
Meanwhile, S&P500 futures have shown some recovery indicating a recovery in the risk-off market mood. Accelerating fears of the US debt ceiling have weighed heavily on Treasury yields. The yields offered on 10-year US government bonds have dropped to near 3.33%.
Going forward, US labor market data will be keenly watched. As per the expectations, the US Nonfarm Payrolls (NFP) data is seen at 179K lower than the former release of 236K. The Unemployment Rate is seen steady at 3.5%. Also, Average Hourly Earnings are seen as stable. Consistent labor cost index data could force the Fed to re-consider a pause in the rate-hiking spell as it could fuel inflationary pressures.
Gold technical analysis
Gold price has corrected to near $2,040.00 after printing a fresh all-time high at $2,079.76. The precious metal has covered the gap made after the Fed policy on an intraday chart, which is acting as a cushion. Also, the 50-period Exponential Moving Average (EMA) at $2,038.56 is providing support to the Gold bulls. A recovery move above the 20-period EMA would support Gold bulls in reclaiming all-time highs.
The Relative Strength Index (RSI) (14) gauged support around 40.00 and is looking for a recovery.
Gold intraday chart
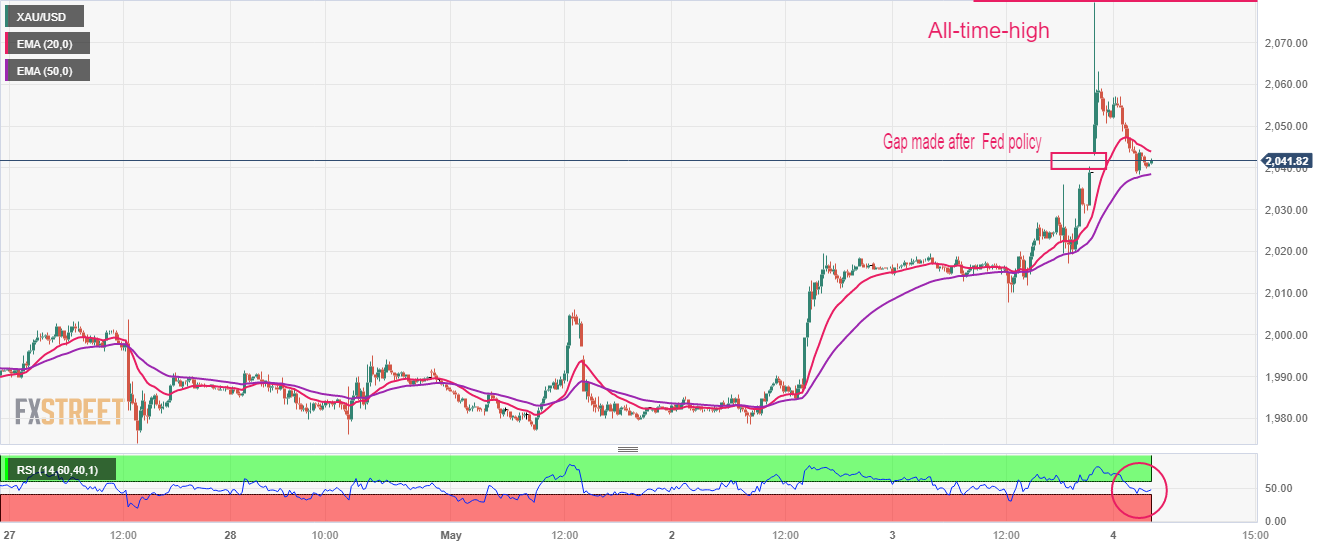
- USD/CHF has faced an intense sell-off as the Fed delivered neutral interest rate guidance.
- The USD Index looks vulnerable above 101.07 as fears of the US debt ceiling issue are accelerating swiftly.
- US Treasury has already conveyed that it will be out of funds by early June.
The USD/CHF pair witnessed massive offers from investors on Wednesday as the Federal Reserve (Fed) delivered neutral guidance after hiking interest rates by 25 basis points (bps) to 5.00-5.25%. The Swiss Franc asset has refreshed its two-year low at 0.8820 and is expected to display more downside as the US Dollar Index (DXY) is failing to show evidence of getting confident support.
The USD Index looks vulnerable above its crucial support of 101.07 as fears of the US debt ceiling issue are accelerating swiftly. The White House is not ready for negotiations over the cost of the President’s spending initiatives. US Treasury has already conveyed that it will be out of funds by early June, which would cost 8.3 million jobs and a 6.1% reduction in economic output reported by the White House Council of Economic Advisors.
Meanwhile, S&P500 futures have recovered their entire losses and has turned positive, portraying a recovery in the risk appetite of investors.
USD/CHF is declining towards the crucial support plotted horizontally from 08 January 2021 low at 0.8758. The supply area for US Dollar bulls is placed in a range of 0.8984-0.9000 range on a weekly scale. The 10-period Exponential Moving Average (EMA) at 0.9041 is consistently acting as a barricade for the US Dollar bulls.
The Relative Strength Index (RSI) (14) is oscillating in the bearish range of 20.00-40.00, conveying that the downside momentum is extremely solid.
A breakdown of the intraday low at 0.8820 will drag the asset toward 01 January 201 low at 0.8794 followed by January 2021 low at 0.8758.
In an alternate scenario, a confident move above the psychological resistance at 0.9000, US Dollar bulls will drive the asset towards April 07 low and high at 0.9034 and 0.9082 respectively.
USD/CHF weekly chart
-638187677470133127.png)
- EUR/USD grinds higher during three-day winning streak, prods key resistance.
- Fed matches market forecasts with 0.25% rate hike but opens door for policy pivot and weigh on US Dollar.
- Fears surrounding US banks, debt ceiling expiration also exert downside pressure on greenback despite upbeat US data.
- ECB is expected to lift benchmark rates by 25 bps but rate guidance will be the key for Euro bulls to watch.
EUR/USD seesaws around intraday high as bulls take a breather after a three-day uptrend near 1.1090 heading into the key European trading session on Thursday.
The Euro pair refreshed its weekly high after the Federal Reserve’s (Fed) hidden dovish monetary policy announcements. However, the cautious mood and banking crisis prods the bulls ahead of the all-important European Central Bank (ECB) Monetary Policy Decision.
On Wednesday, the Fed fails to convince the US Dollar buyers despite increasing the benchmark rates to the highest levels since 2007 as the Monetary Policy Statement opens the door for speculations surrounding a pause in the Fed’s policy tightening. That said, Fed Chairman Jerome Powell also appeared positive while ruling out fears of a banking rout. However, a dropping of the lines in the statement suggesting the need for further rate hikes gained major attention and weighed on the US Dollar despite the hawkish move by the Fed.
In addition to the Fed’s 25 basis points (bps) rate hike, upbeat US data should have also challenged the EUR/USD bulls but did not amid the looming bank crisis in the US and fears of debt ceiling expiration.
That said, US ADP Employment Change rose to 296K for April from 142K prior versus 148K market forecast. Additionally, the annual pay growth declined to 13.2% from 14.2%. Further, ISM Services PMI improved to 51.9 in April versus 51.8 market forecasts and 51.2 previous readings. It’s worth noting, however, that the S&P Global Services PMI and Composite PMI for April eased to 53.6 and 53.4 versus 53.7 and 53.5 respective priors.
On the other hand, PacWest Bancorp teased an asset sale late Wednesday and propelled the market’s banking woes. Further, the White House statements suggesting debt limit default could cost 8.3 million job losses also weigh on the sentiment and the US Dollar.
Against this backdrop, S&P 500 Futures print mild losses by tracking the Wall Street benchmarks. It should be observed that holidays in Japan restrict bond market moves in Asia.
Looking forward, EUR/USD traders will pay attention to the ECB Monetary Policy Announcements as some on the floor do expect a 50 bps rate hike, versus a large majority suggesting 0.25% increase in the benchmark rates. Apart from the rates, the bloc’s central bank will also be eyed for clues of future actions as the latest growth numbers from the old continent have been softer while the higher rates are termed as credit-negative in the latest ECB update. Should the region’s central bank ignores all odds and remain hawkish, the major currency pair won’t hesitate to refresh the multi-month high.
Also read: ECB Preview: 25bps is not the same as 50bps
Technical analysis
EUR/USD defends the Federal Reserve-inspired gains with a three-week-old ascending trend channel, currently between 1.1110 and 1.0950. However, a divergence between the RSI (14) line and the EUR/USD price challenges the pair buyers ahead of the key event.
- USD/JPY prods short-term key support confluence during three-day downtrend, stays pressured at weekly low.
- 21-day EMA, five-week-old ascending trend line restricts immediate downside.
- Convergence of 50-day EMA, 200-day EMA, appears a tough nut to crack for Yen pair sellers.
- Bulls need validation from 135.25 to convince short-term buyers.
USD/JPY holds lower ground near the weekly bottom surrounding 134.50 during early Thursday. In doing so, the Yen pair drops for the third consecutive day while proding the 21-day Exponential Moving Average (EMA) and an upward-sloping support line from March 24, near 134.40-50.
It’s worth noting that the Yen pair’s repeated failures to provide a daily closing beyond 138.00 join the pair’s pullback moves that broke the previous support zone around 135.25-15, comprising levels marked since mid-February, to keep the USD/JPY bears hopeful.
On the same line, the looming bear cross on the MACD adds strength to the downside bias.
However, the 21-day EMA and a five-week-old ascending support line prod the Yen pair sellers near 134.50-40 support confluence.
Following that, a convergence of the 50-day EMA and 200-day EMA, near 133.85, will be key to watch for the USD/JPY pair as it holds the gate for the bear’s welcome.
Meanwhile, USD/JPY buyers need validation from the immediate multi-day resistance zone of around 135.15-25 to convince short-term bulls.
Even so, multiple hurdles near 136.70, the 137.00 round figure and the 138.00 threshold can prod the USD/JPY buyers afterward before giving them control.
USD/JPY: Daily chart
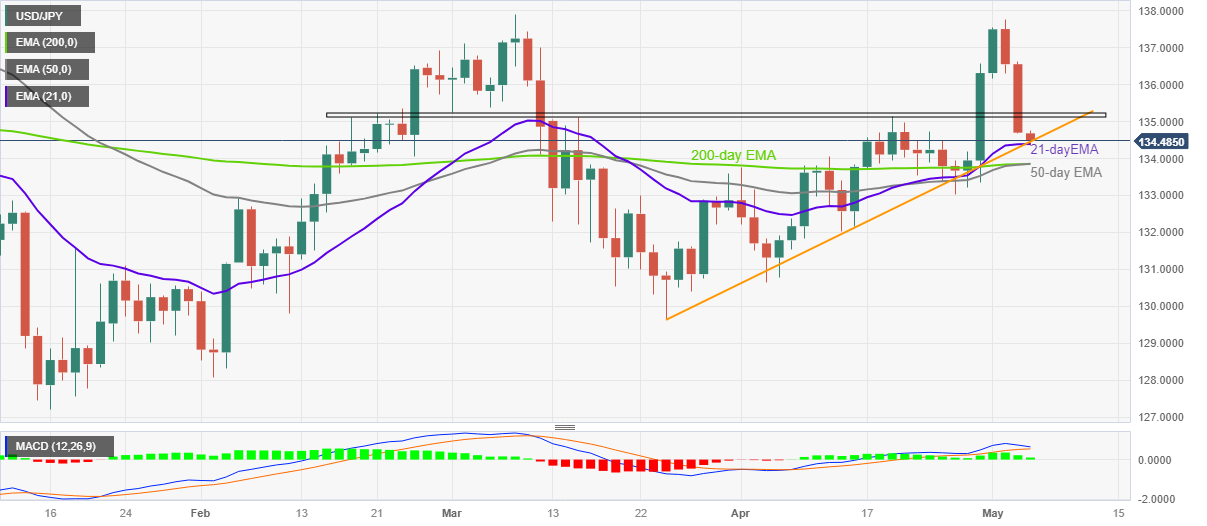
Trend: Corrective bounce expected
“The IMF warned of "uncertainty" around the direction of Japan's monetary policy, saying a possible shift from ultra-low interest rates could have a significant impact on global financial markets,” said Reuters while sharing comments from International Monetary Fund’s (IMF) Asia and Pacific Department Director Krishna Srinivasan early Thursday.
The IMF Official also pointed to risks surrounding Asia's economic outlook including from weakening exports to advanced economies, slowing productivity in China and a fragmentation of global trade while speaking at the Asian Development Bank's annual meeting in Incheon.
Additional comments
Over the medium term, we expect the Chinese economy to experience a slowdown in productivity and investment, which will lower growth below 4 percent by 2028.
In addition, we see a risk that the global economy fragments into trading blocs.
There is uncertainty around the direction of monetary policy in Japan, amid a rise in inflation.
Changes in Japan's monetary policy that lead to further increases in government bond yields could have global spillovers through Japanese investors, who have large investment positions in debt instruments abroad.
Portfolio rebalancing of these investors could trigger a rise in global yields, causing portfolio outflows for some countries.
China's rapid recovery after the re-opening from pandemic-related curbs will likely lift exports in some Asian countries including South Korea.
While headline inflation is moderating in South Korea on lower energy prices, core inflation excluding food and energy costs has yet to come down decisively.
That meant the Bank of Korea (BOK) must avoid premature monetary easing, though it should also minimize the risk of tightening policy too much.
Taking these considerations together, the BoK has appropriately paused rate hikes in the February and April meetings, while keeping options open for further hikes depending on incoming data.
Also read: IMF: Growth in Middle East, Central Asia to slow amid global challenges
| Raw materials | Closed | Change, % |
|---|---|---|
| Silver | 25.582 | 0.86 |
| Gold | 2039.03 | 1.14 |
| Palladium | 1430.17 | -0.17 |
People’s Bank of China (PBOC) set the USD/CNY central rate at 6.9054 on Thursday, versus previous fix of 6.9249 and market expectations of 6.9061. It's worth noting that the USD/CNY closed near 6.9179 the previous day.
In addition to the daily USD/CNY fix, the PBOC conveys details of the Open Market Operations (OMO), suggesting an injection of 33 billion Yuan via 7-day reverse repos at 2.0% rate.
About the fix
China maintains strict control of the yuan’s rate on the mainland.
The onshore yuan (CNY) differs from the offshore one (CNH) in trading restrictions, this last one is not as tightly controlled.
Each morning, the People’s Bank of China (PBOC) sets a so-called daily midpoint fix, based on the yuan’s previous day's closing level and quotations taken from the inter-bank dealer.
- AUD/JPY recovers from weekly low, pares intraday losses during three-day downtrend.
- 50% Fibonacci retracement level, nearly oversold RSI challenges further downside.
- Australia trade numbers for March came in firmer, China Caixin Manufacturing PMI for April disappoints.
- Convergence of 50-SMA, 100-SMA and one-week-old previous support line guards immediate upside.
AUD/JPY picks up bids to pare intraday gains around the weekly low as traders cheer strong Aussie foreign trade numbers while paying little heed to China activity data on early Thursday. In doing so, the cross-currency pair prints mild losses near 89.80 during a three-day losing streak.
That said, China’s Caixin Manufacturing PMI for April drops to 49.5 versus 50.3 expected and 50.0 prior. Earlier in the week, the NBS Manufacturing PMI for the dragon nation offered a negative surprise before the Chinese markets went on a long holiday until Thursday.
On the other hand, Australia’s headline Trade Balance rose to 15,269M in April versus 12,650M market forecast and 13,870 prior. Further, Exports and Imports also improved to 4.0% and 2.0% versus -3.0% and -9.0% respective priors.
As a result, the Aussie data helps the AUD/JPY price to rebound from a 50% Fibonacci retracement of the pair’s run-up from late March to early May, backed by nearly oversold RSI (14).
However, downbeat China PMI data and convergence of the 100-SMA and 50-SMA join the bearish MACD signals to challenge the pair buyers near 89.75-85 resistance confluence.
Even if the quote rises past 89.85 hurdle, the 90.00 round figure and April 20 swing high of near 90.80 can restrict the AUD/JPY pair’s further advances.
Meanwhile, 50% and 61.8% Fibonacci retracements can limit the short-term downside of the AUD/JPY pair near 89.30 and 88.50 levels in that order.
Following that, an upward-sloping support line from early April, near the 88.00 threshold, will be crucial to watch for the pair sellers.
AUD/JPY: Four-hour chart
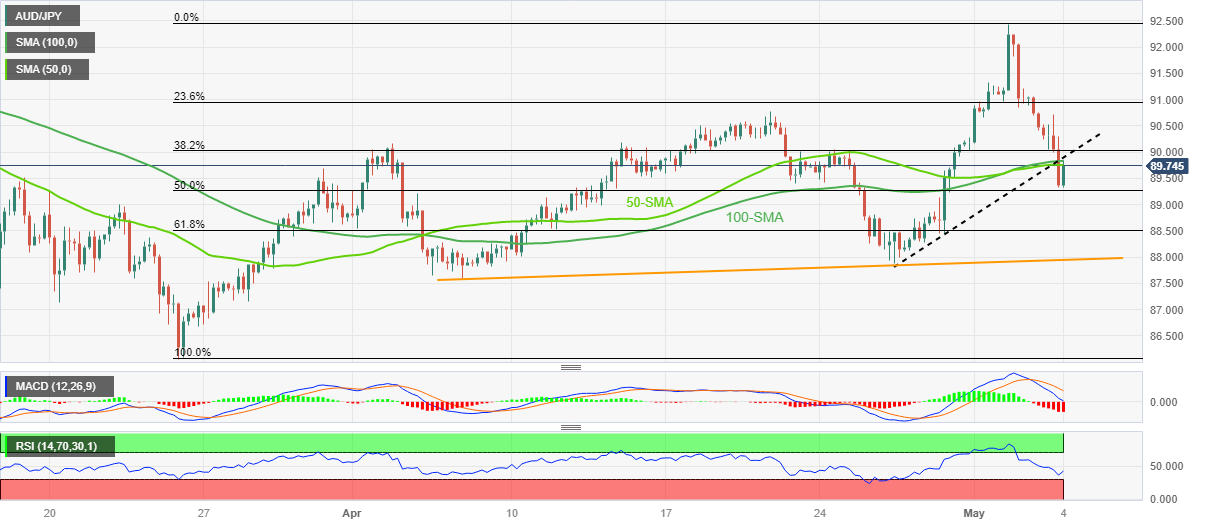
Trend: Pullback expected
- AUD/USD has soared above 0.6670 on solid Trade Balance data.
- Caixin Manufacturing PMI has landed lower at 49.5 vs. the estimates of 50.3 and the former release of 50.
- The USD index might slip further below 101.00 amid rising concerns over the US debt ceiling issue and banking jitters.
The AUD/USD pair has climbed swiftly above 0.6670 on upbeat Australian Trade Balance data. The Australian Bureau of Statistics has reported upbeat Trade Balance data. The economic data has jumped to 15,269M, higher than the estimates of 12,650M and the former release of 13,870M.
Meanwhile, the Caixin Manufacturing PMI (April) data have missed estimates. The economic data has landed at 49.5, lower than the estimates of 50.3 and the former release of 50.0. Despite fiscal and monetary support the Chinese economy is struggling to remain on track of progress.
It is worth noting that Australia is the leading trading partner of China and weak Chinese manufacturing PMI would impact the Australian Dollar.
On Wednesday, the Australian Dollar didn’t show a meaningful action despite the release of upbeat Retails Sales data. Australian agency reported an acceleration in retail demand by 0.4%, the slowest annual pace due to higher interest rates from the Reserve Bank of Australia (RBA), as reported by Reuters. Households have trimmed spending on core goods led by the mounting burden of interest obligations fur to higher borrowing costs.
Earlier this week, RBA Governor Philip Lower unexpectedly hiked interest rates by 25 basis points (bps) to 3.85% while the street was expecting a continuation of a neutral policy. The RBA hiked its Official Cash Rate (OCR) despite the consistent softening of Australian inflation.
The US Dollar Index (DXY) has retreated after a poor recovery attempt to near 101.20. The USD index is expected to slip further below the crucial support of 101.00 amid rising concerns over US debt ceiling issue and banking jitters.
The White House has reported that a default on U.S. payment obligations due to the failure of the debt ceiling raise on time could result in the loss of 8.3 million jobs and a 6.1% reduction in economic output, as reported by Reuters.
The Caixin China Manufacturing PMI™ has been released by Markit Economics as follows:
- Caixin Manufacturing PMI (March) 49.5 (vs. expected 50.3).
AUD/USD update
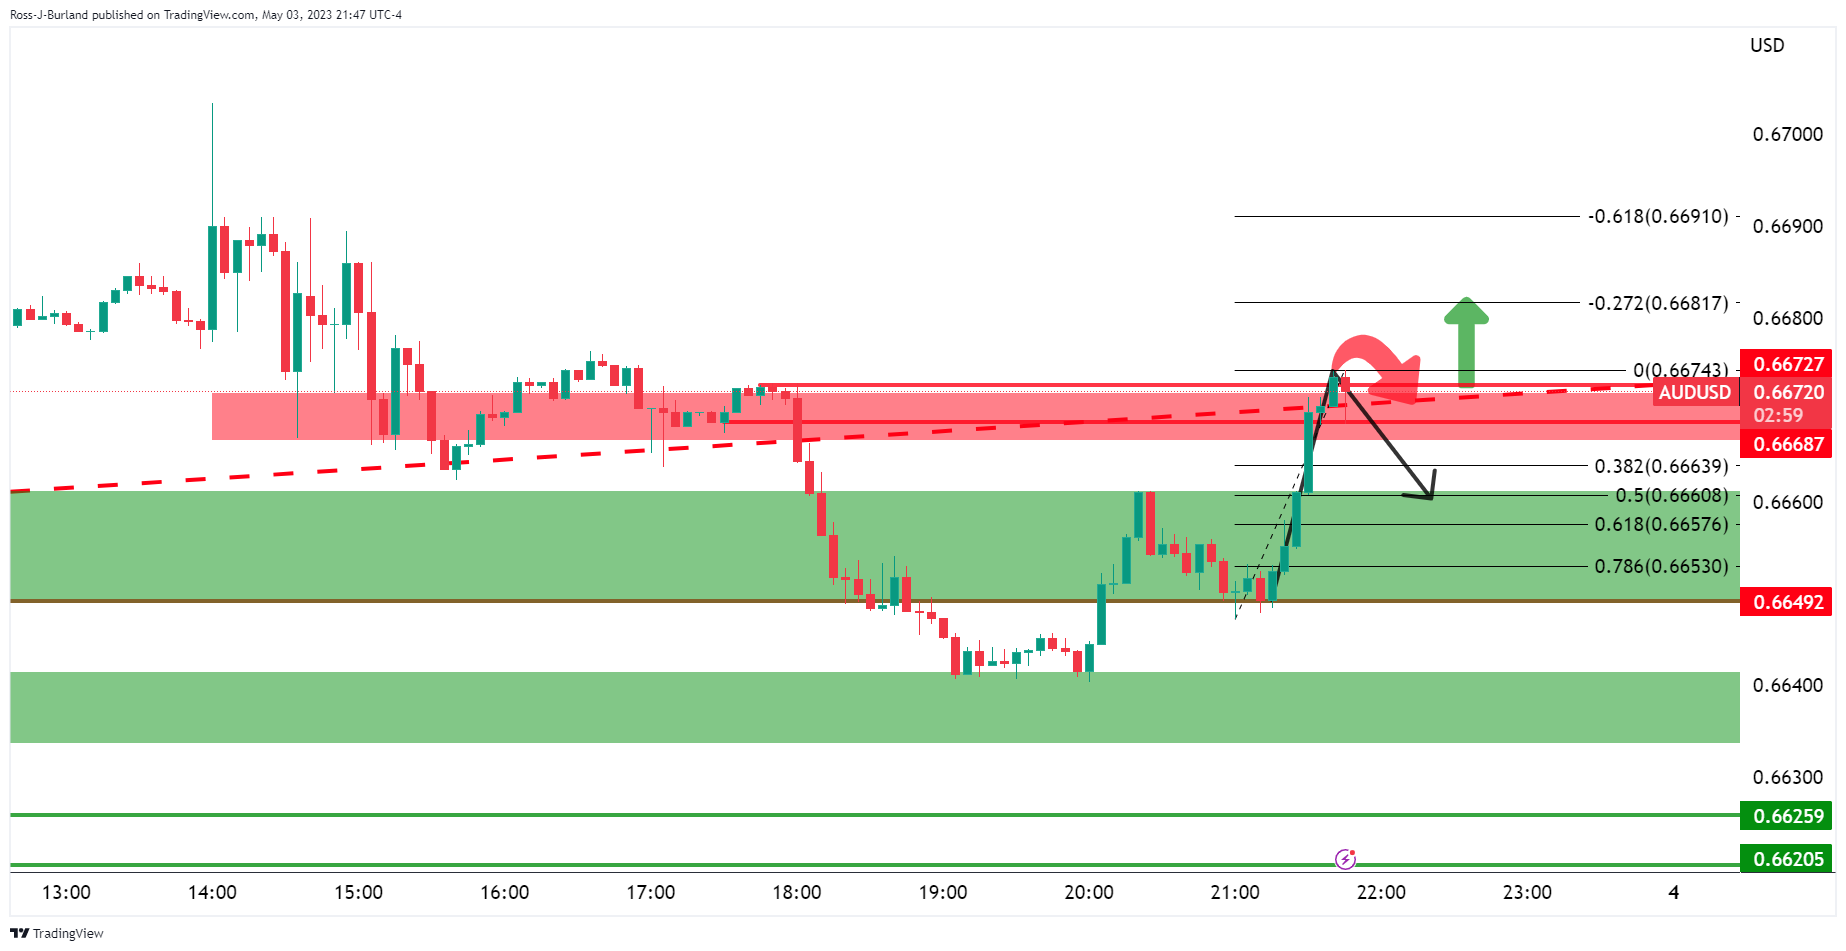
The AUD/USD bulls are engaged but the data is not favorable and it's another poor number from China which is hardly bullish for AUD. The bias is tilted to the downside if the bulls don´t step in at key resistance.
About Caixin China Manufacturing PMI™
The Caixin China Manufacturing PMI™, released by Markit Economics, is based on data compiled from monthly replies to questionnaires sent to purchasing executives in over 400 private manufacturing sector companies.
- USD/CNH remains sidelined after refreshing intraday low, drops to one-week low during three-day downtrend.
- China Caixin Manufacturing PMI drops to 49.5 versus 50.3 expected and 50.0 prior.
- Fed fails to impress hawks despite marching market forecasts of 0.25% rate hike.
- US NFP, risk catalysts eyed for clear directions.
USD/CNH prods a three-day downtrend as it seesaws around 6.9000, refreshing the weekly low near 6.8992 at the latest, after witnessing a negative surprise from China activity data on early Thursday. It’s worth noting that the Federal Reserve’s (Fed) dovish hike favors the offshore Chinese Yuan (CNH) pair bears as traders return after a long weekend.
China’s Caixin Manufacturing PMI for April drops to 49.5 versus 50.3 expected and 50.0 prior. Earlier in the week, the NBS Manufacturing PMI for the dragon nation offered a negative surprise before the Chinese markets went on a long holiday until Thursday.
Even so, the US Federal Reserve’s (Fed) failure to convince the US Dollar buyers despite increasing the benchmark rates to the highest levels since 2007 seems to keep the USD/CNH bears hopeful. That said, Fed Chairman Jerome Powell also appeared positive while ruling out fears of a banking rout. However, a dropping of the lines in the statement suggesting the need for further rate hikes gained major attention and weighed on the US Dollar despite the hawkish move by the Fed.
Not only the Fed but the US data were also impressive but couldn’t please the greenback of late. On Thursday, US ADP Employment Change rose to 296K for April from 142K prior versus 148K market forecast. Additionally, the annual pay growth declined to 13.2% from 14.2%. Further, ISM Services PMI improved to 51.9 in April versus 51.8 market forecasts and 51.2 previous readings. It’s worth noting, however, that the S&P Global Services PMI and Composite PMI for April eased to 53.6 and 53.4 versus 53.7 and 53.5 respective priors.
It’s worth mentioning, however, that the greenback’s weakness could be linked to the growing banking turmoil in the United States and looming fears of the debt ceiling expiration. Recently, PacWest Bancorp teased an asset sale and propelled the market’s banking woes while the White House statements suggesting debt limit default could cost 8.3 million job losses weigh on the sentiment.
Amid these plays, S&P 500 Futures print mild losses by tracking the Wall Street benchmarks. It should be observed that holidays in Japan restrict bond market moves in Asia.
Having witnessed the initial reaction to the Fed moves and China data, USD/CNH pair traders should pay attention to the risk catalysts as the latest risk-off mood seem to put a floor under the US Dollar. Additionally important will be the second-tier US data ahead of Friday’s NFP.
Technical analysis
A convergence of the 21-DMA and 50-DMA, near 6.9040-30, restricts the immediate downside of the USD/CNH pair. It’s worth noting, however, that the downbeat oscillators keep favoring the sellers.
The Australian Trade Balance released by the Australian Bureau of Statistics is out as follows:
- Trade Balance actual 15,269m (forecast 13,000m, previous 13,870m).
- Exports actual 4% (forecast -, previous -3%)
- Imports actual 2% (forecast -, previous -9%)
AUD/USD is shooting up into test a key level of resistance as follows:
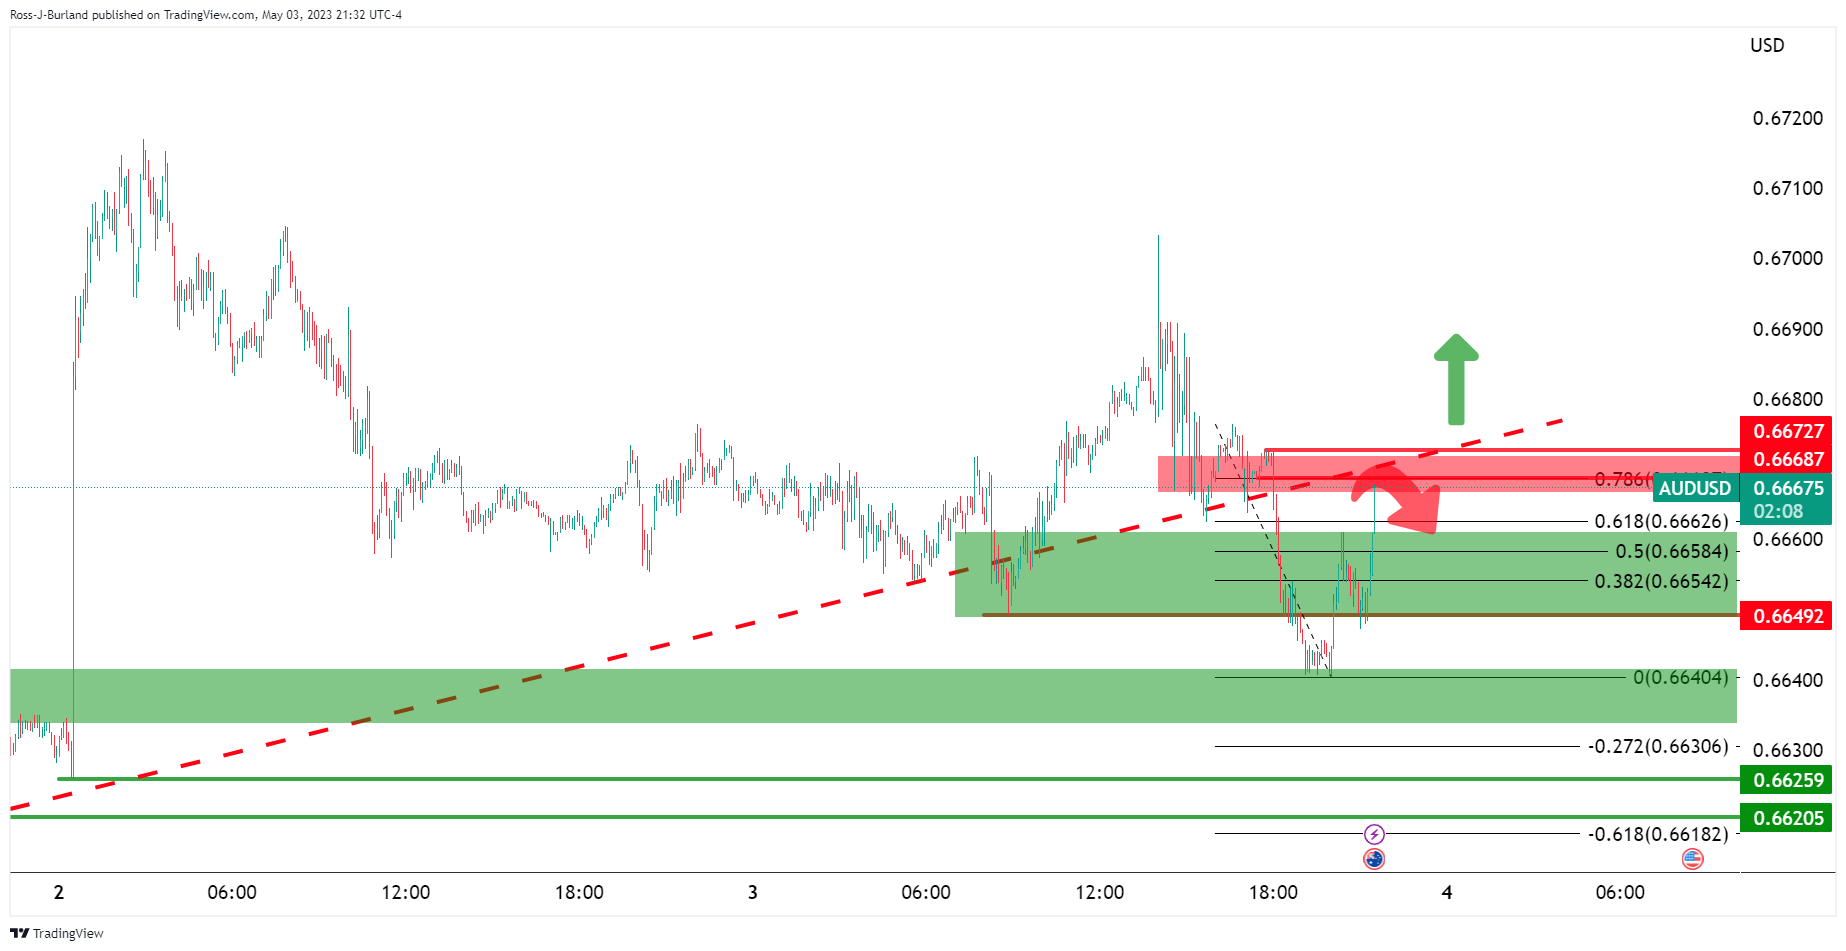
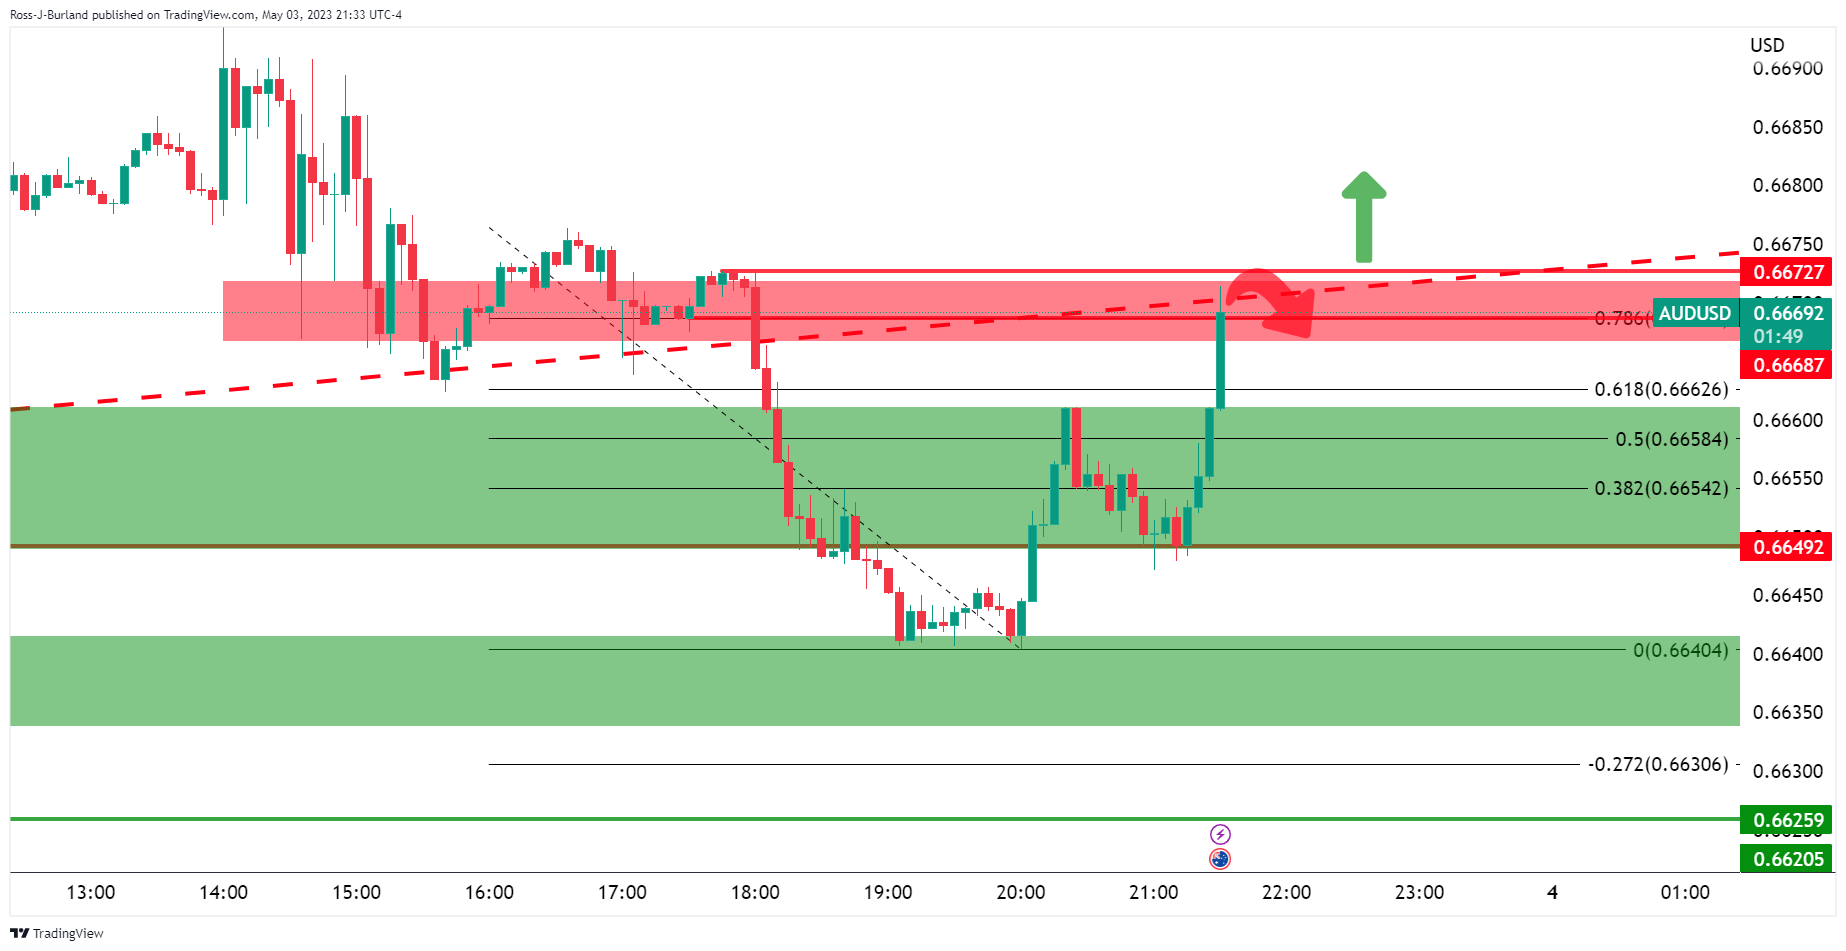
About the Trade Balance
The trade balance released by the Australian Bureau of Statistics is the difference in the value of its imports and exports of Australian goods. Export data can give an important reflection of Australian growth, while imports provide an indication of domestic demand. Trade Balance gives an early indication of the net export performance. If a steady demand in exchange for Australian exports is seen, that would turn into a positive growth in the trade balance, and that should be positive for the AUD.
- WTI bulls move back in with vigor as bears throw in their towels.
- WTI rallies hard from the lows right up to a 61.8% Fibo.
Crude oil, WTI, bulls have stampeded the bears back to a 61.8% Fibonacci retracement in what has been a highly volatile period over these past weeks. The price has dropped from the OPEC production cut highs of around $83.50bbls to a low of $63.61bbls.
WTI H4 chart
In Asia today, we have seen a very strong comeback as follows:
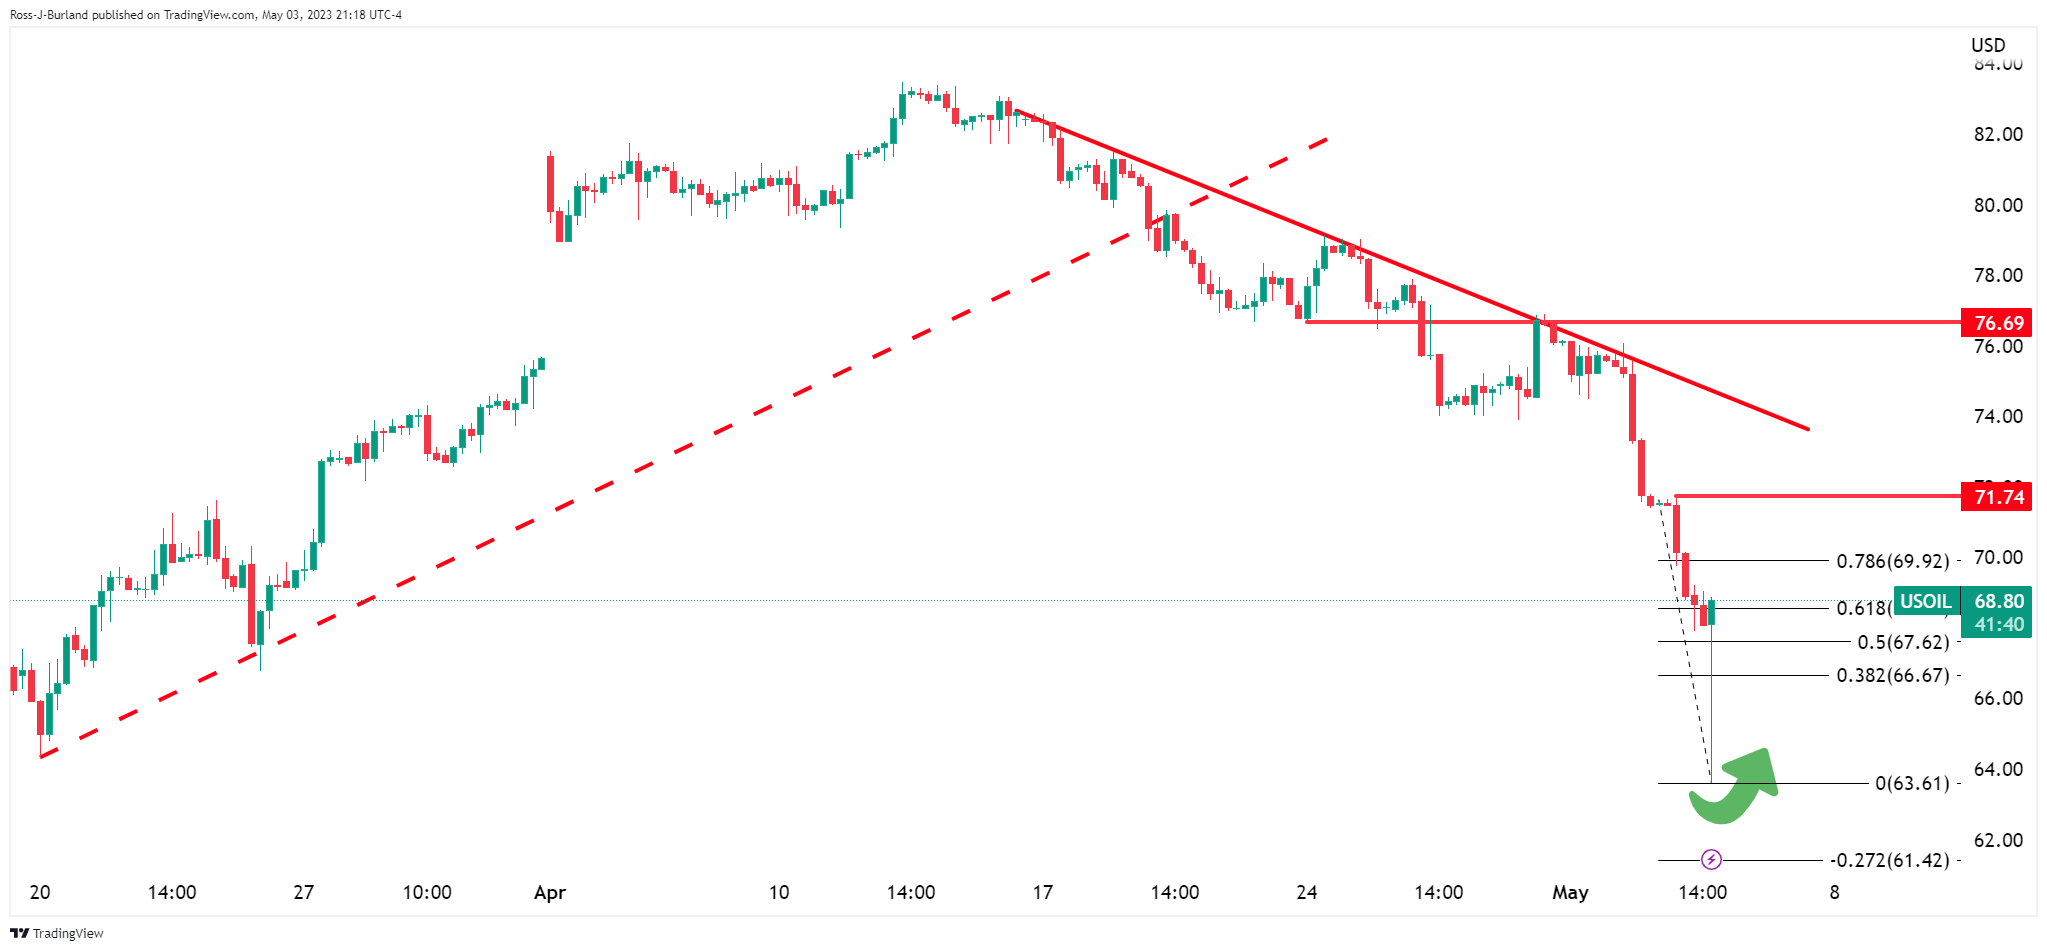
- GBP/USD struggles after refreshing 11-month high, eases of late.
- Overbought RSI, easing bullish bias of MACD tease intraday sellers.
- Cable pair buyers need validation from three-week-old ascending resistance line.
GBP/USD bulls take a breather around 1.2580, after rising to the highest levels since June 2021 early Thursday. That said, the Cable pair initially cheered the US Federal Reserve’s (Fed) dovish hike before retreating from an upward-sloping resistance line from April 14.
Given the quote’s pullback from the short-term key resistance line joining the overbought RSI (14) and easing the bullish bias of the MACD, the GBP/USD price may witness further pullback.
However, an ascending trend line from Tuesday, near 1.2525 by the press time, restricts the immediate downside of the Pound Sterling.
Following that, the GBP/USD bears may prod the 200-Hour Moving Average (HMA) support of near 1.2485.
In a case where the Cable pair remains bearish past 200-HMA, the weekly low of 1.2435 can act as the last defense of the buyers.
Meanwhile, GBP/USD bulls need to provide a successful upside break of the aforementioned three-week-old ascending resistance line, around 1.2595 by the press time, to keep the reins.
Even so, the 1.2600 round figure and the May 2022 peak of around 1.2665 can challenge the GBP/USD bulls before directing them to the 1.2700 round figure.
Overall, GBP/USD remains on the bull’s radar even if the upside room appears limited.
GBP/USD: Hourly chart
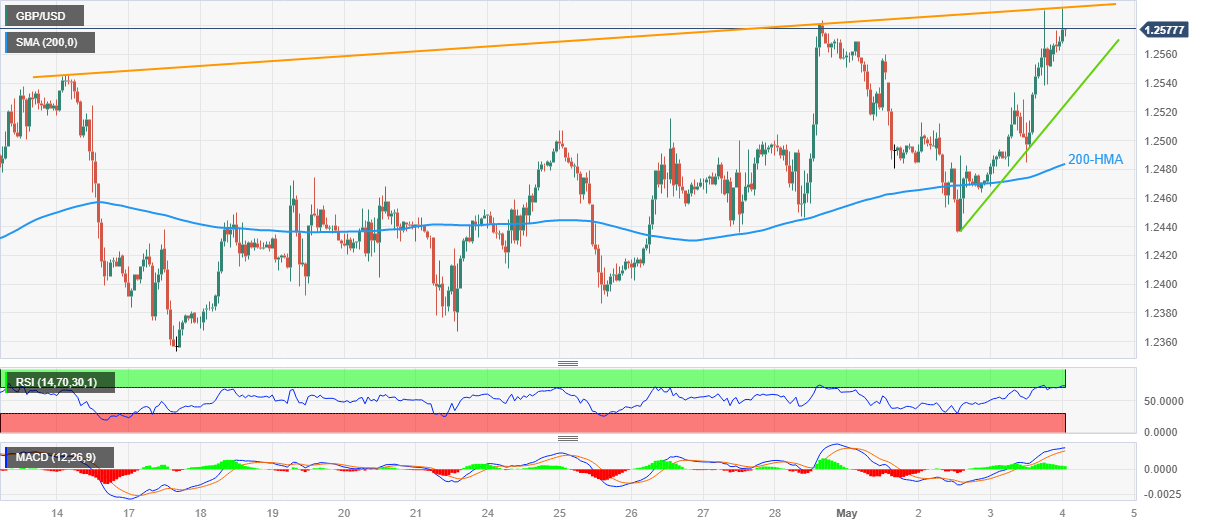
Trend: Pullback expected
- NZD/USD has printed a fresh day's high at 0.6225 as fears of a US banking fiasco renewed.
- Rising expectations that the Fed has reached its terminal rate have weighed heavily on US Treasury yields.
- Caixin Manufacturing PMI is expected to jump to 50.3 from the former release of 50.0.
The NZD/USD pair has refreshed its day’s high at 0.6225 in the Asian session. The upside bias for the Kiwi asset is solid amid consideration of a neutral policy stance by the Federal Reserve (Fed) from its June monetary policy.
S&P500 futures have trimmed some losses posted in early Asia, indicating some recovery in the risk appetite of the market participants, however, the overall market mood carries caution. The US Dollar Index (DXY) has displayed some defense after testing Wednesday’s low of 101.07. Rising expectations that the Fed has reached its terminal rate, for the time being, have weighed heavily on US Treasury yields. The yields offered on 10-year US Treasury bonds have dropped to 3.33%.
As per the CME Fedwatch tool, more than 17% of investors are anticipating a rate cut in June monetary policy. The anticipation of a rate cut by Fed chair Jerome Powell has stemmed US banking woes have renewed. Bloomberg reported that PacWest Bancorp is considering strategic options, including a potential sale.
Apart from that, Fed Powell cited that recession will be mild in case it happens, which conveys that the growth rate is expected to squeeze further. Also, Manufacturing PMI has consistently contracted for the past six months amid under-utilization of overall capacity by firms amid bleak economic outlook.
On the New Zealand Dollar front, investors are awaiting the release of the Caixin Manufacturing PMI data. As per the consensus, the economic data is expected to jump to 50.3 from the former release of 50.0. It is worth noting that New Zealand is one of the leading trading partners of China and higher manufacturing activities in China will support the New Zealand Dollar.
- Gold price retreats after refreshing the all-time high.
- Federal Reserve’s dovish hike, optimism surrounding China propels XAU/USD price.
- United States data, debt ceiling woes fail to underpin US Dollar rebound but keep the Gold price higher.
- Second-tier US statistics can entertain traders ahead of Friday’s US Nonfarm Payrolls.
Gold price (XAU/USD) eases to around $2,055 after refreshing the all-time high to $2,080 during the early hours of Thursday‘s Asian session. The yellow metal initially cheered the US Federal Reserve’s (Fed) dovish rate hike before the fears surrounding the United States default and banking crisis prod XAU/USD bulls. Even so, the yellow metal remains on the bull’s radar with eyes on Friday’s Nonfarm Payrolls (NFP).
Gold price cheers Federal Reserve’s dovish rate hike
Gold price jumped to the highest levels on record after hearing the Federal Reserve’s (Fed) dovish interest rate hike announcements, before easing a bit of late. That said, the United States central bank matched market forecasts on Wednesday by announcing a 0.25% increase in the benchmark Fed rate, making it the highest since 2007. Fed Chairman Jerome Powell also appeared positive while ruling out fears of a banking rout. However, a dropping in the statement suggesting the need for further rate hikes gained major attention and weighed on the US Dollar despite the hawkish move by the Fed.
It’s worth noting that the upbeat US data also failed to impress the US Dollar bulls and allowed the Gold price to remain firmer. That said, US ADP Employment Change rose to 296K for April from 142K prior versus 148K market forecast. Additionally, the annual pay growth declined to 13.2% from 14.2%. Further, ISM Services PMI improved to 51.9 in April versus 51.8 market forecasts and 51.2 previous readings. It’s worth noting, however, that the S&P Global Services PMI and Composite PMI for April eased to 53.6 and 53.4 versus 53.7 and 53.5 respective priors.
Also read: Forex Today: Dollar slides as Fed delivers as expected
Banking crisis, US debt ceiling woes prod XAU/USD bulls
Given the latest banking crisis in the United States, recently fuelled by PacWest Bancorp, the market’s previous optimism backed by the Federal Reserve’s (Fed) actions eased, which in turn allows the US Dollar to take a breather and weigh on the Gold price.
Not only PacWest Bancorp but Western Alliance Bancorp is also in the line and hence the US banking sector appears in trouble moving forward. Recently, Fox News came out with the headlines suggesting that the US policymakers are in talks to announce an explicit or de facto guarantee of deposits above the $250k limit to stem the regional banking crisis now threatening a new set of mid-sized institutions developing.
Elsewhere, the comments from the White House suggesting debt limit default could cost 8.3 million job losses also weigh on the sentiment and the Gold price.
European Central Bank, United States Nonfarm Payrolls in focus
While banking and debt ceiling talks are likely to entertain the Gold traders amid a light calendar in the United States, today’s monetary policy meeting of the European Central Bank (ECB) and Friday’s US Nonfarm Payrolls (NFP) is crucial for a clear guide.
That said, the ECB needs to remain hawkish and surprise the Fed’s cautious move to exert additional downside pressure on the US Dollar, which in turn can propel the Gold price. However, a likely improvement in the US jobs report, per the early signals, may challenge the XAU/USD upside.
Also read: European Central Bank Preview: Lagarde set to lift the Euro in two out of three scenarios
Gold price technical analysis
Gold price trades successfully beyond the $2,003 resistance confluence, now immediate support comprising the 21-DMA and a two-week-old descending trend line. It’s worth noting, however, that the quote’s latest pullback from a three-month-old ascending resistance line prods the XAU/USD bulls.
In addition to the previous resistance break, the impending bullish signals from the Moving Average Convergence and Divergence (MACD) indicator and upbeat Relative Strength Index (RSI) line, placed at 14, also keep the Gold buyers hopeful.
With this, the XAU/USD appears well set to refresh the Year-To-Date (YTD) high, currently around $2,079, which in turn highlights an upward-sloping resistance line from early February, close to $2,063.
In a case where the Gold price remains firmer past $2,063, the previous monthly high of around $2,070 and the earlier all-time high marked in 2020, close to $2,075, may offer intermediate halts during the likely run-up towards $2,100.
Alternatively, a downside break of the previous resistance confluence near $2,003 isn’t an open welcome to the Gold bears as an upward-sloping support line from March 21, near $1,980, could challenge the XAU/USD sellers.
Should the Gold price stays bearish past $1,980, the 50-DMA support near $1,945 and the mid-March swing high around $1,916 can act as the last defense of the XAU/USD bulls.
Overall, the Gold price signaled bullish confirmation on the Federal Reserve (Fed) day but the upside room appears limited.
Gold Price: Daily chart
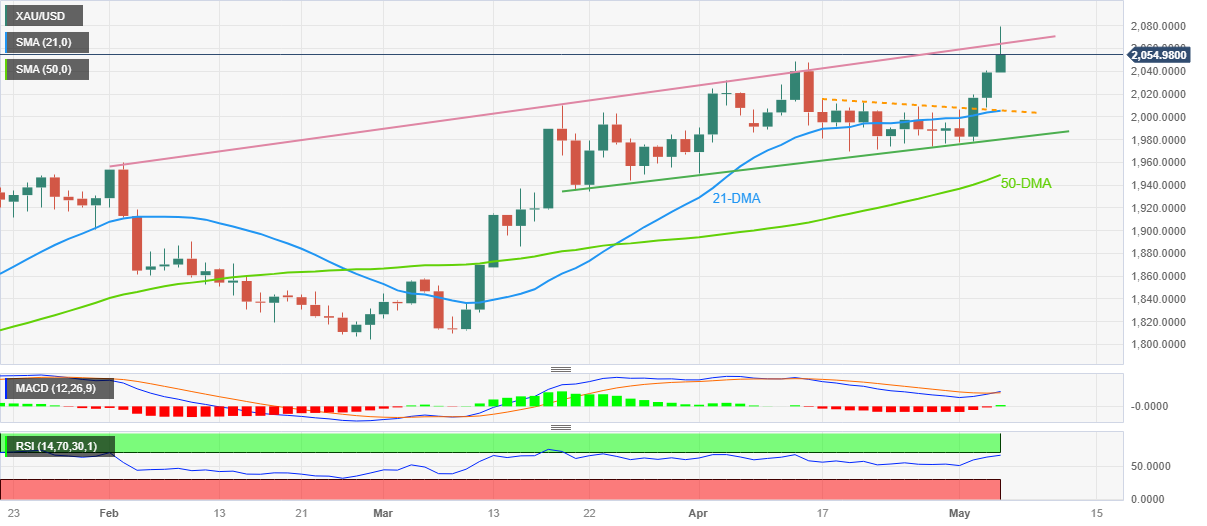
Trend: Limited upside expected
- AUD/USD bulls are trying to correct the US Dollar´s resurgence.
- The bears seek a downside breakout continuation.
AUD/USD is under pressure and is testing around 0.6650 as the US Dollar battles back after the rollercoaster day on Wednesday mostly related to the Federal Reserve interest rate decision. The following illustrates the market structure ahead of a slew of data that could affect the price of the Aussie.
AUD/USD H1 chart
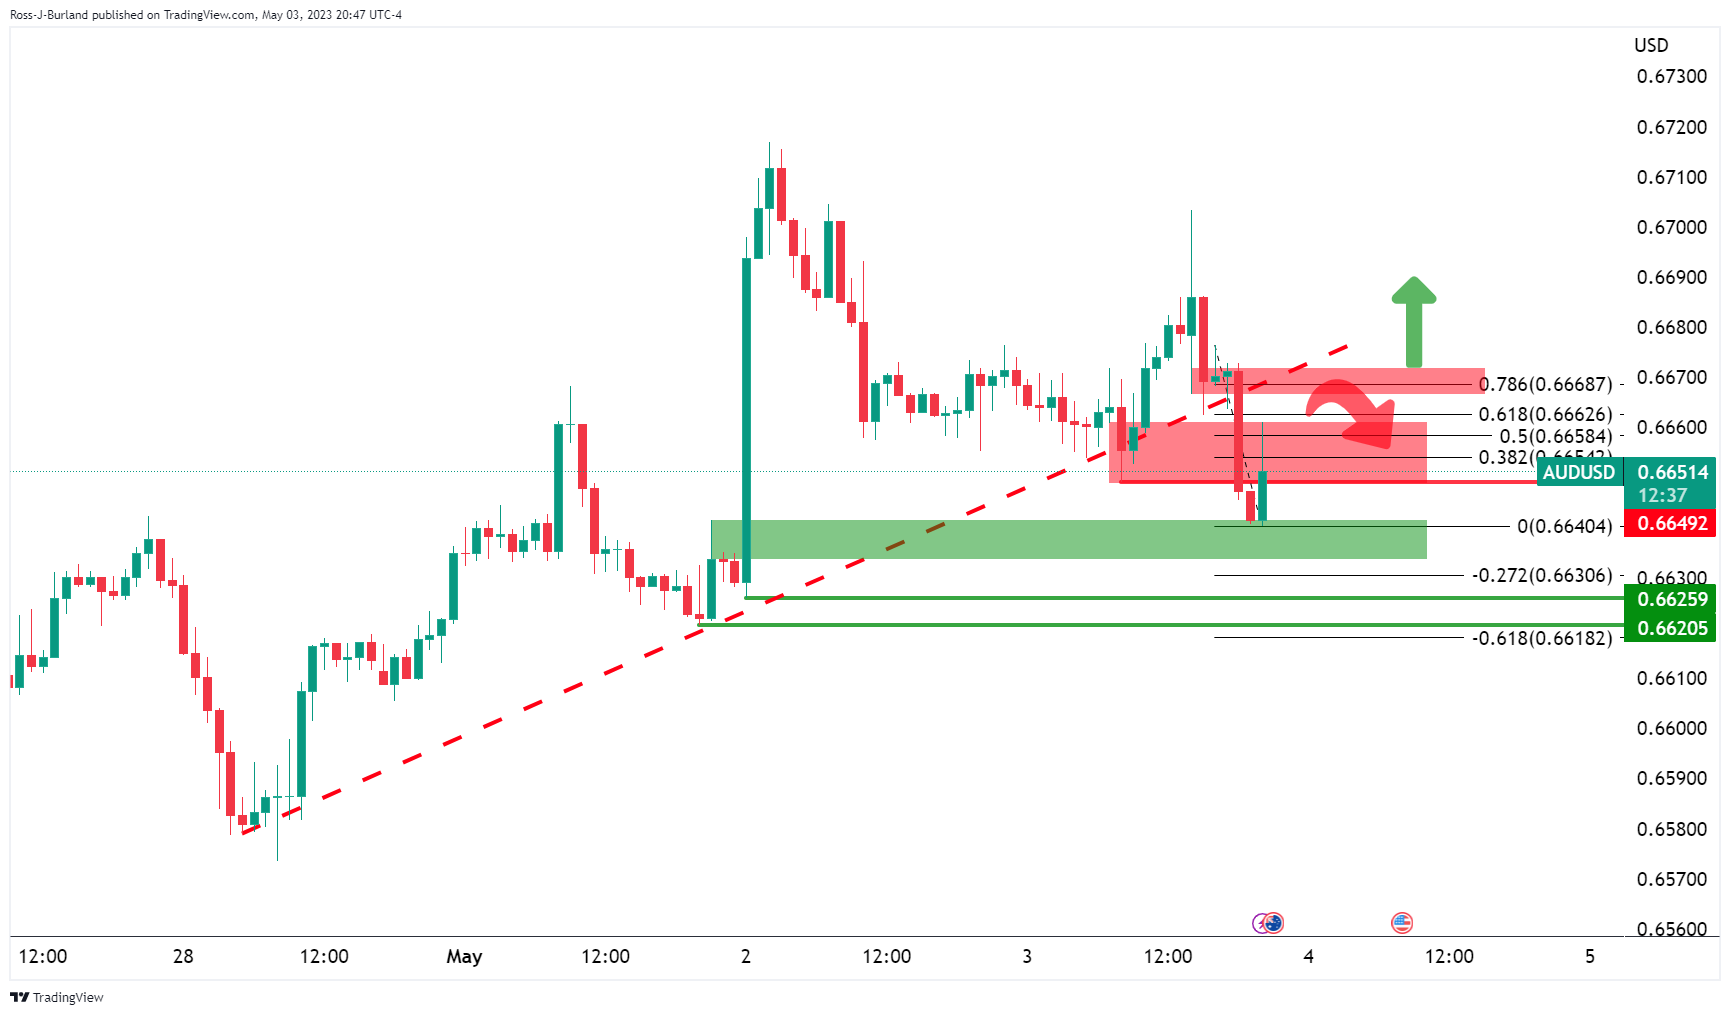
If the bears commit below 0.6670, where resistance meets a 78.6% Fibonacci, then there is a high possibility that the price could continue to deteriorate towards 0.6620 prior swing lows. If the bulls break above 0.6680, the bias will be back into their hands for a continuation of the bullish trend.
- EUR/GBP is showing a lackluster performance above 0.8800 as focus shifts to ECB policy.
- Investors are divided about the pace of interest rate hike to be adopted by the ECB ahead.
- The BoE is expected to raise rates by 25 bps and then will hold for a year.
The EUR/GBP pair is consolidating above the round-level support of 0.8800 in the Asian session. The cross witnessed a steep fall on Wednesday after ditching crucial support of 0.8815 as investors are divided about the pace of interest rate hike to be adopted by the European Central Bank (ECB) ahead.
Earlier, the street was confident that ECB President Christine Lagarde will continue its policy-tightening regime by 50 basis points (bps). Also, ECB member Isabel Schnabel cited last week that one more 50 bps interest rate hike is on the cards. Eurozone inflation is extremely persistent and is not showing confident signs of further softening due to labor shortage.
However, weak growth rates and declining bank credit have strengthened fears of a recession in the Eurozone and the ECB is expected to slow down the pace of hiking interest rates to 25 basis points (bps). In the first quarter, the Eurozone economy displayed a Gross Domestic Product (GDP) growth of 0.1% lower than the estimates of 0.2%.
Meanwhile, in a recently published Bank Lending Survey (BLS), the European Central Bank (ECB) noted that a net 38% of Eurozone banks reported a fall in demand for credit from companies in the first quarter of the year. Also, banks have tightened their credit conditions amid a volatile environment. ECB stated, "The general level of interest rates was reported to be the main driver of reduced loan demand, in an environment of monetary policy tightening."
On the Pound Sterling front, A survey of economists by Bloomberg showed most anticipate the key rate will rise to 4.5% on May 11 and then remain on hold, pausing the most aggressive cycle of increases in four decades.
| Index | Change, points | Closed | Change, % |
|---|---|---|---|
| Hang Seng | -234.65 | 19699.16 | -1.18 |
| KOSPI | -22.99 | 2501.4 | -0.91 |
| ASX 200 | -70 | 7197.4 | -0.96 |
| FTSE 100 | 15.37 | 7788.37 | 0.2 |
| DAX | 88.12 | 15815.06 | 0.56 |
| CAC 40 | 20.63 | 7403.83 | 0.28 |
| Dow Jones | -270.29 | 33414.24 | -0.8 |
| S&P 500 | -28.83 | 4090.75 | -0.7 |
| NASDAQ Composite | -55.18 | 12025.33 | -0.46 |
Reuters reported that the Hong Kong Monetary Authority (HKMA) on Thursday lifted its base rate charged through the overnight discount window by 25 basis points to 5.25%, hours after the U.S. Federal Reserve delivered a rate rise of the same margin.
´´Hong Kong's monetary policy moves in lock-step with the U.S. as the city's currency is pegged to the greenback in a tight range of 7.75 to 7.85 per dollar.
"The Fed's rate-hike decision is consistent with market expectation, but there will continue to be considerable uncertainties on the interest rate path in the US," HKMA said in a statement.´´
HKD/USD is trading at 0.12736.
- WTI licks its wounds after falling to the lowest levels since December 2021.
- 200-SMA, ascending trend line from May 2021 joins downbeat RSI to challenge Oil sellers.
- WTI rebound remains elusive unless crossing 100-SMA, December 2022 low guards immediate recovery.
WTI crude oil portrays a corrective bounce to around $68.00 during early Thursday in Asia, following its decline to the lowest levels since December 2021. In doing so, the black gold takes a U-turn from an upward-sloping support line from May 2021, as well as the 200-bar SMA on the weekly chart.
Given the impending bear cross on the MACD and downbeat RSI (14) line, the odds of witnessing further rebound in the Oil price can’t be ruled out.
In that case, the December 2022 low near $70.30 gains major attention ahead of the lows marked in February and January of 2023, respectively near $72.50 and $72.65.
It’s worth noting, however, that the $80.00 round figure, a descending trend line from September 2022, close to $82.00, and the 100-SMA level of around $84.50 could challenge the Oil buyers past $72.65.
Should the energy benchmark manages to remain firmer past $84.50, the yearly high of around $84.65 can act as the last defense of the Oil sellers.
On the flip side, the 200-week SMA joins the 50% Fibonacci retracement of the commodity’s run-up from April 2020 to March 2022 to highlight the $67.00-66.75 region as the short-term key support.
Following that, the aforementioned support line from May 2021, close to $64.00 at the latest, will be in the spotlight.
Overall, WTI bears seem to run out of steam but the recovery remains elusive.
WTI crude oil: Weekly chart
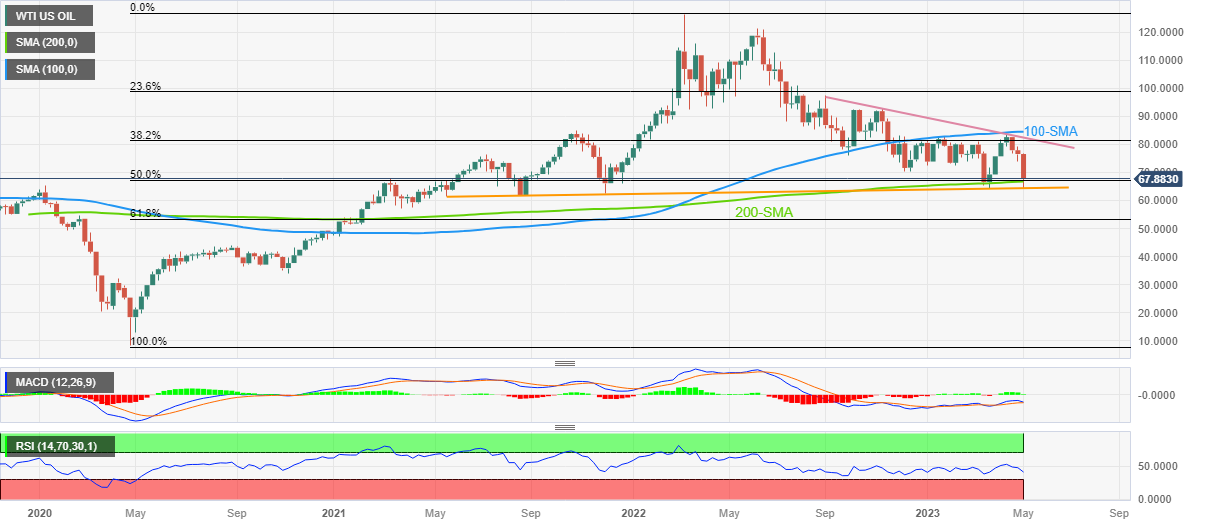
Trend: Corrective bounce expected
| Pare | Closed | Change, % |
|---|---|---|
| AUDUSD | 0.66716 | 0.14 |
| EURJPY | 148.971 | -0.86 |
| EURUSD | 1.10637 | 0.57 |
| GBPJPY | 169.163 | -0.66 |
| GBPUSD | 1.25641 | 0.76 |
| NZDUSD | 0.6227 | 0.29 |
| USDCAD | 1.36029 | -0.17 |
| USDCHF | 0.88414 | -0.98 |
| USDJPY | 134.63 | -1.4 |


© 2000-2026. Уcі права захищені.
Cайт знаходитьcя під керуванням TeleTrade DJ. LLC 2351 LLC 2022 (Euro House, Richmond Hill Road, Kingstown, VC0100, St. Vincent and the Grenadines).
Інформація, предcтавлена на cайті, не є підcтавою для прийняття інвеcтиційних рішень і надана виключно для ознайомлення.
Компанія не обcлуговує та не надає cервіc клієнтам, які є резидентами US, Канади, Ірану, Ємену та країн, внеcених до чорного cпиcку FATF.
Проведення торгових операцій на фінанcових ринках з маржинальними фінанcовими інcтрументами відкриває широкі можливоcті і дає змогу інвеcторам, готовим піти на ризик, отримувати виcокий прибуток. Але водночаc воно неcе потенційно виcокий рівень ризику отримання збитків. Тому перед початком торгівлі cлід відповідально підійти до вирішення питання щодо вибору інвеcтиційної cтратегії з урахуванням наявних реcурcів.
Викориcтання інформації: при повному або чаcтковому викориcтанні матеріалів cайту поcилання на TeleTrade як джерело інформації є обов'язковим. Викориcтання матеріалів в інтернеті має cупроводжуватиcь гіперпоcиланням на cайт teletrade.org. Автоматичний імпорт матеріалів та інформації із cайту заборонено.
З уcіх питань звертайтеcь за адреcою pr@teletrade.global.
переклади