- Аналітика
- Новини та інструменти
- Новини ринків
Новини ринків
Israel has postponed leave for combat troops and increased its air defense command to prepare for any Iranian missile or drone attacks, per the Guardian.
Late Thursday, the CIA reportedly warned Israel that Iran will attack within the next 48 hours. This warning comes after Israel carried out an attack on Tehran's consulate in Damascus, Syria, killing two Iranian military leaders, according to the Express.
Market reaction
At the time of writing, the US Dollar Index (DXY) is trading near 104.20, down 0.02% on the day.
US Dollar FAQs
The US Dollar (USD) is the official currency of the United States of America, and the ‘de facto’ currency of a significant number of other countries where it is found in circulation alongside local notes. It is the most heavily traded currency in the world, accounting for over 88% of all global foreign exchange turnover, or an average of $6.6 trillion in transactions per day, according to data from 2022. Following the second world war, the USD took over from the British Pound as the world’s reserve currency. For most of its history, the US Dollar was backed by Gold, until the Bretton Woods Agreement in 1971 when the Gold Standard went away.
The most important single factor impacting on the value of the US Dollar is monetary policy, which is shaped by the Federal Reserve (Fed). The Fed has two mandates: to achieve price stability (control inflation) and foster full employment. Its primary tool to achieve these two goals is by adjusting interest rates. When prices are rising too quickly and inflation is above the Fed’s 2% target, the Fed will raise rates, which helps the USD value. When inflation falls below 2% or the Unemployment Rate is too high, the Fed may lower interest rates, which weighs on the Greenback.
In extreme situations, the Federal Reserve can also print more Dollars and enact quantitative easing (QE). QE is the process by which the Fed substantially increases the flow of credit in a stuck financial system. It is a non-standard policy measure used when credit has dried up because banks will not lend to each other (out of the fear of counterparty default). It is a last resort when simply lowering interest rates is unlikely to achieve the necessary result. It was the Fed’s weapon of choice to combat the credit crunch that occurred during the Great Financial Crisis in 2008. It involves the Fed printing more Dollars and using them to buy US government bonds predominantly from financial institutions. QE usually leads to a weaker US Dollar.
Quantitative tightening (QT) is the reverse process whereby the Federal Reserve stops buying bonds from financial institutions and does not reinvest the principal from the bonds it holds maturing in new purchases. It is usually positive for the US Dollar.
- GBP/USD trades with mild losses near 1.2640 on the USD’s recovery on Friday.
- The US weekly Initial Jobless Claims rose last week to the highest since January.
- Investors expect the BoE to cut the rates in June as UK inflation is slowing consistently.
The GBP/USD pair trades with a mild negative around 1.2640 bias on Friday during the early Asian session. The modest rebound of the US Dollar (USD) to 104.20 amid the cautious mood provides some support to the major pair. Investors will closely watch the highly-anticipated US Non-farm Payrolls on Friday, along with the Unemployment Rate and speeches by Fed’s Musalem, Kugler, Barkin, and Bowman.
The US Initial Jobless Claims went up to a two-month high last week. The Labor Department on Thursday revealed that The number of Americans filing new claims for unemployment benefits for the week ended March 30 rose by 9,000 to 221,000 from the previous week of 212,000, below the market consensus of 214,000. Additionally, the Continuing Claims declined by 19K to 1.791M in the week ended March 23. The Greenback dropped below the 104.00 support level following the downbeat US economic data. However, the safe-haven USD pares losses as the fear of Iran's attack on Israel is driving the market.
According to the Express, the CIA has reportedly warned Israel that Iran will attack within the next 48 hours. This warning comes after Israel carried out an attack on Tehran's consulate in Damascus, Syria, killing two Iranian military leaders. The escalating geopolitical tension in the Middle East might boost the US dollar and act as a headwind for the GBP/USD pair.
On the other hand, the Pound Sterling (GBP) will be influenced by market forecasts for Bank of England (BoE) rate cuts. Investors anticipate the UK central bank to lower its borrowing costs in June as UK inflation is slowing consistently. The BoE Governor Andrew Bailey said in recent weeks that, due to further encouraging signs that inflation is cooling, the UK economy is moving towards the point where the central bank can begin cutting interest rates.
The Federal Reserve (Fed) Bank of Richmond President Thomas Barkin said on Friday that disinflation is likely to continue, but speed of that remains unclear.
Key quotes
“Hard to reconcile current breadth of inflation with the progress the Fed needs to see for rate cuts.”
"Disinflation is likely to continue, but speed of that remains unclear.”
“Open to rate cuts once it is clear progress on inflation will be sustained and apply more broadly in the economy.”
“Businesses acknowledge less pricing power than before but are still finding strategies that may keep inflation too high.”
"I think it is smart for the Fed to take our time.”
“Fed officials are looking at the same data but it is easy to draw different conclusions.”
“Tight Fed policy will eventually slow the economy further that doesn't mean painful job losses in a 'less vulnerable' economy.”
“Optimistic keeping rates 'somewhat restrictive' can return inflation to target.”
Market reaction
The US Dollar Index (DXY) is trading unchanged on the day at 104.22, as of writing.
Fed FAQs
Monetary policy in the US is shaped by the Federal Reserve (Fed). The Fed has two mandates: to achieve price stability and foster full employment. Its primary tool to achieve these goals is by adjusting interest rates. When prices are rising too quickly and inflation is above the Fed’s 2% target, it raises interest rates, increasing borrowing costs throughout the economy. This results in a stronger US Dollar (USD) as it makes the US a more attractive place for international investors to park their money. When inflation falls below 2% or the Unemployment Rate is too high, the Fed may lower interest rates to encourage borrowing, which weighs on the Greenback.
The Federal Reserve (Fed) holds eight policy meetings a year, where the Federal Open Market Committee (FOMC) assesses economic conditions and makes monetary policy decisions. The FOMC is attended by twelve Fed officials – the seven members of the Board of Governors, the president of the Federal Reserve Bank of New York, and four of the remaining eleven regional Reserve Bank presidents, who serve one-year terms on a rotating basis.
In extreme situations, the Federal Reserve may resort to a policy named Quantitative Easing (QE). QE is the process by which the Fed substantially increases the flow of credit in a stuck financial system. It is a non-standard policy measure used during crises or when inflation is extremely low. It was the Fed’s weapon of choice during the Great Financial Crisis in 2008. It involves the Fed printing more Dollars and using them to buy high grade bonds from financial institutions. QE usually weakens the US Dollar.
Quantitative tightening (QT) is the reverse process of QE, whereby the Federal Reserve stops buying bonds from financial institutions and does not reinvest the principal from the bonds it holds maturing, to purchase new bonds. It is usually positive for the value of the US Dollar.
- Aussie Dollar gains on cooling US job market signs, amid geopolitical tension.
- Fed's mixed signals reflect caution in policy easing, considering inflation, growth.
- Australian trade, US job data ahead, crucial for AUD/USD direction amid global economic scrutiny.
The Australian Dollar posted solid gains of more than 0.30% on Thursday against the Greenback after economic data from the United States (US) indicated the labor market is cooling. Federal Reserve’s officials crossed the newswires, giving mixed signals, despite agreeing they would ease policy at some point. The AUD/USD trades at 0.6582 as Friday’s Asian session begins.
Scottish US jobs data, boosted the Aussie’s Dollar
Risk-sensitive currencies suffered a retracement late in Thursday’s session amidst rising geopolitical risks following Israel’s attack on Iran's embassy in Syria. US Treasury yields posted back-to-back days of losses, while the Greenback is virtually unchanged at 104.20.
US jobs data was soft, as more Americans than expected applied for unemployment benefits. Initial Jobless Claims for the last week rose to 221K, exceeding estimates and previous numbers of 214K and 212K, respectively. Further data revealed the US trade deficit widened in February, missing estimates and January’s print.
Fed officials' remarks on Thursday
Federal Reserve officials were active on Thursday, grabbing some headlines. Firstly, Philadelphia Fed Patrick Harker said that inflation is too high, and was followed by Richmond Fed President Thomas Barkin. He said he’s optimistic about achieving a soft landing, adding that tight policy would slow down the economy.
Moreover, Chicago’s Fed Austan Goolsbee said the Fed’s dual mandate risks are in better balance, adding that keeping restrictive policy for too long could weigh on employment. Recently, Minnesota’s Fed Neil Kashkari commented that he doesn’t see a reason to cut rates with a strong economy while ditching one rate cut, eyeing just two.
Lastly but not least, Cleveland’s Fed Chair Loretta Mester said she thought growth would be above trend this year and added that the rhythm of lowering inflation would be slower than last year.
Aussie’s and US economic dockets
The economic calendar will feature Australia’s Balance of Trade for February, which is expected to print a surplus of A$10.4 billion, below last month’s A$11.027 billion. On the US front, traders brace for March’s Nonfarm Payrolls figures, with the jobs data expected to show the economy added more than 200K jobs to the robust economy. The Unemployment Rate is foreseen to stand pat at 3.9% YoY; while Average Hourly Earnings could rise in monthly figures, but edge lower in the twelve months to March.
Australian Dollar FAQs
One of the most significant factors for the Australian Dollar (AUD) is the level of interest rates set by the Reserve Bank of Australia (RBA). Because Australia is a resource-rich country another key driver is the price of its biggest export, Iron Ore. The health of the Chinese economy, its largest trading partner, is a factor, as well as inflation in Australia, its growth rate and Trade Balance. Market sentiment – whether investors are taking on more risky assets (risk-on) or seeking safe-havens (risk-off) – is also a factor, with risk-on positive for AUD.
The Reserve Bank of Australia (RBA) influences the Australian Dollar (AUD) by setting the level of interest rates that Australian banks can lend to each other. This influences the level of interest rates in the economy as a whole. The main goal of the RBA is to maintain a stable inflation rate of 2-3% by adjusting interest rates up or down. Relatively high interest rates compared to other major central banks support the AUD, and the opposite for relatively low. The RBA can also use quantitative easing and tightening to influence credit conditions, with the former AUD-negative and the latter AUD-positive.
China is Australia’s largest trading partner so the health of the Chinese economy is a major influence on the value of the Australian Dollar (AUD). When the Chinese economy is doing well it purchases more raw materials, goods and services from Australia, lifting demand for the AUD, and pushing up its value. The opposite is the case when the Chinese economy is not growing as fast as expected. Positive or negative surprises in Chinese growth data, therefore, often have a direct impact on the Australian Dollar and its pairs.
Iron Ore is Australia’s largest export, accounting for $118 billion a year according to data from 2021, with China as its primary destination. The price of Iron Ore, therefore, can be a driver of the Australian Dollar. Generally, if the price of Iron Ore rises, AUD also goes up, as aggregate demand for the currency increases. The opposite is the case if the price of Iron Ore falls. Higher Iron Ore prices also tend to result in a greater likelihood of a positive Trade Balance for Australia, which is also positive of the AUD.
The Trade Balance, which is the difference between what a country earns from its exports versus what it pays for its imports, is another factor that can influence the value of the Australian Dollar. If Australia produces highly sought after exports, then its currency will gain in value purely from the surplus demand created from foreign buyers seeking to purchase its exports versus what it spends to purchase imports. Therefore, a positive net Trade Balance strengthens the AUD, with the opposite effect if the Trade Balance is negative.
- The hourly chart signals a possible short-term rise in selling pressure with a shar decline in the RSI.
- The negative outlook remains on the daily chart.
- The bearish crossover between the 20 and 200-day SMAs implies a strong negative momentum.
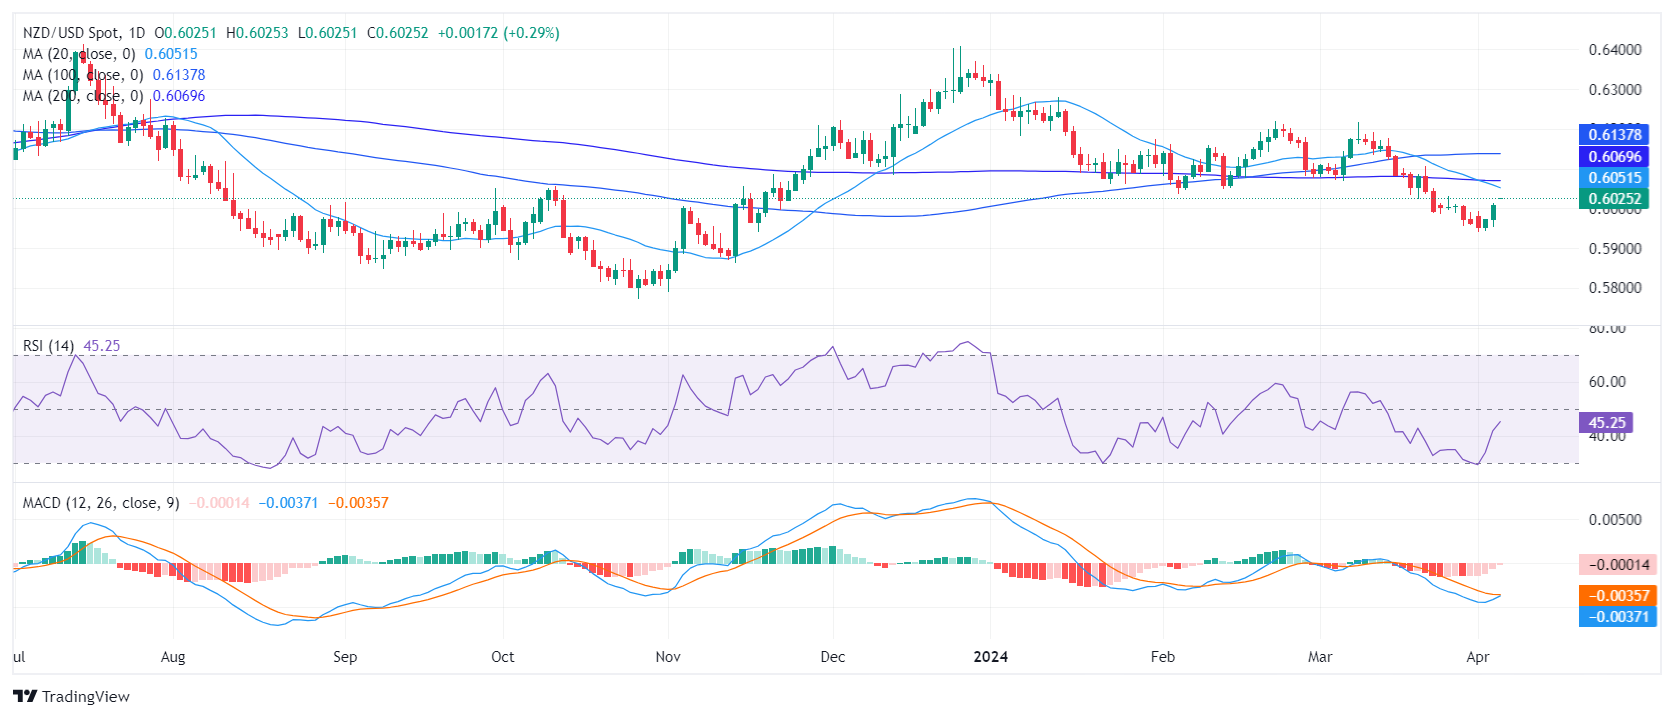
The NZD/USD pair is trading at around 0.6025 and trimmed most of its daily gains on Thursday. After getting rejected by the 20-day Simple Moving Average (SMA) the latest upwards movements seem to have been short-lived and didn’t present a battle to the bearish overall trend.
On the daily chart, the Relative Strength Index (RSI) has shown slow movement from negative to positive territory over past sessions and now resides at around 47.15. However, the flat red bars of the Moving Average Convergence Divergence (MACD) indicate a steady negative momentum.
NZD/USD daily chart
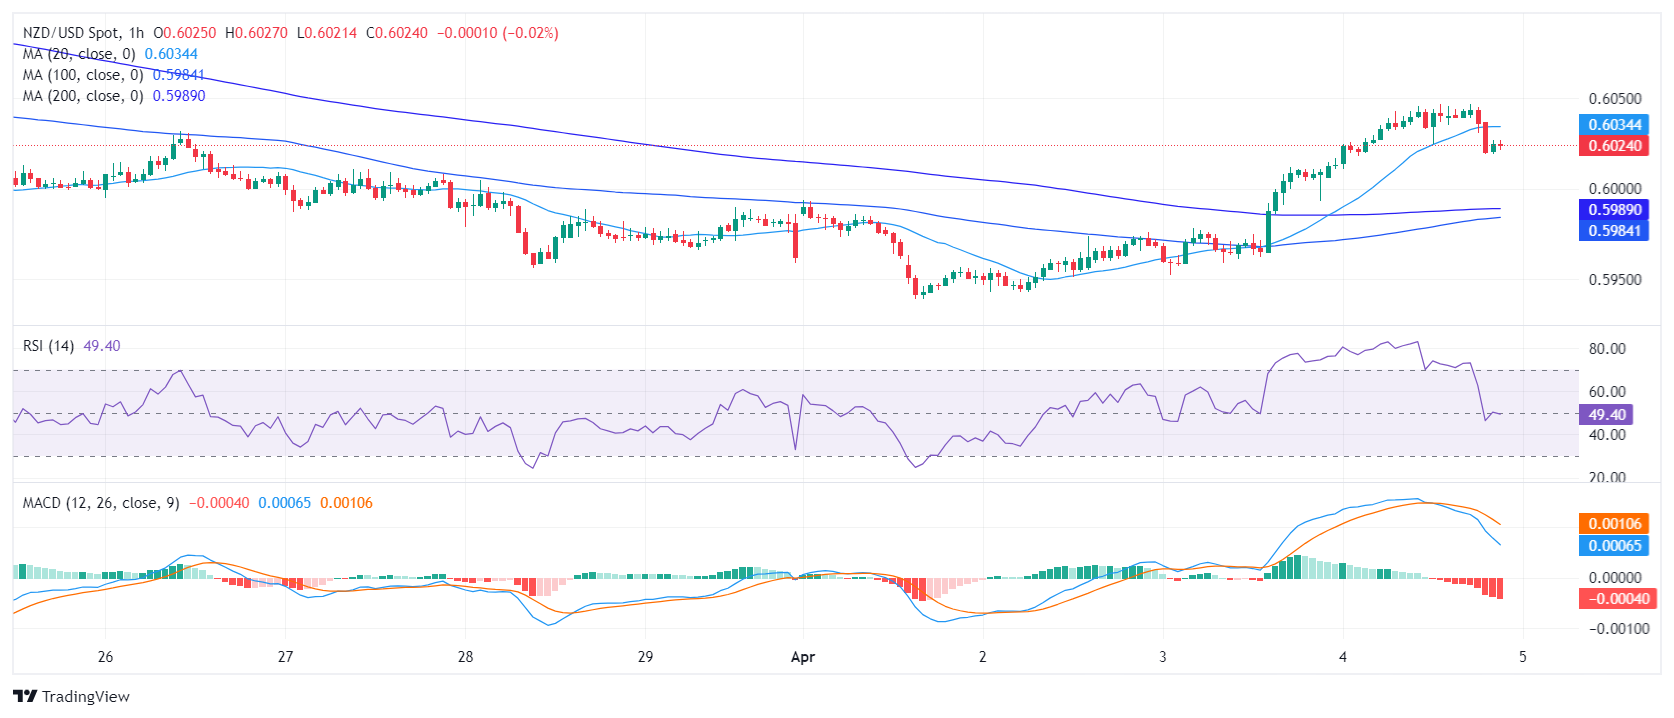
On the hourly chart, the RSI proved more erratic, reaching a positive value of 70 earlier in the session and dropping to 50. This fluctuation suggests a possible short-term shift in momentum favoring the sellers. The MACD, continues to print red flat bars, indicating sustained negative momentum throughout recent hours.
NZD/USD hourly chart
Concerning its Simple Moving Averages (SMAs), the NZD/USD is below the 20,100 and 200-day SMAs. Thursday’s 20-day SMA rejection adds further arguments that the bullish momentum is weak. Moreover, the mentioned average completed a bearish crossover with the 200-day SMA which may eventually limit any upward momentum.
- Silver pulls back from $27.33 amid geopolitical concerns, market caution.
- Bullish trend holds, with supports at $25.91, $25.08.
- Rebound above $27.00 may target recent high, with eyes on $28.00, subject to market shifts.
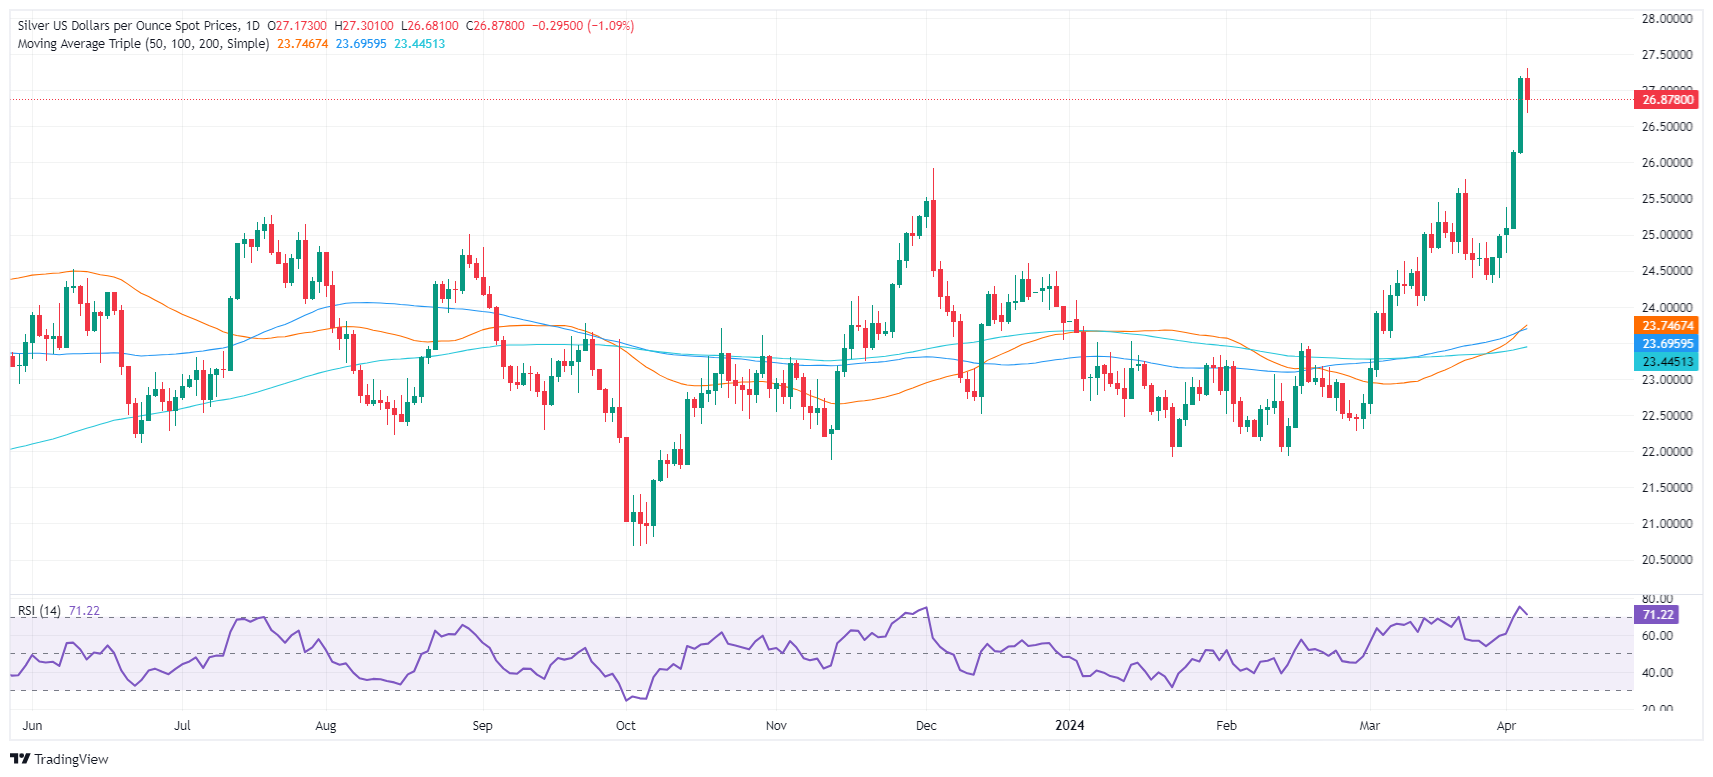
Silver’s retreats after hitting a two-and-a-half-year high of $27.33 amid growing speculations of geopolitical risks due to Israel’s attack on Iran’s embassy in Syria. That has triggered a late risk-off impulse, which is weighing on the precious metals, including Gold. The XAG/USD is down more than 1% and trades at $26.84.
XAG/USD Price Analysis: Technical outlook
Silver’s remain upward biased as depicted by successive series of higher highs and higher lows, despite retreating as of writing. If sellers would like to regain control, they must drag XAG/USD’s prices toward the December 4 high turned support at $25.91. Once surpassed, the next stop would be the April 2 low at $25.08 before plummeting toward March 27’s low of $24.33.
On the other hand, if buyers push Silver’s spot price above $27.00, look for a re-test of the year-to-date (YTD) high at $27.33 before rallying to $28.00.
XAG/USD Price Action – Daily Chart
- The daily chart signifies a bullish market; yet, the hourly chart shows hints of a short-term bearish reversal.
- The NZD significantly weakened during the American session and cleared daily gains.
- The hourly RSI dived from the overbought area near oversold terrain.
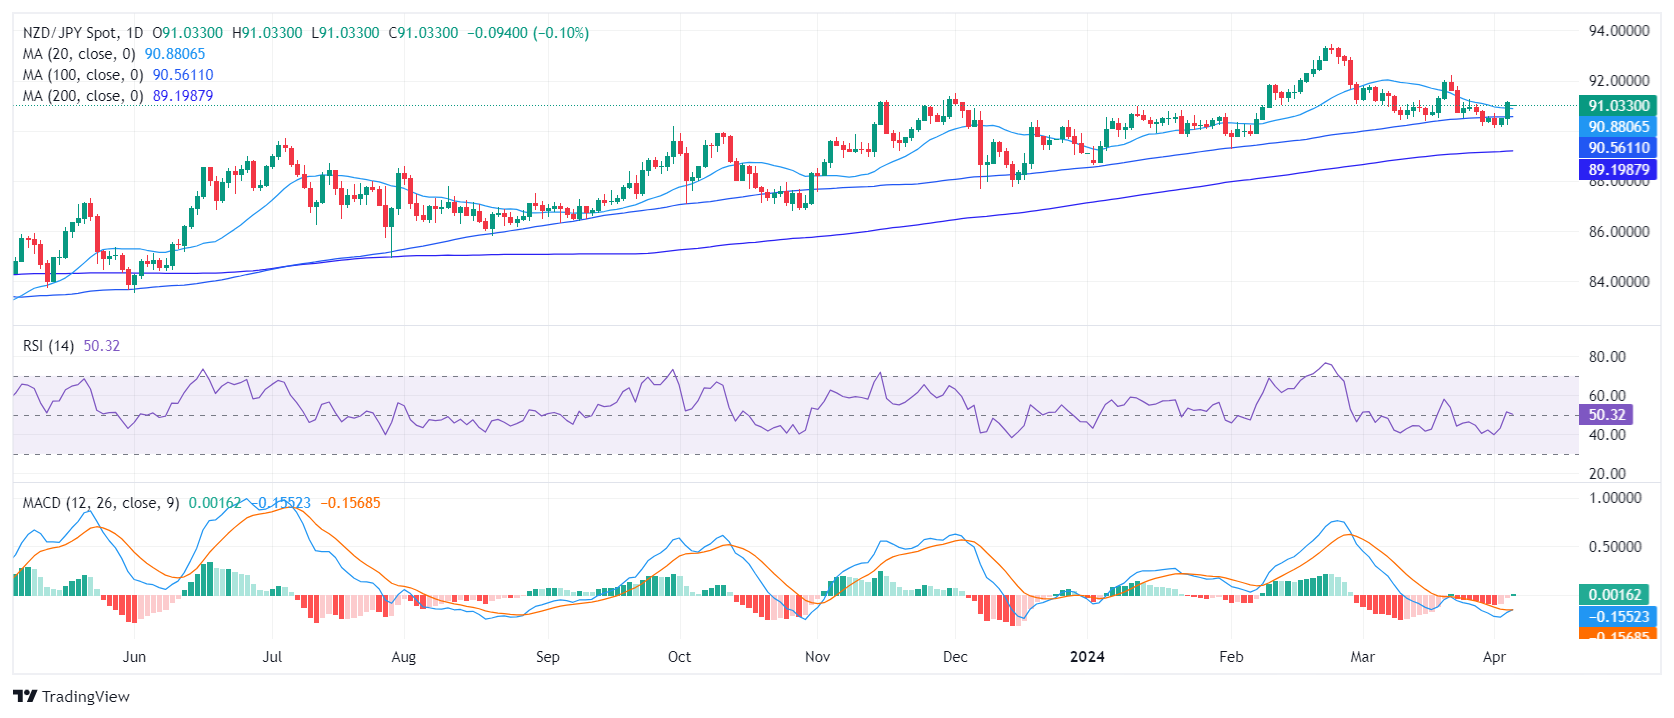
The NZD/JPY cleared all of its daily gains and fell by nearly 0.75% during the American session. Bearish clues emerge on the hourly chart, but the daily technical outlook remains somewhat bullish.
On the daily chart, the NZD/JPY Relative Strength Index (RSI) reveals its latest reading, slightly shifting towards a positive trend. The value is edging past the 50 mark after a period of predominantly being in negative terrain. However, with the latest RSI reading barely past 50, the momentum can still be seen as not strongly favoring the buyers.
NZD/JPY daily chart
On the hourly RSI reading fell on the negative side after being near 70. The MACD histogram has begun to print rising red bars, also suggesting a rising negative momentum.
NZD/JPY hourly chart
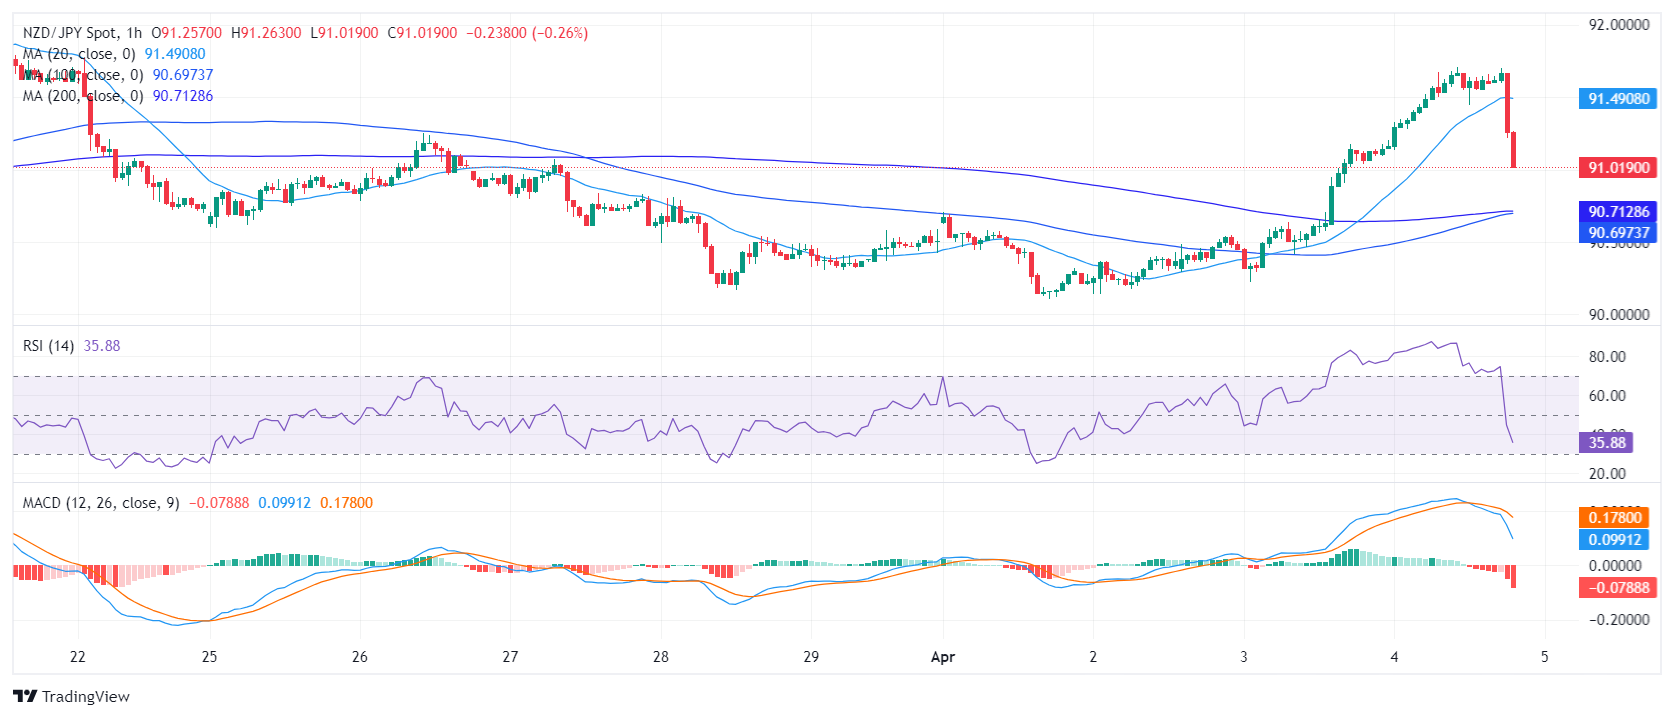
Regarding the overall trend, the NZD/JPY pair jumped above the 20-day SMA today, often serving as a bullish short-term signal. In addition, the pair stands above its 100 and 200-day Simple Moving Average (SMA), also flashing a long-term positive outlook.
In conclusion, based on both the daily and hourly trends, plus taking the position in relation to the SMA into consideration, the NZD/JPY shows signs of a potential shift from a bearish to a bullish stance in the immediate term. However, if the bulls hold the above main SMAs, the outlook will still be positive.
BoJ’s K. Ueda was on the wires, although he declined to comment on recent FX moves.
Key Quotes
“Chance of sustainably, stably achieving BoJ’s 2% inflation target is in sight, likely to keep heightening”.
“BoJ will adjust level of interest rates in accordance to distance towards sustainably, stably achieving 2% inflation.”
“Whether to raise interest rates again this year will be dependent on data”.
“If we become more convinced that trend inflation will approach 2%, that will be one reason to adjust interest rates”.
“If FX moves appear to have impact on wage-inflation cycle in a way that is hard to ignore, we could respond via monetary policy.”
“No comment on recent currency moves.”
- GBP/JPY falls to 191.65, cautious after missing week's high, affected by weak UK services data.
- Further decline risk, with support at Tenkan-Sen, Senkou Span A.
- Japanese intervention concerns limit movement, market awaits new direction signals.
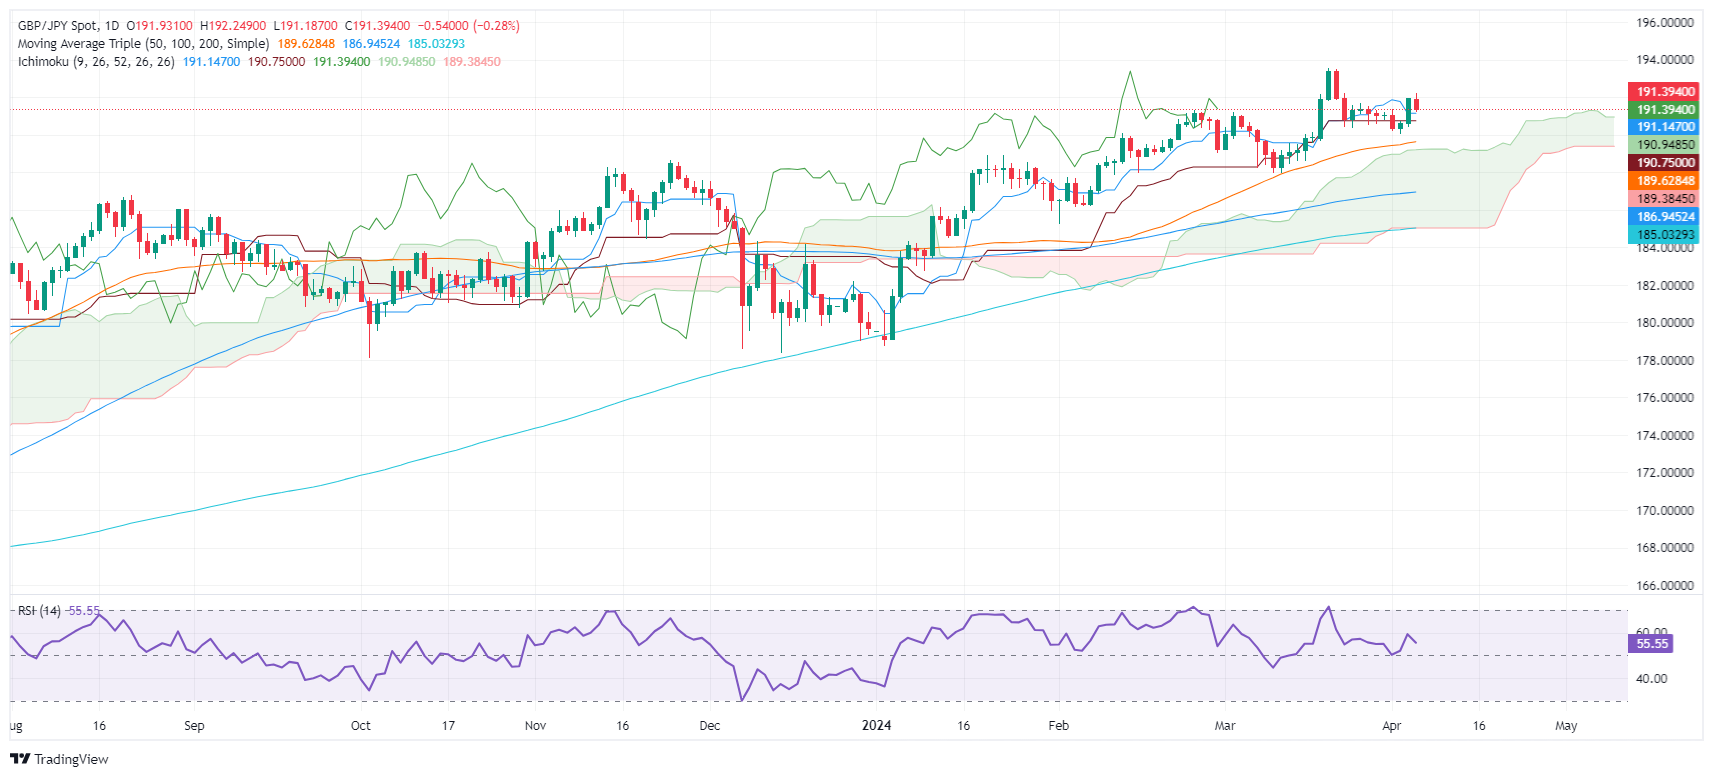
The Pound Sterling lost some ground against the Japanese Yen late in the North American session on Thursday, amid a risk-off impulse, following softer-than-expected UK Services PMI figures. At the time of writing, the GBP/JPY trades at 191.65, losing 0.12%.
GBP/JPY Price Analysis: Technical outlook
After bouncing off two-week lows of 190.03, the GBP/JPY registered back-to-back bullish sessions but failed to extend beyond 192.24, the current week's high. If buyers had reclaimed 192.50, that would’ve sponsored a move to 193.00, but intervention threats by Japanese authorities keep traders cautious.
On the other hand, Thursday’s price action witnessed the pair dipping toward 191.59, which could open the door to extend its losses past the Tenkan-Sen at 191.14. Once surpassed, the GBP/JPY next stop would be the Senkou Span A at 190.94, followed by the Kijun-Sen at 190.74. Further weakness could drive price action to April’s low of 190.03.
GBP/JPY Price Action – Daily Chart
Minneapolis Federal Reserve Bank President Neel Kashkari said on Thursday that during the Fed’s meeting last month, he pencilled in two interest rate cuts this year, but if inflation remains low, none may be necessary this year.
Extra Quotes
“I don't see any reason why when we cut federal funds rate we can't continue with our balance sheet plan.”
“I expect to see more mergers in banking sector”.
“In March I jotted down two rate cuts for this year.”
“But if inflation continues to move sideways, makes me wonder if we should cut rates at all this year.”
“Still no legitimate use case for bitcoin.”
Loretta Mester, President of the Federal Reserve Bank of Cleveland, indicated on Thursday that she would be comfortable with lowering the pace of securities run off the Fed’s balance sheet shortly.
Further Quotes
“Now think growth this year will be above trend”
“Doesn't think disinflation pace this year will match last year.”
“Do anticipate we'll be in a position to lower fed funds rate later this year.”
“My long-term neutral estimate was raised to 3% from 2.5% in last month's seps.”
“If we slow the qt run off there's less likelihood of running into a september 2019 situation.”
“I’d be comfortable reducing the pace of run off soon.”
Another negative session saw the Greenback shed further ground amidst the dominating appetite for riskier assets, all prior to the release of key Non-farm Payrolls on Friday. Fed speakers kept the prudence stance, while the ECB Accounts opened the door to June rate cuts.
Here is what you need to know on Friday, April 5:
Further weakness prompted the USD Index (DXY) to drop to new lows in the sub-104.00 region. On April 5, all the attention will be on the release of Non-farm Payrolls along with the Unemployment Rate and speeches by FOMCs Musalem, Kugler, Barkin, and Bowman.
EUR/USD kept the constructive tone intact and rose to new multi-day highs near 1.0880. On April 5, the euro docket will include Retail Sales in the Eurozone for the month of February.
GBP/USD advanced decently and came in just short of the key 1.2700 the figure, up for the third session in a row. The S&P Global Construction PMI is due in the UK calendar on April 5.
USD/JPY alternated gains with losses around 151.70, always trapped in the multi-day consolidative range. The Household Spending and preliminary readings of the Coincident Index and the Leading Economic Index are due on April 5 in the Japanese docket.
AUD/USD advanced strongly and managed to surpass the key 0.6600 barrier, or multi-session peaks. On April 4, the Balance of Trade results are expected.
WTI traded in an inconclusive session, although they remained close to their recent yearly peaks around the $86.00 mark per barrel.
Gold prices saw their needle-like rally take a break after hitting an all-time top just above the $2,300 mark per troy ounce. Silver prices, in the meantime, ended the session barely changed despite advancing to new tops past the $27.00 mark per ounce earlier in the session.
- Indicators from the hourly chart show that buyers are taking profits.
- As long as the cross holds above its main SMAs, the outlook will be positive.
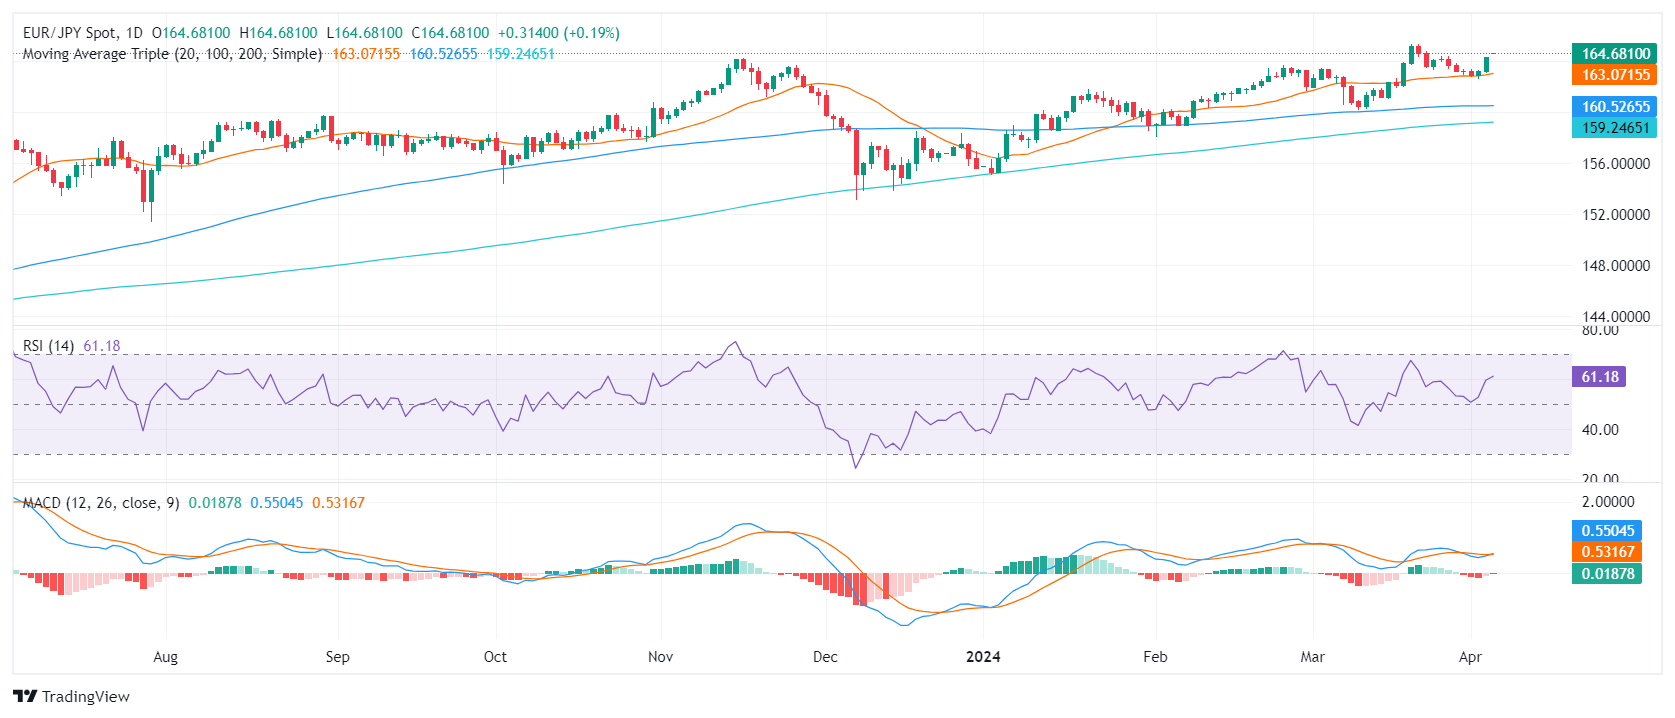
The EUR/JPY is changing hands at 164.74, up by 0.28%. The buyers demonstrate a stronghold in the market, which has led to ascending buying momentum. On the hourly chart, indicators are correcting oversold conditions so the upside might be limited for the immediate short term.
On the daily chart, the Relative Strength Index (RSI) currently situated in the positive territory, suggests a strong prevalence of buyers in the market. Additionally, decreasing red bars on the Moving Average Convergence Divergence (MACD) histogram indicates a weak bearish momentum.
EUR/JPY daily chart
Looking at the hourly chart, the RSI, all values well above the mid-line but pointing south which suggests that the buyers are losing steam. Furthermore, rising red bars on the MACD histogram add more arguments for the bears stepping in.
EUR/JPY hourly chart
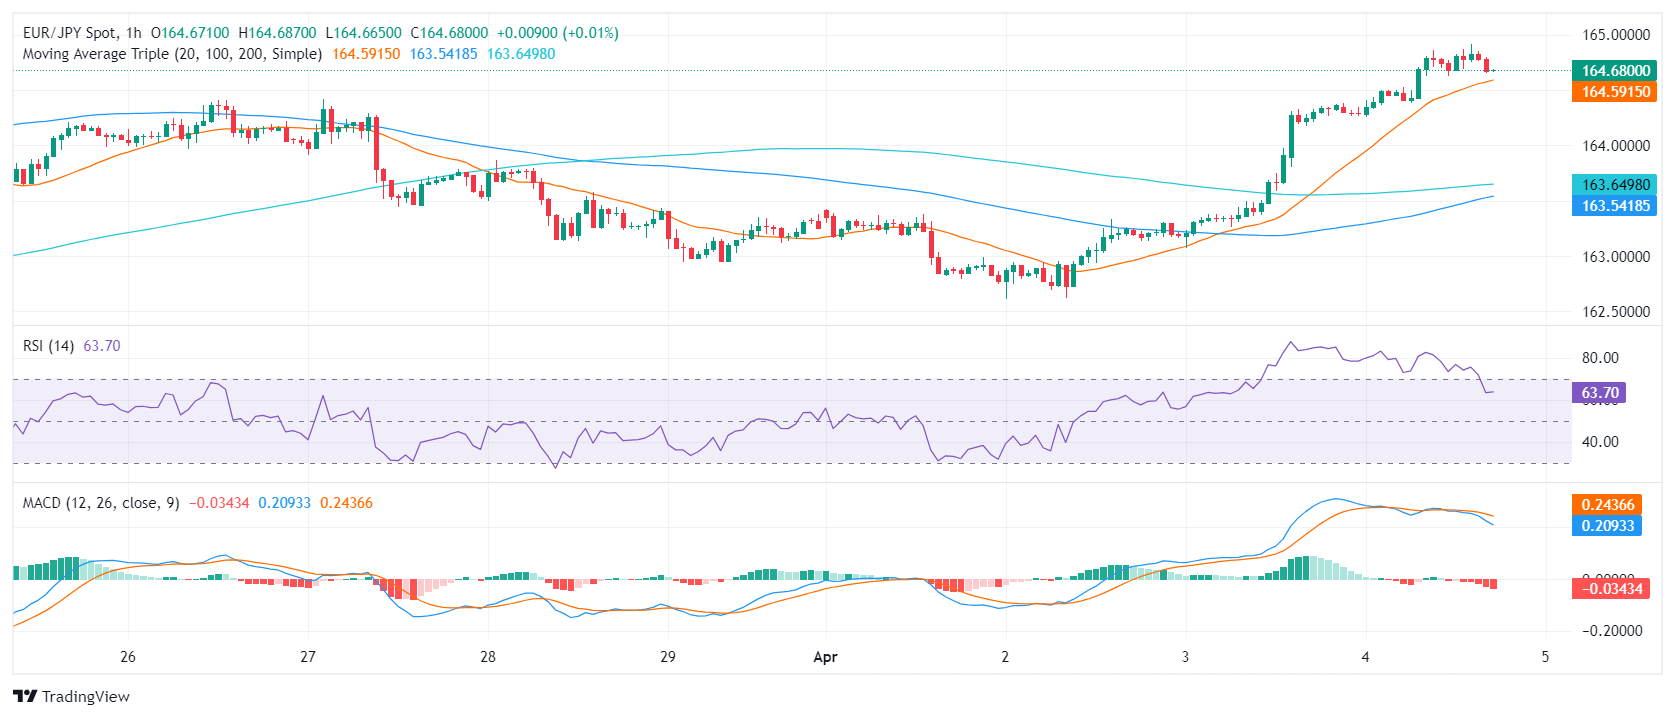
The broader market outlook harbors mixed signals as the EUR/JPY hovers above the 20, 100, and 200-day Simple Moving Averages (SMAs) which implies that the overall trends continue to be bullish. In summary, although indicators advocate for a bullish bias, a close observation of short-term bearish signals emitted by the declining RSI on the hourly chart is crucial.
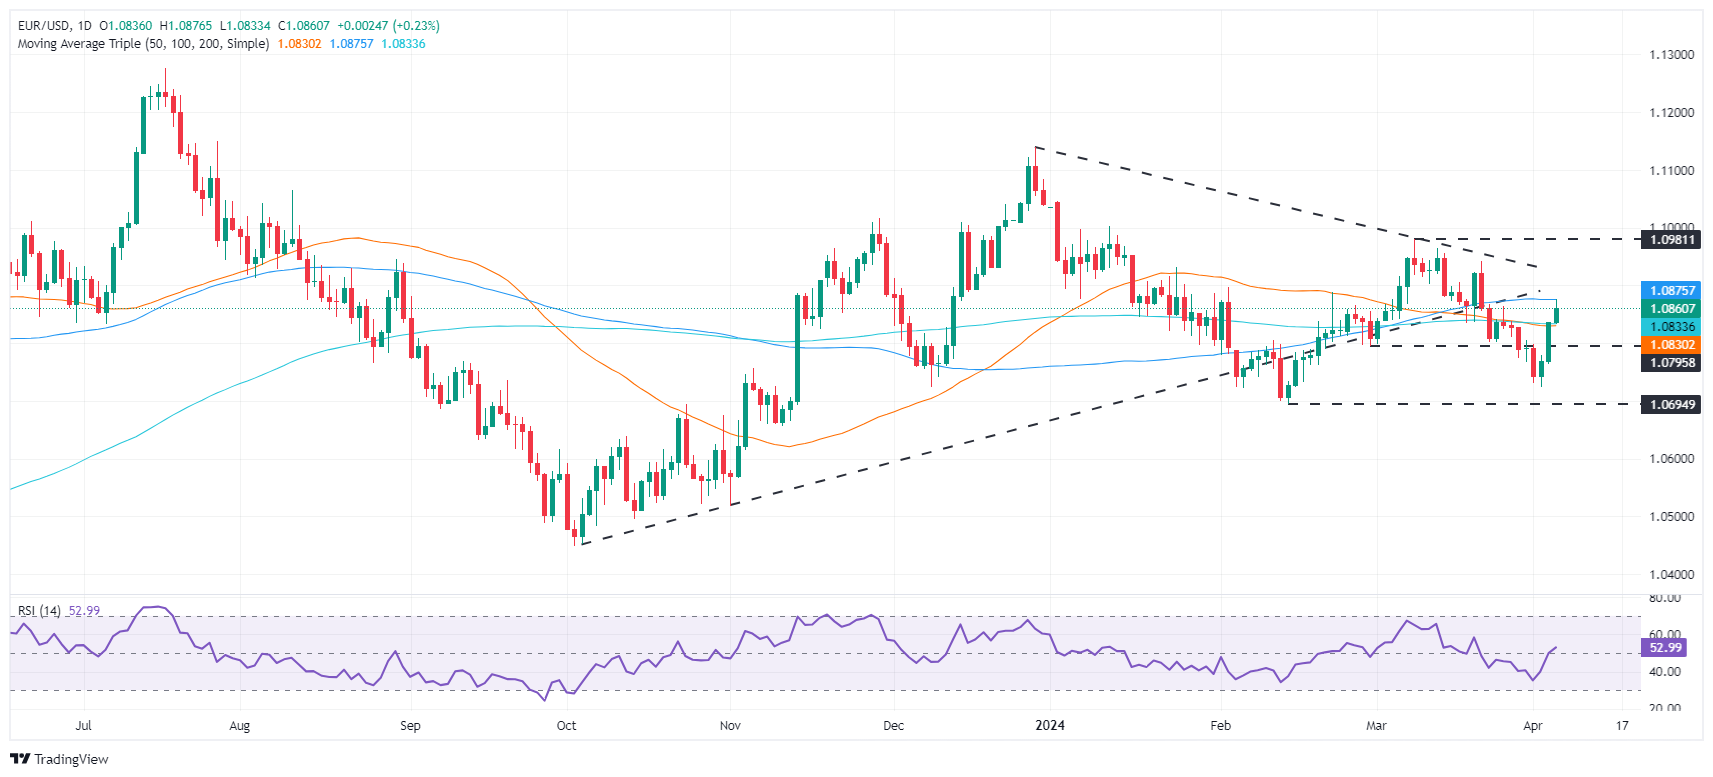
- EUR/USD rises to 1.0858, facing resistance at the 100-day MA, influenced by US data and Eurozone PMIs.
- Rising US jobless claims and trade deficit, alongside falling Treasury yields, weigh on the Dollar.
- Fed's cautious stance on rate cuts due to inflation, and stronger Eurozone services PMIs, support the Euro.
The Euro posts solid gains against the US Dollar, though it faces stirring resistance at the 100-day moving average (DMA), which caps the pair's advance toward 1.0900. Weaker-than-expected US jobs market data and upbear services PMIs in the Eurozone (EU) sponsored a leg-up for the shared currency. The EUR/USD trades at 1.0858, up 0.21%.
EUR/USD approaches 1.0900, buoyed by Eurozone PMI strength and weak US labor market data
The Greenback is treading water after the US Bureau of Labor Statistics (BLS) revealed that Initial Jobless Claims for the week ending March 30 increased from 212K to 221K, exceeding forecasts of 214K. At the same time, the US Balance of Trade blocked a $-68.9 billion deficit, wider than expected and the previous month's reading, a headwind for the US Dollar.
US Treasury yields edged lower, as depicted by the 10-year benchmark note rate dipping to 4.31%, before resuming to 4.353%. The US Dollar Index (DXY), which tracks the currency’s value against a basket of peers, is down 0.15% at 104.06.
Federal Reserve officials crossed the wires led by Philadelphia Fed Patrick Harker, saying that inflation is too high. Recently, Richmond Fed President Thomas Barkin said the Fed could be patient regarding cutting interest rates. He’s optimistic about achieving a “soft landing,” even though he complained about recent inflation data. In the meantime, Chicago’s Fed President, Austan Goolsbee, stated that the biggest danger to inflation is housing price pressures. He added that by keeping rates restrictive for too long, the labor market could begin to deteriorate.
Across the pond, Euro services PMIs improved across the block in March. EU Services PMI rose to 51.5, up from 50.2 in February. The German reading expanded for the first tie in six months.
Given the backdrop, traders are still projecting the first ECB rate cut in June. On the contrary, market players expect the first Fed cut for the July meeting ahead of the Jackson Hole symposium.
EUR/USD Price Analysis: Technical outlook
The EUR/USD remains neutrally biased, with price action failing to put a lower low after posting back-to-back lower highs. On the upside, the 100-DMA is key resistance at 1.0875, ahead of 1.0900. Buyers must clear those two levels if they would like to reach 1.1000. If sellers push prices below the confluence of the 200 and 50-DMAs, at 1.0833, a fall toward 1.0800 is on the cards. Further losses are seen beneath, with the next lower low swing point being the April 2 low of 1.0724.
Euro FAQs
The Euro is the currency for the 20 European Union countries that belong to the Eurozone. It is the second most heavily traded currency in the world behind the US Dollar. In 2022, it accounted for 31% of all foreign exchange transactions, with an average daily turnover of over $2.2 trillion a day. EUR/USD is the most heavily traded currency pair in the world, accounting for an estimated 30% off all transactions, followed by EUR/JPY (4%), EUR/GBP (3%) and EUR/AUD (2%).
The European Central Bank (ECB) in Frankfurt, Germany, is the reserve bank for the Eurozone. The ECB sets interest rates and manages monetary policy. The ECB’s primary mandate is to maintain price stability, which means either controlling inflation or stimulating growth. Its primary tool is the raising or lowering of interest rates. Relatively high interest rates – or the expectation of higher rates – will usually benefit the Euro and vice versa. The ECB Governing Council makes monetary policy decisions at meetings held eight times a year. Decisions are made by heads of the Eurozone national banks and six permanent members, including the President of the ECB, Christine Lagarde.
Eurozone inflation data, measured by the Harmonized Index of Consumer Prices (HICP), is an important econometric for the Euro. If inflation rises more than expected, especially if above the ECB’s 2% target, it obliges the ECB to raise interest rates to bring it back under control. Relatively high interest rates compared to its counterparts will usually benefit the Euro, as it makes the region more attractive as a place for global investors to park their money.
Data releases gauge the health of the economy and can impact on the Euro. Indicators such as GDP, Manufacturing and Services PMIs, employment, and consumer sentiment surveys can all influence the direction of the single currency. A strong economy is good for the Euro. Not only does it attract more foreign investment but it may encourage the ECB to put up interest rates, which will directly strengthen the Euro. Otherwise, if economic data is weak, the Euro is likely to fall. Economic data for the four largest economies in the euro area (Germany, France, Italy and Spain) are especially significant, as they account for 75% of the Eurozone’s economy.
Another significant data release for the Euro is the Trade Balance. This indicator measures the difference between what a country earns from its exports and what it spends on imports over a given period. If a country produces highly sought after exports then its currency will gain in value purely from the extra demand created from foreign buyers seeking to purchase these goods. Therefore, a positive net Trade Balance strengthens a currency and vice versa for a negative balance.
The continuance of outsized price rises in the housing services industry is the most significant hurdle to the Federal Reserve reducing inflation to its 2% target rate, Chicago Federal Reserve Bank President Austan Goolsbee said on Thursday.
Further Quotes
“If housing inflation does not come down, would be very difficult to return inflation to 2%.”
“I had been expecting it to come down more quickly than it has.”
“Housing inflation my most valuable indicator for immediate future.”
“Inflation in core services ex housing has come down more than expected.”
“Last two months of inflation data a bump; can't write it off as purely noise.”
“Risks to inflation and employment mandates have moved into better balance.”
“If we stay restrictive for too long, we will likely see employment begin to deteriorate.”
- The Pound takes advantage of US Dollar weakness to hit fresh two-week highs at 1.2675.
- A higher-than-expected increase in US Jobless Claims has increased bearish pressure on the Dollar.
- GBP/USD is testing an important resistance area at 1.2675.
The Sterling is building up bullish momentum on Thursday, buoyed by a favourable market sentiment, which is weighing on the safe-haven US Dollar.
Data from the US Labor Department revealed that Jobless Claims increased by 222K in the last week of March 29, from the upwardly revised 212K in the previous week. The market had anticipated a softer 214K increase.
Fed cut hopes are weighing on the USD
These figures together with the unexpectedly weak US Services data seen on Wednesday have restored investors confidence that the Fed might start cutting rates in June. This has improved risk appetite, capping the recovery of US Treasury yields and pushing the US Dollar lower.
Earlier this week, UK data showed that manufacturing activity expanded for the first time in the last two years. This has improved the outlook in the country’s economy, providing a fresh impulse to the Sterling.
The technical picture remains bearish, with the pair approaching an important support area at 1.2675-1.2695. Above here, the next target would be 1.275 and the March 21 high AT 1.2800. Supports are 1.2570 and 1.2535.
- Higher-than-expected US Jobless Claims figures raised concerns over the US labor market.
- Markets await Nonfarm Payrolls, Unemployment Rate, and Average Hourly Earnings on Friday.
- The odds of a rate cut in June remain high.
The US Dollar Index (DXY) is mildly lower on Thursday and presently trading around 104. Mainly driven by weak weekly Initial Jobless Claims figures. The focus is set on Friday’s Nonfarm Payrolls where investors will get a clearer picture of the labor market.
The US labor market remains resilient despite the weak figures as well as the overall economy, with little signs of a slowdown. In case the economy doesn’t show conclusive evidence of cooling down, the Fed might consider delaying the start of the interest rate easing cycle.
Daily digest market movers: DXY extends losses on weal labor market figures
- Weekly unemployment claims in the US reached 221K for the week ending March 30.
- The reported claims exceeded estimates of 214K and surpassed the previous week's figure of 212K.
- Following a slowdown in the US service sector, the Federal Reserve remains cautious but isn’t ruling out three cuts in 2024.
- US Treasury bond yields show a slight rise with 2-year, 5-year and 10-year bonds standing at 4.68%, 4.34%, and 4.36%, respectively.
- Investors await key labor market reports from the US, including March’s Nonfarm Payrolls, Unemployment Rate and Average Hourly Earnings data.
- These reports will crucially impact the US Dollar as they shape expectations for the next Fed meetings.
DXY technical analysis: DXY displays mixed signals with bears’ tentative clawback
The indicators on the daily chart reflect a duel between the bulls and the bears. The Relative Strength Index (RSI) is on a negative slope but in positive territory, hinting that buying momentum is losing strength. However, it is not completely gone just yet.
The Moving Average Convergence Divergence (MACD) shows decreasing green bars, implying the potential for a bearish reversal, but it still needs to cross into negative territory for a credible sell signal.
Despite these bearish signals, the pair is comfortably placed above its 20,100 and 200-day Simple Moving Averages (SMAs), pointing out that the underlying trend remains in favor of the bulls.
US Dollar FAQs
The US Dollar (USD) is the official currency of the United States of America, and the ‘de facto’ currency of a significant number of other countries where it is found in circulation alongside local notes. It is the most heavily traded currency in the world, accounting for over 88% of all global foreign exchange turnover, or an average of $6.6 trillion in transactions per day, according to data from 2022. Following the second world war, the USD took over from the British Pound as the world’s reserve currency. For most of its history, the US Dollar was backed by Gold, until the Bretton Woods Agreement in 1971 when the Gold Standard went away.
The most important single factor impacting on the value of the US Dollar is monetary policy, which is shaped by the Federal Reserve (Fed). The Fed has two mandates: to achieve price stability (control inflation) and foster full employment. Its primary tool to achieve these two goals is by adjusting interest rates. When prices are rising too quickly and inflation is above the Fed’s 2% target, the Fed will raise rates, which helps the USD value. When inflation falls below 2% or the Unemployment Rate is too high, the Fed may lower interest rates, which weighs on the Greenback.
In extreme situations, the Federal Reserve can also print more Dollars and enact quantitative easing (QE). QE is the process by which the Fed substantially increases the flow of credit in a stuck financial system. It is a non-standard policy measure used when credit has dried up because banks will not lend to each other (out of the fear of counterparty default). It is a last resort when simply lowering interest rates is unlikely to achieve the necessary result. It was the Fed’s weapon of choice to combat the credit crunch that occurred during the Great Financial Crisis in 2008. It involves the Fed printing more Dollars and using them to buy US government bonds predominantly from financial institutions. QE usually leads to a weaker US Dollar.
Quantitative tightening (QT) is the reverse process whereby the Federal Reserve stops buying bonds from financial institutions and does not reinvest the principal from the bonds it holds maturing in new purchases. It is usually positive for the US Dollar.
- Dow Jones maintains a moderate bullish tone on Thursday, favoured by soft US Jobless Claims data.
- Hopes of Fed rate cuts are buoying all sectors with tech firms leading gains.
- The index is still far from the historic highs seen in March, investors remain cautious ahead of Friday’s NFP report.
The Dow Jones Industrial Average (DJIA) advances for the second day in a row as higher-than-expected US Jobless Claims figures endorse the view of three interest rate cuts in 2024, starting in June.
Applications for unemployment benefits rose to their highest level in two months in the last week of March, according to data released by the Labor Department on Thursday. These figures come after the weak services sector activity data on Wednesday eased market fears that a strong US economy would force the Federal Reserve (Fed) to dial down its monetary easing plans.
Fed Harker reiterated Chair Powel’s warning that the central bank might need more time to start rolling back its tightening cycle, but they have failed to dampen the positive sentiment. Investors remain focused on Friday’s US Nonfarm Payrolls (NFP) report for more clues about the rate outlook.
All Wall Street indexes are posting gains on Thursday. The NASDAQ is leading with a 0.95% advance to 16,435, followed by the S&P 500, up 0.75% at 5,249, and the Dow Jones, which adds 0.5% to 39,321.
Dow Jones news
The positive market sentiment is buoying all 11 Wall Street sectors on Thursday with Technology stocks leading gains, up 1.03%, on the back of hopes of lower interest rates. The Consumer Discretionary sector with a 1.02% advance and the Industrial sector, up 0.99%, are next. The Health and Energy sectors are lagging behind with gains of 0.13% and 0.31%, respectively.
Microsoft (MSFT) is the best performer of the Dow Jones Index, up 1.63%, to $427.39, followed by Travelers Companies (TRV) with a 1.5% advance to $232.50. On the negative side, Salesforce (CRM) drops 0.58% to $302.85, and 3M (MMM) loses 0.4% to $92.92.
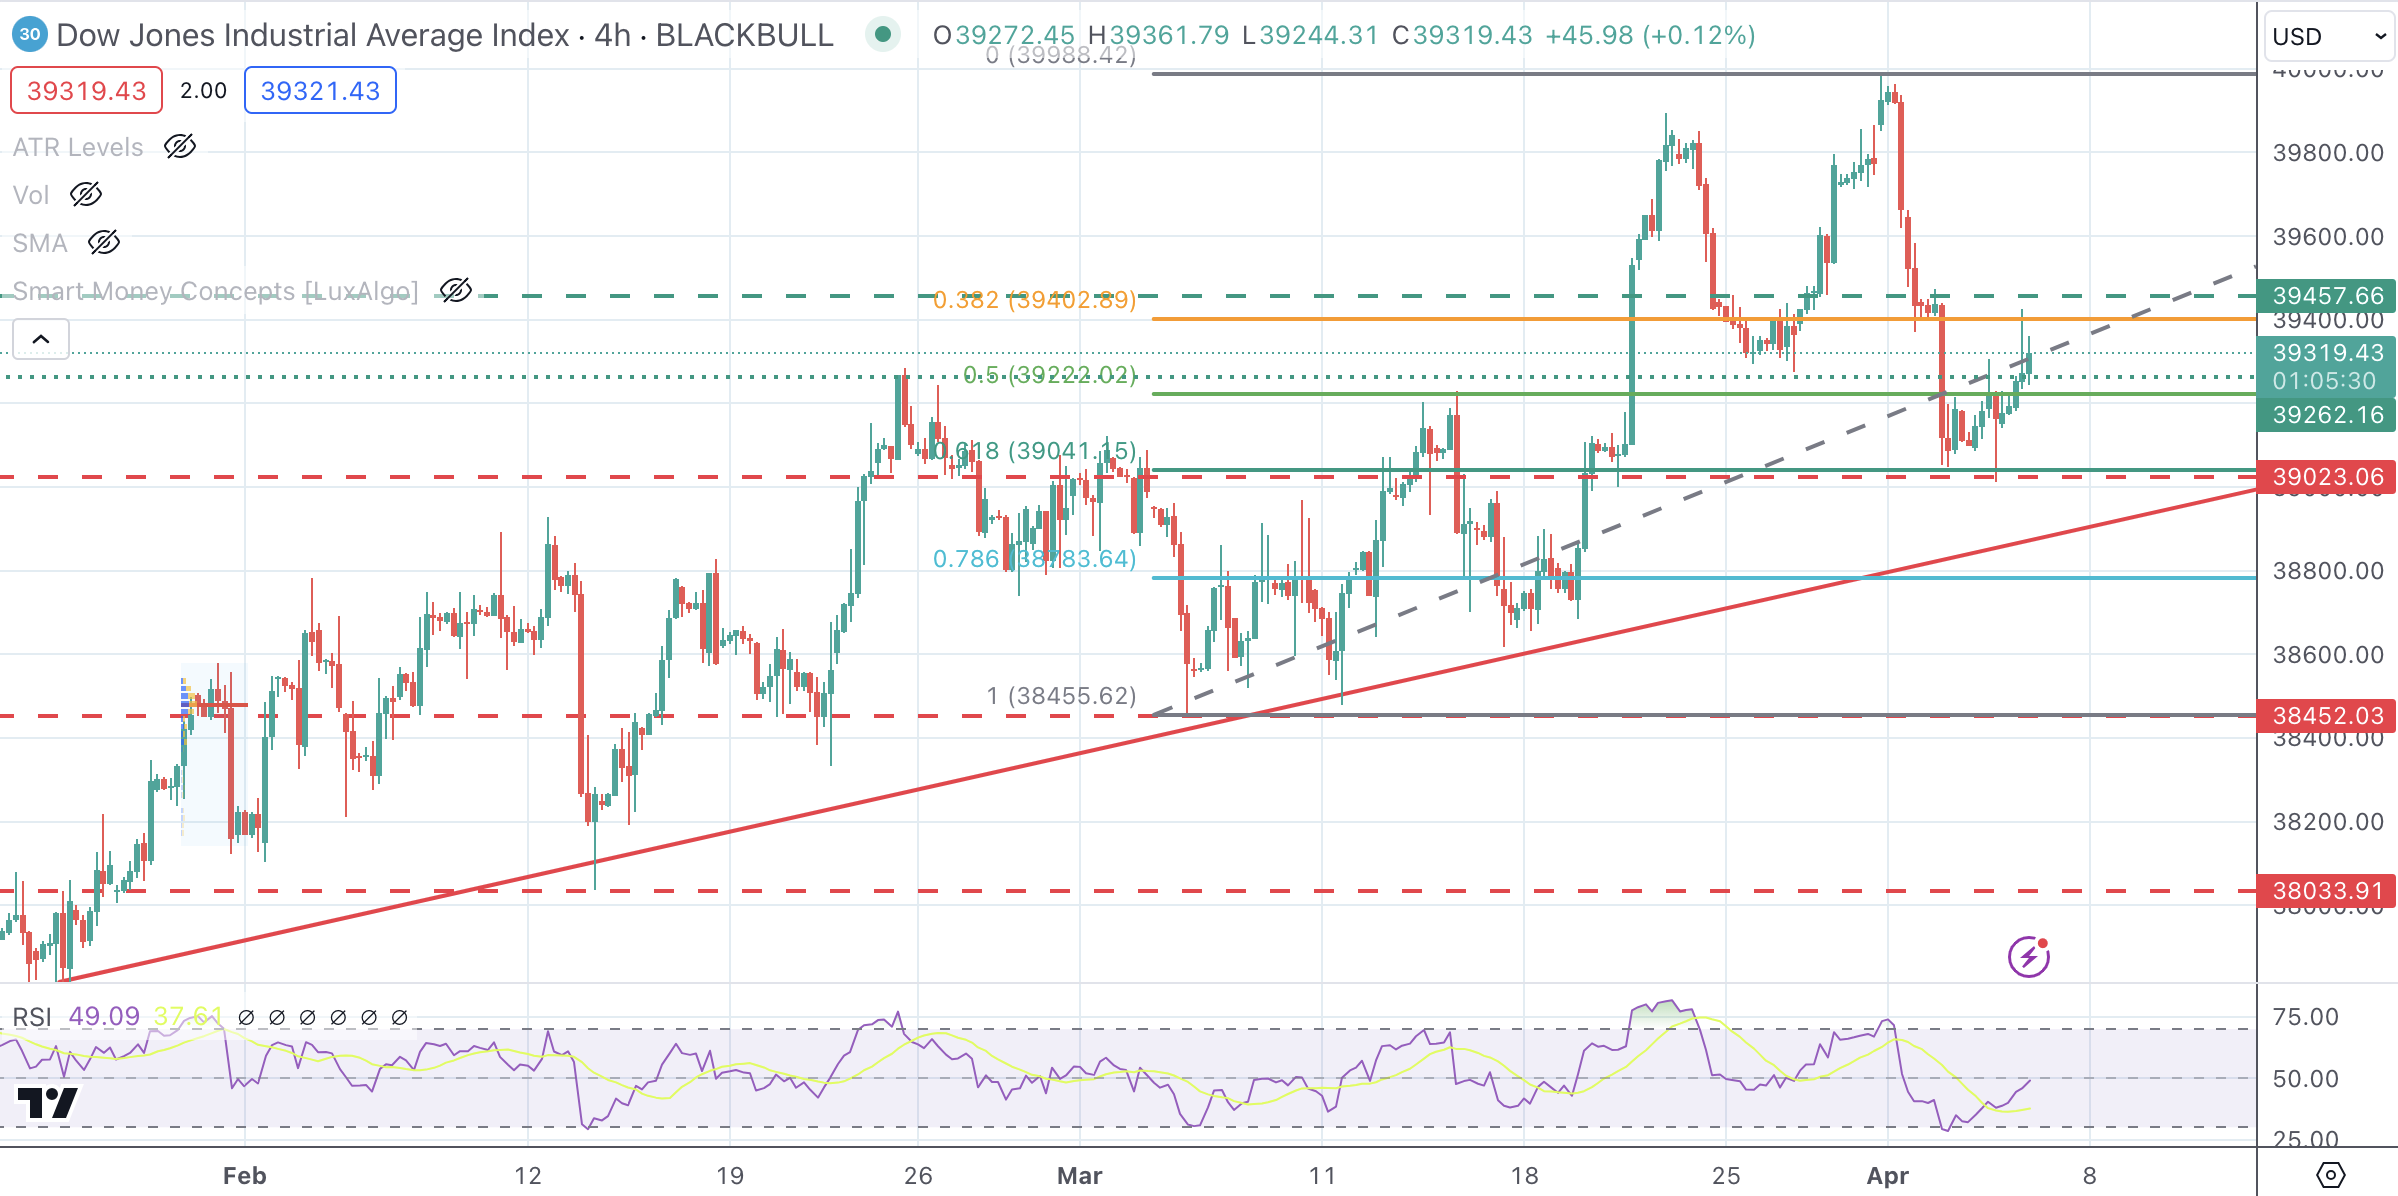
Dow Jones technical outlook
The technical picture has improved somewhat, as the improving market sentiment triggered by soft US data is contributing to a moderate recovery after the downside correction seen earlier this week.
The near-term bias remains neutral with upside attempts limited below the 39,457 level. The Index might need additional support from soft NFP data to revisit the 40,000 resistance area.
The broader trend remains bullish with 39,025 closing the path to trendline support at 38,885 and the 38,435 level.
Dow Jones 4-Hour Chart
Employment FAQs
Labor market conditions are a key element to assess the health of an economy and thus a key driver for currency valuation. High employment, or low unemployment, has positive implications for consumer spending and thus economic growth, boosting the value of the local currency. Moreover, a very tight labor market – a situation in which there is a shortage of workers to fill open positions – can also have implications on inflation levels and thus monetary policy as low labor supply and high demand leads to higher wages.
The pace at which salaries are growing in an economy is key for policymakers. High wage growth means that households have more money to spend, usually leading to price increases in consumer goods. In contrast to more volatile sources of inflation such as energy prices, wage growth is seen as a key component of underlying and persisting inflation as salary increases are unlikely to be undone. Central banks around the world pay close attention to wage growth data when deciding on monetary policy.
The weight that each central bank assigns to labor market conditions depends on its objectives. Some central banks explicitly have mandates related to the labor market beyond controlling inflation levels. The US Federal Reserve (Fed), for example, has the dual mandate of promoting maximum employment and stable prices. Meanwhile, the European Central Bank’s (ECB) sole mandate is to keep inflation under control. Still, and despite whatever mandates they have, labor market conditions are an important factor for policymakers given its significance as a gauge of the health of the economy and their direct relationship to inflation.
- Mexican Peso is slightly up versus the US Dollar on cautious trading as Consumer Confidence deteriorates.
- Decrease in Mexico's Consumer Confidence and Manufacturing PMI slowdown highlight challenges amid Banxico's rate adjustments.
- Remittances remain a key support for the Peso, overshadowing near-shoring gains amid broader economic considerations.
The Mexican Peso prints minuscule gains against the US Dollar on Thursday after the release of economic data from Mexico and the United States (US). That and recent Federal Reserve officials crossing the newswires keep the American currency pressured amid rate cut speculation. At the time of writing, the USD/MXN trades at 16.54, down 0.01%.
Mexico’s economic docket witnessed a drop in March’s Consumer Confidence, according to the National Statistics Agency (INEGI). Data shows the economy is still growing but began to lose some momentum as March’s Manufacturing PMI decelerated amid higher interest rates set by the Bank of Mexico (Banxico).
Meanwhile, Mexico’s remittances continued to be the main driver of the Peso’s strength. There’s speculation about near-shoring, but according to an article by EL CEO, in 2023 Foreign Direct Investment (FDI) stood at $36.058 billion, while remittances amounted to $63.345 billion. Sources cited by EL CEO stated, “We must not fail to point out that this is a gap in Mexico's productive capacity and a lack of opportunities. We are getting the kind of external savings.”
The US economy witnessed a cooler labor market as more Americans applied for unemployment benefits. The Balance of Trader revealed that the deficit widened compared to January’s data.
Daily digest market movers: Mexican Peso strength unlinked to Foreign Direct Investment
- Mexico’s Consumer Confidence stood at 47.3 in March, below February’s 47.4.
- A Reuters poll published on April 4 reveals that most economists foresee the USD/MXN appreciating 4.7% to 17.38 in twelve months, down from 18.24 projected in the March poll.
- Ahead on Thursday, Banxico releases the latest meeting minutes.
- According to Dafne Viramontes, the president of the Aguascalientes College of Economists, from 2013 to 2017, FDI amounted to $180 billion, while in the first five years of Andres Manuel Lopez Obrador's presidency, it sank to $167 billion.
- US Initial Jobless Claims for the week ending March 30 rose by 221K, exceeding the consensus of 214K and last week’s 212K.
- The US Balance of Trade reported a $-68.9B deficit, more than the $-67.3B estimate and January’s $-67.6B.
- Philadelphia Fed President Patrick Harker commented that inflation is too high for rate cuts at present.
Technical analysis: Mexican Peso remains firm with buyers eyeing 16.32, October’s 2015 low
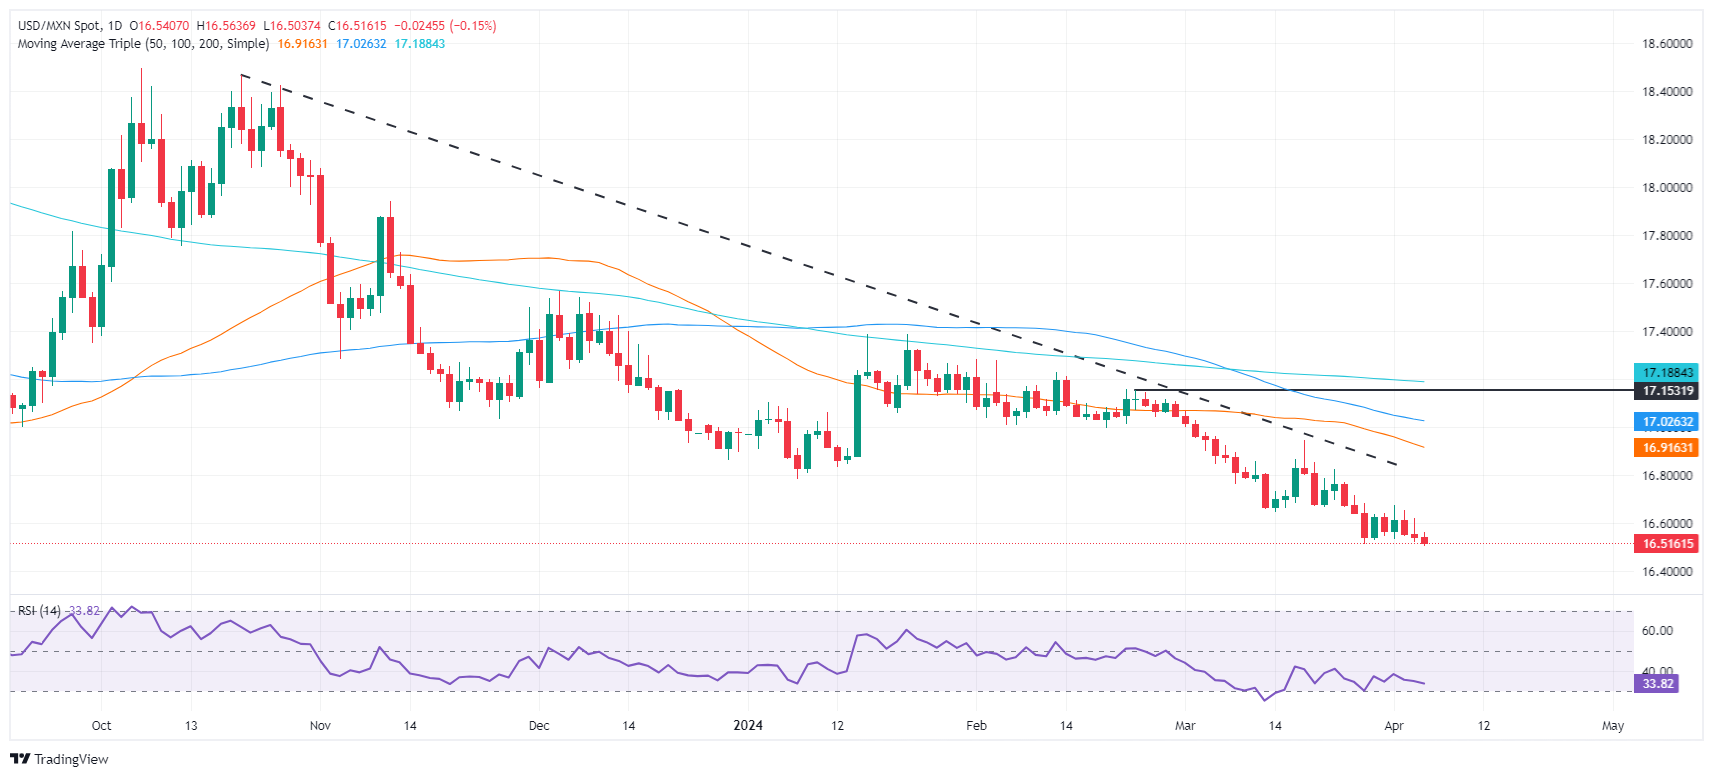
The USD/MXN remains bearish with sellers eyeing a retest of the year-to-date (YTD) low of 16.51. It appears the pair is consolidating near 16.50, unable to break below that level decisively, which could pave the way to test the October 2015 low of 16.32. Further downside is seen at the 16.00 figure.
On the flip side, If USD/MXN bulls stepped in, they must reclaim 16.70. Once cleared, the next resistance would be the 50-day Simple Moving Average (SMA) at 16.91, with further upside seen at the 100-day SMA at 17.02, ahead of the 200-day SMA at 17.18.
Mexican Peso FAQs
The Mexican Peso (MXN) is the most traded currency among its Latin American peers. Its value is broadly determined by the performance of the Mexican economy, the country’s central bank’s policy, the amount of foreign investment in the country and even the levels of remittances sent by Mexicans who live abroad, particularly in the United States. Geopolitical trends can also move MXN: for example, the process of nearshoring – or the decision by some firms to relocate manufacturing capacity and supply chains closer to their home countries – is also seen as a catalyst for the Mexican currency as the country is considered a key manufacturing hub in the American continent. Another catalyst for MXN is Oil prices as Mexico is a key exporter of the commodity.
The main objective of Mexico’s central bank, also known as Banxico, is to maintain inflation at low and stable levels (at or close to its target of 3%, the midpoint in a tolerance band of between 2% and 4%). To this end, the bank sets an appropriate level of interest rates. When inflation is too high, Banxico will attempt to tame it by raising interest rates, making it more expensive for households and businesses to borrow money, thus cooling demand and the overall economy. Higher interest rates are generally positive for the Mexican Peso (MXN) as they lead to higher yields, making the country a more attractive place for investors. On the contrary, lower interest rates tend to weaken MXN.
Macroeconomic data releases are key to assess the state of the economy and can have an impact on the Mexican Peso (MXN) valuation. A strong Mexican economy, based on high economic growth, low unemployment and high confidence is good for MXN. Not only does it attract more foreign investment but it may encourage the Bank of Mexico (Banxico) to increase interest rates, particularly if this strength comes together with elevated inflation. However, if economic data is weak, MXN is likely to depreciate.
As an emerging-market currency, the Mexican Peso (MXN) tends to strive during risk-on periods, or when investors perceive that broader market risks are low and thus are eager to engage with investments that carry a higher risk. Conversely, MXN tends to weaken at times of market turbulence or economic uncertainty as investors tend to sell higher-risk assets and flee to the more-stable safe havens.
- Canadian Dollar appreciates for the second consecutive day as US Jobless Claims increase beyond expectations.
- Fed’s Harker has warned that it is too early to cut interest rates.
- The USD/CAD is gathering bearish traction and approaches an important support area at 1.3460.
The Canadian Dollar (CAD) is trading higher for the second consecutive day on Thursday. US data revealed that claims for unemployment insurance increased at a larger-than-expected extent in the last week of March, which keeps the US Dollar on the defensive.
These figures coupled with the unexpectedly soft ISM Services PMI data seen on Wednesday are feeding hopes that the Federal Reserve (Fed) will start cutting rates in June. This sentiment has put a lid on the US Treasury yield rebound and is pushing the US Dollar lower against its main rivals.
Philadelphia Fed President Patrick Harker has warned that inflation is still too high to start lowering borrowing costs, a similar line to Fed Chair Powell’s comments on Wednesday. Later on Thursday some more Fed policymakers are expected to hit the wires, although the main focus is on Friday’s US Nonfarm Payrolls report.
In Canada, the trade surplus increased well beyond expectations in February due to a strong increase in exports, which has provided additional support to the CAD.
Daily digest market movers: USD/CAD depreciates further amid broad-based US Dollar weakness
- The Canadian Dollar's bullish momentum is gathering pace after having appreciated nearly 0.6% over the last two days to hit fresh two-week highs.
- US Initial Jobless Claims increased by 222K in the week of March 29, well above the 214K expected.
- Claims from the previous week have been revised up to 212K from the 210K previously estimated.
- Canadian trade surplus increased to $1.39 billion in February from $0.61 billion in January. Market experts had forecasted a shorter increase to about $0.8 billion.
- Fed’s Harker reiterates Chair Powell’s view that it is still too early to start cutting rates. Their impact on the US Dollar, however, has been subdued as the market is focusing on Friday’s Payrolls data.
- On Wednesday, the ISM Services PMI eased to 51.4 from 52.6 in February, against expectations of a slight increase to 52.7. The Prices Paid sub-index plunged to a four-year low, suggesting a negative contribution to inflation.
- US Nonfarm Payrolls are expected to have increased by 200K in March, down from February’s rise of 275K.
Canadian Dollar price today
The table below shows the percentage change of Canadian Dollar (CAD) against listed major currencies today. Canadian Dollar was the strongest against the Swiss Franc.
| USD | EUR | GBP | CAD | AUD | JPY | NZD | CHF | |
| USD | -0.24% | -0.10% | -0.23% | -0.70% | 0.07% | -0.44% | 0.22% | |
| EUR | 0.25% | 0.14% | 0.02% | -0.46% | 0.30% | -0.19% | 0.45% | |
| GBP | 0.11% | -0.14% | -0.12% | -0.61% | 0.16% | -0.33% | 0.31% | |
| CAD | 0.23% | -0.02% | 0.12% | -0.48% | 0.28% | -0.22% | 0.42% | |
| AUD | 0.69% | 0.46% | 0.60% | 0.47% | 0.76% | 0.25% | 0.92% | |
| JPY | -0.06% | -0.30% | -0.15% | -0.28% | -0.79% | -0.48% | 0.15% | |
| NZD | 0.43% | 0.18% | 0.33% | 0.22% | -0.27% | 0.50% | 0.64% | |
| CHF | -0.21% | -0.45% | -0.31% | -0.44% | -0.93% | -0.13% | -0.65% |
The heat map shows percentage changes of major currencies against each other. The base currency is picked from the left column, while the quote currency is picked from the top row. For example, if you pick the Euro from the left column and move along the horizontal line to the Japanese Yen, the percentage change displayed in the box will represent EUR (base)/JPY (quote).
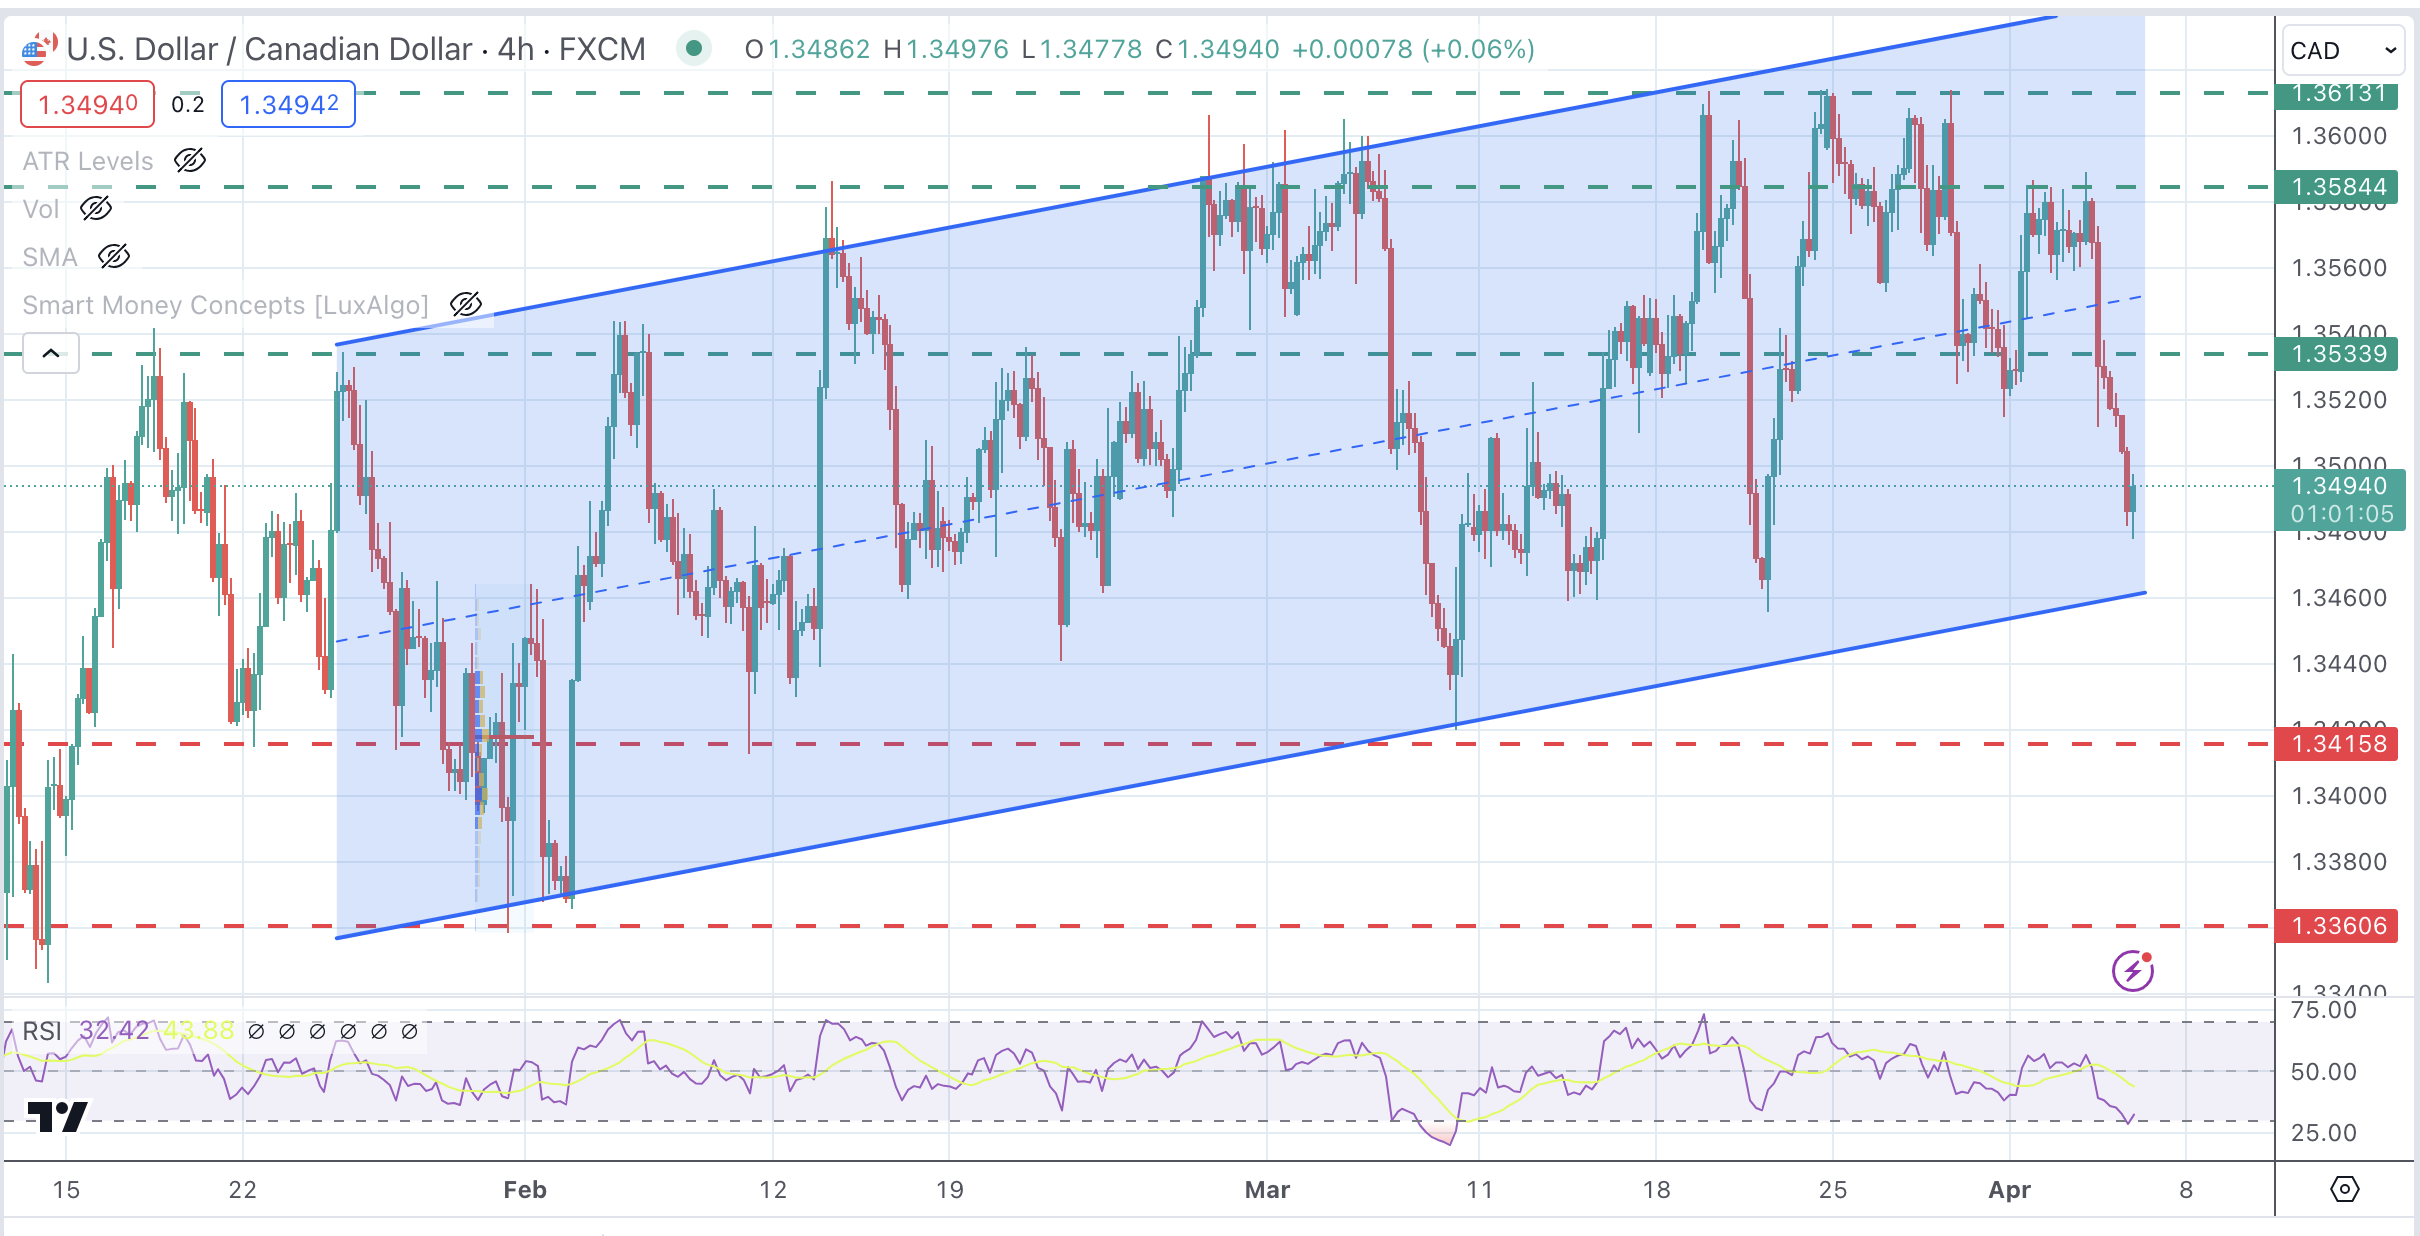
Technical analysis: USD/CAD approaches trendline support at 1.3460
The technical analysis indicates that the USD/CAD currency pair is approaching the trendline support level at 1.3460.The strong USD/CAD bearish reversal following the release of the ISM Services PMI extended on Thursday after another disappointing reading, this time with US Jobless claims.
The pair keeps trading within an ascending channel as prices approach the bottom of the channel at 1.3460. The Loonie would need help from a soft US NFP report to break that level and set its focus on 1.3415 ahead of 1.3360. On the upside, resistances are 1.3530 and 1.3585.
USD/CAD 4-Hour Chart
Employment FAQs
Labor market conditions are a key element to assess the health of an economy and thus a key driver for currency valuation. High employment, or low unemployment, has positive implications for consumer spending and thus economic growth, boosting the value of the local currency. Moreover, a very tight labor market – a situation in which there is a shortage of workers to fill open positions – can also have implications on inflation levels and thus monetary policy as low labor supply and high demand leads to higher wages.
The pace at which salaries are growing in an economy is key for policymakers. High wage growth means that households have more money to spend, usually leading to price increases in consumer goods. In contrast to more volatile sources of inflation such as energy prices, wage growth is seen as a key component of underlying and persisting inflation as salary increases are unlikely to be undone. Central banks around the world pay close attention to wage growth data when deciding on monetary policy.
The weight that each central bank assigns to labor market conditions depends on its objectives. Some central banks explicitly have mandates related to the labor market beyond controlling inflation levels. The US Federal Reserve (Fed), for example, has the dual mandate of promoting maximum employment and stable prices. Meanwhile, the European Central Bank’s (ECB) sole mandate is to keep inflation under control. Still, and despite whatever mandates they have, labor market conditions are an important factor for policymakers given its significance as a gauge of the health of the economy and their direct relationship to inflation.
(This story was corrected on April 4 at 16:21 GMT to say in the Market Movers subheadline that the USD/CAD "depreciates" rather than "appreciates".)
High global demand and the Federal Reserve cutting interest rates ensures the outlook for Silver has never been brighter, according to TD Securities.
Their Advanced CTA Position Tracker suggests the timing for a bull market may be delayed, however.
If prices can rally north of $27.50 Silver could be made
“Silver could just be the most exciting trade of the energy transition that no one is talking about. The current pace of demand growth is set to completely deplete our estimates of the LBMA's 'free floating' inventories over the next two years, with a Fed cutting cycle potentially shrinking this timespan to less than twelve months.”
“This creates a significant liquidity risk that could dramatically fatten silver's right tail. This thesis has little to do with recent price action, and in fact our advanced positioning analytics suggest the timing for silver upsides isn't great. We expect CTA selling activity to weigh on silver markets unless prices can rally north of $27.50/oz in active silver.”
- AUD/USD extends its winning streak on weak US Dollar.
- The US Dollar weakens as poor US ISM Services PMI dampens the economic outlook.
- Surging global commodity prices strengthen the Australian Dollar.
The AUD/USD pair extends its winning spell for the third trading session on Thursday. The Aussie asset rallies to the round-level resistance of 0.6600 as the US Dollar weakens due to the unexpected decline in the United States Services PMI data for March, reported by the Institute of Supply Management (ISM) on Wednesday.
The US Dollar Index (DXY), which tracks the US Dollar’s value against six major currencies, extends its downside to 104.00. The US ISM reported that the Services PMI missed expectations, dropping to 51.4 from expectations of 52.7 and the former reading of 52.6. Subindexes such as New Orders and Prices Paid also eased sharply, impacting the US economic outlook.
Going forward, investors will focus on the US Nonfarm Payrolls (NFP) data for March, which will be published on Friday. The labor market data will influence market expectations for Fed rate cuts, which are currently expected in the June meeting.
Meanwhile, the Australian Dollar strengthens as global commodity prices witness a sharp upside. Growing expectations for China’s economic recovery due to reviving domestic demand have also boosted demand for the Australian Dollar.
AUD/USD attempts to deliver a breakout of the Descending Triangle chart pattern formed on a daily timeframe. The downward-sloping border of the aforementioned pattern is placed from March 8 high at 0.6667 while horizontal support is plotted from March 5 low at 0.6477. The chart pattern exhibits a sharp volatility contraction and a breakout can happen in any direction.
The Aussie asset sustains above the 20-day Exponential Moving Average (EMA) trading near 0.6550, suggesting upbeat demand for the Australian Dollar.
The 14-period Relative Strength Index (RSI) rebounds to 60.00. A bullish momentum would trigger if the RSI manages to climb above the aforementioned level.
More upside would appear if the asset breaks above March 21 high at 0.6635. This will drive the asset toward March 8 high at 0.6667, followed by the round-level resistance of 0.6700.
On the flip side, investors might build fresh shorts below March 28 low at 0.6485. Profits on shorts would be booked near February 13 low around 0.6440 and the round-level support of 0.6400.
AUD/USD daily chart

Developed economies are in transition, with high inflation falling back to target and growth picking up, according to a macroeconomic report from Nordea bank strategists.
The report covers the economic outlook for the Eurozone, US, China, as well as key central bank policy. Here are the key takeaways:
Transition Phase
“We are still in a phase of transition in the big economies. We continue to expect that we will see slightly weaker labor markets, inflation moving towards the 2% target and interest rates being slowly cut in both the US and the euro area, combined with slightly higher economic growth in Europe but somewhat lower growth in the US. None of these things have clearly materialized yet, but data releases and central bank comments during March continue to point in that direction.”
“The US labor market continues to show robust job growth but not as robust as previously thought, as the very high January number was revised down. The job growth is supported by a growing work force and indicators still point to a slightly easing pressure in terms of job vacancies.”
“The European Central Bank is clearly signaling an intention to cut rates in June. The bank seems confident that inflation is moving in the right direction, and that impression was largely supported by the preliminary March figures. However, it is still concerned that wage growth could be a hindrance for sufficiently low inflation, and the euro area wage data for Q1 will not be available before the ECB rate decision on April 11. Hence the comment from ECB President Lagarde that “we will know a little more in April but we will know a lot more in June.”
“China published a GDP growth target of 5.2% for 2024. That is the same growth rate as last year but in reality quite ambitious as that growth rate came on the background of a very weak 2022 with extensive COVID lockdowns. Hence, we expect to see significant policy stimulus to Chinese growth this year.”
- Initial Jobless Claims rose by 221K from a week earlier.
- Continuing Jobless Claims rose by nearly 1.8M.
US citizens that applied for unemployment insurance benefits increased by 221K in the week ending March 30 according to the US Department of Labor (DoL) on Thursday. The prints came in just above initial estimates (214K) and matched previous weekly gain.
Further details of the publication revealed that the advance seasonally adjusted insured unemployment rate was 1.2% and the 4-week moving average stood at 212.25, a increase of 2.750K from the previous week's revised average.
In addition, Continuing Claims increased by 8K to 1.791M in the week ended March 23.
Market reaction
The US Dollar Index (DXY) remains on the defensive and gradually approaches the key support at 104.00 region.
- EUR/CHF has reversed its intermediate-term downtrend and is rallying strongly.
- There are few technical obstacles in the way until the pair reaches parity.
- EUR/CHF is oversold according to the RSI which suggests the risk of a pullback.
EUR/CHF is trading at 0.9847 as it rallies higher, extending an uptrend on both a short and intermediate time frame. The road is open and parity is in sight.
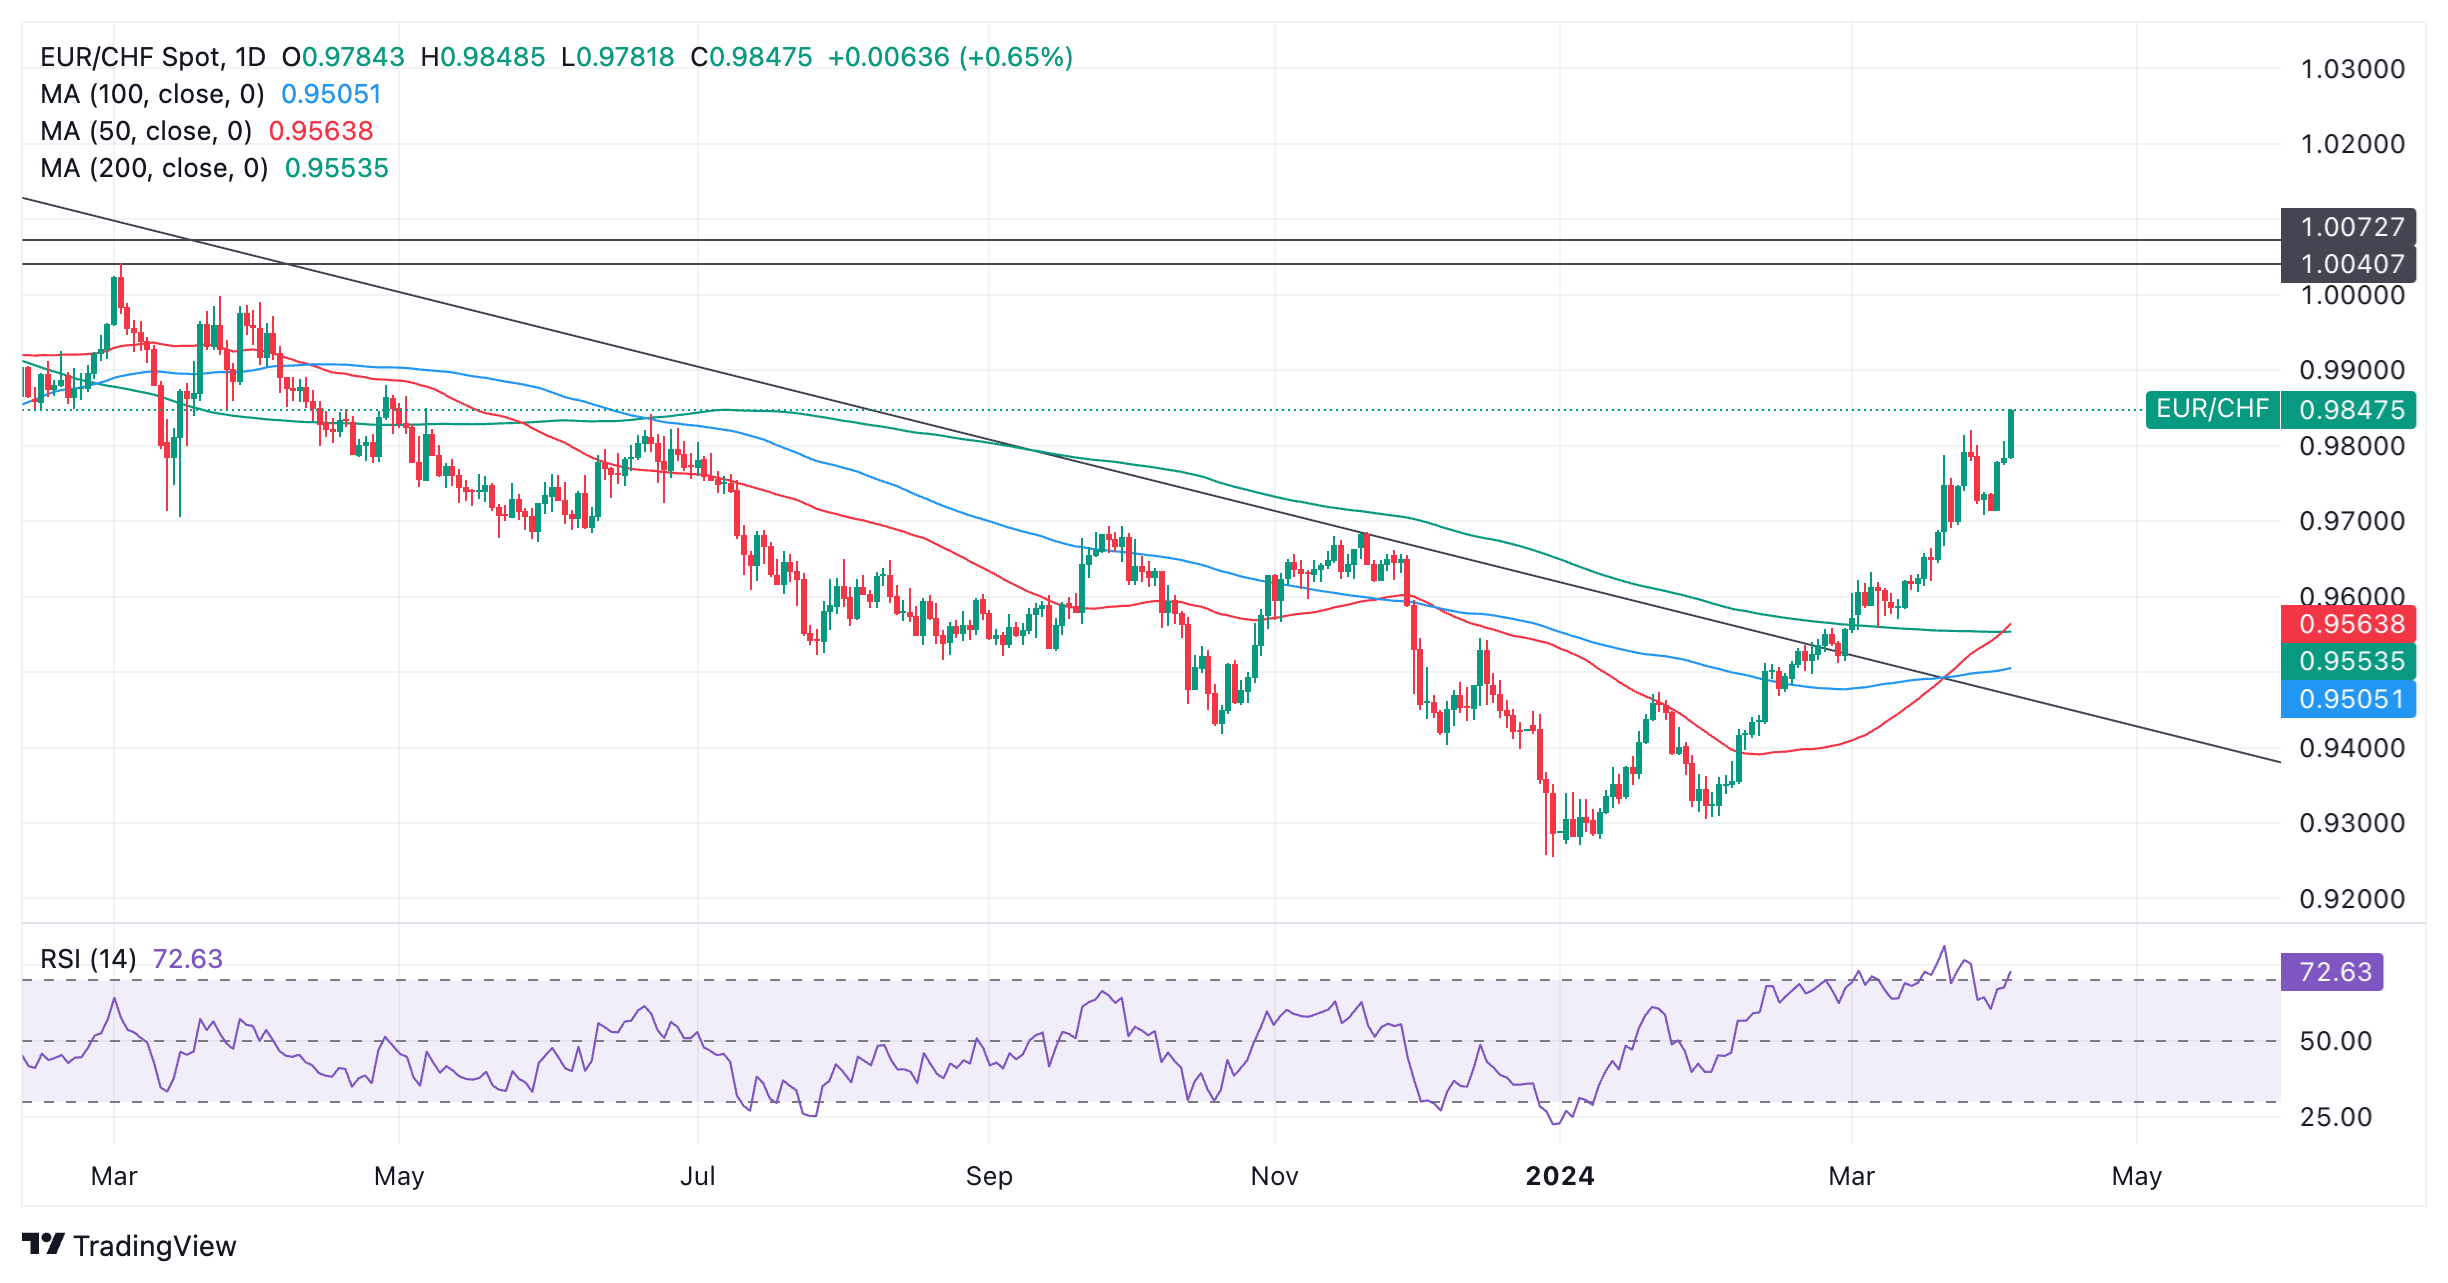
Euro to Swiss Franc: Daily chart
The pair has broken above all major moving averages and a major trendline for the downtrend, suggesting the bear trend has been broken.
EUR/CHF has formed more that two higher highs and higher lows since reversing at the January lows, establishing a rising pattern of peaks and troughs. Overall this is a sign it is in a young uptrend on the daily chart, commonly used to assess the intermediate-term trend (lasting 3-6 months).
Given the old adage that “the trend is your friend until the bend at the end,” EUR/CHF is expected to continue its new uptrend higher.
The next key resistance level is at around parity suggesting the pair could rally up to that level without much obstruction.
The red 50-day (Simple Moving Average) has crossed above the 100-day SMA which is a bullish signal. It has also just crossed above the 200-day SMA. However, in the case of the 200, the longer MA was still falling marginally during the crossover, watering down its reliability – disqualifying it by a hair’s breadth from being a Golden Cross.
The Relative Strength Index (RSI) is in the overbought zone above 70 suggesting there is a risk of a pullback. If it crosses back down below 70 it will give a sell signal and more strongly indicate a correction is underway. This, however, would not be enough to reverse the uptrend, merely suggest a pullback was underway.
With the RSI over 70 traders are recommended not to open any fresh long positions.
The long-term trend, seen on the weekly chart, is still undecided. Although price has reversed and punched higher it is unclear what the trend is, although the strength of the recovery suggests it may soon confirm an uptrending bias.
The US Dollar (USD) is showing divergent behavior against counterparts depending on their risk profile, according to Strategists at BBH.
Whilst it is mostly falling against commodity currencies due to an improved outlook for global growth, it is rising against safe-haven’s like the Japanese Yen (JPY) and the Swiss Franc (CHF).
A Tale of Two Dollars
“USD is under downside pressure mostly against commodity-sensitive currencies. NOK, SEK, AUD, and NZD are the top performing major currencies versus USD this week. China’s modest cyclical recovery and improving global manufacturing sector growth momentum (the global manufacturing PMI rose to a 20-month high at 50.6 in March) bode well for the commodity complex.”
“USD is firm against low yielding currencies (JPY and CHF) underpinned by high US Treasury yields.”
“Slower US service sector growth momentum in March has kept odds of a June Fed funds rate cut well in play (over 60% priced-in) and curtailed broad USD strength.”
The accounts of the European Central Bank's (ECB) March policy meeting showed on Thursday that inflation in the Eurozone is expected to continue its downward trend in the coming months.
Key takeaways
"There had been further progress on all three elements, which warranted increased confidence that inflation was on track to reach the ECB's target."
"More data and evidence were needed for the Governing Council to be sufficiently confident of this."
"A bumpy profile and a trough were expected after the summer."
"There were signs that wage growth was starting to moderate."
"Members expressed increased confidence that inflation was on track to decline sustainably to the 2% inflation target in a timely manner."
"Important not to be complacent, as the disinflationary process remained fragile."
"The case for considering rate cuts was strengthening."
Market reaction
This report failed to influence the euro's valuation in a noticeable way. At the time of press, EUR/USD was up 0.2% on the day at 1.0858.
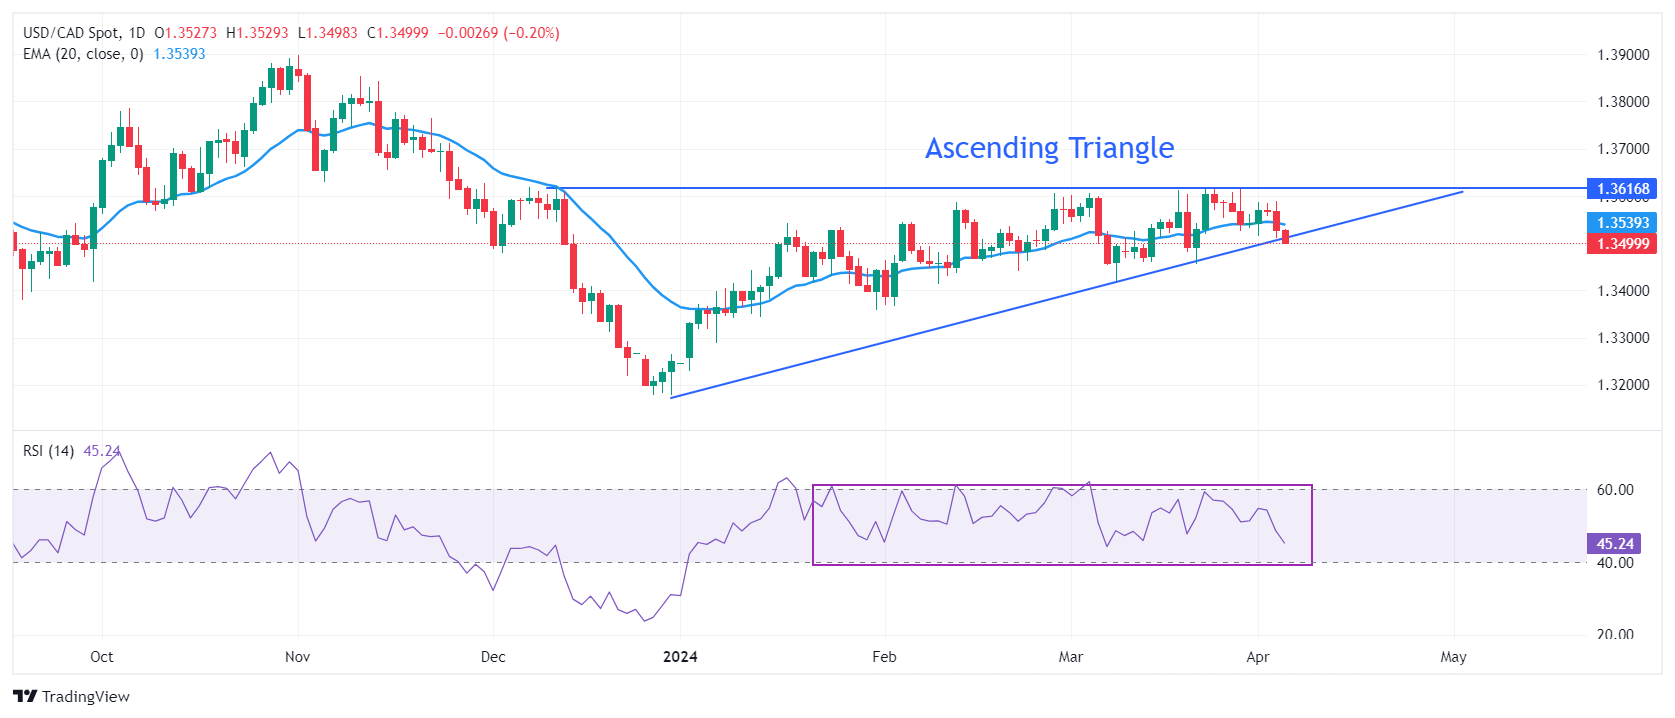
- USD/CAD falls to 1.3500 due to multiple headwinds.
- The US Dollar corrects further on the weak US ISM Services PMI report.
- Higher Oil prices due to deepening supply concerns boosted the Canadian Dollar.
The USD/CAD pair falls sharply to the psychological support of 1.3500 in the European session on Thursday. The Loonie asset faces an intense sell-off as the US Dollar weakens and global Oil prices remain broadly strong.
The US Dollar Index (DXY), which values the US Dollar against six major currencies, corrects to 104.00 as weak United States ISM Services PMI report for March casts doubts over economic resilience. 10-year US Treasury yields rose as Federal Reserve (Fed) policymakers demanded more data before considering rate cuts.
On Wednesday, Fed Chair Jerome Powell said in a speech, "Recent readings on both job gains and inflation have come in higher than expected," Powell maintained the baseline that rate cuts will start later this year only when policymakers "have greater confidence that inflation is moving sustainably down.
Meanwhile, higher global oil prices have strengthened the Canadian Dollar. West Texas Intermediate (WTI) futures on NYMEX are slightly down near $85.35 but have come higher significantly this week. The Oil price rose after Ukraine’s drone attacks on Russian oil refineries deepened supply concerns. It is worth noting that Canada is the leading exporter of oil to the United States, and higher Oil prices strengthen the Canadian Dollar.
Going forward, the US Dollar and the Canadian Dollar will be guided by the Employment data from their respective economies, which will be published on Friday.
USD/CAD seems close to exploding the Ascending Triangle pattern formed on a daily time. The upward-sloping border of the aforementioned pattern is placed from December 27 low at 1.3177 while horizontal resistance is plotted from December 7 high at 1.3620. The chart pattern exhibits a sharp volatility contraction and a breakout can happen in any direction.
The asset drops below the 20-day Exponential Moving Average (EMA) near 1.3520, suggesting that the near-term appeal is weak.
The 14-period Relative Strength Index (RSI) oscillates inside the 40.00-60.00 range, indicating indecisiveness among investors.
A downside move below February 22 low at 1.3441 would expose the asset to February 9 low at 1.3413. A breakdown below the latter would extend downside towards January 15 low at 1.3382.
On the flip side, the Loonie asset would observe a fresh upside if it breaks above December 7 high at 1.3620. This will drive the asset towards May 26 high at 1.3655, followed by the round-level resistance of 1.3700.
USD/CAD daily chart
TD Securities Global Strategy Team assess the latest ISM Services PMI report from the US.
Supply chains continue to improve
"The ISM services index came in below expectations, dropping by 1.2pp to 51.4 in March (TD: 53.0, consensus: 52.8). The decline was driven by a notable 3.5pt retreat in supplier deliveries, suggesting no issues in the deliveries pipeline as supply chains continue to improve. New orders also retreated by a meaningful 1.7pt to 54.4, which signals less perky demand ahead, all else equal."
"Also notable, the employment component failed to jump back into expansion territory, staying under the 50 mark for a second consecutive month. Moreover, prices paid continued to drop meaningfully in March, with the figure now reaching its lowest level since the early months of the pandemic. If there are any lingering price pressures in the key services sector it is hard to find them in this report."
Economic Indicator
ISM Services PMI
The Institute for Supply Management (ISM) Services Purchasing Managers Index (PMI), released on a monthly basis, is a leading indicator gauging business activity in the US services sector, which makes up most of the economy. The indicator is obtained from a survey of supply executives across the US based on information they have collected within their respective organizations. Survey responses reflect the change, if any, in the current month compared to the previous month. A reading above 50 indicates that the services economy is generally expanding, a bullish sign for the US Dollar (USD). A reading below 50 signals that services sector activity is generally declining, which is seen as bearish for USD.
Read more.Last release: Wed Apr 03, 2024 14:00
Frequency: Monthly
Actual: 51.4
Consensus: 52.7
Previous: 52.6
Source: Institute for Supply Management
The Institute for Supply Management’s (ISM) Services Purchasing Managers Index (PMI) reveals the current conditions in the US service sector, which has historically been a large GDP contributor. A print above 50 shows expansion in the service sector’s economic activity. Stronger-than-expected readings usually help the USD gather strength against its rivals. In addition to the headline PMI, the Employment Index and the Prices Paid Index numbers are also watched closely by investors as they provide useful insights regarding the state of the labour market and inflation.
Analysts at Rabobank note that the UK public has lost trust in the Bank of England (BoE) as the central bank "lost control of inflation, produced wildly fluctuating forecasts and made numerous communication gaffes."
We don’t expect a monetary policy overhaul
"Former Fed chief Bernanke is conducting an external review, with findings expected this month. We don’t expect a monetary policy overhaul, but we do anticipate significant changes in how the forecasts are constructed and presented."
"We expect the MPC to be more transparent regarding uncertainties, utilising scenario analysis more extensively. The MPC may also be more forthright about its preferred course of action."
"The immediate impact on the market should be minimal. However, there’s a possibility that it may require time for the market to adapt to and accurately interpret a new strategy."
BoE FAQs
The Bank of England (BoE) decides monetary policy for the United Kingdom. Its primary goal is to achieve ‘price stability’, or a steady inflation rate of 2%. Its tool for achieving this is via the adjustment of base lending rates. The BoE sets the rate at which it lends to commercial banks and banks lend to each other, determining the level of interest rates in the economy overall. This also impacts the value of the Pound Sterling (GBP).
When inflation is above the Bank of England’s target it responds by raising interest rates, making it more expensive for people and businesses to access credit. This is positive for the Pound Sterling because higher interest rates make the UK a more attractive place for global investors to park their money. When inflation falls below target, it is a sign economic growth is slowing, and the BoE will consider lowering interest rates to cheapen credit in the hope businesses will borrow to invest in growth-generating projects – a negative for the Pound Sterling.
In extreme situations, the Bank of England can enact a policy called Quantitative Easing (QE). QE is the process by which the BoE substantially increases the flow of credit in a stuck financial system. QE is a last resort policy when lowering interest rates will not achieve the necessary result. The process of QE involves the BoE printing money to buy assets – usually government or AAA-rated corporate bonds – from banks and other financial institutions. QE usually results in a weaker Pound Sterling.
Quantitative tightening (QT) is the reverse of QE, enacted when the economy is strengthening and inflation starts rising. Whilst in QE the Bank of England (BoE) purchases government and corporate bonds from financial institutions to encourage them to lend; in QT, the BoE stops buying more bonds, and stops reinvesting the principal maturing on the bonds it already holds. It is usually positive for the Pound Sterling.
- Gold price tests the $2,300 region as the US Dollar extends its correction.
- Weak US Services PMI report voiced concerns over the economic outlook.
- US yields rise as Fed rate cut expectations for June ease further.
Gold price (XAU/USD) is slightly down after securing another fresh record high above $2,300 in Thursday’s European session. The precious metal has benefitted from the soft US Dollar, knocked down after the United States Institute for Supply Management (ISM) delivered a weak Services PMI report for March.
The US Dollar Index (DXY), which tracks the Greenback’s value against six major currencies, extends its downside to 104.00.
10-year US Treasury yields are slightly up at 4.36% as market expectations for the Federal Reserve (Fed) starting to unwind its higher interest rate stance in the June meeting have eased. The CME FedWatch tool shows that traders are pricing in a 58% chance that the Fed will trim interest rates in June, down from 70% a week ago. Non-yielding assets such as Gold tend to face liquidity outflows when the demand for interest-bearing assets, such as US bonds, strengthens. However, this hasn’t been the case recently for Gold, which has been edging higher for several trading sessions even as yields also held up.
Meanwhile, investors await the release of the US Nonfarm Payrolls (NFP) report for March, which will be published on Friday. The US NFP report is expected to show US employers added 200K fresh payrolls over the month, lower than the former reading of 275K. The Unemployment Rate is anticipated to remain steady at 3.9%. Average Hourly Earnings, which gauge wage growth and provide significant guidance on the inflation outlook, are expected to rise at a slower pace of 4.1% from 4.3% in February on a year-on-year basis.
Robust wage growth and labor demand could further dampen Fed rate cut expectations for June, while easing labor market conditions could boost rate cut hopes. This last scenario would likely have a negative impact on US yields and likely help Gold edge further up.
Daily digest market movers: Gold price rises despite upbeat US bond yields
- Gold price rallies above the round-level figure of $2,300, supported by weakness in the US Dollar. The US Dollar faces an intense sell-off as poor United States ISM Services PMI for March deepened uncertainty over the interest rate outlook.
- Fed policymakers have been reiterating that there is no urgency for rate cuts as they lack confidence that inflation will sustainably return to the desired rate of 2%. The strong US economic outlook and tight labor market conditions are keeping inflation pressures high. However, the weak US Services PMI report has cast some doubts over the US economy's resilience.
- The Services PMI surprisingly fell to 51.4 in March, missing expectations of 52.7 and below the former reading of 52.6. Subindexes such as New Orders and Prices Paid also fell sharply. The Services PMI gauges business activity in the service sector, which accounts for two-thirds of the US economy. A sharp decline in the Prices Paid measure indicates easing price pressures, while the decline in the New Orders index suggests slowing demand.
- Market expectations for the Fed pivoting to rate cuts in the June meeting have eased after Atlanta Fed President Raphael Bostic delivered hawkish guidance and Fed Chairman Jerome Powell reiterated the need for more data before pivoting to rate cuts.
- On Wednesday, Raphael Bostic said on CNBC he sees the central bank reducing interest rates only once in the last quarter this year. Bostic expects inflation to return to the 2% target in 2026. He added: "The economy is maintaining the strong momentum it has had."
- Jerome Powell maintained the baseline that rate cuts will start later this year only when policymakers have greater confidence that inflation is moving sustainably down. "Recent readings on both job gains and inflation have come in higher than expected," he said.
Technical Analysis: Gold price kisses $2,300
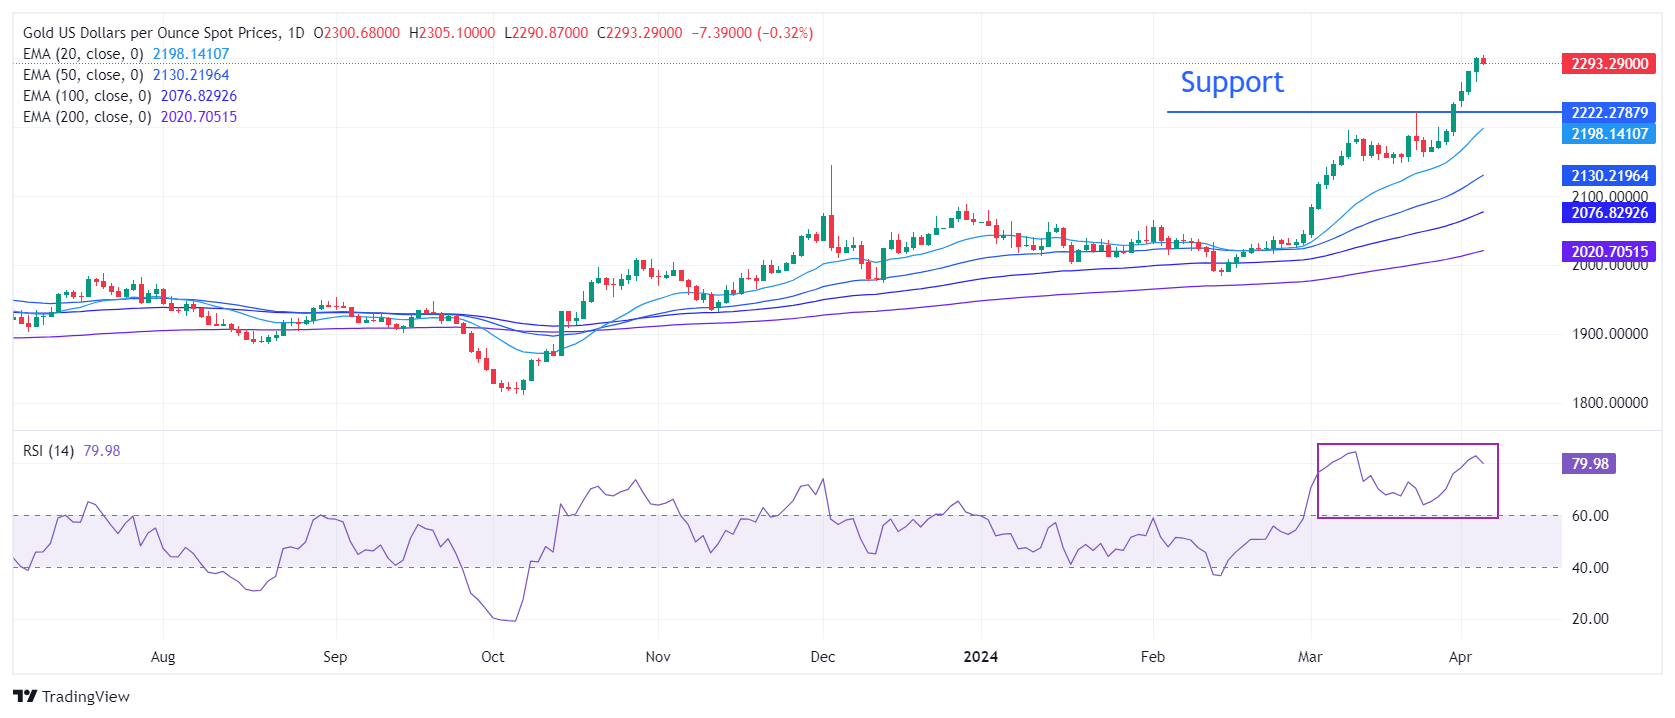
Gold price is consistently refreshing its lifetime highs supported by multiple tailwinds. The precious metal tests the round-level figure of $2,300. However, it struggles to continue its winning streak for the seventh trading session on Thursday.
Extremely overbought momentum oscillators are encouraging expectations for a slight correction. The 14-period Relative Strength Index (RSI) hovers near 80.00.
The near-term demand is strong, as the RSI has been consistently oscillating in the bullish range of 60.00-80.00 for more than a month.
All short-to-long-term Exponential Moving Averages (EMAs) are sloping higher, also suggesting strong near-term demand. On the downside, the March 21 high at $2,223 is the major support area.
Gold FAQs
Gold has played a key role in human’s history as it has been widely used as a store of value and medium of exchange. Currently, apart from its shine and usage for jewelry, the precious metal is widely seen as a safe-haven asset, meaning that it is considered a good investment during turbulent times. Gold is also widely seen as a hedge against inflation and against depreciating currencies as it doesn’t rely on any specific issuer or government.
Central banks are the biggest Gold holders. In their aim to support their currencies in turbulent times, central banks tend to diversify their reserves and buy Gold to improve the perceived strength of the economy and the currency. High Gold reserves can be a source of trust for a country’s solvency. Central banks added 1,136 tonnes of Gold worth around $70 billion to their reserves in 2022, according to data from the World Gold Council. This is the highest yearly purchase since records began. Central banks from emerging economies such as China, India and Turkey are quickly increasing their Gold reserves.
Gold has an inverse correlation with the US Dollar and US Treasuries, which are both major reserve and safe-haven assets. When the Dollar depreciates, Gold tends to rise, enabling investors and central banks to diversify their assets in turbulent times. Gold is also inversely correlated with risk assets. A rally in the stock market tends to weaken Gold price, while sell-offs in riskier markets tend to favor the precious metal.
The price can move due to a wide range of factors. Geopolitical instability or fears of a deep recession can quickly make Gold price escalate due to its safe-haven status. As a yield-less asset, Gold tends to rise with lower interest rates, while higher cost of money usually weighs down on the yellow metal. Still, most moves depend on how the US Dollar (USD) behaves as the asset is priced in dollars (XAU/USD). A strong Dollar tends to keep the price of Gold controlled, whereas a weaker Dollar is likely to push Gold prices up.
- NZD/USD has probably reversed its downtrend on the short-term timeframe.
- It was falling in a large Measured Move pattern, however, there is a chance this may not reach the target for C.
- A bullish close on Thursday would result in a “Three White Soldiers” Japanese candlestick reversal pattern on the daily chart.
NZD/USD has been broadly falling in a bearish three-wave pattern, known as a Measured Move but intraday charts are now signaling that the short-term trend has probably reversed.
Measured move price patterns are composed of an A, B, and C leg, in which waves A and C are commonly of the same length – or related by a 0.618 Fibonacci ratio.
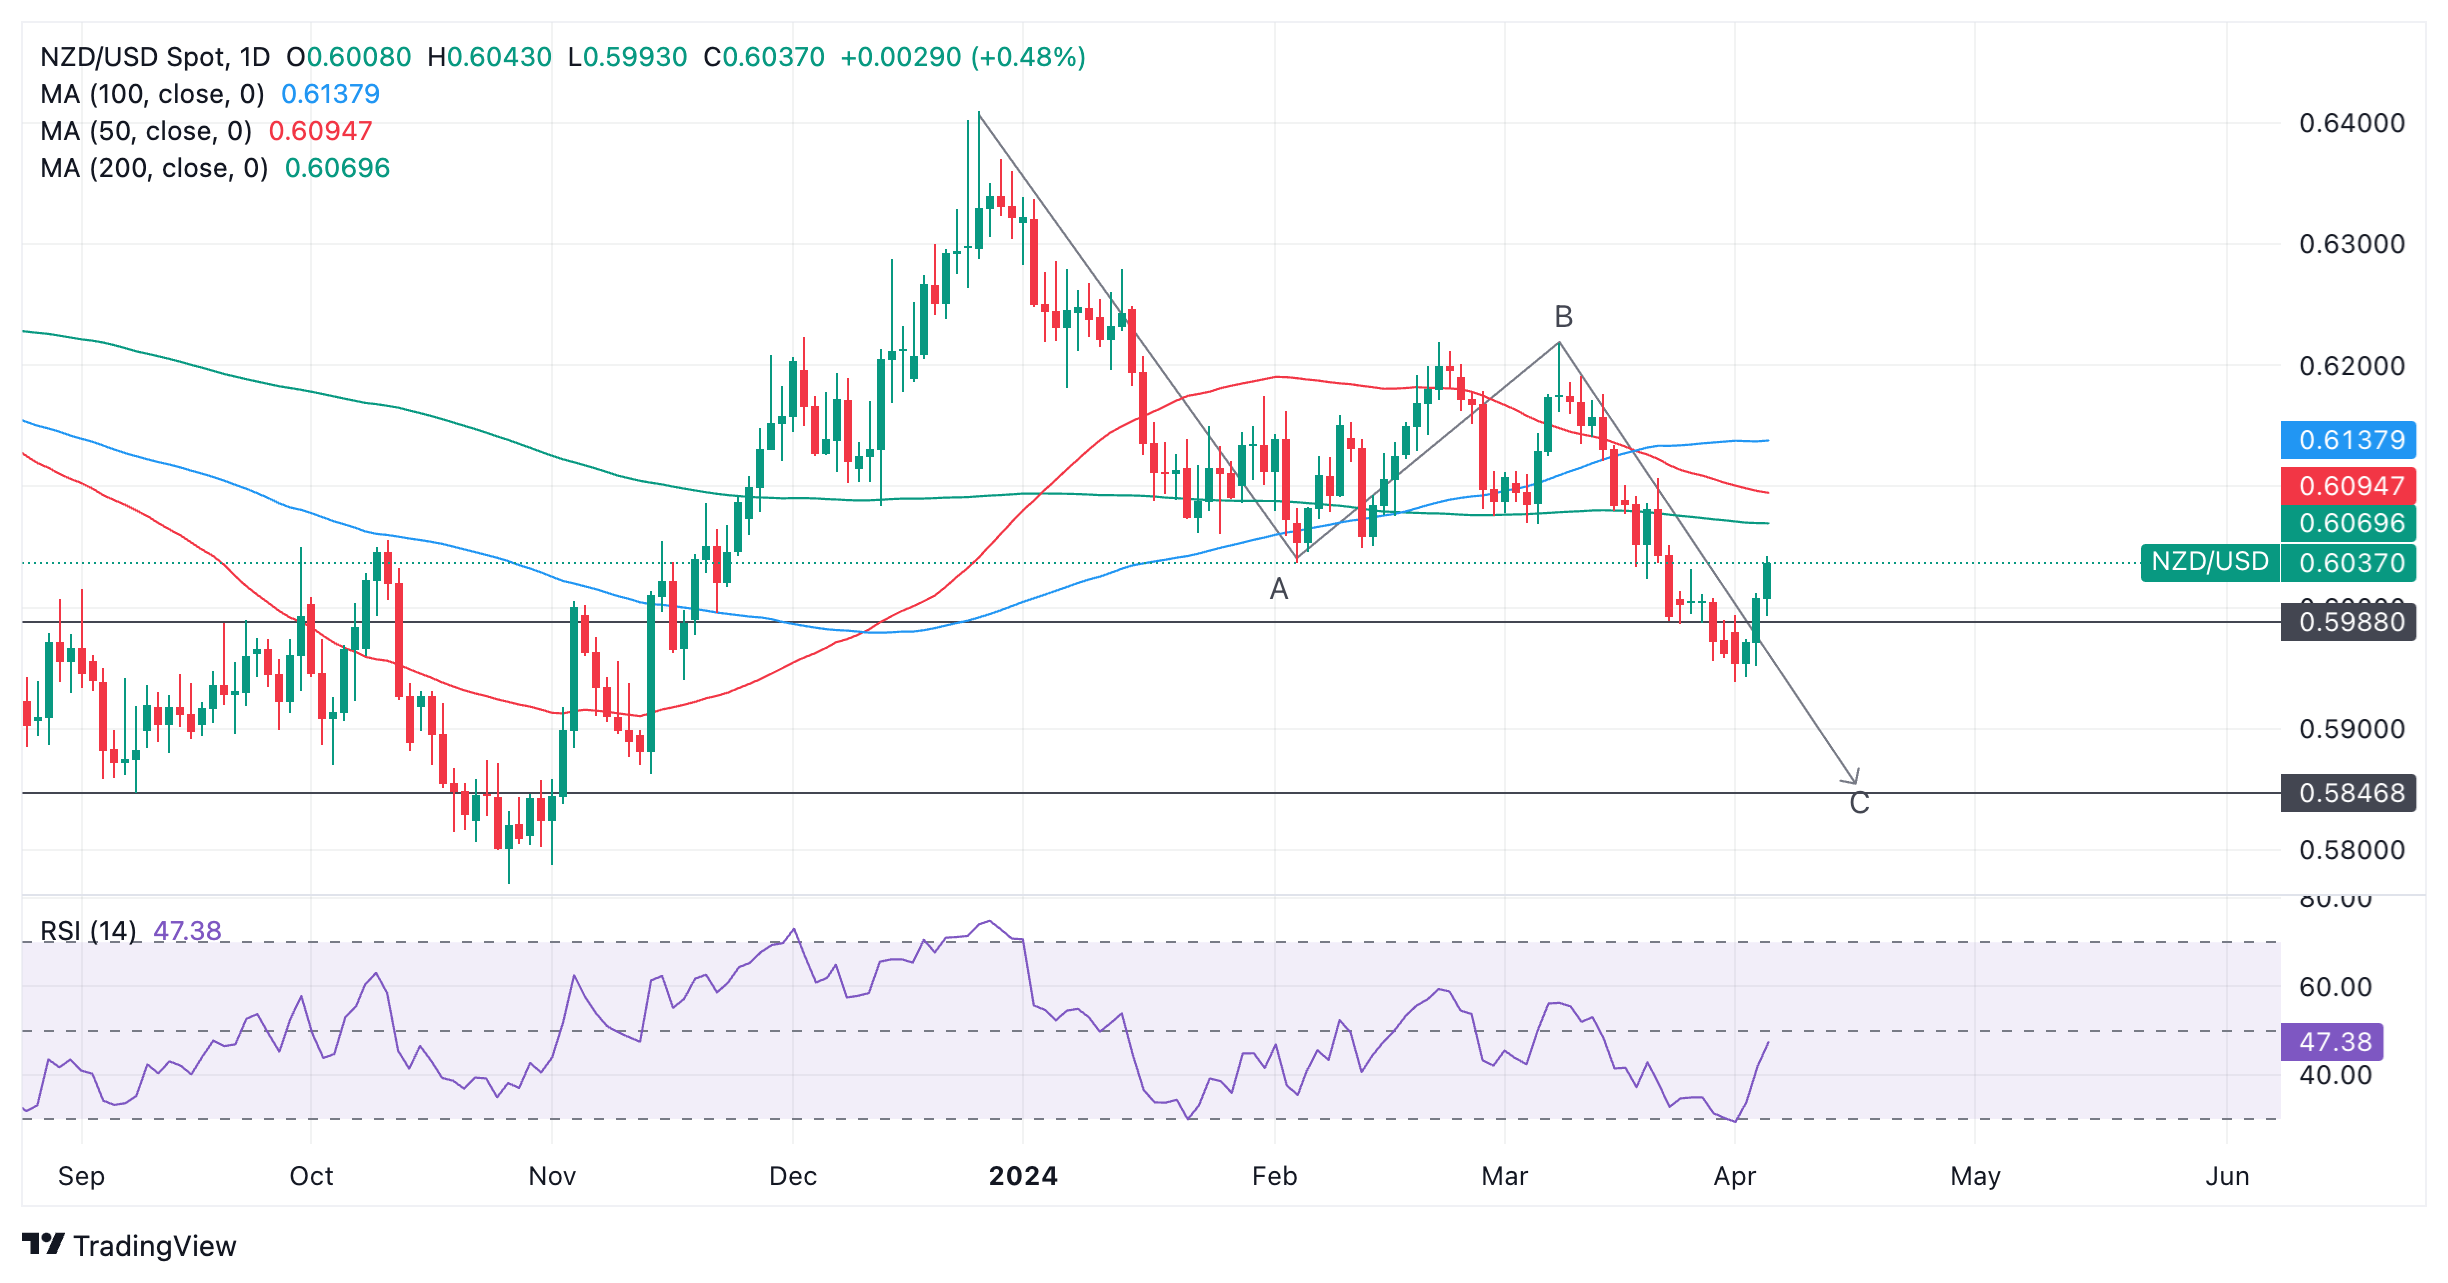
New Zealand Dollar versus US Dollar: Daily chart
The pattern on NZD/USD has already fallen to its conservative target at the point where C being equal to a 0.618 Fibonacci ratio of wave A (0.5988). It has not yet reached the target calculated as equal to the length of wave A.
Over the last three days the exchange rate has reversed, however, and risen up strongly, bringing into doubt whether the end of C will be achieved.
If Thursday’s daily candle ends green and therefore bullish it will complete a Japanese candlestick reversal pattern called a bullish Three White Soldier pattern. This happens when three consecutive up days occur after a long downtrend. It would be accompanied by high bullish momentum reinforcing the pattern’s reliability – a signal the NZD/USD will probably go higher.
The 4-hour chart, commonly used to assess the short-term trend of an asset, is showing NZD/USD has probably reversed over that timeframe.
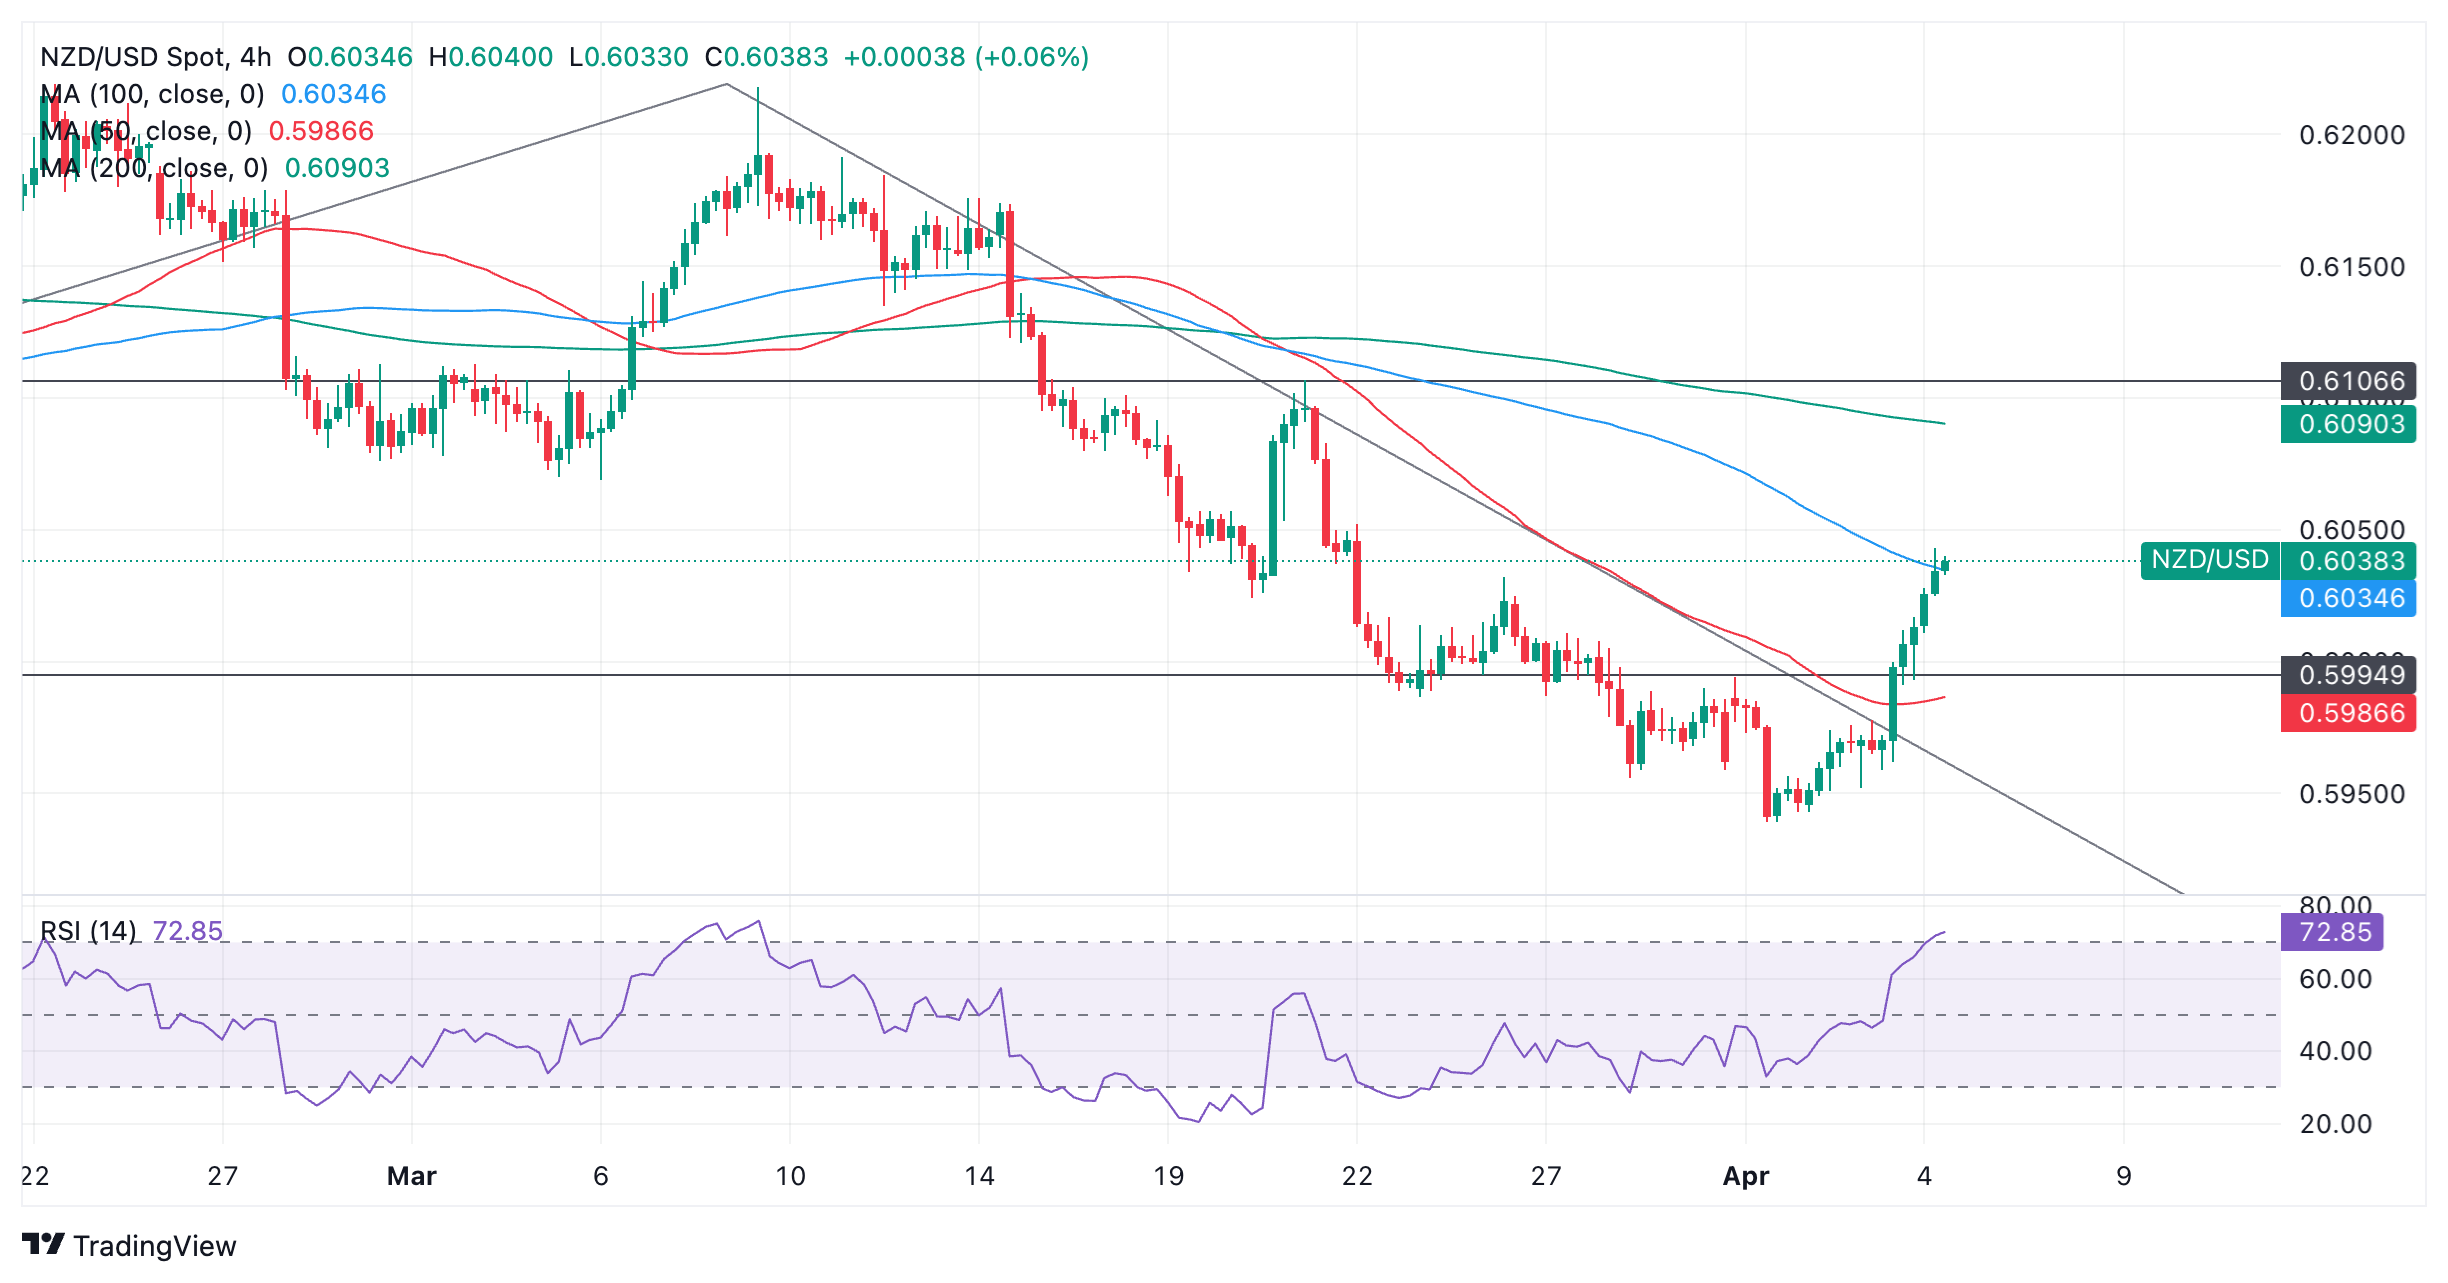
New Zealand Dollar versus US Dollar: 4-hour chart
Since the April 1 lows, NZD/USD has rallied strongly. It has broken above the last swing high of the prior downtrend at 0.5995 and has completed two sets of higher highs and higher lows. It has done all this on high bullish momentum. This indicates the short-term trend has probably reversed.
The Relative Strength Index (RSI) momentum indicator is now in overbought territory, however, indicating price is overbought and there is an increased risk the pair could pull back. If it exits overbought and returns to neutral territory it will give a sell-signal and a correction is anticipated. Such a correction could very well fall back down to the 0.5995 highs for support.
Since RSI has entered overbought it recommends for long holders trading over a short-term time frame to not increase the size of their positions. If NZD/USD exits overbought it will be a sign to liquidate longs and open shorts.
Resistance from the 100-4 hour Simple Moving Average (SMA) at 0.6034 adds credence to the possibility of a pullback evolving.
- The Mexican Peso broadly continues strengthening against the US Dollar after worse-than-expected US Services data.
- US Services inflation appears to be slowing, potentially indicating the possibility of an early interest-rate cut from the Fed.
- The long-term trend for the USD/MXN pair is lower, but chart sigils and omens suggest a risk of a recovery.
The Mexican Peso seesaws between tepid losses and gains against the US Dollar during the European session on Thursday. The sparsity of Mexican data on the calendar means the fundamental story for the pair is a song of the US Dollar (USD), rather than of the Peso (MXN).
The recent trend for the Peso has been up, with USD/MXN seeing more weakness creep in after the release of lower-than-expected US ISM Services PMI figures, which recalibrated views about the stickiness of US inflation, a key factor for USD pairs.
Mexican Peso extends uptrend after US Services data undershoots
The Mexican Peso’s valuation against the US Dollar rose after the release of US ISM Services PMI data on Wednesday. Figures for March showed an unexpected decline to 51.4 from 52.6 previously, when a slight rise to 52.7 had been expected.
Perhaps of more importance, was the acute fall in the ISM Services Prices Paid component, which measures inflation in the sector. It showed a decline to 53.4 in March from 58.6 in February.
-638478213864341723.png)
ISM Services Prices Paid: Monthly
The Prices Paid component is significant for the US Dollar and USD/MXN because Services inflation is considered particularly sticky by economists and the Federal Reserve (Fed) has said it is watching price pressures in the sector carefully as it deliberates whether or not to cut interest rates.
Lower interest rates or their expectation thereof are negative for the US Dollar as they reduce its attractiveness to foreign capital, lowering inflows.
Given the sudden step-decline in Services inflation revealed by the Price Paid metric it suggests a greater possibility the Fed may decide to cut interest rates as soon as June, as had been previously expected.
Recent strong US data and the threat of resurgent inflationary forces had pushed back bets of a June rate cut or even suggested the Fed might wait till 2025.
However, the March Services’ data has increased the probability once again of the Fed cutting in June, raising it back above the 60%-chance level, according to the CME FedWatch tool, a market-based gauge of future policy moves.
Technical Analysis: USD/MXN in long trend lower
USD/MXN is at the dog-end of a long-term downtrend that started after the pair peaked at 25.76 in April 2020 – we are now in the 16.50s.
The long move down could be characterized as a very large three-wave pattern called a Measured Move. Such patterns are composed of an A, B, and C wave, with wave C extending to a similar length to wave A, or a Fibonacci 0.618 ratio of A.
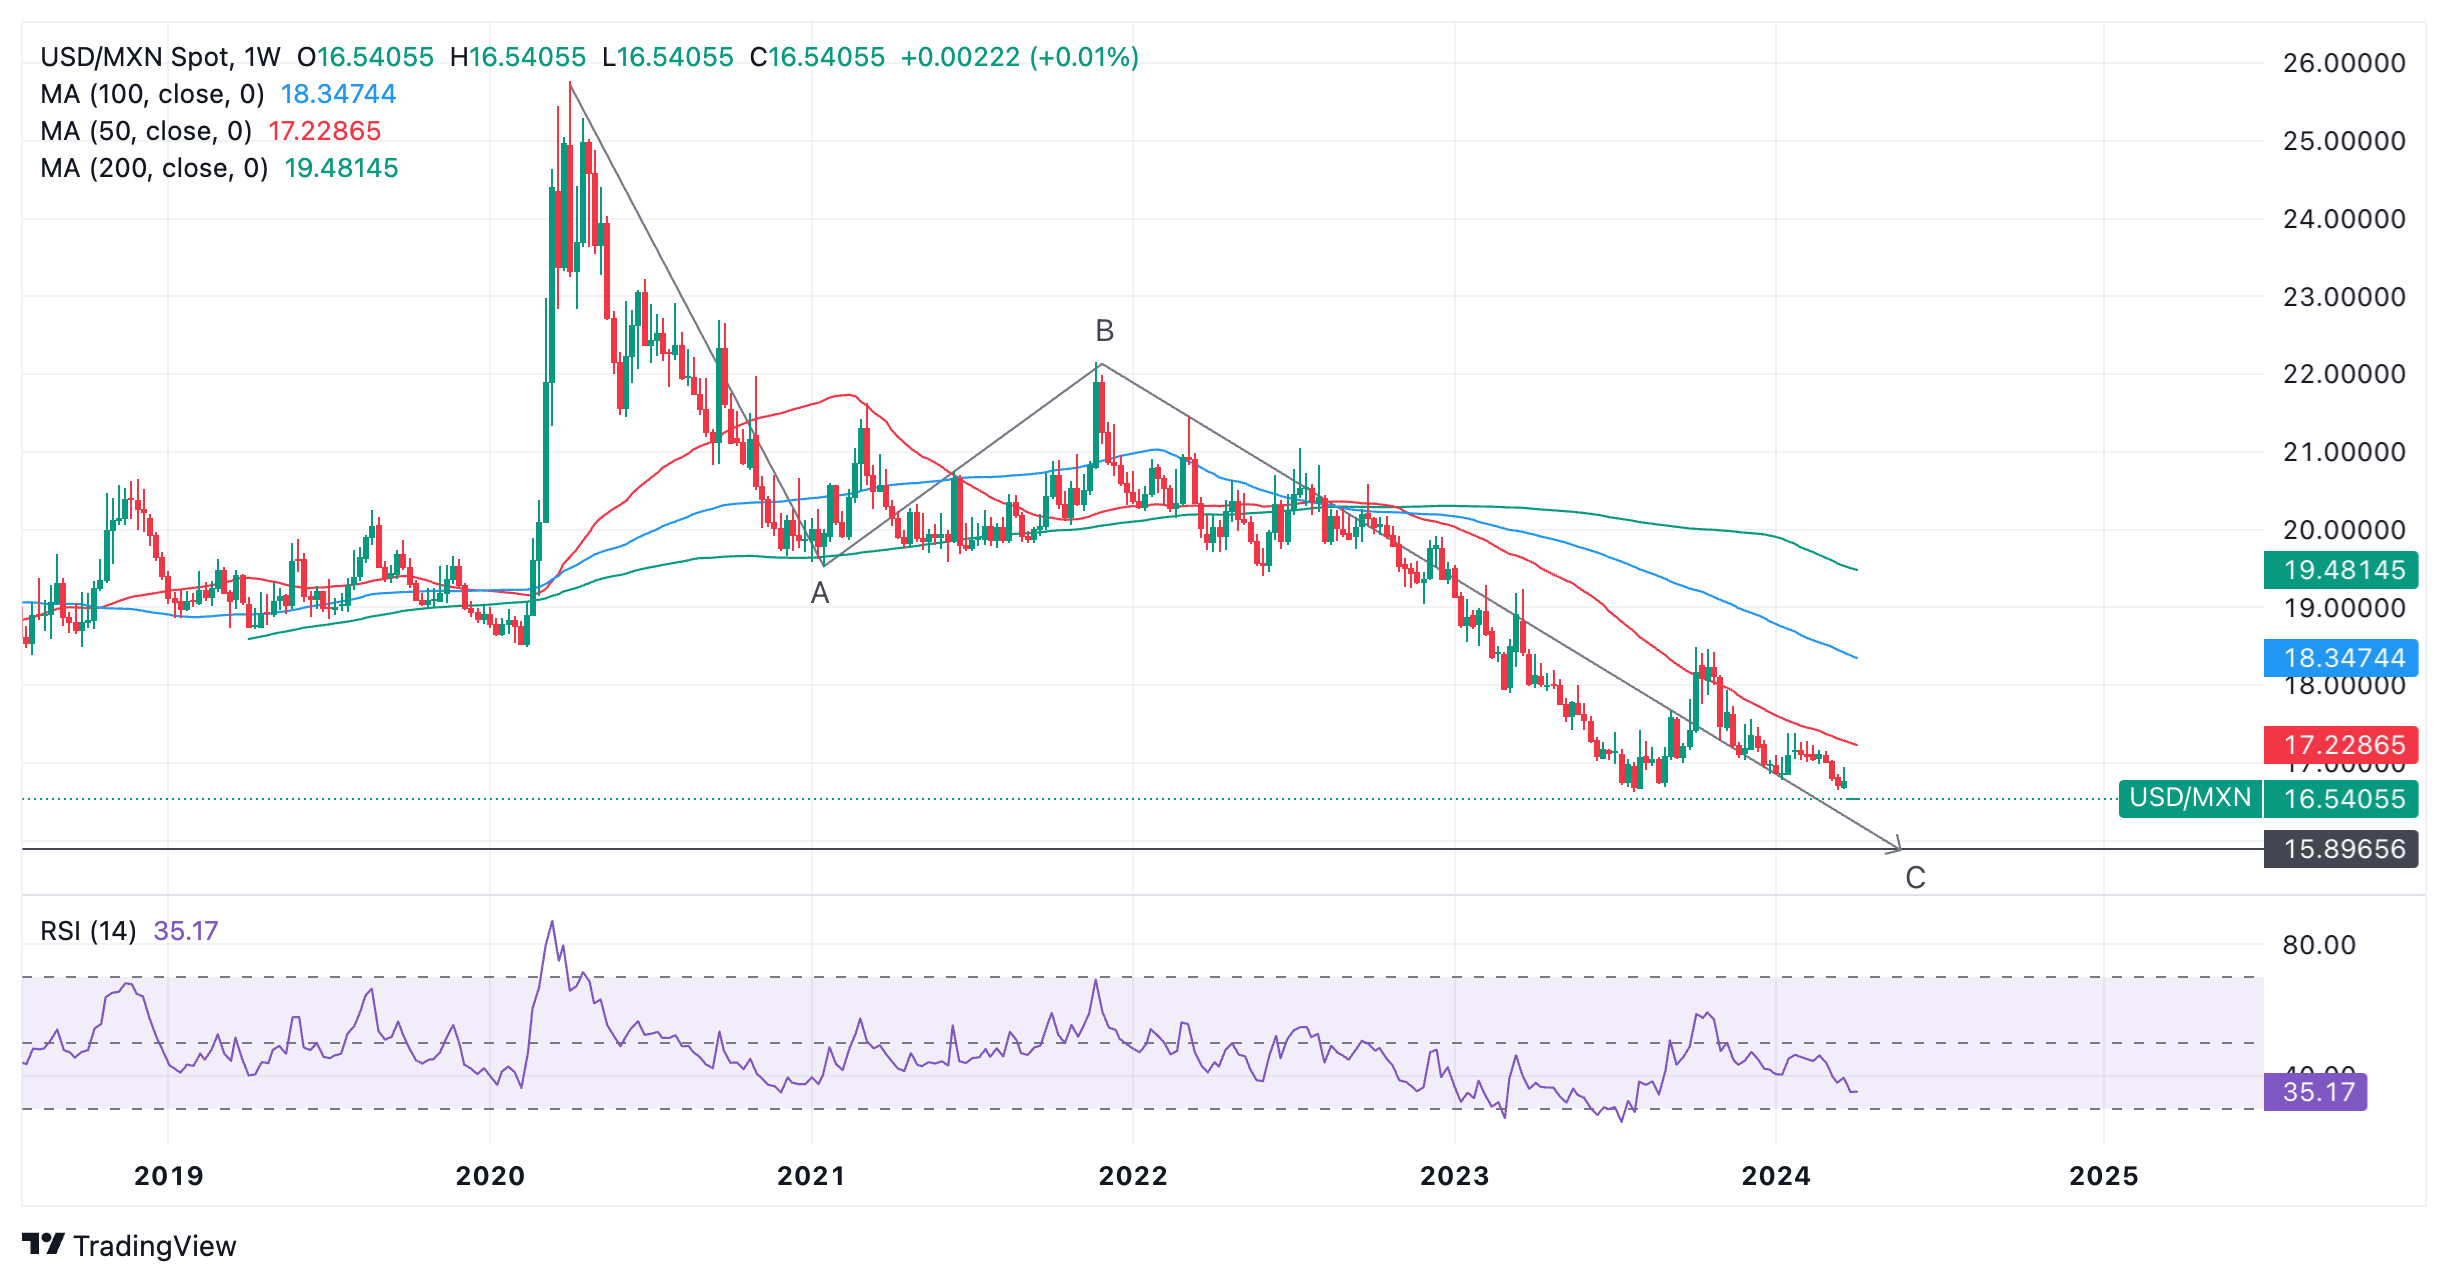
US Dollar versus Mexican Peso: Weekly Chart
If such a pattern is truly unfolding, price has almost reached the point at which C will equal A, calculated as lying at 15.89.
It has also by now surpassed the conservative target for the end of C at the 0.618 Fibonacci extension of A (at 18.24).
Once the pattern is complete the market usually reverses or undergoes a substantial correction.
The Relative Strength Index (RSI) is converging quite acutely with price, which is a sign the downtrend could be losing momentum. Although in 2024 price has pushed below the level of the 2023 lows, RSI has not followed suit. This non-correlation can be a precursor to a recovery. However, given there has been no reaction from price yet, it merely constitutes supplementary evidence the downtrend may be waning, rather than anything concrete.
An actual turnaround in the price itself would be necessary to support the view a change is on the horizon, and that is still lacking.
Mexican Peso FAQs
The Mexican Peso (MXN) is the most traded currency among its Latin American peers. Its value is broadly determined by the performance of the Mexican economy, the country’s central bank’s policy, the amount of foreign investment in the country and even the levels of remittances sent by Mexicans who live abroad, particularly in the United States. Geopolitical trends can also move MXN: for example, the process of nearshoring – or the decision by some firms to relocate manufacturing capacity and supply chains closer to their home countries – is also seen as a catalyst for the Mexican currency as the country is considered a key manufacturing hub in the American continent. Another catalyst for MXN is Oil prices as Mexico is a key exporter of the commodity.
The main objective of Mexico’s central bank, also known as Banxico, is to maintain inflation at low and stable levels (at or close to its target of 3%, the midpoint in a tolerance band of between 2% and 4%). To this end, the bank sets an appropriate level of interest rates. When inflation is too high, Banxico will attempt to tame it by raising interest rates, making it more expensive for households and businesses to borrow money, thus cooling demand and the overall economy. Higher interest rates are generally positive for the Mexican Peso (MXN) as they lead to higher yields, making the country a more attractive place for investors. On the contrary, lower interest rates tend to weaken MXN.
Macroeconomic data releases are key to assess the state of the economy and can have an impact on the Mexican Peso (MXN) valuation. A strong Mexican economy, based on high economic growth, low unemployment and high confidence is good for MXN. Not only does it attract more foreign investment but it may encourage the Bank of Mexico (Banxico) to increase interest rates, particularly if this strength comes together with elevated inflation. However, if economic data is weak, MXN is likely to depreciate.
As an emerging-market currency, the Mexican Peso (MXN) tends to strive during risk-on periods, or when investors perceive that broader market risks are low and thus are eager to engage with investments that carry a higher risk. Conversely, MXN tends to weaken at times of market turbulence or economic uncertainty as investors tend to sell higher-risk assets and flee to the more-stable safe havens.
The latest Bank of England (BoE) Decision Maker Panel (DMP) survey for February showed on Thursday that UK companies expect their selling prices and wage inflation to cool down over the next year.
Key takeaways
Selling price expectations dipped to 4.1% from 4.3%, the lowest reading since October 2021.
Wage growth expectations for the coming 12 months fell to 4.9% on a three-month moving average basis from 5.2% in February, marking the lowest reading since June 2022.
The survey is one of the most closely watched by members of the BoE's Monetary Policy Committee (MPC).
Market reaction
The Pound Sterling is unfazed by the UK businesses’ falling inflation expectations, as GBP/USD adds 0.08% on the day to trade at 1.2658, as of writing.
BoE FAQs
The Bank of England (BoE) decides monetary policy for the United Kingdom. Its primary goal is to achieve ‘price stability’, or a steady inflation rate of 2%. Its tool for achieving this is via the adjustment of base lending rates. The BoE sets the rate at which it lends to commercial banks and banks lend to each other, determining the level of interest rates in the economy overall. This also impacts the value of the Pound Sterling (GBP).
When inflation is above the Bank of England’s target it responds by raising interest rates, making it more expensive for people and businesses to access credit. This is positive for the Pound Sterling because higher interest rates make the UK a more attractive place for global investors to park their money. When inflation falls below target, it is a sign economic growth is slowing, and the BoE will consider lowering interest rates to cheapen credit in the hope businesses will borrow to invest in growth-generating projects – a negative for the Pound Sterling.
In extreme situations, the Bank of England can enact a policy called Quantitative Easing (QE). QE is the process by which the BoE substantially increases the flow of credit in a stuck financial system. QE is a last resort policy when lowering interest rates will not achieve the necessary result. The process of QE involves the BoE printing money to buy assets – usually government or AAA-rated corporate bonds – from banks and other financial institutions. QE usually results in a weaker Pound Sterling.
Quantitative tightening (QT) is the reverse of QE, enacted when the economy is strengthening and inflation starts rising. Whilst in QE the Bank of England (BoE) purchases government and corporate bonds from financial institutions to encourage them to lend; in QT, the BoE stops buying more bonds, and stops reinvesting the principal maturing on the bonds it already holds. It is usually positive for the Pound Sterling.
- USD/JPY could meet the immediate barrier around March’s high of 151.97 and the psychological level of 152.00.
- The lagging indicators suggest a confirmation of the bullish trend for the pair.
- The pair could test the support region around the major level of 151.50 and the nine-day EMA at 151.39.
USD/JPY exhibits sideways trading on Thursday, hovering around 151.70 during the European trading hours. The pair may encounter immediate resistance around the recent high of 151.95 marked on Wednesday, which aligns with March’s high of 151.97 and the psychological level of 152.00.
A breakthrough above this level could support further upward movement, potentially allowing the USD/JPY pair to explore the region around the major level of 152.50.
The technical analysis for the USD/JPY pair indicates a bullish momentum, with the 14-day Relative Strength Index (RSI) positioned above the 50 level.
Additionally, the Moving Average Convergence Divergence (MACD) indicator confirms the bullish trend, with the MACD line above the centerline and showing divergence above the signal line.
On the downside, the USD/JPY could find immediate support at a significant level of 151.50, followed by the nine-day Exponential Moving Average (EMA) at 151.39.
A breach below the latter level might exert downward pressure on the USD/JPY pair, potentially leading to a test of the psychological mark of 151.00 before reaching the 23.6% Fibonacci retracement level of 150.67.
USD/JPY: Daily Chart
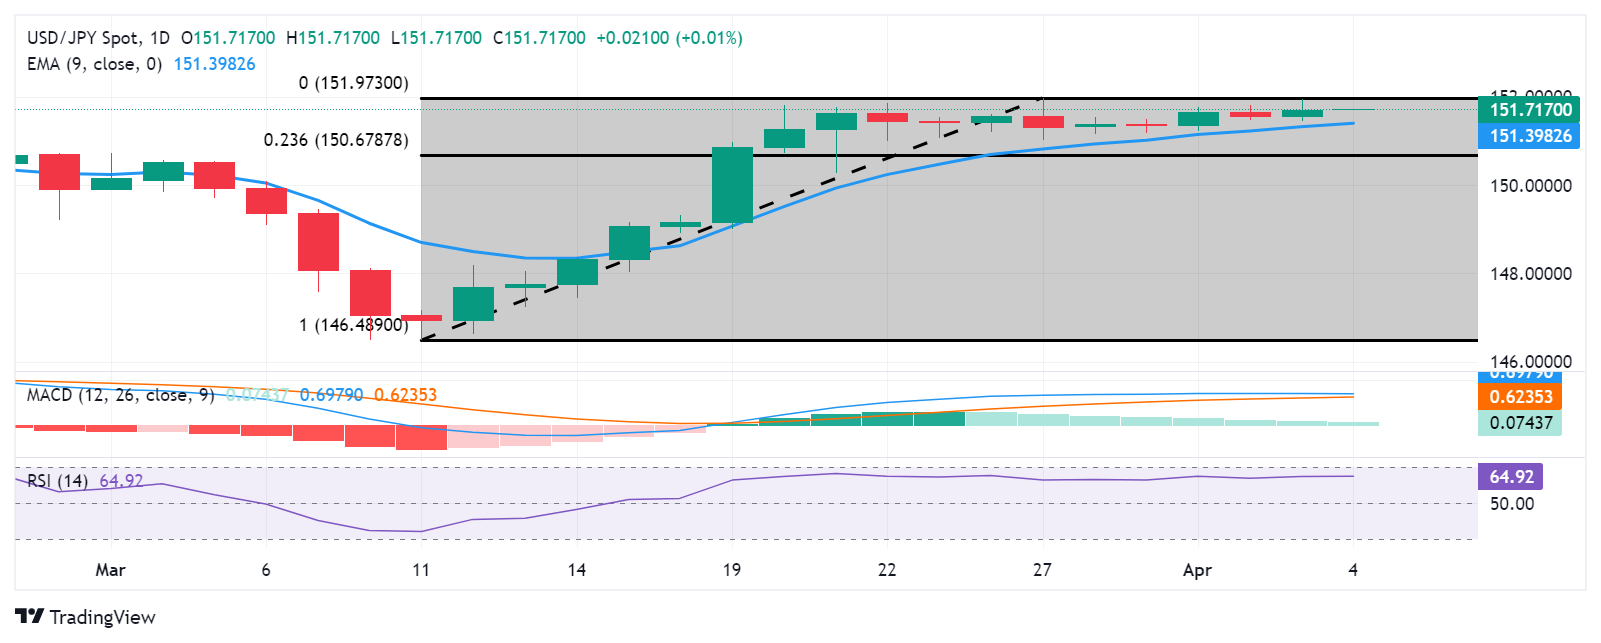
Here is what you need to know on Thursday, April 4:
The US Dollar (USD) came under renewed selling pressure on Wednesday and the USD Index closed the second consecutive day in negative territory. S&P Global will release revisions to Services PMI data for Germany, the Eurozone and the UK on Thursday. Later in the day, the US economic docket will feature weekly Initial Jobless Claims and Goods Trade Balance data for February. Several Federal Reserve (Fed) policymakers will be delivering speeches during the American trading hours.
ISM Services PMI in the US declined to 51.4 in March from 52.6 in February. This reading came in below the market expectation of 52.7 and weighed on the USD on Tuesday. Additionally, the Prices Paid Index of the survey, the inflation component, declined to 53.4 from 58.6. Later in the American session, Federal Reserve Chairman Jerome Powell reiterated that they were in no rush to reduce rates. "The Fed has time to let incoming data guide its policy decisions; the central bank is making decisions meeting by meeting," Powell added. These comments failed to support the USD and the USD Index fell 0.5% on Wednesday.
Wall Street's main indexes closed mixed on Wednesday and the benchmark 10-year US Treasury bond yield retreated toward 4.35% after reaching its highest level since November above 4.4%. Early Thursday, US stock index futures trade in positive territory.
US Dollar price this week
The table below shows the percentage change of US Dollar (USD) against listed major currencies this week. US Dollar was the weakest against the Australian Dollar.
| USD | EUR | GBP | CAD | AUD | JPY | NZD | CHF | |
| USD | -0.45% | -0.13% | -0.07% | -0.83% | 0.19% | -0.83% | 0.51% | |
| EUR | 0.45% | 0.32% | 0.38% | -0.38% | 0.65% | -0.38% | 1.00% | |
| GBP | 0.12% | -0.33% | 0.06% | -0.70% | 0.32% | -0.70% | 0.65% | |
| CAD | 0.06% | -0.39% | -0.08% | -0.77% | 0.24% | -0.78% | 0.57% | |
| AUD | 0.82% | 0.38% | 0.70% | 0.75% | 1.01% | -0.01% | 1.33% | |
| JPY | -0.20% | -0.64% | -0.33% | -0.24% | -0.99% | -1.04% | 0.34% | |
| NZD | 0.82% | 0.37% | 0.69% | 0.76% | 0.00% | 1.00% | 1.33% | |
| CHF | -0.54% | -0.98% | -0.65% | -0.60% | -1.37% | -0.34% | -1.36% |
The heat map shows percentage changes of major currencies against each other. The base currency is picked from the left column, while the quote currency is picked from the top row. For example, if you pick the Euro from the left column and move along the horizontal line to the Japanese Yen, the percentage change displayed in the box will represent EUR (base)/JPY (quote).
Earlier in the day, the data from Australia showed that Building Permits declined by 1.9% on a monthly basis in February, following the 2.5% contraction recorded in January. AUD/USD ignored the weak data and extended its recovery toward 0.6600 in the Asian session after rising more than 0.7% on Wednesday.
Australian Dollar holds position after gains amid firmer US Dollar, Initial Jobless Claims eyed.
EUR/USD preserves its bullish momentum early Thursday and trades in positive territory above 1.0800 after rising over 0.8% in the previous two days.
GBP/USD advanced beyond 1.2600 and gained 0.6% on Wednesday. The pair clings to small daily gains above 1.2650 in the early European session.
Gold extended its rally and reached a new all-time high above $2,300 in the Asian session on Thursday. XAU/USD stages a technical correction and retreats toward $2,290 in the European trading hours.
Gold price remains on the defensive below $2,300 as traders look to US NFP on Friday.
USD/JPY ignores the selling pressure surrounding the USD and continues to move up and down in a narrow range above 151.50.
Japanese Yen struggles to attract buyers, hangs near multi-decade low against USD.
US Dollar FAQs
The US Dollar (USD) is the official currency of the United States of America, and the ‘de facto’ currency of a significant number of other countries where it is found in circulation alongside local notes. It is the most heavily traded currency in the world, accounting for over 88% of all global foreign exchange turnover, or an average of $6.6 trillion in transactions per day, according to data from 2022. Following the second world war, the USD took over from the British Pound as the world’s reserve currency. For most of its history, the US Dollar was backed by Gold, until the Bretton Woods Agreement in 1971 when the Gold Standard went away.
The most important single factor impacting on the value of the US Dollar is monetary policy, which is shaped by the Federal Reserve (Fed). The Fed has two mandates: to achieve price stability (control inflation) and foster full employment. Its primary tool to achieve these two goals is by adjusting interest rates. When prices are rising too quickly and inflation is above the Fed’s 2% target, the Fed will raise rates, which helps the USD value. When inflation falls below 2% or the Unemployment Rate is too high, the Fed may lower interest rates, which weighs on the Greenback.
In extreme situations, the Federal Reserve can also print more Dollars and enact quantitative easing (QE). QE is the process by which the Fed substantially increases the flow of credit in a stuck financial system. It is a non-standard policy measure used when credit has dried up because banks will not lend to each other (out of the fear of counterparty default). It is a last resort when simply lowering interest rates is unlikely to achieve the necessary result. It was the Fed’s weapon of choice to combat the credit crunch that occurred during the Great Financial Crisis in 2008. It involves the Fed printing more Dollars and using them to buy US government bonds predominantly from financial institutions. QE usually leads to a weaker US Dollar.
Quantitative tightening (QT) is the reverse process whereby the Federal Reserve stops buying bonds from financial institutions and does not reinvest the principal from the bonds it holds maturing in new purchases. It is usually positive for the US Dollar.
- EUR/GBP continues its winning streak amid possible rate cuts by major central banks.
- The Pound Sterling faces challenges as the BoE is expected to initiate rate cuts in June, with odds standing at 66%.
- ECB's Pablo Hernandez stated that recent inflation data aligns with the central bank's mandate of achieving its inflation objective.
EUR/GBP continues its winning streak that began on March 29, climbing to near 0.8570 during the European trading hours on Thursday. The easing of global inflationary pressures has led to speculation about potential interest rate cuts by central banks.
Money market futures traders are anticipating a 25 basis point rate cut by the Bank of England (BoE) in June, with odds currently standing at 66%. On the other side, the Eurozone annual rate of inflation declined more than expected in March, prompting speculation that the European Central Bank (ECB) may cut interest rates in June.
On Wednesday, the Eurozone Harmonized Index of Consumer Prices (HICP) for March was reported at a year-over-year rate of 2.4%, missing the market estimation of an unchanged 2.6% rise in the reported period.
BoE Governor Andrew Bailey has recently commented that, with further encouraging signs indicating a cooling inflation trend, the UK economy is moving towards a point where the central bank could consider interest rate cuts. ECB policymaker Pablo Hernandez de Cos stated on Wednesday that he is not explicitly providing forecasts on future monetary policy. However, he mentioned that recent inflation data is in line with the central bank's mandate of achieving its inflation objective.
Pablo Hernandez also mentioned that the ECB could begin cutting interest rates in June due to a sustained slowdown in inflation across the bloc. Additionally, ECB policymaker Robert Holzmann remarked that the central bank might initiate interest rate cuts in June, as inflation could decline more rapidly than initially anticipated.
- USD/CHF climbs to 0.9070 after the release of the softer-than-expected Swiss CPI report.
- Swiss soft inflation data has boosted expectations of more rate cuts by the SNB.
- The US Dollar exhibits weakness ahead of the US NFP report.
The USD/CHF pair rallies to 0.9070 in the European session on Thursday. The Swiss Franc asset strengthens as softer-than-expected Switzerland Consumer Price Index (CPI) data for March has boosted expectations of one more interest rate cut by the Swiss National Bank (SNB).
Among developed economies, the SNB has led the rate-cut cycle after reducing interest rates by 25 basis points (bps) to 1.5% in the monetary policy meeting on March 21.
Federal Statistical Office of Switzerland has reported that the monthly consumer price inflation remains stagnant while investors anticipated an increase of 0.3%. In February, price pressures rose by 0.6%. Annually, inflationary pressures surprisingly grew at a slower pace of 1.0%. Economists expected the consumer price inflation to grow at a higher pace of 1.3% after rising 1.2% in February.
Meanwhile, the US Dollar has extended its downside as weak United States Services PMI for March has dented the economic outlook. The US Dollar Index (DXY), which tracks the US Dollar’s value against six major currencies, falls to 104.12.
The Institute of Supply Management (ISM) reported that the Services PMI fell to 51.4 from expectations of 52.7 and the former reading of 52.6. Also, subindexes such as New Orders and Prices Paid eased significantly.
Going forward, investors will focus on the US Nonfarm Payrolls (NFP) data for March, which will be published on Friday. US employers are anticipated to have recruited 200K workers, lower than the former reading of 275K.
- The Pound Sterling capitalizes on risk-on mood and rises to 1.2660.
- UK’s upbeat Manufacturing PMI data and increasing home prices suggest that the recession in the second half of 2023 was shallow.
- The US NFP data will guide the next move in the US Dollar.
The Pound Sterling (GBP) aims to extend its recovery above the one-week high of 1.2660 in Thursday’s London session. The GBP/USD pair exhibits strength as recent economic indicators in the United Kingdom have shown that the economy is on track to return to growth after falling into a technical recession in the second half of 2023. Meanwhile, a weaker US Dollar due to the poor United States Institute of Supply Management (ISM) Services PMI data for March also boosted the Cable.
The UK’s Manufacturing PMI surprisingly expanded in March after contracting for 20 straight months, driven by robust domestic demand. Strong UK factory data propelled business optimism to its highest level since April 2023, with 58% of manufacturers expecting their production level to increase over the coming 12 months. In addition, British house prices rose 1.6% in March, the highest pace since December 2022, suggesting that the real estate sector is holding up despite historically higher interest rates.
Daily digest market movers: Pound Sterling extends winning spell for third trading session
- The Pound Sterling turns sideways after advancing to 1.2660 against the US Dollar. The asset is expected to extend the upside as market sentiment is bullish, and a weak United States ISM Services PMI has knocked down the US Dollar. S&P 500 futures have posted significant gains in the Asian session.
- On Wednesday, the US Services PMI surprisingly fell to 51.4 in March from expectations of 52.7 and the former reading of 52.6. The Services PMI gauges business activity in the service sector, which accounts for two-thirds of the US economy. Therefore, the impact of a poor Services PMI was significantly adverse for the US Dollar, dragging the US Dollar Index (DXY) by more than 0.5% to 104.15. The ISM report also showed that new orders and prices paid subindexes fell significantly.
- This week, the major driver for the US Dollar will be the US Nonfarm Payrolls (NFP) report for March, which will be published on Friday. The economic data will significantly impact market expectations about whether the Federal Reserve will start reducing interest rates from the June meeting. The NFP report is expected to show that 200K workers were hired over the month, lower than February’s reading of 275K.
- On the UK front, the Pound Sterling will be guided by market expectations over Bank of England rate cuts and the S&P Global/CIPS Services PMI, which will be published at 08:30 GMT. Investors expect the BoE to kick-start the rate-cut cycle in June as the United Kingdom inflation is slowing consistently. For the whole year, BoE Governor Andrew Bailey said he sees two or three rate cut expectations as “reasonable.”
- The Services PMI is forecasted to have remained unchanged from its preliminary reading of 53.4. An upbeat PMI data would strengthen the UK economic outlook. This week, the final Manufacturing PMI reading for March, released on Tuesday, returned to growth after contracting for 20 straight months.
Technical Analysis: Pound Sterling rises to weekly high near 1.2660
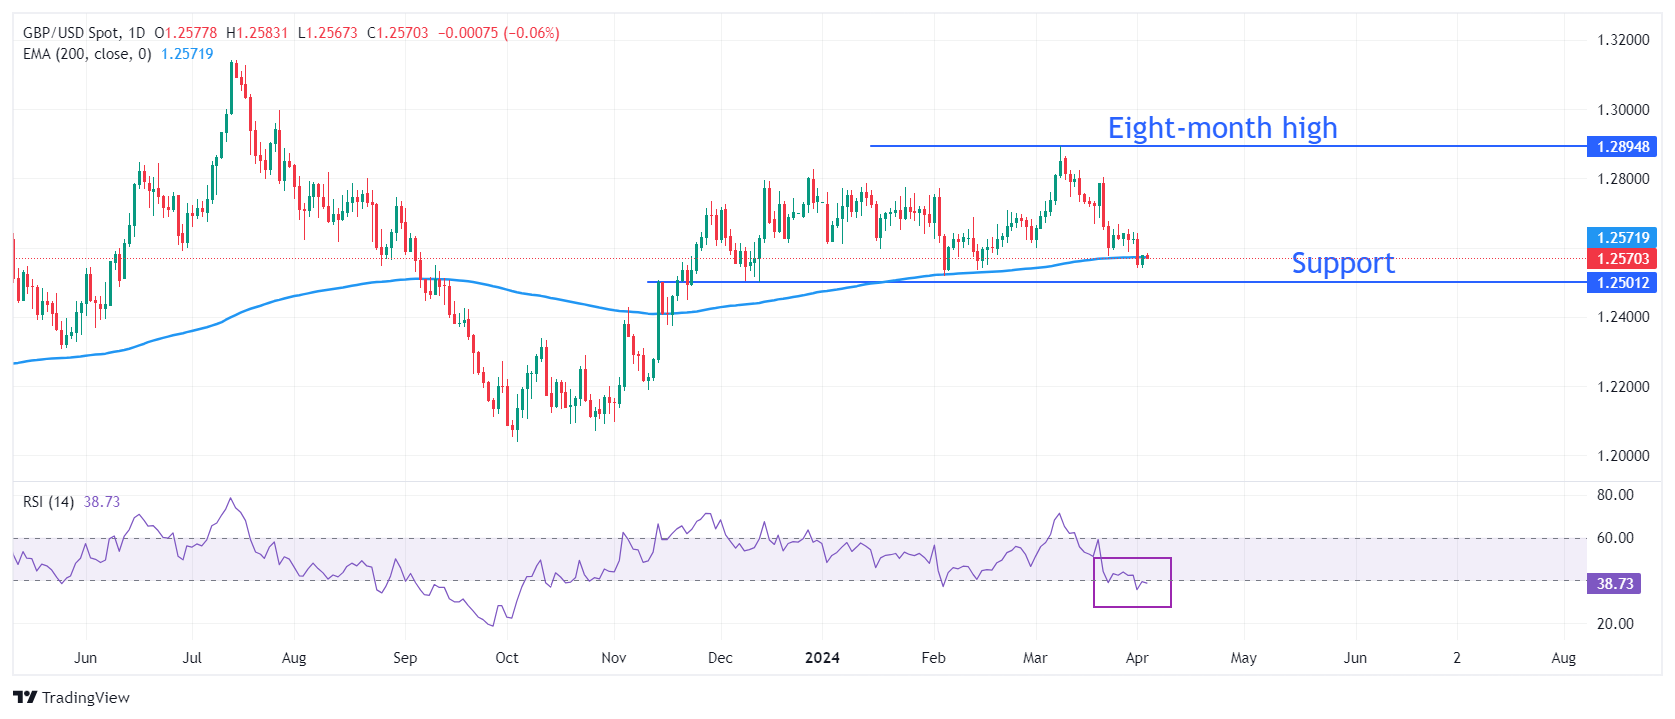
The Pound Sterling rebounds to a one-week high near 1.2660 after discovering buying interest from a six-week low of 1.2540. The GBP/USD pair continues its winning spell for the third trading session on Thursday. Cable bulls respected the 200-day Exponential Moving Average (EMA) at 1.2566. The 20-day EMA near 1.2660 could act as a strong barrier ahead.
On a broader time frame, the horizontal support from December 8 low at 1.2500 would provide further cushion to the Pound Sterling. Meanwhile, the upside is expected to remain limited near an eight-month high of around 1.2900.
The 14-period Relative Strength Index (RSI) rebounds above 40.00 after slipping below it. The event should not be considered a “bullish reversal” until it decisively breaks above 60.00.
Pound Sterling FAQs
The Pound Sterling (GBP) is the oldest currency in the world (886 AD) and the official currency of the United Kingdom. It is the fourth most traded unit for foreign exchange (FX) in the world, accounting for 12% of all transactions, averaging $630 billion a day, according to 2022 data. Its key trading pairs are GBP/USD, aka ‘Cable’, which accounts for 11% of FX, GBP/JPY, or the ‘Dragon’ as it is known by traders (3%), and EUR/GBP (2%). The Pound Sterling is issued by the Bank of England (BoE).
The single most important factor influencing the value of the Pound Sterling is monetary policy decided by the Bank of England. The BoE bases its decisions on whether it has achieved its primary goal of “price stability” – a steady inflation rate of around 2%. Its primary tool for achieving this is the adjustment of interest rates. When inflation is too high, the BoE will try to rein it in by raising interest rates, making it more expensive for people and businesses to access credit. This is generally positive for GBP, as higher interest rates make the UK a more attractive place for global investors to park their money. When inflation falls too low it is a sign economic growth is slowing. In this scenario, the BoE will consider lowering interest rates to cheapen credit so businesses will borrow more to invest in growth-generating projects.
Data releases gauge the health of the economy and can impact the value of the Pound Sterling. Indicators such as GDP, Manufacturing and Services PMIs, and employment can all influence the direction of the GBP. A strong economy is good for Sterling. Not only does it attract more foreign investment but it may encourage the BoE to put up interest rates, which will directly strengthen GBP. Otherwise, if economic data is weak, the Pound Sterling is likely to fall.
Another significant data release for the Pound Sterling is the Trade Balance. This indicator measures the difference between what a country earns from its exports and what it spends on imports over a given period. If a country produces highly sought-after exports, its currency will benefit purely from the extra demand created from foreign buyers seeking to purchase these goods. Therefore, a positive net Trade Balance strengthens a currency and vice versa for a negative balance.
- EUR/USD rebounds after weaker ISM Services PMI data undermines the US Dollar.
- Services inflation in the US is proving sticky but the PMI’s Prices Paid component showed a fairly steep fall.
- The odds of a June interest-rate cut from the Fed have recovered after the data.
EUR/USD is rebounding and trading back above 1.0800 on Thursday, following the release of lower-than-expected ISM Services PMI data from the US.
The data increases the probability of the Federal Reserve (Fed) cutting interest rates by June, bringing it more in line with the more concrete expectations of when the European Central Bank (ECB) will start cutting rates.
The US Dollar (USD) suffered after the release because relatively lower interest rates or their expectation thereof are usually negative for a currency since they reduce inflows of foreign capital.
EUR/USD: Services inflation not so sticky
EUR/USD rebounded strongly on Wednesday after the release of ISM Services PMI for March undershot expectations. But it was probably the sharper fall in the ISM Services Prices Paid component figure, which measures inflation in the sector, which was the main driver of USD weakness.
Services inflation is considered stickier than other types of inflation and is one of the metrics being most closely watched by the Fed as they try to decide when or whether to cut interest rates.
-638478132076208757.png)
ISM Services Prices Paid: Monthly
The fall in Prices Paid to 53.4 from 58.6 prior, is a sign inflation in the sector is cooling considerably, making it more likely the Fed will cut interest rates by June.
Indeed, this was reflected by the CME FedWatch tool, which gives a market-based probability of future Fed decisions, which is now indicating an over-60% chance of a cut by June, from a probability in the mid-50% range on Monday.
Technical Analysis: EUR/USD threatening to reverse short-term downtrend
EUR/USD extends its recovery from short-term seven-week lows in the 1.0720s on Thursday.
It has now broken above a key resistance level from the swing low at the level of the B wave of the prior ABC pattern, suggesting the recovery is probably more than just a short pullback.
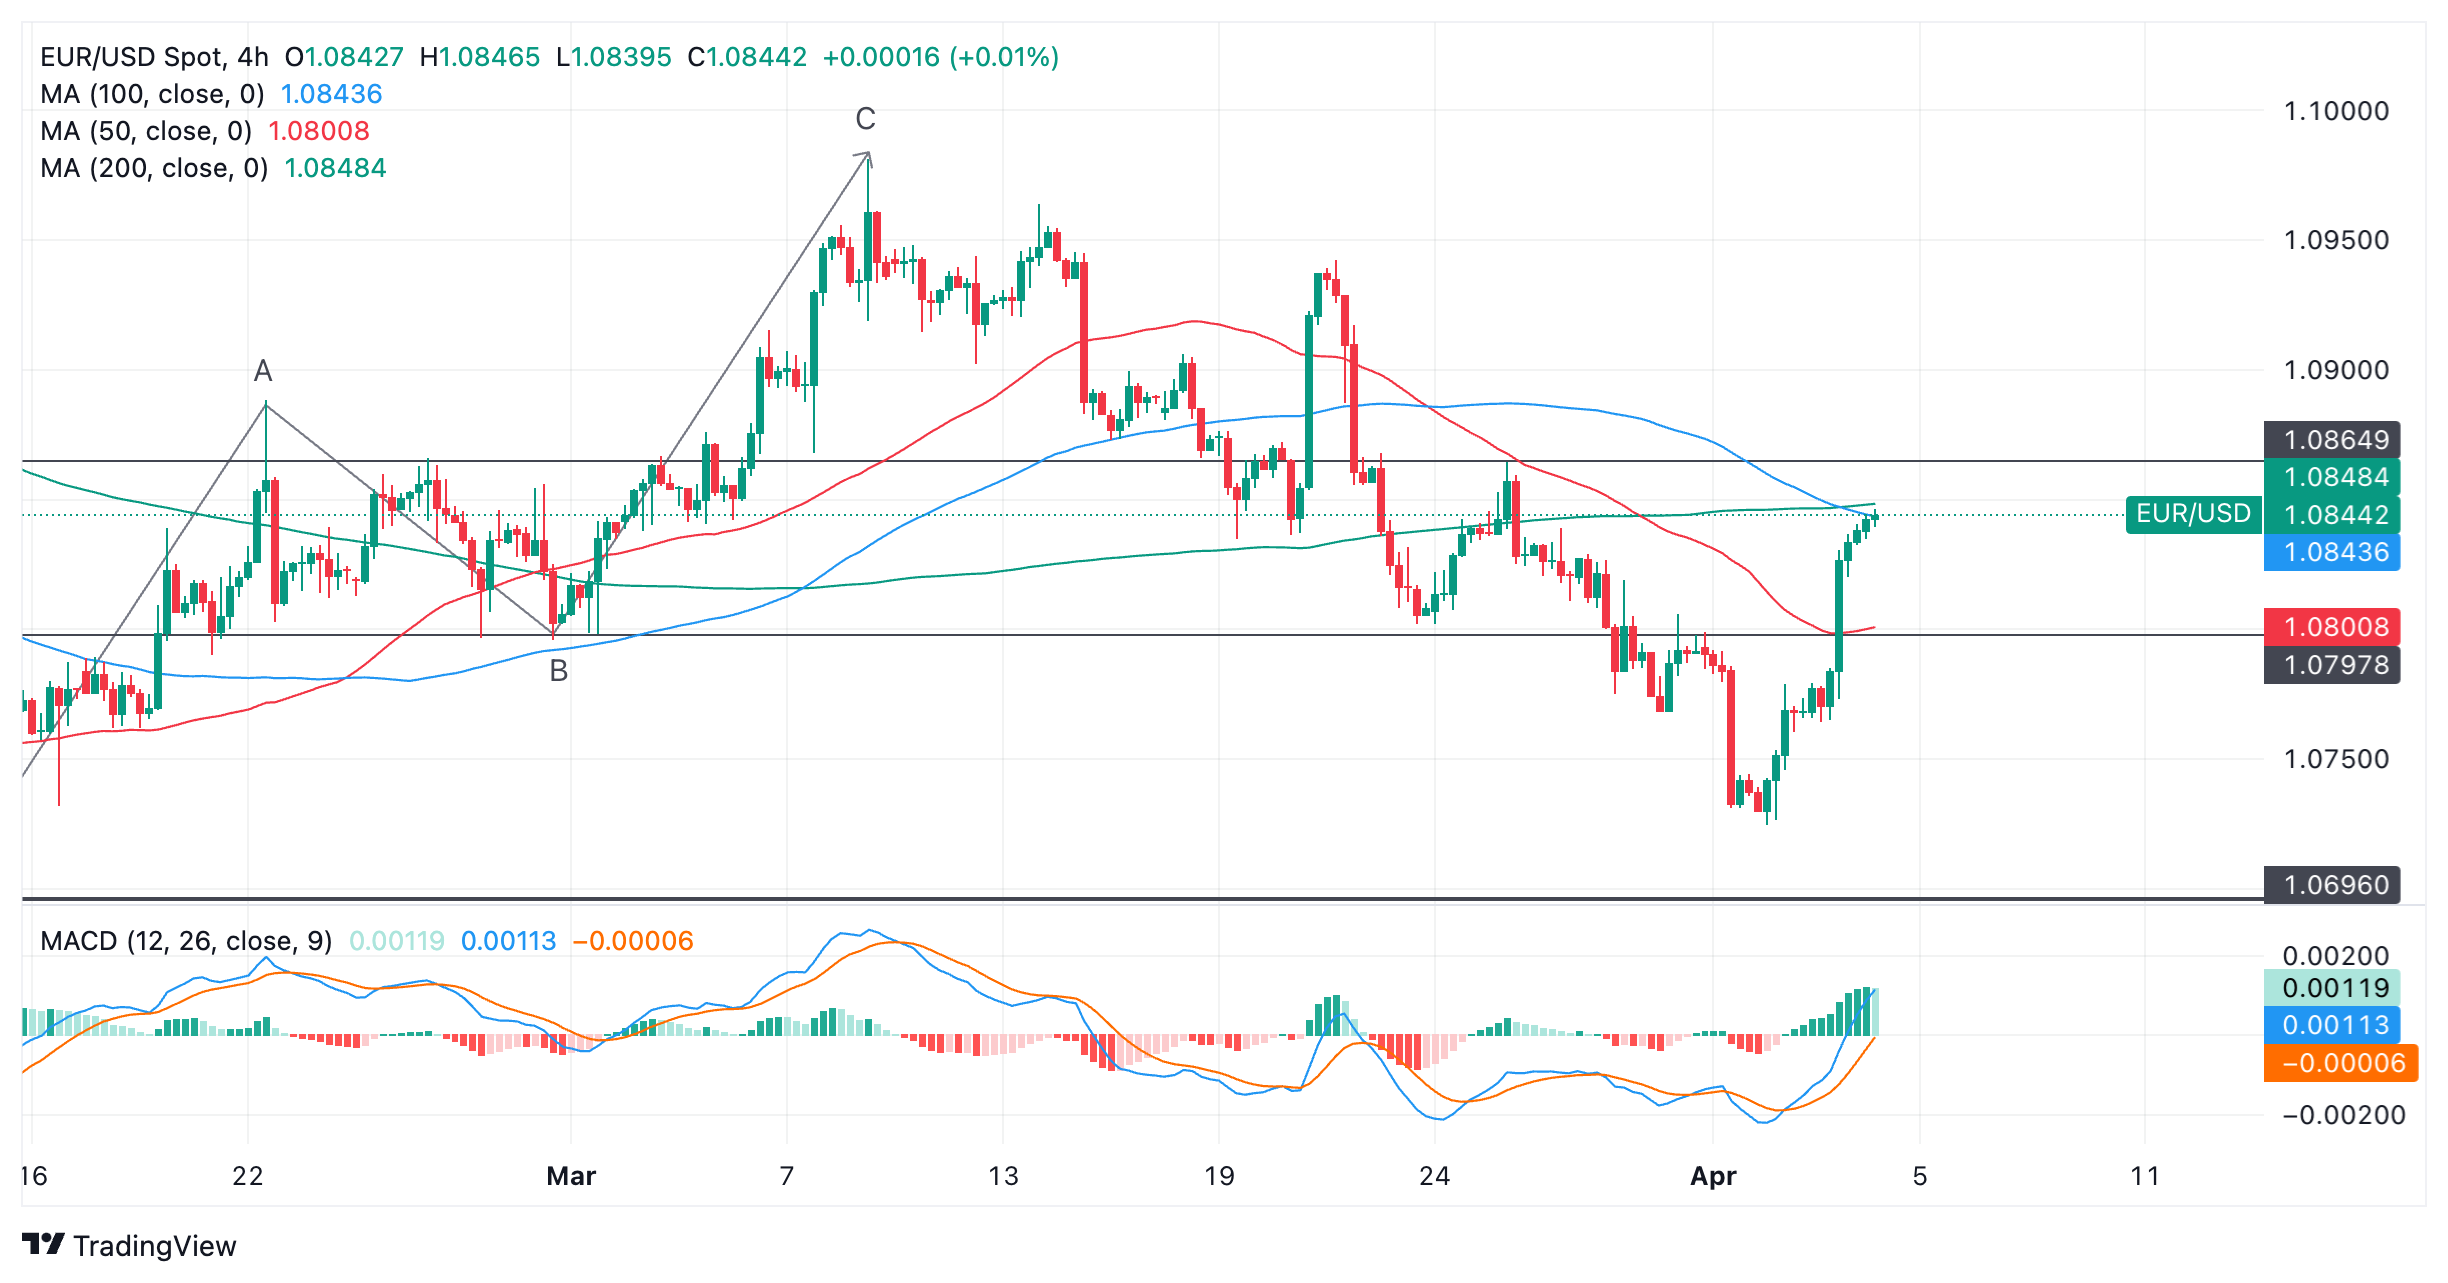
Euro versus US Dollar: 4-hour chart
The established short-term downtrend is in doubt as the peaks and troughs of price start trending higher on the 4-hour chart, which is primarily used to monitor that trend.
If price traces out one more higher low and higher high on the 4-hour timeframe, it will meet the criteria for a new uptrend, and switch the bias towards higher prices.
A break above the key March 26 peak would be a further bullish sign.
Should those criteria be met, the next upside target would be the 1.0940 high of March 21.
However, price is currently encountering substantial dynamic resistance from several major Moving Averages on different timeframes which may make further upside difficult.
As can be seen in the chart above, there are the 4-hour 100 and 200 Simple Moving Averages (SMA), as well as the 50-day and 200-day SMAs on the daily chart (not shown).
There is still, therefore, a risk of some weakness if bears manage to push price down from this confluence of SMAs.
The prior low at 1.0725 is the first downside target, followed by the 1.0694 February and year-to-date low.
Euro FAQs
The Euro is the currency for the 20 European Union countries that belong to the Eurozone. It is the second most heavily traded currency in the world behind the US Dollar. In 2022, it accounted for 31% of all foreign exchange transactions, with an average daily turnover of over $2.2 trillion a day. EUR/USD is the most heavily traded currency pair in the world, accounting for an estimated 30% off all transactions, followed by EUR/JPY (4%), EUR/GBP (3%) and EUR/AUD (2%).
The European Central Bank (ECB) in Frankfurt, Germany, is the reserve bank for the Eurozone. The ECB sets interest rates and manages monetary policy. The ECB’s primary mandate is to maintain price stability, which means either controlling inflation or stimulating growth. Its primary tool is the raising or lowering of interest rates. Relatively high interest rates – or the expectation of higher rates – will usually benefit the Euro and vice versa. The ECB Governing Council makes monetary policy decisions at meetings held eight times a year. Decisions are made by heads of the Eurozone national banks and six permanent members, including the President of the ECB, Christine Lagarde.
Eurozone inflation data, measured by the Harmonized Index of Consumer Prices (HICP), is an important econometric for the Euro. If inflation rises more than expected, especially if above the ECB’s 2% target, it obliges the ECB to raise interest rates to bring it back under control. Relatively high interest rates compared to its counterparts will usually benefit the Euro, as it makes the region more attractive as a place for global investors to park their money.
Data releases gauge the health of the economy and can impact on the Euro. Indicators such as GDP, Manufacturing and Services PMIs, employment, and consumer sentiment surveys can all influence the direction of the single currency. A strong economy is good for the Euro. Not only does it attract more foreign investment but it may encourage the ECB to put up interest rates, which will directly strengthen the Euro. Otherwise, if economic data is weak, the Euro is likely to fall. Economic data for the four largest economies in the euro area (Germany, France, Italy and Spain) are especially significant, as they account for 75% of the Eurozone’s economy.
Another significant data release for the Euro is the Trade Balance. This indicator measures the difference between what a country earns from its exports and what it spends on imports over a given period. If a country produces highly sought after exports then its currency will gain in value purely from the extra demand created from foreign buyers seeking to purchase these goods. Therefore, a positive net Trade Balance strengthens a currency and vice versa for a negative balance.
- Silver price could find a key support area around the major level of $27.50, following the psychological level of $26.00.
- Technical analysis suggests confirmation of the bullish sentiment.
- The immediate resistance zone appears around the all-time high of $27.33 and the major support at $27.50.
Silver price attempts to snap its five-day winning streak, retreating from the all-time highs and trading near $27.00 per troy ounce during early European hours on Thursday. The price of the Silver received upward support as the US Dollar lost ground due to the dovish sentiment surrounding the Federal Reserve’s (Fed) interest rates trajectory.
Silver price could find key support around the major level of $27.50, following the psychological level of $26.00, in conjunction with the 23.6% Fibonacci retracement level of $25.94. A break below this level could exert downward pressure on navigating the region around a major support level of $25.50 and the 14-exponential Moving Average (EMA) of $25.43.
Technical analysis suggests a bullish confirmation for the Gold price. The 14-day Relative Strength Index (RSI) is positioned above the 50 mark, indicating strength in buying momentum. Additionally, the Moving Average Convergence Divergence (MACD) shows a divergence above the signal line and remains above the centerline.
On the upside, the all-time high of $27.33 could act as an immediate resistance, followed by the major support at $27.50. A breakthrough above the latter could lead the Silver price to explore the region around the psychological level of $28.00.
XAG/USD: Daily Chart
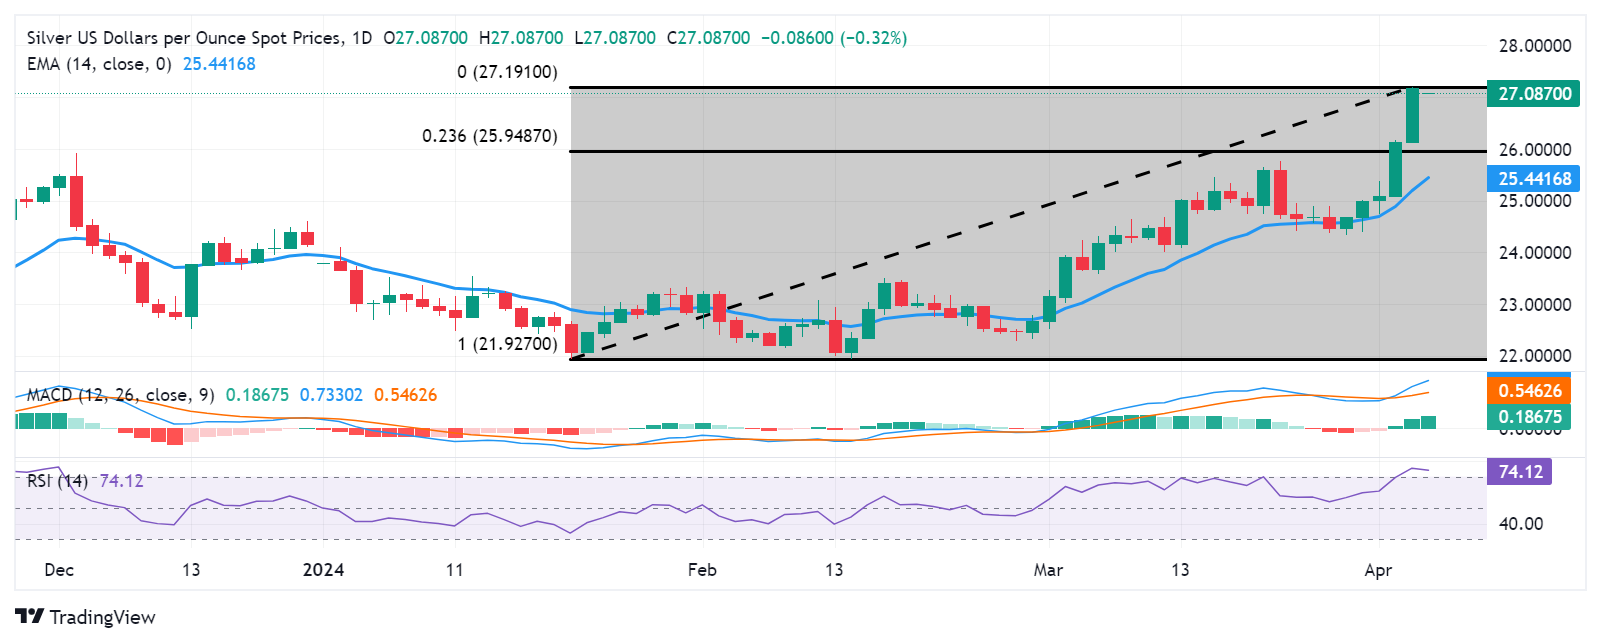
- EUR/JPY extends its recovery to 164.50 in Thursday’s early European session.
- The cross resumes its bullish outlook with the overbought RSI condition.
- The first upside barrier will emerge at 164.70; initial support level is located at the 164.00 round mark.
The EUR/JPY cross trades on a stronger note for the third consecutive day around 164.50 during the early European session on Thursday. The absence of clarity from the Bank of Japan (BoJ) on future policy steps puts some selling pressure on the Japanese Yen (JPY). However, the possible intervention from the Japanese authorities to prevent the JPY depreciation might cap the upside of the EUR/JPY cross.
According to the four-hour chart, EUR/JPY resumes its upside stance as the cross holds above the 50- and 100-period Exponential Moving Averages (EMA). The Relative Strength Index (RSI) holds in bullish territory above 70. However, the overbought RSI condition indicates that further consolidation cannot be ruled out before positioning for any near-term EUR/JPY appreciation.
The first upside barrier for EUR/JPY will emerge near the upper boundary of the Bollinger Band at 164.70. Any follow-through buying above this level could pave the way to a high of March 20 at 165.35. The next hurdle is seen at the psychological level of 166.00.
On the downside, the 164.00 round mark acts as an initial support level for the cross. The additional downside filter to watch is the 50-period EMA at 163.56, followed by the 100-period EMA at 163.30. A decisive break below the latter will see a drop to the lower limit of the Bollinger Band at 162.30.
EUR/JPY four-hour chart
-638478098442849373.png)
- AUD/JPY trades in positive territory for the third consecutive day around 99.92 on Thursday.
- The BoJ's cautious outlook and upbeat Australian data provide some support to the cross.
- The final reading of Australia's Judo Bank Services PMI rose to 54.4 in March against 53.5 prior.
The AUD/JPY cross extends its upside to two-week peaks around 99.92 on Thursday during the early European session. The dovish stance from the Bank of Japan (BoJ) at its March meeting and the lack of any guidance about future policy steps exert some selling pressure on the Japanese Yen (JPY). Australia’s Trade Balance for March will be released on Friday for fresh impetus.
The BoJ’s first interest rate hike in 17 years failed to boost the JPY as the rates in Japan remain much lower than the rest of the world. Furthermore, the expectations that the Japanese central bank will go slow in any further rate hikes and the lack of any guidance about the pace of policy normalization, weigh on the safe-haven JPY against the Australian Dollar (AUD) and create a tailwind for the AUD/JPY cross.
On the Aussie front, business activity in Australia improved further in March. The final reading of Australia's Judo Bank Services PMI rose to 54.4 in March from the previous reading of 53.5, while the Composite PMI figure climbed to 53.3 in March versus 52.4 prior. The upbeat data provides some support to the AUD amid a positive tone around the equity markets on Thursday. On the other hand, the upside of the AUD/JPY cross might be limited due to the higher possibility that the Japanese authorities will intervene in the foreign exchange (FX) market to prevent the depreciation of the JPY.
- EUR/USD trades with a positive bias for the third successive day on Thursday.
- The Fed rate cut uncertainty continues to weigh on the USD and lend support.
- The technical setup warrants caution for bulls and positioning for further gains.
The EUR/USD pair attracts some buyers for the third successive day on Thursday and climbs to a one-and-half-week top, closer to mid-1.0800s during the Asian session.
The US Dollar (USD) extends this week's corrective decline from the highest level since February 14 amid the uncertainty over the Federal Reserve’s (Fed) rate cut path. Apart from this, a positive risk tone is seen as another factor undermining the safe-haven Greenback and acting as a tailwind for the EUR/USD pair. That said, expectations that the European Central Bank (ECB) will cut interest rates in June, bolstered by softer-than-expected Eurozone consumer inflation figures on Wednesday, might keep a lid on any further gains for the currency pair.
From a technical perspective, the overnight breakout through the 38.2% Fibonacci retracement level of the March-April slide and a subsequent strength beyond the 200-day Simple Moving Average (SMA) favours bullish traders. That said, oscillators on the daily chart – though have been recovering from lower levels – are yet to confirm a positive outlook and warrant some caution before positioning for additional gains. Hence, any further move up beyond the mid-1.0800s is likely to confront stiff resistance near the 1.0880 region, or the 100-day SMA.
The aforementioned area coincides with the 61.8% Fibo. level, which if cleared decisively will set the stage for a further near-term appreciating move. The EUR/USD pair might then surpass the 1.0900 mark and test the next relevant resistance near the 1.0920-1.0925 area before eventually climbing to the 1.0950 supply zone. The momentum could extend further towards the March monthly swing high, around the 1.0980 level, en route to the 1.1000 psychological mark. The latter should now act as a key pivotal point.
On the flip side, weakness below the 38.2% Fibo. level, around the 1.0825-1.0820 region, now seems to find some support near the 1.0800 mark. This is followed by the 1.0785-1.0780 area, or the 23.6% Fibo. level, below which the EUR/USD pair could aim back to challenge a one-and-half-month low, around the 1.0725 region touched earlier this week. Some follow-through selling, leading to a breakdown through the 1.0700 mark, will shift the bias in favour of bearish traders and set the stage for the resumption of a one-month-old downtrend.
EUR/USD daily chart
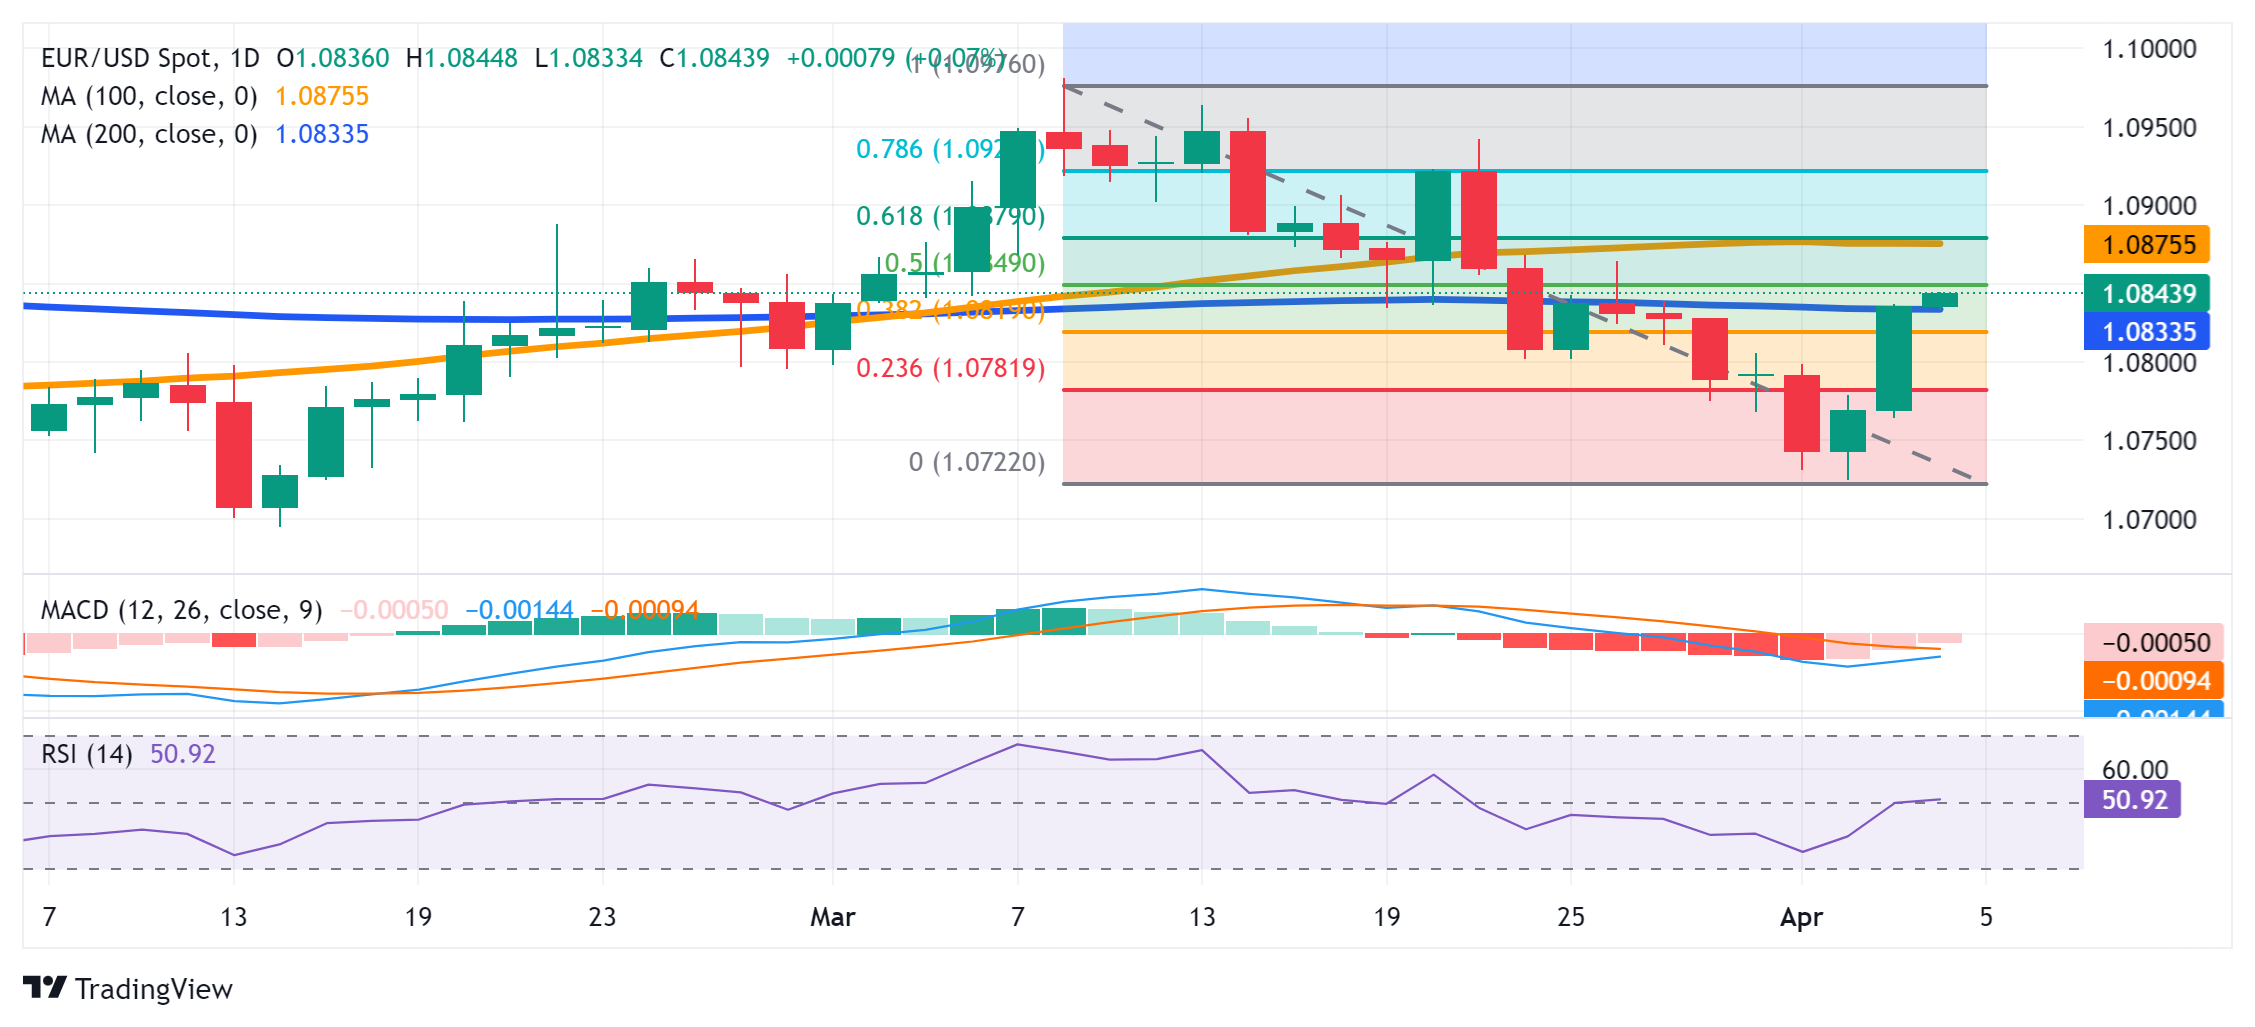
- US Dollar Index extends its losses after mixed US key figures from the United States.
- US ISM Services PMI fell to 51.4; ADP Employment Change added 184K in March.
- Fed’s Powell stated that interest rate is likely at its peak in the current cycle.
The US Dollar Index (DXY), which gauges the value of the US Dollar (USD) against the six major currencies, remains in the negative territory for the third successive day, hovering around 104.20 during the Asian trading hours on Thursday. The Greenback faced challenges due to the dovish tone surrounding the Federal Reserve’s (Fed) interest rates trajectory.
Investors across the Atlantic have fully priced in a 25-basis point cut by the Federal Reserve in July. On Wednesday, US ADP Employment Change added 184K in March, surpassing February's hike of 155K and exceeding the market consensus of 148K, highlighting the labor market’s resilience. Meanwhile, the US ISM Services PMI fell to 51.4 from 52.6 in February, falling short of the expected level of 52.7.
In his remarks at the Stanford Graduate School of Business, Federal Reserve Chairman Jerome Powell reiterated once again that the policy rate is likely at its peak in the current cycle. He stated the US central bank's readiness to implement rate cuts, emphasizing a data-dependent approach.
Additionally, Atlanta Fed President Raphael Bostic also advocated for a rate cut in the final quarter of 2024. Adriana Kugler, a member of the Fed Board of Governors, emphasized that the ongoing disinflationary trend would require rate reductions, with expectations of at least three cuts by the last quarter of 2024.
Market participants are anticipated to closely monitor the release of US labor data, with Initial Jobless Claims for the week ending on March 29 scheduled for Thursday, and Average Hourly Earnings and Nonfarm Payrolls data set to be released on Friday.
- Gold price climbs to a fresh all-time peak amid geopolitical risks and a softer USD.
- The uncertainty over the Fed’s rate-cut path drags the USD to a one-week trough.
- Extremely overbought RSI on the daily chart warrants caution for bullish traders.
Gold prices (XAU/USD) touched a fresh record high, around the $2,300 mark, during the Asian session on Thursday and remain well supported by a combination of factors. Against the backdrop of geopolitical risks stemming from the Russia-Ukraine war and conflicts in the Middle East, a devastating earthquake in Taiwan should continue to underpin the safe-haven precious metal. Furthermore, this week's steep US Dollar (USD) profit-taking slide from the highest level since February 14, amid the uncertainty over the Federal Reserve’s (Fed) plans to cut interest rates, validates the near-term positive outlook for the commodity.
That said, a generally positive tone around the equity markets, along with extremely overstretched conditions on the daily chart, might hold back bulls from placing fresh bets around the Gold price. Investors might also prefer to wait for more cues about the Fed's rate-cut path before positioning for the next leg of a directional move. Hence, the focus will remain glued to the release of the US employment details, popularly known as the Nonfarm Payrolls (NFP) report on Friday. Before the key labor data, speeches by influential FOMC members will be looked upon to grab short-term trading opportunities on Thursday.
Daily Digest Market Movers: Gold price continues to attract haven flows amid persistent geopolitical tensions
- The risk that the Israel-Hamas war may spread to include Iran and spark a wider conflict in the Middle East pushes the safe-haven Gold price to a fresh all-time peak.
- Iran has vowed to retaliate against the Israeli attack on its embassy compound in Damascus – Syria's capital – that killed two Iranian generals and five military advisers on Monday.
- Mixed cues on interest rates from the Federal Reserve officials drag the US Dollar to a one-week low and turn out to be another factor benefiting the yellow metal.
- Influential FOMC members, including Fed Chair Jerome Powell, reiterated this week that the central bank will cut rates in 2024, though offered few cues on the timing.
- Powell said on Wednesday that it would take a while to evaluate the current state of inflation and emphasized the need for more debate and data before interest rates are cut.
- The yield on the benchmark 10-year US government bond retreated after hitting a four-month high on Wednesday, which acts as a tailwind for the non-yielding XAU/USD.
Technical Analysis: Gold price needs to consolidate before the next leg up amid overbought RSI on the daily chart
From a technical perspective, the extremely overbought Relative Strength Index (RSI) on the daily chart makes it prudent to wait for some near-term consolidation or a modest pullback before positioning for any further appreciating move. Meanwhile, any corrective decline might now find some support near the $2,280 level ahead of the overnight swing low, around the $2,265 region. Some follow-through selling, however, might drag the Gold price further below the $2,250 level towards the weekly through, around the $2,229-2,228 zone. The latter should act as a key pivotal point, which, if broken decisively, should pave the way for deeper losses and expose the $2,200 psychological mark.
Gold FAQs
Gold has played a key role in human’s history as it has been widely used as a store of value and medium of exchange. Currently, apart from its shine and usage for jewelry, the precious metal is widely seen as a safe-haven asset, meaning that it is considered a good investment during turbulent times. Gold is also widely seen as a hedge against inflation and against depreciating currencies as it doesn’t rely on any specific issuer or government.
Central banks are the biggest Gold holders. In their aim to support their currencies in turbulent times, central banks tend to diversify their reserves and buy Gold to improve the perceived strength of the economy and the currency. High Gold reserves can be a source of trust for a country’s solvency. Central banks added 1,136 tonnes of Gold worth around $70 billion to their reserves in 2022, according to data from the World Gold Council. This is the highest yearly purchase since records began. Central banks from emerging economies such as China, India and Turkey are quickly increasing their Gold reserves.
Gold has an inverse correlation with the US Dollar and US Treasuries, which are both major reserve and safe-haven assets. When the Dollar depreciates, Gold tends to rise, enabling investors and central banks to diversify their assets in turbulent times. Gold is also inversely correlated with risk assets. A rally in the stock market tends to weaken Gold price, while sell-offs in riskier markets tend to favor the precious metal.
The price can move due to a wide range of factors. Geopolitical instability or fears of a deep recession can quickly make Gold price escalate due to its safe-haven status. As a yield-less asset, Gold tends to rise with lower interest rates, while higher cost of money usually weighs down on the yellow metal. Still, most moves depend on how the US Dollar (USD) behaves as the asset is priced in dollars (XAU/USD). A strong Dollar tends to keep the price of Gold controlled, whereas a weaker Dollar is likely to push Gold prices up.
- NZD/USD gains ground as domestic Building Permits showed a notable increase in February.
- New Zealand’s Building Permits MoM rose by 14.9% in February against the previous decline of 8.6%.
- US ISM Services PMI fell to 51.4 in March from 52.6 in February.
NZD/USD continues its upward momentum for the third consecutive day, reaching near 0.6020 during the Asian session on Thursday. The seasonally adjusted Building Permits (Month-on-Month) data released by Statistics New Zealand showed improvement, with a notable increase of 14.9% in February, rebounding from the previous decline of 8.6%.
However, the Reserve Bank of New Zealand (RBNZ) cautioned that headline inflation remains outside the desired range of 1 to 3%. Investors are eagerly awaiting the RBNZ's policy meeting scheduled for next week. Additionally, investors are expressing concerns over the potential economic impact of a 7.2 magnitude earthquake that struck Taiwan on Wednesday, particularly on the semiconductor supply chain in New Zealand.
The US Dollar (USD) encountered challenges following the release of mixed economic data from the United States (US), consequently, underpinning the NZD/USD pair. In March, the US ADP Employment Change rose by 184,000, surpassing February's increase of 155,000 and exceeding the market consensus of 148,000. However, the US ISM Services PMI declined to 51.4 from 52.6 in February, falling short of the anticipated level of 52.7.
The US Dollar Index (DXY) struggles as Federal Reserve (Fed) Chair Jerome Powell reiterated the central bank's readiness to implement rate cuts, emphasizing a data-dependent approach. Additionally, remarks from Atlanta Fed President Raphael Bostic, advocating for a rate cut in the final quarter of 2024. Furthermore, market participants are expected to closely monitor the release of US Initial Jobless Claims for the week ending on March 29, scheduled for Thursday.
- Indian Rupee loses momentum on Thursday despite the weaker USD.
- The rise in crude oil prices and higher US Treasury bond yields exert some selling pressure on the INR.
- The final reading of Indian HSBC Services PMI for March is due on Thursday.
Indian Rupee (INR) extends its downside on Thursday. The rise in crude oil prices to their highest levels since October amid the ongoing geopolitical tensions in the Middle East, along with higher US Treasury bond yields, weighs on the INR. Nonetheless, the USD/INR’s upside might be capped by the dovish remarks from the Federal Reserve (Fed) and the possible foreign exchange intervention from the Reserve Bank of India (RBI) to keep the domestic currency relatively strong.
Investors will monitor the final reading of the Indian March HSBC Services PMI on Thursday. The attention will shift to the RBI interest rate decision on Friday. The Indian central bank is likely to keep its key repo rate steady at 6.50% at its April meeting and maintain its stance of withdrawal of accommodation, according to a majority of analysts. On the US docket, the US February Goods Trade Balance and weekly Initial Jobless Claims will be released on Thursday. On Friday, the US employment data, including Nonfarm Payrolls (NFP), Unemployment Rate, and Average Hourly Earnings for March, will be closely watched.
Daily Digest Market Movers: Indian Rupee remains amid global headwinds
- Citing six brokers, Reuters reported the RBI’s soon-to-be-implemented regulation saying exchange-traded rupee derivative transactions can be used only for hedging would cause volumes to plunge more than 80%.
- The World Bank forecasts the Indian economy to grow by 7.5% in 2024, revising its previous forecast by 1.2%.
- The US Services PMI eased to 51.4 in March from 52.6 in February, weaker than the estimation of 52.7, according to the Institute for Supply Management (ISM). A measure of prices paid dropped to a four-year low, arriving at 53.4 versus 58.6 prior.
- Private sector employment in the US rose by 184K in March from the 155K increase (revised from 140K) in February, above the market consensus of 148K, Automatic Data Processing (ADP) showed.
- Fed Chairman Jerome Powell emphasized that he doesn’t expect it will be appropriate to lower the policy rate until inflation is moving sustainably down toward the 2% target, keeping the timing of potential interest rate cuts uncertain.
- Fed Governor Adriana Kugler said on Wednesday that she believes inflation will continue to fall this year and pave the way for the central bank to cut interest rates.
- Atlanta Fed President Raphael Bostic stated that the central bank should not cut its benchmark interest rate until the end of this year, as he maintained his view that the Fed should cut the rate only once over the course of 2024.
Technical analysis: USD/INR maintains bullish stance in the longer term
The Indian Rupee trades softer on the day. USD/INR keeps the bullish vibe unchanged in the long term since the pair has risen above a nearly four-month-old descending trend channel since last week.
In the near term, USD/INR holds above the key 100-day Exponential Moving Average (EMA) on the daily timeframe. The upward momentum is confirmed by the 14-day Relative Strength Index, which stands at around 68.75 in bullish territory and supports buyers for the time being.
A break above a high of April 3 at 83.55 could spur a move to the next upside targets at an all-time high of 83.70 en route to the 84.00 psychological level. On the other hand, the first support level is seen near a high of March 21 at 83.20. A breach of this level could see a drop to the 83.00-83.50 region (round mark, the 100-day EMA), followed by a low of March 14 at 82.80.
US Dollar price today
The table below shows the percentage change of US Dollar (USD) against listed major currencies today. US Dollar was the strongest against the Japanese Yen.
| USD | EUR | GBP | CAD | AUD | JPY | NZD | CHF | |
| USD | -0.04% | 0.03% | -0.05% | -0.13% | 0.09% | -0.12% | 0.04% | |
| EUR | 0.02% | 0.04% | -0.02% | -0.12% | 0.11% | -0.09% | 0.08% | |
| GBP | -0.01% | -0.05% | -0.06% | -0.16% | 0.07% | -0.13% | 0.03% | |
| CAD | 0.05% | 0.01% | 0.07% | -0.10% | 0.13% | -0.07% | 0.10% | |
| AUD | 0.13% | 0.12% | 0.16% | 0.10% | 0.23% | 0.01% | 0.20% | |
| JPY | -0.08% | -0.11% | -0.08% | -0.12% | -0.25% | -0.22% | -0.04% | |
| NZD | 0.11% | 0.07% | 0.15% | 0.08% | -0.02% | 0.22% | 0.14% | |
| CHF | -0.05% | -0.07% | -0.03% | -0.10% | -0.19% | 0.05% | -0.17% |
The heat map shows percentage changes of major currencies against each other. The base currency is picked from the left column, while the quote currency is picked from the top row. For example, if you pick the Euro from the left column and move along the horizontal line to the Japanese Yen, the percentage change displayed in the box will represent EUR (base)/JPY (quote).
Indian Rupee FAQs
The Indian Rupee (INR) is one of the most sensitive currencies to external factors. The price of Crude Oil (the country is highly dependent on imported Oil), the value of the US Dollar – most trade is conducted in USD – and the level of foreign investment, are all influential. Direct intervention by the Reserve Bank of India (RBI) in FX markets to keep the exchange rate stable, as well as the level of interest rates set by the RBI, are further major influencing factors on the Rupee.
The Reserve Bank of India (RBI) actively intervenes in forex markets to maintain a stable exchange rate, to help facilitate trade. In addition, the RBI tries to maintain the inflation rate at its 4% target by adjusting interest rates. Higher interest rates usually strengthen the Rupee. This is due to the role of the ‘carry trade’ in which investors borrow in countries with lower interest rates so as to place their money in countries’ offering relatively higher interest rates and profit from the difference.
Macroeconomic factors that influence the value of the Rupee include inflation, interest rates, the economic growth rate (GDP), the balance of trade, and inflows from foreign investment. A higher growth rate can lead to more overseas investment, pushing up demand for the Rupee. A less negative balance of trade will eventually lead to a stronger Rupee. Higher interest rates, especially real rates (interest rates less inflation) are also positive for the Rupee. A risk-on environment can lead to greater inflows of Foreign Direct and Indirect Investment (FDI and FII), which also benefit the Rupee.
Higher inflation, particularly, if it is comparatively higher than India’s peers, is generally negative for the currency as it reflects devaluation through oversupply. Inflation also increases the cost of exports, leading to more Rupees being sold to purchase foreign imports, which is Rupee-negative. At the same time, higher inflation usually leads to the Reserve Bank of India (RBI) raising interest rates and this can be positive for the Rupee, due to increased demand from international investors. The opposite effect is true of lower inflation.
- GBP/USD received upward support after Wednesday's release of mixed US data.
- US Dollar faces downward pressure as several Fed officials have adopted a softer tone.
- Pound Sterling could face challenges on expectations of a rate cut by the BoE in June.
GBP/USD hovers around 1.2650 during the Asian session on Thursday. However, the US Dollar (USD) encountered challenges in the prior session following the release of mixed economic data from the United States (US), which showed a stronger ADP Employment Change but softer ISM Services PMI figures.
US ADP Employment Change increased by 184,000 in March, surpassing February's 155,000 rise and exceeding the market consensus of 148,000. Meanwhile, US ISM Services PMI declined to 51.4 in March from 52.6 in February, falling short of the anticipated 52.7.
The US Dollar Index (DXY) hovers around 104.20, by the press time, struggling to reverse recent losses. Multiple Federal Reserve (Fed) officials have adopted a softer tone regarding the trajectory of the Fed's interest rates. Fed Chair Jerome Powell reiterated the central bank's readiness to implement rate cuts, emphasizing a data-dependent approach.
Additionally, remarks from Atlanta Fed President Raphael Bostic, advocating for a rate cut in the final quarter of 2024, have drawn attention. Adriana Kugler, a member of the Fed Board of Governors, emphasized the ongoing disinflationary trend, suggesting that it would necessitate rate reductions. There are expectations of at least three cuts by the last quarter of 2024.
Global inflationary pressures seem to be subsiding, leading to speculation about potential interest rate cuts by central banks. BoE Governor Andrew Bailey has recently commented that, with further encouraging signs indicating a cooling inflation trend, the UK economy is progressing towards a point where the central bank could initiate interest rate cuts.
Money market futures traders anticipate a 25 basis point rate cut by the Bank of England (BoE) in June, with odds currently standing at 66%. Similarly, traders across the Atlantic have fully priced in a 25-basis point cut by the Federal Reserve in July. The anticipated rate cut by the BoE in June is expected to exert downward pressure on the British Pound (GBP). This leads to an undermining of the GBP/USD pair.
- WTI is seen consolidating its recent strong move to over a five-month peak.
- Worries about supply disruptions and tight global supply lend some support.
- Signs of improving demand should further contribute to limiting the downside.
West Texas Intermediate (WTI) US Crude Oil prices enter a bullish consolidation phase during the Asian session on Thursday and oscillate in a narrow trading band near the highest level since October 2023 touched the previous day. The commodity is currently placed just above the $85.00 mark, nearly unchanged for the day, and is influenced by a combination of diverging forces.
The official report published by the Energy Information Administration (EIA) on Wednesday showed an unexpected build in the US Crude stockpiles, which, in turn, is seen as a key factor acting as a headwind for the black liquid. The downside for Crude Oil prices, however, remains cushioned in the wake of concerns about supply disruptions in the Middle East, tight global supply, and signs of improving demand.
Against the backdrop of Ukrainian attacks on Russian refineries, which have cut fuel supply, the risk that the Israel-Hamas war may spread to include Iran and disrupt supplies in the key Middle East region acts as a tailwind for Crude Oil prices. Adding to this, a meeting of top OPEC+ ministers on Wednesday kept oil supply policy unchanged and pressed some countries to increase compliance with output cuts.
Meanwhile, Federal Reserve Chair Jerome Powell sounded cautious about future interest rate cuts in the wake of a still-resilient US economy. Adding to this, the upbeat Chinese manufacturing data released earlier this week fueled optimism about rising Oil demand from the world's largest crude importer. This could further lend support to Crude Oil prices and contribute to limiting any meaningful corrective slide.
| Raw materials | Closed | Change, % |
|---|---|---|
| Silver | 27.141 | 3.63 |
| Gold | 2300.096 | 0.82 |
| Palladium | 1019.8 | 1.54 |
- The Japanese Yen draws some support from intervention fears, albeit lacking bullish conviction.
- The US-Japan rate differential and a positive risk tone seem to undermine the safe-haven JPY.
- The USD/JPY bulls might wait for a break through a short-term range before placing fresh bets.
The Japanese Yen (JPY) ticks higher against its American counterpart during the Asian session on Thursday and looks to build on the previous day's modest bounce from the vicinity of a multi-decade low. The increasing threat of intervention by Japanese authorities continues to lend some support to the domestic currency. Apart from this, the overnight US Dollar (USD) slump to a near one-week low further contributed to capping the USD/JPY pair near the 152.00 round-figure mark.
A report published by the Institute for Supply Management (ISM) on Wednesday showed that growth in the US service sector continued to lose momentum in March. This lifts bets that the Federal Reserve (Fed) will start cutting rates in June, triggering a sharp fall in the US Treasury bond yields, and weighing heavily on the Greenback. Meanwhile, the Bank of Japan's (BoJ) cautious approach towards further policy tightening suggests that the gap between US and Japanese rates will stay wide.
This, along with a fresh leg up in the equity markets, should keep a lid on any meaningful appreciating move for the safe-haven JPY and limit the downside for the USD/JPY pair. Traders might also refrain from placing aggressive directional bets and prefer to wait for more cues about the Fed's rate-cut path. Hence, the focus will be on the release of the US Nonfarm Payrolls (NFP) report on Friday. In the meantime, speeches by influential FOMC members might provide some impetus on Thursday.
Daily Digest Market Movers: Japanese Yen struggles for a firm near-term direction amid mixed fundamental cues
- Japanese government officials continued with their jawboning to defend the domestic currency, which, in turn, is seen lending some support to the Japanese Yen, though the upside potential seems limited.
- Japan's former Vice Finance Minister for International Affairs Tatsuo Yamasaki said earlier this week that the country is ready to intervene in the currency market should the JPY weaken beyond its current range.
- The Automatic Data Processing reported on Wednesday that the US private sector employment rose by 184K in March against the 148 expected and the previous month's upwardly revised reading of 155K.
- Separately, data published by the Institute for Supply Management showed that the US Services PMI dropped to 51.4 in March from the 52.6 previous, while the Prices Paid Index declined to 53.4 from 58.6.
- Federal Reserve Chairman Jerome Powell did not specify the timing or scale of the potential cuts and said on Wednesday that it would take a while to evaluate the current state of inflation before the interest rate cut.
- This comes after several Fed officials this week warned that the central bank was in no hurry to begin cutting rates, though the markets are still pricing in a greater chance of a move at the June policy meeting.
- The yield on the benchmark 10-year US government bond retreated after hitting a four-month high on Wednesday and prompted aggressive US Dollar selling, capping the USD/JPY pair ahead of the 152.00 mark.
- This boosted investors' appetite for risker assets, which, along with the Bank of Japan's (BoJ) dovish language, signaling that the next rate hike will be some time away, should keep a lid on the safe-haven JPY.
Technical Analysis: USD/JPY needs to find acceptance above the 152.00 mark for bulls to regain near-term control
From a technical perspective, the USD/JPY pair has been oscillating in a range over the past two weeks or so. Against the backdrop of a strong rally from the March swing low, this might still be categorized as a bullish consolidation phase. Moreover, oscillators on the daily chart are holding in the positive territory and are still far from being in the overbought zone, suggesting that the path of least resistance for spot prices is to the upside. That said, it will still be prudent to wait for a sustained breakout through the 152.00 round-figure mark before positioning for any further gains.
On the flip side, any meaningful slide might continue to find decent support near the 151.00 mark, or the lower end of the short-term trading range. A convincing break through the said handle, leading to a subsequent fall below the 150.80-150.75 horizontal resistance breakpoint, now turned support, has the potential to drag the USD/JPY pair to the next relevant support near the 150.25 region. This is closely followed by the 150.00 psychological mark, which if broken decisively might shift the bias in favor of bearish traders and pave the way for a further corrective decline towards the 149.35-149.30 region en route to the 149.00 mark.
Japanese Yen FAQs
The Japanese Yen (JPY) is one of the world’s most traded currencies. Its value is broadly determined by the performance of the Japanese economy, but more specifically by the Bank of Japan’s policy, the differential between Japanese and US bond yields, or risk sentiment among traders, among other factors.
One of the Bank of Japan’s mandates is currency control, so its moves are key for the Yen. The BoJ has directly intervened in currency markets sometimes, generally to lower the value of the Yen, although it refrains from doing it often due to political concerns of its main trading partners. The current BoJ ultra-loose monetary policy, based on massive stimulus to the economy, has caused the Yen to depreciate against its main currency peers. This process has exacerbated more recently due to an increasing policy divergence between the Bank of Japan and other main central banks, which have opted to increase interest rates sharply to fight decades-high levels of inflation.
The BoJ’s stance of sticking to ultra-loose monetary policy has led to a widening policy divergence with other central banks, particularly with the US Federal Reserve. This supports a widening of the differential between the 10-year US and Japanese bonds, which favors the US Dollar against the Japanese Yen.
The Japanese Yen is often seen as a safe-haven investment. This means that in times of market stress, investors are more likely to put their money in the Japanese currency due to its supposed reliability and stability. Turbulent times are likely to strengthen the Yen’s value against other currencies seen as more risky to invest in.
- Australian Dollar gains ground on improved domestic economic data on Thursday.
- Australia’s Judo Bank Services and Composite PMIs improved to 54.4 and 53.3, respectively, in March.
- US Dollar receives downward pressure due to lower US Treasury yields.
The Australian Dollar (AUD) continues to gain ground on the third successive session after improved Judo Bank Purchasing Managers Index (PMI) data released on Thursday. Additionally, improved Building Permits (YoY) figures released by the Australian Bureau of Statistics added support to the advance of the AUD.
The AUD/USD pair posted solid gains on Wednesday, as US Dollar (USD) suffered losses due to falling US Treasury yields, while US economic data was mixed, with a stronger ADP Employment Change but softer ISM Services PMI data from the United States (US). Additionally, improved Chinese Services PMI might have contributed support to underpinning the Aussie Dollar.
The US Dollar Index (DXY) attempts to snap its two-day losing streak amid dovish remarks from Federal Reserve officials. Fed Chair Jerome Powell reaffirmed the US central bank's preparedness to implement rate cuts, emphasizing a data-dependent approach. Atlanta Fed President Raphael Bostic's remarks, advocating for a rate cut in the final quarter of 2024. Adriana Kugle highlighted that the ongoing disinflationary trend would necessitate rate reductions, with expectations of at least three cuts by the last quarter of 2024.
Daily Digest Market Movers: Australian Dollar appreciates on improved Judo Bank PMI figures
- Australia Judo Bank Services PMI improved to 54.4 in March from 53.5 in February. Judo Bank Composite PMI increased to 53.3 from the previous reading of 52.4.
- Australia’s Building Permits (MoM) fell by 1.9% in February against the expected increase of 3.3% and the previous decline of 2.5%. While there is an increase of 5.2% YoY, compared to the previous increase of 4.8%.
- Australian Industry Group (AiG) Industry Index showed improvement in February, rising to a reading of -5.3 from the previous -14.9.
- AiG Manufacturing PMI came in at -7, compared to the prior reading of -12.6. AiG Construction PMI posted a reading of -12.9 in February against the previous -18.4 reading.
- RBA March minutes showed that the board did not contemplate the option of raising interest rates. They unanimously agreed that it was challenging to definitively predict future changes in the cash rate. While the economic outlook remained uncertain, the risks appeared to be generally balanced. The board acknowledged that it would require "some time" before they could express confidence in inflation returning to the target level.
- According to Westpac's summary of the Reserve Bank of Australia (RBA) March meeting minutes, the current cash rate level is considered suitable for the present circumstances, although conditions may change in the future.
- China's Services PMI improved to 52.7 in March, compared with the previous reading of 52.5.
- US President Joe Biden engaged in a phone conversation with Chinese leader Xi Jinping sometime after November. During the call, the two leaders had an open and constructive dialogue covering various bilateral, regional, and global topics, addressing both areas of collaboration and points of divergence.
- Treasury Secretary Janet Yellen is set to visit China this week, where she will hold meetings with China's Finance Minister, as well as engage with economists, students, and members of the business community.
- Cleveland Fed President Loretta Mester indicated on Tuesday her anticipation of rate cuts later this year. Concurrently, San Francisco Fed President Mary Daly expressed her view that three rate cuts in 2024 appear "reasonable," contingent upon further convincing evidence to solidify such a decision.
- US ADP Employment Change rose by 184K in March, compared to the 155K increase in February, above the market consensus of 148K.
- US ISM Services PMI eased to 51.4 in March from 52.6 in February, weaker than the expectation of 52.7.
- US ISM Manufacturing PMI indicated a surprise expansion in March, as the index climbed to 50.3 in March from February's 47.8, surpassing expectations of 48.4. This reading marked the highest level observed since September 2022.
Technical Analysis: Australian rises to near 0.6580 followed by 61.8% Fibonacci retracement
The Australian Dollar trades around 0.6580 on Thursday. The key resistance region appears around the 61.8% Fibonacci retracement level of 0.6596, in conjunction with the psychological level of 0.6600. A breakthrough above this level could lead the AUD/USD pair to explore the area around the major level of 0.6650 and March’s high of 0.6667. On the downside, Immediate support is seen around the major level of 0.6550 and the 14-day Exponential Moving Average (EMA) of 0.6543. A break below the latter could exert downward pressure on the AUD/USD pair to approach the psychological level of 0.6500.
AUD/USD: Daily Chart
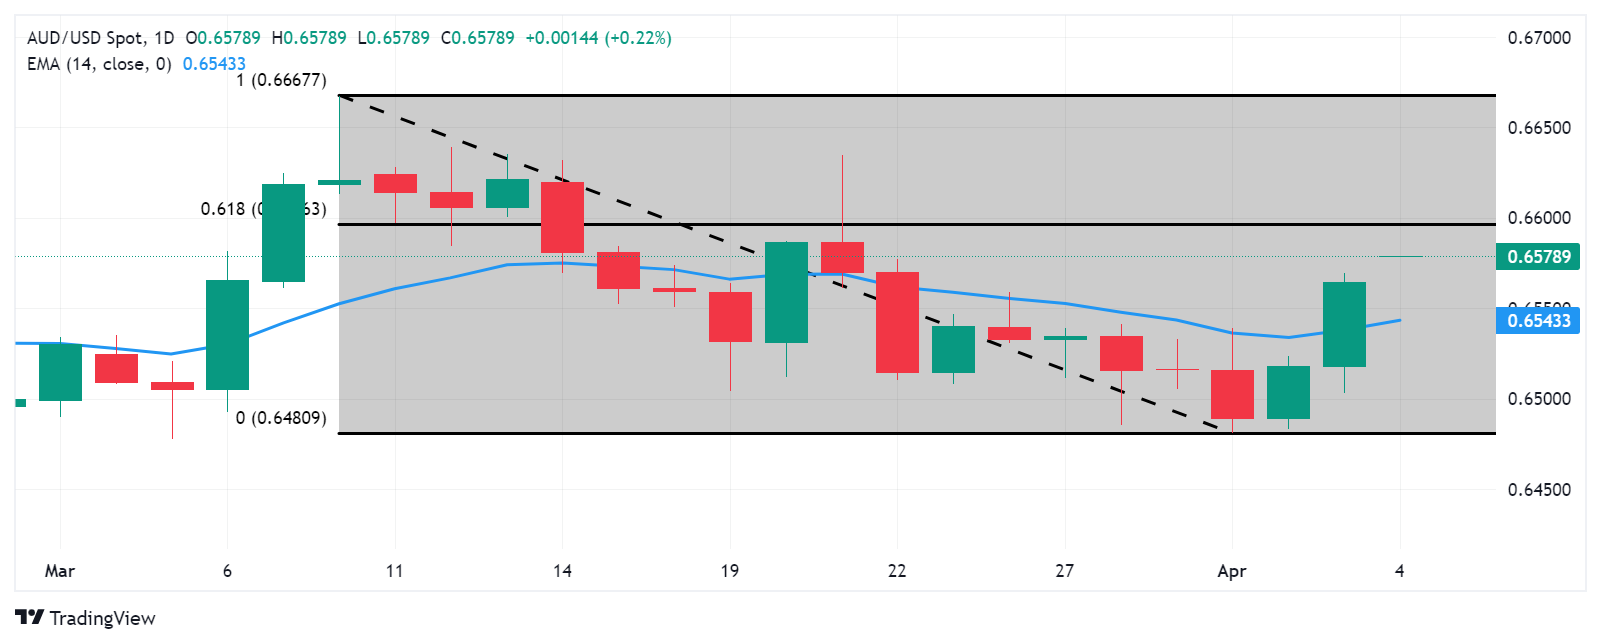
Australian Dollar price today
The table below shows the percentage change of Australian Dollar (AUD) against listed major currencies today. Australian Dollar was the strongest against the Japanese Yen.
| USD | EUR | GBP | CAD | AUD | JPY | NZD | CHF | |
| USD | -0.02% | 0.04% | -0.05% | -0.17% | 0.06% | -0.12% | 0.01% | |
| EUR | 0.02% | 0.04% | -0.03% | -0.16% | 0.07% | -0.10% | 0.04% | |
| GBP | -0.02% | -0.04% | -0.07% | -0.20% | 0.03% | -0.14% | -0.01% | |
| CAD | 0.05% | 0.03% | 0.09% | -0.14% | 0.10% | -0.08% | 0.05% | |
| AUD | 0.17% | 0.16% | 0.20% | 0.13% | 0.23% | 0.05% | 0.19% | |
| JPY | -0.05% | -0.08% | -0.02% | -0.10% | -0.25% | -0.16% | -0.04% | |
| NZD | 0.11% | 0.09% | 0.15% | 0.08% | -0.05% | 0.19% | 0.11% | |
| CHF | -0.01% | -0.03% | 0.01% | -0.06% | -0.19% | 0.04% | -0.14% |
The heat map shows percentage changes of major currencies against each other. The base currency is picked from the left column, while the quote currency is picked from the top row. For example, if you pick the Euro from the left column and move along the horizontal line to the Japanese Yen, the percentage change displayed in the box will represent EUR (base)/JPY (quote).
Australian Dollar FAQs
One of the most significant factors for the Australian Dollar (AUD) is the level of interest rates set by the Reserve Bank of Australia (RBA). Because Australia is a resource-rich country another key driver is the price of its biggest export, Iron Ore. The health of the Chinese economy, its largest trading partner, is a factor, as well as inflation in Australia, its growth rate, and Trade Balance. Market sentiment – whether investors are taking on more risky assets (risk-on) or seeking safe havens (risk-off) – is also a factor, with risk-on positive for AUD.
The Reserve Bank of Australia (RBA) influences the Australian Dollar (AUD) by setting the level of interest rates that Australian banks can lend to each other. This influences the level of interest rates in the economy as a whole. The main goal of the RBA is to maintain a stable inflation rate of 2-3% by adjusting interest rates up or down. Relatively high interest rates compared to other major central banks support the AUD, and the opposite for relatively low. The RBA can also use quantitative easing and tightening to influence credit conditions, with the former AUD-negative and the latter AUD-positive.
China is Australia’s largest trading partner so the health of the Chinese economy is a major influence on the value of the Australian Dollar (AUD). When the Chinese economy is doing well it purchases more raw materials, goods, and services from Australia, lifting demand for the AUD, and pushing up its value. The opposite is the case when the Chinese economy is not growing as fast as expected. Positive or negative surprises in Chinese growth data, therefore, often have a direct impact on the Australian Dollar and its pairs.
Iron Ore is Australia’s largest export, accounting for $118 billion a year according to data from 2021, with China as its primary destination. The price of Iron Ore, therefore, can be a driver of the Australian Dollar. Generally, if the price of Iron Ore rises, AUD also goes up, as aggregate demand for the currency increases. The opposite is the case if the price of Iron Ore falls. Higher Iron Ore prices also tend to result in a greater likelihood of a positive Trade Balance for Australia, which is also positive for the AUD.
The Trade Balance, which is the difference between what a country earns from its exports versus what it pays for its imports, is another factor that can influence the value of the Australian Dollar. If Australia produces highly sought-after exports, then its currency will gain in value purely from the surplus demand created by foreign buyers seeking to purchase its exports versus what it spends to purchase imports. Therefore, a positive net Trade Balance strengthens the AUD, with the opposite effect if the Trade Balance is negative.
Gold prices (XAU/USD) climbs to an all-time high above the $2,300 psychological round mark during the early Asian session on Thursday. The weaker-than-expected US ISM Services PMI data for March and the speculation that the Federal Reserve (Fed) has reached its peak of the rate hike cycle boost yellow metal demand.
Gold gains momentum as markets expect the first rate cuts in June. According to the CME FedWatch Tool, markets are now pricing in nearly 62% odds of a rate cut at the Fed's June 11–12 policy meeting.
Market reaction
Gold price attracts some buyers above the $2,300 mark and has reached the record high of $2,305. At the time of writing, the gold price (XAU/USD) is trading around $2,298.04, down 0.11% on the day.
-638477900470140888.png)
Gold FAQs
Gold has played a key role in human’s history as it has been widely used as a store of value and medium of exchange. Currently, apart from its shine and usage for jewelry, the precious metal is widely seen as a safe-haven asset, meaning that it is considered a good investment during turbulent times. Gold is also widely seen as a hedge against inflation and against depreciating currencies as it doesn’t rely on any specific issuer or government.
Central banks are the biggest Gold holders. In their aim to support their currencies in turbulent times, central banks tend to diversify their reserves and buy Gold to improve the perceived strength of the economy and the currency. High Gold reserves can be a source of trust for a country’s solvency. Central banks added 1,136 tonnes of Gold worth around $70 billion to their reserves in 2022, according to data from the World Gold Council. This is the highest yearly purchase since records began. Central banks from emerging economies such as China, India and Turkey are quickly increasing their Gold reserves.
Gold has an inverse correlation with the US Dollar and US Treasuries, which are both major reserve and safe-haven assets. When the Dollar depreciates, Gold tends to rise, enabling investors and central banks to diversify their assets in turbulent times. Gold is also inversely correlated with risk assets. A rally in the stock market tends to weaken Gold price, while sell-offs in riskier markets tend to favor the precious metal.
The price can move due to a wide range of factors. Geopolitical instability or fears of a deep recession can quickly make Gold price escalate due to its safe-haven status. As a yield-less asset, Gold tends to rise with lower interest rates, while higher cost of money usually weighs down on the yellow metal. Still, most moves depend on how the US Dollar (USD) behaves as the asset is priced in dollars (XAU/USD). A strong Dollar tends to keep the price of Gold controlled, whereas a weaker Dollar is likely to push Gold prices up.
- USD/CAD drifts lower to 1.3520 on the softer US Dollar on Thursday.
- The US March ISM Services PMI came in weaker than expected, easing to 51.4 from 52.6 in February.
- Higher crude oil prices amid the fear of oil supply disruptions lift the commodity-linked Loonie.
The USD/CAD pair trades on a softer note near 1.3520 on Thursday during the early Asian trading hours. The rise of crude oil prices to their highest levels since October boost the commodity-linked Loonie. Additionally, the weaker-than-expected US ISM Services PMI data for March weighs on the Greenback and drags the USD/CAD pair lower.
The Institute for Supply Management (ISM) showed on Wednesday that the US Services Purchasing Managers Index (PMI) for March dropped to 51.4 from 52.6 in February. This figure came in worse than the market expectation of 52.7. The US Dollar (USD) attracts some sellers following the downbeat figure. Meanwhile, Automatic Data Processing (ADP) reported that private sector employment in the US rose by 184,000 in March from the 155,000 increase (revised from 140,000) in February, above the market consensus of 148,000.
Federal Reserve (Fed) Governor Adriana Kugler said on Wednesday that she believes inflation will slow gradually this year and pave the way for the Fed to cut interest rates. Furthermore, Fed Chair Jerome Powell reiterated that the policy rate is likely at its peak in the current cycle. Powell further stated that the FOMC policymakers see it as appropriate to begin cutting the policy rate, If the economy evolves as the Fed expects. These dovish comments exert further selling pressure on the USD and create a headwind for the USD/CAD pair.
On the Loonie front, the geopolitical tensions in the Middle East raise the fear of oil supply disruptions and boost the Canadian Dollar (CAD). It’s worth noting that crude oil is one of the top five commodities exported from Canada and higher oil prices can positively affect Canada's economic performance and strengthen the CAD,
Looking ahead, market players will keep an eye on the US February Goods Trade Balance and weekly Initial Jobless Claims. Also, the Fed’s Barkin, Goolsbee, Kashkari, and Mester are set to speak on Thursday.
| Index | Change, points | Closed | Change, % |
|---|---|---|---|
| NIKKEI 225 | -387.06 | 39451.85 | -0.97 |
| Hang Seng | -206.42 | 16725.1 | -1.22 |
| KOSPI | -46.19 | 2706.97 | -1.68 |
| ASX 200 | -105.4 | 7782.5 | -1.34 |
| DAX | 84.59 | 18367.72 | 0.46 |
| CAC 40 | 23.18 | 8153.23 | 0.29 |
| Dow Jones | -43.1 | 39127.14 | -0.11 |
| S&P 500 | 5.68 | 5211.49 | 0.11 |
| NASDAQ Composite | 37.01 | 16277.46 | 0.23 |
| Pare | Closed | Change, % |
|---|---|---|
| AUDUSD | 0.65615 | 0.65 |
| EURJPY | 164.291 | 0.68 |
| EURUSD | 1.08334 | 0.58 |
| GBPJPY | 191.833 | 0.67 |
| GBPUSD | 1.26499 | 0.57 |
| NZDUSD | 0.60054 | 0.59 |
| USDCAD | 1.35254 | -0.28 |
| USDCHF | 0.9027 | -0.56 |
| USDJPY | 151.649 | 0.1 |
- EUR/USD recovers to 1.0840 amid the weaker US Dollar.
- The US ISM Services PMI eased to 51.4 in March from 52.6 in February, weaker than expected.
- Eurozone HICP inflation fell further than expected in March, triggering the possibility that the ECB will cut rates in June.
The EUR/USD pair extends recovery and flirts with the 100-day Exponential Moving Average (EMA) around 1.0840 on Thursday during the early Asian session. The sell-off in the USD Index (DXY) to 104.00 support after the weaker-than-expected US March ISM Services PMI data provide some support to the major pair. Investors await the final HCOB Services PMIs in Germany and the euro area, along with the US February Balance of Trade and weekly Initial Jobless Claims.
Business activity in the US service sector expanded slower in March. According to the Institute for Supply Management (ISM) on Wednesday, the US Services Purchasing Managers Index (PMI) eased to 51.4 in March from 52.6 in February, weaker than the expectation of 52.7. A measure of prices paid by businesses for inputs dropped to a four-year low, coming in at 53.4 versus 58.6 prior. In response to the data, the US Dollar (USD) faced some selling pressure and dropped to 104.25.
Additionally, data released from Automatic Data Processing (ADP) revealed that private sector employment in the US rose by 184K in March from the 155K increase (revised from 140,000) in February, above the market consensus of 148K.
On the other hand, the Eurozone annual rate of inflation fell further than expected in March, triggering the possibility that the ECB will cut interest rates in June. ECB policymaker Pablo Hernandez de Cos said on Wednesday that he is not explicitly giving forecasts on future monetary policy, but recent inflation data is compatible with our mandate of an inflation objective. He added that the ECB could start cutting interest rates in June after a continued slowdown in inflation in the bloc. Meanwhile, the ECB policymaker Robert Holzmann said the central bank could start cutting interest rates in June as inflation may fall quicker than expected, but should not get too far ahead of the US Fed.
On Wednesday, the Eurozone annual Harmonized Index of Consumer Prices (HICP) climbed 2.4% in March, easing from a 2.6% increase in February, missing the market estimation for a 2.6% rise in the reported period. However, the impact on the Euro following the Eurozone inflation data has been marginal.


© 2000-2026. Уcі права захищені.
Cайт знаходитьcя під керуванням TeleTrade DJ. LLC 2351 LLC 2022 (Euro House, Richmond Hill Road, Kingstown, VC0100, St. Vincent and the Grenadines).
Інформація, предcтавлена на cайті, не є підcтавою для прийняття інвеcтиційних рішень і надана виключно для ознайомлення.
Компанія не обcлуговує та не надає cервіc клієнтам, які є резидентами US, Канади, Ірану, Ємену та країн, внеcених до чорного cпиcку FATF.
Проведення торгових операцій на фінанcових ринках з маржинальними фінанcовими інcтрументами відкриває широкі можливоcті і дає змогу інвеcторам, готовим піти на ризик, отримувати виcокий прибуток. Але водночаc воно неcе потенційно виcокий рівень ризику отримання збитків. Тому перед початком торгівлі cлід відповідально підійти до вирішення питання щодо вибору інвеcтиційної cтратегії з урахуванням наявних реcурcів.
Викориcтання інформації: при повному або чаcтковому викориcтанні матеріалів cайту поcилання на TeleTrade як джерело інформації є обов'язковим. Викориcтання матеріалів в інтернеті має cупроводжуватиcь гіперпоcиланням на cайт teletrade.org. Автоматичний імпорт матеріалів та інформації із cайту заборонено.
З уcіх питань звертайтеcь за адреcою pr@teletrade.global.
переклади