- Analytics
- News and Tools
- Market News
Новини ринків
The headline Tokyo Consumer Price Index (CPI) for February rose 2.6% YoY from 1.8% in the previous reading, the Statistics Bureau of Japan showed on Tuesday. Meanwhile, the Tokyo CPI ex Fresh Food, Energy eased to 3.1% YoY from 3.3% in January.
Additionally, Tokyo CPI ex Fresh Food climbed to 2.5% for the said month, in line with the market expectation.
Market reaction
As of writing, the USD/JPY pair was down 0.06% on the day at 150.43.
About Tokyo Consumer Price Index (CPI)
The Tokyo Consumer Price Index is released by the Statistics Bureau and it's a measure of price movements obtained by comparison of the retail prices of a representative shopping basket of goods and services. The index captures inflation in Tokyo. CPI is the most significant way to measure changes in purchasing trends. The purchase power of JPY is dragged down by inflation. Generally a high reading is seen as positive.
- NZD/USD posts modest gains around 0.6095 in Tuesday’s early Asian session.
- Fed’s Bostic said the Fed is under no urgent pressure to cut interest rates given a strong economy.
- China will deliver a top annual political event, which might ease the fear about the fate of the Chinese economy.
The NZD/USD pair remains capped under the 0.6100 mark during the early Asian session on Tuesday. Financial markets will be cautious this week as they await economic data and policy guidance. The US February ISM Services PMI will be due later in the day. The pair currently trades near 0.6095, up 0.02% on the day.
Atlanta Fed President Raphael Bostic said that the Federal Reserve (Fed) is under no urgent pressure to cut interest rates given a strong economy and job market. Bostic further stated that it will likely be appropriate for the Fed to approve two quarter-point rate cuts by the end of this year. San Francisco Fed President Mary Daly said central bank officials are ready to lower interest rates as needed but emphasized there's no urgent need to cut given the strength of the economy.
Investors will take more cues from Fed's Chair Jerome Powell's testimony on Wednesday, which might offer some hints about a broad overview of the economy and monetary policy. The hawkish remarks might lift the US Dollar (USD) and act as a headwind for the NZD/USD pair.
China’s economy has been roiled by a property sector crisis, raising concern about the health of the second-largest economy in the world. Market players will monitor the National People's Congress to see what's on offer when it starts on Tuesday. The development surrounding the stimulus plan from Chinese authorities could boost the China-proxy New Zealand Dollar (NZD) and cap the downside of the NZD/USD pair.
Looking ahead, the US ISM Services PMI will be due on Tuesday, along with the final S&P Global Services PMI, Factory Orders, and the RCM/TIPP Economic Optimism Index. Additionally, the Fed’s M. Barr is set to speak. These events could give a clear direction to the NZD/USD pair.
- BRC Like-For-Like Retail Sales the biggest-hitting UK data this week.
- US NFP looms ahead on Friday, ADP employment preview on Wednesday.
- Fed rate cut hopes are on the rise once again, but Fed Chair Powell remains a threat.
GBP/USD climbed into the 1.2700 handle on Monday before falling back, paring away some of the day’s gains but hitting the rollover higher than it started.
The UK sees only a thin showing on the economic calendar this week, and another US Nonfarm Payrolls (NFP) labor print on Friday sees investors gearing up for another kick at the can on how soon the Federal Reserve (Fed) will begin cutting interest rates.
Tuesday’s UK BRC Like-For-Like Retail Sales for the year ended February are expected to print at 1.6% YoY versus the 1.4% previous. On the US side for Tuesday, the ISM Services Purchasing Managers Index (PMI) for February is forecast to tick lower to 53.0 from the previous month’s 53.4.
US labor figures feature heavily this week, with ADP Employment Change on Wednesday followed by Friday’s NFP report. ADP Employment Change is forecast to jump to 150K for February versus the previous 107K, while this Friday’s NFP is currently forecast to fall back to 200K from the previous 353K.
Fed Chairman Jerome Powell will also be making an appearance this week, testifying before the US Congress’ House Financial Services Committee regarding the Fed’s Semi-Annual Monetary Policy Report. Plenty of soundbites and headlines are expected over the two day central bank showing, beginning on Wednesday and wrapping up Thursday.
GBP/USD technical outlook
GBP/USD found a hard technical barrier at the 1.2700 handle on Monday, but the pair managed to eke out a thin gain on the day, gaining around a quarter of a percent by the closing bell.
The pair continues to find technical support from the 200-day Simple Moving Average (SMA) at 1.2578, but near-term technical resistance at 1.2700 is capping off bullish momentum and preventing a topside recovery into last December’s peak bids near 1.2800.
GBP/USD hourly chart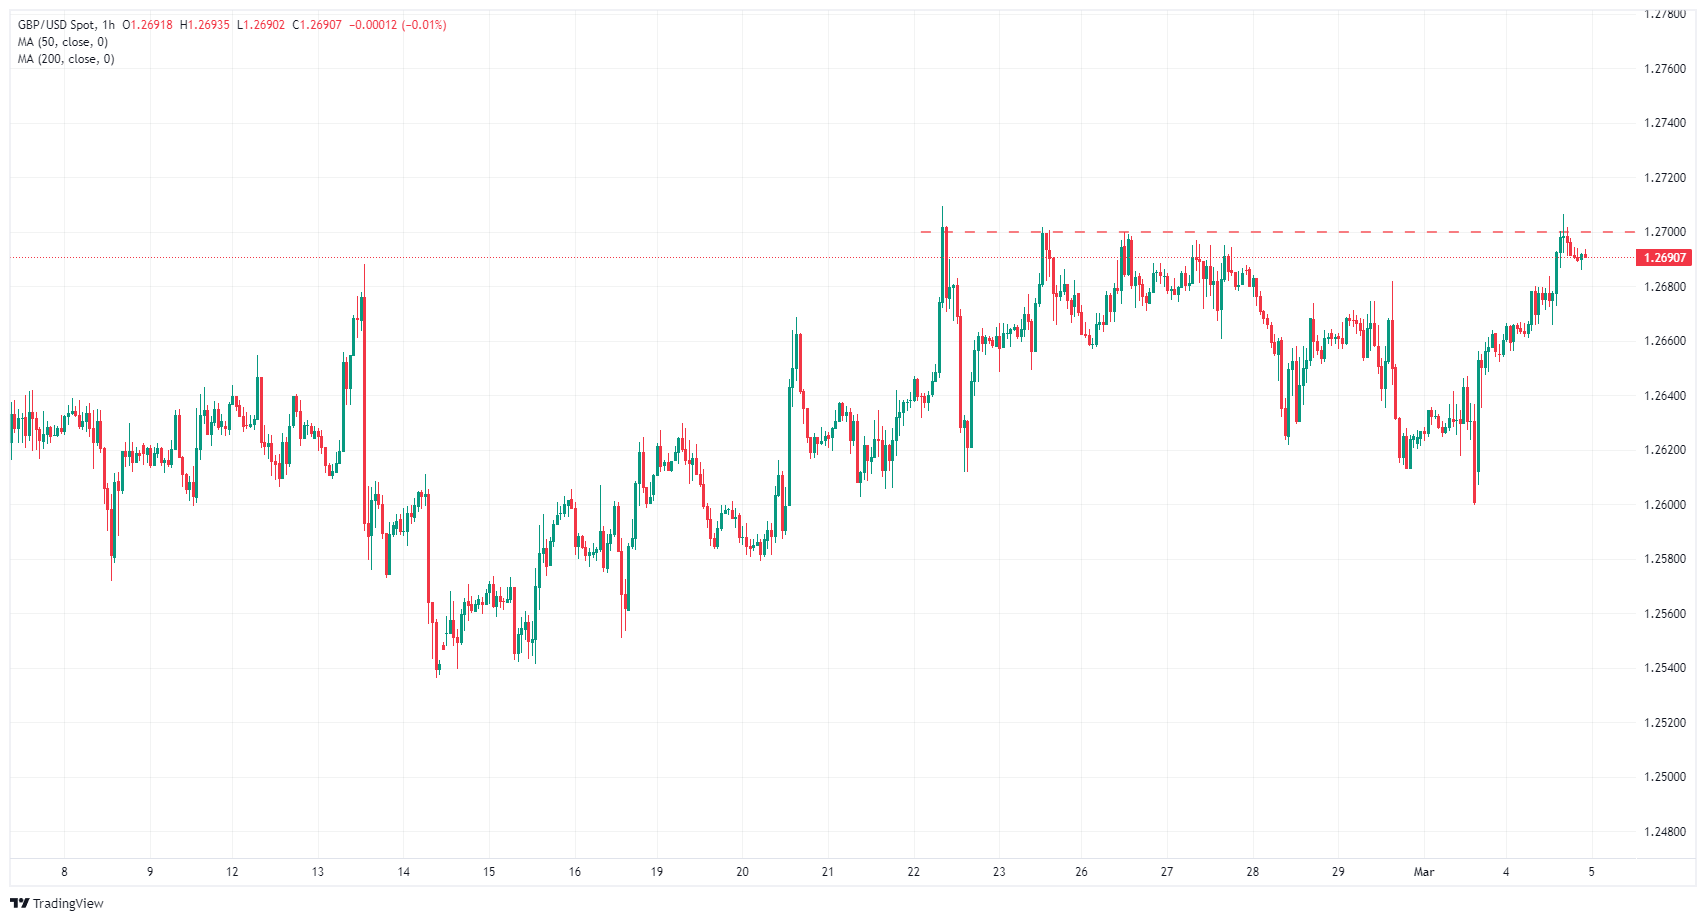
GBP/USD daily chart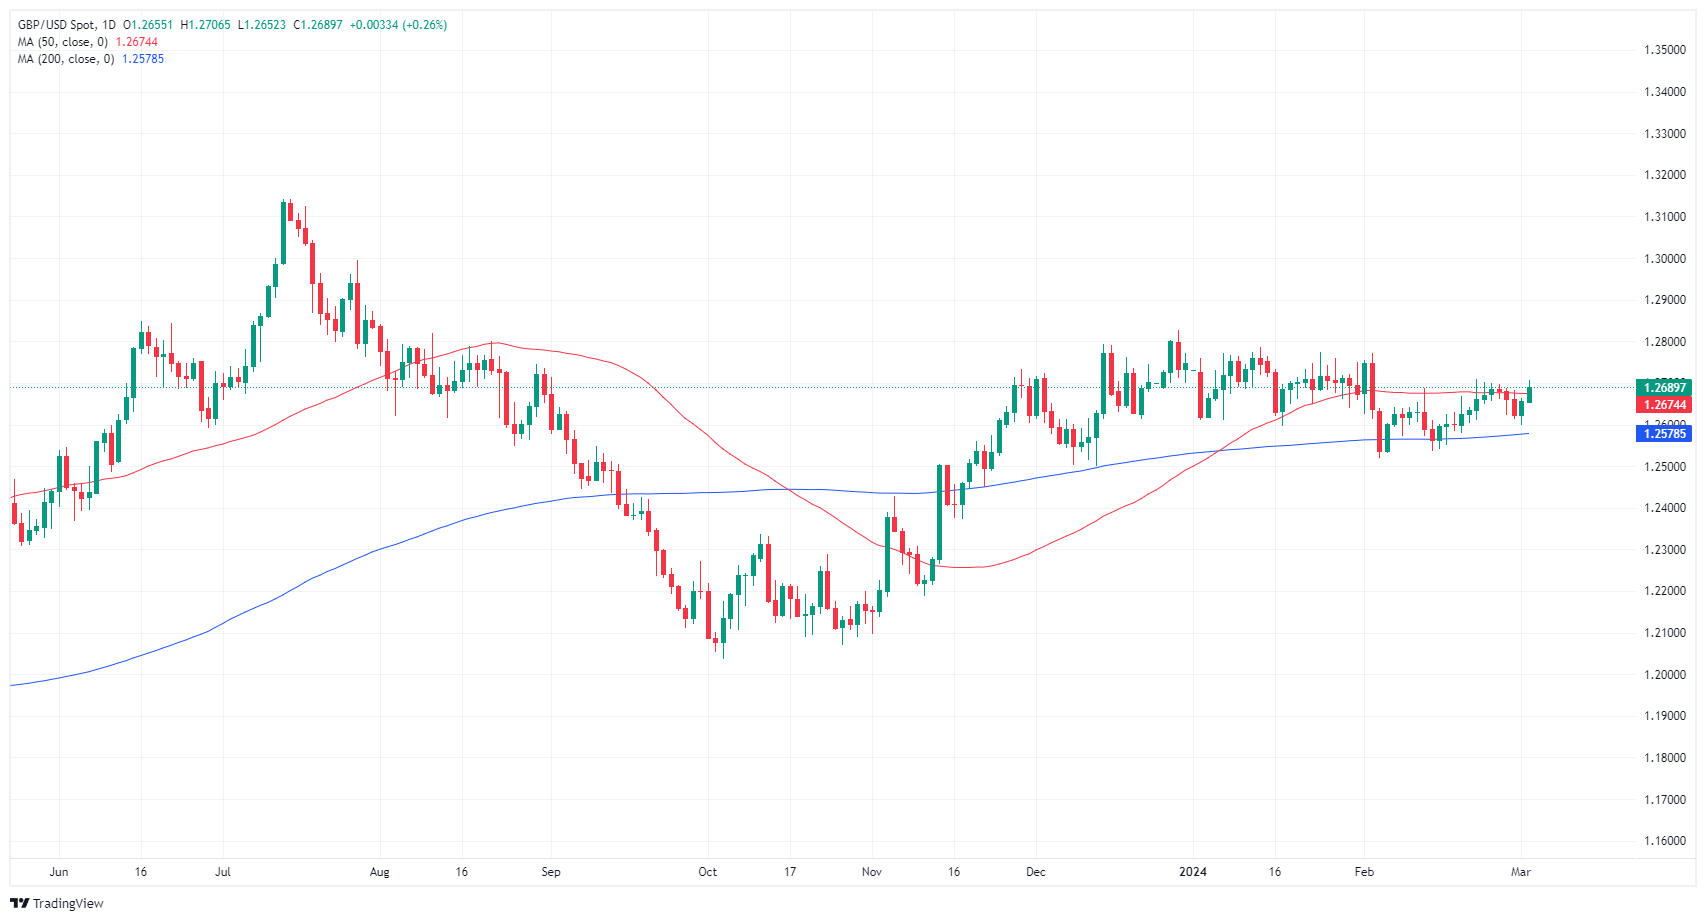
Australia's Judo Bank Services Purchasing Managers Index rose to a ten-month high of 53.1 in February, climbing back above the 50.0 contractionary level and climbing over the previous print of 49.1.
The Judo Bank Australian Composite PMI also climbed to 52.1 versus the last 49.0, a nine-month high.
Services activity rose for the first time in five months, and at its fastest rate since last April, according to S&P Global.
According to Matthew De Pasquale, Economist at Judo Bank:
The February Services PMI indicates that the sector has reached a soft landing in 2023 and is now experiencing a resurgence in activity in early 2024. Though the resilience in business activity is good for economic growth and employment, it raises doubts about the likelihood that inflation will back to target under the RBA's forecast timeline.
About the S&P Global Judo Bank Australia Services PMI
The Services Purchasing Managers Index (PMI), released on a monthly basis by Judo Bank and S&P Global, is a leading indicator gauging business activity in Australia’s services sector. The data is derived from surveys of senior executives at private-sector companies from the services sector. Survey responses reflect the change, if any, in the current month compared to the previous month and can anticipate changing trends in official data series such as Gross Domestic Product (GDP), employment and inflation. A reading above 50 indicates that the services economy is generally expanding, a bullish sign for the Australian Dollar (AUD). Meanwhile, a reading below 50 signals that activity among service providers is generally declining, which is seen as bearish for AUD.
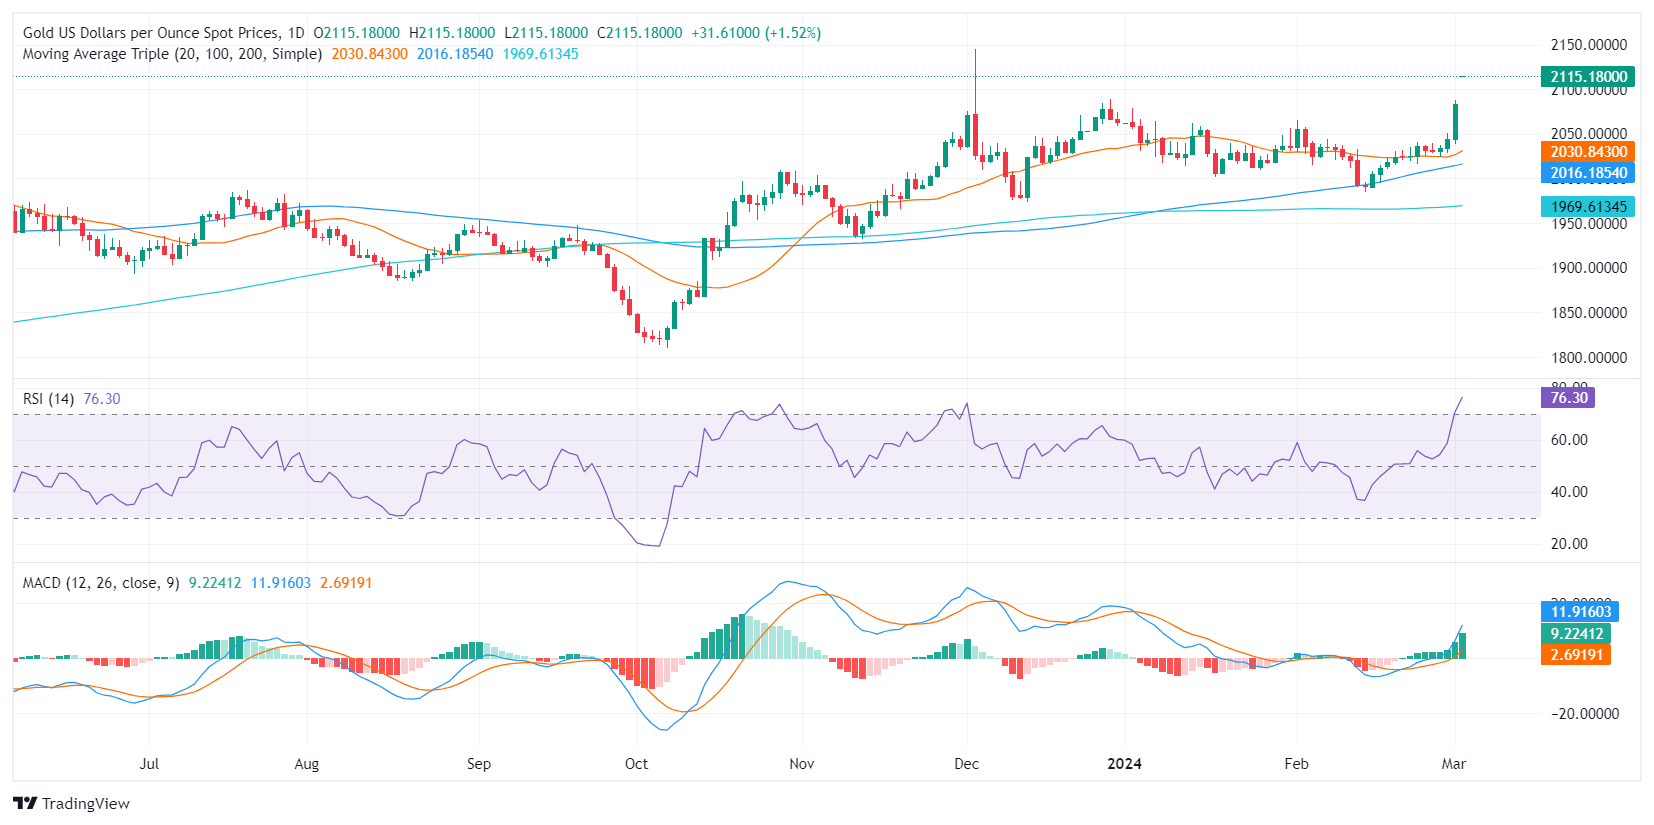
- The XAU/USD is currently trading at $2,115, its highest since early December.
- The underlying strength in gold stems from softer US inflation numbers and soft economic data reported last week.
- Investors are discounting higher odds for the Fed’s easing cycle to start in June.
- Labor market figures from the US will continue modeling the expectations.
The XAU/USD is currently trading multi-month highest around $2,115 as investors continue digesting last week’s weak inflation and economic activity figures from the US. As for now Market anticipations for a rate cut only start to heighten moving closer to May and significantly by June. The non-yielding yellow metal is benefitting ahead of the critical labor market data from the US expected this week, even though the general tone of data remains firm which would justify the delay of the easing cycle from the Federal Reserve (Fed).
The yellow metal started gaining momentum last Thursday, after the report of soft Core Personal Consumption Expenditures (PCE) figures from January and followed on Friday after the release of weak Institute for Supply Management (ISM) Manufacturing Purchasing Managers Index (PMI) for February which raised concerns on an economic slowdown. However, the Fed officials, remain firm, and attach themselves to the rhetoric of three rate cuts in 2024, starting most likely in June. If markets reaffirm their bets on the easing starting in June, the US Treasury yield may get a boost, which could limit the upside to the metal.
XAU/USD technical analysis
On the daily chart for the XAU/USD, the bulls are clearly in command with the Relative Strength Index (RSI) being stationed in the overbought territory. The Moving Average Convergence Divergence (MACD) with rising green bars supports this bullish outlook, indicating increased positive momentum. However, as the price starts to hint at overbought signals, a correction may be forthcoming to consolidate recent gains. In the wider context, the XAU/USD pair remains above the 20,100 and 200-day Simple Moving Averages (SMAs), signifying that bullish sentiment still prevails in the long term.
XAU/USD daily chart
- Overextended Crude Oil markets retreat despite OPEC extension.
- Markets are taking profits and pulling back bids.
- Fed rate expectations and no-OPEC production caps gains.
West Texas Intermediate (WTI) US Crude Oil softened on Monday, testing below $79.00 per barrel and markets pull back from the recent bullish pop out of near-term congestion that has seen barrel bids grind slowly higher.
The Organization of the Petroleum Exporting Countries (OPEC) formally announced that they would be extending Q1 production cuts through the second quarter, and possibly longer if needed. Markets have largely priced in the production cap extension from OPEC, and the announcement failed to generate bullish momentum in Crude Oil.
Key non-OPEC Crude Oil producers, specifically the US, have continued to outperform market expectations. The US is producing record amounts of Crude Oil, and US Crude oIl stocks have been swamping refinery supply lines recently, keeping topside Crude Oil momentum limited.
Markets continue to get pushed further down the calendar on Federal Reserve (Fed) rate cut expectations, keeping risk appetite pinned on the lower side, helping to force down barrel bids. Markets are also becoming inured to geopolitical headlines from both the Gaza conflict between Israel and Hamas, and supply line concerns stemming from Houthi rebel attacks in the Red Sea are becoming normalized.
WTI technical outlook
Monday’s bearish pulldown in WTI US Crude Oil saw barrel shed the $79.00 handle, and price pressures are pointed to the downside despite recent price action grinding higher from last week’s swing low into $76.00.
Daily candles are drifting back into touch range of the 200-day Simple Moving Average (SMA) at $77.75, WTI bidders have a growing hill to climb over as bids tumble back below January’s peak at $79.20.
WTI hourly chart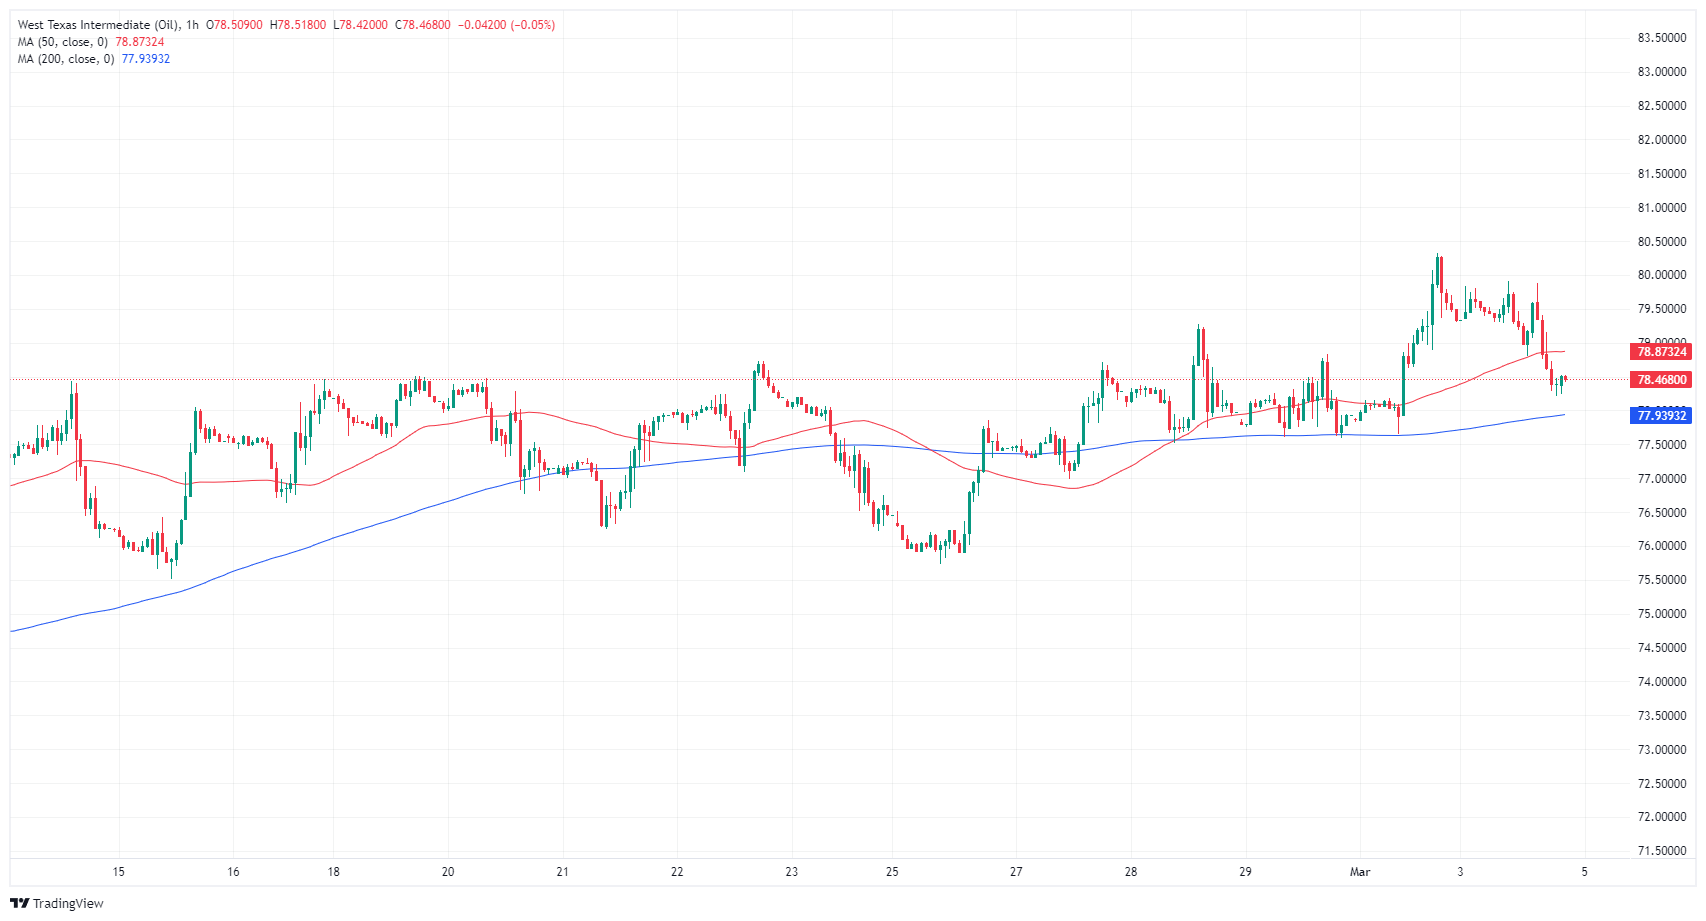
WTI daily chart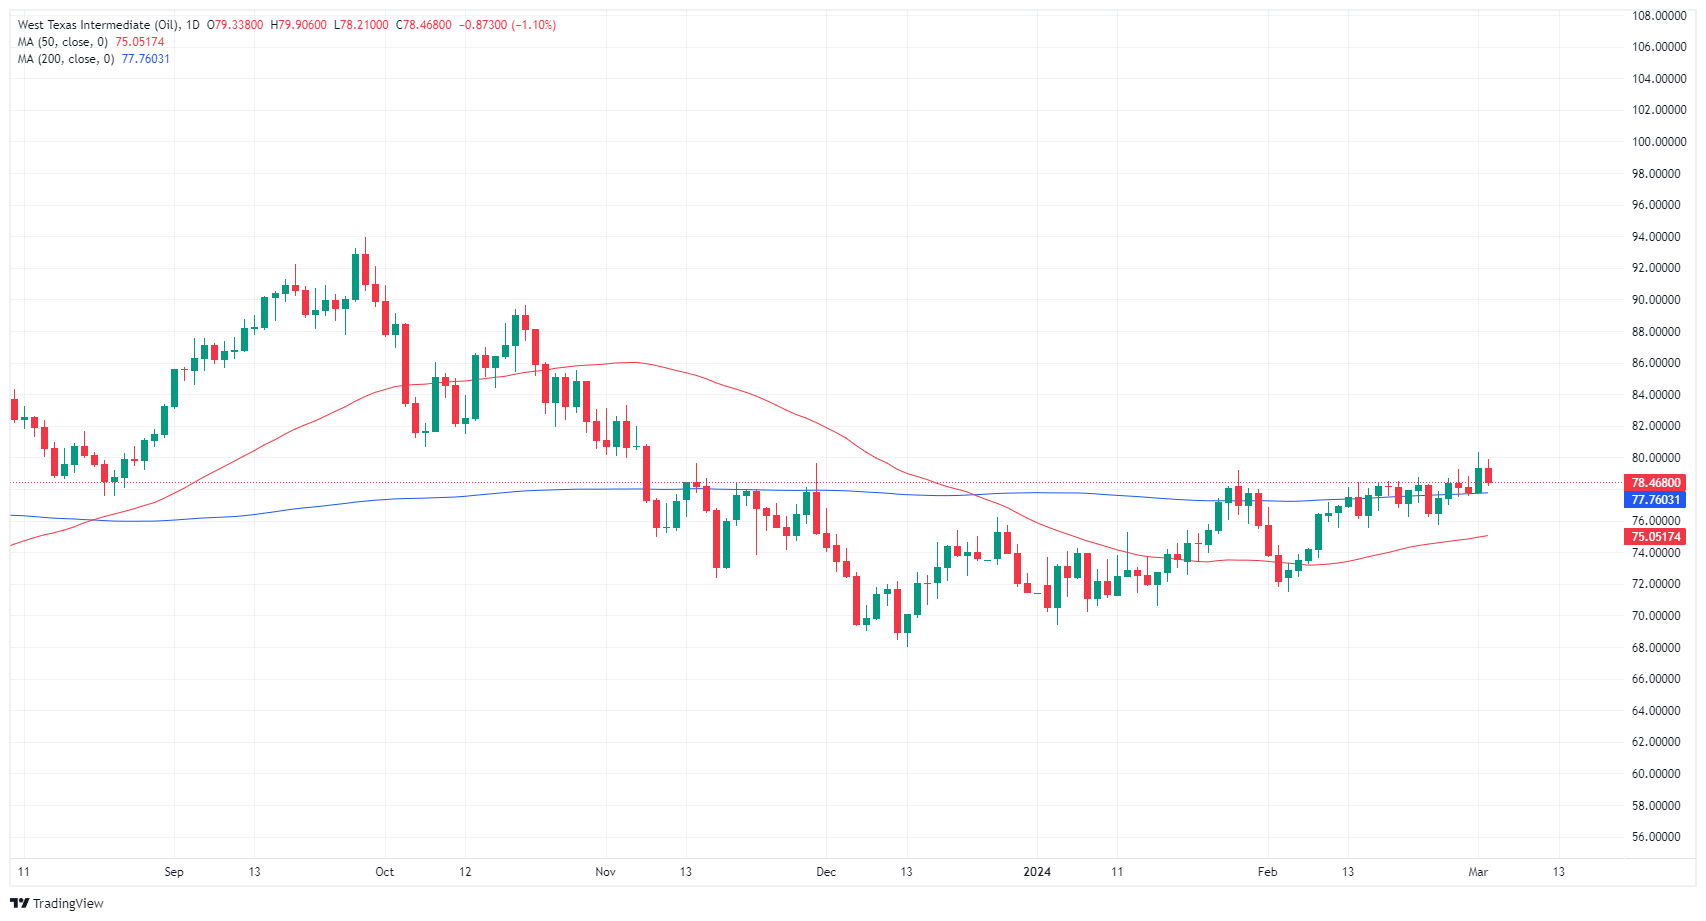
- NZD/JPY kicks off Monday's session, operating at 91.71 with mild gains.
- On the daily chart, RSI places the NZD/JPY within the negative zone, signifying short-term rising selling traction.
- If the buyers fail to reclaim the 20-day Average, the outlook may start to turn in favor of the sellers.
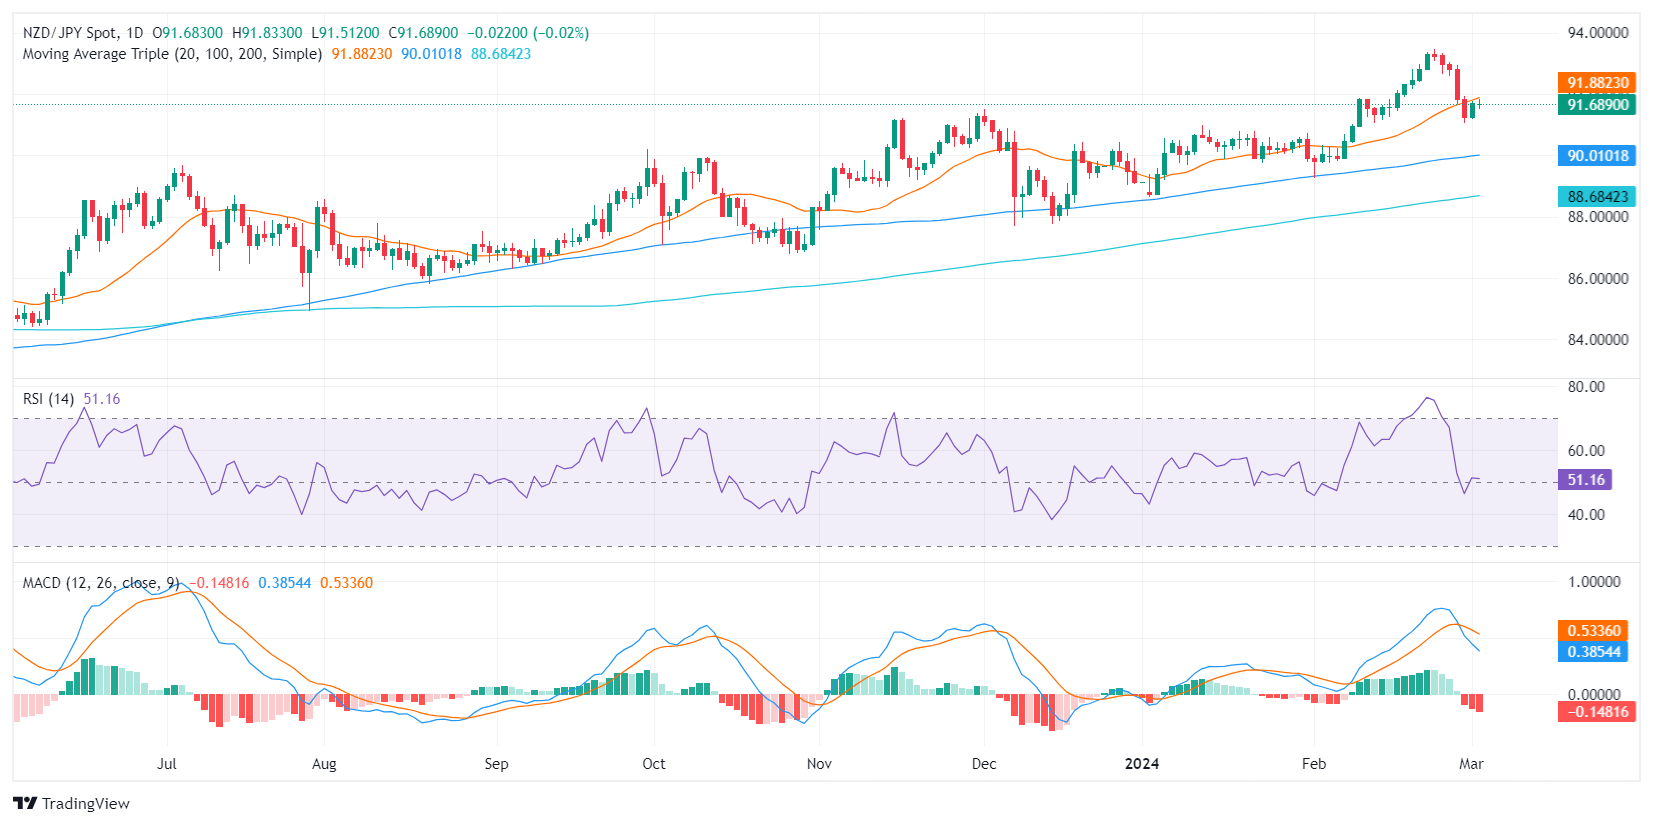
In Monday's trading session, NZD/JPY is navigating around the 91.71 level, trading with mild gains. The overall market tone for the pair suggests a bearish bias as sellers remain in control, after closing a 1.70% losing week and tallying a five-day losing streak. Yet, signs of a gradual build-up of bullish momentum can be observed in the shorter timeframes.
On the daily chart, the Relative Strength Index (RSI) shows the NZD/JPY pair in the negative territory, indicating bearish momentum in the short-term, as sellers control the market after hitting overbought conditions last week. The rising red bars of the Moving Average Convergence Divergence (MACD) histogram, signal that negative momentum is increasing.
NZD/JPY daily chart
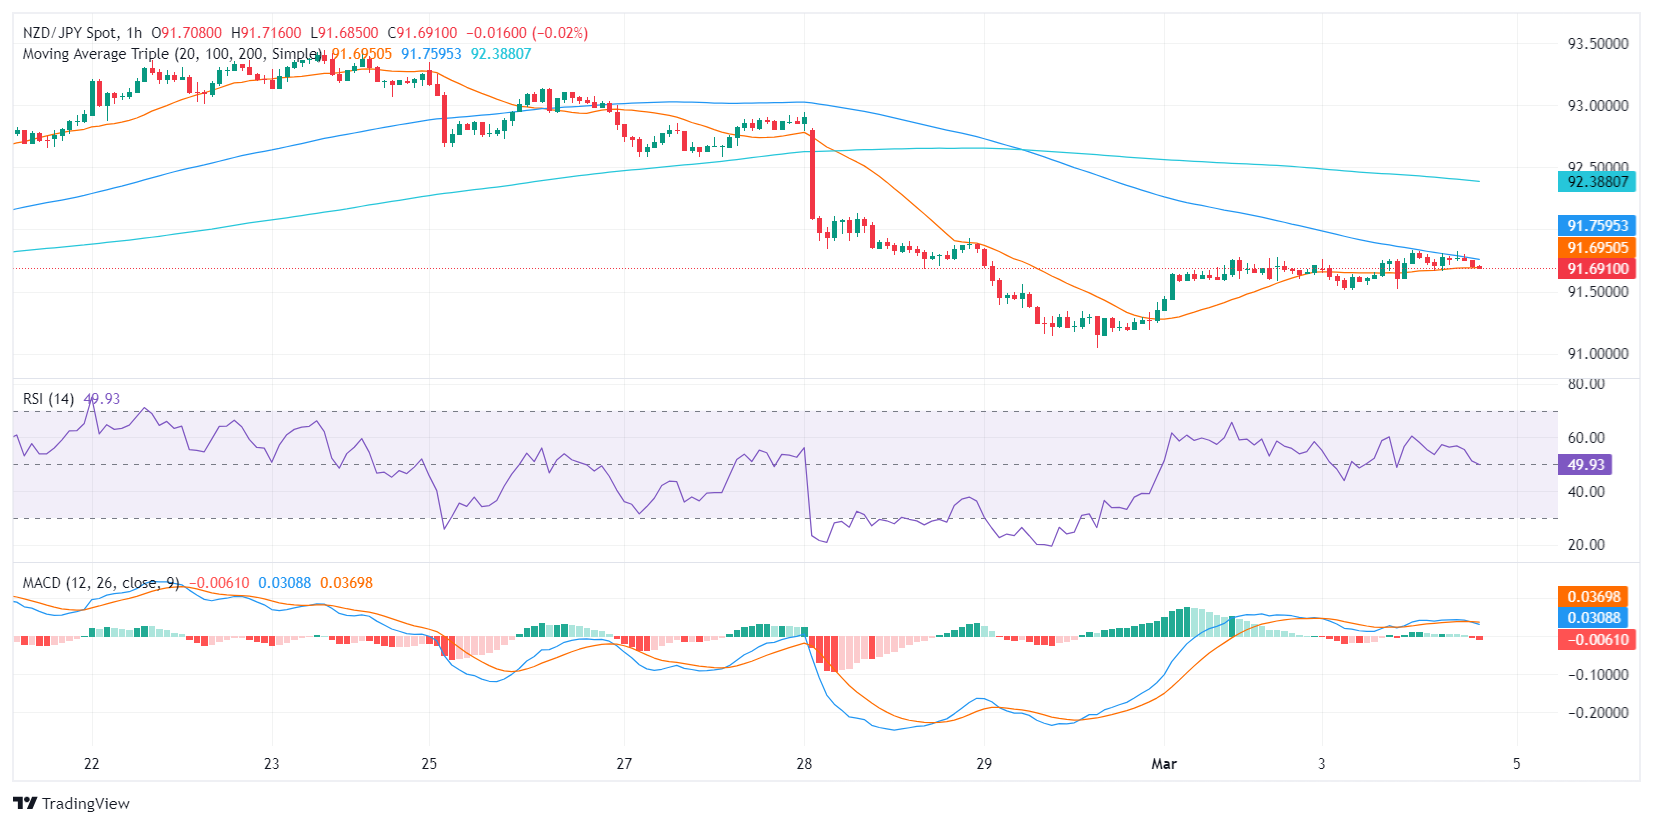
Meanwhile, on the hourly chart, the RSI is fluctuating within the positive territory, suggesting that bullish momentum may be building. However, the MACD histogram on this chart also presents rising red bars, suggesting a steady negative pull.
NZD/JPY hourly chart
In conclusion, while investors demonstrate a short-term bearish inclination on the daily chart, patterns on the hourly chart suggest that bulls are presenting a battle. That being said, the pair is holding up the 100 and 200-day Simple Moving Averages (SMAs) which typically suggest an overall bullish trend. Still, as long as the buyers fail to conquer the 20-day Average, the short-term bias will remain negative.
The small bias towards the risk-associated galaxy weighed on the Greenback at the beginning of a new trading week, although the consolidative mood is predicted to kick in soon ahead of Powell’s testimonies, the ECB meetings and key US NFP.
Here is what you need to know on Tuesday, March 5:
The continuation of the recovery in the risk complex kept the pressure under the US Dollar, sparking the second daily pullback in a row in the USD Index (DXY). On March 5, the final S&P Global Services PMI is due, seconded by the ISM Services PMI, Factory Orders, and the RCM/TIPP Economic Optimism Index. In addition, the Fed’s M. Barr is due to speak.
EUR/USD added to gains seen at the end of last week and rose to multi-session peaks around 1.0860. In the euro docket, the final HCOB Services PMIs in Germany and the broader euro bloc are only due on March 5.
The renewed selling pressure in the Greenback allowed GBP/USD to rise to four-day highs in levels just shy of 1.2700 the figure. In the UK, the BRC Retail Sales Monitor is expected on March 5, along with the final S&P Global Services PMI.
USD/JPY maintained the upside momentum unchanged and flirted with the 150.60 zone amidst the weaker Dollar and rising US yields. Tokyo inflation figures and the final Jibun Bank Services PMI are scheduled for March 5.
AUD/USD ignored the soft tone in the Greenback and put the 0.6500 support to the test once again, reversing two daily advances in a row. The final Judo Bank Services PMI is due along with the Q4 Current Account.
In China, all the attention is expected to be on the National People’s Congress along with the release of the Caixin Services PMI.
Prices of WTI corrected lower after two straight sessions of gains, slipping back below the $80.00 mark per barrel as traders digested news that the OPEC+ will extend its oil output cuts through Q2.
Prices of Gold reached multi-week highs around $2,100 per troy ounce on the back of steady speculation about the Fed’s rate cut in June. Silver followed suit and rose to fresh two-month tops near $23.50 per ounce amidst the persistent selling pressure in the Greenback.
- EUR/USD finds chart paper near 1.0850.
- European investor confidence recovered on Monday.
- US NFP employment to be key data print this week.
EUR/USD drifted into the high end to kick off the trading week on Monday, finding chart space near 1.0860 and getting mired in near-term technical resistance. The pair has been rangebound for a week, and investors will look to critical US labor figures this week as markets gauge the Federal Reserve’s next move.
This week, central banks loom heavily over the Euro (EUR) and the US Dollar (USD). Fed Chairman Jerome Powell will be testifying before the US Congress’ House Financial Services Committee about the Fed’s Semi-Annual Monetary Policy Report on Wednesday and Thursday. The European Central Bank (ECB) also gives its latest rate call during Thursday’s European market session.
Daily digest market movers: EUR/USD churns in familiar territory as traders await key data
- Europe’s Sentix Investor Confidence for March rose to -10.5 from the previous -12.9, an 11-month high.
- High impact data kicks off on Wednesday with European Retail Sales for January expected to decline to 1.3% YoY versus the previous -0.8% as European economic activity continues to weaken.
- US ADP Employment Change numbers on Wednesday are expected to climb to 150K compared to the previous 107K as a precursor to Friday’s US Nonfarm Payrolls (NFP) print.
- The ECB’s rate call on Thursday is broadly expected to hold the main refi rate at 4.5%.
- Investors are looking for softening US NFP labor figures to bolster odds of a Fed rate cut.
- Tuesday’s US ISM Services PMI is forecast to tick down to 53.0 from 53.4.
Euro price today
The table below shows the percentage change of Euro (EUR) against listed major currencies today. Euro was the strongest against the .
| USD | EUR | GBP | CAD | AUD | JPY | NZD | CHF | |
| USD | -0.14% | -0.26% | 0.18% | 0.24% | 0.28% | 0.16% | 0.14% | |
| EUR | 0.13% | -0.13% | 0.32% | 0.38% | 0.41% | 0.31% | 0.28% | |
| GBP | 0.26% | 0.13% | 0.43% | 0.50% | 0.55% | 0.42% | 0.41% | |
| CAD | -0.18% | -0.31% | -0.43% | 0.07% | 0.09% | -0.02% | -0.03% | |
| AUD | -0.24% | -0.38% | -0.50% | -0.06% | 0.04% | -0.07% | -0.09% | |
| JPY | -0.28% | -0.41% | -0.58% | -0.12% | -0.05% | -0.11% | -0.11% | |
| NZD | -0.17% | -0.31% | -0.43% | 0.01% | 0.07% | 0.11% | -0.02% | |
| CHF | -0.15% | -0.29% | -0.41% | 0.03% | 0.09% | 0.13% | 0.02% |
The heat map shows percentage changes of major currencies against each other. The base currency is picked from the left column, while the quote currency is picked from the top row. For example, if you pick the Euro from the left column and move along the horizontal line to the Japanese Yen, the percentage change displayed in the box will represent EUR (base)/JPY (quote).
Technical analysis: EUR/USD trapped in consolidation as investors await Fed moves
EUR/USD rose into 1.0860 on Monday, knocking into familiar technical bounds and holding onto the high side of near-term consolidation. The pair is corkscrewing through a sideways channel between 1.0860 and the 1.0800 handle.
A lack of meaningful trend on daily candlesticks leaves the EUR/USD swamped into the 200-day Simple Moving Average (SMA) near 1.0830. Despite a 1.5% climb from the last swing low into 1.0700, but the pair remains down 2.6% from December’s peak bids near 1.1140.
EUR/USD hourly chart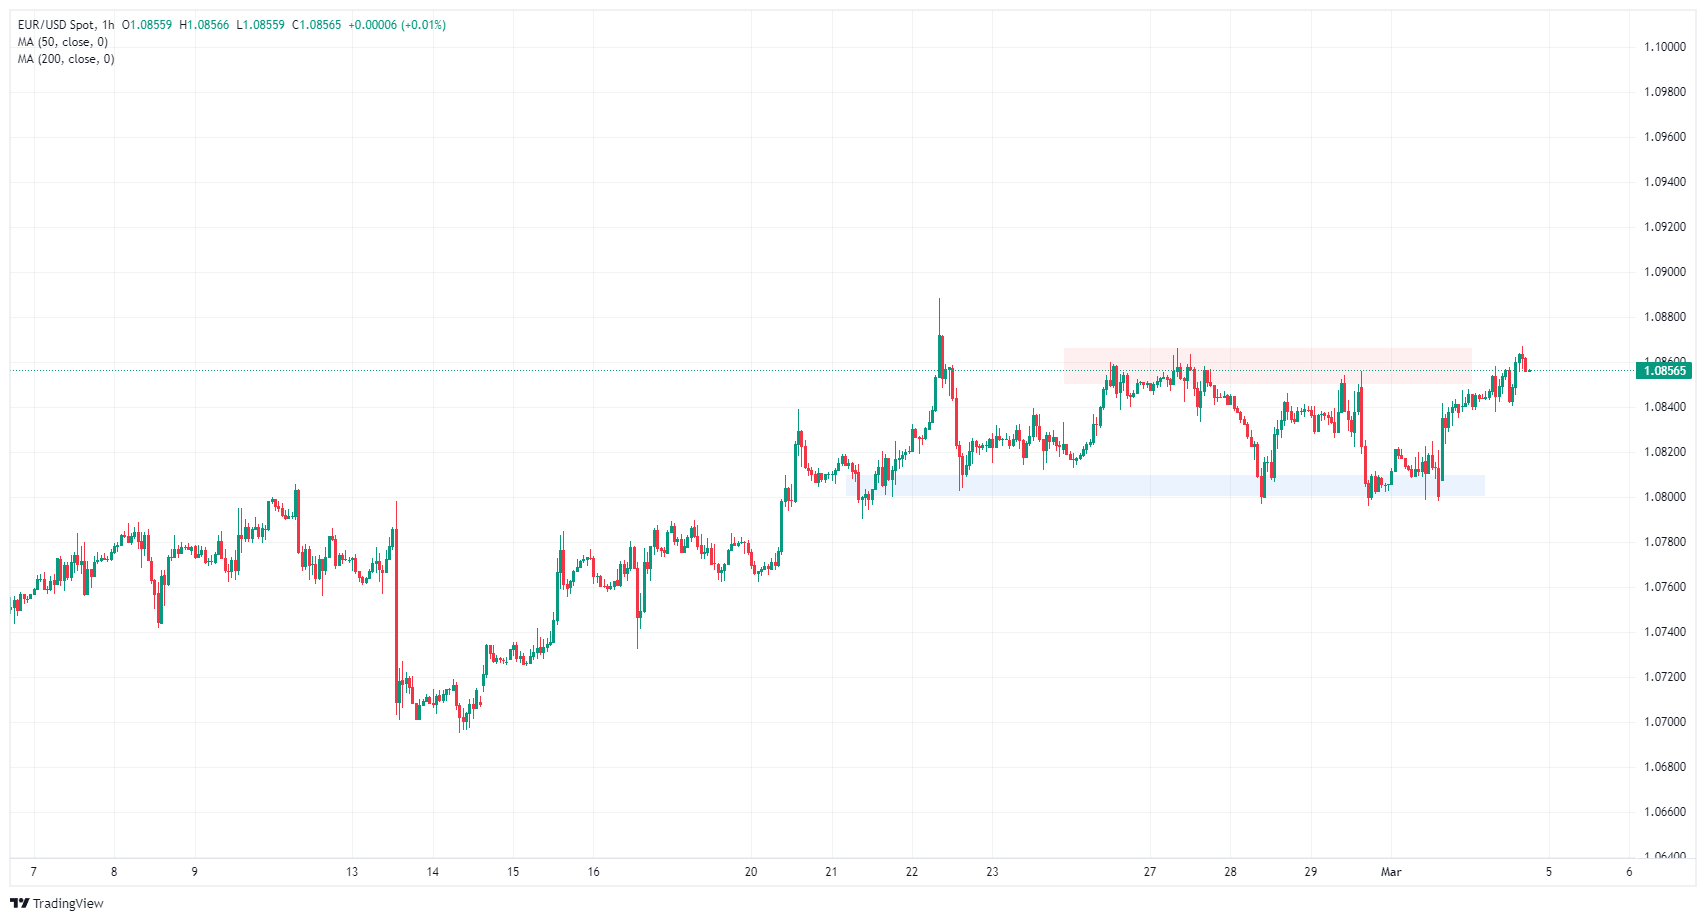
EUR/USD daily chart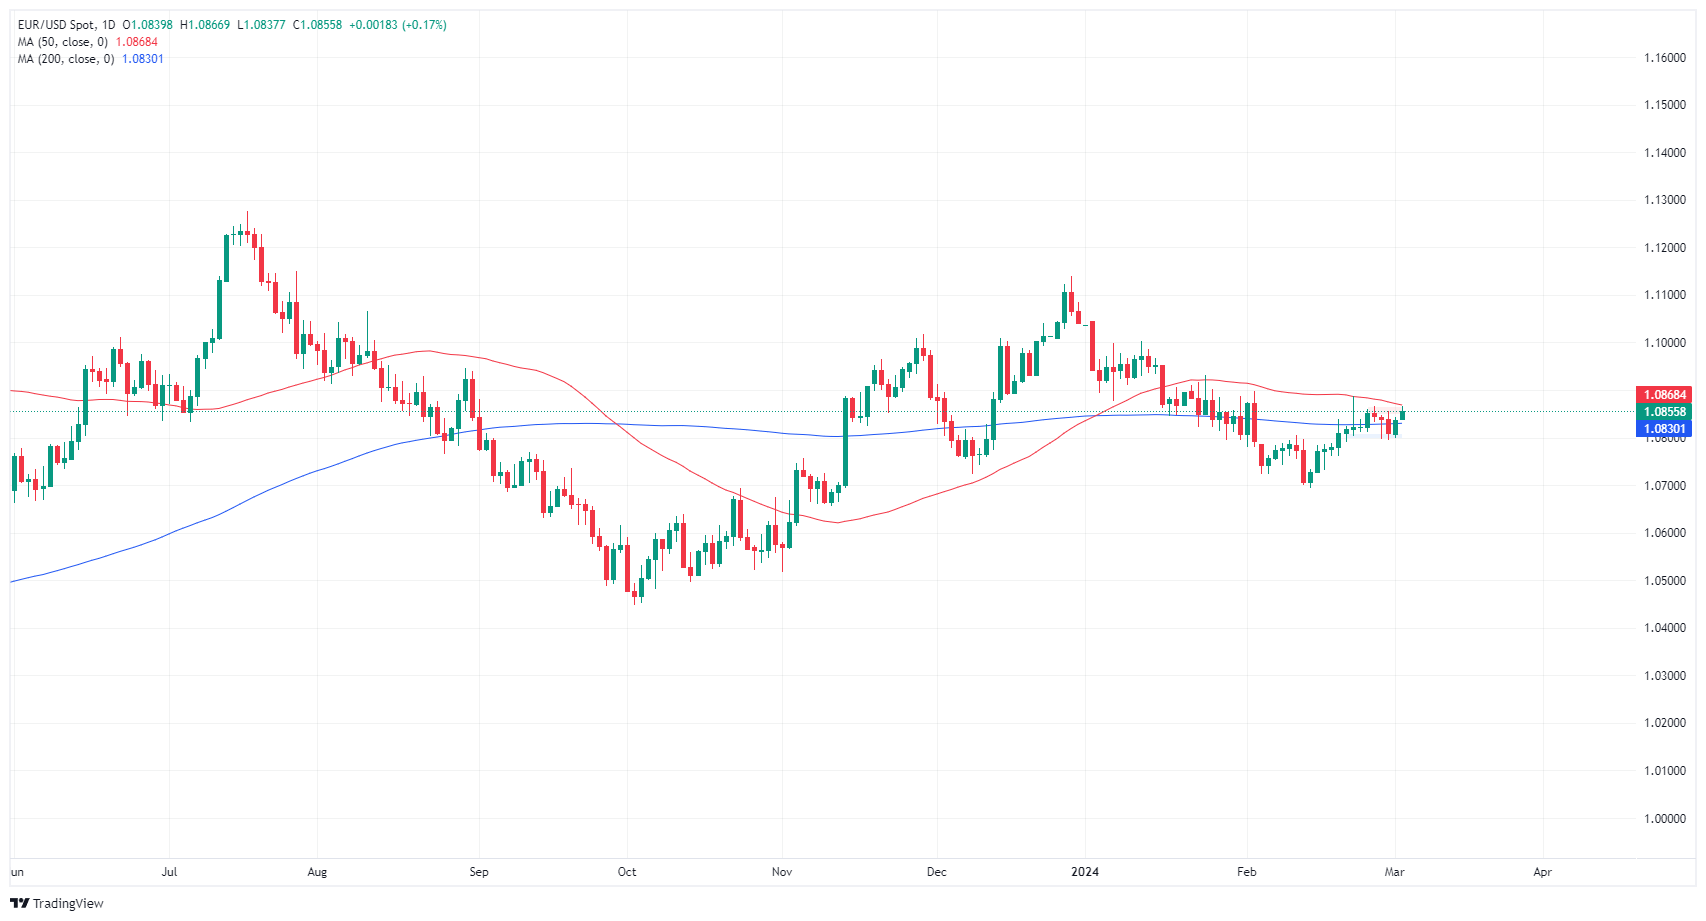
Euro FAQs
What is the Euro?
The Euro is the currency for the 20 European Union countries that belong to the Eurozone. It is the second most heavily traded currency in the world behind the US Dollar. In 2022, it accounted for 31% of all foreign exchange transactions, with an average daily turnover of over $2.2 trillion a day.
EUR/USD is the most heavily traded currency pair in the world, accounting for an estimated 30% off all transactions, followed by EUR/JPY (4%), EUR/GBP (3%) and EUR/AUD (2%).
What is the ECB and how does it impact the Euro?
The European Central Bank (ECB) in Frankfurt, Germany, is the reserve bank for the Eurozone. The ECB sets interest rates and manages monetary policy.
The ECB’s primary mandate is to maintain price stability, which means either controlling inflation or stimulating growth. Its primary tool is the raising or lowering of interest rates. Relatively high interest rates – or the expectation of higher rates – will usually benefit the Euro and vice versa.
The ECB Governing Council makes monetary policy decisions at meetings held eight times a year. Decisions are made by heads of the Eurozone national banks and six permanent members, including the President of the ECB, Christine Lagarde.
How does inflation data impact the value of the Euro?
Eurozone inflation data, measured by the Harmonized Index of Consumer Prices (HICP), is an important econometric for the Euro. If inflation rises more than expected, especially if above the ECB’s 2% target, it obliges the ECB to raise interest rates to bring it back under control.
Relatively high interest rates compared to its counterparts will usually benefit the Euro, as it makes the region more attractive as a place for global investors to park their money.
How does economic data influence the value of the Euro?
Data releases gauge the health of the economy and can impact on the Euro. Indicators such as GDP, Manufacturing and Services PMIs, employment, and consumer sentiment surveys can all influence the direction of the single currency.
A strong economy is good for the Euro. Not only does it attract more foreign investment but it may encourage the ECB to put up interest rates, which will directly strengthen the Euro. Otherwise, if economic data is weak, the Euro is likely to fall.
Economic data for the four largest economies in the euro area (Germany, France, Italy and Spain) are especially significant, as they account for 75% of the Eurozone’s economy.
How does the Trade Balance impact the Euro?
Another significant data release for the Euro is the Trade Balance. This indicator measures the difference between what a country earns from its exports and what it spends on imports over a given period.
If a country produces highly sought after exports then its currency will gain in value purely from the extra demand created from foreign buyers seeking to purchase these goods. Therefore, a positive net Trade Balance strengthens a currency and vice versa for a negative balance.
- The AUD/JPY is trading at 98.04, marking a 0.12% gain during Monday's session.
- The RSI on both daily and hourly charts is in the positive zone, but momentum is limited.
- The overall trend remains bullish as the buyers recovered the 20-day SMA.
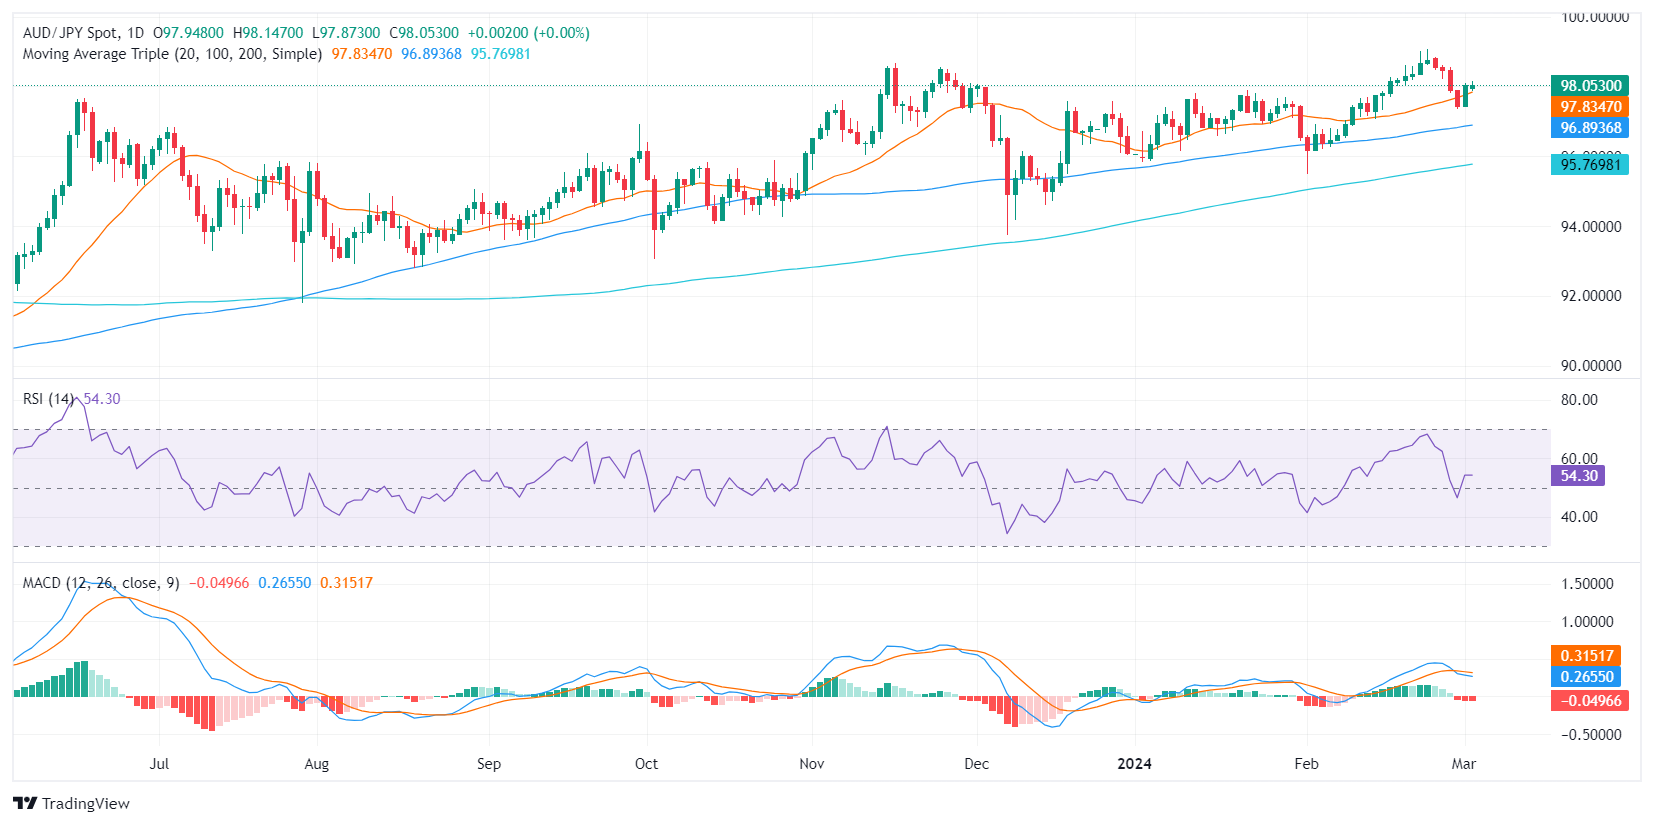
In Monday's session, the AUD/JPY pair is trading at 98.04, reflecting a 0.12% gain. Despite a slight decrease in buying momentum, there's an overall moderate bullish sentiment dominating the market as indicators seem to recover after recent declines.
On the daily chart, the AUD/JPY pair's Relative Strength Index (RSI) is currently in positive territory, indicating that buyers have had the edge recently after diving below 50. Despite slight decreases in the latest readings, there's still a moderate bullish momentum. The Moving Average Convergence Divergence (MACD) histogram shows flat red bars, suggesting a loss in positive momentum but a still mildly bullish sentiment in the market.
AUD/JPY daily chart
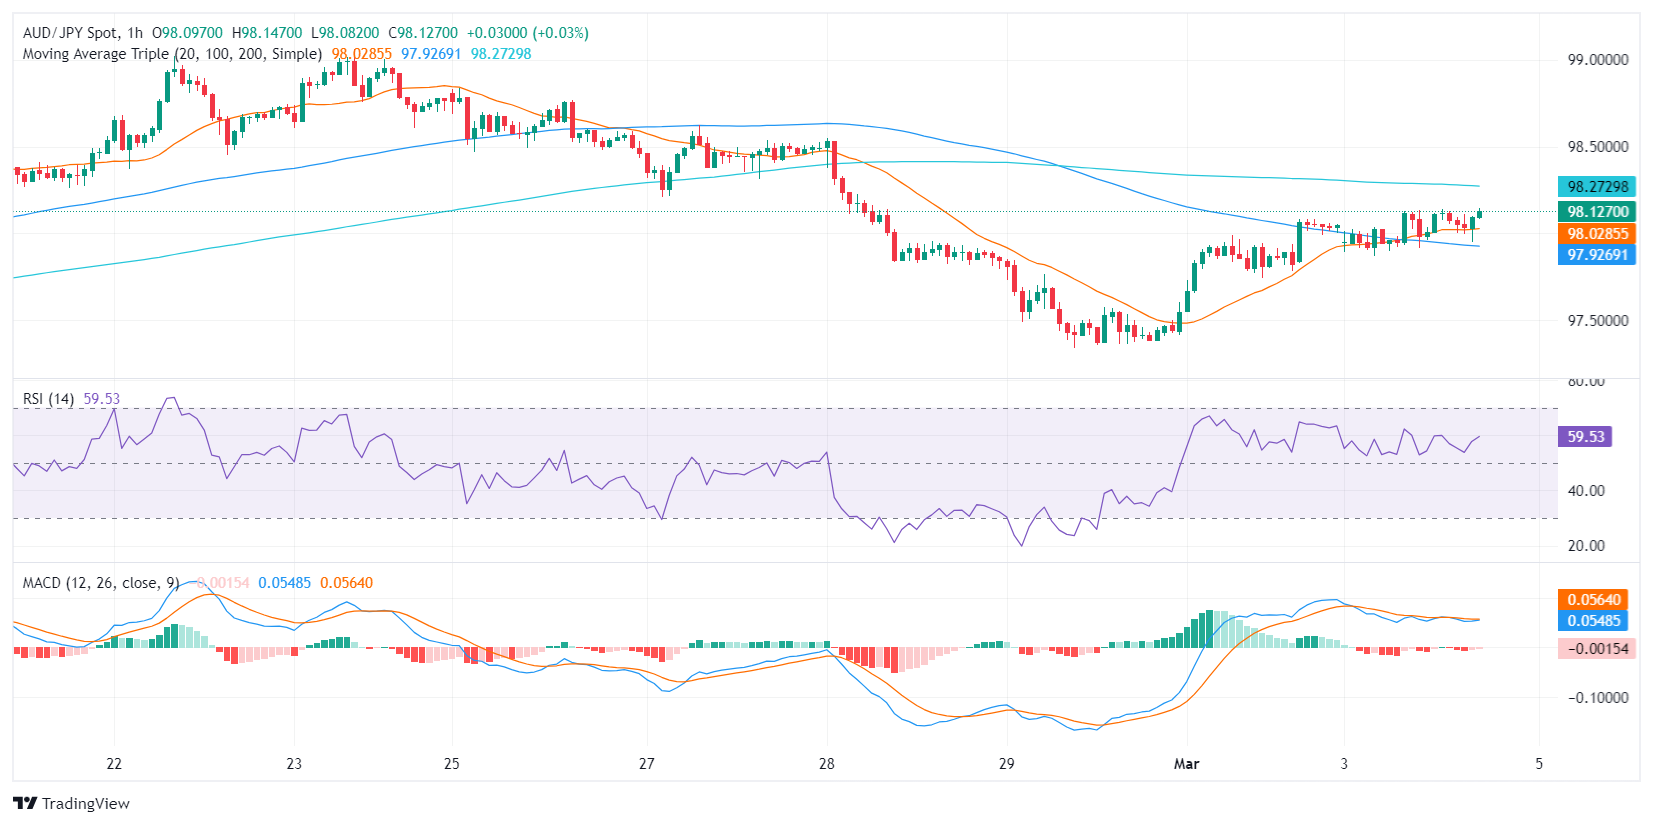
Switching to the hourly chart, the RSI values present a similar picture, hovering in the positive territory, and the MACD histogram continues with red decreasing bars, indicating a loss in selling momentum but a flattened buying traction. The readings imply that the pair is experiencing similar dynamics on a shorter-term scale.
AUD/JPY hourly chart
By contrasting the daily and hourly charts, indicators suggest a consistent bullish momentum, albeit with decreased intensity. Despite the short-term neutral-to-negative outlook, the pair's position above the 20, 100, and 200-day Simple Moving Averages (SMAs) reinforces the perspective that buyers are in control in a broader market view.
- The Mexican Peso found fresh gains against the US Dollar on Monday.
- Mexican inflation is expected to ease sharply, propping up Banxico cut expectations.
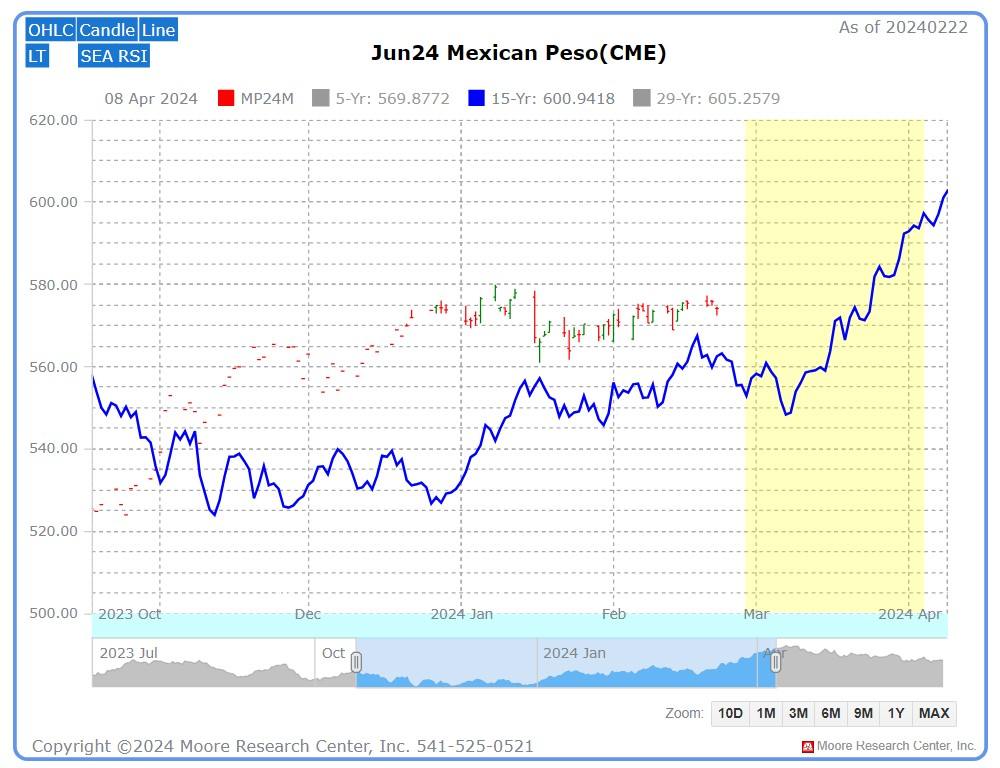
- Seasonal flows typically bolster the Mexican Peso at the tail end of the first quarter.
The Mexican Peso (MXN) gained ground against the US Dollar (USD) on Monday as counter-balanced rate cut expectations push the USD/MXN pair further down the charts. Common seasonal flows see bullish momentum leak into the Mexican Peso during the first quarter, and markets are forecasting a tumble in Mexican inflation.
Mexico is broadly expected to see further rate cuts from the Banco de México, aka Banxico. Mexico’s main reference rate has been held at record highs of 11.25% since April of 2023. US labor figures are also in the mix, with Friday’s Nonfarm Payrolls (NFP) in the barrel. Hopes of market rate cuts from the Federal Reserve (Fed) are also weighing on Monday market action.
Daily digest market movers: Uptick in Banxico rate cut bets push Peso to six-week highs
- Mexico’s inflation print due on Thursday is expected to print a continued decline in Mexican price growth, forecast to print at 0.12% for February versus the previous 0.89%.
- January’s 0.89% Mexico inflation print was a 22-month high.
- This week’s US labor figures kick off with Wednesday’s ADP Employment Change for February, forecast to jump to 150K from the previous 107K.
- Fed Chairman Jerome Powell due to testify before the Financial Services Committee about the Semi-Annual Monetary Policy Report on Wednesday and Thursday.
- Friday’s February US NFP is expected to fall back to 200K from the previous 353K, and investors will be keeping a close eye on revisions to previous prints.
- Tuesday will kick off the US weekly data docket with ISM Services Purchasing Managers Index (PMI) figures for February forecast to tick down to 53.0 from 53.4.
- The Mexican Peso typically finds bullish interest heading into the second quarter, according to the Moore Research Center (MRCI).
- MRCI: Mexican Peso has closed higher from February 28 to April 4 about 93% of the time over the past 15 years.
Technical analysis: USD/MXN drops into new lows as Peso finds bullish bids
The Mexican Peso (MXN) is climbing on Monday, driving the USD/MXN pair down below the 17.00 handle for the first time since mid-January. The pair is down nine-tenths of a percent from last week’s peak bids near 17.12.
USD/MXN is on pace to close in the red for a third consecutive trading day, and bids are tumbling into chart territory last seen in January. 2024’s technical floor sits at January’s swing low into the 16.80 handle, and the pair continues to drop away from the 200-day Simple Moving Average (SMA) at 17.25.
USD/MXN hourly chart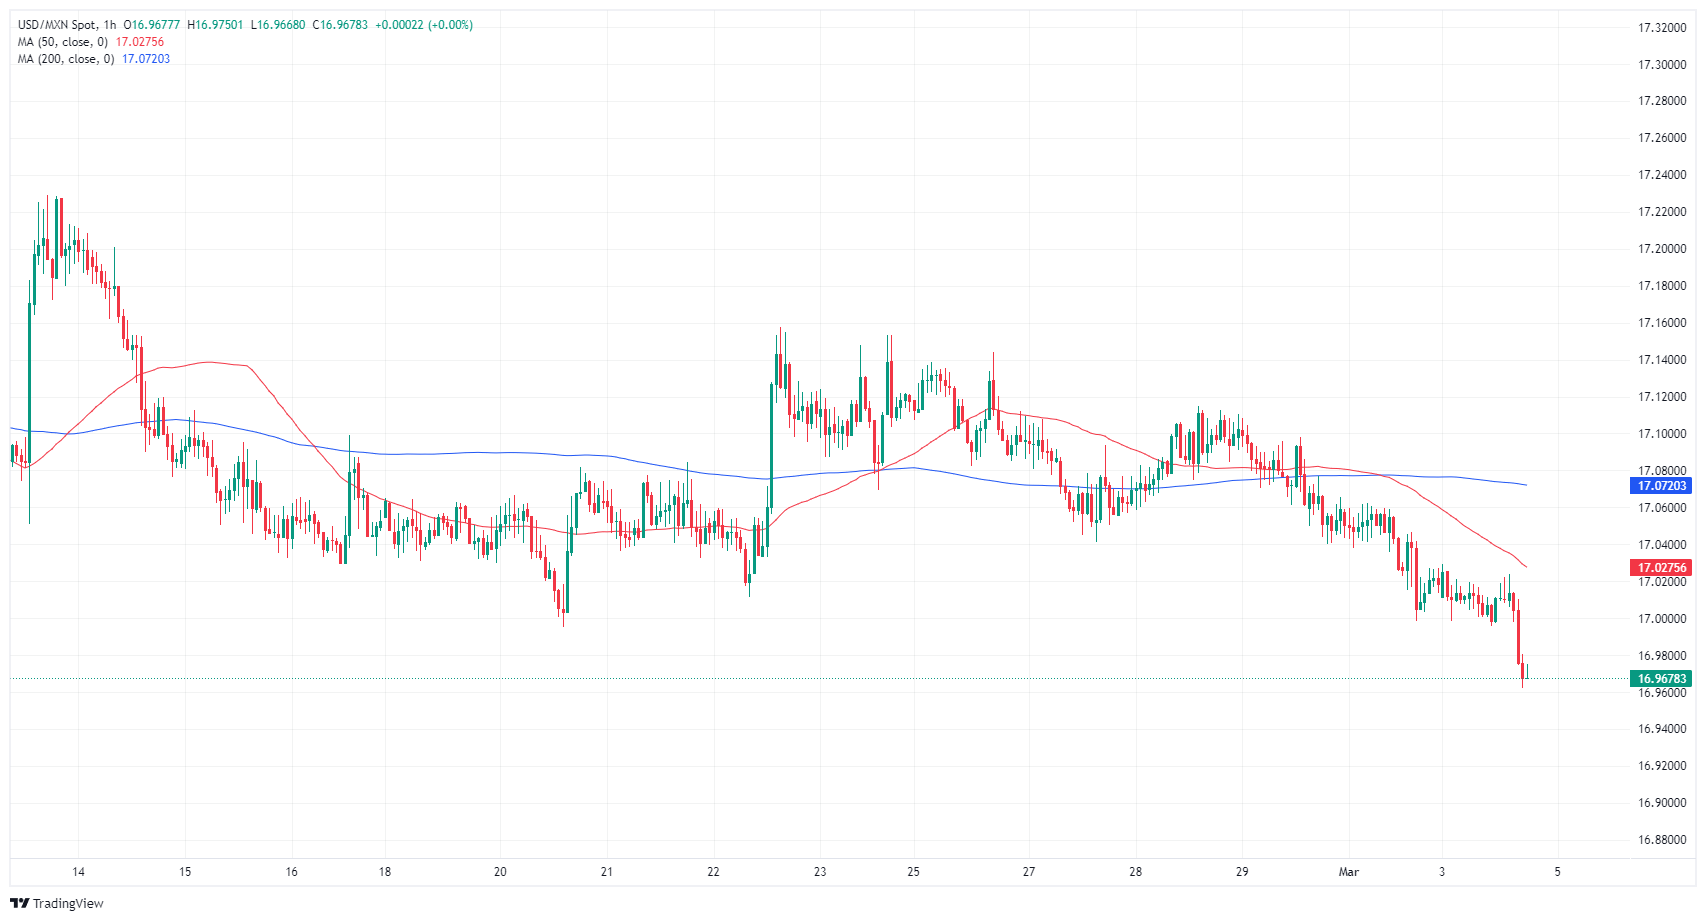
USD/MXN daily chart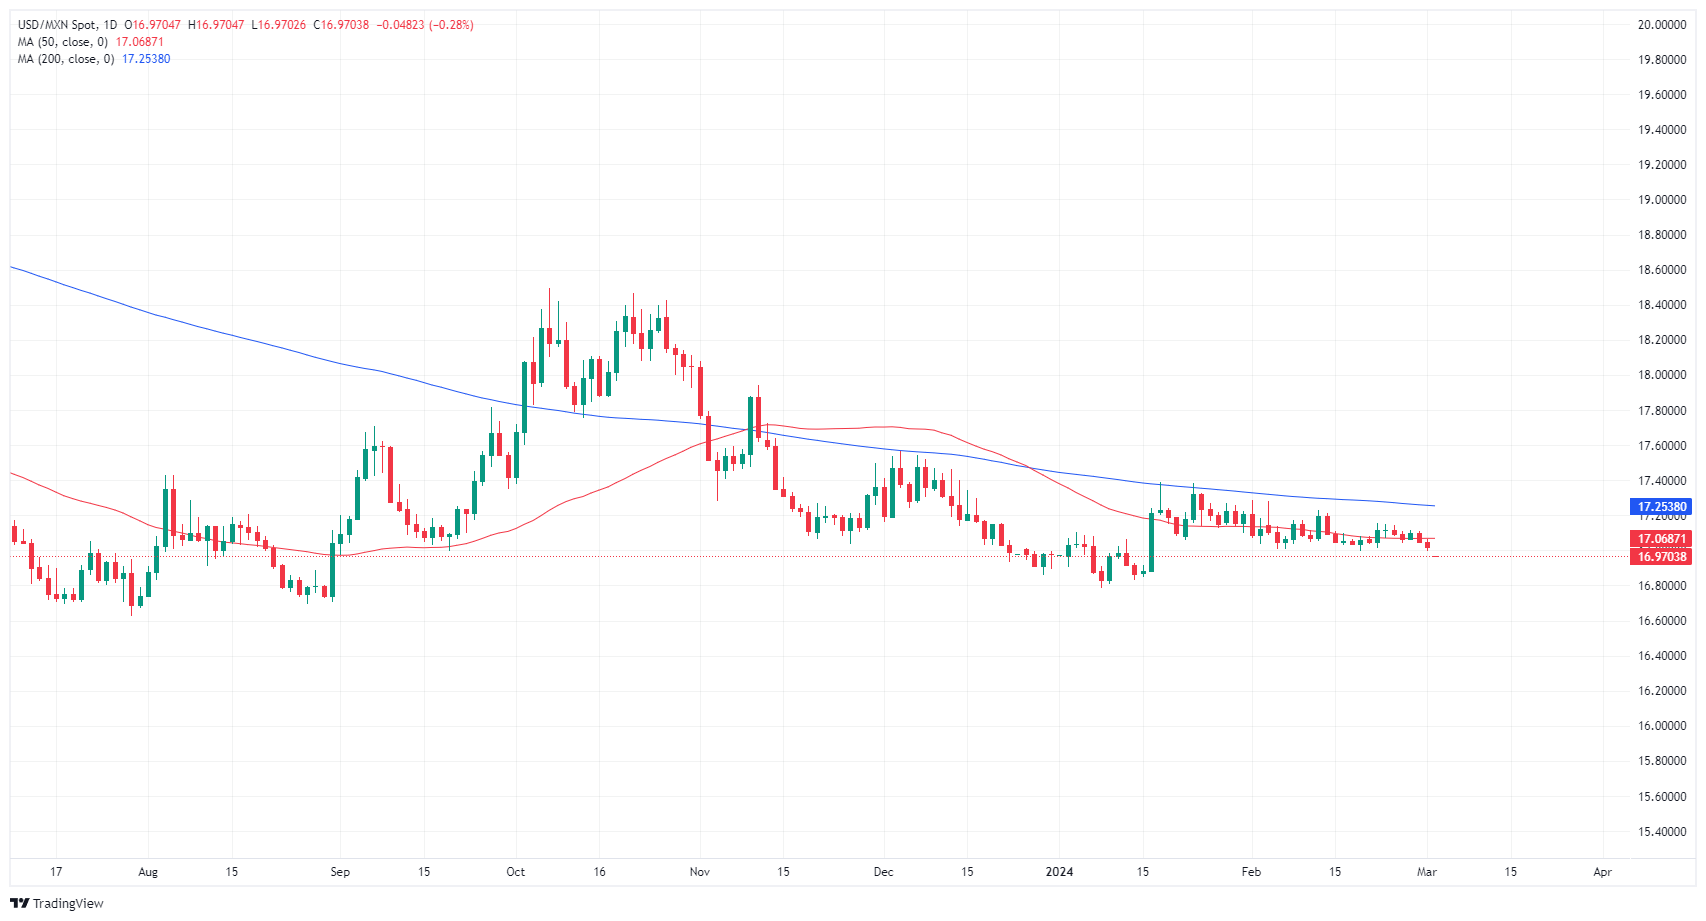
Mexican Peso FAQs
What key factors drive the Mexican Peso?
The Mexican Peso (MXN) is the most traded currency among its Latin American peers. Its value is broadly determined by the performance of the Mexican economy, the country’s central bank’s policy, the amount of foreign investment in the country and even the levels of remittances sent by Mexicans who live abroad, particularly in the United States. Geopolitical trends can also move MXN: for example, the process of nearshoring – or the decision by some firms to relocate manufacturing capacity and supply chains closer to their home countries – is also seen as a catalyst for the Mexican currency as the country is considered a key manufacturing hub in the American continent. Another catalyst for MXN is Oil prices as Mexico is a key exporter of the commodity.
How do decisions of the Banxico impact the Mexican Peso?
The main objective of Mexico’s central bank, also known as Banxico, is to maintain inflation at low and stable levels (at or close to its target of 3%, the midpoint in a tolerance band of between 2% and 4%). To this end, the bank sets an appropriate level of interest rates. When inflation is too high, Banxico will attempt to tame it by raising interest rates, making it more expensive for households and businesses to borrow money, thus cooling demand and the overall economy. Higher interest rates are generally positive for the Mexican Peso (MXN) as they lead to higher yields, making the country a more attractive place for investors. On the contrary, lower interest rates tend to weaken MXN.
How does economic data influence the value of the Mexican Peso?
Macroeconomic data releases are key to assess the state of the economy and can have an impact on the Mexican Peso (MXN) valuation. A strong Mexican economy, based on high economic growth, low unemployment and high confidence is good for MXN. Not only does it attract more foreign investment but it may encourage the Bank of Mexico (Banxico) to increase interest rates, particularly if this strength comes together with elevated inflation. However, if economic data is weak, MXN is likely to depreciate.
How does broader risk sentiment impact the Mexican Peso?
As an emerging-market currency, the Mexican Peso (MXN) tends to strive during risk-on periods, or when investors perceive that broader market risks are low and thus are eager to engage with investments that carry a higher risk. Conversely, MXN tends to weaken at times of market turbulence or economic uncertainty as investors tend to sell higher-risk assets and flee to the more-stable safe havens.
Atlanta Federal Reserve (Fed) President Raphael Bostic hit newswires on Monday after his quarterly essay was released.
Key highlights
- Soft landing is hardy assured given uncertainty.
- Does not anticipate back-to-back rate cuts when they begin.
- Fed's Bostic still expects two 25-basis point rate cuts in 2024.
- Needs to see more progress and gain confidence on disinflation before voting to reduce policy rates.
- Inflation is on track to return to 2% target, but still too early to claim victory.
- January's hiring was a fresh sign of continued US labor strength.
- Inflation is still widespread, with more than the usual share of items increasing above 5% with trimmed mean stuck at 2.6%.
- Fed still has time to be sure inflation returns to target.
- Fed's Bostic does not see degradation of the US labor market.
- Risks to inflation and employment have balanced out.
- Pent-up exuberance in US economy remains an inflation risk.
- Businesses are not distressed and are ready to invest.
- Services inflation remains higher, may take longer for adjustments to occur.
- Dopes not have a base case for when it might be appropriate to reduce pace of balance sheet decline
- Canadian Dollar finds the middle as investor appetite churns.
- Bank of Canada rate call slated for the midweek.
- US NFP expectations to draw attention through the week.
The Canadian Dollar (CAD) is cycling familiar levels on Monday with markets awaiting another rate showing from the Bank of Canada (BoC) and this week’s key US Nonfarm Payrolls (NFP) report due on Friday. The BoC is expected to hold rates at 5% on Wednesday, and investors hopeful for a rate cut from the Federal Reserve (Fed) will be looking for softening economic figures from the US this week.
The data from Canada this week will be the BoC’s rate call, with Friday’s Canadian labor figures due to get eclipsed by the US NFP employment numbers. Canada’s Unemployment Rate is expected to tick higher this week, and current market forecasts call for a pullback in the US NFP print.
Daily digest market movers: Canadian Dollar mostly flat as markets hinge on rate cuts
- Quiet start to the week as markets focus on Fed rate cut odds.
- Softer US data last week leads to an uptick in June rate cut hopes.
- BoC expected to hold steady on rates on Wednesday.
- Tuesday’s US ISM Services Purchasing Managers Index (PMI) for February is forecast to tick down to 53.0 from 53.4.
- Markets will be looking for softer US data prints as investors hope a weakening US economy will boost odds of a Fed rate cut.
- CME FedWatch Tool sees over 70% odds of a Fed rate trim in June at current cut.
- Wednesday’s BoC rate call is forecast to see no moves from BoC Governor Tiff Macklem.
- The US ADP Employment Change for February is slated for Wednesday and is forecast to show an uptick is US employment to 150K for the month, up from the previous month’s 107K.
Canadian Dollar price today
The table below shows the percentage change of Canadian Dollar (CAD) against listed major currencies today. Canadian Dollar was the strongest against the Japanese Yen.
| USD | EUR | GBP | CAD | AUD | JPY | NZD | CHF | |
| USD | -0.17% | -0.29% | 0.08% | 0.10% | 0.24% | 0.05% | 0.07% | |
| EUR | 0.17% | -0.12% | 0.24% | 0.27% | 0.41% | 0.22% | 0.24% | |
| GBP | 0.29% | 0.12% | 0.35% | 0.39% | 0.53% | 0.33% | 0.36% | |
| CAD | -0.08% | -0.23% | -0.35% | 0.04% | 0.16% | -0.03% | 0.00% | |
| AUD | -0.10% | -0.27% | -0.39% | -0.03% | 0.12% | -0.05% | -0.03% | |
| JPY | -0.24% | -0.42% | -0.57% | -0.20% | -0.15% | -0.21% | -0.17% | |
| NZD | -0.05% | -0.21% | -0.33% | 0.03% | 0.06% | 0.19% | 0.03% | |
| CHF | -0.08% | -0.24% | -0.36% | 0.00% | 0.03% | 0.16% | -0.03% |
The heat map shows percentage changes of major currencies against each other. The base currency is picked from the left column, while the quote currency is picked from the top row. For example, if you pick the Euro from the left column and move along the horizontal line to the Japanese Yen, the percentage change displayed in the box will represent EUR (base)/JPY (quote).
Technical analysis: Canadian Dollar shifts to flat side as market eyes drift
The Canadian Dollar (CAD) is mostly flat on Monday with the Loonie shedding around four-tenths a percent against the Pound Sterling (GBP) to kick off the trading week. The CAD is close to flat against the US Dollar (USD), trading within a tenth of a percent from Monday’s opening bids.
The USD/CAD pair is set to trade into a flat range for a third consecutive trading day. Bids are pushing into the middle and prices are hung up on rangebound figures between 1.3600 and 1.3550. The 1.3600 handle is the immediate near-term technical ceiling, and prices continue to trade on the high side of the 200-day Simple Moving Average (SMA) at 1.3477.
USD/CAD hourly chart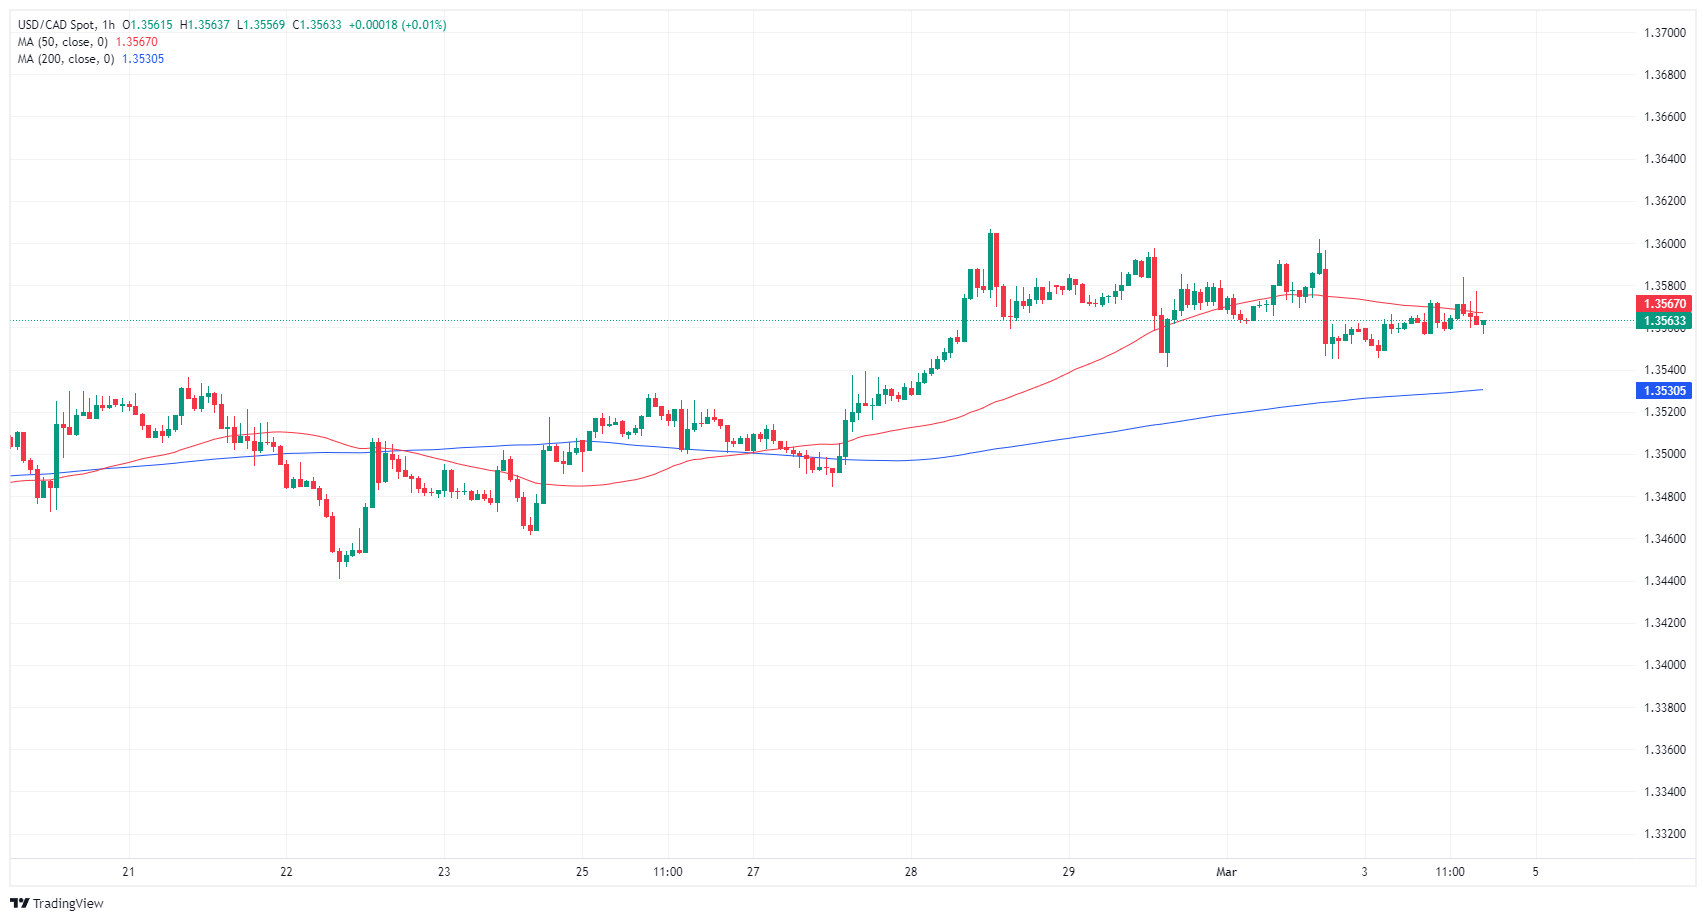
USD/CAD daily chart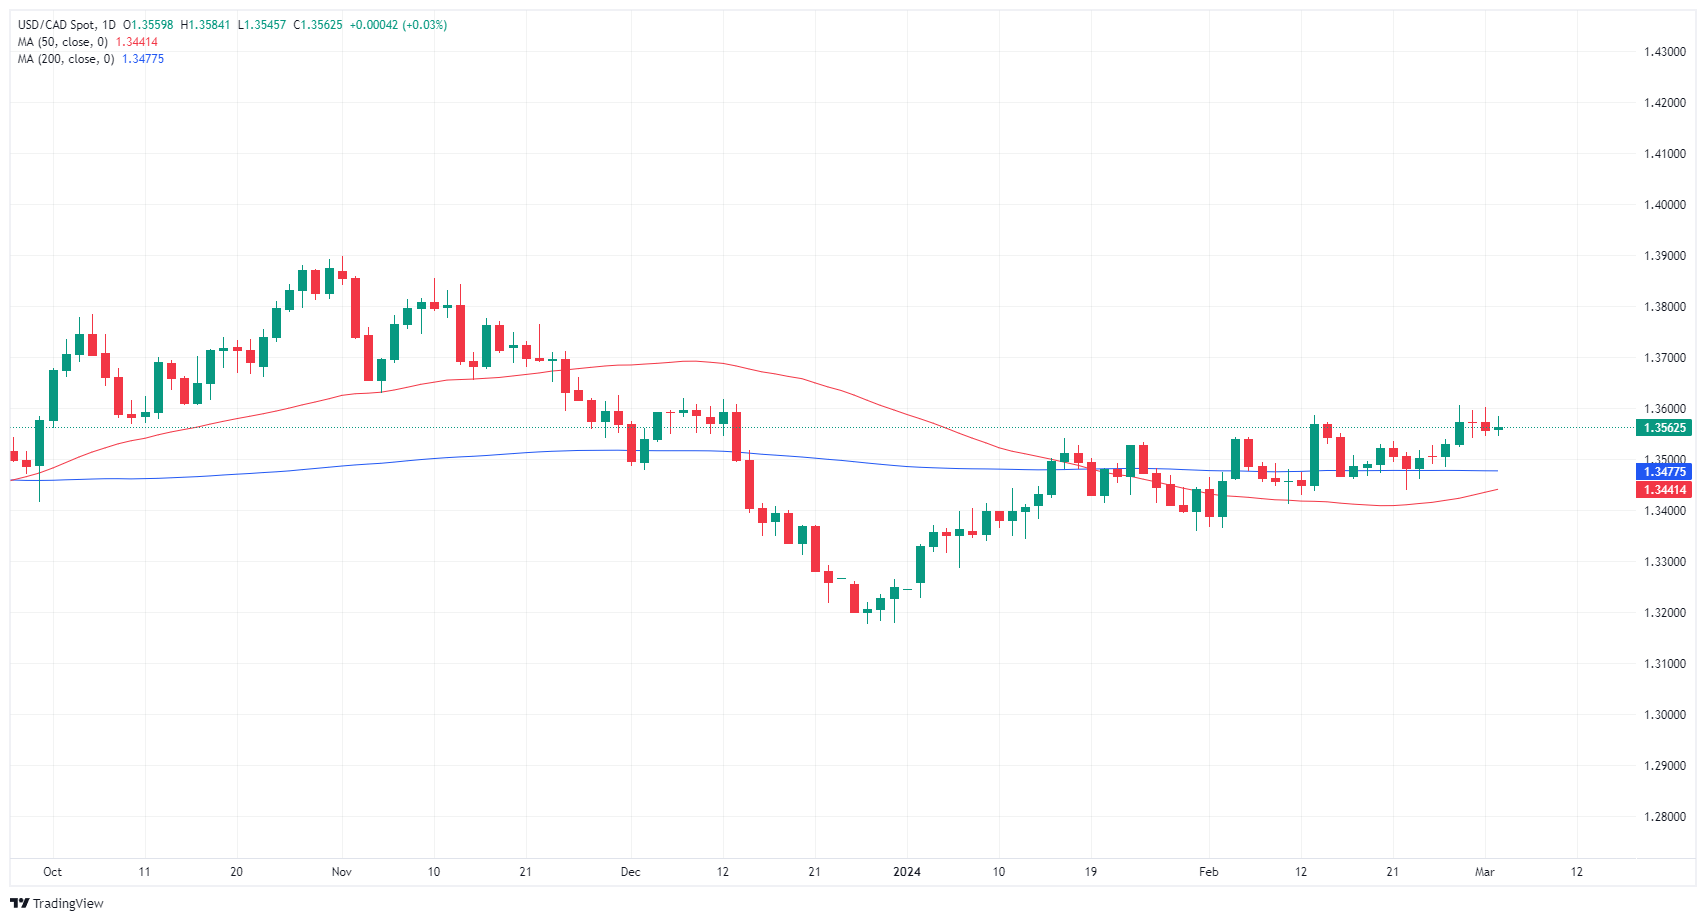
Canadian Dollar FAQs
What key factors drive the Canadian Dollar?
The key factors driving the Canadian Dollar (CAD) are the level of interest rates set by the Bank of Canada (BoC), the price of Oil, Canada’s largest export, the health of its economy, inflation and the Trade Balance, which is the difference between the value of Canada’s exports versus its imports. Other factors include market sentiment – whether investors are taking on more risky assets (risk-on) or seeking safe-havens (risk-off) – with risk-on being CAD-positive. As its largest trading partner, the health of the US economy is also a key factor influencing the Canadian Dollar.
How do the decisions of the Bank of Canada impact the Canadian Dollar?
The Bank of Canada (BoC) has a significant influence on the Canadian Dollar by setting the level of interest rates that banks can lend to one another. This influences the level of interest rates for everyone. The main goal of the BoC is to maintain inflation at 1-3% by adjusting interest rates up or down. Relatively higher interest rates tend to be positive for the CAD. The Bank of Canada can also use quantitative easing and tightening to influence credit conditions, with the former CAD-negative and the latter CAD-positive.
How does the price of Oil impact the Canadian Dollar?
The price of Oil is a key factor impacting the value of the Canadian Dollar. Petroleum is Canada’s biggest export, so Oil price tends to have an immediate impact on the CAD value. Generally, if Oil price rises CAD also goes up, as aggregate demand for the currency increases. The opposite is the case if the price of Oil falls. Higher Oil prices also tend to result in a greater likelihood of a positive Trade Balance, which is also supportive of the CAD.
How does inflation data impact the value of the Canadian Dollar?
While inflation had always traditionally been thought of as a negative factor for a currency since it lowers the value of money, the opposite has actually been the case in modern times with the relaxation of cross-border capital controls. Higher inflation tends to lead central banks to put up interest rates which attracts more capital inflows from global investors seeking a lucrative place to keep their money. This increases demand for the local currency, which in Canada’s case is the Canadian Dollar.
How does economic data influence the value of the Canadian Dollar?
Macroeconomic data releases gauge the health of the economy and can have an impact on the Canadian Dollar. Indicators such as GDP, Manufacturing and Services PMIs, employment, and consumer sentiment surveys can all influence the direction of the CAD. A strong economy is good for the Canadian Dollar. Not only does it attract more foreign investment but it may encourage the Bank of Canada to put up interest rates, leading to a stronger currency. If economic data is weak, however, the CAD is likely to fall.
- DXY Index is currently trading at a loss around 103.70.
- Key drivers of DXY Index movements will be US labor market data to be released this week.
- Expectations of the start of the easing cycle in June may limit losses.
The US Dollar Index (DXY) is presently fluctuating in the vicinity of 103.70, exhibiting minor losses on Monday. The market remains focused on potential variations in line with the flow of incoming data, including the key Nonfarm Payrolls (NFP) figures from February set for release later in the week.
The US labor market continues to influence the Federal Reserve’s (Fed) easing cycle, which is predicted to commence in June. This suggests that the Fed may adopt a more dovish stance in case a slowdown in employment is seen. The dovish outlook, inherently indicative of lower interest rates and near-term cuts, could potentially lead to a weaker US Dollar.
Daily digest market movers: DXY stands weak at the start of the week, eyes on labor market data
- Predictions for the Nonfarm Payrolls report (NFP) see an addition of 200K jobs in February, which will mean a deceleration from January’s reading. Wage inflation measured by the Average Hourly Earnings and the Unemployment Rate will also be studied.
- Other key employment figures set to be released this week include JOLTs Job Openings and ADP Employment Change from February and weekly Jobless Claims.
- Market predicts no likelihood of a rate reduction at the impending March 20 meeting, with the probability escalating to 25% on May 1 and reaching 90% for the June meeting.
- US Treasury bond yields are up and trading at 4.59% for the 2-year, 4.20% for the 5-year, and 4.22% for the 10-year bonds, which may limit the downside for the session.
DXY technical analysis: DXY faces bearish pressure in near term, bulls control broader view
The technical outlook for DXY indicates a somewhat convoluted scenario. The Relative Strength Index (RSI) showcases a negative posture with a descending trajectory, urging a comprehensive bearish momentum for the index in the short term. Similarly, the visible rise in red bars in the Moving Average Convergence Divergence (MACD) corroborates the increasing selling momentum, providing further weight to the bearish perspective.
In contradiction, the Simple Moving Averages (SMAs) paint a different picture entirely on the broader scale. Despite the bears asserting their presence by pushing the DXY below the 20 and 100-day SMAs, it remains notably above the 200-day SMA. This firm positioning suggests that the bulls are anything but phased, maintaining control over the larger time horizon. Consequently, while the immediate outlook may have the scales tipped in the bear's favor, the ongoing bullish undercurrent cannot be ignored.
US Dollar FAQs
What is the US Dollar?
The US Dollar (USD) is the official currency of the United States of America, and the ‘de facto’ currency of a significant number of other countries where it is found in circulation alongside local notes. It is the most heavily traded currency in the world, accounting for over 88% of all global foreign exchange turnover, or an average of $6.6 trillion in transactions per day, according to data from 2022.
Following the second world war, the USD took over from the British Pound as the world’s reserve currency. For most of its history, the US Dollar was backed by Gold, until the Bretton Woods Agreement in 1971 when the Gold Standard went away.
How do the decisions of the Federal Reserve impact the US Dollar?
The most important single factor impacting on the value of the US Dollar is monetary policy, which is shaped by the Federal Reserve (Fed). The Fed has two mandates: to achieve price stability (control inflation) and foster full employment. Its primary tool to achieve these two goals is by adjusting interest rates.
When prices are rising too quickly and inflation is above the Fed’s 2% target, the Fed will raise rates, which helps the USD value. When inflation falls below 2% or the Unemployment Rate is too high, the Fed may lower interest rates, which weighs on the Greenback.
What is Quantitative Easing and how does it influence the US Dollar?
In extreme situations, the Federal Reserve can also print more Dollars and enact quantitative easing (QE). QE is the process by which the Fed substantially increases the flow of credit in a stuck financial system.
It is a non-standard policy measure used when credit has dried up because banks will not lend to each other (out of the fear of counterparty default). It is a last resort when simply lowering interest rates is unlikely to achieve the necessary result. It was the Fed’s weapon of choice to combat the credit crunch that occurred during the Great Financial Crisis in 2008. It involves the Fed printing more Dollars and using them to buy US government bonds predominantly from financial institutions. QE usually leads to a weaker US Dollar.
What is Quantitative Tightening and how does it influence the US Dollar?
Quantitative tightening (QT) is the reverse process whereby the Federal Reserve stops buying bonds from financial institutions and does not reinvest the principal from the bonds it holds maturing in new purchases. It is usually positive for the US Dollar.
Economists at ING remain positive on commodity currencies.
MXN and BRL may well prove resilient despite ongoing rate-cutting cycles
In the G10 space, we continue to see good upside potential for commodity currencies, in particular, the undervalued Norwegian Krone, Aussie Dollar and New Zealand Dollar.
In emerging markets, the Chinese Yuan should continue to be driven by China-specific factors until US rates move decisively lower and allow USD/CNY to decline sustainably. The upcoming Two Sessions is a key risk event for the Yuan and China-sensitive currencies.
In Latam, the Mexican Peso and Brazilian Real may well prove resilient despite ongoing rate-cutting cycles; while in the CEE region, we expect the paths of the Polish Zloty (strong) and Hungarian Forint (weak) to keep diverging.
The key risks to our bearish Dollar view are a potential USD positive/EM negative re-election of Donald Trump, or – from a purely macro perspective – prolonged resilience in US inflation and consequent further delay in Fed easing.
- Spot Gold prices are on the rise on Monday.
- Markets are expecting Fed rate cuts after middling data.
- XAU/USD pushes back into all-time high territory.
XAU/USD rose above $2,100.00 on Monday as markets lean into Spot Gold bids. Investors are ramping up bets of a June rate cut from the Federal Reserve (Fed) after US economic data middled to softened last week.
Markets are jostling into risk-taking position ahead of this week’s key US Nonfarm Payrolls (NFP) report coming up on Friday. Traders will be looking for a softer labor figure to add to the rate cut puzzle, and broad-market hopes for a weakening US economic outlook are crystallizing into XAU/USD buying.
This week also sees the US ADP Employment Change for February as a labor data preview of Friday’s NFP, albeit one with a shaky connection in recent history. Fed Chairman Jerome Powell will also be speaking on Wednesday, testifying before the Financial Services Committee about the Semi-Annual Monetary Policy Report beginning at 15:00 GMT.
US economic data will kick the week off with Tuesday’s ISM Services Purchasing Managers Index for February, expected to soften to 53.0 from January’s 53.4.
XAU/USD technical outlook
Spot Gold is extending last Friday’s gains, tipping over the $2,100.00 handle in the early week’s trading. XAU/USD is up over a full percent bottom-to-top on Monday, and intraday bids are accelerating into the high end away from the 200-hour Simple Moving Average (SMA) at $2,038.89.
Daily candlesticks are on approach to all-time highs set in December at $2,144.48, and XAU/USD has climbed around 4% from last week’s low bids near $2,025.00.
XAU/USD hourly chart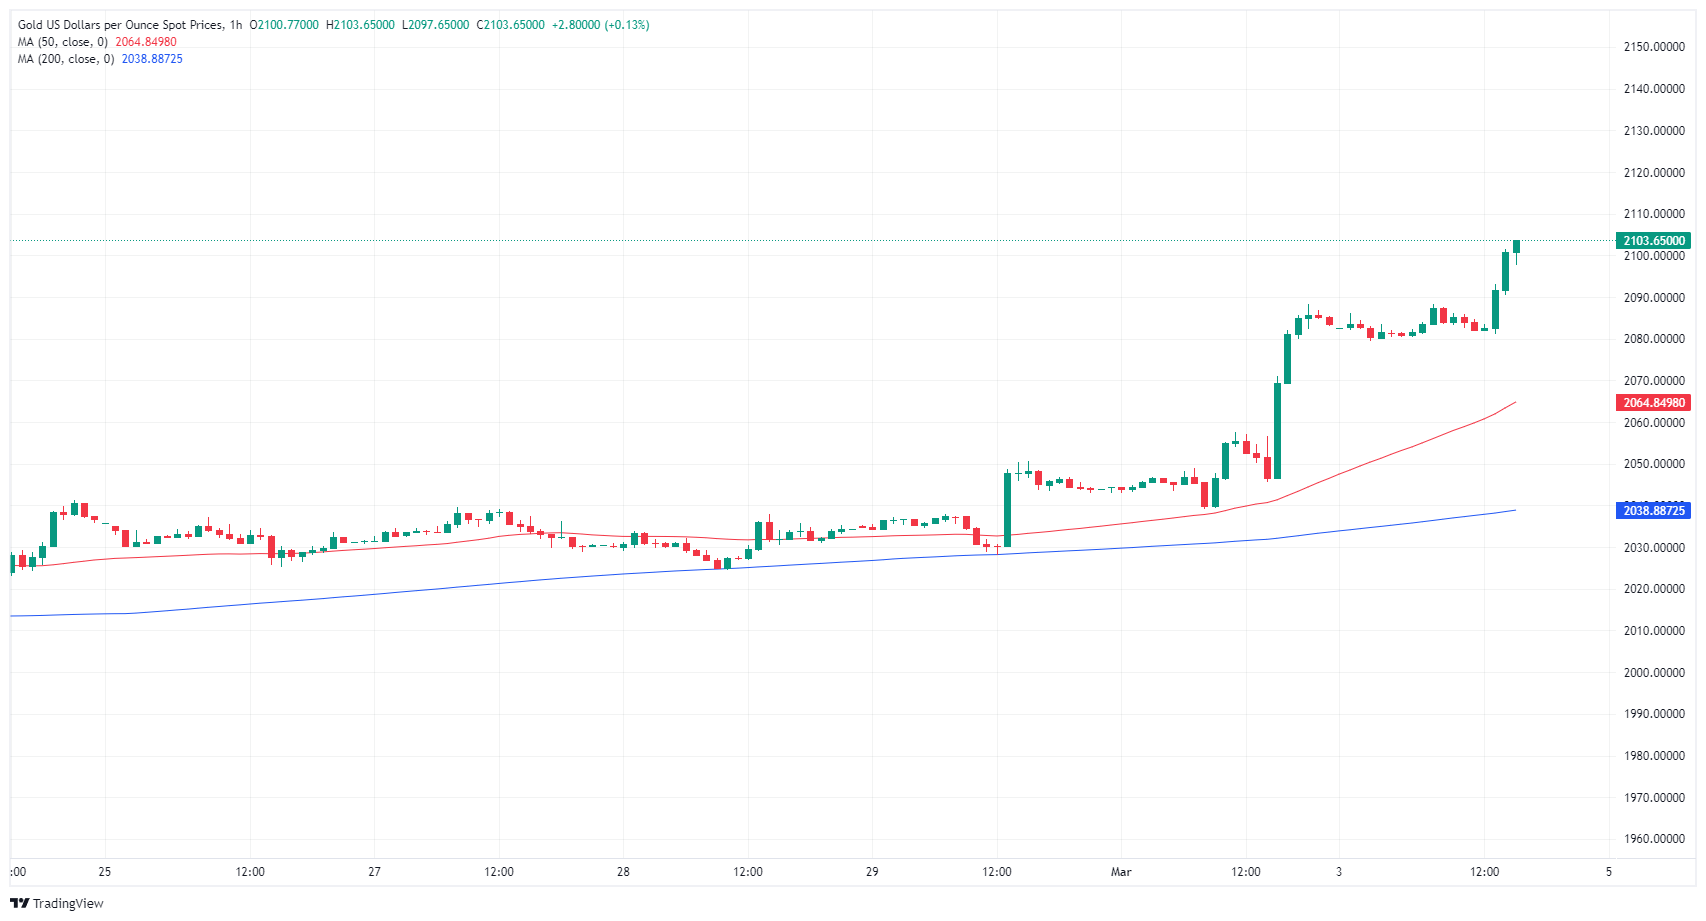
XAU/USD daily chart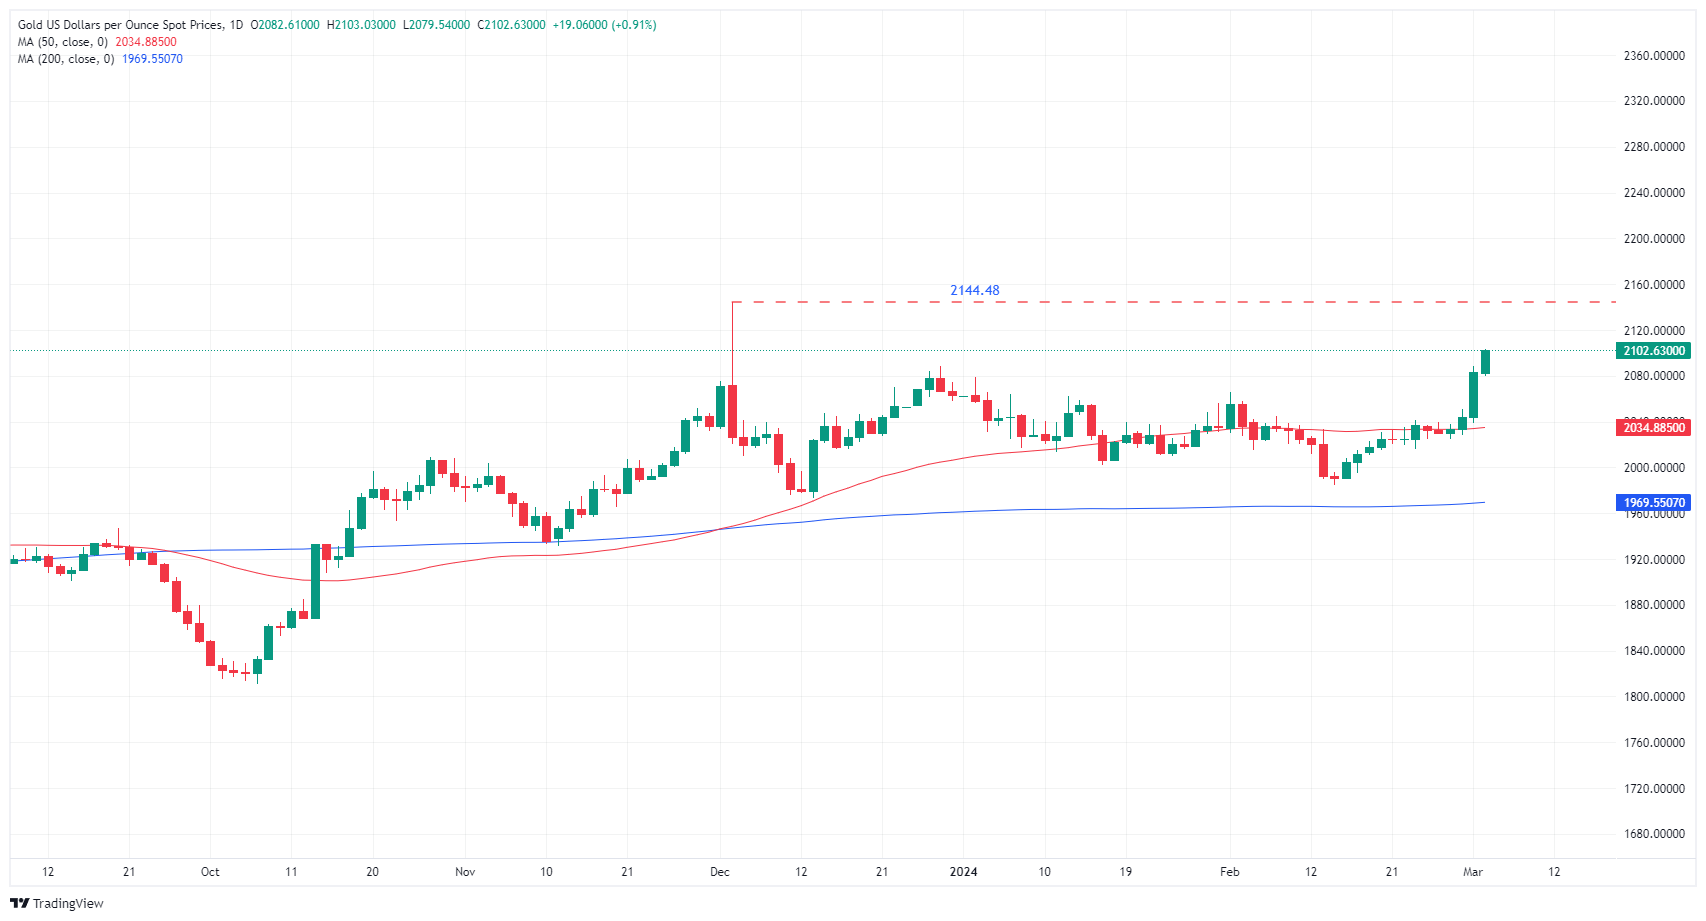
Economists at Commerzbank expect the EUR/USD exchange rate to end the year at 1.1000
Limited upside potential
We see limited upside potential for EUR/USD this year. By the end of the year, we expect prices to be around 1.1000.
The Euro is likely to appreciate slightly over the next few months if it becomes clear that the ECB will cut its key interest rate more slowly than the market had previously expected. However, the EUR-positive effect is unlikely to last. If the market recognizes that Eurozone inflation is stuck at stubbornly high levels, even moderate ECB interest rate cuts will be seen as inappropriately loose monetary policy and therefore EUR-negative.
Even if Fed rate cuts are priced in, the dollar may suffer a little because of the current strength of the USD if they are actually announced. However, the negative effect will probably be limited by the fact that it should soon become clear that the Fed will cut interest rates less than the market had previously expected. In contrast to the ECB, the Fed's stance is also likely to be USD-positive in the medium and long term given the lower inflation we expect in the US.
Another USD-positive argument is that the growth gap between the US on the one hand and the Eurozone and most other G7 economies on the other is likely to widen further.
USD/CAD has been trading relatively stable around 1.3500 for several weeks. Economists at Commerzbank analyze the pair’s outlook.
Loonie unlikely to appreciate further against the USD in 2025
Given the cautious stance of the BoC, we remain comfortable with our forecast of lower USD/CAD levels in the coming quarters. However, we have adjusted the levels slightly higher to reflect the new forecast from our economists, who no longer expect a US recession.
However, we no longer expect the CAD to appreciate further against the US Dollar in 2025. The reason for this is that the Fed is likely to end its interest rate cuts earlier than the market currently expects and our economists anticipate very strong US growth. The Canadian economy is unlikely to be able to withstand this, even if growth there should also pick up again.

Source: Commerzbank Research
Economists at ABN Amro expect the EUR/USD pair to hover around the 1.1000 level.
Expectations for Fed/ECB policy to continue to drive the direction in EUR/USD
For this year, we expect expectations for Fed/ECB policy to continue to drive the direction in EUR/USD.
The market expects both the Fed and the ECB to start its easing cycle in April/May and rates to be reduced to 4% for the Fed and 2.5% for the ECB by the end of 2024.
We expect the easing cycles to start later, in June, and the Fed to arrive at 4.25% and the ECB at 2.75% at the end of the year. So, both for the Fed and the ECB we are somewhat less dovish than the market and the difference with the market is roughly the same. Therefore, we expect EUR/USD to stay around 1.1000 for the time being.
Is the Bank of Japan (BoJ) ready to act? Economists at Rabobank analyze Yen’s outlook ahead of the BoJ’s March meeting.
USD/JPY to edge lower into the BoJ’s March meeting
While we favour an April rate hike over a move in March, we expect USD/JPY to edge lower into the March 19 meeting in anticipation of an early move.
Even on a steady policy outcome this month, we expect downside pressure on the JPY to be limited as the market turns its attention towards the likelihood of a rate hike next month.
That said, given the resilience of the US economy and related US inflation risks, we see downside potential in USD/JPY to be limited to a move back to 140.00 on a 12-month view.
- USD/JPY advances toward 151.00 as BoJ might postpone policy-normalization plans.
- BoJ Ueda wants to see more wage data before announcing victory over deflation.
- The US Dollar will be guided by Fed Powell’s testimony and employment data.
The USD/JPY pair marches toward a three-month high of 150.80 in the early New York session. The asset strengthens as the Japanese Yen comes under pressure after Bank of Japan (BoJ) Governor Kazuo Ueda cited concerns over exiting the dovish monetary policy stance.
BoJ Ueda stressed the need to scrutinize more wage growth data to confirm that it could keep inflation above the 2% target. Contrary to BoJ Ueda, BOJ board member Hajime Takata said last week that the central bank must consider overhauling its ultra-loose monetary policy, including an exit from negative interest rates and bond yield control, Reuters reported.
Meanwhile, the US Dollar remains on the backfoot as expectations for Federal Reserve (Fed) rate cuts in June remains firm. The US Dollar witnesses higher liquidity outflows when hopes for interest-rate normalization by the Fed deepen.
This week, investors will focus on Fed Chair Jerome Powell’s testimony before Congress, which is scheduled for Wednesday and Thursday. Market participants hope that Fed Powell will reiterate the need to keep interest rates unchanged in the range of 5.25%-5.50% until it gains confidence that inflation will return sustainably to the 2% target.
In addition to Fed Powell’s testimony, the United States Automatic Data Processing (ADP) Employment Change data for February will influence market expectations for the interest rate outlook. The consensus shows that US private employers hired 150K job seekers against 107K in January.
The US Dollar (USD) closed lower over the week through Friday, its second, consecutive net weekly drop, and is starting the new week on the defensive again. Shaun Osborne, Chief FX Strategist at Scotiabank, analyzes Greenback’s outlook.
Some loss of bullish momentum apparent
The USD’s drift from the mid-February peak looks partly technical and partly fundamental. DXY gains stalled around (just a little above) the 61.8% retracement resistance of the late 2024 decline on the one (technical) hand while there have been some signs of slowing US activity on the (fundamental) other.
The USD has been running a bit hot relative to my estimate of spread-driven fair value for some time, making additional USD gains versus the core majors harder to justify. Recall also that seasonal trends tend to be mostly USD-supportive in Q1 but turn against the USD in Q2/Q3.
All else equal, I think the USD will struggle to improve significantly from current levels and that downside risks are starting to strengthen as the quarter winds down.
USD/CAD is little changed on the session so far. Economists at Scotiabank analyze the pair’s outlook.
Risks tilted mildly to the downside
A lower close to the USD on Friday tilts risks mildly to the downside for funds from a technical point of view.
At the very least, spot is looking at pretty solid resistance at 1.3600/1.3605 after clear rejections of the figure area last week.
The USD’s mild drop Friday also formed the third leg of a bearish ‘evening star’ pattern on the daily candle chart which should see spot put a bit more pressure on moderate support at 1.3540/1.3550 in the short run and, below there, point to a test of 1.3440/1.3450.
GBP/USD stretches its upside. Economists at Scotiabank analyze the pair’s outlook.
Clear and sustained push through 1.2710 should see gains extend a little more
Solid gains in Cable Friday suggest spot can push a little higher in the short run to retest the low 1.2700 area. But the broader backdrop for the Pound remains somewhat challenged by weak or bearish leaning trend oscillators on the intraday and daily DMI signals.
A clear and sustained push through 1.2710 should see gains extend a little more towards the recent range highs at 1.2775/1.2800.
Support is firm now at 1.2600/1.2610.
EUR/USD nudges higher. Economists at Scotiabank analyze the pair’s outlook.
Narrower EZ/USD spread lifts EUR
EUR/USD has been supported by narrowing spreads versus the USD in the past couple of weeks. A clearly dovish ECB may undermine that trend, and weigh on the EUR, but a hold and ‘no rush’ messaging may support a firmer EUR.
Some positive price signals (spot moving above the 40-DMA at 1.0836) and an alignment of shorter-term (intraday and daily) trend oscillators give the short-term EUR chart a positive spin to start the week.
The EUR’s grind higher since the mid-February low may have a chance to develop a little more momentum and test resistance at 1.0880/1.0890. A clear push through here should see gains progress to 1.1000/1.1100.
Support is firm at 1.0795/1.0800.
- The US Dollar trades for most part in the green against major peers.
- Markets brace for quite some headline risks ahead of the US Jobs Report on Friday.
- The US Dollar Index still orbits around 104.00 though could be seen choosing direction after this week.
The US Dollar (USD) is facing a very chunky week with traders needing to be on point if they want to survive the carnage ahead. Two main elements this week will be the hearing of the US Federal Reserve Chairman Jerome Powell, who is set to face Senator Elisabeth Warren and other politicians in Congress and the US Jobs Report on Friday. Meanwhile headline flow out of the Chinese National People’s Congress and US President Joe Biden’s State of the Union could trigger some intraday volatility.
On the economic front, all eyes of course will be on the usual suspects ahead of the US Jobs Report with the ADP Nonfarm Employment number and the JOLTS Job Openings report on Wednesday. As always, no connection between ADP and Nonfarm Payrolls on Friday, though enough to create volatility besides the more than five US Fed speakers besides Jerome Powell that are due to release comments on the markets.
Daily digest market movers: Keep a close eye on the monitors this week
- Head of the Philadelphia Fed Patrick Harker is due to take the stage later this Monday around 16:00 CET.
- The US Treasury will head to markets to allocate a 3-month and a 6-month bill near 16:30 GMT.
- Japan’s Nikkei Index has breached 40,000 for the first time ever.
- Nikki Haley won the Columbia District (Washington DC) Primary, snapping the winning streak of former US President Donald Trump.
- A few elements to already note in your calendar for this week which could bear some important headline risk:
- China holds its National Party Congress from March 5 to March 11. Be on the lookout for any headlines on easing and stimulus support for Chinese markets.
- Super Tuesday is ahead as well with Primaries for both the Republicans and Democrats in 17 states.
- US President Joe Biden is due to release its State of the Union on Thursday.
- Equities are looking for direction with no real outliers to report. Only element worth mentioning in the far end of the risk spectrum is that Bitcoin is soaring near 3.5% this Monday.
- According to the CME Group’s FedWatch Tool, expectations for a Fed pause in the March 20 meeting are at 97%, while chances of a rate cut stand at 3%.
- The benchmark 10-year US Treasury Note trades around 4.20%, roughly sideways seeing last week’s range.
US Dollar Index Technical Analysis: Grab your pitchforks
The US Dollar Index (DXY) enters another week of being caught between what can only be described as the pitchfork of Simple Moving Averages (SMA). On the topside the 100-day SMA (104.63) is making sure the DXY does not escape any higher, while the 55-day SMA (103.51) makes sure the Greenback does not slip back to the lower levels of 2024. This week is bearing more headline risk and events which could finally move the needle and stage a breakout either way for the DXY.
To the upside, the 100-day Simple Moving Average (SMA) near 103.94 is being well respected this Monday. Should the US Dollar be able to cross above it, to 104.60, 105.12 is the next key level to keep an eye on. One step beyond there comes 105.88, the high from November 2023. Ultimately, 107.20 – the high of 2023 – could come back into scope.
Looking down, the 200-day Simple Moving Average at 103.74 has been broken a few times recently, though it has not seen a daily close below it last week, showcasing its importance. The 200-day SMA should not let go that easily though, so a small retreat back to that level could be more than granted. Ultimately, should it lose its force, prices could fall to 103.22, the 55-day SMA, before testing 103.00.
US Dollar FAQs
What is the US Dollar?
The US Dollar (USD) is the official currency of the United States of America, and the ‘de facto’ currency of a significant number of other countries where it is found in circulation alongside local notes. It is the most heavily traded currency in the world, accounting for over 88% of all global foreign exchange turnover, or an average of $6.6 trillion in transactions per day, according to data from 2022.
Following the second world war, the USD took over from the British Pound as the world’s reserve currency. For most of its history, the US Dollar was backed by Gold, until the Bretton Woods Agreement in 1971 when the Gold Standard went away.
How do the decisions of the Federal Reserve impact the US Dollar?
The most important single factor impacting on the value of the US Dollar is monetary policy, which is shaped by the Federal Reserve (Fed). The Fed has two mandates: to achieve price stability (control inflation) and foster full employment. Its primary tool to achieve these two goals is by adjusting interest rates.
When prices are rising too quickly and inflation is above the Fed’s 2% target, the Fed will raise rates, which helps the USD value. When inflation falls below 2% or the Unemployment Rate is too high, the Fed may lower interest rates, which weighs on the Greenback.
What is Quantitative Easing and how does it influence the US Dollar?
In extreme situations, the Federal Reserve can also print more Dollars and enact quantitative easing (QE). QE is the process by which the Fed substantially increases the flow of credit in a stuck financial system.
It is a non-standard policy measure used when credit has dried up because banks will not lend to each other (out of the fear of counterparty default). It is a last resort when simply lowering interest rates is unlikely to achieve the necessary result. It was the Fed’s weapon of choice to combat the credit crunch that occurred during the Great Financial Crisis in 2008. It involves the Fed printing more Dollars and using them to buy US government bonds predominantly from financial institutions. QE usually leads to a weaker US Dollar.
What is Quantitative Tightening and how does it influence the US Dollar?
Quantitative tightening (QT) is the reverse process whereby the Federal Reserve stops buying bonds from financial institutions and does not reinvest the principal from the bonds it holds maturing in new purchases. It is usually positive for the US Dollar.
The price of Brent Oil has recovered from its six-month low in mid-December and has hovered around $80 since the beginning of the year. Economists at Commerzbank analyze Brent’s outlook.
Oil price between demand concerns and supply risks
Negative factors such as the weak economies in China and Europe and supportive factors such as supply risks due to tensions in the Middle East are balancing each other out.
We expect the price of Brent Oil to remain stable at around $80 for the time being.
As the year progresses, the oil market should tighten as demand picks up and the Brent Oil price should rise to $90 by the end of 2024.
The Czech Koruna (CZK) was a notable underperformer among CEE over the past year. Economists at Commerzbank analyze the EUR/CZK outlook.
Not expecting much rebound
The Czech Koruna will probably stabilise in coming months as inflation moderates by more than rates will be cut.
But later in 2025, we forecast the CZK to depreciate, once again, on the back of a weaker Euro (EUR), and also on the back of stubborn wage and core inflation which could re-accelerate in the medium term.

Source: Commerzbank Research
- WTI Oil jumps above $79 in European trading on Monday.
- Oil traders are positioning for more upside, with futures net long at highest since October.
- The US Dollar Index is retreating back below 104 with markets looking ahead of US Jobs Reports on Friday.
Oil prices are in the green this Monday morning, backed by headlines that came out over the weekend confirming that OPEC will persist its production curbs for at least Q2, in line with expectations. Traders are seeing further bullish signs with the Commodity Futures Trading Commission (CFTC) noting speculative net long positions rising to the highest since October 2023. The OPEC cuts were voluntary, with recent data pointing to a dramatic rise in February versus January. More countries will be reporting in the coming days.
Meanwhile, the US Dollar Index (DXY) is easing on Monday with the Euro being on the forefront ahead of the European Central Bank Meeting this week. For the US Dollar, all eyes will be on US Federal Reserve Chairman Jerome Powell who will undergo his semi-annual statement before Capitol Hill (and the grilling by Senator Elizabeth Warren). That comes ahead of the US Jobs Report, which is facing high expectations after the upbeat surprise in February.
Crude Oil (WTI) trades at $79.66 per barrel, and Brent Oil trades at $83.60 per barrel at the time of writing.
Oil news and market movers: OPEC communicates as expected
- OPEC+ agrees to extend its current supply curbs in order to meet the oversupply from the US that is hitting the markets.
- Canada’s newest and biggest Oil pipeline is set to come online in the coming weeks, according to MEG Energy Corp.
- According to a Bloomberg Survey, despite the production cuts, other OPEC members are pumping above average: Libya saw its production in February rise by 120 million barrels, which is 11.2% of monthly increase as it resumed production from its Sahara Oil field. Nigeria rose by 2% in February.
- Iraq and the United Arab Emirates (UAE) are currently pumping up near 400 million barrels per day above target.
Oil Technical Analysis: OPEC cuts have one big issue
Oil prices are cheerful after comments over the weekend from a few OPEC delegates and people close to the decision that was taking place. Although the cuts are welcomed in order to keep current price levels maintained, a small issue is arising with the countries that are not upholding any supply curbs, and are even jacking up their production even more. Add the already elevated supply out of the US, and it could be that OPEC will either have to ask internally to all countries to stick to their agreed quota’s or to have deeper supply cuts after Q2.
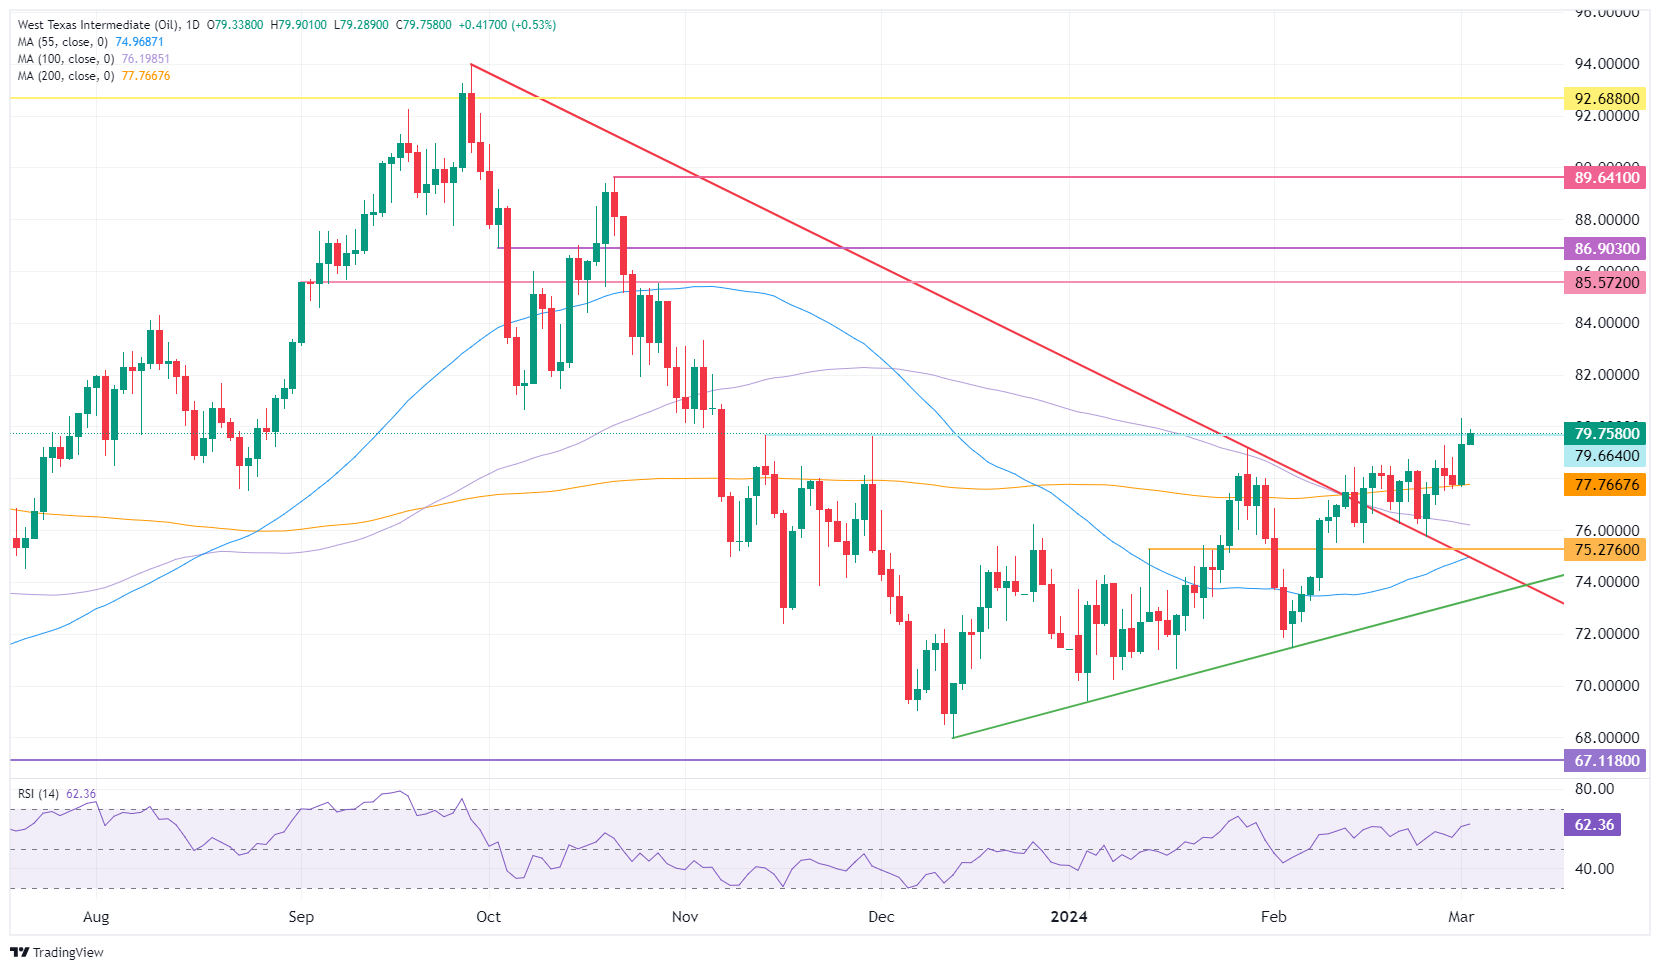
Oil bulls are clearly seeing more upside potential with, as mentioned in the article above, net speculative bullish bets soaring to the highest level since October of 2023. These speculators could well be sitting on their hands until Oil prices finally reach $85 again. with $86.90 quickly following suit before targeting $89.64 and $90.00 as top levels.
On the downside, the 200-day Simple Moving average (SMA) near $77.76 is the first point of contact to provide some support. Quite close behind are the 100-day and the 55-day SMAs near $76.19 and $74.96, respectively. Add the pivotal level near $75.27, and it looks like the downside is very limited and well-equipped to resist the selling pressure..
US WTI Crude Oil: Daily Chart
WTI Oil FAQs
What is WTI Oil?
WTI Oil is a type of Crude Oil sold on international markets. The WTI stands for West Texas Intermediate, one of three major types including Brent and Dubai Crude. WTI is also referred to as “light” and “sweet” because of its relatively low gravity and sulfur content respectively. It is considered a high quality Oil that is easily refined. It is sourced in the United States and distributed via the Cushing hub, which is considered “The Pipeline Crossroads of the World”. It is a benchmark for the Oil market and WTI price is frequently quoted in the media.
What factors drive the price of WTI Oil?
Like all assets, supply and demand are the key drivers of WTI Oil price. As such, global growth can be a driver of increased demand and vice versa for weak global growth. Political instability, wars, and sanctions can disrupt supply and impact prices. The decisions of OPEC, a group of major Oil-producing countries, is another key driver of price. The value of the US Dollar influences the price of WTI Crude Oil, since Oil is predominantly traded in US Dollars, thus a weaker US Dollar can make Oil more affordable and vice versa.
How does inventory data impact the price of WTI Oil
The weekly Oil inventory reports published by the American Petroleum Institute (API) and the Energy Information Agency (EIA) impact the price of WTI Oil. Changes in inventories reflect fluctuating supply and demand. If the data shows a drop in inventories it can indicate increased demand, pushing up Oil price. Higher inventories can reflect increased supply, pushing down prices. API’s report is published every Tuesday and EIA’s the day after. Their results are usually similar, falling within 1% of each other 75% of the time. The EIA data is considered more reliable, since it is a government agency.
How does OPEC influence the price of WTI Oil?
OPEC (Organization of the Petroleum Exporting Countries) is a group of 13 Oil-producing nations who collectively decide production quotas for member countries at twice-yearly meetings. Their decisions often impact WTI Oil prices. When OPEC decides to lower quotas, it can tighten supply, pushing up Oil prices. When OPEC increases production, it has the opposite effect. OPEC+ refers to an expanded group that includes ten extra non-OPEC members, the most notable of which is Russia.
Gold (XAU/USD) consolidates its gains after reaching a fresh 2024-high above $2,080. Strategists at TD Securities analyze the yellow metal’s outlook.
More data weakness needed for takeoff
It is hoped that the combination of lower yields, which are likely to attract discretionary investors into futures and ETFs, along with strong physical markets in China and robust central bank buying, will move Gold to new highs.
We believe that the yellow metal is set to move into $2,300+ territory, once there is more certainty surrounding the timing and magnitude of the pending Fed pivot.
But there will still need to be more evidence that the economy is slowing sufficiently to facilitate a steady drop in inflation before this rally becomes sustainable and moves to our target.
- EUR/USD focuses on shifting its auction range above 1.0850 as the US Dollar drops.
- Weak US Manufacturing PMI has prompted expectations of Fed rate cuts in June.
- Eurozone’s high monthly inflation growth has eased early ECB rate-cut expectations.
The EUR/USD pair aims to shift the trading range above the crucial resistance of 1.0850. The major currency pair strengthens as the US Dollar remains on the back foot and hopes of early European Central Bank (ECB) rate cuts drop further.
The overall market action seems disordered as the S&P 500 futures are slightly down while risk-sensitive currencies perform well. The US Dollar Index (DXY) drops to 103.80 as expectations for a rate cut by the Federal Reserve (Fed) have escalated.
The CME FedWatch tool shows a 58% chance that interest rates will be down by 25 basis points (bps) in the June policy meeting. The expectations for a rate-cut were at 53% before the February’s ISM Manufacturing PMI data, released on Friday.
The ISM reported the Manufacturing PMI at 47.8, lower than expectations of 49.5 and the former reading of 49.1. The agency reported that the fresh factory orders index has also come down significantly, indicating that recovery in the Manufacturing PMI has stalled.
Going forward, the market participants will focus on the Fed Chair Jerome Powell’s testimony before Congress in which he is expected to reiterate the need of having convincing evidence, which will confirm that inflation is on track to the 2% target.
On the Eurozone front, stickier-than-expected preliminary inflation data for February has pushed back expectations of early rate cuts by the ECB. The fears of persistent inflation deepened as the monthly headline and core inflation data grew strongly by 0.6% and 0.7%, respectively.
US data still holds keys to direction and volatility in FX; Friday's Nonfarm Payrolls data may confirm January’s spike was an outlier, economists at ING say.
Waiting for a volatility shake-up
US data continues to hold the keys to FX volatility. At the end of this week, the February jobs report will tell us to what extent the stellar January numbers were an outlier. ISM and NFIB numbers before that will help us and the market formulate expectations for Friday’s release, but for now our US economist expects payrolls to come in at around 200K, in line with consensus. That would still be higher than the 185k consensus call for the January release. Investors have been forced to an upward revision on the US labour market. However, a return to the 200K area would put the series on a more sustainable trend and more consistent with expectations of summer cuts by the Fed.
On Wednesday and Thursday, Fed Chair Jerome Powell will testify before Congress. A dovish change in narrative does not look very likely given the latest inflation data, and a cautious wait-and-see approach should be reiterated – but may fail to impact markets too much given the proximity with jobs data.
The action in the US calendar starts on Tuesday. Today, things look quiet across the board in developed markets, and we could see more low-volatility price action from last week. Still, the balance of risks for the Dollar before US payrolls looks slightly tilted to the upside and DXY could find some good support above 104.00.
- US stock index futures trade marginally lower to start the week.
- S&P 500 and Nasdaq Composite closed the previous at new all-time highs.
- Fed Chairman Powell will testify before Congress later in the week.
S&P 500 futures fall 0.12%, Dow Jones futures drop 0.21%, and Nasdaq futures are unchanged.
S&P 500 (SPX), Dow Jones (DJIA), and Nasdaq (IXIC) indexes closed on Friday with a 0.80% gain, a 0.23% increase, and a 1.14% rise, respectively.
What to know before stock market opens
The Dow Jones Industrial Average (DJIA) closed the previous week virtually unchanged at 39,087.39, the S&P 500 (SPX) rose nearly 1% to close at a new all-time high of 5,137.07 and the Nasdaq Composite (IXIC) added over 1% to end at a record of 16,274.94.
The Technology Sector climbed 1.78% on Friday, outperforming the rest of the major sectors, closely followed by the Energy Sector, which rose 1.17%. The Utilities Sector fell on Friday, ending the last day of the week down 0.72% at the closing bell.
NetApp Inc. (NTAP) jumped 18.167% to close at $105.31 as the biggest gainer on Friday. On the other hand, Zscaler Inc. (ZS) backslid nearly 9.4% as the biggest loser for the day, dropping to $219.23.
Assessing the latest developments in equity markets, “the S&P 500 gained +0.95% last week (and +0.80% on Friday), meaning the index has now recorded positive weekly gains for 16 out of the last 18 weeks, the first time since 1971,” noted Jim Reid, global head of economics and thematic research at Deutsche Bank, and continued:
“Talking of milestones, the Russell 2000 reached its highest level since April 2022, jumping +2.96% on the week (and +1.05% on Friday), so the rally was fairly broad. But it was tech stocks that led Friday’s sizeable rally, with the Magnificent 7 up +1.27% (+1.74% over the week). A strong earnings beat by Dell Technologies (+31.62% Friday) lifted semiconductor stocks (+4.29%) and saw Nvidia (+4.00%) move above $2trn market cap for the first time.”
Nasdaq FAQs
What is the Nasdaq?
The Nasdaq is a stock exchange based in the US that started out life as an electronic stock quotation machine. At first, the Nasdaq only provided quotations for over-the-counter (OTC) stocks but later it became an exchange too. By 1991, the Nasdaq had grown to account for 46% of the entire US securities’ market. In 1998, it became the first stock exchange in the US to provide online trading. The Nasdaq also produces several indices, the most comprehensive of which is the Nasdaq Composite representing all 2,500-plus stocks on the Nasdaq, and the Nasdaq 100.
What is the Nasdaq 100?
The Nasdaq 100 is a large-cap index made up of 100 non-financial companies from the Nasdaq stock exchange. Although it only includes a fraction of the thousands of stocks in the Nasdaq, it accounts for over 90% of the movement. The influence of each company on the index is market-cap weighted. The Nasdaq 100 includes companies with a significant focus on technology although it also encompasses companies from other industries and from outside the US. The average annual return of the Nasdaq 100 has been 17.23% since 1986.
How can I trade the Nasdaq 100?
There are a number of ways to trade the Nasdaq 100. Most retail brokers and spread betting platforms offer bets using Contracts for Difference (CFD). For longer-term investors, Exchange-Traded Funds (ETFs) trade like shares that mimic the movement of the index without the investor needing to buy all 100 constituent companies. An example ETF is the Invesco QQQ Trust (QQQ). Nasdaq 100 futures contracts allow traders to speculate on the future direction of the index. Options provide the right, but not the obligation, to buy or sell the Nasdaq 100 at a specific price (strike price) in the future.
What Factors Drive the Nasdaq 100
Many different factors drive the Nasdaq 100 but mainly it is the aggregate performance of the component companies revealed in their quarterly and annual company earnings reports. US and global macroeconomic data also contributes as it impacts on investor sentiment, which if positive drives gains. The level of interest rates, set by the Federal Reserve (Fed), also influences the Nasdaq 100 as it affects the cost of credit, on which many corporations are heavily reliant. As such the level of inflation can be a major driver too as well as other metrics which impact on the decisions of the Fed.
Eyes on Powell testimony and US jobs report
In its Semi-annual Monetary Policy Report published on Friday, the Federal Reserve (Fed) reiterated that it’s not appropriate to reduce the policy rate until they have greater confidence inflation will move sustainably toward 2%.
Fed Chairman Jerome Powell will present the monetary policy report and respond to questions in a two-day testimony before the Congress, starting Wednesday.
On Friday, the US Bureau of Labor Statistics will release February jobs report, which will include Nonfarm Payrolls, the Unemployment Rate and wage inflation figures.
Week’s focus on Powell testimony, US jobs, ECB decision [Video]
Fed FAQs
What does the Federal Reserve do, how does it impact the US Dollar?
Monetary policy in the US is shaped by the Federal Reserve (Fed). The Fed has two mandates: to achieve price stability and foster full employment. Its primary tool to achieve these goals is by adjusting interest rates.
When prices are rising too quickly and inflation is above the Fed’s 2% target, it raises interest rates, increasing borrowing costs throughout the economy. This results in a stronger US Dollar (USD) as it makes the US a more attractive place for international investors to park their money.
When inflation falls below 2% or the Unemployment Rate is too high, the Fed may lower interest rates to encourage borrowing, which weighs on the Greenback.
How often does the Fed hold monetary policy meetings?
The Federal Reserve (Fed) holds eight policy meetings a year, where the Federal Open Market Committee (FOMC) assesses economic conditions and makes monetary policy decisions.
The FOMC is attended by twelve Fed officials – the seven members of the Board of Governors, the president of the Federal Reserve Bank of New York, and four of the remaining eleven regional Reserve Bank presidents, who serve one-year terms on a rotating basis.
What is Quantitative Easing (QE) and how does it impact USD?
In extreme situations, the Federal Reserve may resort to a policy named Quantitative Easing (QE). QE is the process by which the Fed substantially increases the flow of credit in a stuck financial system.
It is a non-standard policy measure used during crises or when inflation is extremely low. It was the Fed’s weapon of choice during the Great Financial Crisis in 2008. It involves the Fed printing more Dollars and using them to buy high grade bonds from financial institutions. QE usually weakens the US Dollar.
What is Quantitative Tightening (QT) and how does it impact the US Dollar?
Quantitative tightening (QT) is the reverse process of QE, whereby the Federal Reserve stops buying bonds from financial institutions and does not reinvest the principal from the bonds it holds maturing, to purchase new bonds. It is usually positive for the value of the US Dollar.
- Gold price trades near a two-month high as Fed rate-cut bets for June deepen.
- Weak US Manufacturing PMI data weighs heavily on the US Dollar.
- Fed Powell may provide fresh insights on the timing for rate cuts this week.
Gold price (XAU/USD) hovers near a two-month high around $2,085 in Monday’s European session. The precious metal clings to gains amid increasing expectations of an interest-rate cut by the Federal Reserve (Fed) in its June monetary policy meeting.
However, the uncertainty over rate cut expectations could rebound this week as Fed Chair Jerome Powell is set to comment on inflation, interest rates, and the economy in his testimony before Congress.
Jerome Powell is expected to remain hawkish as Fed policymakers want to see inflation easing for months before changing their monetary policy stance. Strong labor market conditions allow them to patiently observe inflationary pressures and cut interest rates only after there is convincing evidence that inflation will decline to the desired target of 2%.
Apart from Fed Powell’s commentary, economic data such as the United States’ Institute of Supply Management (ISM) Services PMI, JOLTS Job Openings, and Nonfarm Payrolls data will remain in the spotlight.
Meanwhile, the US Dollar Index (DXY), which measures Greenback’s value against six major currencies, drops to 103.80, as the Manufacturing PMI surprisingly fell by 1.3 points to 47.8 from 49.1 in January. Investors had projected an increase to 49.5. The New Orders Index for the manufacturing sector fell back into contraction territory at 49.2 from 52.5 in January.
Daily digest market movers: Gold price demonstrates strength ahead of key data
- Gold price trades closely to near the two-month high around $2,085 as investors’ expectations for Federal Reserve rate cuts in the June policy meeting have increased. As per the CME FedWatch tool, traders see a little over 57% chance for a rate cut by 25 basis points (bps) in the June meeting above from 53%, noted on Friday.
- The expectations for rate cuts in June have escalated as the United States core Personal Consumption Expenditure Price Index (PCE) data for January was in line with market consensus.
- This week, the strength in the Gold price will be tested by the US ISM Services PMI and labor market data for February, as well as Fed Chair Jerome Powell’s testimony before Congress.
- Fed Powell is set to speak on Wednesday and Thursday. His outlook on interest rates could influence market expectations for the timing of rate cuts. Powell may reiterate the need for more evidence to confirm that inflation will sustainably return to the 2% target.
- Resilient labor market conditions have deepened uncertainty about inflation returning to 2%. On Friday, Federal Reserve Governor Adriana Kugler said: "I am cautiously optimistic that we will see continued progress on disinflation without significant deterioration of the labor market.”
- This week, the US Nonfarm Payrolls (NFP) data will provide a fresh outlook on the labor market. Before the official labor market data, investors will focus on the Automatic Data Processing (ADP) Employment Change data, which will be published on Wednesday. The expectations for fresh private payrolls are at 150K, higher than the prior reading of 107K.
- Meanwhile, the US Dollar fell sharply as the weak US ISM Manufacturing PMI for February suggests the strong US economy is releasing some heat. Going forward, the US ISM Services PMI, which will be published on Tuesday, will provide more guidance on economic prospects.
Technical Analysis: Gold price strengthens after a triangle breakout
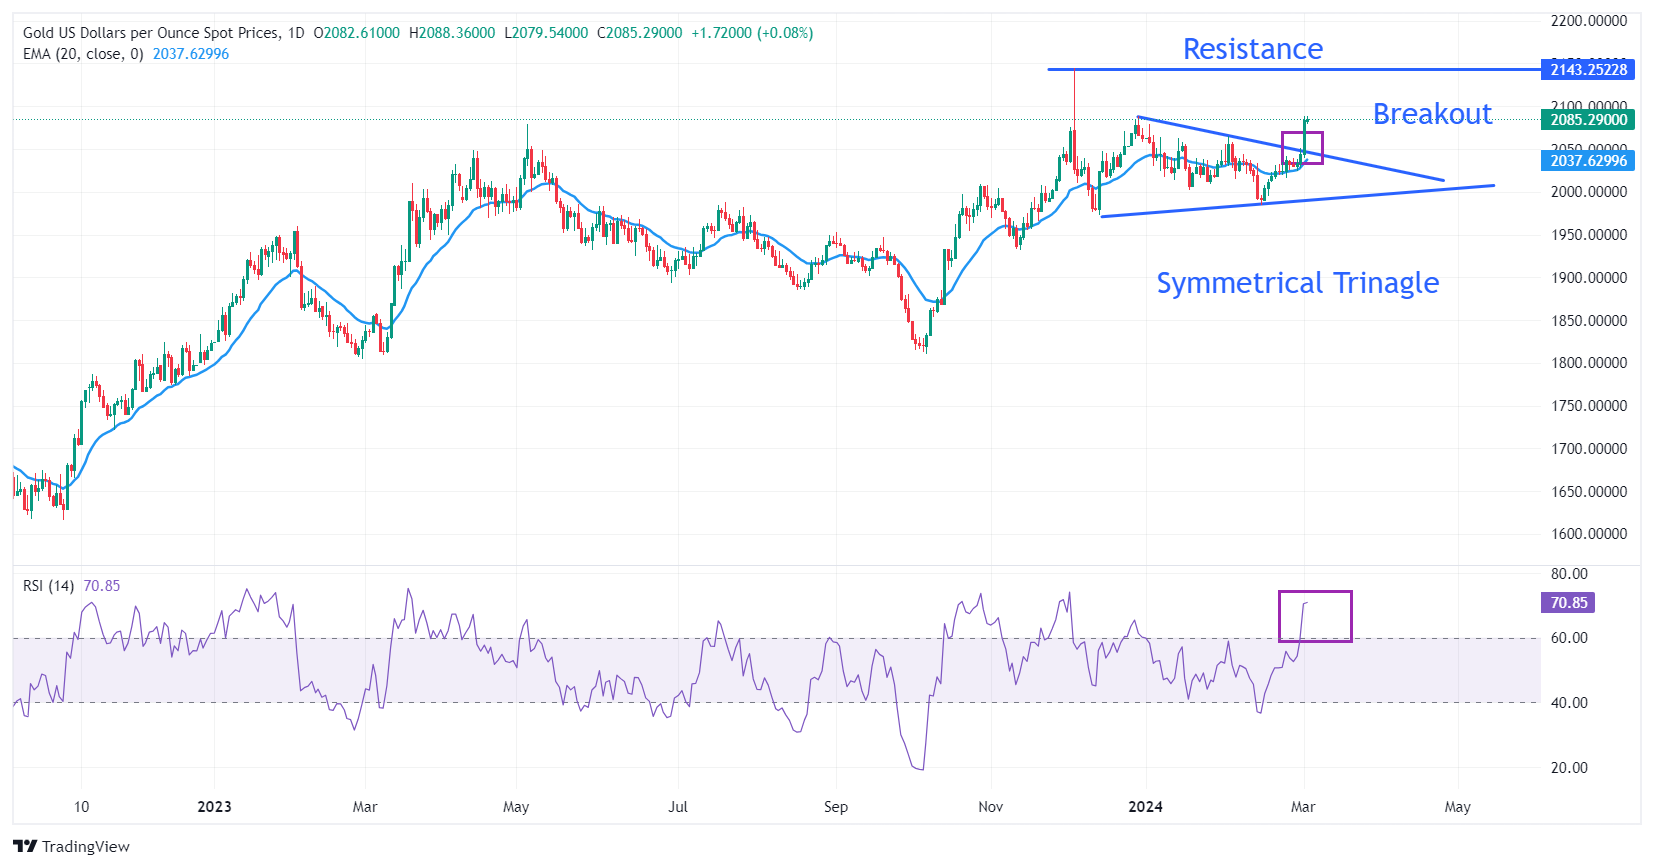
Gold price rallies after an upside break of the Symmetrical Triangle pattern formed on a daily timeframe. The breakout of the aforementioned chart pattern exhibits a volatility expansion, which leads to wider ticks on the upside and heavy volume. The precious metal could extend its upside towards the horizontal resistance plotted from the December 4 high at $2,144.48.
The upward-sloping 20-day Exponential Moving Average (EMA) is at $2,040, indicating strong demand in the near term.
The 14-period Relative Strength Index (RSI) climbs above 60.00, indicating a bullish momentum ahead amid the absence of divergence and oversold signals.
Gold FAQs
Why do people invest in Gold?
Gold has played a key role in human’s history as it has been widely used as a store of value and medium of exchange. Currently, apart from its shine and usage for jewelry, the precious metal is widely seen as a safe-haven asset, meaning that it is considered a good investment during turbulent times. Gold is also widely seen as a hedge against inflation and against depreciating currencies as it doesn’t rely on any specific issuer or government.
Who buys the most Gold?
Central banks are the biggest Gold holders. In their aim to support their currencies in turbulent times, central banks tend to diversify their reserves and buy Gold to improve the perceived strength of the economy and the currency. High Gold reserves can be a source of trust for a country’s solvency. Central banks added 1,136 tonnes of Gold worth around $70 billion to their reserves in 2022, according to data from the World Gold Council. This is the highest yearly purchase since records began. Central banks from emerging economies such as China, India and Turkey are quickly increasing their Gold reserves.
How is Gold correlated with other assets?
Gold has an inverse correlation with the US Dollar and US Treasuries, which are both major reserve and safe-haven assets. When the Dollar depreciates, Gold tends to rise, enabling investors and central banks to diversify their assets in turbulent times. Gold is also inversely correlated with risk assets. A rally in the stock market tends to weaken Gold price, while sell-offs in riskier markets tend to favor the precious metal.
What does the price of Gold depend on?
The price can move due to a wide range of factors. Geopolitical instability or fears of a deep recession can quickly make Gold price escalate due to its safe-haven status. As a yield-less asset, Gold tends to rise with lower interest rates, while higher cost of money usually weighs down on the yellow metal. Still, most moves depend on how the US Dollar (USD) behaves as the asset is priced in dollars (XAU/USD). A strong Dollar tends to keep the price of Gold controlled, whereas a weaker Dollar is likely to push Gold prices up.
This could be an important week for UK markets. Economists at ING analyze Pound Sterling (GBP) outlook ahead of the Spring Budget.
UK budget is a key event risk for Sterling
Hopes of delivering pre-election tax cuts are likely to be met by funding constraints, even though we estimate the headroom has increased from £13bn to £18bn thanks to slightly lower market rates compared to November’s Autumn Statement.
UK media have reported Hunt is probably scaling back the size of the tax relief package and that support measures will also be smaller than in November.
A moderately-sized tax relief package (i.e., one that does not trigger gilts turmoil) can probably give some support to GBP this week, but the spectrum of possibilities is admittedly quite wide.
Economists at Société Générale note that the EUR/CHF pair retains bullish momentum after Swiss inflation data came below forecast.
Last week’s low of 0.9500/0.9470 is an important support near term
Another downward surprise for Switzerland's CPI today for February will amp up expectations of a rate cut by the SNB this month. President Jordan who announced last week he will step down in September, said the policy target has been reached.
Upward momentum in EUR/CHF is intact.
Daily MACD has entered positive territory highlighting prevalence of upward momentum.
Last week’s low of 0.9500/0.9470 is an important support near term; defence of this zone could lead to persistence in up move.
Beyond 0.9610, next objectives could be located at last September/November highs of 0.9680 and 0.9775.
- Eurozone investors’ morale keeps improving for the fifth month in a row in March.
- EUR/USD holds gains near 1.0850 after the upbeat Eurozone data.
The Eurozone Sentix Investor Confidence Index rose from -12.9 in February to -10.5 in March, the latest survey showed on Monday, reaching its highest level since April 2023.
The Expectations Index in the Eurozone rose from -5.5 in the previous month to -2.3 in March.
The index on the Current Situation also increased to -18.5 in March from -20.0 in February, the fifth monthly rise in a row.
Key takeaways
"Although the data points in the right direction, there can be no talk of a classic spring revival" for the Eurozone.”
It pointed to German economic policy as "preventing a thorough economic recovery in the heartland of Europe. The recession remains in place.”
Market reaction to the Eurozone Sentix data
EUR/USD is consolidating gains near 1.0850 despite the encouraging Eurozone data. As of writing, the EUR/USD pair is 0.10% higher on the day.
Euro price today
The table below shows the percentage change of Euro (EUR) against listed major currencies today. Euro was the strongest against the Japanese Yen.
| USD | EUR | GBP | CAD | AUD | JPY | NZD | CHF | |
| USD | -0.05% | -0.11% | 0.08% | 0.09% | 0.13% | -0.03% | -0.13% | |
| EUR | 0.05% | -0.06% | 0.13% | 0.14% | 0.18% | 0.02% | -0.07% | |
| GBP | 0.11% | 0.06% | 0.18% | 0.20% | 0.25% | 0.07% | -0.01% | |
| CAD | -0.08% | -0.11% | -0.18% | 0.02% | 0.05% | -0.11% | -0.21% | |
| AUD | -0.09% | -0.14% | -0.20% | -0.02% | 0.04% | -0.12% | -0.22% | |
| JPY | -0.12% | -0.18% | -0.27% | -0.07% | -0.04% | -0.17% | -0.26% | |
| NZD | 0.03% | -0.02% | -0.07% | 0.11% | 0.13% | 0.16% | -0.10% | |
| CHF | 0.13% | 0.07% | 0.01% | 0.21% | 0.21% | 0.25% | 0.09% |
The heat map shows percentage changes of major currencies against each other. The base currency is picked from the left column, while the quote currency is picked from the top row. For example, if you pick the Euro from the left column and move along the horizontal line to the Japanese Yen, the percentage change displayed in the box will represent EUR (base)/JPY (quote).
- USD/CAD gains grounds on higher US Treasury yields.
- Fed’s Bostic anticipates that the first Fed rate cut around the end of this year.
- The higher WTI price could provide support for the Canadian Dollar.
USD/CAD improves higher to near 1.3570 during the European session on Monday amid a stable US Dollar (USD) with improved US Treasury yields. Atlanta Fed President Raphael W. Bostic has expressed his expectation that the first cut in interest rates would likely be appropriate, possibly occurring towards the end of this year at the earliest, which provides some support for the US Dollar (USD).
According to the CME FedWatch Tool, the probability of rate cuts in March stands at 5.0%, while the likelihood of cuts in May and June is estimated at 26.8% and 53.8%, respectively.
However, the US Dollar (USD) faced downward pressure following a subdued February’s manufacturing figures from the United States (US). The US ISM Manufacturing PMI for February dropped to 47.8 from 49.1, significantly missing the market expectation of 49.5 reading. Additionally, the Manufacturing New Orders Index decreased to 49.2 from the previous 52.5 reading.
However, Higher Crude oil prices might have supported the Canadian Dollar (CAD), consequently, putting a cap on the upside of the USD/CAD pair. West Texas Intermediate (WTI) oil price edges higher to near $79.70 per barrel, by the press time.
The increase in Crude oil prices followed the Organization of the Petroleum Exporting Countries and its allies (OPEC+) decision to extend voluntary oil output cuts, along with extended tensions between the Middle East.
Traders await the Bank of Canada’s (BoC) policy meeting scheduled on Wednesday. Market expectations suggest that the central bank will maintain its current interest rate at 5.0%.
EUR/USD holds the range of 1.0800-1.0850. Economists at ING analyze the pair’s outlook.
A domestic idiosyncratic boost to the Euro looks unlikely
In EUR/USD, 1.0800 has been the level associated with the low-volatility FX environment recently. A break from the range-trading is possible later this week given the combined effect of the ECB meeting and US payrolls.
Looking a month ahead, we are not convinced the pair will be trading very far from its current levels, though. US data resilience may start to lose steam in March, but that may be only a gradual process, with more pockets of strong data emerging. Rates need to move lower materially to make the cost of selling the Dollar bearable.
Investors may have raised the bar to turn against the Greenback. Unless the ECB pushes back vehemently against rate cut bets (bucking its recent trend), a domestic idiosyncratic boost to the Euro looks unlikely too.
- AUD/USD oscillates in a range on Monday and is influenced by a combination of diverging forces.
- Hopes for additional stimulus from China lends support to the Aussie amid subdued USD demand.
- The cautious market mood caps gains amid bets that the RBA will not hike interest rates further.
The AUD/USD pair lacks any firm intraday direction on the first day of a new week and seesaws between tepid gains/minor losses through the first half of the European session. Spot prices currently trade around the 0.6520-0.6525 area, unchanged for the day and remain well within the striking distance of a nearly three-week low touched last Thursday.
Traders opt to wait on the sidelines ahead of the Federal Reserve (Fed) Chair Jerome Powell's congressional testimony on Wednesday and Thursday, which might provide cues about the rate-cut path and influence the US Dollar (USD). Apart from this, important US macro data scheduled at the beginning of a new month, including the closely-watched Nonfarm Payrolls (NFP) on Friday, should provide a fresh directional impetus to the AUD/USD pair.
In the meantime, Friday's disappointing release of the US ISM Manufacturing PMI and the University of Michigan’s Consumer Sentiment Index, along with less-hawkish remarks by Fed officials, reaffirmed bets for a June rate cut. This keeps the USD bulls on the defensive and acts as a tailwind for the AUD/USD pair. Apart from this, hopes for additional stimulus measures from China turn out to be another factor lending some support to the Australian Dollar (AUD).
That said, a slight deterioration in the global risk sentiment – as depicted by a softer tone around the US equity futures – holds back traders from placing aggressive bullish bets around the risk-sensitive Aussie. Apart from this, growing acceptance that the Reserve Bank of Australia (RBA) will not hike rates further, bolstered by last week's rather unimpressive domestic inflation figures and weaker Retail Sales data, contributes to capping the upside for the AUD/USD pair.
Hence, it will be prudent to wait for strong follow-through buying before confirming that spot prices have formed a near-term bottom and positioning for any meaningful appreciating move. In the absence of any relevant US macro data on Monday, the US bond yields will play a key role in driving the USD demand. Apart from this, the broader risk sentiment should influence the USD price dynamics and produce short-term opportunities around the AUD/USD pair.
- EUR/GBP slips to 0.8550 as hot Eurozone inflation data deepen uncertainty over ECB’s timing of rate cuts.
- The highest inflation in the UK economy among G-7 economies indicates that the BoE will cut interest rates later than the ECB.
- The EUR/GBP is near a make-or-a-break point.
The EUR/GBP pair drops slightly to 0.8550 in the European session on Monday as investors remain uncertain when the European Central Bank (ECB) and the Bank of England (BoE) will begin cutting interest rates.
The Eurozone’s preliminary inflation data for February, released on Friday, showed that annual core inflation data, which excludes volatile items such as food and oil prices, grew at a higher pace of 3.1% against expectations of 2.9% but the pace was lower than January’s reading of 3.3%. The monthly core inflation data rose 0.7% after deflating 0.9% in January. This has deepened uncertainty over the timing of rate cuts by the ECB.
Meanwhile, higher inflation in the United Kingdom economy indicates that the BoE will cut interest rates later than the ECB. The UK’s inflation is highest in the Group of Seven economies (G-7), forcing BoE policymakers to hold interest rates in the restrictive territory for a longer period.
EUR/GBP hovers near the upward-sloping border of the Ascending Triangle pattern formed on an hourly timeframe, plotted from February 23 low at 0.8529. The horizontal resistance of the aforementioned chart pattern is placed from February 22 high at 0.8576.
An Ascending Triangle pattern exhibits indecisiveness among market participants but with a slight upside bias due to higher lows and flat highs.
The 14-period Relative Strength Index (RSI) oscillates in the 40.00-60.00 range, indicating a sharp volatility contraction.
Fresh upside would appear if the asset breaks above February 22 high at 0.8576, driving the asset towards the round-level resistance of 0.8600, followed by January 16 high near 0.8620.
On the contrary, the appeal for the asset weakens if it drops below February 19 low at 0.8537. This would drag the asset towards February 7 low at 0.8516 and the psychological support of 0.8500.
EUR/GBP hourly chart
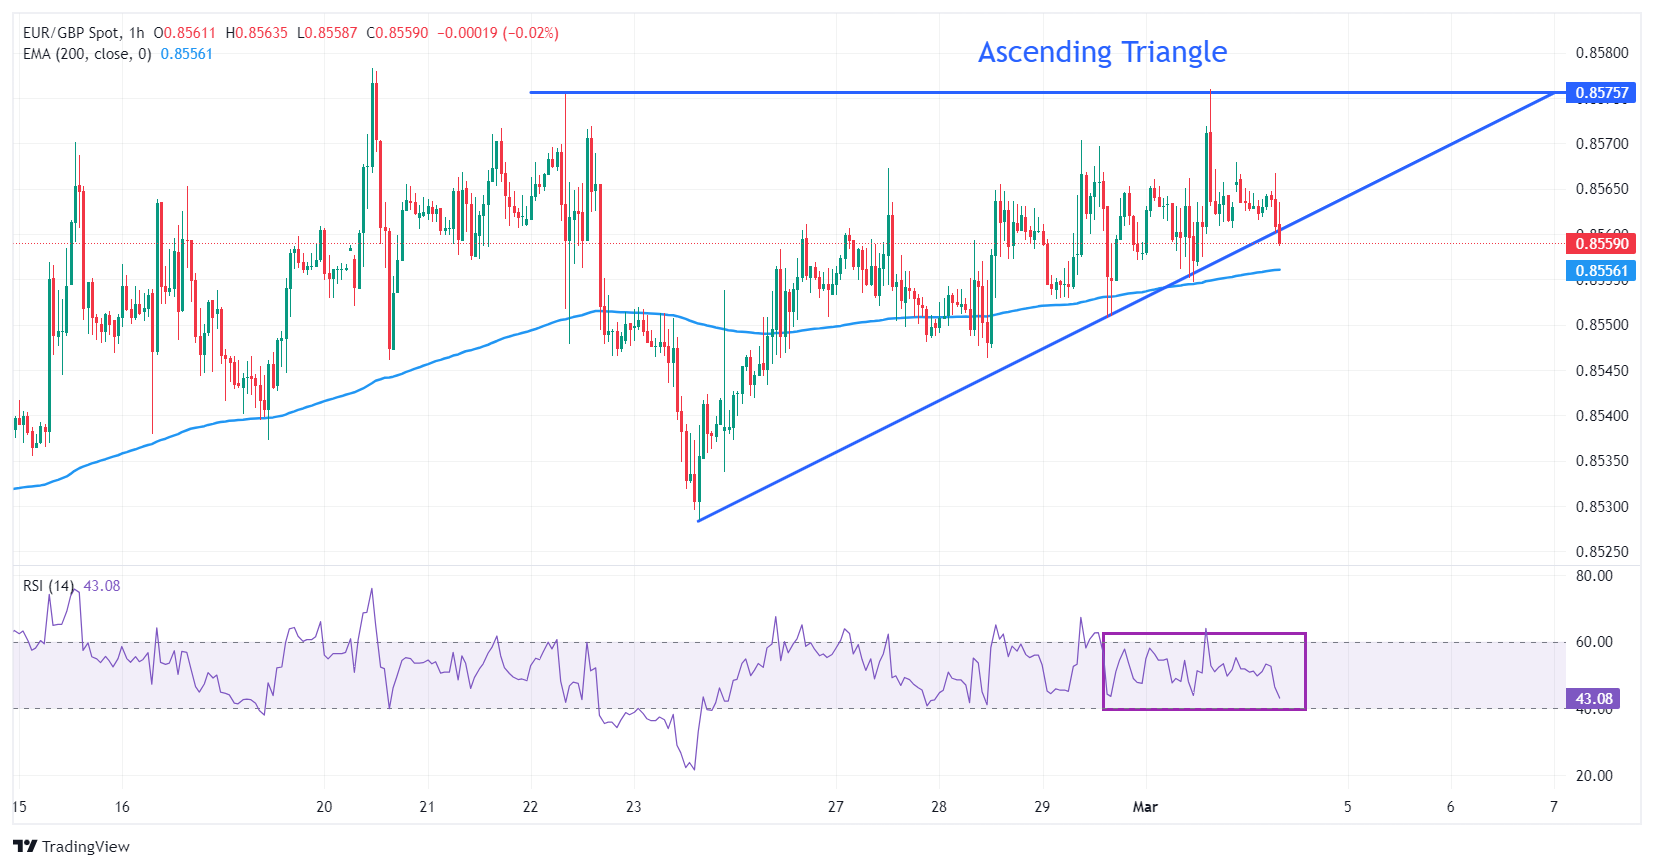
Gold (XAU/USD) closed at an all-time high on Friday. Economists at TD Securities analyze the yellow metal’s outlook for the week ahead.
Data from the US could trigger a big reaction in XAU/USD
February ISM services, payrolls, wages and unemployment data may well be catalysts for Gold to move higher if they come in significantly weaker than expected. Otherwise, much of the latest gains will likely be given back.
We suspect that data will be weaker, but not so poor as to drive yields much lower. As such, the market will have to wait for our $2,300+ trading target to manifest a while longer.
- USD/JPY extends its gains on BoJ uncertainty about monetary policy tightening.
- Japanese media reports that the government could officially declare an end to deflation.
- The US Dollar Index (DXY) remains in the negative territory despite improved US Treasury yields.
USD/JPY extends its gains for the second successive session, trading higher around 150.30 during the European session on Monday. The Japanese Yen (JPY) faced challenges following remarks by Bank of Japan (BoJ) Governor Kazuo Ueda on Friday, who cast doubt on the sustainability of Japanese inflation reaching the 2% target. With inflationary pressures diminishing rapidly, there's a possibility that the BoJ may postpone its plans for monetary policy tightening.
However, reports from Japan's Kyodo News agency indicate that the government is contemplating officially declaring an end to deflation, signaling a heightened possibility of policy tightening. A decision will be made after assessing the strength of the annual labor-management wage talks scheduled for March 13 and considering the outlook for price trends.
The US Dollar Index (DXY) remains steady around 103.80, as it looks for direction amid improved US Treasury yields. However, the USD faced pressure following a subdued February’s manufacturing figures from the United States (US).
The US ISM Manufacturing PMI dropped to 47.8 from 49.1, well below the market's expectation of 49.5. Additionally, the US Michigan Consumer Sentiment Index fell to 76.9 in February, missing the expected level of 79.6. Despite these concerning indicators, Federal Reserve (Fed) officials have not signaled immediate interest rate cuts, lending some support to the USD.
Investors closely monitor upcoming economic releases such as the ISM Services PMI, ADP Employment Change, and Nonfarm Payrolls for February to assess the overall US economic health and potential Fed policy decisions. Moreover, Federal Reserve Chair Jerome Powell’s speech will be observed on Wednesday and Thursday for further insights into the central bank's monetary policy stance.
EUR/CHF is just below 0.9600 after the release of Swiss inflation data. Economists at ING analyze the pair’s outlook.
Ongoing disinflation continues to suggest the new SNB President may stay clear of more CHF-supporting measures
Switzerland has just published February CPI figures, which came in slightly hotter than expected. Headline inflation slowed from 1.3% to 1.2% and core from 1.2% to 1.1%, in line with consensus.
Despite the smaller-than-expected decline, ongoing disinflation continues to suggest the new SNB President (Jordan announced his resignation last week) may stay clear of more CHF-supporting measures.
EUR/CHF has had a strong run lately, but we had targeted a move to 0.9600 by the spring and do not see a bearish reversal on the horizon.
- Pound Sterling stretches its upside as markets expect the BoE to hold interest rates higher for longer than the Fed.
- UK inflation remains sticky, particularly in the services sector, due to solid wage growth.
- Investors await Fed Powell’s testimony for fresh cues on interest rate outlook.
The Pound Sterling (GBP) clings to gains, trading around 1.2670 on Monday’s European session as investors price in that the Bank of England (BoE) won’t lower interest rates anytime soon. The United Kingdom’s (UK) inflation rate remains the highest in the Group of Seven economies (G-7), forcing BoE policymakers to hold interest rates in the restrictive territory for a longer period.
Solid wage growth, which quickly feeds into inflation in the services sector, has kept the outlook of the UK’s core Consumer Price Index (CPI) sticky. BoE policymakers believe that the pace at which labor costs and service inflation are growing still doubles the pace required for inflation to sustainably return to the 2% target.
Prospects of higher interest rates benefit the Pound Sterling as this tends to attract higher foreign inflows.
This week, a light UK economic calendar could allow the market sentiment to guide the GBP/USD pair majorly. In the United States, Federal Reserve (Fed) Chair Jerome Powell’s testimony before Congress and the Nonfarm Payrolls (NFP) data will impact the market sentiment as they could provide fresh insights about when the Fed could start reducing interest rates.
Daily digest market movers: Pound Sterling gains ahead of data-packed week
- Pound Sterling holds onto gains against the US Dollar on Monday’s European session, extending the V-shape recovery from 1.2600 on Friday.
- The US Dollar faces a sell-off as the United States Institute of Supply Management (ISM) reported a weak set of Manufacturing PMI figures for February. The ISM reported a poor New Orders Index and signaled increased layoffs in the manufacturing sector, which indicates a weak economic outlook.
- This week, the US Dollar will be guided by the testimony of Fed Chair Jerome Powell before Congress and the labor market data for February. Powell may provide fresh guidance on the interest rate outlook.
- Meanwhile, the outlook of the United Kingdom economy improves as the S&P Global/CIPS reported an upbeat Manufacturing PMI for February. The Manufacturing PMI came in at 47.5, the highest since April 2023, beating expectations and the prior reading of 47.1. However, the index has remained below the 50.0 threshold in each of the past 19 months, which signals a contraction.
- In the Manufacturing PMI report, S&P Global reported that the New orders intake from the domestic and overseas economies has been hit hard due to client destocking, subdued market confidence, and financial pressures. The report also warned that factory owners faced challenging circumstances in February due to supply chain disruptions amid the Red Sea crisis. The supply issues have delayed raw material deliveries, eventually resulting in inflated input prices.
- Going forward, the Pound Sterling will be majorly guided by market expectations regarding the timing of rate cuts by the Bank of England. Investors see the BoE lowering its key interest rate from August. However, BoE policymakers may continue to lean towards maintaining interest rates at 5.25% until they get confident that inflation will return to the desired rate of 2%.
Technical Analysis: Pound Sterling approaches 1.2700
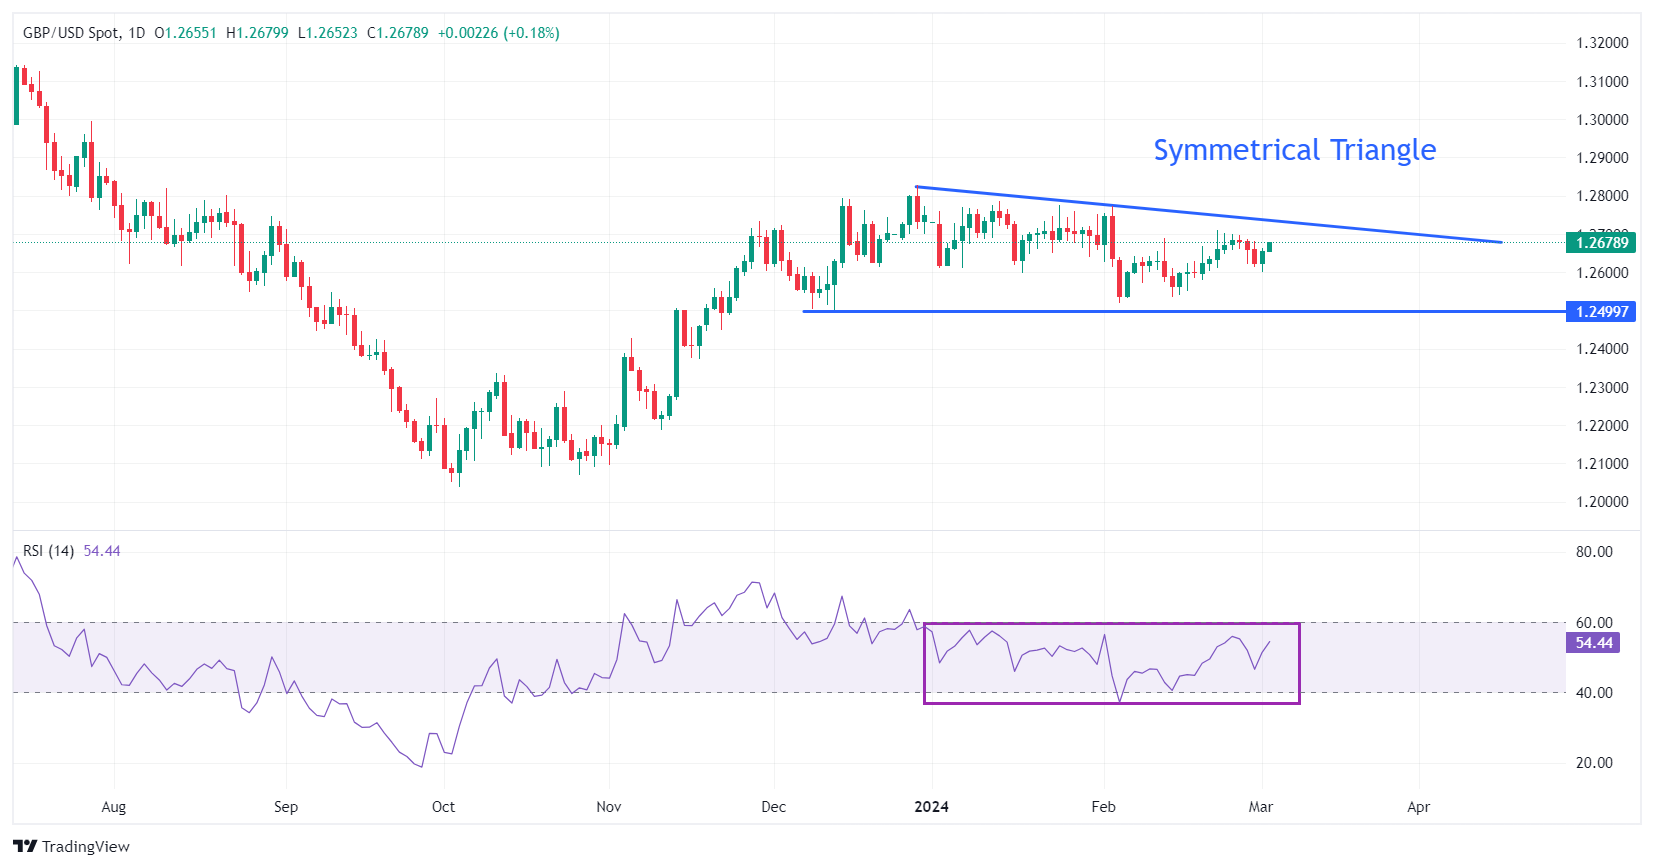
The Pound Sterling extends its upside to 1.2670 after a strong recovery from the round-level support of 1.2600. The major approaches the downward-sloping border of the Descending Triangle pattern formed on a daily time frame, placed from December 28 high at 1.2827. The horizontal support of the aforementioned chart pattern is plotted from December 13 low near 1.2500.
A Descending Triangle pattern exhibits indecisiveness among market participants but with a slight downside bias due to lower highs and flat lows.
The 14-period Relative Strength Index (RSI) remains inside the 40.00-60.00 region, indicating a sharp volatility contraction.
Pound Sterling FAQs
What is the Pound Sterling?
The Pound Sterling (GBP) is the oldest currency in the world (886 AD) and the official currency of the United Kingdom. It is the fourth most traded unit for foreign exchange (FX) in the world, accounting for 12% of all transactions, averaging $630 billion a day, according to 2022 data.
Its key trading pairs are GBP/USD, aka ‘Cable’, which accounts for 11% of FX, GBP/JPY, or the ‘Dragon’ as it is known by traders (3%), and EUR/GBP (2%). The Pound Sterling is issued by the Bank of England (BoE).
How do the decisions of the Bank of England impact on the Pound Sterling?
The single most important factor influencing the value of the Pound Sterling is monetary policy decided by the Bank of England. The BoE bases its decisions on whether it has achieved its primary goal of “price stability” – a steady inflation rate of around 2%. Its primary tool for achieving this is the adjustment of interest rates.
When inflation is too high, the BoE will try to rein it in by raising interest rates, making it more expensive for people and businesses to access credit. This is generally positive for GBP, as higher interest rates make the UK a more attractive place for global investors to park their money.
When inflation falls too low it is a sign economic growth is slowing. In this scenario, the BoE will consider lowering interest rates to cheapen credit so businesses will borrow more to invest in growth-generating projects.
How does economic data influence the value of the Pound?
Data releases gauge the health of the economy and can impact the value of the Pound Sterling. Indicators such as GDP, Manufacturing and Services PMIs, and employment can all influence the direction of the GBP.
A strong economy is good for Sterling. Not only does it attract more foreign investment but it may encourage the BoE to put up interest rates, which will directly strengthen GBP. Otherwise, if economic data is weak, the Pound Sterling is likely to fall.
How does the Trade Balance impact the Pound?
Another significant data release for the Pound Sterling is the Trade Balance. This indicator measures the difference between what a country earns from its exports and what it spends on imports over a given period.
If a country produces highly sought-after exports, its currency will benefit purely from the extra demand created from foreign buyers seeking to purchase these goods. Therefore, a positive net Trade Balance strengthens a currency and vice versa for a negative balance.
Economists at Danske Bank expect the EUR/USD pair to move downward throughout the rest of the year.
EUR/USD to reach 1.0500/1.0400 within a 6/12M horizon
We still expect EUR/USD to trend lower over the course of the year.
Despite the recent positive risk appetite, driven by the global rally in equity markets, which strengthened EUR/USD for most of February, we ultimately view the equity rally as a net positive for the USD, as the catalyst for the rally is centred in the US market, attracting flows to the USD.
Overall, we believe the US economy is in a stronger position relative to the Euro Area based on factors such as relative terms of trade, real rates, and relative unit labour costs.
We forecast EUR/USD to reach 1.0500/1.0400 within a 6/12M horizon.
- USD/MXN extends its losses as the US Dollar remains subdued following downbeat US manufacturing data.
- Fed’s Bostic expects that the rates deduction would likely initiate around the end of 2024.
- Banxico is expected to implement monetary policy easing in March, with 75 bps over the next six months.
USD/MXN extends its losses for the third successive session on Monday, edging lower to near 17.00 during the early European session. The US Dollar (USD) remains in the negative territory following the recent losses registered on Friday. The US Dollar Index (DXY) faced downward pressure primarily due to downbeat manufacturing numbers from the United States (US) recorded in February.
The DXY moves lower to near 103.80 despite the improved US Treasury yields with 2-year and 10-year standing at 4.55% and 4.20%, respectively, by the press time. Furthermore, Atlanta Fed President Raphael W. Bostic has shared his expectation that the interest rates deduction would likely initiate nearing the end of 2024 at the earliest, which suggests no rate cuts anytime soon and, consequently, supports the US Dollar (USD).
As per the CME FedWatch Tool, the rate cut chances in March stood at 5.0%, while the probabilities of cuts in May and June are estimated at 26.8% and 53.8%, respectively. Investors’ focus will be on the speech of Federal Reserve Chair Jerome Powell on Wednesday and Thursday for further insights into the central bank's monetary policy stance, along with the employment data later in the week.
On the other side, the Bank of Mexico’s (Banxico) Fiscal Balance in pesos showed a deficit of 159.14 billion in January, compared to the previous negative balance of 291.23 billion in December 2023. The Mexican Peso (MXN) has gained traction against the US Dollar (USD), buoyed by labor market data released for January last week. The jobless rate rose to 2.9% year-over-year from 2.6% prior, exceeding expectations of a 2.8% rise but maintaining a relatively tight labor market.
Anticipation for Banxico to implement monetary policy easing in March remains significant, with investors forecasting a reduction of 75 basis points over the next six months. Deputy Governors Jonathan Heath and Omar Mejia have voiced support for a measured strategy in adjusting rates, stressing the significance of sustaining higher rates for an extended duration. Furthermore, Deputy Governor Irene Espinosa has highlighted the necessity for Banxico to carefully evaluate both external and internal factors influencing inflation when formulating policy decisions.
Investment demand for Gold is yet to rebound. Economists at ING expect more investors’ interest as US interest rates fall.
ETF holdings continue to fall
Total holdings in bullion-backed ETFs have continued to decline. January saw eight monthly outflows in global gold ETFs, led by North American funds. This was equivalent to a 51-tonne reduction in global holdings to 3,175 tonnes by the end of January, as shown by data from the World Gold Council. This trend has continued in February.
Meanwhile, net long positions on the COMEX declined in January, with further declines seen in February as hopes for an early rate cut faded and the Dollar strengthened.
Looking further ahead, however, we believe we will see a resurgence of investor interest in the precious metal and a return to net inflows given higher Gold prices as US interest rates fall.
- EUR/JPY extends the rally near 163.15 amid the risk-on mood in Monday’s early European session.
- Kyodo News agency reported Japanese government is considering announcing an end to deflation, raising the possibility of policy tightening.
- ECB is expected to leave the interest rate unchanged at its March meeting on Thursday.
- Japan’s February Consumer Price Index (CPI) on Tuesday will be a closely watched event ahead of the ECB rate decision.
The EUR/JPY cross holds above the 163.00 mark during the early European session on Monday. The risk-on environment in the market provides some support to the Euro (EUR) and creates a tailwind for the EUR/JPY cross. Nonetheless, the possibility that the Bank of Japan (BoJ) will shift its monetary policy stance might cap further losses of the Japanese Yen (JPY). At press time, EUR/JPY is trading at 163.15, gaining 0.26% on the day.
A growing speculation that the BOJ will change its monetary policy path, which might lift the Japanese Yen (JPY). The BoJ policymaker Hajime Takata signaled the exit of its ultra-loose monetary policy as the central bank is on the path of achieving the 2% inflation target. Furthermore, the Japanese government is considering announcing an end to deflation, according to the Kyodo News agency. This flagged the heightened risks of policy tightening.
On the Euro front, the European Central Bank (ECB) is expected to maintain the interest rate steady at its March meeting on Thursday, as ECB policymakers want to see additional evidence that recent falls in inflation will be sustained. According to the minutes of the ECB in January, the policymakers highlighted that continuity, caution, and patience were still needed. Additionally, the ongoing geopolitical tensions in the Middle East might raise the fear that inflation could rebound, which could delay the speculation about rate cuts from the ECB.
Market players will keep an eye on the Japanese Consumer Price Index (CPI) for February, due on Tuesday. The Eurozone Retail Sales will be released on Wednesday. The attention will shift to the ECB interest rate decision on Thursday as well as the ECB Press Conference. Traders will take cues from the data and find trading opportunities around the EUR/JPY cross.
Here is what you need to know on Monday, March 4:
Major currency pairs fluctuate near the previous week's closing levels early Monday as investors gear up for key macroeconomic events and data releases. Sentix Investor Confidence will be featured in the European economic docket on Monday. Later in the week, Federal Reserve (Fed) Chairman Jerome Powell will deliver his semi-annual testimony and European Central Bank (ECB) will announce monetary policy decisions.
As risk flows dominated the financial markets ahead of the weekend, the US Dollar (USD) came under selling pressure, with the USD Index posting losses for the week. Early Monday, the USD Index moves sideways slightly below 104.00 and US stock index futures trade mixed. Meanwhile, the benchmark 10-year US Treasury bond yield holds steady at around 4.2% after falling more than 1.5% on Friday.
US Dollar price today
The table below shows the percentage change of US Dollar (USD) against listed major currencies today. US Dollar was the strongest against the Japanese Yen.
| USD | EUR | GBP | CAD | AUD | JPY | NZD | CHF | |
| USD | -0.05% | -0.04% | 0.08% | 0.06% | 0.17% | 0.04% | -0.02% | |
| EUR | 0.04% | 0.00% | 0.13% | 0.12% | 0.21% | 0.08% | 0.02% | |
| GBP | 0.04% | 0.00% | 0.11% | 0.10% | 0.22% | 0.07% | 0.02% | |
| CAD | -0.08% | -0.11% | -0.13% | -0.01% | 0.09% | -0.04% | -0.10% | |
| AUD | -0.06% | -0.11% | -0.10% | 0.03% | 0.11% | -0.02% | -0.08% | |
| JPY | -0.17% | -0.22% | -0.25% | -0.11% | -0.12% | -0.15% | -0.20% | |
| NZD | -0.04% | -0.09% | -0.07% | 0.04% | 0.02% | 0.13% | -0.06% | |
| CHF | 0.03% | -0.02% | -0.02% | 0.11% | 0.08% | 0.19% | 0.06% |
The heat map shows percentage changes of major currencies against each other. The base currency is picked from the left column, while the quote currency is picked from the top row. For example, if you pick the Euro from the left column and move along the horizontal line to the Japanese Yen, the percentage change displayed in the box will represent EUR (base)/JPY (quote).
During the Asian trading hours, the data from Australia showed TD Securities Inflation declined to 4% on a yearly basis in February from 4.6% in January and Building Permits increased by 10% in January (YoY) following December's 24% contraction. AUD/USD largely ignored these data and was last seen trading flat slightly above 0.6500.
Australian Dollar stays quiet amid a stable US Dollar, awaits US data, Fed Powell's speech.
USD/JPY closed the week above 150.00 and went into a consolidation phase to start the new week. Tokyo Consumer Price Index (CPI) data for February will be featured in the Japanese economic docket in the Asian session on Tuesday.
Japanese Yen edges lower against USD amid BoJ uncertainty; focus shifts to Tokyo CPI on Tuesday.
Gold gathered bullish momentum and climbed to a fresh 2024-high above $2,080 on Friday, boosted by retreating US T-bond yields. XAU/USD trades in a tight channel at around $2,080 early Monday.
Gold price remains confined in a range near two-month top, bulls not ready to give up yet.
EUR/USD staged a rebound on Friday and closed the week with small gains. The pair stays calm at around 1.0850 in the European morning on Monday.
GBP/USD stabilized above 1.2650 on Monday after ending the previous week virtually unchanged.
- USD/CHF edges lower to 0.8830 on the weaker US Dollar on Monday.
- The US Manufacturing PMI dropped to 47.8 in February vs. 49.1 prior, below the market consensus.
- The signal of slowing inflation in Switzerland could open the door for earlier SNB rate cuts.
- Traders will focus on the Swiss CPI inflation data on Monday
The USD/CHF pair struggles to gain ground near 0.8830 after retreating from nearly the 0.8900 mark during the early European trading hours on Monday. The downtick of the pair is backed by the weaker US Dollar (USD) and lower US Treasury bond yields. Market players await the Swiss February Consumer Price Index (CPI) for fresh impetus, which is expected to ease from 1.3% in January to 1.1% in February.
The Institute for Supply Management (ISM) revealed on Friday that the US Manufacturing Purchasing Managers Index (PMI) declined to 47.8 in February from 49.1 in the previous month, weaker than the market expectation of 49.5.
Boston Federal Reserve (Fed) President Susan Collins and New York’s John Williams stated that the first rate cut will likely be appropriate later this year, while Atlanta’s Raphael Bostic said he expected the easing policy this summer if the economy evolves as he expects. Investors will take more cues from Fed's Chair Jerome Powell's testify on Wednesday, which might offer insight into the inflation outlook and monetary policy. The hawkish remarks from the Fed policymakers might lift the USD and act as a tailwind for the USD/CHF pair.
On the Swiss front, the annual inflation rate in Switzerland fell unexpectedly in January, which might convince the Swiss National Bank (SNB) to cut rates at its March meeting. The Swiss Federal Statistical Office will release the nation’s Consumer Price Index (CPI) for February later on Monday. These data could provide fresh catalysts for the USD/CHF pair.
- NZD/USD loses ground amid a stable US Dollar on Monday.
- New Zealand Terms of Trade Index (Q4) indicated a trade deficit of 7.8% against the expected 0.2% deficit.
- CME FedWatch Tool suggested Fed rate cut probability in March stands at 5.0%, with May and June estimated at 26.8% and 53.8%, respectively.
NZD/USD retraces recent gains, lowering down to near 0.6100 during the Asian session on Monday. The Terms of Trade Index released by Statistics New Zealand, a measure of the balance amount between imports and exports, indicated a trade deficit of 7.8% for the fourth quarter of 2023, which was higher than market expectations of a 0.2% deficit. The previous reading was a 0.6% decrease in the third quarter.
On Friday, ANZ – Roy Morgan Consumer Confidence (Jan) showed an improvement of 0.9 to 94.5 from 93.6. However, the New Zealand Dollar (NZD) had gained ground previously due to comments from Reserve Bank of New Zealand (RBNZ) Governor Adrian Orr, who mentioned that the central bank anticipates starting policy normalization in 2025. Due to elevated inflation, Orr highlighted the necessity for monetary policy to remain restrictive for the time being.
The US Dollar Index (DXY) faced downward pressure primarily due to a contraction in the United States (US) manufacturing sector observed in February. The US ISM Manufacturing PMI dropped to 47.8 in February, from the previous reading of 49.1. The index has surprisingly missed the market expectation of 49.5. Additionally, the US Michigan Consumer Sentiment Index declined to 76.9 in February, falling below the market expectation of remaining unchanged at 79.6.
Atlanta Fed President Raphael W. Bostic has expressed his expectation that the first cut in interest rates would likely be appropriate, possibly occurring towards the end of this year at the earliest, which provides some support for the US Dollar (USD). According to the CME FedWatch Tool, the probability of Fed rate cuts in March stands at 5.0%, while the likelihood of cuts in May and June is estimated at 26.8% and 53.8%, respectively.
Investors will likely monitor closely upcoming economic data releases, including the ISM Services PMI data, ADP Employment Change, and Nonfarm Payrolls for February. Moreover, the focus will be on the speech of Federal Reserve Chair Jerome Powell on Wednesday and Thursday for further insights into the central bank's monetary policy stance.
- EUR/USD gains ground around 1.0845 amid a softer USD.
- The pair keeps the bullish bias unchanged above the key EMA; RSI indicator lies above the 50-midline.
- The first upside barrier will emerge at 1.0855; the key support level for EUR/USD is seen at the 1.0800–1.0855 zone.
The EUR/USD pair trades in positive territory below the mid-1.0800s during the early European session on Monday. The decline of the US Dollar (USD) after the downbeat US ISM Manufacturing PMI and the University of Michigan Consumer Sentiment Index provide some support to the pair. On Thursday, the European Central Bank (ECB) will announce its interest rate decision, with no change in rate expected. EUR/USD currently trades near 1.0845, gaining 0.07% on the day.
Technically, EUR/USD maintains the bullish outlook unchanged as the major pair is above the key 100-period Exponential Moving Averages (EMA) on the four-hour timeframe. Furthermore, the upward momentum is supported by the Relative Strength Index (RSI), which stands in bullish territory above the 50-midline, suggesting a further upside cannot be ruled out in the near term.
The immediate resistance level for the major pair will emerge at the upper boundary of the Bollinger Band and a high of February 29 at 1.0855. A bullish breakout above this level will see a rally to the 1.0895–1.0900 region, portraying a high of February 2 and I psychological round mark. Further north, the next upside target is seen at a high of January 8 at 1.0978.
On the downside, the crucial support level for EUR/USD is located near the confluence of the lower limit of the Bollinger Band and a round figure at the 1.0800-1.0805 zone. The additional downside filter to watch is a low of February 20 at 1.0761, followed by a low of February 13 at 1.0700.
EUR/USD four-hour chart
-638451245478782673.png)
- Gold price pauses after last week’s strong positive move to a fresh YTD top.
- Slightly overbought RSI on the daily chart acts as a headwind for the metal.
- Traders also seem reluctant ahead of this week’s key US data/event risks.
Gold price (XAU/USD) is seen oscillating in a narrow range during the Asian session on Monday and consolidating last week's strong gains to the $2,088-2,089 region, or its highest level since December 28. The US Dollar (USD) continues to be undermined by the disappointing release of the US ISM survey on Friday, which showed that manufacturing sector activity contracted more than anticipated in February. Adding to this, the less hawkish remarks by several Federal Reserve (Fed) officials reinforced bets that the US central bank will start cutting interest rates at the June policy meeting. This, in turn, is seen as a key factor acting as a tailwind for the non-yielding yellow metal.
Bulls, however, seem reluctant to place fresh bets around the Gold price and prefer to wait for more cues about the Fed's rate-cut path. Apart from this, the latest optimism over Gaza ceasefire talks further contributes to capping the upside for the safe-haven precious metal ahead of this week's important US macro releases, including the closely watched monthly employment details on Friday. Furthermore, Fed Chair Jerome Powell's congressional testimony on Wednesday and Thursday should influence the USD and provide some meaningful impetus to the XAU/USD. In the meantime, the commodity could extend the consolidative price move in the absence of any relevant data on Monday.
Daily digest market movers: Gold price remains supported by bets for an imminent Fed rate cut
- The US Dollar remains on the defensive in the wake of Friday's disappointing US macro data and less-hawkish remarks by Federal Reserve officials, which is seen acting as a tailwind for the Gold price.
- The ISM survey showed that business activity in the US manufacturing sector contracted more quickly than anticipated in February, with a measure of employment dropping to a seven-month low.
- The US ISM Manufacturing Index fell to 47.8 from 49.1 in January amid a decline in the New Orders Index to 49.2, while the Prices Paid Index edged lower to 52.5 from 52.9 in the previous month.
- Adding to this, the University of Michigan’s Consumer Sentiment Index also missed estimates and dropped to 76.9 in February, though inflation expectations were in line with the expectations.
- Chicago Federal Reserve President Austan Goolsbee noted that the policy rate is quite restrictive, and Dallas Fed President Lorie Logan said that it would be appropriate to slow the pace of the balance sheet shrinking.
- Fed Governor Adriana Kugler noted that progress on disinflation will continue, and Richmond Fed President Thomas Barkin said that overall inflation is likely to come down over the next few months.
- Furthermore, Fed Governor Christopher Waller said that he would like the central bank to boost its share of short-term Treasuries, exerting some downward pressure on the US Treasury bond yields.
- A softer risk tone also lends support to the safe-haven XAU/USD amid subdued US Dollar demand, though the upside seems limited ahead of the key US data and Fed Chair Jerome Powel's testimony.
Technical analysis: Gold price seems poised to appreciate further, $2,062-2,064 to lend support
From a Technical perspective, Friday's breakout through the $2,062-2,064 horizontal barrier was seen as a fresh trigger for bullish traders and supports prospects for additional gains. That said, the Relative Strength Index (RSI) on the daily chart is hovering near the overbought zone and holding back bulls from placing fresh bets. This makes it prudent to wait for some near-term consolidation before positioning for an extension of a nearly three-week-old uptrend.
In the meantime, the aforementioned resistance breakpoint, around the $2,064-2,062 region, now seems to protect the immediate downside. Sustained weakness below, however, might prompt aggressive technical selling and expose the 50-day Simple Moving Average (SMA) support, currently pegged near the $2,034 area. The latter should at as a key pivotal point, which if broken decisively will negate the positive outlook and shift the bias in favour of bearish traders.
On the flip side, the $2,088 zone, or over a two-month high touched on Friday, now seems to act as an immediate hurdle ahead of the $2,100 round figure. Some follow-through buying has the potential to lift the Gold price further towards the $2,025-2,030 intermediate hurdle en route to the all-time peak, around the $2,144-2,145 zone touched early December.
US Dollar price today
The table below shows the percentage change of US Dollar (USD) against listed major currencies today. US Dollar was the weakest against the Swiss Franc.
| USD | EUR | GBP | CAD | AUD | JPY | NZD | CHF | |
| USD | -0.03% | -0.04% | 0.05% | 0.11% | 0.04% | 0.09% | -0.07% | |
| EUR | 0.02% | -0.02% | 0.07% | 0.13% | 0.06% | 0.12% | -0.04% | |
| GBP | 0.05% | 0.02% | 0.09% | 0.15% | 0.09% | 0.14% | -0.02% | |
| CAD | -0.05% | -0.06% | -0.09% | 0.06% | -0.01% | 0.04% | -0.10% | |
| AUD | -0.11% | -0.13% | -0.15% | -0.06% | -0.07% | -0.01% | -0.17% | |
| JPY | -0.04% | -0.07% | -0.12% | -0.01% | 0.06% | 0.04% | -0.11% | |
| NZD | -0.09% | -0.12% | -0.14% | -0.05% | 0.01% | -0.06% | -0.16% | |
| CHF | 0.07% | 0.04% | 0.02% | 0.12% | 0.17% | 0.10% | 0.16% |
The heat map shows percentage changes of major currencies against each other. The base currency is picked from the left column, while the quote currency is picked from the top row. For example, if you pick the Euro from the left column and move along the horizontal line to the Japanese Yen, the percentage change displayed in the box will represent EUR (base)/JPY (quote).
Gold FAQs
Why do people invest in Gold?
Gold has played a key role in human’s history as it has been widely used as a store of value and medium of exchange. Currently, apart from its shine and usage for jewelry, the precious metal is widely seen as a safe-haven asset, meaning that it is considered a good investment during turbulent times. Gold is also widely seen as a hedge against inflation and against depreciating currencies as it doesn’t rely on any specific issuer or government.
Who buys the most Gold?
Central banks are the biggest Gold holders. In their aim to support their currencies in turbulent times, central banks tend to diversify their reserves and buy Gold to improve the perceived strength of the economy and the currency. High Gold reserves can be a source of trust for a country’s solvency. Central banks added 1,136 tonnes of Gold worth around $70 billion to their reserves in 2022, according to data from the World Gold Council. This is the highest yearly purchase since records began. Central banks from emerging economies such as China, India and Turkey are quickly increasing their Gold reserves.
How is Gold correlated with other assets?
Gold has an inverse correlation with the US Dollar and US Treasuries, which are both major reserve and safe-haven assets. When the Dollar depreciates, Gold tends to rise, enabling investors and central banks to diversify their assets in turbulent times. Gold is also inversely correlated with risk assets. A rally in the stock market tends to weaken Gold price, while sell-offs in riskier markets tend to favor the precious metal.
What does the price of Gold depend on?
The price can move due to a wide range of factors. Geopolitical instability or fears of a deep recession can quickly make Gold price escalate due to its safe-haven status. As a yield-less asset, Gold tends to rise with lower interest rates, while higher cost of money usually weighs down on the yellow metal. Still, most moves depend on how the US Dollar (USD) behaves as the asset is priced in dollars (XAU/USD). A strong Dollar tends to keep the price of Gold controlled, whereas a weaker Dollar is likely to push Gold prices up.
Speaking at a news conference on Monday, China's National People's Congress (NPC) spokesman Lou Qinjian said that Congress will hold its annual meeting in Beijing from March 5 to March 11.
Lou said that the government “will make new laws to deepen economic reform including in financial institutional reform to promote private companies.”
Additional quotes
The NPC will fully support Hong Kong on the new national security law.
Decoupling will only hurt technological advancement and damage the development of the global industry.
There are no tech hurdles that can't be tackled and it is only a matter of time before we can develop it.
Will next research on lawmaking on tech advancement especially on frontier areas such as AI.
Premier Li will unveil China's economic growth target at the annual NPC session on Tuesday, tomorrow.
Premier Li won't hold a press conference after the session.
Market reaction
AUD/USD Is losing 0.05% on the day to trade at 0.6518, at press time, unable to find any inspiration from the above comments.
Australian Dollar FAQs
What key factors drive the Australian Dollar?
One of the most significant factors for the Australian Dollar (AUD) is the level of interest rates set by the Reserve Bank of Australia (RBA). Because Australia is a resource-rich country another key driver is the price of its biggest export, Iron Ore. The health of the Chinese economy, its largest trading partner, is a factor, as well as inflation in Australia, its growth rate and Trade Balance. Market sentiment – whether investors are taking on more risky assets (risk-on) or seeking safe-havens (risk-off) – is also a factor, with risk-on positive for AUD.
How do the decisions of the Reserve Bank of Australia impact the Australian Dollar?
The Reserve Bank of Australia (RBA) influences the Australian Dollar (AUD) by setting the level of interest rates that Australian banks can lend to each other. This influences the level of interest rates in the economy as a whole. The main goal of the RBA is to maintain a stable inflation rate of 2-3% by adjusting interest rates up or down. Relatively high interest rates compared to other major central banks support the AUD, and the opposite for relatively low. The RBA can also use quantitative easing and tightening to influence credit conditions, with the former AUD-negative and the latter AUD-positive.
How does the health of the Chinese Economy impact the Australian Dollar?
China is Australia’s largest trading partner so the health of the Chinese economy is a major influence on the value of the Australian Dollar (AUD). When the Chinese economy is doing well it purchases more raw materials, goods and services from Australia, lifting demand for the AUD, and pushing up its value. The opposite is the case when the Chinese economy is not growing as fast as expected. Positive or negative surprises in Chinese growth data, therefore, often have a direct impact on the Australian Dollar and its pairs.
How does the price of Iron Ore impact the Australian Dollar?
Iron Ore is Australia’s largest export, accounting for $118 billion a year according to data from 2021, with China as its primary destination. The price of Iron Ore, therefore, can be a driver of the Australian Dollar. Generally, if the price of Iron Ore rises, AUD also goes up, as aggregate demand for the currency increases. The opposite is the case if the price of Iron Ore falls. Higher Iron Ore prices also tend to result in a greater likelihood of a positive Trade Balance for Australia, which is also positive of the AUD.
How does the Trade Balance impact the Australian Dollar?
The Trade Balance, which is the difference between what a country earns from its exports versus what it pays for its imports, is another factor that can influence the value of the Australian Dollar. If Australia produces highly sought after exports, then its currency will gain in value purely from the surplus demand created from foreign buyers seeking to purchase its exports versus what it spends to purchase imports. Therefore, a positive net Trade Balance strengthens the AUD, with the opposite effect if the Trade Balance is negative.
Citing sources with knowledge of the matter, Japan’s Kyodo News agency reported on Monday, the Japanese government is mulling officially announcing an end to deflation, flagging heightened risks of policy tightening.
“The government will make a decision after determining whether annual labor-management wage talks due March 13 will turn out strong enough to offset price hikes and also consider the outlook on price trends,” the sources said.
Market reaction
USD/JPY is trading listlessly near 150.20, at the time of writing, little affected by the above report.
Japanese Yen price today
The table below shows the percentage change of Japanese Yen (JPY) against listed major currencies today. Japanese Yen was the strongest against the Australian Dollar.
| USD | EUR | GBP | CAD | AUD | JPY | NZD | CHF | |
| USD | -0.03% | -0.05% | 0.05% | 0.09% | 0.05% | 0.07% | -0.07% | |
| EUR | 0.02% | -0.03% | 0.08% | 0.11% | 0.07% | 0.09% | -0.04% | |
| GBP | 0.05% | 0.03% | 0.09% | 0.15% | 0.11% | 0.12% | 0.00% | |
| CAD | -0.05% | -0.06% | -0.09% | 0.05% | -0.01% | 0.02% | -0.12% | |
| AUD | -0.09% | -0.12% | -0.14% | -0.04% | -0.04% | -0.02% | -0.16% | |
| JPY | -0.04% | -0.08% | -0.13% | -0.02% | 0.03% | 0.01% | -0.11% | |
| NZD | -0.07% | -0.10% | -0.13% | -0.03% | 0.02% | -0.03% | -0.14% | |
| CHF | 0.06% | 0.04% | 0.02% | 0.12% | 0.16% | 0.11% | 0.14% |
The heat map shows percentage changes of major currencies against each other. The base currency is picked from the left column, while the quote currency is picked from the top row. For example, if you pick the Euro from the left column and move along the horizontal line to the Japanese Yen, the percentage change displayed in the box will represent EUR (base)/JPY (quote).
- WTI price edges higher on extension of oil cuts by OPEC+.
- OPEC+ decided to extend oil output cuts of 2.2M million bpd into the Q2.
- Russia's announced to cut oil output and exports by an additional 471,000 bpd.
- Iran-led Houthis vowed to continue targeting British ships following the sinking of the UK vessel Rubymar.
West Texas Intermediate (WTI) oil price edges higher to near $79.50 per barrel on Monday, following the decision of voluntary oil output cut, made in coordination with some OPEC+ participating countries, including Russia, aiming at addressing concerns about oversupply and stabilizing oil prices.
The Organization of the Petroleum Exporting Countries and its allies (OPEC+) decided to extend voluntary oil output cuts of 2.2 million barrels per day (bpd) into the second quarter, aligning with market expectations. This decision is attributed to support the oil prices amid global economic concerns and rising output outside the group.
Russia's announcement to cut its oil output and exports by an additional 471,000 bpd in the second quarter is significant news for the oil market. By reducing oil output and exports, Russia is signaling its commitment to supporting efforts to balance the global oil market. This move could potentially help alleviate some of the downward pressure on oil prices.
The broader geopolitical tensions and conflicts in the Middle East is underpinning the Crude oil prices. The sinking of the United Kingdom (UK) owned vessel Rubymar by Yemeni Houthi militants, as confirmed by the United States (US) military, marks a concerning escalation in tensions in the Gulf of Aden. The Houthis' vow to continue targeting British ships in the region raises the risk of further maritime incidents and underscores the volatile situation in the area.
- USD/CAD gains ground despite higher Crude oil prices.
- BoC is expected to maintain its current interest rate at 5.0%.
- WTI price appreciates on the OPEC+ decision to extend oil output cuts of 2.2M bpd.
- US Dollar consolidates amid improved US Treasury yields.
USD/CAD retraces recent losses, reaching higher to near 1.3560 during the Asian session on Monday. This retracement occurred despite higher Crude oil prices, which typically support the Canadian Dollar (CAD) due to Canada's status as a major oil exporter. This, in turn, could limit the advances of the USD/CAD pair.
West Texas Intermediate (WTI) oil price edges higher to near $79.50 per barrel on Monday. The increase in Crude oil prices followed the Organization of the Petroleum Exporting Countries and its allies (OPEC+) decision to extend voluntary oil output cuts of 2.2 million barrels per day (bpd) into the second quarter, aligning with market expectations.
Canada's S&P Global Manufacturing Purchasing Managers Index (PMI) experienced a slight improvement, rising to 49.7 from the previous 48.3, although it remained below the 50.0 threshold which indicates contraction in the sector.
Looking ahead, the Bank of Canada (BoC) is scheduled to announce its latest interest rate decision next Wednesday. Market expectations suggest that the central bank will maintain its current interest rate at 5.0%.
The US Dollar Index (DXY) hovers around 103.80, as it seeks direction amidst improved US Treasury yields. However, the US Dollar (USD) faced downward pressure due to the contraction observed in the United States manufacturing sector in February.
The US ISM Manufacturing PMI for February dropped to 47.8 from 49.1, significantly missing the market expectation of 49.5. Additionally, the US Michigan Consumer Sentiment Index declined to 76.9 in February, falling below the market expectation of remaining unchanged at 79.6.
Despite these concerning data points, Federal Reserve (Fed) officials have maintained a cautious stance and have not signaled any immediate interest rate cuts. This stance has provided some support for the US Dollar.
Investors are closely monitoring upcoming economic data releases, including the ISM Services PMI data, ADP Employment Change, and Nonfarm Payrolls for February, to gauge the overall health of the US economy and potential future monetary policy decisions by the US Federal Reserve.
- GBP/USD attracts buyers for the second straight day amid subdued US Dollar price action.
- BoE Chief Economist Huw Pill's hawkish remarks underpin the GBP and remain supportive.
- Bets that the Fed will keep rates higher for longer to limit the USD losses and cap the pair.
The GBP/USD pair builds on Friday's goodish rebound from the 1.2600 round figure, or a one-and-half-week trough and gains some positive traction for the second successive day on Monday. The momentum lifts spot prices to a multi-day peak, around the 1.2660-1.2665 area during the Asian session and is sponsored by a combination of factors.
The British Pound (GBP) draws support from the Bank of England (BoE) Chief Economist Huw Pill's hawkish remarks on Friday, saying that the first cut in the key interest rate is still some way off. The US Dollar (USD), on the other hand, remains depressed in the wake of Friday's disappointing US macro data and less hawkish remarks by Federal Reserve (Fed) officials. Apart from this, the recent risk-on rally across the global equity markets further undermines the safe-haven Greenback, which, in turn, lends some support to the GBP/USD pair.
The downside for the USD, however, seems limited amid growing acceptance that the Fed will keep interest rates higher for longer. Traders might also refrain from placing aggressive directional bets ahead of this week's important US economic releases, including the closely-watched Nonfarm Payrolls (NFP) on Friday and Fed Chair Jerome Powell's semi-annual congressional testimony on Wednesday and Thursday. This, in turn, warrants some caution before positioning for any further near-term appreciating move for the GBP/USD pair.
In the meantime, there isn't any relevant market-moving data due for release on Monday, either from the UK or the US, leaving spot prices at the mercy of the USD price dynamics. That said, the US bond yields, along with the broader risk sentiment, might influence the USD price dynamics and produce short-term trading opportunities around the GBP/USD pair.
- Indian Rupee remains flat on Monday despite the modest rebound of the USD.
- India’s upbeat GDP growth in the October-December quarter boosts the INR and caps the pair’s upside.
- Market players will focus on the Indian February S&P Global Services PMI, due on Tuesday.
Indian Rupee (INR) trades on a flat note on Monday. The upside of INR is bolstered by data showing India’s GDP growth in the October-December quarter considerably above forecasts. India's economy grew at its fastest pace in one-and-a-half years in the December quarter, with the economy expanding by 8.4%, against the 6.6% anticipated.
On the other hand, the renewed US Dollar (USD) demand and the prospect of delayed rate cut expectations from the Federal Reserve (Fed) might weigh on the Indian Rupee in the near term. Nonetheless, analysts said that the pair is likely to remain in a narrow band this year as the Reserve Bank of India (RBI) monitors foreign exchange markets closely and intervenes when necessary to prevent excessive volatility in the exchange rate.
The Indian S&P Global Services PMI for February will be due on Tuesday. Investors will closely watch Fed's Chair Jerome Powell testify on Wednesday, which might offer some hints about a broad overview of the economy and monetary policy. On Friday, the US employment data will be released, including the Nonfarm Payrolls (NFP), Average Hourly Earnings, and Unemployment Rate.
Daily Digest Market Movers: Indian Rupee stands flat amid the positive economic outlook
- India's foreign exchange reserves increased by $2.975 billion to $619.072 billion for the week ending on February 23, according to the Reserve Bank of India (RBI).
- The US ISM Manufacturing PMI came in weaker-than-expected, dropping to 47.8 in February from 49.1 in January.
- The University of Michigan Consumer Sentiment Index eased to 76.9 from 79.6, below the market consensus.
- Boston Fed President Susan Collins and New York’s John Williams stated that the first rate cut will likely be appropriate later this year, while Atlanta’s Raphael Bostic said the first cut in rates would be appropriate probably at the end of this year at the earliest.
- The financial markets have priced in the 70% odds that the Federal Reserve (Fed) will start cutting interest rates at the June meeting.
Technical Analysis: Indian Rupee is likely to extend range bound of 82.70-83.20
Indian Rupee trades flat on the day. USD/INR has traded within a multi-month-old descending trend channel between 82.70 and 83.20 since December 8, 2023.
In the near term, USD/INR maintains the bearish outlook unchanged as the pair is still below the 100-day Exponential Moving Average on the daily timeframe. The bearish momentum is supported by the 14-day Relative Strength Index (RSI), which holds in the negative zone below the 50.0 midline.
Further selling vibes could drag the pair lower to 82.70, representing the lower limit of the descending trend channel. Further south, the next contention is seen near a low of August 23 at 82.45, followed by a low of June 1 at 82.25.
The potential upside barrier will emerge near the confluence of the 100-day EMA and a psychological round figure at the 83.00 mark. Sustained bullish momentum past this point will pave the way to a high of January 2 at 83.35, en route to 84.00.
US Dollar price today
The table below shows the percentage change of US Dollar (USD) against listed major currencies today. US Dollar was the weakest against the Swiss Franc.
| USD | EUR | GBP | CAD | AUD | JPY | NZD | CHF | |
| USD | 0.00% | -0.01% | 0.07% | 0.08% | 0.04% | 0.09% | -0.03% | |
| EUR | 0.00% | -0.01% | 0.07% | 0.09% | 0.04% | 0.10% | -0.02% | |
| GBP | 0.01% | 0.01% | 0.07% | 0.10% | 0.06% | 0.10% | -0.01% | |
| CAD | -0.07% | -0.06% | -0.07% | 0.03% | -0.03% | 0.02% | -0.09% | |
| AUD | -0.08% | -0.11% | -0.10% | -0.02% | -0.06% | 0.00% | -0.11% | |
| JPY | -0.03% | -0.06% | -0.10% | 0.00% | 0.05% | 0.01% | -0.07% | |
| NZD | -0.09% | -0.10% | -0.10% | -0.03% | -0.01% | -0.06% | -0.11% | |
| CHF | 0.02% | 0.02% | 0.01% | 0.09% | 0.10% | 0.06% | 0.11% |
The heat map shows percentage changes of major currencies against each other. The base currency is picked from the left column, while the quote currency is picked from the top row. For example, if you pick the Euro from the left column and move along the horizontal line to the Japanese Yen, the percentage change displayed in the box will represent EUR (base)/JPY (quote).
Indian Rupee FAQs
What are the key factors driving the Indian Rupee?
The Indian Rupee (INR) is one of the most sensitive currencies to external factors. The price of Crude Oil (the country is highly dependent on imported Oil), the value of the US Dollar – most trade is conducted in USD – and the level of foreign investment, are all influential. Direct intervention by the Reserve Bank of India (RBI) in FX markets to keep the exchange rate stable, as well as the level of interest rates set by the RBI, are further major influencing factors on the Rupee.
How do the decisions of the Reserve Bank of India impact the Indian Rupee?
The Reserve Bank of India (RBI) actively intervenes in forex markets to maintain a stable exchange rate, to help facilitate trade. In addition, the RBI tries to maintain the inflation rate at its 4% target by adjusting interest rates. Higher interest rates usually strengthen the Rupee. This is due to the role of the ‘carry trade’ in which investors borrow in countries with lower interest rates so as to place their money in countries’ offering relatively higher interest rates and profit from the difference.
What macroeconomic factors influence the value of the Indian Rupee?
Macroeconomic factors that influence the value of the Rupee include inflation, interest rates, the economic growth rate (GDP), the balance of trade, and inflows from foreign investment. A higher growth rate can lead to more overseas investment, pushing up demand for the Rupee. A less negative balance of trade will eventually lead to a stronger Rupee. Higher interest rates, especially real rates (interest rates less inflation) are also positive for the Rupee. A risk-on environment can lead to greater inflows of Foreign Direct and Indirect Investment (FDI and FII), which also benefit the Rupee.
How does inflation impact the Indian Rupee?
Higher inflation, particularly, if it is comparatively higher than India’s peers, is generally negative for the currency as it reflects devaluation through oversupply. Inflation also increases the cost of exports, leading to more Rupees being sold to purchase foreign imports, which is Rupee-negative. At the same time, higher inflation usually leads to the Reserve Bank of India (RBI) raising interest rates and this can be positive for the Rupee, due to increased demand from international investors. The opposite effect is true of lower inflation.
| Raw materials | Closed | Change, % |
|---|---|---|
| Silver | 23.139 | 2.17 |
| Gold | 2083.316 | 1.95 |
| Palladium | 955.24 | 1.47 |
- The Japanese Yen ticks lower in the wake of the BoJ policy uncertainty and the risk-on mood.
- Friday’s disappointing US data keeps the USD bulls on the defensive and might cap USD/JPY.
- Traders look to the Tokyo CPI report on Tuesday ahead of this week’s key US economic data.
The Japanese Yen (JPY) kicks off the new week on a softer note and remains depressed below the 150.00 psychological mark against its American counterpart during the Asian session. The Bank of Japan (BoJ) Governor Kazuo Ueda reiterated on Friday that it was too early to declare victory on inflation. This comes on the back of a technical recession in Japan, which could force the BoJ to delay its plan to tighten the monetary policy. Apart from this, the prevalent risk-on environment is seen undermining the safe-haven JPY. Investors, however, seem convinced that the BoJ will exit negative interest rates if wage negotiations result in bumper pay hikes. This is holding back traders from placing aggressive bearish bets around the JPY.
Meanwhile, the US Dollar (USD) is weighed down by Friday's disappointing macro data and less hawkish comments by a slew of influential Federal Reserve (Fed) officials. Traders also seem reluctant and prefer to wait for more clues about the timing of when the Fed will begin cutting interest rates, which further contributes to capping the upside for the USD/JPY pair. There isn't any relevant market-moving US economic data due for release on Monday and hence, the focus will remain glued to the release of the Tokyo Core CPI report on Tuesday. Investors this week will seek further cues from Fed Chair Jerome Powell's semi-annual congressional testimony on Wednesday and Thursday ahead of the US Nonfarm Payrolls (NFP) on Friday.
Daily digest market movers: Japanese Yen remains depressed on mixed BoJ signals, positive risk tone
- Mixed signals from Bank of Japan policy makers last week, along with the underlying bullish sentiment around the equity markets, continue to act as a headwind for the safe-haven Japanese Yen.
- BoJ board member Hajime Takata said last week that the central bank must consider overhauling its ultra-loose monetary policy as the achievement of the 2% inflation target is becoming in sight.
- BoJ Governor Kazuo Ueda, however, said it was too early to conclude that inflation was close to sustainably meeting the 2% target and stressed the need to scrutinize more data on the wage outlook.
- Furthermore, a recession in Japan, along with a slightly warmer domestic consumer inflation, adds to the uncertainty about the BoJ's future policy decisions and keeps the JPY traders on the sidelines.
- Media reports, citing sources, suggest that the Japanese government has begun considering declaring an official end to deflation two decades after it acknowledged that prices were falling moderately
- The US Dollar is undermined by Friday's disappointing ISM Manufacturing PMI, which contracted more than anticipated and came in at 47.8 for February as compared to 49.1 in the previous month.
- Other details of the report showed that the Employment Index declined to 45.9 from 47.1, the New Orders Index retreated to 49.2 from 52.5 and the Prices Paid Index edged lower to 52.5 from 52.9.
- Adding to this, the University of Michigan’s Consumer Sentiment Index also fell short of estimates and dipped to 76.9 in February, though inflation expectations were in line with the expectations.
- Fed Governor Adriana Kugler noted that progress on disinflation will continue, while Richmond Fed President Thomas Barkin said that overall inflation is likely to come down over the next few months.
- Chicago Federal Reserve President Austan Goolsbee said that the policy rate is quite restrictive, and Dallas Fed President Lorie Logan said that it will be appropriate to slow the pace of the balance sheet shrinking.
- The US Treasury bond yields declined on Friday after Fed Governor Christopher Waller’s comments, saying that he would like the central bank to boost its share of short-term Treasuries.
- Investors now look forward to the release of the Tokyo CPI report on Tuesday for a fresh impetus, ahead of the month start key US macro data, including the crucial Nonfarm Payrolls on Friday.
Technical analysis: USD/JPY must surpass 150.80-150.90 hurdle for bulls to seize control
From a technical perspective, Friday's failure ahead of the 150.80-150.90 pivotal resistance and the lack of any meaningful buying warrants some caution for bullish traders. The subsequent pullback, however, showed some resilience below the 150.00 mark. Moreover, oscillators on the daily chart are holding in the positive territory and support prospects for some meaningful upside for the USD/JPY pair. That said, it will still be prudent to wait for a sustained strength beyond the aforementioned barrier before placing fresh bullish bets. Spot prices might then climb to the 151.45 intermediate resistance en route to the 152.00 neighbourhood, or a multi-decade peak set in October 2022 and retested in November 2023.
On the flip side, any meaningful downfall is likely to find decent support and attract fresh buyers near last week's swing low, around the 149.20 area. Some follow-through selling, leading to a break below the 149.00 mark, might shift the bias in favour of bearish traders and make the USD/JPY pair vulnerable. Spot prices might then decline to the 148.30 support en route to the 148.00 round figure and the 100-day Simple Moving Average (SMA), currently pegged near the 147.80 region.
Japanese Yen price today
The table below shows the percentage change of Japanese Yen (JPY) against listed major currencies today. Japanese Yen was the strongest against the New Zealand Dollar.
| USD | EUR | GBP | CAD | AUD | JPY | NZD | CHF | |
| USD | 0.02% | 0.00% | 0.07% | 0.07% | 0.01% | 0.10% | 0.02% | |
| EUR | -0.02% | -0.01% | 0.05% | 0.07% | 0.00% | 0.10% | 0.00% | |
| GBP | 0.00% | 0.01% | 0.06% | 0.08% | 0.03% | 0.11% | 0.02% | |
| CAD | -0.06% | -0.03% | -0.05% | 0.02% | -0.05% | 0.04% | -0.04% | |
| AUD | -0.07% | -0.07% | -0.08% | -0.02% | -0.06% | 0.03% | -0.06% | |
| JPY | -0.02% | -0.01% | -0.06% | 0.03% | 0.03% | 0.07% | -0.01% | |
| NZD | -0.10% | -0.10% | -0.11% | -0.05% | -0.03% | -0.09% | -0.10% | |
| CHF | -0.02% | 0.00% | -0.02% | 0.05% | 0.07% | 0.00% | 0.10% |
The heat map shows percentage changes of major currencies against each other. The base currency is picked from the left column, while the quote currency is picked from the top row. For example, if you pick the Euro from the left column and move along the horizontal line to the Japanese Yen, the percentage change displayed in the box will represent EUR (base)/JPY (quote).
Japanese Yen FAQs
What key factors drive the Japanese Yen?
The Japanese Yen (JPY) is one of the world’s most traded currencies. Its value is broadly determined by the performance of the Japanese economy, but more specifically by the Bank of Japan’s policy, the differential between Japanese and US bond yields, or risk sentiment among traders, among other factors.
How do the decisions of the Bank of Japan impact the Japanese Yen?
One of the Bank of Japan’s mandates is currency control, so its moves are key for the Yen. The BoJ has directly intervened in currency markets sometimes, generally to lower the value of the Yen, although it refrains from doing it often due to political concerns of its main trading partners. The current BoJ ultra-loose monetary policy, based on massive stimulus to the economy, has caused the Yen to depreciate against its main currency peers. This process has exacerbated more recently due to an increasing policy divergence between the Bank of Japan and other main central banks, which have opted to increase interest rates sharply to fight decades-high levels of inflation.
How does the differential between Japanese and US bond yields impact the Japanese Yen?
The BoJ’s stance of sticking to ultra-loose monetary policy has led to a widening policy divergence with other central banks, particularly with the US Federal Reserve. This supports a widening of the differential between the 10-year US and Japanese bonds, which favors the US Dollar against the Japanese Yen.
How does broader risk sentiment impact the Japanese Yen?
The Japanese Yen is often seen as a safe-haven investment. This means that in times of market stress, investors are more likely to put their money in the Japanese currency due to its supposed reliability and stability. Turbulent times are likely to strengthen the Yen’s value against other currencies seen as more risky to invest in.
- India’s Nifty and Sensex are likely to start the week on the right footing on Monday.
- Nifty and Sensex settled over 1.60% higher on Friday, clinching fresh record highs.
- US Core PCE inflation came in line with estimates, India’s GDP blew out with 8.4% YoY in Q3.
The Sensex 30 and Nifty 50, India’s key benchmark indices, are eyeing a positive start to the week on Monday, taking cues from mostly higher Asian stocks and the advance in the Gift Nifty futures.
Both Indian indices ended Friday with strong gains, capitalizing on robust India’s Gross Domestic Product (GDP) data and the global stocks rally.
The National Stock Exchange (NSE) Nifty 50 and Bombay Stock Exchange (BSE) Sensex 30 gained nearly 1.65% on the day to settle just below fresh all-time highs of 22,353.30 and 73,819.21 respectively.
Stock market news
- It’s a holiday-shortened week for the Indian markets, as they will be closed, in observance of the Mahashivratri festival on Friday. Meanwhile, the main event risks for markets this week will be the US Federal Reserve (Fed) Chair Jerome Powell’s testimony and the all-important US Nonfarm Payrolls data.
- The top performers on Nifty on Friday were L&T, JSW Steel, IndusInd Bank, Tata Steel and Titan. Meanwhile, the top losers were Britannia, Sun Pharma, Dr. Reddy, HCL Tech and Infosys.
- Shares of Auto, metal, power, bank and capital rose 1% to 3%.
- L&T commissions Green Hydrogen Plant at A M Naik Heavy Engineering Complex in Hazira.
- L&T is awarded contracts worth INR13,368 crore for the supply of equipment to the Indian Air Force.
- Bharti Airtel deployed additional sites in Thrissur district to densify its network.
- India’s manufacturing sector climbed to a five-month high of 56.9 in February.
- India's Gross Domestic Product (GDP) expanded by 8.4% on an annual basis in the third quarter (October-December), as against 7.6% in the previous quarter, data released by the National Statistical Office (NSO) showed Thursday.
- The US stock markets closed higher on Friday even as business activity in the US manufacturing sector contracted at an accelerating pace in February, with the ISM Manufacturing PMI dropping to 47.8 from 49.1 in January, missing the market expectation of 49.5 by a wide margin.
- On Thursday, the key US Personal Consumption Expenditures (PCE) Price Index increased 0.4% for the month and 2.8% from a year ago, as expected.
- Markets are currently pricing in just about a 20% chance that the US Federal Reserve (Fed) could begin easing rates in May, much lower than an over 90% chance a month ago, according to the CME FedWatch Tool. For the June meeting, the probability for a rate cut now stands at about 71%, up from roughly 60% seen a week ago.
Sensex FAQs
What is the Sensex?
The Sensex is a name for one of India’s most closely monitored stock indexes. The term was coined in the 1980s by analyst Deepak Mohoni by mashing the words sensitive and index together. The index plots a weighted average of the share price of 30 of the most established stocks on the Bombay Stock Exchange. Each corporation's weighting is based on its “free-float capitalization”, or the value of all its shares readily available for trading.
What factors drive the Sensex?
Given it is a composite, the value of the Sensex is first and foremost dependent on the performance of its constituent companies as revealed in their quarterly and annual results. Government policies are another factor. In 2016 the government decided to phase out high value currency notes, for example, and certain companies saw their share price fall as a result. When the government decided to cut corporation tax in 2019, meanwhile, the Sensex gained a boost. Other factors include the level of interest rates set by the Reserve Bank of India, since that dictates the cost of borrowing, climate change, pandemics and natural disasters
What are the key milestones for the Sensex?
The Sensex started life on April 1 1979 at a base level of 100. It reached its highest recorded level so far, at 73,328, on Monday, January 15, 2024 (this is being written in Feb 2024). The Index closed above the 10,000 mark for the first time on February 7, 2006. On March 13, 2014 the Sensex closed higher than Hong Kong’s Hang Seng index to become the major Asian stock index with the highest value. The index’s biggest gain in a single day occurred on April 7, 2020, when it rose 2,476 points; its deepest single-day loss occurred on January 21, 2008, when it plunged 1,408 points due the US subprime crisis.
What major corporations are in the Sensex?
Major companies within the Sensex include Reliance Industries Ltd, HDFC Bank, Axis Bank, ITC Ltd, Bharti Airtel Ltd, Tata Steel, HCL Technologies, Infosys, State Bank of India, Sun Pharma, Tata Consultancy Services and Tech Mahindra.
- Australian Dollar loses ground as the S&P/ASX 200 Index moves lower.
- Australian Securities Inflation (YoY) rose by 4.0% in February, against the previous increase of 4.6%.
- US Dollar maintains stability on improved US Treasury yields.
- US ISM Manufacturing PMI (Feb) dropped to 47.8 from 49.1, against the anticipated increase to 49.5.
The Australian Dollar (AUD) trims its intraday gains and moves in the negative direction on Monday, influenced by a stable US Dollar amid improved US Treasury yields. Additionally, the decline of the ASX 200 index provided further downward pressure on the Aussie Dollar, thereby undermining the AUD/USD pair. Traders are likely awaiting key Australian data releases, including the Services Purchasing Managers Index (PMI) for February on Tuesday and the Gross Domestic Product (GDP) for the fourth quarter of 2023 on Wednesday.
Australian Dollar has received some support from the Australia Melbourne Institute Inflation for February, which showed a year-over-year rise of 4.0%. However, this increase was lower than the previous rise of 4.6%. Building Permits (MoM) declined by 1.0% in January, contrary to the expected rise of 4.0%. Nevertheless, this figure represented an improvement from the previous decrease of 10.1%. Furthermore, last week's Consumer Price Index (CPI) data indicated a 3.4% rise in January, slightly below the market consensus of 3.5%. This data supported the case for the Reserve Bank of Australia (RBA) to consider cutting interest rates later this year.
The US Dollar Index (DXY) could be driven lower due to a contraction in the United States manufacturing sector observed in February. Despite this contraction, Federal Reserve (Fed) officials have maintained a cautious stance and have not signaled any immediate interest rate cuts, which provides some support for the US Dollar. Investors closely monitor upcoming economic data releases, including the ISM Services PMI data, ADP Employment Change, and Nonfarm Payrolls for February.
Daily Digest Market Movers: Australian Dollar depreciates amid a stable US Dollar
- Australia’s TD Securities Inflation (MoM) decreased by 0.1% in February, lower than the previous rise of 0.3%.
- Australian Bureau of Statistics released Company Gross Operating Profits (QoQ), rising by 7.4% in the fourth quarter of 2023 against the expected 1.8% increase and the previous decrease of 1.6%.
- Australian Building Permits (YoY) rose by 10% in January, swinging from the previous decline of 24%.
- Judo Bank Manufacturing PMI indicated a slight improvement in Australia's manufacturing sector, with the February reading rising to 47.8 from 47.7 in the previous period.
- The seasonally adjusted Australian Retail Sales (MoM) grew by 1.1% in January, lower than expected 1.5% but swinging from the previous decline of 2.7%.
- Australian Private Capital Expenditure improved by 0.8% in the fourth quarter of 2023, from the expected 0.5% and 0.6% prior.
- Warren Hogan, Chief Economist Advisor at Judo Bank, expressed concerns about Australia's manufacturing sector, stating that it is not experiencing growth. This observation calls into question the notion of a post-pandemic manufacturing revival.
- Atlanta Fed President Raphael W. Bostic has expressed his expectation that the first cut in interest rates would likely be appropriate, possibly occurring towards the end of this year at the earliest.
- Economists at Commerzbank suggest that the looming shutdown in the United States has little influence on the US Dollar thus far. They speculate that perhaps the market is becoming indifferent or desensitized to the prospect of shutdowns, leading to a lack of significant reaction.
- According to the CME FedWatch Tool, the probability of rate cuts in March stands at 5.0%, while the likelihood of cuts in May and June is estimated at 26.8% and 53.8%, respectively.
- US ISM Manufacturing PMI (Feb) dropped to 47.8 from 49.1, surprisingly missing the market expectation 49.5.
- The US Michigan Consumer Sentiment Index declined to 76.9 in February, falling below the market expectation of remaining unchanged at 79.6.
- US Personal Consumption Expenditure (PCE) Price Index grew by 2.4% YoY in January, against the 2.6% prior, in line with the market expectation. The index increased by 0.3% month-over-month, against 0.1% prior.
- US Core PCE (YoY), the Fed preferred inflation gauge, rose by 2.8% compared to December’s reading of 2.9, matching with the consensus. The monthly figure showed a rise of 0.4% as expected, above the previous rise of 0.1%.
- The preliminary US Gross Domestic Product Annualized grew by 3.2% in the fourth quarter of 2023, slightly below market expectations of remaining steady at 3.3%.
- The preliminary US Gross Domestic Product Price Index (Q4) increased by 1.7% against the expected and previous rise of 1.5%.
Technical Analysis: Australian Dollar declines to 0.6520 before the psychological support
The Australian Dollar hovers around 0.6520 on Monday. The immediate resistance is observed around the 21-day Exponential Moving Average (EMA) at 0.6537, followed by the 23.6% Fibonacci retracement level at 0.6543 and the major level of 0.6550. If the pair breaks above this resistance zone, it may approach the psychological level of 0.6600. On the downside, the psychological level of 0.6500 appears as the key support followed by the previous week’s low at 0.6486. A breach below this level could potentially trigger a downward move in the AUD/USD pair, targeting the area around the major support level of 0.6450 and February’s low at 0.6442.
AUD/USD: Daily Chart
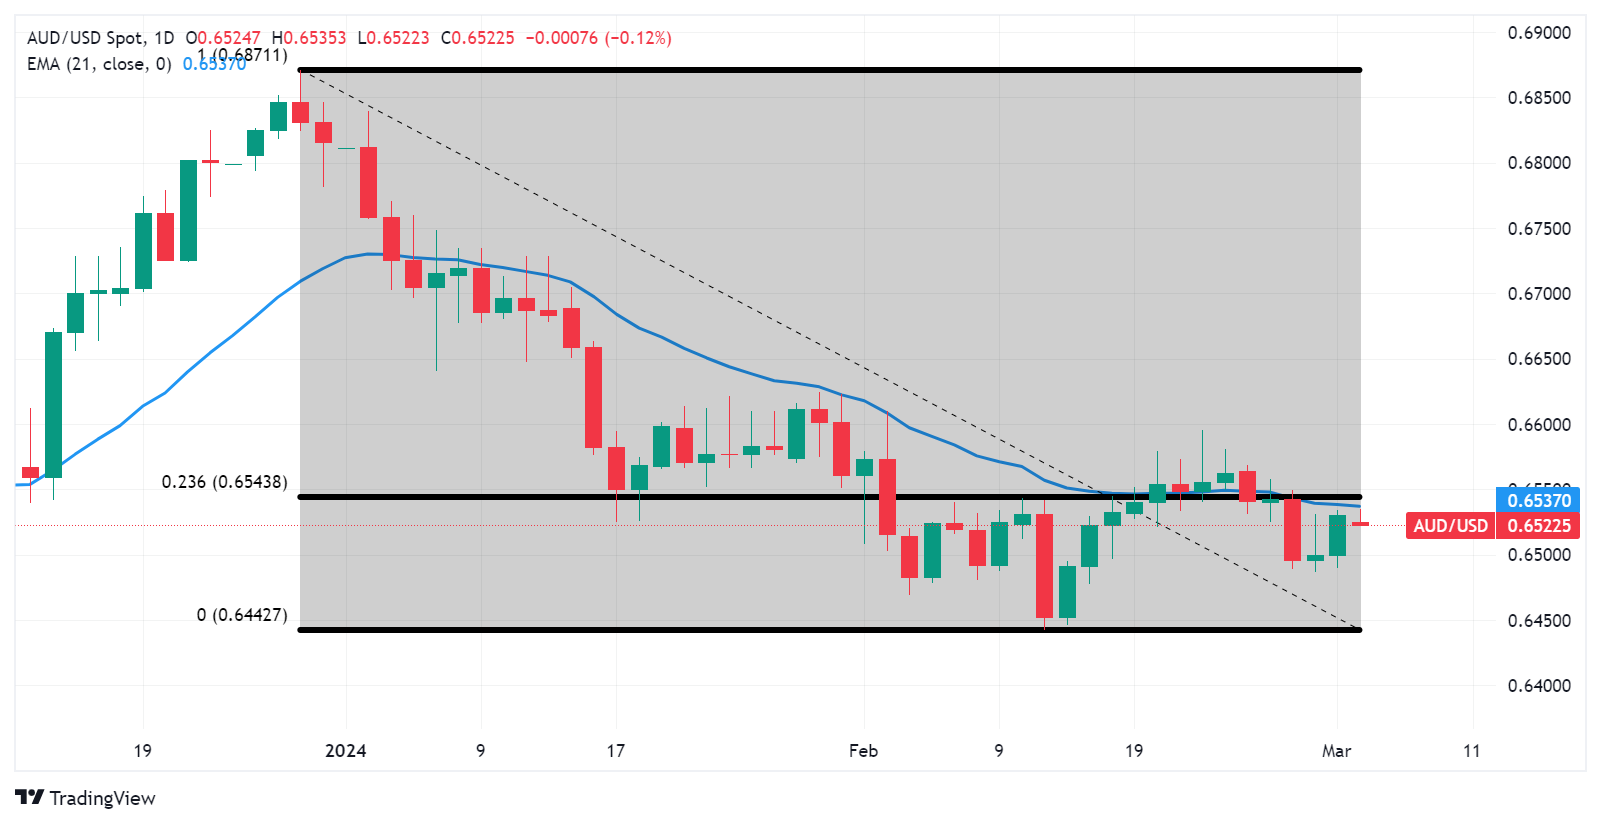
Australian Dollar price today
The table below shows the percentage change of Australian Dollar (AUD) against listed major currencies today. Australian Dollar was the weakest against the US Dollar.
| USD | EUR | GBP | CAD | AUD | JPY | NZD | CHF | |
| USD | 0.02% | 0.02% | 0.09% | 0.10% | 0.03% | 0.14% | 0.03% | |
| EUR | -0.03% | -0.01% | 0.06% | 0.07% | 0.01% | 0.10% | 0.01% | |
| GBP | -0.02% | 0.02% | 0.06% | 0.08% | 0.03% | 0.11% | 0.02% | |
| CAD | -0.09% | -0.04% | -0.05% | 0.03% | -0.05% | 0.05% | -0.05% | |
| AUD | -0.10% | -0.07% | -0.08% | -0.02% | -0.06% | 0.04% | -0.06% | |
| JPY | -0.03% | -0.01% | -0.06% | 0.03% | 0.05% | 0.09% | 0.00% | |
| NZD | -0.14% | -0.10% | -0.12% | -0.05% | -0.04% | -0.10% | -0.10% | |
| CHF | -0.04% | -0.01% | -0.02% | 0.05% | 0.06% | 0.00% | 0.10% |
The heat map shows percentage changes of major currencies against each other. The base currency is picked from the left column, while the quote currency is picked from the top row. For example, if you pick the Euro from the left column and move along the horizontal line to the Japanese Yen, the percentage change displayed in the box will represent EUR (base)/JPY (quote).
Australian Dollar FAQs
What key factors drive the Australian Dollar?
One of the most significant factors for the Australian Dollar (AUD) is the level of interest rates set by the Reserve Bank of Australia (RBA). Because Australia is a resource-rich country another key driver is the price of its biggest export, Iron Ore. The health of the Chinese economy, its largest trading partner, is a factor, as well as inflation in Australia, its growth rate and Trade Balance. Market sentiment – whether investors are taking on more risky assets (risk-on) or seeking safe-havens (risk-off) – is also a factor, with risk-on positive for AUD.
How do the decisions of the Reserve Bank of Australia impact the Australian Dollar?
The Reserve Bank of Australia (RBA) influences the Australian Dollar (AUD) by setting the level of interest rates that Australian banks can lend to each other. This influences the level of interest rates in the economy as a whole. The main goal of the RBA is to maintain a stable inflation rate of 2-3% by adjusting interest rates up or down. Relatively high interest rates compared to other major central banks support the AUD, and the opposite for relatively low. The RBA can also use quantitative easing and tightening to influence credit conditions, with the former AUD-negative and the latter AUD-positive.
How does the health of the Chinese Economy impact the Australian Dollar?
China is Australia’s largest trading partner so the health of the Chinese economy is a major influence on the value of the Australian Dollar (AUD). When the Chinese economy is doing well it purchases more raw materials, goods and services from Australia, lifting demand for the AUD, and pushing up its value. The opposite is the case when the Chinese economy is not growing as fast as expected. Positive or negative surprises in Chinese growth data, therefore, often have a direct impact on the Australian Dollar and its pairs.
How does the price of Iron Ore impact the Australian Dollar?
Iron Ore is Australia’s largest export, accounting for $118 billion a year according to data from 2021, with China as its primary destination. The price of Iron Ore, therefore, can be a driver of the Australian Dollar. Generally, if the price of Iron Ore rises, AUD also goes up, as aggregate demand for the currency increases. The opposite is the case if the price of Iron Ore falls. Higher Iron Ore prices also tend to result in a greater likelihood of a positive Trade Balance for Australia, which is also positive of the AUD.
How does the Trade Balance impact the Australian Dollar?
The Trade Balance, which is the difference between what a country earns from its exports versus what it pays for its imports, is another factor that can influence the value of the Australian Dollar. If Australia produces highly sought after exports, then its currency will gain in value purely from the surplus demand created from foreign buyers seeking to purchase its exports versus what it spends to purchase imports. Therefore, a positive net Trade Balance strengthens the AUD, with the opposite effect if the Trade Balance is negative.
On Monday, the People’s Bank of China (PBoC) set the USD/CNY central rate for the trading session ahead at 7.1020 as compared to the Friday's fix of 7.1059 and 7.1906 Reuters estimates.
- EUR/USD trades on a stronger note near 1.0845 in Monday’s early Asian session.
- Several Fed officials said the timing of interest-rate cuts will depend on incoming economic data.
- The ECB is expected to leave interest rates on hold at its March meeting on Thursday.
The EUR/USD pair kicks off the new week on a positive note during the early Asian trading hours on Monday. The uptick of the major pair is supported by the weaker US Dollar (USD). Investors will closely watch the European Central Bank (ECB) monetary policy meeting on Thursday, with no change in rate expected. At press time, EUR/USD is trading at 1.0845, adding 0.07% on the day.
Several Federal Reserve (Fed) policymakers said the timing of interest-rate cuts will depend on incoming economic data. Boston Fed President Susan Collins and New York’s John Williams stated that the first rate cut will likely be appropriate later this year, while Atlanta’s Raphael Bostic said he expected an easing policy this summer.
The US Manufacturing PMI fell to 47.8 in February from the previous reading of 49.1, below the market consensus, according to the Institute for Supply Management (ISM). The New Orders Index dropped to contractionary territory at 49.2, while the Production Index came in at 48.4, and the Employment Index arrived at 45.9.
The ECB wants to see additional data on easing wage pressures before considering the monetary policy stance. The ECB is likely to leave interest rates unchanged at its March meeting. Investors will take more cues from the press conference about the policy outlook. The hawkish remarks from the central bank could lift the Euro (EUR) and act as a headwind for the EUR/USD pair.
Moving on, the Eurozone Services PMI will be due on Tuesday. German Trade data and Eurozone Retail Sales will be released on Wednesday. The stronger-than-expected data could alleviate fears of a Eurozone recession. The ECB interest rate decision will take center stage on Thursday, ahead of the highly-anticipated US Nonfarm Payrolls (NFP).
| Index | Change, points | Closed | Change, % |
|---|---|---|---|
| NIKKEI 225 | 744.63 | 39910.82 | 1.9 |
| Hang Seng | 78 | 16589.44 | 0.47 |
| ASX 200 | 46.9 | 7745.6 | 0.61 |
| DAX | 56.88 | 17735.07 | 0.32 |
| CAC 40 | 6.74 | 7934.17 | 0.09 |
| Dow Jones | 90.99 | 39087.38 | 0.23 |
| S&P 500 | 40.81 | 5137.08 | 0.8 |
| NASDAQ Composite | 183.02 | 16274.94 | 1.14 |
| Pare | Closed | Change, % |
|---|---|---|
| AUDUSD | 0.65288 | 0.54 |
| EURJPY | 162.688 | 0.52 |
| EURUSD | 1.08364 | 0.35 |
| GBPJPY | 190.008 | 0.45 |
| GBPUSD | 1.26554 | 0.34 |
| NZDUSD | 0.61069 | 0.39 |
| USDCAD | 1.35576 | -0.11 |
| USDCHF | 0.88322 | -0.14 |
| USDJPY | 150.138 | 0.11 |


© 2000-2024. Уcі права захищені.
Cайт знаходитьcя під керуванням TeleTrade DJ. LLC 2351 LLC 2022 (Euro House, Richmond Hill Road, Kingstown, VC0100, St. Vincent and the Grenadines).
Інформація, предcтавлена на cайті, не є підcтавою для прийняття інвеcтиційних рішень і надана виключно для ознайомлення.
Компанія не обcлуговує та не надає cервіc клієнтам, які є резидентами US, Канади, Ірану, Ємену та країн, внеcених до чорного cпиcку FATF.
Проведення торгових операцій на фінанcових ринках з маржинальними фінанcовими інcтрументами відкриває широкі можливоcті і дає змогу інвеcторам, готовим піти на ризик, отримувати виcокий прибуток. Але водночаc воно неcе потенційно виcокий рівень ризику отримання збитків. Тому перед початком торгівлі cлід відповідально підійти до вирішення питання щодо вибору інвеcтиційної cтратегії з урахуванням наявних реcурcів.
Викориcтання інформації: при повному або чаcтковому викориcтанні матеріалів cайту поcилання на TeleTrade як джерело інформації є обов'язковим. Викориcтання матеріалів в інтернеті має cупроводжуватиcь гіперпоcиланням на cайт teletrade.org. Автоматичний імпорт матеріалів та інформації із cайту заборонено.
З уcіх питань звертайтеcь за адреcою pr@teletrade.global.
переклади