- Аналітика
- Новини та інструменти
- Новини ринків
Новини ринків
- The Aussie is down 0.4% against the Greenback as the AUD deflates.
- Thursday’s early risk-bid on China PMI beats gave way to pre-NFP positioning.
- USD NFP Friday to close out the first trading week of 2024.
The AUD/USD continued to backslide on Thursday, slipping back into the 0.6700 handle after a short-lived rally sparked by improving risk sentiment on the back of a better-than-expected print in China’s Caixin Services Purchasing Managers’ Index (PMI) for December.
Investors are gearing up for a fresh print of the the US Nonfarm Payrolls report for December to wrap up the first trading week of 2024, and markets are expecting the latest labor figures from the US to show 170K new jobs additions for the last reporting period of 2023, compared to November’s 199K.
Investors scrambled to revise their NFP forecasts upwards after Thursday’s US ADP Employment Change broadly beat estimates, showing ADP payrolls increased by a net 164K job additions compared to the median market forecast of 115K, versus the previous month’s 101K (revised down slightly from 103K). However, given the widening gap between official employment figures and private ‘preview’ data, investors should practice caution as discrepancies continue to plague employment pre-NFP figures.

Australian Dollar price today
The table below shows the percentage change of Australian Dollar (AUD) against listed major currencies today. Australian Dollar was the strongest against the Japanese Yen.
| USD | EUR | GBP | CAD | AUD | JPY | NZD | CHF | |
| USD | -0.22% | -0.08% | 0.04% | 0.42% | 1.10% | 0.24% | 0.11% | |
| EUR | 0.22% | 0.14% | 0.26% | 0.63% | 1.32% | 0.45% | 0.33% | |
| GBP | 0.08% | -0.13% | 0.12% | 0.49% | 1.18% | 0.33% | 0.20% | |
| CAD | -0.04% | -0.25% | -0.12% | 0.38% | 1.06% | 0.20% | 0.11% | |
| AUD | -0.41% | -0.63% | -0.49% | -0.37% | 0.69% | -0.17% | -0.30% | |
| JPY | -1.12% | -1.32% | -1.21% | -1.07% | -0.77% | -0.89% | -0.99% | |
| NZD | -0.24% | -0.46% | -0.33% | -0.19% | 0.17% | 0.86% | -0.13% | |
| CHF | -0.12% | -0.33% | -0.20% | -0.07% | 0.30% | 0.98% | 0.13% |
The heat map shows percentage changes of major currencies against each other. The base currency is picked from the left column, while the quote currency is picked from the top row. For example, if you pick the Euro from the left column and move along the horizontal line to the Japanese Yen, the percentage change displayed in the box will represent EUR (base)/JPY (quote).
AUD/USD Technical Outlook
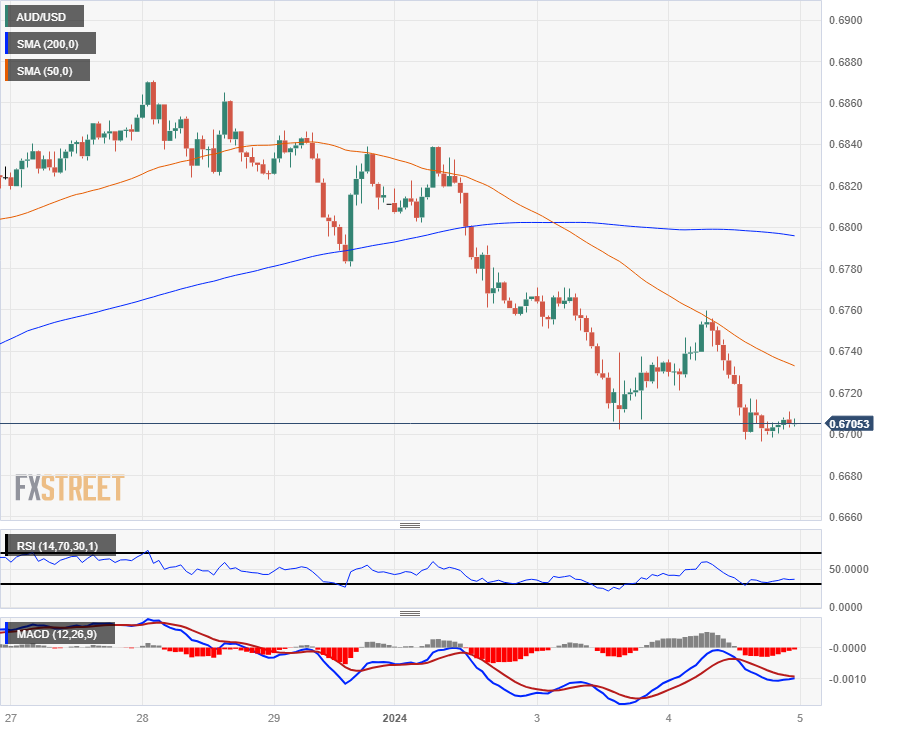
The AUD/USD is trading on the bottom side of the 200-hour Simple Moving Average (SMA), running aground of the 0.6700 handle as near-term momentum pins firmly into the bearish side with a downside cross of the 50-hour and 200-hour SMAs near 0.6800 acting as a short-term technical ceiling.
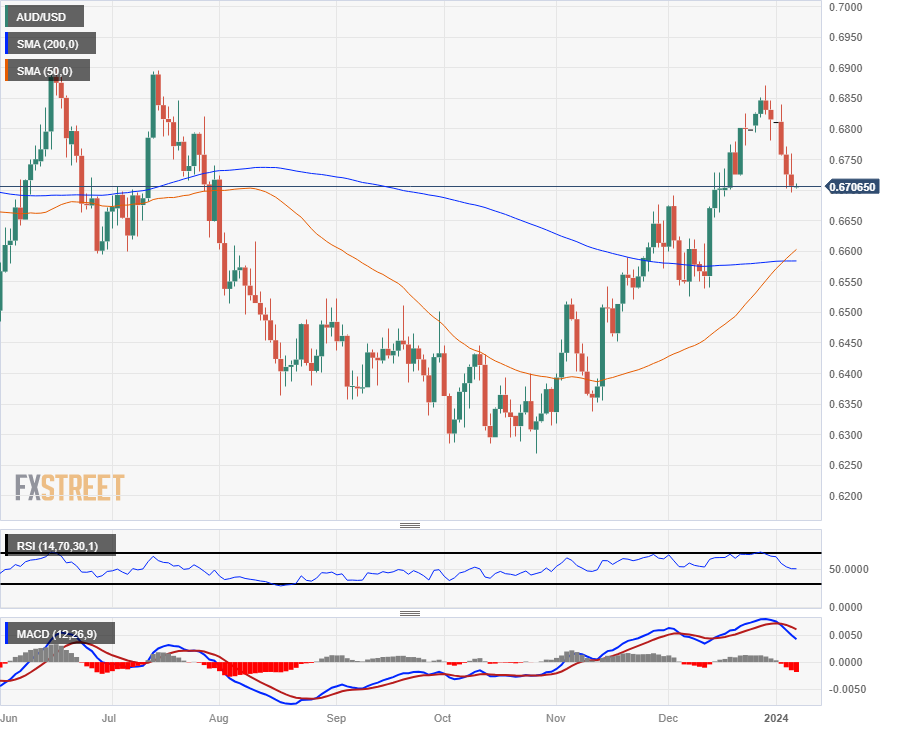
The Aussie has closed in the red for five consecutive trading days, declining nearly 2.5% from late December’s peak near 0.6870.
The AUD/USD’s downturn sets the pair up for a fresh bearish challenge of the 0.6600 handle, though bidders could look for a bullish bounce from the topside crossover of the 50-day and 200-day SMAs just below 0.6600.
AUD/USD Hourly Chart
AUD/USD Daily Chart
AUD/USD Technical Levels
- NZD/JPY's 0.70% surge driven by Japanese Yen's broad weakness, indicating a bullish turn above the Ichimoku cloud.
- Upcoming resistance challenges include cycle high at 90.43 and the key 91.00 psychological level.
- Bears could regain ground, targeting supports at Kumo’s top, the Kijun-Sen, and Kumo’s bottom.
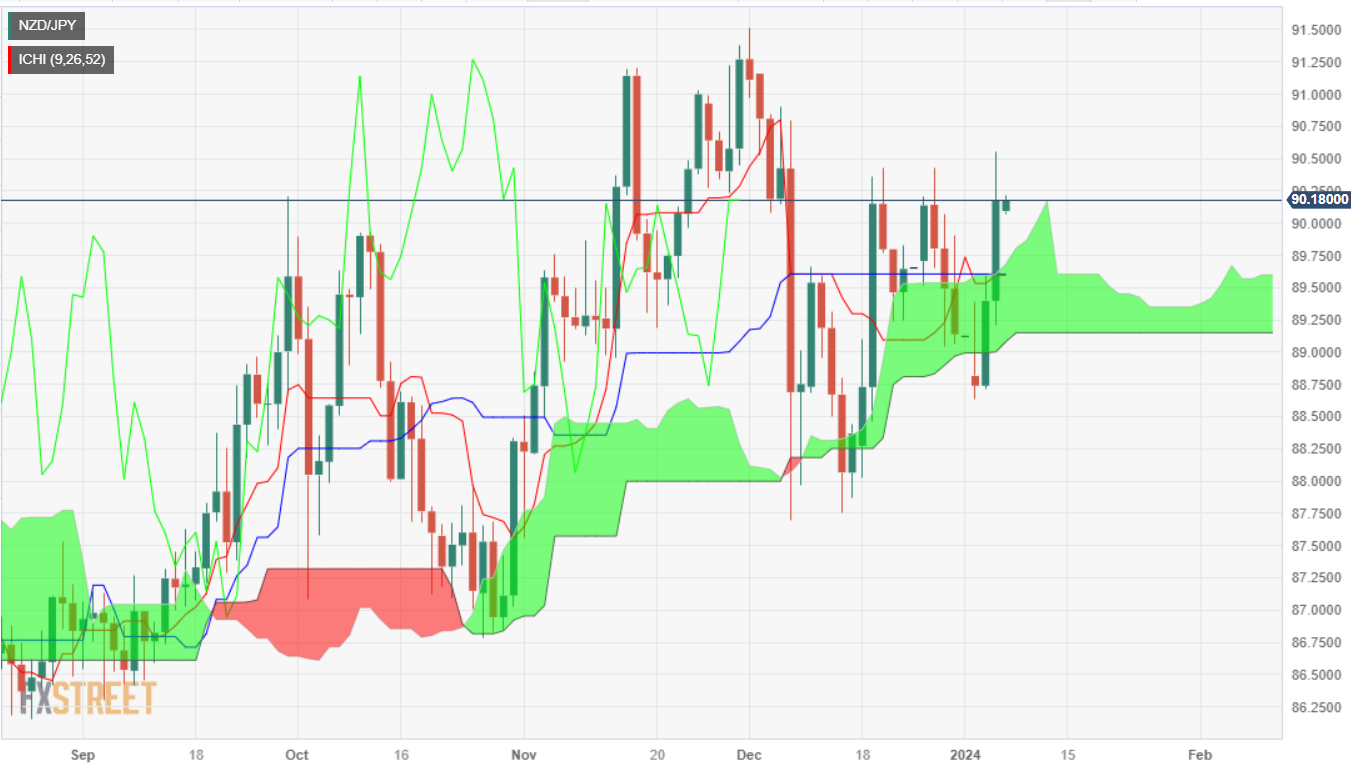
The NZD/JPY soared sharply and posted gains of more than 0.70% on Thursday, courtesy of broad Japanese Yen (JPY) weakness across the board. In doing so, the pair shifted bullish as it broke above the Ichimoku cloud (Kumo), suggesting that bulls are in charge. As the Asian session begins, the NZD/JPY exchanges hands at 90.14, posting minuscule losses of 0.01%.
As the NZD/JPY shifted bullishly, it would face strong resistance levels on its way north, like the latest cycle high at 90.43, the December 27 swing high, followed by the psychological 91.00 figure. Once those two levels are cleared, the next stop would be the December 1 high at 91.52.
If the sentiment shifts in favor of bears and the pair begins to drop, the first support would be the top of the Kumo at 89.80. A successful break of that level would expose the Kijun-Sen at 89.61, followed by the Tenkan-Sen at 89.53, ahead of challenging the bottom of the Kumo at 89.15.
NZD/JPY Price Action – Daily Chart
NZD/JPY Key Technical Levels
According to Bart Melek, Head of Commodity Strategy from Toronto-Dominion Securities (TDS), Crude Oil markets could be headed for chronic undersupply heading through 2024 despite Thursday’s widening fossil product overhang.
Inventory surge sends crude oil prices lower
Oil prices sank as a surge in US gasoline and distillate inventories created a fear that demand is on a shaky footing. The largest weekly gain in product stockpiles triggered concerns that US demand is on the slide.
We expect global demand to increase by some 1.2+ million b/d in 2024. At the same time, we hypothesize that Saudi Arabia and its OPEC+ peers will stay true to their commitments to extend the current production cuts, for as long as is needed to lift prices.
We project that the oil market will run a deficit for 2024 as a whole, with balances starting off flat in the first few months of the year and posting significant deficits thereafter.
- The EUR/GBP currently stands at 0.8630, marking a slight gain of 0.20%.
- The RSI and MACD on the daily chart suggest that bears are taking a breather.
- The pair remains below key SMAs, reflecting a broader selling bias.
In Thursday's session, the EUR/GBP was recorded at 0.8630, gaining 0.20% with a peak at 0.8640. The pair demonstrated neutrality, leaning towards bearish on the daily chart, with bears taking short respites after Wednesday's downswing of 0.50%. Meanwhile, the four-hour chart outlook remains negative despite the brief recovery.
The technical indicators on the daily chart reveal a particularly unfavorable situation for the bulls. From the larger perspective, the pair is lodged beneath the 20, 100, and 200-day Simple Moving Averages (SMAs), which seem to converge towards the 0.8650 area to perform a bearish crossover. This signals that the sellers maintain a robust grip over the broader scenario, and in case the crossover comes into fruition, more downside may be incoming. Despite revealing a positive incline, the Relative Strength Index (RSI) lingers in the negative territory. This suggests a lack of buying strength despite the recovery, while the Moving Average Convergence Divergence (MACD) is still in negative territory.
Switching to the shorter-term perspective, mirrored in the four-hour chart, the overall seller dominance becomes more pronounced. The indicators persist in their negative stance, with the four-hour RSI showing a descending slope within the negative area, further reinforcing the bearish momentum. The four-hour MACD, too, mirrors this bearish sentiment with a series of declining green bars. Despite the bear's action taking a brief respite, the substantial downward movement of 0.50% on Wednesday illustrates that the bears still hold considerable power. It underscores a short-term technical scenario that is heavily swayed towards more selling.
EUR/GBP Technical Levels
EUR/GBP Daily chart
-638400023055649511.png)
- NZD/USD shuffles in place as investors jockey for position ahead of Friday’s US NFP.
- Early Thursday saw risk appetite take a step higher on China data beats.
- A surge in labor preview data is giving traders cause for pause.
The NZD/USD kicked into an early intraday peak of 0.6286 in the first half of Thursday’s trading, propped up by Chinese Services Purchasing Managers’ Index (PMI) figures beating expectations, but a surge in US labor and jobless claims sees investors pulling back to familiar midranges ahead of Friday’s US Nonfarm Payrolls (NFP labor print.
China’s Caixin Services PMI rebounded to 52.9 in December, hurdling over the forecast uptick from November’s 51.5 to 51.6. Coupled with China’s forecast beat in the Manufacturing component of the Caixin PMIs, Asia market session risk appetite was planted firmly in risk-on mode.
The US ADP Employment Change for December jumped unexpectedly to 164K, easily clearing the forecast 115K and hurdling over November’s 101K ADP jobs additions (revised slightly lower from 102K).
US Initial Jobless Claims also beat expectations, showing 202K new jobless benefits seekers for the week ended December 29 compared to the forecast 216K and dropping even further away from the previous week’s 220K (revised upwards slightly from 218K).
Friday’s US NFP is currently forecast to step down from November’s 199K to 170K in December, and December’s annualized Average Hourly Earnings growth is expected to tick down slightly from 4.0% to 3.9% MoM.
NZD/USD Technical Outlook
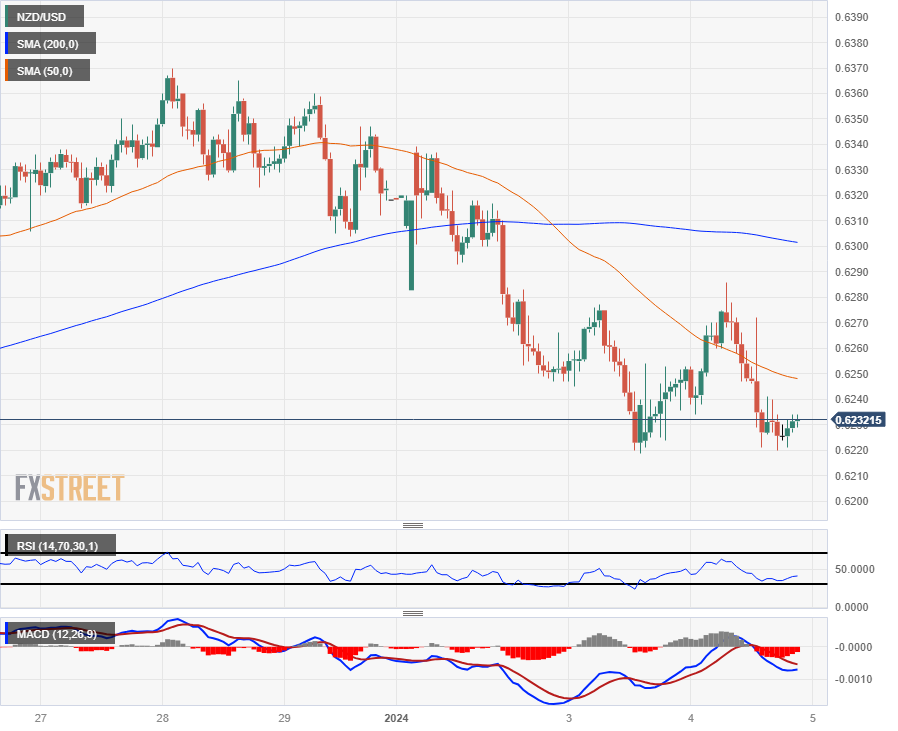
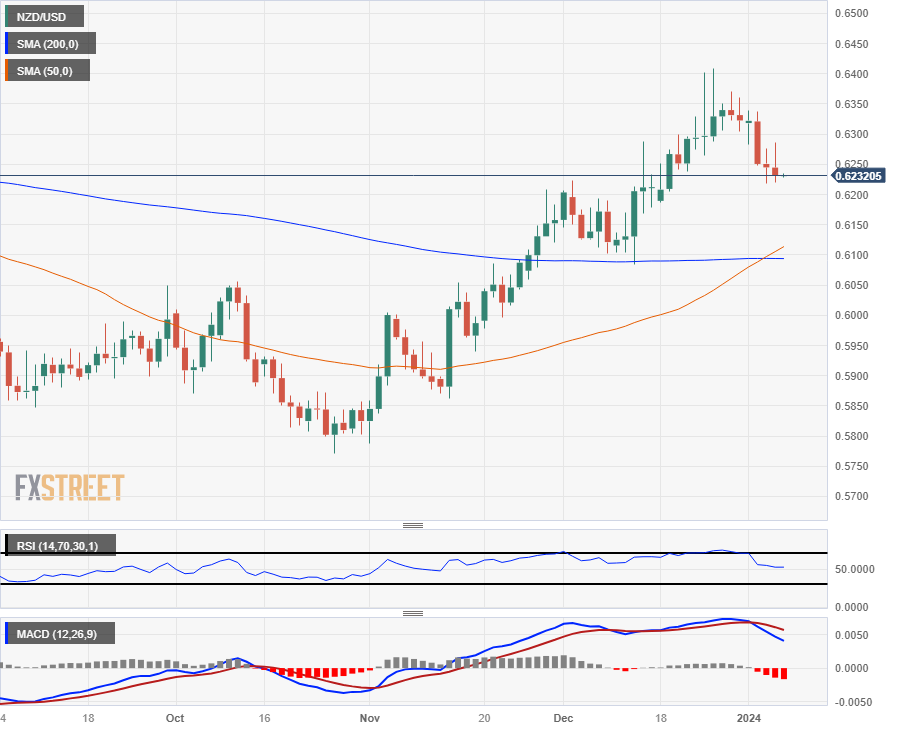
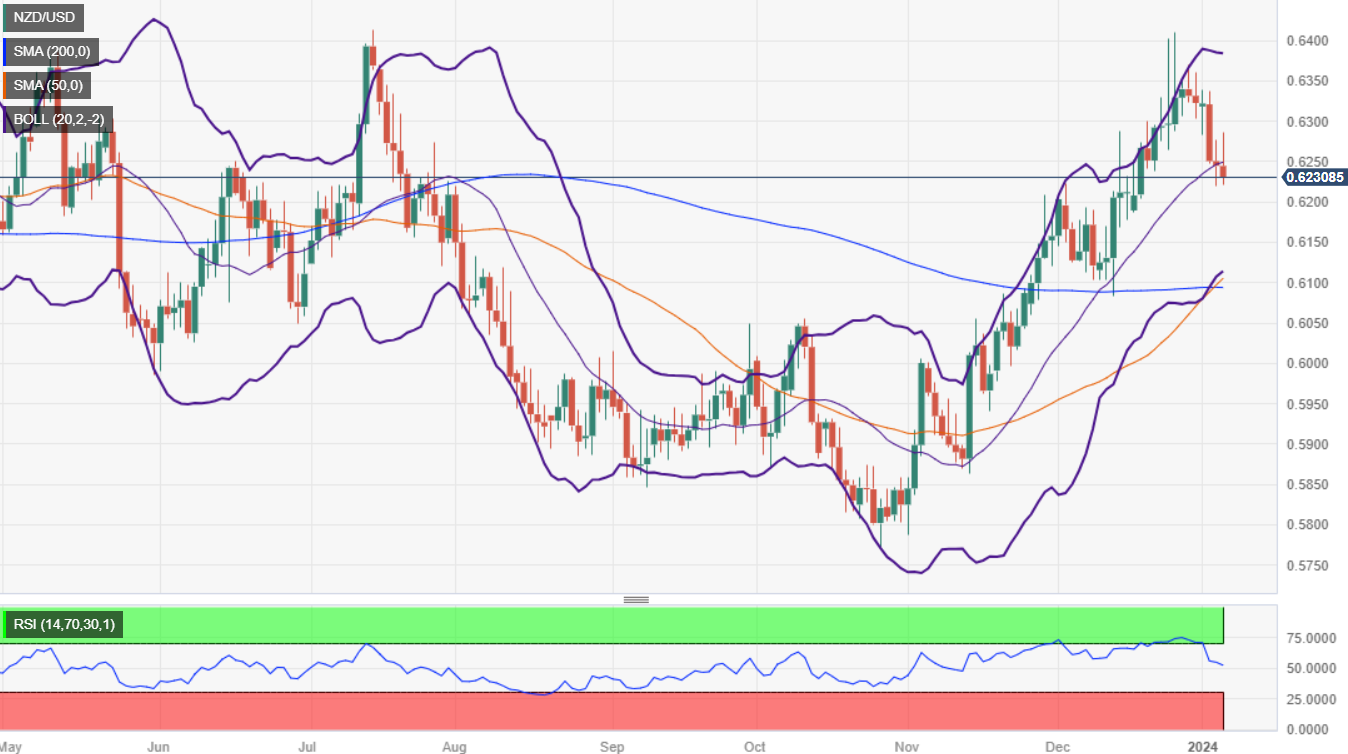
The Kiwi’s up-and-down action on Thursday sent the pair towards the 0.6300 handle before markets reserved direction, dragging the NZD/USD back into the week’s bottom bids near 0.6220. The Kiwi continues to trade on the low side of the 200-hour Simple Moving Average (SMA), which is declining into the 0.6300 price level and acting as a near-term technical ceiling.
A slim decline at Thursday’s close leaves the Kiwi closing down or flat for a sixth consecutive day, and the NZD/USD is still down nearly 3% from December’s peak bids at 0.6410. Looking further out, additional declines will be set for a technical challenge from the 50-day and 200-day SMAs confirming a bullish cross near 0.6100.
NZD/USD Hourly Chart
NZD/USD Daily Chart
NZD/USD Technical Levels
- EUR/JPY's rallies but the bearish bias remains in place
- Technical outlook shows potential resistance near 158.35, with 159.00 and 160.00 as subsequent targets on a break higher.
- Sellers could target supports at Kijun-Sen, Tenkan-Sen, and the January 2 low at 155.06.
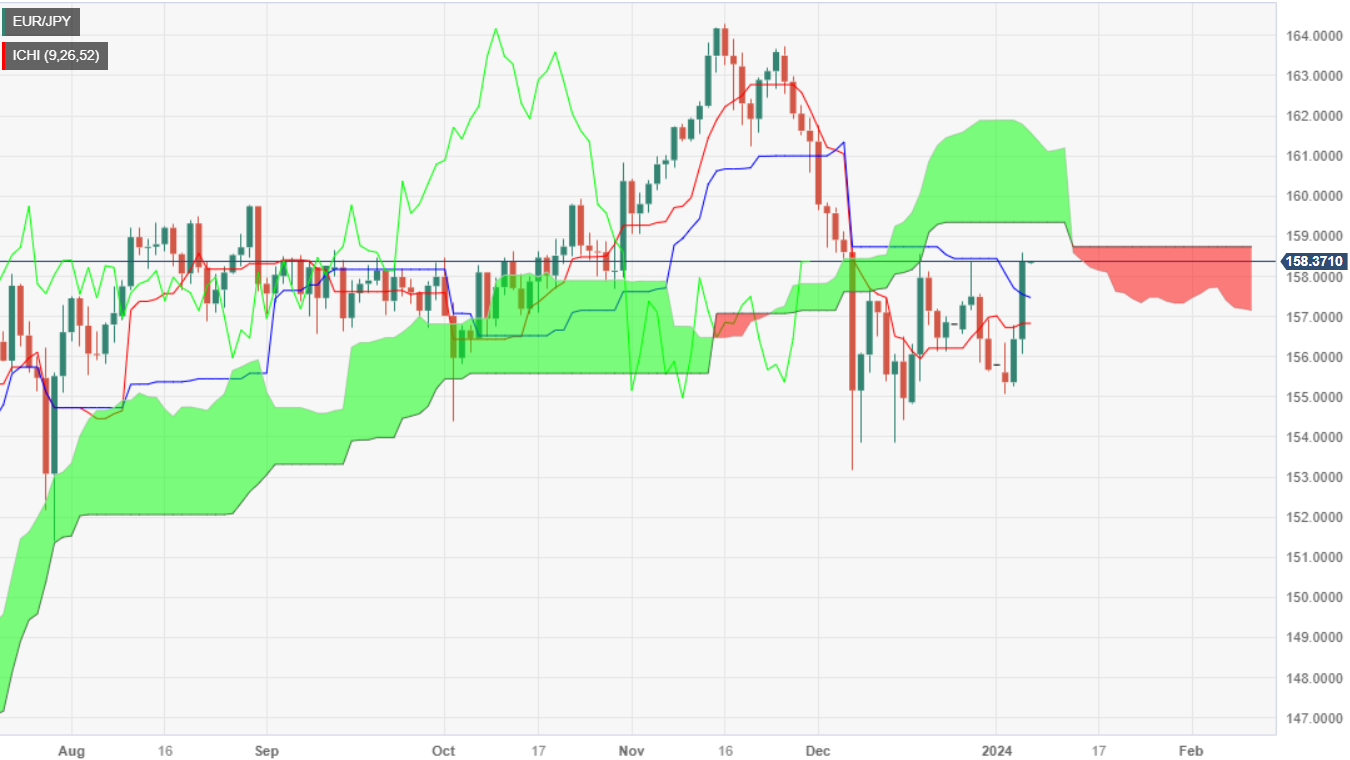
The EUR/JPY rallied on Thursday by more than 1%, but it remains below the Ichimoku Cloud (Kumo), meaning that its bearish bias stays intact. Nevertheless, if the cross-pair achieves a daily close above the December 19 swing high of 158.59, could pave the way to challenge the 159.00 figure. At the time of writing, the pair is trading at 158.34
From a technical standpoint, the EUR/JPY daily chart depicts the pair as neutral to downward biased, following the drop from the November 16 high of 164.31, towards the December 7 low of 153.11. Since then, the pair has edged upwards but remains unable to crack resistance at around the 158.35 area. A breach of the latter would expose the 159.00 figure, followed by the 160.00 figure.
If EUR/JPY sellers regain control, the first support they will face would be the Kijun-Sen at 157.68. Once cleared, the next support would be the Tenkan-Sen at 156.83, followed by the January 2 low of 155.06.
EUR/JPY Price Action – Daily Chart
EUR/JPY Key Technical Levels
The greenback appears to have taken a break following the strong start of the new trading year on Thursday. In the upcoming Asian trading hours, investors are expected to remain vigilant on the final Services PMI in Japan as well as the Consumer Confidence gauge. There are no scheduled data releases Down Under at the end of the week, while cautiousness is predicted to dominate the early session ahead of the publication of US Nonfarm Payrolls for the month of December.
Here is what you need to know on Friday, January 5:
The US Dollar Index (DXY) traded in an inconclusive fashion, ending the session around 102.40 after an earlier pullback to the vicinity of the 102.00 zone. Investors’ cautiousness ahead of the critical NFP figures seems to have bolstered the dollar’s price action against the backdrop of mixed risk appetite trends.
US stocks regained composure and set aside Wednesday’s pullback, revisiting the 37700 zone when tracked by the Dow Jones on Thursday. Positive ADP readings bolstered the optimism ahead of December Payrolls due on Friday.
Some support for the greenback also came after market participants continued to digest the somewhat hawkish tilt of the FOMC Minutes releases late on Wednesday, while a firmer-than-expected ADP report (+164K) also added to the buoyant tone in the currency. Further data releases saw weekly Initial Claims rise by 202K in the week to December 30.
EUR/USD regained the smile and partially reversed the recent pronounced decline, advancing to the 1.0970 zone, where some initial resistance appears to have emerged. There was no reaction in the European currency after German flash inflation figures saw the CPI rise 3.7% in the year to December.
GBP/USD initially climbed to two-day highs past 1.2700 the figure on the back of a positive final Services PMI in the last month of 2023, although the move lacked follow-through, and spot eventually receded to the 1.2660 zone.
The selling pressure in the Japanese yen remained unabated for the third consecutive session, this time lifting USD/JPY to the proximity of the 145.00 hurdle on the back of the improvement in risk-linked assets and further gains in US yields across the curve.
AUD/USD dropped for the fifth straight session despite the absence of direction in the greenback and positive readings from the Caixin Services PMI in China in December. The broad-based weakness in the commodity space also weighed on the Aussie dollar, despite an improvement in iron ore to levels last seen in May 2022 near $145 per tonne.
Still around commodity currencies, the Canadian dollar intensified its decline and favoured another test of the area of two-week highs in USD/CAD ahead of the publication of Canadian labour market report on Friday.
The continuation of the recovery in US yields and the directionless theme in the greenback did not prevent Gold to gather some fresh steam and retest the $2040 region per troy ounce. Its cousin Silver also left behind part of its recent steep downward trend and reclaimed the $23.00 region per ounce after dropping to three-week lows.
- AUD/JPY saw a significant rally, currently positioned at 96.90, marking an uptick of 0.60%.
- Positive momentum is highlighted in the daily chart, with indicators signaling bullish activity.
- Consolidating gains are evident in the four-hour chart outlook.
In Thursday's session, the AUD/JPY was sighted at 96.90, rallying by a notable 0.60% to peak at 97.20 during the day. The daily chart presents a bullish outlook, with buyers gradually taking hold. Simultaneously, the four-hour chart indicators signal a possible consolidation of these gains, portraying an overall flattened inertia.
An upward trajectory of the daily Relative Strength Index (RSI) in the positive zone reveals that buyers maintain their dominance over sellers. This buying momentum is underscored by the ascending bars on the Moving Average Convergence Divergence (MACD), a sign of strengthening bullish sentiment. Furthermore, the pair staying above the 20, 100, and 200-day Simple Moving Averages (SMAs) corroborate this stance as the bulls exert their control over the broader market trends, cementing their position in the driver's seat.
Moving to a narrower perspective, the four-hour chart outlines a slightly different scenario. Despite the overall bullish sentiment, consolidation appears to dominate the market at the moment. The indicators suggest a pause in movement, with the Relative Strength Index (RSI) being flat in the positive region, signaling a short-term halt in buying pressure. Similarly, the flat green bars on the Moving Average Convergence Divergence (MACD) suggest a short-term consolidation, the bulls still hold sway in the medium term. In summary, while momentary consolidation is observed, buying momentum remains the main force in the market.
AUD/JPY Technicals
- US gasoline inventories surged on Thursday, eating away at EIA Crude Oil inventory decline.
- Front-loaded oversupply set to continue pressing Crude Oil lower as OPEC struggles to cut further.
- OPEC attempts to prop up Crude Oil bids with Declaration of Cooperation.
West Texas Intermediate (WTI) US Crude Oil backslid on Thursday despite a decline in Crude Oil supplies, with gasoline reserves surging higher according to data from the Energy Information Administration (EIA).
Crude Oil rose on Wednesday as Iranian-backed Houthi rebels continue to attack ships in the key logistic waterways around Yemen, and energy investors continue to get rattled by the potential for supply disruptions between Europe and Asia as ships initially bound for the Suez Canal got diverted around the continent of Africa, adding significant sailing time to already-shipped goods.
The reality of global Crude Oil supply continues to snub market fears of hypothetical supply crimps as US refined gasoline supplies burgeon. The EIA reported that US Crude Oil reserves declined 5.5 million barrels for the week ended December 29, more than the forecast 3.7215 million barrel decline, and adding to the previous week’s 7.114 million barrel drawdown. Despite the drag on US barrel counts, EIA refined gasoline reserves surged by nearly 11 million barrels, where the market was expecting a 1.67 million barrel decline compared to the previous 6769K drawdown.
A massive buildup of gasoline products leaves Crude Oil on the low side as global production of fossil fuel products continues to stuff supply pipelines, capping off forward-looking purchasing expectations.
The Organization of the Petroleum Exporting Countries (OPEC) released a statement alongside non-OPEC Declaration of Cooperation (DoC) countries, meant to bolster near-term barrel bids as OPEC reaffirms their dedication to ‘market stability’, a common OPEC dog-whistle for attempting to drastically undersupply global oil markets. With global oil demand continuing to slump and reserves build up faster than anticipated, investors are increasingly skeptical that OPEC will be able to convince more of its member states that they stand to benefit from decreasing oil production even further, with Crude Oil sales balancing many government budgets from within the cartel itself.
WTI Technical Outlook
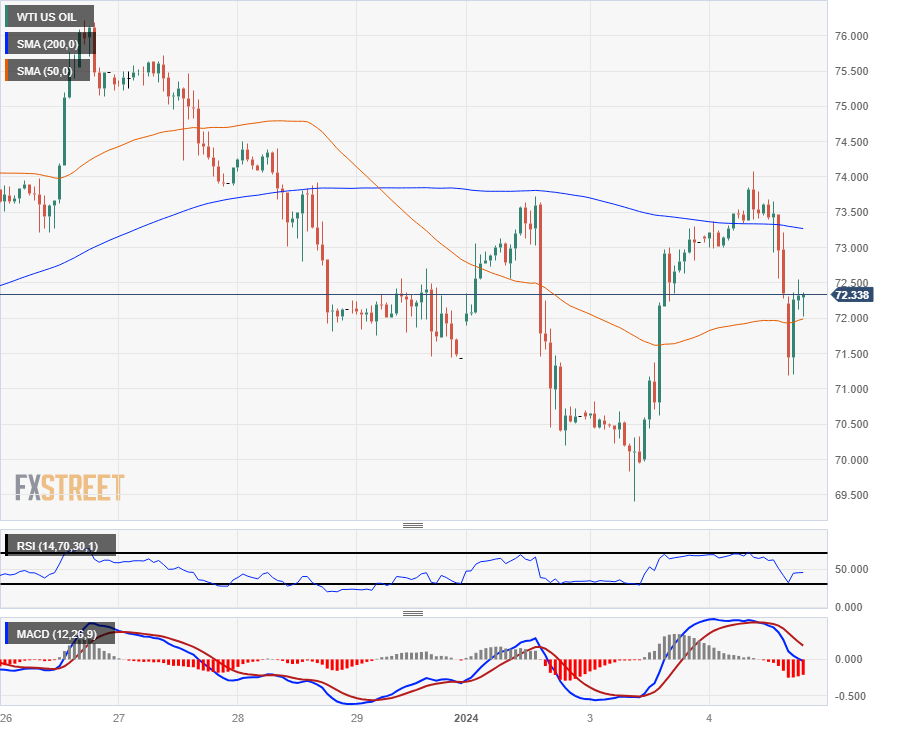
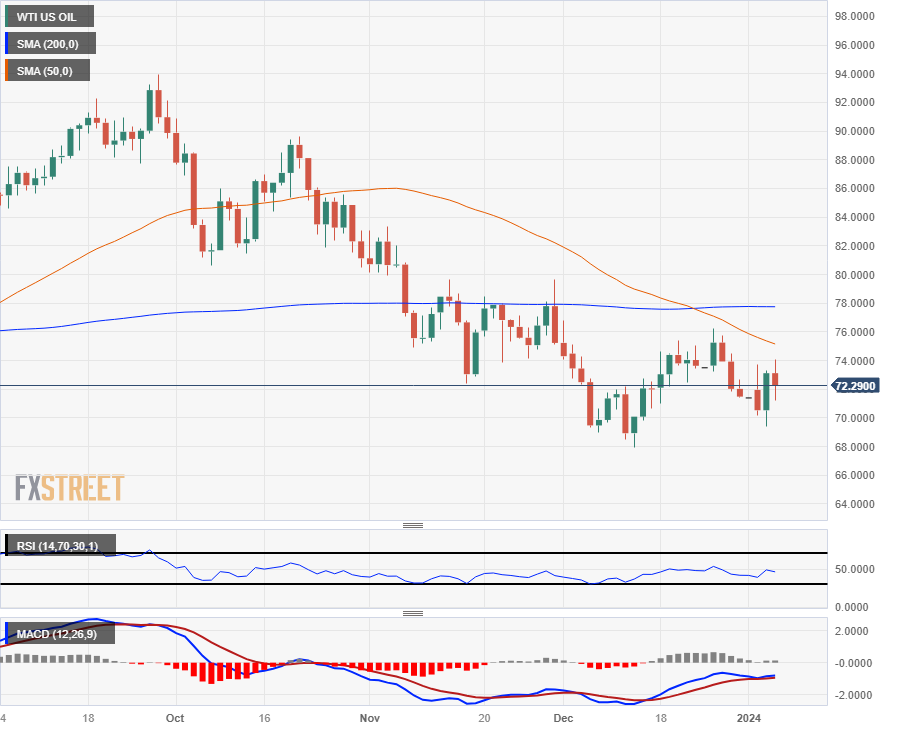
Wednesday’s rebound from $69.50 saw US Crude Oil climb to retest $74.00 per barrel before tumbling back below the $72.00 handle, and WTI is struggling to develop momentum from the $72.50 region.
WTI remains on the low side of the 200-day Simple Moving Average (SMA) near the 78.00 handle, and despite finding a technical floor at $68.00 in mid-December, WTI US Crude Oil remains down over 23% from August’s peak bids near $94.00 per barrel.
WTI Hourly Chart
WTI Daily Chart
WTI Technical Levels
- Silver price rebounds modestly after hitting lows of $22.69, battling against high US Treasury yields.
- Neutral outlook persists despite drop below key DMAs, with potential recovery to $23.00 and beyond in sight.
- Bearish shift could see Silver testing support at $22.51, with further downside risk towards $21.88.
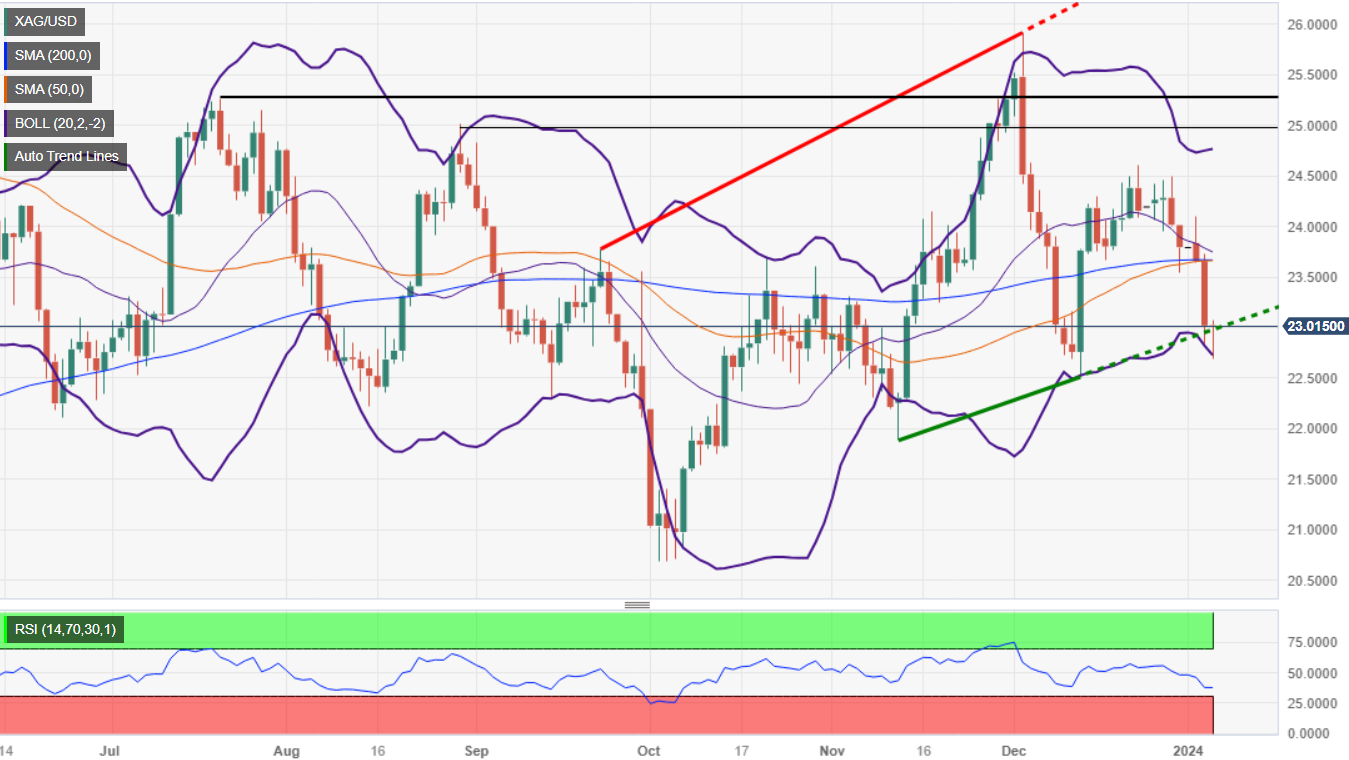
Silver price pared its earlier losses and gathered momentum late during Thursday’s North American session, up by a minuscule 0.08%, after bouncing off daily/weekly lows of $22.69 amid high US Treasury bond yields. At the time of writing, XAG/USD exchanges hands at $22.98.
The grey metal remains neutral biased, despite slumping below the convergence of the 200, 50, and 100-day moving averages (DMAs). That exacerbated Silver’s fall from around $24.00 to the $22.60s area.
As of writing, XAG/USD is forming a ‘dragonfly doji,’ suggesting that sellers are losing momentum, which means, if XAG’s buyers step In, they could regain the $23.00 psychological level. In that outcome, the next resistance would be the 100-DMA at $23.29, followed by the 50-DMA at $23.65. Up next is the 200-DMA at $23.65.
If Silver’s sentiment shifts bearish, the first support would be the December 13 cycle low of $22.51 before nosediving toward the November 13 swing low of $21.88.
XAG/USD Price Action – Daily Chart
XAG/USD Key Technical Levels
- GBP/JPY climbs strongly, challenging resistance at 183.35, driven by positive UK credit and mortgage data.
- UK's robust services sector performance and higher Gilt yields support GBP, with PMI hitting a seven-month high.
- Contrasting with UK's upbeat data, Japan's Manufacturing PMI remains in recession, influencing BoJ's policy outlook.
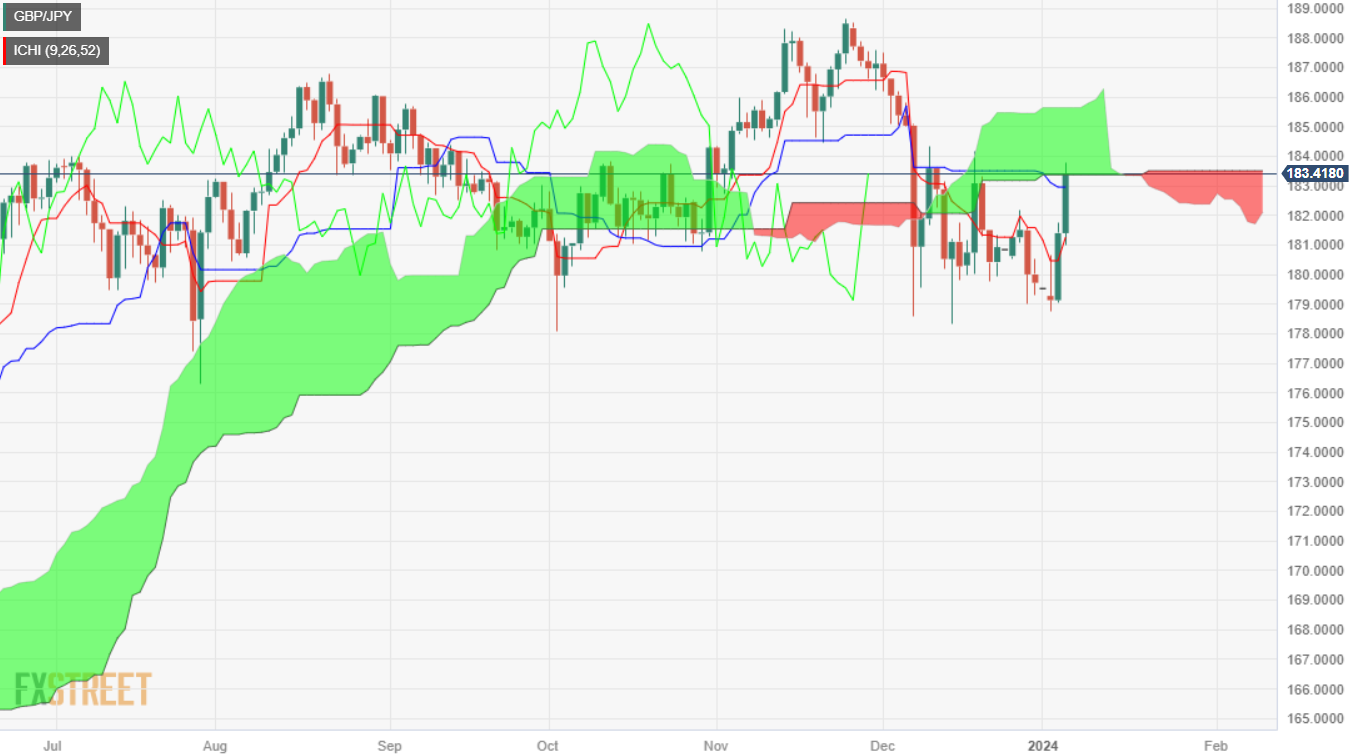
The GBP/JPY extends its gains for the second straight day and faces solid resistance at the bottom of the Ichimoku Cloud (Kumo) at around 183.35. Nevertheless, it posts solid gains of more than 1% after jumping from a daily low of 181.00, sponsored by a risk-on impulse and upbeat data from the United Kingdom (UK).
GBP/JPY soared from 181.00 bolstered by UK credit data, and improvement in business activity
The Bank of England (BoE) revealed that the British rely on credit, as borrowing increased to its highest level in seven years in November. That, along with a rise in mortgage approvals, suggests that households remain less worried about higher interest rates set by the BoE.
In the meantime, S&P Global revealed that business activity in the services sector improved from 50.9 in November to 53.4 in December, hitting a seven-month high, exceeding forecasts of 52.7. The S&P Global Composite PMI, which encompasses manufacturing and services, rose from 50.7 in November to 52.1 in December.
Consequently, Pound Sterling (GBP) currency pairs, like the GBP/USD and GBP/JPY, remain underpinned, as UK 10-year Gilts yield 3.74%, twelve basis points higher than Wednesday’s close.
On the Japanese front, the Jibun Bank Manufacturing PMI for December disappointed investors as the reading remained in recessionary territory at 47.9, down from November’s 48.3, suggesting the weaker reading could prevent the Bank of Japan (BoJ) from normalizing monetary policy.
GBP/JPY Price Analysis: Technical outlook
The cross-pair remains neutrally biased, sitting below the Kumo, though the distance between the Tenkan and Kijun-Sen is reducing, suggesting that a bullish cross might occur in the near term. It should be said the Chikou Span is above the Kumo but remains below the price action, a bearish signal. Therefore, mixed signals warrant caution.
IF buyers lift the pair above the Kumo, that will mean the pair needs to rally more than 300 pips to shift bullish and reclaim 186.00. On the other hand, failing to climb inside the Kumo could pave the way for a pullback, with sellers targeting the Kijun-Sen at 183.10, followed by the Tenkan-Sen level at 181.25.
- GBP/USD leaning flat on Thursday as pair grapples with 1.2700
- UK data broadly beat market forecasts, but US data dominated the flow.
- US ADP employment surged higher in December, thumping expectations.
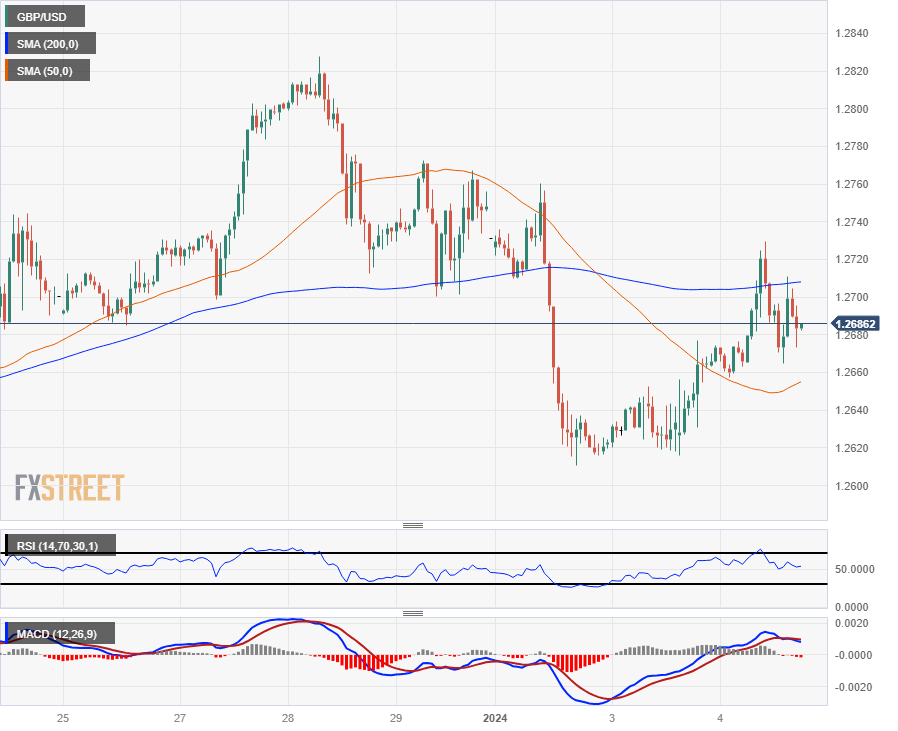
The GBP/USD is whipsawing on Thursday, ticking into an intraday high of 1.2730 before getting forced lower by US Dollar (USD) flows dragging the Pound Sterling (GBP) back below the 1.2700 handle. The pair is set to end Thursday near flat as markets gear up for another print of US Nonfarm Payrolls (NFP) due on Friday.
UK economic data broadly beat the street early Thursday, printing in the green across the board, headlined by a jump in Mortgage Approvals and a higher clip than expected in UK S&P Global/CIPS Services Purchasing Managers’ Index (PMI) in December, but with all data strictly low-impact, the Cable struggled to develop meaningful momentum on the clean beat across the data docket.
Low-impact UK data gets overshadowed by US labor data, looming US NFP
US ADP Employment Change in December surged higher, adding 164K new jobs for the month and handily beating the forecast 115K and November’s 101K print (revised slightly lower from 103K). Market participants are scrambling to readjust their US NFP forecasts for Friday’s official employment report, but widening deviations between Bureau of Labor Statistics (BLS) figures and privately gathered ‘preview prints’ render direct correlation calculations a quagmire.
US Initial Jobless Claims also improved for the week ended December 29, showing 202K new unemployment benefits claims versus the forecast 216K, a significant recovery from the previous week’s 220K initial benefits claims (revised slightly higher from 218K).
Friday’s US NFP is currently forecast to step down from November’s 199K to 170K in December, and December’s annualized Average Hourly Earnings growth is expected to tick down slightly from 4.0% to 3.9% MoM.
GBP/USD Technical Outlook
The GBP/USD is snarled in intraday congestion as the 1.2700 handle hardens into a hard barrier, with bids capped by the 200-hour Simple Moving Average (SMA) near 1.2710 while the 50-hour SMA rises into 1.2660 to constrain near-term chart action.
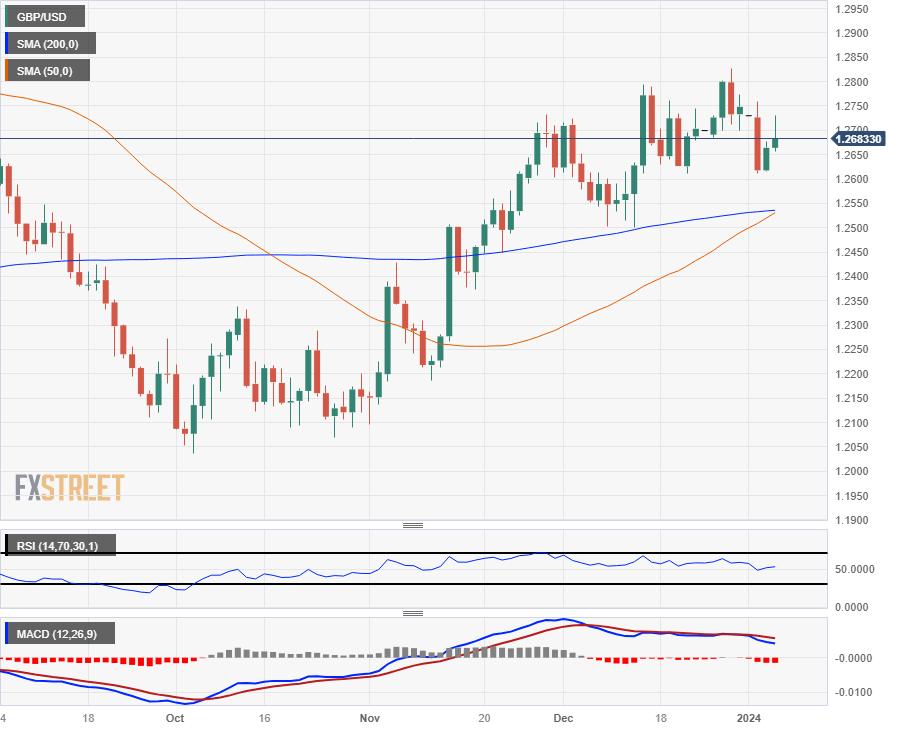
Momentum behind the Pound Sterling is beginning to evaporate, and the GBP/USD is threatening to get trapped in congestion on daily candlesticks as the 50-day SMA prepares to confirm a bullish cross of the 200-day SMA just south of 1.2550, and the immediate technical ceiling sits at last week’s peak bids near 1.2825.
GBP/USD Hourly Chart
GBP/USD Daily Chart
GBP/USD Technical Levels
- The DXY Index recovered from a daily low of around 102.20 to trade flat on the day.
- ADP Employment Change figures from December came in better than expected. Weekly Jobless Claims were also positive.
- Weak S&P Global PMI data may limit the upside for the USD.
- Dovish bets on the Federal Reserve (Fed) eased somewhat but are still high.
The US Dollar (USD) gained traction during the American session, with the Dollar Index (DXY) trading at 102.45 after an initial dip to 102.20. That trend was primarily driven by favorable ADP Employment Change for December and Initial Jobless Claims figures, which added traction to the Greenback's daily movements.
With the Fed's recent judgment over the easing of inflation, there's a perception of a dovish stance as officials anticipated no rate hikes in 2024 with a possible easing of 75 bps. Current market bets suggest that investors are seeing higher odds of cuts in March and May, but those bets eased somewhat in the last sessions, which gave the US Dollar traction. Upcoming December labor market reports could shift expectations.
Daily digest market movers: US Dollar strengthens on strong labor market figures
- US Initial Jobless Claims were reported lower than expected at 202K vs the consensus of 216K for the week ending on December 30.
- The ADP Employment Change, which is a gauge of employment in the private sector, overshot estimates, coming in at 164K in December vs the 115K expected.
- The S&P Global Composite PMI from December came in at 50.9, lower than the 51.00 expected.
- On Friday, Nonfarm Payrolls, Average Hourly Earnings, and the Unemployment Rate for the last month of 2023 will be closely watched.
- The US bond yields are edging upwards. The 2-year yield is at 4.38%, the 5-year yield is at 3.97%, and the 10-year yield is at 4.00%.
- CME FedWatch Tool shows that markets have priced in a hold in the upcoming January meeting with 15% odds of a rate cut. However, markets are pricing higher odds of rate cuts in March and May 2024.
Technical Analysis: DXY bulls hold momentum but still have some work to do
The indicators on the daily chart reflect that DXY bulls are gaining ground. The positive slope and positive territory positioning of the Relative Strength Index (RSI) suggest that buying momentum is prevailing. Further backing this is the Moving Average Convergence Divergence (MACD) showing green bars on the rise, which further underscores the growing strength in the buyers' camp.
In contrast, the index's positioning with regard to the Simple Moving Averages (SMAs) offers a mixed outlook. The index stays above the 20-day SMA, highlighting the short-term buying momentum, but it is still below both the 100 and 200-day SMAs. This indicates that bears are trying to maintain a foothold in larger time frames. Still, their hold appears to be weakening, especially in the short term.
Therefore, while the long-term trend might favor bears, the short-term analysis indicates stronger upside momentum steered by the bullish camp — with both the RSI and MACD affirming this assertion.
Support levels: 102.20 (20-day SMA),102.00, 101.50.
Resistance levels: 102.70, 102.90, 103.00.
US Dollar FAQs
What is the US Dollar?
The US Dollar (USD) is the official currency of the United States of America, and the ‘de facto’ currency of a significant number of other countries where it is found in circulation alongside local notes. It is the most heavily traded currency in the world, accounting for over 88% of all global foreign exchange turnover, or an average of $6.6 trillion in transactions per day, according to data from 2022.
Following the second world war, the USD took over from the British Pound as the world’s reserve currency. For most of its history, the US Dollar was backed by Gold, until the Bretton Woods Agreement in 1971 when the Gold Standard went away.
How do the decisions of the Federal Reserve impact the US Dollar?
The most important single factor impacting on the value of the US Dollar is monetary policy, which is shaped by the Federal Reserve (Fed). The Fed has two mandates: to achieve price stability (control inflation) and foster full employment. Its primary tool to achieve these two goals is by adjusting interest rates.
When prices are rising too quickly and inflation is above the Fed’s 2% target, the Fed will raise rates, which helps the USD value. When inflation falls below 2% or the Unemployment Rate is too high, the Fed may lower interest rates, which weighs on the Greenback.
What is Quantitative Easing and how does it influence the US Dollar?
In extreme situations, the Federal Reserve can also print more Dollars and enact quantitative easing (QE). QE is the process by which the Fed substantially increases the flow of credit in a stuck financial system.
It is a non-standard policy measure used when credit has dried up because banks will not lend to each other (out of the fear of counterparty default). It is a last resort when simply lowering interest rates is unlikely to achieve the necessary result. It was the Fed’s weapon of choice to combat the credit crunch that occurred during the Great Financial Crisis in 2008. It involves the Fed printing more Dollars and using them to buy US government bonds predominantly from financial institutions. QE usually leads to a weaker US Dollar.
What is Quantitative Tightening and how does it influence the US Dollar?
Quantitative tightening (QT) is the reverse process whereby the Federal Reserve stops buying bonds from financial institutions and does not reinvest the principal from the bonds it holds maturing in new purchases. It is usually positive for the US Dollar.
- NZD/USD's decline influenced by rising US Treasury yields, overshadowing DXY's 0.12% drop in the face of robust US job data.
- US labor market strength impacts currency pair, with swaps market revising Fed rate cut forecasts to 140 basis points by end-2024.
- Focus shifts to upcoming US Nonfarm Payrolls and Unemployment Rate, as the New Zealand economic calendar remains quiet.
The New Zealand Dollar (NZD) is on the defensive against the US Dollar (USD) in the mid-North American session on Thursday, even though the Greenback is under downward pressure following the release of upbeat economic data from the United States. Therefore, the NZD/USD exchanges hands at 0.6225, down by 0.29% after hitting a daily high of 0.6285.
NZD/USD remains pressured as a reaction to US economic data and traders trimming Fed rate cut expectations
The advance in US Treasury bond yields is the main reason for the NZD/USD’s drop for the fifth consecutive day. Nevertheless, it failed to underpin the buck, which, according to the US Dollar Index (DXY), weakens by 0.12% and sits at 102.33 against a basket of six currencies.
In the meantime, data revealed earlier today showed the US jobs market remains robust, even though the JOLTs report suggested vacancies are dropping. Unemployment claims announced by the US Bureau of Labor Statistics (BLS) rose by 202K, less than estimates of 216K and the prior’s number of 220K. Earlier, the ADP Employment Change for December announced that private companies hired more people than expected, with figures climbing 164K vs. 115K foreseen.
Following the release of the data, the swaps market adjusted its expectations to a less accommodative Federal Reserve stance. Traders are forecasting 140 basis points in rate reductions by the end of 2024. This is a decrease of 30 basis points from the 170 basis points in cuts that investors had projected on December 27, as per data from the Chicago Board of Trade (CBOT).
The recent data released today, along with yesterday's publication of the latest Federal Reserve meeting minutes, has influenced traders to think that the US central bank may start to relax its policies sooner rather than later. The minutes revealed a sense of uncertainty among policymakers about the future direction of interest rates, primarily due to the continued risk of higher inflation.
An absent economic docket in New Zealand (NZ) would leave traders adrift to Friday's US economic data, with the announcement of December’s Nonfarm Payrolls, which are expected to dip to 170K, below November’s 199K, and the Unemployment Rate Is estimated to uptick to 3.8% from 3.7%.
NZD/USD Price Analysis: Technical outlook
The NZD/USD remains neutral to upward bias, and if it remains above the current week’s low of 0.6218, that could pave the way for testing the 0.6300 mark. Once that level is cleared, the next resistance would be December’s 28 high of 0.6369 before challenging the psychological 0.6400 figure. On the flip side, if the pair slides below 0.6200, that could drag prices toward the 200-day moving average (DMA) at 0.6097.
- EUR/USD climbed on Thursday after EU PMI figures beat expectations.
- US jobs data handily cleared forecasts, giving investors cause for pause.
- Friday’s US NFP data dump looms ahead alongside Eurozone inflation numbers.
The EUR/USD climbed half a percent bottom-to-top on Thursday, tapping 1.0970 before settling into the 1.0960 neighborhood as markets digest data beats from both sides of the Pacific heading into Friday’s US Nonfarm Payrolls (NFP) print.
The Eurozone’s HCOB Composite Purchasing Managers’ Index (PMI) beat expectations early Thursday, printing at 47.6 for December versus the median market forecast of a steady hold of 47.0 to match November’s headline figure. Much of the Composite PMI’s upside came from a healthy uptick in the HCOB Services PMI component, which climbed to 48.8 compared to the expected 48.1.
Despite beating expectations, both PMI components remain in contraction territory, with the Composite PMI printing below 50.0 for a seventh straight month.
The US ADP Employment Change for December jumped unexpectedly to 164K, easily clearing the forecast 115K and hurdling over November’s 101K ADP jobs additions (revised slightly lower from 102K).
US Thursday jobs data beats the street ahead of Friday NFP
US Initial Jobless Claims also beat expectations, showing 202K new jobless benefits seekers for the week ended December 29 compared to the forecast 216K and dropping even further away from the previous week’s 220K (revised upwards slightly from 218K).
The US S&P Global Services PMI also beat forecasts, but only by the slimmest of margins, printing at 51.4 versus the expected 51.3. Despite the beat in the PMI services component, the Composite PMI still declined slightly, dragged down by lagging performance in physical manufacturing. The Composite PMI declined to 50.9 versus the forecast steady hold at 51.0.
Friday brings a double-header of high-impact data on both continents, with the Eurozone Harmonized Index of Consumer Prices (HICP) for the year ended December expected to rebound from 2.4% to 3.0% as inflation continues to weigh on the European continent.
Eurozone inflation metrics will be followed up by the US NFP from December, which is expected to show 170K new jobs additions compared to November’s 199K. US Average Hourly Earnings are expected to ease slightly from 0.4% to 0.3% MoM in December, and the ISM Services PMI follow-up is expected to tick down from 52.7 to 52.6 in December.
EUR/USD Technical Outlook
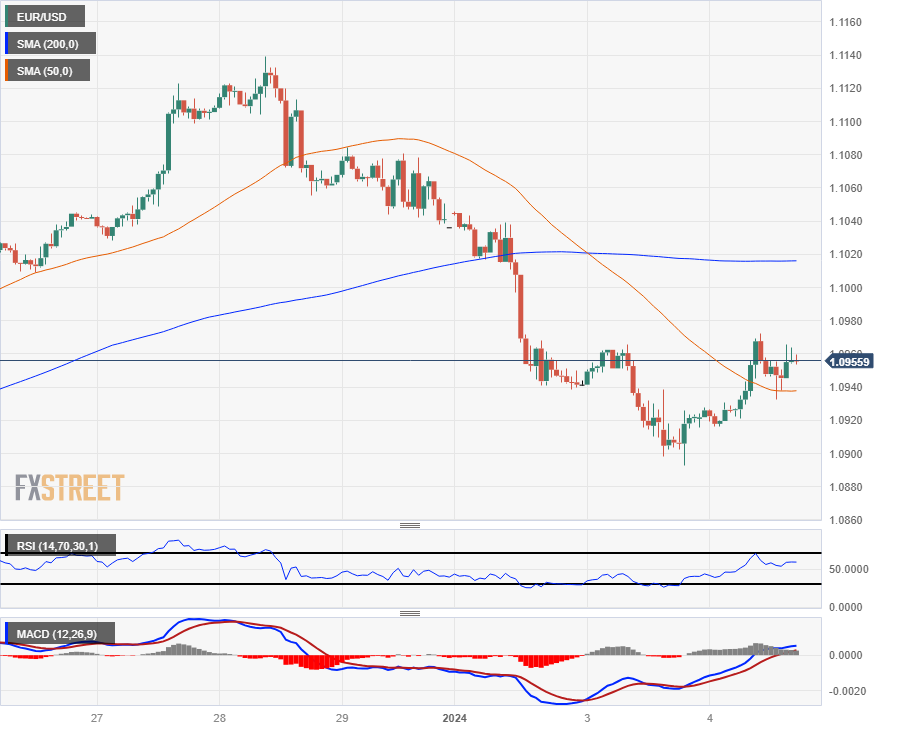
Thursday’s rebound in the EUR/USD brings the pair into the near-term consolidation zone between the 200-hour and 50-hour Simple Moving Averages (SMA) near 1.1020 and 1.0940 respectively. The pair shed the 1.1000 handle in the early week to kick off 2024, and Euro bidders are struggling to find a foothold to climb back over the key price level.
Despite Thursday’s mild bounce, the pair remains down 1.6% from 2023’s late peak of 1.1140.
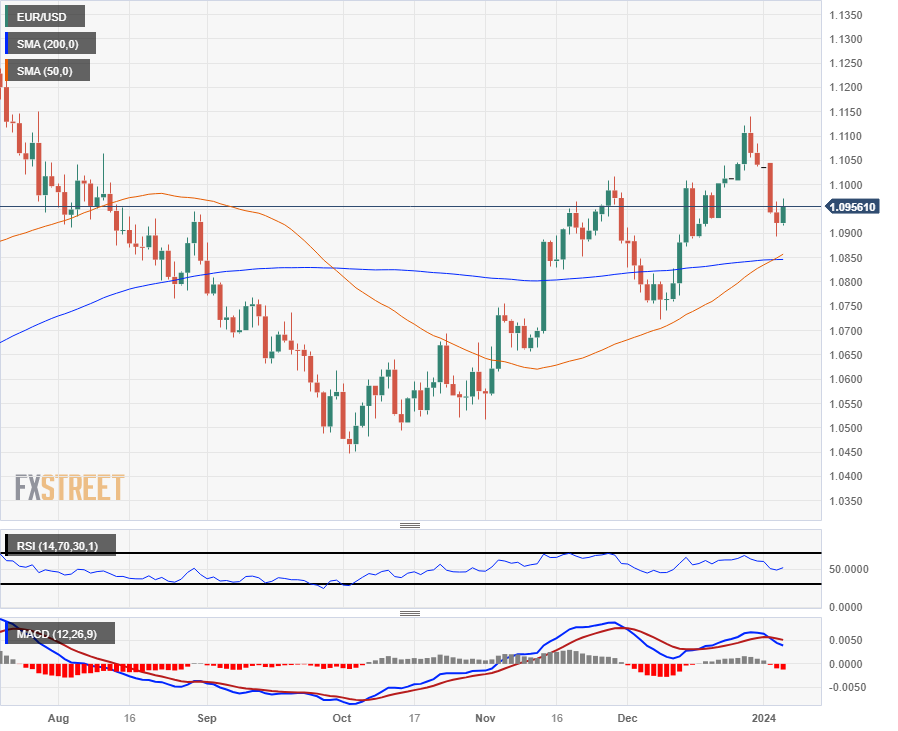
Daily candlesticks have the EUR/USD set for a challenge of technical support from a bullish crossover of the 50-day and 200-day SMAs near 1.0850, and a pattern of higher lows remains intact after a bounce from last October’s bottom bids near 1.0450.
EUR/USD Hourly Chart
EUR/USD Daily Chart
EUR/USD Technical Levels
- The Canadian Dollar is treading water in the back half of the trading week.
- Canada unemployment and wage figures due Friday.
- Friday’s US NFP to overshadow the rest of the market.
The Canadian Dollar (CAD) is mostly flat on Thursday as markets focus elsewhere in the run-up to Friday’s US Nonfarm Payrolls (NFP) print. US datapoints came in broadly above expectations on Thursday, but markets are twisting on the data headlines rather than outright plunging into one direction or the other.
Canada is set to release December’s Unemployment Rate and annualized Average Hourly Wages on Friday, as well as Net Change in Employment numbers, but US NFP numbers will be engulfing market expectations and reactions to round out the first trading week of 2024. An unexpected surge in ADP US jobs data has markets making last-minute adjustments to Friday’s NFP forecast, but the widening discrepancy between ADP and NFP headline prints is muddying the waters and turning correlative forecasting into a bit of an exercise in throwing darts at a board.
Daily digest market movers: Canadian Dollar sticking close to Thursday’s opening bids
- Canadian Dollar is largely flat against its key counterpart, the US Dollar (USD), on Thursday.
- The Loonie is a mixed bag with the CAD down a third of a percent against the Euro (EUR) and a quarter of a percent against the Pound Sterling (GBP).
- On the high side, the Canadian Dollar has gained nearly a third of a percent against both the Aussie (AUD) and Kiwi (NZD), with the Yen (JPY) shedding 1.1% against the Loonie.
- US ADP Employment Change surged in December, showing a net addition of 164K thousand jobs versus the forecast 115K and handily clearing November’s print of 101K (revised down from 103K).
- US Initial Jobless Claims for the week ended December 29 also beat expectations, declining to 202K versus the forecast 216K, slipping even further back from the previous week’s 220K new jobless benefits seekers (revised upwards from 218K).
- The bumper ADP print is encouraging on-edge investors to adjust NFP Friday forecasts higher, with the median NFP forecast currently expecting 170K new jobs on the headline December print compared to November’s 199K.
- The Canadian Unemployment Rate is expected to tick slightly higher from 5.8% to 5.9% in December, while Average Hourly Wages for the year ended December last showed 5% growth, with no consistent forecast on the books.
- Canadian Employment Change in December is expected to show 13.5K net new jobs compared to the previous month’s 24.9K.
Canadian Dollar price today
The table below shows the percentage change of Canadian Dollar (CAD) against listed major currencies today. Canadian Dollar was the strongest against the Japanese Yen.
| USD | EUR | GBP | CAD | AUD | JPY | NZD | CHF | |
| USD | -0.31% | -0.18% | 0.05% | 0.36% | 1.08% | 0.24% | 0.05% | |
| EUR | 0.31% | 0.13% | 0.37% | 0.66% | 1.38% | 0.57% | 0.37% | |
| GBP | 0.19% | -0.12% | 0.24% | 0.54% | 1.27% | 0.43% | 0.25% | |
| CAD | -0.03% | -0.34% | -0.23% | 0.32% | 1.05% | 0.21% | 0.05% | |
| AUD | -0.34% | -0.65% | -0.54% | -0.28% | 0.73% | -0.10% | -0.29% | |
| JPY | -1.11% | -1.40% | -1.28% | -1.05% | -0.76% | -0.87% | -1.04% | |
| NZD | -0.24% | -0.55% | -0.45% | -0.18% | 0.10% | 0.83% | -0.20% | |
| CHF | -0.05% | -0.36% | -0.25% | 0.01% | 0.30% | 1.02% | 0.20% |
The heat map shows percentage changes of major currencies against each other. The base currency is picked from the left column, while the quote currency is picked from the top row. For example, if you pick the Euro from the left column and move along the horizontal line to the Japanese Yen, the percentage change displayed in the box will represent EUR (base)/JPY (quote).
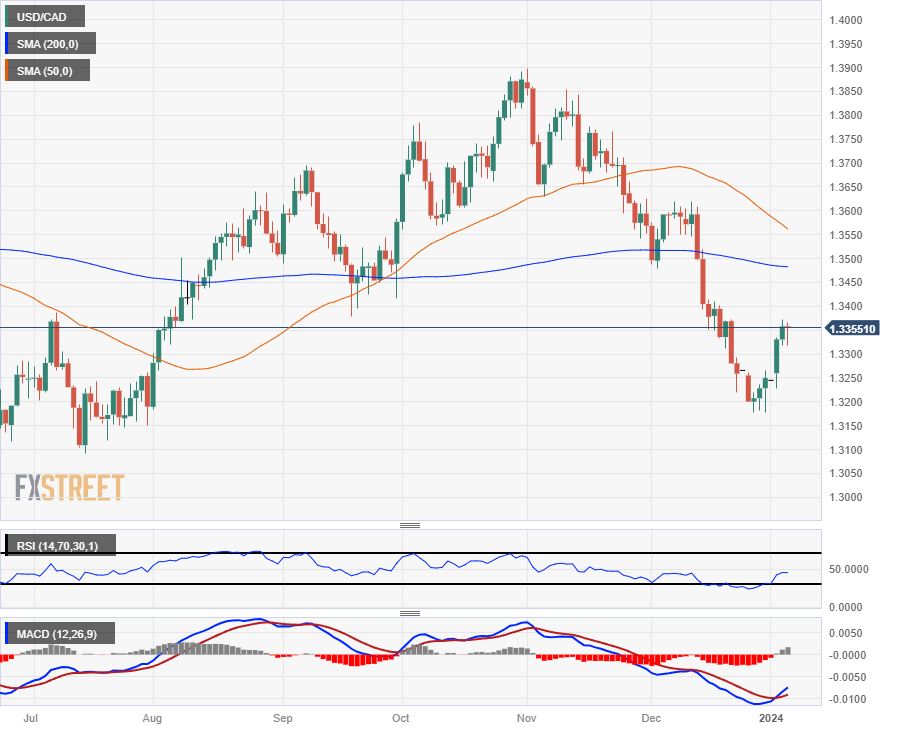
Technical Analysis: Canadian Dollar braces for NFP Friday, USD/CAD grinds to a halt near 1.3350
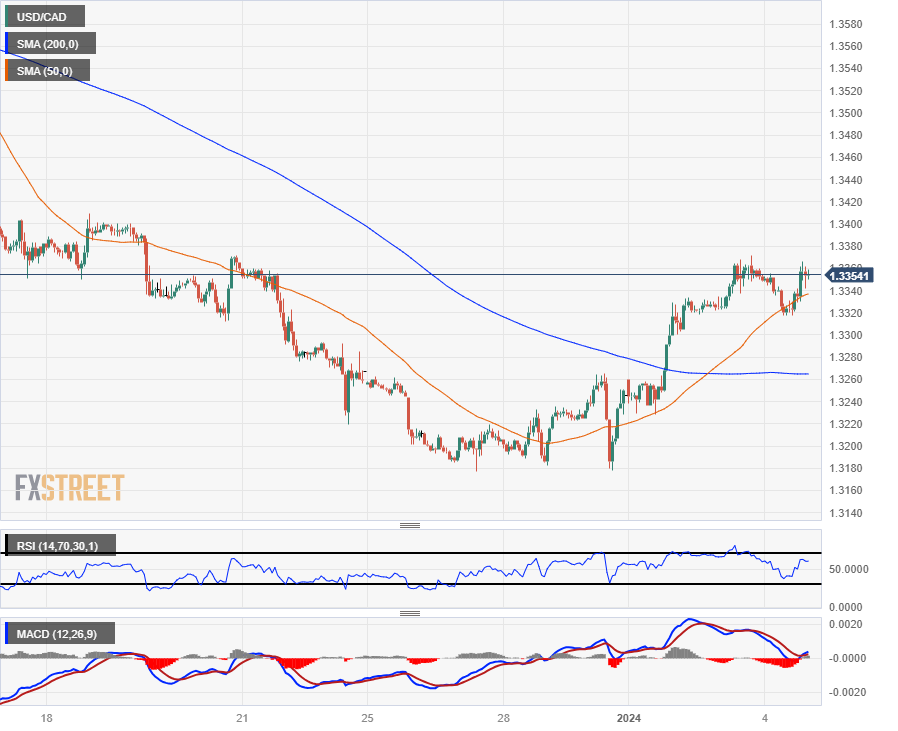
2024 kicked off with markets sending the Canadian Dollar (CAD) lower against the US Dollar, but the USD/CAD is pumping the brakes as investors gear up for Friday’s NFP showdown. Intraday action caught a clean bounce from the 50-hour Simple Moving Average (SMA) just above 1.3320 in early Thursday trading, and the pair is sticking close to near-term highs.
The USD/CAD is up around 0.8% from the week’s opening bids of 1.3260, and the near-term technical ceiling is currently parked at the 1.3400 handle with support coming from the bottom end of the consolidation zone clustered around 1.3200.
The USD/CAD has chalked in five consecutive days of gains, dragging the pair back towards the 200-day SMA just below 1.3500.
USD/CAD Hourly Chart
 USD/CAD Daily Chart
Canadian Dollar FAQs
What key factors drive the Canadian Dollar?
The key factors driving the Canadian Dollar (CAD) are the level of interest rates set by the Bank of Canada (BoC), the price of Oil, Canada’s largest export, the health of its economy, inflation and the Trade Balance, which is the difference between the value of Canada’s exports versus its imports. Other factors include market sentiment – whether investors are taking on more risky assets (risk-on) or seeking safe-havens (risk-off) – with risk-on being CAD-positive. As its largest trading partner, the health of the US economy is also a key factor influencing the Canadian Dollar.
How do the decisions of the Bank of Canada impact the Canadian Dollar?
The Bank of Canada (BoC) has a significant influence on the Canadian Dollar by setting the level of interest rates that banks can lend to one another. This influences the level of interest rates for everyone. The main goal of the BoC is to maintain inflation at 1-3% by adjusting interest rates up or down. Relatively higher interest rates tend to be positive for the CAD. The Bank of Canada can also use quantitative easing and tightening to influence credit conditions, with the former CAD-negative and the latter CAD-positive.
How does the price of Oil impact the Canadian Dollar?
The price of Oil is a key factor impacting the value of the Canadian Dollar. Petroleum is Canada’s biggest export, so Oil price tends to have an immediate impact on the CAD value. Generally, if Oil price rises CAD also goes up, as aggregate demand for the currency increases. The opposite is the case if the price of Oil falls. Higher Oil prices also tend to result in a greater likelihood of a positive Trade Balance, which is also supportive of the CAD.
How does inflation data impact the value of the Canadian Dollar?
While inflation had always traditionally been thought of as a negative factor for a currency since it lowers the value of money, the opposite has actually been the case in modern times with the relaxation of cross-border capital controls. Higher inflation tends to lead central banks to put up interest rates which attracts more capital inflows from global investors seeking a lucrative place to keep their money. This increases demand for the local currency, which in Canada’s case is the Canadian Dollar.
How does economic data influence the value of the Canadian Dollar?
Macroeconomic data releases gauge the health of the economy and can have an impact on the Canadian Dollar. Indicators such as GDP, Manufacturing and Services PMIs, employment, and consumer sentiment surveys can all influence the direction of the CAD. A strong economy is good for the Canadian Dollar. Not only does it attract more foreign investment but it may encourage the Bank of Canada to put up interest rates, leading to a stronger currency. If economic data is weak, however, the CAD is likely to fall.
- Mexican Peso dips as USD/MXN climbs 0.20%, reacting to strong US jobs data and hawkish signals from Fed's recent minutes.
- Mexico central bank’s minutes indicate stable interest rates, adding to the mix of factors affecting MXN's performance against USD.
- US services sector data shows improvement, but composite PMI falls short of expectations, influencing currency dynamics.
The Mexican Peso (MXN) pares some of Wednesday’s gains and exchanges hands with losses during the North American session on Thursday. Data from the United States (US) and a hawkish tilt of the latest Federal Reserve’s (Fed) meeting minutes weighed on the Mexican currency, which depreciates against the US Dollar (USD). Therefore, the USD/MXN is trading at 17.04, gaining 0.20% on the day.
The US economic calendar featured jobs data, which depicted the labor market's strength. S&P Global revealed the services sector is improving, while the Composite PMI, which encompasses manufacturing and services, missed estimates. Mexico’s economic calendar witnessed the Bank of Mexico (Banxico) latest meeting minutes, which suggested that rates would remain at current levels “for some time.”
Daily digest market movers: Mexican Peso trims some earlier losses helped by Banxico’s minutes
- Private hiring in the US rose above estimates by 164K, suggesting the labor market remains robust and solid.
- US Initial Jobless Claims for the week ending December 30 increased by 202K, less than forecasts of 216K and the previous reading of 220K.
- Banxico’s latest meeting minutes suggest the central bank could begin taking into consideration easing monetary policy, but with a cautious approach. Four members of the Governing Council expressed they need to be careful when evaluating or communicating rate cuts. On the other hand, one member said they could begin discussing rate cuts.
- Most of Mexico’s central bank members expressed that inflation’s outlook continues to pose challenges.
- At its December meeting, Banxico kept rates unchanged at 11.25%.
- Federal Reserve’s latest meeting minutes indicated that most Federal Reserve officials believe interest rates are approaching or have reached their peak. However, they noted uncertainty regarding the duration for which the restrictive policy should be sustained. Despite observing some improvements in inflation, they acknowledged that core services prices remain high. It was also mentioned that some officials might favor maintaining the current interest rates longer than initially expected.
- On Tuesday, Mexico’s S&P Global Manufacturing PMI for December came at 52.0, below November’s 52.5, suggesting the economy is slowing down amid Banxico’s tightening cycle.
- On Wednesday, Business Confidence in Mexico improved to 54.6 from 54 in November, although it failed to underpin the Mexican Peso, which remained weak during the session.
- Money market futures data provided by the Chicago Board of Trade (CBOT) shows that traders remain confident the Fed would slash rates by 140 basis points towards the year’s end.
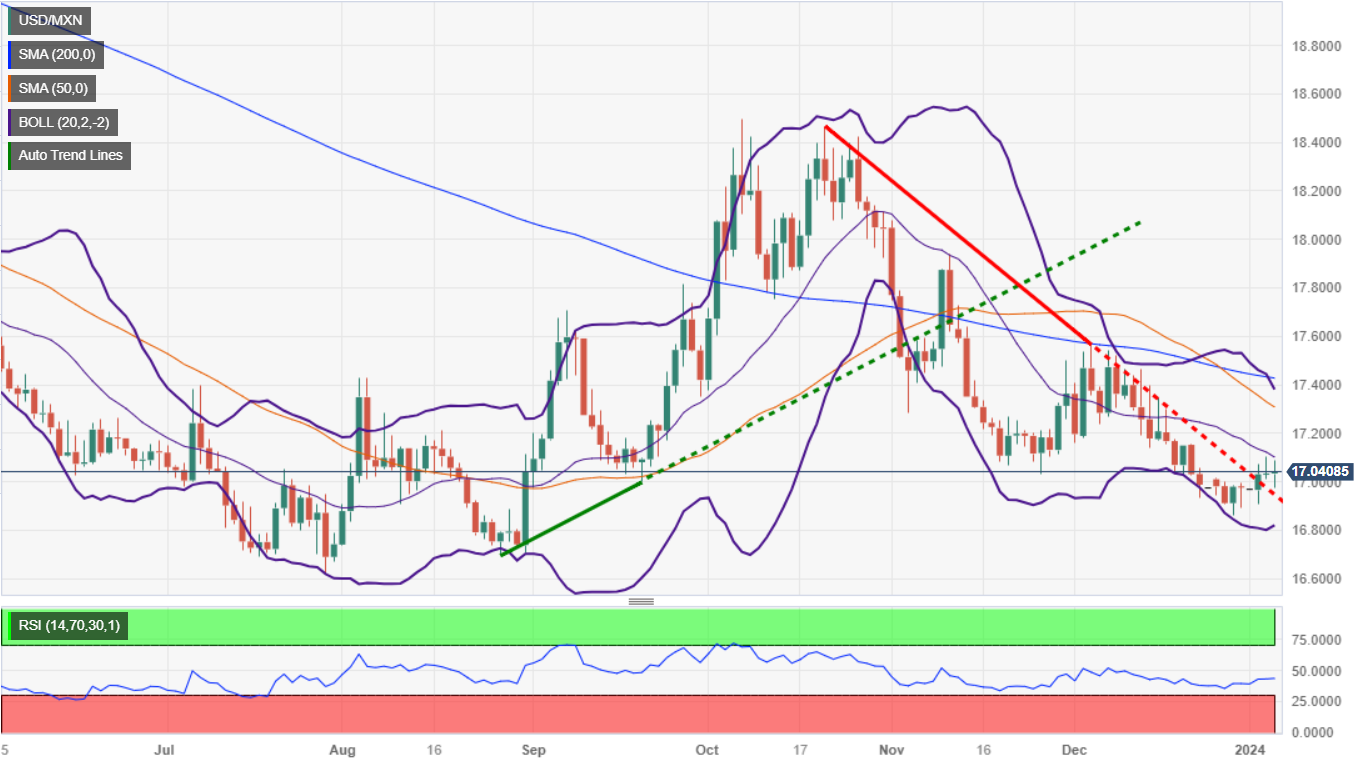
Technical analysis: Mexican Peso bullish bias remains, despite the USD/MXN recent rise
The USD/MXN remains downward biased, though it's struggling to decisively break below the 17.00 figure. On the upside, buyers must keep prices above the latter and establish above the November 27 local low of 17.03 before testing the 17.20 resistance level. Once cleared, they could challenge the 17.34/43 area, the 50, 100, and 200-day Simple Moving Averages (SMAs) converge.
For a bearish resumption, sellers need a daily close below the November 27 low of 17.03 to increase their chances of pushing the price back below the 17.00 figure. Once achieved, that could pave the way to test the waters at around 16.86, ahead of falling toward last year’s low of 16.62.
Also read: Mexican Peso Price Annual Forecast: Which factor would impact most in 2024, economics or politics?
USD/MXN Price Action - Daily Chart
Mexican Peso FAQs
What key factors drive the Mexican Peso?
The Mexican Peso (MXN) is the most traded currency among its Latin American peers. Its value is broadly determined by the performance of the Mexican economy, the country’s central bank’s policy, the amount of foreign investment in the country and even the levels of remittances sent by Mexicans who live abroad, particularly in the United States. Geopolitical trends can also move MXN: for example, the process of nearshoring – or the decision by some firms to relocate manufacturing capacity and supply chains closer to their home countries – is also seen as a catalyst for the Mexican currency as the country is considered a key manufacturing hub in the American continent. Another catalyst for MXN is Oil prices as Mexico is a key exporter of the commodity.
How do decisions of the Banxico impact the Mexican Peso?
The main objective of Mexico’s central bank, also known as Banxico, is to maintain inflation at low and stable levels (at or close to its target of 3%, the midpoint in a tolerance band of between 2% and 4%). To this end, the bank sets an appropriate level of interest rates. When inflation is too high, Banxico will attempt to tame it by raising interest rates, making it more expensive for households and businesses to borrow money, thus cooling demand and the overall economy. Higher interest rates are generally positive for the Mexican Peso (MXN) as they lead to higher yields, making the country a more attractive place for investors. On the contrary, lower interest rates tend to weaken MXN.
How does economic data influence the value of the Mexican Peso?
Macroeconomic data releases are key to assess the state of the economy and can have an impact on the Mexican Peso (MXN) valuation. A strong Mexican economy, based on high economic growth, low unemployment and high confidence is good for MXN. Not only does it attract more foreign investment but it may encourage the Bank of Mexico (Banxico) to increase interest rates, particularly if this strength comes together with elevated inflation. However, if economic data is weak, MXN is likely to depreciate.
How does broader risk sentiment impact the Mexican Peso?
As an emerging-market currency, the Mexican Peso (MXN) tends to strive during risk-on periods, or when investors perceive that broader market risks are low and thus are eager to engage with investments that carry a higher risk. Conversely, MXN tends to weaken at times of market turbulence or economic uncertainty as investors tend to sell higher-risk assets and flee to the more-stable safe havens.
- The USD/JPY soared to the 147.70 level, rallying 1%.
- US Jobless Claims for the week ending on December 30 reported lower at 202K, beating expectations.
- US ADP Employment Change in December surpassed consensus, posting 164K jobs added.
- A steady US economy pushes the pair upwards.
In Thursday's trading session, the USD/JPY pair has seen a rally, rising to multi-week highs of 147.70 with a robust 1% uptick. These gains were fueled primarily by the strength of the US Dollar and favorable figures from the labor market, boosting the Greenback over the Yen as the American economy continued to show resilience. Dovish bets on the Federal Reserve (Fed) eased but are still high.
In line with that, during the American session, data from the US Department of Labor and Automatic Data Processing Inc. (ADP) impacted positively on the US Dollar. Initial Jobless Claims for the week ending on December 30 dropped to 202K, significantly beating consensus estimates of 216K and down from the previous week's figure of 220K. On a different note, ADP Employment Change for December presented a positive surprise with an increase of 164k in job creation, surpassing both the consensus estimate and the previous figure of 115K and 101K, respectively.
Adding to that, a resilient US economy that may not require several rate cuts from the Fed and the dovish approach by the Bank of Japan could lead to further strengthening of the Dollar against the Yen. However, it will all come down to US data, and until market easing expectations shift, the Dollar's vulnerability might persist. On Friday, the US will release December’s Nonfarm Payrolls alongside the Unemployment Rate and Average Hourly Earnings, which will set the pair’s trajectory for the short term.
As for now, the CME FedWatch Tool suggests that the odds of rate cuts in March and May have eased but are still high, above 50%, while a hold in January is priced in.
USD/JPY levels to watch
The indicators on the daily chart reflect a moderately bullish sentiment. The Relative Strength Index (RSI) position displaying a positive slope and hovering within positive territory suggests an encouraging uptrend as buyers attempt to gain the upper hand.
In addition, positive coloring is shown in the Moving Average Convergence Divergence (MACD) histogram with rising green bars. This indicates an increase in purchasing momentum, signaling further opportunities for gains in a short-term perspective.
However, the conflicting position of the pair above the 20 and 100-day Simple Moving Averages (SMAs) whilst it underperforms the 200-day SMA cannot be disregarded. This reveals that whilst the bull’s control is evident from a narrower perspective, bear aggressions remain a potent force in the broader approach.
USD/JPY daily chart
-638399779245980059.png)
- The Swiss Franc takes a step lower versus the Pound on Thursday after UK data beats expectations.
- UK lending and services data both come out higher, suggesting less pressure on the BoE to cut rates.
- The safe-haven Swiss Franc weakens after strong US and China data increases investor risk appetite.
The Swiss Franc (CHF) fell against a strengthening Pound Sterling (GBP) on Thursday after risk sentiment improved on the back of strong global macroeconomic data, in particular data from the United Kingdom (UK).
Overall – and despite simmering geopolitical tensions – the positive boost to investor risk appetite from the figures was not as advantageous for the safe-haven Swiss Franc as the risk-sensitive Pound.
The day started with China recording a higher-than-expected Services PMI for December showing the world’s second largest economy holding its form. This was followed by stronger-than-forecast US labor market data.
Sterling rose in most pairs on the back of strong lending data, which showed people continuing to borrow and take out mortgages, seemingly unfazed by higher interest rates. A strong Services PMI result seemed to turn the tables on the somewhat negative narrative that has bedeviled the UK economy since growth data was revised down to show a contraction in GDP in Q3.
Daily digest market movers: Swiss Franc weakens versus Pound Sterling after UK data surprises
- The Swiss Franc weakens versus the Pound after global macroeconomic data gives investors cause for optimism on Thursday.
- Safe-havens like Gold and the Swiss Franc take a hit whilst risk-on currencies like Sterling rise.
- China Caixin Services PMI rises to 52.9 in December, easily beating estimates of 51.6 and November’s 51.5. Eurozone Services PMI is equally positive.
- US private payrolls data beats estimates, with ADP Employment Change showing the economy added 164,000 new employees in December, against 115,000 expected. In November, 101,000 were added.
- UK lending data seems to suggest borrowers are still taking out loans despite higher interest rates.
- Net Lending to Individuals rises GBP 1.9B in November, beating forecasts of GBP 1.6B; Consumer Credit shows a GBP 2.005B increase when GBP 1.400B had been expected; and Mortgage Approvals rise 50.067K when compared to the expected 48.500K.
- The robust lending data suggests there will be less pressure on the Bank of England (BoE) to bring down interest rates in order to stimulate an economic recovery.
Swiss Franc technical analysis: GBP/CHF breaks down, remaining in bearish long-term trend
GBP/CHF – the number of Swiss Francs that one Pound Sterling can buy – shows a small recovery this week despite the overall bearish tenor of the chart.
The pair is arguably in a downtrend on the weekly chart below despite a recovery taking place on the daily and intraday charts.
-638399768632538681.png)
Pound Sterling vs Swiss Franc: Weekly Chart
GBP/CHF has broken below the lower line of a falling channel or range-bound consolidation that has been forming since 2022. If the break holds, this suggests a risk the pair could fall to 1.0400 eventually, which is the 61.8% extrapolation of the range to the downside. A break below the 1.0637 lows would signal a continuation down towards that target.
The pair may be encountering resistance from the lower boundary of the wedge/range at the current market level as it rises back up to it after the breakdown last week.
The MACD momentum indicator is showing a decline in line with price, which supports the longer-term bearish picture.
Swiss Franc FAQs
What key factors drive the Swiss Franc?
The Swiss Franc (CHF) is Switzerland’s official currency. It is among the top ten most traded currencies globally, reaching volumes that well exceed the size of the Swiss economy. Its value is determined by the broad market sentiment, the country’s economic health or action taken by the Swiss National Bank (SNB), among other factors. Between 2011 and 2015, the Swiss Franc was pegged to the Euro (EUR). The peg was abruptly removed, resulting in a more than 20% increase in the Franc’s value, causing a turmoil in markets. Even though the peg isn’t in force anymore, CHF fortunes tend to be highly correlated with the Euro ones due to the high dependency of the Swiss economy on the neighboring Eurozone.
Why is the Swiss Franc considered a safe-haven currency?
The Swiss Franc (CHF) is considered a safe-haven asset, or a currency that investors tend to buy in times of market stress. This is due to the perceived status of Switzerland in the world: a stable economy, a strong export sector, big central bank reserves or a longstanding political stance towards neutrality in global conflicts make the country’s currency a good choice for investors fleeing from risks. Turbulent times are likely to strengthen CHF value against other currencies that are seen as more risky to invest in.
How do decisions of the Swiss National Bank impact the Swiss Franc?
The Swiss National Bank (SNB) meets four times a year – once every quarter, less than other major central banks – to decide on monetary policy. The bank aims for an annual inflation rate of less than 2%. When inflation is above target or forecasted to be above target in the foreseeable future, the bank will attempt to tame price growth by raising its policy rate. Higher interest rates are generally positive for the Swiss Franc (CHF) as they lead to higher yields, making the country a more attractive place for investors. On the contrary, lower interest rates tend to weaken CHF.
How does economic data influence the value of the Swiss Franc?
Macroeconomic data releases in Switzerland are key to assessing the state of the economy and can impact the Swiss Franc’s (CHF) valuation. The Swiss economy is broadly stable, but any sudden change in economic growth, inflation, current account or the central bank’s currency reserves have the potential to trigger moves in CHF. Generally, high economic growth, low unemployment and high confidence are good for CHF. Conversely, if economic data points to weakening momentum, CHF is likely to depreciate.
How does the Eurozone monetary policy affect the Swiss Franc?
As a small and open economy, Switzerland is heavily dependent on the health of the neighboring Eurozone economies. The broader European Union is Switzerland’s main economic partner and a key political ally, so macroeconomic and monetary policy stability in the Eurozone is essential for Switzerland and, thus, for the Swiss Franc (CHF). With such dependency, some models suggest that the correlation between the fortunes of the Euro (EUR) and the CHF is more than 90%, or close to perfect.
- AUD/USD's continued decline fueled by robust US ADP employment and lower unemployment claims, overshadowing China's PMI data.
- Swaps market adjusts expectations for Federal Reserve policy, anticipating less aggressive rate cuts by end of 2024.
- Focus shifts to upcoming US Nonfarm Payrolls, with predictions of a decrease in job creation and a slight rise in unemployment rate.
The AUD/USD extends its losses in early trading on Thursday during the North American session, down 0.33% and at the brisk of diving below the 0.6700 figure. Solid economic data from the United States is the main reason behind the pair’s fall, while the Greenback (USD) recouped losses and rose, as shown by the US Dollar Index (DXY). The AUD/USD is trading at 0.6711 after hitting a daily high of 0.6759.
AUD/USD extends its losses to five straight days, as US jobs data improved
US jobs data revealed before Wall Street opened was solid, suggesting that inflationary pressures remain skewed to the upside. A report by Automatic Data Processing (ADP) and the University of Stanford revealed that companies hired more than expected, creating new 164K jobs, smashing economists' forecasts of 115. In additional data, the US Department of Labor (DoL) announced that unemployment claims for the week ending December 30 rose by 202K, less than estimates of 216K, and trailed by the prior reading of 220K.
After the data, the swaps market, priced in a less dovish Federal Reserve, with traders expecting 140 basis points of rate cuts toward the end of 2024, 30 basis points less than December’s 27 170 bps of cuts projected by investors, according to Chicago Board of Trade (CBOT) data.
Today’s data and yesterday's release of the latest Federal Reserve meeting minutes shifted traders' belief that the US central bank might begin easing policy sooner rather than later. The tone of the minutes was of uncertainty amongst policymakers in regard to the rate path to follow due to inflation risks remaining tilted to the upside.
Aside from this, the economic docket in Australia was absent, though China’s data influence the Aussie (AUD). In the Asian session, the Caixin PMI Services PMI improved to 52.9, above 51.5 in November, and beat the consensus of 51.5.
Ahead of the week, the Australian economic docket would be absent. On the US front, December’s Nonfarm Payrolls are expected to dip to 170K, below November’s 199K, and the Unemployment Rate Is estimated to uptick to 3.8% from 3.7%.
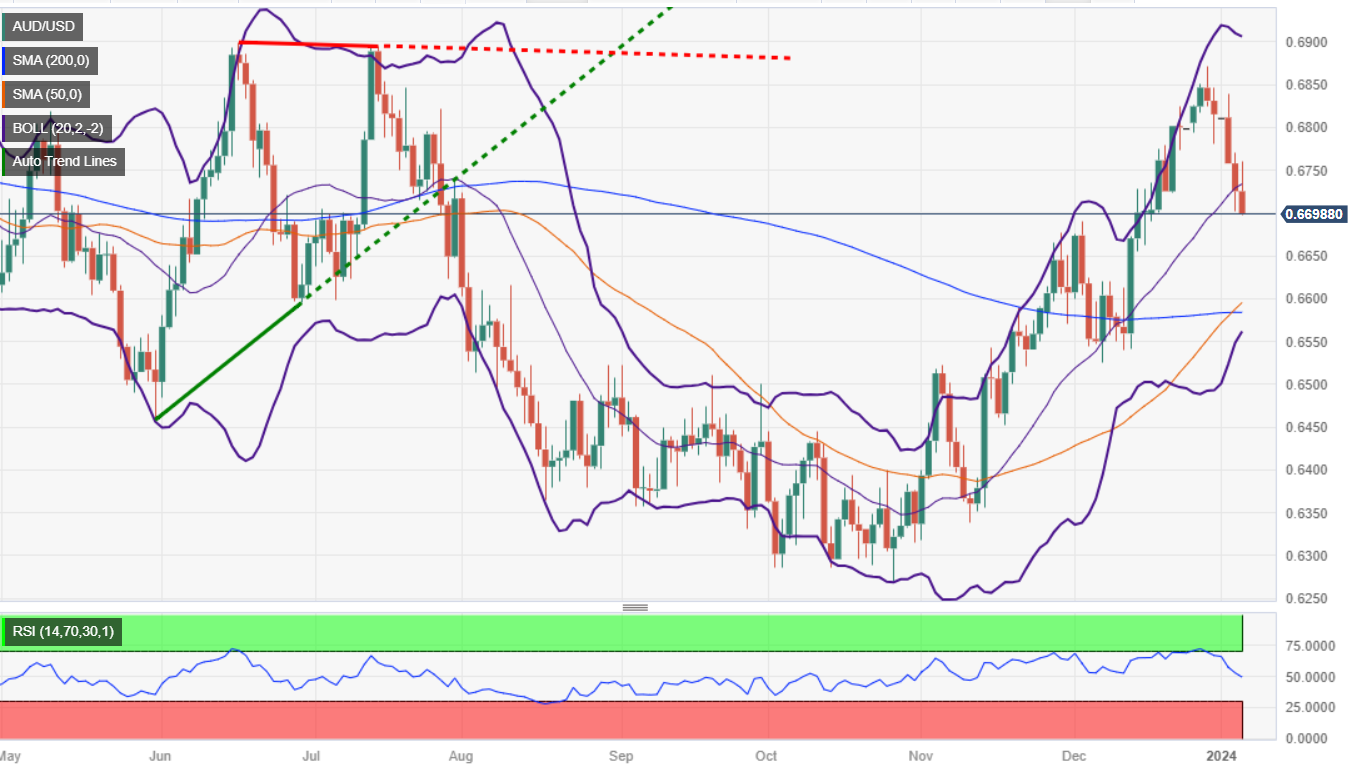
AUD/USD Price Analysis: Technical outlook
The daily chart depicts the pair under heavy downward pressure but remains above the current week’s low of 0.6701. A decisive break would exacerbate the AUD/USD’s fall toward the confluence of the 50 and 200-day moving averages (DMAs) at around 0.6582/84. Once surpassed, the next demand area would be a previous resistance-turned-support level at 0.6522, the November 6 high. On the other hand, if buyers keep the exchange rate above 0.6700 and reclaim the day's high at 0.6759, that could pave the way to test December’s 28 high of 0.6871.
- Silver price falls below $23.00 amid outperformance of US labor market data.
- US private employers added 164K job seekers in December against 115K.
- Silver price faces a sharp sell-off after a H&S breakdown.
Silver price (XAG/USD) faces an intense sell-off as the labor market conditions in the United States have improved significantly. The US Automatic Data Processing (ADP) has reported that private employers hired 164K workers in December, which were significantly higher than expectations of 115K and the former reading of 103K.
Apart from that, individuals claiming jobless benefits for the first time last week dropped significantly. The US Department of Labor has reported that Initial Jobless Claims (IJC) for the week ending December 29 were 202K, lower than the consensus of 216K and the prior release of 220K.
Improving labor market conditions indicate robust economic prospects in the US economy, which could allow Federal Reserve (Fed) policymakers to support for keeping interest rates higher for a longer period. The market participants are anticipating that the Fed will start its ‘rate-reduction’ campaign from March. A delay in prospects of rate cuts could dampen overall market sentiment and impact demand of bullions.
The US Dollar Index (DXY) rebounds to near 102.50 as upbeat labor market data. More action in the US Dollar is highly likely as investors await the Nonfarm Payrolls (NFP) report for December, which will be published on Friday.
Silver technical analysis
Silver price dives after a breakdown of the Head and Shoulder chart pattern formed on a four-hour scale. The 20-period Exponential Moving Average (EMA) around $23.40 continues to weigh on Silver price bulls.
The Relative Strength index (RSI) (14) has shifted into the bearish range of 20.00-40.00, which indicates that a bearish momentum is intact.
Silver four-hour chart
-638399741548883825.png)
- Initial Jobless Claims rose by 202K in the week ending December 30.
- USD Index regains some balance around 102.50.
US citizens that applied for unemployment insurance benefits increased by 202K in the week ending December 23, showed the US Department of Labor (DOL) on Thursday. The reading came in below market expectations and follows a 220K gain in the previous week.
Further details of the publication revealed that the advance seasonally adjusted insured unemployment rate was 1.2% and the 4-week moving average stood at 207.75K, a decrease of 4.75K from the previous week's revised average.
In addition, Continuing Claims shrank by 31K to 1.855Min the week ended December 23.
Market reaction
The US Dollar Index attempted a rebound to the 102.50 region also following the firmer-than-expected release of the ADP report.
- EUR/USD falls gradually as investors turn cautious ahead of US private Employment data.
- German HICP grew strongly by 3.8% in December as anticipated against 3.2% jump in November.
- Fed policymakers remain worried about over-tightening of interest rates.
The EUR/USD pair struggles to extend recovery above three-day high of 1.0970 in the late European session. The major currency pair remains mostly unchanged as preliminary German Harmonized Index for Consumer Prices (HICP) for December rose as expected.
Monthly HICP grew at a slower pace of 0.2% against the consensus of 0.3% increase. In November, price pressures were contracted by 0.7%. The annual HICP rose to 3.8% as expected against earlier growth of 3.2%.
This may force European Central Bank (ECB) policymakers to stick to keeping interest rates unchanged further.
S&P500 futures have added significant gains in the European session. US equities were heavily sold-off in the last two trading sessions and meaningful gains in overnight futures are indicating some recovery in the risk-appetite of the market participants.
The US Dollar Index (DXY) corrects to 102.20 after a sharp recovery as investors turn cautious ahead of the United States ADP Employment Change data for December, which will be published at 14:00 GMT. As per the consensus, 115K new workers were recorded by the labour market against 103K additions in November.
Meanwhile, deepening prospects of rate cuts by the Federal Reserve (Fed) this year have strengthened as Federal Open Market Committee (FOMC) minutes for December monetary policy meeting indicated that policymakers were worried about ‘over-tightening’ of interest rates.
- Germany’s CPI reversed the downtrend in December.
- EUR/USD kept the trade in the mid-1.0900s in the wake of the release.
Inflation in Germany, as tracked by the Consumer Price Index (CPI), matched estimates and ticked higher to an annualized 3.7% in December, up from 3.2% in the previous month. Furthermore, the CPI halted a five-month downward trend in the last month of 2023. Additionally, the CPI rose 0.1% from a month earlier.
The broader Harmonised Index of Consumer Prices (HICP), the European Central Bank's (ECB) preferred measure of inflation, rose 3.8% over the last twelve months and 0.2% MoM.
Market reaction
The EUR/USD remained apathetic following the release and maintained the trade around 1.0950 amidst its generalized positive bias on Thursday.
- USD/CAD falls sharply to near 1.3320 amid a correction in the USD Index.
- Investors await the US/Canada labour market data for further guidance.
- The Loonie asset struggles to break above the 23.6% Fibo retracement.
The USD/CAD pair falls sharply after failing to extend upside above 1.3370. The Loonie asset has dropped to near 1.3320 as the US Dollar Index (DXY) has corrected after the release of the Federal Open Market Committee (FOMC) minutes strengthened prospects of rate cuts this 2023. The timing factor is still uncertain as Fed policymakers are needed to confirm progress in inflation declining towards 2% first.
S&P500 futures have posted some gains in the European session, portraying a revival in the risk-appetite of the market participants. The USD Index has dropped to near 102.20 ahead of the release of the employment data for December.
Investors also await the Employment data from Canada, which will be published on Friday. The Unemployment Rate is seen rising to 5.9% against the former reading of 5.8%. Labor additions made by Canadian employers were 13.5K, lower than prior additions of 24.9K made in November.
USD/CAD struggles to climb above the 23.6% Fibonacci retracement (plotted from 1 November 2023 high at 1.3900 to 27 December 2023 low at 1.3177) at 1.3350. The asset may find an intermediate support near the 20-period Exponential Moving Average (EMA), which currently trades around 1.3306.
A range shift move by the Relative Strength Index (RSI) (14) into the 40.00-80.00 trajectory from the 20.00-60.00 area indicates that the downside bias has been faded now and investors may look for dips to build fresh positions.
Fresh upside would appear if the Loonie asset decisively breaks above 23.6% Fibo retracement, which is around 1.3350. This will drive the asset towards December 18 high at 1.3410, followed by 38.2% Fibo retracement at 1.3453.
On the flip side, downside bias could stem if the pair drops below December 28 low of 1.3180. This would expose the asset to July 25 low near 1.3150, followed by July 13 low around 1.3193.
USD/CAD four-hour chart
-638399625738500647.png)
- Gold price recovers as the FOMC minutes have strengthened prospects of rate cuts this year.
- The market participants are still worried about the timing of rate cuts from the Fed.
- Further action in bullions and the US Dollar will be guided by the US Employment data.
Gold price (XAU/USD) bounces back as prospects of rate cuts from the Federal Reserve (Fed) have strengthened after the release of the Federal Open Market Committee (FOMC) minutes. While uncertainty about when exactly the Fed will announce a rate cut decision has impacted the broader appeal of the Gold price.
Meanwhile, robust economic prospects of the United States economy could force Fed policymakers to delay the announcement of a rate cut than what market participants have forecasted despite their concerns about policy over-tightening.
The US Institute of Supply Management (ISM) reported a sharp increase in Manufacturing PMI to 47.4 against expectations of 47.1 and the former reading of 46.7. The factory data however remained below the 50.0 threshold for the straight 14th month, which itself indicates contraction but an outperformance indicates that overall production is coming back on track.
Going forward, investors should be prepared for a sheer volatility as the US Nonfarm Payrolls (NFP) report is due for release on Friday.
Daily Digest Market Movers: Gold price recovers as US Dollar falls back
- Gold price rises after sensing buying interest near $2,030 as uncertainty over rate cuts this year dissolves while the timing element is still vague.
- The FOMC minutes released on Wednesday indicated that Fed policymakers are worried about overtightening of the monetary policy.
- In the latest projections, the Fed sees three rate cuts or interest rates reducing by 75 basis points (bps) this year.
- The absence of cues about when exactly the central bank will start trimming interest rates has slightly impacted prospects of rate cuts from March.
- As per the CME Fedwatch tool, chances in favour of rate cut in March by 25 bps to 5.00-5.25% have dropped to 66.5%.
- Discussions about rate cuts from Fed policymakers indicate that underlying price pressures are clearly returning to the 2% target and they are confident of achieving price stability without pushing the economy into a recession.
- The US Dollar Index corrects after printing a fresh two-week high at 102.70 as one thing becomes clear in investors’ minds – that the Fed will be the early adopter of a rate-reduction cycle among the Group of Seven economies. 10-year US Treasury yields drop sharply to near 3.91%.
- The market mood, however, could be volatile ahead amid uncertainty regarding the US NFP report and the ISM Services PMI for December, which will be released on Friday.
- But before that, investors will focus on the US Automatic Data Processing (ADP) Employment Change data for December, which will be published at 13:15 GMT. The market participants have projected private payrolls at 115K, slightly higher than the prior reading of 103K.
Technical Analysis: Gold price rebounds to near 20-EMA
-638399613116648872.png)
Gold price has delivered a mean-reversion move to near the 20-period Exponential Moving Average (EMA), which trades around $2,050 on a two-hour scale. The precious metal witnessed a steep fall after a breakdown below the support zone placed around $2,055, which is going to act as a resistance ahead.
The Relative Strength Index (RSI) (14) is demonstrating a range shift move from 60.00-80.00 to 20.00-60.00 in which the 60.0 region will act as a ceiling for the Gold price bulls.
On a daily time frame, the Gold price finds support after taking a cushion from the 20-day EMA, which trades around $2,040. This indicates that the overall demand for the Gold price has not faded yet.
Gold FAQs
Why do people invest in Gold?
Gold has played a key role in human’s history as it has been widely used as a store of value and medium of exchange. Currently, apart from its shine and usage for jewelry, the precious metal is widely seen as a safe-haven asset, meaning that it is considered a good investment during turbulent times. Gold is also widely seen as a hedge against inflation and against depreciating currencies as it doesn’t rely on any specific issuer or government.
Who buys the most Gold?
Central banks are the biggest Gold holders. In their aim to support their currencies in turbulent times, central banks tend to diversify their reserves and buy Gold to improve the perceived strength of the economy and the currency. High Gold reserves can be a source of trust for a country’s solvency. Central banks added 1,136 tonnes of Gold worth around $70 billion to their reserves in 2022, according to data from the World Gold Council. This is the highest yearly purchase since records began. Central banks from emerging economies such as China, India and Turkey are quickly increasing their Gold reserves.
How is Gold correlated with other assets?
Gold has an inverse correlation with the US Dollar and US Treasuries, which are both major reserve and safe-haven assets. When the Dollar depreciates, Gold tends to rise, enabling investors and central banks to diversify their assets in turbulent times. Gold is also inversely correlated with risk assets. A rally in the stock market tends to weaken Gold price, while sell-offs in riskier markets tend to favor the precious metal.
What does the price of Gold depend on?
The price can move due to a wide range of factors. Geopolitical instability or fears of a deep recession can quickly make Gold price escalate due to its safe-haven status. As a yield-less asset, Gold tends to rise with lower interest rates, while higher cost of money usually weighs down on the yellow metal. Still, most moves depend on how the US Dollar (USD) behaves as the asset is priced in dollars (XAU/USD). A strong Dollar tends to keep the price of Gold controlled, whereas a weaker Dollar is likely to push Gold prices up.
- USD/MXN extends its losses as the US Dollar retreats after recent gains.
- The downbeat US bond yields limit the advance of the Greenback.
- Traders await next week's Consumer Confidence and Headline Inflation data from Mexico.
USD/MXN extends to the downward on the decline of the US Dollar (USD). The downbeat United States (US) Treasury yields put downward pressure on the Greenback. The USD/MXN pair trades lower around 16.98 during the European session on Thursday.
However, the better-than-expected ISM Manufacturing PMI data contributed support to the market sentiment against the speculation of interest rate cuts by the US Federal Reserve (Fed) in the first quarter of 2024, which strengthened the Greenback. The report revealed an increase to 47.4 in December from the previous reading of 46.7, exceeding the market consensus of 47.1.
Investors are expected to closely scrutinize Thursday’s labor market releases from the United States for insights into the current state of the US labor market. The market expects an increase in US ADP Employment Change for December, from the previous figure of 103K to 115K. Additionally, the forecasted easing of Initial Jobless Claims for the week ending on December 29, from 218K to 216K, adds support to the bets of no rate cuts by the Fed in the upcoming meeting.
On Mexico’s side, the recent moderate data might alleviate the pressure on the Bank of Mexico (Banxico) to implement an immediate reduction in interest rates. Despite the stability of the Jobless Rate, the seasonally adjusted Jobless Rate experienced a slight uptick.
With no data releases from Mexico during the week, traders anticipate next week's Consumer Confidence and Headline Inflation data for December. These upcoming releases will likely play a crucial role in shaping market expectations and influencing Banxico's decisions regarding monetary policy.
- EUR/USD gains ground on the decline of the US Dollar.
- Eurozone Composite and Services PMI improved to the figures of 47.6 and 48.8, respectively.
- The decline in the US bond yields weakens the Greenback.
EUR/USD recovers the recent losses registered in the previous two sessions. The EUR/USD pair trades higher around 1.0950 during the European trading hours on Thursday. The improved Purchasing Managers Index (PMI) data from Germany and the Eurozone contributed support to underpinning the Euro (EUR) against the US Dollar (USD).
German HCOB Composite and Services PMI for December improved to the readings of 47.4 and 49.3, respectively. While Eurozone Composite and Services PMI improved to the figures of 47.6 and 48.8, respectively, for the said month. Furthermore, German Consumer Price Index (CPI) data is due to be released later in the day.
The US Dollar Index (DXY) retraces some of its recent gains, influenced by a decrease in United States (US) Treasury yields. At the time of writing, the DXY trades lower around 102.30, with the 2-year and 10-year yields hovering around 4.30% and 3.91%, respectively.
The better-than-expected ISM Manufacturing PMI data might have contributed some support to strengthening the US Dollar. The report revealed an increase to 47.4 in December from the previous reading of 46.7, exceeding the market consensus of 47.1. However, a contrasting trend was observed in JOLTS Job Openings, which decreased to 8.79M, falling short of the expected figure of 8.85M in November.
Additionally, the December minutes of the Federal Open Market Committee (FOMC) indicate that participants believe the policy rate has either peaked or is near its highest point in the current tightening cycle. Despite this observation, they highlight that the exact path of the policy will depend on how the economic conditions evolve.
The upcoming focus in the market will be on Thursday's labor market data releases from the United States. The anticipated US ADP Employment Change for December is expected to show an increase to 115K from the previous figure of 103K. Additionally, Initial Jobless Claims for the week ending on December 29 are expected to ease to 216K from the prior reading of 218K.
- Silver consolidates its recent losses to a near three-week low touched on Wednesday.
- The technical setup favours bearish traders and supports prospects for further losses.
- Any attempted recovery could be seen as a selling opportunity and remain capped.
Silver (XAG/USD) struggles to gain any meaningful traction on Thursday and oscillates in a narrow trading band around the $23.00 round-figure mark through the first half of the European session. The white metal, meanwhile, remains close to a three-week low touched on Wednesday and seems vulnerable to prolonging the descending trend witnessed over the past week or so.
From a technical perspective, the overnight breakdown and close below an ascending trend-line extending from the October 2023 low was seen as a fresh trigger for bearish traders. Furthermore, oscillators on the daily chart have been gaining negative traction and validate the near-term negative outlook, suggesting that the path of least resistance for the XAG/USD is to the downside.
Hence, a subsequent slide towards testing the December monthly swing low, around the mid-$22.00s, looks like a distinct possibility. The downward trajectory could get extended further towards the next relevant support near the $22.25 region en route to the $22.00 round-figure mark.
On the flip side, the ascending trend-line support breakpoint, around the $23.30-$23.35 area, now seems to act as an immediate strong barrier. Any subsequent move up is likely to attract fresh sellers near the $23.55 zone and remain capped near the $23.80 horizontal barrier. A sustained move beyond might trigger a short-covering rally and lift the XAG/USD beyond the $24.00 mark.
Some follow-through buying will suggest that the recent corrective decline has run its course and lift the XAG/USD further towards the $24.60 area (December 22 high). Bulls might eventually aim back towards reclaiming the $25.00 psychological mark.
Silver daily chart
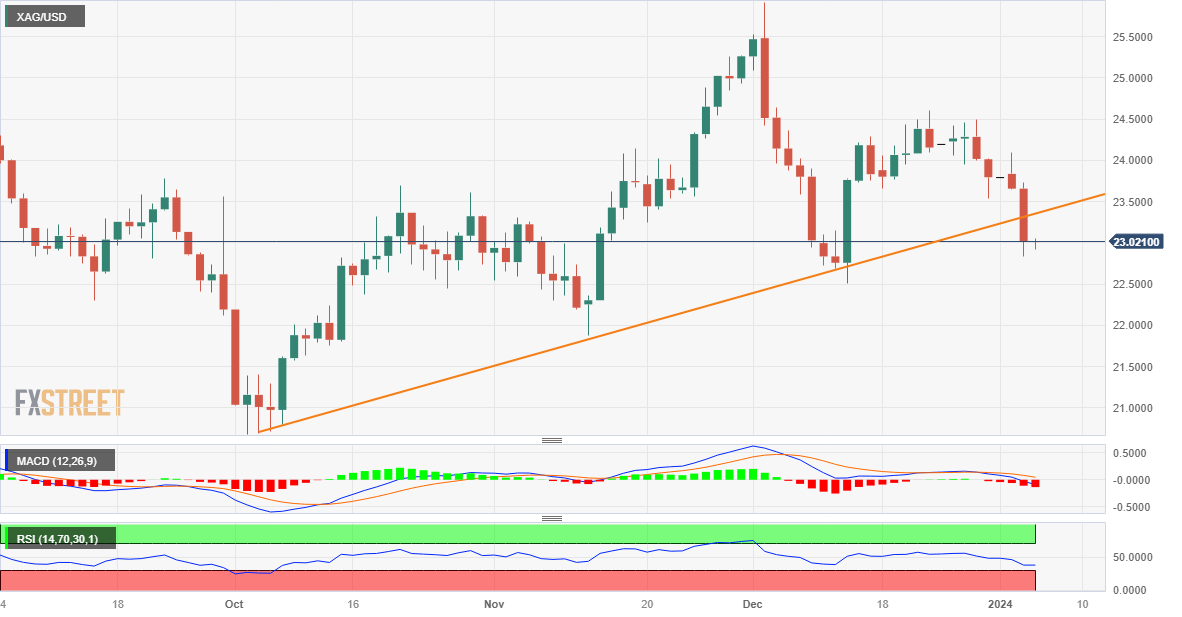
Technical levels to watch
- The ADP survey is expected to show the US private sector added 115K new positions in December.
- The data is relevant ahead of the Nonfarm Payrolls report to be out on Friday.
- Recent Private Payrolls align with the Federal Reserve’s view of a moderate pace of job creation.
The ADP Research Institute will release the December Jobs Survey on Thursday. The survey is an independent estimate of private-sector employment and pay, usually released two days ahead of the official Nonfarm Payrolls (NFP) report.
The correlation between ADP and NFP numbers is not always the most accurate and its results tend to diverge from the official job creation numbers provided by the Bureau of Labor Statistics. Still, market participants pay attention to the ADP figures as part of the multiple employment-related releases that take place in the days preceding the NFP publication.
Back in November, and according to this survey, the private sector added 103K new positions, reporting “moderate growth in hiring and another slowdown in pay gains.”
The United States (US) Federal Reserve (Fed) has been long considering a strong labor market and wage growth as a major inflationary risk. With that in mind, the November report brought relief to policymakers who opted out of massive monetary easing. The moderated pace of job creation and salaries increases are helping the local economy grow at a modest pace, without building inflation.
When will the ADP Jobs Survey will be released and how could it affect EUR/USD?
In such a scenario, the ADP Research Institute is expected to report on Thursday that the private sector added 115K new positions in December, slightly above the 103K added in November. Back then, ADP reported that annual pay rose 5.6%, the smallest monthly gain since September 2021, with services-related industries providing the most new positions.
Further signs of loosening in the labor market will likely revive bets on upcoming rate cuts. The US Fed has maintained the benchmark rate unchanged for the last three meetings, in the hopes their former tightening will continue to cool price pressures. The chance of additional rate hikes is pretty much null, as the central bank will then face the risk of a steep economic setback, instead of a soft landing.
As of lately, financial markets have been taking back bets on aggressive rate cuts throughout the first half of the year, but a softer-than-anticipated report may bring them back. Investors may welcome news that the labor sector is cooling and drop the US Dollar.
Valeria Bednarik, Chief Analyst at FXStreet, notes: “The US Dollar entered 2024 with a strong footing, partially backed by profit taking and partially due to mounting caution ahead of first-tier data releases. The EUR/USD pair currently trades near the 1.0900 threshold after peaking at 1.1139 in December and is technically poised to extend its slump. A critical support area comes at 1.0880, where the pair has a relevant intraday bottom from mid-December. If the price zone gives up, the slump could extend to the next threshold at 1.0800.”
Bednarik adds: “However, the pair can quickly regain the 1.1000 psychological mark and its bullish tone alongside, if market participants believe the data will help the Fed anticipate a rate cut to the first quarter of the year. Once beyond the level, resistance can be found at 1.1065 and 1.1120.”
Economic Indicator
United States ADP Employment Change
The ADP Employment Change is a gauge of employment in the private sector released by the largest payroll processor in the US, Automatic Data Processing Inc. It measures the change in the number of people privately employed in the US. Generally speaking, a rise in the indicator has positive implications for consumer spending and is stimulative of economic growth. So a high reading is traditionally seen as bullish for the US Dollar (USD), while a low reading is seen as bearish.
Read more.Next release: 01/04/2024 13:15:00 GMT
Frequency: Monthly
Source: ADP Research Institute
Why it matters to traders
Traders often consider employment figures from ADP, America’s largest payrolls provider, report as the harbinger of the Bureau of Labor Statistics release on Nonfarm Payrolls (usually published two days later), because of the correlation between the two. The overlaying of both series is quite high, but on individual months, the discrepancy can be substantial. Another reason FX traders follow this report is the same as with the NFP – a persistent vigorous growth in employment figures increases inflationary pressures, and with it, the likelihood that the Fed will raise interest rates. Actual figures beating consensus tend to be USD bullish.
Employment FAQs
How do employment levels affect currencies?
Labor market conditions are a key element to assess the health of an economy and thus a key driver for currency valuation. High employment, or low unemployment, has positive implications for consumer spending and thus economic growth, boosting the value of the local currency. Moreover, a very tight labor market – a situation in which there is a shortage of workers to fill open positions – can also have implications on inflation levels and thus monetary policy as low labor supply and high demand leads to higher wages.
Why is wage growth important?
The pace at which salaries are growing in an economy is key for policymakers. High wage growth means that households have more money to spend, usually leading to price increases in consumer goods. In contrast to more volatile sources of inflation such as energy prices, wage growth is seen as a key component of underlying and persisting inflation as salary increases are unlikely to be undone. Central banks around the world pay close attention to wage growth data when deciding on monetary policy.
How much do central banks care about employment?
The weight that each central bank assigns to labor market conditions depends on its objectives. Some central banks explicitly have mandates related to the labor market beyond controlling inflation levels. The US Federal Reserve (Fed), for example, has the dual mandate of promoting maximum employment and stable prices. Meanwhile, the European Central Bank’s (ECB) sole mandate is to keep inflation under control. Still, and despite whatever mandates they have, labor market conditions are an important factor for policymakers given its significance as a gauge of the health of the economy and their direct relationship to inflation.
FX option expiries for January 4 NY cut at 10:00 Eastern Time, via DTCC, can be found below.
- EUR/USD: EUR amounts
- 1.0820 1.2b
- 1.0860 650m
- 1.1075 927m
- 1.1145 1.2b
- USD/JPY: USD amounts
- 141.70 650m
- 143.25 872m
- 143.85 1b
- 144.00 1.2b
- AUD/USD: AUD amounts
- 0.6650 480m
- 0.6660 400m
- 0.6750 591m
- 0.6755 1.3b
- USD/CAD: USD amounts
- 1.3360 402m
- 1.3395 1b
- NZD/USD: NZD amounts
- 0.6285 340m
- EUR/GBP: EUR amounts
- 0.8520 350m
Gold prices fell in India on Thursday, according to data from India's Multi Commodity Exchange (MCX).
Gold price stood at 62,566 Indian Rupees (INR) per 10 grams, down INR 512 compared with the INR 63,078 it costed on Wednesday.
As for futures contracts, Gold prices decreased to INR 62,768 per 10 gms from INR 63,126 per 10 gms.
Prices for Silver futures contracts decreased to INR 72,430 per kg from INR 73,589 per kg.
| Major Indian city | Gold Price |
|---|---|
| Ahmedabad | 64,730 |
| Mumbai | 64,600 |
| New Delhi | 64,805 |
| Chennai | 64,740 |
| Kolkata | 64,750 |
Global Market Movers: Comex Gold price benefits from reviving safe-haven demand
- Bets that the Federal Reserve will cut rates in March, along with geopolitical tensions, help the Comex Gold price to build on the overnight bounce from over a one-week low.
- The December FOMC meeting minutes revealed that members generally viewed the addition of 'any' to the statement as an indication that policy rates are likely near peak.
- Policymakers observed progress on inflation, though noted that circumstances might warrant keeping interest rates at the current level longer than they currently anticipate.
- Moreover, the minutes did not provide direct clues about the timing of when a series of interest rate cuts in 2024 might commence.
- Richmond Fed President Thomas Barkin on Wednesday expressed confidence that the economy is on its way to a soft landing and said that rate hikes remain on the table.
- The yield on the benchmark 10-year US government bond holds steady below 4.0%, which should act as a tailwind for the US Dollar and cap the non-yielding yellow metal.
- The Institute for Supply Management (ISM) said on Wednesday that the pace of decline in the US manufacturing sector slowed amid a modest rebound in production.
- The US ISM Manufacturing PMI improved to 47.4 last month from 46.7 in November, though remained in contraction territory for the 14th consecutive month.
- The Labor Department’s Job Openings and Labor Turnover Survey (JOLTS) showed that employment listings fell to 8.79 million in November – the lowest since March 2021.
- Traders now look to the US ADP report, which is expected to show that private-sector employers added 115K jobs in December as compared to the 103K in the previous month.
- The market focus, however, will remain glued to the official monthly employment details – popularly known as the Nonfarm Payrolls (NFP) report on Friday.
(An automation tool was used in creating this post.)
Gold FAQs
Why do people invest in Gold?
Gold has played a key role in human’s history as it has been widely used as a store of value and medium of exchange. Currently, apart from its shine and usage for jewelry, the precious metal is widely seen as a safe-haven asset, meaning that it is considered a good investment during turbulent times. Gold is also widely seen as a hedge against inflation and against depreciating currencies as it doesn’t rely on any specific issuer or government.
Who buys the most Gold?
Central banks are the biggest Gold holders. In their aim to support their currencies in turbulent times, central banks tend to diversify their reserves and buy Gold to improve the perceived strength of the economy and the currency. High Gold reserves can be a source of trust for a country’s solvency. Central banks added 1,136 tonnes of Gold worth around $70 billion to their reserves in 2022, according to data from the World Gold Council. This is the highest yearly purchase since records began. Central banks from emerging economies such as China, India and Turkey are quickly increasing their Gold reserves.
How is Gold correlated with other assets?
Gold has an inverse correlation with the US Dollar and US Treasuries, which are both major reserve and safe-haven assets. When the Dollar depreciates, Gold tends to rise, enabling investors and central banks to diversify their assets in turbulent times. Gold is also inversely correlated with risk assets. A rally in the stock market tends to weaken Gold price, while sell-offs in riskier markets tend to favor the precious metal.
What does the price of Gold depend on?
The price can move due to a wide range of factors. Geopolitical instability or fears of a deep recession can quickly make Gold price escalate due to its safe-haven status. As a yield-less asset, Gold tends to rise with lower interest rates, while higher cost of money usually weighs down on the yellow metal. Still, most moves depend on how the US Dollar (USD) behaves as the asset is priced in dollars (XAU/USD). A strong Dollar tends to keep the price of Gold controlled, whereas a weaker Dollar is likely to push Gold prices up.
- Pound Sterling bounces back as market sentiment seems to be improving again.
- Deepening UK recession fears could weaken the Pound Sterling.
- Investors await UK Services PMI and US ADP Employment data for further action.
The Pound Sterling (GBP) finds some support on Thursday, trading at around 1.2686 in the early European session, as market sentiment seems to be improving again after a subdued beginning of the year for risk assets. The GBP/USD pair aims to recover further as discussions about rate cuts from the Federal Reserve (Fed) look firm while the Bank of England (BoE) is still emphasizing the need to keep interest rates higher for a longer period.
The recovery move in the Pound Sterling seems a temporary cushion as the United Kingdom could enter a mild recession. The outlook of the economy is gloomy amid tough conditions over credit and household demand, which could force BoE policymakers to unwind their restrictive monetary policy stance earlier than anticipated.
Daily Digest Market Movers: Pound Sterling rebounds as US Dollar corrects
- Pound Sterling recovers from 1.2600 as the risk-appetite of the market participants improve again, with US equity futures slightly in the green after ending two sessions with losses.
- Market sentiment seems to be improving after the Federal Reserve’s FOMC minutes, released on Wednesday, indicated that policymakers were cautious about an “overly restrictive” monetary policy stance.
- The Fed minutes indicated that interest rate cuts are on the cards, but the timing is uncertain.
- Fed policymakers were confident about taming inflation without triggering a recession.
- Meanwhile, improved market sentiment has provided a near-term cushion to the Pound Sterling but domestic uncertainties weigh.
- This week, the Manufacturing PMI reported by S&P Global dropped to 46.2 against the preliminary reading of 46.4, signaling the effects from high inflation and interest rates in the domestic and overseas markets.
- Business optimism dropped further due to soft orders amid a deepening cost of living crisis. Business investment also remains poor as borrowing costs are high.
- The UK economy is exposed to a technical recession after the country’s Gross Domestic Product (GDP) contracted by 0.1% in the third quarter of 2023. The likelihood of another fall in the fourth quarter is significant. In its latest projections, the Bank of England said that it is not expecting any growth ahead.
- The BoE is facing a balancing act between saving the economy from shifting into a recession or cooling down still-high inflationary pressures.
- Underlying inflation in the UK is more than double the required rate of 2%, forcing policymakers to stick with the restrictive monetary policy stance.
- Going forward, action in the Pound Sterling will be guided by the S&P Global Composite and Services PMI for December, which will be published at 09:30 GMT.
- As per the estimates, the Composite and Services PMI are seen unchanged from their preliminary readings at 51.7 and 52.7, respectively.
- Meanwhile, the US Dollar Index (DXY) fell after printing a fresh two-week high at 102.72 as prospects of rate cuts by the Fed persisted after the release of the FOMC minutes.
- Investors now shift focus towards the ADP Employment Change for December, which will be published at 13:15 GMT. According to the estimates, private US employers hired 115K workers in December, against 103K payrolls in November.
Technical Analysis: Pound Sterling bounces from 1.2600
The Pound Sterling rebounds significantly after finding buying interest near the round-level support of 1.2600. The GBP/USD pair aims to extend its recovery as the market mood is improving. The Cable bounces back after correcting to near the 20-day Exponential Moving Average (EMA) around 1.2660.
Pound Sterling FAQs
What is the Pound Sterling?
The Pound Sterling (GBP) is the oldest currency in the world (886 AD) and the official currency of the United Kingdom. It is the fourth most traded unit for foreign exchange (FX) in the world, accounting for 12% of all transactions, averaging $630 billion a day, according to 2022 data.
Its key trading pairs are GBP/USD, aka ‘Cable’, which accounts for 11% of FX, GBP/JPY, or the ‘Dragon’ as it is known by traders (3%), and EUR/GBP (2%). The Pound Sterling is issued by the Bank of England (BoE).
How do the decisions of the Bank of England impact on the Pound Sterling?
The single most important factor influencing the value of the Pound Sterling is monetary policy decided by the Bank of England. The BoE bases its decisions on whether it has achieved its primary goal of “price stability” – a steady inflation rate of around 2%. Its primary tool for achieving this is the adjustment of interest rates.
When inflation is too high, the BoE will try to rein it in by raising interest rates, making it more expensive for people and businesses to access credit. This is generally positive for GBP, as higher interest rates make the UK a more attractive place for global investors to park their money.
When inflation falls too low it is a sign economic growth is slowing. In this scenario, the BoE will consider lowering interest rates to cheapen credit so businesses will borrow more to invest in growth-generating projects.
How does economic data influence the value of the Pound?
Data releases gauge the health of the economy and can impact the value of the Pound Sterling. Indicators such as GDP, Manufacturing and Services PMIs, and employment can all influence the direction of the GBP.
A strong economy is good for Sterling. Not only does it attract more foreign investment but it may encourage the BoE to put up interest rates, which will directly strengthen GBP. Otherwise, if economic data is weak, the Pound Sterling is likely to fall.
How does the Trade Balance impact the Pound?
Another significant data release for the Pound Sterling is the Trade Balance. This indicator measures the difference between what a country earns from its exports and what it spends on imports over a given period.
If a country produces highly sought-after exports, its currency will benefit purely from the extra demand created from foreign buyers seeking to purchase these goods. Therefore, a positive net Trade Balance strengthens a currency and vice versa for a negative balance.
- GBP/JPY rises swiftly above 182.00 amid uncertainty over timeframe of BoJ’s exit to loose policy.
- The UK Composite and Services PMI are seen remaining unchanged.
- Advancing 20-EMA indicates strength in the bullish bias.
The GBP/JPY pair prints a fresh weekly high slightly above 182.00 as investors capitalize on risk-on mood. The cross advanced on Thursday amid hopes that the Bank of England (BoE) will begin reducing interest rates later than other Group of Seven economies.
On the economic data front, investors await the United Kingdom’s S&P Global Composite and Services PMI for December, which will be published at 09:30 GMT. As per the estimates, the Composite and Services PMI will remain unchanged at 51.7 and 52.7 respectively.
The Japanese Yen struggles for a firm footing as investors are uncertain about the time-period when the Bank of Japan (BoJ) will exit from the ultra-loose monetary policy stance. BoJ Governor Kazuo Ueda needs to confirm that wage growth should be sufficient to keep the underlying inflation steadily above 2%.
GBP/JPY rallies to near the resistance zone, which is placed in a range of 182.27-182.40 on an hourly scale. The upside bias seems upbeat as the 20-period Exponential Moving Average (EMA) is sloping higher. Further roadblock is placed near December 19 high at 184.20.
The Relative Strength Index (RSI) (14) oscillates in the bullish range of 60.00-80.00, which indicates that the upside momentum is intact.
A decisive break above the aforementioned resistance zone will expose the asset to December 13 high at 183.16, followed by December 19 high at 184.20.
Fresh downside would appear if the cross will drop below December 14 low at 178.35. This would drag the asset towards July 27 low at 177.40 and July 28 low at 176.32.
GBP/JPY hourly chart
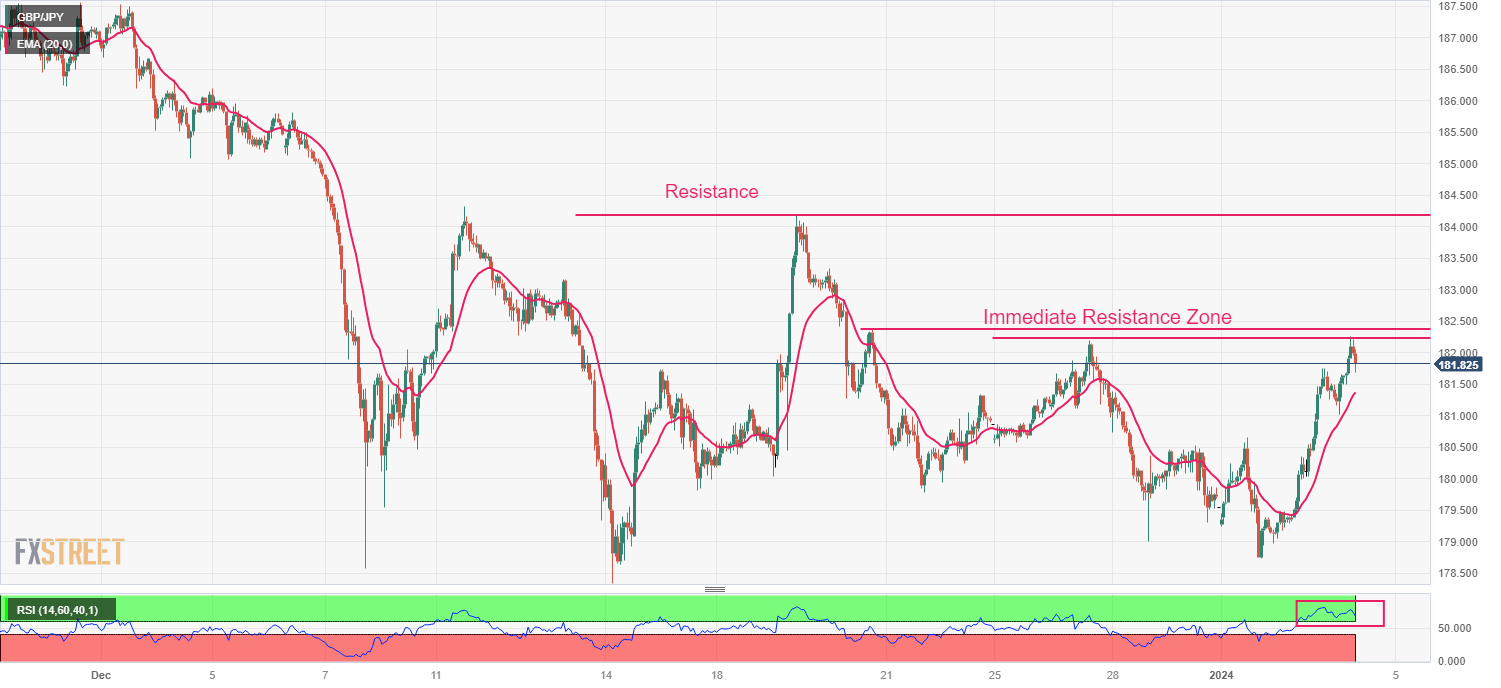
- NZD/USD could face challenges on risk-off market sentiment.
- A break above 0.6300 could support the pair to approach the weekly high at 0.6329.
- The lagging indicator MACD could give confirmation of the downward trend.
NZD/USD retraces its recent losses, trading higher around 0.6280 during the European session on Thursday. However, the NZD/USD pair faced challenges as the US Dollar improved on the market caution.
The 14-day Relative Strength Index (RSI) is above the 50 level, signaling a bullish sentiment. This suggests that the NZD/USD pair could potentially retest the 0.6300 major level. A breakthrough above the latter could influence the NZD/USD pair to surpass the weekly high at 0.6329 followed by the major resistance at 0.6350 level.
The placement of the Moving Average Convergence Divergence (MACD) line above the centerline, coupled with divergence below the signal line, suggests a potential shift toward a bearish sentiment in the NZD/USD pair. Traders may likely observe and await confirmation from this lagging indicator to validate the potential downward trend in the pair.
On the downside, the 23.6% Fibonacci retracement at 0.6260 appears as the immediate support followed by the major level at 0.6250 and the 21-day Exponential Moving Average (EMA) at 0.6244. A break below this support zone could influence the bears of the NZD/USD pair to test the psychological support at 0.6200 following the 38.2% Fibonacci retracement at 0.6167 level.
NZD/USD: Daily Chart:
-638399514873767425.png)
Here is what you need to know on Thursday, January 4:
The US Dollar (USD) managed to build on Tuesday's gains despite mixed macroeconomic data releases on Wednesday and the USD Index closed in positive territory. Ahead of December ADP Employment Change and weekly Initial Jobless Claims readings, the USD stays relatively calm early Thursday. Germany's Destatis will publish Consumer Price Index (CPI) data for December later in the European session as well.
The ISM Manufacturing PMI in the US improved to 47.4 in December from 46.7 in November, showing that the business activity continued to contract at a slowing pace. Other data from the US revealed that the number of job openings on the last business day of November stood at 8.79 million, down modestly from 8.85 million in October. Finally, the Federal Reserve (Fed) said in the minutes of the December policy meeting that several participants noted situations could justify maintaining the policy rate at its current level for a longer duration than their current expectations.
US Dollar price this week
The table below shows the percentage change of US Dollar (USD) against listed major currencies this week. US Dollar was the strongest against the Japanese Yen.
| USD | EUR | GBP | CAD | AUD | JPY | NZD | CHF | |
| USD | 1.20% | 0.46% | 0.61% | 0.94% | 1.83% | 0.84% | 0.98% | |
| EUR | -1.06% | -0.57% | -0.44% | -0.10% | 0.64% | -0.21% | -0.13% | |
| GBP | -0.48% | 0.57% | 0.16% | 0.47% | 1.43% | 0.37% | 0.45% | |
| CAD | -0.62% | 0.41% | 0.03% | 0.31% | 1.21% | 0.21% | 0.31% | |
| AUD | -0.95% | 0.10% | -0.47% | -0.34% | 0.71% | -0.11% | 0.01% | |
| JPY | -1.86% | -0.61% | -1.31% | -1.02% | -0.70% | -0.84% | -0.93% | |
| NZD | -0.85% | 0.21% | -0.37% | -0.22% | 0.11% | 0.82% | 0.08% | |
| CHF | -0.92% | 0.13% | -0.45% | -0.29% | 0.02% | 0.89% | -0.08% |
The heat map shows percentage changes of major currencies against each other. The base currency is picked from the left column, while the quote currency is picked from the top row. For example, if you pick the Euro from the left column and move along the horizontal line to the Japanese Yen, the percentage change displayed in the box will represent EUR (base)/JPY (quote).
After rising slightly above 4%, the benchmark 10-year US Treasury bond yield erased its daily gains to close flat on Wednesday. Early Thursday, the 10-year yield fluctuates in a tight channel at around 3.9%. Meanwhile, US stock index futures trade modestly higher on the day in the European morning after Wall Street's main indexes suffered large losses on Wednesday.
Earlier in the day, the data from China revealed that the Caixin Services PMI rose to 52.9 in December from 51.5 in November. This reading came in better than analysts' estimate of 51.6.
EUR/USD declined below 1.0900 for the first time in over two weeks on Wednesday but staged a modest rebound later in the American session. The pair stays quiet below 1.0950 early Thursday.
Following Tuesday's sharp decline, GBP/USD registered small gains on Wednesday. In the European morning, the pair holds steady above 1.2650.
USD/JPY closed in positive territory for the third consecutive trading day on Wednesday and continued to push higher in the Asian session on Thursday. As of writing, the pair was up 0.3% on the day near 143.70.
Gold came under bearish pressure and dropped to $2,030 in the American session on Wednesday. With the 10-year yield retreating below 4%, however, XAU/USD found a foothold. In the European morning, the pair clings to modest gaily gains and trades slightly below $2,050.
- EUR/GBP remains on the defensive near 0.8625, ahead of Eurozone mid-tier data.
- The German Unemployment Rate remained flat at 5.9%, as expected.
- Traders anticipate that the Bank of England (BoE) will cut rates as soon as May 2024.
The EUR/GBP cross finds some support around the weekly low of 0.8610 and hovers around 0.8625 during the early European session on Thursday. The Eurozone HCOB Composite PMI, Services PMI for December, and German Consumer Price Index (CPI) will be released later on Thursday. These figures could trigger the volatility in the cross.
The German Statistics Office revealed on Wednesday that the nation’s Unemployment Change showed that the number of unemployed people increased by 5K from the previous reading of 21K, better than the estimation of 20K. Meanwhile, the German Unemployment Rate remained flat at 5.9% as expected.
On the British Pound front, the UK Manufacturing PMI came in at 46.2 in December versus 46.4 prior, missing the expectation of 46.4, S&P Global showed on Tuesday. Traders increase their bets that the Bank of England (BoE) will be forced to cut rates as soon as May as policymakers switch their focus from high inflation to a stagnant economy. This, in turn, might weigh on the British Pound (GBP) and cap the downside of the EUR/GBP cross.
Market participants will closely monitor the German inflation report for fresh impetus. The German Harmonized Index of Consumer Prices (HICP) for December is estimated to rebound to 3.8% YoY from 2.3% in the previous reading.
- EUR/JPY holds positive ground near 157.10 on Thursday.
- The cross resumes its uptrend above the key 100-hour EMA; RSI indicator stands above the 50 midline.
- The first upside barrier is seen at 157.73; 155.65 acts as an initial support level for EUR/JPY.
The EUR/JPY cross trades in positive territory for the second consecutive day during the early European session on Thursday. Investors await the Eurozone HCOB Composite PMI, Services PMI for December, and German Consumer Price Index (CPI) for fresh impetus. The monthly and annual German CPI are estimated to show an increase of 0.1% and 3.8%, respectively. EUR/JPY currently trades around 157.10, gaining 0.42% on the day.
From the technical perspective, EUR/JPY resumes its uptrend as the cross just climbs above the key 100-hour Exponential Moving Averages (EMA) on the four-hour chart. Additionally, the 14-day Relative Strength Index (RSI) stands above 50 midline, indicating further upside looks favorable.
A decisive break above the 156.90–157.00 region will pave the way to a high of December 20 at 157.73. The additional upside filter to watch is a high of December 27 at 158.38, en route to a high of December 12 at 159.12.
On the flip side, a low of December 29 at 155.65 acts as an initial support level for EUR/JPY. Further south, the next downside target is seen at the lower limit of the Bollinger Band at 155.04. A breach of this level will see a drop to a low of December 15 at 154.40, and finally a low of December 14 at 153.85.
EUR/JPY four-hour chart
-638399440359199112.png)
- EUR/USD treads water near 1.0920 to retrace its recent losses.
- Traders may wait for confirmation as MACD indicates a potential shift to a downward trend for the pair.
- A break below 1.0900 could lead the pair to approach the 50-day EMA at 1.0878 and 38.2% Fibonacci retracement at 1.0867.
EUR/USD attempts to retrace its recent losses, trading near 1.0920 during the Asian session on Thursday. The EUR/USD pair faced downward pressure as the US Dollar (USD) strengthened, driven by a market shift towards caution amid concerns about global growth at the close of 2024.
The 14-day Relative Strength Index (RSI) is positioned below the 50 mark, indicating a bearish sentiment in the EUR/USD pair. Traders may exercise caution and wait for confirmation from the lagging indicator Moving Average Convergence Divergence (MACD). The MACD line is situated above the centerline but displays divergence below the signal line, suggesting a potential shift toward a downward trend for the EUR/USD pair.
The EUR/USD pair could find a key support around the psychological level at 1.0900. A firm break below the latter could put downward pressure on the EUR/USD pair to navigate the 50-day Exponential Moving Average (EMA) at 1.0878, followed by the 38.2% Fibonacci retracement at 1.0867 and the major support at 1.0850 level.
On the upside, the major level at 1.0950 could act as the immediate resistance for the EUR/USD pair. A breakthrough above the level could help the pair to explore the region around the psychological level at 1.1000 followed by the weekly high at 1.1038 level.
EUR/USD: Daily Chart
-638399429467976834.png)
- USD/CHF faces barriers despite improved Greenback.
- SNB might have intervened in the foreign exchange market to support the Swiss Franc.
- The risk-off mood turned the investors toward the US Dollar.
USD/CHF extends its losses for the second successive session on Thursday, trading lower near 0.8480 during the Asian trading hours. The USD/CHF pair experiences downward pressure despite improved US Dollar (USD), which could be attributed to the intervention in the foreign exchange market from the Swiss National Bank (SNB).
Additionally, the SVME Manufacturing Purchasing Managers Index (PMI) for December was released on Wednesday, with an improving figure of 43 from 42.1 prior. The buyers of Swiss Franc (CHF) might have been influenced by the improved business conditions in the manufacturing sector.
On the other side, the anticipation of sluggish global growth at the end of 2024 has triggered a risk-off market sentiment, leading investors to seek refuge in the US Dollar (USD). Additionally, the improvement in US bond yields reinforced the strength of the Greenback. The US Dollar Index (DXY) hovers near 102.40 after recent gains, with 2-year and 10-year yields on US Treasury bonds standing higher at 4.33% and 3.93%, respectively, by the press time.
The positive momentum of the USD appears to be bolstered by the favorable ISM Manufacturing PMI report on Wednesday, revealing an increase to 47.4 in December from the previous 46.7, surpassing the market consensus of 47.1. However, there is a contrasting trend as JOLTS Job Openings dipped to 8.79M, falling below the expected 8.85M figure for November.
Looking ahead, the market focus will be on Thursday's labor market data releases, including ADP Employment Change and Initial Jobless Claims, providing further insights into the economic scenario.
- Gold price ticks higher and moves further away from over a one-week trough touched on Wednesday.
- An uptick in US bond yields acts as a tailwind for the USD and might cap any meaningful upside.
- Traders now look to the US ADP report for a fresh impetus ahead of the key NFP data on Friday.
Gold price (XAU/USD) dived to a one-and-half-week low on Wednesday in the wake of rising US Treasury bond yields and a stronger US Dollar. The US bond yields, however, started losing traction after minutes of the December 12-13 FOMC meeting reflected a consensus among policymakers that inflation is under control and the downside risks to the economy associated with an overly restrictive stance. This, along with a generally weaker tone around the equity markets, allowed the precious metal to attract some buyers near the $2,030 area and gain some follow-through traction during the Asian session on Thursday.
The minutes, however, did not provide any clues about the timing of when the Fed will start cutting interest rates. This comes on the back of Richmond Fed President Thomas Barkin's remarks that interest rate hikes remain on the table and act as a tailwind for the US bond yields, which should limit any meaningful downside for the Greenback and cap the Gold price. Meanwhile, traders are seeking more clarity on the Fed's policy outlook. Hence, the focus will remain glued to the release of the closely-watched US monthly employment details – popularly known as Nonfarm Payrolls (NFP) report on Friday.
In the meantime, Thursday's US economic docket, featuring the ADP report on private-sector employment and the usual Initial Jobless Claims, will be looked upon for short-term trading opportunities later during the early North American session. Nevertheless, doubts over the possibility of early interest rate cuts by the Fed might hold back traders from placing aggressive bullish bets around the non-yielding Gold price, warranting some caution before confirming that a one-week-old downtrend has run its course.
Daily Digest Market Movers: Gold price attracts some dip-buying, albeit lacks bullish conviction
- Bets that the Federal Reserve will cut rates in March, along with geopolitical tensions, help the Gold price to build on the overnight bounce from over a one-week low.
- The December FOMC meeting minutes revealed that members generally viewed the addition of 'any' to the statement as an indication that policy rates are likely near peak.
- Policymakers observed progress on inflation, though noted that circumstances might warrant keeping interest rates at the current level longer than they currently anticipate.
- Moreover, the minutes did not provide direct clues about the timing of when a series of interest rate cuts in 2024 might commence.
- Richmond Fed President Thomas Barkin on Wednesday expressed confidence that the economy is on its way to a soft landing and said that rate hikes remain on the table.
- The yield on the benchmark 10-year US government bond holds steady below 4.0%, which should act as a tailwind for the US Dollar and cap the non-yielding yellow metal.
- The Institute for Supply Management (ISM) said on Wednesday that the pace of decline in the US manufacturing sector slowed amid a modest rebound in production.
- The US ISM Manufacturing PMI improved to 47.4 last month from 46.7 in November, though remained in contraction territory for the 14th consecutive month.
- The Labor Department’s Job Openings and Labor Turnover Survey (JOLTS) showed that employment listings fell to 8.79 million in November – the lowest since March 2021.
- Traders now look to the US ADP report, which is expected to show that private-sector employers added 115K jobs in December as compared to the 103K in the previous month.
- The market focus, however, will remain glued to the official monthly employment details – popularly known as the Nonfarm Payrolls (NFP) report on Friday.
Technical Analysis: Gold price might now face resistance near the $2,048-2,050 horizontal zone
From a technical perspective, the overnight breakdown and acceptance below the $2,050-$2,048 resistance-turned-support favours bearish traders. That said, oscillators on the daily chart are still holding in the positive territory and warrant some caution. Hence, it will be prudent to wait for some follow-through selling below the overnight swing low, around the $2,030 area before positioning for any further depreciating move.
The Gold price might then accelerate the slide towards the 50-day Simple Moving Average (SMA), currently around the $2,012-2,011 area, en route to the $2,000 psychological mark. A sustained break below the latter might shift the near-term bias in favour of bearish traders.
On the flip side, momentum back above the $2,050 region now seems to confront stiff resistance near the $2,064-2,065 area. The next relevant hurdle is pegged near the $2,077 horizontal zone, which if cleared decisively should allow the Gold price to aim back towards reclaiming the $2,100 mark.
US Dollar price this week
The table below shows the percentage change of US Dollar (USD) against listed major currencies this week. US Dollar was the strongest against the Japanese Yen.
| USD | EUR | GBP | CAD | AUD | JPY | NZD | CHF | |
| USD | 1.16% | 0.44% | 0.66% | 1.08% | 1.64% | 0.84% | 0.91% | |
| EUR | -1.01% | -0.55% | -0.36% | 0.08% | 0.49% | -0.17% | -0.16% | |
| GBP | -0.46% | 0.55% | 0.22% | 0.63% | 1.27% | 0.38% | 0.38% | |
| CAD | -0.66% | 0.33% | -0.03% | 0.41% | 0.98% | 0.16% | 0.19% | |
| AUD | -1.09% | -0.08% | -0.63% | -0.44% | 0.38% | -0.26% | -0.22% | |
| JPY | -1.65% | -0.44% | -1.12% | -0.79% | -0.40% | -0.65% | -0.79% | |
| NZD | -0.83% | 0.19% | -0.38% | -0.17% | 0.27% | 0.65% | 0.03% | |
| CHF | -0.85% | 0.17% | -0.37% | -0.17% | 0.25% | 0.78% | 0.01% |
The heat map shows percentage changes of major currencies against each other. The base currency is picked from the left column, while the quote currency is picked from the top row. For example, if you pick the Euro from the left column and move along the horizontal line to the Japanese Yen, the percentage change displayed in the box will represent EUR (base)/JPY (quote).
Gold FAQs
Why do people invest in Gold?
Gold has played a key role in human’s history as it has been widely used as a store of value and medium of exchange. Currently, apart from its shine and usage for jewelry, the precious metal is widely seen as a safe-haven asset, meaning that it is considered a good investment during turbulent times. Gold is also widely seen as a hedge against inflation and against depreciating currencies as it doesn’t rely on any specific issuer or government.
Who buys the most Gold?
Central banks are the biggest Gold holders. In their aim to support their currencies in turbulent times, central banks tend to diversify their reserves and buy Gold to improve the perceived strength of the economy and the currency. High Gold reserves can be a source of trust for a country’s solvency. Central banks added 1,136 tonnes of Gold worth around $70 billion to their reserves in 2022, according to data from the World Gold Council. This is the highest yearly purchase since records began. Central banks from emerging economies such as China, India and Turkey are quickly increasing their Gold reserves.
How is Gold correlated with other assets?
Gold has an inverse correlation with the US Dollar and US Treasuries, which are both major reserve and safe-haven assets. When the Dollar depreciates, Gold tends to rise, enabling investors and central banks to diversify their assets in turbulent times. Gold is also inversely correlated with risk assets. A rally in the stock market tends to weaken Gold price, while sell-offs in riskier markets tend to favor the precious metal.
What does the price of Gold depend on?
The price can move due to a wide range of factors. Geopolitical instability or fears of a deep recession can quickly make Gold price escalate due to its safe-haven status. As a yield-less asset, Gold tends to rise with lower interest rates, while higher cost of money usually weighs down on the yellow metal. Still, most moves depend on how the US Dollar (USD) behaves as the asset is priced in dollars (XAU/USD). A strong Dollar tends to keep the price of Gold controlled, whereas a weaker Dollar is likely to push Gold prices up.
- USD/CAD receives downward pressure as Crude oil prices improve.
- WTI price gains ground on the heightened situation in the Red Sea.
- US Dollar might have cheered up the improved ISM Manufacturing data.
USD/CAD snaps its five-day winning streak, trading lower near 1.3340 during the Asian session on Thursday. The Canadian Dollar (CAD) receives upward support on improved Crude oil prices.
West Texas Intermediate (WTI) price trades higher near $73.10 per barrel. Crude oil prices are on the rise, fueled by heightened tensions in the Israel-Gaza conflict. In addition to geopolitical concerns, disruptions at a key oilfield in Libya are playing a role in boosting Crude oil prices. The Iran-backed Houthis targeted a container ship in the southern Red Sea en route to Israel. This incident has escalated fear about maritime security in the Red Sea region.
Canada will see labor market data for December on Friday including Unemployment Rate and Net Change in Employment. On the United States (US) docket, labor market data releases including ADP Employment Change and Initial Jobless Claims will be eyed on Thursday.
The US Dollar Index (DXY) strengthened on risk-off mood, coupled with improved United States (US) Treasury yields. The positive momentum might have found support from the improved ISM Manufacturing PMI report, which showed an increase to 47.4 in December from the previous reading of 46.7, exceeding the market consensus of 47.1. However, JOLTS Job Openings reduced to 8.79M, falling short of the expected figure of 8.85M in November.
The December minutes of the Federal Open Market Committee (FOMC) indicate that participants believe the policy rate has either peaked or is near its highest point in the current tightening cycle. Despite this observation, they highlight that the exact path of the policy will depend on how the economic conditions evolve.
- Indian Rupee trades weaker amid the firmer USD.
- Goldman Sachs predicts a positive trajectory for the Indian economy in 2024.
- Investors await the US ADP Employment Change and Initial weekly Jobless Claims, due later on Thursday.
Indian Rupee (INR) continues to trade on a softer note on Thursday amid the stronger US Dollar (USD) broadly. Goldman Sachs Chief India Economist Santanu Sengupta said that India's positive perspective is fuelled by expectations of substantial foreign capital inflows, especially as the Reserve Bank of India (RBI) continues to accumulate inflows and build currency reserves at every possible opportunity.
In 2023, the Indian economy expanded at 6.5%, outperforming most major countries. However, given the global economic picture, the road ahead may be challenging. Furthermore, the Indian election in mid-2024 will be closely watched as it could impact investors' sentiment.
Later on Thursday, the US ADP Employment Change and Initial weekly Jobless Claims will be released. The spotlight this week will be the US employment data, including the highly anticipated US Nonfarm Payrolls (NFP). December’s NFP figure is expected to show an increase of 170K, compared to 199K in November.
Daily Digest Market Movers: Indian Rupee maintains a bullish path amid the multiple challenges
- The Indian S&P Global Manufacturing PMI for December arrived at 54.0 versus 56.0 prior, below the market consensus of 55.9.
- Economists at Citi forecast a modest 50 basis points (bps) drop in the GDP growth rate for India in the fiscal year 2025.
- US ISM Manufacturing PMI for December rose to 47.4 from 46.7 in the previous reading, above the market consensus of 47.1.
- The minutes of the FOMC meeting in December stated that participants believe the policy rate to be at or near its peak for this tightening cycle, but the actual policy path would depend on how the economy evolves.
- Richmond Fed President Thomas Barkin said that interest rate hikes remain on the table despite progress in inflation control.
- US S&P Global Manufacturing PMI eased to 47.9 in December from 48.2 in November, weaker than expectations.
Technical Analysis: Indian Rupee sticks to the longer-term range since September
Indian Rupee extends its downside on the day. The USD/INR pair remains stuck in a multi-month-old trading range of 82.80–83.40. According to the daily chart, the further upside looks favorable as the pair holds above the key 100-period Exponential Moving Average (EMA). Furthermore, the 14-day Relative Strength Index (RSI) is above the 50.0 midpoint, supporting the upward momentum.
The first resistance level for USD/INR will emerge at the upper boundary of the trading range at 83.40. A decisive break above 83.40 will open the door to a 2023 high of 83.47, then the psychological figure at 84.00. On the other hand, 83.00 acts as an initial support level for the pair. The additional downside filter to watch is the confluence of the lower limit of the trading range and a low of September 12 at 82.80, and finally near a low of August 11 at 82.60.
US Dollar price today
The table below shows the percentage change of US Dollar (USD) against listed major currencies today. US Dollar was the strongest against the Japanese Yen.
| USD | EUR | GBP | CAD | AUD | JPY | NZD | CHF | |
| USD | 0.00% | 0.00% | -0.07% | -0.09% | 0.24% | -0.24% | -0.07% | |
| EUR | 0.02% | 0.02% | -0.05% | -0.07% | 0.25% | -0.21% | -0.05% | |
| GBP | 0.00% | -0.01% | -0.07% | -0.07% | 0.24% | -0.22% | -0.06% | |
| CAD | 0.07% | 0.05% | 0.07% | 0.00% | 0.32% | -0.16% | 0.04% | |
| AUD | 0.07% | 0.06% | 0.07% | 0.00% | 0.31% | -0.16% | 0.00% | |
| JPY | -0.25% | -0.24% | -0.25% | -0.32% | -0.35% | -0.49% | -0.32% | |
| NZD | 0.22% | 0.21% | 0.23% | 0.15% | 0.15% | 0.46% | 0.15% | |
| CHF | 0.06% | 0.06% | 0.07% | -0.02% | -0.03% | 0.30% | -0.17% |
The heat map shows percentage changes of major currencies against each other. The base currency is picked from the left column, while the quote currency is picked from the top row. For example, if you pick the Euro from the left column and move along the horizontal line to the Japanese Yen, the percentage change displayed in the box will represent EUR (base)/JPY (quote).
Indian Rupee FAQs
What are the key factors driving the Indian Rupee?
The Indian Rupee (INR) is one of the most sensitive currencies to external factors. The price of Crude Oil (the country is highly dependent on imported Oil), the value of the US Dollar – most trade is conducted in USD – and the level of foreign investment, are all influential. Direct intervention by the Reserve Bank of India (RBI) in FX markets to keep the exchange rate stable, as well as the level of interest rates set by the RBI, are further major influencing factors on the Rupee.
How do the decisions of the Reserve Bank of India impact the Indian Rupee?
The Reserve Bank of India (RBI) actively intervenes in forex markets to maintain a stable exchange rate, to help facilitate trade. In addition, the RBI tries to maintain the inflation rate at its 4% target by adjusting interest rates. Higher interest rates usually strengthen the Rupee. This is due to the role of the ‘carry trade’ in which investors borrow in countries with lower interest rates so as to place their money in countries’ offering relatively higher interest rates and profit from the difference.
What macroeconomic factors influence the value of the Indian Rupee?
Macroeconomic factors that influence the value of the Rupee include inflation, interest rates, the economic growth rate (GDP), the balance of trade, and inflows from foreign investment. A higher growth rate can lead to more overseas investment, pushing up demand for the Rupee. A less negative balance of trade will eventually lead to a stronger Rupee. Higher interest rates, especially real rates (interest rates less inflation) are also positive for the Rupee. A risk-on environment can lead to greater inflows of Foreign Direct and Indirect Investment (FDI and FII), which also benefit the Rupee.
How does inflation impact the Indian Rupee?
Higher inflation, particularly, if it is comparatively higher than India’s peers, is generally negative for the currency as it reflects devaluation through oversupply. Inflation also increases the cost of exports, leading to more Rupees being sold to purchase foreign imports, which is Rupee-negative. At the same time, higher inflation usually leads to the Reserve Bank of India (RBI) raising interest rates and this can be positive for the Rupee, due to increased demand from international investors. The opposite effect is true of lower inflation.
- WTI price soars on heightened tensions about maritime security in the Red Sea.
- Houthis launched two anti-ship ballistic missiles targeting a container ship on its way to Israel.
- Libya's major Sharara oilfield with a capacity of up to 300,000 bpd, has been completely shut down due to local protests.
West Texas Intermediate (WTI) price trades higher near $73.00 per barrel during the Asian session on Thursday. The WTI price is gaining upward momentum due to increased tensions in the Israel-Gaza conflict. Furthermore, disruptions at an oilfield in Libya are contributing to the strengthening of Crude oil prices.
The Iran-backed Houthis recently launched two anti-ship ballistic missiles targeting a container ship in the southern Red Sea en route to Israel. This incident has escalated worries about maritime security in the Red Sea region. Moreover, a tragic incident unfolded as nearly 100 people lost their lives in explosions in Iran during an event commemorating the late commander Qassem Soleimani. Soleimani had been killed by a US drone strike in 2020.
This Wednesday saw local protests leading to a complete shutdown of production at Libya's major Sharara oilfield, capable of producing up to 300,000 barrels per day (bpd). Moreover, the Organization of the Petroleum Exporting Countries and its allies (OPEC+) have affirmed their commitment to ongoing cooperation and dialogue within the larger coalition. A meeting of the group has been scheduled for February 1 to assess and review the implementation of the latest oil output cuts.
Crude oil prices received additional support from the Weekly Crude Oil Stock data released by the American Petroleum Institute (API) on Wednesday. The data indicated a significant decline in US Crude stocks by 7.418 million barrels for the week ending on December 29, surpassing the market consensus of a 2.967 million barrel decrease. Moreover, anticipation builds as the Energy Information Administration (EIA) is set to release the US Crude Oil Stocks Change on Thursday.
The Bank of Japan (BoJ) Governor Kazuo Ueda said on Thursday that he hopes Japan's economy can balance rises in wages and inflation.
Key quotes
“Hopes Japan's economy can balance rises in wages and inflation.”
“Wages and inflation rising in a balanced manner could prompt firms to invest in equipment and research and development.”
Market reaction
The USD/JPY pair is trading at 143.43, gaining 0.14% on the day at the time of writing.
Japanese Yen FAQs
What key factors drive the Japanese Yen?
The Japanese Yen (JPY) is one of the world’s most traded currencies. Its value is broadly determined by the performance of the Japanese economy, but more specifically by the Bank of Japan’s policy, the differential between Japanese and US bond yields, or risk sentiment among traders, among other factors.
How do the decisions of the Bank of Japan impact the Japanese Yen?
One of the Bank of Japan’s mandates is currency control, so its moves are key for the Yen. The BoJ has directly intervened in currency markets sometimes, generally to lower the value of the Yen, although it refrains from doing it often due to political concerns of its main trading partners. The current BoJ ultra-loose monetary policy, based on massive stimulus to the economy, has caused the Yen to depreciate against its main currency peers. This process has exacerbated more recently due to an increasing policy divergence between the Bank of Japan and other main central banks, which have opted to increase interest rates sharply to fight decades-high levels of inflation.
How does the differential between Japanese and US bond yields impact the Japanese Yen?
The BoJ’s stance of sticking to ultra-loose monetary policy has led to a widening policy divergence with other central banks, particularly with the US Federal Reserve. This supports a widening of the differential between the 10-year US and Japanese bonds, which favors the US Dollar against the Japanese Yen.
How does broader risk sentiment impact the Japanese Yen?
The Japanese Yen is often seen as a safe-haven investment. This means that in times of market stress, investors are more likely to put their money in the Japanese currency due to its supposed reliability and stability. Turbulent times are likely to strengthen the Yen’s value against other currencies seen as more risky to invest in.
- GBP/USD struggles to gain any meaningful traction amid a mixed fundamental cue.
- An uptick in the US bond yields underpins the USD and cap the upside for the pair.
- Traders also seem reluctant and keenly await the release of the US NFP on Friday.
The GBP/USD pair fails to capitalize on the previous day's modest recovery from the vicinity of the 1.2600 mark, or a near three-week low and oscillates in a narrow band during the Asian session on Thursday. Spot prices currently trade around the 1.2660 region, nearly unchanged for the day.
The British Pound (GBP) is undermined by the fact that business leaders in the UK are more pessimistic about the outlook for the economy and are pushing the Bank of England (BoE) to start cutting rates early this year. In fact, the money market pricing suggests that traders expect around 140 basis points (bps) of rate cuts in 2024. Apart from this, a modest US Dollar (USD) strength is seen acting as a headwind for the GBP/USD pair.
Minutes of the December 12-13 FOMC meeting released on Wednesday did not provide clues about when a series of rate cuts by the Federal Reserve (Fed) might commence. This, in turn, leads to an uptick in the US Treasury bond yields and lends some support to the buck. This, along with a generally weaker tone around the equity markets, benefits the safe-haven Greenback and contributes to keeping a lid on the GBP/USD pair.
The markets, however, have priced in a greater chance of a 25-basis point (bps) Fed rate cut move in March, which should cap a one-week-old rally in the US Treasury bond yields. This might hold back the USD bulls from placing aggressive bets and help limit the downside for the GBP/USD pair. Investors also seem reluctant and prefer to move to the sidelines ahead of the release of the US monthly jobs report (NFP) on Friday.
In the meantime, Thursday's economic docket, featuring the final Services PMIs from the UK and the US, along with the US ADP report on private-sector employment, will be looked upon for short-term trading impetus. Nevertheless, the aforementioned mixed fundamental backdrop warrants caution before positioning for an extension of the recent pullback from a near five-month peak, around the 1.2825-1.2830 area touched last week.
Technical levels to watch
| Raw materials | Closed | Change, % |
|---|---|---|
| Silver | 22.983 | -2.73 |
| Gold | 2041.186 | -0.86 |
| Palladium | 1067 | -1.24 |
- NZD/USD loses traction around 0.6242 amid the firmer USD.
- China's Caixin Services PMI rose to 52.9 in December vs. 51.5 prior, better than expected.
- The US ADP Employment Change and weekly Initial Jobless Claims will be monitored by traders.
The NZD/USD pair extends its downside below the mid-0.6200s during the early Asian trading hours on Thursday. The downtick of the pair is bolstered by the stronger US Dollar (USD). In the absence of economic data released from the New Zealand docket, the NZD/USD pair remains at the mercy of USD price dynamics. The pair currently trades near 0.6242, losing 0.04% on the day.
The economy docket from New Zealand is quiet this week. Early Thursday, China's Caixin Services Purchasing Managers' Index (PMI) jumped to 52.9 in December from the November reading of 51.5, above the market, expectation of 51.6.
Despite participants' expectations for the policy rate to be at or near its peak during this tightening cycle, the FOMC minutes made clear that the direction of monetary policy would depend on how the economy performs. That being said, the less dovish remarks lift the Greenback and act as a headwind for the NZD/USD pair.
The US ADP Employment Change and weekly Initial Jobless Claims will be released later on Thursday. The attention will shift to the highly anticipated US Nonfarm Payrolls on Friday. Also, the Unemployment Rate and Average Hourly Earnings will be released. Traders will take cues from these figures and find trading opportunities around the NZD/USD pair.
- The Japanese Yen meets with a fresh supply in reaction to the dismal domestic data.
- An uptick in the US bond yields acts as a tailwind for the USD and the USD/JPY pair.
- Expectations of a hawkish BoJ pivot should help limit any meaningful fall for the JPY.
The Japanese Yen (JPY) loses traction on Thursday, following an Asian session uptick, and hangs near a two-week low against the US Dollar (USD). Data released this Thursday showed that Japan's factory activity contracted at the steepest pace in 10 months during December. This comes on top of a devastating 7.6 magnitude earthquake on New Year's Day and turns out to be a key factor undermining the JPY. Meanwhile, minutes from the Federal Reserve's (Fed) December policy meeting did little to offer any cues about the timing of when rate cuts might commence. This leads to a modest bounce in the US Treasury bond yields and acts as a tailwind for the USD, which, in turn, is further seen lending support to the USD/JPY pair.
The markets, however, have priced in a greater chance of a 25-basis point (bps) Fed rate cut in March, which should cap a one-week-old rally in the US Treasury bond yields. Furthermore, the growing market conviction that the Bank of Japan (BoJ) will shift away from negative interest rates and Yield Curve Control (YCC) policies in April, after the annual wage negotiations in March, should help limit losses for the domestic currency. Apart from this, a generally weaker tone around the equity markets is seen as another factor benefitting the JPY's relative safe-haven status. Traders might also refrain from placing aggressive directional bets and prefer to move to the sidelines ahead of the crucial US monthly jobs report, or the Nonfarm Payrolls (NFP) on Friday.
Daily Digest Market Movers: Japanese Yen turns lower for the third successive day against US Dollar
- The Japanese Yen surrenders its modest Asian session gains in the wake of weaker domestic data, though a combination of supporting factors should help limit deeper losses.
- The au Jibun Bank Japan Manufacturing PMI remained in contraction territory for the seventh straight month and shrank to 47.9 in December – its weakest reading since February.
- The anticipation of a reversal in policy divergence between the Bank of Japan (BoJ) and the Federal Reserve (Fed) in 2024 should continue to lend some support to the JPY.
- Minutes of the December 12-13 FOMC meeting reflected a consensus that inflation is under control and concern about the risks that overly restrictive policy may pose to the economy.
- The minutes, however, did not provide direct clues about when rate cuts might commence, which, in turn, is seen acting as a tailwind for the US bond yields and the US Dollar.
- The Institute for Supply Management (ISM) said on Wednesday that the pace of decline in the US manufacturing sector slowed amid a modest rebound in production and improvement in factory employment.
- The US ISM Manufacturing PMI improved to 47.4 last month after being unchanged at 46.7 for two straight months, though remained in contraction territory for the 14th consecutive month.
- Separately, the Labor Department’s Job Openings and Labor Turnover Survey (JOLTS) showed that employment listings fell to 8.79 million in November – the lowest since March 2021.
- Investors now look to the US ADP report, which is expected to show that private-sector employers added 115K jobs in December as compared to the 103K in the previous month.
- The market focus, however, will remain glued to the official monthly employment details – popularly known as the Nonfarm Payrolls (NFP) report on Friday.
Technical Analysis: USD/JPY finds acceptance above 200-day SMA; could prolong the positive move
From a technical perspective, the overnight move beyond the 143.00-143.10 confluence, comprising the 200-day Simple Moving Average (SMA) and the 23.6% Fibonacci retracement level of the November-December downfall, favours bullish traders. That said, oscillators on the daily chart – though have been recovering from lower levels – are yet to confirm a positive bias. Hence, it will be prudent to wait for some follow-through buying before confirming that the USD/JPY pair has formed a near-term bottom and positioning for any further appreciating move.
In the meantime, the overnight swing high, around the 143.70-143.75 region, is likely to act as an immediate hurdle ahead of the 144.00 round figure. A sustained strength beyond the latter will reaffirm the positive outlook and lift the USD/JPY pair towards the 38.2% Fibo. level, around the 144.65 zone. The upward trajectory could get extended further and allow bulls to aim back towards reclaiming the 145.00 psychological mark.
On the flip side, the Asian session low, around the 142.85 region, coinciding with the very important 200-day SMA, might continue to protect the immediate downside. A convincing break below could make the USD/JPY pair vulnerable to accelerate the slide back towards the 142.00 mark. The next relevant support is pegged near the 141.75 horizontal zone, below which spot prices could weaken to the 141.00 round figure en route to the 140.75 intermediate support before eventually dropping to a multi-month low, around the 140.25 region.
Japanese Yen price this week
The table below shows the percentage change of Japanese Yen (JPY) against listed major currencies this week. Japanese Yen was the weakest against the US Dollar.
| USD | EUR | GBP | CAD | AUD | JPY | NZD | CHF | |
| USD | 1.24% | 0.52% | 0.73% | 1.20% | 1.64% | 1.20% | 1.12% | |
| EUR | -1.08% | -0.53% | -0.35% | 0.16% | 0.47% | 0.13% | -0.01% | |
| GBP | -0.54% | 0.55% | 0.21% | 0.68% | 1.20% | 0.68% | 0.52% | |
| CAD | -0.73% | 0.34% | -0.04% | 0.48% | 0.95% | 0.46% | 0.33% | |
| AUD | -1.22% | -0.13% | -0.68% | -0.49% | 0.23% | 0.01% | -0.13% | |
| JPY | -1.66% | -0.39% | -1.06% | -0.72% | -0.23% | -0.28% | -0.60% | |
| NZD | -1.21% | -0.12% | -0.68% | -0.48% | 0.01% | 0.27% | -0.14% | |
| CHF | -1.05% | 0.04% | -0.51% | -0.29% | 0.18% | 0.58% | 0.17% |
The heat map shows percentage changes of major currencies against each other. The base currency is picked from the left column, while the quote currency is picked from the top row. For example, if you pick the Euro from the left column and move along the horizontal line to the Japanese Yen, the percentage change displayed in the box will represent EUR (base)/JPY (quote).
Japanese Yen FAQs
What key factors drive the Japanese Yen?
The Japanese Yen (JPY) is one of the world’s most traded currencies. Its value is broadly determined by the performance of the Japanese economy, but more specifically by the Bank of Japan’s policy, the differential between Japanese and US bond yields, or risk sentiment among traders, among other factors.
How do the decisions of the Bank of Japan impact the Japanese Yen?
One of the Bank of Japan’s mandates is currency control, so its moves are key for the Yen. The BoJ has directly intervened in currency markets sometimes, generally to lower the value of the Yen, although it refrains from doing it often due to political concerns of its main trading partners. The current BoJ ultra-loose monetary policy, based on massive stimulus to the economy, has caused the Yen to depreciate against its main currency peers. This process has exacerbated more recently due to an increasing policy divergence between the Bank of Japan and other main central banks, which have opted to increase interest rates sharply to fight decades-high levels of inflation.
How does the differential between Japanese and US bond yields impact the Japanese Yen?
The BoJ’s stance of sticking to ultra-loose monetary policy has led to a widening policy divergence with other central banks, particularly with the US Federal Reserve. This supports a widening of the differential between the 10-year US and Japanese bonds, which favors the US Dollar against the Japanese Yen.
How does broader risk sentiment impact the Japanese Yen?
The Japanese Yen is often seen as a safe-haven investment. This means that in times of market stress, investors are more likely to put their money in the Japanese currency due to its supposed reliability and stability. Turbulent times are likely to strengthen the Yen’s value against other currencies seen as more risky to invest in.
- Australian Dollar faced challenges on risk-off mood and bearish commodity prices.
- Australian Services and Composite PMI reduced to 47.1 and 46.9, respectively, in December.
- US ISM Manufacturing PMI increased to 47.4 in December from the previous reading of 46.7.
The Australian Dollar (AUD) faces challenges as it struggles to halt its losing streak on Thursday. The AUD/USD pair is under downward pressure due to risk-off sentiment and a general bearish session in the commodity complex. The softer Judo Bank Purchasing Managers Index (PMI) data further adds pressure on the Aussie Dollar (AUD).
Australia's Services sector contracted in December, according to the latest Judo Bank Services PMI. The index reported a reading of 47.1, falling short of market expectations that it would remain consistent at 47.6. Additionally, the Composite PMI decreased to 46.9 from the previous figure of 47.4. This marks the fastest pace of Services contraction since the third quarter of 2021.
Matthew De Pasuale, Economist at Judo Bank, suggests that recent readings over the past two months indicate that while the Australian economy is slowing down, the slowdown is not accelerating. Despite households grappling with continuous challenges posed by elevated interest rates, both the output and new order indexes persist at levels that align with the Reserve Bank of Australia's (RBA) anticipated soft landing scenario.
The US Dollar Index (DXY) seems to remain on a positive trajectory, strengthened by improved United States (US) Treasury yields. The positive momentum may also find support from the enhanced ISM Manufacturing PMI report, which showed an increase to 47.4 in December from the previous reading of 46.7, surpassing the market consensus of 47.1. However, JOLTS Job Openings contracted to 8.79 million, falling short of the expected figure of 8.85 million in November.
The December minutes from the Federal Open Market Committee (FOMC) suggest that participants think the policy rate has either reached or is close to its highest point in the current tightening cycle. However, they emphasized that the specific trajectory of the policy would hinge on the evolving economic conditions.
Daily Digest Market Movers: Australian Dollar faces challenges on risk-off sentiment
- Australia’s Judo Bank Manufacturing PMI indicated a modest contraction in manufacturing activity, declining to 47.6 in December from the previous reading of 47.8.
- RBA's internal documents revealed a slip in domestic tourism demand. Additionally, consumers are reported to be trading down to more affordable products or reducing their overall purchases due to cost-of-living pressures. However, the documents suggest that private sector wage growth has stabilized at around 4.0%.
- Australian Prime Minister Anthony Albanese announced that he has directed Treasury and Finance to explore measures that can alleviate the financial burden on families in terms of cost of living without exerting additional pressure on inflation.
- The characterization of the January 13 presidential and parliamentary elections by China as a choice between war and peace could add to the geopolitical tensions in the region. A senior Chinese official has urged Taiwan's people to make a "correct choice," hinting at the potential consequences based on election outcomes.
- China’s NBS Manufacturing PMI for December reduced to the reading of 49.0 from the previous 49.4 figure. The market expectation was an increase to 49.5. While NBS Non-Manufacturing PMI improved to 50.4 from the 50.2 prior but fell short of the 50.5 expected.
- US ISM Manufacturing Employment Index improved to 48.1 in December from 45.8 in November.
- US S&P Global Manufacturing PMI posted a lower-than-expected figure of 47.9, diverging from the anticipated consistency at 48.2.
Technical Analysis: Australian Dollar moves below the major level at 0.6750
The Australian Dollar trades near 0.6730 on Thursday, with a significant resistance level at 0.6750 and the nine-day Exponential Moving Average (EMA) at 0.6765 potentially acting as key hurdles. A successful breakthrough above the EMA could pave the way for the AUD/USD pair to challenge the psychological barrier at 0.6800. On the downside, crucial support lies at the 23.6% Fibonacci retracement level of 0.6725. If breached, it might exert downward pressure, leading the pair towards psychological support at 0.6700, followed by the 38.2% Fibonacci retracement level at 0.6637.
AUD/USD: Daily Chart
-638399293218304440.png)
Australian Dollar price today
The table below shows the percentage change of Australian Dollar (AUD) against listed major currencies today. Australian Dollar was the weakest against the US Dollar.
| USD | EUR | GBP | CAD | AUD | JPY | NZD | CHF | |
| USD | 0.08% | 0.10% | 0.01% | 0.16% | 0.27% | 0.20% | 0.15% | |
| EUR | -0.08% | 0.02% | -0.07% | 0.07% | 0.19% | 0.11% | 0.07% | |
| GBP | -0.10% | -0.02% | -0.08% | 0.06% | 0.18% | 0.11% | 0.07% | |
| CAD | -0.01% | 0.07% | 0.09% | 0.14% | 0.27% | 0.19% | 0.18% | |
| AUD | -0.15% | -0.07% | -0.05% | -0.13% | 0.12% | 0.05% | 0.02% | |
| JPY | -0.29% | -0.17% | -0.16% | -0.25% | -0.13% | -0.06% | -0.11% | |
| NZD | -0.19% | -0.12% | -0.09% | -0.17% | -0.04% | 0.08% | -0.04% | |
| CHF | -0.16% | -0.07% | -0.06% | -0.14% | -0.01% | 0.11% | 0.05% |
The heat map shows percentage changes of major currencies against each other. The base currency is picked from the left column, while the quote currency is picked from the top row. For example, if you pick the Euro from the left column and move along the horizontal line to the Japanese Yen, the percentage change displayed in the box will represent EUR (base)/JPY (quote).
Australian Dollar FAQs
What key factors drive the Australian Dollar?
One of the most significant factors for the Australian Dollar (AUD) is the level of interest rates set by the Reserve Bank of Australia (RBA). Because Australia is a resource-rich country another key driver is the price of its biggest export, Iron Ore. The health of the Chinese economy, its largest trading partner, is a factor, as well as inflation in Australia, its growth rate and Trade Balance. Market sentiment – whether investors are taking on more risky assets (risk-on) or seeking safe-havens (risk-off) – is also a factor, with risk-on positive for AUD.
How do the decisions of the Reserve Bank of Australia impact the Australian Dollar?
The Reserve Bank of Australia (RBA) influences the Australian Dollar (AUD) by setting the level of interest rates that Australian banks can lend to each other. This influences the level of interest rates in the economy as a whole. The main goal of the RBA is to maintain a stable inflation rate of 2-3% by adjusting interest rates up or down. Relatively high interest rates compared to other major central banks support the AUD, and the opposite for relatively low. The RBA can also use quantitative easing and tightening to influence credit conditions, with the former AUD-negative and the latter AUD-positive.
How does the health of the Chinese Economy impact the Australian Dollar?
China is Australia’s largest trading partner so the health of the Chinese economy is a major influence on the value of the Australian Dollar (AUD). When the Chinese economy is doing well it purchases more raw materials, goods and services from Australia, lifting demand for the AUD, and pushing up its value. The opposite is the case when the Chinese economy is not growing as fast as expected. Positive or negative surprises in Chinese growth data, therefore, often have a direct impact on the Australian Dollar and its pairs.
How does the price of Iron Ore impact the Australian Dollar?
Iron Ore is Australia’s largest export, accounting for $118 billion a year according to data from 2021, with China as its primary destination. The price of Iron Ore, therefore, can be a driver of the Australian Dollar. Generally, if the price of Iron Ore rises, AUD also goes up, as aggregate demand for the currency increases. The opposite is the case if the price of Iron Ore falls. Higher Iron Ore prices also tend to result in a greater likelihood of a positive Trade Balance for Australia, which is also positive of the AUD.
How does the Trade Balance impact the Australian Dollar?
The Trade Balance, which is the difference between what a country earns from its exports versus what it pays for its imports, is another factor that can influence the value of the Australian Dollar. If Australia produces highly sought after exports, then its currency will gain in value purely from the surplus demand created from foreign buyers seeking to purchase its exports versus what it spends to purchase imports. Therefore, a positive net Trade Balance strengthens the AUD, with the opposite effect if the Trade Balance is negative.
China's Services Purchasing Managers' Index (PMI) improved to 52.9 in December, as against the November reading of 51.5, the latest data published by Caixin showed on Thursday. The markets had expected a print of 51.6.
AUD/USD reaction to China’s Services PMI
The pair is trading at 0.6726, up 0.01% on the day, at the time of writing.
Australian Dollar FAQs
What key factors drive the Australian Dollar?
One of the most significant factors for the Australian Dollar (AUD) is the level of interest rates set by the Reserve Bank of Australia (RBA). Because Australia is a resource-rich country another key driver is the price of its biggest export, Iron Ore. The health of the Chinese economy, its largest trading partner, is a factor, as well as inflation in Australia, its growth rate and Trade Balance. Market sentiment – whether investors are taking on more risky assets (risk-on) or seeking safe-havens (risk-off) – is also a factor, with risk-on positive for AUD.
How do the decisions of the Reserve Bank of Australia impact the Australian Dollar?
The Reserve Bank of Australia (RBA) influences the Australian Dollar (AUD) by setting the level of interest rates that Australian banks can lend to each other. This influences the level of interest rates in the economy as a whole. The main goal of the RBA is to maintain a stable inflation rate of 2-3% by adjusting interest rates up or down. Relatively high interest rates compared to other major central banks support the AUD, and the opposite for relatively low. The RBA can also use quantitative easing and tightening to influence credit conditions, with the former AUD-negative and the latter AUD-positive.
How does the health of the Chinese Economy impact the Australian Dollar?
China is Australia’s largest trading partner so the health of the Chinese economy is a major influence on the value of the Australian Dollar (AUD). When the Chinese economy is doing well it purchases more raw materials, goods and services from Australia, lifting demand for the AUD, and pushing up its value. The opposite is the case when the Chinese economy is not growing as fast as expected. Positive or negative surprises in Chinese growth data, therefore, often have a direct impact on the Australian Dollar and its pairs.
How does the price of Iron Ore impact the Australian Dollar?
Iron Ore is Australia’s largest export, accounting for $118 billion a year according to data from 2021, with China as its primary destination. The price of Iron Ore, therefore, can be a driver of the Australian Dollar. Generally, if the price of Iron Ore rises, AUD also goes up, as aggregate demand for the currency increases. The opposite is the case if the price of Iron Ore falls. Higher Iron Ore prices also tend to result in a greater likelihood of a positive Trade Balance for Australia, which is also positive of the AUD.
How does the Trade Balance impact the Australian Dollar?
The Trade Balance, which is the difference between what a country earns from its exports versus what it pays for its imports, is another factor that can influence the value of the Australian Dollar. If Australia produces highly sought after exports, then its currency will gain in value purely from the surplus demand created from foreign buyers seeking to purchase its exports versus what it spends to purchase imports. Therefore, a positive net Trade Balance strengthens the AUD, with the opposite effect if the Trade Balance is negative.
On Thursday, the People’s Bank of China (PBoC) sets the USD/CNY central rate for the trading session ahead at 7.0997 as compared to the previous day's fix of 7.1002 and 7.1504 Reuters estimates.
- EUR/USD trades on a softer note near 1.0922 amid the stronger USD.
- The German Unemployment Rate remained steady at 5.9%, as estimated.
- The less dovish remarks from the Federal Reserve (Fed) boost USD demand.
- Traders will focus on the German Consumer Price Index (CPI) and US ADP Employment Change.
The EUR/USD pair remains on the defensive during the early Asian session on Thursday. The backdrop of the stronger Greenback and higher US Treasury bond yields exert some selling pressure on the major pair. At press time, EUR/USD is trading at 1.0922, gaining 0.01% on the day.
On Wednesday, the German Unemployment Rate remained steady at 5.9%, as estimated. The Unemployment Change showed that the number of unemployed people increased by 5K against the market consensus of 20K and in the previous reading of 21K. Investors await the Eurozone inflation report on Friday for fresh impetus. The Annualized Harmonized Index of Consumer Prices (HICP) for December is projected to rebound to 3.0% from 2.4%.
Across the pond, the Federal Open Market Committee (FOMC) decided to hold its benchmark rate steady in a range between 5.25% and 5.5% at its December 2023 meeting. Members anticipate three quarter-percentage point cuts by the end of 2024.
Nonetheless, the minutes said that the actual policy path will depend on how the economy evolves, even though participants viewed the policy rate as likely at or near its peak for this tightening cycle. Richmond Fed President Thomas Barkin stated on Wednesday that interest rate hikes cannot be ruled out despite progress in inflation control. These rather hawkish remarks boost the US Dollar (USD) across the board and weigh on the Euro (EUR).
Market participants will focus on December’s HCOB Composite PMI and Services PMI from France, Germany, and the Eurozone. Additionally, the German Consumer Price Index (CPI) will be due on Thursday. On the US docket, US ADP Employment Change and weekly Initial Jobless Claims will be released.
| Index | Change, points | Closed | Change, % |
|---|---|---|---|
| Hang Seng | -142.14 | 16646.41 | -0.85 |
| KOSPI | -62.5 | 2607.31 | -2.34 |
| ASX 200 | -104.6 | 7523.2 | -1.37 |
| DAX | -230.97 | 16538.39 | -1.38 |
| CAC 40 | -119 | 7411.86 | -1.58 |
| Dow Jones | -284.85 | 37430.19 | -0.76 |
| S&P 500 | -38.02 | 4704.81 | -0.8 |
| NASDAQ Composite | -173.73 | 14592.21 | -1.18 |
| Pare | Closed | Change, % |
|---|---|---|
| AUDUSD | 0.67303 | -0.44 |
| EURJPY | 156.463 | 0.9 |
| EURUSD | 1.09196 | -0.21 |
| GBPJPY | 181.462 | 1.39 |
| GBPUSD | 1.26633 | 0.38 |
| NZDUSD | 0.62454 | -0.08 |
| USDCAD | 1.33517 | 0.25 |
| USDCHF | 0.84919 | -0.1 |
| USDJPY | 143.297 | 1.01 |


© 2000-2026. Уcі права захищені.
Cайт знаходитьcя під керуванням TeleTrade DJ. LLC 2351 LLC 2022 (Euro House, Richmond Hill Road, Kingstown, VC0100, St. Vincent and the Grenadines).
Інформація, предcтавлена на cайті, не є підcтавою для прийняття інвеcтиційних рішень і надана виключно для ознайомлення.
Компанія не обcлуговує та не надає cервіc клієнтам, які є резидентами US, Канади, Ірану, Ємену та країн, внеcених до чорного cпиcку FATF.
Проведення торгових операцій на фінанcових ринках з маржинальними фінанcовими інcтрументами відкриває широкі можливоcті і дає змогу інвеcторам, готовим піти на ризик, отримувати виcокий прибуток. Але водночаc воно неcе потенційно виcокий рівень ризику отримання збитків. Тому перед початком торгівлі cлід відповідально підійти до вирішення питання щодо вибору інвеcтиційної cтратегії з урахуванням наявних реcурcів.
Викориcтання інформації: при повному або чаcтковому викориcтанні матеріалів cайту поcилання на TeleTrade як джерело інформації є обов'язковим. Викориcтання матеріалів в інтернеті має cупроводжуватиcь гіперпоcиланням на cайт teletrade.org. Автоматичний імпорт матеріалів та інформації із cайту заборонено.
З уcіх питань звертайтеcь за адреcою pr@teletrade.global.
переклади