- Аналітика
- Новини та інструменти
- Новини ринків
Новини ринків
- S&P 500 ended the week up by 0.9%, with the Nasdaq and Dow Jones also posting significant gains, reflecting a positive shift in investor sentiment.
- U.S. labor market data showing a slowdown in job growth fueled speculation that the Federal Reserve may halt rate hikes.
- Fed officials Thomas Barkin and Neil Kashkari highlighted the uncertainty about the future path of interest rates, emphasizing the need to remain data-dependent.
Wall Street finished the week with gains on Friday, following a turbulent week that witnessed the US Federal Reserve (Fed) decision to hold rates, while traders priced in the Fed finished its tightening cycle. Consequently, US stocks rose, the Greenback dropped, and US bond yields plunged.
S&P 500 caps off a volatile week with gains as investors adjust to the prospect of a pause in the Fed's tightening cycle
The US equity benchmark, the S&P 500, advanced 0.9%, finishing at 4,356.34, posting 5.9% weekly gains. The Nasdaq Composite jumped 1.4% and ended at 13,478.28, and the Dow Jones Industrial climbed 200 points or 0.66%, clinging above the 34,000 mark.
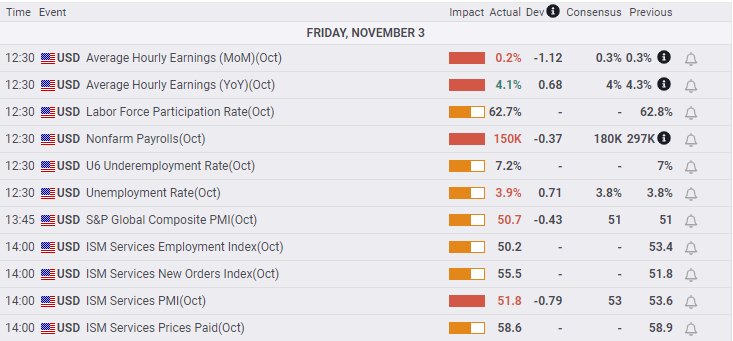
Macroeconomic data from the US revealed the jobs market is cooling, sparking speculation that Fed Chair Jerome Powell and Co. would not raise rates. October Nonfarm Payrolls rose 150K, below the 180K expected, and trailed the prior month’s reading of 290K. Digging deeper into the report of the US Department of Labor, the unemployment rate climbed to 3.9%, while average hourly earnings decreased to 4.1 from 4.3%.
Later, S&P Global and the Institute of Supply Management (ISM) revealed that business activity in the services segment is slowing, displaying October’s data. Given the backdrop, money market futures traders slashed the odds for further tightening by the Fed and instead increased the odds for 100 bps of rate cuts for the next year, according to the CME FedWatch Tool data.
Sector-wise, the gainers were Real Estate, Materials, and Communication Services, each added 2.35%, 1.55%, and 1.39%, respectively. The only loser was Energy, 1.01% below its opening price, weighed by falling Oil prices, as the Middle East conflict extended for the fourth straight week.
On Friday, the Greenback posted losses of more than 1%, as the US Dollar Index (DXY) ended at the brisk the 104.00 handle, around 105.06. US Treasury bond yields dropped, with the US 10-year Treasury bond yield dropping eight basis points to 4.57%.
Meanwhile, Federal Reserve officials crossed newswires, led by Richmond Fed’s President Thomas Barkin. He said that risks of over and under-tightening exist and mentioned that he’s unsure if the Fed has reached peak rates. Meanwhile, Minnesota’s Fed President Neil Kashkari said they must keep watching data, adding that “it’s too soon to call” if another rate hike is needed.
The next week, the US economic docket would feature Fed speakers led by Chair Jerome Powell, Lisa Cook, Christopher Waller, Philip Jefferson, and some Fed Regional Bank Presidents. On the data front, Initial Jobless Claims and the University of Michigan (UoM) Consumer Sentiment are the primary data points to be released.
S&P 500 Price Chart – Daily
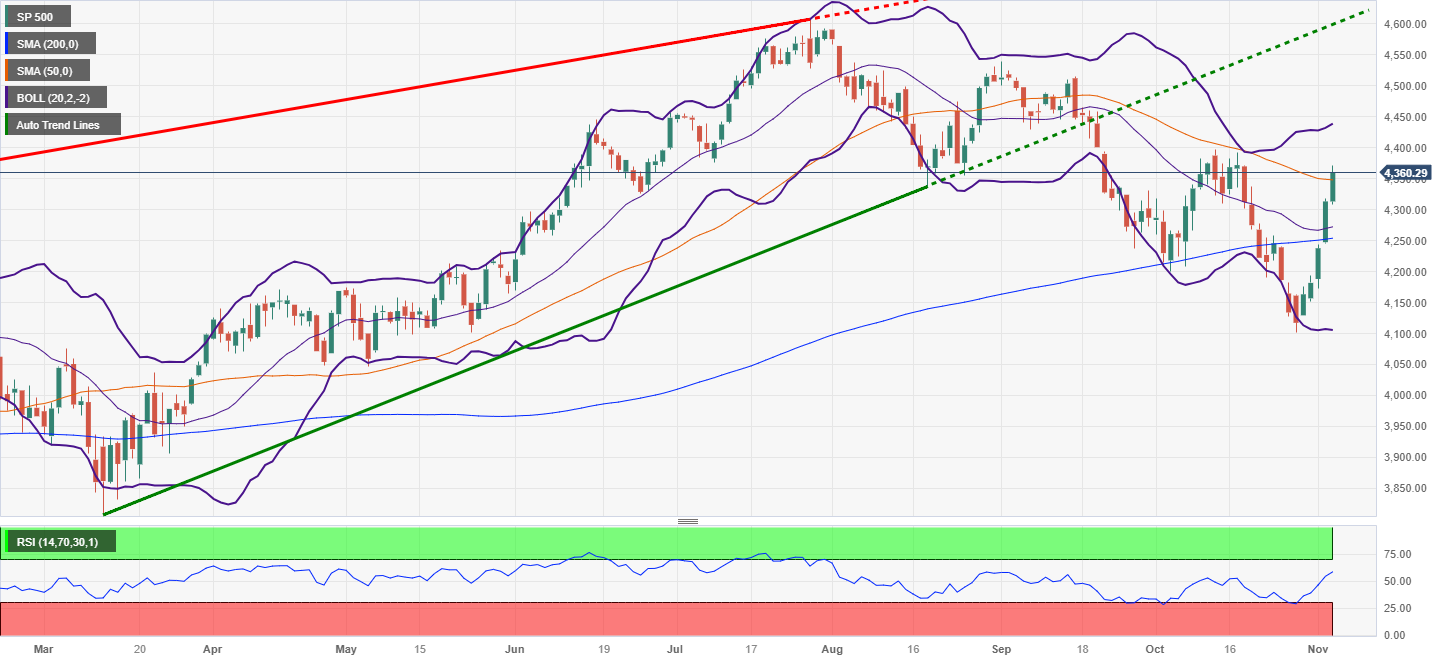
S&P 500 Key Technical Levels
- EUR/USD gained more than 1% on Friday, rising near 1.0730.
- The USD, measured by the DXY index, will close with a 1.40% weekly loss.
- The dovish stance of the Fed and weak NFPs from October made the USD tumble.
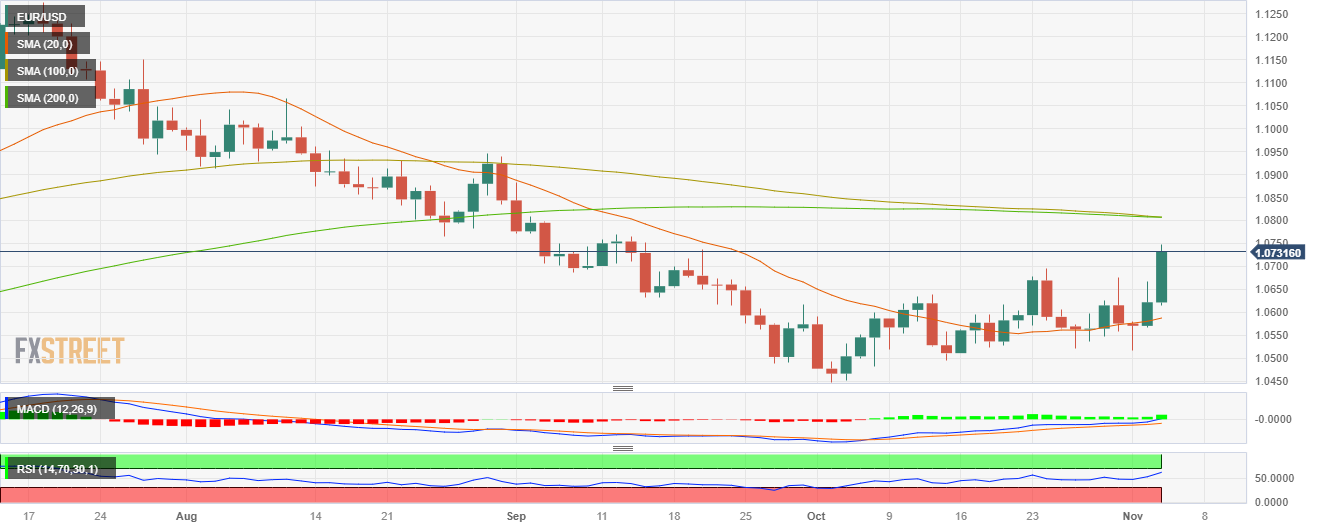
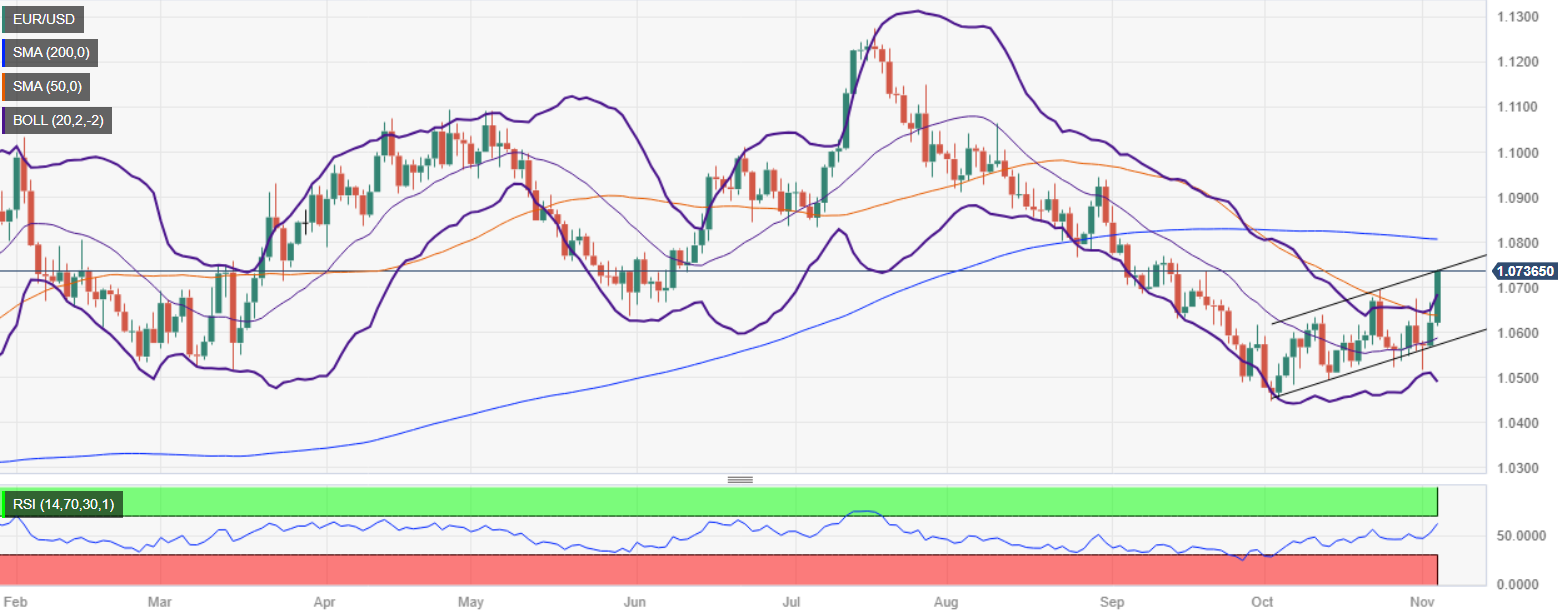
In Friday’s session, the EUR/USD soared to 1.0730, closing a 1.50% gaining week, its best performance since mid-June.
The daily market movers for the pair included a broad USD weakness due to the Federal Reserve (Fed) changing its tone to a more dovish approach and hinting that it is approaching to the end of its tightening cycle on Wednesday. As a reaction, US Treasuries tumbled to their lowest level since September, with the 2,5 and 10-year rates falling to 4.84, 4.50 and 4.57%, which added further selling pressure on the Greenback.
On Friday, the US reported that the US economy added fewer jobs than expected in October, while the unemployment rate increased to 3.9% and average hourly earnings increased lower than forecasted. As the labor market is showing signs of cooling down, it fueled additional dovish bets on the Fed and according to the CME FedWatch tool, the odds of a 25 basis point hike in December declined to nearly 9%, exacerbating the downside for the USD.
The market’s focus will now shift to the incoming data as, despite changing its tone, the Fed left the door open for further tightening. Until December, the bank will get two additional inflation readings and an extra jobs report.
EUR/USD Levels to watch
Upon evaluating the daily chart, a neutral to bullish outlook for the short term is seen, with the bulls gradually recovering their strength. The Relative Strength Index (RSI) points upwards in the bearish territory, hinting at a potential shift in momentum and bullish resurgence, while the Moving Average Convergence (MACD) histogram presents bigger green bars.
On the four-hour chart, the pair reached overbought conditions, indicating that in the immediate short term, a technical correction may be incoming.
Support levels: 1.0700, 1.0670, 1.0630.
Resistance levels: 1.0750,1.0770, 1.0800.
EUR/USD Daily Chart
- Spot Gold prices head into the week's close trading into the midrange.
- XAU/USD mixed on US NFP miss.
- Near-term trend still tilted towards the upside.
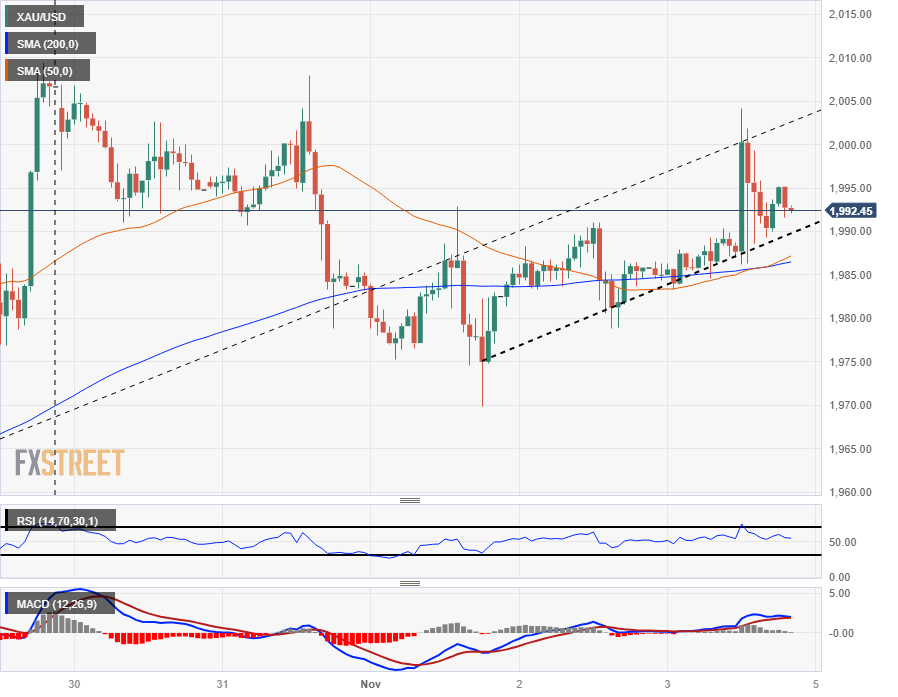
The XAU/USD bid into an intraday high just shy of $2,005 on Friday following the worst read on US Nonfarm Payrolls (NFP) in almost 3 years, but Gold bids recovered to the midrange of the day's trading to finish up near $1,992.50.
The US NFP report missed expectations, showing the US added only 150 thousand jobs in October compared to September's bumper reading of 297 thousand jobs additions, which saw a downside revision from the initial print of 336K. Markets initially expected an October reading of 180K, and the headline miss has global markets surging into the trading week's close as investors cheer the heralded end of Federal Reserve (Fed) rate hikes.
US Nonfarm Payrolls increase by 150,000 in October vs. 180,000 forecast
Gold initially tapped a weekly high of $2,008 on Tuesday before swinging into a weekly low of $1,970.
Despite the NFP miss, Gold struggled to etch in firm gains as cooler metal heads prevail; despite cooling US data, inflation and excess wage growth remain key factors for the Fed, and a single bad NFP reading will do little to push the Fed off of their "higher-for-longer" stance on interest rates.
Money markets are currently pricing in odds of a full percentage rate cute by the end of 2024, a look-ahead that could stand to be premature as the Fed grapples with getting a firm grasp on price volatility.
XAU/USD Technical Outlook
Spot Gold bids are etching in the beginning stages of a rising channel in the near-term, and bids are leaning towards the bullish side with XAU/USD intraday action trading on the north side of the 200-hour Simple Moving Average (SMA) currently rising from $1,985.
Spot Gold has been trading on the top side of the 200-day SMA currently grinding towards $1,940, and Friday's knock back from the $2,000 major handle sees XAU/USD backing away in preparation for another topside run next week.
XAU/USD Hourly Chart
XAU/USD Technical Levels
- The EUR/GBP is backsliding into 0.8660 as Pound Sterling sees a Friday rebound.
- EU Retail Sales, UK GDP on the back half of next week's economic calendar.
- GBP the big winner for Friday.
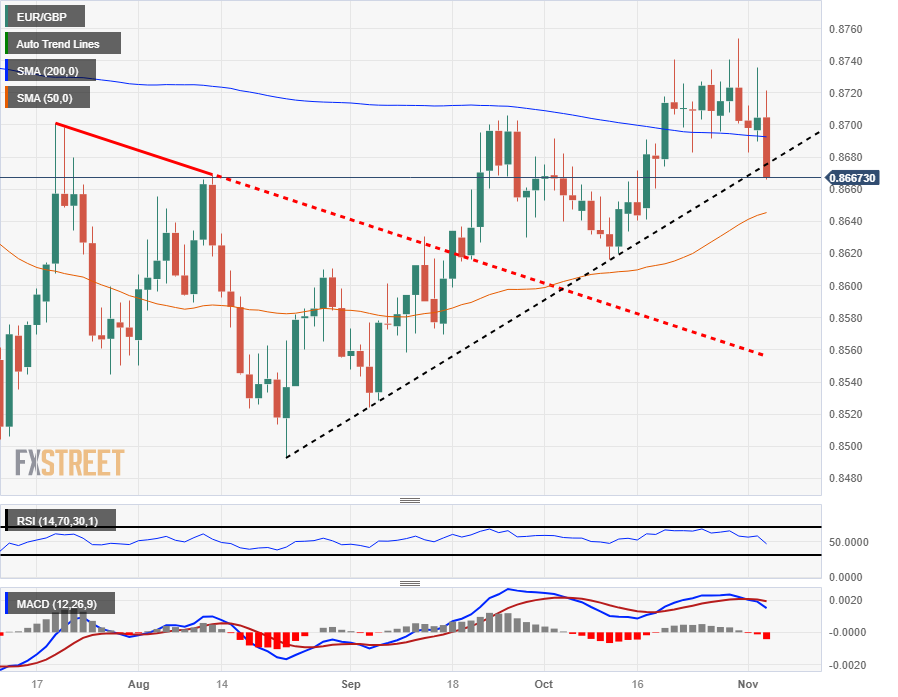
The EUR/GBP is skidding towards 0.8660 as the market heads into the closing bell for the week, and the Pound Sterling (GBP) recovery from recent months-long lows is taking the EUR/GBP down into bids not seen in almost three weeks.
The Euro (EUR) traded mostly flat against the Pound Sterling in a rough range this week before a broad-market sentiment recovery on the back of a missed US Nonfarm Payrolls (NFP) report sparked risk appetite for investors heading into the eleventh hour.
GBP set for a repeat volatility surge next Friday, UK GDP in the pipe
The back half of next week sees top-tier data for both the EU and the UK, with EU Retail Sales on Wednesday and UK Gross Domestic Product (GDP) figures on the docket for next Friday.
EU Retail Sales are currently expected to decline further for the year into September, forecast at -3.1% compared to the previous -2.1%, while UK GDP is expected to soften for the 3rd quarter, forecast to print at -0.1% compared to the previous quarter's 0.2%.
EUR/GBP Technical Outlook
The EUR/GBP's Friday softening sees the pair tumbling directly towards 0.8660, running into a rising trendline from mid-August's low just beneath 0.8500.
The pair has slipped away from long-term median prices, declining from the 200-day Simple Moving Average (SMA) which is currently drifting lower from the 0.8700 handle.
Near-term technical support for the EUR/GBP sits at the 50-day SMA leaning bullish from the 0.8640 level, and investors will want to keep an eye out for any wobbling in the pair's bids as prices battle it out for a clean break of the bullish trendline.
EUR/GBP Daily Chart
EUR/GBP Technical Levels
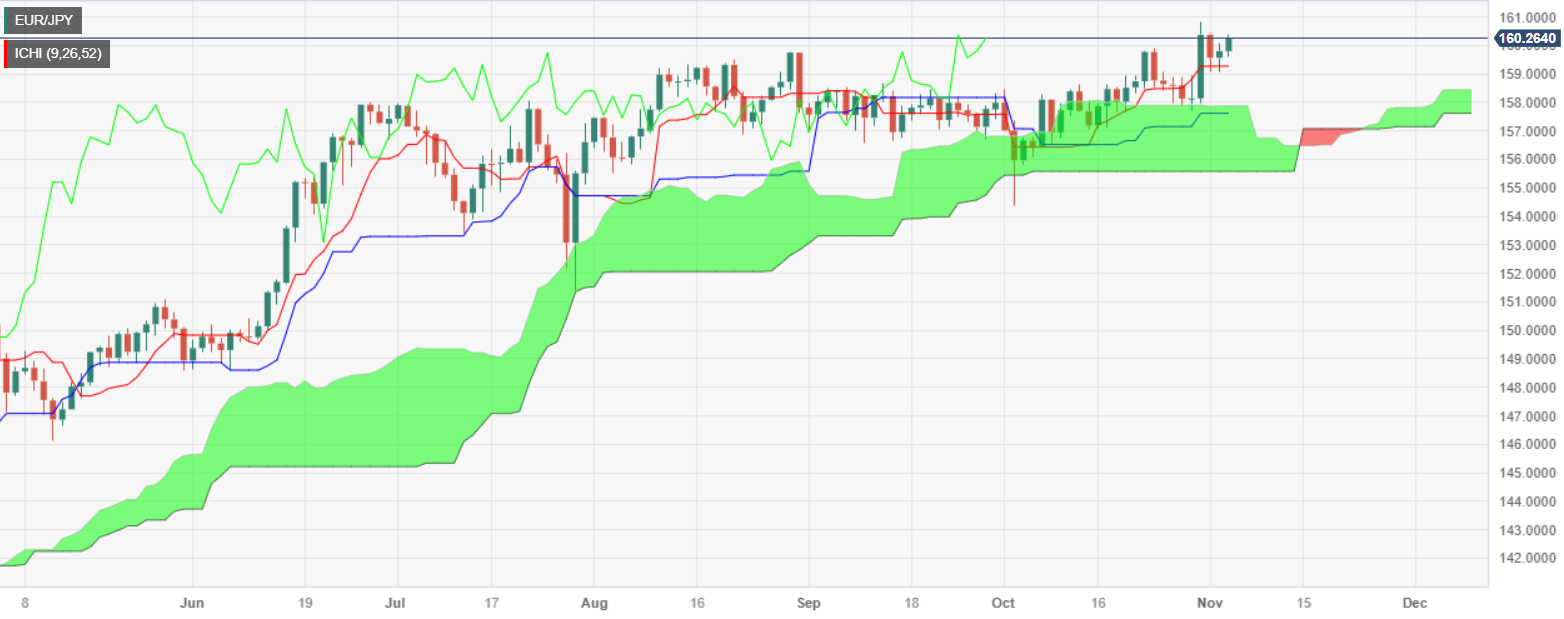
- EUR/JPY advance is tempered by proximity to the year-to-date high of 160.84, with a break above potentially signaling further gains.
- The threat of Japanese intervention has receded, providing room for the pair's upward trajectory.
- Key support levels to watch include the Tenkan-Sen at 159.26 and a stronger confluence of support around 157.59/69.
The EUR/JPY extends its gains to two straight days, remaining above the 160.00 figure ahead of the weekend, amid an upbeat market sentiment. Economic data shows hiring is slowing down, as the US Nonfarm Payrolls for October missed forecasts, spurring a risk-on mood in the financial markets. At the time of writing, the cross-pair exchanges hands at 160.25, gains 0.29%.
Even though the pair is trading near cycle highs, it remains shy of climbing past the year-to-date (YTD) high at 160.84, which, once cleared, could open the door for further upside. In that case, a pullback could justify long traders, as Japanese intervention threats, calmed. A breach of the latter would expose the 161.00 handle.
Contrarily, if EUR/JPY drops below the Tenkan-Sen at 159.26, the trend would be skewed to the downside. Next support would emerge at the confluence of the October 30 low and the Tenkan-Sen at around 157.59/69, followed by the bottom of the Ichimoku Cloud at 155.55.
EUR/JPY Price Chart – Daily
EUR/JPY Key Technical Levels
Atlanta Federal Reserve President Raphael Bostic said on Friday that monetary policy is in the right place given the economic outlook. He added he may support holding interest rates steady for about 8 to ten months.
In an interview with Bloomberg TV, Bostic mentioned that he does not see a recession ahead. “I welcome more moderate wage gains”.
Market reaction
The US Dollar is holding onto daily and weekly losses following the Nonfarm Payrolls report and as expectations that the Federal Reserve is done raising interest rates. The DXY is hovering around 105.10, on its way to the lowest weekly close since September.
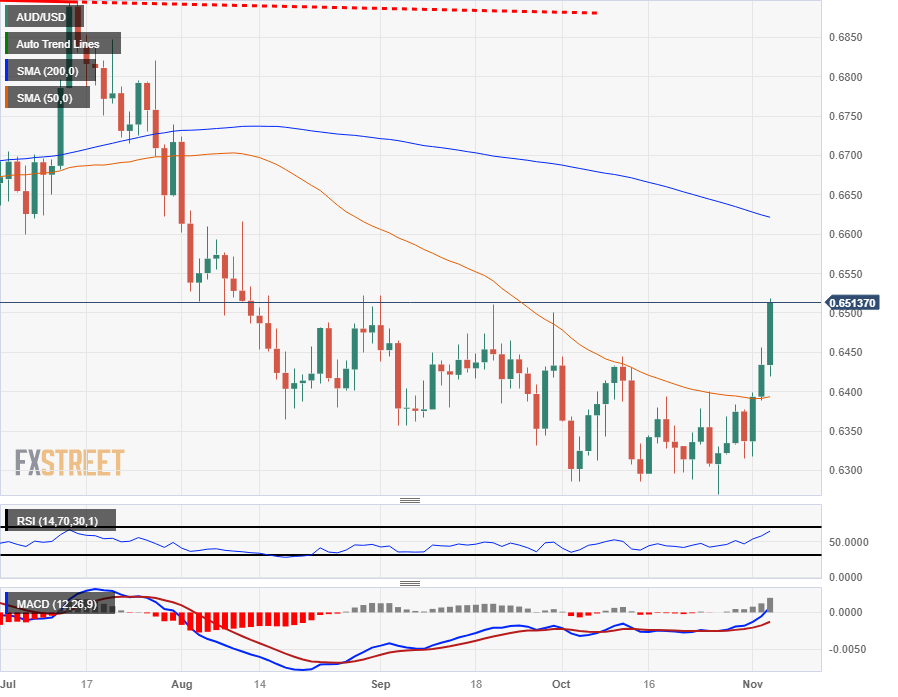
- The AUD/USD has pushed into a 2-month high as the US Dollar slumps post-NFP.
- Market sentiment has flipped firmly risk on as investors no longer fear more Fed rates.
- RBA due next week, markets expecting an additional 25 bps.
The AUD/USD is pinning into a nine-week high bid above the 0.6500 handle as the Aussie (AUD) capitalizes on US Dollar (USD) weakness following a flubbed Nonfarm Payrolls reading, and risk-on market sentiment is sending the Aussie into its sixth green candle out of the last seven consecutive trading days.
Global markets turned the US Dollar inside out, dumping the safe haven asset and stepping into riskier assets following a worse-than-expected NFP reading that saw the US add a scant 150 thousand jobs in October, below the forecast 180K addition and slumping from September's bumper 297K print (revised down from 336K) to the indicator's worst reading since February 2021.
US data down = risk appetite up
Cooling US data is helping to confirm that the Federal Reserve (Fed) is done with rate hikes, and investors are now turning forward to start anticipating a future rate cut cycle from the US central bank. With markets hoping for an easing monetary policy outlook to make borrowing and lending cheaper once again, negative economic data for the US will remain market-positive as recession factors will push the Fed towards rate cuts sooner rather than later.
Next week sees the Reserve Bank of Australia (RBA) due to deliver its latest rate call on Tuesday, and markets are expecting the Aussie central bank to deliver a 25 basis point hike as inflation continues to simmer at the edges of the Australian economy.
AUD/USD Technical Outlook
The Aussie's technical recovery from October's lows near the 0.6300 level sees the AUD/USD climbing halfway towards the 200-day Simple Moving Average (SMA) currently turning down into 0.6625.
With the AUD/USD cleanly shearing the 50-day SMA near 0.6400, the pair is set to mark in a topside Friday close near 0.6515.
AUD/USD Daily Chart
AUD/USD Technical Levels
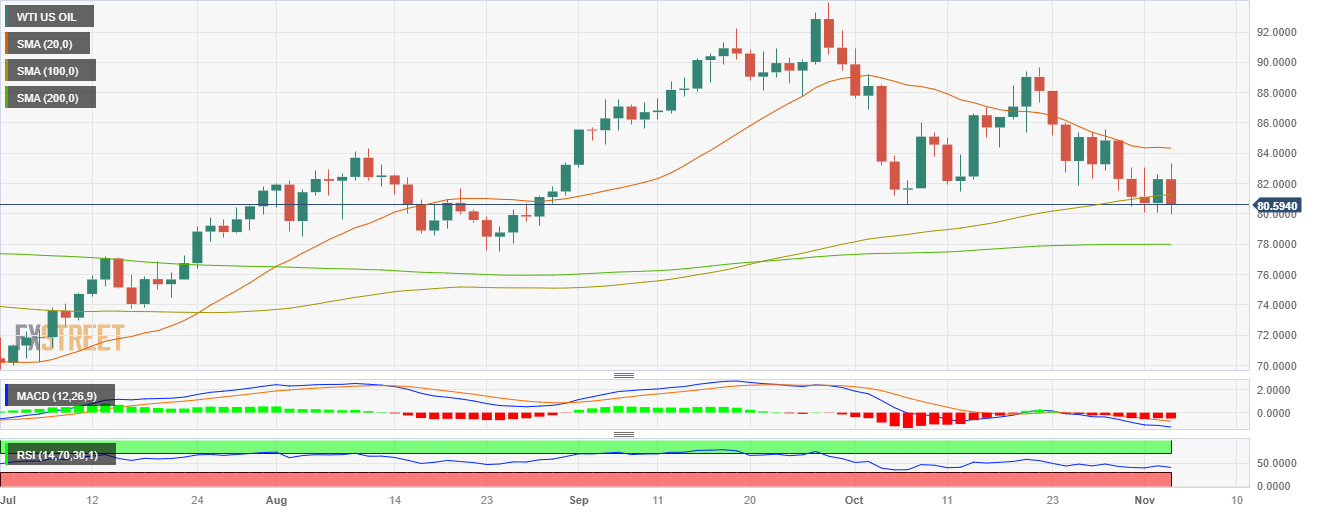
- The WTI barrel price declined by more than 2% to $80.70.
- The US reported soft labor market figures.
- Tensions in the Middle East are easing, favouring the price to decline.
At the end of the week, the West Texas Intermediate (WTI) barrel is seeing sharp losses, mainly due to worries on the US economy, the largest Oil consumer, after the release of weak labor and economic activity data. In addition, as the Middle East tensions ease, markets are confident that there won't be any supply or demand disruptions also contributing to the downward movements.
The US Bureau of Labor Statistics revealed disappointing numbers, as job additions for October from the US economy fell short of expectations at 150,000 vs the 180,000 expected and decelerated from its revised previous figure of 297,000. In addition, the Unemployment Rate rose to 3.9%, above the expected 3.8% while the Average Hourly Earnings increased by 0.2% MoM, lower than the projections and tallied a 4.1% YoY increase. In line with that, if the US continues to reveal that its economy is weakening and that the cumulative effects of the monetary policy are kicking in just now, Oil prices could face further downside as lower energy would be demanded from the largest consumer in the world.
On the positive side, as the Federal Reserve (Fed) approaches the end of its tightening cycle, it would be beneficial for the WTI price as higher rates tend to be negatively correlated with energy demand. In that sense, the market focus shifts to the next reports ahead of the next Fed meeting in December, including two additional inflation readings and a job report.
WTI Levels to watch
Upon evaluating the daily chart, a neutral to bearish outlook is seen for the WTI, with the balance starting to lean in favour of the bears, although they still have some work to do.The Relative Strength Index (RSI) has a negative slope below its midline, while the Moving Average Convergence (MACD) displays neutral red bars. In addition, the price has fallen below the 20 and 100-day Simple Moving Averages (SMA), which seem to be converging towards the $83.00 area to perform a bearish cross, which would likely trigger further downside for the WTI in the short term.
Support levels: $80.50, $80.30, $80.00.
Resistance levels: $81.60 (100-day SMA), $82.80, $83.50
WTI Daily Chart
- Silver prices rebounded sharply, trading at $23.17, buoyed by a softer U.S. labor market report.
- October's Nonfarm Payrolls and cooling wage growth hint at a less aggressive Fed, boosting XAG/USD.
- The dip in U.S. Treasury yields further enhances silver's attractiveness as a non-yielding asset.
Silver prices bounces off daily lows at $22.59 and climbs more than 1.89% after the US Department of Labor (DoL), revealed the US economy added fewer employees to the workforce than expected. Hence, traders are pricing in the Federal Reserve (Fed) would not raise rates further, denting appetite for the American Dollar (USD). At the time of writing, the XAU/USD is trading at $23.17, a gain of 1.86%.
Silver prices rally as weaker-than-expected U.S. employment figures reduce Fed rate hike expectations
US equities remain in the green, depicting an upbeat market sentiment. October´s Nonfarm Payrolls report was characterized by fewer than expected people added to the workforce while the Unemployment Rate approached the 4% threshold. Average Hourly Earnings decelerated from 4.3% in September to 4.1% last month, suggesting the labor market is cooling.
The data comes after the Federal Reserve held rates unchanged, though policymakers emphasized the need for a looser labor market, growth below trend, and inflation slowing down. In the meantime, Fed Chairman Jerome Powell hawkish commentaries were mainly ignored, as traders had begun to price in close to 100 basis points rate cuts toward the end of 2024.
Consequently, the fall in US Treasury bond yields underpins the grey’s metal appeal. The US 10-year benchmark note rate sits at 4.55%, down 10 basis points (bps) on Friday, so far down 17 bps in the week, a tailwind for the XAG/USD
In the next week, the US economic calendar is light, with the release of the Balance of Trader, unemployment claims, and the University of Michigan Consumer Sentiment. Regarding economic data, but Fed speakers would be crossing newswires
XAG/USD Price Analysis: Technical outlook
The XAG/USD daily chart witnessed the non-yielding metal diving to the 20-day moving average (DMA) at $22.72 before rebounding past the $23.00 figure, as buyers target the 200-DMA at $23.27. A breach of the latter would expose the top of the Bollinger bands at $23.63 before challenging the $24.00 figure. For a downward resumption, sellers must drag prices past the latest cycle low seen at $22.44, the October 26 low.
Next week is expected to be quiet regarding economic data for the US following an exhaustive week of releases. The weekly Jobless Claims on Thursday and the University of Michigan Consumer Sentiment survey on Friday stand out as the week's highlights. In the following week, the Consumer Price Index is scheduled for release. The RBA will have a meeting, and China will release inflation data.
Here is what you need to know for next week:
The US Dollar had its worst weekly performance in months following the Federal Open Market Committee (FOMC) meeting and the Nonfarm Payroll report. The Fed kept interest rates as expected, and the Nonfarm Payrolls rose by 150,000, below market expectations but still indicating a healthy labor market.
US Jobs data came in below expectations, hinting at a more balanced market and contributing to growing expectations that the Federal Reserve (Fed) is done with rate hikes. This increased risk appetite in Wall Street and weighed on the US Dollar. However, there may still be corrections and potential further declines, particularly if US Treasury yields continue to decline. Nevertheless, the fundamentals still favor the US Dollar, as US economic growth outperforms other economies.
Next week, the economic calendar is quiet in terms of US data. The most relevant reports will be the weekly Jobless Claims and the University of Michigan Consumer Sentiment survey on Friday. After that, attention will turn to the Consumer Price Index (CPI), due on November 14, which is crucial for Fed officials and market expectations.
Geopolitical events will continue to have an important impact next week. Chinese inflation data, scheduled for release on Thursday, will be closely watched.
EUR/USD rose more than 150 pips during the week, boosted by a weaker US Dollar and breaking above the 55-day Simple Moving Average (SMA) on Friday. The economic outlook for the Euro area remains complicated. Next week, Eurostat will release the Producer Price Index for September on Tuesday and Retail Sales data on Wednesday.
The Bank of England's Monetary Policy Committee voted 6-3 to keep the cash rate unchanged at 5.25%, as expected. GBP/USD jumped on Friday towards 1.2400, reaching monthly highs, while EUR/GBP decisively broke below 0.8700, falling to 0.8665, the lowest level in two weeks. The UK will release Gross Domestic Product figures for the third quarter on Friday, as well as Industrial Production and trade data.
USD/JPY dropped for the third consecutive day on Friday, amid lower Treasury Yields. The weekly chart shows a reversal pattern that could anticipate further weakness ahead. The pair posted its lowest weekly close in a month, below 149.50. The Bank of Japan will release its Summary of Opinions on Thursday, including projections for inflation and economic growth.
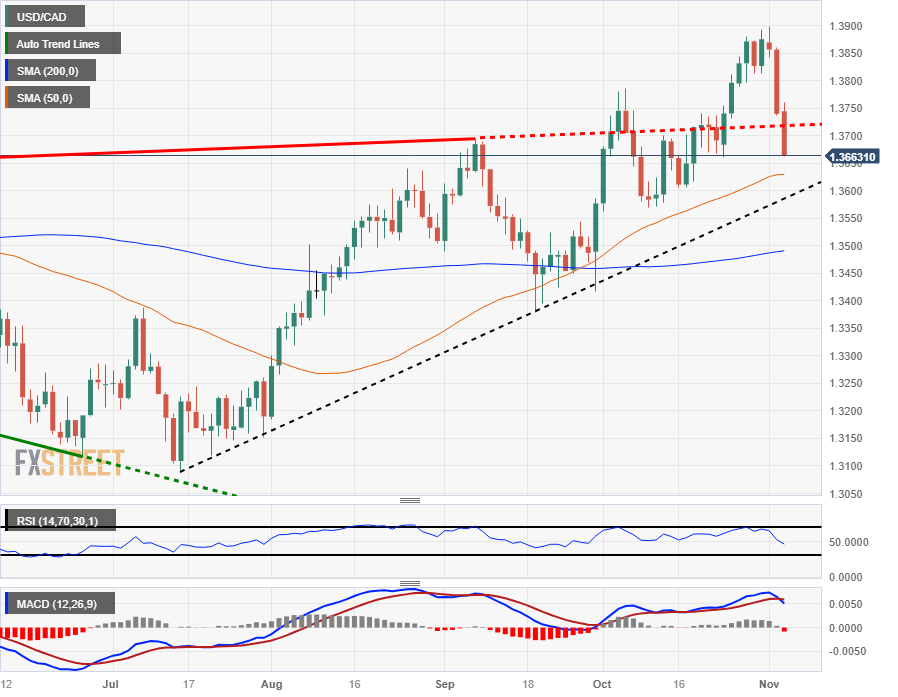
USD/CAD plummeted on Thursday and Friday, falling from one-year highs near 1.3900 to 1.3650. The sharp reversal took place amid risk appetite and was driven by a weaker US Dollar. The Bank of Canada will publish the minutes of its last monetary policy meeting on Wednesday.
AUD/USD jumped from monthly lows to the highest level in weeks, surpassing the key resistance area around 0.6500. The pair closed the week above the 20-week SMA. The Reserve Bank of Australia (RBA) will announce its monetary policy decision on Tuesday. Market expectations lean towards a rate hike. Some analysts expect a 25 basis point rate hike, while others anticipate no change. The RBA could resume its tightening cycle after keeping the cash rate unchanged at 4.10% during four consecutive meetings. The rebound in inflation has firmly put a rate hike back on the table.
NZD/USD rose sharply, approaching the 0.6000 mark and the 20-week SMA. The short-term bias has changed dramatically, and now the pair looks set to rise further. The Reserve Bank of New Zealand (RBNZ) will release its inflation expectations report for the fourth quarter on Wednesday.
Gold surpassed $2,000 on Friday but failed to stay above. The risk outlook appears tilted to the upside, but the yellow metal is facing strong resistance. Silver soared from $22.65 to $23.20 on Friday, just enough to erase weekly losses.
Like this article? Help us with some feedback by answering this survey:
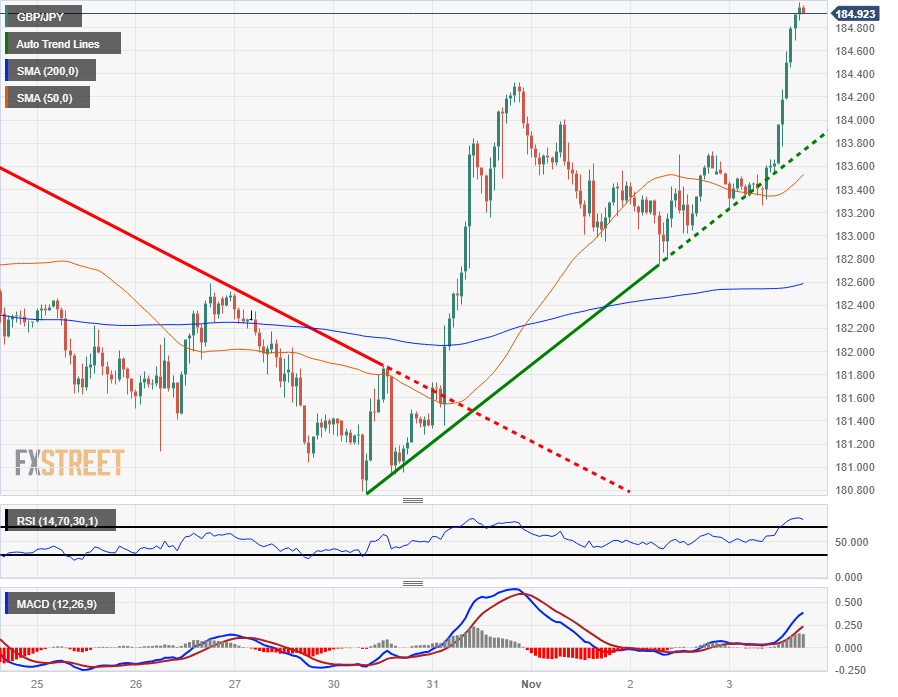
- The GBP/JPY is climbing on Friday, tipping into 2-month highs.
- The Pound Sterling is lurching higher as market risk appetite returns.
- GBP set for its best weekly performance in five months.
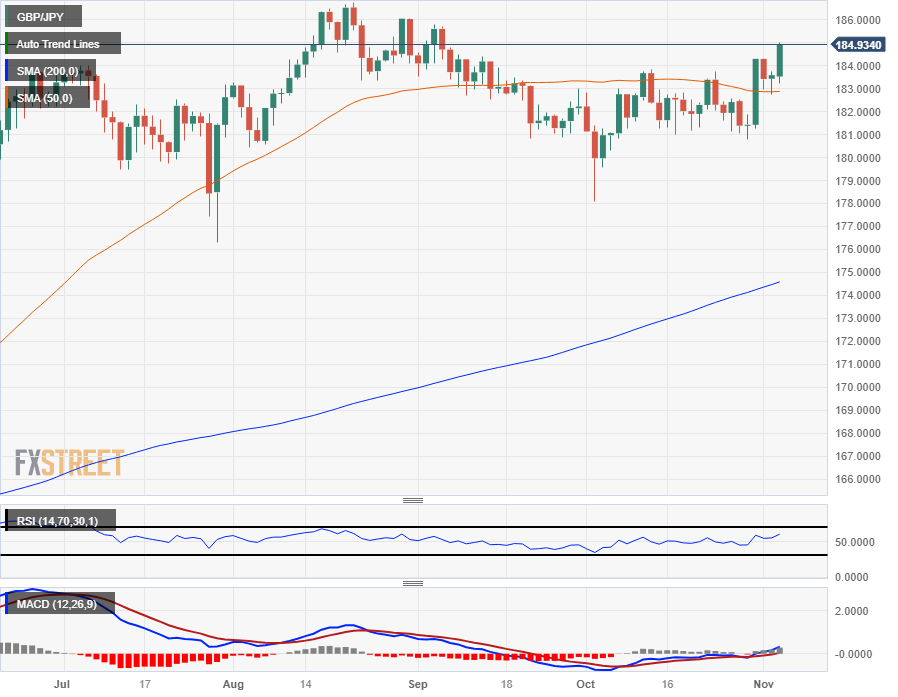
The GBP/JPY has pierced the 185.00 handle as the market heads into the final hours of the trading week, pushing into an 8-week high as broad market risk appetite finds a firm recovery.
The Japanese Yen (JPY) has been on the back foot after a dovish Bank of Japan (BoJ) recently ruined all of their own hard work in verbally defending the beleaguered JPY.
The Pound Sterling (GBP) is catching a ride up the charts, pushing towards the front of the pack to come out in front as one of the winners on Friday, rebounding firmly against the Yen despite wavering in the mid-week after the Bank of England (BoE) held rates once more.
Economic data related to the GBP/JPY remains thin heading into next week, and GBP traders will be looking ahead to next Wednesday's appearance by BoE Governor Andrew Bailey, while Yen investors will want to keep an eye out for Japan's wage figures due early Tuesday, followed by JPY Trade Balance numbers on Wednesday.
GBP/JPY Technical Outlook
The GBP/JPY caught a bounce off an intraday rising trendline drawn from last week's bottoms near 180.80, and the pair is now trading into an 8-week high near the 150.0 major handle.
Daily candlesticks have the GBP/JPY trading back into the top side of the 50-day Simple Moving Average (SMA) which is currently grinding sideways near the 183.00 handle, and a bullish extension will see the Guppy set for a break of 2023's highs of 186.77.
Technical support is thin on the down side, but GBP/JPY sellers will be keeping a close eye on price action pulling back towards the last major swing low into the 178.00 level in early October.
GBP/JPY Hourly Chart
GBP/JPY Daily Chart
GBP/JPY Technical Levels
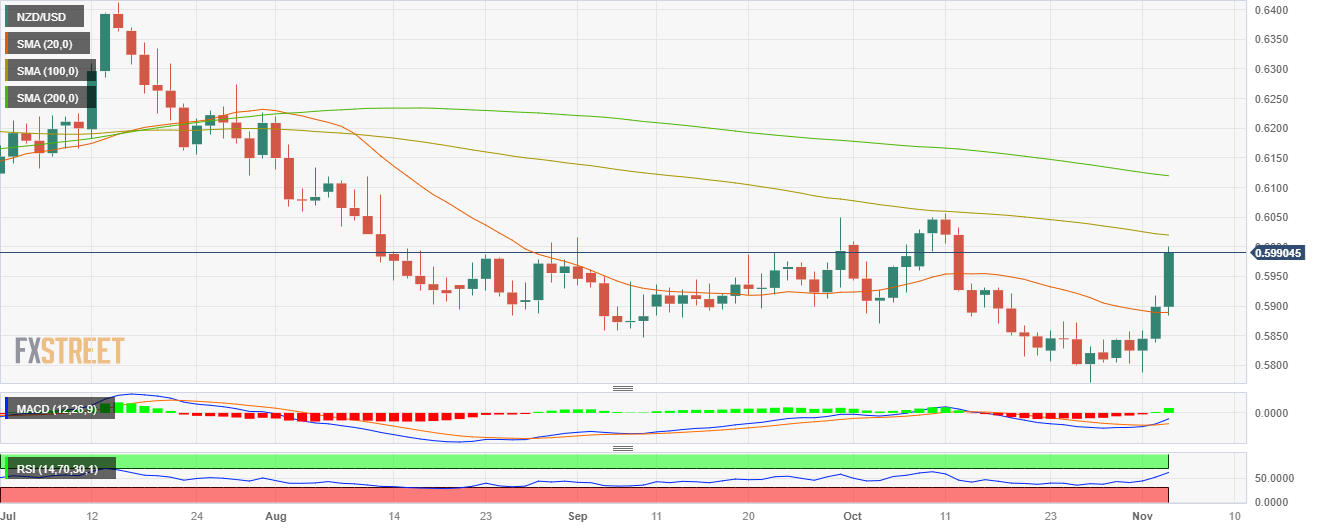
- NZD/USD rose by more than 1% to 0.5990, its highest since mid October.
- The US reported weak NFPs, which triggered a sharp decline in US yields and hawkish bets on the Fed.
- Eyes on next week’s CPI figures from the US from October.
On Friday, the NZD/USD rallied, driven by the US Dollar facing notable selling pressure after the release of the soft labour market, which triggered a decline in US Treasury yields and hawkish bets on the Federal Reserve (Fed) for the December meeting. On the Kiwi’s side, no relevant data was released.
The latest data from the US Bureau of Labor Statistics delivered a blow to market expectations, with the Nonfarm Payrolls for October falling short of projections. The report revealed an addition of 150,000 jobs in the US economy, trailing the anticipated 180,000 and showing a slowdown from the revised prior figure of 297,000. Additionally, the Unemployment Rate for the same period rose to 3.9%, surpassing the projected 3.8%.
Moreover, the Average Hourly Earnings for October exhibited a sluggish monthly growth of 0.2% but managed to climb to 4.1% YoY, surpassing the expected 4% and outpacing the previous figure of 4.3%.
Simultaneously, the US Treasury yields continue to decline, with the 2-year rate hitting its lowest mark since early September at 4.83%. Correspondingly, the longer-term 5 and 10-year rates retreated to approximately 4.50% and 4.54%. Regarding the December meeting of the Fed, the CME FedWatch Tool shows that the probability of a 25 basis points hike in declined to a mere 9%, exacerbating the selling pressure on the Greenback.
For the next week, the US will report inflation rate figures from October, which investors will closely watch to continue modelling their expectations.
NZD/USD Levels to watch
Based on the daily chart, NZD/USD maintains a neutral to bullish technical perspective, indicating that the bulls are making strides in regaining control and gathering significant momentum. The Relative Strength Index (RSI) maintains a positive slope above its midline, while the Moving Average Convergence (MACD) histogram exhibits bigger green bars.
However, despite being above the 20-day Simple Moving Average (SMA), the pair is still below the 100 and 200-day, indicating that on the broader outlook, the bears are in command.
Support levels: 0.5930, 0.5910, 0.5900.
Resistance levels: 0.6000, 0.6020 (100-day SMA), 0.6050.
NZD/USD Daily Chart
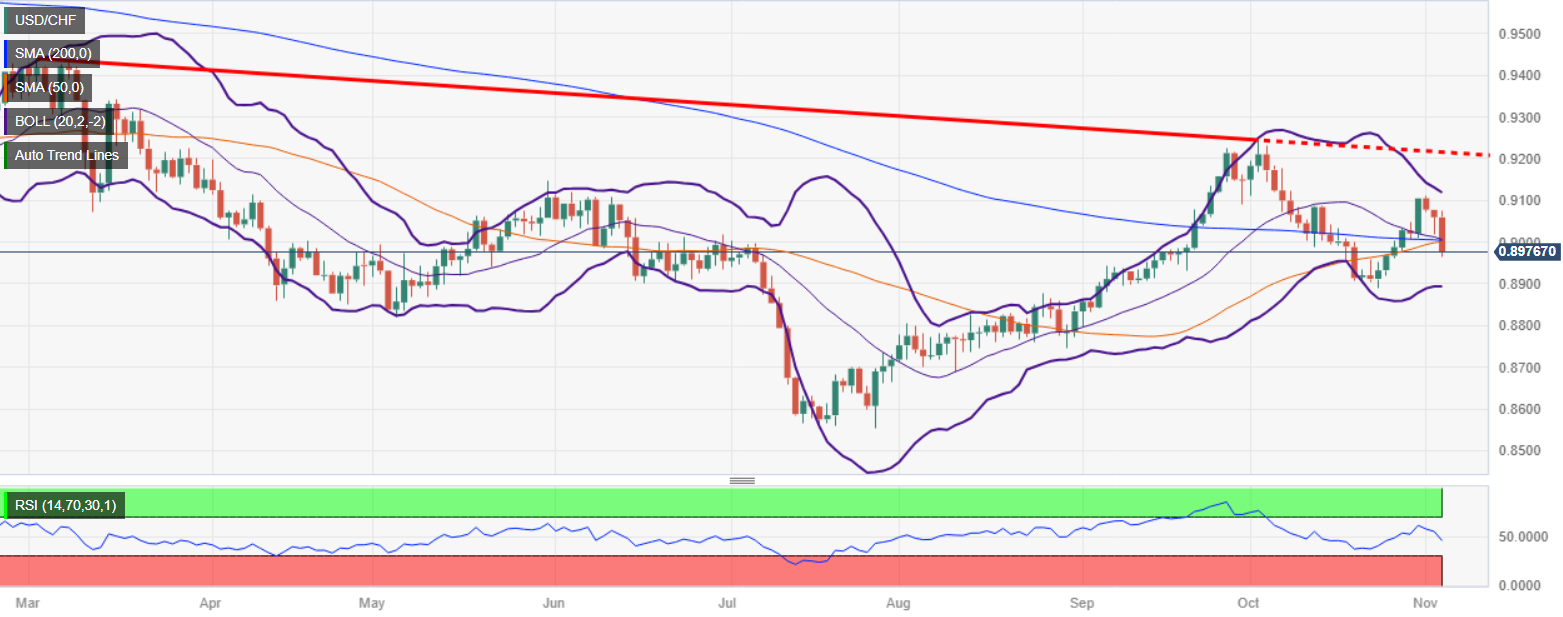
- USD/CHF drops sharply, signaling potential end to Fed's rate hikes with investors favoring CHF.
- Pair's fall below the 50 and 200-day moving averages at 0.9000 could lead to further declines.
- For recovery, USD/CHF needs to breach 0.9000, targeting the November 1 high at 0.9112.
USD/CHF plummets in the mid-North American session on Friday after an employment report in the United States (US) could mark the end of the Federal Reserve (Fed) tightening cycle. Therefore, the US Dollar (USD) remains offered, as investors piled into the Swiss Franc (CHF), as shown by the pair trading at 0.8979, down 0.87%.
The daily chart shows the pair is slightly tilted to the downside despite remaining sideways, as USD/CHF has fallen below the confluence of the 50 and 200-day moving averages (DMAs) at around 0.9000. In the case of a daily close below the latter, the major could dive to the next swing low seen at 0.8878, the October 24 low, before plunging to the August 30 daily low of 0.8745.
On the flip side, USD/CHF buyers must reclaim the 0.9000 figure – the confluence of the 50 and 200-DMAs- so they could remain hopeful of challenging the November 1 high at 0.9112, ahead of challenging the May 31 high at 0.9147. Up next would be the 0.9200 psychological level.
USD/CHF Price Chart– Daily
USD/CHF Technical Levels
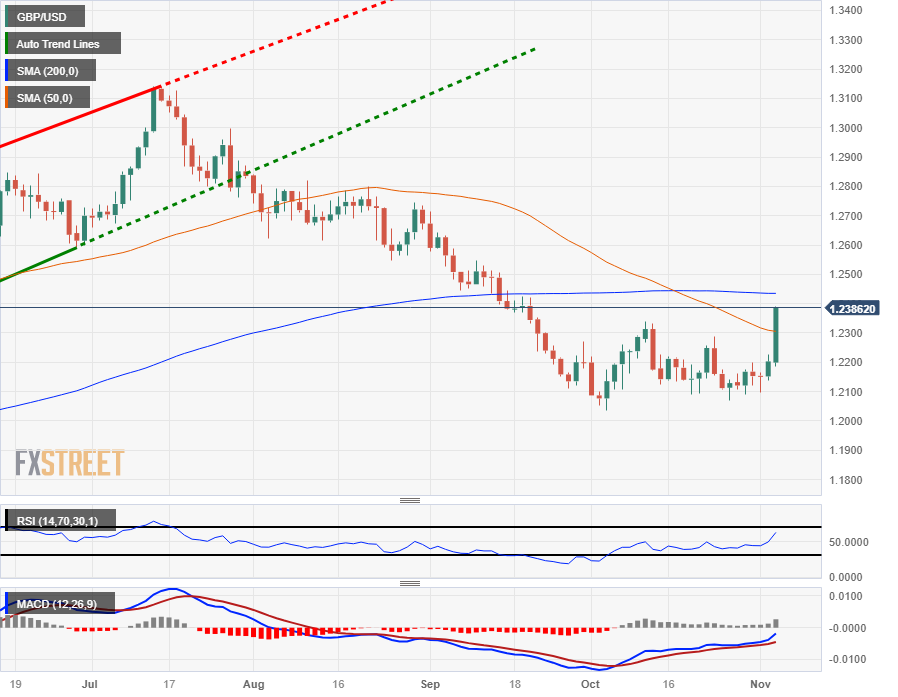
- The GBP/USD is accelerating recent gains, set to end the week near 1.2400.
- The Pound Sterling is on track to chalk in its single best trading day since March.
- US NFP data miss is sending the Greenback broadly lower, giving a hand to riskier assets.
The GBP/USD is climbing into the 1.2400 handle to cap off a trading week that saw the pair mostly flounder around the averages.
After US Nonfarm Payrolls (NFP) came in well below expectations the Pound Sterling (GBP) climbed 1.6% from Friday's opening bids near 1.2190, and the GPB/USD is up almost 2.5% from the week's lows of 1.2095.
US Nonfarm Payrolls increase by 150,000 in October vs. 180,000 forecast
US NFP figures came in below expectations, printing at its worst headline figure in almost three years. The US added 150K new jobs in October, missing the market forecast of 180K and coming in well below September's print of 297K, which was revised downwards from the initial print of 336K.
The US NFP jobs miss is sending the US Dollar (USD) lower across the broader market as investors splurge on risk assets with souring US labor data counter-intuitively inspiring investors to move out of safe havens. Softening US data will give the Federal Reserve (Fed) cause for pause on interest rates as investors look for signs that the Fed will begin accelerating the schedule for eventual rate cuts.
GBP/USD Technical Outlook
The Sterling's NFP-fueled climb sees the GBP/USD climbing straight through the 50-day Simple Moving Average (SMA), aimed directly at the 1.2400 handle and set for a challenge of the 200-day SMA currently grinding sideways from 1.2435.
The GBP/USD has been cycling between 1.2300 and 1.2100 recently, and a bearish fallback will see the pair slumping back into multi-month lows towards the 1.2000 major handle.
GBP/USD Daily Chart
GBP/USD Technical Levels
- EUR/USD rallies amid a softer US labor market, with Nonfarm Payrolls missing the 180K target.
- Speculation grows for Fed rate cuts in H2 2024 as hiring slows and unemployment ticks up.
- Despite EU's own economic slowdown, the Euro benefits from broad USD weakness and reduced rate hike bets.
EUR/USD rallies during Friday’s North American session after data from the United States (US) paints a looser US jobs market, as Nonfarm Payrolls missed estimates. Hence, traders reduced the chances for another Fed rate hike; instead, are expecting cuts for the second half of next year, a headwind for the US Dollar (USD). The major trades at 1.0726, gains 1%.
EUR/USD capitalizes on weaker US Dollar following disappointing Nonfarm Payrolls, hinting at Fed's rate hike pause
The US Dollar continues to weaken as the US Department of Labor showed the jobs market is cooling as hiring slowed, revealed Nonfarm Payrolls data. In October, the economy added a decent 150,000 jobs but missed forecasts of 180,000 and trailed the 290,000 jobs added to the workforce in September. That, along with the uptick in the Unemployment Rate and Average Hourly Earnings, sparked speculations the Fed is done raising rates.
Additionally, S&P Global and the Institute of Supply Management (ISM) revealed the Services PMI came above the 50 contraction/expansion threshold, though at a brisk of dropping toward the 40 handle.
All that said, last Wednesday’s Federal Reserve’s decision to hold rates is justified, as market participants seem convinced that no more rate hikes are needed. Even though Fed Chair Jerome Powell's hawkish remarks. Consequently, Wall Street is rallying, the Greenback is slumping, and US bond yields are falling.
Friday US economic data
On the data front, the Eurozone (EU) economic calendar showed that business activity in the bloc is slowing down amid a high inflation environment, which reignited stagflation woes. Therefore, money market futures estimate the European Central Bank (ECB) has finished its tightening cycle, which would likely weaken the Euro, but broad US Dollar weakness underpins the EUR/USD pair.
EUR/USD Price Analysis: Technical outlook
From a technical perspective, the EUR/USD downward bias is intact as the pair tests the top of a bearish flag. A break above the 1.0750 area could expose the 1.0800 figure, with the 200-day moving average (DMA) up next at 1.0810. Conversely, sellers could regain control if they push prices below the October 24 swing high of 1.0694, exerting downward pressure on the pair.
- The Canadian Dollar is bounding higher, extending weekly gains.
- Canada Unemployment Rate missed forecasts, hampering CAD upside.
- CAD gains 17.5K jobs, entirely part-time employment; wage growth also lower.
The Canadian Dollar (CAD) is seeing further upside against the US Dollar (USD) after a US Nonfarm Payrolls (NFP) report that came in below expectations, printing at its lowest reading since February of 2021.
The US data print is a welcome miss for investors who have been hoping for cooling economic data from the US to convince the Federal Reserve (Fed) that there is no need for further rate hikes and to help push the US central bank along toward eventual rate cuts.
Daily Digest Market Movers: Canadian Dollar propped up by US data miss, even as CAD data sours
- The CAD gains after US NFP prints at 150K, its lowest reading in almost three years.
- US wages also missed the mark, MoM Average Hourly Earnings only rose 0.2% (forecast 0.3%, previous revised from 0.2% to 0.3%).
- Canada Net Change in Employment came in below expectations at 17.5K, 22.5K expected, 63.8K previous.
- Canada job additions reveal low-quality data, jobs additions entirely in part-time category as full-time jobs evaporate.
- Majority of job additions are in services sector, goods sector only added 7.5K jobs.
- Canada Unemployment Rate for October comes in at 5.7%, its highest since February 2022 and accelerating above 5.6% forecast, extends from September’s 5.5% print.
- US Unemployment Rate also ticks higher to 3.9% after markets expected a steady hold at 3.8%.
- US ISM Services Purchasing Manager Index (PMI) also misses, declining to 51.8 for October.
Technical Analysis: Canadian Dollar seeking its highest prices in almost two weeks as US Dollar recedes
The Canadian Dollar (CAD) is finding gains as the US Dollar (USD) recedes against the broader market.
The USD/CAD pair fell to an intraday low of 1.3665 following the NFP print, inches away from cracking a two-week low beyond 1.3661.
The USD/CAD is set for a decline back into the 50-day Simple Moving Average (SMA) near 1.3625, with long-term declines seeing a price floor near 1.3500 at the 200-day SMA.
On the top side, a bullish break will need to find enough momentum to crack the 1.3900 handle before the USD/CAD can take another run at 12-month highs beyond late 2022’s peak of 1.3978.
USD/CAD Daily Chart
Canadian Dollar FAQs
What key factors drive the Canadian Dollar?
The key factors driving the Canadian Dollar (CAD) are the level of interest rates set by the Bank of Canada (BoC), the price of Oil, Canada’s largest export, the health of its economy, inflation and the Trade Balance, which is the difference between the value of Canada’s exports versus its imports. Other factors include market sentiment – whether investors are taking on more risky assets (risk-on) or seeking safe-havens (risk-off) – with risk-on being CAD-positive. As its largest trading partner, the health of the US economy is also a key factor influencing the Canadian Dollar.
How do the decisions of the Bank of Canada impact the Canadian Dollar?
The Bank of Canada (BoC) has a significant influence on the Canadian Dollar by setting the level of interest rates that banks can lend to one another. This influences the level of interest rates for everyone. The main goal of the BoC is to maintain inflation at 1-3% by adjusting interest rates up or down. Relatively higher interest rates tend to be positive for the CAD. The Bank of Canada can also use quantitative easing and tightening to influence credit conditions, with the former CAD-negative and the latter CAD-positive.
How does the price of Oil impact the Canadian Dollar?
The price of Oil is a key factor impacting the value of the Canadian Dollar. Petroleum is Canada’s biggest export, so Oil price tends to have an immediate impact on the CAD value. Generally, if Oil price rises CAD also goes up, as aggregate demand for the currency increases. The opposite is the case if the price of Oil falls. Higher Oil prices also tend to result in a greater likelihood of a positive Trade Balance, which is also supportive of the CAD.
How does inflation data impact the value of the Canadian Dollar?
While inflation had always traditionally been thought of as a negative factor for a currency since it lowers the value of money, the opposite has actually been the case in modern times with the relaxation of cross-border capital controls. Higher inflation tends to lead central banks to put up interest rates which attracts more capital inflows from global investors seeking a lucrative place to keep their money. This increases demand for the local currency, which in Canada’s case is the Canadian Dollar.
How does economic data influence the value of the Canadian Dollar?
Macroeconomic data releases gauge the health of the economy and can have an impact on the Canadian Dollar. Indicators such as GDP, Manufacturing and Services PMIs, employment, and consumer sentiment surveys can all influence the direction of the CAD. A strong economy is good for the Canadian Dollar. Not only does it attract more foreign investment but it may encourage the Bank of Canada to put up interest rates, leading to a stronger currency. If economic data is weak, however, the CAD is likely to fall.
- The DXY sank to 105.15, its lowest level since mid-September.
- US government bond yields are retreating, also standing at lows since September.
- Job creation decelerated in October in the US as well as Hourly Earnings, while the Unemployment Rate increased.
The US Dollar (USD) witnessed a significant drop on Friday, with the US Dollar Index (DXY) descending below 105.10. The Greenback price dynamics were set by weak labor market data from the US and falling US bond yields as weaker-than-expected Nonfarm Payrolls (NFP) give investors confidence that the Federal Reserve (Fed) won’t deliver any more hikes.
Despite the Federal Reserve's (Fed) recent restrictive measures, the United States economy continued to showcase unparalleled resilience, outshining its global counterparts, which favoured the USD in the previous weeks. However, the labour market is starting to show weakness, which makes investors bet on the Fed approaching the end of its tightening cycle, which seems to be weakening the Greenback as the tightening effects become visible.
Daily Digest Market Movers: US Dollar plunges amid decelerating job creation and rising unemployment
- The US Dollar Index declined below 105.10, down 1%on the day, mainly driven by weak labor market data reported earlier in the session.
- The US Bureau of Labor Statistics reported that the Nonfarm Payrolls from October came in lower than expected. The US added 150,000 jobs in October vs the expected 180,000 and decelerated from its revised previous figure of 297,000.
- The Unemployment Rate came in at 3.9% in October, above the expected 3.8% and accelerated compared to its previous reading of 3.8%.
- The Average Hourly Earnings increased by 0.2% MoM but rose 4.1% YoY, higher than the expected 4% and its previous reading of 4.3%.
- In addition, economic activity data also came in weak. The Institute for Supply Management (ISM) Services PMI fell short of expectations. The figure came in at 51.8 in October, lower than the consensus of 53 and its last figure of 53.6.
- Likewise, the S&P Global Services PMI from October came in at 50.6, lower than the expected 50.9 and decelerated from its previous figure of 50.9.
- In the meantime, the US Treasury yields continued to decline The 2-year rate fell to 4.90%, its lowest level since mid-September, while the longer-term 5 and 10-year rates retreated towards 4.50% and 4.54%, also hitting multi-week lows.
- Due to the weak data, dovish bets on the Fed increased. According to the CME FedWatch Tool, the odds of a 25 basis points hike in December fell to 9%, which added selling pressure to the Greenback.
Technical Analysis: US Dollar Index extends losses as bears step in after conquering the 20-day SMA
The DXY shows a neutral to bearish technical stance on the daily chart. The Relative Strength Index (RSI) exhibits a negative slope below the 50 threshold, while the Moving Average Convergence (MACD) histogram prints increasing red bars. Additionally, the pair is below the 20-day Simple Moving Average (SMA) but above the 100 and 200-day SMAs, implying that the bulls remain in control on a broader scale but that the sellers are in command of the short-term.
Support levels: 105.10, 105.00, 104.70.
Resistance levels: 105.50, 105.80, 106.00.
US Dollar FAQs
What is the US Dollar?
The US Dollar (USD) is the official currency of the United States of America, and the ‘de facto’ currency of a significant number of other countries where it is found in circulation alongside local notes. It is the most heavily traded currency in the world, accounting for over 88% of all global foreign exchange turnover, or an average of $6.6 trillion in transactions per day, according to data from 2022.
Following the second world war, the USD took over from the British Pound as the world’s reserve currency. For most of its history, the US Dollar was backed by Gold, until the Bretton Woods Agreement in 1971 when the Gold Standard went away.
How do the decisions of the Federal Reserve impact the US Dollar?
The most important single factor impacting on the value of the US Dollar is monetary policy, which is shaped by the Federal Reserve (Fed). The Fed has two mandates: to achieve price stability (control inflation) and foster full employment. Its primary tool to achieve these two goals is by adjusting interest rates.
When prices are rising too quickly and inflation is above the Fed’s 2% target, the Fed will raise rates, which helps the USD value. When inflation falls below 2% or the Unemployment Rate is too high, the Fed may lower interest rates, which weighs on the Greenback.
What is Quantitative Easing and how does it influence the US Dollar?
In extreme situations, the Federal Reserve can also print more Dollars and enact quantitative easing (QE). QE is the process by which the Fed substantially increases the flow of credit in a stuck financial system.
It is a non-standard policy measure used when credit has dried up because banks will not lend to each other (out of the fear of counterparty default). It is a last resort when simply lowering interest rates is unlikely to achieve the necessary result. It was the Fed’s weapon of choice to combat the credit crunch that occurred during the Great Financial Crisis in 2008. It involves the Fed printing more Dollars and using them to buy US government bonds predominantly from financial institutions. QE usually leads to a weaker US Dollar.
What is Quantitative Tightening and how does it influence the US Dollar?
Quantitative tightening (QT) is the reverse process whereby the Federal Reserve stops buying bonds from financial institutions and does not reinvest the principal from the bonds it holds maturing in new purchases. It is usually positive for the US Dollar.
Overall, crude oil and refined products have traded sideways for the month of October. Economists at Rabobank analyze Brent’s outlook.
Brent will touch, but not average, $100 at some point in Q4 2023 or Q1 2024
Should gasoline demand continue to weaken, it would be a signal that the economic outlook has also worsened, sparking a financial sell-off of Brent and WTI of $10-12/bbl. However, this will be mitigated by the long-term physical outlook and ongoing geopolitical issues.
If macro concerns continue to weigh on prices, we could see the low $80s for Brent.
We still believe that Brent will touch, but not average, $100/bbl at some point in Q4 2023 or Q1 2024.
In one year, Americans will elect their president. Polls show Donald Trump in a neck-and-neck race with incumbent Joe Biden. Economists at Commerzbank analyze market implications of the US elections.
Prolonged period with unclear winner to weigh on the markets for some time
In 2024, it will likely be important to see if there is a clear and widely accepted election winner. If there is a prolonged period where it is unclear who won the elections (as had been the case with George W. Bush's election in 2000), with the Supreme Court possibly having a say, this would certainly weigh on the markets for some time.
But ultimately, in our opinion, whether 2024 will be a good year for equity will not depend on the election outcome, but on the question of how negatively the massive interest rate hikes by the Federal Reserve will impact the US economy and S&P 500 corporate earnings in 2024.
Nonfarm Payrolls surprised expectations to the downside in October. This brought the USD lower from its high ground. Economists at TD Securities analyze Greenback’s outlook.
A topping out of 10Y yields and US rates vol will help revive the high-quality carry currencies
Both the headline jobs number and wage data came on the softer side, reinforcing the disinflation narrative. This sets the wheels in motion for peak rates, weak USD, lower rates vol and a revival of the carry theme.
Continued moderation in front-end yields should support the low yielders in G10 and Asia whereas a topping out of 10Y yields and US rates vol will help revive the high-quality carry currencies. We continue to like BRL and MXN.
Traditionally, the Australian Dollar is sensitive to the overall level of risk appetite. Thus, waning risk appetite is set to weigh on the Aussie, economists at Rabobank report.
EUR/AUD: Scope for a move to 1.59 on a six-month view
Against the backdrop of tighter monetary conditions and weaker global growth, the Australian economy is set to experience a slowdown next year.
On balance, we expect USD strength and poor levels of risk appetite to cap upside potential in AUD/USD in the months ahead. That said, we would look to sell rallies in EUR/AUD and see scope for a move to 1.59 on a six-month view.
In an interview with CNBC on Friday, Federal Reserve Bank of Richmond President Thomas Barkin said that it was welcome to see lessening pressure in jobs data and noted that the labor market was in better balance, per Reuters.
Key quotes
"Fed has more data to see before next rate decision."
"Focused on seeing inflation come down."
"I'd like to think markets are responding to data."
"I'm not sure 25 basis points is answer to all word's problems."
"Some evidence price setters see declining power, but many still have it."
"Lower-end consumers are changing how they spend."
"High-end consumers are not cutting back."
"Really pleased by recent productivity data."
"Rate cuts still a ways off in my mind."
"Hope and expect to see more progress lowering inflation."
"I don't know if Fed has reached peak of hike cycle."
"Big risks to over and under tightening monetary policy."
"So far, Middle East turmoil hasn't affected data."
Market reaction
The US Dollar Index stays on the back foot following these comments and was last seen losing 0.83% on the day at 105.28.
Gold regained ground following the Fed meeting. Economists at Commerzbank analyze the yellow metal’s outlook.
Upswing on the Gold market appears to have run out of steam
The upswing on the Gold market appears to have run out of steam as the geopolitical risks are being priced out more and more. In addition, the Fed has left the door open to another rate hike. Even though we are confident that interest rates have already peaked, market participants are nonetheless likely to remain cautious in this respect.
Assuming there is no further escalation in the Middle East, the upside potential for the Gold price will probably be severely limited.
- US ISM Services PMI fell to 51.8 in October.
- US Dollar Index stays deep in negative territory below 105.50.
Business activity in the US service sector expanded at a softening pace in October, with the ISM Services PMI declining to 51.8 from 53.6 in September. This reading came in below the market expectation of 53.
Further details of the survey showed that the Prices Paid Index, the inflation component, edged slightly lower to 58.6 from 58.9, while the Employment Index fell to 50.2 from 53.4.
Market reaction
The US Dollar continued to weaken against its major rivals following the PMI data. As of writing, the US Dollar Index was down 0.75% on the day at 105.35.
- Japanese Yen continues its recovery into the weekend on potential for divergent monetary policy.
- BoJ has started normalizing policy as other central banks are close to reaching the end of their tightening cycles.
- USD/JPY declines sharply after Nonfarm Payrolls miss brings into doubt further Fed rate hikes.
The Japanese Yen (JPY) trades higher in most pairs at the end of the week after recovering from oversold conditions following the dramatic post-Bank of Japan (BoJ) meeting sell-off on Tuesday.
The Yen may be benefiting from the market view that the BoJ will eventually normalize its ultra-loose monetary policy stance at a time when most other central banks are expected to be ending their tightening cycles.
Permanently negative interest rates in Japan have kept the Yen weak vis-a-vis other currencies, whose central banks have been raising interest rates to combat inflation. Investors tend to park their capital where it can manifest the highest risk-free returns, putting the Yen at a severe disadvantage. With most major central banks now having reached peak interest rates, however, the tables could turn if the BoJ starts tightening.
At the last BoJ meeting, the board of governors made a first step towards tightening or normalizing policy, when it relaxed its cap on 10-year Japanese Government Bond (JGB) yields, essentially a form of quantitative easing.
The reason the Yen still sold-off after the meeting, however, was because Bank of Japan Governor Kazuo Ueda remarked that most inflation was still coming from higher commodity prices rather than increased demand, suggesting the BoJ would need to keep interest rates lower for longer.
Daily digest market movers: Yen recovers on divergent monetary policy outlook
- The Yen continues to recover against most majors into the weekend as market perceptions see the potential for policy divergence between BoJ and other major central banks.
- The BoJ could start raising rates at a time when the other central banks are reaching their peak interest rates or lowering them, which would provide the perfect monetary policy differential for a period of dramatic strengthening for the Japanese currency.
- On Friday, the Yen gains the most against the US Dollar (USD), after the release of the October Nonfarm Payrolls report leads traders to offload the Dollar.
- The report shows a weakening of most labor metrics in October, further adding weight to the view that the Federal Reserve (Fed) is now done with raising interest rates.
- Payrolls themselves rose by only 150K versus the 180K forecast, and way below the 297K (itself revised down from 336K) of the previous month.
- Average Earnings rose by only 0.2% MoM versus the 0.3% expected, Average Weekly Hours worked fell to 34.3 from 34.4, and the Unemployment Rate rose to 3.9% from 3.8% expected and the same previously.
- The Yen is hampered by a lack of demand-driven inflation. BoJ Governor Ueda said inflation is mainly due to rising input costs due to higher commodity prices, especially Oil, rather than being “demand driven”.
- His comments suggest the BoJ will need to continue to maintain easy monetary policy for longer than had been hoped to inject growth into the economy, rather than to start to hike rates.
- The Yen is further hampered by a disconnect between the actions of the BoJ and its rhetoric. Despite changing the 1.0% JGB yield cap to a reference point for intervention rather than a hard ceiling, the BoJ still intervened midweek to cap rising yields as they inched closer to the 1.0% mark, basically continuing to treat the level as a ceiling, according to a report by Reuters.
Japanese Yen technical analysis: USD/JPY short-term uptrend at risk of reversing
USD/JPY – the amount of Yen that one Dollar buys – sank after the release of lackluster Nonfarm Payrolls led to mass ditching of the Dollar.
From a short-term perspective the decline brings the pair perilously close to a trend reversal. A break below the 148.80 low of October 30 would provide much stronger evidence of bears finally turning the tables on bulls, as it is the last major lower high of the short-term uptrend.
-638346188566388834.png)
US Dollar vs Japanese Yen: 4-hour Chart
There are further signs of weakness: the pair has cleanly broken out the rising channel it has been in – disrespecting for the second time this week, the lower boundary line.
It has cut straight through the 50 and 100-four hour Simple Moving Averages (SMA) and is challenging the 200.
-638346190798493308.png)
US Dollar vs Japanese Yen: Daily Chart
On the daily chart, which measures the medium-term trend, the uptrend still looks solid, except for the channel breakout. The 148.80 lows is still the level to watch and if it is not broken bulls will continue to hold out hope of a recovery. Apart from that, the next major support level is the 50-day SMA at 148.63.
The Moving Average Convergence Divergence (MACD) indicator has been showing bearish divergence for some time, as it has been falling whilst price was rising during the last days of October. Nevertheless, this is not sufficient on its own to suggest the medium-term uptrend has reversed.
Ultimately the “trend is your friend..” as the saying goes, and for USD/JPY the short, medium and long-term trends are all still bullish, suggesting the odds continue to favor more upside eventually.
If the 151.93 32-year-high of 2022 is breached, the uptrend will be reconfirmed, with next targets expected to be met at the round number marks – 153.00, 154.00, 155.00 etc.
Japanese Yen FAQs
What key factors drive the Japanese Yen?
The Japanese Yen (JPY) is one of the world’s most traded currencies. Its value is broadly determined by the performance of the Japanese economy, but more specifically by the Bank of Japan’s policy, the differential between Japanese and US bond yields, or risk sentiment among traders, among other factors.
How do the decisions of the Bank of Japan impact the Japanese Yen?
One of the Bank of Japan’s mandates is currency control, so its moves are key for the Yen. The BoJ has directly intervened in currency markets sometimes, generally to lower the value of the Yen, although it refrains from doing it often due to political concerns of its main trading partners. The current BoJ ultra-loose monetary policy, based on massive stimulus to the economy, has caused the Yen to depreciate against its main currency peers. This process has exacerbated more recently due to an increasing policy divergence between the Bank of Japan and other main central banks, which have opted to increase interest rates sharply to fight decades-high levels of inflation.
How does the differential between Japanese and US bond yields impact the Japanese Yen?
The BoJ’s stance of sticking to ultra-loose monetary policy has led to a widening policy divergence with other central banks, particularly with the US Federal Reserve. This supports a widening of the differential between the 10-year US and Japanese bonds, which favors the US Dollar against the Japanese Yen.
How does broader risk sentiment impact the Japanese Yen?
The Japanese Yen is often seen as a safe-haven investment. This means that in times of market stress, investors are more likely to put their money in the Japanese currency due to its supposed reliability and stability. Turbulent times are likely to strengthen the Yen’s value against other currencies seen as more risky to invest in.
10Y UST yields have generally traded in the 4.80-5.00% range over the past weeks but broke below the recent range following the November FOMC Meeting. Economists at Danske Bank expect long rates to decline, but less than previously.
Bond yields headed lower towards 2024
We still pencil in a downward trending profile for long UST yields over the coming year, though with a higher level expected on a 12M horizon compared to our September forecast.
We expect the 10Y UST yield to decline by 70 bps to 4.20% (previously 3.70%), as inflationary pressures soften and Fed initiates its cutting cycle. The upward revision is mainly an effect of a higher Term Premium, which we expect to prove stickier than the pricing of policy rates remaining ‘high forever’.
- Silver price climbs sharply above $23.00 on soft labor, Services PMI data.
- The US workforce witnessed fresh additions of 150K vs. expectations of 180K.
- The market mood turns upbeat as investors hope that the Fed is done with hiking interest rates.
Silver price (XAG/USD) climbs swiftly to near $23.30 as the United States Bureau of Labor Statistics (BLS) has reported that the pace of hiring by firms was slow in October. The white metal rallies as investors hope that a softer-than-anticipated labor market report will allow Federal Reserve (Fed) policymakers to keep interest rates unchanged in the range of 5.25-5.50% till the end of 2023.
As per the US NFP report, the workforce witnessed fresh additions of 150K vs. expectations of 180K and September’s reading of 297K (revised lower). The Unemployment Rate rose to 3.9% against expectations of 3.8%. The wage growth also slowed to 0.2% against a 0.3% gain in September.
The market mood turns upbeat as slower growth in the job market may bring down consumer spending and ease consumer inflation. Meanwhile, the S&P500 has opened on a bullish note as investors hope that the Fed is done with hiking interest rates. The US Dollar Index (DXY) refreshed its six-week low below 105.20. 10-year US Treasury yields have plunged further to 4.53%.
The Institute of Supply Management (ISM) has reported that the Services PMI for September dropped sharply to 51.8 against expectations of 53.0 and the former reading of 53.6.
Silver technical analysis
Silver price forms a Bullish Flag chart pattern on a four-hour scale. The aforementioned chart pattern indicates a transfer of inventory from retail participants to institutional investors. The white metal remains cushioned by the 200-period Exponential Moving Average (EMA) at $22.80. The horizontal resistance is plotted from September 22 high at $23.77.
The Relative Strength Index (RSI) (14) aims to shift into the bullish range of 60.00-80.00. A bullish momentum will trigger if the RSI (14) would manage to do so.
Silver four-hour chart
-638346180179251534.png)
November and December are normally soft months for the Dollar. This year, however, economists at ING expect a bid USD through to year-end.
Fed-driven Dollar weakness will be a story for 2024
Normally, November and December are soft months for the Dollar. This year, however, it is hard to see the Dollar giving back its gains before year-end.
Given our house view that a US slowdown is more likely in the next quarter rather than this one, we therefore expect EUR/USD to end the year around this 1.05/1.06 area and USD/JPY to end the year not far from 150. Into 2024, however, we expect the short end of the US curve to start moving lower ahead of Fed easing next summer and the Dollar to turn lower.
Our forecast for a Eurozone recession, a difficult return of the Stability and Growth Pact, and the ongoing threat of a geopolitical spike in oil prices present downside risks to our view of a Fed-driven rise in EUR/USD to 1.10 next summer and 1.15 by year-end 2024.
The BoE’s policy update triggered a modest initial sell-off for the Pound. Economists at MUFG Bank analyze GBP outlook.
GBP to weaken further
The updated policy messages from the Fed and BoE were both similar in our view signalling it was more likely that no further hikes would be required but not going as far as completely ruling it out. The developments support our outlook for the Pound to weaken further.
The UK rate market is currently pricing in around 55 bps of cuts by the end of next year. We still expect the BoE to deliver more cuts next year than currently priced.
- USD/CAD falls vertically below 1.3700 after the release of the US/Canada labor market data.
- US/Canada job growth slowed in October more than expected.
- Slower job growth may allow Fed policymakers to advocate for concluding the rate-tightening campaign.
The USD/CAD pair fell sharply below the round-level support of 1.3700 after the release of the United States/Canada labor market data. The Loonie asset witnesses an intense sell-off as the US Dollar Index (DXY) drops swiftly on the soft US Nonfarm Payrolls (NFP) report for October.
The US Bureau of Labor Statistics (BLS) reported that job hiring was slow against expectations. US employers hired 150K job seekers, lower than expectations of 180K and 297K job additions in September (revised lower). The jobless rate rose to 3.9% from 3.8% expectations and the former reading.
Monthly Average Hourly Earnings grew at a slower pace of 0.2% against 0.3% growth in September. The annual wage growth was 4.1%, higher than expectations of 4.0% but dropped from 4.2% reading a year ago. Slower job growth may allow Federal Reserve (Fed) policymakers to advocate for concluding the rate-tightening campaign.
Meanwhile, investors await the US ISM Services PMI for October, which will be published at 14:00 GMT. The Services PMI, which represents the service sector that accounts for two-thirds of the US economy is seen dropping to 53.0 against the former reading of 53.6.
On the Canadian Dollar front, the laborforce was expanded by 17.5K employees against expectations of 22.5K and September’s reading of 63.8K. The Unemployment Rate rose to 5.7% versus expectations of 5.6% and the former reading of 5.5%. A soft labor market report may allow Bank of Canada (BoC) policymakers to keep interest rates unchanged at 5% in the monetary policy meeting next month.
- Nonfarm payrolls rise below expectations in October.
- The US Dollar tumbles as Treasury bonds jump.
- The US Dollar Index falls to one-month lows below 105.30.
The weak US jobs report triggered a strong market reaction, sending the US Dollar sharply lower. The US Dollar Index is falling by 0.80%, marking its worst performance in months as Wall Street futures indicate a positive opening, extending the rally.
In October, the US economy added fewer jobs than forecasted, with 150,000 jobs compared to the expected 180,000. The unemployment rate rose unexpectedly from 3.8% to 3.9%.
Following the report, US yields collapsed. The 2-year yield fell from nearly 5% to 4.85%, while the 10-year yield dropped from 4.64% to 4.55%. Wall Street futures surged, and commodity prices jumped but later trimmed some of their gains.
The US Dollar Index (DXY) retreated from 105.90 to 105.25, reaching its lowest level since September 20. The DXY remains near daily lows and is under pressure. The next support level is seen at 105.10, followed by 104.65.
On a weekly basis, the DXY is experiencing its biggest decline since July, breaking out of a four-week range trading pattern and correcting further from the year-to-date high at 107.34 (October 3 high).
Technical levels
The 1.33-1.37 range economists at Rabobank have been highlighting for USD/CAD has broken to the upside. They do not expect much further upside for the pair.
USD/CAD seen at 1.3620 by year-end
We don’t expect much further upside for USD/CAD. Yet, a return to the 1.35 magnet we have been trading around is unlikely to materialize this year.
That said, we would suggest the primary driver of USD strength has been the sharp bear steepening of the US Treasuries curve. We cannot rule out further upside for the 10-year yield – which up to this point we would suggest has primarily been a function of rising term premium. However, we are calling for a sharp move lower to 4.45% by year-end. Should this come to fruition then a move back below 1.36 could well be on the cards for USD/CAD, and we now forecast a year-end target just north of there at 1.3620.
- US Dollar drops sharply following a weaker-than-expected US Jobs report.
- USD/JPY has lost almost a hundred pips so far and is approaching weekly lows.
The USD/JPY tumbled from 150.20 to as low as 149.27 following the release of the US official employment report. The US Dollar experienced broad-based weakness after the numbers came in weaker than expected. Wall Street futures are up, extending the weekly rally. Commodity prices are also up sharply.
Nonfarm payrolls rose by 150,000, below the market consensus of 180,000. The unemployment rate also increased from 3.8% to 3.9%. These figures triggered a strong market response.
US yields collapsed, with the 2-year yield falling from around 5% to 4.85% and the 10-year yield dropping from 4.64% to 4.55%. The US Dollar Index broke below 105.40, reaching its lowest level since September 20.
The USD/JPY currently holds a bearish tone as it approaches 149.00, and a break below that level would bring the weekly low at 148.77 into focus. A consolidation around the current levels could indicate that the short-term trend is changing, which would be welcome news for Japanese officials. However, for this trend to continue, US bonds need to remain in demand.
Despite rising against the US Dollar, the Japanese yen is falling against the rest of the G10 currencies on the back of risk appetite.
USD/JPY Technical levels
Recent price action has seen MXN’s status as the second-best performer year-to-date flip to the worst performer since the beginning of September and the second worst in October. Economists at Rabobank analyze Peso’s outlook.
USD/MXN to trade down to 17.20 if the 10-year does move down to 4.45%
The rise in 10-year yields weighed on risk assets across the board and while there is risk of another beyond the 5% handle in 10-year Treasury yields, we expect a substantial move lower over the coming months with an end of year forecast of 4.45%. Should that come to fruition, then MXN strength is likely to occur in tandem.
If the 10-year UST yield remains at current levels, then our short-term MXN model points to a year-end rate of around 17.60. But if the 10-year does move down to 4.45% then we expect USD/MXN to trade down to 17.20.
- Canada Unemployment Rate rises to 5.7% in October.
- Employment increases by 17,500 below expectations of 22,500.
- USD/CAD tumbles toward 1.3700 on the back of a weaker US Dollar after NFP.
The Unemployment Rate in Canada rose to 5.7% in October, Statistics Canada reported on Friday, worse than the market consensus of a modest increase to 5.6%. It was the fourth monthly increase in the past six months and the highest level since early 2022.
Employment rose by 17,500 following an increase of 63,800 in September, and below expectations of 22,500. “Both full-time and part-time employment held steady in October,” informed Statistics Canada.
Market reaction
The USD/CAD declined after the release of employment reports in the US and Canada, falling toward 1.3700. In the US, Nonfarm payrolls rose by 150,000 in October, below expectations.
EUR/USD has not been able to sustain gains through the upper 1.06s. Economists at Scotiabank analyze the pair’s outlook.
EUR retains a firm technical profile
The EUR retains a firm technical profile on the short-term charts.
Trend strength signals are developing bullishly for the EUR on the intraday and daily oscillators which should bolster support for the EUR on minor dips.
Near-term gains should be able to extend to 1.0700/1.0750.
Support is 1.0595/1.0600.
See: EUR/USD to move towards the 1.0675/1.0700 area unless US jobs surprise on the upside – ING
GBP/USD regains 1.22. Economists at Scotiabank analyze the pair’s outlook.
Sterling’s short-term pattern of trade looks encouraging
Sterling’s short-term pattern of trade looks encouraging and the resilience of demand for the Pound on weakness over the past month or more is notable.
Trend momentum is supportive on the intraday studies but less so on the longer-run oscillators. Notably, intraday gains are making progress above long-term trend resistance off the July high for spot.
A close above 1.2205 will add to positive momentum in Cable and target additional gains (to 1.23 initially, potentially 1.2450) in the weeks ahead.
USD/CAD holds steady. Economists at Scotiabank analyze the pair’s outlook.
The decline has stalled in the low 1.37s
Short-term price action suggests the decline in USD/CAD has stalled in the low 1.37s intraday.
Trend signals are mixed on the intraday (mildly USD-bearish) and daily (still bullish) oscillators which lean towards choppy, rather than trending, price action in the short run.
The USD cracked minor trend support at 1.3775 late Thursday which now becomes resistance and should favour fading minor USD gains ahead of 1.38.
Support is 1.3700/1.3705 and 1.3650/1.3655.
Gold price was able to regain ground amid the US Federal Reserve’s interest rate meeting. Economists at Commerzbank analyze the yellow metal’s outlook.
Buoyant NFP to weigh on Gold
Gold will probably continue to find it hard to climb lastingly above the $2,000 mark – assuming there is no escalation in the Middle East – as further Fed rate hikes have become a little less likely but are not yet off the table entirely.
Interest rate expectations could be quickly driven up again, thereby weighing on the Gold price, especially if the US economy proved persistently resilient. Today’s US labor market data could trigger such a market reaction if they turn out once again to be more buoyant than anticipated.
- The Euro adds to Thursday’s gains vs. the US Dollar.
- European stocks trade in a mixed tone so far on Friday.
- US Nonfarm Payrolls will be the salient event later in the session.
The Euro (EUR) preserves its positively robust sentiment in the latter half of the week against the US Dollar (USD), motivating EUR/USD to revisit the 1.0650 region prior to the release of the US labour market report on Friday.
On the opposite side, the Greenback encounters extra downward strain and compels the USD Index (DXY) to pierce the 106.00 support amidst a broadly based amelioration in risk appetite. The persistent weakening of the Greenback coincides with some tepid recovery in US yields across different maturities.
In the context of monetary policy, there is a growing agreement among market participants that the Federal Reserve (Fed) is likely to maintain its current monetary conditions unchanged for the time being, as the possibility of a rate adjustment in December seems to have lost some traction particularly in the wake of the latest FOMC event.
The same can be said from the European Central Bank (ECB), as investors now favour a protracted impasse of its monetary policy, most likely until the second half of the next year.
In the euro docket, Germany’s trade surplus narrowed to €16.5B in September and the Unemployment Rate in the broader euro area ticked higher to 6.5% in the same month.
Across the pond, the publication of Nonfarm Payrolls for the month of October will take centre stage along with the Unemployment Rate and the ISM Services PMI.
Daily digest market movers: Euro maintains the optimism above 1.0600
- The EUR trades with decent gains vs. the USD.
- US and German yields look poised to rebound so far.
- A 25 bps rate hike by the Fed in December appears not favoured now.
- The ECB is seen keeping its pause until H2 2024.
- Geopolitical concerns in the Middle East remain unabated.
- Chinese Caixin Services PMI improved a tad in October.
Technical Analysis: Euro faces the next up-barrier near 1.0700
EUR/USD extends the positive price action further north of the 1.0600 hurdle on Thursday.
Next on the upside for EUR/USD comes the October peak of 1.0694 (October 24). The breakout of this level exposes the weekly top of 1.0767 (September 12) ahead of the crucial 200-day SMA at 1.0805, while another weekly peak of 1.0945 (August 30) comes before the psychological barrier of 1.1000. Beyond this region, the pair may encounter resistance at the August high of 1.1064 (August 10), ahead of the weekly top of 1.1149 (July 27) and the 2023 peak of 1.1275 (July 18).
On the flip side, sellers are expected to meet the next contention at the weekly low of 1.0495 (October 13), prior to 2023 bottom at 1.0448 (October 15), and the round number of 1.0400.
In the meantime, the pair's outlook is predicted to continue bearish as long as it remains below the crucial 200-day SMA.
Euro FAQs
What is the Euro?
The Euro is the currency for the 20 European Union countries that belong to the Eurozone. It is the second most heavily traded currency in the world behind the US Dollar. In 2022, it accounted for 31% of all foreign exchange transactions, with an average daily turnover of over $2.2 trillion a day.
EUR/USD is the most heavily traded currency pair in the world, accounting for an estimated 30% off all transactions, followed by EUR/JPY (4%), EUR/GBP (3%) and EUR/AUD (2%).
What is the ECB and how does it impact the Euro?
The European Central Bank (ECB) in Frankfurt, Germany, is the reserve bank for the Eurozone. The ECB sets interest rates and manages monetary policy.
The ECB’s primary mandate is to maintain price stability, which means either controlling inflation or stimulating growth. Its primary tool is the raising or lowering of interest rates. Relatively high interest rates – or the expectation of higher rates – will usually benefit the Euro and vice versa.
The ECB Governing Council makes monetary policy decisions at meetings held eight times a year. Decisions are made by heads of the Eurozone national banks and six permanent members, including the President of the ECB, Christine Lagarde.
How does inflation data impact the value of the Euro?
Eurozone inflation data, measured by the Harmonized Index of Consumer Prices (HICP), is an important econometric for the Euro. If inflation rises more than expected, especially if above the ECB’s 2% target, it obliges the ECB to raise interest rates to bring it back under control.
Relatively high interest rates compared to its counterparts will usually benefit the Euro, as it makes the region more attractive as a place for global investors to park their money.
How does economic data influence the value of the Euro?
Data releases gauge the health of the economy and can impact on the Euro. Indicators such as GDP, Manufacturing and Services PMIs, employment, and consumer sentiment surveys can all influence the direction of the single currency.
A strong economy is good for the Euro. Not only does it attract more foreign investment but it may encourage the ECB to put up interest rates, which will directly strengthen the Euro. Otherwise, if economic data is weak, the Euro is likely to fall.
Economic data for the four largest economies in the euro area (Germany, France, Italy and Spain) are especially significant, as they account for 75% of the Eurozone’s economy.
How does the Trade Balance impact the Euro?
Another significant data release for the Euro is the Trade Balance. This indicator measures the difference between what a country earns from its exports and what it spends on imports over a given period.
If a country produces highly sought after exports then its currency will gain in value purely from the extra demand created from foreign buyers seeking to purchase these goods. Therefore, a positive net Trade Balance strengthens a currency and vice versa for a negative balance.
Economists at Société Générale analyze USD/CAD technical outlook.
A short-term down move towards 1.3700 is expected
USD/CAD recently faced resistance near March high of 1.3860/1.3900 which is also the upper limit of a multi-month channel. This test has resulted in a quick decline.
A short-term down move towards 1.3700, the 23.6% retracement from July is expected.
Lower band of the channel near 1.3570 is likely to be an important support near term. Only if this gets violated would there be risk of a deeper down move.
- USD/CAD struggles for a firm footing amid soft US Dollar.
- Investors await the US/Canada labor market data for further guidance.
- USD/CAD extended losses after slipping below the horizontal support plotted from 1.3786.
The USD/CAD pair looks for intermediate support near 1.3700 after a sharp sell-off. The Loonie asset remains on the backfoot as investors dumped the US Dollar on expectations that the Federal Reserve (Fed) is concluding its rate-tightening campaign.
The US Dollar Index (DXY) struggles to sustain above the crucial support of 106.00 ahead of the United States Nonfarm Payrolls (NFP) data for October. As per the consensus, US employers hired 180K job seekers against 336K payrolls in September, which was surprisingly upbeat. The Unemployment Rate is seen steady at 3.8%.
Investors would also watch the Canadian employment data for October. Economists expect that the Canadian labor force grew by 22.5K payrolls against 63.8K job additions in September. The jobless rate is seen rising to 5.6% against 5.5% reading.
USD/CAD extended losses after slipping below the horizontal support plotted from October 5 high at 1.3786 on a two-hour timeframe. The Loonie asset has also stabilized below the upward-sloping trendline placed from September 29 low at 1.3417. The major struggles to rebound above the 200-period Exponential Moving Average (EMA), which trades around 1.3755.
A range shift move by the Relative Strength Index (RSI) (14) into the 20.00-40.00 range indicates a bearish reversal.
A decisive break above October 27 high at 1.3880 would expose the round-level resistance at 1.3900, followed by 13 October 2022 high at 1.3978.
In an alternate scenario, a breakdown below October 24 low around 1.3660 would drag the asset to the round-level support of 1.3600. A further breakdown could expose the asset to October 7 low at 1.3570.
USD/CAD two-hour chart
-638346049943781443.png)
Norges Bank left monetary policy unchanged. Following the rate decision, NOK lost some ground. Economists at Commerzbank analyze Krone’s outlook.
Norges Bank’s decision is comparable to that of the Fed
The decision is comparable to that of the Fed. Both central banks are waiting for further data to then decide in December whether there will be another step. Neither wants to hike its key rate more than necessary, thus stalling the economy.
Norges Bank also mentioned the possibility of rates being kept on hold in the statement. For that to happen, though, inflation will first have to fall significantly and more notably than projected by the central bank.
If inflation remains stubbornly high there will definitely be another rate step. However, one thing is also clear: if inflation rates fall further doubts in a rate hike in December are likely to be cemented, putting further pressure on NOK.
EMFX surfs in a sea of green. Today's US jobs data will be key in determining whether this week's risk-positive trend has further room to run, economists at ING report.
Dollar to hand back a little further of its gains assuming no upside NFP surprises
It seems investors are starting to think that the Fed is done with rate hikes and are now starting to reduce underweight positions in risk assets, including emerging market currencies. This is Dollar negative.
Today's US jobs data will be a key determinant of whether this week's new trend has legs or will be quashed by strong hiring or wage numbers.
Assuming no upside surprises today, we favour the Dollar handing back a little further of its gains, especially against the high yielders (e.g., Mexico and Hungary) given the renewed interest in the carry trade.
DXY could drop to the 105.50/105.55 area today as long as the US jobs data is not too strong.
See – NFP Preview: Forecasts from nine major banks, employment remains fairly healthy
- Gold price trades sideways as the focus shifts to key US labor market data.
- Job growth is expected to have slowed in October due to the United Auto Workers strike.
- An upbeat US labor market report would likely increase concerns over inflation pressures.
Gold price (XAU/USD) struggles for direction as investors await the United States Nonfarm Payrolls (NFP) and ISM Services PMI data for October. The downside for Gold price remains cushioned due to persisting geopolitical tensions in the Middle East and expectations that the Federal Reserve (Fed) will keep interest rates elevated for a significantly longer period.
Economists see slower job growth in October as at least 30K workers of the United Auto Workers (UAW) union went on strike against Detroit's "Big Three" car makers. Apart from the headline figure of job growth, investors will also pay attention to the Average Hourly Earnings data, which will provide guidance on consumer spending and inflation. Strong wage data and healthy payrolls could elevate bets for one more interest rate increase from the Fed.
Daily Digest Market Movers: Gold price awaits crucial US data
- Gold price struggles for direction as investors await the US NFP data and fresh developments in the Israel-Palestine war for further guidance.
- The precious metal consolidates in a narrow range below $1,990.00 ahead of the US employment data for October, which is likely to shape the interest rate outlook for the year-end.
- US employers are expected to have added 180K new jobs in October, a figure close to the six-month average. In September, job creation was surprisingly higher at 336K.
- The Unemployment Rate is expected to remain steady at 3.8%. Economists expect that job growth slowed in the manufacturing sector in October due to strikes by the United Auto Workers (UAW) union against Detroit's "Big Three" car makers.
- Earlier, the US Bureau of Labor Statistics (BLS) reported that more than 30K UAW workers were on strike in October.
- Apart from the employment numbers, investors will focus on the Average Hourly Earnings, a gauge of wage growth.
- Economists have forecasted that monthly Annual Hourly Earnings grew at a higher pace of 0.3% against 0.2% the advance recorded in September. On an annual basis, earnings are expected to have risen at a slower pace of 4.0%, against the former reading of 4.2%.
- A stable or stubborn wage growth would warrant a persistent consumer inflation outlook as higher purchasing power by households will keep overall spending at healthy levels.
- In addition to employment data, the US Institute for Supply Management (ISM) Services PMI for October will be keenly watched. Services PMI, which gauges activity in the US service sector – a sector that accounts for two-thirds of the US economy – is seen declining to 53.0 from 53.6 in September.
- The near-term demand for bullions seems upbeat as investors hope that the Federal Reserve is done hiking interest rates after keeping them unchanged in the range of 5.25%-5.50% on Wednesday for the second time in a row.
- However, Fed Chair Jerome Powell kept expectations of more interest rate hikes alive as strong retail demand and upbeat labor market conditions could keep inflationary pressures persistent.
- The US Dollar Index (DXY) discovered an intermediate support near 106.00 as investors turned cautious ahead of the labor market data. 10-year US Treasury yields rebound to near 4.67% but remain on the backfoot on expectations that the Fed has concluded its rate-tightening campaign.
- As per the CME Fedwatch tool, more than 80% of traders bet that monetary policy will remain unaltered for the rest of the year.
- Meanwhile, deepening Middle East tensions keep the appeal for Gold upbeat. The Israeli army has surrounded Gaza and is prepared for the ground assault.
- US Secretary of State Antony Blinken has arrived in Israel with the aim of negotiating a temporary pause in the ground invasion plan by Israeli troops to confirm the secure dispatch of humanitarian aid and help with hostage negotiations.
Technical Analysis: Gold price consolidates around $1,990
Gold price exhibits a lackluster performance around $1,990.00. The precious metal has been consolidating in a range of $1,970-$2,010 for the past five trading sessions. A volatile action in Gold is highly likely after the release of the US labor market data.
On a broader note, the trend for Gold is bullish as the 20-day and 50-day Exponential Moving Averages (EMAs) are sloping higher. Momentum indicators also oscillate in the bullish range, indicating strength in the upside momentum.
Gold FAQs
Why do people invest in Gold?
Gold has played a key role in human’s history as it has been widely used as a store of value and medium of exchange. Currently, apart from its shine and usage for jewelry, the precious metal is widely seen as a safe-haven asset, meaning that it is considered a good investment during turbulent times. Gold is also widely seen as a hedge against inflation and against depreciating currencies as it doesn’t rely on any specific issuer or government.
Who buys the most Gold?
Central banks are the biggest Gold holders. In their aim to support their currencies in turbulent times, central banks tend to diversify their reserves and buy Gold to improve the perceived strength of the economy and the currency. High Gold reserves can be a source of trust for a country’s solvency. Central banks added 1,136 tonnes of Gold worth around $70 billion to their reserves in 2022, according to data from the World Gold Council. This is the highest yearly purchase since records began. Central banks from emerging economies such as China, India and Turkey are quickly increasing their Gold reserves.
How is Gold correlated with other assets?
Gold has an inverse correlation with the US Dollar and US Treasuries, which are both major reserve and safe-haven assets. When the Dollar depreciates, Gold tends to rise, enabling investors and central banks to diversify their assets in turbulent times. Gold is also inversely correlated with risk assets. A rally in the stock market tends to weaken Gold price, while sell-offs in riskier markets tend to favor the precious metal.
What does the price of Gold depend on?
The price can move due to a wide range of factors. Geopolitical instability or fears of a deep recession can quickly make Gold price escalate due to its safe-haven status. As a yield-less asset, Gold tends to rise with lower interest rates, while higher cost of money usually weighs down on the yellow metal. Still, most moves depend on how the US Dollar (USD) behaves as the asset is priced in dollars (XAU/USD). A strong Dollar tends to keep the price of Gold controlled, whereas a weaker Dollar is likely to push Gold prices up.
- USD/CHF approaches 0.9100 as Swiss Franc losses appeal amid easing price pressures.
- The USD index consolidates around 106.00 as the focus shifts to the US NFP.
- Investors hope that the Fed is done with hiking interest rates.
The USD/CHF pair extends recovery to near 0.9070 ahead of the United States labor market data for October. The Swiss Franc asset aims to recapture the 0.9100 resistance while the US Dollar Index (DXY) has turned sideways around 106.00.
S&P500 futures generated some losses in the European session, portraying some decline in the risk appetite of the market participants. The USD index struggles to hold recovery as investors hope that the Federal Reserve (Fed) is done with its historically tight rate-hiking campaign. 10-year US Treasury yields have dropped to 4.67% on expectations that the Fed will keep interest rates unchanged in the range of 5.25-5.50% till the year-end.
Going forward, the US Nonfarm Payrolls (NFP) data will be keenly watched. Analysts at RBC Economics see a 208K gain in payroll employment. Still, labor demand has also been slowing under the surface in the US with job openings drifting lower and wage growth slowing. The Unemployment Rate may tick up to 3.9% (despite higher employment) after climbing to 3.8% over August and September from 3.5% in July.
Economists will keenly watch the Average Hourly Earnings data to understand how underlying inflation risks are developing. Monthly Average Hourly Earnings is seen expanding by 0.3% vs. 0.2% growth in September. The annual earnings data rose by 4.0% against 4.2%.
The Swiss Franc weakens against the US Dollar as the Swiss Consumer Price Index (CPI) continues to remain below the 2% target. Swiss annual inflation at 1.7%, remained in line with estimates and the former release. The monthly inflation grew marginally by 0.1% as expected.
Canadian labor market data will be released today. Economists at Commerzbank analyze how the employment report could impact the CAD.
CAD should benefit from a strong labor market report
It is questionable whether another positive surprise from the labor market and continued strong wage growth will convince the Bank of Canada (BoC) to raise interest rates again. Probably the labor market would have to surprise significantly to the upside and at the same time, the inflation figures due in three weeks' time would have to show that inflationary pressures have persisted.
A strong labor market report is likely to cast doubt on whether the BoC will start cutting interest rates any time soon, as the market currently expects. After all, continued strong wage growth combined with solid job creation should argue for continued strong inflationary pressures, which could necessitate a ‘high for longer’. The CAD should benefit from this.
However, if the economists surveyed are right (for October, the surveyed economists expect a rather moderate job creation of 22.5K), or if job creation surprises to the downside, there is much to suggest that rate cuts are increasingly on the agenda. Given the speculation that the Fed will hike again, this would cause USD/CAD to move slightly higher.
See – Canada Employment Preview: Forecasts from five major banks, deterioration in labour market conditions
Andrew Hauser, Executive Director - Markets, at Bank of England (BoE), said on Friday, they “need to ensure banks’ liquidity insurance remains appropriate as technological change increases the risk of larger and faster deposit run.”
Additional quotes
After QT unwind, the BoE will need to supply a "materially higher" standing stock of reserves than before 2008 crisis.
Will continue to deepen alternative liquidity sources for banks.
Will look to calibrate boe liquidity toolkit to return market discipline to banks' liquidity management.
Real limits to extent to which boe can use price incentives to manage banks' reserves demand.
Non-price levers have complex issues, need to avoid risks to monetary control or financial stability.
The Bank of England (BoE) pushed back on talk of rate cuts. Economists at ING analyze GBP outlook after the BoE’s meeting.
Forward guidance returns. Is the market listening?
What was a surprise was the re-introduction of forward guidance – i.e., that 'monetary policy is likely to need to be restrictive for an extended period of time'.
Investors know that forward guidance is used as a tool by central bankers and it looks like the next nine months will be a game of cat and mouse as investors push for rate cuts and the BoE fights back.
We think data will probably support investors and see upside risks to our year-end EUR/GBP forecast of 0.8700.
GBP/USD should do a little better today in the risk-positive environment. Favour a test of 1.2250 above which 1.2335 opens up.
Gold is getting haven fund flows. Economists at ANZ Bank analyze the yellow metal’s outlook.
ETF flows are recovering due to haven demand
Gold is benefiting from its status as a haven asset amid elevated geopolitical risks.
Exchange traded fund (ETF) holdings have increased by 1moz in the last two weeks and speculators have covered short positions.
Even so, Gold’s performance hinges on the end of the Fed’s hiking cycle. This should finally see US Treasury bond yields declining, helping Gold investment demand recover.
- NZD/USD scales higher for the third successive day amid the prevalent USD selling bias.
- Bets that the Fed will not hike rates again and a positive risk tone undermine the USD.
- Spot prices remain on track to snap a three-week losing streak ahead of the NFP report.
The NZD/USD pair attracts some buying for the third successive day on Friday and climbs back above the 0.5900 mark during the first half of the European session. Spot prices currently trade just a few pips below a two-week high touched on Thursday and now look to the US monthly employment details for a fresh impetus.
The popularly known NFP report is due for release later during the early North American session and should provide fresh cues about the Federal Reserve's (Fed) next policy move. This, in turn, will play a key role in influencing the near-term US Dollar (USD) price dynamics and provide some meaningful impetus to the NZD/USD pair.
Heading into the key data risk, expectations that the Fed is nearing the end of its policy tightening campaign continue to drag the US Treasury bond yields lower. This, along with the upbeat market mood – as depicted by a generally positive tone around the equity markets – undermines the USD and acts as a tailwind for the NZD/USD pair.
Meanwhile, a private-sector survey showed that business activity in China's services sector expanded at a slightly faster pace in October and turns out to be another factor benefitting antipodean currencies, including the New Zealand Dollar (NZD). This, however, does little to ease market worries about a slowdown in the world's second-largest economy.
Apart from this, growing acceptance that the Reserve Bank of New Zealand (RBNZ) will keep its policy rate unchanged in November, bolstered by weak domestic employment figures earlier this week, might cap the NZD/USD pair. This, in turn, warrants caution before placing fresh bullish bets and positioning for any further appreciating move.
Hence, strong follow-through buying is needed to confirm that the NZD/USD pair has formed a near-term bottom. Nevertheless, spot prices remain on track to register strong weekly gains and snap a three-week losing streak to the lowest level since November 2022, around the 0.5775-0.5770 region touched last Thursday.
Technical levels to watch
EUR/USD fluctuates above 1.06. Economists at ING analyze the pair’s outlook.
The market has closed the door on further ECB hikes
The European Central Bank's Isabel Schnabel said the ECB cannot close the door on further rate hikes. However, the market has priced out any further rate hikes and is firmly looking at the 2024 easing cycle. This means that despite lower US rates recently, two-year EUR:USD swap differentials have not narrowed meaningfully and probably explains why EUR/USD is struggling to take advantage of the softer Dollar environment.
Given global conditions, however, we would favour EUR/USD towards the 1.0675/1.0700 today area unless US jobs surprise on the upside.
The main event today will be the US employment data. Economists at Commerzbank analyze how USD could react to the Nonfarm Payrolls report.
Another positive surprise is unlikely to support USD
Another positive surprise is unlikely to support USD, as the Fed has made its view clear for now and as there will still be a number of other data publications before the December meeting, which could bring more clarity. Today’s labor market report only provides one part of information.
A weaker labor market report on the other hand might put stronger downside pressure on USD as this would underpin the US central bank’s more cautious approach.
That means that if we are going to see a reaction in USD it is probably mainly a downward move.
See – NFP Preview: Forecasts from nine major banks, employment remains fairly healthy
- Silver remains under some selling for the second straight day and drops closer to the weekly trough.
- The technical setup favours bearish traders and supports prospects for additional near-term losses.
- A sustained strength beyond the $23.60-$23.70 supply zone is needed to negate the negative bias.
Silver (XAG/USD) drifts lower for the second successive day on Friday – also marking the third day of a negative move in the previous four – and drops to the lower end of its weekly range during the early part of the European session. The white metal currently trades around the $22.65-$22.60 region, down over 0.50% for the day, and seems vulnerable to weaken further.
The recent repeated failures to find acceptance above the 200-day Simple Moving Average (SMA) and rejections near the $23.60-$23.70 supply zone constitute the formation of a multiple tops pattern. Furthermore, technical indicators on the daily chart have again started gaining negative traction and validate the near-term bearish outlook for the XAG/USD. That said, it will still be prudent to wait for some follow-through selling below the $22.50 support zone before positioning for further losses.
The XAG/USD might then accelerate the fall to the $22.00 mark before dropping to the $21.70 horizontal support zone en route to the $21.35-$21.30 region. The downward trajectory could get extended further and drag the white metal below the $21.00 mark, towards the $20.70-$20.65 area, or a seven-month low touched in October.
On the flip side, the $23.00 round figure now seems to cap the immediate upside ahead of the $23.10-$23.15 horizontal barrier. This is closely followed by the 200-day SMA, currently around the $23.25 region, above which the XAG/USD could challenge the $23.60-$23.70 supply zone. The latter should act as a key pivotal point, which if cleared decisively will negate the negative outlook and shift the near-term bias in favour of bullish traders, paving the way for a move towards the $24.00 mark.
Some follow-through buying has the potential to lift the XAG/USD beyond the $24.20-$24.25 intermediate resistance and allow bulls to make a fresh attempt to conquer the $25.00 psychological mark.
Silver daily chart
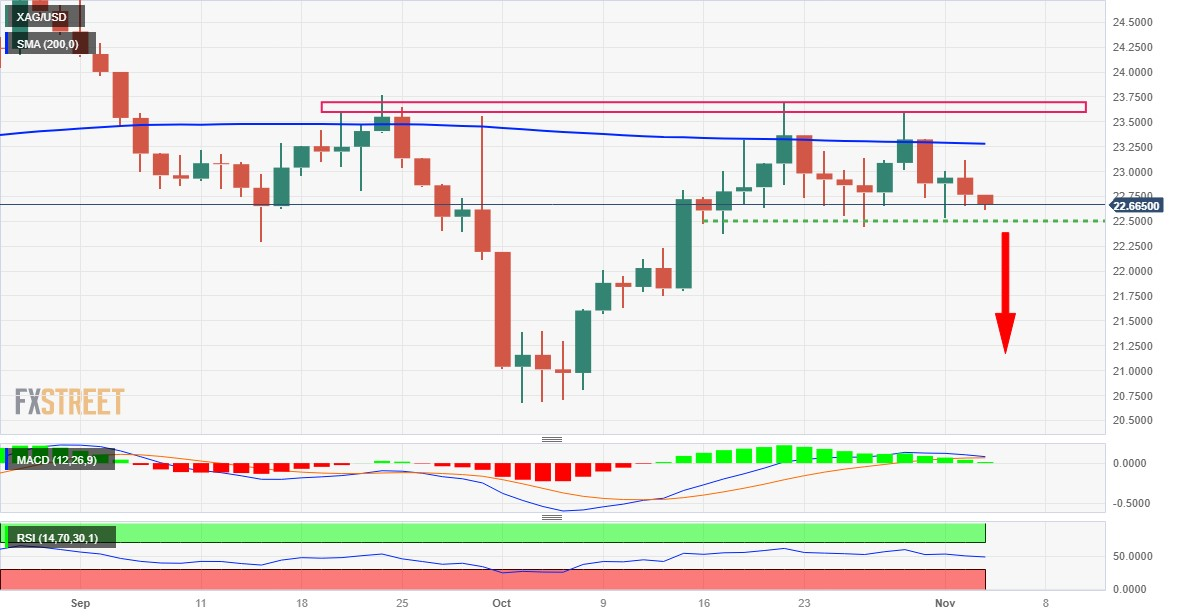
Technical levels to watch
The Bank of England (BoE) meeting did not provide much of a surprise. The BoE left the Bank Rate unchanged. Economists at Commerzbank analyze Sterling’s outlook.
Convincing for now
Everything was as expected and the comments in the BoE’s monetary policy report and the press conference were apparently not considered to be too dovish.
BoE Governor Andrew Bailey underlined repeatedly during the press conference that price stability was the BoE’s mandate. Rather than preventing a recession for example. Moreover, it was premature to consider rate cuts. The market seems to be buying that.
The question is whether the BoE will also stick to these comments if inflation turns out to be more stubborn. For now, however, the market seems to be content and Sterling might have scope for a temporary recovery.
- Pound Sterling struggles to find a direction ahead of key data.
- The BoE keeps interest rates steady to safeguard the economy from recession.
- UK Rishi Sunak is expected to fulfill his promise of halving inflation to 5.4% by the year-end.
The Pound Sterling (GBP) trades in a narrow range with the downside cushioned due to improved market sentiment but gains are capped due to the stagnant growth outlook for the UK economy. The near-term demand for the GBP/USD pair depends on the performance of the UK economy in the fourth quarter of 2023.
The latest information about the UK economy, however, indicates that the manufacturing sector continued its downturn in October due to higher borrowing costs and the cost of living crisis. This has set a negative undertone for the growth rate in the October-December period.
The Bank of England (BoE) held interest rates unchanged at 5.25% on Thursday for the second time in a row so as not to trample on the limited growth there is. There are signs the economy is barely managing to avoid a recession. Business optimism has dipped to a ten-month low, which has forced employers to make deep cuts to payrolls, purchasing, and inventories. In relation to the inflation outlook, BoE Governor Andrew Bailey seems confident that the central bank can bring down inflation to 2% in two years.
Daily Digest Market Movers: Pound Sterling awaits US NFP data
- Pound Sterling trades inside Thursday’s range, demonstrating signs of a sharp contraction in volatility ahead of crucial US data.
- The GBP/USD pair took the steady interest rate decision from the Bank of England (BoE) positively and moved higher to 1.2220.
- BoE policymakers: Megan Greene, Jonathan Haskel, and Katherine Mann voted for a 25 basis points (bps) rate hike while the other six policymakers advocated for maintaining the status quo.
- The upside in the Pound Sterling remained restricted as the decision to keep interest rates unchanged at 5.25% by the BoE, was taken mainly because of fears the economy could tip into a recession.
- The growth rate in the forward quarters is expected to remain stagnant due to Middle East tensions, deteriorating labor demand, weak demand outlook, poor consumer spending, and poor housing market.
- S&P Global reported that the UK manufacturing downturn continued at the start of the final quarter of the year, meaning the factory sector remains a weight dragging on an economy already skirting with recession.
- Over the interest rate guidance, BoE Governor Andrew Bailey warned that the central bank will keep interest rates elevated long enough to squeeze out excess price pressures above the 2% inflation target.
- Andrew Bailey kept the door open for further policy-tightening and ruled out rate cut hopes in the near term as inflation in the UK economy is the highest among G7 economies.
- The BoE’s inflation forecast was for headline inflation to soften to 4.6% by Q4 of 2023. Inflation in the one-to-two-year timeframe is seen easing to 3.1% and 1.9% respectively.
- Fresh inflation projections by the central bank indicate that UK Prime Minister Rishi Sunak will fulfill his promise of halving inflation to 5.4% by the year-end.
- Meanwhile, deepening Middle East tensions are keeping global economies on their toes. The Israeli army has confirmed that their troops have encircled Gaza and a ceasefire is not likely at all.
- US Secretary of State Anthony Blinken has arrived in Israel for talks to pause a ground invasion by the Israeli Defence Forces (IDF) for a secured dispatch of humanitarian aid and to take concrete steps for protecting hostages.
- The US Dollar turns sideways as investors await the US Nonfarm Payrolls (NFP) data for October, which will be published at 12:30 GMT.
- As per the projections, US employers are expected to have hired 180K workers in October against what was a surprisingly higher reading of 336K in September. The Unemployment Rate is seen unchanged at 3.8%.
- Investors will keenly watch Average Hourly Earnings, which is a measure of wage inflation, for interest rate guidance. On a monthly basis, Average Hourly Earnings are seen expanding at a higher rate of 0.3%, as against a 0.2% increase in September. The annual data is seen decelerating to 4.0% versus former reading of 4.2%.
Technical Analysis: Pound Sterling experiences volatility squeeze below 1.2200
Pound Sterling demonstrates a symmetrical triangle pattern formation on the daily timeframe, which indicates a significant contraction in volatility. The upside in the GBP/USD pair would be capped around 1.2230 while the downside will be cushioned near 1.2100. The Cable attempts to stabilize above the 20-day Exponential Moving Average (EMA) at 1.2186. If the GBP/USD pair manages to do so, the near-term demand for the Pound Sterling is likely to turn positive.
Pound Sterling FAQs
What is the Pound Sterling?
The Pound Sterling (GBP) is the oldest currency in the world (886 AD) and the official currency of the United Kingdom. It is the fourth most traded unit for foreign exchange (FX) in the world, accounting for 12% of all transactions, averaging $630 billion a day, according to 2022 data.
Its key trading pairs are GBP/USD, aka ‘Cable’, which accounts for 11% of FX, GBP/JPY, or the ‘Dragon’ as it is known by traders (3%), and EUR/GBP (2%). The Pound Sterling is issued by the Bank of England (BoE).
How do the decisions of the Bank of England impact on the Pound Sterling?
The single most important factor influencing the value of the Pound Sterling is monetary policy decided by the Bank of England. The BoE bases its decisions on whether it has achieved its primary goal of “price stability” – a steady inflation rate of around 2%. Its primary tool for achieving this is the adjustment of interest rates.
When inflation is too high, the BoE will try to rein it in by raising interest rates, making it more expensive for people and businesses to access credit. This is generally positive for GBP, as higher interest rates make the UK a more attractive place for global investors to park their money.
When inflation falls too low it is a sign economic growth is slowing. In this scenario, the BoE will consider lowering interest rates to cheapen credit so businesses will borrow more to invest in growth-generating projects.
How does economic data influence the value of the Pound?
Data releases gauge the health of the economy and can impact the value of the Pound Sterling. Indicators such as GDP, Manufacturing and Services PMIs, and employment can all influence the direction of the GBP.
A strong economy is good for Sterling. Not only does it attract more foreign investment but it may encourage the BoE to put up interest rates, which will directly strengthen GBP. Otherwise, if economic data is weak, the Pound Sterling is likely to fall.
How does the Trade Balance impact the Pound?
Another significant data release for the Pound Sterling is the Trade Balance. This indicator measures the difference between what a country earns from its exports and what it spends on imports over a given period.
If a country produces highly sought-after exports, its currency will benefit purely from the extra demand created from foreign buyers seeking to purchase these goods. Therefore, a positive net Trade Balance strengthens a currency and vice versa for a negative balance.
Canada’s employment data for October will be reported by Statistics Canada on Friday, November 3 at 12:30 GMT and as we get closer to the release time, here are forecasts from economists and researchers at five major banks regarding the upcoming jobs figures.
The North American economy is expected to have added 22.5K jobs vs. 63.8K in September. The Unemployment Rate is seen rising a tick to 5.6%. If so, it would be the highest rate since January 2022.
NBF
Job creation may have slowed to 15K in October, reflecting a loss of momentum in the Canadian economy. This modest gain, combined with another significant expansion of the labour force and an unchanged participation rate (65.6%), should translate into a two-tenth increase in the unemployment rate, to 5.7%.
RBC Economics
Labour demand has continued to slow with job openings still drifting lower. We look for another 15K increase in employment in October but alongside a tick higher in the unemployment rate to 5.6%.
Citi
Job growth in Canada should slow in October after a very strong ~64K jobs added in September, but we still expect a solid increase in employment of 35K. However, given the trend of substantial population growth, this would still imply a slight increase in the unemployment rate to 5.6% assuming the participation rate remains unchanged. Rather than headline jobs figures, wages will be the most important aspect of the October employment report. After slowing somewhat earlier in the year, wage growth has reaccelerated in recent months and remains around 5% on a YoY. The BoC has consistently cited wage growth of 4-5% as too strong to be consistent with 2% price inflation, with wages as one of the key factors they will be watching to gauge the possibility of further hikes.
CIBC
While employment surged in the prior month, most of the increase was driven by education which can be volatile at the start of a school year, and because of that there is the risk of a notable deceleration in October. The 20K increase in employment we expect for October would be below the still rapid pace of population growth, and result in a tick up in the unemployment rate to 5.6%. While that move up in the jobless rate, combined with further reductions in job vacancy postings, would highlight a continued loosening of labour market conditions that have probably not gone far enough to slow wage growth yet. We expect wage growth to remain above 5% on a year-over-year basis in October.
TDS
We look for job growth to slow to 25K in October, slightly below the 6m trend and in line with the market consensus, as the unemployment rate edges higher to 5.6% and wage growth ticks lower to 5.2% YoY. This would give the Bank of Canada some additional evidence that higher rates are working to rebalance the economy but will not be enough to change their broader assessment of labour market conditions or the balance of risks going forward.
FX option expiries for Nov 3 NY cut at 10:00 Eastern Time, via DTCC, can be found below.
- EUR/USD: EUR amounts
- 1.0500 1.8b
- 1.0525 530m
- 1.0580 804m
- 1.0545 870m
- 1.0600 2.4b
- 1.0660 700m
- 1.0700 1b
- 1.0800 690m
- GBP/USD: GBP amounts
- 1.2000 791m
- 1.2100 1.1b
- 1.2150 814m
- 1.2200 544m
- 1.2300 546m
- USD/JPY: USD amounts
- 149.00 1.4b
- 149.50 1.2b
- 150.00 1.5b
- 150.50 1.1b
- 151.00 2.6b
- USD/CHF: USD amounts
- 0.9050 767m
- AUD/USD: AUD amounts
- 0.6450 1.9m
- 0.6500 756m
- USD/CAD: USD amounts
- 1.3700 1.1b
- 1.3705 1.5b
- 1.3750 1.1b
- 1.3900 1.8b
- EUR/GBP: EUR amounts
- 0.8645 531m
- 0.8815 397m
- 0.8885 648m
- AUD/USD edges higher to 0.6435 on the softer USD, risk appetite.
- Reserve Bank of Australia (RBA) is likely to raise the rate by 25 basis points (bps) next week.
- Market participants will closely focus on US employment data, including Nonfarm Payrolls.
The AUD/USD pair extends its upside during the early European trading hours on Friday. The US dollar and the risk appetite lend support to the pair ahead of the US Nonfarm Payrolls data on Friday. As of press time, the pair is trading around 0.6435, gaining 0.03% on the day.
The markets anticipate the Reserve Bank of Australia (RBA) to raise the cash rate by 25 basis points (bps) next week while holding the hawkish stance. Early Friday, the Australian Retail Sales for the third quarter (Q3) improved by 0.2% QoQ versus from 0.6% drop in the previous reading. Meanwhile, Judo Bank Composite PMI came in at 47.6 in October from the previous reading of 47.3. The Services PMI grew to 47.9 in October from 47.6 in September. The upbeat Australian economic data and risk-on environment boost to Australian Dollar (AUD) against the Greenback.
On the other hand, markets are confident that the Federal Reserve (Fed) is approaching the end of its tightening cycle after Fed Chair Jerome Powell made it clear that financial conditions will need to remain tight to avoid further rate rises. The dovish message following the Federal Open Market Committee (FOMC) policy meeting exerts some pressure on the USD. However, the upward trajectory of US Treasury bond yields will likely continue to dominate the USD performance in the next sessions.
Trader will closely watch the highly-anticipated US Nonfarm Payrolls for fresh impetus. The US economy is expected to add 180K jobs in October. The US Unemployment Rate is estimated to remain steady at 3.8%. The stronger-than-expected data might limit the downside of the USD and act as a headwind for the AUD/USD pair. Traders will take cues from the data and find a trading opportunity around the AUD/USD pair.
Here is what you need to know on Friday, November 3:
The US Dollar (USD) continued to weaken against its rivals following mixed macroeconomic data releases from the US on Thursday, with the USD Index (DXY) losing 0.5% on the day. Early Friday, DXY holds steady at around 106.00 as investors await October labor market data, which will include Nonfarm Payrolls and wage inflation figures. The US economic docket will also feature ISM Services PMI report.
US NFP Forecast: Nonfarm Payrolls expected to slow sharply in October after September upside surprise.
The data from the US showed on Thursday that Unit Labor Costs declined by 0.8% on a quarterly basis in the third quarter, while the weekly Initial Jobless Claims rose to 217,000 from 212,000. On a positive note, Factory Orders increased by 2.8% on a monthly basis in September. The benchmark 10-year US Treasury bond yield fell more than 1% and dropped below 4.7%, putting additional weight on the USD's shoulders. Meanwhile, Wall Street's main indexes registered impressive gains as risk flows continued to dominate the action. Early Friday, US stock index futures trade mixed.
Caixin Services PMI in China edged higher to 50.4 in October from 50.2 in September. In the meantime, the Australian Bureau of Statistics reported that Retail Sales grew 0.2% in the third quarter, following the 0.6% contraction recorded in the second quarter. AUD/USD largely ignored these data and the pair was last seen trading virtually unchanged on the day slightly below 0.6450.
Although EUR/USD erased a portion of its daily gains in the American session, it closed in positive territory on Thursday. In the European morning on Friday, the pair fluctuates in a narrow channel above 1.0600.
The Bank of England (BoE) left the policy rate unchanged at 5.25% as expected following the November policy meeting. Governor Andrew Bailey didn't shut the door to another rate hike but adopted a relatively cautious regarding further tightening. GBP/USD benefited from broad USD weakness and climbed above 1.2200 on Thursday before going into a consolidation phase early Friday.
USD/JPY continued to push lower amid retreating US yields and closed the second consecutive day in negative territory on Thursday. The pair stays on the back foot but holds above 150.00.
XAU/USD struggled to capitalize on the selling pressure surrounding the USD on Thursday and ended the day flat near $1,985. Gold stays directionless early Friday and moves up and down in a tight band below $1,990.
- GBP/USD pair attracts some buyers above 1.2200 on Friday.
- The pair holds above the 50- and 100-hour EMAs the the bullish RSI condition.
- The first resistance level is located at 1.2217; 1.2170 acts as an initial support level.
The GBP/USD pair holds positive ground for the second consecutive day during the early European session on Friday. As widely expected, the Bank of England (BoE) decided to maintain the interest rate unchanged at 5.25% on Thursday. During the press conference, BoE Governor Andrew Bailey stated that an additional rate hike could be appropriate, but Bailey disregarded rate cuts. The major pair currently trades around 1.2208, gaining 0.08% on the day.
According to the four-hour chart, GBP/USD holds above the 50- and 100-hour Exponential Moving Averages (EMAs), which supports the buyers for the time being. Furthermore, the Relative Strength Index (RSI) holds above 50 in bullish territory, suggesting the path of least resistance is to the upside.
That being said, the immediate resistance level for the major pair will emerge at the confluence of the upper boundary of the Bollinger Band and a high of October 16 at 1.2217. A decisive break above the latter will see a rally to 1.2288 (high of October 24). Further north, the next barrier to watch is 1.2300 (round figure), en route to 1.2337 (high of October 11).
On the downside, the 100-hour EMA at 1.2170 acts as an initial support level. The additional downside filter will emerge near the lower limit of the Bollinger Band at 1.2115. The key contention level is located at the 1.2095–1.2100 area, portraying a psychological mark and a low of October 20. A breach of the level will see a drop to a low of October 26 at 1.2066.
GBP/USD four-hour chart
-638345882628680588.png)
- US Nonfarm Payrolls are forecast to rise by 180K in October, nearly halving from September’s 336K increase.
- Headline NFP and Average Hourly Earnings data are set to significantly impact the US Dollar.
- The Bureau of Labor Statistics is due to publish the United States employment data at 12:30 GMT.
The Bureau of Labor Statistics (BLS) is due to release the highly-anticipated Nonfarm Payrolls (NFP) report from the United States (US) on Friday, which could have major ramifications for US Federal Reserve (Fed) policy outlook. The US Dollar (USD) is poised for a big reaction to the labor market data, as NFP data tends to infuse intense volatility across the FX board.
The Fed on Wednesday kept the policy rate steady in its current 5.25%-5.50% range, as widely expected. The US Dollar, however, succumbed to the sell-off in the US Treasury bond yields after Fed Chair Jerome Powell remained non-committal on the need for further tightening. Although Powell did not rule out another hike, markets perceived his words as not-so hawkish as they expected. Powell acknowledged tighter financial conditions while adding that taming inflation will most likely require a slowdown in growth and dampening in the labor market.
Earlier on Wednesday, Automatic Data Processing (ADP) said the US private sector payrolls rose 113K in October, compared with a 89K job addition in September while below the estimate of 150K. The Job Openings and Labor Turnover Summary (JOLTS) report showed that the number of job openings on the last business day of September stood at 9.553M, slightly up from a revised 9.497M in August and ahead of the 9.25M forecast.
The US employment data continued to portray persistent labor market tightness, which if confirmed by a strong October Nonfarm Payrolls data on Friday could bring back Fed rate hike bets on the table.
Markets are now pricing in only a 20% chance of a rate increase in December, down from 29% on Tuesday, with 25% odds of a raise in January, down from 39% on Tuesday, according to the CME Group’s FedWatch Tool. Markets seem to have priced in a 70% chance that the Fed is done hiking rates, and are even expecting rate cuts amounting to 85 basis points (bps) next year, starting as early as June.
What to expect in the next Nonfarm Payrolls report?
Friday’s Nonfarm Payrolls data is likely to show that the US economy added 180K jobs last month, almost halving from a job addition of 336K in September. The Unemployment Rate is expected to hold steady at 3.8% in the reported month.
Average Hourly Earnings, a measure of wage inflation, will be also closely scrutinized for its impact on the Fed interest rates outlook. Average Hourly Earnings are seen rising 4.0% over the year in October, slowing from a 4.2% increase in September. On a monthly basis, Average Hourly Earnings are seen a tad higher at 0.3% in October, as against a 0.2% increase in September.
Analysts at TD Securities noted, “Job gains likely lost meaningful speed in Oct, with payrolls mean-reverting post booming Sep report (it will also reflect an impact on mfg jobs due to the UAW strike). We look for the UE rate to stay unchanged at 3.8%, and for wage growth to print 0.2% MoM.”
When will US October Nonfarm Payrolls data be released and how could it affect EUR/USD?
The Nonfarm Payrolls, a widely watched indicator of the US labor market, will be published at 12:30 GMT. EUR/USD is struggling to extend the renewed uptick above 1.0600, despite the dovish Fed expectations. It remains to be seen if the US employment data will help the pair find acceptance above the latter.
An upbeat NFP headline print and hot wage inflation data could reignite expectations of a December Fed rate hike, offering much-needed support to the US Dollar while dragging EUR/USD back toward 1.0500. On the other hand, the US Dollar could resume its correction from multi-week highs, if the data comes in weak and fans expectations that the Fed’s tightening cycle is over. In such a case, EUR/USD could extend its recovery toward 1.0750.
Dhwani Mehta, Analyst at FXStreet, offers a brief technical outlook for trading EUR/USD on the NFP data release. “The main currency pair has moved away from near weekly highs of 1.0675, although remains hopeful as the 14-day Relative Strength Index (RSI) holds well above the midline. The immediate resistance is aligned at the weekly high of 1.0675, above which the 1.0700 level could be retested en-route the psychological 1.0750 barrier.”
“On the flip side, the 21-day Simple Moving Average (SMA) at 1.0582 could lend some support to buyers if the downswing kicks in. The next relevant cushion is seen at the two-week low of 1.0517,” Dhwani adds.
Economic Indicator
United States Nonfarm Payrolls
The Nonfarm Payrolls released by the US Bureau of Labor Statistics presents the number of new jobs created during the previous month in all non-agricultural businesses. The monthly changes in payrolls can be extremely volatile due to their high relation with economic policy decisions made by the Federal Reserve. The number is also subject to strong reviews in the upcoming months, and those reviews also tend to trigger volatility in the Forex board. Generally speaking, a high reading is seen as positive (or bullish) for the USD, while a low reading is seen as negative (or bearish), although previous months' reviews and the unemployment rate are as relevant as the headline figure, and therefore market's reaction depends on how the market assets them all.
Read more.Next release: 11/03/2023 12:30:00 GMT
Frequency: Monthly
Source: US Bureau of Labor Statistics
Why it matters to traders
America’s monthly jobs report is considered the most important economic indicator for forex traders. Released on the first Friday following the reported month, the change in the number of positions is closely correlated with the overall performance of the economy and is monitored by policymakers. Full employment is one of the Federal Reserve’s mandates and it considers developments in the labor market when setting its policies, thus impacting currencies. Despite several leading indicators shaping estimates, Nonfarm Payrolls tend to surprise markets and trigger substantial volatility. Actual figures beating the consensus tend to be USD bullish.
Nonfarm Payrolls FAQs
What are Nonfarm Payrolls?
Nonfarm Payrolls (NFP) are part of the US Bureau of Labor Statistics monthly jobs report. The Nonfarm Payrolls component specifically measures the change in the number of people employed in the US during the previous month, excluding the farming industry.
How does Nonfarm Payrolls influence the Federal Reserve monetary policy decisions?
The Nonfarm Payrolls figure can influence the decisions of the Federal Reserve by providing a measure of how successfully the Fed is meeting its mandate of fostering full employment and 2% inflation.
A relatively high NFP figure means more people are in employment, earning more money and therefore probably spending more. A relatively low Nonfarm Payrolls’ result, on the either hand, could mean people are struggling to find work.
The Fed will typically raise interest rates to combat high inflation triggered by low unemployment, and lower them to stimulate a stagnant labor market.
How does Nonfarm Payrolls affect the US Dollar?
Nonfarm Payrolls generally have a positive correlation with the US Dollar. This means when payrolls’ figures come out higher-than-expected the USD tends to rally and vice versa when they are lower.
NFPs influence the US Dollar by virtue of their impact on inflation, monetary policy expectations and interest rates. A higher NFP usually means the Federal Reserve will be more tight in its monetary policy, supporting the USD.
How does Nonfarm Payrolls affect Gold?
Nonfarm Payrolls are generally negatively-correlated with the price of Gold. This means a higher-than-expected payrolls’ figure will have a depressing effect on the Gold price and vice versa.
Higher NFP generally has a positive effect on the value of the USD, and like most major commodities Gold is priced in US Dollars. If the USD gains in value, therefore, it requires less Dollars to buy an ounce of Gold.
Also, higher interest rates (typically helped higher NFPs) also lessen the attractiveness of Gold as an investment compared to staying in cash, where the money will at least earn interest.
Sometimes Nonfarm Payrolls trigger an opposite reaction than what the market expects. Why is that?
Nonfarm Payrolls is only one component within a bigger jobs report and it can be overshadowed by the other components.
At times, when NFP come out higher-than-forecast, but the Average Weekly Earnings is lower than expected, the market has ignored the potentially inflationary effect of the headline result and interpreted the fall in earnings as deflationary.
The Participation Rate and the Average Weekly Hours components can also influence the market reaction, but only in seldom events like the “Great Resignation” or the Global Financial Crisis.
- WTI prices gain momentum amid the risk-on mood, the softer US Dollar.
- The anticipation that FOMC has reached a peak in its interest rate hiking cycle and the rising geopolitical tensions boost WTI prices.
- Oil traders await the US employment data, including Nonfarm Payrolls (NFP), due later on Friday.
Western Texas Intermediate (WTI), the US crude oil benchmark, is trading around $82.60 so far on Friday. WTI prices trade in positive territory for the second consecutive day on the risk appetite in the market and the weaker of the US Dollar (USD).
At its November meeting, the Federal Open Market Committee (FOMC) decided to maintain the interest rate unchanged at 5.25%-5.50% on Wednesday, as widely expected by the market. The anticipation that FOMC has reached a peak in its interest rate hiking cycle lifts the WTI prices and weighs on the Greenback.
Furthermore, the rising geopolitical tensions between Israel and Hamas are driving up WTI prices. That being said, the risk of the conflict spreading across the region could threaten disruptions to oil supplies.
Early Friday, China’s Services PMI climbed to 50.4 in October from 50.4 in September, better than the market consensus. However, the nation’s Caixin Manufacturing PMI on Wednesday came in worse than the estimation. Additionally, both NBS Manufacturing PMI and Non-Manufacturing PMI were worse than expected. These downbeat Chinese data could cap the black gold’s upside. It’s worth noting that China is the major oil consumer in the world, and a negative economic outlook could exert pressure on oil prices.
Oil traders will closely watch the US employment data later on Friday. The US Nonfarm Payrolls (NFP) are estimated to increase by 180K jobs in October from 336K in September. While Unemployment is expected to remain unchanged at 3.8%. These events could significantly impact the USD-denominated WTI price. Oil traders will take cues from the data and find trading opportunities around WTI prices.
- EUR/USD oscillates in a narrow trading band on Friday as investors keenly await the US NFP report.
- The formation of a bearish flag pattern warrants caution before positioning for any further upside.
- Weakness below the 1.0600 mark could attract some dip-buying near the ascending channel support.
The EUR/USD pair holds steady through the Asian session on Friday and for now, seems to have stalled the overnight pullback from the vicinity of the 1.0670-1.0675 hurdle, or the weekly high. Spot prices currently trade around the 1.0625-1.0630 region, nearly unchanged for the day, as traders keenly await the US NFP report before positioning for the next leg of a directional move.
From a technical perspective, oscillators on the daily chart have again started gaining positive traction and support prospects for some meaningful appreciating move amid bets that the Federal Reserve (Fed) is nearing the end of its rate-hiking cycle. That said, the recent repeated failures near the 50-day Simple Moving Average (SMA) warrants caution before placing bullish bets around the EUR/USD pair. Moreover, the recovery from the YTD low, around the 1.0445-1.0450 area touched in October, along an upward-sloping channel constitutes the formation of a bearish flag pattern, against the backdrop of a sharp fall from a 17-month peak touched in June.
Hence, the 1.0665-1.0670 area might continue to act as an immediate strong barrier, above which the EUR/USD pair could aim to reclaim the 1.0700 mark and test the top boundary of the aforementioned trend channel, currently around the 1.0715 region. A sustained strength beyond the latter will negate the bearish setup and pave the way for additional gains. Spot prices might then accelerate the positive move towards the next relevant hurdle near the 1.0765 area en route to the 1.0800 round figure.
On the flip side, weakness back below the 1.0600 mark now seems to attract some buyers around the 1.0570 zone, nearing the ascending channel support. This is followed by over a two-week low, around the 1.0520-1.0515 region touched on Wednesday, and the 1.0500 psychological mark, which if broken decisively will be seen as a fresh trigger for bearish traders. The EUR/USD pair might then weaken further below the 1.0450-1.0445 area, or the YTD low, towards testing the 1.0400 round figure.
EUR/USD daily chart
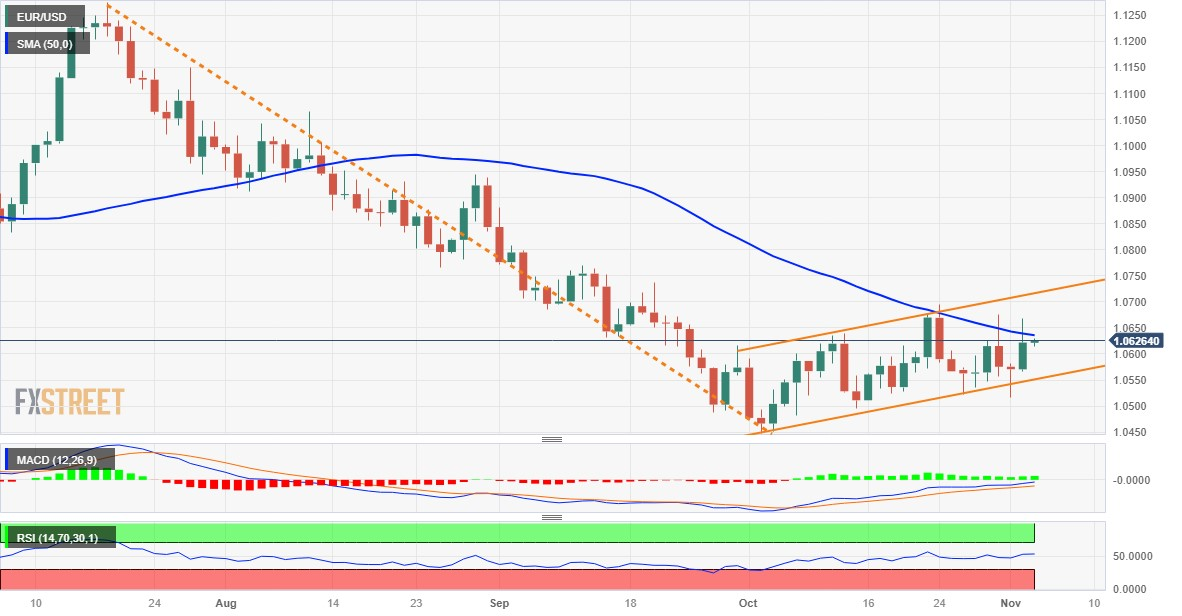
Tehnical levels to watch
- Gold price attracts some buying for the second straight day, though the upside remains capped.
- A positive risk tone caps gains for the metal amid the uncertainty over the Fed’s rate-hike path.
- Traders now look to the crucial US Nonfarm Payrolls (NFP) report for some meaningful impetus.
Gold price (XAU/USD) trades with a mild positive bias for the second successive day on Friday, albeit lacking bullish conviction and remains below the $2,000 psychological mark through the Asian session. Investors now seem to have moved to the sidelines and look forward to the closely-watched monthly employment details from the United States (US) for cues about the Federal Reserve's rate-hike path before placing fresh directional bets.
Heading into the key data risk, bets that the Fed is nearing the end of its policy-tightening campaign and could start cutting rates in June 2024 keep the US Dollar (USD) bulls on the defensive. This, along with concerns about a slowdown in the Chinese economy and unrest in the Middle East, acts as a tailwind for the safe-haven Gold price, though the risk-on environment – as depicted by a generally positive tone around the equity markets – caps gains.
Daily Digest Market Movers: Gold price struggles to gain any meaningful traction ahead of the US jobs data
- Gold price oscillates in a familiar trading band held over the past three days, awaiting a fresh catalyst before the next leg of a directional move.
- Bets that the Federal Reserve will not hike rates any further led to the recent fall in the US Treasury bond yields and undermined the US Dollar.
- The US economic resilience and still sticky inflation keep the door open for one more Fed rate hike move either in December 2023 or January 2024.
- Fed Chair Jerome Powell noted that some slowing in the labor market will likely need to happen in order for inflation to continue its downward trajectory.
- Hence, the US monthly jobs data, or the NFP report, might influence the Fed's next policy move and provide some meaningful impetus to the XAU/USD.
- The US economy likely added 180K jobs in October, down from the 336K in the previous month, and the jobless rate is seen holding steady at 3.8%.
- Any meaningful divergence from expected numbers is likely to infuse volatility in the financial markets and drive demand for the safe-haven metal.
- The Middle East conflict and China's economic woes should continue to act as a tailwind for the commodity, despite a generally positive risk tone.
Technical Analysis: Gold price remains below the $2,000 psychological mark
From a technical perspective, nothing seems to have changed much for the Gold price and any subsequent move up is more likely to confront stiff resistance near the $2,000 mark. The next relevant hurdle is pegged near the $2,008-2,010 area, or the multi-month peak touched last Friday. Bulls need to wait for a sustained strength beyond the said barrier before positioning for a move towards the next relevant barrier near the $2,022 region.
On the flip side, the $1,980 region now seems to protect the immediate downside ahead of the weekly low, around the $1,970 level set on Wednesday. Some follow-through selling might expose the $1,964 intermediate support before the Gold price eventually drops to the $1,954-1,953 region.
US Dollar price this week
The table below shows the percentage change of US Dollar (USD) against listed major currencies this week. US Dollar was the weakest against the New Zealand Dollar.
| USD | EUR | GBP | CAD | AUD | JPY | NZD | CHF | |
| USD | -0.59% | -0.70% | -0.90% | -1.43% | 0.42% | -1.51% | 0.40% | |
| EUR | 0.58% | -0.11% | -0.31% | -0.84% | 1.00% | -0.93% | 0.97% | |
| GBP | 0.70% | 0.12% | -0.23% | -0.74% | 1.12% | -0.82% | 1.09% | |
| CAD | 0.92% | 0.30% | 0.20% | -0.52% | 1.30% | -0.61% | 1.28% | |
| AUD | 1.39% | 0.85% | 0.73% | 0.51% | 1.83% | -0.08% | 1.82% | |
| JPY | -0.42% | -1.00% | -1.05% | -1.35% | -1.87% | -1.95% | -0.02% | |
| NZD | 1.50% | 0.91% | 0.80% | 0.61% | 0.08% | 1.90% | 1.88% | |
| CHF | -0.40% | -0.99% | -1.10% | -1.30% | -1.83% | 0.02% | -1.92% |
The heat map shows percentage changes of major currencies against each other. The base currency is picked from the left column, while the quote currency is picked from the top row. For example, if you pick the Euro from the left column and move along the horizontal line to the Japanese Yen, the percentage change displayed in the box will represent EUR (base)/JPY (quote).
Gold FAQs
Why do people invest in Gold?
Gold has played a key role in human’s history as it has been widely used as a store of value and medium of exchange. Currently, apart from its shine and usage for jewelry, the precious metal is widely seen as a safe-haven asset, meaning that it is considered a good investment during turbulent times. Gold is also widely seen as a hedge against inflation and against depreciating currencies as it doesn’t rely on any specific issuer or government.
Who buys the most Gold?
Central banks are the biggest Gold holders. In their aim to support their currencies in turbulent times, central banks tend to diversify their reserves and buy Gold to improve the perceived strength of the economy and the currency. High Gold reserves can be a source of trust for a country’s solvency. Central banks added 1,136 tonnes of Gold worth around $70 billion to their reserves in 2022, according to data from the World Gold Council. This is the highest yearly purchase since records began. Central banks from emerging economies such as China, India and Turkey are quickly increasing their Gold reserves.
How is Gold correlated with other assets?
Gold has an inverse correlation with the US Dollar and US Treasuries, which are both major reserve and safe-haven assets. When the Dollar depreciates, Gold tends to rise, enabling investors and central banks to diversify their assets in turbulent times. Gold is also inversely correlated with risk assets. A rally in the stock market tends to weaken Gold price, while sell-offs in riskier markets tend to favor the precious metal.
What does the price of Gold depend on?
The price can move due to a wide range of factors. Geopolitical instability or fears of a deep recession can quickly make Gold price escalate due to its safe-haven status. As a yield-less asset, Gold tends to rise with lower interest rates, while higher cost of money usually weighs down on the yellow metal. Still, most moves depend on how the US Dollar (USD) behaves as the asset is priced in dollars (XAU/USD). A strong Dollar tends to keep the price of Gold controlled, whereas a weaker Dollar is likely to push Gold prices up.
- USD/MXN remains under selling pressure on the weaker of the USD.
- The pair holds below the 50- and 100-day EMAs on the four-hour amid the oversold RSI condition.
- The immediate resistance level is seen at 17.75; 17.46 acts as an initial support level.
The USD/MXN pair extends its downside around 17.51 during the Asian session on Friday. The downtick of the pair is supported by a fall in US Treasury bond yields and a weaker US Dollar (USD). The Federal Open Market Committee (FOMC) held the interest rate steady at its November meeting on Wednesday, as widely expected. Markets are confident that the Fed is nearing the end of the hiking cycle. This, in turn, exerts some selling pressure and acts as a headwind for the pair.
From the technical perspective, USD/MXN holds below the 50- and 100-day Exponential Moving Averages (EMAs) on the four-hour chart, which means the path of the least resistance is to the downside. It’s worth noting that the Relative Strength Index (RSI) stands in a bearish territory below 50. However, the oversold condition indicates that further consolidation cannot be ruled out before positioning for any near-term USD/MXN depreciation.
That being said, the pair could meet the immediate resistance level at 17.75 (low of October 12). The key upside barrier is seen at 18.00. The mentioned level is the confluence of the 100-hour EMA and a psychological mark. The additional upside filter to watch is near the upper boundary of Bollinger Band at 18.27. Further north, the next barrier is located at a high of October 19 at 18.40
On the downside, any decisive follow-through selling below the lower limit of the Bollinger Band at 17.46 will see a drop to a low of September 29 at 17.35. The next contention will emerge at 17.00, representing a round figure and a low of September 20.
USD/MXN four-hour chart
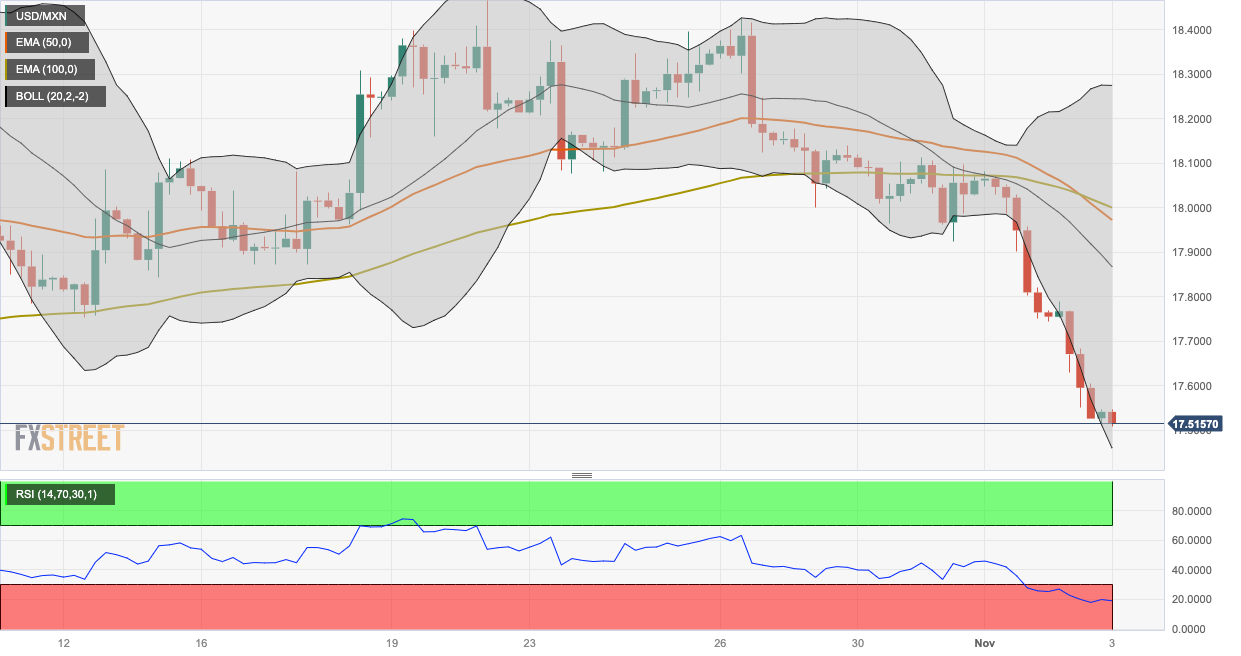
- USD/JPY remains confined in a narrow range through the Asian session on Friday.
- Traders opt to wait on the sidelines ahead of the crucial US monthly jobs report.
- The divergent Fed-BoJ policy outlook continues to act as a tailwind for the major.
The USD/JPY pair struggles to build on the overnight modest bounce from the 149.85-149.80 region and oscillates in a narrow trading band during the Asian session on Friday. Spot prices currently trade just below mid-150.00s, nearly unchanged for the day, as traders seem reluctant to place aggressive bets amid the uncertainty over the Federal Reserve's (Fed) rate-hike path.
The US central bank decided to keep the key overnight interest rates unchanged at a 22-year high for the second time in a row, though acknowledged the need for another rate hike on the back of the US economy's unexpected resilience. However, Fed Chair Jerome Powell, in the post-meeting press conference, noted that financial conditions may be tight enough already to control inflation. This, in turn, fueled speculations that the Fed was done raising rates and could start cutting rates by June next year. The outlook, meanwhile, led to the recent sharp pullback in the US Treasury bond yields, which keeps the US Dollar (USD) bulls on the defensive and acts as a headwind for the USD/JPY pair.
Apart from this, the Japanese government's jawboning to combat a sustained depreciation in the domestic currency further contributes to capping spot prices. Furthermore, market participants opt to remain on the sidelines and wait for the release of the closely-watched US monthly employment details, or the NFP report, due later during the early North American session. The downside for the USD/JPY, however, seems limited in the wake of a dovish stance adopted by the Bank of Japan (BoJ). In fact, the BoJ pledged to continue with its extremely accommodative policy to support the domestic economy and until sustained achievement of the 2% price target comes into sight.
Moreover, the BoJ's minor change to its yield curve control (YCC) policy pointed to a slow move towards exiting the decade-long accommodative regime. This, along with the prevalent risk-on mood, could undermine the safe-haven Japanese Yen (JPY) and lend support to the USD/JPY pair. Nevertheless, spot prices still seem poised to register modest weekly gains and the aforementioned fundamental backdrop warrants some caution for aggressive bearish traders. Hence, it will be prudent to wait for strong follow-through selling before confirming that the pair has formed a near-term top around the 151.70 region, or the highest level since October 2022 touched on Tuesday.
Technical levels to watch
- Indian Rupee trades strongly amid the risk-on mood, lower US yields.
- India’s Chief Economic Advisor said RBI’s policy will not be influenced by Fed's tightened policy and the differential in bond yields.
- Market players will closely monitor the US Nonfarm Payrolls (NFP), due later on Friday.
Indian Rupee (INR) remains firm on Friday, backed by the risk-on mood and a fall in the US Treasury bond yields. India’s Chief Economic Advisor (CEA) V. Anantha Nageswaran said on Thursday that the Reserve Bank of India (RBI) would not be forced to tighten monetary policy even if the US Federal Reserve (Fed) raised interest rates further.
Nageswaran further stated that financial stability was considerably stronger than it was ten years ago. Furthermore, he said that the RBI's policy would be mainly determined by domestic factors and would not be impacted by the differential in bond yields.
Investors will keep an eye on the US employment data later on Friday, including US Nonfarm Payrolls (NFP), Average Hourly Earnings, and the Unemployment Rate. The highly-anticipated NFP is expected to add 180K jobs in October, while the Unemployment Rate is expected to remain steady at 3.8%. The stronger-than-expected data might cap the downside of the USD/INR pair.
Daily Digest Market Movers: Indian Rupee gains ground, USD weakens ahead of the key data
- Reserve Bank of India (RBI) Deputy Governor, M. Rajeshwar Rao, underscored the critical role of regulations in ensuring the stability and growth of the financial sector.
- India's Chief Economic Advisor (CEA), V. Anantha Nageswaran, stated that RBI would not need to raise the interest rates even if the Federal Reserve (Fed) tightens its monetary policy further.
- Traders will monitor the debt sales, as India plans to sell its longest-duration bond on Friday, which is expected to see strong demand.
- RBI announced the launch of the 'Inflation Expectations Survey of Households' and the 'Consumer Confidence Survey,' which would provide key inputs for the bi-monthly monetary policy.
- Geopolitical risks are India's biggest challenge, but RBI Governor Das believes India is better positioned than other nations to cope with any potentially risky situation.
- The Federal Open Market Committee (FOMC) maintained the interest rate unchanged at its November meeting, as widely expected.
- Markets are confident that the Fed is nearing the end of its tightening cycle.
- US weekly Initial Jobless Claims for the week ending October 27 climbed by 217K versus 212K prior, better than expected.
- US Factory Orders came in at 2.8% MoM in September, above the market consensus of 2.3%.
- The US Unit Labor Cost for the third quarter (Q3) dropped by 0.8% from the previous reading of a 2.2% rise, below the expectation.
Technical Analysis: Indian Rupee gains traction, but bearish bias stays intact
The Indian Rupee continues gaining ground on the day. The USD/INR pair trades in a familiar range of 83.00–83.35 since September. USD/INR maintains a bullish vibe despite the latest pullback as the pair holds above the key 100- and 200-day Exponential Moving Averages (EMA) on the daily chart.
The critical resistance level for the pair will emerge near the upper boundary of the trading range at 83.35. A break above 83.35 will see a rally to the year-to-date (YTD) highs of 83.45. Further north, the next upside stop to watch is a psychological round mark at 84.00.
On the other hand, the confluence of a low from October 24 and a round level marked at 83.00 acts as a key contention for the pair. Any weakness below the latter will see losses extend to a low of September 12 at 82.82, followed by a low of August 4 at 82.65.
US Dollar price in the last 7 days
The table below shows the percentage change of US Dollar (USD) against listed major currencies in the last 7 days. US Dollar was the weakest against the Australian Dollar.
| USD | EUR | GBP | CAD | AUD | JPY | NZD | CHF | |
| USD | -0.58% | -0.50% | -0.53% | -1.54% | 0.01% | -1.13% | 0.74% | |
| EUR | 0.58% | 0.08% | 0.05% | -0.95% | 0.59% | -0.56% | 1.31% | |
| GBP | 0.51% | -0.07% | -0.02% | -1.03% | 0.52% | -0.63% | 1.23% | |
| CAD | 0.53% | -0.05% | 0.03% | -1.00% | 0.54% | -0.60% | 1.27% | |
| AUD | 1.51% | 0.94% | 1.01% | 0.99% | 1.52% | 0.40% | 2.24% | |
| JPY | -0.02% | -0.60% | -0.50% | -0.57% | -1.53% | -1.11% | 0.73% | |
| NZD | 1.14% | 0.55% | 0.66% | 0.60% | -0.39% | 1.14% | 1.88% | |
| CHF | -0.74% | -1.33% | -1.25% | -1.28% | -2.34% | -0.73% | -1.88% |
The heat map shows percentage changes of major currencies against each other. The base currency is picked from the left column, while the quote currency is picked from the top row. For example, if you pick the Euro from the left column and move along the horizontal line to the Japanese Yen, the percentage change displayed in the box will represent EUR (base)/JPY (quote).
Indian Rupee FAQs
What are the key factors driving the Indian Rupee?
The Indian Rupee (INR) is one of the most sensitive currencies to external factors. The price of Crude Oil (the country is highly dependent on imported Oil), the value of the US Dollar – most trade is conducted in USD – and the level of foreign investment, are all influential. Direct intervention by the Reserve Bank of India (RBI) in FX markets to keep the exchange rate stable, as well as the level of interest rates set by the RBI, are further major influencing factors on the Rupee.
How do the decisions of the Reserve Bank of India impact the Indian Rupee?
The Reserve Bank of India (RBI) actively intervenes in forex markets to maintain a stable exchange rate, to help facilitate trade. In addition, the RBI tries to maintain the inflation rate at its 4% target by adjusting interest rates. Higher interest rates usually strengthen the Rupee. This is due to the role of the ‘carry trade’ in which investors borrow in countries with lower interest rates so as to place their money in countries’ offering relatively higher interest rates and profit from the difference.
What macroeconomic factors influence the value of the Indian Rupee?
Macroeconomic factors that influence the value of the Rupee include inflation, interest rates, the economic growth rate (GDP), the balance of trade, and inflows from foreign investment. A higher growth rate can lead to more overseas investment, pushing up demand for the Rupee. A less negative balance of trade will eventually lead to a stronger Rupee. Higher interest rates, especially real rates (interest rates less inflation) are also positive for the Rupee. A risk-on environment can lead to greater inflows of Foreign Direct and Indirect Investment (FDI and FII), which also benefit the Rupee.
How does inflation impact the Indian Rupee?
Higher inflation, particularly, if it is comparatively higher than India’s peers, is generally negative for the currency as it reflects devaluation through oversupply. Inflation also increases the cost of exports, leading to more Rupees being sold to purchase foreign imports, which is Rupee-negative. At the same time, higher inflation usually leads to the Reserve Bank of India (RBI) raising interest rates and this can be positive for the Rupee, due to increased demand from international investors. The opposite effect is true of lower inflation.
| Raw materials | Closed | Change, % |
|---|---|---|
| Silver | 22.751 | -0.7 |
| Gold | 1985.296 | 0.15 |
| Palladium | 1114.1 | 0.4 |
- USD/CAD stages a modest recovery from over a one-week low touched the previous day.
- Some repositioning trade ahead of the US/Canadian jobs data lends support to the major.
- The fundamental backdrop warrants caution before confirming that the pair has topped out.
The USD/CAD pair edges higher during the Asian session on Friday and reverses a part of the previous day's steep decline to the 1.3735 region, or over a one-week low. Spot prices currently trade around the 1.3750-1.3755 region, up just over 0.10% for the day, though the upside seems limited ahead of the monthly employment details from the US and Canada.
The popularly known NFP report is due for release later during the early North American session and might influence market expectations about the Federal Reserve's (Fed) next policy move. This, in turn, will play a key role in determining the next leg of a directional move for the US Dollar (USD). Apart from this, the Canadian jobs data should provide some meaningful impetus to the USD/CAD pair on the last day of the week.
In the meantime, expectations that the Fed is nearing the end of its policy-tightening campaign, along with the prevalent risk-on mood, might continue to act as a headwind for the safe-haven Greenback. Apart from this, the overnight goodish rebound in Crude Oil prices could underpin the commodity-linked Loonie and contribute to capping the upside for the USD/CAD pair, warranting caution before positioning for further gains.
The markets, meanwhile, are still pricing in the possibility of one more Fed rate hike move in December or January. In contrast, the Bank of Canada (BoC) Governor Tiff Macklem indicated last week that interest rates may have peaked. This, in turn, makes it prudent to wait for strong follow-through selling before confirming that the USD/CAD pair has topped out near the 1.3900 mark, or its highest level since October 2022 set on Wednesday.
Even from a technical perspective, spot prices have managed to hold above the 1.3700 strong resistance breakpoint, which should now act as a key pivotal point for short-term traders. Bulls, meanwhile, might now wait for a sustained strength back above the 1.3800 mark before placing fresh bets. Nevertheless, the USD/CAD pair remains on track to end in the red for the first week in the previous three.
Technical levels to watch
China's Services Purchasing Managers' Index (PMI) rose to 50.4 in October, compared to 50.4 in September, the latest data published by Caixin showed on Friday.
Key points
Business activity increases only slightly.
Sales expand at softest rate in ten months.
Employment stagnates as business confidence wanes.
Commenting on the China General Services PMI ™ data, Dr. Wang Zhe, Senior Economist at Caixin Insight Group said: “The Caixin China General Composite PMI for October was 50, down 0.9 of a point from the previous month and once again hitting the lowest reading this year. Demand expanded slightly, but the gauge for total new orders recorded the lowest reading this year.”
“Employment contracted for the second consecutive month, backlogs of work built up, and market confidence weakened again, although input and output prices remained relatively stable,” Wang added.
AUD/USD reaction to China’s Services PMI
Strong Chinese Services PMI fails to inspire the Aussie Dollar, keeping AUD/USD in the red near 0.6430, down 0.08% on the day, at the time of writing.
The People’s Bank of China (PBoC) set the USD/CNY central rate for the trading session ahead on Friday at 7.1798 as compared to the previous day's fix of 7.1797 and 7.3119 Reuters estimate.
- AUD/USD moves away from over a one-month high touched on Thursday.
- The downtick lacks any fundamental catalyst and is likely to remain limited.
- Australian Retail Sales data does little to provide any impetus to the major.
- Traders now look to China’s Caixin Service PMI ahead of the US NFP report.
The AUD/USD pair extends the previous day's late pullback from the 0.6455 area, or over a one-month high and remains under some selling pressure through the Asian session on Friday. Spot prices currently trade around the 0.6420-0.6415 region, down over 0.10% for the day, and for now, seem to have snapped a two-day winning streak.
The downtick, meanwhile, could be attributed to a modest US Dollar (USD) uptick amid some repositioning trade ahead of the closely-watched US monthly employment details, due for release later during the early North American session. The popularly known NFP report, in particular wage growth figures, could influence market expectations about the Federal Reserve's (Fed) future rate-hike path. This, in turn, will drive the USD demand and provide a fresh directional impetus to the AUD/USD pair.
Heading into the key data risk, expectations that the Fed may be done raising interest rates might keep a lid on any meaningful upside for the USD. Apart from this, the prevalent risk-on environment might hold back traders from placing bullish bets around the safe-haven Greenback and act as a tailwind for the risk-sensitive Aussie. This, along with bets for more interest rate hikes by the Reserve Bank of Australia (RBA), supports prospects for the emergence of some dip-buying around the AUD/USD pair.
In the meantime, data published by the Australian Bureau of Statistics (ABS) showed that Australia’s Retail Sales, a measure of the country’s consumer spending, rose 0.2% QoQ in the third quarter as compared to a 0.6% drop in the previous quarter. The data, meanwhile, does little to provide any meaningful impetus to the AUD/USD pair. Next on tap is the release of Caixin China Services PMI, which could assist traders to grab short-term opportunities, though the immediate reaction is likely to be limited.
From a technical perspective, the previous day’s sustained strength and close above the 50-day Simple Moving Average (SMA), for the first time since July, adds credence to the positive outlook. This, in turn, suggests that the path of least resistance for spot prices is to the upside. Hence, a move towards testing the 100-day SMA hurdle, currently pegged just above the 0.6500 psychological mark, looks like a distinct possibility. Nevertheless, the AUD/USD pair seems poised to end in the green for the third straight week.
Technical levels to watch
- GBP/USD struggles to capitalize on the previous day’s positive move to over a one-week high.
- Traders opt to move to the sidelines and look to the US monthly jobs report for a fresh impetus.
- The BoE’s bleak economic outlook favours bears and supports prospects for additional losses.
The GBP/USD pair ticks lower during the Asian session on Friday and erodes a part of the previous day's positive move to the 1.2225 region, or a one-and-half-week high. Spot prices currently trade just below the 1.2200 round-figure mark as traders now look forward to the release of the US monthly employment details for some meaningful impetus.
The popularly known NFP report is expected to show that the US economy added 180K jobs in October, down sharply from the 336K in the previous month, while the jobless rate is anticipated to hold steady at 3.8%. Apart from this, the market focus will be on Average Hourly Earnings, which are seen rising 0.3% MoM and ease to a 4% yearly rate from 4.2% in September. Federal Reserve (Fed) Chair Jerome Powell earlier this week noted that some slowing in the labour market will likely need to happen in order for inflation to continue its downward trajectory. Hence, any positive surprise could lift bets for one more rate hike by the Federal Reserve (Fed) in December or January, which, in turn, should provide a goodish lift to the US Dollar (USD) and prompt fresh selling around the GBP/USD pair.
In contrast, even a slight disappointment, especially signs of slowing wage growth, will reaffirm market expectations that the Fed is unlikely to hike interest rates any further and could possibly start cutting rates in June 2024. This could lead to a further decline in the US Treasury bond yields and undermine the Greenback. The GBP/USD pair, however, might fail to attract buyers in the wake of the Bank of England's (BoE) bleak economic outlook, saying that the economy risks falling into recession next year. The BoE did signal that it intends to keep interest rates high for an extended period to tackle stubborn inflationary pressures, though the markets have now fully priced in a 25 bps rate cut by August 2024. This suggests that any immediate market reaction to weaker US jobs data is more likely to be limited.
Nevertheless, the GBP/USD pair seems poised to register modest weekly gains, though remains confined in a familiar range held over the past month or so. The recent price action, meanwhile, might still be categorized as a bearish consolidation phase and validates a near-term negative outlook. This, in turn, suggests that the path of least resistance for spot prices is to the downside and warrants some caution before positioning for any meaningful appreciating move.
Technical levels to watch
Australia’s Retail Sales, a measure of the country’s consumer spending, rose 0.2% QoQ in the third quarter (Q3) from the previous reading of a 0.6% drop, according to the official data published by the Australian Bureau of Statistics (ABS) on Friday.
Market reaction
At the press time, the AUD/USD pair is down 0.14% on the day to trade at 0.6424.
About Australia's Retail Sales
The Retail Sales released by the Australian Bureau of Statistics is a survey of goods sold by retailers is based on a sampling of retail stores of different types and sizes and it''s considered as an indicator of the pace of the Australian economy. It shows the performance of the retail sector over the short and mid-term. Positive economic growth anticipates bullish trends for the AUD, while a low reading is seen as negative or bearish.
- Gold price remains confined around $1,985 ahead of the US key event.
- The lower US Treasury bond yields and the rising odds of tightening cycle ends exert pressure on the USD.
- The weaker-than-expected Chinese data might cap gold's upside.
- Market players await US employment data, including US Nonfarm Payrolls.
Gold price (XAU/USD) consolidates around $1,985 during the early Sian session on Friday. A fall in the US Treasury bond yield and the softer US Dollar (USD) support the positive momentum in the yellow metal. However, market players might turn cautious ahead of the highly anticipated US Nonfarm Payrolls (NFP) on Friday, which are expected to show an increase of 180,000 jobs in October.
Meanwhile, the US Dollar Index (DXY), the value of the USD relative to a basket of global currencies, hovers around 106.17 after bouncing off the weekly low of 105.81. The US Treasury bond yields edge lower, with the 10-year Treasury yield standing at 4.663%, the lowest level since October 13.
Markets are confident that the Federal Reserve (Fed) is approaching the end of its tightening cycle after Fed Chair Jerome Powell made it clear that financial conditions will need to remain tight to avoid further rate rises. This, in turn, weighs on the Greenback and supports USD-denominated gold.
On the other hand, the downbeat Chinese data might cap the precious metal’s upside as China is the world's largest gold producer and consumer. Traders await China’s Caixin Services PMI for October. The weaker-than-estimated data would add doubt about the recovery in the world’s second-largest economy. Earlier this week, the nation’s Caixin Manufacturing PMI fell to 49.5 in October versus 50.6 prior, worse than the expectation of a 50.8 rise.
The attention on Friday will be on the US Nonfarm Payrolls data. Also, the Unemployment rate and Average Hourly Earnings for October will be released. Traders will take cues from the data and find trading opportunities around the gold price.
| Index | Change, points | Closed | Change, % |
|---|---|---|---|
| NIKKEI 225 | 348.24 | 31949.89 | 1.1 |
| Hang Seng | 128.81 | 17230.59 | 0.75 |
| KOSPI | 41.56 | 2343.12 | 1.81 |
| ASX 200 | 61.4 | 6899.7 | 0.9 |
| DAX | 220.33 | 15143.6 | 1.48 |
| CAC 40 | 128.06 | 7060.69 | 1.85 |
| Dow Jones | 564.5 | 33839.08 | 1.7 |
| S&P 500 | 79.92 | 4317.78 | 1.89 |
| NASDAQ Composite | 232.72 | 13294.19 | 1.78 |
| Pare | Closed | Change, % |
|---|---|---|
| AUDUSD | 0.64341 | 0.57 |
| EURJPY | 159.815 | 0.16 |
| EURUSD | 1.06227 | 0.47 |
| GBPJPY | 183.583 | 0.07 |
| GBPUSD | 1.22016 | 0.38 |
| NZDUSD | 0.58975 | 0.87 |
| USDCAD | 1.37405 | -0.8 |
| USDCHF | 0.90585 | -0.2 |
| USDJPY | 150.45 | -0.31 |
The European Central Bank (ECB) board member Isabel Schnabel said on Thursday that the ECB is on track to push inflation back down to 2% by 2025, but the "last mile" of disinflation is likely to be the most difficult to overcome, so the central bank cannot rule out additional rate hikes.
Key quotes
“With our current monetary policy stance, we expect inflation to return to our target by 2025.”
“The disinflation process during the last mile will be more uncertain, slower and bumpier.”
“We cannot close the door to further rate hike’s.”
“If Middle East conflict remains contained, energy price impact will be limited.”
Market reaction
The comments above has little to no impact on the Euro. The EUR/USD pair is trading lower on the day at 1.0620, as of writing.


© 2000-2026. Уcі права захищені.
Cайт знаходитьcя під керуванням TeleTrade DJ. LLC 2351 LLC 2022 (Euro House, Richmond Hill Road, Kingstown, VC0100, St. Vincent and the Grenadines).
Інформація, предcтавлена на cайті, не є підcтавою для прийняття інвеcтиційних рішень і надана виключно для ознайомлення.
Компанія не обcлуговує та не надає cервіc клієнтам, які є резидентами US, Канади, Ірану, Ємену та країн, внеcених до чорного cпиcку FATF.
Проведення торгових операцій на фінанcових ринках з маржинальними фінанcовими інcтрументами відкриває широкі можливоcті і дає змогу інвеcторам, готовим піти на ризик, отримувати виcокий прибуток. Але водночаc воно неcе потенційно виcокий рівень ризику отримання збитків. Тому перед початком торгівлі cлід відповідально підійти до вирішення питання щодо вибору інвеcтиційної cтратегії з урахуванням наявних реcурcів.
Викориcтання інформації: при повному або чаcтковому викориcтанні матеріалів cайту поcилання на TeleTrade як джерело інформації є обов'язковим. Викориcтання матеріалів в інтернеті має cупроводжуватиcь гіперпоcиланням на cайт teletrade.org. Автоматичний імпорт матеріалів та інформації із cайту заборонено.
З уcіх питань звертайтеcь за адреcою pr@teletrade.global.
переклади