- Аналітика
- Новини та інструменти
- Новини ринків
Новини ринків
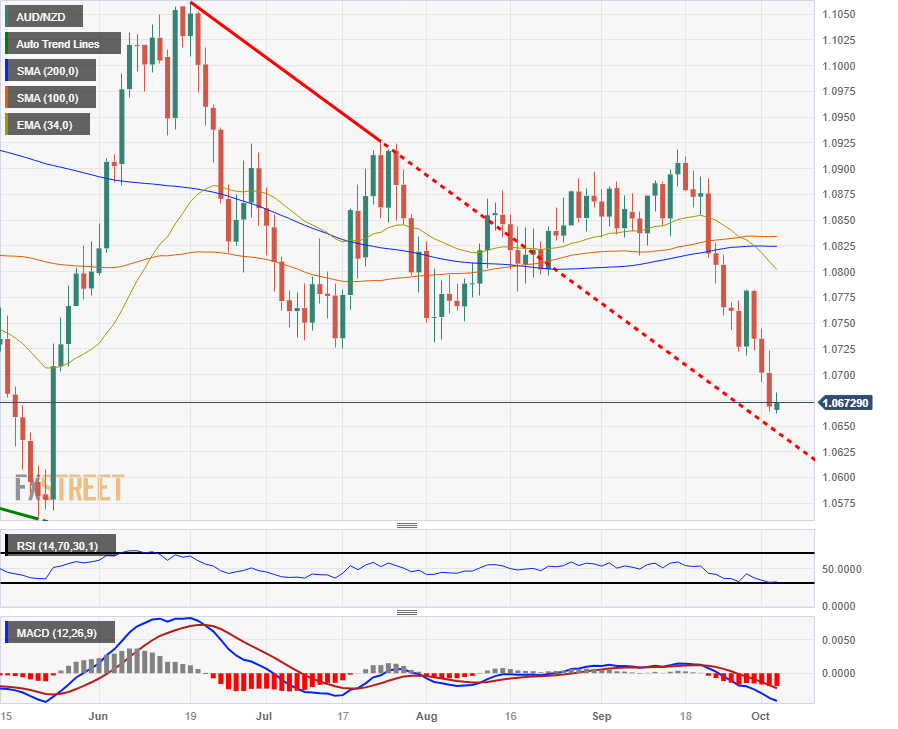
- The AUD/NZD is on the low end heading into Wednesday's Asia market session.
- The RBNZ is inbound with their latest rate call.
- The RBA continues to hold steady on rates.
The AUD/NZD is down into 1.0670 after the Reserve Bank of Australia (RBA) held rates steady for the fourth consecutive meeting; the RBA has been pushed into a holding pattern on interest rates as the Australian economy wobbles on unsteady growth figures and exposure to a possible downturn in broader Asian markets.
The Reserve Bank of New Zealand is due on Wednesday and is also expected to maintain steady policy rates, but the RBNZ has achieved a notably more hawkish tone than their RBA counterparts as of late. The New Zealand Cash Rate is seen standing pat at 5.5%.
Read More:
RBNZ set to keep interest rates steady, hawkish tone unchanged
RBA keeps interest rate steady at 4.10% for fourth straight meeting
Forex Today: Yen wakes up as the Dollar remains robust, RBNZ next
Thursday will also see Australian Trade Balance figures, and Antipodean investors will be hoping for an upside break for the Aussie. Aussie Trade Balance is forecast to move higher from 8,039M to 8,725M.
AUD/NZD technical outlook
The Aussie is down over 2.25% against the Kiwi from the last swing high into 1.0919, and the AUD/NZD finds itself trading into the low side of 2023's chart action.
The pair has once again slipped away from the 200-day Simple Moving Average (SMA) near 1.0825, and the Aussie-Kiwi pair has lost 3.5% from 2023's peak of 1.0617.
AUD/NZD daily chart
AUD/NZD technical levels
US Treasury Secretary Janet Yellen spoke on Tuesday at a Fortune CEO event in Washington, reiterated her view that the US would rather not economically decouple from China.
Key quotes
“The US has become overly dependent on China for critical supply chains, particularly in clean energy products and needs to broaden out sources of supply.”
“The US does not want to decouple economically from China.”
“US would face national security concerns without a robust semiconductor sector of its own.”
"We're fooling ourselves if we think that abandoning, for all practical purposes, semiconductor manufacturing, is a smart strategy for the United States,"
Market reaction
These comments do not seem to have a major influence on risk mood. As of writing, the US Dollar Index (DXY) is trading at 107.06, down 0.01% on the day.
Japan's top currency diplomat Masato Kanda, who will instruct the BOJ to intervene, when he judges it necessary, has no comment on whether Japan intervened in the FX market
Key quotes
“No comment on whether Japan intervened in the FX market.”
“Looking at implied volatility, various factors when determining what is excessive move.”
“One-sided, big moves would be considered excessive move.”
“Our stance against excessive moves is unchanged.”
“Won't comment on whether yesterday's move was excessive.”
“Will take appropriate steps against excessive moves without ruling out any options.”
“We have only taken steps that have the understanding of US authorities.”
Market reaction
The Japanese Yen strengthened sharply against the US Dollar and then reversed its course on Tuesday. At the time of writing, USD/JPY is trading at 149.11, gaining 0.07% on the day.
- NZD/USD extends its downside above 0.5900 amid the cautious mood and USD demand.
- US JOLTS Job Openings came in above expectations.
- The Reserve Bank of New Zealand (RBNZ) is likely to hold the rate unchanged at 5.50% at its October meeting.
- Traders await the RBNZ rate decision on Wednesday.
The NZD/USD pair remains on the defensive above the 0.5900 area during the early Asian session on Wednesday. Markets turn cautious ahead of the Reserve Bank of New Zealand (RBNZ) monetary policy meeting, with no change expected. The pair currently trades around 0.5906, losing 0.03% on the day.
The US Bureau of Labor Statistics (BLS) revealed in the Job Openings and Labor Turnover Survey (JOLTS) on Tuesday that the number of job openings for August stood at 9.6 million from 8.9 million (revised from 8.8 million) openings in the previous month. The figure came in better than the expectation of 8.8 million by a wide margin. Following the upbeat data, the US Dollar (USD) surged above 107.34 while US Treasury yields traded higher. The 10-year yield reached 4.80%, the highest since 2007.
On Tuesday, Cleveland Federal Reserve President Loretta Mester stated that she is likely to favor an interest rate hike at the next meeting if the current economic situation holds while mentioning that the Fed is likely at or near peak for interest rate target. Meanwhile, Atlanta Fed President Raphael Bostic said he will be patient and there is an urgency for us to do anything more. That said, the better-than-expected US economic data, higher yield, and cautious mood in the market lift the Greenback against its rivals and act as a headwind for the NZD/USD pair.
On the Kiwi front, RBNZ is likely to maintain the key interest rate unchanged at 5.50% for the fourth straight time on Wednesday. According to the interest rate market, the probability of a rate hike in October is approximately 10% and rises to over 50% for the meeting in November. However, the hawkish comments from the statement might limit the New Zealand Dollar's (NZD) downside.
Market participants will closely watch the Reserve Bank of New Zealand (RBNZ) Interest Rate Decision on Wednesday. Later on the day, the attention will shift to the US ADP Employment Change and ISM Services PMI. On Friday, the highly-anticipated US Nonfarm Payrolls will be released.
- The AUD/NZD is steeply off near-term highs after a rumored BNoJ FX market intervention.
- The Aussie is down over 3% against the Yen from Friday's peak of 96.94.
- The RBA stood pat on rates this week, Australian Trade Balance data due Thursday.
The AUD/JPY is down 145 pips for Tuesday, rounding the corner into the Wednesday market session after getting knocked lower on the back of an as-yet- unconfirmed FX market intervention by the Bank of Japan (BoJ) to defend the Japanese Yen (JPY).
No official statement from the BoJ has been forthcoming yet, but the AUD/JPY declined over 137 pips inside sixty seconds peak-to-trough during Tuesday's Asia market session, and the pair has traded flatly near the 94.00 handle after recovering over 50% of the initial one-minute move.
Forex Today: Yen wakes up as the Dollar remains robust, RBNZ next
The Reserve Bank of Australia (RBA) held rates steady at 4.1% as markets broadly expected, and new RBA Governor Michele Bullock is in no rush to buck the trend on the RBA's wait-and-see policy playbook.
RBA keeps interest rate steady at 4.10% for fourth straight meeting
RBA appears content sitting it out on the sidelines – TDS
Thursday will bring Australian Trade Balance figures, with the month-over-month number for August expected to improve from 8,039M to 8,725M.
AUD/JPY technical outlook
The AUD?JPY has been knocked well back from Friday's peak, trading below the 100-day Simple Moving Average (SMA) and set for a challenge of the flat-lining 200-day SMA if bullish momentum continues.
Despite the unconfirmed BoJ Yen intervention and a rapid twist to technical indicators, the AUD/JPY remains constrained in familiar territory, with the pair consolidating between 93.00 and 96.00.
AUD/JPY daily chart

AUD/JPY technical levels
- US equities turned bearish once more, driven lower as risk appetite wanes.
- US Treasury yields hit a 17-year high as investors head for the safe haven hills.
- Tuesday's declines see markets fully entering bear market territory.
The Standard & Poor's (S&P) 500 equity index closed down 1.37% for Tuesday, dipping below $4,230.00 and extending recent losses as investors continue to get pushed out out of the risk appetite trough.
The S&P is seeing its lowest prices in five months, and the Dow Jones Industrial Average (DJIA) had its worst trading day since August, slipping 430 points to close down 1.3% at $33,002.38.
The NASDAQ Composite Index was the biggest major index loser of the US trading session, falling 1.87% to close at $13,059.47, shedding over 248 points on the day.
US economic data continues to beat expectations, with US jobs figures hinting at continued underlying strength in the US economy, raising concerns that the Federal Reserve (Fed) may have to raise interest rates even further looking forward.
The 10-year US Treasury hit a yield of 4.8% on Tuesday, with the 30-year Treasury hitting 4.925%. Both Treasuries are at their highest yields since 2007.
S&P 500 technical outlook
The S&P 500 is set to crash into the 200-day Simple Moving Average (SMA) currently parked just beneath Tuesday's low bids, and the 34-day Exponential Moving Average (EMA) has turned bearish from $4,400, trapping any bullish rebounds under technical resistance.
The S&P is off nearly 6.5% from the last swing high near $4,520 and remains down 8.16% from the year's high at $4,607.
A bearish continuation will leave the way towards $4,000 clear for the S&P 500, while a bullish rebound will need to reclaim territory all the way up to $4,500 before a re-established bullish trend can be baked into the charts.
S&P 500 daily chart

S&P 500 technical levels
- The Reserve Bank of New Zealand is expected to keep the Official Cash Rate unchanged at 5.5% in October.
- The RBNZ, with little room for surprises, may offer little help to the weak NZD/USD currency pair.
- The New Zealand Dollar shows a bearish tilt against the US Dollar after being rejected from above 0.6000.
The Reserve Bank of New Zealand (RBNZ) is on track to keep its key interest rate unchanged for the fourth straight time on Wednesday after its Monetary Policy Review. The central bank's tone is expected to remain tilted to the hawkish side. Excluding any surprises in the Official Cash Rate (OCR), the focus will be on policy guidance.
The RBNZ will likely follow the RBA, which kept interest rates unchanged on Tuesday. The New Zealand Dollar (NZD) could remain relatively steady if the central bank delivers as expected.
RBNZ interest rate decision: All you need to know on Wednesday
- US stocks closed in negative territory on Tuesday, with the Dow Jones losing 1.29% and the Nasdaq down by 1.87%. Meanwhile, the 10-year US Treasury bond yield reached 4.80% for the first time since 2007.
- The latest Chinese PMI survey offered mixed signs, indicating some stabilization in economic activity, which is a positive development after the deterioration seen in previous months.
- The US ISM Manufacturing PMI surpassed expectations, increasing from 47.6 in August to 49 in September, compared to the market consensus of 47.7. The Price Paid component dropped from 48.4 to 43.8. Key US jobs data is due later in the week, with the ADP Private Payroll report on Wednesday and the Nonfarm Payrolls on Friday. Solid US data has been a crucial driver in the ongoing US Dollar rally.
- The latest NZIER Quarterly Survey of Business Opinion (QSBO) showed improved Business Confidence in New Zealand, rising from -63 to -52 over the quarter through September, but sentiment remains generally downbeat.
- Most NZIER's Monetary Policy Shadow Board members recommended that the central bank hold the OCR at 5.50% in the October Monetary Policy Review. Two members recommended a 25 basis point hike.
- The RBNZ is unlikely to provide significant relief for NZD/USD, as US Dollar dynamics drive its movement in a context of risk aversion and lower commodity prices.
Reserve Bank of New Zealand interest rate expectations: How will it impact NZD/USD?
Analysts expect the Reserve Bank of New Zealand to keep the Official Cash Rate at 5.50% at the October Monetary Policy Review. The decision will be published at 01:00 GMT on Wednesday.
Market analysts and the shadow board see the RBNZ keeping rates unchanged. This reflects the expectation that the economy still has to fully experience the impact of past rate hikes.
At the August meeting, the RBNZ mentioned that they agreed that interest rates "need to stay at restrictive levels for the foreseeable future to ensure annual consumer price inflation returns to the 1-3% target range. In the near term, there is a risk that activity and inflation measures do not slow as much as expected."
During the second quarter, Gross Domestic Product (GDP) growth came in stronger than expected, expanding by 0.9%, and the annual rate slowed from 2.2% to 1.8%, less markedly than expected. The Consumer Price Index (CPI) rose 1.1%, and the annual rate dropped from 6.7% to 6%. The RBNZ will likely wait until the following inflation report (due October 16) to consider changing the monetary policy stance. The next meeting of the RBNZ is scheduled for November 28-29, and the central bank will release the quarterly Monetary Policy Statement and hold a press conference, providing a better opportunity to deliver any changes.
According to the interest rate market, the odds of a hike in October are around 10% and rise to more than 50% for the November meeting. This represents a risk for the New Zealand Dollar, considering that if the central bank delivers a message that lowers these expectations, the Kiwi would suffer. On the contrary, it would take a bold hawkish twist to increase those expectations and potentially support the Kiwi. Policymakers have arguments to deliver the message in either way. However, most analysts expect no significant changes. There appears to be little room for surprises.
Two shadow board members consider that the appropriate approach would be a 25 basis points rate hike, arguing that "upside risks to inflation have appeared more crystallized recently, and the Reserve Bank should increase the OCR sooner rather than later if it still expects to start cutting the OCR later next year."
The New Zealand Dollar will likely witness volatility around the policy announcement. The NZD/USD has experienced a sharp reversal during the last sessions. On Friday, it reached monthly highs near 0.6050 but then started to decline, falling below 0.6000. More recently, it has slid below the 20-day Simple Moving Average (SMA) and approached the September low that stands around 0.5860, which is a critical support area. A break below 0.5860 would increase the selling pressure, exposing the next support area between 0.5780 and 0.5800.
The New Zealand Dollar needs to post a daily close clearly above 0.6000 against the US Dollar in order to increase the odds of a more robust recovery. While below that level, the pair will likely continue to trade sideways around the 0.5900 mark, with risks tilted to the downside.
Economic Indicator
New Zealand RBNZ Interest Rate Decision
RBNZ Interest Rate Decision is announced by the Reserve Bank of New Zealand. If the RBNZ is hawkish about the inflationary outlook of the economy and rises the interest rates it is positive, or bullish, for the NZD.
Read more.Next release: 10/04/2023 01:00:00 GMT
Frequency: Irregular
Source: Reserve Bank of New Zealand
Why it matters to traders
The Reserve Bank of New Zealand (RBNZ) holds monetary policy meetings seven times a year, announcing their decision on interest rates and the economic assessments that influenced their decision. The central bank offers clues on the economic outlook and future policy path, which are of high relevance for the NZD valuation. Positive economic developments and upbeat outlook could lead the RBNZ to tighten the policy by hiking interest rates, which tends to be NZD bullish. The policy announcements are usually followed by Governor Adrian Orr’s press conference.
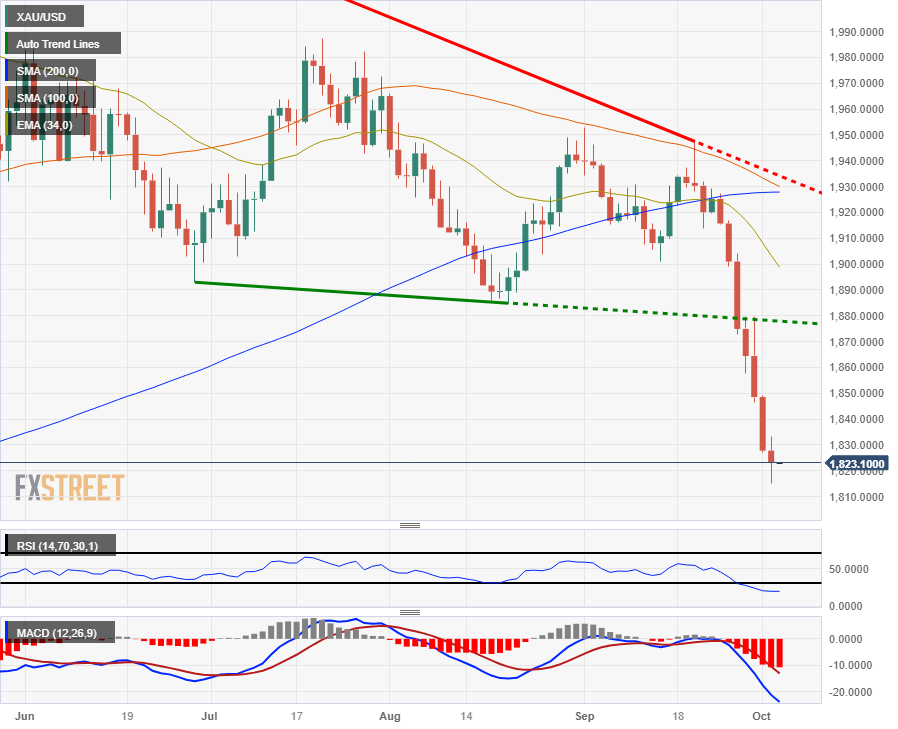
- Gold on pace to close in the red for the seventh consecutive day.
- XAU/USD has closed lower for ten of the last eleven daily trading sessions.
- Gold prices are down nearly 6.5% from the last swing high into $1,947.55.
Gold prices are softly down on Tuesday as broader markets continue to radiate risk-off energy, trading into $1,823.30 as risk aversion remains the key theme for markets heading into the mid-week.
The XAU/USD is trading into seven-month lows, and a break lower south of $1,804.76 will see Gold trading into its lowest prices in nearly a year, and will set new lows for 2023.
Broad-market risk appetite has evaporated in recent days, sparked by rising concerns of the odds of a global recession, and investors have been flocking into the safe haven US Dollar (USD) as market headwinds continue to rise.
US Treasury yields have been climbing as the US government narrowly averted a shutdown on partisan brinkmanship, but the temporary stopgap measure only funds the US government through mid-November. Investors are unlikely to have much confidence stoked by the 45-day reprieve, and markets can expect to be forced back into another tension spiral by November 17th if the US can't square away a functioning budget.
Gold Futures: Further losses on the cards
Gold price struggles to capitalize on modest intraday recovery from multi-month low
XAU/USD technical outlook
Gold prices are down over 5% in under a week and a half, sliding from $1,926 and extending the precious metal's decline from 2023's peak near $2,075.
Daily candlesticks see the XAU/USD tumbling well away from technical indicators, with the 200-day Simple Moving Average (SMA) well above current price action near $1,930 and technical indicators breaking in oversold territory.
The Relative Strength Index (RSI) is at its lowest value of 19.58 since 2015, and a break into $1,800 will see Gold prices turn red for the year.
XAU/USD daily chart
XAU/USD technical levels
- The USD/JPY sunk to 147.31 on rumored BoJ intervention before settling near 148.80.
- Market intervention on the Yen remains a rumor until official confirmation from Japan sources.
- It took three minutes for the USD/JPY to collapse over 270 pips, or -1.81%.
The USD/JPY into the low end heading into Wednesday's market session after an assumed Bank of Japan (BoJ) intervention on Tuesday saw the pair tumble nearly 2% from the day's peak just over the 150.00 major handle.
The pair is now trading down into 148.80 after the pair staged a moderate recovery immediately following the rumored BoJ intervention.
Traders will be looking ahead to Wednesday's US Services Purchasing Manager Index (PMI), which is expected to tick down slightly from 54.5 to 53.6.
Forex Today: Yen wakes up as the Dollar remains robust, RBNZ next
The economic calendar is notably thin for the Japanese side, and the data docket is free for USD/JPY to jostle into position heading into another US Non-Farm Payrolls (NFP) on Friday.
Broad-market sentiment has soured lately, sending investors piling into the US Dollar (USD). A narrowly-averted US government shutdown is likely to continue weighing on investor confidence, as the emergency stopgap measures only see US federal operations funded through mid-November.
Rising US Treasury yields on a lack of government confidence and ongoing fears of a potential global economic slowdown sees the US Dollar in a firm position, and any declines in the US Dollar Index are unlikely to be maintained.
USD/JPY technical outlook
Despite the rumored BoJ intervention, the USD/JPY remains in a notably bullish position, with market prices not far from yearly highs, and a bounce back above 150.00 will see the pair trading into its highest prices in decades.
Daily candlesticks see the USD/JPY remaining well-buoyed by the 34-day Exponential Moving Average (EMA) near 147.00, far above the 200-day Simple Moving Average (SMA) near 138.00.
Technical indicators have been breaking under the weight of the Greenback's march up the charts, and the Relative Strength Index (RSI) has been at or near the overbought limit since August.
USD/JPY daily chart

USD/JPY technical levels
During the Asian session, the key event will be the Reserve Bank of New Zealand monetary policy decision. Throughout the day, the final Service PMIs will be released. Eurostat will report the Producer Price Index and Retail Sales. The US will report the ISM Services PMI and Factory Orders. ADP will release its private employment report.
Here is what you need to know on Wednesday, October 4:
The Yen jumped on Tuesday, most likely due to an intervention from Japanese authorities to prevent further depreciation of the currency. The move occurred when USD/JPY was trading above 150.00 and sent the pair as low as 147.28. However, it later trimmed losses and rose to 149.00. The short-term bias is downward, with volatility expected.
US JOLTS Job Openings came in above expectations and pushed US yields higher. The 10-year yield reached 4.80%, the highest since 2007. The US Dollar Index climbed to 107.34, the highest since November of last week, but pulled back with the USD/JPY retreat, ending the day slightly below 107.00.
The Greenback remains supported across the board by positive US data, higher yields, and cautious market sentiment. On Wall Street, stocks lost an average of 1.40% on Tuesday. On Wednesday, the ADP Employment report is due.
EUR/USD printed a fresh ten-month low near 1.0450 and then rebounded modestly to 1.0470. The pair remains under pressure. On Wednesday, Eurostat will release Retail Sales and the Producer Price Index.
GBP/USD finished the day flat, moving sideways around 1.2070. The pair bottomed after US data at 1.2052, the lowest level since March.
The Swiss Franc lagged behind following a lower-than-expected reading of the Swiss Consumer Price Index (CPI) for September, with the annual rate rising from 1.6% to 1.7%, below the expected 1.8%. USD/CHF peaked at 0.9244 and then pulled back toward 0.9200.
The Reserve Bank of New Zealand (RBNZ) will announce its decision on Wednesday. The key rate is expected to remain unchanged at 5.5%. NZD/USD dropped below the 20-day Simple Moving Average (SMA) but managed to rise back above 0.5900.
AUD/USD tumbled for the second consecutive day, affected by the risk-off sentiment and the stronger dollar. The pair reached levels below 0.6300 last seen back in November 2022.
USD/CAD rose for the third consecutive day, breaking above September highs. The pair closed above 1.3700 and is now approaching March highs at 1.3861.
Gold dropped for the seventh day in a row, bottoming at $1,814 before trimming losses and moderately rising to $1,825. Silver recovered somewhat after falling more than 5% in the previous session, ending around $21.20.
Like this article? Help us with some feedback by answering this survey:
- WTI looking to reclaim $88.50 as energies see mild recovery.
- Crude oil got crushed last week after broad-market risk-off flows sent investors piling into the US Dollar.
- US Dollar Index's ten-month high sent crude barrels into a three-week low.
West Texas Intermediary (WTI) Crude Oil barrel prices staged a mild rally to recover the $88.50 level after finishing a week-long plunge into three-week lows as broad-market risk aversion sent market participants fleeing into safe havens.
US Crude Oil prices stretched to ten-month peaks as global oil production is set to undersupply global demand.
Earlier reports of a resumption of an Iraqi oil pipeline got cold water splashed on them after Turkey stated that talks about resuming construction are still underway. A critical Iraqi oil-exporting pipeline running through Turkey is still sitting in the dark after almost six months of work stoppage on the project.
Energies traders will be awaiting the US' API Weekly Crude Oil Stocks update for the week into September 29th due late in the Tuesday trading session. US crude reserves were last shown down 1.586M barrels as global production flubs crude demand by nearly 2 million bpd.
WTI technical levels
WTI crude barrel prices are looking for a recovery after getting kicked down nearly 7.5% from the last peak just pennies shy of the $94.00 handle.
Last week's top end represents a ten-month high for WTI, and US crude oil has closed higher for four consecutive trading weeks.
Technical support on the daily candles is coming from the 34-day Exponential Moving Average just north of $86.00, and medium-term bullish momentum for WTI prices sees bids well above the 200-day Simple Moving Average (SMA) currently turning bullish into $78.00.
WTI daily chart

WTI technical levels
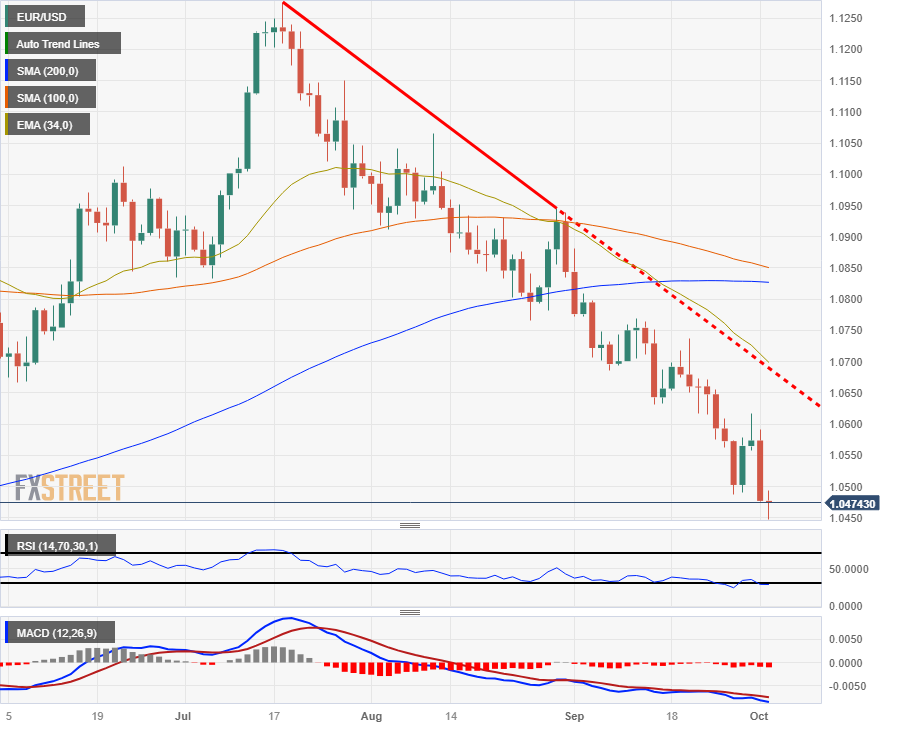
- The EUR/USD is softly lower for Tuesday as traders gear up for a busy back half of the week.
- EU Retail Sales, US PMIs on the docket for Wednesday.
- Friday's US NFP looms ahead.
The EUR/USD is looking to build out a floor on Tuesday, down a scant 0.18% for the day's market session as Euro (EUR) bulls try to find a foothold heading into Wednesday's data dump. The pair is trading near 1.0470 as broad-market USD support remains high.
Early Wednesday will see European Producer Price Index (PPI) and Retail Sales figures for the month of August; the annualized EU PPI for August is expected to steepen its contraction from -7.6% to -11.6%, while Retail Sales for the same period are also forecast to decline, from -1% to -1.2%.
Wednesday will also bring US Services Purchasing Manager Index (PMI) figures, with September's PMI slated to printed a mild downtick from 54.5 to 53.6.
The window of Dollar strength should mean EUR/USD moving close to parity – MUFG
The European Central Bank (ECB) is firmly off their rate hike cycle, and markets are broadly expecting that no meaningful rate increases will be coming from the ECB for the foreseeable future.
On the US side, the Federal Reserve (Fed) is seeing inflation easing in the US domestic economy, but only slightly, and any upticks in price growth data could see the Fed set for further rate hikes moving forward.
With the rate differential between the Euro and the US Dollar set on the high side, USD strength versus the Euro could be the ongoing trend moving forward.
EUR/USD technical outlook
The Euro remains steeply off the year's highs, down over 7% from the July peak near 1.275 as the EUR/USD continues its trending tumble towards parity.
A descending trendline from the year's high remains firmly in place, and price action continues to slump far below the 200-day Simple Moving Average (SMA) near 1.0825.
The EUR/USD is still well above its 2002 lows just north of 0.9500, but little technical resistance remains if short-sellers are able to push the Euro further down into lows that the pair hasn't seen in over twelve months.
EUR/USD daily chart
EUR/USD technical levels
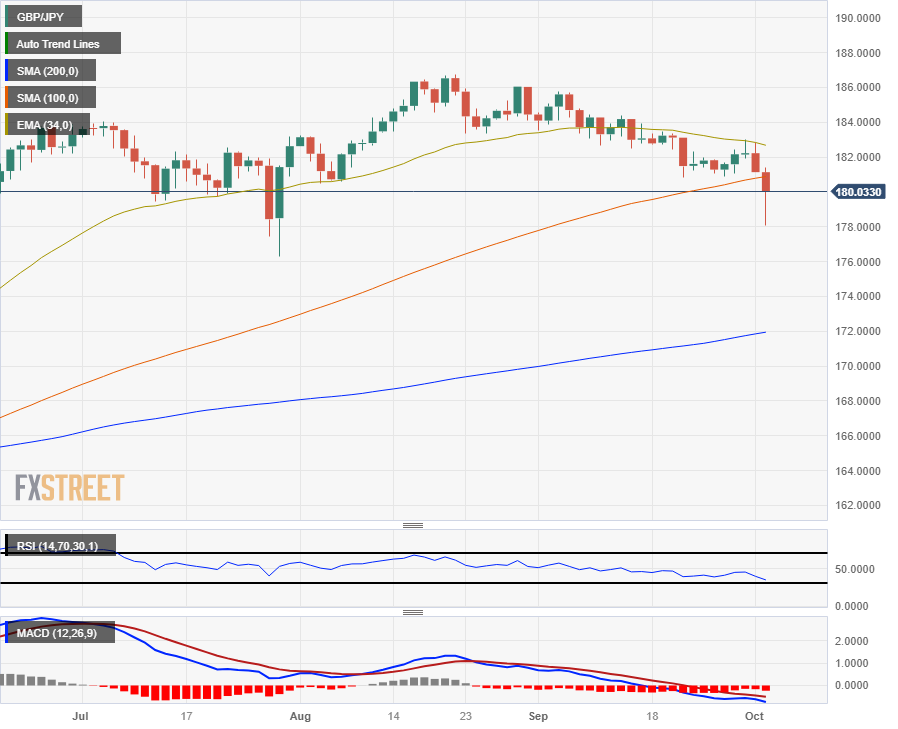
- The GBP/JPY sank nearly 300 pips early Tuesday before rebounding to 180.00.
- Market rumors of BoJ intervention in FX markets will need to wait to be confirmed by official sources.
- The economic calendar remains practically empty for both the GBP and the JPY this week.
The GBP/JPY got completely shredded early Tuesday, plummeting nearly 300 pips inside sixty seconds to just shy of 178.00. Markets are broadly assuming that the Bank of Japan (BoJ) intervened in global currency markets in an effort to defend the Japanese Yen (JPY), but investors will need to wait for any official confirmation from government sources.
The peak-to-trough price range on the Guppy is over 1.8% on Tuesday, and the GBP/JPY is strung out at the 180.00 major handle after retracing over 50% of the rumored intervention drop.
The economic calendar is functionally barren for the entirety of the trading week for both the Pound Sterling (GBP) and the JPY; low-tier, low-impact data dots the landscape, but the closest thing to a notable datapoint this week will be the annualized Japanese Labor Cash Earnings for August, slated for late Thursday at 23:30 GMT. Japanese labor earnings last printed at 1.3%, and a miss for wage growth could see the BoJ knocked back even further from future rate hikes as the Japanese central bank braces to see if inflation falls below their 2% target boundary.
BOJ September Meeting Summary: End to negative rate must be tied to success of achieving 2% inflation target
BOJ’s Ueda: Still a distance to go to exit loose policy
GBP/JPY technical outlook
The GBP/JPY has been steadily trading towards the down side despite the rumored JPY market intervention, and has fallen below the 100-day Simple Moving Average (SMA) for the first time since late March.
The Guppy is down over 3.5% from August's swing high into 186.75, and an utter lack of buying conviction in GBP market flows is set to see the GBP/JPY lose its footing and tumble into the 200-day SMA currently pushing upwards from 172.00.
GBP/JPY daily chart
GBP/JPY technical levels
- The AUD/USD is struggling to find support as the US Dollar movers higher across the broader market.
- The Aussie is facing multiple bearish pressures as the RBA keeps rates unchanged as markets expected.
- The rest of the week still sees key data points for both the Aussie and the Greenback.
The AUD/USD is pinned into the 0.6300 level after the Reserve Bank of Australia (RBA) kept its benchmark rate at 4.1% early Tuesday. The RBA was broadly forecast to stand pat on interest rates for their fourth straight meeting as inflation expectations ease, though the RBA Governor Michele Bullock noted that inflation is likely to remain on the high side until sometime in 2025.
RBA keeps interest rate steady at 4.10% for fourth straight meeting
Diverging talking points from different officials from the US Federal Reserve (Fed) leaves rate cycle expectations hung in the middle. The Fed's Mester and Bostic both hit the newswires on Tuesday, leaving investors twisted around as Bostic cooled rate expectations going forward but Mester appearing notably hawkish.
Fed's Mester: Likely to favor hike at next meeting if current economic situation holds
Fed's Bostic: No urgency for the Fed to do anything more
The rest of the week sees plenty of data for both the Aussie (AUD) and the Greenback (USD); late Tuesday sees the Australian S&P Purchasing Managers Index (PMI) figures, followed by the US' own Services PMIs on Wednesday.
Thursday will see Australian Trade Balance figures early on, followed by US Challenger Job Cuts and Initial Jobless Claims, and market participants will be bristling ahead of Friday's US Non-Farm Payrolls (NFP).
AUD/USD technical outlook
The AUD/USD extended declines for Tuesday, tumbling into the 0.6300 handle and is struggling to find bid support as broad-market risk appetite favors the US Dollar.
The pair is down over 3% from last week's swing high, falling over 210 pips over three trading days after getting rejected from the 0.6500 handle.
Intraday chart action is capped off by the 200-hour Simple Moving Average (SMA) currently building a resistance zone near 0.6400.
On the daily candlesticks, the AUD/USD has slipped out of recent consolidation, and is extending a downside move after seeing a clean rejection from the 34-day Exponential Moving Average (EMA).
The pair is now set for a challenge of 12-month lows below 0.6200 if bearish momentum continues unchallenged.
AUD/USD daily chart

AUD/USD technical levels
- Concerns about future Federal Reserve actions weigh on the market mood.
- S&P Global will release the final estimates of the September PMIs on Wednesday.
- GBP/USD meets sellers at around 1.2100 as demand for the USD prevails.
GBP/USD fell to 1.2051, a seven-month low Tuesday as speculative interest rushed into the safe-haven US Dollar. The American currency rallied on renewed speculation the United States (US) Federal Reserve (Fed) will maintain its aggressive posture on monetary policy, as inflation remains “too high,” according to different officials, while the labor market remains tight.
On Tuesday, the Bureau of Labor Statistics (BLS) reported that the number of job openings on the last business day of August stood at 9.6 million, much higher than the 8.8 million anticipated. The headline spurred risk aversion, and Wall Street nose-dived as government bond yields soared, reflecting investors’ concerns. Additionally, the US reported that IBD/TIPP Economic Optimism plunged to 36.6 in October from 43.2 in the previous month.
Market players will keep an eye on the September S&P Global Services and Composite PMIs, which will be out on Wednesday. The UK Services PMI is expected to be confirmed at 46.8, while the Composite index is foreseen at 47.2. Across the pond, the US will publish the September ADP Employment Change, predicted at 1.53K, and the official ISM Services PMI, anticipated at 53.6 in September.
GBP/USD technical outlook
The GBP/USD pair trades around 1.2080 mid-American afternoon, meeting sellers at around the 1.2100 threshold. The 1.2000 threshold is the next potential bearish target and is a strong psychological barrier. Significant stop loss should accumulate below the figure, and if those get triggered, the slide could accelerate towards the 1.1900 figure.
- Canadian Dollar outflows continue for Tuesday as investors pile into the US Dollar.
- Canada PMIs, labor data still ahead later in the week, but US NFP to overshadow.
- Crude Oil prices are rebounding for Tuesday, providing limited support for the CAD.
The Canadian Dollar (CAD) continues to sink against the US Dollar (USD) as broad-market risk-off flows remain the overall theme for investors on Tuesday. Oil-dependent CAD is catching only minor support from Crude Oil prices, which are seeing a minor rebound after halting a three-day decline.
Canada has both Purchasing Manager Index (PMI) and Employment Rate figures due this week on Thursday and Friday respectively, but market impact will likely remain muted as investors jockey for position ahead of the US Non-Farm Payroll (NFP) data drop on Friday.
Daily Digest Market Movers: Canadian Dollar gives up further ground, USD/CAD probing above 1.3700
- The USD/CAD crossed the 1.3700 technical barrier early Tuesday, sending the pair to a daily high of 1.3736.
- The US Dollar remains well-bid across overly cautious markets as investor confidence shakes out.
- Rising US Treasury yields, faltering global growth outlook, supply-constrained rising Oil prices, and a short-term government funding stopgap for the US are all sending investors into the safe-haven USD.
- Crude Oil prices are rebounding after three straight days of declines as CAD tries to suture the bleed against the USD.
- Economists from several large banks are starting to caution that the USD/CAD could be poised for a rebound if market flows ease up.
- Economists at Scotiabank noted that a firm showing for Canada data this week is needed to bolster expectations of another Bank of Canada (BoC) rate hike.
- MUFG Bank economists don’t see the USD/CAD pair returning to the 1.3600 region until the end of the fourth quarter.
- The US-Canada rate differential remains the key theme to capping USD/CAD chart flows according to HSBC analysts.
Technical Analysis: Canadian Dollar hits 1.3736 as markets extend their risk-off dogpile into US Dollar
Canadian Dollar (CAD) selling peaked at an intraday high of 1.3736 in Tuesday trading, and US Dollar bulls are looking to build out a price floor from the 1.3700 handle.
The USD/CAD has risen nearly 2.5% since last Friday’s dip into 1.3417, where the pair saw a technical rejection from the 200-day Simple Moving Average (SMA).
A continued run up the charts will see the USD/CAD set for a challenge of 1.3860, a region that the pair hasn’t seen since March.
Hourly candles have the USD/CAD drifting steadily higher as short interest fails to push the pair back into the 34-hour Exponential Moving Average (EMA). Bullish momentum appears to be running out of steam, and the Relative Strength Index (RSI) is drifting out of overbought territory.
Sellers will want to build up enough momentum to send the pair back down to 1.3560 near the 100-hour SMA, while bidders will be looking to mark a new high for the day beyond 1.3736.
Canadian Dollar FAQs
What key factors drive the Canadian Dollar?
The key factors driving the Canadian Dollar (CAD) are the level of interest rates set by the Bank of Canada (BoC), the price of Oil, Canada’s largest export, the health of its economy, inflation and the Trade Balance, which is the difference between the value of Canada’s exports versus its imports. Other factors include market sentiment – whether investors are taking on more risky assets (risk-on) or seeking safe-havens (risk-off) – with risk-on being CAD-positive. As its largest trading partner, the health of the US economy is also a key factor influencing the Canadian Dollar.
How do the decisions of the Bank of Canada impact the Canadian Dollar?
The Bank of Canada (BoC) has a significant influence on the Canadian Dollar by setting the level of interest rates that banks can lend to one another. This influences the level of interest rates for everyone. The main goal of the BoC is to maintain inflation at 1-3% by adjusting interest rates up or down. Relatively higher interest rates tend to be positive for the CAD. The Bank of Canada can also use quantitative easing and tightening to influence credit conditions, with the former CAD-negative and the latter CAD-positive.
How does the price of Oil impact the Canadian Dollar?
The price of Oil is a key factor impacting the value of the Canadian Dollar. Petroleum is Canada’s biggest export, so Oil price tends to have an immediate impact on the CAD value. Generally, if Oil price rises CAD also goes up, as aggregate demand for the currency increases. The opposite is the case if the price of Oil falls. Higher Oil prices also tend to result in a greater likelihood of a positive Trade Balance, which is also supportive of the CAD.
How does inflation data impact the value of the Canadian Dollar?
While inflation had always traditionally been thought of as a negative factor for a currency since it lowers the value of money, the opposite has actually been the case in modern times with the relaxation of cross-border capital controls. Higher inflation tends to lead central banks to put up interest rates which attracts more capital inflows from global investors seeking a lucrative place to keep their money. This increases demand for the local currency, which in Canada’s case is the Canadian Dollar.
How does economic data influence the value of the Canadian Dollar?
Macroeconomic data releases gauge the health of the economy and can have an impact on the Canadian Dollar. Indicators such as GDP, Manufacturing and Services PMIs, employment, and consumer sentiment surveys can all influence the direction of the CAD. A strong economy is good for the Canadian Dollar. Not only does it attract more foreign investment but it may encourage the Bank of Canada to put up interest rates, leading to a stronger currency. If economic data is weak, however, the CAD is likely to fall.
- NZD/USD fell to fresh multi-week lows below 0.5900 on Tuesday.
- The broad-based US Dollar strength weighed on the pair.
- RBNZ is forecast to leave its policy rate unchanged at 5.5%.
Following Monday's sharp decline, NZD/USD came under renewed bearish pressure on Tuesday and dropped to its weakest level in nearly three weeks below 0.5900. At the time of press, the pair was down 0.8% on the day at 0.5895.
USD rally continues on Tuesday
The risk-averse market environment provided a boost to the US Dollar (USD) in the second half of the day and forced NZD/USD to continue to push lower. Reflecting the souring market mood, Wall Street's main indexes opened deep in negative territory. As of writing, the S&P 500 Index was losing 1.3% on the day and the Nasdaq Composite was down 1.6%.
Meanwhile, the number of job openings on the last business day of August stood at 9.6 million, the US Bureau of Labor Statistics (BLS) reported on Tuesday, compared to 8.9 million in July. This reading surpassed the market expectation of 8.8 million by a wide margin and highlighted tight labor market conditions in the US. The benchmark 10-year US Treasury bond yield climbed to fresh multi-year highs above 4.7% after this data and the USD gathered further strength against its major rivals.
New Zealand Dollar price today
The table below shows the percentage change of New Zealand Dollar (NZD) against listed major currencies today. New Zealand Dollar was the weakest against the Japanese Yen.
| USD | EUR | GBP | CAD | AUD | JPY | NZD | CHF | |
| USD | 0.15% | 0.11% | 0.23% | 0.96% | -0.58% | 0.68% | 0.44% | |
| EUR | -0.15% | -0.04% | 0.07% | 0.82% | -0.73% | 0.52% | 0.29% | |
| GBP | -0.11% | 0.04% | 0.12% | 0.84% | -0.69% | 0.56% | 0.32% | |
| CAD | -0.23% | -0.08% | -0.12% | 0.74% | -0.81% | 0.45% | 0.21% | |
| AUD | -0.97% | -0.82% | -0.87% | -0.74% | -1.56% | -0.29% | -0.53% | |
| JPY | 0.57% | 0.74% | 0.69% | 0.80% | 1.54% | 1.27% | 1.03% | |
| NZD | -0.65% | -0.53% | -0.57% | -0.43% | 0.30% | -1.23% | -0.24% | |
| CHF | -0.44% | -0.29% | -0.33% | -0.21% | 0.52% | -1.02% | 0.23% |
The heat map shows percentage changes of major currencies against each other. The base currency is picked from the left column, while the quote currency is picked from the top row. For example, if you pick the Euro from the left column and move along the horizontal line to the Japanese Yen, the percentage change displayed in the box will represent EUR (base)/JPY (quote).
In the early Asian session on Wednesday, the Reserve Bank of New Zealand (RBNZ) will announce monetary policy decisions. The RBNZ is widely expected to leave its policy rate unchanged at 5.5%.
Previewing the RBNZ policy meeting, "we expect the RBNZ to retain the tightening bias expressed in the August Statement and will aim to retain maximum flexibility to tighten (or not) in November should data warrant," said analysts at Westpac. "A surprise tightening to 5.75% is a risk, but we think no more than a 10-20% chance," they added.
Technical levels to watch for
Cleveland Federal Reserve President Loretta Mester said on Tuesday that she is likely to favor an interest rate hike at the next meeting if the current economic situation holds, as reported by Reuters.
Key takeaways
"Long-term yield rise will affect monetary policy outlook."
"Higher long-term rates will moderate growth."
"Fed likely at or near peak for interest rate target."
"Expecting to hit 2% inflation by end of 2025."
"Not seeing rate cuts happening any time soon."
"Yields are up on a number of factors, including changed outlook on growth."
Market reaction
The US Dollar Index edged slightly higher after these comments and it was last seen rising 0.15% on the day at 107.20.
Commenting on the Federal Reserve's (Fed) policy outlook, "I am not in a hurry to raise, not in a hurry to reduce either," Atlanta Fed President Raphael Bostic said. "I am willing to be patient. I don't think there is an urgency for us to do anything more," he added.
Additional takeaways
"Fed is in restrictive territory and that is helping inflation fall."
"Fed still has a ways to go to get inflation back to target."
"Question now is how fast the economy will slow."
"As long as expectations don't spike, the Fed can afford to be patient."
"Fed should be on hold for a long time."
Once the Fed has chosen an inflation target, it has to stick with it."
"There may be reasons to reconsider the 2% target, but that will be a whole exercise that must come after reaching 2%."
Market reaction
The US Dollar Index holds steady near 107.00 in the American session on Tuesday.
The Canadian Dollar advanced in September which was notable given the broad US Dollar strength. Economists at MUFG Bank analyze Loonie’s outlook.
CAD resilience but downside risks persist before recovery takes hold
If US 10-year yields continue to drift higher the risk of an equity market correction will increase – if a correction unfolds, the risk of a spike in USD/CAD is high.
If the Fed hikes before year-end, the BoC could be in a position to limit the scale of increase in USD/CAD.
USD/CAD – Q4 2023 1.3600 Q1 2024 1.3400 Q2 2024 1.3300 Q3 2024 1.3200
The Reserve Bank of New Zealand (RBNZ) will announce its Interest Rate Decision on Wednesday, October 4 at 01:00 GMT and as we get closer to the release time, here are the expectations as forecast by the economists and researchers of five major banks.
The RBNZ is expected to hold the key Official Cash Rate (OCR) steady at 5.50%. At the last meeting, the bank kept the interest rate unchanged but it was a hawkish hold. Traders will keep an eye on the statement following the meeting.
ANZ
We expect the RBNZ to keep the OCR unchanged at 5.5% while striking a more hawkish tone. Data since the August Monetary Policy Statement (MPS) has overall been stronger than anticipated, dairy prices aside. Potential wealth effects from the reheating housing market are concerning. We continue to expect a hike at the November meeting and risks are tilting towards even more being required in 2024.
TDS
We expect the RBNZ to stay on hold though data since the August meeting adds support to inflation remaining elevated for longer. The question now is whether the Bank is re-assessing the balance of risks around inflation or sticking with the lagged impacts of rate hikes still to filter through. We are not expecting a more hawkish shift but we are on the lookout for it. Would a hawkish RBNZ statement inspire a NZD comeback? For now, the NZD is closely tied to factors such as risk sentiment and US 10Y real yields. Our expectation of a marked deterioration in US data in the months ahead should take the tailwind away from the USD and could benefit the NZD.
Westpac
We think the RBNZ will keep the OCR at 5.50% at its October review. We expect the RBNZ to retain the tightening bias expressed in the August Statement and will aim to retain maximum flexibility to tighten (or not) in November should data warrant. A surprise tightening to 5.75% is a risk, but we think no more than a 10-20% chance.
Citi
The RBNZ is unlikely to raise interest rates again. However, risks are tilted squarely hawkish.
Wells Fargo
While a further moderation in growth trends and inflation pressures seems possible over time, it appears far too early yet for the RBNZ to contemplate monetary policy easing. Accordingly, we look for the RBNZ to keep its policy rate steady at 5.50%.
- The Japanese Yen rapidly strengthens across the board, indicating possible intervention.
- USD/JPY plunges from above 150.00 to 147.28 within a few minutes.
The USD/JPY experienced a sudden collapse, plunging more than 250 pips within a few minutes. The pair, which had been trading above 150.00 following the release of better-than-expected US data, sharply dropped to 147.28 and then rebounded to 149.00.
Significant volatility was observed in Yen crosses due to recent developments, indicating a potential intervention by Japanese officials to strengthen the currency. The trigger for this could have been the USD/JPY rising above 150.00 following the release of positive US economic data. However, no official announcement has been made thus far.
The US JOLTS Job Opening report exceeded expectations, coming in at 9.61 million in August, surpassing the consensus estimate of 8.8 million. Following the report, the US 10-year Treasury bond yield surged to 4.74%, reaching a new high not seen since 2007. This boost in yields propelled the USD/JPY above 150.00, with the pair peaking at 150.15, the highest level in almost a year, before the dramatic reversal occurred.
In September, the Yen weakened further versus the US Dollar. Economists at MUFG Bank analyze USD/JPY outlook.
Yen weakness to turn
The risk-reward in USD/JPY remains skewed to the downside at this juncture although a break higher initially now seems more likely, which will then likely prompt the intervention being hinted at. Hence, the prospect of remaining above those levels for long time is low.
A shift in BoJ policy also becomes more likely and we would expect strong resistance to Yen weakness at levels over 150.00.
- Silver price falls back as US Job Openings data outperformed expectations.
- Upbeat job openings data indicate that labor demand by US employers improves.
- Silver price delivered a breakdown of the H&S chart pattern, which resulted in a vertical sell-off.
Sliver price (XAG/USD) resumes its downside journey as the United States Bureau of Labor Statistics has reported an upbeat JOLTS Job Opening report. In August, employers posted 9.61 million job vacancies against expectations of 8.8 million.
The US Dollar Index (DXY) climbs above a fresh 11-month high at 107.20 on higher-than-expected job vacancies. The 10-year US Treasury yields jump to near 4.75%. Upbeat job openings data indicate that labor demand by US employers improves. This would elevate consumer spending as a significant demand for labor would be offset by offering higher wages from employers.
Meanwhile, investors shift focus to Automatic Data Processing (ADP) Employment Change data for September, which will be published on Wednesday. As per the estimates, the US economy recorded fresh additions of 160K employees against 177K reading in August month.
The S&P500 opens on a bearish note amid a cautious market mood. The escalating expectations about one more interest rate hike from the Federal Reserve (Fed) in the remainder of 2023 have dampened the market mood.
Fed policymakers: Cleveland Fed Bank President Loretta Mester and Fed Governor Michelle Bowman expect that the central bank is not done with hiking interest rates.
Silver technical analysis
Silver price delivers a breakdown of the Head and Shoulder chart pattern on a daily scale, which results in a vertical sell-off. The white metal breaks sharply below the neckline of the aforementioned chart pattern plotted from June 23 low at $22.11. Potential support is placed from March 08 low at $19.93.
The asset trades below the 200-day Exponential Moving Average (EMA), which indicates that the long-term trend is bearish.
The Relative Strength Index (RSI) (14) slips into the bearish range of 20.00-40.00, which warrants more downside.
Silver daily chart
-638319395259312764.png)
The yield on the 10-year US Treasury climbed 50 basis points in September, starting the month at 4.11% and ending at 4.61%. Economists at UBS analyze bond outlook.
The case for bonds remains despite the recent rise in yields
Our base case is for the yield on 10-year US Treasuries to stand at 3.5% in 12 months, 4% in our upside scenario for growth, and 2.75% in our downside scenario of a recession.
That would translate into total returns over the period of 14% in our base case, 10% in our upside economic scenario, and 20% in our downside scenario.
- EUR/USD sheds further ground and drops to new YTD lows.
- Next on the downside comes the round level of 1.0400.
EUR/USD alternates gains with losses after bottoming out in new 2023 lows near 1.0460 on Tuesday.
If bears remain in control, the pair could embark on a probable challenge of the round level of 1.0400. If spot breaches this level, then it should meet the next support of note at 1.0290 (November 30, 2022).
Meanwhile, further losses remain on the table as long as the pair navigates the area below the key 200-day SMA, today at 1.0.825.
EUR/USD daily chart
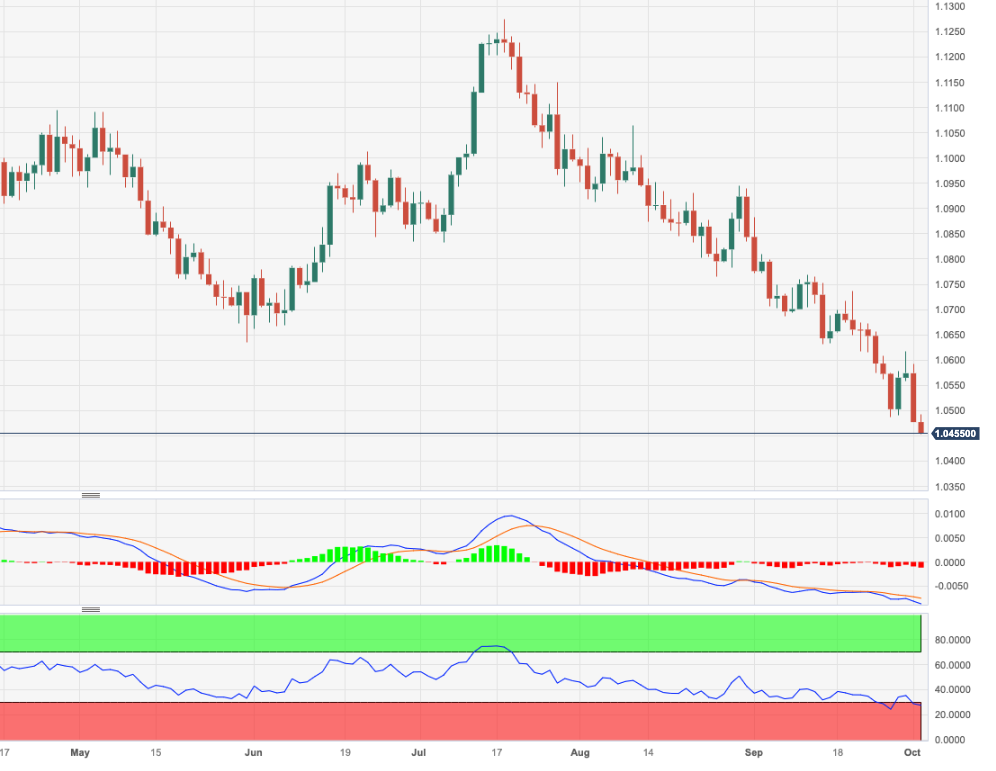
The Euro is approaching lows of the year. Economists at MUFG Bank analyze EUR/USD outlook.
USD upside risks over the short term but depreciation should unfold in 2024
The global growth backdrop is set to remain conducive to continued Dollar strength this quarter before Dollar depreciation sets in from Q1 2024 as the evidence of slower US economic growth builds and pricing for rate cuts increases.
We see a window for further Dollar strength that could take EUR/USD back toward parity. A November FOMC rate hike (not our view) would reinforce strength although we do not expect a break back below parity.
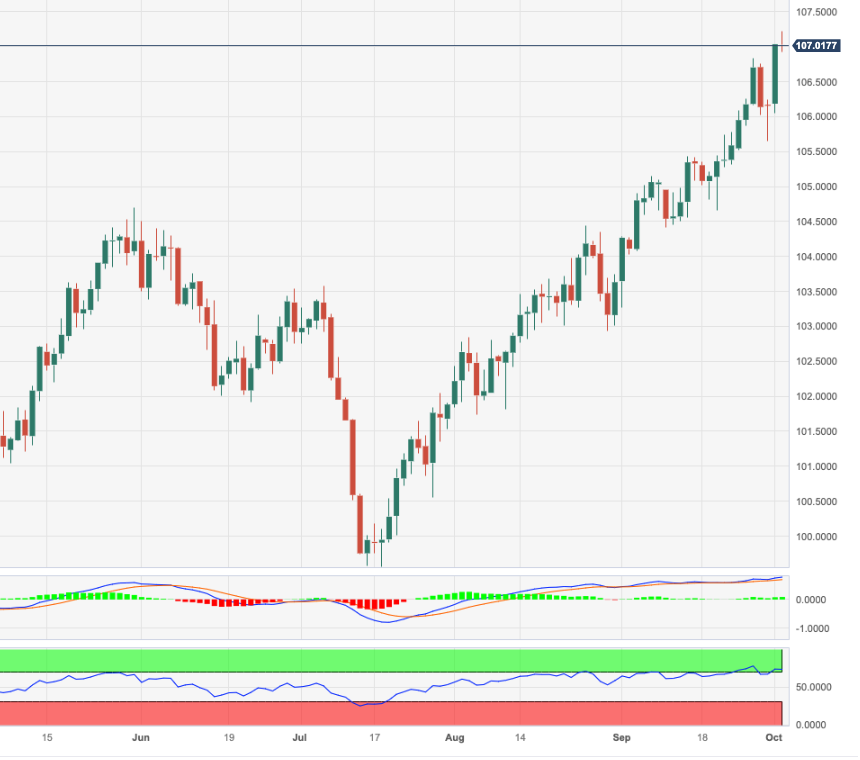
- DXY advances further and prints new highs above 107.00.
- Further up emerges the weekly high at 107.99.
DXY picks up extra pace and surpasses the 107.00 barrier for the first time since November 2022.
The continuation of the rally could prompt the index to now challenge the weekly peak at 107.99 (November 21 2022), closely followed by the round level of 108.00.
In the meantime, while above the key 200-day SMA, today at 103.12, the outlook for the index is expected to remain constructive.
DXY daily chart
The Yen has gone from bad to worse with USD/JPY trading around 150. Economists at Nordea analyze the pair’s outlook.
BoJ continues to disappoint
The government’s verbal intervention threats have curbed the fall of the JPY but are not sufficient to turn JPY fortunes. Even with a high likelihood of intervention, we see further Yen weakening in the short term.
We still expect that a reversal is in the cards longer term – that is more likely to occur when major central banks turn dovish rather than the BoJ turning hawkish.
USD/JPY – 3M 150 Mid-2024 145 End-2024 140 Mid-2025 130
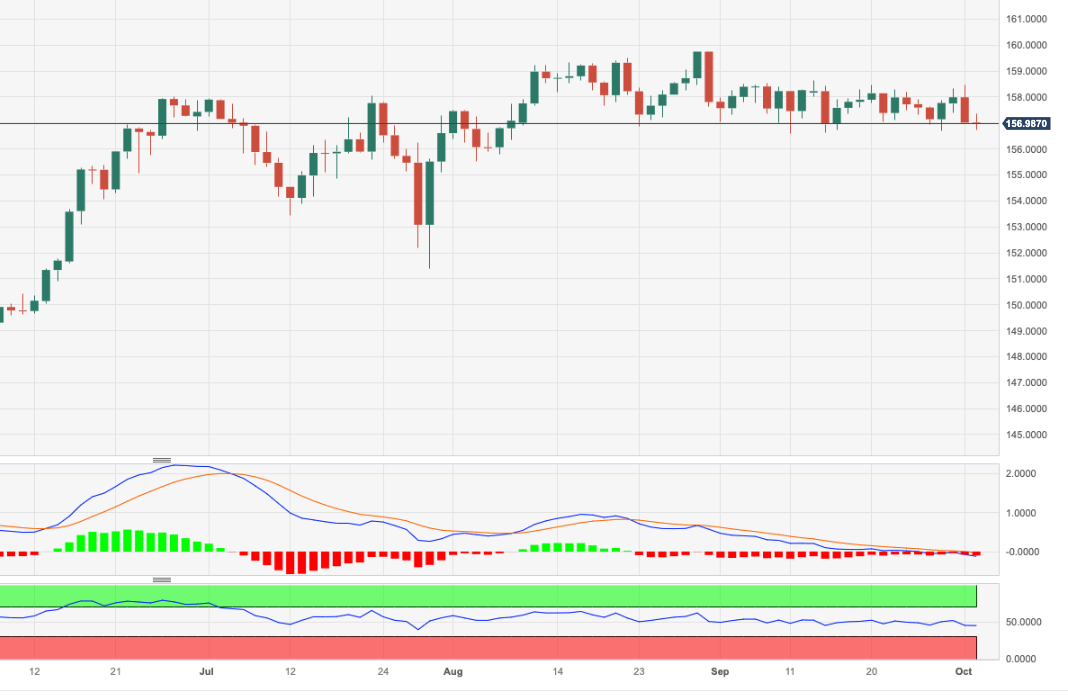
- EUR/JPY hovers around the 157.00 region on Tuesday.
- The cross remains poised for extra range bound trade.
EUR/JPY navigates a narrow range around 157.00 following Monday’s strong pullback.
In the meantime, the cross remains stuck within the consolidative range and the breakout of it exposes a visit to the so far monthly high of 158.65 (September 13) prior to the 2023 top at 159.76 (August 30), which precedes the key round level at 160.00.
So far, the longer term positive outlook for the cross appears favoured while above the 200-day SMA, today at 149.58.
EUR/JPY daily chart
The Mexican Peso showed a sizeable weakening in September. Economists at MUFG Bank analyze MXN outlook.
Tight monetary policies abroad and Mexican presidential elections to weigh on MXN
Although we expect MXN to remain supported by high carry-trade returns, we keep our outlook for MXN weakening path next year due to concerns over a global economic slowdown amid tighter monetary policies for longer worldwide. Such a scenario might spark some risk-off, thus hitting the high MXN.
At last, investors might gradually focus on the presidential election scheduled for June 2024, which might bring some concerns over the next steps of economic policies.
USD/MXN – Q4 2023 17.40 Q1 2024 17.50 Q2 2024 17.60 Q3 2024 17.70
- NZD/USD slips sharply to near 0.5900 as the RBNZ is expected to keep policy unchanged.
- The risk-off impulse remains intact as Fed policymakers see the US central bank as not done with hiking interest rates.
- US Manufacturing PMI improved but failed to capture the 50.0 threshold.
The NZD/USD pair drops vertically to near the round-level support of 0.5900 in the early New York session. The Kiwi asset faces selling pressure as the market mood is risk-off amid the inability of Asian economies to handle the consequences of higher interest rates from central bankers.
The S&P500 is expected to open on a bearish note, considering negative cues from overnight futures. US equities have been under pressure in the past few trading sessions as Federal Reserve (Fed) policymakers are supporting one more interest rate hike this year. Fed policymakers delivered hawkish guidance on interest rates on Monday as the resilient United States economy is expected to slow down progress in bringing down inflation to 2%.
Fed policymakers: Cleveland Fed Bank President Loretta Mester and Fed Governor Michelle Bowman supported a final interest rate increase by 25 basis points (bps) this year to 5.50-5.75% before announcing a pause.
Labor market conditions and consumer spending have remained robust in the US economy and now the manufacturing sector has en-routed on the path of recovery. On Monday, the US Institute of Supply Management (ISM) reported Manufacturing PMI for September at 49.0 against estimates of 47.7 and the August reading of 47.6. Although, the economic data failed to capture the 50.0 threshold but strong order book and robust wage growth could lead to further improvement ahead.
On the Kiwi front, investors await the interest rate decision from the Reserve Bank of New Zealand (RBNZ), which will be announced on Wednesday. The RBNZ is expected to keep the Official Cash Rate (OCR) unchanged at 5.5%.
Economist at UOB Group Enrico Tanuwidjaja and Junior Economist Agus Santoso assess the recently published inflation figures in Indonesia.
Key Takeaways
Indonesia's headline inflation in Sep eased to 2.3% y/y vs 3.3% in Aug on the back of lower inflation in almost all components, except for food & beverages (F&B) and infocomm. Supply restrictions drove prices of rice, garlic, chicken meat, fish, and other food commodities higher in Sep. In addition, disruptions in the global rice supply chain as a result of export restrictions by several rice exporters has led to higher food inflation in Sep.
Sep's inflation data reinforces our view for 2023 inflation to come lower than previously expected. We reduced our 2023 inflation forecast from 3.8% y/y to 3.6% (2022: 4.2%) due to faster than expected declines in core and administered price inflation. However, we do not exclude the risks that the recent rupiah depreciation could potentially add some upside to inflation in 4Q23.
As a result of this recent weakness, the Pound has lost its crown as the best performing G10 currency in the year to date. Economists at Rabobank analyze GBP outlook.
EUR/GBP to move lower within its range on a three-month view
While we expect US growth to slow to a technical recession in the early part of 2024, the current resilience of the US economy and fears that the Fed may still hike rates further suggests that Cable is likely to stay on the back foot. We see risks of a dip to GBP/USD 1.19 on a three-month view.
While we see scope for USD strength to push Cable lower on a three-month view, we continue to see the risks facing the EUR and GBP as better balanced. EUR/GBP failed to push above the top of its range last week with the 200-DMA in the 0.8708 area remaining intact. We continue to favour selling rallies to this level and see scope for EUR/GBP to move lower within its range on a three-month view given the growth clouds gathering over Germany.
UOB Group’s Economist Ho Woei Chan, CFA, reviews the latest set of PMI releases in the Chinese economy.
Key Takeaways
The official and private sector Caixin PMI reports indicated that both manufacturing and services sectors were in expansion in Sep. Although the official PMIs picked up and were above expectation, private sector Caixin PMIs unexpectedly softened.
The employment index barely improved in Sep, underlining the weaknesses in the economy. Meanwhile, further improvements in output/selling prices likely indicated higher cost passthrough and should ease concerns over deflation risks.
Overall, we still think the economy will be able to achieve the official growth target of 5.0% in 2023. Further monetary policy easing is also likely in 4Q23 to boost domestic demand.
- AUD/USD prints a fresh 11-month low at 0.6300 as RBA kept interest rates unchanged.
- The market mood is cautious as the resilient US economy has forced Fed policymakers to support one more interest rate increase.
- Investors await the US JOLTS Job Openings data, which is seen as little unchanged from prior reading of 8.8 million.
The AUD/USD pair witnessed extreme selling pressure after the Reserve Bank of Australia (RBA) kept interest rates unchanged at 4.10%. The Aussie asset has refreshed its 11-month low at 0.6300 as investors see policy divergence between the Federal Reserve (Fed) and the RBA intact.
As expected, RBA policymakers voted for a stable interest rate policy but cited that some further policy tightening is appropriate. RBA Governor Michele Bullock kept room open for further policy tightening as inflation is more than twice the desired rate of 2% and more interest rates could be needed to bring inflation down in a reasonable timeframe.
Meanwhile, S&P500 futures generated some losses in the London session, portraying a further decline in the risk appetite of the market participants. The broader market mood is cautious as the resilient United States economy has forced Federal Reserve (Fed) policymakers to support one more interest rate increase in the remainder of 2023.
Cleveland Fed Bank President Loretta Mester expressed that the Fed is not done with hiking interest rates. Fed Mester said that one more interest rate hike is well-needed this year and they are required to remain high for a longer period. Interest rates should remain high for long enough until the central bank assesses the impact of policy-tightening yet done.
The US Dollar Index (DXY) prints a fresh 11-month high at 107.25 amid multiple tailwinds and 10-year US Treasury yields jump to near 4.75%.
For now, investors await the US JOLTS Job Openings data for August, which will be published at 14:00 GMT. The number of job openings on the last business day of August is forecast to stay little changed at around 8.8 million.
USD sentiment remains bullish. Economists at Scotiabank analyze Greenback’s outlook.
Technical signals suggest the rise may slow in the short run
The broader USD trend higher is elevated and looks overextended but evolving market sentiment and positioning suggest the USD rise could well extend further.
Technical signals suggest the rise may slow – at least – in the short run. The intraday chart shows the DXY reversing from the top of the bull channel that has guided the index higher since July. Losses may not extend much more than 0.4-0.5% while elevated US yields are driving sentiment, however.
EUR/USD steady after sliding to a new cycle low. Economists at Scotiabank analyze the pair’s outlook.
The trend is your friend
Comments from a Finnish ECB official – representing Governor Rehn – echoed the line from ECB President Lagarde (rates are at a level which, maintained for long enough, will bear down on inflation) but added that this did not necessarily mean that rates will not rise again. The comments had little impact on the EUR, which struggled to regain the 1.05 handle, however. Markets clearly feel the ECB has peaked.
Trend momentum is bearish and EUR losses through key support (now resistance) in the low 1.06 area leaves the door open for the slide to extend to 1.04 (1.0406 is the 50% retracement of the Sep’22/Jul’23 rally).
The GBP/USD pair tests retracement support just below 1.21. Economists at Scotiabank analyze Cable’s technical outlook.
Resistance is seen at 1.2115
Cable losses are probing the 38.2% retracement of the past year’s rally (at 1.2075).
Solidly bearish trend momentum suggests the strong risk of additional weakness on a clear push through support towards the 1.17/1.18 zone – congestion from earlier this year and the 50% retracement (1.1746).
Resistance is 1.2115.
See:
- GBP/USD set to test the 1.20 level – ING
- GBP/USD: 1.20 test inevitable? – SocGen
The CAD’s slump over the past few days is its worst three-day run since last November. Economists at USD/CAD analyze USD/CAD outlook.
Bullish momentum reinvigorated
Canadian data prints this week need to reflect some resiliency in Canadian growth to help steady the exchange rate; markets are pricing in marginally more risk of another BoC rate hike before year-end (14 bps) relative to the Fed and have 18 bps of tightening factored in by January. If those odds weaken, the CAD may ease further still – despite already looking cheap.
With little or no obvious technical sign that the USD rise is peaking on the short-term chart, the risk of further USD gains towards the 1.38 area is hard to exclude; the snap higher in the USD has reinvigorated bullish momentum on the shorter-term studies which will have the effect of limited short-term USD corrections – likely to the mid/upper 1.36 area.
- Traders sell precious metals with Copper, Gold, Silver plunging to yearly lows.
- Focal point this week is US Nonfarm Payrolls on Friday.
- US Dollar Index breaks above 107 and prints 11-month high.
The US Dollar (USD) seems to like the number 11 as the Greenback was able to book its eleventh week of gains last week and currently has breached the eleventh-month high at 107.21. King Dollar is not going away any time soon as US Federal Reserve Chairman Jerome Powell on Monday evening communicated to the markets that the central bank will advance with careful decisions on rates and that rates will remain elevated to get inflation down to 2%.
It thus does not seem that this rate differential story will go away anytime soon, unless something fundamental happens. After the recent Institute of Supply Management (ISM) numbers, it becomes clear that the US economy is still withstanding these elevated rates. Focus this Tuesday will be on the JOLTS job posting numbers to see if there is a slowdown in labor demand, which could tip the scale in the coming months.
Daily digest: US Dollar goes big
- At 12:55 GMT, the lighter data calendar for this Tuesday kicks off with the weekly Redbook Index. Previous print was 3.8%.
- Near 14:00 GMT, all eyes will be on the JOLTS Job Openings for August. Although it is a backward-looking indicator, it will tell a bit more about the appetite and demand for the labor force. Will the downtrend continue as the previous number was 8.827 million with projections at 8.83 million, meaning a standstill is expected.
- The US Treasury will hit the markets again and needs to place a 52-week bill at these elevated levels.
- Equities are not dealing well with this stronger Greenback and are sinking lower. Several equities indices are trading in the red for the year: In Asia, markets are red across the board with the Nikkei and Topix indices sinking more than 1%. The Hang Seng is down over 2%. European equities are hovering around 0.50% in the red, while US equity futures are mildly in the red.
- The CME Group FedWatch Tool shows that markets are pricing in a 74.3% chance that the Federal Reserve will keep interest rates unchanged at its meeting in November.
- The benchmark 10-year US Treasury yield is lower at 4.69% printing a new high yet again for the year. The rate differential story is back as a driving force in the US bond market.
US Dollar Index technical analysis: This is not going to end soon
The US Dollar Index is on track to become the trade of the year. WIth several equity indices trading in the red for their performance in 2023, and precious metals hitting several floors. The US Dollar seems to be the only place to get a solid return, together with Crude oil prices. The importance of the US data will become even more important in order to time when this US Dollar cycle will come to an end.
The US Dollar Index opened around 107.21, though the overheated Relative Strength Index (RSI) is acting up again and heading back into an overbought regime. With 107.19 – the high of November 30, 2022 – being tested as we speak, it will be important to see if it can get a daily close. If that is the case, 109.30 is the next level to watch.
On the downside, the recent resistance at 105.88 should be seen as first support. Still, that barrier has just been broken to the upside, so it isn’t likely to be strong. Instead, look for 105.12 to do the trick and keep the DXY above 105.00.
US Dollar FAQs
What is the US Dollar?
The US Dollar (USD) is the official currency of the United States of America, and the ‘de facto’ currency of a significant number of other countries where it is found in circulation alongside local notes. It is the most heavily traded currency in the world, accounting for over 88% of all global foreign exchange turnover, or an average of $6.6 trillion in transactions per day, according to data from 2022.
Following the second world war, the USD took over from the British Pound as the world’s reserve currency. For most of its history, the US Dollar was backed by Gold, until the Bretton Woods Agreement in 1971 when the Gold Standard went away.
How do the decisions of the Federal Reserve impact the US Dollar?
The most important single factor impacting on the value of the US Dollar is monetary policy, which is shaped by the Federal Reserve (Fed). The Fed has two mandates: to achieve price stability (control inflation) and foster full employment. Its primary tool to achieve these two goals is by adjusting interest rates.
When prices are rising too quickly and inflation is above the Fed’s 2% target, the Fed will raise rates, which helps the USD value. When inflation falls below 2% or the Unemployment Rate is too high, the Fed may lower interest rates, which weighs on the Greenback.
What is Quantitative Easing and how does it influence the US Dollar?
In extreme situations, the Federal Reserve can also print more Dollars and enact quantitative easing (QE). QE is the process by which the Fed substantially increases the flow of credit in a stuck financial system.
It is a non-standard policy measure used when credit has dried up because banks will not lend to each other (out of the fear of counterparty default). It is a last resort when simply lowering interest rates is unlikely to achieve the necessary result. It was the Fed’s weapon of choice to combat the credit crunch that occurred during the Great Financial Crisis in 2008. It involves the Fed printing more Dollars and using them to buy US government bonds predominantly from financial institutions. QE usually leads to a weaker US Dollar.
What is Quantitative Tightening and how does it influence the US Dollar?
Quantitative tightening (QT) is the reverse process whereby the Federal Reserve stops buying bonds from financial institutions and does not reinvest the principal from the bonds it holds maturing in new purchases. It is usually positive for the US Dollar.
The US Dollar has surged in recent months. Economists at Charles Schwab analyze Greenback’s outlook.
Where is the US Dollar headed?
The Dollar's strength is likely to continue until there are signs that the Federal Reserve is poised to shift from its tight monetary policy stance to easing.
We do not expect the US Dollar to go back to last year's peak. However, it is likely to remain in an uptrend until the underlying fundamental factors propelling it higher change.
See: How on earth can the Dollar be turned around? – SocGen
The RBA's new Governor Michele Bullock sent a message of continuity and added pressure on AUD. Economists at ING analyze Aussie’s outlook.
New RBA governor fails to surprise
The RBA kept rates on hold as Michele Bullock made her debut as Governor. Markets are pricing in around 10 bps of tightening by December. We are more hawkish than the general consensus, seeing non-negligible chances that a CPI surprise will force one last hike to the peak.
Ultimately, even another hike would not be a game changer for the Aussie.
The sharp rise in US yields and soft risk environment should keep AUD/USD under pressure for now.
Risks are now that the correction extends to 0.6200/0.6250.
- Natural Gas price is steady at $3.
- The US Dollar squeezes all asset classes to lower levels.
- US Natural Gas prices could sink if demand keeps deteriorating.
Natural Gas prices are on the brink of a breakdown as a very mild fall kicks off the last two seasons in Europe, weighing on demand. In several parts of Europe, temperatures are still above 20 degrees Celsius, not demanding households to open up the heating. With this delay and the European gas provisions for the winter still near full levels, demand is set to deteriorate further for the first upcoming gas contracts expiring in November.
Meanwhile, the US Dollar (USD) is squashing all asset classes with its roaring performance for yet another week. Commodities, except for Crude oil, bonds and equities are all dropping like flies and are flirting with yearly lows or more. It appears that the Greenback strength will not go away anytime soon as US Federal Reserve Chairman Jerome Powell repeated on Monday that the Fed will keep rates higher until inflation is down to its target.
Natural Gas is trading at $2.997 per MMBtu at the time of writing.
Natural Gas news and market movers
- European storage sites keep adding reserves, with inventories in the bloc up to 96% full, according to data from Gas Infrastructure Europe.
- November gas contracts have declined 5.4%, to the lowest level since January 2022, as demand is fading fast. Over the past three sessions, contracts declined by 10%.
- Recent numbers show that in the EU and UK demand in September was already 9% lower than a year ago.
- The European gas regulator has reported an uptick in market participants trading contracts, with even Brazilian banks taking part in the gas market. The huge volatility since the Russian invasion of Ukraine has attracted several hedge funds and commercial banks looking for volatility to make profit.
- Egypt is set to resume its LNG exports in October, according to Tarek Ahmed El Molla, the Egyptian Minister of Petroleum and Mineral Resources.
- Markets are reacting nervously to comments coming out of the Adipec Summit, ahead of the COP 28 in November.
- Indian petroleum minister Marpadi Veerappa Moily commented during the Adipec Summit that oil above $100 is not in anyone's interest.
Natural Gas Technical Analysis: Watch the trend line for a breakdown
Natural Gas has been unable to move higher on the triangle breakout. Instead, a false break and drop back into the triangle got triggered. With demand fading quickly, it looks that the green ascending trend line is the important line in the sand, near $2.95, to time a decline to $2.60.
As mentioned, the pivotal level near $3.07 has been broken to the upside. This level needs to hold now as a new floor, squeezing prices higher. With respect of the ascending trend channel, the upside looks limited toward $3.30-$3.40 to test the upper barrier.
On the downside, the newly formed floor at $3.07 should act as support together with the psychological effect of $3 as a big figure. In case demand abates further, or more supply out of Norway comes back online, expect to see an initial drop back to the green ascending trendline near $2.95. Should that give way, $2.80 is an area with two moving averages (the 55-day and the 100-day) and the lower barrier of the trend channel that could encourage bulls to catch any falling price action.
-638319217694072842.png)
XNG/USD (Daily Chart)
Natural Gas FAQs
What fundamental factors drive the price of Natural Gas?
Supply and demand dynamics are a key factor influencing Natural Gas prices, and are themselves influenced by global economic growth, industrial activity, population growth, production levels, and inventories. The weather impacts Natural Gas prices because more Gas is used during cold winters and hot summers for heating and cooling. Competition from other energy sources impacts prices as consumers may switch to cheaper sources. Geopolitical events are factors as exemplified by the war in Ukraine. Government policies relating to extraction, transportation, and environmental issues also impact prices.
What are the main macroeconomic releases that impact on Natural Gas Prices?
The main economic release influencing Natural Gas prices is the weekly inventory bulletin from the Energy Information Administration (EIA), a US government agency that produces US gas market data. The EIA Gas bulletin usually comes out on Thursday at 14:30 GMT, a day after the EIA publishes its weekly Oil bulletin. Economic data from large consumers of Natural Gas can impact supply and demand, the largest of which include China, Germany and Japan. Natural Gas is primarily priced and traded in US Dollars, thus economic releases impacting the US Dollar are also factors.
How does the US Dollar influence Natural Gas prices?
The US Dollar is the world’s reserve currency and most commodities, including Natural Gas are priced and traded on international markets in US Dollars. As such, the value of the US Dollar is a factor in the price of Natural Gas, because if the Dollar strengthens it means less Dollars are required to buy the same volume of Gas (the price falls), and vice versa if USD strengthens.
- AUD/NZD drops and prints a fresh four-month low at 1.0680 as RBA kept doors open for further interest rate hikes.
- The RBA kept interest rates steady at 4.10% as expected by market participants.
- On Wednesday, the RBNZ is expected to keep interest rates steady at 5.5%.
The AUD/NZD pair printed a fresh four-month low at 1.0680 on Tuesday after the Reserve Bank of Australia (RBA) announced an unchanged interest rate decision. The maintenance of a status quo from RBA policymakers was anticipated by market participants.
In August, the Australian Consumer Price Index (CPI) accelerated to 5.2% on a monthly basis from the 4.9% reading in July due to rising fuel prices. The impact of higher energy prices was limited as RBA policymakers considered core inflationary pressures for policymaking. This allowed the RBA to keep interest rates unchanged at 4.10% for the fourth time in a row.
As inflation is more than double the required rate, RBA Governor Philip Lowe left doors open for further policy tightening. RBA Lowe cited that inflation has come down from its peak but is still too high and the achievement of price stability in a reasonable timeframe is the board’s priority.
Last week, a poll from Reuters showed that the RBA will keep interest rates unchanged but one hike of 25 basis points (bps) is possible, which will push interest rates to 4.35%.
About the economic outlook, RBA Lowe remains upbeat citing that inflation is coming down, the labor market remains strong and the economy is operating at a high level of capacity utilization.
On the New Zealand front, investors await the monetary policy from the Reserve Bank of New Zealand (RBNZ), which will be announced on Wednesday. RBNZ Governor Adrian Orr is expected to deliver a neutral interest rate policy. The next monetary policy meeting in November is going to be crucial as policymakers will have inflation figures for the July-September quarter.
The quarter-end flows effect has faded. Kit Juckes, Chief Global FX Strategist at Société Générale, analyzes the FX market outlook.
What to own amid the chaos?
The USD/JPY pair seems doomed to spike higher once it breaks 150, and if that pressure on CNH, then another leg down for AUD, NZD and to a lesser extent CAD will follow too.
What to own amid the chaos? Short AUD/CAD, short GBP/NOK and GBP/SEK (or EUR/NOK, EUR/SEK and EUR/CHF) look like the tactical trades for now.
- Gold price remains under pressure as Fed policymakers see one more interest rate hike this year.
- A resilient US economy could slow down progress in the inflation battle.
- After an upbeat US Manufacturing PMI, investors shifted focus to the labor market data.
Gold price (XAU/USD) continues its decline, pressured by multiple headwinds. Federal Reserve (Fed) policymakers support one more interest rate increase in the remainder of 2023 as a resilient United States economy could slow down the progress against inflation. Apart from that, a strong improvement in the US Manufacturing PMI despite higher interest rates has strengthened the economic outlook.
The US economy has been performing strongly, based on parameters such as labor market conditions and consumer spending. Meanwhile, the manufacturing sector has been underperforming. A meaningful recovery in factory activity would strengthen the US economy further and make inflation more stubborn ahead, which would warrant more interest rate hikes from the Fed.
Daily Digest Market Movers: Gold price faces pressure amid multiple headwinds
- Gold price drops to near $1,820.00 after closing in red for six trading sessions in a row.
- The precious metal is expected to deliver more downside as Federal Reserve policymakers favored more interest rate hikes as the US manufacturing sector appears to be reviving.
- The message from Cleveland Fed Bank President Loretta Mester was ‘loud and clear’ that the Fed is not done with hiking interest rates. Mester said that one more interest rate hike is well-needed this year and that rates are required to remain high for a longer period. Interest rates should remain high for long enough until the central bank assesses the impact of policy-tightening already in place, she said.
- In addition to Mester, Fed Governor Michelle Bowman projected one more interest rate hike by 25 basis points (bps) to 5.50%-5.75% by the year-end if inflation progress slows.
- Meanwhile, Fed Governor Michael Barr expressed caution about how long interest rates should be held higher to bring down core inflation to 2%. Barr said that the US economy is resilient and price stability could be achieved without dampening job growth.
- The US economy is resilient on the grounds of labor market conditions and consumer spending. After the stronger-than-expected PMI data, a recovery in the factory sector is expected to strengthen the US economy further.
- On Monday, the Institute for Supply Management (ISM) reported an improvement in US factory activity. The Manufacturing PMI jumped to 49.0, much higher than estimates and the former release of 47.7 and 47.6, respectively.
- Despite the strong improvement, the Manufacturing PMI remained below the 50.0 threshold for the 11th time in a row, suggesting that the sector remains in contraction. The New Orders Index also outperformed expectations, jumping to 49.2 from the August reading of 46.8.
- A strong order book and upbeat labor market conditions indicate that the Manufacturing PMI could achieve the 50.0 benchmark in the upcoming months.
- The optimism for the Manufacturing PMI achieving the 50.0 yardstick is also backed by commentary from Fed chair Jerome Powell after engaging with small business owners in York, Pennsylvania, on Monday.
- After listening to concerns about higher inflation interest rates, and persistent labor shortages, Fed Powell assured that inflation would come down to 2% and emphasized the importance of strong labor market conditions.
- Meanwhile, investors await the Employment Change data for September by Automatic Data Processing (ADP), which is scheduled for Wednesday. As per the estimates, the US economy created 160K jobs against the 177K increase recorded in August.
- Before that, investors await the JOLTS Job Openings data for August, which will be published at 14:00 GMT. According to estimates, employers posted 8.83 million job vacancies in August, broadly unchanged from July’s reading of 8.827M.
- The US Dollar Index (DXY) refreshes a 10-month high at 107.20, supported by a hawkish stance from Fed policymakers, upbeat Manufacturing PMI data, and a cautious market mood.
Technical Analysis: Gold price sees support near $1,800
Gold price finds buying interest near $1,820.00 after an intense sell-off while the broader bias remains bearish due to multiple headwinds. The precious metal trades near a fresh six-month low and is expected to find support near the crucial support at $1,800.00. A bear cross, represented by the 20-day and 200-day Exponential Moving Averages (EMAs), warrants more downside. Momentum oscillators indicate strength in the bearish impulse.
Inflation FAQs
What is inflation?
Inflation measures the rise in the price of a representative basket of goods and services. Headline inflation is usually expressed as a percentage change on a month-on-month (MoM) and year-on-year (YoY) basis. Core inflation excludes more volatile elements such as food and fuel which can fluctuate because of geopolitical and seasonal factors. Core inflation is the figure economists focus on and is the level targeted by central banks, which are mandated to keep inflation at a manageable level, usually around 2%.
What is the Consumer Price Index (CPI)?
The Consumer Price Index (CPI) measures the change in prices of a basket of goods and services over a period of time. It is usually expressed as a percentage change on a month-on-month (MoM) and year-on-year (YoY) basis. Core CPI is the figure targeted by central banks as it excludes volatile food and fuel inputs. When Core CPI rises above 2% it usually results in higher interest rates and vice versa when it falls below 2%. Since higher interest rates are positive for a currency, higher inflation usually results in a stronger currency. The opposite is true when inflation falls.
What is the impact of inflation on foreign exchange?
Although it may seem counter-intuitive, high inflation in a country pushes up the value of its currency and vice versa for lower inflation. This is because the central bank will normally raise interest rates to combat the higher inflation, which attract more global capital inflows from investors looking for a lucrative place to park their money.
How does inflation influence the price of Gold?
Formerly, Gold was the asset investors turned to in times of high inflation because it preserved its value, and whilst investors will often still buy Gold for its safe-haven properties in times of extreme market turmoil, this is not the case most of the time. This is because when inflation is high, central banks will put up interest rates to combat it.
Higher interest rates are negative for Gold because they increase the opportunity-cost of holding Gold vis-a-vis an interest-bearing asset or placing the money in a cash deposit account. On the flipside, lower inflation tends to be positive for Gold as it brings interest rates down, making the bright metal a more viable investment alternative.
- GBP/JPY eyes more downside below 180.50 as a BoJ’s intervention in the FX domain cannot be ruled out.
- The BoJ will continue with its expansionary monetary policy to keep inflation above 2% through wage growth.
- BoJ Mann favored for more interest rate hikes as more inflation shocks are imminent.
The GBP/JPY pair attracts bids near 180.50 while the broader bias remains bearish as a stealth intervention by the Bank of Japan (BoJ) in the FX domain remains inevitable. The Japanese yen has been weakening as the BoJ is consistently favoring an expansionary monetary policy to ensure a sustainable inflation above the 2% target.
The Japanese Yen is inch far from the crucial 150.00 level against the US Dollar and authority has already warned that they are closely watching FX moves with a high sense of urgency. The BoJ is expected to continue with an easy monetary policy to keep inflation above target through wage growth and not external factors. Therefore, a stealth intervention is the last resort for BoJ policymakers.
While the Pound Sterling weakens due to economic turmoil as United Kingdom’s Manufacturing PMI continues to remain in the contraction territory. The S&P Global reported factory activities in September at 44.3, marginally higher than expectations and the former release of 44.2. The economic data remains below the 50.0 threshold for the 14th straight period as firms cut on inventory and laborforce due to weak domestic and overseas demand.
The expectation for a slowdown in the UK economy elevated on Monday after Bank of England (BoE) policymaker Katherine Mann delivered a hawkish interest rate outlook. BoE Mann said that interest rates have reached near restrictive level but more rate hikes are well-need the more inflation shocks cannot be ruled.
The BoE unexpectedly paused its policy-tightening cycle on September 21, kept interest rates unchanged at 5.25% while investors anticipated an interest rate hike by 25 basis points (bps).
“We don't see a stagflation prospect in the euro area, European Central Bank (ECB) Governing Council member,” Tuomas Välimäki, said on Tuesday.
“It appears we can avoid a wage-price spiral in the eurozone,” Välimäki added.
Market reaction
EUR/USD was last seen trading at 1.0490, up 0.13% on the day.
Monday’s price action set markets back on the short-bonds/long-USD track that has been the norm since mid-July. Economists at ING analyze USD outlook.
Markets are steadily back on a short-bond/long-dollar track
The USD 2-year swap rate climbed back above 5.0% on Monday, which might now work as a floor with the Fed sending hawkish messages and barring a turn for the worst in US data in the near term. The residual gap between the dot plot projections and market pricing for 2023 and 2024 also indicates good chances that USD short-term rates can build some support.
Volatility in back-end yields should continue to determine the direction of FX moves.
Another bearish leg to 4.75%+ in US 10-year bonds can probably keep DXY on track to hit 108.00 in the near future.
Economist at UOB Group Lee Sue Ann suggests the RBNZ could pause its hiking cycle at its event later in the week.
Key Quotes
There is a risk that the RBNZ may raise its OCR once more by 25bps. But we think the RBNZ will opt to pause at the Oct meeting and will likely wait till the 29 Nov one, with the benefit of having the 2Q23 CPI figures (17 Oct).
There will also be a Monetary Policy Statement accompanying the Nov announcement, which will provide details about the outlook for inflation and interest rates.
- USD/CHF receives downward pressure due to the Soft Swiss inflation data.
- Economic indicators suggest bullish momentum in the price movement.
- The major level at September’s high emerges as the immediate barrier, aligned to 0.9250 major level.
USD/CHF traces the upward path on the second day due to the firmer US data and weaker-than-expected Switzerland’s inflation figures. The Swiss Consumer Price Index (CPI) for September, increased to 1.7% (YoY) from the previous 1.6% rise, falling short of expectations at 1.8%.
On a monthly basis, inflation dipped to 0.1%, below the market consensus of flat 0.0%. The downbeat data has led to a loss of momentum for the Swiss Franc (CHF) against the US Dollar.
The current upward momentum in the pair suggests a bullish bias, with the 14-day Relative Strength Index (RSI) holding above the 50 level. The USD/CHF pair trades higher around the 0.9200 psychological level during the European session on Tuesday, followed by September’s high at the 0.9225 level.
A firm break above the level could open the doors for the pair to explore the region around the 0.9250 major level.
On the downside, the psychological level at 0.9150 could act as immediate support aligned with the seven-day Exponential Moving Average (EMA) at 0.9135.
A firm break below the latter could push the USD/CHF pair to navigate the region around 0.9100, following the 23.6% Fibonacci retracement at 0.9062.
The Moving Average Convergence Divergence (MACD) indicator is signaling strength for the Dollar bulls, with the MACD line positioned above the centerline and the signal line. This setup indicates potentially strong momentum in the USD/CHF price movement.
USD/CHF: Daily Chart
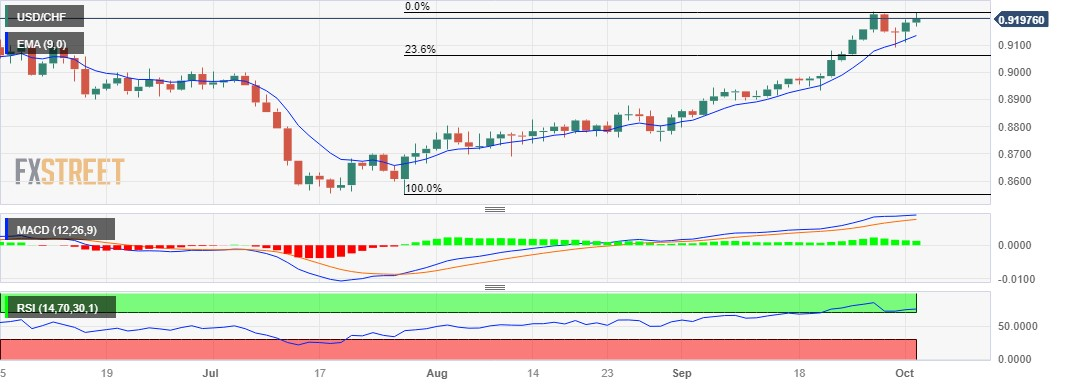
The Australian Dollar depreciated again in September but the drop was more modest than in August. Economists at MUFG Bank analyze Aussie’s outlook.
AUD downside risks initially with reversal going into 2024
If US yields continue to grind higher it is very likely that we will see lows around where we got to last September/October time (0.6200).
Whether China developments reinforce the move lower or help support AUD remains unclear but at this juncture, we see the China pessimism as likely to continue over the short term which will likely add to downside pressure for AUD/USD.
If we do go lower in AUD/USD we would expect the move to reverse as US economic activity slows into year-end and China policy stimulus starts to show through in China data.
Further side-lined trade looks the name of the game for USD/CNH for the time being, comment UOB Group’s Markets Strategist Quek Ser Leang and Senior FX Strategist Peter Chia.
Key Quotes
24-hour view: Last Friday, USD dropped to a low of 7.2812 and then rebounded. Yesterday (Monday), we indicated that “the rebound has room to extend, but it is unlikely to break the strong resistance level at 7.3200.” The anticipated advance exceeded our expectations as USD broke above 7.3200 and reached 7.3229. Upward momentum has improved, albeit not much. USD could continue to advance, but today it is highly unlikely to reach the major resistance at 7.3600 (there is another resistance at 7.3400). On the downside, if USD breaks below 7.3070 (minor support is at 7.3150), it would indicate that USD is not advancing further.
Next 1-3 weeks: Our latest narrative was from last Friday (29 Sep, spot at 7.2975), wherein “if USD breaks clearly below 7.2800, it could trigger a rapid drop to 7.2600.” USD then dropped to 7.2812 and rebounded. Yesterday, USD broke above our ‘strong resistance’ level at 7.3200. The momentum buildup has faded. In other words, USD is not ready to break below 7.2800. From here, USD is likely to trade in a range, probably between 7.2800 and 7.3600.
Open interest in in natural gas futures markets increased for the third consecutive session on Monday, this time by around 5.5K contracts according to preliminary readings from CME Group. In the same direction, volume went up by nearly 7K contracts after three daily drops in a row.
Natural Gas: Bullish attempts appear limited by $3.00
Prices of natural gas dropped to multi-day lows at the beginning of the week. The continuation of the leg lower came in tandem with rising open interest and volume and exposes a deeper decline in the very near term. On the upside, the $3.00 mark per MMBtu continues to be a solid resistance for bulls for the time being.
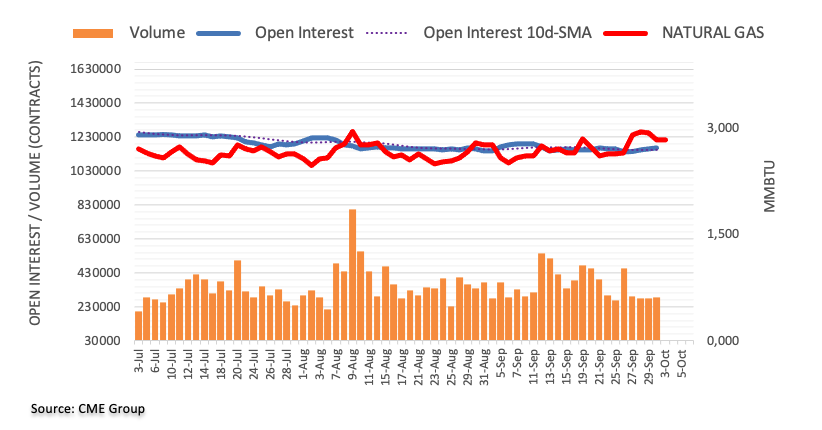
- JOLTS report will be watched closely by Fed officials ahead of September jobs data.
- Job openings are forecast to hold steady at around 8.8 million on the last business day of August.
- US labor market conditions remain out of balance despite Fed rate hikes.
The Job Openings and Labor Turnover Survey (JOLTS) will be released on Tuesday by the US Bureau of Labor Statistics (BLS). The publication will provide data about the change in the number of job openings in August, alongside the number of layoffs and quits.
JOLTS data will be scrutinized by market participants and Federal Reserve policymakers because it could provide valuable insights regarding the supply-demand dynamics in the labor market, a key factor driving up salaries and inflation.
What to expect in the next JOLTS report?
The number of job openings on the last business day of August is forecast to stay little changed at around 8.8 million. "Over the month, the number of hires and total separations changed little at 5.8 million and 5.5 million, respectively," the BLS noted in July’s JOLTS. "Within separations, quits (3.5 million) decreased, while layoffs and discharges (1.6 million) changed little," the publication further read.
Job openings have declined steadily since April, falling from 10.3 million to 8.8 million in July. Following the September policy meeting, Federal Reserve (Fed) Chairman Jerome Powell acknowledged that the supply and demand in the labor market continued to come into a better balance but noted that conditions were still tight. Although the revised Summary of Economic Projections showed that the majority of policymakers saw it appropriate to raise the policy rate one more time before the end of the year, market participants are still pricing in a more than 50% probability that the interest rate will be held steady at the 5.25%-5.5% range this year, according to the CME Group FedWatch Tool.
FXStreet Analyst Eren Sengezer shares his view on the importance of the JOLTS Job Openings data and the potential market reaction:
“Growing fears over a government shutdown in the US triggered a sell-off in US government bonds toward the end of September and surging yields provided a boost to the US Dollar (USD). With US Congress passing a stopgap funding bill to avert a shutdown until November 17, investors could shift their attention back to US data releases and their potential impact on the Fed’s policy outlook.”
“Ahead of Friday’s September jobs report, a smaller-than-expected Job Openings reading, at or below 8.5 million, could attract dovish Fed bets and weigh on the USD. On the other hand, an unexpected increase in the data with a print of 9.5 million or higher could provide a boost to the currency. Given the USD’s overbought conditions, however, the market reaction to a weak figure is likely to be more severe than a reaction to a positive surprise.”
When will the JOLTS report be released and how could it affect EUR/USD?
Job openings data will be published at 14:00 GMT. EUR/USD closed every week of September in the red and lost 2.5% on a monthly basis. If the JOLTS report reaffirms cooling conditions in the labor market, the pair could gather recovery momentum.
Eren points out key technical levels to watch for EUR/USD ahead of JOLTS data:
“EUR/USD dropped below the lower limit of the descending regression channel coming from late July and the Relative Strength Index (RSI) indicator on the daily chart dropped below 30 early Tuesday, suggesting that the pair could stage a correction before the next leg lower”
“1.0500 (static level, psychological level) aligns as a key pivot point for the pair. If EUR/USD fails to reclaim that level and continues to use it as resistance, 1.0415 (static level from November 2022) could be set as the next bearish target before 1.0350 (static level from May 2022). On the flip side, buyers could show interest if the pair climbs out of the descending channel by stabilizing above 1.0600. Above that level, 1.0650 (20-day Simple Moving Average) could be seen as next resistance before 1.0700 (static level, psychological level)”
Economic Indicator
United States JOLTS Job Openings
JOLTS Job Openings is a survey done by the US Bureau of Labor Statistics to help measure job vacancies. It collects data from employers including retailers, manufacturers and different offices each month.
Read more.Next release: 10/03/2023 14:00:00 GMT
Frequency: Monthly
Source: US Bureau of Labor Statistics
USD/JPY could still advance further and surpass the key 150.00 hurdle in the short-term horizon, according to UOB Group’s Markets Strategist Quek Ser Leang and Senior FX Strategist Peter Chia.
Key Quotes
24-hour view: We highlighted yesterday that “the strong rebound in USD has room to extend, but a clear break of 150.00 is unlikely.” Our view was not wrong as USD rose to a high of 149.90. The upside bias remains intact, and today there is a chance for USD to break above 150.00. However, the next resistance at 150.50 is unlikely to come into view. Support is at 149.60, followed by 149.30.
Next 1-3 weeks: Our update from yesterday (02 Oct, spot at 149.50) is still valid. As highlighted, USD could edge upwards, but any advance is likely part of a higher range of 148.50/150.50. In other words, a clear break above 150.50 is unlikely.
CME Group’s flash data for crude oil futures markets noted traders reduced their open interest positions for the third consecutive session on Monday, this time by around 1.3K contracts. Volume followed suit and shrank for the third straight session, now by around 55.8K contracts.
WTI meets initial support near $88.00
WTI prices extended the corrective decline on Monday, closing below the key $90.00 mark per barrel. The daily downtick, however, was on the back of declining open interest and volume and suggests that further retracements seem not favoured in the very near term. In the meantime, the $88.00 region per barrel emerges as quite a decent support for the time being.
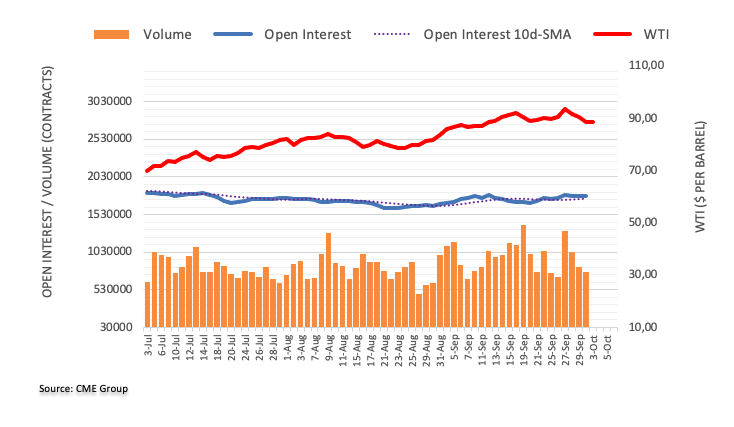
EUR/USD looks on track to test the 1.0400 support level, economists at ING report.
Back-end yield premium weighing on the Euro
The 10 bps tightening in the EUR/USD 2-year swap rate differential on Friday was completely erased on Monday, with the spread once again at a -120 bps level. Such a wide gap was observed in two other periods in 2023 – at the very beginning of January and throughout February and March. Interestingly, EUR/USD never traded below 1.0500 in those periods, a testament to the back-end US-yields premium currently adding pressure on the pair.
Latest CFTC figures on speculative positioning suggest EUR/USD still had some residual net-longs (+14% of open interest) to be unwound, and the ever-deteriorating rate gap with the Dollar means that 1.0400 may well be tested this week. Swings in the volatile bond market will likely determine when that can happen.
- USD/CAD retreats a few pips from over a six-month high touched earlier this Tuesday.
- Rebounding Oil prices and a modest USD pullback from the YTD top act as a headwind.
- The fundamental backdrop and technical setup seem tilted in favour of bullish traders.
The USD/CAD pair gains positive traction for the third straight day on Tuesday and climbs to its highest level since late March, albeit retreats a few pips during the first half of the European session. Spot prices currently trade with modest intraday gains, around the 1.3700 mark, though the fundamental backdrop supports prospects for a further near-term appreciating move.
A modest recovery in the equity markets prompts some profit-taking around the safe-haven US Dollar (USD). Apart from this, rebounding Crude Oil prices underpin the commodity-linked Loonie and act as a headwind for the USD/CAD pair. That said, rising bets for further policy tightening by the Federal Reserve (Fed) should limit any meaningful USD corrective decline. This, along with firming expectations that the Bank of Canada (BoC) is finished hiking interest rates, validates the near-term positive outlook for the major.
From a technical perspective, the recent solid rebound from the vicinity of the 100-day Simple Moving Average (SMA), around the 1.3400 mark, and the subsequent move up favours bullish traders. Moreover, oscillators on the daily chart are holding in the positive territory and are still far from being in the overbought zone. This, in turn, suggests that the path of least resistance for the USD/CAD pair is to the upside. Some follow-through buying beyond the daily high, around the 1.3715 area, will reaffirm the constructive outlook.
Spot prices might then surpass an intermediate hurdle near the 1.3755-1.3760 region and aim to reclaim the 1.3800 round-figure mark. The upward trajectory could get extended further and allow the USD/CAD pair to challenge the YTD peak, around the 1.3860 area touched on March 10.
On the flip side, the Asian session low, around mid-1.3600s, should protect the immediate downside ahead of the 1.3610-1.3600 horizontal support. The latter should act as a key pivotal point for short-term traders, which if broken decisively might prompt some technical selling and pave the way for deeper losses. The corrective decline might then drag the USD/CAD pair further below mid-1.3500s intermediate support, towards testing the 1.3500 psychological mark. The 1.3465 area, however, is likely to limit any further near-term losses.
That said, a convincing break below the latter will expose the 1.3400 support, or the 100-day SMA, which if broken decisively will shift the bias in favour of bearish traders. The USD/CAD pair might then turn vulnerable to accelerate the fall towards the 1.3320 area before eventually dropping to the 1.3300 mark en route to the next relevant support near the 1.3240 region.
USD/CAD daily chart

Technical levels to watch
GBP/USD looks on track to test the 1.2000 support level, economists at ING report.
1.2000 in sight
The GBP/USD 2-year swap rate gap has shrunk to only 17 bps – from a 135 bps peak in July – after the combined effect of a hawkish Fed and dovish Bank of England repricing. That swap rate gap is consistent with GBP/USD trading around current levels and a break below 1.2000 would not be an aberration compared to recent history.
Should we see the 1.2000 support collapse, the 1.1830 March low is the next support level to watch.
- EUR/GBP extends gains for a second successive month.
- BoE’s decision to pause the rate-hiking cycle weakens the Pound Sterling.
- Investors await ECB officials to deliver speeches during the week, seeking fresh cues on the ECB’s stance.
EUR/GBP extends its gains for the fourth successive day, trading higher around 0.8670 during the European trading hours on Tuesday.
The British Pound (GBP) is grappling with a relative underperformance, primarily driven by the Bank of England's (BoE) unexpected decision to pause its rate-hiking cycle in September. This marked a departure from the trend observed since December 2021, as the BoE opted not to raise interest rates.
The central bank also revised its growth forecast for the July-September period from 0.4% to just 0.1%, providing little indication of its intent to pursue further rate increases. Coupled with the prevailing strong bullish sentiment surrounding the US Dollar (USD), these factors pose obstacles for the Pound Sterling (GBP).
Furthermore, the UK S&P Global/CIPS Manufacturing PMI for September rose to 44.3 from the previous 44.2, in line with expectations.
On the Euro’s side, speculation is rife in the market regarding a potential impasse in policy changes at the European Central Bank (ECB), despite inflation levels surpassing the bank's objective and growing concerns about a potential recession.
Traders and investors are closely monitoring any indications or statements from the ECB to gain insights into the central bank's approach to addressing current economic challenges.
On Monday, Germany's HCOB Manufacturing PMI declined to 39.6 from the previous reading of 39.8, contrary to expectations of it remaining unchanged in September. Meanwhile, the Eurozone's PMI and Unemployment Rate held steady at 43.4 and 6.4%, respectively, as anticipated.
The upcoming week is set to feature a series of speeches from ECB officials, with particular attention likely focused on President Christine Lagarde's address at a monetary policy conference scheduled for Wednesday. These communications are expected to provide further clarity on the ECB's stance and potential policy directions.
AUD/USD drifts to 11-month low on RBA hold. Economists at Société Générale analyze the pair’s outlook.
Regaining downward momentum
AUD/USD has experienced multiple attempts of rebound since August however it has consistently failed to reclaim the hurdle at 0.6525 which is also the 50-DMA. Break below lower limit of recent range denotes regain of downward momentum.
The pair is now drifting towards potential objective of 0.6300 representing the trend line connecting lows of March and May. There is risk of a deeper downtrend if it struggles to cross above previous range limit at 0.6370.
Next projections are located at 0.6200/0.6170.
Here is what you need to know on Tuesday, October 3:
Following a quiet start to the new week, the US Dollar (USD) benefited from surging US Treasury bond yields in the American session on Monday. The US Dollar Index touched its highest level since November above 107.00 and went into a consolidation phase early Tuesday. Later in the session, August JOLTS Job Openings data will be featured in the US economic docket alongside IBD/TIPP Economic Optimism Index for October.
US Dollar price this week
The table below shows the percentage change of US Dollar (USD) against listed major currencies this week. US Dollar was the strongest against the Australian Dollar.
| USD | EUR | GBP | CAD | AUD | JPY | NZD | CHF | |
| USD | 0.74% | 0.84% | 0.90% | 1.73% | 0.15% | 1.36% | 0.62% | |
| EUR | -0.75% | 0.10% | 0.17% | 0.98% | -0.57% | 0.64% | -0.12% | |
| GBP | -0.83% | -0.08% | 0.07% | 0.91% | -0.68% | 0.53% | -0.21% | |
| CAD | -0.90% | -0.16% | -0.02% | 0.82% | -0.73% | 0.47% | -0.28% | |
| AUD | -1.73% | -0.97% | -0.87% | -0.82% | -1.57% | -0.35% | -1.11% | |
| JPY | -0.16% | 0.57% | 0.69% | 0.74% | 1.52% | 1.22% | 0.46% | |
| NZD | -1.37% | -0.64% | -0.53% | -0.48% | 0.35% | -1.22% | -0.76% | |
| CHF | -0.62% | 0.12% | 0.22% | 0.28% | 1.10% | -0.46% | 0.76% |
The heat map shows percentage changes of major currencies against each other. The base currency is picked from the left column, while the quote currency is picked from the top row. For example, if you pick the Euro from the left column and move along the horizontal line to the Japanese Yen, the percentage change displayed in the box will represent EUR (base)/JPY (quote).
The benchmark 10-year US T-bond yield climbed to a multi-year-high above 4.7% on Monday. Wall Street's main indexes opened in positive territory but closed mixed, with the Dow Jones Industrial Average losing 0.22% and the Nasdaq Composite gaining 0.83% on a daily basis. In the European morning, US stock index futures trade virtually unchanged on the day.
During the Asian trading hours, the Reserve Bank of Australia (RBA) announced that it left the policy rate unchanged at 4.1% as expected. In the policy statement, the RBA repeated that some further tightening of the monetary policy may be required. AUD/USD came under renewed bearish pressure following the RBA's inaction and declined toward 0.6300, touching its lowest level in nearly a year in the process.
EUR/USD fell to a new 2023-low below 1.0460 in the Asian session on Tuesday before staging a modest rebound toward 1.0500.
After failing to stabilize above 1.2200, GBP/USD extended its downtrend and dropped below 1.2100 for the first time since March.
Pressured by surging US yields, Gold price suffered heavy losses on Monday and continued to push lower early Tuesday. After falling to a new multi-month low below $1,820, XAU/USD staged a technical correction and recovered toward $1,830 by the European morning.
USD/JPY turned sideways slightly below the critical 150.00 level during the Asian trading hours as investors moved to the sidelines on growing expectations of an intervention in the foreign exchange market. Japanese Finance Minister Shunichi Suzuki said that they stand ready to respond to movements in exchange markets but refrained from commenting on currency intervention.
Economists at MUFG Bank turn cautious INR in the near-term but remain positive on India’s macro over the medium to long term.
USD/INR likely to trade in a higher range of between 82.00 and 84.00
We turn cautious on INR in the near-term, and raise our USD/INR forecast to 83.70 in three months and 82.00 in 12 months, with USD/INR likely to trade in a higher range of between 82.00 and 84.00.
We are positive over the medium-term picture for capital flows in India. First, bond index inclusion should bring at least $20bn of flows starting June 2024 or even earlier. Second, FDI should also improve given existing investment commitments. On inflation, we saw some moderation in tomato prices, but upside risks to food prices remain given the weak monsoon.
We expect RBI to remain hawkish, and now see the first cut starting Sep 2024.
- Pound Sterling prints fresh six-month low after short-lived pullback as UK slowdown fears remain intact.
- UK firms cut labor force on inventory backlog due to vulnerable demand.
- BoE Mann supported further rate-tightening as more inflation shocks remain imminent.
The Pound Sterling (GBP) witnessed a sell-off on Monday after a pullback move and has extended the downside move on Tuesday as investors foresee a slowdown in the United Kingdom’s economy due to economic turmoil. The GBP/USD pair weakened after S&P Global reported the Manufacturing PMI contracted for the 14th time in a row in September as firms underutilized their capacity, cut inventories sharply, and trimmed their workforce amid a poor demand outlook.
While investors think the Bank of England (BoE) is done hiking interest rates after it paused its policy-tightening spell last month to avert recession fears, policymaker Katherine Mann has a different verdict from her teammates. BoE Mann still favors more interest rate hikes and keeps them permanently higher as inflation shocks are likely to be more frequent.
Daily Digest Market Movers: Pound Sterling weakens as risk-aversion theme intensifies
- Pound Sterling refreshes six-month low near 1.2070 as investors rush to safe-haven assets due to deepening global slowdown fears.
- The UK economy is failing to cope with the consequences of higher interest rates from the Bank of England.
- UK factory activities improved marginally in September. S&P Global reported its Manufacturing PMI at 44.3, marginally higher than expectations and the former release of 44.2, but it remains below the 50.0 threshold for the 14th straight period as firms continue to operate on lower capacity due to deteriorating demand.
- S&P Global said, "The end of the third quarter saw the downturn at UK manufacturers continue. Output, new orders, and employment were all cut back further, amid weaker intakes of new work from both domestic and overseas clients."
- On Monday, the British Retail Consortium (BRC) reported annual shop price inflation at 6.2%, the lowest since September 2022 and a lower pace than 6.9% in August. This indicates that consumer inflation may continue to fall further as retail demand slows.
- Investors should note that strong labor demand and higher food inflation were major contributors to the UK’s stubborn inflation. The British labor force has been laid off in the past two months, and food inflation softened significantly from its all-time high of 19.1% to 13.6% in August.
- While inflation is progressively easing in the past few months, BoE policymaker Katherine Mann still supports further interest rate hikes ahead. BoE’s most hawkish rate-setter said that interest rates have only just reached restrictive territory.
- BoE Mann further added that policymakers are facing a “world where inflation shocks are likely to be more frequent” with stronger price growth, meaning interest rates will need to be permanently higher, as reported by Bloomberg.
- On the UK political front, UK Finance Minister Jeremy Hunt supports freezing the size of the government workforce, which should be followed by a cut that will save 1 billion Pounds. The attempt was made to make peace with his own party’s workers, who actively favor tax cuts.
- The market mood remains downbeat as European and Asia-Pacific economies are expecting a slowdown due to a poor demand environment.
- The risk-off market mood improves the appeal of the US Dollar, pushing the US Dollar Index (DXY) to a fresh 10-month high at 107.21.
- Investors rushed to the US Dollar after a significant improvement in the US Manufacturing PMI data for September. The Institute of Supply Management (ISM) reported factory activities at 49.0 against estimates of 47.7 and the August reading of 47.6.
- Despite a strong rebound, the Manufacturing PMI failed to climb above the 50.0 threshold, which indicates that contraction in manufacturing continues.
Technical Analysis: Pound Sterling prints fresh six-month low near 1.2070
The Pound Sterling faced an intense sell-off on Monday after slipping below Friday’s low of 1.2180 as it resulted in an activation of the Gravestone Doji candlestick pattern. The GBP/USD pair refreshed its six-month low near 1.2070 and is expected to continue the downside spree. Declining 20 and 50-day Exponential Moving Averages (EMAs) indicate that the short-term trend is bearish. Momentum oscillators continue to trade on a bearish trajectory.
BoE FAQs
What does the Bank of England do and how does it impact the Pound?
The Bank of England (BoE) decides monetary policy for the United Kingdom. Its primary goal is to achieve ‘price stability’, or a steady inflation rate of 2%. Its tool for achieving this is via the adjustment of base lending rates. The BoE sets the rate at which it lends to commercial banks and banks lend to each other, determining the level of interest rates in the economy overall. This also impacts the value of the Pound Sterling (GBP).
How does the Bank of England’s monetary policy influence Sterling?
When inflation is above the Bank of England’s target it responds by raising interest rates, making it more expensive for people and businesses to access credit. This is positive for the Pound Sterling because higher interest rates make the UK a more attractive place for global investors to park their money. When inflation falls below target, it is a sign economic growth is slowing, and the BoE will consider lowering interest rates to cheapen credit in the hope businesses will borrow to invest in growth-generating projects – a negative for the Pound Sterling.
What is Quantitative Easing (QE) and how does it affect the Pound?
In extreme situations, the Bank of England can enact a policy called Quantitative Easing (QE). QE is the process by which the BoE substantially increases the flow of credit in a stuck financial system. QE is a last resort policy when lowering interest rates will not achieve the necessary result. The process of QE involves the BoE printing money to buy assets – usually government or AAA-rated corporate bonds – from banks and other financial institutions. QE usually results in a weaker Pound Sterling.
What is Quantitative tightening (QT) and how does it affect the Pound Sterling?
Quantitative tightening (QT) is the reverse of QE, enacted when the economy is strengthening and inflation starts rising. Whilst in QE the Bank of England (BoE) purchases government and corporate bonds from financial institutions to encourage them to lend; in QT, the BoE stops buying more bonds, and stops reinvesting the principal maturing on the bonds it already holds. It is usually positive for the Pound Sterling.
- USD/JPY trades below the highest level in eleven months.
- Traders watch for BoJ’s intervention, which could limit the losses of the Japanese Yen.
- US Treasury yields elevate, providing support to the US Dollar.
USD/JPY hovers around 149.80 during the early European trading session on Tuesday, slightly below its highest level in eleven months. The Bank of Japan (BoJ) continues to maintain its ultra-loose monetary policy framework, as indicated by its recent announcement of an unscheduled bond-purchasing exercise on Monday.
This action is intended to address the rising yields in Japanese government bonds, signaling the central bank's commitment to its accommodative monetary stance.
However, Bank of Japan (BoJ) Governor Kazuo Ueda reiterated the central bank's stance, emphasizing that they will not hesitate to implement additional easing measures if deemed necessary. Ueda clarified that a recent comment regarding a "quiet exit" from monetary easing was misinterpreted.
The US Dollar Index (DXY) has surged to an 11-month high, hovering around 107.10. This strength in the Greenback is attributed to the rise in US Treasury yields. The 10-year US Treasury yield has surpassed its highest level since 2007, standing at 4.68% by the press time, following the avoidance of a partial government shutdown in the United States (US).
Moreover, market caution regarding the interest rates trajectory set by the US Federal Reserve (Fed) is contributing to the positive sentiment for the US Dollar (USD). This caution could lead to increased demand for the US Dollar as a safe-haven currency.
Market participants await the US employment data, with the release of the ADP report on Wednesday and the Nonfarm Payrolls on Friday.
- The Euro succumbs to further US Dollar’s strength.
- Stocks in Europe open Monday’s session on the defensive.
- EUR/USD retreats to new 2023 lows around 1.0460.
- The USD Index (DXY) advances to fresh tops north of 107.00.
- JOLTs Job Openings will take centre stage later in the session.
The Euro (EUR) accelerates its losses against the US Dollar (USD), dragging EUR/USD to the area of new YTD lows around 1.0460 on Tuesday.
In the meantime, the march north in the Greenback remains everything but abated for yet another session, navigating past the 107.00 hurdle when measured by the USD Index (DXY) for the first time since late November 2022. It is worth noting that the index has entered its 12th consecutive week of gains.
The monetary policy outlook remains unchanged, as investors maintain their expectation of a 25-bps interest rate hike by the Federal Reserve (Fed) before the year concludes. Simultaneously, market discussions persist regarding a potential halt in policy adjustments at the European Central Bank (ECB), despite inflation levels surpassing the bank's target and growing concerns about a potential recession or even stagflation in the region.
The lack of data releases in the domestic docket leaves attention to the publication of the JOLTs Job Openings for the month of August and the IBD/TIPP Economic Optimism index.
Daily digest market movers: Euro remains well under pressure on USD-buying
- The EUR extends the retracement vs. the USD.
- US and German yields appear slightly bid so far on Tuesday.
- Markets anticipate one further rate rise by the Fed before the end of the year.
- Investors anticipate a stalemate in the ECB's tightening drive.
- The RBA left the OCR unchanged at 4.10%, as expected.
- Concerns about FX intervention remain strong around USD/JPY.
Technical Analysis: Next on the downside emerges 1.0290
EUR/USD faces increasing selling pressure and prints new lows for the year in the 1.0460/55 band on Tuesday.
On the downside, the continuation of the downward should prompt EUR/USD to meet the next support at the round level of 1.0300 prior to minor support at the weekly lows of 1.0290 (November 30 2022) and 1.0222 (November 21 2022).
In case of occasional bullish attempts, the pair should encounter the next up-barrier at the weekly high of 1.0767 (September 12), before reaching the crucial 200-day SMA at 1.0825. If the pair breaks beyond this level, it may set up a challenge of the weekly top at 1.0945 (August 30) and the psychological barrier of 1.1000. The surpass of the latter might prompt the pair to test the August peak of 1.1064 (August 10) ahead of the weekly high of 1.1149 (July 27) and the 2023 top of 1.1275. (July 18).
However, it is critical to remember that as long as the EUR/USD remains below the 200-day SMA, the possibility of more negative pressure exists.
Euro FAQs
What is the Euro?
The Euro is the currency for the 20 European Union countries that belong to the Eurozone. It is the second most heavily traded currency in the world behind the US Dollar. In 2022, it accounted for 31% of all foreign exchange transactions, with an average daily turnover of over $2.2 trillion a day.
EUR/USD is the most heavily traded currency pair in the world, accounting for an estimated 30% off all transactions, followed by EUR/JPY (4%), EUR/GBP (3%) and EUR/AUD (2%).
What is the ECB and how does it impact the Euro?
The European Central Bank (ECB) in Frankfurt, Germany, is the reserve bank for the Eurozone. The ECB sets interest rates and manages monetary policy.
The ECB’s primary mandate is to maintain price stability, which means either controlling inflation or stimulating growth. Its primary tool is the raising or lowering of interest rates. Relatively high interest rates – or the expectation of higher rates – will usually benefit the Euro and vice versa.
The ECB Governing Council makes monetary policy decisions at meetings held eight times a year. Decisions are made by heads of the Eurozone national banks and six permanent members, including the President of the ECB, Christine Lagarde.
How does inflation data impact the value of the Euro?
Eurozone inflation data, measured by the Harmonized Index of Consumer Prices (HICP), is an important econometric for the Euro. If inflation rises more than expected, especially if above the ECB’s 2% target, it obliges the ECB to raise interest rates to bring it back under control.
Relatively high interest rates compared to its counterparts will usually benefit the Euro, as it makes the region more attractive as a place for global investors to park their money.
How does economic data influence the value of the Euro?
Data releases gauge the health of the economy and can impact on the Euro. Indicators such as GDP, Manufacturing and Services PMIs, employment, and consumer sentiment surveys can all influence the direction of the single currency.
A strong economy is good for the Euro. Not only does it attract more foreign investment but it may encourage the ECB to put up interest rates, which will directly strengthen the Euro. Otherwise, if economic data is weak, the Euro is likely to fall.
Economic data for the four largest economies in the euro area (Germany, France, Italy and Spain) are especially significant, as they account for 75% of the Eurozone’s economy.
How does the Trade Balance impact the Euro?
Another significant data release for the Euro is the Trade Balance. This indicator measures the difference between what a country earns from its exports and what it spends on imports over a given period.
If a country produces highly sought after exports then its currency will gain in value purely from the extra demand created from foreign buyers seeking to purchase these goods. Therefore, a positive net Trade Balance strengthens a currency and vice versa for a negative balance.
The New Zealand Dollar actually advanced marginally versus the US Dollar in September and was the best performing G10 currency. Economists at MUFG Bank analyze Kiwi’s outlook.
NZD holding up well but near-term risks still to the downside
The resilience of NZD in part reflected some improved optimism over the outlook for growth following the much stronger-than-expected real GDP growth in Q2. However, the breakdown of the GDP data suggests some caution over the outlook ahead.
A general election will take place on 14th October and the main opposition party, which is polling well, has promised to return the RBNZ policy mandate to inflation only and implement a more restrained fiscal stance.
Yield will help limit NZD downside for now before modest recovery takes hold as the Fed embarks on monetary easing in H1 2024.
The Reserve Bank of Australia kept rates unchanged. Economists at TD Securities highlight takeaways from the meeting.
RBA to keep the target cash rate at current levels until Q3 of next year
The RBA sticks to its central inflation forecast to get inflation back within the 2-3% target range by late 2025 citing recent data, wage growth, and medium-term inflation expectations as consistent with that goal. As such, the RBA appears in no pressing rush to hike.
China risks are unlikely to force the RBA to hike this year, leaving an outsized CPI print later this month or in November as the only real catalyst for the Bank to act by year-end. We expect the RBA to keep the target cash rate at current levels until Q3 of next year but view China risks potentially adding to the case for an insurance hike next year.
- Crude oil prices extend losses due to the hawkish sentiment on the Fed’s interest rates trajectory.
- Turkey made an announcement to resume operations on a pipeline from Iraq; weighing on oil prices.
- US Treasury yields rose after the US averted a partial government shutdown, bolstering the US Dollar.
Western Texas Intermediate (WTI) oil price trades lower around $87.70 per barrel. The Crude oil prices are experiencing a fourth consecutive day of losses, having declined by 1.0% during the early Asian trading session on Tuesday. Despite this downward trend, there has been a slight recovery, with prices trimming some of the intraday losses.
Turkey's announcement that it will resume operations on a pipeline from Iraq, after being suspended for about six months, has added further pressure on oil prices.
OPEC+ is anticipated to maintain its current output settings when it convenes on Wednesday. This decision is expected to keep oil supplies tight, impacting the overall supply and demand balance in the market.
OPEC+ meetings are closely monitored by market participants as they have a significant influence on oil prices and the global energy landscape.
As per a Reuters survey, Saudi Arabia is expected to increase its November official selling price of Arab Light crude to Asia for the fifth consecutive month.
US Dollar Index (DXY) climbed to an 11-month high, trading around 107.10 by the press time. The Greenback strengthens on the back of higher US Treasury yield.
The 10-year US Treasury yield rose above its highest level since 2007 after the United States (US) averted a partial government shutdown. The spot price stands at 4.68% at the time of writing.
The market caution surrounding the US Federal Reserve’s (Fed) interest rates trajectory is reinforcing the positive sentiment for US Dollar (USD).
Furthermore, the mixed United States (US) data released on Monday, reinforced the Greenback. US ISM Manufacturing PMI improved to 49.0 in September from 47.6 in the previous reading, above the market consensus of 47.7. Manufacturing Prices Paid fell significantly from 48.4 to 43.8. The Employment Index rose from 48.4 to 51.2.
Federal Reserve (Fed) Governor Michelle Bowman expressed on Monday that it seems appropriate to further increase the policy rate and sustain it at restrictive levels for an extended period.
In contrast, Fed Vice Chair for Supervision Michael Barr stressed a cautious approach to monetary policy. Barr highlighted the importance of considering interest rates trajectory. Nevertheless, Barr is optimistic that the Fed can navigate inflation without causing significant harm to the job market.
Oil traders await the US employment data, with the release of the ADP report on Wednesday and the Nonfarm Payrolls on Friday.
Indian government bonds will be included in the JP Morgan GBI EM Index from June 2024 onwards. Economists at Société Générale note that the announcement is positive for the currency and bond yields.
Another positive catalyst for assets
The recent announcement to include Indian Government bonds into JPM GBI EM Global Diversified Index is bullish for INR rates and significantly limits downside risks in the currency.
Given the current market conditions (higher Oil prices and US yields), the bullish outcomes from the inclusion could be realised later into 2024 – closer to the actual inclusion (June 2024).
We lower our 2Q24 and 3Q24 forecasts for 10y bond yields by 20 bps and 30 bps respectively and maintain our current view on the INR.
A potential rally in the currency could be counteracted by RBI’s accumulation of reserves. However, the currency should continue to outperform on a total returns basis.
- USD/CHF holds above the 0.9200 mark following the Swiss CPI data.
- The Swiss Consumer Price Index (CPI) for September came in at 1.7% YoY vs. 1.6% prior, worse than expected.
- The business conditions in the US manufacturing sector continued to contract in September.
- Market players will focus on the US JOLTS Job Openings for August due on Tuesday.
The USD/CHF pair gains traction above 0.9200 during the early European session on Tuesday. The upside of the pair is bolstered by the firmer US data and the weaker-than-expected Swiss inflation data.
The latest data from the Swiss Federal Statistical Office revealed on Tuesday that the nation’s Consumer Price Index (CPI) for September came in at 1.7% YoY from the previous reading of 1.6%, worse than the expectation of 1.8%. On a monthly basis, the inflation figure fell to 0.1%% versus a 0.2% rise prior, below than the market consensus of 0%. In response to the downbeat data, the Swiss Franc (CHF) loses momentum against the US Dollar.
On the US dollar front, the business conditions in the US manufacturing sector continued to contract in September. The US ISM Manufacturing PMI came in at 49.0 in September versus 47.6 prior, above the market consensus of 47.7. Furthermore, the Prices Paid Index dropped from 48.4 to 43.8. The Employment Index grew from 48.4 to 51.2. Finally, the New Orders Index rose from 46.8 to 49.2.
The Federal Reserve (Fed) Bank of Cleveland President, Loretta Mester, stated earlier on Tuesday that the Fed will likely need to raise interest rates again this year and the Fed's monetary policy path will depend on how the economy performs. In addition, Fed Governor Michelle Bowman stated on Monday that it will likely be necessary to raise the policy rate further and maintain it at restrictive levels for an extended period of time. That said, the higher-for-longer rate narrative in the US boosts the Greenback and acts as a tailwind for the USD/CHF pair.
Looking ahead, traders await the US JOLTS Job Openings for August due on Tuesday. The attention will shift to the US employment data later this week, including the US ADP report on Thursday and the US Nonfarm Payrolls, Average Hourly Earnings, and Unemployment Rate on Friday. Traders will take cues from these figures and find trading opportunities around the USD/CHF pair.
European Central Bank (ECB) Chief Economist, Philip Lane, made some comments on the bloc’s inflation outlook.
Key quotes
We won't make progress to 2% inflation as quickly as we would to 4%.
Services inflation is now a big contributor.
Food inflation is still a substantial issue.
We don't expect the current low gas price to be maintained.
Services are very connected to the energy sector.
Related reads
- ECB’s Šimkus: Inflation is on its way down
- EUR/USD Price Analysis: Attracts some sellers below 1.0470 amid the oversold condition
OPEC countries' new strategy is driving up Oil prices. Economists at Natixis analyze the big difference between the effects of high Oil prices on the US and the Eurozone.
The Eurozone is getting poorer relative to the US
The new strategy of the OPEC countries, with their production cuts, will result in fairly high Oil prices for the long term.
Since the US is an Oil exporter and the Eurozone is an Oil importer, a high Oil price increases US real income and reduces Eurozone real income.
For every $10 rise in the price of Oil, the US becomes 0.11% richer as a percentage of US GDP and the Eurozone becomes 1.65% poorer as a percentage of Eurozone GDP.
This enrichment of the US and impoverishment of the Eurozone will therefore probably be long-lasting since the new strategy of OPEC countries is also long-lasting.
European Central Bank (ECB) Governing Council Gediminas Šimkus said on Tuesday, “Inflation is on its way down.”
Further comments
The prompt response of monetary policy was effective.
Inflation still faces many lines of resistance.
Rates need to stay restrictive to tame prices.
Market reaction
EUR/USD is lingering in YTD lows near 1.0460 on the above comments, down 0.08% on the day.
- NZD/USD weakens due to the Fed’s hawkish tone regarding interest rates trajectory.
- Market expects RBNZ to maintain rates at the current level of 5.50%.
- US Treasury yields rose after the US averted a partial government shutdown, bolstering the US Dollar.
NZD/USD extends its losses on the second consecutive day, trading around 0.5910 during the Asian session on Tuesday. The US Dollar Index (DXY) climbed to an 11-month high, trading around 107.10 by the press time.
The Greenback strengthens on the back of higher US Treasury yield. The 10-year US Treasury yield rose above its highest level since 2007 after the United States (US) averted a partial government shutdown. The spot price stands at 4.68% at the time of writing.
Additionally, the market caution surrounding the US Federal Reserve’s (Fed) interest rates trajectory is reinforcing the positive sentiment for US Dollar (USD).
Furthermore, the mixed United States (US) data released on Monday, reinforced the Greenback. US ISM Manufacturing PMI improved to 49.0 in September from 47.6 in the previous reading, above the market consensus of 47.7. Manufacturing Prices Paid fell significantly from 48.4 to 43.8. The Employment Index rose from 48.4 to 51.2.
Federal Reserve (Fed) Governor Michelle Bowman expressed on Monday that it seems appropriate to further increase the policy rate and sustain it at restrictive levels for an extended period.
In contrast, Fed Vice Chair for Supervision Michael Barr stressed a cautious approach to monetary policy. Barr highlighted the importance of considering interest rates trajectory. Nevertheless, Barr is optimistic that the Fed can navigate inflation without causing significant harm to the job market.
Traders await the US employment data, with the release of the ADP report on Wednesday and the Nonfarm Payrolls on Friday.
On the Kiwi side, the Reserve Bank of New Zealand (RBNZ) is set to announce its interest rate decision on Wednesday. The market anticipates that the RBNZ will maintain rates at the current level of 5.50%. However, traders will closely watch the accompanying statement for any indications of a potential future rate hike, which could limit the downside of the Kiwi pair.
The New Zealand Institute of Economic Research reported the business outlook for the third quarter. NZIER Business Confidence data reported a decrease of 52%, which is an improvement from the previous 63% decline.
In the view of UOB Group’s Markets Strategist Quek Ser Leang and Senior FX Strategist Peter Chia, extra downside in NZD/USD is likely to meet a tough support around 0.5880.
Key Quotes
24-hour view: Yesterday, we expected NZD to consolidate. Our expectation was incorrect as it plunged to a low of 0.5944 before ending the day on a weak note at 0.5948 (-0.84%). Unsurprisingly, the rapid drop is oversold, but with no signs of stabilisation just yet, NZD is likely to weaken further. However, any decline is unlikely to reach 0.5880 today (there is another support at 0.5910). Resistance is at 0.5970, followed by 0.5990.
Next 1-3 weeks: After NZD soared to a high of 0.6044 last Friday (29 Sep), we highlighted that “the improving upward momentum suggests NZD could test and potentially break above the resistance at 0.6050.” We added, “a breach of 0.5930 would suggest that NZD is not ready to test 0.6050.” NZD then fell sharply and reached a low of 0.5944 in NY. While our ‘strong support’ level has not been breached yet, the buildup in upward momentum has fizzled out. Not only that, but downward momentum is also building. From here, as long as NZD stays below 0.6010 in the next few days, NZD is likely to weaken. That said, any decline is likely to face strong support at 0.5880. This support level is followed closely by another strong support at 0.5860 (the low in Sep).
- Silver price can find some support near the $21.00 mark on Tuesday.
- The upbeat US data lifted the USD broadly and weigh on the XAG/USD.
- The first resistance level is seen at $21.68; $20.65 acts as an initial support level.
Silver price (XAG/USD) recovers some lost ground around $21.00 during the early European session on Tuesday. However, the upside of the silver price seems to be limited. The firmer US Dollar (USD) and higher US Treasury yields are the main factors that exert some selling pressure on XAG/USD.
Meanwhile, the US Dollar Index (DXY), a measure of the value of the USD relative to a basket of foreign currencies, climbs to 107.20, the highest level since November last year. The US Treasury yields also edge higher on Tuesday, with the US 10-Y yield staying at 4.69%, the highest level since 2007.
On Monday, the US ISM Manufacturing PMI came in at 49.0 in September from 47.6 in the previous reading, above the market consensus of 47.7. This figure showed that business activity in the US manufacturing sector continued to contract. The upbeat US data lifted the USD across to board and exert some selling pressure on the precious metal.
Traders will focus on the US JOLTS Job Openings for August due on Tuesday. Later this week, the US ISM Services PMI and ADP report will be released on Wednesday. The highlight of the week will be the US Nonfarm Payrolls on Friday. These events could give a clear direction to the silver price.
Silver price (XAG/USD) technical outlook
From the technical perspective, silver price holds below the 50- and 100-hour Exponential Moving Averages (EMAs) with a downward slope on the one-hour chart, which means the path of the least resistance is to the downside. Additionally, the Relative Strength Index (RSI) is located in the bearish territory below 50, supporting the sellers for the time being.
Resistance level: $21.68 (the upper boundary of the Bollinger Band, 50-hour EMA), $22.10 (100-hour EMA), and $22.83 (a high of September 28)
Support level: $20.65 (the lower limit of the Bollinger Band), $20.00 (a low of March 7), and $19.63 (a high of October 28, 2022)
XAG/USD one-hour chart
-638319104097582424.png)
FX option expiries for Oct 3 NY cut at 10:00 Eastern Time, via DTCC, can be found below.
- EUR/USD: EUR amounts
- 1.0495 1.3b
- 1.0600 480m
- GBP/USD: GBP amounts
- 1.2100 555m
- USD/JPY: USD amounts
- 149.25 506m
- 149.80 495m
- 150.00 1.1b
- USD/CHF: USD amounts
- 0.9300 473m
- USD/CAD: USD amounts
- 1.3500 300m
- 1.3600 1.2b
- 1.3675 888m
- EUR/GBP: EUR amounts
- 0.8505 310m
- The index accelerates its upside beyond the 107.00 hurdle.
- Higher US yields underpin the strong rally in the greenback.
- JOLTs Job Openings next on tap in the US docket.
The USD Index (DXY), which tracks the greenback vs. a bundle of its main rival currencies, extends the robust uptrend above the 107.00 barrier to print new 2023 peaks on turnaround Tuesday.
USD Index looks at yields, data, Fed
The index advances for the third consecutive session and adds to the positive start of the week, recording new yearly peaks in levels last seen in November 2022, north of 107.00 the figure.
The equally sharp move higher in US yields across the curve also underpins the pronounced uptick in the dollar, which has been in place since mid-July and has entered its 12th consecutive week of gains so far.
The continuation of the upside bias in the greenback appears propped up by speculation of further tightening by the Federal Reserve (an extra rate hike is priced in before year-end), a view that has been reinforced by hawkish comments from FOMC M. Bowman on Monday.
In the US docket, the release of the JOLTs Job Openings will be in the limelight later in the NA session seconded by the speech by Atlanta Fed R. Bostic (2024 voter, hawk).
What to look for around USD
The greenback trades in a firmer note and surpasses the 107.00 hurdle to print new YTD highs on Tuesday.
In the meantime, support for the dollar keeps coming from the good health of the US economy, which at the same time appears underpinned by the renewed tighter-for-longer stance narrative from the Federal Reserve.
Key events in the US this week: JOLTs Job Openings (Tuesday) – MBA Mortgage Applications, ADP Employment Change, Final Services PMI, ISM Services PMI, Factory Orders (Wednesday) - Initial Jobless Claims, Balance of Trade (Thursday) – Nonfarm Payrolls, Unemployment Rate, Consumer Credit Change (Friday).
Eminent issues on the back boiler: Persevering debate over a soft or hard landing for the US economy. Incipient speculation of rate cuts in early 2024. Geopolitical effervescence vs. Russia and China.
USD Index relevant levels
Now, the index is gaining 0.13% at 107.16 and a breakout of 107.19 (2023 high October 3) would open the door to 107.99 (weekly high November 21 2022) and finally 110.99 (high November 10 2022). On the other hand, initial support emerges at 104.42 (weekly low September 11) ahead of 103.12 (200-day SMA) and then 102.93 (weekly low August 30).
Further weakness could drag GBP/USD to the 1.2000 zone in the next few weeks, note UOB Group’s Markets Strategist Quek Ser Leang and Senior FX Strategist Peter Chia.
Key Quotes
24-hour view: After GBP rose to a high of 1.2271 last Friday, we indicated yesterday that “the short-lived advance did not lead to any buildup in momentum, and GBP is unlikely to advance further.” We expected GBP to consolidate in a range of 1.2145/1.2255. Instead of consolidating, GBP plunged to a low of 1.2086. While severely oversold, there is room for GBP to weaken further. However, the major support at 1.2000 is likely out of reach for now (there is another support at 1.2050). On the upside, if GBP breaks above 1.2155 (minor resistance is at 1.2120), it would mean that the weakness in GBP has stabilised.
Next 1-3 weeks: Our most recent narrative was from last Friday (29 Sep, spot at 1.2200), wherein the recent month-long weakness has ended, and GBP could consolidate in a range of 1.2100/1.2380 for the time being. We did not expect GBP to drop below 1.2100 so quickly, as it plummeted to a low of 1.2086 in NY trade. The rapid decline suggests that the weakness in GBP has resumed, likely towards 1.2000. In order to maintain the momentum buildup, GBP must not move above 1.2190, the current of ‘strong resistance’ level.
Considering advanced prints from CME Group for gold futures markets, open interest increased for the second session in a row on Monday, this time by around 1.3K contracts. Volume, instead, shrank by around 43.6K contracts amidst the ongoing choppy performance.
Gold: On its way to $1800?
Gold prices extended its marked decline for yet another session on Monday. The move was against the backdrop of rising open interest, which is indicative that further losses could still be in store for the commodity in the very near term. The next contention of note is expected around the 2023 low at $1804 per troy ounce (February 28).
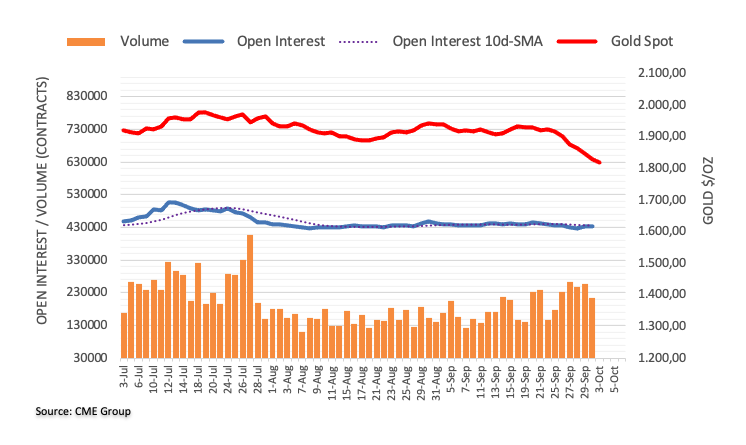
- GBP/USD loses momentum and holds below the mid-1.2000s on Tuesday.
- The pair holds below the 50- and 100-hour EMAs with an oversold RSI condition.
- The immediate resistance level is seen at 1.2107; 1.2050 acts as an initial support level.
The GBP/USD pair extends its downside and trades in negative territory for the fifth consecutive week during the early European trading session on Tuesday. The sell-off of the pair is supported by the firmer US Dollar (USD) and the hawkish stance of the Federal Reserve (Fed). GBP/USD currently trades around 1.2066, losing 0.16% on the day.
Technically, GBP/USD holds below the 50- and 100-hour Exponential Moving Averages (EMAs) with a downward slope on the one-hour chart, which means further downside looks favorable.
The immediate resistance level for GBP/USD will emerge near the middle line of the Bollinger Band at 1.2107. The additional upside filter to watch is 1.2145 (the 50-hour EMA). The key barrier for the pair is located near the confluence of the upper boundary of the Bollinger Band and the 100-hour EMA at 1.2170. Further north, a psychological round mark at 1.2200 will be the next stop.
On the flip side, any decisive follow-through selling below the lower limit of the Bollinger Band at 1.2050 will see a drop to 1.2010 (a low of March 15). The next contention level is seen at 1.1965 (a low of February 16) en route to 1.1925 (a low of March 2).
It’s worth noting that the Relative Strength Index (RSI) holds in bearish territory below 50. However, the oversold RSI condition indicates that further consolidation cannot be ruled out before positioning for any near-term GBP/USD depreciation.
GBP/USD one-hour chart
-638319070569590989.png)
UOB Group’s Markets Strategist Quek Ser Leang and Senior FX Strategist Peter Chia suggest EUR/USD could weaken further and even break below 1.0400.
Key Quotes
24-hour view: The sharp selloff that sent EUR to a fresh year’s low of 1.0475 came as a surprise (we were expecting range trading). While the rapid decline appears to be overdone, there is no sign of stabilisation just yet. Today, EUR is likely to weaken further, but the support level at 1.0430 could be out of reach. On the upside, 1.0535 (minor resistance is at 1.0505) is likely strong enough to cap any intraday rebound.
Next 1-3 weeks: Yesterday (02 Oct, spot at 1.0560), we highlighted that EUR “appears to have entered a consolidation phase,” and we expected it to trade in a range between 1.0495 and 1.0650. We did not anticipate EUR to plunge to a fresh year’s low of 1.0475. The price action suggests that EUR is not in a consolidation phase. Instead, it is still likely in a bearish phase. From here, as long as EUR remains below 1.0565, it is likely to weaken to 1.0430, potentially below 1.0400.
- Asian shared decline across the board amid worries about a deeper global economic downturn.
- The spillover effect from the recent slump in the US fixed-income market weighs on the sentiment.
- Fears of contagion from China Evergrande's debt crisis further dampen investors' risk appetite.
Asian shares fell on Tuesday, with Japan's Nikkei, Hong Kong's Hang Seng Index and Australia's S&P/ASX 200 Index falling anywhere between 1% to 3%. The initial optimistic market reaction led by a deal to avoid a US government shutdown and signs that China's economy has begun to bottom out fades rather quickly in the wake of the recent slump in Treasuries, triggered by the Federal Reserve's (Fed) hawkish outlook.
Fed officials continue to back the case for further policy tightening to bring inflation back to the 2% target, reaffirming bets for at least one more rate hike by the end of this year. This, in turn, pushed the yield on the benchmark 10-year US government bond to its highest level since 2007, fueling concerns about economic headwinds stemming from rising borrowing costs and tempering investors' appetite for perceived riskier assets.
Furthermore, persistent worries about China's ailing property sector take a toll on the global risk sentiment. Meanwhile, shares of China Evergrande jumped over 40% in a volatile trade on Tuesday, touching its highest level since September 25. After being suspended last Thursday, the resumption of trading raises hopes of potential progress in debt restructuring and boosts the Evergrande's stock, though risks of the company being liquidated are increasing.
The ongoing investigation complicates the world's most indebted developer's restructuring plan. Moreover, Reuters reported last Tuesday that a major Evergrande offshore creditor group was planning to join a liquidation court petition filed against the developer if it does not submit a new debt revamp plan by the end of October. This raises fears of a contagion, which might continue to weigh on investors' sentiment and cap any attempted recovery.
- EUR/USD loses traction below the 1.0500 psychological mark on Tuesday.
- The major pair holds below the 50- and 100-hour EMAs on the four-hour chart amid the oversold RSI condition.
- The key support level is seen at 1.0400; the immediate resistance level will emerge at 1.0577.
The EUR/USD pair extends its downside around 1.0465 after breaking below the 1.0500 mark during the Asian trading hours on Tuesday. The downtick of the major pair to the fresh year-to-date (YTD) lows is supported by the stronger US Dollar (USD) broadly and the sign of ending the rate hike cycle by the European Central Bank (ECB).
According to the four-hour chart, EUR/USD holds below the 50- and 100-hour Exponential Moving Averages (EMAs) with a downward slope, which means the path of least resistance for the pair is to the downside. The Relative Strength Index (RSI) holds in bearish territory below 50. However, the oversold condition indicates that further consolidation cannot be ruled out before positioning for any near-term EUR/USD depreciation.
That said, any decisive follow-through selling below the lower limit of the Bollinger Band at 1.0465 will see a drop to a psychological round figure at 1.0400. The next contention is located near a low of September 25 at 1.0355. Further south, the next stop of the major pair is seen at 1.0320 (a low of November 29).
On the upside, the immediate resistance level for EUR/USD will emerge near the 50-hour EMA at 1.0577. The critical barrier to watch is the confluence of the upper boundary of the Bollinger Band and the 100-hour EMA at 1.0630. The additional upside filter is seen at 1.0670 (a high of September 22), followed by a psychological figure at 1.0700.
EUR/USD four-hour chart
-638319040095957867.png)
- Gold price drifts lower for the seventh day and drops to a near seven-month trough.
- The Fed’s hawkish outlook, elevated US bond yields and a bullish USD continue to weigh.
- A softer risk tone does little to lend support to the safe-haven XAU/USD or stall the decline.
Gold price (XAU/USD) has been trending lower after the Federal Reserve (Fed) warned that sticky inflation was likely to attract at least one more interest rate hike in 2023 and reiterated the higher-for-longer narrative in September. Moreover, the incoming resilient macro data from the United States (US) supports prospects for further policy tightening by the Fed and continues to push the US Treasury bond yields higher. This, in turn, lifts the US Dollar (USD) to its highest level since November 2022 and drives flows away from the non-yielding yellow metal.
The downward trajectory remains uninterrupted for the seventh successive day on Tuesday and drags the Gold price to the $1,815 level, or its lowest level since March 9 during the Asian session. The descent, meanwhile, seems rather unaffected by a generally weaker tone around the equity markets, which tends to benefit the precious metal's relative safe-haven status. This, in turn, suggests that the path of least resistance for the XAU/USD is to the downside. That said, extremely oversold conditions on the daily chart warrant some caution for bearish traders.
Daily Digest Market Movers: Gold price continues losing ground on hawkish Fed expectations
- Gold price registers its longest losing streak since August 2022 in the wake of rising bets for more interest rate hikes by the Federal Reserve.
- Fed officials reiterate that monetary policy will need to stay restrictive for some time to bring inflation back down to the 2% target.
- Fed Governor Michelle Bowman is willing to support raising rates further if the incoming data indicates that progress on inflation has stalled or is too slow.
- Fed Vice Chair Michael Barr said that the important question at this point is how long to hold rates at a sufficiently restrictive level to achieve the goals.
- Cleveland Fed President Loretta Mester also said that risks to inflation are tilted toward the upside and higher rates are needed to make sure the disinflation process continues.
- The US ISM Manufacturing PMI recorded its highest reading since November 2022 and increased to 49.0 in September, marking improvement for the third straight month.
- Moreover, the rise in consumer spending, along with surging gasoline prices, points to higher prices going forward and supports prospects for further policy tightening.
- Markets are now pricing in a 45% chance of another 25 basis point (bps) rate hike this year and the outlook pushes the yield on the benchmark 10-year US government bond to a 16-year peak.
- The US Dollar also advances to its highest level since November 2022 and continues to undermine the Gold price. Bulls fail to gain any respite from a weaker risk tone.
Technical Analysis: Gold price struggles to find any support despite oversold conditions
The Relative Strength Index (RSI) on the daily chart is already flashing oversold conditions, though the lack of any buying interest suggests that the downtrend is still far from being over. That said, it will still be prudent to wait for some near-term consolidation or a modest bounce before positioning for a further depreciating move. Nevertheless, the Gold price remains vulnerable to weakening further towards the $1,800 round-figure mark. Some follow-through selling will expose the next relevant support near the $1,770-1,760 region. On the flip side, any attempted recovery might now confront stiff resistance and remain capped near the $1,830-1,832 horizontal zone. A sustained strength beyond, however, might trigger a short-covering rally and lift the yellow metal to the $1,850 intermediate hurdle en route to the $1,858-1,860 strong barrier.
Interest rates FAQs
What are interest rates?
Interest rates are charged by financial institutions on loans to borrowers and are paid as interest to savers and depositors. They are influenced by base lending rates, which are set by central banks in response to changes in the economy. Central banks normally have a mandate to ensure price stability, which in most cases means targeting a core inflation rate of around 2%.
If inflation falls below target the central bank may cut base lending rates, with a view to stimulating lending and boosting the economy. If inflation rises substantially above 2% it normally results in the central bank raising base lending rates in an attempt to lower inflation.
How do interest rates impact currencies?
Higher interest rates generally help strengthen a country’s currency as they make it a more attractive place for global investors to park their money.
How do interest rates influence the price of Gold?
Higher interest rates overall weigh on the price of Gold because they increase the opportunity cost of holding Gold instead of investing in an interest-bearing asset or placing cash in the bank.
If interest rates are high that usually pushes up the price of the US Dollar (USD), and since Gold is priced in Dollars, this has the effect of lowering the price of Gold.
What is the Fed Funds rate?
The Fed funds rate is the overnight rate at which US banks lend to each other. It is the oft-quoted headline rate set by the Federal Reserve at its FOMC meetings. It is set as a range, for example 4.75%-5.00%, though the upper limit (in that case 5.00%) is the quoted figure.
Market expectations for future Fed funds rate are tracked by the CME FedWatch tool, which shapes how many financial markets behave in anticipation of future Federal Reserve monetary policy decisions.
- USD/INR receives upward support due to the Fed’s hawkish tone.
- RBI is expected to maintain its current interest rates at 6.50% in the upcoming meeting.
- US Dollar surges on the back of elevated US Treasury yields.
USD/INR struggles to snap the recent gains, hovering around 83.20 during the Asian session on Tuesday. US Dollar (USD) benefits due to the market caution surrounding the US Federal Reserve’s (Fed) interest rates trajectory.
The Indian Rupee (INR) trades with a negative bias but market participants expect possible intervention from the Reserve Bank of India (RBI) to support the national currency.
The US Dollar Index (DXY) climbed to an 11-month high on the back of higher US Treasury yield, trading around 107.10 by the press time.
The 10-year US Treasury yield rose above its highest level since 2007 after the United States (US) averted a partial government shutdown. The spot price stands at 4.68% at the time of writing.
Additionally, the mixed United States (US) data released on Monday, reinforced the Greenback. US ISM Manufacturing PMI improved to 49.0 in September from 47.6 in the previous reading, above the market consensus of 47.7. Manufacturing Prices Paid fell significantly from 48.4 to 43.8. The Employment Index rose from 48.4 to 51.2.
Federal Reserve (Fed) Governor Michelle Bowman stated on Monday that it sounds appropriate to raise the policy rate further and maintain it at restrictive levels for an extended period.
Fed Vice Chair for Supervision Michael Barr emphasized a cautious approach to monetary policy. Barr stated that the central bank should be mindful not just of how much interest rates will increase, but also of the duration they will be held at a sufficiently restrictive level. Despite this, Barr believes that the Fed can manage inflation without causing significant harm to the job market.
Traders await the US employment data, with the release of the ADP report on Wednesday and the Nonfarm Payrolls on Friday. RBI Interest Rate Decision will also be eyed on Friday, which is expected to remain consistent at current levels of 6.50%.
- AUD/JPY hovers around 95.05 following the Reserve Bank of Australia (RBA) rate decision.
- RBA decided to hold the rate unchanged at 4.1%, as widely expected.
- BoJ Governor said there was a long way to go for BoJ before exiting its ultra-loose monetary policy.
- The attention will shift to the Australian PMI ahead of the Trade Balance.
The AUD/JPY cross attracts some buyers and hovers around 95.15 during the Asian session on Tuesday. The pair posts modest gains following the Reserve Bank of Australia (RBA) monetary policy meeting. However, the fear of FX intervention by the Japanese authorities might cap the upside of the cross in the next sessions.
The Reserve Bank of Australia (RBA) board members decided to maintain the interest rate unchanged at 4.10% at its October monetary policy meeting on Tuesday. RBA Governor Michele Bullock stated that the central bank needed to see more data before changing the cash rate. Bullock added that the RBA was closely watching the rate of inflation in Australia and that more rate hikes may be required. This, in turn, boosts the Australian Dollar (AUD) against the Japanese Yen (JPY) and acts as a tailwind for the AUD/JPY cross.
On the JPY’s front, Japanese Finance Minister Shunichi Suzuki said on Monday that he was watching currency moves “cautiously”. Additionally, BoJ Governor Kazuo Ueda said on Saturday that there was "a distance to go" for BoJ before exiting its ultra-loose monetary policy. According to the BoJ Summary of Opinions at the Monetary Policy Meeting on September 21 and 22, BOJ said that they do not need to make additional tweaks to YCC as long-term rates moving fairly stably and said that end to negative rate must be tied to the success of achieving 2% inflat
About the data, the overall business conditions of the large manufacturing companies in Japan improved in the third quarter (Q3). The Japanese Tankan Large Manufacturing Index (Q3) came in at 9.0 from 5.0 in the previous reading, above the market consensus of 6.0.
Looking ahead, market participants will keep an eye on the Australian S&P Global Composite PMI and Services PMI for September due on Wednesday. The Australia’s Trade Balance for August will be released on Thursday and Japan’s Labor Cash Earnings will be due on Friday. Traders will take cues from these figures and find trading opportunities around the AUD/JPY cross.
- USD/MXN trades higher due to the Fed's hawkish stance on interest rate trajectory.
- Momentum indicators suggest a potential bullish sentiment in the price dynamics.
- The major level at 17.7200 emerges as the immediate barrier.
USD/MXN continues the gains on the second successive day, trading higher around 17.7150 aligned with the 17.7200 psychological level during the Asian session on Tuesday.
A break above the latter could open the doors for the pair to explore the region around 17.8000 major level, following September’s high at 17.8174.
This upward movement is attributed to the US Dollar (USD) benefiting from the market caution surrounding the US Federal Reserve’s (Fed) interest rates trajectory.
On the downside, the 23.6% Fibonacci retracement at 17.6243 appears to be the key support, following the 38.2% Fibonacci retracement at 17.5049 level.
A firm break below the level could push the USD/MXN pair to navigate the 14-day Exponential Moving Average (EMA) at 17.4347 lined up with the 17.4000 major level.
The current upward momentum in the pair suggests a bullish bias, given that the 14-day Relative Strength Index (RSI) remains above the 50 levels.
The Moving Average Convergence Divergence (MACD) indicator is providing a strong signal for the Dollar bulls. The MACD line lies above the centerline and the signal line. This configuration suggests that there is potentially strong momentum in the USD/MXN's price movement.
USD/MXN: Daily Chart
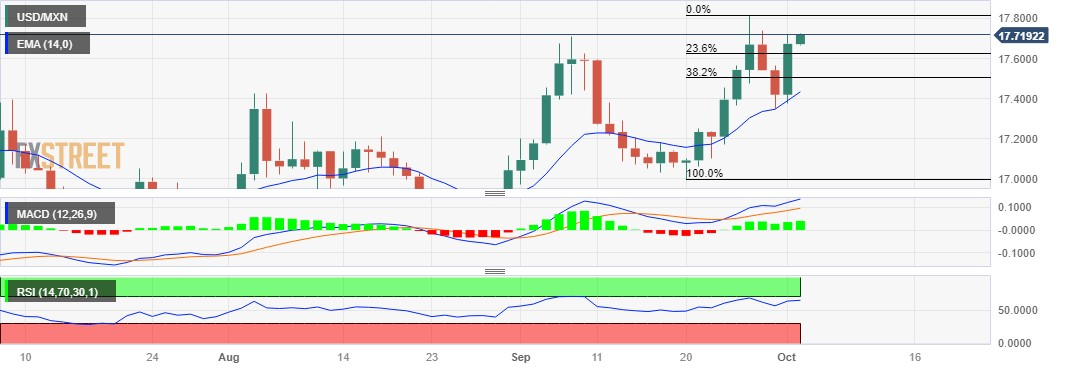
- WTI loses momentum for the fifth straight day on Tuesday.
- Investors fear the impact of higher interest rates on oil consumption.
- The extension of the production cuts by Saudi Arabia and Russia could boost the WTI prices higher.
- Oil traders await the weekly Crude Oil Stock data, US JOLTS Job Openings due on Tuesday.
Western Texas Intermediate (WTI), the US crude oil benchmark, is trading around $86.95 so far on Tuesday. WTI trades in negative territory for the fifth consecutive day and loses traction to a three-week low as the US Dollar (USD) resumes its upward path and investors worry about the impact of higher interest rates on oil consumption.
Data released on Monday revealed that the US ISM Manufacturing PMI came in at 49.0 in September from 47.6 in the previous reading, above the market consensus of 47.7. This figure showed that business activity in the US manufacturing sector continued to contract. The upbeat US data lifted the USD across to board and exerted some selling pressure on the WTI prices. This figure could convince the Federal Reserve (Fed) for an additional rate hike this year. It's worth noting that higher interest rates raise borrowing costs, which can slow the economy and diminish oil demand.
OPEC oil production grew for the second consecutive month in September, led by Nigeria and Iran, despite ongoing market-supporting oil cuts by Saudi Arabia and Russia. That said, the extension of the production cuts could boost the WTI prices higher.
Oil traders will keep an eye on the US JOLTS Job Openings and the weekly Crude Oil Stock from API and EIA for the week ending of September 29 due on Tuesday. Later this week, the US ISM Services PMI and ADP report will be released on Wednesday. The highlight of the week will be the US Nonfarm Payrolls on Friday. These events could significantly impact the USD-denominated WTI price. Oil traders will take cues from the data and find trading opportunities around the WTI prices.
- USD/CAD gains traction for the third straight day and climbs to a fresh multi-month top.
- Retreating Oil prices undermines the Loonie and remains supportive amid a bullish USD.
- The divergent Fed-BoC expectations support prospects for a further appreciating move.
The USD/CAD pair builds on last week's solid bounce from the vicinity of the very important 200-day Simple Moving (SMA) support near the 1.3400 mark and scales higher for the third successive day on Tuesday. Spot prices climb to the highest level since late March during the Asian session, with bulls now awaiting some follow-through strength beyond the 1.3700 round figure before placing fresh bets.
The US Dollar (USD) advances to a fresh 10-month high in the wake of growing acceptance that the Federal Reserve (Fed) will stick to its hawkish stance, bolstered by the incoming resilient US macro data. Adding to this, comments by Cleveland Fed President Loretta Mester reaffirmed market bets that the US central bank will keep interest rates higher for longer. This, in turn, pushes the yield on the benchmark 10-year US government bond to a 16-year peak, which, along with a generally weaker risk tone, continues to benefit the safe-haven Greenback and acts as a tailwind for the USD/CAD pair.
The Canadian Dollar (CAD), on the other hand, is weighed down by firming expectations that the Bank of Canada (BoC) is finished hiking interest rates. Statistics Canada reported on Friday that Canada's economic growth stalled in July as the manufacturing sector posted its biggest decline in more than two years. This comes on top of a 0.2% GDP contraction in June and fueled speculations that the BoC will keep interest rates on hold despite sticky inflation. This, along with a further pullback in Crude Oil prices, undermines the commodity-linked Loonie and lends support to the USD/CAD pair.
Oil prices extend the recent retracement slide from over a one-year top and continue losing ground for the fourth straight day, hitting a three-week low. The ongoing downfall could be attributed to some profit-taking in the wake of concerns that economic headwinds stemming from higher interest rates in the US will dent fuel demand. That said, signs of a tight global supply should help limit the downside. Nevertheless, the fundamental backdrop favours the USD bulls, which, along with the overnight breakout through the 1.3600 mark, support prospects for a further appreciating move for the USD/CAD pair.
Technical levels to watch
| Raw materials | Closed | Change, % |
|---|---|---|
| Silver | 21.042 | -4.92 |
| Gold | 1828.066 | -1.05 |
| Palladium | 1204.67 | -3.35 |
- USD/JPY strengthens due to the increased risk-off sentiment.
- BoJ announced an unscheduled bond-purchasing exercise on Monday.
- Higher US Treasury yields contribute support to underpin the Greenback.
USD/JPY surges to its highest level in eleven months, hovering around the 149.90. This upward movement is attributed to the US Dollar (USD) benefiting from a decline in investor appetite and increased risk-off sentiment, leading to a flow of funds into the safe-haven USD.
The Bank of Japan (BoJ) is persisting in its ultra-loose monetary policy framework, as evidenced by its announcement of an unscheduled bond-purchasing exercise on Monday. This move is aimed at curbing the upward spiral in Japanese government bond yields.
The BoJ's intervention in the bond market is part of its ongoing efforts to maintain monetary accommodation and stabilize financial markets. The central bank often engages in bond-purchasing activities to influence interest rates and ensure liquidity in the financial system.
The US Dollar Index (DXY) climbed to an 11-month high on the back of higher US Treasury yield. The 10-year US Treasury yield rose above its highest level since 2007, which stands at 4.67% at the time of writing.
Additionally, the mixed United States (US) data released on Monday, reinforced the Greenback. US ISM Manufacturing PMI improved to 49.0 in September from 47.6 in the previous reading, above the market consensus of 47.7. Manufacturing Prices Paid fell significantly from 48.4 to 43.8. The Employment Index rose from 48.4 to 51.2.
Federal Reserve (Fed) Governor Michelle Bowman stated on Monday that it sounds appropriate to raise the policy rate further and maintain it at restrictive levels for an extended period.
Fed Vice Chair for Supervision Michael Barr emphasized a cautious approach to monetary policy. Barr stated that the central bank should be mindful not just of how much interest rates will increase, but also of the duration they will be held at a sufficiently restrictive level. Despite this, Barr believes that the Fed can manage inflation without causing significant harm to the job market.
Traders await the US employment data, with the release of the ADP report on Wednesday and the Nonfarm Payrolls on Friday.
Japanese Finance Minister Shunichi Suzuki said on Tuesday that he “will stand ready to respond while closely watching FX moves.”
Additional comments
Important for currencies to move in stable manner reflecting fundamentals.
Will make appropriate steps on FX moves with a high sense of urgency.
Japan's price inflation is affected by weak Yen along with Ukraine situation.
Long-term interest rates are affected by various factors.
Closely watching long-term interest rate, impacts on household lives.
Won't comment on currency intervention.
Currency interventions are not targeting FX levels.
Whether to carry out currency intervention is determined by volatility.
His comments come as the USD/JPY pair remains within striking distance of the alleged intervention level, pegged at 150.00.
At the time of writing, the pair is trading flat at 149.85.
- GBP/USD remains on the defensive near a multi-month trough touched this Tuesday.
- A combination of factors lifts the USD to a fresh YTD top and weighed on the major.
- The BoE's surprise pause continues to weigh on the GBP and favours bearish traders.
The GBP/USD pair is seen oscillating in a narrow trading band below the 1.2100 mark and consolidating its recent losses to the lowest level since March 16 touched during the Asian session this Tuesday. Extremely oversold conditions on the daily chart hold back bearish traders from placing fresh bets, though the fundamental backdrop suggests that the path of least resistance for spot prices is to the downside.
The British Pound (GBP) continues with its relative underperformance in the wake of the Bank of England's (BoE) surprise move to pause its rat-hiking cycle in September. This was the first time since December 2021 that the BoE did not raise interest rates. Adding to this, the UK central bank also lowered its forecast for economic growth in the July-September period to just 0.1% from the previous projection of 0.4% and provided little hints of its intention to raise rates any further. This, along with the underlying strong bullish sentiment surrounding the US Dollar (USD), acts as a headwind for the GBP/USD pair.
The USD Index (DXY), which tracks the Greenback against a basket of currencies, climbs to its highest level since November 2022 and remains well supported by growing acceptance that the Federal Reserve (Fed) will stick to its hawkish stance. In fact, the markets have been pricing in the possibility of at least one more rate hike by the year-end. Adding to this, Cleveland Fed President Loretta Meste said that the US central bank will need to keep rates restrictive to get inflation back to the 2% target. This, in turn, pushes the US Treasury bond yields to a fresh multi-decade high and continues to underpin the USD.
Apart from the Fed's higher-for-longer interest rate narrative, a generally weaker risk tone is seen as another factor benefitting the Greenback's relative safe-haven status and weighing on the GBP/USD pair. The initial market reaction to the mixed Chinese PMIs and the passage of a US stopgap funding bill over the weekend turned out to be short-lived amid worries about economic headwinds stemming from rapidly rising borrowing costs. This continues to drive investors towards traditional safe-haven assets and favours the USD bulls, which, in turn, validates the near-term negative outlook for the major.
Moving ahead, there isn't any relevant market-moving economic data due for release from the UK, leaving the GBP/USD pair at the mercy of the USD price dynamics. Later during the early North American session, traders will take cues from the US JOLTS Job Openings data. This, along with the US bond yields and the broader risk sentiment, will influence the USD price dynamics and provide some impetus. The focus, however, will remain on the US NFP report, due on Friday.
Technical levels to watch
- Australian Dollar extends losses due to a stronger US Dollar.
- Australian Bureau of Statistics showed the number of permits for new construction projects improved in August.
- Higher US Treasury yields bolster the Greenback, coupled with mixed US data.
The Australian Dollar (AUD) continues its losses on Tuesday due to another surge in US Dollar (USD) and US Treasury yields. Additionally, the AUD/USD pair is under pressure ahead of the interest rate decision by the Reserve Bank of Australia (RBA).
Australia’ central bank is expected to remain the interest rate unchanged in the upcoming policy meeting on Tuesday, which puts pressure on the Aussie pair. However, there is a likelihood of hiking it to a peak of 4.35% by the end of this year as inflation remains above target, according to a Reuters poll.
Australian Bureau of Statistics showed the number of permits for new construction projects improved in August. While ANZ Job Advertisements data showed a slump in September from the previous reading.
The US Dollar Index (DXY) extends gains as the 10-year U.S. Treasury yield rose above its highest level since 2007 and the dollar climbed to its highest in almost a year after mixed data from the United States (US) on Monday.
US ISM Manufacturing PMI improved in September from August’s reading. The Manufacturing Employment Index (Sep) also showed improvement but Manufacturing Prices Paid declined in said month.
Daily Digest Market Movers: Australian Dollar falls ahead of RBA interest rate decision, stronger US Dollar
- AUD/USD extends losses, trading lower around 0.6360 at the time of writing on Monday.
- The Aussie Dollar is under pressure ahead of the RBA interest rates decision.
- RBA is expected to keep current interest rates at 4.1% in the upcoming policy meeting on Tuesday.
- Australia’s Building Permits (MoM) rose to 7% compared to the 2.5% expected in August, swinging from the previous 8.1% decline.
- ANZ Job Advertisements data showed a 0.1% decline in September from the previous hike of 1.9%.
- China’s Manufacturing PMI data rose into positive territory. China’s NBS Manufacturing PMI for August grew to 50.2 from the previous 49.7 figures, exceeding the 50.0 expected.
- US ISM Manufacturing PMI improved to 49.0 in September from 47.6 in the previous reading, above the market consensus of 47.7.
- Manufacturing Prices Paid fell significantly from 48.4 to 43.8. The Employment Index rose from 48.4 to 51.2.
- On Friday, bills were successfully passed in the US to avert a government shutdown, securing funding until November 17. This development has prompted a resumption of the US Dollar Index (USD) upward trajectory.
- Federal Reserve (Fed) Governor Michelle Bowman expressed on Monday that it is likely appropriate to raise the policy rate further and maintain it at restrictive levels for an extended period.
- Fed Vice Chair for Supervision Michael Barr emphasized a cautious approach to monetary policy. Barr stated that the central bank should be mindful not just of how much interest rates will increase, but also of the duration they will be held at a sufficiently restrictive level. Despite this, Barr believes that the Fed can manage inflation without causing significant harm to the job market.
- Traders await the US employment data, with the release of the ADP report on Wednesday and the Nonfarm Payrolls on Friday.
Technical Analysis: Australian Dollar hovers around 0.6350, support at September’s low
Australian Dollar trades around 0.6360 aligned with the 0.6350 level. September’s low at 0.6331 emerges as the immediate support, followed by the 0.6300 psychological level. On the upside, the 23.6% Fibonacci retracement at 0.6464 level appears to be a key barrier, followed by the 50-day Exponential Moving Average (EMA) at 0.6475.
AUD/USD: Daily Chart
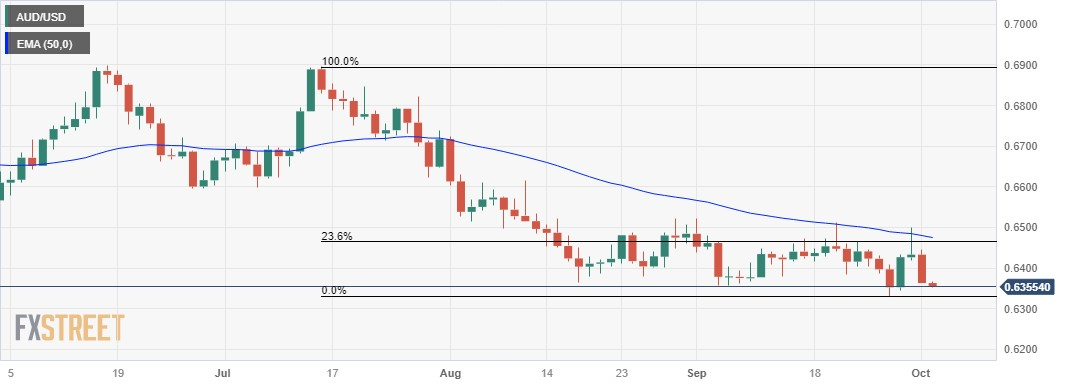
Economic Indicator
Australia RBA Interest Rate Decision
RBA Interest Rate Decision is announced by the Reserve Bank of Australia. If the RBA is hawkish about the inflationary outlook of the economy and raises the interest rates it is positive, or bullish, for the AUD. Likewise, if the RBA has a dovish view of the Australian economy and keeps the ongoing interest rate, or cuts the interest rate it is seen as negative, or bearish.
Read more.Next release: 10/03/2023 03:30:00 GMT
Frequency: Irregular
Source: Reserve Bank of Australia
- Gold continues losing ground for the seventh straight day and drops to a fresh multi-month trough.
- Hawkish Fed expectations, elevated US bond yields and bullish USD continue to weigh on the metal.
- A softer risk tone fails to lend support, though oversold conditions could help limit any further losses.
Gold price (XAU/USD) prolongs its recent well-established downtrend for the seventh successive day and drops to the $1,820 area, its lowest since March 9 during the Asian session on Tuesday.
The Federal Reserve’s (Fed) higher-for-longer interest rate narrative pushes the US Treasury bond yields to a fresh multi-decade high and continues to underpin the US Dollar (USD), which, in turn, is seen undermining the Gold price. Investors now seem convinced that the US central bank will stick to its hawkish stance and have been pricing in the possibility of at least one more rate hike by the end of this year.
The bets were reinforced by Cleveland Fed President Loretta Mester, saying that risks to inflation remain tilted towards the upside and the US central bank will need to keep rates restrictive to get it back to the 2% target. This ensures that the Fed will continue to tighten its monetary policy and turns out to be another factor that further contributes to driving flows away from the non-yielding Gold price.
The ongoing downward trajectory, meanwhile, seems rather unaffected by a generally weaker risk tone, which tends to benefit the precious metal's safe-haven status. The initial market reaction to the mixed Chinese PMIs and the passage of a US stopgap funding bill over the weekend turned out to be short-lived amid worries about a deeper economic downturn, albeit does little to lend any support to the Gold price.
That said, the Relative Strength Index (RSI) on the daily chart is flashing extremely oversold conditions, which might hold back bearish traders from placing fresh bearish bets around the XAU/USD. Nevertheless, the aforementioned fundamental backdrop suggests that the path of least resistance for the Gold price is to the downside and any meaningful recovery attempt might still be seen as a selling opportunity.
Technical levels to watch
- USD/CHF remains confined in a narrow range around 0.9184 on Tuesday.
- Business conditions in the US manufacturing sector continued to contract in September.
- Biden administration has warned China that additional semiconductor export curbs are due early this month.
- Market players will focus on the Swiss inflation data, US JOLTS Job Openings.
The USD/CHF pair holds positive ground for two straight days but remains capped below the 0.9200 barrier during the early Asian session on Tuesday. The uptick of the pair is bolstered by the firmer US dollar (USD), higher US Treasury yield, and the hawkish comments from the Federal Reserve (Fed) officials. The pair currently trades near 0.9184, gaining 0.02% on the day.
The Federal Reserve (Fed) Bank of Cleveland President, Loretta Mester, stated earlier on Tuesday that the Fed will likely need to raise interest rates again this year and that the Fed's monetary policy path will depend on how the economy performs. In addition, Fed Governor Michelle Bowman stated on Monday that it will likely be necessary to raise the policy rate further and maintain it at restrictive levels for an extended period of time.
Fed Vice Chair for Supervision Michael Barr stated that monetary policy should be approached with caution. He stated that the most important question is not how much interest rates will rise, but how long they will remain at a sufficiently restrictive level.
About the data, the Institute for Supply Management (ISM) showed on Monday that business conditions in the US manufacturing sector continued to contract in September. The US ISM Manufacturing PMI came in at 49.0 in September from 47.6 in August, beating the market expectation of 47.7. Furthermore, the Prices Paid Index fell from 48.4 to 43.8. The Employment Index climbed from 48.4 to 51.2. Finally, the New Orders Index grew from 46.8 to 49.2.
On the other hand, the Swiss Consumer Price Index (CPI) will be released later on Tuesday. The annual figure is expected to rise 1.8% in September from 1.6% in the previous reading while the monthly figure is expected to stay at 0% in September to 0.2% in August.
Apart from this, the Biden administration has warned China that additional export restrictions on AI chips and chipmaking tools to China are due early this month, per Reuters. This would be an update around the one-year anniversary of the initial unveiling of the measures on October 7, 2022. The exacerbating tension between the world’s two largest economies should dampen market optimism. This, in turn, might benefit the traditional safe-haven Swiss Franc and act as a headwind for the USD/CHF pair.
Moving on, market participants will monitor the Swiss Consumer Price Index (CPI) for September and the US JOLTS Job Openings for August due on Tuesday. Later this week, the US ISM Services PMI and ADP report will be released on Wednesday. The highlight of the week will be the US Nonfarm Payrolls on Friday. These events could give a clear direction to the USD/CHF pair.
- EUR/USD refreshes YTD low on Tuesday and is pressured by a combination of factors.
- Bets that further ECB rate hikes may be off the table continue to undermine the Euro.
- The Fed’s hawkish outlook pushes the USD to an 11-month top and contributes to the fall.
The EUR/USD pair now seems to have entered a bearish consolidation phase and is seen oscillating in a narrow trading band, around the 1.0465 area, or a fresh YTD low touched during the Asian session this Tuesday.
The shared currency is undermined by signs of the beginning of the end of the high inflation in the Eurozone and weakness in Germany – the economic engine of Europe. Eurozone's largest economy. This, in turn, has been fueling speculations that additional rate hikes by the European Central Bank (ECB) may be off the table for now. The markets are not betting that the ECB's next move is likely to be a rate cut. Apart from this, the underlying strong bullish sentiment surrounding the US Dollar (USD) continues to weigh on the EUR/USD pair.
The USD Index (DXY), which tracks the Greenback against a basket of currencies, climbs to its highest level since November 2022 and continues to draw support from the Federal Reserve’s (Fed) higher-for-longer interest rate narrative. The hawkish outlook was reinforced by Cleveland Fed President Loretta Mester, saying that the US central bank will likely need to hike rates one more time this year. Mester added that the Fed will keep rates restrictive to get inflation down and higher rates are needed to make sure the disinflation process continues.
This remains supportive of a further rise in the US Treasury bond yields, which, along with a generally weaker risk tone, is seen benefitting the safe-haven USD and acting as a headwind for the EUR/USD pair. That said, the Relative Strength Index (RSI) on the daily chart is flashing oversold conditions and might hold back traders from placing fresh bearish bets around the major. Hence, it will be prudent to wait for some near-term consolidation or a modest recovery before traders start positioning for an extension of the recent well-established downtrend.
Nevertheless, the aforementioned fundamental backdrop suggests that the path of least resistance for the EUR/USD pair is to the downside and any meaningful bounce is more likely to get sold into. In the absence of any relevant market-moving macro data from the Eurozone and a bank holiday in Germany, the USD price dynamics will continue to play a key role in influencing the major. Later during the early North American session, traders will take cues from the release of the US JOLTS Job Openings for short-term opportunities.
Technical levels to watch
- Interest rate in Australia is seen on hold at 4.10% for the fourth straight meeting in October.
- Reserve Bank of Australia’s new Governor Michele Bullock could hint at more rate hikes.
- The Australian Dollar gears up for a big reaction to RBA policy announcement and guidance.
The Reserve Bank of Australia (RBA) is on track to keep its key interest rate unchanged for the fourth straight time on Tuesday, in a meeting that will be the first one for Michele Bullock as the new central bank Governor.
However, it remains to be seen if the newly appointed ninth Governor of RBA will leave the door open for more tightening by year-end.
Reserve Bank of Australia interest rate decision: All you need to know on Tuesday
- AUD/USD is sitting at three-day lows below 0.6300 as the US Dollar holds at 11-month highs.
- US S&P 500 futures trade modestly flat following a mixed close on Wall Street overniight. Meanwhile, the benchmark 10-year US Treasury bond yield consolidates gains above 4.60%.
- China’s business PMIs came in mixed over the weekend. The Caixin/S&P Global manufacturing purchasing managers’ index (PMI) fell to 50.6 in September from 51.0 in the previous month, missing forecasts of 51.2. The services index dropped to 50.2 in September from 51.8 in August, the lowest reading since December.
- The official data released by China’s National Bureau of Statistics (NBS) showed on Saturday that the Manufacturing PMI and the Non-Manufacturing PMI outpaced expectations at 50.2 and 51.7, respectively, in September.
- On Friday, the Fed’s most preferred inflation measure, the Core Personal Consumption Expenditures (PCE) Price Index arrived at 0.1% MoM and 3.9% YoY in August, softening from the previous month.
- The RBA interest-rate decision could provide a temporary breather to the AUD/USD downside amid a Golden Week holiday in China. The Australian central bank will also publish its bi-annual Financial Stability Review report on Friday.
RBA interest rate expectations: How will it impact AUD/USD?
Economists expect the Reserve Bank of Australia to hold the Official Cash Rate steady at 4.10% after the conclusion of the first monetary policy meeting presided over by Governor Michele Bullock on Tuesday. The decision will be announced at 03:30 GMT.
All major local banks, ANZ, CBA, Westpac and NAB also predict the RBA to stand pat at this week’s meeting. Markets are pricing one final 25 basis points rate hike by the RBA in November before standing pat at least until March next year.
In the September policy statement, the RBA maintained that “some further tightening of monetary policy may be required.” Bullock and her colleagues are likely to stick to the language from the previous policy statement, keeping more interest rate hikes in the offing.
Although Australian Consumer Price Index (CPI) inflation ticked higher to 5.2% in August as against a 4.9% increase in July, experts say that the central bank will wait for the full quarterly inflation and labor market report due later this month to decide on the policy action beyond the October meeting.
The RBA will assess the lagging effects of the monetary policy tightening and the impact of the recent surge in Oil prices. Mounting risks to the Australian economic outlook will remain a major factor dissuading the Bank to hike rates on Tuesday.
Previewing the RBA policy decision, analysts at BBH said, “Reserve Bank of Australia meets Tuesday and is expected to keep rates steady at 4.10%. This will be new Governor Bullock’s first meeting and WIRP suggests no odds of a hike. However, those odds rise to nearly 35% on November 7, 45% on December 5, and top out above 95% in March. At the last meeting on September 5, the bank kept rates steady at 4.10% but warned that further tightening may be required.“
Therefore, the Australian Dollar (AUD) is set to witness intense volatility on the RBA policy announcement, as traders will look for fresh cues on Bullock’s path forward on interest rates.
Meanwhile, Dhwani Mehta, Asian Session Lead Analyst at FXStreet, notes key technicals to trade AUD/USD on the policy verdict. “AUD/USD is back under the 21-day Simple Moving Average (SMA) at 0.6410 in the lead-up to the RBA showdown. The 14-day Relative Strength Index (RSI) is pointing south below the 50 level, keeping the downside risks intact for the Aussie pair.”
“The immediate support is seen at the September low of 0.6331. Further down, the 0.6300 round figure will be tested. On the flip side, acceptance above the 0.6450 level is needed to initiate a meaningful recovery toward the downward-sloping 50-day SMA at 0.6479. The next upside barrier is seen at the 0.6500 round level.”
Australian Dollar price this week
The table below shows the percentage change of Australian Dollar (AUD) against listed major currencies this week. Australian Dollar was the strongest against the New Zealand Dollar.
| USD | EUR | GBP | CAD | AUD | JPY | NZD | CHF | |
| USD | 0.88% | 0.89% | 0.79% | 1.21% | 0.18% | 0.97% | 0.37% | |
| EUR | -0.89% | 0.01% | -0.09% | 0.32% | -0.70% | 0.08% | -0.53% | |
| GBP | -0.89% | 0.00% | -0.10% | 0.33% | -0.71% | 0.08% | -0.53% | |
| CAD | -0.79% | 0.10% | 0.14% | 0.43% | -0.60% | 0.18% | -0.42% | |
| AUD | -1.22% | -0.32% | -0.32% | -0.42% | -1.03% | -0.24% | -0.86% | |
| JPY | -0.21% | 0.67% | 0.69% | 0.61% | 0.97% | 0.76% | 0.17% | |
| NZD | -0.97% | -0.08% | -0.07% | -0.18% | 0.24% | -0.80% | -0.62% | |
| CHF | -0.35% | 0.53% | 0.53% | 0.43% | 0.85% | -0.18% | 0.62% |
The heat map shows percentage changes of major currencies against each other. The base currency is picked from the left column, while the quote currency is picked from the top row. For example, if you pick the Euro from the left column and move along the horizontal line to the Japanese Yen, the percentage change displayed in the box will represent EUR (base)/JPY (quote).
RBA FAQs
What is the Reserve Bank of Australia and how does it influence the Australian Dollar?
The Reserve Bank of Australia (RBA) sets interest rates and manages monetary policy for Australia. Decisions are made by a board of governors at 11 meetings a year and ad hoc emergency meetings as required. The RBA’s primary mandate is to maintain price stability, which means an inflation rate of 2-3%, but also “..to contribute to the stability of the currency, full employment, and the economic prosperity and welfare of the Australian people.” Its main tool for achieving this is by raising or lowering interest rates. Relatively high interest rates will strengthen the Australian Dollar (AUD) and vice versa. Other RBA tools include quantitative easing and tightening.
How does inflation data impact the value of the Australian Dollar?
While inflation had always traditionally been thought of as a negative factor for currencies since it lowers the value of money in general, the opposite has actually been the case in modern times with the relaxation of cross-border capital controls. Moderately higher inflation now tends to lead central banks to put up their interest rates, which in turn has the effect of attracting more capital inflows from global investors seeking a lucrative place to keep their money. This increases demand for the local currency, which in the case of Australia is the Aussie Dollar.
How does economic data influence the value of the Australian Dollar?
Macroeconomic data gauges the health of an economy and can have an impact on the value of its currency. Investors prefer to invest their capital in economies that are safe and growing rather than precarious and shrinking. Greater capital inflows increase the aggregate demand and value of the domestic currency. Classic indicators, such as GDP, Manufacturing and Services PMIs, employment, and consumer sentiment surveys can influence AUD. A strong economy may encourage the Reserve Bank of Australia to put up interest rates, also supporting AUD.
What is Quantitative Easing (QE) and how does it affect the Australian Dollar?
Quantitative Easing (QE) is a tool used in extreme situations when lowering interest rates is not enough to restore the flow of credit in the economy. QE is the process by which the Reserve Bank of Australia (RBA) prints Australian Dollars (AUD) for the purpose of buying assets – usually government or corporate bonds – from financial institutions, thereby providing them with much-needed liquidity. QE usually results in a weaker AUD.
What is Quantitative tightening (QT) and how does it affect the Australian Dollar?
Quantitative tightening (QT) is the reverse of QE. It is undertaken after QE when an economic recovery is underway and inflation starts rising. Whilst in QE the Reserve Bank of Australia (RBA) purchases government and corporate bonds from financial institutions to provide them with liquidity, in QT the RBA stops buying more assets, and stops reinvesting the principal maturing on the bonds it already holds. It would be positive (or bullish) for the Australian Dollar.
| Index | Change, points | Closed | Change, % |
|---|---|---|---|
| NIKKEI 225 | -97.74 | 31759.88 | -0.31 |
| ASX 200 | -15.4 | 7033.2 | -0.22 |
| DAX | -139.37 | 15247.21 | -0.91 |
| CAC 40 | -66.9 | 7068.16 | -0.94 |
| Dow Jones | -74.15 | 33433.35 | -0.22 |
| S&P 500 | 0.34 | 4288.39 | 0.01 |
| NASDAQ Composite | 88.45 | 13307.77 | 0.67 |
- NZD/USD attracts some sellers near 0.5938 amid the USD demand.
- US ISM Manufacturing PMI (Sep) came in at 49.0 vs. 47.6 prior, stronger than expected.
- The Reserve Bank of New Zealand (RBNZ) is likely to hold the interest rate unchanged at 5.5% on Wednesday.
The NZD/USD pair remains under selling pressure below the mid-0.5900s after falling to hold above the 0.6000 barrier during the early Asian trading hours on Tuesday. The rally of the US Dollar (USD) and higher US Treasury yield weigh on the Kiwi. The pair currently trades around 0.5938, down 0.13% on the day.
The Institute for Supply Management (ISM) showed on Monday that business conditions in the US manufacturing sector continued to contract in September. The US ISM Manufacturing PMI came in at 49.0 in September from 47.6 in August, beating the market expectation of 47.7. Furthermore, the Prices Paid Index fell from 48.4 to 43.8. The Employment Index climbed from 48.4 to 51.2. Finally, the New Orders Index grew from 46.8 to 49.2.
Earlier Tuesday, Federal Reserve (Fed) Bank of Cleveland President Loretta Mester said that the Fed will likely need to hike rates one more time this year and monetary policy path will depend on how the economy performs. Additionally, Fed Governor Michelle Bowman said on Monday that it will likely be appropriate to raise the policy rate further and hold it at restrictive levels for some time.
Meanwhile, Fed Vice Chair for Supervision Michael Barr stated that the central bank should approach monetary policy with caution. He said the most important question is not how much interest rates will rise, but how long they will remain at a sufficiently restrictive level. That said, the upbeat US economic data and the hawkish remarks from most Fed officials lift the US Dollar (USD) and act as a headwind for the NZD/USD pair.
On the Kiwi front, the Reserve Bank of New Zealand (RBNZ) will announce its interest rate decision on Wednesday. Markets expect the RBNZ to hold rates unchanged at 5.5%. However, traders will keep an eye on the statement following the meeting. Any hint about a further rate hike might limit the downside of the Kiwi.
Moving on, the Reserve Bank of New Zealand (RBNZ) monetary policy meeting on Wednesday will be in the spotlight. On the US docket, the focus will be the US employment data, with the release of the ADP report on Wednesday and the Nonfarm Payrolls on Friday.
| Pare | Closed | Change, % |
|---|---|---|
| AUDUSD | 0.63631 | -1.02 |
| EURJPY | 157.018 | -0.59 |
| EURUSD | 1.04784 | -0.8 |
| GBPJPY | 181.101 | -0.61 |
| GBPUSD | 1.20869 | -0.82 |
| NZDUSD | 0.59477 | -0.66 |
| USDCAD | 1.36714 | 0.68 |
| USDCHF | 0.91748 | 0.22 |
| USDJPY | 149.834 | 0.22 |
Adding to her earlier comments, Federal Reserve Bank of Cleveland President Loretta Mester, during the Q&A session before the 50 Club of Cleveland Monthly Meeting, said that higher rates are needed to make sure the disinflation process continues.
Additional quotes:
Fed will keep rates restrictive to get inflation down
A.I. technology will change a lot in the economy
Student loan restart won't bring immediate change in consumer spending
Do not see the US Dollar (USD) getting dethroned; USD is a very strong currency.
Market reaction
The hawkish-sounding remarks assist the USD Index, which tracks the Greenback against a basket of currencies, to stand tall near its highest level since late November 2022 touched during the Asian session on Tuesday.


© 2000-2026. Уcі права захищені.
Cайт знаходитьcя під керуванням TeleTrade DJ. LLC 2351 LLC 2022 (Euro House, Richmond Hill Road, Kingstown, VC0100, St. Vincent and the Grenadines).
Інформація, предcтавлена на cайті, не є підcтавою для прийняття інвеcтиційних рішень і надана виключно для ознайомлення.
Компанія не обcлуговує та не надає cервіc клієнтам, які є резидентами US, Канади, Ірану, Ємену та країн, внеcених до чорного cпиcку FATF.
Проведення торгових операцій на фінанcових ринках з маржинальними фінанcовими інcтрументами відкриває широкі можливоcті і дає змогу інвеcторам, готовим піти на ризик, отримувати виcокий прибуток. Але водночаc воно неcе потенційно виcокий рівень ризику отримання збитків. Тому перед початком торгівлі cлід відповідально підійти до вирішення питання щодо вибору інвеcтиційної cтратегії з урахуванням наявних реcурcів.
Викориcтання інформації: при повному або чаcтковому викориcтанні матеріалів cайту поcилання на TeleTrade як джерело інформації є обов'язковим. Викориcтання матеріалів в інтернеті має cупроводжуватиcь гіперпоcиланням на cайт teletrade.org. Автоматичний імпорт матеріалів та інформації із cайту заборонено.
З уcіх питань звертайтеcь за адреcою pr@teletrade.global.
переклади