- Аналітика
- Новини та інструменти
- Новини ринків
Новини ринків
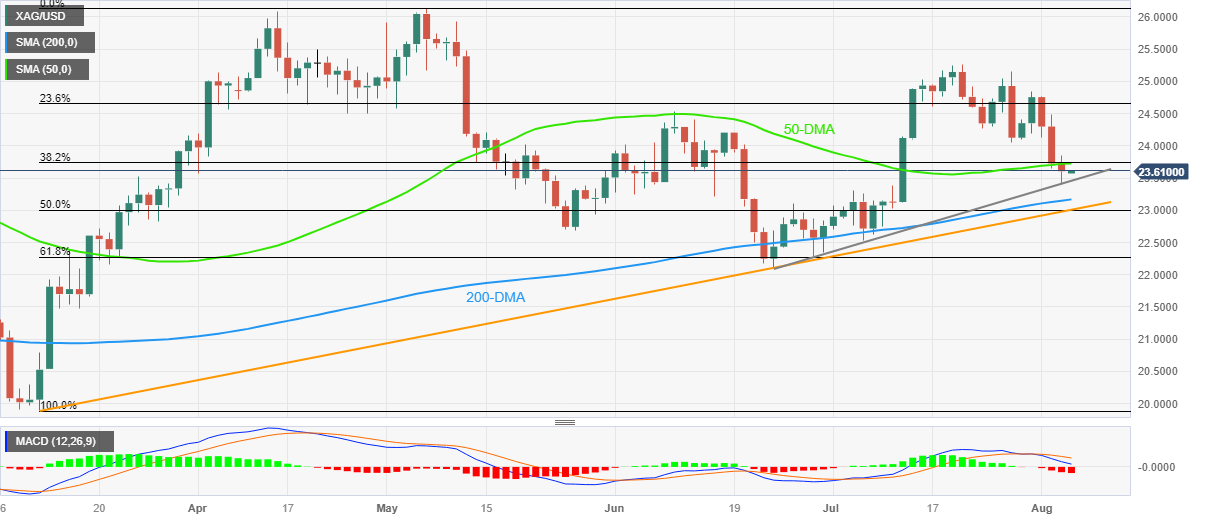
- Silver Price snaps three-day losing streak by recovering from 1.5-month-old rising support line.
- Convergence of 50-DMA, 38.2% Fibonacci retracement challenges XAG/USD buyers.
- 200-DMA, $23.00 appear tough nuts to crack for Silver bears during further downside.
- Firmer US NFP can trigger XAG/USD retreat but sellers have a bumpy road to travel.
Silver Price (XAG/USD) prints the first daily gains in four as it rebounds from the lowest level in three weeks amid early Friday in Asia. In doing so, the XAG/USD prints mild gains around $23.60 while bouncing off an upward-sloping support line from June 23.
Adding credence to the corrective bounce could be the US Dollar’s consolidation ahead of the US employment report for June.
Also read: Forex Today: A cautions tone ahead of NFP
However, a convergence of the 50-DMA and 38.2% Fibonacci retracement of the metal’s March-May upside, near $23.75, appears the key upside hurdle to watch during the further recovery of the Silver Price.
Even if the precious metal manages to cross the $23.75 hurdle, the late July swing low of around $24.05 and June’s peak of near $24.55 can act as additional upside filters before giving control to the XAG/USD buyers.
Following that, July’s high of around $25.30 will be the last defense of the Silver sellers before challenging the yearly peak of near $26.15 marked in May.
On the flip side, a daily closing beneath the stated immediate support line, close to $23.45 at the latest, won’t provide open invitations to the Silver bears as the 200-DMA can prod a further downside near $23.15.
In a case where the XAG/USD remains bearish past $23.15, an ascending trend line from March and a 50% Fibonacci retracement together highlight the $23.00 round figure as the key support to watch for bears.
Silver Price: Daily chart
Trend: Pullback expected
USD/CAD seesaws at the highest level in a month, making rounds to 1.3350 during early Friday morning in Asia, as traders await the top-tier employment statistics from the US and Canada for July.
It’s worth noting that the Loonie pair trader’s doubts about the US Dollar’s latest retreat jostle with the firmer prices of Canada’s main export item, namely WTI crude oil, to also challenge the USD/CAD pair prices at the multi-day high amid a sluggish Asian session.
Even so, the options market traders remain bullish about the pair. That said, the one-month risk reversal (RR) of the USD/CAD price, a gauge of the spread between the call and put options, remains on the front foot for the third consecutive day while posting a 0.059 figure by the end of Thursday’s North American session.
More importantly, the weekly RR braces for the biggest jump since late April while printing 0.130 numbers by the press time.
With this, the Loonie pair appears more likely to register the consecutive third weekly gain but may witness hardships in defending the biggest weekly jump in 10 unless the scheduled US data prints comparatively better figures than their Canadian counterparts.
Also read: USD/CAD Price Analisis: Bulls gave up following weak US data
- USD/CHF oscillates in a narrow trading band, investors await the key event.
- The US Dollar retreats from a weekly high following the mixed US readings.
- The headline surrounding the US-China relationship remains in focus.
- The week's highlight is the US Nonfarm Payrolls, due later in the American session.
The USD/CHF pair consolidates its recent gains near 0.8745 during the early Asian session on Friday. Meanwhile, the US Dollar Index (DXY), a measure of the value of USD against six other major currencies, snaps a five-day winning streak and currently trades near 102.48.
Data released from the US on Thursday showed that Initial Jobless Claims rose to 227,000 for the week ended July 29, as expected. The ISM Service PMI for July fell to 52.7 from 53.9 in June and was below the expectation of 53. Additionally, Unit Labor Costs from Q2 increased to 1.6%, lower than the 2.6% expected. After the mixed economic data release, the Greenback retreated from a weekly high of around 102.85.
The US Nonfarm Payrolls (NFP) report will be closely watched and is expected to trigger volatility in the FX markets. However, the upbeat figure might convince the Federal Reserve (Fed) to take a more aggressive stance, which favors the US Dollar and acts as a tailwind for the USD/CHF pair.
On the other hand, the headline surrounding the US-China relationship remains in focus. China stated on Thursday that its government is willing to maintain communications with the US over an upcoming visit to Washington, DC, by Chinese Foreign Minister Wang Yi. The exacerbated tensions between the world’s two largest economies might benefit the safe-haven Swiss Franc and act as a headwind for the USD/CHF pair.
Moving on, the highlight of the week is the US Nonfarm Payrolls due later in the American session. The US economy is expected to have created 180,000 jobs in July. Also, the Unemployment Rate and Average Hourly Earnings will be released on Friday. The Unemployment Rate is expected to remain at 3.6%, and Average Hourly Earnings YoY are expected to increase by 4.2%. Market participants will keep an eye on these events and find trading opportunities around the USD/CHF pair.
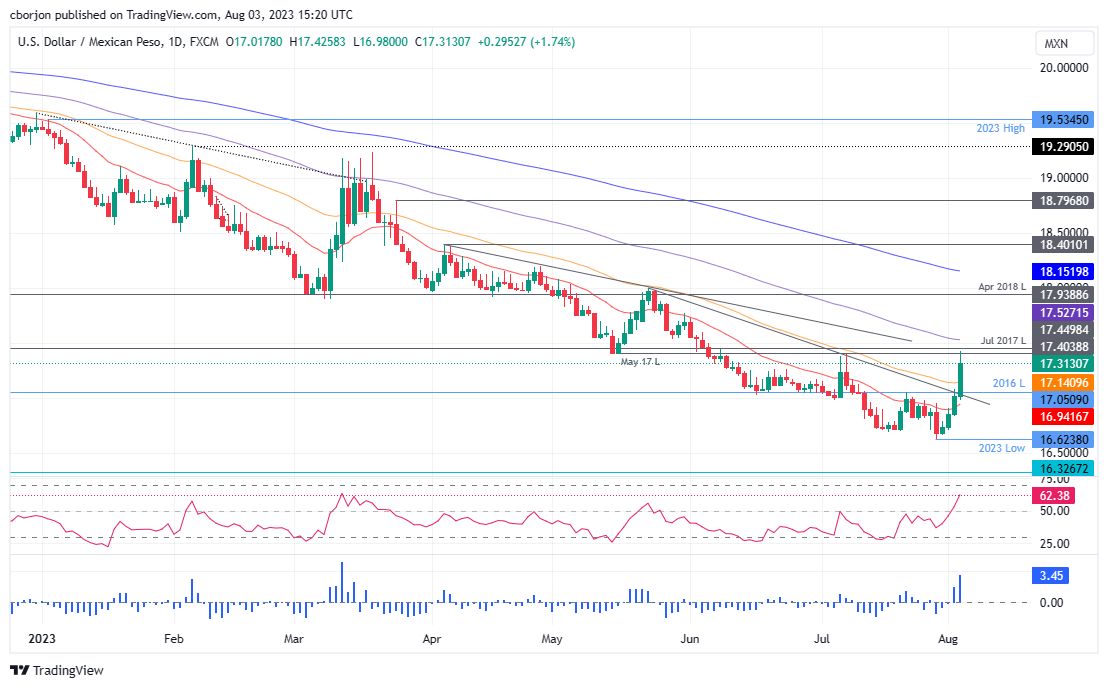
- USD/MXN struggles to defend recent gains at two-month high, prods four-day uptrend ahead of US NFP.
- Overbought RSI, multiple levels since June test Mexican Peso sellers.
- Pullback needs validation from previous resistance line, 200-SMA and US employment report.
USD/MXN prints mild losses around 17.33 as it reverses from the highest level in two months while consolidating the biggest daily gains since March amid early Friday in Asia. In doing so, the Mexican Peso (MXN) pair portrays the market’s cautious mood ahead of the top-tier US employment data.
Apart from the pre-NFP consolidation, overbought RSI (14) and a horizontal area comprising multiple levels marked since early June, around 17.39–43, also challenge the Mexican Peso sellers.
It’s worth noting, however, that the bullish MACD signals and the pair’s sustained trading beyond the previously key technical resistances, now supports, keep the USD/MXN buyers hopeful.
Among them, the resistance-turned-support line from May 23 and the 200-SMA, respectively near 17.04 and 16.98, gain major attention.
Following that, a one-week-old rising support line near 16.98 will act as the final defense of the USD/MXN buyers.
On the contrary, a daily closing beyond the 17.43 resistance will need validation from the 61.8% Fibonacci retracement of May–July downbeat, near 17.47, quickly followed by the 17.50 round figure, to convince the USD/MXN buyers.
In a case where the Mexican Peso bears keep the reins past 17.50, the odds of witnessing a move towards late May swing low near the 18.00 psychological magnet can’t be ruled out.
USD/MXN: Four-hour chart
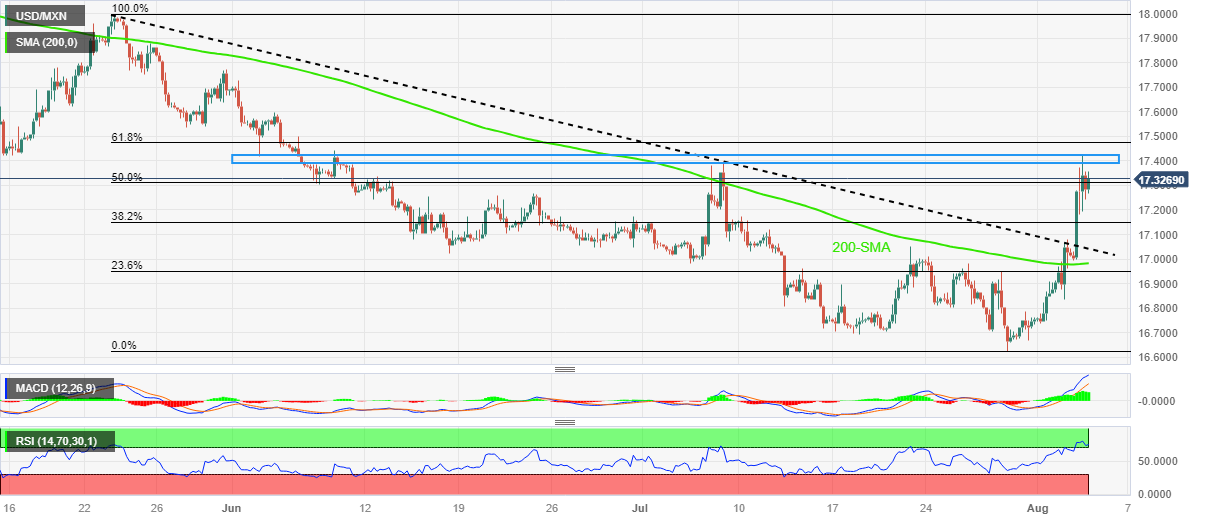
Trend: Pullback expected
- EUR/USD fades bounces off one-month low ahead of key EU/US data.
- US Dollar bulls take a breather on mixed statistics but Treasury bond yields refresh multi-day high and check Euro buyers.
- Bloc’s unimpressive economics underpins recession fears and join mixed ECB talks to favor EUR/USD bears.
- German Factory Orders, Eurozone Retail Sales for June will precede US NFP for July to entertain traders.
EUR/USD struggles to regain buyer’s acceptance as it remains sidelined near 1.0950 despite bouncing off a one-month low the previous day. In doing so, the Euro pair portrays the market’s cautious mood ahead of the top-tier data from the old continent and the US. Also exerting downside pressure on the quote could be comparatively stronger economic fears surrounding the bloc than the US, even as Fitch Ratings downgraded Washington’s credit rating.
Despite the US Dollar-driven corrective bounce mixed Eurozone data and the lack of confidence among the European Central Bank (ECB) Officials seem to keep the EUR/USD bears hopeful as the top-tier data looms.
On Thursday, Eurozone Producer Price Index (PPI) for June dropped to the lowest level in three years with -3.4% YoY figures, versus -3.1% expected and -1.6% prior (revised). Further, the final readings of the bloc’s HCOB Composite PMI and Services PMI for July deteriorated while the same activity numbers for Germany improved from the initial forecasts for the said month.
European Central Bank board member Fabio Panetta conveyed his support for high interest rates for a longer time via a webinar. The policymaker, however, also added, “Inflation risks are balanced and economic activity is weak.”
On the other hand, the mixed US data triggered the US Dollar’s retreat from the highest level in a month, strong US Treasury bond yields put a floor under the Greenback’s haven demand. Additionally, hopes of witnessing upbeat US employment data, backed by firmer early signals, allow the USD to stay on the bull’s radar despite the latest U-turn.
That said, US ISM Services PMI dropped to 52.7 for July from 53.9 prior, versus 53.0 market forecasts. The details of the ISM Services Survey unveiled that Employment Index and New Order Index also came in softer but the Prices Paid jumped to a three-month high. Further, the US Factory Orders improved to 2.3% MoM for June versus 0.4% prior (revised) and 2.2% market forecasts while Initial Jobless Claims matches 227K expected figures for the week ended on July 28 from 221K prior. Additionally, the preliminary readings of the Nonfarm Productivity for the second quarter (Q2) rallied by 3.7% compared to 2.0% expected and -1.2% previous readings whereas Unit Labor Cost eased to 1.6% for the said period versus 2.6% consensus and 3.3% prior.
Talking about the yields, the US 10-year Treasury bond yields rose to a fresh high since November 2022 before ending the trading day near 4.18% whereas the Wall Street benchmark marked mild losses by the end of Thursday’s North American session. It’s worth noting that the US bond coupons are heading towards the worrisome levels that previously triggered economic hardships, which in turn prod EUR/USD bulls.
Looking ahead, Germany’s Factory Orders and Eurozone Retail Sales for June will be closely observed amid fears of weak economic activity, which if confirmed could weigh on the EUR/USD. Following that, the US employment report for July will be closely watched as Fed’s September rate hike has been talked about. That said, headline Nonfarm Payrolls (NFP) bears downbeat market forecasts, likely softening to 200K versus 209K prior. Further, the Unemployment Rate is likely to remain static at 3.6%.
Technical analysis
Despite the corrective bounce off the 100-DMA, around 1.0920 by the press time, the EUR/USD bears remain hopeful unless providing a daily close beyond the support-turned-resistance line stretched from May 31, close to 1.0990 at the latest.
- NZD/USD consolidates in the 0.6075-0.6090 range after posting two days of losses.
- Mixed US data limits the US Dollar's movement ahead of the US Nonfarm Payrolls (NFP).
- Investors will closely watch the US NFP, Average Hourly Earnings due on Friday.
The NZD/USD pair oscillates in a narrow range below the 0.6080 mark in the early Asian session on Friday. Market participants prefer to wait on the sidelines ahead of the key events later in the day. The figure is expected to trigger volatility in the FX markets. Meanwhile, the US Dollar Index (DXY), a measure of the value of USD against six other major currencies, snaps a five-day winning streak and currently trades near 102.48.
Data released by the US Department of Labor on Thursday revealed that Initial Jobless Claims increased to 227,000 for the week ended July 29, matching expectations. The ISM Service PMI for July dropped to 52.7 from 53.9 prior and was worse than expected at 53. Lastly, Unit Labor Costs from Q2 came in at 1.6%, lower than the 2.6% expected.
Investors will take more cues from the US wage inflation and unemployment figures on Friday. The stronger data could convince the Federal Reserve (Fed) to hike additional rates this year, which benefits the US Dollar and acts as a headwind for the NZD/USD pair.
On the Kiwi front, Statistics New Zealand reported on Wednesday that the New Zealand Unemployment Rate for Q2 came in at 3.6%, above the consensus of 3.5% and 3.4% prior. Employment Change QoQ rose 1.0%, better than expected at 0.5% and 0.8% previously. The mixed New Zealand economic data undermines the NZD/USD risk-barometer pair.
Looking ahead, market participants will closely watch the US Nonfarm Payrolls, the Unemployment Rate and Average Hourly Earnings later in the American session. The US economy is expected to create 200,000 jobs in July, below the 209,000 in June, while the Unemployment Rate is expected to remain at 3.6%. These events could significantly impact the US Dollar's dynamic and give the NZD/USD pair a clear direction.
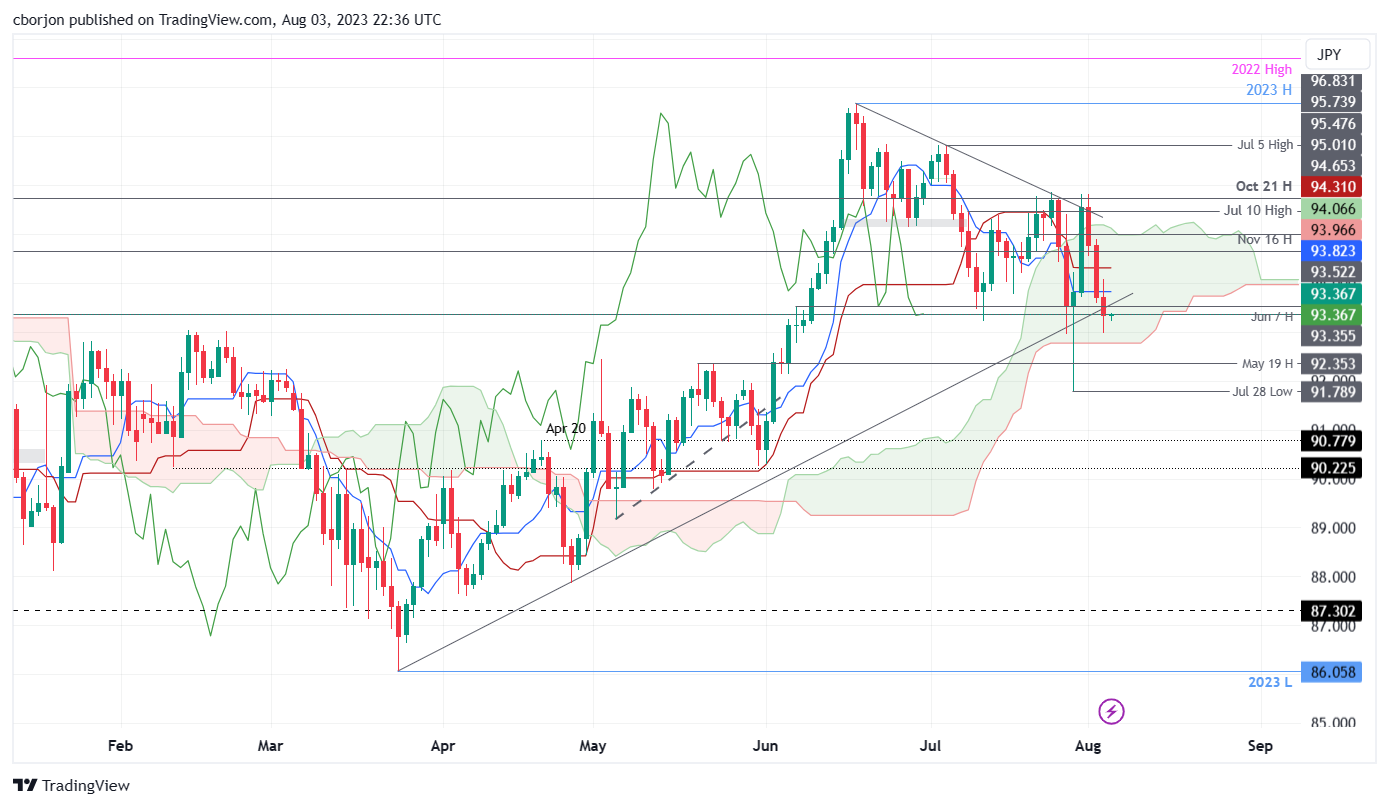
- AUD/JPY extends losses for three straight days, breaking below a five-month support trendline at 93.40/50, registering marginal gains of 0.05%.
- The pair exhibits a downward bias, with indicators such as the Kijun and Tenkan-Sen lines signaling bearish momentum following the BoJ's tweaks to YCC.
- Key support lies at the bottom of the Kumo at 92.78, with potential further downside to 91.78. Resistance can be found at the Tenkan-Sen at 93.82, with potential moves towards 94.00.
The AUD/JPY broke below a five-month-old support trendline at around 93.40/50 and extended its losses to three straight days, with the pair getting deep inside the Ichimoku Cloud (Kumo), about to turn bearish as the Asian session begins. At the time of writing, the AUD/JPY is trading at 93.37, registering minuscule gains of 0.05%.
AUD/JPY Price Analysis: Technical outlook
From a daily chart perspective, the AUD/JPY remains downward biased, with price action already below the Kijun and Tenkan- Sen lines, while the Chikou Span lies below the June 30 low, which sits at 95.59. In addition, the AUD/JPY breaking below a support trendline confirms that sellers are gathering momentum following the Bank of Japan (BoJ) decision to tweak the Yield Curve Control (YCC).
That said, AUD/JPY traders must be aware of volatility levels increasing in most Japanese Yen (JPY) pairs. Also, the AUD/JPY would remain subject to market sentiment, which could turn worse, if global equities continue to drop.
Hence, the AUD/JPY path of least resistance is downwards. The first support would be the bottom of the Kumo at 92.78, which once cleared, could pave the way to test the July 28 low at 91.78. Conversely, if AUD/JPY achieves a daily close above the Tenkan-Sen at 93.82, that will set a move towards 94.00. Further upside, could put in risk, Thursday’s high of 94.08.
AUD/JPY Price Action – Daily chart
- GBP/USD stays defensive after bouncing off a five-week low.
- Dragonfly Doji bullish candlestick joins downbeat RSI to underpin minor recovery but Cable stays below key technical support-turned-resistance.
- BoE’s dovish hike, mostly upbeat US data and hopes of positive surprise from NFP favor Pound Sterling sellers.
- Further downside needs validation from late June swing low.
GBP/USD treads water around 1.2730 as it defends the previous day’s rebound from the lowest levels in five weeks but lacks upside momentum during early Friday morning in Asia. In doing so, the Cable pair struggles to justify the previous day’s Dragonfly Doji bullish candlestick, as well as the downbeat RSI (14) line, amid a cautious mood ahead of the US Nonfarm Payrolls (NFP).
The reason could be linked to the Bank of England’s (BoE) dovish hike joining the bearish MACD signals and the Pound Sterling’s sustained trading beneath the previously key technical support.
Also raed: GBP/USD recovers slightly after BoE’s rate hike, soft US economic data
Among them, the 50-DMA level of around 1.2735 gains the immediate attention of the GBP/USD buyers ahead of the five-month-old support-turned-resistance line around 1.2750.
Also challenging the short-term Cable upside is a downward-sloping resistance line from July 14, close to 1.2805 at the latest.
Meanwhile, the Pound Sterling’s pullback remains elusive unless it defies the bullish candlestick formation by slipping beneath the latest low of 1.2620. Even so, the late June bottom of around 1.2590 can act as an additional downside filter for the GBP/USD bears.
Overall, GBP/USD is likely to remain depressed despite the bullish candlestick and the pre-NFP consolidation.
GBP/USD: Daily chart
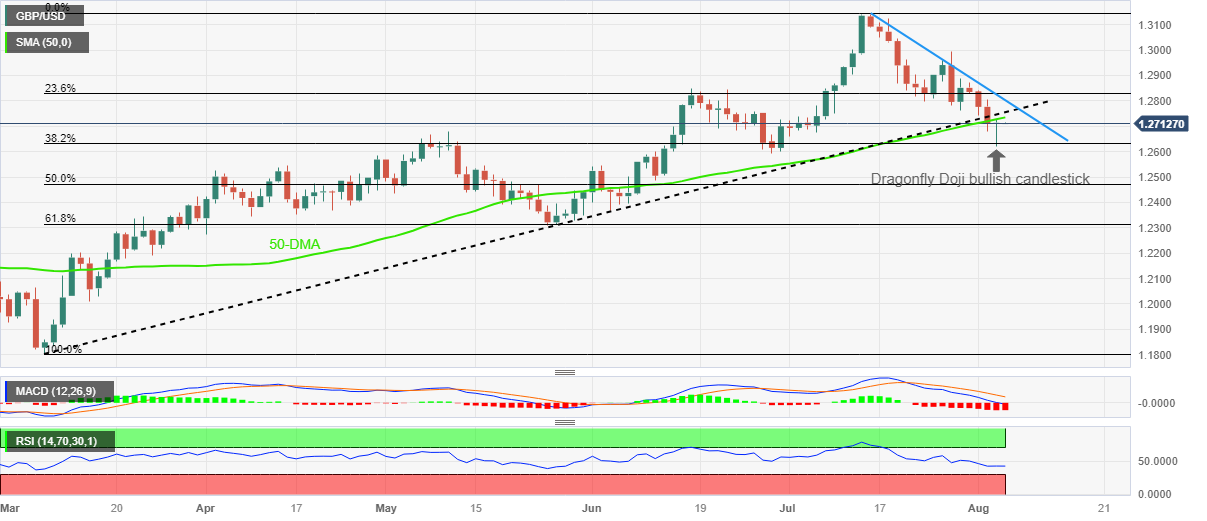
Trend: Further downside expected
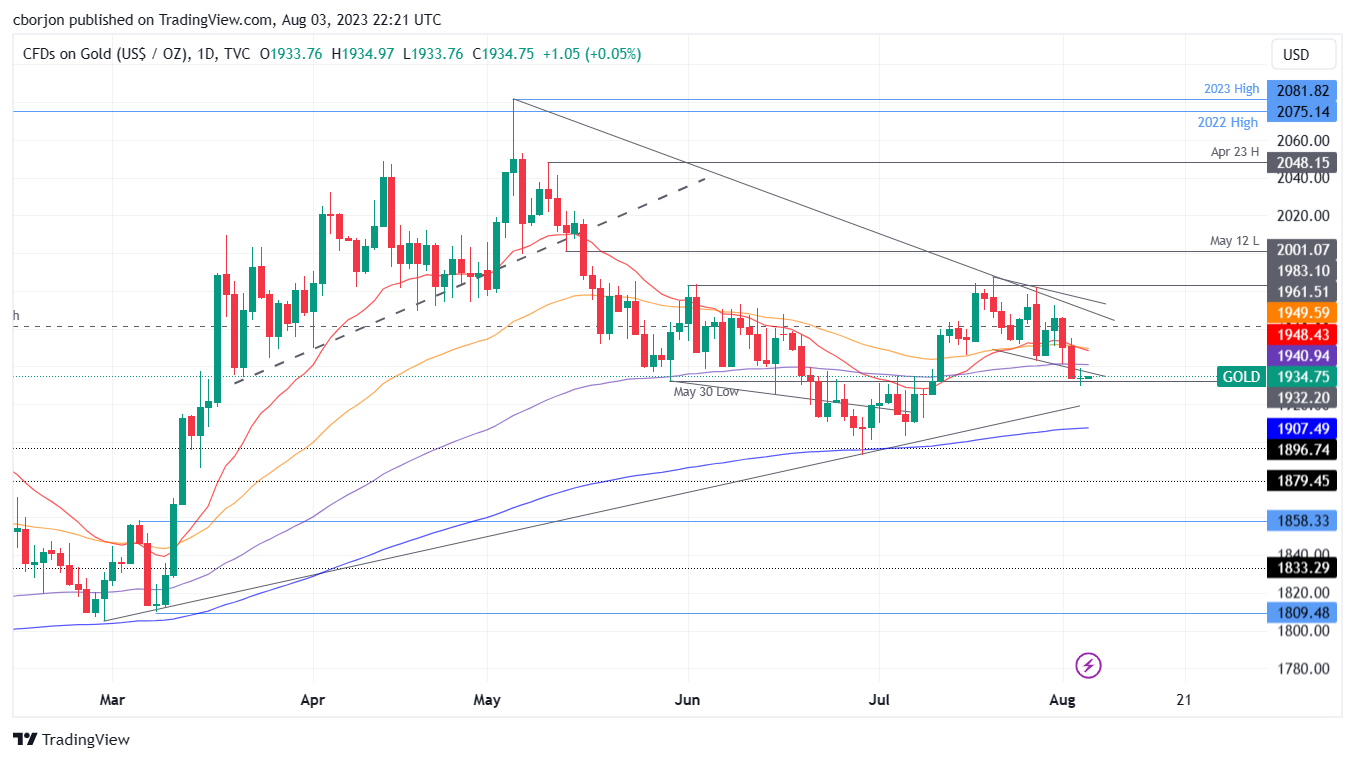
- US Treasury Bond Yields Rise: The US 10-year Treasury bond yield climbed nine basis points to 4.179%, weighing on the gold price, while Real yields hit 1.99%.
- US Jobless Claims came in as expected at 227K, and ISM Non-Manufacturing PMI decelerated to 52.7 from 53.9, reflecting a potential slowdown in business activity.
- Focus on Nonfarm Payrolls: Traders are eyeing the July US Nonfarm Payrolls report, expecting 200K new jobs and an unemployment rate of 3.6%.
Gold price strumbled for the third consecutive trading session and posted a three-week low as high US Treasury bond yields weighed on the non-yielding metal amidst a soft US Dollar (USD) during Thursday’s trading session. At the time of writing, the XAU/USD exchanges hands at $1,933.21, down 0.02%, as Friday’s Asian session commences.
Despite a soft US Dollar, higher Treasury bond yields continue to pressure the non-yielding gold as investors await US NFP
Wall Street finished Thursday’s session with losses as US Treasury bond yield soared. The US 10-year Treasury bond yield rose nine basis points, up at 4.179%, but failed to underpin the greenback. US Real yields, which is nominal yields minus inflation expectations in 10 years, advanced and climbed ten basis points, up to 1.99%, its highest level since the week of July 3, when it hit 2.15%.
Data-wise, the US economic docket featured Initial Jobless Claims for the week ending July 29, hit 227K, as foreseen, a sign that even though it could encourage investors to bet the labor market is easing, releases in the latest three months, make difficult to asses the job market trend.
After that data release, the ISM Non-Manufacturing PMI for July decelerated to 52.7 from June’s 53.9 and missed estimates of 53. The data portrays business activity as slowing down, though it remains to be seen if the services segment in the US drops to recessionary territory.
Although data was mixed, US Treasury bond yields continued to climb. XAU/USD began the session at a nearby $1,938.72 before dropping toward the day lows amid a softer greenback.
XAU/USD traders focus on Friday’s July US Nonfarm Payrolls report release. Figures are expected to show the US economy added 200K jobs to the economy, with the Unemployment Rate expected to remain at 3.6%. Any upward deviations from the forecast could be positive for the buck and negative for XAU. That could weigh on Gold and put into play a test of the 200-day EMA at $1,907.49. On the contrary, XAU/USD could rally if the outcome misses estimates.
XAU/USD Price Analysis: Technical outlook
From a daily chart perspective, XAU/USD is neutral to downward biased once the yellow metal dipped below the 50, 20, and 100-day Exponential Moving Averages (EMAs), each at $$1950.18, 1,949.83, and $1,941.06. Although XAU/USD is testing the May 30 daily low of $1,932.20, a decisive break could expose a support trendline that passes around $1,915/20 before Gold reaches $1,900. Otherwise, if buyers hold prices above the former, first resistance would emerge at the 100-day EMA, followed by the confluence of the 20 and 50-day EMAs, at around $1,949-$1,950.
- AUD/USD struggles to defend corrective bounce off two-month low.
- Mixed US data prod US Dollar bulls ahead of NFP but firmer yields keep Greenback bulls hopeful.
- Unimpressive statistics from Australia, China join market’s cautious mood to test Aussie buyers.
- RBA Monetary Policy Statement needs to defy dovish hopes after two consecutive inactions to defend AUD/USD.
AUD/USD portrays the typical inaction ahead of the key data/events as it makes rounds to 0.6550 amid early Friday morning in Canberra. In doing so, the Aussie pair signals the trader’s anxiety ahead of the Reserve Bank of Australia’s (RBA) Monetary Policy Statement (MPS) and the US Nonfarm Payrolls (NFP). It’s worth noting that the quote bounced off a two-month low the previous day amid the US Dollar’s retreat from a multi-day high but struggles to defend the buyers of late.
On Thursday, mixed US data joined the pre-NFP consolidation to check the US Dollar bulls after the Greenback rose to the highest level since July 07. Even so, strong US Treasury bond yields and dovish bias surrounding the Reserve Bank of Australia (RBA), as well as mixed data from the Pacific nation, challenge the risk-barometer pair.
The Australian Bureau of Statistics (ABS) unveiled details of Australia’s preliminary readings of the second quarter (Q2) Retail Sales and foreign trade numbers for June. The details suggest a slight improvement in the Aussie Q2 Retail Sales, to -0.5% QoQ from -0.6% prior, as well as a deterioration in the Trade Balance that eased to 11,321M compared to 11,791M in previous readouts and 11,000M expected. Furthermore, the final readings of Australia’s S&P Global Composite PMI eased to 48.2 for July from 48.3 while the Services PMI slide to 47.9 from 48.0.
On a positive note, China’s Caixin Services PMI jumps to 54.1 in July from 53.9 prior and 52.5 market expectations.
Meanwhile, US ISM Services PMI dropped to 52.7 for July from 53.9 prior, versus 53.0 market forecasts. The details of the ISM Services Survey unveiled that Employment Index and New Order Index also came in softer but the Prices Paid jumped to a three-month high.
Further, the US Factory Orders improved to 2.3% MoM for June versus 0.4% prior (revised) and 2.2% market forecasts while Initial Jobless Claims matches 227K expected figures for the week ended on July 28 from 221K prior.
Additionally, the preliminary readings of the Nonfarm Productivity for the second quarter (Q2) rallied by 3.7% compared to 2.0% expected and -1.2% previous readings whereas Unit Labor Cost eased to 1.6% for the said period versus 2.6% consensus and 3.3% prior.
It should be noted that the US 10-year Treasury bond yields rose to a fresh high since November 2022 before ending the trading day near 4.18% whereas the Wall Street benchmark marked mild losses by the end of Thursday’s North American session. It’s worth noting that the US bond coupons are heading towards the worrisome levels that previously triggered economic hardships, which in turn prod AUD/USD bulls.
Moving on, the RBA MPS will be crucial to watch after the Aussie central bank kept the rates unchanged in the last two consecutive meetings. Traders will seek clues to confirm the policy pivot bias as many banks are now flagging the RBA’s policy pivot.
Further, the early signals for the employment report have been positive but the headline Nonfarm Payrolls (NFP) bears downbeat market forecasts, likely softening to 200K versus 209K prior. Further, the Unemployment Rate is likely to remain static at 3.6%.
Technical analysis
An upward-sloping support line from mid-October 2022, around 0.6540 by the press time, defends the AUD/USD pair buyers even if the corrective bounce appears elusive below late June’s low of near 0.6600.
- GBP/JPY declined for a second consecutive day, near the 181.00 area.
- As expected, BoE hiked rates by 25 bps but hinted at a possible pause.
- The BoJ carried out an unexpected bond-buying operation, pushing the 10-year yield to multi-year highs.
The GBP/JPY declined towards the 181.00 area on Thursday, mainly driven by the JPY’s strength amid the expectations of a potential Bank of Japan (BoJ) tweak. On the other hand, the GBP weakened against most of its rivals following the Bank of England’s (BoE) decision.
As anticipated, the BoE increased the policy rate today by 25 bps, bringing the Bank Rate to 5.25%—two members for 50bp and one member voting for keeping the Bank Rate unchanged.
In the statement, the BoE acknowledged the potential risks of inflation increasing, especially concerning wage growth. Despite this, the bank pointed out that its current monetary policy is restrictive, and Andrew Bailey considered it is already having an “impact”. They also mentioned that they would maintain a sufficiently restrictive Bank Rate for a considerable duration to bring inflation back to the target of 2% in the medium term. This suggests that the BoE may prepare the financial markets for an upcoming pause or potential cuts.
Reacting to the decision, the British yields are seeing mixed movements. The 2-year rate declined to 4.93%, while the 5- and 10-year products stand at 4.44%, with the last one seeing more than a 1% increase.
On the other hand, the JPY is trading with gains against most of its rivals, mainly amid expectations of further tweaks on the Yield Control Curve (YCC) policy of the Bank of Japan (BoJ). On Thursday, the bank carried out an unexpected bond-buying operation, pushing the 10-year Japanese yield to a nine-year high of 0.65%. These movements hint at a potential monetary policy pivot. In the meantime, divergences in the financial policies between the BoE and BoJ should push the pair to the upside.
GBP/JPY levels to watch
The daily chart highlights a neutral to bearish technical outlook for GBP/JPY, indicating possible bullish exhaustion. The Relative Strength Index (RSI) maintains a negative slope above its midline, and the Moving Average Convergence Divergence (MACD) prints a red bar. However, the pair is below the 20-day Simple Moving Average (SMA) but above the 100 and 200-day SMAs, suggesting that the bears struggle to challenge the overall bullish trend.
Support levels: 179.85, 179.00, 178.00.
Resistance levels: 181.40 (20-day SMA), 182.00, 183.00.
-638266962199564438.png)
It's NFP Day. During the Asian session, the Reserve Bank of Australia will release its Monetary Policy Statement, following Tuesday's pause. On European hours, Germany will report Factory Orders and Eurostat will release Retail Sales data. Later, Canada and the US will release their employment reports.
Here is what you need to know on Friday, August 4:
The US employment report is due on Friday, with Nonfarm Payrolls expected to have risen by 200,000 in July, below the 209,000 recorded in June. The Unemployment Rate is expected to remain at 3.6%, and Average Hourly Earnings are expected to rise at an annual rate of 4.2%. These numbers will close a week full of employment figures that have so far shown small signs of softening. The NFP report will be closely watched and is expected to trigger volatility in the markets.
NFP Preview: Forecasts from 9 major banks, moderate downward trend in job growth
Data released from the US on Thursday showed that Initial Jobless Claims rose to 227,000 for the week ended July 29, as expected. Q2 Unit Labor Costs rose at a rate of 1.6%, below the expected 2.6%, and Q1 was revised from 4.2% to 3.3%. Factory Orders rose by 2.3% in June, in line with expectations, while the ISM Services PMI declined from 53.9 to 52.7, below the estimated 53.
Analysts at Wells Fargo on US Productivity:
Productivity growth bounced back strongly in Q2, surpassing expectations and rising at a 3.7% clip. Over the past year, output per hour worked has risen 1.3%, the first positive one-year gain since late 2021. The improving trend in productivity along with slowing nominal wage growth points to inflationary pressures from the labor market starting to subside.
US economic figures had limited impact on the US Dollar, as caution prevailed across markets. US stocks finished modestly lower, and the US 10-year Treasury yield jumped to 4.17%, the highest since November. The US stock market continues to trend lower, following Fitch's credit downgrade, as investors appear to be taking profits after the rally that began on July 10.
The US Dollar Index hit fresh weekly highs but later declined, ending a five-day positive streak, trading around 102.50. EUR/USD hit monthly lows below 1.0950 but then rebounded, ending flat near 1.0950. Germany will report Factory Orders and the Eurozone will release Retail Sales data on Friday.
The Bank of Japan announced a second unscheduled round of bond buying to cap the increase in Japanese Government bond yields. USD/JPY reached a monthly high just below 144.00 before turning to the downside, ending around 142.50.
As expected, the Bank of England (BoE) raised its key rate by 25 bps to 5.25%, which is the highest level in 15 years. There was a three-way split on the Monetary Policy Committee, with two members voting for a 50 bps hike and one member for no change. It is not clear what the BoE will do next, and there will be two monthly inflation reports before the September meeting. The pound weakened moderately after the decision, with GBP/USD bottoming at 1.2620, the lowest level in almost five weeks, before bouncing to the upside above 1.2700.
Analysts at TD Securities on BoE:
Language around the hike suggests the MPC is preparing to reach a terminal rate soon; we continue to expect 25bps hikes in both September and November, but the probability of a November hike, while still our base case, is now lower.
AUD/USD finished moderately higher after falling sharply on the previous two days. The trend remains to the downside, but the pair was able to hold above 0.6500. The Reserve Bank of Australia (RBA) will release its Statement on Monetary Policy, including new macroeconomic forecasts.
USD/CAD rose for the third day in a row but the bullish momentum faded. The pair was unable to break above June highs and retraced towards 1.3350. Canada will report employment data on Friday, with employment change expected to be positive at 21,100, following a surge of 59,900 in June; and the Unemployment Rate is expected to rise modestly from 5.4% to 5.5%.
USD/CHF declined after rising for five consecutive days, falling to 0.8730. Switzerland reported a decline in the annual Consumer Price Index (CPI) to 1.6%, the lowest since January 2022.
Like this article? Help us with some feedback by answering this survey:
- USD/CAD peaked at a daily high of 1.3377 and then consolidated at 1.3355, still holding daily gains.
- Further Oil production cuts by Saudi prospects lifted prices, favouring the CAD.
- Services sectors weakened in July, according to ISM.
On Thursday’s session, the USD/CAD reversed as the USD lost traction following weak mid-tier economic data. The pair rose to nearly 1.3380 and then settled at 1.3355, while the CAD also benefited from rising Oil prices.
In July, the US Services sector displayed some weakness on the data front but stayed resilient. The S&P index came in at 52.3, lower than the consensus and previous figures of 52.4, while the Institute for Supply Management (ISM) came in at 52.7, failing to live up to the expected 53 and the last 53.9.
Labour market data indicated a slight increase in Jobless Claims to 227,000 at the end of July, as anticipated. However, Unit Labor Costs from Q2 rose by 1.6%, falling short of the expected 2.6% and the previous 3.3%. On Friday, Nonfarm Payrolls (NFPs) will offer investors a clearer outlook on the sector, along with wage inflation and unemployment figures. Overall, data on Thursday showed that the US Services sector remains resilient, but the labour market signals are mixed so NFP data will be closely watched.
On the CAD side, no relevant data will be released by Canada for the rest of the week. Rising Oil prices are giving traction to the Canadian currency, as the West Texas Intermediate (WTI) barrel rose more than 2% to $81.68 on the back of expectations of production cuts by Saudi Arabia in September.
USD/CAD Levels to watch
The technical analysis for USD/CAD on the daily chart suggests a neutral to bearish outlook as the bulls show signs of exhaustion. While the Relative Strength Index (RSI) maintains a negative slope above its midline, the Moving Average Convergence Divergence (MACD) printed neutral green bars. On the other hand, the pair is above the 20-day Simple Moving Average (SMA) but below the 100 and 200-day SMAs, suggesting that despite the recent bearish sentiment, the bulls are still resilient, holding some momentum.
Resistance levels: 1.3385 (July’s high), 1.3405 (100-day SMA), 1.3454 (200-day SMA).
Support levels: 1.3280, 1.3250, 1.3240.
USD/CAD Daily chart
-638266888616204909.png)
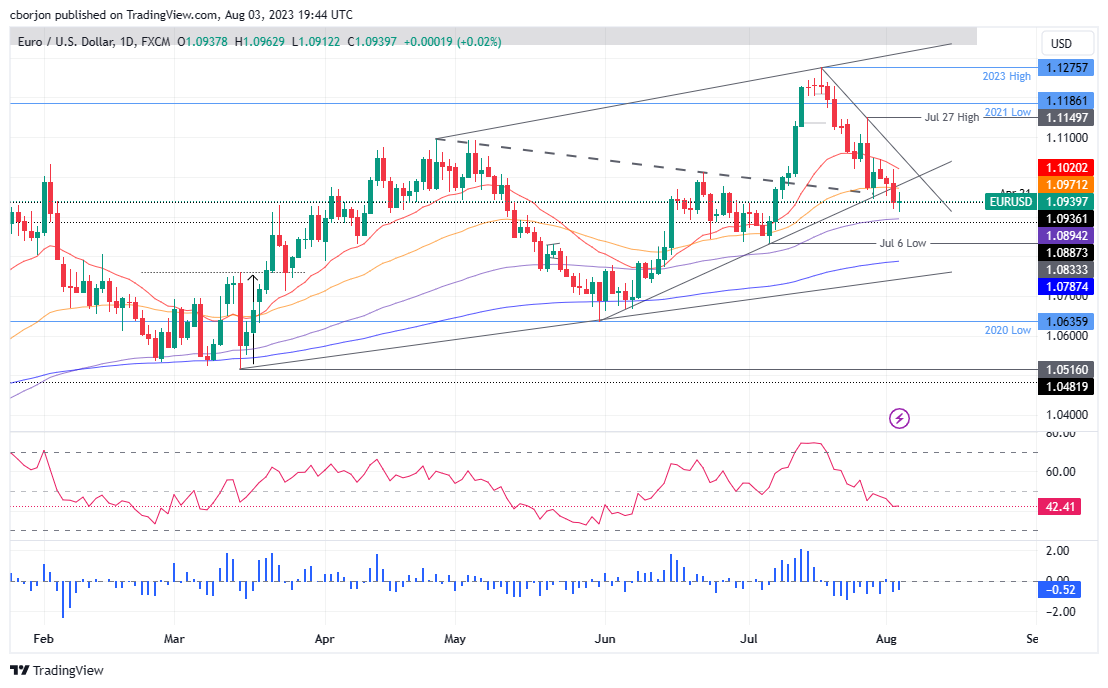
- EUR/USD falls to 1.0912 but rebounds before breaching 1.0900, trading at 1.0942 with a slight gain of 0.04% on Thursday.
- A potential doji formation shows market indecision; the pair might consolidate within the 1.0900/1.1000 range, with 100-day EMA at 1.0894 as a key support level.
- Resistance lies at 1.0971 (50-day EMA), with further upside targets at 1.1000, 1.1020 (29-day EMA), and 1.1100. Conversely, a breach below the 100-day EMA could lead to further losses toward 1.0833 and 1.0800.
The EUR/USD fell to a one-month-low of 1.0912 but bounced before breaching below the 1.0900 figure and is gaining traction, as the major gains 0.04% on Thursday. Hence, the EUR/USD is trading at 1.0942, about to form a doji, which depicts indecision among buyers and sellers.
EUR/USD Price Analysis: Technical outlook
It should be said the EUR/USD dropped below the 50-day Exponential Moving Average (EMA) at 1.0871, suggesting the pair is accelerating its downtrend, but the 100-day EMA at 1.0894 capped the EUR/USD’s fall to test the July 6 swing low of 1.0833. Despite the fact that the EUR/USD’s scenario is turning bearish, the pair might consolidate within the 1.0900/1.1000 area, as a downslope trendline passes around 1.1000, while the 100-day EMA could cushion the EUR/USD around 1.0900.
However, if EUR/USD extends its losses past the latter, the 100-day EMA around 1.0894 would be tested. A breach of the latter would immediately expose the July 6 low at 1.0833, followed by the 1.0800 figure, ahead of the 200-day EMA.
Conversely, if the EUR/USD reclaims the 50-day EMA at 1.0971, the 1,1000 figure would be up for grabs. Break above would set the stage to test the 29-day EMA at 1.1020, followed by the 1.1100 mark.
Oscillator-wise, the Relative Strength Index (RSI) remains in bearish territory, but its slope is almost turning neutral. The three-day Rate of Change (RoC) portrays a positive divergence, as the RoC aims upward, while EUR/USD’s price action extends its losses. Nevertheless, a doji emerging at around 1.0900 could signal buyers to enter the market.
EUR/USD Price Action – Daily chart
- BoE’s raises rates to 5.25%, though GBP/USD dipped to a one-month low.
- The BoE’s decision was on a split vote, with two members eyeing a 50 bps rate hike.
- US Initial Jobless Claims came in line with estimates at 227K, while the ISM’s business services activity reading was 52.7, indicating a potential slowing down in the economy.
GBP/USD trims some of its earlier losses after the Bank of England (BoE) decided to raise rates by a quarter of a percentage point, as it warned borrowing costs will stay high. That, alongside business activity in the United States (US) slowing down, has lent a lifeline to the Sterling (GBP), which tumbled after BoE’s decision to a one-month low of 1.2620. At the time of writing, the GBP/USD is trading at 1.2705, registering minuscule losses of 0.04%.
Sterling rebounds from a one-month low, buoyed by the Bank of England’s decision to lift rates and slower US business activity. The pair is now trading at 1.2705, with minimal losses of 0.04%
The GBP/USD dived sharply after the BoE lited rates to 5.25% and warned, “The MPC will ensure that Bank Rate is sufficiently restrictive for sufficiently long to return inflation to the 2% target.” The BoE noted that although inflationary pressures are easing, the UK’s Consumer Price Index (CPI) remained at 7.9% in June, the highest in any major economy. In the meantime, market participants polled by Reuters expect UK Bank Rates to peak around 5.75%, indicating that two additional rate increases are expected toward the end of the year.
The BoE’s vote split was 6-3, with two members expecting a 50 bps hike, while Swati Dhingra voted to keep rates unchanged.
Aside from this, US economic data revealed the labor market gave signs of easing in the week ending July 29, with Initial Jobless Claims coming at 227K, aligned with estimates. Even though the data is encouraging, mixed reports during the last few months keep investors guessing the job market trend.
Other data released by the Institute for Supply Management (ISM) recently revealed that business services activity remains at expansionary territory at 52.7, below forecasts of 53, and trailed June’s 53.9. Even though data remains positive, it shows that activity is cooling down, putting on the table a recessionary scenario if consumers don’t support the economy.
Following the data, the greenback weakened as the GBP/USD gained some traction, trading back above 1.2700. Despite rising US Treasury bond yields, which had continued to edge higher, the US 10-year Treasury bond yield gained eleven basis points at 4.191%.
The upcoming US Nonfarm Payrolls report for July is anticipated to provide a comprehensive assessment of the labor market. If the report reveals unexpected positive outcomes, it may lead to discussions about implementing further interest rate hikes by the US Federal Reserve (Fed). Conversely, if the results fall short of expectations, the Fed might adopt a cautious approach in preparation for the September monetary policy meeting.
Meanwhile, Richmond’s Federal Reserve President, Thomas Barkin, made statements emphasizing the concern over high inflation levels. He mentioned that the inflation reading from the previous month was favorable, and he hopes it indicates a positive direction in managing inflationary pressures.
GBP/USD Technical Levels
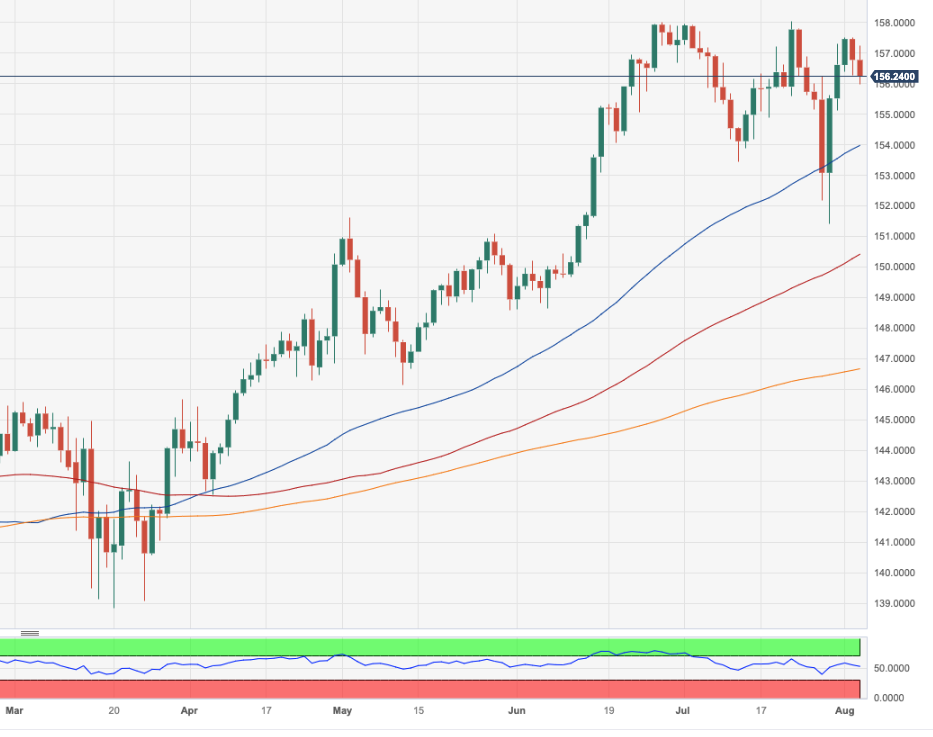
- EUR/JPY found support at the 20-day SMA at 155.75 but keeps daily losses.
- The Services sector in the EU somewhat decelerated in July.
- BoJ policy tweaks expectated to make the JPY gain traction.
On Thursday, the EUR/JPY lost ground, retreating towards 156.00 but still holding the 20-day Simple Moving Average. The Euro weakened after soft Services PMIs released during the European sessions while the JPY strengthened on the back of expectations of the Bank of Japan (BoJ) turning hawkish.
Overall, the Service sector in the Eurozone slightly decelerated in July. The PMI service released by the S&P Global and Hamburg Commercial Bank (HCOB) from the Eurozone came in at 50.9 – lower than the 51.1 expected, while the German index showed strength, beating the expectations of 52, coming in at 52.3. In addition, the French, Italian and Spanish PMIs came in slightly below the consensus.
As a reaction, the EUR is trading weak against most of its rivals but rising German yields may limit the losses. The 10-year yield led the way, showing a 2.64% increase to 2.56%.
On the Japanese side, analysts at Rabobank see the USD/JPY retreating to 138.00 by year's end. They predict that fundamental factors will eventually drive the BoJ to leave their accommodative stance, but only gradually. In the meantime, the bank has been sending mixed signals to the markets, and they recently held an unexpected bond-buying operation which made the 10-year JGB rise to multi-year highs, which may hint at a possible pivot.
EUR/JPY Levels to watch
Analysing the daily chart, a neutral-to-bearish technical outlook is evident for EUR/JPY, suggesting that the bulls are losing momentum. The Relative Strength Index (RSI) maintains a negative slope above its midline, and the Moving Average Convergence Divergence (MACD) showed a higher red bar. On the other hand, the pair is above the 20, 100 and 200-day SMAs, indicating a favourable position for the bulls in the bigger picture.
Support levels: 155.75, 155.00, 154.00.
Resistance levels: 156.50, 157.00, 157.50.
EUR/JPY Daily chart
-638266833047395872.png)
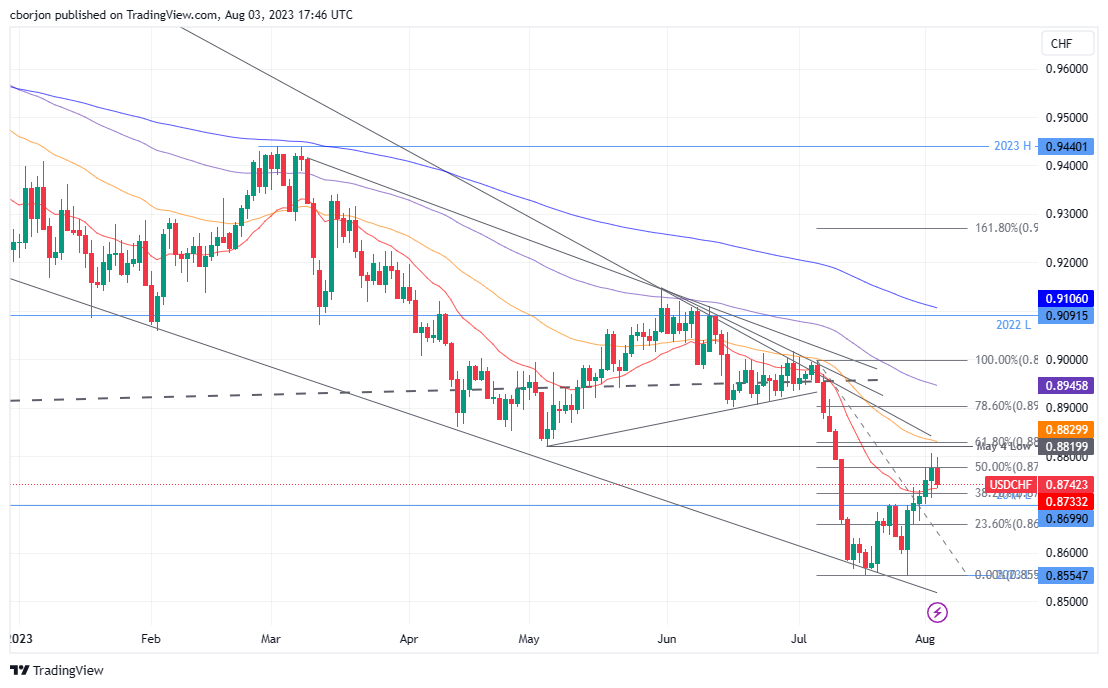
- USD/CHF retraces from four-week highs, trading at 0.8742, down 0.44% as USD dips even as Treasury bond yields remain elevated.
- Formation of a ‘bearish-harami’ two-candle chart pattern indicates potential further downside, with key support levels at 0.8733 (20-day EMA), 0.8724 (38.2% Fib), and 0.8700.
- If buyers prevail, resistance levels to watch are 0.8776 (50% Fib), 0.8805 (week’s high), and 0.8828 (61.8% Fib).
USD/CHF retraces as the US Dollar (USD) dips, despite US Treasury bond yields remaining high as market participants prepare for Friday’s US Nonfarm Payrolls report. Sentiment has shifted and is mixed, hence the greenback’s sudden weakness after hitting a new four-week high of 102.843, as shown by the US Dollar Index (DXY). At the time of writing, the USD/CHF is trading at 0.8742, down 0.44%.
USD/CHF Price Analysis: Technical outlook
From a daily chart perspective, the USD/CHF is forming a ‘bearish-harami’ two-candle chart pattern, which warrants further downside is expected, but support emerging at the 20-day Exponential Moving Average (EMA) at 0.8733, could hurt sellers’ plans for lower prices. If that scenario plays out, the USD/CHF next support to challenge would be the 38.2% Fibonacci (Fib) retracement at 0.8724, followed by the August 2 daily low of 0.8713, ahead of the 0.8700 figure.
On the other hand, if USD/CHF buyers move in, technical resistance emerges at the 50% Fib level at 0.8776, which, once cleared, will expose the current week’s high of 0.8805. A breach of the latter, the USD/CHF would rally toward the 61.8% Fib retracement at 08828.
USD/CHF Price Action – Daily chart
- XAG/USD dropped to a daily low of around $23.37, but the bulls managed to push the price back to $23.60.
- The USD retreated following weak Services and Labour market data.
- Still, US Treasury yield will limit the metal’s advance.
The XAG/USD silver’s spot price traded soft on Thursday but cleared daily losses. The USD reversed following soft Services PMI, allowing the metal to gain ground but rising US yields may limit the greenback’s losses.
Investors digest Services sector data from the US. Eyes on NFPs
In July, the US Services sector showed weakness, with the S&P index and the Institute Supply Management (ISM) figures coming in lower than expected. In addition, Labour market data also displayed mixed signals along the week, with ADP figures coming above expectations on Wednesday and Jobless Claims accelerating in the last week of July. That being said, Friday Nonfarm Payrolls (NFPs) will provide investors a clearer outlook on the sector's performance, wage inflation, and unemployment figures, which will model the expectations regarding the next Federal Reserve (Fed) decisions.
US Treasury yields, often considered the opportunity cost of holding metals, retreated but hold to a daily increase. The 2-year yield stands at 4.88% while the 5 and 10-year rates are at 4.29% and 4.18%, with both tallying significant advanced of 1.37% and 2.62%, respectively, which seems to cushion the USD’s losses. Regarding the following Fed decisions, the odds of a hike in September remain low, while the probability of an increase in November stands around 30%, according to the CME FedWatch tool.
XAG/USD Levels to watch
Analysing the daily chart, the XAG/USD technical outlook is bearish in the short term. The Relative Strength Index (RSI) is comfortably positioned below its midline in negative territory, further supported by a bearish signal from the Moving Average Convergence Divergence (MACD), displaying red bars, underscoring the growing bearish momentum. Moreover, the metal’s price is below the 20 and 100-day Simple Moving Averages (SMAs), but above the 200-day SMA, suggesting that the downside may be limited.
Support levels: $23.30,$23.15 (200-day SMA), $23.00.
Resistance levels. $24.00 (100-day SMA), $24.27 (20-day SMA), $24.50.
XAG/USD Daily chart
-638266800472465564.png)
- USD/JPY reached a four-week high of 143.88 amid BoJ’s unscheduled bond-buying intervention.
- Initial unemployment claims came within estimates at 227K, and while ISM business services activity remains in expansionary territory, a reading of 52.7 indicates a cooling down.
- Upcoming US Nonfarm Payrolls data for July could give additional direction to the USD/JPY pair.
USD/JPY retraces after hitting a four-week high at 143.88 after the Bank of Japan (BoJ) stepped in to buy Japanese Government Bunds (JGBs) following its tweaking of the Yield Curve Control (YCC). Nevertheless, buyers’ hopes were short-lived as overall Japanese Yen (JPY) strength weighed on the USD/JPY pair. The USD/JPY exchanges hands at around 142.40s, below its opening price by approximately 0.60% in the mid-North American session.
The pair drops below its opening price by approximately 0.60%, as the Bank of Japan’s unexpected bond-buying action and mixed US economic data
Investors’ sentiment remains sour, as witnessed by US equities tumbling. US Treasury bond yields rise sharply, particularly the 10-year benchmark note, at 4.183%, gaining almost ten basis points, but cannot underpin the USD/JPY, as the JPY remains solid. US economic data revealed earlier showed that unemployment claims came within estimates of 227K, reported the US Department of Labor. Although the data is encouraging the labor market is easing, mixed reports in the last few months keep market participants unable to time when the jobs market would cool down.
The Institute for Supply Management (ISM) recently revealed that business services activity remains at expansionary territory at 52.7, below forecasts of 53, and trailed June’s 53.9. Even though data remains positive, it shows that activity is cooling down, putting on the table a recessionary scenario if consumers don’t support the economy.
Aside from this data, Friday’s US Nonfarm Payrolls report for July is expected to deliver a clear reading of the labor market. Any upward surprises could put on the table additional rate hikes by the US Federal Reserve (Fed). Otherwise, the Fed could take a cautious approach ahead of the September monetary policy meeting.
In the meantime, Richmond’s Fed President Thomas Barkin crossed the wires, said that inflation is too high, and that “ last month’s inflation read was a good one, and I hope it is a sign.”
On the Japanese front, the BoJ held an unscheduled bond-buying operation, as the 10-year JGB hit a high of 0.66% when the BoJ stepped into the market to buy JPY 400 billion across different maturities. Hence, Japanese Yen traders must be aware of this news, as volatility increases during the Asian session.
USD/JPY Price Analysis: Technical outlook
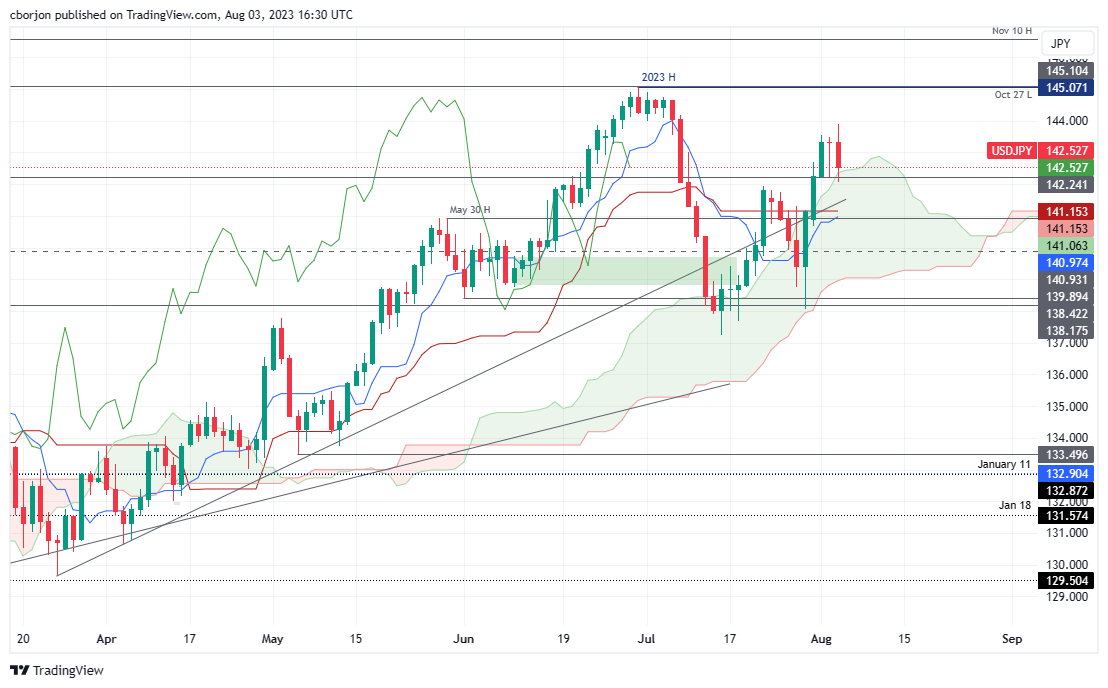
The USD/JPY remains upward biased but drifts toward the top of the Ichimoku Cloud (Kumo), a support area at around 142.35/45. If USD/JPY falls inside the Kumo, that could pave the way for further losses, with support levels found at the Kijun and Tenkan-Sen levels, each at 141.15 and 140.97. Conversely, if buyers reclaim 143.00, that could open the door to testing the weekly high of 143.88.
- The NZD/USD rose near the 0.6090 area following two days of losses.
- Services PMIs from the US came in soft, and Jobless Claims slightly increased at the end of July.
- All eyes are now on Friday’s NFPs.
On Thursday, the NZD/USD bulls stepped up and pushed the price near the 0.6090 area. In the meantime, investors digest fresh mid-tier economic data from the US ahead of Friday's awaited Nonfarm Payrolls (NFPs).
The Services sector from the US in July showed weakness. The S&P index came in at 52.3, lower than the consensus and previous figures of 52.4, while the Institute for Supply Management (ISM) came in at 52.7, failing to live up to the expected 53 and the last 53.9. Labor market data showed Jobless Claims slightly increasing to 227,000 at the end of July, according to expectations. Unit Labor Costs from Q2 increased by 1.6%, lower than the 2.6% expected and the previous 3.3%.
Overall, the Services sector is resilient, while the labour market flashed mixed signals during the week. Nonfarm Payrolls (NFPs) on Friday will provide investors a clearer outlook of the sector alongside wage inflation and unemployment figures.
Following the data, the DXY cleared daily gains, which saw the index peaking at 102.83 and then settling at 102.57, seesawing between small gains and losses.
NZD/USD Levels to watch
With both Relative Strength Index (RSI) and Moving Average Convergence Divergence (MACD) comfortably placed in negative territory on the daily chart, the NZD/USD sellers hold the upper hand. Additionally, the pair is below the 20,100 and 200-day Simple Moving Averages (SMAs), indicating a challenging position for the buyers in the bigger picture as the bears remain in command.
Support levels: 0.6060, 0.6050, 0.6035.
Resistance levels:0.6100, 0.6130, 0.6150.
NZD/USD Daily chart
-638266755022842203.png)
- USD/MXN hits a two-month high at 17.4256, gains in the week by almost 4%.
- Steady US Initial Jobless Claims underpins the US Dollar, despite a soft ISM Non-Manufacturing PMI.
- The surprise rate cut by Brazil’s Central Bank could set a precedent for other Latin American central banks, yet the Bank of Mexico upholds its restrictive monetary policy.
The Mexican Peso (MXN) plunges sharply against the US Dollar (USD), accumulating losses of 2% on Thursday and 4% in the week spurred by higher US Treasury bond yields and traders beginning to unwind the carry trade. Additionally, a surprise rate cut of 50 bps by the Brazil Central Bank could be seen as setting the tone for other Latin American central banks. At the time of writing, the USD/MXN is trading at 17.3617 after hitting a daily low of 16.9800.
The Mexican Peso plunges against the US Dollar, buoyed by robust USD performance and negative sentiment following the Fitch downgrading US creditworthiness
Wall Street is trading in negative territory as investors’ mood remains depressed, courtesy in part of Fitch’s downgrade to US creditworthiness. Also, a strong US Dollar (USD) across the board underpins the USD/MXN higher, reaching a two-month-high of 17.4256 early in the North American session, as data from the United States (US) crossed the wires.
Initial Jobless Claims for the week ending July 29 rose by 227K aligned with estimates, the US Bureau of Labor Statistics (BLS) reported. The report shows the labor market is easing, but the trend remains uncertain, with mixed releases during the last couple of months with data depicting the opposite.
In other data, the ISM Non-Manufacturing PMI for July, also known as Services PMI, came at 52.7, below 53 forecasts and 53.9 in June. Digging into the data, a gauge of paid prices by services businesses rose to 56.8 from 54.1 in June, portraying the stickiness of inflation in services activity.
Aside from this data, Friday’s US Nonfarm Payrolls report for July is expected to deliver a clear reading of the labor market. Any upward surprises could put on the table additional rate hikes by the US Federal Reserve (Fed). Otherwise, the Fed could take a cautious approach ahead of the September monetary policy meeting.
Another cause behind the USD/MXN is the rise in US Treasury bond yields. The 10-year benchmark note gains eight basis points, and sits at 4.171%, its highest level since November 2022.
In the meantime, Richmond’s Fed President Thomas Barkin crossed the wires, said that inflation is too high, and that “ last month’s inflation read was a good one, and I hope it is a sign.”
Aside from this, the Brazil Central Bank delivered a dovish surprise, cutting rates 50 bps to 13.25%, from 25 bps estimated by analysts, delivering dovish forward guidance saying, “If the scenario evolves as expected, the Committee members unanimously anticipate further reductions of the same magnitude in the next meetings.”
That opposes the Bank of Mexico (Banxico) Deputy Governor Jonathan Heath, who said on Wednesday, “restrictive monetary policy stance should be held for a while to wait for it to have effect,” expressed in a Banorte podcast interview. Nevertheless, he said interest rates, which the TIIE stands at 11.25%, are “correct” even if the Fed hikes again.
USD/MXN Price Analysis: Technical outlook
The USD/MXN is staging an outstanding recovery, hitting 17.4256 as its daily high, reaching a new two-month high, but failed to crack essential resistance found at May 17 daily low at 17.4038. With a daily close above the latter, the USD/MXN could rally towards the 100-day Exponential Moving Average (EMA) at 17.5273, with buyers eyeing May 24 swing high at 17.9798, followed by the 200-day EMA at 18.1520. Conversely, if USD/MXN drops below 17.0000, that could exacerbate a re-test of the year’s lows at around 16.6238.
Economists at Société Généralestay positive on the BRL and see the local swap curve bull-steepening.
Staying sanguine on BRL, and expecting swap curve to bull steepen
We maintain our call to go long the BRL on any weakness. The easing risk premium, still-high carry and low volatility, coupled with small external imbalances and efforts to reduce fiscal risks, should support the currency. The undemanding valuations, light positioning, and high terms of trade should also help. Finally, once the dust settles in the external environment, the end of the Fed’s tightening cycle, lukewarm global growth, and easing global financial conditions as the year progresses should all add to the positive picture.
We see USD/BRL trading in a 4.70-5.00 range in the month ahead.
We still expect the swap curve (DI33-25) to bull steepen as the central bank is likely to continue cutting rates, by perhaps 50 bps in each of the next three meetings – moving towards 11.75% by year-end. The long end is set to benefit from the smaller risk premium but should show more of a range bound pattern.
The US Bureau of Labor Statistics (BLS) will release the July jobs report on Friday, August 4 at 12:30 GMT and as we get closer to the release time, here are the forecasts by the economists and researchers of 9 major banks regarding the upcoming employment data.
Nonfarm Payrolls are expected to add 200K jobs in July vs. 209K in June, while the Unemployment Rate is expected to remain steady at 3.6%. Average Hourly Earnings are expected to ease to 4.2% YoY against the former release of 4.4%.
Commerzbank
We expect 200K new jobs and an unchanged unemployment rate of 3.6%. This would make it clear that the US economy did not slip into recession in July either. However, it is difficult to assess the risk of recession in the coming months on the basis of the labor market, as it is at best a coincident indicator. Certainly, however, the risk of recession would increase if labor incomes stopped growing because this would hit private consumption. The decisive variable here, i.e. the product of employment, average working hours and average hourly wages, is the index of 'aggregate weekly payrolls of all employees'. In June, labor income was still 0.8% higher than in May.
Credit Suisse
We expect payroll gains to slow slightly further to 200K in July. We expect growth in average hourly earnings to slow marginally to 0.3% MoM, which would cause YoY wage growth to edge lower to 4.2%.
TDS
We expect gains to have stayed above trend in July, registering a firm 260K increase. Payrolls have clearly lost momentum over the past year, but they remain above levels that are consistent with a gradual rise in the UE rate. In fact, we forecast the UE rate to drop again by a tenth to 3.5% following its unexpected jump to 3.7% in May, as we expect the participation rate to remain largely steady at 62.6% amid still strong job creation. Wage growth likely fell a tenth to 0.3% MoM, dragging the YoY pace lower at 4.2% from 4.4% in June.
RBC Economics
We expect the unemployment rate to hold steady at 3.6%, and NFP employment to rise 185K in July. Labour markets remain firm, but we look for unemployment to drift higher during the second half of the year.
NBF
Hiring could have slowed if previously released soft indicators such as S&P Global’s Composite PMI are any guide but this may have been offset by a decrease in the number of layoffs. With these two trends cancelling each other, we expect job creation to have remained roughly unchanged in the month at 215K. The household survey could show a similar gain, something which would translate into a one-tick decline in the unemployment rate to 3.5%.
SocGen
We look for job growth moderation in July with total NFP climbing by just 190K workers. We believe any gain above 150-175K jobs remains strong. Such a gain, overtime, supports further declines in the unemployment rate. Even with job gains slowing, we expect the unemployment rate to dip back to 3.5% in July from 3.6% in June. The reading in June is a rounded-up figure. We see gains in the number of jobs that imply the unemployment rate could still dip. Wages are likely to rise 0.3% for July.
CIBC
Initial jobless claims eased over the July survey reference period, suggesting that a healthy 185K jobs could have been created in the US. That’s in line with the climb in participation seen lately in the prime-age working group, which coincides with a drawdown of excess savings. Still strong demand for workers, as evidenced by elevated job openings, suggests that new labor force entrants are being absorbed quickly into vacant positions. The unemployment rate could have remained steady at 3.6%, while a rise in participation also would have left more room for hiring without putting additional upwards pressure on wages, which likely slowed to 0.3% MoM. We’re slightly lower than the consensus on hiring which could result in bond yields falling.
Citi
After the first downside surprise to NFP growth in 15 months in June, we expect a strong bounce-back in July job growth, with total NFP rising by 290K. We expect average hourly earnings to again rise by 0.4% MoM, although this increase would be close to rounding to 0.3%. Note, however, that the Fed’s preferred measure of labor costs, the employment cost index, showed a modest slowing to 1.0% QoQ in Q2, in data released last week. We also expect the unemployment rate to decline further in July to 3.5%, as the unrounded unemployment rate was already very close to 3.5% at 3.57% unrounded in June with an unchanged participation rate at 62.6%.
Wells Fargo
We look for a softer, but still robust, addition of 210K new jobs in July as the labor market moves closer into balance. We also look for the unemployment rate to stay flat at 3.6%. Wages appeared to be cooling on trend, but faster-than-expected wage growth in June and upward revisions to prior months have forced a reassessment. Overall, we expect average hourly earnings to increase 0.3% over the month.
On a one-day view, the Yen is the best performing G10 currency. Economists at Rabobank analyze JPY outlook.
Changes in BoJ policy will not happen quickly
Fundamental factors are moving in favour of inflation in Japan. Last week the government recommended a 4% increase in the minimum wage and the spring Shunto wage round produced the highest increase in pay in around three decades. There is also more evidence that firms are more willing to pass on price rises to consumers.
Changes in BoJ policy will not happen quickly. However, on the assumption that hopes remain that the BoJ can creep towards a gradual move away from extremely accommodative policy, we see the potential for USD/JPY to move back towards 138 on a three-to-six-month view.
The Bank of England (BoE) hiked the policy rate by 25 bps, bringing the Bank Rate to 5.25%. Economists at Danske Bank stay negative on GBP with BoE nearing peak.
Negative GBP stance
The BoE hiked the Bank Rate (key policy rate) by 25 bps to 5.25% with 6 members voting for a 25 bps hike, two members for 50 bps and one member voting for keeping the Bank Rate unchanged.
We stick to our call of a final 25 bps hike in September marking a peak in the Bank Rate of 5.50%. Wage growth and service inflation remain the key releases to follow.
We continue to see relative rates as a positive for EUR/GBP from here, which is one of several reasons behind our fundamental predisposition to buying EUR/GBP dips.
Fitch’s announcement that it was cutting the US sovereign credit rating by one notch to AA+ caught the market by surprise. Economists at Scotiabank analyze USD outlook.
Fitch ratings cut not fatal, but not good for the USD
The universe of solid, AAA sovereign credits has shrunk. So weak fiscal policy is not a challenge unique to the USD. The decision is unlikely to shape near to medium term trading patterns in the USD which will continue to reflect economic data and their implications for yields and interest rate differentials.
At the margin though, the downgrade is clearly a negative for the USD. Central bank reserve managers have been trying to avoid the USD in recent years and the downgrade will give sovereign accounts another reason to diversify, if only passively, away from the USD.
The liquidity, scale and (relative) safety of US financial markets mean that the USD will very likely remain the primary global reserve asset for the foreseeable future. But challenges are emerging, which the Fitch decision and its reference to governance highlight.
Still, the obvious question for anyone considering moving out of the USD right now is: what alternatives are there? The answer is that no currency can offer the advantages of the USD at this point (liquidity, convertibility, track record etc.). The EUR and CNY are potential rivals for the USD but this remains a long-term prospect.
The Mexican Peso continued its appreciation path in July. Economists at MUFG analyze MXN outlook.
Attention might gradually shift to presidential elections
In Q3 23, we expect the MXN to remain supported by high carry-trade return and the continuity of nearshoring investments. Assuming that the Fed signals no further rate hikes either at the Jackson Hole symposium in late August or at the September FOMC meeting, we expect the US Dollar to weaken further and keep USD/MXN at lower levels.
However, from Q4 23 onwards, we maintain our outlook for a moderate weakening of the MXN influenced by concerns over a global economic slowdown amid an environment of tight monetary policies worldwide.
A slowdown in the US especially might curtail USD inflows into Mexico. And on the local side, investors might gradually shift their attention to the presidential election scheduled to June 2024, which might bring some concerns on the next steps of economic policies.
Investors might adopt a cautious approach before the election and the MXN might weaken somewhat.
- US ISM Services PMI declined modestly in July.
- US Dollar Index stays in positive territory above 102.50.
The economic activity in the US service sector continued to expand in July, albeit at a softer pace than in June, with the ISM Services PMI declining to 52.7 from 53.9. This reading came in below the market expectation of 53.
Further details of the publication revealed that the Employment Index edged lower to 50.7 from 53.1, while the Prices Paid Index climbed to 56.8 from 54.1, pointing into increasing input price pressures.
Commenting on the data, “there has been a slight pullback in the rate of growth for the services sector," said Anthony Nieves, Chair of the Institute for Supply Management (ISM) Services Business Survey Committee.
"This is due mostly to the decrease in the rate of growth for business activity, new orders and employment, as well as ongoing faster delivery times," Nieves further explained. "The majority of respondents are cautiously optimistic about business conditions and the overall economy.”
Market reaction
The US Dollar Index clings to modest daily gains above 102.50 after this report.
The Brazilian central bank (Banco Central do Brasil, BCB) decided to cut 50 bps off its benchmark rate to 13.25%. Economists at Commerzbank analyze Real (BRL) outlook after the Interest Rate Decision.
BCB cuts key interest rate by 50 bps
The BCB kicked off its rate-cutting cycle on Wednesday with a larger-than-expected 50 bps cut in its benchmark rate to 13.25. The larger move increases our fears that the BCB may now be acting more dovishly, especially with further 50 bps cuts on the horizon. However, these concerns will be more relevant in the future.
Currently, the inflation trajectory is in line with reaching the target on a sustainable basis in 2025, which could justify these faster rate cuts, given the still restrictive (real) interest rate level, which therefore should not weigh excessively on the BRL. However, it will be crucial to see how the BCB's central bankers react to a change in the inflationary environment. We suspect that monetary policy will be less supportive of the Real in the future than it has been in recent times.
Strategists at TD Securities continue to be bullish Oil after the recent gains consolidate.
Strong fundamentals
Stronger-than-expected demand in the US, pending stimulus in China and the ongoing post-COVID normalization all point to demand surging be over 2 million b/d this year. Furthermore, ongoing OPEC+ production reductions, which now will likely include a 500K b/d reduction from Russia, also suggest this market should tighten as the year unfolds. Indeed, these realities should generate a deficit in both Q3 and Q4.
This will more than offset the surplus accumulated in the first half of 2023 and tighten markets. With that, and significantly elevated crack spreads amid a low inventory environment and recent major refinery outages, crude should perform very well.
We continue to expect WTI to approach the $90 mark in the latter part of the year. So far, we are right on target with our Q3-23 target of $78.
- Saudi Arabia announced that it will extend its voluntary production cut through September.
- Crude oil prices rebounded and turned positive following the announcement.
- WTI rose towards $81.00, gaining more than 1%.
Crude oil prices rebounded from their weekly lows after Saudi Arabia announced that it will extend the voluntary cut of one million barrels per day for another month. The Ministry of Energy informed that it could be extended or extended and deepened.
Market reaction:
Following the announcement, the West Texas Intermediate (WTI) crude oil price per barrel surged from $79.00 to $80.85 and was trading around $80.50, indicating a gain of roughly 1.75% for the day. This rebound occurred after a sharp decline on Tuesday.
Economists at HSBC expect a stronger EUR in the months ahead.
EUR may take its cue from risk appetite over the near term
With both central banks taking a data-dependent approach, monetary policy divergence may not drive EUR/USD in the weeks ahead. Instead, FX may take its cue from risk appetite which, in turn, may hinge on whether the data in the US and elsewhere supports a global ‘soft landing’.
The EUR has faced some cyclical challenges, but history suggests that downside data surprises are unlikely to persist to the same extent as they have over the last few months. The EUR could also benefit from an improving broader macro backdrop in the Eurozone. For example, there has been a rapid turnaround in the current account position, which dipped into deficit territory in 2022 but is now improving sharply.
- EUR/USD appear to have met some contention around 1.0910.
- The loss of this region exposes a drop to 1.0830.
The selling pressure around EUR/USD remains everything but abated on Thursday, as this time the pair visits new multi-week lows around 1.0910.
Considering the ongoing price action, spot risks more sustained losses once 1.0900 is cleared. Against that, the pair could then challenge the July low of 1.0833 (July 6) sooner rather than later.
A deeper retracement from here should put a potential test of the key 200-day SMA at 1.0737 back on the radar, although this scenario remains out of favour for the time being.
Looking at the longer run, the positive view remains unchanged while above the 200-day SMA.
EUR/USD daily chart
- USD/CAD jumps above 1.3350 as the focus shifts to US/Canada employment data.
- Market sentiment is quite bearish after Fitch downgraded the United States government's long-term credit rating.
- The US Dollar Index drops sharply as Q2 Unit Labor Costs expanded at a slower pace than expected.
The USD/CAD pair climbs above the crucial resistance of 1.3350 amid strength in the US Dollar in the early New York session. The Loonie asset remains in the bullish trajectory as the market sentiment is quite bearish after Fitch downgraded the United States government's long-term credit rating.
S&P500 futures generate losses in Europe amid cautious market mood. US equities were heavily sold on Wednesday after Fitch downgrade citing concerns about higher fiscal spending in coming years. The market mood remained risk-off despite US Treasury Secretary Janet Yellen calling Fitch's downgrade to the US government ‘entirely unwarranted’ amid a resilient labor market, spending, and easing inflationary pressures.
The US Dollar Index (DXY) drops sharply as Q2 Unit Labor Costs expanded at a slower pace than expectations. The economic data grew by 1.6% while investors were anticipating a higher pace of 2.6%. A significant decline in wage prices signals that inflationary pressures would soften further. The decline in disposable income would slow down the resilience in consumer spending and reduce the purchase of big-ticket items.
Meanwhile, individuals claiming jobless benefits for the very first time remain in line with expectations at 227K for the week ending July 28.
Going forward, investors will focus on the US Nonfarm Payrolls (NFP) data, which will be published on Friday at 12:30 GMT. On Wednesday, Automatic Data Processing (ADP) reported the addition of fresh payrolls by 324K vs. expectations of 188K. This has set a positive undertone for the NFP data.
On the Canadian Dollar front, investors are also awaiting the labor market data. As per the estimates, the Canadian labor market witnessed fresh additions of 21.1K employees, lower than the prior reading of almost 60K. The Unemployment Rate is expected to increase to 5.5% against the former release of 5.4%.
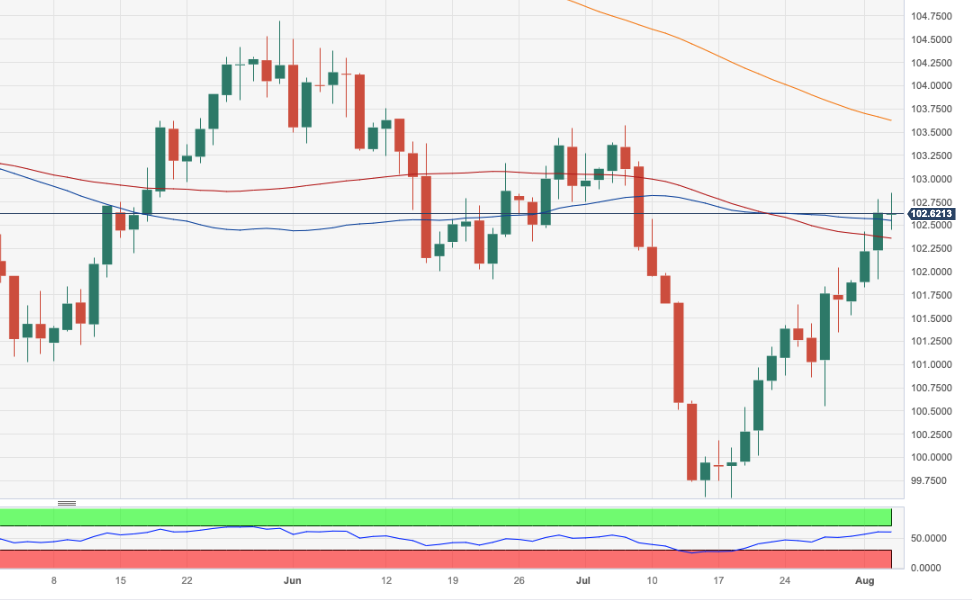
- DXY climbs to new highs around 102.85 on Thursday.
- A close above the 55-day SMA should alleviate the selling pressure.
DXY rises further and gradually approaches the key barrier at the 103.00 hurdle on Thursday.
The index appears poised to extend the ongoing multi-week recovery for the time being. Against that, a convincing surpass of the provisional 55-day SMAs at 102.53 should mitigate the downside bias in the dollar and allow for extra gains to the next target at the July high of 103.57 (July 3), which appears underpinned by the proximity of the key 200-day SMA, today at 103.61.
Looking at the broader picture, while below the 200-day SMA the outlook for the index is expected to remain negative.
DXY daily chart
Today’s MPC statement and accompanying material have seen Sterling sell off around 0.5%. Economists at ING analyze GBP outlook.
BoE reverts back to a 25 bps hike
Better news on inflation has, as expected, enabled the BoE to pivot back to a 25 bps rate hike this month. The BoE is keeping all its options open on future rate hikes, although another rise in September seems highly likely. Whether that's repeated in November is a more open question, particularly if services inflation starts to fall more noticeably between now and then.
We expect the general direction of travel for EUR/GBP to lie towards the 0.88 area later this year as evidence builds that rates may in fact peak at 5.50%.
We still like a higher GBP/USD on the back of the softer Dollar story – but that does rely on both US inflation and activity showing a marked deceleration over the coming months.
We currently see GBP/USD ending the year just above 1.30.
The BoE delivered a 25 bps hike as expected, which is a bit of a double-edged sword for GBP, economists at TD Securities report.
Setting the groundwork for terminal
The MPC hiked 25 bps. Language around the hike suggests the MPC is preparing to reach a terminal rate soon; we continue to expect 25 bps hikes in both September and November, but the probability of a November hike, while still our base case, is now lower.
We’re of the view that higher rates might not provide the best support, given the trade-offs between growth, inflation, and domestic housing markets. While higher rates would make it harder to sell the currency, given the carry costs, markets are likely to reward FX with greater growth momentum.
For GBP, the knee-jerk won’t be positive, reflecting the market mentality that higher rates are good, though the growth momentum story has also lost steam recently.
- US Q1 Unit Labor Costs rise 1.6% in the second quarter.
- US Dollar Index remains relatively steady after data, around 4-week highs.
The US Bureau of Labor Statistics reported that Unit Labor Cost (ULC) rose 1.6% during the second quarter, a reading below market estimates of 2.6%. ULC rose 3.3% during the first quarter (revised from 4.2%).
Nonfarm Productivity increased 3.7%, more than the 2% of market consensus. The 2.1% decline of the first quarter was revised to -1.2%.
Key takeaways from the report:
“Nonfarm business sector labor productivity increased 3.7 percent in the second quarter of 2023, the U.S. Bureau of Labor Statistics reported today, as output increased 2.4 percent and hours worked decreased 1.3 percent.”
“The decline in hours worked is the first decline since the second quarter of 2020 and was the result of a 1.3-percent decline in average weekly hours; employment was unchanged.”
“From the same quarter a year ago, nonfarm business sector labor productivity increased 1.3 percent, reflecting a 2.6- percent increase in output and a 1.2-percent increase in hours worked; this is the first increase in the four-quarter productivity measure since the fourth quarter of 2021.”
“Unit labor costs in the nonfarm business sector increased 1.6 percent in the second quarter of 2023, reflecting a 5.5-percent increase in hourly compensation and a 3.7-percent increase in productivity. Unit
labor costs increased 2.4 percent over the last four quarters.”
Market reaction:
The US Dollar Index continued to trade around 102.70 after the release of US data that also included the weekly Jobless Claims report. Later on the day, the ISM Service PMI is due.
- Initial Jobless Claims advanced by 6,000 in the week ending July 29.
- Continuing Jobless Claims rise by 21,000 in the week ending July 22.
- US Dollar Index remains around four-week highs near 102.70.
Initial Jobless claims totaled 227,000 in the week ending July 29, the weekly data published by the US Department of Labor (DOL) showed on Thursday. The print follows the previous week's 221,000 (unrevised) and came in line with market expectations. Further details showed that “the 4-week moving average was 228,250, a decrease of 5,500 from the previous week's unrevised average of 233,750.”
Continuing Claims increase by 21,000 in the week ended July 22 to 1.7 million, a reading that matched market estimates. The four-week moving average “was 1,712,250, a decrease of 4,500 from the previous week's revised average.”
Market reaction:
Along with the Jobless Claims, Q2 Unit Labor Costs were released. The US Dollar Index remained near four-week highs after the reports trading around 102.70.
- GBP/JPY is expected to deliver more weakness as BoE-BoJ policy divergence widens.
- The BoE raises interest rates by 25 bps to 5.25% and comments that the bank rate will stay "sufficiently restrictive for sufficiently long".
- GBP/JPY delivers a breakdown of the consolidation formed in a range of 181.75-182.70.
The GBP/JPY pair bounces back after a vertical sell-off to near 180.50 in the European session. The cross discovers strength as the Bank of England (BoE) raises interest rates by 25 basis points (bps) to 5.25% to build more pressure on stubborn inflation.
Out of the nine-member led Monetary Policy Committee (MPC), BoE policymaker Swati Dhingra voted for a steady interest rate decision. BoE Governor Andrew Bailey conveyed that the bank rate will stay "sufficiently restrictive for sufficiently long" to return to the inflation target.
An interest rate hike by the United Kingdom's central bank has widened the BoE-Bank of Japan (BoJ) policy divergence. Last week, the BoJ allowed more flexibility to the Yield Curve Control (YCC) that would soft bond-buying operations.
GBP/JPY delivers a breakdown of the consolidation formed in a range of 181.75-182.70 on an hourly scale. A breakdown of the consolidation results in wider ticks and heavy volume. A declining 20-period Exponential Moving Average (EMA) indicates that the short-term trend is bearish.
The Relative Strength Index (RSI) (14) shifts into the bearish range of 20.00-40.00, which indicates that the downside momentum is active.
Pound Sterling exposes to more downside if the cross drops below the immediate support of 180.50. A decisive breakdown would drag the asset towards July 13 low at 179.50, followed by July 27 low at 177.40.
On the flip side, a recovery move above July 31 high at 183.20 would drive the asset toward July 05 high at 184.00. Breach of the latter would drive the asset into unchartered territory.
GBP/JPY hourly chart

The Bank of England raised Bank Rate by 25 bps to 5.25% as expected. Economists at Commerzbank expect a further and final rate hike in September
Close to the peak?
The BoE decided to raise the key interest rate (Bank Rate) by 25 bps. With this 14th step in the current rate hike process, Bank Rate rises to 5.25%, the highest level since March 2008.
The BoE continues to expect inflation to fall significantly in the medium term, to 5% by the end of the year. Inflation is not expected to fall to the bank's 2% target until mid-2025.
After around 5 percentage points of rate hikes, the BoE now sees monetary policy as restrictive. This indicates that the BoE probably considers the rate peak not to be too far away, especially since the BoE's updated projections indicate weaker growth compared with the May projection and a weakening of the labor market from mid-2024.
We expect a further and final rate hike in September; the rate peak should then be reached at 5.50%.
The Canadian Dollar trades weaker as external factors pull USD/CAD to test major technical resistance, economists at Scotiabank report.
Short-term price trends are clearly USD-bullish
A generally firm USD, rising US bond yields and weak equities are a perfect short-term storm for the CAD which finds itself under a little more pressure.
The USD has experienced a vertical take-off since testing the 1.3150 area Monday. But spot gains have reached what should be firm resistance in the upper 1.33 zone – former trend support from Nov last year which underpinned the USD range until the June rally in the CAD. This is where the USD rebound stopped in early July and it should be stiff resistance to a further USD advance here.
Minor support is 1.33.
Andrew Bailey, Governor of the Bank of England, comments on the policy outlook and responds to questions from the press following the Bank of England's (BoE) decision to hike the policy rate by 25 basis points to 5.25% in August.
Key quotes
"Economy is more resilient, I would not use words like 'pain' to describe policy impact."
"We hope we can deliver the path we expect with no recession, we will have to see."
"June interest rate rise was passed pretty much in full to sight deposits, unlike before."
"Public should feel they can shop around for deposit interest rates, transparency is important."
"Latest news on pass-through of rates to deposits is encouraging, but I can't say it's done."
About Andrew Bailey
Andrew Bailey previously held the role of Deputy Governor, Prudential Regulation and CEO of the PRA from 1 April 2013. While retaining his role as Executive Director of the Bank, Andrew joined the Financial Services Authority in April 2011 as Deputy Head of the Prudential Business Unit and Director of UK Banks and Building Societies. In July 2012, Andrew became Managing Director of the Prudential Business Unit, with responsibility for the prudential supervision of banks, investment banks and insurance companies. Andrew was appointed as a voting member of the interim Financial Policy Committee at its June 2012 meeting.
Andrew Bailey, Governor of the Bank of England, comments on the policy outlook and responds to questions from the press following the Bank of England's (BoE) decision to hike the policy rate by 25 basis points to 5.25% in August.
Key quotes
"Unemployment remains historically very low."
"We had some unpleasant surprises in June, we have seen some of that turn round."
"I don't think there was a case for a 50 basis points rate rise today."
"Not time to declare it's all over and we are sticking where we are on rates."
"There is no presumed path for interest rates from here."
About Andrew Bailey
Andrew Bailey previously held the role of Deputy Governor, Prudential Regulation and CEO of the PRA from 1 April 2013. While retaining his role as Executive Director of the Bank, Andrew joined the Financial Services Authority in April 2011 as Deputy Head of the Prudential Business Unit and Director of UK Banks and Building Societies. In July 2012, Andrew became Managing Director of the Prudential Business Unit, with responsibility for the prudential supervision of banks, investment banks and insurance companies. Andrew was appointed as a voting member of the interim Financial Policy Committee at its June 2012 meeting.
Andrew Bailey, Governor of the Bank of England, comments on the policy outlook and responds to questions from the press following the Bank of England's (BoE) decision to hike the policy rate by 25 basis points to 5.25% in August.
Key quotes
"We have to balance risks, we have risks both ways."
"Relative to May, more of the risk we saw has crystallised."
"Projection for economic activity has weakened since May."
"Key question is what confidence we have of wage demands following inflation expectations lower."
"Pay element of labour market has not softened, unlike other elements."
"I do not agree that BoE has lost control of inflation."
About Andrew Bailey
Andrew Bailey previously held the role of Deputy Governor, Prudential Regulation and CEO of the PRA from 1 April 2013. While retaining his role as Executive Director of the Bank, Andrew joined the Financial Services Authority in April 2011 as Deputy Head of the Prudential Business Unit and Director of UK Banks and Building Societies. In July 2012, Andrew became Managing Director of the Prudential Business Unit, with responsibility for the prudential supervision of banks, investment banks and insurance companies. Andrew was appointed as a voting member of the interim Financial Policy Committee at its June 2012 meeting.
Andrew Bailey, Governor of the Bank of England, comments on the policy outlook and responds to questions from the press following the Bank of England's (BoE) decision to hike the policy rate by 25 basis points to 5.25% in August.
Key quotes
"Latest pay growth is materially above BoE's May forecast."
"Pay growth is notably stronger than standard models would suggest."
"Upside surprises on wage inflation suggest that it will take longer for second-round effects to fade."
"Evidence is clear that higher bank rate is having an impact."
"I will not judge what the path of BoE rates will be."
"More than one path for rates may deliver inflation back to target."
"We will judge what is most appropriate path for rates based on evidence."
About Andrew Bailey
Andrew Bailey previously held the role of Deputy Governor, Prudential Regulation and CEO of the PRA from 1 April 2013. While retaining his role as Executive Director of the Bank, Andrew joined the Financial Services Authority in April 2011 as Deputy Head of the Prudential Business Unit and Director of UK Banks and Building Societies. In July 2012, Andrew became Managing Director of the Prudential Business Unit, with responsibility for the prudential supervision of banks, investment banks and insurance companies. Andrew was appointed as a voting member of the interim Financial Policy Committee at its June 2012 meeting.
- EUR/GBP gauges more gains despite hawkish BoE policy.
- Nine-member BoE committee decides to raise interest rates by 25 bps to 5.25% in which one favors the status quo.
- More interest rate hikes from the ECB are still anticipated as a victory against inflation is not announced yet.
The EUR/GBP pair tests the resistance of 0.8650 as the Bank of England (BoE) maintains a hawkish stance in its August monetary policy. BoE policymakers elevate interest rates by 25 basis points (bps) to 5.25%. Nine-member-led-BoE Monetary Policy Committee (MPC) shows a majority towards an interest rate hike while policymaker Swati Dhingra supports an unchanged interest rate decision.
Inflationary pressures in the United Kingdom economy are highest in comparison with other G7 economies due to labor shortages, high food inflation, and resilience in consumer spending. And, a continuation of the policy-tightening spell was highly expected by the market participants.
One league of investors was expecting that the BoE will raise interest rates consecutively by 50 bps as inflation is almost four times the desired rate of 2%. UK PM Rishi Sunak promised a decline in inflation to at least 5% by year-end and for that fat rate hikes are warranted.
In a monetary policy statement, BoE Governor Andrew Bailey conveyed BoE reiterated that it will ensure that the bank rate will stay "sufficiently restrictive for sufficiently long" to return to the inflation target.
Meanwhile, the Euro remains solid as inflationary pressures in Eurozone are softening. Headline and core inflation in July deflated by 0.1% on a monthly and prices of products at factory gates are declining as firms are passing the benefit of lower input prices to end consumers.
In spite of easing price pressures fears of more interest rate hikes from the European Central Bank (ECB) are still elevated as a victory against inflation is not announced yet.
Andrew Bailey, Governor of the Bank of England, comments on the policy outlook and responds to questions from the press following the Bank of England's (BoE) decision to hike the policy rate by 25 basis points to 5.25% in August.
Key quotes
"We expect inflation to take a further step down in July to around 7%."
"We expect inflation to fall to around 5% in October."
"More gradual pass through of energy price falls explains difference between UK and Eurozone CPI."
"Less clear how fast non-energy prices will come down."
"Food and drink inflation appears to have peaked."
"We expect food price inflation to fall gradually this year."
"Services price inflation brings unwelcome news since May."
"We should not read too much into this, services price inflation reflects volatile elements."
"Continued strength in services price inflation may suggest high inflation will persist."
About Andrew Bailey
Andrew Bailey previously held the role of Deputy Governor, Prudential Regulation and CEO of the PRA from 1 April 2013. While retaining his role as Executive Director of the Bank, Andrew joined the Financial Services Authority in April 2011 as Deputy Head of the Prudential Business Unit and Director of UK Banks and Building Societies. In July 2012, Andrew became Managing Director of the Prudential Business Unit, with responsibility for the prudential supervision of banks, investment banks and insurance companies. Andrew was appointed as a voting member of the interim Financial Policy Committee at its June 2012 meeting.
GBP/USD skids below the 1.2700 level. Economists at Scotiabank analyze the pair’s technical outlook.
A softer phase of price action is developing
Sterling looks soft on the charts and is prone to more losses.
Weakness below major trend support – now resistance – at 1.2855 suggests a softer phase of price action is developing.
Support is 1.2600/05 and 1.2575/80 (100-Day Moving Average at 1.2579).
See:
- GBP/USD could drop to the 1.2580/1.2600 area – ING
-
BoE: Expected downside risks for the growth and inflation outlook points to weaker GBP – Commerzbank
- EUR/JPY adds to Wednesday’s pullback and breaches 156.00.
- If the selling pressure picks up pace, the cross could revisit 154.00.
EUR/JPY loses ground for the second session in a row and briefly pierces the key support at 156.00 the figure on Thursday.
In case seller push harder, the cross could attempt a move to the transitory 55-day SMA near 154.00, where it is expected to meet initial contention.
Looking at the longer run, the continuation of the upside momentum appears likely with the initially target still at the 2023 high at 158.04 (July 21). The surpass of this level exposes a move to the round level of 160.00 in the not-so-distant future.
So far, the longer term positive outlook for the cross appears favoured while above the 200-day SMA, today at 146.63.
EUR/JPY daily chart
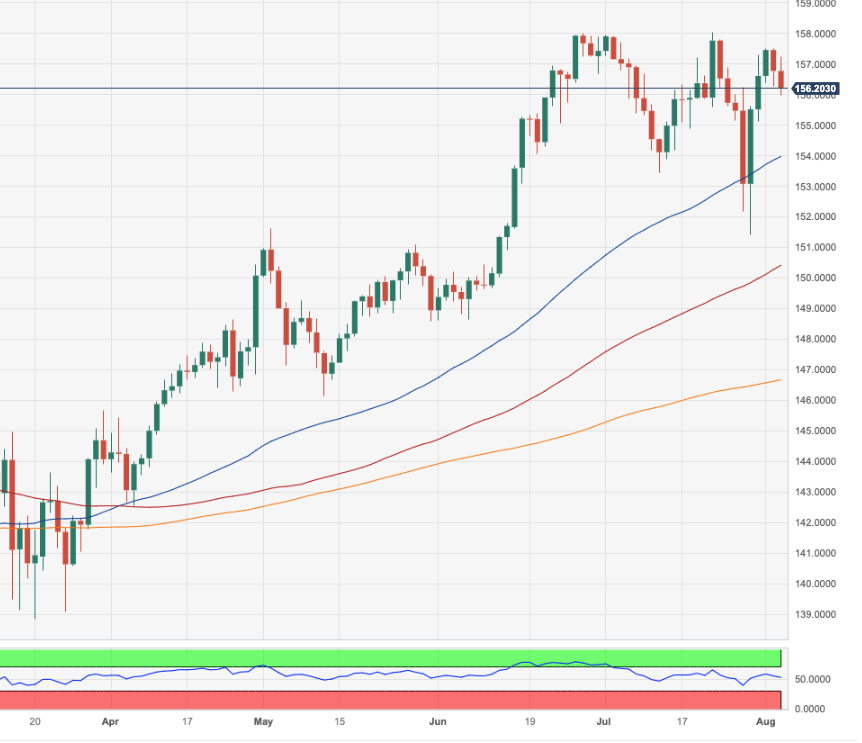
EUR/USD steadies in low 1.09s but price action retains a soft undertone. Economists at Scotiabank report.
Gains through 1.1000 would suggest some additional stabilization
EUR losses are slowing as spot tests major support in the form of a trendline off the Sep 2022 spot low and the combined 50 and 100-DMA signals which are all converging around 1.0925.
While EUR losses are slowing, there is little sign of a rebound developing at this point. EUR gains through 1.1000 would suggest some additional stabilization.
A push through 1.1040/50 would be mildly bullish.
The Dollar was able to benefit from the strong ADP result on Wednesday. Economists at Commerzbank analyze EUR/USD outlook after a strong ADP report.
Dollar benefits from another set of strong US data
Yes, it is very easy to disagree about the suitability of the ADP employment report as an indicator of the official labour market. However, it is hardly surprising that the Dollar was able to benefit from the strong ADP result as the data confirmed the recent impression of an increasing economic divergence between the US and Europe.
Whereas the headwinds for the economy in Europe are increasing, the US economy is remarkably resilient. That means the risks for monetary policy are also shifting towards a relatively more hawkish Fed short-term. For the time being, this is likely to limit EUR/USD to the upside.
The main event today will be the BoE’s latest policy update. Economists at MUFG Bank analyze how GBP could react to the Interest Rate Decision.
Will BoE disappoint expectations for more aggressive rate hikes?
If the BoE raises rates by 25 bps as we expect then it will trigger some initial disappointment and Pound selling. The initial sell-off could be dampened by the BoE continuing to send a hawkish signal that it is prepared to hike rates further in response to fears over more persistent inflation in the UK.
At the same time, there is some speculation that the BoE will announce updated plans for quantitative tightening. The BoE halted reinvestments of its maturing gilts and has been actively selling gilts since September targeting a GBP80 billion annual reduction in their QE portfolio. The BoE is expected to announce a higher target for the next twelve months from October 2023 to September 2024 as more gilts totalling GBP50 billion are set to mature in the next twelve months. It could offer some modest support for the Pound if the BoE steps up active sales as well.
Economists at the Bank of America discuss today’s Bank of England policy decision and its implications for the GBP.
BoE to increase the Bank Rate by 25 basis points
We expect the BoE to increase the Bank Rate by 25 bps. The decision to slow down to a 25 bps hike is based on recent economic data not significantly outperforming expectations. This is unlike the situation before the June meeting when data had been notably positive. However, since the BoE did not update its forecasts in June, it's challenging to gauge their precise expectations and reactions to the current data.
Currently, the markets have priced in a substantial likelihood of a 50 bps hike for the upcoming meeting. Coupled with a higher projected terminal rate than our base case, this could introduce downward pressure on the GBP around the meeting time. The extended GBP position held by hedge funds can further accentuate this potential downside risk.
See – BoE Preview: Forecasts from 10 major banks, 25 bps or 50 bps? That is the question
EUR/GBP to 0.8650 or 0.8550? Economists at Société Générale analyze how the pair could react to the upcoming Bank of England Interest Rate Decision.
25 bps MPC hike is likely, and GBP/USD is vulnerable
A 50 bps hike could push UK pricing back up to a 6% peak, dragging EUR/GBP back towards 0.8550 or so.
A 25 bps hike would send EUR/GBP back up towards July’s peak at 0.8650, but it could also fuel speculation that this was the last hike of the cycle.
If the market prices greater confidence in the ECB reaching 4%, than the UK MPC getting above 4%, EUR/GBP has more upside and in the current climate, GBP/USD is very vulnerable.
See – BoE Preview: Forecasts from 10 major banks, 25 bps or 50 bps? That is the question
Economist Enrico Tanuwidjaja and Junior Economist Agus Santoso at UOB Group comment on the latest release of inflation figures in Indonesia.
Key Takeaways
Indonesia's headline inflation in Jul eased to 3.1% y/y viz. 3.5% in Jun, underpinned largely by decrease in agricultural commodities due to an improvement in food production and stocks. The implementation of agricultural technology and high-productivity seeds of red onion and chili lifted its productivity and drive deflation of these commodities in Jul.
Lower inflation in Jul can be attributed to the decline in most of the subcomponents, except health and education. Food-related sub-component eased to 1.9% y/y viz. 2.9%, marking the largest price deceleration among the sub-components, followed by transportation, and housing. Meanwhile, education sub-component recorded higher inflation in line with new schoolyear period.
Jul’s inflation reaffirms that headline inflation may moderate to under 3% y/y in 3Q2023. However, there are still notable potential upside risks to prices. First, the impact of climate change, namely El Nino that could cause a decrease in the supply of goods and increasing prices. It has been seen from the increase in food commodity prices in several regions. The other factor is the risk of rising global food prices due to export restrictions undertaken by several main food exporters including Russia, India, Thailand, and Vietnam.
Economists at ING analyze SNB’s policy outlook and its implications for the Swiss Franc (CHF).
SNB expected to remain hawkish and hike 25 bps at its September meeting
The Swiss National Bank (SNB) is expected to remain hawkish and hike 25 bps at its September meeting. The SNB also continues to guide the nominal Swiss Franc higher.
Given that USD/CHF is now rallying, the SNB may need more of that trade-weighted Swiss Franc appreciation to come via EUR/CHF. That could mean that 0.9650 now proves the top of a new – and lower – 0.9500-0.9650 range.
European Central Bank board member Fabio Panetta, in a webinar on Thursday, supported keeping interest rates high for longer.
"Emphasising persistence may be particularly valuable in the current situation, where the policy rate is around the level necessary to deliver medium-term price stability, the risk of a de-anchoring of inflation expectations is low, inflation risks are balanced and economic activity is weak," Panetta said.
Market reaction
The above comments fail to have little impact on the Euro, with EUR/USD trading at 1.0925, down 0.05% on the day.
- EUR/JPY corrects sharply to 156.00 as the market mood turns extremely cautious.
- Eurozone inflation is almost three times the desired rate of 2%, therefore, further policy-tightening seems warranted.
- The BoJ provided more flexibility to the YCC and delivered a message that the central bank is exiting from the expansionary policy.
The EUR/JPY pair drops swiftly near 156.00 as the Eurostat reports that June’s Producer Price Index (PPI) deflated in June beyond expectations. The monthly PPI contracted by 0.4% while investors were anticipating a deflation at a pace of 0.2%. It seems that producers are passing on the impact of the decline in input prices to end consumers.
Going forward, investors will focus on German Factory Orders data for June. Monthly factory orders are seen contracting by 2.0% from May’s expansion pace of 6.4%. It seems that the manufacturing sector is feeling the heat of an aggressive rate-tightening cycle by the European Central Bank (ECB).
Apart from the German factory orders, Eurozone Retail Sales for June will also hog the limelight. Monthly consumer spending momentum is seen expanding at a pace of 0.2% vs. a stagnant performance being reported in May. Annual Retail Sales are expected to deliver a decline in contraction to 1.7%
ECB President Christine Lagarde raised interest rates by 25 basis points (bps) last week to 4.25% and commented that the central bank will remain dependent on incoming data for further policy action. Inflationary pressures are almost three times the desired rate of 2%, therefore, further policy-tightening seems warranted.
Meanwhile, the Japanese Yen is performing better against the Euro due to a cautious market mood and a strong message delivered by the Bank of Japan (BoJ) that it is considering an exit from the ultra-dovish policy stance. In the monetary policy meeting announced last week, the BoJ provided more flexibility to the Yield Curve Control (YCC).
The Pound is bracing for a potentially choppy day ahead. Economists at Société Générale analyze GBP outlook.
The BoE is mulling whether to raise bank rate by 25 bps or by 50 bps
The BoE is mulling whether to raise bank rate by 25 bps or by 50 bps for a second successive meeting. The choice could depend on whether the bank believes wage growth (AWE ex-bonuses 7.3%) keeps inflation higher for longer. For bank rate, we forecast 25 bps followed by another 25 bps in September to a peak of 5.50%.
Previous MPC decisions this year have almost uniformly resulted in a decline in GBP/USD and a rally in EUR/GBP, the one exception being March when Cable rose 0.4%.
Equally as important will be the new inflation forecasts. The implied peak rate has shot up since May to 5.75% and implicitly this should be helpful to inflation returning to target faster towards the end of the forecast period.
See – BoE Preview: Forecasts from 10 major banks, 25 bps or 50 bps? That is the question
- AUD/USD drifts lower for the third straiday and drops to its lowest level since early June.
- Bets for more rate hikes by the Fed continue to underpin the USD and exert downward pressure.
- The fundamental and technical setup favour bears and support prospects for additional losses.
The AUD/USD pair prolongs its recent downward trajectory witnessed over the past three weeks or so and continues losing ground for the third successive day on Thursday. This also marks the sixth day of a negative move in the previous day and drags spot prices to the 0.6515 area, or the lowest level since early June during the first half of the European session.
The Australian Dollar (USD) did get a minor lift following the better-than-expected release of the Chinese Caixin Services PMI, which unexpectedly rose to 54.1 in July from 53.9 in the previous month. That said, the Australian trade balance data, showing a 2% drop in exports and a 4% decline in imports from May, pointed to cooling commodity demand in China and worsening economic conditions. This, along with the Reserve Bank of Australia's (RBA) surprise decision to leave the cash rate unchanged earlier this week and the prevalent bullish sentiment surrounding the US Dollar (USD), prompts fresh selling around the AUD/USD pair.
In fact, the USD Index (DXY), which tracks the Greenback against a basket of currencies, touches its highest level since July 7 and remains supported by expectations for further policy tightening by the Federal Reserve (Fed). The bets were reaffirmed by the ADP report on Wednesday, which showed that private-sector employers added 324K jobs in July against the 189K estimated and pointed to continued labour market resilience. This should shield the economy from a recession, allowing the Fed to keep rates higher for longer, which pushes the yield on the benchmark 10-year US government bond to its highest level since November and underpins the buck.
The hawkish outlook, meanwhile, overshadows the Fitch downgrade of the US government's credit rating to AA+ late Tuesday and suggests that the path of least resistance for the USD is to the upside. Furthermore, the AUD/USD pair confirmed a fresh breakdown through the 0.6600-0.6595 strong horizontal support on Wednesday, which, in turn, supports prospects for a further near-term depreciating move. Hence, a subsequent slide below the 0.6500 psychological mark, towards retesting the YTD low around the 0.6460-0.6455 region, looks like a distinct possibility ahead of the US macro data, due later during the early North American session.
Thursday's US economic docket features the release of the usual Weekly Initial Jobless Claims, the ISM Services PMI and Factor Orders data. This, along with the US bond yields, might influence the USD price dynamics and provide some impetus to the AUD/USD pair. Traders will further take cues from the broader risk sentiment to grab short-term opportunities around the risk-sensitive Aussie. The focus, however, will remain on the closely-watched US monthly employment details, popularly known as the NFP report on Friday.
Technical levels to watch
The Bank of England is set to announce its Interest Rate Decision and release a new Monetary Policy Report (MPR) at 11:00 GMT. Economists at ING analyze how the announcement could impact the British Pound (GBP).
Some downside risks to Sterling
A slightly risk-off environment and our baseline call of the BoE only hiking 25 bps could be a mild negative for Sterling – especially were the BoE to go further than the Fed in acknowledging the process of disinflation.
For Cable that means an outside risk of a drop to the 1.2580/1.2600 area (depending on the Dollar environment), while EUR/GBP could be correcting back to the 0.8640 area.
See – BoE Preview: Forecasts from 10 major banks, 25 bps or 50 bps? That is the question
- Gold price seems fragile above $1,930.00 as the US labor market remains resilient while wage growth slows.
- Janet Yellen calls Fitch’s downgrade to US government long-term credit rating ‘entirely unwarranted’.
- Investors await US Services PMI, monthly Factory Orders, and weekly jobless claims data.
Gold price (XAU/USD) looks supported above the immediate support of $1,930.00, but the downside seems favored as the United States labor market data arrives more resilient than expectations. Stellar additions to private payrolls in July indicate that the Nonfarm Payrolls (NFP) report should outperform consensus on Friday. Additionally, Federal Reserve (Fed) policymakers may now consider a continuation of the rate-tightening cycle at its September policy meeting.
Strength in the US Dollar Index backed by a cautious market mood due to the Fitch downgrade also builds pressure on the Gold price. Apart from that, weak Gold demand reported by the World Gold Council (WGC) is consistently building pressure on the Gold price. Meanwhile, investors await ISM Services PMI data for further guidance.
Daily Digest Market Movers: Gold price eyes more downside ahead of NFP data
- Gold price looks set for a further breakdown as US labor market data turns out more resilient than expected.
- ADP reported on Wednesday that the US domestic labor market added an estimated 324K positions in July. The economic data outperformed expectations of 189K but remained lower than employment additions in June of 497K.
- Nela Richardson, chief economist at ADP, said, “The economy is doing better than expected, and a healthy labor market continues to support household spending.” She further added that the economy continues to see a slowdown in wage growth without broad-based job losses.
- Concerning the US wage index, ADP’s Richardson said that annual wages grew at their slowest pace of 6.2% since November 2021. For job changers, pay growth slowed to 10.2%.
- Upbeat ADP Employment Change data sets a positive undertone for Nonfarm Payrolls but discomfort for Federal Reserve policymakers as they could consider a further policy-tightening spell in the face of the tight labor market.
- Per estimates, US NFP report might show fresh additions of 200K jobs, slightly lower than June’s 209K. The US Unemployment Rate is expected to remain stable at 3.6%.
- Before the US NFP event, Services PMI data will be in focus, which will be published at 14:00 GMT. Unlike the contracting Manufacturing PMI, the service sector has consistently been in an expansionary phase, but analysts expect the July Services PMI to arrive lower at 53.0, below June’s reading of 53.9.
- New orders for Services PMI are expected to remain marginally higher at 55.6 against the former release of 55.5.
- In addition to US Services PMI data, Q2 Unit Labor Costs, weekly Initial Jobless Claims, and monthly Factory Orders will be in the spotlight.
- The US Dollar Index is approaching the crucial resistance of 103.00 as the market mood is quite cautious after Fitch downgraded the US government due to fiscal spending and governance issues.
- US Treasury Secretary Janet Yellen called Fitch's downgrade to the US government ‘entirely unwarranted’ amid a resilient labor market, spending, and easing inflationary pressures.
- JPMorgan CEO Jamie Dimon called the US government's long-term debt rating downgrade ‘ridiculous’ since events on the basis of which it was downgraded were already known.
- Gold price is consistently facing pressure this week due to weak Gold demand reported by the World Gold Council (WGC). The agency reported a 2% YoY decline in purchases by global central banks due to higher interest rates and a costly gold price.
- Mixed commentary from Fed policymakers baffles investors about Fed policy guidance.
- Chicago Fed Bank President Austan Goolsbee favors further policy tightening despite easing inflationary pressures. Atlanta Fed Bank President Raphael Bostic thinks an interest rate hike in September is no longer required.
- Meanwhile, Jeffrey Schmid has been appointed Kansas City Fed Bank President.
Technical Analysis: Gold price delivers breakdown of H&S pattern
Gold price consolidates in a narrow range above the crucial support of $1,930.00. The precious metal faced selling pressure on Wednesday after slipping below the 20 and 50-day Exponential Moving Averages (EMAs). The yellow metal delivered a breakdown of the Head and Shoulders chart pattern, which confirms a bearish reversal. A decisive breakdown below $1,930.00 would expose the asset to the sound-level support of $1,900.00.
Fed FAQs
What does the Federal Reserve do, how does it impact the US Dollar?
Monetary policy in the US is shaped by the Federal Reserve (Fed). The Fed has two mandates: to achieve price stability and foster full employment. Its primary tool to achieve these goals is by adjusting interest rates.
When prices are rising too quickly and inflation is above the Fed’s 2% target, it raises interest rates, increasing borrowing costs throughout the economy. This results in a stronger US Dollar (USD) as it makes the US a more attractive place for international investors to park their money.
When inflation falls below 2% or the Unemployment Rate is too high, the Fed may lower interest rates to encourage borrowing, which weighs on the Greenback.
How often does the Fed hold monetary policy meetings?
The Federal Reserve (Fed) holds eight policy meetings a year, where the Federal Open Market Committee (FOMC) assesses economic conditions and makes monetary policy decisions.
The FOMC is attended by twelve Fed officials – the seven members of the Board of Governors, the president of the Federal Reserve Bank of New York, and four of the remaining eleven regional Reserve Bank presidents, who serve one-year terms on a rotating basis.
What is Quantitative Easing (QE) and how does it impact USD?
In extreme situations, the Federal Reserve may resort to a policy named Quantitative Easing (QE). QE is the process by which the Fed substantially increases the flow of credit in a stuck financial system.
It is a non-standard policy measure used during crises or when inflation is extremely low. It was the Fed’s weapon of choice during the Great Financial Crisis in 2008. It involves the Fed printing more Dollars and using them to buy high grade bonds from financial institutions. QE usually weakens the US Dollar.
What is Quantitative Tightening (QT) and how does it impact the US Dollar?
Quantitative tightening (QT) is the reverse process of QE, whereby the Federal Reserve stops buying bonds from financial institutions and does not reinvest the principal from the bonds it holds maturing, to purchase new bonds. It is usually positive for the value of the US Dollar.
Economists at Commerzbank expect the USD/CNY to remain confined between 7.10 and 7.20.
The PBoC will continue to defend the Yuan by tweaking the daily fixing
USD/CNY will likely continue to trade largely between the 7.10 and 7.20 range.
On the one hand, Yuan’s weakness will remain until the recent stimulus takes effect and economic growth picks up (albeit likely at a moderate pace).
On the other hand, the PBoC will continue to defend the Yuan by tweaking the daily fixing and perhaps will roll out other measures if needed, to smooth out short-term volatility.
Considering the recent price action, USD/CNH is now seen trading between 7.1300 and 7.2450, comment UOB Group’s Markets Strategist Quek Ser Leang and Senior FX Strategist Peter Chia.
Key Quotes
24-hour view: Yesterday, we indicated that USD could rise to 7.2000. However, we were of the view that “a sustained rise above this level is unlikely.” USD rose more than expected as it soared to 7.2151 before pulling back. Despite the advance, upward momentum has not improved much, and USD is unlikely to strengthen much further. Today, USD is more likely to trade in range, probably between 7.1830 and 7.2180.
Next 1-3 weeks: There is not much to add to our update from yesterday (02 Aug, spot at 7.1800). As highlighted, the current price actions are likely part of a consolidation phase. For the time being, USD is likely to trade in a range of 7.1300/7.2450.
- Euro extends further the weekly leg lower vs. the US Dollar.
- Stocks in Europe open the session sharply in the red.
- EUR/USD risks a potential deeper drop to 1.0900.
- The USD Index (DXY) shifts its attention to the 103.00 level.
- Chinese Caixin PMI prints showed mixed results in July.
- Final Services PMIs in Germany and the euro area came in mixed.
The Euro (EUR) has been steadily losing ground against the US Dollar (USD) this week, with EUR/USD approaching the key support level of 1.0900 on Thursday.
Meanwhile, the Greenback has been performing well and maintaining its rally, pushing the USD Index (DXY) to flirt with fresh four-week highs around the 103.00 mark.
The surge in the index is closely linked to the relentless climb in US yields, with the belly and the long end of the yield curve reaching nine-month highs of about 4.20% and 4.27%, respectively.
This week, market participants will be closely monitoring important economic data releases from both the US and Europe, which are expected to challenge the recently emphasized data-dependency approach adopted by the Federal Reserve and the European Central Bank (ECB) in their interest rate decisions.
In terms of domestic data, Germany's trade surplus widened to €18.7B in June, while the final Services PMIs in Germany and the broader Eurozone came in at 52.3 and 50.9, respectively, during the previous month.
Meanwhile, in the US, usual weekly Initial Jobless Claims, the final S&P Global Services PMI, Factory Orders, and the ISM Services PMI are all slated for release later in the session.
Daily digest market movers: Euro extends the decline on Dollar’s advance
- The EUR remains well under pressure near 1.0900 vs. the USD.
- The USD Index advances to 4-week peaks near 103.00.
- The BoE is expected to hike its policy rate later on Thursday.
- Speculation that the Fed might have ended its hiking cycle runs high.
- Markets’ focus remain on the US labour market this week.
Technical Analysis: Euro now shifts its focus to 1.0900
EUR/USD weakens further and trades near the 1.0900 region, an area also coincident with the transitory 55-day and 100-day SMAs.
The loss of the 1.09100 region, where the provisional 55-day and 100-day SMAs converge, leaves EUR/USD vulnerable to a probable drop to the July low of 1.0833 (July 6) ahead of the key 200-day SMA at 1.0737 and the May low of 1.0635 (May 31). South from here emerges the March low of 1.0516 (March 15) before the 2023 low of 1.0481 (January 6).
On the other hand, occasional bullish attempts could motivate the pair to initially dispute the weekly top at 1.1149 (July 27). Above this level the downside pressure could mitigate somewhat and could encourage the pair to test the 2023 high at 1.1275 (July 18). Once this level is cleared, there are no resistance levels of significance until the 2022 peak of 1.1495 (February 10), which is closely followed by the round level of 1.1500.
Furthermore, the constructive view of EUR/USD appears unchanged as long as the pair trades above the key 200-day SMA.
Euro FAQs
What is the Euro?
The Euro is the currency for the 20 European Union countries that belong to the Eurozone. It is the second most heavily traded currency in the world behind the US Dollar. In 2022, it accounted for 31% of all foreign exchange transactions, with an average daily turnover of over $2.2 trillion a day.
EUR/USD is the most heavily traded currency pair in the world, accounting for an estimated 30% off all transactions, followed by EUR/JPY (4%), EUR/GBP (3%) and EUR/AUD (2%).
What is the ECB and how does it impact the Euro?
The European Central Bank (ECB) in Frankfurt, Germany, is the reserve bank for the Eurozone. The ECB sets interest rates and manages monetary policy.
The ECB’s primary mandate is to maintain price stability, which means either controlling inflation or stimulating growth. Its primary tool is the raising or lowering of interest rates. Relatively high interest rates – or the expectation of higher rates – will usually benefit the Euro and vice versa.
The ECB Governing Council makes monetary policy decisions at meetings held eight times a year. Decisions are made by heads of the Eurozone national banks and six permanent members, including the President of the ECB, Christine Lagarde.
How does inflation data impact the value of the Euro?
Eurozone inflation data, measured by the Harmonized Index of Consumer Prices (HICP), is an important econometric for the Euro. If inflation rises more than expected, especially if above the ECB’s 2% target, it obliges the ECB to raise interest rates to bring it back under control.
Relatively high interest rates compared to its counterparts will usually benefit the Euro, as it makes the region more attractive as a place for global investors to park their money.
How does economic data influence the value of the Euro?
Data releases gauge the health of the economy and can impact on the Euro. Indicators such as GDP, Manufacturing and Services PMIs, employment, and consumer sentiment surveys can all influence the direction of the single currency.
A strong economy is good for the Euro. Not only does it attract more foreign investment but it may encourage the ECB to put up interest rates, which will directly strengthen the Euro. Otherwise, if economic data is weak, the Euro is likely to fall.
Economic data for the four largest economies in the euro area (Germany, France, Italy and Spain) are especially significant, as they account for 75% of the Eurozone’s economy.
How does the Trade Balance impact the Euro?
Another significant data release for the Euro is the Trade Balance. This indicator measures the difference between what a country earns from its exports and what it spends on imports over a given period.
If a country produces highly sought after exports then its currency will gain in value purely from the extra demand created from foreign buyers seeking to purchase these goods. Therefore, a positive net Trade Balance strengthens a currency and vice versa for a negative balance.
- NZD/USD remains depressed for the third straight day and hits a fresh multi-week low.
- The overnight breakdown through the 0.6145-0.6140 confluence favours bearish traders.
- Bears might now aim back to retest sub-0.6000 levels, or the YTD trough touched in May.
The NZD/USD pair edges lower for the third successive day – also marking the sixth day of a negative move in the previous seven – and drops to its lowest level since late June on Thursday. Spot prices remain on the defensive, around the 0.6070-0.6065 region through the early part of the European session and seem vulnerable to extending a three-week-old descending trend.
Against the backdrop of this week's failure near a technically significant 200-day Simple Moving Average (SMA), the overnight breakdown through the 0.6145-0.6140 confluence support was seen as a fresh trigger for bearish traders. The said area comprises the 61.8% Fibonacci retracement level of the May-July rally and an ascending trend-line extending from the YTD trough. This should now act as a pivotal point and cap any attempted recovery for the NZD/USD pair.
Meanwhile, technical indicators on the daily chart are holding deep in the negative territory and are still far from being in the oversold territory, adding credence to the bearish outlook for the NZD/USD pair. Some follow-through selling below the 0.6050 area (June 29 low) will reaffirm the negative bias and make spot prices vulnerable to accelerate the downward trajectory towards the 0.6000 psychological mark en route to the YTD low, around the 0.5985 region touched in May.
On the flip side, the 0.6100 round figure now seems to act as an immediate barrier ahead of the 0.6140-0.6145 confluence support breakpoint, now turned resistance. A sustained strength beyond might trigger a short-covering rally and allow the NZD/USD pair to aim back to reclaim the 0.6200 mark, which coincides with the 50% Fibo. level. This is closely followed by the 200-day SMA, around the 0.6220-0.6225 region, which if cleared could negate the negative outlook.
NZD/USD daily chart
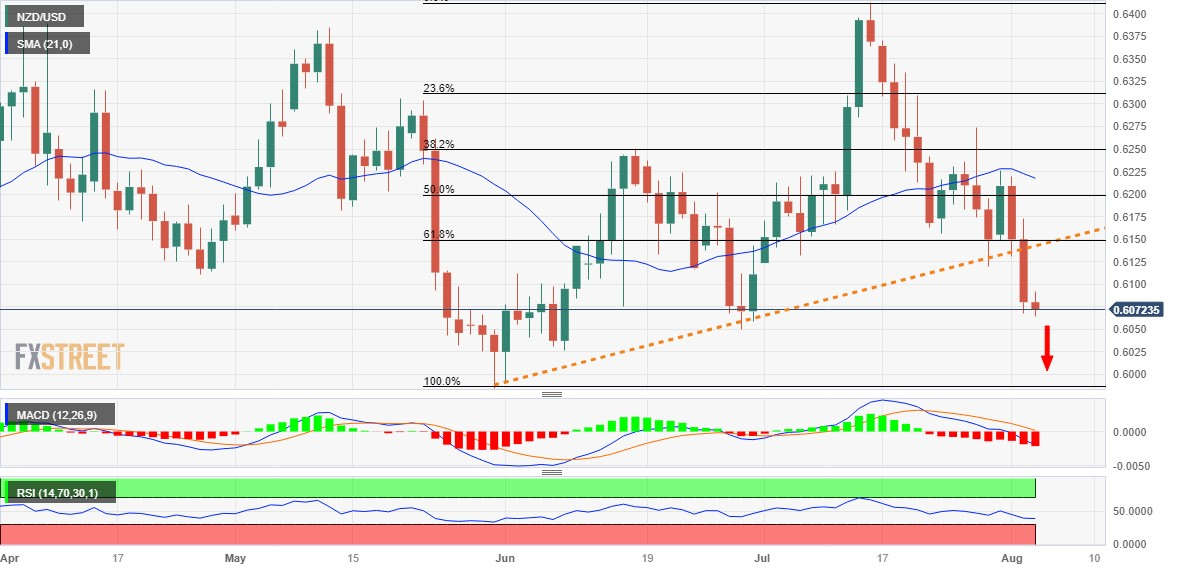
Key levels to watch
Here is what you need to know on Thursday, August 3:
Safe-haven flows continue to dominate the financial markets on Thursday, allowing the US Dollar to preserve its strength. The Bank of England (BoE) will announce the interest rate decision and BoE Governor Andrew Bailey will deliver a statement on the policy outlook and respond to questions from the press. Later in the day, the weekly Initial Jobless Claims, second-quarter Unit Labor Costs and ISM Services PMI survey for July will be featured in the US economic docket.
The US Dollar Index, which tracks the USD's performance against its major rivals, registered strong gains on Wednesday and continued to push higher toward 103.00 early Thursday, touching its highest level in nearly a month. Wall Street's main indexes suffered heavy losses on Wednesday following the downgrade of US credit rating. In the European session, US stock index futures are down between 0.4% and 0.6%, reflecting the sour market mood.
The BoE is widely expected to raise its policy rate by 25 basis points to 5.25%. Softening inflation, worsening economic outlook and tightening conditions in the labour market, however, put the BoE in a tough spot regarding future policy steps. At the time of press, GBP/USD was trading modestly lower on the day a few pips below 1.2700.
BoE Interest Rate Decision Preview: Stuck between high inflation and gloomy outlook.
EUR/USD closed the third straight day in negative territory and stretched lower toward 1.0900 early Thursday.
During the Asian trading hours, the Bank of Japan (BoJ) reportedly intervened in the bond market and purchased an unlimited amount of 5 to 10-year JGBs to stem the incline in the yield curve.after the benchmark Japanese government bond yield hit a fresh 9-year high near 0.65%. USD/JPY rose toward 144.00 in the Asian session but came under heavy bearish pressure in the European morning. As of writing, the pair was trading in negative territory at around 143.00.
Pressured by surging US Treasury bond yields after the upbeat ADP private sector employment data on Wednesday, gold price declined sharply. After touching a multi-week low at $1,930 early Thursday, XAU/USD staged a rebound toward $1,940.
Bitcoin failed to build on Tuesday's recovery gains and lost nearly 2% on Wednesday. BTC/USD stays on the back foot and trades slightly below $29,000 in the European session. Similarly, Ethereum declined 1.8% on Wednesday and continued to push lower in the Asian session. ETH/USD was last seen losing more than 0.5% on the day at $1,825.
Economists at ING analyze USD outlook ahead of Initial Jobless Claims and the Services ISM index figures.
Dollar will hang onto recent gains barring a significant rise in Claims or a big dip in the Services ISM
The focus today will be on the Initial Jobless Claims (these have been moving markets) and the Services ISM index. Barring a significant rise in claims or a big dip in the Services ISM, it looks like the Dollar will hang onto recent gains into what should be a decent US July Nonfarm Payrolls report on Friday.
DXY could grind its way toward the 103.50 area.
25 bp or 50 bp – how much will the Bank of England (BoE) hike its key rate by? Economists at Commerzbank analyze GBP outlook ahead of the decision.
How hawkish is the BoE?
Market expectations and analysts’ consensus tend towards the ‘small’ rate step of 25 bps. A minority considers a further 50 bps rate hike to still be justified and might therefore react with disappointment to a smaller rate step, trading Sterling weaker.
What is decisive for the medium-term GBP outlook is the question of what will happen after today’s decision. This is likely to be influenced by the new projections. Due to the expected downside risks for the growth and inflation outlook these are likely to support our expectation of a cautious BoE monetary policy, pointing towards lower rate expectations and a weaker Sterling.
If the BoE was to surprise with a 50 bps rate hike today it would be considerably more hawkish than we expect and we would probably have to re-examine our view of the BoE and the future development of GBP exchange rates.
See – BoE Preview: Forecasts from 10 major banks, 25 bps or 50 bps? That is the question
- Silver drifts lower for the third successive day and drops to over a three-week low.
- The overnight breakdown through key technical supports favours bearish traders.
- Any attempted recovery is likely to get sold into and remain capped near $24.00.
Silver remains under some selling pressure for the third successive day on Thursday and drops to over a three-week low during the early part of the European session. The white metal currently trades around the $23.50-$23.45 region, down over 1% for the day, and seems vulnerable to prolonging its downward trajectory witnessed over the past two weeks or so.
The overnight breakdown below the $24.10-$24.00 confluence, comprising the 38.2% Fibonacci retracement level of the June-July rally and the 100-day Simple Moving Average (SMA), was seen as a fresh trigger for bearish traders. The subsequent slide below the 50% Fibo. level adds credence to the negative outlook and suggests that the path of least resistance for the XAG/USD is to the downside. Moreover, technical indicators on the daily chart have just started gaining negative traction and support prospects for a further near-term depreciating move.
Hence, some follow-through weakness below the 61.8% Fibo. around the $23.35 region, towards testing the next relevant support near the $23.00 round-figure mark, looks like a distinct possibility. The latter coincides with the very important 200-day SMA, which if broken decisively will make the XAG/USD vulnerable to accelerate the downfall towards the multi-month low, around the $22.15-$22.10 area touched in June.
On the flip side, attempted recovery back above the $23.70 area, or the 50% Fibo. level is more likely to attract fresh sellers and remain capped near the $24.00 strong support breakpoint, now turned resistance. A sustained strength beyond, however, might trigger a short-covering rally and lift the XAG/USD back towards the 23.6% Fibo. level, around $24.45-$24.50 supply zone. Some follow-through buying has the potential to lift Siver towards the $24.75 intermediate hurdle en route to the $25.00 psychological mark and the $25.25 resistance zone.
The latter should act as a pivotal point, above which the XAG/USD could surpass the $25.50-$25.55 resistance zone and aim to reclaim the $26.00 mark before eventually climbing to test the YTD peak, around the $26.10-$26.15 area touched in May.
Silver daily chart
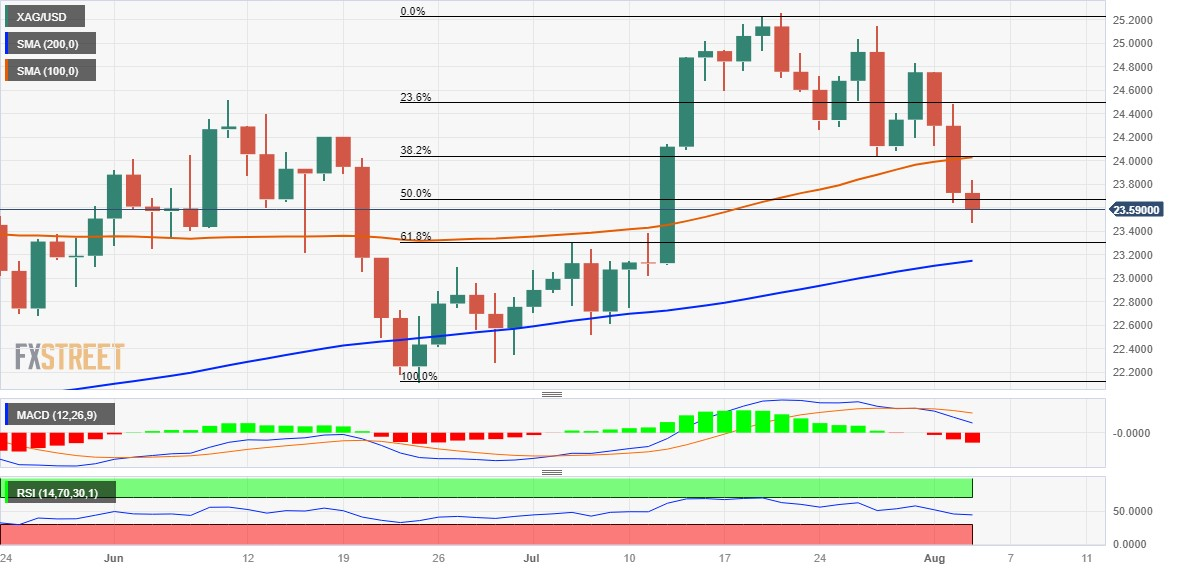
Key levels to watch
The strong upside momentum could now motivate USD/JPY to retest the 145.00 region in the next weeks, according to UOB Group’s Markets Strategist Quek Ser Leang and Senior FX Strategist Peter Chia.
Key Quotes
24-hour view: We highlighted yesterday that “Conditions remain severely overbought, and USD is unlikely to rise much further.” We expected USD to trade in a range of 142.40/143.65. In London trade, USD dropped to 142.22 and then rebounded to 143.47 before closing unchanged at 143.32 in NY. Overbought conditions have unwounded somewhat, and today there is room for USD to edge higher. However, any advance is expected to face solid resistance at 144.00. Support is at 142.80, followed by 142.40.
Next 1-3 weeks: Our update from yesterday (02 Aug, spot at 143.10) still stands. As highlighted, while USD could continue to rise, it remains to be seen if there is enough momentum to carry it to June’s high near 145.00The upside risk is intact as long as USD stays above 142.00 (‘strong support’ level was at 141.50 yesterday).
Considering advanced prints from CME Group for natural gas futures markets, open interest rose for the third session in a row on Wednesday, now by around 20.8K contracts. In the same direction, volume added around 27.4k contracts to the previous daily build.
Natural Gas risks a drop to $2.40
Prices of natural gas have been closing with losses since Monday, shedding around 8% during the same period. Wednesday’s downtick came on the back of rising open interest and volume and is indicative that further losses appear on the cards in the very near term. That said, further downside could prompt the commodity to visit the transitory 100-day SMA around the $2.40 region per MMBtu.

EUR/USD is currently going through its third significant correction of the year. Economists at ING analyze the pair’s outlook.
EUR/USD dip should be temporary
Unless US activity data surprisingly softens today, expect EUR/USD to continue to press the 100-DMA near 1.0930, below which there is an outside risk to the 1.0850 area.
We do, however, believe this dip should be temporary and continue to forecast 1.12 by the end of September on further signs of US disinflation and finally some softer US activity data, too.
- The index keeps the rally well in place so far.
- US 10-year yields rose to nine-month tops past 4.15%.
- Weekly Initial Claims, ISM Services PMI, Factory Orders next on tap.
The rally in the greenback remains well and sound and lifts the USD Index (DXY) to the vicinity of the key barrier at 103.00 the figure on Thursday.
USD Index focused on data, yields
The index advances for the sixth session in a row and already hovers around the 78.6% Fibo retracement of the sharp drop seen in the first couple of weeks in July in the 102.80/85 band.
The strong uptick in the index comes hand-in-hand with the equally robust performance of US yields, particularly in the belly of the curve, where they hit levels last traded in November 2022 near the 4.20%.
Later in the NA session, the labour market will remain in the centre of the debate – especially following Wednesday’s stronger-than-expected ADP report – with the publication of the usual weekly Initial Claims, seconded by the ISM Services PMI, the final S&P Global Services PMI and Factory Orders.
What to look for around USD
The index keeps the recovery unchanged and keeps the immediate target at the key 103.00 barrier.
In the meantime, the dollar appears benefited from the post-ECB weakness in the risk-associated space, while it could face extra headwinds in response to the data-dependent stance from the Fed against the current backdrop of persistent disinflation and cooling of the labour market.
Furthermore, speculation that the July hike might have been the last of the current hiking cycle is also expected to keep the buck under some pressure for the time being.
Key events in the US this week: Initial Jobless Claims, Final Services PMI, ISM Services PMI, Factory Orders (Thursday) – Nonfarm Payrolls, Unemployment Rate (Friday).
Eminent issues on the back boiler: Persistent debate over a soft or hard landing for the US economy. Terminal Interest rate near the peak vs. speculation of rate cuts in late 2023 or early 2024. Geopolitical effervescence vs. Russia and China. US-China trade conflict.
USD Index relevant levels
Now, the index is gaining 0.19% at 102.78 and the breakout of 102.84 (weekly high August 3) would open the door to 103.54 (weekly high June 30) and finally 103.61 (200-day SMA). On the other hand, immediate contention emerges at 100.55 (weekly low July 27) prior to 100.00 (psychological level) and then 99.57 (2023 low July 13).
Economists at TD Securities discuss the Bank of England Interest Rate Decision and its implications for the GBP/USD pair.
Hawkish (35%): 50 bps and unchanged guidance
The MPC decisively votes (8-1) to hike rates by 50 bps, and leaves key forward guidance unchanged, implying that policy will continue to be decided on a meeting-by-meeting basis. Despite weak inflation projections, there's no sign the MPC is done hiking. GBP/USD +0.20%.
Base Case (55%): 25 bps hike & unchanged guidance
The MPC hikes 25 bps, with guidance left largely unchanged. Little emphasis is put on the projections, which show much weaker inflation at Years 2 and 3. The bottom-line message is that hikes will continue so long as the data justifies them. GBP/SD -0.50%.
Dovish (10%): 50 bps hike but signals terminal
The hike is bigger, at 50 bps, but the language around the decision implies that this was a rush to terminal, and forward guidance is changed such that it raises the bar for future hikes. The MPC pushes back on market pricing of terminal rates, and emphasises the low level of inflation in Year 2 and Year 3 of its forecast. GBP/USD -0.80%.
In the view of UOB Group’s Markets Strategist Quek Ser Leang and Senior FX Strategist Peter Chia, NZD/USD risks a probable drop to the 0.6020 region in the near term.
Key Quotes
24-hour view: We expected NZD to weaken yesterday, and we indicated that the level to watch is 0.6100. NZD fell more than expected as it plummeted to 0.6069. While the decline is oversold, strong downward momentum suggests NZD could dip below June’s low near 0.6050. However, it remains to be seen if NZD can maintain a foothold below this level (the next support is at 0.6020). In order to maintain the momentum, NZD must stay below 0.6120 (minor resistance is at 0.6100).
Next 1-3 weeks: Yesterday (02 Aug, spot at 0.6130), we noted that “Short-term downward momentum is building rapidly.” We added, “NZD must break and stay below 0.6100 before a sustained decline is likely.” We did not quite expect the sharp drop as NZD plunged and closed lower by 1.14% (NY close of 0.6080). The price actions suggest NZD is likely to continue to weaken. The level to watch is 0.6020, followed by the year’s low near 0.5985. The downside risk is intact as long as NZD stays below 0.6160 (‘strong resistance’ level was at 0.6200 yesterday).
- USD/CHF remains on the front foot for the sixth consecutive day, clings to mild gains of late.
- Swiss CPI slides to -0.1% MoM, 1.6% YoY in July.
- Clear upside break of 21-DMA, bullish MACD signals keep buyers hopeful.
- May’s bottom lures bulls but 0.8880 is a tough nut to crack for bulls.
USD/CHF sticks to mild gains around 0.8785-90 as it justifies downbeat Swiss Inflation data for July heading into Thursday’s European session. In doing so, the Swiss Franc (CHF) pair also takes clues from the firmer US Dollar, as well as a cautious mood, ahead of the US ISM Services PMI.
That said, the Swiss Consumer Price Index (CPI) matches market forecasts by rising 1.6% YoY in July versus 1.7% previous readings. The monthly readings, however, edge lower to -0.1% from 0.1% prior and -0.2% market forecasts.
Technically, the successful break of the 21-DMA and bullish MACD signals keep USD/CHF buyers hopeful of poking May’s bottom of around 0.8820.
However, a convergence of the 50-DMA and a downward-sloping resistance line from May 31, close to 0.8880 by the press time, appears a tough nut to crack for the Swiss Franc (CHF) pair buyers.
Following that, June’s bottom surrounding 0.8900 will act as the last defense of the sellers.
On the contrary, a daily closing beneath the 21-DMA level of 0.8706 needs validation from the 0.8700 round figure encompassing the late July swing high.
Should the USD/CHF bears dominate past 0.8700, a 12-day-long horizontal support zone near 0.8560 and a six-month-old descending support line, near 0.8535 as we write, will challenge the sellers.
USD/CHF: Daily chart
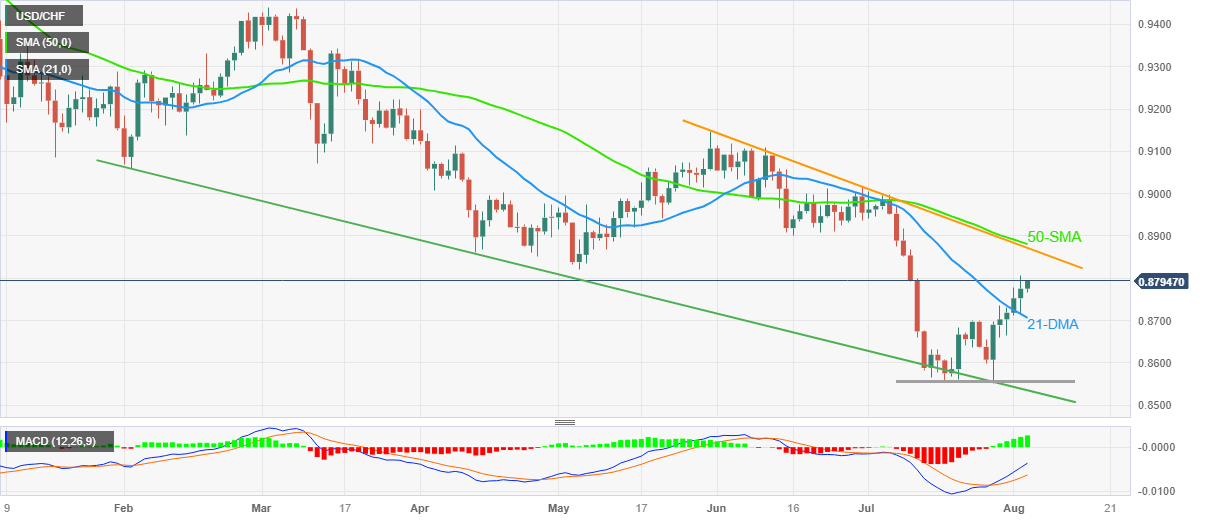
Trend: Further upside expected
- Pound Sterling tests crucial support of 1.2700 ahead of BoE’s interest-rate policy.
- A fat rate hike announcement by the BoE would elevate recession fears in the United Kingdom.
- UK’s 12-month consumer inflation expectations soften to 4.3%.
The Pound Sterling (GBP) continues its two-day losing spell as investors seem cautious ahead of the interest rate decision by the Bank of England (BoE). The GBP/USD pair faces pressures of bearish market sentiment and fears of a deep recession in the United Kingdom as the central bank prepares to raise interest rates consecutively for the 14th time.
Investors remain mixed about the pace at which interest rates will be raised by the BoE. Inflationary pressures in the United Kingdom economy are highest among G7 economies and households face the heavy burden of a squeeze on their real income. Consideration of a fat interest rate hike by the BoE would dampen the economic outlook.
Daily Digest Market Movers: Pound Sterling turns cautious ahead of interest rate policy
- Pound Sterling tests 1.2700 amid cautious market mood ahead of the Bank of England monetary policy decision.
- This would be the 14th consecutive interest-rate hike by the BoE in which policymakers are expected to consider a 25 basis point (bp) increase to elevate interest rates to 5.25%.
- The option of a second consecutive 50 bps rate push by the BoE is still in the picture, knowing that inflation in the United Kingdom economy is four times the required rate of 2%.
- Also, the recent recovery in oil prices and resilient consumer spending could force BoE policymakers to discuss a fat rate hike for the August policy.
- Meanwhile, a survey from Citi/YouGov shows that one-year forward consumer inflation expectations drop sharply to 4.3% vs. former expectations of 5.0%.
- Credit Suisse forecasts that one member (Swati Dhingra) is likely to vote for unchanged rates, but there are risks that if the majority vote is for 50 bps, one or two members vote for 25 bps.
- Apart from the interest rate decision, the outlook on inflation and the economy, and policy guidance for the remaining 2023 will be in focus.
- Also, investors would like to know whether UK PM Rishi Sunak would meet his promise of halving inflation to 5% by year-end.
- UK’s housing sector and factory activities face the heat of an aggressive rate-tightening cycle by the central bank. Factory activities have been contracting for several months due to weak global demand and higher unsold inventory.
- Britain’s mortgage lender Nationwide reported on Tuesday that housing prices fell by the most in July since 2009 on an annual basis. The reasoning behind the decline in housing demand is the lower affordability power of first-time buyers due to higher borrowing costs.
- Before BoE’s policy, investors will focus on the Services PMI for July, which will be published at 08:30 GMT. The economic data is seen as stable at 51.5.
- The market mood is extremely cautious as Fitch downgrades the United States government, citing concerns over rising fiscal spending in coming years.
- US Treasury Secretary Janet Yellen said that the Fitch downgrade to the US economy is ‘entirely unwarranted’ as the economy is resilient due to a tight labor market and continued growth.
- Along with Yellen, JPMorgan chief executive Jamie Dimon told CNBC on Wednesday that the United States government's long-term debt rating downgrade was "ridiculous," saying "It doesn't really matter". The Fitch downgrade is based on those economic indicators that are already known.
- The US Dollar Index continued its five-day winning spell on Thursday as upbeat Automatic Data Processing (ADP) Employment Change data set a positive undertone for Friday’s Nonfarm Payrolls (NFP) and the Federal Reserve’s (Fed) September monetary policy.
- Before US NFP, Services PMI for July will be reported by the Institute of Supply Management (ISM). Unlike factory activities, the service sector is expanding but the July reading is expected to remain lower at 53.0 against June’s figure of 53.9.
Technical Analysis: Pound Sterling retraces 80% from July’s high
Pound Sterling retraced almost 80% from its July high of 1.3140 on Thursday. The Cable came under severe pressure after slipping below the 20 and 50-days Exponential Moving Averages (EMAs). The asset delivers a breakdown of the Rising Channel chart pattern but needs to pass through more filters for confirmation.
Pound Sterling FAQs
What is the Pound Sterling?
The Pound Sterling (GBP) is the oldest currency in the world (886 AD) and the official currency of the United Kingdom. It is the fourth most traded unit for foreign exchange (FX) in the world, accounting for 12% of all transactions, averaging $630 billion a day, according to 2022 data.
Its key trading pairs are GBP/USD, aka ‘Cable’, which accounts for 11% of FX, GBP/JPY, or the ‘Dragon’ as it is known by traders (3%), and EUR/GBP (2%). The Pound Sterling is issued by the Bank of England (BoE).
How do the decisions of the Bank of England impact on the Pound Sterling?
The single most important factor influencing the value of the Pound Sterling is monetary policy decided by the Bank of England. The BoE bases its decisions on whether it has achieved its primary goal of “price stability” – a steady inflation rate of around 2%. Its primary tool for achieving this is the adjustment of interest rates.
When inflation is too high, the BoE will try to rein it in by raising interest rates, making it more expensive for people and businesses to access credit. This is generally positive for GBP, as higher interest rates make the UK a more attractive place for global investors to park their money.
When inflation falls too low it is a sign economic growth is slowing. In this scenario, the BoE will consider lowering interest rates to cheapen credit so businesses will borrow more to invest in growth-generating projects.
How does economic data influence the value of the Pound?
Data releases gauge the health of the economy and can impact the value of the Pound Sterling. Indicators such as GDP, Manufacturing and Services PMIs, and employment can all influence the direction of the GBP.
A strong economy is good for Sterling. Not only does it attract more foreign investment but it may encourage the BoE to put up interest rates, which will directly strengthen GBP. Otherwise, if economic data is weak, the Pound Sterling is likely to fall.
How does the Trade Balance impact the Pound?
Another significant data release for the Pound Sterling is the Trade Balance. This indicator measures the difference between what a country earns from its exports and what it spends on imports over a given period.
If a country produces highly sought-after exports, its currency will benefit purely from the extra demand created from foreign buyers seeking to purchase these goods. Therefore, a positive net Trade Balance strengthens a currency and vice versa for a negative balance.
- USD/JPY gains momentum and edges higher to the 143.65 mark.
- The pair stands above the 50- and 100-hour EMAs with an upward slope.
- The initial resistance level to watch is 143.80; the first support stop is located at 142.80.
The USD/JPY pair extends its upside heading into the early European session on Thursday. Bank of Japan (BoJ) Governor Kazuo Ueda indicated that the tolerance band for the benchmark 10-year Japanese Government Bonds (JGB) will widen from 0.5% to 1.0%. The move pushed JGB yields to their highest level since 2014. The 10-year JGB rose to 0.65% on Thursday. The major pair currently trades around 143.65, up to 0.24% for the day.
According to the four-hour chart, the USD/JPY pair stands above the 50- and 100-hour Exponential Moving Averages (EMAs) with an upward slope, which means the path of least resistance is to the upside for the time being.
Any meaningful follow-through buying beyond 143.80 (the upper boundary of the Bollinger Band) could pave the way to the next hurdle at 144.65 (High of July 6). Further north, the 145.00 area appears to be a tough nut to crack for USD/JPY. The mentioned level is a confluence of a psychological round mark and a year-to-date high (YTD).
On the other hand, the first support stop for USD/JPY is located at 142.80 (midline of the Bollinger Band). The additional downside filter to watch is 141.78, highlighting the 50-hour EMA and the lower limit of the Bollinger Band. A decisive break below the latter would see a drop to 141.35 (100-hour EMA) and 141.00 (a psychological round figure).
It’s worth noting that the Relative Strength Index (RSI) stands above 50, and the MACD holds in bullish territory, which indicates that the upside momentum has been activated.
USD/JPY four-hour chart
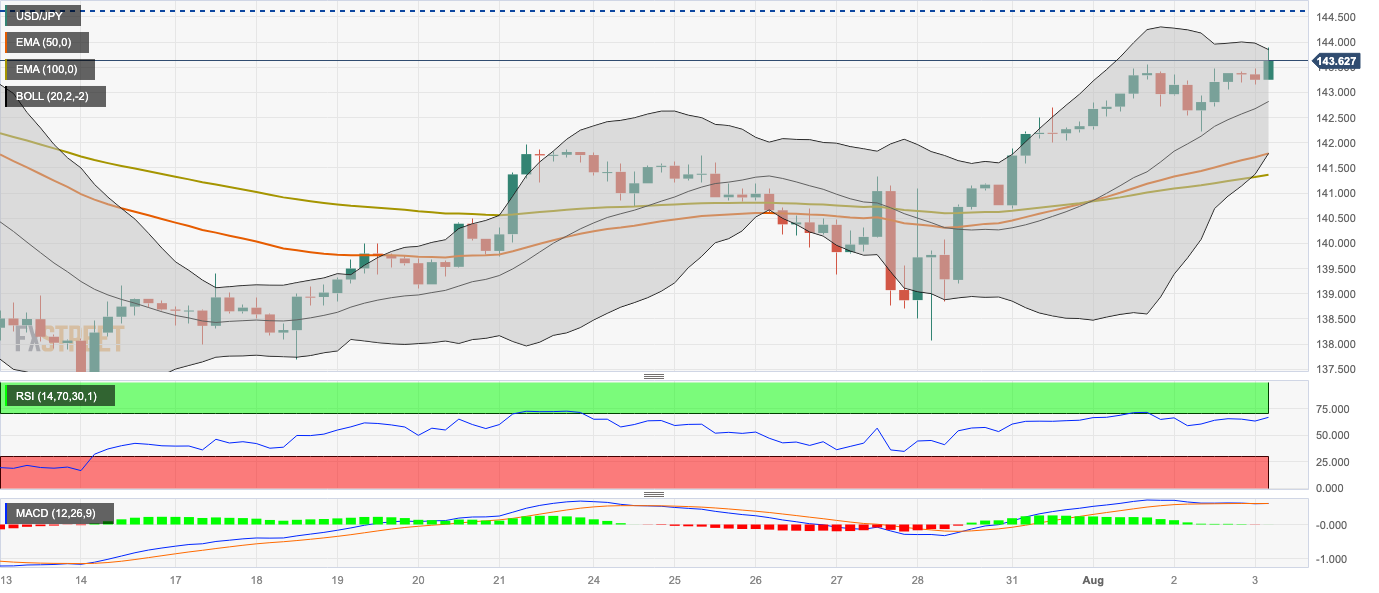
Economists at Commerzbank assess the likelihood of a renewed rate hike at the Swiss National Bank’s (SNB) next monetary policy meeting in September and Franc (CHF) outlook.
A sustainable return to the inflation target is uncertain
Today’s inflation data for July is likely to play a decisive role in determining how clearly a continuation of the rate hike cycle will be priced out. The weaker inflation turns out to be, the more likely the market is to bet on a downward revision of inflation and thus unchanged interest rates for the time being, given the weaker economic environment.
If the Franc weakens too much in the wake of a reassessment of the Swiss interest rate outlook, actual or feared intervention by the SNB is likely to quickly put the brakes on the depreciation.
While a sustainable return to the inflation target is uncertain – that means at least until September – EUR/CHF is, therefore, likely to struggle on its way up.
FX option expiries for Aug 3 NY cut at 10:00 Eastern Time, via DTCC, can be found below.
- EUR/USD: EUR amounts
- 1.0850 553m
- 1.0870 795m
- 1.0900 3.8b
- 1.0915 2.3b
- 1.0925 698m
- 1.0950 569m
- 1.1000 794m
- 1.1010 1.7b
- 1.1030 506m
- 1.1100 1.2b
- 1.1130 980m
- GBP/USD: GBP amounts
- 1.2525 591m
- USD/JPY: USD amounts
- 140.35 739m
- 141.00 747m
- 142.00 632m
- 143.65 960m
- 143.95 1.1b
- USD/CHF: USD amounts
- 0.8955 817m
- AUD/USD: AUD amounts
- 0.6350 505m
- 0.6685 933m
- 0.6700 883m
- 0.6800 451m
- 0.6825 372m
- EUR/GBP: EUR amounts
- 0.8755 434m
Continued USD strength in the wake of better data and higher US bond yields is weighing on NZD/USD. Economists at ANZ Bank analyze Kiwi outlook.
US jobs data in focus
Another lift in the USD and US bond yields has taken the US Dollar Index all the way back to early July levels, before its precipitous decline to the year’s low. The culprit: strong US ADP jobs data and bond market nervousness about Fitch’s downgrade of the US credit rating which has ironically seen the USD firm. Clouded and muddy? For sure.
Local Q2 labour market data did play a role in the weakness, mostly on account of the rise in unemployment and a labour supply side thematic, but the big story for NZD/USD now looks to be the USD into NFP data on Friday.
Technically, support at 0.6050 is close, and all eyes are on 0.60.
- USD/CAD prods July’s peak after two-day uptrend, sidelined of late.
- Oil Price extends fall from multi-day high amid fears of no change in OPEC+ output cut policy, risk-off mood.
- Market’s consolidation after a volatile day, preparations for US data prod Loonie pair at multi-day top.
- Bulls flex muscles amid hawkish Fed hopes, upbeat yields and firmer early signals for top-tier data.
USD/CAD buyers keep the reins around 1.3350, despite the latest inaction, as market players await the key US data heading into Thursday’s European session. In doing so, the Loonie pair seesaws at the highest levels in a month, flashed earlier in the day, while pausing a two-day winning streak.
That said, the quote’s latest inaction could be linked to a pullback in the WTI crude oil price, Canada’s main export item, as well as the lackluster moves of the US Dollar Index (DXY) ahead of the top-tier data.
WTI crude oil rose to the highest level since April 17 before ending the day with the heaviest losses in six weeks as risk aversion joined talks that the Oil producers won’t risk any more cuts to the output. On Wednesday, Reuters cited six OPEC and its allies (OPEC+) sources to report that the Oil cartel is expected to make no changes to its current oil output policy when they meet on Friday, August 4. It should be noted that the black gold prints a two-day downtrend near $79.20, down 0.40% intraday at the latest.
Elsewhere, the DXY cheered the risk-off mood and also benefited from the strong US Treasury bond yields on Wednesday to refresh a three-week high. Also likely to have favored the US Dollar Index bulls were the strong US ADP Employment Change numbers for July. However, failure to cross a nine-week-old resistance line limits the Greenback’s gauge versus the six major currencies to 102.60 at the latest.
Apart from the technical details, the US Treasury Secretary Janet Yellen and White House (WH) Economic Adviser Jared Bernstein’s defense of the US Treasury bonds may have tamed the previous risk-off mood and allow the USD/CAD pair to stabilize.
With this, US 10-year Treasury bond yields rose to the highest level since November 2022 whereas the Wall Street benchmarks closed in the red. That said, the S&P500 Futures remain sidelined at a two-week low after declining in the last two consecutive days.
Looking ahead, multiple US data surrounding employment and activity will be important to watch for the USD/CAD traders. Among them, US ISM Services PMI, Factory Orders, Weekly Initial Jobless Claims and quarterly readings of Nonfarm Productivity and Unit Labor Costs gain major attention.
Technical analysis
A daily closing beyond the 50-DMA and a two-month-old previous resistance line, respectively near 1.3280 and 1.3295, keeps USD/CAD buyers hopeful of witnessing further upside.
CME Group’s flash data for crude oil futures markets noted traders trimmed their open interest positions by around 15.5K contracts on Wednesday after two consecutive daily builds. On the other hand, volume went up for the second straight session, now by around 144.2K contracts.
WTI: The 200-day SMA holds the downside so far
Prices of WTI charted a substantial drop on Wednesday and returned to the sub-$80.00 region. The downtick of the commodity was accompanied by shrinking open interest, which removes strength from prospects for extra losses in the very near term. In the meantime, there is a decent contention around the 200-day SMA, today at $76.55 per barrel.

UOB Group’s Markets Strategist Quek Ser Leang and Senior FX Strategist Peter Chia suggest GBP/USD could accelerate its downside to the 1.2640 zone in the short-term horizon.
Key Quotes
24-hour view: Our view that GBP would trade in a range yesterday was incorrect. Instead of trading in a range, GBP plummeted to a low of 1.2680. While severely oversold, there appears to be enough momentum for GBP to dip below 1.2680. The major support at 1.2645 is likely out of reach today. In order to keep the momentum going, USD must stay below 1.2795 (minor resistance is at 1.2755).
Next 1-3 weeks: Last Friday (28 Jul, spot at 1.2800), we noted that “while downward momentum is building again, it remains to be seen if GBP can break the major support at 1.2720.” After GBP dropped to 1.2742 and rebounded, we highlighted yesterday that “While there is no clear increase in momentum, there is still a chance for GBP to drop to 1.2720.” In early NY trade, GBP cracked 1.2720 and plummeted to 1.2680. Having breached the rather solid support at 1.2720, GBP is likely to weaken further. The next level to aim for is 1.2640, followed by another rather solid support at 1.2580. The downside risk is intact as long as GBP stays below 1.2830 (‘strong resistance’ level was at 1.2880).
Open interest in gold futures markets increased by just 691 contracts after six consecutive daily pullbacks on Wednesday, according to preliminary readings from CME Group. Volume followed suit and went up for the second session in a row, this time by nearly 1.5K contracts.
Gold: Next on the downside comes $1893
Wednesday’s downtick in gold prices was on the back of increasing open interest and volume, hinting at the idea that extra decline could be in the pipeline for the yellow metal in the very near term. Against that, the next support of note comes at the round level of $1900 per troy ounce prior to the June low of $1893 (June 29).
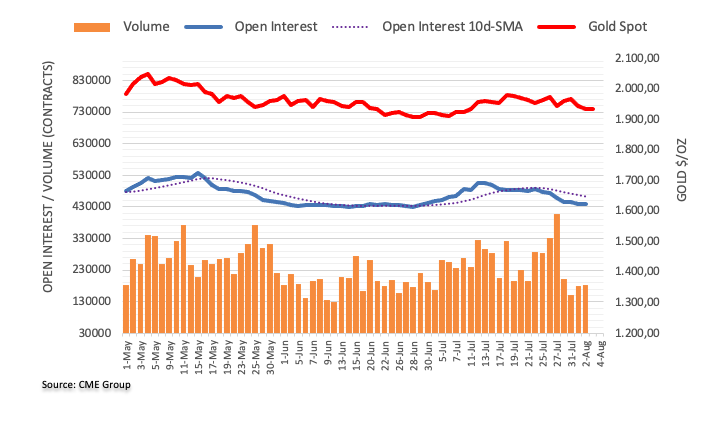
Today’s BoE rate decision has been subject to intense gyrations in terms of expectations. Economists at Credit Suisse analyze GBP outlook ahead of the meeting.
EUR/GBP to move towards 0.8450
Sonia-implied peak rate sits now at 5.85% vs 6.50% pre-CPI. We would be surprised if GBP were to react in a very negative fashion if only a 25 bps rate hike is delivered, given the correction that has already taken place.
It would likely need an exceptionally dovish BoE inflation report and/or comments by Governor Bailey to cause more damage, something we struggle to see given that the central bank is still trying to explain why its original projections were so off the mark.
At the same time, if the BoE does go ahead and deliver a 50 bps rate hike, the market could be caught wrong-footed after marking down UK rates so aggressively recently, and it may require a terminal rate closer to 6.00% to be priced in again.
Given this asymmetry, we prefer to stick to our guns and continue to call for EUR/GBP to move towards our 0.8450 target, a view that is also pro-carry in a low-vol market environment.
Further downside could see EUR/USD retreat to the 1.0860 region in the next few weeks, note UOB Group’s Markets Strategist Quek Ser Leang and Senior FX Strategist Peter Chia.
Key Quotes
24-hour view: We did not anticipate the sharp drop in EUR that sent it to a low of 1.0916 (we were expecting it to trade sideways). While the rebound from the low has dented the downward momentum somewhat, EUR could drop to 1.0900 before stabilisation is likely. The next major support at 1.0865 is likely out of reach today. Resistance is at 1.0970; if EUR breaks above 1.0995, it would indicate that the weakness in EUR has stabilised.
Next 1-3 weeks: We turned negative in EUR in the middle of last week (see annotations in the chart below). After EUR rebounded strongly in early Asian trade yesterday (02 Aug, spot at 1.1010), we indicated that “the chance of EUR dropping to 1.0920 this time around is slim.” We added, “However, only a breach of 1.1070 would indicate that the current downward pressure has faded.” We did anticipate EUR to drop sharply and broke below 1.0920 (low has been 1.0916 in NY trade). The boost in momentum suggests EUR could weaken further to 1.0865. On the upside, the ‘strong resistance’ level has moved lower to 1.1020 from 1.1070.
- EUR/GBP remains sidelined after refreshing a one-week high the previous day.
- Bearish moving average crossover teases sellers but three-week-old rising support line can prod downside moves.
- BoE needs to defy dovish bias to convince EUR/GBP sellers.
- Five-week-old horizontal resistance challenges buyers targeting July’s top.
EUR/GBP aptly portrays the traders’ anxiety ahead of the Bank of England (BoE) Interest Rate Decision while making rounds to 0.8600 amid early Thursday in Europe. In doing so, the cross-currency pair pauses the two-day winning streak at the highest level since July 25.
Also read: Bank of England Preview: Sell Sterling? Why Bailey may break the Pound, even with a bigger hike
Apart from the market’s indecision about the size of the BoE’s rate increase, the impending “Death Cross” on the four-hour chart also highlights the EUR/GBP pair for the intraday traders. That said, “Death Cross” is a moving average cross when 50-SMA pierces 200-SMA from above and suggests further downside of the underlying.
It’s worth noting, however, that BoE’s hawkish move a clear break of the SMA confluence, around 0.8585 by the press time, becomes necessary to welcome the EUR/GBP sellers.
Even so, an upward-sloping support line from July 11, close to 0.8560 at the latest, can prod the bears before directing them to the previous monthly low of around the 0.8500 threshold.
Meanwhile, EUR/GBP recovery remains elusive unless crossing a five-week-old horizontal resistance area surrounding 0.8645.
Following that, July’s peak of near 0.8700 round figure may lure the EUR/GBP bulls.
EUR/GBP: Four-hour chart
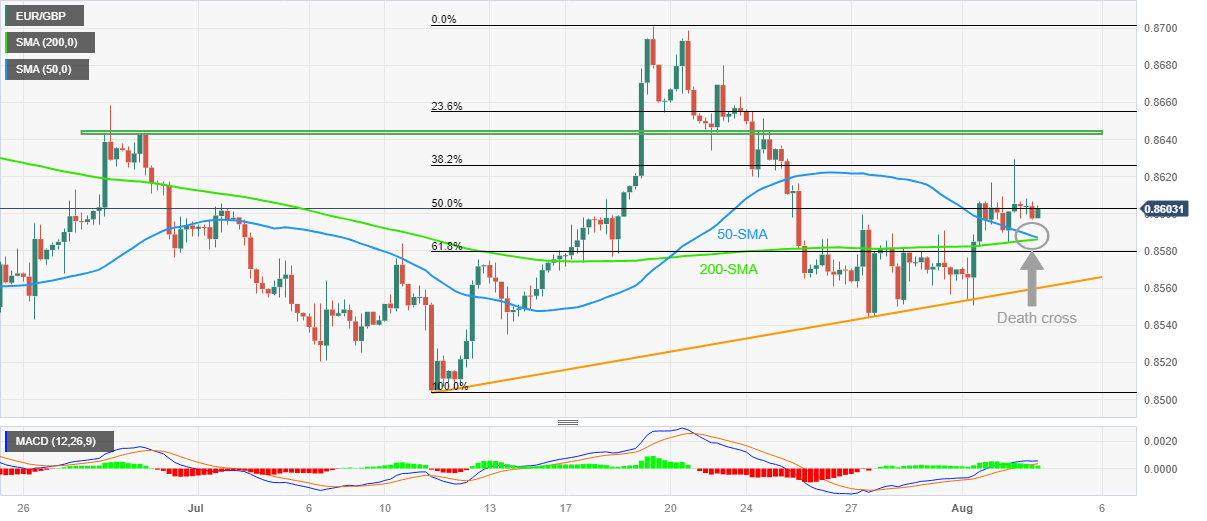
Trend: Downside expected
- AUD/JPY attracts some buyers and holds ground near the 94.00 mark on Thursday.
- The stronger Chinese data offset the disappointing Australian data.
- AUD/JPY trades within a descending trend channel line from the middle of June.
- The immediate resistance level is seen at 95.50; the initial support level is located at 93.30.
The AUD/JPY cross recovers some lost ground and hovers around the 94.00 mark heading into the early European trading hours on Thursday. The cross currently trades around 94.07, gaining 0.37% for the day.
The stronger Chinese data on Thursday offset the disappointing Australian economic data. That said, China’s Caixin Services PMI climbed to 54.1 in July from 53.9 prior, better than the market consensus of 52.5. The upbeat Chinese economic figure could benefit the China-proxy Australian Dollar (AUD) against its rivals.
From a technical perspective, AUD/JPY trades within a descending trend channel line from the middle of June on the four-hour chart. That said, the path of least resistance for the AUD/JPY is to the downside as the cross holds below the 50- and 100-hour Exponential Moving Averages (EMAs).
95.50 acts as the immediate resistance level for AUD/JPY. The mentioned level indicates the upper boundary of a descending trend channel and a high of August 1. The next barrier to watch is 96.85 (High of July 4) en route to 97.60 (YTD high).
On the downside, the cross will meet an initial support level at 93.30 (Low of July 12). The next downside stop appears at 92.60 (Low of July 28) and 92.40 (the lower limit of a descending trend channel). A break below the latter will see a drop to 92.15 (Low of June 6).
It’s worth noting that the Relative Strength Index (RSI) and Moving Average Convergence/Divergence (MACD) hold in bearish territory, supporting the sellers for now.
AUD/JPY four-hour chart
-638266380783128567.png)
- UK central bank expected to hike interest rate by 25 bps to 5.25% on ‘Super Thursday’, but a 50 bps not out of cards.
- Bank of England faces a dilemma amidst cooling inflation and a tight labor market.
- BoE updated economic forecasts and Governor Bailey’s presser to stir Pound Sterling markets.
The Pound Sterling (GBP) is primed for intense volatility, as the Bank of England (BoE) is widely expected to raise interest rate at its fourteenth straight meeting on August 3.
It’s a ‘Super Thursday’, as the central bank’s policy announcements will be accompanied by the Minutes of the meeting and the United Kingdom’s (UK) updated economic projections, followed by BoE Governor Andrew Bailey’s press conference.
Bank of England Interest Rate Decision: What to know in markets on Thursday, August 3
- GBP/USD remains vulnerable near monthly lows near 1.2700, as the US Dollar (USD) sees persistent demand due to US economic resilience.
- The Greenback also capitalizes on the souring mood, as traders stay cautious ahead of the BoE event risks, US ISM Services PMI and tech giants' earnings reports.
- US S&P 500 futures are fluctuating between gains and losses while the benchmark 10-year US Treasury bond yields trading at nine-month highs above 4.10%.
- Early Thursday, China's Services Purchasing Managers' Index (PMI) rose to 54.1 in July, compared with a 53.9 expansion and the expected drop to 52.5.
- On Wednesday, US private sector employment gains in July totaled 324,000 against expectations of 189,000 job additions, according to the data published by ADP.
- The BoE policy announcements will hold the key for a fresh directional move in the GBP/USD pair while the Jobless Claims and ISM Services PMI from the United States will also have a significant bearing on the pair.
When will the BoE announce its interest rate decision and how could it affect GBP/USD?
Economists expect the BoE to hike the benchmark interest rate by 25 basis points (bps) from 5.00% to 5.25% on “Super Thursday”, August 3 at 11:00 GMT. However, some industry experts argue for another 50 bps lift-off, making it a close call for the central bank.
Analysts at TD Securities (TDS) believe that “this meeting is a tricky one: incoming data and projections are likely to support a 25bps hike, but the MPC may be tempted to repeat a 50bps hike alongside a dovish lean to speed up their journey to terminal. They've signalled nothing about their intentions in recent weeks, either. Ultimately we think 25bps will prevail, but it's a very close call.”
Back in June, the BoE surprised markets with a 50 bps rate hike, as against expectations of a quarter percentage points increase. Two policymakers, Silvana Tenreyro and Swati Dhingra, voted to keep the policy rate on hold at 4.50%.
The BoE reiterated in its June policy statement, "if there were to be evidence of more persistent pressures, then further tightening in monetary policy would be required."
Following the June BoE policy announcement, the first high-impact UK economic data release was that of the labor market, which continued to show tight conditions and record high wage inflation, backing the case for another 50 bps rate hike by the BoE in August.
According to the Office for National Statistics (ONS), the UK’s ILO Unemployment Rate rose to 4.0% in the quarter to May from the 3.8% seen during the three months to April. However, the country’s Average Earnings, excluding bonuses, jumped 7.3% 3Mo/YoY May, matching the record high growth seen in April.
However, expectations for a 50 bps BoE August rate hike were quickly watered down after the UK inflation softened significantly in June, with core inflation down to 6.9% YoY (although remained sticky above 6.0%) from a 31-year high of 7.1% in May. The headline annual Consumer Price Index (CPI) rose 7.9% in June, slowing sharply from an 8.7% increase recorded in May while falling short of the 8.2% growth anticipated.
At the moment, markets are pricing about a 65% probability of a 25 bps rate increase by the Bank of England. Markets also believe that risks of over-tightening on the economic outlook could prompt the Bank to go for a smaller rate hike.
That said, the BoE’s updated economic forecasts will be closely scrutinized for any hints on a likely UK recession. The central bank could downgrade the UK economic activity for 2024-2025 even if it assures markets that the economy would avert a recession. The BoE’s view on inflation will be also key, as it has maintained that “CPI is expected to fall significantly this year, mostly due to energy prices."
Alongside the projections, all eyes will be focused on the voting composition, with a 7-2 split vote in favor of a rate hike widely expected. Should a couple of policymakers lean toward a 50 bps increase, it could be seen as a hawkish rate hike, rendering positive for the Pound Sterling. In a scenario, where the Bank of England lowers its growth and inflation forecasts, providing no commitment on the future policy path while emphasizing a data-dependent approach, GBP/USD is likely to see a sharp sell-off. Any reaction in the GBP/USD pair to the BoE policy announcements, however, could be quickly reversed during Governor Bailey’s press conference.
All in all, volatility is expected to remain high during the BoE policy event, making it an exciting “Super Thursday” for Pound Sterling traders.
Dhwani Mehta, Asian Session Lead Analyst at FXStreet, offers a brief technical outlook for the major and explains: “Having breached the upward-sloping 50-Daily Moving Average (DMA) at 1.2727 on a daily closing basis on Wednesday, risks remains skewed to the downside for GBP/USD heading into the BoE interest rates decision. The 14-day Relative Strength Index (RSI) has turned flat but remains well below the 50 level, suggesting that there is additional room for Cable sellers to flex their muscles.”
Dhwani also outlines important technical levels to trade the GBP/USD pair: “The next relevant support aligns at the 1.2650 psychological level, below which a sell-off toward the bullish 100 DMA at 1.2580 cannot be ruled out. On the upside, recapturing the 50 DMA support-turned-resistance on a sustained basis is critical to initiating any meaningful recovery toward the 1.2800 figure. Further north, the horizontal resistance of the 21 DMA at 1.2890 will be on the radars of Pound Sterling buyers.”
BoE FAQs
What does the Bank of England do and how does it impact the Pound?
The Bank of England (BoE) decides monetary policy for the United Kingdom. Its primary goal is to achieve ‘price stability’, or a steady inflation rate of 2%. Its tool for achieving this is via the adjustment of base lending rates. The BoE sets the rate at which it lends to commercial banks and banks lend to each other, determining the level of interest rates in the economy overall. This also impacts the value of the Pound Sterling (GBP).
How does the Bank of England’s monetary policy influence Sterling?
When inflation is above the Bank of England’s target it responds by raising interest rates, making it more expensive for people and businesses to access credit. This is positive for the Pound Sterling because higher interest rates make the UK a more attractive place for global investors to park their money. When inflation falls below target, it is a sign economic growth is slowing, and the BoE will consider lowering interest rates to cheapen credit in the hope businesses will borrow to invest in growth-generating projects – a negative for the Pound Sterling.
What is Quantitative Easing (QE) and how does it affect the Pound?
In extreme situations, the Bank of England can enact a policy called Quantitative Easing (QE). QE is the process by which the BoE substantially increases the flow of credit in a stuck financial system. QE is a last resort policy when lowering interest rates will not achieve the necessary result. The process of QE involves the BoE printing money to buy assets – usually government or AAA-rated corporate bonds – from banks and other financial institutions. QE usually results in a weaker Pound Sterling.
What is Quantitative tightening (QT) and how does it affect the Pound Sterling?
Quantitative tightening (QT) is the reverse of QE, enacted when the economy is strengthening and inflation starts rising. Whilst in QE the Bank of England (BoE) purchases government and corporate bonds from financial institutions to encourage them to lend; in QT, the BoE stops buying more bonds, and stops reinvesting the principal maturing on the bonds it already holds. It is usually positive for the Pound Sterling.
- Gold Price seesaws at three-week low after breaking key supports, having wide open space towards the south.
- Firmer US data, risk-off mood underpin bearish bias about XAU/USD.
- US ISM Services PMI, Federal Reserve concerns eyed for clear directions.
- Gold buyers need validation from $1,955 and softer US Dollar, yields.
Gold Price (XAU/USD) remains on the back foot at the lowest level in three weeks despite recent consolidation. In doing so, the precious metal prints a three-day losing streak amid a firmer US Dollar and risk-off mood. It’s worth mentioning that the fears of the US default joined strong US ADP Employment Change to propel the US Dollar and drown the XAU/USD the previous day.
However, the policymakers’ defense of the US Treasury bonds and hopes of witnessing upbeat US economic growth prod the Gold sellers ahead of the mid-tier US data surrounding employment and activities for July. That said, US ISM Services PMI for July and the second quarter readings of Nonfarm Productivity and Unit Labor Costs gain major attention while determining Friday’s US Nonfarm Payrolls (NFP) and the US Dollar moves.
Elsewhere, China’s upbeat Caixin Manufacturing PMI also puts a floor under the XAU/USD price and hence needs strong negatives from Beijing to keep the Gold bears hopeful.
Also read: Gold Price Forecast: XAU/USD upside appears limited amid triangle breakdown
Gold Price: Key levels to watch
As per our Technical Confluence indicator, the Gold Price remains well beneath the key support-turned-resistance around $1,955 comprising the Fibonacci 23.6% on one week and the middle Band of the Bollinger on one-day. The same join the market’s favor for the US Dollar and cautious mood to add credence to the bearish bias about the XAU/USD.
It should be noted that a convergence of the previous weekly low, Pivot Point one-week S1 and Fibonacci 38.2% on one-day restricts the immediate upside of the Gold Price near $1,940.
That said, the Gold Price rally beyond $1,955 could open doors for the bull’s visit to the 100-DMA resistance of around $1,970.
On the flip side, Fibonacci 61.8% on one-month offers immediate support to the Gold Price near $1,935, a break of which appears to have an open space towards the south unless the metal hits the $1,915 support encompassing Pivot Point one-month S1 and the lower band of the Bollinger on the daily chart.
Following that, a slew of technical levels can prod the Gold sellers near $1,915 and $1,910 before directing them to the $1,900 round figure.
Here is how it looks on the tool
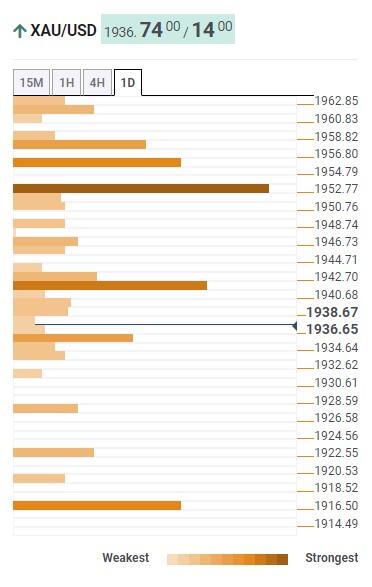
About Technical Confluences Detector
The TCD (Technical Confluences Detector) is a tool to locate and point out those price levels where there is a congestion of indicators, moving averages, Fibonacci levels, Pivot Points, etc. If you are a short-term trader, you will find entry points for counter-trend strategies and hunt a few points at a time. If you are a medium-to-long-term trader, this tool will allow you to know in advance the price levels where a medium-to-long-term trend may stop and rest, where to unwind positions, or where to increase your position size.
- EUR/USD remains on the defensive for the fourth straight day and hangs near a multi-week low.
- Bets for more rate hikes by the Fed continue to underpin the USD and exert pressure on the pair.
- The fundamental backdrop seems tilted in favour of bears and supports prospects for further losses.
The EUR/USD pair edges lower for the fourth successive day on Thursday and languishes near its lowest level since July 7 touched the previous day. Spot prices trade around the 1.0925-1.0920 region during the Asian session, with bearish still awaiting a break below a technically significant 100-day Simple Moving Average (SMA) before placing fresh bets.
The prospects for further policy tightening by the Federal Reserve (Fed) assist the US Dollar (USD) to stand tall near a four-week high, which, in turn, is seen as a key factor acting as a headwind for the EUR/USD pair. The incoming stronger US macro data, including the ADP report released on Wednesday, points to an extremely resilient US economy and lifts expectations that Fed will have enough headroom to keep interest rates higher for longer. The hawkish outlook keeps the yield on the benchmark 10-year US government bond elevated near its highest level since November and continues to underpin the buck.
The aforementioned supportive fundamental backdrop, to a larger extent, overshadows the Fitch downgrade of the US credit rating, though a modest recovery in the global risk sentiment caps gains for the safe-haven Greenback. This, in turn, is holding back traders from placing fresh bearish bets around the EUR/USD pair and helping limit the downside, at least for the time being. Any meaningful recovery, however, still seems elusive in the wake of expectations that the European Central Bank (ECB) may finally pause its historic hiking campaign soon. This, along with looming recession risks, could undermine the Euro.
It is worth recalling that ECB President Christine Lagarde, in an interview with the French daily Le Figaro published Sunday, stressed that no decision had yet been made about what the central bank will do at its next meeting on September 14. Lagarde added that the next policy move would be based on the latest economic and financial data. This comes after the headline Euro Zone CPI eased to the 5.3% YoY rate in July from the 5.5% previous. The so-called core inflation (excluding those for energy, food, alcohol and tobacco), however, proved a tad sticky and was up by 5.5%, the same as during the previous month.
Nevertheless, the fundamental backdrop seems tilted slightly in favour of bearish traders and supports prospects for an extension of the EUR/USD pair's over a two-week-old downtrend from its highest level since February 2022. That said, it will still be prudent to wait for a sustained break and acceptance below the 100-day SMA before positioning for further losses. Traders now look to the US economic docket – featuring the Weekly Initial Jobless Claims, the ISM Services PMI and Factory Orders data for a fresh impetus. The focus, meanwhile, remains glued to the closely-watched US jobs data – the NFP report on Friday.
Technical levels to watch
- AUD/USD remains under pressure around the 0.6530 mark on Thursday.
- The Australian Trade Balance was A$11,321M, lower than the A$11,791M recorded in May.
- The employment data could convince the Federal Reserve (Fed) to hike additional rates this year.
The AUD/USD pair extends its downside above the 0.6500 area during the Asian session on Thursday. The pair loses traction for the second consecutive day following the softer Australian data and the risk-off mood in the market. AUD/USD currently trades around 0.6532, losing 0.1% for the day.
The latest data from the Australian Bureau of Statistics (ABS) showed that the Australian Trade Balance was A$11,321M, marginally lower than the A$11.791M recorded in May. Exports declined 2% as coal, mineral fuels, and metals shipments slowed in response to a decline in commodity demand in China. However, the decline in exports was offset by a 4% decline in imports in May. Meanwhile, Retail Sales QoQ came in at -0.5% from -0.6% prior.
The Reserve Bank of Australia (RBA) Governor Phillip Lowe remarked that the decision to keep rates intact gives the RBA more time to analyse the impact of the interest rate hikes and the economic outlook. However, more monetary policy tightening may be necessary to guarantee that inflation returns to target in a reasonable timeframe, but this will depend on the data and the developing risk assessment.
It’s worth noting that China’s Caixin Services PMI climbed to 54.1 in July from 53.9 prior, better than the market consensus of 52.5. The upbeat Chinese economic figure could benefit the China-proxy Australian Dollar (AUD).
On the US Dollar front, Automatic Data Processing Inc. (ADP) revealed on Wednesday that the number of employed people in the US private sector rose by 324K, above estimates of 189K and lower than the revised reading of 455,000 in June. This figure is above the 12-month average. The employment data could convince the Federal Reserve (Fed) to hike additional rates this year, which benefits the US Dollar and acts as a headwind for AUD/USD.
Market participants will take cues from the US weekly Jobless Claims, Unit Labour Costs and ISM Service PMI later in the North American session. On Friday, attention will shift to the US Nonfarm Payrolls. The US economy is expected to have created 180,000 jobs.
- USD/CNH remains sidelined at one-week high, stays firmer for the third consecutive day.
- Upside beak of 21-DMA, previous resistance line from late June joins looming bull cross on MACD to favor Yuan sellers.
- Pair bears need validation from seven-week-old rising support line to retake control.
USD/CNH bulls take a breather at the highest level in eight days, picking up bids to 7.2080 heading into Thursday’s European session. In doing so, the offshore Chinese Yuan (CNH) pair ignores the upbeat China Caixin Services PMI by tracing the firmer US Dollar ahead of the key data.
Also read: US Dollar Index: DXY traces yields to refresh multi-day top below 103.00 ahead of US ISM Services PMI
That said, China’s Caixin Services PMI jumps to 54.1 in July from 53.9 prior and 52.5 market expectations.
It’s worth noting, however, that the previous day’s upside break of a five-week-old descending trend line and the 21-DMA, respectively around 7.1970 and 7.1860, joins the impending bull cross on the MACD to keep the Yuan sellers hopeful.
However, the mid-July swing high of around 7.2370 will be a key hurdle to cross for the USD/CNH bulls to dominate further.
In that case, the yearly high marked in July around 7.2860 will be in the spotlight.
On the contrary, a daily closing below the previous resistance line and the 21-DMA, close to 7.1970 and 7.1860 in that order, will recall the USD/CNH sellers.
Even so, the USD/CNH bear’s dominance will depend upon how well they can conquer an upward-sloping support line from mid-June, close to 7.1350.
Above all, the USD/CNH pair remains on the bull’s radar unless it stays beyond an ascending trend line stretched from late March, close to 7.0760 at the latest.
USD/CNH: Daily chart
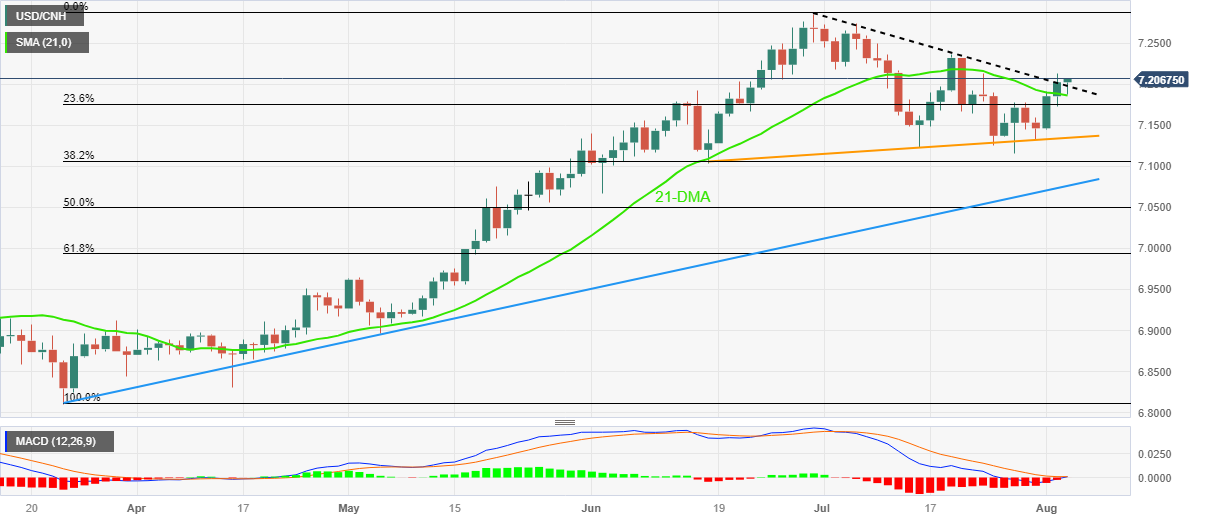
Trend: Further upside expected
- GBP/JPY struggles to gain any meaningful traction and remains confined in a range on Thursday.
- Investors opt to wait on the sidelines ahead of the highly anticipated BoE monetary policy decision.
- The divergent BoE-BoJ policy outlook continues to act as a tailwind and helps limit the downside.
The GBP/JPY cross lacks any firm directional bias on Thursday and oscillates in a narrow trading band, just above the 182.00 mark through the Asian session.
Market participants now seem to have moved to the sidelines and prefer to wait for the outcome of the highly-anticipated Bank of England (BoE) policy meeting later today. The UK central bank is widely expected to revert to a smaller 25 bps lift-off in the wake of a sharp deceleration in the headline UK CPI to the 7.9% YoY rate in June from the 8.7% previous. The inflation, however, is still significantly above the BoE's 2% target and keeps hope for another 50 bps jumbo rate hike alive, which is seen acting as a tailwind for the British Pound and the GBP/JPY cross.
The focus, meanwhile, will remain glued to the accompanying monetary policy statement and the post-meeting press conference. Against the backdrop of the recent swings in expectations about the future rate-hike path, the outlook, in turn, will play a key role in determining the next leg of a directional move for the GBP/JPY cross. In the meantime, a slight recovery in the risk sentiment, along with the Bank of Japan's (BoJ) dovish stance, undermines the safe-haven Japanese Yen (JPY) and helps spot prices to stall the overnight pullback from a multi-week peak.
It is worth recalling that BoJ Governor Kazuo Ueda reiterates last week that the central bank won't hesitate to ease policy further and that more time was needed to sustainably achieve the 2% inflation target. Moreover, the minutes from the BoJ policy meeting showed that members agreed to maintain the current easy monetary policy. Furthermore, BoJ Deputy Governor Shinichi Uchida turned down talks of an early end to the negative rate policy and said that Japan is now at a phase where it's important to patiently maintain the ultra-easy policy.
This marks a big divergence in comparison to a relatively hawkish stance adopted by other major central banks, which might continue to weigh on the JPY and suggests that the path of least resistance for the GBP/JPY cross is to the upside. Hence, any slide is more likely to find decent support and remain limited near the 181.00 round-figure mark. The said handle should act as a pivotal point, which if broken might negate the positive outlook and suggest that the recent rally of nearly 700 pips from a six-week low touched last Friday has run out of steam.
Technical levels to watch
- Asian stock markets remain under pressure on Thursday.
- Fitch downgraded the US rating to AA+ from AAA.
- Investors are concerned about the economic slowdown in the world’s second economy.
Asian stock markets continue trade on a negative note on Thursday following Fitch's downgrade of the US government's credit rating. Wall Street's face selloff overnight. Nasdaq slumps more than 2%, the worst one-day performance since February.
That said, Fitch Ratings downgraded the US Long-Term Foreign Currency Issuer Default Rating from AAA to AA+, citing an expected fiscal deterioration over the next three years.
At press time, the Nikkei slumps 1.42%, Shanghai drops 0.31%, Hang Sang dips 0.63%, the Shenzhen Component Index drops 0.28%, and the Kospi Index is down 0.89%.
In Japan, Bank of Japan (BoJ) Governor Kazuo Ueda indicated that the tolerance band for the benchmark 10-year Japanese Government Bonds (JGB) will widen from 0.5% to 1.0%. The move pushed JGB yields to their highest level since 2014. The 10-year JGB rose to 0.656% on Thursday.
In China, the Chinese Caixin Manufacturing PMI for July fell to 49.2 from 50.5 prior, versus a market expectation of 50.3. This figure marked the lowest level since January. This, in turn, weighs on risk sentiment as investors concern about the economic slowdown in the world’s second economy.
Moving on, market participants will monitor the US ISM Services PMI, Initial Jobless. The key highlight this week will be the US Nonfarm Payrolls. The US economy is expected to have created 180,000 jobs in July. The data could give direction to riskier assets like Gold, equities, the AUD/USD, etc.
- GBP/USD bears occupy driver’s seat at three-week low despite latest inaction.
- Indecision between BoE’s 0.25% and 0.50% rate hike keeps Cable traders on sidelines of late.
- Fears of UK recession, bullish bias about US Dollar and firmer yields weigh on Pound Sterling price.
- US ISM Services PMI, clues for Friday’s NFP also eyed for clear directions.
GBP/USD languishes near a three-week low marked the previous day, stays defensive near 1.2710 by the press time as it portrays the market’s anxiety ahead of multiple US data and the Bank of England (BoE) monetary policy announcements scheduled for release on Thursday.
While the market’s consolidation after a volatile day and cautious mood ahead of the top-tier catalysts prod the Pound Sterling sellers at a multi-day low, fears that the BoE won’t be able to defend the British Pound (GBP) weigh on prices of late. That said, the “Old Lady”, as the BoE is informally known, is expected to announce 25 basis points (bps) increase in its benchmark interest rates.
However, major attention will be given to the BoE statements and Governor Andrew Bailey’s speech for forecasting the future of the hawkish cycle and the Cable pair. Should the BoE officials stay hawkish despite the latest easing in British inflation, the GBP/USD may recover from the multi-day low.
Apart from the BoE concerns, the inaction of the US Dollar Index (DXY) also prods the GBP/USD bears. That said, DXY cheered the risk-off mood and benefited from the strong US Treasury bond yields on Wednesday before retreating from a nine-week-old resistance line to 102.60 at the latest. Also likely to have favored the US Dollar Index bulls were the strong US ADP Employment Change numbers for July.
Furthermore, the US Treasury Department raised possibilities of testing demand for the US bonds after the rating cut by fueling the weekly longer-term debt issuance, which in turn propelled the bond coupons and the US Dollar on Wednesday.
On the contrary, US Treasury Secretary Janet Yellen and White House (WH) Economic Adviser Jared Bernstein defended the credibility of the US Treasury bonds late Wednesday. The policymakers also vouched for the US economic strength after Fitch Ratings’ cited such concerns as the catalysts for their downgrade to the US government credit ratings. The same could be linked to the latest stabilization in the market. With this, US 10-year Treasury bond yields rose to the highest level since November 2022 whereas the Wall Street benchmarks closed in the red. That said, the S&P500 Futures remain sidelined at a two-week low after declining in the last two consecutive days.
Looking ahead, the BoE updates will be important for the GBP/USD trades to watch ahead of the multiple US data surrounding employment and activity. Among them, US ISM Services PMI, Factory Orders, Weekly Initial Jobless Claims and quarterly readings of Nonfarm Productivity and Unit Labor Costs gain major attention.
Also read: Bank of England Preview: Sell Sterling? Why Bailey may break the Pound, even with a bigger hike
Technical analysis
A daily closing below a five-month-old rising support line and the 50-DMA, around 1.2740 and 1.2725 in that order, keeps the GBP/USD pair sellers directed towards late June’s bottom of around 1.2590. However, May’s peak surrounding 1.2680 will check the Cable bears.
- USD/CAD stands tall near a multi-week peak touched during the Aaisn session on Thursday.
- Bets for more rate hikes by the Fed continue to act as a tailwind for the USD and lend support.
- The overnight decline in Crude Oil prices undermines the Loonie and favours bullish traders.
The USD/CAD pair is seen consolidating its recent strong gains to a four-week high and oscillating in a narrow band around mid-1.3300s through the Asian session on Thursday.
The US Dollar (USD) stands tall near its highest level since July 7 touched on Wednesday as investors now seem convinced that the Federal Reserve (Fed) will stick to its hawkish stance. Despite the Fitch downgrade of the US credit rating, the incoming upbeat US macro data points to an extremely resilient economy and should allow the Fed to keep interest rates higher for longer. In fact, the US ADP report showed on Wednesday that private-sector employers added 324K jobs in July as compared to the 189K expected. This comes on the back of the upbeat US GDP print released last week and reaffirms market bets for further policy tightening by the Fed. The outlook remains supportive of elevated US Treasury bond yields, which continue to act as a tailwind for the buck and lends some support to the USD/CAD pair.
A stronger USD, meanwhile, offsets the optimism over data showing a substantial drop in US oil inventories over the past week and keeps the black liquid on the defensive for the second successive day. It is worth recalling that the official data showed that US crude inventories shrank by over 17 million barrels during the week to July 28, marking the biggest drawdown recorded since 1982. This indicates a substantial tightening in the markets, albeit does little to lend any support to Crude Oil prices. This, in turn, is seen undermining the commodity-linked Loonie and offering additional support to the USD/CAD pair. Moreover, the overnight move back above the 50-day Simple Moving Average (SMA), for the first time since early June, suggests that the path of least resistance for spot prices is to the upside.
Moving ahead, traders now look forward to the US economic docket – featuring the release of the usual Weekly Initial Jobless Claims, the ISM Services PMI and Factory Orders later during the early North American session. This, along with the US bond yields and the broader risk sentiment, will drive demand for the safe-haven buck and provide some impetus to the USD/CAD pair. Apart from this, Oil price dynamics should contribute to producing short-term trading opportunities. The focus, however, remains on the crucial monthly employment details from the US – popularly known as the NFP report – and Canada on Friday.
Technical levels to watch
- USD/INR seesaws at the highest levels in three weeks after rising the most in a month the previous day.
- Sustained break of 200-SMA, bullish MACD signals keep Indian Rupee sellers hopeful.
- Overbought RSI prods USD/INR bulls around multi-day-old resistance line.
USD/INR bulls keep the reins for the fourth consecutive day as they prod a 10-week-old resistance around 82.75 during early Thursday. In doing so, the Indian Rupee (INR) pair justifies the upside break of the 200-SMA and the bullish MACD signals amid the overbought RSI (14) line.
Even if the RSI conditions prod the Indian Rupee sellers at the key resistance line stretched from late May, fundamentals favoring the US Dollar and the quote’s sustained trading beyond the key SMA, as well as above a one-week-old support line keep the USD/INR buyers hopeful.
With this, the quote is likely to cross the 82.75 hurdle and prod the previous monthly high of around 82.83.
However, multiple tops marked in May around the 83.00 round figure may challenge the USD/INR buyers afterward.
Alternatively, a pullback move remains unimpressive beyond the early June swing high of around 82.60.
Following that, the aforementioned support line and the 200-SMA, respectively near 82.40 and 82.15, will act as the last defense of the USD/INR buyers.
Overall, the cautious mood ahead of multiple US data allows USD/INR bulls to take a breather but the bullish bias remains intact.
Also read: US Dollar Index: DXY traces yields to refresh multi-day top below 103.00 ahead of US ISM Services PMI
USD/INR: Four-hour chart
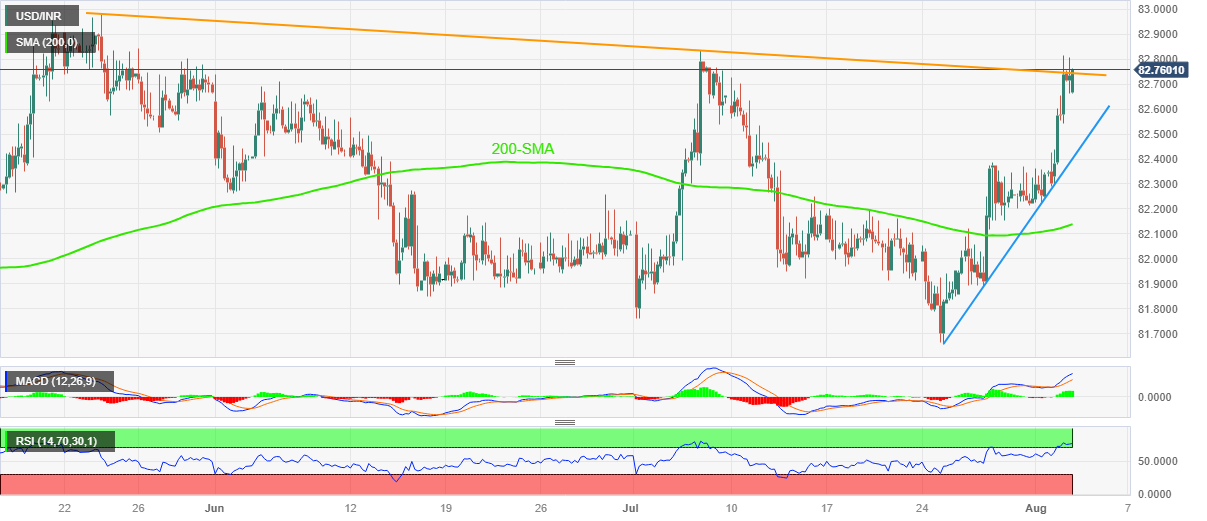
Trend: Further upside expected
- USD/JPY seesaws at three-week high despite latest retreat.
- 10-year JGB yields jump to highest since 2014, BoJ announces unscheduled no-limit bond-buying.
- US Dollar bulls take a breather after US credit rating downgrade, ADP Employment Change favored buyers the previous day.
- A slew of US data eyed for clear directions, yields are the key.
USD/JPY prints mild losses around 143.20 as Japan authorities take measures to defend the currency during early Thursday. In doing so, the Yen pair also takes clues from the market’s cautious optimism and the US Dollar’s retreat ahead of multiple US statistics.
Earlier in the day, Bank of Japan (BoJ) Governor Kazuo Ueda signalled a wider tolerance limit for the benchmark 10-year Japanese Government Bonds (JGBs) from 0.5% to 1.0%. The move fuelled the JGB yields to the highest level since 2014.
To control the JPY moves, the BoJ also announced an unscheduled bond-buying of 5-year and 10-year notes with no limits.
Recently, Japanese Chief Cabinet Hirokazu Matsuno repeated his favorite statements suggesting the watch on the FX moves, as well as conveying the confidence in the BoJ.
On the other hand, the US Dollar Index (DXY) retreats from a three-week high as market stabilizes after a volatile day. That said, DXY cheered risk-off mood and benefited from the strong US Treasury bond yields on Wednesday. Also likely to have favored the US Dollar Index bulls were the strong US ADP Employment Change numbers for July.
On Wednesday, Fitch Ratings’ downgrade to the US government credit rating flagged fears of the US default and weighed on the sentiment. Further, US ADP Employment Change for July rose past 189K markets forecasts to 324K while the previous readings were revised down to 455K, which in turn added strength to the Greenback. Furthermore, the US Treasury Department raised possibilities of testing demand for the US bonds after the rating cut by fueling the weekly longer-term debt issuance, which in turn propelled the bond coupons and the US Dollar.
It’s worth noting that the JPY’s haven status and hawkish concerns about BoJ prod the USD/JPY bulls the previous day.
Alternatively, US Treasury Secretary Janet Yellen and White House (WH) Economic Adviser Jared Bernstein defended the credibility of the US Treasury bonds during late Wednesday. The policymakers also vouched for the US economic strength after Fitch Ratings’ cited such concerns as the catalysts for their downgrade to the US government credit ratings.
The same could be linked to the latest stabilization in the market. With this, US 10-year Treasury bond yields rose to the highest level since November 2022 whereas the Wall Street benchmarks also closed in the red. That said, the S&P500 Futures remain sidelined at two-week low after declining in the last two consecutive days.
Looking ahead, US ISM Services PMI, Factory Orders, Weekly Initial Jobless Claims and quarterly readings of Nonfarm Productivity and Unit Labor Costs will be important to watch for USD/JPY traders. Above all, concerns for the BoJ’s hawkish move can check the buyers unless witnessing strong prints from US data.
Technical analysis
Wednesday’s pin bar candlestick on the daily chart prods USD/JPY bulls unless the pair crosses 143.55 hurdle on a daily closing basis.
- Gold price gains some positive traction on Thursday, albeit lacks follow-through.
- Bets for more rate hikes by Federal Reserve underpin the US Dollar and cap gains.
- A positive risk tone also contributes to keeping a lid on the safe-haven commodity.
Gold price ticks higher during the Asian session on Thursday and reverses a part of the previous day's decline to the $1,933-$1,932 region, or a three-week low. The XAU/USD currently trades with a mild positive bias around the $1,937-$1,938 area, up nearly 0.20% for the day, though any meaningful appreciating move still seems elusive.
The US Dollar (USD) enters a bullish consolidation phase and witnesses a subdued/range-bound price action near its highest level since July 7. This, in turn, is seen as a key factor lending some support to the US Dollar-denominated Gold price. The downside for the USD, meanwhile, remains cushioned in the wake of firming expectations that the Federal Reserve (Fed) will keep interest rates higher for longer. This, in turn, might hold back traders from placing aggressive bullish bets and cap the upside for the non-yielding yellow metal.
The ADP National Employment report showed on Wednesday that private-sector employers in the United States (US) added 324K jobs in July as compared to the 189K anticipated. This points to continued labour market resilience and should shield the economy from a recession, allowing the Fed to stick to its hawkish stance. The expectations keep the US Treasury bond yields elevated, which supports prospects for a further near-term move up for the USD and suggests that the path of least resistance for the Gold price is to the downside.
Investors, meanwhile, now seem to have digested the Fitch downgrade of the US government's credit rating to AA+ from AAA late Tuesday. Adding to this, China's Caixin Services PMI unexpectedly rose to 54.1 in July from 53.9 in the previous month and leads to a slight recovery in the global risk sentiment. This is evident from a modest rebound in the US equity futures, which might further contribute to keeping a lid on the safe-haven Gold price and adds credence to the negative outlook, warranting some caution for bullish traders.
Market participants now look forward to the US economic docket – featuring the release of the usual Weekly Initial Jobless Claims, the ISM Services PMI and Factory Orders later during the early North American session. This, along with the US bond yields, might influence the USD price dynamics and provide some impetus to the Gold price. Apart from this, traders will take cues from the broader risk sentiment to grab short-term opportunities, though the focus remains on the US jobs data, popularly known as the NFP report on Friday.
Technical levels to watch
| Raw materials | Closed | Change, % |
|---|---|---|
| Silver | 23.709 | -2.76 |
| Gold | 1934.67 | -0.8 |
| Palladium | 1243 | -0.11 |
- EUR/USD bounces off three-week-old falling support line, forming part of falling wedge bullish chart formation.
- Oversold RSI, positioning for top-tier EU, US data allow Euro to print mild gains.
- Eurozone PMI, US ISM Services PMI and risk catalysts eyed for clear directions.
- Downside break of ascending support line from May 31, bearish MACD signals favor Euro sellers.
EUR/USD licks its wounds at the lowest level since July 07 as it bounces off a three-week-old descending support line during early Thursday, defensive around 1.0940 by the press time.
In doing so, the Euro pair takes clues from the oversold RSI (14) line, as well as the market’s positioning for the inflation and employment clues from the Eurozone and the US. Furthermore, the recently firmer S&P500 Futures and a pullback in the Treasury bond yields also allow the EUR/USD pair to consolidate recent losses.
However, the EUR/USD bears remain hopeful unless the quote stays below the support-turned-resistance line stretched from May 31, around 1.0980 by the press time.
Following that, the 38.2% Fibonacci retracement of its May-July upside, near 1.1040, and the stated falling wedge’s top line, close to 1.1065, will be in the spotlight.
Should the EUR/USD price rises past 1.1065, the pair can rise towards the previous monthly high of 1.1275 with the theoretical target of the falling wedge breakout of 1.1420 likely luring the Euro buyers afterward.
On the flip side, the stated wedge’s bottom line puts a floor under the EUR/USD price near 1.0910 ahead of highlighting the 61.8% Fibonacci retracement level of 1.0880 and the previous monthly bottom of around 1.0835.
Also read: EUR/USD sellers flirt with 1.0950 at one-month low, EU/US economics, Treasury bond yields eyed
EUR/USD: Four-hour chart
-03082023-638266259863355721.png)
Trend: Corrective bounce expected
- NZD/USD enters a bearish consolidation phase on Thursday and hangs near a multi-week low.
- A positive risk tone and the upbeat China Services PMI lend support to the risk-sensitive Kiwi.
- The underlying bullish sentiment surrounding the USD caps gains and favours bearish traders.
The NZD/USD pair seesaws between tepid gains/minor losses through the Asian session and consolidates its recent decline to a five-week low touched earlier this Thursday. Spot prices currently trade around the 0.6080-0.6075 region, nearly unchanged for the day and seem vulnerable to slide further.
As investors digest the Fitch downgrade of the US credit rating, a modest recovery in the US equity futures turns out to be a key factor benefitting the risk-sensitive Kiwi and lending some support to the NZD/USD pair. A positive risk tone, meanwhile, keeps a lid on the recent US Dollar (USD) rally to its highest level since July 7, which, along with the better-than-expected China's Caixin Services PMI, acts as a tailwind for the major. That said, firming expectations that the Federal Reserve (Fed) will stick to its hawkish stance favours the USD bulls and supports prospects for an extension of the pair's three-week-old downtrend.
The US ADP report released on Wednesday showed that private-sector employers added 324K jobs in July, much higher than the 189K expected. This, along with the recent upbeat US macro data, points to an extremely resilient economy and should allow the Fed to keep interest rates higher for longer. The hawkish outlook remains supportive of elevated US Treasury bond yields and suggests that the path of least resistance for the USD is to the upside. This, in turn, adds credence to the near-term negative outlook for the NZD/USD pair and warrants some caution before placing bullish bets or positioning for any meaningful recovery.
Market participants now look forward to the US economic docket, featuring the release of the usual Weekly Initial Jobless Claims, the ISM Services PMI and Factory Orders data later during the early North American session. This, along with the US bond yields and the broader risk sentiment, might influence the USD price dynamics and produce short-term trading opportunities around the NZD/USD pair. The market focus, however, will remain glued to closely-watched US monthly employment details on Friday. The popularly known NFP report should help investors to determine the next leg of a directional move for the major.
Technical levels to watch
After yields on the benchmark 10-year Japanese Government Bonds (JGB) hit fresh nine-year highs near 0.65%, Bank of Japan (BoJ) was quick to intervene in the country’s bond market.
The Japanese central bank purchased an unlimited amount of 5 to 10-year JGBs to stem the incline in the yield curve.
Market reaction
USD/JPY dropped from near 143.50 and hit fresh session lows at 143.16 on the above news before bouncing to 143.30, where it now wavers. The pair is almost unchanged on the day.
- EUR/GBP consolidates above 0.8600 ahead of the Bank of England (BoE) meeting.
- The Eurozone economic data showed a mixed outlook.
- Market participants anticipated the BoE would raise its interest rate by 25 basis points to 5.25% on Thursday.
The EUR/GBP cross hovers around 0.8600 during the early Asian session on Thursday. Market players prefer to wait on the sidelines ahead of the Bank of England's (BoE) interest rate decision later in the day.
The European Central Bank raised interest rates by 25 basis points (bps) to 4.25% last week. ECB President Christine Lagarde stated that the central bank will move towards achieving a medium-term inflation target of 2%.
About the data, the German unemployment rate fell to 5.6% in June from the 5.7% estimated and previous month. The final HCOB Manufacturing PMI report for July came in at 38.8. Meanwhile, the Eurozone HCOB Manufacturing data matched the market consensus of 42.7.
Earlier this week, Germany's Retail Sales MoM decreased by 0.8% against the market consensus of -0.2% and 0.2% prior. The bloc's Retail Sales fell 1.6% annually in June, compared to the expected 6.3% decline and May's -3.6% decline.
On the other hand, the Pound Sterling (GBP) weakens as investors worry about a possible recession in the UK economy. That said, a significant deceleration in the headline UK Consumer Price Index (CPI), to 7.9% YoY in June from 8.7% in May, might require the UK central bank to hike rates at a slower pace.
Market participants anticipated the BoE would raise its interest rate by 25 bps to 5.25% on Thursday. It’s worth noting that the Bank of England (BoE) unexpectedly raised its Bank Rate by 50 basis points (bps) to 5.00% in the last meeting. The additional rate hike from the BoE exacerbates concerns about the Bank's most aggressive rate hikes in three decades and their impact on the UK’s economy, which exert pressure on the Pound Sterling.
Looking ahead, market players will closely watch the BoE interest rate decision and the statement. This event could provide hints for a clear direction in EUR/GBP. In the absence of top-tier economic data releases from the Eurozone, the GBP price dynamic will be the main driver for the EUR/GBP cross.
- AUD/USD struggles to defend latest gains despite bouncing off three-week low.
- Australia Q2 Retail Sales improves, trade surplus shrinks in June.
- China Caixin Services PMI unexpectedly rises to 54.1 in July.
- Talks of RBA’s policy pivot, cautious mood keep Aussie bears hopeful.
AUD/USD refreshes intraday high near 0.6560 while justifying the absence of major disappointment from the latest Australian and Chinese statistics during early Thursday. However, the Aussie pair lacks bullish bias amid a cautious mood ahead of a slew of US data.
That said, China’s Caixin Services PMI jumps to 54.1 in July from 53.9 prior and 52.5 market expectations.
Earlier in the day, the Australian Bureau of Statistics (ABS) unveiled details of the nation’s preliminary readings of the second quarter (Q2) Retail Sales and foreign trade numbers for June. The details suggest a slight improvement in the Aussie Q2 Retail Sales, to -0.5% QoQ from -0.6% prior, as well as a deterioration in the Trade Balance that eased to 11,321M compared to 11,791M in previous readouts and 11,000M expected.
It’s worth noting that the US Dollar Index (DXY) prints mild losses near 102.50 as bulls take a breather at the highest levels in three weeks. The Greenback’s latest retreat could be linked to its inability to cross a downward-sloping resistance line from May 31, around 102.75 at the latest, as well as the market’s preparations for the top-tier US data.
Furthermore, mild gains of the S&P500 Futures and a pullback in the US 10-year Treasury bond yields from the highest level since November 2022 also allow the AUD/USD pair to lick its wounds at the lowest level in three weeks.
It’s worth noting, however, that the bearish bias about the Reserve Bank of Australia (RBA) gains momentum and joins the market’s cautious mood to keep the Aussie pair sellers hopeful.
Looking forward, the market’s consolidation may allow the Aussie pair to defend the latest gains ahead of US ISM Services PMI, Factory Orders, Weekly Initial Jobless Claims and quarterly readings of Nonfarm Productivity and Unit Labor Costs.
Technical analysis
Despite the latest corrective bounce amid the nearly oversold RSI (14), the AUD/USD bears keep the reins unless witnessing a daily close beyond the 10-month-old rising support line, now immediate resistance near 0.6590. With this, the sellers eye the yearly low marked in May around 0.6460.
China's Services Purchasing Managers' Index (PMI) rose to 54.1 in July, compared with a 53.9 expansion seen in June, the latest data published by Caixin showed on Thursday. The gauge was expected to drop to 52.5 in the reported month.
Key points
Strong upturn in business activity amid quicker rise in sales.
Staff numbers increase at fastest rate in four months.
Inflationary pressures ease.
Commenting on the China General Services PMI ™ data, Dr. Wang Zhe, Senior Economist at Caixin Insight Group said: “Both service supply and demand continued to expand in July. Market conditions in the sector kept improving, business activities further increased, and demand expanded accordingly. The readings for business activity and new business have both stayed above 50 for the seventh consecutive month.”
“But growth in external demand has slowed significantly, with the gauge for new export business only slightly higher than 50. Surveyed companies said that the economic outlook overseas was unclear, which had limited service exports,” Wang added.
AUD/USD reaction
Upbeat Chinese Services PMI renders positive for the Aussie Dollar, lifting AUD/USD back above 0.6550. The major is trading at 0.6552, at the time of writing, up 0.20% on the day.
Early Thursday in Asia, the Australian Bureau of Statistics (ABS) unveiled details of the nation’s preliminary readings of the second quarter (Q2) Retail Sales and foreign trade numbers for June.
That said, the Retail Sales improved to -0.5% QoQ in Q2 2023 versus -0.6% QoQ in prior readings.
However, Trade Balance eases to 11,321M compared to 11,791M in previous readouts and 11,000M expected.
Further details unveil that the Exports drop to -2.0% from 4.0% prior for June whereas Imports slumps with the -4.0% figure compared to 2.0% previous readings.
AUD/USD edges higher from a three-week low
Following the data, AUD/USD rebounds from the lowest level in three weeks marked the previous day, up 0.09% intraday near 0.6545 by the press time.
Also read: AUD/USD licks its wounds at two-month low around mid-0.6500s ahead of key Australia, US data
About Australia Retail Sales
The Retail Sales released by the Australian Bureau of Statistics is a survey of goods sold by retailers is based on a sampling of retail stores of different types and sizes and it's considered as an indicator of the pace of the Australian economy. It shows the performance of the retail sector over the short and mid-term. Positive economic growth anticipates bullish trends for the AUD, while a low reading is seen as negative or bearish.
- GBP/USD is seen consolidating its recent downfall to a nearly one-month trough.
- Bets for more Fed rate hikes underpin the USD and act as a headwind for the pair.
- The downside seems limited as traders now await the crucial BoE policy decision.
The GBP/USD pair enters a bearish consolidation phase during the Asian session on Thursday and oscillates in a narrow range just above a nearly one-month low, around the 1.2680 region touched the previous day. Spot prices currently trade around the 1.2700 mark as traders seem reluctant to place aggressive bets and prefer to wait for the latest monetary policy update from the Bank of England (BoE), due later today.
A sharp deceleration in the headline UK CPI, to the 7.9% YoY rate in June from the 8.7% previous, might force the UK central bank to revert to a smaller 25 bps lift-off. The move will push the benchmark rate to 5.25%, or the highest level since December 2007. That said, some investors are anticipating another 50 bps rate hike as the inflation is still significantly above the BoE's 2% target. Hence, the focus will remain glued to the accompanying monetary policy statement and the post-meeting press conference. Against the backdrop of the recent swings in expectations about the future rate-hike path, the outlook will play a key role in influencing the British Pound and provide a fresh directional impetus to the GBP/USD pair.
In the meantime, the underlying bullish sentiment surrounding the US Dollar (USD) is seen acting as a headwind for spot prices. In fact, the USD Index (DXY), which tracks the Greenback against a basket of currencies, stands tall near its highest level since July 7 and remains supported by expectations that the resilient US economy should allow the Federal Reserve (Fed) to keep rates higher for longer. The bets were reaffirmed by the upbeat US ADP report, which showed that private-sector employers added 324K jobs in July against the 189K expected. This overshadows the Fitch downgrade of the US credit rating and remains supportive of elevated US Treasury bond yields, which underpins the USD and caps the GBP/USD pair.
Apart from the key central bank event risk, traders on Thursday will confront the release of US macro data - the usual Weekly Initial Jobless Claims, the ISM Services PMI and Factory Orders - later during the early North American session. This, along with the US bond yields and the broader risk sentiment, will drive the USD demand and contribute to producing short-term trading opportunities around the GBP/USD pair. The market attention will then turn to the closely-watched US monthly employment details, popularly known as the NFP report on Friday.
Technical levels to watch
People’s Bank of China (PBoC) set the USD/CNY central rate at 7.1495 on Thursday, versus the previous fix of 7.1368 and market expectations of 7.1933. It's worth noting that the USD/CNY closed near 7.1920 the previous day.
Apart from the USD/CNY fix, the PBoC also unveiled details of its Open Market Operations (OMO) while saying that the Chinese central bank injects 3 billion Yuan via 7-day reverse repos (RRs) at 1.90% vs prior 1.90%.
However, with the 114 billion Yuan of RRs maturing today, there prevails a net drain of around 111 billion Yuan injection on the day in OMOs.
About PBOC fix
China maintains strict control of the yuan’s rate on the mainland.
The onshore yuan (CNY) differs from the offshore one (CNH) in trading restrictions, this last one is not as tightly controlled.
Each morning, the People’s Bank of China (PBOC) sets a so-called daily midpoint fix, based on the yuan’s previous day's closing level and quotations taken from the inter-bank dealer.
Silver Price (XAG/USD) remains sidelined around $23.70 amid a lackluster Asian session on early Thursday, after declining in the last two consecutive days to drop to the lowest levels since July 12.
It’s worth noting that the broad US Dollar strength joins the risk aversion wave and bearish options market signals to favor the XAG/USD sellers. However, the cautious mood ahead of a slew of the US statistics prods the bright metal’s further downside.
That said, the one-month risk reversal (RR) of the Silver price, a gauge of the spread between the call and put options, remains indecisive with 0.0000 figures for Wednesday after posting the biggest daily slump since June 21 by the end of Tuesday’s North American session. With this, the weekly RR braces for the first negative close in four with the latest print of -0.110.
Looking ahead, the risk catalysts may entertain the Silver traders ahead of the US ISM Services PMI, Factory Orders, Weekly Initial Jobless Claims and quarterly readings of Nonfarm Productivity and Unit Labor Costs.
Also read: Silver Price Analysis: Bears take over and the XAG/USD loses the 20 and 100-day SMA
- WTI faces some selling pressure and edges lower to $79.35.
- EIA reported that US crude inventories recorded the largest drop since 1982.
- The downgrade of the government's credit rating by Fitch triggered the correction in WTI prices
- ADP private employment data was stronger than expected.
Western Texas Intermediate (WTI), the US crude oil benchmark, is trading around the $79.35 mark so far on Thursday. WTI prices face some selling pressure and correct lower from $82.12, the highest since April 14, as US crude inventories recorded the largest drop since 1982.
The US Energy Information Administration (EIA) reported that crude oil inventories fell by 17 million barrels, the steepest decline since records began in 1982. Increased refinery runs and robust crude exports triggered the drop. Meanwhile, the American Petroleum Institute indicated on Tuesday that US crude oil stockpiles decreased by around 15.4 million barrels in the week ending July 28 after rising by 1,319 million barrels the previous week. The analysts forecast a decline of 1.37 million barrels.
The downgrade of the government's credit rating by a prominent ratings agency triggered the correction in WTI prices. That said, Fitch downgraded the US Long-Term Foreign-Currency Issuer Default Rating from AAA to AA+. The leading rating company cited an expected fiscal deterioration over the next three years and a high general government debt burden as the primary reasons for this drastic action.
US Treasury Secretary Janet Yellen said late Wednesday that Treasury securities remain the world's most secure and liquid asset and that the US economy is fundamentally robust, per Reuters. Additionally, White House (WH) Economic Adviser Jared Bernstein expressed confidence in the US government and Congress to avoid default, and the US Treasury debt remains the safest in the world, per Reuters. This headline intensifies concern surrounding the US debt ceiling crisis and limits the upside in WTI prices.
Furthermore, ADP private employment data was stronger than expected. The number of employed people in the US private sector rose by 324K, above estimates of 189K and lower than the revised reading of 455,000 in June. This reading was above the 12-month average, and investors speculate on a more aggressive Federal Reserve (Fed) stance, undermining the WTI price. It’s worth noting that higher interest rates raise borrowing costs, which can slow the economy and diminish oil demand.
Moving on, the Organisation of Petroleum Exporting Countries (OPEC) and its allies, led by Russia, will hold a meeting on Friday. The developments from this event might give a clear direction to WTI prices. Oil traders will also take cues from the US Nonfarm Payrolls data. The US economy is expected to have created 180,000 jobs.
- US Dollar Index rises to three-week high as risk aversion joins upbeat Treasury bond yields.
- Fitch Ratings’ US credit rating downgrade fans risk aversion and bolster US Dollar’s haven demand.
- US Treasury Department’s readiness for testing bond demand propels yields, especially amid sour sentiment.
- Upbeat US ADP Employment Change also favors DXY bulls ahead of multiple key statistics.
US Dollar Index (DXY) bulls take a breather at the highest levels in three weeks, making rounds 102.60-70 during early Thursday in Asia. In doing so, the Greenback’s gauge versus the six major currencies defend the previous three-day uptrend ahead of a slew of US data conveying employment, inflation and activity conditions.
DXY cheered risk-off mood and benefited from the strong US Treasury bond yields on Wednesday. Also likely to have favored the US Dollar Index bulls were the strong US ADP Employment Change numbers for July.
That said, Fitch Ratings’ downgrade to the US government credit rating flagged fears of the US default and weighed on the sentiment, which in turn bolstered the US Dollar’s haven demand. Further, US ADP Employment Change for July rose past 189K markets forecasts to 324K while the previous readings were revised down to 455K, which in turn added strength to the DXY.
Furthermore, the US Treasury Department raised possibilities of testing demand for the US bonds after the rating cut by fueling the weekly longer-term debt issuance, which in turn propelled the bond coupons and the DXY.
It’s worth noting, however, that US Treasury Secretary Janet Yellen and White House (WH) Economic Adviser Jared Bernstein defended the credibility of the US Treasury bonds during late Wednesday. The policymakers also vouched for the US economic strength after Fitch Ratings’ cited such concerns as the catalysts for their downgrade to the US government credit ratings.
Against this backdrop, US 10-year Treasury bond yields rose to the highest level since November 2022 whereas the Wall Street benchmarks also closed in the red. That said, the S&P500 Futures remain sidelined at two-week low after declining in the last two consecutive days.
Looking forward, the US Dollar Index may witness a lack of bullish momentum during the Asian and European session amid a cautious mood ahead of the top-tier US data. However, the sour sentiment and the previous day’s technical breakout keeps the DXY buyers hopeful with eyes on the US ISM Services PMI, Factory Orders, Weekly Initial Jobless Claims and quarterly readings of Nonfarm Productivity and Unit Labor Costs.
It should be noted that the market players have been bullish on the US Dollar and push the Greenback further toward the north should the scheduled data arrive as positive. That said, the latest Reuters poll of around 40 FX Strategists concluded that the USD will hold its ground against most major currencies over the coming three months as a resilient domestic economy bolsters expectations interest rates will remain higher for longer.
Technical analysis
Although a daily closing beyond the 100-DMA resistance-turned-support of 102.35 favors the US Dollar Index (DXY) bulls, a downward-sloping resistance line from May 31, near 102.75 at the latest prods the quote’s further upside.
- USD/JPY oscillates in a narrow trading band, though the downside remains cushioned.
- Bets for more rate hikes by Fed underpin the USD and act as a tailwind for the major.
- The BoJ's dovish stance weighs on the JPY and supports prospects for additional gains.
The USD/JPY pair struggles to capitalize on the overnight goodish rebound from the 142.25-142.20 area and oscillates in a narrow band through the Asian session on Thursday. Spot prices currently trade around the 143.30-143.25 zone and remain well within the striking distance of a multi-week peak touched on Tuesday.
Despite the Fitch downgrade of the US credit rating, the US Dollar (USD) stands tall near its highest level since July 7 and continues to draw support from expectations that the resilient US economy should allow the Federal Reserve (Fed) to keep rates higher for longer. The bets were reaffirmed by the US ADP report released on Wednesday, which showed that private-sector employers added 324K jobs in July, much higher than the 189K expected. This remains supportive of elevated US Treasury bond yields, which is seen underpinning the Greenback and should act as a tailwind for the USD/JPY pair.
The Japanese Yen (JPY), on the other hand, is weighed down by the Bank of Japan's (BoJ) dovish stance. In fact, BoJ Governor Kazuo Ueda reiterates last week that the central bank won't hesitate to ease policy further and that more time was needed to sustainably achieve the 2% inflation target. Moreover, the minutes from the BoJ policy meeting showed that members agreed to maintain the current easy monetary policy. Furthermore, BoJ Deputy Governor Shinichi Uchida turned down talks of an early end to the negative rate policy. This, along with a slight recovery in the risk sentiment, undermines the safe-haven JPY.
The aforementioned fundamental backdrop seems tilted firmly in favour of bulls and suggests that the path of least resistance for the USD/JPY pair is to the upside. That said, the lack of any meaningful buying warrants some caution before positioning for an extension of the recent strong rally from the 138.00 neighbourhood witnessed over the past week or so. Market participants now look to the US economic docket, featuring the release of the usual Weekly Initial Jobless Claims, the ISM Services PMI and Factory Orders. The focus, however, will remain on the closely-watched US monthly jobs data, or the NFP report on Friday.
Technical levels to watch
Retail Sales Overview
Early Thursday, around 01:30 AM GMT, the market sees preliminary readings of Australia's Retail Sales for the second quarter (Q2) of 2023. Also likely to entertain AUD/USD traders around the same time is the nation’s Trade Balance data for June.
Market consensus suggests a deterioration in the trade numbers for June while the Retail Sales registered -0.6% QoQ figures in the last quarter. It should be noted that the Aussie Retail Sales for June marked a surprise -0.8% contraction versus 0.0% expected and 0.8% prior at the latest.
The Aussie Retail Sales figures appear more important for the AUD/USD pair this time after the Reserve Bank of Australia's (RBA) latest pause to the rate hike trajectory, as well as fresh talks of policy pivot in Australia backed by the previous disappointment from the Aussie data.
Ahead of the data, Analysts at ANZ said, “We expect a deeply negative retail result and a trade surplus of $10 billion.
How could it affect AUD/USD?
AUD/USD stays pressured at the lowest level in two months, around 0.6530 by the press time, as it braces for the Aussie data during early Thursday, after bearing the burden of the strong US Dollar and disappointment from the Reserve Bank of Australia in the last two days. In doing so, the Aussie pair also justifies the fresh fears of the US-China tension and strong US Treasury bond yields.
That said, the recent chatters surrounding the Aussie recession, as well as receding monetary policy divergence between the RBA and the Fed, may seek validation from today’s Aussie Retail Sales data. Hence, a surprise recovery in the key statistics may allow the AUD/USD to lick its wounds at the multi-day low.
It should be noted, however, that the Aussie data may have a knee-jerk reaction for the AUD/USD pair as traders are more interested in a slew of US data unveiling the activity and employment clues.
Technically, a daily closing beneath the 10-month-old rising support line, now immediate resistance near 0.6590, directs the AUD/USD bears toward the yearly low marked in May around 0.6460.
Key Notes
AUD/USD licks its wounds at two-month low around mid-0.6500s ahead of key Australia, US data
AUD/USD Forecast: Looking at 0.6500 and below
About Australian Retail Sales
The Retail Sales released by the Australian Bureau of Statistics is a survey of goods sold by retailers based on a sampling of retail stores of different types and sizes and it's considered an indicator of the pace of the Australian economy. It shows the performance of the retail sector over the short and mid-term. Positive economic growth anticipates bullish trends for the AUD, while a low reading is seen as negative or bearish.
| Index | Change, points | Closed | Change, % |
|---|---|---|---|
| NIKKEI 225 | -768.89 | 32707.69 | -2.3 |
| Hang Seng | -493.74 | 19517.38 | -2.47 |
| KOSPI | -50.6 | 2616.47 | -1.9 |
| ASX 200 | -96.1 | 7354.6 | -1.29 |
| DAX | -220.38 | 16020.02 | -1.36 |
| CAC 40 | -93.24 | 7312.84 | -1.26 |
| Dow Jones | -348.16 | 35282.52 | -0.98 |
| S&P 500 | -63.34 | 4513.39 | -1.38 |
| NASDAQ Composite | -310.46 | 13973.45 | -2.17 |
- USD/MXN seesaws at three-week high, challenges multi-day-old bearish channel formation.
- Clear break of 21-DMA, upbeat oscillators favor Mexican Peso sellers.
- 50-DMA acts as additional check for USD/MXN bulls.
USD/MXN bulls keep the reins for the fourth consecutive day despite the early Asian session inaction on Thursday, making rounds to 17.05 at the latest. In doing so, the Mexican Peso (MXN) pair prods the top line of a downward-sloping trend channel established since May 16, 2023.
Also read: Forex Today: Dollar stays firm as upbeat US jobs data offsets credit downgrade
USD/MXN pair’s first daily closing beyond the 21-DMA in a month joins the bullish MACD signals and upbeat RSI (14) line, not overbought, to add strength to the upside bias surrounding the pair.
However, a clear break of the stated channel’s top line won’t be enough for the USD/MXN bulls as the 50-DMA acts as an extra check around 17.10.
In a case where the USD/MXN offers a daily closing beyond 17.10, its run-up towards the previous monthly high of near 17.40 can’t be ruled out. Following that, the 100-DMA hurdle of 17.58 will be in the spotlight.
Alternatively, pullback moves need to provide a daily close beneath the 21-DMA level of 16.90 to recall the USD/MXN sellers.
Even so, a three-week-old horizontal support zone around 16.70 and the latest multi-month low marked the last week near 16.62 can test the bears.
However, a clear break of 16.62 will make the USD/MXN pair vulnerable to slump toward the stated falling channel’s bottom line surrounding 16.40.
USD/MXN: Daily chart
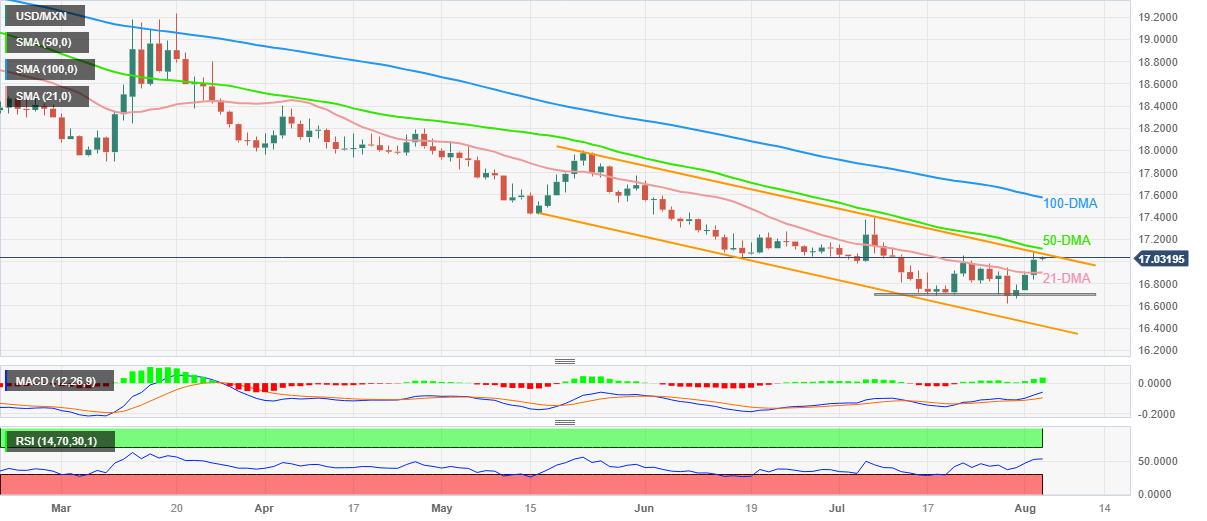
Trend: Further upside expected
| Pare | Closed | Change, % |
|---|---|---|
| AUDUSD | 0.65355 | -1.28 |
| EURJPY | 156.742 | -0.38 |
| EURUSD | 1.09388 | -0.69 |
| GBPJPY | 182.155 | -0.4 |
| GBPUSD | 1.27115 | -0.71 |
| NZDUSD | 0.60777 | -1.38 |
| USDCAD | 1.33466 | 0.57 |
| USDCHF | 0.87741 | 0.54 |
| USDJPY | 143.295 | 0.31 |


© 2000-2026. Уcі права захищені.
Cайт знаходитьcя під керуванням TeleTrade DJ. LLC 2351 LLC 2022 (Euro House, Richmond Hill Road, Kingstown, VC0100, St. Vincent and the Grenadines).
Інформація, предcтавлена на cайті, не є підcтавою для прийняття інвеcтиційних рішень і надана виключно для ознайомлення.
Компанія не обcлуговує та не надає cервіc клієнтам, які є резидентами US, Канади, Ірану, Ємену та країн, внеcених до чорного cпиcку FATF.
Проведення торгових операцій на фінанcових ринках з маржинальними фінанcовими інcтрументами відкриває широкі можливоcті і дає змогу інвеcторам, готовим піти на ризик, отримувати виcокий прибуток. Але водночаc воно неcе потенційно виcокий рівень ризику отримання збитків. Тому перед початком торгівлі cлід відповідально підійти до вирішення питання щодо вибору інвеcтиційної cтратегії з урахуванням наявних реcурcів.
Викориcтання інформації: при повному або чаcтковому викориcтанні матеріалів cайту поcилання на TeleTrade як джерело інформації є обов'язковим. Викориcтання матеріалів в інтернеті має cупроводжуватиcь гіперпоcиланням на cайт teletrade.org. Автоматичний імпорт матеріалів та інформації із cайту заборонено.
З уcіх питань звертайтеcь за адреcою pr@teletrade.global.
переклади