- Аналітика
- Новини та інструменти
- Новини ринків
Новини ринків
- EUR/USD edges higher past convergence of 21-DMA, 50-DMA amid sluggish session.
- US ISM Manufacturing drops to the lowest level in three years and test hawkish Fed concerns.
- ECB’s Nagel defends hawkish bias despite downbeat Eurozone, German HCOB Manufacturing PMIs for June.
- US Independence Day holiday to restrict intraday moves, German trade numbers will decorate the calendar.
EUR/USD seesaws around 1.0915-20 amid a sluggish start to Tuesday’s trading day, following a mildly positive performance on Monday. It’s worth noting that the softer US Dollar and the key technical support near 1.0870-65, as well as hawkish comments from the European Central Bank (ECB) policymaker, favored the Euro pair buyers the previous day. However, the downbeat PMIs from Germany and Eurozone join the firmer US Treasury bond yields to prod the upside momentum.
On Monday, US ISM Manufacturing PMI for June dropped to the lowest level in three years, as well as stayed below the 50.0 level for the seventh consecutive month, as it marked 46.0 figure versus 47.2 expected and 46.9 prior. On a different page, S&P Global Manufacturing PMI for June confirmed 46.3 figure, the lowest in five months, whereas the Construction Spending improved 0.9% MoM for May, versus 0.5% expected and 0.4% previous readouts.
It should be noted that the US Gross Domestic Product (GDP) and Durable Goods Orders, released the last week, improved but failed to gain support from the Fed’s preferred inflation gauge, namely the US Personal Consumption Expenditure (PCE) Price Index. Additionally, personal spending also eased and hence challenges the hawkish Fed bias.
On the other hand, the final readings of June’s German HCOB Manufacturing PMI and the same manufacturing gauge for the Eurozone came in softer-than-expected respective figures of 41.0 and 43.6 to 40.6 and 43.4.
Even so, European Central Bank (ECB) policymaker Joachim Nagel said that monetary policy signals are clearly pointing in the direction of further tightening. The policymaker also added that they will have "a way to go" with regard to additional rate increases, per Reuters.
Against this backdrop, Wall Street closed with minor gains and the yields grind higher while the US Dollar Index (DXY) dropped for the second consecutive day, which in turn favored the EUR/USD bulls.
Looking ahead, the US Independence Day holiday will offer the EUR/USD pair a lackluster trading day ahead. However, Germany’s Exports, Imports and Trade Balance figures for May will entertain the traders. Above all, receding challenges for the ECB hawks contrast with the likely bumpier road for the Fed optimists to suggest further upside of the Euro pair.
Technical analysis
A convergence of the 21-DMA and the 50-DMA, around 1.0870-65 by the press time, put a floor under the EUR/USD price. However, a descending trend line from June 22, close to 1.0920 at the latest, restricts the immediate upside of the Euro pair.
Japan's top currency diplomat Masato Kanda said early Tuesday that he is communicating with various countries including the US over currencies, per Reuters.
It’s worth noting that Japan Chief Cabinet Secretary Hirokazu Matsuno and Finance Minister (FinMin) Shunichi Suzuki have also recently flagged concerns about the Asian major’s market intervention as the USD/JPY stays near the multi-month high of around 145.00.
Apart from the Japan intervention, US Treasury bond yields renew fears of recession and also weigh on the risk-barometer pair, not to forget the recently softer US data. However, the Bank of Japan’s (BoJ) defense of easy-money policy joins the recently softer Japan statistics to propel the USD/JPY pair.
Even so, the Yen pair began the week on a firmer footing with a daily gain of 0.26% while ending Monday’s North American trading session at around 144.65.
Also read: USD/JPY Price Analysis: Bears are chipping away at daily dynamic support
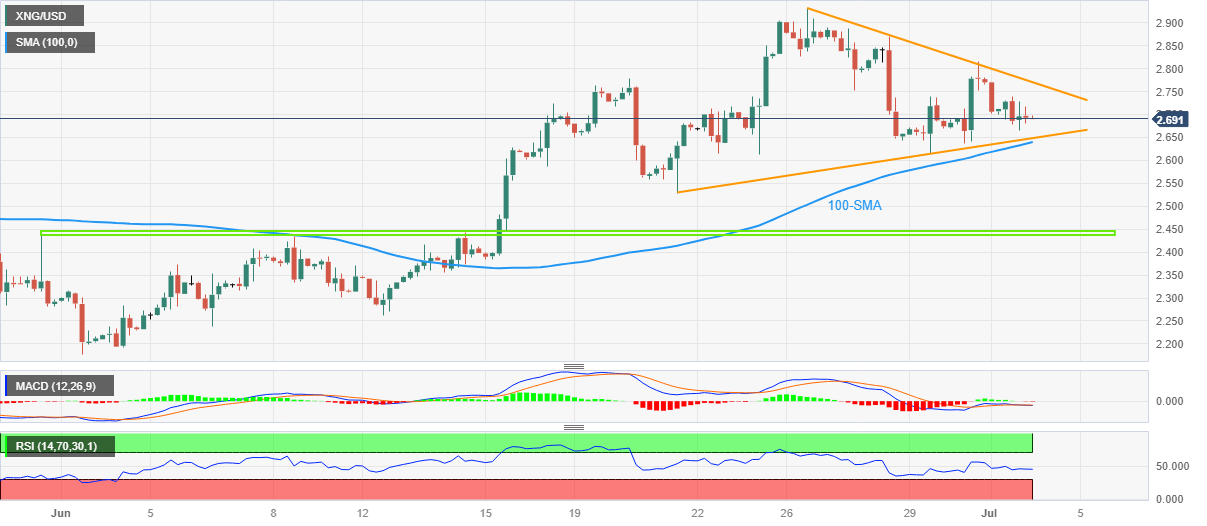
- Natural Gas remains sidelined after snapping two-day winning streak within fortnight-old symmetrical triangle.
- Steady oscillators suggest further grinding of XNG/USD price within $2.77 and $2.64 key technical levels.
- 100-SMA adds strength to $2.64 support, bulls need validation from June’s high to keep the reins.
- Softer US Dollar, hopes of more stimulus from China, India favor XNG/USD bulls.
Natural Gas Price (XNG/USD) licks its wounds near $2.70 amid Tuesday’s sluggish Asian session, after printing the first daily loss in three the previous day.
In doing so, the energy instrument remains within a two-week-old symmetrical triangle, recently approaching the bottom line.
It’s worth noting, however, that the steady RSI (14) line and mildly bullish MACD signals, despite being sluggish of late, keep the Natural Gas buyers hopeful.
Adding strength to the XNG/USD price are the headlines suggesting a likely improvement in the US-China ties and more investments in India. Considering Asia’s major energy consumption, upbeat news about China and India underpins optimism about the XNG/USD price.
That said, the 100-SMA adds strength to the $2.64 support comprising the stated triangle’s bottom line.
Following that, a quick fall toward the late June swing low of near $2.52 can’t be ruled out. However, a horizontal area comprising multiple levels marked since May 31, close to $2.43-44, can challenge the Natural Gas sellers afterward.
Meanwhile, the XNG/USD upside hinges on a clear break of the stated triangle’s top line, currently around $2.77. Even so, the previous monthly high of near $2.93 and the $3.00 psychological magnet will test the Natural Gas buyers.
Natural Gas Price: Four-hour chart
Trend: Further upside expected
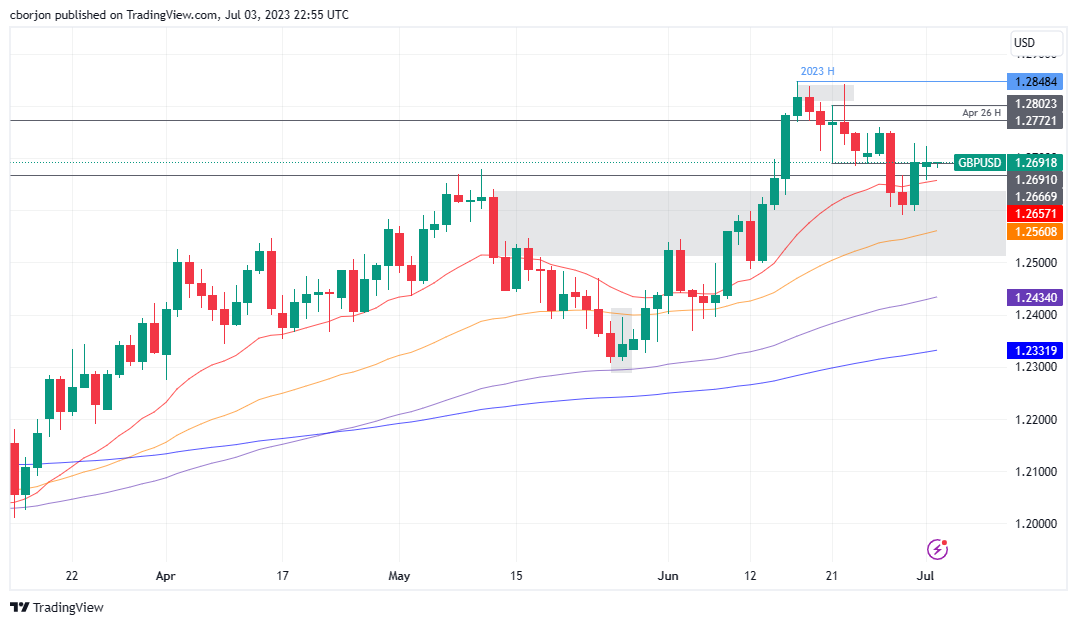
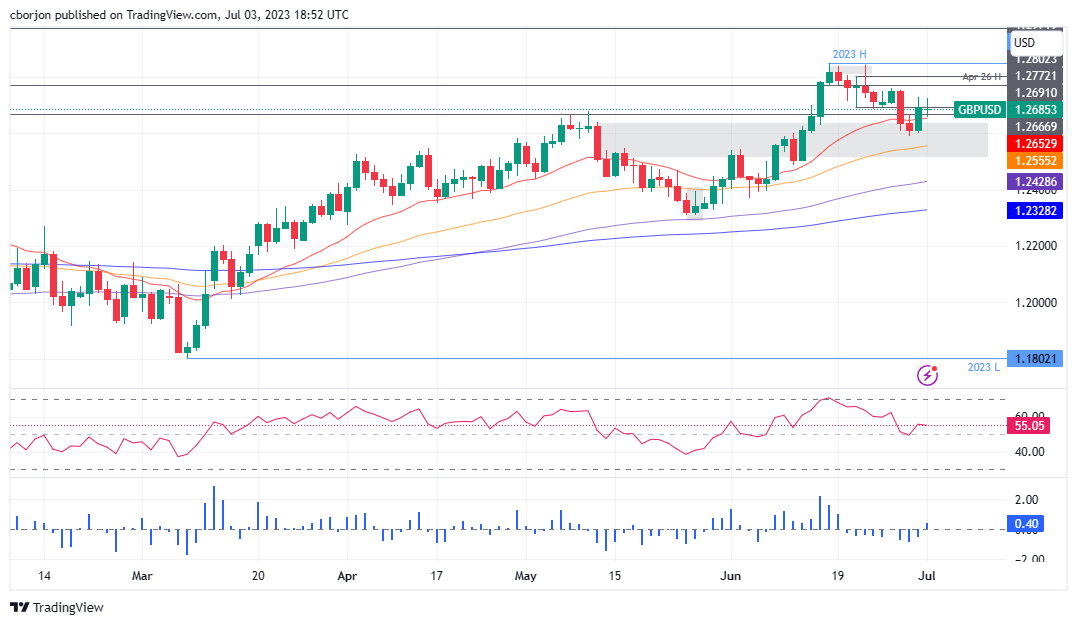
- GBP/USD remains in the 1.2690s range, showing a neutral to an upward bias in technical analysis.
- Daily EMAs indicate a potential bullish continuation, with resistance levels at 1.2728, 1.2750, and 1.2800.
- Downside pressure if GBP/USD fails to reclaim 1.2700, with support levels at 1.2590, 1.2561, and 1.2500.
GBP/USD stays at around the 1.2690s area as the Tuesday Asian session gains; after trading within a 70-pip range on Monday, the pair seesawing around the 1.2658/1.2722 daily high-low. At the time of writing, the GBP/USD exchanges hands at 1.2692.
GBP/USD Price Analysis: Technical outlook
From a daily chart perspective, the GBP/USD remains neutral to upward biased, though Monday’s price action formed a spinning top, meaning indecision surrounding the pair. However, a bullish continuation is expected as the daily Exponential Moving Averages (EMAs) lie below the current exchange rates.
Therefore, the GBP/USD first resistance would be June 30 daily high at 1.2728, followed by the 1.2750 psychological level. Once cleared, the next resistance would be 1.2800, ahead of challenging the year-to-date (YTD) high of 1.2848.
Nonetheless, further downside is expected if GBP/USD fails to reclaim 1.2700 and drops past the 20-day EMA at 1.2657. The GBP/USD next support would be the June 29 daily low of 1.2590, followed by the 50-day EMA at 1.2561 and the 1.2500 figure.
GBP/USD Price Action – Daily chart
- Gold Price remains sidelined after refreshing one-week high, approaching short-term key resistance after three-day uptrend.
- XAU/USD bulls benefit from softer US Dollar as downbeat United States data fails to back hawkish Federal Reserve bias.
- Mixed concerns about China, pullback in US Treasury bond yields also underpin the Gold Price upside.
- US Holiday may restrict XAU/USD moves but bullish move towards $1,945 resistance confluence appears intact.
Gold Price (XAU/USD) remains sidelined around $1,921, after rising to the highest level in a week, as markets seek more clues during early Tuesday in Asia after witnessing a softer start to the week. It’s worth noting that the United States Independence Day holiday restricts the market performance but the recently downbeat US data weigh on the greenback and keeps the Gold Price on the bull’s radar. Adding strength to the XAU/USD price could be the hopes of witnessing improvement in the US-China ties and optimism in India, one of the world’s top Gold customers.
Gold Price marches as softer United States data weigh on US Dollar
Gold Price cheer downbeat United States statistics while paying no attention to the hawkish Federal Reserve (Fed) bets as the US Dollar retreats from a three-week high.
On Monday, US ISM Manufacturing PMI for June dropped to the lowest level in three years, as well as stayed below the 50.0 level for the seventh consecutive month, as it marked 46.0 figure versus 47.2 expected and 46.9 prior. Further details reveal that the ISM Manufacturing Employment Index slide to a three-month low of 48.1 in June from 51.4 previous readings but the New Orders Index improved to 45.6 from 42.6 marked in May and 44.0 maket forecasts. Additionally, the ISM Manufacturing Prices Pair nosedived to the lowest since April 2020, to 41.8, during the said month from 44.2 previous readings.
On a different page, S&P Global Manufacturing PMI for June confirmed 46.3 figure, the lowest in five months, whereas the Construction Spending improved 0.9% MoM for May, versus 0.5% expected and 0.4% previous readouts.
It should be noted that the US Gross Domestic Product (GDP) and Durable Goods Orders, released the last week, improved but failed to gain support from the Fed’s preferred inflation gauge, namely the US Personal Consumption Expenditure (PCE) Price Index. Additionally, personal spending also eased and hence challenges the hawkish Fed bias while fueling the Gold Price.
That said, the interest rate futures suggest 85% probability of witnessing a 25 basis points (bps) of Fed rate hike in July. On the same line, Reuters said, “Futures markets had reflected rate cuts at the Fed's September meeting as recently as May, and are now projecting that the first cuts will come in January.” The market's hawkish Fed bets could be linked to the last week’s hawkish comments from the Federal Reserve Officials at the European Central Bank (ECB) Forum in Sintra, which in turn caps the Gold Price despite the XAU/USD bull’s optimism.
China, India headlines lure XAU/USD bulls
While softer US data and downbeat US Dollar propel the Gold Price, upbeat catalysts surrounding the world’s top two XAU/USD customers, namely India and China, add strength to the metal’s run-up. Recently, a jump in the Foreign Portfolio Investors (FPIs) rush toward India raised concerns about major Gold demand from the Asian nation. As per the latest update, the FPIs have parked the biggest sum in 10 months in India, not to forget marking the fourth consecutive advance.
On the other hand, the US Treasury Secretary Janet Yellen’s China visit during July 06-09 period witnessed mixed responses from the Gold traders. While the news appears positive for the sentiment on the front, the details seem less impressive as US Treasury Secretary Yellen is likely to flag concerns about human rights abuses against the Uyghur Muslim minority, China's recent move to ban sales of Micron Technology memory chips, and moves by China against foreign due diligence and consulting firms, per Reuters.
It should be noted that the better-than-forecast China’s Caixin Manufacturing PMI, to 50.5 for June versus 50.9 prior and 50.2 market expectations, favor the odds of witnessing more stimulus from Beijing, which in turn can help the Gold Price to remain firmer.
US holiday to restrict Gold Price moves but bulls can keep the reins
While most of the aforementioned catalysts are in favor of the Gold buyers, the United States Independence Day holiday will restrict the XAU/USD moves. The same highlights headlines surrounding China and India to watch carefully for clear directions while allowing the Gold buyers to keep the reins. It should be noted that this week’s Federal Reserve (Fed) Monetary Policy Meeting Minutes and Nonfarm Payrolls (NFP) are the key data that will determine the near-term Gold Price directions.
Gold Price Technical Analysis
Gold Price run-up justifies the previous week’s upside break of a fortnight-old resistance line, now support around $1,911. Adding strength to the bullish bias about the XAU/USD is Thursday’s Dragonfly Doji candlestick.
Furthermore, the impending bull cross on the Moving Average Convergence and Divergence (MACD) indicator joins an upward-sloping Relative Strength Index (RSI) line, placed at 14, to also favor the Gold buyers.
With this, the Gold Price appears well-set to confront a convergence of the 100-DMA and a downward-sloping resistance line from early June, around $1,945.
However, the XAU/USD’s upside past $1,945 appears bumpy as multiple resistances near $1,985 and the $2,000 psychological magnet will challenge the bullion buyers before giving them control.
On the flip side, the Gold sellers could return to the table on witnessing a downside break of the previous resistance line, close to $1,911. Though, an eight-month-old horizontal support region, close to $1,985-92, appears a tough nut to crack for the XAU/USD bears afterward.
Gold Price: Daily chart
-04072023-638240210748986650.png)
Trend: Further upside expected
- EUR/GBP rebounds after two consecutive losses but struggles to close above 0.86, indicating potential selling pressure.
- Technical analysis shows the pair as neutral to downward biased, with EMAs acting as resistance levels.
- Bearish scenario if EUR/GBP breaks below 0.8576 and targets June’s low of 0.8536, with further support at the YTD low of 0.8518.
The EUR/GBP snaps two days of consecutive losses, gained some 0.13% on Monday but failed to print a daily close above the 0.86 figure. Therefore, the EUR/GBP could be exposed to selling pressure. At the time of writing, the EUR/GBP is trading at 0.8598 post modest gains of 0.02%.
EUR/GBP Price Analysis: Technical outlook
The EUR/GBP daily chart portrays the pair as neutral to downward biased. On the upside is capped by the 50, 100, and 200-day Exponential Moving Averages (EMAs), each at 0.8643, 0.8689, and 0.8693, respectively. Conversely, the 20-day EMA 0.8596 acts like a magnet, with the EUR/GBP cross wavering around it as the pair struggles to get direction.
Of note, the EUR/GBP printed successive series of higher-highs, higher-lows, but until the pair cracks the 50-day EMA and above June’s 28 swing high of 0.8658, the EUR/GBP could be subject to selling pressure and extending its losses.
A EUR/GBP bearish scenario could happen if the pair breaks below the June 30 daily low of 0.8576 and extends its losses past the June 23 low of 0.8536. Once cleared, the next support into lay would be the year-to-date (YTD) low of 0.8518.
Conversely, the EUR/GBP would turn bullish above 0.8658, with the confluence of the 100/200-day EMAs around 0.8689-93, ahead of the 0.8700 figure. A decisive break will expose 0.8800.
EUR/GBP Price Action – Daily chart

- NZD/USD grinds near weekly high, lacks upside momentum despite firmer Q2 Business Confidence.
- NZIER Business Confidence improves to -63.0% in Q2 but Capacity Utilization deteriorates.
- Softer US Dollar defends Kiwi buyers but pre-RBA anxiety seems to prod traders.
- RBA can offer notable volatility but US holiday will restrict the moves afterward.
NZD/USD remains sidelined near 0.6150 despite upbeat business confidence from New Zealand, after refreshing a one-week high around 0.6170, as market players await the key Reserve Bank of Australia (RBA) decision amid early Tuesday. Apart from the pre-RBA anxiety, the US Independence Day holiday also restricts the Kiwi pair’s reaction to the data.
That said, the New Zealand Institute of Economic Research's (NZIER) quarterly survey of business opinion (QSBO), mostly known as NZIER Business Confidence, improved in the second quarter to -63.0% versus -66.0% prior. The reason could be linked to the deterioration in the Capacity Utilization data, down to 81.7% versus 94.0% prior. NZIER said, per Reuters, "While demand continues to soften, the marked decline in capacity utilization amongst builders and manufacturers and the proportion of firms reporting difficulty in finding labour, especially unskilled labour, point to a considerable easing in capacity pressures in the New Zealand economy." The news also quotes NZIER report saying that the downbeat mood was broad-based across sectors, but retailers are particularly bearish about the general economic outlook.
It’s worth noting that upbeat New Zealand Building Permits and risk-on mood joined hawkish hopes from the RBA to propel the NZD/USD price on Monday. That said, the NZ Building Permits improved to -2.2% MoM for May from -2.6% prior.
Apart from that, the downbeat US data and hopes of an improvement in the US-China ties also underpinned the NZD/USD run-up the previous day.
On Monday, US ISM Manufacturing PMI for June dropped to the lowest level in three years, as well as stayed below the 50.0 level for the seventh consecutive month, as it marked a 46.0 figure versus 47.2 expected and 46.9 prior. Further, S&P Global Manufacturing PMI for June confirmed 46.3 figures, the lowest in five months, whereas the Construction Spending improved 0.9% MoM for May, versus 0.5% expected and 0.4% previous readouts.
Amid these plays, Wall Street closed on the positive side and the yields grind higher while the US Dollar Index (DXY) dropped for the second consecutive day.
Moving on, NZD/USD traders should pay attention to the RBA details and risk catalysts for clear directions amid the US holiday. Markets expect the RBA to keep the rates unchanged after two consecutive hawkish surprises and due to the softer inflation data. However, there is a thin line among the hawks expecting RBA’s 0.25% rate hike and no rate change, making the event more interesting.
Technical analysis
Although the 21-DMA breakout lures the NZD/USD buyers, the 200-DMA level of around 0.6170 limits the Kiwi pair’s immediate upside. Following that, a two-month-old descending resistance line, close to 0.6190 will be in the spotlight.
- AUD/JPY maintains an upward bias, breaking resistance levels and distancing from the Ichimoku cloud.
- Failure to surpass June 23 daily high may limit the immediate upside, while the next resistance lies at 97.00 and YTD high at 97.67.
- Potential downside targets include 95.74, 94.98, and 93.96 support levels if the Tenkan-Sen line is breached.
AUD/JPY began the year's second half on a bullish tone, extending its gains to three straight days, breaking the technical resistance levels and distancing from the Ichimoku cloud, a sign that the uptrend remains intact. As the Asian session begins, the AUD/JPY trades at 96.49, gaining 0.01%.
AUD/JPY Price Analysis: Technical outlook
The AUD/JPY daily chart portrays the pair as upward biased, surpassing the Tenkan-Sen line at 95.99, exacerbating a rally to the psychological 96.50 area. However, AUD buyers failed to challenge the June 23 daily high at 96.84, which, if cleared, would send the rally to test the next resistance level at 97.00 before challenging the year-to-date (YTD) high of 97.67.
Conversely, if AUD/JPY drops below the Tenkan-Sen, that could open the door for further losses, with first support seen at the October 21 daily high of 95.74. Once that level is broken, the Senkou Span A line will emerge at 94.98, just below the 95.00 figure, followed by the Kijun Sen line at 93.96.
AUD/JPY Price Action – Daily chart

- USD/CAD bears eye a correction in the daily 61.8% Fibo.
- USD/CAD bulls eye a move higher to test the weekly bearish run.
The Canadian Dollar weakened against the greenback on Monday despite poor US data as the yield on the Canadian benchmark government debt fell. USD/CAD was trading at 1.3244 and between the day's range of 1.3244 and 1.3248 in early Asia following a 42 pip opening balance on Monday. Meanwhile, from a technical perspective, the bulls are taking control and eye a significant correction as the following will illustrate:
USD/CAD weekly charts
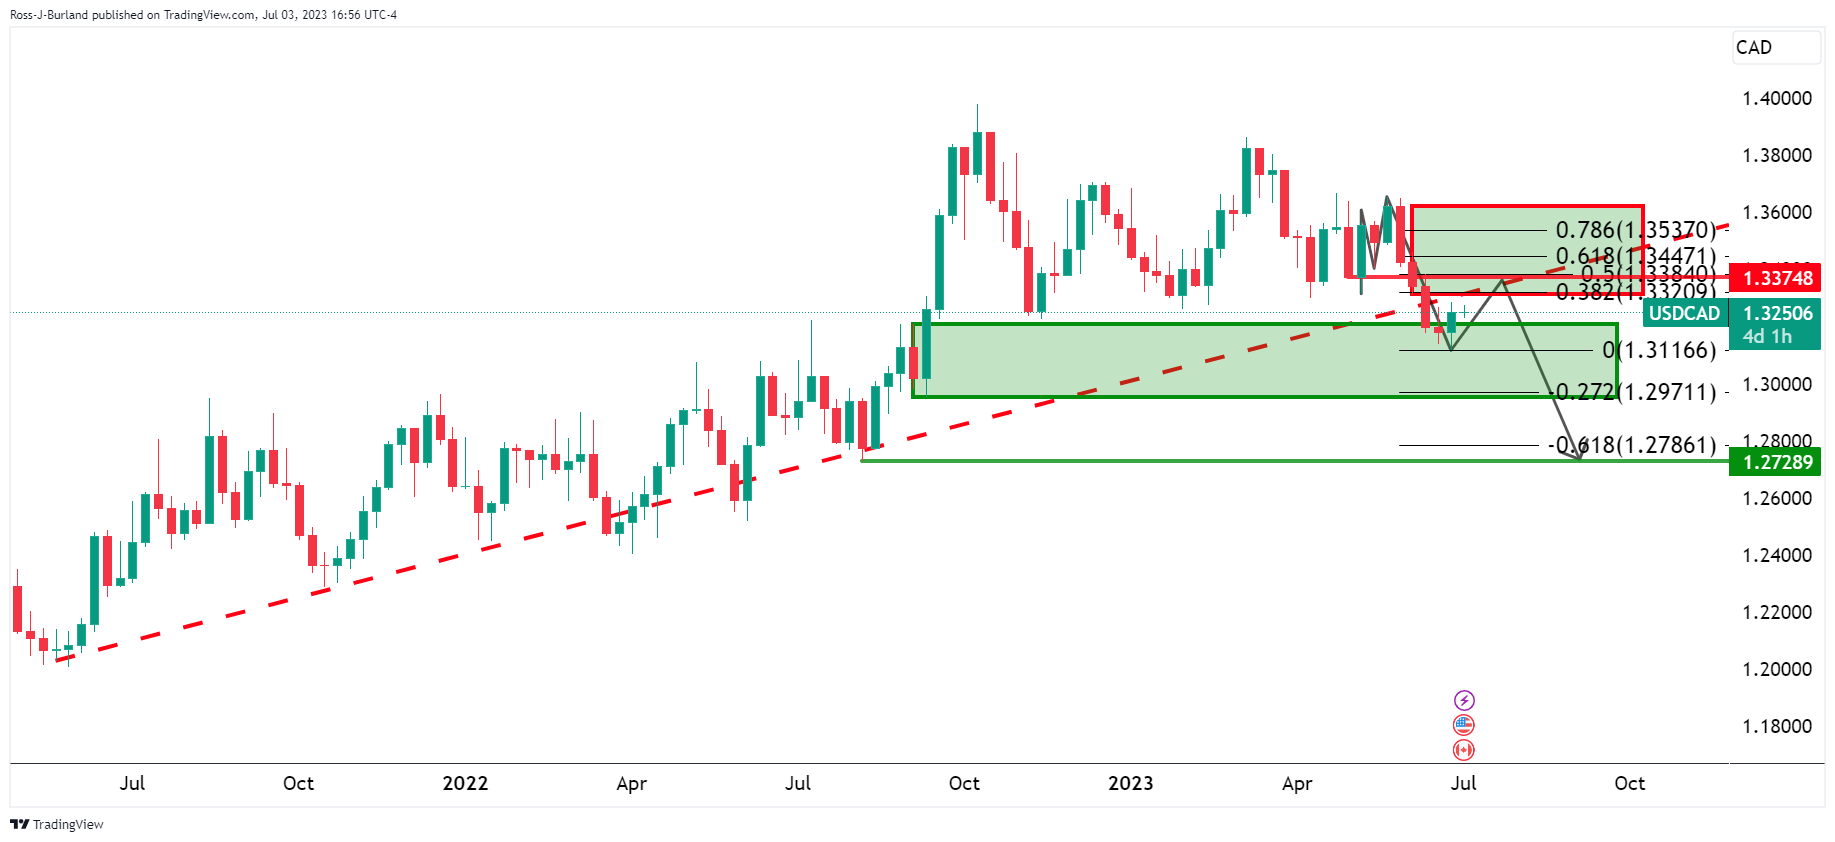
The price is heading into a 38.2% Fibonacci on the weekly bearish impulse, but there is some way to go yet.
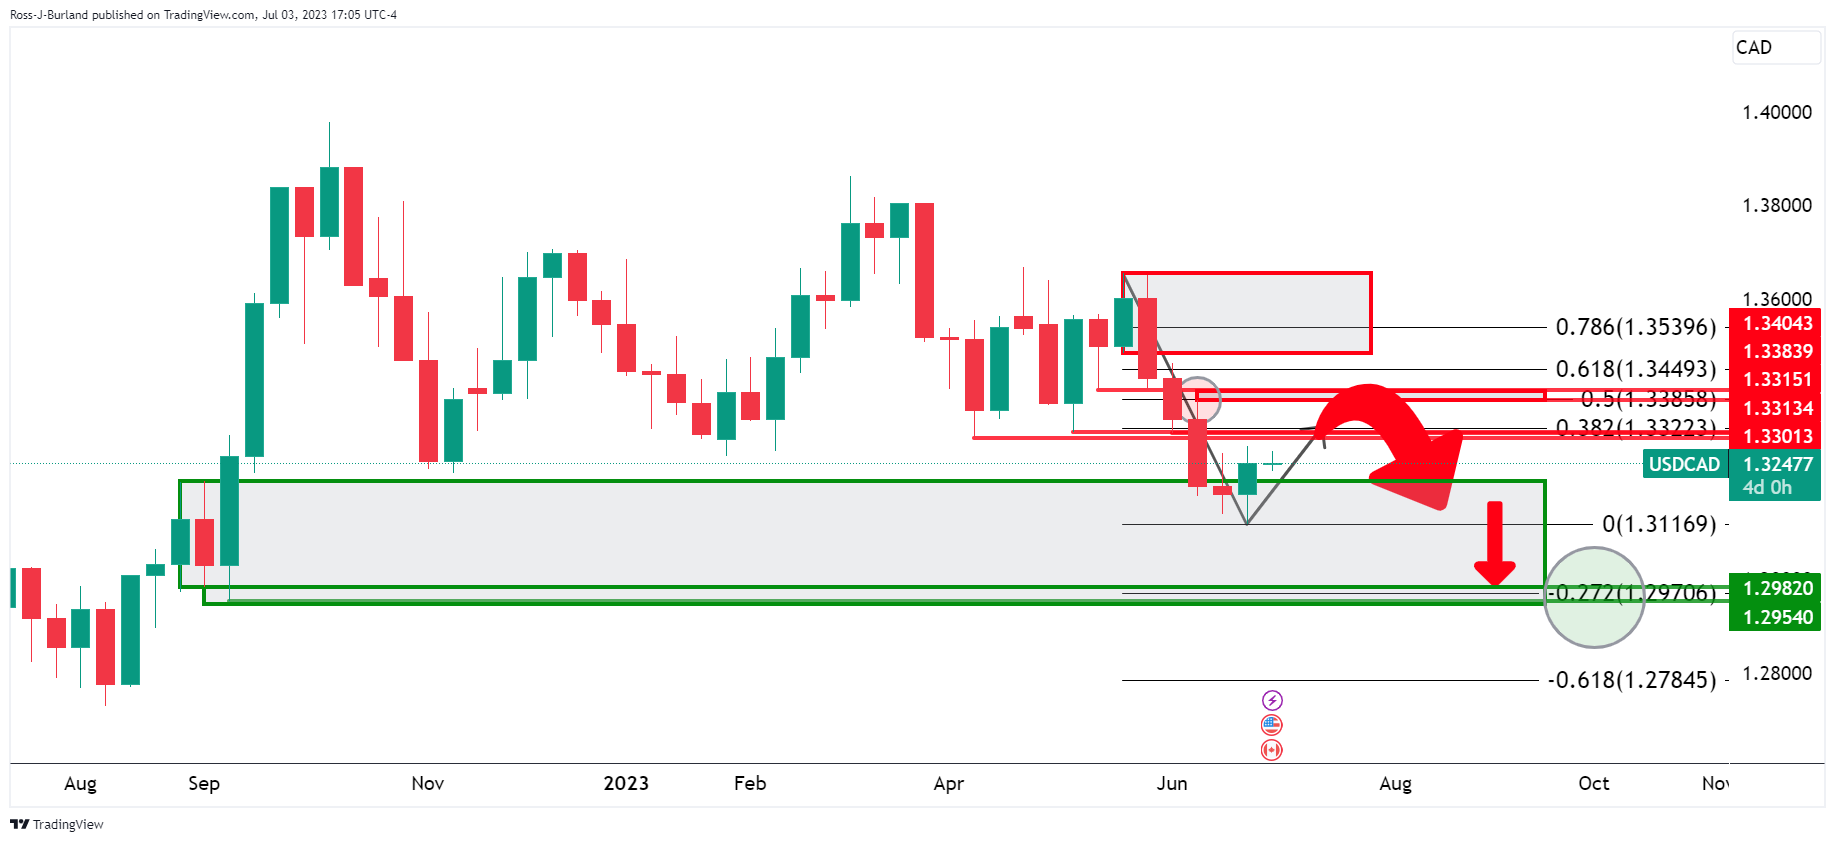
USD/CAD daily charts
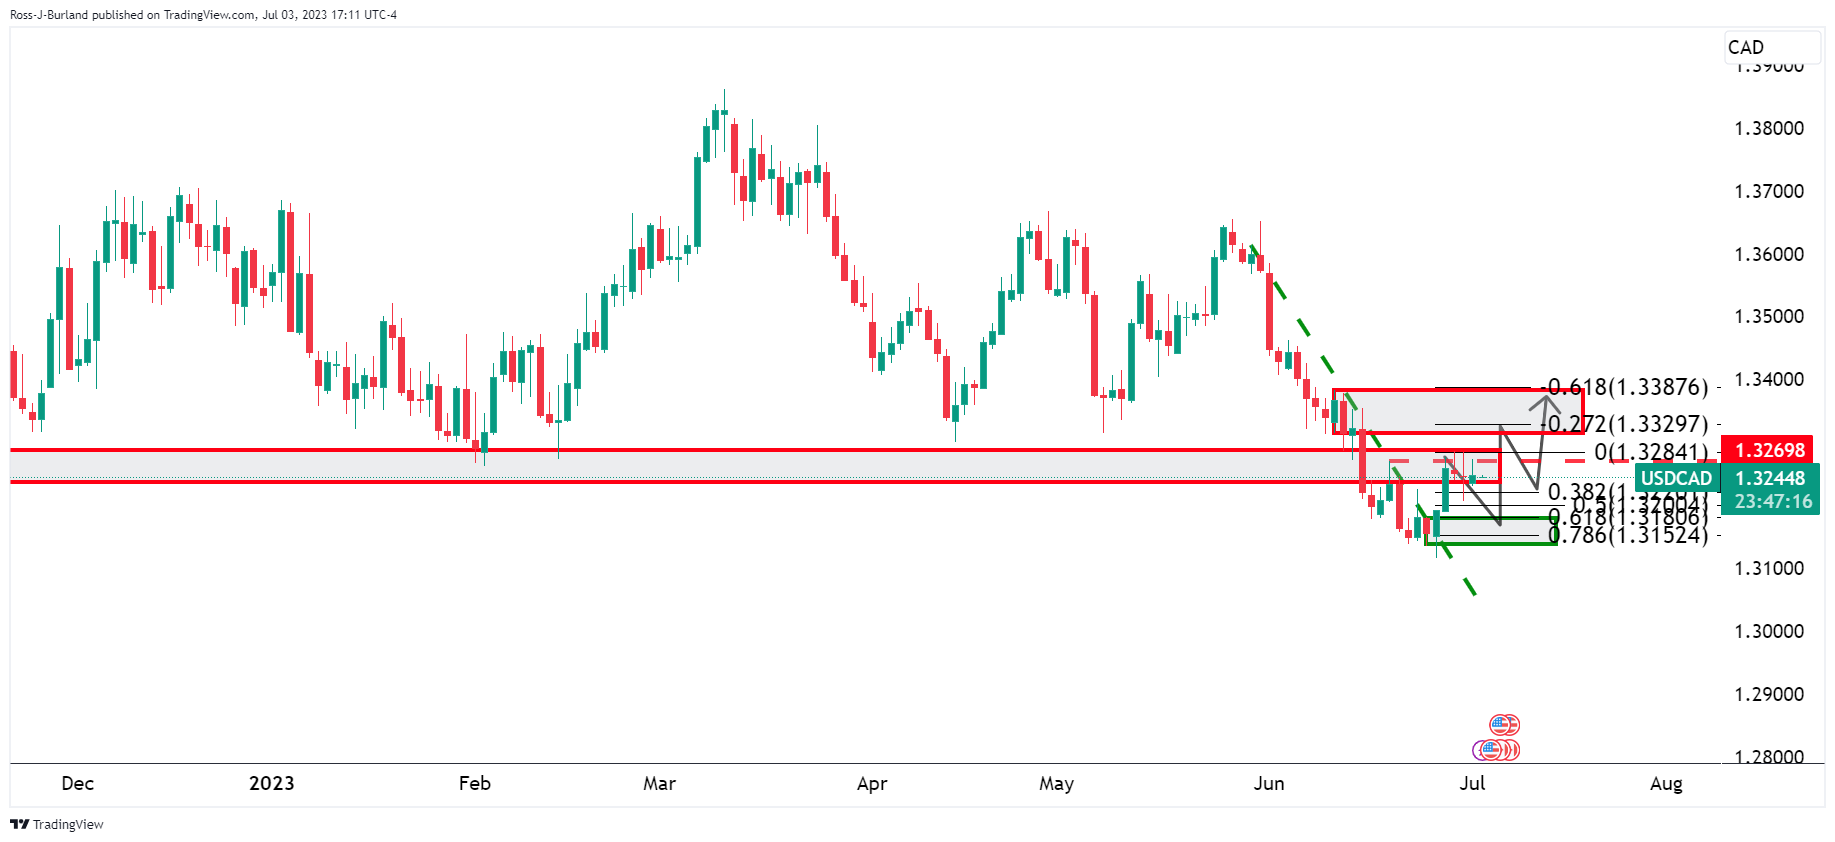
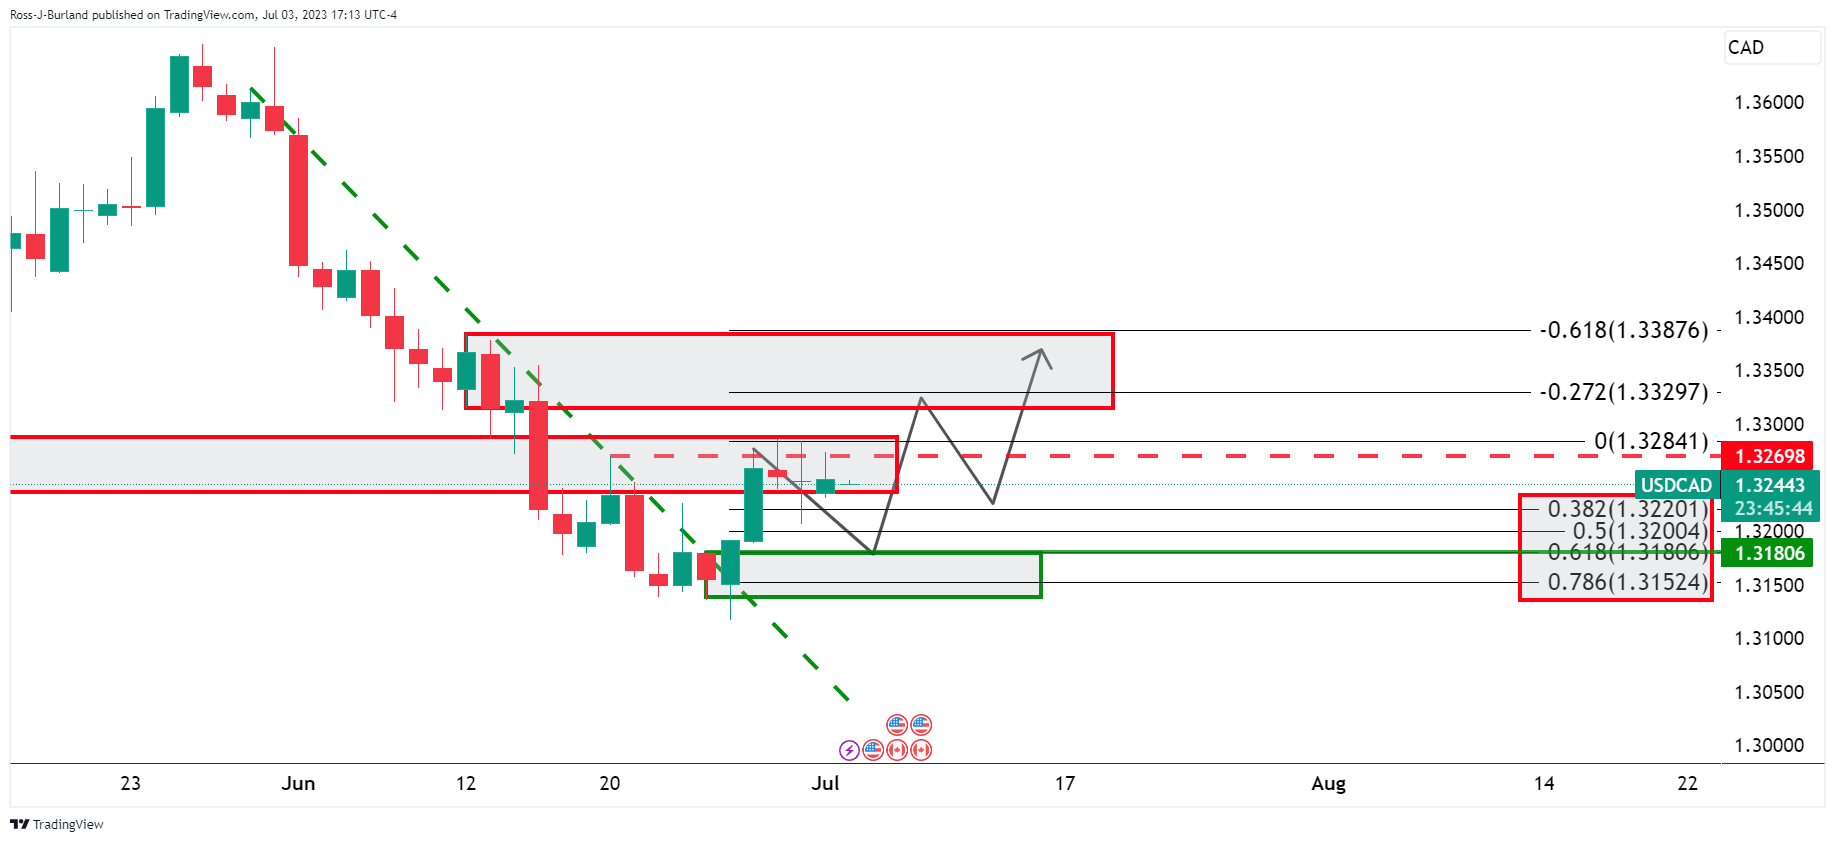
Zooming down on the daily chart, we can see the price correcting into the prior bullish impulse and the bulls will look to the prior highs that meet with the 61.8% Fibonacci retracement level.
- AUD/USD traded in a 55-pip range on Monday and held to daily gains.
- The USD weakened after the release of US ISM Manufacturing PMI from June.
- RBA’s decision to be the highlight of the early Asian session.
The AUD/USD maintained its upward momentum and traded within a range of 0.6691 to 0.6636. The US dollar faced weakness following the release of the June Institute Supply Management (ISM) Manufacturing PMI data while market participants await the Reserve Bank of Australia (RBA) decisions. The central bank is expected to raise rates to 4.35%.
The AUD traded with gains against most of its rivals ahead of the RBA decision
Ahead of the RBA decision in the early Asian session on Tuesday, the Aussie strengthened against most of its rivals. In that sense, it gained ground against the USD, EUR, GBP, JPY and CHF while investors await an announcement of a 25 basis points (bps) hike. However, according to a Reuters poll, economists expect this decision to be a close call as falling inflation supports a dovish decision. Still, the surprise hike in early June opens the door for another hike.
On the other hand, the USD lost traction after the June ISM Manufacturing PMI fell below expectations and the previous reading. With a reading of 46, it came in lower than the anticipated 47.2 and the previous figure of 46.9. Eyes are now on labour data to be released Thursday and Friday, including June’s Non-Farm Payrolls and ADP Employment change figures.
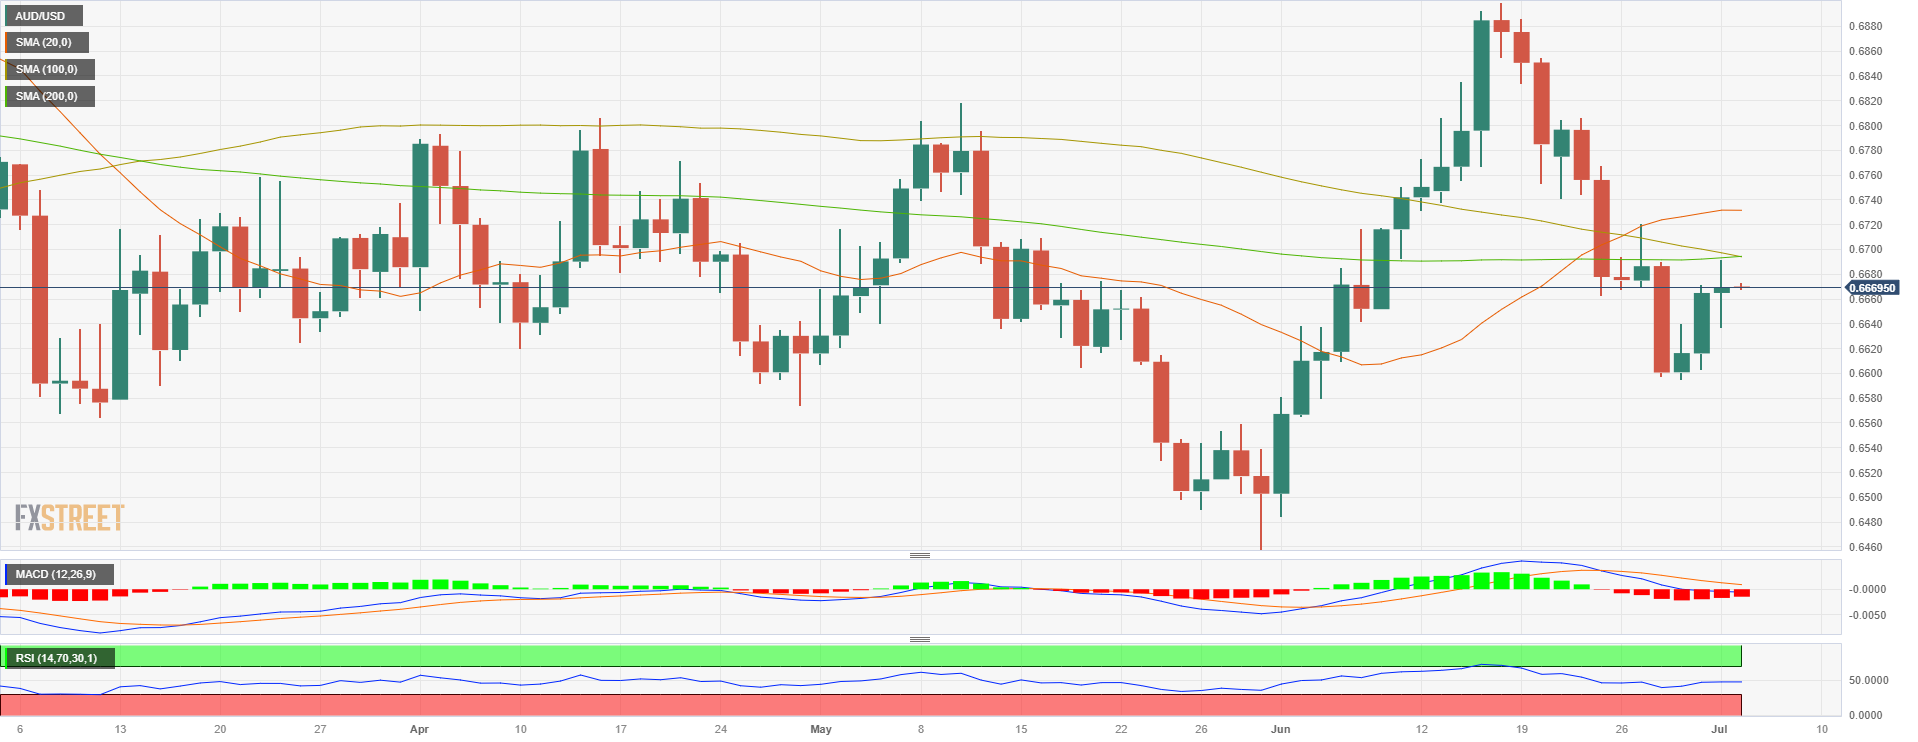
AUD/USD Levels to watch
According to the daily chart, the technical outlook for the AUD/USD is neutral as indicators turned flat and seem to await a catalyst to determine short-term trajectory. That said, traders should eye 0.6700, where the 200- and 100-day Simple Moving Average (SMA) are about to perform a bullish cross.
Resistance levels: 0.6693 (200-day SMA), 0.6720, 0.6730 (20-day SMA).
Support levels: 0.6640, 0.6600, 0.6595.
AUD/USD Daily chart
After a quiet start, the second day of the second half of the year will offer the decision of the Reserve Bank of Australia, which will be the key event. The US market will remain closed due to Independence Day.
Here is what you need to know on Tuesday, July 4:
On a quiet Monday, US stocks finished modestly higher on a shortened session. On Tuesday, Wall Street will remain closed due to Independence Day. The low volume could lead to consolidation and/or erratic moves.
The US dollar lost momentum on Monday following the release of the ISM Manufacturing PMI, which came in below expectations. The ISM Manufacturing PMI dropped from 46.9 to 46, against expectations of a modest increase to 47.2.; the Prices Paid Index fell from 44.2 to 41.8, and the Employment declined from 51.4 to 48.1. The DXY bottomed and then rebounded to end the day flat at around 103.00.
The J.P. Morgan Global Manufacturing PMI dropped to the lowest level in six months:
Conditions in the global manufacturing sector worsened at the end of the second quarter. June saw output fall back into contraction territory following a further decrease in new order intakes. This led to a more cautious approach from manufacturers, with purchasing cut back sharply, inventory destocking, employment broadly flat and business optimism dipping to a seven-month low.
After the holiday, on Wednesday the Fed will release the FOMC June meeting minutes. Later, attention will turn to US employment data with ADP, Jobless Claims, and JOLTS on Thursday, and the Nonfarm Payrolls on Friday.
EUR/USD finished flat, hovering around 1.0900. The pair peaked at 1.0935 after US data and then pulled back. It is currently trading sideways, without a clear direction. Germany will release trade data on Tuesday.
GBP/USD failed to make a clear run above 1.2700 and finished flat around 1.2690. EUR/GBP rose modestly but closed below 0.8600.
USD/CHF continued to move sideways below 0.9000. The Swiss franc lagged on Monday on the back of softer-than-expected Switzerland inflation data. The Consumer Prices Index dropped to 1.7% YoY.
USD/JPY ended higher around 144.70 on a volatile Monday after testing levels under 144.00 following US data. A rebound in government bond yields weighed on the Japanese yen.
AUD/USD rose for the third consecutive day as it extended its recovery from weekly lows, but it still settled below 0.6700. On Tuesday, the Reserve Bank of Australia (RBA) will announce its decision on monetary policy. The uncertainty is whether the RBA will hike its key rate by 25 basis points or stay on hold. A no-hike decision could weigh down on the Aussie.
NZD/USD rose, boosted by risk appetite and a weaker US dollar, rising above 0.6150. The NZIER Q2 Business Confidence is due.
USD/CAD continues to move sideways around 1.3250. On Tuesday, the Bank of Canada will release its Business Outlook Survey.
Crude oil prices reached weekly highs and then reversed. The WTI dropped 0.40%, around $70.00. Cryptocurrencies performed mixed, with Bitcoin gaining 2% and rising above $31,200, while Ethereum rose 2.30% approaching $2,000.
Like this article? Help us with some feedback by answering this survey:
- EUR/USD bulls come up for air but stay below key resistance.
- Bears eye a lower high for prospects of a break below 1.0840s.
EUR/USD has ranged between 1.0870 and 1.0331 on Monday as the markets soaked up the dreary final euro zone PMI manufacturing index and the US Manufacturing PMI dropped to 46.0 from 46.9 in May, the lowest reading since May 2020. The US ISM survey was consistent with an economy in recession, suggesting US inflation is coming under control, negative for the Greenback.
The following illustrates EUR/USD attempting to come up for air on the 4-hour chart:
EUR/USD H4 chart
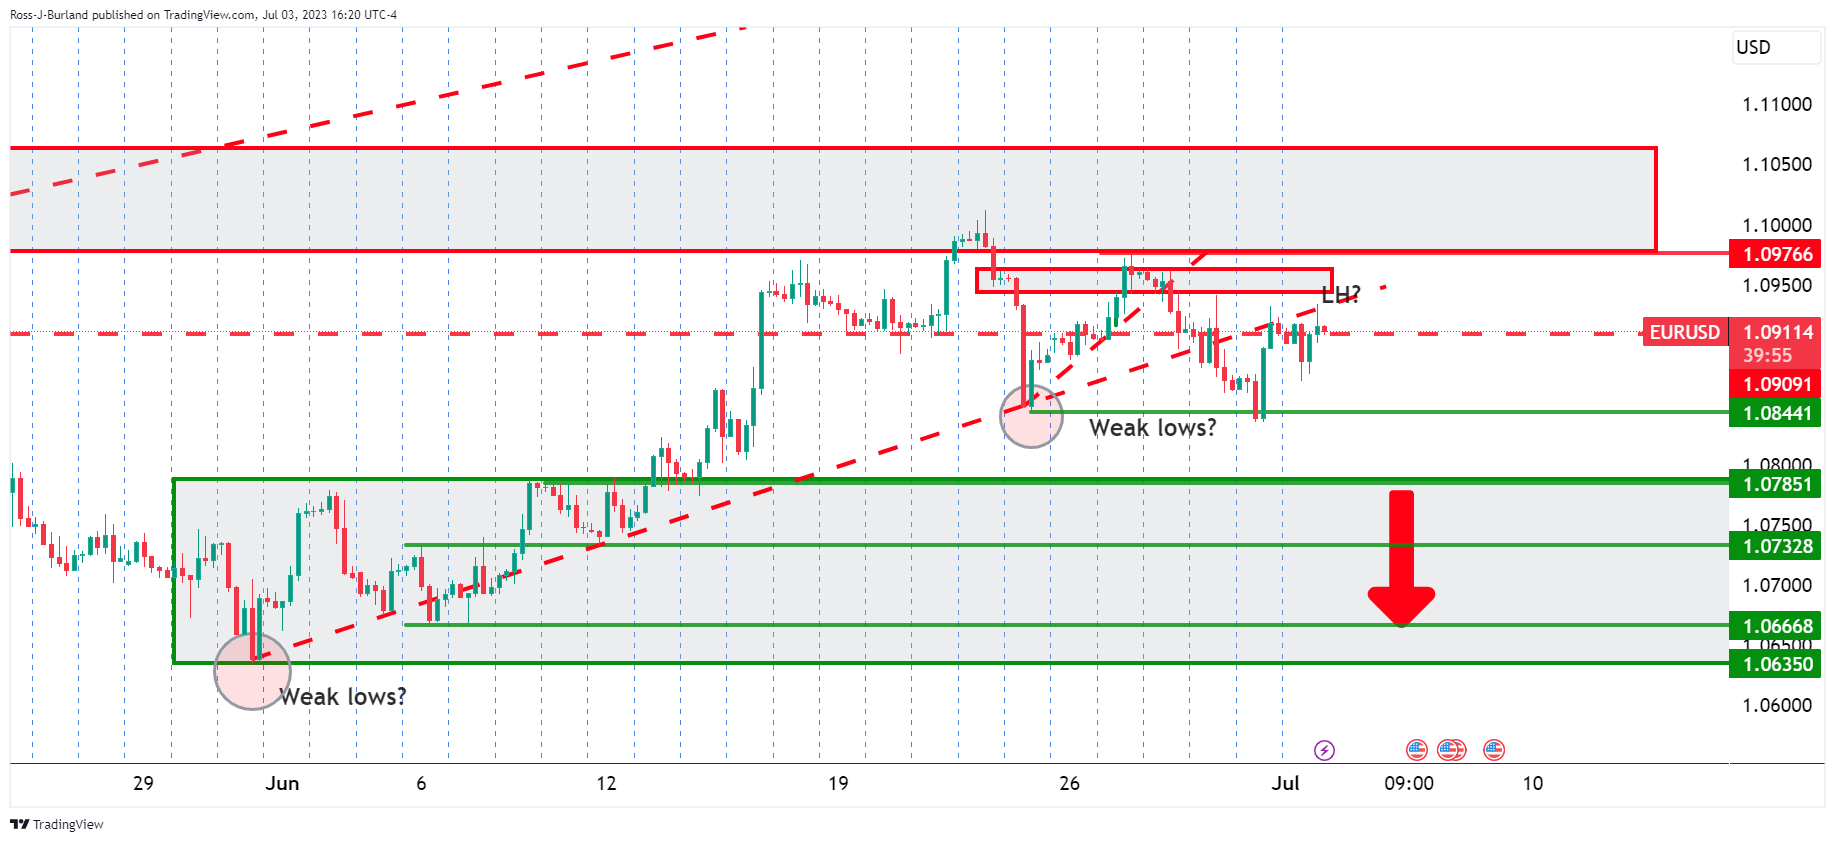
The potential of a lower high, however, doe snot bode well for the bulls and the weak lows could be targeted again in the coming days. A break of the 1.0840s opens risk to a run to test the 1.0635s on the downside at the swing lows.
A break of the 1.0970s, however, opens the risk of a run to test 1.1000 in the days ahead.
- WTI crude oil is down 0.55% at $70 per barrel amid fears of a global economic slowdown impacting oil demand.
- Saudi Arabia and Russia’s supply cut announcement fails to offset concerns over manufacturing activity slowdown worldwide.
- Deceleration in China, Eurozone, and the US manufacturing PMI data contribute to the downward pressure on WTI prices.
Western Texas Intermediate (WTI), the US crude oil benchmark, slides towards the end of the New York session, down 0.55% at $70 per barrel, as worries for a global economic slowdown might dent oil’s demand, despite Saudi Arabia and Russia’s supply cut announcement. At the time of writing, WTI exchanged hands at $70.01 after hitting a daily high of $71.72.
Worldwide economic slowdown fears overshadow Saudi Arabia, and Russia cut announcements as WTI dives
WTI remained under pressure despite Saudi Arabia’s intentions to cut oil output by one million barrels in July, extending it to August. Although it triggered an upward reaction, WTI edged lower as manufacturing activity worldwide slowed down, as revealed by S&P Global PMIs.
China’s Caixin PMI expanded modestly by 50.5, exceeding estimates of 50.2, but continues to decelerate as June’s data trailed May’s 50.9. That, alongside Eurozone’s (EU) deceleration, Germany’s technical recession, and recently revealed ISM Manufacturing PMI data in the US staying at recessionary readings, capped WTI rally.
The ISM Manufacturing PMI for June came at a recessionary area at 46.0, below estimates and the prior’s month reading, suggesting the US economy is decelerating. That could refrain the US Federal Reserve from increasing rates twice towards the end of 2023 as investors brace for July’s 25 basis points rate hike.
Aside from this, Russia’s intent to boost oil prices reported that it would reduce its exports by 500,000 bpd in August, revealed Deputy Prime Minister Alexander Novak.
Meanwhile, the total crude oil output brings the Organization of Petroleum Exporting Countries (OPEC) and its allies production to 5.16 million barrels per day (bpd). It should be said that Riyadh and Moscow have been trying to bolster prices, though China’s reopening after Covid-19 is failing to gather pace.
WTI Price Analysis: Technical outlook
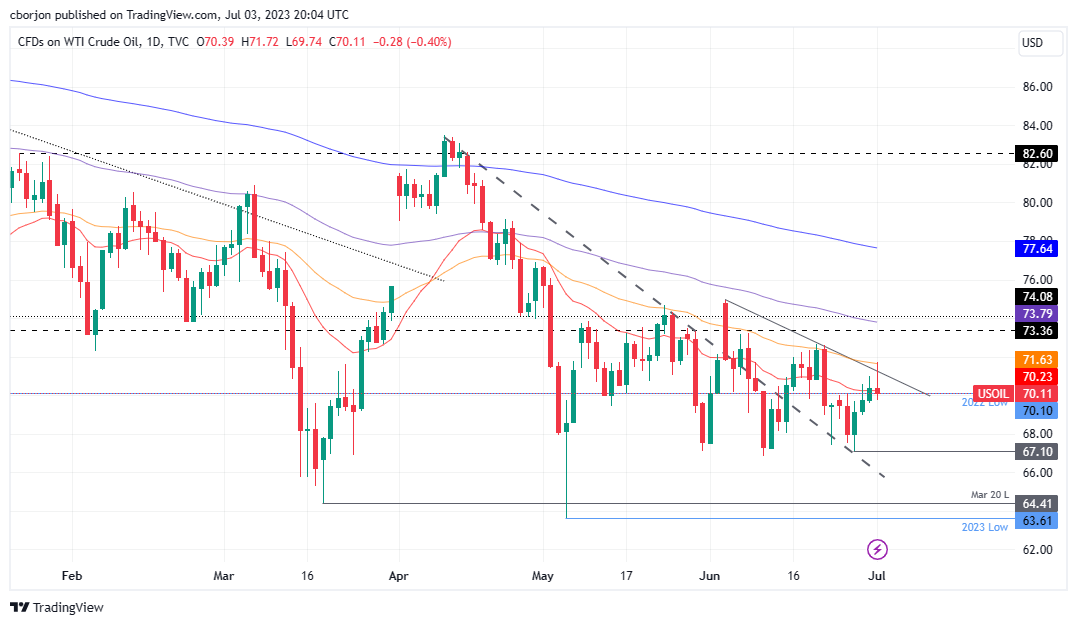
WTI remains neutral to downward biased after failing to crack the 50-day Exponential Moving Average (EMA) at $71.63, though capped on the downside by the 20-day EMA at $70.22. However, late in the US session, WTI slipped below the latter, opening the door for a re-test of the $70.00 figure. A breach of the latter will expose immediate support at $67.10, followed by the March 20 daily low of $64.41. Once cleared, WTI would dive to the year-to-date (YTD) low of $63.61.
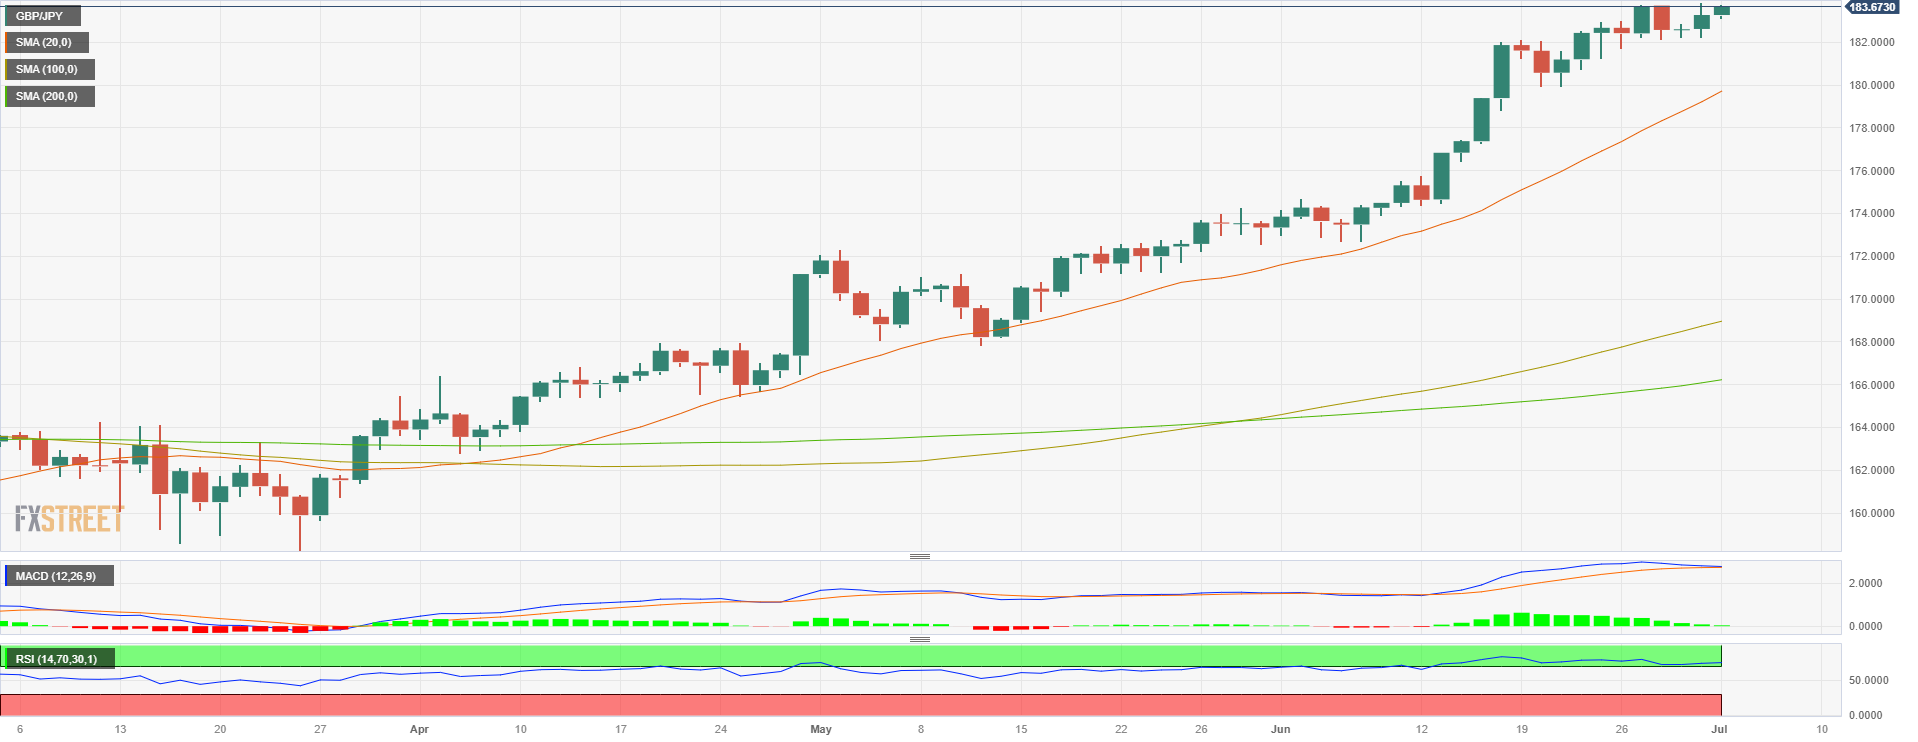
- The GBP/JPY cross jumps above the 183.60 area on Monday, its highest level since 2015.
- British Manufacturing PMI saw a contraction but one that was lower than expected, giving the Pound traction.
- Japanese Takan Index came in better than expected, still the BoJ may remain dovish.
At the start of the week, the GBP/JPY gained ground after the release of the Manufacturing PMI from the UK, which contracted but not as much as expected. In response, rising British yields gave traction to Sterling while the Yen remined vulnerable amid the Bank of Japan’s (BoJ) dovish stance. Despite Takan indexes improving in Q2, BoJ officials may need more evidence to pivot.
The UK reported a better-than-expected Manufacturing PMI
The S&P Global/CIPS Manufacturing PMI for the UK in June recorded a reading of 46.5, which was higher than the previous figure of 46.2. As a reaction, British yields saw more than 1% increases, with the 2,5, and 10-year rates jumping to 5.35%, 4.73% and 4.44%, respectively.
In Japan, the Tankan Large Manufacturing Index for Q2 exceeded expectations, reaching 5 compared to the consensus of 3 and the previous reading of 1. The Tankan Large Manufacturing Outlook for Q2 also showed a notable improvement, reaching 9 versus the consensus of 5 and the previous reading of 3. While these positive figures suggest a strengthening economy, the Bank of Japan (BoJ) may require further evidence of robust economic activity before considering a shift in its dovish monetary policy stance. Meanwhile, its likely that the Yen will continue to weaken agains most of its rivals.
GBP/JPY Levels to watch
The daily chart suggests that the outlook is bullish for GBP/JPY even though the cross has shown overbought conditions since mid-June. In addition, the Moving Average Convergence Divergence (MACD) shows signs of exhaustion of the bullish momentum. Yet for a confirmed sell signal, the Relative Strength index would have to break back down below 70, and in the absence of such a break the outlook remains bullish.
On the upside, resistances levels to monitor line up at 183.70, 184.00 and 185.00.
In a downward correction, the next support levels are seen at 183.15, followed by 183.00 and 182.00.
- USD/JPY bears are staring to lick their lips.
- The price is breaking daily dynamic support.
USD/JPY is up some 0.3% on the day trading at around 144.70 having travelled up from a low of 143.98 to a high of 144.91 so far. at this juncture, the Yen that's under intervention watch after the Japanese finance minister warned last week of excessive moves in the currency market.
Data on the day in the US from the Institute for Supply Management (ISM) showed that manufacturing PMI dropped to 46.0 from 46.9 in May, the lowest reading since May 2020. It marked the eighth straight month that the PMI has been below the 50 threshold indicating contraction. Consequently, USD/JPY's current bullish trend could continue to decelerate as we have seen over the last few days.
The following illustrates the prospects of a correction in a top-down analysis:
USD/JPY monthly charts
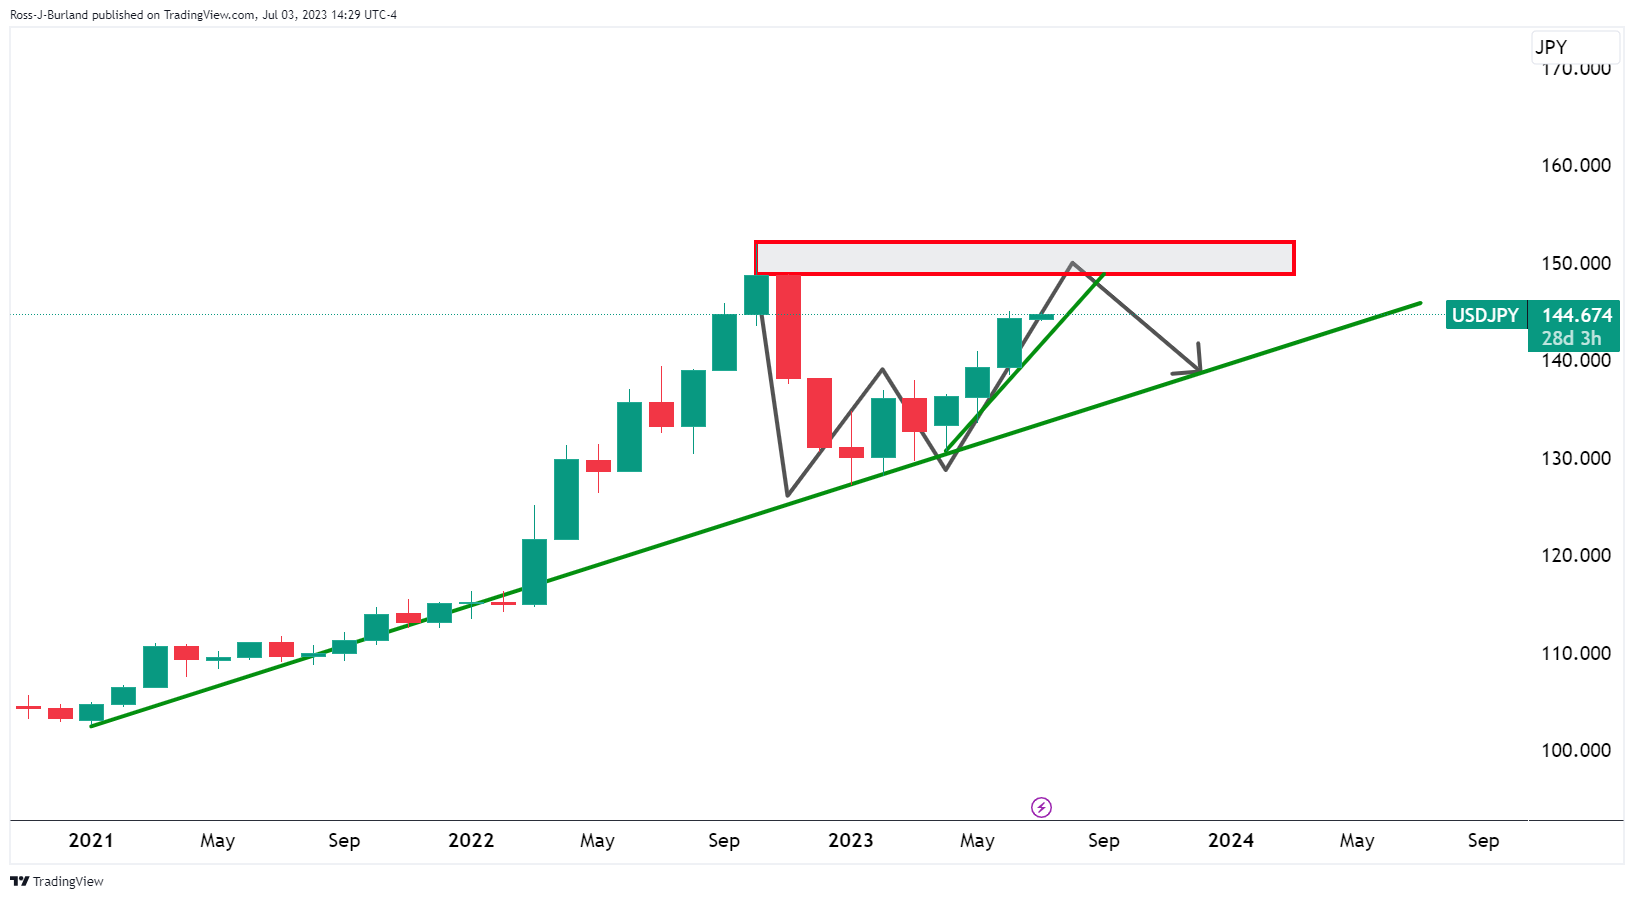
The W-formation is a reversion pattern that could play out to the downside in time.
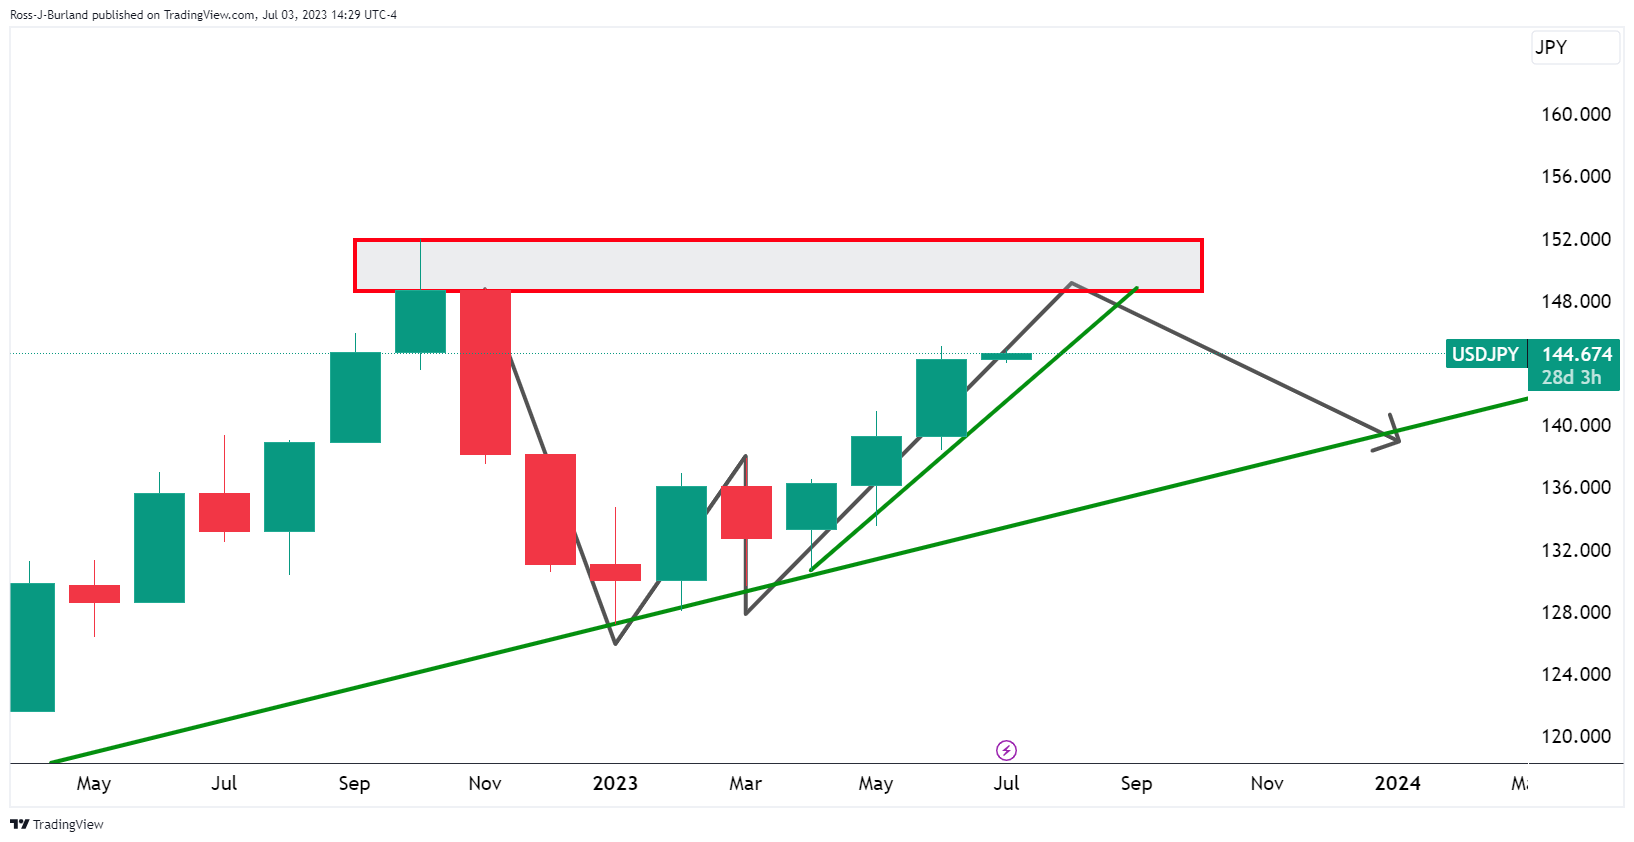
USD/JPY weekly
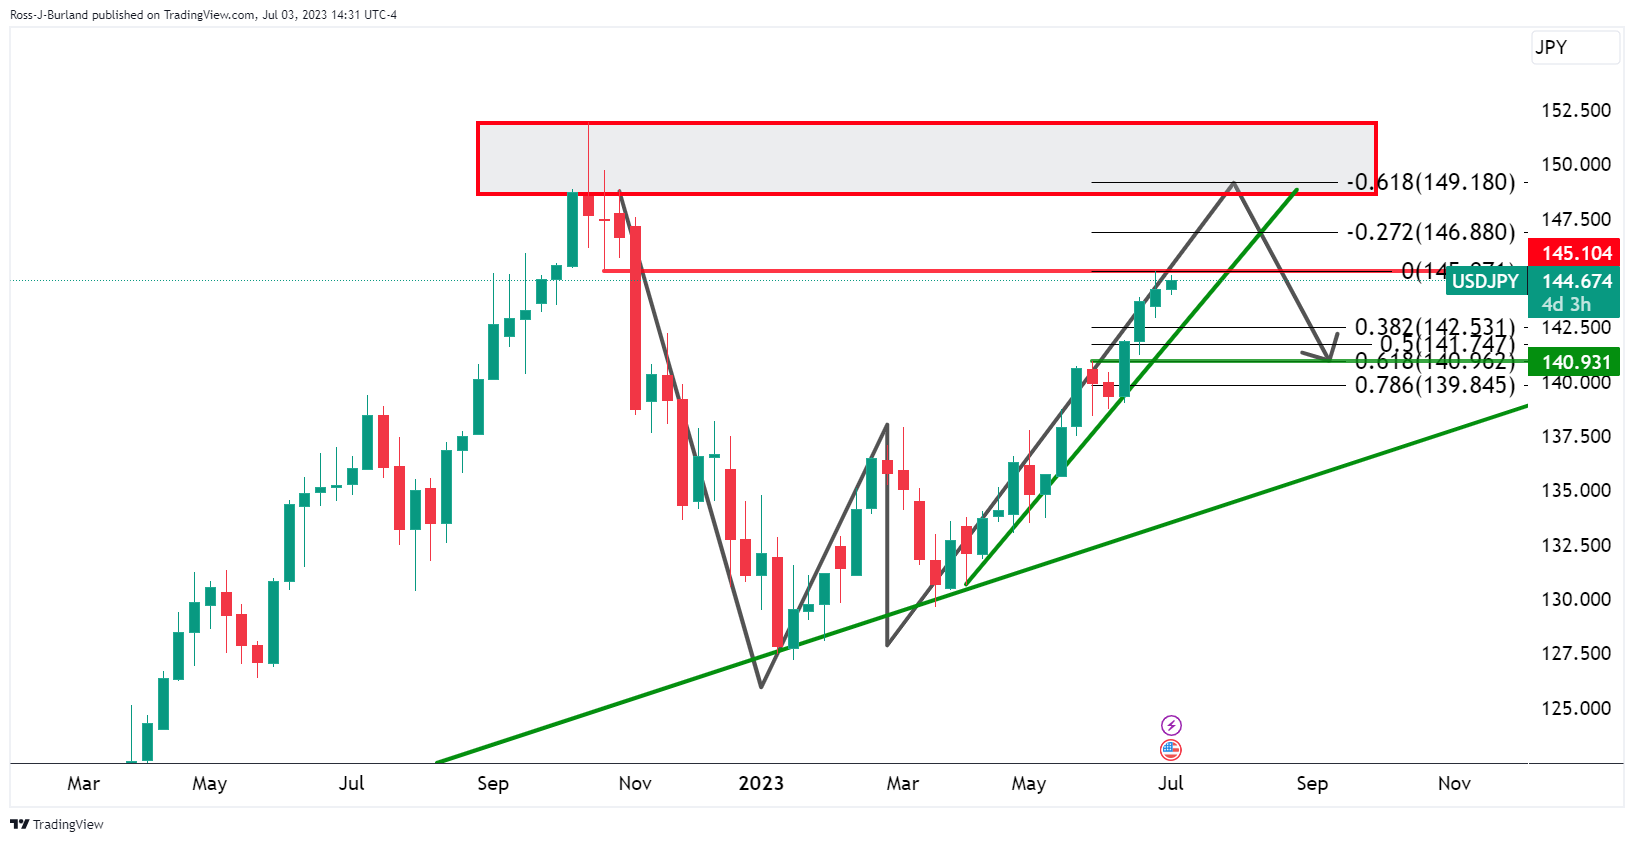
The current weekly highs could be the highest pot we will see for some time and as correction back to old highs neat 140.90 could be on the cards. The 61.8% Fibonacci aligns with those as well.
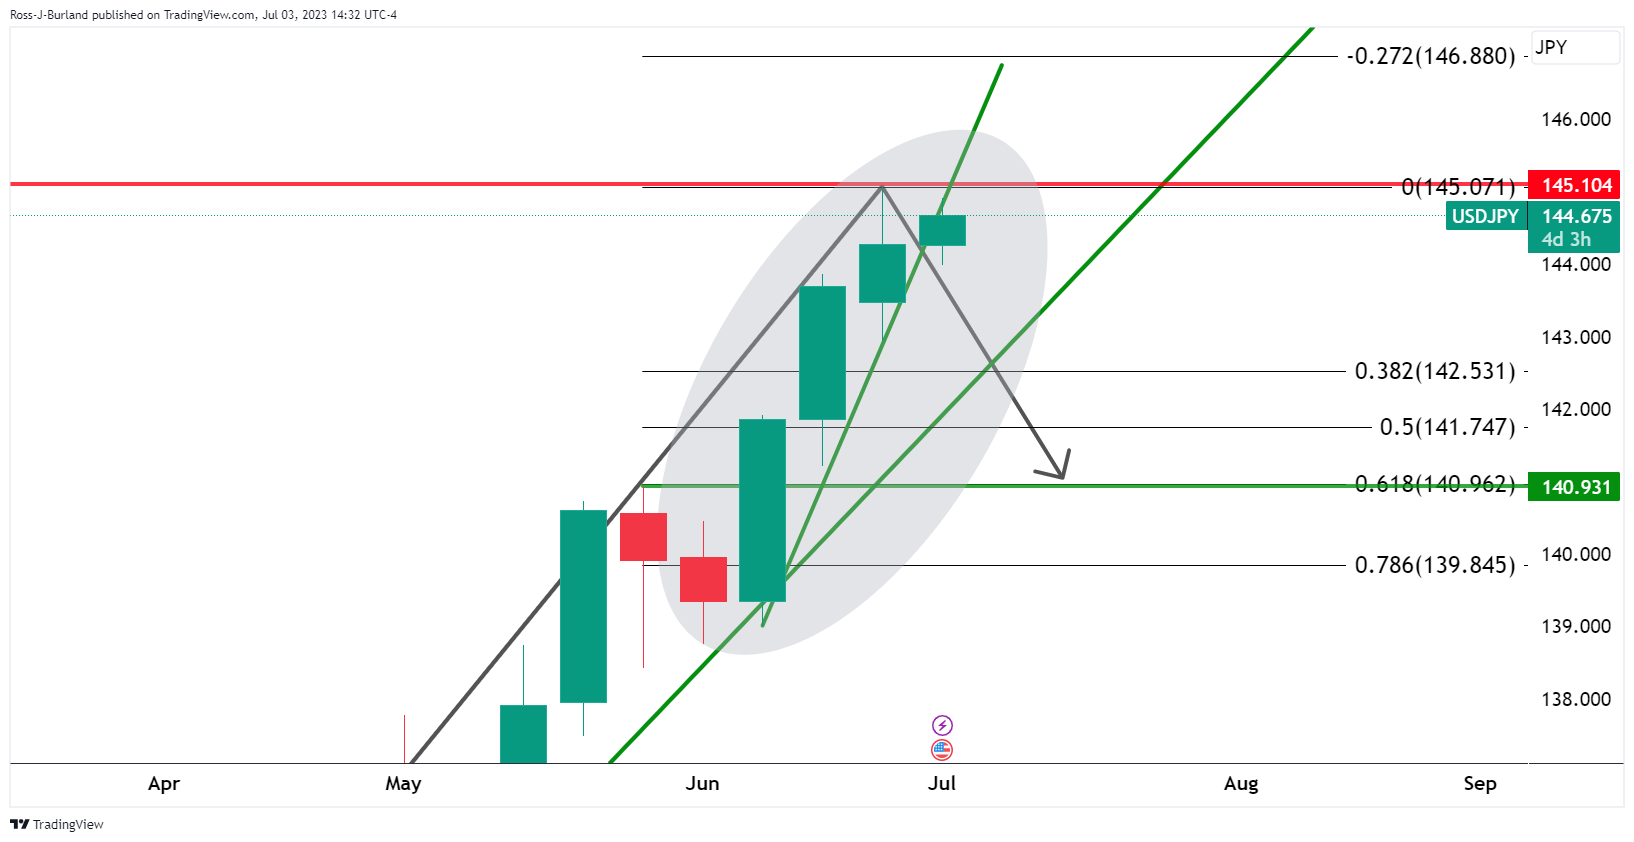
USD/JPY daily chart
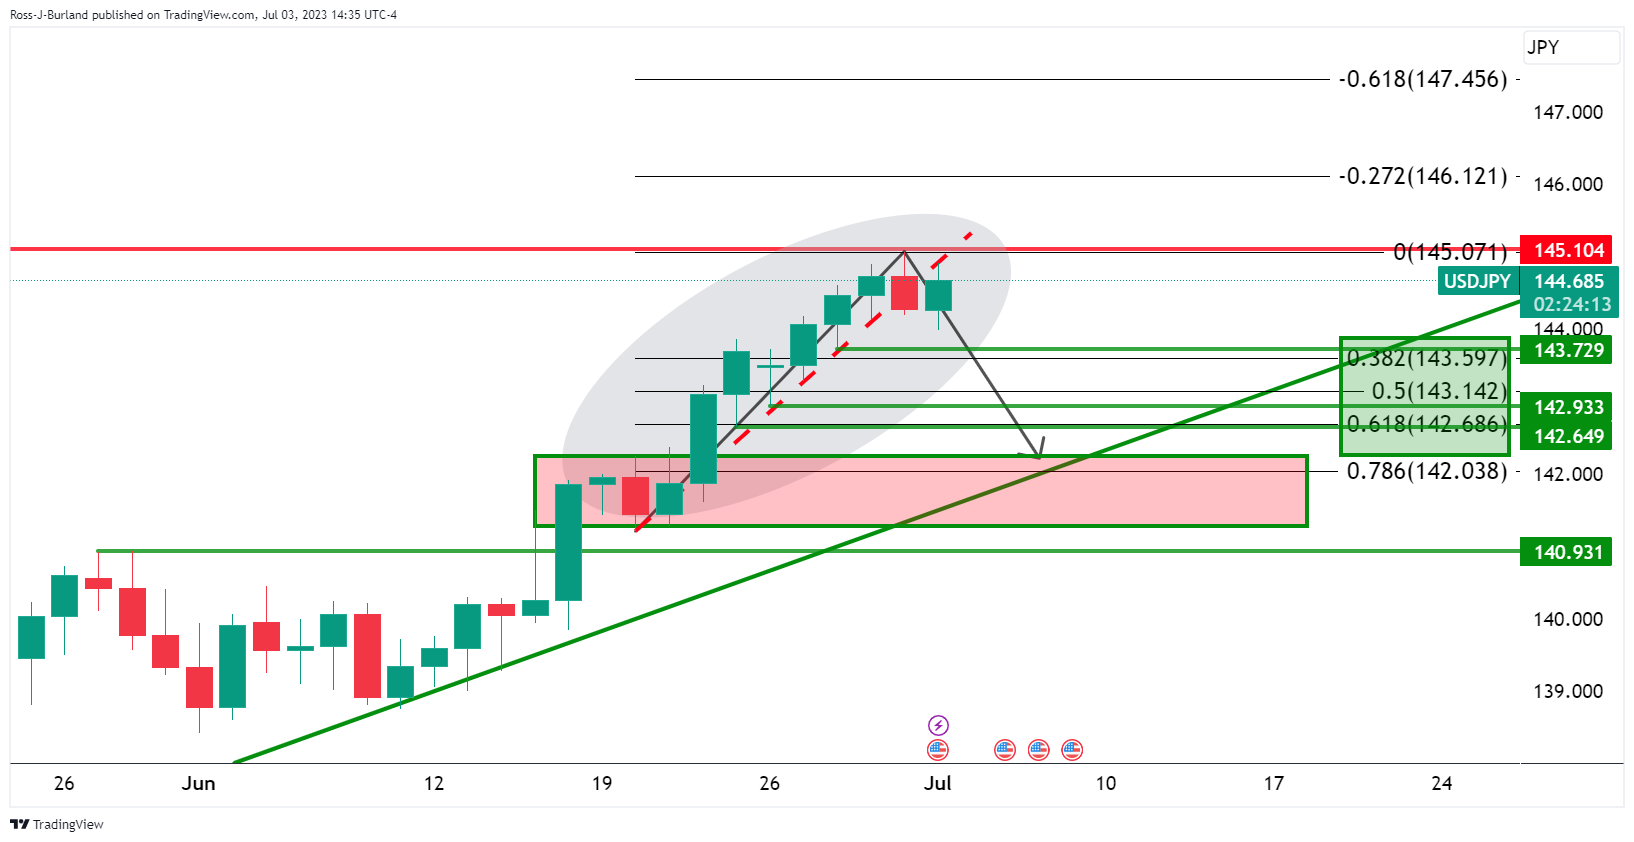 \
\
Nearer term, the daily chart is breaking the trendline support and a target of 142.00 aligns with old highs and a 78.6% Fibonacci level.
- GBP/USD remains stable around 1.2690 despite the US manufacturing activity slowdown.
- UK data shows slight improvement but remains in recessionary territory, raising economic concerns.
- Speculations of the Fed’s interest rate increases impact GBP/USD, while the US Dollar strengthens against a basket of currencies.
GBP/USD stayed firm at the beginning of the year’s second half, at around the 1.2690s area; post-data release in the United States (US) showed manufacturing activity slowed down. Meanwhile, UK data portrayed a slight improvement but remained in recessionary territory. At the time of writing, the GBP/USD is trading at 1.2690, almost unchanged.
US manufacturing slowdown and UK recessionary concerns influence GBP/USD stability
The Institute for Supply Management (ISM) revealed its June Manufacturing PMI poll, which showed that business activity is deteriorating further, as data stood at contractionary territory at 46.0, below May’s 46.9 and estimates of 47.0. The data highlighted that input prices continued to slow down, signaling inflation edges down amidst 500 basis points of rate increases by the US Federal Reserve (Fed).
The GBP/USD reacted upwards to the data, trimming speculations of the Fed’s two interest rate increases. Chances for July’s 25 bps lift remained at 89.3%, above last Friday’s peak, as reported by the CME FedWatch Tool, while for November, odds slumped from 37% to 34%.
Last week’s data pushed aside recession fears in the United States (US), after Q1’s Gross Domestic Product (GDP) crushed the advance and preliminary readings, opening the door for further tightening. Nonetheless, US inflation data was softer than estimated; hence traders braced for a less aggressive Federal Reserve.
The US Dollar Index, a gauge of the buck’s value against a basket of six currencies, climbs 0.08% and is back above 103.002, a headwind for the GBP/USD pair.
On the UK front, the S&P Global/CIPS Manufacturing PMI for June came at 46.5, above estimates of 46.2, but trailed May’s 47.1, flashing signs of an economic slowdown. Recession fears had increased in the UK, with the Bank of England (BoE) expected to continue to tighten monetary conditions. Money market futures estimate the BoE would raise rates by at least 6%, representing the most aggressive tightening cycle among the majors. Even though the Sterling (GBP) could appreciate in the short term, the recession risks increased, suggesting that despite higher rates, the GBP/USD could depreciate, as traders seeking safety would likely buy the US Dollar.
GBP/USD Price Analysis: Technical outlook
The GBP/USD remains upward biased, although it’s forming a doji after failing to break above the 1.2700 figure, suggesting that in the near term, a dip toward the 20-day Exponential Moving Average (EMA) at 1.2683 or below could pave the way for buyers to post new bets, as the GBP/USD could re-test the year-to-date (YTD) highs at 1.2848. On its way north, GBP/USD buyers must surpass 1.2700 and the June 21 daily high at 1.2802. Conversely, if GBP/USD bears drag prices below the June 29 swing low, seen as intermediate support at 1.2590, that will pave the way for a test of 1.2500 and probably the 100-day EMA at 1.2428.
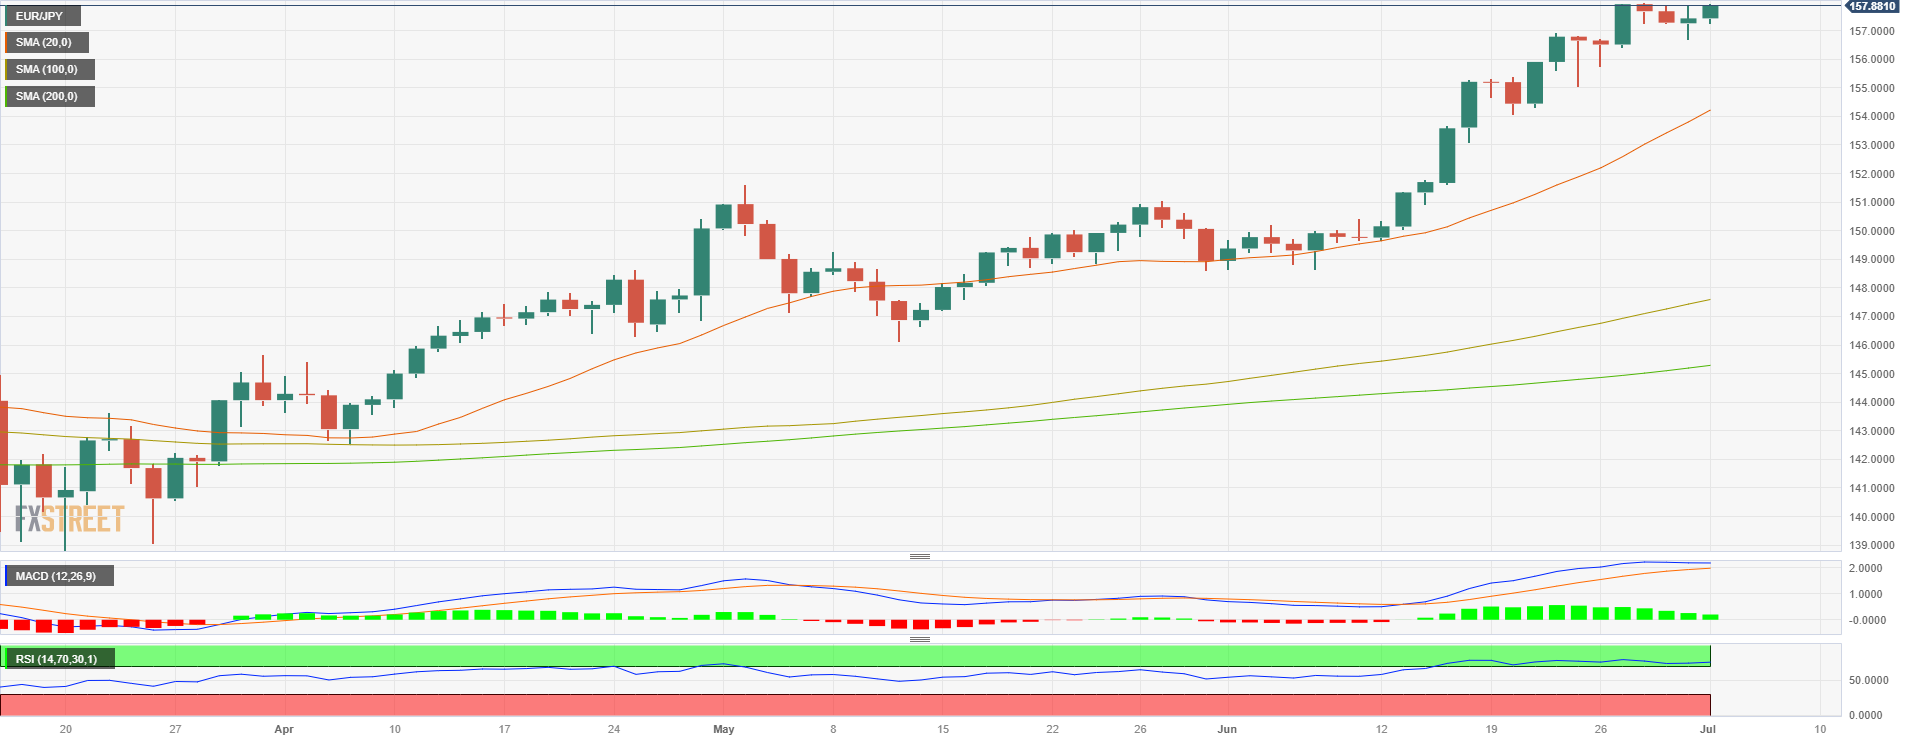
- EUR/JPY trades with gains for a second consecutive day near 157.90.
- European PMIs from June came in weak.
- Japan’s Tankan Manufacturing Index improved in Q2.
The EUR/JPY tallies a consecutive day of gains standing near the 157.90 zone. The European Purchasing Managers' Index (PMI) data for June revealed weakness, contrasting with the improved performance of Japan's Tankan Manufacturing Index in the second quarter released during the Asian session. However, the Yen is still vulnerable on dovish expectations on the BoJ after soft inflation figures were reported last Friday.
European PMIs came in weak, while Japan’s Economic Outlook improved in Q2
The Manufacturing PMI data for June was released for four European countries. In Germany, the HCOB Manufacturing PMI came in at 45.5, slightly below the consensus expectation of 46 and unchanged from the previous reading. Meanwhile, in France, the survey was reported at 41, missing the consensus of 41.6 and showing a decline from the previous figure 40.6. Finally, the index was recorded in Italy at 43.6, in line with the consensus and slightly lower than the previous reading of 43.4, while Spain's figure came in at 48, matching expectations.
Despite weak PMI figures, the Euro seems to find support in hawkish bets on the European Central Bank (ECB). As indicated by the WIRP (World Interest Rate Probability), it suggests that markets are betting on a strong likelihood of a 25 basis points hike by 90% on July 27 while the odds of another 25 basis points increase to stand at approximately 60% on September 14 meeting.
On the Japanese, the Tankan Large Manufacturing Index for Q2 for Japan came in at 5, surpassing both the consensus of 3 and the previous reading of 1. Additionally, the Tankan Large Manufacturing Outlook for Q2 significantly improved, reaching 9 compared to the consensus of 5 and the previous reading of 3. However, the BoJ may need more evidence of strong economic activity to pivot its dovish monetary policy stance, so monetary policy divergences may continue to weaken the Yen agains most of its rivals.
EUR/JPY Levels to watch
Based on the daily chart analysis, the bullish momentum in the EUR/JPY pair appears to be losing steam, with signs of exhaustion from the bulls. In addition, the Relative Strength Index (RSI) remains in overbought territory, suggesting that a technical correction may come soon.
Regarding potential support levels in case of a correction, traders should monitor the 157.00, 156.50, and 156.00 levels. On the other hand, if the bulls manage to extend their control, resistance levels to watch out for are located at 158.00, 158.50, and 159.00.
EUR/JPY Daily chart
- USD/MXN was down by 0.30% in H2 2023 following weak US manufacturing data and yield curve inversion.
- US manufacturing activity slows for an eighth consecutive month, impacting USD performance.
- Recession fears rise as the US yield curve experiences pronounced inversion, signaling a potential economic slowdown.
USD/MXN begins the second half of 2023 with losses of almost 0.30% after hitting a daily high of 17.1485 after data from the United States (US) showed manufacturing activity continues at depressed levels. Furthermore, a deep inversion of the US yield curve sparked recession fears, a headwind for the US Dollar (USD). At the time of writing, the USD/MXN is trading at 17.0467.
Sluggish US manufacturing and yield curve inversion weigh on USD/MXN exchange rate outlook
US manufacturing activity slowed for eight straight months, as revealed by the Institute for Supply Management (ISM), with June data coming below May 46.9 at 46.0. Digging into the report, prices paid by manufacturers slowed down for the third month In a row, contrarily to services, though it remains above December 2022 through of 39.40. In the services sector, input prices remain high due to wage growth, reflecting a tight labor market.
Regarding traders, expectations for a 25 bps rate hike in July remained unchanged compared to last Friday’s odds at 87%, as shown by the CME FedWatch Tool. Nevertheless, today’s data released pushed the odds lower for the November FOMC meeting to 33%.
Of note, USD/MXN must be wary that recent data pushed aside woes for a recession, but last Friday’s US inflation report lowered expectations the Federal Reserve (Fed) would hike two times toward the end of 2023. Nevertheless, the US Dollar Index (DXY), which measures the buck’s performance against a basket of peers, advanced 0.03%, up at 102.951, as US Treasury bond yield recovered.
The US yield curve has experienced its most pronounced inversion since March 2023, with a negative spread of -1.078%. This development arises from the US 2-year yield reaching 4.923%, while the 10-year yield stands at 3.843%. This inversion indicates that investors anticipate the potential impact of continued tightening measures by the Fed, potentially leading to a slowdown in economic growth and even the risk of a recession.
Across the border, the latest employment report in Mexico on Friday was a headwind for the Mexican Peso (MXN). Meanwhile, data revealed on Monday by S&P Global showed the Manufacturing PMI for June came at 50.90, exceeding May’s 50.50.
In the meantime, the Bank of Mexico (Banxico) reported that remittances in May, came to $5.7 billion, breaking a monthly record, according to the central bank. Aside from this, Banxico’s poll showed that most analysts estimate interest rates will finish at 11.00% in 2023 while revising inflation lower. Regarding the USD/MXN exchange rate, most analysts expect the pair to end the year at 18.33 pesos per dollar, below the prior’s poll figure of 18.96.
Hence, the interest rate differential is still favoring USD/MXN downside, as the Fed is expected to lift rates to 5.25%-5.50%, as shown by money market futures, while Banxico is estimated to end at 11%. That would likely keep potential USD/MXN gains capped.
USD/MXN Price Analysis: Technical outlook
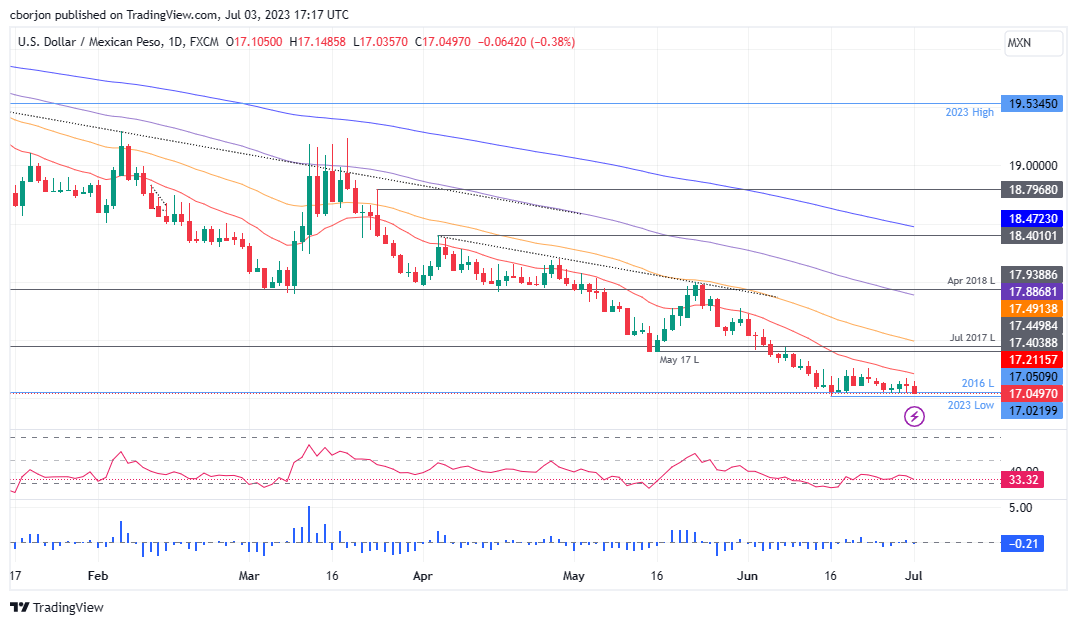
From a technical perspective, the USD/MXN would likely extend its downtrend as it approaches the 17.00 barrier, threatening to reach levels last seen in October 2015, at 16.3267, before USD/MXN sellers edge toward the 16.00 figure. On the flip side, USD/MXN buyers remain unable to reclaim the 20-day Exponential Moving Average at 17.2113, which, once cleared and the USD/MXN pair could rally toward the May 26 low turned resistance at 17.4038 before testing the 50-day EMA at 17.4912.
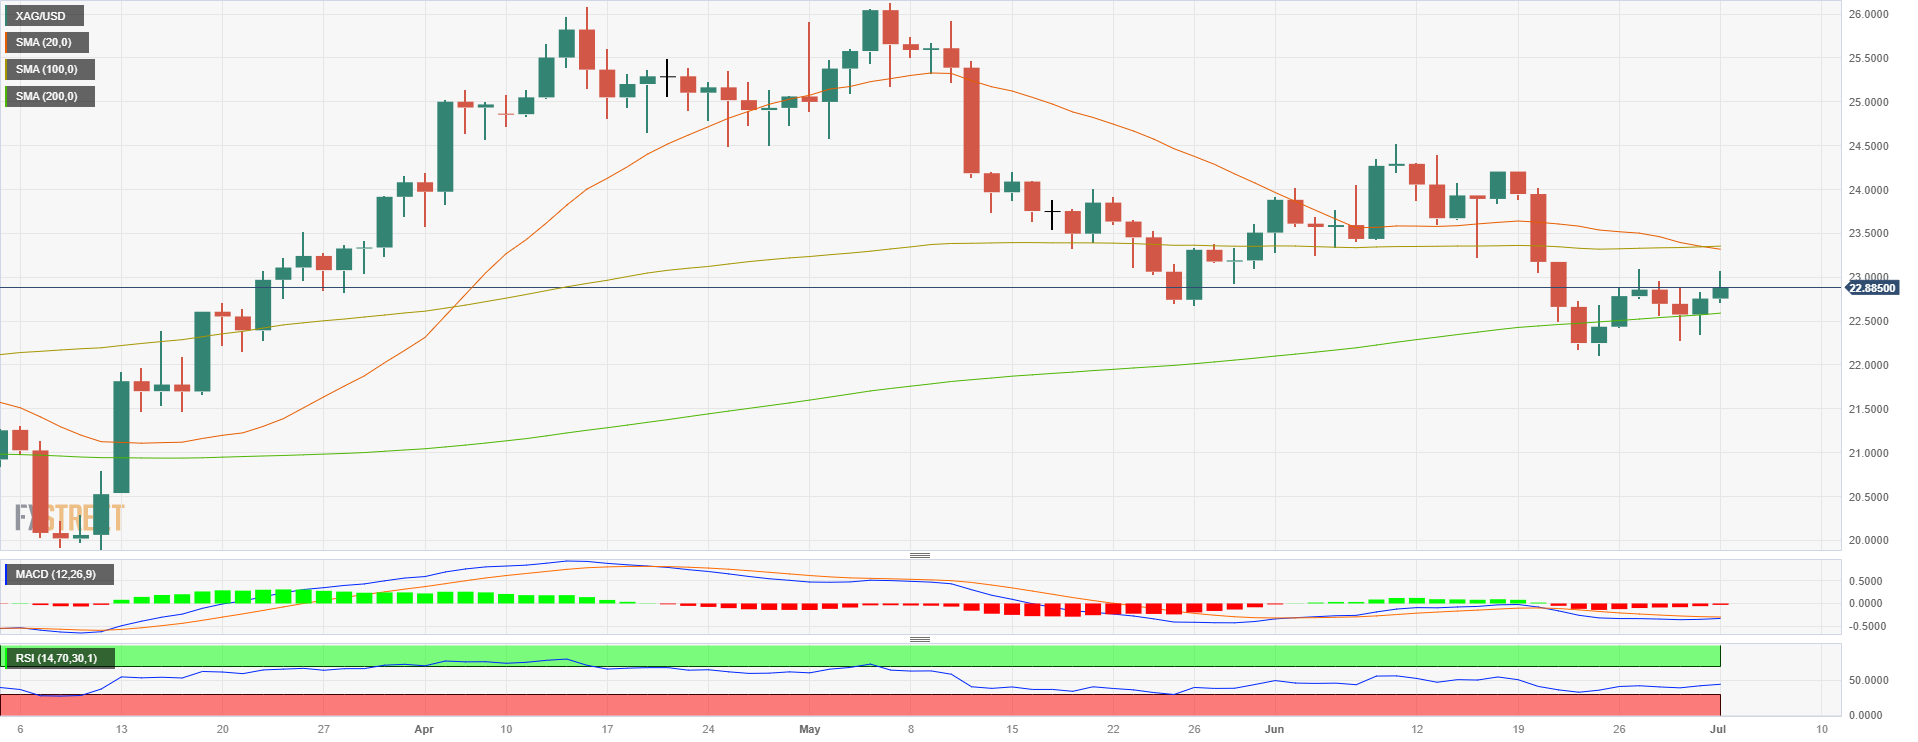
- XAG/USD stands with nearly 0.50% gains near $22.90 after reaching a daily high of $23.70.
- US Manufacturing PMI fell to 46 in June, a contraction worse than expected.
- Falling US Treasury yields gave room for the precious metal to rise.
Silver prices (XAG/USD) are rising, showing gains of approximately 0.70% and trading near $22.90, following a surge that led to a daily high of $23.70. This upward momentum comes in response to the weak US Manufacturing Purchasing Managers' Index (PMI) for June, which recorded a contractionary figure of 46, falling short of expectations. The decline in US Treasury yields has allowed the precious metal to advance, although it is worth noting that yields are still in positive territory, which can limit the XAG/USD’s upside potential.
US reported weak Manufacturing PMI; yields hold their ground
The most recent release of the Institute for Supply Management's (ISM) Manufacturing Purchasing Managers Index (PMI) for June revealed a reading of 46, falling short of the expected 47.2 and the previous figure of 46.9.
Despite a broad retreat in US yields (which could be seen as the opportunity cost of holding Silver), the Federal Reserve's (Fed) hawkish expectations for July have remained firm. The CME FedWatch Tool indicates that a 25 basis points (bps) hike in the upcoming July 31 meeting is practically priced in, while the likelihood of another 25 bps hike in 2023 has increased to around 40%. Furthermore, market participants eagerly await the release of Non-Farm Payroll (NFP) data on Friday, as it will continue shaping expectations regarding the Fed's future decisions.
That being said, it's worth noticing that higher interest rates tend to weaken precious metal prices, so traders should be aware that a hot NFP reading may trigger further downside for the XAG/USD.
XAG/USD Levels to watch
According to the daily chart, the technical outlook for the XAG/USD remains neutral with a bearish bias. The 20 and 100-day Simple Moving Averages (SMAs) are about to perform a bearish cross while indicators remain in negative territory.
If the metal continues to gain ground, resistance levels to consider are seen at the daily high of around $23.05, followed by $23.10 and the mentioned bearish cross at $23.30. Conversely, support levels are seen at the $22.80 level and below at the 200-day SMA at $23.55 and the $23.55 area.
XAG/USD Daily chart
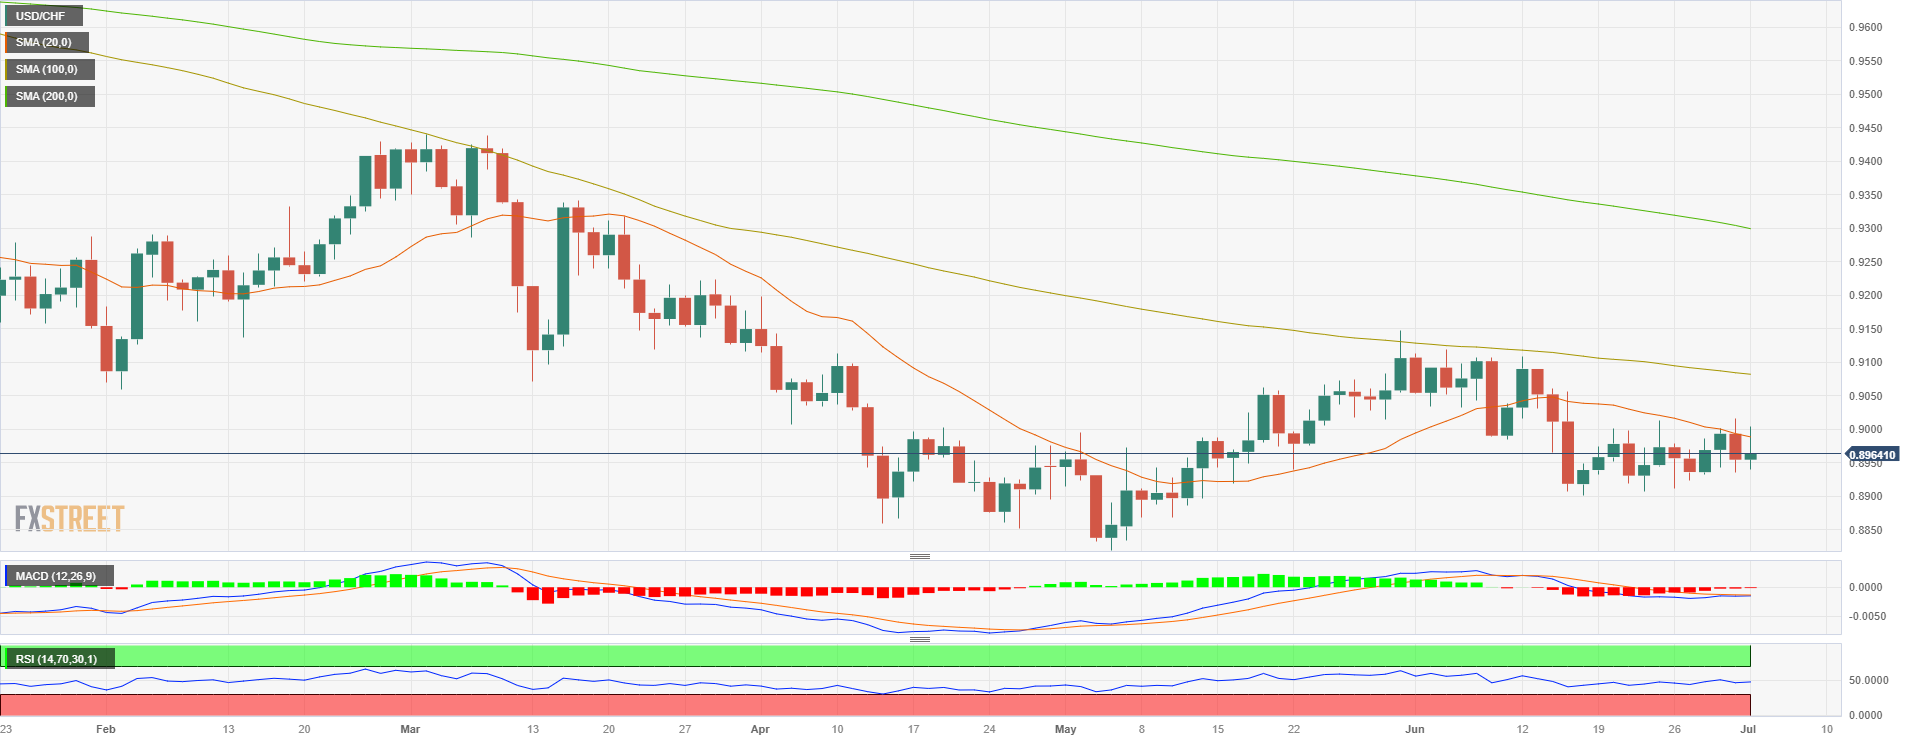
- The USD/CHF rises to a daily high of 0.9000, above the 20-day SMA, then retreats towards the 0.8960 area.
- Soft Swiss inflation figures from June weakened the Swiss Franc during the European session.
- US Manufacturing PMI dropped to 46 in June, weighing on the US Dollar.
At the start of the week, the USD/CHF saw some volatility but remained in positive territory. Soft inflation figures from Switzerland weakened the Swiss Franc leading USD/CHF to rise initially while falling Treasury yields made the USD lose interest following a soft Manufacturing Purchasing Managers Index (PMI) release. The pair remains in positive territory, however, but has erased its daily gains which had seen the pair jump to a high of 0.9000 during the European session.
US yields fall after weak US Manufacturing PMI
The latest release from the Institute for Supply Management's (ISM) Manufacturing Purchasing Managers Index (PMI) for June showed a reading of 46, coming in below the 47.2 expected and the previous figure of 46.9.
Despite US yields retreating across the board, the Federal Reserve’s (Fed) hawkish expectations for July remain steady. According to the CME FedWatch Tool, a 25 basis points (bps) hike at the next meeting on July 31 is almost priced in, while the odds of another 25 bps hike in 2023 have risen to around 40%. In addition, markets await Non-Farm Payroll (NFP) data on Friday, which will continue modelling the expectations for the next Fed decision.
On the other hand, Switzerland's Consumer Price Index (CPI) declined to 1.7% in June, falling from 2.2% in May and falling short of the forecasted 1.8%. This drop brought the Swiss CPI back within the Swiss National Bank's (SNB) target range of 0% to 2%, marking the first time it has been within this range since January 2022. In that sense, dovish bets on the SNB seem to have weakened the CHF, but markets still discount at least one more hike this year.
USD/CHF Levels to watch
According to the daily chart, the technical outlook still favours the CHF despite daily losses. The Relative Strength Index (RSI) and the Moving Average Convergence Divergence (MACD) still hold in negative territory. In addition, the pair trades below the 20, 100 and 200-day Simple Moving Averages, suggesting that the sellers are in control.
Resistance Levels to watch: 0.8978 (20-day SMA), 0.9000, 0.9050.
Support Levels to watch: 0.8940, 0.8915,0.8900.
USD/CHF Daily chart
- Manufacturing activity weakened for the eighth month, weighing on the US Dollar.
- Investors expect a July rate hike by the Fed despite weak data, while chances of a November hike decline.
- The New Zealand Dollar (NZD) is expected to take cues from the Reserve Bank of Australia’s (RBA) upcoming monetary policy decision, with expectations of a 25 bps rate increase to 4.35%.
NZD/USD advances as the third quarter, the second half of the year begins, due to worse-than-expected data in the United States (US) reignited recession fears, as business activity slows down. That, alongside a deep inversion of the US 10s-2s yield curve, signs traders are bracing for a recession amidst a cycle of central banks increasing borrowing costs to curb inflation. The NZD/USD is trading at 0.6156 after hitting a daily low of 0.6115.
Worse-than-expected US data reignited recession worries, supports the NZD/USD; yield curve inversion raises concerns
The Institute for Supply Management (ISM) in the US revealed that manufacturing activity weakened further in June, to 46.0 below May’s 46.9, missing estimates of 47. According to the report, it’s the eighth straight month of losses. The data showed that prices paid in the manufacturing front are deflating, contrarily to services, which remained higher due to stronger wage growth from a tight labor market.
Despite weaker-than-expected data, investors see the US Federal Reserve (Fed) raising rates in July, as the CME FedWatch Tool odds for a 25 bps lift stood at around 87%. However, chances for November slipped to 33% after the data.
NZD/USD traders should be aware that recent data pushed aside woes for a recession, but last Friday’s US inflation report tempered speculations the Fed will hike twice toward the end of the year. That weighed on the greenback, which according to the US Dollar Index (DXY), stays firm at 102.979, even though yields continued to drop.
The US yield curve inverted the most since March of 2023, at -1.078%, as the US 2-year yield 4.923%, while the 10-year yields 3.843%, a sign that market players expect further Fed tightening would decelerate the economy, and it might tip it into a recession.
Meanwhile, the New Zealand economic agenda was light, with no data reported. However, the New Zealand Dollar (NZD) is expected to get cues from the Reserve Bank of Australia (RBA) monetary policy decision. On Tuesday, the RBA is expected to raise rates by 25 bps to 4.35%, though odds are 50%, according to a Reuters poll, with 16 of 31 economists expecting the increase, while the rest foresee a pause.
Upcoming events
During the week, the New Zealand agenda will feature the NZIER Business Confidence. ISM and S&P Global PMIs would be revealed on the US front, alongside Fed speakers, Factory Orders, May’s FOMC minutes, and crucial labor market data.
NZD/USD Price Analysis: Technical outlook
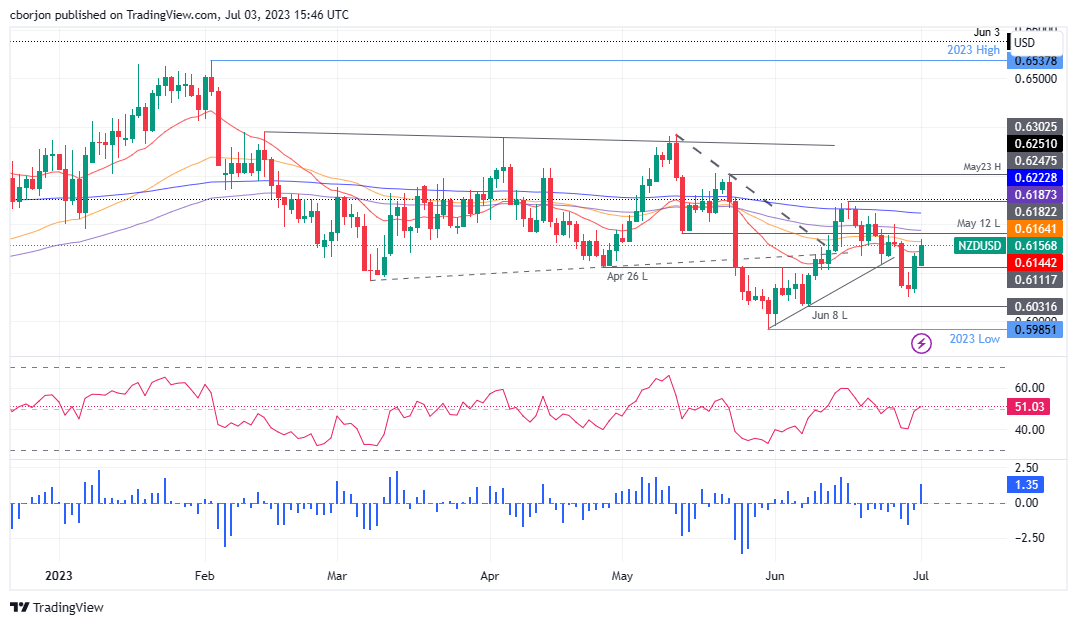
The NZD/USD daily chart shows investors tested the 50-day Exponential Moving Average (EMA) at 0.6164 but failed to stay above, suggesting that sellers remain in charge. Furthermore, NZD buyers could not break a two-week-old downslope resistance trendline, an additional sign that the NZD/USD would stay exposed to sellers. In that outcome, the NZD/USD first support would be the 20-day EMA 0.6144, followed by the 0.6100 mark, before testing the June 30 daily low of 0.6059. On the flip side, if NZD/USD buyers reclaim the 50-day EMA, that will expose key resistance levels, like the 100-day EMA at 0.6187, the 0.6200 figure, and the 200-day EMA at 0.6222.
- Gold gains momentum after US ISM Manufacturing.
- XAU/USD extends rebounds from monthly lows, tests $1,930/oz.
- US Dollar erases gains, US yields pullback from weekly highs.
Following the release of weaker-than-expected US economic data, Gold price jumped to $1,931, reaching the highest level in a week. The weaker data triggered a decline of the US Dollar and boosted Treasury bonds.
US ISM Manufacturing below expectations
The US ISM Manufacturing PMI dropped from 46.9 to 46.0, falling short of expectations for a modest recovery to 47.2. The Prices Paid Index also fell, declining from 44.2 to 41.8, while Employment dropped from 51.4 to 41.8.
These numbers indicate ongoing problems in the manufacturing sector and softer price pressures, which weighed on the US dollar. As a result, the DXY fell to 102.75, testing Friday's lows, while the 10-year US bond yield pulled back from 3.86% and bottomed at 3.78%.
Following the report, XAU/USD jumped to $1,931 but failed to hold above $1,930. It is currently hovering around $1,926, up for the second consecutive trading day.
Gold continues to rebound after falling on Thursday to $1,982, the lowest level since March. While the technical outlook for the yellow metal has improved in the short-term, the bias on the daily chart remains to the downside, and the price remains well below the 20-day Simple Moving Average (SMA) that stands at $1,936.
Technical levels
Gold fell last week as investors bet on further rate hikes by the Fed. Economists at TD Securities analyze XAU/USD outlook.
High probability of another 25 bps in late-July
Investors are worried that a lack of economic weakness in the US and core inflation trending more than double the US central bank's inflation target will force policymakers to deliver on additional rate hikes in the coming months. Indeed, the futures market is pricing a high probability of another 25 bps in late July.
While there are fewer price pressures in the economy, recent data suggest that rates will move higher on the front end of the curve and stay at elevated levels for some time, which implies that Gold will continue to have little reason to move significantly higher anytime soon.
The S&P 500 gapped higher on Friday. Analysts at Credit Suisse analyze the index's technical outlook.
S&P 500 stays seen on course for key resistance at 4513/4535
The immediate risk stays seen higher for a test of key resistance at 4513/4535 – the 78.6% retracement of the 2022 downtrend, ‘reversal day’ high from late April 2022 and now also the top of the uptrend channel that has been in place from March this year. We continue to look for a fresh attempt for a cap here and for a retracement lower/consolidation phase to emerge. Should strength directly extend though, we would see resistance next at 4593, then the March 2022 high at 4637.
Support is seen at 4422 initially, with the immediate risk seen higher whilst above the lower end of the price gap from Friday and 13-day average at 4398/80. A close below here would suggest we may be getting close to a near-term peak, but only back below the 4328 low of last week would be seen to mark a near-term top.
The Australian Dollar has been trading on a softer footing going into tomorrow’s RBA policy meeting after correcting lower throughout the second half of last month. Economists at MUFG Bank analyze how the monetary policy decision could impact the Aussie.
RBA to leave rates on hold
The Australian rate market is currently pricing in only 4 bps of hikes for tomorrow’s RBA policy meeting. We agree with current market pricing and expect the RBA to leave rates on hold tomorrow.
If the RBA leaves rates on hold as we expect, then market attention will quickly shift to future rate guidance from the RBA. The Australian market is pricing in around 40 bps of hikes by the end of this year with the next hike expected in either August or September.
Current pricing highlights that a hawkish hold is expected, and anything less would weigh on the Australian Dollar.
See – RBA Preview: Banks split between a pause and 25 bps hike after softer inflation
- US ISM Manufacturing PMI continued to decline in June.
- US Dollar Index stays in the red below 103.00.
The economic activity in the US manufacturing sector continued to contract at an accelerating pace in June, with the ISM Manufacturing PMI dropping to 46 from 46.9 in May. This reading came in worse than the market expectation of 47.2.
Further details of the publication revealed that the New Orders Index improved to 45.6 from 42.6, while the Employment Index fell to 48.1, revealing a decline in the sector's payrolls. .4 from 50.2. Finally, the inflation component, Prices Paid Index, dropped to 41.8 from 44.2.
Assessing the survey's findings, "demand remains weak, production is slowing due to lack of work, and suppliers have capacity," said Timothy R. Fiore, Chair of the Institute for Supply Management. "There are signs of more employment reduction actions in the near term. Seventy-one percent of manufacturing gross domestic product (GDP) contracted in June, down from 76 percent in May."
Market reaction
The US Dollar Index edged lower with the initial reaction and was last seen losing 0.1% on the day at 102.85.
Economists at Credit Suisse continue to look for EUR/USD to hold below retracement resistance at 1.0998 for a test of its uptrend from last September at 1.0778
EUR/USD is in the process of constructing a major top
EUR/USD has been capped at the 78.6% retracement of the 2022/2023 fall at 1.0998, now also the location of near-term downtrend and with the 10yr US/Germany bond yields spread seen in the process of constructing a large base we believe EUR/USD may be in the process of building a large top.
We take a negative bias looking for a fall back to the low of last week at 1.0835 initially, then a test of the uptrend from last September at 1.0778/74. A break below this latter area is needed to add weight to a topping story for a test of the 1.0732 next, then the 1.0634 May low.
Resistance is seen at 1.0934/43 initially, with 1.0998 ideally capping on a closing basis.
CAD lost ground against a generally stronger USD last week but losses were duly limited to around 0.4% on the week, a little worse than most of its G10 peers. Economists at Scotiabank analyze USD/CAD outlook.
CAD downside limited
Fundamental risks appear neutral to mildly positive for the CAD.
Our week-ahead model anticipates a 1.3170/1.3430 range for USD/CAD.
Technical pointers correctly highlighted upside risks for the USD last week but signals are now more nuanced in terms of guidance for the week ahead. Trends still rather suggest to me that upside potential in the USD is limited and gains may not exceed key resistance at 1.3315/25. An overshoot, given positive weekly price action, is hard to rule out, however.
Support is 1.3200/10, with USD losses below here liable to extend back to 1.3150/75 quickly.
- AUD/USD is showing non-directional performance around 0.6660 ahead of US PMI data.
- The Australian Dollar would show a power-pack action ahead of the interest rate decision by the RBA.
- AUD/USD has delivered a breakout of Wyckoff’s Accumulation phase.
The AUD/USD pair is showing topsy-turvy moves around 0.6660 in the early New York session. The Aussie asset has turned sideways as investors are awaiting the release of the United States ISM Manufacturing PMI data.
S&P500 is set to open on a flat note following choppy cues from US 500 futures. Overall market mood has turned quiet as investors are keeping an eye on the upcoming quarterly result season. The US Dollar Index (DXY) has extended its downside journey marginally below 103.00.
The Australian Dollar would show a power-pack action ahead of the interest rate decision by the Reserve Bank of Australia (RBA). Analysts at Bank of America (BofA) expect the RBA will keep rates unchanged at 4.1% in July due to softer monthly inflation. This gives the RBA an opportunity to wait for Q2 CPI data due on July 28th, as well as another labor force release on July 20th. But there is a potential for a 25 bps hike in August, taking the cash rate to 4.35%.
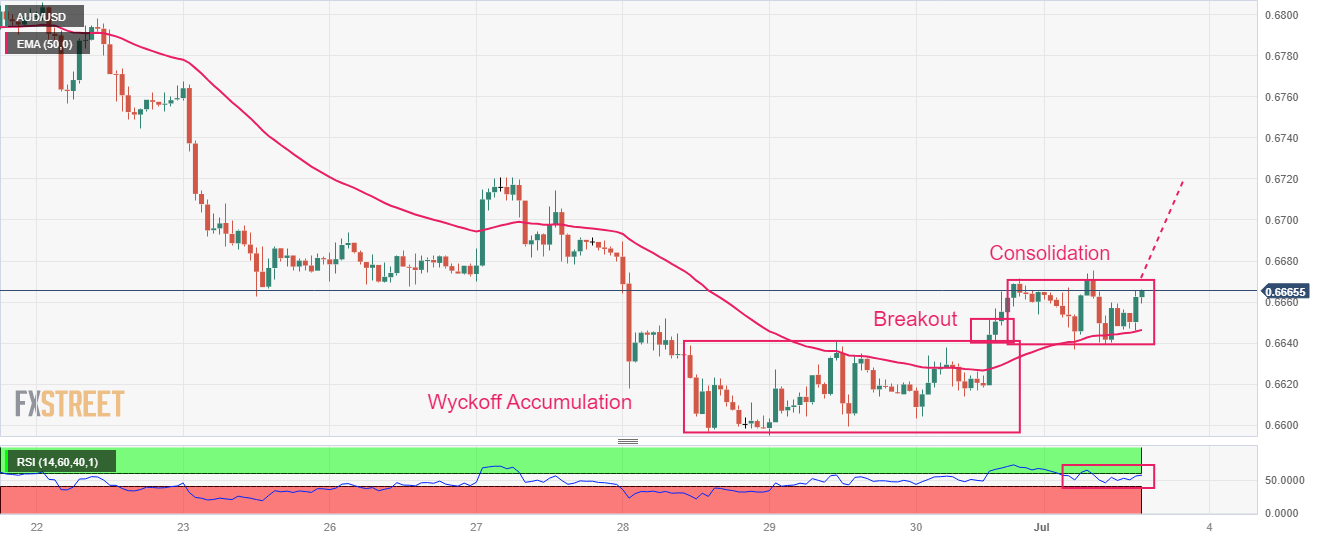
AUD/USD has delivered a breakout of Wyckoff’s Accumulation phase in which inventory is shifted from retail participants to institutional investors. The Aussie asset is consolidating for now but is expected to deliver further breakout. The 50-period Exponential Moving Average (EMA) at 0.6646 is providing support to the Aussie bulls.
Meanwhile, the Relative Strength Index (RSI) (14) has dropped into the 40.00-60.00 range, which indicates that the upside momentum has faded but the upside bias is still intact.
A decisive break above the intraday high at 0.6680 would expose the asset to June 27 high at 0.6720 followed by June 23 high at 0.6767.
On the flip side, a confident break June 29 low at 0.6595 would drag the asset toward June 02 low at 0.6565 and the round-level support at 0.6500.
AUD/USD hourly chart
USD/JPY pushed higher again last week. Credit Suisse’s 145.00/12 next target has been achieved, but their broader outlook stays bullish for the “measured base objective” at 148.57.
Support is seen at 144.22/12, then 143.30/20
USD/JPY achieved our next target at the ‘neckline’ to the October/November 2022 top at 145.00/12. With trend channel resistance from last December seen here also at 145.17, we continue to look for a fresh cap here for a consolidation phase. Big picture though we look for 145.12/17 to be conclusively cleared in due course with resistance then seen next at 146.66 and with the ‘measured base objective’ at 148.57.
Support is seen at 142.22/12 initially, below which can ease the immediate upside bias for a pullback to the 13-day exponential average and price support at 143.30/20, but with this ideally holding on a closing basis.
- EUR/USD struggles to gather traction above 1.0900.
- Extra gains should challenge the area above 1.1000.
EUR/USD reverses the earlier pullback and looks to consolidate the break above 1.0900 the figure on Monday.
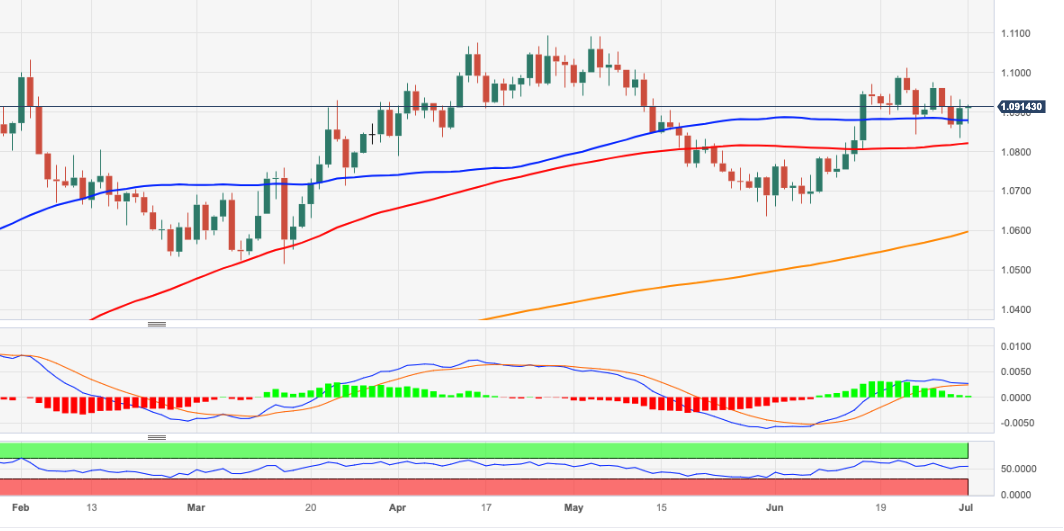
Price action around the pair looks firmer for the time being. That said, the next resistance level of note comes at the psychological 1.1000 barrier ahead of the June peak at 1.1012 (June 22). North from here, the pair is expected to embark on a move to the 2023 top just below 1.1100 (April 26).
Looking at the longer run, the positive view remains unchanged while above the 200-day SMA, today at 1.0596.
EUR/USD daily chart
- DXY attempts a mild recovery and retakes 103.00.
- Next on the upside comes the weekly high around 103.50.
DXY kicks in the new trading with on a positive foot and regains the 103.00 hurdle and beyond on Monday.
The index manages to pick up upside traction and looks to extend the rebound north of 103.00 the figure on Monday. Immediately to the upside now emerges the weekly high at 103.54 (June 30). The breakout of this level could open the door to a move to the May high at 104.69 (May 31).
Looking at the broader picture, while below the 200-day SMA at 104.84 the outlook for the index is expected to remain negative.
DXY daily chart

The Reserve Bank of Australia (RBA) will announce its next monetary policy decision on Tuesday, July 4 at 04:30 GMT and as we get closer to the release time, here are the forecasts by the economists and researchers of 10 major banks regarding the upcoming central bank's decision.
At the June meeting, the RBA raised the cash rate by 25 bps to 4.10%. The consensus is for the bank to keep interest rates unchanged; however, it is a close call.
ANZ
We don’t think the RBA will be swayed to pause by this month’s inflation result, with other data from the month less encouraging for the inflation outlook. We think the strength in this month’s employment data should outweigh any optimism on inflation. We think the quarterly CPI result in Q2, released in July, will be key to the RBA raising the cash rate in August.
BofA
We expect that the RBA will keep rates unchanged at 4.1% in July due to softer monthly inflation. This gives the RBA an opportunity to wait for Q2 CPI data due on July 28th, as well as another labor force release on July 20th. But there is a potential for a 25 bps hike in August, taking the cash rate to 4.35%. If the RBA holds rates in July, it may weigh on the AUD in the near term. However, the AUD's downside would be limited if the RBA signals that further tightening is likely.
ING
Following the surprisingly large fall in May headline CPI inflation to 5.6% YoY from 6.8% in April, there seems little prospect of the RBA hiking rates again following what, by its own admission, was a finely balanced decision in June. That hike only got over the line because of the large upward spike in April inflation, so it would seem extremely odd to hike again if inflation surprises on the downside. We are keeping an open mind on one final hike this cycle, and the September meeting looks like the most likely candidate to us. July CPI will have to absorb a large electricity tariff spike of 20% YoY, or more by some estimates, and the base effects are less helpful over the third quarter too. But that will probably be it for the RBA.
Standard Chartered
We expect the RBA to pause in July, but to hike by 25 bps each in August and September. The RBA meets every month (except in January) compared to the longer break between meetings for other developed market central banks. Hence, we think it is unlikely to hike at a trot.
TDS
Another line-ball call with cons. expecting no hike and OIS market pricing in ~50% prob of a 25 bps hike. Contrary to cons., we expect the RBA to hike. The labour market is too tight, upside retail sales beat for May, rebound in domestic housing prices in June and elevated household savings provides room for the RBA to continue its hike to return inflation back to target.
UOB
We continue to emphasize that every meeting in the near term will be live. Following the latest employment data, we are now penciling in a 25 bps hike at the next monetary policy meeting on 4 Jul.
SocGen
We expect the RBA to maintain its cash rate target of 4.10% at its 4 July policy meeting, after the two 25 bps hikes in May and June, as in our view, it would be difficult for policymakers to implement such a rate hike for three months in a row following the significant decline in monthly inflation in May. We maintain our base-case scenario, in which we assume a terminal policy rate of 4.35%, under the assumption that the RBA will opt to ‘pause’ with no meaningful changes in policy statement in July. The likelihood of the terminal rate being higher than 4.35% would increase in the event of a rate hike and/or hawkish changes in the policy statement.
BMO
We still expect another rate hike on July 4, bringing the cash rate from 4.10% to 4.35%. Credit demand and job growth are still very strong, and 5.6% inflation, though at a 13-month low, is still well above the 2%-to-3% target. The debate will, once again, be between 25 bps and holding rates steady. (Will 15 bps finally make it into the discussion? Here's hoping... I'm not giving up.) It will likely be even more ‘finely balanced’ than it was in June but will tip over to the 25 bps hike camp. (Expect a more dovish tone, though.)
Wells Fargo
Despite the slowing in the latest inflation print, we still lean toward the RBA raising rates 25 bps to 4.35% at the July meeting. Our forecast is distinct from the consensus forecast, which is for the policy rate to remain unchanged at the July meeting, though we acknowledge it is a close call and would not be surprised if the RBA paused at this meeting.
Citi
The RBA will likely deliver another 25 bps hike. Although the decision will be once again ‘finely balanced’, we believe that the economic data has surprised on the upside. The most crucial upside surprise was the labour force survey in May, which saw the unemployment rate decline despite a record increase in the labour force participation rate. Elsewhere, services inflation remains sticky and house prices have rebounded further, implying that financial conditions need to tighten further. We believe the Bank should hike further by 25 bps in July and August.
The prospects for copper remain surrounded by uncertainty in the near-to-medium term, as suggested by UOB Group’s Quarterly Global Outlook.
Key Takeaways
Over the past quarter, increasing worries of disappointing growth slowdown in China weighed down on Copper. As 2Q23 progressed, it became apparent that the much-anticipated post Covid recovery for China did not materialize as most investors had hoped for. Instead, together with other high frequency activities, China’s Manufacturing PMI started to turn south yet again, amidst the further slowdown in industrial production, and renewed pullback in credit growth.
Despite the near term weak dynamics, as we have highlighted over the past year, the longer term prospects for Copper is not so dire. Slowing mine production volumes add to potential longer term supply bottlenecks. In addition, the longer term transition to electric vehicles (EV) adds to longer term demand for Copper. E.g. China’s demand for refined copper has kept pace with its increasing electricity consumption.
Overall, given near term uncertainty with China’s economic recovery, we maintain our mild negative outlook for LME Copper, forecasting USD 8,000 / MT in 2H23 and USD 7,000 / MT in 1H24.
- USD/JPY is marching towards its previous week’s high at 145.00 ahead of US factory activity data.
- Investors are turning cautious ahead of the quarterly result season.
- A stealth intervention by the BoJ in the FX moves is widely anticipated as the Japanese Yen is consistently depreciating.
The USD/JPY pair is looking to recapture the previous week’s high of 145.00 in the early London session. The asset is broadly having strength despite the sheer correction in the US Dollar Index (DXY). The USD Index has surrendered the majority of gains added in the Asian session as investors are cautious about United States Manufacturing PMI data.
S&P500 futures have surrendered their gains and have turned negative, portraying a decline in the risk appetite of the market participants. Investors are turning cautious ahead of the quarterly result season. Banking and technology stocks are likely to be under pressure due to tight credit conditions and higher interest rates by the Federal Reserve (Fed).
The US Dollar Index has corrected to near 103.00 ahead of the key PMI figures. According to the estimates, Manufacturing PMI is seen expanding to 47.2 vs. the former release of 46.9. Investors should note that factory activities have been contracting straight for the past seven months and are expected to continue their contracting spell due to higher interest rates from the Fed. Apart from that, New Orders Index is expected to jump to 44.0 vs. the former release of 42.6.
Later this week, Federal Open Market Committee (FOMC) minutes will remain in focus. The minutes will provide a detailed explanation of the steady interest rate policy. However, Fed chair Jerome Powell has conveyed that two small interest rate hikes are appropriate this year.
On the Japanese Yen front, a stealth intervention by the Bank of Japan (BoJ) in the FX moves is widely anticipated as the Japanese Yen is consistently depreciating. BoJ Deputy Governor Ryozo Himino stated last week that signs of cost-push inflation are easing and demand-driven inflation is taking some place. This could be the outcome of an expansionary interest rate policy and rising wages.
EUR/USD is now close to where it was at the start of the COVID pandemic. Economists at Société Générale analyze the pair’s outlook.
A rally but no change in long-term trend yet
What seems clear is that at this point, major currencies (and EUR/USD in particular) are very sensitive to changes in short-term rate differentials, probably because there is so much uncertainty around the bigger picture.
We expect the gap between ECB and Fed rates to continue narrowing in the second half of this year and into 2024, and the 1-year rate differential seems set to narrow further than it did in 2020 – and it dragged EUR/USD above 1.20 that time.
Even if we see rate convergence, it seems unlikely a new major Euro uptrend will start without stronger growth.
- EUR/JPY adds to Friday’s gains above 157.00.
- Further upside remains in the pipeline near term.
EUR/JPY extends the rebound to the boundaries of 158.00 the figure at the beginning of the week.
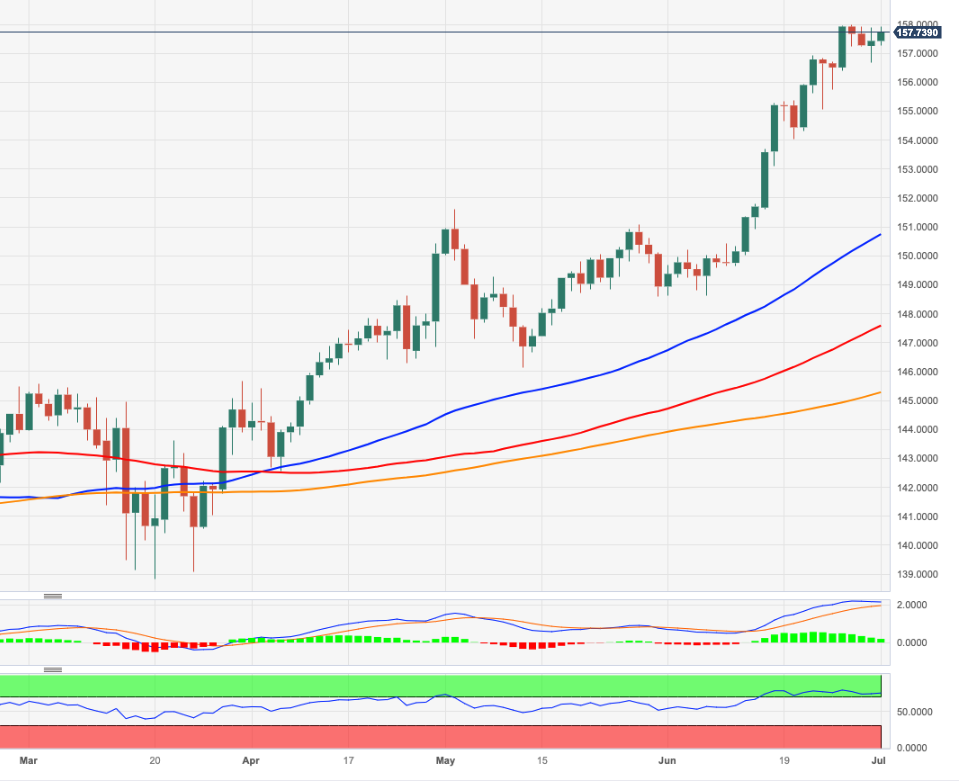
Considering the ongoing price action, extra upside appears likely in the very near term. That said, the continuation of the uptrend should meet the next hurdle of significance not before the weekly high of 163.09 (August 22 2008).
The ongoing overbought conditions of the cross, however, are indicative that a deeper knee-jerk should not be ruled out at some point in the short-term horizon.
So far, further upside looks favoured while the cross trades above the 200-day SMA, today at 145.25.
EUR/JPY daily chart
The GBP/USD uptrend continues to lose momentum, and economists at Credit Suisse look for a test and then break of key uptrend support at 1.2594.
The immediate risk is shifting lower
With weekly RSI momentum unable to confirm the new highs and with daily MACD momentum turning lower we believe the immediate risk is shifting lower.
Key support is seen from the uptrend from September last year and last week's low at 1.2594/90, below which should see downside pressure increase further for a test of the 55-DMA next, currently at 1.2542. A close below here would then be seen to expose 1.2485 next.
Resistance is seen at 1.2729 initially, with a break above 1.2761 seen needed to ease the immediate downside bias for strength back to 1.2843/50. Above here can clear the way for strength to 1.2894/1.2900 next, then what we look to be tougher resistance at the March/April 2022 lows at 1.2973/1.3000.
European Central Bank (ECB) policymaker Joachim Nagel said on Monday that monetary policy signals are clearly pointing in the direction of further tightening and added that they will have "a way to go" with regard to additional rate increases, per Reuters.
Nagel further argued that they need to significantly reduce the Eurosystem's balance sheet in the coming years.
Market reaction
These comments don't seem to be impacting the Euro's performance against its rivals. As of writing, the EUR/USD pair was trading at 1.0900, losing 0.1% on a daily basis.
The US Dollar sold off at the end of last week following the release of the weaker-than-expected US PCE deflator report for May. Economists at MUFG Bank analyze USD outlook.
Softer US inflation takes the wind out of the USD’s sails
At this stage, the softer US PCE deflator report has mainly put a dampener on upward momentum for the US yields and the US Dollar in the near term rather than triggering a more sustained reversal lower.
Further weaker US inflation data will be required to trigger a more sustained reversal lower.
- Oil prices have concluded their corrective move as Saudi proposes an extension in oil cuts.
- Better-than-expected Caixin Manufacturing PMI data has supported the oil price.
- WTI is looking for a breakout of the Rising Channel chart pattern.
West Texas Intermediate (WTI), futures on NYMEX, have rebounded after concluding its corrective move to near $71.00 in the London session. The oil price is expected to reclaim the intraday high of $71.60 as discussions about further extension in oil production cuts have deepened.
Saudi Arabia's Ministry for Energy announced it would be extending its production cut for crude for an extra month, as reported by Newswires.
Meanwhile, better-than-expected Caixin Manufacturing PMI data has supported the oil price. The economic data landed at 50.5 higher than the expectations of 50.2 but remained lower than the prior release of 50.9. It is worth noting that China is the largest oil importer in the world and decent factory activities have improved the oil demand outlook.
WTI is looking for a breakout of the Rising Channel chart pattern on an hourly scale in which each pullback is considered as buying opportunity for the market participants. The rally in the oil price will be further strengthened after a pattern breakout.
The 50-period Exponential Moving Average (EMA) is consistently providing support to the oil bulls.
The Relative Strength Index (RSI) (14) has shifted into the bullish range of 60.00-80.00, which indicates that the upside momentum has been activated.
Should the asset break above the intraday high at $71.83, oil bulls would drive the asset towards June 08 high at $73.23 followed by the crucial resistance around $75.00.
On the flip side, a downside move below May 31 low at $67.12 will drag the asset toward the $65.00 support followed by the ultimate support around $64.31.
WTI hourly chart
-638239828711111081.png)
Economists at Société Générale analyze AUD outlook.
RBA needs to become more hawkish if we are to see AUD/USD trade back above 0.70
We now expect a protracted range-bound period where buying AUD should be a frustrating exercise.
At the end of this year, we expect RBA rates to be 75 bps below Fed rates, almost exactly what is currently priced into the market. The RBA needs to become more hawkish if we are to see AUD/USD trade back above 0.70.
Australia’s iron exports to China are on a declining trend since the start of the year. With contracting demand for metal production and thus for the currency, the Aussie is gradually losing its sparkle.
Saudi Arabia will extend its voluntary oil output cut of one million barrels per day by one more month to include August, the state news agency reported on Monday, per Reuters.
Meanwhile, Russia's Deputy Prime Minister Alexander Novak's office stated that Russia will reduce oil output by an additional 500,000 barrels per day in August.
Market reaction
Crude oil prices continued to push higher following these headlines. As of writing, the barrel of West Texas Intermediate was trading at $71.35, gaining 1.4% on a daily basis.
Economists at HSBC expect another 25 bps hike in Canada on 12 July. The BoC’s forward guidance will play a crucial role in determining whether the CAD could capitalise on the gain.
Positive risk appetite could also support the CAD
Given the hawkishness of the BoC statement, our economists expect a follow-up rate hike of 25 bps at the 12 July meeting, bringing the policy rate to 5.0%. The market is currently priced for 15 bps of tightening at that meeting (Bloomberg, 29 June 2023), so there may be some modest upside for the CAD in terms of a knee-jerk reaction.
The issue for the market is what kind of guidance the BoC then offers for rates thereafter. We think that while the BoC will probably signal another ‘conditional pause’ after raising the policy rate to 5.0% in July, it is possible that 5.0% might not be the peak. With core CPI inflation still running at about 4%, and economic activity data exceeding expectations, the risks remain to the hawkish side for the BoC and the bullish side for the CAD over the near term.
If risk appetite becomes supportive, USD/CAD could challenge the resistance level of 1.30 over the near term.
- USD/CAD is marching towards 1.3280 as the USD index is gauging support.
- S&P500 futures have generated marginal gains in Europe, portraying strength in the risk-appetite theme.
- Fed Bostic believes that the central bank has reached to a point where interest rates are sufficiently restrictive to bring down inflation to 2%.
The USD/CAD pair is approaching the immediate resistance of 1.3280 in the London session. The Loonie asset is gathering strength to capture the aforementioned resistance as the US Dollar Index (DXY) has gauged support after correcting to near 103.11.
S&P500 futures have generated marginal gains in Europe, portraying strength in the risk-appetite theme. The market mood is quite upbeat as investors are anticipating that only one interest rate hike has left till the year-end. The US Dollar Index (DXY) is looking to conclude its corrective move and will resume its upside journey toward its intraday high of 103.24.
The strength in the USD Index has not impacted despite dovish commentary from Atlanta Fed Bank President Raphael Bostic. Fed Bostic believes that the central bank has reached to a point where interest rates are sufficiently restrictive to bring down inflation to 2%. A pause should be taken by the Fed to avoid impacting economic activities.
Investors would get much clarity about the economic conditions in the United States with the release of the Manufacturing PMI by the ISM department at 14.00 GMT. Investors are anticipating some increase in the economic data to 47.2 vs. the former release of 46.9. US factory activities have been contracting straight for the past seven months.
Apart from that, the US factory orders index will also remain in focus. The economic data is seen higher at 44.0 against the former release of 42.6.
On the Canadian Dollar front, inflation softening and some cracks in Employment numbers have lifted the odds of a pause in the policy-tightening spell by the Bank of Canada (BoC). Investors should note that BoC Governor Tiff Macklem has already raised interest rates to 4.75%.
Oil prices have shown some correction after reaching near $71.60. The black gold is expected to resume its upside journey as Saudi Arabia's Ministry for Energy announced it would be extending its production cut for crude for an extra month, as reported by Newswires.
It is worth noting that Canada is the leading exporter of oil to the United States and higher oil prices would support the Canadian Dollar.
EUR/USD has staged a steady rebound after forming an important trough near 0.9535 last September. The move has stalled at a multi-year ascending trend-line resistance point near 1.1070/1.1100. Economists at Société Générale analyze the pair’s technical outlook.
1.0570/1.0510, a crucial support zone
A retest of the upper limit of the range near 1.1070/1.1100 cannot be ruled out. However, the next leg of the uptrend can only be confirmed once the pair breaks above this zone.
Beyond 1.1100, further potential hurdles are located at 1.1270, the 61.8% retracement from 2021 and graphical levels of 1.1450/1.1495, representing the March 2020/February 2022 peaks.
In the case of a short-term down-move, the lower end of the recent consolidation phase near 1.0570/1.0510 would be a crucial support zone.
According to UOB Group’s Quarterly Global Outlook, gold prices are expected to pick up traction and surpass the key $2000 mark per troy ounce in the second half of the year.
Key Takeaways
Broadly speaking, little has changed in terms of the key drivers for gold. As in the previous few quarters, gold remain mostly driven by USD and US interest rates movements. Specifically, gold maintains its inverse relationship with USD and interest rates. As such, whenever USD strengthens and / or when US interest rates rise, gold tends to weaken anew.
Despite the near term set back, we maintain our positive outlook for gold. We continue to see US interest rates topping out in the months ahead as the Fed reaches the tail end of its rate hiking cycle. Our view remains for USD to top out as well (albeit with a bit of delay towards the end of this year). And gold remains an important diversifier of portfolio risk. In fact, Emerging Market and Asian central banks continue to load up on gold reserves, specifically China.
Overall, we maintain our positive view for gold and forecast that gold will trade above USD 2,000 /oz in 2H23 and thereafter, rising further to USD 2,100 / oz in 1H24.
Ulrich Leuchtmann, Head of FX and Commodity Research at Commerzbank, analyzes the Bank of Japan’s (BoJ) strategy and its implications for the Yen (JPY).
It seems quite difficult to understand why the Japanese are objecting to a weak Yen
It seems quite difficult to understand why the Japanese are objecting to a weak Yen. The BoJ is pursuing an ultra-expansionary monetary policy, so does everything to push inflation up (or to be precise: to prevent the expected fall in inflation to below the 2% target). A weak JPY would be very helpful to reach this target because it would increase import prices.
Of course, the desired inflationary effect and the positive economic effect are set off against a negative wealth effect. However, there is no such thing as a free lunch. If inflationing really was being taken seriously Japanese institutions would probably be willing to pay this price.
And so to some extent what Japan has often been accused of: inflationing has failed for approx. 30 years now because it is not taken seriously enough. I can only hope that this lack of consistency will not have the opposite effect one day: that it will turn into high inflation levels that are difficult to control, into a crisis of national finances and in explicit Yen weakness to an extent that will make the current Yen exchange rates seem like a walk in the park.
Economists at Société Générale analyze NOK outlook.
Long NOK/SEK looks like an appealing relative value trade
Despite relatively elevated inflation, Norway still enjoys the strongest real growth and the biggest current account surplus in G10.
Given the limited NOK market liquidity, currency resilience is more likely to stem from fundamentals than from incoming flows, and EUR/NOK downside is likely to be very gradual.
The NOK/SEK cross is strongly undershooting its relative fundamentals and we think that 0.95 was probably the bottom. While it is still difficult to turn bullish NOK across the board (especially against the EUR), long NOK/SEK looks like an appealing relative value trade.
The month of June saw the dollar weaken against all G10 currencies except for the Japanese Yen, but the greenback has been quite supported in the past few days. Economists at ING analyze USD outlook.
Data in focus amid thin holiday volumes
The Independence Day holiday in the US means the week should start quietly in markets, but US data will soon attract the market's attention again now that a July Fed rate hike is a consensus view and there is also speculation about a move in September.
Today, all eyes will be on the ISM manufacturing index, although a greater focus will be on the services survey released on Thursday (the May print dropped more than expected). On Friday, jobs figures for the month of June will be published: after the latest comments by Powell, it will probably take a very weak reading to put a July hike under discussion.
On the Fed side, the first event to note is on Wednesday, when the June FOMC minutes are released. The Dollar can probably find some more support this week as markets see more reasons in the data and the minutes to gradually align with the more hawkish dot plot projections.
Economists at TD Securities analyze the Gold outlook after US Core PCE data lifted the yellow metal.
Risk of a drop down to the 200-DMA reduced
At 4.6%, the US May YoYcore PCE is slightly lower than expected and with weaker personal May personal spending, the market drove yields lower. With that, the USD dropped, and Gold bounced convincingly above $1,900. This reduces the risk of a drop down to the 200-DMA, for now.
Inflation is still too high, so the Fed's restrictive narrative will continue, but it bodes well for the long term, as there is evidence building that inflation has peaked and is trending lower. This suggests that while the yellow metal won't plunge, big gains are unlikely for a while yet. After all, the market is still pricing a hike next FOMC.
- The US Dollar edges higher after Friday’s PCE inflation data.
- Focus turns to US ISM data before markets close early on Monday in a shortened session.
- The US Dollar Index jumps back above 103.00, right in the middle of a one-month range.
The US Dollar (USD) starts the week in a good mood after its lacklustre performance on Friday following US Personal Consumer Expenditures (PCE) numbers. Markets though are still convinced that the US Federal Reverse and its Chairman Jerome Powell will deliver only one interest-rate hike and be done with the tightening cycle, even as he said multiple times last week that the Fed is committed to do at least two. On Monday, the Greenback advances again against most currencies after the firm correction on the back of PCE numbers on Friday.
Monday features a very short trading day ahead as traders will head out for the July 4 US national holiday. Bond trading and the New York Stock Exchange (NYSE) will close at 17:00 GMT and will remain shut on Tuesday. This means that the regular economic calendar is very condensed toward the end of the week with the US Jobs report (NFP) on Friday. On Monday, a batch of data from the Institute for Supply Management (ISM) with focus on the Manufacturing sector is due at 14:00 GMT, broken down in the headline Purchasing Manager Index (PMI) and the Prices Paid, New Orders, and Employment subindexes.
Daily digest: US Dollar stronger in shortened trading day
- US Treasury Secretary Janet Yellen is set to head to China July 6-9 in order to underpin and build trust and collaboration between the two nations.
- The S&P Global Manufacturing Purchasing Manager Index (PMI) data for June will be released at 13:45 GMT. The PMI is expected to be unchanged from its preliminary reading at 46.3.
- The ISM Manufacturing numbers will be published at 14:00 GMT. The headline PMI is expected to come in at 47.2 from 46.9. The New Orders Index is anticipated to head higher as well, from 42.6 to 44.0.
- Equities are firmly in the green in Asia. The Hang Seng jumps over 2% near its closing bell, while Japan already closed up 1.41% on Monday. European stocks are under a bit of pressure after Apple issued a warning that it needs to cut Vision Pro Headset production forecast models because of some production issues. US Equity Futures are in the red for both the Dow Jones and S&P 500 index.
- The CME Group FedWatch Tool shows that markets are pricing in a 87.4% chance of a 25 basis points (bps) interest-rate hike on July 26. The dislocation between market expectations and what the Fed has been communicating in terms of number of rate hikes is still persistent and could trigger a stronger US Dollar once markets get to the point of realisation.
- The benchmark 10-year US Treasury bond yield trades at 3.83% and is not really making any big waves this Monday. Normally it should be a steady session for the US T-notes as bond trading will stop early with the US National holiday on Tuesday.
US Dollar Index technical analysis: USD halfway through making it back to Friday’s starting point
The US Dollar is back in the green as traders are heading back into the Greenback, which is already halfway through paring back Friday’s losses. The US Dollar Index (DXY) already reclaimed 103.00 as a big figure and psychological level. In terms of positioning, it should not be a coincidence that the DXY is near the middle of a one-month-range and might stay around that point in a wait-and-hold pattern before choosing sides on the back of the US job report (NFP) on Friday.
On the upside, look for 103.54 as the next key resistance level which falls in line with the high of last week. The 200-day Simple Moving Average (SMA) at 104.94 is still quite far away. So the intermediary level to look for is the psychological level at 104.00 and May 31 peak at 104.70.
On the downside, the 55-day SMA near 102.72 has proven its importance as it clearly underpinned price action on Friday by triggering a turnaround after the firm weakening of the Greenback. A touch lower, 102.50 will be vital to hold from a psychological point of view. In case the DXY slips below 102.50, more weakness is expected with a full slide to 102.00 and a retest of June’s low at 101.92.
How does Fed’s policy impact US Dollar?
The US Federal Reserve (Fed) has two mandates: maximum employment and price stability. The Fed uses interest rates as the primary tool to reach its goals but has to find the right balance. If the Fed is concerned about inflation, it tightens its policy by raising the interest rate to increase the cost of borrowing and encourage saving. In that scenario, the US Dollar (USD) is likely to gain value due to decreasing money supply. On the other hand, the Fed could decide to loosen its policy via rate cuts if it’s concerned about a rising unemployment rate due to a slowdown in economic activity. Lower interest rates are likely to lead to a growth in investment and allow companies to hire more people. In that case, the USD is expected to lose value.
The Fed also uses quantitative tightening (QT) or quantitative easing (QE) to adjust the size of its balance sheet and steer the economy in the desired direction. QE refers to the Fed buying assets, such as government bonds, in the open market to spur growth and QT is exactly the opposite. QE is widely seen as a USD-negative central bank policy action and vice versa.
GBP/CHF experienced a V-shaped rebound from the low of 1.0185 formed in September 2022. The first wave of the up-move found stiff resistance near 1.1500/1.1580, representing the 61.8% retracement from May 2022. Economists at Société Générale analyze the pair’s technical outlook.
1.1000 expected to act as an important support
The pair has entered a phase of wide consolidation in the form of a rectangle, consisting of flattish upper and lower bands. The downside has so far remained contained near 1.1000 which is expected to act as an important support.
Currently, a pullback is underway, however, the recent pivot low of 1.1140 should cushion the downside.
GBP/CHF is expected to head towards the upper limit of the multi-month range near 1.1500/1.1580. Once this is overcome, an extended uptrend is likely towards 1.1710 and the trend line drawn since 2021 at 1.1800.
Economists at ING analyze EUR/USD outlook.
USD leg will drive most of the EUR/USD moves this week
With ECB members having had the opportunity to clarify their rhetoric at the Sintra symposium last week, this week’s speakers may not have a very strong impact on the Euro, even though markets will be interested in comments following the inflation report for June.
It seems likely that the USD leg will drive most of the EUR/USD moves this week, especially once US data starts to come in.
There is some room for the pair to decline modestly on the back of some Dollar strength, although a big drop below 1.0800 may be premature.
- Gold price has dropped to near $1,910.00 as Fed Powell is reiterating that two more small interest rate hikes are appropriate.
- The US Dollar Index has strongly rebounded to near 103.20 ahead of the US Manufacturing PMI data.
- Gold price is looking for support near the 61.8% Fibonacci retracement at $1,909.55.
Gold price (XAU/USD) has reported a corrective move to near $1,910.00 in the London session. The precious metal is under pressure as consistent reiteration of more interest rate hikes from the Federal Reserve (Fed) is deepening worries about persistent inflation in the United States economy.
S&P500 futures have posted nominal gains in the London session, portraying further improvement in the risk appetite of the market participants. US equities were also heavily bought on Friday ahead of the quarterly result season.
The US Dollar Index (DXY) has strongly rebounded to near 103.20 as investors are awaiting the release of the US Manufacturing PMI data (June). As per the preliminary report, the economic data is seen higher at 47.2 vs. the former release of 46.9. Investors should note that a figure below 50.0 is considered a contraction and the US factory activities have already contracted straight for seven months.
Gold price is facing pressure despite dovish commentary from Atlanta Fed Bank President Raphael Bostic. Fed Bostic stated last week that the central bank has reached to a point where interest rates are sufficiently restrictive to bring down inflation to 2%.
On the labor market front, US Treasury Secretary Janet Yellen said on Friday that the U.S. economy is on a path to maintain a strong labor market while reducing inflation, even if the economy cools a bit more, as reported by Reuters.
Gold technical analysis
Gold price is looking for support near the 61.8% Fibonacci retracement (plotted from February 28 low at $1,804.76 to May 03 high at $2,079.76) at $1,909.55 on a four-hour scale. The 50-period Exponential Moving Average (EMA) at $1,920.00 is acting as a barricade for the Gold bulls. The downward-sloping trendline from May 03 high at $2,079.76 will continue to remain a barrier for the precious metal.
The Relative Strength Index (RSI) (14) is hovering in the bearish range of 20.00-60.00, which indicates that the downside momentum is active.
Gold four-hour chart

Economists at Commerzbank analyze the Swiss National Bank’s (SNB) strategy and its implications for the Franc (CHF).
SNB is likely to be able to maintain its intervention strategy, but not forever
Short to medium term the SNB is likely to be able to maintain its intervention strategy, but not forever.
Its strategy will only work out under the condition that inflation pressure will ease on its own over the coming months or quarters. That is the most likely scenario, but it is far from certain. For that reason, there are CHF risks, even though the SNB is doing everything it can to give those a good time who are holding CHF-long positions.
Citing sources from Germany's Finance Ministry on Monday, Reuters reported that the country’s Finance Minister, Christian Lindner, is planning net new debt of EUR16.6 billion ($18.06 billion) for the 2024 federal budget, which includes record spending on defence.
The draft 2024 budget and financial plan would be published on Wednesday, the sources added.
Additional takeaways
Record budget of EUR51.8 bln planned in defence for 2024 and EUR19.2 bln outflows from special funds.
German 2024 budget and financial planning until 2027 will comply with debt brake.
Still gap of EUR14.4 bln in midterm budget planning until 2027.
Draft 2024 budget includes EUR54.2 bln in investments.
Interest costs estimated at EUR36.9 bln in 2024 following EUR39.9 bln expected in 2023.
Market reaction
EUR/USD is unperturbed by the German headlines, trading at 1.0889, down 0.19% on the day, at the press time.
- USD/JPY kicks off the new week on positive note and reverses Friday’s retracement slide.
- The Fed-BoJ policy divergence continues to lend some support amid renewed USD buying.
- Intervention fears might cap the upside ahead of this week’s important releases from the US.
The USD/JPY pair regains strong positive traction on the first day of a new week and reverses a major part of Friday's pullback from its highest level since November 2022. The pair builds on its steady intraday ascent and climbs to a fresh daily high during the early European session, albeit remains below the 145.00 psychological mark.
The Japanese Yen (JPY) continues to be undermined by a big divergence in the monetary policy stance adopted by the Bank of Japan (BoJ) and other major central banks, including the Federal Reserve (Fed). This, in turn, is seen as a key factor acting as a tailwind for the USD/JPY pair. The markets seem convinced that BoJ's negative interest-rate policy will remain in place at least until next year. Moreover, BoJ Governor Kazuo Ueda recently ruled out the possibility of any change in ultra-loose policy settings and signalled no immediate plans to alter the yield curve control measures.
In contrast, Fed Chair Jerome Powell reiterated last week that two more rate increases are likely by the end of this year. Adding to this, the fact that the US PCE Price Index remains well above the 2% target supports prospects for further policy tightening. In fact, the markets are currently pricing in a nearly 85% chance of a 25 bps lift-off at the upcoming FOMC meeting on July 25-26. This remains supportive of elevated US Treasury bond yields, which helps revive the US Dollar (USD) demand and turns out to be another factor pushing the USD/JPY pair hgher on Monday.
That said, speculations about an eventual intervention by Japanese authorities to support the weakened domestic currency seem to hold back traders from placing aggressive bearish bets around the JPY. Market participants also seem reluctant and might prefer to wait on the sidelines ahead of this week's release of the FOMC meeting minutes. Apart from this, important US macro data scheduled at the beginning of a new month, starting with the ISM Manufacturing PMI on Monday, should influence the USD and provide a fresh directional impetus to the USD/JPY pair.
Hence, it will be prudent to wait for some follow-through buying and acceptance above the 145.00 mark before positioning for an extension of the recent strong uptrend trajectory witnessed over the past month or so. Nevertheless, the fundamental backdrop suggests that the path of least resistance for the USD/JPY pair is to the upside. Hence, any meaningful corrective decline might continue to attract fresh buyers and is more likely to remain limited, at least for the time being.
Technical levels to watch
- Silver struggles to preserve its modest intraday gains to a four-day peak.
- Acceptance above the 100-hour SMA favours bulls and should limit losses.
- A convincing break below the $22.50 area could negate the positive bias.
Silver touches a four-day peak during the first half of trading on Monday, albeit stalls the positive move just ahead of the $23.00 mark. The white metal surrenders its modest intraday gains and drops to the lower end of its daily trading range, around the $22.75-$22.70 region during the early European session.
From a technical perspective, the XAG/USD now seems to have found acceptance above 200-hour Simple Moving Average (SMA) for the first time since June 19. The said resistance breakpoint, around the $22.70-$22.65 region, coincides with the 23.6% Fibonacci retracement level of the downfall from the June swing high and should now act as a key pivotal point. Meanwhile, oscillators on hourly charts have been gaining positive traction and are still far from being in the overbought territory, supporting prospects for some meaningful intraday appreciating move.
That said, technical indicators on the daily chart - though have recovered from lower levels - are yet to confirm the bullish outlook and warrant some caution. Hence, it will be prudent to wait for some follow-through buying beyond the $23.00 mark, representing 38.2% Fibo. level, before placing fresh bullish bets. This is followed by the $23.30 area, or the 50% Fibo., which if cleared decisively will confirm that the XAG/USD has bottomed out and trigger a short-covering move. Bulls might then aim to surpass the next relevant hurdle near the $23.60 area, or the 61.8% Fibo. and reclaim the $24.00 mark.
On the flip side, the $22.70-$22.65 confluence resistance breakpoint now seems to protect the immediate downside. A convincing break below will be seen as a fresh trigger for bearish traders and drag the XAG/USD back towards the multi-month low, around the $22.10 region touched in June. Some follow-through selling below the $22.00 mark should pave the way for deeper losses towards the $21.70-$21.65 zone en route to the $21.25 support zone. The XAG/USD could eventually drop to test the $21.00 round-figure mark.
Silver 1-hour chart
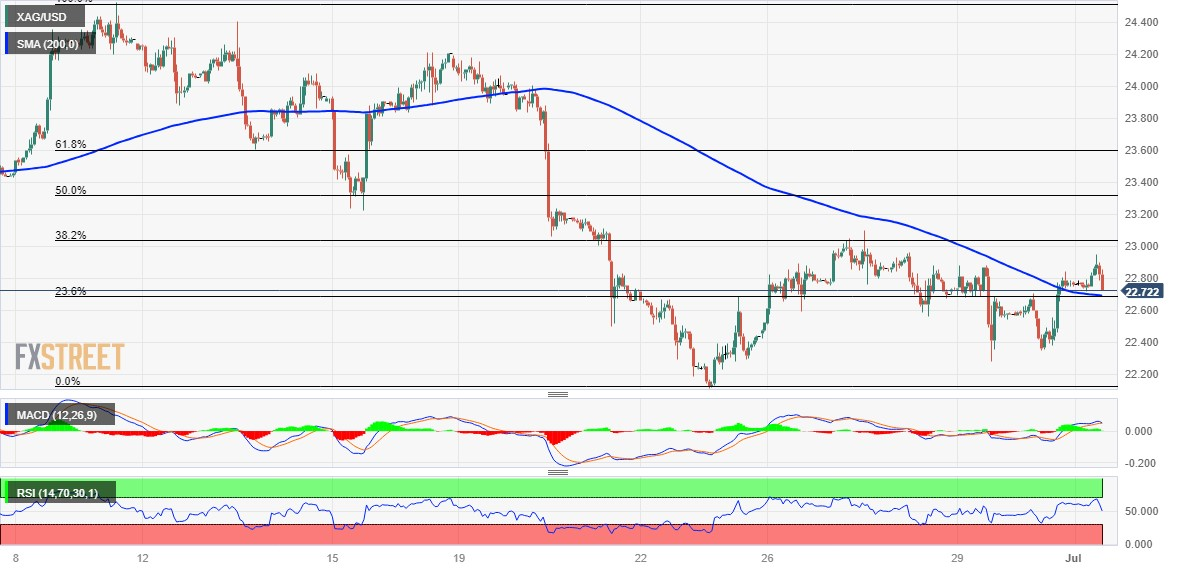
Key levels to watch
- EUR/JPY is aiming to jump above 157.80 as ECB is expected to tighten policy further.
- Inflation in Eurozone is turning critical as the headline and core CPI is showing wide deviation.
- BoJ Himino conveyed that signs of cost-push inflation are easing and demand-driven inflation is taking some place.
The EUR/JPY pair is consistently making efforts for testing the critical resistance of 158.00 in the European session. The asset has faced selling pressure around 157.80 a few times despite investors hoping that the European Central Bank (ECB) is looking to raise interest rates further to tame stubborn inflation.
Inflation in Eurozone is turning critical as the headline and core Consumer Price Index (CPI) is showing wide deviation. A preliminary report for June has shown that the decline in the cost of gasoline prices is heavily weighing on the rising cost of services. Headline price pressures have softened to 5.5% in June vs. the prior release of 6.1%. This is the seventh decline in price pressures in the past eight months.
Meanwhile, core inflation that excludes volatile oil and food prices has softened marginally to 6.8% from the former release of 6.9%. Core inflation is the preferred gauge for ECB policymakers while building a roadmap for constructing monetary policy.
ECB President Christine Lagarde conveyed in the ECB forum of Central Banking that the interest rate policy is not sufficiently restrictive to bring inflation to 2%. The expectations for rate cuts are out of context amid severe stubbornness in inflation.
On the Japanese Yen front, signs Bank of Japan (BOJ) Deputy Governor Ryozo Himino said recent price rises were stronger than previously projected and inflation expectations were moving up, a sign the economy is getting closer to achieving the bank's 2% inflation target, as reported by Reuters.
BoJ Himino further added that signs of cost-push inflation are easing and demand-driven inflation is taking some place. This could be the outcome of an expansionary interest rate policy and rising wages.
- AUD/USD oscillates in a narrow trading band through the early European session on Monday.
- A goodish pickup in the USD demand is seen as a key factor acting as a headwind for the pair.
- The downside seems limited ahead of the RBA on Tuesday and this week’s key US macro data.
The AUD/USD pair struggles for a firm direction on the first day of a new week and seesaws between tepid gains/minor losses through the early European session. Spot prices currently trade just above mid-0.6600s, nearly unchanged for the day, though manage to hold comfortably above a nearly four-week low touched last Thursday.
The US Dollar (USD) regains positive traction and reverses a major part of its Friday's downfall, which, in turn, is seen as a key factor acting as a headwind for the AUD/USD pair. Data released from the US on Friday showed that the PCE Price Index remains well above the Federal Reserve's 2% target and supports prospects for further policy tightening. Moreover, Fed Chair Jerome Powell reiterates last week that borrowing costs may still need to rise as much as 50 bps by the end of this year. This remains supportive of elevated US Treasury bond yields, which continue to underpin the Greenback and keep a lid on the major.
Apart from this, worries about a global economic downturn, particularly in China, further contribute to capping the upside for the Aussie. The official data published by the country’s National Bureau of Statistics (NBS) this Monday showed China's Manufacturing PMI came in at 50.5 in June as compared to the 50.2 anticipated. This, however, is below May's reading of 50.9% and does little to ease worries about slowing growth in the world's second-largest economy. The downside for the AUD/USD pair, however, remains cushioned, at least for now, as traders await important US macro data and the central bank event risk.
A rather busy week kicks off with the release of the US ISM Manufacturing PMI, due later during the North American session. This will be followed by the Reserve Bank of Australia (RBA) monetary policy decision on Tuesday. The focus, however, will remain glued to the FOMC meeting minutes on Wednesday and the closely-watched US monthly employment details - popularly known as the NFP report on Friday. This will play a key role in influencing the USD and provide a fresh directional impetus to the AUD/USD pair.
Technical levels to watch
USD/JPY is approaching potential resistance at 145/146.10. Economists at Société Générale analyze the pair’s technical outlook.
139/138, a key support zone
The pair is gradually inching higher towards the graphical resistance zone of 145/146.10, representing the peak of last September and the 76.4% retracement of the pullback during last October and January. This is an interim hurdle that could result in a phase of correction. The upper part of the previous consolidation phase near 139/138 would be a key support zone.
If the pair breaks above 145/146.10, the rebound could extend towards 149 and the previous high of 152.
- Euro kicks in the week on the back foot on US Dollar recovery.
- Stocks in Europe open the week within tight ranges.
- EUR/USD slips back below the 1.0900 support on Monday.
- Final Manufacturing PMIs take centre stage later in the session.
- US ISM Manufacturing PMI will be in the limelight in NA trading hours.
At the start of the new trading week, the Euro (EUR) is under noticeable pressure, retracing part of Friday's strong gains and forcing EUR/USD to drop below the key support level of 1.0900 the figure.
Meanwhile, the US Dollar (USD) is showing a better performance, with the USD Index (DXY) gaining renewed strength and surpassing the key level of 103.00, despite the lack of direction in US yields on Monday.
The potential future actions of the Federal Reserve and the European Central Bank (ECB) in normalizing their monetary policies remain a topic of ongoing debate amidst increasing speculation about an economic slowdown on both sides of the Atlantic. Currently, bets remain firm that there will be a 25 basis point rate increase by both central banks at their meetings in July.
Looking at the latest CFTC Positioning Report, net longs in EUR remained steady and reached a 2-week high of around 145K contracts in the week ending June 27, despite the spot reaching new monthly highs above 1.1000, which ultimately fizzled out due to the recovery in the risk-off trade and buying interest in the USD.
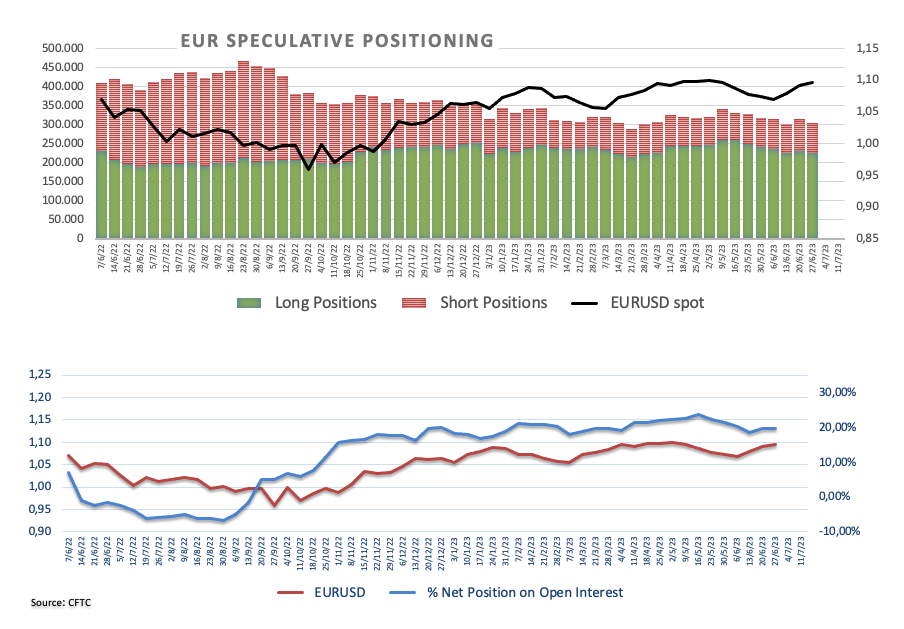
In terms of economic data, the final Manufacturing PMI figures for the euro area and Germany in June were 43.4 and 40.6, respectively.
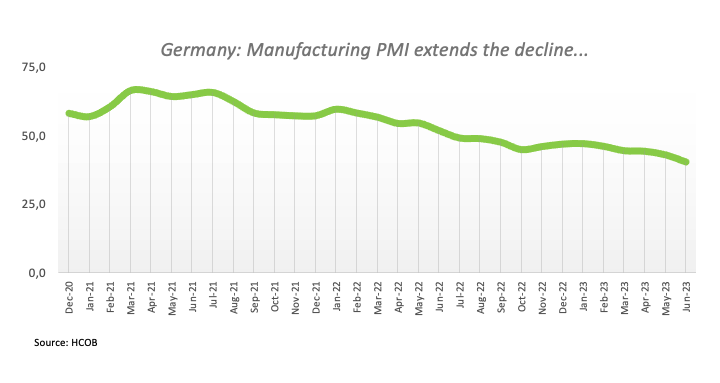
Meanwhile, in the US, the ISM Manufacturing PMI will be the centre of attention, alongside the final S&P Global Manufacturing PMI and Construction Spending.
Daily digest market movers: Euro appears offered amidst US Dollar gains
- The EUR reverses course and retreats to the sub-1.0900 zone.
- US markets face a shortened trading week due to Independence Day.
- Chinese Caixin Manufacturing PMI failed to surprised markets.
- The probability of a Fed rate hike is near 88%.
Technical Analysis: Euro could revisit the 100-day SMA
EUR/USD appears under pressure and risks a potential deeper drop in case the selling bias picks up pace. That said, the loss of the weekly low at 1.0835 (June 30) could open the door to a test of the interim 100-day SMA at 1.0819. The breakdown of the latter should meet the next contention area not before the May low of 1.0635 (May 31) ahead of the March low of 1.0516 (March 15) and the 2023 low of 1.0481 (January 6).
If bulls regains the upper hand, the next hurdle is then expected at the June peak of 1.1012 (June 22) prior to the 2023 high of 1.1095 (April 26), which is closely followed by the round level of 1.1100. North from here emerges the weekly top of 1.1184 (March 31, 2022), which is supported by the 200-week SMA at 1.1181, just before another round level at 1.1200.
The constructive view of EUR/USD appears unchanged as long as the pair trades above the crucial 200-day SMA, today at 1.0595.
Euro FAQs
What is the Euro?
The Euro is the currency for the 20 European Union countries that belong to the Eurozone. It is the second most heavily traded currency in the world behind the US Dollar. In 2022, it accounted for 31% of all foreign exchange transactions, with an average daily turnover of over $2.2 trillion a day.
EUR/USD is the most heavily traded currency pair in the world, accounting for an estimated 30% off all transactions, followed by EUR/JPY (4%), EUR/GBP (3%) and EUR/AUD (2%).
What is the ECB and how does it impact the Euro?
The European Central Bank (ECB) in Frankfurt, Germany, is the reserve bank for the Eurozone. The ECB sets interest rates and manages monetary policy.
The ECB’s primary mandate is to maintain price stability, which means either controlling inflation or stimulating growth. Its primary tool is the raising or lowering of interest rates. Relatively high interest rates – or the expectation of higher rates – will usually benefit the Euro and vice versa.
The ECB Governing Council makes monetary policy decisions at meetings held eight times a year. Decisions are made by heads of the Eurozone national banks and six permanent members, including the President of the ECB, Christine Lagarde.
How does inflation data impact the value of the Euro?
Eurozone inflation data, measured by the Harmonized Index of Consumer Prices (HICP), is an important econometric for the Euro. If inflation rises more than expected, especially if above the ECB’s 2% target, it obliges the ECB to raise interest rates to bring it back under control.
Relatively high interest rates compared to its counterparts will usually benefit the Euro, as it makes the region more attractive as a place for global investors to park their money.
How does economic data influence the value of the Euro?
Data releases gauge the health of the economy and can impact on the Euro. Indicators such as GDP, Manufacturing and Services PMIs, employment, and consumer sentiment surveys can all influence the direction of the single currency.
A strong economy is good for the Euro. Not only does it attract more foreign investment but it may encourage the ECB to put up interest rates, which will directly strengthen the Euro. Otherwise, if economic data is weak, the Euro is likely to fall.
Economic data for the four largest economies in the euro area (Germany, France, Italy and Spain) are especially significant, as they account for 75% of the Eurozone’s economy.
How does the Trade Balance impact the Euro?
Another significant data release for the Euro is the Trade Balance. This indicator measures the difference between what a country earns from its exports and what it spends on imports over a given period.
If a country produces highly sought after exports then its currency will gain in value purely from the extra demand created from foreign buyers seeking to purchase these goods. Therefore, a positive net Trade Balance strengthens a currency and vice versa for a negative balance.
Economists at ING analyze the GBP outlook for this week.
EUR/GBP may struggle to find very sustainable support beyond current levels
This week will offer little input from the data side in the United Kingdom, and the list of Bank of England (BoE) speakers is also quite short.
Cable may be primarily driven by the Dollar leg, and faces some risk of a correction.
EUR/GBP may struggle to find very sustainable support beyond current levels.
See: GBP/USD can test the 1.30 level – Credit Suisse
- Pound Sterling has faced selling pressure above 1.2700 as investors are shifting their focus to PMI numbers.
- Investors are worried about United Kingdom’s economic prospects as inflation seems stuck above 8.5%.
- Financial markets are anticipating that interest rates by the Bank of England would peak around 6.5%.
The Pound Sterling (GBP) has retreated as investors are worried that higher interest rates by the Bank of England (BoE) are going to dampen economic activities in the United Kingdom. The GBP/USD pair broadly looks well-supported as inflationary pressures in the Britain region are struck above 8.5% and showing no signs of easing despite the restrictive monetary policy.
Investors are shifting their focus toward global PMI numbers to asset the impact of interest rates yet elevated to contain stubborn inflation. Manufacturing PMI in the United Kingdom for June is expected to show stability but would remain in contraction.
Daily digest market movers: Pound Sterling capped below 1.2700 ahead of PMI day
- Pound Sterling is likely to remain under pressure ahead of the release of the S&P Global Manufacturing PMI data (June). The economic data is seen steady at 46.2. A figure below 50.0 is considered a contraction.
- Higher interest rates by the Bank of England (BoE) are weighing pressure on the economic activities in the United Kingdom as firms are saying “no” to fresh credit to avoid higher interest obligations.
- BoE policymaker Silvana Tenreyro is opposing further increases in interest rates as risks having to make a sharp U-turn if it tightens policy anymore. She further added that further policy-tightening is already in the pipeline.
- Contrary to Tenreyro, BoE Governor Andrew Bailey supported further interest rate hikes as the UK economy is dealing with more persistent inflation.
- In the speech at European Central Bank (ECB) forum, Andrew Bailey drew a distinction between how high rates would go, and how long they would need to stay at their peak.
- Financial markets are anticipating that the BoE will raise interest rates to 6.25% from the current state of 5%.
- The Guardian reported that the UK and other European powers are expected to announce plans to breach the 2015 Iran nuclear deal for the first time when they confirm they are not going to lift sanctions on Tehran’s use of missiles.
- Market mood is quiet as investors have sidelined ahead of the quarterly result season.
- The US Dollar Index (DXY) has climbed sharply above 103.00 ahead of the United States ISM Manufacturing PMI data.
- Manufacturing PMI is seen expanding to 47.2 vs. the former release of 46.9.
- Investors should note that US Manufacturing PMI has been contracting straight for the past seven months and is expected to continue its contracting spell due to higher interest rates from the Federal Reserve (Fed).
- Fed Chairman Jerome Powell reiterated that more interest rate hikes are appropriate. He further added that the June pause has bought some time for the central bank to assess monetary policy conditions.
- Atlanta Fed Bank President Raphael Bostic stated last week that the central bank has reached a point where interest rates are sufficiently restrictive to bring down inflation to 2%.
Technical Analysis: Pound Sterling bullish long-term trend remains in place
Pound Sterling is looking to regain the round-level resistance of 1.2700 after a V-shape recovery from 1.2600. The Cable is being supported by the 200-period Exponential Moving Average (EMA), which indicates that the long-term trend is bullish. The asset is broadly trading in a Rising Channel in which each pullback is considered as buying opportunity for the market participants.
Momentum oscillators are showing exhaustion in the upside momentum, however, the upside bias has not faded yet.
Pound Sterling FAQs
What is the Pound Sterling?
The Pound Sterling (GBP) is the oldest currency in the world (886 AD) and the official currency of the United Kingdom. It is the fourth most traded unit for foreign exchange (FX) in the world, accounting for 12% of all transactions, averaging $630 billion a day, according to 2022 data.
Its key trading pairs are GBP/USD, aka ‘Cable’, which accounts for 11% of FX, GBP/JPY, or the ‘Dragon’ as it is known by traders (3%), and EUR/GBP (2%). The Pound Sterling is issued by the Bank of England (BoE).
How do the decisions of the Bank of England impact on the Pound Sterling?
The single most important factor influencing the value of the Pound Sterling is monetary policy decided by the Bank of England. The BoE bases its decisions on whether it has achieved its primary goal of “price stability” – a steady inflation rate of around 2%. Its primary tool for achieving this is the adjustment of interest rates.
When inflation is too high, the BoE will try to rein it in by raising interest rates, making it more expensive for people and businesses to access credit. This is generally positive for GBP, as higher interest rates make the UK a more attractive place for global investors to park their money.
When inflation falls too low it is a sign economic growth is slowing. In this scenario, the BoE will consider lowering interest rates to cheapen credit so businesses will borrow more to invest in growth-generating projects.
How does economic data influence the value of the Pound?
Data releases gauge the health of the economy and can impact the value of the Pound Sterling. Indicators such as GDP, Manufacturing and Services PMIs, and employment can all influence the direction of the GBP.
A strong economy is good for Sterling. Not only does it attract more foreign investment but it may encourage the BoE to put up interest rates, which will directly strengthen GBP. Otherwise, if economic data is weak, the Pound Sterling is likely to fall.
How does the Trade Balance impact the Pound?
Another significant data release for the Pound Sterling is the Trade Balance. This indicator measures the difference between what a country earns from its exports and what it spends on imports over a given period.
If a country produces highly sought-after exports, its currency will benefit purely from the extra demand created from foreign buyers seeking to purchase these goods. Therefore, a positive net Trade Balance strengthens a currency and vice versa for a negative balance.
On Thursday, the Riksbank disappointed with its decision. Ulrich Leuchtmann, Head of FX and Commodity Research at Commerzbank, analyzes the Riksbank policy outlook and its implications for the Swedish Krona (SEK).
Thedéen does not have the funds to intervene
Riksbank governor Erik Thedéen does not have the funds to intervene. And empty threats are not only unproductive, but counterproductive.
One can only recommend to the Riksbank to pursue a more attractive monetary policy from the FX market’s point of view if it wants to see a stronger Krona.
The Kiwi ended June higher as the USD slipped, likely supported by month-end portfolio rebalancing flows. Tomorrow’s RBA decision will be key, economists at ANZ Bank report.
NFP on Friday, a key input into the July Fed decision
Rebalancing flows undoubtedly favoured the Kiwi, with the NZD up just 0.9% in June vs the S&P 500’s 6.5% gain, implying that investors wanting to maintain portfolio weightings would have sold US stocks and the USD. So the question is, was that a one-off flow, or can this bounce be sustained? Let’s see.
This week is another quiet one on the local data front, but with the AUD leading the Kiwi, tomorrow’s RBA meeting (we expect a hike) is key by association. We also get US Nonfarm Payrolls on Friday, a key input into the July Fed decision (we expect a +25 bps hike).
Here is what you need to know on Monday, July 3:
Following Friday's uninspiring performance, the US Dollar (USD) holds its ground against its rivals early Monday. Ahead of the ISM Manufacturing PMI report for June, The US Dollar Index clings to small daily gains above 103.00. The European economic docket will feature revisions to HCOB Manufacturing PMIs. Markets will also keep a close eye on comments from central bank officials. It's worth noting that stock and bond markets in the US will close early on Monday and remain closed on Tuesday in observance of the Independence Day holiday.
Annual inflation in the US, as measured by the change in Personal Consumption Expenditures (PCE) Price Index, fell to 3.8% in May from 4.3% in April, the US Bureau of Economic Analysis reported on Friday. In the same period, the Core PCE Price Index edged slightly lower to 4.6% from 4.7%. The initial reaction to soft inflation readings caused the USD to lose some strength ahead of the weekend.
During the Asian trading hours on Monday, June Caixin Manufacturing PMI in China came in at 50.5, down from 50.9 in May but better than analysts' forecast of 50.2. The Shanghai Composite Index remains on track to post a daily gain of more than 1% and Hong Kong's Hang Seng Index is up 2% on the day. Nevertheless, US stock index futures trade flat in the European morning.
Following Friday's rebound, EUR/USD closed the week virtually unchanged. The pair stays under modest bearish pressure early Monday and trades below 1.0900.
GBP/USD gained nearly 100 pips on Friday and ended the week near 1.2700. With the USD staying resilient on Monday, the pair fluctuates slightly below that level.
USD/JPY staged a downward correction on Friday but regained its traction at the beginning of the week. As of writing, the pair was trading in positive territory near 144.80. “Japanese companies expect consumer prices to rise an average 2.6% a year from now, lower than their 2.8% projections three months ago,” the Bank of Japan’s (BoJ) noted in its quarterly Tankan survey. Meanwhile, the headline Tankan Large Manufacturing Index improved to 5.0 in Q2 from 1.0 and surpassed analysts' forecast of 3.0.
Australian Trade Minister Don Farrell said early Monday that they will be announcing new measures to improve trade relations with China soon. AUD/USD edged higher in the Asian session but reversed its direction in the European morning. AUD/USD was last seen losing more than 0.3% on the day below 0.6650. On Tuesday, the Reserve Bank of Australia announce its interest rate decision.
Gold snapped a four-day losing streak on Friday and erased a large portion of its weekly losses. XAU/USD stays calm above $1,910 early Monday.
Bitcoin struggled to find direction over the weekend and extended its sideways grind above $30,500 early Monday. Ethereum gathered bullish momentum and reached its strongest level since May above $1,950.
- The index trades with small gains above the 103.00 mark.
- US markets will be closed due to Independence Day on Tuesday.
- US ISM Manufacturing PMI takes centre stage later on Monday.
The greenback, in terms of the USD Index (DXY), starts the week on the positive foot and looks to reclaim the 103.00 hurdle in convincing fashion on Monday.
USD Index focused on US ISM
The index partially reverses Friday’s strong pullback and advances past the key 103.00 barrier on the back of some loss of momentum in the risk complex at the beginning of the week.
On the speculative front, net longs in the US Dollar increased to levels last seen in late March, around 15K contracts in the week ended June 27, according to the CFTC Positioning Report. The dollar’s strength during that period was once again underpinned by the Fed’s hawkish narrative amidst steady bets of a 25 bps rate hike at the July 26 meeting.
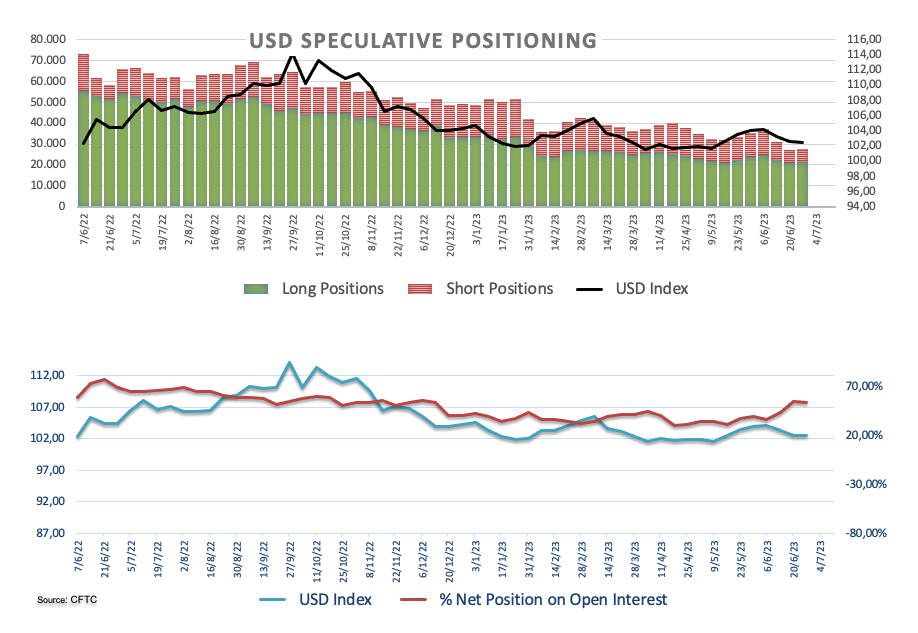
Moving forward, trading conditions are expected to shrink against the backdrop of an early close of US markets on July 3 and the Independence Day holiday on July 4.
In the US data space, the release of the ISM Manufacturing PMI for the month of June will take centre stage, seconded by the final S&P Global Manufacturing PMI and Construction Spending, both for the month of May.
What to look for around USD
The index regains the smile and advances north of the 103.00 hurdle at the beginning of the week.
Meanwhile, the likelihood of another 25 bps hike at the Fed's upcoming meeting in July remains high, supported by the continued strength of key US fundamentals such as employment and prices.
This view was further bolstered by comments from Fed Chief Powell at the June FOMC event, who referred to the July meeting as "live" and indicated that most of the Committee is prepared to resume the tightening campaign as early as next month.
Key events in the US this week: Final Manufacturing PMI, ISM Manufacturing, Construction Spending (Monday) – Factory Orders, FOMC Minutes (Wednesday) – ADP Employment Change, Balance of Trade, Initial Jobless Claims, Final Services PMI, ISM Services PMI (Thursday) – Nonfarm Payrolls, Unemployment Rate (Friday).
Eminent issues on the back boiler: Persistent debate over a soft/hard landing of the US economy. Terminal Interest rate near the peak vs. speculation of rate cuts in late 2023/early 2024. Fed’s pivot. Geopolitical effervescence vs. Russia and China. US-China trade conflict.
USD Index relevant levels
Now, the index is up 0.20% at 103.12 and the breakout of 103.54 (weekly high June 30) would open the door to 104.69 (monthly high May 31) and then 104.84 (200-day SMA). On the other hand, the next contention emerges at 101.92 (monthly low June 16) followed by 100.78 (2023 low April 14) and finally 100.00 (round level).
Economists at ING analyze the outlook for currencies of the Central and Eastern European (CEE) region this week.
EUR/CZK should return below 23.70 and EUR/HUF to 370
In the FX market, the region should benefit today with a delay from Friday's upward movement of EUR/USD as well as the positive sentiment in Europe from the end of last week. On the other hand, the bad news for the Hungarian Forint and the Czech Koruna is the renewed rise in gas prices, which is once again becoming a strong player in this part of the region.
A dovish NBP in the second half of the week should not come as a surprise to the market and therefore we do not expect much pain for the Polish Zloty.
So overall, we are slightly bullish on FX in the CEE region this week. If gas prices calm down again, EUR/CZK should return below 23.70 and EUR/HUF to 370. EUR/PLN should stay below 4.450.
- EUR/GBP remains pressured, mostly inactive, after two-day downtrend amid sluggish markets.
- Trader’s wait for Eurozone/UK PMIs for June also restrict immediate EUR/GBP moves.
- Mixed EU data raise doubts on hawkish ECB talks but fears of UK recession prod EUR/GBP bulls.
- Hoes of easing British employment crunch, challenges for ECB rate hikes keep sellers hopeful.
EUR/GBP holds lower grounds near 0.8590 as it struggles for clear directions but the bears refrain from relinquishing control heading into Monday’s European session. In doing so, the cross-currency pair justifies a recently upbeat headline from the UK amid fears that the European Central Bank (ECB) has multiple challenges to defend the hawkish bias.
The UK Times came out with the news suggesting British Health Secretary Steve Barclay’s willingness to give doctors a bigger pay rise, calling for an end to consultant strikes to resume negotiations. “Barclay’s admission came as the head of the NHS (National Health Services) warned that the disruption to routine healthcare would become “more significant” this month,” said the news. It should be noted that the UK’s employment report appeared mixed and signaled an easing of the British labor crunch.
Elsewhere, the preliminary readings of Germany’s inflation per the Consumer Price Index (CPI) rose to 6.4% YoY in June from 6.1% in May and 6.3% expected. On the same line, the European Central Bank’s (ECB) favorite inflation gauge, namely the Harmonised Index of Consumer Prices (HICP), also jumped to 6.8% on a yearly basis from 6.3% prior and 6.7% market forecasts. Further, the preliminary Eurozone HICP inflation number rose to 0.3% MoM versus 0.0% expected and prior while the yearly figures eased to 5.5% from 5.6% market forecasts and 6.1% previous readings.
It’s worth noting that the European Central Bank (ECB) officials tried defending their rate hike bias but softer inflation data and looming fears of Germany’s recession restrict markets from believing in them, which in turn weigh on the EUR/GBP Price. Alternatively, the UK inflation numbers and the Bank of England (BoE) policymakers’ hawkish bias put a floor under the pair’s price.
Moving on, final readings of the June month PMIs from the Eurozone and the UK will be important to watch for clear directions of the EUR/GBP pair. Also important to watch are the central bankers’ comments and risk catalysts.
Technical analysis
EUR/GBP extends pullback from the 50-day Exponential Moving Average (EMA), around 0.8645 by the press time, towards a fortnight-old rising support line near 0.8565. That said, the cross-currency pair’s further downside appears less impressive.
Economists at the Bank of America expect the EUR/USD pair to hover around 1.15 by the end of 2024.
US Dollar to exhibit moderate softness through to the end of next year
We expect the US Dollar to experience moderate softness through the end of next year.
Despite some expectations that technological advancements might contribute to productivity growth, we do not expect strong productivity growth in its USD outlook. The US is likely to remain in a softer growth mode for the medium term.
We expect the EUR/USD pair to be around the 1.15 level by the end of next year. Beyond that, we predict that EUR/USD will move towards its fair value in the 1.20s.
Considering advanced figures from CME Group for natural gas futures markets, open interest shrank by around 5.1K contracts after two consecutive daily builds on Friday. Just the opposite, volume increased by around 44.4K contracts following two daily drops in a row.
Natural Gas faces initial hurdle around $3.00
Friday’s uptick in prices of the natural gas was amidst diminishing open interest, which hints at the idea that further upside appears out of favour in the very near term. In the meantime, the $3.00 region per MMBtu (March tops) continues to offer tough resistance to occasional bullish moves in the commodity.
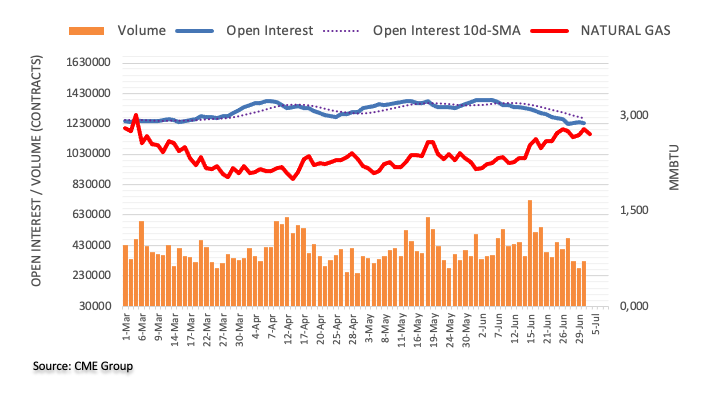
CME Group’s flash data for crude oil futures markets noted traders scaled back their open interest positions for the fourth session in a row on Friday, now by around 15.3K contracts. On the other hand, volume reversed two daily drops in a row and went up by more than 150K contracts.
WTI: Next on the upside comes $72.00
Prices of the barrel of WTI reclaimed the key $70.00 region on Friday, extending the recovery for the third straight session at the same time. The improvement in prices, however, was amidst shrinking open interest, removing some strength from the continuation of the rebound in the very near term. Immediately to the upside still emerges the weekly high around $72.70 (June 21).
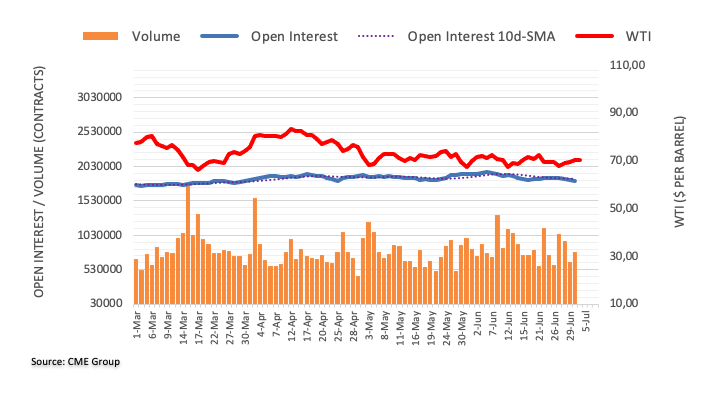
Economists at ANZ Bank see no hard evidence yet that central banks have reached an appropriate level of restrictiveness for rates.
Fed, ECB and BoE to maintain hawkish guidance
For the foreseeable future, therefore, we expect that the central banks will remain hawkish.
Changes in both the magnitude and frequency of rate rises reflect the reality that central banks have moved quickly to get policy to restrictive levels. It is natural for monetary strategy to evolve and that is not a reflection of a less hawkish monetary stance. Economies take time to respond to monetary tightening and it is appropriate that central banks embrace that in their frameworks.
We do not see the conditions yet in place for a central bank pivot. We continue to expect the Fed, ECB and BoE to tighten further. The evolution of the data will determine if additional rate hikes are required in the northern autumn.
Whilst embracing patience, we currently see the risks to our rate profile as higher for longer.
- USD/CAD struggles for clear directions between 50-EMA and 12-day-old resistance line.
- Previous resistance line, 200-EMA acts as additional trading filters.
- Bearish MACD signals challenge recovery from yearly low, lures Loonie pair sellers.
USD/CAD remains sidelined near 1.3250-60 despite picking up bids ahead of Monday’s European session. In doing so, the Loonie pair stays within a short-term trading range comprising the 50-Exponential Moving Average (EMA) and an upward-sloping resistance line from mid-June.
It’s worth noting the quote’s successful upside break of the one-month-old previous resistance line joins a U-turn from the 50-EMA to keep the USD/CAD buyers hopeful. However, the stated 200-EMA and bearish MACD signals challenge the pair’s advances.
Hence, the Loonie pair remains on the bear’s radar unless it stays below the 200-EMA level of around 1.3330. That said, the fortnight-old resistance line guards the immediate upside of the quote near 1.3290.
In a case where the USD/CAD price crosses the 1.3330 hurdle, the June 12 swing high of near 1.3385 will act as the last defense of the bears.
Alternatively, the 50-EMA and the aforementioned resistance-turned support line from June 05, respectively near 1.3230 and 1.3170, limits the nearby downside of the USD/CAD pair.
Following that, the yearly low marked in the last week around 1.3115 and the 1.3000 psychological magnet will gain the market’s attention.
USD/CAD: Four-hour chart
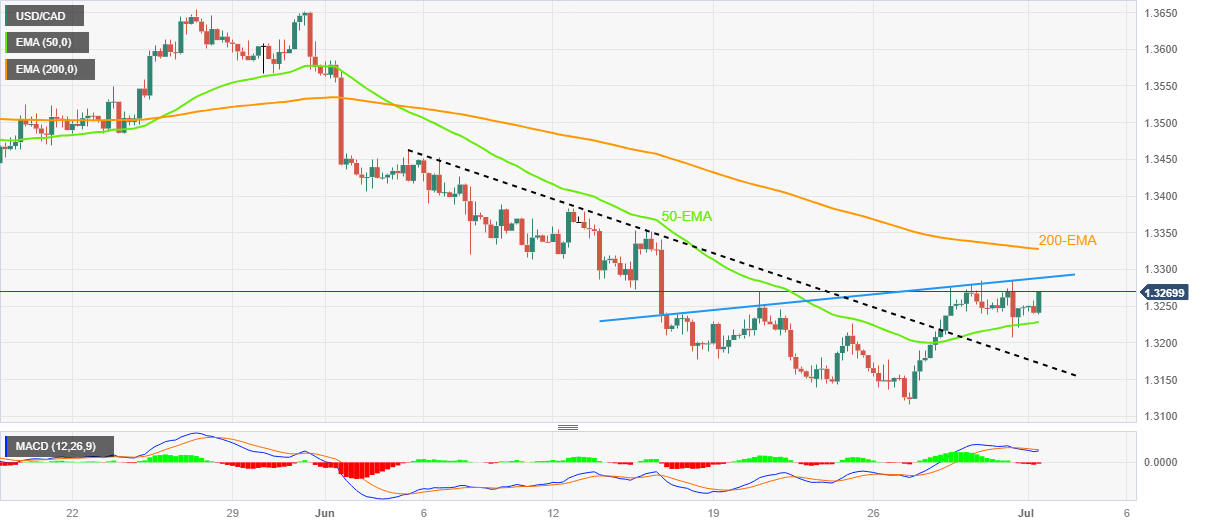
Trend: Downside expected
- NZD/USD has sensed marginal selling pressure around a three-day high at 0.6160.
- Investors are awaiting the release of the US ISM Manufacturing PMI data for further guidance.
- NZD/USD is approaching the downward-sloping trendline plotted from June 15 high at 0.6250.
The NZD/USD pair has faced some pressure after printing a fresh three-day high at 0.6160 in the early European session. The Kiwi asset is still possessing strength as the Caixin Manufacturing PMI data has outperformed expectations. The economic data landed at 50.5 higher than the expectations of 50.2 but remained lower than the prior release of 50.9.
It is worth noting that New Zealand is one of the leading trading partners to China and higher manufacturing activities in China support the New Zealand Dollar.
The US Dollar Index (DXY) is looking to climb above 103.00 as investors are awaiting the release of the United States ISM Manufacturing PMI data for further guidance.
NZD/USD is approaching the downward-sloping trendline plotted from June 15 high at 0.6250 on a four-hour scale. The Kiwi asset is facing barricades around the 200-period Exponential Moving Average (EMA) at 0.6150, which indicates that the long-term trend has not turned bullish yet. Horizontal resistance is placed from May 19 high at 0.6306.
The Relative Strength Index (RSI) is making efforts to shift into the bullish range of 60.00-80.00. An occurrence of the same would strengthen the New Zealand Dollar bulls.
Going forward, a decisive break above June 27 high at 0.6200 will drive the asset towards June 14 high at 0.6236 followed by May 17 high at 0.6274.
Alternatively, a downside move below June 23 low at 0.6116 will expose the asset June 05 low at 0.6041. A slippage below the latter would expose the asset to psychological support at 0.6000.
NZD/USD four-hour chart
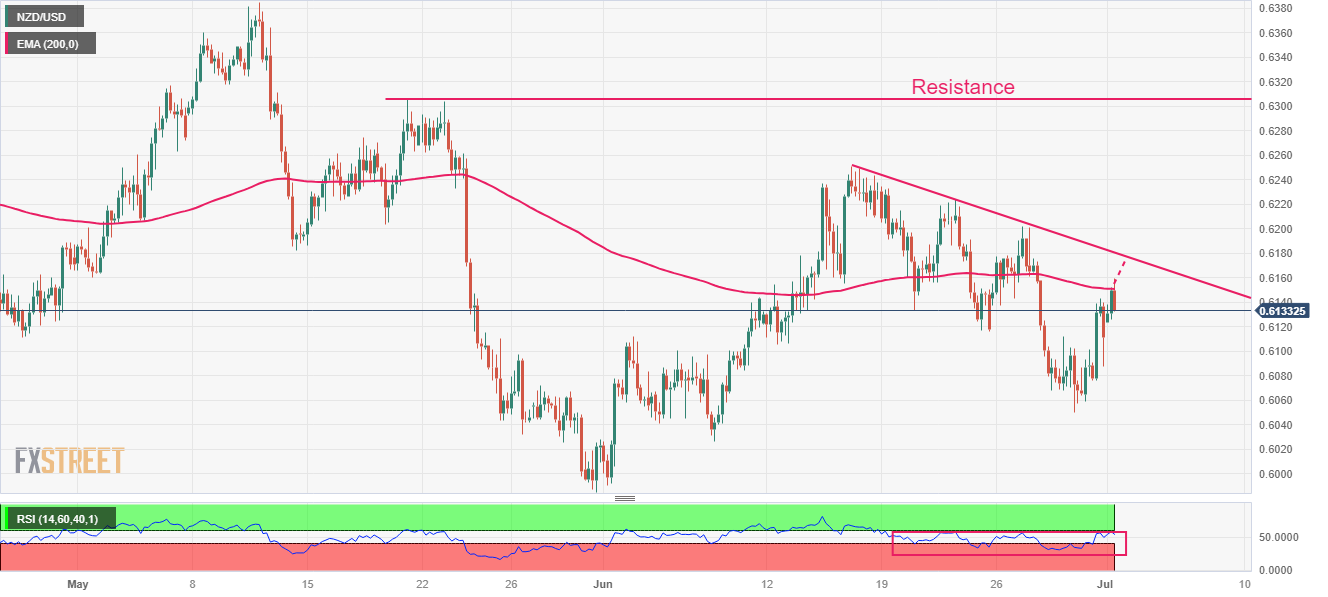
Open interest in gold futures markets rose for the second session in a row on Friday, this time by nearly 5K contracts according to preliminary readings from CME Group. Volume, instead, maintained the choppy trade well in place and dropped by around 29.5K contracts.
Gold faces minor support near $1890
Friday’s marked uptick in gold prices was on the back of rising open interest and a strong drop in volume. That said, while further gains appear on the cards in the very near term, a sustained bounce seems not favoured. On the downside, the yellow metal faces immediate support around the $1890 region per troy ounce.
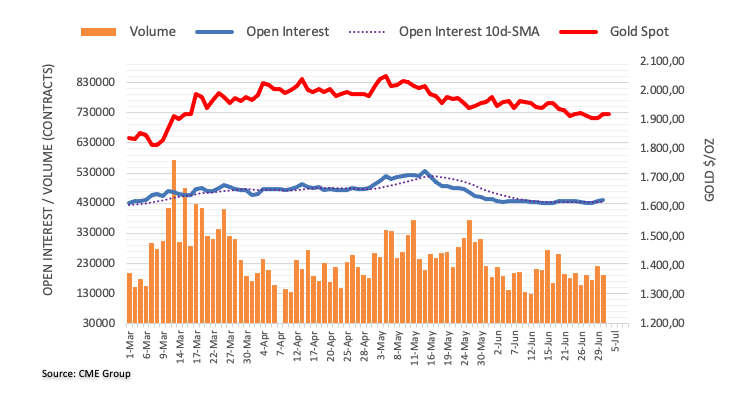
FX option expiries for July 3 NY cut at 10:00 Eastern Time, via DTCC, can be found below.
- EUR/USD: EUR amounts
- 1.0780 1.3b
- 1.0850 760m
- 1.0900 1.2b
- 1.0915 836m
- 1.0950 371m
- 1.1000 345m
- 1.1070 1.1b
- GBP/USD: GBP amounts
- 1.2650 331m
- 1.2700 394m
- 1.2750 360m
- 1.2850 350m
- USD/JPY: USD amounts
- 143.00 843m
- 144.50 480m
- 145.00 317m
- USD/CHF: USD amounts
- 0.8840 976m
- AUD/USD: AUD amounts
- 0.6650 340m
- NZD/USD: NZD amounts
- 0.6105 624m
- EUR/GBP: EUR amounts
- 0.8600 455m
- 0.8655 353m
- Gold Price stays defensive after bouncing off short-term key support, stays below $1,930 resistance confluence.
- Mixed concerns about China, Fed’s next moves prod XAU/USD traders ahead of the key FOMC Minutes, US NFP.
- US ISM Manufacturing PMI, risk catalysts will direct intraday moves.
Gold Price (XAU/USD) struggles to extend late last week’s corrective bounce off the three-month low as market players await top-tier data events. Also acting as trading filters for the XAU/USD are mixed concerns about the US Treasury Secretary Janet Yellen’s China visit and the Federal Reserve’s (Fed) rate hike moving in July and afterward. It should be noted that Friday’s easy prints of the US Personal Consumption Expenditure (PCE) Price Index for May, as well as softer outcomes of the US spending survey released previously, prod the Fed talks suggesting two more rate hikes in 2023. Elsewhere, the upbeat performance of equities also diverts the funding towards the shares, from the bullions, which in turn limits the Gold Price moves
Above all, the cautious mood ahead of this week’s Federal Open Market Committee (FOMC) Monetary policy meeting Minutes and the US jobs report for June restricts the Gold Price momentum of late. For the day, US ISM Manufacturing PMI will be important to watch.
Also read: Gold Price Forecast: XAU/USD looks south toward $1,890 ahead of US ISM Manufacturing PMI
Gold Price: Key levels to watch
As per our Technical Confluence Indicator, the Gold Price remains sidelined between the $1,915 and $1,930 trading range. However, the road towards the north appears bumpier and joins the multiple fundamental challenges to pod the XAU/USD bulls.
That said, Fibonacci 38.2% on one-month joins Pivot Point one-day R1 to restrict the bullion’s immediate upside near $1,930.
Following that, the previous weekly high of around $1,934 may prod the Gold buyers before directing them to a convergence of the Pivot Point one-week R1 and the middle band of the Bollinger on one-day, close to $1,940.
Meanwhile, Fibonacci 23.6% on one-day and 61.8% on one-week together highlight $1,918 as the immediate support.
However, major attention is given to the $1,915 support encompassing the Fibonacci 38.2% on one-day and 23.6% on one-month, as well as the 5-DMA.
Should the quote breaks the $1,915 support, minor supports near $1,904 and the $1,900 round figure may prod the Gold sellers.
Here is how it looks on the tool
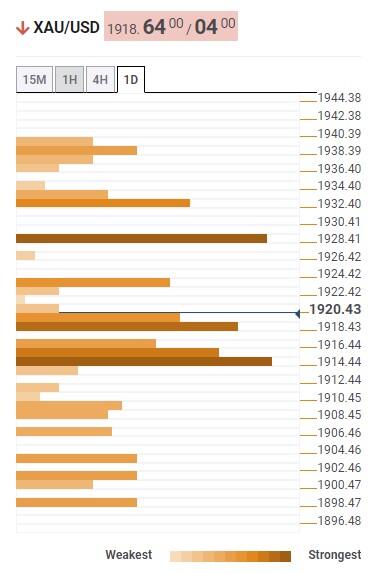
About Technical Confluences Detector
The TCD (Technical Confluences Detector) is a tool to locate and point out those price levels where there is a congestion of indicators, moving averages, Fibonacci levels, Pivot Points, etc. If you are a short-term trader, you will find entry points for counter-trend strategies and hunt a few points at a time. If you are a medium-to-long-term trader, this tool will allow you to know in advance the price levels where a medium-to-long-term trend may stop and rest, where to unwind positions, or where to increase your position size
- USD/CHF is struggling in keeping its auction above 0.8920 amid weakness in the USD Index.
- S&P500 futures are showing choppy moves as investors are getting cautious ahead of the quarterly result season.
- US Manufacturing PMI is expected to continue its seven months contraction further.
The USD/CHF pair has fallen back after a short-lived recovery move to near 0.8957 in the Asian session. The Swiss Franc asset is expected to continue its downside journey after dropping below the crucial support of 0.8930 ahead of crucial economic events.
S&P500 futures are showing choppy moves in early Europe as investors are getting cautious ahead of the kick-start of the quarterly result season and the release of the United States Manufacturing PMI data (June). Investors are worried that quarterly figures from banking stocks could be subdued due to tight credit conditions and technology stocks could remain under pressure amid expectations of weak guidance.
The US Dollar Index (DXY) has faced barricades around 103.00 as the overall market mood is quite upbeat. Investors are anticipating that the Federal Reserve (Fed) will not raise interest rates more than once by year-end. While Fed chair Jerome Powell has already conveyed that two small interest rate hikes are appropriate.
Later on Monday, the street will keep focusing on the US Manufacturing PMI, which will release at 14.00 GMT. According to the preliminary report, Manufacturing PMI is seen expanding to 47.2 vs. the former release of 46.9. This indicates that the economic data would continue its seven monthly contractions further.
On the Swiss Franc front, investors are awaiting June inflation data. Annual Consumer Price Index (CPI) data is seen softening to 1.8% vs. the prior release of 2.2%. Higher interest rates by the Swiss National Bank (SNB) are weighing heavily on price pressures. SNB Chairman Thomas J. Jordan has already conveyed that more rate hikes are expected ahead.
Economist at UOB Group Lee Sue Ann sees the RBA raising the OCR by 25 bps at its meeting on July 4.
Key Quotes
We continue to emphasize that every meeting in the near term will be live. Following the latest employment data, we are now penciling in a 25bps hike at the next monetary policy meeting on 4 Jul.
Employment strength has been a key factor in the RBA’s confidence that Australia can avoid a recession. The latest job figures showed that annual jobs growth rose to 3.4%, from 3.1% at the start of the year.
- Markets in Asia-Pacific zone edge higher even as China prods bulls.
- Unimpressive prints of China Caixin Manufacturing PMI for June, fears of US-China tension weigh on sentiment.
- Nikkei 225 rises more than 1.5% to refresh one-week high as BoJ Tankan survey defends easy monetary policy.
- 10-month high FPI inflows propel Indian equities, Indonesia’s IDX Composite grinds higher on softer inflation.
Equities in the Asia-Pacific region begin the week’s trading on a firmer footing, despite witnessing hurdles from China. That said, the hopes of more stimulus and upbeat foreign investments joined recent challenges to hawkish Fed concerns while favoring the share prices early Monday. However, downbeat China data and fears of economic recovery in the Asian major prod optimism as the key week comprising the Federal Open Market Committee (FOMC) Monetary policy meeting Minutes and the US jobs report begin.
While portraying the mood, the MSCI’s index of Asia-Pacific shares ex-Japan rises 1.40% intraday whereas Japan’s Nikkei 225 leads the region’s bulls with 1.65% daily gains to around 33,735 by the press time.
It’s worth noting that better-than-forecast China Caixin Manufacturing PMI fails to impress equity buyers from Beijing amid doubts about the world’s biggest industrial player’s economic recovery. Adding to the market’s indecision are mixed feelings about US Treasury Secretary Janet Yellen’s China visit during July 06-09 period. While the news appears positive for the sentiment on the front, the details seem less impressive as US Treasury Secretary Yellen is likely to flag concerns about human rights abuses against the Uyghur Muslim minority, China's recent move to ban sales of Micron Technology memory chips, and moves by China against foreign due diligence and consulting firms, per Reuters.
With this in mind, Australia’s ASX 200 grinds higher while New Zealand’s NZX50 bears the burden of upbeat New Zealand Building Permits. Furthermore, India’s Nifty50 renews a record high amid a 10-month top inflow from Foreign Portfolio Investors (FPIs).
Elsewhere, Friday’s downbeat performance of the Fed’s favorite inflation numbers, namely the US Personal Consumption Expenditure (PCE) Price Index for May, as well as softer outcomes of the US spending survey released previously, allowed Wall Street to close on the positive side. However, the S&P500 Futures and the US Treasury bond yields struggle for clear directions of late.
Looking forward, the US ISM Manufacturing PMI and other risk catalysts for intraday directions but major attention will be given to Fed Minutes and US Nonfarm Payrolls (NFP) report for a clear guide.
Also read: After a solid H1, how much more is left in the tank
- USD/IDR is looking for stability above 15,000 amid a decline in Indonesian inflation.
- US equities were heavily bought on Friday as the street is anticipating that the Fed might go with only one interest rate hike.
- US Manufacturing PMI is expected to continue its contracting spell due to higher interest rates from the Fed.
The USD/IDR pair is aiming for stability above the crucial resistance of 15,000 in the Asian session. The asset has picked some strength as Statistics Indonesia has reported that the Consumer Price Index (CPI) softened in June.
Monthly inflation showed a mild pace of 0.14% while the street was estimating a higher pace of 0.24% but remained higher than the pace of 0.09% being recorded last month. Annual inflation decelerated to 3.52% vs. the consensus of 3.64% and the former release of 4%. Core inflation that excludes oil and food prices landed at 2.58% but remained lower than the expectations of 2.64% and the prior release of 2.66%. This might allow the Bank Indonesia (BI) to keep the interest rates steady further.
Meanwhile, S&P500 futures are flat portraying a quite market mood. US equities were heavily bought last week as the street is anticipating that the Federal Reserve (Fed) might go with only one interest rate hike. The US Dollar Index (DXY) has faced barricades around 103.00 and is expected to remain volatile ahead of the United States Manufacturing PMI data to be released by the Institute of Supply Management (ISM) department.
As per the consensus, Manufacturing PMI is seen expanding to 47.2 vs. the former release of 46.9. Investors should note that US Manufacturing PMI has been contracting straight for the past seven months and is expected to continue its contracting spell due to higher interest rates from the Fed. Apart from that, New Orders Index is expected to jump to 44.0 vs. the former release of 42.6.
- AUD/USD seesaws around intraday high, struggles to defend three-day winning streak within immediate rising trend channel.
- Clear bounce off 100-HMA lures Aussie buyers despite channel’s top line, 200-HMA prod further upside.
- Bearish consolidation in play, fundamental clues eyed for clear directions ahead of RBA.
AUD/USD bulls struggle around the intraday high of near 0.6665-70 as a short-term key upside hurdle prods the risk-barometer pair’s three-day winning streak amid early Monday in Europe. In doing so, the Aussie pair justifies the trader’s anxiety ahead of Tuesday’s Reserve Bank of Australia (RBA) Interest Rate Decision.
That said, the AUD/USD pair’s latest run-up could be linked to its ability to recover from the 100-Hour Moving Average (HMA). Adding strength to the upside bias is the quote’s sustained break of a downward-sloping resistance line from June 16, now support near 0.6620.
However, an upward-sloping trend channel since the last Wednesday, currently between 0.6670 and 0.6615, restricts the quote’s immediate upside.
It’s worth noting that the major currency pair’s run-up beyond 0.6670 needs validation from the 200-HMA hurdle of around 0.6690, as well as the 0.6700 round figure, to convince the AUD/USD bulls.
Even so, the previous weekly high of 0.6720 can challenge the pair ahead of directing the run-up toward the 0.6800 round figure and then to the last monthly peak of near 0.6820.
Meanwhile, the 100-HMA and the previous resistance line, respectively near 0.6645 and 0.6620, restrict the short-term downside of the AUD/USD pair.
Following that, the stated channel’s bottom line and the monthly low, close to 0.6615 and 0.6595 in that order, will act as the final defense of the Aussie pair bears.
AUD/USD: Hourly chart
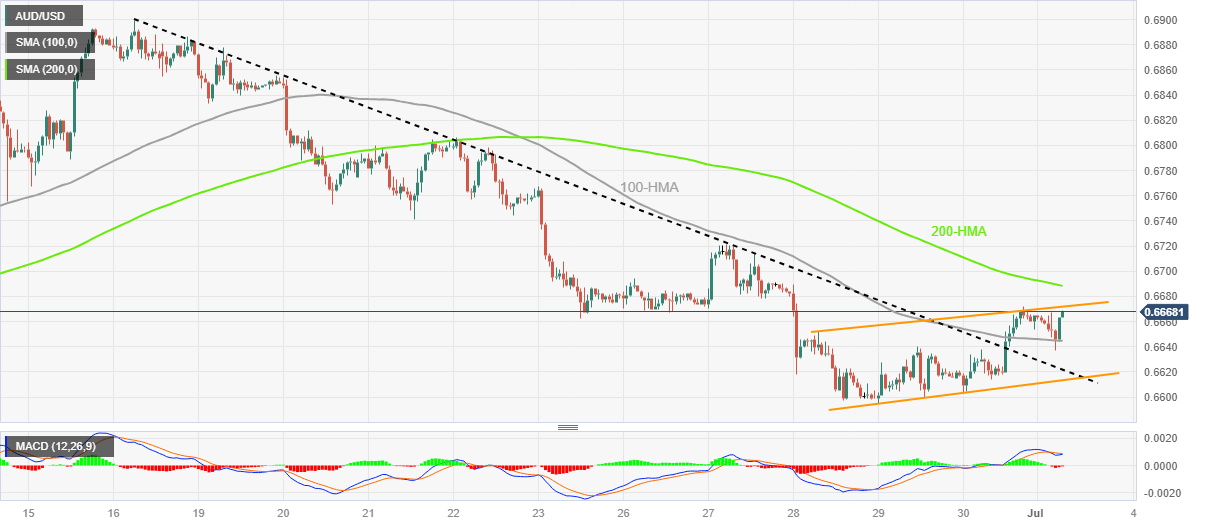
Trend: Limited upside expected
- EUR/USD holds steady above the 1.0900 mark, though struggles to attract any buyers.
- Bets for more Fed rate hikes revive the USD demand and act as a headwind for the pair.
- Worries about a global economic downturn contribute to capping gains for the major.
The EUR/USD pair struggles to gain any meaningful traction on the first day of the new week and oscillates in a narrow trading band through the Asian session. Spot prices, however, manage to defend the 1.0900 mark, though remain below the 200-hour Simple Moving Average (SMA) resistance, warranting caution before positioning for an extension of Friday's goodish rebound from a two-week low.
The shared currency continues to draw some support from rising bets for another 25 bps lift-off by the European Central Bank (ECB) in July and turns out to be a key factor lending some support to the EUR/USD pair. The preliminary report published by Eurostat showed that the annual Euro Zone Harmonised Index of Consumer Prices (HICP) decelerated from 6.1% to 5.5% in June. That said, the Core HICP rose by 0.3% MoM and edged higher to the 5.4% YoY rate, reaffirming expectations for more rate hikes by the ECB in the coming months.
That said, the emergence of some US Dollar (USD) buying, supported by the Federal Reserve's (Fed) hawkish stance, is holding back bulls from placing aggressive bets around the EUR/USD pair and acting as a headwind. It is worth recalling Fed Chair Jerome Powell reiterated last week that borrowing costs may still need to rise as much as 50 bps by the end of this year. Moreover, the current market pricing indicates a nearly 85% chance of a 25 bps lift-off at the July FOMC meeting and the bets were reaffirmed by Friday's mixed US PCE Price Index.
In fact, the Bureau of Economic Analysis reported that the annual PCE Price Index decelerated to 3.8% in May from 4.3% in the previous month. Additional details showed the Core PCE Price Index, excluding the volatile food and energy components, ticked down to 4.6% during the reported month from 4.7% in April. The gauge, however, remains well above the Fed's 2% target and supports prospects for further policy tightening. This remains supportive of elevated US Treasury bond yields, which lend support to the USD and cap the EUR/USD pair.
Apart from this, worries about economic headwinds stemming from rapidly rising borrowing costs warrant some caution for bullish traders ahead of this week's important macro releases, starting with the US ISM Manufacturing PMI on Monday. The focus, meanwhile, will remain glued to the FOMC meeting minutes on Wednesday, which will be followed by the closely-watched US monthly employment details - popularly known as NFP. This will play a key role in influencing the USD and provide a fresh directional impetus to the EUR/USD pair.
Technical levels to watch
- USD/INR prints the biggest daily loss on a day, so far, since early June on breaking the key support.
- India reports the biggest FPI inflow of 2023 in June, up for the fourth consecutive month.
- Firmer Oil price, mixed sentiment and softer US inflation gauge prod Indian Rupee traders.
- FOMC Minutes, US NFP will be crucial for clear directions.
USD/INR drops to the lowest levels since early May after breaking the short-term key support, backed by upbeat Indian fundamentals, amid Monday morning in Europe.
That said, an upward-sloping trend line from November 2022 has been restricting the Indian Rupee (INR) pair’s downside of late and hence the latest break of the same triggered the quote’s slump towards the multi-day low.
Adding strength to the USD/INR downside momentum is the news that the Foreign Portfolio Investors (FPIs) have parked the biggest sum in 10 months in India, not to forget marking the fourth consecutive advance. “The foreign portfolio investors (FPIs) pumped in ₹47,148 crore in Indian equities in June, the highest monthly buying of the year,” said The Mint.
While cheering a technical breakdown and the heavy equity flow that propels India’s benchmark equity gauges to an all-time high, the USD/INR pair ignores upbeat prices of WTI crude oil. WTI crude oil rises for the fourth consecutive day to $70.65 by the press time, up 0.34% intraday at the latest. It’s worth observing that India’s heavy reliance on energy imports makes the INR vulnerable to Oil price moves.
Not only the Oil price but the US Dollar’s rebound also fails to inspire the USD/INR buyers. The reason could be linked to Friday’s downbeat performance of the Fed’s favorite inflation numbers, namely the US Personal Consumption Expenditure (PCE) Price Index for May, as well as softer outcomes of the US spending survey released previously. With this, the US Dollar Index (DXY) prints mild gains around 103.00, reversing the previous day’s pullback from a two-week high.
Elsewhere, the US Treasury Secretary Janet Yellen’s China visit during July 06-09 period witnessed mixed responses from the market. While the news appears positive for the sentiment on the front, the details seem less impressive as US Treasury Secretary Yellen is likely to flag concerns about human rights abuses against the Uyghur Muslim minority, China's recent move to ban sales of Micron Technology memory chips, and moves by China against foreign due diligence and consulting firms, per Reuters.
Having witnessed the initial market reaction to the trend line breakout and upbeat fundamentals, the USD/INR traders should pay attention to the US ISM Manufacturing PMI and other risk catalysts for intraday directions. However, major attention will be given to Fed Minutes and US Nonfarm Payrolls (NFP) report for a clear guide.
Technical analysis
A clear downside break of an eight-month-old rising support line, now immediate resistance near 81.95, directs the USD/INR bears toward the April month’s bottom of around 81.60.
- USD/JPY grinds near intraday high, reverses previous day’s pullback from eight-month high.
- Treasury bond yields remain sidelined, S&P500 Futures struggle amid dicey markets.
- BoJ Tankan survey defends easy-money policy, Japan PMI weakens for June.
- US ISM Manufacturing PMI, risk catalysts eyed for clear directions.
USD/JPY seesaws around 144.60 as it seeks fresh clues to defend intraday gains amid a sluggish start to another key trading week. In doing so, the Yen pair reverses the previous day’s retreat from the highest levels since November 2022 amid mixed risk catalysts and downbeat Japan data.
Japan’s Tankan Manufacturing Survey for the second quarter (Q2) of 2023 appears to defend the Bank of Japan’s (BoJ) dovish monetary policy bias as it expects easy inflation. Also likely to have weighed on the USD/JPY price could be the downbeat prints of Japan’s final prints of Jibun Bank Manufacturing PMI for June, to 49.8 as it matches the initial forecasts.
Also read: Japan firms expect CPI to rise 2.6% a year from now – BoJ Tankan Survey
Elsewhere, the market’s fears of Japan's intervention recede after the Yen pair retreated from 145.07 the previous day. However, the mixed headlines about China and the cautious mood ahead of this week’s top-tier data/events, comprising the Federal Open Market Committee (FOMC) Monetary policy meeting Minutes and the US jobs report, also prod the USD/JPY bulls.
It’s worth noting that the US Treasury Secretary Janet Yellen’s China visit during July 06-09 period witnessed mixed responses from the market. While the news appears positive for the sentiment on the front, the details seem less impressive as US Treasury Secretary Yellen is likely to flag concerns about human rights abuses against the Uyghur Muslim minority, China's recent move to ban sales of Micron Technology memory chips, and moves by China against foreign due diligence and consulting firms, per Reuters.
On the other hand, the Federal Reserve’s (Fed) preferred inflation gauge, namely US Personal Consumption Expenditure (PCE) Price Index, for May, came in at 0.3% MoM and 4.6% YoY versus market expectations of reprinting the 0.4% and 4.7% figures for monthly and yearly prior readings. With this, the key inflation numbers marked the smallest yearly gain in six months. Further, the Personal Consumption Expenditure (PCE) Price for Q1 2023 eased to 4.1% QoQ from 4.2% expected and prior whereas the Pending Home Sales slumped to -2.7% MoM for May compared to 0.2% expected and -0.4% prior (revised). Hence, the cooling of spending and easy inflation challenge Fed Chair Jerome Powell’s support for “two more rate hikes in 2023” and prod the USD/JPY buyers.
Amid these plays, S&P500 Futures fail to trace the upbeat Wall Street performance whereas the US Treasury bond yields struggle of late.
Moving on, the US ISM Manufacturing PMI for June will join the risk catalysts to direct intraday moves but major attention will be given to Fed Minutes and US Nonfarm Payrolls (NFP) report for a clear guide.
Technical analysis
USD/JPY remains on the bull’s radar unless breaking the 143.90 trend line support, comprising the bottom line of a one-month-old rising trend channel.
- GBP/JPY kicks off the new week on a positive note and climbs back closer to the multi-year peak.
- The BoJ’s dovish stance continues to undermine the JPY and remains supportive of the move-up.
- Looming recession risks act as a headwind for the GBP and might cap the upside for spot prices.
The GBP/JPY cross attracts fresh buyers on the first day of a new week and steadily climbs back closer to its highest level since December 2015 touched on Friday. Spot prices currently trade around the 183.70-183.65 region, up over 0.20% for the day, and seem poised to prolong the recent well-established uptrend witnessed over the past three months or so.
The Japanese Yen (JPY) continues with its relative underperformance in the wake of a more dovish stance adopted by the Bank of Japan (BoJ) and turns out to be a key factor lending support to the GBP/JPY cross. In fact, market participants seem convinced that BoJ's negative interest-rate policy will remain in place at least until next year. Moreover, BoJ Governor Kazuo Ueda recently ruled out the possibility of any change in ultra-loose policy settings and signalled no immediate plans to alter the yield curve control measures.
In contrast, the Bank of England (BoE) Governor Andrew Bailey said last week that rates could remain at peak levels for longer than traders currently expect. Apart from this, a generally positive tone around the equity markets is seen undermining the safe-haven JPY and further acting as a tailwind for the GBP/JPY cross. That said, worries about economic headwinds stemming from rapidly rising borrowing costs might keep a lid on any further appreciating move against the backdrop of fears of an intervention by Japanese authorities.
Concerns that the British economy is heading for a recession mounted sharply following a surprise 50 bps rate hike by the BoE in June. This, in, might hold back traders from placing aggressive bullish bets around the British Pound and cap gains for the GBP/JPY cross in the wake of overbought technical indicators on the daily chart. Market participants now look forward to the release of the final UK Manufacturing PMI for a fresh impetus. Nevertheless, the aforementioned supportive fundamental backdrop still seems tilted in favour of bulls.
Technical levels to watch
- GBP/USD remains confined in a narrow trading band through the Asian session on Monday.
- Bets for more Fed rate hikes help revive the USD demand and cap the upside for the major.
- The BoE’s aggressive tightening fuel recession fears and also act as a headwind for the GBP.
The GBP/USD pair struggles to gain any meaningful traction on the first day of a new week and oscillates in a narrow trading band, around the 1.2700 mark through the Asian session. Spot prices, meanwhile, remain below Friday's swing high and so far, have been struggling to make it through the 200-hour Simple Moving Average (SMA).
Expectations the Federal Reserve (Fed) will continue to tighten its monetary policy assist the US Dollar (USD) to attract some buyers on Monday, which, in turn, is seen as a key factor acting as a headwind for the GBP/USD pair. Data released from the US on Friday showed that the PCE Price Index remains well above the Fed's 2% target and supports prospects for further policy tightening. In fact, the current market pricing indicates a nearly 85% chance of a 25 bps lift-off at the next FOMC policy meeting in July.
Fed Chair Jerome Powell reiterated last week that borrowing costs may still need to rise as much as 50 bps by the end of this year. This, in turn, remains supportive of elevated US Treasury bond yields, which helps revive the USD demand and fails to assist the GBP/USD pair to capitalize on Friday's solid rebound from sub-1.2600 levels. That said, a generally positive tone around the equity markets keeps a lid on any further gains for the safe-haven Greenback and should help limit the downside for the major.
Traders might also refrain from placing aggressive bets and prefer to wait on the sidelines ahead of key US macro data scheduled at the beginning of a new month. A rather busy week kicks off with the release of the US ISM Manufacturing PMI, due later during the early North American session. The focus, however, will remain glued to the FOMC meeting minutes on Wednesday, which will be followed by the closely-watched US monthly jobs report - popularly known as NFP on Friday - and drive the USD.
In the meantime, growing concerns that the UK economy is heading for recession, especially after a surprise 50 bps rate hike by the Bank of England (BoE) in June, might keep a lid on any meaningful upside for the GBP/USD pair. This makes it prudent to wait for strong follow-through buying before confirming that the recent pullback from a 14-month peak has run its course and positioning for a further appreciating move.
Technical levels to watch
- Natural Gas Price prints the first daily loss in three while reversing from three-week-old previous support.
- Looming bear cross on MACD, descending RSI line add strength to downside bias targeting 21-EMA.
- 61.8% Fibonacci retracement checks XNG/USD bears; 1.5-month-old ascending resistance line appears key hurdle for Natural Gas buyers.
Natural Gas Price (XNG/USD) drops more than 2.0% to $2.71 early Monday as it snaps the previous day's two-day run-up while reversing from a six-week-old support-turned-resistance line.
Not only the XNG/USD’s U-turn from the previous support line but the impending bear cross on the MACD and downward-sloping RSI (14) line from the overbought territory add strength to the bearish bias about the Natural Gas Price.
However, the 21-Exonential Moving Average (EMA) level of $2.66 put a floor under the short-term XNG/USD price.
It’s worth noting that the 61.8% Fibonacci retracement of its March-April fall, near $2.71, limits the immediate downside of the Natural Gas Price whereas the 50% Fibonacci retracement level can act as additional support for the energy instrument near $2.60.
In a case where the XNG/USD remains bearish past $2.60, April’s peak of $2.58 will act as the last defense of the Natural Gas sellers.
On the contrary, a run-up beyond the previous support line, around $2.83 by the press time, isn’t an open invitation to the Natural Gas buyers as an upward-sloping resistance line from May 19, close to $2.95, will challenge the upside momentum before directing the price to March’s peak of near $3.08.
Also acting as an upside filter is the $3.00 psychological magnet.
Overall, the Natural Gas Price is likely to witness further downside but the room towards the south appears limited.
Natural Gas Price: Daily chart
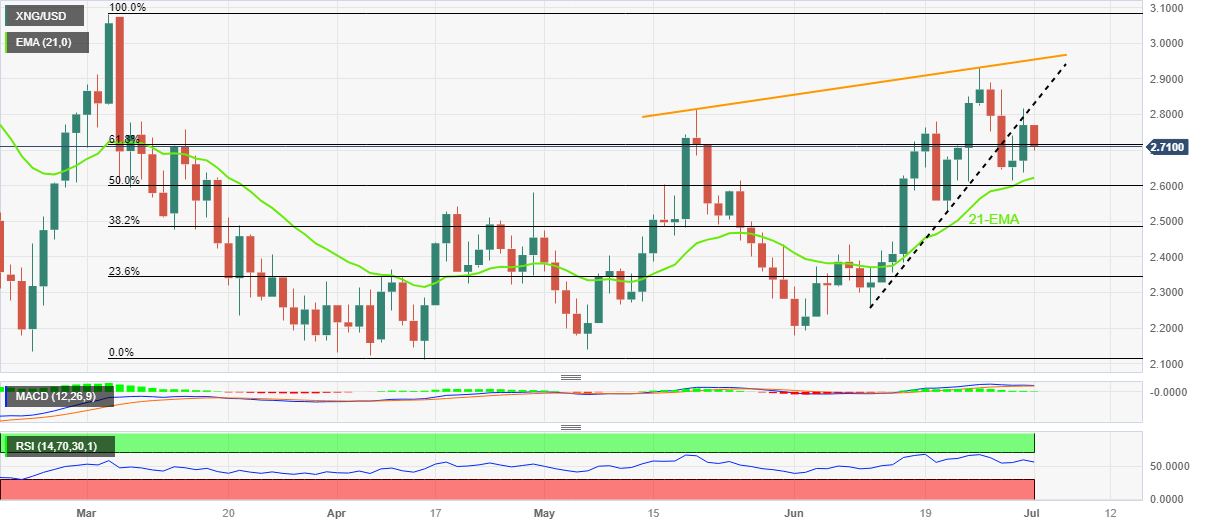
Trend: Further weakness expected
- Gold price edges lower on Monday and stalls its recent recovery from a multi-month low.
- Bets for more rate hikes by Federal Reserve revive US Dollar demand and exert pressure.
- Economic woes could limit losses for the XAU/USD ahead of this week’s US macro data.
Gold price kicks off the new week on a softer note and for now, seems to have stalled the recent recovery from the $1,893-$1,892 area, or its lowest level since mid-March touched last Thursday. The XAU/USD currently trades around the $1,916-$1,917 region, down nearly 0.20% for the day.
Modest US Dollar uptick weighs on Gold price
The US Dollar (USD) attracts some buyers and recovers a part of Friday's heavy losses, which, in turn, is seen as a key factor weighing on the Gold price. Data released from the United States (US) on Friday showed that the Personal Consumption Expenditures (PCE) Price Index decelerated to 3.8% in May from 4.3% previous. Furthermore, the Core PCE Price Index, excluding the volatile food and energy components, ticked down to 4.6% during the reported month from 4.7% in April. The gauge, however, remains well above the Fed's 2% target and supports prospects for further policy tightening.
Hawkish major central banks also undermine XAU/USD
In fact, the current market pricing indicates a nearly 85% chance of a 25 basis points (bps) lift-off at the next Federal Open Market Committee policy meeting on July 25-26. Moreover, Fed Chair Jerome Powell reiterated last week that borrowing costs may still need to rise as much as 50 bps by the end of this year. This, in turn, remains supportive of elevated US Treasury bond yields and acts as a tailwind for the Greenback. Apart from this, a more hawkish outlook by other major central banks further seems to undermine demand for the safe-haven Gold price and contributes to a modest intraday downtick on Monday.
Economic woes could limit losses for Gold price
That said, worries about a global economic downturn, particularly in China, could lend some support to the safe-haven precious metal and help limit deeper losses, at least for the time being. The market concerns, meanwhile, remain intact following the release of a slightly better-than-expected Chinese Manufacturing Purchasing Managers' Index (PMI), which came in at 50.5 for June, though marked a slowdown from the previous month's reading of 50.9. This might hold back traders from placing fresh bearish bets around Gold price ahead of key macro US data scheduled at the beginning of a new month.
Investors look to important releases from US for fresh impetus
The release of the US ISM Manufacturing PMI, due later during the early North American session this Monday, marks the beginning of a rather busy week, which also features the closely-watched US monthly employment details. The focus, however, will remain glued to the FOMC meeting minutes on Wednesday, which will play a key role in influencing the USD price dynamics and provide some meaningful impetus to the Gold price. Nevertheless, the aforementioned fundamental backdrop seems tilted in favour of bearish traders and suggests that the path of least resistance is to the downside.
Gold price technical outlook
From a technical perspective, any subsequent slide is likely to find some support near the $1,900 round-figure mark ahead of the multi-month low, around the $1,893-$1,892 region. Some follow-through selling will make the Gold price vulnerable to accelerate the slide towards the very important 200-day Simple Moving Average (SMA), currently around the $1,859 area.
On the flip side, momentum beyond the $1,922 immediate barrier is likely to confront stiff resistance near the $1,936 horizontal zone. This is closely followed by the 100-day SMA, around the $1,942 region, which if cleared decisively might trigger a short-covering rally. The Gold price might then accelerate the recovery towards the $1,962-$1,964 hurdle en route to the $1,970-$1,972 supply zone. Some follow-through buying should allow bulls to reclaim the $2,000 psychological mark and test the $2,010-$2,012 resistance.
Key levels to watch
Australian Trade Minister Don Farrell said that he expected more announcements on improving trade with China soon
In an interview with a local public broadcaster ABC over the weekend, Australian Agriculture Minister Murray Watt said, “ties between Australia and China have gradually warmed.
Watt’s comments come after his meeting with his Chinese counterpart, the first meeting since 2019.
Market reaction
AUD/USD is losing further ground on the day, despite encouraging comments from Australian officials. The pair is down 0.41% on the day to trade at 0.6636, as of writing.
| Raw materials | Closed | Change, % |
|---|---|---|
| Silver | 22.765 | 0.84 |
| Gold | 1919.15 | 0.55 |
| Palladium | 1226.44 | -0.03 |
- WTI crude oil pares intraday gains after rising in the last four consecutive day.
- China Caixin Manufacturing PMI came in better than forecast in June but mixed US-China updates prod Oil buyers.
- Hopes of Saudi price cut contrasts with OPEC+ production cut concerns to trouble energy traders.
- OPEC updates, US PMIs and NFP will be crucial for clear directions.
WTI crude oil remains on the front foot for the fourth consecutive day, up 0.30% intraday near $70.65 amid early Monday. In doing so, the black gold cheer the better-than-forecast China PMI data amid hopes of higher Oil demand, versus supply crunch from the major energy producers.
China’s Caixin Manufacturing PMI eased to 50.5 for June, from 50.9 prior, but came in above forecasts of 50.2.
It’s worth noting that Saudi Arabia-inspired crude oil supply cuts contrast with the hopes of upbeat energy demand to prod the energy buyers. That said, Reuteres’ forecasts suggest no change in the Organization of the Petroleum Exporting Countries (OPEC) and Saudi Oil price with a floor of near $80.00.
Recently, Asia refiners expect Saudi Arabia to cut August crude prices, which in turn will result in higher energy demand amid a recent pullback in the US Dollar Index (DXY) and receding economic fears surrounding China and the US, namely the top oil consumers.
On a different page, mixed reactions to recently confirmed US Treasury Secretary Janet Yellen’s China visit, during July 06-09 period, test the Oil traders. While the news appears positive for the sentiment on the front, the details seem less impressive as US Treasury Secretary Yellen is likely to flag concerns about human rights abuses against the Uyghur Muslim minority, China's recent move to ban sales of Micron Technology memory chips, and moves by China against foreign due diligence and consulting firms, per Reuters.
It’s worth observing that the easing in the Fed’s favorite inflation numbers joins hawkish Fed talks to prod the WTI bulls of late.
Moving on, US ISM Manufacturing PMI for June will direct intraday moves but major attention will be given to this week’s OPEC+ meeting and the US employment report for a clear guide.
Technical analysis
A daily closing beyond the 21-DMA, around $70.35 at the latest, directs WTI crude oil buyers to aim for a five-week-old descending resistance line, at $71.90 by the press time.
- USD/CNH remains pressured around intraday low, stretches pullback from the highest level since November 2022.
- China Caixin Manufacturing PMI came in better than forecast to 50.5 in June.
- PBoC announced a surprise easing in USD/CNH fix after fueling it in the last few days.
- Mixed concerns about US-China talks, softer US inflation clues, spending also prod offshore Yuan traders.
USD/CNH prints the biggest daily loss in a week, so far, with its quick slide to 7.2450 after better-than-expected China activity data. However, the mixed concerns about the US-China ties and the People’s Bank of China’s (PBoC) latest moves prod the offshore Chinese Yuan (CNH) pair early Monday.
That said, China’s Caixin Manufacturing PMI eased to 50.5 for June, from 50.9 prior, but came in above forecasts of 50.2.
On the other hand, the PBoC set the onshore Chinese Yuan (USD/CNY) rate at 7.2157 on Monday, versus the previous fix of 7.2258 and market expectations of 7.2464. It's worth noting that the USD/CNY closed near 7.2510 the previous day. With this, the Chinese central bank's onshore Yuan (CNY) fix retreats from the yearly top marked the previous day.
Elsewhere, mixed reactions to recently confirmed US Treasury Secretary Janet Yellen’s China visit during July 06-09 period test the USD/CNH traders. While the news appears positive for the sentiment on the front, the details seem less impressive as US Treasury Secretary Yellen is likely to flag concerns about human rights abuses against the Uyghur Muslim minority, China's recent move to ban sales of Micron Technology memory chips, and moves by China against foreign due diligence and consulting firms, per Reuters.
It’s worth noting that the USD/CNH reversed from the multi-month high the previous day after the Federal Reserve’s (Fed) preferred inflation gauge, namely US Personal Consumption Expenditure (PCE) Price Index, for May, came in at 0.3% MoM and 4.6% YoY versus market expectations of reprinting the 0.4% and 4.7% figures for monthly and yearly prior readings. With this, the key inflation numbers marked the smallest yearly gain in six months.
On the same line, the Personal Consumption Expenditure (PCE) Price for Q1 2023 eased to 4.1% QoQ from 4.2% expected and prior whereas the Pending Home Sales slumped to -2.7% MoM for May compared to 0.2% expected and -0.4% prior (revised).
The cooling of spending and easy inflation challenge Fed Chair Jerome Powell’s support for “two more rate hikes in 2023” and prod the USD/CNH buyers.
Amid these plays, S&P500 Futures fail to trace the upbeat Wall Street performance whereas the US Treasury bond yields struggle of late.
Moving forward, the US ISM Manufacturing PMI for June will join the risk catalysts to direct intraday moves but major attention will be given to Fed Minutes and US jobs report for a clear guide.
Technical analysis
Although Friday’s Doji candlestick on the daily chart, at a multi-month high, joins the overbought RSI (14) line to tease the USD/CNH bears, a fortnight-old support line, near 7.2530 at the latest, challenges the sellers.
- AUD/USD seesaws between tepid gains/minor losses through the Asian session on Monday.
- A positive risk tone and a slightly better-than-expected Chinese PMI lend support to the pair.
- Bets for more rate hikes by the Fed help revive the USD demand and cap gains for the major.
The AUD/USD pair struggles to capitalize on last week's bounce from sub-0.6600 levels and oscillates in a narrow trading band through the Asian session on Monday. Spot prices currently trade around mid-0.6600s, nearly unchanged for the day, and move little in reaction to the official Chinese PMI print.
The mixed US PCE Price Index released on Friday raised doubt about the possibility of a more aggressive policy tightening by the Federal Reserve (Fed) and boosted investors' sentiment, which, in turn, benefits the risk-sensitive Aussie. This, along with subdued US Dollar (USD) demand, acts as a tailwind for the AUD/USD pair, which draws additional support from slightly better-than-expected Chinese macro data.
In fact, the official data published by the country’s National Bureau of Statistics (NBS) showed China's Manufacturing PMI came in at 50.5 in June as compared to the 50.2% anticipated. This, however, is below May's reading of 50.9% and does little to ease worries about a slowdown in the world's second-largest economy. Apart from this, bets for additional rate hikes by the Fed lend support to the USD and cap the AUD/USD pair.
In fact, the current market pricing indicates a nearly 85% chance of a 25 bps lift-off at the next FOMC policy meeting in July. Moreover, Fed Chair Jerome Powell reiterated last week that borrowing costs may still need to rise as much as 50 bps by the end of this year. This remains supportive of elevated US Treasury bond yields, which supports prospects for the emergence of some USD dip-buying and keeping a lid on the AUD/USD pair.
Market participants now look forward to the release of the US ISM Manufacturing PMI, due later during the early North American session, which marks the start of this week's key US macro releases scheduled at the beginning of a new month. The key focus, meanwhile, will remain on the FOMC meeting minutes on Wednesday and the closely-watched US monthly employment details - popularly known as the NFP report on Friday.
Technical levels to watch
- US Dollar Index extends previous day’s losses amid slightly downbeat market sentiment.
- Softer prints of Fed’s favorite inflation, US personal spending challenge hawkish concerns about US central bank and test DXY bulls.
- US ISM Manufacturing PMI, US-China news can direct intraday moves of the DXY but FOMC Minutes, NFP details are crucial.
US Dollar Index (DXY) takes offers to refresh its intraday low near 102.90 as it stretches the previous day’s U-turn from a three-week top amid a sluggish start to the key week comprising the Federal Open Market Committee (FOMC) Monetary policy meeting Minutes and the US jobs report.
It’s worth noting that the downbeat prints of the US inflation clues and spending numbers challenge the hawkish Fed concerns. However, mixed feelings about the US-China ties and dicey markets put a floor under the DXY prices.
That said, the Federal Reserve’s (Fed) preferred inflation gauge, namely US Personal Consumption Expenditure (PCE) Price Index, for May, came in at 0.3% MoM and 4.6% YoY versus market expectations of reprinting the 0.4% and 4.7% figures for monthly and yearly prior readings. With this, the key inflation numbers marked the smallest yearly gain in six months.
On the same line, the Personal Consumption Expenditure (PCE) Price for Q1 2023 eased to 4.1% QoQ from 4.2% expected and prior whereas the Pending Home Sales slumped to -2.7% MoM for May compared to 0.2% expected and -0.4% prior (revised).
Hence, the cooling of spending and easy inflation challenge Fed Chair Jerome Powell’s support for “two more rate hikes in 2023” and prod the US Dollar Index buyers even as the greenback’s gauge versus six major currencies rose in the last two consecutive weeks while printing the first quarter gains in three.
Elsewhere, mixed reactions to recently confirmed US Treasury Secretary Janet Yellen’s China visit during July 06-09 period prod the DXY traders. While the news appears positive for the sentiment on the front, the details seem less impressive as US Treasury Secretary Yellen is likely to flag concerns about human rights abuses against the Uyghur Muslim minority, China's recent move to ban sales of Micron Technology memory chips, and moves by China against foreign due diligence and consulting firms, per Reuters.
Amid these plays, S&P500 Futures grind higher by tracing upbeat Wall Street performance whereas the US Treasury bond yields remain firmer.
Looking ahead, the US ISM Manufacturing PMI for June will join the risk catalysts to direct intraday moves but major attention will be given to Fed Minutes and US jobs report for a clear guide.
Technical analysis
A downside break of a one-week-old rising trend line, now immediate resistance near 103.00, teases US Dollar Index sellers.
China's Caixin Manufacturing Purchasing Managers' Index (PMI) came in at 50.5 in June, compared with May’s 50.9 readout, according to the latest data published on Monday. The market expectation was for a 50.2 expansion.
Key highlights (via Caixin)
Output expands marginally as demand growth remains mild.
Input prices fall at quickest rate since January 2016.
Business confidence slips to eight-month low.
On Friday, China's official Manufacturing PMI arrived at 49.0 in June as against the 48.8 contraction seen in May.
AUD/USD reaction
The upbeat print of the Chinese Manufacturing PMI failed to lift the Aussie Dollar, with AUD/USD testing the 0.6650 mark. The spot is trading at 0.6658, at the time of writing, down 0.12% on the day.
- USD/CAD attracts some buyers on Monday and is supported by a modest USD uptick.
- Bets for more rate hikes by the Fed helps revive the USD demand and act as a tailwind.
- Investors now look to this week’s US macro data and FOMC minutes for a fresh impetus.
The USD/CAD pair kicks off the new week on a positive note, following a good two-way price swings on Friday, and maintains its bid tone, around mid-1.3200s through the Asian session.
Firming expectations the Federal Reserve (Fed) will continue to tighten its monetary policy assist the US Dollar (USD) to attract some buyers on Monday, which, in turn, is seen as a key factor acting as a tailwind for the USD/CAD pair. It is worth recalling that Fed Chair Jerome Powell reiterated last week that borrowing costs may still need to rise as much as 50 bps by the end of this year. Moreover, the current market pricing indicates a nearly 85% chance of a 25 bps lift-off at the next FOMC policy meeting in July and the bets were reaffirmed by the fact that the US PCE Price Index remains well above the 2% inflation target.
In fact, the US Bureau of Economic Analysis report on Friday the annual PCE Price Index decelerated to 3.8% in May from 4.3% in the previous month and the core gauge, excluding the volatile food and energy components, ticked down to 4.6% from 4.7% in April. Additional details, however, showed that the US consumer spending slowed sharply in May, which, in turn, is holding back the USD bulls from placing aggressive bets and keeping a lid on any meaningful upside for the USD/CAD pair. Crude Oil prices, meanwhile, consolidate last week's strong recovery gains and do little to influence the commodity-linked Loonie.
That said, the softer domestic consumer inflation for May, which registered its slowest pace of rise since June 2021, might continue to undermine the Canadian Dollar (CAD) and lend support to the USD/CAD pair. The monthly Canadian GDP print released on Friday, however, leaves the door open for the Bank of Canada to hike interest rates in July. This, in turn, makes it prudent to wait for strong follow-through buying before traders start positioning for the resumption of the pair's recent bounce from the 1.3115 region, or its lowest level since September 2022 touched last week.
Market participants now look forward to important US macro data scheduled at the beginning of a new month, starting with the release of the ISM Manufacturing PMI later during the early North Amreican session this Monday. The key focus, meanwhile, will remain on the FOMC meeting minutes on Wednesday and the closely-watched US monthly employment details - popularly known as the NFP report on Friday. This, along with Canadian jobs data and Oil price dynamics, will drive demand for the CAD and make it an eventful week for the USD/CAD pair.
Technical levels to watch
- EUR/USD takes offers to refresh intraday low while reversing from short-term key resistance confluence.
- Convergence of 50-SMA, one-week-old descending resistance line limits immediate Euro upside.
- Upbeat MACD signals, steady RSI keeps bullish bias intact unless breaking 200-SMA support.
- EU/US PMIs for June will entertain intraday traders, Fed Minutes, US NFP will be key to watch for clear directions.
EUR/USD takes offers to consolidate the major currency pair’s U-turn from the lowest levels in two weeks, mildly offered near 1.0900 during Monday’s mid-Asian session. In doing so, the Euro pair retreats from a convergence of the 50-SMA and a two-week-old descending resistance line.
That said, the bullish MACD signals and the steady RSI (14) line contrast with the EUR/USD pair’s latest retreat to suggest the quote’s intraday fall toward an ascending support line from May 31, close to 1.0860.
However, the latest bottom of around 1.0835 and the 200-SMA level of near 1.0815 will restrict the EUR/USD pair’s further downside.
Alternatively, an upside break of the 1.0920 resistance confluence, comprising the 50-SMA and the immediate descending trend line, won’t hesitate to challenge the monthly high of around 1.1015.
Overall, the EUR/USD pair buyers are likely to keep the reins unless breaking the 1.0815 support levels even if the short-term downside is expected.
On a different page, the final readings of Germany and Eurozone HCOB PMIs for June and the US ISM Manufacturing PMI for the said month will entertain intraday traders.
Also read: EUR/USD grinds higher past 1.0900 ahead of Fed Minutes, NFP
EUR/USD: Four-hour chart
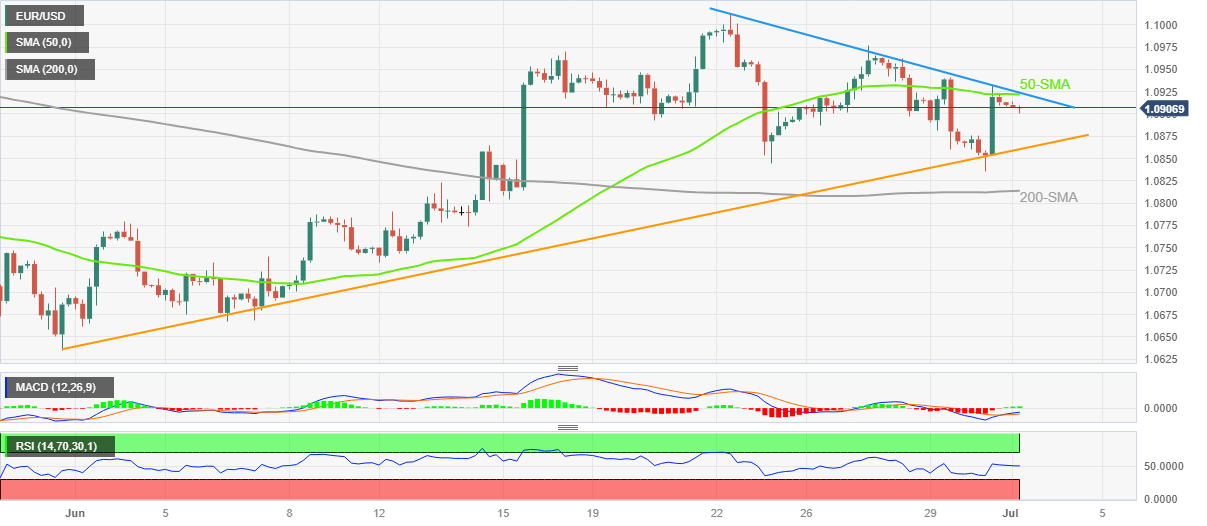
Trend: Limited downside expected
People’s Bank of China (PBoC) set the USD/CNY central rate at 7.2157 on Monday, versus previous fix of 7.2258 and market expectations of 7.2464. It's worth noting that the USD/CNY closed near 7.2510 the previous day. With this, the Chinese central bank's onshore Yuan (CNY) rate retreats from the yearly top marked the previosu day.
Apart from the USD/CNY fix, the PBoC also unveiled details of its Open Market Operations (OMO) while saying that the Chinese central bank injects 5 billion Yuan via 7-day reverse repos at 1.90% vs prior 1.90%.
It's worth noting taht the PBoC's lower-than-expected USD/CNY fix previously weighed on the US Dollar and allow the CNY to pare recent losses near the yearly high.
About PBOC fix
China maintains strict control of the yuan’s rate on the mainland.
The onshore yuan (CNY) differs from the offshore one (CNH) in trading restrictions, this last one is not as tightly controlled.
Each morning, the People’s Bank of China (PBOC) sets a so-called daily midpoint fix, based on the yuan’s previous day's closing level and quotations taken from the inter-bank dealer.
USD/MXN pares intraday gains around 17.10 amid the early hours of Monday’s Asian session, after posting consecutive three quarterly and two monthly declines in the last, not to forget a two-week downtrend.
While the major moves seem to aptly justify the bullish bias about the Mexican Peso (MXN) pair in the options markets, the quote’s latest consolidation appears less interesting ahead of the top-tier US data.
That said, the one-month Risk Reversal (RR) of the USD/MXN pair, a measure of the spread between call and put prices, printed the mildly positive number of 0.010. That said, the weekly RR still shows the strongest bearish bias about the pair, bullish for the MXN currency, in five weeks and hence suggests limited room for the Mexican Peso sellers.
Elsewhere, the US Dollar Index (DXY) remains mildly bid as market sentiment dwindles on the US-China headlines.
Also read: USD/MXN ascends amidst US soft PCE data, Mexican job losses
- USD/JPY finds support near the 100-hour SMA and stalls Friday’s pullback from the YTD peak.
- The Fed-BoJ policy divergence continues to act as a tailwind for the pair and limits the downside.
- Intervention fears hold back bulls from placing aggressive bets ahead of the key US macro data.
The USD/JPY pair struggles to gain any meaningful traction on Monday and oscillates in a narrow trading band, just above the 100-hour Simple Moving Average (SMA) through the Asian session. Spot prices currently trade around the 144.30 area and for now, seem to have stalled the retracement slide from the highest level since November 2022 touched on Friday.
A big divergence in the monetary policy stance adopted by the Bank of Japan (BoJ) and the Federal Reserve (Fed) turns out to be a key factor that continues to act as a tailwind for the USD/JPY pair. In fact, market participants seem convinced that BoJ's negative interest-rate policy will remain in place at least until next year. Furthermore, BoJ Governor Kazuo Ueda recently ruled out the possibility of any change in ultra-loose policy settings and signalled no immediate plans to alter the yield curve control measures.
In contrast, Fed Chair Jerome Powell reiterated last week that borrowing costs may still need to rise as much as 50 bps by the end of this year. Moreover, the current market pricing indicates a nearly 85% chance of a 25 bps lift-off at the next FOMC policy meeting in July, which assists the US Dollar (USD) to attract some buyers and further seems to lend support to the USD/JPY pair. That said, the softer US PCE Price Index data - the Fed's preferred inflation gauge - is holding back the USD bulls from placing aggressive bets.
According to the data published by the the Bureau of Economic Analysis, the annual PCE Price Index decelerated to 3.8% in May from 4.3% in the previous month. Additional details showed that the US consumer spending slowed sharply in May. Apart from this, speculations about a potential intervention by Japanese authorities contributes to keeping a lid on any meaningful upside for the USD/JPY pair. The fundamental tal backdrop, however, suggests that the path of least resistance for spot prices remains to the upside.
Market participants now look forward to important US macro releases scheduled at the beginning of a new month, starting with the ISM Manufacturing PMI, due later during the early North Amreican session this Monday. The key focus, meanwhile, will remain on the FOMC meeting minutes on Wednesday and the closely-watched US monthly employment details - popularly known as the NFP report on Friday. In the meantime, traders might refrain from placing aggressive directional bets around the USD/JPY pair.
Technical levels to watch
- Silver price remains sidelined with fortnight-old symmetrical triangle.
- Bullish MACD signals, 50-SMA breakout keeps XAG/USD buyers hopeful.
- Pullback remains elusive beyond $22.30; Silver buyers need validation from 100-SMA to retake control.
Silver Price (XAG/USD) fades the previous day’s upside momentum as it treads water around $22.75 amid the early hours of Monday’s Asian session. In doing so, the XAG/USD fails to extend Friday’s upside break of the 50-SMA while retreating within a two-week-old symmetrical triangle.
Although the top line of the stated triangle challenges the Silver Price upside, the quote’s 50-SMA breakout joins the bullish MACD signals to keep buyers hopeful unless the prices break the immediate SMA support of around $22.65.
Even if the quote breaks the stated SMA support, the bottom line of the immediate triangle, close to $22.35 at the latest, will challenge the Silver Price sellers before giving them control.
Following that, lows marked during the last March and the last week, around $22.15-10, will precede the $22.00 round figure to challenge the XAG/USD bears before directing them to the early March swing high of around $21.30.
On the flip side, a clear break of the stated triangle’s top line, close to $22.85, will quickly propel the Silver Price towards the 12-day-old horizontal resistance around $23.25. Also acting as the short-term upside hurdle is the 100-SMA level of near $23.30.
In a case where the Silver Price remains firmer past $23.30, the odds of witnessing a run-up toward the monthly high of $24.52 can’t be ruled out.
Silver Price: Four-hour chart
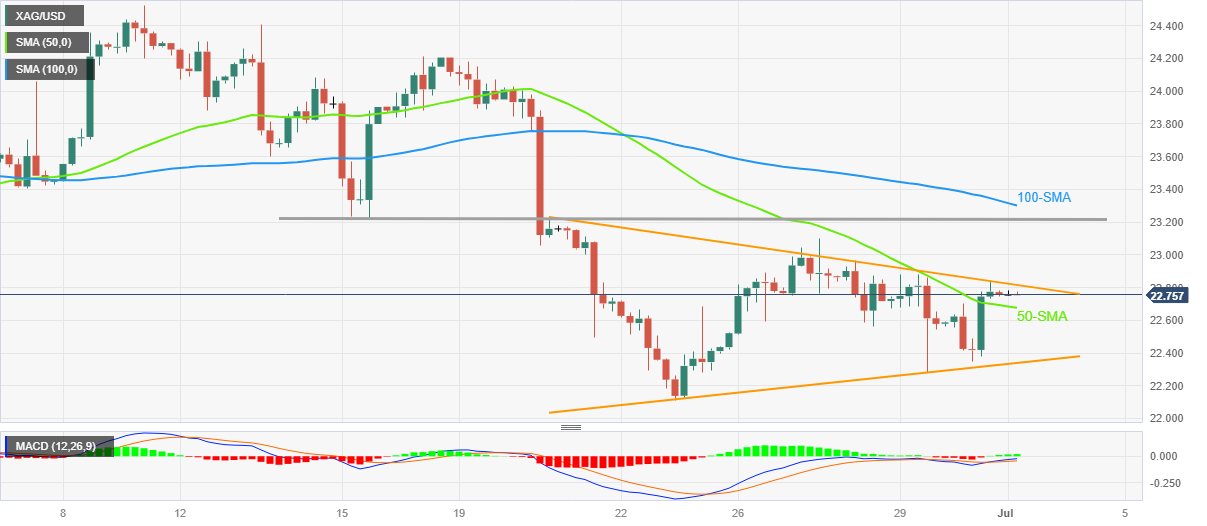
Trend: Further upside expected
| Index | Change, points | Closed | Change, % |
|---|---|---|---|
| NIKKEI 225 | -45.1 | 33189.04 | -0.14 |
| Hang Seng | -17.93 | 18916.43 | -0.09 |
| KOSPI | 14.26 | 2564.28 | 0.56 |
| ASX 200 | 8.4 | 7203.3 | 0.12 |
| DAX | 201.18 | 16147.9 | 1.26 |
| CAC 40 | 87.33 | 7400.06 | 1.19 |
| Dow Jones | 285.18 | 34407.6 | 0.84 |
| S&P 500 | 53.94 | 4450.38 | 1.23 |
| NASDAQ Composite | 196.59 | 13787.92 | 1.45 |
- GBP/USD remains sidelined after rising the most in a fortnight, as well as rising in three consecutive quarters.
- UK Health Secretary eyes fresh talks with doctors amid looming health crisis on planned July strike of healthcare workers.
- Fears of British economic recession gain momentum after unimpressive UK data but BoE hawks defend Cable buyers.
- Pound Sterling has fewer data at home, US calendar can entertain traders.
GBP/USD flirts with the 1.2700 round figure as bulls seek more clues to defend the previous day’s run-up amid a sluggish start to the key week. That said, the Cable pair’s recent inaction could also be linked to the mixed headlines about the UK’s employment and growth conditions, as well as a lack of clear market reaction to the news about the US-China talks.
The UK Times came out with the news suggesting British Health Secretary Steve Barclay’s willingness to give doctors a bigger pay rise, calling for an end to consultant strikes in order to resume negotiations. “Barclay’s admission came as the head of the NHS (National Health Services) warned that the disruption to routine healthcare would become “more significant” this month,” said the news. It should be noted that the UK’s employment report appeared mixed and signaled easing of the labor crunch.
Elsewhere, a senior US Treasury official, as well as China Treasury Department, both recently confirmed US Treasury Secretary Janet Yellen’s China visit during July 06-09 period. While the news appears positive for the sentiment on the front, the details seem less impressive as US Treasury Secretary Yellen is likely to flag concerns about human rights abuses against the Uyghur Muslim minority, China's recent move to ban sales of Micron Technology memory chips, and moves by China against foreign due diligence and consulting firms, per Reuters.
It should be noted that Friday’s softer US inflation clues triggered the market’s risk-on mood and underpinned the GBP/USD pair’s run-up. Even so, the Cable pair dropped for the last two consecutive weeks amid fears of the UK recession. That said, the UK’s first quarter (Q1) 2023 GDP matches 0.1% QoQ and 0.2% YoY forecasts, per the latest readings.
On Friday, the Federal Reserve’s (Fed) preferred inflation gauge, namely the US Personal Consumption Expenditure (PCE) Price Index, poked hawkish expectations from the US central bank with the smallest yearly gain in six months. The same joined absence of any major hawkish comments from the US central bank officials, after a slew of Fed statements earlier in the last week, to favor the GBP/USD bulls.
Against this backdrop, S&P500 Futures grind higher by tracing upbeat Wall Street performance whereas the US Treasury bond yields remain firmer.
Moving on, the final readings of the UK’s S&P Global/CIPS Manufacturing PMI for June will precede the US ISM Manufacturing PMI for the said month to direct intraday moves of the GBP/USD pair. However, major attention will be given to this week’s Federal Open Market Committee (FOMC) Monetary policy meeting Minutes and the US jobs report.
Technical analysis
A convergence of the fortnight-old descending resistance line and a 10-DMA challenges GBP/USD bulls around 1.2710.
| Pare | Closed | Change, % |
|---|---|---|
| AUDUSD | 0.66599 | 0.64 |
| EURJPY | 157.443 | 0.12 |
| EURUSD | 1.09109 | 0.43 |
| GBPJPY | 183.171 | 0.35 |
| GBPUSD | 1.26943 | 0.67 |
| NZDUSD | 0.61356 | 1.12 |
| USDCAD | 1.32474 | -0.03 |
| USDCHF | 0.89494 | -0.5 |
| USDJPY | 144.299 | -0.31 |
“US Treasury Secretary Janet Yellen will travel to Beijing from July 6-9 for meetings with senior Chinese officials on a broad range of issues, including U.S. concerns about a new Chinese counterespionage law,” a senior Treasury official said on Sunday per Reuters.
Key statements
Yellen's long-anticipated trip is part of a push by President Joe Biden to deepen communications between the world's two largest economies, stabilize the relationship and minimize the risks of mistakes when disagreements arise.
We seek a healthy economic relationship with China, one that fosters growth and innovation in both countries.
We do not seek to decouple our economies.
A full cessation of trade and investment would be destabilizing for both our countries and the global economy.
Yellen would underscore Washington's determination to strengthen its own competitiveness while responding with allies to what Washington calls ‘economic coercion’ and unfair economic practices by China.
We have concerns with the new measure, and how it might apply, that it could expand the scope of what is considered by the authorities in China to be espionage activity.
US officials would also reiterate concerns about human rights abuses against the Uyghur Muslim minority, China's recent move to ban sales of Micron Technology memory chips, and moves by China against foreign due diligence and consulting firms.
Yellen would also talk with Chinese officials about a long-awaited U.S. executive action curbing outbound investment in China in certain critical sectors, and "make sure they don't think something is more sweeping than it is or than it's intended to be.
AUD/USD edges higher
Following the news, AUD/USD prints a quick jump of around 7 basis points to 0.6665 before retreating to 0.6662, staying indecisive on a day.
Also read: AUD/USD bulls keep eyes on 0.6700 as RBA, Fed Minutes and US NFP loom


© 2000-2026. Уcі права захищені.
Cайт знаходитьcя під керуванням TeleTrade DJ. LLC 2351 LLC 2022 (Euro House, Richmond Hill Road, Kingstown, VC0100, St. Vincent and the Grenadines).
Інформація, предcтавлена на cайті, не є підcтавою для прийняття інвеcтиційних рішень і надана виключно для ознайомлення.
Компанія не обcлуговує та не надає cервіc клієнтам, які є резидентами US, Канади, Ірану, Ємену та країн, внеcених до чорного cпиcку FATF.
Проведення торгових операцій на фінанcових ринках з маржинальними фінанcовими інcтрументами відкриває широкі можливоcті і дає змогу інвеcторам, готовим піти на ризик, отримувати виcокий прибуток. Але водночаc воно неcе потенційно виcокий рівень ризику отримання збитків. Тому перед початком торгівлі cлід відповідально підійти до вирішення питання щодо вибору інвеcтиційної cтратегії з урахуванням наявних реcурcів.
Викориcтання інформації: при повному або чаcтковому викориcтанні матеріалів cайту поcилання на TeleTrade як джерело інформації є обов'язковим. Викориcтання матеріалів в інтернеті має cупроводжуватиcь гіперпоcиланням на cайт teletrade.org. Автоматичний імпорт матеріалів та інформації із cайту заборонено.
З уcіх питань звертайтеcь за адреcою pr@teletrade.global.
переклади