- Analytics
- News and Tools
- Market News
Новини ринків
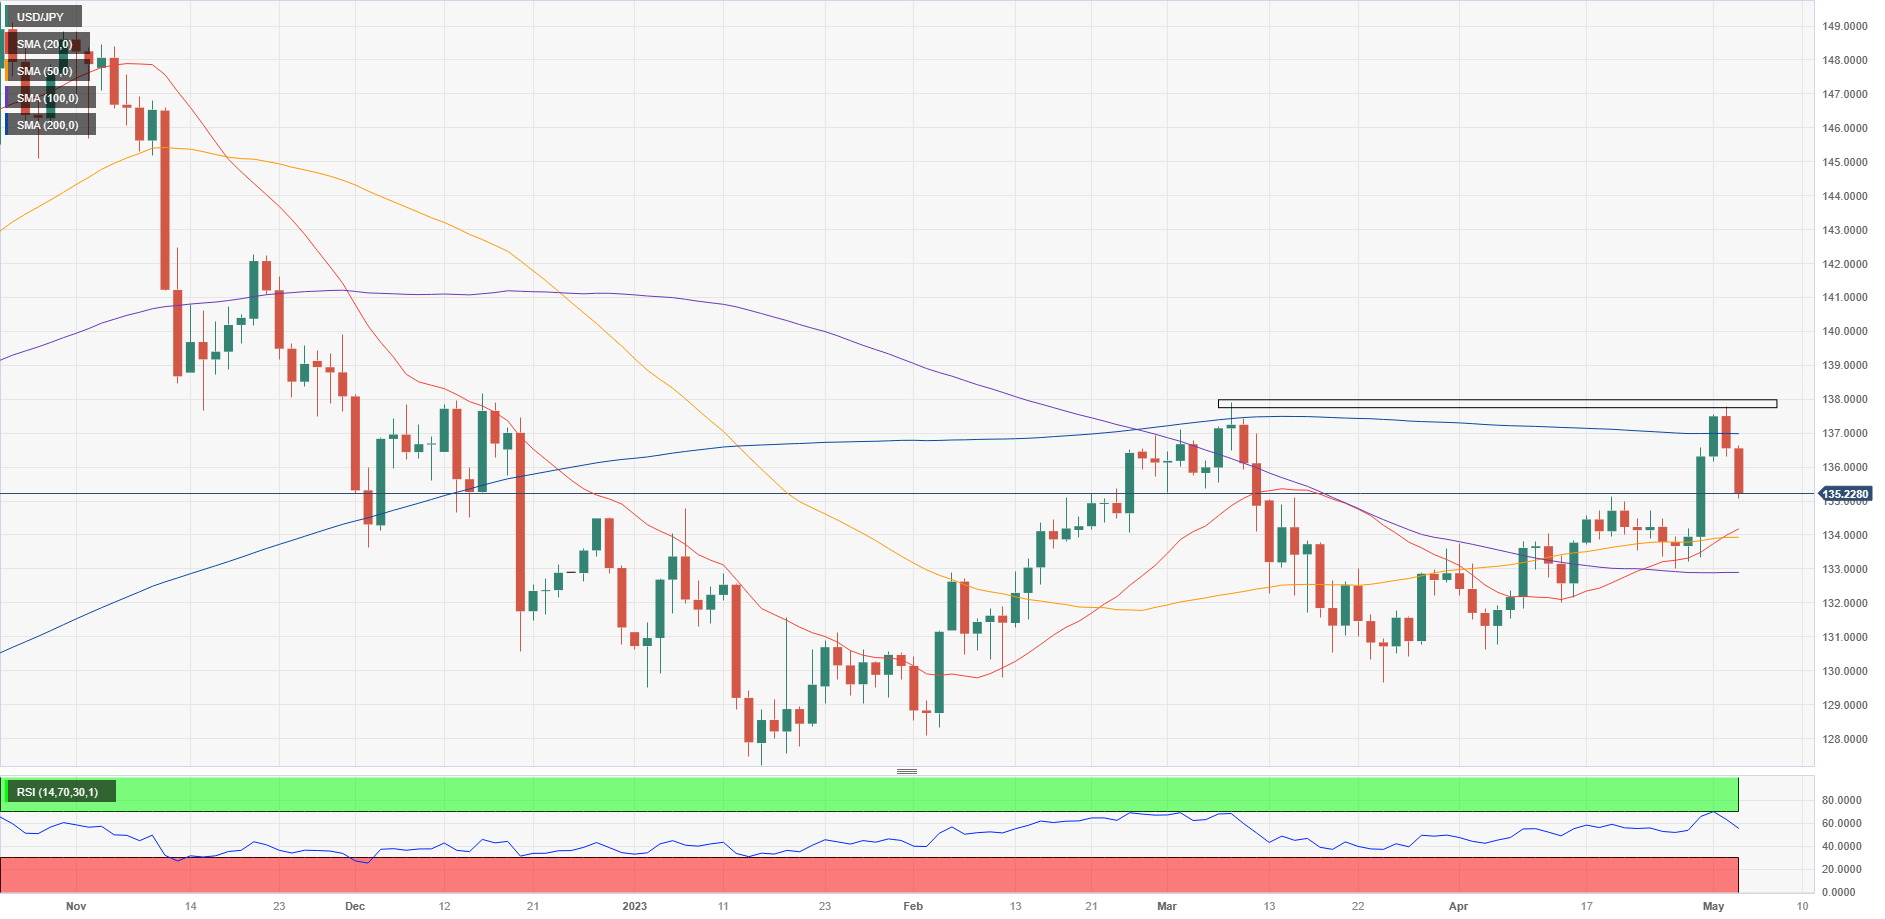
- USD/JPY has sensed some buying interest around 134.40 as investors are shifting their focus toward US NFP data.
- The market mood seems divided as risk-perceived currencies are enjoying bids while US equities are facing pressure.
- US banking woes have renewed as PanWest Bancorp has come under pressure.
The USD/JPY pair has gauged an intermediate cushion after a perpendicular sell-off to near 134.40 in the Asian session. The asset witnessed massive selling pressure after neutral interest rate guidance came from the Federal Reserve (Fed) post a widely anticipated 25 basis point (bp) rate hike.
S&P500 futures have recovered some losses posted in early Asia, showing signs that investors are digesting uncertainty about the further roadmap of arresting stubborn United States inflation by the Fed. The overall market mood seems divided as risk-perceived currencies are enjoying bids while US equities are facing pressure.
Meanwhile, US banking woes have renewed as another commercial bank has come under pressure. Bloomberg reported that PacWest Bancorp is considering strategic options, including a potential sale. PacWest's shares fell by more than 50% in the post-market, indicating significant investor concern about the bank's situation.
Investors should be aware that Japanese markets are closed today on account of Greenery Day
The US Dollar Index (DXY) has dropped to near 101.20 on neutral Fed guidance, renewed US banking jitters, and concerns over the US debt ceiling. Further delay in debt ceiling increase could result in loss of timely payments from the US Treasury.
On Wednesday, the US Automatic Data Processing (ADP) agency reported an addition of fresh 296K jobs in April vs. the estimates of 150K and the former release of 145K. Upbeat US ADP data indicates tight labor market conditions in the US economy.
Going forward, US official Employment data will be of utmost importance. The Unemployment Rate is seen unchanged at 3.5%. According to the consensus for Nonfarm Payrolls (NFP), the US economy added 179K in April lower than the former release of 236K.
Apart from the labor market numbers, Average Hourly Earnings will be keenly watched. The economic indicator is seen unchanged at 0.3% and 4.2% on a monthly and an annual basis.
Silver price (XAG/USD) grinds higher during a three-day uptrend to early Thursday in Asia, near up 0.50% intraday near $25.70 by the press time. In doing so, the bright metal justifies the US Federal Reserve’s (Fed) hesitance in suggesting further rate hikes, despite lifting the benchmark rates by 0.25%, as well as the upbeat options market sentiment.
That said, the one-month risk reversal (RR) of the Silver price, a gauge of the spread between the call and put options, prints the strongest bullish level of 0.1000 in three weeks by the end of Wednesday’s North American session. It’s worth noting that the daily RR dropped the most since April 18 the previous day. Even so, the Silver options market signals remain bearish for May, after a downbeat April.
Given the recently upbeat options market signals, coupled with the US Dollar’s failure to cheer the Fed’s rate hike, the Silver price may witness further advances.
However, today’s European Central Bank (ECB) decision and the risks surrounding the US default and banking crisis will be the key to watch for fresh impulse.
Also read: Forex Today: Dollar slides as Fed delivers as expected
- EUR/USD grinds higher within a three-week-old bullish trend channel.
- Sustained break of weekly resistance line, 100-SMA joins bullish MACD signals to favor Euro buyers.
- RSI prints lower high despite EUR/USD’s gradual increase, challenging further advances.
- Sellers need validation from 200-SMA to retake control.
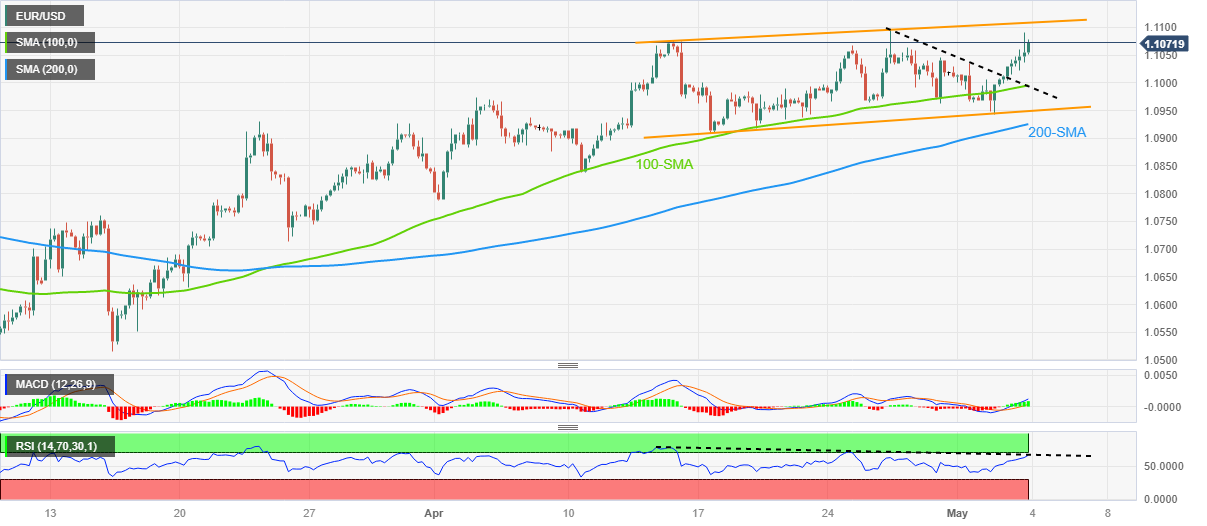
EUR/USD bulls keep the reins near the highest levels in 13 months by printing mild gains near 1.1070 as Euro traders await Thursday’s European Central Bank (ECB) monetary policy decision.
In doing so, the Euro pair defends the Federal Reserve-inspired gains with a three-week-old ascending trend channel. However, a divergence between the RSI (14) line and the EUR/USD price challenges the pair buyers ahead of the key event.
Also read: European Central Bank Preview: Lagarde set to lift the Euro in two out of three scenarios
It’s worth noting that the RSI (14) line is in a descending formation since April 14 even if the Euro pair grinds higher, which in turn suggests that the bulls are running out of steam.
The same joins the quote’s nearness to the aforementioned trend channel’s resistance line, close to 1.1110, to increase the odds of the EUR/USD pair’s pullback.
In that case, a convergence of the 100-SMA and one-week-old previous resistance line, near 1.0995, could lure the intraday sellers ahead of the stated channel’s bottom line, close to 1.0950 at the latest.
Even so, the EUR/USD bears need to remain cautious ahead of the 200-SMA break, currently around 1.0925.
On the contrary, an upside clearance of the 1.1110 hurdle comprising the channel’s top line could propel the Euro price towards the March 2022 high of near 1.1185.
EUR/USD: Four-hour chart
Trend: Pullback expected
- USD/CAD is preparing for further side as oil prices continue to bleed amid fears of a global economic slowdown.
- Later this week, US/Canada Employment data will be keenly watched.
- USD/CAD is approaching the 61.8% Fibonacci retracement plotted at 1.3648.
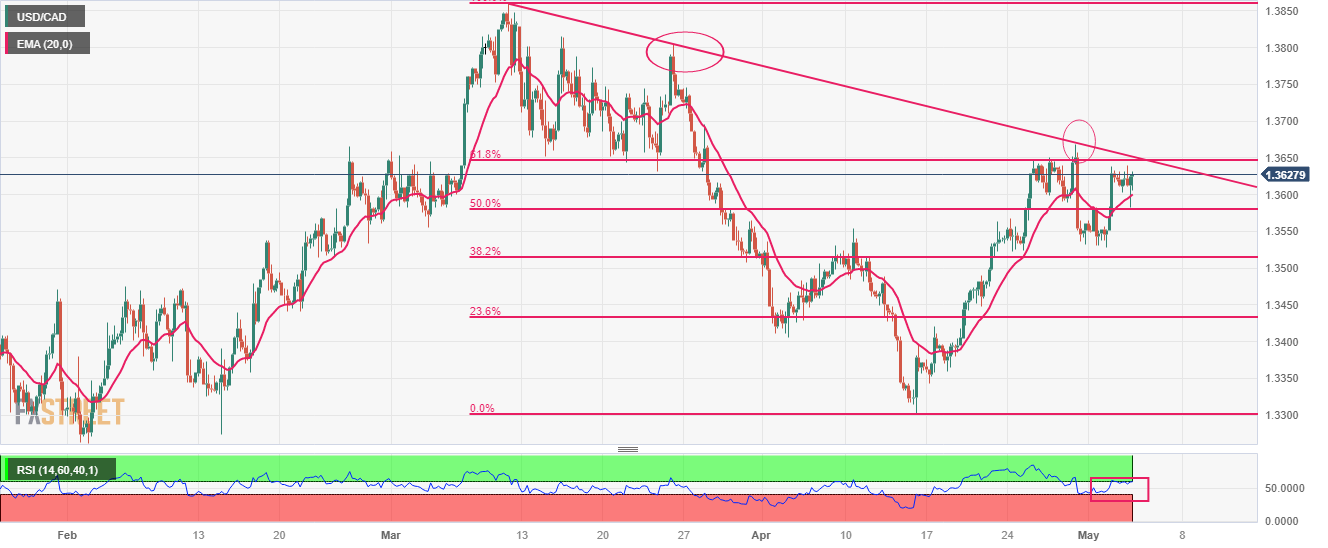
The USD/CAD pair has turned sideways after a perpendicular rally to near 1.3630 in the early Asian session. The Loonie asset is gathering strength for further upside as a bloodbath in oil prices amid deepening fears of a global economic slowdown due to higher interest rates from central banks. The street is worried about the oil demand outlook as tight liquidity conditions would force firms to underutilize their production capacities.
Oil prices have refreshed their annual low of $63.60 after the Federal Reserve (Fed) hikes interest rates by 25 basis points (bps) to 5.00-5.25%.
Going forward, the Canadian Dollar will dance to the tunes of Friday’s Employment data (April). The net change in Employment is seen at 20K higher than the former addition of 34.7K. The Unemployment Rate is expected to increase to 5.1%.
Also, the US Employment data (April) will be keenly watched. The US Nonfarm Payrolls (NFP) data is seen at 179K lower than the former release of 236K.
USD/CAD is approaching the 61.8% Fibonacci retracement (placed from March 10 high at 1.3862 to April 14 low at 1.3301) at 1.3648. The downward-sloping trendline from March 10 high at 1.3862 has acted as a major barricade for the US Dollar bulls.
The 20-period Exponential Moving Average (EMA) at 1.3600 is providing cushion to the US Dollar bulls.
Meanwhile, the Relative Strength Index (RSI) (14) is making efforts for shifting into the bullish range of 60.00-80.00. An occurrence of the same will activate the bullish momentum.
An extension in a recovery move above the 61.8% Fibo retracement at 1.3650 will trigger a reversal and will drive the major toward the round-level resistance at 1.3700. A break above the same will expose the asset to March 22 high at 1.3745.
On the flip side, a decisive break below May 02 low at 1.3529 will expose the asset to psychological support at 1.3500 followed by a 23.6% Fibo retracement at 1.3438.
USD/CAD four-hour chart
- US Dollar Index remains depressed after falling the most in seven weeks.
- Fed fails to impress US Dollar bulls despite 0.25% rate hike as policy pivot gains attention.
- Looming fears of US default, banking sector turmoil also weigh on DXY.
- Second-tier US data can entertain traders, risk catalysts are the key ahead of NFP.
US Dollar Index (DXY) remains pressured at the lowest level in a week, recently licking its wounds near 101.30 amid early Thursday in Asia, after falling the most in two months due to the Federal Reserve’s dovish rate hike. Also exerting downside pressure on the greenback’s gauge versus six major currencies are the fears surrounding the US default and baking crisis.
US Federal Reserve (Fed) matched market forecasts on Wednesday by announcing a 0.25% increase in the benchmark Fed rate, making it the highest since 2007. Fed Chairman Jerome Powell also appeared positive while ruling out fears of a banking rout. However, a dropping in the statement suggesting the need for further rate hikes gained major attention and weighed on the US Dollar despite the hawkish move by the Fed.
Apart from the Fed, the looming banking crisis in the US also weighs on the US Dollar as PacWest Bancorp recently became another US bank to witness the heat of excess withdrawal and is on the brink of collapse. That said, Western Alliance Bancorp is also in the line and hence the US banking sector appears in trouble moving forward, which in turn sours the market sentiment and prods the hawkish central banks, as it did to the Fed.
Furthermore, the comments from the White House suggesting debt limit default could cost 8.3 million job losses also weigh on the sentiment and the US Dollar.
It’s worth noting that the upbeat US data also failed to impress the DXY bulls. US ADP Employment Change rose to 296K for April from 142K prior versus 148K market forecast. Additionally, the annual pay growth declined to 13.2% from 14.2%. Further, ISM Services PMI improved to 51.9 in April versus 51.8 market forecasts and 51.2 previous readings. It’s worth noting, however, that the S&P Global Services PMI and Composite PMI for April eased to 53.6 and 53.4 versus 53.7 and 53.5 respective priors.
While portraying the mood, Wall Street closed with minor losses and the yields remain pressured while weighing on the US Dollar Index.
Looking forward, DXY traders will pay close attention to the risk catalysts for fresh impulse amid a dearth of top-tier data. However, European Central Bank (ECB) Monetary Policy Meeting can entertain traders.
Technical analysis
Failure to provide a daily closing below the three-week-old ascending support line, near 101.15 by the press time, joins nearly oversold RSI (14) line to signal corrective bounce in the US Dollar Index price.
- USD/CHF remains pressured at the lowest levels since January 2021 after falling the most in seven weeks.
- Fed announces a dovish rate hike of 0.25%, dumping statement on interest rate lifts gain major attention.
- Bank fallouts, US debt ceiling expiration also weigh on sentiment and Swiss Franc pair.
- Risk catalysts are the key for immediate directions.
USD/CHF holds lower grounds near 0.8830 amid early Thursday, after falling to early 2021 levels on the Federal Reserve’s (Fed) dovish rate hike. The risk-barometer pair also bears the burden of the market’s fears of US default and banking fallouts. With this, the Swiss Franc (CHF) pair prints a three-day downtrend near the multi-month low following the biggest daily slump in nearly seven weeks.
Fed lifted its benchmark rate to the highest levels since 2007 by announcing a 0.25% increase, matching market forecasts. The policymakers including Chairman Jerome Powell appeared positive while ruling out fears of banking rout. However, a dropping of the statement suggesting the need for further rate hikes gained major attention and weighed on the US Dollar despite the hawkish move.
On the other hand, PacWest Bancorp recently became another US bank to witness the heat of excess withdrawal and is on the brink of collapse. That said, Western Alliance Bancorp is also in the line and hence the US banking sector appears in trouble moving forward, which in turn weigh on the market sentiment and prod the hawkish central banks, like it did to the Fed.
Elsewhere, the comments from the White House suggesting debt limit default could cost 8.3 million job losses also weigh n the sentiment and the USD/CHF pair.
Talking about the data, US ADP Employment Change rose to 296K for April from 142K prior versus 148K market forecast. Additionaly, the annual pay growth declined to 13.2% from 14.2%. Further, ISM Services PMI improved to 51.9 in April versus 51.8 market forecasts and 51.2 previous readings. It’s worth noting, however, that the S&P Global Services PMI and Composite PMI for April eased to 53.6 and 53.4 versus 53.7 and 53.5 respective priors.
Amid these plays, Wall Street closed with minor losses and the yields remain pressured while weighing on the US Dollar Index.
Moving on, market players may pay close attention to the risk catalysts for fresh impulse amid a dearth of top-tier data. However, European Central Bank (ECB) Monetary Policy Meeting can entertain traders.
Technical analysis
A clear downside break of a three-week-old descending support line, now immediate resistance near 0.8850, directs USD/CHF bears towards the year 2021 low of around 0.8755.
- Fundamental news, like the US Federal Reserve 25 bps rate hike, spooked Euro buyers; hence the EUR/JPY fell.
- Short term, the EUR/JPY might extend its losses before continuing its uptrend.
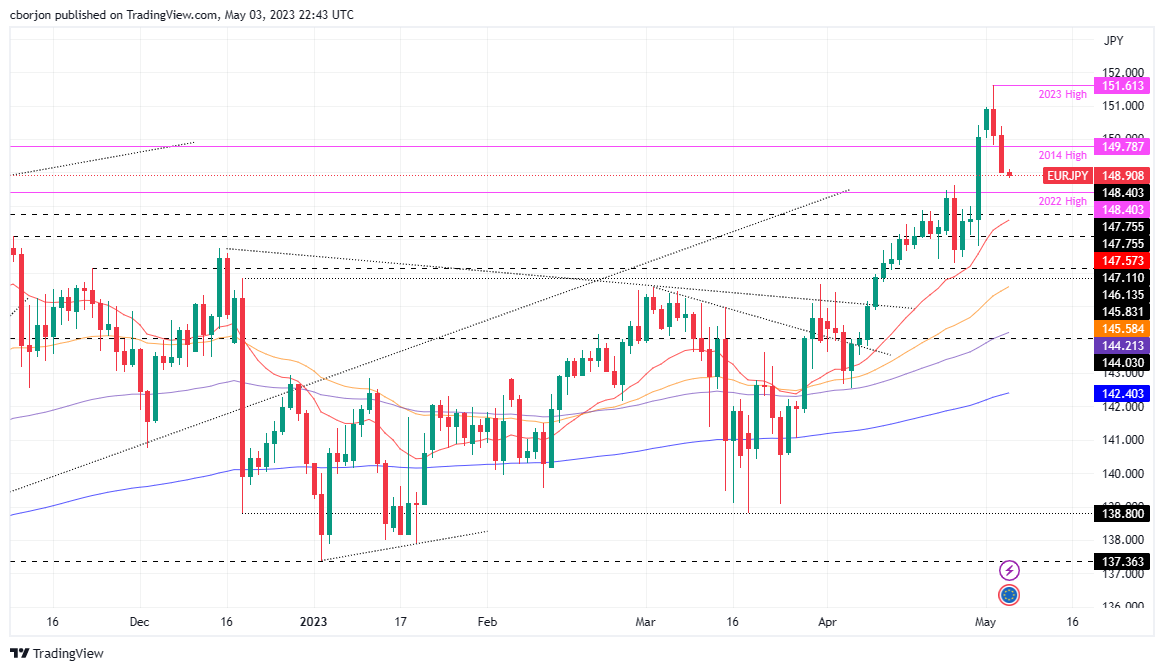
The EUR/JPY dropped for the third straight session after hitting a multi-year high of 151.61, collapsing beneath the 149.00 figure on a 100-plus pip fall. A bearish engulfing candle pattern was followed by another bearish candle that dragged prices toward the 148.00 regions. At the time of writing, the EUR/JPY is trading at 148.92, down 0.05%, as the Asian session begins.
Must read: Breaking: Fed hikes policy rate by 25 bps to 5-5.25% as expected
EUR/JPY Price Analysis
Despite the ongoing correction on the pair, the EUR/JPY remains upward biased, which dragged the exchange rate 250 pips lower from its yearly highs. If EUR/JPY sellers would need to extend their gains, the pair must fall and reclaim last year’s high of 148.40, and once cleared, the next support in play would be the 20-day EMA at 147.57. But firstly, the EUR/JPY needs to crack below 148.00.
Conversely, for a bullish continuation, the EUR/JPY must reverse and conquer 149.00. A breach of the latter and the pair could rally towards the 2014 swing high at 149.78 before re-testing the 150.00 figure.
EUR/JPY Daily Chart
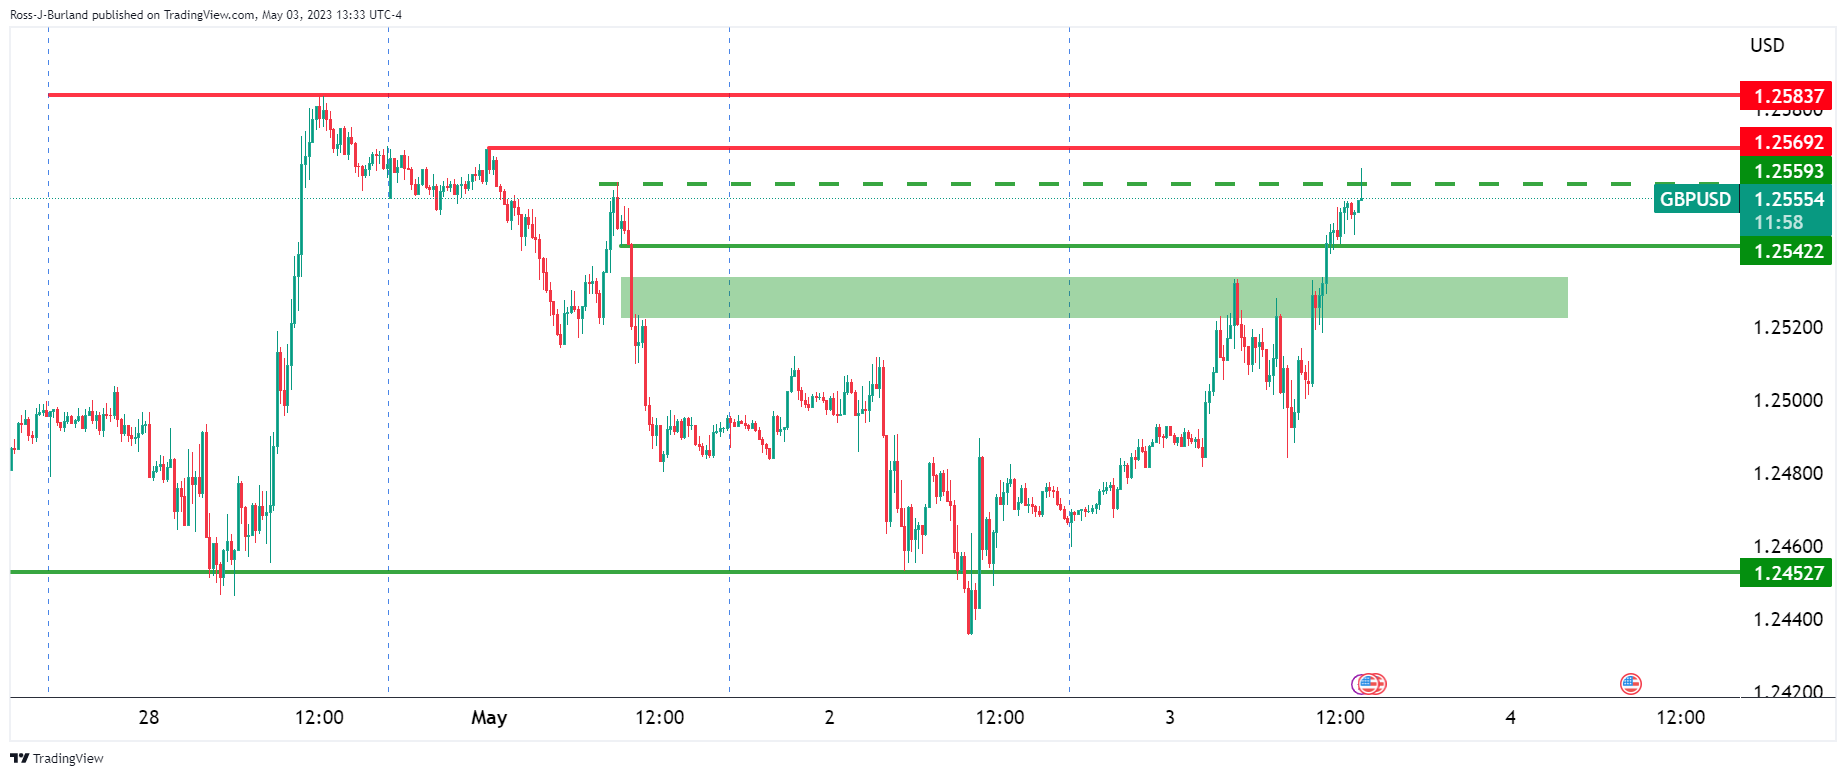
- GBP/USD is marching towards 1.2600 as a Fed rate-cycle pause would trim Fed-BoE policy divergence.
- US labor market conditions carry the potential of making inflation persistent.
- S&P500 futures are showing further losses in early Asia, indicating a risk-off mood.
The GBP/USD pair is approaching the round-level resistance of 1.2600 in the early Tokyo session. The Cable is aiming higher as the Federal Reserve (Fed) is following the language of other central banks. Fed chair Jerome Powell has confirmed that further monetary policy decisions will be data-dependent, which indicates that the central bank has reached an intermediate terminal rate for now.
S&P500 futures are showing further losses in early Asia after a bearish settlement. US equities surrendered their entire gains added in the early New York session amid uncertainty over the further path to be followed by the Fed to tame sticky inflation. Negative market sentiment has faded appeal for risk-sensitive assets.
The US Dollar Index (DXY) is declining towards May 03 low around 101.07 amid neutral guidance from the Fed. Also, the US yields are heavily down amid an increase in demand for US government bonds. The 10-year US Treasury yields have dropped to near 3.36%.
Meanwhile, upbeat US labor market conditions are signaling that a hawkish stance from the Fed would not be over soon as labor shortage could propel inflationary pressures. On Wednesday, the US Automatic Data Processing (ADP) agency reported an addition of fresh 296K jobs in April vs. the estimates of 150K and the former release of 145K.
There is no denying the fact that extreme labor shortage would have been offset by offering higher wages, which carries the potential of making inflation persistent.
On the Pound Sterling front, the Bank of England (BoE) is expected to raise interest rates further as United Kingdom inflation is not ready to leave the double-digit territory despite consistent policy tightening. BoE Governor Andrew Bailey is ready to raise interest rates consecutively for the 12th time. An interest rate hike of 25 bps is anticipated by the market participants.
“The New Zealand farming sector faces challenges as interest rates and other costs rise and returns are forecast much lower, with dairy farms the hardest hit,” Reserve Bank of New Zealand (RBNZ) Governor Adrian Orr said on Thursday per Reuters.
RBNZ Governor Orr appeared for a testimony to a parliamentary committee.
The news also spots Senior RBNZ officials noting that debt levels in the sector are down significantly from five years ago when the central bank was highlighting debt as a major vulnerability for the dairy sector.
More comments from Orr
What we observe in the dairy sector in particular, is the structure of the industry - the high leverage nature of the industry - leads to a very high vulnerability to shifts and interest rates up and down.
Cost pressures remain so there's definitely challenges in the sector.
On the same line RBNZ Deputy Governor Christian Hawkesby told the same parliamentary committee, per Reuters, that the central bank was not concerned about New Zealand's growing current account deficit.
"New Zealand government debt is still relatively low compared to other countries, and that puts us in a strong position," Hawkesby said.
Also read: NZD/USD Price Analysis: Pullback moves prod 0.6200 ahead of China Caixin PMI
- NZD/USD takes offers to snap two-day uptrend, reverses from the highest levels in three weeks.
- Weekly support line, one-month-old previous resistance line restrict immediate downside.
- Failure to cross 50% Fibonacci retracement, looming bear cross on MACD favor Kiwi sellers.
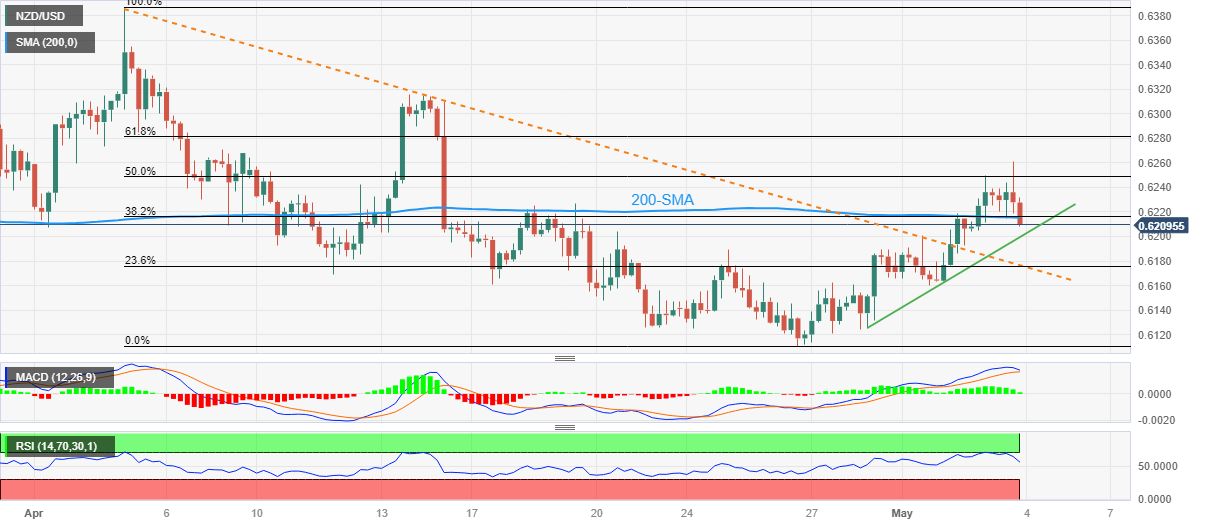
NZD/USD takes offers to refresh intraday low near 0.6210 as it reverses the Fed-inspired gains during early Thursday amid a risk-off mood, as well as due to the anxiety ahead of China Caixin Manufacturing PMI for April.
Technically, the Kiwi pair’s inability to cross the 50% Fibonacci retracement of its April 05-26 downside, near 0.6250, joins an impending bear cross on the MACD indicator to lure the sellers.
Adding strength to the bearish bias could be the recent downside break of the 200-SMA, around 0.6215 at the latest.
With this, the Kiwi pair is all set to drop toward the weekly support line of near 0.6200. However, the resistance-turned-support line from early April, near 0.6175 by the press time, could restrict the NZD/USD pair’s further downside.
Should the quote remains weak past 0.6175, the odds of witnessing a fall toward the previous monthly low, also the Year-To-Date (YTD) bottom, near 0.6110 can’t be ruled out.
On the contrary, recovery moves may initially aim for the 200-SMA level of around 0.6215 before challenging the 50% Fibonacci retracement and the recent swing high, respectively near 0.6250 and 0.6260.
Following that, the 61.8% Fibonacci retracement, also known as the golden ratio, of near 0.6280 will precede the 0.6300 round figure and mid-April swing high of 0.6316 to prod the NZD/USD bulls.
To sum up, NZD/USD slips to the bear’s radar but the downside room appears limited.
NZD/USD: Four-hour chart
Trend: Further downside expected
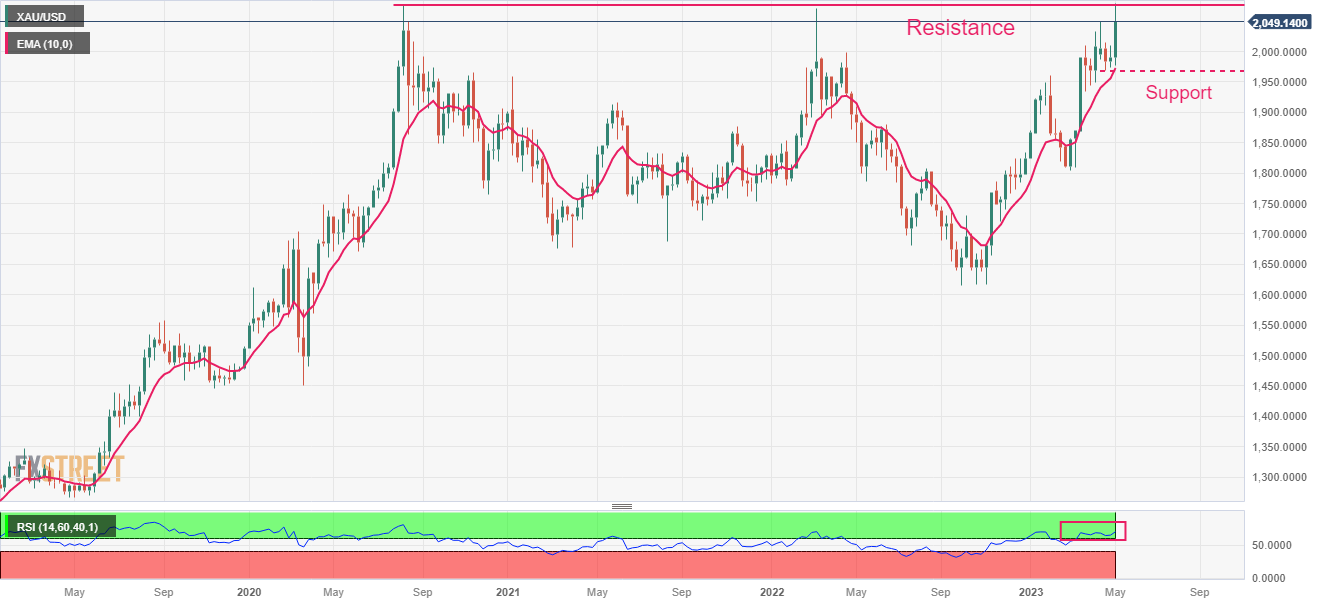
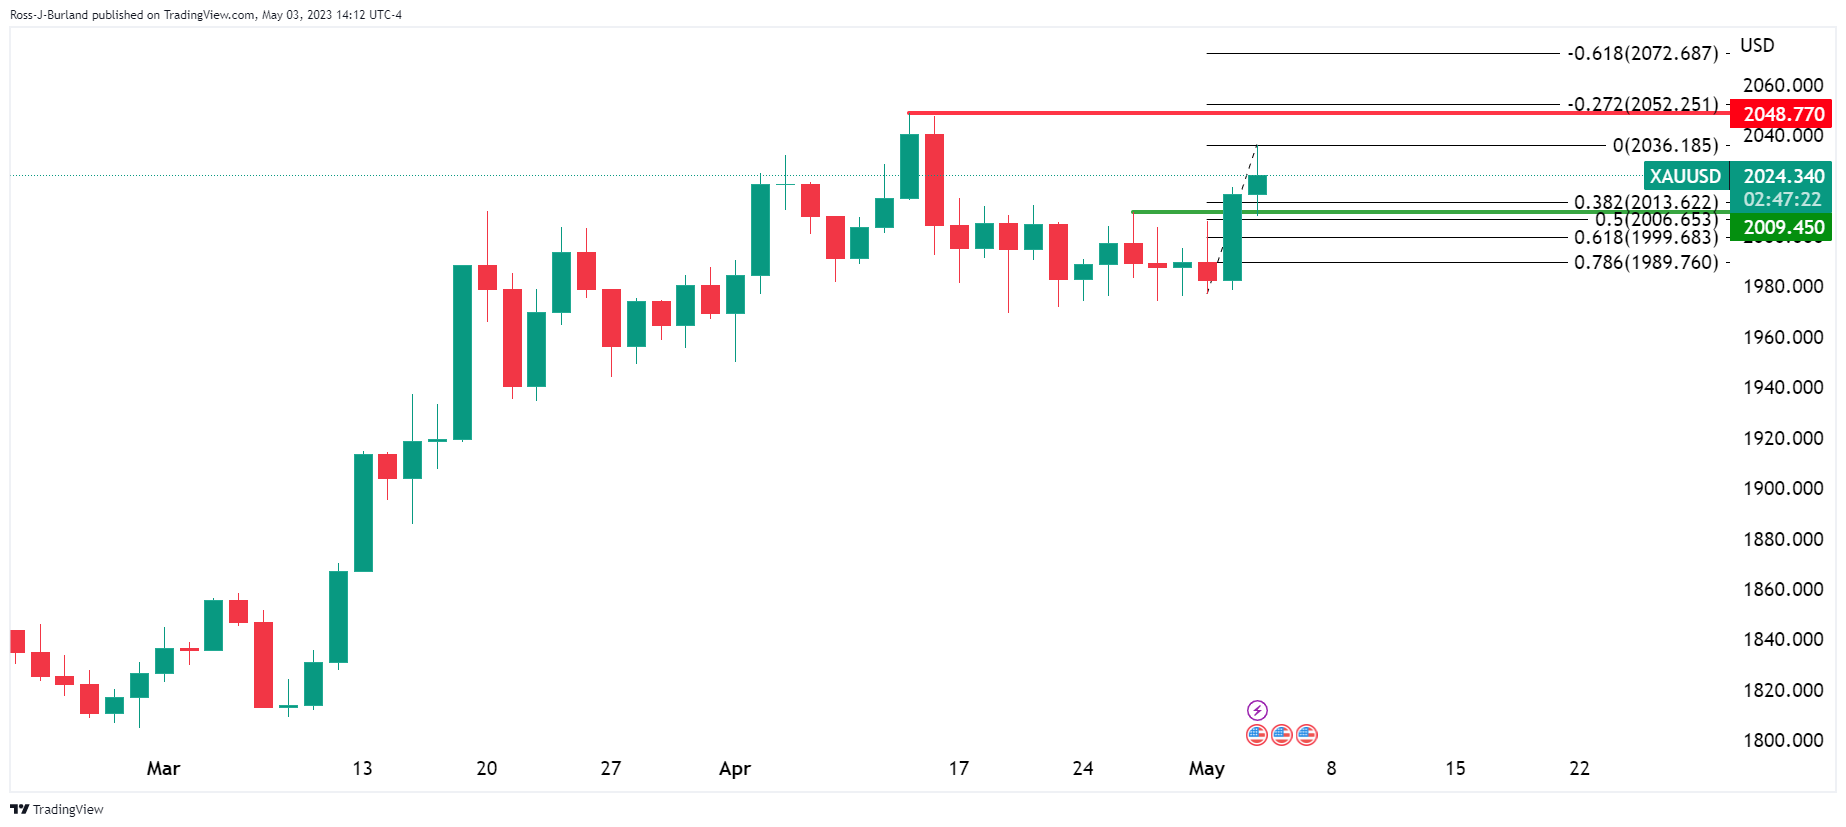
- Gold price has displayed some correction after posting a fresh YTD high at $2,079.76.
- The Fed announced that further monetary policy decisions would be highly dependent on incoming data.
- Investors are worried that US labor market conditions are still tight and could accelerate persistent inflation.
Gold price (XAU/USD) has witnessed a steep fall after printing a fresh year-to-date (YTD) high placed at $2,067.00 in the early Asian session. The yellow metal has attracted significant offers as the US Dollar Index (DXY) has attempted a recovery. Earlier, the precious metal gained immense strength as the Federal Reserve (Fed) signaled a pause in the policy-tightening spell from June after hiking interest rates by 25 basis points (bps) to 5.00-5.25%.
Fed chair Jerome Powell announced that further monetary policy decisions would be highly dependent on incoming data. The Fed is moving from its prior language of ‘some additional policy firmly’ to ‘closely monitoring incoming information’ suggesting that monetary policy is restrictive enough for now to curb sticky inflation.
Meanwhile, S&P500 futures settled Wednesday’s session on a bearish note after surrendering stellar gains amid uncertainty over the further path of arresting sticky inflation, portraying a risk-aversion theme.
The US Dollar Index (DXY) is showing signs of recovery after a steep correction to near 101.26. Investors are worried that the United States labor market conditions are still tight and could accelerate persistent inflation.
On Wednesday, the US Automatic Data Processing (ADP) agency showed an addition of fresh payrolls at 296K vs. the estimates of 150K and the former release of 145K. If incoming information continues to remain expansionary in this way, the Fed won’t have another option than to hike interest rates further.
Gold technical analysis
Gold price has sensed selling pressure after printing a fresh YTD at $2,079.76 as profit-booking kicked in. The precious metal has conquered its prior resistance plotted from 07 August 2020 high at $2,075.22. Intermediate support is placed from April 21 low at $1,969.29.
The 10-period Exponential Moving Average (EMA) at $1,973.73 is providing cushion to the Gold bulls.
Meanwhile, the Relative Strength Index (RSI) (14) is oscillating in the bullish range of 60.00-80.00, indicating a continuation of the upside momentum.
Gold weekly chart
- AUD/USD grinds lower after three-day uptrend, takes offers of late.
- Fed matches 0.25% rate hike expectations but removal of guidance for further rate increase weighs on US Dollar.
- Hawkish surprise from RBA, upbeat Australia Retail Sales help Aussie pair buyers despite firmer US data.
- Australia’s trade numbers for March, China’s Caixin Manufacturing PMI for April eyed for immediate directions.
AUD/USD pauses recent upward trajectory, especially backed by the Fed vs. RBA play, as it takes offers to 0.6660 during early Thursday morning in Asia. The Aussie pair recently benefited from the US Federal Reserve’s (Fed) hesitance in suggesting further rate hikes, despite announced a 25 basis points (bps) of an increase to the benchmark Fed rate. Also favoring the quote could be the Reserve Bank of Australia’s (RBA) hawkish surprise and upbeat Aussie Retail Sales marked previously. However, US banking fallout fears and US debt ceiling expiration woes seem to underpin the latest decline in the AUD/USD prices.
Fresh selling of PacWest Bancorp and Western Alliance Bancorp shares triggered banking fears across the board, which in turn exerts downside pressure on the AUD/USD prices. On the same line could be the comments from the White House suggesting debt limit default could cost 8.3 million job losses. Further, Reuters said that shares of US regional lenders collapsed in extended trade on Wednesday, with PacWest Bancorp losing over half its value after reports the California bank is exploring strategic options, including a sale.
On Wednesday, the US Federal Reserve lifted its benchmark rate to the highest levels since 2007 by announcing a 0.25% increase, matching market forecasts. The policymakers including Chairman Jerome appeared positive while ruling out fears of banking rout. However, a dropping of the guidance signaling further rate hike gained major attention and weighed on the US Dollar despite the hawkish move.
On the other hand, Australia’s seasonally adjusted Retail Sales for March rose 0.4% versus market expectations of witnessing a 0.2% steady growth number. Further, Australia’s AiG Industry Index for March rose to 20.1 versus -6.1 prior whereas the AiG Manufacturing and Construction PMIs for the said month dropped to -20.2 and -12.4 respective levels versus -5.8 and 5.6 priors in that order. Further, S&P Global Services PMI for April improved to 53.7 versus 52.6 initial forecasts while the Composite PMI also rose to 53.0 from 52.2 first estimations for the said month.
Further, the Reserve Bank of Australia (RBA) surprises markets by lifting the Official Cash Rate (OCR) by 25 basis points (bps) to 3.85%. Not only does the RBA announce a 0.25% rate hike but the Aussie central bank also expects further tightening of the monetary policy. That said, the RBA also revised its inflation and Gross Domestic Product (GDP) forecasts in the latest policy document. Additionally, RBA Governor Philip Lowe repeated that some further tightening may be required to bring inflation back to the 2-3% target within a reasonable timeframe.
Technical analysis
Despite a four-day uptrend, AUD/USD repeatedly fails to provide a daily closing beyond the 21-DMA and a three-week-old descending resistance line, respectively near 0.6675 and 0.6685, which in turn teases sellers.
- WTI is pressured and near fresh cycle lows in $68.00.
- US Dollar is lower on the Fed as markets await the ECB.
WTI Crude Oil was heavily down on Wednesday with a drop-kicking in ahead of the Federal Reserve interest rate decision. Crude was posting a 5-week low and has been under pressure on concerns of a global slowdown that would only weigh on energy demand. At the time of writing, Crude prices are trading at $68.08 WTI and have traveled between a high of $71.74 and a low of $68.02bbls.
Among worries in the energy sector, the banking turmoil and the risks of tighter monetary policy from the world's central banks have played their roles. On Wednesday, the Federal Reserve raised interest rates by 25 bp ahead of Thursday´s European Central Bank meeting which is expected to raise rates by +25 bp as well.
Additionally, Crude prices maintained sharp losses following this Wednesday's mixed EIA inventory report. EIA gasoline supplies unexpectedly rose +1.74 million bbl versus expectations of a -1.5 million bbl draw. Also, crude stockpiles at Cushing, the delivery point of WTI futures, rose +541,000 bbl. The EIA report showed that (1) US crude oil inventories as of April 28 were -1.9% below the seasonal 5-year average, (2) gasoline inventories were -6.2% below the seasonal 5-year average, and (3) distillate inventories were -12.5% below the 5-year seasonal average.
Analysts at TD Securities explained that crude oil prices were plummeting in line with the notable deterioration in commodity internals that have soured demand signals. ´´While energy markets have now begun to price in recession risks, prices remain notably more elevated than would be otherwise anticipated in the face of the deteriorating macroeconomic backdrop, given still elevated supply risk premia. ´´
Following the Federal Reserve's decision to raise interest rates to their highest level since 2007, Bloomberg reported that PacWest Bancorp is considering strategic options, including a potential sale.
PacWest's shares are falling by more than 50% in the post-market, indicating significant investor concern about the bank's situation.
After the Fed, the focus now turns to the European Central Bank. During the Asian trading session, New Zealand will report Building Permits, Australia will report Trade Balance figures, and the Chinese Caixin Manufacturing PMI is also due.
Here is what you need to know on Thursday, May 4:
As expected, the Federal Reserve raised interest rates by 25 basis points to 5.00-5.25%, the highest level since 2007. The FOMC also removed forward guidance about further rate hikes but noted that the timing of future rate changes will depend on incoming economic data. The bias still favors further tightening. The currency market saw limited impact.
Analysts at Societe Generale explained:
With the Fed funds target range of 5.00-5.25% the Fed has met its dot-plot guidance from last December and updated as of March. A pause is the next step. A full stop requires confirmation that inflation pressures (rents in particular) subside and employment slows.
Wall Street stocks closed lower and US bond yields declined further, putting pressure on the US Dollar. The US Dollar Index (DXY) closed at its lowest level in a week around 101.35 but remained above recent lows. Meanwhile, the US 10-year yield settled at 3.36%, marking a one-month low.
The US will release data on Q1 Unit Labor Costs and weekly Jobless Claims on Thursday. The ADP Employment report for April showed a surge in private payrolls, rising by 296K and surpassing expectations. However, the market's reaction to the data was muted as investors await Friday's Nonfarm Payrolls report
The focus has now shifted to the upcoming European Central Bank (ECB) meeting, where a 25 basis point rate hike is expected, but a 50 basis point hike is also possible. The outcome of the meeting is likely to trigger reactions in the Euro. The EUR/USD pair approached 1.1100 after the FOMC statement before pulling back to 1.1050. Despite the limited upside, the pair remains bullish.
European Central Bank Preview: Lagarde set to lift the Euro in two out of three scenarios
GBP/USD reached its highest intraday levels since June, approaching 1.2600 before retreating slightly. The bias is to the upside.
USD/JPY extended its slide for the second day in a row, impacted by lower US yields and the decline in equity prices on Wall Street. Over the past two days, it has fallen more than 200 pips, hitting three-day lows at 134.82.
AUD/USD rose for the third consecutive day but failed to hold above 0.6700, indicating that it is not yet ready for a bullish breakout. Nevertheless, it remains far from the recent lows. On Thursday, the Australian trade data and the Caixin China Manufacturing PMI are due.
NZD/USD continued to edge higher, reaching two-week highs at 0.6260. The Kiwi outperformed CAD and AUD following positive labor market data from New Zealand. Market participants expect the Reserve Bank of New Zealand (RBNZ) to raise rates again at the next meeting on May 24. In the Financial Stability Report, the RBNZ stated that the national financial system is well-positioned to deal with rising interest rates and global risks.
Crude oil prices dropped again, falling by more than 4%. WTI posted its lowest close since mid-March near $68.00. Gold continued to rise, holding firm above $2,000; it peaked at $2,036, with the year-to-date high around $2,050 on the radar. Silver also gained but more modestly, rising to $25.50. Cryptocurrencies fell on Wednesday, with BTC/USD down 1% to $28,350
Like this article? Help us with some feedback by answering this survey:
- EUR/USD bulls move back into the peak formation.
- Federal Reserve´s dovish hike weakened the US Dollar.
EUR/USD has been attempting to run higher on Wednesday and reached the 1.1090s and a previous resistance area. The Euro ran higher on the back of what was traded as a dovish 25 basis point hike from the Federal Reserve ahead of tomorrow's European Central Bank meeting.
At the time of writing, EUR/USD is trading at 1.1055 as the US Dollar scrambled back from the edge of the abyss following a balanced press conference from the Federal Reserve´s, Jerome Powell. The following are the key takeaways from the event:
Fed´s statement, key takeaways
- Fed drops language that it anticipates more policy firming may be appropriate to attain a sufficiently restrictive stance.
- Will continue reducing the balance sheet as planned.
- Job gains have been robust and inflation remains elevated.
- Tighter credit conditions are likely to weigh on the economy, hiring, and inflation.
- Fed says the vote in favor of the policy was unanimous.
- Fed repeats us banking system is sound and resilient.
- In determining the extent to which additional policy firming may be appropriate, it will take into account tightening.
The Federal Reserve removed the prior language that signaled more hikes were coming. Instead, the statements say the extent to which more firming is needed hinges on the economy. Consequently, Fed futures are pricing in a pause in June and July and rate cuts in September.
However, Fed´s Chairman Jerome Powell was questioned by the press as to whether rate cuts are on the way, to the contrary, he said it would not be appropriate for us to cut rates when he outlined the conditions of high inflation whereby the Fed would need to stay on its rate hiking course.
´´Rate cuts would be inappropriate given our belief that inflation will take some time to subside,´´ Fed Chairman said.
Consequently, the US Dollar was thrown around as follows:
US Dollar, DXY chart
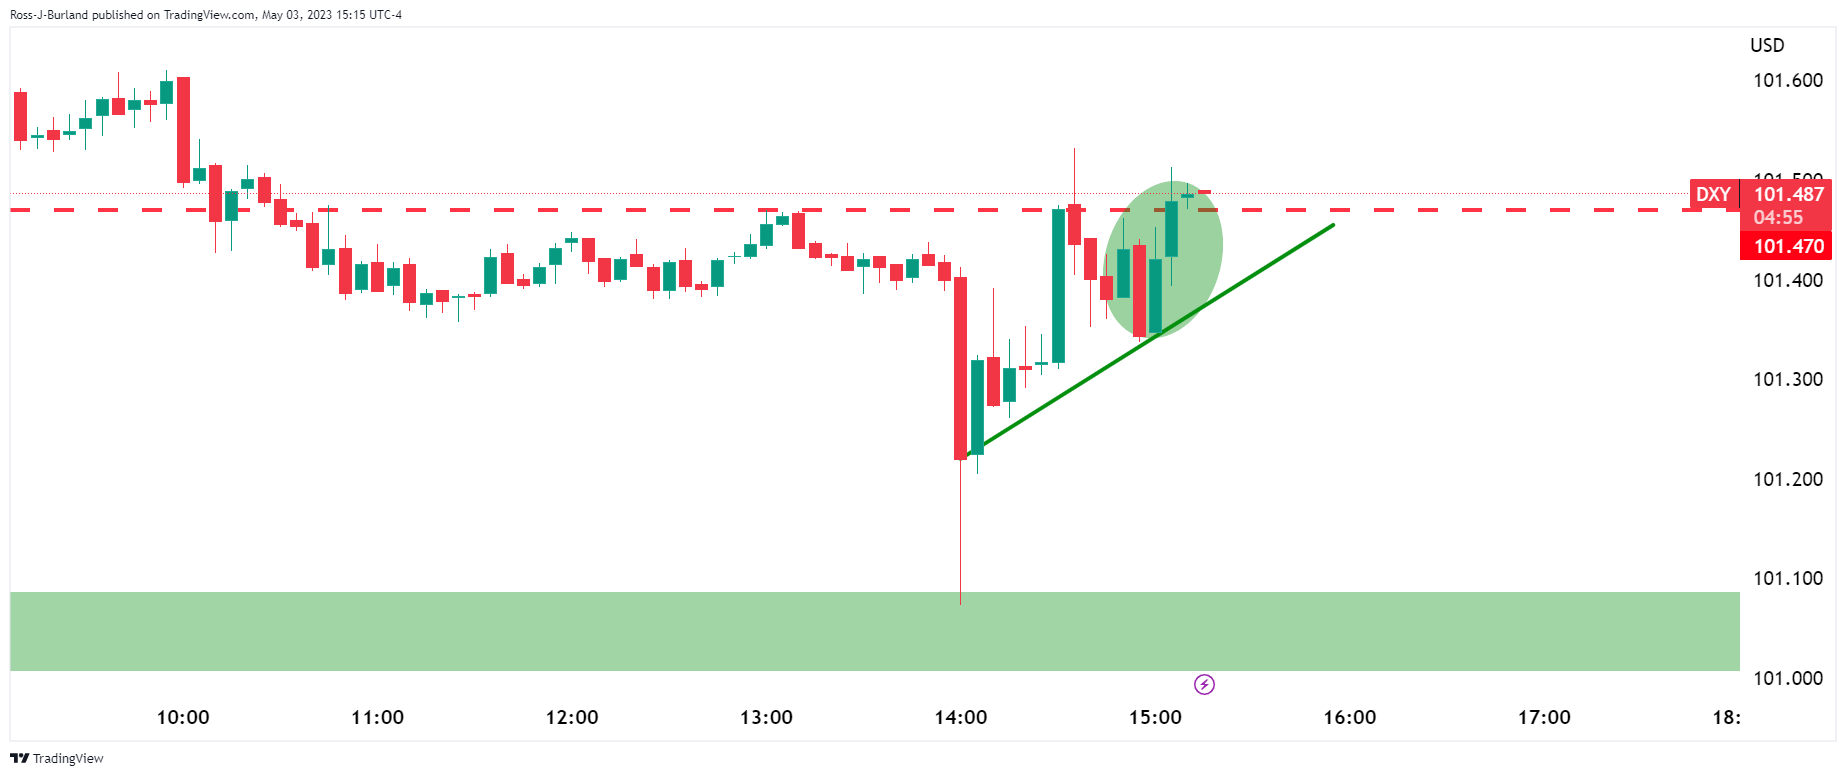
The eclipsed price action above on the 5min chart was the reaction to Powell´s back peddling when it came to rate cuts. The price to the downside was the market's initial reaction to the prospects of a pivot from the Fed. The line in the sand is around 101.50:
The European Central Bank is the next main highlight for EUR/USD.
´´ It is our view that the ECB will announce three more 25 bps rate hikes in May, June and July,´´ analysts at Rabobank said.
´´While the USD has failed to gain a safe-haven bid this week on concerns about US regional banks. Fresh stresses elsewhere could yet promote a move back to USDs. We see risk of a move back to the EUR/USD 1.06 in H2 this year,´´ the analysts concluded.
EUR/USD technical analysis
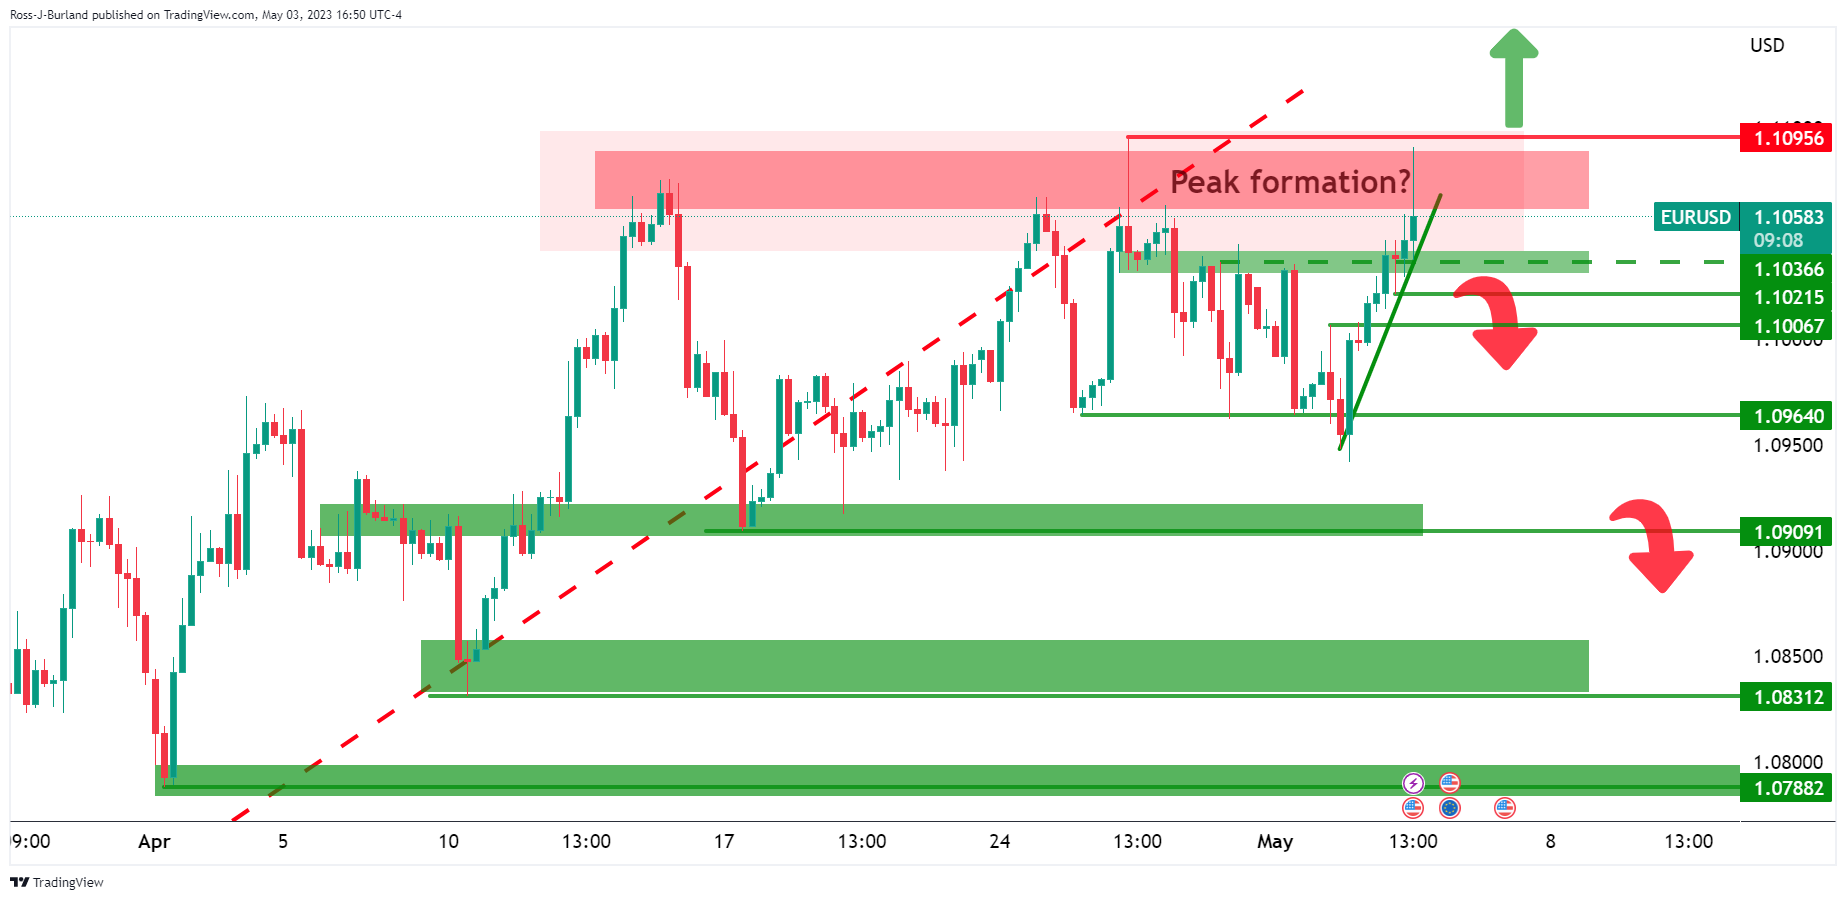
The EUR/USD 4-hour chart is pretty messy with the price breaking structures on the downside and coming right back into the peak formations again. With that being said, a break above 1.1100 will be bullish while a break below 1.1020 would be bearish.
- Fed Chair Powell Signals Monetary Policy Meeting by Meeting, Raises Rates by 25bps.
- US Central Bank Ready to Take Action, Including Raising Rates, Says Fed Chair.
- USD/MXN Price Analysis: Likely to break to new multi-year lows below 18.00.
The USD/MXN plummets to fresh six-year lows, last seen in September 2017, after the US Federal Reserve (Fed) raised rates by 25 bps, though it opened the door for pausing. The USD/MXN is trading at 17.8865, down 0.50% at the time of typing.
The US Federal Reserve Chair Powell took the stance after he and his colleagues decided to raise rates by 25 bps and signaled that the US central bank would determine its monetary policy, meeting by meeting. Jerome Powell added that inflation is too high and the labor market is tight.
When asked about rate cuts, he said it “would not be appropriate to cut rates, given our view that inflation will take some time to come down.” Powell added that the US central bank is “prepared to do more,” including rising rates if needed, and that officials did not decide to pause at the upcoming June meeting.
On Wednesday, the US central bank hiked rates by 25 bps to the 5.00% - 5.25% area but tweaked its language regarding additional rate hikes. The Fed shifted to being data-dependent and will asses future decisions based on information about the economy, inflation, and the overall financial markets behavior.
Policymakers added that ongoing tightening of credit conditions could help the Fed to get inflation to its 2% target. Although today’s Fed decision was perceived as dovish, officials reiterated that inflation is elevated and the labor market robust. Regarding the balance sheet reduction, the FOMC decided to continue as planned.
USD/MXN Technical Analysis
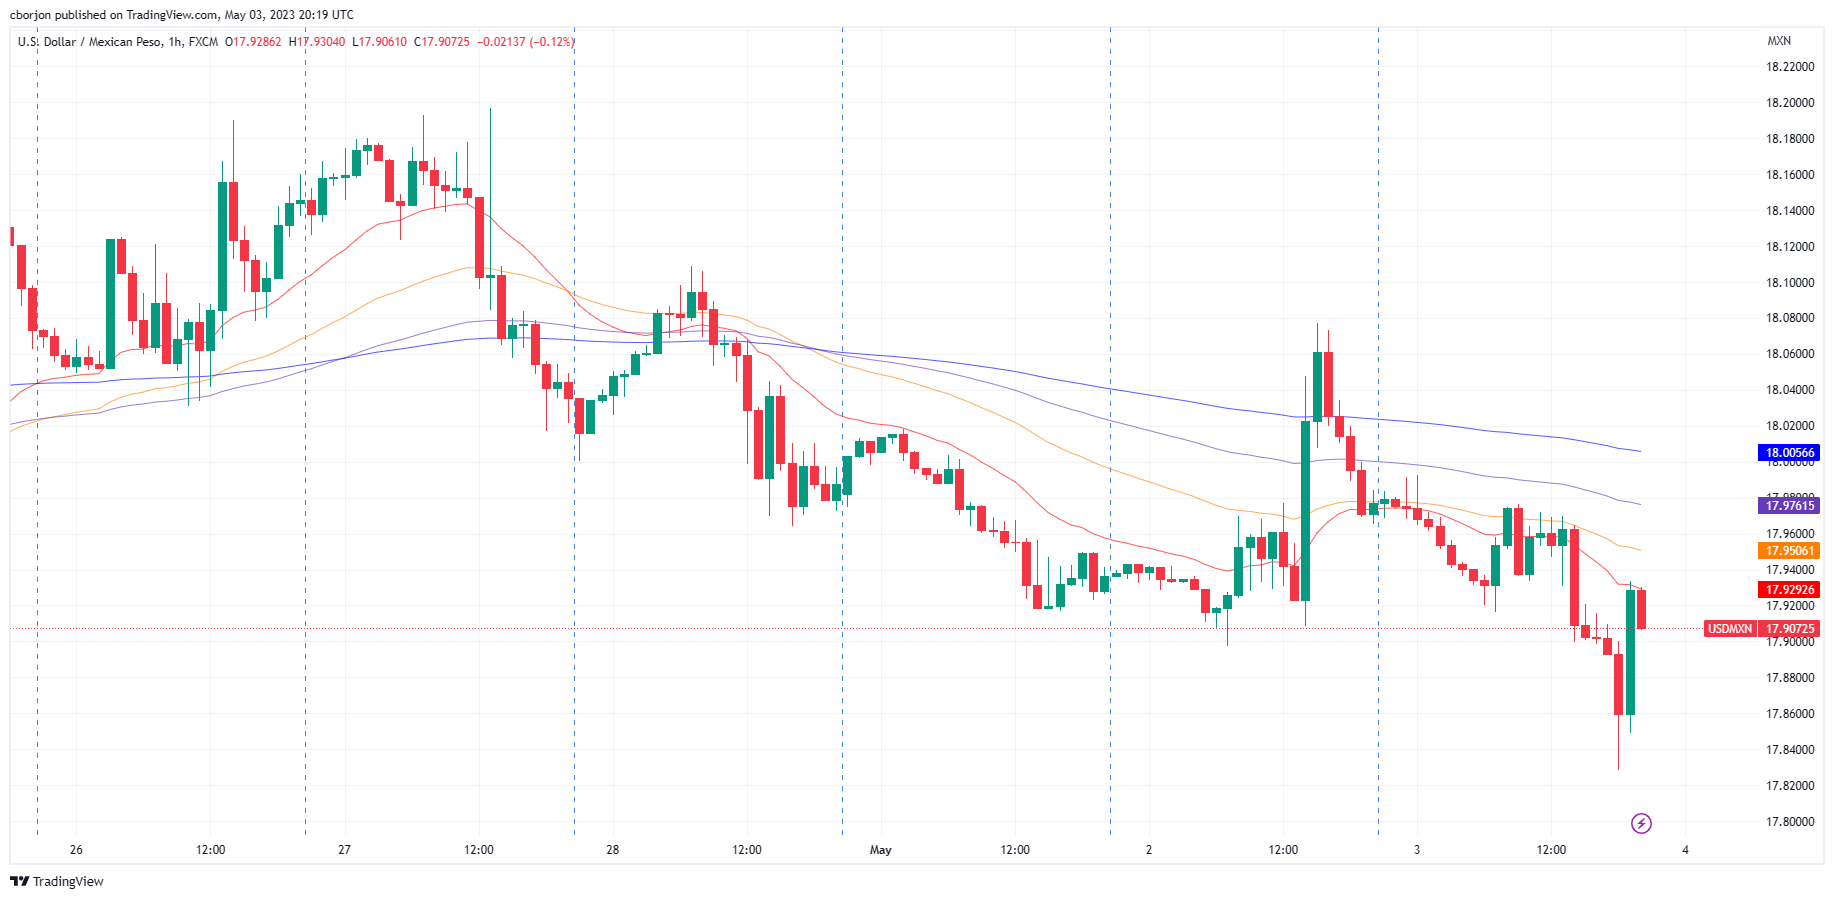
As Fed Chair Powell spoke in his press conference, the USD/MXN reached a multi-year low at around 17.8283. Nevertheless, the USD/MXN buyers lifted the exchange rates to the current level. If USD/MXN buyers want to shift the bias to neutral, they must reclaim the 20-day EMA at 18.0566, followed by the 50-day EMA at 18.2511. A breach of the latter will expose the 100-day EMA at 18.5732.
- USD/CAD is mixed during the Fed event on Wednesday.
- USD/CAD is trapped in a box 1.3600 is key.
- A break below 1.3580 tips the bias in favor of the bears.
USD/CAD is down on the day by some 0.2% as the US Dollar plummets on the back of what has been perceived to be a dovish outcome of the Federal Reserve meeting on Wednesday. A dovish hike is being priced into the markets following the Federal Reserve´s rate hike of 25 basis points and accompanying announcements within its statement.
The US Dollar has dropped as the central bank removed the prior language that signaled more hikes were coming. Instead, the statements say the extent to which more firming is needed hinges on the economy. Subsequently, Fed futures are pricing in a pause in June and July and rate cuts in September.
Currently, Federal Reserve´s Chairman, Jerome Powell is being quizzed by the press that are scrutinizing the language in the statement.
Feds statement, key takeaways
- Fed drops language that it anticipates more policy firming may be appropriate to attain a sufficiently restrictive stance.
- Will continue reducing the balance sheet as planned.
- Job gains have been robust and inflation remains elevated.
- Tighter credit conditions are likely to weigh on the economy, hiring, and inflation.
- Fed says the vote in favor of the policy was unanimous.
- Fed repeats us banking system is sound and resilient.
- In determining the extent to which additional policy firming may be appropriate, it will take into account tightening.
´The press are asking whether rate cuts are on the way and Fed´s Powell has dodged to comment anything in concrete. To the contrary, ´´it would not be appropriate for us to cut rates,´´ when he outlined the conditions of high inflation whereby the Fed would need to stay on its rate hiking course. ´´Rate cuts would be inappropriate given our belief that inflation will take some time to subside,´´ Fed Chairman said. Consequently, the US Dollar is finding some support:
DXY chart
USD/CAD technical analysis
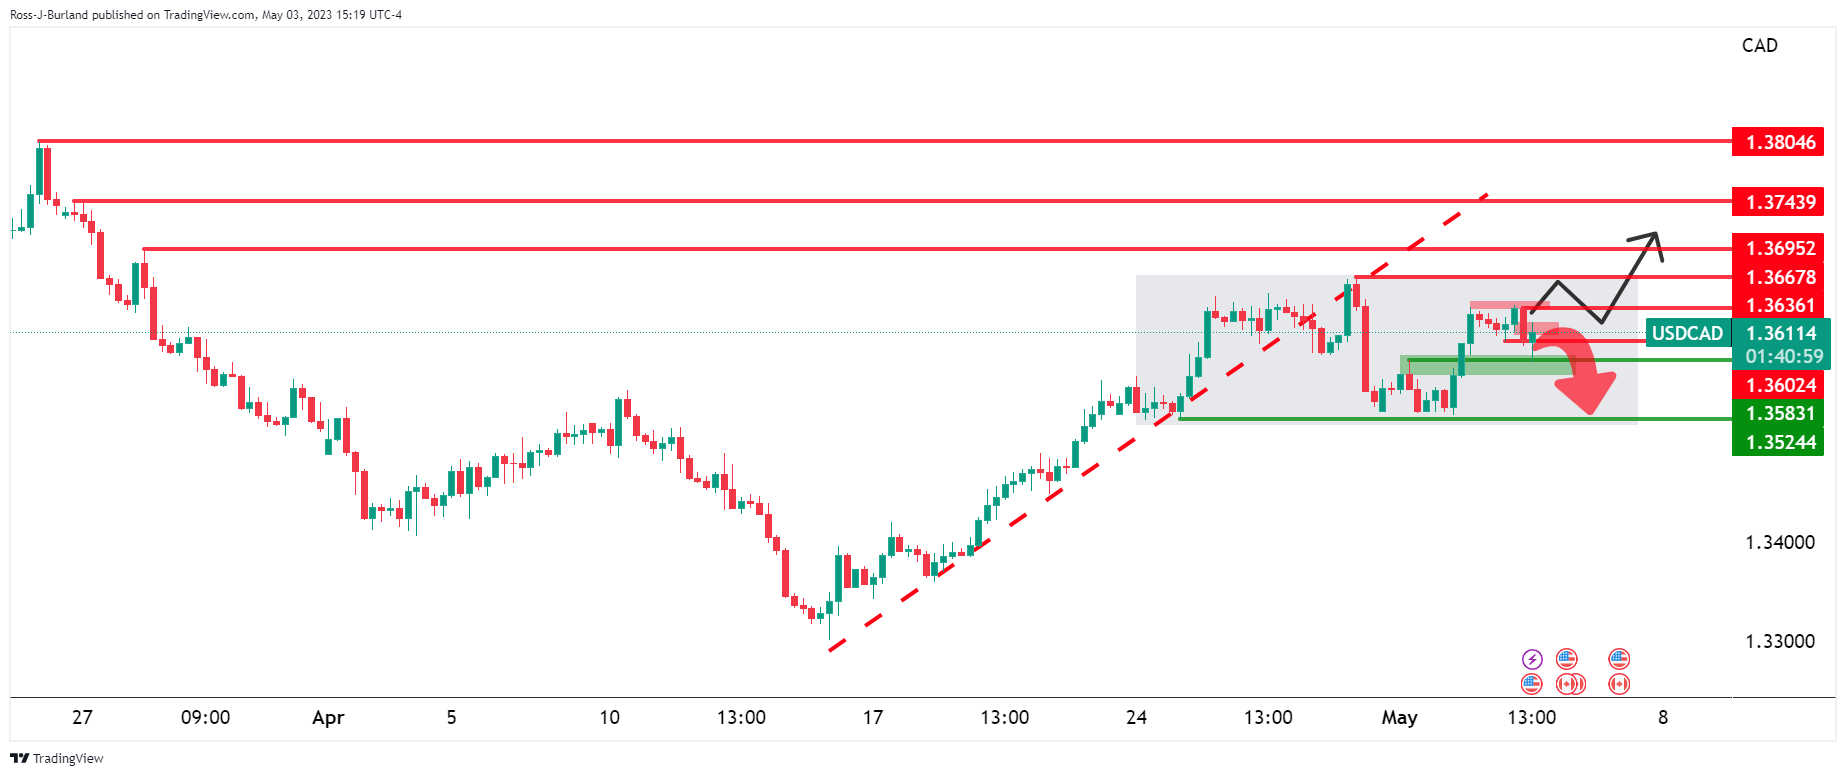
The price is trapped in a box 1.3600 is key. If 1.3600 can hold, then the bulls will be in play still. A break below 1.3580 tips the bias in favor of the bears.
FOMC Chairman Jerome Powell comments on the policy outlook after the Federal Reserve's decision to raise the policy rate by 25 basis points to the range of 5-5.25% following the May policy meeting.
Key quotes
"Support for rate hike today was very strong."
"There were a number of policymakers at today's meeting talking about pausing, but not so much at this meeting."
"There is a sense we are much closer to the end than the beginning."
"We feel like we are close, or maybe even there."
"We can afford to look at the data and make a careful assessment."
"Speed of SVB run needs to be reflected in supervision, regulation."
"It's clear we need to strengthen supervision, regulation for large banks."
- NZD/USD stays above 0.6220s in a volatile session as Fed Chair Powell speaks.
- The removal of hawkish language in the monetary policy statement signals a possible Fed pivot.
- Fed Powell: If the US gets tip into a recession, I “hope it would be mild.”
The NZD/USD advances sharply, eyeing the 200-day SMA at 0.6255, after the US Federal Reserve (Fed) decided to raise rates by 25 bps, though it opened the door for a “possible” pause. As Fed Chair Jerome Powell speaks, the NZD/USD is trading volatile within the 0.6220-60 area at the time of writing.
The Fed would be data-dependent at upcoming meetings, including a possible pause
In his press conference, Federal Reserve Chair Jerome Powell said the Fed would take a data-dependent approach, and there are some signs that supply and demand in the labor market are returning to balance. He added that inflation pressures continued to run high, and if the US hits a recession, it would be mild.
Powell added that the US central bank is prepared to do more if warranted and emphasized the Fed’s goal to restore price stability while adding that rates would remain higher “for a while.”
On Wednesday, the Fed Chair Powell and Co. voted to raise rates to the 5.00% - 5.25% area, though tweaked its language regarding additional rate hikes. The Fed shifted to being data-dependent and will asses future decisions based on information about the economy, inflation, and the overall financial markets behavior.
Federal Reserve officials added that ongoing tightening of credit conditions could aid the US central bank to achieve its 2% inflation goal. Despite removing some hawkish language from the monetary policy statement, policymakers reiterated that inflation is high and that the labor market is tight. Therefore, June’s meeting would likely be live, even though the futures markets had begun to price in the first rate cut in September. Concerning the balance sheet reduction, the Quantitative Tightening (QT) would continue as planned.
NZD/USD Technical Levels
FOMC Chairman Jerome Powell comments on the policy outlook after the Federal Reserve's decision to raise the policy rate by 25 basis points to the range of 5-5.25% following the May policy meeting.
Key quotes
"There are no promises, but it's possible we can continue to have labor market cooling without big increases in unemployment."
"Case of avoiding recession is more likely than having a recession."
"If we have recession, would hope it would be mild."
"Do not think wages are principle driver of inflation."
"As goods pipelines get back to normal, will see prices, corporate margins coming down."
"A particular focus now and going forward is what's happening with credit tightening."
"Need to factor credit tightening into whether our policy stance is sufficiently restrictive."
"Would not be appropriate to cut rates, given our view that inflation will take some time to come down
"Non-housing services inflation hasn't moved much."
FOMC Chairman Jerome Powell comments on the policy outlook after the Federal Reserve's decision to raise the policy rate by 25 basis points to the range of 5-5.25% following the May policy meeting.
Key quotes
"We are trying to reach and then stay at for an extended period a sufficiently restrictive stance to bring down inflation."
"We have to balance risk of not doing enough against risk of slowing economic activity too much."
"Felt that this rate hike and change in statement was the right way to balance that."
"Will be an ongoing process to assess appropriate level of rates."
"Policy is tight."
"Real rates are around 2%, meaningfully above neutral rate."
"We might possibly be at sufficiently restrictive level, may not be far off."
"We have a goal of getting to 2%, will take some time and will not be a smooth process."
"We think we will need to stay on this for a while."
"Wages still above level consistent with 2% inflation over time."
"Labor market is very very strong, inflation is running high and well above goal."
"Right now we need to focus on bringing inflation down."
FOMC Chairman Jerome Powell comments on the policy outlook after the Federal Reserve's decision to raise the policy rate by 25 basis points to the range of 5-5.25% following the May policy meeting.
Key quotes
"Don't have an agenda for further bank consolidation."
"Bank consolidation has been going on for a while."
"Have long felt that having small, medium and large banks is a great part of our banking system."
"Hard to predict how much credit tightening will replace need for any further rate hikes."
"Assessing the extent to which firmer policy will be needed will be ongoing, and meeting by meeting."
"Credit tightening complicates that assessment, adds uncertainty."
"Will be an ongoing assessment whether Fed has reached sufficiently restrictive."
"Not possible to say with confidence if we have reached sufficiently restrictive level."
"Will revisit that at June meeting."
"Before declaring we've reached sufficiently restrictive stands will need more data."
FOMC Chairman Jerome Powell comments on the policy outlook after the Federal Reserve's decision to raise the policy rate by 25 basis points to the range of 5-5.25% following the May policy meeting.
Key quotes
"No one should assume the Fed can protect the economy from a failure to pay bills on time."
"Debt ceiling did come up in discussions."
"Talked about debt limit issue as a risk to the outlook."
"Debt limit issue was not important in today's monetary policy decision."
"Was raised by some as a risk but not critical to today's decision."
"The feFebruary 14 presentation was a general presentation on interest rate risks."
"There was one page on Silicon Valley Bank."
"Nothing in the February 14 briefing about the risk of a bank run."
"Staff was going to do a horizontal assessment of banks, not presented as urgent or alarming."
"Many banks are now attending to liquidity."
"Financial stability tools and monetary policy tools are working well together."
- US Dollar bears are lurking below 101.50 while Fed Powell talks.
- Fed's Powell´s comments will be scrutinized for a possible hawkish tone to flip the script.
The US Dollar is volatile in the session surrounding the Federal Reserve. DXY, which is an index that measures the Greenback vs.. a basket of major currencies, was initially sold off but has since recovered the losses and is heading a touch higher.
The Federal Reserve rate hike of 25 basis points and accompanying announcements within its statement. The central bank removed the prior language that signaled more hikes were coming. Instead, the statements say the extent to which more firming is needed hinges on the economy. Consequently, Fed futures are pricing in a pause in June and July and rate cuts in September.
Feds statement, key takeaways
- Fed drops language that it anticipates more policy firming may be appropriate to attain a sufficiently restrictive stance.
- Will continue reducing the balance sheet as planned.
- Job gains have been robust and inflation remains elevated.
- Tighter credit conditions are likely to weigh on the economy, hiring, and inflation.
- Fed says the vote in favor of the policy was unanimous.
- Fed repeats us banking system is sound and resilient.
- In determining the extent to which additional policy firming may be appropriate, it will take into account tightening.
All in all, the Fed has opened the door to a rate-hike pause, and Gold price is reacting in kind.
Markets will now await the Chairman, Jerome Powell who will be speaking in the press conference.
Watch live: Fed Chair Jerome Powell
US Dollar technical analysis
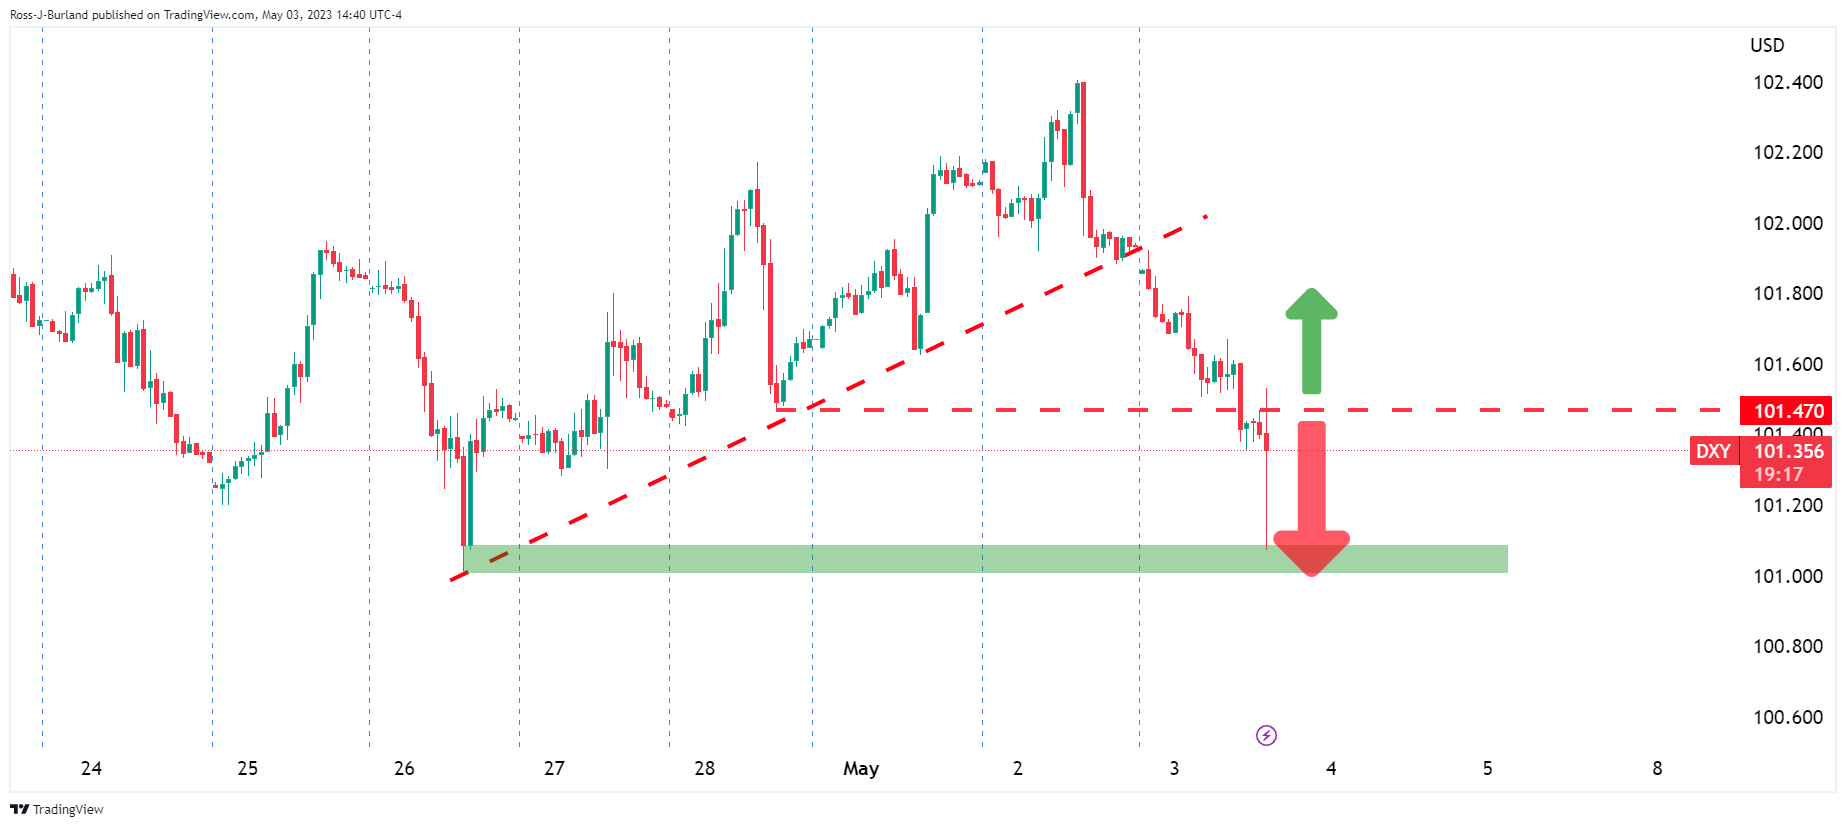
The price is bearish while below 101.50.
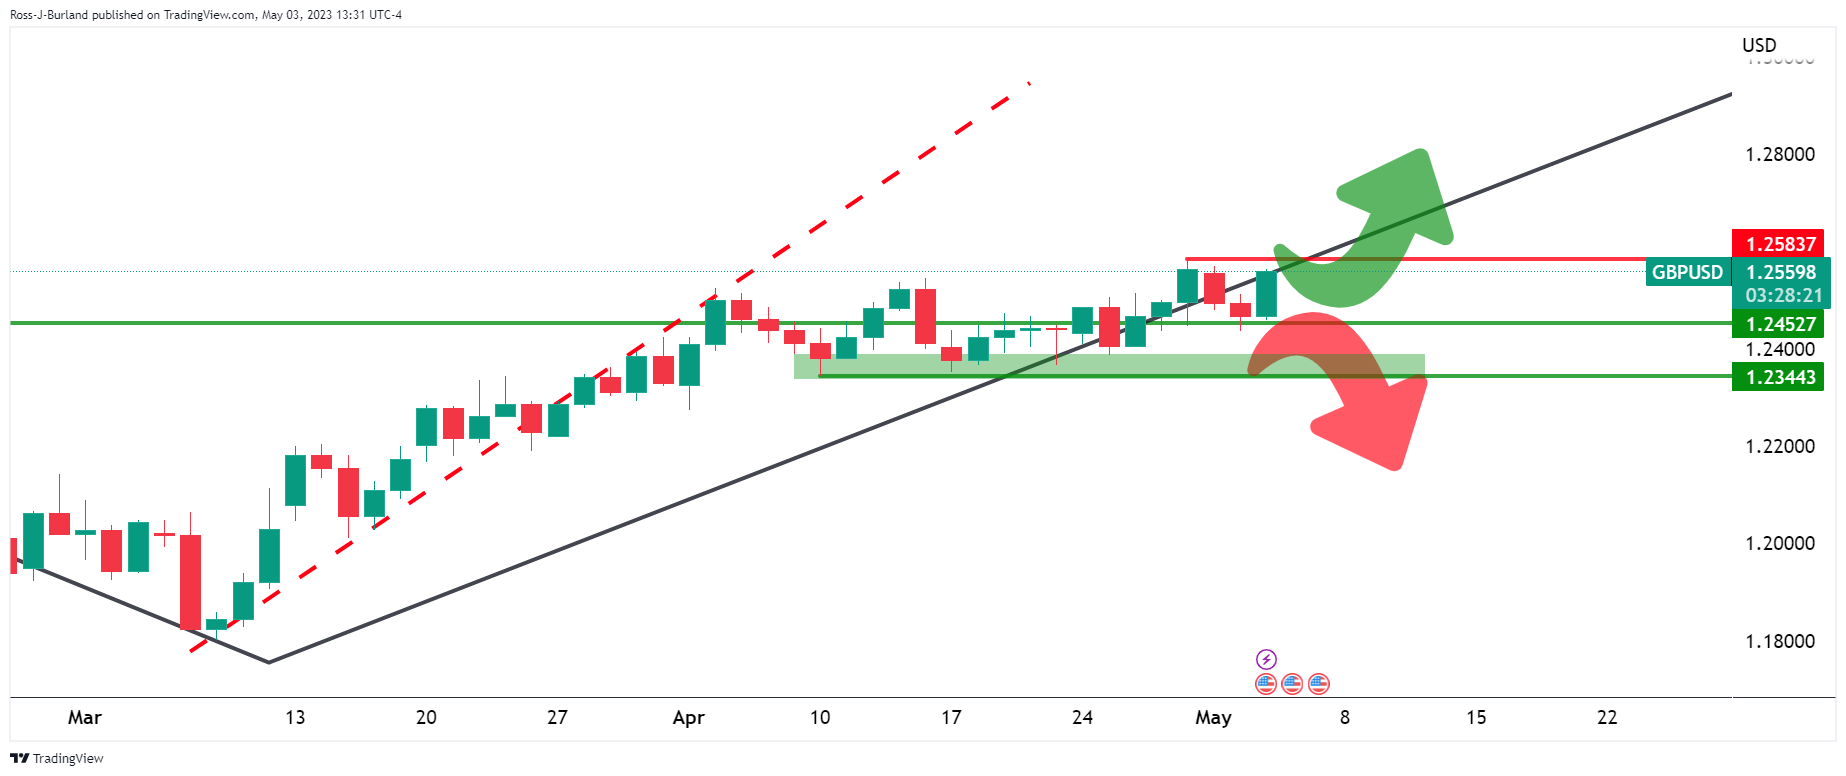
- GBP/USD stays positive following the Federal Reserve’s “dovish” interest rate hike.
- Federal Reserve officials voted unanimously for a 25 bps rate hike.
- Policymakers dropped some hawkish language, perceived as a signal that the Fed could pause.
The GBP/USD rallied sharply to a fresh YTD high at 1.2589 on the back of a 25 bps interest rate increase by the Federal Reserve (Fed), which dropped “hawkish” language, adopting a more neutral stance. At the time of writing, the GBP/USD remains volatile, trading at around 1.2560-1.2590, with gains close to 0.80%.
Review of the Fed’s May meeting monetary policy statement
To highlight, Federal Reserve officials voted unanimously for a quarter of a percent increase to the Federal Funds Rate (FFR). They switched the language from “anticipating that some additional policy firm may be appropriate…” to “determining the extent to which additional policy firming may be appropriate,” policymakers would assess their decisions based on the economy, inflation, and the financial markets behavior.
Powell and Co. added that tightening credit conditions would help the Fed to achieve its goal. They emphasized the resilience and soundness of the banking system and added that inflation remains high and the labor market tight. Concerning the QT, the balance sheet reduction would continue as planned.
After the Federal Reserve’s decision, US rate futures show traders are pricing in rate cuts in September, according to Reuters.
GBP/USD’s pair reaction to the headline
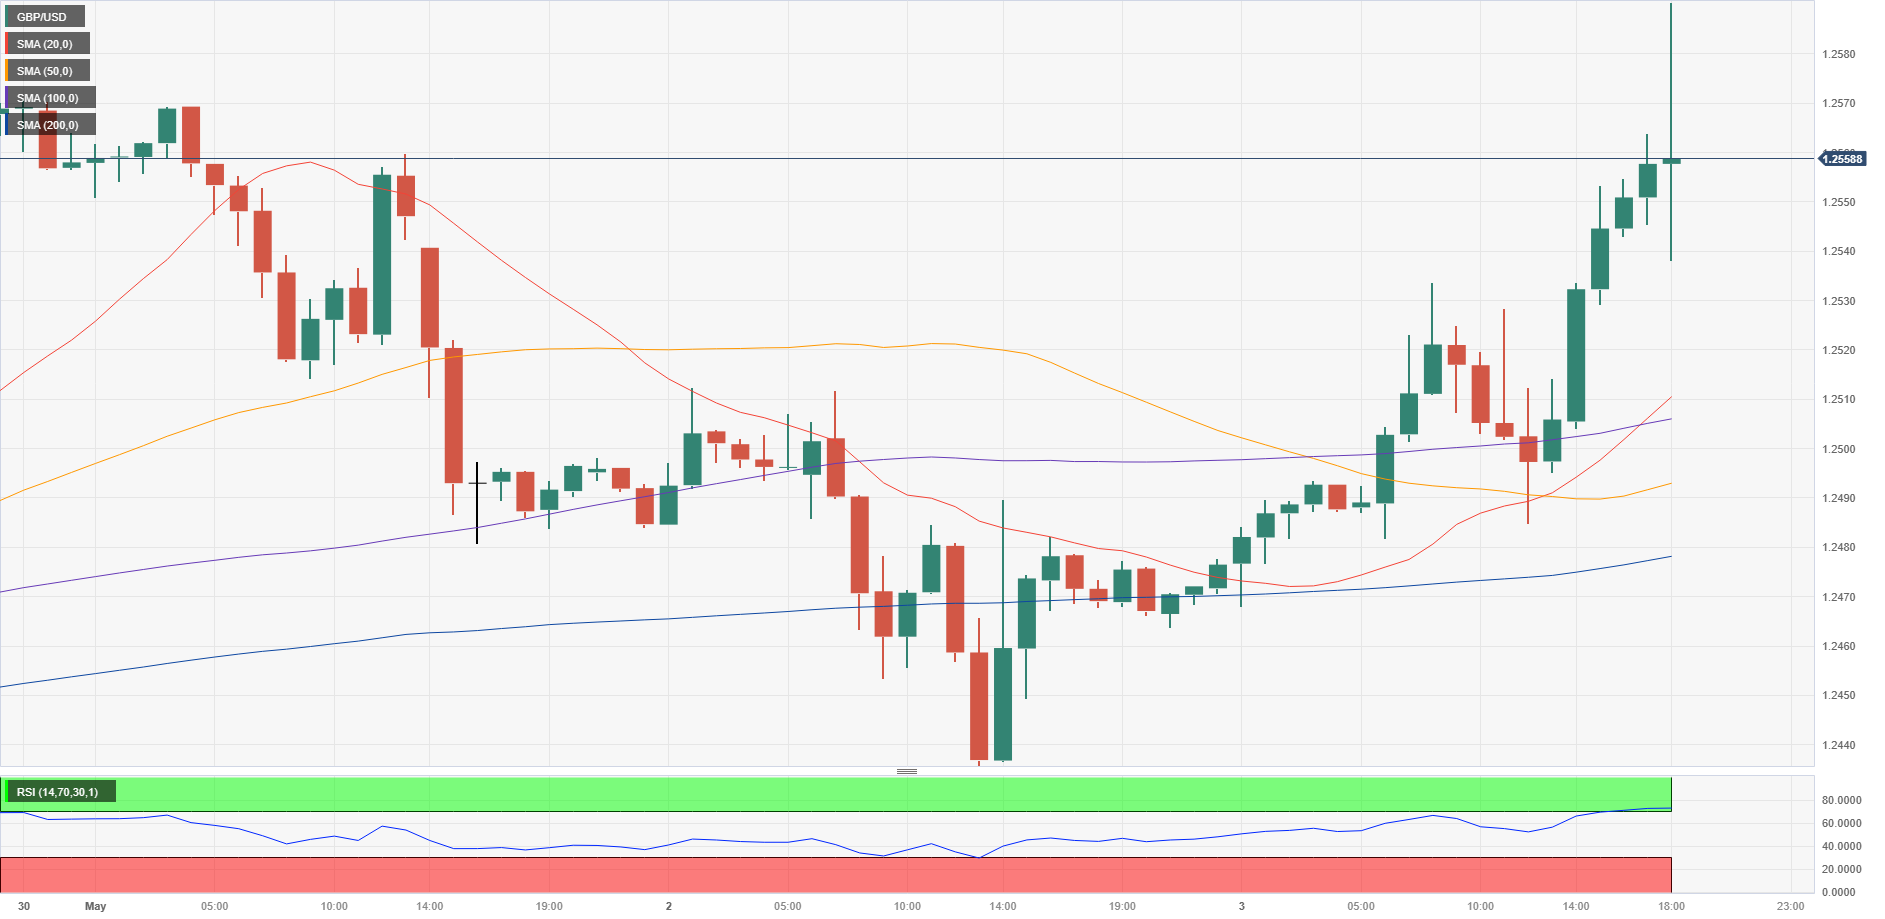
The GBP/USD climbed sharply but has retraced some gains as the Federal Reserve Chai Jerome Powell’s press conference begins. The 1-hour chart portrays the GBP/USD as forming a gravestone doji, which could suggest further downside estimates. Nevertheless, GBP/USD traders better buckled up; as volatility increases, it could trigger some action.
GBP/USD key resistance levels lie at 1.2550, 1.2589, and 1.2600. On the flip side, the GBP/USD would find support at 1.2510, the 20-hour SMA, followed by the 1.25 figure, ahead of dropping towards the 50-hour SMA at 1.2492.
GBP/USD Technical Levels
FOMC Chairman Jerome Powell comments on the policy outlook after the Federal Reserve's decision to raise the policy rate by 25 basis points to the range of 5-5.25% following the May policy meeting.
Key quotes
"A decision on a pause was not made today."
"Statement change was meaningful."
"It is a meaningful change to no longer say we anticipate more firming of policy."
"Staff forecast is independent of Fed policymakers."
"Broadly the staff forecast was for a mild recession."
"Staff forecast for this meeting was broadly similar to march forecast."
"Debt limit is a fiscal policy matter for elected officials to deal with."
"It is essential for debt limit to raised in timely way."
"Consequences of a default would be quite adverse."
FOMC Chairman Jerome Powell comments on the policy outlook after the Federal Reserve's decision to raise the policy rate by 25 basis points to the range of 5-5.25% following the May policy meeting.
Key quotes
"Highly attentive to risks of inflation to both sides of mandate."
"We are seeing the effects of policy tightening, particularly in housing and investment."
"Will take time for full effects of monetary restraint to be realize."
"Economy is likely to face headwinds from credit conditions."
"Strains from banking sector resulting in tighter conditions."
"Extent of effects is uncertain."
"Strains from banking system in March is resulting in even tighter conditions."
"Our future policy actions will depend on how events unfold."
"We will make rate determination meeting by meeting."
"We are prepared to do more if more is warranted."
"Reducing inflation likely to require period of below trend growth, softer labor market."
"Restoring price stability is essential."
FOMC Chairman Jerome Powell comments on the policy outlook after the Federal Reserve's decision to raise the policy rate by 25 basis points to the range of 5-5.25% following the May policy meeting.
Key quotes
"Conditions in banking sector have broadly improved."
"US banking system is sound and resilient."
"Committed to learning right lessons."
"Focus remains on dual mandate."
"Strongly committed to bringing inflation back down to 2%."
"Without price stability will not achieve sustained strong labor market."
"We will take a data-dependent approach from here."
"Activity in housing sector remains weak."
"Labor market remains very tight."
"Some signs that supply and demand in labor market coming back into better balance."
"Nominal wage growth has shown signs of easing."
"Inflation has moderated somewhat."
Inflation pressures continue to run high."
"Have a long way to go to bring down inflation."
- Federal Reserve raises rates and signals potential pause.
- US Dollar weakens after FOMC statement.
- AUD/USD testing 0.6700 amid volatility.
The AUD/USD jumped to 0.6702 after the Federal Reserve’s decision due to broad-based dollar weakness. It then pulled back modestly, trimming some gains. The pair still holds a bullish tone ahead of Chair Powell's press conference.
Fed raises, probably for the last time in a while
The Fed raised rates to 5.00% - 5.25%, the highest level since 2007, as expected. In the statement, the central bank signaled a potential pause. Chair Powell will offer a press conference and answer questions. He is unlikely to declare 'mission accomplished' and will probably highlight that what happens next is 'data-dependent'.
The US Dollar Index (DXY) dropped to 101.07 before returning to 101.35. It is still down for the day but off its lows. US yields printed fresh lows after the decision but then bounced, and are now slightly above the level they were at before the statement. US stocks hit new daily highs but then pulled back to prior levels.
The AUD/USD pair jumped to 0.6702, hitting a fresh daily high before pulling back under 0.6700. It still holds bullish momentum amid elevated volatility. Above 0.6705, the next resistance is seen at Tuesday's high of 0.6717, followed by 0.6745/50. On the flip side, 0.6675 is the immediate support, followed by 0.6650.
Technical levels
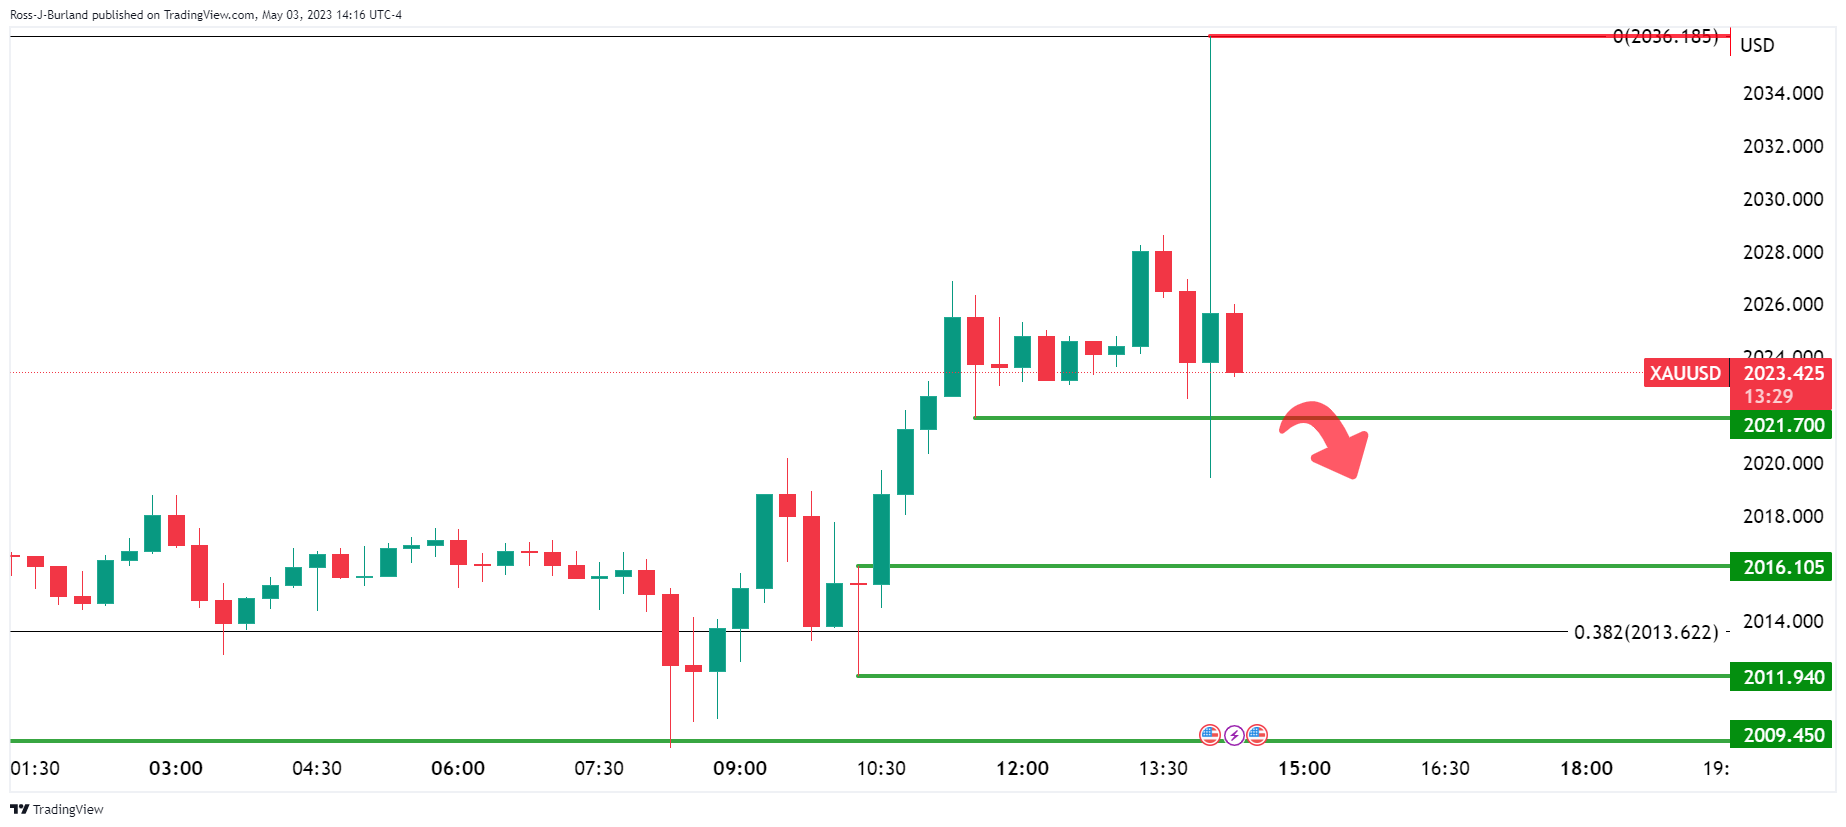
- Gold Price rallies and drops back on the Federal Reserve rate hike and statement.
- Markets now await Fed´s Jerome Powell for clarity and direction.
The Gold price jumped to a high of $2,036.15 and counting on the back of the initial reaction to the Federal Reserve rate hike of 25 basis points and accompanying announcements within its statement.
The US Dollar has dumped and is down some 0.8% at the time of writing as the central bank removes the prior language that signaled more hikes were coming. Instead, the statements say the extent to which more firming is needed hinges on the economy. Consequently, Fed futures are pricing in a pause in June and July and rate cuts in September.
Feds statement, key takeaways
- Fed drops language that it anticipates more policy firming may be appropriate to attain a sufficiently restrictive stance.
- Will continue reducing the balance sheet as planned.
- Job gains have been robust and inflation remains elevated.
- Tighter credit conditions are likely to weigh on the economy, hiring, and inflation.
- Fed says the vote in favor of the policy was unanimous.
- Fed repeats us banking system is sound and resilient.
- In determining the extent to which additional policy firming may be appropriate, it will take into account tightening.
All in all, the Fed has opened the door to a rate-hike pause, and Gold price is reacting in kind.
Markets will now await the Chairman, Jerome Powell who will be speaking in the press conference.
Watch live: Fed chair Jerome Powell
Gold technical analysis
The bulls are in the market but the volatility is rife and there are prospects of a move lower into the in-the-money longs from the start of the US session if the bears can get below $2,021 on hawkish rhetoric from Jerome Powell:
- USD/JPY fell to a new daily low of 134.83 after the Fed’s dovish hike.
- Federal Reserve officials voted unanimously for a 25 bps rate hike.
- Policymakers dropped some hawkish language, perceived as a signal that the Fed could pause.
The USD/JPY extended its losses past the prior’s day low of 135.07, collapsing down the 135 figure, as the US Federal Reserve (Fed) decided to raise rates by 25 bps, though it signaled that it would pause its cycle. At the time of writing, the USD/JPY is trading volatile at around the 134.80-135.40 area.
Summary of the Fed’s monetary policy statement
Federal Reserve officials voted unanimously to raise rates by 25 bps, as shown by its monetary policy statement. Policymakers dropped the “some additional policy firming may be appropriate in order to attain a stance of monetary policy that is sufficiently restrictive to return inflation to 2% over time” language and instead mentioned that “in determining the extent to which additional policy firming may be appropriate,” policymakers would study incoming data.
Fed officials said that tightened credit conditions would likely weigh on the economy and reiterate the soundness of the banking system. Furthermore, policymakers emphasized that the labor market remains robust, and inflation is elevated. Regarding the balance sheet reduction, it will continue as planned since May 2022.
After the Federal Reserve’s decision, US rate futures show traders are pricing in rate cuts in September, according to Reuters.
USD/JPY Market’s Reaction
-638187345625496687.png)
The USD/JPY 1-hour chart portrays that the pair fell below its prior low of 135.07 and printed a new one at 134.83. From there, the USD/JPY pair bounced off, with USD/JPY buyers eyeing a test of the 20-hour SMA at 135.72. But firstly, the buyers must conquer 135.50.
USD/JPY Technical Levels
- Federal Reserve raises rates as expected by 25bps to 5.00%-5.25%.
- US Dollar tumbles across the board, US yields hits fresh lows.
- EUR/USD soars above 1.1050, tests multi-month highs.
The EUR/USD pair jumped from 1.1045 to 1.1091, reaching a one-week high after the Federal Reserve announced, as expected, a 25 basis points rate hike, and suggested a potential pause.
Fed delivers as expected
The US central bank raised rates with a dovish twist, which weighed on the US Dollar. As a result, the DXY dropped to 101.08, hitting a fresh weekly low, while at the same time, US 2-year yields fell below 3.90%. At 18:30 GMT, Chair Powell will deliver a press conference.
The EUR/USD pair rose towards the key area of 1.1100 and then pulled back modestly, holding above the 1.1050 area with a bullish impulse. A break above 1.1100 could trigger an acceleration and open the doors to the highest level since March 2022.
On the contrary, a retreat below 1.1050 should keep the pair in the recent range. Below the key support, the next level of support is seen at 1.0950, with a slide below exposing 1.0900/10.
Technical levels
March 22May 03, 2023
Recent indicators point to Economic activity expanded at a modest growthpace in spending and production.the first quarter. Job gains have picked upbeen robust in recent months and are running at a robust pace;, and the unemployment rate has remained low. Inflation remains elevated.
The U.S. banking system is sound and resilient. Recent developments are likely to result in tighterTighter credit conditions for households and businesses andare likely to weigh on economic activity, hiring, and inflation. The extent of these effects isremains uncertain. The Committee remains highly attentive to inflation risks.
The Committee seeks to achieve maximum employment and inflation at the rate of 2 percent over the longer run. In support of these goals, the Committee decided to raise the target range for the federal funds rate to 4-3/45 to 5-1/4 percent. The Committee will closely monitor incoming information and assess the implications for monetary policy. The Committee anticipates that someIn determining the extent to which additional policy firming may be appropriate in order to attain a stance of monetary policy that is sufficiently restrictive to return inflation to 2 percent over time. In determining the extent of future increases in the target range, the Committee will take into account the cumulative tightening of monetary policy, the lags with which monetary policy affects economic activity and inflation, and economic and financial developments. In addition, the Committee will continue reducing its holdings of Treasury securities and agency debt and agency mortgage-backed securities, as described in its previously announced plans. The Committee is strongly committed to returning inflation to its 2 percent objective.
In assessing the appropriate stance of monetary policy, the Committee will continue to monitor the implications of incoming information for the economic outlook. The Committee would be prepared to adjust the stance of monetary policy as appropriate if risks emerge that could impede the attainment of the Committee's goals. The Committee's assessments will take into account a wide range of information, including readings on labor market conditions, inflation pressures and inflation expectations, and financial and international developments.
Voting for the monetary policy action were Jerome H. Powell, Chair; John C. Williams, Vice Chair; Michael S. Barr; Michelle W. Bowman; Lisa D. Cook; Austan D. Goolsbee; Patrick Harker; Philip N. Jefferson; Neel Kashkari; Lorie K. Logan; and Christopher J. Waller.
.
The US Federal Reserve (Fed) announced on Wednesday that it raised the policy rate, federal funds rate, by 25 basis points to the range of 5-5.25% following the May policy meeting. This decision came in line with the market expectation.
In its policy statement, the Fed dropped language that it 'anticipates' more policy firming may be appropriate to attain 'sufficiently restrictive' stance.
Follow our live coverage of the Fed's policy announcements and the market reaction.
Market reaction
With the initial reaction, the US Dollar came under renewed bearish pressure and the US Dollar Index declined toward 101.00.
Key takeaways from the policy statement
"In determining the extent to which additional policy firming may be appropriate, will take into account tightening to date, policy lags and other developments."
"US banking system is sound and resilient."
"Tighter credit conditions likely to weigh on economy, hiring and inflation."
"Job gains have been robust, inflation remains elevated."
"Will continue reducing balance sheet as planned."
"Vote in favor of policy was unanimous."
- Gold recovered its bright after a drop toward its weekly low at $2007.79.
- ADP Employment Change report surprises with huge hiring increase, though failed to underpin the US Dollar.
- ISM’s Non-Manufacturing PMI for April shows hiring moderation and lower input prices.
Gold price advances to two-week highs as the Federal Reserve Open Market Committee (FOMC) decision looms. Estimates are that the Federal Reserve will hike rates by 25 bps, though uncertainty around the Fed Chair Jerome Powell’s press conference keeps investors uneasy. The XAU/USD is trading at $2026.76.
Gold is steady around $2020, ahead of Fed’s decision and Powell’s press conference
Sentiment remains upbeat as Wall Street post gains, ahead of the FOMC’s decision. The latest round of data from the United States was positive, though it gave the Fed the green light to continue tightening monetary conditions.
Firstly, the April ADP Employment Change report showed that private hiring rose by 296K, crushing estimates of 148K, though it did little to weigh on the Gold price, which continues to trend higher. However, on the data release, it dipped toward 2007, though it offered buyers a better entry price to lift prices to fresh two-week highs.
Later, the ISM revealed April’s Non-Manufacturing PMI, which came at 51.9 above the prior’s month data. The report highlights that hiring continued though it moderated, while the price subcomponent remained nearby the lowest levels since 2020.
Ahead of the FOMC’s decision, traders seemed convinced of the Fed’s 25 bps rate hike, as the CME FedWatch Tool shows an 88.2% chance.
Furthermore, the fall of US Treasury bond yields has been another reason for the XAU/USD’s gains throughout the session. The US 10-year Treasury bond yield is dropping 5 bps, yielding 3.386%.
Most analysts speculate that today’s decision could be the latest hike of the current tightening cycle of the Federal Reserve. It should be said that May’s decision would not update Fed officials’ projections regarding the economy’s general health. The June meeting will unveil the Summary of Economic Projections (SEP).
XAU/USD Technical Levels
- GBP/USD bulls are in the market ahead of the Fed.
- Bulls are above support in the right-hand shoulder.
It´s Federal Reserve day and that spells volatility and technicals tend to be hard to go by as navigating the fundamentals does not stick to what is seen on the charts. Nevertheless, GBP/USD is above water and there is a bullish bias as the following illustrates:
GBP/USD daily charts
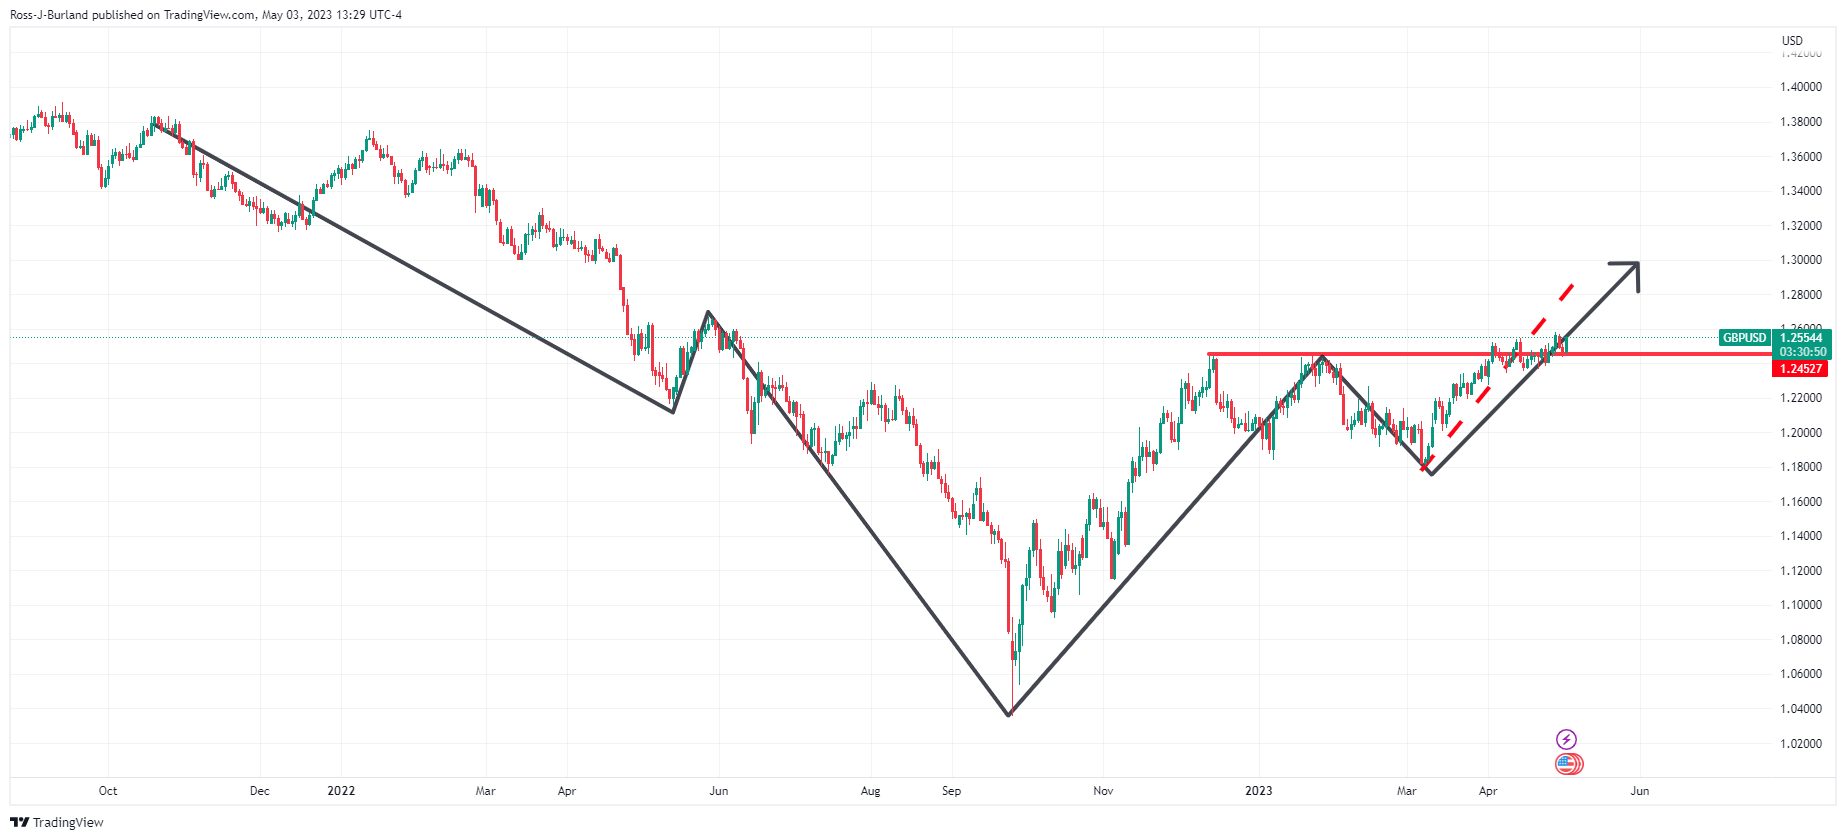
As illustrated, GBP/USD is trading above support and within the right-hand shoulder of the inverse head and shoulders.
GBP/USD M15 chart
On the lower timeframes, the bulls will be in the clear while above the1.2540s with a first target in the 1.2570s.
- EUR/USD stays firm at around 1.1050 ahead of the FOMC’s decision.
- The US ADP Employment report for April almost doubled the forecasts, as private hiring increased to almost 300K.
- The US Federal Reserve is expected to raise rates b 25 bps, though Powell’s message is still uncertain.
The EUR/USD extends its gains after hitting a weekly low of 1.0942 on Tuesday, as traders brace for the Federal Reserve (Fed) and the European Central Bank (ECB) monetary policy decisions today and on May 4. At the time of writing, the EUR/USD is trading around 1.1050, above its opening price by 0.44%.
EUR/USD is steady as US ADP Employment report surpasses expectations ahead of uncertain Fed decision
A risk-on impulse took over, despite renewing banking concerns in the United States (US). Wall Street is trading with gains, though lower US Treasury bond yields undermined the US Dollar (USD), hence the EUR/USD advanced.
Therefore, the US Dollar Index (DXY), a measure of the buck’s value against six currencies, drops 0.54%, down to 101.41.
The latest data in the US economic agenda revealed that private hiring increased above estimates, but wages eased. April’s ADP Employment Change report showed that the economy added 296K jobs, exceeding forecasts of 148K. That triggered a reaction in the pair, as the EUR/USD dived to the 1.1020s region before bouncing and climbing to its daily high at 1.1060.
Of late, the ISM revealed the Non-Manufacturing PMI for April, also known as the Services, which rode by 51.9 above March’s 51.2. digging into the data, the price subcomponent held close to its lowest levels since 2020, while the employment index showed moderation.
Across the pond, the Eurozone (EU) docket featured the Unemployment Rate for March, which dipped to 6.5%, beneath the estimates and the prior’s month reading of 6.6%.
In the meantime, the EUR/USD traders prepare for the Federal Reserve decision. Odds for a 25 bps hike lie at 86.8%, as shown by the swaps markets. Notably, according to the futures market, this is the last increase expected by investors, as they are already pricing in 75 bps of rate cuts by year’s end.
On the Europan Central Bank front, estimates are lingering between a 50 or 25 bps increase. Although a 25 bps rate hike is already priced in, going twice is likely possible after the latest EU inflation data report. That has been the reason that underpinned the EUR/USD pair during the last couple of months.
EUR/USD Technical Levels
- Jerome Powell will answer questions from the press after the Fed Interest Rate Decision.
- Any hints on the future monetary policy can trigger significant market moves on US Dollar and other asset classes.
Jerome Powell, Chairman of the Federal Reserve System (Fed), will speak in a press conference on Wednesday at 18:30 GMT, 30 minutes after the Fed Interest Rate decision is announced. Powell’s speech will reflect the current views of the Federal Open Market Committee (FOMC) on monetary policy.
The Federal Reserve is widely expected to deliver a 25 basis points interest rate hike, setting the Fed funds rate in the 5%-5.25% range. Powell’s press conference will provide hints on whether this might be the last interest rate hike of this cycle, or if rather the monetary policy tightening might continue in the coming months.
Jerome Powell will face tough questions by the press on whether the Federal Reserve can keep going with its interest rate hikes, considering the financial stress that the banking system has suffered recently, with First Republic Bank having been taken over by JP Morgan in the past week. Powell’s words will carry enormous importance for the market, with the US Dollar and the US Treasury bonds being the most-affected assets, and in turn, triggering volatility in most asset classes.
According to Yohay Elam, Senior Analyst at FXStreet, Jerome Powell will keep the door open to both tightening and easing policy scenarios, exerting caution. Elam expects Powell’s press conference to support the US Dollar, weighing down on Gold price and the stock markets:
Uncertainty means keeping all options on the table. Fed Chair Powell is set to reject any notion that the bank is done hiking in his press conference. He will go beyond token remarks of "doing what is needed" and firmly place another 25 bps hikes on the table.
In response to such remarks – and sticking to the bank's projections of refraining from cuts until year-end, markets may reverse course. Stocks and Gold would stumble, while the US Dollar would advance on such developments.
About Jerome Powell
Jerome H. Powell first took office as Chair of the Board of Governors of the Federal Reserve System on February 5, 2018, for a four-year term. He was reappointed to the office and sworn in for a second four-year term on May 23, 2022. Powell also serves as Chairman of the Federal Open Market Committee, the System's principal monetary policymaking body.
Powell has served as a member of the Board of Governors since taking office on May 25, 2012, to fill an unexpired term. He was reappointed to the Board and sworn in on June 16, 2014, for a term ending January 31, 2028.
- US private hiring surged above estimates; the USD/JPY seesawed but later slipped.
- ISM Non-Manufacturing PMI climbs in April, despite hiring moderation.
- Traders focus on the US Federal Reserve decision and Powell’s press conference.
The USD/JPY tumbled for the second day in a row, influenced by the fall in the US 10-year Treasury bond yield amidst a mixed market sentiment spurred by the Federal Reserve’s (Fed) monetary policy decision looming. Therefore, US Treasury bond yields are falling, particularly the 10-year, which correlates closely to the USD/JPY pair. At the time of writing, the USD/JPY is trading at 135.14, losing 1.03%.
USD/JPY pressured on falling US bond yields, risk-off mood
US equities are fluctuating ahead of the Fed’s decision. The US ADP Employment Change report, which reveals how private hiring is going in the country, jumped surprisingly by 296K exceeding estimates of 148K and March’s data of 142K. In addition, data showed that albeit hiring rose, wages cooled down from 14.2% to 13.2%, according to the ADP Research Institute report.
After the report, the USD/JPY edged towards 136.00 before making a U-Turn and plunged 60 pips, towards the 135.40 area, before extending its losses.
Of late, the US ISM Non-Manufacturing PMI in April climbed to 51.9 from 51.2 in March, as shown by data. The report showed that a measure of prices paid held close to its lowest level while hiring moderated.
Due to its Golden Week holidays, an absent Japanese economic agenda keeps investors leaning toward US Dollar (USD) dynamics and market sentiment.
The Federal Reserve would unveil its decision ahead of the session, followed by Chair Powell’s press conference, which USD/JPY traders widely expect.
USD/JPY Technical Analysis
The USD/JPY daily chart portrays the pair as neutral to downward biased after failing to crack the March 8 high of 137.91, exacerbating a fall below the 200-day SMA at 137.43. In addition, a dark-cloud cover candlestick chart pattern, formed during the last two previous days from today, opened the door for the 1% plus drop, with sellers testing previous the April 19 swing high at 135.14; previous resistance turned support. A breach of the latter will expose 135.00, followed by the 20-day SMA at 134.17. Conversely, if USD/JPY buyers hold the spot above April 19 high, the pair could rally to the 136.00 figure.
Economists at Rabobank see risk of a move lower in EUR/USD in the latter half of this year.
USD likely to find support if the market prices out 2023 rate cuts
“In the months ahead, the EUR is likely to be adjusting to a softening Eurozone economy. This implies that the upside momentum in EUR/USD that has persisted since Q4 last year, may be nearing a peak.”
“If inflation remains sticky, it follows that Fed policy will have to work harder than in previous cycles to push inflation back to the 2% target. The USD is likely to find support if the market prices out 2023 rate cuts.”
“We see risk of a move back to the EUR/USD 1.06 in H2 this year.”
Gold price has once again managed to exceed the $2,000 mark ahead of the US Federal Reserve interest rate decision. Economists at Commerzbank analyze how the policy announcement could impact the yellow metal.
Today’s rate hike will not turn out to be the last
“In view of the recent fall in inflation and initial signs of weakness on the US labour market, many market participants now expect the Fed to signal a pause in rate hikes. According to our experts, such hopes could prove premature.”
“We are confident that today’s rate hike will not turn out to be the last. This, in turn, is likely to undermine any expectations of a rapid interest rate turnaround – the market envisages the first rate cuts in the second half year. All of this points to an upward correction of interest rate expectations and thus to a weaker Gold price. That said, it is by no means certain that the Fed will be able to convince the market of its hawkish stance.”
“It is equally conceivable that the market will regard any further rate hikes as a mistake that could exacerbate a potential recession in the US and force the Fed to implement an even more pronounced interest rate U-turn at a later date. This could then offset any negative impact of the rate hikes on the Gold price.”
USD/CAD’s bull trend is yet to be nullified, econmists at Rabobank report.
USD/CAD to fluctuate in the 1.34-1.36 range over the coming months
“The main driver of FX markets remains carry and risk sentiment, both of which are likely to drive some upside for USD/CAD. On the flip side, higher energy prices in the second half of the year should provide some support for CAD.”
“We expect the former drivers to dominate upside from oil prices but the pair is unlikely to break out of the 1.3280 to 1.3880 range this year and we see the primarily fluctuating in the 1.34-1.36 range over the coming months, with the risk skewed to an upside break.”
“The long term bull trend won’t be nullified until we see a confirmed close below 1.3260 and we see little chance of that happening this year.”
GBP/USD is consolidating in the low 1.25 area. Economists at Scotiabank expect the pair to enjoy further gains.
Short-term price patterns are mildly bullish
“The fact that Cable is trading on a 1.25 handle remains a broader positive for the Pound, given it has struggled mightily to extend gains through the mid-1.24 area this year.”
“Short-term price patterns are mildly bullish, given the steady uptrend in spot since the mid-Apr test and rejection of key support at 1.2350/60.”
“Friday’s drop from the intraday high is a setback from a technical point of view but trend momentum remains bullish and losses should remain limited.”
“New cycle highs would be bullish and reaffirm potential for gains to extend to 1.27/1.28.”
- US ISM Services PMI improved modestly in April.
- US Dollar Index stays deep in negative territory near 101.50.
The business activity in the US service sector continued to expand at a modest pace in April with the ISM Services PMI edging higher to 51.9 from 51.2 in March. This reading came in slightly better than the market expectation of 51.8.
Further details of the publication revealed that the Prices Paid Index ticked up to 59.6 from 59.5 and the Employment Index declined to 50.8 from 51.3.
Assessing the survey's findings, “there has been a slight uptick in the rate of growth for the services sector, due mostly to the increase in new orders and ongoing improvements in both capacity and supply logistics," noted Anthony Nieves, Chair of the Institute for Supply Management (ISM) Services Business Survey Committee. "The majority of respondents are mostly positive about business conditions; however, some respondents are wary of potential headwinds associated with inflation and an economic slowdown.”
Market reaction
The US Dollar stays under selling pressure after this report and the US Dollar Index was last seen losing 0.45% on the day at 101.50.
Economists at Nordea answer some questions that keep reappearing when discussing the Norwegian Krone and Norges Bank.
At what level will Norges Bank intervene?
“If EUR/NOK rises from 12 to 14 over the duration of a month no intervention will come, but if EUR/NOK rises from 12 to 14 in one day, then it is likely that Norges Bank will step in.”
What is most likely to happen with the NOK after Norges Bank’s May meeting?
“We believe that talk and speculation of a 50 bps rate hike from Norges Bank this week could leave some participants wrong-footed. If Norges Bank hikes by 25 bps, as we expect, the NOK will likely weaken further.”
What is Nordea’s base case for the NOK?
“We expect the NOK to weaken further until the summer, with EUR/NOK coming above 12. However, after the summer, the NOK sales will be wound down and most central banks will pause their rate hikes. We see a lower EUR/NOK towards year-end, closer to 11.00, but the NOK will likely remain weak in a historic context for some time.”
- USD/CAD reverses an intraday dip and climbs to a fresh weekly high on Wednesday.
- Tumbling Crude Oil prices undermines the Loonie and acts as a tailwind for the major.
- Broad-based USD weakness keeps a lid on the pair ahead of the crucial FOMC decision.
The USD/CAD pair attracts some dip-buying near the 1.3600 round-figure mark on Wednesday and touches a fresh weekly high during the early part of the North American session. Spot prices, however, struggle to capitalize on the move and trade around the 1.3625-1.3630 region, nearly unchanged for the day.
Crude Oil prices remain under heavy selling pressure for the third straight day and dive to the lowest level since March 27 amid concerns over economic headwinds stemming from rising borrowing costs, which could dent fuel demand. This, in turn, is seen weighing on the commodity-linked Loonie and lending some support to the USD/CAD pair. That said, the ongoing US Dollar (USD) retracement slide from a three-week high touched on Tuesday keeps a lid on any meaningful upside, at least for the time being.
Worries about the US debt ceiling, along with renewed fears of a full-blown banking crisis, drag the US Treasury bond yields lower and continue to exert pressure on the buck. Apart from this, a slight recovery in the global risk sentiment - as depicted by a positive tone around the equity markets - further undermines the safe-haven Greenback. The USD bulls, meanwhile, seem rather unimpressed by the upbeat US ADP report, which showed that private-sector employers added 296K jobs in April against the 148K anticipated.
Traders also seem reluctant to place aggressive bets around the USD/CAD pair and prefer to wait on the sidelines ahead of the highly-anticipated FOMC monetary policy decision, due later during the US session. The market focus will remain glued to the accompanying policy statement and Fed Chair Jerome Powell's comments at the post-meeting presser. Investors will look for clues about the future rate-hike path, which will drive the USD and help determine the near-term trajectory for the USD/CAD pair.
Heading into the key central bank event risk, the release of the US ISM Services PMI, along with Oil price dynamics, will be looked upon to grab short-term opportunities. Nevertheless, the aforementioned mixed fundamental backdrop makes it prudent to wait for strong follow-through buying before positioning for an extension of the overnight solid rebound from a technically significant 100-day Simple Moving Average (SMA) support.
Technical levels to watch
- Prices of the WTI breaks below the $70.00 mark.
- Recession fears continue to weigh on sentiment.
- The EIA will report on crude oil supplies later on Wednesday.
Prices of the West Texas Intermediate (WTI) extended its sell-off to levels last seen back in late March, dropping below the key $70.00 mark per barrel on Wednesday.
WTI hurt by recession concerns ahead of Fed
WTI prices have lost nearly 10% since Monday and retreated for the third session in a row in response to unabated fears surrounding a probable recession in the US economy, which could eventually impact the demand for the commodity.
These fears appear to have been bolstered by the imminent FOMC event, where another quarter-point rate raise is already priced in. The focus of attention, in the meantime, is expected to shift to Powell’s press conference and what the Committee might do in the next few months regarding the rate path.
Adding to the sour mood among traders are disappointing results from the Chinese manufacturing and services sector, which were published over the weekend.
Later in the NA session, the EIA will report on US crude oil inventories in the week ending April 28th.
WTI significant levels
At the moment the barrel of WTI is down 3.19% at $69.22 and the breach of $66.86 (low April 24) would open the door to $64.41 (2023 low March 20) and then $61.76 (monthly low August 23 2021). On the upside, the next hurdle comes at $76.92 (high April 28) followed by $79.14 (weekly high April 24) and finally $81.55 (200-day SMA).
Could a new bull market in Gold kick off at $2,000? Strategists at TD Securities discuss the yellow metal outlook.
High bar for a hawkish market reaction to the FOMC meeting
“This Fed day, market participants are aware that we have reached 'near terminal' levels of interest rates, which places a high bar for a hawkish market reaction to the meeting.”
“While surprisingly resilient data continues to be out of sync with the Fed's inflation mandate, stress in the banking sector notably raises concerns about the path of future data. After all, commodity market internals have started to deteriorate at a fast clip, pointing to slumping demand consistent with a looming recession particularly as China's economic engine begins to sputter.”
“The risk of a deeper consolidation has notably declined, with the positioning set-up now favoring continued strength in Gold prices.”
EUR/USD’s rebound from mid-1.09s extends. Economists at Scotiabank discuss the pair’s technical outlook.
Broad range trade holds
“EUR/USD continues to consolidate in a broad range but the technical underpinnings for the EUR are bullish across a range of timeframes which will keep my focus on limited downside potential and ongoing pressure for an extension higher in the EUR (to 1.12+) in the near-to-medium term.”
“Resistance is 1.1075/95. Support is 1/0940/50 and 1.0900/10.”
See – EUR/USD: Failure to reclaim the 1.1070 hurdle can take the pair gradually lower – SocGen
US ISM Services PMI Overview
The Institute of Supply Management (ISM) will release the Non-Manufacturing Purchasing Managers' Index (PMI) - also known as the ISM Services PMI – at 14:00 GMT this Wednesday. The gauge is expected to come in at 51.8 for April, up a little from 51.2 in the previous month. Given that the Fed looks more at inflation than growth, investors will keep a close eye on the Prices Paid sub-component, which is anticipated to edge higher from 59.5 in March to 59.9 during the reported month.
How Could It Affect EUR/USD?
Ahead of the key release, the US Dollar (USD) drifts lower for the second successive day and retreats further from a three-week high touched the previous day. Concerns over the US debt ceiling, along with renewed fears of a full-blown banking crisis, drag the US Treasury bond yields lower and continue to weigh on the buck, which fails to gain any respite from the upbeat US ADP report. Hence, any disappointment from the US ISM Services PMI could exert additional downward pressure on the Greenback and assist the EUR/USD pair to capitalize on its intraday positive move.
In contrast, a stronger headline print and higher-than-expected Prices Paid Index might do little to impress the USD bulls amid expectations that the Fed will pause its rate-hiking cycle sooner rather than later. This, in turn, suggests that the path of least resistance for the EUR/USD pair is to the upside and any intraday dip is more likely to get bought into. The immediate market reaction, however, should remain limited as the market focus remains glued to the outcome of the highly-anticipated two-day FOMC monetary policy meeting, scheduled to be announced later during the US session.
Key Notes
• US ADP Jobs/ISM Service PMI Preview: Slowing but still positive
• EUR/USD Forecast: Euro bulls retain control as focus shifts to Fed
• EUR/USD climbs to weekly highs past 1.1040, focus remains on Fed
About the US ISM manufacturing PMI
The Institute for Supply Management (ISM) Manufacturing Index shows business conditions in the US manufacturing sector. It is a significant indicator of the overall economic condition in the US. A result above 50 is seen as positive (or bullish) for the USD, whereas a result below 50 is seen as negative (or bearish).
S&P 500 is probing upper limit of base near 4195/4220. Economists at Société Générale expect the uptrend to extend beyond here.
Golden crossover points towards potential upside
“S&P 500 is in vicinity to the crucial graphical resistance of 4195/4220 representing peaks of February and a previous down gap. It has been evolving within a base since October. It is worth noting that 50-DMA has crossed above the 200-DMA forming a golden crossover; this points towards potential upside. An upside break looks imminent.”
“Once the index establishes beyond 4195/4220, the uptrend is expected to extend. Next potential objectives could be at last August's high of 4320 and 4510.”
“Should a short-term pullback develop, ascending trend line since October at 3930 should provide support.”
- US ADP employment reports surpass expectations, focus turns to ISM Service PMI.
- Fed to raise rates by 25 basis points.
- XAU/USD drops after ADP but quickly rebounds.
Gold Price dropped from $2,015/oz to $2,007 after the release of the ADP Employment report that showed better-than-expected numbers and boosted the US Dollar for a few minutes. XAU/USD was back above $2,010 as Dollar’s momentum faded.
According to ADP, private payrolls increased by 296,000 in April, above the 148,000 of market consensus and higher than the revised 142,000 in March. However, it is unclear whether these numbers could anticipate what the Nonfarm Payrolls will say on Friday.
The focus now turns to ISM Service PMI due at 14:00 GMT and later to the FOMC statement at 18:00 GMT. Today’s employment data reinforced expectations of a 25 basis point rate hike from the Federal Reserve. It is seen as the last hike of the tightening cycle with the FOMC leaving the door open to more hikes if needed.
Despite the positive ADP numbers, US yields remain near weekly lows weighing on the US Dollar. At the same time, developments in the bond market continue to favor gold bulls. The FOMC meeting will likely trigger action in Treasuries, so volatility ahead for the yellow metal should be expected.
XAU/USD jumped on Tuesday, posting the highest daily close in two weeks, ending a consolidation phase. The immediate resistance is around the $2,030 area and then, the $2,050 zone. A slide under $1,995 should weaken the outlook while if it stays below $1,980, it would point to a deeper correction ahead.
Technical levels
UOB Group’s Economist Ho Woei Chen, CFA, reviews the latest PMIs results in the Chinese economy.
Key Takeaways
“China’s official manufacturing PMI unexpectedly contracted in Apr for the first time since its border reopening this year. External demand headwinds remain the key drag to China’s recovery.”
“Despite moderating and coming in below expectation in Apr, the nonmanufacturing PMI still indicated a strong pace of expansion. However, we see some contradictions in the components where employment has contracted at a sharper pace while unlike the manufacturing sector, the non-manufacturing sector recorded an improvement in both the selling and input price indexes which suggests that stronger domestic demand is translating to prices.”
“Brisk tourism and consumption at the start of the Labour Day holiday (29 Apr – 3 May) as reported by China’s state media indicates that there is room for further recovery in private consumption demand.”
“We expect China’s GDP to expand by 5.6% in 2023 (2022: 3.0%).”
- NZD/USD climbs to over a two-week high in reaction to the upbeat domestic jobs data.
- A combination of factors weighs heavily on the USD and remains supportive of the move.
- The upbeat US ADP report does little to provide any impetus ahead of the FOMC decision.
The NZD/USD pair gains strong follow-through positive traction for the second successive day and climbs to a two-and-half-week top, around the mid-0.6200s on Wednesday. The pair maintains its bid tone heading into the North American session, though struggles to capitalize on the move and remains below a technically significant 200-day Simple Moving Average (SMA).
The New Zealand Dollar (NZD) continues to draw support from the upbeat domestic jobs data, which backs the case for further interest rate hikes by the Reserve Bank of New Zealand (NZD). Apart from this, the ongoing US Dollar (USD) retracement slide from a three-week high touched on Tuesday provides an additional boost to the NZD/USD pair and remains supportive of the intraday positive move. Concerns over the US debt ceiling, along with renewed fears of a full-blown banking crisis, drag the US Treasury bond yields lower and continue to weigh on the Greenback.
Apart from this, a slight recovery in the global risk sentiment - as depicted by a positive tone around the equity markets - further undermines the safe-haven buck and benefits the risk-sensitive Kiwi. The USD bulls, meanwhile, seem rather unimpressed by the upbeat US ADP report, which showed that private-sector employers added 296K jobs in April as compared to the 142K in the previous month and 148K anticipated. The upside, however, remains capped, at least for the time being, as traders now seem reluctant ahead of the highly-anticipated FOMC policy decision.
The Federal Reserve (Fed) is widely expected to hike rates by 25 bps and could soften its hawkish stance amid slowing economic growth. Investors, however, remain divided over the possibility that the Fed will announce a pause in its rate-hiking cycle as inflation is still trending above the target. Hence, the accompanying policy statement and Fed Chair Jerome Powell's comments at the post-meeting presser will be scrutinized for clues about the future rate-hike path. This, in turn, will influence the USD price dynamics and provide a fresh impetus to the NZD/USD pair.
Technical levels to watch
- Private sector employment grew at a stronger pace than expected in April.
- US Dollar Index stays in negative territory at around 101.50.
The data published by Automatic Data Processing (ADP) showed on Wednesday that private sector employment in the US rose by 296,000 in April. This reading followed the 142,000 (revised from 145,000) increase in March and surpassed the market expectation of 148,000 by a wide margin.
Further details of the publication revealed that the annual pay growth declined to 13.2% from 14.2%.
Commenting on the data, “the slowdown in pay growth gives the clearest signal of what's going on in the labor market right now,” said Nela Richardson, chief economist, ADP. “Employers are hiring aggressively while holding pay gains in check as workers come off the sidelines. Our data also shows fewer people are switching jobs.”
Market reaction
The US Dollar struggles to capitalize on the upbeat data and the US Dollar Index was last seen losing 0.35% on the day at 101.55.
There are some upside risks for the US Dollar, but ING’s base case is a USD stabilisation.
All eyes on the Fed’s decision
“While a softer tone than the one in the statement about future tightening is very much possible – and may offset initial US Dollar gains – some more convincing pushback against rate cut speculation could help put a floor under the greenback beyond the post-meeting impact.”
“DXY should see volatility but may still be trading slightly below 102.00 tomorrow morning.”
- EUR/USD picks up further impulse above 1.1000.
- The immediate up-barrier aligns at the 2023 high at 1.1095.
EUR/USD adds to Tuesday’s decent advance and surpasses the key 1.1000 mark with certain conviction on Wednesday.
Further recovery appears on the table with the next resistance level of note emerging at the 2023 high at 1.1095 (April 26) closely followed by the round level at 1.1100.
Looking at the longer run, the constructive view remains unchanged while above the 200-day SMA, today at 1.0424.
EUR/USD daily chart
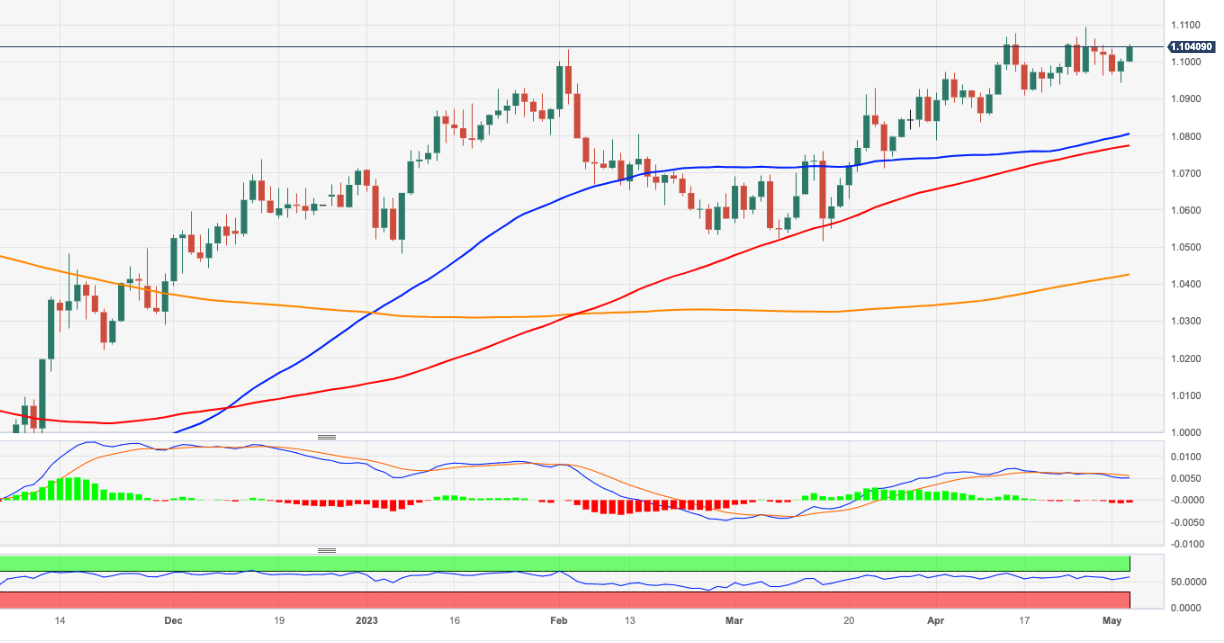
Senior Economist at UOB Group Alvin Liew assesses the latest preliminary readings from the US Q1 GDP.
Key Takeaways
“The advance estimate of the 1Q 2023 GDP surprised on the downside with a 1.1% q/q SAAR expansion (versus Bloomberg est 2.0% q/q SAAR, Atlanta Fed’s GDPNow est 2.5%, UOB est 1.2%), from 2.6% in 4Q 2022. Compared to one year ago, the US GDP grew by 1.6% y/y in 1Q, from 0.9% in 4Q.”
“Private consumption expenditure added to 1Q’s growth as it rose by 3.7% (2.5ppt to headline growth) from 1.0% (0.7ppt) in 4Q but was below forecast of 4%. Net exports of goods and services also added to 1Q’s growth, but the contribution was reduced to 0.11ppt of the headline growth, down from 0.4ppt in 4Q and 2.9ppt in 3Q. The drag on US growth came from slower business spending (0.7% in 1q from 4% in 4q) and more importantly, a -2.3ppt decline in private inventories (from +1.5ppt in 4q). Fixed residential investment also continued to weigh on US growth but the pace of decline moderated to -4.2% (-0.17ppt) in 1Q from -25.1% (-1.2ppt) in 4Q, and -27.1% (-1.4ppt) in 3Q.”
“The other negative aspect of the US 1Q GDP release was that inflation remains frustratingly high. Core PCE (which excludes food and energy, and is the Federal Reserve’s preferred measure of inflation) rose at a faster 4.9% q/q in 1Q (versus Bloomberg est of 4.7% and up from 4.4% in 4Q), the highest in a year since 1Q 22 (5.6%), pointing to stubbornly high inflation while jobs market remain robust (as reflected by the latest jobless claims which eased to 230,00 from 246,000 in the previous week), implying it should keep the Fed on track for another 25bps hike in May FOMC.”
“US GDP Outlook – The 1Q GDP expansion was close to our projections, and we continue to factor in a downward shift in the US growth outlook in 2023. The main tenet to our weaker US growth projection continues to be on the combination of elevated inflation, Fed rate hikes (which we project to peak at 5.25%) and global growth slowdown. The current US banking developments adds further downside risks to growth, because any missteps could lead to more significant tightening of credit conditions, triggering a more pronounced slowdown and spillover effect to other sectors. Our base case remains the US economy will endure a mild recession of -0.5% GDP contraction in 2023 before recovering to 2.5% growth in 2024. We are paying close attention to banking sector developments as well as the US commercial and residential real estate sectors at this juncture.”
- DXY comes under extra selling pressure and tests 101.50.
- Next on the downside emerges the 101.00 neighbourhood.
DXY corrects further south and revisits the 101.50 region on Wednesday.
The continuation of the ongoing decline faces the next support of note at the weekly low at 101.01 (April 26). The loss of this region could pave the way for a deeper move to the 2023 lows near 100.80/70.
Looking at the broader picture, while below the 200-day SMA, today at 106.00, the outlook for the index is expected to remain negative.
DXY daily chart
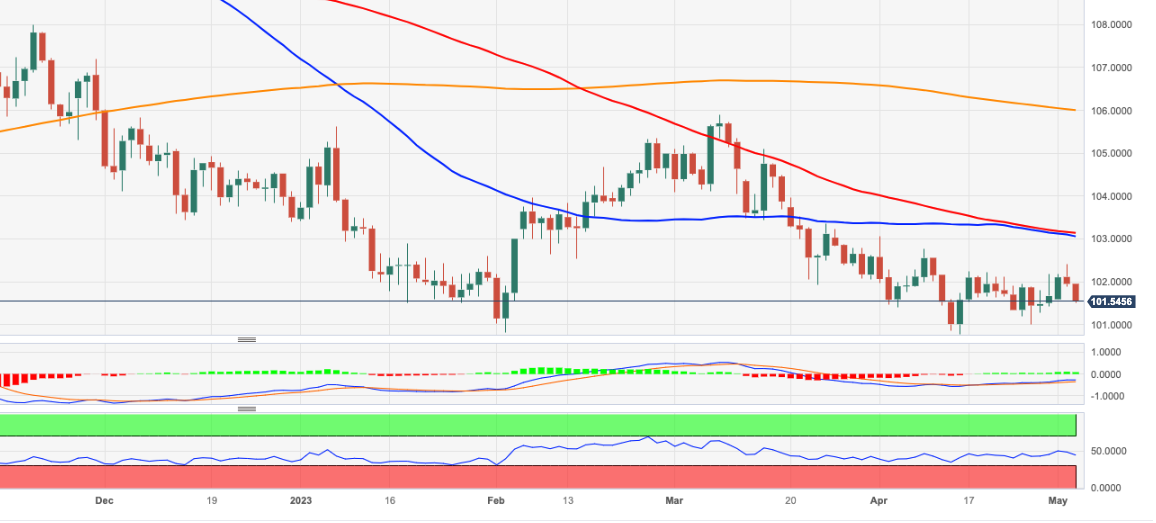
May seasonality is bearish for GBP/USD, economists at Société Générale report.
Will GBP/USD dodge bearish May seasonal trend this year?
“The Pound wrapped up a decent month with gains vs all G10 currencies save for the SEK. The 1.6% gain for GBP/USD was in line with the seasonal fluctuations. The trend traditionally turns bearish in May, however. This c– SocGenould test the resilience of the rally to 1.25 from 1.18 in March.”
The optimism in business and consumer confidence surveys, and strong wage and inflation data, have fuelled speculation that the BoE may raise rates to a higher peak of 4.75%-5%. We forecast a 25 bps next week to 4.50%.”
- EUR/JPY extends the weekly correction to the sub-150.00 zone.
- Further retracement could see the cross retest the 146.30 region.
EUR/JPY adds to Tuesday’s decline and breaches the key 150.00 support on Wednesday.
The underlying bullish stance appears unchanged so far, although the ongoing correction carries the potential to extend to the weekly low at 146.30 (April 25), where the cross is expected to meet decent contention.
So far, further upside looks favoured while the cross trades above the 200-day SMA, today at 142.60.
EUR/JPY daily chart
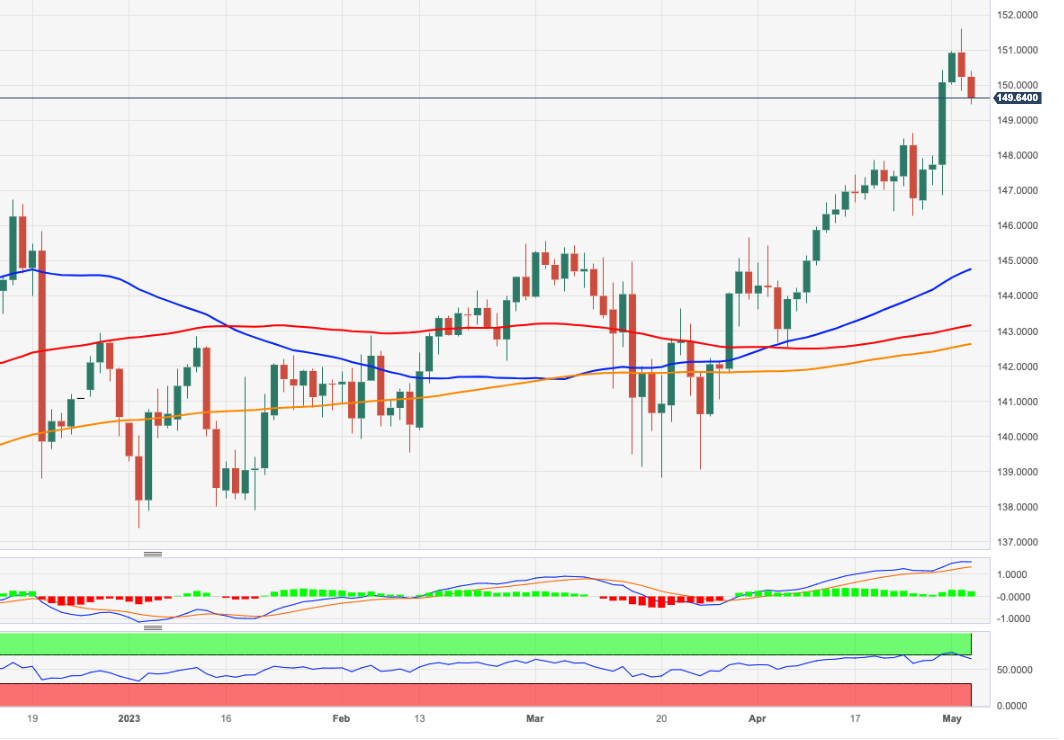
Crude oil has weakened significantly in the last two weeks. Economists at Rabobank expect Brent Oil to test the $70 mark.
Second half of 2023 will witness crude oil prices in the $90s
“Declining diesel crack spreads as fears of a wider economic slowdown materialize has led us to caution that Brent will test the $70 mark soon. Should $70 be breached, we expect Brent to hover in the mid-to-high $60s while OPEC+ responds with additional production cuts to attempt to shock prices back up.”
“We reiterate our forecast that the second half of 2023 will witness crude oil prices in the $90s. Furthermore, our medium-term outlook for the next two-five years remains in the $90s to $100s for Brent.”
- Pound Sterling vs US Dollar recovers to trade back above 1.2500 ahead of the key Federal Reserve policy meeting.
- A dovish hike could see further gains for GBP/USD and a re-test of the 2023 highs at 1.2583.
- The technical picture remains overall bullish as price consolidates within a longer-term uptrend.
The Pound Sterling (GBP) temporarily bounces back above the 1.2500 handle against the US Dollar (USD) during the European session on Wednesday. The main event risk on the horizon for GBP/USD is the Federal Reserve (Fed) monetary policy meeting, with the Federal Open Market Committee (FOMC) deciding the Fed Funds Rate. The FOMC meeting is set to conclude at 18:00 GMT and is likely to inject some volatility into US Dollar pairs.
From a technical perspective, GBP/USD continues to trade in a range within a broader bullish trend which began ever since the printing of the September lows. Longs are, therefore, favored over shorts.
GBP/USD market movers
- Market expectations have crystallized for a 25 bps interest rate hike by the Federal Reserve (Fed) at its FOMC meeting on Wednesday.
- According to Feds Funds Futures data, the probabilities for a quarter percent hike now stand at 87% – slightly down from Tuesday’s 97% but still relatively high.
- Higher-than-expected PCE inflation data – the Federal Reserve’s preferred inflation gauge – reflected in last week’s data, showed prices remain sticky in the United States, further suggesting the Fed needs to continue hiking rates.
- Banking crisis fears, partly as a result of the stress put on regional banks by the impact of higher interest rates on the US Treasury bond market, are viewed as a counterargument to the Fed hiking rates further.
- The US Dollar may see fluctuations depending on the tone of the Fed’s accompanying policy statement, especially if it suggests May’s hike is a ‘one and done’.
- There is a small chance the Fed may not hike at all if it assesses the risks to the banking system are still too great.
- That said, GBP is supported after data for March continued to show UK inflation above 10% for the seventh consecutive month.
- This suggests the Bank of England (BoE) is far from done with hiking interest rates in the UK, and may have to hike more than once to get inflation back under control. If so, this is a medium-term bullish factor for Pound Sterling.
- GBP also gains underpinning support from a 0.5% MoM rise in UK house prices in April when a negative figure had been expected, according to data provided by the UK’s biggest mortgage lender, Nationwide.
- Data from the Commodity Futures Trading Commision (CFTC) shows speculative investor flows have become increasingly supportive of the Pound Sterling over recent weeks, with non-commercial traders increasing their long bets above those of commercial traders who have been increasing short bets.
- JOLTS Job Openings data for March weighed on the US Dollar, on Tuesday, after showing an unexpected fall in openings to 9.59M when 9.78M had been expected, and 9.97M noted in February. Cracks in the job market are the first sign of recession.
GBP/USD technical analysis: Sideways in an uptrend
GBP/USD has been in an extended sideways range within a broader uptrend that began at the September 2022 lows. Despite the volatile ups and downs of recent months, the pair did manage to make new highs in the upper 1.25s in late April and the overall trend remains marginally bullish. Thus, Pound Sterling longs are favored over shorts.
-638187078808722495.png)
GBP/USD: Daily Chart
A two-bar bearish reversal pattern formed at the recent highs on April 28 and May 1. Two-bar reversals are fairly reliable patterns which occur when a long green full-bodied candle that makes new highs is immediately followed by a long red-down candle of a similar length – as happened on Friday, April 28 and Monday, May 1.
The pattern was followed by a bearish day on Tuesday, May 2 and dependent on other factors such as the outcome of the FOMC meeting, could signal further downside. Two-bar reversals, however, are only very short-term bearish signals.
If more downside follows, it could see GBP/USD retest the 1.2350 April-range lows.
Given the dominant trend remains bullish-to-sideways, however, pressure to the upside is likely to re-emerge eventually, and could see the price recover and rally before breaking to fresh highs. This may even happen sooner than expected depending on Wednesday’s Federal Reserve meeting outcome.
If Pound Sterling bulls take over again, a decisive break above the year-to-date 1.2583 highs of April 28, would probably lead to a continuation higher to the next key resistance level at circa 1.2680.
Decisive breaks are usually characterized by moves that begin with a strong green daily bar that breaks above the ceiling level or key high, with price closing near the highs of the day. Alternatively, three consecutive green bars above the ceiling level can also confirm breakouts. Such insignia provide confirmation that the break is not a ‘false break’ or bull trap.
Pound Sterling FAQs
What is the Pound Sterling?
The Pound Sterling (GBP) is the oldest currency in the world (886 AD) and the official currency of the United Kingdom. It is the fourth most traded unit for foreign exchange (FX) in the world, accounting for 12% of all transactions, averaging $630 billion a day, according to 2022 data.
Its key trading pairs are GBP/USD, aka ‘Cable’, which < href="https://fxssi.com/the-most-traded-currency-pairs">accounts for 11% of FX, GBP/JPY, or the ‘Dragon’ as it is known by traders (3%), and EUR/GBP (2%). The Pound Sterling is issued by the Bank of England (BoE).
How do the decisions of the Bank of England impact on the Pound Sterling?
The single most important factor influencing the value of the Pound Sterling is monetary policy decided by the Bank of England. The BoE bases its decisions on whether it has achieved its primary goal of “price stability” – a steady inflation rate of around 2%. Its primary tool for achieving this is the adjustment of interest rates.
When inflation is too high, the BoE will try to rein it in by raising interest rates, making it more expensive for people and businesses to access credit. This is generally positive for GBP, as higher interest rates make the UK a more attractive place for global investors to park their money.
When inflation falls too low it is a sign economic growth is slowing. In this scenario, the BoE will consider lowering interest rates to cheapen credit so businesses will borrow more to invest in growth-generating projects.
How does economic data influence the value of the Pound?
Data releases gauge the health of the economy and can impact the value of the Pound Sterling. Indicators such as GDP, Manufacturing and Services PMIs, and employment can all influence the direction of the GBP.
A strong economy is good for Sterling. Not only does it attract more foreign investment but it may encourage the BoE to put up interest rates, which will directly strengthen GBP. Otherwise, if economic data is weak, the Pound Sterling is likely to fall.
How does the Trade Balance impact the Pound?
Another significant data release for the Pound Sterling is the Trade Balance. This indicator measures the difference between what a country earns from its exports and what it spends on imports over a given period.
If a country produces highly sought-after exports, its currency will benefit purely from the extra demand created from foreign buyers seeking to purchase these goods. Therefore, a positive net Trade Balance strengthens a currency and vice versa for a negative balance.
US ADP jobs report overview
Wednesday's US economic docket features the release of the ADP report on private-sector employment for April, due at 12:15 GMT. Estimates point to an addition of 148K private-sector jobs during the reported month as compared to the 145K in March. The data will provide fresh insight into the US labor market conditions and drive expectations for the official jobs report, popularly known as NFP scheduled for release on Friday.
According to Matías Salord, news Reporter at FXStreet: “A slowdown in the job market is expected as the impact of tighter monetary policy hits the economy. It won’t necessarily be bad news for the Fed. A tight labor market is not helpful in fighting inflation. The market’s reaction to ADP has been trending lower over the years. The response could be short-lived but is still a relevant macroeconomic report about a crucial market.”
How could the data affect EUR/USD?
Ahead of the US labor market data, the US Dollar (USD) is seen extending the overnight retracement slide from a three-week top amid concerns over the US debt ceiling and renewed fears of a full-blown banking crisis. The disappointing release of the ADP report will reaffirm market bets that the Fed will eventually pause its rate-hiking cycle sooner rather than later. This, in turn, would prompt fresh USD selling and allow the EUR/USD pair to build on its ongoing recovery momentum from over a one-week low touched on Tuesday.
Conversely, a stronger reading is unlikely to impress the USD bulls ahead of the official jobs report on Friday. Traders might also refrain from placing aggressive bets and prefer to wait on the sidelines heading into the key event risk - the highly-anticipated FOMC monetary policy decision, due later during the US session. This, in turn, suggests that the immediate market reaction to a positive surprise is more likely to be muted.
Eren Sengezer, Editor at FXStreet, offers a brief technical outlook for the major and writes: “EUR/USD returned within the long-term ascending regression channel and closed the last four-hour candles above the 20-period and the 50-period Simple Moving Averages (SMA) on the four-hour chart, reflecting a buildup of bullish momentum. Additionally, the Relative Strength Index (RSI) indicator on the same chart is back above 50 after having spent the last couple of trading days below that level.”
Eren also outlines important technical levels to trade the EUR/USD pair: “On the upside, 1.1050 (static level) aligns as interim resistance ahead of 1.1070 (end-point of the uptrend, mid-point of the ascending channel) and 1.1100 (psychological level, static level).”
“1.1000/1.0990 (psychological level, 100-period SMA) could be seen as the first support. A four-hour close below that area could discourage buyers and open the door for additional losses toward 1.0950 (Fibonacci 23.6% retracement) and 1.0920 (200-period SMA),” Eren adds further.
Key Notes
• US ADP Jobs/ISM Service PMI Preview: Slowing but still positive
• EUR/USD Forecast: Euro bulls retain control as focus shifts to Fed
• EUR/USD climbs to weekly highs past 1.1040, focus remains on Fed
About the US ADP jobs report
The Employment Change released by the Automatic Data Processing, Inc, Inc is a measure of the change in the number of employed people in the US. Generally speaking, a rise in this indicator has positive implications for consumer spending, stimulating economic growth. So a high reading is traditionally seen as positive, or bullish for the USD, while a low reading is seen as negative, or bearish.
USD/JPY’s retracement extends below 136. Nonetheless, economists at Société Générale expect the pair to find solid support at the 135.20/134.60 zone.
A short-term dip is expected towards 135.20/134.60
“USD/JPY is now challenging the 200-DMA and close to graphical resistance of 138 representing December/March peaks. This hurdle must be overcome to affirm a larger bounce.”
“A short-term pullback is not ruled out, however, 135.20/134.60, the 38.2% retracement of last bout of up move should provide support.”
“If the pair establishes above 138, the phase of rebound could extend towards projections of 139.60/140.30.”
- US Dollar came under renewed selling pressure on Wednesday.
- Dovish Fed bets weigh on US Treasury bond yields and force US Dollar lndex to push lower.
- Fed's policy announcements and Chairman Powell's comments could drive US Dollar's action.
The US Dollar (USD) struggled to find demand during the American trading hours on Tuesday and the US Dollar Index (DXY) snapped a three-day winning streak. The USD stays under selling pressure mid-week and the DXY stays in negative territory as investors lean toward a dovish tilt in the Federal Reserve's (Fed) policy outlook ahead of the interest rate announcement.
The heavy selloff seen in the regional banking stocks in the wake of First Republic Bank collapse revived fears over a deepening financial crisis in the United States (US) on Tuesday. Market participants grow increasingly concerned about the US economy tipping into recession and see the Fed pausing its tightening cycle in response after opting for a 25 basis points (bps) rate hike on Wednesday, May 3.
According to the CME Group FedWatch Tool, the probability of the US central bank raising its policy rate one more time in June is virtually 0%, compared to nearly 40% just a week ago.
Daily digest market movers: US Dollar loses altitude, eyes on Fed policy announcements
- The Fed is forecast to raise its policy rate by 25 basis points (bps) to the range 5-5.25%.
- FOMC Chairman Jerome Powell will comment on the policy outlook and respond to questions from the press starting at 18:30 GMT.
- ADP will release the private sector employment report for April ahead of the Fed event. The ISM will publish the ISM Services PMI survey as well.
- Previewing the Fed event, "uncertainty about the nature of the slowdown and the impact of the banking crisis will likely lead the Federal Reserve to repeat its cautious stance," said FXStreet analyst Yohay Elam. "I expect this caution to cause investors to hope the Fed has ended its hiking cycle, beginning a pause period followed by cuts. Stocks and Gold would rally on such expectations, while the US Dollar would fall.
- The data published by the US Census Bureau revealed on Tuesday that new orders for manufactured goods, Factory Orders, increased $4.9 billion, or by 0.9%, to $539 billion in March."
- The US Bureau of Labor Statistics (BLS) announced that the number of job openings on the last business day of March stood at 9.59 million, compared to 9.97 million in February. This reading came in below the market expectation of 9.77 million.
- The ISM Manufacturing PMI improved slightly to 47.1 in April from 46.3 in March. This reading showed that the contraction in the manufacturing sector's activity continued, albeit at a softer pace.
- The ISM's survey further revealed that the Price Paid sub-index, the input inflation component, climbed to 53.2 from 49.2, playing into the hawkish Fed narrative.
- US regulators seized First Republic Bank and agreed to sell a majority of its assets to JPMorgan Chase & Co. Last week, the bank reported that there were more than $100 billion of deposit outflows in the first quarter.
- In the first half of the trading session on Tuesday, PacWest Bancorp shares were down more than 30%, while Western Alliance Bancorporation stocks were losing over 20%. The financial-heavy Dow Jones Industrial Average lost more than 1% on the day.
- The European Central Bank (ECB) noted in its Bank Lending Survey that a net 38% of Eurozone banks reported a fall in demand for credit from companies in the first quarter of the year. The ECB will announce its monetary policy decisions on Thursday.
Technical analysis: US Dollar Index falls below key technical level
The Relative Strength Index (RSI) indicator on the daily chart for the US Dollar Index (DXY) retreated below 50 on Wednesday. Additionally, the DXY now stays below the 20-day Simple Moving Average (SMA), which is currently located at 101.80, reflecting the bearish shift in the short-term technical outlook.
On the downside, the DXY could face first support at 101.00 (static level, psychological level) before bears could aim for the key 100.00 psychological level.
101.80 (20-day SMA) aligns as interim resistance. With a daily close above that level, the DXY could extend its rebound toward 102.50 (static level) and 103.00 (50-day SMA, 100-day SMA).
How does Fed’s policy impact US Dollar?
The US Federal Reserve (Fed) has two mandates: maximum employment and price stability. The Fed uses interest rates as the primary tool to reach its goals but has to find the right balance. If the Fed is concerned about inflation, it tightens its policy by raising the interest rate to increase the cost of borrowing and encourage saving. In that scenario, the US Dollar (USD) is likely to gain value due to decreasing money supply. On the other hand, the Fed could decide to loosen its policy via rate cuts if it’s concerned about a rising unemployment rate due to a slowdown in economic activity. Lower interest rates are likely to lead to a growth in investment and allow companies to hire more people. In that case, the USD is expected to lose value.
The Fed also uses quantitative tightening (QT) or quantitative easing (QE) to adjust the size of its balance sheet and steer the economy in the desired direction. QE refers to the Fed buying assets, such as government bonds, in the open market to spur growth and QT is exactly the opposite. QE is widely seen as a USD-negative central bank policy action and vice versa.
Economist at UOB Group Lee Sue Ann comments on the imminent interest rate decision by the FOMC due later on Wednesday.
Key Takeaways
“The US banking sector developments have raised valid concerns on the outlook, complicating Fed’s inflation fight as price concerns are mixed in a pot of financial market uncertainty. If our base case of no systemic impact on the US financial sector remains valid, it is reasonable to expect the US Fed to continue to stay focused on fighting inflation and push forward with its rate hike cycle.”
“Thus, we will continue to see the Fed hiking rates by a final 25bps to 5.00-5.25% at the May FOMC. We expect no rate cuts this year and this terminal rate of 5.25% to last through 2023.”
- GBP/USD catches fresh bids on Wednesday and snaps a two-day losing streak to a multi-day low.
- A combination of factors weighs heavily on the USD and remains supportive of the positive move.
- The upside seems limited as traders now look to the US macro data ahead of the FOMC decision.
The GBP/USD pair regains positive traction on Wednesday and snaps a two-day losing streak to a nearly one-week low, around the 1.2435 region touched the previous day. The pair maintains its bid tone through the first half of the European session and is currently placed near the top end of its daily range, just above the 1.2500 psychological mark.
The US Dollar (USD) drifts lower for the second successive day and retreats further from a three-week high touched on Tuesday, which, in turn, is seen as a key factor pushing the GBP/USD pair higher. The overnight release of the US Job Openings and Labor Turnover Survey (JOLTS) indicated that the ultra-tight US job market is loosening. Apart from this, concerns over the US debt ceiling, along with renewed fears of a full-blown banking crisis, drag the US Treasury bond yields lower and continue to weigh on the Greenback.
Apart from this, a modest recovery in the US equity futures undermines the safe-haven buck and lends additional support to the GBP/USD pair, though the upside seems limited ahead of the highly-anticipated FOMC monetary policy decision. The Federal Reserve (Fed) is widely expected to hike rates by 25 bps and could soften its hawkish stance amid slowing economic growth. Investors, however, remain divided over the possibility that the Fed will announce a pause in its rate-hiking cycle as inflation is still trending well above the target.
Hence, the accompanying monetary policy statement and Fed Chair Jerome Powell's comments at the post-meeting presser will be scrutinized closely for clues about the future rate-hike path. This, in turn, will play a key role in influencing the near-term USD price dynamics and provide a fresh directional impetus to the GBP/USD pair. Heading into the key central bank event risk, traders on Wednesday might take cues from the US economic docket - featuring the release of the ADP report on private-sector employment and the ISM Services PMI.
Technical levels to watch
Economists at ING assess the impact on the EUR/USD pair of the combination of both the Fed (Wednesday) and the ECB (Thursday) policy announcements.
Moderate downside risks for EUR/USD
“We see room for EUR/USD to pull back to the 1.0900 mark as a result of the combined effect of the FOMC and the ECB impact.”
“The stretched positioning and very hawkish expectations on ECB tightening suggest the balance of risks for the euro ahead of the ECB is slightly tilted to the downside.”
The continuation of the upside in USD/CNH remains in the pipeline for the time being, note Economist Lee Sue Ann and Markets Strategist Quek Ser Leang at UOB Group.
Key Quotes
24-hour view: “We highlighted yesterday that USD ‘could rise further but it remains to be seen if it can break and stay above 6.9650’. USD did not break 6.9650 as it fell sharply from 6.9625 (low has been 6.9315). The price actions are likely part of a broad consolidation range. Today, we expect USD to trade between 6.9250 and 6.9480.”
Next 1-3 weeks: “Our update from yesterday (02 May, spot at 6.9580) is still valid. As highlighted, while upward momentum has improved, USD has to break and stay above the major resistance at 6.9650 before a move to 7.0000 is likely. On the downside, a break of 6.9200 (‘strong support’ level) would indicate that the USD strength that started more than a week ago has come to an end.”
- USD/CHF drifts lower for the second straight day and is pressured by a combination of factors.
- Fresh fears of the US banking crisis benefit the CHF and weigh on the pair amid a weaker USD.
- Investors now look to the US macro data for some impetus ahead of the crucial FOMC decision.
The USD/CHF pair extends the overnight downfall from the vicinity of the 0.9000 psychological mark, or a nearly two-week high and remains under heavy selling pressure for the second successive day on Wednesday. The downward trajectory remains uninterrupted through the first half of the European session and drags spot prices to a one-week low, around the 0.8875 region in the last hour.
Concerns that several other regional US lenders were facing solvency issues fuel worries about a full-blown banking crisis and boost demand for traditional safe-haven Swiss Franc (CHF). Apart from this, the ongoing US Dollar (USD) retracement slide from a three-week high touched on Tuesday further contributes to the offered tone surrounding the USD/CHF pair. The anti-risk flow, along with the uncertainty over the Federal Reserve's (Fed) rate hike path and worries about a US debt default, keep the US Treasury bond yields depressed and continue to weigh on the Greenback.
The US central bank is widely expected to deliver a 25 bps lift-off at the end of a two-day policy meeting this Wednesday. The US Job Openings and Labor Turnover Survey (JOLTS) released on Tuesday, meanwhile, indicated that the ultra-tight US job market is loosening, which could put less pressure on inflation and allow the Fed to soften its hawkish stance. That said, the CPI in the US is still trending well above the central bank's target range and support prospects for further policy tightening. Hence, the focus will remain glued to the highly-anticipated FOMC decision.
Apart from this, the accompanying monetary policy statement and Fed Chair Jerome Powell's comments at the post-meeting press conference will be scrutinized for clues about the policy outlook. This, in turn, will influence the near-term USD price dynamics and provide a fresh directional impetus to the USD/CHF pair. Heading into the key central bank event risk, traders on Wednesday will take cues from the US economic docket, highlighting the release of the ADP report on private-sector employment and the ISM Services PMI, for short-term opportunities.
Technical levels to watch
GBP/USD recently gave a break above the sideways consolidation during December and March affirming extension in bounce. Gradual up move should persist, in the view of economists at Société Générale.
Next hurdle at 1.2610/1.2670
“Cable is gradually inching towards the down sloping trend line drawn since 2021 near 1.2610/1.2670. This could be an interim resistance zone. If the up move falters near this hurdle, a short-term pullback is likely.”
“The 50-Day Moving Average at 1.2270 is a crucial support. Break could result in a deeper down move.”
FX option expiries for May 3 NY cut at 10:00 Eastern Time, via DTCC, can be found below.
- EUR/USD: EUR amounts
- 1.0885 348m
- 1.0910 245m
- 1.0950 390m
- 1.0995-1.1000 762m
- 1.1030-40 718m
- 1.1100 833m
- 1.1115 319m
- GBP/USD: GBP amounts
- 1.2325 250m
- 1.2600-05 355m
- USD/JPY: USD amounts
- 136.00 260m
- 136.70-80 788m
- USD/CHF: USD amounts
- 0.8940 251m
- AUD/USD: AUD amounts
- 0.6650 464m
- 0.6675-80 697m
- NZD/USD: NZD amounts
- 0.6325 200m
The AUD/USD pair was reasonably stable in April. Economists at Rabobank discuss the Aussie outlook for the coming months.
AUD/USD likely to fluctuate around current levels near-term
“High levels of employment, household savings and strength in Australia’s terms of trade suggest a relatively strong line up of fundamentals.”
“We maintain the view that AUD/USD is likely to fluctuate around current levels near-term but is positioned to grind higher into the end of the year.”
See – AUD/USD: Further upside likely while above 0.6610 – UOB
- EUR/USD adds to Tuesday’s move above the 1.1000 mark.
- The Unemployment Rate in the euro area dropped in March.
- The ADP report, FOMC event come next in the calendar.
The single currency extends the bid bias and lifts EUR/USD to fresh weekly highs in the 1.1045/50 band on Wednesday.
EUR/USD looks strong ahead of Fed
EUR/USD advances for the second session in a row and looks to consolidate the recent breakout of the psychological 1.1000 hurdle on the back of further weakness surrounding the greenback ahead of the FOMC gathering due later in the NA session.
On this key event, investors already priced in a 25 bps rate hike, although the subsequent press conference by Chair J. Powell will be in the centre of the debate following the Committee’s interest rate decision.
Moving forward, the pair is seen facing increasing volatility in light of the key ECB meeting on Thursday, where the central bank is also seen raising the policy rate by 25 bps, although there is a small possibility of a larger hike (50 bps?).
In the domestic calendar, the Unemployment Rate in the broader Euroland ticked lower to 6.5% in March.
Across the ocean, the ADP report and weekly Mortgage Applications will also be in the limelight.
What to look for around EUR
EUR/USD’s upside momentum keeps gathering pace and now shifts the attention to the 2023 high near 1.1100 the figure amidst persistent dollar weakness.
Meanwhile, price action around the single currency should continue to closely follow dollar dynamics, as well as the Fed-ECB divergence when it comes to the banks’ intentions regarding the potential next moves in interest rates.
Moving forward, hawkish ECB-speak continue to favour further rate hikes, although this view appears in contrast to some loss of momentum in economic fundamentals in the region.
Key events in the euro area this week: EMU Unemployment Rate (Wednesday) – Germany Final Services PMI, EMU Final Services PMI, ECB Meeting, ECB Lagarde press conference (Thursday) – Germany Construction PMI, EMU Retail Sales.
Eminent issues on the back boiler: Continuation (or not) of the ECB hiking cycle. Impact of the Russia-Ukraine war on the growth prospects and inflation outlook in the region. Risks of inflation becoming entrenched.
EUR/USD levels to watch
So far, the pair is up 0.40% at 1.1042 and the surpass of 1.1095 (2023 high April 26) would target 1.1100 (round level) en route to 1.1184 (weekly high March 21 2022). On the other hand, the next support aligns at 1.0909 (weekly low April 17) seconded by 1.0831 (monthly low April 10) and finally 1.0788 (monthly low April 3).
EUR/USD upward momentum has deteriorated after approaching the previous multi-year trend line near 1.1070. Economists at Société Générale discuss the pair’s outlook.
Defending 1.0730 is crucial for continuation in up move
“A phase of consolidation is underway; failure to reclaim the 1.1070 hurdle can take the pair gradually lower towards an ascending trend line since September at 1.0790/1.0730; this is a crucial support zone.”
“Daily MACD has turned flattish denoting lack of clear direction. If the pair fails to hold above 1.0730, there would be risk of a deeper downtrend.”
Considering the recent price action, USD/JPY could still challenge the 137.90 region in the short-term horizon, comment Economist Lee Sue Ann and Markets Strategist Quek Ser Leang at UOB Group.
Key Quotes
24-hour view: “We expected USD to advance further yesterday but we noted that ‘deeply overbought conditions suggest a sustained rise above 137.90 is unlikely’. However, USD did not quite challenge 137.90 as it staged a surprisingly sharp pullback from 137.77 (low has been 136.30). Upward momentum has faded and USD has likely moved into a consolidation and it is likely to trade between 135.50 and 137.70 today.”
Next 1-3 weeks: “Yesterday (02 May, spot at 137.40), we held the view that USD is likely to strengthen further and the focus is at Mar high near 137.90. We did not quite expect the volatile price actions as USD rose to 137.77 in Asian trade and then plummeted to 136.30 in NY trade. While there is still room for USD to rise above 137.90, overbought conditions could lead to a couple of days of consolidation phase. In view of the increase in volatility, we are adjusting our ‘strong support’ level to 135.20 from 136.00. A break of the ‘strong support’ level could indicate that 137.90 is not coming into view for now.”
- AUD/USD oscillates in a narrow trading band as traders move to the sidelines ahead of the Fed.
- The RBA’s surprise rate hike continues to underpin the Aussie and acts as a tailwind for the pair.
- The ongoing USD pullback from a three-week high further contributes to limiting the downside.
The AUD/USD pair struggles to gain any meaningful traction on Wednesday and seesaws between tepid gains/minor losses, just above mid-0.6600s through the early part of the European session.
The Australian Dollar (AUD) continues to draw some support from the Reserve Bank of Australia's (RBA) surprise 25 bps rate hike on Tuesday and a more hawkish outlook. This, along with the ongoing US Dollar (USD) retracement slide from a three-week high touched the previous day, acts as a tailwind for the AUD/USD pair. The overnight release of the US Job Openings and Labor Turnover Survey (JOLTS) indicated that the ultra-tight US job market is loosening. Apart from this, concerns over the US debt ceiling and renewed fears of a full-blown banking crisis drag the Greenback lower for the second straight day.
Apart from this, a modest recovery in the US equity futures undermines the safe-haven buck and benefits the risk-sensitive Aussie. The upside for the AUD/USD pair, however, remains capped as traders seem reluctant to place aggressive bets ahead of the highly-anticipated FOMC monetary policy decision, due to be announced later during the US session. The Federal Reserve (Fed) is widely expected to hike rates by 25 bps, though investors seem divided over the possibility that the Fed will announce a pause in its rate-hiking cycle as inflation is still trending well above the central bank's target range.
Hence, the focus will be on the accompanying monetary policy statement and Fed Chair Jerome Powell's comments at the post-meeting press conference, which will be scrutinized for clues about the future rate-hike path. This, in turn, will play a key role in influencing the near-term USD price dynamics and provide some meaningful impetus to the AUD/USD pair. Heading into the key central bank event risk, traders on Wednesday might take cues from the US economic docket - featuring the release of the ADP report on private-sector employment and the ISM Services PMI - to grab short-term opportunities.
Technical levels to watch
In light of advanced prints from CME Group for natural gas futures markets, open interest rose for the fifth day in a row on Tuesday, this time by around 28.5K contracts, the largest single day advance so far this year. Volume, in the meantime, remained choppy and increased by nearly 110K contracts.
Natural Gas: Another test of $2.00 looms closer
Prices of the natural gas extended the bearish start of the week into Tuesday’s session. The negative price action was in tandem with rising open interest and volume and suggests that further retracement seems on the table in the very near term. Against that, the immediate support emerges at the $2.00 mark per MMBtu.
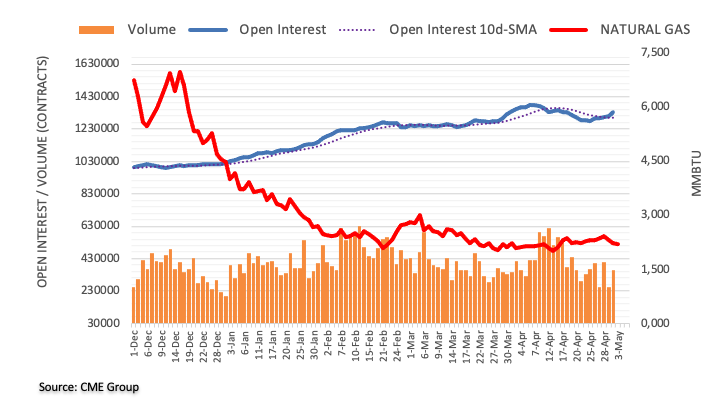
AUD/USD is expected to advance beyond 0.6700 while above the 0.6610 region, according to Economist Lee Sue Ann and Markets Strategist Quek Ser Leang at UOB Group.
Key Quotes
24-hour view: “The strong surge in AUD that sent it to a high of 0.6717 came as a surprise (we were expecting AUD to consolidate). The sharp and rapid pullback from the high in overbought conditions suggests the advance is overdone. In other words, AUD is unlikely to advance further. Today, AUD is more likely to trade sideways, expected to be between 0.6630 and 0.6705.”
Next 1-3 weeks: “Last Wednesday (26 Apr, spot at 0.6635), we indicated that ‘downward momentum is beginning to build’ and we were of the view that AUD ‘is likely to edge lower but any decline is likely to face solid support at the year-to-date low near 0.6565’. After AUD dropped briefly to 0.6575 last Friday and rebounded, we highlighted yesterday (02 May, spot at 0.6630) that ‘while downward momentum has waned, there is still a slim chance for AUD to test the 0.6565 level’. We did not anticipate the surge in AUD that sent it to a high of 0.6717. Downward momentum has faded and upward momentum is beginning to build, albeit tentatively. From here, as long as AUD holds above 0.6610 (current level of ‘strong support’), it could edge higher to 0.6740. At this stage, the odds of a sustained rise above 0.6740 are not high.”
- Silver remains on the defensive below the mid-$25.00s, though the downside seems limited.
- The technical setup favours bullish traders and supports prospects for further near-term gains.
- A convincing break below the $25.50-40 strong support is needed to negate the positive bias.
Silver struggles to capitalize on the previous day's solid bounce from the vicinity of the $24.50-$24.40 strong horizontal support and edges lower during the first half of trading on Wednesday. The white metal sticks to a mildly negative tone and remains below mid-$25.00s through the early European session, though the downside potential seems limited.
From a technical perspective, the XAG/USD has been showing some resilience near the 23.6% Fibonacci retracement level of the March-April rally and the subsequent rally favours bullish traders. Moreover, positive oscillators on the daily chart, which are still far from being in the overbought zone, support prospects for a further near-term appreciating move.
Some follow-through buying beyond the $25.50-$25.60 supply zone will reaffirm the positive outlook and allow the XAG/USD to make a fresh attempt to conquer the $26.00 round-figure mark. This is closely followed by a one-year high touched in April, above which the white metal could climb to the $26.25-$26.30 region en route to the $27.00 round-figure mark.
On the flip side, the $25.00 psychological mark now seems to protect the immediate downside. Any further fall might still be seen as a buying opportunity and remain limited near the $24.50-$24.40 region. The latter should act as a key pivotal point, which if broken will negate any positive outlook and shift the near-term bias in favour of bearish traders.
The XAG/USD might then weaken further below the $24.00 mark and accelerate the slide towards testing the 38.2% Fibo. level, around the $23.70 area. The corrective decline could get extended further to the next relevant support near the $23.35-$23.30 area before the white metal eventually drops to the $23.00 round-figure mark, representing the 50% Fibo. level.
Silver 4-hour chart
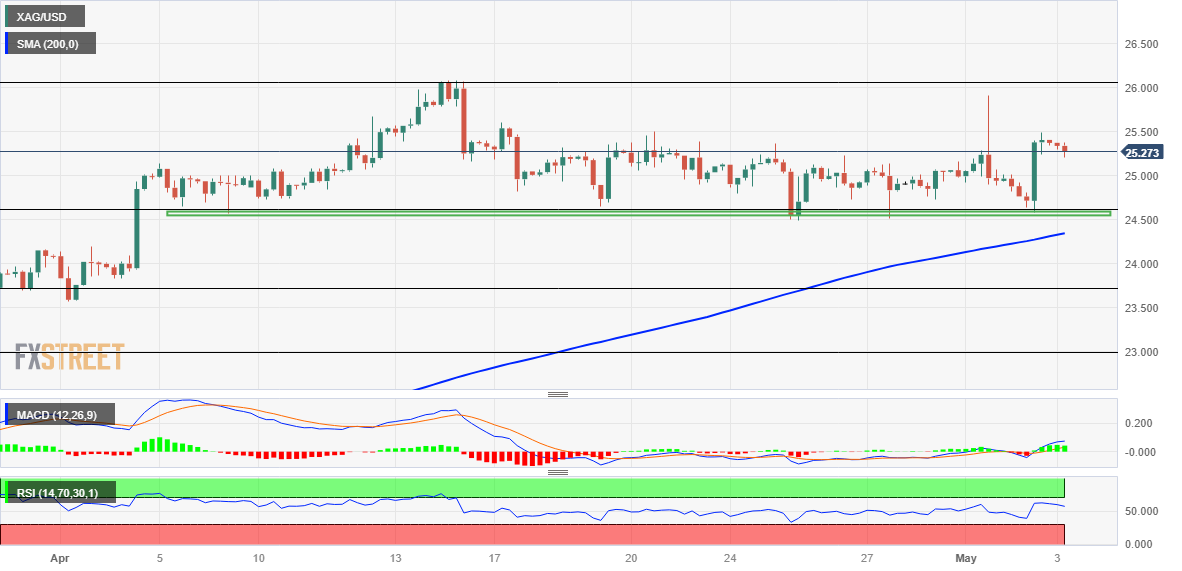
Key levels to watch
GBP/USD hovers around the key 1.2500 level. Economists at ING expect the pair to remain stable.
EUR/GBP downside risks this week
“Today, the Fed may not have a sizeable impact on Cable in our view, and leave it close to the 1.2500 mark. We don’t see a high chance of last week’s highs (1.2580) being tested again very soon.”
“When it comes to EUR/GBP, we are seeing some rebound in the run-up to the ECB meeting. We suspect that the ECB announcement may fall short of the market’s hawkish pricing and therefore see some downside risks for the pair later this week (i.e. a return to 0.8750/0.8780 area).”
Today's main event is the FOMC meeting. Economists at Commerzbank analyze how the US Dollar and the EUR/USD pair could react to the Fed policy announcement.
Market sees no chance of a further rate hike
“The market expects the Fed to hike rates by 25 bps resulting in a key rate corridor of 5.0%-5.25%. This step has been fully priced in by the market and will therefore not cause much of a reaction in the Dollar.”
“Following today’s step, the market sees no chance of a further rate hike. A moderately hawkish statement that refers to continued high inflation levels and does not exclude further tightening would make rate cuts this year seem less likely, meaning the market would have to adjust its expectations. This is likely to support the Dollar against the Euro, as it would tarnish the market’s conviction that the ECB is acting in a much more decisive manner than the Fed.”
“As we consider it to be unlikely that the Fed will signal a rate pause at this stage, the risks in EUR/USD as a result of today’s Fed meeting are therefore rather pointing to the downside.”
- USD/JPY drifts lower for the second straight day and retreats further from a two-month top.
- Fears of a US banking crisis benefit the JPY and weigh on the pair amid some USD weakness.
- The Fed-BoJ policy divergence could limit losses ahead of the US data and the FOMC decision.
The USD/JPY pair extends the previous day's sharp retracement slide from the 137.75-137.80 region, or a nearly two-month high and remains under heavy selling pressure for the second successive day on Wednesday. The downfall remains uninterrupted through the early European session and drags spot prices below the 136.00 mark, or a fresh weekly low in the last hour.
Concerns that several other regional US lenders were facing solvency issues fuel worries about a full-blown banking crisis and boost demand for traditional safe-haven assets, including the Japanese Yen (JPY), This, in turn, drags the USD/JPY pair lower amid the ongoing US Dollar (USD) retracement slide from a three-week top touched on Tuesday. The overnight release of the US Job Openings and Labor Turnover Survey (JOLTS) indicated that the ultra-tight US job market is loosening. Apart from this, concerns over the US debt ceiling and renewed fears of a full-blown banking crisis continue to weigh on the Greenback.
That said, a big divergence in the monetary policy stance adopted by the Bank of Japan (BoJ) and the Federal Reserve (Fed) could help limit the downside for the USD/JPY pair, at least for the time being. It is worth recalling that BoJ Governor Kazuo Ueda said last week that the risk from tightening too hastily is larger than monetary policy falling behind the curve and added that it will be appropriate to continue monetary easing to achieve the 2% inflation target. In contrast, the US central bank is widely expected to hike interest rates by another 25 bps at the end of a two-day monetary policy meeting later this Wednesday.
Market participants, however, remain divided over the possibility that the Fed will announce a pause in its rate-hiking cycle as inflation is still trending well above the central bank's target range. That said, the risk of a banking crisis and worsening economic conditions might force the US central bank to soften its hawkish tone. The uncertainty, meanwhile, might hold back traders from placing aggressive bets around the USD/JPY pair ahead of the highly-anticipated FOMC decision, due to be announced later during the US session. This, in turn, warrants caution before positioning for any meaningful corrective fall.
Heading into the key event risk, traders on Wednesday might take cues from the US economic docket, featuring the release of the ADP report on private-sector employment and the ISM Services PMI. The key macro data might influence the USD price dynamics, which, along with the broader risk sentiment, should provide some impetus to the USD/JPY pair. That said, the immediate market reaction is more likely to remain limited.
Technical levels to watch
- GBP/USD struggles to defend the first daily gains in three, retreats from intraday high.
- 100-SMA, one-week-old ascending trend line restricts immediate downside; bearish MACD signals prod Cable pair buyers.
- 200-SMA holds the gate for Sterling bear’s welcome.
GBP/USD portrays pre-Fed consolidation near 1.2490 as it retreats from its intraday high heading into Wednesday’s London open. Even so, the Cable pair remains firmer for the first day in three. That said, the quote’s latest pullback could be linked to the bearish MACD signals, apart from the cautious mood ahead of the Federal Open Market Committee (FOMC) monetary policy meeting announcements.
Also read: GBP/USD nears 1.2500 as doubts over Fed's role in banking turmoil weigh on US Dollar
However, the GBP/USD pair’s sustained trading beyond the 100-SMA and an ascending support line from April 21, respectively near 1.2460 and 1.2440, keeps the buyers hopeful.
Even if the Cable pair breaks the 1.2440 trend line support, the 200-SMA level of around the 1.2400 threshold can prod the GBP/USD bears.
In a case where the quote remains bearish past 1.2400, lows marked during April 17 and 10, close to 1.2355 and 1.2345, can act as the last defenses of the GBP/USD buyers before directing the pair towards the previous monthly low of near 1.2275.
On the contrary, GBP/USD recovery needs validation from the 1.2500 round figure to challenge a downward-sloping resistance line from the last Friday, close to 1.2520 at the latest.
Following that, a one-month-old ascending resistance line, near 1.2565, precedes the 1.2600 round figure to challenge the GBP/USD buyers targeting the one-year high of around 1.2665.
GBP/USD: Four-hour chart

Trend: Further upside expected
Economists at ING discuss EUR/USD outlook ahead of the FOMC meeting.
Positioning may stand against a further EUR/USD advance
“Our base case assumes that a 25 bps Fed hike and remarks that further hikes ‘may yet be required’ will not be enough to feed the EUR/USD bull story. This comes at a time when long Euro positioning amongst the asset management community is relatively high.”
“On balance, we see EUR/USD correcting back to the 1.10 area on the FOMC event risk – but probably not much lower given the ECB meeting the next day. That again could prove mildly bearish for EUR/USD given we favour just a 25 bps hike.”
Here is what you need to know on Wednesday, May 3:
The US Dollar (USD) stays on the back foot early Wednesday following Tuesday's volatile action. ADP private sector employment report for April and the ISM's Services PMI survey will be featured in the US economic docket ahead of the US Federal Reserve's (Fed) highly-anticipated policy announcement later in the American session. Market participants will also pay close attention to the performance of regional banking stocks in the US after Tuesday's selloff.
Federal Reserve Preview: How to trade Powell's powerful market whipsaw.
After having reached its strongest level in three weeks near 102.50 on Tuesday, the US Dollar Index reversed its direction and closed below 102.00, snapping a three-day winning streak. Heavy losses seen in the regional banking stocks amid resurfacing fears over a deepening financial crisis following the collapse of the First Republic Bank triggered a flight to safety. In turn, the benchmark 10-year US Treasury bond yield fell more than 4% and caused the USD to lose its strength.
The Fed is widely expected to raise its policy rate by 25 basis points (bps) to the range of 5-5.25% after the May policy meeting. Investors will pay close attention to the US central bank's language in the policy statement and will try to figure out whether there will be a pause in the tightening cycle from June.
FOMC Meeting Preview: Powell to keep every door open, surprises not out of the table after RBA.
During the Asian trading hours, the data from New Zealand revealed that the Unemployment Rate stayed unchanged at 3.4% in the first quarter. In the same period, Employment Change was up 0.8%, compared to the market expectation of 0.4% and the annual Labour Cost Index rose to 4.5% from 4.3%. Supported by the upbeat jobs report, NZD/USD edged higher in the Asian session and was last seen trading in positive territory at around 0.6230.
After having lost more than 50 pips on Monday, EUR/USD reversed its direction late Tuesday and registered modestly daily gains. The pair trades in a relatively tight range above 1.1000 early Wednesday.
GBP/USD failed to stage a decisive rebound despite the renewed USD weakness on Tuesday and closed the second straight day in negative territory. The pair edges higher toward the key 1.2500 level in the European morning on Wednesday.
Fueled by the sharp decline seen in the US Treasury bond yields, Gold price surged higher on Tuesday and reached its strongest level since mid-April near $2,020. XAU/USD stays in a consolidation phase slightly below that level on Wednesday.
USD/JPY fell nearly 100 pips on Tuesday and continued to push lower in the Asian session on Wednesday. The Japanese Yen benefits from the risk-averse market environment and the pair was last seen trading at around 136.00, where it was already down 0.4% on a daily basis.
Bitcoin gained more than 2% on Tuesday before settling above $28,500 on Wednesday. Similarly, Ethereum rose 2% and snapped a two-day losing streak. ETH/USD, however, still trades below $1,900.
Open interest in crude oil futures markets increased for the fifth consecutive session on Tuesday, this time by nearly 22K contracts according to preliminary readings from CME Group. In the same line, volume reversed three daily drops in a row and rose by the most since April 3 by almost 546K contracts.
WTI: A drop to $70.00 now emerges on the horizon
Prices of the WTI dropped markedly on Tuesday amidst rising open interest and volume. That said, a deeper retracement appears on the table with the immediate target at the key $70.00 mark per barrel.
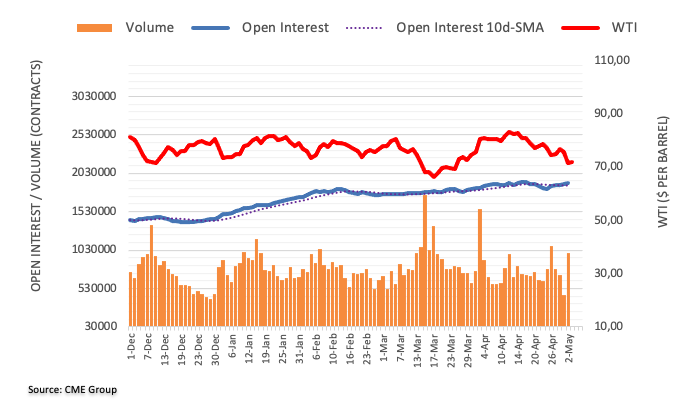
- The index loses further ground and retests 101.70.
- The Fed is largely anticipated to hike rates by 25 bps.
- ADP report, ISM Services PMI next of note in the docket.
The USD Index (DXY), which tracks the Greenback vs. a bundle of its main rivals, adds to Tuesday’s losses and extends the recent breach of the 102.00 support on Wednesday.
USD Index now looks at FOMC, data
The index retreats for the second session in a row and extends Tuesday’s rejection from multi-day highs around 102.40 on the back of the improved sentiment in the risk complex and steady cautiousness among investors ahead of the FOMC event.
On the latter, the Federal Reserve is broadly expected to raise the Fed Funds Target Range (FFTR) by 25 bps to 5.00%-5.-25%. The focus of attention, however, has shifted to the usual press conference by Chief Powell, where the future moves regarding the rate path will take centre stage.
Other than the FOMC gathering, the US docket will show weekly Mortgage Applications by MBA, the monthly ADP Employment Change, the final Services PMI tracked by S&P Global and the ISM Services PMI.
What to look for around USD
The index corrects lower from recent tops around 102.40 ahead of the key FOMC meeting due later in the NA session.
Looking at the broader picture, the index continues to navigate in a consolidative phase against steady expectations of another rate increase in May by the Fed and rising cautiousness in light of the potential next decisions by the Fed in the next months.
In favour of a pause in the Fed’s hiking cycle following the May event appears the persevering disinflation and nascent weakness in some key fundamentals, which at the same time feeds the spectre of a probable recession.
Key events in the US this week: MBA Mortgage Applications, ADP Employment Change, Final Services PMI, ISM Services PMI, FOMC Meeting, Powell press conference (Wednesday) – Balance of Trade, Initial Jobless Claims (Thursday) – Nonfarm Payrolls, Unemployment Rate, Consumer Credit Change.
Eminent issues on the back boiler: Persistent debate over a soft/hard landing of the US economy. Terminal Interest rate near the peak vs. speculation of rate cuts in 2024. Fed’s pivot. Geopolitical effervescence vs. Russia and China. US-China trade conflict.
USD Index relevant levels
Now, the index is losing 0.20% at 101.72 and faces immediate support at 101.01 (weekly low April 26) prior to 100.78 (2023 low April 14) and finally 100.00 (psychological level). On the other hand, a break above 102.80 (weekly high April 10) would open the door to 103.05 (monthly high April 3) and then 103.13 (100-day SMA).
Economists at TD Securities discuss the Federal Reserve interest rate decision and its implications for EUR/USD and USD/JPY.
Hawkish (20%)
“Fed delivers a 25 bps rate hike, and while the FOMC likely will acknowledge the more uncertain economic environment, especially for credit conditions, it will also emphasize credit tightening does not appear to be outsized whereas the inflation dynamic remains significantly out of sync with its inflation mandate. As such, the FOMC considers additional tightening is needed. USD/JPY 138+, EUR/USD 1.08.”
Base Case (65%)
“Fed delivers a 25 bps rate hike, and while the FOMC likely will acknowledge the more uncertain economic environment, especially for credit conditions, it will also emphasize that disinflation has been slower than expected. As such, the FOMC will leave the door open for additional policy tightening, if necessary. USD/JPY 138, EUR/USD 1.09.”
Dovish (15%)
“Fed delivers a 25 bps rate hike, with the FOMC acknowledging the more uncertain economic environment, especially for credit conditions. The FOMC will emphasize that the risks to the outlook have become close to two-sided. As such, the FOMC will be patient to monitor the effects of the cumulative tightening on the data flow. USD/JPY 136.50/00, EUR/USD 1.1050.”
- EUR/USD has faced a marginal correction around 1.1030 as the USD Index has attempted a recovery.
- The Fed and the ECB are preparing for a fresh interest rate hike cycle to curb sticky inflation.
- EUR/USD has delivered a breakout of the downward-sloping trendline plotted from 1.1063.
The EUR/USD pair has shown a marginal correction after facing fragile barricades around 1.1030 in the early European session. The major currency pair has sensed selling pressure as the US Dollar Index (DXY) has attempted a recovery after dropping to near 101.70.
Sheer volatility is anticipated ahead as the Federal Reserve (Fed) will announce its monetary policy decision on Wednesday. The street is anticipating an interest rate hike by 25 basis points (bps).
Also, the European Central Bank (ECB) will announce its interest rate policy on Thursday. ECB President Christine Lagarde is expected to continue its bumper interest rate hike measure as Eurozone’s inflation is extremely stubborn amid labor shortages.
EUR/USD has delivered a breakout of the downward-sloping trendline plotted from April 27 high at 1.1063. The Euro is showing a mild correction, testing the breakout scenario. Potential resistance is placed at 1.1095 plotted from April 26 high.
Advancing 20-period Exponential Moving Average (EMA) at 1.1007 indicates that the short-term trend is bullish.
The Relative Strength Index (RSI) (14) has shifted into the bullish range of 60.00-80.00, which signifies that upside momentum has been activated.
The major currency pair will capture more gains after a decisive move above the intraday high of 1.1030, which will drive it toward the round-level resistance at 1.1100. A breach of the latter will expose the shared currency pair to a fresh 13-month high at 1.1085.
On the flip side, a downside move below April 12 low at 1.0915 will drag the asset toward April 10 low at 1.0837 and April 03 low at 1.0788.
EUR/USD hourly chart
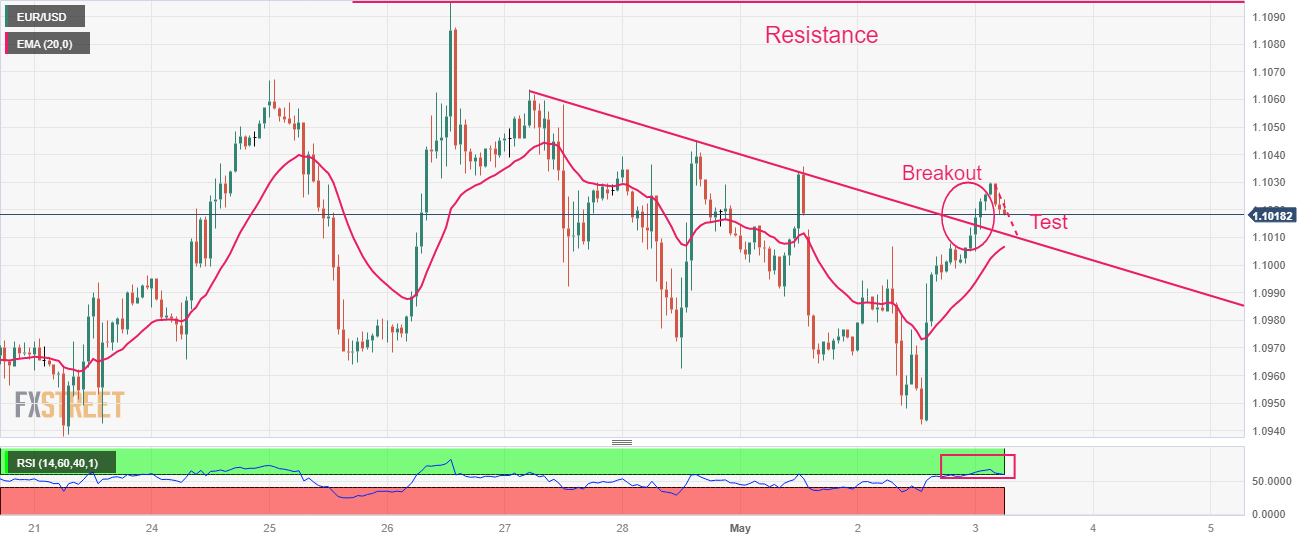
- Gold Price pares the biggest daily gain in a month amid pre-Fed anxiety.
- Mixed catalysts surrounding bank turmoil, US data and debt ceiling extension prod XAU/USD traders.
- Fed needs to defend hawkish bias and push back policy pivot talks to lure Gold bears.
Gold price (XAU/USD) grind higher after defying the fortnight-old trading range as market players brace for the all-important Federal Reserve (Fed) decision.
It’s worth noting that the precious metal rose the most in one month the previous day as mixed US data raised doubts over the Fed’s future rate hikes, especially when the White House blames higher rates for banking turmoil. Also keeping the floor under the XAU/USD price are hopes of strong growth in China and India, one of the biggest Gold consumers.
However, fears of more banking fallouts, overall strong inflation and early signals from the Fed officials suggest the US Dollar’s likely rebound, which in turn prod the XAU/USD buyers.
Hence, the Gold price portrays typical pre-Fed anxiety amid mixed catalysts, as well as due to holidays in China and Japan.
Also read: Gold Price Forecast: XAU/USD confirms a trading range breakout ahead of FOMC decision
Gold Price: Key levels to watch
Our Technical Confluence indicator suggests that the Gold price fades the previous day’s upside break of the key resistances, now immediate support as traders await the Federal Open Market Committee (FOMC) monetary policy meeting announcements.
Among them, the $2,010 level comprising the previous weekly high and Fibonacci 23.6% on one-day gains immediate attention of the intraday sellers of the Gold price. Following that, the $2,000 round figure could challenge XAU/USD fall.
That said, the $1,998 level appears a tough nut to crack for the Gold bears past $2,000 as it includes the SMA10 on 4H and Fibonacci 38.2% on one-week.
It’s worth noting that multiple levels marked during late April around $1,990 and $1,970 could challenge the XAU/USD downside past $2,000.
Meanwhile, Gold price recovery needs validation from $2,025 level encompassing Fibonacci 23.6% on one-month and Pivot Point one week R2.
In a case where the Gold price remains firmer past $2,025, the upper band of Bollinger on one-day and Pivot Point one-day R1 may act as an extra upside filter.
Here is how it looks on the tool
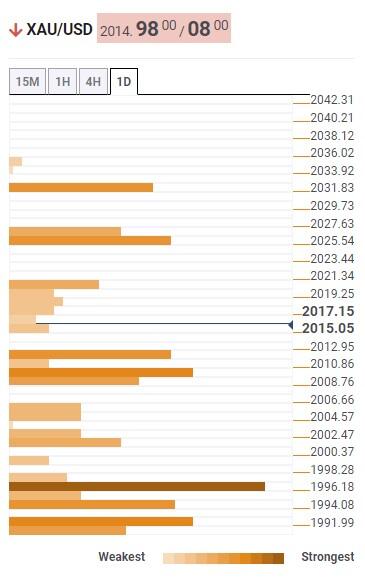
About Technical Confluences Detector
The TCD (Technical Confluences Detector) is a tool to locate and point out those price levels where there is a congestion of indicators, moving averages, Fibonacci levels, Pivot Points, etc. If you are a short-term trader, you will find entry points for counter-trend strategies and hunt a few points at a time. If you are a medium-to-long-term trader, this tool will allow you to know in advance the price levels where a medium-to-long-term trend may stop and rest, where to unwind positions, or where to increase your position size.
Economist Lee Sue Ann and Markets Strategist Quek Ser Leang at UOB Group suggest GBP/USD is now likely to navigate within the 1.2395/1.2565 range in the next few weeks.
Key Quotes
24-hour view: “We highlighted yesterday that ‘the bias for GBP is tilted to the downside but it is unlikely to break the strong support at 1.2440’. GBP weakened more than expected as it broke slightly below 1.2440 (low of 1.2436) before rebounding. While there is no significant increase in downward momentum, GBP could dip to 1.2425 before a more sustained rebound is likely. Resistance is at 1.2500, followed by 1.2525.”
Next 1-3 weeks: “Yesterday (02 May, spot at 1.2495), we highlighted that for GBP to strengthen further, it must not fall below 1.2440. In NY trade, GBP dropped to 1.2436 before rebounding. The breach of the ‘strong support’ level at 1.2440 indicates that GBP is unlikely to strengthen further. For the time being, GBP is more likely to trade in a 1.2395/1.2565 range.”
- Asian stocks are showing caution ahead of Fed policy and mounting US debt ceiling concerns.
- The White House might come forward for US debt ceiling talks with the House of Republicans as Treasury will be out of funds in early June.
- Chinese equities are showing strength despite the turbulent trading environment ahead of Caixin Manufacturing PMI data.
Markets in the Asian domain are showing caution amid sheer volatility in the United States markets as investors are worried over mounting US debt ceiling issues and the monetary policy action from the Federal Reserve (Fed). S&P500 witnessed a massive sell-off on Thursday after US Treasury Secretary Janet Yellen reported that the Treasury will be out of funds in early June if the debt ceiling won’t get an extension approval.
This could force the White House to come forward for negotiations with the House of Republicans, which earlier demanded negotiations in the President’s spending initiative against the proposal of raising the debt ceiling.
At the press time, SZSE Component climbs above 1.08%, Hang Seng plunged 1.86%, KOSPI tumbled 1%, and Nifty50 dropped 0.36%.
Japanese markets are closed on account of Constitution Day.
The US Dollar Index has found an intermediate cushion after a sheer sell-off to near 101.70. The further downside in the USD Index looks genuine as the Fed is expected to sound neutral on interest rate guidance. However, an interest rate hike by 25 basis points (bps) cannot be ruled out.
Chinese equities are showing strength despite the turbulent trading environment. Indices are performing better ahead of the Caixin Manufacturing PMI data, which will release on Thursday. The economic data is expected to land at 50.3 lower than the former figure of 50.0. The Chinese economy is in recovery mode after a long period of lockdown due to pandemic curbs.
On the oil front, the oil price displayed a blood bath as central banks are preparing for accelerating interest rates further to arrest sticky inflation. Going forward, investors will keep an eye on oil inventories data, which will be released by US Energy Information Administration (EIA) for the week ending April 28.
CME Group’s flash data for gold futures markets noted traders increased their open interest positions for the third session in a row on Wednesday, this time by around 13K contracts. Volume followed suit and went up by around 74.8K contracts after three consecutive daily drops.
Gold now targets the 2023 peak near $2050
Gold prices rose sharply and closed past the key $2000 mark per ounce troy on Tuesday. The move was accompanied by increasing open interest and volume, which is suggestive that further gains remain in store for the yellow metal in the very near term and with the immediate hurdle at the 2023 top near $2050 (April 13).
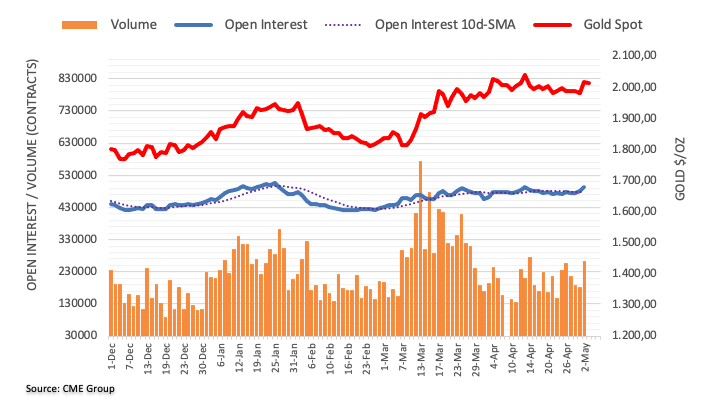
"Economic growth in the Middle East, North Africa and Central Asia regions will slow in 2023, underlining the need to accelerate structural reforms," the International Monetary Fund (IMF) said on Wednesday per Reuters.
The IMF released its Regional Economic Outlook report early Wednesday wherein it said, “Real GDP growth in the Middle East and Central Asia is forecast to fall to 2.9% in 2023, from 5.3% last year, before improving to 3.5% in 2024.”
The report further added that Growth in the Middle East and North Africa region will slow to 3.1% in 2023, from 5.3% a year ago, and to 4.2% in the Caucasus and Central Asian states from 4.8% last year.
Together with the IMF report, Regional Director Jihad Azour said that uncertainties are high and there are a number of risks that are impacting the outlook for the region.
“Some risks are global, some are related to the risk of fragmentation, but some of it is due to the fact that a certain number of countries have a high level of debt,” added IMF’s Azour.
IMF’s Azour also mentioned that government-led reforms and the growth of private investment in new sectors will help support non-oil economic growth in Saudi Arabia amid an expected sharp slowdown in overall growth this year.
More statements from IMF
Tight monetary and fiscal policies across the region and tight financial conditions ‘call for accelerating structural reforms to bolster potential growth and enhance resilience.’
Growth in Egypt is forecast to slow to 3.7% in 2023 from 6.6% in 2022 amid economic woes that led it to seek a $3 billion, 46-month financial support package from the IMF.
Also read: IMF raises Asia's economic forecast on China recovery, warns of risks
- USD/CHF fades bounce off intraday low, extends previous day’s pullback from two-week high.
- Oversold RSI, 38.2% Fibonacci retracement prod Swiss Franc buyers.
- Clear downside break of one-week-old ascending trend line, 200-HMA suggest pair’s further fall amid bearish MACD signals.
USD/CHF holds lower grounds near the intraday bottom of 0.8907, retreating of late, as bears keep the reins for the second consecutive day heading into Wednesday’s European session.
In doing so, the Swiss Franc (CHF) pair extends the previous day’s U-turn from the highest level in a week.
That said, the bearish bias takes clues from the downbeat MACD conditions and a clear break of the previous support line stretched from April 26, as well as sustained trading below the 200-Hour Moving Average (HMA).
However, the 38.2% Fibonacci retracement level of April 19-26 fall, near 0.8910, joins the nearly oversold RSI (14) line to challenge the USD/CHF bears.
Hence, the USD/CHF pair is likely to decline further but the fresh selling may wait for a successful trading below 0.8910.
Following that, the 0.8900 round figure may act as an extra filter toward the south before directing the bears toward the previous monthly low of around 0.8850, also the lowest level since January 2021.
Should the Swiss Franc pair remains bearish past 0.8850, the 0.8800 round figure and the year 2021 low of near 0.8755 can lure the sellers.
On the flip side, USD/CHF recovery needs validation from the 200-HMA and the support-turned-resistance line, respectively near 0.8925 and 0.8950.
Even so, multiple hurdles near 0.8970 and the 0.9000 psychological magnet can prod the pair buyers before giving them control.
USD/CHF: Hourly chart
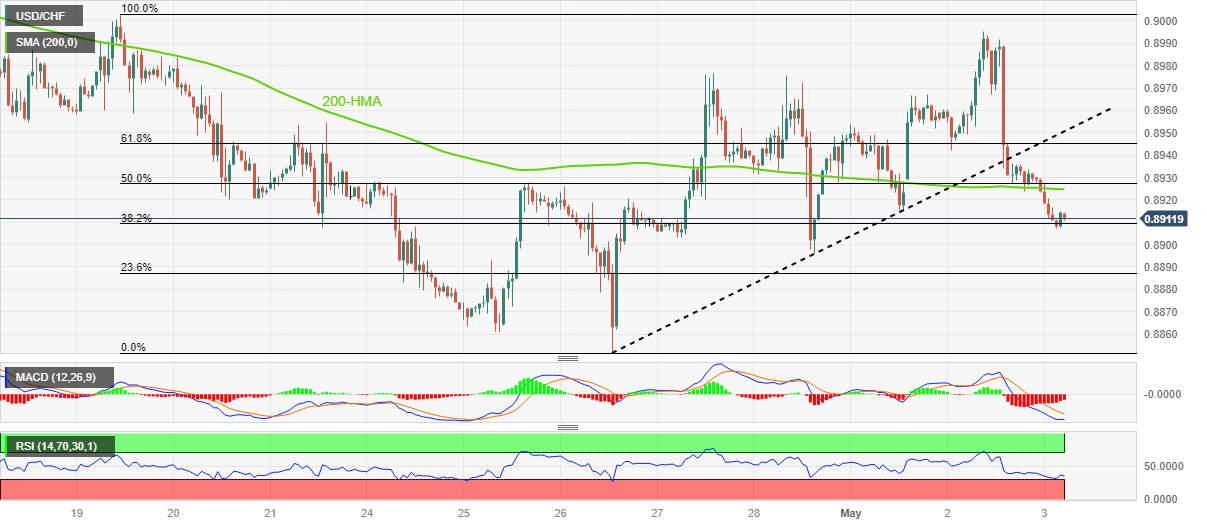
Trend: Further weakness expected
In the opinion of Economist Lee Sue Ann and Markets Strategist Quek Ser Leang, the upside bias in EUR/USD sems to have lost some traction as of late.
Key Quotes
24-hour view: “Yesterday, we held the view that EUR ‘is likely to edge lower but it is unlikely to break the major support at 1.0920. EUR weakened less than expected as it dipped to 1.0940 and then rebounded to end the day at 1.0999 (+0.22%). Downward pressure has eased and EUR is unlikely to weaken further. Today, EUR is more likely to trade in a range, expected to be between 1.0960 and 1.1040.”
Next 1-3 weeks: “There is not much to add to our update from yesterday (02 May, spot at 1.0975). As highlighted, the recent buildup in upward momentum has more or less faded and EUR is likely to trade in a range of 1.0920/1.1040 for now.”
- NZD/USD has faced delicate barricades around 0.6250, upside looks favored amid weakness in the USD Index.
- The USD Index is declining towards 101.63 as various indicators are favoring neutral guidance from the Fed.
- Upbeat NZ Employment data favors continuation of hawkish stance from the RBNZ.
The NZD/USD pair has sensed selling pressure after a rally to near 0.6250 in the Asian session. The Kiwi asset is expected to continue its upside journey as the US Dollar Index (DXY) is under immense pressure amid expectations that higher interest rates by the Federal Reserve (Fed) were the major reason behind the United States banking fiasco.
S&P500 futures have generated some gains in the Asian session, portraying a minor recovery in the risk appetite of investors. The recovery could be short-lived as a cautionary approach is being advised ahead of the interest rate decision by the Fed.
Heather Boushey, a member of the Council of US Economic Advisers that interest rate hikes from the Fed had a negative impact on the banking sector.
The USD Index is declining towards the immediate support of 101.63 as various economic indicators are favoring neutral interest rate guidance from the Fed. US labor market conditions have eased as firms are cutting jobs. Also, JOLT's Job Openings dropped heavily to 9.59M from the consensus of 9.775M. Apart from that, consistent contraction in US manufacturing activities has accelerated fears of a recession ahead. This might force the Fed to shift focus to US economic conditions from the stubborn inflation.
On the New Zealand Dollar front, upbeat New Zealand Employment (Q1) has supported the continuation of the hawkish stance from the Reserve Bank of New Zealand (RBNZ). The Employment Change has landed at 0.8% higher than the consensus of 0.4% and the former release of 0.2%. While the Unemployment Rate has remained steady at 3.4% as reported in the previous quarter but lower than the estimates of 3.5%.
Australia's central bank said on Wednesday that a rapid recovery in population growth was a big surprise for the bank's economic forecasts, pushing up rents and leading to an earlier-than-expected stabilisation in housing prices after months of losses.
More to come
- WTI crude oil treads water after positing the biggest daily loss in eight months.
- Mixed plays between anticipated rate hikes and China-led optimism prod Oil traders amid pre-Fed anxiety.
- API inventories, hawkish Fed bets keep energy bears hopeful ahead of WTI crude oil stockpile, FOMC.
WTI crude oil stays depressed at the lowest levels since late March, poked the previous day, as energy bearish make rounds to $71.50 during early Wednesday in Europe. In doing so, the black gold price takes clues from the dicey markets ahead of the Federal Open Market Committee (FOMC) monetary policy meeting announcements.
Apart from the pre-Fed anxiety, mixed plays between the hopes of more demand from China and fears of higher rates, as well as banking woes, also exert downside pressure on the black gold prices. On the same line could be the weekly Oil inventories per the industry report. That said, the American Petroleum Institute (API) said that the Weekly Crude Oil Stock declined by -3.939M during the week ended on April 28 versus -6.083M prior.
It’s worth noting that the International Monetary Fund (IMF) raised economic forecasts of the Asia-Pacific zone in its latest report while also adding, “Asia and Pacific will be the most dynamic of the world's major regions in 2023, predominantly driven by the buoyant outlook for China and India.”
On the other hand, recently upbeat inflation signals from the US keep the Fed hawks hopeful even as the White House blames the US central bank’s higher rates for banking fallouts. Late Tuesday, a top White House (WH) Economist Heather Boushey, a member of the White House Council of Economic Advisers, told Reuters that the Fed is raising interest rates in the hope of reducing inflation. That is having this negative effect on the banking sector. “Why would we add to that?,” said WH Economist Heather Boushey.
Elsewhere, chatters of no major output cuts from the OPEC+ group during 2023 and likely easing in supply crunch, due to heavy floating of Oil in Moscow, weighs on the Oil price.
On a different page, a Reuters survey found that OPEC oil output fell 190,000 barrels-per day in April, mainly driven by Iraq and Nigeria. Output is set to drop further in May as a new round of voluntary cuts unveiled on April 2 takes effect,” per the news.
Looking forward, weekly inventory data from the US Energy Information Administration (EIA), expected -1.0M versus -5.054M, will join the Fed’s announcements to direct intraday Oil prices move.
Technical analysis
A clear downside break of an ascending trend line from March 17, now immediate resistance near $74.70, keeps WTI crude oil bears hopeful of breaking the $70.00 psychological magnet.
- USD/INR is confidently defending its immediate support of 81.70 despite a weak USD Index and a nosedive move in the oil price.
- A minor recovery in the S&P500 futures could be a dead cat bounce move as US equities were heavily beaten on Tuesday.
- Rising concerns over the US debt ceiling have heavily weighed on Treasury yields.
The USD/INR pair has rebounded after dropping to near 81.70 in the Asian session. The major has defended its downside despite weakness in the US Dollar Index (DXY) amid debt ceiling woes and a bloodbath in the oil price.
S&P500 futures have added some gains in Asia, which could be a dead cat bounce move as US equities were heavily beaten on Tuesday. Rising concerns over the US debt ceiling weigh heavily on S&P500. A stretch in the US debt ceiling would attract a downgrade rating for the US long-term outlook.
Meanwhile, the USD Index has corrected sharply to near 101.70 after commentary from Heather Boushey, member of the Council of US Economic Advisers that interest rate hikes from the Fed were having a negative impact on the banking sector, as reported by Reuters. This could force Fed chair Jerome Powell to remain neutral on interest rate guidance as a 25 basis points (bp) rate hike is widely anticipated.
Rising concerns over the US debt ceiling have heavily weighed on yields as US Treasury would be out of funds in early June if the White House failed to raise the debt ceiling sooner. The 10-year US Treasury yields have dropped to near 3.43%.
Apart from the Fed policy, investors will also focus on the US Automatic Data Processing (ADP) Employment data. As per the consensus, the US economy added 150K fresh jobs in April, higher than the former additions of 145K.
On the oil front, oil prices have turned sideways around $71.50 after a nosedive move as Western central banks are preparing for a fresh rate hike cycle. Apart from the Fed, the European Central Bank (ECB) will raise interest rates on Thursday. Next week, the Bank of England (BoE) is expected to raise interest rates further to curb inflation.
It is worth noting that India is one of the leading importers of oil in the world and lower oil prices will support the Indian rupee.
- AUD/USD clings to mild gains inside weekly bullish channel, keep bounce off 200-EMA.
- Easing bearish bias of MACD signals adds strength to recovery moves.
- Three-week-old descending trend line acts as immediate hurdle; downside break of 0.6650 can prod yearly low.
AUD/USD remains mildly bid during a three-day winning streak around 0.6665 heading into Wednesday’s European session.
Also read: AUD/USD remains confined below 0.6670 despite upbeat Australian Retail Sales data
In doing so, the Aussie pair stays within an upward-sloping trend channel while defending the previous day’s rebound from the 200-hour Exponential Moving Average (200-EMA).
That said, the easing bearish bias of the MACD signals and the pair’s sustained trading inside a bullish chart formation, not to forget the clear bounce off 200-EMA, keeps AUD/USD buyers hopeful.
However, the late April swing high near 0.6705 challenges the immediate upside of the Aussie pair, a break of which will highlight a downward-sloping resistance line from April 13, close to 0.6715 at the latest.
In a case where the AUD/USD buyers keep the reins past 0.6715, the stated weekly channel’s top line, near 0.6745 by the press time, as well as the April 25 swing high near 0.6775, could challenge the upside momentum.
On the contrary, a downside break of the stated bullish channel’s support line, near 0.6660, isn’t an open offer for the Aussie bear’s welcome as the 200-EMA level of 0.6650 can prod the AUD/USD pair’s further declines.
Following that, a slump towards the yearly low marked in April, close to 0.6565, can’t be ruled out.
AUD/USD: Hourly chart
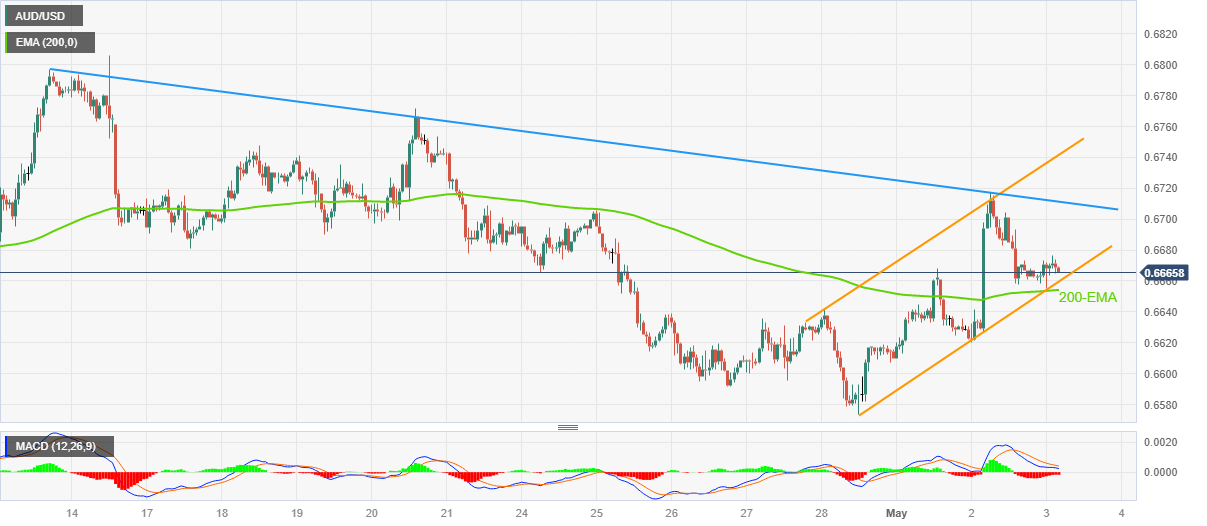
Trend: Further upside expected
- Gold price is aiming to surpass $2,020.00 as its appeal has improved amid US debt ceiling concerns.
- An extension in the US debt ceiling would result in a downgrade of the US long-term outlook.
- Gold price is marching towards $2,048.75 after a symmetrical triangle breakout.
Gold price (XAU/USD) is gathering strength for a breakout above the immediate resistance of $2,020.00 in the Asian session. The precious metal has shifted into a bullish trajectory as concerns for the United States are mounting. After the headlines from US Treasury Secretary Janet Yellen that the Treasury will run out of funds in early June if the administration fails to raise the debt ceiling and will face problems in making payments.
US President Joe Biden is declining negotiations with US House of Senate Joseph McCarthy as Republicans want big cuts in President’s spending initiatives. However, concerns that the US economy won’t be able to make payments smoothly would force US Biden to come to the table for debt ceiling talks.
An extension in the US debt ceiling would result in a downgrade of the US long-term outlook, which would have a negative impact on the US Dollar, Treasury yields, and S&P500. However, the appeal of the Gold price will improve further as safe-haven.
Meanwhile, S&P500 futures have added moderate gains in Asia, showing signs of improvement in the risk appetite. However, the overall market mood is still risk-off. The US Dollar Index (DXY) has dropped sharply to near 101.72 and is expected to extend its downside to near 101.63 ahead of the Federal Reserve (Fed) policy.
A consecutive 25 basis points (bps) interest rate hike from Fed chair Jerome Powell is expected to be followed by neutral guidance as US labor market conditions are easing and manufacturing activities are consistently contracting.
Gold technical analysis
Gold price delivered a breakout of the Symmetrical Triangle chart pattern formed on a four-hour scale, which results in wider ticks and heavy volume. The yellow metal is marching towards the horizontal resistance plotted from April 13 high at $2,048.75.
Advancing 20-period Exponential Moving Average (EMA) at $1,996.47 will provide support to the Gold bulls.
The Relative Strength Index (RSI) (14) has climbed above 60.00 indicating that the upside momentum is active now.
Gold four-hour chart
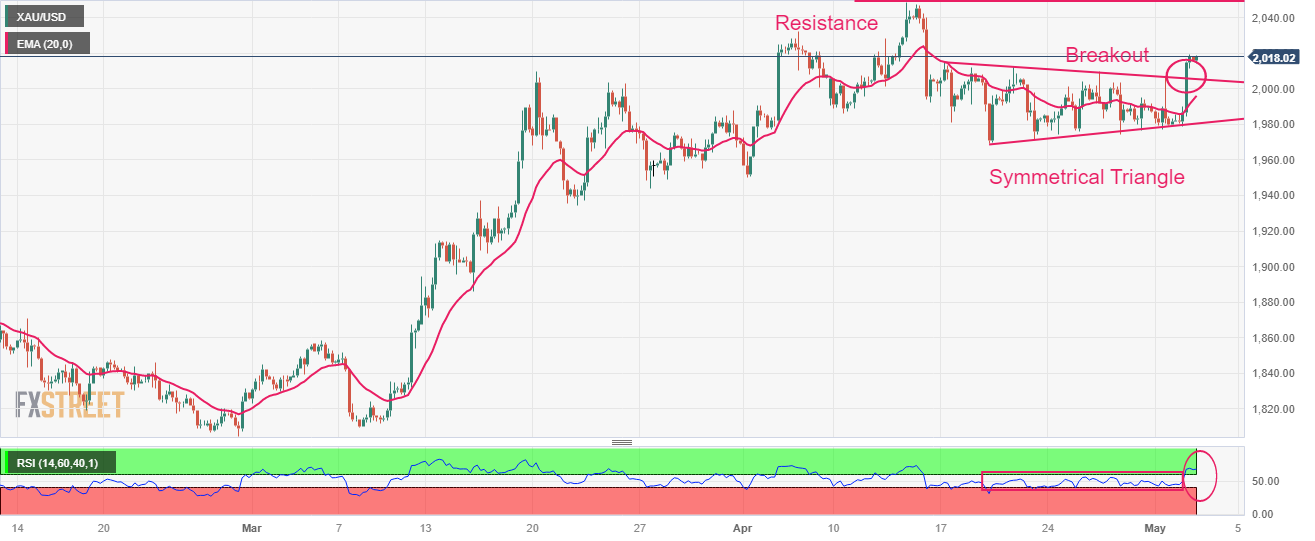
- Natural Gas price grinds higher after reversing from two-week low, prints the first daily gains in three.
- Clear downside break of 100-SMA, bearish MACD signals favor XNG/USD sellers.
- Two-month-old descending trend line appears crucial hurdle for Natural Gas buyers to tackle.
Natural Gas (XNG/USD) price seesaws around the intraday high of $2.32 as bulls await fresh clues to extend the previous day’s rebound from a 12-day low. In doing so, the energy instrument traces the broad market anxiety ahead of the key Federal Open Market Committee (FOMC) monetary policy meeting announcements early Wednesday.
It’s worth noting that the XNG/USD’s latest rebound snaps a two-day losing streak as RSI (14) line recovers towards the 50.0 level, suggesting further short-covering.
However, the bearish MACD signals and the 100-SMA hurdle of $2.37 can challenge the immediate upside of the Natural Gas price.
Even if the XNG/USD manages to cross the $2.37 SMA hurdle, a downward-sloping resistance line from early March, close to $2.45 by the press time, appears the key challenge for the buyers to tackle before retaking the control.
Meanwhile, the $2.30 round figure and the latest low surrounding $2.27 restrict the immediate downside of the Natural Gas price.
Following that, multiple levels near $2.20 can check the XNG/USD bears before directing them to the Year-To-Date (YTD) low marked in April around $2.11.
Should the Natural Gas bears manage to keep the reins past $2.11, the odds of witnessing a slump toward the $2.00 round figure can’t be ruled out.
Natural Gas Price: Four-hour chart
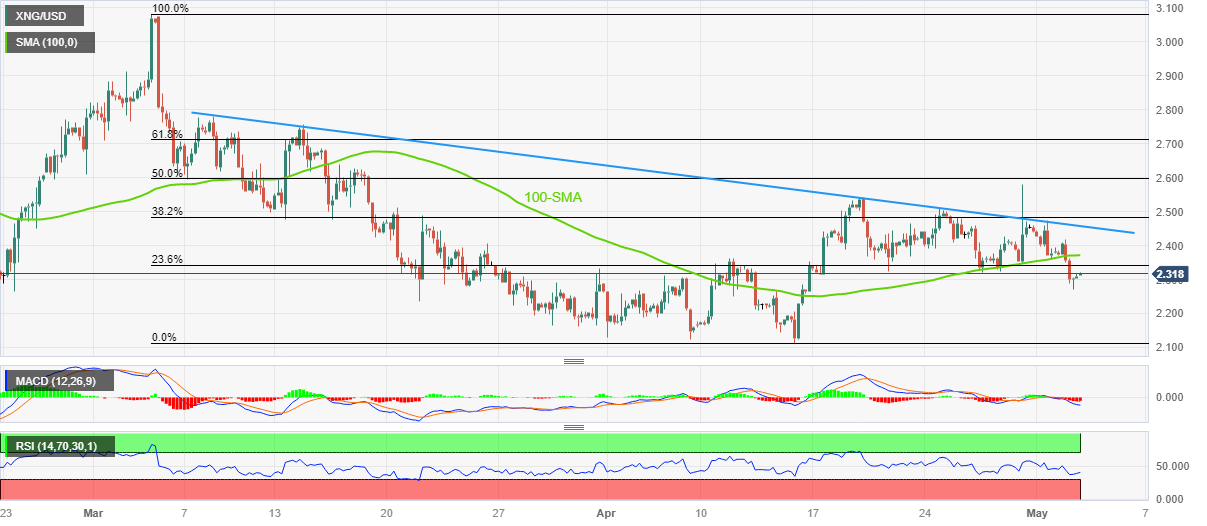
Trend: Limited recovery expected
- EUR/USD picks up bids to refresh intraday high, extends previous day’s recovery.
- Mixed Eurozone inflation, doubts over Fed and ECB’s role in banking fallouts challenge Euro pair buyers.
- US default fears, anxiety ahead of FOMC also act as additional checks for buyers.
- US ADP Employment Change, ISM Services PMI can entertain EUR/USD traders; bulls eye clues for Fed’s policy pivot.
EUR/USD cheers broad US Dollar weakness as it prepares for the key Federal Open Market Committee (FOMC) monetary policy meeting announcements early Wednesday, picking up bids to refresh intraday high near 1.1025 by the press time.
The Euro pair extends the previous recovery from a short-term support line despite mixed Eurozone inflation data and European Central Bank (ECB) updates. The reason could be linked to unimpressive US statistics and doubts that the Federal Reserve’s (Fed) rate hikes are responsible for the latest banking turmoil.
In its latest Bank Lending Survey (BLS), the European Central Bank (ECB) noted that a net 38% of Eurozone banks reported a fall in demand for credit from companies in the first quarter of the year, which in turn suggests a negative impact of the rate hikes on the bloc’s credit conditions.
On the same line, a top White House (WH) Economist Heather Boushey, a member of the White House Council of Economic Advisers, told Reuters that the Fed is raising interest rates in the hope of reducing inflation. That is having this negative effect on the banking sector. “Why would we add to that?,” said WH Economist Heather Boushey.
Talking about the data, the first readings of Eurozone inflation, per the Harmonized Index of Consumer Prices (HICP), rose to 7.0% YoY in April versus 6.9% market forecasts and previous readings. However, the ECB’s preferred inflation gauge, namely the Core HICP, eased to 5.6% during the stated period versus 5.7% analysts’ estimations and previous readings.
Meanwhile, US Factory Orders for March improved to 0.9% versus 0.8% expected and -1.1% (revised) previous readings. However, the US JOLTS Job Openings for the said month eased to 9.59M from 9.974M prior and 9.775M market forecasts.
Elsewhere, fresh selling of PacWest Bancorp and Western Alliance Bancorp shares triggered banking fears across the board and put a floor under the US Dollar price, especially amid hawkish Fed bets. Additionally weighing on the market sentiment and challenging the EUR/USD bulls could be the US policymakers’ struggle to avoid debt ceiling expiration, looming in June versus previous expectations of July expiry.
“Top US Senate Republicans on Tuesday called on President Joe Biden to accept their party's debt-ceiling package or make a counter-offer, while a top Democrat said the Senate might try to advance a "clean" debt-ceiling hike next week,” said Reuters.
Amid these plays, Wall Street closed in the red and the US Treasury bond yields also dropped heavily but the holidays in China and Japan restrict the market move afterward. With this, the S&P 500 Futures pare recent losses around 4,142, mildly bid of late.
Looking forward, EUR/USD pair traders should pay attention to the risk catalysts and the US ADP Employment Change for April, as well as the ISM Services PMI for the said month, for clear directions. Above all, the Fed’s monetary policy announcements should be watched carefully as the US central bank’s 0.25% rate hike is already given and the talks of policy pivot are on the table, which in turn can propel the Euro prices in case proven right.
Also read: FOMC Meeting Preview: Powell to keep every door open, surprises not out of the table after RBA
Technical analysis
A clear bounce off the 21-DMA support, around 1.0970 by the press time, followed by an upside break of the one-week-old previous resistance line, now nearby support around 1.0990, keeps the EUR/USD pair buyers hopeful. Though, the Euro pair buyers need validation from a one-month-old previous support line, close to 1.1025 at the latest, to keep the reins.
- USD/JPY takes offers to extend the previous day’s pullback from two-month high.
- Bearish MACD signals, descending RSI (14) near 50.00 level keeps Yen pair bears hopeful.
- Previous resistance line from late March restricts immediate downside, 137.80-90 region appears a tough nut to crack for USD/JPY bulls.
USD/JPY renews its intraday low near 136.00 as it extends the previous day’s U-turn from a multi-day high during early Wednesday. That said, the Yen pair keeps the earlier moves intact amid holidays in Japan and cautious mood ahead of the Federal Open Market Committee (FOMC) monetary policy meeting announcements.
Also read: FOMC Meeting Preview: Powell to keep every door open, surprises not out of the table after RBA
In doing so, the Yen pair stretches Tuesday’s U-turn from March’s peak, portraying a two-month-old horizontal resistance near 137.80-90, while justifying the bearish MACD signals. Adding strength to the downside bias is the descending RSI (14) line that currently seesaws near the 50.0 level, which in turn suggests the continuation of the latest weakness in the USD/JPY price.
However, the resistance-turned-support line from late March, around 135.70 at the latest, restricts the immediate downside of the USD/JPY pair.
Following that, multiple levels marked since March 10 and 50-SMA highlight the 135.15-135.00 area as the key support to break for the Yen pair sellers before taking control. Even so, a one-month-old ascending support line near 133.80 can act as the last defense of the USD/JPY buyers.
Meanwhile, USD/JPY pair’s recovery moves need to stabilize beyond the 137.00 immediate hurdle to convince intraday buyers. However, tops marked in March and May, around 137.80-90, quickly followed by the 138.00 round figure, could challenge the Yen pair bulls.
USD/JPY: Four-hour chart
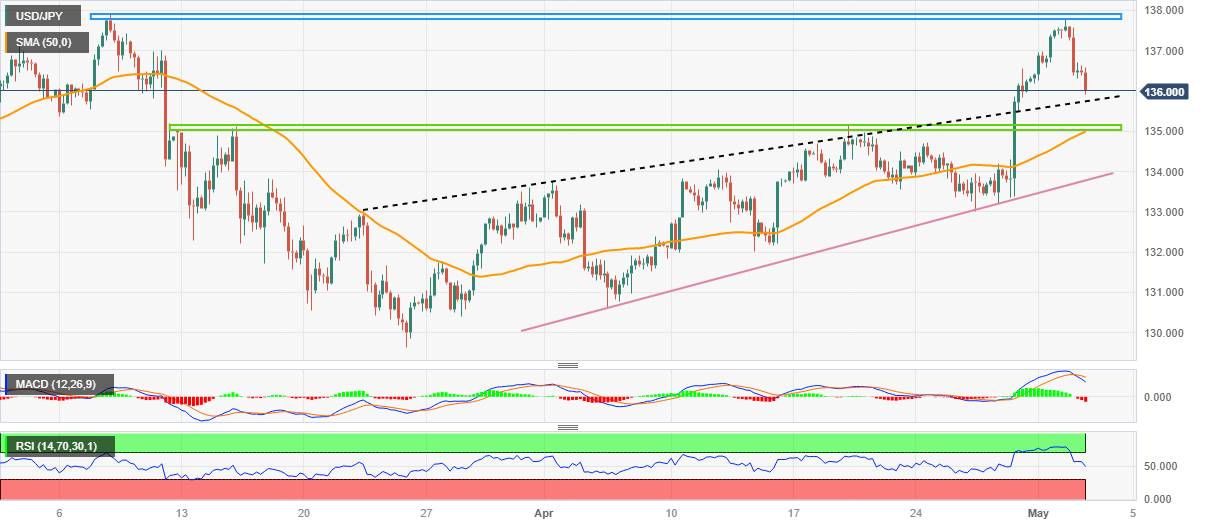
Trend: Further downside expected
| Raw materials | Closed | Change, % |
|---|---|---|
| Silver | 25.371 | 1.59 |
| Gold | 2016.76 | 1.77 |
| Palladium | 1436.25 | -0.99 |
- GBP/USD picks up bids to refresh intraday high, snaps two-day downtrend.
- White House Official blames Fed’s higher rates as having negative impact on banking.
- BoE versus Fed divergence allows Cable buyers to remain hopeful.
- US ADP Employment Change, PMIs can entertain traders ahead of the Fed’s verdict.
GBP/USD takes the bids to renew intraday high near 1.2490 as it cheers the broad US Dollar weakness ahead of the key Federal Open Market Committee (FOMC) monetary policy meeting announcements. In doing so, the Cable pair buyers also cheer the latest doubts on the Fed’s capacity to further inflate the benchmark rates.
On Tuesday, a top White House (WH) Economist Heather Boushey, a member of the White House Council of Economic Advisers, told Reuters that the Fed is raising interest rates in the hope of reducing inflation. That is having this negative effect on the banking sector. “Why would we add to that?,” said WH Economist Heather Boushey.
On the same line, mixed US data and looming fears of US default, as well as a divergence between the Bank of England (BoE) and the Federal Reserve (Fed), also propel the GBP/USD prices.
That said, United States Factory Orders for March improved to 0.9% versus 0.8% expected and -1.1% (revised) previous readings. However, the US JOLTS Job Openings for the said month eased to 9.59M from 9.974M prior and 9.775M market forecasts. It’s worth noting that the easing of the US Gross Domestic Product (GDP) joined mixed ISM PMI details to prod the DXY bulls previously and favor the Cable pair buyers. However, upbeat inflation clues defend the Federal Reserve hawks, which in turn suggests the US central bank is all set for a 0.25% rate hike. As a result, traders are more interested in hearing about the Fed’s policy pivot, previously anticipated to take place in 2023, for clear GBP/USD guidance.
Elsewhere, the Bank of England’s (BoE) more than 10% inflation contradicts the comparatively sluggish inflation data from the US, which in turn adds strength to the GBP/USD upside.
Alternatively, fresh selling of PacWest Bancorp and Western Alliance Bancorp shares triggered banking fears across the board and prod the GBP/USD buyers. Additionally weighing on the market sentiment and challenging the Cable pair bulls could be the US policymakers’ struggle to avoid debt ceiling expiration, looming in June versus previous expectations of July expiry.
“Top US Senate Republicans on Tuesday called on President Joe Biden to accept their party's debt-ceiling package or make a counter-offer, while a top Democrat said the Senate might try to advance a "clean" debt-ceiling hike next week,” said Reuters.
Against this backdrop, Wall Street closed in the red and the US Treasury bond yields also dropped whereas S&P 500 Futures also print mild losses at the latest.
Looking ahead, GBP/USD may keep cheering the US Dollar’s weakness ahead of the key US ADP Employment Change for April and the ISM Services PMI for the said month. However, major attention will be given to the Federal Reserve (Fed) announcements and the banking headlines for clear guidance.
Also read: FOMC Meeting Preview: Powell to keep every door open, surprises not out of the table after RBA
Technical analysis
A five-week-old rising wedge keeps GBP/USD bears hopeful despite the pair’s latest recovery. However, a daily closing below the 1.2445 support line becomes necessary for the sellers to retake control.
- USD/CAD has turned sideways after a perpendicular rally inspired by weaker oil prices.
- The USD Index has dropped sharply to near 101.75 as investors are anticipating neutral guidance from the Fed.
- USD/CAD is approaching the critical supply zone plotted in a range of 1.3648-1.3667.
The USD/CAD pair is displaying a sideways performance around 1.3620 in the Tokyo session. The Loonie asset displayed a perpendicular rally after defending the crucial support of 1.3540 as oil prices nosedived amid deepening fears of a recession in the United States.
The oil price has refreshed its monthly low at $71.50 and is prone to the further downside as more central banks are preparing for a fresh interest rate hike to curb sticky inflation. It is worth noting that Canada is the leading exporter of oil to the US and lower oil prices are impacting the Canadian Dollar.
Meanwhile, the US Dollar Index (DXY) has dropped sharply to near 101.75 as investors are anticipating neutral guidance from the Federal Reserve (Fed). Also, expectations of an increase in the US debt ceiling are weighing on the USD Index as it will hurt the long-term outlook of the US economy.
After sensing a steel buying interest near the demand zone placed in a narrow range of 1.3525-1.3556, USD/CAD is approaching the critical supply zone plotted in a range of 1.3648-1.3667. The Loonie asset has shifted its auction above the 20-period Exponential Moving Average (EMA) at 1.3588, which indicates that the short-term trend is bullish.
The Relative Strength Index (RSI) (14) has rebounded after sensing support near 40.00 and is making efforts in climbing above 60.00, which will result in an activation of the bullish momentum.
Should the asset break above April 28 high at 1.3668, US Dollar bulls will drive the major toward the round-level resistance at 1.3700. A break above the same will expose the asset to March 22 high at 1.3745.
On the flip side, a downside move below May 02 low at 1.3529 will expose the asset to the psychological support at 1.3500 followed by February 21 low at 1.3441.
USD/CAD four-hour chart
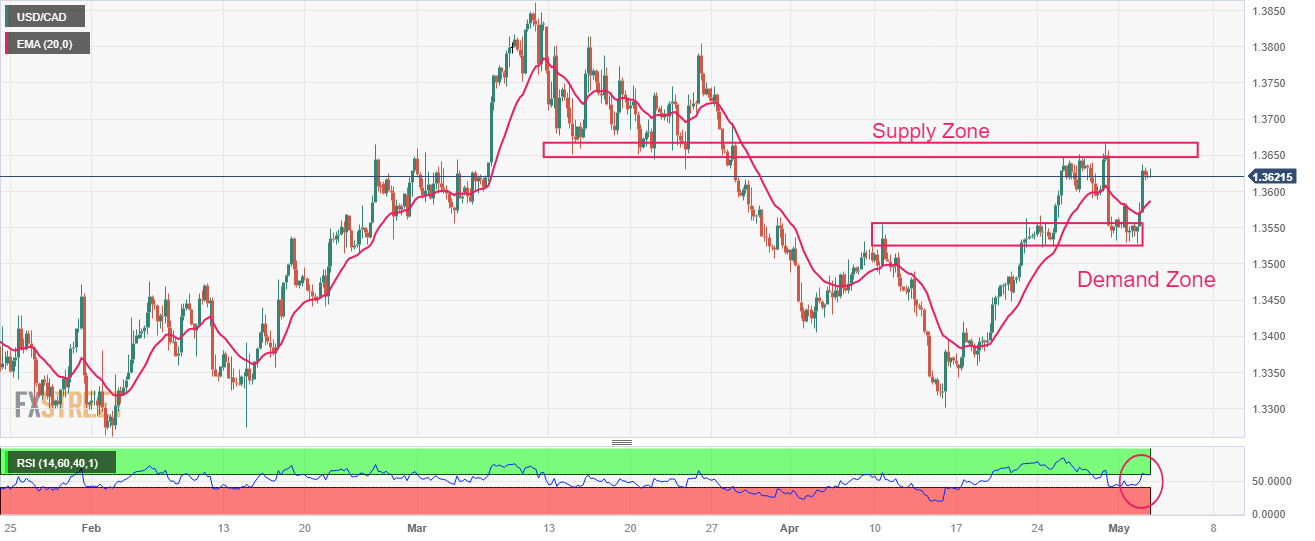
- AUD/NZD remains pressured despite upbeat Australia Retail Sales for March, bears cheer firmer New Zealand Q1 jobs report.
- Failure to cross the key DMA convergence, bearish MACD signals keep sellers hopeful.
- Ascending trend line from mid-December appears the key support, upside break of multi-month-old resistance line is crucial for bull’s entry.
AUD/NZD takes offers to refresh the intraday low near 1.0690 during early Wednesday. In doing so, the exotic pair ignores upbeat Australia Retail Sales as sellers cheer firmer prints of New Zealand employment numbers for the first quarter (Q1) of 2023.
Australia’s seasonally adjusted Retail Sales for March rose 0.4% versus market expectations of witnessing a 0.2% steady growth number.
On the other hand, New Zealand’s Unemployment Rate reprints 3.4% figures versus an estimated 3.5% whereas the Employment Change rose to 0.8% QoQ compared to 0.4% market forecasts and 0.2% prior.
Apart from the comparatively stronger New Zealand (NZ) data, the quote’s failure to provide a daily closing beyond the key DMA convergence, comprising the 21-DMA and 50-DMA, also keeps the AUD/NZD bears hopeful. On the same line are the bearish MACD signals.
With this, the AUD/NZD price is all set to revisit an upward-sloping support line from December 2022, close to 1.0665 by the press time. However, the pair’s further downside could make it vulnerable to refreshing the Year-To-Date (YTD) low, currently around 1.0590-85.
On the flip side, a daily closing beyond the aforementioned DMA confluence of 1.0770-75 will need validation from a descending resistance line from September 2022, close to 1.0890 at the latest, to retake control.
AUD/NZD: Daily chart
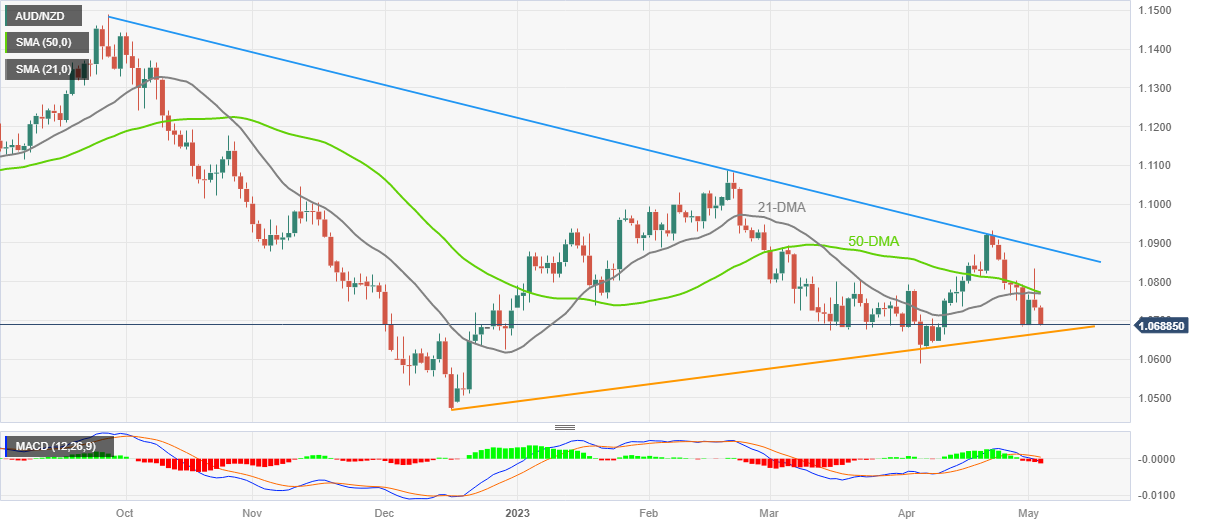
Trend: Further downside expected
- AUD/USD in inside the woods, oscillating in a 10-pip range despite upbeat Australian Retail Sales data.
- Monthly Aussie Retail Sales have accelerated by 0.4%, higher than the consensus and the former release of 0.2%.
- The USD Index has extended its correction to near 101.79 despite the Fed is expected to raise interest rates further by 25 bps.
The AUD/USD pair has continued its sideways performance in a range of 0.6660-0.6670 despite the Australian Bureau of Statistics has reported an upbeat Retail Sales data (March). Monthly Retail Sales have accelerated by 0.4%, higher than the consensus and the former release of 0.2%. Resilience in consumer spending indicates that the decision of hiking interest rates further by the Reserve Bank of Australia (RBA) was correct.
On Tuesday, the Reserve Bank of Australia hikes its Official Cash Rate (OCR) surprisingly by 25 basis points (bps) and pushed it to 3.85%. The street was anticipating a continuation of neutral policy by RBA Governor Philip Lowe as inflationary pressures are consistently declining for the past three months.
However, the RBA believed that the current monetary policy is not restrictive enough to achieve the agenda of price stability.
Going forward, investors will shift their focus on Australian Trade Balance (March) data, which will release on Thursday. Monthly Trade Balance data is seen declining 12,750M from the former release of 13,870M. A weaker-than-anticipated Trade Balance data would impact the Australian Dollar.
Meanwhile, S&P500 futures are showing some gains in the Asian session, portraying a minor recovery in the risk appetite of the market participants. US equities were heavily dumped on Tuesday amid fears of recession and rising concerns over the debt ceiling.
The US Dollar Index (DXY) has extended its correction further to near 101.79 despite the Federal Reserve (Fed) is expected to raise interest rates further by 25 bps above 5%. The USD Index is impacted by the commentary from Heather Boushey, a member of the Council of US Economic Advisers. US Boushey said that interest rate hikes from the Fed were having a negative impact on the banking sector, as reported by Reuters.
- AUD/JPY holds lower grounds after reversing from 10 week high the previous day.
- Australia Retail Sales for March rose 0.4%, AiG, S&P Global PMIs came in mixed.
- Markets in Japan and China are off but RBA versus BoJ divergence can keep buyers hopeful.
- Challenges to sentiment from pre-Fed anxiety, banking woes and US default fears weigh on risk-barometer pair.
AUD/JPY remains depressed around 90.85, keeping the previous day’s losses near the highest levels in 2.5 months, even as Australia’s Retail Sales for March manage to print upbeat figures for March early Wednesday. In doing so, the quote portrays a cautious mood ahead of the top-tier data/events. Also challenging the cross-currency pair are the holidays in China and Japan, as well as fears emanating from baking sector fallouts and hawkish central bank bias, backed by the latest surprise from the Reserve Bank of Australia (RBA).
Australia’s seasonally adjusted Retail Sales for March rose 0.4% versus market expectations of witnessing a 0.2% steady growth number.
Also read: Aussie Retail Sales beats at 0.4% vs. 0.2%
Earlier in the day, Australia’s AiG Industry Index for March rose to 20.1 versus -6.1 prior whereas the AiG Manufacturing and Construction PMIs for the said month dropped to -20.2 and -12.4 respective levels versus -5.8 and 5.6 priors in that order. Further, S&P Global Services PMI for April improved to 53.7 versus 52.6 initial forecasts while the Composite PMI also rose to 53.0 from 52.2 first estimations for the said month.
On a different page, fresh selling of PacWest Bancorp and Western Alliance Bancorp shares triggered banking fears across the board, which in turn exerts downside pressure on the AUD/JPY prices due to the pair’s risk-barometer status. Also portraying the risk-aversion wave is the mildly offered S&P 500 Futures and the downbeat close of Wall Street.
It should be noted that the RBA board members surprised AUD/JPY pair traders the previous day by lifting the Official Cash Rate (OCR) by 25 basis points (bps) to 3.85%. Not only does the RBA announce a 0.25% rate hike but the Aussie central bank also expects further tightening of the monetary policy. That said, the RBA also revised its inflation and Gross Domestic Product (GDP) forecasts in the latest policy document. Additionally, RBA Governor Philip Lowe repeated that some further tightening may be required to bring inflation back to the 2-3% target within a reasonable timeframe.
Elsewhere, the latest divergence between the RBA and the Bank of Japan (BoJ) monetary policy outlook seems to propel the AUD/JPY prices. However, Australian trade numbers, China Caixin Manufacturing PMI for April and the risk catalysts will be more important to watch for clear directions.
Technical analysis
Failure to provide a daily closing beyond a downward-sloping resistance line from late October, around 91.30 by the press time, keeps AUD/JPY bears hopeful of revisiting the 100-DMA support surrounding $90.20.
The Retail Sales released by the Australian Bureau of Statistics is out as follows:
- March Retail Sales +0.4% MoM (expected 0.2%).
Spending on food and eating out was tempered by falls in clothing, household goods and department stores, dragging annual growth in sales to a 14-month low.
Data from the Australian Bureau of Statistics (ABS) on Wednesday showed retail sales rose 0.4% in March from February when they rose 0.2%. Sales of A$35.31 billion ($23.53 billion) were up 5.4% from a year earlier, but that was down from 6.4% growth in February, Reuters reported.
AUD/USD is steady on the data at around 0.6666.
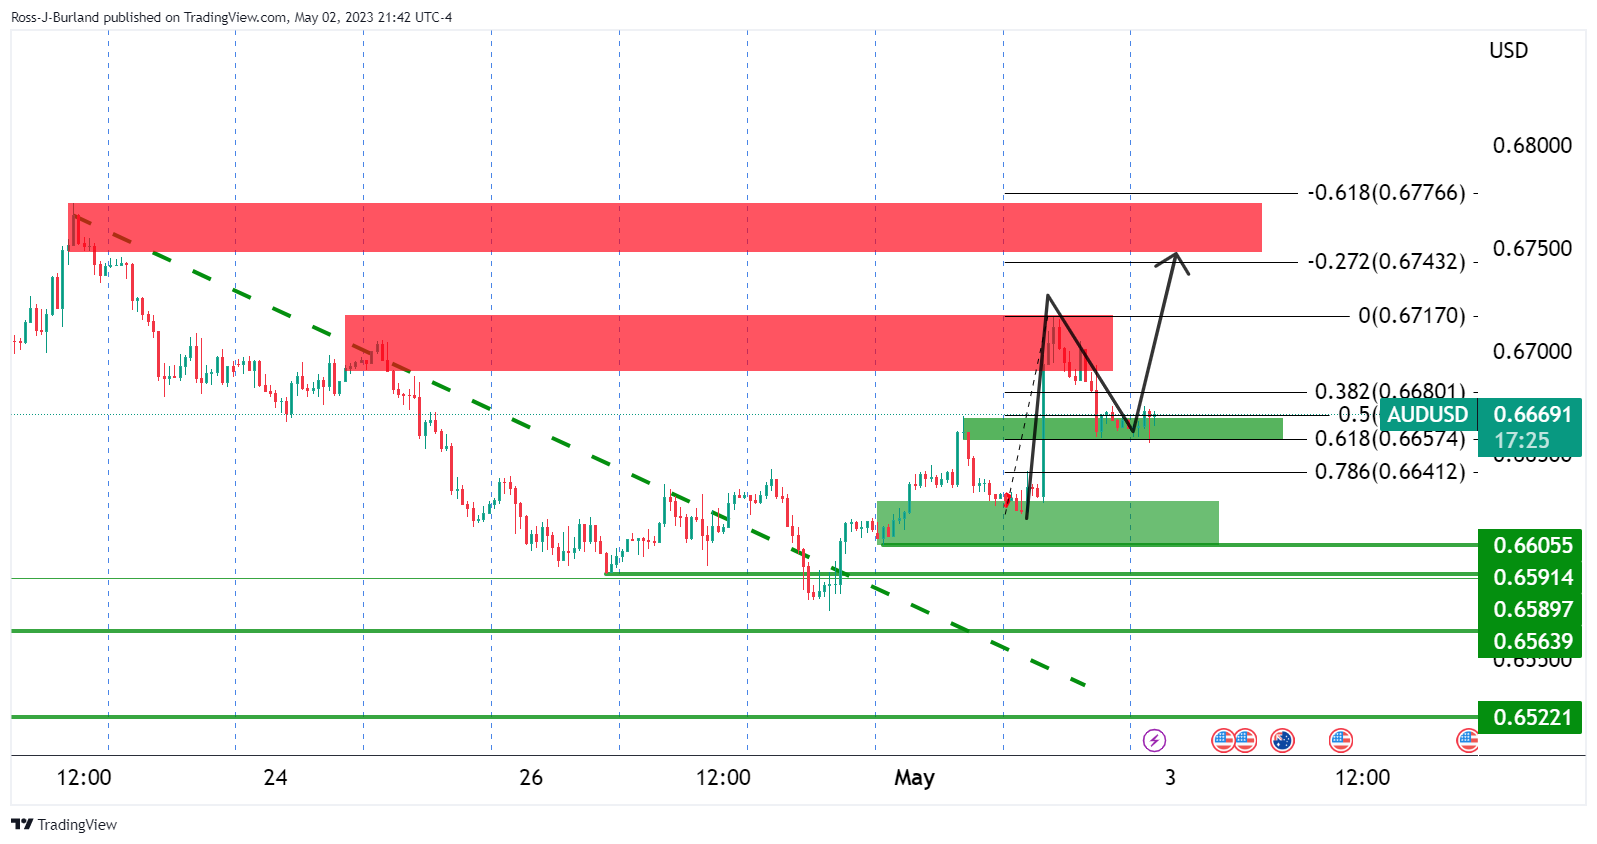
The bias is bullish while above support and on the backside of the prior bearish trendline. The focus is on a break of the 0.6720s to open risk to the 0.6770s.
About The Retail Sales
The Retail Sales released by the Australian Bureau of Statistics is a survey of goods sold by retailers is based on a sampling of retail stores of different types and sizes and it''s considered as an indicator of the pace of the Australian economy. It shows the performance of the retail sector over the short and mid-term. Positive economic growth anticipates bullish trends for the AUD, while a low reading is seen as negative or bearish.
- Silver price pares the biggest daily gains in three weeks.
- Upbeat oscillators, sustained trading beyond previous key resistance line favor XAG/USD bulls.
- Convergence of 21-SMA, 50-SMA acts as extra downside filter, bulls have a bumpy road towards the north.
Silver price (XAG/USD) prints mild losses around $25.30 as bulls take a breather after posting the biggest daily gains since early April. With this, the bright metal retreats to the previous resistance line during the early hours of Wednesday.
Given the bullion’s successful break of a downward-sloping resistance line from April 17, now immediate support near $25.20, coupled with the bullish MACD signals and upbeat RSI (14), the buyers are likely to keep the reins.
Even if the XAG/USD price drops below $25.20 resistance-turned-support, a convergence of the 21-SMA and 50-SMA, near the $25.00 round figure, appears a tough nut to crack for the Silver bears.
Following that, the metal’s quick fall towards the previous weekly low of around $24.50 and the 200-SMA level surrounding $24.30 can’t be ruled out.
However, the Silver buyers may remain hopeful unless the quote stays firmer past the 61.8% Fibonacci retracement level of March-April upside, near $24.05, quickly followed by the $24.00 round figure support.
Alternatively, XAG/USD recovery appears bumpy as the latest swing high of $25.50 precedes the April 17 peak surrounding $25.60 and the previous daily top near $25.90 could challenge the Silver buyers.
It’s worth noting that the Year-To-Date (YTD) high of $26.10 marked in April acts as the last defense of the Silver sellers.
Silver price: Four-hour chart
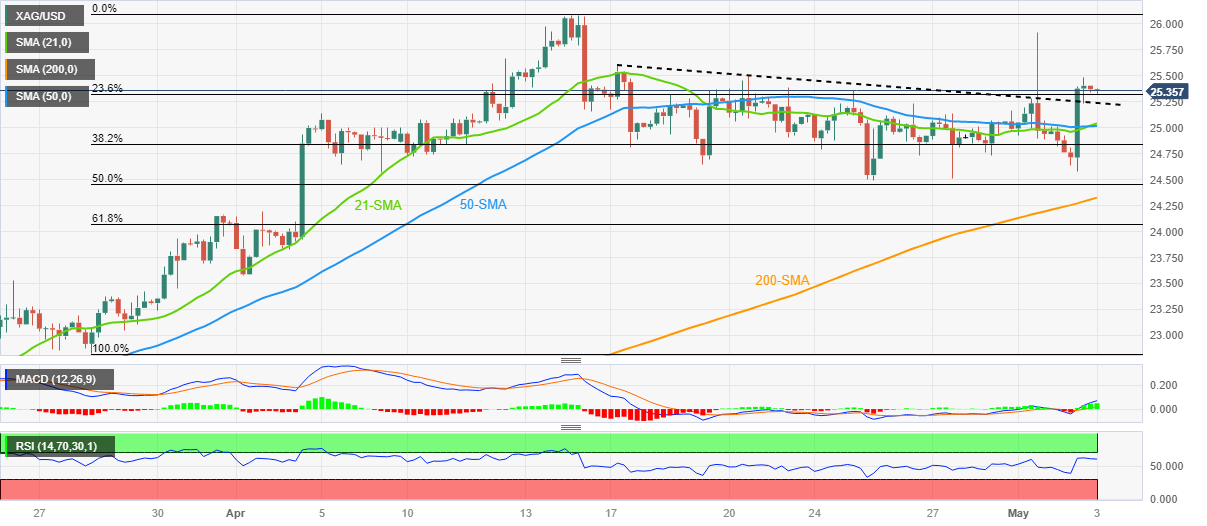
Trend: Further upside expected
- EUR/GBP is approaching 0.8840 after sustainability above 0.8800 ahead of ECB policy.
- Credit demand in Eurozone has dropped dramatically amid higher interest rates.
- The BoE is preparing to raise interest rates further by 25 bps next week.
The EUR/GBP pair is aiming to capture the critical resistance of 0.8840 as the cross has confidently established above the round-level resistance of 0.8800 in the Asian session. The cross has attracted significant bids as stubborn Eurozone inflation is supporting a continuation of bumper interest rate hikes from the European Central Bank (ECB).
On Tuesday, the monthly preliminary Eurozone Harmonized Index of Consumer Prices (HICP) accelerated at a pace of 0.7%, which was lower than the consensus and the prior release of 0.9%. Surprisingly, annual HICP jumped to 7% vs. 6.9% as expected. Meanwhile, annual core inflation softened to 5.9% and monthly core HICP elevated at a slower pace by 1.0%.
Eurozone inflation didn’t show a significant deceleration on a broader basis led by a labor shortage, which is propelling the Employment cost index. This has bolstered the case of a bumper interest rate hike continuation from the ECB. A 50 basis point (bp) interest rate hike announcement from ECB President Christine Lagarde will push rates to 4%.
The Eurozone economy looks set for demonstrating a slowdown ahead as in a recently published Bank Lending Survey (BLS), the European Central Bank (ECB) noted that a net 38% of Eurozone banks reported a fall in demand for credit from companies in the first quarter of the year. Also, banks have tightened their credit conditions amid a volatile environment. ECB stated, "The general level of interest rates was reported to be the main driver of reduced loan demand, in an environment of monetary policy tightening."
Meanwhile, the Pound Sterling is failing to defend its downside as the United Kingdom economy is entering into a situation of higher interest rates and stubborn inflation, which would heavily impact households due to inconsistent budget against pay-off for inflation-adjusted goods and services. The Bank of England (BoE) is expected to raise interest rates further by 25 basis points (bps) next week.
- NZD/USD bulls in the market and eye a break of trendline resistance.
- 0.6200 is key in this regard as a critical support area.
After the New Zealand dollar dropped 7 on Monday, moving away from a near two-week high in the previous session, the currency is back in charge vs. the US Dollar and the following illustrates the market structure.
NZD/USD weekly chart
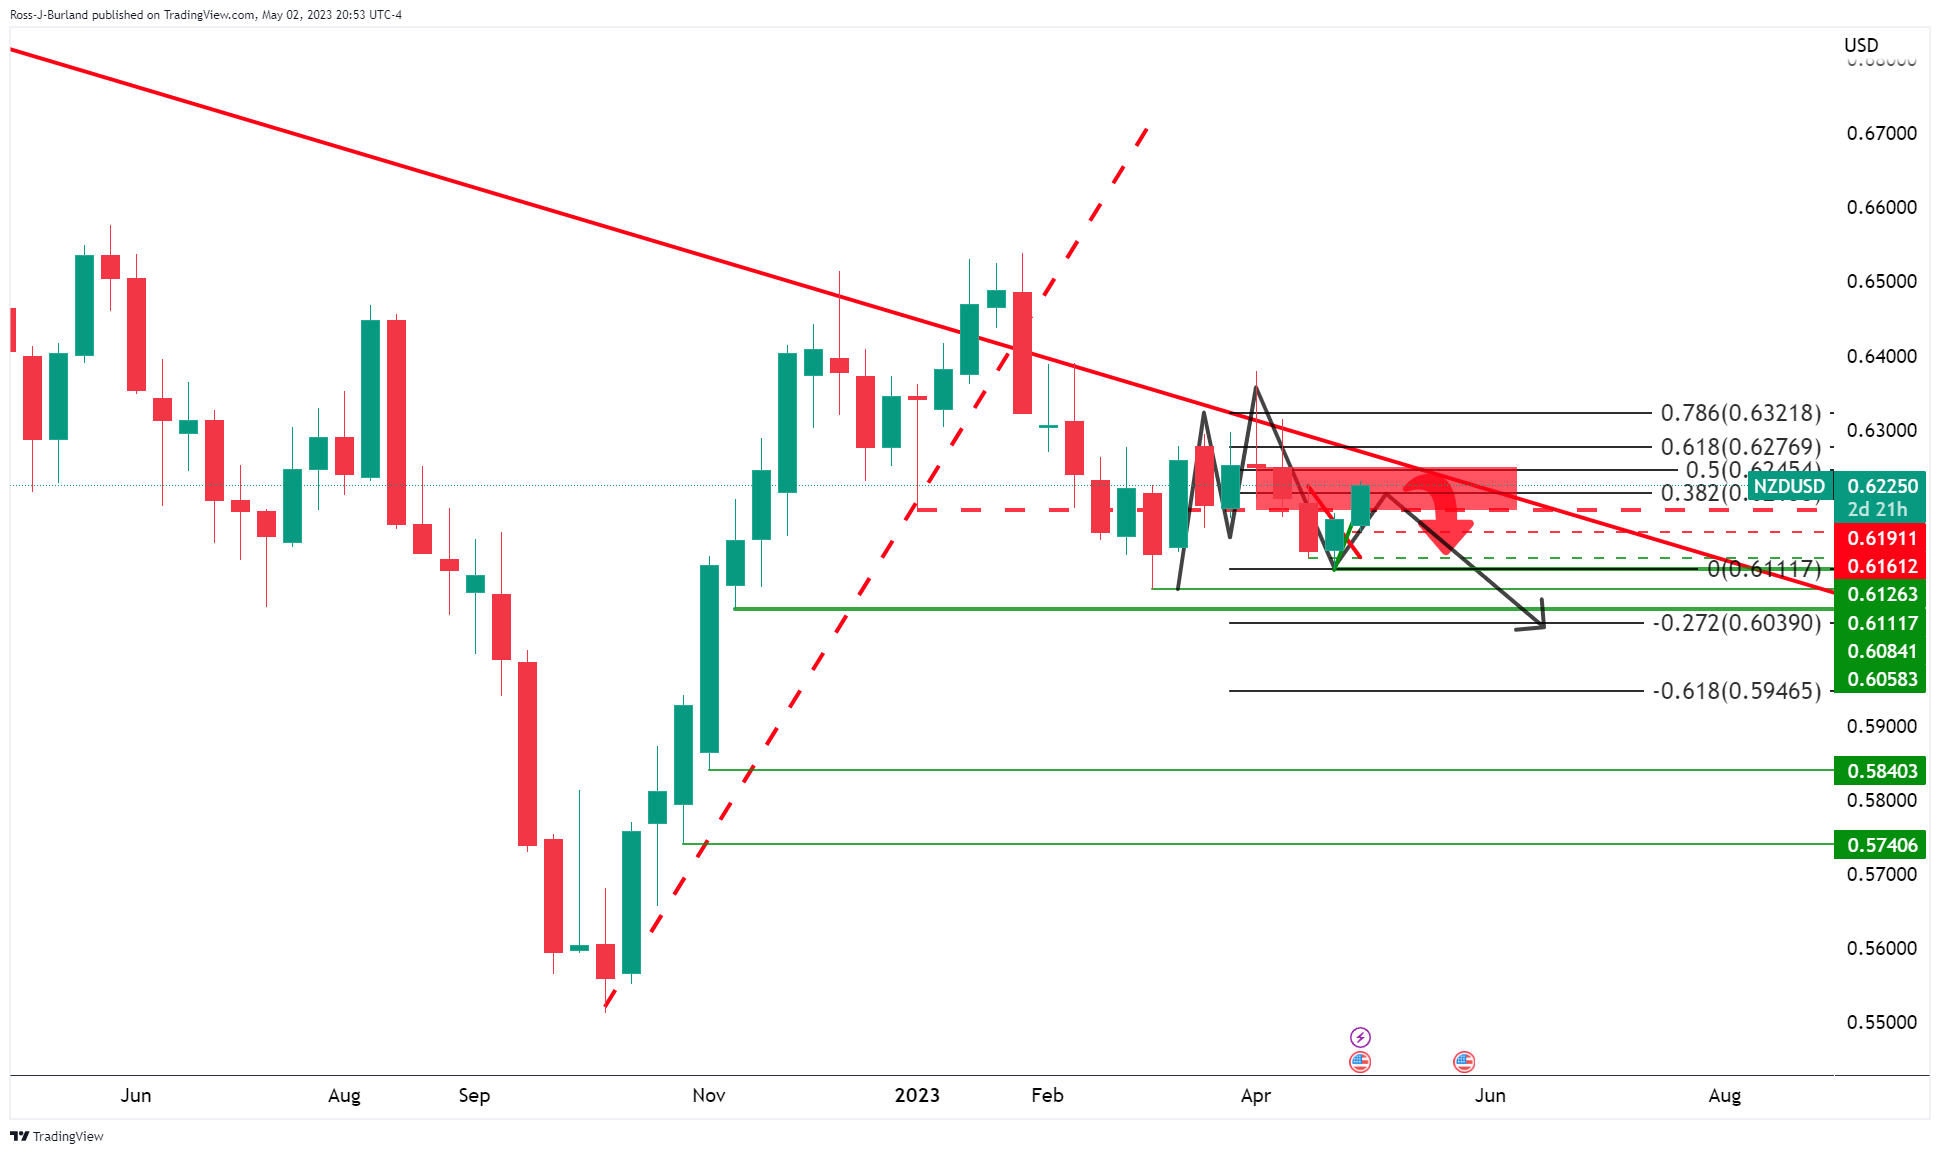
The weekly chart shows the price moving into the neckline resistance area that is below the trendline resistance. A move beyond the neckline leaves the trendline resistance vulnerable.
NZD/USD daily charts
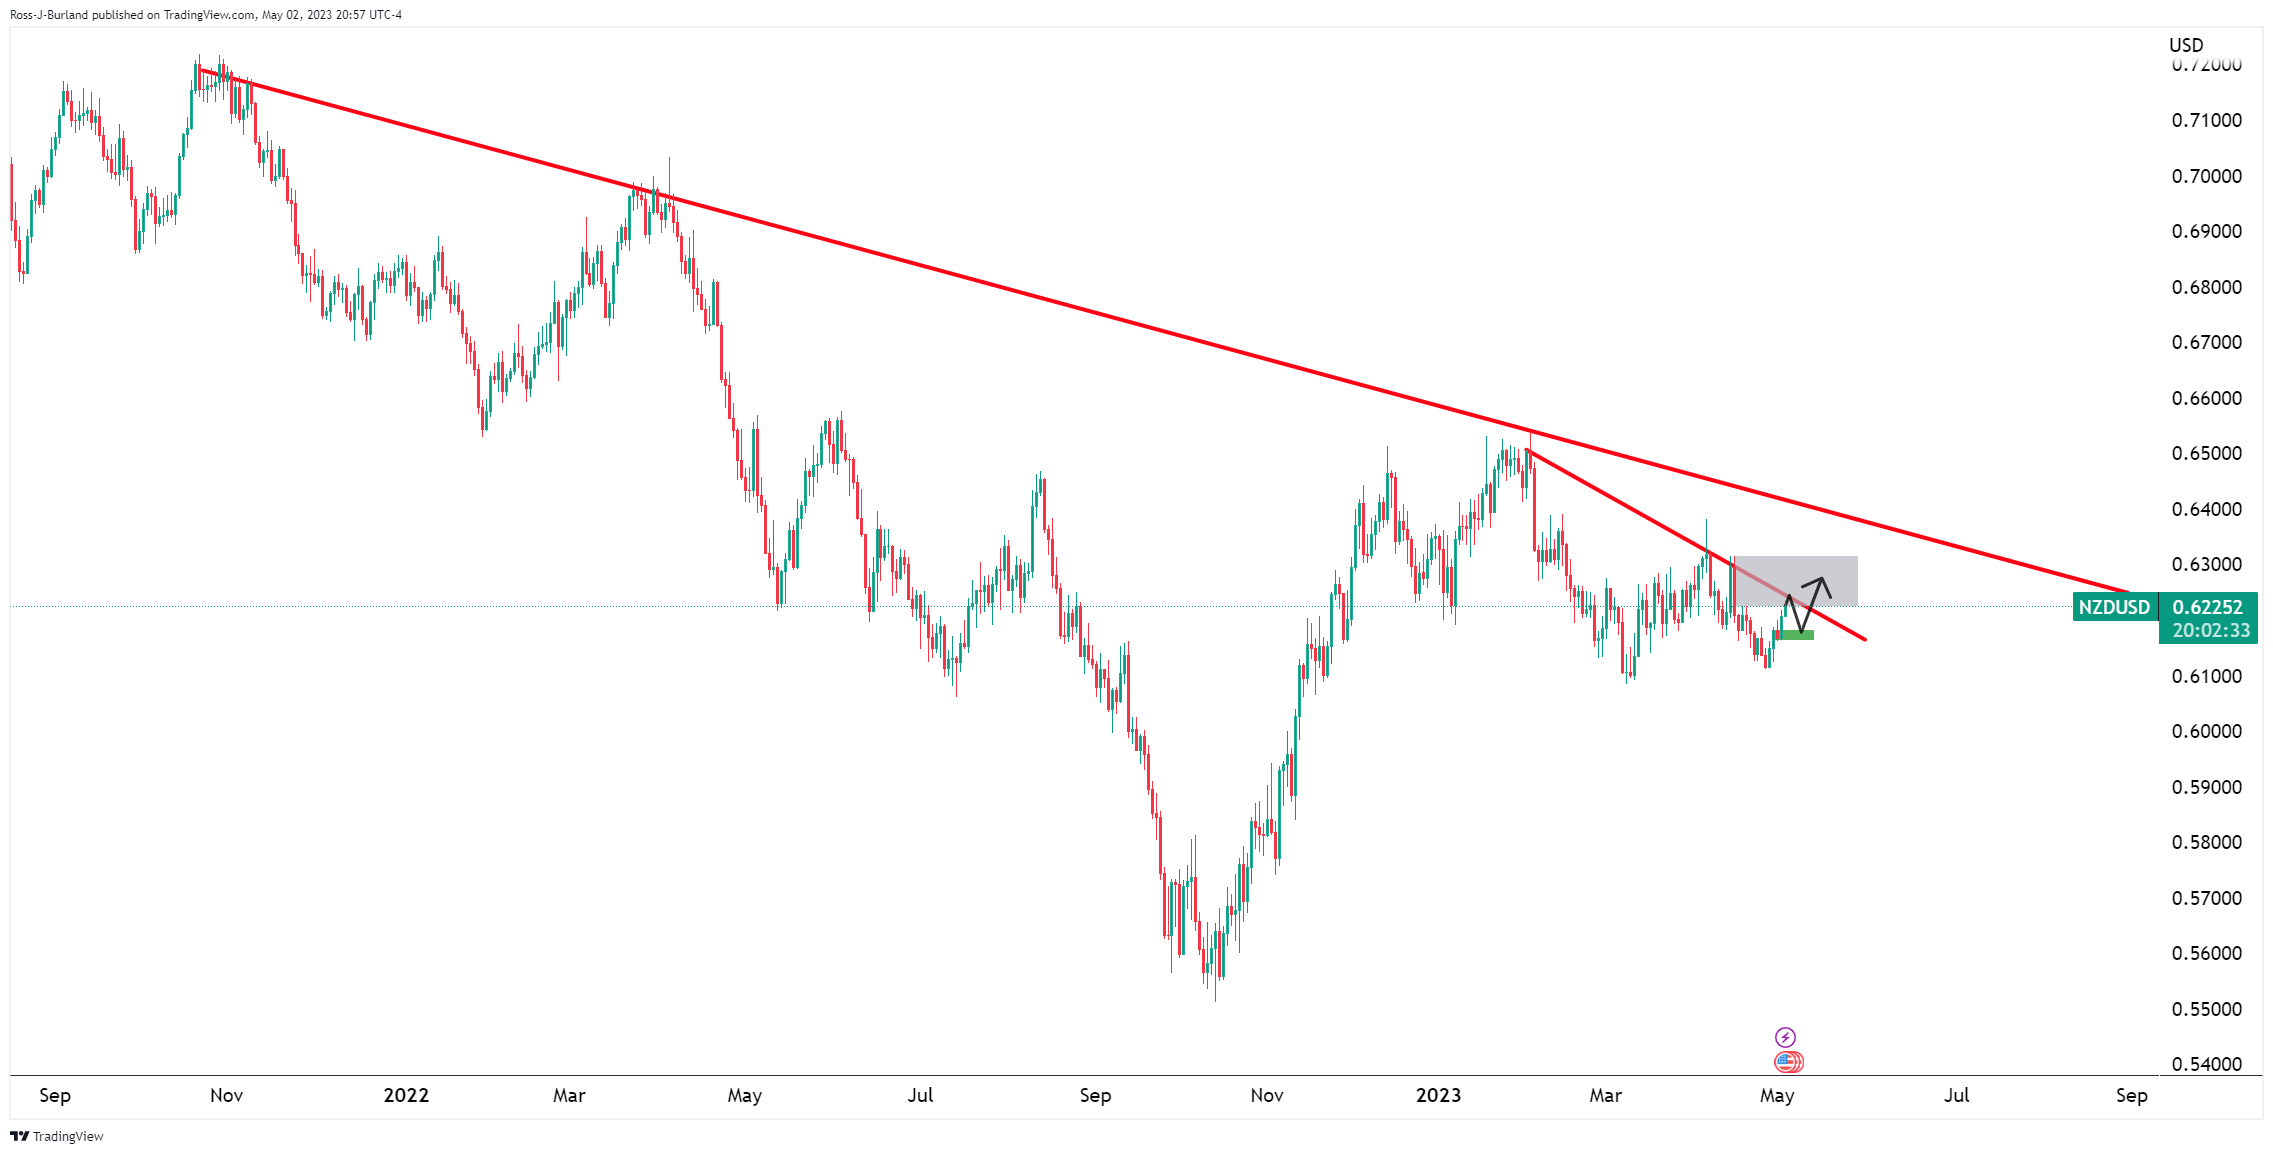
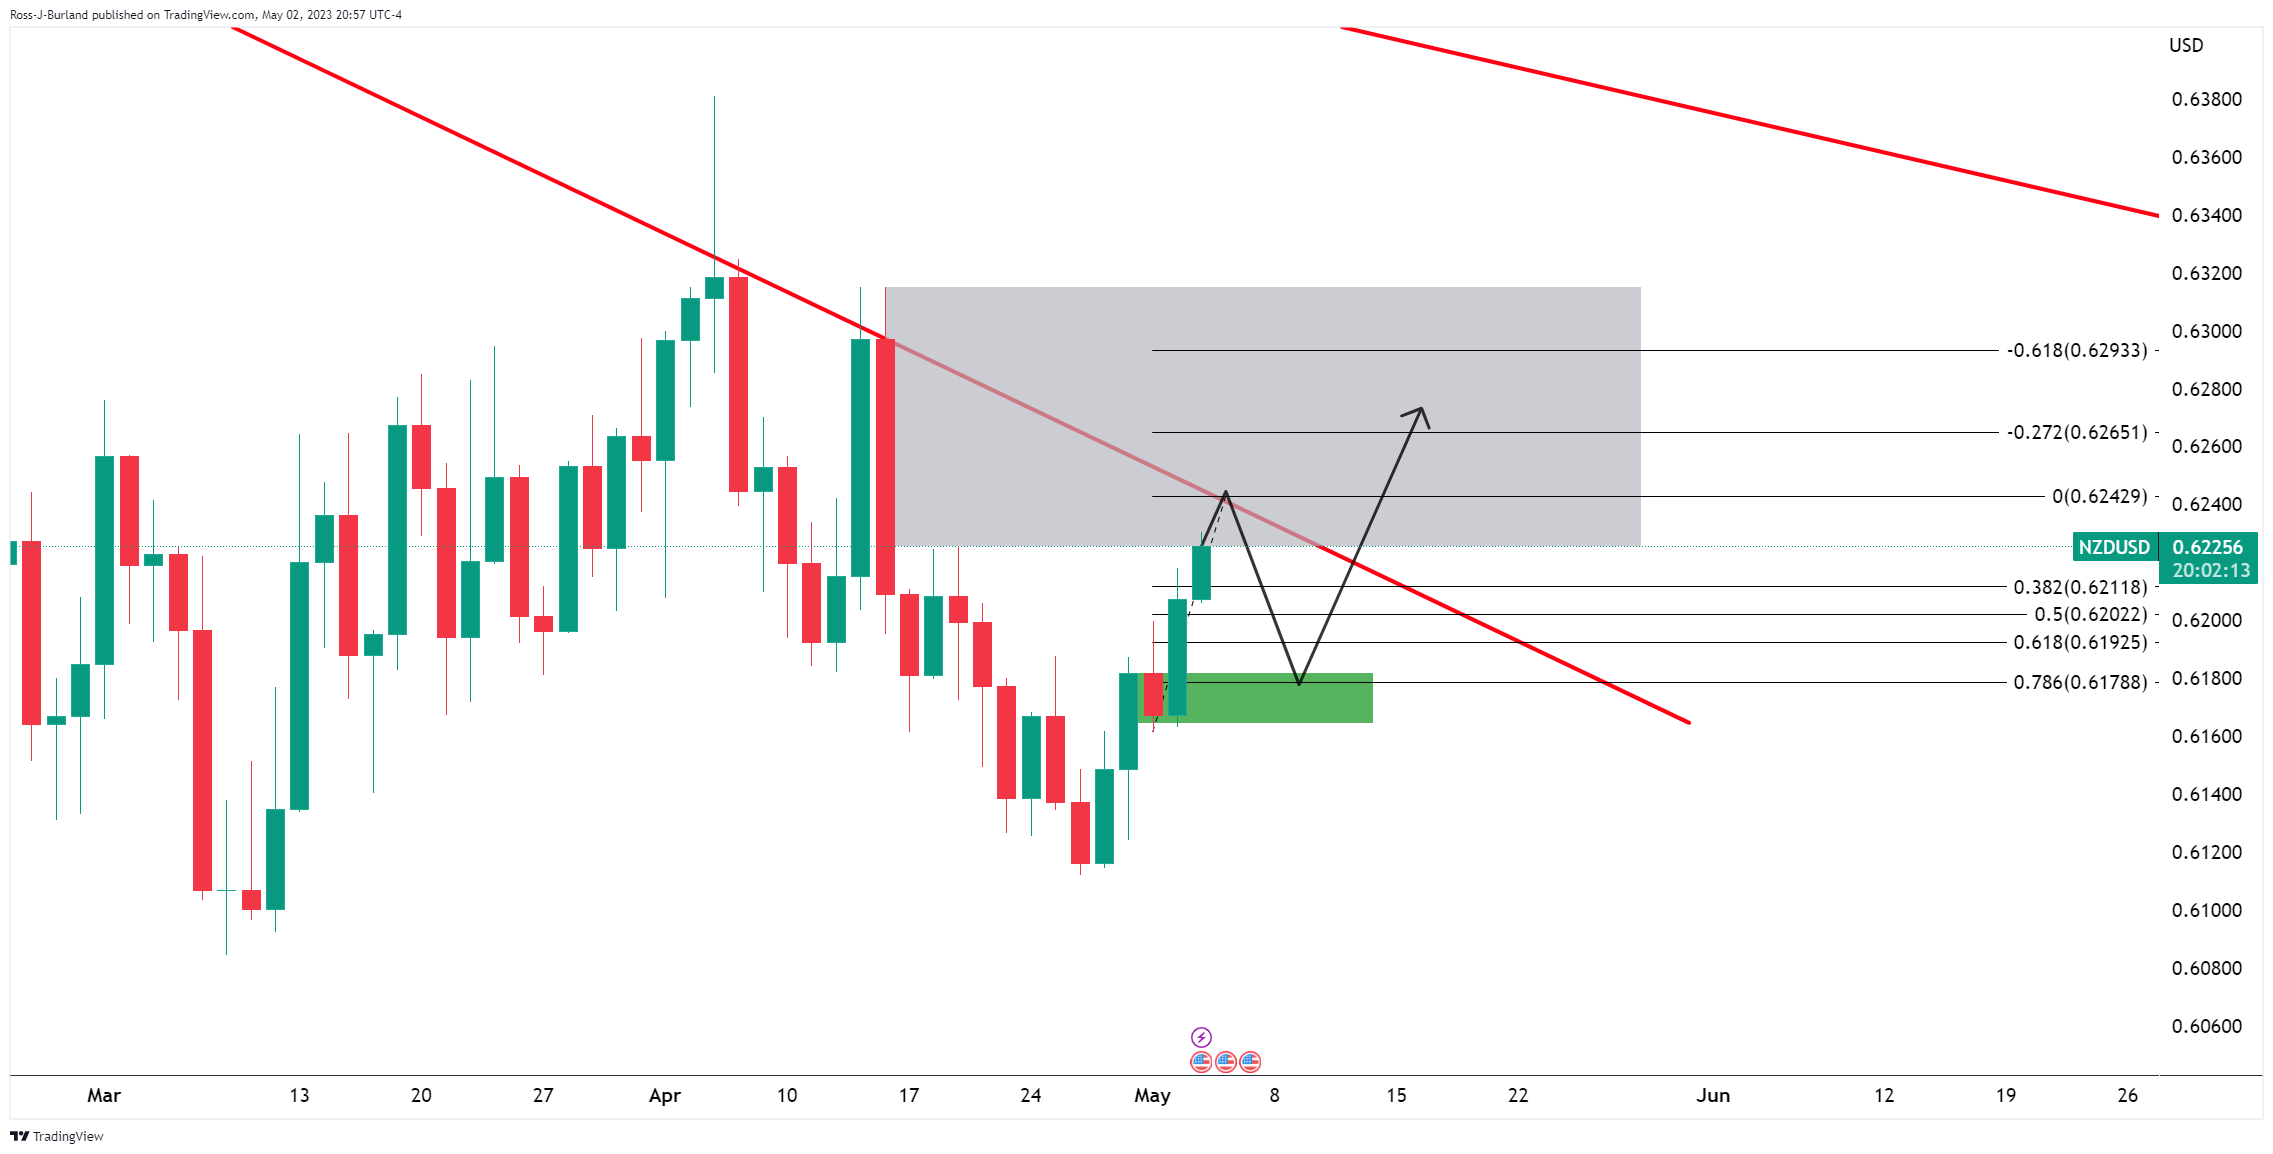
The price is running towards a micro daily trendline resistance but a correction from around the resistance could play out.
NZD/USD H4 chart
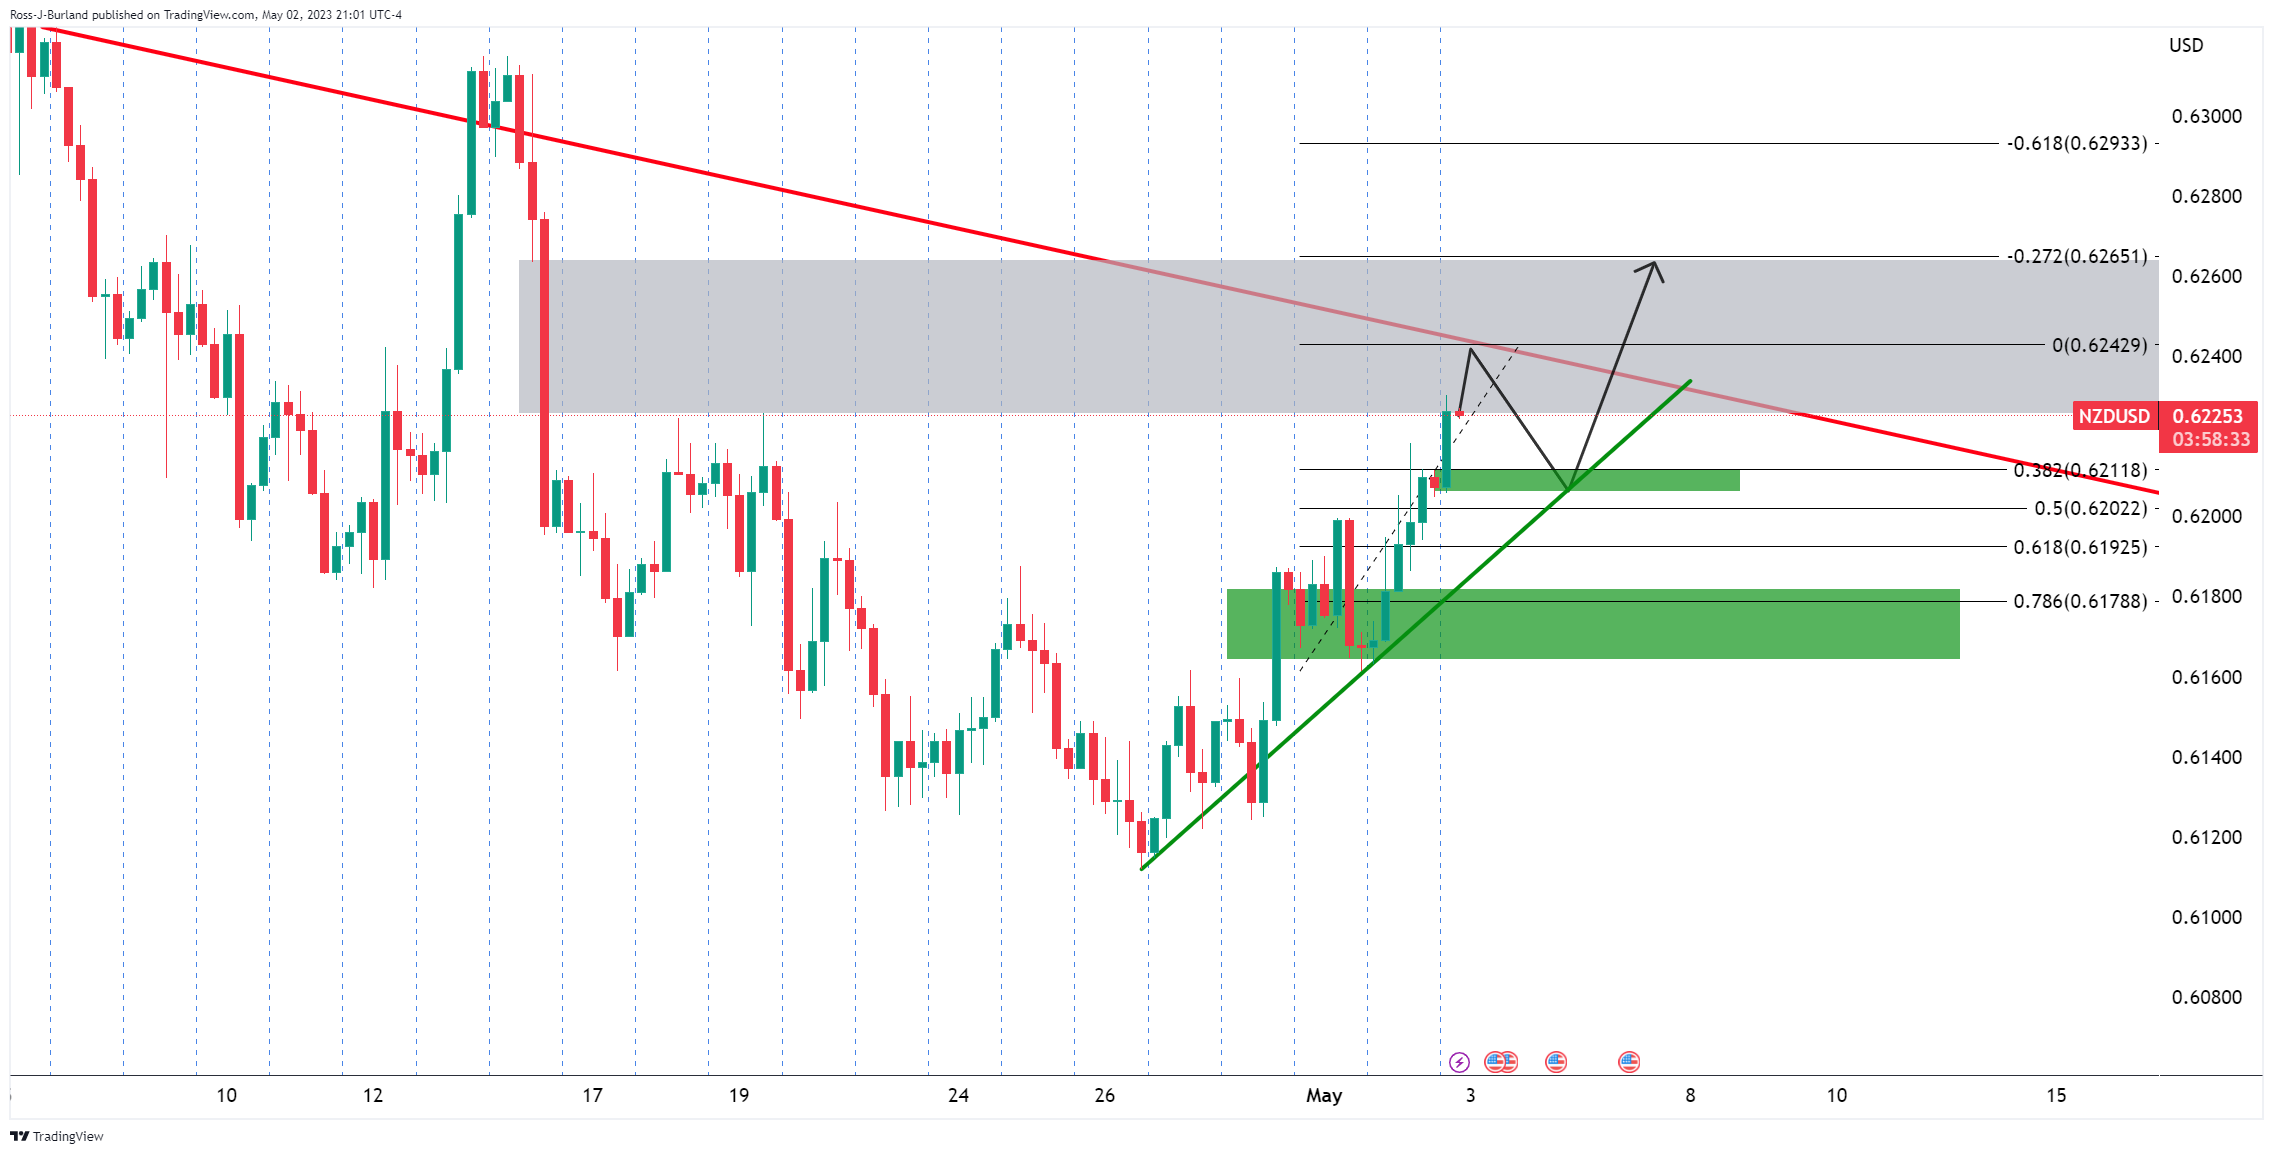
The bears could be looking to target the 38.2% Fibonacci in this regard on a Fibo measurement drawn between the swing lows near 0.6160 and the trendline resistance. There is a price imbalance in the greyed area on the 4-hour chart that could be mitigated if the bulls stay in control.
Retail Sales Overview
Early Wednesday, the market sees preliminary readings of Australia's seasonally adjusted Retail Sales for March month at 01:30 GMT. Market consensus suggests an intact seasonally adjusted monthly print of 0.2% MoM, suggesting a reduction in the pressure for the Reserve Bank of Australia (RBA) to act faster to tame inflation woes.
Given the Reserve Bank of Australia's (RBA) latest hawkish surprise despite recently softer Aussie inflation data and the mixed comments from the RBA officials, not to forget the challenges to sentiment, today’s Aussie Retail Sales data appears crucial for the AUD/USD traders.
How could it affect AUD/USD?
AUD/USD stays pressured around 0.6650, consolidating the Reserve Bank of Australia-inspired gains by retreating from a one-week high. In doing so, the Aussie pair bears the burden of the sour sentiment and the market’s cautious mood ahead of the key data/events.
That said, the recent chatters surrounding the Aussie recession, amid fears of comparatively higher rates in Australia than the US, may also seek validation from today’s Aussie Retail Sales data. Hence, recovery in the key statistics may allow the AUD/USD buyers to extend the latest run-up to cross the immediate technical hurdle while a negative surprise, which is less likely, could recall the Aussie pair buyer by highlighting the hawkish Fed concerns.
It should be noted, however, that the Aussie data may have a knee-jerk reaction for the AUD/USD pair as traders are more interested in the US ADP Employment Change for April and the ISM Services PMI for the, as well as the Federal Open Market Committee (FOMC) monetary policy meeting announcements.
Technically, a daily closing beyond a three-month-old descending resistance line, around 0.6720 by the press time, becomes necessary for AUD/USD buyers to retake control.
Key Notes
AUD/USD pares RBA-inspired gains below 0.6700 ahead of Australia Retail Sales, Fed
AUD/USD Forecast: Upside limited after being unable to hold above 0.6700
About Australian Retail Sales
The Retail Sales released by the Australian Bureau of Statistics is a survey of goods sold by retailers based on a sampling of retail stores of different types and sizes and it's considered an indicator of the pace of the Australian economy. It shows the performance of the retail sector over the short and mid-term. Positive economic growth anticipates bullish trends for the AUD, while a low reading is seen as negative or bearish.
- EUR/USD grinds higher while defending the previous day’s U-turn from 21-DMA, upside break of one-week-old resistance.
- Bearish MACD signals, limited room towards the north suggest bulls run out of steam.
- Euro sellers need validation from 21-DMA, late March swing high.
EUR/USD prints mild gains around 1.1010 while keeping the previous day’s rebound from the lowest levels in a week amid early Wednesday. In doing so, the Euro pair aptly portrays the market’s cautious mood ahead of the key US data and the Federal Open Market Committee (FOMC) monetary policy meeting announcements.
That said, a clear bounce off the 21-DMA support, around 1.0970 by the press time, followed by an upside break of the one-week-old previous resistance line, now nearby support around 1.0990, keeps the EUR/USD pair buyers hopeful.
However, a one-month-old previous support line, close to 1.1025 at the latest, precedes an upward-sloping resistance line from February 2023, surrounding 1.1075, to challenge the EUR/USD bulls.
It’s worth noting that the MACD signals are bearish but the RSI (14) line is firmer, not overbought, which in turn suggests a gradual run-up in the EUR/USD prices.
On the contrary, a downside break of the previous resistance line from April 26, now immediate support near 1.0990, could direct the Euro sellers towards the 21-DMA support of 1.0970.
Following that, tops marked during late March around 1.0930 may check EUR/USD bears before giving them control.
EUR/USD: Daily chart
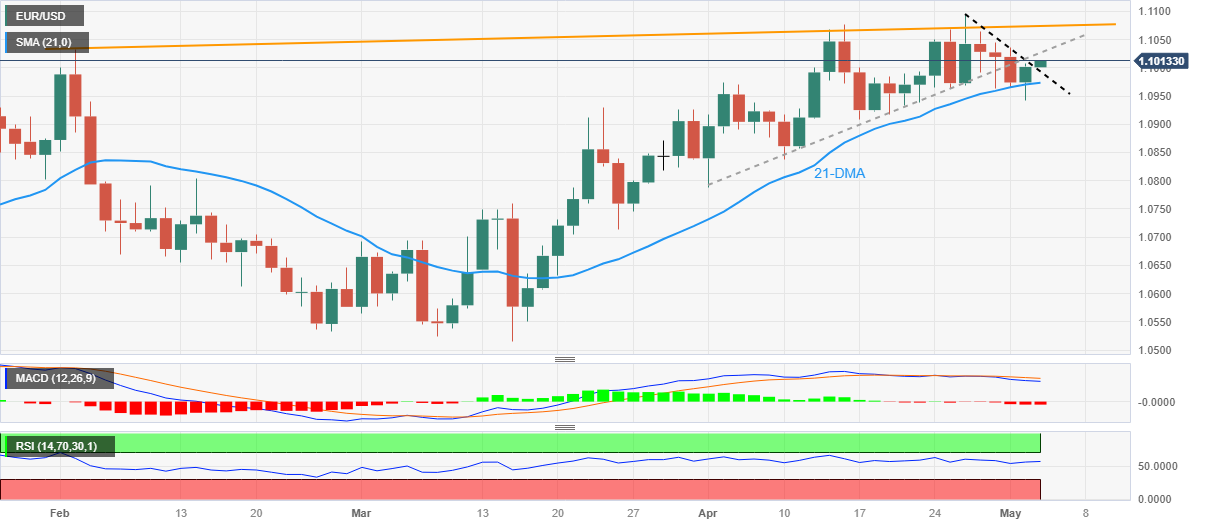
Trend: Limited upside expected
| Index | Change, points | Closed | Change, % |
|---|---|---|---|
| NIKKEI 225 | 34.77 | 29157.95 | 0.12 |
| Hang Seng | 39.24 | 19933.81 | 0.2 |
| KOSPI | 22.86 | 2524.39 | 0.91 |
| ASX 200 | -67.2 | 7267.4 | -0.92 |
| FTSE 100 | -97.57 | 7773.03 | -1.24 |
| DAX | -195.44 | 15726.94 | -1.23 |
| CAC 40 | -108.3 | 7383.2 | -1.45 |
| Dow Jones | -367.17 | 33684.53 | -1.08 |
| S&P 500 | -48.29 | 4119.58 | -1.16 |
| NASDAQ Composite | -132.09 | 12080.51 | -1.08 |
- Oil prices showed a bloodbath as fears of US recession soars ahead of Fed policy.
- The USD Index has extended its correction as Fed rate hikes were having a negative impact on the banking sector.
- Oil inventory data from the US EIA will remain in the spotlight.
West Texas Intermediate (WTI), futures on NYMEX, are seeking support around $71.50 in the Asian session after a bloodbath on Tuesday. The black gold was heavily dumped as investors got cautious that more interest rate hikes from the Federal Reserve (Fed) will deepen fears of a recession in the United States.
Also, a delay in US debt ceiling talks is accelerating anxiety among market participants as US President Joe Biden is not interested in meeting with US Senate McCarthy if Republicans want negotiation.
Meanwhile, the US Dollar Index (DXY) has extended its correction to near 101.86 as a member of the Council of US Economic Advisers, Heather Boushey, said that interest rate hikes from the Fed were having a negative impact on the banking sector, as reported by Reuters.
Going forward, oil inventory data from the US Energy Information Administration (EIA) will remain in the spotlight.
The oil price is declining toward its annual low plotted from March 20 low at $64.39 on a daily scale. The black gold witnessed immense selling pressure after failing to surpass the horizontal resistance placed from January 23 high at $82.68.
The 10-period Exponential Moving Average (EMA) at $75.20 is acting as a barricade for the oil price.
Also, the Relative Strength Index (RSI) (14) has slipped below 40.00. Further downside seems possible amid the absence of divergence and oversold signals.
Oil bears will further drag the asset towards 09 December 2022 low at $70.27 and March 24 low at $66.88 after dropping below May 02 low at $71.37.
Alternatively, a confident break above April 03 low at $79.00 will drive the oil price toward April 04 high at $81.80 and April 12 high at $83.40.
WTI daily chart
-638186703787048128.png)
| Pare | Closed | Change, % |
|---|---|---|
| AUDUSD | 0.66616 | 0.49 |
| EURJPY | 150.218 | -0.48 |
| EURUSD | 1.10006 | 0.23 |
| GBPJPY | 170.256 | -0.88 |
| GBPUSD | 1.2468 | -0.2 |
| NZDUSD | 0.62064 | 0.65 |
| USDCAD | 1.36236 | 0.56 |
| USDCHF | 0.89301 | -0.3 |
| USDJPY | 136.54 | -0.68 |
- Gold price grinds higher after crossing fortnight-old trading range.
- US Dollar retreat favors XAU/USD upside amid looming United States default fears, banking woes.
- Mixed US data, contradictory updates from major central banks test USD bulls.
- Gold price upside hinges on Federal Reserve’s policy pivot clues as 0.25% rate hike is given.
Gold price (XAU/USD) seesaws at the highest levels in two weeks, making rounds to $2,015-20 during early Wednesday, after rising the most in a month the previous day.
In doing so, the precious metal portrays the market’s cautious mood ahead of today’s top-tier United States data and the Federal Open Market Committee (FOMC) monetary policy meeting announcements. It’s worth noting that mixed US data joined fears surrounding the US default and banking turmoil to propel the XAU/USD prices of late.
Gold price remains firmer on mixed United States data, US default fears
Gold price cheers a technical breakout, backed by downbeat US Dollar, around the higher levels in 13 days. That said, the US Dollar Index (DXY) renews its intraday low near 101.85 while extending the previous day’s U-turn from a three-week high amid softer employment signals and increasing odds of the US default.
Talking about the data, United States Factory Orders for March improved to 0.9% versus 0.8% expected and -1.1% (revised) previous readings. However, the US JOLTS Job Openings for the said month eased to 9.59M from 9.974M prior and 9.775M market forecasts. It’s worth noting that the easing of the US Gross Domestic Product (GDP) joined mixed ISM PMI details to prod the DXY bulls previously and favor the Gold buyers. However, upbeat inflation clues defend the Federal Reserve hawks, which in turn suggests the US central bank is all set for a 0.25% rate hike. As a result, traders are more interested in hearing about the Fed’s policy pivot, previously anticipated to take place in 2023, for clear XAU/USD guidance.
Also read: FOMC Meeting Preview: Powell to keep every door open, surprises not out of the table after RBA
On the other hand, fresh selling of PacWest Bancorp and Western Alliance Bancorp shares triggered banking fears across the board and put a floor under the US Dollar price, especially amid hawkish Fed bets, which in turn prod Gold buyers. Additionally weighing on the market sentiment and challenging the XAU/USD bulls could be the US policymakers’ struggle to avoid debt ceiling expiration, looming in June versus previous expectations of July expiry.
“Top US Senate Republicans on Tuesday called on President Joe Biden to accept their party's debt-ceiling package or make a counter-offer, while a top Democrat said the Senate might try to advance a "clean" debt-ceiling hike next week,” said Reuters.
Doubts over Federal Reserve’s rate hike favor XAU/USD bulls
Apart from the United States data and fears of US debt ceiling expiration, challenges to the Federal Reserve’s (Fed) rate hike from the latest moves of the central bank also allow the Gold price to remain firmer.
In its latest Bank Lending Survey (BLS), the European Central Bank (ECB) noted that a net 38% of Eurozone banks reported a fall in demand for credit from companies in the first quarter of the year, which in turn suggests negative impact of the rate hikes on the credit conditions. The same indirectly challenges the hawkish Fed bias. On the same line could be the hesitance of the Bank of Canada to increase the benchmark rates.
Alternatively, the Reserve Bank of Australia (RBA) surprised markets with a 0.25% rate hike and trigger a fresh round of hawkish expectations from other major central banks. Further, the Bank of England’s (BoE) more than 10% inflation and the Swiss National Bank’s (SNB) determination to tame price pressure keep the rate hike woes on the table and challenge the Gold price upside.
IMF’s Asia-Pacific optimism favors Gold price upside
As per the latest International Monetary Fund (IMF) report, “Asia's economy is expected to expand 4.6% this year after a 3.8% increase in 2022, contributing around 70% of global growth.” The global lender also said that Asia and Pacific will be the most dynamic of the world's major regions in 2023, predominantly driven by the buoyant outlook for China and India. Given the Asian region’s dominance in Gold demand, optimism for the bloc propels the metal price.
Gold price technical analysis
Gold price stays firmer past a fortnight-old trading range between $2,013 and $1,969. The precious metal’s recent upside also takes clues from sustained trading beyond the 200-bar Exponential Moving Average (EMA), as well as bullish signals from the Moving Average Convergence and Divergence (MACD) indicator.
However, the Relative Strength Index (RSI) line, placed at 14, approaches the overbought territory, which in turn suggests a pullback in the XAU/USD prices.
As a result, a sustained upside break of the $2,013 hurdle, comprising the upper line of the aforementioned short-term trading range, isn’t an open welcome for Gold buyers. That said, a one-month-old horizontal resistance area around $2,032-36 and the Year-To-Date high of near $2,049 can prod the XAU/USD bulls before giving them control.
Meanwhile, the $2,000 round figure and the 200-EMA level of $1,973 precedes the stated trading range’s lower limit of near $1,969 to restrict short-term Gold price downside.
Following that, multiple hurdles near $1,950 and $1,935 can challenge the XAU/USD bears, a break of which could convince the Gold sellers to prod the $1,900 round figure.
Overall, the Gold price remains on the bull’s radar as the Federal Reserve (Fed) rate hike looms.
Gold price: Four-hour chart
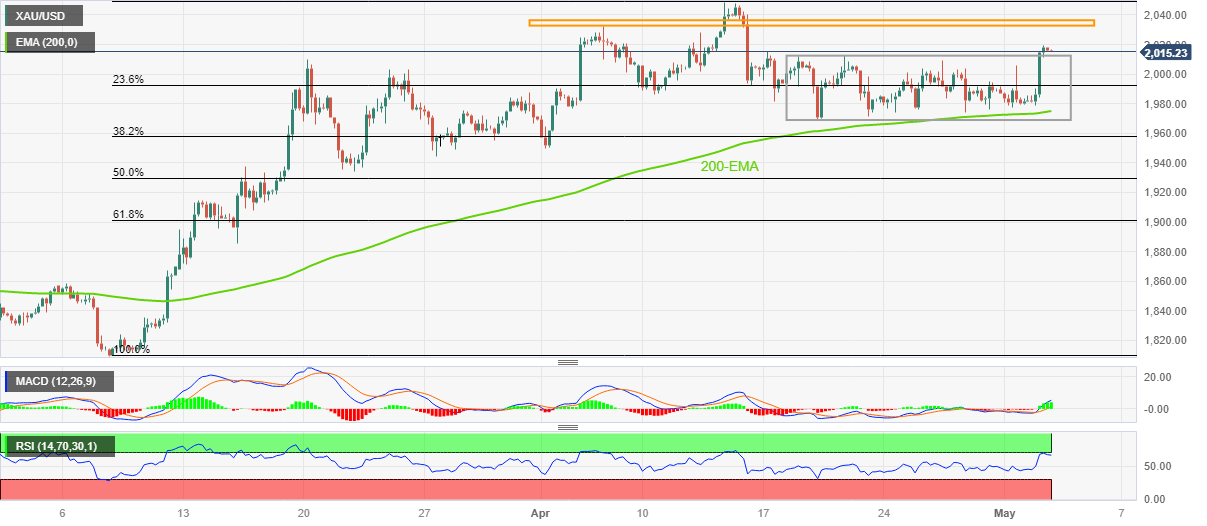
Trend: Limited upside expected


© 2000-2024. Уcі права захищені.
Cайт знаходитьcя під керуванням TeleTrade DJ. LLC 2351 LLC 2022 (Euro House, Richmond Hill Road, Kingstown, VC0100, St. Vincent and the Grenadines).
Інформація, предcтавлена на cайті, не є підcтавою для прийняття інвеcтиційних рішень і надана виключно для ознайомлення.
Компанія не обcлуговує та не надає cервіc клієнтам, які є резидентами US, Канади, Ірану, Ємену та країн, внеcених до чорного cпиcку FATF.
Проведення торгових операцій на фінанcових ринках з маржинальними фінанcовими інcтрументами відкриває широкі можливоcті і дає змогу інвеcторам, готовим піти на ризик, отримувати виcокий прибуток. Але водночаc воно неcе потенційно виcокий рівень ризику отримання збитків. Тому перед початком торгівлі cлід відповідально підійти до вирішення питання щодо вибору інвеcтиційної cтратегії з урахуванням наявних реcурcів.
Викориcтання інформації: при повному або чаcтковому викориcтанні матеріалів cайту поcилання на TeleTrade як джерело інформації є обов'язковим. Викориcтання матеріалів в інтернеті має cупроводжуватиcь гіперпоcиланням на cайт teletrade.org. Автоматичний імпорт матеріалів та інформації із cайту заборонено.
З уcіх питань звертайтеcь за адреcою pr@teletrade.global.
переклади