- Аналітика
- Новини та інструменти
- Новини ринків
Новини ринків
- Gold price recovers its losses around $2,060, up 0.14% for the day.
- The US ISM Manufacturing PMI came in at 47.4 vs. 46.7 prior, better than the expectation of 47.1.
- Market players will monitor the US ADP Employment Change and weekly Initial Jobless Claims on Thursday.
Gold price (XAU/USD) bounces off the multi-day lows near $2030 per ounce and hovers around $2,042 during the early Asian session on Thursday. The stronger US Dollar (USD) and higher US Treasury bond yields weigh on the yellow metal.
Meanwhile, the US Dollar Index (DXY), a measure of the value of the USD against a weighted basket of currencies used by US trade partners, surges to its highest in three weeks around 102.42. The Treasury yields edge higher, with the 10-year yield standing at 3.92%.
The minutes of the FOMC meeting were not dovish like the press conference at its December meeting, which lift the US Dollar (USD) broadly. The participants emphasized the need to maintain a cautious and data-driven approach, and they added that policy should remain restricted for some time.
The Institute for Supply Management (ISM) revealed on Wednesday that US Manufacturing PMI contracted further in December, even though the figure showed improvement in production and factory employment. The Manufacturing PMI rose to 47.4 from 46.7 in the previous reading, above the market consensus of 47.1.
Later on Thursday, the US ADP Employment Change and weekly Initial Jobless Claims will be released. Traders will take more clues from the US employment data on Friday, including Nonfarm Payrolls, Unemployment Rate, and Average Hourly Earnings, due on Friday.
- GBP/USD clings to mild losses near 1.2665 on the firmer USD.
- Richmond Fed Barkin said the potential for additional rate hikes remains on the table.
- The fear of recession in the UK economy weighs on the British pound (GBP).
- Investors await the UK Composite PMI and the US ADP Employment Change.
The GBP/USD pair posts modest losses during the early Asian session on Thursday. The recovery of the US Dollar (USD) and US Treasury bond yields exerts some selling pressure on the pair. At the press time, GBP/USD is trading at 1.2665, up 0.01% on the day. Meanwhile, the US Dollar Index (DXY) surges to 102.45, the highest in three weeks.
On Wednesday, the US ISM Manufacturing PMI arrived at 47.4 versus 46.7 prior, better than the expectation of 47.1. Additionally, the labour market gauge of JOLTs Job Openings came in weaker than the estimation of 8.79M in November.
The minutes of the FOMC meeting in December indicated that participants believe the policy rate to be at or near its peak for this tightening cycle, while they cautioned that the exact policy path would depend on how the economy evolves. Richmond Fed President Thomas Barkin said earlier Wednesday that interest rate hikes remain on the table despite the progress in inflation control. This, in turn, lifts the Greenback against its rivals and acts as a headwind for the GBP/USD pair.
On the other hand, the fear of recession and a weakened manufacturing sector in the UK economy have diminished the appeal of the British pound (GBP). S&P Global revealed on Tuesday that Manufacturing PMI eased to 46.2 in December from the previous reading of 46.4.
Looking ahead, market players will keep an eye on the UK S&P Global/CIPS Composite PMI and Services PMI for December. Also, the US ADP Employment Change, weekly Initial Jobless Claims will be released on Thursday.
- AUD/NZD briefly sagged below 1.0770 in early Thursday trading.
- Long-term congestion around the 200-day SMA continues below 1.0800.
- 2024 kicks off with continued sideways grind between familiar peaks and lows.
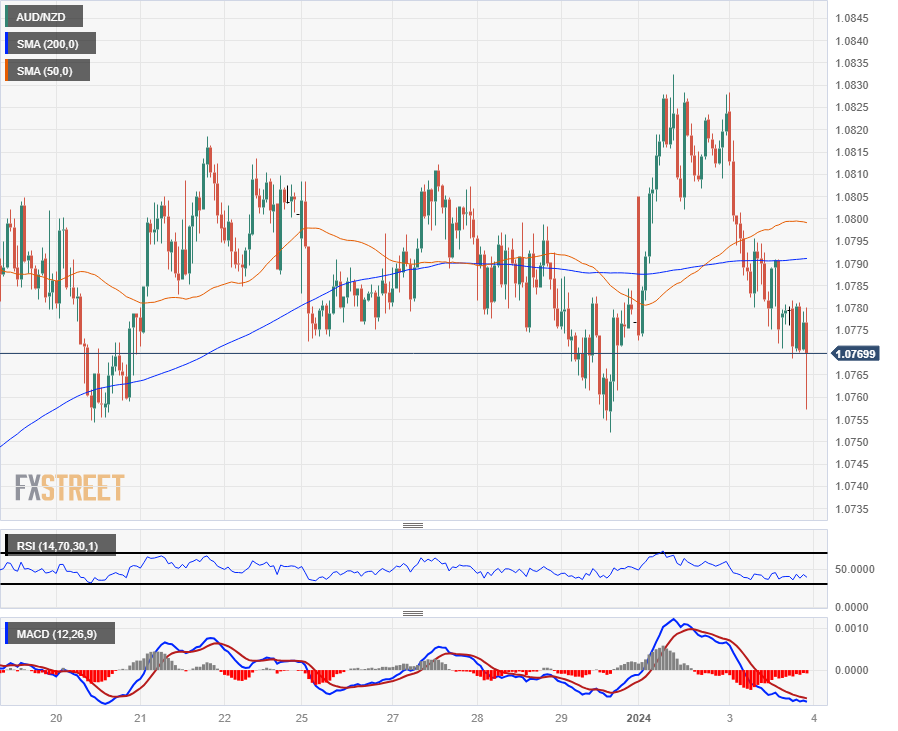
The AUD/NZD pair waffled on Wednesday, drifting from a near-term peak just below 1.0830 to sink back into familiar near-term lows near 1.0770, briefly testing into 1.0760 in early Thursday trading.
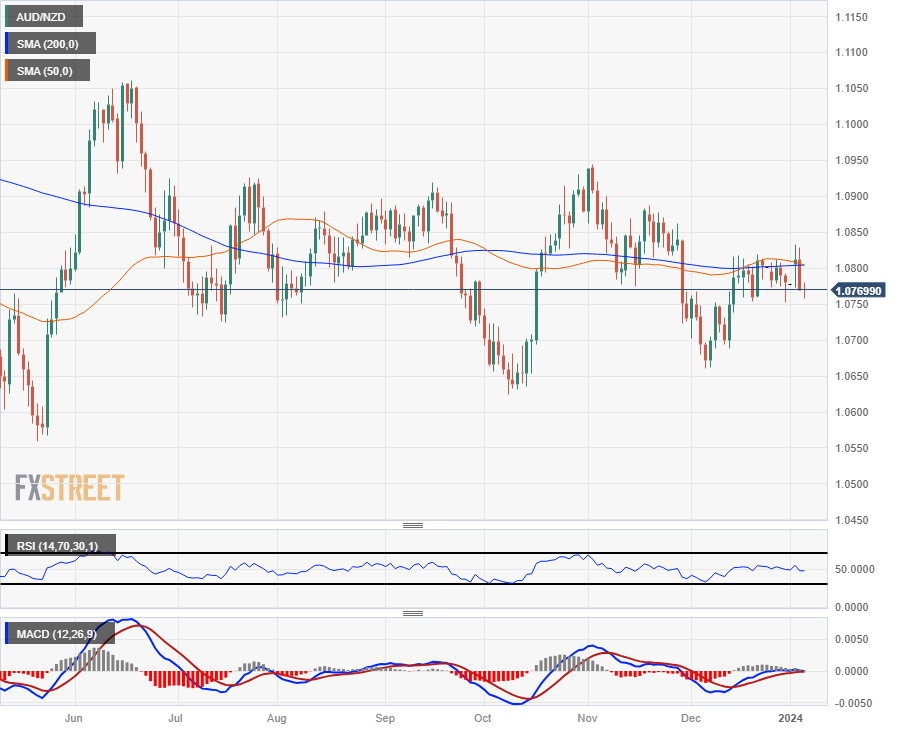
The Antipodean pair has been earmarked by congestion through the entirety of 2023 following a drastic rebalancing from 2022’s peak of 1.1490, sinking nearly 9% to a December 2022 low of 1.0470. The AUD/NZD has been caught in long-term consolidation ever since, cycling the 1.0800 handle as the 200-day Simple Moving Average (SMA) treads water in the familiar price zone.
Intraday action has the pair drifting into the low side of the 200-hour SMA near 1.0790, set for a bounce from chart territory near the last swing low at 1.0750, and the immediate topside technical ceiling sits at 1.0830, 2024’s early swing high.
Australian Dollar price this week
The table below shows the percentage change of Australian Dollar (AUD) against listed major currencies this week. Australian Dollar was the strongest against the Japanese Yen.
| USD | EUR | GBP | CAD | AUD | JPY | NZD | CHF | |
| USD | 1.21% | 0.51% | 0.76% | 1.22% | 1.50% | 1.12% | 0.97% | |
| EUR | -1.07% | -0.54% | -0.31% | 0.17% | 0.29% | 0.06% | -0.15% | |
| GBP | -0.53% | 0.54% | 0.26% | 0.71% | 1.07% | 0.61% | 0.39% | |
| CAD | -0.76% | 0.28% | -0.07% | 0.44% | 0.74% | 0.34% | 0.16% | |
| AUD | -1.24% | -0.18% | -0.71% | -0.48% | 0.11% | -0.10% | -0.30% | |
| JPY | -1.50% | -0.26% | -0.93% | -0.53% | -0.09% | -0.21% | -0.59% | |
| NZD | -1.13% | -0.06% | -0.63% | -0.36% | 0.11% | 0.20% | -0.20% | |
| CHF | -0.92% | 0.15% | -0.39% | -0.13% | 0.33% | 0.57% | 0.23% |
The heat map shows percentage changes of major currencies against each other. The base currency is picked from the left column, while the quote currency is picked from the top row. For example, if you pick the Euro from the left column and move along the horizontal line to the Japanese Yen, the percentage change displayed in the box will represent EUR (base)/JPY (quote).
AUD/NZD Hourly Chart
AUD/NZD Daily Chart
AUD/NZD Technical Levels
- AUD/JPY edges down to 96.35 after a 0.46% gain, with bullish-harami pattern suggesting potential upside momentum.
- Buyers aim for the January 2 high of 96.71 and the 97.00 mark, with subsequent resistance levels at 97.67 and 98.00.
- If the upside is capped, sellers might target Senkou Span B at 96.14 and Kijun Sen at 95.90, with 94.58 as further support.
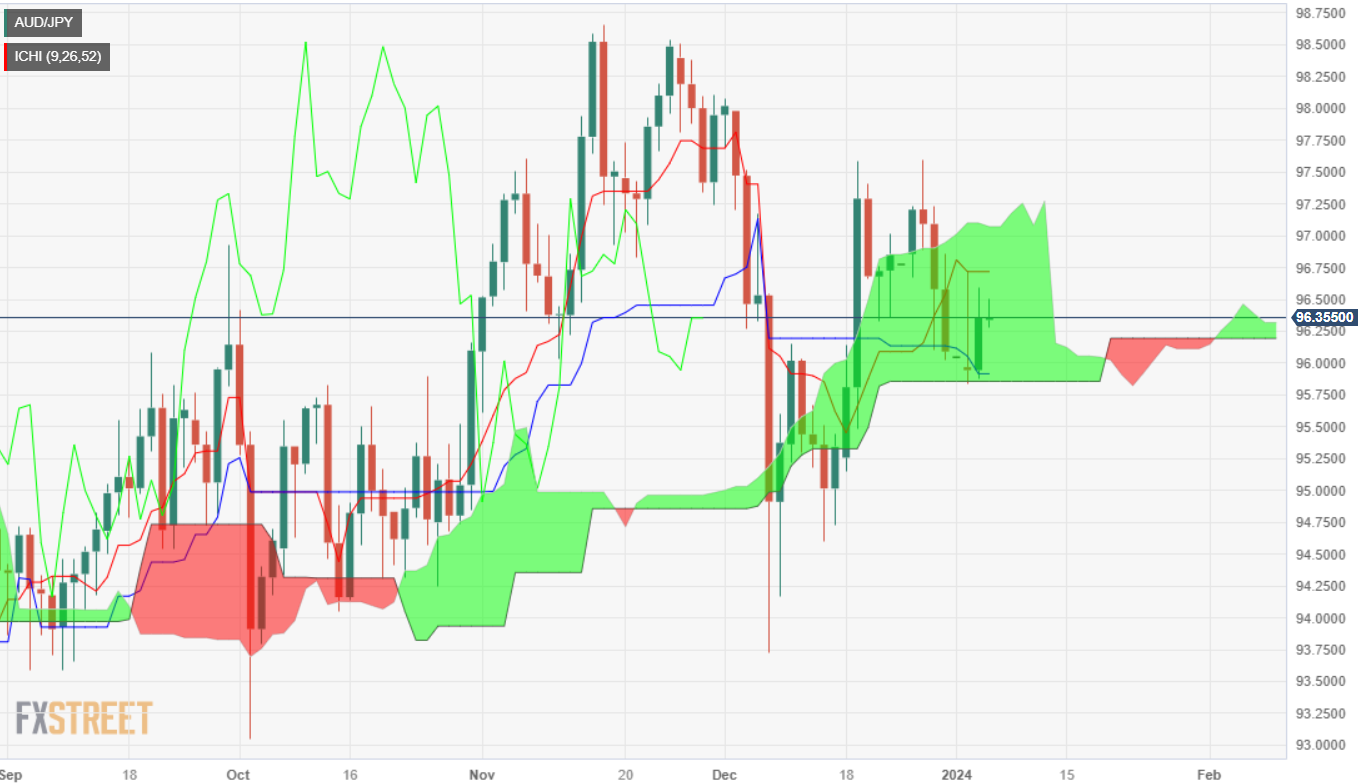
The AUD/JPY registered moderated gains on Wednesday of 0.46%, though it begins Thursday’s session on a lower note, trading below yesterday’s close of 96.42. Nevertheless, buyers reclaiming the Kijun-Sen and stepping in around the bottom of the Ichimoku Cloud (Kumo) has opened the door for further gains. At the time of writing, the cross-pair exchanges hands at 96.35, down 0.07%.
The daily chart portrays the pair range-bound, though the formation of a ‘bullish-harami’ candlestick pattern could pave the way for further upside. For a bullish resumption, buyers must conquer the January 2 high of 96.71, followed by the 97.00 figure. Once those two levels are cleared, the next resistance level would be the June 19 high at 97.67. Up next would be the 98.00 psychological level.
On the other hand, if sellers capped the AUD/JPY advance above 96.71, sellers could step in and drag prices toward th Senkou Span B at 96.14, followed by the Kijun Sen at 95.90. Once that is achieved, the next demand area to test would e the December 14 low of 94.58.
AUD/JPY Price Action – Daily Chart
AUD/JPY Technical Levels
- Judo Bank’s Australian Services PMI sinks to second-lowest print in 23 months.
- Australian Composite PMI also slipped to 46.9 from 47.4.
The Australian Services sector contracted once more, according to the latest Purchasing Managers’ Index (PMI) data from Judo Bank.
Despite the seasonally-adjusted figure rising from November’s 46.0 to 47.1 in December, a third consecutive reading below 50.0 points towards a full quarter of services activity contraction.
This marks the fastest pace of services contraction since the third quarter of 2021.
According to Matthew De Pasuale, Economist at Judo Bank: “The composite output index ended the year with a reading of 46.9, a slight improvement from November. Readings over the past two months suggest that while the economy is slowing down, the slowdown is not accelerating. The new orders index softened for the third consecutive month to 46.7 in December, the lowest level since late 2021. Despite households facing ongoing pressure from elevated interest rates, the output and new order indexes remain at levels consistent with the RBA's forecast soft-landing for the Australian economy.”
Market reaction
The Australian Dollar is broadly unmoved by the figures, with the AUD/USD cycling the 0.6730 level with an ongoing economic downturn in the domestic Australian economy broadly priced into market expectations already.
About the Judo Bank Services PMI
The Services Purchasing Managers Index (PMI), released on a monthly basis by Judo Bank and S&P Global, is a leading indicator gauging business activity in Australia’s services sector. The data is derived from surveys of senior executives at private-sector companies from the services sector. Survey responses reflect the change, if any, in the current month compared to the previous month and can anticipate changing trends in official data series such as Gross Domestic Product (GDP), employment and inflation. A reading above 50 indicates that the services economy is generally expanding, a bullish sign for the Australian Dollar (AUD). Meanwhile, a reading below 50 signals that activity among service providers is generally declining, which is seen as bearish for AUD.
- The NZD/JPY stands elevated after a rally towards 89.40, giving it a breather from its recent trailing losses.
- Daily chart indicators like the hint at potential buying momentum despite being in negative territory.
- Regardless of the short-term negative outlook, above 20,100,200-day SMAs indicates a broader bullish control.
In Wednesday's session, the NZD/JPY clocked an uptick of 0.70%, seeing the pair rally to 89.40. An inconsistent journey was seen on the daily chart, hinting at neutral to slightly bullish momentum, with sellers taking a break after four out of the last five days of losses. Despite the upside, in the immediate short term, the four-hour chart indicators have flattened, hinting at a potential shift to the downside as investors may be set to take profits.
Surveying the indicators on the daily chart shows that the buying momentum currently holds the upper hand. Despite the Relative Strength Index (RSI) showing an increasing trend while in negative territory and the Moving Average Convergence Divergence (MACD) displaying steady red bars suggesting a potentially bearish signal, the dominant force is nevertheless the buying side. This is largely attributable to the fact that the pair remains above its 20, 100, and 200-day Simple Moving Averages (SMAs). Such positioning implies a strong bullish dominance over the broader time horizon.
With respect to the shorter time frame, the four-hour chart exposes a somewhat different dynamic. Momentum indicators appear to have reached an equilibrium, slightly favoring the downside. The four-hour RSI, despite sitting in positive territory, is exhibiting a downsloping trend, which typically signals a decrease in buying pressure. Correspondingly, the four-hour MACD, with its flat red bars, reiterates this neutral sentiment.
NZD/JPY daily chart
-638399156401418411.png)
- USD/JPY took a step back from Wednesday’s grind higher after failing to claim 143.75.
- Yen selling pressure eased off after Fed’s latest meeting minutes poised to disappoint markets.
- China Services PMI to drive market sentiment in early Thursday market session.
The USD/JPY drove higher on Wednesday as the US Dollar (USD), the day’s single best-performing currency clambered over the Yen (JPY), the day’s biggest loser. The USD/JPY climbed one and a third percent bottom-to-top for the midweek market session, slipping back from just below 143.75 to wrap up Wednesday’s trading just above the 143.00 handle.
FOMC Minutes: Interest rates seem to be at or near peaks
The Federal Reserve’s (Fed) meeting minutes from the US central bank’s December discussion revealed that Fed policymakers may not be as far along the path towards rate cuts as market have been hoping for. Fed officials noted that, while rates appear to be “at or near” the peak, the main policy rate could hold higher for longer than market participants are currently expecting. The meeting minutes stand in stark contrast to the market’s broad risk-on reaction following Fed Chairman Jerome Powell’s surprise pivot in December which sent market expectations of rate cuts through 2024 skyrocketing.
The upcoming Thursday Asia market session is set for the second half of Purchasing Managers’ Index (PMI) figures from China with the China Caixin Services PMI slated to drop early at 01:45 GMT, and markets are expecting a slight uptick from November’s 51.5 to 51.6 in December.
China’s Caixin Manufacturing PMI on Tuesday came in above expectations, surprising to the upside and ticking higher from 50.7 to 50.8 in December, easily clearing the median market forecast of 50.4. A matching beat for Thursday’s Services PMI will help bolster risk appetite as markets kick off the back half of the first trading week of 2024.
High-impact data will wrap up the trading week with Friday’s US Nonfarm Payrolls, expected to slip back slightly from 199K to 168K in December.
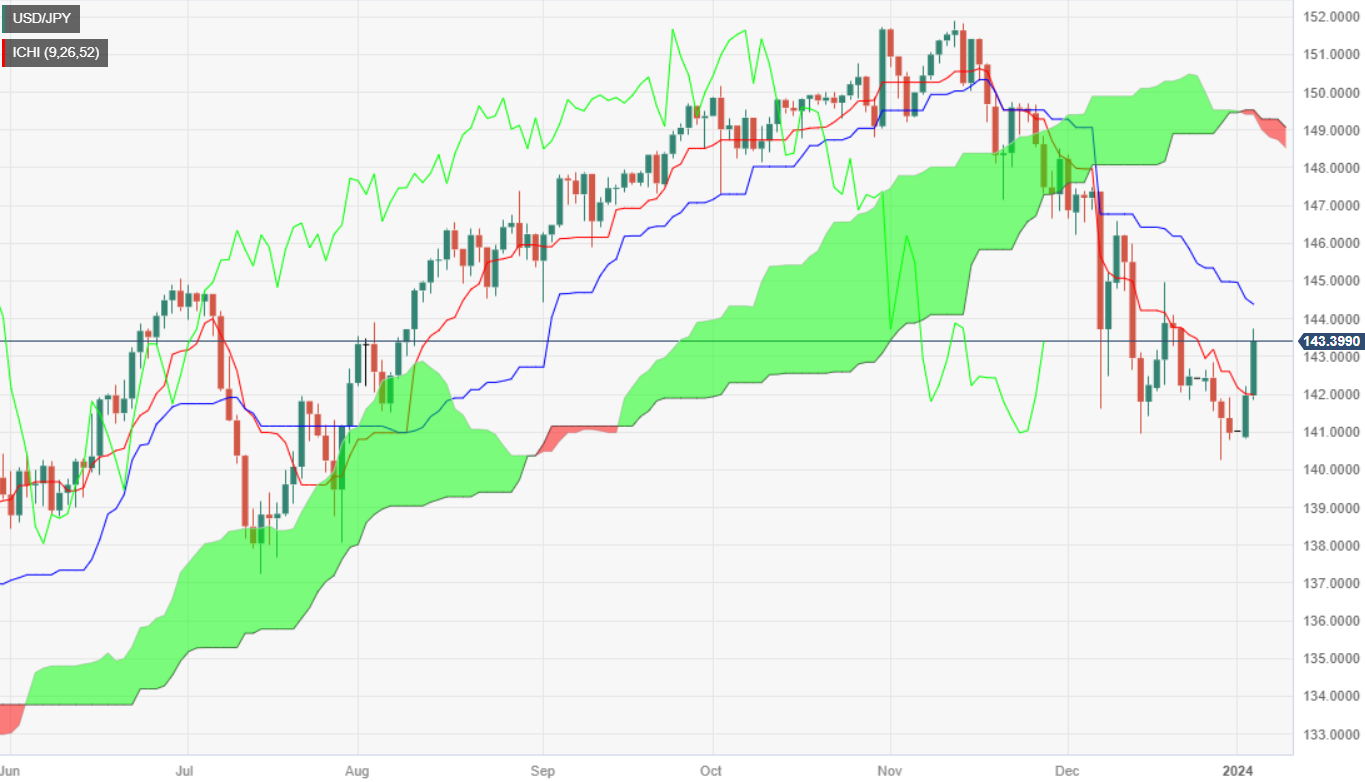
USD/JPY Technical Outlook
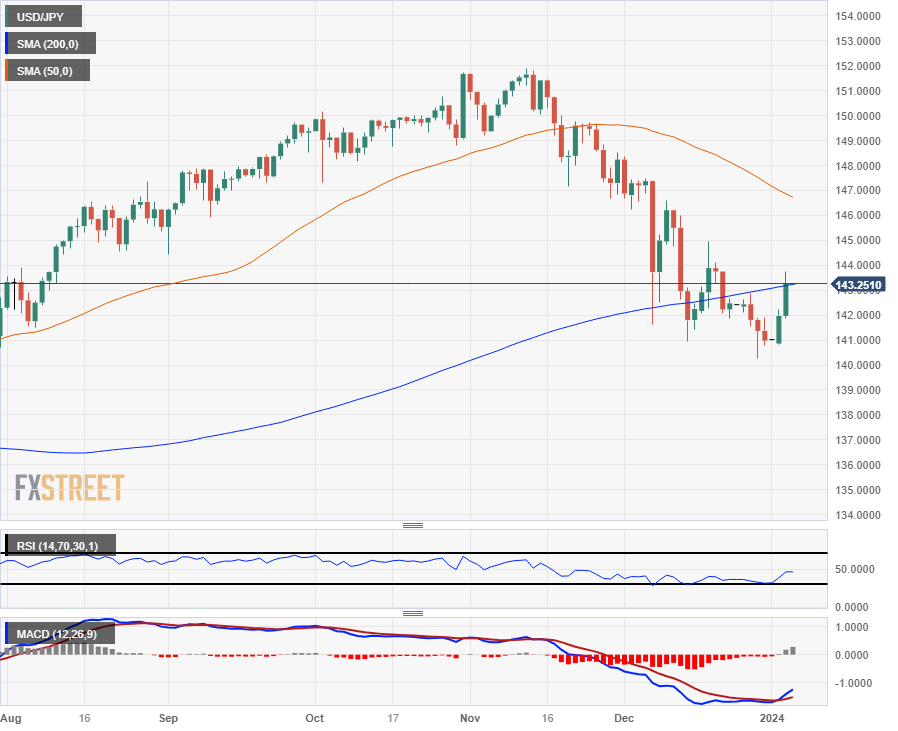
The USD/JPY’s rally on Wednesday took the pair cleanly through the 200-hour Simple Moving Average (SMA) just above 142.00, sending the pair just shy of 143.75 before settling back towards the 143.00 handle.
Daily candlesticks have the pair running directly into technical resistance from the 200-day SMA just above 143.00, and the pair’s 7.5% peak-to-trough decline from November’s peak of 151.91 remains intact.
USD/JPY Hourly Chart

USD/JPY Daily Chart
USD/JPY Technical Levels
The beginning of the new trading year continued to see the greenback on the positive foot. Moving forward, Asian markets should closely follow the Chinese calendar, where Caixin Services and Composite PMIs are due. In Japan, the final Manufacturing PMI tracked by Jibun Bank is due, while nothing is scheduled in Oz on Thursday.
Here is what you need to know on Thursday, January 4:
The US Dollar Index (DXY) climbed to the area of three-week tops around 102.70 on the back of the persevering selling bias in the risk-associated universe. In addition, US yields rose further to multi-week peaks across different maturities, reinforcing at the same time the constructive tone around the dollar.
US stocks probed the area of multi-day lows, extending the corrective move after hitting a new all-time high just below the 38000 yardstick when gauged by the reference Dow Jones.
Data released on Wednesday showed an improvement in the always relevant US ISM Manufacturing PMI to 47.4 in the last month of 2023, while the labour market gauge of JOLTs Job Openings missed estimates at 8.79M in November, showing further cooling of the US labour market prior to key releases of the ADP and weekly Initial Jobless Claims (Thursday) and the December Nonfarm Payrolls (Friday).
EUR/USD sank to the sub-1.0900 region for the first time since mid-December against the backdrop of the stronger greenback and generalized weakness in the risky assets.
GBP/USD was a kind of exception after revisiting the upper-1.2600 amidst decent gains and following three consecutive sessions of losses.
Another negative session for the Japanese yen saw USD/JPY climb to the 143.70 region on the back of the continuation of the upside momentum of US yields and a directionless patter in JGB 10-year yields.
AUD/USD remained well on the defensive and retreated for the fourth session in a row against the backdrop of further pressure surrounding the high-beta currencies and the generalized bearish session in the commodity complex.
Speaking about the commodity universe, the Canadian dollar lost ground for the fifth consecutive session, lifting USD/CAD to the 1.3370 zone, or two-week highs.
The intense move higher in the greenback and US yields weighed on gold and sponsored a drop to multi-day lows near $2030 per ounce. In the same line, silver prices added to the pessimistic start of the year and broke below the $23.00 mark per ounce to clinch a new two-week lows.
No news from the FOMC Minutes left the positive momentum in the US Dollar unchanged after the committee's belief that rates are nearing their peak cycle and projections indicating a lower rate by 2024 were already widely anticipated. Moreover, some participants expressed the view that it may be necessary to maintain the policy rate at its current level for a longer period than initially anticipated.
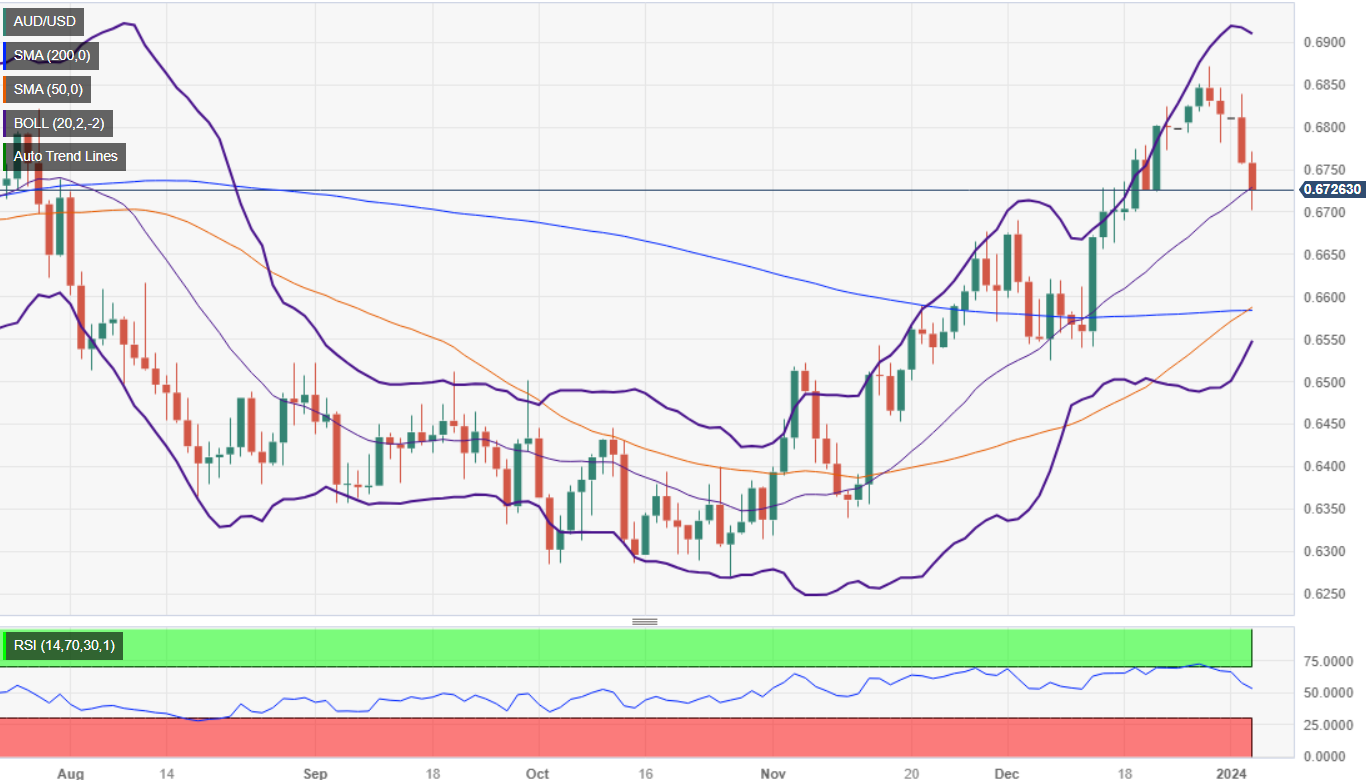
- AUD/USD's downward trajectory influenced by strong US Dollar, dropping to 0.6701 following 'hawkish' Fed release.
- Potential golden cross on the horizon as 50-day moving average nears 200-DMA, hinting at possible uptrend to 0.6800.
- Staying below 0.6800 could lead AUD/USD towards further support levels, with 0.6650 and 0.6576/82 as key targets.
The AUD/USD dropped to a nine-day low of 0.6701 and extended its losses to four straight days, courtesy of broad US Dollar (USD) strength across the board. US economic data revealed on Wednesday, alongside the release of “hawkish” meeting minutes by the Federal Reserve, kept the pair downward pressured, trading at around 0.6724 and losing close to 0.50%.
The daily chart portrays the pair printed a three-dark-crowds chart pattern, which found support at around the 0.6700 figure. Since reaching that level, the AUD/USD trimmed some of its losses, at the same time the 50-day moving average (DMA) approaches the 200-DMA to form a golden cross. In that outcome, the pair could resume its uptrend and test the 0.6800 figure, followed by December’s monthly high of 0.6871. A breach of the latter will expose the 0.6900 mark.
On the flip side, if the AUD/USD stays below 0.6800, that could open the door to test the 0.6700 figure. Once surpassed, the next support would emerge at 0.6650, followed by the confluence of the 50 and 200-DMAs at around 0.6576/82.
AUD/USD Price Action – Daily Chart
AUD/USD Key Technical Levels
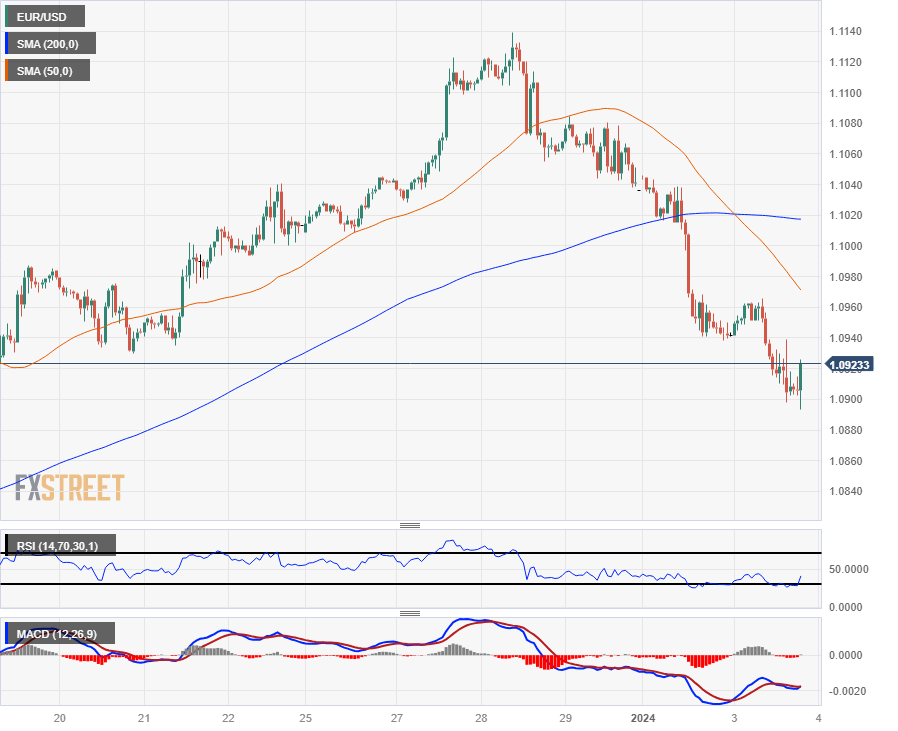
- EUR/USD looking for a foothold after backsliding into the 1.0900 handle.
- Latest meeting minutes see Fed officials attempt to cool market rate cut expectations.
- An absence of EU data on Wednesday leaves markets focusing on US PMI figures.
The EUR/USD slid into the 1.0900 handle on Wednesday after an equivocating Federal Reserve (Fed) put significant effort into not moving too far in either direction on rate cuts, keeping the US Dollar (USD) propped up amidst a broad-market recovery in the USD.
FOMC Minutes: Interest rates seem to be at or near peaks
The Fed successfully slid a softer package of rate discussions past the markets with little volatile reaction, with Fed officials noting that while rates appear to be at or near the peak, the main policy rate could hold higher for longer than markets are currently anticipating. While Fed officials agree that 2024 will see the start of the next rate cut cycle, cuts could come much later in the year than currently expected.
The Fed’s minutes from its December meeting reveal a US central bank that is much less dovish than market participants initially expected after Fed chairman Jerome Powell’s unexpected pivot at the last rate statement.
The meeting minutes, in conjunction with comments from Richmond Fed President Thomas Barkin early Wednesday, will give investors betting on a fast pace of rate cuts through 2024 plenty of food for thought to chew on as 2024 gears up for a fresh print of the US Nonfarm Payrolls (NFP) on Friday.
Friday’s US NFP is expected to show a slight downtick in jobs additions, forecast to print at 170K for December versus November’s print of 199K.
Before that, Eurozone inflation figures are due earlier Friday, and the annualized Harmonized Index of Consumer Prices (HICP) for the year ended December is expected to rebound slightly from 2.4% to 3.0% as inflation continues to grip the European continent.
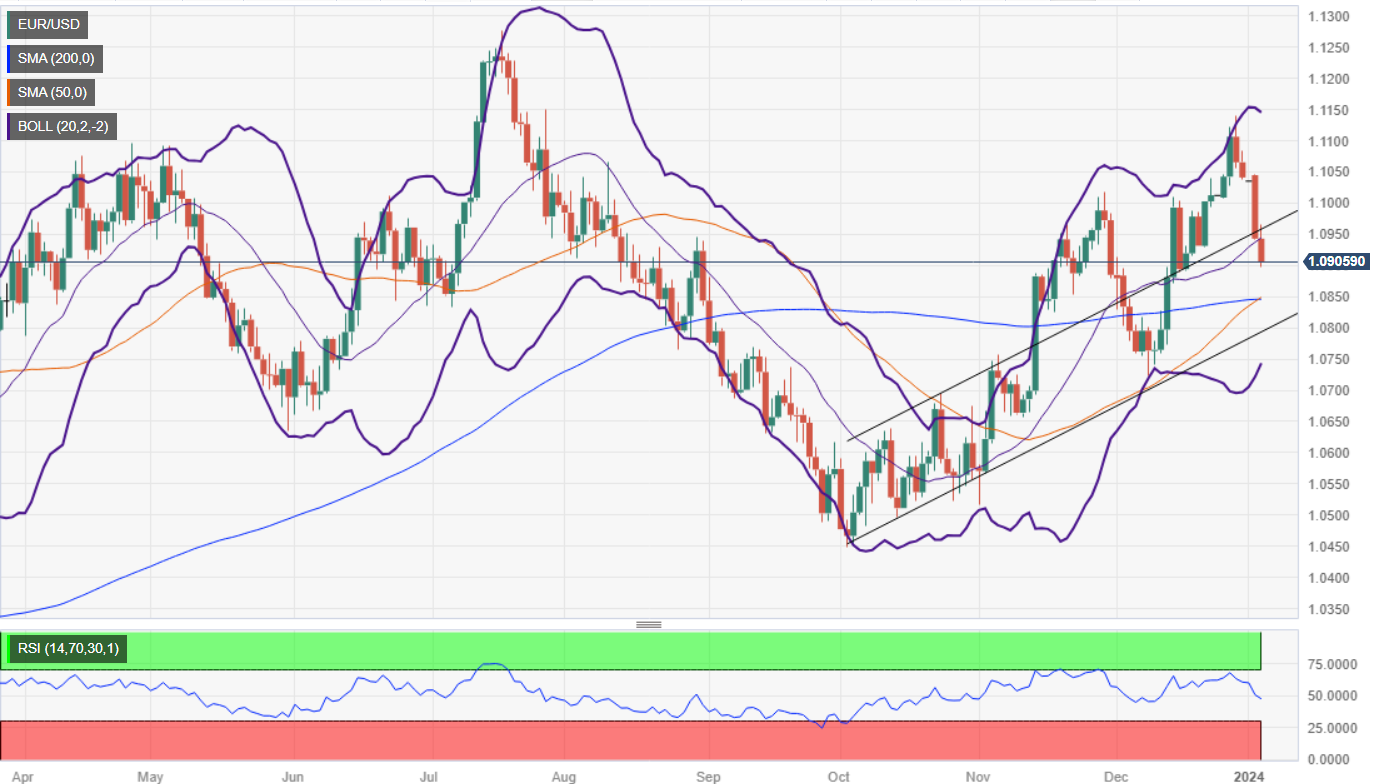
EUR/USD Technical Outlook
The EUR/USD’s late-Wednesday rebound from the 1.0900 handle sees the pair bouncing from a two-week low near 1.0893. Intraday action is firmly on the low side after the EUR/USD slid straight through the 200-hour Simple Moving Average (SMA) near 1.1020, sending the pair below the 1.1000 major handle on Monday and the pair is struggling to find the bullish momentum necessary to stage a corrective recovery.
Downside momentum looks increasingly likely with daily candles slipping back towards the 200-day SMA near 1.0850 with the 50-day SMA set to confirm a bullish crossover of the longer moving average. The EUR/USD has slid nearly 2% from last week’s peak bids of 1.1195, with technical support sitting at the last swing low into 1.0750.
EUR/USD Hourly Chart
EUR/USD Daily Chart
EUR/USD Technical Levels
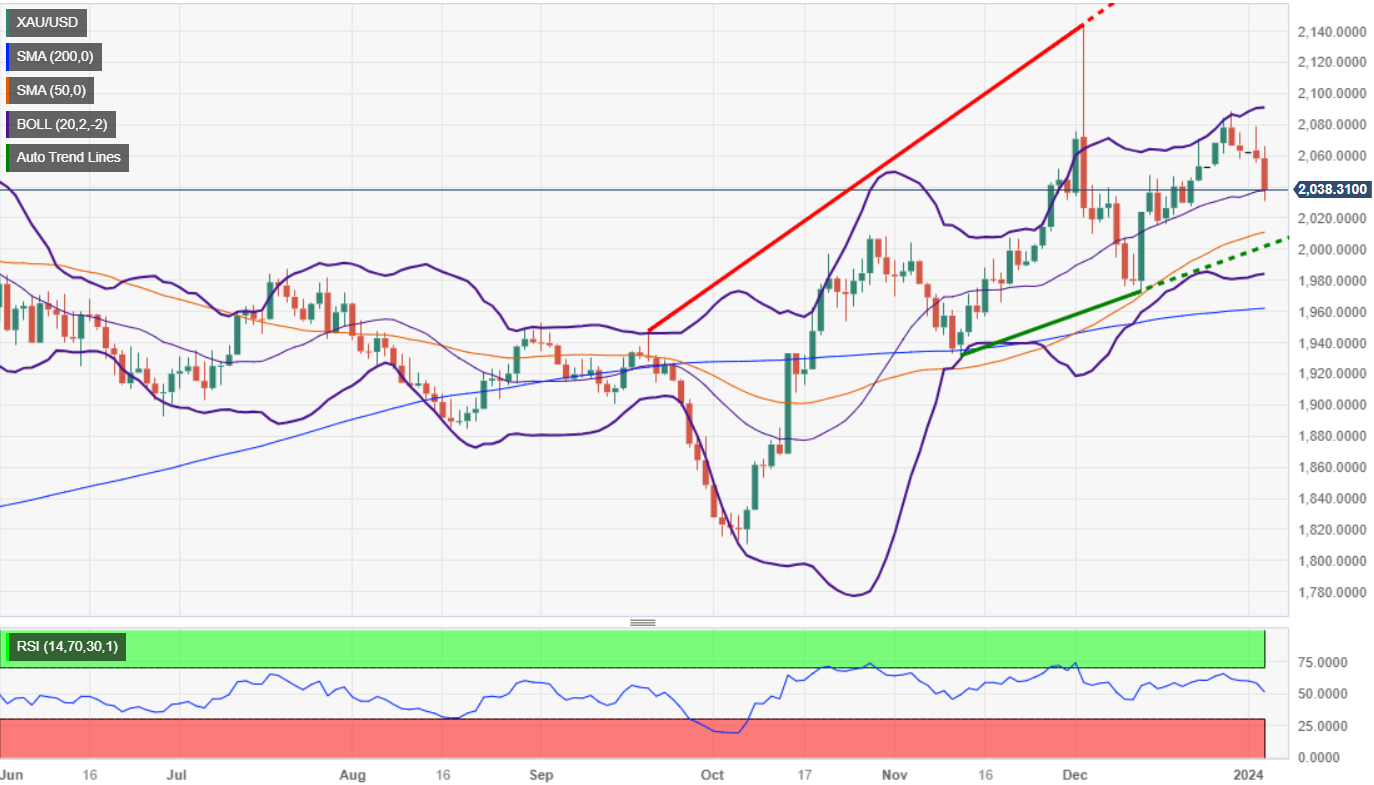
- Gold slumps to two-week low after Fed minutes show no dovish tilt, despite acknowledging inflation progress.
- XAU/USD struggles with over 1% loss as US Dollar Index surges 1.11%, reflecting robust USD performance.
- Market eyes upcoming US ADP Employment data, Jobless Claims, and PMIs, with focus on December's Nonfarm Payrolls report.
Gold price slid during the last hour on Wednesday after the US Federal Reserve (Fed) released December’s meeting minutes, which didn’t deliver any dovish hints. Therefore, the Greenback resumed to the upside and reached a new 11-day high before retracing somewhat. At the time of writing, XAU/USD is trading at $2040 per troy ounce, down by more than 0.90%.
Gold prices to remain pressured as Fed officials didn’t discussed about rate cuts
The minutes suggest most of the Fed officials see rates are likely or near their peak, though “a number of participants highlighted uncertainty around how long restrictive policy would need to be maintained.” Even though participants observed progress on inflation, core services are still elevated. It should be said that several participants might want to keep rates at current levels longer than they currently anticipate.
Given the backdrop, Gold slumped to a new two-week low at around $2030.30 before jumping $6.00, to $2036, but it remains changing hands with losses of more than 1%. At the same time, the US 10-year Treasury bond yield fell two basis points, though it clings to the 3.90% threshold, while the US Dollar (USD), as measured by the US Dollar Index (DXY), gains 1.11%, sits at 102.45.
Earlier, economic data revealed by the Institute for Supply Management (ISM) showed that Manufacturing activity remained at a recessionary level for 14 straight months, while the JOLTS report revealed by the US Department of Labor showed the jobs market is cooling down.
Meanwhile, expectations for rate cuts by the Fed remained unchanged for December 2024, with market players betting the US central bank would slash rates by more than 150 basis points.
Ahead of the week, the US economic docket will feature the ADP Employment Change report, followed by Initial Jobless Claims and Flash PMIs revealed by S&P Global; all the data will be announced by Thursday. After that, Gold traders' focus will shift towards the December Nonfarm Payrolls report.
XAU/USD Price Analysis: Technical outlook
Even though the technical picture suggests the yellow metal remains bullish, a drop below the confluence of the October 27 cycle high of $2009.42 and the 100-day moving average (DMA) around that area would pave the way for testing the $2000 threshold. A breach of the latter would expose the December 13 swing low of $1973.13.
- The NZD/USD currently recovered near the 0.6245 level, trimming practically all of its daily losses.
- ISM December Manufacturing PMIs came in better than expected.
- FOMC minutes from the December meeting revealed a hawkish tilt, indicating prolonged higher rates.
The New Zealand Dollar (NZD) encountered a downtrend in Wednesday's trading, forfeiting gains against a strong US Dollar (USD), with the NZD/USD landing near 0.6225 but then recovering towards 0.6245, above the 20-day Simple Moving Average (SMA). The pair's slight slipping is primarily attributable to the strength of the USD and the influence of the Federal Open Market Committee (FOMC) minutes from the December meeting, which sounded hawkish. Strong ISM data from the US outshined weak JOLTs Job Opening figures from November.
The U.S. Bureau of Labor Statistics indicated a slight decrease in JOLT job Openings in November, falling short of the consensus estimate of 8.85M to 8.79M, despite it being marginally higher than the previous figure of 8.852M. On the positive side, the US Institute for Supply Management (ISM) Manufacturing PMI for December came in at 47.4, higher than 47.1, while the Employment index for the same month posted a figure of 48.1, exceeding the anticipated 46.1, which shows resilience in the Manufacturing sector.
In addition, the FOMC December minutes showed that policymakers acknowledged that monetary policy may be at or nearing its peak but that they consider it prudent to hold current rates for a longer period. Meanwhile, according to the CME FedWatch Tool, dovish bets on the Fed eased somewhat, but the odds of cuts in March and May are still high, above 50%. A hold in January is priced in.
NZD/USD levels to watch
The daily chart suggests the pair harbors a neutral to bearish outlook. Despite being in positive territory, the negative slope of the Relative Strength Index (RSI) can be construed as a sign of dwindling buying momentum, giving rise to a potential retreat. This is supported further by the rising red bars of the Moving Average Convergence Divergence (MACD), which generally reflects a stronger inclination towards the sellers' side.
However, examining the larger context reveals a rather bullish undertone. The pair continues to stand above the 20,100,200-day Simple Moving Averages (SMAs), indicating that the overarching control seems to be with the buyers. Despite the near-term bearish signals, the medium-to-long-term perspective shed by the position of the Simple Moving Averages (SMAs) leans more toward the optimistic end.
NZD/USD daily chart
-638399071016194325.png)
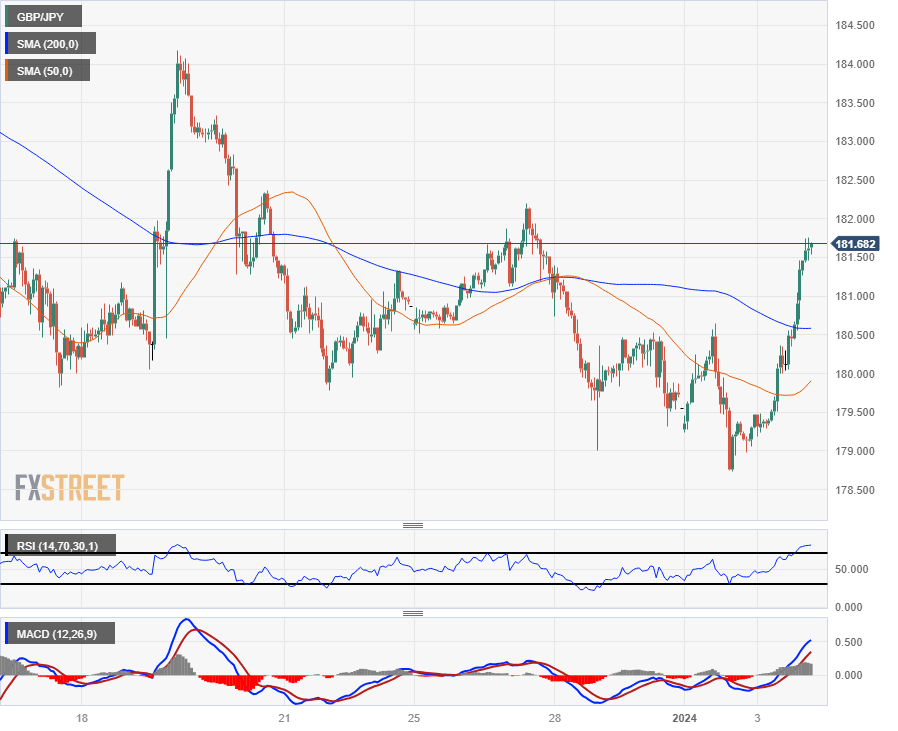
- GBP/JPY looking to reclaim 182.00 as Yen-based pairs recover ground.
- A thin economic calendar has markets focusing on broad directional flows.
- China Services PMI early Thursday could drive Asia market session risk appetite.
The GBP/JPY has climbed over 1.3% on Wednesday as the Pound Sterling (GBP) recovered recently lost ground against the Japanese Yen (JPY), rising from a two-week low near 178.75 to come within challenge range of the 182.00 handle.
FX market flows are broadly pivoting out of JPY bets, driving the Japanese Yen down across the board and making the JPY handily the worst performer of the major currency bloc for the mid-week.
The Yen is kicking off 2024 with a broad-base selloff as equity pours out of the Yen in favor of higher-yielding assets with the Bank of Japan (BoJ) firmly entrenched in their hypereasy monetary policy stance.
The Asia market session saw moderating risk appetite on Tuesday following China’s unexpected beat in Chinese Manufacturing Purchasing Managers’ Index (PMI) figures, coming in at 50.8 for December compared to November’s 50.7, a small gain but upending market forecasts of a decline to 50.4. With the Chinese Services PMI due early Thursday, a joint beat of PMI figures could see risk sentiment broadly hold higher heading into the back half of the first trading week of 2024.
GBP/JPY Technical Outlook
The Guppy’s Wednesday surge has the GBP/JPY easily clearing the 200-hour Simple Moving Average (SMA) near 180.50 as the pair gears up for a fresh run at the 182.00 handle. Despite the mid-week surge, the GBP/JPY remains firmly down from recent swing highs into 184.00 from mid-December.
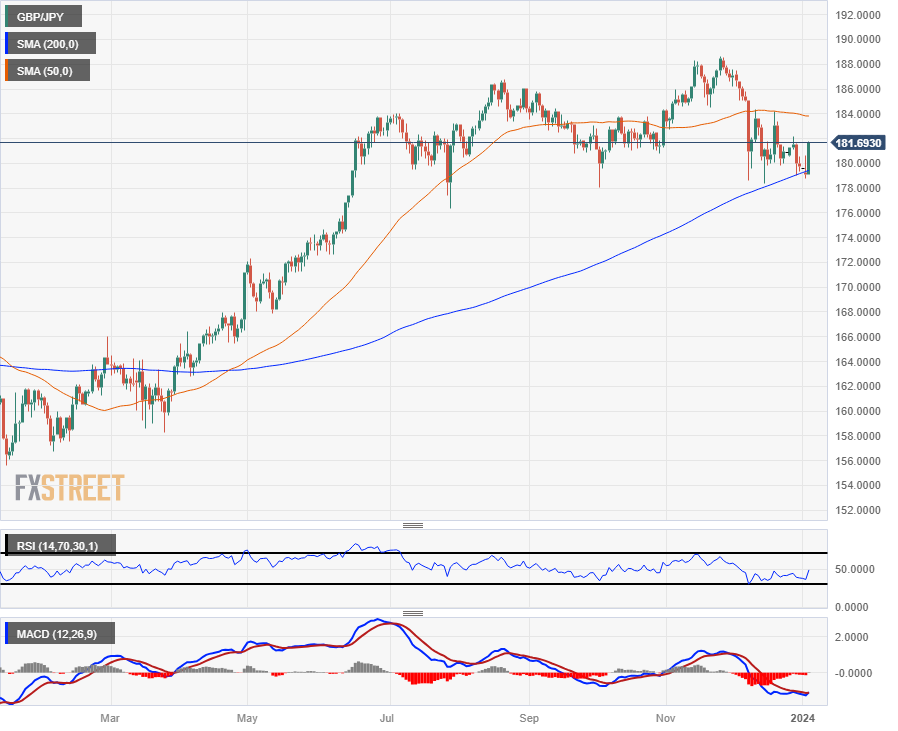
Daily candlesticks reveal potential for an extended topside run after a bounce from the 200-day SMA near 179.50. The GBP/JPY could be geared for a challenge of the 50-day SMA near the 184.00 handle with the pair seeing a bullish rejection from the 200-day SMA for the first time since breaking into the high side of the long-term moving average back in April of 2023.
GBP/JPY Hourly Chart
GBP/JPY Daily Chart
GBP/JPY Technical Levels
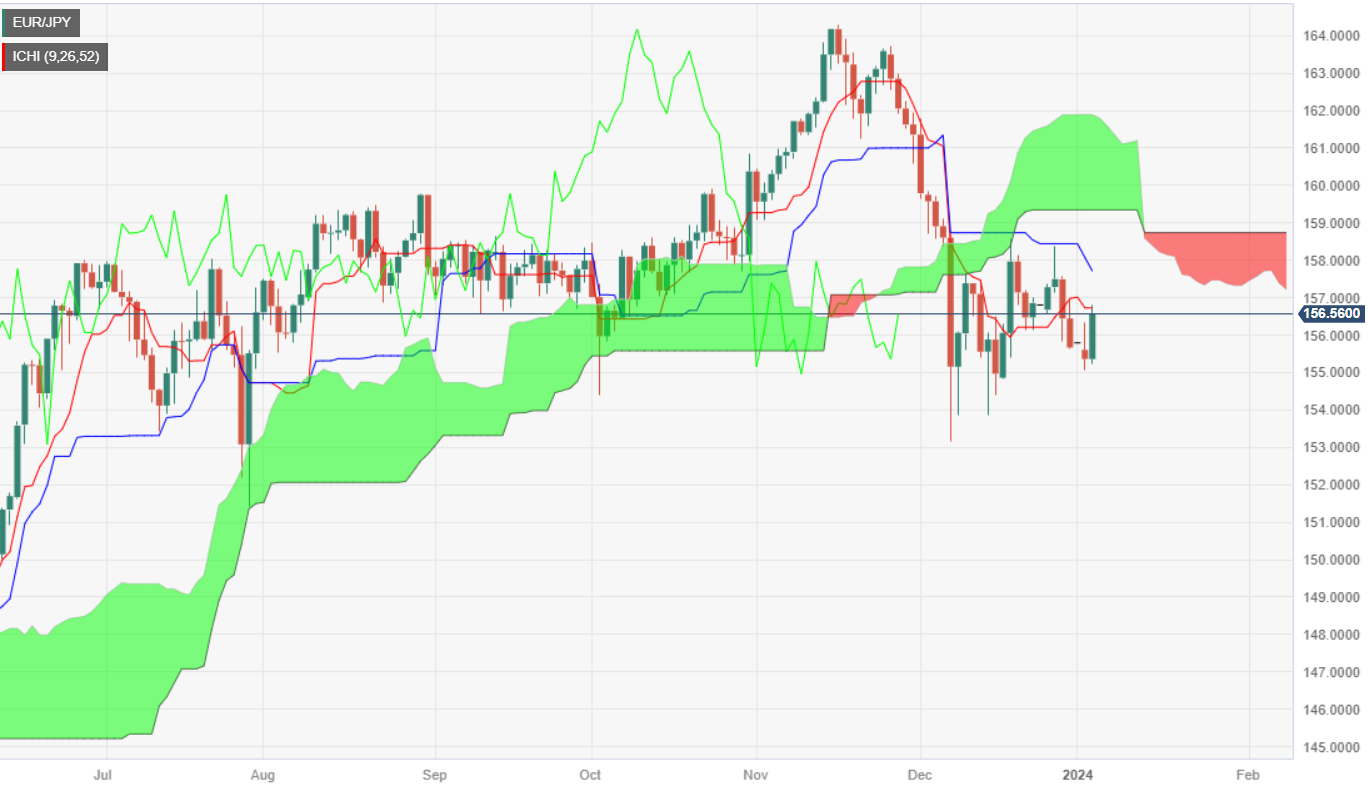
- EUR/JPY gains traction, rising to 156.47, as JPY weakens in a quiet Eurozone and Japanese economic setting.
- For sustained upward momentum, EUR/JPY buyers need to surpass the Tenkan-Sen and 157.00 resistance levels.
- Sideways trading likely if pair remains below 157.00, with potential support at 153.85 and December low of 153.11.
The EUR/JPY bounced off Tuesday’s lows of 155.06, and rallied more than 0.70% during Wednesday's session, trading at 156.47, as the Japanese Yen (JPY) began the year on the back foot. A scarce economic docket in the Eurozone (EU) and Japan would likely leave traders adrift to market sentiment swings in the first trading week of the year.
The cross-pair remains neutral to downward biased despite registering a leg-up on Wednesday, exacerbated by a bullish-engulfing candle pattern. Nevertheless, buyers must reclaim the Tenkan-Sen at 156-72, followed by the 157.00 mark, if they want to remain hopeful of higher prices in the EUR/JPY pair. In that outcome, the EUR/JPY's next resistance would be the Kijun-Sen at 158.02. A breach of the latter will expose the Senkou Span B at 158.71.
On the flip side, if sellers keep prices below 157.00, the pair will remain trading sideways, within the 155.00-156.70 mark. Once the bottom of the range is broken, the first support would emerge at 153.85, the December 14 low, followed by the latest cycle low at 153.11, reached on December 7.
EUR/JPY Price Action – Daily Chart
EUR/JPY Technical Levels
According to the FOMC Minutes:
- Members generally perceived the inclusion of the word "any" in remarks about potential additional firming as a way to convey their assessment that rates were probably at or close to the peak of the cycle.
- According to the projections, nearly all participants indicated that their baseline suggested a lower federal funds rate would be suitable by the conclusion of 2024.
- Additionally, several participants noted that situations could justify maintaining the policy rate at its current level for a longer duration than their current expectations.
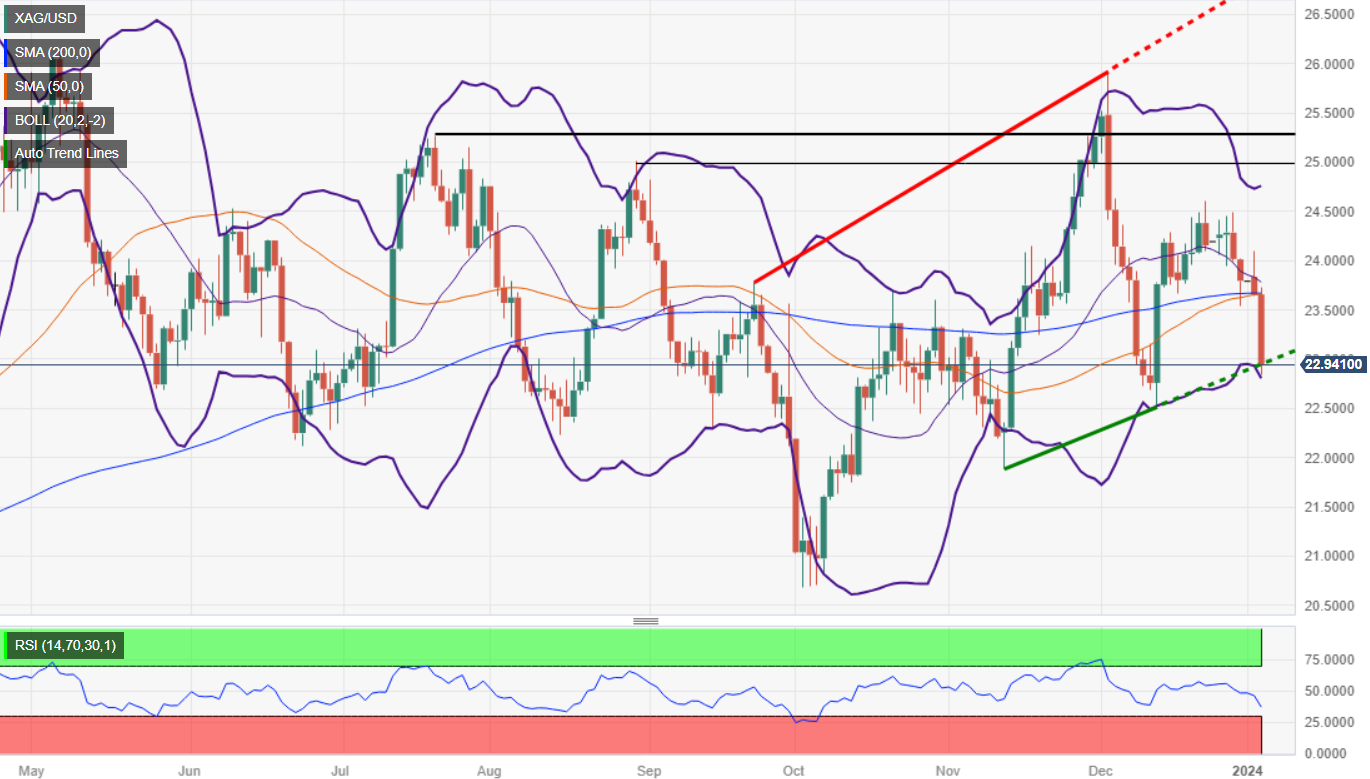
- Silver's sharp decline to $22.89 was driven by US bond yield fluctuations and USD strength before the release of key Fed minutes.
- A potential break below the three-month support trendline could lead XAG/USD towards $22.00 and previous lows.
- Recovery above the 100-day moving average might fuel a rally, targeting key resistances at $23.64 and $24.00.
Silver plunged more than 3% on Wednesday, as US Treasury bond yields pare their earlier gains, while the Greenback (USD) exploits to the upside ahead of the release of the Federal Reserve’s December meeting minutes. At the time of writing, the XAG/USD is trading at $22.89 after hitting a daily high of $23.72.
The daily chart portrays the grey metal as neutral-biased, but if it prints a daily close below the three-month-old upslope support trendline drawn from the lows of October 2023, that could pave the way for further losses. In that outcome, the XAG/USD could dive below the $22.00 figure and test the November 13 low of $21.88, followed by the October monthly low of $20.69.
On the other hand, if Silver trims some of today’s losses and buyers reclaim the 100-day moving average (DMA) at around $23.29, that would keep buyers hopeful of higher prices, with the first resistance level emerging at the confluence of the 50 and 200-DMAs, each at $23.64 and $23.66, respectively. Once those levels are surpassed, the next resistance would be the $24.00 mark.
XAG/USD Price Action – Daily Chart
XAG/USD Technical Levels
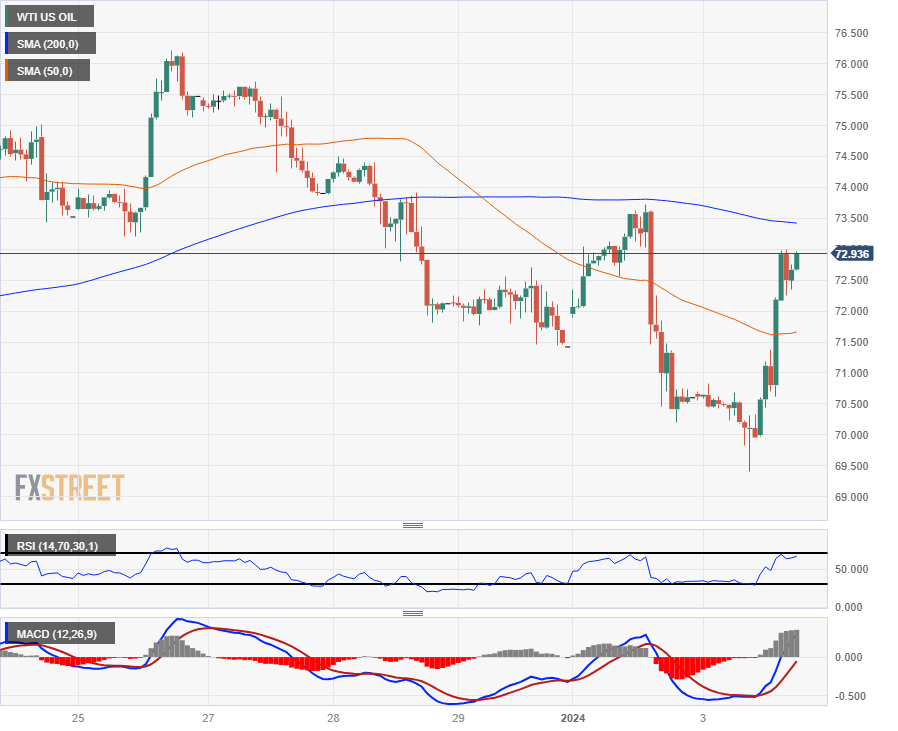
- WTI climbed back into $73 per barrel, recovering ground from early week declines.
- OPEC is set for further supply drawdowns in the face of renewed oversupply.
- USD Crude Oil slumped to a two-week low of $69.50 before rallying 5%.
Further gains are on the cards for West Texas Intermediate (WTI) US Crude Oil after a recovery rally on Wednesday propped up barrel bids to retest the $73.00 handle as the Organization of the Petroleum Exporting Countries (OPEC) is set to bring about further production cuts in an effort to bolster flagging Crude Oil prices.
OPEC pumped an average of 28.05 barrels per day through December according to survey reporting by Bloomberg, and OPEC is expected to pursue an additional 900K bpd in production cuts, but energy markets remain unsure whether or not OPEC production caps will be enough to stave off Crude Oil oversupply from the US and other non-OPEC rivals.
Crude Oil continues to whipsaw amidst shaky production cuts
Many member nations of the 22-country OPEC+ extended alliance are already stretched to their breaking point on the amount of production cuts their government budgets can shoulder, and with OPEC lacking any mechanisms to reinforce production quotas or to punish members that flout production limits, Crude Oil traders remain concerned that production will continue to outpace slumping global crude demand.
OPEC+ will be holding a monitoring meeting to review activities in Crude Oil markets on February 1, to be followed up by a meeting of OPEC+ ministers in early June. Confidence in OPEC's ability to provide benefits for all members came under scrutiny recently after member nation Angola left the oil cartel in favor of pursuing uncapped Crude Oil production.
Crude Oil continues to catch support in the near term from Federal Reserve (Fed) rate cut expectations, and an overly dovish/hawkish showing from the Fed’s latest meeting minutes due later on Thursday could further bolster barrel bids, or send Crude Oil back down again as investors readjust expectations following the Fed’s latest meeting update.
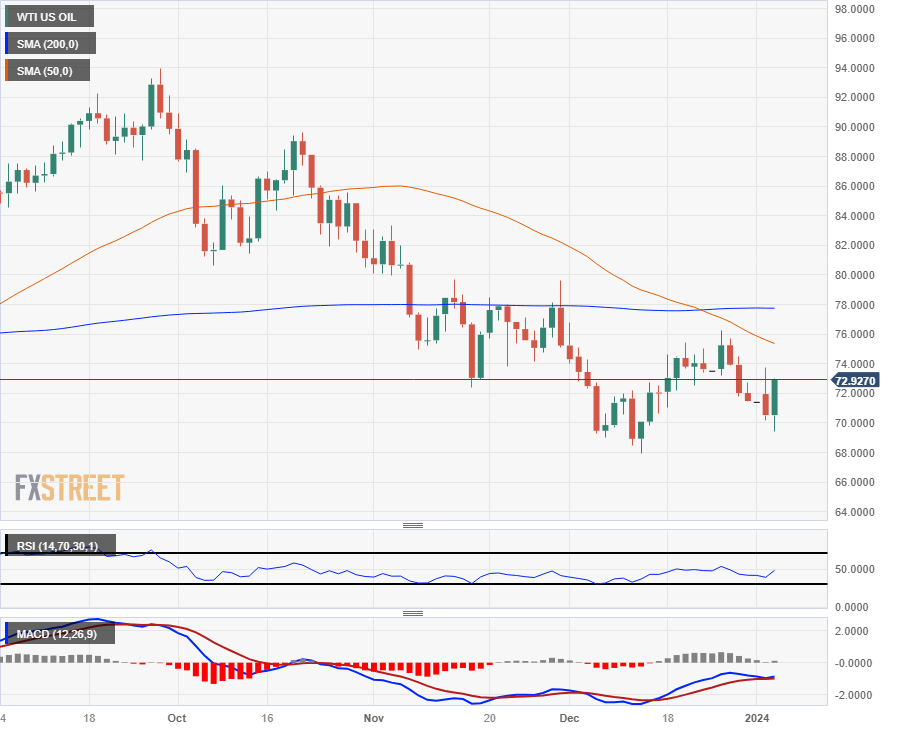
WTI Technical Outlook
Wednesday’s rebound in WTI further highlights just how far Crude Oil has fallen; WTI remains down an eye-watering 22% from September’s peak of $93.98. Daily candlesticks remain below the 200-day Simple Moving Average (SMA) at $78.00, and a bearish cross of the 50-day SMA has baked in a technical ceiling near $76.00.
Intraday action remains capped below the 200-hour SMA near $73.50, and a bullish break to the topside will see additional technical resistance from last week’s peak near the $76.00 handle.
WTI Hourly Chart
WTI Daily Chart
WTI Technical Levels
- The USD/CHF is navigating towards the 0.8515 level, registering a modest gain of 0.3% after jumping to a daily high of 0.8555.
- The US JOLTs Job Openings for November were reported at 8.79M by the US Bureau of Labor Statistics, lower than expected.
- The US ISM Manufacturing PMI for December reported lower at 47.4, better than the 47.1 expected.
- FOMC minutes might provide additional guidance to the markets.
In Wednesday's trading session, the USD/CHF pair exhibited a bullish stance but failed to hold its momentum, which took it to a high of around 0.8555 and stabilized at 0.8515. This upward surge is largely attributed to a strengthened US Dollar following the release of mid-tier economic data from the US, which drove investors to the US Dollar. Later in the session, the Federal Reserve (Fed) will release the December meeting minutes, which may affect the pair's dynamics.
The US labor market demonstrated a slightly negative outlook, with the JOLT's Job Openings falling short of expectations. As reported by the U.S. Bureau of Labor Statistics, the figures for November came in at 8.79M, failing to meet the 8.85M consensus, while slightly lower than the previous figure of 8.85M. However, the situation of the labor sector will be better portrayed by the Nonfarm Payrolls alongside the Average Hourly Earnings and the Unemployment rate from December, to be reported on Friday.
The US dollar is regaining some of its losses as, despite the soft JOLTs figures, the US is still showcasing the strength of its economy. In that sense, December's ISM Manufacturing PMI came in at 47.4, from November's 46.7, further lagging behind market expectations of 47.1, while the Manufacturing employment index also beat expectations coming in at 48.1 vs the 46.1 expected. However, the Dollar susceptibility persists until market easing expectations adjust.
USD/CHF levels to watch
On the daily chart, indicators suggest that bears are losing ground but haven't given up yet. The positive slope in the Relative Strength Index (RSI), albeit in negative territory, suggests that buying momentum may slowly build up despite being in an overall bearish zone. This could potentially hint at a possible transition from selling to buying pressure.
In line with that, the Moving Average Convergence Divergence (MACD) prints decreasing red bars, an indication that selling pressure, despite receding, it seems to be maintaining its grip. This means that sellers still have some momentum on their side and could possibly hinder any bullish advancement in the short term.
Regarding the broader perspective of the market, bears are in command as the pair remains well below its 20,100 and 200-day Simple Moving Averages (SMAs).
USD/CHF daily chart
-638399008492723154.png)
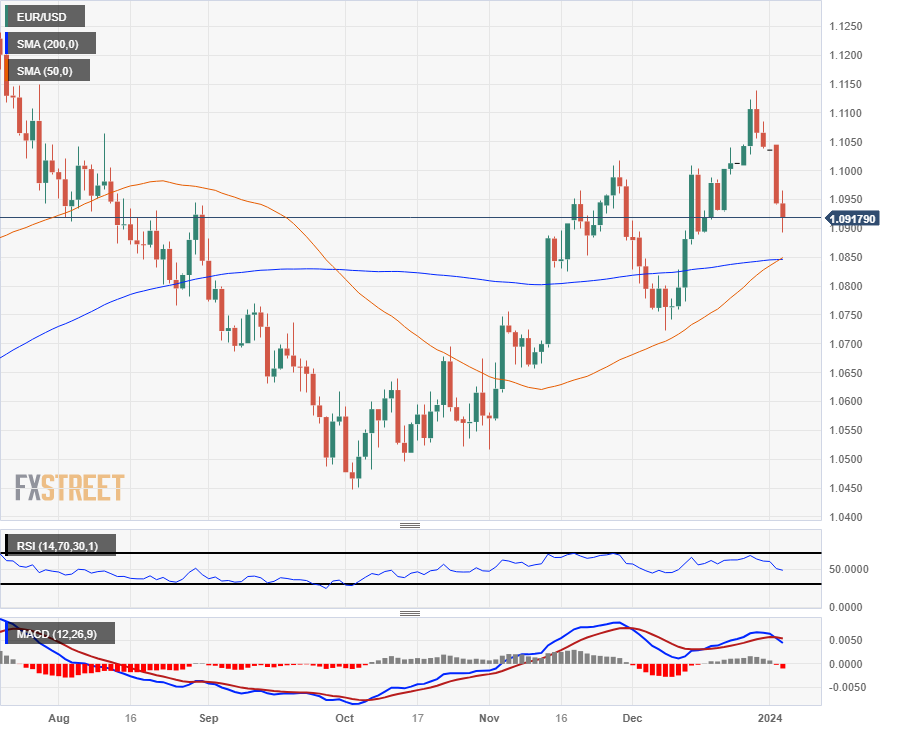
- EUR/USD trades at around the 1.0900 lows, reacting to upbeat US ISM Manufacturing PMI and JOLTS job openings data.
- Market anticipates potential policy easing in Fed's December FOMC minutes; six rate cuts priced in by futures data.
- Germany's stable unemployment rate at 5.9% contrasts with busy EU and US economic calendars, including upcoming PMIs and jobs data.
The EUR/USD remained on the defensive since the first trading day of 2024, falling 0.27% on the day after economic data from the United States (US) suggests the economy remains robust, though the labor market cooled down. At the time of writing, the major is trading at 1.0910 after posting a daily high of 1.0965.
Euro struggles as US data signals robust economy
The US economic agenda revealed upbeat data. The Institute for Supply Management (ISM) announced December’s Manufacturing PMI improved to 47.4, above forecasts and November’s readings, but it remained in recessionary territory for 14 straight months. At the same time, the US Bureau of Labor Statistics (BLS), revealed the JOLTS report, which showed a slight increase to 8.79 million, below the anticipated 8.85 million.
Aside from this, traders are awaiting the release of December’s Federal Open Market Committee (FOMC) minutes. In that meeting, Fed officials opened the door to ease monetary policy in 2024, with the majority projecting three 25 basis points rate cuts toward the end of the year. Nevertheless, according to futures data from the Chicago Board of Trade (CBOT), market participants had priced in six rate cuts.
Meanwhile, Federal Reserve’s (Fed) speakers had begun to cross newswires, led by the Richmond Fed President Thomas Barkin. He said that although the US central bank is making real progress on curbing stickier inflation, and the economy remains robust, the risks of missing a soft landing remain.
Across the pond, the Eurozone’s (EU) economic docket featured Germany’s employment data, which showed the unemployment rate stood pat at 5.9%, as estimated by economists polled by Reuters.
Ahead of the week, the EU’s calendar will feature S&P Services and Composite PMIs on Thursday. In the US, Flash PMIs would be updated, and jobs data could rock the boat, with ADP and Initial Jobless Claims pending to be released.
EUR/USD Price Analysis: Technical outlook
The EUR/USD daily chart depicts the formation of a golden cross, which could pave the way for further gains, but a three-dark crows chart pattern could keep the pair downward pressured. Nevertheless, sellers failure to push prices below 1.0900, and buyers could lift the exchange rate to test a 32-month-old downslope trendline that passes around 1.1025/40.
- GBP/USD struggles to find momentum for a recovery after Tuesday’s backslide.
- UK data is thin this week, with investors focusing on US labor and output figures.
- US ISM PMI beat the street, underlying manufacturing costs outlook eases further.
The GBP/USD is cycling near 1.2650, holding steady despite a lack of recovery from Tuesday’s sharp decline. Broader markets are largely focused on US data on Wednesday, with the US ISM Manufacturing Purchasing Managers’ Index (PMI) leading the charge.
The US USM Manufacturing PMI for December beat expectations, but still remains in contraction territory after printing at 47.4 versus the forecast 47.1 in a slight rebound from November’s 46.7.
Read More: US ISM Manufacturing surprised to the upside in December
The US ISM Manufacturing Employment Index for December also beat expectations, coming in at 48.1 against the forecast 46.1, a healthy uptick from the previous four-month low of 45.8. ISM Manufacturing Prices Paid settled lower than expected, coming in at 45.2 compared to the forecast 47.5, and easing back even further from November’s 49.9 as producer inflation continues to cool.
Wednesday’s big data beat will come from the Federal Reserve’s (Fed) latest meeting minutes, slated to release towards the end of the US session at 19:00 GMT. Fed officials have been working overtime trying to throw cold water on red-hot market expectations that broke off the chain after Fed Chairman Jerome Powell’s perceived rate pivot in December, but results have been mixed and market expectations of a more furious pace of rate cuts in 2024 have only slightly subsided.
With the meeting minutes drafted after Fed chair Powell’s latest public appearance, investors can expect the meeting review to come in a carefully wrapped expectations-managing package.
Thursday brings another round of ADP Employment Change numbers for December as a preview of Friday’s US Nonfarm Payrolls (NFP), but the indicator has had a shaky relationship with the larger, heftier, and later data release as of late, and investors should expect the numbers to mix on their respective results.
Thursday’s ADP Employment Change is forecast to tick upwards from 103K to 115K, while Friday’s NFP data is expected to soften from 199K to 168K. Revisions to older data should be expected.
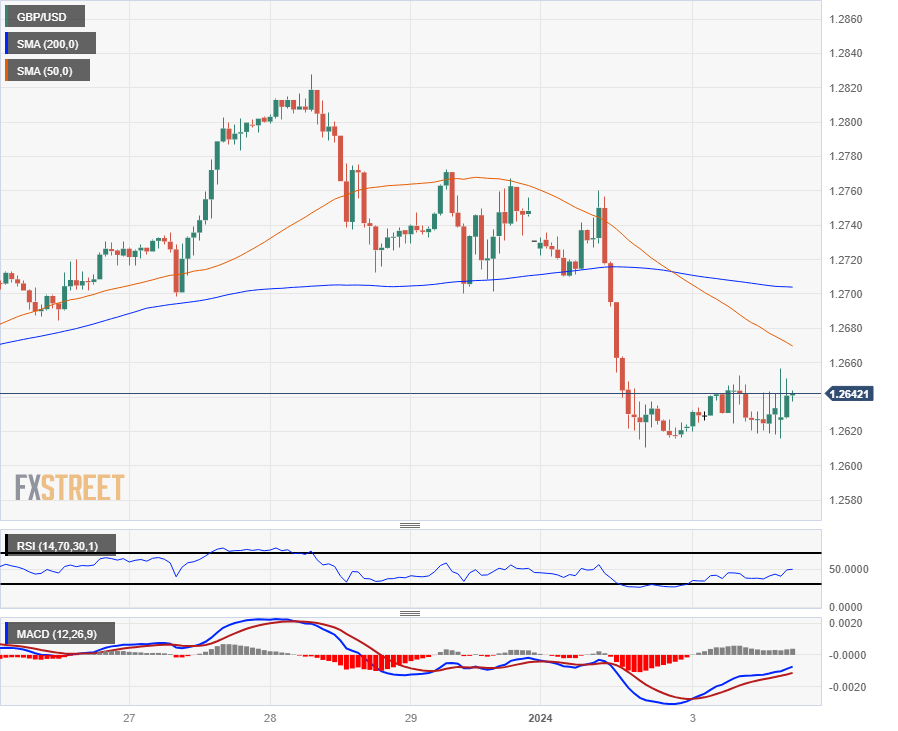
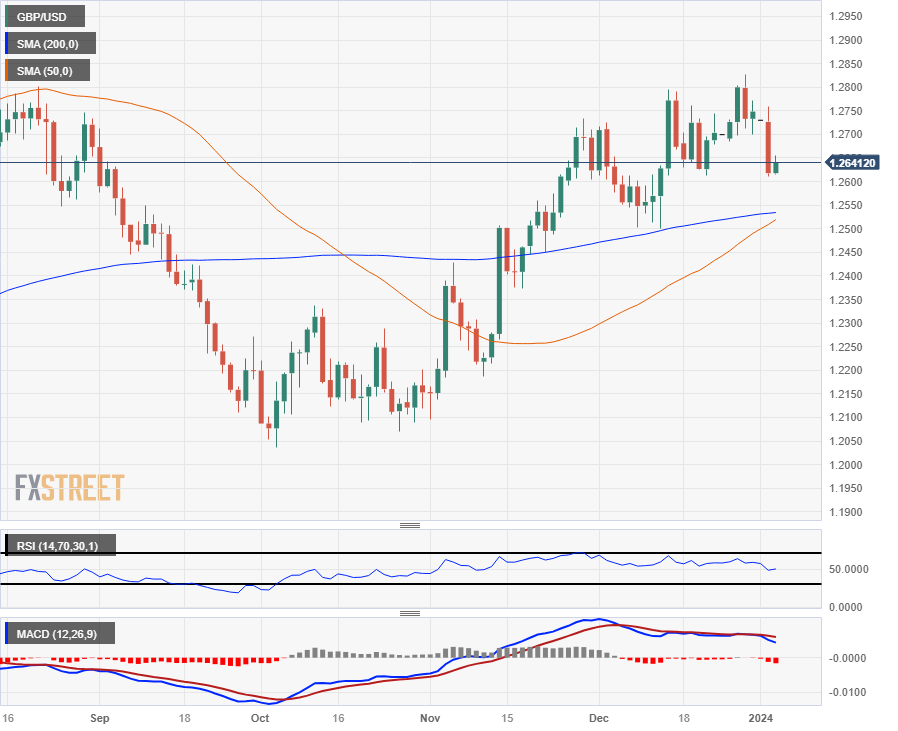
GBP/USD Technical Outlook
The Pound Sterling remains sharply off near-term highs against the US Dollar, with the GBP/USD down nearly 1.5% from last week’s peak of 1.2828. Intraday action is set to face bearish technical pressure following a downside cross of the 50-hour and 200-hour Simple Moving Averages (SMA), and the 1.2700 handle represents the level for bulls to beat.
Things are notably more bullish on the daily candlesticks with the GBP/USD trading on the high side of the 200-day SMA near 1.2550, and the 50-day SMA is set for a bullish cross of the longer moving average. On the low side, technical indicators have been softening since the start of December, and further topside momentum sees growing headwinds with higher highs making notably less progress than at the outset of the bullish rollover from October’s lows near 1.2050.
GBP/USD Hourly Chart
GBP/USD Daily Chart
GBP/USD Technical Levels
- The DXY Index sees strong gains and recovers above the 20-day SMA.
- US JOLTs Jobs Openings from November came in below expectations, while ISM’s December Manufacturing PMI came in higher than anticipated.
- Dovish bets on the Fed eased somewhat but are still high.
The US Dollar (USD) Index trades with noteworthy gains at 102.60, having successfully reclaimed the 20-day Simple Moving Average (SMA). This comes after the dovish bets on the Federal Reserve (Fed) eased somewhat following the release of the Institute Supply Management (ISM) Manufacturing PMI for December and the JOLTs Job Openings data for November. At 19:00 GMT, the Fed will release the minutes from its December meeting.
The Fed's dovish stance in its last 2023 meeting, welcoming cooling inflation and dismissing rate hikes in 2024, was positively received by markets that dumped the US Dollar in the last session. However, despite investors anticipating high odds of rate cuts in March and May 2023, incoming data could modify these expectations and focus shifts to December labor reports.
Daily digest market movers: US Dollar gains momentum ahead of FOMC minutes, labor market data eyed
- The ISM's Manufacturing PMI for December climbed to 47.4, slightly above the consensus of 47.1.
- JOLTs Job Openings reported by the U.S Bureau of Labor Statistics came in at 8.75M, below the expected 8.85M.
- Market participants are eagerly awaiting reports such as US Nonfarm Payrolls, Average Hourly Earnings, Unemployment Rate, and the Automatic Data Processing Inc. (ADP) Employment Change from December to continue placing their bets on the Fed.
- The Federal Open Market Committee (FOMC) minutes might provide additional guidance to investors.
- Market speculation, as inferred from the CME FedWatch Tool, suggests that the odds of rate cuts in March and May have eased but are still high. A hold in January is priced in.
Technical Analysis: DXY index short-term indicators gain traction, outlook still fragile
The Relative Strength Index (RSI), with its position in positive territory and positive slope, indicates a strengthening buying momentum in the DXY, showing that buyers may continue pushing up the currency index price. This is reinforced by the rising green bars of the Moving Average Convergence Divergence (MACD), which suggest a shift towards bullish territory.
However, the picture isn't entirely optimistic, as seen in the Simple Moving Averages (SMAs). The index's position above the 20-day SMA underscores the short-term buying momentum, but its position below the 100 and 200-day SMAs serves as a reminder of the sustained selling strength that continues to prevail on broader time frames. This suggests a bearish undercurrent that may need to gain more momentum before the situation could tip in favor of sellers.
Support levels: 102.40 (20-day SMA),102.00, 101.50.
Resistance levels: 102.70, 102.90, 103.00.
US Dollar FAQs
What is the US Dollar?
The US Dollar (USD) is the official currency of the United States of America, and the ‘de facto’ currency of a significant number of other countries where it is found in circulation alongside local notes. It is the most heavily traded currency in the world, accounting for over 88% of all global foreign exchange turnover, or an average of $6.6 trillion in transactions per day, according to data from 2022.
Following the second world war, the USD took over from the British Pound as the world’s reserve currency. For most of its history, the US Dollar was backed by Gold, until the Bretton Woods Agreement in 1971 when the Gold Standard went away.
How do the decisions of the Federal Reserve impact the US Dollar?
The most important single factor impacting on the value of the US Dollar is monetary policy, which is shaped by the Federal Reserve (Fed). The Fed has two mandates: to achieve price stability (control inflation) and foster full employment. Its primary tool to achieve these two goals is by adjusting interest rates.
When prices are rising too quickly and inflation is above the Fed’s 2% target, the Fed will raise rates, which helps the USD value. When inflation falls below 2% or the Unemployment Rate is too high, the Fed may lower interest rates, which weighs on the Greenback.
What is Quantitative Easing and how does it influence the US Dollar?
In extreme situations, the Federal Reserve can also print more Dollars and enact quantitative easing (QE). QE is the process by which the Fed substantially increases the flow of credit in a stuck financial system.
It is a non-standard policy measure used when credit has dried up because banks will not lend to each other (out of the fear of counterparty default). It is a last resort when simply lowering interest rates is unlikely to achieve the necessary result. It was the Fed’s weapon of choice to combat the credit crunch that occurred during the Great Financial Crisis in 2008. It involves the Fed printing more Dollars and using them to buy US government bonds predominantly from financial institutions. QE usually leads to a weaker US Dollar.
What is Quantitative Tightening and how does it influence the US Dollar?
Quantitative tightening (QT) is the reverse process whereby the Federal Reserve stops buying bonds from financial institutions and does not reinvest the principal from the bonds it holds maturing in new purchases. It is usually positive for the US Dollar.
- Canadian Dollar slips further on Wednesday as US Dollar bids firm up.
- Canada economic data on hold until Friday, to be overshadowed by US NFP.
- US ISM PMI beat expectations but still on the contractionary side.
The Canadian Dollar (CAD) is falling for the fifth consecutive trading day against the US Dollar (USD), with the Greenback getting bolstered against the broader FX market after the US ISM Manufacturing Purchasing Managers’ Index (PMI) for December came in above expectations, despite still printing in contractionary territory below the 50.0 midline.
Economic data from Canada is once again absent from the data docket on Wednesday, and Friday’s Canadian Unemployment Rate and Average Hourly Wages are set to be entirely eclipsed by the US Nonfarm Payrolls (NFP) for December.
Daily digest market movers: Canadian Dollar giving up further ground amidst USD push
- Despite declines against the outperforming Greenback and Pound Sterling (GBP), the CAD is in a firm position against the rest of the majors.
- The Canadian Dollar is down around a fifth of a percent against the USD and a third of a percent against the GBP.
- The Aussie (AUD) has given up around 0.4% against the Loonie, while the Yen (JPY) has retreated nearly three-quarters of a percent against the Canadian Dollar.
- The US ISM Manufacturing PMI for December printed at 47.4, beating the market forecast of 47.1 and climbing over November’s print of 46.7.
- The US JOLTS Job Openings in November showed less hiring potential than expected, with 8.79 million jobs available versus the forecast 8.85 million. October’s JOLTS openings were also revised up slightly from 8.733 million to 8.852 million.
- Investors will note that JOLTS has a small sample size that leaves the data prone to volatility, as well as the published figures being subject to revision up to five years after publication.
- Wednesday’s key data release comes towards the end of the US trading session when the Federal Reserve (Fed) drops their latest meeting minutes at 19:00 GMT.
Canadian Dollar price today
The table below shows the percentage change of Canadian Dollar (CAD) against listed major currencies today. Canadian Dollar was the strongest against the Japanese Yen.
| USD | EUR | GBP | CAD | AUD | JPY | NZD | CHF | |
| USD | 0.31% | -0.12% | 0.20% | 0.70% | 0.92% | 0.25% | 0.29% | |
| EUR | -0.31% | -0.44% | -0.12% | 0.38% | 0.61% | -0.07% | -0.02% | |
| GBP | 0.12% | 0.44% | 0.32% | 0.82% | 1.04% | 0.37% | 0.41% | |
| CAD | -0.19% | 0.12% | -0.31% | 0.51% | 0.74% | 0.07% | 0.11% | |
| AUD | -0.70% | -0.36% | -0.82% | -0.50% | 0.24% | -0.45% | -0.40% | |
| JPY | -0.93% | -0.64% | -1.06% | -0.73% | -0.22% | -0.70% | -0.63% | |
| NZD | -0.26% | 0.06% | -0.37% | -0.05% | 0.44% | 0.68% | 0.05% | |
| CHF | -0.29% | 0.03% | -0.42% | -0.10% | 0.40% | 0.63% | -0.05% |
The heat map shows percentage changes of major currencies against each other. The base currency is picked from the left column, while the quote currency is picked from the top row. For example, if you pick the Euro from the left column and move along the horizontal line to the Japanese Yen, the percentage change displayed in the box will represent EUR (base)/JPY (quote).
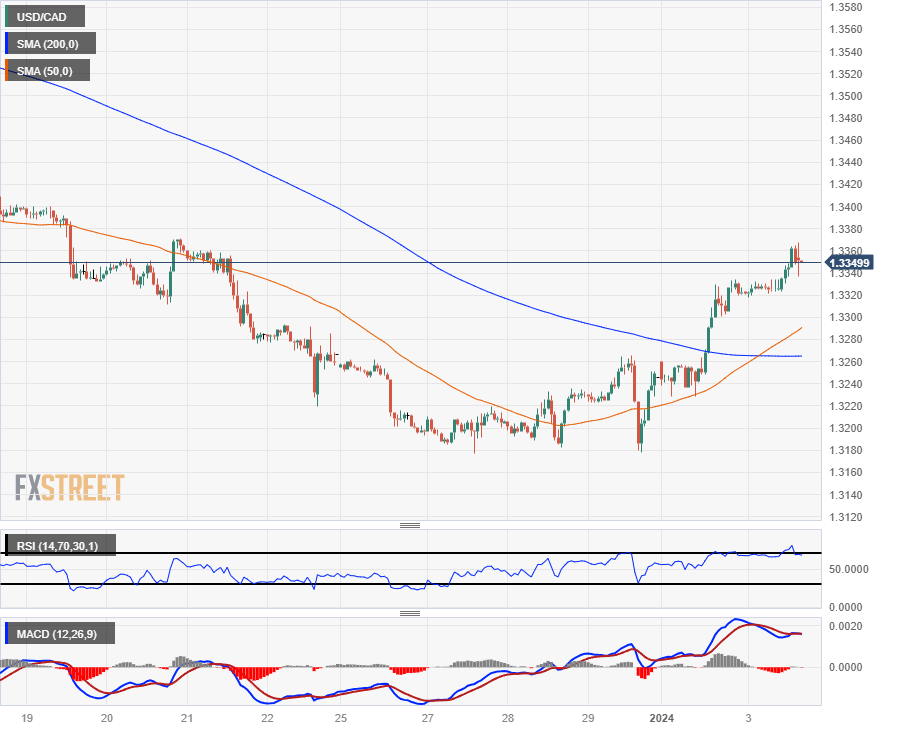
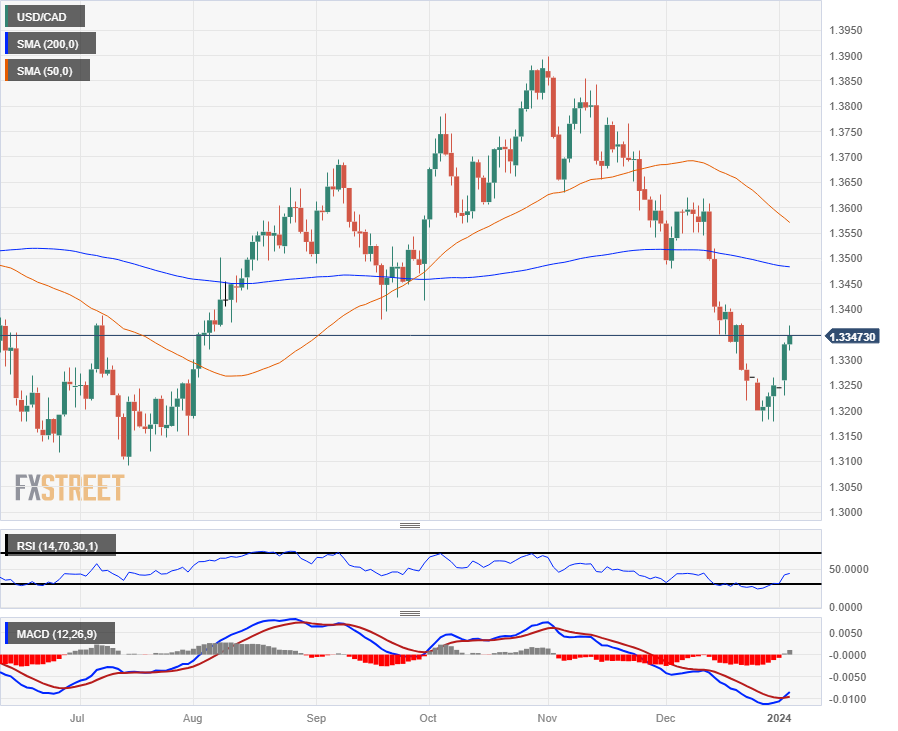
Technical Analysis: Canadian Dollar heading for a fifth straight day of losses
The Canadian Dollar (CAD) is slipping back against the US Dollar, extending recent declines and driving the USD/CAD pair further above the 200-hour Simple Moving Average (SMA). The pair is set for a fresh challenge of the 1.3400 level, provided near-term action continues to catch support from the bullish crossover of the 50-hour and 200-hour SMAs near 1.3275.
Daily candlesticks have the USD/CAD extending a bullish correction into a fifth consecutive trading day, but the pair remains firmly below the 200-day SMA near 1.3500. Despite this, technical indicators are still recovering from getting pinned deep into oversold territory after the pair’s multi-week decline from November’s peak of 1.3899. Further room to run could be uncovered before the 50-day SMA manages to make a bearish cross of the 200-day SMA.
USD/CAD Hourly Chart
USD/CAD Daily Chart
Canadian Dollar FAQs
What key factors drive the Canadian Dollar?
The key factors driving the Canadian Dollar (CAD) are the level of interest rates set by the Bank of Canada (BoC), the price of Oil, Canada’s largest export, the health of its economy, inflation and the Trade Balance, which is the difference between the value of Canada’s exports versus its imports. Other factors include market sentiment – whether investors are taking on more risky assets (risk-on) or seeking safe-havens (risk-off) – with risk-on being CAD-positive. As its largest trading partner, the health of the US economy is also a key factor influencing the Canadian Dollar.
How do the decisions of the Bank of Canada impact the Canadian Dollar?
The Bank of Canada (BoC) has a significant influence on the Canadian Dollar by setting the level of interest rates that banks can lend to one another. This influences the level of interest rates for everyone. The main goal of the BoC is to maintain inflation at 1-3% by adjusting interest rates up or down. Relatively higher interest rates tend to be positive for the CAD. The Bank of Canada can also use quantitative easing and tightening to influence credit conditions, with the former CAD-negative and the latter CAD-positive.
How does the price of Oil impact the Canadian Dollar?
The price of Oil is a key factor impacting the value of the Canadian Dollar. Petroleum is Canada’s biggest export, so Oil price tends to have an immediate impact on the CAD value. Generally, if Oil price rises CAD also goes up, as aggregate demand for the currency increases. The opposite is the case if the price of Oil falls. Higher Oil prices also tend to result in a greater likelihood of a positive Trade Balance, which is also supportive of the CAD.
How does inflation data impact the value of the Canadian Dollar?
While inflation had always traditionally been thought of as a negative factor for a currency since it lowers the value of money, the opposite has actually been the case in modern times with the relaxation of cross-border capital controls. Higher inflation tends to lead central banks to put up interest rates which attracts more capital inflows from global investors seeking a lucrative place to keep their money. This increases demand for the local currency, which in Canada’s case is the Canadian Dollar.
How does economic data influence the value of the Canadian Dollar?
Macroeconomic data releases gauge the health of the economy and can have an impact on the Canadian Dollar. Indicators such as GDP, Manufacturing and Services PMIs, employment, and consumer sentiment surveys can all influence the direction of the CAD. A strong economy is good for the Canadian Dollar. Not only does it attract more foreign investment but it may encourage the Bank of Canada to put up interest rates, leading to a stronger currency. If economic data is weak, however, the CAD is likely to fall.
- USD/JPY climbs to 143.66, buoyed by US 10-year bond yield surpassing 4% and positive ISM Manufacturing PMI data.
- JOLTS report shows slight job opening increase; market anticipates December FOMC minutes for Fed's rate cut insights.
- Japan's financial markets to reopen post-holiday, facing challenges from a recent earthquake and awaited Manufacturing PMI data.
The USD/JPY rises sharply during the North American session after economic data from the United States (US) prompted investors to extend the US bond sell-off, as the US 10-year bond yield is back above the 4% threshold. Therefore, the major is prolonging its gains of more than 1.20%, trading at 143.66.
USD/JPY gains more than 1.20% as the US 10-year bond yield surpasses 4%, market await Fed minutes
The US economic calendar revealed that business activity is recovering slightly, as the ISM Manufacturing PMI was 47.4, exceeding forecasts of 47.1 November’s 46.7 reading. According to the ISM, a PMI reading below 48.7 over some time generally indicates a contraction of the economy as a whole.
The November Job Openings and Labor Turnover Survey (JOLTS) report indicated a slight increase to 8.79 million, below the anticipated 8.85 million. Additionally, the data for October was revised upwards to 8.852 million.
Meanwhile, Federal Reserve’s (Fed) speakers had begun to cross newswires, led by the Richmond Fed President Thomas Barkin. He said that although the US central bank is making real progress on curbing stickier inflation, and the economy remains robust, the risks of missing a soft landing remain.
Even though the USD/JPY is skyrocketing during Wednesday’s session, upside risks remain, with additional US economic data pending to be released. The Federal Reserve is expected to reveal December’s Federal Open Market Committee (FOMC) minutes, which would be digested by investors looking for rate cut discussions or any pushback by the “hawks” left at the US central bank.
In the meantime, traders remain aggressively pricing in more than 150 basis points of rate cuts by the Fed, according to futures data provided by the Chicago Board of Trade (CBOT). The odds for a rate cut in March stand at around 80%, but for May, it is fully priced in.
In Japan, the financial markets would re-open following a holiday and a bumpy start to 2024, as the country was hit by a 7.6 magnitude earthquake on January 1. Its economic docket will feature the release of the Jibun Bank Manufacturing PMI for December.
USD/JPY Price Analysis: Technical outlook
The USD/JPY daily chart depicts the pair as downward biased despite posting a leg-up of more than 140 pips, above the 143.00 figure. On the upside, buyers need to reclaim the 144.00 figure to remain hopeful of higher prices but would face strong resistance at the Kijun-Sen price level at 144.54. On the flip side, if sellers step in and drag prices below 143.00, that would pave the way for a resumption of the ongoing downtrend, with the next support seen at December 28 low of 140.24.
- Mexican Peso at the mercy of US economic data, with traders waiting for the Fed’s last meeting minutes.
- Mexico's Manufacturing PMI dips to 52.0, exerting pressure on the Peso amid positive business confidence data.
- USD/MXN recovers to over 17.00 after a dip, fueled by a rise in US Treasury yields and strong sentiment towards the US Dollar
The Mexican Peso (MXN) began the year on a lower note against the US Dollar (USD) after the exotic pair dipped to a three-month low on December 28 of 16.86. Nevertheless, a rise in US Treasury Bond yields and overall bullish sentiment towards the Greenback (USD) underpins the pair above the 17.05 area for a 0.21% daily gain.
On Tuesday, Mexico’s economic docket featured the S&P Global Manufacturing PMI for December, which printed 52.0, below November’s 52.5, and weighed on the Mexican currency. During the day, business confidence improved while USD/MXN traders digested economic data from the United States (US) revealed at around 15:00 GMT. However, market players await the release of the latest Federal Reserve’s (Fed) meeting minutes.
Daily digest market movers: Mexican Peso losses steam on positive US data
- Commentary from Richmond Federal Reserve (Fed) President Thomas Barkin supported the US Dollar after he stated the US central bank is making real progress in taming inflation. He added that although the economy is headed for a soft landing, risks remain, adding that the potential for additional rate hikes is on the table.
- US economic docket revealed the ISM Manufacturing PMI came in at 47.4, exceeding expectations of 47.1, while the prior reading was 46.7.
- At the same time, the November Job Openings and Labor Turnover Survey (JOLTS) report rose less than estimates of 8.85 million to 8.79 million, while October’s figures were upwardly revised to 8.852 million.
- Later, December’s Federal Open Market Committee (FOMC) minutes will be scrutinized by traders, following Federal Reserve Chairman Jerome Powell’s dovish pivot that fueled a stock rally towards the end of 2023. Fed officials estimate three rate cuts toward the end of December 2024, as depicted by the Summary of Economic Projections (SEP).
- Money market futures data provided by the Chicago Board of Trade (CBOT) shows that traders remain confident the Fed would slash rates by 150 basis points towards the year’s end.
Technical analysis: Mexican Peso stays bearish despite USD/MXN buyers' effort
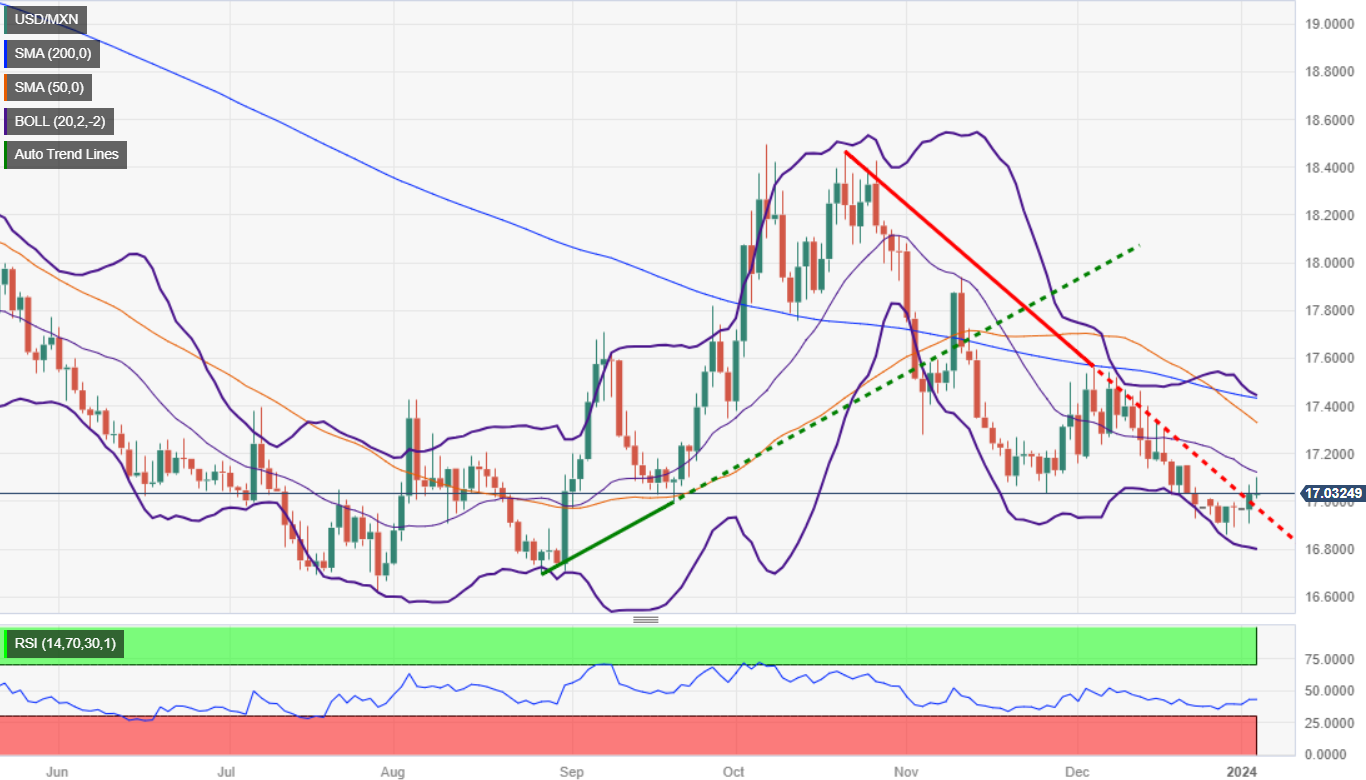
From a technical perspective, the USD/MXN remains bearishly biased, though sellers need a daily close below the November 27 low of 17.03 to increase their chances of pushing the price back below the 17.00 figure. Once achieved, that could pave the way to test the waters at around 16.86, ahead of falling toward last year’s low of 16.62.
On the flip side, if USD/MXN stays above the 17.00 figure, that could pave the way for a move toward the 17.37-17.43 area, the confluence of the 50, 100, and 200-day Simple Moving Averages (SMAs). If that area is surpassed, expect the USD/MXN to reach the psychological 17.50 area, ahead of the November 10 high at 17.93.
Also read: Mexican Peso Price Annual Forecast: Which factor would impact most in 2024, economics or politics?
USD/MXN Daily Chart
Mexican Peso FAQs
What key factors drive the Mexican Peso?
The Mexican Peso (MXN) is the most traded currency among its Latin American peers. Its value is broadly determined by the performance of the Mexican economy, the country’s central bank’s policy, the amount of foreign investment in the country and even the levels of remittances sent by Mexicans who live abroad, particularly in the United States. Geopolitical trends can also move MXN: for example, the process of nearshoring – or the decision by some firms to relocate manufacturing capacity and supply chains closer to their home countries – is also seen as a catalyst for the Mexican currency as the country is considered a key manufacturing hub in the American continent. Another catalyst for MXN is Oil prices as Mexico is a key exporter of the commodity.
How do decisions of the Banxico impact the Mexican Peso?
The main objective of Mexico’s central bank, also known as Banxico, is to maintain inflation at low and stable levels (at or close to its target of 3%, the midpoint in a tolerance band of between 2% and 4%). To this end, the bank sets an appropriate level of interest rates. When inflation is too high, Banxico will attempt to tame it by raising interest rates, making it more expensive for households and businesses to borrow money, thus cooling demand and the overall economy. Higher interest rates are generally positive for the Mexican Peso (MXN) as they lead to higher yields, making the country a more attractive place for investors. On the contrary, lower interest rates tend to weaken MXN.
How does economic data influence the value of the Mexican Peso?
Macroeconomic data releases are key to assess the state of the economy and can have an impact on the Mexican Peso (MXN) valuation. A strong Mexican economy, based on high economic growth, low unemployment and high confidence is good for MXN. Not only does it attract more foreign investment but it may encourage the Bank of Mexico (Banxico) to increase interest rates, particularly if this strength comes together with elevated inflation. However, if economic data is weak, MXN is likely to depreciate.
How does broader risk sentiment impact the Mexican Peso?
As an emerging-market currency, the Mexican Peso (MXN) tends to strive during risk-on periods, or when investors perceive that broader market risks are low and thus are eager to engage with investments that carry a higher risk. Conversely, MXN tends to weaken at times of market turbulence or economic uncertainty as investors tend to sell higher-risk assets and flee to the more-stable safe havens.
Economic activity in the manufacturing sector expanded in December for the second straight month. The ISM Manufacturing PMI improved to 47.4 from 46.7 in the previous month, surpassing at the same time market consensus at 47.1.
Extra details of the release showed the ISM Manufacturing Employment rose to 48.1 (from 45.8), ISM Manufacturing New Orders eased to 47.1 and finally ISM Manufacturing Prices decreased to 45.2.
Market reaction
The USD Index (DX) pulled back from the highest level in almost three weeks near 102.60 to the 102.30 region soon after the release. The knee-jerk also followed the lower-than-expected reading from the November’s JOLTs Job Openings (8.79M).

- Silver price plunges to near $23.15 as appeal for bullions fade ahead of FOMC minutes.
- Investors reconsider Fed’s rate cut bets amid robust US economic prospects.
- More downside in Silver is likely amid a H&S breakdown.
Silver price (XAG/USD) fell vertically to near $23.15 as investors rush for safe-haven assets in the early New York session. The white metal is heavily dump by the market participants as investors have started reconsidering their bets in favour of early rate cuts by the Federal Reserve (Fed).
The S&P500 is expected to open on a weak note, portraying a significant decline in the risk-appetite of the market participants. The US Dollar Index (DXY) has rebounded to near its two-week high around 102.55 as investors turn cautious ahead of the Federal Open Market Committee (FOMC) minutes and the United States Manufacturing PMI to be reported by the Institute of Supply Management (ISM) for December.
As per the CME Fedwatch tool, chances for the Fed reducing interest rates by 25 basis points (bps) to 5.00-5.25% in the March monetary policy meeting have dropped to 65% vs. 72% recorded on Tuesday.
Investors have reconsidered Fed’s early rate bets as they mulls over resilient US economic prospects, which could delay ‘rate-cut’ campaign.
On the economic data front, investors await the US ISM Manufacturing PMI, which is seen higher at 47.1 vs. the former reading of 46.7.
Silver technical analysis
Silver price witnesses a steep fall after a breakdown of the Head and Shoulder chart pattern formed on a four-hour scale. The Relative Strength Index (RSI) (14) has shifted into the bearish range of 20.00-40.00, which indicates that a bearish momentum has been triggered.
Silver four-hour chart
-638398875619522808.png)
Richmond Federal Reserve President Thomas Barkin said on Wednesday that they are making real progress on inflation while the economy remains healthy, per Reuters.
Barkin added that they can see the case for a soft landing developing in the data but noted that it was not 'inevitable.'
He further explained that risks to soft landing include delayed impact of high interest rates on credit, outside shocks, services inflation getting stuck at a high levels and demand remaining strong. "That's why the potential for additional rate hikes remains on the table," Barkin said.
Market reaction
The US Dollar preserves its strength following these comments and the US Dollar Index was last seen rising 0.3% on the day at 102.52.
- USD/CAD advances to near 1.3350 as investors’ risk-appetite fades.
- The FOMC minutes will provide outlook on inflation and interest rates.
- Canadian jobless rate is seen higher at 5.9% vs. 5.8% in November.
The USD/CAD pair jumps to near the crucial resistance of 1.3350 in the late London session. The Loonie asset recovers swiftly, following footprints of the US Dollar Index (DXY) amid caution among market participants ahead of the Federal Open Market Committee (FOMC) minutes and the United States ISM Manufacturing PMI for December.
S&P500 futures have generated nominal losses in the European session, portraying further decline in the risk-appetite of the market participants. The USD Index advances to near 102.50 as chances of a likely rate cut decision by the Federal Reserve (Fed) from March have eased slightly. The 10-year US Treasury yields have extended their upside to near 4%.
The FOMC minutes will demonstrate how much policymakers are interested in reducing interest rates. Meanwhile, the US factory data will be keenly watched. As per the preliminary estimates, the Manufacturing PMI is seen higher at 47.1 from the prior reading of 46.7 but will remain below the 50.0 threshold consecutively for 14th month.
In addition to that, US JOLTS Job Openings for November will be in focus. Investors have projected that US employers posted 8.85M jobs, which are higher than 8.733M postings recorded in October.
On the Canadian Dollar front, investors await the employment data for December, which will be published on Friday. As per the estimates, the Unemployment Rate rose to 5.9% against the former reading of 5.85. Number of job-seekers employed by Canadian employers were 13.5K, lower than 24.9K additions in November.
- USD/CHF advances above 0.8500 amid a sharp recovery in the US Dollar.
- Investors’ risk-appetite trims ahead of the FOMC minutes.
- USD/CHF aims stabilization above 0.8500 for further upside.
The USD/CHF pair delivers a decisive break above the psychological resistance of 0.8500 in the European session. The Swiss franc asset has extended its recovery to near 0.8520 amid a sharp rebound by the US Dollar Index (DXY) ahead of the Federal Open Market Committee (FOMC) minutes and the Manufacturing PMI data for December by the Institute of Supply Management (ISM).
The market mood has turned risk-averse amid caution that absence of discussions of interest rate cuts from policymakers in the FOMC minutes of December’s monetary policy could spoil recent recovery in risk-perceived assets.
For the ISM Manufacturing PMI, investors see a nominal recovery to 47.1 vs. the former reading of 46.7. The economic data is expected to remain below the 50.0 threshold for the 14th straight month.
On the Swiss Franc front, the Manufacturing PMI for December improved to 43.0 vs. the former reading of 42.1.
USD/CHF advances swiftly after delivering a breakout of the consolidation formed in a narrow range around 0.8500. The Swiss Franc asset has climbed above the horizontal resistance plotted from 22 December 2023 low at 0.8514. Sustainability above the same would strengthen the US Dollar bulls.
Upward-sloping 50-period Exponential Moving Average (EMA) indicates strength in the near-term trend.
The Relative Strength Index (RSI) (14) oscillates in the bullish range of 60.00-80.00, indicating strength in the upside momentum.
Further upside above December 26 high near 0.8580 would drive the asset towards the round-level resistance of 0.8600, followed by December 21 high at 0.8633.
On the contrary, a downside move below December 28 high around 0.8450 would drag the asset towards the round-level support of 0.8400 and December 29 low of 0.8357.
USD/CHF hourly chart
-638398752715416950.png)
- Gold price pares intraday gains as bets in favour of early rate cuts by the Fed drop slightly.
- Action in the FX domain could turn volatile as FOMC Minutes and Manufacturing PMI are due for release.
- The US Dollar Index recovers as upbeat sentiment-based rally pauses.
Gold price (XAU/USD) surrenders gains generated in the early Asian session amid caution ahead of the Federal Open Market Committee (FOMC) minutes and crucial data from the United States, namely the Institute for Supply Management (ISM) Manufacturing PMI for December and JOLTS Job Openings data for November.
The precious metal faces selling pressure as investors reconsider their bets in favour of a rate cut by the Federal Reserve (Fed) in March. An absence of significant discussions about rate cuts by Fed policymakers in the FOMC minutes will dampen the near-term appeal for Gold and support the US Dollar (USD) and Treasury yields.
On the economic data front, the ISM PMI is expected to signal that the US manufacturing sector remained in a contraction trajectory for the 14th month in a row. Meanwhile, higher job postings by US employers will indicate a steady labor demand.
Daily Digest Market Movers: Gold price surrenders gains ahead of FOMC minutes
- Gold price surrenders the majority of gains generated on early Wednesday as prospects of early rate cuts by the Federal Reserve have trimmed slightly ahead of the publication of the FOMC minutes.
- As per the CME Fedwatch tool, chances of an interest rate cut by 25 basis points (bps) in March have dropped to 67% from 72%.
- The FOMC minutes will provide a detailed explanation about the decision to maintain rates on hold in December’s monetary policy for the third time in a row.
- Apart from that, the outlook on interest rates and the underlying inflation for 2024 and 2025 will be keenly watched.
- Less discussions about rate cuts among policymakers may dampen the near-term appeal for Gold and demand for safe-haven assets will heat up.
- Fed Chair Jerome Powell, in its monetary policy statement, said rate cuts will be a topic of discussion going forward. Cues favouring a delay in rate cuts may stem a dismal market mood.
- In addition to the FOMC minutes, investors will keep an eye on the ISM Manufacturing PMI for December, which will be published at 15:00 GMT.
- The Manufacturing PMI is seen at 47.1, below the 50.0 threshold for the 14th straight month, but higher than the former reading of 46.7. A figure below 50.0 signals contraction in the manufacturing sector.
- Investors will also focus on the fresh orders for the manufacturing sector, which will provide the outlook for 2024.
- Apart from that, the US Bureau of Labor Statistics will publish the JOLTS Job openings data for November. Estimates indicate that job postings were higher at 8.85M against the former reading of 8.733M.
- Meanwhile, a sharp recovery in the US Treasury yields has capped the upside in Gold prices. The 10-year US Treasury yields have recovered to nearly 4.0% as investors are realizing that robust strength in the United States economy in 2024 could delay rate cuts.
- The US Dollar Index (DXY) clings to gains near 102.20 as investors are uncertain in a data-packed week.
- After the ISM factory data, investors will look for the crucial labour market data for December. On Thursday, the Automatic Data Processing (ADP) Employment data will provide fresh cues about labour demand.
- As per estimates, private US employers added 115K job-seekers in December against 103K payrolls created in November.
Technical Analysis: Gold price falls to near $2,060
Gold price falls back slightly below the crucial support of $2,060 after failing to sustain above the $2,080 resistance. The precious metal trades at make or a break ahead of crucial US events. A breakdown below Tuesday’s low of $2,056 could unveil fresh downside for the Gold price towards $2,045. Upward-sloping 20-day and 50-day Exponential Moving Averages (EMAs) indicate that the overall trend is still bullish.
Gold FAQs
Why do people invest in Gold?
Gold has played a key role in human’s history as it has been widely used as a store of value and medium of exchange. Currently, apart from its shine and usage for jewelry, the precious metal is widely seen as a safe-haven asset, meaning that it is considered a good investment during turbulent times. Gold is also widely seen as a hedge against inflation and against depreciating currencies as it doesn’t rely on any specific issuer or government.
Who buys the most Gold?
Central banks are the biggest Gold holders. In their aim to support their currencies in turbulent times, central banks tend to diversify their reserves and buy Gold to improve the perceived strength of the economy and the currency. High Gold reserves can be a source of trust for a country’s solvency. Central banks added 1,136 tonnes of Gold worth around $70 billion to their reserves in 2022, according to data from the World Gold Council. This is the highest yearly purchase since records began. Central banks from emerging economies such as China, India and Turkey are quickly increasing their Gold reserves.
How is Gold correlated with other assets?
Gold has an inverse correlation with the US Dollar and US Treasuries, which are both major reserve and safe-haven assets. When the Dollar depreciates, Gold tends to rise, enabling investors and central banks to diversify their assets in turbulent times. Gold is also inversely correlated with risk assets. A rally in the stock market tends to weaken Gold price, while sell-offs in riskier markets tend to favor the precious metal.
What does the price of Gold depend on?
The price can move due to a wide range of factors. Geopolitical instability or fears of a deep recession can quickly make Gold price escalate due to its safe-haven status. As a yield-less asset, Gold tends to rise with lower interest rates, while higher cost of money usually weighs down on the yellow metal. Still, most moves depend on how the US Dollar (USD) behaves as the asset is priced in dollars (XAU/USD). A strong Dollar tends to keep the price of Gold controlled, whereas a weaker Dollar is likely to push Gold prices up.
- EUR/USD gains ground amid upbeat US Dollar.
- German Unemployment Change reduced to 5K from 22K prior.
- The seasonally adjusted Unemployment Rate remained consistent at 5.9%.
- The improved US Treasury yields are reinforcing the strength of the Greenback.
EUR/USD struggles to retrace its recent losses registered in the previous session, trading near 1.0940 during the European session on Wednesday. The moderate German Unemployment data for December seems to have weighed on the Euro (EUR). The Unemployment Change showed that the number of unemployed people was reduced to 5K against the market consensus of 20K and 22K prior. However, the seasonally adjusted Unemployment Rate remained consistent at 5.9% as expected.
EUR/USD pair faced challenges due to the risk-off market sentiment. Market participants lean towards the possibility of policy rate cuts from the European Central Bank (ECB) as a measure to prop up the economy. Moreover, ECB policymaker Pablo Hernandez de Cos emphasized on Tuesday that economic data uncertainty remains high and the ECB’s decision to start cutting interest rates would be data-driven. However, investors seem to have priced in six rate cuts for 2024 from the ECB.
Market participants are reassessing the likelihood of interest rate cuts by the US Federal Reserve (Fed) in the first quarter of 2024, driven by expectations of tepid growth in the United States (US) economy towards the end of the year. This reassessment has contributed to the strength of the Greenback, with the upbeat US Dollar Index (DXY) maintaining its winning streak near 102.30 by the press time.
The continued gains of the US Dollar are supported by enhanced US Treasury yields. At the time of writing, the 2-year and 10-year yields on US Treasury bonds stand higher at 4.36% and 3.98%, respectively. Investors are anticipated to closely monitor US data on Wednesday, including the December ISM Manufacturing PMI, November JOLTS Job Openings, and the Federal Open Market Committee (FOMC) Minutes.
Gold prices fell in India on Wednesday, according to data from India's Multi Commodity Exchange (MCX).
Gold price stood at 63,078 Indian Rupees (INR) per 10 grams, down INR 230 compared with the INR 63,308 it cost on Tuesday.
As for futures contracts, Gold prices decreased to INR 63,126 per 10 gms from INR 63,257 per 10 gms.
Prices for Silver futures contracts decreased to INR 73,589 per kg from INR 74,095 per kg.
| Major Indian city | Gold Price |
|---|---|
| Ahmedabad | 65,295 |
| Mumbai | 65,150 |
| New Delhi | 65,160 |
| Chennai | 65,290 |
| Kolkata | 65,525 |
Global Market Movers: Comex Gold price stays weak amid rising US Treasury bond yields
- A combination of supporting factors assists the Comex Gold price to regain positive traction on Wednesday and snap a three-day losing streak.
- Bets that the Federal Reserve will cut interest rates in March turn out to be a key factor lending support to the non-yielding yellow metal.
- The possibility of a further escalation of conflict in the Red Sea, along with China's economic woes, also acts as a tailwind for the safe-haven metal.
- The official Chinese PMI released over the weekend indicated a further deterioration in manufacturing activity and little signs of recovery at the end of 2023.
- A private survey showed on Tuesday that China's factory activity expanded at a quicker pace in December but business confidence for 2024 remained subdued.
- The US Dollar consolidates the overnight strong gains to a more than one-week top, helped by a sharp rise in the US bond yields, and caps the commodity.
- Traders might also prefer to wait on the sidelines ahead of the US ISM Manufacturing PMI, JOLTS Job Openings data and the crucial FOMC meeting minutes.
(An automation tool was used in creating this post.)
Gold FAQs
Why do people invest in Gold?
Gold has played a key role in human’s history as it has been widely used as a store of value and medium of exchange. Currently, apart from its shine and usage for jewelry, the precious metal is widely seen as a safe-haven asset, meaning that it is considered a good investment during turbulent times. Gold is also widely seen as a hedge against inflation and against depreciating currencies as it doesn’t rely on any specific issuer or government.
Who buys the most Gold?
Central banks are the biggest Gold holders. In their aim to support their currencies in turbulent times, central banks tend to diversify their reserves and buy Gold to improve the perceived strength of the economy and the currency. High Gold reserves can be a source of trust for a country’s solvency. Central banks added 1,136 tonnes of Gold worth around $70 billion to their reserves in 2022, according to data from the World Gold Council. This is the highest yearly purchase since records began. Central banks from emerging economies such as China, India and Turkey are quickly increasing their Gold reserves.
How is Gold correlated with other assets?
Gold has an inverse correlation with the US Dollar and US Treasuries, which are both major reserve and safe-haven assets. When the Dollar depreciates, Gold tends to rise, enabling investors and central banks to diversify their assets in turbulent times. Gold is also inversely correlated with risk assets. A rally in the stock market tends to weaken Gold price, while sell-offs in riskier markets tend to favor the precious metal.
What does the price of Gold depend on?
The price can move due to a wide range of factors. Geopolitical instability or fears of a deep recession can quickly make Gold price escalate due to its safe-haven status. As a yield-less asset, Gold tends to rise with lower interest rates, while higher cost of money usually weighs down on the yellow metal. Still, most moves depend on how the US Dollar (USD) behaves as the asset is priced in dollars (XAU/USD). A strong Dollar tends to keep the price of Gold controlled, whereas a weaker Dollar is likely to push Gold prices up.
- Silver drifts lower for the fourth straight day and touches a near three-week trough.
- The technical set-up favours bearish traders and supports prospects for further losses.
- A sustained strength beyond the $24.00 mark is needed to negate the negative outlook.
Silver (XAG/USD) remains under some selling pressure for the fourth successive day on Wednesday and drops to a near three-week low, below mid-$23.00s during the first half of the European session.
With the latest leg down, the XAG/USD confirms a breakdown through the 50% Fibonacci retracement level of the $22.51-$24.61 move up and seems vulnerable to decline further. The negative outlook is reinforced by the fact that technical indicators on the daily chart have again started gaining negative traction and are holding deep in the negative territory on hourly charts. This, in turn, suggests that the path of least resistance for the white metal is to the downside.
Any subsequent slide, however, is likely to find some support near the 61.8% Fibo. level, around the $23.30 region, ahead of the $23.15 zone, representing a multi-month-old ascending trend-line support, and the $23.00 round-figure mark. The latter should act as a key pivotal point, which if broken decisively will be seen as a fresh trigger for bearish traders and pave the way for an extension of the recent downfall witnessed over the past week or so.
The XAG/USD might then accelerate the downfall further towards the December monthly swing low, around mid-$22.00s, before dropping to the $22.25 support and the $22.00 round-figure mark.
On the flip side, recovery back above the $23.55 region (50% Fibo. level) might now be seen as a selling opportunity near the $23.75-$23.80 area, or the 38.2% Fibo. level. This is closely followed by the $24.00 mark, which if cleared decisively will suggest that the recent corrective slide has run its course and push the XAG/USD further towards the $24.60 area (December 22 high). Bulls might eventually aim to reclaim the $25.00 psychological mark.
Silver 4-hour chart
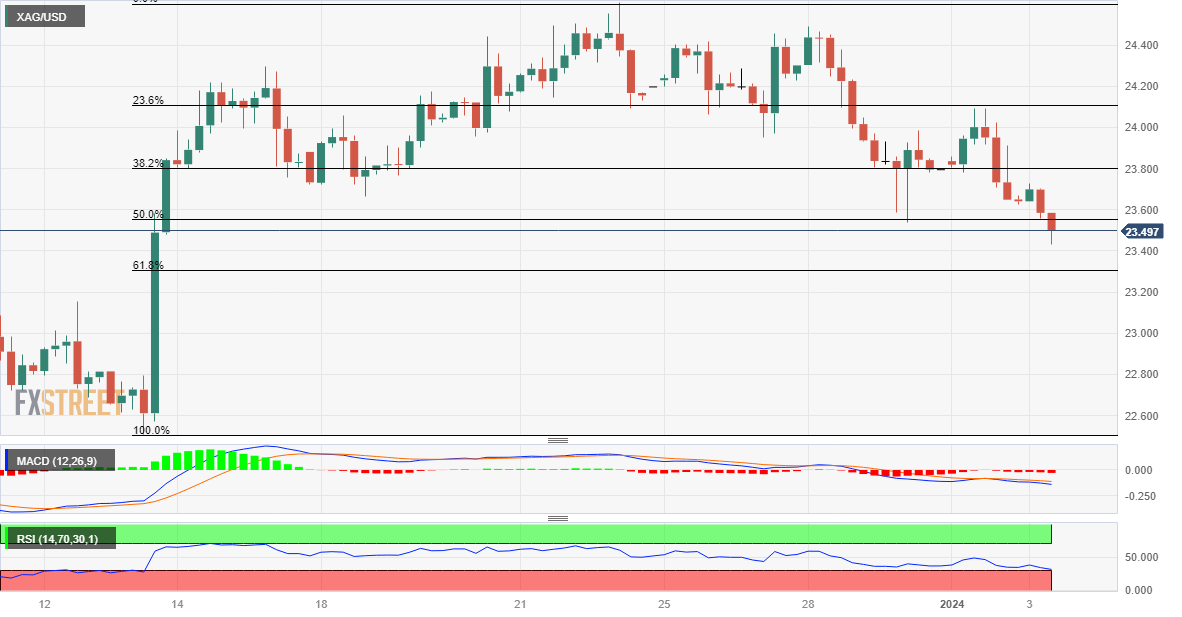
Technical levels to watch
- USD/CHF retraces recent gains as the US Dollar halts its winning streak.
- The recent Mexico data reduce Banxico’s immediate pressure for policy-tightening decisions.
- The Greenback gains ground on improved US Treasury yields.
USD/MXN continues the winning streak that began on Thursday, trading higher near 17.03 during the European session on Wednesday. The Mexican Peso (MXN) loses ground as the US Dollar (USD) improves on risk-off sentiment. Market participants reconsider the possibility of interest rate cuts by the Federal Reserve in the first quarter of 2024, which pushes the investors to return towards the Greenback.
The recent data from Mexico indicates an increase in the Fiscal Deficit to 87.78 billion in November, a significant rise from the 29.58 billion recorded in October. Despite this, the Jobless Rate remained stable at 2.7%, slightly below market expectations of 2.6%. However, the seasonally adjusted Jobless Rate saw a minor uptick to 2.8% from the previous 2.6%. This shift is attributed to the impact of the higher policy rates maintained by the Bank of Mexico (Banxico). The moderate data may offer some relief to Banxico, potentially reducing the immediate pressure for further tightening of monetary policy.
The US Dollar Index (DXY) could maintain its winning streak for the fourth consecutive session on enhanced US Treasury yields, trading higher around 102.10, with the 2-year and 10-year yields on US Treasury bonds standing higher at 4.34% and 3.96%, respectively, by the press time. The US S&P Global Manufacturing PMI posted a lower-than-expected figure than anticipated. Looking ahead, investors are likely to pay close attention to US data on Wednesday, which includes the December ISM Manufacturing PMI, November JOLTS Job Openings, and the Federal Open Market Committee (FOMC) Minutes.
- NZD/USD recovers from 0.6250 as the US Dollar turns sideways ahead of FOMC minutes.
- The likelihood of an interest rate cut by the Fed in March 2024 has dropped slightly.
- NZD/USD manages to sustain inside the Rising Channel chart pattern.
The NZD/USD pair has rebounded after discovering buying support near 0.6250 on Wednesday. The Kiwi asset finds cushion as the US Dollar Index (DXY) is struggling for a direction ahead of the release of the Manufacturing PMI for December to be reported by the United States Institute of Supply Management (ISM) at 15:00 GMT and the Federal Open Market Committee (FOMC) minutes.
S&P500 futures remains subdued in the Asian session, portraying caution among market participants ahead of crucial US economic events. The USD Index consolidates around 102.20 after a sharp recovery as investors reconsider about risk sentiment.
Bets supporting an interest rate cut by 25 basis points (bps) by the Federal Reserve (Fed) in March 2024 have dropped. As per the CME Fedwatch tool, the likelihood of an interest rate cut in March has come down to 67% from 72% projected on Tuesday.
NZD/USD trades in a Rising Channel chart pattern on a four-hour scale in which each pullback is considered as a selling opportunity by the market participants. The Kiwi asset slips below the 50-period Exponential Moving Average (EMA), which indicates that the near-term upside bias has dampened for now. The broader appeal will remain bullish until the asset sustains in the upward-sloping channel.
The Relative Strength Index (RSI) (14) has slipped into the bearish range of 20.00-40.00. Fresh recovery would appear when the momentum oscillator will deliver a range shift move.
Investors should capitalize a mean-reversion move to near the lower portion of the aforementioned chart pattern, which is around 0.6235. This would result in a recovery move towards 13 December 2023 high at 0.6287, followed by January 2 high at 0.6335.
In an alternate scenario, a breakdown below December 18 low near 0.6200 would expose the asset to 12 December 2023 high at 0.6170 and 8 December 2023 low near 0.6100.
NZD/USD four-hour chart
-638398659413830379.png)
The US JOLTS data will be watched closely by investors ahead of the December jobs report.
Job openings are forecast to edge higher to 8.85 million on the last business day of November.
Further loosening in labor market conditions could ramp up expectations of a Fed rate cut in March.
The Job Openings and Labor Turnover Survey (JOLTS) will be released on Wednesday by the US Bureau of Labor Statistics (BLS). The publication will provide data about the change in the number of job openings in November, alongside the number of layoffs and quits.
JOLTS data will be scrutinized by market participants and Federal Reserve (Fed) policymakers because it could provide valuable insights regarding the supply-demand dynamics in the labor market, a key factor impacting salaries and inflation. While job openings have been trending down during 2023 – a sign of cooling demand for labor – these remain well above pre-pandemic levels.
What to expect in the next JOLTS report?
"Over the month, the number of hires and total separations changed little at 5.9 million and 5.6 million, respectively," the BLS noted in the October report and added: "Within separations, quits (3.6 million) and layoffs and discharges (1.6 million) changed little."
After declining steadily from 10.3 million to 8.9 million in the April-July period, job openings rose to 9.49 million in August. In September, this number retreated to 9.3 million and dropped to its lowest level since March 2021 at 8.7 million in October. For the upcoming November data, markets expect another slight uptick to 8.85 million. Meanwhile, Nonfarm Payrolls increased by only 150,000 in October and by 199,000 in November.
Following the Federal Reserve’s (Fed) December policy meeting, the US Dollar (USD) has been struggling to stay resilient against its rivals. The USD Index fell over 2% on a monthly basis and touched its weakest level in five months at 100.60 in the last week of 2023. The Fed’s revised Summary of Economic Projections (SEP) showed that policymakers saw a total of 75 basis points (bps) rate cuts in 2024. Meanwhile, Fed Chairman Jerome Powell said in the post-meeting press conference that policymakers were talking about when it will be appropriate to lower the policy rate and added that they are very focused on “not making the mistake of keeping rates too high too long.” According to the CME Group FedWatch Tool, markets are pricing in an 85% probability that the Fed will lower the policy rate by 25 bps in March.
FXStreet Analyst Eren Sengezer shares his view on the JOLTS Job Openings data and the potential market reaction:
“JOLTS Job Openings data for October surprised to the downside and suggested that labor market conditions continued to loosen following unexpected increases in openings in August and September. A reading at or above 9 million could cause investors to scale back dovish bets and help the USD find demand. On the other hand, a print between 8 and 8.5 million could make it difficult for the currency to hold its ground. However, a significant decline could also hurt the risk mood and trigger a sell-off in US stocks. In this scenario, the USD’s losses could remain limited.”
When will the JOLTS report be released and how could it affect EUR/USD?
Job openings numbers will be published at 15:00 GMT. Eren points out key technical levels to watch for EUR/USD ahead of JOLTS data:
“EUR/USD started the new year under bearish pressure and declined below the lower limit of the ascending regression channel coming from early October, currently located near 1.1000. At the same time, the Relative Strength Index (RSI) retreated toward 50, reflecting a loss of bullish momentum. The 1.0950 level (Fibonacci 23.6% retracement of the October-December downtrend) aligns as the first support for the pair. If this level fails and starts acting as resistance, 1.0850 (200-day Simple Moving Average (SMA), Fibonacci 38.2% retracement) could be set as the next bearish target.
On the upside, buyers could show interest in case EUR/USD returns within the ascending channel by flipping 1.1000 into support. In this scenario, 1.1100 (mid-point of the ascending channel) could be seen as the next resistance before 1.1140 (December 28 high).”
Economic Indicator
United States JOLTS Job Openings
JOLTS Job Openings is a survey done by the US Bureau of Labor Statistics to help measure job vacancies. It collects data from employers including retailers, manufacturers and different offices each month.
Read more.Next release: 01/03/2024 15:00:00 GMT
Frequency: Monthly
Source: US Bureau of Labor Statistics
Employment FAQs
How do employment levels affect currencies?
Labor market conditions are a key element to assess the health of an economy and thus a key driver for currency valuation. High employment, or low unemployment, has positive implications for consumer spending and thus economic growth, boosting the value of the local currency. Moreover, a very tight labor market – a situation in which there is a shortage of workers to fill open positions – can also have implications on inflation levels and thus monetary policy as low labor supply and high demand leads to higher wages.
Why is wage growth important?
The pace at which salaries are growing in an economy is key for policymakers. High wage growth means that households have more money to spend, usually leading to price increases in consumer goods. In contrast to more volatile sources of inflation such as energy prices, wage growth is seen as a key component of underlying and persisting inflation as salary increases are unlikely to be undone. Central banks around the world pay close attention to wage growth data when deciding on monetary policy.
How much do central banks care about employment?
The weight that each central bank assigns to labor market conditions depends on its objectives. Some central banks explicitly have mandates related to the labor market beyond controlling inflation levels. The US Federal Reserve (Fed), for example, has the dual mandate of promoting maximum employment and stable prices. Meanwhile, the European Central Bank’s (ECB) sole mandate is to keep inflation under control. Still, and despite whatever mandates they have, labor market conditions are an important factor for policymakers given its significance as a gauge of the health of the economy and their direct relationship to inflation.
FX option expiries for Jan 3 NY cut at 10:00 Eastern Time, via DTCC, can be found below.
- EUR/USD: EUR amounts
- 1.1000 960m
- 1.1050 645m
- 1.1085 759m
- 1.1100 830m
- USD/CHF: USD amounts
- 0.8430 555m
- AUD/USD: AUD amounts
- 0.6720 527m
- 0.6900 326m
- USD/CAD: USD amounts
- 1.3330 515m
- 1.3340 1b
- 1.3495 924m
- NZD/USD: NZD amounts
- 0.6150 330m
- EUR/GBP: EUR amounts
- 0.8690 377m
- 0.8960 549m
- Pound Sterling drops vertically as risk-on rally cools.
- The BoE may reconsider their restrictive monetary policy stance amid a bleak economic outlook.
- UK’s business pessimism deepens amid higher interest rates and escalating cost of living crisis.
The Pound Sterling (GBP) searches for a potential cushion after Tuesday’s intense breakdown. The GBP/USD pair was beaten down after investors reconsidered the positive sentiment underpinning the rally in risk-sensitive assets. In addition to that, deepening recession fears and a vulnerable manufacturing sector in the United Kingdom economy have dampened appeal for the Pound Sterling.
A major factor of the outperformance by the Pound Sterling against the US Dollar was the expectation that the Federal Reserve (Fed) would start reducing interest rates earlier than the Bank of England (BoE). However, the UK’s gloomy outlook, due to deepening business pessimism amid escalating cost-of-living crisis, may force BoE policymakers to reconsider their stance of keeping interest rates elevated for a longer period.
Daily Digest Market Movers: Pound Sterling falls as US Dollar refreshes weekly high
- Pound Sterling finds an interim support slightly above 1.2600 after an intense sell-off.
- The GBP/USD pair falls on the backfoot after a sharp recovery in the US Dollar and deepening recession risks in the United Kingdom economy.
- The UK Office for National Statistics (ONS) reported a contraction in the Gross Domestic Product (GDP) by 0.1% in its latest projections for the third quarter of 2023.
- The UK manufacturing sector continues to remain vulnerable as the overall demand in the domestic economy and from the overseas market has been dampened due to higher interest rates and a deepening cost of living crisis.
- On Tuesday, the S&P Global reported a decline in the Manufacturing PMI to 46.2 against the former reading of 46.4. This was the 17th straight month of contraction in the Manufacturing PMI.
- The S&P Global reported that British employers heavily cut back on inventory and employment, which indicates a gloomy outlook for the manufacturing sector.
- In addition to that, the Institute of Directors (IOD) Confidence Index reported that the number of business leaders who are pessimistic about the economic outlook have been consistently rising gradually from June.
- The agency indicated that businesses are in dire need of a potential boost that could result in a meaningful economic growth in 2024.
- A vulnerable UK manufacturing sector and deepening recession fears may compel Bank of England policymakers to roll back their tight monetary policy stance and start discussing reducing interest rates.
- BoE policymakers have been backing higher borrowing costs for a longer period to ensure inflation returns to 2% in a timely manner.
- Price pressures in the UK economy have decelerated significantly but are still far from the desired rate and are highest among Group of Seven economies.
- The asset is at a make or a break level as investors shift focus to the crucial US economic data, which will be released this week.
- A slew of US economic data such as: Manufacturing and Services PMI by the Institute of Supply Management (ISM), job openings and labour market data awaits.
- But before that, investors will focus on the Federal Open Market Committee (FOMC) minutes for December’s monetary policy meeting, out on Wednesday at 19:00 GMT.
- The FOMC minutes will provide a detailed explanation behind the third straight unchanged interest rate decision and guidance on interest rates for 2024.
- A steep decline in the risk-appetite of the market participants has improved appeal for the US Dollar. The US Dollar Index (DXY) has printed a fresh weekly high slightly above 102.00.
Technical Analysis: Pound Sterling finds is at make or a break near 1.2600
Pound Sterling discovers nominal buying interest after a sharp decline to near 1.2600. The GBP/USD pair fell vertically after failing to sustain above the round-level resistance of 1.2800. The Cable has formed a Double Top chart pattern on an intraday time frame and a breakdown below the immediate support of 1.2600 will result in a fresh downside.
On a daily time frame, the GBP/USD pair has dropped below the 20-period Exponential Moving Average (EMA), which indicates that the near-term trend is not bullish anymore.
Pound Sterling FAQs
What is the Pound Sterling?
The Pound Sterling (GBP) is the oldest currency in the world (886 AD) and the official currency of the United Kingdom. It is the fourth most traded unit for foreign exchange (FX) in the world, accounting for 12% of all transactions, averaging $630 billion a day, according to 2022 data.
Its key trading pairs are GBP/USD, aka ‘Cable’, which accounts for 11% of FX, GBP/JPY, or the ‘Dragon’ as it is known by traders (3%), and EUR/GBP (2%). The Pound Sterling is issued by the Bank of England (BoE).
How do the decisions of the Bank of England impact on the Pound Sterling?
The single most important factor influencing the value of the Pound Sterling is monetary policy decided by the Bank of England. The BoE bases its decisions on whether it has achieved its primary goal of “price stability” – a steady inflation rate of around 2%. Its primary tool for achieving this is the adjustment of interest rates.
When inflation is too high, the BoE will try to rein it in by raising interest rates, making it more expensive for people and businesses to access credit. This is generally positive for GBP, as higher interest rates make the UK a more attractive place for global investors to park their money.
When inflation falls too low it is a sign economic growth is slowing. In this scenario, the BoE will consider lowering interest rates to cheapen credit so businesses will borrow more to invest in growth-generating projects.
How does economic data influence the value of the Pound?
Data releases gauge the health of the economy and can impact the value of the Pound Sterling. Indicators such as GDP, Manufacturing and Services PMIs, and employment can all influence the direction of the GBP.
A strong economy is good for Sterling. Not only does it attract more foreign investment but it may encourage the BoE to put up interest rates, which will directly strengthen GBP. Otherwise, if economic data is weak, the Pound Sterling is likely to fall.
How does the Trade Balance impact the Pound?
Another significant data release for the Pound Sterling is the Trade Balance. This indicator measures the difference between what a country earns from its exports and what it spends on imports over a given period.
If a country produces highly sought-after exports, its currency will benefit purely from the extra demand created from foreign buyers seeking to purchase these goods. Therefore, a positive net Trade Balance strengthens a currency and vice versa for a negative balance.
Here is what you need to know on Wednesday, January 3:
The US Dollar (USD) gathered bullish momentum and outperformed its rivals on the first trading day of 2024 as the market mood soured. After rising nearly 1% on Tuesday, the USD Index seems to have stabilized above 102.00 early Wednesday. November JOLTS Job Openings and December ISM Manufacturing PMI data will be featured in the US economic docket. Later in the American session, the Federal Reserve (Fed) will release the minutes of the December policy meeting.
US Dollar price this week
The table below shows the percentage change of US Dollar (USD) against listed major currencies this week. US Dollar was the strongest against the Swiss Franc.
| USD | EUR | GBP | CAD | AUD | JPY | NZD | CHF | |
| USD | 0.88% | 0.75% | 0.59% | 0.73% | 0.74% | 0.77% | 1.11% | |
| EUR | -0.73% | 0.03% | -0.13% | -0.01% | -0.14% | 0.04% | 0.30% | |
| GBP | -0.75% | -0.02% | -0.14% | -0.02% | 0.07% | 0.03% | 0.29% | |
| CAD | -0.60% | 0.10% | 0.33% | 0.09% | 0.13% | 0.16% | 0.44% | |
| AUD | -0.73% | 0.00% | 0.03% | -0.15% | -0.18% | 0.04% | 0.34% | |
| JPY | -0.73% | 0.17% | 0.08% | 0.06% | 0.18% | 0.23% | 0.31% | |
| NZD | -0.81% | -0.05% | -0.03% | -0.18% | -0.06% | -0.22% | 0.25% | |
| CHF | -1.03% | -0.29% | -0.26% | -0.41% | -0.28% | -0.31% | -0.23% |
The heat map shows percentage changes of major currencies against each other. The base currency is picked from the left column, while the quote currency is picked from the top row. For example, if you pick the Euro from the left column and move along the horizontal line to the Japanese Yen, the percentage change displayed in the box will represent EUR (base)/JPY (quote).
The benchmark 10-year US Treasury bond yield rose toward 4% and provided a boost to the USD on Tuesday as trading conditions normalized. Meanwhile, Wall Street's main indexes opened in negative territory and the Nasdaq Composite Index fell more than 1.5%. Early Wednesday, the 10-year US yield holds steady at around 3.95% and US stock index futures trade marginally lower.
EUR/USD came under technical selling pressure after dropping below 1.1000 and touched its lowest level in nearly two weeks at 1.0938 on Tuesday. The pair stays in a consolidation phase slightly above 1.0950 in the European morning on Wednesday. Germany's Destatis will release Unemployment Rate data for December.
GBP/USD lost more than 100 pips on Tuesday and came within a touching distance of 1.2600 before staging a modest rebound. The pair was last seen trading modestly higher on the day at around 1.2650.
USD/JPY rallied on Tuesday, fuelled by rising US yields and broad USD strength. The pair lost its bullish momentum during the Asian trading hours and started to move sideways near 142.00.
USD/CAD rose sharply on Tuesday and stabilized above 1.3300 early Wednesday. In addition to the upbeat performance of the USD, falling Crude Oil prices helped the pair push higher by weighing on the commodity-sensitive Canadian Dollar.
After rising toward $2,080 on Tuesday, Gold reversed its direction in the American session and closed the day virtually unchanged near $2,060 on Tuesday. XAU/USD holds steady and fluctuates in a narrow band slightly above $2,060 in the European morning.
- EUR/GBP posts modest losses around 0.8670 on Wednesday.
- The UK S&P Global PMI arrived at 46.2 vs. 46.4 prior, below the consensus.
- The Eurozone HCOB Manufacturing PMI climbed to 44.4 in December 2023 from 44.2 in November, beating the expectation.
- Traders will take more cues from the release of German employment data, due on Wednesday.
The EUR/GBP cross sticks to the range-bound theme between 0.8665-0.8675 during the early European session on Wednesday. Investors await the German employment data for December. The unemployment rate is estimated to remain steady at 5.9%. The cross currently trades near 0.8670, losing 0.02% on the day.
The activity in the UK manufacturing sector worsened in December 2023. The UK S&P Global PMI came in at 46.2 from the previous reading of 46.4, below the market consensus. Furthermore, the negative outlook on the British economy and the fear of technical recession exert some selling pressure on the British Pound (GBP) and acts as a tailwind for the EUR/GBP cross.
On the Euro front, the Eurozone HCOB Manufacturing PMI climbed to 44.4 in December 2023 from 44.2 in November, beating expectations. Meanwhile, the German Manufacturing PMI came in better than market expectations, rising to 43.3 in December from the previous reading of 43.1.
The German employment data, including the Unemployment Rate and Unemployment Change, are due later on Wednesday. On Thursday, the Eurozone HCOB Composite PMI, Services PMI and Consumer Price Index (CPI) for December will be released. These reports could give a clear direction to the EUR/GBP cross.
- USD/CAD moves sideways after halting a winning streak that began on December 27.
- MACD indicator suggests a potential shift in the pair’s direction.
- A break above the 23.6% Fibonacci retracement at 1.3351 could lead the pair to surpass the 21-day EMA at 1.3363.
USD/CAD hovers near 1.3330 during the Asian session on Wednesday. The USD/CAD pair receives upward support as investors turn back to the US Dollar (USD) on risk-off sentiment.
The technical analysis of the Moving Average Convergence Divergence (MACD) for the USD/CAD pair suggests a potential shift in the pair's trend as the MACD line lies below the centreline but shows divergence above the signal line.
However, the lagging indicator 14-day Relative Strength Index (RSI) is positioned below 50. Traders will likely wait for confirmation implying that the USD/CAD pair could change its direction.
The USD/CAD pair could find key support near the psychological level at 1.3300 following the major support at 1.3250 level. A break below the latter could push the pair to navigate the region around the weekly low at 1.3228 followed by the psychological level at 1.3200.
The analysis suggests that on the upside, the major level at 1.3350 aligned with the 23.6% Fibonacci retracement level at 1.3351 could act as a key resistance zone. A breakthrough above the key resistance zone could lead the USD/CAD pair to surpass the 21-day Exponential Moving Average (EMA) at 1.3363 following the psychological barrier at 1.3400.
If the USD/CAD pair manages to pass through the psychological resistance, it may explore further upward movement toward the 38.2% Fibonacci retracement level at 1.3456.
USD/CAD: Daily Chart
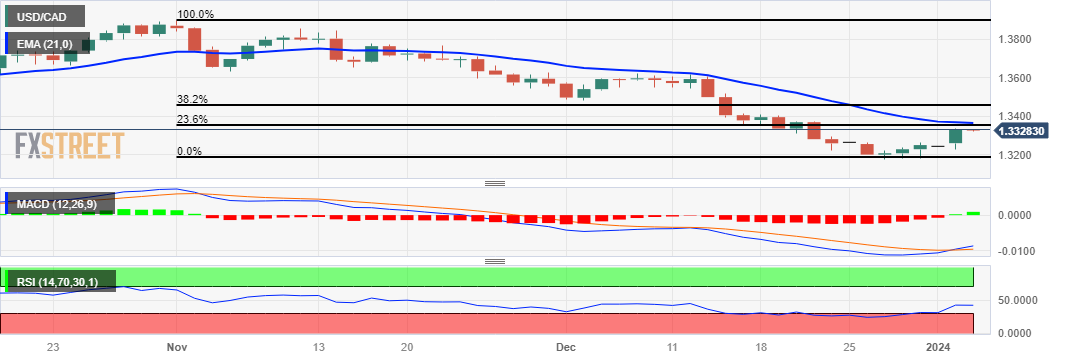
- EUR/JPY gains ground near 155.61 on Wednesday.
- The cross maintains a bearish outlook below the key EMA; the RSI indicator stands below the 50 midline.
- The first upside barrier will emerge at 156.38; 155.05 acts as an initial support level for EUR/JPY.
The EUR/JPY cross recovers some lost ground above the mid-155.00s during the early European session on Wednesday. The upside of the cross might be capped as investors anticipate that the Bank of Japan (BoJ) will abandon its ultra-loose monetary policy settings by the first half of 2024. At press time, EUR/JPY is trading at 155.61, gaining 0.16% on the day.
Technically, the bearish outlook of EUR/JPY remains intact as the cross holds below the 50- and 100-hour Exponential Moving Averages (EMAs) on the four-hour chart. The downward momentum is supported by the 14-day Relative Strength Index (RSI) which stands below 50 midline, indicating further downside looks favorable.
The first upside barrier will emerge near the 50-hour EMA at 156.38. Any follow-through buying above the latter will see a rally to the key resistance level at the 156.90–157.00 zone, portraying the confluence of the 50-hour EMA, the upper boundary of the Bollinger Band, and a psychological round mark. Further north, the next hurdle is seen at a high of December 20 at 157.73, en route to a high of December 27 at 158.38.
On the other hand, the lower limit of the Bollinger Band at 155.05 acts as an initial support level for EUR/JPY. The next contention is located near a low of December 15 at 154.40. The additional downside filter to watch is a low of December 14 at 153.85, followed by a low of December 7 at 153.16.
EUR/JPY four-hour chart
-638398573317566133.png)
- USD/CHF retraces recent gains as the US Dollar halts its winning streak.
- IMF Managing Director Kristalina Georgieva’s moderate comments could weaken the Greenback.
- Traders await Swiss Manufacturing PMI data to gain fresh impetus on the Swiss economy.
USD/CHF retraces its recent gains registered on Tuesday, trading lower near 0.8490 during the Asian session on Wednesday. The US Dollar (USD) received upward support against the Swiss Franc (CHF) due to the risk-off market sentiment, prompting investors to seek refuge in the US Dollar (USD) ahead of key economic data releases from the United States (US).
The US S&P Global Manufacturing PMI's lower-than-expected figure of 47.9, differing from the anticipated 48.2, is a noteworthy economic development. Looking ahead, investors are likely to pay close attention to US data on Wednesday, which includes the December ISM Manufacturing PMI, November JOLTS Job Openings, and the Federal Open Market Committee (FOMC) Minutes. The FOMC Minutes are particularly relevant given Chairman Jerome Powell's mention of potential rate cuts following the latest Federal Reserve (Fed) monetary policy decision.
The USD might have encountered downward pressure following the moderate comments from International Monetary Fund (IMF) Managing Director Kristalina Georgieva. Her optimism about the US economy, coupled with the advice for Americans to "cheer up," suggests a less aggressive stance. Georgieva anticipates that interest rates will moderate in 2024 due to a decline in inflation. This perspective deviates from a more hawkish stance and could contribute to a softer trajectory for the Federal Reserve's (Fed) interest rates, potentially influencing the USD negatively.
The Swiss ZEW Survey – Expectations experienced a further decline in December, indicating subdued economic sentiment. However, the KOF Swiss Leading Indicator surprisingly improved, defying expectations. The Swiss National Bank (SNB) is anticipated to actively intervene in the foreign exchange market to support the Swiss Franc (CHF).
Looking forward, the SVME Manufacturing Purchasing Managers Index (PMI) data will be closely monitored by the investors on Wednesday to gain fresh impetus on the Swiss economy.
- WTI price receives downward pressure US Dollar improves on risk-off sentiment.
- The expected higher oil supply in the first half of 2024 put pressure on Crude oil prices.
- OPEC+ plans to convene a JMMC meeting in early February to assess the adherence to its production agreements.
West Texas Intermediate (WTI) price trades near $70.50 per barrel during the Asian session on Wednesday. The WTI price faced challenges in the previous session as market expectations for the Federal Reserve's (Fed) rate cuts diminished. This shift in expectations is attributed to signs of sluggish growth in the United States (US) economy towards the end of 2024.
Crude oil prices face challenges despite the potential supply disruptions following the naval clash in the Red Sea. The recent attack by Houthi militants on a Maersk container ship was repelled by US helicopters, preventing a potential escalation. However, the threat level rises with reports of an Iranian warship entering the Red Sea.
The downward pressure on Crude oil prices is rooted in concerns over the deceleration of global economic growth and the escalating worry about heightened oil supply in the first half of 2024, particularly from producers outside the Organization of the Petroleum Exporting Countries and its allies (OPEC+).
OPEC+ is anticipated to convene a meeting of its Joint Ministerial Monitoring Committee (JMMC) in early February to assess the adherence to its production agreements. In the previous meeting, OPEC+ agreed to voluntary output cuts totaling approximately 2.2 million barrels per day (bpd) for the current quarter.
The upcoming release of the US EIA Crude Oil Stocks Change and API Weekly Crude Oil Stock data for the week ending on December 29 will be closely monitored on Wednesday. Analysts polled by Reuters anticipate a decline in crude stockpiles for the last week, while distillate and gasoline stocks are expected to have increased.
- EUR/USD regains positive traction on Wednesday and snaps a three-day losing streak.
- A modest USD downtick lends support ahead of the US macro data and FOMC minutes.
- A convincing break below the 50% Fibo. might shift the bias in favour of bearish traders.
The EUR/USD pair attracts some buying during the Asian session on Wednesday and for now, seems to have snapped a three-day losing streak to over a one-week low touched the previous day. Spot prices currently trade around the 1.0960 region, up just over 0.15% for the day, and remain at the mercy of the US Dollar (USD) price dynamics.
The USD Index (DXY), which tracks the Greenback against a basket of currencies, erodes a part of Tuesday's strong gains amid some repositioning trade ahead of important US macro data and the crucial FOMC meeting minutes. In the meantime, doubts over early rate cuts by the Federal Reserve (Fed) might hold back traders from placing aggressive bearish bets around the buck and keep a lid on any further gains for the EUR/USD pair.
From a technical perspective, spot prices showed some resilience below the 100-period Simple Moving Average (SMA) on the 4-hour chart and found decent support near the 50% Fibonacci retracement level of the December 11-28 rally. The latter is pegged near the 1.0940 area and should now act as a key pivotal point, which if broken should pave the way for an extension of the pullback from the 1.1135-1.1140 area, or a five-month peak touched last week.
The EUR/USD pair might then weaken below the 200-period SMA on the 4-hour chart, currently around the 1.0920 region, and the 1.0900 mark, towards testing the 61.8% Fibo. level, around the 1.0885-1.0880 zone. Some follow-through selling will be seen as a fresh trigger for bearish traders and drag spot prices further towards the 1.0835-1.0830 intermediate support en route to the 1.0800 round-figure mark and the 1.0765-1.0760 region.
Meanwhile, oscillators on the daily chart – though have been losing traction – are still holding in the positive territory and favour bullish traders. That said, any further intraday move-up is likely to confront some resistance near the 1.0980 area. This is closely followed by the 1.1000 psychological mark, above which the EUR/USD pair could climb to the 1.1040-1.1045 region en route to the 1.1080-1.1085 zone before aiming to reclaim the 1.1100 round figure.
EUR/USD 4-hour chart
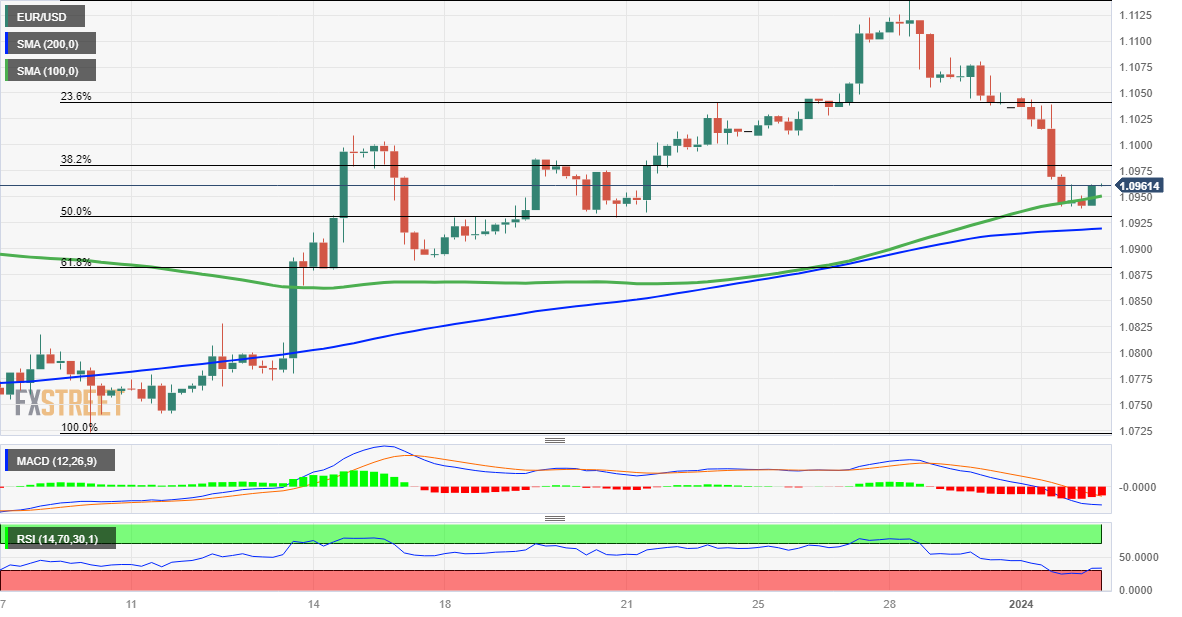
Technical levels to watch
- Gold price attracts dip-buying amid Fed rate cut bets, geopolitical risks and China’s economic woes.
- The USD preserves the overnight strong gains amid elevated US bond yields and acts as a headwind.
- Traders might also refrain from placing aggressive bets ahead of US data and FOMC meeting minutes.
Gold price (XAU/USD) retreated over $20 intraday and finally settled in the red for the third successive day on Tuesday, albeit lacking follow-through selling. Expectations the Federal Reserve (Fed) will ease its monetary policy this year, along with concerns about fragile economic recovery in China and geopolitical risks, continue to act as a tailwind for the precious metal. Apart from this, subdued US Dollar (USD) price action and the cautious market mood assist the safe-haven commodity to attract some buyers during the Asian session on Wednesday.
That said, doubts over early interest rate cuts by the Fed, which led to the overnight sharp move higher in the US Treasury bond yields, act as a headwind for the non-yielding Gold price. Traders might also refrain from placing aggressive bullish bets ahead of the FOMC meeting minutes, which could offer more clarity on the Fed's next policy moves and drive the USD demand in the near term. In the meantime, the US macro data – ISM Manufacturing PMI and JOLTS Job Openings data – will be looked upon for short-term trading opportunities.
Daily Digest Market Movers: Gold price edges higher ahead of FOMC meeting minutes
- A combination of supporting factors assists the Gold price to regain positive traction on Wednesday and snap a three-day losing streak.
- Bets that the Federal Reserve will cut interest rates in March turn out to be a key factor lending support to the non-yielding yellow metal.
- The possibility of a further escalation of conflict in the Red Sea, along with China's economic woes, also acts as a tailwind for the safe-haven metal.
- The official Chinese PMI released over the weekend indicated a further deterioration in manufacturing activity and little signs of recovery at the end of 2023.
- A private survey showed on Tuesday that China's factory activity expanded at a quicker pace in December but business confidence for 2024 remained subdued.
- The US Dollar consolidates the overnight strong gains to a more than one-week top, helped by a sharp rise in the US bond yields, and caps the commodity.
- Traders might also prefer to wait on the sidelines ahead of the US ISM Manufacturing PMI, JOLTS Job Openings data and the crucial FOMC meeting minutes.
Technical Analysis: Gold price might continue to confront stiff resistance near $2,078 region
From a technical perspective, the overnight failure near the all-time high closing, around the $2,077-2,078 region, and the subsequent slide warrants caution for bullish traders. The said hurdle should now act as a key pivotal point, which if cleared decisively will set the stage for a move towards reclaiming the $2,100 round-figure mark. Meanwhile, oscillators on the daily chart are holding comfortably in the positive territory and support prospects for the emergence of some dip-buying at lower levels.
The overnight low, around the $2,055 area, now seems to protect the immediate downside ahead of the $2,040 horizontal zone. A convincing break below the latter might turn the Gold price vulnerable to accelerate the downfall further towards the $2,020 intermediate support en route to the 50-day Simple Moving Average (SMA), currently near the $2,008-2,007 region, and the $2,000 psychological mark. Some follow-through selling will expose the $1,960 confluence, comprising the 100- and the 200-day SMAs.
US Dollar price today
The table below shows the percentage change of US Dollar (USD) against listed major currencies today. US Dollar was the weakest against the .
| USD | EUR | GBP | CAD | AUD | JPY | NZD | CHF | |
| USD | -0.16% | -0.11% | 0.04% | 0.11% | -0.15% | -0.18% | -0.07% | |
| EUR | 0.17% | 0.03% | 0.19% | 0.25% | 0.01% | -0.03% | 0.08% | |
| GBP | 0.11% | -0.04% | 0.16% | 0.22% | -0.05% | -0.07% | 0.04% | |
| CAD | -0.03% | -0.19% | -0.15% | 0.06% | -0.18% | -0.21% | -0.11% | |
| AUD | -0.11% | -0.24% | -0.21% | -0.06% | -0.25% | -0.28% | -0.18% | |
| JPY | 0.15% | -0.03% | 0.02% | 0.19% | 0.23% | -0.07% | 0.06% | |
| NZD | 0.18% | 0.03% | 0.07% | 0.24% | 0.30% | 0.03% | 0.11% | |
| CHF | 0.09% | -0.07% | -0.03% | 0.11% | 0.19% | -0.07% | -0.10% |
The heat map shows percentage changes of major currencies against each other. The base currency is picked from the left column, while the quote currency is picked from the top row. For example, if you pick the Euro from the left column and move along the horizontal line to the Japanese Yen, the percentage change displayed in the box will represent EUR (base)/JPY (quote).
Gold FAQs
Why do people invest in Gold?
Gold has played a key role in human’s history as it has been widely used as a store of value and medium of exchange. Currently, apart from its shine and usage for jewelry, the precious metal is widely seen as a safe-haven asset, meaning that it is considered a good investment during turbulent times. Gold is also widely seen as a hedge against inflation and against depreciating currencies as it doesn’t rely on any specific issuer or government.
Who buys the most Gold?
Central banks are the biggest Gold holders. In their aim to support their currencies in turbulent times, central banks tend to diversify their reserves and buy Gold to improve the perceived strength of the economy and the currency. High Gold reserves can be a source of trust for a country’s solvency. Central banks added 1,136 tonnes of Gold worth around $70 billion to their reserves in 2022, according to data from the World Gold Council. This is the highest yearly purchase since records began. Central banks from emerging economies such as China, India and Turkey are quickly increasing their Gold reserves.
How is Gold correlated with other assets?
Gold has an inverse correlation with the US Dollar and US Treasuries, which are both major reserve and safe-haven assets. When the Dollar depreciates, Gold tends to rise, enabling investors and central banks to diversify their assets in turbulent times. Gold is also inversely correlated with risk assets. A rally in the stock market tends to weaken Gold price, while sell-offs in riskier markets tend to favor the precious metal.
What does the price of Gold depend on?
The price can move due to a wide range of factors. Geopolitical instability or fears of a deep recession can quickly make Gold price escalate due to its safe-haven status. As a yield-less asset, Gold tends to rise with lower interest rates, while higher cost of money usually weighs down on the yellow metal. Still, most moves depend on how the US Dollar (USD) behaves as the asset is priced in dollars (XAU/USD). A strong Dollar tends to keep the price of Gold controlled, whereas a weaker Dollar is likely to push Gold prices up.
- Indian Rupee weakens on the firmer US Dollar.
- The positive outlook of the Indian economy has boosted the market capitalization of Indian equities to rank fifth globally.
- Indian S&P Global Manufacturing PMI, US final ISM Manufacturing PMI, and FOMC Minutes will be due on Wednesday.
Indian Rupee (INR) edges lower on Wednesday amid renewed US Dollar (USD) demand. The optimistic outlook in the Indian economy by domestic and overseas investors has boosted the market capitalization of Indian equities to become the fifth largest in the world, just behind Hong Kong.
The Nifty experienced a rise of 20% in 2023, with over half of the gain occurring in the last two months. This was supported by faster-than-expected quarterly growth, rising bets on Federal Reserve (Fed) rate cuts in the first half of 2024, and steady retail participation.
The Indian S&P Global Manufacturing PMI is due later on Wednesday and is estimated to ease from 56.0 in November to 55.9 in December. Nonetheless, the INR is likely to take more cues this week from moves in the US Dollar. Market players will keep an eye on the US final ISM Manufacturing PMI report and FOMC Minutes on Wednesday. On Friday, the US Nonfarm Payrolls report will be the highlight this week.
Daily Digest Market Movers: Indian Rupee remains strong amid the multiple headwinds
- A pickup in foreign inflows into Indian markets has also boosted the Indian Rupee, but the upside is capped as the RBI likely intervened in the previous two weeks to absorb the inflows, according to traders.
- The RBI has consistently intervened in foreign currency markets on both sides in recent weeks, maintaining the USD/INR pair in a limited trading range, according to traders.
- Indian share of global market capitalization hit a record 3.8% in the last week of 2023, according to Bloomberg data.
- The US final Manufacturing PMI came in at 47.9 in December from 48.2 in November, weaker than expected.
- As per the CME FedWatch tool, the markets anticipate no hike at its upcoming January meeting and have priced in 78% odds of a rate cut in the March meeting.
Technical Analysis: Indian Rupee clings to the longer-term range theme
Indian Rupee trades softer on the day. The USD/INR pair continues to move in a multi-month-old trading band of 82.80–83.40. Technically, the path of least resistance of USD/INR is to the upside as the pair holds above the key 100-period Exponential Moving Average (EMA) on the daily chart. The upward momentum is supported by the 14-day Relative Strength Index (RSI) which stands above the 50.0 midpoint.
The upper boundary of the trading range at 83.40 acts as the first upside barrier for USD/INR. Any follow-through buying above 83.40 will see a rally to the 2023 high of 83.47, en route to the 84.00 psychological figure. On the flip side, the initial contention level will emerge at 83.00. Further south, the downside target will emerge at the confluence of the lower limit of the trading range and a low of September 12 at 82.80. A breach of this level will see a drop to a low of August 11 at 82.60.
US Dollar price today
The table below shows the percentage change of US Dollar (USD) against listed major currencies today. US Dollar was the strongest against the Australian Dollar.
| USD | EUR | GBP | CAD | AUD | JPY | NZD | CHF | |
| USD | -0.12% | -0.09% | 0.03% | 0.09% | -0.13% | -0.18% | -0.05% | |
| EUR | 0.12% | 0.02% | 0.14% | 0.20% | -0.02% | -0.08% | 0.06% | |
| GBP | 0.09% | -0.02% | 0.13% | 0.19% | -0.04% | -0.10% | 0.05% | |
| CAD | -0.03% | -0.14% | -0.12% | 0.05% | -0.16% | -0.21% | -0.08% | |
| AUD | -0.09% | -0.19% | -0.18% | -0.06% | -0.21% | -0.28% | -0.13% | |
| JPY | 0.13% | 0.00% | 0.04% | 0.16% | 0.20% | -0.07% | 0.08% | |
| NZD | 0.19% | 0.08% | 0.10% | 0.23% | 0.29% | 0.06% | 0.15% | |
| CHF | 0.05% | -0.05% | -0.04% | 0.08% | 0.15% | -0.08% | -0.14% |
The heat map shows percentage changes of major currencies against each other. The base currency is picked from the left column, while the quote currency is picked from the top row. For example, if you pick the Euro from the left column and move along the horizontal line to the Japanese Yen, the percentage change displayed in the box will represent EUR (base)/JPY (quote).
Indian Rupee FAQs
What are the key factors driving the Indian Rupee?
The Indian Rupee (INR) is one of the most sensitive currencies to external factors. The price of Crude Oil (the country is highly dependent on imported Oil), the value of the US Dollar – most trade is conducted in USD – and the level of foreign investment, are all influential. Direct intervention by the Reserve Bank of India (RBI) in FX markets to keep the exchange rate stable, as well as the level of interest rates set by the RBI, are further major influencing factors on the Rupee.
How do the decisions of the Reserve Bank of India impact the Indian Rupee?
The Reserve Bank of India (RBI) actively intervenes in forex markets to maintain a stable exchange rate, to help facilitate trade. In addition, the RBI tries to maintain the inflation rate at its 4% target by adjusting interest rates. Higher interest rates usually strengthen the Rupee. This is due to the role of the ‘carry trade’ in which investors borrow in countries with lower interest rates so as to place their money in countries’ offering relatively higher interest rates and profit from the difference.
What macroeconomic factors influence the value of the Indian Rupee?
Macroeconomic factors that influence the value of the Rupee include inflation, interest rates, the economic growth rate (GDP), the balance of trade, and inflows from foreign investment. A higher growth rate can lead to more overseas investment, pushing up demand for the Rupee. A less negative balance of trade will eventually lead to a stronger Rupee. Higher interest rates, especially real rates (interest rates less inflation) are also positive for the Rupee. A risk-on environment can lead to greater inflows of Foreign Direct and Indirect Investment (FDI and FII), which also benefit the Rupee.
How does inflation impact the Indian Rupee?
Higher inflation, particularly, if it is comparatively higher than India’s peers, is generally negative for the currency as it reflects devaluation through oversupply. Inflation also increases the cost of exports, leading to more Rupees being sold to purchase foreign imports, which is Rupee-negative. At the same time, higher inflation usually leads to the Reserve Bank of India (RBI) raising interest rates and this can be positive for the Rupee, due to increased demand from international investors. The opposite effect is true of lower inflation.
- GBP/USD halts its losing streak while US Dollar stays calm after a recent surge.
- IMF Managing Director Kristalina Georgieva expects policy rates to be reduced in 2024 due to a decline in inflation.
- UK executives urge the BoE to lower interest rates as the Economic Confidence Index fell to 28 from the previous month's decline of 21.
GBP/USD rebounds after posting losses at the previous three successive sessions amid a stable US Dollar (USD). The GBP/USD pair trades higher near 1.2630 during the Asian session on Wednesday. The USD could face downward pressure again on the moderate comments by the International Monetary Fund (IMF) Managing Director Kristalina Georgieva.
In an interview with CNN on Tuesday, IMF Managing Director Georgieva expressed optimism about the US economy, advising Americans to "cheer up." She highlighted that despite a robust labor market, interest rates are expected to moderate in 2024 due to a decline in inflation. This positive outlook suggests a potential easing of economic pressures and provides a less aggressive perspective on the Federal Reserve’s (Fed) interest rate trajectory.
The US Dollar Index (DXY) could maintain its strength on enhanced US Treasury yields. The 2-year and 10-year yields on US bond coupons improved to 4.32% and 3.94%, respectively, by the press time. The signs of sluggish global growth towards the end of 2024 initially led investors to seek refuge in the USD. However, there's a shift as market players reevaluate their aggressive bets on imminent rate cuts by the Fed.
The Pound Sterling (GBP) faces selling pressure due to the negative outlook on the British economy. The Institute of Directors' Economic Confidence Index survey revealed a continued decline in optimism among British directors about the country's economy for the next 12 months, with the index dropping to 28 in December from the previous month's decline of 21. Corporate executives in the United Kingdom (UK) are urging the Bank of England (BoE) to lower interest rates promptly to provide support to the struggling economy.
S&P Global's commentary also added to the concerns, stating that UK manufacturing output contracted at an accelerated rate at the close of 2023. The Bank of England (BoE) is now highly anticipated to cut interest rates starting from May 2024, reflecting the view that the UK's economy is vulnerable to a technical recession.
Wednesday brings the US data releases, including the December ISM Manufacturing PMI, November JOLTS Job Openings, and the Federal Open Market Committee (FOMC) Minutes. In the absence of any high-impact data from the UK’s docket during the week, the market participants will observe low-impact events including December S&P Global/CIPS Composite PMI and Halifax House Prices.
Citing the Reserve Bank of Australia’s (RBA) internal documents showing how rising interest rates have impacted households and businesses, Bloomberg said “the private sector wage growth appeared to have stabilized at “around” 4.0%.”
Additional takeaways
“Domestic tourism demand slipped from high levels.”
“Consumers have continued to trade down to cheaper products, or purchased fewer items, due to cost-of-living pressures.
“Community services organizations seeing ... cost‐of‐living pressures remain acute for their constituents”
“More people than usual are seeking support from community services organizations, including wage earners and households with mortgages who have sought food support.”
Market reaction
AUD/USD is holding lower ground following the findings of the above report, currently trading at 0.6755, down 0.07% on the day.
| Raw materials | Closed | Change, % |
|---|---|---|
| Silver | 23.659 | -0.64 |
| Gold | 2058.986 | -0.3 |
| Palladium | 1083.1 | -1.54 |
- USD/CAD ticks higher for the fifth straight day and draws support from a combination of factors.
- Weaker Oil prices undermine the Loonie, while doubt over early Fed rate cuts benefits the USD.
- Traders now look to the US macro data for some impetus ahead of the FOMC meeting minutes.
The USD/CAD pair trades with a positive bias for the fifth successive day on Wednesday and hovers around the 1.3330 area, or over a one-week high during the Asian session.
Easing concerns that tensions in the Red Sea will disrupt supplies, along with weak economic data from top importer China, keep Crude Oil prices depressed near a two-week low. This, along with the Bank of Canada (BoC) Governor Tiff Macklem's recent remarks, saying that the central bank could also start cutting rates sometime in 2024, undermines the commodity-linked Loonie and acts as a tailwind for the USD/CAD pair.
The US Dollar (USD), on the other hand, enters a bullish consolidation phase after recording its biggest daily percentage gains since October on Tuesday amid doubts over early interest rate cuts by the Federal Reserve (Fed). This, along with the overnight sharp move higher in the US Treasury bond yields and the cautious market mood, is seen benefiting the safe-haven Greenback and lending some support to the USD/CAD pair.
Investors now look to the US economic docket, featuring the release of the ISM Manufacturing PMI and JOLTS Job Openings data later during the North American session. The focus, however, will remain on the FOMC meeting minutes, which will be scrutinized for cues about the timing of when the Fed will start cutting rates. This, in turn, will drive the USD demand. Apart from this, Oil price dynamics should influence the USD/CAD pair.
Technical levels to watch
- NZD/USD attracts some buyers around 0.6256, adding 0.08% on the day.
- The FOMC signaled around three 25 basis points (bps) rate cuts in 2024.
- China's Caixin Manufacturing PMI rose to 50.8 in December versus 50.7 prior, better than estimated.
- Market players will focus on Chinese Caixin Service and US ISM Manufacturing PMI ahead of FOMC Minutes.
The NZD/USD pair gains ground during the early Asian trading hours on Wednesday. The renewed US Dollar (USD) demand exerts some selling pressure on the pair. NZD/USD currently trades near 0.6256, up 0.08% on the day.
At the FOMC December meeting, the committee signaled around three 25 basis points (bps) rate cuts in 2024. According to the CME FedWatch tool, the markets expected no hike for the January meeting and have priced in over 78% odds of rate cuts for March 2024, according to the CME FedWatch tool.
The release of the minutes of the December FOMC meeting late Wednesday will provide additional information about policymakers' views. Traders will also take more cues from the US labor data. The NFP figure is expected to add 168K jobs in the US economy in December versus 199K in November, while the Unemployment Rate is estimated to rise to 3.8%. Stronger than expected daughter called to challenge the market’s anticipation of rate cuts and might lift the USD higher against its rivals.
The economy docket from New Zealand is quiet this week. On Tuesday, China's Caixin Manufacturing Purchasing Managers' Index (PMI) rose to 50.8 in December from November’s expansion of 50.7, better than the market expectations of a 50.4 print. The positive developments surrounding the Chinese economy could support the China-proxy New Zealand Dollar (NZD) and act as a tailwind for the NZD/USD pair.
Looking ahead, market participants await the Chinese Caixin Services PMI for December. Also, the final US ISM Manufacturing PMI report and FOMC Minutes will be due on Wednesday.
- The Japanese Yen continues to draw support from expectations for a shift in the BoJ’s policy stance.
- A softer risk tone further benefits the safe-haven JPY and caps USD/JPY amid subdued USD demand.
- Investors now look to the US economic data for some impetus ahead of the FOMC meeting minutes.
The Japanese Yen (JPY) attracts some buyers during the Asian session on Wednesday and reverses a part of the previous day's heavy losses against the US Dollar (USD). As investors assess the impact of a powerful New Year's Day earthquake in Japan, the anticipation of a reversal in policy divergence between the Bank of Japan (BoJ) and the Federal Reserve (Fed) in 2024 lends some support to the JPY. In fact, the BoJ is anticipated to abandon its ultra-loose monetary policy settings, while the US central bank is expected to deliver a series of interest rate cuts throughout the year.
This, along with a softer risk tone, benefits the JPY's relative safe-haven status and fails to assist the USD/JPY pair to capitalize on the overnight rally of over 140 pips from the 140.80 area. The USD, on the other hand, consolidates Tuesday's strong gains – its biggest daily percentage rise since October – and remains well supported by higher US Treasury bond yields. This, in turn, might hold back traders from placing aggressive bearish bets around the USD/JPY pair ahead of the FOMC meeting minutes, scheduled to be released later during the US session.
In the meantime, Wednesday's US economic docket also highlights the ISM Manufacturing PMI and JOLTS Job Openings data might provide some impetus to the USD/JPY pair. The market attention will then shift to the US ADP report on private-sector employment, followed by the official Nonfarm Payrolls (NFP) on Thursday and Friday, respectively. The key labor market reports will shape expectations about the Fed's next policy move, which will play a key role in influencing the USD price dynamics and determining the near-term trajectory for the major.
Daily Digest Market Movers: Japanese Yen reverses a part of the overnight slide against the USD
- The initial market reaction to a 7.6 magnitude earthquake in Japan on Monday fades rather quickly amid expectations of a hawkish shift in the Bank of Japan's policy stance.
- The BoJ is anticipated to exit its ultra-loose policy in April, after the annual wage negotiations in March, though the possibility of such a move in January cannot be ruled out.
- Meanwhile, the Federal Reserve is widely expected to start cutting interest rates as early as March and deliver 150 basis points (bps) of cumulative rate cuts by the year-end.
- The overnight sharp move up in the US Treasury bond yields, however, reflected doubts that the Fed will deliver the extent of monetary easing that is priced in the markets.
- The yield on the benchmark 10-year US government bond rose above 4.0% for the first time in two weeks on Tuesday and provided a strong boost to the US Dollar.
- Rising US bond yields weighed on growth stocks and triggered a corrective decline in the US equity markets, benefitting the safe-haven JPY and capping the USD/JPY pair.
- Traders now look to the US ISM Manufacturing PMI and JOLTS Job Openings data ahead of the FOMC minutes, which will be scrutinized to ascertain the timing of potential rate cuts.
- The market attention will then shift to the ADP's US private-sector employment report on Thursday, though the focus remains on the crucial Nonfarm Payrolls (NFP) on Friday.
Technical Analysis: USD/JPY bears have the upper hand below 200-day SMA
From a technical perspective, a move beyond the 142.00 round figure might have set the stage for further gains, albeit bearish oscillators on the daily chart warrant caution for bullish traders. Hence, any subsequent move up is more likely to attract fresh sellers near the 142.40 region and remain capped near the very important 200-day Simple Moving Average (SMA) support breakpoint, currently around the 143.00 mark.
On the flip side, the 141.55 zone now seems to protect the immediate downside, below which the USD/JPY pair could slide back to the 141.00 round figure. Some follow-through selling will expose the multi-month low, around the 140.25 area touched last week, and the 140.00 psychological mark. The latter should act as a key pivotal point, which if broken decisively will be seen as a fresh trigger for bearish traders. Spot prices might then accelerate the fall towards the 139.35 region en route to the 139.00 mark, the 138.75 area and the 138.00 mark (July 28 low).
Japanese Yen price today
The table below shows the percentage change of Japanese Yen (JPY) against listed major currencies today. Japanese Yen was the strongest against the Australian Dollar.
| USD | EUR | GBP | CAD | AUD | JPY | NZD | CHF | |
| USD | -0.11% | -0.05% | 0.02% | 0.07% | -0.16% | -0.08% | -0.07% | |
| EUR | 0.11% | 0.05% | 0.13% | 0.17% | -0.05% | 0.02% | 0.04% | |
| GBP | 0.05% | -0.05% | 0.08% | 0.12% | -0.11% | -0.03% | -0.02% | |
| CAD | -0.02% | -0.13% | -0.08% | 0.03% | -0.17% | -0.10% | -0.09% | |
| AUD | -0.07% | -0.16% | -0.12% | -0.04% | -0.22% | -0.15% | -0.14% | |
| JPY | 0.16% | 0.05% | 0.09% | 0.18% | 0.22% | 0.05% | 0.09% | |
| NZD | 0.08% | -0.02% | 0.03% | 0.11% | 0.15% | -0.08% | 0.02% | |
| CHF | 0.08% | -0.03% | 0.01% | 0.09% | 0.14% | -0.09% | -0.02% |
The heat map shows percentage changes of major currencies against each other. The base currency is picked from the left column, while the quote currency is picked from the top row. For example, if you pick the Euro from the left column and move along the horizontal line to the Japanese Yen, the percentage change displayed in the box will represent EUR (base)/JPY (quote).
Japanese Yen FAQs
What key factors drive the Japanese Yen?
The Japanese Yen (JPY) is one of the world’s most traded currencies. Its value is broadly determined by the performance of the Japanese economy, but more specifically by the Bank of Japan’s policy, the differential between Japanese and US bond yields, or risk sentiment among traders, among other factors.
How do the decisions of the Bank of Japan impact the Japanese Yen?
One of the Bank of Japan’s mandates is currency control, so its moves are key for the Yen. The BoJ has directly intervened in currency markets sometimes, generally to lower the value of the Yen, although it refrains from doing it often due to political concerns of its main trading partners. The current BoJ ultra-loose monetary policy, based on massive stimulus to the economy, has caused the Yen to depreciate against its main currency peers. This process has exacerbated more recently due to an increasing policy divergence between the Bank of Japan and other main central banks, which have opted to increase interest rates sharply to fight decades-high levels of inflation.
How does the differential between Japanese and US bond yields impact the Japanese Yen?
The BoJ’s stance of sticking to ultra-loose monetary policy has led to a widening policy divergence with other central banks, particularly with the US Federal Reserve. This supports a widening of the differential between the 10-year US and Japanese bonds, which favors the US Dollar against the Japanese Yen.
How does broader risk sentiment impact the Japanese Yen?
The Japanese Yen is often seen as a safe-haven investment. This means that in times of market stress, investors are more likely to put their money in the Japanese currency due to its supposed reliability and stability. Turbulent times are likely to strengthen the Yen’s value against other currencies seen as more risky to invest in.
- Australian Dollar faced challenges as investors returned to the US Dollar.
- Australian economic data will be crucial for the RBA’s policy tightening.
- Traders reconsider the possibility of rate cuts by the Fed in the first quarter of 2024.
The Australian Dollar (AUD) could halt a three-day losing streak on Wednesday on the tepid US Dollar (USD). The commodity-linked Aussie Dollar (AUD) faced downward pressure following the indications of sluggish global growth at the close of 2024, prompting investors to turn back to the USD. However, market players are now re-evaluating their aggressive bets on imminent rate cuts by the Federal Reserve (Fed) anytime soon. However, the positive surprise in China’s manufacturing data might have potentially limited the losses of the AUD.
Australia's economic data will play a pivotal role, especially with the Reserve Bank of Australia (RBA) emphasizing the significance of scrutinizing additional data to assess risk balance before making decisions on future interest rates. The recent release of the Judo Bank Manufacturing PMI on Tuesday indicated a softening in economic activity. The upcoming release of Composite and Services PMI data on Friday is highly anticipated to fall below the 50 readings, suggesting a potential contraction in these sectors.
The Australian Dollar could exhibit resilience, buoyed by persistent inflation and housing prices. The market expectations lean towards the RBA refraining from monetary policy tightening in the upcoming February meeting, which could contribute to the AUD's stability.
The US Dollar Index (DXY) could persist in its upward trajectory, propelled by enhanced US Treasury yields. However, the S&P Global Manufacturing PMI posted a lower-than-expected figure of 47.9, diverging from the anticipated consistency at 47.2.
Investors will likely observe US data on Wednesday, including the December ISM Manufacturing PMI, November JOLTS Job Openings, and the Federal Open Market Committee (FOMC) Minutes.
The FOMC Minutes could hold relevance following Chairman Jerome Powell's mention of potential rate cuts in the aftermath of the latest Federal Reserve (Fed) monetary policy decision.
Daily Digest Market Movers: Australian Dollar faces challenges on improved US Dollar
- Australia’s Judo Bank Manufacturing PMI indicated a modest contraction in manufacturing activity, declining to 47.6 in December from the previous reading of 47.8.
- China’s NBS Manufacturing PMI for December reduced to the reading of 49.0 from the previous 49.4 figure. The market expectation was an increase to 49.5. While NBS Non-Manufacturing PMI improved to 50.4 from the 50.2 prior but fell short of the 50.5 expected.
- China's Caixin Manufacturing Purchasing Managers Index (PMI) improved to a reading of 50.8, surpassing both the market consensus of 50.4 and the previous reading of 50.7.
- The Chicago Purchasing Managers Index reduced to 46.9 in December from the previous 55.8.
Technical Analysis: Australian Dollar stays above the major support at 0.6750
The Australian Dollar trades near 0.6760 on Wednesday. The psychological level at 0.6800 could act as a key resistance following the major level at 0.6850. On the downside, the AUD/USD pair could find a key support at the 0.6750 major level followed by the 21-day Exponential Moving Average (EMA) at 0.6733 and the 23.6% Fibonacci retracement level at 0.6725. A breach below the latter could put pressure on the AUD/USD pair to navigate the psychological support level at 0.6700 following the 38.2% Fibonacci retracement level at 0.6637.
AUD/USD: Daily Chart
-638398418215149402.png)
Australian Dollar price today
The table below shows the percentage change of Australian Dollar (AUD) against listed major currencies today. Australian Dollar was the strongest against the New Zealand Dollar.
| USD | EUR | GBP | CAD | AUD | JPY | NZD | CHF | |
| USD | -0.07% | -0.05% | 0.03% | 0.16% | -0.06% | 0.07% | -0.03% | |
| EUR | 0.07% | 0.02% | 0.10% | 0.24% | 0.02% | 0.11% | 0.04% | |
| GBP | 0.03% | -0.02% | 0.08% | 0.22% | -0.02% | 0.10% | 0.01% | |
| CAD | -0.03% | -0.10% | -0.09% | 0.13% | -0.08% | 0.03% | -0.05% | |
| AUD | -0.19% | -0.23% | -0.23% | -0.15% | -0.24% | -0.12% | -0.21% | |
| JPY | 0.06% | -0.03% | -0.02% | 0.10% | 0.21% | 0.06% | 0.02% | |
| NZD | -0.08% | -0.13% | -0.12% | -0.03% | 0.09% | -0.13% | -0.08% | |
| CHF | 0.03% | -0.03% | -0.02% | 0.06% | 0.20% | -0.02% | 0.08% |
The heat map shows percentage changes of major currencies against each other. The base currency is picked from the left column, while the quote currency is picked from the top row. For example, if you pick the Euro from the left column and move along the horizontal line to the Japanese Yen, the percentage change displayed in the box will represent EUR (base)/JPY (quote).
Australian Dollar FAQs
What key factors drive the Australian Dollar?
One of the most significant factors for the Australian Dollar (AUD) is the level of interest rates set by the Reserve Bank of Australia (RBA). Because Australia is a resource-rich country another key driver is the price of its biggest export, Iron Ore. The health of the Chinese economy, its largest trading partner, is a factor, as well as inflation in Australia, its growth rate and Trade Balance. Market sentiment – whether investors are taking on more risky assets (risk-on) or seeking safe-havens (risk-off) – is also a factor, with risk-on positive for AUD.
How do the decisions of the Reserve Bank of Australia impact the Australian Dollar?
The Reserve Bank of Australia (RBA) influences the Australian Dollar (AUD) by setting the level of interest rates that Australian banks can lend to each other. This influences the level of interest rates in the economy as a whole. The main goal of the RBA is to maintain a stable inflation rate of 2-3% by adjusting interest rates up or down. Relatively high interest rates compared to other major central banks support the AUD, and the opposite for relatively low. The RBA can also use quantitative easing and tightening to influence credit conditions, with the former AUD-negative and the latter AUD-positive.
How does the health of the Chinese Economy impact the Australian Dollar?
China is Australia’s largest trading partner so the health of the Chinese economy is a major influence on the value of the Australian Dollar (AUD). When the Chinese economy is doing well it purchases more raw materials, goods and services from Australia, lifting demand for the AUD, and pushing up its value. The opposite is the case when the Chinese economy is not growing as fast as expected. Positive or negative surprises in Chinese growth data, therefore, often have a direct impact on the Australian Dollar and its pairs.
How does the price of Iron Ore impact the Australian Dollar?
Iron Ore is Australia’s largest export, accounting for $118 billion a year according to data from 2021, with China as its primary destination. The price of Iron Ore, therefore, can be a driver of the Australian Dollar. Generally, if the price of Iron Ore rises, AUD also goes up, as aggregate demand for the currency increases. The opposite is the case if the price of Iron Ore falls. Higher Iron Ore prices also tend to result in a greater likelihood of a positive Trade Balance for Australia, which is also positive of the AUD.
How does the Trade Balance impact the Australian Dollar?
The Trade Balance, which is the difference between what a country earns from its exports versus what it pays for its imports, is another factor that can influence the value of the Australian Dollar. If Australia produces highly sought after exports, then its currency will gain in value purely from the surplus demand created from foreign buyers seeking to purchase its exports versus what it spends to purchase imports. Therefore, a positive net Trade Balance strengthens the AUD, with the opposite effect if the Trade Balance is negative.
The People’s Bank of China (PBoC) sets the USD/CNY central rate for the trading session ahead on Wednesday at 7.1002 as compared to the previous day's fix of 7.0770 and 7.1512 Reuters estimates.
- Gold price gains momentum near $2,060 despite renewed USD demand.
- The markets have priced in no hike for the January meeting and forecasted rate cuts for March and May 2024.
- China's average daily home sales during the three-day New Year holiday in 40 cities dropped by 26% compared to last year.
- Market players will monitor US ISM Manufacturing PMI and FOMC Minutes on Wednesday.
Gold price (XAU/USD) snaps the three-day losing streak during the early Asian section on Wednesday. The yellow metal edges higher despite a stronger US Dollar (USD). At press time, gold price is trading around $2,060, up 0.13% for the day.
Meanwhile, the US Dollar Index (DXY), a measure of the value of the USD against a weighted basket of currencies used by US trade partners, trades in positive territory for the fourth consecutive day. The DXY bounces off 100.60 and hovers around 102.20. The Treasury yields edge lower, with the 10-year yield standing at 3.94%.
That being said, the potential rate cuts from the Federal Reserve (Fed) might cap the Greenback’s upside and lift the USD-denominated commodities. The markets have priced in no hike for the January meeting and forecasted rate cuts for March and May 2024, according to the CME FedWatch tool.
On Tuesday, the US final Manufacturing PMI arrived at 47.9 in December from 48.2 in the previous reading, below the market consensus. Last week, the US Chicago Purchasing Managers' Index (PMI) came in at 46.9 versus 55.8 prior, worse than the market expectation of 51.0.
China's average daily home sales during the three-day New Year holiday in 40 cities, dropped 26% compared to the same time last year, according to Reuters on Tuesday. Top Chinese authorities acknowledged resolving real estate risks and supporting steady and healthy market growth at a key conference in December to plan the economic route for 2024. The positive developments surrounding the Chinese economy might boost yellow metal as China is one of the world's largest Gold consumers.
Moving on, the final US ISM Manufacturing PMI report and the Fed’s latest Meeting Minutes are due on Wednesday. The attention will shift to the US labor data on Friday. The NFP figure is expected to show an increase of 163K in December versus 199K in November. The Unemployment Rate is estimated to climb to 3.8%, while December’s Average Hourly Earnings are expected to grow 0.3% MoM. Traders will take cues from these figures and find trading opportunities around the gold price.
| Index | Change, points | Closed | Change, % |
|---|---|---|---|
| Hang Seng | -258.84 | 16788.55 | -1.52 |
| KOSPI | 14.53 | 2669.81 | 0.55 |
| ASX 200 | 37 | 7627.8 | 0.49 |
| DAX | 17.72 | 16769.36 | 0.11 |
| CAC 40 | -12.32 | 7530.86 | -0.16 |
| Dow Jones | 25.5 | 37715.04 | 0.07 |
| S&P 500 | -27 | 4742.83 | -0.57 |
| NASDAQ Composite | -245.41 | 14765.94 | -1.63 |
| Pare | Closed | Change, % |
|---|---|---|
| AUDUSD | 0.676 | -0.68 |
| EURJPY | 155.361 | -0.11 |
| EURUSD | 1.09413 | -0.91 |
| GBPJPY | 179.182 | 0.02 |
| GBPUSD | 1.26192 | -0.8 |
| NZDUSD | 0.62499 | -1.05 |
| USDCAD | 1.33215 | 0.71 |
| USDCHF | 0.8504 | 1.32 |
| USDJPY | 141.994 | 0.81 |


© 2000-2026. Уcі права захищені.
Cайт знаходитьcя під керуванням TeleTrade DJ. LLC 2351 LLC 2022 (Euro House, Richmond Hill Road, Kingstown, VC0100, St. Vincent and the Grenadines).
Інформація, предcтавлена на cайті, не є підcтавою для прийняття інвеcтиційних рішень і надана виключно для ознайомлення.
Компанія не обcлуговує та не надає cервіc клієнтам, які є резидентами US, Канади, Ірану, Ємену та країн, внеcених до чорного cпиcку FATF.
Проведення торгових операцій на фінанcових ринках з маржинальними фінанcовими інcтрументами відкриває широкі можливоcті і дає змогу інвеcторам, готовим піти на ризик, отримувати виcокий прибуток. Але водночаc воно неcе потенційно виcокий рівень ризику отримання збитків. Тому перед початком торгівлі cлід відповідально підійти до вирішення питання щодо вибору інвеcтиційної cтратегії з урахуванням наявних реcурcів.
Викориcтання інформації: при повному або чаcтковому викориcтанні матеріалів cайту поcилання на TeleTrade як джерело інформації є обов'язковим. Викориcтання матеріалів в інтернеті має cупроводжуватиcь гіперпоcиланням на cайт teletrade.org. Автоматичний імпорт матеріалів та інформації із cайту заборонено.
З уcіх питань звертайтеcь за адреcою pr@teletrade.global.
переклади