- Аналітика
- Новини та інструменти
- Новини ринків
Новини ринків
- EUR/USD stabilizes at the lowest level in a month as it bounces off 100-DMA to prod three-day downtrend.
- US Dollar surprisingly cheers US credit rating downgrade via risk aversion, strong yields.
- Lack of entertainment from the ‘Old Continent’ allows Greenback bulls to keep the reins.
- Slew of inflation, employment and activity data from Eurozone, US will entertain Euro traders, bears occupy driver’s seat below 1.0985.
EUR/USD seesaws around 1.0940-50 during the early hours of Thursday’s Asia session after declining to the lowest level in a month by posting a three-day downtrend in the last. In doing so, the Euro pair portrays the market’s cautious mood ahead of a slew of data from the Eurozone and the US. It’s worth noting that the risk aversion wave joins upbeat Treasury bond yields and an empty plate to offer from the bloc to underpin the US Dollar’s rally the previous day, which in turn dragged the Euro towards the lowest level since early July.
Fitch Ratings’ downgrade to the US government credit rating flagged fears of the US default and weighed on the sentiment, which in turn bolstered the US Dollar’s haven demand, drowning the EUR/USD pair due to its risk-barometer status. Apart from the haven demand, upbeat prints of the US ADP Employment Change and a run-up in the Treasury bond yields also pleased the Euro bears.
On Wednesday, US ADP Employment Change for July rose past 189K markets forecasts to 324K while the previous readings were revised down to 455K.
That said, US Treasury Secretary Janet Yellen and White House (WH) Economic Adviser Jared Bernstein defended the credibility of the US Treasury bonds and vouched for the US economic strength after Fitch Ratings’ cited such concerns as the catalysts for their downgrade to the US government credit ratings. On the same line, the US Treasury Department raised possibilities of testing demand for the US bonds after the rating cut by fueling the weekly longer-term debt issuance. The same pushed markets to remain worrisome and rush for risk safety.
Amid these plays, US 10-year Treasury bond yields rose to the highest level since November 2022 while the US Dollar Index (DXY) also jumped to a three-week top. Further, the Wall Street benchmarks also closed in the red and portrayed risk aversion.
Looking forward, Eurozone Producer Price Index (PPI) for June will precede the final activity data for July to entertain EUR/USD traders during early Thursday. Should the EU numbers flash upbeat data, the Euro pair may consolidate the latest losses.
Following that, the US ISM Services PMI, Factory Orders, Weekly Initial Jobless Claims and quarterly readings of Nonfarm Productivity and Unit Labor Costs will be crucial to watch for clear directions. It’s worth noting that the EUR/USD bears are more likely to witness further downside but it all depends upon how strongly the scheduled statistics defend the Federal Reserve’s (Fed) September rate hike.
Technical analysis
A daily closing beneath the nine-week-old rising support line, now immediate resistance near 1.0985, keeps EUR/USD sellers hopeful even if the 100-DMA tests further downside around 1.0915.
- USD/CAD oscillates in a narrow range near 1.3345, down 0.03% for the day.
- ADP showed that the US economy created 324K jobs in July, above the estimation.
- A decrease in oil prices has undermined the Loonie.
- The key events to monitor are the Canadian Employment Change and Nonfarm Payrolls.
The USD/CAD pair consolidates its recent gains around 1.3345 during the early Asian session on Thursday. The major pair is on track for its sixth weekly close above 1.3200. Lower Oil prices are the main driver of the Canadian Dollar's depreciation.
On Wednesday, Automatic Data Processing Inc. (ADP) revealed that the number of employed people in the US private sector rose by 324K, above estimates of 189K and lower than the revised reading of 455,000 in June. This figure is above the 12-month average. The employment data could convince the Federal Reserve (Fed) to hike additional rates this year, which benefits the US Dollar and acts as a tailwind for the USD/CAD pair.
On the Canadian Dollar front, investors await the Canadian Employment Change on Friday as it could offer hints into the strength of domestic activity and the direction of the BoC's monetary policy.
Earlier this week, Canada’s manufacturing sector declined for the third consecutive month in July. The S&P Global Canada Manufacturing PMI rose to 49.6. This figure followed the previous month's 48.8 and was better than expected at 48.9. A reading below 50 indicates sector contraction. It has been below that level since May. Meanwhile, a decrease in oil prices has undermined the Loonie since Canada is the largest oil exporter to the United States.
Market participants will keep an eye on the US weekly Jobless Claims, Unit Labour Costs and ISM Service PMI later in the American session. On Friday, attention will shift to Canadian Employment Change and Nonfarm payrolls. The US economy is expected to have created 180,000 jobs. While economists forecast that the Canadian economy will create 21,100 jobs in July. The data will be critical for determining a clear movement for the USD/CAD pair.
Technically, the further upside appears favorable for USD/CAD as the Relative Strength Index (RSI) stands above 50 on the one-hour chart. The immediate resistance level is seen at 1.3385 (High of June 6) and the initial support level appears at 1.3300 (a psychological round mark).
- GBP/JPY stays pressured after reversing from three-week-old ascending resistance line.
- Downbeat oscillators, fears of BoE’s dovish hike direct sellers toward previous resistance line.
- Buyers need validation from BoE Governor Andrew Bailey and yearly high marked in July to retake control.
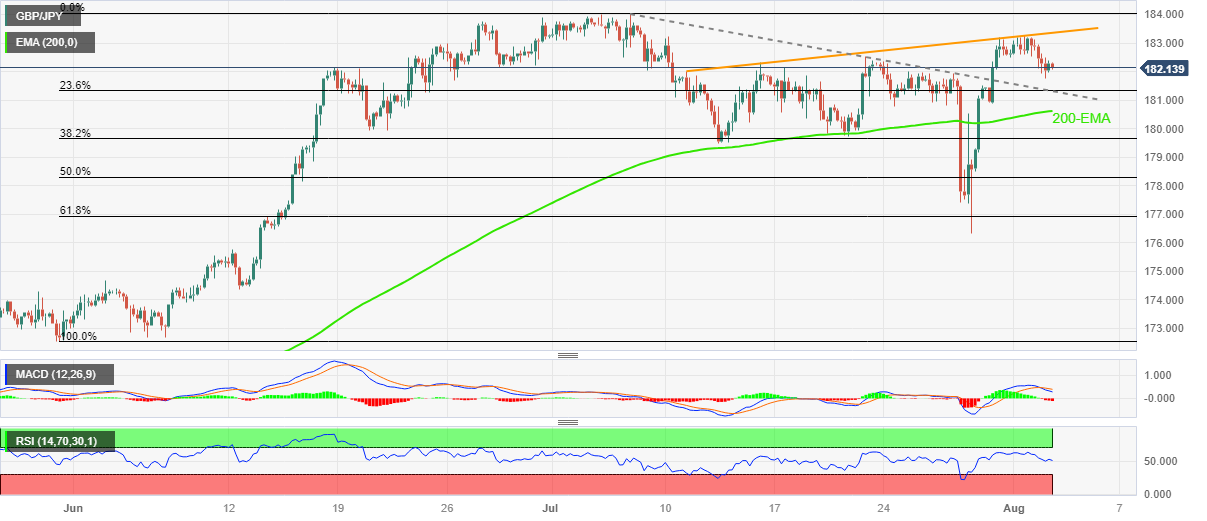
GBP/JPY holds lower grounds near 182.00 after snapping a three-day uptrend the previous day. In doing so, the cross-currency pair keeps Wednesday’s U-turn from a three-week-old rising trend line as market players await the Bank of England (BoE) Interest Rate Decision on Thursday.
Also read: Bank of England Preview: Sell Sterling? Why Bailey may break the Pound, even with a bigger hike
Not only the quote’s pullback from the key resistance line stretched from July 11 but bearish MACD signals and downward-sloping RSI (14), not oversold, also weigh on the GBP/JPY price on a crucial day.
With this, the pair sellers appear well set to test the previous resistance line from July 06, close to 181.30 by the press time.
In a case where the market’s disappointment from the BoE becomes too heavy and breaks the 181.30 support, the 200 Exponential Moving Average (EMA) level of 180.60 and the 180.00 round figure will challenge the GBP/JPY pair’s further downside.
On the flip side, a clear break of the aforementioned resistance line, close to 183.40 by the press time, could convince sellers to stay in the line. However, they may want to wait for a clear upside break of the yearly high marked in July, around 184.00, for further dominance.
To sum up, GBP/JPY stays on the bear’s radar as markets prepare for the BoE’s dovish hike.
GBP/JPY: Four-hour chart
Trend: Further downside expected
- EUR/JPY retraces from the weekly high of 157.50, falling past 157.00, trading at 156.78, failing to test the YTD high of 157.99.
- Japanese Yen’s strength is attributed to the Bank of Japan’s Yield Curve Control flexibility and a downgrade of US creditworthiness from AAA to AA+.
- Technicals show a peak around the 156.80/157.40 area, with bearish signals from the Tenkan-Sen, Kijun-Sen, and Chikou Span.
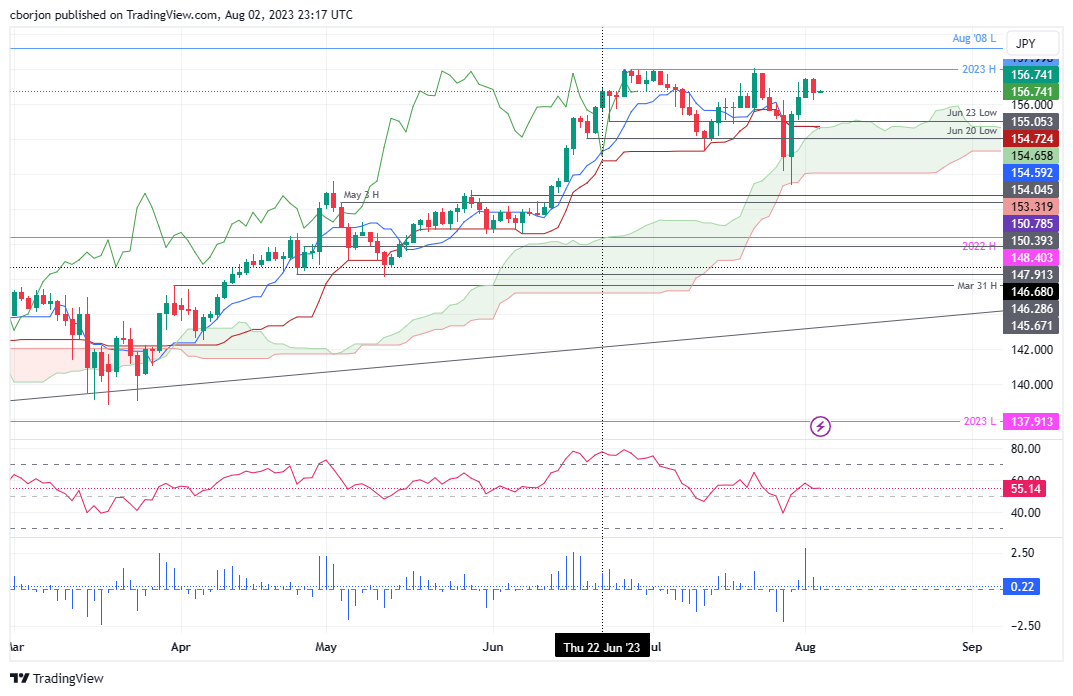
EUR/JPY retraces from weekly highs of 157.50 and drops below 157.00 as buyers failed to extend their gains and test the year-to-date (YTD) high of 157.99. The reasons behind the Japanese Yen (JPY) strength are the Yield Curve Control (YCC) flexibility imposed by the Bank of Japan (BoJ), as well as the downgrade of US creditworthiness from AAA to AA+. Therefore, the EUR/JPY tumbled and is trading at 156.78.
EUR/JPY Price Analysis: Technical outlook
The EUR/JPY appears to have peaked at around the 156.80/157.40 area, as depicted in the daily chart. The cross-currency pair has failed to decisively clear the 158.00 mark, exacerbating its fall beneath the 157.00 figure. In addition, a two-day candlestick called dark cloud cover looms, but Thursday’s price action must clear Wednesday’s daily low of 156.25 and achieve a daily close below the latter to extend its losses.
Notably, the Tenkan-Sen sits below the Kijun-Sen, at around the top of the Ichimoku Cloud (Kumo) at around 154.59/72, a bearish signal. Furthermore, the Chikou Span is positioned below the price action, suggesting that sellers could regain control in the near term.
The EUR/JPY first support would be 156.25, followed by the figure at 156.00. A breach of the latter will expose the Kijun-Sen at 154.72, followed by the Tenkan-Sen at 154.59, before dipping inside the Kumo. Conversely, if EUR/JPY reclaims 157.00, that could open the door for further upside, with buyers challenging 158.00.
EUR/JPY Price Action – Daily chart
- AUD/USD portrays corrective bounce after falling heavily in the last two consecutive days to refresh a multi-week low.
- US Dollar cheered risk aversion, strong yields after Fitch Ratings’ downgrade to US government credit rating.
- Upbeat US ADP Employment Change, RBA’s surprise pause add strength to downside bias about Aussie pair.
- Australia Retail Sales, Trade Balance and a slew of activity/employment clues from China and US eyed for clear directions.
AUD/USD prints mild gains around 0.6540 amid the initial Asian session on Thursday as it consolidates the recent losses after falling heavily in the last two consecutive days to the lowest levels since early June. In doing so, the Aussie pair braces for a slew of top-tier data from Australia, China and the US after bearing the burden of the Reserve Bank of Australia’s (RBA) rate hike pause and the strong US Dollar.
That said, the Fitch Ratings’ downgrade to the US government credit rating flagged fears of the US default and weighed on the sentiment, which in turn bolstered the US Dollar’s haven demand, drowning the AUD/USD pair due to its risk-barometer status. Apart from the haven demand, upbeat prints of the US ADP Employment Change and a run-up in the Treasury bond yields also pleased the Aussie bears.
It’s worth mentioning that downbeat prints of Australia’s AiG activity numbers for June also weighed on the AUD/USD price.
On Wednesday, Australia’s AiG Industry Index for June slumped to -14.7 from -11.9 whereas AiG Manufacturing PMI for the said month nosedived to -25.6 from -19.8 previous readings. That said, Australia’s S&P Global Composite PMI edges lower to 48.2 for July from 48.3 while the Services PMI eases to 47.9 from 48.0.
On the other hand, US ADP Employment Change for July rose past 189K markets forecasts to 324K while the previous readings were revised down to 455K.
It should be noted that US Treasury Secretary Janet Yellen and White House (WH) Economic Adviser Jared Bernstein defended the credibility of the US Treasury bonds and vouched for the US economic strength after Fitch Ratings’ cited such concerns as the catalysts for their downgrade to the US government credit ratings. On the same line, the US Treasury Department raised possibilities of testing demand for the US bonds after the rating cut by fueling the weekly longer-term debt issuance. The same pushed markets to remain worrisome and rush for risk safety. As a result, US 10-year Treasury bond yields rose to the highest level since November 2022 while the US Dollar Index (DXY) also jumped to a three-week top. Further, the Wall Street benchmarks also closed in the red and portrayed risk aversion.
Looking forward, Australia’s second-quarter (Q2) Retail Sales and Trade Balance for June will join China’s Caixin Services PMI for July to entertain AUD/USD traders during the Asian session. Following that, the US ISM Services PMI, Factory Orders, Weekly Initial Jobless Claims and quarterly readings of Nonfarm Productivity and Unit Labor Costs will be crucial to watch for clear directions. Although the RBA is more likely to have reached the policy pivot, especially after the latest two consecutive pauses, today’s Aussie data and Friday’s RBA Monetary Policy Statement can help confirm the bias and may flag further downside of the AUD/USD pair.
Technical analysis
A daily closing beneath the 10-month-old rising support line, now immediate resistance near 0.6590, directs the AUD/USD bears toward the yearly low marked in May around 0.6460.
- USD/CHF remains confined in a tight range between 0.8770 and 0.8780 ahead of the Swiss inflation data.
- The number of employed people in the US private sector rose by 324K, above estimates of 189K.
- Fitch downgraded the US government's credit rating from AAA to AA+, fueling concern about the US debt ceiling crisis.
- Investors await the Swiss Consumer Price Index (CPI), the US weekly Jobless Claims and Unit Labor Cost.
The USD/CHF pair consolidates in a narrow range above 0.8770 in the early Asian session after retreating from the key barrier around 0.8800. The solid US ADP Employment Change lifts the Greenback. The US Dollar Index (DXY), a measure of the value of USD against six other major currencies, surges to its highest level since July 7 at 102.80 in response to the news.
That said, Automatic Data Processing Inc. (ADP) revealed on Wednesday that the number of employed people in the US private sector rose by 324K, above estimates of 189K and lower than the revised reading of 455,000 in June. This figure is above the 12-month average. Investors speculate on a more aggressive Federal Reserve (Fed) stance, which benefits the US Dollar and acts as a tailwind for the USD/CHF pair.
On the other hand, markets turned cautious after Fitch downgraded the United States government's credit rating from AAA to AA+. The leading rating company cited an expected fiscal deterioration over the next three years and a high general government debt burden as the primary reasons for this drastic action.
US Treasury Secretary Janet Yellen said late Wednesday that Treasury securities remain the world's most secure and liquid asset and that the US economy is fundamentally robust, per Reuters. Additionally, White House (WH) Economic Adviser Jared Bernstein expressed confidence in the US government and Congress to avoid default, and the US Treasury debt remains the safest in the world. However, this headline fuels concern about the US debt ceiling crisis and might cap the upside in the Greenback. This, in turn, might benefit the Swiss Franc, a traditional safe-haven asset.
Looking ahead, market participants await the Swiss Consumer Price Index (CPI) YoY for July. Also, investors will take cues from more US employment data. The US weekly Jobless Claims and Unit Labor Costs are due later in the day. The highlight of the week is the US Nonfarm Payrolls on Friday. The economy is expected to have created 180,000 jobs in July.
- Gold Price remains pressured at three-week low after breaking key support confluence.
- Firmer US Dollar, Treasury bond yields weigh on XAU/USD price ahead of United States activity, employment clues.
- Upbeat US ADP Employment Change, US credit rating woes join likely weak physical Gold demand from Asia to favor sellers.
- Firmer prints of US ISM Services PMI, Factory Orders and Q2 Unit Labor Costs will favor XAU/USD bears before NFP.
Gold Price (XAU/USD) languishes at the lowest level since July 12, making rounds to $1,935 after breaking the $1,945 support confluence, as bears lick their wounds ahead of a slew of United States statistics scheduled for release on Thursday. That said, a jump in the US Treasury bond yields and the US Dollar weighed on the Gold Price the previous day. While tracing the catalysts, the market’s fears emanating from the Fitch Ratings’ downgrade to the US credit rating, the US Treasury’s testing of the market’s acceptance and the upbeat Automatic Data Processing (ADP) Employment Change for July gained major attention.
Gold Price drops as US Dollar cheers upbeat United States employment data, strong yields
Gold Price dropped for the second consecutive day to the lowest level in three weeks as the Firth Ratings’ downgrade to the US government credit rating flagged fears of the US default and weighed on the sentiment, which in turn bolstered the US Dollar’s haven demand and weighed on the Gold Price. Apart from the haven demand, upbeat prints of the US ADP Employment Change and a run-up in the Treasury bond yields also favored the US Dollar, as well as weighed on the XAU/USD.
Late on Wednesday, US Treasury Secretary Janet Yellen and White House (WH) Economic Adviser Jared Bernstein defended the credibility of the US Treasury bonds and vouched for the US economic strength after Fitch Ratings’ cited such concerns as the catalysts for their downgrade to the US government credit ratings.
On the same line, the US Treasury Department raised possibilities of testing demand for the US bonds after the rating cut by fueling the weekly longer-term debt issuance.
Elsewhere, US ADP Employment Change for July rose past 189K markets forecasts to 324K while the previous readings were revised down to 455K.
Amid these plays, US 10-year Treasury bond yields rose to the highest level since November 2022 while the US Dollar Index (DXY) also jumped to a three-week top, which in turn weighed on the Gold Price. It should be noted that the Wall Street benchmarks also closed in the red and portrayed risk aversion while favoring the XAU/USD bears.
Gold sellers seek more clues to confirm Federal Reserve rate hike in September
Although the firmer US Treasury bond yields and the US Dollar keep the Gold sellers hopeful, the Greenback buyers need more clues to defend the latest strength as markets brace for Friday’s United States Nonfarm Payrolls (NFP).
As a result, today’s US ISM Services PMI, Factory Orders, Weekly Initial Jobless Claims and quarterly readings of Nonfarm Productivity and Unit Labor Costs will be crucial to watch for the Gold traders. Should these figures keep coming in firmer, the markets can expect a firmer US NFP and increase their bets on the Federal Reserve (Fed) rate hike in September, which in turn will favor the US Dollar and weigh on the Gold Price.
Also read: Gold Price Forecast: XAU/USD pressuring a critical support level
Gold Price Technical Analysis
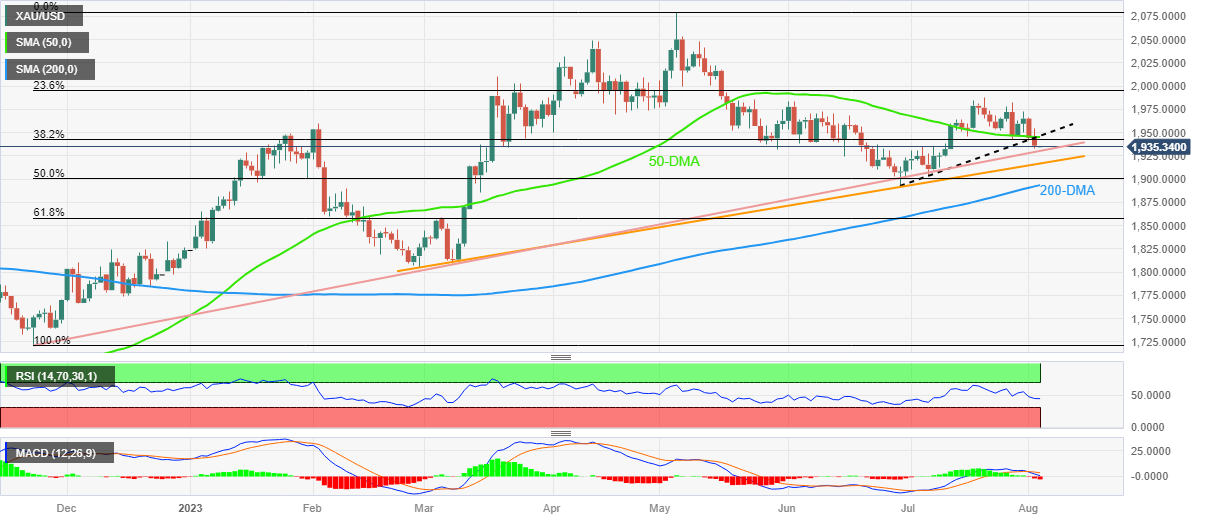
Gold Price offered a clear break of the $1,945 support confluence, now resistance, and welcomed bears on Wednesday.
Adding strength to the downside bias for the XAU/USD price is the descending Relative Strength Index (RSI) line, placed at 14, as well as bearish signals from the Moving Average Convergence and Divergence (MACD) indicator.
With this, the Gold sellers prod an ascending support line from late November 2022, close to $1,930 by the press time, a break of which could drag the bullion prices to a five-month-long rising trend line, near $1,918 at the latest.
In a case where the XAU/USD remains weak past $1,918, the 50% Fibonacci retracement of its November 2022 to May 2023 upside, around the $1,900 round figure, will precede the 200-DMA support of $1,892 to offer the last fight to the bears before the bull’s surrender.
On the contrary, a daily closing beyond the $1,945 resistance confluence comprising the 50-DMA and a five-week-old upward-sloping trend line, could direct the Gold Price toward February’s peak of around $1,960.
It’s worth observing, however, that the Gold Price remains on the bear’s radar unless crossing the previous monthly high surrounding $1,988.
Overall, the Gold Price is likely to witness further downside but the road towards the south is long and bumpy.
Gold Price: Daily chart
Trend: Further downside expected
- GBP/USD breaks below the bottom of an ascending channel and the 50-day EMA at 1.2742, trading at 1.2715 with a neutral to downward bias.
- If the pair drops below the 1.2700 psychological level, support may be found at the 100-day EMA at 1.2591, followed by the 200-day EMA at 1.2440.
- A rebound above 1.2700 and reclaiming the 50-day EMA could lead to a rally towards 1.2800, with the next resistance at the 20-day EMA at 1.2827.
- The RSI has turned bearish, while the three-day RoC suggests that the 1.2700 level might hold in the short term amid the BoE monetary policy decision.
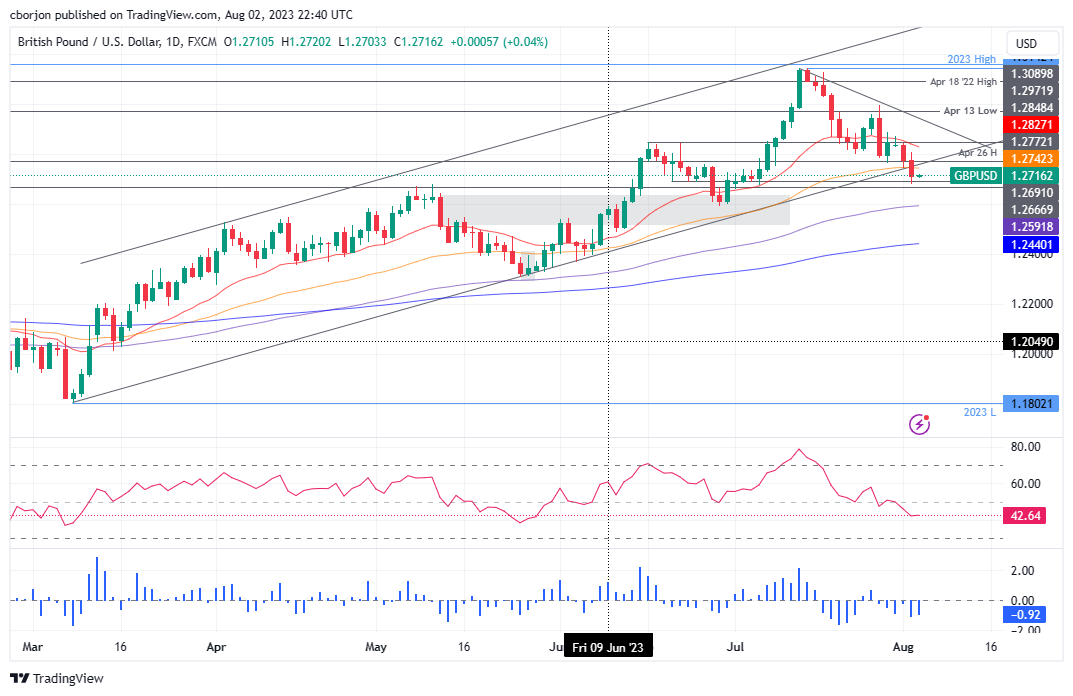
GBP/USD breaks below the bottom of an ascending channel, ahead of the Bank of Englan’s (BoE) monetary policy decision on Thursday, as the pair aims toward the 1.2700 psychological figure. As the Asian session commences, the GBP/USD is exchanging hands at 1.2715, posting minuscule gains of 0.04%.
GBP/USD Price Analysis: Technical outlook
The GBP/USD is neutral to downward biased, as the daily chart depicts, as the pair dropped on Wednesday’s session below the 50-day Exponential Moving Average (EMA) at 1.2742. In addition, the GBP/USD extended its fall below the bottom of the ascending channel, opening the door for further losses. That, alongside the Relative Strength Index (RSI) indicator turning bearish, could pave the way for a drop below 1.2700. Nevertheless, the three-day Rate of Change (RoC) portrays a slight divergence with price action, suggesting that the 1.2700 psychological level might hold in the near term.
If GBP/USD drops below 1.2700, next support emerges at the 100-day EMA at 1.2591, followed by the 200-day EMA at 1.2440. Conversely, if GBP/USD stays above 1.2700 and reclaims the 50-day EMA at 1.2742, that could exacerbate a rally towards 1.2800 and beyond. Next resistance emerges at the 20-day EMA at 1.2827, followed by a downslope resistance trendline at 1.2925/40.
GBP/USD Price Action – Daily chart
“Treasury securities remain the world's preeminent safe and liquid asset, and that the American economy is fundamentally strong,” said US Treasury Secretary Janet Yellen on late Wednesday while at an Internal Revenue Service contractor office near Washington, per Reuters.
On the same line, White House (WH) Economic Adviser Jared Bernstein also said that the US Treasury debt remains the safest in the world.
More to come…
- NZD/USD has taken a hit, declining by more than 1%, with a daily high previously at 0.6169.
- The US credit rating was downgraded from AAA to AA+, causing a surge in demand for the US Dollar and the Japanese Yen in the FX market.
- New Zealand’s unemployment rate rose to 3.6%, above expectations, and wage growth was weaker than anticipated, aligning with the RBNZ’s decision to end its tightening cycle.
NZD/USD plunged more than 1% on Wednesday, courtesy of a risk-off impulse as US credit rating was downgraded by Fitch, sparking a jump in US Treasury bond yields. That, alongside a solid July ADP National Employment report, boosted appetite for the US Dollar (USD). Hence, the NZD/USD slumps toward 0.6077 at the time of writing after reaching a daily high of 0.6169.
Risk-off sentiment boosts the US Dollar as Fitch downgrades US credit rating, and soft employment figures in New Zealand weigh on the Kiwi
Market sentiment was dampened after Tuesday’s Fitch Ratings downgraded US creditworthiness from AAA to AA+ “on a perceived deterioration in US governance, which it said gave less confidence in the government’s ability to address fiscal and debt issues,” according to the report. After the release, traders seeking refugee bought the US Dollar (USD) and the Japanese Yen (JPY) in the FX space.
Earlier, data revealed by ADP revealed that private hiring in July improved sharply, with the economy adding 324K jobs smashing 189K estimates, ahead of Friday’s US Nonfarm Payrolls report. According to a Reuters poll, the US economy created 200K jobs, as revealed by analysts. In other data, July’s manufacturing activity continued to improve in the US, as the ISM shows, arriving at 46.4, below 46.8 estimates but exceeding June’s 46.0.
On the New Zealand (NZ) front, labor market data for the second quarter (Q2) of 2023 was soft. The Unemployment rate rose by 3.6% above 3.5% estimates, and wages, including and excluding overtime, came in at 1.1% q/q vs. 1.2% expected and 0.9% in Q1. Regarding Average hourly earnings, they came at 1.9% QoQ below Q1 2.1%, supporting the Reserve Bank of New Zealand’s (RBNZ) decision to finish its tightening cycle. The swaps market suggests the RBNZ would keep rates unchanged for August and October, but November is still open. Nevertheless, if data remains weak, the RBNZ will hold rates at the current level.
NZD/USD Price Analysis: Technical outlook
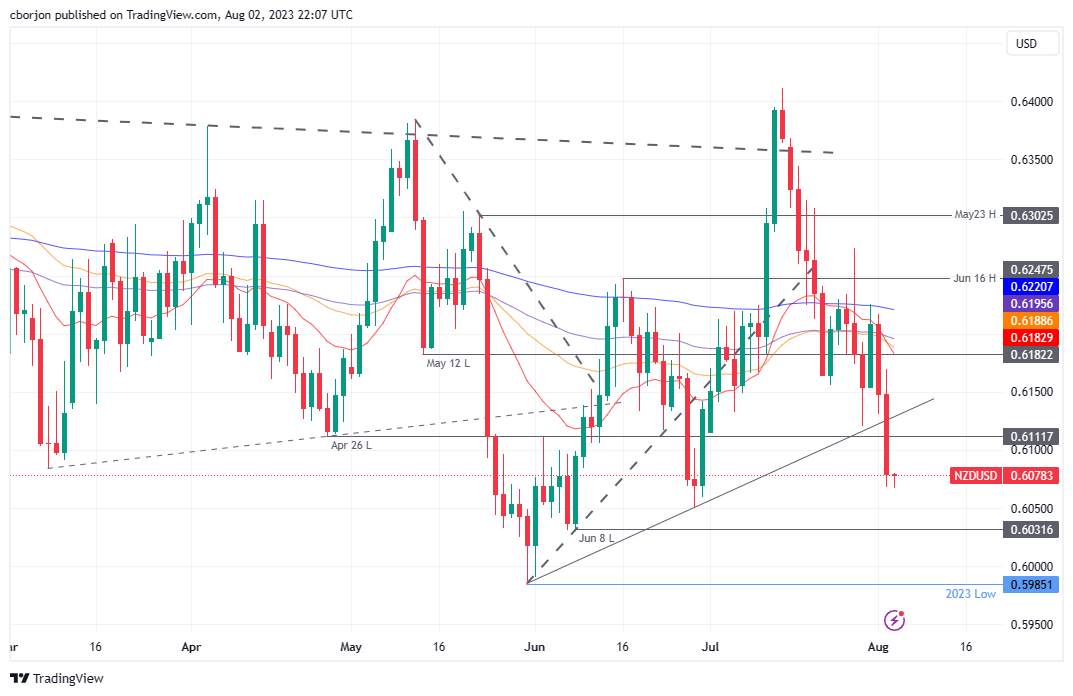
From a daily chart standpoint, the NZD/USD has turned bearish since the start of the week, dropping below the 200, 100, and 20-day Exponential Moving Averages (EMAs), spurring a 146 pip drop. Also, the NZD/USD breaking below the two-month-old upslope support trendline opened the door to test year-to-date (YTD) lows of 0.5985, but sellers must conquer demand zones on its way down. Firstly the June 29 daily low of 0.6050, followed by June’s 8 low of 0.6045, ahead of 0.6000. On the other hand, if NZD/USD stays above 0.6100, that could pave the way to test the psychological 0.6150, ahead of challenging a busy area with the daily EMAs hovering around 0.6200.
- EUR/USD tallies a third stright daily loss, and fell to the 1.09370 level.
- The Labour market in the US and in the EUR showed positive results this week.
- All eyes are now on Friday’s US NFPs.
The EUR/USD is trading in negative territory after 3 consecutive days of losses, fueled by a stronger USD following robust labour market data. The greenback, measured by the DXY index, gained ground in the middle of the week and jumped to its highest label since July 7.
According to, Automatic Data Processing (ADP), Inc released the US Employment Change for July, which measures the change in the number of employed people in the US, came in at 324k, better than the expected 189k but below the previous 455k. With this in mind, hot labour market data may set the tone for the Federal Reserve (Fed) to consider one additional hike in 2023, and that is what is driving the USD upwards.
That being said, Jobless Claims on Thursday and the Nonfarm Payrolls report on Friday will give additional clues to the markets regarding the labour situation in the US and will continue placing their bets for the next Fed meeting. As for now, according to the CME FedWatch tool, the most likely case is that the Federal Open Market Committee (FOMC) won't hike in September or November.
For the Eurozone’s side, Spain released the Unemployment Change for July, which showed that the number of unemployed workers added during the previous month, came in better than expected. This comes after Germany also reported strong labour figures on Tuesday. Its worth noting that Christine Lagarde highlighted that the labour market remains robust and also mentioned that incoming data will be considered for the following interest rate decisions, so strong data may fuel hawkish bets on the European Central Bank (ECB). For the rest of the week, Services PMIs from European countries will be released on Thursday, giving further guidance to both markets and the ECB regarding the economic activity situation in the zone.
EUR/USD Levels to watch
According to the daily chart, bears are gaining ground as the Relative Strength Index (RSI) is in negative territory and has a slope below its midline. The Moving Average Convergence Divergence (MACD) prints strong growing red bars indicating that bulls are not in the scene.
Resistance levels: 1.0950, 1.1000, 1.1075 (20-day SMA).
Support levels: 1.0913 (100-day SMA), 1.0900, 1.0850.
EUR/USD Daily chart
-638266079408531297.png)
During the Asian session, Australian data includes the final S&P Global Composite PMI, retail sales, and trade data. The Chinese Caixin Services PMI is also due. Later in the day, Switzerland will report inflation, and Eurostat will release the June Producer Price Index. The main event in Europe will be the Bank of England's decision. In the US, the weekly jobless claims, ISM Services PMI, and Unit Labor Costs are due, all ahead of Friday's NFP.
Here is what you need to know on Thursday, August 3:
US stocks dropped on Wednesday following Fitch Ratings' downgrade of the US government credit rating late on Tuesday. The Dow Jones lost 0.98%, and the Nasdaq plummeted 2.17%. US yields peaked after the release of US data and then pulled back, with the 10-year settling around 4.07% and the 2-year at 4.88%.
Market participants will digest earnings results from Apple, Amazon, ConocoPhillips, Airbnb, among others on Thursday.
While on Tuesday, the decline in job openings showed signs of easing, the ADP private employment report came in stronger than expected and above the average of the last 12 months, with private employment rising by 324K, surpassing expectations of 189K.
Nela Richardson Chief Economist, ADP:
“The economy is doing better than expected and a healthy labor market continues to support household spending. We continue to see a slowdown in pay growth without broad-based job loss.”
The combination of risk aversion and soft US data boosted the Greenback. The US Dollar Index (DXY) climbed to 102.80, reaching the highest level since July 7. More US employment data is due on Thursday with jobless claims and unit labor cost. Also due is the Factory Orders report. All of this takes place ahead of Friday's Nonfarm Payrolls (NFP). Early on Thursday, the Chinese Caixin Service PMI will be released.
EUR/USD posted its lowest close in almost four weeks after breaking an uptrend line. It remains under pressure below 1.0960, with the next support level at 1.0900. On Thursday, the final Eurozone PMIs are due, as well as the June Producer Price Index.
GBP/USD dropped for the third consecutive day and tested levels below 1.2700 on the back of a stronger US dollar. The Bank of England (BoE) will announce its monetary policy decision on Thursday, with a rate hike expected.
Analysts at TD Securities:
We expect the MPC to hike Bank Rate by 25bps in a 1-7-1 decision. The risks of a 50bps hike are material. Accompanying projections are likely to show a sizeable downgrade to the inflation outlook.
USD/JPY bounced all the way back from 142.30 to the 143.50 zone. The initial reaction to the US credit downgrade was offset by US jobs data, also helped by higher Treasury yields.
AUD/USD dropped below 0.6600 and accelerated to the downside, closing at 0.6540, the lowest since early June. Risk aversion, lower commodity prices, and the strong US Dollar offer a negative context for the Aussie. The bias is to the downside. Australia will report trade data and retail sales on Thursday.
NZD/USD fell below 0.6100 to 0.6068, a one-month low. Soft employment data from New Zealand supported expectations that the Reserve Bank of New Zealand (RBNZ) has ended its tightening cycle.
USD/CAD edged further higher to the 1.3350 zone and is looking at the June high at 1.3386. The Canadian Dollar hit monthly highs versus the Aussie and the Kiwi.
Crude oil prices ended a positive streak with a 2% slide. The WTI barrel pulled back under $80.00. Cryptocurrencies fell moderately, with Bitcoin at $29,130 and Ethereum at $1,840. Litecoin tumbled 5.85%.
Like this article? Help us with some feedback by answering this survey:
- XAG/USD fell below $24.00, seeing losses of 2.40%.
- US private employment beat estimates in July.
- Higher US yields and a stronger dollar are driving commodities prices lower.
On Wednesday’s session, the XAG/USD Silver spot price fell to its lowest point since July 12 driven by a stronger USD to the $23.70 area. The DXY index is rising for a fifth consecutive day, mainly because the US economy is resilient and may push the Federal Reserve (Fed) not to halt its tightening cycle.
According to Automatic Data Processing Inc. (ADP), there were 324,000 employed people in the US in July, higher than the 189,000 expectations but lower than the revised number of 455,000 in June. As the labour market is still extremely tight, it may push the Fed to consider hiking in September, strengthening the USD.
In response, US bond yields and the opportunity cost of holding Silver are rising. The yields on the 5- and 10-year bonds increased by 4.26% and 4.10%, respectively, each by more than 1%. The 2-year yield increased by 0.60% on the day to 4.92%.
As for now, according to the CME FedWatch tool, markets anticipate that the Fed won't hike in September and bet on a low odd of 20% of a 25 basis point hike, while the chances of a hike in November top out at 30% in November.
XAG/USD Levels to watch
The daily chart analysis indicates a bearish outlook for the XAG/USD in the short term. The Relative Strength Index (RSI) is below its midline in negative territory, with a negative slope, aligning with the negative signal from the Moving Average Convergence Divergence (MACD), which displays red bars, reinforcing the strong bearish sentiment. On the other hand, the pair is below the 20 and 100-day Simple Moving Averages (SMAs), but above the 200-day SMA, indicating that the bulls aren't done yet and that the outlook is still positive, looking at the bigger picture.
Support levels: $23.40,$23.15 (200-day SMA), $23.00.
Resistance levels. $24.00 (100-day SMA), $24.27 (20-day SMA), $24.50.
XAG/USD Daily chart
-638266036123266746.png)
- WTI crude oil benchmark is down 3.24% after hitting a daily high of $82.39.
- Fitch’s revision of US Government debt from AAA to AA+ impacts market sentiment, adding pressure on oil and other US Dollar-denominated commodities.
- A decline in China’s factory activity for the fourth consecutive month hints at slowing economic recovery and potentially reduced oil demand.
Western Texas Intermediate (WTI), the US crude oil benchmark, tumbled more than 3% on Wednesday as risk aversion surfaced, following Fitch’s downgrading US credit rating from AAA to AA+. Furthermore, a drop in US stockpiles weighed on oil prices. WTI is trading at $79.44 per barrel, down 3.24% after hitting a daily high of $82.39.
WTI’s price falls sharply as risk aversion surfaces
Fitch’s revision to US Government debt from AAA to AA+ was blamed “on a perceived deterioration in US governance, which it said gave less confidence in the government’s ability to address fiscal and debt issues,” according to sources cited by Reuters. That said, Wall Street plunged, while most US Dollar denominated commodities, like precious metals and oil, drifted lower.
The US Energy Information Administration (EIA) revealed that stockpiles dropped by 17 million barrels, the largest fall in US crude oil inventories, according to records from 1982. Increased refinery runs and strong US crude exports spurred stockpiles to dip.
In the meantime, weaker PMIs revealed in China showed that factory activity fell for the fourth month in a row in July, suggesting China’s demand for oil would continue to dent as the economic recovery slowdown.
Market players anticipate Saudi Arabia to extend its 1 million barrels per day (bpd) crude output for another month, including September, in a meeting of oil producers on Friday.
WTI Price Analysis: Technical outlook
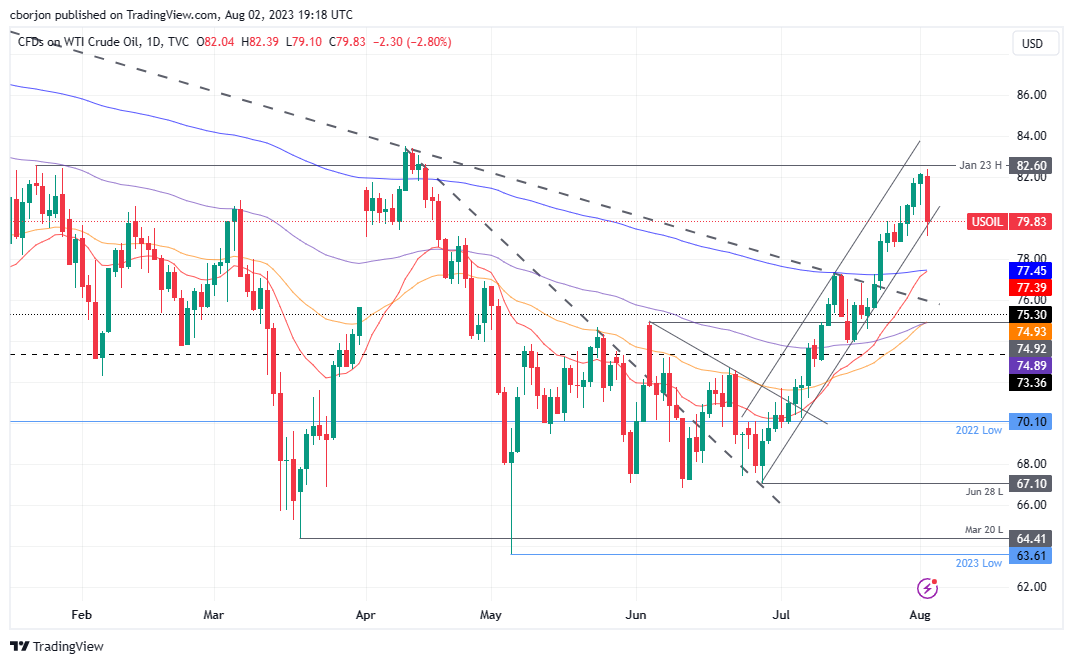
WTI is trading within the bottom boundaries of an ascending channel, which witnessed the US crude oil benchmark advance from around $67.10 above $82.00 per barrel. However, as sentiment turns negative, WTI is extending its losses past $80.00 a barrel, threatening to extend its losses toward the intersection of the 200 and 20-day EMAs, each at $77.45 and $77.37, respectively. If that area is cleared, WTI’s next stop would be the confluence of the 50 and 100-day EMAs, at $74.91 and $74.88. On the other hand, if WTI stays above $80.00, that could pave the way for a recovery toward higher prices.
- XAU/USD extended its drop as US bond yields, particularly 10s, climbed above 4%.
- The credit rating agency’s downgrade of US Government debt from AAA to AA+ has impacted market sentiment, leading investors towards safety in the US Dollar and Japanese Yen.
- ADP National Employment report showed that private hiring grew by 324K, exceeding estimates, ahead of Friday’s crucial Nonfarm Payrolls data.
Gold price extends its drop to two consecutive days as US bond yield climb due to market sentiment shifting sour. That, alongside US Dollar (USD) strength following an upbeat US jobs report, is the primary driver of XAU/USD’s price action. At the time of writing, the XAU/USD is trading at $1,937.75, down 0.73%.
Gold price dips for the second straight day as US yields rise, boosting the US Dollar
Wall Street treads water as sentiment remains depressed following Fitch’s downgrading of debt of the United States (US). Despite that, US Treasury bond yields rose, led by the US 10-year benchmark note rate at 4.067%, which gains four basis points after reaching 4.126% during the North American session.
Fitch’s revision to US Government debt from AAA to AA+ was blamed “on a perceived deterioration in US governance, which it said gave less confidence in the government’s ability to address fiscal and debt issues,” according to sources cited by Reuters. Hence, market participants sought safety, with the US Dollar and the Japanese Yen (JPY) leaders in Wednesday’s session.
In the meantime, the ADP National Employment report flashed that private hiring grew by 324K exceeding estimates of 189K, ahead of July’s US Nonfarm Payrolls data on Friday, with forecasts circa 200K people added to the workforce.
Regarding Tuesday’s data, the ISM Manufacturing PMI came at recessionary territory below the 50 figure for the ninth straight month, though it continued to improve; compared to June’s 46, it arrived at 46.4. Even though it was an improvement, the trend appears to slow down.
In the meantime, the US Dollar Index (DXY), a measure of the buck’s value against a basket of six currencies, advances 0.54% at 102.514, prolonging its gains to six straight days, with traders eyeing a break above the 100-day EMA at 102.561.
XAU/USD Price Analysis: Technical outlook
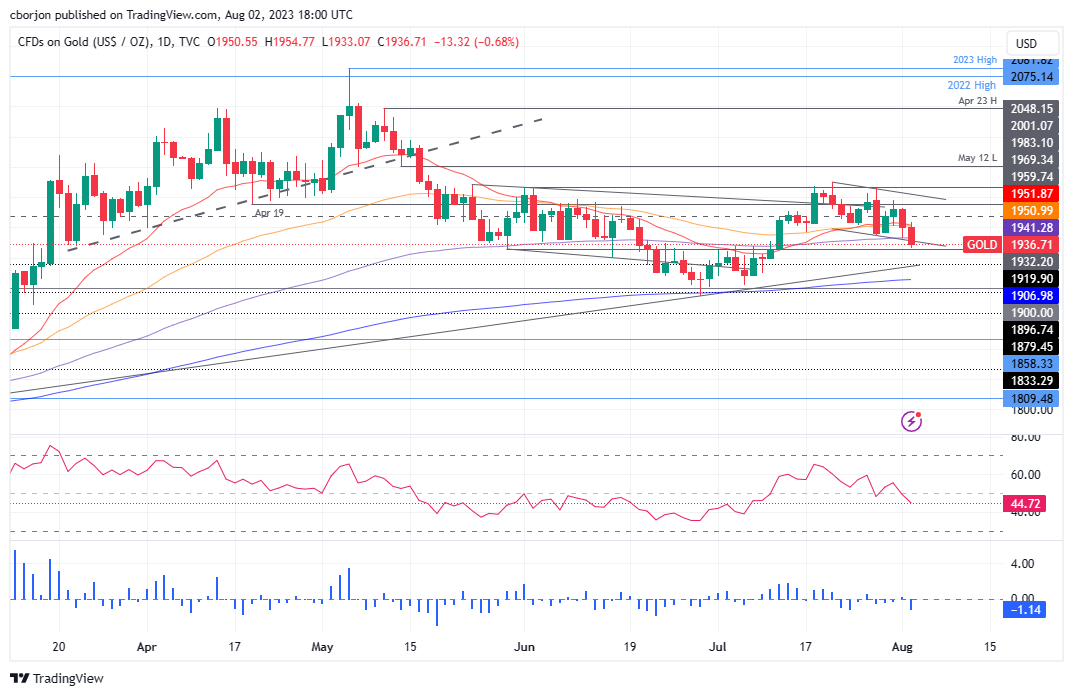
Although XAU/USD achieved a higher high on Friday 20 daily high at $1,987.42, the XAU/USD retraced back below the $1,950 area, extending its losses below the 20 and 50-day Exponential Moving Averages (EMAs), at $1,952.02 and $1,951.05, respectively. Additionally, XAU/USD dropped under the 100-day EMA, opening the door for further downside. Nevertheless, the emergence of a ‘bullish flag’ can pave the way for further upside, with prices edging toward $2,000. On the flip side, if XAU/USD falls below $1,933.07, that would exacerbate a dip toward the 200-day EMA at $1,906.99.
- USD/CHF jumped near 0.8800, setting a five-day winning streak.
- The US reported hot ADP figures, which strengthened the USD.
- The USD DXY index is rising and trades at 102.65.
The USD/CHF has risen to its highest level since mid-July, towards 0.8800 and then settled near 0.8770, driven by a stronger USD. In simple terms, the US economy is holding firm, making investors place bets on a more aggressive bet on the Federal Reserve (Fed) which is benefiting the greenback.
The number of employed people in the US was 324,000 in July, according to Automatic Data Processing Inc. (ADP), which was higher than the 189,000 expectations but lower than the revised figure of 455,000 in June.
US bond yields are increasing globally in response to the data. The 5- and 10-year yields increased by 4.26% and 4.10%, respectively, with both seeing more than 1% increases. The 2-year yield rose to 4.92%, with a 0.60% increase on the day.
Regarding Fed expectations, according to the CME FedWatch tool, market participants are betting on low odds of a hike in September, while the probability of a walk in November stands near 30%, and investors foresee low odds of a 50 bps increase. However, the highlight with which the markets will make their projections will be Friday's Nonfarm payrolls (NFPs) report. The unemployment rate is anticipated to stay constant at 3.6%, while consensus for NFP has increased to 200k from 209k in June, while Average Hourly Earnings are expected to have eased.
For the rest of the session, the Swiss and American calendars will have nothing relevant to offer, so market sentiment and Fed bets will set the pace.
USD/CHF Levels to watch
Considering the daily chart, the USD/CHF shows a bullish sentiment for the short term. The Relative Strength Index (RSI), positioned above its midline in positive territory with a northward slope, supports this view along with the positive indication from the Moving Average Convergence Divergence (MACD), which is displaying green bars, pointing towards a strengthening bullish impulse. Plus, is consolidating above the 20-day Simple Moving Average (SMA), indicating that the outlook is still positive for the short term.
Resistance levels: 0.8810, 0.8830, 0.8850.
Support levels: 0.8700 (20-day SMA), 0.8660, 0.8630.
USD/CHF Daily chart
-638265960240503705.png)
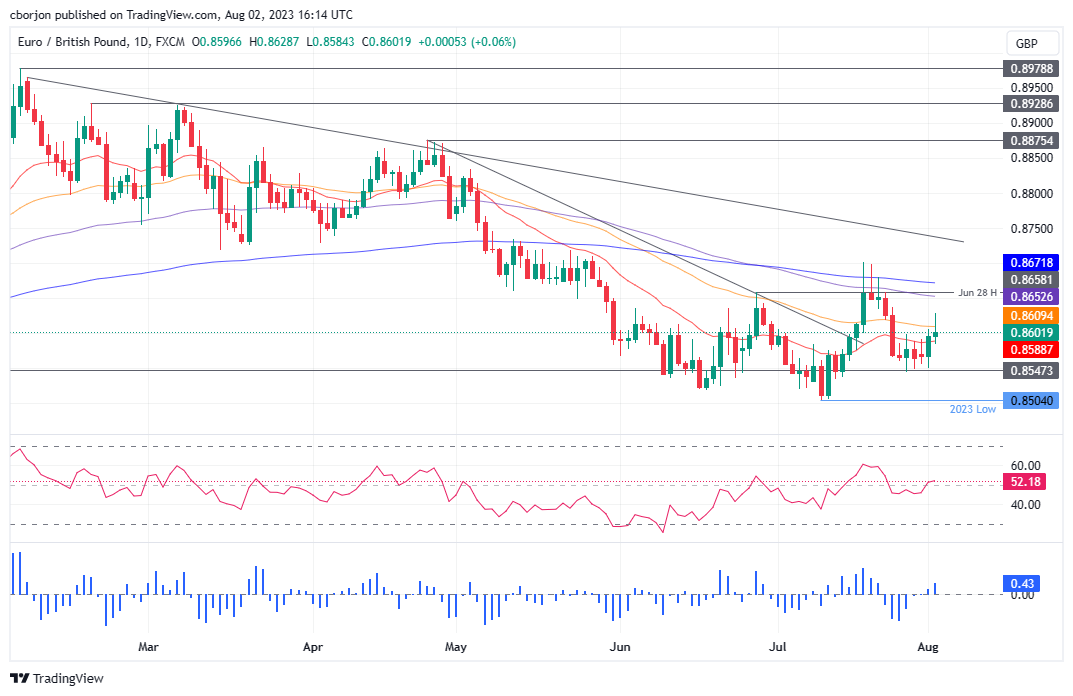
- EUR/GBP remains neutral to downward biased, with strong resistance at around 0.8650/75, potentially hindering buyers’ attempts to reach 0.8700.
- If the pair breaks above 0.8675, it may target 0.8700, followed by a seven-month-old downslope resistance trendline around 0.8730/50.
- A daily close below the 50-day EMA at 0.8609 could open the way for a drop toward last week’s low of 0.8544 or the YTD low of 0.8504.
The EUR/GBP extends its gains to two consecutive days but faces solid resistance at around 0.8630, with the EUR/GBP pair dropping below the 50-day Exponential Moving Average (EMA) at 0.8609. At the time of writing, the EUR/GBP exchanges hands at 0.8607, gaining 0.12% after reaching a low of 0.8584.
EUR/GBP Price Analysis: Technical outlook
The EUR/GBP daily chart portrays the pair as neutral to downward biased, despite the recent lower low being above the year-to-date (YTD) low of 0.8504 at 0.8544 but strong resistance at 0.8650/75, which could cap buyers’ attempts to reach the 0.8700 figure in the near term.
If EUR/GBP breaks above 0.8675, the next supply zone would be 0.8700. A breach of the latter will expose a seven-month-old downslope resistance trendline at around 0.8730/50, followed by a rally to 0.8800.
On the other hand, if EUR/GBP prints a daily close below the 50-day EMA at 0.8609, that could open the door for a break below the 0.8600 mark. The following support would be the 20-day EMA at 0.8689, followed by the last week’s low of 0.8544, ahead of the YTD low of 0.8504.
Oscillator-wise, the Relative Strength Index (RSI) turned bullish, while the three-day Rate of Change (RoC) suggests buyers are entering the market. However, they must reclaim solid resistance levels if they would like to extend their gains toward the 0.8700 figure.
EUR/GBP Price Action – Daily chart
- USD/CAD rose near 1.3340, displaying more than 0.40% gains on the day.
- ADP showed that the US created more jobs than expected in July.
- Dropping Oil prices and a negative market sentiment also contribute to the upwards momentum.
On Wednesday’s session, the USD/CAD rose for a second consecutive day, near 1.3340. A stronger Dollar amid hot labour market data from the US and lower Oil prices are the main responsible for the CAD’s weakness.
The US created more jobs than expected in July
The number of employed people in the US was 324,000 in July, according to Automatic Data Processing Inc. (ADP), which was higher than the 189,000 expectations but lower than the revised figure of 455,000 in June. Despite decelerating from its previous reading, it may suggest to the Federal Reserve (Fed) that the sector is still tight and may contribute to inflationary pressures via rising wages. That said, investors will closely look at Nonfarm Payrolls and Average Hourly Earnings data on Friday.
Reacting to the data, the USD strengthened as US yields rose and Wall St indexes dropped. The 2-year yield rose to 4.93% while the S&P 500 (SPX) declined by 1.23% as well as the Dow Jones and the Nasdaq Composite, which are seeing losses of 0.76% and 1.84%, respectively.
In that sense, investors may place bets on a more aggressive Fed. Still, as Chair Powell stated, monetary policy decisions will depend on data, so the labour market on Thursday and Friday will dictate the pace of the markets.
USD/CAD Levels to watch
From a technical standpoint, the USD/CAD maintains a bullish outlook for the short term, as observed on the daily chart. The Relative Strength Index (RSI) is comfortably positioned in the positive territory above its midline. It has a northward slope, complemented by a positive signal from the Moving Average Convergence Divergence (MACD), showing green bars, signalling a growing bullish momentum. Additionally, the pair is above the 20-day Simple Moving Average (SMA) but below the 100 and 200-day SMAs, suggesting that despite the recent bearish sentiment, the bulls are still resilient, holding some momentum.
Resistance levels: 1.3385 (July’s high), 1.3407 (100-day SMA), 1.3455 (200-day SMA).
Support levels: 1.3280, 1.3250, 1.3240.
-638265914308186468.png)
- USD/MXN pair is trading at 17.0378, up from its daily low of 16.8333 and above its 20-day Exponential Moving Average (EMA).
- Banxico’s Heath said interest rate levels are correct, even though the Fed hikes again.
- USD/MXN remains intact but is subject to correction, with significant resistance near the 17.00 mark and the 50-day EMA at 17.1336.
The Mexican Peso (MXN) weakens as the North American session progresses, down 0.82%, as the USD/MXN exchange rate looms around 17.0000 with strength for the first time since July 21, 2023. The USD/MXN is trading at 17.0378, above its 20-day Exponential Moving Average (EMA), bouncing from a daily low of 16.8333.
USD/MXN advances 0.97% on risk-off impulse, Banxico’s Heath dovish comments
A recent downgrade of debt issued by the United States (US) turned market sentiment sour as Wall Street trades with losses. Private hiring in the US rose by 324K, according to figures published by the ADP Research Institute in collaboration with Stanford Digital Economy Lab, exceeding estimates of 189K. Although the data is encouraging, it hasn’t been a prelude to the Nonfarm Payrolls report, which is expected on Friday, to show the economy added just 200K people to the workforce in July.
Regarding Tuesday’s data, the ISM Manufacturing PMI came at recessionary territory below the 50 figure for the ninth straight month, though it continued to improve; compared to June’s 46, it arrived at 46.4. Even though it was an improvement, the trend appears to slow down.
The USD/MXN resumed its uptrend based on the data bolstering the US Dollar (USD) as shown by the US Dollar Index (DXY). The DXY, which tracks the greenback’s performance against a basket of peers, stands at 102.663, gaining 0.69%, underpinned by US Treasury bond yields advance.
On the Mexican front, the Bank of Mexico (Banxico) Deputy Governor Jonathan Heath said, “restrictive monetary policy stance should be held for awhile to wait of it to have effect,” expressed in a Banorte podcast interview. He acknowledged that core inflation is not easing as the headline, adding that “it’s important for the exchange rate to be as flexible as possible with no intervention to manipulate it to a rate where it shouldn’t be.” He added that interest rates are “correct” even if the Fed hikes again.
USD/MXN Price Analysis: Technical outlook
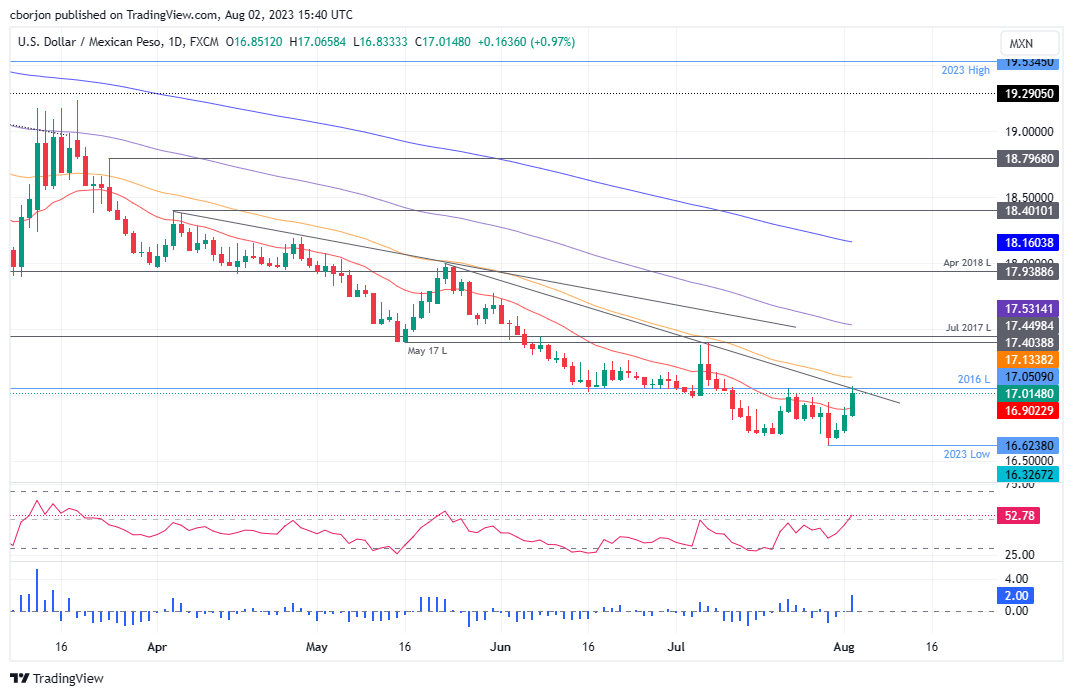
From a technical standpoint, the USD/MXN downtrend remains intact but subject to a correction, as the 20-day EMA at 16.9005 has been left behind, with the exchange rate eyeing higher prices. The USD/MXN would face solid resistance at a three-month-old downslope resistance trendline nearby the 17.00 mark, below the 50-day EMA at 17.1336. Once that area is cleared, the USD/MXN could challenge a crucial resistance area at a May 17 low of 17.4038, which, once cleared, the 100-day EMA at 17.5313 would be up for grabs. On the downside, if USD/MXN drops below 16.9011, the year-to-date (YTD) low at 16.6238 could be tested.
- USD/JPY trades flat at 143.35 after finding support at a low of 142.22.
- According to ADP, the number of employed people rose by 324k in July.
- Rising yields allowed the USD to gain traction.
On Wednesday, the USD gained traction following hot labour market data from the US. The DXY index trades rose above the 100-day Simple Moving Average towards 102.70, its highest level since early July.
Automatic Data Processing Inc. (ADP) revealed that the number of employed people in the US was 324,000 in July, higher than the 189,000 expected but lower than the revised figure of 455,000 in June.
As a reaction, US bond yields are rising across the board. The 2-year yield jumped to 4.92%, while the 5 and 10-year yields to 4.26% and 4.10%, respectively, with the latter increasing by more than 1%. Regarding bets on the Federal Reserve (Fed), according to the CME FedWatch tool, markets are confident that the Federal Open Market Committee (FOMC) won’t hike in September but started low bets on a 50 basis point hike (bps) in the November meeting. In addition, the odds of a lower hike of 25 bps stand around 25%.
Focus now shifts to Jobless Claims data on Thursday and Nonfarm Payrolls on Friday, as Jerome Powell clearly stated that ongoing decisions will depend “solely” on incoming data.
USD/JPY Levels to watch
Based on the daily chart, the USD/JPY exhibits a bullish outlook for the short term. The Relative Strength Index (RSI) and Moving Average Convergence Divergence (MACD) remain in positive territory, with the RSI above its midline with a positive slope. The MACD is also displaying green bars, indicating a strengthening bullish momentum.
Resistance levels: 143.50, 144.00, 144.50.
Support levels: 142.30,140.70 (20-day SMA), 140.00.
USD/JPY Daily chart
-638265865638007581.png)
Gold has been very sensitive to upside and downside economic data surprises. When data starts to come in below expectations, XAU/USD could surge above $2,100, economists at TD Securities report.
Mean reverting nature of economic surprises points to $2,100+ Gold
The cyclicity and mean reverting nature of economic data surprises, along with the Fed's restrictive rate policies, should work in tandem to precipitate a downdrift in US economic surprise indices.
If the Fed Fund futures reaction remains constant, dropping on negative data surprises as it rose in response to positive surprises, the resulting lower yield along the forward curve should see Gold rally. We project that this, along with technical factors, could help the yellow metal move into $2,100+ territory into late-2023.
Central bank policies are set to diverge from the steady hikes characterizing the first half of 2023, contributing to increased market volatility for the remainder of the year, economists at Charles Schwab report.
More volatility in currencies, interest rates and stocks
In the second half of the year, central bank policy is diverging from the steady pace of hikes seen in the first half of the year.
Perhaps most significantly, a potential unwinding of the Yen carry trade could roil markets.
These shifts could mean more volatility in currencies, interest rates and stocks than seen in the first half of the year.
Economists at Rabobank share their USD/JPY and EUR/JPY forecasts.
Fibonacci retracement at EUR/JPY 151.30 is key support
Our forecast of USD/JPY 138 on a three-month view assumes that speculation of further potential tweaks by the BoJ remains, though we expect that progress will be slow on this front.
We see the EUR/JPY pair at 149 in three months. EUR/JPY broke below trendline support on the back of the ECB’s dovish hike in late July. The Fibonacci retracement at EUR/JPY 151.30 is key support.
The US Dollar weakened further in July as it fell to fresh year-to-date lows. Economists at MUFG Bank analyze Greenback’s outlook.
US Dollar to rebound in the H1 of next year
We expect the US Dollar to weaken further through the rest of this year.
The main risk to our view would be if US inflation proves more sticky than expected thereby limiting room for Fed cuts, and/or if the US economy becomes too hot or too cold.
In our forecast profile, we show the US Dollar beginning to rebound in the H1 of next year to reflect the risk of a sharper US/global slowdown in response to tighter monetary policy that boosts demand for safe havens such as the USD.
The Bank of England (BoE) will announce its Interest Rate Decision on Thursday, August 3 at 11:00 GMT and as we get closer to the release time, here are the expectations forecast by the economists and researchers of 10 major banks.
The BoE is expected to hike rates by 25 basis points to 5.25%. Markets flirt with the option of a larger hike to 5.50%. Updated macro forecasts will be released. The central bank's Decision Maker Panel survey will be out as well.
SocGen
We believe the MPC will hike by 25 bps at the August meeting to address the signs of more persistent inflationary pressures that have developed since the previous meeting. Namely, the continued overshoot in pay growth. Nevertheless, the other indicators of persistent services inflation and labour market tightness, have eased since the previous meeting, meaning a 50 bps hike could be avoided. After the August meeting, the data should still point to the need for more tightening but again by 25 bps to 5.5%. Thereafter, softening data are likely to convince the MPC that it has done enough to bring inflation under control, albeit slowly.
ING
There’s just enough in the latest data flow for the Bank to be comfortable reverting back to a 25 bps hike in August. We shouldn’t rule out a 50 bps hike though, especially if the committee concludes they think they’ll hike again in September.
TDS
This meeting is a tricky one: incoming data and projections are likely to support a 25 bps hike, but the MPC may be tempted to repeat a 50 bps hike alongside a dovish lean to speed up their journey to terminal. They've signalled nothing about their intentions in recent weeks, either. Ultimately we think 25 bps will prevail, but it's a very close call.
Danske Bank
We expect the BoE to hike the Bank Rate by 25 bps. We expect a peak in the Bank Rate of 5.50% with risks tilted to the upside. We see current market pricing of a peak in policy rates of 5.90% as too aggressive. EUR/GBP is set to move modestly higher on announcement. We do not expect the press conference to offer much further guidance than the written material.
Nomura
With the inflation data having softened, there being more signs of an easing labour market (albeit from very tight levels in the first place) and some key surveys highlighting downside risks to the growth outlook, we think the Bank will be cautious and hike by a quarter point. Aside from the data, BoE guidance and uncertainties about policy lags also favour a 25 bps hike. We expect the discussion among the MPC to be primarily between 25 bps and 50 bps. The latter remains on the table because of above-normal service inflation, strong wage growth and a general view that inflation might prove stickier in the UK than elsewhere. Despite this, we think the stronger justifications for a smaller move will result in a 1-7-1 vote in favour of the decision for 25 bps (one member voting for no change, seven for 25 bps and one for 50 bps). After the August meeting, we expect further 25 bps hikes in September and November for a peak Bank Rate of 5.75%. We ultimately see rate cuts but not until the very end of 2024.
Credit Suisse
We expect the BoE to vote 8-1 to raise rates 50 bps at its August meeting from 5.0% to 5.5% on the back of elevated services inflation and record-high wage growth. However, given the recent fall in inflation, it is quite possible that the BoE hikes 25 bps, making the August decision a close call. One member (Swati Dhingra) is likely to vote for unchanged rates, but there are risks that if the majority vote is for 50 bps, one or two members vote for 25 bps.
Rabobank
The Bank of England still faces the difficult trade-off between reducing inflation and avoiding an unnecessarily deep recession. Our view remains that the BoE aims for a stance slightly more hawkish than the Fed or the ECB while avoiding any excess hawkishness. Though inflationary pressures persist, signs of slowing economic growth and initial progress on bringing inflation down support scaling back to a 25 bps hike. We expect a 2-6-1 vote split, with the core of the MPC preferring slower hikes while remaining explicitly vigilant on inflation.
Deutsche Bank
We expect a 25 bps hike taking the Bank Rate to 5.25%, although it is a close call between that and 50 bps. Beyond next week's decision, we see two more 25 bps hikes, with rate cuts potentially starting from Q2-24.
BMO
We continue to look for a 50 bps hike to 5.50%, although the market’s conviction is waning after the ECB’s move away from the hawkish door. But remember: Britain’s 7.9% inflation rate is far higher than the Euro area’s 5.5% rate, and Governor Bailey (and Chancellor Hunt) has been under a microscope over his failure to rein inflation in. The BoE’s credibility is at stake, and it was glaringly obvious with the appointment of former Fed Chair Ben Bernanke to head up the review into the BoE’s forecasting. Less polite company would say an outsider was brought in to find out why the Bank was so wrong. It also helps that the MPC’s biggest dove is out and has been replaced with what seems like a hawk. There seem to be few reasons to downshift to 25 bps.
Wells Fargo
After a 7-2 vote to raise interest rates by 50 bps at the June meeting, slowing but still elevated inflation, along with slower activity growth, makes it a closer call as to whether the BoE will raise by 50 bps again in August, or lift rates by a smaller 25 bps increment. We still lean toward a 50 bps increase but acknowledge a 25 bps move is a distinct possibility (indeed, the consensus forecast is for a smaller quarter-point hike). We will also be paying attention to the BoE's updated economic projections for insight in the potential pace and magnitude of further monetary tightening beyond the August meeting.
Brazil's central bank (Banco Central do Brasil, BCB) is ahead of rate cuts. Economists at Commerzbank analyze BRL outlook.
A less hawkish monetary policy could prove to be a drag on the BRL next year
Today's BCB decision is widely expected to result in a rate cut. The big question is whether the interest rate will be cut by 25 bps or 50 bps. Although the latter is seen as more likely by the market, it would certainly be the more dovish signal that could weigh more heavily on the BRL. However, the new inflation forecasts are likely to have a greater impact on the expected overall size of future rate cuts.
We expect the BCB to emphasize a prudent approach in its accompanying statement and to leave no doubt that it will react promptly to any upside risks to inflation. Its track record gives it a high degree of credibility, which is why we expect the Real to trade at strong levels against the USD for the time being, below 5.00 in USD/BRL terms.
The most interesting question is whether the statement will reflect a possible more dovish signature of the two central bankers newly appointed by President Lula da Silva, Gabriel Galipoli and Ailton Aquino. Because I still fear that a less hawkish monetary policy after the end of BCB Governor Roberto Campos Neto's term in December 2024 could prove to be a drag on the BRL next year.
- Silver price drops vertically as US ADP reports fresh additions of 324K payrolls in July vs. estimates of 189K.
- The US Dollar Index climbs above the crucial resistance of 102.40 amid negative market sentiment.
- Silver price is maintaining a lower high formation, which indicates that investors are capitalizing pullbacks as selling opportunities.
Silver price (XAG/USD) falls back swiftly after a short-lived pullback near $24.45 in the early New York session. The white metal faces a significant sell-off as the additions of fresh private payrolls in the United States labor market were higher than expectations in July.
The Automatic Data Processing (ADP) agency of the US economy reported that fresh 324K individuals were recruited in July while investors were anticipating employment of 189K. Strong demand for labor by US private sector indicates that inflationary pressures could rebound ahead. This has also set a positive undertone for the Nonfarm Payrolls (NFP) data, which will be published on Friday at 12:30 GMT.
The Federal Reserve (Fed) said in the monetary policy statement that further policy action will be highly data-dependent. And now, a tight labor market along with stellar Q2 Gross Domestic Product (GDP) performance could consider one more interest rate hike from the Fed.
Meanwhile, the US Dollar Index (DXY) climbs above the crucial resistance of 102.40 amid negative market sentiment. S&P500 is expected to open on a negative note following bearish sentiment from overnight futures. US equities are expected to remain under pressure as Fitch downgraded the US economy amid concerns over rising fiscal spending.
Silver technical analysis
Silver price is maintaining a lower high formation on an hourly scale, which indicates that investors are capitalizing pullbacks as selling opportunities. The asset could deliver further downside if it drops below the horizontal support plotted from July 27 low around $24.00.
The 200-period Exponential Moving Average (EMA) at $24.50 is acting as a barricade for the Silver bulls.
Meanwhile, the Relative Strength Index (RSI) (14) slips into the bearish range of 20.00-40.00m indicating an activation of the downside momentum.
Silver hourly chart
-638265801401784578.png)
Economists at Rabobank are leaving their forecasts for USD/MXN unchanged. Peso is overvalued, it is overbought, but it can stay that way.
Overvalued, overbought but...
We would argue, that there is little reason to expect a significant sell-off in MXN in the coming month. There are a multitude of reasons to expect continued strength. But, at the same time, it is uncomfortable to suggest that a significantly overvalued currency will not just remain overvalued (which is our base case) but will in fact become even more so. This is the position we find ourselves in, however.
Despite these words, we are leaving our forecasts for USD/MXN unchanged. 16.80 by the end of Q3 and 17.60 by the end of Q4. The risk to our mind is skewed to the downside in the short-term, with the potential for USD/MXN to break through support at 16.70 and text 16.40, while the risk toward the end of the year we see skewed to the upside with the potential for USD/MXN to break 18 by year-end.
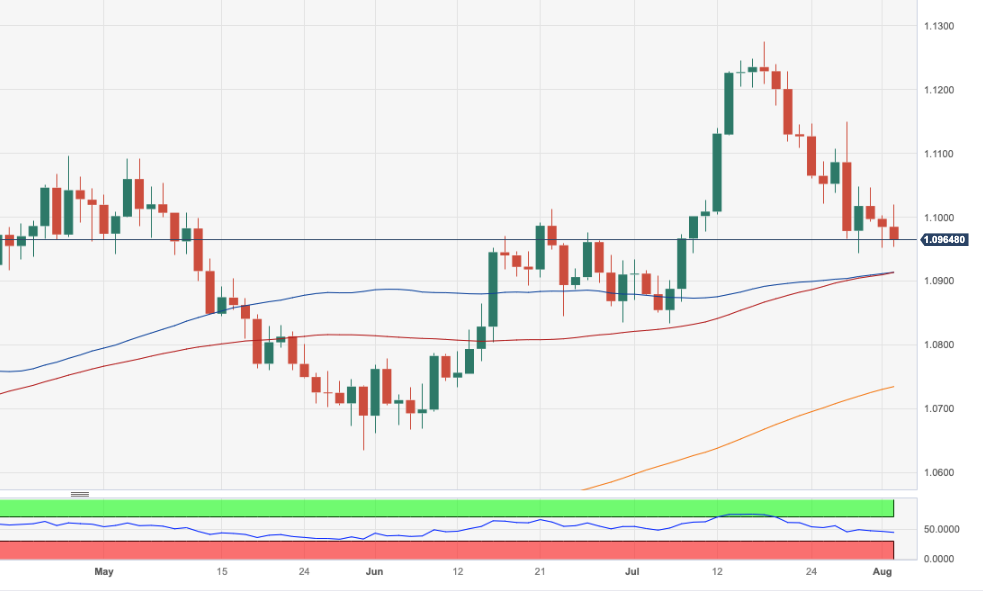
- EUR/USD adds to the weekly leg lower and revisits 1.0950.
- The weekly high at 1.1150 continues to cap the upside.
EUR/USD comes under intense selling pressure and flirts once again with weekly lows in the mid-1.0900s on Wednesday.
Considering the ongoing price action, spot could see its downside momentum accelerate and retest the weekly low of 1.0943 (July 28). The breakdown of this region could put a test of the 1.0910 zone, where the transitory 55-day and 100-day SMAs coincide, back on the radar.
Looking at the longer run, the positive view remains unchanged while above the 200-day SMA, today at 1.0733.
EUR/USD daily chart
The Pound continued to strengthen in July hitting fresh year-to-date highs against the US Dollar and Euro. Economists at MUFG Bank analyze GBP outlook.
Turning point has not yet been reached
We believe that the Pound’s recent strong rebound is starting to lose some upward momentum.
Evidence of much weaker UK growth in the 2H of this year and/or a faster-than-expected slowdown in inflation will be required to trigger a reversal of Pound gains.
EUR/GBP – Q3 2023 0.8550 Q4 2023 0.8650 Q1 2024 0.8850 Q2 2024 0.8900
GBP/USD – Q3 2023 1.2870 Q4 2023 1.2950 Q1 2024 1.2770 Q2 2024 1.2360
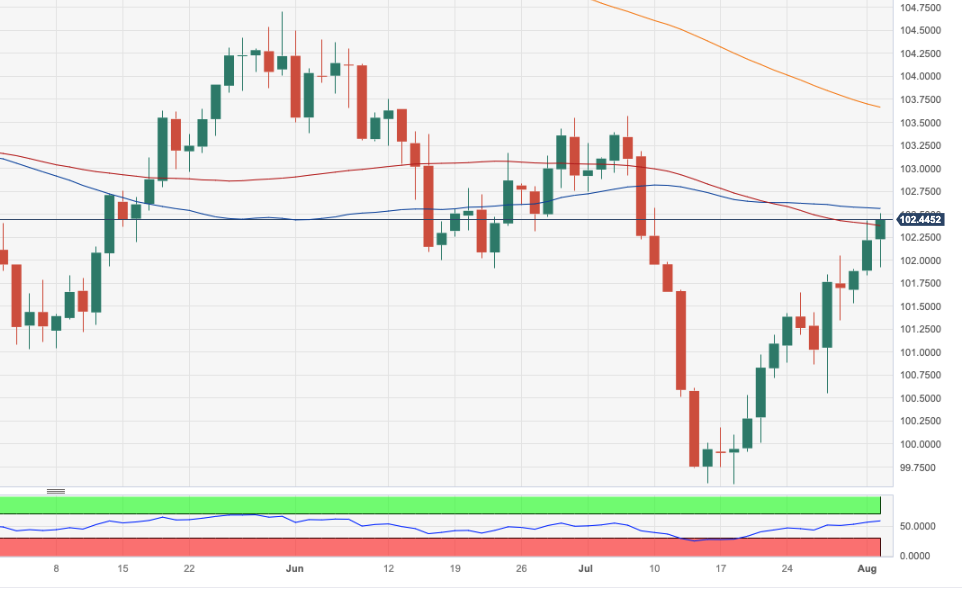
- DXY advances for the fifth straight session on Wednesday.
- The downside pressure should alleviate on a breakout of 102.50.
DXY extends the upside to new four-week peaks around 102.50, an area also coincident with the interim 55-day and 100-day SMAs.
The index appears poised to extend the ongoing multi-session recovery for the time being. Against that, the surpass of the weekly/monthly top of 102.50 (August 1) should prompt the index to rapidly challenge the temporary 55-day SMAs at 102.54.
Once the latter is cleared, it should alleviate the downside bias in the dollar and allow for extra gains to the next target at the July high of 103.57 (July 3), which appears underpinned by the proximity of the key 200-day SMA, today at 103.65.
Looking at the broader picture, while below the 200-day SMA the outlook for the index is expected to remain negative.
DXY daily chart
Fitch lowered the US credit rating to AA+ from AAA. Do downgrades matter? Economists at Rabobank analyze USD outlook.
The resilience of US growth this year is a positive factor
In past periods of stress regarding the US debt ceiling, treasuries have seen buying pressures on the back of safe-haven demand. A negative risk event generally triggers a positive USD response, almost irrespective of its source. This is related to Greenback’s use worldwide as an invoicing currency and its dominance in the global payments system.
While the USD has not shown much initial reaction to Fitch’s announcement, the news should draw attention back to the management of fiscal policies in the US.
The resilience of US growth this year is a positive factor. That said, growth is expected to slow this year and both the budget deficit and the debt/GDP ratios are expected to rise through 2023 and 2024. The Bloomberg survey forecasts the US budget deficit at 5.7% and 5.8% of GDP in 2023 and 2024 respectively from 5.4% in 2022. The survey also forecasts that US debt will stand at 97.3% of GDP this year and 99.8% next year. These numbers are notably higher than in the pre-pandemic years.
It is possible that over the medium-term the USD will be impacted more by the political reactions that the Fitch announcement generates, rather than by the announcement per se.
Economists at Société Générale analyze USD/BRL technical outlook.
Below 4.69; next potential support is at 4.61/4.59
USD/BRL broke through the lower limit of a multi-month range near 5.01 resulting in a steady decline. It has recently tested the lower band of a descending channel at 4.69.
An initial bounce is under way and revisit of 50-DMA near 4.86 can’t be ruled out. Lower limit of previous consolidation at 4.95/5.01 is an important resistance zone near term. Failure to overcome this could lead to continuation in the downtrend.
Below 4.69; next potential support is at last year's low of 4.61/4.59.
- Australian Dollar pierces new lows after the release of strong US labor data for July.
- ADP Employment Change rises by 324K, easily beating the 189K estimate.
- The data follows a run of weakness for the Aussie after a sour market mood turned investors risk averse.
The Australian Dollar (AUD) reaches new two-month lows against the US Dollar (USD) on Wednesday, after the release of US private payrolls data shows a larger-than-expected expansion of the workforce in July.
Data from the US’s largest payroll processor ADP, showed an unexpected rise of 324K jobs in July versus the 189K predicted. The data reinforces the view that the US labor market is rock solid and inflation is likely to remain stubbornly high. The Federal Reserve is more likely to maintain interest rates higher for longer if more people are earning, and higher interest rates are positive for the US Dollar as they attract greater foreign capital inflows.
Australia’s largest export Iron Ore is also in decline, further hitting the Australian Dollar, with Chinese Iron Ore Futures reaching a new low for July in the $108s.
AUD/USD trades in the 0.65s as the US session gets underway.
Australian Dollar news and market movers
- The Australian Dollar loses ground against the USD after ADP payroll data shows a greater-than-expected rise in new employees in July.
- US private sector added 324K new workers in July when only a 189K increase had been forecast by economists, although the figure was still below the 497K in June.
- A risk-off mood permeated markets on Tuesday, weighing on the Australian Dollar after weaker-than-expected US ISM Manufacturing PMIs for July and JOLTS Job Openings in June weighed on animal spirits.
- The market mood was not helped by data from China, showing business activity in the manufacturing sector fell into contractionary territory in July, with the Caixin Manufacturing PMI falling to 49.2 in July from 50.5 in June.
- The Australian Dollar was already on a weak footing after the RBA left the policy rate unchanged at 4.1% on Tuesday morning, against the market expectation for a 25 basis points hike. In the policy statement, the RBA explained that the decision to hold rates unchanged would provide them more time to assess the impact of policy tightening to date and the economic outlook.
- That said, they did not completely rule out the possibility of more rate hikes in the future, "Some further tightening of monetary policy may be required to ensure that inflation returns to target in a reasonable timeframe, but that will depend upon the data and the evolving assessment of risks," the RBA noted.
Australian Dollar technical analysis
AUD/USD is in a sideways trend on both the long and medium-term charts. The February high at 0.7158 is a key hurdle, which if vaulted, will alter the outlook to one that is more bullish longer term.
The 0.6458 low established in June is a key level for bears, which if breached decisively, would give the chart a more bearish overtone. Price is currently moving down nearer to this key low.
-638265776565483304.png)
Australian Dollar vs US Dollar: Weekly Chart
Price has now broken cleanly through the confluence of moving averages (MA) close to 0.6700, made up of most of the major SMAs – the 50-week, 50-day and 100-day. The breaching of this key support and resistance level is a bearish sign.
-638265777037404459.png)
Australian Dollar vs US Dollar: Daily Chart
It is possible price may have completed a Measured Move pattern or three wave ABC correction (see daily chart), in July. If so, there is a chance it may be about to start a short-term upcycle. Given how bearish price action is at the moment, however, the chances of this scenario unfolding are diminishing by the hour.
AUD/USD has now also broken below the 0.6600 June lows on an intraday basis, and a continuation down to the key May lows at 0.6460, is quite possible. A decisive break below them would open the way for a move down to 0.6170 and the 2022 lows.
Because the pair is in a sideways trend on the higher time-frame charts, the probabilities do not favor either bears or bulls overall – nor is the Relative Strength Index (RSI) providing much insight on either timeframe.
In technical terms, a ‘decisive break’ consists of a long daily candlestick, which pierces cleanly above or below the critical level in question and then closes near to the high or low of the day. It can also mean three up or down days in a row that break cleanly above or below the level, with the final day closing near its high or low and a decent distance away from the level.
- AUD/USD is expected to extend its downside below 0.6565 amid the upbeat US ADP employment report.
- The USD Index drives higher as the stellar addition of private payrolls would set a positive undertone for Fed policy.
- RBA Lowe kept doors open for more interest rates as inflation will take time to return to 2% amid the tight labor market.
The AUD/USD pair prepares to extend losses below the immediate support of 0.6565 as the United States Automatic Data Processing (ADP) reports that employment additions were higher than expectations. The US labor market witnessed an addition of fresh 324K private payrolls, significantly higher than the estimates of 189K but lower than the former release of 497K.
The US Dollar Index (DXY) delivers a breakout of the consolidation formed around 102.10 as upbeat labor market conditions have propelled hopes of one more interest rate hike from the Federal Reserve (Fed).
ADP Employment data set a positive undertone for the US Nonfarm Payrolls (NFP) data for July, which will be published on Friday at 12:30 GMT. According to the estimates, the economic data is seen at 200K, slightly lower than the former reading of 209K. The Unemployment Rate is expected to remain steady at 3.6%. Apart from the employment additions, investors will keenly focus on the Average Hourly Earnings.
Expectations state that labor earnings gained at a pace of 0.3% in July, lower than the former pace of 0.4%. The annual data is expected to decelerate to 4.2% against the former release of 4.4%.
On the Australian Dollar front, the Reserve Bank of Australia (RBA) kept interest rates unchanged at 4.1%. RBA Governor Philip Lowe kept doors open for more interest rates as inflation will take time to return to 2% amid a tight labor market. Over the inflation outlook, the central bank forecasted that inflation will return to 2-3% by late 2025.
- The US Dollar outperforms its rivals as markets adopt a cautious stance.
- The US Dollar Index stays in positive territory above 102.00 following Tuesday's choppy action.
- USD benefits from souring market mood after Fitch downgraded US credit rating.
The US Dollar gathered strength against its rivals after Tuesday's indecisive trading. The USD Index – which tracks the USD's valuation against a basket of six major currencies – held above 102.00 despite the pullback seen in the American session on Tuesday and stretched higher on Wednesday.
Global rating agency Fitch announced late Tuesday that it downgraded the US government's credit rating to AA+ from AAA, citing anticipated fiscal deterioration over the next three years and a high and growing general government debt burden. This development caused market participants to stay away from risk-sensitive assets, allowing the USD to find demand as a safe haven.
The US private sector employment rose by 324,000 in July, the data published by Automatic Data Processing (ADP) showed on Wednesday. This reading surpassed the market expectation for an increase of 189,000 and provided further support to the USD. June's figure was revised lower from 497,000 (the highest since February 2022) to 455,000.
“The economy is doing better than expected and a healthy labor market continues to support household spending,” said Nela Richardson, chief economist, ADP. “We continue to see a slowdown in pay growth without broad-based job loss.”
Daily digest market movers: US Dollar benefits from risk aversion
- 10-year US Treasury bond yield holds steady above 4% following Tuesday's upsurge.
- The number of job openings on the last business day of June stood at 9.58 million, the US Bureau of Labor Statistics (BLS) reported in the Job Openings and Labor Turnover Survey (JOLTS) on Tuesday. This reading followed 9.61 million openings in May and came in slightly below the market expectation of 9.62 million.
- US ISM Manufacturing PMI imrpoved modestly to 46.4 in July from 46 in June. This reading came in below the market expectation of 46.8 and showed an ongoing contraction in the manufacturing sector's business activity.
- The Employment component of the ISM PMI survey declined to 44.4 from 48.1.
- “Banks reported that, on balance, levels of standards are currently on the tighter end of the range for all loan categories. Compared with the July 2022 survey, banks reported tighter levels of standards in every loan category," the Fed said in the July 2023 Senior Loan Officer Opinion Survey on Bank Lending Practices (SLOOS).
- The ISM reported on Monday that the Chicago PMI improved to 42.8 in July from 41.5 in June.
- The Federal Reserve Bank of Dallas' Texas Manufacturing Survey revealed that the headline Manufacturing Business Index edged higher to -20 in July from -23.2 in June.
- Inflation in the US, as measured by the change in Personal Consumption Expenditures (PCE) Price Index, fell to 3% on a yearly basis in June from 3.8% in May, the US Bureau of Economic Analysis reported on Friday. This reading came in below the market expectation of 3.1%.
- Core PCE Price Index, the Federal Reserve's preferred gauge of inflation, arrived at 4.1% on a yearly basis, down from 4.6% in May and below the market forecast of 4.2%. Further details of the publication revealed that Personal Income and Personal Spending increased 0.3% and 0.5% on a monthly basis, respectively.
- In an interview with CBS over the weekend, Minneapolis Federal Reserve Bank President Neel Kashkari said that he was not sure whether the Fed was done raising rates. Commenting on the jobs markets, Kashkari noted that it would not surprise him to see the unemployment rate tick up slightly.
- The Fed raised its policy rate by 25 basis points (bps) to the range of 5.25%-5.5% following the July policy meeting as expected. In the post-meeting press conference, Fed Chairman Jerome Powell refrained from confirming another rate hike this year and said that every policy meeting will be live. "If we see inflation coming down credibly, we can move down to a neutral level and then below neutral at some point," Powell told reporters, noting that the policy was already restrictive.
Technical analysis: US Dollar Index trades near key resistance
The US Dollar Index (DXY) holds above 102.00 (psychological level, static level) and the Relative Strength Index (RSI) indicator on the daily chart edges higher toward 60 on Wednesday, reflecting a buildup of bullish momentum.
DXY faces next resistance at 102.50 (50-day SMA, 100-day SMA). A daily close above the latter could attract buyers and pave the way for an extended uptrend toward 103.00 (psychological level, static level) and 103.70 (200-day Simple Moving Average).
Looking south, sellers could show interest if DXY fails to hold above 102.00. In that case, 101.30 (20-day SMA) could be seen as next bearish target before 101.00 (psychological level, static level) and 100.50 (static level).
US Dollar FAQs
What is the US Dollar?
The US Dollar (USD) is the official currency of the United States of America, and the ‘de facto’ currency of a significant number of other countries where it is found in circulation alongside local notes. It is the most heavily traded currency in the world, accounting for over 88% of all global foreign exchange turnover, or an average of $6.6 trillion in transactions per day, according to data from 2022.
Following the second world war, the USD took over from the British Pound as the world’s reserve currency. For most of its history, the US Dollar was backed by Gold, until the Bretton Woods Agreement in 1971 when the Gold Standard went away.
How do the decisions of the Federal Reserve impact the US Dollar?
The most important single factor impacting on the value of the US Dollar is monetary policy, which is shaped by the Federal Reserve (Fed). The Fed has two mandates: to achieve price stability (control inflation) and foster full employment. Its primary tool to achieve these two goals is by adjusting interest rates.
When prices are rising too quickly and inflation is above the Fed’s 2% target, the Fed will raise rates, which helps the USD value. When inflation falls below 2% or the Unemployment Rate is too high, the Fed may lower interest rates, which weighs on the Greenback.
What is Quantitative Easing and how does it influence the US Dollar?
In extreme situations, the Federal Reserve can also print more Dollars and enact quantitative easing (QE). QE is the process by which the Fed substantially increases the flow of credit in a stuck financial system.
It is a non-standard policy measure used when credit has dried up because banks will not lend to each other (out of the fear of counterparty default). It is a last resort when simply lowering interest rates is unlikely to achieve the necessary result. It was the Fed’s weapon of choice to combat the credit crunch that occurred during the Great Financial Crisis in 2008. It involves the Fed printing more Dollars and using them to buy US government bonds predominantly from financial institutions. QE usually leads to a weaker US Dollar.
What is Quantitative Tightening and how does it influence the US Dollar?
Quantitative tightening (QT) is the reverse process whereby the Federal Reserve stops buying bonds from financial institutions and does not reinvest the principal from the bonds it holds maturing in new purchases. It is usually positive for the US Dollar.
- EUR/JPY comes under pressure following a test of 157.50.
- Extra gains continue to target the 2023 high beyond 158.00.
EUR/JPY reverses three consecutive daily advances and faces some selling pressure soon after testing weekly highs near 157.50 on Wednesday.
The continuation of the upside momentum should initially target the 2023 high at 158.04 (July 21), while the surpass of this levels exposes a move to the round level of 160.00 in the not-so-distant future.
So far, the longer term positive outlook for the cross appears favoured while above the 200-day SMA, today at 146.58.
EUR/JPY daily chart
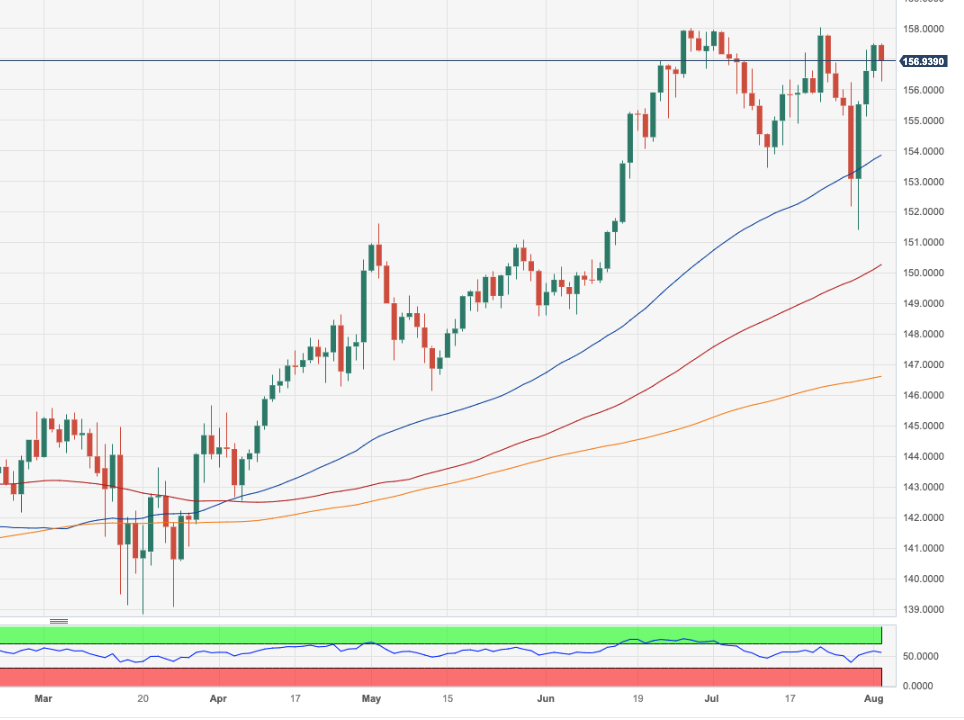
- Employment in the US private sector rose sharply again in July.
- June’s surge was revised modestly lower to 455,000.
- US Dollar Index claims to fresh daily highs above 102.30.
Private sector employment in the US rose by 324,000 in July, the data published by Automatic Data Processing (ADP) showed on Wednesday. This reading surpassed the market expectation for an increase of 189,000. June's figure was revised lower from 497,000 (the highest since February 2022) to 455,000.
“The economy is doing better than expected and a healthy labor market continues to support household spending,” said Nela Richardson, chief economist, ADP. “We continue to see a slowdown in pay growth without broad-based job loss.”
The report added that “annual pay was up 6.2 percent year-over-year”. “Job stayers saw a year-over-year pay increase of 6.2 percent, the slowest pace of gains since November 2021. For job changers, pay growth slowed to 10.2 percent”, the ADP further noted in its publication.
More employment data is due on Thursday, including the weekly Jobless Claims and Q2 Unit Labor Cost, and on Friday with the release of Nonfarm payrolls.
Market reaction:
The US Dollar Index rose to fresh daily highs following the data toward 102.40, as US Treasury yields bounce to the upside.
GBP/USD consolidates below 1.28 ahead of Thursday’s BoE decision. Economists at Scotiabank analyze the pair’s outlook.
Cable should continue to find support on dips
Markets remain undecided about whether the BoE will deliver a 25 or 50 bps hike but the GBP should continue to find support on dips from positive yield spreads against the USD along the curve for now.
The GBP should find support in the short-run around 1.2725/50.
Resistance is 1.2810 and 1.2875. Gains through 1.29 are needed to give Cable a stronger, technical lift, however.
EUR/USD has drifted back through to the upper 1.09s again. Economists at Scotiabank analyze the pair’s outlook.
Rebound through 1.1045/50 required to give the EUR a more sustainable technical bid
Market positioning and uncertainty over the ECB policy outlook suggest the EUR may retain a soft undertone in the short run but bargain hunters may start to show renewed interest in the EUR on dips to the low/mid 1.09 area from here.
Spot trends are soft but EUR losses have slowed as the market nears support defined by the 100-DMA and trend line support off the late 2022 lows at 1.0925. EUR losses through here will point to a more sustained drop in all likelihood.
Resistance is 1.1025 while a rebound through 1.1045/50 is required to give the EUR a more sustainable technical bid.
The Canadian Dollar is softer on the day. Economists at Scotiabank analyze USD/CAD outlook.
Gains through to a 1.33 handle may develop a little more now
CAD losses are extending a little more as the USD establishes a foothold above minor resistance around 1.3275 – now support.
Gains through to a 1.33 handle may develop a little more now, with trend momentum positive on the intraday chart.
Firm resistance is likely to emerge between 1.3350 and 1.3375.
See: USD/CAD to move lower in the coming weeks and break through support at 1.31 – HSBC
The Fed raised rates 25 bps in July and kept the door open for another lift in September, which could cap Gold’s price rise, strategists at ANZ Bank report.
Investment demand remains lackluster
Gold’s macroeconomic backdrop looks a bit uncertain after the US Fed raised rates another 25 bps and left the door open for another rise in September. We expect shifting expectations around its terminal rate could cap the upside in the near term.
Investment demand remains lackluster, as investors wait for the Fed to end its tightening cycle.
EUR/HUF pierced 390 on Tuesday. Economists at Société Générale analyze the pair’s outlook.
The Forint carry trade is unravelling fast amid the MNB’s normalisation drive
The Forint carry trade, a popular theme until recently, is unravelling fast amid the MNB’s normalisation drive.
A retest of the March peak of 402.50 could be next in line after the pair breached the 200-Day Moving Average – situated at 386.44 convincingly earlier this week.
See – EUR/HUF: EU relations and monetary policy to remain fundamental negative factors for the Forint – Commerzbank
Markets were taken aback by Fitch's downgrade of US debt on Tuesday. Economists at ING analyze implications for the FX market.
Fitch downgraded the US from AAA to AA+
Fitch downgraded the US from AAA to AA+, with a stable outlook. EUR/USD jumped on the news, but high-beta currencies suffered, and the dollar seems to have been shielded by safe-haven demand.
Will this prove to be a driver for the FX market beyond the knee-jerk reaction? We doubt that. Treasury Secretary Janet Yellen described the downgrade as ‘outdated’, and markets will likely see it in a similar way (i.e. strictly tied to the debt ceiling standoff) especially in a week full of important data releases and with the next Federal Reserve rate hike hanging in the balance.
See: Rating changes no longer have the signaling effect that could trigger violent capital flows – Commerzbank
The Yen has continued to re-weaken at the start of this week. Economists at MUFG Bank analyze JPY outlook.
Yen to strengthen in the year ahead
We now believe that the BoJ has started the process of removing YCC by first allowing greater flexibility for the 10-year JGB yield to move above 0.5%.
A full removal of yield curve control could be phased in through the remainder of this year if the 10-year JGB yield begins to stabilize below the new hard cap at 1.0%. The next step would then be for the BoJ to begin raising interest rates out of negative territory.
We are now forecasting the first rate hike from the BoJ in the 1H of next year. The shift toward tighter BoJ policy supports our outlook for the Yen to strengthen in the year ahead, although the recent YCC policy tweak has not been sufficient on its own to trigger a reversal of Yen weakness in the near-term.
- USD/JPY drops below 142.50 amid caution due to the US economy's downgrade.
- The job openings pace has already slowed down in the US as the ideology of switching jobs to get a quick hike is changing now.
- After providing more flexibility to the YCC, the BoJ could look for scrapping it as Japan’s industry mood is changing.
The USD/JPY pair stretches downside below the crucial support of 142.50 in the London session. The asset faces significant pressure amid strength in the Japanese Yen as investors hope that the Bank of Japan (BoJ) would leave the support of a dovish interest rate policy sooner.
The US Dollar Index (DXY) consolidates in a narrow range above the crucial support of 102.00 as investors await United States employment data. According to the consensus, the US economy added fresh 189K private payrolls in July, significantly lower than the former release of 497K. Easing employment opportunities would convey a message that a tight labor market is releasing heat and the Federal Reserve (Fed) can consider keeping interest rates steady ahead.
The pace of job openings has already slowed down in the US economy as the ideology of switching jobs to get a quick hike is changing now knowing the fact that the labor cost index is reverting to mean. Overall market mood is quite cautious as emerging economies have come under pressure after Fitch downgrade the credit rating of the US economy to ‘AA+’ from ‘AAA’, citing that fiscal spending will elevate in forward years.
Meanwhile, S&P500 futures generate significant losses in Europe amid bearish market sentiment. The 10-year US Treasury yields have dropped to near 4.02%.
A significant fall in the USD/JPY pair amid consolidating US Dollar indicates strength in the Japanese Yen. Investors believe that after providing more flexibility to the Yield Curve Control (YCC), the Bank of Japan (BoJ) could look for scrapping the YCC as Japan’s industry mood is changing.
- Gold price recovers as investors await US labor market data.
- The US Dollar Index struggles for a firm footing as US Factory activities contract for ninth months consecutively.
- The impact of a decline in Gold demand, reported by the World Gold Council, starts fading.
Gold price (XAU/USD) bounced back after gauging intermediate support near its three-week low around $1,940.00 on Wednesday. The precious metal discovers support as the impact of a decline in gold demand reported by the World Gold Council (WGC) fades and the United States Manufacturing PMI continues its contracting spell for the third quarter in a row.
A power-pack action is anticipated in the Gold price as Automatic Data Processing (ADP) will report US private employment data. The employment data will set the undertone for the interest rate decision by the Federal Reserve (Fed) for its September monetary policy meeting as labor market conditions have remained extremely tight.
Daily Digest Market Movers: Gold price eyes US ADP Employment data
- Gold price remains sideways around $1,950.00 as investors await United States labor market data for further guidance.
- The precious metal witnessed heavy selling on Tuesday after the World Gold Council reported a decline in Gold demand by global central banks. Gold purchased by central banks in the first half of 2023 dropped by 2% YoY amid higher interest rates and costly bullion.
- In addition to that, a significant recovery in United States factory orders kept the Gold price on a bearish trajectory.
- US new factory orders surprisingly rose to 47.3 in July from downwardly revised expectations of 44.0 against June’s reading of 45.6.
- The Institute of Supply Management (ISM) reported that Manufacturing PMI contracted for the ninth month in a row. July’s figure edged up to 46.4 from a previous figure of 46.0 but failed to match expectations of 46.8. All figures under 50.0 are contractionary.
- A straight three-quarter contraction in the Manufacturing PMI is sufficient enough to display the consequences of an aggressive rate-tightening cycle by the Federal Reserve.
- US JOLTS Job Openings dropped in July to 9.582M from its expectations and former reading. The July data recorded its lowest reading in more than two years as job changes waned due to easing wage growth.
- For more guidance about the labor market, investors will focus on the US Nonfarm Payrolls (NFP) and the Unemployment Rate, which will be published on Friday at 12:30 GMT.
- But before that, the entire focus will be on Automatic Data Processing Employment Change, which will be released at 12:15 GMT. Per estimates, US ADP will report the addition of fresh private payroll data in July by 189K vs. the strong addition of 497K recorded in June.
- Tight labor market conditions could force the Fed to raise interest rates further in September monetary policy meeting.
- Chicago Federal Reserve Bank President Austan Goolsbee said on Tuesday that inflation is on track to return to 2% without elevating the jobless rate significantly.
- The US Dollar Index (DXY) demonstrated a stellar recovery on Tuesday despite Fitch downgrading the United States government’s credit rating, citing concerns over forward fiscal spending.
Technical Analysis: Gold price short and mid-term trend is bearish
Gold price finds some support after printing a fresh three-week low at around $1,940.00 ahead of key labor market data. The precious metal trades below the 20 and 50-day Exponential Moving Averages (EMAs), which indicates that the short and mid-term trend is bearish. Gold price forms a Head and Shoulders chart pattern on a lower time frame and a breakdown will occur if the asset fails to defend the neckline plotted around a fresh three-week low.
Fed FAQs
What does the Federal Reserve do, how does it impact the US Dollar?
Monetary policy in the US is shaped by the Federal Reserve (Fed). The Fed has two mandates: to achieve price stability and foster full employment. Its primary tool to achieve these goals is by adjusting interest rates.
When prices are rising too quickly and inflation is above the Fed’s 2% target, it raises interest rates, increasing borrowing costs throughout the economy. This results in a stronger US Dollar (USD) as it makes the US a more attractive place for international investors to park their money.
When inflation falls below 2% or the Unemployment Rate is too high, the Fed may lower interest rates to encourage borrowing, which weighs on the Greenback.
How often does the Fed hold monetary policy meetings?
The Federal Reserve (Fed) holds eight policy meetings a year, where the Federal Open Market Committee (FOMC) assesses economic conditions and makes monetary policy decisions.
The FOMC is attended by twelve Fed officials – the seven members of the Board of Governors, the president of the Federal Reserve Bank of New York, and four of the remaining eleven regional Reserve Bank presidents, who serve one-year terms on a rotating basis.
What is Quantitative Easing (QE) and how does it impact USD?
In extreme situations, the Federal Reserve may resort to a policy named Quantitative Easing (QE). QE is the process by which the Fed substantially increases the flow of credit in a stuck financial system.
It is a non-standard policy measure used during crises or when inflation is extremely low. It was the Fed’s weapon of choice during the Great Financial Crisis in 2008. It involves the Fed printing more Dollars and using them to buy high grade bonds from financial institutions. QE usually weakens the US Dollar.
What is Quantitative Tightening (QT) and how does it impact the US Dollar?
Quantitative tightening (QT) is the reverse process of QE, whereby the Federal Reserve stops buying bonds from financial institutions and does not reinvest the principal from the bonds it holds maturing, to purchase new bonds. It is usually positive for the value of the US Dollar.
In Brazil, the central bank should start cutting rates today. Economists at ING analyze BRL outlook.
Brazil set to start its easing cycle
The only question it seems for the market is whether the BCB will kick off the cycle with a 25 bps or 50 bps cut.
The interest rates market already prices close to 500 bps of easing over the next year – so may not drop too much further – but we think the Brazilian Real may not need to sell off too harshly. After all, real interest rates remain hugely in positive territory and a recent sovereign rating upgrade – and lower volatility – suggest the BRL will continue to be a recipient of carry trade flow.
FX option expiries for Aug 2 NY cut at 10:00 Eastern Time, via DTCC, can be found below.
- EUR/USD: EUR amounts
- 1.0925 390m
- 1.0975 878m
- 1.0990 817m
- 1.1050 411m
- 1.1065 353m
- 1.1160 401m
- 1.1180 615m
- USD/JPY: USD amounts
- 141.00 590m
- 141.50 905m
- 142.00 353m
- 142.50 389m
- 143.00 670m
- USD/CHF: USD amounts
- 0.8450 590m
- 0.8550 600m
- AUD/USD: AUD amounts
- 0.6660 630m
- 0.6675 430m
- 0.6685 690m
- 0.6700 536m
- 0.6780 683m
- 0.6850 750m
- 0.6870 798m
- NZD/USD: NZD amounts
- 0.6630 997m
- 0.6400 783m
From early February to late March EUR and CHF moved more or less in parallel. Since then, the Franc has been performing much better than the European single currency. Ulrich Leuchtmann, Head of FX and Commodity Research at Commerzbank, analyzes what is driving the EUR/CHF pair.
The risk of losses resulting from CHF longs is very limited
The threat of interventions implies that the risk of losses resulting from CHF longs is very limited (‘SNB put’). A situation like that can easily turn into a focal point at which large volumes of speculative demand can accumulate.
There is no support for the view that this CHF strength had anything to do with the US Dollar. Sometimes the franc appreciates even if the dollar appreciates and sometimes when the dollar weakens.
‘That is driven by USD/CHF’ implies a causality, with the Greenback acting as a cause. This view is not supported by reality.
Citing six OPEC and its allies (OPEC+) sources, Reuters reported on Wednesday, the alliance is expected to make no changes to its current oil output policy when they meet on Friday, August 4.
Additional takeaways
“The committee would probably not make any changes to existing policy during Friday's online meeting.”
“Rising oil price is a reason to take no action.”
Market reaction
Despite the above report, WTI is keeping its recovery mode intact toward the $82 mark. The US oil is down 0.22% on the day.
Further consolidation is expected in USD/CNH for the time being, comment Markets Strategist Quek Ser Leang and Senior FX Strategist Peter Chia at UOB Group.
Key Quotes
24-hour view: We did not expect USD to rise to 7.1897 (we were expecting it to trade sideways). Upward momentum has increased, albeit not much. Today, USD could rise to 7.2000. However, a sustained rise above this level is unlikely. Support is at 7.1670, followed by 7.1500.
Next 1-3 weeks: Our most recent narrative was from last Friday (28 Jul, spot at 7.1700). We indicated in our update that “If USD breaks above 7.2000 it would suggest that 7.1000 is not coming into view this time around.” Yesterday, USD rose to a high of 7.1897. While our ‘strong resistance’ level of 7.2000 has not been breached yet, downward momentum has more or less dissipated. The current price actions are likely part of a consolidation phase. For the time being, USD is likely to trade in a range of 7.1300/7.2450.
NZD is dropping in line with other pro-cyclical currencies after the US credit downgrade. Nonetheless, economists at ING expect the NZD/USD pair to recover in the coming weeks.
NZD/USD to reach 0.63 by the autumn
We think the Kiwi has now priced in much of the negative news (China growth repricing, RBNZ pause) and is emerging as an attractive option in August should a stable risk environment and subdued FX volatility favour carry trades and recovery in undervalued currencies.
We still expect a recovery to 0.63 in NZD/USD by the autumn.
- GBP/JPY corrects sharply from a three-week high and is pressured by reviving safe-haven demand.
- The risk-off impulse provides a strong lift to the JPY and is seen as a key factor weighing on the cross.
- The BoJ-BoE policy divergence should limit losses ahead of the central bank event risk on Thursday.
The GBP/JPY cross comes under heavy selling pressure on Wednesday and snaps a three-day winning streak to over a three-week high, around the 183.25 region touched the previous day. The downward trajectory extends through the early part of the European session and drags spot prices to a fresh daily low, around the 182.00 mark in the last hour.
The global risk sentiment took a turn for the worst after Fitch unexpectedly downgraded the US Long-Term Foreign-Currency Issuer Default Rating (IDR) to 'AA+' from 'AAA', citing fiscal deterioration over the next three years. This anti-risk flow forces investors to take refuge in traditional safe-haven currencies, which, in turn, benefits the Japanese Yen (JPY) and turns out to be a key factor weighing on the GBP/JPY cross.
Apart from this, the decline could further be attributed to some long-unwinding trade, especially after a strong rally of nearly 700 pips from the 176.30 area, or a six-week low touched last Friday. Any further decline, however, is more likely to remain limited, at least for the time being, in the wake of a big divergence in the monetary policy stance adopted by the Bank of Japan (BoJ) and the Bank of England (BoE).
In fact, BoJ Governor Kazuo Ueda reiterates last week that the central bank won't hesitate to ease policy further and that more time was needed to sustainably achieve the 2% inflation target. Adding to this, the minutes from the BoJ policy meeting released earlier today revealed that members agreed to maintain the current easy monetary policy. Furthermore, BoJ Deputy Governor Shinichi Uchida turned down talks of an early end to the negative rate policy and said that Japan is now at a phase where it's important to patiently maintain the ultra-easy policy.
In contrast, the BoE is widely expected to raise its benchmark interest rate by 25 bps at its upcoming monetary policy meeting on Thursday, to 5.25%, or the highest since early 2008. Moreover, the markets have been pricing in two more BoE rate hikes by the end of this year as price pressures persist. This, in turn, could act as a tailwind for the British Pound and might hold back traders from placing aggressive bearish bets around the GBP/JPY cross ahead of the key central bank event risk, warranting some caution before positioning for any further losses.
Technical levels to watch
Economists at Credit Suisse analyze USD/JPY outlook after the latest BoJ decision.
Strong downside surprises for US data could cap upside
While our call for unchanged policy we made last week did not work out, we feel vindicated by the ‘spirit’ of both the very modest shift in policy and Monday’s very rapid yield-capping intervention.
Our expectation for Q3 is 135-152, and we have seen the 145 level as a natural magnet. If that level were to break, we see little reason for a move to test 150 to not unfold, unless in the meantime there are strong downside surprises for US data. At that point, we suspect the BoJ will be tempted to intervene again in the FX market as it did in Sep/Oct 2022, at which point we would be looking to take profits on long positions.
According to Economist Lee Sue Ann at UOB Group, the BoE is widely expected to raise its policy rate by 25 bps at its event on August 3.
Key Takeaways
We believe the outsized move in Jun will be a one off. The recent slew of economic data should ease some of the pressure to keep on raising interest rates sharply.
We keep to our view that the BOE will likely hike by 25bps at each of its next two meetings (3 Aug and 21 Sep), culminating with a terminal rate of 5.50%.
- Euro trades with small losses near 1.0980 vs. the US Dollar.
- Stocks in Europe extend the downtrend on Wednesday’s opening.
- EUR/USD returns to the sub-1.1000 area amidst rising cautiousness.
- The USD Index (DXY) picks up extra pace above 102.00.
- Spanish unemployment shrank by 11K individuals in July.
- The ADP report gathers all the attention on Wednesday.
The Euro (EUR) keeps its erratic performance unchanged so far this week and retreats marginally against the US Dollar (USD), motivating EUR/USD to gyrate around the 1.0980 region following the opening bell in the old continent on Wednesday.
Tracked by the USD Index (DXY), the Greenback manages to maintain the strong recovery in place since mid-July and still looks to consolidate the recent breakout of 102.00 – which was helped by rising US yields and some loss of appeal in the risk-linked galaxy.
During this week, the attention of market participants will be drawn toward crucial economic data releases in both the United States and Europe. These releases are expected to challenge the recently emphasized data-dependency approach that has been adopted by both the Federal Reserve and the European Central Bank (ECB) in their decisions on interest rates.
The absence of relevant data releases in the Euro area should leave all attention to the US calendar, where the publication of the ADP Employment Change is expected to be at the centre of the debate. In addition, MBA will release its weekly report on Mortgage Applications for the week ended July 28.
Daily digest market movers: Euro lacks convincing strength to surpass 1.1000
- The EUR comes under pressure after briefly testing 1.1000 vs. the USD.
- The USD Index navigates the area of 3-week tops above 102.00.
- BoJ’s Uchida left the door open to intervention if yields approach 1%.
- The US ADP report is expected at around 190K in July.
- Investors see the Fed on hold for the remainder of the year.
- Market focus remains on the US labour market this week.
Technical Analysis: Euro’s outlook remains negative below 1.1150
EUR/USD could not sustain an earlier move to the area beyond the psychological 1.1000 hurdle, returning to the 1.0980 zone soon afterwards instead.
If bears push harder, EUR/USD should put the weekly low of 1.0943 (July 28) to the test sooner rather than later ahead of a probable move to the interim 55-day and 100-day SMAs at 1.0913 and 1.0912, respectively. The loss of this region could open the door to a potential visit to the July low of 1.0833 (July 6) ahead of the key 200-day SMA at 1.0733 and the May low of 1.0635 (May 31). South from here emerges the March low of 1.0516 (March 15) before the 2023 low of 1.0481 (January 6).
On the other hand, occasional bullish attempts could motivate the pair to initially dispute the weekly top at 1.1149 (July 27). Above this level the downside pressure could mitigate somewhat and encourage the pair to test the 2023 high at 1.1275 (July 18). Once this level is cleared, there are no resistance levels of significance until the 2022 peak of 1.1495 (February 10), which is closely followed by the round level of 1.1500.
Furthermore, the constructive view of EUR/USD appears unchanged as long as the pair trades above the key 200-day SMA.
Euro FAQs
What is the Euro?
The Euro is the currency for the 20 European Union countries that belong to the Eurozone. It is the second most heavily traded currency in the world behind the US Dollar. In 2022, it accounted for 31% of all foreign exchange transactions, with an average daily turnover of over $2.2 trillion a day.
EUR/USD is the most heavily traded currency pair in the world, accounting for an estimated 30% off all transactions, followed by EUR/JPY (4%), EUR/GBP (3%) and EUR/AUD (2%).
What is the ECB and how does it impact the Euro?
The European Central Bank (ECB) in Frankfurt, Germany, is the reserve bank for the Eurozone. The ECB sets interest rates and manages monetary policy.
The ECB’s primary mandate is to maintain price stability, which means either controlling inflation or stimulating growth. Its primary tool is the raising or lowering of interest rates. Relatively high interest rates – or the expectation of higher rates – will usually benefit the Euro and vice versa.
The ECB Governing Council makes monetary policy decisions at meetings held eight times a year. Decisions are made by heads of the Eurozone national banks and six permanent members, including the President of the ECB, Christine Lagarde.
How does inflation data impact the value of the Euro?
Eurozone inflation data, measured by the Harmonized Index of Consumer Prices (HICP), is an important econometric for the Euro. If inflation rises more than expected, especially if above the ECB’s 2% target, it obliges the ECB to raise interest rates to bring it back under control.
Relatively high interest rates compared to its counterparts will usually benefit the Euro, as it makes the region more attractive as a place for global investors to park their money.
How does economic data influence the value of the Euro?
Data releases gauge the health of the economy and can impact on the Euro. Indicators such as GDP, Manufacturing and Services PMIs, employment, and consumer sentiment surveys can all influence the direction of the single currency.
A strong economy is good for the Euro. Not only does it attract more foreign investment but it may encourage the ECB to put up interest rates, which will directly strengthen the Euro. Otherwise, if economic data is weak, the Euro is likely to fall.
Economic data for the four largest economies in the euro area (Germany, France, Italy and Spain) are especially significant, as they account for 75% of the Eurozone’s economy.
How does the Trade Balance impact the Euro?
Another significant data release for the Euro is the Trade Balance. This indicator measures the difference between what a country earns from its exports and what it spends on imports over a given period.
If a country produces highly sought after exports then its currency will gain in value purely from the extra demand created from foreign buyers seeking to purchase these goods. Therefore, a positive net Trade Balance strengthens a currency and vice versa for a negative balance.
A rating agency downgraded the US Treasury. Economists at Commerzbank analyze implications for the Dollar.
No significant Dollar reaction to rating change
A major rating agency has downgraded the US Treasury. USD exchange rates reacted, but so little that you'd better have a magnifying glass handy if you want to find the effect in the chart.
Since foreigners tend to invest in the US at relatively low risk, it is primarily US government bonds that determine the overall attractiveness of the US as an investment destination. But we are not living in the 1980s anymore. Rating changes no longer have the signaling effect that could trigger violent capital flows.
EUR/USD averted a move below 1.0950. Economists at ING analyze the pair’s outlook.
The Dollar leg should remain dominant
EUR/USD remains a Dollar story and with the US data calendar about to pick up (ADP, ISM services, payrolls), the Dollar leg should remain dominant given that most key Eurozone data was already published earlier this week.
More pressure on the pair is definitely on the cards should US data prove robust. A test of 1.0900 by the end of the week seems feasible.
- AUD/USD drifts lower for the second straight day and drops to a nearly two-month low.
- The risk-off impulse, China’s economic woes and the RBA’s inaction weigh on the Aussie.
- Retreating US bond yields undermines the USD, though fails to lend support to the pair.
The AUD/USD pair remains under some selling pressure for the second successive day on Wednesday and continues losing ground through the early European session. Spot prices drop to a near two-month low, around the 0.6575 region in the last hour, and seem vulnerable to prolonging the recent downward trajectory witnessed over the past three weeks or so.
The global risk sentiment takes a hit after Fitch unexpectedly downgraded the US Long-Term Foreign-Currency Issuer Default Rating (IDR) to 'AA+' from 'AAA', citing fiscal deterioration over the next three years. This, along with China's economic woes and the Reserve Bank of Australia's (RBA) surprise decision to leave the Official Cash Rate (OCR) unchanged for the second straight meeting, weighs heavily on the Australian Dollar (AUD). Even a modest US Dollar (USD) weakness fails to impress bulls or lend any support to the AUD/USD pair.
The global flight to safety triggers a modest decline in the US Treasury bond yields and fails to assist the buck to capitalize on a two-week-old uptrend to its highest level since July 10 touched on Tuesday. In fact, the USD Index (DXY), which tracks the Greenback against a basket of currencies, so far, has struggled to make it through a technically significant 100-day Simple Moving Average (SMA) barrier. That said, rising bets for further policy tightening by the Federal Reserve (Fed) continue to act as a tailwind and help limit the intraday dip.
It is worth recalling that Fed Chair Jerome Powell had said that the economy still needs to slow and the labour market to weaken for inflation to credibly return to the 2% target. Moreover, the incoming US macro data points to an extremely resilient economy and keeps the door for another 25 bps lift-off in September or November wide open. This, along with a convincing break and acceptance below the 0.6600 round-figure mark, favours the AUD/USD bears and suggests that the path of least resistance for spot prices remains to the downside.
Market participants now look forward to the US ADP report on private-sector employment, due for release later during the early North American session. Apart from this, the US bond yields will influence the USD price dynamics and provide a fresh impetus to the AUD/USD pair. Traders will further take cues from the broader risk sentiment to grab short-term opportunities around the risk-sensitive Aussie. The focus, however, remains glued to the release of the crucial US monthly employment details, popularly known as the NFP report on Friday.
Technical levels to watch
Economists at Credit Suisse remain alert to the possibility of stronger data surprises, and restate their firmly neutral stance on AUD/USD, as per the 0.6600 end-Q3 target.
Going nowhere fast
We remain sceptical of the market’s shift to a clearly dovish RBA outlook and remain alert to the possibility of near-term corrections, e.g. on occasion of the SOMP release on 4 Aug or of the Q2 wage price index and July employment data in mid-Aug.
We stay neutral on AUD/USD with an end Q3 target of 0.6600 and remain committed to fading moves close to the extremes of our Q3 range between 0.6350 and 0.6900.
The continuation of the uptrend in USD/JPY could extend to the 145.00 region in the next few weeks, suggest Markets Strategist Quek Ser Leang and Senior FX Strategist Peter Chia at UOB Group.
Key Quotes
24-hour view: We held the view yesterday that “the strong rally in USD could extend to 143.20 before the risk of a pullback increases.” While USD rose as expected, it soared to a high of 143.54. Conditions remain severely overbought, and USD is unlikely to rise much further. Today, USD is more likely to trade in a range of 142.40/143.65.
Next 1-3 weeks: Yesterday (01 Aug, spot at 142.30), we highlighted that USD “must break and stay above 143.20 before further sustained advance is likely.” USD then soared to a high of 143.54 before closing at 143.32. While the price actions suggest USD could continue to rise, it remains to be seen if there is enough momentum to carry it to June’s high near 145.00. Meanwhile, overbought short-term conditions could lead to 1-2 days of consolidation. The upside risk is intact as long as USD stays above 141.50 (‘strong support’ level was at 140.50 yesterday).
- The index extends the upside momentum north of 102.00.
- US yields look for direction in the European morning.
- The ADP report will take centre stage later in the NA session.
The USD Index (DXY), which gauges the greenback vs. a bundle of its main competitors, keeps the optimism well and sound for yet another session on Wednesday.
USD Index remains focused on data
The index extends its sharp recovery from lows near 99.50 recorded in mid-July and looks to consolidate further the recent breakout of the key 102.00 hurdle amidst the weekly recovery in US yields across all maturities and the loss of traction in the risk complex.
Indeed, the index closed with losses in only three sessions since the July low in the 99.60/55 band pari passu with the persistent resilience of the US economy and investors’ repricing of further decisions regarding monetary policy by the Federal Reserve as well as other major central banks.
Later in the NA session, the US labour market will be in the centre of the debate with the publication of the ADP report for the month of July, which gauges the job creation by the US private sector. Additional data will see the usual weekly report by MBA on Mortgage Applications.
What to look for around USD
The index keeps the recovery well in place and maintains its initial target at the key 102.60 region, home of the interim 55-day and 100-day SMAs.
In the meantime, the dollar appears benefited from the post-ECB weakness in the risk-associated space, while it could face extra headwinds in response to the data-dependent stance from the Fed against the current backdrop of persistent disinflation and cooling of the labour market.
Furthermore, speculation that the July hike might have been the last of the current hiking cycle is also expected to keep the buck under some pressure for the time being.
Key events in the US this week: MBA Mortgage Applications, ADP Employment Change (Wednesday) – Initial Jobless Claims, Final Services PMI, ISM Services PMI, Factory Orders (Thursday) – Nonfarm Payrolls, Unemployment Rate (Friday).
Eminent issues on the back boiler: Persistent debate over a soft or hard landing for the US economy. Terminal Interest rate near the peak vs. speculation of rate cuts in late 2023 or early 2024. Geopolitical effervescence vs. Russia and China. US-China trade conflict.
USD Index relevant levels
Now, the index is gaining 0.23% at 102.19 and the breakout of 102.43 (weekly high August 1) would open the door to 103.54 (weekly high June 30) and finally 103.65 (200-day SMA). On the other hand, immediate contention emerges at 100.55 (weekly low July 27) prior to 100.00 (psychological level) and then 99.57 (2023 low July 13).
- Silver struggles to preserve modest intraday gains, though holds above the weekly low.
- The technical setup warrants some caution before positioning for any meaningful slide.
- A break below the $24.00 mark, or the 100-day SMA, is needed to confirm a breakdown.
Silver attracts fresh selling following an intraday uptick to the $24.45 region on Wednesday and touches a fresh daily trough during the early European session on Wednesday. The white metal currently trades around the $24.30-$24.25 region, nearly unchanged for the day, and manages to hold its neck above the weekly low touched on Tuesday.
Any subsequent fall is more likely to find support near last week's swing low, around the $24.00 mark, which now coincides with a technically significant 100-day Simple Moving Average (SMA) and should act as a pivotal point. Meanwhile, oscillators on the daily chart - though have been losing traction - are yet to confirm a bearish outlook. This makes it prudent to wait for a sustained break below the said handle before positioning for any further depreciating move.
The XAG/USD might then accelerate the downward trajectory towards challenging the very important 200-day SMA, currently around the $23.15-$23.20 region. This is closely followed by the $23.00 round-figure mark, which if broken will expose the multi-month low, around the $22.15-$22.10 area touched in June.
On the flip side, the daily peak, around the $24.45 area, now seems to act as an immediate hurdle ahead of the $24.75 region, or the overnight swing high, and the $25.00 psychological mark. The next relevant hurdle is pegged near the monthly peak, around the $25.25 zone, which if cleared could lift the XAG/USD beyond the $25.50-$25.55 hurdle. Bulls might then aim to reclaim the $26.00 mark and retest the YTD peak, around the $26.10-$26.15 area touched in May.
Silver daily chart
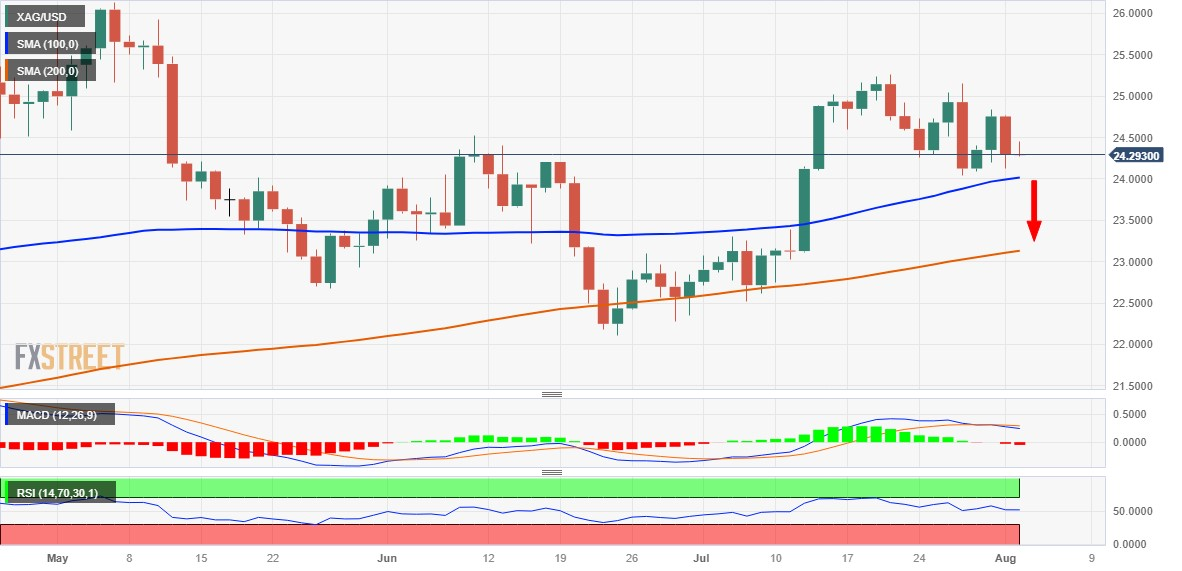
Key levels to watch
Ulrich Leuchtmann, Head of FX and Commodity Research at Commerzbank, analyzes JGB's attractiveness and Yen's weakness.
Uncertainty about how the BoJ intends to control the yields going forward
The fact that the Yen is experiencing another period of weakness, first of all, reflects the uncertainty about how the BoJ intends to control the yields going forward. And also something quite trivial: high yields only make JGBs attractive if one can assume that they do not rise further.
At present it seems quite possible that the adjustment of the ceiling in December and the vague wording last Friday constitute two steps in a painfully slow process, which will end in much higher yields. Perhaps it is even the beginning of the end of the yield curve control. At that point, global investors might want to avoid JGBs. From my point of view that is one of the reasons for the current JPY weakness.
- USD/CAD attracts some dip-buying and edges higher to 1.3305, gaining 0.19% for the day.
- The next barrier for USD/CAD is located at 1.3350; 1.3285 acts as an initial support level.
- The Relative Strength Index (RSI) stands above 50.
The USD/CAD pair gains momentum and surges above the 1.3300 barrier heading into the early European session on Wednesday. The major pair is on track for its sixth weekly close above 1.3200.
Fitch downgraded the US government's credit rating from AAA to AA+, but expectations for an additional 25 basis point (bps) rate hike by the Federal Reserve (Fed) support the US Dollar (USD) and help USD/CAD attract some dip-buying on Wednesday. However, an increase in oil prices would benefit the Canadian Dollar, since Canada is the largest oil exporter to the United States. Market players await the US ADP employment data later in the American session.
According to the four-hour chart, any meaningful follow-through buying above the 1.3300 area will see a rally to the next barrier at 1.3350 (High of June 15). Following that, the July 7 high of 1.3385 will be the next hurdle, followed by 1.3450 (High of June 6).
Looking at the downside, any extended weakness below 1.3285 (the midline of the Bollinger Band) will challenge the next downside filter at 1.3265 (the lower limit of the Bollinger Band) en route to 1.3235 (100-hour EMA) and 1.3220 (the 200-hour EMA). A decisive break below the latter would drive the pair towards 1.3200 (a psychological round mark).
However, the further upside appears favorable as the Relative Strength Index (RSI) stands above 50, activating the bullish momentum for the USD/CAD pair for the time being.
USD/CAD four-hour chart
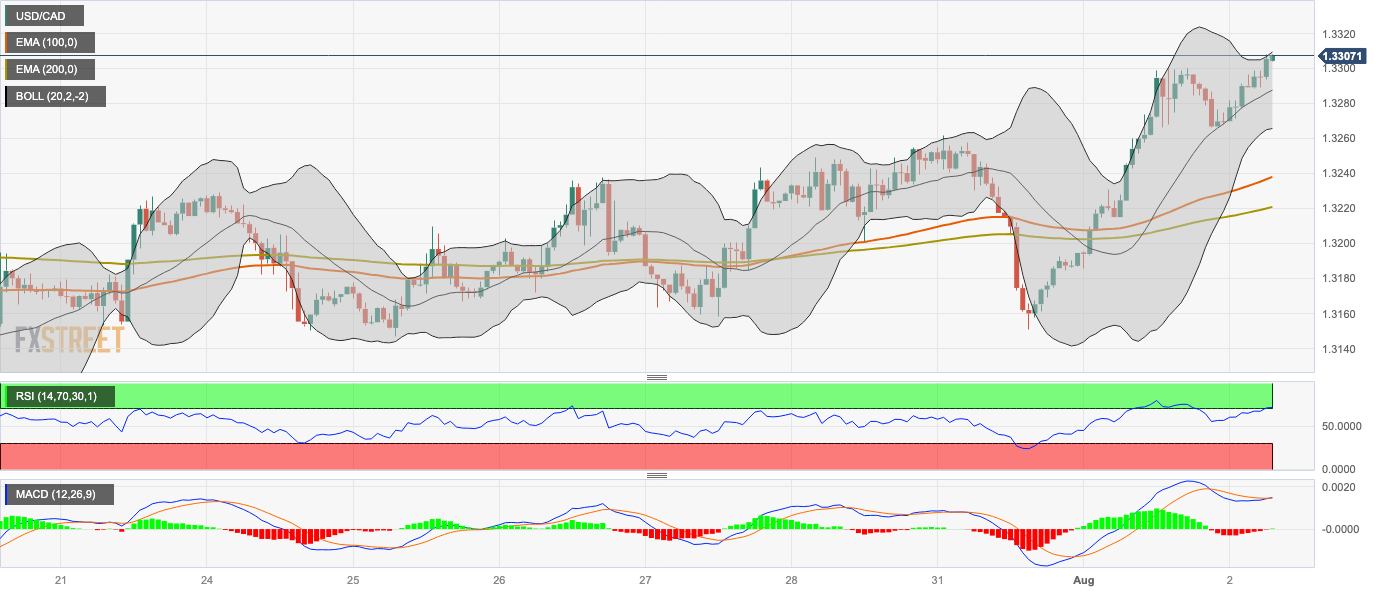
- Gold Price bounces off three week low but stays on bear’s radar on breaking key supports, now resistances.
- US credit rating cut prods US Dollar bulls, puts a floor under XAU/USD price.
- Fears of hawkish Fed moves, receding Gold demand from Asia weigh on bullion.
- Strong US employment data can bolster September Fed rate hike odds and exert downside pressure on XAU/USD.
Gold Price (XAU/USD) clings to mild gains as it bounces off the lowest levels in three weeks. However, the metal’s current position remains elusive to lure the XAU/USD buyers as it stays beneath the key supports as markets await the top-tier US employment data comprising the ADP Employment Change and the Nonfarm Payrolls.
Late on Tuesday, global credit rating agency Fitch Ratings downgraded the US credit rating from AAA to AA+. However, the recent market chatters, mainly from big bankers, suggest that such a rating cut is likely to have a minor negative impact on the US fundamentals and hence recently challenge the risk-off mood, as well as prod the Gold buyers.
Further, hawkish comments from Chicago Federal Reserve Bank President Austan Goolsbee and fears of Fed policy pivot, as cited by Atlanta Federal Reserve Bank President Raphael Bostic escalate the market’s anxiety ahead of the key data and prod the Gold buyers.
It should be noted that the latest World Gold Council (WGC) report suggests a 2.0% fall in the annual demand and anticipates a 10% fall in the gold demand from India, one of the major customers, to challenge the XAU/USD bulls. Additionally, downbeat China statistics and fears of easing economic growth in the key Gold customer also prod the precious metal price.
Also read: Gold Price Forecast: XAU/USD’s sustained reccovery hinges on weak US ADP jobs data
Gold Price: Key levels to watch
Our Technical Confluence indicator signals that the Gold Price remains well beneath the $1,950 and $1,970 trading range that previously restricted the XAU/USD moves as market players brace for the US employment and activity data scheduled for release this week.
That said, the previous day’s downside break of the $1,952 support confluence, now resistance serves as the immediate signal to favor the Gold bears despite the metal’s recent intraday gains. It should be noted that the Fibonacci 23.6% on one week highlights the importance of the said technical level.
With this, the Gold Price is likely to decline towards the lower band of the Bollinger on hourly play joins Pivot Point one-week S1 and 200-HMA, around $1,940.
Following that, a convergence of the Pivot Point one-day S1 and 61.8% Fibonacci retracement of one-month, can act as the final defense of the Gold buyers near $1,935 before directing them to the $1,900 round figure.
Alternatively, an upside clearance of the $1,952 hurdle can direct the Gold Price toward the 10-DMA resistance of around $1,962.
However, major attention will be given to the $1,969-70 resistance zone comprising the Fibonacci 61.8% on one week, 100-DMA and Fibonacci 23.6% on one-day and one-month.
Should the Gold buyers manage to cross the $1,970 hurdle, a multi-day-old horizontal resistance zone surrounding $1,985 may prod the XAU/USD bulls before directing them to the $2,000 psychological magnet.
Here is how it looks on the tool
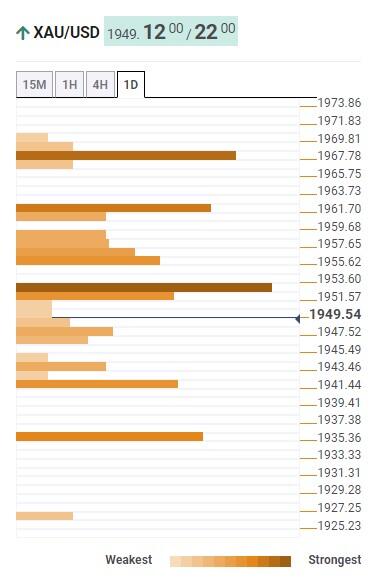
About Technical Confluences Detector
The TCD (Technical Confluences Detector) is a tool to locate and point out those price levels where there is a congestion of indicators, moving averages, Fibonacci levels, Pivot Points, etc. If you are a short-term trader, you will find entry points for counter-trend strategies and hunt a few points at a time. If you are a medium-to-long-term trader, this tool will allow you to know in advance the price levels where a medium-to-long-term trend may stop and rest, where to unwind positions, or where to increase your position size.
CME Group’s flash data for natural gas futures markets noted traders added nearly 18K contracts to their open interest positions on Tuesday. In the same line, volume reversed two consecutive daily declines and increased by around 64.2K contracts.
Natural Gas could revisit the $2.50 region near term
Prices of natural gas dropped for the second session in a row on Tuesday. The daily downtick was amidst increasing open interest and volume and leaves the commodity vulnerable to further losses in the very near term. That said, the next contention emerges at the lower end of the ongoing range bound theme around the $2.50 zone per MMBtu.

Here is what you need to know on Wednesday, August 2:
The US Dollar preserves its strength mid-week as market mood remains cautious. US stock index futures are down between 0.35% and 0.75% in the early European morning, while the US Dollar Index (DXY) clings to modest daily gains above 102.00. ADP will release private sector employment data for July to kickstart the American session.
ADP Jobs Preview: Will a softer report slow down the US Dollar?
The data from the US showed on Tuesday that the business activity in the manufacturing sector continued to contract in July and the number of job openings on the last business day of June declined to 9.58 million. Although DXY retreated from the multi-week high it touched above 102.40 after these data, it closed the day in positive territory. In the late American session, Global rating agency Fitch announced that it downgraded the US government's credit rating to AA+ from AAA, citing anticipated fiscal deterioration over the next three years and a high and growing general government debt burden.
During the Asian trading hours, the Bank of Japan’s (BoJ) Minutes of the June monetary policy meeting showed that policymakers shared the view that there was no need to make operational tweaks to Yield Curve Control (YCC) at this point. Meanwhile, BoJ Deputy Governor Shinichi Uchida reiterated that it was important for the BoJ to patiently maintain easy policy. Following a three-day rally that saw the pair gain nearly 3%, USD/JPY came under renewed bearish pressure and was last seen losing 0.5% on the day at around 142.60. Despite the dovish BoJ tone, the Japanese Yen seems to be benefitting from risk aversion.
The data from New Zealand showed on Wednesday that the Unemployment Rate rose to 3.6% in the second quarter from 3.4% in the first quarter. In the same period, the Participation Rate increased to 72.4% from 72% and the Labor Cost Index rose 1.1% on a quarterly basis. NZD/USD extended its slide in the Asian session and was last seen trading at its lowest level in a month near 0.6100.
EUR/USD recovered above 1.1000 in the Asian session but retreated below that level at the beginning of the European session on Wednesday.
GBP/USD closed below 1.2800 for the first time in three weeks on Tuesday. The pair stays relatively quiet early Wednesday.
Pressured by rising US Treasury bond yields, Gold price turned south and dropped toward $1,940. As the 10-year US yield holds steady at around $1,940, XAU/USD consolidates its losses near $1,950.
Bitcoin staged a rebound following a drop below $28,500 but lost its bullish momentum after testing $30,000. Ethereum came within a touching distance of $1,800 on Tuesday but turned north in the second half of the day. ETH/USD, however, struggled to build on recovery gains early Wednesday and trades in negative territory near $1,850.
In the view of Markets Strategist Quek Ser Leang and Senior FX Strategist Peter Chia at UOB Group, further downside could force AUD/USD to slip back towards the 0.6540 region in the short-term horizon.
Key Quotes
24-hour view: The outsized selloff of 1.57% (NY close of 0.6613) in AUD yesterday came as a surprise (we were of the view that AUD could advance further but is unlikely to break 0.6785). Not surprisingly, conditions are severely oversold. However, the weakness in AUD has not stabilised. Today, AUD could break below June’s low of 0.6595. In view of the oversold conditions, the next major support at 0.6540 is unlikely to come under threat. On the upside, if AUD breaks above 0.6655 (minor resistance is at 0.6635), it would mean that the weakness in AUD has stabilised.
Next 1-3 weeks: In our most recent narrative from Monday (31 Jul, spot at 0.6660), we highlighted that “there is a chance, albeit not a high one, for AUD to drop to June’s low of 0.6595.” Yesterday, AUD nosedived to a low of 0.6603 before closing on a weak note at 0.6613 (-1.57%). The boost in downward momentum suggests a break of 0.6595 will not be surprising. A break of 0.6595 will shift the focus to 0.6540. Overall, the weakness in AUD that started more than a week ago is intact unless AUD breaks above 0.6710 (‘strong resistance’ has moved sharply lower from yesterday’s level of 0.6785).
Economists at Commerzbank analyze the Reserve Bank of India (RBI) policy outlook and its implications for the USD/INR pair.
RBI to maintain a wait-and-see mode
RBI will remain vigilant and watchful on the inflation front. Lower commodity and oil prices have helped headline inflation to moderate to under 5% YoY in June. It is likely to remain around this level in Q3 but is expected to pick up in Q4, driven by the lower base and higher cost pressures.
We expect RBI to maintain a wait-and-see mode and leave rates unchanged for the rest of the year.
For USD/INR, RBI will be content with the stability. It continues to hold within the 81-83 range since the start of the year.
Open interest in crude oil futures markets went up for the second straight session on Tuesday, this time by around 2.1K contracts according to preliminary readings from CME Group. Volume followed suit and rose by nearly 106K contracts after two consecutive daily pullbacks.
WTI: The hunt for the 2023 high
WTI prices extended its upside momentum for yet another session amidst rising open interest and volume on Tuesday. Against that, the rally appears to have further legs to go and with the immediate target at the YTD high at $83.49 (April 12).
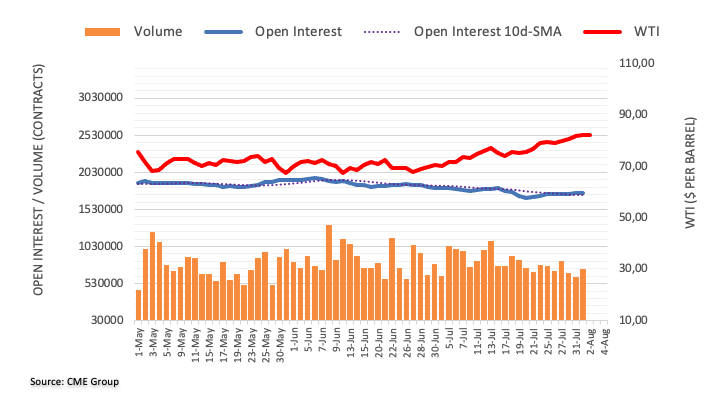
GBP/USD could still slip back towards the 1.2720 region in the near term, according to Markets Strategist Quek Ser Leang and Senior FX Strategist Peter Chia at UOB Group.
Key Quotes
24-hour view: We expected GBP to trade sideways in a range of 1.2795/1.2865 yesterday. Our view was incorrect, as GBP dropped to a low of 1.2742 before rebounding quickly. Downward pressure has eased with the rapid rebound, and the 1.2742 low could be a bottom for now. That said, it is too early to expect a major reversal. Today, GBP is likely to trade in a range, probably between 1.2755 and 1.2850.
Next 1-3 weeks: Our most recent update was from last Friday (28 Jul, spot at 1.2800). In our update, we noted that “while downward momentum is building again, it remains to be seen if GBP can break the major support at 1.2720.” Yesterday, GBP dropped to 1.2742 before rebounding quickly. While there is no clear increase in momentum, there is still a chance for GBP to drop to 1.2720. All in all, we expect GBP to trade with a downward bias as long as it stays below 1.2880 (‘strong resistance’ level previously at 1.2900).
Economists at Danske Bank expect the Bank of England (BoE) to hike the Bank Rate (key policy rate) by 25 bps on Thursday, lifting EUR/GBP slightly.
Topside risk to EUR/GBP with a return to 25 bps steps
In our base case of a 25 bps hike, we expect EUR/GBP to move slightly higher and volatility to be high.
We anticipate Governor Bailey to reiterate the BoE’s data dependent approach at the press conference, essentially kicking the can down the road.
Overall, we expect the BoE to highlight the continued tight labour market and keep the door open for further tightening.
On balance, we continue to see relative rates as positive for EUR/GBP, which is one of several reasons behind our fundamental predisposition of buying EUR/GBP dips.
- USD/JPY reverses from three-week high, prints the first daily loss in four as BoJ’s Uchida sounds hawkish.
- 61.8% Fibonacci retracement, 21-DMA limits Yen pair’s downside amid bullish MACD signals.
- Descending trend line from late October 2022 appears a tough nut to crack for bulls.
USD/JPY slides to 142.80 as it fades bounce off intraday low heading into Wednesday’s European session. In doing so, the Yen pair reverses from the highest levels in three weeks while poking the 61.8% Fibonacci retracement of October 2022 to January 2023 downside.
That said, hawkish comments from Bank of Japan (BoJ) Deputy Governor Shinichi Uchida, suggesting a likely tweak to the central bank’s Yield Curve Control (YCC) policy, recently drowned the USD/JPY pair, which in turn snapped a three-day winning streak by the press time.
However, the key Fibonacci retracement level surrounding 142.50, also known as the golden Fibonacci ratio, challenges the USD/JPY bears amid bullish MACD signals.
Even if the quote drops below 142.50 support, the 21-DMA level of around 140.90 and the 140.00 psychological magnet will test the USD/JPY sellers.
Following that, the 50% Fibonacci retracement level and a four-month-old support line, near 139.60 and 138.70 in that order, will be in the spotlight.
On the contrary, a descending trend line from October 2022, close to 144.20 at the latest, precedes the yearly high of around 144.90 and the 145.00 round figure to challenge the USD/JPY buyers.
USD/JPY: Daily chart
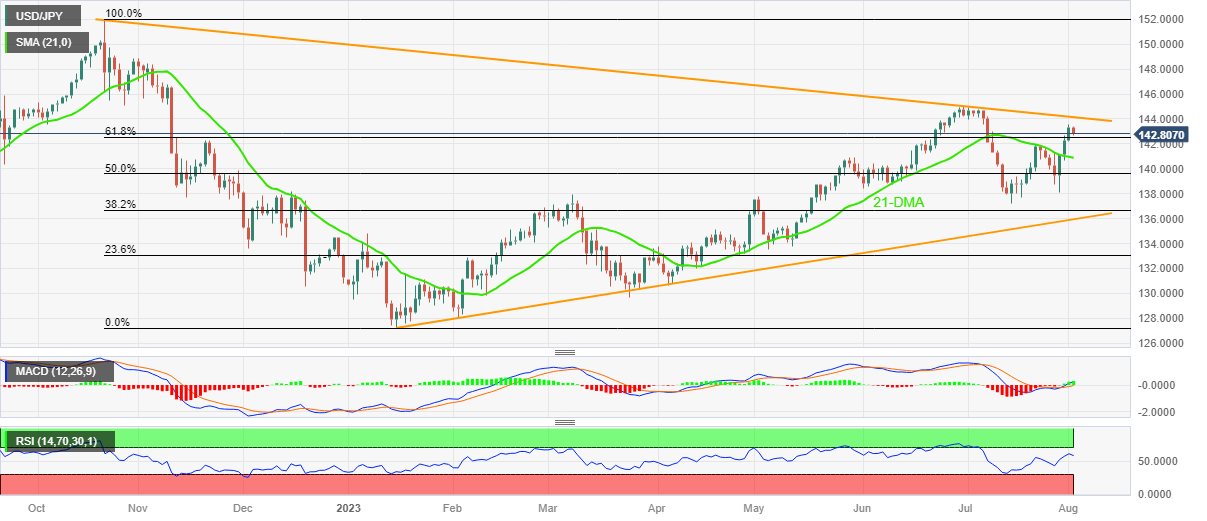
Trend: Limited downside expected
- AUD/JPY extends its downside near the 93.80 area on Wednesday.
- BoJ policymaker stated that Japan is in a position where it is critical to maintain an easy policy.
- AUD/JPY trades within a descending trend channel on the four-hour chart.
- The immediate level is seen at 95.50; the initial support level is located at 93.30.
The AUD/JPY cross trades in negative territory for the second consecutive day heading into the early European trading hours on Wednesday. The cross currently trades around 93.80, losing 1.03% for the day. The Aussie faces some follow-through selling following the Reserve Bank of Australia (RBA) interest rate decision and Bank of Japan (BoJ) Meeting Minutes.
The RBA board members decided to maintain the interest rate unchanged at 4.10% at Tuesday's August monetary policy meeting. On the other hand, the BoJ surprised financial markets by making its yield curve control (YCC) more flexible. The central bank will allow the 10-year yield to move above the cap as long as it stays below 1.0% rather than being capped at 0.5%. Additionally, BoJ Deputy Governor Shinichi Uchida stated early Wednesday that Japan is in a position where it is critical to maintain an easy policy.
According to the four-hour chart, AUD/JPY trades within a descending trend channel line from the middle of June. That said, the path of least resistance for the AUD/JPY is to the downside as the cross holds below the 50- and 100-hour Exponential Moving Averages (EMAs). Additionally, the Relative Strength Index (RSI) holds bearish territory, supporting the sellers for now.
The immediate level is seen at 95.50, indicating the upper boundary of a descending trend channel and a high of August 1. The additional upside filter to watch is 96.85 (High of July 4), and 97.60 (YTD high).
On the flip side, the initial support level is located at 93.30 (Low of July 12). The next contention appears at 92.60 (Low of July 28) en route to 92.40 (the lower limit of a descending trend channel). A break below the latter will see a drop to 92.15 (Low of June 6).
AUD/JPY four-hour chart
-638265538155630127.png)
Considering advanced prints from CME Group for gold futures markets, open interest extended the downtrend and this time dropped by around 4.5K contracts on Tuesday. Volume, instead, reversed two consecutive daily pullbacks and increased by around 29.3K contracts.
Gold: Support emerges around $1940
Tuesday’s marked pullback in gold prices was against the backdrop of the shrinking open interest, leaving the door open to a near-term rebound following another test of the key support around the $1940 region per troy ounce.
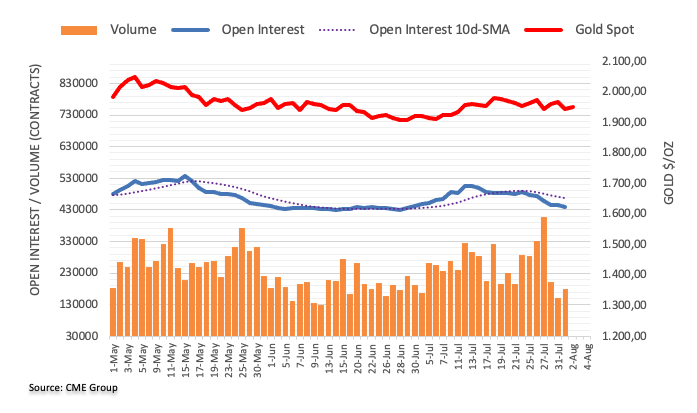
Bank of Japan (BoJ) Deputy Governor Shinichi Uchida said on Wednesday that “depending on the speed of moves, BoJ will step in before the 10-year yield hits 1.0%.”
Additional quotes
If economic and price conditions change from now, there is a chance BoJ’s response could change.
If economic and price conditions do not change much, long-term rates won't rise much so current policy will likely be fairly robust.
Japan's deflationary mindset is showing signs of change, by nurturing this change we can achieve 2% inflation.
Also read: BoJ’s Uchida: Japan is now at a phase where it's important to patiently maintain easy policy
Market reaction
USD/JPY came under renewed selling pressure and reversed sharply to near 142.65 region before bouncing back to 142.90, where it now wavers. The spot is down 0.31% on the day.
- EUR/GBP bulls take a breather at weekly top after rising the most in fortnight the previous day.
- Market’s reassessment of mixed Eurozone, German data joins UK recession woes to prod buyers.
- BoE is expected to ease on rate hikes as inflation woes recede, 0.25% lift in benchmark rates loom on Thursday.
- ECB’s dovish hike may prod pair buyers even if the BoE tames the hawks.
EUR/GBP struggles to remain firmer around the 0.8600 round figure heading into Wednesday’s London open. That said, the cross-currency pair ignored mixed Eurozone data while justifying the UK’s economic fears to post the biggest daily jump in two weeks the previous day.
That said, the last week’s downbeat prints of the UK’s inflation data allow the Bank of England (BoE) hawks as they struggle to tame the heavy inflation amid downbeat economic activities and workforce problems at home. Also challenging the British Pound (GBP) is the latest disappointment for the ruling Tory Party, as Rishi Sunak’s team lost some of the key seats in the by-elections.
On the other hand, the German Unemployment Rate eased to 5.6% for June versus 5.7% expected and prior whereas the final prints of HCOB Manufacturing PMI for July confirmed a 38.8 figure. On the same line, the last readings of Eurozone HCOB Manufacturing also matched initial forecasts of 42.7.
It should be noted that the European Central Bank’s (ECB) “meeting-by-meeting” approach while announcing a 0.25% rate hike in the last week prod the EUR/GBP bulls.
Above all, the market’s cautious mood ahead of the BoE Monetary Policy Meeting, up for release on Thursday, challenges the pair traders amid mixed feelings even if the UK central bank is likely to announce a 0.25% rate hike. In a case where the “Old Lady”, as the BoE is casually termed, pauses the rate increase or sounds dovish, the EUR/GBP will have further upside to trace.
Technical analysis
Although a clear upside break of 50-DMA, around 0.8590 by the press time, keeps the EUR/GBP buyers hopeful, a downward-sloping resistance line from late April, close to .8630 at the latest, challenges the bulls before giving them control.
Markets Strategist Quek Ser Leang and Senior FX Strategist Peter Chia at UOB Group see a dwindling likelihood of a move to the 1.0920 region in EUR/USD.
Key Quotes
24-hour view: Yesterday, we noted the “slightly weaker underlying tone”, and we expected EUR to “trade in a lower range of 1.0970/1.1030.” However, EUR dropped to 1.0950 before rebounding to end the day at 1.0982 (-0.10%). EUR rose in early Asian trade, but there is no clear increase in momentum. The current price actions appear to be part of a consolidation. Today, we expect EUR to trade sideways between 1.0970 and 1.1030.
Next 1-3 weeks: We have held a negative EUR view since the middle of last week. Our latest narrative was from Monday (31 Jul, spot at 1.1025), wherein “downward momentum has eased somewhat, but only a breach of 1.1070 would indicate that EUR is not weakening further.” Yesterday, EUR dropped to 1.0950 and then rebounded. Today, EUR rose sharply in early Asian trade. Downward momentum has deteriorated further, and the chance for EUR to drop to the major support at 1.0920 this time around is slim. However, only a breach of 1.1070 would indicate that the current downward pressure has faded.
- USD/CHF pauses four-day winning streak amid market’s indecision amid dicey US Dollar.
- Fitch downgrades US credit rating but market players rule out fears.
- Rising trend channel from Friday, sustained trading beyond key moving averages keep Swiss Franc pair buyers hopeful.
- Sellers need validation from 0.8700 support confluence to retake control.
USD/CHF stabilizes near 0.8750 as bulls run out of steam after ruling for four consecutive days ahead of Wednesday’s European session. The Swiss Franc (CHF) pair’s latest inaction could be linked to the market’s struggle to justify the US credit rating downgrade as bankers and White House officials turn down the fears of witnessing any major negatives from the Fitch Ratings’ move.
Also read: US Dollar Index: DXY ignores softer yields to reclaim 102.00 as sentiment sours on US credit rating cut
Apart from the sluggish US Dollar, the steady RSI (14) also prods the USD/CHF bulls. However, an upward-sloping trend channel formation established since Friday, currently between 0.8790 and 0.8700, keeps the pair buyers hopeful.
Even so, the impending bull cross on the MACD and the quote’s successful trading beyond the key moving averages, as well as the aforementioned bullish channel, underpins upside bias for the USD/CHF pair.
That said, a convergence of an ascending trend line from Monday and the 50-Hour Moving Average (HMA), around 0.8730 at the latest, restricts the Swiss Franc pair’s immediate downside.
Following that, the 100-HMA and the stated channel’s bottom line, close to the 0.8700 round figure by the press time, could act as the final defense of the USD/CHF buyers.
In a case where the USD/CHF bears dominate past 0.6700, the odds of witnessing a slump toward the yearly low marked the last week around 0.8550 can’t be ruled out.
On the contrary, an upside break of the channel’s top line, close to 0.8790, needs validation from the 0.8800 round figure to help the USD/CHF bulls in challenging May’s bottom of around 0.8820 and dominate afterward.
USD/CHF: Hourly chart
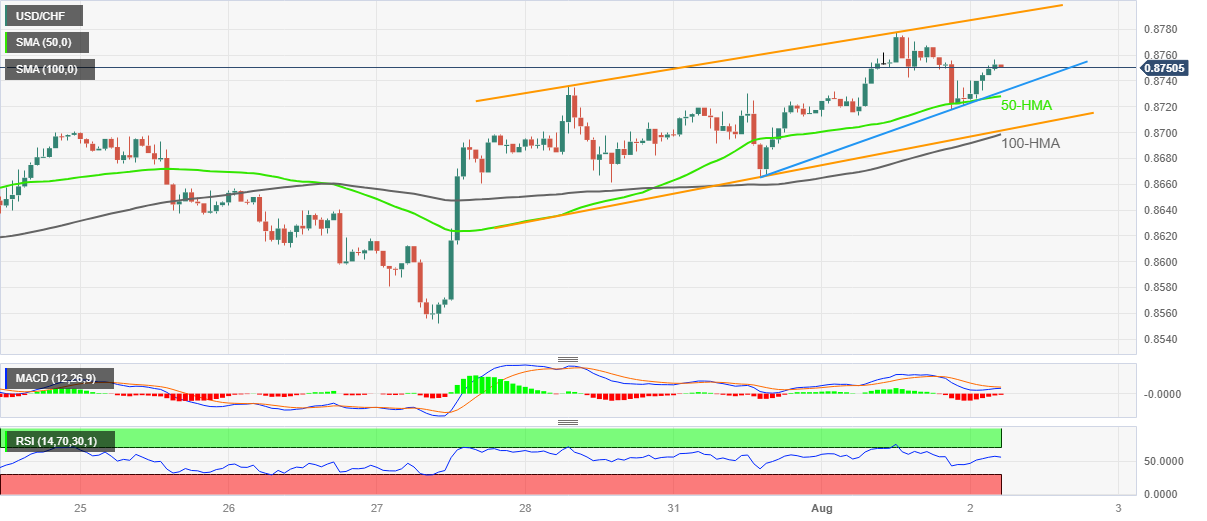
Trend: Further upside expected
- Asian stock markets trade on a negative note as investors worry about the possible US debt ceiling crisis.
- After Fitch downgraded the US government's credit rating, markets turn cautious from AAA to AA+.
- BoJ policymaker stated that Japan is in a position where it is critical to maintain an easy policy.
Asian stock markets trade in negative territory on Wednesday. The market turned to a risk-off mood amid the concern of the US credit rating cut, the renewed tension between the US-China and mixed US economic data ahead of the Nonfarm Payrolls report.
The Asian stock market remains under pressure after Fitch downgraded the US Long-Term Foreign-Currency Issuer Default Rating from AAA to AA+. The leading rating company cites an expected fiscal deterioration over the next three years and a high general government debt burden as the primary reasons for this drastic action.
At press time, the Nikkei slumps 2.02%, Shanghai drops 0.84%, Hang Sang dipped 1.99%, the Shenzhen Component Index drops 0.42%, the Kospi Index is down 1.64%, and the Nifty50 falls 0.57%.
In Japan, the Bank of Japan (BoJ) maintained its ultra-low interest rates on Friday and decided to maintain its short-term interest rates at -0.1% while keeping its 10-year JGB yield target around 0%.
However, the BoJ surprised financial markets by making its yield curve control (YCC) more flexible. The central bank will allow the 10-year yield to move above the cap as long as it stays below 1.0%, rather than being capped at 0.5%. Additionally, BoJ Deputy Governor Shinichi Uchida stated early Wednesday that Japan is in a position where it is critical to maintain an easy policy.
On Tuesday, the Chinese Caixin Manufacturing PMI for July fell to 49.2 from 50.5 prior, versus a market expectation of 50.3. This figure marked the lowest level since January. This, in turn, weighs on risk sentiment.
Additionally, the escalating tensions between the US-China might exert some pressure on riskier assets and benefit the safe-haven Japanese Yen. Chinese authorities announced on Monday restrictions on the export of certain drones and drone-related equipment to the United States, citing "national security and interests”. On the other hand, US President Joe Biden plans to sign an executive order curbing US technology investments in China by mid-August.
Moving on, market participants will monitor the development of the US-China relationship. The renewed trade war tension could undermine riskier assets like Gold, equities, the AUDUSD, etc. In addition, the US ADP Employment Change data will be released later in the American session.
- EUR/USD drops below 1.1000 amid cautious market mood ahead of US Employment data.
- In spite of downgraded ratings by FITCH, the US Dollar Index has rebounded after a corrective move to near 102.00.
- Outperformance by Eurozone in the April-June quarter on GDP parameter could force the ECB to raise interest rates.
The EUR/USD pair faces selling pressure above the psychological resistance of 1.1000 in the Asian session. The major currency pair comes under pressure as investors turn cautious ahead of the United States labor market data, which will be published at 12:15 GMT.
S&P500 futures posts significant losses in Tokyo, portraying a cautious market mood. US equities were under pressure on Tuesday as credit rating firm FITCH downgraded the United States economy. FITCH downgraded US ratings from ‘AAA’ to ‘AA+’ citing concerns about extended spending in forward years.
In spite of downgraded ratings, the US Dollar Index (DXY) has rebounded after a corrective move to near 102.00. The US Dollar Index rebounded on Tuesday despite a decline in US Job Openings and weak Manufacturing PMI data. US JOLTS Job Openings data were released at 9.582M against the prior release of 9.62M.
Meanwhile, US Manufacturing PMI contracted straight for the ninth month, landing at 46.4 below expectations of 46.8. Contrary to that, Factory Orders were recorded at 47.3 and outperformed expectations of 44.0.
On Wednesday, US Employment data will be in focus to be reported by the Automatic Data Processing (ADP) agency. Market consensus is for an increase in private payroll of 188,000; such a reading would be the slowest growth in four months and would follow the surprise of June that showed a super strong increase of 497,000.
On the Eurozone front, inflationary pressures deflated in July by 0.1% but outperformance in the April-June quarter on GDP parameters could force the European Central Bank (ECB) to raise interest rates further. Later this week, investors will keep an eye on Retail Sales data. An impression of solid consumer spending momentum would elevate hawkish ECB bets.
- WTI crude oil seesaws at multi-day high as risk-off mood prods energy buyers.
- Notable draw in Oil inventories, the heaviest slump in OPEC crude output in three years favor bulls.
- US credit rating cut, fears of US-China tussle prod sentiment and the WTI buyers.
- US ADP Employment Change for July, EIA Weekly Oil Storage Change eyed for clear directions.
WTI crude oil struggles to keep the bullish momentum intact after a four-day uptrend that poked the highest level since April 17 early Wednesday. That said, the energy benchmark remains sidelined, easing of late, around $81.80-85 heading into the European session as the risk aversion jostles with the talks of receding energy supplies.
On Tuesday, Bloomberg came out with a survey suggesting the heaviest fall in Crude Oil production by the Organization of Petroleum Exporting Countries (OPEC) in three years, to 900,000 barrels per day (bps) last month to an average of 27.79 million barrels per day.
Additionally favoring the black gold buyers is a steep draw in the Oil inventories as per the American Petroleum Institute (API). That said, the API Weekly Oil Storage Change slumped to -15.4M from 1.319M prior.
On the contrary, market sentiment sours as the Fitch Ratings downgrades the US government credit rating from AAA to AA+ while terming fears of the debt crisis as the key catalysts. Following the announcements, the White House and US Treasury Secretary Janet Yellen rushed to criticize the move and defend the US Dollar but failed of late. However, the recent market chatters, mainly from big bankers, suggest that such a rating cut is likely to have a major negative impact on the US fundamentals and hence test the risk-off mood.
While portraying the mood, the S&P500 Futures printed a 0.40% intraday loss to 4,590, down for the second consecutive day after Wall Street closed mixed, whereas the US 10-year Treasury bond yields retreat from a three-week high to 4.03% by the press time. Additionally, the US Dollar Index (DXY) stays defensive around 102.00, recently picking up bids, as it prints the first daily loss in three after refreshing the highest levels since July 10 the previous day.
Moving on, the weekly Oil inventories from the US Energy Information Administration (EIA), expected -0.9M versus -0.6M prior, will be crucial to watch for clear directions of the Oil price. Also important is the US ADP Employment Change for July, expected 189K versus 497K prior.
Technical analysis
WTI crude oil appears running out of upside momentum as RSI (14) line turns overbought. Also challenging the black gold buyers is the existence of a nine-month-old horizontal resistance area surrounding $83.30. Though, the Oil price pullback appears elusive beyond the $80.00 round figure.
- Gold price oscillates in a narrow range below $1,950, gaining 0.2% as the market turns cautious.
- Fitch downgraded the US government's credit rating from AAA to AA+, fueling concern about the US debt ceiling crisis.
- The escalating tensions between the US-China might exert some pressure on the US Dollar.
- Market participants await the US ADP Employment Change, the US-Sino relationship.
The gold price consolidates in a narrow range between $1,945 and $1,952 during the Asian session on Wednesday. XAU/USD recovers some of the previous day's drop to the $1,941 level.
Market sentiment remains sour as Fitch downgraded the US Long-Term Foreign-Currency Issuer Default Rating from AAA to AA+. The leading rating company cites an expected fiscal deterioration over the next three years and a high general government debt burden as the primary reasons for this drastic action.
US Treasury Secretary Janet Yellen expressed her strong disagreement with Fitch's decision to downgrade the US government's credit rating, calling it "arbitrary and based on outdated data”, according to Reuters. This headline fuels concern about the US debt ceiling crisis and might cap the upside in the Greenback. This, in turn, might benefit the price of gold, a traditional safe-haven asset.
Furthermore, the escalating tensions between the US-China might exert some pressure on the US Dollar. Chinese authorities announced on Monday restrictions on the export of certain drones and drone-related equipment to the United States, citing "national security and interests." Notably, the United States is China's largest export market for drones. Additionally, US President Joe Biden plans to sign an executive order curbing US technology investments in China by mid-August.
On the other hand, the odds of additional rate hikes by the Federal Reserve (Fed), the European Central Bank (ECB), and the Bank of England (BoE) may limit the US Dollar's upside and act as a tailwind for the gold price. It’s worth noting that gold is sensitive to rising interest rates as they raise the opportunity cost of holding non-yielding bullion.
Market participants await the US ADP Employment Change due later in the American session. Also, the US weekly Jobless Claims and Unit Labour Cost will be released later this week. The highlight of the week will be the US Nonfarm Payrolls (NFP). The US economy is expected to have created 180,000 jobs. In the meantime, gold traders will closely monitor the headlines surrounding the US-China relationship for a clear direction in the gold price.
- USD/CAD attracts some dip-buying and climbs back closer to a three-week high set on Tuesday.
- Bets for one more Fed rate hike help the USD to reverse modest intraday losses and lend support.
- Bullish Crude Oil prices could underpin the Loonie and cap any meaningful upside for the major.
The USD/CAD pair turns positive for the second straight day on Wednesday, following an Asian session dip to the 1.3260 area, and climbs back closer to over a three-week high touched the previous day. Bullish traders, however, might still wait for a sustained strength above the 1.3300 round-figure mark before positioning for any further appreciating move.
Despite the fact that Fitch downgraded the US government's credit rating to AA+ from AAA, expectations for one more 25 bps rate hike by the Federal Reserve (Fed) act as a tailwind for the US Dollar (USD) and assist the USD/CAD pair to attract some dip-buying. In fact, Fed Chair Jerome Powell said last week that the economy still needs to slow and the labour market to weaken for inflation to credibly return to the 2% target. Moreover, the incoming US macro data points to an extremely resilient economy and supports prospects for further policy tightening by the Fed.
Apart from this, a slight deterioration in the global risk sentiment - as depicted by a generally weaker tone around the equity markets - further benefits the safe-haven Greenback. That said, the recent bullish run-up in Crude Oil prices to the highest level since April 17 underpins the commodity-linked Loonie and might hold back bulls from placing aggressive bets around the USD/CAD pair. A substantially larger-than-expected drawdown in US inventories over the past week helps offset demand concerns and continues to lend some support to the black liquid.
From a technical perspective, however, the overnight move and acceptance above the 1.3240-1.3245 supply zone suggest that the path of least resistance for the USD/CAD pair is to the upside. Some follow-through buying beyond the 50-day Simple Moving Average (SMA) will reaffirm the positive outlook and pave the way for further gains. Traders now look to the US ADP report on private-sector employment, due later during the early North American session. This, along with the broader risk sentiment, will drive the USD and provide some impetus to the major.
Apart from this, Oil price dynamics should allow traders to grab short-term opportunities. The focus, meanwhile, will remain glued to the monthly employment details from the US - popularly known as the NFP report - and Canada, due for release on Friday.
Technical levels to watch
- Natural Gas Price remains on the back foot for the second consecutive day within two-month-old symmetrical triangle.
- 50-EMA, stated triangle’s bottom line prod XNG/USD bears.
- Natural Gas buyers need validation from $2.77 for conviction.
Natural Gas Price (XNG/USD) prints mild gains around $2.61 heading into Wednesday’s European session as sellers attack the key support amid a broad risk-off mood due to the US credit rating downgrade.
That said, a downward-sloping RSI (14) line, not oversold and stays near 50.00, joins the XNG/USD’s failure to keep the previous day’s rebound from the 50-day Exponential Moving Average (EMA) to favor the sellers.
However, a bottom line of the symmetrical triangle comprising levels marked since early June, close to $2.59 at the latest, appears the key to letting the Natural Gas sellers sneak in. Ahead of that the 50-EMA level of $2.60 limits the immediate downside of the XNG/USD.
In a case where the energy instrument drops below $2.59, the odds of witnessing a slump toward the previous monthly low of around $2.47 can’t be ruled out.
However, multiple levels marked around $2.35-30 may challenge the XNG/USD before directing the sellers toward the yearly low reported in April around $2.11.
On the flip side, the 61.8% Fibonacci retracement of the XNG/USD’s downturn from March to April, near $2.71, holds the gate for the buyer’s entry.
Even so, the aforementioned triangle’s top line, near $2.74 at the latest, precedes the 100-EMA hurdle of around $2.75 to challenge the Natural Gas bull before giving them control.
Natural Gas Price: Daily chart
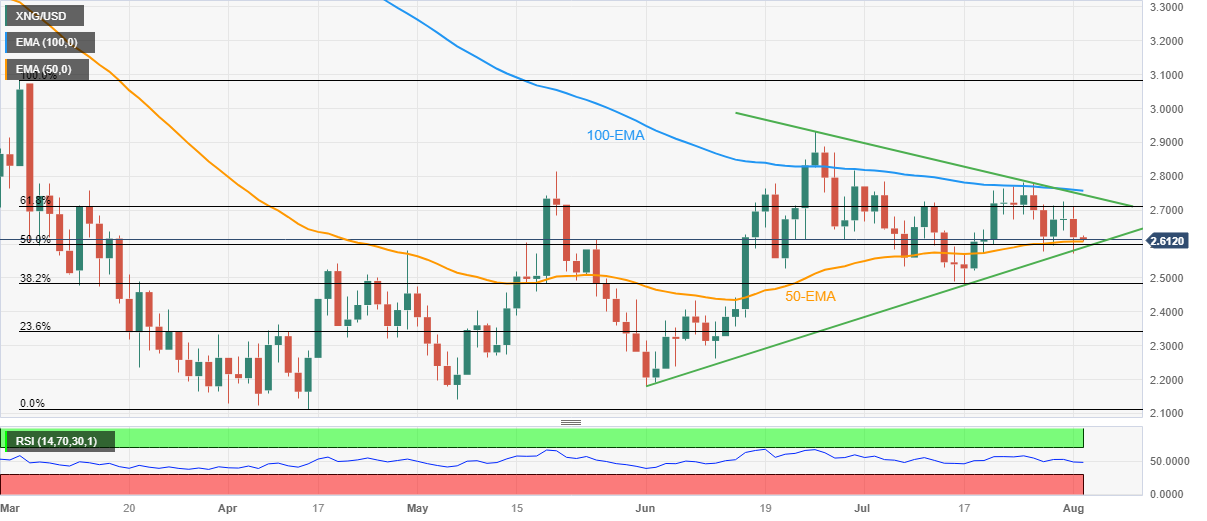
Trend: Further downside expected
- GBP/USD remains on the defensive for the third successive day, albeit lacks follow-through.
- The emergence of some USD dip-buying turns out to be a key factor weighing on the major.
- The downside seems limited as traders seem reluctant ahead of the BoE meeting on Thursday.
The GBP/USD pair struggles to capitalize on its modest Asian session uptick to levels just above the 1.2800 mark and turns lower for the third successive day on Wednesday. Spot prices currently trade around the 1.2770-1.2765 region, just a few pips above a nearly four-week low touched on Tuesday.
The US Dollar (USD) reverses an intraday dip that followed the Fitch downgrade of the US government's credit rating to AA+ from AAA and continues to draw support from bets for further policy tightening by the Federal Reserve (Fed). The British Pound (GBP), on the other hand, is weighed down by diminishing odds for more aggressive rate hikes by the Bank of England (BoE), which further contribute to capping the upside for the GBP/USD pair.
It is worth recalling that Fed Chair Jerome Powell said last week that the economy still needs to slow and the labour market to weaken for inflation to credibly return to the 2% target. Moreover, the incoming US macro data points to an extremely resilient economy and keeps the door open for one more 25 bps Fed rate hike in September or November. This remains supportive of elevated US Treasury bond yields and underpins the Greenback.
Apart from this, a generally weaker risk tone - as depicted by a downfall in the US equity futures - further benefits the Greenback's relative safe-haven status. The downside for the GBP/USD pair, however, remains cushioned, at least for now, as the markets have been pricing in two more BoE rate hikes by the end of this year as price pressures persist. Hence, the focus will remain glued to the crucial BoE monetary policy meeting on Thursday.
Heading into the key central bank event risk, traders will take cues from the US ADP report on private-sector employment, due for release later during the early North American session this Wednesday. This, along with the US bond yields and the broader risk sentiment, might influence the USD and provide some impetus to the GBP/USD pair. The aforementioned mixed fundamental backdrop, meanwhile, warrants caution before placing directional bets.
Technical levels to watch
- USD/JPY holds a positive note near 143.30, down 0.03% for the day.
- Bank of Japan (BoJ) policymakers said that Japan needs to maintain an easy policy.
- The US ISM Manufacturing PMI in July rose to 46.4 from 46.0 prior, below expectations of 46.8.
- Market participants will focus on the US ADP Employment Change for fresh impetus.
The USD/JPY pair resumes its north-side journey and reclaims the 143.30 mark during the Asian session on Wednesday. Market participants await the US ADP Employment Change despite the lack of top-tier economic data released from Japan. USD/JPY currently trades around 143.30, losing 0.03% for the day.
The Bank of Japan (BoJ) maintained its ultra-low interest rates on Friday and decided to maintain its short-term interest rates at -0.1% while keeping its 10-year JGB yield target around 0%. However, the BoJ surprised financial markets by making its yield curve control (YCC) more flexible.
That said, the central bank will allow the 10-year yield to move above the cap as long as it stays below 1.0% rather than being capped at 0.5%. BoJ Deputy Governor Shinichi Uchida stated early Wednesday that Japan is in a position where it is critical to maintain an easy policy.
Across the pond, the US ISM Manufacturing PMI in July rose to 46.4 from 46.0 prior but fell short of expectations of 46.8. Meanwhile, JOLTS Job Openings came in at 9.58 million in June. This reading followed May's 9.82 million openings and was below the market consensus of 9.62 million. The robust economic data could convince the Federal Reserve (Fed) to keep its hawkish stance. This may lift the US Dollar and act as a tailwind for USD/JPY.
Fed Chairman Jerome Powell reiterated that another rate hike is possible. He added that the Fed will consider the incoming data for additional rate hikes if needed. The hints that the Fed could hike additional rates this year might lift the Greenback.
Moving on, market participants will focus on the US ADP Employment Change for fresh impetus. Investors will take cues from the data ahead of the US Nonfarm Payrolls due on Friday. In the meantime, the weekly Jobless Claims, Unit Labour Cost and ISM Service PMI will be due later this week. Investors will monitor this development and find opportunities around the USD/JPY pair.
- USD/INR prints three-day uptrend at the highest level since early July.
- US Dollar remains sidelined after refreshing three-week high even as Fitch Ratings cut US credit rating to AA+ from AAA.
- Market chatters about US rating downgrade, mixed US data and Fed talks prod US Dollar ears.
- Risk aversion in Asia, light calendar in India allow Rupee to remain depressed ahead of US ADP Employment Change.
USD/INR clings to mild gains around 82.40 as it prints a three-day winning streak amid early Wednesday morning in Europe. In doing so, the Indian Rupee (INR) pair justifies the risk-off mood in the Asia-Pacific region, as well as the US Dollar’s hesitance in pushing back the bullish bias despite the US credit rating downgrade.
Late on Tuesday, global credit rating agency Fitch Ratings downgraded the US credit rating from AAA to AA+ by citing the debt crisis as the key catalyst. Following the announcement, the White House and US Treasury Secretary Janet Yellen rushed to criticize the move and defend the US Dollar by terming the move as inappropriate. On the same line, the recent market chatters, mainly from big bankers, suggest that such a rating cut is likely to have a minor negative impact on the US fundamentals and hence recently challenge the risk-off mood.
Further, the mixed US data and the Fed talks also put a floor under the US Dollar and propel the USD/INR price. On Tuesday, US ISM Manufacturing PMI for July improves to 46.4 from 46.0 prior, versus 46.8 expected. Further details unveil that ISM Manufacturing Employment Index slumped to 44.4 from 48.0 expected and 48.1 prior whereas the ISM Manufacturing Price Paid for the said month rose to 42.6 from 41.8, compared to 42.8 market forecasts. Elsewhere, the US JOLT Job Openings for June also eased to 9.582M compared to 9.62M expected and 9.616M previous readings (revised). On the other hand, Atlanta Federal Reserve Bank President Raphael Bostic crossed wires via Reuters while ruling out the need for a September rate hike while warning of the risk of over-tightening. Before him, Chicago Federal Reserve Bank President Austan Goolsbee sought more proof of inflation easing to support the end of rate hikes.
Amid these plays, stocks in the Asia-Pacific zone trade mixed with Japan’s Nikkei falling more than 1.5% while Chinese equities also print the red. However, shares in Australia and New Zealand print mild gains by the press time and prod the bears. It should be noted that Indian equities retreated in the last few days after refreshing the record top in July.
In addition to the risk-off mood and sturdy US Dollar, upbeat Oil price also propel the USD/INR price due to India’s reliance on energy imports. That said, WTI crude oil rises to a fresh high since April, up 0.10% intraday near $82.20 by the press time.
Moving on, the risk catalysts and the US ADP Employment Change for July, expected 189K versus 497K prior, will be crucial for intraday directions of the USD/INR pair amid a light calendar in India.
Technical analysis
A successful break of the 200-SMA on the daily chart, around 82.15 by the press time, directs USD/INR buyers toward a downward-sloping resistance line from late May, close to 82.65 at the latest.
- NZD/USD turns lower for the second straight day and drops to a nearly one-month low.
- The mixed domestic jobs data and a softer risk tone undermine the risk-sensitive Kiwi.
- Break below an ascending trend-line support favours bears amid renewed USD buying.
The NZD/USD pair attracts fresh sellers following an Asian session uptick to the 0.6175 region and drifts into negative territory for the second successive day on Wednesday. Spot prices drop to over a one-month low in the last hour and currently trade just above the 0.6100 round-figure mark, down 0.75% for the day.
The New Zealand Dollar (NZD) weakens in reaction to the mixed domestic employment details, which showed that the jobless rate climbed to 3.6% during the second quarter and offset a larger-than-anticipated rise in the number of employed people. Adding to this, the Labour Cost Index also falls short of market expectations and pushes back against bets for further rate hikes by the Reserve Bank of New Zealand (RBNZ).
Apart from this, a softer risk tone assists the safe-haven US Dollar (USD) to reverse its modest intraday losses and turns out to be another factor driving flows away from the risk-sensitive Kiwi. Despite the fact that Fitch downgraded the US government's credit rating to AA+ from AAA, rising bets for one more 25 bps rate hike by the Federal Reserve (Fed) act as a tailwind for the Greenback and further weigh on the NZD/USD pair.
From a technical perspective, spot prices have now slipped below support marked by an upward sloping trend-line extending from the YTD low touched on May 31. Moreover, oscillators on the daily chart have again started gaining negative traction and support prospects for an extension of a nearly three-week-old downtrend. That said, bearish traders might still wait for a break below the 0.6100 mark before placing fresh bets.
The NZD/USD pair might then accelerate the fall towards testing the next relevant support near the 0.6065-0.6055 region before eventually dropping to the 0.6000 psychological mark. This is closely followed by the YTD low, around the 0.5985 region, which if broken decisively will set the stage for a further near-term depreciating move.
On the flip side, the immediate hurdle is pegged near the 0.6150 region ahead of the daily swing high, around the 0.6165-0.6170 area. Any subsequent move up is likely to attract fresh sellers near the 0.6200 round-figure mark and remain capped near a technically significant 200-day Simple Moving Average (SMA), around the 0.6225 zone. A sustained strength beyond might shift the bias in favour of bulls and trigger a short-covering rally.
NZD/USD daily chart
-638265428727681553.png)
Key levels to watch
- EUR/JPY prods three-day uptrend, making rounds to one-week high.
- BoJ Minutes, Deputy Governor Uchida defend Japan central bank’s easy-money policy.
- Five-week-old descending resistance line appears the key challenge for bulls.
- Looming bull cross on MACD, upbeat RSI and BoJ clues favor cross-currency pair’s buyers.
EUR/JPY remains sidelined near 157.30-40 as bulls struggle to defend a three-day uptrend at the highest levels since July 24 amid early Wednesday. In doing so, the cross-currency pair falls short of justifying the Bank of Japan’s (BoJ) dovish rhetoric, via June month’s monetary policy meeting minutes, as well as the dovish comments from BoJ Deputy Governor Shinichi Uchida.
It’s worth noting that the sour sentiment, driven by the US credit rating cut, exerts downside pressure on the EUR/JPY as markets await the top-tier data/events.
Technically, sustained rebound from the 100-day Exponential Moving Average (EMA), around 151.35 by the press time, joins the looming bull cross on the MACD and the upbeat RSI (14) line to favor the EUR/JPY buyers.
Following that, a convergence of the 21-EMA and an upward-sloping support line from late March, close to 155.90 at the latest, will challenge the EUR/JPY bulls.
It’s worth noting, however, that the pair buyers remain off the table unless witnessing a daily closing beyond the five-week-old descending resistance line, near 157.70 at the latest.
On the contrary, a daily closing below 155.90 can trigger the short-term downside of the EUR/JPY pair ahead of the 100-EMA level of 151.35.
Following that, the 150.00 round figure will act as the final defense of the EUR/JPY bulls.
EUR/JPY: Daily chart
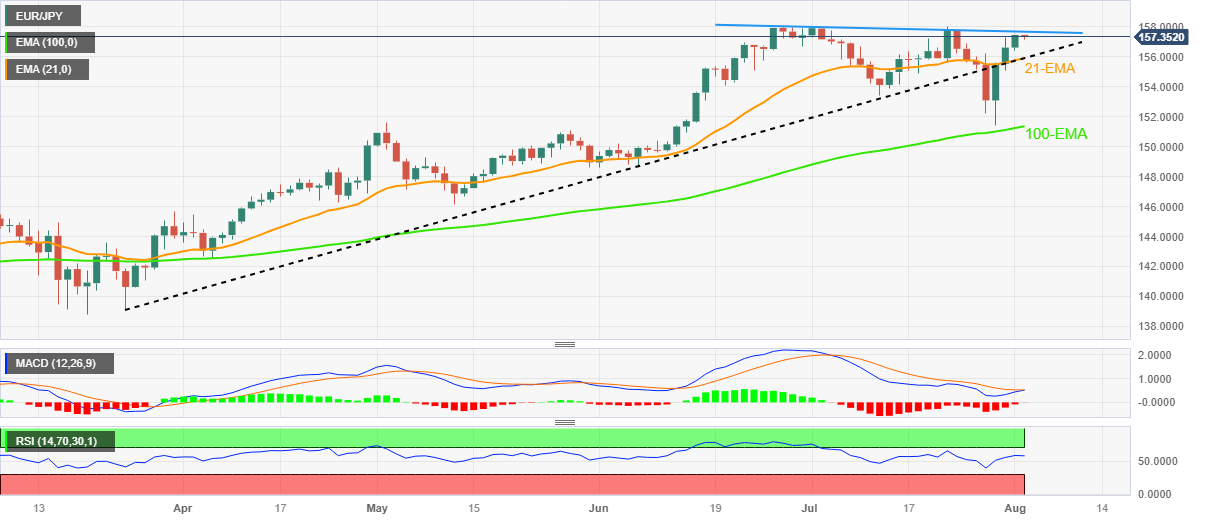
Trend: Further upside expected
- AUD/USD oscillates in a narrow trading band just above a nearly one-month low.
- RBA’s inaction and China’s economic woes continue to cap the Australian Dollar.
- Bets for one more Fed rate hike offset Fitch downgrade and lend support to the USD.
- The fundamental backdrop supports prospects for additional losses for the the major.
The AUD/USD pair consolidates its recent downfall to a nearly one-month low and seesaws between tepid gains/minor losses through the Asian session on Wednesday. Spot prices currently trade just above the 0.6600 round-figure mark, nearly unchanged for the day, and the lack of any meaningful buying supports propsects for an extendion of the recent descending trend witnessed over the past three weeks or so.
The AUD/USD pair did get a minor lift in the wake of some intraday US Dollar (USD) selling that followed the Fitch downgrade of the US Long-Term Foreign-Currency Issuer Default Rating (IDR) to 'AA+' from 'AAA'. The intial market reaction, however, remains limited on the back of a generally softer risk tone, which tends to undermine the risk-sensitive Aussie. Apart from this, rising bets for one more 25 bps rate hike by the Federal Reserve (Fed) in September or November act as a tailwind for the USD and contribute to caping the upside for the major.
It is worth recalling that Fed Chair Jerome Powell said last week that the economy still needs to slow and the labour market to weaken for inflation to credibly return to the 2% target. Furthermore, the incoming US macro data points to an extremely resilient economy and further supports prospects for further tightening by the Fed. This remains supportive of elevated US Treasury bond yields and lends support to the USD. Apart from this, the Reserve Bank of Australia's (RBA) decision to leave rates unchanged on Tuesday favours the AUD/USD bears.
The aforementioned fundamental backdrop suggests that the path of least resistance for spot prices is to the downside, though hopes for more stimulus from China could help limit losses for the China-proxy Australian Dollar (AUD). Hence, it will be prudent to wait for a sustained break below the 0.6600 mark before positioning for further losses. Traders now look to the US ADP report on privaet-sector employment, due later during the early North American session, which, along with the broader risk sentiment, should provide some impetus to the AUD/USD pair.
Technical levels to watch
| Raw materials | Closed | Change, % |
|---|---|---|
| Silver | 24.295 | -1.84 |
| Gold | 1944.2 | -1.09 |
| Palladium | 1240.6 | -3.1 |
- Market sentiment remains mildly offered amid fears emanating from US credit rating downgrade, cautious mood ahead of US statistics.
- S&P500 Futures drop for the second consecutive day but lacks follow-through of late.
- US Treasury bond yields fade the previous day’s corrective bounce.
- Asian stocks drop, US Dollar retreats and commodities edge higher ahead of US ADP Employment Change for July.
The risk profile remains downbeat during early Wednesday as market players struggle to determine the effects of the US credit rating cut before the US ADP Employment Change release for July. Also troubling the traders could be the recently mixed US data and statements from the Federal Reserve (Fed) officials.
While portraying the mood, the S&P500 Futures printed a 0.40% intraday loss to 4,590, down for the second consecutive day after Wall Street closed mixed, whereas the US 10-year Treasury bond yields retreat from a three-week high to 4.03% by the press time. It’s worth observing that the US two-year Treasury bond yields drop 0.16% intraday to 4.90% as we write.
Furthermore, the US Dollar Index (DXY) stays defensive around 102.00, recently picking up bids, as it prints the first daily loss in three after refreshing the highest levels since July 10 the previous day. With this, the Gold price prints mild gains while the crude oil jumps to a fresh high since April 17. Even if the US Dollar retreats and the recently firmer commodities, the Antipodeans appear pressured.
Additionally, stocks in the Asia-Pacific zone trade mixed with Japan’s Nikkei falling more than 1.5% while Chinese equities also print the red. However, shares in Australia and New Zealand print mild gains by the press time and prod the bears.
That said, Fitch Ratings downgrades the US government credit rating from AAA to AA+ while terming fears of the debt crisis as the key catalysts. Following the announcements, the White House and US Treasury Secretary Janet Yellen rushed to criticize the move and defend the US Dollar but failed of late. However, the recent market chatters, mainly from big bankers, suggest that such a rating cut is likely to have a major negative impact on the US fundamentals and hence recently challenge the risk-off mood.
Apart from that, the mixed US data and the Fed talks also prod the traders ahead of the US ADP Employment Change for July, expected 189K versus 497K prior. On Tuesday, US ISM Manufacturing PMI for July improves to 46.4 from 46.0 prior, versus 46.8 expected. Further details unveil that ISM Manufacturing Employment Index slumped to 44.4 from 48.0 expected and 48.1 prior whereas the ISM Manufacturing Price Paid for the said month rose to 42.6 from 41.8, compared to 42.8 market forecasts. Elsewhere, the US JOLT Job Openings for June also eased to 9.582M compared to 9.62M expected and 9.616M previous readings (revised).
During the late Tuesday, Atlanta Federal Reserve Bank President Raphael Bostic crossed wires via Reuters while ruling out the need for a September rate hike while warning of the risk of over-tightening. Before him, Chicago Federal Reserve Bank President Austan Goolsbee sought more proof of inflation easing to support the end of rate hikes.
Elsewhere, mixed earnings from Wall Street giants and receding fears of higher rates from the top-tier central banks entertained the market players as they brace for Thursday’s Bank of England (BoE) monetary policy meeting announcements and Friday’s US Nonfarm Payrolls (NFP).
Also read: Forex Today: Dollar remains strong ahead of more jobs data
- USD/CAD loses traction but remains well supported above 1.3260.
- Fitch lowered the United States government's credit rating from AAA to AA+ on Tuesday.
- The US ISM Manufacturing PMI rose to 46.4 from 46.0 in July, below expectations of 46.8.
- Canada’s manufacturing sector declined for the third consecutive month in July.
- The Canadian Employment Change and Nonfarm Payrolls will be the week's highlights for USD/CAD.
The USD/CAD pair loses ground after approaching the 1.3300 mark and holds above 1.3275 during the early Asian session on Wednesday. The major pair is on track for its sixth weekly close above the 1.3200 area. Meanwhile, the US Dollar Index (DXY), a measure of the value of the Greenback against six other major currencies, hovers around 102.12 following the mixed economic reading and the headlines surrounding the US rating cut.
Fitch lowered the United States government's credit rating from AAA to AA+ on Tuesday. The leading rating agency cites an anticipated fiscal deterioration over the next three years and a high general government debt level as the primary reasons for this radical action.
Regarding the US data, the US ISM Manufacturing PMI rose to 46.4 from 46.0 in July but fell short of expectations of 46.8. The report also indicated that the New Orders Index increased from 45.6 to 47.3, while the Employment Index decreased from 48.1 to 44.4. Finally, the Prices Paid Index increased to 42.6 from 41.8.
Additionally, the US Bureau of Labour Statistics (BLS) reported on Tuesday that JOLTS Job Openings totaled 9.58 million in June. This reading followed May's 9.82 million openings and was below the 9.62 million market consensus. The more robust data could convince the Federal Reserve (Fed) to keep its hawkish stance. This may lift the US Dollar and act as a tailwind for USD/CAD.
On the Canadian Dollar front, Canada’s manufacturing sector declined for the third consecutive month in July. The S&P Global Canada Manufacturing PMI rose to 49.6. This figure followed the previous month's 48.8 and was better than expected at 48.9. A reading below 50 indicates sector contraction. It has been below that level since May.
The Bank of Canada (BoC) policymakers indicated they are still likely to further hike their benchmark interest rate after raising it by 25 basis points (bps) to 5.0% on July 12. BoC Governor Tiff Macklem disclosed that future policy decisions would be based on incoming data and the inflation outlook. However, market participants anticipated that the Bank of Canada (BoC) would not deem it necessary to increase interest rates further this year.
However, the Canadian Employment Change on Friday could offer hints into the strength of domestic activity and the direction of the BoC's monetary policy. Economists forecast that the Canadian economy will create 21,100 jobs in July.
That said, an increase in oil prices has bolstered the Loonie and helped offset a slump in the Canadian economy. Higher crude prices benefit the Canadian Dollar, since Canada is the largest oil exporter to the United States.
Market players await the US ADP employment data later in the American session. Also, the US weekly Jobless Claims, Unit Labour Cost and ISM Service PMI. On Friday, attention will shift to Canadian Employment Change and Nonfarm payrolls. The US economy is expected to have created 180,000 jobs. The data will be critical for determining a clear movement for the USD/CAD pair.
- EUR/USD prints the first daily gains in three as US credit rating downtrend weighs on Greenback.
- Convergence of 50-EMA, two-month-old rising support line triggers latest recovery.
- 21-EMA, fortnight-old descending resistance line will join US ADP Employment Change.
- Downbeat sentiment, bearish MACD signals favor Euro bears despite recent rebound.
EUR/USD clings to mild gains around 1.1000 round figure as it snaps a two-day losing streak during early Wednesday. In doing so, the Euro pair benefits from the US Dollar’s pullback amid the US credit rating downgrade while reversing from a convergence of the 50-day Exponential Moving Average (EMA) and an upward-sloping support line from early June as it awaits the US ADP Employment Change for July, expected 189K versus 497K prior.
Also read: EUR/USD regains 1.1000 on US credit rating cut, focus on ADP Employment Change
Even if the major currency pair bounces off the 1.0980 key support comprising 50-EMA and a multi-day-old rising trend line, the 21-EMA hurdle of around 1.1035 joins the bearish MACD signals and steady RSI to challenge the buyers.
Although the quote crosses the 1.1035 upside hurdle, a two-week-long descending resistance line will act as the final defense of the EUR/USD bears near 1.1080.
Following that, May’s high of 1.1090 and the late July swing high of around 1.1150 could lure the Euro bulls before directing them to the yearly high marked the last month around 1.1275.
Alternatively, a daily closing below 1.0980 support confluence could quickly drag EUR/USD toward the previous monthly low of 1.0833 before highlighting the early June swing high of near 1.0780 to them.
However, an ascending trend line from mid-March, close to 1.0770 at the latest, could challenge the EUR/USD bears afterward.
EUR/USD: Daily chart
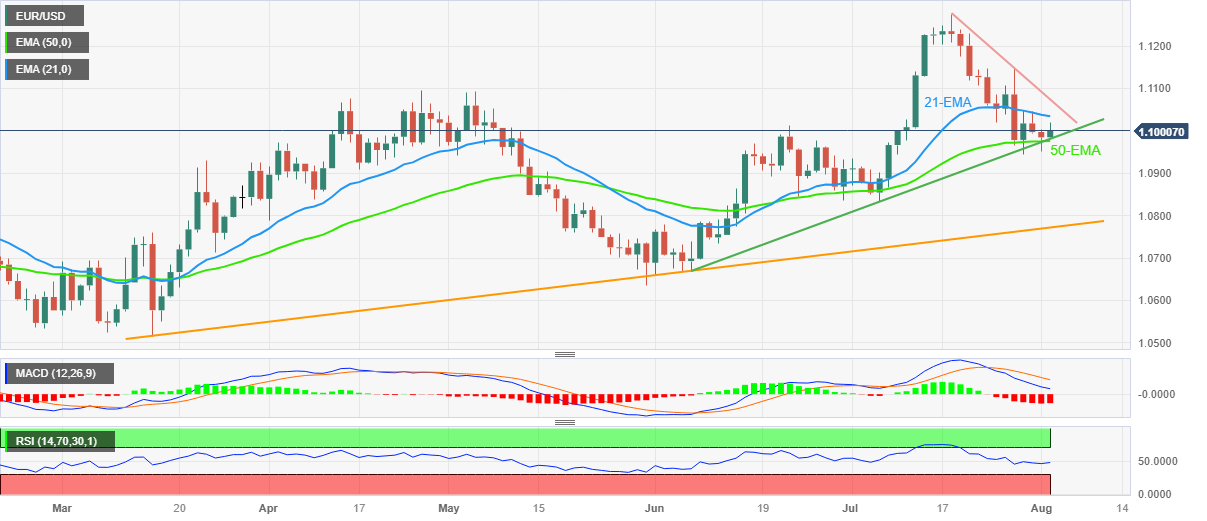
Trend: Further downside expected
- Gold price attracts some haven flows on Wednesday, albeit lacks follow-through.
- Fitch downgrade of the US rating weighs on the USD and offers some support.
- Bets for one more Fed rate hike and hawkish central banks cap any further gains.
Gold price gains some positive traction during the Asian session on Wednesday and reverses a part of the previous day's sharp fall to the $1,941 area, or a three-week low. The XAU/USD, however, struggles to capitalize on the modest intraday uptick and currently trade just below the $1,950 level, still up over 0.20% for the day.
Fitch downgraded the US Long-Term Foreign-Currency Issuer Default Rating (IDR) to 'AA+' from 'AAA', pointing to expected fiscal deterioration over the next three years, an erosion of governance and a growing general debt burden. The announcement tempers investors' appetite for riskier assets, which is evident from a modest decline in the US equity futures and offers some support to the traditional safe-haven Gold price. This, along with some intraday US Dollar (USD) selling, turns out to be another factor acting as a tailwind for the XAU/USD.
The downside for the USD, however, remains cushioned, at least for the time being, in the wake of rising bets for one more 25 basis points (bps) rate hike by the Federal Reserve (Fed) in September or November. It is worth recalling that Fed Chair Jerome Powell said last week that the economy still needs to slow and the labour market to weaken for inflation to credibly return to the 2% target. Adding to this, the incoming US macro data points to an extremely resilient economy and further supports prospects for further tightening by the Fed.
In fact, the Advance US Gross Domestic Product (GDP) report revealed last week that the world's largest economy expanded by a 2.4% annualized pace during the second quarter and eased exaggerated recession fears. Apart from this, data on Tuesday showed the US factory production rebounded in the second quarter and ended two straight quarterly declines. Furthermore, construction spending increased solidly last month and May's data was revised higher, which US job openings remained consistent with tight labor market conditions.
This, in turn, raises hopes of a soft landing for the US economy, which helps limit any meaningful losses for the USD and keeps a lid on the US Dollar-denominated Gold price. Apart from this, rising bets for additional rate hikes by the European Central Bank (ECB) and the Bank of England (BoE), along with expectations that the Bank of Japan (BoJ) will eventually move away from the ultra-accomodative policy stance, contributes to caping the non-yielding yellow metal. This, in turn, warrants some caution before placing aggressive bullish bets.
Traders now look foward to the US economic docket, featuring the release of the ADP report on private-sector employment later during the early North American session. This might influence the USD price dynamics, which, along with the broader risk sentiment, should provide a fresh impetus to the Gold price. The focus, however, will remain glued to the closely-watched US monthly employment details, popularly known as the NFP report, due on Friday. In the meantime, the XAU/USD is more likely to extend its range-bound price action.
Technical levels to watch
Bank of Japan (BoJ) Deputy Governor Shinichi Uchida said early Wednesday, “Japan is now at a phase where it's important to patiently maintain easy policy.”
Additional quotes
At present, risk of losing chance to hit price target with premature shift from easy policy is bigger than risk of being too late in tightening.
There is still quite a long distance before conditions fall in place to raise short-term rate target.
BoJ will maintain policy framework as we have yet to see inflation sustainably, stably hit price target.
Every policy has cost, there is no free lunch.
As we control interest rates, the impact on market function is unavoidable.
When inflation expectations heighten, the effect of monetary stimulus increases but so does the side-effects so we need to adjust both factors.
BoJ will offer to buy unlimited amount of bonds at 1.0% in fixed-rate operation to contain interest rate rises.
When the 10-year bond yield is moving between 0.5% and 1.0%, we will adjust amount of bond buying, use various operation tools to curb excessive yield rise in accordance to level, pace of moves in long-term rates.
Unlike in december last year, there is no clear side-effect, distortion in shape of yield curve.
There is high uncertainty over economic, price outlook both upside and downside.
Inflation expectations showing signs of re-accelerating.
If inflation expectations continue to heighten, rigidly capping 10-year jgb yield at 0.5% would cause bond market distortion, affect market volatility including for exchange rates.
Last week's decision was a pre-emptive step aimed at continuing monetary easing without disruptions
Timing for reviewing ycc would depend on conditions at the time, as responding after problems erupt would make it difficult to fix the problems.
BoJ’s decision to make ycc more flexible is aimed at maintaining easy policy, not something with eye on exit from easy policy.
BoJ must fine-tune YCC at times, make the framework flexible, to ensure it can patiently sustain easy policy.
Will scrutinise whether wages will rise sufficiently and underpin consumption, and whether wage hikes will become embedded in japan's society next year and beyond.
We are seeing some signs of change in corporate wage, price-setting behaviour.
Even if inflation overshoots, chance of wages rising sharply and triggering further price rises is not big.
Market reaction
At the time of writing, USD/JPY is holding its recovery mode above 143.00, trading at 143.11, still down 0.16% on the day.
USD/MXN takes offers to refresh the intraday low near 16.83 as it prints the first daily loss in three while reversing from the weekly high on early Wednesday.
In doing so, the Mexican Peso ignores upside options market signals while justifying the US Dollar’s struggle to defend the previous gains amid the US credit rating downgrade.
Also read: Fitch downgrades US government’s AAA credit rating to AA+, US Dollar retreats
That said, the one-month Risk Reversal (RR) of the USD/MXN pair, a measure of the spread between call and put prices, rose in the last two consecutive days to 0.025 by the end of Tuesday’s North American trading session.
In doing so, the options market figures challenge the latest pullback of the USD/MXN price. It should be noted that the options market gauge prints a three-week winning streak with the latest figures of 0.034.
Given the upside options market bias and the risk-off mood, the USD/MXN pair may recover soon. However, the risk catalysts and the US ADP Employment Change for July, expected 189K versus 497K prior, will be important to watch for clear directions.
- Silver Price struggles to defend corrective bounce off 21-DMA as risk aversion prods buyers.
- US credit rating cut weighs on sentiment even as White House, US banks rush to tame fears.
- Oscillators tease XAG/USD bears but $23.10 appears a tough nut to crack for them to retake control.
- Silver Price recovery aims for three-month-old descending resistance line.
Silver Price (XAG/USD) grinds near an intraday high of around $24.40 as it struggles to keep the bounce off 21-DMA during early Wednesday. That said, the bright metal’s latest retreat could be linked to the risk-off mood due to the US credit rating cut by the global rating agency Fitch Ratings.
Also read: Fitch downgrades US government’s AAA credit rating to AA+, US Dollar retreats
It’s worth noting that the XAG/USD snapped a two-day winning streak the previous day but failed to break the 21-DMA.
Even so, the bearish MACD signals and steady RSI, as well as the sour sentiment, challenge the Silver buyers as they brace for the $25.00 round figure.
Following that, a downward-sloping resistance line from early May, close to $25.10, will test the XAG/USD bulls before giving them control.
On the contrary, a daily closing beneath the 21-DMA level of around $24.20 needs validation from the $24.00 round figure to drag the commodity price toward the early July swing high of near $23.30.
However, a convergence of the 200-DMA and a five-month-old rising trend line, close to $23.10, will be a tough challenge for the Silver bears to conquer to keep control afterward.
Silver Price: Daily chart

Trend: Further weakness expected
People’s Bank of China (PBoC) set the USD/CNY central rate at 7.1368 on Wednesday, versus the previous fix of 7.1283 and market expectations of 7.1664. It's worth noting that the USD/CNY closed near 7.1770 the previous day.
Apart from the USD/CNY fix, the PBoC also unveiled details of its Open Market Operations (OMO) while saying that the Chinese central bank injects 9 billion Yuan via 7-day reverse repos (RRs) at 1.90% vs prior 1.90%.
However, with the 104 billion Yuan of RRs maturing today, there prevails a net drain of around 95 billion Yuan injection on the day in OMOs.
About PBOC fix
China maintains strict control of the yuan’s rate on the mainland.
The onshore yuan (CNY) differs from the offshore one (CNH) in trading restrictions, this last one is not as tightly controlled.
Each morning, the People’s Bank of China (PBOC) sets a so-called daily midpoint fix, based on the yuan’s previous day's closing level and quotations taken from the inter-bank dealer.
- USD/JPY drifts lower on Wednesday and snaps a three-day winning streak to a three-week top.
- Fitch downgrade of the US rating weighs on the USD and benefits the JPY's safe-haven status.
- The divergent BoJ-Fed outlook lends some support to the pair and helps limit any further losses.
The USD/JPY pair meets with some supply during the Asian session on Wednesday and erodes a part of the previous day's strong gains to the 143.55 area, or over a three-week high. Spot prices, however, manage to rebound a few pips from the daily low and currently trade just above the 143.00 mark, down less than 0.20% for the day.
The US Dollar (USD) weakens a bit after Fitch downgraded the US government's credit rating to AA+ from AAA, citing concerns over the state of the country's finances and its debt burden. The announcement took its toll on the global risk sentiment, which is evident from a modest downfall in the US equtiy futures and benefits the safe-haven Japanese Yen (JPY). Apart from this, the Bank of Japan (BoJ) noted that there is strong chance consumer inflation will moderate, but won't slow back below 2%, toward middle of current fiscal year. This lends additional support to the JPY and exerts some downward pressure on the USD/JPY pair.
That said, the minutes from the BoJ policy meeting revealed that members agreed to maintain the current easy monetary policy. Moreover, BoJ Governor Kazuo Ueda had said that the central bank won't hesitate to ease policy further and added that more time was needed to sustainably achieve the 2% inflation target. This, in turn, keeps a lid on any meaningful gains for the JPY. Apart from this, the emergence of some USD dip-buying assists the USD/JPY pair to recover over 40 pips from the daily trough, warranting some caution before placing aggressive bearish bets and positioning for any meaingful intraday depreciating move.
The incoming US macro data continues to point to an extremely resilient economy and keeps the door open for one more 25 bps rate hike by the Federal Reserve (Fed) in September or November. Against the backdrop of the upbeat US GDP report released last week, data showed factory production rebounded in the second quarter and ended two straight quarterly declines. Moreover, US construction spending increased solidly last month and May's data was revised higher. Adding to this, JOLTS report remains consistent with tight labor market conditions and supports prospects for further policy tightening by the Fed.
Market participants now look to the US economic docket, featuring the release of the ADP report on private-sector employment. This, along with the broader risk sentiment, will be looked upon for short-term trading opportunities around the USD/JPY pair. The market focus, however, will remain glued to the closely-watched US monthly employment details, popularly known as the NFP report, due on Friday.
Technical levels to watch
- US Dollar Index picks up bids to reverse late Tuesday’s retreat from three-week high.
- Fitch Ratings cuts US government credit rating to AA+ from AAA by citing debt crisis as the key catalyst.
- US Dollar’s haven status, mostly upbeat US data defend DXY bulls even as Fed talks have been downbeat of late.
- US ADP Employment Change, risk catalysts eyed for clear directions.
US Dollar Index (DXY) picks up bids to pare the first daily loss in three at the highest level since early July amid risk aversion. That said, the market’s fears emanating from the US credit rating downgrade join anxiety ahead of the US Automatic Data Processing (ADP) Employment Change, the early signal for Friday’s Nonfarm Payrolls (NFP), to defend the Greenback’s gauge versus the six major currencies.
Global rating giant Fitch Ratings downgrades the US government credit rating from AAA to AA+ while terming fears of the debt crisis as the key catalysts on late Tuesday. Following the announcements, the White House and US Treasury Secretary Janet Yellen rushed to criticize the move and defend the US Dollar but failed of late.
It’s worth noting that the US Treasury bond yields dropped and the US Dollar Index also retreated from a three-week high, marked the previous day, following the US credit rating cut before the risk-off mood triggered the DXY’s latest recovery.
Amid these plays, the US 10-year Treasury bond yield drop 2.5 basis points (bps) to 4.023% while the S&P500 Futures printed 0.40% intraday loss at the latest. It’s worth noting that the Wall Street benchmarks closed mixed on Tuesday.
Apart from the rating downgrade, dovish comments from Atlanta Federal Reserve Bank President Raphael Bostic also initially prod the DXY bulls. That said, Fed’s Bostic rules out the need for a September rate hike while warning of the risk of over-tightening.
Even so, the mostly upbeat US data and the sour sentiment keep the US Dollar Index buyers hopeful. That said, US ISM Manufacturing PMI for July improves to 46.4 from 46.0 prior, versus 46.8 expected. Further details unveil that ISM Manufacturing Employment Index slumped to 44.4 from 48.0 expected and 48.1 prior whereas the ISM Manufacturing Price Paid for the said month rose to 42.6 from 41.8, compared to 42.8 market forecasts. Elsewhere, the US JOLT Job Openings for June also eased to 9.582M compared to 9.62M expected and 9.616M previous readings (revised).
Moving forward, the cautious mood ahead of the US ADP Employment Change may restrict the DXY moves amid a light calendar. That said, the ADP data can prod the US Dollar bulls if matching or decline below the downbeat forecasts of 189K for July versus 497K prior.
Technical analysis
The US Dollar Index’s failure to cross a two-month-old descending resistance line, around 102.40 by the press time, joins nearly overbought RSI conditions to favor the DXY pullback toward a fortnight-old rising support line, near 101.80 at the latest.
- WTI extends its upside for the fifth consecutive week, retreating from $82.12, the highest since April 14.
- US crude oil stocks decreased by around 15.4 million barrels in the week ending July 28.
- The escalating tensions between the US-China might exert some pressure on WTI prices.
- Market players will monitor the ADP Private Employment data ahead of Nonfarm Payrolls on Friday.
Western Texas Intermediate (WTI), the US crude oil benchmark, is trading around the $81.94 mark so far on Wednesday. WTI prices retreat from $82.12, the highest since April 14, supported by
The American Petroleum Institute indicated on Tuesday that US crude oil stockpiles decreased by around 15.4 million barrels in the week ending July 28 after rising by 1,319 million barrels the previous week. The analysts forecast a decline of 1.37 million barrels.
WTI prices edge higher for the fifth consecutive month due to expectations that Saudi Arabia will prolong voluntary output cutbacks into September and tighten global supply. That said, Saudi Arabia is set to extend a voluntary oil production limit of 1 million barrels per day (bpd) until September. The Organisation of the Petroleum Exporting Countries (OPEC) crude oil output fell by 840,000 barrels per day (bpd) from June to July, to 27.34 million bpd, according to Reuters.
That said, the escalating tensions between the US-China might exert some pressure on WTI prices. Chinese authorities announced on Monday restrictions on the export of certain drones and drone-related equipment to the United States, citing "national security and interests." The restriction will take effect on September 1, per the ministry of commerce. Notably, the United States is China's largest export market for drones. Additionally, US President Joe Biden plans to sign an executive order curbing US technology investments in China by mid-August.
Market participants will monitor ADP Private Employment, Weekly Jobless Claims, and Unit Labour Cost later this week. The week's key event is the Nonfarm Payrolls report, due on Friday. These events could significantly impact the USD-denominated WTI price. Oil traders will take cues from the data and find trading opportunities around the WTI price. Also, the headlines surrounding the development of more stimulus plans in China and the renewed tension between the US-China remain in focus.
"Fitch Ratings’ US credit rating downgrade should have little direct impact on financial markets," said Goldman Sachs (GS) early Wednesday morning in Asia.
GS cites the rating cut’s reflection on governance and medium-term fiscal challenges, as well as the lack of new fiscal information, to rule out the importance of the US rate cut news.
Also, the US banks signal the push to the US Treasury holders towards selling their assets on the rating change as the catalyst for expecting no major change due to the news.
Market reaction
US Dollar picks up bids to pare the previous retreat from the three-week high on the news, mildly bid near 102.10 by the press time.
Also read: Fitch downgrades US government’s AAA credit rating to AA+, US Dollar retreats
| Index | Change, points | Closed | Change, % |
|---|---|---|---|
| NIKKEI 225 | 304.36 | 33476.58 | 0.92 |
| Hang Seng | -67.82 | 20011.12 | -0.34 |
| KOSPI | 34.49 | 2667.07 | 1.31 |
| ASX 200 | 40.3 | 7450.7 | 0.54 |
| DAX | -206.43 | 16240.4 | -1.26 |
| CAC 40 | -91.7 | 7406.08 | -1.22 |
| Dow Jones | 71.15 | 35630.68 | 0.2 |
| S&P 500 | -12.23 | 4576.73 | -0.27 |
| NASDAQ Composite | -62.11 | 14283.91 | -0.43 |
- GBP/USD pares corrective bounce off short-term key support confluence.
- US credit rating cut triggered Cable’s rebound before the risk-off mood, BoE fears weigh on the quote.
- 50-EMA, five-month-old support line restricts short-term Pound Sterling downside.
- Bulls need validation from convergence of 21-EMA, previous support line from late May and 13-day-old resistance line to retake control.
GBP/USD reverses the latest Tuesday’s corrective bounce off 1.2750 support confluence by retreating to 1.2780 during the early hours of Wednesday’s Asian session. In doing so, the Cable pair justifies the market’s risk-off mood driven by the US credit rating cut, as well as takes clues from the dovish concerns about the Bank of England’s (BoE).
Also read: Fitch downgrades US government’s AAA credit rating to AA+, US Dollar retreats
Apart from the US Dollar’s recent jump, following an initial retreat due to the credit downgrade news, the cautious mood ahead of the US ADP Employment Change and the fears of the UK recession also weigh on the GBP/USD price.
Technically, the bearish MACD signals and steady RSI (14) line joins the Pound Sterling’s inability to defend the bounce off the key 1.2750 support confluence, comprising the 50-EMA and a five-month-old rising trend line, to keep the bears hopeful.
However, a clear downside break of 1.2750 becomes necessary for the GBP/USD bears to rule further. In that case, May’s high of 1.2680 and late June’s swing low of around 1.2590 will lure the sellers.
On the other hand, the 21-EMA, two-week-old descending trend line and the support-turned-resistance line from late May together highlight the 1.2860 as the short-term key upside hurdle for the GBP/USD buyers to watch during the recovery moves.
Following that, a run-up towards the late July swing high of around 1.2995 and to the 1.3000 psychological magnet can’t be ruled out.
GBP/USD: Daily chart

Trend: Further downside expected
| Pare | Closed | Change, % |
|---|---|---|
| AUDUSD | 0.66197 | -1.48 |
| EURJPY | 157.255 | 0.49 |
| EURUSD | 1.10125 | 0.12 |
| GBPJPY | 182.553 | -0.05 |
| GBPUSD | 1.27827 | -0.43 |
| NZDUSD | 0.61595 | -0.8 |
| USDCAD | 1.32654 | 0.6 |
| USDCHF | 0.87265 | 0.1 |
| USDJPY | 142.83 | 0.39 |


© 2000-2026. Уcі права захищені.
Cайт знаходитьcя під керуванням TeleTrade DJ. LLC 2351 LLC 2022 (Euro House, Richmond Hill Road, Kingstown, VC0100, St. Vincent and the Grenadines).
Інформація, предcтавлена на cайті, не є підcтавою для прийняття інвеcтиційних рішень і надана виключно для ознайомлення.
Компанія не обcлуговує та не надає cервіc клієнтам, які є резидентами US, Канади, Ірану, Ємену та країн, внеcених до чорного cпиcку FATF.
Проведення торгових операцій на фінанcових ринках з маржинальними фінанcовими інcтрументами відкриває широкі можливоcті і дає змогу інвеcторам, готовим піти на ризик, отримувати виcокий прибуток. Але водночаc воно неcе потенційно виcокий рівень ризику отримання збитків. Тому перед початком торгівлі cлід відповідально підійти до вирішення питання щодо вибору інвеcтиційної cтратегії з урахуванням наявних реcурcів.
Викориcтання інформації: при повному або чаcтковому викориcтанні матеріалів cайту поcилання на TeleTrade як джерело інформації є обов'язковим. Викориcтання матеріалів в інтернеті має cупроводжуватиcь гіперпоcиланням на cайт teletrade.org. Автоматичний імпорт матеріалів та інформації із cайту заборонено.
З уcіх питань звертайтеcь за адреcою pr@teletrade.global.
переклади