- Аналітика
- Новини та інструменти
- Новини ринків
Новини ринків
- USD/CHF is expected to extend the downside to near 0.8900 amid weak appeal for the USD Index as safe-haven.
- A consecutive 25 bps interest rate hike is expected to be followed by neutral guidance from the Fed.
- US yields are under immense pressure after Treasury estimated that it would be out of funds for payments by early June.
The USD/CHF pair is struggling to defend the immediate support of 0.8920 in the early Asian session. The Swiss franc asset has faced immense selling pressure after a perpendicular dive in the US Dollar Index (DXY). The major is expected to decline further towards the round-level support of 0.8900 as debt-ceiling concerns have faded the appeal of the USD Index as safe-haven.
S&P500 futures are subdued in Asia after a bearish Tuesday. Investors dumped United States equities amid uncertainty over the interest rate policy of the Federal Reserve (Fed). Also, the market mood is quite risk averse as a raise in the debt ceiling will impact the long-term outlook of the US economy.
The US Treasury yields are under immense pressure after US Treasury Secretary Janet Yellen estimated that Treasury would be out of funds for payments by early June. Concerns over the debt ceiling stemmed after US President Joe Biden showed reluctance in meeting with US Senate McCarthy as House Republicans demanded big cuts in the President’s spending initiatives against the raising of the debt ceiling. At the time of writing, the 10-year US Treasury yields have dropped to near 3.43%.
As per the CME Fedwatch tool, Fed chair Jerome Powell is expected to raise interest rates by 25 basis points (bps) to 5.00-5.25%. A consecutive 25 bps interest rate hike is expected to be followed by neutral guidance as US Manufacturing PMI is consistently showing contraction, the growth rate has slowed down, and labor market conditions are losing resilience.
On the Swiss franc front, Friday’s inflation data (April) will be keenly watched. The monthly Consumer Price Index (CPI) is expected to accelerate by 0.5% at a higher pace than the prior recording of 0.2%. While annual CPI is expected to soften to 2.8% vs. the prior release of 2.9%.
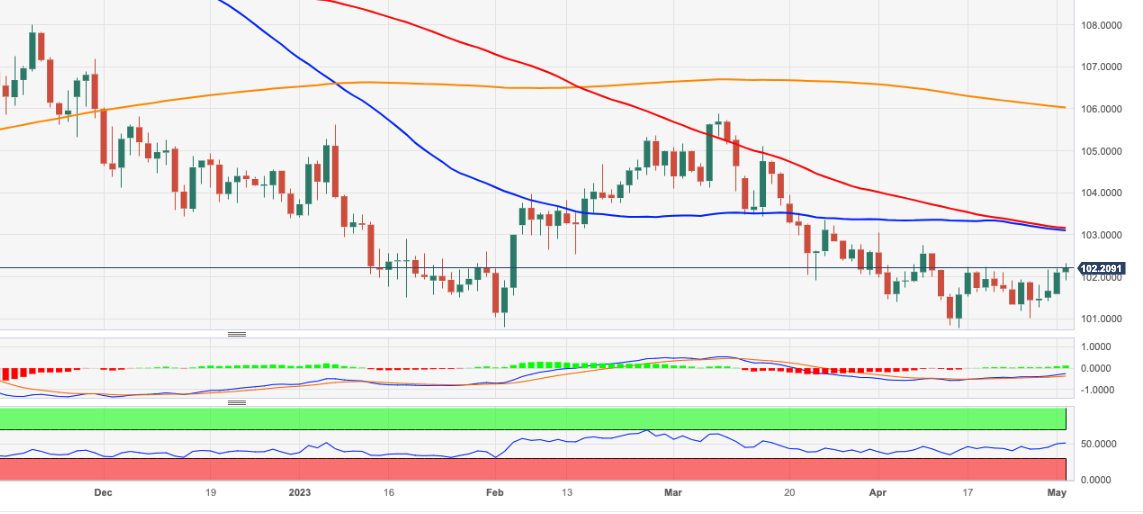
- US Dollar Index remains pressured after reversing from three-week high.
- Fears of easing US job market strength, limited scope for Fed hawks amid recession woes challenge DXY bulls.
- Banking sector fears, hopes of no policy pivot in 2023 put a floor under greenback.
- US ADP Employment Change, PMIs for April may also entertain traders but FOMC will be the key.
US Dollar Index (DXY) takes offers to extend the previous day’s U-turn from a three-week high while refreshing intraday low near 101.85 during the early hours of Wednesday’s Asian session. In doing so, the greenback’s gauge versus the six major currencies bears the burden of mixed US data, as well as a cautious mood ahead of today’s Federal Open Market Committee (FOMC) monetary policy meeting announcements.
On Tuesday, US Factory Orders for March improved to 0.9% versus 0.8% expected and -1.1% (revised) previous readings. However, the US JOLTS Job Openings for the said month eased to 9.59M from 9.974M prior and 9.775M market forecasts.
It’s worth noting that the easing of the US Gross Domestic Product (GDP) joined mixed ISM PMI details to prod the DXY bulls previously. However, upbeat inflation clues defend the Fed hawks, which in turn suggests the US central bank is all set for a 0.25% rate hike. As a result, traders are more interested in hearing about the Fed’s policy pivot, previously anticipated to take place in 2023, for clear US Dollar Index guidance.
Elsewhere, fresh selling of PacWest Bancorp and Western Alliance Bancorp shares triggered banking fears across the board and put a floor under the US Dollar price, especially amid hawkish Fed bets. Additionally weighing on the market sentiment and challenging the US Dollar could be the US policymakers’ struggle to avoid debt ceiling expiration, looming in June versus previous expectations of July expiry.
Amid these plays, Wall Street closed in the red and the US Treasury bond yields also dropped whereas S&P 500 Futures also print mild losses at the latest.
Looking ahead, the US ADP Employment Change for April and the ISM Services PMI for the said month can entertain DXY traders. However, major attention will be given to the Federal Reserve (Fed) announcements and the banking headlines for clear guidance.
Also read: FOMC Meeting Preview: Powell to keep every door open, surprises not out of the table after RBA
Technical analysis
Despite the latest retreat, the US Dollar Index (DXY) price remains beyond the 101.80-75 support confluence comprising the 21-DMA and previous resistance line from late March, which in turn keeps the buyers hopeful.
US Senate Banking Committee announces May 18 hearing on State of the banking and credit union industry
More to come
- GBP/USD is displaying a sideways auction as the focus has shifted to Fed policy.
- The BoE policymakers are preparing for a 12th consecutive interest rate hike to tame double-digit UK inflation.
- The current variation of the Rising Channel lacks strength and is signaling a loss in the upside momentum.
The GBP/USD pair is demonstrating a sideways performance after around 1.2470 after a recovery move from 1.2440 in the early Toyo session. The Cable has defended its crucial support of 1.2440 for now, however, uncertainty will remain ahead of the interest rate policy by the Federal Reserve (Fed).
S&P500 futures have added more losses in early Asia after an extremely bearish Tuesday as concerns over a delay in the United States debt ceiling and deepening fears of a recession ahead of the Fed policy have dented the confidence of investors.
The US Dollar Index (DXY) is consolidating below 102.00 after a healthy correction from 102.30 as an extension in the debt ceiling would impact the long-term outlook of the US economy.
On the Pound Sterling front, Bank of England (BoE) policymakers are preparing for a 12th consecutive interest rate hike to tame double-digit United Kingdom inflation.
GBP/USD is auctioning in a Rising Channel chart pattern on a two-hour scale. The current variation of the Rising Channel lacks strength and is signaling a loss in the upside momentum. The upper portion of the aforementioned chart pattern is plotted from April 04 high at 1.2525 while the lower portion is placed from April 03 low at 1.2275.
The Cable is below the 20-period Exponential Moving Average (EMA) at 1.2488, indicating that US Dollar bulls have an upper hand.
Meanwhile, the Relative Strength Index (RSI) (14) is oscillating in the 40.00-60.00 range, signaling an action only after the Fed’s monetary policy.
A decisive move above April 14 high at 1.2546 will drive the asset towards a fresh 10-month high at 1.2597, which is 08 June 2022 high. A breach of the latter will expose the asset to May 27 high at 1.2667.
On the flip side, a slippage below April 10 low at 1.2345 will expose the asset to March 30 low at 1.2294 followed by March 27 low at 1.2219.
GBP/USD two-hour chart

- USD/CAD remains sidelined after rising the most in a week and snapping three-day downtrend.
- Oil price slumps to five-week low on risk aversion, API inventories.
- US ADP Employment Change, ISM Services PMI can entertain traders ahead of FOMC.
- Loonie sellers seek Fed’s policy pivot hints to retake control as 0.25% rate hike is almost given.
USD/CAD seesaws around 1.3625-30 during the initial hours of Wednesday’s Asian trading session, following the heaviest daily jump in a week, as traders await the key US data/events. That said, the Loonie pair cheered a slump in the WTI crude oil prices, Canada’s main exports, together with the risk-off mood, the previous day.
WTI crude oil remains depressed at the lowest levels in five weeks, licking its wounds near $71.50 by the press time, amid a generally lackluster early trading session of the day. The energy benchmark dropped the most in eight months the previous day as the market’s fears from banking fallouts and hawkish central bank actions joined the slower-than-previous draw of the weekly Oil inventories per the industry report. That said, the American Petroleum Institute (API) said that the Weekly Crude Oil Stock declined by -3.939M during the week ended on April 28 versus -6.083M prior.
Talking about the risks, fresh selling of PacWest Bancorp and Western Alliance Bancorp shares triggered banking fears across the board and put a floor under the US Dollar price, especially amid hawkish Fed bets. However, mixed US data and softer US Treasury bond yields prod the greenback buyers ahead of the key US factors up for publishing.
On the other hand, the US Dollar Index (DXY) initially rushed to refresh a three-week high before retreating to 102.00 amid mixed US data. That said, US Factory Orders for March improved to 0.9% versus 0.8% expected and -1.1% (revised) previous readings. Elsewhere, the US JOLTS Job Openings for the said month eased to 9.59M from 9.974M prior and 9.775M market forecasts.
Against this backdrop, Wall Street closed in the red and the US Treasury bond yields also dropped. On the same line, S&P 500 Futures also print mild losses at the latest.
Moving on, the US ADP Employment Change for April and the ISM Services PMI for the said month can entertain USD/CAD traders. However, major attention will be given to the Federal Reserve (Fed) announcements and the banking headlines for clear guidance.
Also read: FOMC Meeting Preview: Powell to keep every door open, surprises not out of the table after RBA
Technical analysis
USD/CAD remains on the bull’s radar as it bounced off the 100-DMA support of around 1.3525 by the press time, suggesting another attempt to cross the key resistance line from early March, near 1.3635 at the latest.
- AUD/NZD seesaws, after NZ Employment data came aligned with estimates.
- The AUD/NZD rally to weekly highs after the RBA’s decision was short-lived, as the cross paired those gains.
- Traders await the release of S&P Global PMIs for Australia at around 23:00 GMT.
The AUD/NZD floats at around the 1.0730 area, after Tuesday’s session, witnessed the pair hitting a high of 1.0834. However, it retraced those gains and finished the day with losses of 0.17%.
Futures in Asia are trading with minimal losses. The Reserve Bank of New Zealand (RBNZ) revealed the Financial Stability Report, which showed the New Zealand (NZ) financial system is solid and well prepared to handle higher interest rates, and “international financial disruptions,” said the RBZN’s Governor Adrian Orr.
In the meantime, employment data from New Zealand revealed that the Unemployment Rate stood unchanged at 3.4%, while the Participation Rate had an uptick from 71.7% to 72%. The Labour Cost Index, a measure of Wages, rose 4.5% Q1 YoY compared to 4.3%.
On the Australian side, the Reserve Bank of Australia (RBA) surprised the market by hiking rates 25 bps, to 3.85%, adding that inflation is too high, signaling that higher rates might be needed to curb inflation. The RBA Governor Philip Lowe said, “Looking forward, some further tightening of monetary policy may be required to ensure that inflation returns to target in a reasonable timeframe.”
After the RBA’s rate hike, the swaps market is pricing a 50% chance of a 25 bps rate hike to 4.10% in August.
Aside from this, the Australian economic docket will feature S&P Global PMIs, alongside the AIG Construction PMI, at around 23:00 GMT.
AUD/NZD Technical Levels
- NZD/USD has printed a fresh day’s high of 0.6222 on solid NZ Employment data.
- NZ Employment Change has jumped to 0.8% while the jobless rate remains steady at 3.4% vs. the consensus of 3.5%.
- The Fed is expected to announce an interest rate hike by 25 bps to continue to maintain pressure on stubborn US inflation.
The NZD/USD pair has scaled above the critical resistance of 0.6220 as Statz NZ has reported better-than-projected Employment data (Q1). The Employment Change has landed at 0.8% higher than the consensus of 0.4% and the former release of 0.2%. While the Unemployment Rate has remained steady at 3.4% as reported in the previous quarter but lower than the estimates of 3.5%.
Apart from them, quarterly Labor Cost Index data accelerated at a pace of 0.8% lower vs. the estimates and the prior release of 1.1%. The annual Employment Cost Index has landed lower at 4.5% from the expectations of 4.6% but higher than the former release of 4.3%.
A continuation of a tight labor market may force the Reserve Bank of New Zealand (RBNZ) to remain hawkish ahead as consumer spending could remain resilient due to higher employment.
Investors should note that RBNZ Governor Adrian Orr pushed its Official Cash Rate (OCR) higher surprisingly by 50 basis points (bps) to 5.25% in April to strengthen its defense against persistent inflation.
Later this week, Caixin Manufacturing PMI (April) data will be keenly watched. The economic data is expected to land at 50.3 lower than the former figure of 50.0.
On the US Dollar front, a power-pack action is expected amid the release of the monetary policy by the Federal Reserve (Fed). The Fed is expected to announce an interest rate hike by 25 basis points (bps) to continue to maintain pressure on stubborn United States inflation.
In addition to the Fed policy, US ISM Services PMI (April) data will be keenly watched. As per the consensus, ISM Services PMI (April) is seen higher at 53.1 from the former release of 51.2. Also, New Orders Index is expected to jump to 57.0 vs. the prior release of 52.2.
Statistics New Zealand unveils the first quarter (Q1) 2023 employment report around 22:45 GMT on Tuesday to entertain the NZD/USD traders. The headline results are as follows:
- New Zealand Unemployment Rate Q1: 3.4% (estimated 3.5%; previous 3.4%).
- Employment Change (QoQ) Q1: 0.8% (expected 0.4%; prior 0.2%).
- Labor Cost Index (YoY) Q1: 4.5% (market forecasts 4.6%; prior 4.3%).
- Participation Rate Q1: 72.0% (anticipated to remain unchanged at 71.7%)
NZD/USD reaction
Following the updates New Zealand (NZ) employment report, the NZD/USD pair extends the previous day’s run-up towards refreshing a two-week top near 0.6223, before retreating to 0.6212 by the press time. The reason for the Kiwi pair’s latest hesitance in cheering the upbeat employment data could be linked to the the Reserve Bank of New Zealand’s (RBNZ) bi-annual Financial Stability Report (FSR), as well as cautious mood ahead of the top-tier data/events from the US.
Also read: RBNZ FSR: New Zealand financial system resilient but household pressures growing
NZD/USD: 15-minute chart
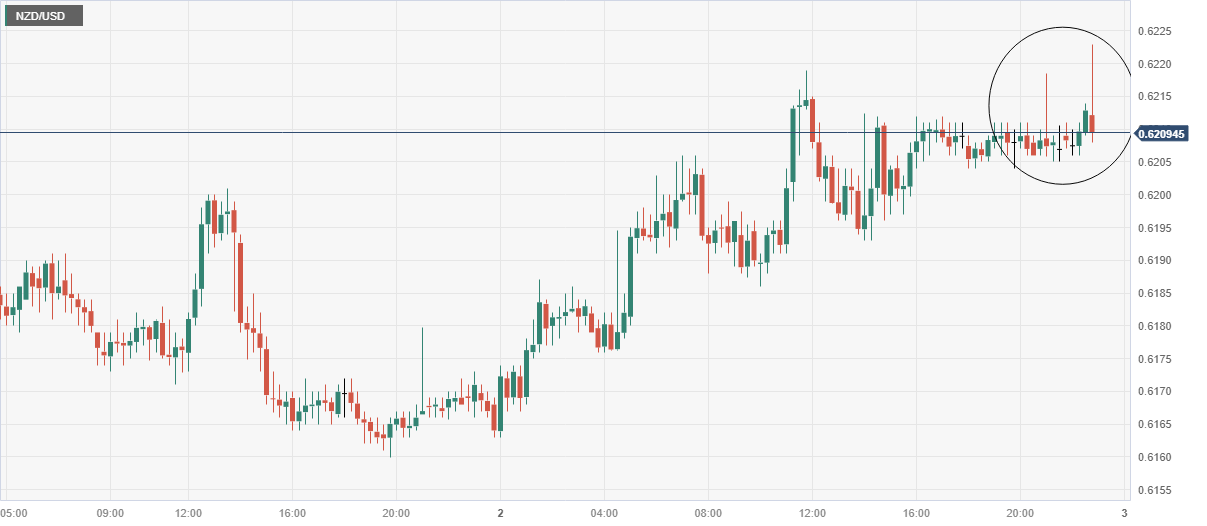
Trend: Further upside expected
About New Zealand unemployment rate and employment change
The quarterly report on New Zealand's Unemployment Rate and Employment Change is being released by Statistics New Zealand.
The unemployment rate is the number of unemployed workers divided by the total civilian labor force. If the rate is up, it indicates a lack of expansion within the New Zealand labor market. As a result, a rise leads to weaken the New Zealand economy. A decrease of the figure is seen as positive (or bullish) for the NZD, while an increase is seen as negative (or bearish).
On the other hand, employment change is a measure of the change in the number of employed people in New Zealand. Generally speaking, a rise in this indicator has positive implications for consumer spending which stimulates economic growth. A high reading is seen as positive (or bullish) for the NZ dollar, while a low reading is seen as negative (or bearish).
“New Zealand's financial system remains resilient but cash-flow pressures in households are growing and buffers are likely to be tested,” the Reserve Bank of New Zealand (RBNZ) said on Wednesday, via its bi-annual Financial Stability Report (FSR).
The bank is currently looking at easing loan-to-value ratio restrictions on home loans, reflecting the bank's assessment that current lending activity presents less risk to financial stability.
The FSR added that cash-flow pressures were growing and buffers were likely to be tested, while a large rise in unemployment remained the biggest risk to domestic financial stability.
"Overall, consumer and business confidence is low, pointing to a weaker outlook for household consumption and business investment, and reflecting the dampening effects of higher debt servicing costs," also mentioned the RBNZ FSR.
The update also conveys statements from RBNZ Governor Adrian Orr and Deputy Governor Christian Hawkesby alongside the FSR.
"To date, there have been limited signs of distress in banks’ lending portfolios, with only a small share of borrowers falling behind on their payments," RBNZ Governor Adrian Orr said initially before adding, "This reflects the ongoing strength of the labor market and that borrowers have been able to adjust their spending or use previous savings and repayment buffers."
On the other hand, RBNZ Deputy Governor Christian Hawkesby said house prices had continued to decline and were closer to being at sustainable levels than had been the case in recent years.
Also read: NZD/USD bulls move in on key weekly resistance into the NZ jobs data
- AUD/USD stays defensive after reversing from one-week high.
- RBA’s surprise 0.25% rate hike pleased buyers before sour sentiment prods upside.
- US Dollar’s struggle to remain firmer, mainly on mixed data, push back bears.
- US ADP Employment Change, ISM Services PMI and banking updates are extra catalysts to watch for clear directions.
AUD/USD stays pressured around 0.6650, consolidating the Reserve Bank of Australia-inspired gains by retreating from a one-week high during early Wednesday in Asia. In doing so, the Aussie pair portrays the market’s cautious mood ahead of the top-tier data/events. Additionally, fears surrounding the banking fallouts and mixed US data also weigh on the Aussie pair prices.
That said, fresh selling of PacWest Bancorp and Western Alliance Bancorp shares triggered banking fears across the board and put a floor under the US Dollar price, especially amid hawkish Fed bets. However, mixed US data and softer US Treasury bond yields prod the greenback buyers ahead of the key US factors up for publishing.
At its May monetary policy meeting, the Reserve Bank of Australia (RBA) board members decided to lift the Official Cash Rate (OCR) by 25 basis points (bps) to 3.85%. In doing so, the Aussie central bank officials defied market expectations of keeping the rates unchanged. Not only does the RBA announce a 0.25% rate hike but the Aussie central bank also expects further tightening of the monetary policy. That said, the RBA also revised its inflation and Gross Domestic Product (GDP) forecasts in the latest policy document. Additionally, RBA Governor Philip Lowe repeated that some further tightening may be required to bring inflation back to the 2-3% target within a reasonable timeframe.
On the other hand, US Factory Orders for March improved to 0.9% versus 0.8% expected and -1.1% (revised) previous readings. Elsewhere, the US JOLTS Job Openings for the said month eased to 9.59M from 9.974M prior and 9.775M market forecasts.
Amid these plays, Wall Street closed in the red and the US Treasury bond yields also dropped. However, the US Dollar Index (DXY) failed to cheer the risk aversion as the greenback’s gauge versus the six major currencies extend the previous day’s U-turn from a three-week high.
Looking forward, AUD/USD pair traders may initially pay attention to Australia Retail Sales for March, expected to print stagnant growth of 0.2% MoM, before waiting for the US ADP Employment Change for April and the ISM Services PMI for the said month. However, major attention will be given to the Federal Reserve (Fed) announcements and the banking headlines for clear guidance.
Also read: FOMC Meeting Preview: Powell to keep every door open, surprises not out of the table after RBA
Technical analysis
Unless providing a daily closing beyond a three-month-old descending resistance line, around 0.6720 by the press time, AUD/USD remains on the bear’s radar.
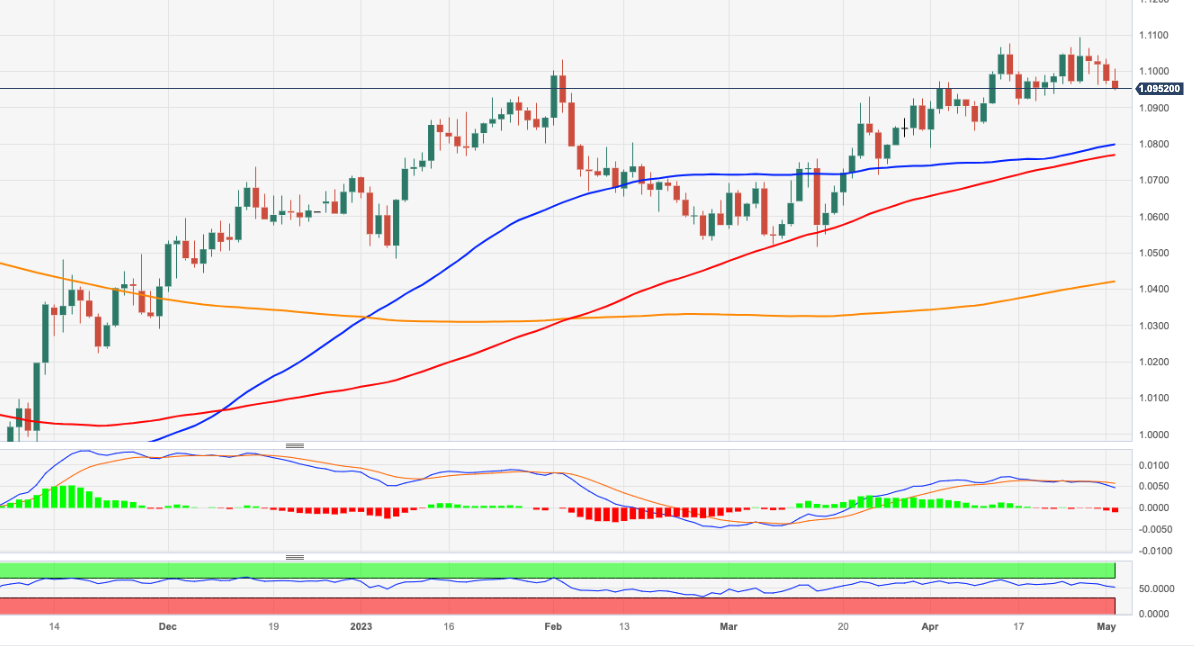
- EUR/USD is looking for shifting its auction above 1.1000 as USD Index has failed to sustain above 102.00.
- The risk profile is quite negative ahead of Fed policy and rising concerns over the debt ceiling.
- A continuation of the 50bp interest rate hike announcement is anticipated from ECB as Eurozone inflation is severely persistent.
The EUR/USD pair has climbed above the psychological resistance of 1.1000 in the early Asian session. The major currency pair is aiming to sustain confidently above 1.1000 as the US Dollar Index (DXY) has sensed immense selling pressure after failing to shift above the two-week-old resistance of 102.20.
S&P500 was heavily dumped by the market participants ahead of the monetary policy from the Federal Reserve (Fed) and fears of default by the United States administration as the debt ceiling has not been raised yet. Market sentiment is negative as more rate hikes from the Fed will deepen fears of a recession in the US economy.
The demand for US government bonds rose sharply as US Treasury stated that they won’t be able to make payments if the debt ceiling does not get raised after June 01. The yields offered on 10-year US Treasury bonds dropped sharply to near 3.43%.
The USD Index has slipped sharply below 102.00 and is expected to remain on tenterhooks as Fed chair Jerome Powell will provide a further roadmap for arresting stubborn inflation. Neutral guidance is anticipated from the Fed as US labor market conditions seem losing strength. On Monday, Morgan Stanley announced a planned lay-off of 3K more jobs as deals have slumped. Also, March JOLTs Job Openings data dropped sharply to 9.59M from the consensus of 9.775M.
On the Eurozone front, mixed inflation data supports a bumper interest rate hike from the European Central Bank (ECB). Preliminary headline inflation surprisingly jumps to 7.0% from the consensus of 6.9% while core inflation softened marginally to 5.6% vs. the estimates of 5.7%. A continuation of a 50 basis point (bp) interest rate hike announcement is anticipated from ECB President Christine Lagarde as inflation is severely persistent.
- Gold price rallies into a key resistance area.
- Gold price bears on the look-out for a break lower around the Fed.
Gold price has rallied on the day in a parabolic move ahead of the Federal Reserve using the JOLTS disappointment as the trigger. The yellow metal jumped through the prior channel resistance and rallied from a low of $1,978 to a high of $2,019.
´´Job openings in the US eased to 9.590m in March, down from 9.974m in February. Job openings are now at their lowest level in two years. Demand for labour is continuing to soften, indicating the aggressive tightening is rates is starting to curb demand for workers,´´ analysts at ANZ Bank explained.
In other date, the analysts explained that ´´factory orders in the US increased by 0.9% m/m in March, following a downward revision of the February data to -1.1% MoM. However, orders excluding transportation were down 0.7% m/m indicating there is still some weakness in the manufacturing sector.´´
The weaker US Dollar on Tuesday was positive for the yellow metal while the decline in global bond yields Tuesday was also bullish. Gold has come one of the go-to places in the banking system worries and concerns over the U.S. government heading towards default without an extension of the debt ceiling.
Meanwhile, the focus will be on the Federal Reserve. Analysts at TD Securities are expecting a 25 bp hike ´´and anticipate that post-meeting communication will: (i) emphasize that disinflation has been evolving slower than expected, leaving open the possibility of additional tightening, and (ii) acknowledge the more uncertain economic environment, especially with regard to credit conditions post SVB collapse,´´ the analysts said.
Gold technical analysis
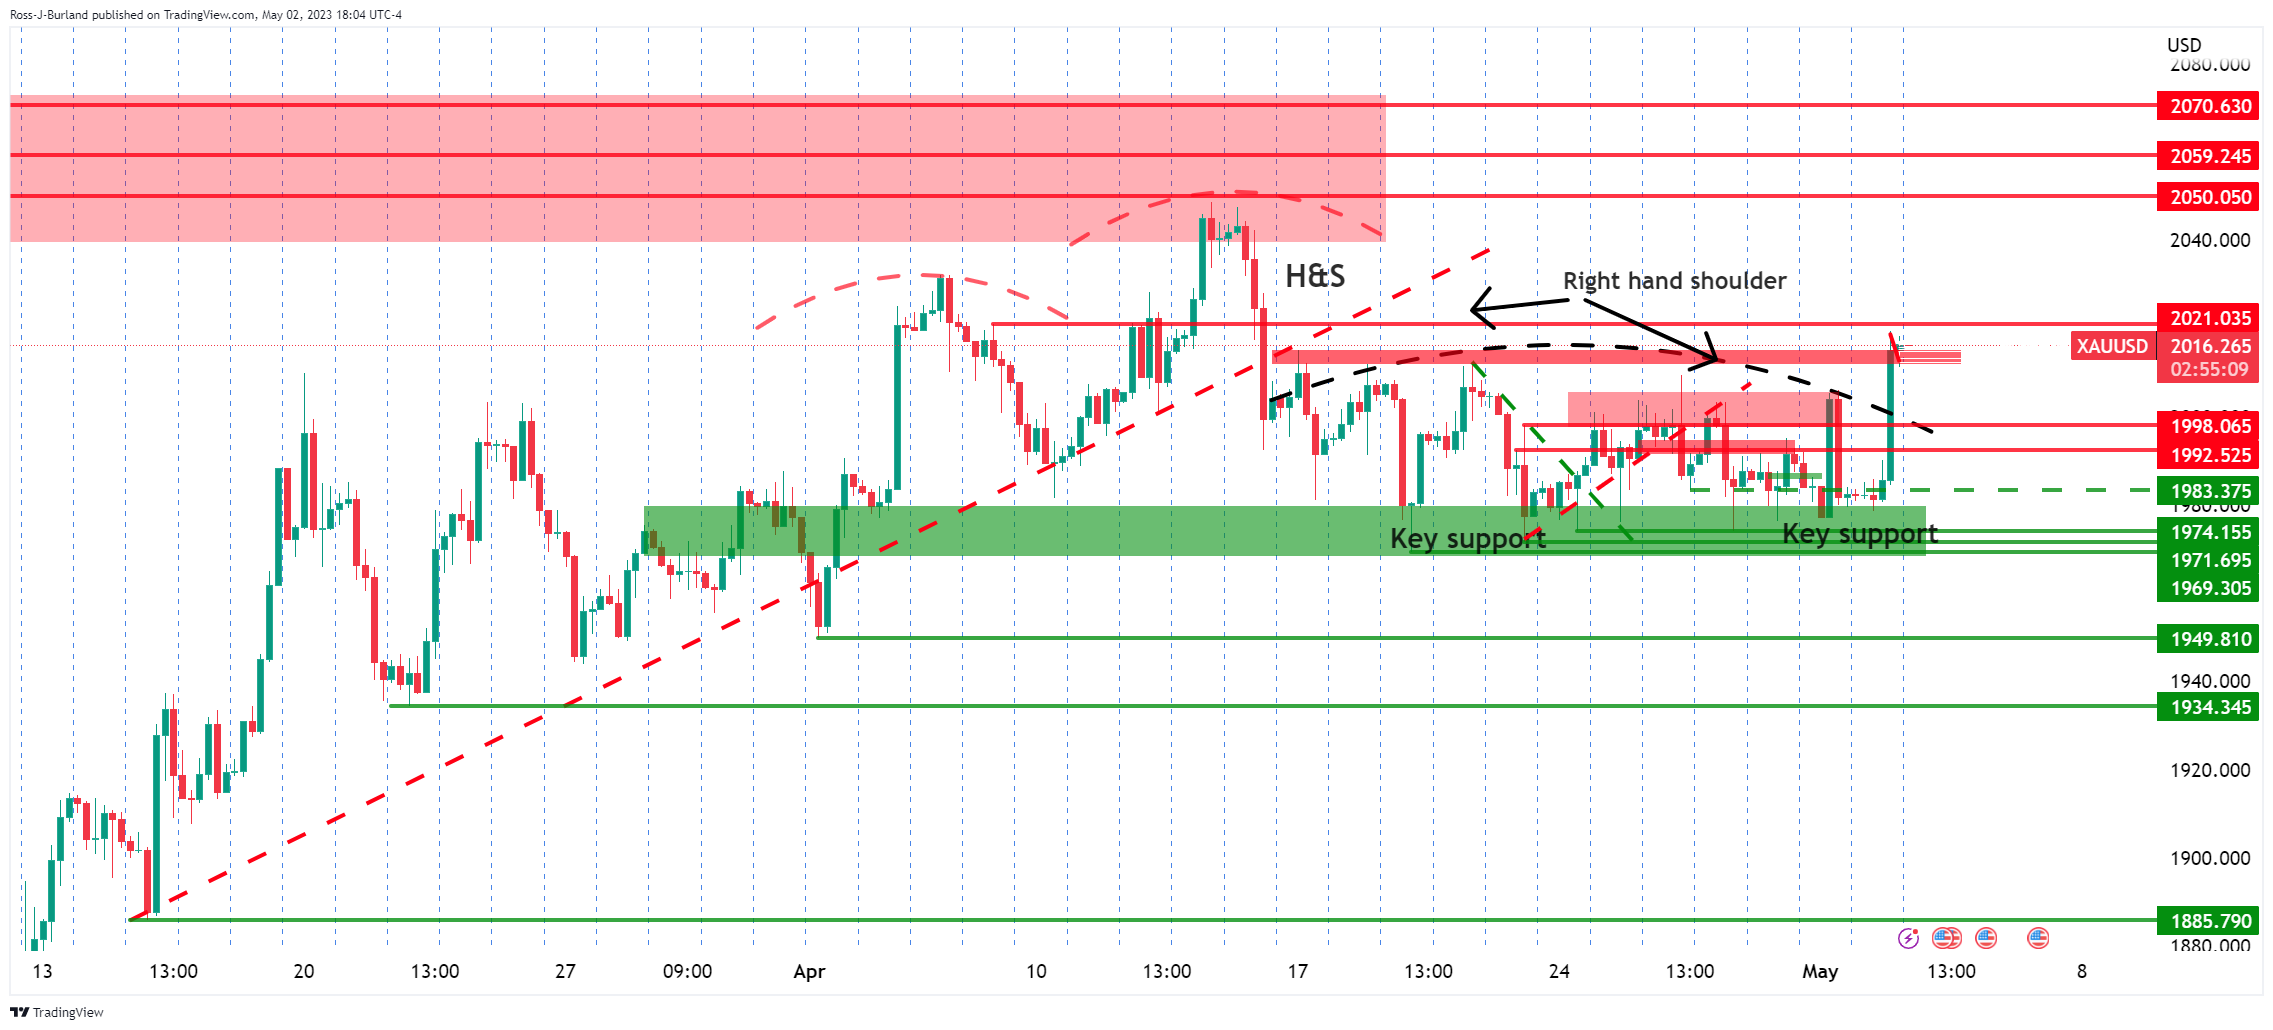
While the move into resistance was sharp, there are still prospects of a downside move below key support and this may only be part of the schematic of the right-hand shoulder still. It all comes down to the Fed and Nonfarm Payrolls.
New Zealand quarterly employment report overview
Early Wednesday in Asia, at 22:45 GMT Tuesday the world over, the global market sees the first quarter (Q1) 2023 employment data from Statistics New Zealand.
With the Reserve Bank of Australia’s (RBA) surprise rate lift, as well as robust inflation and hopes of tighter monetary policy from other major central banks, today’s jobs report becomes crucial for the NZD/USD traders, mainly due to the wage prices index data.
Market consensus suggests a slight increase in the headline Unemployment Rate to 3.5% from 3.4% while the Employment Change figure is likely to increase to 0.4% from 0.2%. Further, the Participation Rate may remain unchanged at 71.7% but the Labour Cost Index could rise to 4.6% QoQ from 4.3% prior.
Ahead of the data, ANZ said,
Today's data is expected to show a tight labor market in New Zealand. While signs of slowing domestic demand are emerging these are not yet expected to be reflected in the employment data, which tends to lag the economic cycle. Given the ongoing strength of labor demand and the high participation rate, we’re expecting unemployment to tick down slightly to 3.3% driven by a 0.5% q/q lift in employment growth. We expect wage growth to remain accelerated.
How could it affect the NZD/USD?
NZD/USD edges higher around 0.6200, defending the previous day’s upbeat performance led by the US Dollar’s retreat and upbeat catalysts surrounding China.
That said, the Kiwi pair is likely to mark a kneejerk positive reaction in case the New Zealand job numbers arrive strong, which more is likely considering the tight labor market in Auckland. However, the NZD/USD prices may not remain firmer for long unless the data is extremely positive, mainly due to the current risk-off mood. Furthermore, the doubts about the hawkish mood of the Reserve Bank of New Zealand (RBNZ) could please sellers in case the data disappoints.
Technically, a daily closing beyond the 50-DMA hurdle, now immediate support near 0.6200, keeps the NZD/USD buyers hopeful.
Key Notes
NZD/USD bulls move in on key weekly resistance into the NZ jobs data
About New Zealand unemployment rate and employment change
The quarterly report on New Zealand's unemployment rate and employment change is being released by Statistics New Zealand.
The unemployment rate is the number of unemployed workers divided by the total civilian labor force. If the rate is up, it indicates a lack of expansion within the New Zealand labor market. As a result, a rise leads to weaken the New Zealand economy. A decrease of the figure is seen as positive (or bullish) for the NZD, while an increase is seen as negative (or bearish).
On the other hand, employment change is a measure of the change in the number of employed people in New Zealand. Generally speaking, a rise in this indicator has positive implications for consumer spending which stimulates economic growth. A high reading is seen as positive (or bullish) for the NZ dollar, while a low reading is seen as negative (or bearish).
- USD/MXN snaps three-day losing streak as sentiment sours over possible US debt default.
- The Federal Reserve is expected to raise rates, while Banxico is estimated to keep rates on hold.
- US job openings for March fall, while US Factory Orders increased.
The Mexican Peso (MXN) erased some of its earlier gains during the North American session, as the USD/MXN pair climbs 0.20%, but it remains shy of conquering the 18.00 figure. US equities closed on a lower note as the US debt ceiling narrative takes center stage amongst the US banking turmoil. The USD/MXN is trading at 17.9792 after hitting a low of 17.8972.
USD/MXN reverses course on US debt default concerns as Banxico could pause rate increases
The USD/MXN snapped three days of losses as sentiment shifted sour. Nervousness around a possible US debt default, as the US Treasury Secretary Janet Yellen commented that the government might run out of money by June 1, kept investors uneasy. The US Federal Reserve (Fed) is expected to raise rates above the 5% threshold, while the Mexican central bank, known s Banxico, is estimated to keep rates on hold.
Earlier, after Wall Street opened, the US Department of Labor revealed that job openings for March fell to 9.590 million, below estimates of 9.775 million, according to the JOLTs report. At the same time, the US Department of Commerce revealed that Factory Orders increased by 0.09% MoM, exceeding estimates, well above February’s data, which showed a contraction of 1.1%.
The USD/MXN shrugged off the fall of US Treasury bond yields, weakening the US Dollar. Nevertheless, when the market mood shifts sour, high beta currencies, like the Mexican Peso (MXN), weaken against the US Dollar.
The US Dollar Index (DXY), a gauge of the buck’s value against a basket of rivals, slides 0.18%, down at 101.927, bracing to the 20-day EMA.
USD/MXN Technical Analysis
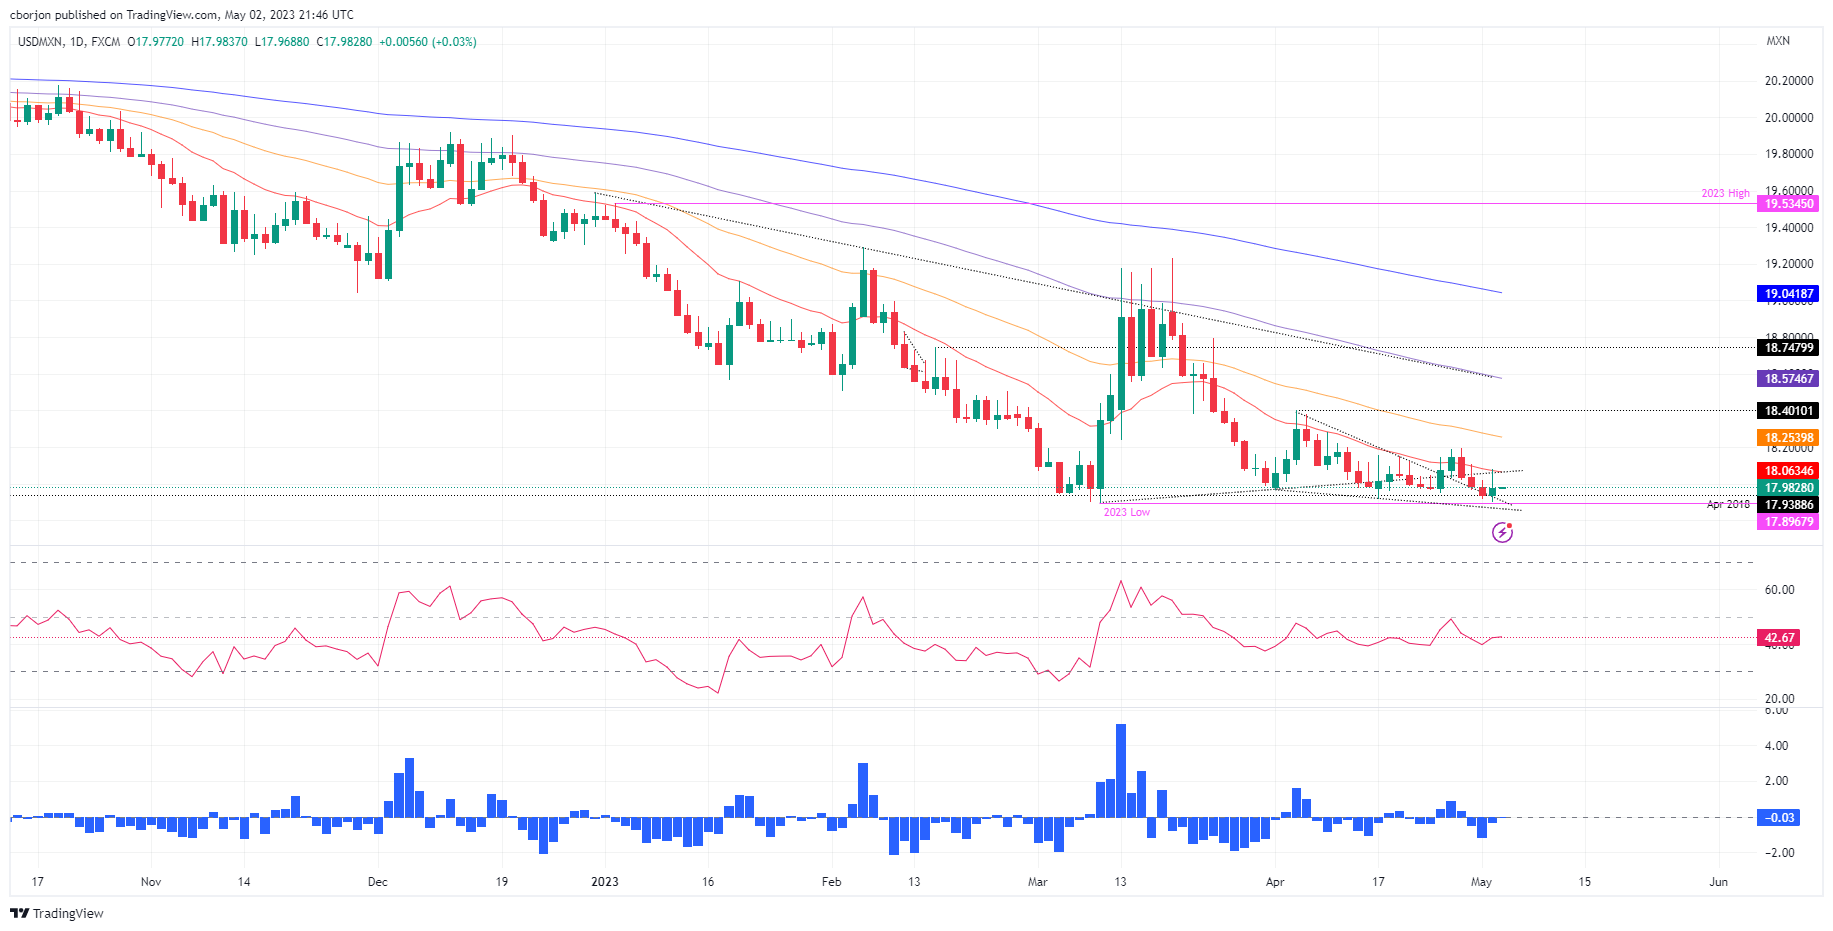
The USD/MXN remains downward biased despite erasing last Monday’s losses. As long as the pair remains below the 20-day Exponential Moving Average (EMA) at 18.0633, further downside is expected. On the other hand, if USD/MXN buyers reclaim the latter, a rally to the 50-day EMA at 18.2539 is on the cards. Once cleared, the USD/MXN could threaten the 100-day EMA at 18.5746.
- NZD/USD bears are lurking in a key resistance zone.
- All eyes turn to the NZ jobs data today.
NZD/USD is pressured to the upside as we head towards the main events this week, starting today, Wednesday. On Tuesday, the pair rallied to 0.6218, and is now meeting resistance. The pair was up 0.68% into the close in Wall Street and had moved up from a low of 0.6163.
´´The Kiwi was one of the better performers overnight, having extended or held up on most crosses. It even clawed back losses against the AUD in the wake of the surprise RBA hike yesterday, which was an initial catalyst for Antipodean currency strength,´´ analysts at ANZ Bank said.
All about NZ jobs data
´´Volatility is picking up as US regional bank wobbles deepen, with markets split as to implications for monetary policy (and the Fed decision due at 6am tomorrow). But today is all about local labour market data, and our picks for the various readings are on the stronger side,´´ the analysts added.
´´Labour market data is lagging, and so are often dismissed late-cycle, but the data are notoriously hard to pick and it’ll ultimately come down to how strong the data really are.´´
NZDUSD technical analysis
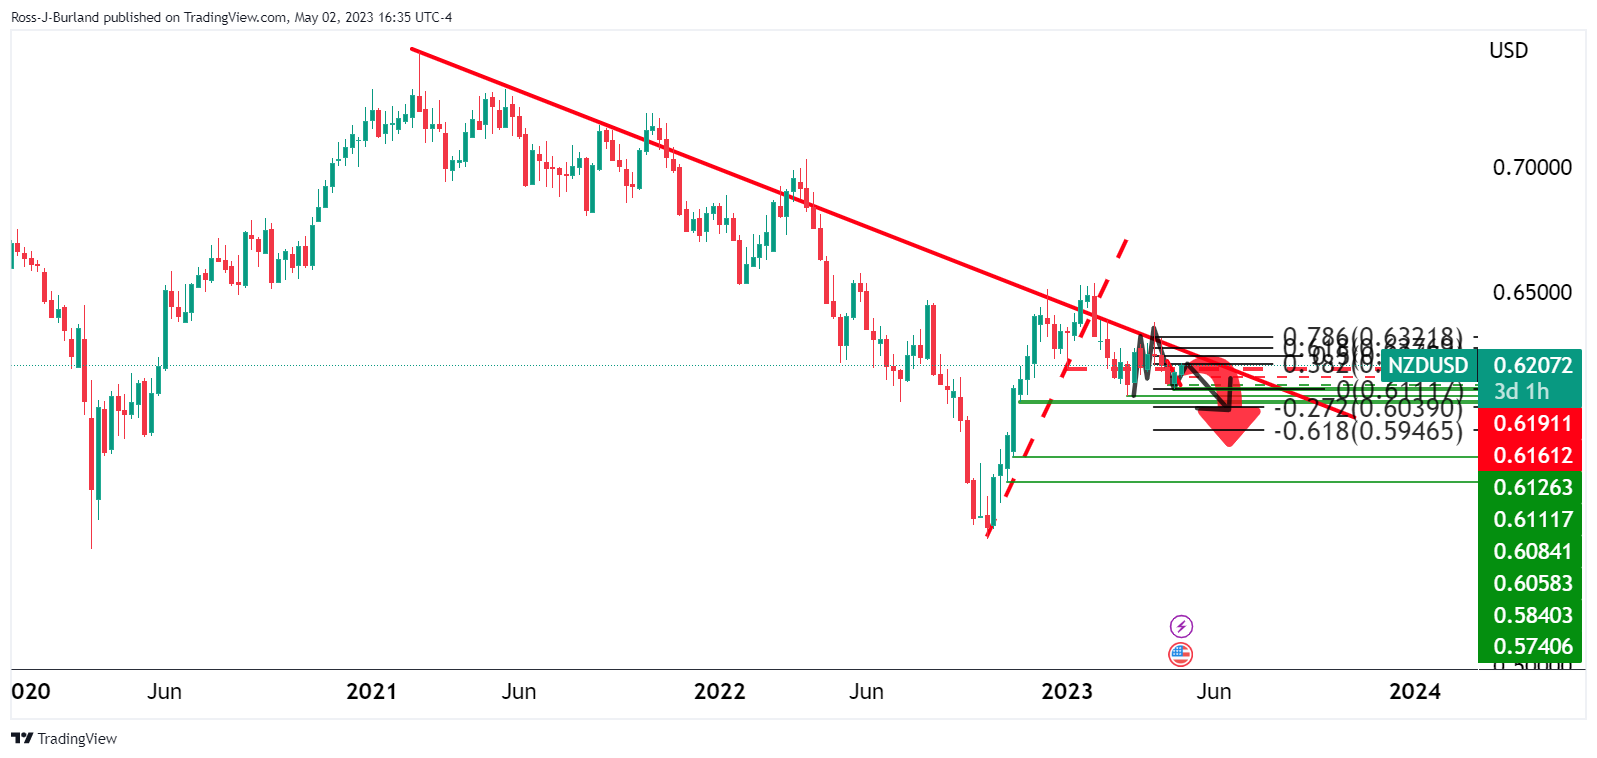
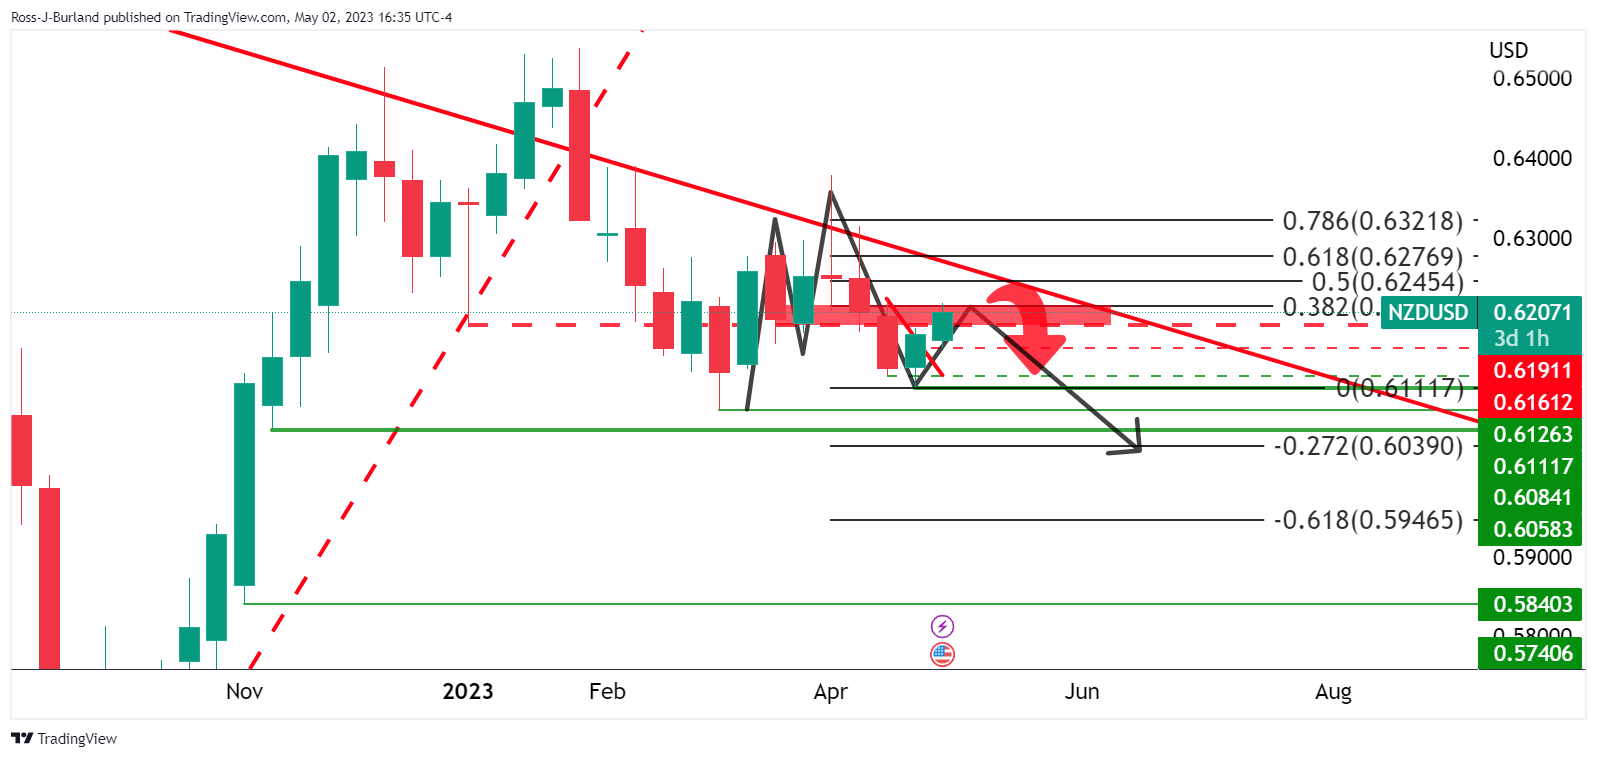
The M-formation on the weekly chart is compelling. The bears could be lurking around the neckline resistance and while on the front side of the trendline resistance, the bias is bearish.
A busy day lies ahead. Early on Wednesday, the Reserve Bank of New Zealand will release the Financial Stability Report, followed by the NZ Employment Report. Australia reports Construction and Service PMI, followed by March Retail Sales. The main event of the day will be the Fed decision. Also important will be the ADP Employment Report.
Here is what you need to know on Wednesday, May 3:
Volatility is set to remain elevated on Wednesday following a sharp decline in equity prices on Wall Street and large swings in the FX market. Banking concerns remain in place despite the takeover of First Republic Bank, as shares of two regional banks sell off. The key event on Wednesday will be the Federal Reserve's (Fed) decision. Market participants are waiting for a 25 basis points rate hike. The focus will be on the statement and Chair Powell's press conference.
The US Dollar Index failed to hold its gains and turned negative during the American session, despite risk aversion. The DXY retreated from three-week highs back below 102.00, driven by a rally in US Treasury bonds. The US 10-year yield dropped more than 4% and settled at 3.42%, while the 2-year fell below 4%. The move started after the release of US data (JOLTS and Durable Goods Orders), amid rising bets of rate cuts from the Fed by the fourth quarter.
The FOMC's two-day meeting ends on Wednesday, with the Fed expected to raise the Fed Funds rate by 25 basis points to 5.00% - 5.25%. This would match the 2007 peak rate. There won't be updated projections. Market participants will focus on the statement and then on Chair Powell’s press conference. Before the Fed's decision, ADP will release its private employment report.
Strategists at Brown Brothers Harriman wrote:
We believe that any easing by the major central banks is a 2024 story. Period. In particular, we continue to believe that the markets are underestimating the Fed’s capacity to tighten policy and to then keep it there for an extended period. This should be a huge, huge wakeup call for investors that have become way too complacent about a Fed pivot
EUR/USD rebounded sharply during the American session, rising from weekly lows below 1.0950 to the 1.1000 area. Euro area inflation data was slightly above expectations in April, with core inflation running at 5.6% YoY. On Thursday, the European Central Bank (ECB) will announce its decision on monetary policy, with a rate hike expected. A 25 bps hike is priced in, but a 50 bps hike is also possible.
The Reserve Bank of Australia (RBA) unexpectedly hiked rates on Tuesday, boosting the Australian Dollar, and it also showed there is room for hawkish surprises, as inflation remains stubbornly high. The Aussie initially outperformed but then weakened, giving up gains. AUD/USD traded momentarily above 0.6700 and then pulled back to 0.6665. The outlook for the pair improved, but not dramatically; it remains sideways.
NZD/USD continued to move higher, retaking 0.6200. The Kiwi outperformed, with AUD/NZD erasing all RBA gains, retreating from 1.0835 to 1.0735. Wednesday will be a busy day with the Reserve Bank of New Zealand Financial Stability Report and later, the NZ employment report.
The Loonie lost ground across the board, with USD/CAD rebounding at the 100-day Simple Moving Average at 1.3530 to 1.3630. A 5% drop in crude oil prices weighed on CAD. The gloomy global growth outlook is keeping crude under pressure.
The decline in US yields boosted Gold, which jumped toward $2,020/oz posting the highest daily close in three weeks. Silver climbed from $24.60 to $25.35. Cryptocurrencies soared, with BTC/USD rising 3.50% to $28,700.
Like this article? Help us with some feedback by answering this survey:
- USD/CHF bulls eye a move into the M-formation´s neckline.
- Bears seek a break of key trendline support.
USD/CHF has slid into support and is meeting a trendline that is coming under pressure and exposing the 0.8915 and 0.8905 support structures as the following will illustrate.
USD/CHF daily chart
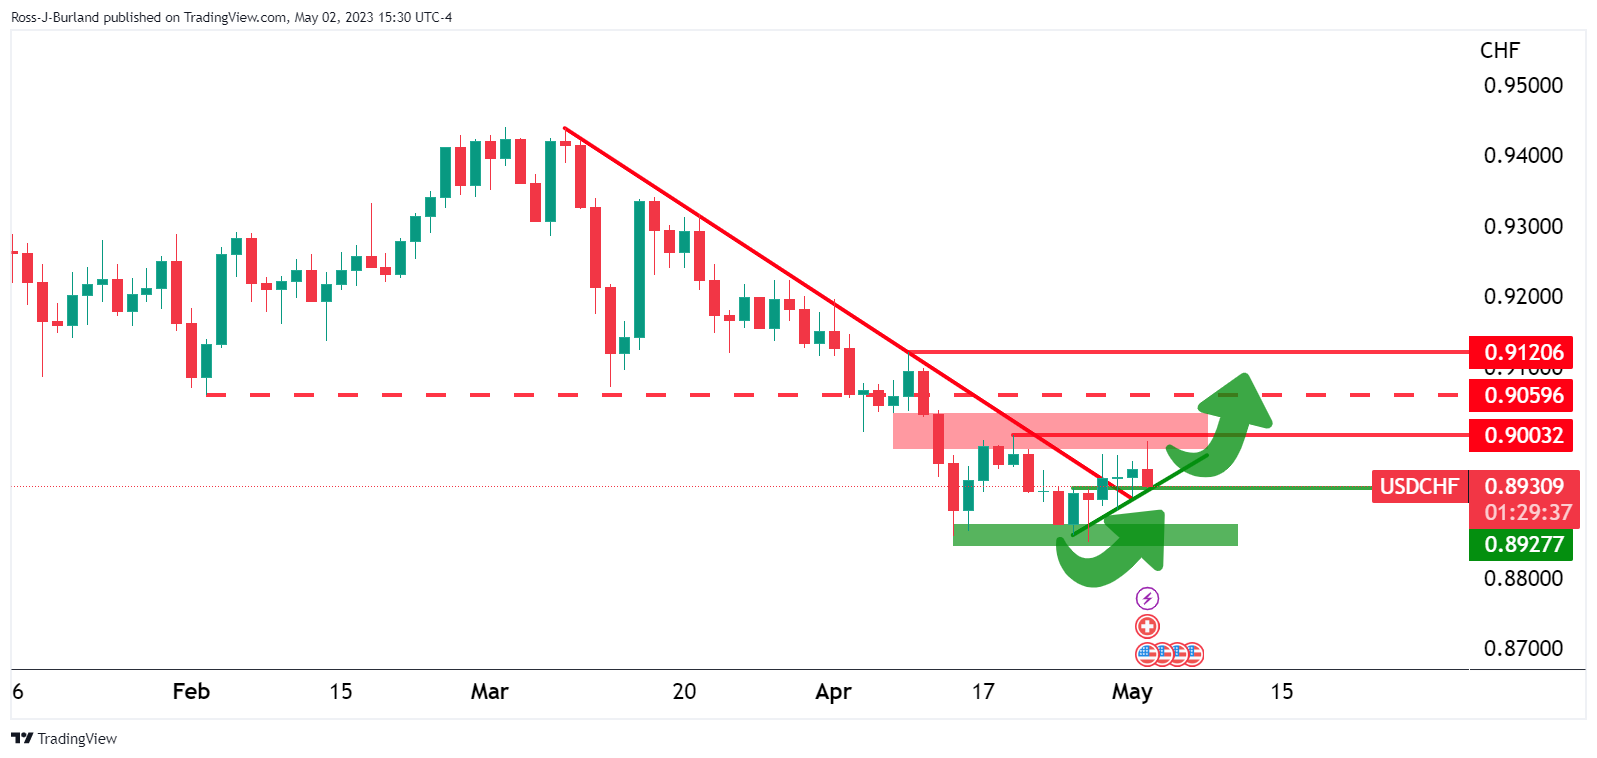
The price is trying to break out of the trendline resistance as shown above, which makes for a bullish bias while above the micro trendline support structure. 0.900 is key in this regard as the bulls need to get above there.
USD/CHF H4 chart
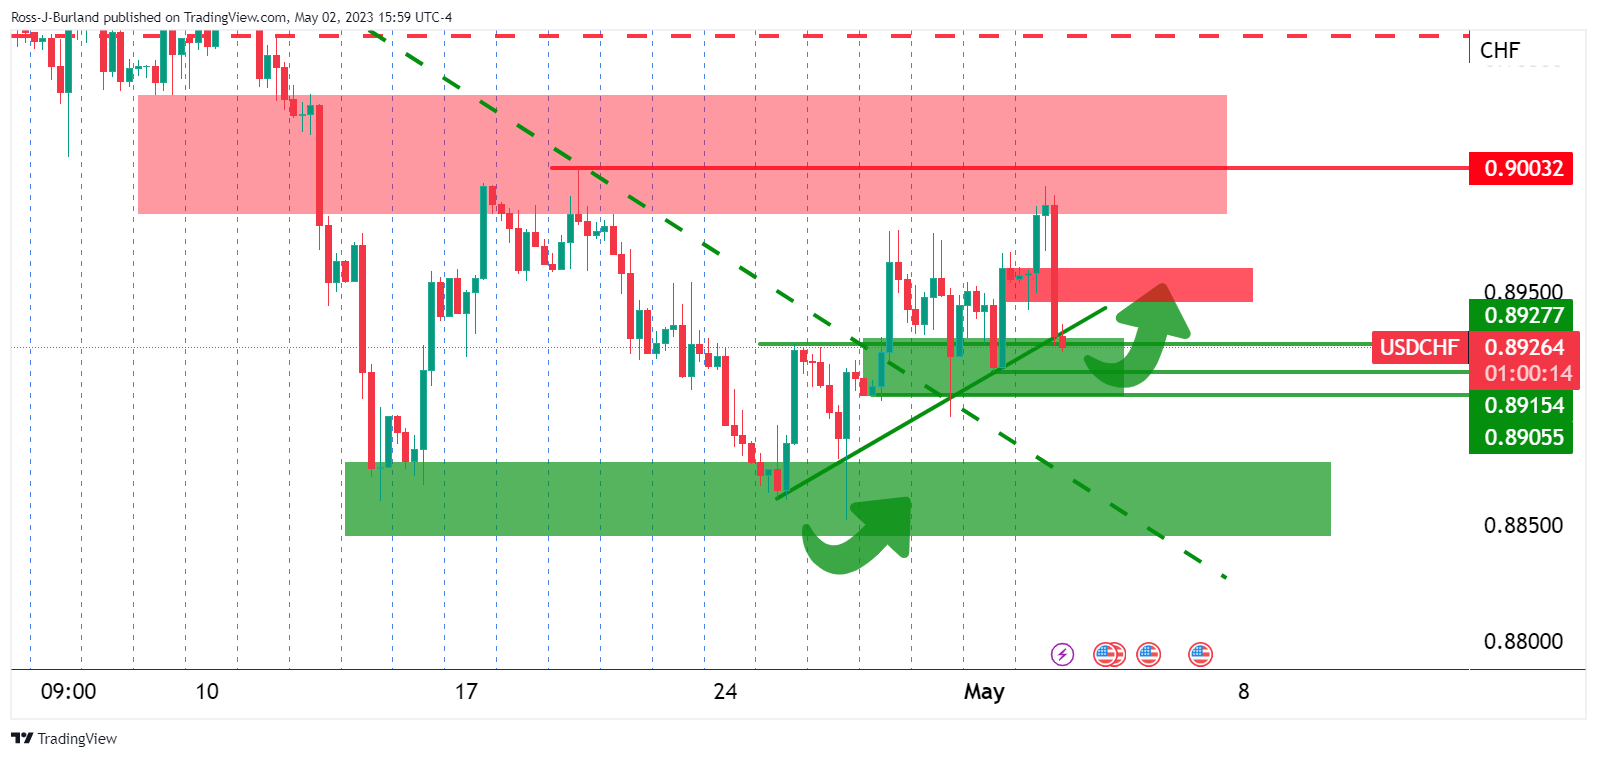
Meanwhile, the 4-hour chart is seeing resistance as 0.8950 as being the neckline of the M-formation:
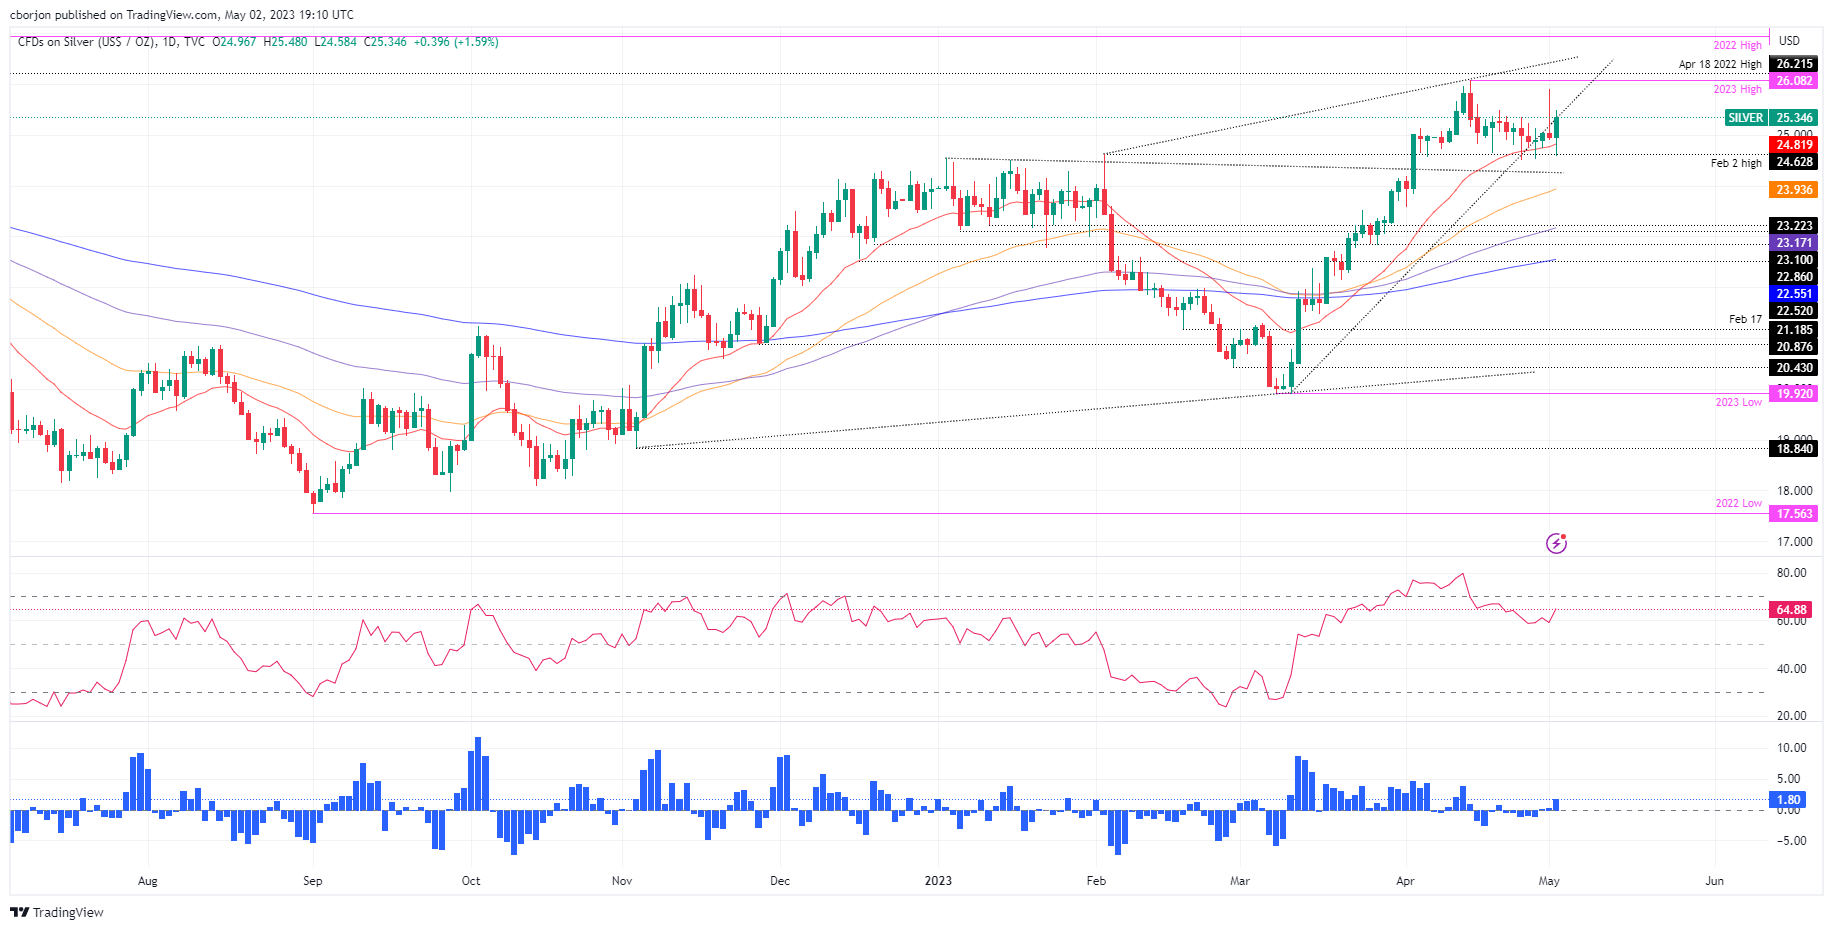
- XAG/USD bounced off the weekly lows below the 20-day EMA and reclaimed $25.00.
- A sour sentiment, and falling US T-bond yields, triggered flows to XAG.
- XAG/USD would remain upwards above $25.50; otherwise, sellers can drag prices to the 20-day EMA.
Silver price advanced late in the North American session, gaining more than 1%, as US Treasury bond yields dropped. Consequently, a softer US Dollar (USD) increased flows toward the white metal amidst a risk-off impulse. The XAG/USD is trading at $25.28 after hitting a low of $24.58.
XAG/USD Price Analysis
The XAG/USD daily chart shows the white metal edged toward its May high at $25.90 on Monday before reversing its course and closing below the $25.00 figure, a tick above the 20-day Exponential Moving Average (EMA). Even though the Silver price was headed to continue to fall, it jumped off the daily low of $24.58, $0.30 below the 20-day EMA, and climbed to the bottom of an upslope support trendline drawn from March 2023 lows.
If XAG/USD buyers reclaim $25.50, that could pave the way to May’s high before challenging the YTD high at $26.08.
Conversely, if sellers stepped in around resistance at $25.50, it could exacerbate a test of the $25.00 mark before dropping to the 20-day EMA. Once cleared, the next support in play would be the February 2 high at $24.63.
XAG/USD Daily Chart
- AUD/SD traders await the Federal Reserve for next cues.
- Bears digging into support in a firm correction.
AUD/USD lept over 1% against the US Dollar on Tuesday after a surprise rate hike by the Reserve Bank of Australia, RBA, reaching a high of 0.6717 from a low in the 0.6620s.
The RBA hiked 25bp to 3.85%. ´´Given our own concerns about the stickiness of services and non-tradable price inflation, plus the robustness in the labor market and the business sector, we expect another 25bp rate hike in August,´´ analysts at ANZ Bank explained.
The RBA began hiking rates back in May 2022 and has made 375 bp of tightening so far. According to analysts at Brown Brothers Harriman, there are ´´no more hikes priced in and the easing cycle is priced to start Q1 2024 with 25 bp of easing seen over the next 12 months and 50 bp over the next 24 months.´´
Meanwhile, the US Dollar is bid ahead of main events of the week that begin Wednesday with the Federal Reserve that began its own tightening cycle in March 2022 with 475 bp of tightening so far. the markets are pricing in another 25 bp with the easing cycle priced to start in November.
´´We expect a 25bp rate hike at next week's FOMC meeting and anticipate that post-meeting communication will: (i) emphasize that disinflation has been evolving slower than expected, leaving open the possibility of additional tightening, and (ii) acknowledge the more uncertain economic environment, especially with regard to credit conditions post SVB collapse,´´ analysts at TD Securities explained.
AUD/SD technical analysis
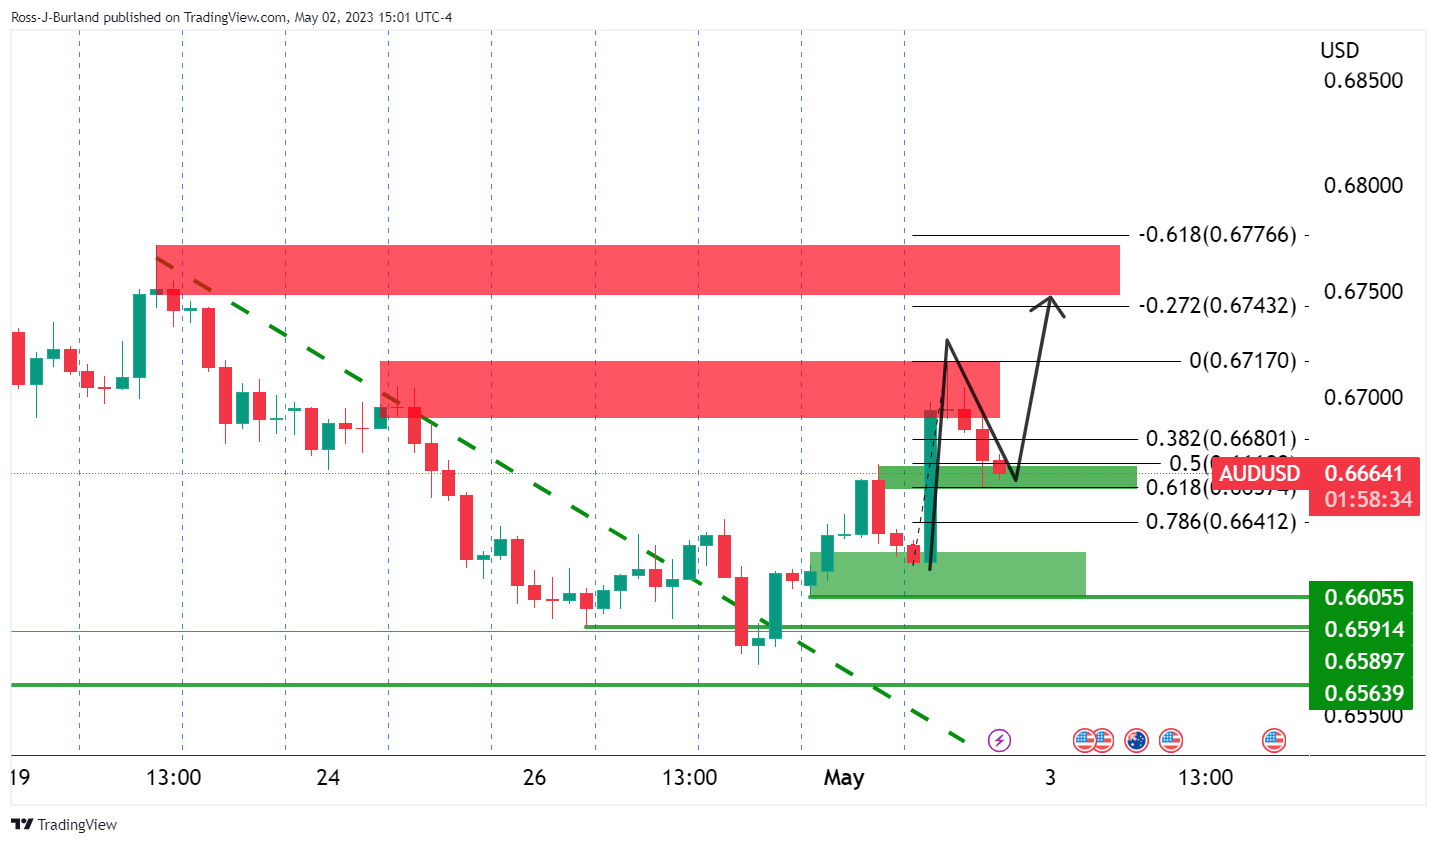
AUD/USD is holding in support but there could be another thrust from the bulls in the coming days with 0.6750 eyed. However, it depends on the outcome of the Federal Reserve and markets will be data-dependent.
- GBP/USD falls on risk-off impulse as the US bank crisis worsens.
- US job openings for March were below estimates, while Factory Orders rose by 0.09% MoM, beating expectations
- GBP/USD Price Analysis: A break below the 20-day EMA leads to the downside, else re-test of the YTD high is likely.
The Pound Sterling (GBP) lost some ground against the US Dollar (USD) spurred by risk aversion amidst growing fears that the banking crisis in the United States (US), while the US debt ceiling theme, take the spotlight ahead of the Federal Reserve (Fed) decision. At the time of typing, the GBP/USD is trading at around the 1.2470-80 areas after dipping towards 1.2435.
Investors mood turning sour, weighed on the Pound Sterling
Sentiment deteriorated, even though JP Morgan acquired the First Republic Bank on Monday. The US bank crisis continues, as the KBW Regional Banking Index, dropped more than 6%, at its lowest level since November 2020.
The GBP/USD dropped on a risk-off impulse, triggered by the US Secretary of Treasure Janet Yellen commenting that her office would not meet all the US government obligations by the beginning of June, wrote in a letter to the US Congress.
Nevertheless, the GBP/USD’s fall was cushioned, as data from the United States (US) revealed by the Bureau of Labor Statistics (BLS) flashed that job openings for March dropped to 9.590 million, below estimates of 9.775 million, according to the JOLTs report. At the same time, the US Department of Commerce revealed that Factory Orders increased by 0.09% MoM, exceeding estimates and distancing from February’s drop of 1.1%.
On the UK front, British factory output and new orders contracted at the beginning of Q2, though the report showed that input costs rose to their weakest level since May 2020.
In the meantime, the GBP/USD uptrend might stall as investors brace for the Fed’s May meeting that ends on Wednesday. Money market futures odds for a 25 bps rate increase are 87.3%. Nevertheless, traders estimate three rate cuts by the end of 2023, contrary to expectations for further tightening by the Bank of England (BoE)
GBP/USD Technical Analysis
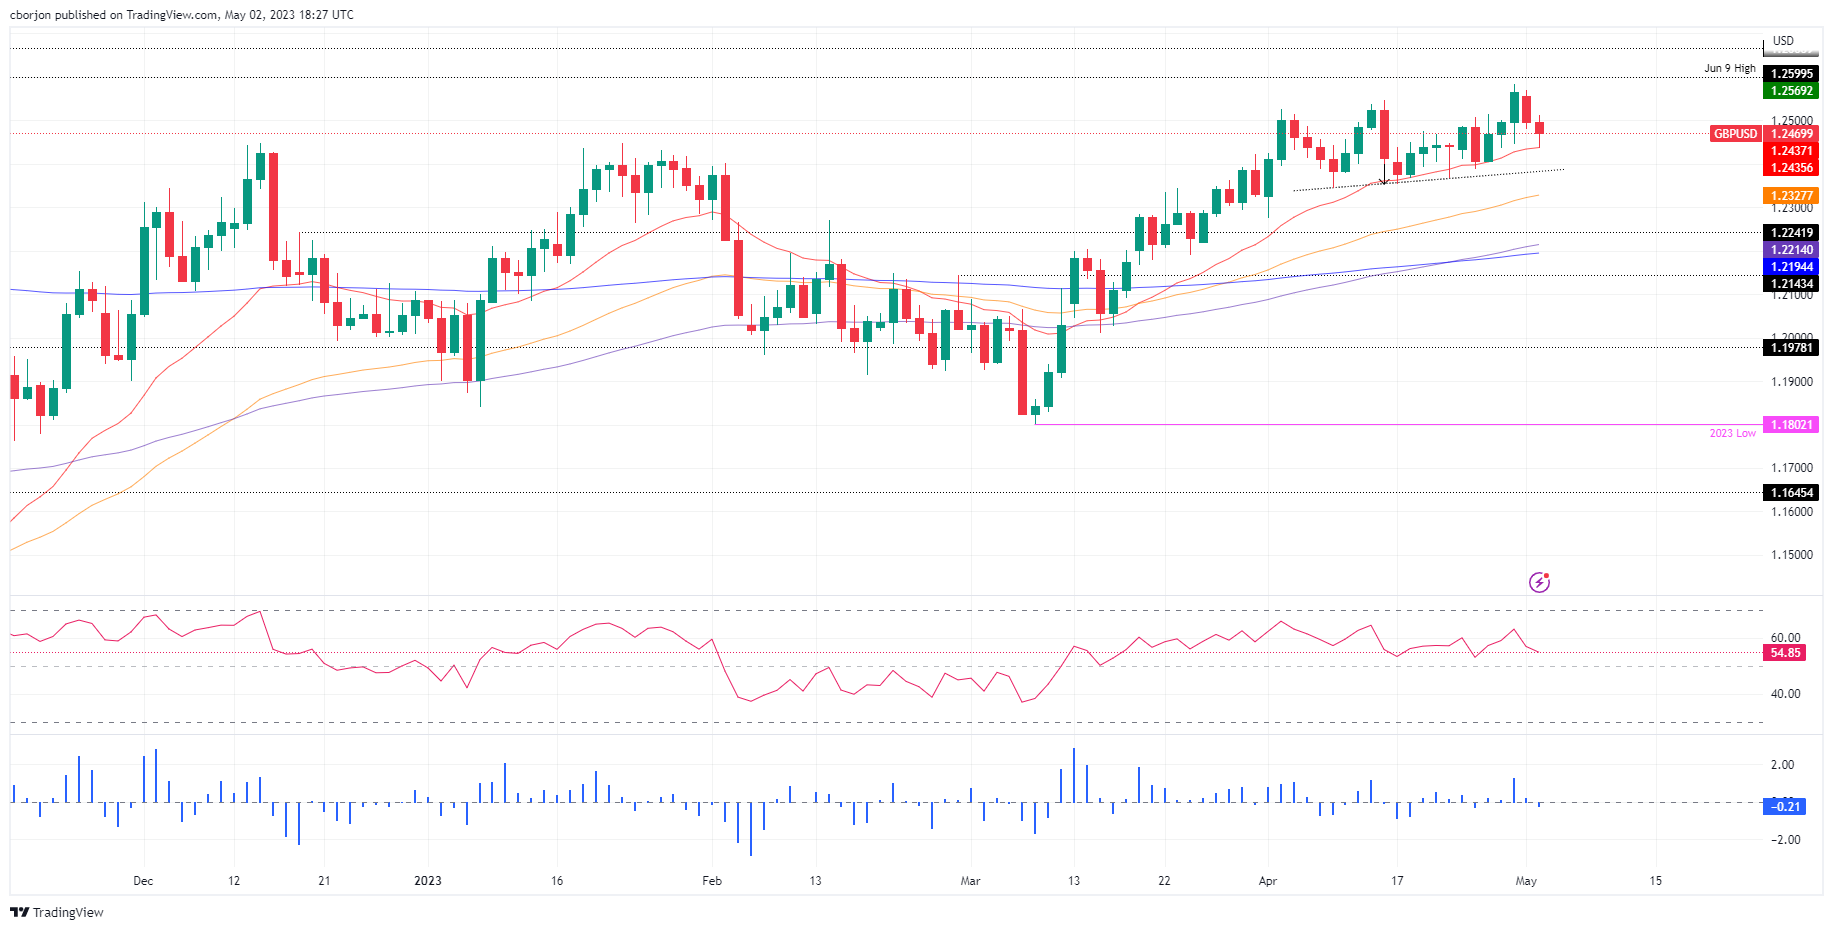
After dipping to a weekly low of 1.2435, the GBP/USD found support at the 20-day Exponential Moving Average (EMA) at 1.2437. Although the pair printed back-to-back bearish candlesticks, a daily close below the latter will exacerbate a fall to the last week’s low, April’s 21 cycle low at 1.2367. Conversely, if GBP/USD buyers reclaim the 1.2500 figure, a re-test of the YTD high at 1.2583 is likely to happen, ahead of 1.2600.
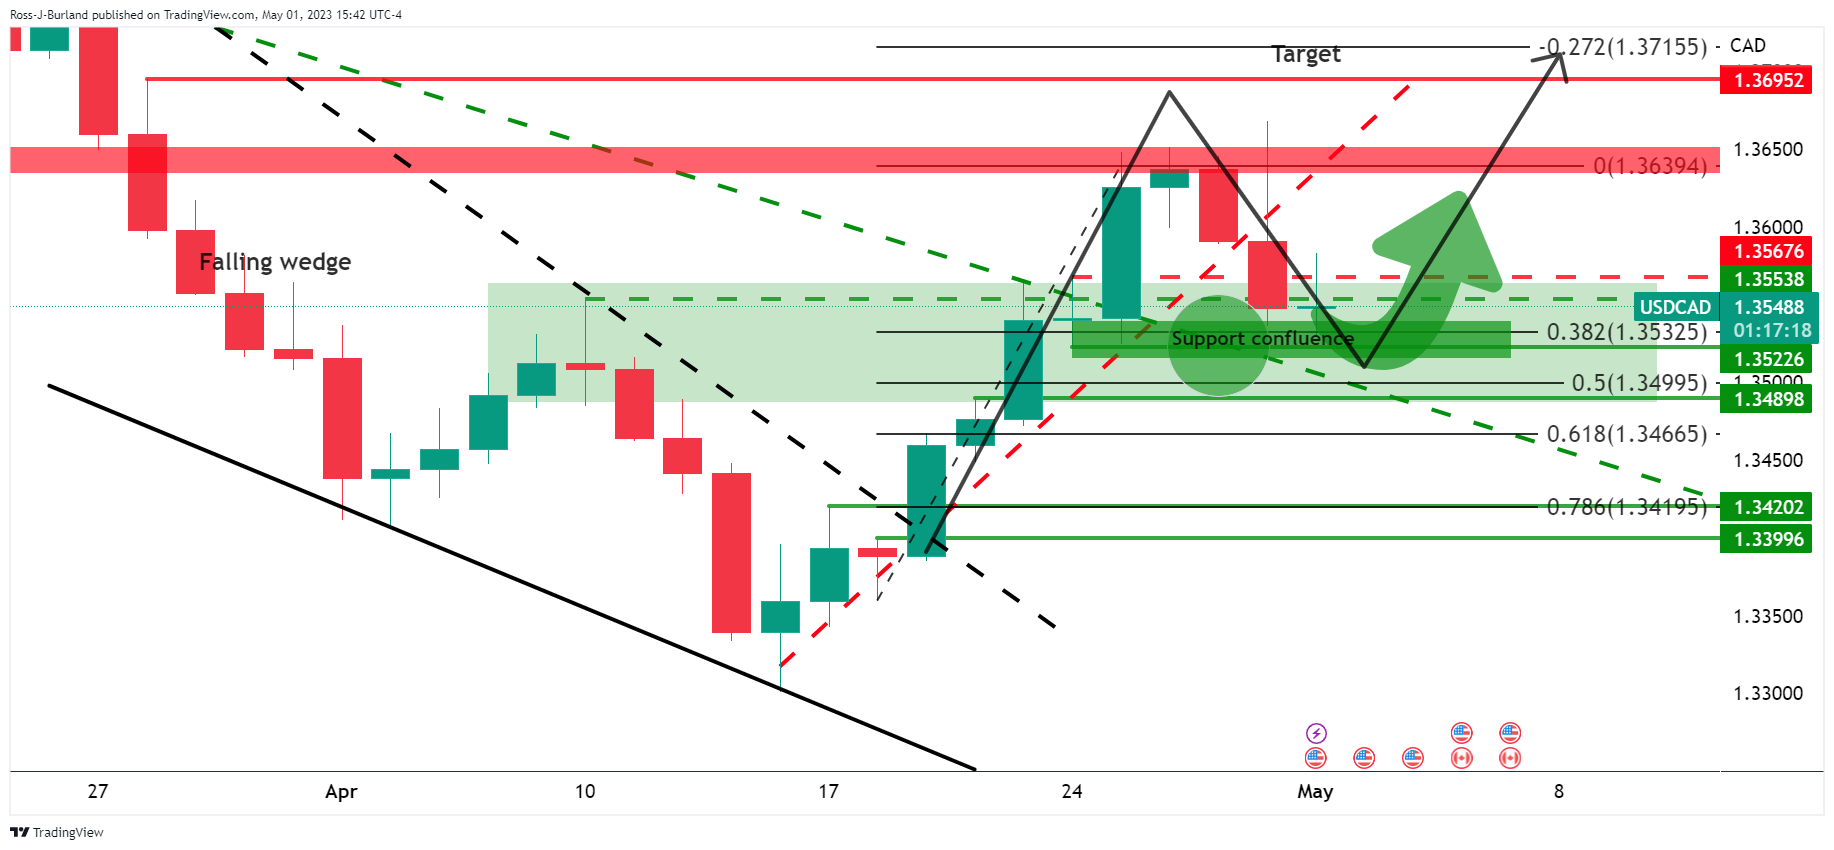
- Bears eye a break of the support line and the horizontal structure around 1.3616.
- Bulls eye a run into 1.3700 as the bullish building blocks stack up.
As per the prior analysis, USD/CAD Price Analysis: Bulls are guarding critical support structures and eye 1.3700, the bulls remain in control and continue to eye a move higher as the following will illustrate.
USD/CAD prior analysis
´´The bulls are starting to engage at the start of the week and the 1.3520s could be key in this regard where the counter trendlñinme support meets horizontal structures as illustrated above.´´
USD/CAD H4 chart
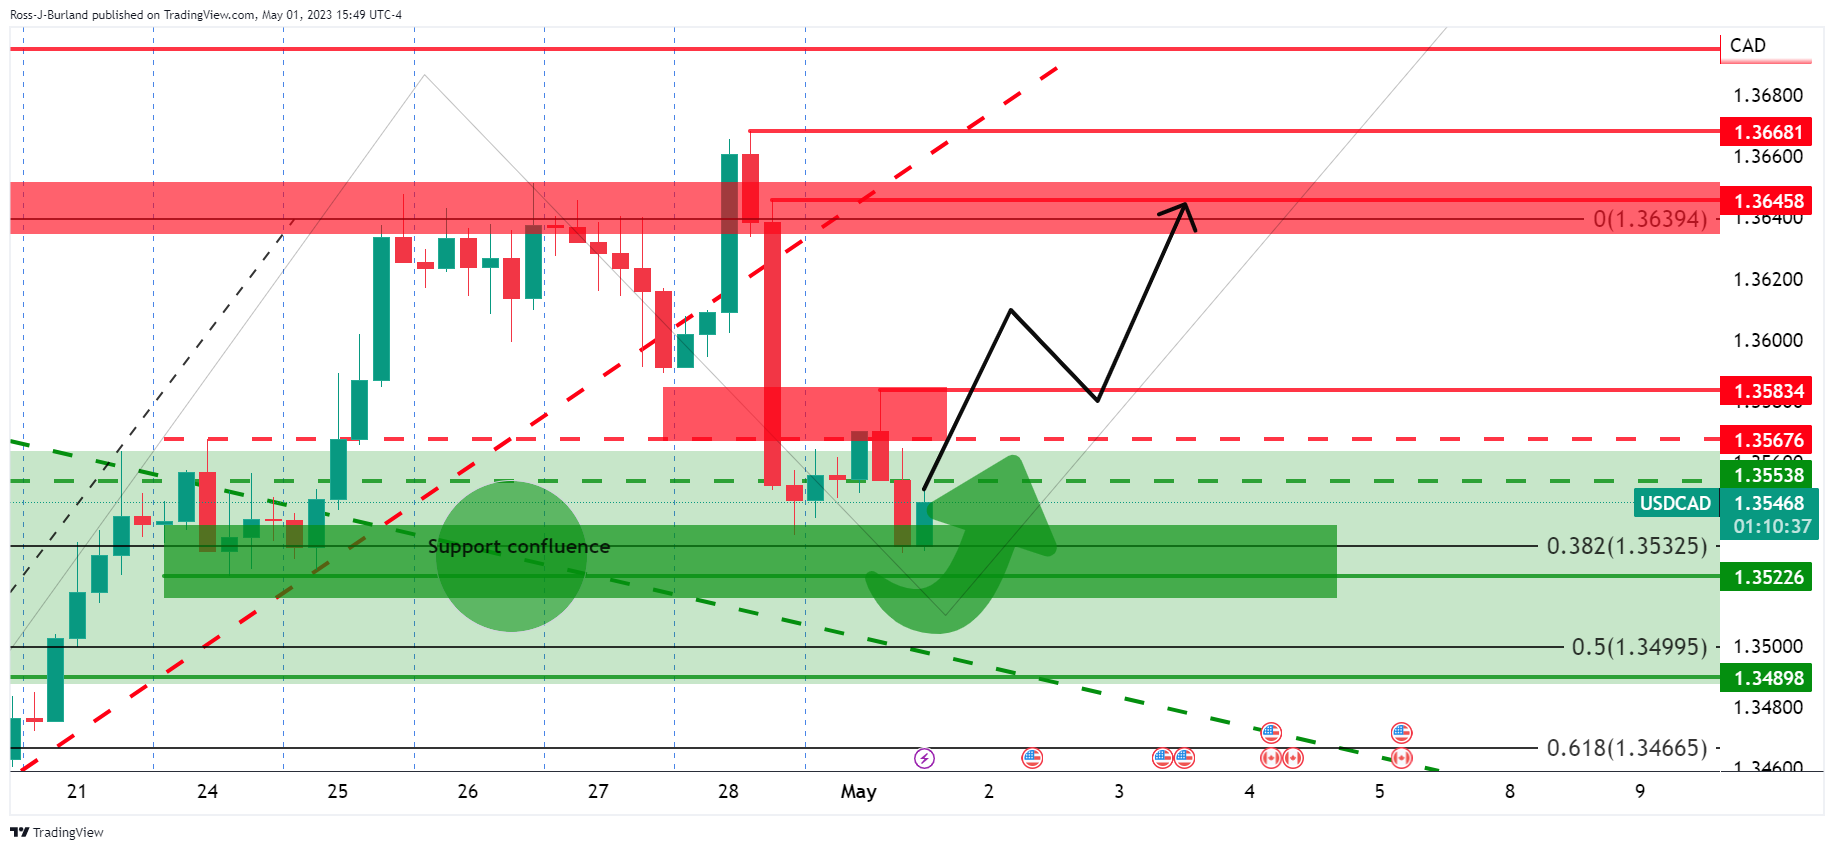
´´On the lower time frames, we can identify key levels as illustrated above. In this regard, the bulls really need to get above the 4-hour 1.3580 structure and then 1.3650-70.´´
USD/CAD live updates
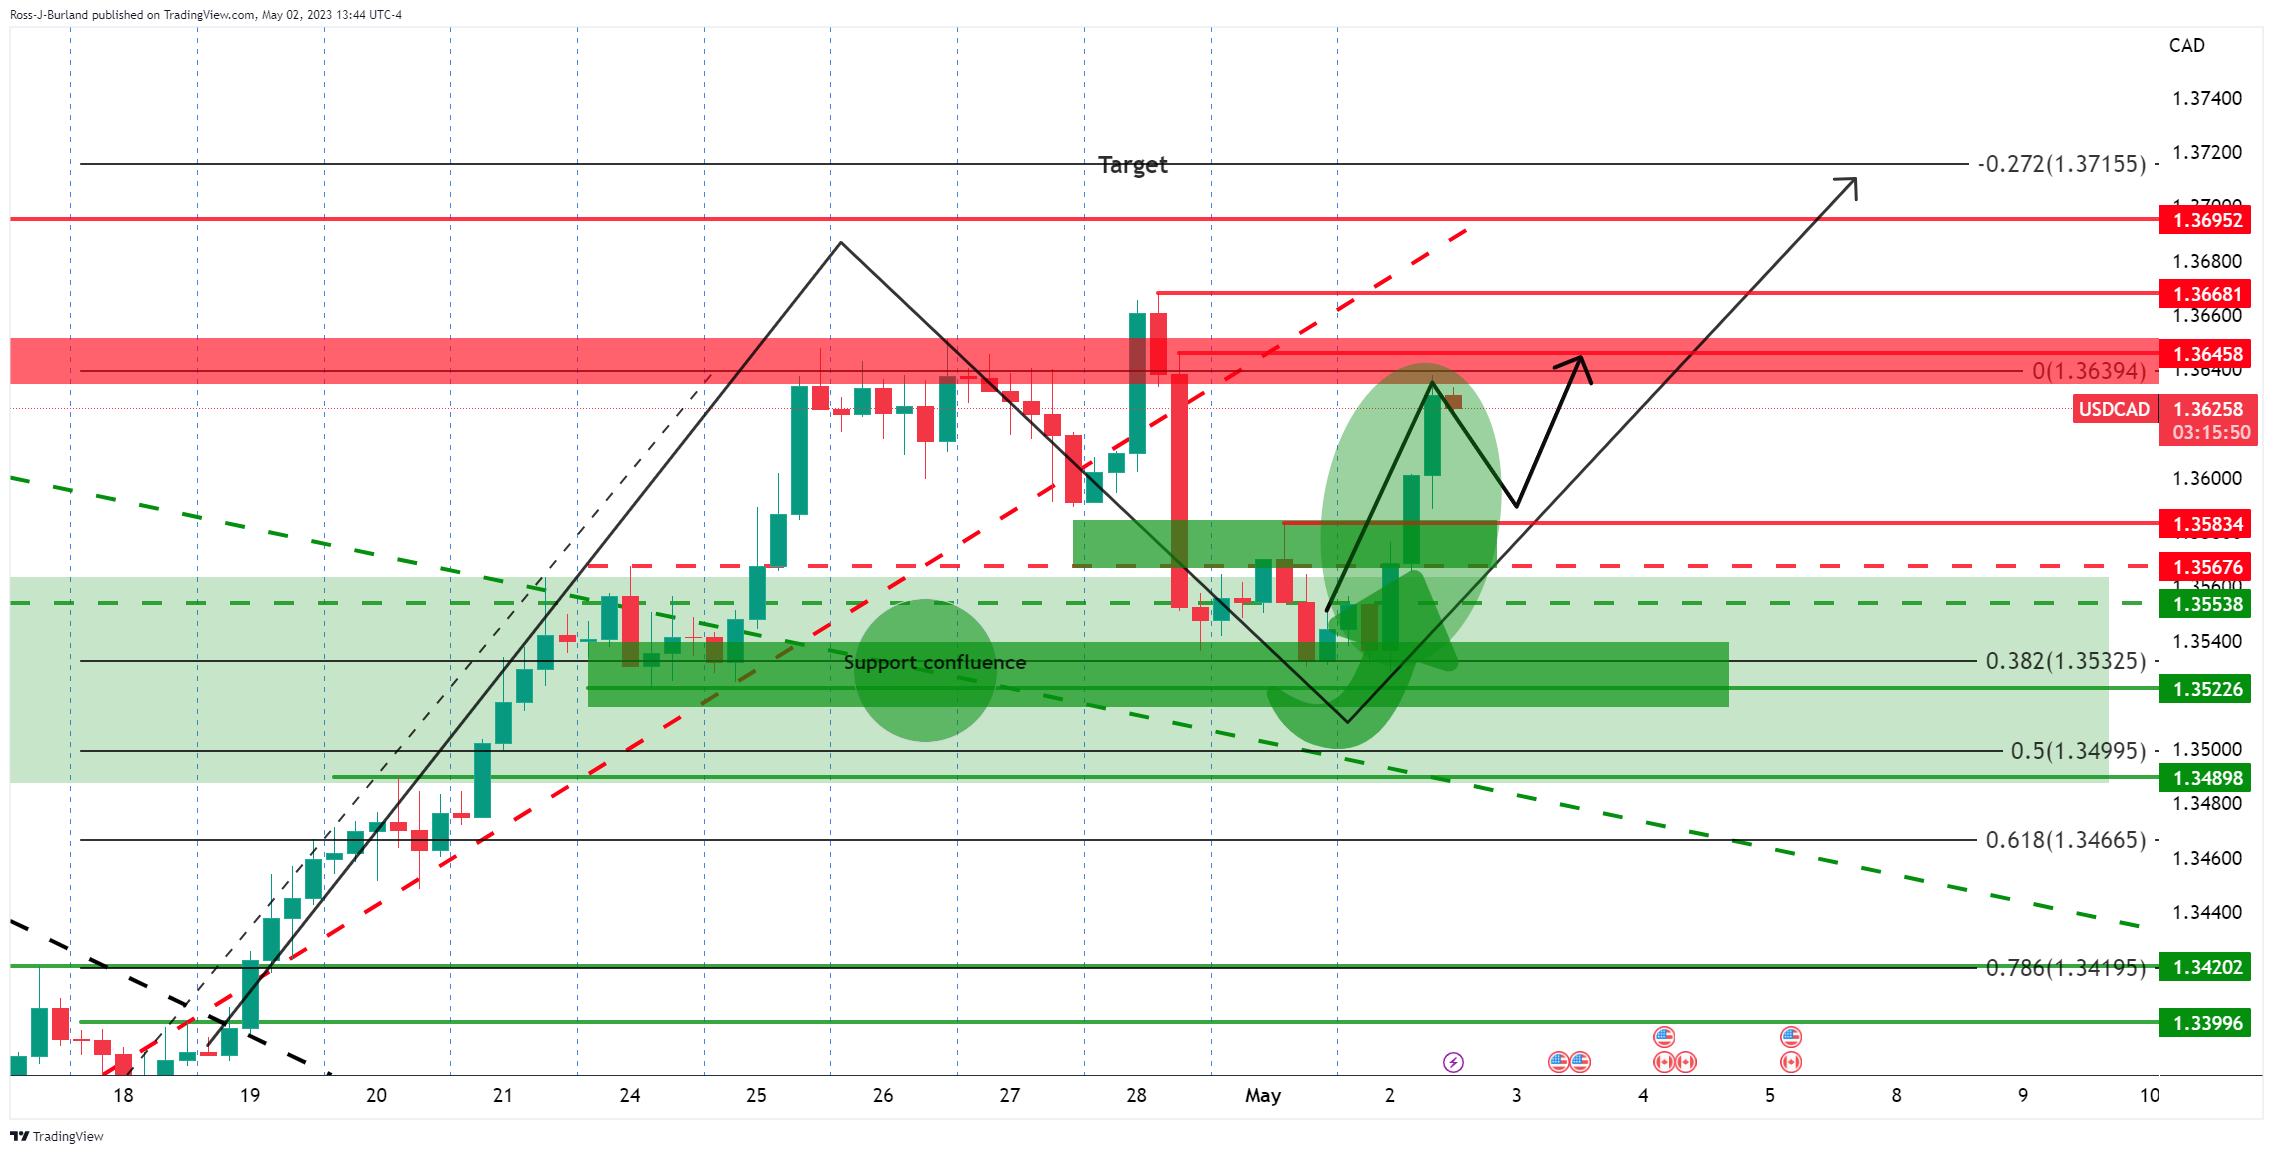
As seen, the market has rallied into the resistance area. A pullback into prior resistance could be on the cards where it meets the 1.3580s.
USD/CAD M15 chart
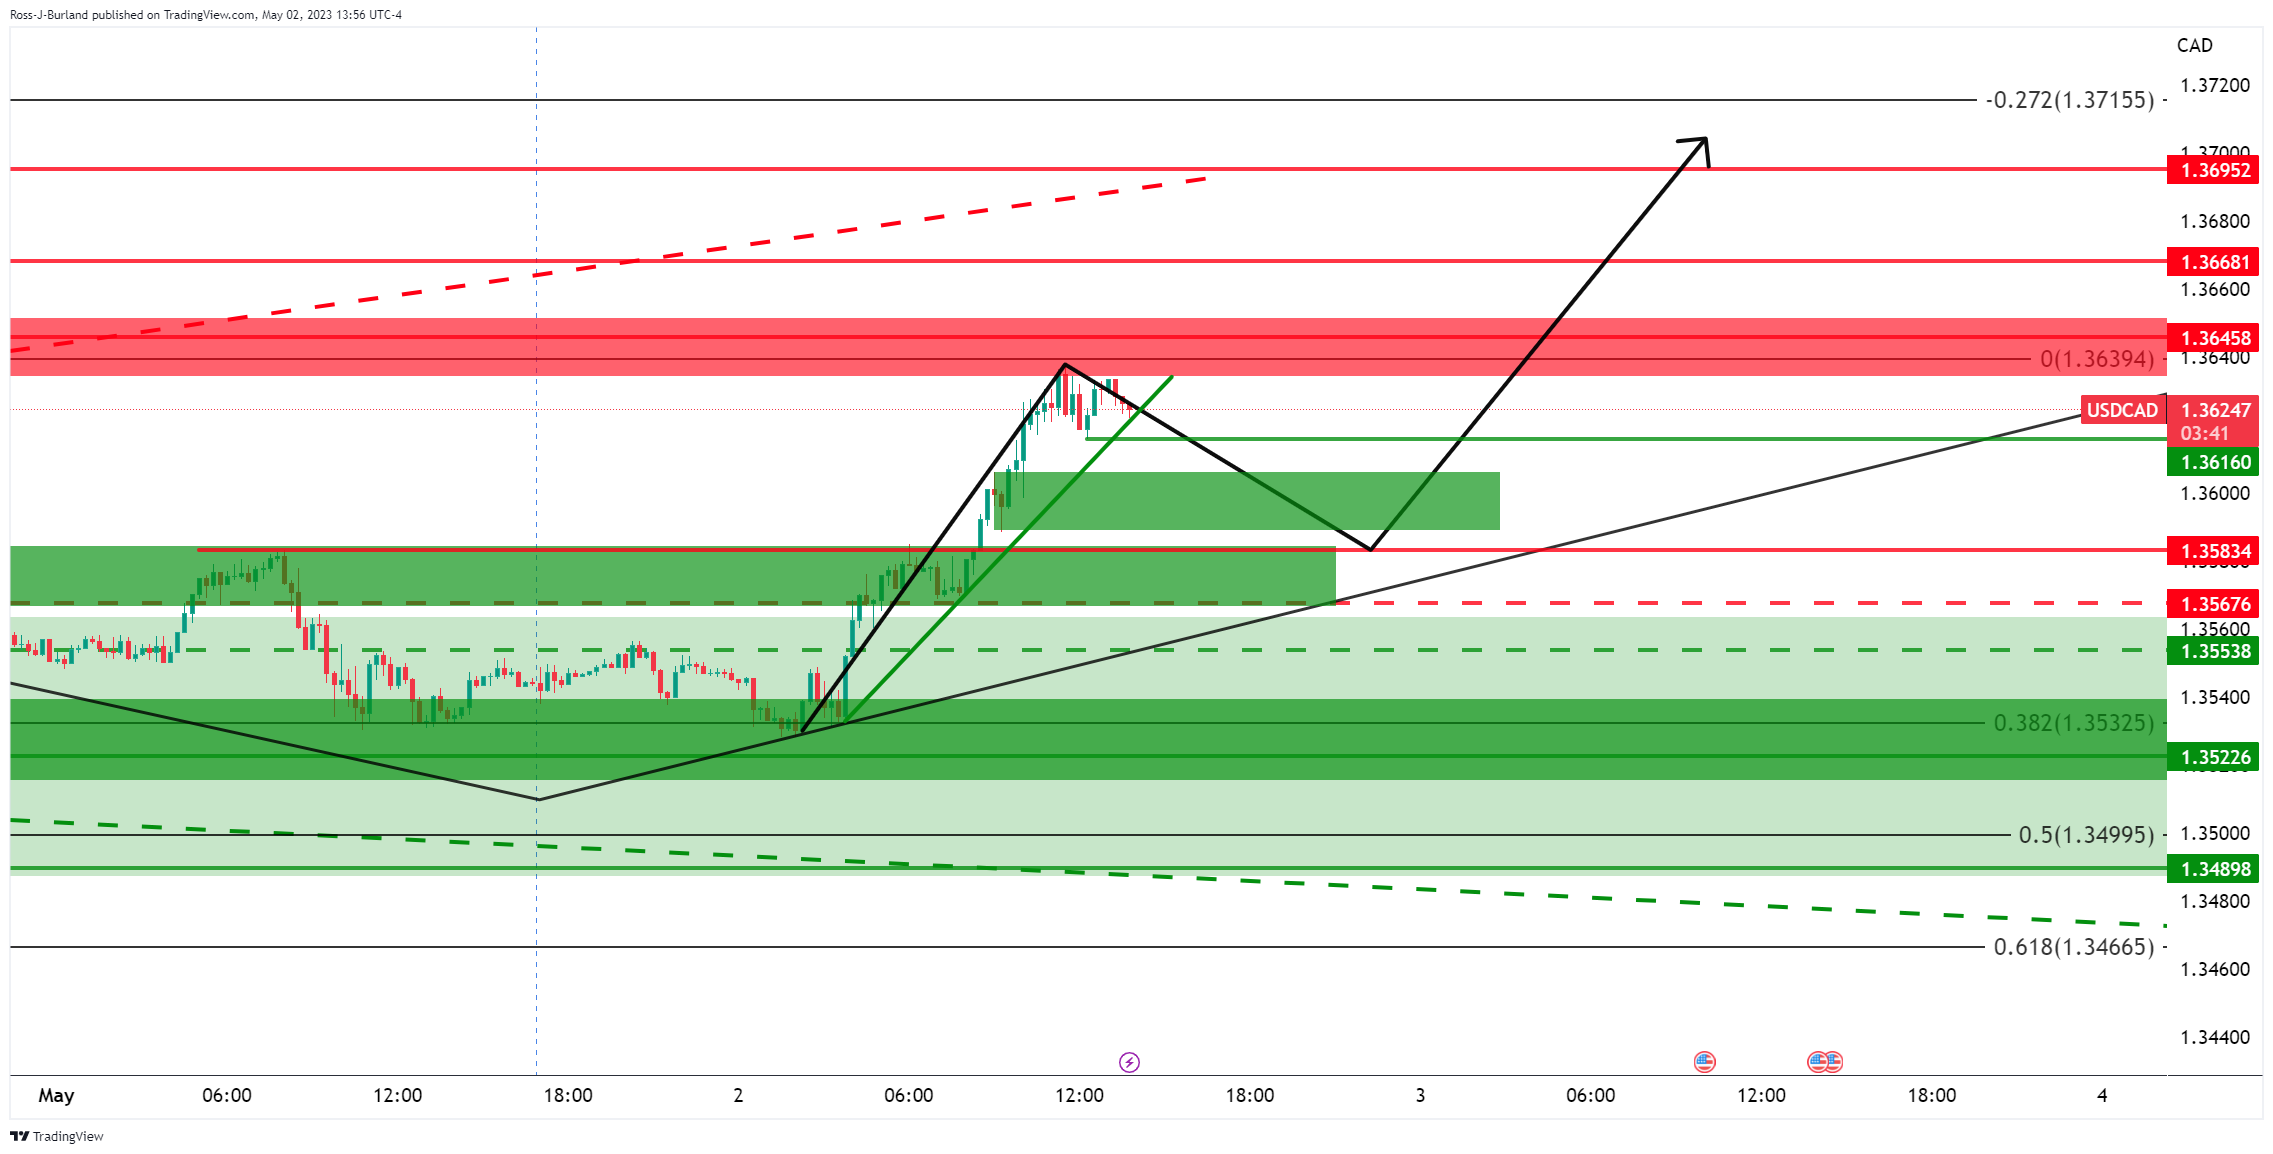
The market is still in an uptrend but a break of the support line and the horizontal structure around 1.3616 could be the signal that the market is headed lower.
- WTI loses ground for a fourth consecutive day as Wall Street reacts to Yellen’s debt obligation warning.
- Oil prices are pressured by weak manufacturing activity in China.
- OPEC production cuts cushioned WTI price amidst economic uncertainty and falling demand.
Western Texas Intermediate (WTI), the US crude oil benchmark, plunges more than 4%, reaching a five-week low, on risk aversion spurred by fears of contagion amongst US regional banks, alongside worries about the debt ceiling in the US. The latest report on business activity in China showed that the economy dipped. Therefore, WTI is trading at $71.99 per barrel, down 4.94%.
WTI extended its losses for four straight days. Wall Street registers losses after US Treasury Secretary Haney Yellen commented that the US government could not pay its debt obligations by June 1.
Oil prices came under pressure as China’s manufacturing activity shrank in April, as the National Bureau of Statistics (NBS) revealed. Manufacturing PMI dropped from 51.9 to 49.2 in April, while the Non-Manufacturing PMI edged down to 56.4 vs. 58.2 in March. The Composite figure stood at 54.4 from 57.0.
Zhao Qinghe, a Senior NBS statistician, said, “A lack of market demand and the high-base effect from the quick manufacturing recovery in the first quarter” was among the factors that led to the contraction in April.”
Reuters cited sources commented, “The unpredictable action of central banks in their mission to tame elevated consumer and producer prices, the rhetoric and action of consuming and producing nations have all cast a rather long shadow of doubt on prospects going forward.”
Two major central banks are expected to hike rates in the week: the Federal Reserve (Fed) and the European Central Bank (ECB).
Aside from this, WTI was cushioned as the Organization of Petroleum Exporting Countries (OPEC) cut its output by 190K bpd in March. The cartel agreed to cut production in late 2022 as the economic outlook worsened. For April, OPEC agreed to cut output by 1.27 million bpd, part of a 2 million reduction by the OPEC+ last year.
WTI Technical Levels
- Japanese Yen rises across the board amid lower US yields and risk aversion.
- Dow Jones falls 1.50%, US 10-year yield drops to 3.44%.
- USD/JPY slides more than a hundred pips after the beginning of the US session.
The Japanese Yen gained momentum during the American session amid risk aversion, causing the USD/JPY to drop from the highest level in seven weeks near 137.75 to 136.36, hitting a fresh daily low.
US regional bank stocks are under pressure on Tuesday, weighing on market sentiment, despite the takeover of First Republic Bank.
US data came in a little softer than expected ahead of Wednesday's FOMC decision. Market participants still expect a 25 basis point rate hike, but bets of a rate cut later in the year have risen during the last hours. The US 10-year Treasury yield is falling more than 4% to 3.43%, while the 2-year fell from 4.14% to 3.94%, reaching the lowest levels since last Thursday.
The decline in government yields is helping the Japanese Yen. Wall Street indexes are falling by more than 1.5%, and the VIX has jumped 20%.
USD/JPY worst day in weeks
The USD/JPY pair is experiencing its largest daily loss in a month. The reversal is occurring from the 200-day Simple Moving Average (SMA), which is presently at 137.00. The next level of support could be found around 136.00, followed by 135.20. If the pair recovers above 137.20, it would ease the current bearish pressure.
Considering current price action in financial markets and upcoming key events such as the FOMC and ECB decisions, as well as the NFP, volatility is expected to remain high.
Technical levels
Data released on Tuesday showed the number of job openings decreased to 9.59 million in March. Analysts at Wells Fargo point out that although still high, this was the lowest level since April 2021.
Key quotes:
“The Job Openings and Labor Turnover Survey (JOLTS) for March offered additional evidence that supply and demand in the labor market are coming into better balance.”
"The quit rate edged lower and the layoffs and discharges rate ticked higher, trends that are consistent with a labor market that continues to incrementally cool.”
“In an absolute sense, the labor market remains tight with openings and quits still above pre-pandemic levels and involuntary separations just getting back to what prevailed in 2018-2019. But a clear trend is emerging, and we expect labor demand to keep receding in the months to come.”
“We look for another step down in the pace of job growth in Friday's employment report, with more weakness to come later this year and into 2024.”
- The gold price jumped over $20.00 on a risk-off impulse, lowering US T-bond yields.
- Sentiment deteriorated as US Treasury Secretary Yellen warns of obligation shortfall.
- US job openings decline for the third consecutive month, as shown by the JOLTs report.
Gold price breaks the barrier of the $2000 figure on woes surrounding a banking crisis in the United States (US) while market players wait for the US Federal Reserve (Fed) decision about raising rates. After hitting a daily low of $1978.58, the XAU/USD exchanges hands at $2008.52, gaining more than 1%.
XAU/USD surges on risk-off impulse on Yellen’s warning about hitting the debt ceiling
Risk aversion was one of the reasons behind the $25.00 gains in Gold. JP Morgan’s acquisition of First Republic Bank easied worries in the banking industry. However, fiscal policy, mainly the rise of the debt ceiling in the US, keeps investors nervous. The US Treasury Secretary Janet Yellen commented in a letter to the US Congress that the office would not meet all US government obligations by June 1.
Aside from this, the US economic agenda revealed that job openings fell for the third straight month in March, though they remained at steady levels. The US Department of Labor (DoL) announced the JOLTs report, which came at 9.590 million, below the 9.775 million estimated by analysts.
In other data, Factory Orders for March jumped to 0.9%, above estimates of 0.8% and better than February’s contraction of 1.1%. Despite Monday’s ISM Manufacturing PMI report in contractionary territory, orders improved.
Additionally, XAU/USD found a bid, sponsored by lower US Treasury bond yields, across the board. US 2-year T-note yields are plunging 20 bps at 3.935%, while the 10-year benchmark note rate yields 3.431%, plummeting 14 bps.
Meanwhile, the Federal Reserve Open Market Committee (FOMC) two-day meeting begins today. The swaps markets, as shown by the CME FedWatch Tool, with traders expecting an 81.8% chance of a 25 bps rate hike to the Federal Funds Rate (FFR). Nevertheless, probabilities for a rate cut, uptick with investors estimating three 25 bps rate cuts by the year’s end.
Ahead of the week, XAU/USD traders await the FOMC’s decision, followed by Fed’s Chair Jerome Powell’s press conference at around 18:30 GMT.
XAU/USD Technical Analysis
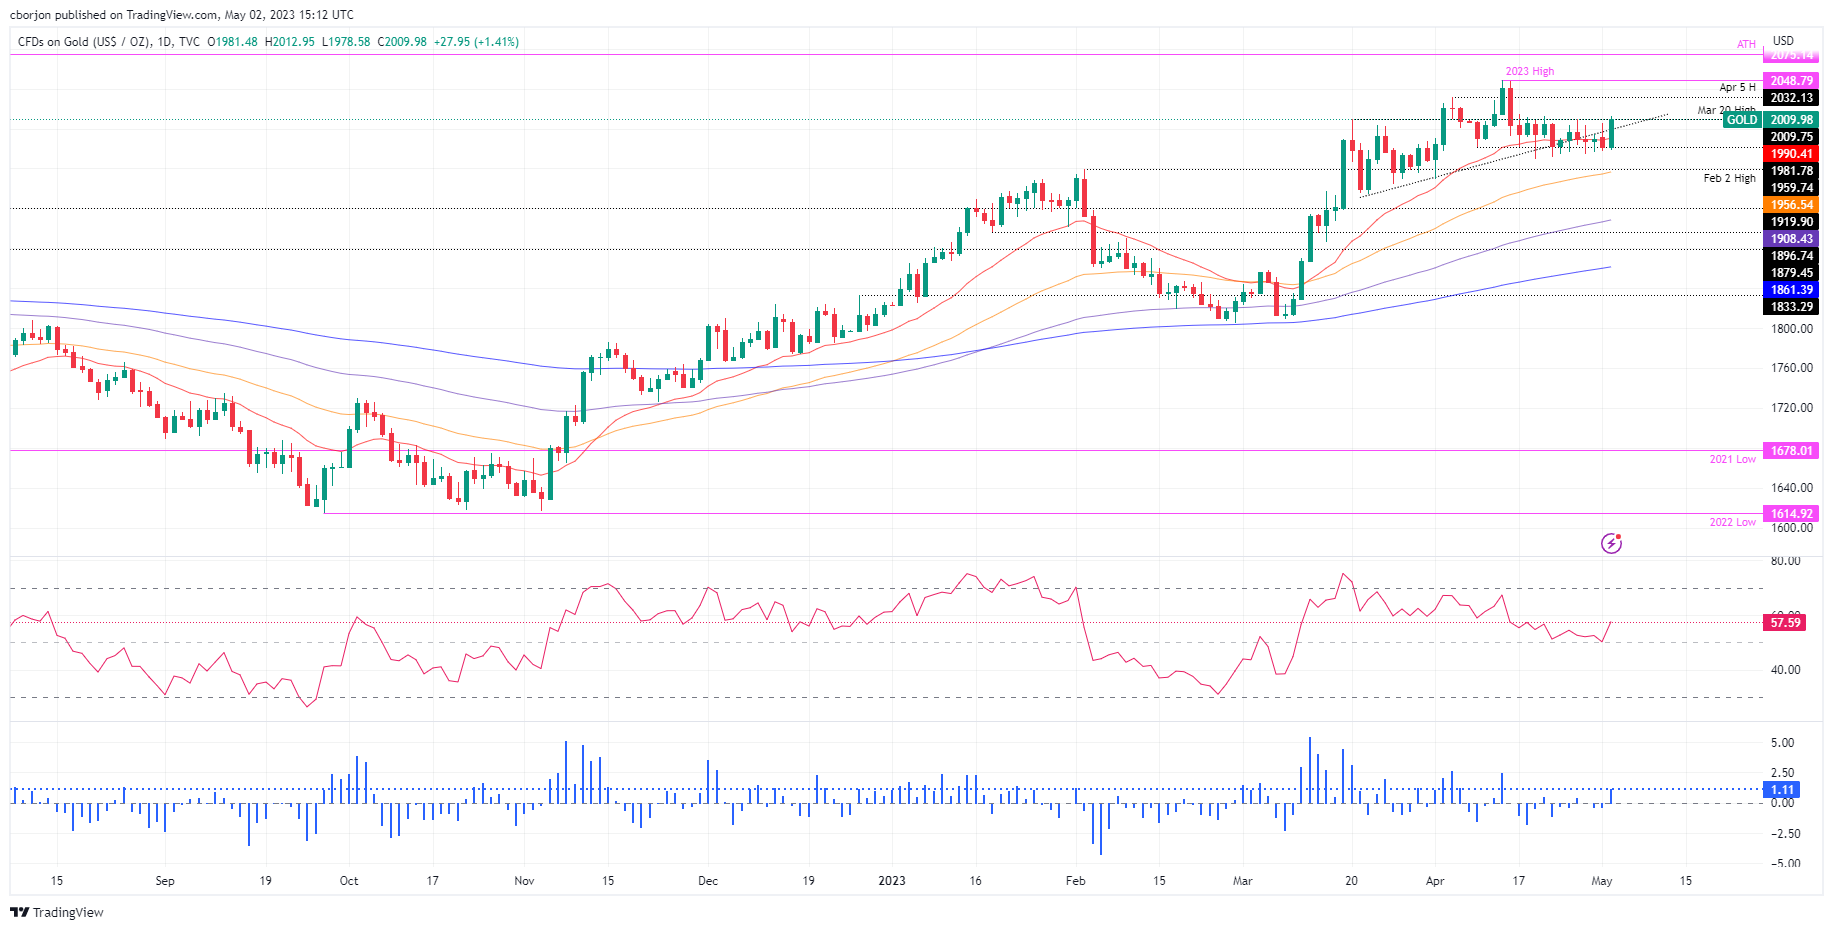
The XAU/USD continued to trade sideways, but the jump above the 20-day EMA at $1990.12 exacerbated a test of the $2000 figure. The Relative Strength Index (RSI) oscillator tested the 50-midline but widened its distance, as it’s aiming up, while the Rate of Change (RoC) confirms that buyers are gathering momentum ahead of the FOMC’s decision. Upwards key resistance levels lie the April 5 high at $2032.13, followed by the YTD high at $2048.79. On the flip side, the $2000 will be the first line of defense for Gold buyers, followed by the 20-day EMA at around $1990.
- US JOLTS comes in below expectations while Factory Orders rise 0.9% versus the expected 0.8%.
- The FOMC meeting kicks off, with a 25 basis points rate hike already priced in.
- EUR/USD turns flat for the day amid a weaker US Dollar.
The EUR/USD erased losses after the release of US economic data, rising from its weekly lows to levels above 1.0970. The pair is now flat for the day, ending a three-day negative streak, ahead of crucial central bank meetings.
Mixed US data after EZ inflation, ahead of FOMC
The final reading of US Factory Orders showed a rise of 0.9% in March, slightly above the market consensus of 0.8%. The JOLTS report showed that "the number of job openings decreased to 9.6 million on the last business day of March," softer than the expected 9.7 million.
The US Dollar lost momentum after the reports, and EUR/USD rebounded rising more than 25 pips. The US Dollar Index is up for the day, trading at 102.25. US yields have plunged to new lows, with the US 10-year yields falling to 3.47% and the 2-year to 4.04%.
Attention now turns to the central banks. The FOMC will announce its decision on Wednesday, with a 25 basis point rate hike already priced in, while the European Central Bank (ECB) will have its meeting on Thursday. Prior to the FOMC, ADP will release its employment report on Wednesday.
Short-term outlook
The EUR/USD pair currently holds a bearish bias in the short term and is challenging an important support level around 1.0950. It bottomed on Tuesday at 1.0941, the lowest level since April 21, but has since bounced back toward 1.0980.
If the Euro recovers levels above 1.0970, it could change the intraday bias to positive; resistance levels above are located at 1.0990 and 1.1005. Under 1.0950, further weakness seems likely, with the next crucial support level at 1.0930.
Technical levels
- JOLTS Job Openings in the US continued to decline in March.
- US Dollar Index holds above 102.00 in the American session.
The data published by the US Bureau of Labor Statistics (BLS) revealed on Tuesday that the number of job openings on the last business day of March stood at 9.59 million, compared to 9.97 million in February. This reading came in below the market expectation of 9.77 million.
"Over the month, the number of hires and total separations were little changed at 6.1 million and 5.9 million, respectively," the BLS further noted in its publication. "Within separations, quits (3.9 million) changed little, while layoffs and discharges (1.8 million) increased."
Market reaction
The US Dollar Index showed no immediate reaction to this data and was last seen rising 0.1% on the day at 102.21.
- Factory Orders in the US rose more than expected in March.
- US Dollar Index stays in positive territory above 102.00.
The data published by the US Census Bureau revealed on Tuesday that new orders for manufactured goods, Factory Orders, increased $4.9 billion, or by 0.9%, to $539 billion in March. This print followed February's decline of 1.1% and came in slightly better than the market expectation for an increase of 0.8%.
"New orders for manufactured durable goods in March, up following two consecutive monthly decreases, increased $8.5 billion or 3.2 percent to $276.2 billion, unchanged from the previously published increase," the publication further read.
Market reaction
The US Dollar Index clings to modest daily gains above 102.00 after this data.
Analysts at Nordea offer their take on the flash Eurozone CPI print released earlier this Tuesday, showing that the Harmonized Index of Consumer Prices (HICP) edged higher to 7% YoY rate in April from 6.9% and the Core HICP ticked down to 5.6%.
Key quotes:
“Inflation remains much too high and while base effects from last year’s energy price increases will lead to lower headline inflation in the coming months, core inflation remains a huge concern at the ECB. The economic outlook is weak, which was underscored by banks reporting lower loan demand and by Q1 GDP, but the banking stress at the end of Q1 does not seem to have added to expectations of faster tightening of credit conditions. Thus, the ECB has more ground to cover and the preview for the May ECB meeting on Thursday with a 25bp policy rate hike and hawkish comments still stands. Further ahead, the ECB probably needs to see a clear improvement in the outlook for core inflation or a significant weakening of the economic outlook to stop hiking rates. Our baseline forecast has three more 25bp rate hikes including one this week.”
The Global Strategy Team at TD Securities (TDS) offers a brief preview of the upcoming release of the quarterly employment details from New Zealand, scheduled during the Asian session on Wednesday.
Key quotes:
“We expect labour market tightness to show signs of easing in Q1, with the unemployment rate edging higher to 3.6% (RBNZ: 3.5%) from 3.4% in the previous quarter. We expect some disruption to the jobs market in Q1 given the impact of Cyclone Gabrielle and see flat employment growth over the quarter. However, a fall in the participation rate could help cap a rise in the unemployment rate. We expect private wages to rise at a still-firm pace of 1.0% q/q, bringing the annual increase in the Labour Cost Index (LCI) to 4.6% y/y, a new record. After its surprise 50bps hike, the RBNZ has shown its resolve to tame inflation and a softer labour market print may not be enough to dissuade them from hiking another 25bps in May.”
Senior Economist at UOB Group Alvin Liew assesses the latest BoJ event.
Key Takeaways
“The Bank of Japan (BOJ) kept its policy measures unchanged at the Apr Monetary Policy Meeting (MPM) helmed by new BOJ Governor Ueda. The decision was unanimous, as the BOJ kept steadfastly to its easing stance but made adjustments to its forward guidance in the MPM statement via, 1) removal of the reference to Covid-19, and more importantly, 2) scrapping the forward guidance on interest rates. The BOJ also announced it will be conducting a broad perspective review of BOJ’s monetary policy which will take 1 to 1.5 years.”
“The revisions in the latest Apr 2023 Outlook for economic activity and prices (The Bank’s View) were more about trimming GDP growth further in FY2022 to FY2024 while making material upward adjustments to the price forecasts during the same period. According to BOJ, the growth downgrades in FY 2022 and FY2023 were due to weaker private consumption projections, while the upward inflation revisions for FY2023 and FY2024 were due to “higher projections for wages”. It is noted that FY2024 CPI inflation forecast was revised higher to 2.0% (from previous estimate of 1.8%), touching the BOJ price objective.”
“BOJ Outlook – Buying Time With Broad Policy Review, So No Change To Negative Rates & YCC In The Interim: While there were already various segments of the markets speculating that one of the first course of actions under Governor Ueda could be undertaking a policy review, the announcement of one that would span between 12 and 18 months still came as a surprise. With the policy review now in place, this has likely secured “policy inaction” in the interim. This also reinforces our belief that policy normalisation/unwinding under Governor Ueda will be carried out at a gradual, well-telegraphed pace, and not a sharp and sudden reversal. We had expected to see it in two broad steps, 1) protracted adjustment to its forward guidance on YCC and interest rates (Apr to Dec 2023) and 2) scrapping of YCC and lifting of the negative policy rate in early 2024. With the broad perspective policy review, there is now the possibility of an even longer runway (till Apr 2024) before any material policy unwinding will take place.”
Economists at BBH offer a brief insight into the US Dollar price action and a preview of the highly-anticipated FOMC policy meeting starting this Tuesday.
Key quotes:
“DXY is trading higher for the fourth straight day near 102.294, the highest since April 11 and on track to test the April 10 high near 102.807. Break above that would set up a test of the April 3 high near 103.058.”
“The Reserve Bank of Australia sent a message that should reverberate across global markets. By hiking rates unexpectedly today, the RBA action underscored just how difficult it is proving to get stubbornly high inflation back to target. Simply put, it is obvious that interest rates around the world will go higher for longer. It’s really that simple and so any notions of quick monetary policy pivots are misguided. We believe that any easing by the major central banks is a 2024 story. Period. In particular, we continue to believe that the markets are underestimating the Fed’s capacity to tighten policy and to then keep it there for an extended period. This should be a huge, huge wakeup call for investors that have become way too complacent about a Fed pivot.”
“Chair Powell acknowledged that the Fed considered a pause but added that it was too soon to say how Fed policy has been impacted by the banking crisis. We think that still holds true now and so we expect the Fed to leave the door wide open to further hikes. Updated forecasts and Dot Plots will come at the June meeting, which we believe is more in play than markets believe. Of note, WIRP now suggests 25% odds of another hike June 14 and we think this is likely to move higher. Yet the market is still pricing in a cut by year-end and we continue to view this as highly unlikely.”
- EUR/USD extends the leg lower and retests the mid-1.0900s.
- The weekly low near 1.0910 awaits in case losses pick up pace.
EUR/USD loses the grip and drops to multi-session lows near 1.0950 on turnaround Tuesday.
The continuation of the corrective retracement should not be ruled out in the very near term. That said, the next support of note emerges at the weekly low at 1.0909 (April 17) ahead of another weekly low at 1.0831 (April 10).
Looking at the longer run, the constructive view remains unchanged while above the 200-day SMA, today at 1.0420.
EUR/USD daily chart
- USD/CAD rebounds swiftly from the 100 DMA, a one-week low touched this Tuesday.
- Sliding Oil prices undermines the Loonie and lends support amid a modest USD uptick.
- Bets for another 25 bps Fed rate hike and a softer risk tone benefit the safe-haven buck.
The USD/CAD pair attracts fresh buying near the 100-day Simple Moving Average (SMA) for the second successive day and stages a solid recovery from a one-week low, around the 1.3530-1.3525 region touched this Tuesday. The intraday positive move lifts spot prices to the 1.3600 neighbourhood during the early North American session and is sponsored by a combination of factors.
Crude Oil prices remain under some selling pressure for the second straight day and languish near a one-month low touched last week amid worries about economic headwinds stemming from rising borrowing costs, which might dent fuel demand. This, in turn, is seen undermining the commodity-linked Loonie and acts as a tailwind for the USD/CAD pair. The US Dollar (USD), on the other hand, touches a fresh two-week high amid the prospects for additional intraday rate hikes by the Federal Reserve (Fed) and provides an additional boost to the major.
In fact, the markets now seem to have fully priced in another 25 bps rate hike at the end of the two-day meeting on Wednesday. Moreover, the US ISM report released on Monday showed that there was a build-up of inflation pressures last month and kept alive the possibility of a further hike in June. This, along with looming recession fears and a generally weaker tone around the equity markets, further benefit the Greenback's relative safe-haven status and remains supportive of the USD/CAD pair's strong intraday rally of around 75 pips.
Next on tap is the release of the JOLTS Job Openings and Factory Orders data from the US. Apart from this, the broader risk sentiment will drive the USD demand and provide some impetus to the USD/CAD pair. Traders will further take cues from Oil price dynamics to grab short-term opportunities. The focus, however, will remain glued to the highly-anticipated FOMC decision, which, along with the US monthly employment details (NFP) on Friday, will help investors to determine the next leg of a directional move for the major.
Technical levels to watch
- USD/JPY edges lower on Tuesday, albeit lacks any follow-through selling.
- A softer risk tone underpins the JPY and acts as a headwind for the pair.
- The Fed-BoJ policy divergence lends support and helps limit the downside.
The USD/JPY pair pulls back from a nearly two-month high, around the 137.75-137.80 region touched earlier this Tuesday and remains on the defensive heading into the North American session. The pair is currently placed just below the mid-137.00s, down less than 0.10% for the day, and seems poised to prolong its recent appreciating move.
A softer risk tone drives some haven flows towards the Japanese Yen (JPY) and is seen as a key factor exerting some downward pressure on the USD/JPY pair amid subdued US Dollar (USD) price action. In fact, the USD Index (DXY), which tracks the Greenback against a basket of currencies, struggles to capitalize on its intraday uptick to a two-week high touched on Tuesday. A fresh leg down in the US Treasury bond yields, dragged down by expectations that the Federal Reserve (Fed) will signal a pause in its policy-tightening cycle, acts as a headwind for the buck.
The markets, however, have fully priced in another 25 bps rate hike at the end of the two-day policy meeting on Wednesday. Moreover, the US ISM report released on Monday showed that there was a build-up of inflation pressures last month data kept alive the possibility of a further hike in June and continue to lend support to the Greenback. This marks a big divergence in comparison to the Bank of Japan's (BoJ) dovish stance, which supports prospects for the emergence of some dip-buying around the USD/JPY pair and should help limit the downside.
Even from a technical perspective, the overnight sustained move and close above the very important 200-day Simple Moving Average (SMA) add credence to the near-term positive outlook. Bullish traders, however, might refrain from placing aggressive bets ahead of the highly-anticipated FOMC monetary policy decision on Wednesday. The focus will then shift to the release of the closely-watched US monthly employment details, popularly known as the NFP report on Friday, which should help determine the near-term trajectory for the USD/JPY pair.
Technical levels to watch
Extra losses in USD/IDR should meet tough contention around 14,440 for the time being, notes Markets Strategist Quek Ser Leang at UOB Group.
Key Quotes
“USD/IDR dropped to a low of 14,620 last week. Downward momentum is building and USD/IDR is likely to weaken further.”
“However, oversold conditions suggest any decline is likely to be at a slower pace and is unlikely to break the major support at 14,440. Resistance is at 14,790; a breach of 14,880 would indicate that the weakness in USD/IDR has stabilized.”
- DXY extends the breakout of the 102.00 level on Tuesday.
- The continuation of the bounce could see 102.80 revisited.
DXY maintains the recovery well in place for the fourth consecutive session and looks to consolidate the recent breakout of the 102.00 hurdle on Tuesday.
If the index breaks above the current range bound trade, it could then confront the weekly high at 102.80 (April 10) prior to the April peak at 103.05 (April 3), an area still propped up by the provisional 55- and 100-day SMAs.
Looking at the broader picture, while below the 200-day SMA, today at 106.03, the outlook for the index is expected to remain negative.
DXY daily chart
- Pound Sterling vs US Dollar falls back after US bank rescue means Fed will almost certainly hike interest rates on Wednesday.
- Bearish two-bar reversal pattern suggests short-term downside pressure for GBP/USD.
- JOLTS Job Openings the main data release ahead of May’s FOMC meeting.
The Pound Sterling (GBP) continues bleeding against the US Dollar (USD) during the European session on Tuesday, as USD gains support from the news of the emergency rescue of First Republic Bank over the weekend. This calms markets and suggests the Federal Reserve is much more likely to hike rates at its meeting concluding Wednesday.
From a technical perspective, the GBP/USD pair continues to pull back from new year-to-date highs in the 1.2580s formed on April 28, and forms a two-bar reversal pattern that bodes follow-through lower in the very short-term, though the overarching trend remains bullish.
GBP/USD market movers
- The US Dollar gains support from the news that JP Morgan has come to the rescue of troubled US regional lender, First Republic Bank (FRB), as it will buy up FRB after fears it would be taken over by the Federal Deposit Insurance Corporation (FDIC) over the weekend.
- The US Dollar is still supported by high-than-expected PCE inflation data – the Federal Reserve’s preferred inflation gauge – after last week’s data showed prices remain sticky in the United States.
- Expectations have crystallized for a 25 bps rate hike by the Federal Reserve (Fed) at the upcoming FOMC meeting on Wednesday May 3 – according to Feds Funds Futures data, probabilities for a quarter percent hike have risen from the 85% last week to 97% at the time of writing.
- That said, data for March continued to show UK inflation above 10% for the seventh consecutive month suggesting the Bank of England (BoE) is far from done with putting up interest rates.
- This contrasts with the US Federal Reserve (fed) which is seen nearing the end of its rate-hiking cycle. The prospect of comparatively higher UK interest rates, therefore, favors the Pound Sterling over the Greenback, since it will attract more capital inflows.
- GBP gains underpinning support from an unexpected MoM rise in UK house prices by 0.5% in April versus the negative figure expected, according to data from the UK’s biggest mortgage lender, Nationwide.
- Data from the Commodity Futures Trading Commision (CFTC) shows speculative investor flows have become increasingly supportive of the Pound over recent weeks, with non-commercial traders increasing their long bets above those of commercial traders who have been increasing short bets.
- JOLTS jobs reports data for March, scheduled for release at 14:00 GMT, could impact on the pair. After the release of last month’s JOLTS, for example, the US Dollar declined in as job openings fell from 10.4M to 9.9M.
GBP/USD technical analysis: Correcting within an uptrend
GBP/USD has been a broad sideways trend since the beginning of the year within a longer-term uptrend that began at the September 2022 lows. Despite the volatile ups and downs of recent months, the pair did manage to make new higher highs in the upper 1.25s in late April and the overall trend remains marginally bullish. Thus, Pound Sterling longs are marginally favored over shorts.
-638186242299271023.png)
GBP/USD: Daily Chart
That said, a pullback may be unfolding at the moment after a two-bar bearish reversal pattern formed at the recent highs. Two-bar reversals are fairly reliable patterns which occur when a long green full-bodied candle that makes new highs as formed on April 28 is immediately reversed the following day by a long red-down candle of a similar length. They are bearish short-term signals.
It is possible the two-bar pattern will now be followed by a leg lower which could see GBP/USD retest the 1.2350 April-range lows.
Given the dominant trend remains bullish-to-sideways, however, pressure to the upside is likely to re-emerge, and could see the price recover and rally, before breaking to fresh highs.
A decisive break above the year-to-date 1.2583 highs of April 28, would probably lead to a continuation higher to the next key resistance level at circa 1.2680.
Decisive breaks are usually characterized by moves that begin with a strong green daily bar that breaks above the ceiling or resistance level, with price closing near the highs, or, alternatively by three green consecutive bars forming that break above the ceiling or resistance level. These provide added confirmation that the break is not a ‘false break’ or bull trap.
Pound Sterling FAQs
What is the Pound Sterling?
The Pound Sterling (GBP) is the oldest currency in the world (886 AD) and the official currency of the United Kingdom. It is the fourth most traded unit for foreign exchange (FX) in the world, accounting for 12% of all transactions, averaging $630 billion a day, according to 2022 data.
Its key trading pairs are GBP/USD, aka ‘Cable’, which < href="https://fxssi.com/the-most-traded-currency-pairs">accounts for 11% of FX, GBP/JPY, or the ‘Dragon’ as it is known by traders (3%), and EUR/GBP (2%). The Pound Sterling is issued by the Bank of England (BoE).
How do the decisions of the Bank of England impact on the Pound Sterling?
The single most important factor influencing the value of the Pound Sterling is monetary policy decided by the Bank of England. The BoE bases its decisions on whether it has achieved its primary goal of “price stability” – a steady inflation rate of around 2%. Its primary tool for achieving this is the adjustment of interest rates.
When inflation is too high, the BoE will try to rein it in by raising interest rates, making it more expensive for people and businesses to access credit. This is generally positive for GBP, as higher interest rates make the UK a more attractive place for global investors to park their money.
When inflation falls too low it is a sign economic growth is slowing. In this scenario, the BoE will consider lowering interest rates to cheapen credit so businesses will borrow more to invest in growth-generating projects.
How does economic data influence the value of the Pound?
Data releases gauge the health of the economy and can impact the value of the Pound Sterling. Indicators such as GDP, Manufacturing and Services PMIs, and employment can all influence the direction of the GBP.
A strong economy is good for Sterling. Not only does it attract more foreign investment but it may encourage the BoE to put up interest rates, which will directly strengthen GBP. Otherwise, if economic data is weak, the Pound Sterling is likely to fall.
How does the Trade Balance impact the Pound?
Another significant data release for the Pound Sterling is the Trade Balance. This indicator measures the difference between what a country earns from its exports and what it spends on imports over a given period.
If a country produces highly sought-after exports, its currency will benefit purely from the extra demand created from foreign buyers seeking to purchase these goods. Therefore, a positive net Trade Balance strengthens a currency and vice versa for a negative balance.
While commenting on the Reserve Bank of Australia's (RBA) policy outlook at a post-policy meeting dinner in Perth, RBA Governor Philip Lowe repeated that some further tightening may be required to bring inflation back to 2-3% target within a reasonable timeframe.
Additional takeaways
"We will do what is necessary to bring inflation back to target."
"Board is not on pre-set course, paying attention to consumption, inflation, jobs, global economy."
"We don’t need to get inflation back to target straight away, but can't take too long."
"We are taking a bit more time than some other countries, but there is a limit."
"Since April pause in hikes, house prices and A$ had responded to the changing rate outlook."
"Labour market is still tight, services inflation proving stubborn."
"Experience abroad points to upside risk for services inflation."
"Board is aware higher rates, inflation are squeezing people's budgets."
"Board discussed RBA review recommendations, broadly speaking they make sense."
Market reaction
AUD/USD clings to strong daily gains that it registered following the RBA's unexpected 25 basis points rate hike. As of writing, the pair was trading at around 0.6700, where it was up 1% on a daily basis.
Analysts at TD Securities note that the Reserve Bank of Australia (RBA) surprised the market by raising its policy rate by 25 basis points to 3.85%.
Will assess RBA call following the SoMP on Friday
"We expected the Bank to remain on hold at 3.60% after last week's Q1 CPI release revealed inflation fell by more than the RBA expected."
"The preliminary forecasts provided in today's Statement on balance do not appear significantly different from the February Statement of Monetary Policy (SoMP) forecasts and on balance supported the Bank remaining on hold in our view."
"While the minutes of the April meeting were hawkish and read as more supportive of a hike than a pause at that meeting, today's Statement suggests the Bank may have a few more hikes up its sleeve to deliver. We will assess our RBA call following the SoMP on Friday and potentially after the 9th May Federal Budget."
Commerzbank analysts share a brief assessment of the latest inflation data from the Eurozone.
Inflation rate is likely to fall further
"In the euro area, the inflation rate's downward slide was interrupted in April. As the sharp fall in energy prices in April 2022 dropped from the year-on-year comparison, the inflation rate rose again slightly from 6.9% to 7.0%."
"In the coming months, the inflation rate is likely to fall further, however, especially since the inflationary impulse from food prices is also easing. Underlying inflation has not increased further. The inflation rate excluding the strongly fluctuating prices of energy, food, alcohol and tobacco declined slightly from 5.7% to a still very high 5.6%. In this respect, the pressure on the ECB to raise key interest rates further remains high."
In the view of Markets Strategist Quek Ser Leang at UOB Group, USD/MYR is likely to extend the current upside momentum in the short term.
Key Quotes
“In our latest update from last Tuesday (25 Apr, spot at 4.4360), we highlighted that ‘The underlying appears to be firm, and the bias for USD/MYR this week is still on the upside’. We noted that ‘there are a couple of strong resistance levels at 4.4410 and 4.4550’. The anticipated USD/MYR strength exceeded our expectations as it rose to a high of 4.4625 last Wednesday. Upward momentum has improved, albeit not by much.”
“This week, USD/MYR could strengthen further but a sustained rise above 4.4850 appears unlikely this week. On the downside, a breach of 4.4200 would indicate that USD/MYR is not strengthening further.”
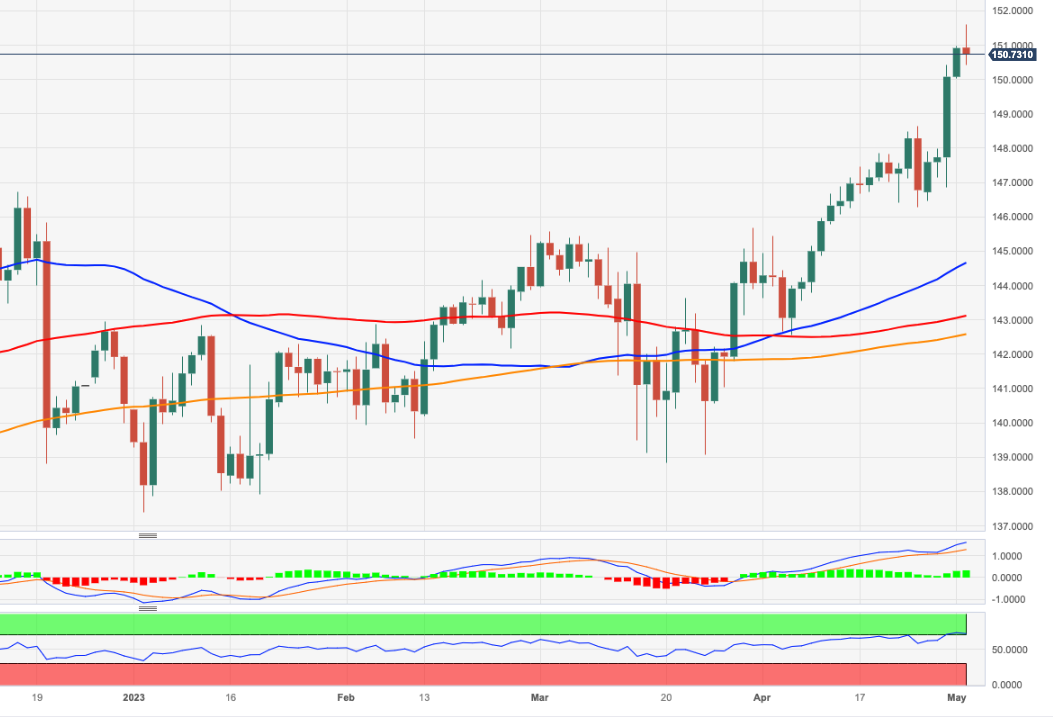
- EUR/JPY rose to fresh tops well past 151.00.
- Next on the upside comes the September 2008 high near 159.60.
EUR/JPY advances further and surpasses the 151.00 mark for the first time since September 2008 on Tuesday.
The underlying strong upside momentum in the cross appears unchallenged for the time being. Against that, the continuation of the upward bias should meet the next hurdle of note at the September 2008 high at 159.62 (September 1).
So far, further upside looks favoured while the cross trades above the 200-day SMA, today at 142.55.
EUR/JPY daily chart
- US Dollar starts the month of May on a firm footing, gathers strength against its major rivals.
- US Dollar Index climbed to its highest level in three weeks above 102.0.
- Federal Reserve's policy meeting could significantly influence the US Dollar's valuation this week.
The US Dollar gathered bullish momentum on Monday and the US Dollar Index (DXY) rose more than 5% on a daily basis, fueled by a more than 4% increase seen in the benchmark 10-year US Treasury bond yield. The DXY continues to push higher on Tuesday and trades at its strongest level since April 11 above 102.00.
The Federal Reserve's (Fed) two-day policy meeting will get underway and the policy decisions will be announced on Wednesday. Although markets are fairly certain that the Fed will raise its policy rate by 25 basis points (bps) to the range of 5%-5.25%, the language in the policy statement regarding a pause in the tightening could influence the USD's valuation significantly. Ahead of this event, March Factory Orders and JOLTS Job Openings data from the United States (US) will be watched closely by market participants on Tuesday.
Daily digest market movers: US Dollar shakes off the selling pressure
- The ISM Manufacturing PMI improved slightly to 47.1 in April from 46.3 in March. This reading showed that the contraction in the manufacturing sector's activity continued, albeit at a softer pace.
- The ISM's survey further revealed that the Price Paid sub-index, the input inflation component, climbed to 53.2 from 49.2, playing into the hawkish Fed narrative.
- Previewing the FOMC event, "we anticipate that post-meeting communication will: (i) emphasize that disinflation has been evolving slower than expected, leaving open the possibility of additional tightening, and (ii) acknowledge the more uncertain economic environment, especially with regard to credit conditions post SVB collapse," said TD Securities analysts.
- The CME Group FedWatch Tool shows that markets are pricing in a 96% probability of a 25 bps Fed rate increase on Wednesday.
- US regulators seized First Republic Bank and agreed to sell a majority of its assets to JPMorgan Chase & Co. Last week, the bank reported that there were more than $100 billion of deposit outflows in the first quarter.
- Wall Street's main indexes closed mixed on Monday. US stock index futures trade modestly lower on Tuesday.
- The data from the Eurozone showed on Tuesday that the annual Core Harmonized Index of Consumer Prices (HICP) declined to 5.6% in April from 5.7% in March.
- The European Central Bank (ECB) noted in its Bank Lending Survey that a net 38% of Eurozone banks reported a fall in demand for credit from companies in the first quarter of the year.
- "The general level of interest rates was reported to be the main driver of reduced loan demand, in an environment of monetary policy tightening," the ECB explained in its publication, weighing on EUR/USD.
Technical analysis: US Dollar Index looks to extend rebound
The US Dollar Index (DXY) closed above the 20-day Simple Moving Average (SMA) for the first time since mid-March on Monday. Moreover, the Relative Strength Index (RSI) indicator recovered above 50, pointing to a bullish shift in the short-term outlook.
On the upside, the DXY faces interim resistance at 102.60 (static level) ahead of 103.00/103.20 area, where the 50-day and the 100-day SMAs are located. A daily close above the latter could bring in additional buyers and open the door for an extended rally toward 104.00 (psychological level).
102.00 (former resistance, static level, 20-day SMA) aligns as first support. If DXY fails to hold above that level, 101.50 (static level) and 101.00 (psychological level) could be seen as next bearish targets.
How does Fed’s policy impact US Dollar?
The US Federal Reserve (Fed) has two mandates: maximum employment and price stability. The Fed uses interest rates as the primary tool to reach its goals but has to find the right balance. If the Fed is concerned about inflation, it tightens its policy by raising the interest rate to increase the cost of borrowing and encourage saving. In that scenario, the US Dollar (USD) is likely to gain value due to decreasing money supply. On the other hand, the Fed could decide to loosen its policy via rate cuts if it’s concerned about a rising unemployment rate due to a slowdown in economic activity. Lower interest rates are likely to lead to a growth in investment and allow companies to hire more people. In that case, the USD is expected to lose value.
The Fed also uses quantitative tightening (QT) or quantitative easing (QE) to adjust the size of its balance sheet and steer the economy in the desired direction. QE refers to the Fed buying assets, such as government bonds, in the open market to spur growth and QT is exactly the opposite. QE is widely seen as a USD-negative central bank policy action and vice versa.
- Silver extends the overnight sharp fall and drifts lower for the second successive day on Tuesday.
- The mixed technical setup warrants caution before positioning for any further depreciating move.
- A sustained weakness below the $24.50-40 area is needed to support prospects for deeper losses.
Silver extends the previous day's sharp retracement slide from the vicinity of the $26.00 mark and remains under heavy selling pressure for the second successive day on Tuesday. The steady intraday descent extends through the first half of the European session and drags the white metal back closer to the $25.50-$25.40 strong horizontal resistance breakpoint, now turned support.
The said area coincides with the 23.6% Fibonacci retracement level of the March-April rally, which if broken decisively will be seen as a fresh trigger for bearish traders and pave the way for deeper losses. The XAG/USD might then turn vulnerable to weaken further below the $24.00 mark and aim to test 38.2% Fibo. level, around the $23.70 area. The corrective decline could get extended further towards the $23.35-$23.30 horizontal support en route to the $23.00 confluence, comprising the 50% Fibo. level and the 50-day Simple Moving Average (SMA).
Oscillators on the daily chart, meanwhile, are still holding in the positive territory and support prospects for the emergence of some dip-buying at lower levels. That said, any intraday move up might now confront resistance near the $25.00 psychological mark. Some follow-through buying has the potential to lift the XAG/USD towards the $25.50 supply zone, above which bulls could attempt to conquer the $26.00 mark. The next relevant hurdle is pegged near the $26.25-$26.30 area, which if cleared will expose the 2022 high, just ahead of the $27.00 mark.
Silver daily chart
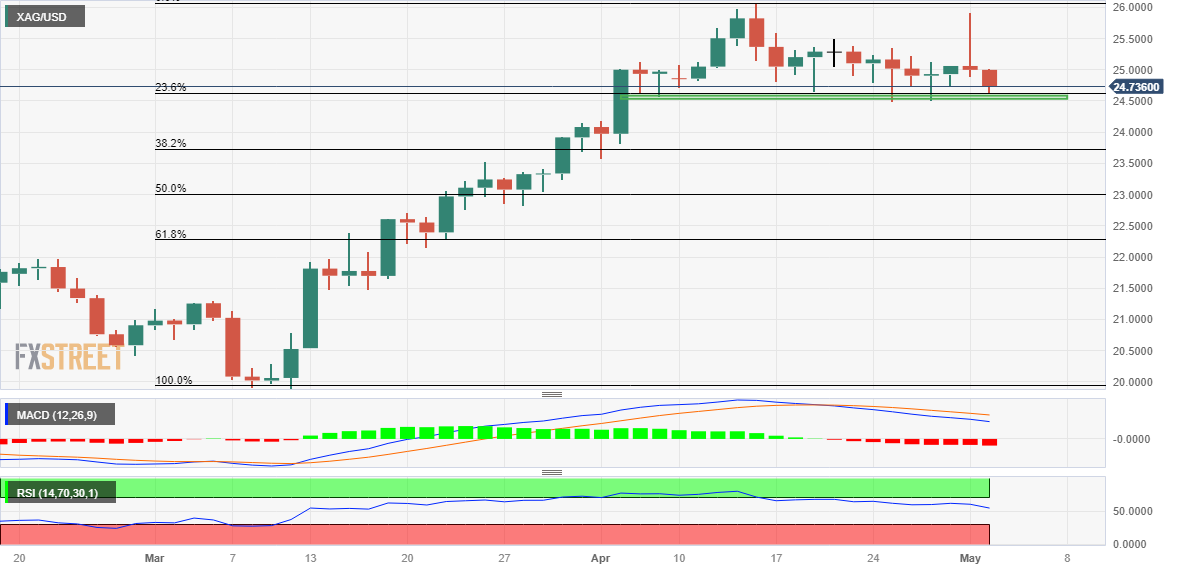
Key levels to watch
- EUR/GBP edges higher for the second successive day, albeit lacks follow-through.
- The prospects for more aggressive ECB rate hikes keep a lid on any further gains.
- Traders also seem reluctant ahead of the crucial ECB policy meeting on Thursday.
The EUR/GBP cross attracts some dip-buying near the 0.8765 region and builds on the overnight bounce from a nearly one-month low. The intraday uptick lifts spot prices to a two-day high during the early European session, though bulls struggle to capitalize on the move beyond the 0.8800 round-figure mark.
A modest US Dollar strength turns out to be a key factor behind the shared currency's relative underperformance amid some repositioning trade ahead of the crucial European Central Bank (ECB) meeting on Thursday. Apart from this, speculations that the Bank of England (BoE) will hike interest rates by 25 bps underpin the British Pound and act as a tailwind for the EUR/GBP cross.
The ECB, meanwhile, is also expected to deliver another rate hike on Thursday and could surprise with an outsized 50 bps lift-off. The bets were lifted by the latest Eurozone consumer inflation figures, which showed that the Harmonized Index of Consumer Prices (HICP) edged higher to 7% YoY in April from 6.9% in the previous month. The Core HICP, however, ticked down to 5.6%.
The aforementioned fundamental backdrop makes it prudent to wait for strong follow-through buying before confirming that the EUR/GBP cross has formed a near-term bottom and positioning for any further appreciating move. Traders might also prefer to wait on the sidelines heading into the key central bank event risk - the highly-anticipated ECB monetary policy meeting on Thursday.
Technical levels to watch
Markets Strategist Quek Ser Leang at UOB Group suggest USD/THB is now likely to trade between 34.05 and 34.50 in the near term.
Key Quotes
“We expected USD/THB to trade in a range between 34.13 and 34.55 last week. However, USD/THB traded in a slightly lower range of 34.06/34.52 before ending the week at 34.16 (-0.84%).”
“The price movements still appear to be consolidative and we continue to expect USD/THB to trade in a range, likely between 34.05 and 34.50.”
- AUD/USD jumps to over a one-week high in reaction to the RBA’s surprise 25 bps rate hike.
- The emergence of some USD dip-buying and a softer risk tone cap the risk-sensitive Aussie.
- The uncertainty over the Fed’s rate-hike path warrants some caution for aggressive traders.
The AUD/USD pair retreats a few pips from over a one-week high touched earlier this Tuesday and trades just below the 0.6700 mark during the first half of the European session, still up over 1% for the day.
The Australian Dollar (AUD) strengthens across the board in reaction to the Reserve Bank of Australia's (RBA) surprise 25 bps rate hike and hawkish outlook. In fact, the Australian central bank indicated that some further tightening of monetary policy may be required to ensure that inflation returns to target in a reasonable timeframe. This, in turn, prompts an aggressive short-covering rally around the AUD/USD pair, though the momentum loses steam near the 0.6715 area.
The US Dollar (USD) reverses an intraday dip and holds steady near a two-week high set earlier this Tuesday amid expectations for additional 25 bps lift-off at the end of the two-day FOMC monetary policy meeting on Wednesday. The bets were reaffirmed by the US ISM PMI report released on Monday, which showed that business activity in the manufacturing sector pulled off a three-year low in April and that there was a build-up of inflation pressures last month.
The prospects for further policy tightening by the Federal Reserve (Fed), meanwhile, add to worries about economic headwinds stemming from rising borrowing costs. This, in turn, tempers investors' appetite for riskier assets, which is evident from a softer tone around the equity markets. The anti-risk flow further benefits the Greenback's relative safe-haven status and contributes to keeping a lid on any further gains for the AUD/USD pair, at least for the time being.
The markets, however, now expect that the US central bank will signal a pause in its rate-hiking cycle beyond May. This might hold back the USD bulls from placing aggressive bets and continue to act as a tailwind for the AUD/USD pair ahead of the highly-anticipated FOMC decision, scheduled to be announced on Wednesday. In the meantime, traders on Tuesday will take cues from the release of the US JOLTS Job Openings data, due later during the early North American session.
Technical levels to watch
FX option expiries for May 2 NY cut at 10:00 Eastern Time, via DTCC, can be found below.
- EUR/USD: EUR amounts
- 1.0960 1.2b
- 1.0975 680m
- 1.0990-1.1000 1.5b
- 1.1050 500m
- GBP/USD: GBP amounts
- 1.2300 375m
- 1.2610 356m
- AUD/USD: AUD amounts
- 0.6600 300m
- 0.6625 402m
- 0.6700-15 1.4b
- EUR/GBP: EUR amounts
- 0.8775 338m
Inflation in the Eurozone, as measured by the Harmonized Index of Consumer Prices (HICP), edged higher to 7% on a yearly basis in April from 6.9% in March. This reading came in above the market expectation of 6.9%.
The Core HICP, the European Central Bank's (ECB) preferred gauge of inflation, ticked down to 5.6% in the same period, compared to analysts' estimate of 5.7%. On a monthly basis, the Core HICP came in at 1%, down from 1.3% recorded in March.
Market reaction
The EUR/USD stays under modest bearish pressure following the mixed inflation figures from the Euro area and was last seen trading in negative territory below 1.0970.
According to UOB Group’s Economist Lee Sue Ann and Markets Strategist Quek Ser Leang, USD/CNH could extend the upside to the 7.0000 region in the near term.
Key Quotes
24-hour view: “After trading sideways to slightly lower for a few days, USD surged to a high of 6.9630 before closing at 6.9628 (+6.9370). While overbought, USD could rise even though it remains to be seen if it can break and stay above 6.9650. The major resistance at 7.0000 is not expected to come under threat. On the downside, a breach of 6.9450 would indicate that the current upward pressure has eased.”
Next 1-3 weeks: “In our latest narrative from last Wednesday (26 Apr, spot at 6.9370), we highlighted that upward momentum in USD has improved further but the major resistance at 6.9650 might not come into view soon. USD traded sideways to slightly lower for a few days before soaring to a high of 6.9630 yesterday. Not surprisingly, upward momentum is strong but 6.9650 remains a major resistance and USD has to break and stay above this level before a move to 7.0000 is likely. On the downside, a break of 6.9200 (‘strong support’ level) would indicate that the USD strength that started more than a week ago has come to an end.”
- GBP/USD edges lower for the second straight day, though lacks follow-through selling.
- The USD reverses an intraday dip and turns out to be a key factor acting as a headwind.
- Bets for another 25 bps BoE rate hike in May underpin the GBP and limit the downside.
The GBP/USD pair turns lower for the second successive day on Tuesday and weakens further below the 1.2500 psychological mark during the first half of the European session.
The US Dollar (USD) attracts some dip-buying and stands tall near a two-week high touched on Monday, which, in turn, is seen as a key factor exerting downward pressure on the GBP/USD pair. Expectations that the Federal Reserve (Fed) will hike interest rates by 25 bps at the end of the two-day FOMC policy meeting on Wednesday led to the overnight rise in the US Treasury bond yields. Apart from this, a softer risk tone - amid looming recession risks - lends additional support to the safe-haven Greenback.
The markets, meanwhile, seem convinced that the US central bank will signal a pause in its rate-hiking cycle. This might hold back the USD bulls from placing aggressive bets. Moreover, the Bank of England (BoE) is also expected to deliver a 25 bps lift-off in May, which might further contribute to limiting the downside for the GBP/USD pair. Hence, it will be prudent to wait for strong follow-through selling before positioning for an extension of the recent pullback from the highest level since June 2022.
On the economic data front, the UK Manufacturing PMI is revised higher and finalized at 47.8 for April as compared to the 46.6 estimated in the flash reading. This, however, does little to impress traders or provide any meaningful impetus to the GBP/USD pair. The US economic docket, meanwhile, features the release of JOLTS Job Openings data. This, along with the US bond yields and the broader risk sentiment, will drive the USD demand and produce short-term trading opportunities around the major.
The focus, however, will remain glued to the highly-anticipated FOMC policy decision, scheduled to be announced during the US session on Wednesday. The market attention will then shift to the closely-watched US monthly employment details, popularly known as the NFP report. This will play a key role in influencing the near-term USD price dynamics and help determine the next leg of a directional move for the GBP/USD pair.
Technical levels to watch
- EUR/USD loses momentum and revisits 1.0960.
- Retail Sales in Germany extended the downtrend in March,
- EMU advanced inflation figures come next in the docket.
The European currency alternates gains with losses vs. the greenback and prompts EUR/USD to hover around the 1.0970/60 band on Tuesday.
EUR/USD focuses on EMU data, FOMC
Sellers remain in control of the sentiment surrounding the euro and kept EUR/USD on the defensive for the time being, all following the rejection from YTD peaks in levels just shy of 1.1100 the figure on April 26.
The so far inconclusive price action in spot comes in tandem with a modest uptick in the German 10-year Bund yields, which now fade part of the earlier advance to the area past 2.40%. Their US peers, in the meantime, leave behind Monday’s auspicious start of the week.
Moving forward, the 2-day FOMC meeting kicks in later on Tuesday, while the ECB will meet on Thursday. That said, both central banks are largely anticipated to hike rates by 25 bps, although a potential pause by the Fed following this meeting vs. speculation of extra hikes by the ECB in June and July could favour extra upside in spot in the short-term horizon.
In the domestic calendar, Retail Sales in Germany contracted 8.6% YoY in March, while final Manufacturing PMIs in Germany and the euro area came at 44.5 and 45.8, respectively, during last month.
Later in the session, the focus of attention will be on the publication of the preliminary inflation figures in the euro bloc. Across the ocean, Factory Orders and JOLTs Job Openings are also due later in the NA session.
What to look for around EUR
EUR/USD’s upside momentum keeps losing traction and flirts once again with the initial contention area near 1.0960.
Meanwhile, price action around the single currency should continue to closely follow dollar dynamics, as well as the Fed-ECB divergence when it comes to the banks’ intentions regarding the potential next moves in interest rates.
Moving forward, hawkish ECB-speak continue to favour further rate hikes, although this view appears in contrast to some loss of momentum in economic fundamentals in the region.
Key events in the euro area this week: Germany Retail Sales, Final Manufacturing PMI, EMU Flash Inflation Rate, Final Manufacturing PMI (Tuesday) – EMU Unemployment Rate (Wednesday) – Germany Final Services PMI, EMU Final Services PMI, ECB Meeting, ECB Lagarde press conference (Thursday) – Germany Construction PMI, EMU Retail Sales.
Eminent issues on the back boiler: Continuation (or not) of the ECB hiking cycle. Impact of the Russia-Ukraine war on the growth prospects and inflation outlook in the region. Risks of inflation becoming entrenched.
EUR/USD levels to watch
So far, the pair is losing 0.02% at 1.0970 and faces the next support at 1.0909 (weekly low April 17) seconded by 1.0831 (monthly low April 10) and finally 1.0788 (monthly low April 3). On the flip side, the surpass of 1.1095 (2023 high April 26) would target 1.1100 (round level) en route to 1.1184 (weekly high March 21 2022).
In its recently published Bank Lending Survey (BLS), the European Central Bank (ECB) noted that a net 38% of Eurozone banks reported a fall in demand for credit from companies in the first quarter of the year.
A net 27% of Eurozone banks reported tightening of ending standards for companies in the same period. "The general level of interest rates was reported to be the main driver of reduced loan demand, in an environment of monetary policy tightening," the ECB explained in its publication.
Market reaction
EUR/USD came under renewed bearish pressure after this publication and was last seen trading modestly lower on the day at 1.0972.
- NZD/USD gains strong positive traction on Tuesday and climbs to over a one-week high.
- A modest USD downtick lends some support to the pair, though the upside seems limited.
- Traders now await the quarterly jobs data from NZ ahead of the FOMC on Wednesday.
The NZD/USD pair regains positive traction on Tuesday and builds on its steady intraday ascent through the early part of the European session. The momentum lifts spot prices to a one-and-half-week high in the last hour, with bulls now looking to build on the momentum further beyond the 0.6200 round-figure mark.
The US Dollar (USD) edges lower and erodes a part of the overnight positive move back closer to a nearly two-week high touched on Friday, which, in turn, is seen as a key factor lending some support to the NZD/USD pair. Traders, however, might refrain from placing aggressive bearish bets around the USD amid the uncertainty over the Federal Reserve's (Fed) rate hike path. This, along with looming recession risks, might keep a lid on any meaningful gains for the risk-sensitive Kiwi, at least for the time being.
In fact, the markets have fully priced in another 25 bps lift-off at the end of the two-day FOMC meeting on Wednesday and expect the US central bank to pause its rate-hiking cycle beyond May. That said, the US ISM Manufacturing PMI released on Monday indicated that there was a build-up of inflation pressures last month and lifted the possibility of a further rate hike in June. This, in turn, led to the overnight rise in the US Treasury bond yields and might continue to lend some support to the Greenback.
Investors, meanwhile, remain worried about economic headwinds stemming from rising borrowing costs. The fears were fueled by weaker Chinese manufacturing data released on Sunday, which keeps a lid on any optimism in the markets. This could further benefit the safe-haven buck and contribute to capping the upside for the NZD.USD pair. Traders might also prefer to move on the sidelines and wait for the outcome of the two-day FOMC monetary policy meeting, scheduled to be announced on Wednesday.
Heading into the key central bank event risk, traders will take cues from Tuesday's release of the US JOLTS Job Openings data. This, along with the US bond yields and the broader risk sentiment, will influence the USD and provide some impetus to the NZD/USD pair ahead of the quarterly employment details from New Zealand on Wednesday.
Technical levels to watch
Further upside momentum could motivate USD/JPY to challenge the 137.90 region ahead of a potential move to 138.50 in the next weeks, comment UOB Group’s Economist Lee Sue Ann and Markets Strategist Quek Ser Leang.
Key Quotes
24-hour view: “USD extended its rally from last Friday as it soared by 0.88% (NY close of 137.48). While the two days of rapid rise appear to be overdone, there is room for USD to advance further. In view of the deeply overbought conditions, a sustained rise above the Mar high near 137.90 is unlikely. Support is at 137.00, followed by 136.60.”
Next 1-3 weeks: “Last Thursday (26 Apr, spot at 133.60), we held the view that USD has moved into a consolidation phase and is likely to trade in a range of 132.85/134.70 for the time being. We did not anticipate the outsize advance as USD surged on Friday and extended its rally yesterday. USD is likely to strengthen further and the focus is at Mar high near 137.90. A break of this major resistance will shift the focus to 138.50. In view of the deeply overbought short-term conditions, any further USD advance is likely to be at a slower pace. Overall, only a break of 136.00 would indicate that USD is not advancing further.”
- The index loses some upside traction and flirts with 102.00.
- US yields start Tuesday’s session on the defensive.
- Factory Orders will be in the limelight later in the session.
The greenback, in terms of the USD Index (DXY), gives away part of the recent recovery and puts the 102.00 region to the test on Tuesday.
USD Index looks at Fed, data
The index now shows some weakness and leaves behind three consecutive daily advances amidst the moderated rebound in the risk-associated universe and declining US yields on Tuesday.
On the latter, yields retreat across the curve and set aside a promising start of the week amidst the start of the 2-day FOMC event later in the day.
On this, the Federal Reserve is broadly expected to hike rates by 25 bps on Wednesday, while investors’ attention is expected to closely follow any hints of the potential moves from the Fed regarding rates in the future, particularly amidst the (increasing) likelihood of a probable pause in its hiking cycle.
Later in the US data space, Factory Orders for the month of March and JOLTs Job Openings will take centre stage in the docket.
What to look for around USD
The dollar seems to have met some decent resistance in the low-102.00s for the time being.
Looking at the broader picture, the index continues to navigate in a consolidative phase against steady expectations of another rate increase in May by the Fed and rising cautiousness in light of the potential next decisions by the Fed in the next months.
In favour of a pivot in the Fed’s hiking cycle following the May event appears the persevering disinflation and nascent weakness in some key fundamentals.
Key events in the US this week: Factory Orders (Tuesday) – MBA Mortgage Applications, ADP Employment Change, Final Services PMI, ISM Services PMI, FOMC Meeting, Powell press conference (Wednesday) – Balance of Trade, Initial Jobless Claims (Thursday) – Nonfarm Payrolls, Unemployment Rate, Consumer Credit Change.
Eminent issues on the back boiler: Persistent debate over a soft/hard landing of the US economy. Terminal Interest rate near the peak vs. speculation of rate cuts in 2024. Fed’s pivot. Geopolitical effervescence vs. Russia and China. US-China trade conflict.
USD Index relevant levels
Now, the index is losing 0.18% at 101.93 and faces immediate support at 100.78 (2023 low April 14) ahead of 100.00 (psychological level) and finally 99.81 (weekly low April 21 2022). On the other hand, a break above 102.80 (weekly high April 10) would open the door to 103.05 (monthly high April 3) and then 103.15 (100-day SMA).
Here is what you need to know on Tuesday, May 2:
The Australian Dollar gathers strength against its rivals as markets react to the Reserve Bank of Australia's (RBA) unexpected decision to lift its policy rate by 25 basis points (bps) to 3.85% after having left it unchanged in April. Meanwhile, the US Dollar Index consolidates Monday's recovery gains. April inflation report from the Eurozone will be watched closely by market participants ahead of JOLTS Job Openings and Factory Orders data from the US in the American session.
In its policy statement, the RBA noted that the board expects that some further tightening of monetary policy may be needed. "Further tightening will depend upon how the economy and inflation evolve," the RBA explained in its policy statement and added that a significant source of uncertainty continues to be the outlook for household consumption. Boosted by the hawkish surprise, AUD/USD is up more than 1% on the day, trading above 0.6700.
The Harmonized Index of Consumer Prices (HICP) and the Core HICP in the Eurozone are forecast to remain unchanged at 6.9% and 5.7% on a yearly basis in April, respectively. Following Monday's decline, EUR/USD clings to modest recovery gains near 1.1000 in the European morning. The European Central Bank's (ECB) Bank Lending Survey will also be scrutinized by market participants to see the impact of the banking crisis on financial conditions in the Euro area.
GBP/USD lost 70 pips on Monday and erased all the gains it recorded on Friday. The pair stays relatively quiet at around 1.2500 early Tuesday.
Once again, Gold price failed to hold above $2,000 and closed in the negative territory on Monday pressured by rising US Treasury bond yields. Early Tuesday, the benchmark 10-year US yield holds steady above 3.5%, not allowing XAU/USD to gain traction. The pair was last seen trading flat on the day slightly above $1,980.
Following the impressive two-day rally, USD/JPY has stretched higher and touched its strongest level since early March above 137.70. The pair clings to its modest daily gains early Tuesday and holds comfortably above 137.50.
Bitcoin fell 4% on Monday and was last seen testing $28,000. Ethereum lost 2% and came in within a touching distance of $1,800 before recovering modestly to $1,850 early Tuesday.
- USD/CAD oscillates in a range and is influenced by a combination of diverging forces.
- Weaker Crude Oil prices undermine the Loonie and continue to lend support to the pair.
- A modest USD downtick might hold back bulls from placing fresh bets and cap the upside.
The USD/CAD pair once again finds support near the 100-day Simple Moving Average (SMA) and attracts some buyers near the 1.3530-1.3525 region, or a one-week low touched this Tuesday, though lacks follow-through. Spot prices seesaw between tepid gains/minor losses through the early European session and currently trade around the 1.3535-1.3540 region, nearly unchanged for the day.
Crude Oil prices remain depressed amid worries that a deeper global economic downturn will dent fuel consumption, which, in turn, weighs on the commodity-linked Loonie and acts as a tailwind for the USD/CAD pair. That said, a modest US Dollar (USD) weakness might hold back bulls from placing aggressive bets and act as a headwind for the major, warranting some caution for aggressive bulls.
The USD downtick comes amid the uncertainty over the Federal Reserve's (Fed) rate-hike path. In fact, the markets have fully priced in another 25 bps lift-off at the end of the two-day FOMC meeting on Wednesday and expect the US central bank to pause its rate-hiking cycle beyond May. That said, the incoming US data keeps alive the possibility of a further hike in June and lends support to the buck.
Hence, the market focus will remain glued to the highly-anticipated FOMC policy decision, scheduled to be announced during the US session on Wednesday. Nevertheless, the aforementioned mixed fundamental backdrop makes it prudent to wait for strong follow-through buying before confirming that the USD/CAD pair's recent pullback from a one-month high touched last Friday has run its course.
Investors will then look to the closely-watched US monthly employment details, popularly known as the NFP report on Friday. Ahead of the key central bank event risk and the US macro data, traders on Tuesday will take cues from the US JOLTS Job Openings data. Apart from this, the US bond yields will drive the USD, which, along with Oil price dynamics, should provide some impetus to the USD/CAD pair.
Technical levels to watch
- Gold price clings to mild gains as traders turn cautious on full markets’ return, ahead of key data/events.
- Sluggish US Dollar, optimism surrounding China, India adds strength to the recovery moves.
- Hawkish Fed bets, US debt ceiling woes prod XAU/USD buyers ahead of Fed, US NFP.
- Multiple key resistances stand tall to challenge the Gold price upside, bears have a smoother road to drive.
Gold price (XAU/USD) portrays the market’s cautious optimism while posting mild gains near $1,985 as traders await the key central bank events amid full markets’ return on Tuesday.
That said, US Dollar’s retreat due to the looming default fears adds strength to the XAU/USD’s rebound. On the same line could be the sigh of relief from the First Republic Bank fallout fears after the US regulators seized assets and sold them to JP Morgan. Additionally, the International Monetary Fund’s (IMF) upbeat economic report surrounding the Asia-Pacific region, one of the biggest consumers of Gold, also allows the XAU/USD price to remain firmer.
However, hawkish Fed bets, the US-China tension and anxiety ahead of the top-tier US data/events, as well as central bank events at other major economies, also prod the Gold price upside.
Also read: Gold Price Forecast: XAU/USD extends the range play heading into key central bank event risks
Gold Price: Key levels to watch
As per our Technical Confluence indicator, the Gold price remains depressed below the $1,990 resistance confluence comprising Fibonacci 61.8% on one-week and one-month, as well as Fibonacci 38.2% on one-day.
In addition to the $1,990 hurdle, the Fibonacci 38.2% on one-week, around $1,998, also acts as a short-term key upside resistance for the Gold buyers to track before retaking control.
Even so, a convergence of the Pivot Point one-day R1, middle band of the Bollinger on daily chart and Fibonacci 23.6% on one-week, near $2,001, can act as the final defense of the Gold sellers.
Meanwhile, the metal’s road towards the south appears smoother with minor support near $1,973, encompassing Pivot Point one-week S1, followed by the $1,970 mark comprising Pivot Point one-day S1 and lower band of the Bollinger on one-day.
Should the Gold bears keep the reins past $1,970, the odds of witnessing a slump toward the previous monthly low of around $1,950 can’t be ruled out.
Here is how it looks on the tool
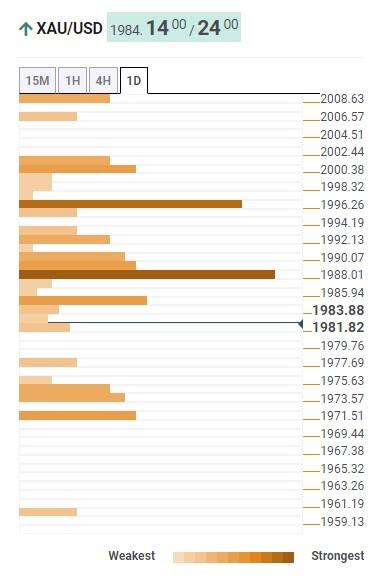
About Technical Confluences Detector
The TCD (Technical Confluences Detector) is a tool to locate and point out those price levels where there is a congestion of indicators, moving averages, Fibonacci levels, Pivot Points, etc. If you are a short-term trader, you will find entry points for counter-trend strategies and hunt a few points at a time. If you are a medium-to-long-term trader, this tool will allow you to know in advance the price levels where a medium-to-long-term trend may stop and rest, where to unwind positions, or where to increase your position size.
In light of advanced prints from CME Group for natural gas futures markets, open interest rose for the fourth consecutive session on Monday, this time by around 1.5K contracts. On the other hand, volume remained choppy and went down by around 158.2K contracts.
Natural Gas: Upside appears capped near $2.50
Monday’s negative price action in natural gas was in tandem with rising open interest and declining volume, suggesting at the same time that further range bound remains well in store for the time being. In the meantime, occasional bullish attempts remain limited by the $2.50 region per MMBtu for the time being.
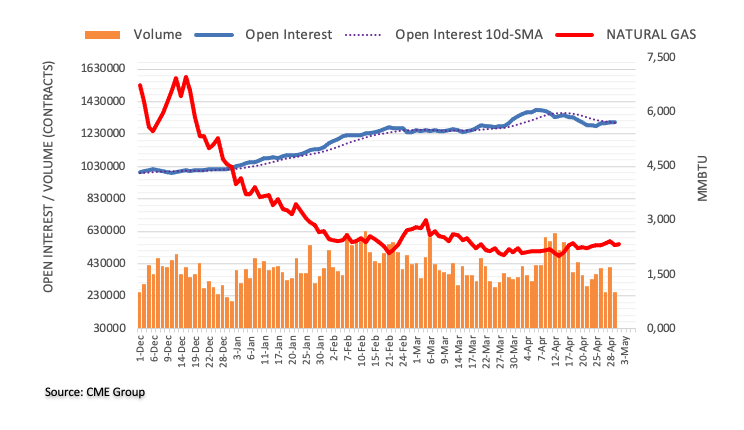
In the opinion of UOB Group’s Economist Lee Sue Ann and Markets Strategist Quek Ser Leang, NZD/USD should maintain the 0.6110-0.6245 range in the next few weeks.
Key Quotes
24-hour view: “NZD popped to a high of 0.6199 yesterday before easing off. Despite the advance, there is no significant increase in upward momentum and NZD is unlikely to rise much further. Today, NZD is more likely to trade sideways, expected to be between 0.6140 and 0.6195.”
Next 1-3 weeks: “In our most recent narrative from last Thursday (27 Apr, spot at 0.6115), we highlighted that the likelihood of NZD breaking below 0.6085 has increased but it has to remain below this level before further decline to 0.6035 is likely. However, did not break 0.6085 as it rebounded to a high of 0.6199 yesterday. The downward pressure that started more than a week ago has faded. NZD appears to have moved into a consolidation phase and it is likely to trade in a range of 0.6110/0.6245 for now.”
- USD/JPY grinds higher at two-month high, prints four-day winning streak.
- Descending resistance line from mid-December 2022, overbought RSI (14) prods Yen pair buyers.
- Sellers need validation from 200-DMA, previous resistance line from late March.
USD/JPY bulls appear running out of steam at the highest levels in two months during early Tuesday, making rounds to 137.70-60 heading into the European session.
In doing so, the Yen pair portrays failure to cross a downward-sloping resistance line from December 2022, close to 137.80 by the press time, amid overbought RSI (14) conditions.
Even if the pair manage to cross the 137.80 hurdle, successful trading beyond the 138.00 round figure becomes necessary to restore the market’s confidence in the bulls.
Following that, the late 2022 swing high near 138.20 and the 140.00 round figure may act as the last defenses of the USD/JPY pair bears before giving control to the buyers.
On the contrary, pullback moves need to conquer the 200-DMA support of 136.95 on a daily closing basis to convince USD/JPY sellers. Even so, the previous resistance line from late March, around 135.75 by the press time, joins the bullish MACD signals to challenge the Yen pair bears.
In a case where the USD/JPY pair closes below the 135.75 resistance-turned-support, the odds of witnessing further downside can’t be ruled out.
To sum up, USD/JPY remains on the bull’s radar even if the upside momentum appears elusive of late.
USD/JPY: Daily chart
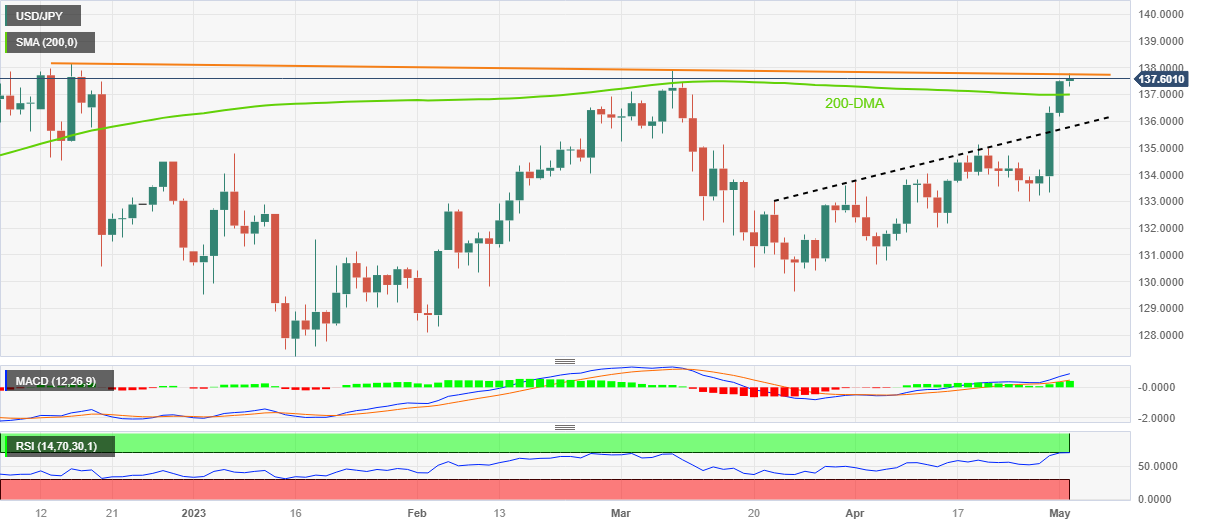
Trend: Pullback expected
- EUR/USD is marching towards 1.1000 after a recovery move as the USD Index has dropped after a short-lived recovery.
- Federal Reserve is widely anticipated to raise interest rates by 25bps to continue to maintain pressure on US CPI.
- Investors are divides divided over the pace of interest rate hike that the European Central Bank will adopt.
- EUR/USD is auctioning in an Ascending Triangle chart pattern, which indicates a sheer contraction in volatility.
EUR/USD has resumed its upside journey towards the psychological resistance of 1.1000 in the early European session. The major currency pair is showing resilience after recovery as the US Dollar Index (DXY) has retreated from 102.10. The upside in the USD Index has remained capped around 102.20 for the past two weeks as investors are cautious amid uncertainty over the interest rate guidance by the Federal Reserve (Fed) to be delivered on Wednesday.
S&P500 futures have recovered their entire losses generated in the Asian session, indicating a strong recovery in the risk appetite of the market participants. Investors are capitalizing on easing United States banking jitters and solid quarterly performance from technology stocks. On Monday, JP Morgan Chase announced the acquisition of First Republic Bank‘s assets after regulators seized the collapsed lender.
Improved market sentiment has also supported the demand for US government bonds, which has trimmed the rally in US yields. The 10-year US Treasury yields have dropped below 3.56%.
Meanwhile, the Euro is expected to remain volatile ahead of the preliminary Eurozone inflation data. Tuesday’s Eurozone preliminary Harmonized Index of Consumer Prices (HICP) holds significant importance as it will be used by European Central Bank (ECB) policymakers while designing the monetary policy scheduled for Thursday.
Fed’s interest rate guidance- a key trigger ahead
To continue to maintain pressure on US Consumer Price Index (CPI), Federal Reserve chair Jerome Powell is widely anticipated to raise interest rates by 25 basis points (bps) consecutively to 5.00-5.25%. Headline inflation in the US economy is continuously declining being supported by lower gasoline prices, however, core inflation has been critically persistent due to resilient consumer spending.
While uncertainty over interest rate guidance is still stable as US economic conditions are changing now. For straight six months, US Manufacturing PMI is landing below the 50.0 threshold which is considered a situation of contraction US Gross Domestic Product (GDP) slowed down to 1.1% in the first quarter from the consensus of 2.0% due to lower inventories. Firms have significantly winded up their inventories due to a bleak economic outlook amid higher interest rates.
Apart from that, US labor market conditions are losing their resilience as firms are cutting jobs due to poor forward demand.
To avoid recession, the Federal Reserve might pause paddling interest rates as it would infuse some confidence in investors and producers. Morgan Stanley has announced a planned lay-off of 3K more jobs as deals have slumped as reported by Bloomberg.
Eurozone inflation to provide cues about ECB’s monetary policy action
After observing a weak pace in Eurozone Gross Domestic Product (GDP) data, which landed at 0.1% vs. the consensus of 0.2%, investors are shifting their focus toward inflation data. As per the consensus, the preliminary headline Harmonized Index of Consumer Prices (HICP) (April) is seen unchanged at 6.9% and 0.9% on a quarterly and monthly basis. Also, annual core HICP is seen steady at 5.9% while monthly core HICP could land lower at 1.1% from the former release of 1.3%.
Eurozone inflation is seen almost unchanged due to the extreme labor shortage, which has shifted the bargaining power for wages to job seekers from hiring agencies.
There is no denying the fact that European Central Bank President Christine Lagarde will hike interest rates to improve its defense against stubborn inflation. The street is divided over the pace of the interest rate hike that the central bank will adopt. In March, the European Central Bank raised interest rates by 50 basis points (bps).
EUR/USD technical outlook
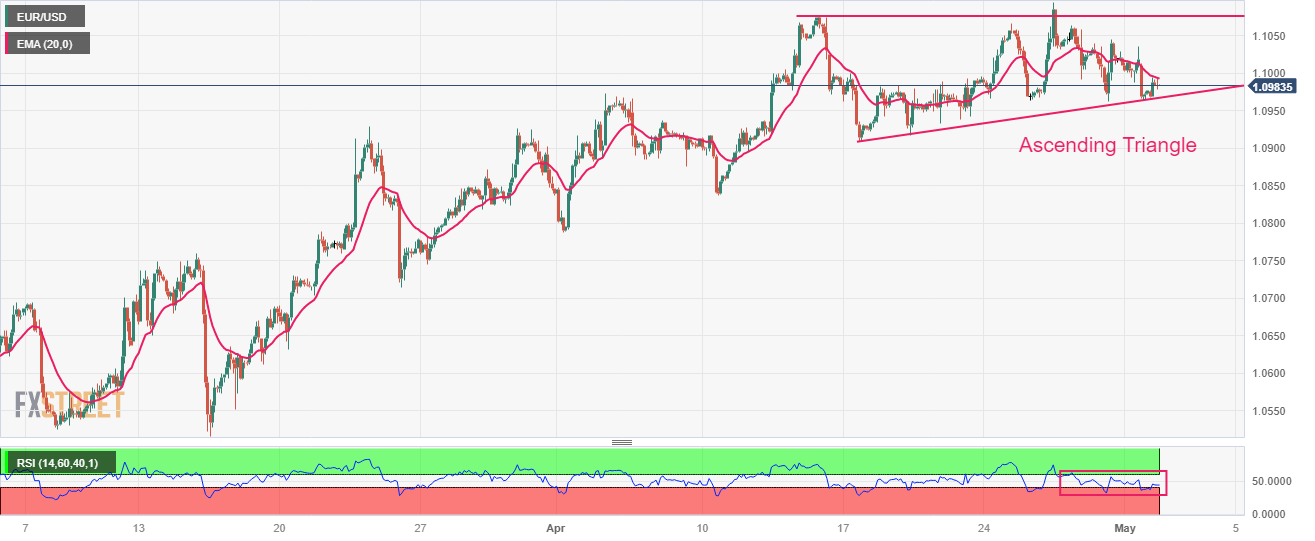
EUR/USD is auctioning in an Ascending Triangle chart pattern on an hourly scale, which indicates a sheer contraction in volatility. The upward-sloping strandline of the triangle pattern is plotted from April 17 low at 1.0909 while the horizontal resistance is placed from April 14 high at 1.1075.
A stick price action with the 20-period Exponential Moving Average (EMA) at 1.0940 indicates a rangebound performance.
Also, the Relative Strength Index (RSI) (14) is oscillating in the 40.00-60.00 range, signaling the need for a potential trigger for a decisive action.
Open interest in crude oil futures markets rose for the fourth session in a row on Monday, this time by around 4.3K contracts, according to preliminary readings from CME Group. On the other hand, volume went down for the third straight session, now by around 260.5K contracts.
WTI: Next on the upside appears $80.00
Prices of the WTI reversed two daily pullbacks in a row and started the week on the positive foot. The daily uptick was midst rising open interest and allows for the continuation of the recovery in the very near term. Against that, the next target of note emerges at the key $80.00 mark per barrel.
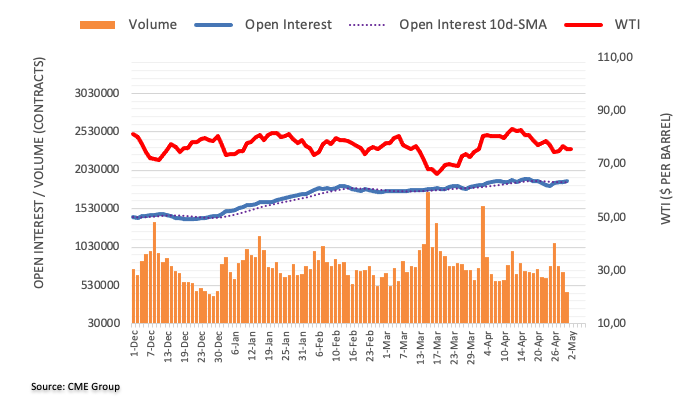
- GBP/USD pares the previous day’s losses, the first in four, with mild gains.
- UK retailers post biggest increase in Food prices since 2005, sees easing inflation ahead.
- US Dollar retreats as debt ceiling concerns join pre-data anxiety amid full markets.
- UK Manufacturing PMI, US Factory Orders can direct intraday moves.
GBP/USD licks its wounds around 1.2500 after posting the biggest daily loss in a week, as well as snapping a three-day uptrend the previous day. In doing so, the Cable pair takes clues from the US Dollar’s retreat while cheering mostly upbeat inflation signals from the UK. However, comparatively more hawkish concerns surrounding the Fed, than the Bank of England (BoE), keep the Cable pair sellers hopeful as it lacks upside momentum near the highest levels in 11 months marked the previous day.
Food prices at British supermarkets rose 15.7% in the year to April, the biggest annual increase in records going back to 2005, but lower prices are on the horizon, the British Retail Consortium (BRC) said on Tuesday per Reuters.
On the other hand, the US Dollar Index (DXY) prints the first daily loss in four around 102.00 as US default fears loom after the Treasury Department bought forward the date of running out of funds to match obligations if the current debt ceiling isn’t altered, to June 01 from previously signaled July. It’s worth noting that a relief from the US First Republic Bank drama, after the US regulators seized assets of a troubled bank and sold them to a new buyer, namely JP Morgan, also weigh on the US Dollar and allow the GBP/USD buyers to return.
It should be noted, however, that the recently upbeat US inflation clues and easing hopes of Fed policy pivot in 2023 seem to keep the US Dollar buyers hopeful. Furthermore, fears surrounding the US-China tension and comparatively stronger US jobs report add strength to the bearish bias about the Cable pair.
Amid these plays, S&P 500 Futures track Wall Street’s indecisiveness near 4,180, retreating from a three-month high, whereas the US 10-year and two-year Treasury bond yields ease from a one-week high to 3.55% and 4.13% at the latest.
Moving on, GBP/USD pair traders should pay attention to the final readings of the UK S&P Global Manufacturing PMI for April, as well as the US Factory Orders for March, for intraday directions. However, major attention will be given to this week’s Federal Reserve (Fed) monetary policy meeting and the US jobs report for April.
Technical analysis
Although the 10-DMA level of around 1.2475 puts a floor under the GBP/USD prices for short-term the Cable pair’s rebound remains elusive unless crossing a one-month-old ascending resistance line, close to 1.2575 at the latest.
- USD/IDR picks up bids to snap eight-day downtrend, recovers from the lowest levels since June 2022.
- Indonesian Inflation, Core Inflation eased in April despite staying beyond 2% to 4% range.
- Cautious optimism in Asia-Pacific zone fails to please Indonesia Rupiah buyers.
- Second-tier US data can entertain USD/IDR traders ahead of Fed, NFP.
USD/IDR justifies downbeat Indonesia inflation while bouncing off an 11-month low to 14,710 heading into Tuesday’s European session. In doing so, the Indonesia Rupiah pair fails to cheer a retreat in the US Dollar prices amid a sluggish session due to the mixed sentiment and anxiety ahead of the key data/events.
Indonesia’s headline Inflation eased to 4.33% YoY in April from 4.97% prior and 4.39% market forecasts while the monthly inflation figures came in mixed to 0.33% versus 0.37% expected and 0.18% prior. Further, the Core Inflation eased to 2.83% during the stated month from 2.89% analysts’ estimation and 2.94% prior.
Reuters released Statistics Indonesia chief Margo Yuwono’s comments after the Inflation data as saying, “Higher transportation fares and prices of fuel and some food commodities around the Islamic holy month of Ramadan contributed to April's inflation,” the policymaker also added, “although the increase was more benign than the Ramadan month in previous years.”
Elsewhere, markets in the Asia-Pacific region remain cautiously optimistic after the International Monetary Fund (IMF) anticipated them to be the most dynamic of the world's major regions in 2023, per the latest reports.
It should be noted, however, that talks surrounding the US default seem to challenge the market’s previously US Dollar positive bias. That said, US Treasury Department renewed fears of US default by pulling forward the date of running out of funds to match obligations if the current debt ceiling isn’t altered, to June 01 from previously signaled July.
On the other hand, relief from the US First Republic Bank issue allowed traders to take a breather as the US regulators seized assets of the First Republic Bank and sold them to a new buyer, namely JP Morgan. The same could be held responsible for the USD/IDR pair’s hesitance in rallying much. Furthermore, Axios came out with headlines suggesting the US allies’ preparations for the US-China war over Taiwan, which in turn keeps the Euro bears hopeful, via the US Dollar’s haven demand.
Moving on, the US Factory Orders for March, expected to rise by 0.8% MoM versus -0.7% prior, may entertain USD/IDR traders ahead of this week’s Federal Reserve (Fed) monetary policy meeting and the US jobs report for April.
Technical analysis
USD/IDR recovers from a lower line of the two-month-old descending triangle, currently near 14,615, backed by the oversold RSI (14) line. The recovery moves, however, need validation from the stated triangle’s top line, close to 14,885 at the latest, to convince the pair buyers.
A more sustained advance in GBP/USD is seen once 1.2550 is cleared, suggest UOB Group’s Economist Lee Sue Ann and Markets Strategist Quek Ser Leang.
Key Quotes
24-hour view: “GBP gave up most of its strong gains from last Friday as it dropped and closed lower by 0.59% (1.2495). Downward momentum is building and the bias for GBP today is tilted to the downside. However, it is unlikely to break the strong support at 1.2440 (minor support is at 1.2470). On the upside, a breach of 1.2540 (minor resistance is at 1.2515) would indicate that the current mild downward pressure has eased.”
Next 1-3 weeks: “In our most recent narrative from last Thursday (27 Apr, spot at 1.2470), we highlighted that ‘in order for GBP to advance in a sustained manner, it has to break and stay above 1.2550’. GBP took out 1.2550 last Friday, rose to 1.2584 before falling back down yesterday to close at 1.2495. Upward momentum has improved, albeit not much. For GBP to strengthen further, it must not fall below the ‘strong support’ level, currently at 1.2440. Looking ahead, if GBP can surmount 1.2585, the focus will shift to 1.2665.”
CME Group’s flash data for gold futures markets noted traders added around 6.1K contracts to their open interest positions on Monday. Volume, instead, shrank for the third consecutive session, this time by around 33.7K contracts.
Gold: Door open to extra range bound below $2000
Monday’s downtick in prices of the ounce troy of gold was on the back of rising open interest and declining volume, which is indicative that further consolidation remains well on the cards for the metal in the very near term and always below the key $2000 mark.
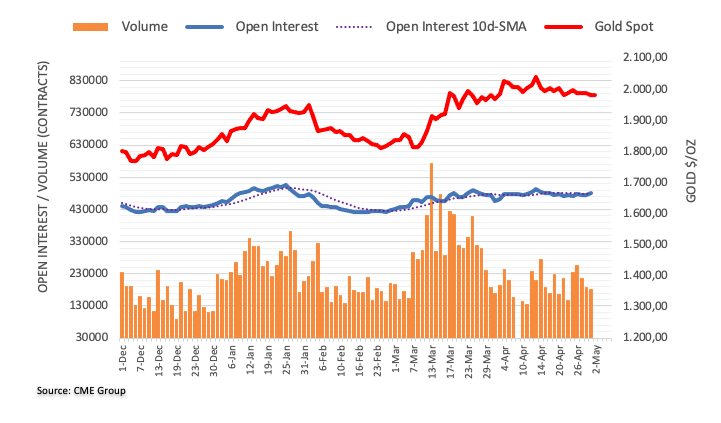
UOB Group’s Economist Lee Sue Ann and Markets Strategist Quek Ser Leang note EUR/USD is expected to navigate within the 1.0920-1.1040 range in the next few weeks.
Key Quotes
24-hour view: “In NY trade, USD dropped sharply to a low of 1.0962. Downward momentum has improved, albeit not much. EUR is likely to edge lower from here but is unlikely to challenge the major support at 1.0915 (there is another support level at 1.0950). The downward pressure is intact as long as it stays below 1.1010 (minor resistance is at 1.0995).”
Next 1-3 weeks: “Our latest narrative was from last Thursday (27 Apr, spot at 1.1045). We highlighted that ‘despite the relatively strong advance to 1.1095 on Wednesday, upward momentum has not improved much’. We added, ‘while EUR could ratchet higher towards 1.1120, the odds for a sustained rise above this major resistance level are not high for now’. Yesterday, EUR dropped to a low of 1.0962. While our ‘strong support’ at 1.0950 has not been breached, upward momentum has more or less faded. In other words, instead of advancing, EUR is more likely to trade in a range of 1.0920/1.1040 for now.”
- AUD/NZD has soared to 1.0830 as RBA has hiked rates by 25 bps against the anticipation of a neutral monetary policy.
- The RBA cited that further policy tightening was needed to anchor inflation expectations.
- A sustained pace in the NZ Employment cost index could force the RBNZ to remain hawkish ahead.
The AUD/NZD pair has witnessed stellar buying interest after a surprise announcement of 25 basis points (bps) interest rate hike by the Reserve Bank of Australia (RBA). An interest rate hike of 25 bps has pushed the Official Cash Rate (OCR) to 3.85%.
In the commentary, RBA stated that further policy-tightening was needed to anchor inflation expectations and the central bank is sticking to its agenda of achieving price stability.
The street was anticipating a continuation of the neutral policy stance by RBA Governor Philip Lowe as Australia’s Consumer Price Index (CPI) is consecutively declining for the past three months. From the historic high of 8.4%, monthly Australian inflation has already trimmed to 6.3% in March. In April’s monetary policy, RBA policymakers announced that the Australian economy would slow down further, which will weigh heavily on inflationary pressures.
Going forward, investors will shift their focus on Australian Trade Balance (March) data, which will release on Thursday. Monthly Trade Balance data is seen declining 12,750M from the former release of 13,870M. A weaker-than-anticipated Trade Balance data would impact the Australian Dollar.
On the New Zealand Dollar front, first-quarter Employment data will be keenly watched. The street is anticipating a steady Employment Change at 0.2%. While the Unemployment Rate is seen rising to 3.5% from the former release of 3.4%.
Apart from them, the quarterly Labor Cost Index is seen unchanged at 1.1%. And annual earnings data is expected to accelerate to 4.6% vs. the prior release of 4.3%. A sustained pace in the Employment cost index could force the Reserve Bank of New Zealand (RBNZ) to remain hawkish ahead.
- AUD/JPY takes the bids to refresh multi-day top, rising for the fourth consecutive day on RBA’s move.
- RBA defies market forecasts of keeping benchmark rate unchanged, lifts OCR to 3.85%.
- Downbeat Aussie inflation expectations, mixed sentiment challenge risk-barometer pair.
- BoJ versus RBA divergence can keep pair buyers hopeful.
AUD/JPY rallies to the highest levels since early March, up 1.10% intraday near 92.15 early Tuesday as the Reserve Bank of Australia (RBA) board members decided to lift the Official Cash Rate (OCR) by 0.25% to 3.85%. In doing so, the cross-currency pair also cheers upbeat economic forecasts from the Australian central bank amid dovish Bank of Japan (BoJ) bias.
Not only does the RBA announce a 0.25% rate hike but the Aussie central bank also expects further tightening of the monetary policy. That said, the RBA also revised its inflation and Gross Domestic Product (GDP) forecasts in the latest policy document.
Also read: RBA: Board expects that some further tightening of monetary policy may be needed
Apart from the RBA moves, the BoJ’s preference for the easy money policy and cautious optimism after the First Republic Bank actions add strength to the AUD/JPY pair’s upside momentum.
Against this backdrop, S&P 500 Futures track Wall Street’s indecisiveness near 4,180, retreating from a three-month high, whereas the US 10-year and two-year Treasury bond yields ease from a one-week high to 3.55% and 4.13% at the latest.
Having witnessed the initial reaction to the RBA’s surprise move, AUD/JPY pair traders may keep their eyes on the risk catalysts for clear directions. Among them, headlines surrounding the US debt ceiling expirations and the US-China tension will be crucial to watch.
Technical analysis
A clear upside break of the downward-sloping resistance line from late October 2022, around 91.40 by the press time, directs AUD/JPY buyers toward February’s high of around 93.05.
Having surprised global markets with a 0.25% rate hike, the Reserve Bank of Australia’s (RBA) economic analysis also allow AUD/USD bulls to remain hopeful.
Also read: Breaking: RBA surprises markets with rate hike to 3.85% in May, AUD/USD rallies
Key statements
Board expects that some further tightening of monetary policy may be needed.
Board remains resolute in its determination to return inflation to target.
Inflation at 7 per cent is still too high and it will be some time yet before it is back in the target range.
Further tightening will depend upon how the economy and inflation evolve.
Central forecast remains that it takes a couple of years before inflation returns to the top of the target range.
A significant source of uncertainty continues to be the outlook for household consumption.
Inflation is expected to be 4½ per cent in 2023 and 3 per cent in mid-2025.
Unemployment rate is forecast to increase gradually to be around 4.5 per cent in mid-2025.
GDP is forecast to increase by 1.25 % this year and around 2 % over the year to mid-2025.
Data also confirmed that the labour market remains very tight, with the unemployment rate at a near 50-year low.
The path to achieving a soft landing remains a narrow one.
Board remains alert to the risk that expectations of ongoing.
High inflation contribute to larger increases in both prices and wages.
Also read: AUD/USD soars above 0.6680 as RBA surprisingly elevates interest rate by 25 bps to 3.85%
- AUD/USD has jumped strongly above 0.6680 as RBA has hiked rates surprisingly by 25 bps to 3.85%.
- The RBA went for a hawkish interest rate policy despite consistently declining Australian inflation.
- The USD Index is expected to reclaim its immediate resistance of 102.20 a break above the same will gear for a firmer rally.
The AUD/USD pair has climbed swiftly above 0.6680 as the Reserve Bank of Australia (RBA) has hiked interest rates surprisingly by 25 basis points (bps) to 3.85%. The street was anticipating an unchanged interest rate policy.
RBA Governor Philip Lowe has hiked the Official Cash Rate (OCR) to 3.85% despite the monthly Australian Consumer Price Index (CPI) consistently declining from December. From a peak of 8.4%, the Australian CPI has already decelerated to 6.3% in March. Also, a further decline in inflationary pressures is expected as RBA policymakers are expecting a slowdown in the Australian economy.
Going forward, the Australian Dollar will dance to the tunes of Caixin Manufacturing PMI (April) data, which will release on Thursday. As per the consensus, the economic data is seen improving to 50.8 from the former release of 50.0. Expansionary Fiscal and monetary measures from the administration and the People’s Bank of China (PBoC) respectively are supporting manufacturing activities and the overall demand.
It is worth noting that Australia is the leading trading partner of China and upbeat manufacturing activities will also support the Australian Dollar.
Meanwhile, the US Dollar Index (DXY) has rebounded after sensing support near 102.00. The USD Index is expected to reclaim its immediate resistance of 102.20 a break above the same will gear for a firmer rally. Anticipation of one more rate hike from the Federal Reserve (Fed) is expected to keep the USD Index in the driving seat.
Apart from that, US ISM Services PMI (April) data will be keenly watched. As per the consensus, ISM Services PMI (April) is seen higher at 53.1 from the former release of 51.2. Also, New Orders Index is expected to jump to 57.0 vs. the prior release of 52.2.
At its May monetary policy meeting, the Reserve Bank of Australia (RBA) board members decided to lift the Official Cash Rate (OCR) by 0.25% to 3.85%. That said, market players widely anticipated the Aussie central bank’s inaction, which in turn gave rise to a strong reaction to the RBA's surprise move.
AUD/USD reaction
Following the Aussie central bank’s surprisingly hawkish move, the AUD/USD pair rallies nearly 60 pips to 0.6684. With this, the pair is trading up for the third consecutive trading day.
Also read: AUD/USD Price Analysis: Well set for further downside past 0.6650 on RBA Day
AUD/USD: 15-minute chart
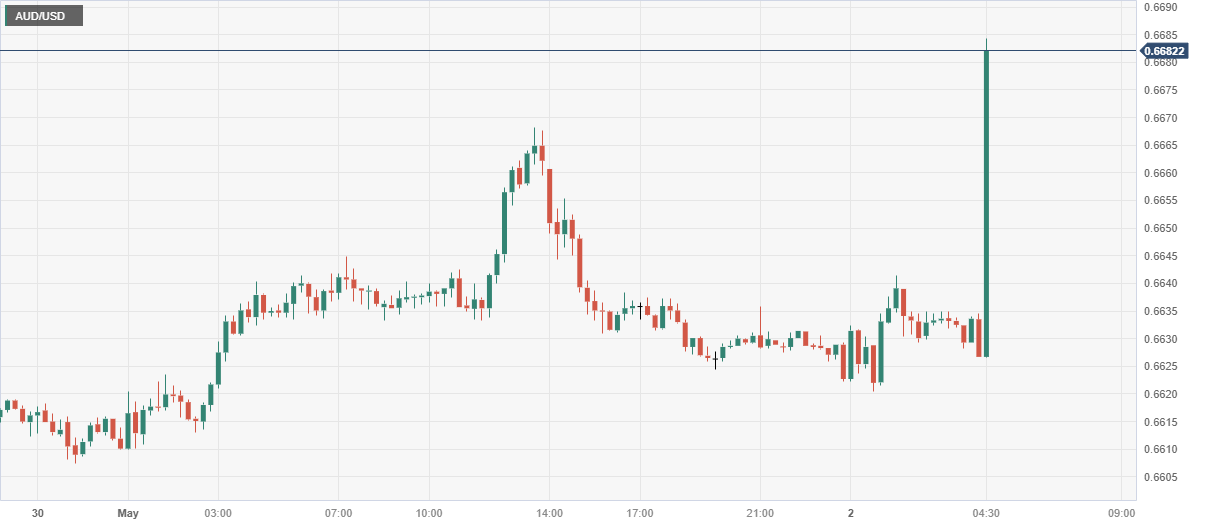
Trend: Further upside expected
About RBA rate decision
RBA Interest Rate Decision is announced by the Reserve Bank of Australia. If the RBA is hawkish about the inflationary outlook of the economy and rises the interest rates it is positive, or bullish, for the AUD. Likewise, if the RBA has a dovish view on the Australian economy and keeps the ongoing interest rate, or cuts the interest rate it is seen as negative, or bearish.
- USD/INR remains pressured around intraday low, marks inactive daily performance.
- IMF says India, China to lead Asia-Pacific growth in its latest report.
- Fears of US default, return of full markets weigh on US Dollar and favor Indian Rupee buyers.
- US Factory Orders can entertain intraday traders ahead of Fed, NFP.
USD/INR treads water around 81.75, recently depressed, as market players seek more clues to cheer the International Monetary Fund’s (IMF) upbeat economic analysis for India and China during early Tuesday. In doing so, the Indian Rupee (INR) pair also pays little heed to the US Dollar’s retreat amid looming fears of default and the market’s anxiety as traders return from a long weekend.
“Asia and Pacific will be the most dynamic of the world's major regions in 2023, predominantly driven by the buoyant outlook for China and India,” said the IMF in its latest report.
Also read: IMF raises Asia's economic forecast on China recovery, warns of risks
On the other hand, talks surrounding the US default seem to challenge the market’s previously US Dollar positive bias. That said, US Treasury Department renewed fears of US default by pulling forward the date of running out of funds to match obligations if the current debt ceiling isn’t altered, to June 01 from previously signaled July. Following that, Reuters came out with the news suggesting the US Senate Majority Leader Chuck Schumer’s push for an expedited process to consider a clean two-year suspension of the federal debt ceiling. Further, chatters of US President Joe Biden’s call to four top US diplomats and arranging a meeting on May 09 also made rounds.
Furthermore, relief from the US First Republic Bank issue allowed traders to take a breather as the US regulators seized assets of the First Republic Bank and sold them to a new buyer, namely JP Morgan.
It’s worth noting that the latest statements from China Beige Book (CBB) suggesting that new data offer the first evidence of a truly robust 2023 recovery in the dragon nation, per analysts from CBB, also seem to favor the USD/INR bears. However, Axios came out with headlines suggesting the US allies’ preparations for the US-China war over Taiwan, which in turn keeps the Euro bears hopeful, via the US Dollar’s haven demand.
Amid these plays, S&P 500 Futures track Wall Street’s indecisiveness near 4,180, retreating from a three-month high, whereas the US 10-year and two-year Treasury bond yields ease from a one-week high to 3.55% and 4.13% at the latest.
Given the return of major markets, except for China, the USD/INR pair may witness a comparatively active trading session ahead. That said, the pair sellers, however, are likely to find hurdles should the risk appetite deteriorates. Also important to watch will be the US Factory Orders for March, expected to rise by 0.8% MoM versus -0.7% prior.
Technical analysis
The previous day’s Doji candlestick joins the downbeat RSI (14) to keep the USD/INR buyers hopeful unless the quote breaks an upward-sloping support line from early November 2022, close to 81.65 by the press time.
Banking sector problems in the United States and Europe were caused by liquidity and interest rates risks, but won't impact on Japan's economy and financial system for now,” said Japanese Economy Minister Shigeyuki Goto said in an interview with Reuters during early Tuesday.
When asked if the US banking woes may cause a delay in any Bank of Japan efforts to normalise its easing policy down the road, Goto said he expected the central bank to steer policy flexibly and appropriately, without elaborating further, reported Reuters.
Key comments
What happened to the West involved risks of liquidity and interest rates.
Financial institutions and authorities will need to respond firmly to liquidity risks.
I don't see the U.S. financial sector facing big problems.
Risk factors warrant attention such as downward any revision to forecasts for the world economy and financial market fluctuations as Western countries continue to tighten monetary policy.
The BOJ as central bank should tackle monetary policy operations, but I don't see the current financial situation impacting Japan's economy and financial sector as a whole.
I expect the BOJ to guide monetary policy flexibly, meaning that the central bank should do so appropriately taking economy and financial markets into account.
It would be difficult to tap sales tax revenue as a funding source to pay for additional childcare spending given the fragile state of the Japanese economy.
As the first step to rein in snowballing debt, the government will stick to its aim of balancing the country's primary budget excluding new bond sales and debt servicing costs by the fiscal year-end in March 2026, a target he described as ‘not easy’.
Also read: USD/JPY traces yields’ retreat to ease from two-month high towards 137.00 amid US debt ceiling woes
- Gold price is showing a sideways performance above $1,980.00 as investors await Fed policy.
- S&P500 futures have recovered more losses recorded in early Asia amid improving risk-taking ability of investors.
- Gold price is consolidating in a narrow range of $1,971-2,021 from the past week.
Gold price (XAU/USD) is displaying a back-and-forth action above $1,980.00 in the Tokyo session. The precious metal is struggling to find direction as investors are awaiting the announcement of the Federal Reserve’s (Fed) monetary policy and other key United States data.
S&P500 futures have recovered more losses recorded in early Asia amid improving the risk-taking ability of the market participants. The US Dollar Index (DXY) is seeking support after a correction around 102.00. In early Asia, the USD Index dropped after failing to conquer two-week-old resistance at 102.20. It seems that the upside in the USD Index is capped as the street is anticipating neutral guidance from Fed chair Jerome Powell on interest rates.
On Monday, the US ISM Manufacturing PMI (April) managed to rebound to 47.1 from its lowest recording of 46.3 recorded since May 2022. However, a figure below the 50.0 threshold is considered a contraction in economic activity. The US Manufacturing PMI Has remained below 50.0 straight for the sixth time as higher interest rates by the Fed and bleak demand outlook have forced firms for capacity underutilization.
Going forward, US Automatic Data Processing (ADP) Employment data will be of significant importance. According to the estimates, the US labor market has witnessed an addition of 150K fresh addition of employees, higher than the former release of 145K.
Gold technical analysis
Gold price is consolidating in a narrow range of $1,971-2,021 from the past week as investors are awaiting the monetary policy by the Fed for a decisive move. Upward-sloping trendline March 22 low at $1,934.34 is acting as a cushion for the Gold bulls.
The 20-period Exponential Moving Average (EMA) at $1,990.28 is showing stickiness to the Gold price, indicating a lackluster performance.
Meanwhile, the Relative Strength Index (RSI) (14) is on the verge of slipping into the bearish range of 20.00-40.00, which will activate the bearish momentum.
Gold four-hour chart
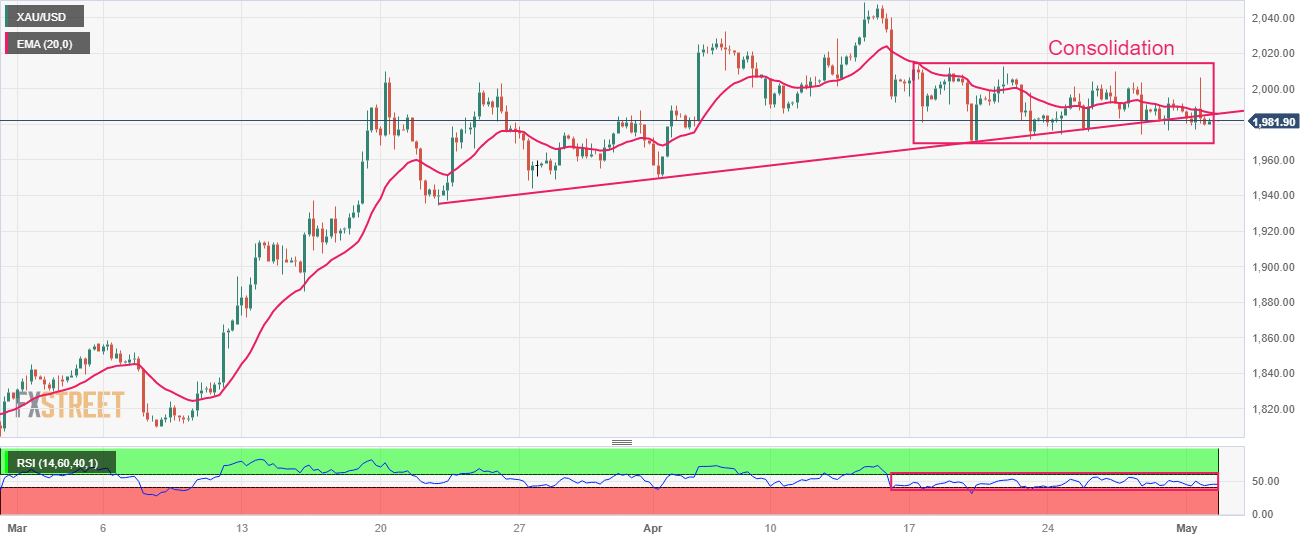
“The International Monetary Fund (IMF) raised Asia's economic forecast on Tuesday as China's recovery underpinned growth, but warned of risks from persistent inflation and global market volatility driven by Western banking-sector woes,” reported Reuters.
The news piece also reports that Asia's economy is expected to expand 4.6% this year after a 3.8% increase in 2022, contributing around 70% of global growth, per the IMF report, upgrading its forecast by 0.3 of a percentage point from October.
Key statements from IMF report
The reopening of China's economy will be pivotal for the region with the spillover to Asia seen focused on consumption and service-sector demand rather than investment.
Asia and Pacific will be the most dynamic of the world's major regions in 2023, predominantly driven by the buoyant outlook for China and India.
As in the rest of the world, domestic demand is expected to remain the largest growth driver across Asia in 2023.
China and India will be key drivers with an expansion of 5.2% and 5.9%, respectively, though growth in the rest of Asia is also expected to bottom out this year.
While spillovers to the region from stress in U.S. and European financial sectors have been relatively contained thus far, Asia remains vulnerable to tightening financial conditions and to sudden and disorderly repricing of assets.
While Asia has strong capital and liquidity buffers to fend off market shocks, the region's highly leveraged corporate and household sectors are "significantly" more exposed to a sharp increase in borrowing costs.
The costs of failing to bring inflation below target are likely to outweigh any benefits from keeping monetary conditions loose.
Insufficient tightening in the short term would require disproportionately more monetary tightening later to avoid high inflation becoming ingrained, making a larger contraction more likely.
Also read: S&P 500 Futures, Treasury bond yields retreat on US debt ceiling woes, full market’s return
- USD/CAD is consistently defending the 1.3540 support, however, a volatile action is anticipated ahead of Fed policy.
- As a 25 bp rate hike by the Fed is already expected, uncertainty about Fed rate guidance is fueling anxiety among investors.
- The US Dollar has witnessed selling interest from 61.8% and 50% Fibo retracements at 1.3648 and 1.3584 respectively.
The USD/CAD pair has been oscillating in a narrow range around 1.3550 from the past two trading sessions. The Loonie asset is continuously defending its immediate support of 1.3540 amid overall strength in the US Dollar Index (DXY).
A power-pack action is anticipated from the asset as investors are awaiting Federal Reserve’s (Fed) monetary policy. A consecutive 25 basis point (bp) interest rate hike is widely anticipated, however, uncertainty over rate guidance is infusing anxiety among market participants.
The USD Index is facing barricades around 102.20 for the past two weeks. Meanwhile, S&P500 futures have trimmed some of their losses, showing some improvement in the risk appetite of the market participants.
USD/CAD is facing selling pressure from Fibonacci retracement like a textbook picture. On a two-hour scale, the Fibonacci retracement tool is placed from March 10 high at 1.3862 to April 14 low at 1.3301. The US Dollar has witnessed selling interest from 61.8% and 50% Fibo retracements at 1.3648 and 1.3584 respectively.
Also, the 20-period Exponential Moving Average (EMA) at 1.3560 is acting as a barricade for the US Dollar.
A slippage into the 20.00-40.00 tunnel by the Relative Strength Index (RSI) (14) will result in the activation of bearish momentum.
Going forward, a decisive break below the intraday low at 1.3533 will expose the asset to psychological support at 1.3500 followed by a 23.6% Fibo retracement at 1.3438.
On the flip side, a recovery move above the 61.8% Fibo retracement at 1.3650 will trigger a reversal and will drive the major toward the round-level resistance at 1.3700. A break above the same will expose the asset to March 22 high at 1.3745.
USD/CAD two-hour chart

The Reserve Bank of Australia’s (RBA) pause to the 10-time rate hike trajectory makes today’s RBA Interest Rate Decision important even if the Officials are less likely to announce any change to the current monetary policy at around 04:30 AM GMT on Tuesday.
It’s worth noting the RBA is likely to throw dice on the dove’s side as traders remain divided over the Aussie central bank’s peak rate.
Given the recently mixed statements in the RBA minutes and a contrasting play between inflation and wage numbers, not to forget the talks of policy pivot, the AUD/USD traders will be more interested in hearing about the end of the rate hike trajectory, making this event crucial.
Ahead of the event, Analysts at ANZ said,
Most economists, including ANZ, expect the RBA will again leave its cash rate unchanged at 3.60% today following a larger-than-expected decline in trimmed mean inflation. The market is pricing in just 3bp (ie a 12% chance of a 25bp hike). However, not only will it be a much closer decision than that suggests, in our view, but there is disagreement about whether 3.6% marks the final peak, making the RBA’s tone today crucial for the market reaction
On the same line, FXStreet’s Matias Salord said,
The (AUD/USD) pair seems to be vulnerable ahead of the RBA meeting. Not much impact is expected from the meeting. The central bank is likely to repeat the same message, leaving market participants with no new information. However, if the RBA suggests it could start hiking again soon, the Aussie could rally, at least until Friday's monetary statement. The signs of an extended pause ahead are what markets expect, so it should not significantly influence the AUD/USD.
How could the RBA decision affect AUD/USD?
AUD/USD remains sidelined near 0.6635-40 while portraying the pre-RBA anxiety among traders. Also challenging the risk-barometer pair are the fears of the fresh US-China tussles over Taiwan and the US default woes, not to forget the hawkish Fed bets.
That said, the RBA is likely to trouble momentum traders as most analysts on the table anticipate no rate change. However, the economic forecasts and talks surrounding the policy pivot rate will be crucial to watch for the Aussie pair traders to watch for clear directions.
Should the RBA shows readiness to resume the rate hike trajectory from the next meeting, or surprises the markets by doing the same in today’s RBA Rate Statement, the AUD/USD may have a further upside to trace. Until then, the AUD/USD may remain on the bear’s radar.
Technically, the Aussie pair defends the previous day’s U-turn from a two-week-old resistance line, as well as the inability to cross the previous support line from early March, now immediate resistance near 0.6655, which in turn joins downbeat oscillators to favor bears.
Key quotes
Reserve Bank of Australia Preview: No change, nothing new for the Aussie
AUD/USD Price Analysis: Well set for further downside past 0.6650 on RBA Day
AUD/USD eases towards 0.6600 with eyes on RBA Interest Rate Decision
About the RBA interest rate decision
RBA Interest Rate Decision is announced by the Reserve Bank of Australia. If the RBA is hawkish about the inflationary outlook of the economy and rises the interest rates it is positive, or bullish, for the AUD. Likewise, if the RBA has a dovish view of the Australian economy and keeps the ongoing interest rate, or cuts the interest rate it is seen as negative, or bearish.
- EUR/USD picks up bids to print mild gains while snapping three-day downtrend.
- US debt ceiling expiration talks, relief from First Republic Bank woes join downbeat yields to weigh on US Dollar.
- Euro cheers hawkish ECB talks despite mixed growth numbers as Eurozone HICP, CPI looms.
- US Factory Orders, risk catalysts are also important for clear directions ahead of Fed, ECB monetary policy decisions.
EUR/USD cheers US Dollar’s retreat to snap a three-day downtrend near 1.0990 during early Tuesday morning in Europe. In doing so, the Euro pair also benefits from the market’s anxiety ahead of the key Eurozone inflation data amid the return of the bloc’s traders after a long weekend.
It’s worth mentioning that the talks surrounding the US default and hawkish Fed bets, as well as about China growth and the Sino-American tension, seem to challenge the market’s previously US Dollar positive bias. The reason could be linked to the European Central Bank (ECB) Officials’ readiness to keep the rate hike, as well as rejection of the recession woes even if the latest Gross Domestic Product (GDP) for Eurozone and Germany appear softer.
That said, US Treasury Department renewed fears of US default by pulling forward the date of running out of funds to match obligations if the current debt ceiling isn’t altered, to June 01 from previously signaled July. Following that, Reuters came out with the news suggesting the US Senate Majority Leader Chuck Schumer’s push for an expedited process to consider a clean two-year suspension of the federal debt ceiling. Further, chatters of US President Joe Biden’s call to four top US diplomats and arranging a meeting on May 09 also made rounds.
Elsewhere, a relief from the US First Republic Bank issue allowed traders to take a breather as the US regulators seized assets of the First Republic Bank and sold them to a new buyer, namely JP Morgan.
On the other hand, the latest statements from China Beige Book (CBB) suggesting that new data offer the first evidence of a truly robust 2023 recovery in the dragon nation, per analysts from CBB, seem to favor the EUR/USD optimists. However, Axios came out with headlines suggesting the US allies’ preparations for the US-China war over Taiwan, which in turn keeps the Euro bears hopeful, via the US Dollar’s haven demand.
It’s worth observing that Friday’s upbeat US inflation clues via Core PCE Price Index join Monday’s mostly firmer US PMI data to underpin hawkish bias about the Federal Reserve (Fed) and weigh on the sentiment. On the same line are the US inflation expectations, as per the 10-year and 5-year breakeven inflation rates from the St. Louis Federal Reserve (FRED) data.
Against this backdrop, S&P 500 Futures print mild losses after retreating from a three-month high, down 0.10% intraday near 4,182 by the press time. On the same line, the US 10-year and two-year Treasury bond yields retreat from a one-week high to 3.55% and 4.13% at the latest.
Looking ahead, German Retail Sales for March and the ECB Bank Landing Survey may entertain EUR/USD pair traders ahead of the first readings of the Eurozone’s key inflation gauge for April, namely Harmonized Index of Consumer Prices (HICP). Given the likely unchanged figures, any negative surprise won’t hesitate to recall the EUR/USD bears amid hawkish Fed bets. In that case, today’s US Factory Orders for March, expected to rise by 0.8% MoM versus -0.7% prior, can offer clear directions ahead of Wednesday’s FOMC and Thursday’s ECB monetary policy meetings.
Technical analysis
Despite the late rebound, EUR/USD keeps the previous day’s downside break of an upward-sloping support line from late March, now immediate resistance near 1.1010, which in turn joins downbeat oscillators to favor Euro pair sellers.
| Raw materials | Closed | Change, % |
|---|---|---|
| Silver | 24.991 | -0.34 |
| Gold | 1982.44 | -0.38 |
| Palladium | 1450.41 | -3.47 |
- Natural Gas price remains pressured after snapping two-day winning streak.
- 50-DMA adds strength to $2.45 upside hurdle, 21-DMA acts as additional support.
- Sluggish oscillators suggest continuation of further XNG/USD grind within bullish chart formation.
Natural Gas Price (XNG/USD) holds lower grounds near $2.37 during the early hours of Tuesday, after posting the first daily loss in three the previous day.
In doing so, the XNG/USD price remains inside a two-week-old descending triangle formation amid sluggish MACD signals and steady RSI (14).
As a result, the Natural Gas Price is likely to remain sideways within a bullish chart pattern, currently between $2.45 and $2.32. That said, the 50-DMA adds strength to the $2.45 upside hurdle.
It’s worth noting that an upside break of $2.45 won’t hesitate to challenge a downward-sloping resistance line from March 08, close to $2.57. Following that, the six-week high marked on Friday at around $2.58 can act as the last defense of the Natural Gas sellers.
On the contrary, the 21-DMA level of around $2.33 restricts the immediate downside of the XNG/USD price before directing the energy instrument towards the bottom of the stated triangle, near $2.32.
Should the quote remains bearish past $2.32, the yearly low marked in April around $2.11 and the $2.00 psychological magnet will gain the market’s attention.
Overall, the Natural Gas Price remains on the bull’s radar despite the latest pullback in the quote.
Natural Gas Price: Daily chart
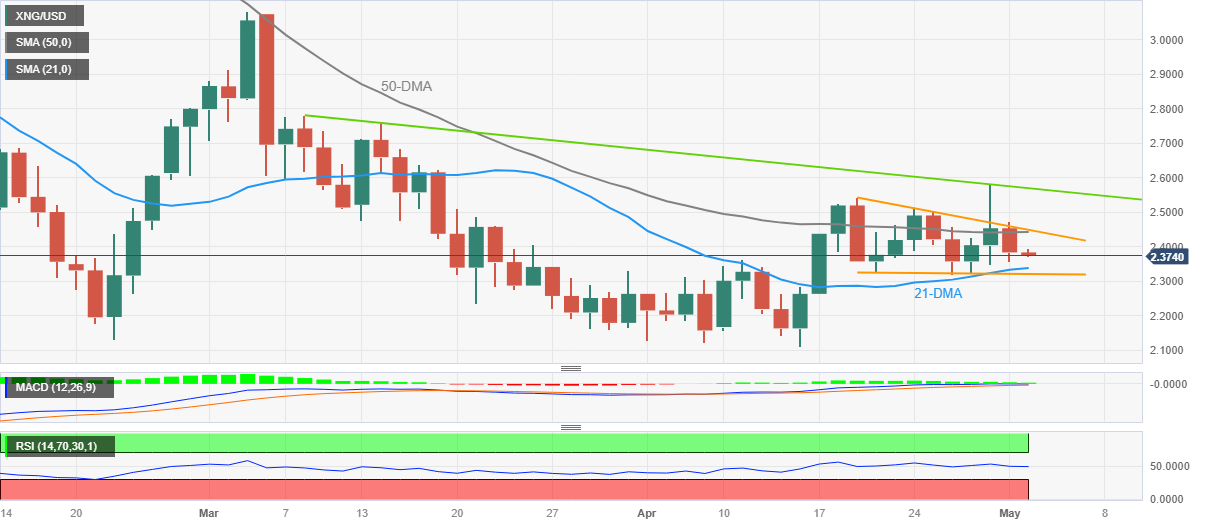
Trend: Further consolidation expected
- GBP/USD bulls are moving in from key support.
- Bears could be lurking around a 50% mean reversion.
GBP/USD is correcting into a potential resistance area, something that was eyed at the start of the week in the following analysis: GBP/USD Price Analysis: Bulls about to make another move? 1.2450 is key
GBP/USD H4 charts, prior analysis
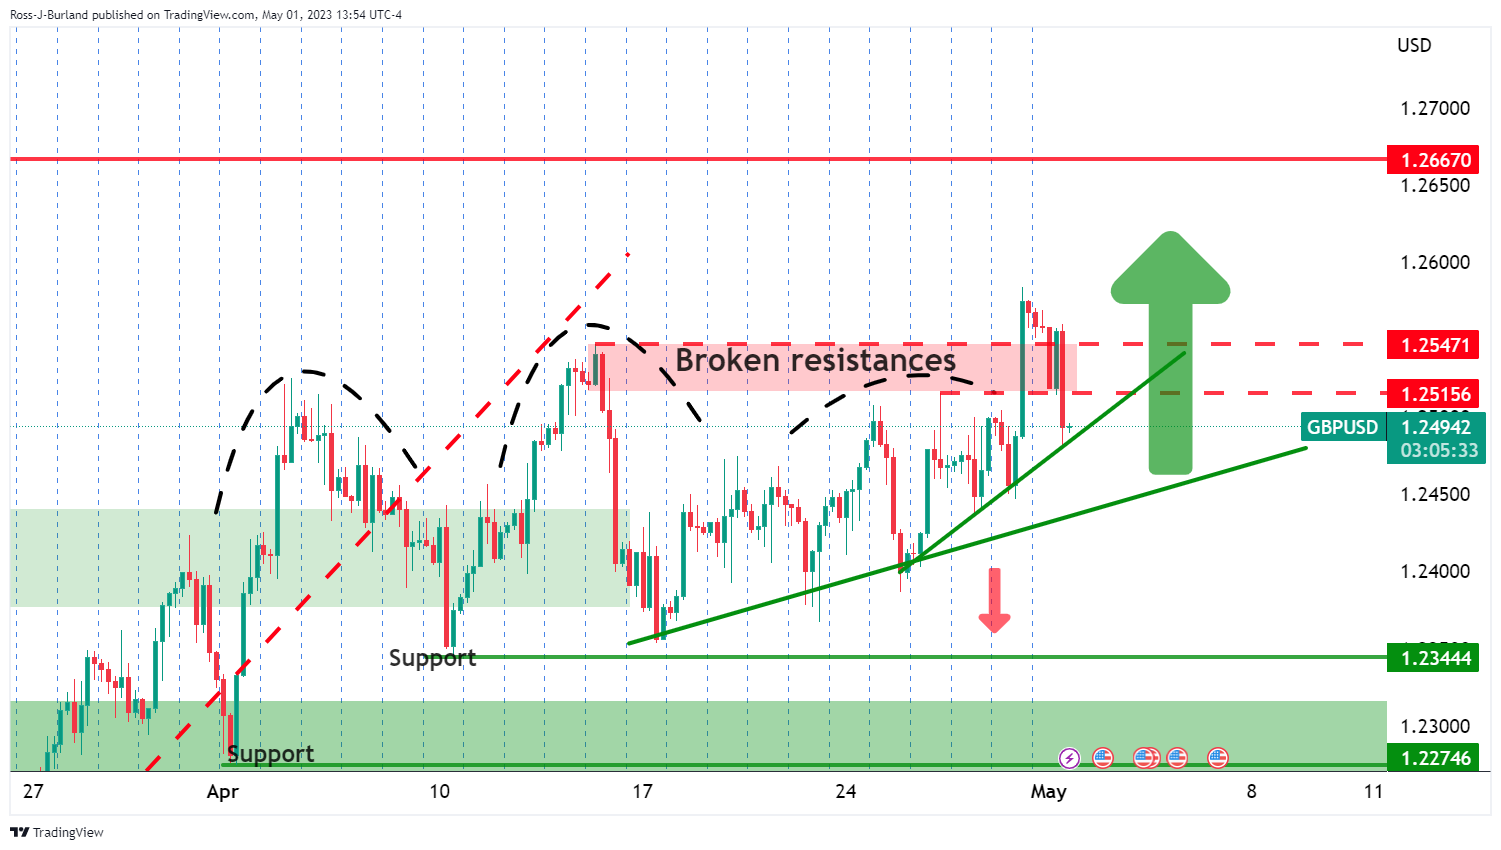
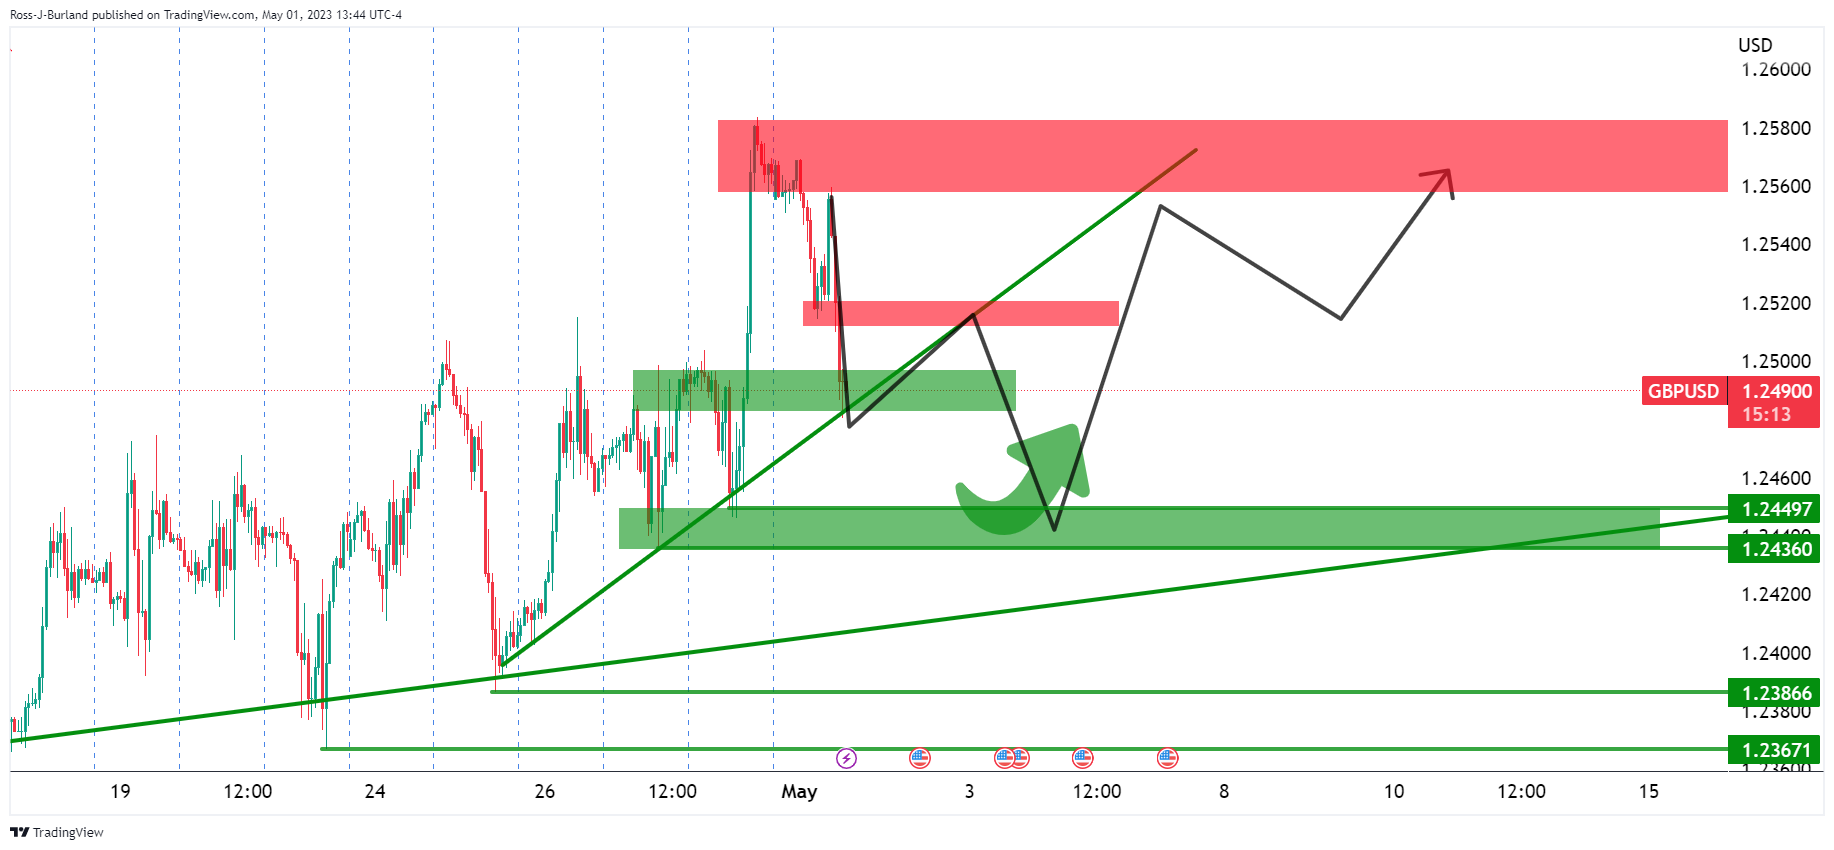
While the above is a theoretical schematic, it identified the key areas of support and resistances in the 4-hour time frame. The micro trendline was under pressure but it was stated that ´´so long as the broader trendline remains intact, meeting 1.2450, or thereabouts, then it would be reasonable to expect the bulls to move in again.´´
GBP/USD live updates

The correction is playing out.
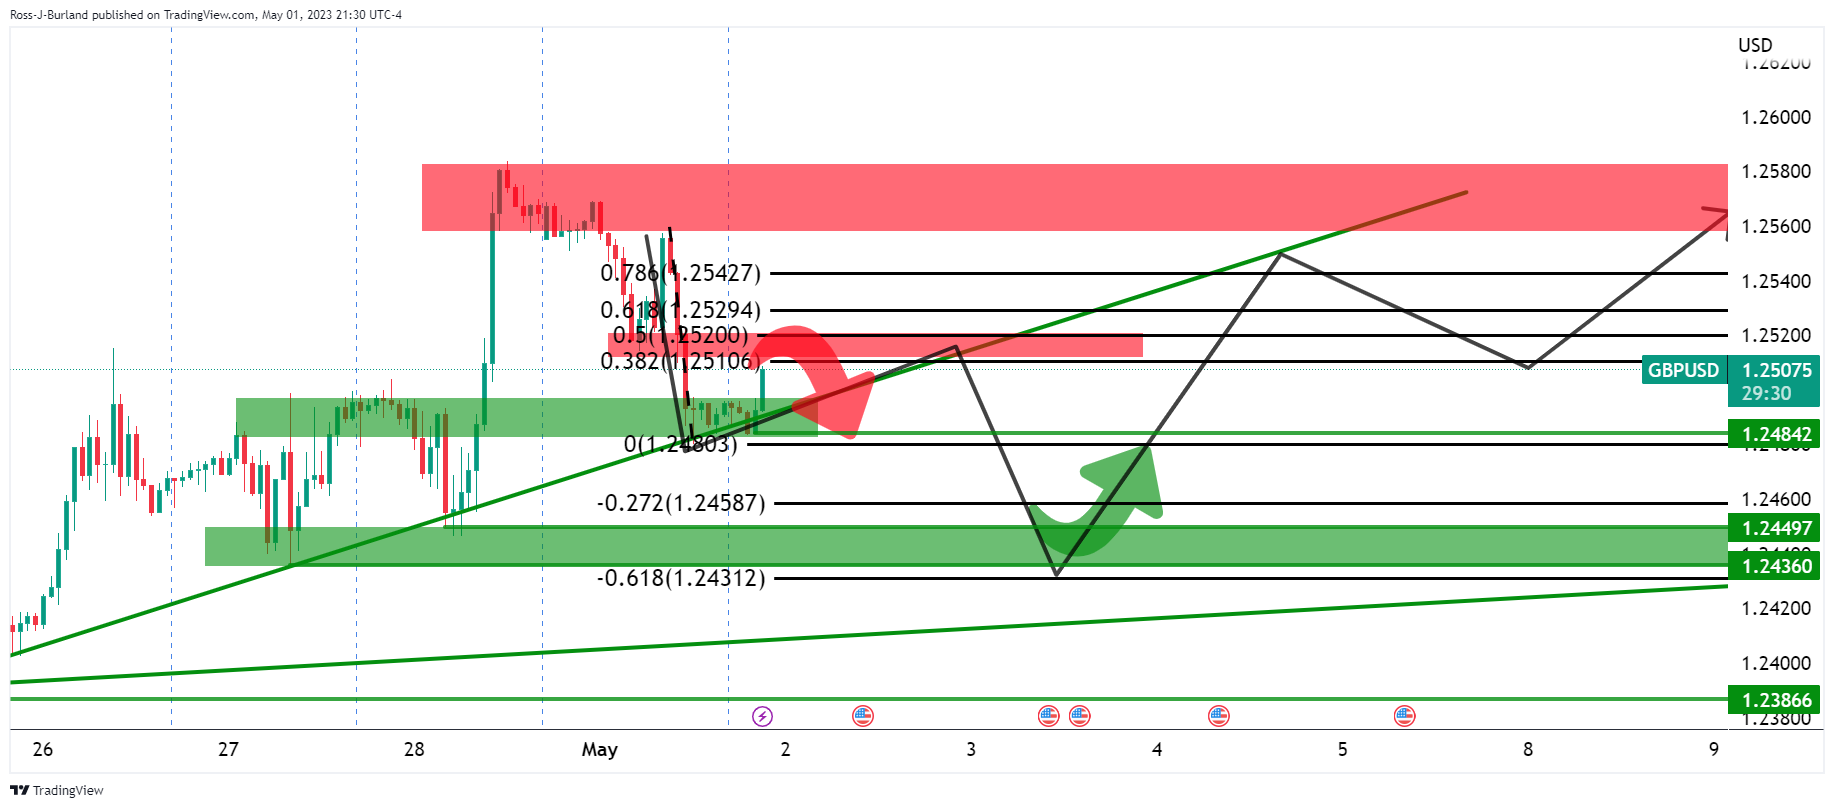
We have seen a move toward resistance and the Fibonacci scale sees the 38.2% ratio under pressure. A subsequent sell-off could be in order if the bears commit at the prior lows that might act as support into a 50% mean reversion.
- Market sentiment remains fragile as traders return from extended holiday.
- US Treasury Depart renews fears of debt ceiling expiration, policymakers rush for quick solutions.
- S&P 500 Futures print mild losses after reversing from three-month high, US Treasury bond yields pare week-start gains.
- Relief over First Republic Bank issue, hawkish Fed bets and recovery in US inflation expectations underpin US Dollar.
Risk profile remains sluggish during early Tuesday, following a cautiously optimistic start of the key week. While tracing the main catalysts, talks surrounding US default and hawkish Fed bets, as well as about China growth and the Sino-American tension, gain major attention as most traders return from a long weekend.
S&P 500 Futures print mild losses after retreating from a three-month high, down 0.10% intraday near 4,182 by the press time. On the same line, the US 10-year and two-year Treasury bond yields retreat from a one-week high to 3.55% and 4.13% at the latest.
US Treasury Department renewed fears of US default by pulling forward the date of running out of funds to match obligations if the current debt ceiling isn’t altered, to June 01 from previously signaled July. Following that, Reuters came out with the news suggesting the US Senate Majority Leader Chuck Schumer’s push for an expedited process to consider a clean two-year suspension of the federal debt ceiling.
Further, chatters of US President Joe Biden’s call to four top US diplomats and arranging a meeting on May 09 also made rounds while US House of Representatives Speaker Kevin McCarthy mentioned that there is a bill sitting in the Senate as we speak that would put the risk of default to rest.
Elsewhere, a relief from the US First Republic Bank issue allowed traders to take a breather as the US regulators seized assets of the First Republic Bank and sold them to a new buyer, namely JP Morgan. “JPMorgan will pay $10.6 billion to the U.S. Federal Deposit Insurance Corp (FDIC) as part of the deal to take control of most of the San Francisco-based bank's assets and get access to First Republic's coveted wealthy client base,” said Reuters.
Also on the positive side are the latest statements from China Beige Book (CBB) suggesting that new data offer the first evidence of a truly robust 2023 recovery in the dragon nation, per analysts from CBB.
On the other hand, Axios came out with headlines suggesting the US allies’ preparations for the US-China war over Taiwan. Additionally, Friday’s upbeat US inflation clues via Core PCE Price Index join Monday’s mostly firmer US PMI data to underpin hawkish bias about the Federal Reserve (Fed) and weigh on the sentiment. On the same line are the US inflation expectations, as per the 10-year and 5-year breakeven inflation rates from the St. Louis Federal Reserve (FRED) data.
Moving ahead, US Factory Orders for March, expected to rise by 0.8% MoM versus -0.7% prior, can offer immediate directions to traders. However, major attention will be given to Wednesday’s US Federal Reserve (Fed) monetary policy announcements and Friday’s jobs report for April for a clear guide.
Also read: Forex Today: US Dollar strengthens ahead of Fed
- Silver price stays defensive after reversing from three-week high.
- Repeated pullbacks from 10-DMA, bearish MACD signals keep XAG/USD sellers hopeful.
- Three-week-long bearish channel restricts immediate Silver price moves ahead of previous resistance line from January.
Silver (XAG/USD) price seesaws around $25.00 as markets portray traders’ anxiety ahead of the key data/events on early Tuesday, after reversing from a three-week top the previous day.
In doing so, the XAG/USD remains within a three-week-old bearish trend channel while staying below the 10-DMA hurdle since April 19.
On only the failure to cross the 10-DMA and a bearish channel but the downbeat MACD signals also keep the Silver price on the seller’s radar.
However, the stated downward-sloping channel’s bottom line, close to $24.50, puts a floor under the Silver price ahead of the resistance-turned-support line stretched from early January, near $24.00 by the press time.
It’s worth noting that the XAG/USD weakness past $24.00 won’t hesitate to direct the commodity price toward January’s low near $22.75.
Meanwhile, an upside clearance of the 10-DMA level of $25.10 can favor the Silver buyers to prod the top line of the aforementioned bearish channel, around $25.90 at the latest.
Following that, the Year-To-Date (YTD) high of around $26.10 and the April 2022 peak near $26.25 will be in the spotlight.
Overall, the Silver price is likely to remain depressed inside a bearish chart formation.
Silver: Daily chart
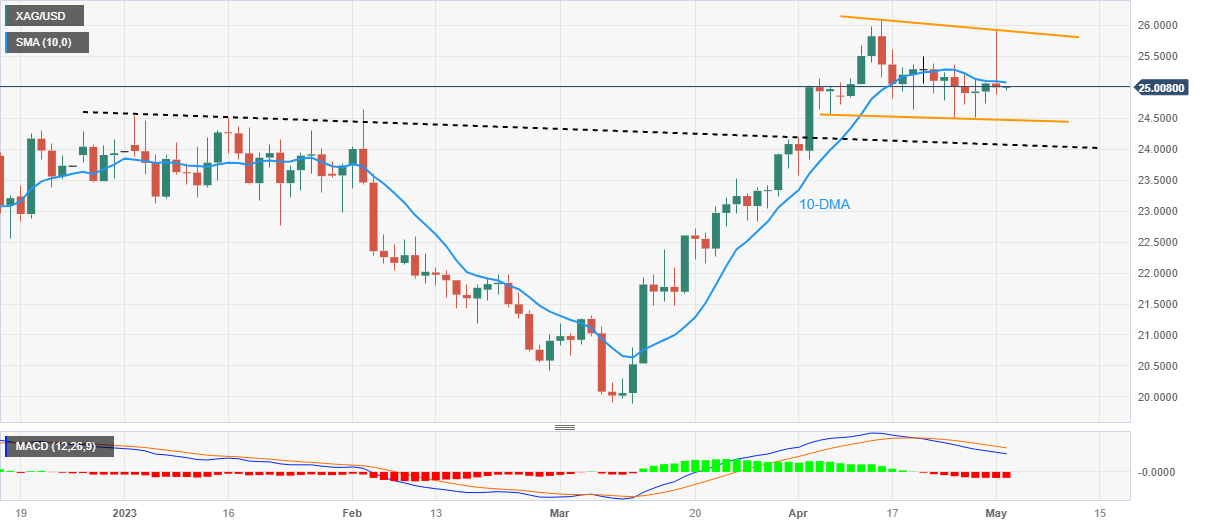
Trend: Limited downside expected
- AUD/NZD is looking for a cushion around 1.0740 as the focus shifts to RBA policy.
- A neutral stance is widely anticipated from the RBA as Australian inflation is consistently decelerating.
- Weak NZ Employment (Q1) data might allow the RBNZ to consider a pause in the policy-tightening spell.
The AUD/NZD pair has corrected to near 1.0740 after failing to sustain a rally above 1.0760 in the Asian session. The cross is expected to remain in action ahead of the interest rate decision by the Reserve Bank of Australia (RBA).
A continuation of a neutral policy stance is anticipated from RBA Governor Philip Lowe. Australian inflation is consistently declining for the past three months. The monthly Australian Consumer Price Index (CPI) has already decelerated from the peak of 8.4% recorded in December to 6.3% in March.
Also, RBA policymakers are confident that the Australian economy is expected to face a severe slowdown due to higher interest rates. This may weigh more pressure on Australian inflation ahead.
Apart from that, Wednesday’s Australian Retail Sales data will be keenly watched. Monthly Retail Sales are expected to remain steady at 0.2%.
On the New Zealand front, investors are keenly awaiting the release of the Employment data (Q1), which is scheduled for Wednesday. As per the estimates, the Employment Change is expected to remain steady at 0.2%. While the Unemployment Rate is seen rising to 3.5% from the former release of 3.4%. The quarterly Employment Cost Index is seen unchanged at 1.1%. Fewer job additions and a higher jobless rate would allow the Reserve Bank of New Zealand (RBNZ) to consider a pause in the policy-tightening process.
Investors should note that RBNZ Governor Adrian Orr pushed its Official Cash Rate (OCR) higher surprisingly by 50 basis points (bps) to 5.25% in April to strengthen its defense against persistent inflation.
- Gold price remains sluggish ahead of the key United States data, events.
- First Republic Bank-induced relief contrasts with fears of US debt ceiling expiry to prod XAU/USD bulls.
- Mixed US PMIs, holidays in major markets offered softer start to a critical week.
- Federal Reserve’s hawkish bias, upbeat US Nonfarm Payrolls become necessary to convince the Gold sellers.
Gold price (XAU/USD) aptly portrays the market’s cautious mood around $1,980, after a downbeat week-start, as full markets return on Tuesday. In doing so, the XAU/USD justifies mixed plays surrounding the US debt ceiling expiration and First Republic Bank, as well as the hawkish concerns about the Federal Reserve (Fed). However, the recently firmer US inflation expectations and data keep the Gold bears hopeful ahead of a busy week.
Gold price seesaws as US default looms, First Republic Bank fears ease
Gold price manages to strike a balance between the market’s fears of the US debt ceiling expiration and the sigh of relief after the First Republic Bank’s takeover by JP Morgan.
That said, Reuters came out with the news suggesting the US Senate Majority Leader Chuck Schumer’s push for an expedited process to consider a clean two-year suspension of the federal debt ceiling. Fueling the US diplomat’s move is the Treasury Department’s recent updates of the default by pulling forward the date of running out of funds to match obligations if the current debt ceiling isn’t altered by June 01, previously signaled as July. “US Treasury Secretary Janet Yellen said in a letter to Congress that the agency may be unable to meet all of its debt obligations as soon as June 1 if the debt ceiling is not raised, putting new urgency on talks in Congress,” said Reuters.
The same triggered chatters of US President Joe Biden’s call to four top US diplomats and arranging a meeting on May 09 made rounds. Further, US House of Representatives Speaker Kevin McCarthy mentioned that there is a bill sitting in the Senate as we speak that would put the risk of default to rest.
On the other hand, the US regulators seized assets of the First Republic Bank and sold them to a new buyer, namely JP Morgan. “JPMorgan will pay $10.6 billion to the U.S. Federal Deposit Insurance Corp (FDIC) as part of the deal to take control of most of the San Francisco-based bank's assets and get access to First Republic's coveted wealthy client base,” said Reuters.
With this, the market sentiment dwindles amid mixed concerns and challenges to the Gold price. While portraying the mood, the S&P 500 Futures print mild losses despite Wall Street’s upbeat close whereas the US Treasury bond yields and the US Dollar Index retreat.
US data, inflation expectations keep XAU/USD bears hopeful
While the risk catalysts do challenge the Gold price, the latest prints of the US data and inflation precursors keep the bearish bias surrounding the XAU/USD intact.
Friday’s upbeat US inflation clues via Core PCE Price Index join Monday’s mostly firmer US PMI data to underpin hawkish bias about the Federal Reserve (Fed) and weigh on the Gold price.
On Monday, US ISM Manufacturing PMI improved to 47.1 for April versus 46.3 prior and 46.6 market forecasts while the S&P Global Manufacturing PMI for the said month eased to 50.2 versus 50.4 first estimations. Further, US inflation expectations, as per the 10-year and 5-year breakeven inflation rates from the St. Louis Federal Reserve (FRED) data, justify the market’s latest reassessment of the Federal Reserve (Fed) concerns by bouncing off a six-week low on Monday.
Looking forward, US Factory Orders for March, expected to rise by 0.8% MoM versus -0.7% prior, can offer immediate directions to the Gold price. However, major attention will be given to Wednesday’s US Federal Reserve (Fed) monetary policy announcements and Friday’s jobs report for April for a clear guide.
Gold price technical analysis
Gold price remains sidelined within a $30.00 trading range comprising a two-week-old descending resistance line and an upward-sloping support line from March 21, respectively near $2,006 and $1,977.
It’s worth observing that the XAU/USD’s repeated failure to cross the 21-DMA hurdle, around the $2,000 round figure, joins the previous week’s Doji candlesticks to suggest the Gold’s bullish exhaustion, which in turn hints at the downside break of $1,979 support.
Additionally luring the XAU/USD sellers are the bearish signals from the Moving Average Convergence and Divergence (MACD) indicator and steady Relative Strength Index (RSI) line, placed at 14.
However, the Gold price weakness below $1,979 needs validation from the 50-DMA support of near $1,939 to convince XAU/USD bears.
On the contrary, an upside clearance of the $2,006 hurdle has multiple resistances near $2,010 and $2,030 levels before the latest peak of around $2,049 can lure the Gold buyers.
Overall, Gold buyers are running out of steam but the sellers need validation from $1,936.
Gold price: Daily chart
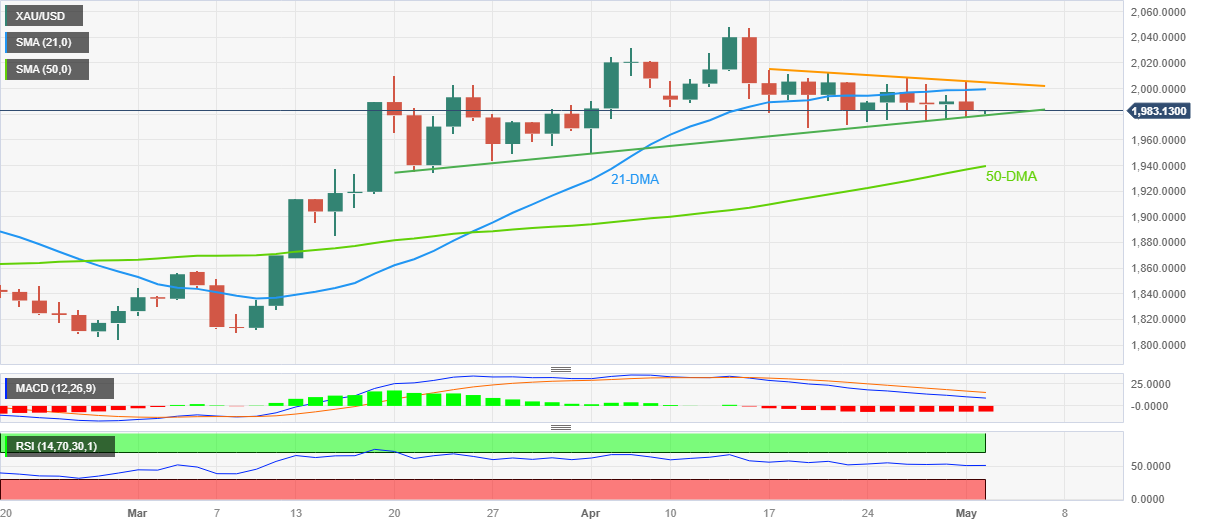
Trend: Further downside expected
- EUR/GBP is marching towards 0.8800 as the ECB is expected to announce a bumper rate hike.
- Eurozone HICP data is seen unchanged despite declining energy prices.
- The BoE is preparing for its 12th consecutive interest rate hike to contain double-digit inflation.
The EUR/GBP pair is oscillating in a narrow range below 0.8890 in the Asian session. The cross is expected to recapture the round-level resistance of 0.8800 ahead as investors are anticipating a bumper interest rate hike announcement from the European Central Bank (ECB) this week.
Consumer spending is getting resilient in Eurozone as the shortage of labor has passed bargaining power from hiring agencies to job seekers. The context is supporting a mega interest rate hike announcement from ECB President Christine Lagarde to contain stubborn inflation.
But before that, Eurozone inflation data will be keenly watched. Tuesday’s Eurozone Harmonized Index of Consumer Prices (HICP) data hold significant importance as it will be critically considered before making an interest rate decision by the ECB.
As per the consensus, the preliminary headline Harmonized Index of Consumer Prices (HICP) (April) is seen unchanged at 6.9% and 0.9% on a quarterly and monthly basis. Also, annual core HICP is seen steady at 5.9% while monthly core HICP could land lower at 1.1% from the former release of 1.3%.
On the Pound Sterling front, United Kingdom’s inflation expectations have trimmed significantly as the Bank of England (BoE) is preparing for its 12th consecutive interest rate hike. Citi said its monthly survey conducted by market research company YouGov showed public expectations for inflation in 12 months' time eased to 5.2% in April from 5.4% in March and expectations for five to 10 years ahead fell to 3.6% from 3.7%, as reported by Reuters.
- EUR/JPY broke into a new high for the bullish cycle but is consolidating.
- The ECB will be the focus for the week ahead.
EUR/JPY is trading at 150.86 and has traded within a range of 150.76 and 150.87 so far. The bears are lurking and eye a break below last week´s and month´s highs for a move into the bullish rally that kicked off on Friday. However, there are a number of events this week that will dictate the price action from here, including the Europen Central Bank interest rate decision.
Easing financial system stress, persistently high inflation, strong wage growth, and avoidance of a winter recession are enough for the ECB to comfortably hike rates by 25bps in May and re-introduce guidance that more tightening is to come,´´ analysts at TD Securities argued.
´We wouldn't completely rule out a 50bps hike should data ahead of the decision surprise significantly but that would come without guidance.´´
Analysts at ANZ Bank explained that ´´if core inflation is still ratcheting higher in annual terms and both bank lending conditions and credit are holding up well, the ECB could opt for a 50bp rise. Hawks have said that a 50bp rise is on the table.´´
´´The question for the ECB is how persistent inflation will be and if second-round effects are emerging. We expect future rate rises to be determined meeting by meeting and see a risk that tightening could extend into Q3,´´ the analysts at TD Securities added.
Meanwhile, the Bank of Japan, instead of tweaking forward guidance, central it entirely. This suggests that the BoJ will become more data-dependent, with two-way policy risks and more flexibility.
BoJ left its key policy levers unchanged as widely expected, with the 10y JGB yield target at about 0%, policy balance rate at -0.1% and YCC band unaltered.
- AUD/USD stays defensive after reversing from 12-day-old resistance line.
- Failure to cross previous support line, easing bullish bias of MACD signals favors Aussie pair sellers.
- RBA is expected to keep monetary policy intact but a surprise move could propel prices beyond 200-SMA key hurdle.
AUD/USD portrays pre-RBA consolidation as it prints mild losses around 0.6630 during early Tuesday. In doing so, the Aussie pair defends the previous day’s U-turn from a two-week-old resistance line ahead of the Reserve Bank of Australia (RBA) Interest Rate Decision.
Also read: AUD/USD eases towards 0.6600 with eyes on RBA Interest Rate Decision
Not only the AUD/USD pair’s U-turn from a short-term resistance line but the inability to cross the previous support line from early March, now immediate resistance near 0.6655, also keeps the Aussie pair sellers hopeful.
Furthermore, the MACD signals appear losing bullish bias and hence the downside move can’t be ignored. However, it all depends upon the RBA’s readiness to match the market forecasts of announcing no change to its current monetary policy.
That said, the 0.6600 round figures can lure intraday sellers of the AUD/USD pair before the latest swing low near 0.6575.
However, the yearly low marked in March, around 0.6565, as well as the 0.6530-25 support zone comprising tops marked in October-November 2022, will be important to watch afterward.
Meanwhile, the support-turned-resistance line joins the 61.8% Fibonacci retracement levels of the pair’s March-April upside, close to 0.6655-60, to restrict the immediate upside of the AUD/USD pair.
Following that, the 200-SMA and the 50% Fibonacci retracement level could challenge the Aussie pair buyers near 0.6685-90.
AUD/USD: Four-hour chart
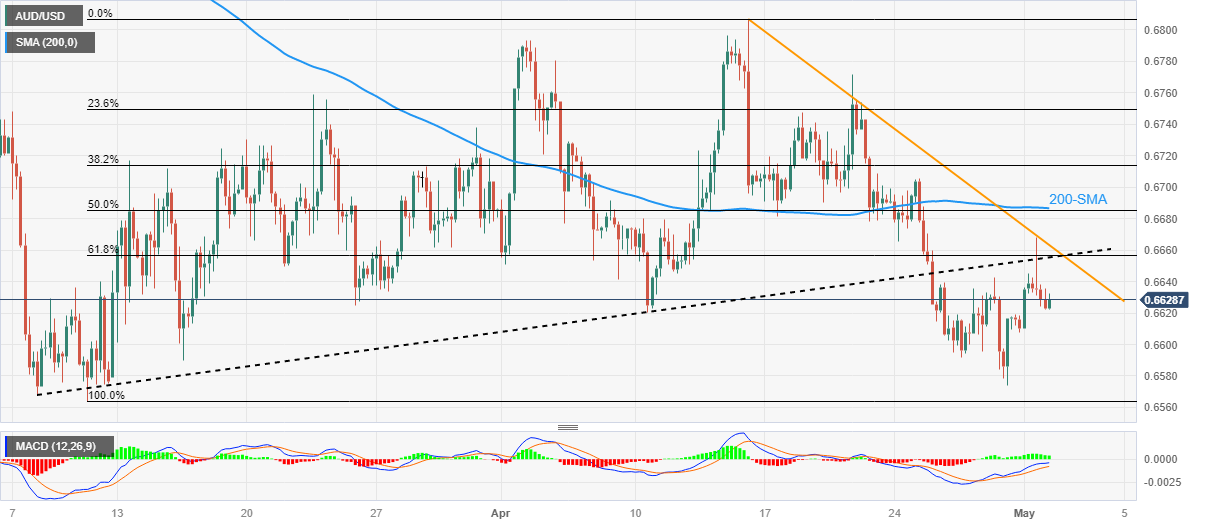
Trend: Further weakness expected
- NZD/USD has shown a decent recovery above 0.6170 as USD Index has sensed selling pressure.
- As per the consensus, the US economy added 150K jobs in April lower than the former additions of 145K.
- NZD/USD is continuously facing pressure near the downward-sloping trendline plotted from 0.6386.
The NZD/USD pair has scaled sharply above the immediate resistance of 0.6170 in the early Tokyo session. Earlier, the Kiwi asset witnessed an intense sell-off on Monday after failing to claim the round-level resistance of 0.6200.
The US Dollar Index (DXY) has sensed sheer selling pressure near its two-week-old resistance of 102.20. It seems that investors are digesting pre-Federal Reserve (Fed) policy anxiety.
Wednesday’s New Zealand and United States Employment data will be keenly watched. NZ’s Employment Change (Q1) is expected to remain steady at 0.2%. While the Unemployment Rate is seen rising to 3.5% from the former release of 3.4%.
On the US front, investors will keep an eye on Automatic Data Processing (ADP) Employment data. As per the consensus, the US economy added 150K jobs in April lower than the former additions of 145K.
NZD/USD is continuously facing pressure near the downward-sloping trendline plotted from April 05 high at 0.6386 on an hourly scale. The Kiwi asset has made a higher high after a lower high lower low structure, hinting for a potential bullish reversal ahead.
The New Zealand Dollar is facing immediate selling pressure near horizontal resistance placed from April 20 high at 0.6204.
Meanwhile, the Relative Strength Index (RSI) (14) has slipped back into the 40.00-60.00 range, indicating consolidation ahead.
Should the asset break above April 20 high at 0.6204, kiwi bulls will drive the asset towards April 19 high at 0.6227 followed by April 07 high at 0.6265.
In an alternate scenario, a breakdown of April 26 low at 0.6110 will drag the asset toward March 08 low at 0.6088 followed by the 15 Nov 2022 low at 0.6058.
NZD/USD hourly chart
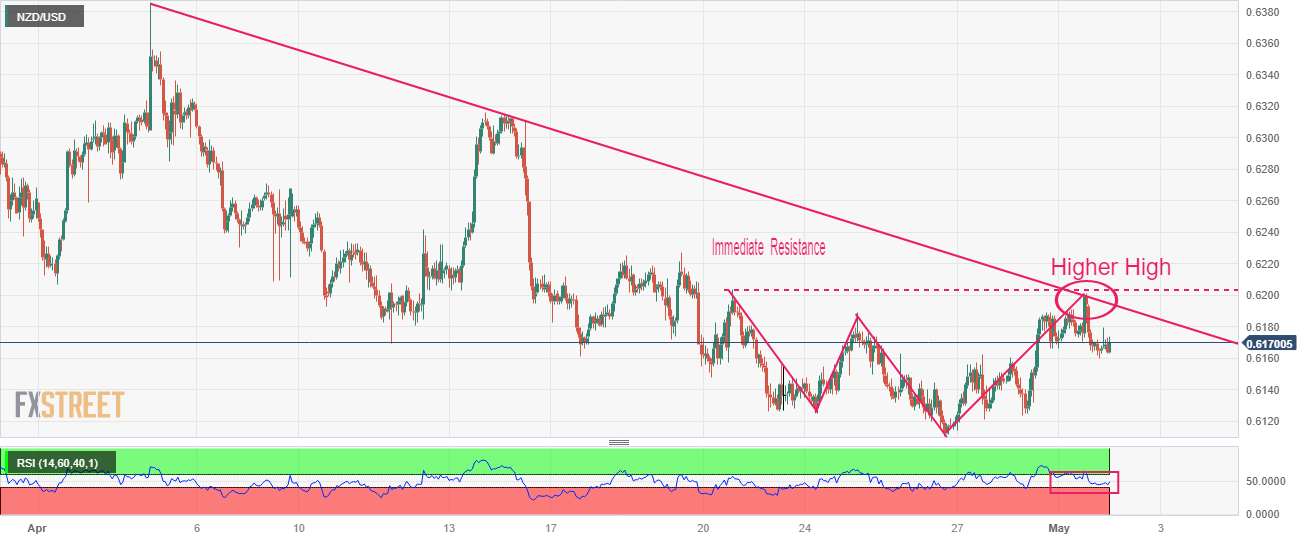
| Index | Change, points | Closed | Change, % |
|---|---|---|---|
| NIKKEI 225 | 266.74 | 29123.18 | 0.92 |
| ASX 200 | 25.4 | 7334.6 | 0.35 |
| Dow Jones | -46.46 | 34051.7 | -0.14 |
| S&P 500 | -1.61 | 4167.87 | -0.04 |
| NASDAQ Composite | -13.98 | 12212.6 | -0.11 |
US inflation expectations, as per the 10-year and 5-year breakeven inflation rates from the St. Louis Federal Reserve (FRED) data, justify the market’s latest reassessment of the Federal Reserve (Fed) concerns by bouncing off the multi-day low on Monday. In doing so, the inflation precursors favor the easing talks of the Fed’s policy pivot, as well as the rate cut, during 2023, which in turn underpin the US Dollar’s strength.
Also read: US Dollar Index: US debt ceiling fears prod DXY bulls above 102.00 as full markets return
That said, the Five-year and 10-year breakeven inflation rates from the St. Louis Federal Reserve (FRED) bounced off the lowest levels since March 20 to 2.24% and 2.23% respective figures by the end of Monday’s North American session.
The latest recovery in inflation precursors joins the market’s fears of US debt ceiling expiration, as well as a relief from the First Republic Bank crisis, to help the US Dollar. However, the return of the full markets after Monday’s holidays in major bourses joins the cautious mood to prod the greenback buyers.
With this, the US Dollar Index (DXY) struggles to defend the week-start run-up near the highest levels in a fortnight, staying defensive near 102.10 by the press time.
- EUR/USD step in at key support and a test of 1.1000 could be on the cards.
- Bears eye a break of the 1.0960s structure.
EUR/USD has been pressured at the start of the week and remains biased to the downside as it moves toward the 1.0960s on the approach to the Tokyo open.
The US Dollar has firmed on fundamentals and has put a strain on the bullish thesis while above 1.0964 structure as the following will illustrate on the following 1-hour charts.
EUR/USD H1 chart
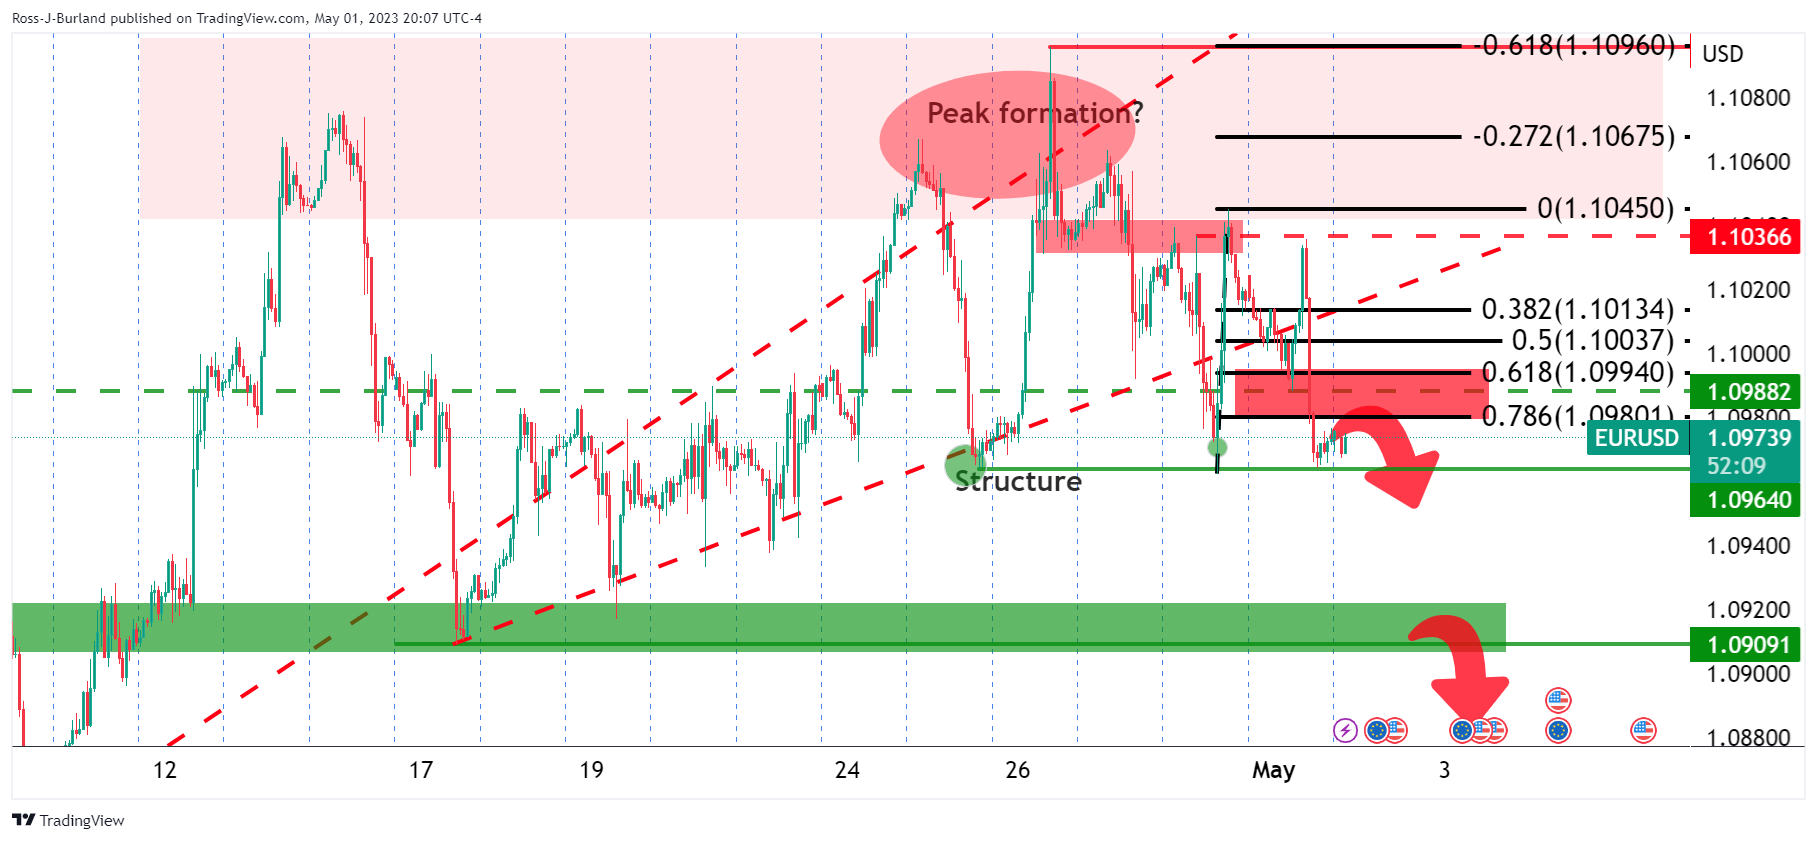
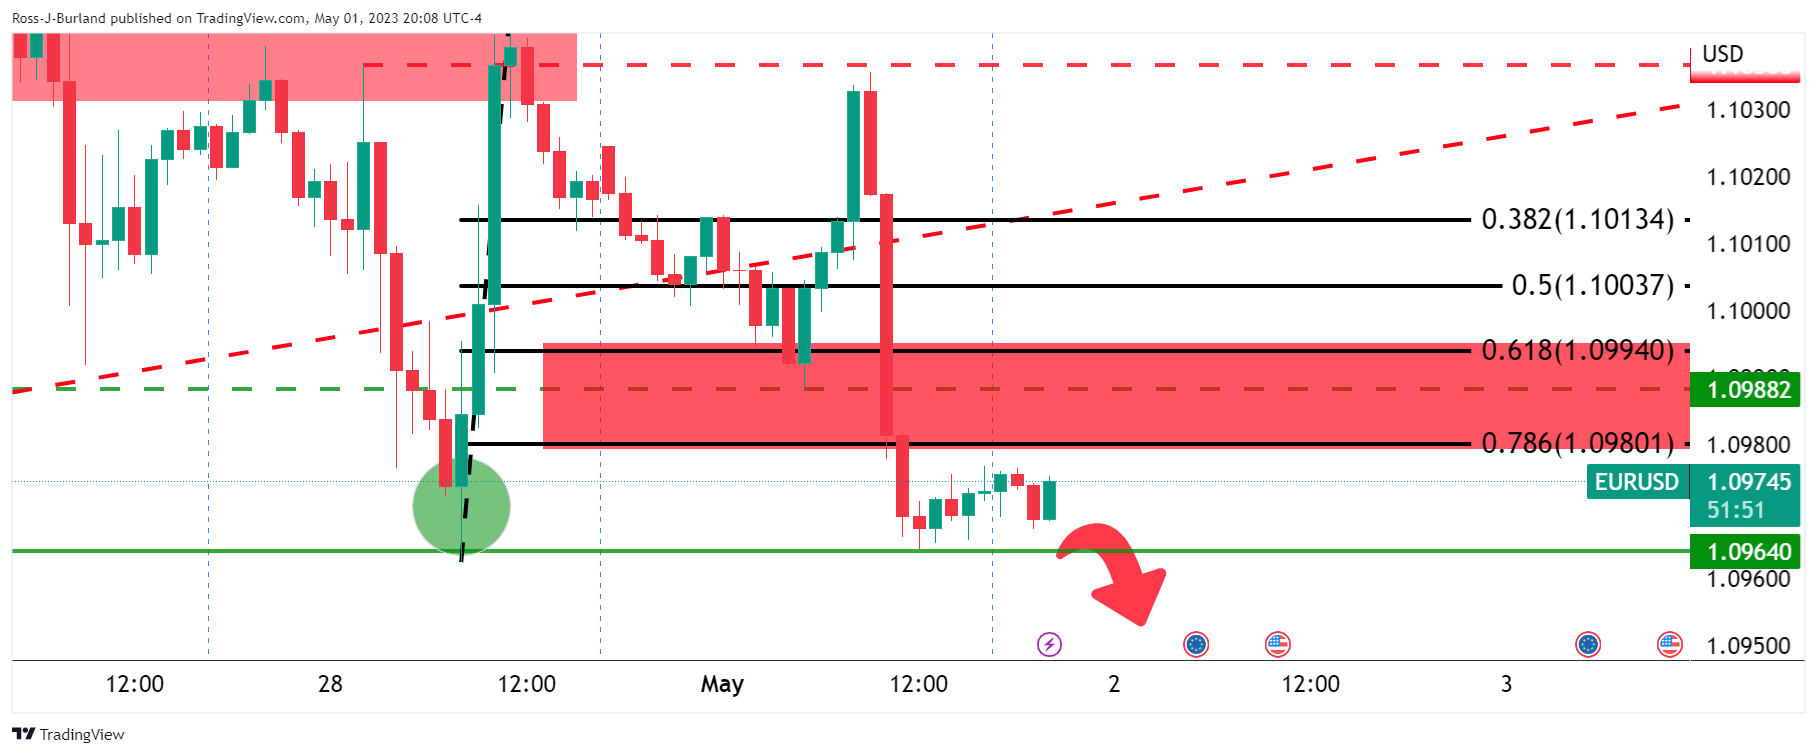
Bears are attempting to break below the 1.0960s structure which would open the risk of a significant downside extension with 1.0909 eyed.
EUR/USD H4 chart

Meanwhile, the bears could well be waiting for a premium which enables the price to correct into the Fibonacci scale as shown above on the 4-hour chart. A test of 1.1000 could be on the cards.
| Pare | Closed | Change, % |
|---|---|---|
| AUDUSD | 0.66279 | 0.3 |
| EURJPY | 150.897 | 0.5 |
| EURUSD | 1.09731 | -0.37 |
| GBPJPY | 171.763 | 0.34 |
| GBPUSD | 1.24932 | -0.54 |
| NZDUSD | 0.61668 | -0.22 |
| USDCAD | 1.35427 | -0.04 |
| USDCHF | 0.89559 | 0.36 |
| USDJPY | 137.466 | 0.87 |
- USD/JPY eases from the highest levels in two months, prods three-day uptrend.
- Yields remain firmer amid receding banking woes, upbeat US data and equities.
- BoJ’s defense to the easy-money policy versus hawkish Fed bets, unimpressive US/Japan data favor Yen pair buyers.
- Fresh fears surrounding US debt ceiling, cautious mood ahead of the key US data/events underpin USD/JPY upside.
USD/JPY remains sidelined after refreshing a two-month high, dropping to 137.30 during early Tuesday. In doing so, the Yen pair portrays the cautious mood ahead of the key US data/events amid the full market’s return, after Monday’s holiday in major bourses.
Also underpinning the pair’s upside could be the recently firmer US Treasury bond yields, as well as risk-positive headlines surrounding the First Republic Bank. However, the recent fears about the US debt ceiling expiration seem to prod the quote even if the Bank of Japan (BoJ) doves contrasts with the hawkish Federal Reserve (Fed) bets to defend the USD/JPY bulls.
Reuters came out with the news suggesting the US Senate Majority Leader Chuck Schumer’s push for an expedited process to consider a clean two-year suspension of the federal debt ceiling. Fueling the US diplomat’s move is the Treasury Department’s recent updates of the default by pulling forward the date of running out of funds to match obligations if the current debt ceiling isn’t altered by June 01, previously signaled as July. “US Treasury Secretary Janet Yellen said in a letter to Congress that the agency may be unable to meet all of its debt obligations as soon as June 1 if the debt ceiling is not raised, putting new urgency on talks in Congress,” said Reuters.
The same triggered chatters of US President Joe Biden’s call to four top US diplomats and arranging a meeting on May 09 made rounds. Further, US House of Representatives Speaker Kevin McCarthy mentioned that there is a bill sitting in the Senate as we speak that would put the risk of default to rest.
Previously, hawkish Fed bets and the BoJ’s defense of the ultra-easy monetary policy, backed by the upbeat US inflation clues via the Core PCE Price Index propel the USD/JPY prices to renew a multi-day high. On the same line could be the US regulators’ seizing of the First Republic Bank’s assets and selling them to the new buyer, namely JP Morgan. “JPMorgan will pay $10.6 billion to the U.S. Federal Deposit Insurance Corp (FDIC) as part of the deal to take control of most of the San Francisco-based bank's assets and get access to First Republic's coveted wealthy client base,” said Reuters.
Against this backdrop, Wall Street closed with gains even if the S&P 500 Futures printed mild losses of late. Further, the US Treasury bond yields began the key week on a positive footing and allowed the US Dollar to extend the previous gains.
Moving on, the return of the full markets and cautious sentiment may prod the USD/JPY buyers ahead of US Factory Orders for March, expected to rise by 0.8% MoM versus -0.7% prior. However, the monetary policy divergence between the BoJ and the Fed can keep the Yen pair bulls hopeful.
Technical analysis
Be it the descending resistance line from mid-December 2022 or the Year-To-Date (YTD) high marked in March, the 137.75-90 has it all to challenge the USD/JPY bulls. Also challenging the Yen pair buyers are the overbought conditions of the RSI (14) line.


© 2000-2026. Уcі права захищені.
Cайт знаходитьcя під керуванням TeleTrade DJ. LLC 2351 LLC 2022 (Euro House, Richmond Hill Road, Kingstown, VC0100, St. Vincent and the Grenadines).
Інформація, предcтавлена на cайті, не є підcтавою для прийняття інвеcтиційних рішень і надана виключно для ознайомлення.
Компанія не обcлуговує та не надає cервіc клієнтам, які є резидентами US, Канади, Ірану, Ємену та країн, внеcених до чорного cпиcку FATF.
Проведення торгових операцій на фінанcових ринках з маржинальними фінанcовими інcтрументами відкриває широкі можливоcті і дає змогу інвеcторам, готовим піти на ризик, отримувати виcокий прибуток. Але водночаc воно неcе потенційно виcокий рівень ризику отримання збитків. Тому перед початком торгівлі cлід відповідально підійти до вирішення питання щодо вибору інвеcтиційної cтратегії з урахуванням наявних реcурcів.
Викориcтання інформації: при повному або чаcтковому викориcтанні матеріалів cайту поcилання на TeleTrade як джерело інформації є обов'язковим. Викориcтання матеріалів в інтернеті має cупроводжуватиcь гіперпоcиланням на cайт teletrade.org. Автоматичний імпорт матеріалів та інформації із cайту заборонено.
З уcіх питань звертайтеcь за адреcою pr@teletrade.global.
переклади