- Аналітика
- Новини та інструменти
- Новини ринків
Новини ринків
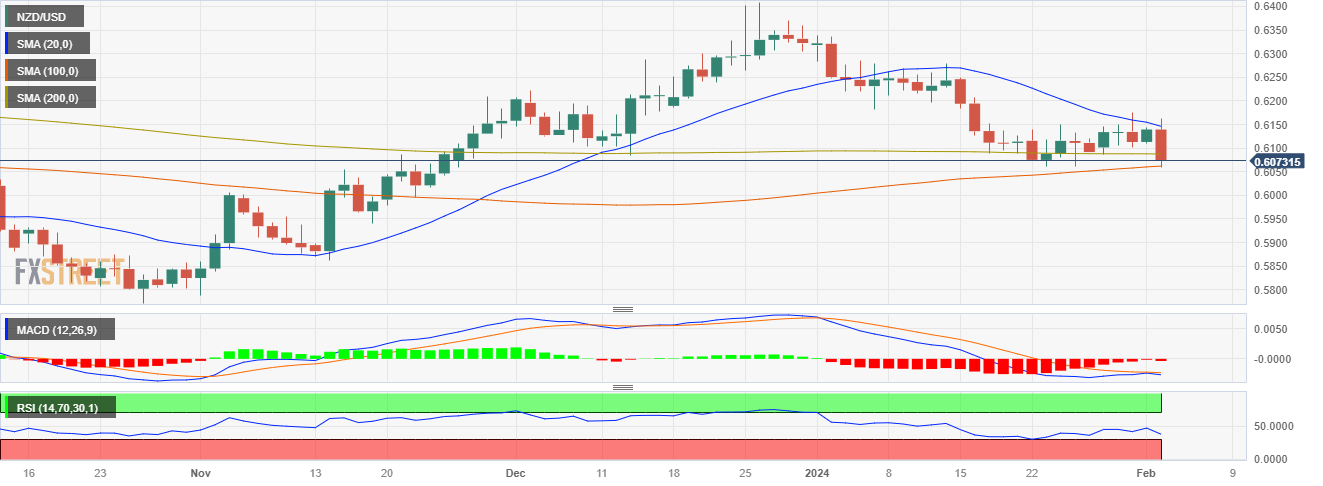
- The NZD/USD showed a strong downward swing, falling near the 0.6060 level.
- US Nonfarm Payrolls added 353K jobs in January surpassing by a wide margin the expectations.
- The bets of a rate cut in March sharply declined and markets pushed the start of the easing to May.
In Friday's trading session, the NZD/USD took a steep turn downwards, landing at a rough level of 0.6060. The pronounced downward trajectory resulted from a surprisingly strong US Nonfarm Payrolls report that pushed the pair into bearish domain as markets gave up the hopes of sooner rate cuts by the Federal Reserve (Fed). For the week, the pair closed a 0.40% weekly loss.
The US Bureau of Labor Statistics reported that the Nonfarm Payrolls for January presented a robust picture with a significant increase of 353K compared to the consensus figure of 180K and the previous 333K. The Average Hourly Earnings in January increased by 0.6%, outstripping the anticipated 0.3% and the preceding 0.4% respectively while the yearly measure soared to a 4.5%, higher than the prior 4.4% and beating the expected 4.1%. Lastly, the Unemployment Rate for January remained steady at 3.7%, which aligns with its previous figure and was slightly lower than the anticipated 3.8%.
As a reaction, the US bond rose across the board as markets start to prepare for the easing cycle of the Fed to start in May rather than in March. The 2-year rate is currently standing at 4.37%, with the 5 and 10-year yields observed at 4% and 4.05% respectively. As per historical financial trends, a rise in yields generally tends to fortify the USD's position as it is more appealling for foreign investors.
In line with that, the CME FedWatch Tool showed a significant drop in the likelihood of a March interest rate cut, with estimates now standing at just 20% while the odds of a cut in the following May meeting rose to nearly 58%.
NZD/USD levels to watch
The daily chart suggests that the pair has a bearish bias, at least in the short-term. Indicators signal declining buying power, as depicted by the negative slope and negative territory in the Relative Strength Index (RSI). Adding to that the histogram of the Moving Average Convergence Divergence (MACD) displays rising red bars, hinting that the overall momentum favors the sellers.
Looking at the pair's position relative to moving averages, it is trading below the 20-day and 200-day Simple Moving Averages (SMAs), another sign of bearish sentiment. Yet, interestingly, it sits above the 100-day SMA, indicating that the bulls are maintaining a bullish grip on the broader outlook.
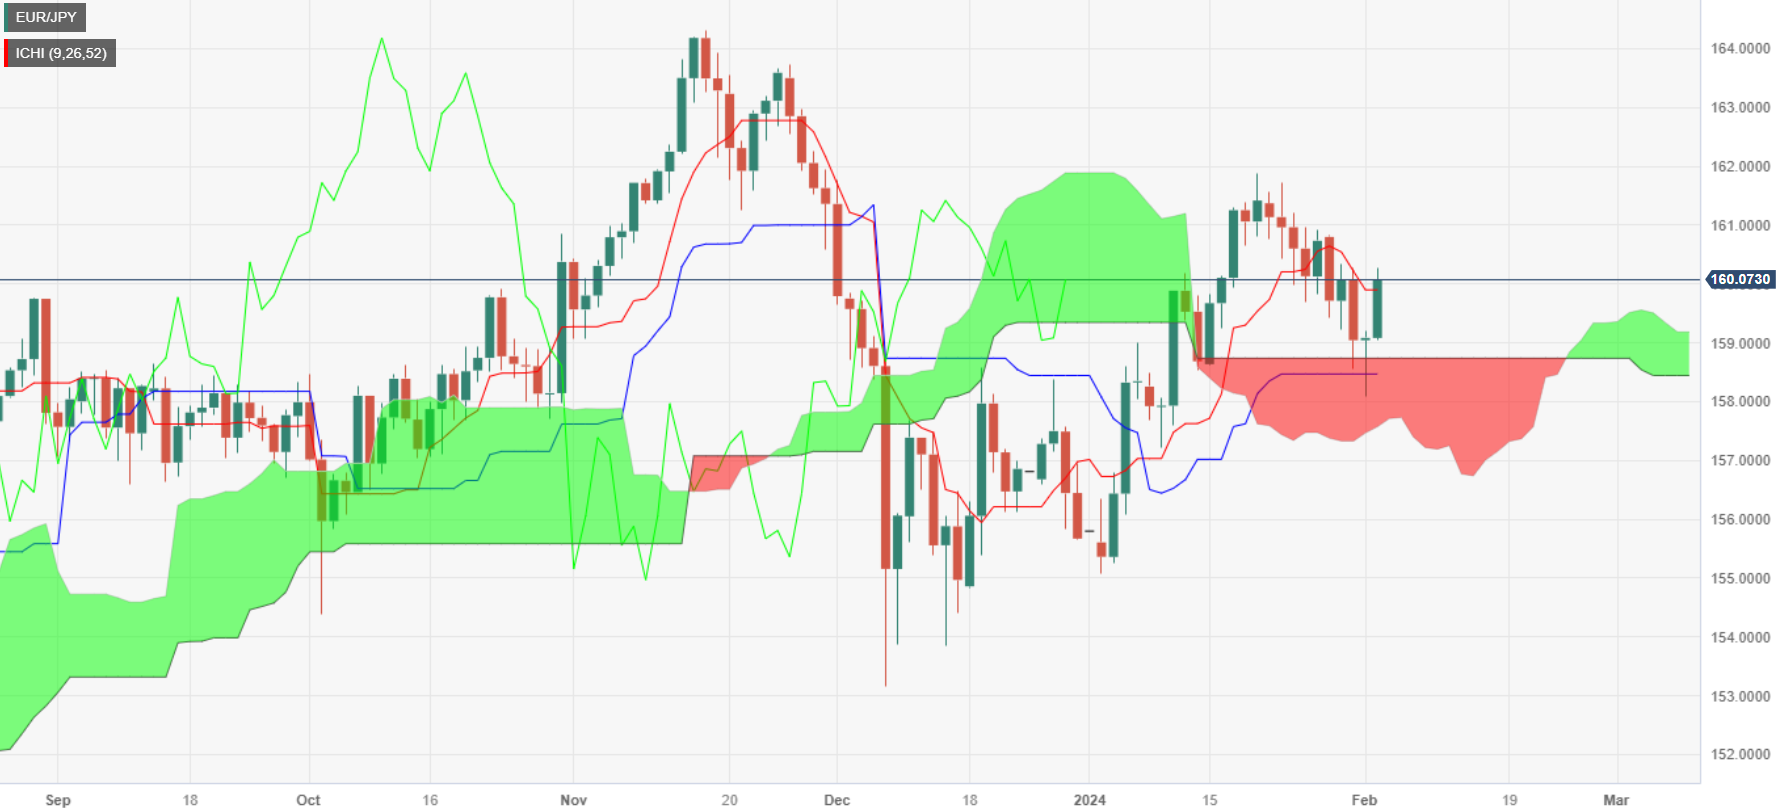
- EUR/JPY rises to 160.07 amid risk-on mood, US equity gains, surpassing key 160.00 mark.
- Technical outlook hints at further rise, aiming for January 19 high at 161.81, with 162.00 as next goal.
- Falling below 160.00 may lead to support retest at Tenkan-Sen, Kijun-Sen, suggesting Ichimoku Cloud consolidation.
The EUR/JPY edged higher late during Friday’s North American session, with buyers reclaiming the 160.00 figure on a risk-on impulse, as US equities traded with solid gains. At the time of writing the cross-pair exchanges hands at 160.07
After dipping inside the Ichimoku Cloud (Kumo) and hitting a weekly low of 158.08, the EUR/JPY recovered ground and regained key resistance levels, with buyers clearing the Tenkan-Sen at 159.83, which opened the door toward the 160.00 mark. If buyers achieve a daily close above, that could open the door to challenge the next cycle high at 161.81, the January 19 high. Further upside is seen at 162.00.
Failure at 160.00 could motivate sellers to drive prices inside the Kumo towards the first support level seen at the Tenkan-Sen, followed by the 159.00 figure, ahead of challenging Kijun-Sen at 158.47.
EUR/JPY Price Action – Daily Chart
EUR/JPY Technical Levels
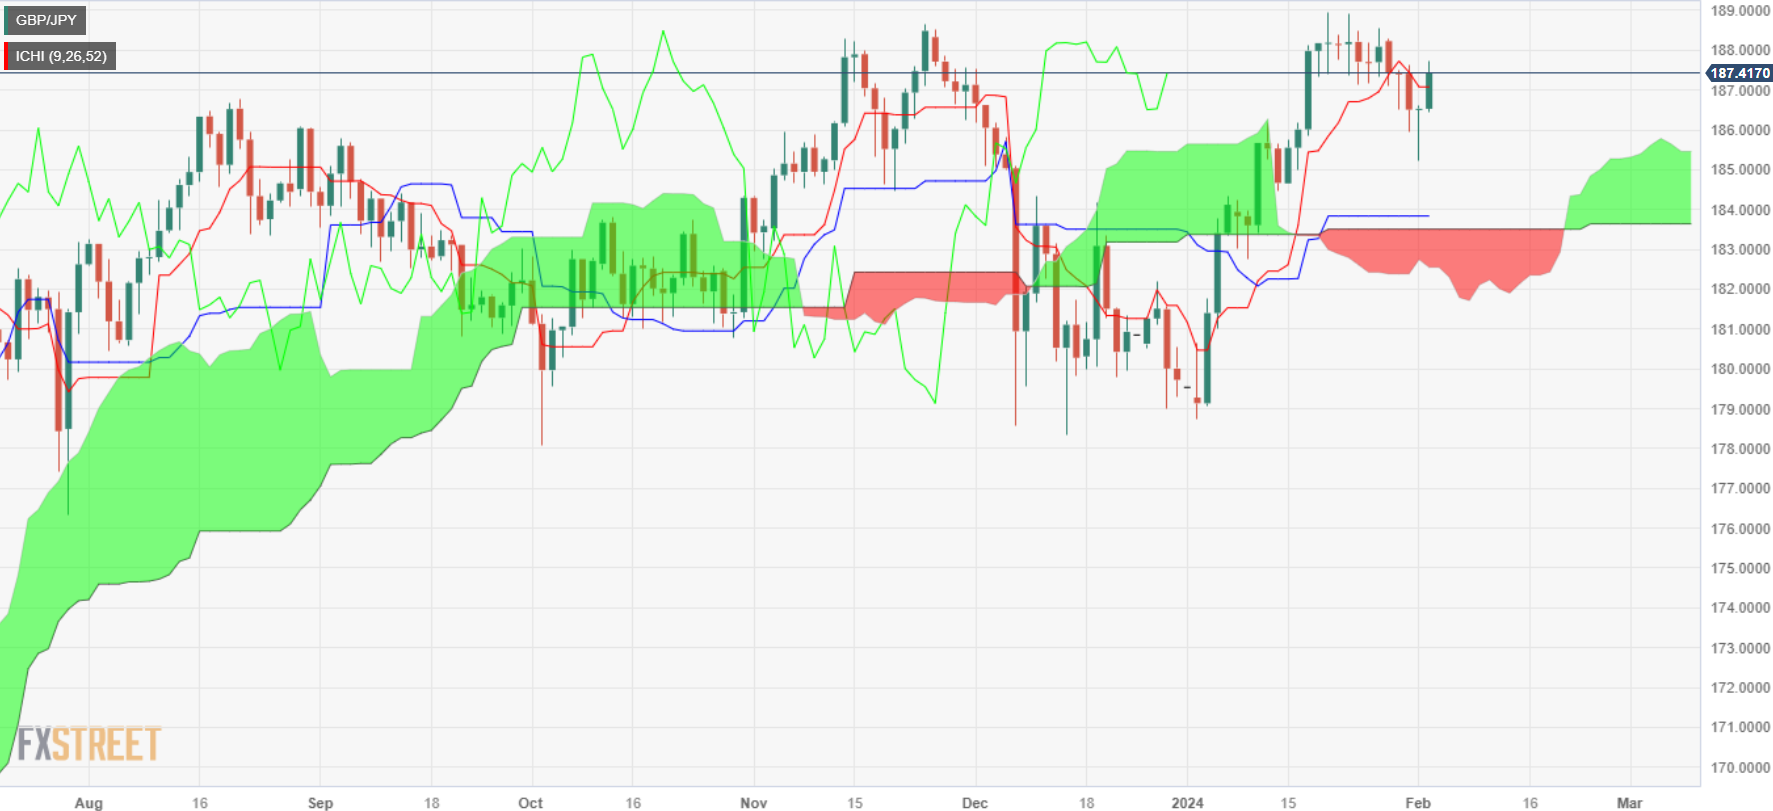
- GBP/JPY climbs 0.48% to 187.44, driven by positive market sentiment and Wall Street's peaks.
- Upward momentum seen, eyeing resistance at 188.00, with goals towards January 19 high of 188.93.
- Downside risks: possible pullback to Tenkan-Sen (187.06), with key supports at 187.00, then 185.44.
The GBP/JPY climbed late in the North American session, extending its gains courtesy of upbeat market sentiment as portrayed by Wall Street reaching new all-time highs. At the time of writing, the cross-pair is trading at 187.44, which is up 0.48%.
The daily chart suggests the pair is upward biased after GBP/JPY price action on February 1 formed a ‘hammer,’ exacerbating today’s rally to a new two-day high of 187.73. if buyers lift the exchange rate past the 188.00 figure, that could pave the way toward the January 19 high at 188.93 before challenging 189.00
Conversely, if GBP/JPY slumps below the Tenkan-Sen at 187.06, that could pave the way to challenge the 187.00 figure. Once those two levels are cleared, the next stop would be the Senkou Span A at 185.44, followed by the February 1 low of 185.22. Further downside is seen at 185.00.
GBP/JPY Price Action – Daily Chart
GBP/JPY Technical Levels
Markets maintained the erratic price action almost the entire week… until a robust US Nonfarm Payrolls surprised everybody and lifted the Greenback to yearly highs when tracked by the USD Index (DXY). Additionally, the Fed kept its monetary status quo, as largely anticipated, while Powell said a rate cut in March looks off the table.
Starting Monday, the US calendar includes the final print of the Services PMI along with the key ISM Services PMI. Balance of Trade figures are due on February 7, while usual weekly Initial Jobless Claims and Wholesale Inventories come on February 8. In the meantime, DXY navigates the area of yearly highs and approaches the key 104.00 barrier, bolstered by rising yields and solid data.
In the euro area, the final Services PMI in Germany and the euro bloc are due on February y along with the German Balance of Trade results. Retail Sales in Euroland come on February 6 and the final Inflation Rate in Germany for the month of January is due on February 9. EUR/USD maintained a consolidative mood during the week, although Friday’s sharp advance in the US Dollar relegated the pair to the sub-1.0800 zone.
Across the Channel, the always-relevant Services PMI is due on February 5, seconded by BRC Retail Sales Monitor and the Construction PMI on February 6. GBP/USD traded in a choppy fashion this week, although the NFP-driven strong rebound in the greenback relegated it to the lower end of the range well south of 1.2700.
In Japan, Household Spending is out on February 6 followed by preliminary readings of the Coincident Index and the Leading Economic Index on February 7. Later in the week, Bank Lending and Foreign Bond Investment are due followed by the Eco Watchers Survey, all on February 8. USD/JPY rose sharply and revisited the 148.50 zone helped by the bout of strength in the greenback and rising US yields.
In the Australian docket, Balance of Trade results opens the week prior to the RBA’s interest rate decision on February 6. Additionally, the Ai Group Industry Index is due early on February 7. AUD/USD traded well on the defensive along with the rest of the risk-linked assets, approaching the 0.6500 zone for the first time since mid-November.
Markets’ attention will also be on China and the release of the Services and Composite PMIs tracked by Caixin on February 5. In addition, the Inflation Rate and Producer Prices are due on February 8 prior to advanced Q4 Current figures on February 9.
In Canada, the BoC Market Participants Survey kicks off the week, while Governor T. Macklem speaks on February 6. On February y comes the Balance of Trade results followed by the labour market report at the end of the week. USD/CAD rose to weekly tops near 1.3480 on Friday, an area coincident with the key 200-day SMA.
- Growing odds of a Gaza ceasefire has seen Crude Oil tumble.
- A surge in US NFP figures sent Crude Oil even lower on Friday.
- OPEC has a long road ahead of it to overcome non-OPEC production growth.
West Texas Intermediate (WTI) US Crude Oil fell into familiar lows on Friday, driven down by geopolitical fears washing out on hostage negotiations and sparks of doubt that OPEC will successfully under-produce pumping growth in the non-OPEC sphere.
Qatar is heading up efforts to negotiate a ceasefire in Gaza, if at least temporarily to allow the exchange of hostages, and Qatar’s steady success in talking down both sides of the conflict is seeing Crude oil flounder as geopolitical tensions ease.
The Organization of the Petroleum Exporting Countries (OPEC) is set to see a long-term challenge in 2024 and 2025 as OPEC tries desperately to undercut global non-OPEC production, imposing stiff production quotas on member nations as non-OPEC producers such as the US outstrip OPEC pumping caps. Analysts are increasingly concerned that the US and other non-OPEC producers could entirely oversupply global markets, and investors will be keeping a close eye on inventories in 2024.
US Nonfarm Payrolls: surge 353,000 in January
US Nonfarm Payrolls (NFP) surged to a twelve-month high of 353,000 in January, well over the market’s median forecast of 180K. With the US economy continuing to show stubborn resilience and the US labor market remaining at record highs, odds of a market-support rate cut from the US Federal Reserve (Fed) continue to decline.
WTI Crude Oil technical outlook
WTI has extended declines and fallen even further away from the 200-hour Simple Moving Average (SMA) at $76.00 per barrel, and US Crude Oil has shed nearly 10% from its last swing high into $79.19.
WTI has declined for a third straight day and closed in the red for four of the last five trading days, facing a daily candlestick rejection from the 200-day SMA near the $78.00 handle.
WTI hourly chart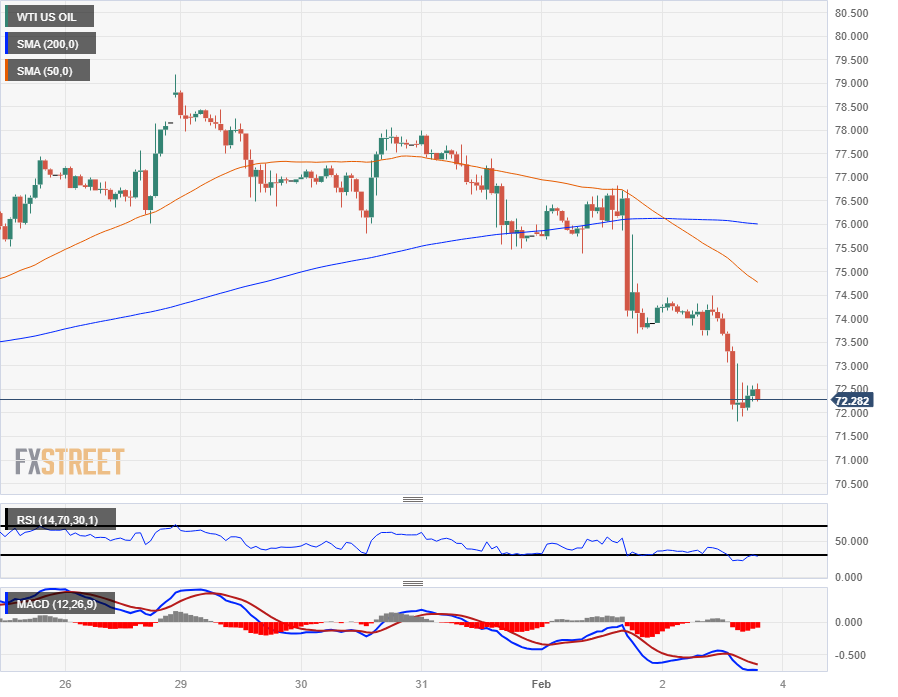
WTI daily chart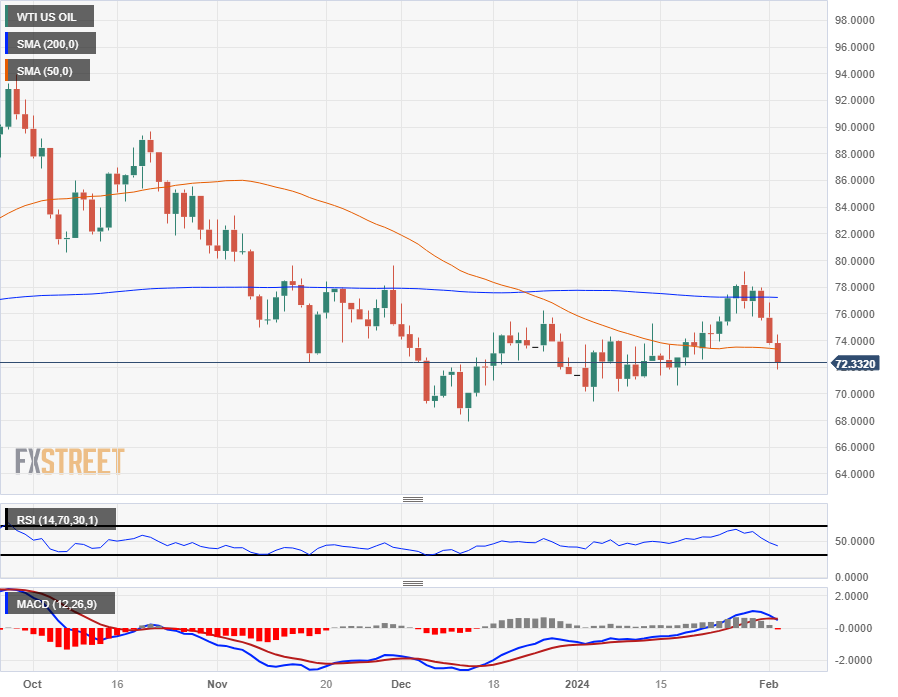
- The AUD/JPY registers gains at 96.60 mark, with a positive 0.40% score on the board.
- Daily indicators flattened in negative territory.
- On the weekly chart chart, bearish momentum is building.
In Friday's session, the AUD/JPY was seen rising to 96.60, recording gains of 0.40% but will still close a 0.70% weekly loss. While bears have dominated in the last sessions, pushing the pair down to its lowest level since mid-December, they seem to be taking a breather which allowed room for the upside. However, on the weekly outlook, the bearish sentiment is still evident, indicating more downside potential as the cross tallies a second consecutive weekly loss.
On the daily chart, despite the bears making some headway and the pair's trading position situated below the 20-day Simple Moving Averages (SMAs), the bulls retain control in the wider frame.. With regards to the Moving Average Convergence Divergence (MACD), the flat red bars indicate a period of consolidation, which could be seen as bears taking a breather as well as the positive slope in negative territory of the Relative Strength Index (RSI).
On the weekly chart, the momentum appears to tilt towards the bears. With the RSI falling in the positive territory and the MACD displaying red bars, it suggests that the selling momentum may be building up. Since mid-January, the cross declined by nearly 1%, and tallies a two-week losing streak.
AUD/JPY daily chart
-638424988703588170.png)
- AUD/USD falls to 0.6511 after US jobs report beats forecasts, reducing prospects for near-term Fed rate cut.
- US sees 353K job additions in January with Hourly Earnings rise, underscoring a strong labor market, uplifting USD.
- RBA's upcoming decision and future economic data releases to play key roles in determining AUD's trajectory.
The AUD/USD plunged more than 0.90% on Friday after a robust US Nonfarm Payrolls report triggered a jump in US Treasury yields as investors disregarded a rate cut by the Federal Reserve in March. At the time of writing, the pair traders at 0.6511
Aussie Dolla falls on January’s NFP, traders eye RBA’s meeting
The latest US Nonfarm Payrolls report exceeded expectations, with the economy adding 353K jobs, far surpassing the forecasted 180K and outdoing the revised December figures of 333K, initially reported as 216K. Unemployment Rate remained steady at 3.7%, unchanged from the previous month. Furthermore, Average Hourly Earnings (AHE) saw an increase, with the monthly AHE rising to 0.6% from 0.4% and the year-over-year rate climbing to 4.5% from 4.4%.
Following this report, the yield on the US 10-year Treasury note rose from around 3.90% to 4.06%, gaining 15 basis points (bps). Additionally, the US Dollar Index (DXY), which measures the dollar's strength against a basket of major currencies, rose to a seven-week high at 104.04 after the data.
Further data was released, with Factory Orders for newly manufactured goods climbed modestly, while Consumer Sentiment by the University of Michigan improved to 79.1 in January.
Next week, the Aussie’s economic calendar will feature the Reserve Bank of Australia (RBA) monetary policy decision, followed by RBA’s Governor Michele Bullock's press conference. After that, the Aussie Dollar could gauge direction from the release of the AI Group Industry Index, Westpac Consumer Confidence, and NAB Business Confidence data.
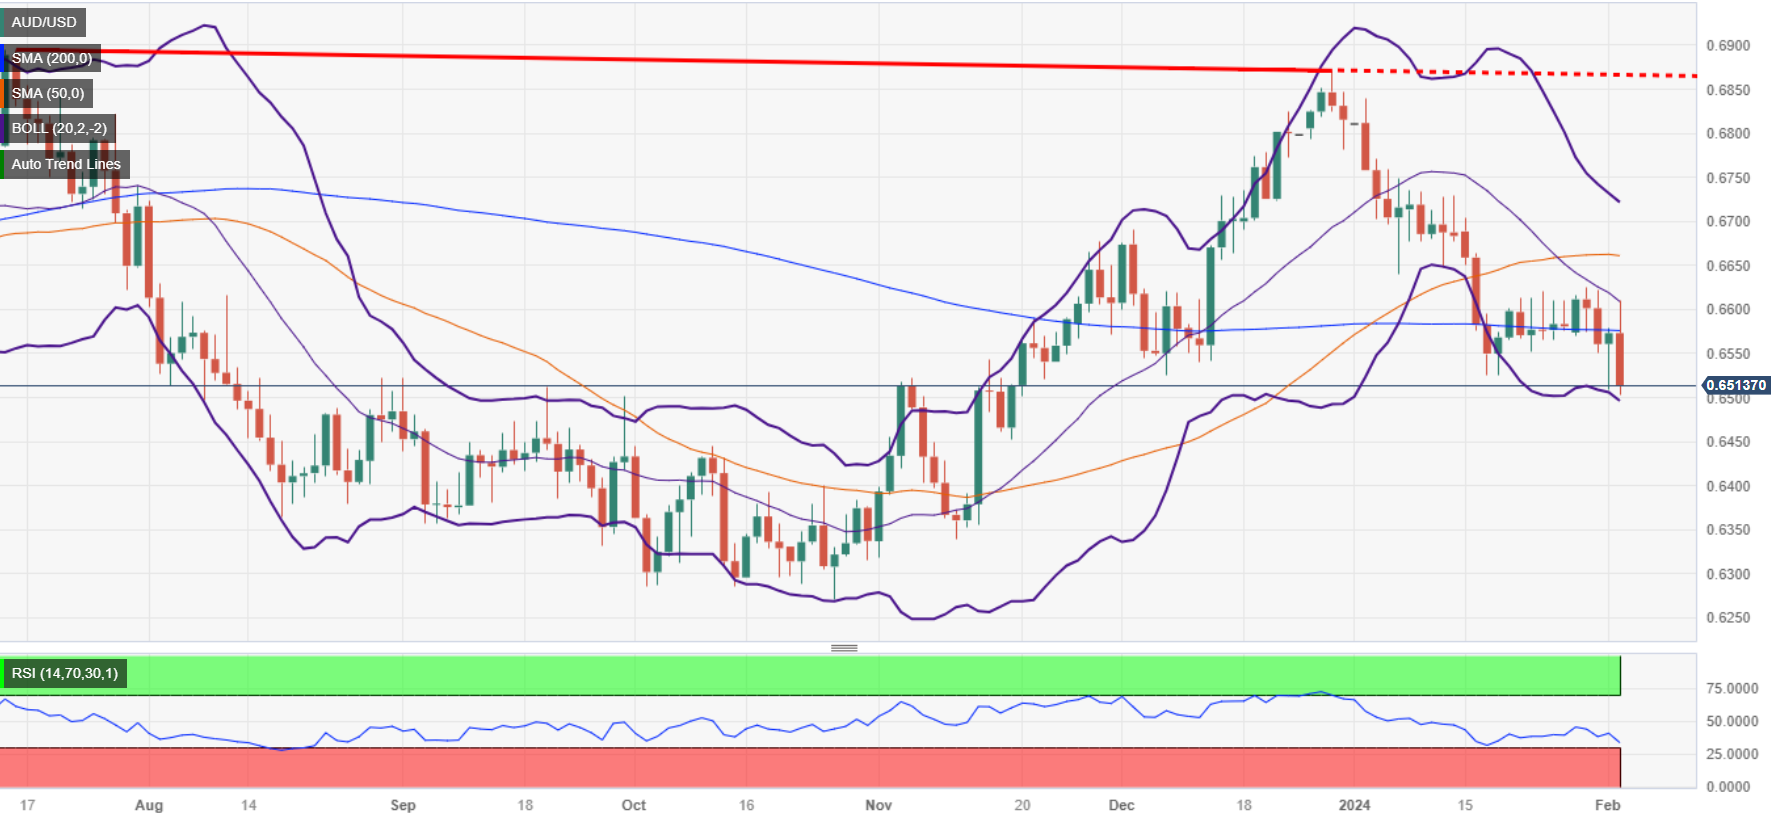
AUD/USD Price Analysis: Technical outlook
After diving below the 200-day moving average (DMA), the AUD/USD has shifted neutral to downward biased, piercing on its way south of the 100-DMA at 0.6527. A daily close below those levels will expose the 0.6500 figure, followed by the psychological 0.6500 mark. On the other hand, if Aussie buyers regain the 100-DMA, the next resistance would be 0.6550, before the 200-DMA.
- The DXY rose by more than 0.80% to 103.90 on Friday
- US Nonfarm Payrolls came in higher than expected for January.
- US bond yields are sharply increasing as markets push to May the start of the easing cycle.
The US Dollar (USD) rose to 103.90 on Friday’s Dollar Index (DXY) chart, mainly fueled by a promising labor market report that has convinced markets a March rate cut is not in the cards.
Fed Chair Powell reinforced the idea that a rate cut in March is unlikely despite ongoing market speculation. In line with that, he stated that the bank will monitor incoming data to set the timing of the easing cycle. As the US labor market remains tight, the bank might consider delaying rate cuts.
Daily digest market movers: US Dollar rallies as markets digest strong labor market data
- Unemployment for January held steady at 3.7%, lower than the 3.8% expected.
- Nonfarm Payrolls increased significantly, surpassing expectations for January. A reported 353K additional jobs were created in the US against a projected 180K, indicating robust job market growth.
- Average Hourly Earnings for January, as per US Bureau of Labor Statistics, were up by 0.6% MoM, exceeding the consensus of 0.3%.
- Annual Average Hourly Earnings for 2024 arrived at 4.5%, surpassing the previous 4.4%.
- US bond yields sharply rose with 2-year, 5-year and 10-year bonds trading at rates of 4.38%, 4.00% and 4.05%, respectively.
- According to the CME FedWatch Tool, the odds of a cut in March plummeted to 20%.
Technical Analysis: DXY bulls show resilience and jump above the 200-day SMA
The indicators on the daily chart indicate a dominance of buying pressure, despite some contrasting signals. The Relative Strength Index (RSI) gliding on a positive slope and in positive territory suggests a build-up of buying momentum, which is further solidified by the rising green bars of the Moving Average Convergence Divergence (MACD). However, mixed signals emanate from the Simple Moving Averages (SMAs). Although the index is above both the 20-day and 200-day SMAs, signifying a bullish outlook, it remains below the 100-day SMA, indicating a bearish hindrance.
US Dollar FAQs
What is the US Dollar?
The US Dollar (USD) is the official currency of the United States of America, and the ‘de facto’ currency of a significant number of other countries where it is found in circulation alongside local notes. It is the most heavily traded currency in the world, accounting for over 88% of all global foreign exchange turnover, or an average of $6.6 trillion in transactions per day, according to data from 2022.
Following the second world war, the USD took over from the British Pound as the world’s reserve currency. For most of its history, the US Dollar was backed by Gold, until the Bretton Woods Agreement in 1971 when the Gold Standard went away.
How do the decisions of the Federal Reserve impact the US Dollar?
The most important single factor impacting on the value of the US Dollar is monetary policy, which is shaped by the Federal Reserve (Fed). The Fed has two mandates: to achieve price stability (control inflation) and foster full employment. Its primary tool to achieve these two goals is by adjusting interest rates.
When prices are rising too quickly and inflation is above the Fed’s 2% target, the Fed will raise rates, which helps the USD value. When inflation falls below 2% or the Unemployment Rate is too high, the Fed may lower interest rates, which weighs on the Greenback.
What is Quantitative Easing and how does it influence the US Dollar?
In extreme situations, the Federal Reserve can also print more Dollars and enact quantitative easing (QE). QE is the process by which the Fed substantially increases the flow of credit in a stuck financial system.
It is a non-standard policy measure used when credit has dried up because banks will not lend to each other (out of the fear of counterparty default). It is a last resort when simply lowering interest rates is unlikely to achieve the necessary result. It was the Fed’s weapon of choice to combat the credit crunch that occurred during the Great Financial Crisis in 2008. It involves the Fed printing more Dollars and using them to buy US government bonds predominantly from financial institutions. QE usually leads to a weaker US Dollar.
What is Quantitative Tightening and how does it influence the US Dollar?
Quantitative tightening (QT) is the reverse process whereby the Federal Reserve stops buying bonds from financial institutions and does not reinvest the principal from the bonds it holds maturing in new purchases. It is usually positive for the US Dollar.
- EUR/USD loses key technical handle after US Jobs Report thumps forecasts.
- US NFP hits highest level in a year, March rate cut hopes all but buried.
- US Average Hourly Earnings also gained ground in January.
EUR/USD continues to churn on Friday, keeping a near-term choppy technical pattern intact as the Euro (EUR) cycles against the US Dollar (USD).
US Nonfarm Payrolls wildly outperformed market expectations, hitting a one-year high and bringing sharp upside revisions to previous datapoints. Investors hoping for faster, sooner rate cuts from the US Federal Reserve (Fed) have seen rate cut hopes dwindle as the US domestic economy continues to surprise with its sturdiness.
Daily digest market movers: EUR/USD back into familiar lows as cyclical pattern drags the pair down.
- EUR/USD climbed into 1.0900 early Friday before getting dragged back down post-NFP.
- US Nonfarm Payrolls climbed to 353K in January, vaulting well over the forecast 180K.
- December’s NFP figure also saw a sharp upside revision to 333K from 216K.
- YoY US Average Hourly Earnings also gained in January, coming in at 4.5% versus the forecast 4.1% and the previous period’s 4.4% (revised upwards from 4.1%).
- MoM US Average Hourly Earnings climbed 0.6% in January versus the forecast 0.3%, 0.4% last.
- US Unemployment Rate held steady at 3.7% in January; markets expected a tick upwards to 3.8%.
- Michigan Consumer Sentiment Index gained to 79.0, above the forecast 78.9 and climbing further above the previous month’s 78.8.
Euro price today
The table below shows the percentage change of Euro (EUR) against listed major currencies today. Euro was the strongest against the Japanese Yen.
| USD | EUR | GBP | CAD | AUD | JPY | NZD | CHF | |
| USD | 0.82% | 0.97% | 0.62% | 1.02% | 1.35% | 1.30% | 1.16% | |
| EUR | -0.82% | 0.17% | -0.21% | 0.19% | 0.52% | 0.50% | 0.32% | |
| GBP | -0.96% | -0.15% | -0.32% | 0.06% | 0.38% | 0.33% | 0.20% | |
| CAD | -0.64% | 0.18% | 0.34% | 0.39% | 0.72% | 0.67% | 0.51% | |
| AUD | -1.01% | -0.19% | -0.02% | -0.36% | 0.32% | 0.31% | 0.12% | |
| JPY | -1.37% | -0.51% | -0.34% | -0.74% | -0.33% | 0.01% | -0.20% | |
| NZD | -1.32% | -0.50% | -0.33% | -0.71% | -0.31% | 0.00% | -0.15% | |
| CHF | -1.16% | -0.32% | -0.15% | -0.52% | -0.12% | 0.20% | 0.18% |
The heat map shows percentage changes of major currencies against each other. The base currency is picked from the left column, while the quote currency is picked from the top row. For example, if you pick the Euro from the left column and move along the horizontal line to the Japanese Yen, the percentage change displayed in the box will represent EUR (base)/JPY (quote).
Technical analysis: EUR/USD steeply off recent highs as whipsaw pattern remains
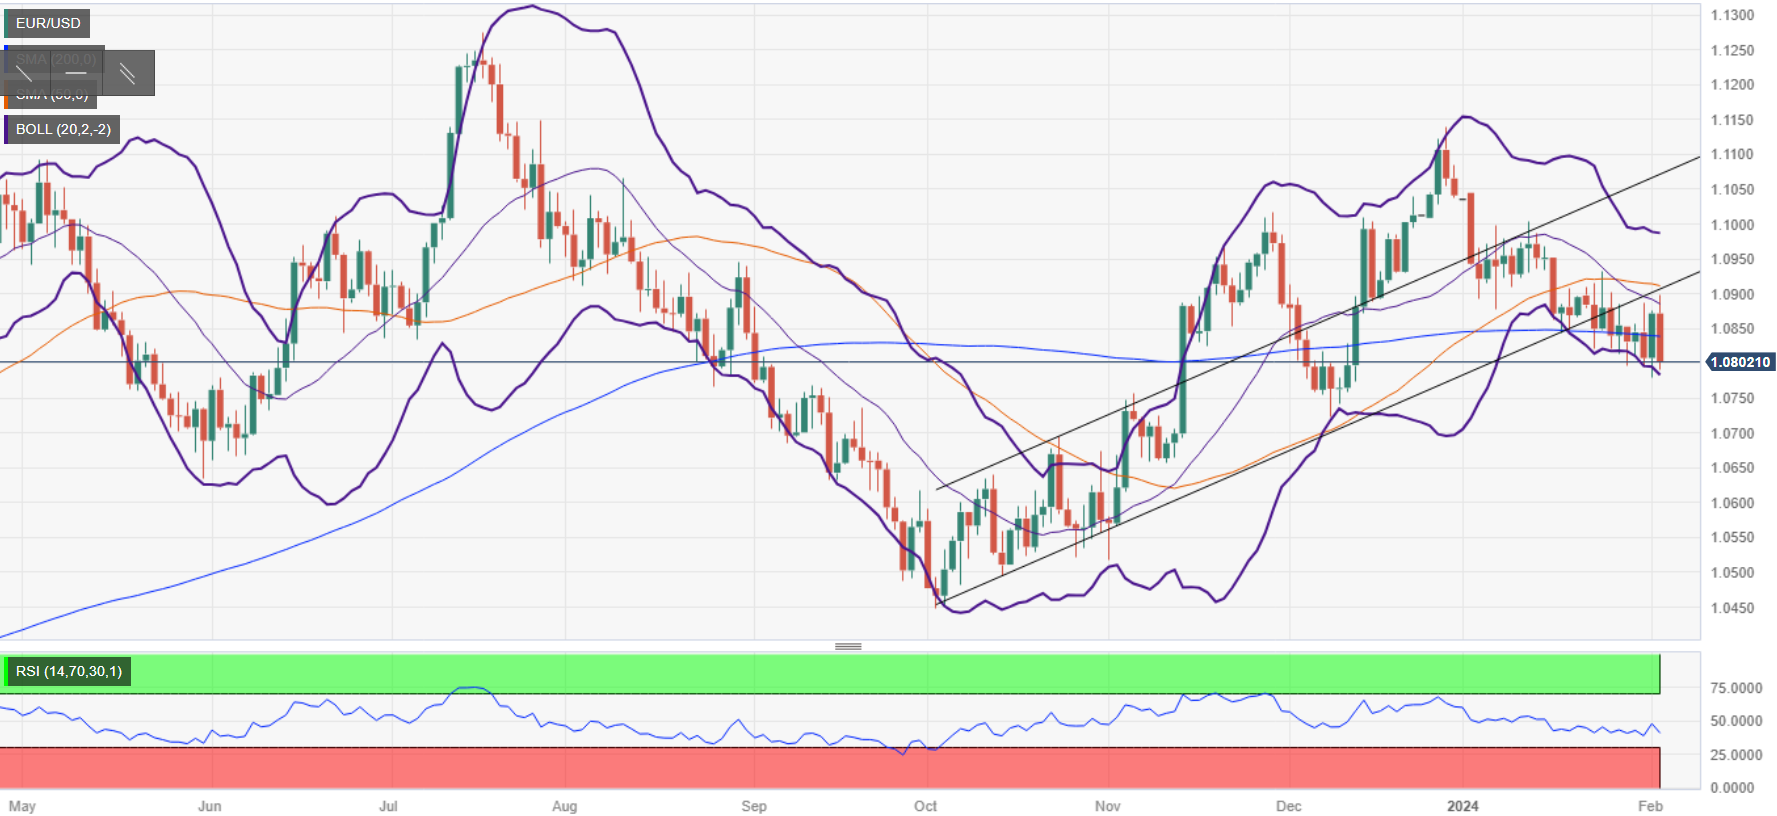
EUR/USD came within touching distance of 1.0900 early Friday, but the pair got dragged back into familiar lows below 1.0800 near 1. 0780.
Friday’s bearish action sees the EUR/USD tumble out of a familiar consolidation zone between the 200-day and 50-day Simple Moving Averages (SMA), between 1.0900 and 1.0850.
The EUR/USD continues to drift into the low side in choppy trading, and the pair is down over 3% from December’s swing high into 1.1140.
EUR/USD hourly chart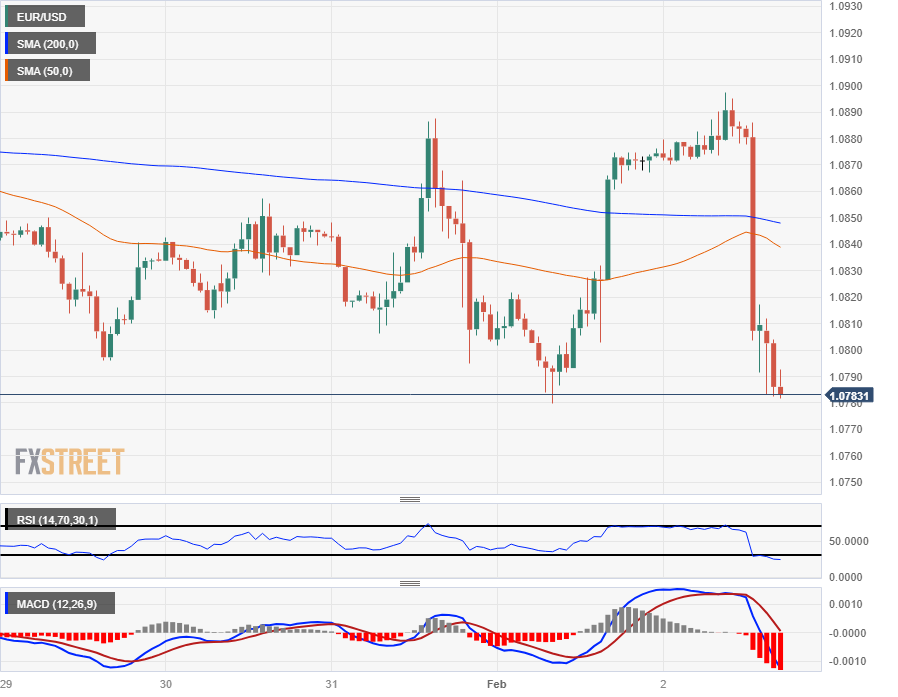
EUR/USD daily chart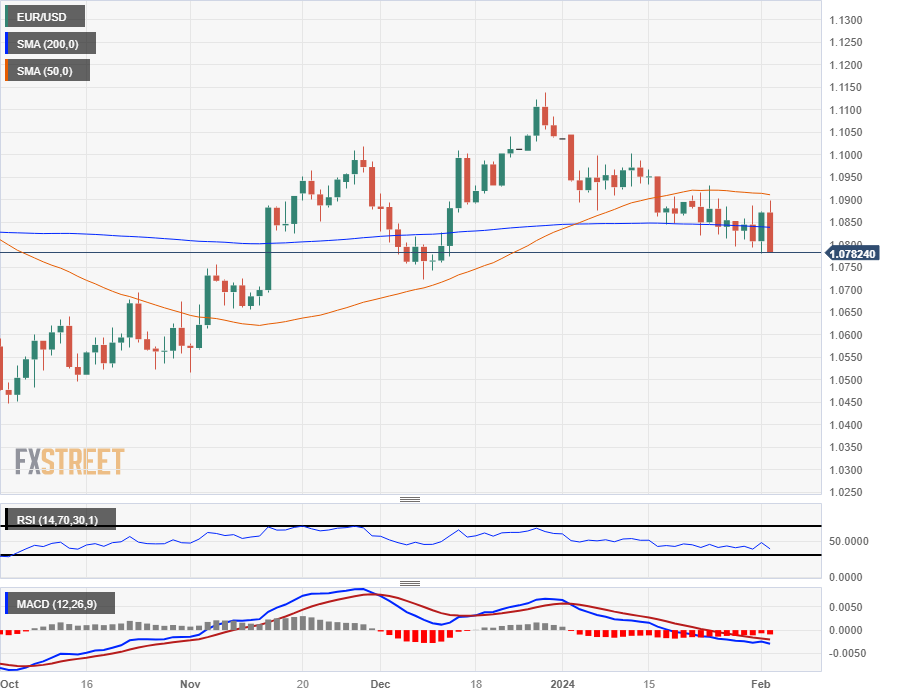
Euro FAQs
What is the Euro?
The Euro is the currency for the 20 European Union countries that belong to the Eurozone. It is the second most heavily traded currency in the world behind the US Dollar. In 2022, it accounted for 31% of all foreign exchange transactions, with an average daily turnover of over $2.2 trillion a day.
EUR/USD is the most heavily traded currency pair in the world, accounting for an estimated 30% off all transactions, followed by EUR/JPY (4%), EUR/GBP (3%) and EUR/AUD (2%).
What is the ECB and how does it impact the Euro?
The European Central Bank (ECB) in Frankfurt, Germany, is the reserve bank for the Eurozone. The ECB sets interest rates and manages monetary policy.
The ECB’s primary mandate is to maintain price stability, which means either controlling inflation or stimulating growth. Its primary tool is the raising or lowering of interest rates. Relatively high interest rates – or the expectation of higher rates – will usually benefit the Euro and vice versa.
The ECB Governing Council makes monetary policy decisions at meetings held eight times a year. Decisions are made by heads of the Eurozone national banks and six permanent members, including the President of the ECB, Christine Lagarde.
How does inflation data impact the value of the Euro?
Eurozone inflation data, measured by the Harmonized Index of Consumer Prices (HICP), is an important econometric for the Euro. If inflation rises more than expected, especially if above the ECB’s 2% target, it obliges the ECB to raise interest rates to bring it back under control.
Relatively high interest rates compared to its counterparts will usually benefit the Euro, as it makes the region more attractive as a place for global investors to park their money.
How does economic data influence the value of the Euro?
Data releases gauge the health of the economy and can impact on the Euro. Indicators such as GDP, Manufacturing and Services PMIs, employment, and consumer sentiment surveys can all influence the direction of the single currency.
A strong economy is good for the Euro. Not only does it attract more foreign investment but it may encourage the ECB to put up interest rates, which will directly strengthen the Euro. Otherwise, if economic data is weak, the Euro is likely to fall.
Economic data for the four largest economies in the euro area (Germany, France, Italy and Spain) are especially significant, as they account for 75% of the Eurozone’s economy.
How does the Trade Balance impact the Euro?
Another significant data release for the Euro is the Trade Balance. This indicator measures the difference between what a country earns from its exports and what it spends on imports over a given period.
If a country produces highly sought after exports then its currency will gain in value purely from the extra demand created from foreign buyers seeking to purchase these goods. Therefore, a positive net Trade Balance strengthens a currency and vice versa for a negative balance.
- Mexican Peso down 0.35% vs. USD, hit by strong US jobs data and Mexico's investment decline.
- S&P maintains Mexico's BBB rating, focusing on 2024 elections impact.
- US economic vigor from employment, Factory Orders and consumer sentiment adds to MXN pressure.
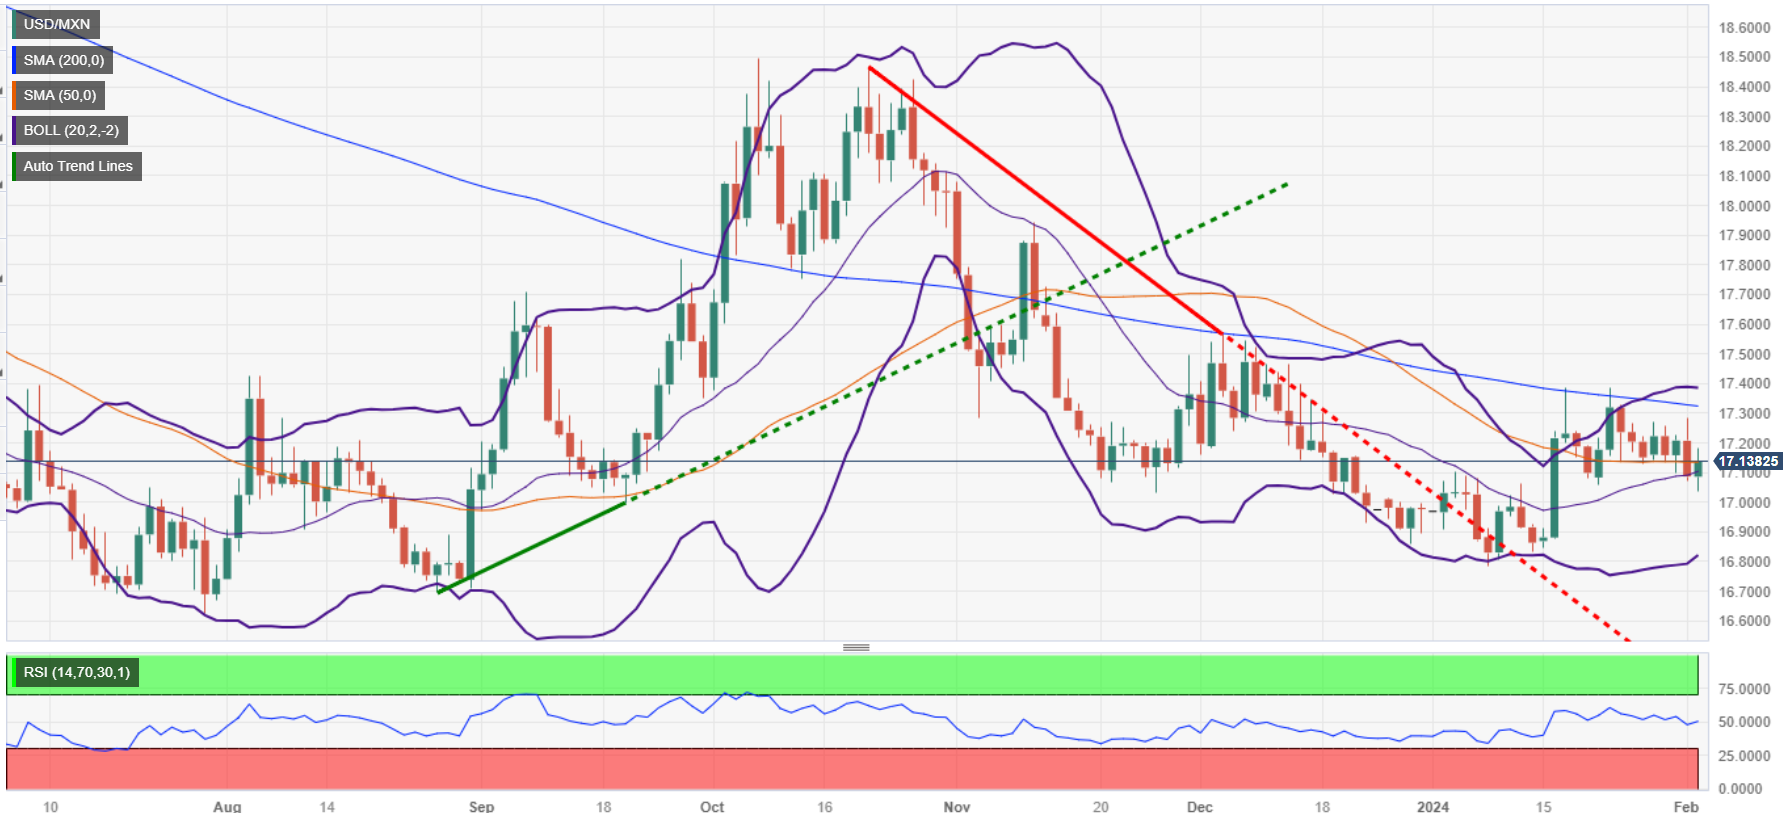
The Mexican Peso (MXN) depreciates against the US Dollar (USD) on Friday following a jobs report revealed by the US Bureau of Labor Statistics (BLS). That report signaled the economy in the United States (US) remains solid amid a tight labor market. Besides that, weaker-than-expected data from Mexico sponsored the exotic pair with a leg up ahead of the weekend. The USD/MXN trades at 17.13, 0.35% higher.
According to November’s data revealed by the National Statistics Agency, Mexico witnessed a dip in Gross Fixed Investment. It should be said that S&P maintained Mexico´s sovereign debt rating as BBB ahead of the general elections on June 2, 2024.
Across the borders, the US Nonfarm Payrolls (NFP) report revealed January’s employment data, which was outstanding, painting an upbeat economic outlook for the US. Further data revealed that Factory Orders rose moderately, while American household sentiment remained positive.
Daily digest market movers: Mexican Peso loses ground on strong US jobs report
- Mexico´s Gross Fixed Investment fell -1.3% MoM in November, below October’s 1.7% expansion.
- S&P Global confirmed Mexico´s BBB foreign currency rating and BBB+ local currency long-term debt rating.
- S&P Global affirmed that stable macroeconomic conditions, with a real growth in Gross Domestic Product above 3% in 2023 that is supported by solid domestic demand and moderating inflation, prepare the way for the general elections in June.
- The US Nonfarm Payrolls for January showed the economy created 353K jobs while exceeding forecasts of 180K and upwardly revised figures for December. Average Hourly Earnings in monthly and yearly numbers rose, signaling that workers are asking for better salaries, while the Unemployment Rate was unchanged at 3.7%.
- Factory Orders for newly manufactured goods climbed modestly by 0.2%, aligning with estimates and trailing November’s 2.6% expansion.
- The University of Michigan Consumer Sentiment index on its final reading for January improved to 79.1 from 78.9. Inflation expectations for one year were 2.9%, down from 3.1%, and for five years they were flat at 2.9%.
Technical Analysis: Mexican Peso weakens further, as USD/MXN buyers target 17.20
The USD/MXN remains trading sideways, but it has pierced above the 50-day Simple Moving Average (SMA) at 17.13, which could pave the way for further gains. If buyers achieve a daily close above that level, they should remain hopeful of challenging the 200-day SMA at 17.32. That level would be followed by the 100-day SMA at 17.38. Once that area is cleared, the exotic pair could extend its gains to 17.50.
Conversely, a bearish resumption could happen if USD/MXN slips below the 50-day SMA, clearing the way toward the January 22 daily low of 17.05. Further downside is expected once the pair breaks below the 17.00 figure.
USD/MXN Price Action – Daily Chart
Mexican Peso FAQs
What key factors drive the Mexican Peso?
The Mexican Peso (MXN) is the most traded currency among its Latin American peers. Its value is broadly determined by the performance of the Mexican economy, the country’s central bank’s policy, the amount of foreign investment in the country and even the levels of remittances sent by Mexicans who live abroad, particularly in the United States. Geopolitical trends can also move MXN: for example, the process of nearshoring – or the decision by some firms to relocate manufacturing capacity and supply chains closer to their home countries – is also seen as a catalyst for the Mexican currency as the country is considered a key manufacturing hub in the American continent. Another catalyst for MXN is Oil prices as Mexico is a key exporter of the commodity.
How do decisions of the Banxico impact the Mexican Peso?
The main objective of Mexico’s central bank, also known as Banxico, is to maintain inflation at low and stable levels (at or close to its target of 3%, the midpoint in a tolerance band of between 2% and 4%). To this end, the bank sets an appropriate level of interest rates. When inflation is too high, Banxico will attempt to tame it by raising interest rates, making it more expensive for households and businesses to borrow money, thus cooling demand and the overall economy. Higher interest rates are generally positive for the Mexican Peso (MXN) as they lead to higher yields, making the country a more attractive place for investors. On the contrary, lower interest rates tend to weaken MXN.
How does economic data influence the value of the Mexican Peso?
Macroeconomic data releases are key to assess the state of the economy and can have an impact on the Mexican Peso (MXN) valuation. A strong Mexican economy, based on high economic growth, low unemployment and high confidence is good for MXN. Not only does it attract more foreign investment but it may encourage the Bank of Mexico (Banxico) to increase interest rates, particularly if this strength comes together with elevated inflation. However, if economic data is weak, MXN is likely to depreciate.
How does broader risk sentiment impact the Mexican Peso?
As an emerging-market currency, the Mexican Peso (MXN) tends to strive during risk-on periods, or when investors perceive that broader market risks are low and thus are eager to engage with investments that carry a higher risk. Conversely, MXN tends to weaken at times of market turbulence or economic uncertainty as investors tend to sell higher-risk assets and flee to the more-stable safe havens.
- European equities trimmed some gains after the US NFP set a one-year high.
- Central bankers continue to weigh on investor rate cut hopes from all angles.
- BoE still sees inflation risks, Europe inflation figures continue to ease slower than expected.
European equity markets mixed on Friday with thin gains for most indexes while London’s FTSE index shed barely a tenth of a percent.
US Nonfarm Payrolls: surge 353,000 in January
US Nonfarm Payrolls surged to a twelve-month high on Friday, driving investors further away from rate cut expectations as the US economy remains stubbornly firm. Investors hoping for an accelerated pace of rate hikes from the US Federal Reserve (Fed) need the US domestic economy to show more weakness and further signs of an accelerating recession in order to push the US central bank into rate-trim territory.
Fed Chairman Jerome Powell threw markets a curveball this week when he all but directly ruled out a March rate cut, and the Bank of England (BoE) also remained fairly hawkish this week, albeit with a mixed vote on whether to cut or hike rates as the majority of BoE policymakers agree rates should just stay where they are for the time being.
European inflation this week also left investors grudgingly accepting the possibility of interest rates remaining where they are for the time being. Headline inflation eased in January, but core inflation fell less than expected and services sector inflation remained stubbornly steady.
The pan-European STOXX600 index rose a scant 0.02%, ending the week at €483.96 while France’s CAC40 gained 0.05%, climbing 3.5 points and closing Friday at €7,592.26.
Germany’s DAX index climbed a healthy 0.35%, gaining nearly 60 points and ending the week at €16,918.21. On the low side, London’s FTSE index shed nearly 7 points to end Friday down about a tenth of a percent at £7,615.54.
DAX technical outlook
The DAX ended the week in the green, gaining a leg higher on Friday, but the major equity index saw another failed run at the €17,000.00 major handle. Near-term technical support sits at the 200-hour Simple Moving Average (SMA) near €16,750.00.
Daily candlesticks show a firm technical ceiling at €17,000.00, but the DAX index could see a fresh run into all-time highs if its able to maintain a bullish stance after a pullback to the 50-day SMA near €16,600.00.
DAX hourly chart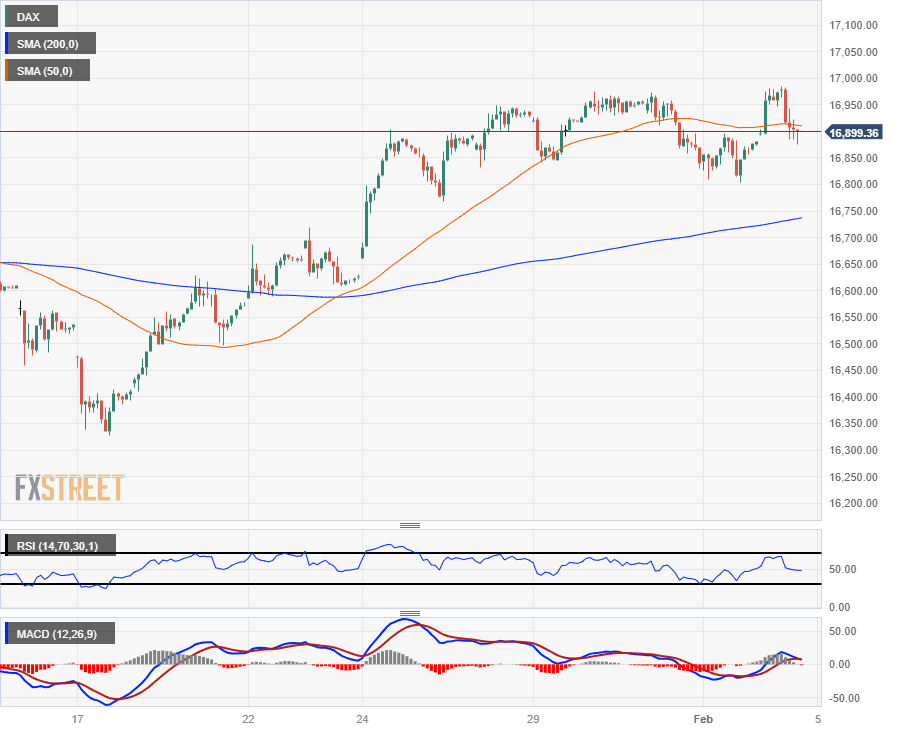
DAX daily chart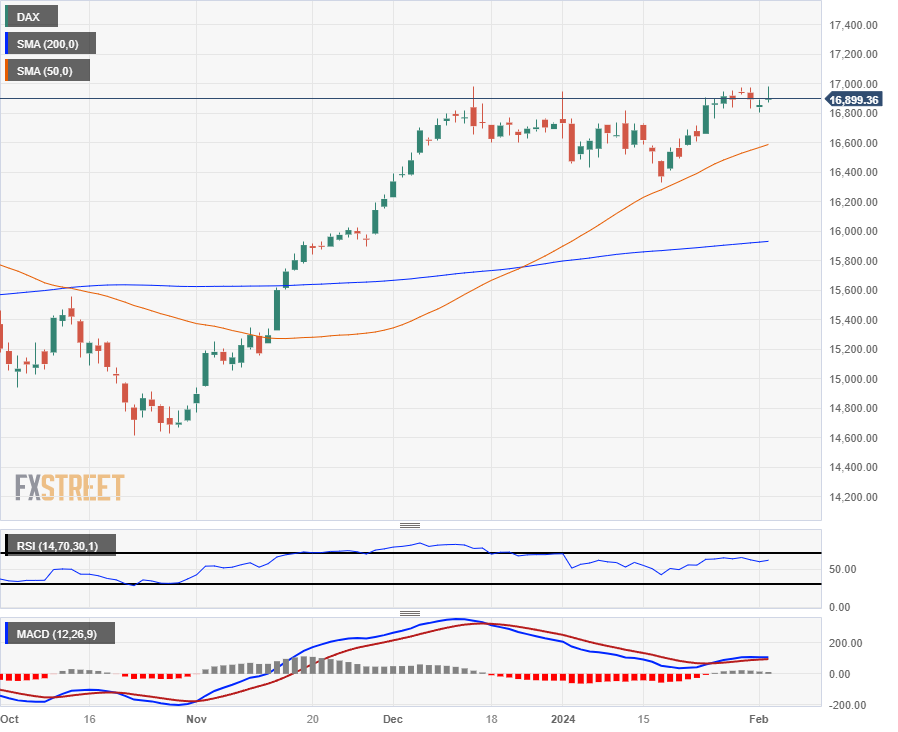
- The EUR/GBP mildly gained to settle at 0.8535, marking a slight retreat for bears after January's significant push.
- The cross will tally its sixth consecutive losing week.
- Markets perceived a dovish tone in the BoE’s decision on Thursday which led to a GBP weakening.
On Friday's session, the EUR/GBP was spotted trading mildly higher at 0.8535, marking scant gains. Although the daily chart displays a neutral to bearish sentiment, sellers appear to be taking a pause, following their push of the pair by over 1.60% in January. Meanwhile, on the weekly chart, indicators linger deep in negative territory, suggesting sellers remain dominant.
On the fundamental side, the Sterling closed the week weaker due to the Bank of England delivering a dovish hold on Thursday. The Bank changed its language and left behind the ‘further tightening’ stance while surprisingly, Swati Dhingra voted for a rate cut. Market forecasts 100-125 basis points worth of rate cuts this year, likely starting in Q2 and as for now, is less easing priced in than the European Central Bank’s (ECB) which may likely limit the upside for the cross.
EUR/GBP technical analysis
The indicators on the daily chart testify to a negative outlook for the cross as the bears mark the terrain. The Relative Strength Index (RSI) attempts to counteract the bearish atmosphere, displaying a positive slope, but is still languishing in a negative territory. Simultaneously, the Moving Average Convergence Divergence (MACD) continues to exhibit its bearishness with diminishing red histogram bars. Furthermore, the currency pair's performance below the 20-day, 100-day, and 200-day Simple Moving Averages (SMAs) evidences the overarching dominance of bearish sentiments. However, following the pair's downtrend being pushed by more than 1.60% over the course of January,the bears taking a breather which may give room for some upside in the short term.
Moving on to the larger time frame, the weekly chart also calibrates a similar pattern, further solidifying the bearish atmosphere. The Relative Strength Index (RSI) on this chart too, is on a negative trajectory while the Moving Average Convergence Divergence (MACD) mimics its daily brother, again with decreasing red bars. That being said, after tallying its sixth straight weekly loss, the pair may consolidate next week, favoring the case of further upward movements.
EUR/GBP daily chart
-638424875829657830.png)
- Markets pile into the US Dollar after NFP posts biggest number in a year.
- Canada wrapped up econ data on Wednesday, Loonie traders await Ivey PMIs next Tuesday.
- US NFPs also saw huge revisions on the back end.
The Canadian Dollar (CAD) is broadly higher for Friday, gaining ground against nearly every major currency peer across the FX market, but the US Dollar (USD) has taken the top spot for the day after US Nonfarm Payrolls (NFP) surged to their highest figure in a year.
Canada is absent from the economic calendar on Friday, and CAD investors will be looking forward to next Tuesday’s Canadian Ivey Purchasing Managers Index (PMI) figures. Bank of Canada (BoC) Governor Tiff Macklem will also be making an appearance next Tuesday.
Daily digest market movers: US NFPs dominate the market, Canadian Dollar trims weight against the Greenback
- US NFPs printed at their highest level in a year, coming in at 353K in January and easily trouncing the forecast of 180K.
- December’s NFP also saw a drastic upside revision, from 216K to 333K.
- US Average Hourly Earnings in January also climbed, printing at 0.6% versus the forecast of 0.3% and the previous month’s 0.4%.
- YoY Average Hourly Earnings climbed to 4.5% for the year ending in January, compared to the forecast of 4.1% and the last print of 4.4% (revised upward from 4.1%).
- The US Dollar surged across the entire FX market post-NFP, marking up gains against all of its major currency peers.
- The US Dollar is one of the best performers on the week and is in the green or flat across the board.
- The Canadian Dollar saw gains against most of its peers, but shed weight against the Greenback.
- CAD and USD vie for top spot on the week, but NFP beat is the Greenback’s clincher.
Canadian Dollar price today
The table below shows the percentage change of Canadian Dollar (CAD) against listed major currencies today. Canadian Dollar was the strongest against the Japanese Yen.
| USD | EUR | GBP | CAD | AUD | JPY | NZD | CHF | |
| USD | 0.68% | 0.73% | 0.51% | 0.87% | 1.22% | 1.17% | 0.91% | |
| EUR | -0.68% | 0.03% | -0.16% | 0.19% | 0.55% | 0.48% | 0.22% | |
| GBP | -0.71% | -0.04% | -0.20% | 0.15% | 0.50% | 0.45% | 0.19% | |
| CAD | -0.51% | 0.17% | 0.22% | 0.35% | 0.70% | 0.66% | 0.37% | |
| AUD | -0.88% | -0.19% | -0.14% | -0.35% | 0.35% | 0.30% | 0.04% | |
| JPY | -1.16% | -0.55% | -0.43% | -0.64% | -0.28% | 0.03% | -0.23% | |
| NZD | -1.18% | -0.49% | -0.45% | -0.66% | -0.31% | 0.05% | -0.27% | |
| CHF | -0.92% | -0.21% | -0.17% | -0.38% | -0.02% | 0.33% | 0.28% |
The heat map shows percentage changes of major currencies against each other. The base currency is picked from the left column, while the quote currency is picked from the top row. For example, if you pick the Euro from the left column and move along the horizontal line to the Japanese Yen, the percentage change displayed in the box will represent EUR (base)/JPY (quote).
Technical Analysis: USD/CAD climbs back into familiar territory near 1.3450
The Canadian Dollar (CAD) is up against the majority of its major currency peers, gaining two-thirds of a percent against the Japanese Yen (JPY) and the New Zealand Kiwi (NZD). The Canadian Dollar shed half a percent against the US Dollar, bringing the USD/CAD within reach of the week’s opening bids as the pair goes flat.
USD/CAD surged back above the 200-hour Simple Moving Average (SMA) near 1.3443, and the pair tested into the 1.3480 neighborhood on Friday.
USD/CAD’s Friday surge sends the pair back into a consolidation pattern between the 50-day and 200-day SMAs, and USD/CAD is set to continue churning in near-term congestion as prices stick close to the 200-day SMA near the 1.3500 handle.
USD/CAD hourly chart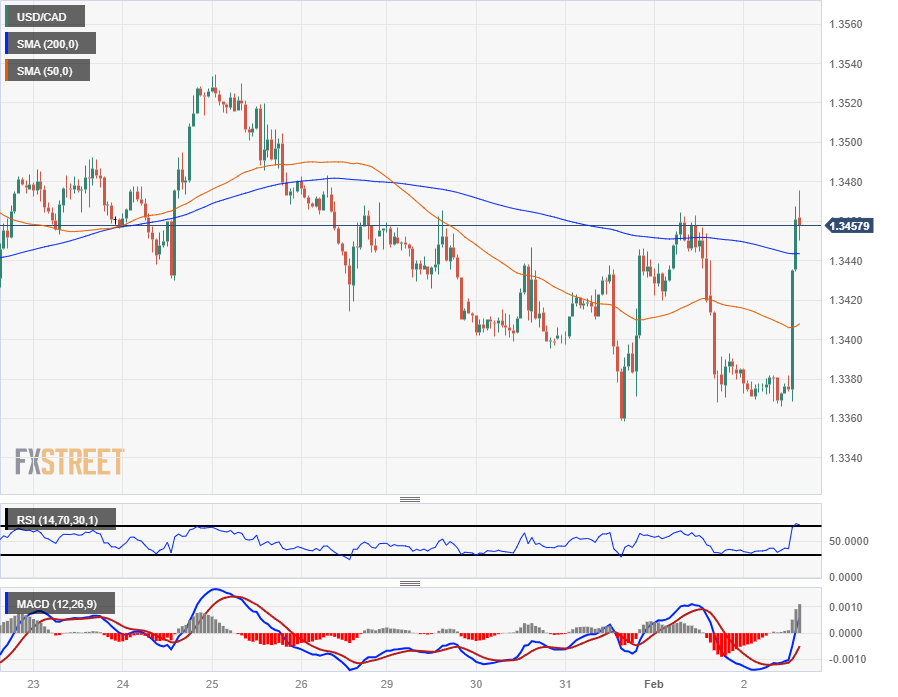
USD/CAD daily chart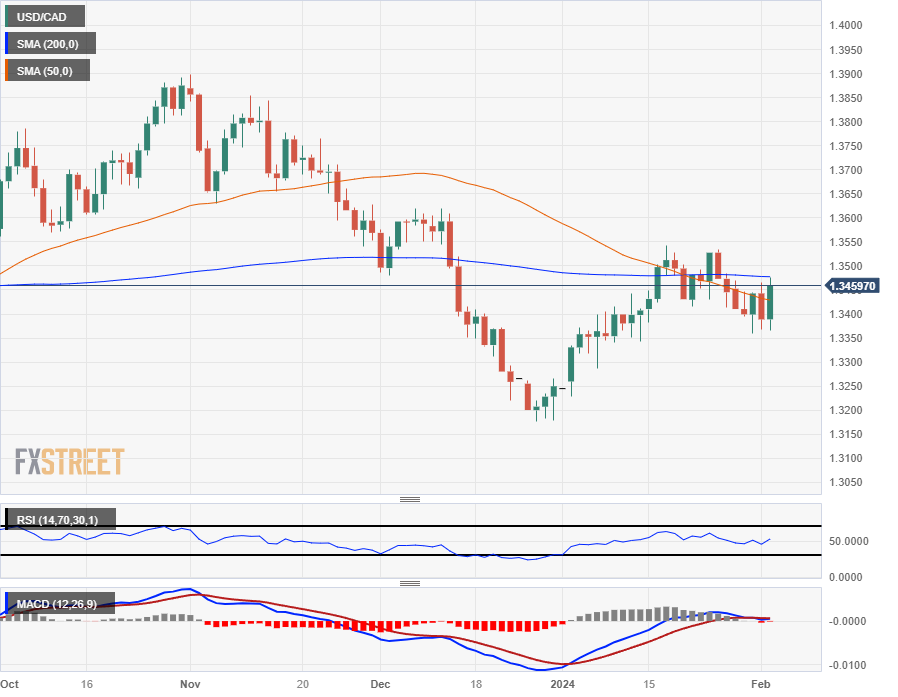
Canadian Dollar FAQs
What key factors drive the Canadian Dollar?
The key factors driving the Canadian Dollar (CAD) are the level of interest rates set by the Bank of Canada (BoC), the price of Oil, Canada’s largest export, the health of its economy, inflation and the Trade Balance, which is the difference between the value of Canada’s exports versus its imports. Other factors include market sentiment – whether investors are taking on more risky assets (risk-on) or seeking safe-havens (risk-off) – with risk-on being CAD-positive. As its largest trading partner, the health of the US economy is also a key factor influencing the Canadian Dollar.
How do the decisions of the Bank of Canada impact the Canadian Dollar?
The Bank of Canada (BoC) has a significant influence on the Canadian Dollar by setting the level of interest rates that banks can lend to one another. This influences the level of interest rates for everyone. The main goal of the BoC is to maintain inflation at 1-3% by adjusting interest rates up or down. Relatively higher interest rates tend to be positive for the CAD. The Bank of Canada can also use quantitative easing and tightening to influence credit conditions, with the former CAD-negative and the latter CAD-positive.
How does the price of Oil impact the Canadian Dollar?
The price of Oil is a key factor impacting the value of the Canadian Dollar. Petroleum is Canada’s biggest export, so Oil price tends to have an immediate impact on the CAD value. Generally, if Oil price rises CAD also goes up, as aggregate demand for the currency increases. The opposite is the case if the price of Oil falls. Higher Oil prices also tend to result in a greater likelihood of a positive Trade Balance, which is also supportive of the CAD.
How does inflation data impact the value of the Canadian Dollar?
While inflation had always traditionally been thought of as a negative factor for a currency since it lowers the value of money, the opposite has actually been the case in modern times with the relaxation of cross-border capital controls. Higher inflation tends to lead central banks to put up interest rates which attracts more capital inflows from global investors seeking a lucrative place to keep their money. This increases demand for the local currency, which in Canada’s case is the Canadian Dollar.
How does economic data influence the value of the Canadian Dollar?
Macroeconomic data releases gauge the health of the economy and can have an impact on the Canadian Dollar. Indicators such as GDP, Manufacturing and Services PMIs, employment, and consumer sentiment surveys can all influence the direction of the CAD. A strong economy is good for the Canadian Dollar. Not only does it attract more foreign investment but it may encourage the Bank of Canada to put up interest rates, leading to a stronger currency. If economic data is weak, however, the CAD is likely to fall.
The Cocoa price continued its rally from last year in the first weeks of 2024. Economists at Commerzbank expect Cocoa prices in New York to approach all-time high of $5,379.
Cocoa market likely to face a supply deficit in the current 2023/24 crop year
There are currently concerns that dry weather fanned by Harmattan winds could affect the mid-crop harvest in West Africa, which begins in April. The Cocoa harvest is already lagging well behind the previous year's level. According to estimates by exporters, arrivals in the ports of the Ivory Coast, by far the largest cocoa-producing country, were 35% lower in the period from the start of the harvest year in October to the end of January than in the same period last year. This means that the Cocoa market is also likely to face a supply deficit in the current 2023/24 crop year, the third in a row.
It seems only a matter of time before the Cocoa price in New York approaches the all-time high of $5,379 per ton set in 1977.
In January, the Mexican Peso (MXN) weakened from 16.97 to 17.17 against the US Dollar (USD). Economists at MUFG Bank analyze Peso’s outlook.
MXN weakening path ahead
Ms. Claudia Sheinbaum from the Morena party is favourite to win the presidential election scheduled on 2nd June, benefitting from the high approval rating of incumbent president Mr. Lopez Obrador. However, we expect gradual MXN weakening during 2024 due to some uncertainties over the economic policies to be adopted by the next administration.
While policy continuity has been signalled, Ms. Sheinbaum’s authority might be constrained by the influence of the incumbent president and other Morena party leaders. On top of that, likely, the Morena party will not have the required two-thirds majority in Congress to pass reforms.
With the US presidential election becoming a hot topic for markets, economists at Nordea look at the potential consequences of a Trump comeback in 2025.
Markets are underestimating the risks that a new Trump presidency would involve
Trump’s comeback would likely lead to more inflationary policies, a renewed escalation of the trade between the US and abroad with China in focus, heightened geopolitical risks and higher US government deficits.
While the first term went relatively well for US stock markets and the global economy even with heightened trade tensions, there is no guarantee that a second Trump term will be the same. We believe that markets are underestimating the risks that a new Trump presidency would involve, especially heightened geopolitical tensions and US sovereign debt concerns. Overall, we believe that a Trump presidency will lead to higher US yields.
For the USD the outlook is more ambiguous, but a Trump reelection will likely continue to support a stronger USD in the short term due to trade and geopolitical tensions, while a weaker USD is likely longer out especially if sovereign debt concerns materialise.
- USD/JPY climbs over 0.90% to 148.05 after strong US jobs report and higher Treasury yields.
- January's 353K job additions lessen Fed rate cut forecasts, indicating a tighter labor market.
- Rises in US 10-year Treasury yield and Dollar Index signal robust confidence in the US economy.
- Anticipation of BoJ ending negative rates complicates USD/JPY outlook, eyes on March meeting.
The USD/JPY bounces from around the 146.00 handle and prints a new three-day high at 148.05 after a strong US Nonfarm Payrolls report pushed aside Federal Reserve’s rate cut speculations amongst the investment community. At the time of writing, the major exchanges hands at 147.77, gains more than 0.90%.
USD/JPY leaps as strong employment figures reinforce US Dollar strength, eyes on BoJ's next move
US Nonfarm Payrolls data was outstanding, with the economy creating 353K new jobs, crushing forecasts of 180K, and above December’s numbers upward revised from 216K to 333K. The Unemployment Rate was flat compared to last month's data at 3.7%, while Average Hourly Earnings (AHE) rose. Monthly AHE came at 0.6%, up from 0.4%, and year-over-year clocked 4.5%, up from 4.4%.
Following the report, the US 10-year Treasury note yield, which closely correlates with the USD/JPY pair, soared from around 3.90% to 4% and gained more than ten basis points (bps). The US Dollar Index (DXY), which tracks the buck´s value versus a basket of peers, advances 0.67%, up at 103.76, after dipping to a low of 102.90.
Meanwhile, a hawkish tilt by the Bank of Japan (BoJ) has increased the odds for Governor Kazuo Ueda and Co. to end the negative interest rates cycle. Analysts at Société Générale said, “The yen snapped back from a challenging January after the hawkish read of the BoJ Summary of Opinions at the January meeting. Our base case is for a rate increase and an end to YCC in March. Demand picked up for 3-month downside strikes in USD/JPY.”
Looking forward in the schedule, the US economic calendar is set to include the release of the University of Michigan Consumer Sentiment as well as Factory Orders.
USD/JPY Technical Levels
The Federal Reserve (Fed) left the target range for the fed funds unchanged at January's meeting. A rate cut in March is not the most likely case, economists at Commerzbank say.
Fed signals rate cut, but not yet in March
As expected, the Fed has left its key interest rates unchanged. The fed funds target range thus remains at 5.25%-5.50%. However, the US central bank has changed its forward guidance and removed the reference to possible further rate hikes.
Instead, it is opening the door to rate cuts, even if it first wants to gain more certainty that inflation has really been beaten. That said, a rate cut already at the next meeting in March is unlikely.
- EUR/USD falls to 1.0791, reacting to US adding 353,000 jobs in January, surpassing expectations.
- Steady US unemployment at 3.7% and faster wage growth signal tight labor market, raising inflation concerns.
- Jump in US Treasury yields and US Dollar Index rally post-job report underscore strong US economic outlook.
The Euro extends its losses versus the US Dollar following a hot US employment report, that witnessed the economy created more than 300,000 jobs in January. Therefore, the EUR/USD trades at around 1.0800, hitting a daily low of 1.0791.
US Nonfarm Payrolls in January crushed forecasts despite the upward revision of December
The US Bureau of Labor Statistics revealed that Nonfarm Payroll employment rose by 353,000 in January, crushing the previous month's reading of 216,000, which was revised upward to 333,000. Digging into the data, the Unemployment Rate was unchanged at 3.7% but below estimates, while Average Hourly Earnings ticked up to 0.6% MoM from 0.4% the previous month. On a yearly basis, earnings by the hour rose 4.5% from 4.4%, with monthly and yearly figures exceeding forecasts.
US equities tumbled on the report, while the US 10-year Treasury note yield rose by more than ten basis points, up above the 4% threshold. Consequently, the Greenback (USD) stages a comeback after the US Dollar Index (DXY) braced to 103.00, its weekly low, before surging to a daily high of 103.86.
Ahead in the calendar, the US docket will feature the release of the University of Michigan Consumer Sentiment alongside Factory Orders.
Recently, Joachim Nagel, the Bundesbank President and member of the governing Council of the European Central Bank (ECB), stated in an interview that it was too early to cut rates after the US Nonfarm Payrolls data was released.
EUR/USD Price Analysis: Technical outlook
From a technical perspective, the EUR/USD breaching of the 200-day moving average (DMA) could open the door for further downside. once sellers crack the 1.0800 figure, further weakness is seen at the 100-DMA at 1.0782, followed by the December 8 daily low, an intermediate support at 1.0724, before slumping to 1.0700. On the flip side, the 200-DMA would be the first barrier for buyers at 1.0832,before aiming toward 1.0900.
We expect the Bank of Japan (BoJ) to exit negative rates in April, while additional tweaks to YCC should support the Japanese Yen (JPY) into the second half of the year.
BoJ still waiting for wage growth
Although current and former officials have noted there are positive signs of increases in the ongoing wage talks, it still makes sense for the BoJ to wait until the shunto talks are over and wage gains are ‘locked in.’ That would give the ‘virtuous cycle’ of wage-price gains (which the BoJ has been seeking for years) a chance at sustainability.
We expect USD/JPY has already peaked and should trade back to 147.00 in Q1 before declining towards 144.00 in Q2 (after a ‘dovish’ BoJ rate hike in April – rates will likely be increased but BoJ guidance will still be dovish). Thereafter, we expect Fed cuts and the outlook for gradual BoJ YCC adjustments to push USD/JPY to 140.00 in Q3 and 135.00 in Q4 2024.
Gold is moving with US Fed rate cut expectations. Economists at ANZ Bank analyze the yellow metal’s outlook.
Positive view on Gold for the year
Market expectations of an early rate cut by the Fed are waning, creating short-term headwinds for the Gold price. This could be magnified by easing safe-haven buying as geopolitical risks abate.
Nevertheless, we continue to hold a positive view on Gold for the year. A transition from tightening monetary policy to easing in H2, elevated geopolitical risks and strong central bank buying should bode well for Gold investment demand. With asset allocation to the sector still low, strong investor demand is likely. This also limits the likelihood of heavy liquidation of positions in the short term.
The US Dollar is heading for a soft close on the week. Economists at Scotiabank analyze Greenback’s outlook.
USD flashes weak technical signals
The US Dollar Index (DXY) looks technically soft and prone to more losses; daily and weekly price signals are bearish.
The daily chart shows a bearish ‘engulfing’ line and a similar signal is building on the weekly chart. A low close today, at or near current levels, will confirm these signals while a push below last week’s DXY low at 102.77 will add to short-term losses and the generally bearish tone of the charts.
- AUD/USD jumps to near 0.6600 as safe-haven appeal fades ahead of US labor market data.
- The US Dollar faces a sell-off despite Fed not offering cues about timing for rate-cuts.
- An upbeat wage growth data would provide a cushion to the US Dollar.
The AUD/USD pair delivers a sharp recovery to near the round-level resistance of 0.6600. The outlook for the Aussie asset seems resilient as the US Dollar has come under pressure despite the Federal Reserve's (Fed) refusal to make speculation on interest rate cuts.
S&P500 futures have generated significant gains in the European session, indicating a decent improvement in the risk appetite of the market participants. The US Dollar Index (DXY) has slipped slightly below the crucial support of 103.00 as investors focus on the fact that rate cuts are invincible.
Meanwhile, investors await the United States Nonfarm Payrolls (NFP) data for January, which will be published at 13:30 GMT. According to the estimates, US employers hired 180K workers in January, lower than 216K personnel recruited in December. The Unemployment Rate is expected to increase to 3.8% against the former reading of 3.7%.
Average Hourly Earnings data will be keenly watched apart from the labor numbers. This would provide a fresh outlook on inflation. Higher wage growth leads to an uptick in retail demand, which fuels price pressures. As per the consensus, Monthly Average Hourly Earnings grew slower than 0.3% against a 0.4% increase in December. The annual wage growth is expected to increase at a steady pace of 4.1%.
Meanwhile, the Australian dollar recovered sharply as investors hoped that the Reserve Bank of Australia (RBA) would hold interest rates at 4.35% for a longer time. Price Pressures in the Australian economy are significantly higher than the desired rate of 2%. This week, the December inflation data released was softened than market participants had anticipated. The monthly Consumer Price Index (CPI) grew at a moderate pace of 3.4% against expectations of 3.7% and the former reading of 4.3%.
USD/CAD remains below 1.3400. Economists at Scotiabank analyze the pair’s outlook.
A push back to 1.3290/1.3300 should follow in the next 1-2 weeks
Despite choppy price action since Wednesday, USD/CAD is still heading for a technically weak close on the week – below the 40-DMA (1.3398) retracement support (1.3403) and the noted 1.3540 double top trigger at 1.3415. The weekly candle chart also shows a likely bearish ‘engulfing’ line forming.
A push back to the 1.3290/1.3300 (double top measured move target) should follow in the next 1-2 weeks (or sooner).
Intraday support is 1.3350/1.3360. Resistance is 1.3390/1.3400.
The Pound Sterling (GBP) is trading on a relatively firm footing. Economists at Scotiabank analyze Cable’s outlook.
Price signals are bullish on the daily chart and lean bullish on the weekly chart
Price signals are bullish on the daily chart (bullish outside range day Thursday) and lean bullish on the weekly chart, with the GBP attracting consistent support on dips under 1.2700 in the past month.
A sustained push above the late December peak at 1.2825 is needed to secure more gains, however. A clear move higher should put Cable on track to rally to 1.3000/1.3050.
Intraday support is 1.2720/1.2740.
EUR/USD is little changed on the day after modest, earlier gains stalled just below 1.0900. Economists at Scotiabank analyze the pair’s outlook.
EUR rally capped below 1.0900 for now
A solid rebound from Thursday’s intraday low (coinciding with a test of the 100-DMA and the 50% Fib retracement of the EUR’s Q4 rally) may well equate to the market setting the low for the EUR’s January decline.
Potentially bullish price action on the weekly chart (‘hammer’ pattern) will support the idea of a EUR rebound if confirmed today.
Support is 1.0865/1.0875. Resistance is 1.0950/1.0975.
- The US Dollar breaks lower on Thursday after jobless data starts to turn ugly.
- Traders watch as the Greenback capitulates ahead of the US Nonfarm payrolls print.
- The US Dollar Index sinks below 103 and could head to 102.
The US Dollar (USD) is getting hammered after a very choppy Thursday where three key elements were enough to punish the Greenback. The first of these was a headline from the US Defense saying that plans had been approved for strikes in Iraq, according to CBS. The second element was a more than double positive print in the US Challenger Job Cuts number which shows the number of layoffs is picking up. Add to that both the Initial and Continuing Weekly jobless Claims ticking up as well, and it could be an early sign that the job market is starting to turn.
On the economic front, traders are bracing for two big elements this Friday: the US Jobs Report is the first, where the Nonfarm Payroll Change number will be of importance. Though traders will also look at the Unemployment Rate and the Average Hourly Earnings numbers as well, to further get confirmation after the jobless data from Thursday, as to whether economic growth in the US is starting to turn. To close off this Friday, the University of Michigan is set to publish its Michigan Consumer Sentiment Index.
Daily digest market movers: NFP Friday ease start
- Markets will be on the lookout for any headlines on a possible ceasefire in the Middle East or other headlines that could point to military actions from the US against Iraq or Houthi rebels.
- At 13:30 GMT the US Jobs Report for January will be released:
- Nonfarm Payrolls is expected to head from 216,000 to 180,000.
- Average Hourly Earnings are expected to head from 0.4% to 0.3% MoM.
- Yearly Average Earnings are seen unchanged at 4.1%.
- The US Unemployment rate should head from 3.7% to 3.8%.
- At 15:00 GMT the University of Michigan will release its numbers for January:
- Consumer Sentiment is expected to head from 78.8 to 78.9.
- Inflation Expectations were at 2.8% for the previous number, no expectations pencilled in.
- Equity markets are mildly in the green ahead of the US Jobs Reports with both Japanese indices up near 0.50%. European equities are doing great as well with both the German Dax and the Euro Stoxx 50 up near 1%. US Futures are already in the green with the Nasdaq even up near 1%.
- The CME Group’s FedWatch Tool is now looking at the March 20th meeting. Expectations for a pause are 63.5%, while 36.5% for a rate cut.
- The benchmark 10-year US Treasury Note trades substantially lower to 3.89%, and even dipped to 3.81% on Thursday.
US Dollar Index Technical Analysis: US Jobs could get ugly
The US Dollar Index (DXY) underwent a meltdown on Thursday evening and went from nearly reaching 104 to breaking below 103. The mix of a pickup in jobless data together with headlines on approval for US strikes in Iraq and Syria has pushed traders away from the Greenback. Should the US Jobs Report this afternoon prove that employment is starting to stall in the US, the Greenback might be in for more downturn with the DXY heading to 102.
Should the US Dollar Index be able to recover Thursday’s losses and break away from the 200-day Simple Moving Average (SMA) at 103.55, traders should look to the 100-day SMA near 104.30 as the next level. Should the US Jobs Report see its components all fall in favor of more US Dollar strength, however, expect to see another jump higher to 105.12. That would mean a fresh three-month-high for the DXY.
The 55-day SMA at 103 is under pressure and has already been breached earlier this Friday. Should that last level snap, a nosedive move to 102.00 could very well be in the cards here. Certainly should the US Jobs Report reveal a negative print expect to see substantial US Dollar weakness.
Nonfarm Payrolls FAQs
What are Nonfarm Payrolls?
Nonfarm Payrolls (NFP) are part of the US Bureau of Labor Statistics monthly jobs report. The Nonfarm Payrolls component specifically measures the change in the number of people employed in the US during the previous month, excluding the farming industry.
How does Nonfarm Payrolls influence the Federal Reserve monetary policy decisions?
The Nonfarm Payrolls figure can influence the decisions of the Federal Reserve by providing a measure of how successfully the Fed is meeting its mandate of fostering full employment and 2% inflation.
A relatively high NFP figure means more people are in employment, earning more money and therefore probably spending more. A relatively low Nonfarm Payrolls’ result, on the either hand, could mean people are struggling to find work.
The Fed will typically raise interest rates to combat high inflation triggered by low unemployment, and lower them to stimulate a stagnant labor market.
How does Nonfarm Payrolls affect the US Dollar?
Nonfarm Payrolls generally have a positive correlation with the US Dollar. This means when payrolls’ figures come out higher-than-expected the USD tends to rally and vice versa when they are lower.
NFPs influence the US Dollar by virtue of their impact on inflation, monetary policy expectations and interest rates. A higher NFP usually means the Federal Reserve will be more tight in its monetary policy, supporting the USD.
How does Nonfarm Payrolls affect Gold?
Nonfarm Payrolls are generally negatively-correlated with the price of Gold. This means a higher-than-expected payrolls’ figure will have a depressing effect on the Gold price and vice versa.
Higher NFP generally has a positive effect on the value of the USD, and like most major commodities Gold is priced in US Dollars. If the USD gains in value, therefore, it requires less Dollars to buy an ounce of Gold.
Also, higher interest rates (typically helped higher NFPs) also lessen the attractiveness of Gold as an investment compared to staying in cash, where the money will at least earn interest.
Sometimes Nonfarm Payrolls trigger an opposite reaction than what the market expects. Why is that?
Nonfarm Payrolls is only one component within a bigger jobs report and it can be overshadowed by the other components.
At times, when NFP come out higher-than-forecast, but the Average Weekly Earnings is lower than expected, the market has ignored the potentially inflationary effect of the headline result and interpreted the fall in earnings as deflationary.
The Participation Rate and the Average Weekly Hours components can also influence the market reaction, but only in seldom events like the “Great Resignation” or the Global Financial Crisis.
USD/BRL retested the 5.0000 level during the second half of January. Economists at CIBC Capital Markets analyze the pair’s outlook.
USD/BRL unlikely to surpass the 5.2000 level in the coming months
A USD/BRL break above the 5.0000 mark would suggest a retest of the 5.0500-5.1000 range last seen in October/early November.
We point out that barring a new external shock, the benevolent trend of the country’s trade balance is likely to prevent an upward move beyond the 5.2000 level in the coming months.
- AUD/JPY recovers from a two-month low at 95.50 recorded on Thursday.
- A Reuters Poll expects RBA to maintain its current interest rate of 4.35% in the February meeting.
- The previous week’s foreign investment might have supported the Japanese Yen.
AUD/JPY continues to gain ground, recovering from the two-month low at 95.50 observed in the previous session. The cross trades higher around 96.80 during the European session on Friday. The Australian Dollar (AUD) has found support from an improved Australian money market, contributing to the strength of the AUD/JPY cross.
Furthermore, the better-than-expected Producer Price Index (PPI) data from Australia underpinned the Aussie Dollar, subsequently underpinning the AUD/JPY cross. The Australian Bureau of Statistics has released the PPI (YoY) for the fourth quarter, reporting an improvement with a growth rate of 4.1%, surpassing the previous growth of 3.8%.
On Thursday, a Reuters Poll showed an expectation that the Reserve Bank of Australia (RBA) could maintain the current interest rate of 4.35% in its upcoming February meeting. Furthermore, former RBA board member Warwick McKibbin suggested that the Australian cash rate may remain around 4.5% for an extended period.
The Australian Dollar has faced challenges, as bond traders have increased their expectations of early interest rate cuts by the Reserve Bank of Australia (RBA) following an unexpectedly weak quarterly inflation report. Futures markets are fully pricing in 50 basis points reductions in 2024, with the first adjustment anticipated in August.
The Bank of Japan's (BoJ) hawkish stance has provided support for the Japanese Yen (JPY). Additionally, the escalated geopolitical tensions in the Middle East might have driven the investors towards the safe-haven Japanese Yen, consequently capping the advances of the AUD/JPY cross.
The Japanese Yen might have gained support from the influx of foreign investment. For the week ending January 26, Foreign Bond Investment in Japan recorded inflows of ¥382.9 billion, a significant turnaround from the previous week's outflows of ¥43.5 billion. Additionally, Foreign Investment in Japanese Stocks rebounded during the same week, rising to ¥720.3 billion compared to the previous week's ¥287 billion.
Economists at Commerzbank analyze Pound Sterling’s (GBP) outlook after the Bank of England (BoE) shifted towards a more neutral approach to monetary policy as persistent inflation is still a concern.
BoE hesitates again – and rightly so
The key point was that the BoE made it clear that the conditions for a rate cut will probably not be met for some time. At the press conference, Governor Bailey had to justify the fact that the BoE had not lowered its key interest rate despite the sharp drop in inflation. According to journalists, the public would suffer from high interest rates. However, Bailey correctly explained that the population was also suffering from high inflation, which despite the recent fall was still at 4%, and that it was therefore important to bring inflation back to the 2% target in the long term.
While I often criticized the BoE last year for being too hesitant, its current reluctance to cut rates should be seen in a different, positive light. If it maintains this stance, the Pound should remain supported.
- Natural Gas trades near $2 – though above the lowest level of $2.04, seen Thursday.
- Traders are seeing a rebound in European industrial output stall because of uncertainties.
- The US Dollar Index sinks into the 102-area ahead of the US Jobs Report.
Natural Gas (XNG/USD) is jumping off the fresh four-year low that got printed on Thursday at $2.04. The jump in Natural Gas comes after the US okayed plans for military strikes in both Iraq and Syria. Meanwhile a cease fire between Israel and Hamas did not go through after Hamas backtracked on earlier commitments it agreed on the terms.
The US Dollar (USD), which is negatively correlated to Nat Gas, had a meltdown overnight where traders sold the Greenback after US Jobless data started to signal a possible tipping point. The US Challenger Job Cuts data revealed more than double the amount of layoffs in January compared to December while both Initial and Continuing Jobless Claims are starting to tick up against last week. A big miss on the US Jobs Report might mean more substantial weakness for the Greenback going forward.
Natural Gas is trading at $2.08 per MMBtu at the time of writing.
Natural Gas market movers: European rebound is not happening
- Gas demand in Europe is not set to pick up more than normal. The hoped-for industrial recovery is not taking place due to uncertainties over a stable Gas price with the supply for next winter uncertain, and the Ukraine-Russia conflict still ongoing.
- Japan’s Natural Gas imports have fallen to the lowest level since 2009 for January.
- Europe signs a deal with Algeria to buy its Gas over a period of ten years.
- The moratorium on Gas mining projects that the Biden administration has put in place, might mean risks for Europe’s Gas dependency on US Gas deliveries for next fall and winter.
Natural Gas Technical Analysis: Ceasefire yes or no?
Natural Gas is trading on the verge of either breaking below $2.00 or jumping back above $2.10. Although Qatar said that Israel agreed to a ceasefire deal on the table, Hamas is not ready to do so. The risk of no ceasefire or a ceasefire deal at the weekend could mean a jump in both Oil and Gas prices on possible uncertainty.
On the upside, Natural Gas is facing some pivotal technical levels to get back to. First, the low of January at $2.10 needs to be reclaimed again. Next is the intermediary level near $2.48. Once that area gets hit, expect to see a test near $2.57 at the purple line.
Once the current low at $2.04 gets tested, or broken again, expect the $2.00 big figure to crack under pressure as well. The first level to look for on the downside is near $1.96 (orange level) which goes back to August 2020. Next is the red line near $1.51, the low of June 2021.
-638424686482221844.png)
XNG/USD (Daily Chart)
Natural Gas FAQs
What fundamental factors drive the price of Natural Gas?
Supply and demand dynamics are a key factor influencing Natural Gas prices, and are themselves influenced by global economic growth, industrial activity, population growth, production levels, and inventories. The weather impacts Natural Gas prices because more Gas is used during cold winters and hot summers for heating and cooling. Competition from other energy sources impacts prices as consumers may switch to cheaper sources. Geopolitical events are factors as exemplified by the war in Ukraine. Government policies relating to extraction, transportation, and environmental issues also impact prices.
What are the main macroeconomic releases that impact on Natural Gas Prices?
The main economic release influencing Natural Gas prices is the weekly inventory bulletin from the Energy Information Administration (EIA), a US government agency that produces US gas market data. The EIA Gas bulletin usually comes out on Thursday at 14:30 GMT, a day after the EIA publishes its weekly Oil bulletin. Economic data from large consumers of Natural Gas can impact supply and demand, the largest of which include China, Germany and Japan. Natural Gas is primarily priced and traded in US Dollars, thus economic releases impacting the US Dollar are also factors.
How does the US Dollar influence Natural Gas prices?
The US Dollar is the world’s reserve currency and most commodities, including Natural Gas are priced and traded on international markets in US Dollars. As such, the value of the US Dollar is a factor in the price of Natural Gas, because if the Dollar strengthens it means less Dollars are required to buy the same volume of Gas (the price falls), and vice versa if USD strengthens.
Economists at HSBC expect the US Dollar (USD) to strengthen modestly over the medium term.
A less aggressive easing path could see risk appetite falter, supporting the USD
Our medium-term expectation remains one of modest USD strength, notably against the EUR and GBP. This is based on the US economy’s continued outperformance against many of the other G10 economies, and US bond yields remain higher than those in most other G10 economies.
In addition, we do not expect the collective easing among G10 central banks to match dovish market expectations. A less aggressive easing path could see risk appetite falter, supporting the USD.
Finally, should other G10 central banks pivot, their currencies are likely to face downward pressure.
- USD/JPY could approach the psychological resistance at 147.00.
- Technical indicators suggest a momentum shift towards a downward trend.
- A break below the 146.50 level could lead the pair to test the psychological level at 146.00.
USD/JPY snaps its two-day losing streak on the weaker US Dollar (USD), trading higher around 146.70 during the European session on Friday. The psychological level at 147.00 appears to be the immediate resistance.
A breakthrough above this resistance level could reinforce the pair’s strength to reach the nine-day Exponential Moving Average (EMA) at 147.12. In case the USD/JPY pair surpasses the nine-day EMA, it could attempt to approach the psychological resistance zone around the level of 148.00 followed by the weekly high at 148.33.
The technical analysis of the 14-day Relative Strength Index (RSI) for USD/JPY suggests a bullish momentum as it is positioned above the 50 level.
However, the lagging indicator of the Moving Average Convergence Divergence (MACD) signals a shift in market sentiment, with the MACD line positioned above the centerline but displaying a divergence below the signal line. Traders may choose to wait for MACD confirmation for a clearer direction before making aggressive bets on the USD/JPY pair.
On the downside, the pair could encounter major support at the 146.50 level, following the psychological support at 146.00. A decisive break below this level could exert downward pressure on the USD/JPY pair, potentially reaching the 38.2% Fibonacci retracement at 145.53, aligned with the major support at 145.50.
USD/JPY: Daily Chart
-638424686762542902.png)
- USD/CAD drops sharply to 1.3370 as appeal for safe-haven bets diminish.
- The USD Index is facing pressure ahead of US NFP data.
- Fed officials need more confidence that a price stability will be achieved for rate-cut speculation.
The USD/CAD pair has dropped to near Thursday’s low around 1.3367 in the European session on Friday. The Loonie asset faces selling pressure as the US Dollar Index (DXY) has dropped sharply ahead of the United States Nonfarm Payrolls (NFP) data for January, which will be published at 13:30 GMT.
As per the estimates, US employers recruited 180K workers, which are lower than the former reading of 216K. The Unemployment Rate is seen increasing slightly to 3.8% from 3.7% in December.
A major focus will be on the Average Hourly Earnings data, which will set a fresh undertone for inflation. Monthly wage growth is seen rising moderately by 0.3% against 0.4% increase in December. The annual Average Hourly Earnings is expected to rise at a steady pace of 4.1%.
S&P500 futures have generated significant gains in the London session, indicating a significant improvement in the risk appetite of the market participants. The USD Index has tested territory below the crucial support of 103.00.
The USD Index has come under pressure as investors hope that rate cuts from the Federal Reserve (Fed) are imminent amid easing price pressures. However, Fed officials are avoiding speculation about the timing of rate cuts as they are not convinced that inflation will sustainably return to the 2% target.
On the Canadian Dollar front, Manufacturing PMI rose sharply to 48.3 in January against 45.4 despite the Bank of Canada (BoC) holding interest rates at 5%.
Gold prices rose again slightly in the second half of January. Strategists at Commerzbank analyze the yellow metal’s outlook.
Gold will only resume its upward trend in the second half of the year
We don't see much more upside potential: after all, Fed Chairman Jerome Powell indicated at the press conference following the Fed meeting that the first Fed rate cuts are likely to take some time to come. He considered an interest rate cut as early as March to be unlikely. The Fed first wants to be sure that inflation will return to the target level on a sustained basis. Weaker economic data alone will probably not be enough.
Investors in the Gold market will have to continue to be patient.
Against this backdrop, we are sticking to our view that the Gold price will initially continue to trend sideways and will only resume its upward trend in the second half of the year.
- Gold price holds to gains as investors price in rate cuts by the Fed in May.
- The US Dollar has come under pressure ahead of the US NFP data.
- Fed officials need more evidence that inflation is declining towards 2%.
Gold price (XAU/USD) aims for a strong weekly gain as investors choose the early rate-cut narrative in the US, shrugging off recent doubts over its timing. In the monetary policy statement, the Federal Reserve (Fed) didn’t explicitly refer to upcoming rate cuts amid the absence of enough evidence that underlying inflation will sustainably return to the 2% target. However, policymakers already signaled in the bank’s latest Summary of Economic Projections (SEP) that interest rates will be reduced by 75 basis points (bps) in 2024.
Gold price could experience volatility ahead as the United States Bureau of Labor Statistics (BLS) will report the Nonfarm Payrolls (NFP) data for January, which will be published at 13:30 GMT. Investors anticipate that labor demand moderated and wage growth slowed as the Fed has maintained interest rates at restricted levels for long.
Daily digest market movers: Gold clings to gains ahead of US labor market data
- Gold price holds onto gains above the crucial resistance of $2,050 as the US Dollar has come under pressure ahead of the United States official Employment data for January.
- The US ADP Employment Change data, released on Wednesday, showed a sharp decline in private payrolls at 107K against the consensus of 145K. This has set a negative undertone for the NFP data.
- According to the estimates, 180K workers were hired by US employers against 216K fresh payrolls added in December. The Unemployment Rate is seen rising to 3.8% against the former reading of 3.7%.
- Investors will focus on the wage growth data, as it will provide fresh outlook on the consumer price inflation. Monthly Average Hourly Earnings are expected to have grown at a slower pace of 0.3% against the 0.4% increase in December. Annual wage growth is expected to increase at a steady pace of 4.1%.
- An upbeat wage growth data would accelerate fears of sticky price pressures, which could further dampen hopes of rate cuts by the Federal Reserve in March.
- As per CME Group Fedwatch tool, traders see more than 61% chances for a 25 bps rate-cut in May to 5.00%-5.25%.
- Expectations for the first rate cut by the Fed after a two-year long rate-tightening campaign have shifted from March to May. In his last press conference, Fed Chair Jerome Powell said a dovish decision in the March meeting is unlikely as the central bank won’t get confident about inflation declining to the 2% target by then.
- Economic indicators such as robust consumer spending, a lower jobless rate, and a recovery in factory data could cast doubts among Fed policymakers about price stability. .
- The US ISM reported on Thursday that the Manufacturing PMI for January rose sharply to 49.1 against expectations of 47.0 and the former reading of 47.1. Still, the PMI remained below the 50.0 threshold. The New Orders Index rose significantly to 52.5 vs. 47.0 in December. A robust factory order book indicates an improvement in demand.
Technical Analysis: Gold price aims to continue four-day winning spell
-638424667320812058.png)
Gold price consolidates in a tight range above $2,050 as investors await the US NFP data for fresh guidance. The precious metal struggles to continue its four-day winning streak. The near-term appeal for the yellow metal is upbeat as it has delivered a breakout of the Symmetrical Triangle chart pattern formed on a daily timeframe. Gold price has also printed a higher high near $2,065, which indicates that the overall trend has turned bullish.
The 20-day Exponential Moving Average (EMA) near $2,035 continues to support the bulls. The 14-period Relative Strength Index (RSI) aims to break above the 60.00 hurdle. A bullish momentum would activate if the oscillator manages to do so.
Gold FAQs
Why do people invest in Gold?
Gold has played a key role in human’s history as it has been widely used as a store of value and medium of exchange. Currently, apart from its shine and usage for jewelry, the precious metal is widely seen as a safe-haven asset, meaning that it is considered a good investment during turbulent times. Gold is also widely seen as a hedge against inflation and against depreciating currencies as it doesn’t rely on any specific issuer or government.
Who buys the most Gold?
Central banks are the biggest Gold holders. In their aim to support their currencies in turbulent times, central banks tend to diversify their reserves and buy Gold to improve the perceived strength of the economy and the currency. High Gold reserves can be a source of trust for a country’s solvency. Central banks added 1,136 tonnes of Gold worth around $70 billion to their reserves in 2022, according to data from the World Gold Council. This is the highest yearly purchase since records began. Central banks from emerging economies such as China, India and Turkey are quickly increasing their Gold reserves.
How is Gold correlated with other assets?
Gold has an inverse correlation with the US Dollar and US Treasuries, which are both major reserve and safe-haven assets. When the Dollar depreciates, Gold tends to rise, enabling investors and central banks to diversify their assets in turbulent times. Gold is also inversely correlated with risk assets. A rally in the stock market tends to weaken Gold price, while sell-offs in riskier markets tend to favor the precious metal.
What does the price of Gold depend on?
The price can move due to a wide range of factors. Geopolitical instability or fears of a deep recession can quickly make Gold price escalate due to its safe-haven status. As a yield-less asset, Gold tends to rise with lower interest rates, while higher cost of money usually weighs down on the yellow metal. Still, most moves depend on how the US Dollar (USD) behaves as the asset is priced in dollars (XAU/USD). A strong Dollar tends to keep the price of Gold controlled, whereas a weaker Dollar is likely to push Gold prices up.
EUR/USD is not so far away from 1.0900, the level it was trading around before the last dovish ECB meeting. Ulrich Leuchtmann, Head of FX and Commodity Research at Commerzbank, analyzes the pair’s outlook.
An inflation risk premium on the Euro is appropriate
The point is that the ECB may not have the room to cut rates too quickly and that an initial cut in March or April may not actually happen. However, one negative factor for the EUR remains, and that is the impression that a large faction within the ECB Governing Council is really dragging its feet and will later take the first opportunity to push for rate cuts. Perhaps too soon, depending on the situation.
I therefore continue to believe that an inflation risk premium on the Euro is appropriate. I would therefore be critical of an immediate return of EUR/USD to the area above 1.0900.
- USD/MXN extends its losses ahead of US employment data release.
- US Dollar could suffer losses if the US NFP declines as expected.
- The advances of the pair could be capped as Banxico is expected to cut a 25 bps rate in March.
USD/MXN loses ground for the second consecutive session, inching lower to near 17.05 during European trading hours on Friday. The mixed labor data from the United States (US) has weakened the US Dollar (USD), acting as a headwind for the USD/MXN pair.
Initial Jobless Claims for the week ending on January 26 rose to 224K, higher than the previous rise of 215K and the expected figure of 212K. The preliminary US Nonfarm Productivity appreciated by 3.2% in Q4, surpassing the expected 2.5%, but down from the previous reading of 4.9%. Furthermore, US Average Hourly Earnings and Nonfarm Payrolls (NFP), are scheduled for release on Friday.
Additionally, the subdued US Treasury yields are adding pressure on the US Dollar (USD). The downward pressure on US Treasury yields followed reports from regional bank New York Community Bancorp, revealing increased stress in its commercial real estate portfolio.
On the other side, markets are factoring in a 25 basis points (bps) interest rate cut by the Bank of Mexico (Banxico) starting in March. A survey of expectations estimates that the bank will lower rates to 9.25% by the end of 2024. Markets expect it to reach 4.17%, and economic growth is anticipated to range from 2.29% to 2.40%. However, Banxico is expected to make no interest rate adjustment in the upcoming February policy meeting.
UK public inflation expectations for the coming year rose to a two-month high in January, a survey conducted by online polling company YouGov and published by Citi Group showed on Friday.
Additional findings
Public expectations for inflation in the next five to 10 years rose to 3.6% in January from 3.4% in December, their highest since April 2023.
Expectations for inflation for the 12 months ahead rose to a two-month high of 3.9% in January from 3.5% in December.
Market reaction
At the time of writing, GBP/USD is adding 0.11% on the day to trade near 1.2750.
Pound Sterling price today
The table below shows the percentage change of Pound Sterling (GBP) against listed major currencies today. Pound Sterling was the strongest against the Japanese Yen.
| USD | EUR | GBP | CAD | AUD | JPY | NZD | CHF | |
| USD | -0.18% | -0.12% | -0.13% | -0.41% | 0.16% | -0.14% | -0.17% | |
| EUR | 0.16% | 0.05% | 0.05% | -0.25% | 0.33% | 0.02% | -0.01% | |
| GBP | 0.10% | -0.08% | -0.01% | -0.32% | 0.26% | -0.05% | -0.08% | |
| CAD | 0.11% | -0.06% | -0.01% | -0.30% | 0.27% | -0.03% | -0.07% | |
| AUD | 0.41% | 0.25% | 0.30% | 0.30% | 0.58% | 0.28% | 0.24% | |
| JPY | -0.16% | -0.34% | -0.26% | -0.30% | -0.56% | -0.30% | -0.34% | |
| NZD | 0.14% | -0.03% | 0.05% | 0.03% | -0.27% | 0.29% | -0.04% | |
| CHF | 0.13% | -0.04% | 0.06% | 0.02% | -0.28% | 0.30% | 0.03% |
The heat map shows percentage changes of major currencies against each other. The base currency is picked from the left column, while the quote currency is picked from the top row. For example, if you pick the Euro from the left column and move along the horizontal line to the Japanese Yen, the percentage change displayed in the box will represent EUR (base)/JPY (quote).
Nonfarm Payrolls (NFP) data today will be high on market’s watchlist. Economists at ING analyze Dollar’s outlook ahead of the the US January job report.
Does US employment continue on a benign trend?
Today, we have the US January jobs report. Consensus is for +185K in jobs gains, while we forecast +200K. We doubt a +200k number needs to trigger a major repricing of the Fed easing cycle. Instead, we are interested to see whether December’s +216k number is revised down. This would then represent 11 of the last 12 NFP jobs releases being revised lower and support the Fed’s contention that tight US labour markets are a thing of the past.
We typically have a slight negative bias for the Dollar on NFP day on the working assumption that investors use NFP-inspired FX liquidity to put money to work outside of the Dollar.
DXY has been trading an exceptionally tight 102.77 to 103.82 range over the last two weeks – but may be due a test of lower levels now.
- USD/CHF extends its losses as the US Dollar loses ground on subdued US yields.
- Swiss Manufacturing PMI improved to 43.1 but fell short of the expected 44.5.
- US Treasury yields face challenges as the regional bank New York Community Bancorp is stressed in its commercial real estate portfolio.
USD/CHF loses ground for the third consecutive session, edging lower to near 0.8560 during the European trading hours on Friday. The downbeat labor data from the United States (US) weakened the US Dollar (USD), which in turn, acted as a headwind for the USD/CHF pair.
The Swiss Manufacturing Purchasing Managers Index (PMI) released by the Trade Association for Purchasing and Supply Management showed that production growth in Switzerland has slightly improved but failed to meet the market expectations. The index improved to 43.1 in January from the previous reading of 43.0, falling short of the expected 44.5 reading.
Recent economic events indicated a decline in Swiss Real Retail Sales and Consumer Demand, contrasting with a rise in Gross Domestic Product that exceeded market consensus. Looking ahead, projections for this year suggest that inflation will average below the 2% threshold. The consensus expectation is for the Swiss National Bank (SNB) to implement its first rate cut in September 2024.
The subdued US Treasury yields are adding pressure on the US Dollar (USD). The downward pressure on US Treasury yields followed reports from regional bank New York Community Bancorp, revealing increased stress in its commercial real estate portfolio.
Furthermore, the US Dollar (USD) faced downward pressure following the release of mixed economic data from the United States (US) on Thursday. Initial Jobless Claims for the week ending on January 26 increased to 224K, surpassing both the previous rise of 215K and the expected figure of 212K.
However, the ISM Manufacturing PMI improved, climbing to 49.1 from the prior reading of 47.1, surpassing the anticipated figure of 47.0 in January. More labor data, including US Average Hourly Earnings and Nonfarm Payrolls (NFP), is scheduled for release on Friday.
Gold prices rose in India on Friday, according to data from India's Multi Commodity Exchange (MCX).
Gold price stood at 62,875 Indian Rupees (INR) per 10 grams, up INR 166 compared with the INR 62,709 it cost on Thursday.
As for futures contracts, Gold prices decreased to INR 62,906 per 10 gms from INR 62,965 per 10 gms.
Prices for Silver futures contracts increased to INR 72,309 per kg from INR 72,218 per kg.
| Major Indian city | Gold Price |
|---|---|
| Ahmedabad | 65,165 |
| Mumbai | 64,925 |
| New Delhi | 65,065 |
| Chennai | 65,060 |
| Kolkata | 65,145 |
Global Market Movers: Comex Gold price remains on the sidelines amid risk-on, ahead of US NFP
- A series of unsubstantiated reports of a ceasefire between Israel and Hamas boosts investors' confidence, capping the upside for the safe-haven Comex Gold price on the last trading day of the week.
- Reports suggest that Hamas received its first proposal for an extended pause to the fighting in Gaza in exchange for releasing the remaining hostages it holds, though has not yet responded to it.
- The Houthi rebels claimed that it struck a US merchant ship in the Red Sea, while the US launched new air strikes in Yemen, targeting ten drones reportedly being set up to launch.
- Concerns about the health of regional lenders in the US resurfaced on Thursday after New York Community Bancorp reported increased stress in its commercial real estate portfolio.
- China's official Manufacturing PMI contracted for a fourth successive month in January, suggesting that the world's second-largest economy is struggling to regain momentum.
- Fed Chair Jerome Powell said on Wednesday that interest rates had peaked and would move lower in coming months, though tempered market expectations for any such a move in March.
- The yield on the benchmark 10-year US government bond remains below the 4% mark amid bets for a steep rate cut by the Federal Reserve in 2024 and undermines the US Dollar.
- The Labor Department reported that Initial Jobless Claims increased by 9,000, to 224K during the week ended January 27 from the previous week's upwardly revised reading of 215 K.
- Separately, the Institute for Supply Management's (ISM) Manufacturing PMI improved from 47.4 to 49.1 in January, while the Prices Paid Index climbed to 52.9 from 45.2 in December.
- The XAU/USD seems poised to snap a two-week losing streak as investors now look to the US jobs data for cues about the Fed's policy path and some meaningful trading opportunities.
- The popularly known NFP report is expected to show that the US economy added 180K jobs in January, down from the 216K previous, and the jobless rate edged higher to 3.8% from 3.7%
(An automation tool was used in creating this post.)
Gold FAQs
Why do people invest in Gold?
Gold has played a key role in human’s history as it has been widely used as a store of value and medium of exchange. Currently, apart from its shine and usage for jewelry, the precious metal is widely seen as a safe-haven asset, meaning that it is considered a good investment during turbulent times. Gold is also widely seen as a hedge against inflation and against depreciating currencies as it doesn’t rely on any specific issuer or government.
Who buys the most Gold?
Central banks are the biggest Gold holders. In their aim to support their currencies in turbulent times, central banks tend to diversify their reserves and buy Gold to improve the perceived strength of the economy and the currency. High Gold reserves can be a source of trust for a country’s solvency. Central banks added 1,136 tonnes of Gold worth around $70 billion to their reserves in 2022, according to data from the World Gold Council. This is the highest yearly purchase since records began. Central banks from emerging economies such as China, India and Turkey are quickly increasing their Gold reserves.
How is Gold correlated with other assets?
Gold has an inverse correlation with the US Dollar and US Treasuries, which are both major reserve and safe-haven assets. When the Dollar depreciates, Gold tends to rise, enabling investors and central banks to diversify their assets in turbulent times. Gold is also inversely correlated with risk assets. A rally in the stock market tends to weaken Gold price, while sell-offs in riskier markets tend to favor the precious metal.
What does the price of Gold depend on?
The price can move due to a wide range of factors. Geopolitical instability or fears of a deep recession can quickly make Gold price escalate due to its safe-haven status. As a yield-less asset, Gold tends to rise with lower interest rates, while higher cost of money usually weighs down on the yellow metal. Still, most moves depend on how the US Dollar (USD) behaves as the asset is priced in dollars (XAU/USD). A strong Dollar tends to keep the price of Gold controlled, whereas a weaker Dollar is likely to push Gold prices up.
USD/JPY consolidates near two-week low. Economists at Société Générale analyze the pair’s technical outlook.
Move beyond 148.10 is essential to confirm next leg of up move
USD/JPY rebound has stalled after approaching projections at 149.10. A brief decline has led the pair back towards 50-DMA at 145.50/145.30 which is a potential support zone.
Daily MACD has dipped below its trigger line, but it is situated in positive territory denoting prevalence of upward momentum.
A short-term bounce is likely; move beyond 148.10, the 76.4% retracement of recent down move is essential to confirm next leg of up move.
In case the pair breaks 145.50/145.30, the decline could extend towards 142.00 and low formed last month near 140.20.
- EUR/USD extends gains as US Dollar weakens after mixed US data.
- The Euro could face challenges as markets speculate over an ECB interest rate cut in June.
- The expected decline in US Nonfarm Payrolls could further weaken the US Dollar.
The EUR/USD pair extends its gains for the second consecutive day, edging higher to near 1.0880 during the European session on Friday. EUR/USD gained upward support following mixed economic data from the United States (US). Further, the subdued US Treasury yields contribute to adding pressure on the US Dollar (USD). US Treasury yields experienced downward pressure following reports from regional bank New York Community Bancorp, which indicated increased stress in its commercial real estate portfolio.
The Euro faced a decline following the release of softer German consumer inflation data on Wednesday, as market sentiment leaned towards the possibility of a speculative interest rate cut by the European Central Bank (ECB) in June. However, the European currency initiated a recovery after the release of mixed Eurozone inflation data on Thursday.
The US Dollar Index (DXY), which measures the performance of the US Dollar (USD) against a basket of six major currencies, struggles to retrace its recent losses. The DXY trades around 103.00, with the 2-year and 10-year US Treasury yields hovering around 4.23% and 3.88%, respectively, at the time of writing.
US Initial Jobless Claims rose to 224K for the week ending on January 26, exceeding both the previous increase of 215K and the expected figure of 212K. However, ISM Manufacturing PMI improved to 49.1 from the prior reading of 47.1, surpassing the anticipated figure of 47.0 in January. On Friday, key labor data is set to be released, including US Average Hourly Earnings and Nonfarm Payrolls (NFP).
Daily digest market movers: EUR/USD extends gains after mixed US economic data
- Eurozone preliminary Core Harmonized Index of Consumer Prices (YoY) increased by 3.3% in January, higher than the expected 3.2% growth but lower than the 3.4% prior.
- The annual Consumer Price Index came in at 2.8%, as expected, against the previous reading of 2.9%. The month-over-month report showed a decline of 0.4%, swinging from the 0.2% rise in December.
- German Consumer Price Index (CPI) for January showed a year-on-year increase of 2.9%, lower than the expected 3.3% and down from December's reading of 3.7%.
- Germany’s consumer inflation met expectations, rising to 0.2% MoM from the previous reading of 0.1%. The Harmonized Index of Consumer Prices YoY increased 3.1%, lower than the previous figure of 3.8%.
- The preliminary US Nonfarm Productivity increased by 3.2% in Q4, higher than the expected 2.5%, but down from the previous reading of 4.9%.
- US Challenger Job Cuts rose to 82,307 in January from the previous 34,817 in December.
- US Unit Labor Costs reported a 0.5% rise against the 1.7% expected in the fourth quarter, swinging from the previous 1.1% decline.
Technical Analysis: EUR/USD moves higher towards psychological barrier at 1.0900
EUR/USD advances to near 1.0880 on Friday, close to the immediate resistance around the psychological level at 1.0900. A breakthrough above the latter could exert upward pressure on the pair to surpass the 38.2% Fibonacci retracement level at 1.0915 to navigate the next barrier around the major level at 1.0950.
On the downside, the major level at 1.0850 appears as the key support, which is aligned with the 21-day Exponential Moving Average (EMA) at 1.0846. A break below this region could push the EUR/USD pair to approach the psychological support at 1.0800, followed by the weekly low at 1.0779.
EUR/USD: Four-Hour Chart
-638424624928399111.png)
Euro price today
The table below shows the percentage change of Euro (EUR) against listed major currencies today. Euro was the strongest against the Japanese Yen.
| USD | EUR | GBP | CAD | AUD | JPY | NZD | CHF | |
| USD | -0.14% | -0.06% | -0.06% | -0.30% | 0.23% | -0.02% | -0.14% | |
| EUR | 0.16% | 0.10% | 0.10% | -0.14% | 0.39% | 0.14% | 0.02% | |
| GBP | 0.10% | -0.06% | 0.05% | -0.22% | 0.32% | 0.04% | -0.07% | |
| CAD | 0.06% | -0.07% | 0.00% | -0.24% | 0.28% | 0.04% | -0.09% | |
| AUD | 0.31% | 0.17% | 0.24% | 0.26% | 0.53% | 0.28% | 0.16% | |
| JPY | -0.23% | -0.40% | -0.32% | -0.26% | -0.50% | -0.27% | -0.38% | |
| NZD | 0.06% | -0.07% | 0.00% | 0.01% | -0.24% | 0.29% | -0.08% | |
| CHF | 0.16% | 0.04% | 0.08% | 0.12% | -0.16% | 0.40% | 0.12% |
The heat map shows percentage changes of major currencies against each other. The base currency is picked from the left column, while the quote currency is picked from the top row. For example, if you pick the Euro from the left column and move along the horizontal line to the Japanese Yen, the percentage change displayed in the box will represent EUR (base)/JPY (quote).
Euro FAQs
What is the Euro?
The Euro is the currency for the 20 European Union countries that belong to the Eurozone. It is the second most heavily traded currency in the world behind the US Dollar. In 2022, it accounted for 31% of all foreign exchange transactions, with an average daily turnover of over $2.2 trillion a day.
EUR/USD is the most heavily traded currency pair in the world, accounting for an estimated 30% off all transactions, followed by EUR/JPY (4%), EUR/GBP (3%) and EUR/AUD (2%).
What is the ECB and how does it impact the Euro?
The European Central Bank (ECB) in Frankfurt, Germany, is the reserve bank for the Eurozone. The ECB sets interest rates and manages monetary policy.
The ECB’s primary mandate is to maintain price stability, which means either controlling inflation or stimulating growth. Its primary tool is the raising or lowering of interest rates. Relatively high interest rates – or the expectation of higher rates – will usually benefit the Euro and vice versa.
The ECB Governing Council makes monetary policy decisions at meetings held eight times a year. Decisions are made by heads of the Eurozone national banks and six permanent members, including the President of the ECB, Christine Lagarde.
How does inflation data impact the value of the Euro?
Eurozone inflation data, measured by the Harmonized Index of Consumer Prices (HICP), is an important econometric for the Euro. If inflation rises more than expected, especially if above the ECB’s 2% target, it obliges the ECB to raise interest rates to bring it back under control.
Relatively high interest rates compared to its counterparts will usually benefit the Euro, as it makes the region more attractive as a place for global investors to park their money.
How does economic data influence the value of the Euro?
Data releases gauge the health of the economy and can impact on the Euro. Indicators such as GDP, Manufacturing and Services PMIs, employment, and consumer sentiment surveys can all influence the direction of the single currency.
A strong economy is good for the Euro. Not only does it attract more foreign investment but it may encourage the ECB to put up interest rates, which will directly strengthen the Euro. Otherwise, if economic data is weak, the Euro is likely to fall.
Economic data for the four largest economies in the euro area (Germany, France, Italy and Spain) are especially significant, as they account for 75% of the Eurozone’s economy.
How does the Trade Balance impact the Euro?
Another significant data release for the Euro is the Trade Balance. This indicator measures the difference between what a country earns from its exports and what it spends on imports over a given period.
If a country produces highly sought after exports then its currency will gain in value purely from the extra demand created from foreign buyers seeking to purchase these goods. Therefore, a positive net Trade Balance strengthens a currency and vice versa for a negative balance.
FX option expiries for Feb 2 NY cut at 10:00 Eastern Time, via DTCC, can be found below.
- EUR/USD: EUR amounts
- 1.0700 455m
- USD/JPY: USD amounts
- 145.00 585m
- 148.50 399m
- USD/CAD: USD amounts
- 1.3315 868m
- 1.3330 480m
- NZD/USD: NZD amounts
- 0.6080 940m
NZD/USD has had a volatile week. Economists at ANZ Bank analyze Kiwi’s outlook.
More reasons to be bullish than bearish
Although we think there are more reasons to be bullish than bearish, there are downside risks too.
While we are forecasting mild NZD strength over 2024, crosscurrents aplenty speak to continued volatility and range trading.
The Yen has been the main beneficiary of US regional bank woes this week, and that has weighed on NZD/JPY. But going the other way, NZD/AUD has appreciated, confounding consensus expectations for weakness. That move may have further to go given pleasing Australian CPI data earlier in the week, which should cement market expectations for RBA cuts by H2 and given the RBNZ’s much less dovish tone. But volatility could be the winner this month.
- Silver oscillates in a narrow trading band just below the 50% Fibo. level on Friday.
- The technical setup favours bullish trades and supports prospects for further gains.
- A convincing break below the $22.55 area is needed to negate the positive outlook.
Silver (XAG/USD) struggles to capitalize on the previous day's solid recovery from the $22.50 region, or a one-week trough and oscillates in a narrow trading band through the first half of the European session on Friday. The white metal currently trades around the $23.15 region, nearly unchanged for the day, as traders keenly await the release of the US monthly jobs report (NFP) before placing fresh directional bets.
From a technical perspective, the XAG/USD, so far, has been struggling to break through a resistance marked by the 50% Fibonacci retracement level of the late December-January downfall. This is closely followed by the very important 200-day Simple Moving Average (SMA), currently around the $23.45 region, and the 61.8% Fibo. level near the $23.55 area. A sustained strength beyond the latter will be seen as a fresh trigger for bullish traders and set the stage for an extension of the recent move up from sub-$22.00 levels, or over a two-month low touched on January 22.
Given that oscillators on the daily chart have just started gaining positive traction, the XAG/USD might then aim back towards reclaiming the $24.00 round figure. The momentum could extend towards the next relevant hurdle near the $24.50-$24.60 area and the $25.00 psychological mark. Some follow-through buying has the potential to lift the white metal to the $25.45-$25.50 intermediate barrier en route to the $26.00 neighbourhood, or the December swing high.
On the flip side, weakness back below the $23.00 mark might continue to find some support near the $22.55 area, which if broken decisively will suggest that a nearly two-week-old uptrend has run its course and shift the bias back in favour of bearish traders. The XAG/USD might then turn vulnerable to retest the $21.95-$21.90 region, or a two-month low, before eventually dropping to the $21.40-$21.35 area en route to the $21.00 mark and the $20.70-$20.65 zone, or the October swing low.
Silver daily chart
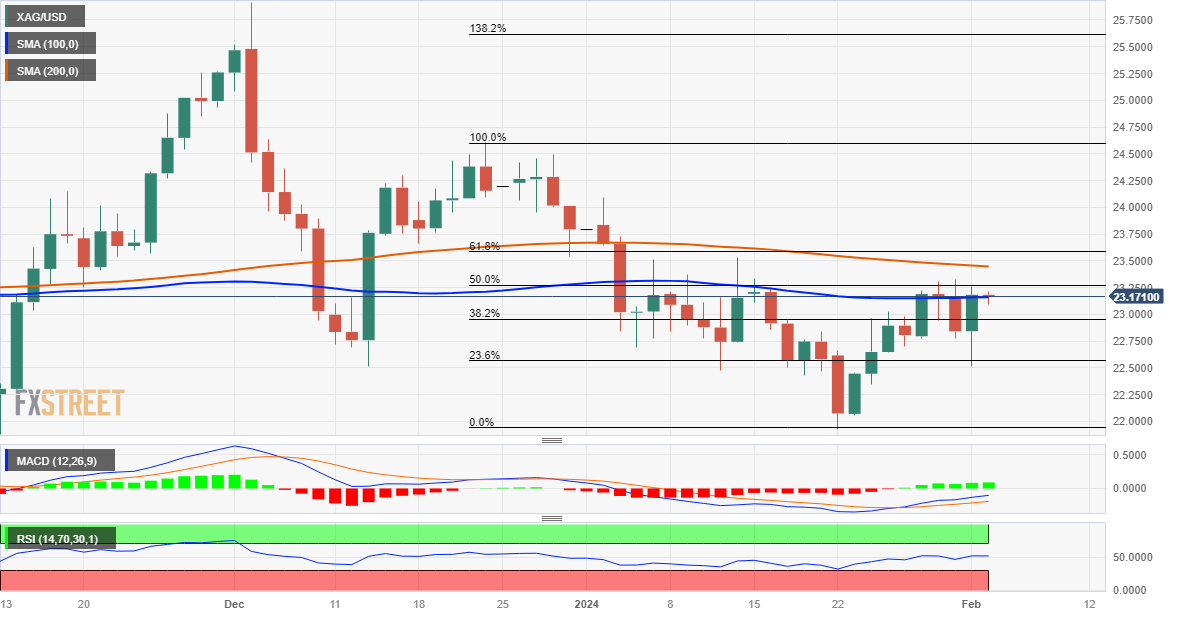
Technical levels to watch
- Oil prices find temporary support as Hamas mulls ceasefire proposal.
- China’s poor economic outlook has deepened upside risks to weak oil demand.
- OPEC is expected to make a fresh decision on oil output in March.
West Texas Intermediate (WTI) futures on NYMEX discover interim support near $73.70 as the OPEC+ has maintained its oil output policy and is expected to make a fresh decision on an extension or decline in voluntary cuts in March.
Even though oil prices are showing some recovery in the early European session on Friday, the benchmark is heading for a weekly loss due to deepening economic risks in China. Investors are worried that the real estate crisis in China could impact the growth outlook. This could lead to a significant fall in demand for oil.
It is worth noting that China is the leading importer of oil in the world, and lower oil demand in China impacts the oil price.
Meanwhile, improving hopes for a ceasefire between Israel and Palestine would also stress the oil price. Hamas leader Ismail Haniyeh is expected to discuss a truce to stop the war in Gaza, which will include the release of Israeli hostages. A ceasefire would improve the oil supply chain, eventually strengthening market sentiment.
Meanwhile, investors await January's United States Nonfarm Payrolls (NFP) data. Investors anticipated 180K new workers would be employed against 216K payroll additions in December. The Unemployment Rate is seen rising to 3.8% vs. 3.7%. An upbeat labor market data would indicate a stick outlook for price pressures.
The US dollar remains under pressure as investors hope the Federal Reserve (Fed) will start reducing interest rates from May.
Pound Sterling (GBP) ticked higher in response to the less-than-dovish BoE statement. Economists at ING analyze GBP outlook.
EUR/GBP can probably trace out a 0.8500-0.8700 range over the coming months
No change from the BoE but Sterling and UK market interest rates nudged higher after two members of the Monetary Policy Committee continued to vote for a 25 bps rate hike.
We doubt GBP needs to embark on a major rally, however, given that we think UK inflation will ultimately play catch-up with the disinflation trends seen in the US and the Eurozone.
We think EUR/GBP can probably trace out a 0.8500-0.8700 range over the coming months, while a strong Dollar environment can keep GBP/USD near the 1.2600/1.2700 region this quarter.
- Pound Sterling witnesses a significant demand as the BoE is expected to keep the restrictive policy longer.
- A hawkish interest-rate outlook has deepened UK recession fears.
- The US Dollar remains on the backfoot ahead of the US NFP data.
The Pound Sterling (GBP) prints a fresh weekly high in the early European session on Friday as the Bank of England (BoE) is expected to start reducing interest rates after the Federal Reserve (Fed) and the European Central Bank (ECB), and the risk-appetite of the market participants has improved.
Recent monetary policy statements from Federal Reserve Chair Jerome Powell, European Central Bank President Christine Lagarde, and Bank of England Governor Andrew Bailey indicated that the first two were more explicit about rate cuts. The Fed has already guided three rate cuts this year, and ECB’s Lagarde sees the central bank commencing the rate-reduction process in late summer.
Like Jerome Powell, Andrew Bailey avoided speculation on rate cuts and warned that price pressures could pick up again in the second half of this year. The BoE chose to tame high price pressures over facing-off deepening recession fears. The United Kingdom economy witnessed a decline in growth of 0.1% in the third quarter of 2023, and higher interest rates are expected to continue to place barriers to economic growth.
The GBP/USD pair clings to gains but could face volatility ahead as the United States Bureau of Labor Statistics (BLS) labor report – the Nonfarm Payrolls (NFP) release for January. Upbeat labor market data would trim hopes of a rate cut by the Fed in May.
Daily Digest Market Movers: Pound Sterling advances while US Dollar faces significant pressure
- Pound Sterling hovers near a weekly high of around 1.2750 after a sharp rally against the US Dollar as investors await the United States NFP report.
- The likelihood for more upside in the Pound Sterling is high as the market sentiment is cheerful, and the Bank of England didn’t express much about interest rate cuts while providing forward guidance on interest rates in the monetary policy announcement on Thursday.
- In the monetary policy statement, BoE Governor Andrew Bailey said that a victory cannot be announced on inflation because, although price growth is expected to fall to 2% in Q2 of 2024, it is expected to pick up again in Q3.
- The BoE advocated keeping interest rates restrictive until they got enough evidence that inflation would sustainably return to the 2% target.
- While Andrew Bailey refrained from endorsing further quantitative tightening, policymakers Jonathan Haskel and Catherine Mann voted for a rate hike by 25 basis points (bps). BoE Swati Dhingra voted for a rate cut of the same size.
- Higher interest rates are expected to worsen the UK’s labor market conditions further. In the latest projections report, the BoE sees the Unemployment Rate rising to 5% by the end of 2026.
- The outlook for the UK economy is more vulnerable now as longer restrictive monetary policy could fade business optimism. Factories may refrain from fresh investment plans to avoid higher installment obligations.
- Meanwhile, the US Dollar Index (DXY) faces a sharp sell-off amid hopes that the Fed will reduce interest rates in May, even though Chair Jerome Powell refused to speculate over rate cuts.
- Jerome Powell said interest rates needed to remain higher until the Fed gets greater confidence that inflation will return to the 2% target sustainably.
- In today’s session, market participants will focus on the US NFP report, which will be published at 13:30 GMT.
- According to the estimates, US employers hired 180K workers in January, lower than 216K recruitments in December. The Unemployment Rate is expected to increase to 3.8% against the former reading of 3.7%.
- Average Hourly Earnings data will be keenly watched apart from the labor numbers. This would provide a fresh outlook on inflation. Higher wage growth leads to an uptick in retail demand, which fuels price pressures.
Technical Analysis: Pound Sterling advances toward 1.2800
Pound Sterling seems set to extend its rally towards the round-level resistance of 1.2800, supported by multiple tailwinds. The GBP/USD pair attempts a breakout of the Descending Triangle chart pattern formed on a daily time frame. The downward-sloping trendline of the aforementioned chart pattern is placed from 28 December 2023 high at 1.2827 while the horizontal support is plotted from 21 December 2023 low at 1.2612. A decisive breakout will result in wider ticks and high volume.
The 14-period Relative Strength Index (RSI) is approaching the 60.00 hurdle. If the RSI (14) manages to sustain above the aforementioned hurdle, it will reflect a bullish turn in market sentiment.
Pound Sterling FAQs
What is the Pound Sterling?
The Pound Sterling (GBP) is the oldest currency in the world (886 AD) and the official currency of the United Kingdom. It is the fourth most traded unit for foreign exchange (FX) in the world, accounting for 12% of all transactions, averaging $630 billion a day, according to 2022 data.
Its key trading pairs are GBP/USD, aka ‘Cable’, which accounts for 11% of FX, GBP/JPY, or the ‘Dragon’ as it is known by traders (3%), and EUR/GBP (2%). The Pound Sterling is issued by the Bank of England (BoE).
How do the decisions of the Bank of England impact on the Pound Sterling?
The single most important factor influencing the value of the Pound Sterling is monetary policy decided by the Bank of England. The BoE bases its decisions on whether it has achieved its primary goal of “price stability” – a steady inflation rate of around 2%. Its primary tool for achieving this is the adjustment of interest rates.
When inflation is too high, the BoE will try to rein it in by raising interest rates, making it more expensive for people and businesses to access credit. This is generally positive for GBP, as higher interest rates make the UK a more attractive place for global investors to park their money.
When inflation falls too low it is a sign economic growth is slowing. In this scenario, the BoE will consider lowering interest rates to cheapen credit so businesses will borrow more to invest in growth-generating projects.
How does economic data influence the value of the Pound?
Data releases gauge the health of the economy and can impact the value of the Pound Sterling. Indicators such as GDP, Manufacturing and Services PMIs, and employment can all influence the direction of the GBP.
A strong economy is good for Sterling. Not only does it attract more foreign investment but it may encourage the BoE to put up interest rates, which will directly strengthen GBP. Otherwise, if economic data is weak, the Pound Sterling is likely to fall.
How does the Trade Balance impact the Pound?
Another significant data release for the Pound Sterling is the Trade Balance. This indicator measures the difference between what a country earns from its exports and what it spends on imports over a given period.
If a country produces highly sought-after exports, its currency will benefit purely from the extra demand created from foreign buyers seeking to purchase these goods. Therefore, a positive net Trade Balance strengthens a currency and vice versa for a negative balance.
EUR/USD did not spend too long under 1.0800 at all on Thursday. Economists at ING analyze the pair’s outlook.
Core inflation disappoints
Short-date Eurozone interest rates got a lift on Thursday from the January CPI numbers where core inflation did not fall as much as expected. The European Central Bank could be concerned that companies do not have the pricing power to avoid margin pressure and will pass higher wage costs onto the consumer. Hence it makes perfect sense for the ECB to wait until June, when it will have the wage data, to cut interest rates.
If today’s US NFP figure is benign, then EUR/USD can knock on the door of 1.0875/1.0900 again. However, one-month EUR/USD realised volatility continues to drift around the lows near 6% and low implied volatilities suggest that investors are not expecting a pick-up in FX volatility anytime soon.
Economists at CIBC Capital Markets do not expect the Australian Dollar to weaken and retain their AUD/USD forecast of 0.6600 in the first quarter of the year.
AUD should be relatively stable
We do not expect RBA cuts until Q3 or later (after the Fed).
Stable RBA policy amid Fed cuts, and strength in the Australian services sector means that AUD should be relatively stable, despite ongoing China weakness.
We think AUD/USD will continue to react to Fed expectations – with March FOMC pricing now at 50% chance for a cut, we think further AUD downside is limited, and maintain our AUD/USD forecast of 0.6600 in Q1.
Here is what you need to know on Friday, February 2:
The US Dollar (USD) came under heavy selling pressure and the USD Index declined nearly 0.5% amid falling US bond yields in the American session on Thursday. Markets stay relatively calm early Friday as focus shifts to the US January jobs report, which will feature Nonfarm Payrolls and wage inflation figures. The University of Michigan will release a revision to January Consumer Sentiment Index data and the Census Bureau will publish Factory Orders for December.
NFP Preview: Forecasts from 10 major banks, new year, same old labor market.
Following the uninspiring employment-related data on Thursday, the benchmark 10-year US T-bond yield dropped to its lowest level since late December below 3.9%. Weekly Initial Jobless Claims came in higher than the market expectation for the week ending January 27 and the Employment Index of the ISM Manufacturing PMI survey edged lower to 47.1 in January from 47.5 in December.
Nonfarm Pyarolls in the US are forecast to rise by 180,000 in January. The Unemployment Rate is expected to tick up to 3.8% and the Average Hourly Earnings are seen rising 0.3% on a monthly basis.
NFP Forecast: US Nonfarm Payrolls expected to increase moderately in January.
US Dollar price this week
The table below shows the percentage change of US Dollar (USD) against listed major currencies this week. US Dollar was the weakest against the Japanese Yen.
| USD | EUR | GBP | CAD | AUD | JPY | NZD | CHF | |
| USD | -0.38% | -0.43% | -0.55% | -0.25% | -1.07% | -0.94% | -0.81% | |
| EUR | 0.37% | -0.05% | -0.18% | 0.13% | -0.67% | -0.56% | -0.43% | |
| GBP | 0.43% | 0.05% | -0.12% | 0.18% | -0.61% | -0.51% | -0.38% | |
| CAD | 0.56% | 0.17% | 0.12% | 0.30% | -0.49% | -0.38% | -0.26% | |
| AUD | 0.25% | -0.14% | -0.19% | -0.30% | -0.81% | -0.68% | -0.56% | |
| JPY | 1.05% | 0.67% | 0.76% | 0.52% | 0.79% | 0.10% | 0.24% | |
| NZD | 0.93% | 0.57% | 0.51% | 0.38% | 0.68% | -0.13% | 0.11% | |
| CHF | 0.80% | 0.42% | 0.37% | 0.26% | 0.54% | -0.24% | -0.14% |
The heat map shows percentage changes of major currencies against each other. The base currency is picked from the left column, while the quote currency is picked from the top row. For example, if you pick the Euro from the left column and move along the horizontal line to the Japanese Yen, the percentage change displayed in the box will represent EUR (base)/JPY (quote).
The Bank of England (BoE) left the bank rate unchanged at 5.25% as expected and revised inflation projection for 2024 lower. In the post-meeting press conference, BoE Governor Andrew Bailey refrained from commenting on the possible timing of a policy pivot. Although the initial reaction caused GBP/USD to edge lower, the pair benefited from renewed USD weakness and closed the day in positive territory above 1.2700 on Thursday. Early Friday, the pair trades in a tight range at around 1.2750.
USD/JPY pushed lower and registered losses for the second consecutive day on Thursday. The pair holds steady at around 146.50 in the European morning on Friday.
After touching its lowest level in nearly 7 weeks at 1.0780, EUR/USD reversed its direction and climbed above 1.0850. The pair continues to stretch higher toward 1.0900 in the early European session.
Gold gathered bullish momentum in the second half of the day on Thursday and climbed to its highest level since early January above $2,060. XAU/USD stays in a consolidation phase slightly below $2,060 ahead of US jobs report.
- USD/CAD remains under selling pressure around 1.3378 amid the USD weakness.
- Bearish outlook of the pair remains intact; the 50-period EMA is on the verge of crossing below the 100-period EMA.
- The key support level is located at 1.3360; the immediate resistance level will emerge at 1.3430.
The USD/CAD pair holds below the 1.3400 mark during the early European trading hours on Friday. The decline in the US Dollar (USD) and lower US Treasury bond yields weigh on the USD/CAD pair. The pair currently trades near 1.3378, down 0.08% on the day. Later on Friday, traders will closely monitor the US Nonfarm Payrolls (NFP) report for fresh catalysts, which is estimated to see 180,000 jobs added in January.
From the technical perspective, USD/CAD maintains the bearish outlook unchanged as the pair is below the 50- and 100-period Exponential Moving Averages (EMA) on the four-hour chart. It’s worth noting that the 50-hour EMA is on the verge of crossing below the 100-hour EMA. If a decisive crossover occurs on the four-hour chart, it would validate a Bear Cross, highlighting that the path of least resistance for USD/CAD is to the downside.
The crucial support level for the pair is seen at 1.3360, representing the lower limit of the Bollinger Band and a low of January 31. A breach of this level will expose the 1.3300 psychological round figure, followed by a low of January 2 at 1.3228.
On the other hand, the first upside barrier of USD/CAD will emerge at the upper boundary of the Bollinger Band at 1.3430. A decisive break above the latter will see a rally to the 1.3500 round mark. The additional upside filter to watch is a high of January 25 at 1.3535.
USD/CAD four-hour chart
-638424524049814505.png)
- NZD/USD extends gains after softer US employment data released on Thursday.
- The Kiwi Building Permit (MoM) improved to 3.7% against the previous decline of 10.6%.
- Investors await more US labor data scheduled to be released on Friday, including US Average Hourly Earnings and NFP.
NZD/USD continues to gain ground for the second trading session on Friday, improving to near 0.6150 during the Asian hours. The depreciation of the US Dollar (USD) could be attributed to the subdued US Treasury yields. US Treasury yields experienced downward pressure amid concerns regarding regional US banks. Additionally, the improved medium-impact data from New Zealand could have provided some support for the New Zealand (NZD) and, consequently, acted as a tailwind for the NZD/USD pair.
The US Dollar Index (DXY), an index to measure the performance of the US Dollar (USD) against a group of six major different currencies, struggles to retrace its recent losses. The DXY hovers around 103.00 with the 2-year and 10-year yields on US Treasury bonds hovering around 4.21% and 3.88%, at the time of writing.
Furthermore, the US Dollar (USD) encountered downward pressure after the release of mixed economic data from the United States (US) on Thursday. Initial Jobless Claims for the week ending on January 26 increased to 224K, exceeding the previous rise of 215K and the expected figure of 212K. However, the ISM Manufacturing PMI showed improvement, climbing to 49.1 from the prior reading of 47.1, surpassing the anticipated figure of 47.0 in January. Additional labor data, including US Average Hourly Earnings and Nonfarm Payrolls (NFP), is scheduled for release on Friday.
On the New Zealand front, the seasonally adjusted Building Permit (MoM) for December exhibited improvement at 3.7%, reversing a previous decline of 10.6% in November. Additionally, ANZ-Roy Morgan Consumer Confidence for December came in at 93.6, compared to the previous reading of 93.1.
The Reserve Bank of New Zealand (RBNZ) emphasizes a target of around the 2% midpoint for future inflation. Investors await New Zealand’s labor market data next week to gain further cues on the country’s economic landscape.
- EUR/GBP attracts some buyers near 0.8531 in Friday’s early European session.
- The Bank of England (BoE) kept interest rates unchanged and softened its stance about when rates would be cut.
- The Eurozone annual inflation eased to 2.8% YoY in January from 2.9% in December.
The EUR/GBP cross gains ground below the mid-0.8500s during the early European session on Friday. Nonetheless, the upside of the cross seems limited. The Bank of England (BoE) held rates steady at its January meeting on Thursday, and BoE Governor Andrew Bailey said more evidence of inflation is needed before lowering rates. At press time, the cross is trading at 0.8531, gaining 0.03% on the day.
On Thursday, six out of nine members of the BoE’s Monetary Policy Committee voted to keep rates at a 15-year high of 5.25%. During his speech, UK central bank Governor Andrew Bailey stated that the BoE needs to see more evidence that inflation is on the course of the 2% target before they can lower interest rates. Furthermore, the sticky inflation and wage growth in the UK economy might convince the BoE to keep rates on hold longer than the European Central Bank (ECB). This, in turn, might lift the Pound Sterling (GBP) and act as a headwind for the EUR/GBP cross.
On the Euro front, the Eurozone Harmonized Index of Consumer Prices (HICP) eased to 2.8% YoY in January from 2.9% in December, in line with market expectations. Meanwhile, the Core inflation dropped to 3.3% YoY in the same month from the previous reading of 3.4%, above the market consensus of 3.2%. Investors anticipate that the ECB will probably cut interest rates in April, contributing to the Euro's recent weakness.
Later on Friday, the French Industrial Output and Budget Balance for December will be due. Also, BoE Chief Economist Huw Pill is set to speak on Friday.
- Asian benchmarks rose as the S&P 500 Index and Nasdaq 100 Index recorded gains of over 1%.
- The expected decline in US Nonfarm Payrolls prompts the Fed to reconsider March rate cuts.
- ASX 200 and Nikkei 225 rose by 1.40% and 0.60%, respectively, by the press time.
- Apple Inc. reported a continued decline in its performance in China.
Asian benchmarks showed improvement on Friday, driven by the rebound in United States (US) tech equities. The positive momentum followed better-than-expected results from Meta and Amazon. Both the S&P 500 Index and the tech-heavy Nasdaq 100 Index recorded gains of over 1% on Thursday.
Market participants are eagerly awaiting the release of US Nonfarm Payrolls data, hoping to discern any signals from the Federal Reserve (Fed) that might prompt a reconsideration of March interest rate cuts. Federal Reserve Chair Jerome Powell pushed back on market speculation regarding rate cuts in March during a Wednesday statement, leading to a sell-off on Wall Street that continued into Thursday.
As of the latest market updates, Chinese benchmarks showed a mixed show with SSE Composite Index experiencing a 0.72% decline, reaching 2,750. Meanwhile, the Shenzhen Component Index is down by 1.49% at 8,117. However, Hong Kong's Hang Seng is up by 0.58% at 15,657.
Australian and Japanese Index rallied with the S&P/ASX 200 increasing by 1.40% to 7,694. Japan's Nikkei 225 has risen to 36,230, reflecting a 0.60% increase. Furthermore, the Korean KOSPI has advanced to 2,601, showing a 2.31% increase.
A rescue operation is in progress in China's equity markets, marked by significant and atypical inflows into blue-chip funds, indicating a surge led by state-backed investors. Meanwhile, Apple Inc. reported a continued decline in its performance in China during the holiday quarter. Despite stronger-than-expected total iPhone sales and the company's return to revenue growth, challenges persist in the Chinese market for Apple.
US Treasury yields experienced another decline amid concerns regarding regional US banks. These concerns were reignited after New York Community Bancorp reported heightened stress in its commercial real estate portfolio, raising worries about the overall health of regional lenders.
- US Nonfarm Payrolls are seen higher by 180K in January after December’s 216K jump.
- The US jobs report will likely impact the market pricing of the dovish Fed pivot and the US Dollar direction.
- The United States Bureau of Labor Statistics will publish the employment data at 13:30 GMT.
The highly-anticipated Nonfarm Payrolls (NFP) data from the United States (US) is due on Friday at 13:30 GMT. The US labor market report will be published by the Bureau of Labor Statistics (BLS) and is expected to have a significant influence on the US Dollar (USD) price direction.
What to expect in the next Nonfarm Payrolls report?
The Nonfarm Payrolls report is expected to show that the US economy added 180,000 jobs in the first month of 2024, down from a whopping 216,000 jobs created in December. The Unemployment Rate is seen ticking up from 3.7% in December to 3.8% in the reported period. A closely-watched measure of wage inflation, Average Hourly Earnings, is expected to rise 4.1% in the year through January, at the same pace as seen in December.
The US labor market data holds the key to gauging the timing and the pace of the US Federal Reserve (Fed) interest rate cut this year, especially after the US central bank pushed back expectations of a March rate cut following the conclusion of its two-day policy meeting on Wednesday.
The Fed left its benchmark interest rates unchanged at the 5.25% to 5.50% range for the fourth consecutive meeting on Wednesday, in line with the market expectations. The statement, however, was read as slightly hawkish, as it stated, "until it has increased confidence that inflation is moving sustainably toward 2 percent, the Committee does not anticipate it will be appropriate to lower the target range for the federal funds rate.”
During his post-policy meeting press conference, Fed Chair Jerome Powell said, "based on the meeting today, I would tell you that I don't think it is likely that the Committee will reach a level of confidence by the time of the March meeting to identify March as the time to do that [lower interest rates], but that is to be seen.”
"It is probably not the most likely case, or what we would call the base case,” Powell added.
The probability of a March Fed rate fell steeply from about 50% at the start of the week to 35% after the Fed policy announcements, according to CME Group’s FedWatch Tool. Meanwhile, markets now see a 90% chance of the Fed lowering borrowing costs in May.
Previewing January’s jobs report, TD Securities (TDS) analysts said: “As it has become customary for Januarys, we look for a strong increase in payrolls at 230k next week.”
“The NFP's annual benchmark and the update to seasonal factors will also add a wrinkle to this report,” the TDS analysts added.
Meanwhile, private sector employment in the US rose by 107,000 in January, data published by Automatic Data Processing (ADP) showed on Wednesday, below the 145,000 anticipated increase.
How will US January Nonfarm Payrolls affect EUR/USD?
The Nonfarm Payrolls, a significant indicator of the US labor market, will be published at 13:30 GMT. EUR/USD gained more than 1% in December and touched its highest level since July at 1.1140 before staging a technical correction to begin 2024. Traders gear up for a big volatility spike on the US jobs report, which could offer a fresh directional impetus to the main currency pair.
An encouraging NFP headline print, above 200,000, combined with a surprise uptick in wage inflation, could add credence to the Fed’s hawkish rhetoric, providing legs to the renewed US Dollar upside while weighing on EUR/USD. Conversely, the USD could come under renewed selling pressure should the data disappoint and reinforce March Fed rate cut bets. Following the Fed’s pushback on early rate cuts, a USD sell-off on a disappointing NFP figure could likely be short-lived.
Dhwani Mehta, Analyst at FXStreet, offers a brief technical outlook for EUR/USD:
“EUR/USD jumped off critical support at the horizontal 100-day Simple Moving Average (SMA), then aligned at 1.0780. The rebound saw the pair break through the key 200-day SMA at 1.0840. Despite the sharp upswing, the 14-day Relative Strength Index (RSI) remains below the 50 level, warranting caution for buyers.”
On the upside, EUR/USD buyers need a daily closing above the 21-day SMA at 1.0891 to sustain the upside. The next relevant topside barrier is envisioned at the 50-day SMA near 1.0920, above which a test of the 1.0950 psychological level cannot be ruled out. Any retracement in the pair could retest the 200-day SMA resistance-turned-support. Meanwhile, 100-day SMA could be the last line of defense for buyers.”
Economic Indicator
United States Nonfarm Payrolls
The Nonfarm Payrolls release presents the number of new jobs created in the US during the previous month in all non-agricultural businesses; it is released by the US Bureau of Labor Statistics (BLS). The monthly changes in payrolls can be extremely volatile. The number is also subject to strong reviews, which can also trigger volatility in the Forex board. Generally speaking, a high reading is seen as bullish for the US Dollar (USD), while a low reading is seen as bearish, although previous months' reviews and the Unemployment Rate are as relevant as the headline figure. The market's reaction, therefore, depends on how the market assesses all the data contained in the BLS report as a whole.
Read more.Next release: 02/02/2024 13:30:00 GMT
Frequency: Monthly
Source: US Bureau of Labor Statistics
Why it matters to traders
America’s monthly jobs report is considered the most important economic indicator for forex traders. Released on the first Friday following the reported month, the change in the number of positions is closely correlated with the overall performance of the economy and is monitored by policymakers. Full employment is one of the Federal Reserve’s mandates and it considers developments in the labor market when setting its policies, thus impacting currencies. Despite several leading indicators shaping estimates, Nonfarm Payrolls tend to surprise markets and trigger substantial volatility. Actual figures beating the consensus tend to be USD bullish.
Nonfarm Payrolls FAQs
What are Nonfarm Payrolls?
Nonfarm Payrolls (NFP) are part of the US Bureau of Labor Statistics monthly jobs report. The Nonfarm Payrolls component specifically measures the change in the number of people employed in the US during the previous month, excluding the farming industry.
How does Nonfarm Payrolls influence the Federal Reserve monetary policy decisions?
The Nonfarm Payrolls figure can influence the decisions of the Federal Reserve by providing a measure of how successfully the Fed is meeting its mandate of fostering full employment and 2% inflation.
A relatively high NFP figure means more people are in employment, earning more money and therefore probably spending more. A relatively low Nonfarm Payrolls’ result, on the either hand, could mean people are struggling to find work.
The Fed will typically raise interest rates to combat high inflation triggered by low unemployment, and lower them to stimulate a stagnant labor market.
How does Nonfarm Payrolls affect the US Dollar?
Nonfarm Payrolls generally have a positive correlation with the US Dollar. This means when payrolls’ figures come out higher-than-expected the USD tends to rally and vice versa when they are lower.
NFPs influence the US Dollar by virtue of their impact on inflation, monetary policy expectations and interest rates. A higher NFP usually means the Federal Reserve will be more tight in its monetary policy, supporting the USD.
How does Nonfarm Payrolls affect Gold?
Nonfarm Payrolls are generally negatively-correlated with the price of Gold. This means a higher-than-expected payrolls’ figure will have a depressing effect on the Gold price and vice versa.
Higher NFP generally has a positive effect on the value of the USD, and like most major commodities Gold is priced in US Dollars. If the USD gains in value, therefore, it requires less Dollars to buy an ounce of Gold.
Also, higher interest rates (typically helped higher NFPs) also lessen the attractiveness of Gold as an investment compared to staying in cash, where the money will at least earn interest.
Sometimes Nonfarm Payrolls trigger an opposite reaction than what the market expects. Why is that?
Nonfarm Payrolls is only one component within a bigger jobs report and it can be overshadowed by the other components.
At times, when NFP come out higher-than-forecast, but the Average Weekly Earnings is lower than expected, the market has ignored the potentially inflationary effect of the headline result and interpreted the fall in earnings as deflationary.
The Participation Rate and the Average Weekly Hours components can also influence the market reaction, but only in seldom events like the “Great Resignation” or the Global Financial Crisis.
- GBP/USD is seen consolidating the Thursday's post-BoE recovery from over a two-week low.
- The technical setup seems tilted in favour of bulls and supports prospects for additional gains.
- Bulls, however, seem reluctant and prefer to wait for the release of the crucial US NFP report.
The GBP/USD pair struggles to capitalize on the previous day's solid recovery of around 130 pips from the 1.2625 area, or over a two-week low and oscillates in a narrow band during the Asian session on Friday. Spot prices currently trade near mid-1.2700s, closer to the weekly peak, as traders look to the US monthly jobs report before placing fresh bets.
Heading into the key data risk, the British Pound (GBP) continues to draw support from a slightly more hawkish stance adopted by the Bank of England (BoE) on Thursday. In fact, BoE Governor Andrew Bailey said that we need to see more evidence that inflation is set to fall all the way to the 2% target and stay there before rates can be lowered. Meanwhile, expectations for an imminent shift in the Federal Reserve’s (Fed) policy stance keep the US Dollar (USD) bulls on the defensive near the weekly low and further act as a tailwind for the GBP/USD pair.
From a technical perspective, the range-bound price action witnessed since the beginning of this year points to indecision among traders over the next leg of a directional move. This, however, might still be categorized as a bullish consolidation phase on the back of a strong rally from the October 2023 swing low. Furthermore, oscillators on the daily chart are holding in the positive territory and are still far from being in the overbought zone, validating the constructive outlook and supporting prospects for a further near-term appreciating move for the GBP/USD pair.
Some follow-through buying beyond the 1.2770-1.2780 horizontal resistance will reaffirm the positive bias and lift spot prices beyond the 1.2800 mark, towards the 1.2825-1.2830 area, or a multi-month peak touched in December. The subsequent move up has the potential to lift the GBP/USD pair towards reclaiming the 1.2900 mark. The momentum could extend further towards the 1.2940-1.2945 region en route to the 1.3000 psychological mark.
On the flip side, any corrective pullback now seems to find some support near the 1.2700 mark ahead of the 1.2625 region or a multi-week low touched on Thursday, and the 1.2600 round figure. A convincing break below the latter would expose the very important 200-day Simple Moving Average (SMA), currently pegged near the 1.2560 area. The said area should act as a key pivotal point, which if broken decisively might shift the near-term bias in favour of bearish traders and prompt aggressive technical selling around the GBP/USD pair.
GBP/USD daily chart
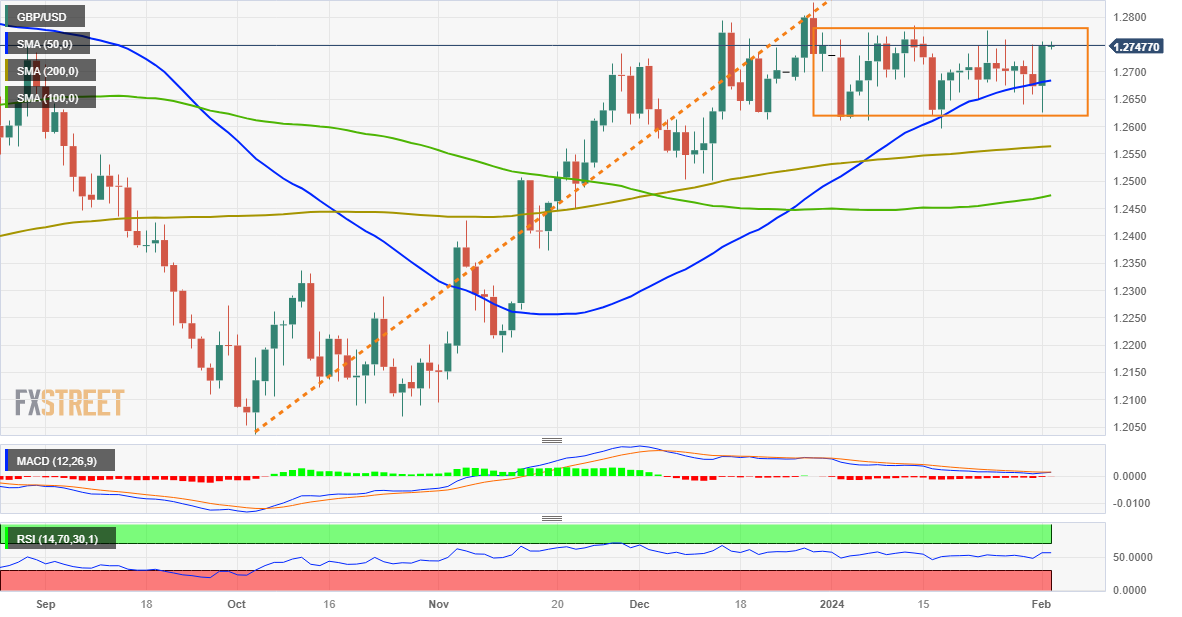
Technical levels to watch
- Gold price consolidates its recent gains to a one-month peak touched on Thursday.
- Traders opt to wait on the sidelines ahead of the release of the critical US jobs report.
- A combination of factors lends support to the XAU/USD and favours bullish traders
Gold price (XAU/USD) oscillates in a narrow trading band during the Asian session on Friday and consolidates its weekly gains to a one-month peak touched the previous day. A generally positive risk tone, bolstered by reports that an Israel-Hamas ceasefire was in the works, turns out to be a key factor acting as a headwind for the safe-haven precious metal. Furthermore, traders opt to wait on the sidelines ahead of the release of the US monthly employment details, which might provide more cues on the Federal Reserve's (Fed) policy path and provide a fresh impetus to the non-yielding yellow metal.
Heading into the key data risk, renewed fears over the health of regional US banks, geopolitical tensions and China's economic woes might continue to act as a tailwind for the safe-haven Gold price. That said, a modest bounce in the US Treasury bond yields helps the US Dollar (USD) to stall the previous day's sharp retracement slide from the highest level since December 13. This might hold back traders from placing fresh bullish bets around the US Dollar-denominated commodity and cap the upside. Nevertheless, the XAU/USD seems poised to register gains for the first week in the previous three.
Daily Digest Market Movers: Gold price pauses the weekly uptrend as traders keenly await the US jobs report
- A series of unsubstantiated reports of a ceasefire between Israel and Hamas boosts investors' confidence, capping the upside for the safe-haven Gold price on the last trading day of the week.
- Fed Chair Jerome Powell said on Wednesday that interest rates had peaked and would move lower in coming months, though tempered market expectations for any such a move in March.
- Reports suggest that Hamas received its first proposal for an extended pause to the fighting in Gaza in exchange for releasing the remaining hostages it holds, though has not yet responded to it.
- The Houthi rebels claimed that it struck a US merchant ship in the Red Sea, while the US launched new air strikes in Yemen, targeting ten drones reportedly being set up to launch.
- Concerns about the health of regional lenders in the US resurfaced on Thursday after New York Community Bancorp reported increased stress in its commercial real estate portfolio.
- China's official Manufacturing PMI contracted for a fourth successive month in January, suggesting that the world's second-largest economy is struggling to regain momentum.
- The yield on the benchmark 10-year US government bond remains below the 4% mark amid bets for a steep rate cut by the Federal Reserve in 2024 and undermines the US Dollar.
- The Labor Department reported that Initial Jobless Claims increased by 9,000, to 224K during the week ended January 27 from the previous week's upwardly revised reading of 215 K.
- Separately, the Institute for Supply Management's (ISM) Manufacturing PMI improved from 47.4 to 49.1 in January, while the Prices Paid Index climbed to 52.9 from 45.2 in December.
- The XAU/USD seems poised to snap a two-week losing streak as investors now look to the US jobs data for cues about the Fed's policy path and some meaningful trading opportunities.
- The popularly known NFP report is expected to show that the US economy added 180K jobs in January, down from the 216K previous, and the jobless rate edged higher to 3.8% from 3.7%.
Technical Analysis: Gold price bulls have the upper hand while above the $2,040-2,042 resistance breakpoint
From a technical perspective, bulls might now wait for some follow-through buying beyond the $2,065 area, or a one-month top touched on Thursday, before placing fresh bets. Given that oscillators on the daily chart have just started gaining positive traction, the Gold price could then accelerate the momentum towards the $2,078-2,079 region, or the YTD peak set in January. The subsequent move-up should allow the XAU/USD to aim back to reclaim the $2,100 mark and climb further towards the next relevant hurdle near the $2,020 area.
On the flip side, the $2,042-2,040 strong horizontal resistance breakpoint now seems to protect the immediate downside ahead of the 50-day Simple Moving Average (SMA), currently pegged near the $2,033-2,032 zone. A convincing break below the latter could drag the Gold price to the $2,012-2,010 area en route to the $2,000 psychological mark. Failure to defend the said support levels might shift the bias in favour of bearish traders and expose the 100-day SMA support near the $1,982 region, before the XAU/USD drops to the very important 200-day SMA, near the $1,965 area.
US Dollar price this week
The table below shows the percentage change of US Dollar (USD) against listed major currencies this week. US Dollar was the weakest against the Japanese Yen.
| USD | EUR | GBP | CAD | AUD | JPY | NZD | CHF | |
| USD | -0.31% | -0.42% | -0.58% | -0.27% | -1.22% | -1.00% | -0.86% | |
| EUR | 0.31% | -0.10% | -0.26% | 0.05% | -0.88% | -0.69% | -0.54% | |
| GBP | 0.40% | 0.09% | -0.18% | 0.13% | -0.79% | -0.60% | -0.45% | |
| CAD | 0.60% | 0.26% | 0.18% | 0.35% | -0.62% | -0.38% | -0.26% | |
| AUD | 0.27% | -0.06% | -0.15% | -0.31% | -0.94% | -0.73% | -0.59% | |
| JPY | 1.21% | 0.89% | 0.94% | 0.62% | 0.91% | 0.17% | 0.36% | |
| NZD | 0.97% | 0.66% | 0.57% | 0.39% | 0.70% | -0.24% | 0.12% | |
| CHF | 0.84% | 0.52% | 0.44% | 0.26% | 0.59% | -0.35% | -0.14% |
The heat map shows percentage changes of major currencies against each other. The base currency is picked from the left column, while the quote currency is picked from the top row. For example, if you pick the Euro from the left column and move along the horizontal line to the Japanese Yen, the percentage change displayed in the box will represent EUR (base)/JPY (quote).
Gold FAQs
Why do people invest in Gold?
Gold has played a key role in human’s history as it has been widely used as a store of value and medium of exchange. Currently, apart from its shine and usage for jewelry, the precious metal is widely seen as a safe-haven asset, meaning that it is considered a good investment during turbulent times. Gold is also widely seen as a hedge against inflation and against depreciating currencies as it doesn’t rely on any specific issuer or government.
Who buys the most Gold?
Central banks are the biggest Gold holders. In their aim to support their currencies in turbulent times, central banks tend to diversify their reserves and buy Gold to improve the perceived strength of the economy and the currency. High Gold reserves can be a source of trust for a country’s solvency. Central banks added 1,136 tonnes of Gold worth around $70 billion to their reserves in 2022, according to data from the World Gold Council. This is the highest yearly purchase since records began. Central banks from emerging economies such as China, India and Turkey are quickly increasing their Gold reserves.
How is Gold correlated with other assets?
Gold has an inverse correlation with the US Dollar and US Treasuries, which are both major reserve and safe-haven assets. When the Dollar depreciates, Gold tends to rise, enabling investors and central banks to diversify their assets in turbulent times. Gold is also inversely correlated with risk assets. A rally in the stock market tends to weaken Gold price, while sell-offs in riskier markets tend to favor the precious metal.
What does the price of Gold depend on?
The price can move due to a wide range of factors. Geopolitical instability or fears of a deep recession can quickly make Gold price escalate due to its safe-haven status. As a yield-less asset, Gold tends to rise with lower interest rates, while higher cost of money usually weighs down on the yellow metal. Still, most moves depend on how the US Dollar (USD) behaves as the asset is priced in dollars (XAU/USD). A strong Dollar tends to keep the price of Gold controlled, whereas a weaker Dollar is likely to push Gold prices up.
- EUR/JPY struggles to find a direction after a choppy session.
- The Euro faced a challenge of the possibility of the ECB rate cut in June.
- Middle East tension might have driven the foreign investments towards the safe-haven JPY.
EUR/JPY experiences difficulty in establishing a clear direction after a choppy previous day, hovering around 159.20 during the Asian session on Friday. The Euro (EUR) gained upward support following the release of mixed Eurozone inflation data on Thursday, consequently providing a foundation for the EUR/JPY cross.
In January, the Eurozone preliminary Core Harmonized Index of Consumer Prices (YoY) registered an increase of 3.3%, surpassing the expected 3.2% growth but slightly lower than the prior 3.4%. The annual Consumer Price Index met expectations at 2.8%, consistent with the previous reading of 2.9%. However, the month-over-month report indicated a decline of 0.4%, contrasting with the 0.2% rise observed in December.
However, the Euro faced a challenge due to the heightened market expectations of an interest rate cut by the European Central Bank (ECB) in June, which could be attributed to the softer preliminary Consumer Price Index (CPI) data from Germany. This, in turn, might have capped the advance of the EUR/JPY cross.
Moreover, ECB member Mario Centeno has suggested that if inflation continues on its current trajectory in the coming months, the ECB's next probable action would be to cut rates. If such a move materializes, it could signal the beginning of a cycle aimed at the normalization of interest rates.
The Bank of Japan's (BoJ) hawkish stance has bolstered the Japanese Yen (JPY), finding support amid geopolitical tensions in the Middle East. Escalated tensions have prompted investors to seek the safe-haven qualities of the JPY.
For the week ending January 26, Foreign Bond Investment in Japan recorded inflows of ¥382.9 billion, a notable increase from the previous week's outflows of ¥-43.5 billion. Additionally, Foreign Investment in Japanese Stocks rebounded during the same week, rising to ¥720.3 billion compared to the previous week's ¥287 billion.
- Indian Rupee extends the rally amid the decline in USD and the release of the India Budget 2024.
- India’s Finance Minister said the government will boost spending on infrastructure projects, build homes for poor villagers, and lower the fiscal deficit.
- Market players will closely watch the January US Nonfarm Payrolls, due on Friday.
Indian Rupee (INR) trades in positive territory for the third consecutive day on Friday. The announcement of the India Budget 2024 by Finance Minister Nirmala Sitharaman provides some support to the INR. Minister Sitharaman said in her budget statement on Thursday that the government will focus on more comprehensive governance, development, and performance. Four groups that will be the priority for the government are the poor, women, youth, and farmers.
Sitharaman also remarked that the government has continued to fund infrastructure building, which has been an important driver of India's economic growth. The budget for physical asset construction, such as roads and ports, has increased by 11% to more than $130 billion this year. Furthermore, the government plans to build an additional 20 million affordable houses over the next five years, in addition to the nearly 30 million houses already built.
Investors will closely monitor the January US labor market data on Friday, including Nonfarm Payrolls, Unemployment Rate, and Average Hourly Earnings. The US economy is estimated to see 185K job additions in January. The Unemployment Rate is expected to tick up to 3.8%, while the Average Hourly Earnings are projected to show an increase of 0.3% MoM.
Daily Digest Market Movers: Indian Rupee remains resilient in the face of global headwinds
- The Indian government will spend a record 11.11 trillion Rupees (approximately $134 billion) on infrastructure development.
- The allocation for capital expenditure for the fiscal year beginning April 1 is 11.1% more than the capex for the current fiscal year, Finance Minister Nirmala Sitharaman said in her budget statement on Thursday.
- The federal government's capital spending as a percentage of GDP increased to 3.3% in 2023/24 and is estimated at 3.4% in the next fiscal year.
- The FY24 fiscal deficit is seen at 5.8% of GDP.
- The Indian government aims to lower the fiscal deficit to below 4.5% by FY26.
- Indian S&P Global Manufacturing PMI improved to 56.5 in January from the previous reading of 54.9.
- The International Monetary Fund (IMF) has raised its growth projection for India, expecting the economy to grow by 6.7% in the fiscal year 2024, compared with the 6.3% forecast earlier.
- The US ISM Manufacturing PMI grew to 49.1 in January from the previous reading of 47.1, the highest since October 2022. This figure came in better than the market expectation of 47.0.
- The New Orders index rose into expansionary territory at 52.5, the Production Index grew to 50.4, and the Price Index climbed to 52.9.
- According to the CME FedWatch Tool, traders have priced in 96% odds of a rate cut in May.
- The Federal Open Market Committee (FOMC) maintained the benchmark Federal Funds Rate unchanged at 5.25–5.50%, as widely expected.
- Fed Chair Jerome Powell stated that the Fed won't begin lowering the target range until it sees further progress on inflation moving sustainably toward the 2% target.
Technical Analysis: Indian Rupee extends the range play between 82.78 and 83.45
Indian Rupee continues to trade on a stronger note on the day. The USD/INR pair remains stuck within a two-month-old descending trend channel of 82.78–83.45. Technically, USD/INR keeps the bearish vibe as the pair decisively breaks below the key 100-period Exponential Moving Average (EMA) on the daily chart. The downward momentum is confirmed by the 14-day Relative Strength Index (RSI), which stands below the 50.0 midline and, is likely to attract some selling pressure.
The potential support level for the pair will emerge at the lower limit of the descending trend channel at 82.72. A bearish breakout below 82.72 might signal that it’s time for the bear to charge again, possibly taking the pair back to a low of August 23 at 82.45, followed by a low of June 1 at 82.25.
On the bright side, a break above the support-turned-resistance level of 83.00 will see a rally to the upper boundary of the descending trend channel and a high of January 20 at 83.20. Any follow-through buying could extend its upswing to a high of January 2 at 83.35.
US Dollar price today
The table below shows the percentage change of US Dollar (USD) against listed major currencies today. US Dollar was the weakest against the Australian Dollar.
| USD | EUR | GBP | CAD | AUD | JPY | NZD | CHF | |
| USD | -0.01% | 0.01% | -0.07% | -0.27% | -0.04% | -0.09% | -0.06% | |
| EUR | 0.01% | 0.01% | -0.06% | -0.26% | -0.02% | -0.08% | -0.05% | |
| GBP | 0.01% | 0.00% | -0.06% | -0.28% | -0.03% | -0.09% | -0.06% | |
| CAD | 0.06% | 0.06% | 0.07% | -0.21% | 0.03% | -0.02% | 0.00% | |
| AUD | 0.27% | 0.27% | 0.28% | 0.21% | 0.24% | 0.19% | 0.21% | |
| JPY | 0.04% | 0.04% | 0.04% | -0.02% | -0.23% | -0.05% | -0.02% | |
| NZD | 0.09% | 0.09% | 0.10% | 0.03% | -0.19% | 0.05% | 0.02% | |
| CHF | 0.06% | 0.06% | 0.07% | 0.00% | -0.21% | 0.02% | -0.03% |
The heat map shows percentage changes of major currencies against each other. The base currency is picked from the left column, while the quote currency is picked from the top row. For example, if you pick the Euro from the left column and move along the horizontal line to the Japanese Yen, the percentage change displayed in the box will represent EUR (base)/JPY (quote).
Indian Rupee FAQs
What are the key factors driving the Indian Rupee?
The Indian Rupee (INR) is one of the most sensitive currencies to external factors. The price of Crude Oil (the country is highly dependent on imported Oil), the value of the US Dollar – most trade is conducted in USD – and the level of foreign investment, are all influential. Direct intervention by the Reserve Bank of India (RBI) in FX markets to keep the exchange rate stable, as well as the level of interest rates set by the RBI, are further major influencing factors on the Rupee.
How do the decisions of the Reserve Bank of India impact the Indian Rupee?
The Reserve Bank of India (RBI) actively intervenes in forex markets to maintain a stable exchange rate, to help facilitate trade. In addition, the RBI tries to maintain the inflation rate at its 4% target by adjusting interest rates. Higher interest rates usually strengthen the Rupee. This is due to the role of the ‘carry trade’ in which investors borrow in countries with lower interest rates so as to place their money in countries’ offering relatively higher interest rates and profit from the difference.
What macroeconomic factors influence the value of the Indian Rupee?
Macroeconomic factors that influence the value of the Rupee include inflation, interest rates, the economic growth rate (GDP), the balance of trade, and inflows from foreign investment. A higher growth rate can lead to more overseas investment, pushing up demand for the Rupee. A less negative balance of trade will eventually lead to a stronger Rupee. Higher interest rates, especially real rates (interest rates less inflation) are also positive for the Rupee. A risk-on environment can lead to greater inflows of Foreign Direct and Indirect Investment (FDI and FII), which also benefit the Rupee.
How does inflation impact the Indian Rupee?
Higher inflation, particularly, if it is comparatively higher than India’s peers, is generally negative for the currency as it reflects devaluation through oversupply. Inflation also increases the cost of exports, leading to more Rupees being sold to purchase foreign imports, which is Rupee-negative. At the same time, higher inflation usually leads to the Reserve Bank of India (RBI) raising interest rates and this can be positive for the Rupee, due to increased demand from international investors. The opposite effect is true of lower inflation.
- EUR/USD extends gains towards the immediate resistance at the 21-day EMA at 1.0882.
- Technical analysis suggests a direction shift towards bullish sentiment for the pair.
- A break above 1.0900 could lead the pair to reach the resistance zone around the 38.2% Fibonacci retracement.
EUR/USD consolidates on recent losses registered in the previous session, hovering around 1.0870 during the Asian session on Friday. The EUR/USD pair could find the immediate resistance zone around the 21-day Exponential Moving Average (EMA) at 1.0882 followed by the psychological level at 1.0900.
A firm break above the resistance zone could support the EUR/USD pair to navigate the region around the 38.2% Fibonacci retracement level at 1.0919 followed by the major barrier at 1.0950 level.
However, the technical analysis for the EUR/USD pair shows a bearish momentum in the market with the 14-day Relative Strength Index (RSI) positioned below the 50 mark.
Moreover, the Moving Average Convergence Divergence (MACD), a lagging indicator, suggests a shift in the pair's direction with the MACD line positioned below the centerline and showing a convergence below the signal line. Traders could wait for the MACD confirmation before making aggressive bets in the EUR/USD pair.
The immediate support for the EUR/USD pair can be found at the major level at 1.0850 following the psychological support of the 1.0800 level. A decisive break below the latter could prompt the pair to retest the weekly low at 1.0779 and could approach the major support level at 1.0750.
EUR/USD: Daily Chart
-638424390138437353.png)
| Raw materials | Closed | Change, % |
|---|---|---|
| Silver | 23.173 | 1.16 |
| Gold | 2054.656 | 0.73 |
| Palladium | 963.36 | -1.39 |
- Australian Dollar strengthens on positive Aussie Producer Price Index data.
- Australia's PPI (YoY) grew by 4.1% in Q4, surpassing the previous growth of 3.8%.
- Former RBA board member Warwick McKibbin suggested cash rate may remain around 4.5%. for some time.
- An expected decline in US Nonfarm Payrolls could further weaken the US Dollar.
The Australian Dollar (AUD) continues its upward momentum on Friday, recovering from a three-month low reached at 0.6508 on Thursday. The US Dollar (USD) faced downward pressure following mixed economic data from the United States (US). Moreover, the Australian Dollar (AUD) received support from improved Producer Price Index (PPI) data. Consequently, these factors collectively provide upward support for the AUD/USD pair.
Australian Bureau of Statistics has released the PPI (YoY) for the fourth quarter, indicating an improvement with a growth rate of 4.1%, surpassing the previous growth of 3.8%. Furthermore, an enhanced Australian money market is contributing support to strengthen the Aussie Dollar. In a Reuters Poll, analysts unanimously expect the Reserve Bank of Australia (RBA) to keep the interest rate steady at 4.35% in its February policy meeting.
Former RBA board member Warwick McKibbin suggests that the Australian cash rate may remain around 4.5% for an extended period. However, the Australian Dollar has encountered challenges, with bond traders heightening their expectations of early interest rate cuts by the Reserve Bank of Australia after an unexpectedly weak quarterly inflation report. Future markets are fully pricing in two quarter-point reductions in 2024, with the first adjustment anticipated in August.
The US Dollar Index (DXY) experienced losses in the wake of mixed US economic data released on Thursday, compounded by subdued US Treasury yields. Initial Jobless Claims for the week ending on January 26 rose to 224K, surpassing the previous increase of 215K and the expected figure of 212K. However, the ISM Manufacturing PMI showed improvement, rising to 49.1 from the prior reading of 47.1, surpassing the anticipated figure of 47.0 in January. On Friday, additional labor data is scheduled for release, including US Average Hourly Earnings and Nonfarm Payrolls (NFP).
Daily Digest Market Movers: Australian Dollar strengthens on positive Aussie PPI
- Australian Producer Price Index (QoQ) grew by 0.9% in the fourth quarter, lower than the previous 1.08% growth.
- Australia’s Investment Lending for Homes declined by 1.3% in December, against the previous growth rate of 1.9%.
- Australia’s Home Loans fell by 5.6% in December as compared to the 0.5% growth in November.
- The preliminary US Nonfarm Productivity increased by 3.2% in Q4, higher than the expected 2.5% but came down from the previous reading of 4.9%.
- US Challenger Job Cuts rose to 82.307K in January from the previous 34.817K in December.
- US Unit Labor Costs reported a 0.5% rise against the 1.7% expected in the fourth quarter, swinging from the previous -1.1%.
Technical Analysis: Australian Dollar could test the psychological barrier at 0.6600
The Australian Dollar trades around 0.6580 on Friday, below the immediate resistance zone around 23.6% Fibonacci retracement at 0.6594 aligned with the psychological level at 0.6600. A successful breakthrough above the resistance zone may lead the AUD/USD pair toward testing the 21-day Exponential Moving Average (EMA) at 0.6614, followed by a crucial resistance level at 0.6650. On the downside, the AUD/USD pair could find the key support at a major level of 0.6550. A breach of this support might prompt the pair to retest the weekly low at 0.6508.
AUD/USD: Daily Chart
-638424359427589488.png)
Australian Dollar price today
The table below shows the percentage change of Australian Dollar (AUD) against listed major currencies today. Australian Dollar was the strongest against the Euro.
| USD | EUR | GBP | CAD | AUD | JPY | NZD | CHF | |
| USD | 0.03% | 0.01% | -0.07% | -0.20% | -0.06% | -0.06% | -0.02% | |
| EUR | -0.03% | -0.02% | -0.10% | -0.24% | -0.09% | -0.10% | -0.05% | |
| GBP | -0.01% | 0.03% | -0.07% | -0.20% | -0.07% | -0.07% | -0.03% | |
| CAD | 0.06% | 0.09% | 0.07% | -0.15% | 0.00% | 0.00% | 0.03% | |
| AUD | 0.22% | 0.24% | 0.23% | 0.15% | 0.15% | 0.16% | 0.19% | |
| JPY | 0.06% | 0.10% | 0.07% | 0.00% | -0.13% | -0.01% | 0.05% | |
| NZD | 0.05% | 0.11% | 0.09% | 0.00% | -0.12% | 0.01% | 0.05% | |
| CHF | 0.02% | 0.06% | 0.03% | -0.04% | -0.19% | -0.04% | -0.05% |
The heat map shows percentage changes of major currencies against each other. The base currency is picked from the left column, while the quote currency is picked from the top row. For example, if you pick the Euro from the left column and move along the horizontal line to the Japanese Yen, the percentage change displayed in the box will represent EUR (base)/JPY (quote).
Australian Dollar FAQs
What key factors drive the Australian Dollar?
One of the most significant factors for the Australian Dollar (AUD) is the level of interest rates set by the Reserve Bank of Australia (RBA). Because Australia is a resource-rich country another key driver is the price of its biggest export, Iron Ore. The health of the Chinese economy, its largest trading partner, is a factor, as well as inflation in Australia, its growth rate and Trade Balance. Market sentiment – whether investors are taking on more risky assets (risk-on) or seeking safe-havens (risk-off) – is also a factor, with risk-on positive for AUD.
How do the decisions of the Reserve Bank of Australia impact the Australian Dollar?
The Reserve Bank of Australia (RBA) influences the Australian Dollar (AUD) by setting the level of interest rates that Australian banks can lend to each other. This influences the level of interest rates in the economy as a whole. The main goal of the RBA is to maintain a stable inflation rate of 2-3% by adjusting interest rates up or down. Relatively high interest rates compared to other major central banks support the AUD, and the opposite for relatively low. The RBA can also use quantitative easing and tightening to influence credit conditions, with the former AUD-negative and the latter AUD-positive.
How does the health of the Chinese Economy impact the Australian Dollar?
China is Australia’s largest trading partner so the health of the Chinese economy is a major influence on the value of the Australian Dollar (AUD). When the Chinese economy is doing well it purchases more raw materials, goods and services from Australia, lifting demand for the AUD, and pushing up its value. The opposite is the case when the Chinese economy is not growing as fast as expected. Positive or negative surprises in Chinese growth data, therefore, often have a direct impact on the Australian Dollar and its pairs.
How does the price of Iron Ore impact the Australian Dollar?
Iron Ore is Australia’s largest export, accounting for $118 billion a year according to data from 2021, with China as its primary destination. The price of Iron Ore, therefore, can be a driver of the Australian Dollar. Generally, if the price of Iron Ore rises, AUD also goes up, as aggregate demand for the currency increases. The opposite is the case if the price of Iron Ore falls. Higher Iron Ore prices also tend to result in a greater likelihood of a positive Trade Balance for Australia, which is also positive of the AUD.
How does the Trade Balance impact the Australian Dollar?
The Trade Balance, which is the difference between what a country earns from its exports versus what it pays for its imports, is another factor that can influence the value of the Australian Dollar. If Australia produces highly sought after exports, then its currency will gain in value purely from the surplus demand created from foreign buyers seeking to purchase its exports versus what it spends to purchase imports. Therefore, a positive net Trade Balance strengthens the AUD, with the opposite effect if the Trade Balance is negative.
- The Japanese Yen remains close to over a two-week high touched against the USD on Thursday.
- The BoJ’s hawkish tilt, along with geopolitical tensions, continue to underpin the safe-haven JPY.
- Expectations for an imminent shift in the Fed’s policy stance keep the USD bulls on the defensive.
- Investors opt to move to the sidelines and look to the US jobs report (NFP) for a fresh impetus.
The Japanese Yen (JPY) enters a bullish consolidation phase during the Asian session on Friday and oscillates in a narrow range just below a two-and-half-week high touched against its American counterpart the previous day. Traders now seem reluctant to place aggressive directional bets and opt to wait for the release of the closely-watched US monthly employment data, popularly known as the Nonfarm Payroll (NFP) report later today. The downside for the JPY, meanwhile, remains cushioned in the wake of the Bank of Japan's (BoJ) hawkish tilt last week. This, along with the risk of a further escalation of geopolitical tensions in the Middle East and China's economic woes, might continue to underpin the safe-haven JPY.
Meanwhile, investors, despite the Federal Reserve's (Fed) less dovish outlook on Wednesday, continue to bet on a steep series of rate cuts this year. This led to the recent decline in the US Treasury bond yields, resulting in the narrowing of the US-Japan rate differential and further benefitting the JPY. Moreover, expectations for an imminent shift in the Fed's policy stance prompted the US Dollar (USD) bulls to lighten their bets, especially after the recent runup to the highest level since December 13. This, in turn, might contribute to capping any meaningful recovery for the USD/JPY pair heading into the key US data risk. Nevertheless, the divergent BoJ-Fed policy expectations suggest that the path of least resistance for spot prices is to the downside.
Daily Digest Market Movers: Japanese Yen consolidates weekly gains; fundamental backdrop favours bullish traders
- The Japanese Yen draws support from the fact that the Bank of Japan last week signalled conviction on hitting inflation goal, setting the stage to pull interest rates out of negative territory at its upcoming meetings in March or April.
- Tensions in the Middle East persist after the US vowed to take "all necessary actions" to defend its troops following a deadly drone attack in Jordan and as Yemen-based Houthi forces continue to attack shipping in the Red Sea.
- Reuters, citing a Palestinian official, reported that Hamas received its first proposal for an extended pause to the fighting in Gaza in exchange for releasing the remaining hostages it holds, though has not yet responded to it.
- An official factory survey showed on Wednesday that manufacturing activity in China contracted for a fourth straight month in January, suggesting that the world's second-largest economy is struggling to regain momentum.
- The US Dollar witnessed a dramatic turnaround from the YTD peak touched on Thursday amid growing acceptance that the Federal Reserve is nearing a long-awaited shift toward cutting interest rates this year.
- Fed Chair Jerome Powell said on Wednesday that interest rates had peaked and would move lower in coming months, though strongly pushed back against market expectations for such a move in March.
- The yield on the benchmark 10-year US government bond bounces off over a one-month trough touched on Thursday, albeit remains below the 4% mark and keeps the US Dollar bulls on the defensive.
- Investors now look forward to the release of the US monthly employment report (NFP), which is expected to show that the economy added 180K jobs in January as compared to the 216K in the previous month.
- Meanwhile, the Unemployment Rate is anticipated to edge higher to 3.8% from 3.7% in December, while Average Hourly Earnings growth is seen holding steady at the 4.1% YoY rate during the reported month.
Technical Analysis: USD/JPY bears need to wait for acceptance below the 146.00 mark before placing fresh bets
From a technical perspective, the overnight breakdown through the 100-period Simple Moving Average (SMA) on the 4-hour chart and the 23.6% Fibonacci retracement level of the December-January favour bearish traders. Moreover, oscillators on the said chart are holding deep in the negative territory and have been losing positive traction on the daily chart. That said, it will still be prudent to wait for acceptance below the 146.00 mark before positioning for deeper losses. The USD/JPY pair might then accelerate the fall towards the 38.2% Fibo. level, around the 145.55 region, before eventually dropping to the 145.00 psychological mark, representing the 200-period SMA on the 4-hour chart.
On the flip side, the 146.75 area now seems to act as an immediate hurdle ahead of the 147.00 mark and the 147.15 area, or the 100-period SMA on the 4-hour chart. A sustained strength beyond the said barriers might shift the bias back in favour of bulls and set the stage for the resumption of the uptrend witnessed since the beginning of this year. The subsequent move up has the potential to lift the USD/JPY pair further towards the 148.00 mark en route to the 148.75-148.80 double-top resistance, or the YTD peak touched in January.
Japanese Yen price today
The table below shows the percentage change of Japanese Yen (JPY) against listed major currencies today. Japanese Yen was the strongest against the Pound Sterling.
| USD | EUR | GBP | CAD | AUD | JPY | NZD | CHF | |
| USD | 0.03% | 0.02% | -0.06% | -0.17% | -0.05% | -0.02% | -0.02% | |
| EUR | -0.03% | -0.02% | -0.08% | -0.21% | -0.08% | -0.07% | -0.05% | |
| GBP | 0.00% | 0.03% | -0.06% | -0.18% | -0.05% | -0.03% | -0.03% | |
| CAD | 0.05% | 0.08% | 0.06% | -0.14% | -0.01% | 0.02% | 0.03% | |
| AUD | 0.18% | 0.22% | 0.20% | 0.14% | 0.13% | 0.15% | 0.17% | |
| JPY | 0.05% | 0.06% | 0.06% | -0.02% | -0.13% | 0.02% | 0.03% | |
| NZD | 0.04% | 0.07% | 0.06% | -0.01% | -0.13% | -0.01% | 0.01% | |
| CHF | 0.02% | 0.06% | 0.04% | -0.02% | -0.14% | 0.01% | 0.00% |
The heat map shows percentage changes of major currencies against each other. The base currency is picked from the left column, while the quote currency is picked from the top row. For example, if you pick the Euro from the left column and move along the horizontal line to the Japanese Yen, the percentage change displayed in the box will represent EUR (base)/JPY (quote).
Japanese Yen FAQs
What key factors drive the Japanese Yen?
The Japanese Yen (JPY) is one of the world’s most traded currencies. Its value is broadly determined by the performance of the Japanese economy, but more specifically by the Bank of Japan’s policy, the differential between Japanese and US bond yields, or risk sentiment among traders, among other factors.
How do the decisions of the Bank of Japan impact the Japanese Yen?
One of the Bank of Japan’s mandates is currency control, so its moves are key for the Yen. The BoJ has directly intervened in currency markets sometimes, generally to lower the value of the Yen, although it refrains from doing it often due to political concerns of its main trading partners. The current BoJ ultra-loose monetary policy, based on massive stimulus to the economy, has caused the Yen to depreciate against its main currency peers. This process has exacerbated more recently due to an increasing policy divergence between the Bank of Japan and other main central banks, which have opted to increase interest rates sharply to fight decades-high levels of inflation.
How does the differential between Japanese and US bond yields impact the Japanese Yen?
The BoJ’s stance of sticking to ultra-loose monetary policy has led to a widening policy divergence with other central banks, particularly with the US Federal Reserve. This supports a widening of the differential between the 10-year US and Japanese bonds, which favors the US Dollar against the Japanese Yen.
How does broader risk sentiment impact the Japanese Yen?
The Japanese Yen is often seen as a safe-haven investment. This means that in times of market stress, investors are more likely to put their money in the Japanese currency due to its supposed reliability and stability. Turbulent times are likely to strengthen the Yen’s value against other currencies seen as more risky to invest in.
- WTI prices recover some lost ground near $74.30 on Friday.
- The modest recovery in WTI prices is backed by expectations for Fed rate cuts and Chinese stimulus measures.
- The US Nonfarm Payrolls report will be in the spotlight on Friday.
Western Texas Intermediate (WTI), the US crude oil benchmark, is trading around $74.30 on Friday. WTI prices snap the two-day losing streak amid the sign of potential interest rate cuts from the US Federal Reserve (Fed).
The modest recovery in WTI prices is supported by the market’s expectations for rate cuts this year after Fed Chair Jerome Powell indicated a peak of the rate hiking cycle during the press conference. It’s worth noting that lower interest rates typically stimulate economic growth which buoys oil demand.
China has revealed measures to encourage development in its faltering property sector. Chinese authorities' emergency reaction and $1 trillion (US$141 billion) yuan liquidity injection helped boost market confidence. The positive developments surrounding China’s economy might lift WTI prices, as China is the world's second-largest oil consumer.
On Thursday, the Organization of the Petroleum Exporting Countries (OPEC) committee said that the group’s members will discuss in March whether or not to extend voluntary oil production cuts in place for the first quarter. The committee said there would be no changes to OPEC’s decision to slash 2.2 million barrels per day from the market this quarter.
Oil traders will closely watch the US Nonfarm Payrolls on Friday. Additionally, the Unemployment Rate, Average Hourly Earnings, Factory Orders, and the final reading of the Michigan Consumer Sentiment will also be released later in the day. These events could significantly impact the USD-denominated WTI price. Oil traders will take cues from the data and find trading opportunities around WTI prices.
On Friday, the People’s Bank of China (PBoC) set the USD/CNY central rate for the trading session ahead at 7.1006 as compared to the previous day's fix of 7.1049 and 7.1655 Reuters estimates.
- USD/CAD remains under some selling pressure around 1.3376 on the weaker USD.
- The US S&P Manufacturing Purchasing Managers' Index came in better than expected in January.
- Canada’s S&P Global Manufacturing PMI arrived at 48.3 in January from 45.4 in December.
- The US Nonfarm Payrolls (NFP), Unemployment Rate, and Average Hourly Earnings will be due later on Friday.
The USD/CAD pair remains on the defensive below the 1.3400 mark during the early Asian trading hours on Friday. The pair snaps a four-week winning streak as the US Dollar (USD) loses its recovery momentum and drops to 103.00. Traders await the US Nonfarm Payrolls (NFP) report for January. This event might trigger the volatility in the market. USD/CAD currently trades near 1.3376, down 0.09% on the day.
Data released on Thursday revealed that the US Manufacturing Purchasing Managers' Index (PMI) improved sharply in January. The US S&P Global Manufacturing PMI came in at 49.1 versus 47.1, beating the market expectation of 47.0. The overall growth was mainly driven by renewed growth in new orders and a slowdown in production contraction. The upbeat Manufacturing PMI figure failed to lift the Greenback as traders digested the information from the January Fed meeting.
On Thursday, the Canadian S&P Global Manufacturing PMI improved to 48.3 in January from the previous reading of 45.4. Earlier this week, the nation’s real Gross Domestic Product (GDP) expanded by 0.2% in November. The growth numbers indicated a resilience in the Canadian economy and could take the pressure off the Bank of Canada (BoC) to cut interest rates. Meanwhile, a decline in oil prices might weigh on the commodity-linked Loonie as Canada is the largest oil exporter to the United States.
Market participants will closely monitor the US labor market data on Friday. The US Nonfarm Payrolls (NFP) is estimated to see 185k job additions in January. The Unemployment Rate is expected to rise to 3.8%, and finally, the Average Hourly Earnings are projected to show an increase of 0.3% MoM. Also, the US Factory Orders and the final reading of the Michigan Consumer Sentiment will be due. Traders will take cues from these figures and find trading opportunities around the USD/CAD pair.
| Index | Change, points | Closed | Change, % |
|---|---|---|---|
| NIKKEI 225 | -275.25 | 36011.46 | -0.76 |
| Hang Seng | 81.14 | 15566.21 | 0.52 |
| KOSPI | 45.37 | 2542.46 | 1.82 |
| ASX 200 | -92.5 | 7588.2 | -1.2 |
| DAX | -44.72 | 16859.04 | -0.26 |
| CAC 40 | -68 | 7588.75 | -0.89 |
| Dow Jones | 369.54 | 38519.84 | 0.97 |
| S&P 500 | 60.54 | 4906.19 | 1.25 |
| NASDAQ Composite | 197.63 | 15361.64 | 1.3 |
| Pare | Closed | Change, % |
|---|---|---|
| AUDUSD | 0.65716 | 0.11 |
| EURJPY | 159.177 | 0.21 |
| EURUSD | 1.08713 | 0.5 |
| GBPJPY | 186.597 | 0.25 |
| GBPUSD | 1.27436 | 0.54 |
| NZDUSD | 0.61434 | 0.48 |
| USDCAD | 1.33836 | -0.37 |
| USDCHF | 0.85785 | -0.33 |
| USDJPY | 146.423 | -0.3 |


© 2000-2026. Уcі права захищені.
Cайт знаходитьcя під керуванням TeleTrade DJ. LLC 2351 LLC 2022 (Euro House, Richmond Hill Road, Kingstown, VC0100, St. Vincent and the Grenadines).
Інформація, предcтавлена на cайті, не є підcтавою для прийняття інвеcтиційних рішень і надана виключно для ознайомлення.
Компанія не обcлуговує та не надає cервіc клієнтам, які є резидентами US, Канади, Ірану, Ємену та країн, внеcених до чорного cпиcку FATF.
Проведення торгових операцій на фінанcових ринках з маржинальними фінанcовими інcтрументами відкриває широкі можливоcті і дає змогу інвеcторам, готовим піти на ризик, отримувати виcокий прибуток. Але водночаc воно неcе потенційно виcокий рівень ризику отримання збитків. Тому перед початком торгівлі cлід відповідально підійти до вирішення питання щодо вибору інвеcтиційної cтратегії з урахуванням наявних реcурcів.
Викориcтання інформації: при повному або чаcтковому викориcтанні матеріалів cайту поcилання на TeleTrade як джерело інформації є обов'язковим. Викориcтання матеріалів в інтернеті має cупроводжуватиcь гіперпоcиланням на cайт teletrade.org. Автоматичний імпорт матеріалів та інформації із cайту заборонено.
З уcіх питань звертайтеcь за адреcою pr@teletrade.global.
переклади