- Аналітика
- Новини та інструменти
- Новини ринків
Новини ринків
- USD/JPY trades in positive territory for two straight days on Wednesday.
- The US final Manufacturing PMI for December came in weaker than expected, easing from 48.2 to 47.9.
- BOJ’s Ueda said that the possibility of the BoJ sustainably achieving the inflation target seems to be gradually rising.
- Investors await the final US ISM Manufacturing PMI report and the Fed’s latest Meeting Minutes, due later on Wednesday.
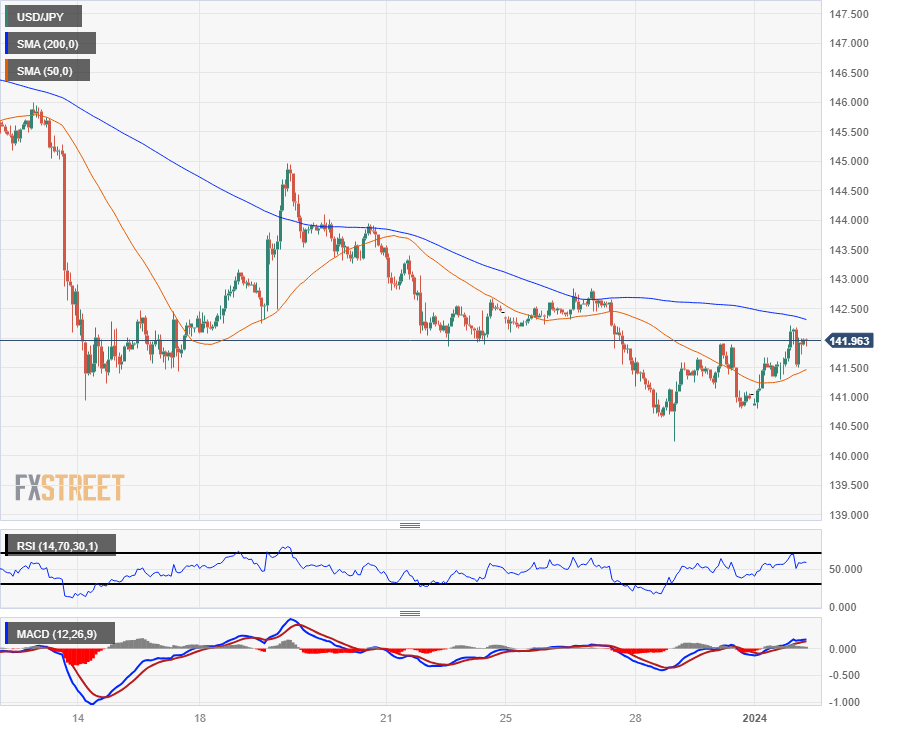
The USD/JPY pair edges higher above the 142.00 mark during the early Asian session on Wednesday. The rebound of US Dollar (USD) lends some support to the pair. Investors await the US ISM Manufacturing PMI for December, due later on Wednesday, which is expected to show an increase to 47.1 from 46.7 in the previous reading. USD/JPY currently trades near 142.10, gaining 0.10% on the day.
The US final Manufacturing PMI for December came in at 47.9 versus 48.2 prior, lower than the expectation. The output fell at the fastest rate for six months as the recent order book decline intensified. The Federal Reserve's (Fed) dovish stance after its December meeting dragged the USD lower across the board. However, the strength in the US economy might limit the greenback’s downside. The International Monetary Fund (IMF) forecasted the US economy to grow by 1.5% in 2024, compared to 1.2% for the eurozone and 4.2% for China.
Market players will closely watch the chance that the Bank of Japan (BOJ) will likely consider changing its monetary policy. The BOJ Governor Kazuo Ueda said on December 25, 2023, that the possibility of the central bank achieving the 2% inflation target sustainably and stably seems to be gradually rising.
Later on Wednesday, the final US ISM Manufacturing PMI report and the Fed’s latest Meeting Minutes will be released. The Japanese Jibun Bank Manufacturing PMI will be due on Thursday. Japan’s Jibun Bank Services PMI and Consumer Confidence will be due on Friday. The US Nonfarm Payrolls (NFP) will be a closely watched event and could keep a clear direction for the USD/JPY pair.
- Tuesday drew the S&P’s rally to a sharp end as risk appetite reverses direction.
- Equities were largely dragged lower by poor showings in tech stocks.
- US data turns red once again, crimping investor confidence.
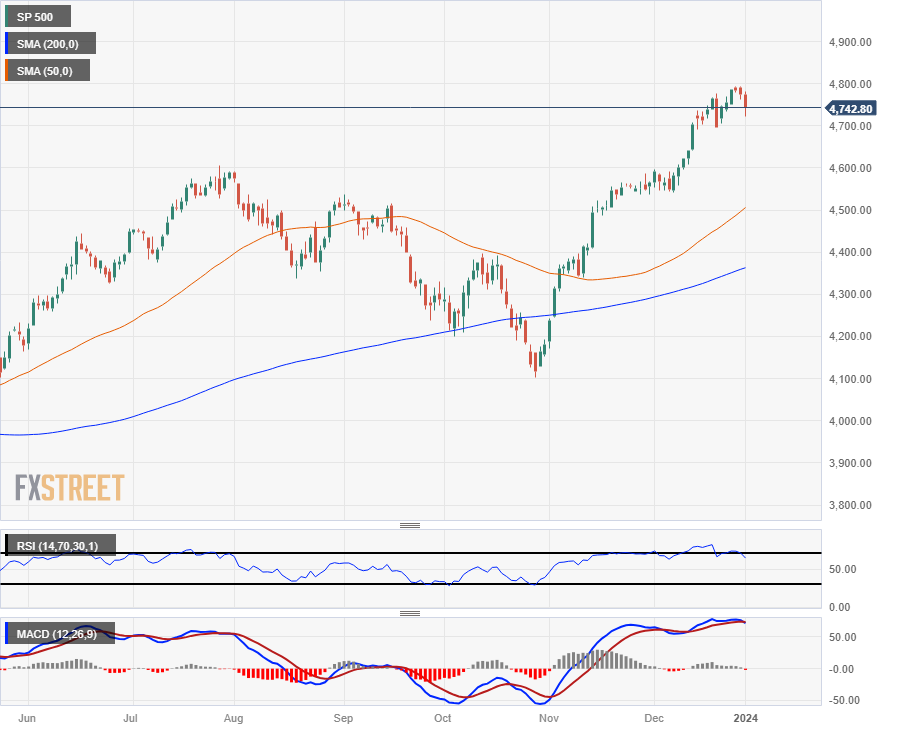
The Standard & Poor’s (S&P) 500 major equity index closed Tuesday sharply lower after falling just short of making all-time highs in December. Risk appetite reversed course and turned sharply lower to kick off 2024, drawing the S&P’s recent rally to a quick close as investors pulled back on US economic data misses.
US equities closed out 2023 with a stall in the recent stock rally which helped close out the year with firm gains across major indexes, with the S&P etching in a nine-straight-week upside swing before sinking back on Tuesday as overextended market flows pull back.
The S&P 500 declined over half of a percent on Tuesday, closing down 27 points at $4,742.83. The tech-heavy NASDAQ saw the largest losses on the day, slipping over 1.6% to close at $14,765.94, down nearly 250 points. The Dow Jones Industrial Average (DJIA) stumped Tuesday’s risk-off flows, closing marginally flat at $37,715.04, rising a scant 0.07% to close 25.5 points higher.
Tech stocks led the charge down the charts as investors pulled back from tech darling Apple (AAPL), which shed 4% on the day following disappointing demand for their latest products, leading Barclay’s to downgrade their outlook on AAPL.
The US S&P Global Manufacturing PMI missed the mark on Tuesday, declining to a four-month low of 47.9 in December versus the market forecast of a steady print of 48.2. Economic data continues to soften in the US, increasing the risk of a “soft landing” economic scenario that threatens to crimp growth and hobble employment, but the Fed will need a bigger push on the inflation front before rates can start coming down.
Wednesday’s US ISM Manufacturing PMI is expected to improve from 46.7 to 47.1 for December, and markets will be keeping a close eye on the Fed’s latest Meeting Minutes due to publish at 19:00 GMT. Investors will be tearing open the Open Market Committee’s latest minutes to try and draw a bead on how steeply Fed policymakers are leaning towards rate cuts, with some particularly eager market participants anticipating the next rate-cutting cycle to begin as soon as March.
2024’s first trading week will wrap up with US Nonfarm Payrolls (NFP), slated for Friday. December’s NFP is expected to show US jobs additions easing back slightly from 199K to 168K.
NFP watchers will first have to survive the midweek hump, with ISM Manufacturing and the Fed’s latest Meeting Minutes releasing on Wednesday, followed by Thursday’s ADP Employment Change and Initial Jobless Claims for the week ending December 29.
S&P 500 Technical Outlook
Despite Tuesday’s bearish 2024 kickoff, the S&P remains firmly entrenched in bull country, trading within reach of fresh all-time-highs beyond $4,814.68, and it would take an 8% decline before the major equity index even reached the 200-day Simple Moving Average (SMA) near $4,363.
$4,600 remains a key technical barrier, providing a technical floor for any extended downturns with the 50-day SMA rising into $4,500 to provide additional technical support.
S&P 500 Daily Chart
S&P 500 Technical Levels
In an interview with CNN on Tuesday, International Monetary Fund (IMF) Managing Director Kristalina Georgieva said that Americans should "cheer up" about the US economy as inflation falls further in 2024 despite a solid labour market and moderating interest rates, per Reuters.
Key quotes
"People should be feeling good about the economy because they finally would see relief in terms of prices.”
"While that has been painful, especially for small businesses, it has brought the desired impact without pushing the economy into recession.”
"My message to everyone is, you have a job, and interest rates are going to moderate this year because inflation is going down. Cheer up. It is a new year, people.”
"So we are all better off to find ways to reduce frictions, to concentrate on security concerns that are real and meaningful, and not go willy-nilly in fragmenting the world economy. We would end up with a smaller pie.”
Market reaction
As of writing, the US Dollar Index was down 0.01% to trade at 102.22 on the day.
- EUR/USD edges lower to 1.0941 amid the firm USD.
- The US S&P Global Manufacturing PMI for December eased to 47.9 vs. 48.2 prior, weaker than expected.
- The increased odds of rate cuts from the European Central Bank (ECB) weigh on the Euro.
The EUR/USD pair remains under pressure during the early Asian session on Wednesday. The downtick of the pair is driven by the stronger US Dollar (USD) broadly. The major pair currently trades around 1.0941, down 0.02% on the day.
On Tuesday, the US S&P Global Manufacturing PMI for December eased to 47.9 from the previous reading of 48.2, weaker than the expectation of 48.2. The figure suggested a slowdown in the manufacturing sector.
The Federal Reserve (Fed) delivered the dovish message at its last meeting of 2023 with the anticipation that the Fed will start easing the cycle with a quarter-point cut in March, followed by similar cuts in May and June. However, market participants will await the highly anticipated US labor data this week for more hints.
Across the pond, an increased possibility of rate cuts from the European Central Bank (ECB) to boost the economy, while the Fed may hold the rate a little longer, exert some selling pressure on the Euro (EUR), and act as a headwind for EUR/USD. Investors have priced in six rate cuts for 2024 from the ECB.
On Tuesday, ECB policymaker Pablo Hernandez de Cos said that economic data uncertainty remained high and that the timing of the ECB policy pivot would be determined by data. He also estimated that inflation in the Eurozone will continue to decline.
Traders will keep an eye on the German Unemployment Rate, the December US ISM Manufacturing PMI, November JOLTS Job Openings, and the Federal Open Market Committee (FOMC) Minutes, due on Wednesday. The attention will shift to the US labor data on Friday, including US Nonfarm Payrolls (NFP), Unemployment Rate, and Average Hourly Earnings, due later on Friday.
- Spot Gold bids eased back to near-term median prices after US data missed the mark.
- Equities and commodities shed weight after US PMI figures flubbed expectations.
- Money markets are beginning to walk back rate cut expectations.
XAU/USD fell short of the $2,080 price level, reversing course and slipping back towards $2,050 as risk appetite soured on continuing misses in US economic data.
The US S&P Global Manufacturing Purchasing Managers’ Index (PMI) for December fell below investor expectations on Tuesday, slipping to a four-month low of 47.9 versus the forecast steady print of 48.2 from November.
Market appetite twisted on the data misprint, and investors are beginning to soften expectations of rate cuts from the US Federal Reserve (Fed), with median market expectations pricing in around 150 basis points in rate cuts through the end of the year. This stands in sharp contrast to the Fed’s own dot plot of rate expectations, which currently see at most 75 basis points in rate cuts through 2024.
Market sentiment is set to roil this week as 2024’s first US Nonfarm Payroll (NFP) print is slated for Friday. December’s NFP is expected to show US jobs additions easing back slightly from 199K to 168K.
NFP watchers will have to survive the midweek hump, with ISM Manufacturing and the Fed’s latest Meeting Minutes releasing on Wednesday, followed by Thursday’s ADP Employment Change and Initial Jobless Claims for the week ending December 29.
XAU/USD Technical Outlook
Intraday action in Spot Gold has the XAU/USD dipping into the 200-hour Simple Moving Average (SMA) near $2,060, with near-term bids capped off by the 50-hour SMA descending below $2,070.
On the daily candlesticks, XAU/USD remains on the high side, but the bottom is opening up as Gold bugs continue to struggle to hoist Spot Gold back into early December’s rally into all-time-highs near $2,140.
Prices remain well-bid above the 200-day SMA near $1,960, and the near-term price floor sits at the 50-day SMA just north of the $2,000 major price handle.
XAU/USD Hourly Chart

XAU/USD Daily Chart

XAU/USD Technical Levels
- The EUR/GBP trades largely unchanged at 0.8670 after falling beneath the 200-day SMA to 0.8645.
- Signals from the daily chart's RSI and MACD are mixed but hint at waning buying momentum.
- Despite the short-term negative outlook, SMA's position supports an overall bullish bias.
In Tuesday's session, the EUR/GBP hovered around 0.8670 with slight losses after finding support at a low of around 0.8645. On the daily chart, buyers and sellers struggle for control with a neutral to bullish outlook, even as the bull's momentum flattens. However, a glance at the four-hour chart shows indicators have flattened, suggesting a potential tilt to the downside.
In line with that, the indicators on the daily chart reflect a flat Relative Strength Index (RSI), hovering comfortably within the positive zone, which typically suggests an upward momentum, while the Moving Average Convergence Divergence (MACD) is exhibiting a diminishing pattern of green bars, signaling a bearish momentum despite remaining in a bullish sector.
However, overriding these short-term cues, the overall trend seems to be governed by the bullish force, owing to the pair's placement above its crucial 20, 100, and 200-day Simple Moving Averages (SMAs). This portrays a possibility of the bulls retaining, at least for now, a reasonably strong foothold despite having shed some ground recently. The fact that the bulls defended the 200-day average also suggests that the outlook is still positive for the cross.
Switching to the four-hour chart it presents more of a bearish setting. The indicators project sideways movement with a downcast tilt, indicating a limited upward potential. Distinctly, the four-hour Relative Strength Index (RSI) is in negative territory, while Moving Average Convergence Divergence (MACD) prints flat red bars.
EUR/GBP daily chart
-638398278567822193.png)
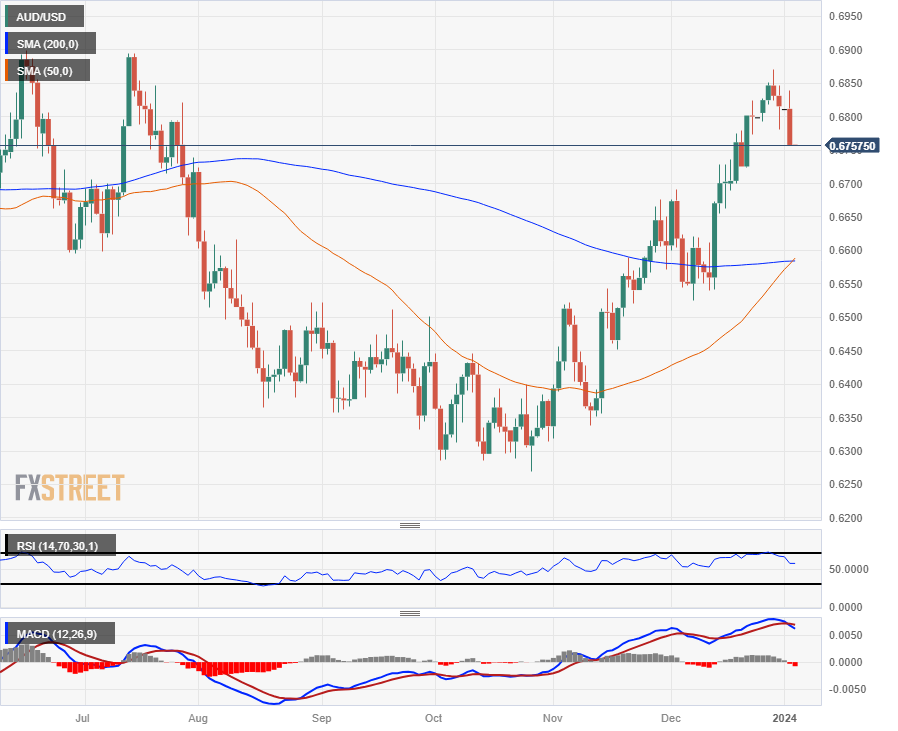
- AUD/USD sheds eight-tenths of a percent on Tuesday.
- Safe-haven bids into the USD are on the rise, propping up US Dollar pairs.
- Despite Greenback gains, Aussie remains well-bid following China PMI upswing.
The AUD/USD fell on Tuesday, sliding 0.8% on the day to kick off the first official trading day of 2024 with broader markets tipping back into the US Dollar (USD), though Aussie (AUD) losses were limited by a better-than-expected print in China’s Caixin Manufacturing Purchasing Managers’ Index (PMI) in December.
Sky-high market bets of rate cuts from the Federal Reserve (Fed) are beginning to ease as investors walk back rate cut forecasts to 150 basis points through 2024, and hobbled economic data from the US is crimping investor sentiment as markets gear up for the year’s first Nonfarm Payrolls (NFP) print due on Friday.
China’s December Manufacturing PMI came in slightly above expectations, printing at 50.8 versus the forecast decline from 50.7 to 50.4, bolstering risk appetite in the Aisa market session and helping to keep the AUD bid against the majority of major currencies, though a softening of the US S&P Global Manufacturing PMI for the same period missed expectations, souring risk appetite and sending the US Dollar higher across the board.
Softer US data props up USD bids
The US Manufacturing PMI in December sunk to a four-month low of 47.9 versus the market forecast of a steady print of 48.2.
The market is gearing up for December’s US NFP print on Friday, which is forecast to decrease from 199K to 168K, but before that will be Thursday’s China Caixin Services PMI which last printed at 51.5, as well as US ADP Employment Change, which is expected to tick up slightly from 103K to 115K.
Wednesday also brings a heavy US-data focus, with the ISM Manufacturing PMI for December forecast to improve from 46.7 to 47.1, as well as the latest Fed Meeting Minutes, which investors will be pouring over to try and catch a glimpse of how far Fed policymakers are leaning towards beginning the next rate cut cycle.
AUD/USD Technical Levels
Tuesday’s AUD/USD decline has sent the pair tumbling below the 200-hour Simple Moving Average (SMA) for the first time since the pair’s strong upshot in mid-December, settling the AUD/USD into a two-week low near 0.6750.
The pair is down over 1.5% from last week’s peak at 0.6870, and the AUD/USD could be set for an extended backslide with technical indicators pinned into overbought territory, though a technical floor is pricing in from just south of the 0.6600 handle with the 50-day SMA confirming a bullish cross of the long-run 200-day SMA.
AUD/USD Hourly Chart

AUD/USD Daily Chart
AUD/USD Technical Levels
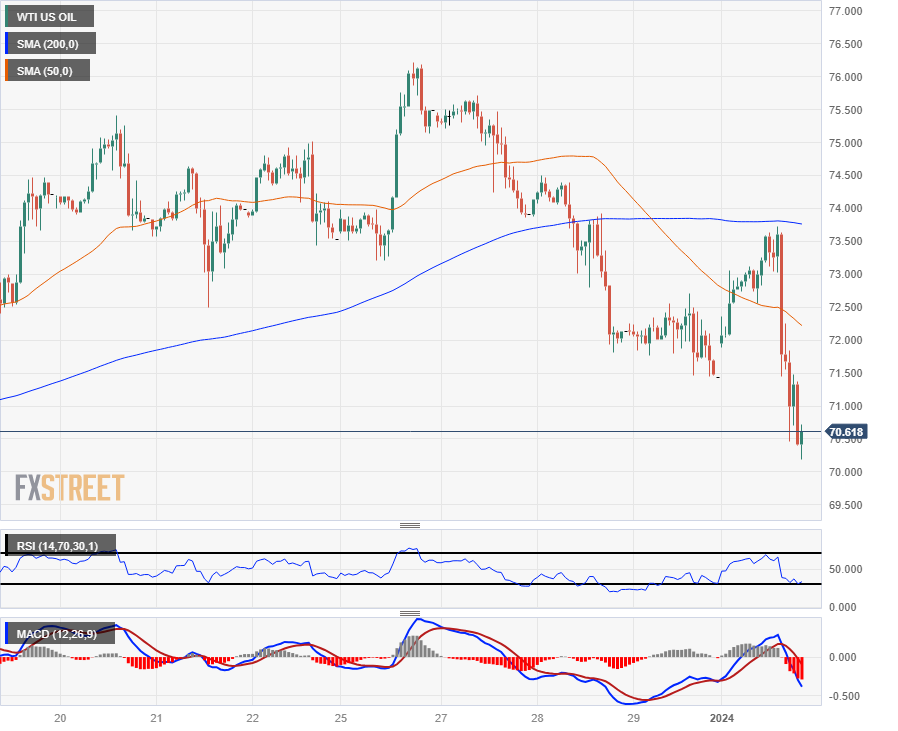
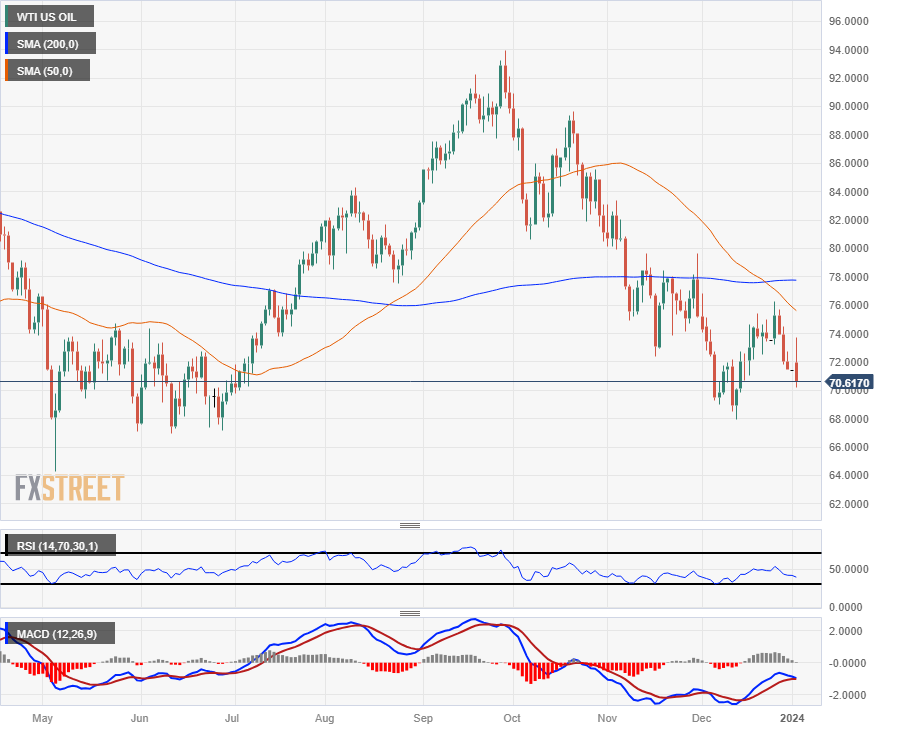
- Crude Oil initially rose on Tuesday after reports of ongoing ship attacks near Yemen.
- Economic data continues to soften, souring Crude Oil bids.
- OPEC production shows an unexpected uptick, further pressuring WTI bids.
West Texas Intermediate (WTI) Crude Oil bids fell on Tuesday following a reversal from the day’s early peak near $73.70, sending barrel bids back toward the $70.00 handle as energies markets face downside pressure from multiple fronts.
Weekend reports of ongoing attacks on cargo ships in Houthi-rebel-controlled waters off the coast of Yemen sparked a brief rally in Crude Oil bids, bolstered by reports that an Iranian warship had entered the region. Iranian-back Houthi rebels have declared their intent to continue attacking ships that travel through the key waterway that connects Europe and Asia, but a majority of logistics companies that initially diverted cargo ships around South Africa have resumed traveling the contested waters under the protection of a coalition naval fleet headed by US warships.
Market fears of supply disruptions remain unrealized, deflating near-term price increases, and near-term action sees a fresh round of selling pressure after production figures from the Organization of the Petroleum Exporting Countries (OPEC) unexpectedly rose, adding 48K barrels per day to monthly production of 26.53 million bpd.
Adding to downside pressure, economic data from the US missed the mark once again, with the S&P Global Manufacturing Purchasing Managers’ Index (PMI) for December sliding to a four-month low of 47.9. Markets were broadly expecting the figure to hold steady at November’s figure of 48.2, and a softening economic outlook for the US is driving down risk appetite, sending Crude Oil further down the charts as investors back into the safe haven US Dollar and sell off equities and commodities to kick off the 2024 trading year.
WTI Technical Outlook
Tuesday’s sharp rejection from the 200-hour Simple Moving Average (SMA) near $73.75 leaves WTI pushing into fresh lows and set for a challenge of the $70.00 major handle. Crude Oil is sharply lower from last week’s peak of $76.22, down nearly 8% peak-to-trough as barrel bids slip away from the 200-day SMA parked near $78.00.
Crude Oil is steadily trending lower, heading for December’s floor near $68.00 as price action looks set to continue accelerating into the low side with WTI set for a fourth consecutive down day on the daily candlesticks as bids see a technical ceiling from the bearish crossover of the 50-day and 200-day SMAs.
WTI Hourly Chart
WTI Daily Chart
WTI Technical Levels
What you need to take care of on Wednesday, January 3:
The US Dollar was the overall winner on Tuesday, appreciating sharply against all its major rivals. Investors returned to the USD following signs of tepid global growth at the end of 2024. S&P Global released the December Manufacturing PMIs for several major economies, all of which indicated economic contraction persisted.
S&P Global EU index was reported at 44.4, slightly better than the previous 44.2. In the UK, manufacturing output resulted at 46.2, worsening from the previous 46.4 and missing expectations. The US PMI came in at 47.9, contracting from the previous 48.2, while the Canadian index contracted to 45.4. Tepid growth figures made market players rethink the aggressive betting on upcoming rate cuts among the most developed economies.
EUR/USD plunged to 1.0940, settling a handful of pips above the level. GBP/USD trades near 1.2600, while commodity-linked currencies are among the biggest losers, with AUD/USD hovering around 0.6760 and USD/CAD at around 1.3320.
Finally, the USD/JPY trades around 142.00, while Gold saw little action, ending the day with modest losses at around $2,060 a troy ounce.
Government bonds edged lower, pushing yields to their highest since mid-December. Wall Street turned south, and the three major indexes posted daily losses.
Wednesday will bring some relevant US figures, including the December ISM Manufacturing PMI, November JOLTS Job Openings and the Federal Open Market Committee (FOMC) Minutes. The latter could be relevant after Chairman Jerome Powell mentioned rate cuts after the latest Federal Reserve (Fed) monetary policy decision. There will not be data released through the Asian session.
- The pair slipped below the 20-day SMA towards 1.2320.
- The US Dollar staged a notable recovery propelled by increasing yield rates and a risk-off market mood.
- December's labor market figures are poised to influence the bets on the next Fed moves.
- If the US economy continues to show resilience, the pair is poised for further downside.
In Tuesday's session, GBP/USD witnessed a substantial dip, trading at around 1.2620, with significant downward momentum primarily triggered by USD strength. A risk-off market environment ahead of key labor market figures from the US contributed to investors seeking refuge in the US Dollar. In addition, the negative outlook on the British economy adds to the selling pressure.
Lately, the UK economy seems shaky, with signs of easing food price inflation while expectations of Bank of England's rate cuts remain elevated for 2024. Moreover, data on the robustness of the US economy suggest that the US dollar may appreciate further against the British pound, making the exchange rate prospects for GBP/USD somewhat bearish in the short term. However, the outcome of the Nonfarm Payrrols, Average Hourly Earnings, and Unemployment rate figures from December will set the pace for the pair for the short term, as weak readings may intensify the dovish bets on the Federal Reserve (Fed).
To add to that, US bond yields are on an upward trajectory, making the Greenback gain interest. The 2-year rate is 4.32%, while the 5-year yield is 3.91% while the 10-year rate stands at 3.94%. The ascent in these yields provides a boost to the USD volume.
GBP/USD technical outlook
The daily Relative Strength Index (RSI), despite bearing a negative tilt, is still rooted in the positive territory, hinting at a remaining demand for the pair. However, the momentum seems to favor sellers as the Moving Average Convergence Divergence (MACD) decreases its green bars, suggesting a dwindling buying interest.
Meanwhile, the Simple Moving Averages (SMAs) paint a slightly different picture. The pair continues to trade under the influence of the bulls in the broader time horizon, attributed to its position above both the 100-day and 200-day SMAs, but the pair has slipped below the 20-day SMA, signaling a possible shift towards a neutral to bearish bias in the shorter term.
In summary, there is a sense of indecision in the pair's short-term technical outlook as buyers appear to sustain control over the wider framework, but selling momentum gradually strengthens.
GBP/USD daily chart
-638398207760730944.png)
- US Dollar climbs against the major currency bloc as investors pull back.
- Thin Japan data leaves US labor and output figures as the key focus for the week.
- Markets have begun to pare back rate-cut bets through 2024.
The USD/JPY rebounded on Tuesday, testing 142.00 after a clean bounce from the 141.00 handle to kick off the first trading week of 2024.
The new year opens up with another print of US Nonfarm Payrolls (NFP) coming down the pipe on Friday, and investors will be keeping a close eye on US output and labor figures due this week in the run-up to NFP.
Japan data to see minimal impact as markets await Fed rate cuts
Economic data from Japan is thin on the docket this week, with an update on foreign investment in Japanese stocks and bonds due early Thursday, closely followed by the Jibun Bank Manufacturing Purchasing Managers’ Index (PMI). Friday’s Japan data sees December’s update to Japan’s Monetary Base, the Jibun Bank Services PMI, and December’s Japan Consumer Confidence Index. All Japan data is strictly low-impact this week, and investors will be focused squarely on US labor figures as money markets start the slow process of sussing out rate cut expectations from the Federal Reserve (Fed).
Money markets have begun to walk back sky-high rate cut expectations in 2024, with median investor forecasts now seeing around 150 basis points in Fed rate declines through the year-end 2024. Market expectations have still run well ahead of the Fed’s own dot plot on rate expectations, which sees up to 75 basis points in rate reductions through the end of 2024.
The US S&P Global Manufacturing PMI missed the mark on Tuesday, declining to a four-month low of 47.9 in December versus the market forecast of a steady print of 48.2. Economic data continues to soften in the US, increasing the risk of a “soft landing” economic scenario that threatens to crimp growth and hobble employment, but the Fed will need a bigger push on the inflation front before rates can start coming down.
Wednesday’s US ISM Manufacturing PMI is expected to improve from 46.7 to 47.1 for December, and markets will be keeping a close eye on the Fed’s latest Meeting Minutes due to publish at 19:00 GMT. Investors will be tearing open the Open Market Committee’s latest minutes to try and draw a bead on how steeply Fed policymakers are leaning towards rate cuts, with some particularly eager market participants anticipating the next rate-cutting cycle to begin as soon as March.
USD/JPY Technical Outlook
The USD/JPY’s rebound on Tuesday sees the pair hamstrung between the 50-hour and 200-hour Simple Moving Averages (SMA) with the pair testing ground near the 142.00 handle.
The pair’s rebound from a 22-week low near 140.25 sees the USD/JPY making a climb back towards the 200-day SMA near the 143.00 handle, with near-term action favoring bidders as technical indicators roll over from deep within oversold territory. The Moving Average Convergence-Divergence hit its most oversold conditions since early 2023, and is poised to telegraph a potential rebound in the USD/JPY, the 50-day SMA is rotating into a bearish decline and could price in a technical ceiling in the near-term as the moving heads for the 200-day SMA.
USD/JPY Hourly Chart
USD/JPY Daily Chart
USD/JPY Technical Levels
- The EUR/USD trades are nearing the 1.0950 mark, reflecting a notable 0.80% decline.
- The US dollar recovered significantly as yields rose, strengthening its position against its peers.
- December's key labor market figures from the US will define short-term forex market trends.
In Tuesday's session, the Euro (EUR) against the US Dollar (USD) exhibited strong downward movements, trading roughly around 1.0950. The primary driver of this movement includes a considerable threat to its 20-day SMA, along with a significant risk-off mood pervading the market, which redirected flows toward the Greenback.
The US dollar started 2024 strongly and the US economy remains robust, with Q4 growth propped above the trend. There's anticipation that if the optimistic US labor market data continues in Q1, market expectations will shift from an easing cycle, positively impacting the dollar and cooling down dovish bets, which recently made it suffer significant selling pressure. On the other hand, the Eurozone's economy seems to face more turbulence, with a contracting money supply and a weak manufacturing sector.
Regarding their monetary policies, the trend in both economies indicates a divergence between the approaches from the Federal Reserve and European Central Bank (ECB), with an increased possibility of rate cuts from the ECB to stimulate the economy while the US may hold a little longer the restrictive rates. As for now, investors have priced in six rate cuts for 2024 from the European bank, while for its American peer markets are starting to back off from their initial predictions of 160 bps of easing.
In the coming week, key labor statistics are set to be disclosed by the US, encompassing data on Nonfarm Payrolls, Wage Inflation, and the Unemployment Rate recorded for the month of December. Other minor data include JOLT's Job opening figures and the Automatic Data Processing Inc. employment change, also from the last month of 2023.
EUR/USD levels to watch
The daily chart suggests that the pair has a neutral to bearish tone for now. The Relative Strength Index (RSI), despite being in positive territory, is indicating a negative slope, suggesting slowing momentum and hints at a possible reversal or consolidation ahead, further reaffirmed by the decreasing green bars from the Moving Average Convergence Divergence (MACD).
However, the broader technical landscape tells a different story. The pair remaining above the 20, 100, and 200-day Simple Moving Averages (SMAs) indicates that, in the broader context, the bulls are still in control. Despite the short-term negative outlook, the underlying buying momentum may still hold the reins, preventing any deep falls.
EUR/USD daily chart
-638398149354107454.png)
- Canadian Dollar falls back as broader markets reverse into Greenback bids.
- Canada economic data continues to slump, Manufacturing PMI flubs expectations.
- Crude Oil continues to slip, dragging down the Loonie.
The Canadian Dollar (CAD) continues to ease back as the 2024 trading year gets underway, extending near-term declines against the US Dollar (USD) to fall a full percentage point as the first trading week of the new year gets underway.
The Canadian S&P Global Manufacturing Purchasing Managers’ Index (PMI) accelerated declines on Tuesday to print at a 43-month low as the Canadian economic outlook continues to deteriorate. The US Manufacturing PMI component also printed below expectations, keeping market risk appetite pinned on the low side and propping up the US Dollar on risk aversion.
Daily digest market movers: Crude Oil, risk aversion bite down on the Canadian Dollar as data misses the mark
- The Canadian Dollar is slipping back against the US Dollar as markets bid up the safe haven Greenback.
- The Canadian Manufacturing PMI printed a multi-year low of 45.4 in December, declining from November’s 47.7.
- The US Manufacturing PMI for December also missed the mark on Tuesday, printing at a four-month low of 47.9. The US PMI missed the market’s expectation of a steady reading from November’s 48.2.
- US Construction Spending also slumped in November, growing by a scant 0.4% versus the market forecast of 0.5%, though October’s MoM Construction Spending print saw a steep late revision from 0.6% to 1.2%.
- Markets have begun to walk back their previous sky-high bets of Federal Reserve (Fed) rate cuts through 2024, with money markets pricing in a median of 150 basis points of rate cuts by year-end.
- US data features heavily on the economic calendar this week, with 2024’s inaugural trading week rounding out the action with Friday’s US Nonfarm Payrolls (NFP).
- Wednesday brings US ISM Manufacturing PMI figures for December, forecast to tick upwards from 46.7 to 47.1, to be closely followed by the Fed’s Meeting Minutes from the latest Open Market Committee meeting.
- Thursday sees the US ADP Employment Change for December, forecast to rise from 103K to 115K, but the recently-inconsistent ADP preview is unlikely to match Friday’s NFP print.
- Friday sees December’s Canadian Unemployment Rate and annualized Canadian Average Hourly Wages, with Canadian unemployment expected to tick higher from 5.8% to 5.9% in December.
- Canadian Friday data can be expected to get overshadowed by US NFP figures, which are forecast to rebound from November’s 199K print to 168K in December.
US Dollar price this week
The table below shows the percentage change of US Dollar (USD) against listed major currencies this week. US Dollar was the strongest against the Swiss Franc.
| USD | EUR | GBP | CAD | AUD | JPY | NZD | CHF | |
| USD | 0.92% | 0.75% | 0.42% | 0.52% | 0.65% | 0.88% | 1.02% | |
| EUR | -0.78% | -0.01% | -0.35% | -0.25% | -0.26% | 0.11% | 0.21% | |
| GBP | -0.76% | 0.01% | -0.32% | -0.24% | -0.02% | 0.13% | 0.20% | |
| CAD | -0.42% | 0.34% | 0.53% | 0.08% | 0.22% | 0.45% | 0.56% | |
| AUD | -0.54% | 0.23% | 0.22% | -0.13% | -0.07% | 0.34% | 0.44% | |
| JPY | -0.64% | 0.29% | 0.18% | -0.03% | 0.05% | 0.43% | 0.31% | |
| NZD | -0.89% | -0.13% | -0.14% | -0.47% | -0.35% | -0.41% | 0.06% | |
| CHF | -0.97% | -0.21% | -0.21% | -0.53% | -0.42% | -0.34% | -0.06% |
The heat map shows percentage changes of major currencies against each other. The base currency is picked from the left column, while the quote currency is picked from the top row. For example, if you pick the Euro from the left column and move along the horizontal line to the Japanese Yen, the percentage change displayed in the box will represent EUR (base)/JPY (quote).
Technical Analysis: Canadian Dollar slips back from multi-month highs in early 2024
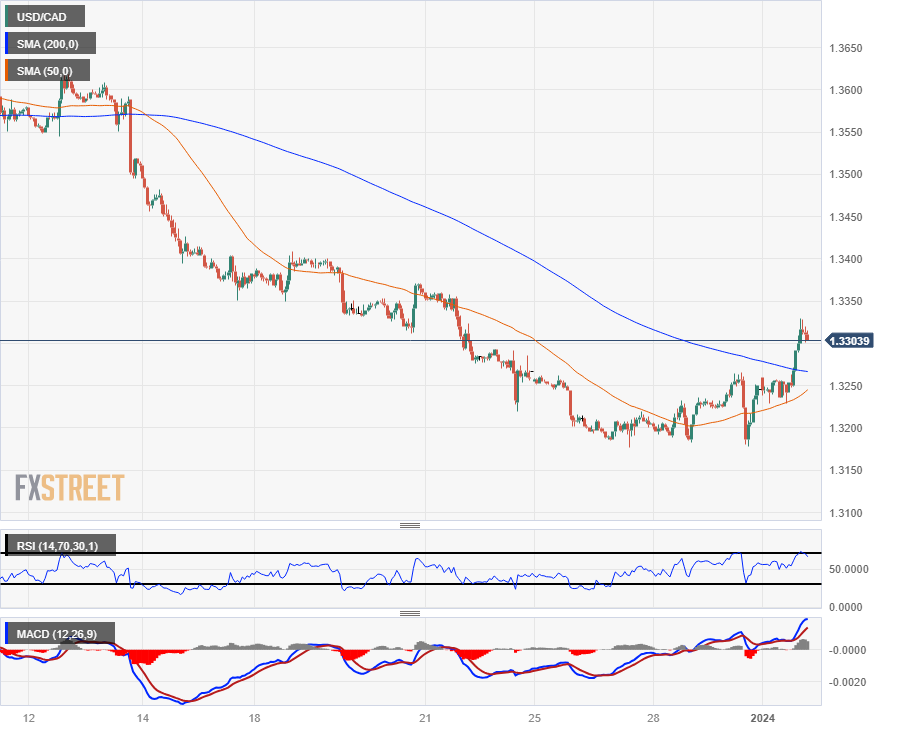
The Canadian Dollar (CAD) has shed around a full percent from Tuesday’s peak bids against the US Dollar, easing back from a 21-week peak and sending the USD/CAD pair rebounding from last week’s lows just below 1.3200.
The USD/CAD has climbed back over the 200-hour Simple Moving Average (SMA) for the first time since mid-December when the pair declined over 3% peak-to-trough from the 1.3600 region.
Despite a near-term rebound in the Greenback, the USD/CAD remains firmly planted in bear country with price action well below the 200-day SMA near the 1.3500 major handle, but the technical outlook favors bidders heading into the new trading year. Technical indicators are pinned firmly into oversold conditions, with both the Relative Strength Index (RSI) and the Moving Average Convergence-Divergence (MCAD) signaling ripe buying conditions as the indicators roll over.
USD/CAD Hourly Chart
USD/CAD Daily Chart
Canadian Dollar FAQs
What key factors drive the Canadian Dollar?
The key factors driving the Canadian Dollar (CAD) are the level of interest rates set by the Bank of Canada (BoC), the price of Oil, Canada’s largest export, the health of its economy, inflation and the Trade Balance, which is the difference between the value of Canada’s exports versus its imports. Other factors include market sentiment – whether investors are taking on more risky assets (risk-on) or seeking safe-havens (risk-off) – with risk-on being CAD-positive. As its largest trading partner, the health of the US economy is also a key factor influencing the Canadian Dollar.
How do the decisions of the Bank of Canada impact the Canadian Dollar?
The Bank of Canada (BoC) has a significant influence on the Canadian Dollar by setting the level of interest rates that banks can lend to one another. This influences the level of interest rates for everyone. The main goal of the BoC is to maintain inflation at 1-3% by adjusting interest rates up or down. Relatively higher interest rates tend to be positive for the CAD. The Bank of Canada can also use quantitative easing and tightening to influence credit conditions, with the former CAD-negative and the latter CAD-positive.
How does the price of Oil impact the Canadian Dollar?
The price of Oil is a key factor impacting the value of the Canadian Dollar. Petroleum is Canada’s biggest export, so Oil price tends to have an immediate impact on the CAD value. Generally, if Oil price rises CAD also goes up, as aggregate demand for the currency increases. The opposite is the case if the price of Oil falls. Higher Oil prices also tend to result in a greater likelihood of a positive Trade Balance, which is also supportive of the CAD.
How does inflation data impact the value of the Canadian Dollar?
While inflation had always traditionally been thought of as a negative factor for a currency since it lowers the value of money, the opposite has actually been the case in modern times with the relaxation of cross-border capital controls. Higher inflation tends to lead central banks to put up interest rates which attracts more capital inflows from global investors seeking a lucrative place to keep their money. This increases demand for the local currency, which in Canada’s case is the Canadian Dollar.
How does economic data influence the value of the Canadian Dollar?
Macroeconomic data releases gauge the health of the economy and can have an impact on the Canadian Dollar. Indicators such as GDP, Manufacturing and Services PMIs, employment, and consumer sentiment surveys can all influence the direction of the CAD. A strong economy is good for the Canadian Dollar. Not only does it attract more foreign investment but it may encourage the Bank of Canada to put up interest rates, leading to a stronger currency. If economic data is weak, however, the CAD is likely to fall.
- The Mexican Peso has slipped as broader markets focus on US data.
- Notable lack of Mexico data on the docket for this week.
- Markets are set to hinge on US labor, output figures ahead of NFP Friday.
The Mexican Peso (MXN) is taking a breather, retreating from a 17-week high against the US Dollar (USD) as markets kick off the new trading year focusing on US labor and output data.
Economic data from Mexico is absent from the calendar for this week, and the USD is set to be the primary driver to usher in 2024. The Greenback is rebounding in early trading as money markets ease back on bets of Federal Reserve (Fed) rate cuts, with the US Dollar reclaiming around a full percent against the Peso.
Daily digest market movers: Mexican Peso gives back recent gains as investors look to US NFP
- The US Dollar is climbing across the board to kick off the new year’s inaugural trading week.
- Money markets have eased back their bets of Fed rate cuts, still see up to 150 basis points in rate cuts through 2024.
- US output continues to fall, S&P Global Manufacturing Purchasing Managers’ Index (PMI) for December declined to 47.9, a four-month low. Median market forecast expected a steady print at November’s 48.2.
- US Construction Spending also missed the mark, slipping from October’s 1.2% (revised up from 0.6%) to print at 0.4% in November, missing the forecast of 0.5%.
- Wednesday brings the US ISM Manufacturing PMI, as well as the latest round of the Fed’s Meeting Minutes.
- Thursday sees the December print of the ADP Employment Change, but the figure has become notoriously inconsistent lately, poorly forecasting the release of Friday’s US Nonfarm Payrolls, alongside US Average Earnings and the ISM Services PMI.
US Dollar price this week
The table below shows the percentage change of US Dollar (USD) against listed major currencies this week. US Dollar was the strongest against the New Zealand Dollar.
| USD | EUR | GBP | CAD | AUD | JPY | NZD | CHF | |
| USD | 0.99% | 0.90% | 0.49% | 0.71% | 0.64% | 0.99% | 0.93% | |
| EUR | -0.84% | 0.08% | -0.35% | -0.12% | -0.36% | 0.16% | 0.04% | |
| GBP | -0.92% | -0.08% | -0.41% | -0.20% | -0.20% | 0.08% | -0.05% | |
| CAD | -0.49% | 0.32% | 0.59% | 0.21% | 0.13% | 0.49% | 0.39% | |
| AUD | -0.70% | 0.11% | 0.22% | -0.22% | -0.25% | 0.29% | 0.19% | |
| JPY | -0.63% | 0.37% | 0.33% | 0.05% | 0.26% | 0.52% | 0.19% | |
| NZD | -1.00% | -0.14% | -0.08% | -0.49% | -0.28% | -0.54% | -0.11% | |
| CHF | -0.87% | -0.02% | 0.06% | -0.35% | -0.15% | -0.24% | 0.13% |
The heat map shows percentage changes of major currencies against each other. The base currency is picked from the left column, while the quote currency is picked from the top row. For example, if you pick the Euro from the left column and move along the horizontal line to the Japanese Yen, the percentage change displayed in the box will represent EUR (base)/JPY (quote).
Technical Analysis: Mexican Peso fades top side, eases back as US Dollar rebounds
The Mexican Peso (MXN) is slipping back from near-term highs, getting pushed back down as market pivot into Greenback bets. The USD/MXN has rebounded above the 200-hour Simple Moving Average (SMA), climbing back over the 17.00 level following last week’s decline to a multi-month low of 16.86.
Bullish momentum in the US Dollar still faces a long climb upwards, with long-term technical resistance sitting at the bearish crossover of the 50-day and 200-day SMAs just south of 17.50. On the low side, a break below 2023’s lows of 16.62 will see the USD/MXN breaking into its lowest bids since 2016.
USD/MXN Hourly Chart
USD/MXN Daily Chart
Mexican Peso FAQs
What key factors drive the Mexican Peso?
The Mexican Peso (MXN) is the most traded currency among its Latin American peers. Its value is broadly determined by the performance of the Mexican economy, the country’s central bank’s policy, the amount of foreign investment in the country and even the levels of remittances sent by Mexicans who live abroad, particularly in the United States. Geopolitical trends can also move MXN: for example, the process of nearshoring – or the decision by some firms to relocate manufacturing capacity and supply chains closer to their home countries – is also seen as a catalyst for the Mexican currency as the country is considered a key manufacturing hub in the American continent. Another catalyst for MXN is Oil prices as Mexico is a key exporter of the commodity.
How do decisions of the Banxico impact the Mexican Peso?
The main objective of Mexico’s central bank, also known as Banxico, is to maintain inflation at low and stable levels (at or close to its target of 3%, the midpoint in a tolerance band of between 2% and 4%). To this end, the bank sets an appropriate level of interest rates. When inflation is too high, Banxico will attempt to tame it by raising interest rates, making it more expensive for households and businesses to borrow money, thus cooling demand and the overall economy. Higher interest rates are generally positive for the Mexican Peso (MXN) as they lead to higher yields, making the country a more attractive place for investors. On the contrary, lower interest rates tend to weaken MXN.
How does economic data influence the value of the Mexican Peso?
Macroeconomic data releases are key to assess the state of the economy and can have an impact on the Mexican Peso (MXN) valuation. A strong Mexican economy, based on high economic growth, low unemployment and high confidence is good for MXN. Not only does it attract more foreign investment but it may encourage the Bank of Mexico (Banxico) to increase interest rates, particularly if this strength comes together with elevated inflation. However, if economic data is weak, MXN is likely to depreciate.
How does broader risk sentiment impact the Mexican Peso?
As an emerging-market currency, the Mexican Peso (MXN) tends to strive during risk-on periods, or when investors perceive that broader market risks are low and thus are eager to engage with investments that carry a higher risk. Conversely, MXN tends to weaken at times of market turbulence or economic uncertainty as investors tend to sell higher-risk assets and flee to the more-stable safe havens.
- The DXY Index trades with gains in the latest session.
- Investors eagerly await Nonfarm Payrolls, Average Hourly Earnings, Unemployment Rate from December, and FOMC Minutes disclosures.
- Rising US bond yields gave the US Dollar traction.
The US Dollar (USD) began trading at 102.10, marking a noteworthy rise in the index. This upward movement may be explained by markets awaiting direction, and investors seeking refuge in the USD ahead of key labor market reports to be released this week.
In the last meeting of 2023, the Federal Reserve adopted a dovish stance, remaining optimistic about easing inflation trends and ruling out rate hikes in 2024. Despite an indicative 75 bps easing forecast, future actions may alter with incoming data, such as the imminent December labor reports. Market speculations for March and May anticipate rate cuts and small odds for the easing cycle to start in the upcoming meeting in January, which may limit the USD’s momentum.
Daily Market Movers: US Dollar strengthens on the back of US yields recovering despite weak S&P revisions
- The US dollar experiences a positive trade ahead of the labor market data, demonstrating an upward momentum.
- December's revisions from the Manufacturing PMI reported by S&P Global came in at 47.9, falling short of the consensus estimate of 48.2, indicating a slowdown in the manufacturing sector.
- This week, the US will report key labor market figures from December, including the Unemployment Rate, Nonfarm Payrolls, and Average Hourly Earnings. Investors are also keenly waiting for the FOMC Minutes this Wednesday from the last meeting from 2023.
- The US bond yields are on the rise, with the 2-year, 5-year, and 10-year yields trading at 4.32%, 3.91%, and 3.94%, respectively.
- As per the CME FedWatch tool, markets have priced in no hike for the upcoming January meeting, with a mere 15% odds for a rate cut. The markets have also forecasted rate cuts for March and May 2024.
Technical Analysis: DXY bear-dominance persists despite hints of possible short-term bullish reversal
The Relative Strength Index (RSI) paints an optimistic picture as it displays a positive slope in negative territory. This suggests an increasing buying momentum as the index may be embarking on a potential reversal after hitting oversold conditions.
The Moving Average Convergence Divergence (MACD) further strengthens this bullish narrative, presenting rising green bars. This indicates the strengthening of upward momentum and a potential continuation of a bullish trend in the short term.
Yet, when glancing at the Simple Moving Averages (SMAs), the index is trading below the 20, 100, and 200-day SMAs. This predominantly reveals the bearish pressure in the market, overriding the short-term bullish signals of the RSI and MACD.
Support levels: 102.00, 102.50, 101.30.
Resistance levels: 102.40 (20-day SMA), 102.50, 102.70.
US Dollar FAQs
What is the US Dollar?
The US Dollar (USD) is the official currency of the United States of America, and the ‘de facto’ currency of a significant number of other countries where it is found in circulation alongside local notes. It is the most heavily traded currency in the world, accounting for over 88% of all global foreign exchange turnover, or an average of $6.6 trillion in transactions per day, according to data from 2022.
Following the second world war, the USD took over from the British Pound as the world’s reserve currency. For most of its history, the US Dollar was backed by Gold, until the Bretton Woods Agreement in 1971 when the Gold Standard went away.
How do the decisions of the Federal Reserve impact the US Dollar?
The most important single factor impacting on the value of the US Dollar is monetary policy, which is shaped by the Federal Reserve (Fed). The Fed has two mandates: to achieve price stability (control inflation) and foster full employment. Its primary tool to achieve these two goals is by adjusting interest rates.
When prices are rising too quickly and inflation is above the Fed’s 2% target, the Fed will raise rates, which helps the USD value. When inflation falls below 2% or the Unemployment Rate is too high, the Fed may lower interest rates, which weighs on the Greenback.
What is Quantitative Easing and how does it influence the US Dollar?
In extreme situations, the Federal Reserve can also print more Dollars and enact quantitative easing (QE). QE is the process by which the Fed substantially increases the flow of credit in a stuck financial system.
It is a non-standard policy measure used when credit has dried up because banks will not lend to each other (out of the fear of counterparty default). It is a last resort when simply lowering interest rates is unlikely to achieve the necessary result. It was the Fed’s weapon of choice to combat the credit crunch that occurred during the Great Financial Crisis in 2008. It involves the Fed printing more Dollars and using them to buy US government bonds predominantly from financial institutions. QE usually leads to a weaker US Dollar.
What is Quantitative Tightening and how does it influence the US Dollar?
Quantitative tightening (QT) is the reverse process whereby the Federal Reserve stops buying bonds from financial institutions and does not reinvest the principal from the bonds it holds maturing in new purchases. It is usually positive for the US Dollar.
- The Swiss Franc starts losing ground against the US Dollar at the start of the new year.
- The move comes on the back of a recovery in the US Dollar amid rising Treasury yields.
- Bond traders may be signaling they think the inflation outlook could be stickier than expected.
The Swiss Franc (CHF) weakens against a strengthening US Dollar (USD) on Tuesday, at the start of the new year. The main reason seems to be higher US Treasury yields, with the 5, 10 and 30-year maturity Bond yields, all up by over 2% at the time of writing. The advances seem to suggest bond holders don’t share the widely held view that interest rates are likely to fall as sharply as some expect in 2024. Higher interest rates mean a stronger Dollar by attracting greater inflows of foreign capital.
Negative press surrounding the Swiss Franc on Tuesday could be denting CHF demand after the news BNP Paribas is to compensate mortgage holders to whom it sold Swiss Franc loans prior to the 2015 devaluation, when CHF dropped its peg with the Euro.
Daily digest market movers: Swiss Franc weakens as Treasury yields rebound
- The Swiss Franc weakens versus the US Dollar as US Treasuries rebound after a sustained decline for most of the end of 2023.
- The Dollar recovery suggests bond holders may not share the widely held view that US inflation is coming down as quickly as some market participants expect.
- The market currently sees the first interest rate cut from the Federal Reserve (Fed) happening at the Fed’s March meeting, however, if US data is particularly strong expectations could get pushed back – a positive for USD.
- Negative press surrounding the Swiss Franc could be weighing on CHF after BNP Paribas made headlines on Tuesday, when it agreed to compensate mortgage holders in France who took out Swiss Franc loans prior to the Euro’s 2015 devaluation.
- The bank was accused of mis-selling mortgages (it paid in Swiss Francs) which customers had to repay in Euros, after the Euro lost its peg against the Franc in 2015 and devalued massively, leaving them with outsized repayments, according to Reuters.
Swiss Franc technical analysis: USD/CHF in strong downtrend, risk of correction
USD/CHF – the number of Swiss Francs that one US Dollar can buy – continues declining and has reached a new over-one-decade low.
The pair is now arguably in a downtrend on all major time frames, suggesting bears are fully in control.
-638398057203511785.png)
US Dollar vs Swiss Franc: Weekly Chart
USD/CHF has broken below the last key chart line at the July 2023 lows of 0.8552 and there is little in the way of key support below.
On the weekly chart, the Relative Strength Index (RSI) is showing slight bullish convergence at the December 2023 lows, however, compared to the July 2023 lows. This suggests the current downtrend may be losing momentum. The convergence occurs because – despite price falling to a new low in December, RSI did not follow suit when compared with July.
During the last week of December the RSI also fell into oversold territory (below 30). If it remains oversold it will be a signal for short-traders not to add to their short positions. If there is a recovery this week and the RSI rises back above 30 it will give a signal to close short positions and buy longs.
This suggests a risk of a correction higher on the horizon. Nevertheless, the dominant trend remains bearish, suggesting the bias is eventually for lower prices.
A break below last week’s 0.8335 low would re-confirm the downtrend and lead to further weakness, probably to 0.8300, and then below that to other round-number levels.
Swiss Franc FAQs
What key factors drive the Swiss Franc?
The Swiss Franc (CHF) is Switzerland’s official currency. It is among the top ten most traded currencies globally, reaching volumes that well exceed the size of the Swiss economy. Its value is determined by the broad market sentiment, the country’s economic health or action taken by the Swiss National Bank (SNB), among other factors. Between 2011 and 2015, the Swiss Franc was pegged to the Euro (EUR). The peg was abruptly removed, resulting in a more than 20% increase in the Franc’s value, causing a turmoil in markets. Even though the peg isn’t in force anymore, CHF fortunes tend to be highly correlated with the Euro ones due to the high dependency of the Swiss economy on the neighboring Eurozone.
Why is the Swiss Franc considered a safe-haven currency?
The Swiss Franc (CHF) is considered a safe-haven asset, or a currency that investors tend to buy in times of market stress. This is due to the perceived status of Switzerland in the world: a stable economy, a strong export sector, big central bank reserves or a longstanding political stance towards neutrality in global conflicts make the country’s currency a good choice for investors fleeing from risks. Turbulent times are likely to strengthen CHF value against other currencies that are seen as more risky to invest in.
How do decisions of the Swiss National Bank impact the Swiss Franc?
The Swiss National Bank (SNB) meets four times a year – once every quarter, less than other major central banks – to decide on monetary policy. The bank aims for an annual inflation rate of less than 2%. When inflation is above target or forecasted to be above target in the foreseeable future, the bank will attempt to tame price growth by raising its policy rate. Higher interest rates are generally positive for the Swiss Franc (CHF) as they lead to higher yields, making the country a more attractive place for investors. On the contrary, lower interest rates tend to weaken CHF.
How does economic data influence the value of the Swiss Franc?
Macroeconomic data releases in Switzerland are key to assessing the state of the economy and can impact the Swiss Franc’s (CHF) valuation. The Swiss economy is broadly stable, but any sudden change in economic growth, inflation, current account or the central bank’s currency reserves have the potential to trigger moves in CHF. Generally, high economic growth, low unemployment and high confidence are good for CHF. Conversely, if economic data points to weakening momentum, CHF is likely to depreciate.
How does the Eurozone monetary policy affect the Swiss Franc?
As a small and open economy, Switzerland is heavily dependent on the health of the neighboring Eurozone economies. The broader European Union is Switzerland’s main economic partner and a key political ally, so macroeconomic and monetary policy stability in the Eurozone is essential for Switzerland and, thus, for the Swiss Franc (CHF). With such dependency, some models suggest that the correlation between the fortunes of the Euro (EUR) and the CHF is more than 90%, or close to perfect.
- Silver price struggles to sustain above $24.00 as demand for safe-haven assets improves.
- Investors await the FOMC minutes, Manufacturing PMI and the labour market data.
- Silver price forms a H&S chart pattern, whose breakdown will result in an intense sell-off.
Silver price (XAG/USD) drops gradually after failing to sustain above the $24.00 resistance in the early New York session. The white metal faces pressures as investors rush for the US Dollar. The appeal for the US Dollar Index (DXY) improves as investors turn cautious ahead of the United States Manufacturing PMI to be released by the Institute of Supply Management (ISM) and the labour market data.
The S&P500 is expected to open on a negative note, considering weak overnight futures. Market mood turns downbeat amid a data-packed week. The 10-year US Treasury yields climb to near 3.96% as the risk-appetite of the market participants fade. The USD index refreshes weekly high near 102.00 amid improvement in demand for safe-haven assets.
Going forward, investors will focus on the Federal Open Market Committee (FOMC) minutes, which will be published on Wednesday. The FOMC minutes for December monetary policy meeting will provide a detailed explanation behind third consecutive unchanged interest rate decision by the Fed. Apart from that, guidance about interest rates for 2024 will be keenly watched.
On the economic data front, the ISM Manufacturing PMI for December is seen higher at 47.1 vs. the prior release of 46.7. Meanwhile, JOLTS Job Openings were higher at 8.85M in November against 8.733M jobs posted earlier.
Silver technical analysis
Silver price forms a Head and Shoulder chart pattern on a two-hour scale, which indicates a prolonged consolidation. The chart pattern would get triggered after a breakdown below the crucial support of $23.60. The asset struggles to sustain above the 20-period Exponential Moving Average (EMA), which trades around $24.00.
The Relative Strength Index (RSI) (14) oscillates in the 40.00-60.00 range, which indicates a consolidation ahead.
Silver two-hour chart
-638398016801419819.png)
- USD/CAD climbs to near 1.3270 as investors’ risk-appetite is fading away.
- The USD jumps to weekly high near 102.00 ahead of US Manufacturing PMI and the FOMC minutes.
- The Canadian Dollar will be guided by the employment data.
The USD/CAD pair prints a fresh weekly high to near 1.3270 in the late European session. The Loonie asset delivers a decisive breakout of the consolidation formed in a range of 1.3180-1.3260, propelled by strength in the US Dollar.
S&P500 futures generated significant losses in the European session, portraying a sharp decline in the risk-appetite of the market participants. The 10-year US Treasury yields climb to near 3.96%.
The US Dollar Index (DXY) jumps to near 102.00 as profit-booking kicks-in due to stretched valuations in the risk-perceived assets in a short-term period. However, the broader appeal for the USD Index is still downbeat as prospects of early rate cuts by the Federal Reserve (Fed) are significantly high.
Going forward, investors will focus on the Institute of Supply Management (ISM) Manufacturing PMI and the Federal Open Market Committee (FOMC) minutes, which will be published on Wednesday.
As per the consensus, the ISM Manufacturing PMI data for December improved to 47.1 against the former reading of 46.7 but remained below the 50.0 threshold. The factory data is set to remain in the contraction phase for 14th month in a row.
On the Canadian Dollar, investors await the labour market data for December, which will be published on Friday. The Unemployment Rate is seen higher at 5.9% vs. the former reading 5.8%. Investors expect that Canadian employers hired 12K fresh workers against 24.9K addition in November.
- EUR/GBP rebounds from 0.8650 on weaker-than-projected UK factory data.
- The outlook of the UK manufacturing sector remains gloomy due to deepening cost of living crisis.
- German HICP is seen significantly higher in December.
The EUR/GBP pair finds cushion near 0.8650 after the United Kingdom S&P Global Manufacturing PMI data for December failed to meet expectations. The S&P Global reported the UK factory data at 46.2, which was lower than the consensus and the former reading of 46.4.
The Manufacturing PMI remains below the 50.0 threshold for the 17th month in a row as higher interest rates and hot price pressures have deepened cost of living crisis.
The S&P Global Market Intelligence reported that tough conditions in the domestic economy and the exports markets notably from the European Union resulted in lower production at UK factories. The agency also reported that business optimism dipped to 12-month low, indicating more cutback in production, new orders and employment ahead.
Meanwhile, fears of a technical recession in the UK economy are already high as the Office for National Statistics (ONS), in its fresh estimates, indicated that the economy shrank by 0.1% in the July-September quarter.
Lower Manufacturing PMI may join deepening recession fears and will compel Bank of England (BoE) policymakers to start discussing rate cuts earlier.
On the Eurozone front, investors await the German’s preliminary Harmonized Index of Consumer Prices (HICP) for December, which will be published on Thursday. As per the consensus, monthly HICP grew by 0.3% against 0.7% decline in November. The annual HICP significantly rose to 3.9% against the former reading of 2.3%.
European Central Bank (ECB) policymaker Pablo Hernandez de Cos said on Tuesday that the uncertainty over the macroeconomic data remains high and added that the timing of the ECB policy pivot will depend on data.
He further noted that inflation in the Euro area is expected to continue its downward trend.
Market reaction
These comments don't seem to be having a noticeable impact on the Euro's performance against its major rivals. At the time of press, EUR/USD was trading at 1.1005, losing 0.35% on a daily basis.
- Gold price moves higher as Fed’s rate-cut bets persist.
- This week, the US NFP and ISM PMI reports will guide further action in the FX domain.
- The US Dollar advances further ahead of crucial economic data.
Gold price (XAU/USD) kicks-off the 2024 year on a promising note, demonstrating a firm-footing on Tuesday amid prospects of a reduction in interest rates by the Federal Reserve (Fed) starting in March. Factors that are boosting rate-cut hopes are significant progress in the underlying inflation declining towards 2% and easing labour market conditions due to restrictive monetary policy stance.
This week, investors should brace for sheer volatility as various economic indicators are lined-up for release. The ISM manufacturing PMI, JOLTS Job Openings data and Federal Open Market Committee (FOMC) minutes of December monetary policy meeting will be followed by Services PMI and the Nonfarm Payrolls (NFP) report. Market participants are unlikely to change bearish stance for the US Dollar and Treasury yields amid deepening rate-cut expectations by the Fed.
Daily Digest Market Movers: Gold price moves higher on Fed's rate cut bets
- Gold price advances to near $2,075 amid prospects of early rate cuts by the Federal Reserve in 2024.
- As per the CME FedWatch tool, there is a 72% chance that the Fed will reduce interest rates by 25 basis points (bps) to 5.00-5.25%. The probability that the Fed will continue reducing rates in May is similar at 72%.
- The appeal for the Gold price has strengthened after Federal Reserve Chairman Jerome Powell changed his tone at the December monetary policy meeting from one that backs higher for longer interest rates to one that sees rate cuts being a topic for discussions going forward.
- However, Jerome Powell warned that the achievement of price stability is the Fed’s foremost objective.
- Investors should be prepared for volatile price action as the labour market, Manufacturing and Services PMI data are due this week. In addition to that, investors will focus on the FOMC minutes, which are set to be released on Wednesday.
- As per the estimates, the Institute of Supply Management (ISM) is expected to report Manufacturing PMI for October at 47.1, higher than the former reading of 46.7.
- A figure below the 50.0 threshold is considered a contraction in economic activity and this would be the 14th straight contraction in the US factory data.
- The US Bureau of Labor Statistics is scheduled to report JOLTS Job Openings data for November, which will also be released on Wednesday. Jobs posted by US employers were 8.850M, higher than the prior demand of 8.733M.
- A major focus for investors will be the FOMC minutes. The FOMC minutes will provide a detailed explanation behind keeping interest rates unchanged in the range of 5.25-5.50% for the third time in a row. Apart from that, investors will be focused on guidance for interest rates in 2024 and detailed projections for inflation and labour market conditions.
- Meanwhile, the US Dollar Index (DXY) has advanced to near 101.50 on Tuesday. In 2023, the USD Index ended its winning streak since 2020 on firmer rate-cut bets.
- This week, action in the USD Index will be guided by the labour market data, which is scheduled for Friday. But before that, market participants will focus on the US Automatic Data Processing (ADP) private payrolls data, which will be published on Thursday.
- As per the consensus, US private employers are expected to have hired 113K job-seekers in December, against hiring of 103K individuals in November.
Technical Analysis: Gold price jumps to near $2,075
Gold price climbs above Friday’s high, supported by expectations of early rate cuts by the Fed. The precious metal is expected to extend further towards the previous week’s high near $2,090. The broader appeal for the Gold price is extremely bullish as short-to-long term Exponential Moving Averages (EMAs) are sloping higher.
Meanwhile, momentum oscillators have shifted into the bullish trajectory, indicating more upside ahead.
Gold FAQs
Why do people invest in Gold?
Gold has played a key role in human’s history as it has been widely used as a store of value and medium of exchange. Currently, apart from its shine and usage for jewelry, the precious metal is widely seen as a safe-haven asset, meaning that it is considered a good investment during turbulent times. Gold is also widely seen as a hedge against inflation and against depreciating currencies as it doesn’t rely on any specific issuer or government.
Who buys the most Gold?
Central banks are the biggest Gold holders. In their aim to support their currencies in turbulent times, central banks tend to diversify their reserves and buy Gold to improve the perceived strength of the economy and the currency. High Gold reserves can be a source of trust for a country’s solvency. Central banks added 1,136 tonnes of Gold worth around $70 billion to their reserves in 2022, according to data from the World Gold Council. This is the highest yearly purchase since records began. Central banks from emerging economies such as China, India and Turkey are quickly increasing their Gold reserves.
How is Gold correlated with other assets?
Gold has an inverse correlation with the US Dollar and US Treasuries, which are both major reserve and safe-haven assets. When the Dollar depreciates, Gold tends to rise, enabling investors and central banks to diversify their assets in turbulent times. Gold is also inversely correlated with risk assets. A rally in the stock market tends to weaken Gold price, while sell-offs in riskier markets tend to favor the precious metal.
What does the price of Gold depend on?
The price can move due to a wide range of factors. Geopolitical instability or fears of a deep recession can quickly make Gold price escalate due to its safe-haven status. As a yield-less asset, Gold tends to rise with lower interest rates, while higher cost of money usually weighs down on the yellow metal. Still, most moves depend on how the US Dollar (USD) behaves as the asset is priced in dollars (XAU/USD). A strong Dollar tends to keep the price of Gold controlled, whereas a weaker Dollar is likely to push Gold prices up.
- USD/MXN loses ground amid Greenback improvement.
- The recent downbeat Mexican data weakened the MXN.
- The speculation of the Fed’s rate cuts strengthens as the US economy is slowing.
USD/MXN loses ground after two days of profits, trading lower near 16.92 during the European hours on Tuesday. The Mexican Peso (MXN) recovers its recent losses against the US Dollar (USD) on improved risk sentiment.
Mexico's Fiscal Balance in Pesos (Nov) revealed a deficit of 87.78 billion, significantly higher than the 29.58 billion recorded in October. Additionally, the Jobless Rate remained stable at 2.7%, slightly below the market expectation of 2.6%. However, the seasonally adjusted Jobless Rate experienced a minor uptick, rising to 2.8% from the previous 2.6%. These data figures may offer some relief to the Bank of Mexico (Banxico) regarding the need for further tightening of monetary policy. However, the potential easing could exert pressure on the Mexican Peso (MXN).
The US Dollar (USD) receives upward support at the beginning of the year, with the US Dollar Index (DXY) edging near 101.50. The signs of a slowing US economy in the last quarter of 2023, reflected in the decline of US labor data, Core PCE Inflation, and GDP Annualized, strengthen the case for potential Federal Reserve (Fed) rate cuts in early 2024. This anticipation exerts negative pressure on the USD, contributing to the downward trend and undermining the strength of the USD/MXN pair.
Additionally, the Chicago Purchasing Managers Index released by ISM-Chicago on Friday indicated a significant reduction in business conditions in the Chicago region, dropping to 46.9 in December from the previous 55.8. This surpassed the market expectation of a decline to 51.0. Looking ahead, investors will be closely watching for ISM Manufacturing PMI figures and the Meeting Minutes from the Federal Open Market Committee (FOMC) scheduled for release on Wednesday, as these events can have notable impacts on market sentiment and expectations.
Gold prices rose in India on Tuesday, according to data from India's Multi Commodity Exchange (MCX).
Gold price stood at 63,308 Indian Rupees (INR) per 10 grams, up INR 225 compared with the INR 63,083 it cost on Monday.
As for futures contracts, Gold prices increased to INR 63,528 per 10 gms from INR 63,320 per 10 gms.
Prices for Silver futures contracts decreased to INR 74,805 per kg from INR 74,390 per kg.
| Major Indian city | Gold Price |
|---|---|
| Ahmedabad | 65,535 |
| Mumbai | 65,360 |
| New Delhi | 65,615 |
| Chennai | 65,530 |
| Kolkata | 65,525 |
Global Market Movers: Comex Gold price remains supported by Fed rate cut bets
- Comex Gold price registered a 13% annual rise in 2023, marking its best year since 2020, and seems poised to prolong its recent well-established appreciating trend.
- Hopes that the Federal Reserve will achieve a soft landing for the economy in 2024 and ease its policy as early as March lend support to the yellow metal.
- The CME's FedWatch tool indicates a more than 85% chance that the Fed will deliver a rate cut in March and a cumulative of 150 basis points (bps) rate cut by the year-end.
- The safe-haven precious metal draws additional support from geopolitical risks stemming from the war in Ukraine and in the Middle East, and China's economic woes.
- US forces struck back against the Iran-backed Houthi group in the Red Sea in response to a series of strikes on several military and commercial vessels in the region.
- The official Chinese PMI released over the weekend indicated a further deterioration in manufacturing activity and little signs of recovery at the end of 2023.
- A private-sector survey, meanwhile, showed on Tuesday that China's factory activity expanded at a quicker pace in December but business confidence for 2024 remained subdued.
- The US Dollar builds on its recovery from a five-month low amid a further rise in the US Treasury bond yields and might cap further gains for the XAU/USD.
- The yield on the benchmark 10-year US government bond recovered further from its lowest level since July touched last week and underpins the buck.
- Traders now look to the release of FOMC minutes on Wednesday and important US macro releases, including the NFP report, for some meaningful impetus.
- This week's busy economic docket also features the ISM Manufacturing PMI and JOLTS Job Openings on Wednesday, followed by the ADP report on Thursday.
(An automation tool was used in creating this post.)
Gold FAQs
Why do people invest in Gold?
Gold has played a key role in human’s history as it has been widely used as a store of value and medium of exchange. Currently, apart from its shine and usage for jewelry, the precious metal is widely seen as a safe-haven asset, meaning that it is considered a good investment during turbulent times. Gold is also widely seen as a hedge against inflation and against depreciating currencies as it doesn’t rely on any specific issuer or government.
Who buys the most Gold?
Central banks are the biggest Gold holders. In their aim to support their currencies in turbulent times, central banks tend to diversify their reserves and buy Gold to improve the perceived strength of the economy and the currency. High Gold reserves can be a source of trust for a country’s solvency. Central banks added 1,136 tonnes of Gold worth around $70 billion to their reserves in 2022, according to data from the World Gold Council. This is the highest yearly purchase since records began. Central banks from emerging economies such as China, India and Turkey are quickly increasing their Gold reserves.
How is Gold correlated with other assets?
Gold has an inverse correlation with the US Dollar and US Treasuries, which are both major reserve and safe-haven assets. When the Dollar depreciates, Gold tends to rise, enabling investors and central banks to diversify their assets in turbulent times. Gold is also inversely correlated with risk assets. A rally in the stock market tends to weaken Gold price, while sell-offs in riskier markets tend to favor the precious metal.
What does the price of Gold depend on?
The price can move due to a wide range of factors. Geopolitical instability or fears of a deep recession can quickly make Gold price escalate due to its safe-haven status. As a yield-less asset, Gold tends to rise with lower interest rates, while higher cost of money usually weighs down on the yellow metal. Still, most moves depend on how the US Dollar (USD) behaves as the asset is priced in dollars (XAU/USD). A strong Dollar tends to keep the price of Gold controlled, whereas a weaker Dollar is likely to push Gold prices up.
FX option expiries for Jan 2 NY cut at 10:00 Eastern Time, via DTCC, can be found below.
- EUR/USD: EUR amounts
- 1.0900 810m
- GBP/USD: GBP amounts
- 1.2750 352m
- USD/CAD: USD amounts
- 1.3150 941m
- 1.3350 388m
- 1.3420 874m
- Pound Sterling trades lacklustre ahead of S&P Global UK Manufacturing PMI data.
- UK factory activities could be lower-than-projected due to festive mood.
- The BoE may start reducing interest rates earlier due to deepening recession fears.
The Pound Sterling (GBP) trades back and forth inside Friday’s range as investors are gradually returning to the trading arsenal after a festive week. The GBP/USD pair is expected to show some action after the release of the S&P Global Manufacturing PMI for December. A steady performance is anticipated in the factory data as workers remained on holiday due to festive mood.
Major action in the Pound Sterling would come from investor speculation regarding the timing of possible rate cuts by the Bank of England (BoE). Market participants currently expect the BoE to start cutting interest rates from May given the United Kingdom economy is exposed to a technical recession. BoE policymakers have been refraining themselves from endorsing interest rate-cut up until now but a likely recession could force them to start discussions about reducing interest rates.
Daily Digest Market Movers: Pound Sterling juggles while US Dollar advances
- Pound Sterling struggles for direction as investors await the United Kingdom’s S&P Global Manufacturing PMI for December, which will be published at 09:30 GMT.
- The economic data is seen remaining unchanged at 46.4. Manufacturing activities in the UK economy are expected to remain muted due to holiday mood in December.
- In addition to that, British firms were operating on lower capacity due to weak demand from the domestic economy and the overseas market.
- Higher interest rates by the Bank of England and underlying price pressures have narrowed pockets of households.
- Broadly, the Pound Sterling has performed well against the US Dollar as the appeal of risk-perceived assets remain upbeat.
- However, the strength in the Pound Sterling could be hampered as the UK is at risk of a technical recession.
- As per the latest estimates from the UK Office for National Statistics (ONS), the UK economy shrank by 0.1% in the third quarter of 2023.
- The BoE is not expecting any growth in the final quarter of 2023. If the UK economy contracts in the October-December period, it will signal a technical recession (two consecutive quarters of negative growth).
- Contrary to UK ONS GDP data, Finance Minister Jeremy Hunt said that the outlook of the economy is not as bad as the data suggested.
- The case of a recession in the UK economy would compel BoE policymakers to consider rate cuts earlier than previously projected.
- Market participants hope that the BoE may start reducing interest rates from May from a previously projected August.
- Later this week, investors will focus on the S&P Global Services PMI data for December, which will be published on Thursday. The economic data is seen steady at 52.7.
- On the US Dollar front, the US Dollar Index (DXY) recovers further to near 101.50 as investors shift focus towards the ISM Manufacturing and Services PMI and labour market data, which will be published this week.
- The broader appeal of the US Dollar is bearish as market participants hope that the Federal Reserve (Fed) will be the first among the Group of Seven economies, to start a rate-cut campaign.
- Investors see the Fed reducing interest rates by 25 basis points (bps) to 5.00-5.25% from March and one more rate cut is anticipated in May.
Technical Analysis: Pound Sterling trades inside Friday’s range
Pound Sterling demonstrates a sheer contraction in volatility around 1.2730 as investors are slowly returning to trading after a festive week. Also, investors await fresh triggers for a meaningful reaction in the FX domain.
On a daily time frame, the GBP/USD pair continues to stay above the 20-day Exponential Moving Average (EMA), which indicates that near-term demand is bullish. Momentum oscillators struggle to sustain in the bearish trajectory.
Pound Sterling FAQs
What is the Pound Sterling?
The Pound Sterling (GBP) is the oldest currency in the world (886 AD) and the official currency of the United Kingdom. It is the fourth most traded unit for foreign exchange (FX) in the world, accounting for 12% of all transactions, averaging $630 billion a day, according to 2022 data.
Its key trading pairs are GBP/USD, aka ‘Cable’, which accounts for 11% of FX, GBP/JPY, or the ‘Dragon’ as it is known by traders (3%), and EUR/GBP (2%). The Pound Sterling is issued by the Bank of England (BoE).
How do the decisions of the Bank of England impact on the Pound Sterling?
The single most important factor influencing the value of the Pound Sterling is monetary policy decided by the Bank of England. The BoE bases its decisions on whether it has achieved its primary goal of “price stability” – a steady inflation rate of around 2%. Its primary tool for achieving this is the adjustment of interest rates.
When inflation is too high, the BoE will try to rein it in by raising interest rates, making it more expensive for people and businesses to access credit. This is generally positive for GBP, as higher interest rates make the UK a more attractive place for global investors to park their money.
When inflation falls too low it is a sign economic growth is slowing. In this scenario, the BoE will consider lowering interest rates to cheapen credit so businesses will borrow more to invest in growth-generating projects.
How does economic data influence the value of the Pound?
Data releases gauge the health of the economy and can impact the value of the Pound Sterling. Indicators such as GDP, Manufacturing and Services PMIs, and employment can all influence the direction of the GBP.
A strong economy is good for Sterling. Not only does it attract more foreign investment but it may encourage the BoE to put up interest rates, which will directly strengthen GBP. Otherwise, if economic data is weak, the Pound Sterling is likely to fall.
How does the Trade Balance impact the Pound?
Another significant data release for the Pound Sterling is the Trade Balance. This indicator measures the difference between what a country earns from its exports and what it spends on imports over a given period.
If a country produces highly sought-after exports, its currency will benefit purely from the extra demand created from foreign buyers seeking to purchase these goods. Therefore, a positive net Trade Balance strengthens a currency and vice versa for a negative balance.
Here is what you need to know on Tuesday, January 2:
Following some choppy action in the last trading days of 2023, financial markets seem to have turned relatively calm to begin the new year. S&P Global will release revisions to December PMI data for Germany, the Euro area, the UK and the US later in the day. ISM Manufacturing PMI, November JOLTS Job Openings data and FOMC Minutes from the US could ramp up volatility in the second half of the day on Wednesday.
The US Dollar (USD) Index, which tracks the USD's performance against a basket of six major currencies, lost 2% on a monthly basis in December as dovish Federal Reserve (Fed) bets dominated the action. In that same period, the benchmark 10-year US Treasury bond yield fell 10%. Early Tuesday, the USD Index holds steady at around 101.50 and the 10-year yield stays below 3.9%.
US Dollar price today
The table below shows the percentage change of US Dollar (USD) against listed major currencies today. US Dollar was the strongest against the Swiss Franc.
| USD | EUR | GBP | CAD | AUD | JPY | NZD | CHF | |
| USD | 0.08% | -0.02% | 0.08% | -0.25% | 0.29% | 0.09% | 0.33% | |
| EUR | -0.07% | -0.09% | 0.01% | -0.33% | 0.21% | 0.01% | 0.25% | |
| GBP | 0.02% | 0.09% | 0.09% | -0.25% | 0.31% | 0.09% | 0.32% | |
| CAD | -0.08% | -0.01% | -0.10% | -0.33% | 0.21% | 0.00% | 0.25% | |
| AUD | 0.23% | 0.30% | 0.23% | 0.31% | 0.52% | 0.32% | 0.56% | |
| JPY | -0.30% | -0.20% | -0.31% | -0.21% | -0.54% | -0.20% | 0.04% | |
| NZD | -0.08% | -0.01% | -0.09% | -0.02% | -0.36% | 0.22% | 0.18% | |
| CHF | -0.34% | -0.24% | -0.33% | -0.24% | -0.60% | -0.02% | -0.23% |
The heat map shows percentage changes of major currencies against each other. The base currency is picked from the left column, while the quote currency is picked from the top row. For example, if you pick the Euro from the left column and move along the horizontal line to the Japanese Yen, the percentage change displayed in the box will represent EUR (base)/JPY (quote).
During the Asian trading hours, the data from China revealed that the Caixin Manufacturing PMI improved modestly to 50.8 in December from 50.7. This reading came in better than the market expectation of 50.4. US stock index futures trade mixed in the European morning.
After touching a multi-month high of 1.1140 in the last week of 2023, EUR/USD staged a correction and declined toward 1.1000 heading into the New Year. Early Tuesday, the pair trades marginally lower on the day slightly below 1.1050.
GBP/USD lost its traction and dropped below 1.2750 following a failed attempt to break above 1.2800 in the previous week. The pair fluctuates in a narrow channel above 1.2700 in the European session on Tuesday.
USD/JPY fell nearly 5% in December and touched its lowest level since July below 140.50 ahead of the New Year holiday. The pair gathered recovery momentum early Tuesday and was last seen rising 0.5% on the day near 141.50.
Gold went into a consolidation phase and moved sideways at around $2,060 in the second half of the previous week. XAU/USD started to edge higher to begin 2024 and was last seen trading in positive territory above $2,070.
- GBP/USD seems to hold its position above 1.2730 on the hawkish stance of BoE.
- MACD suggests a transition to a bearish market sentiment.
- A breach below 1.2700 could push the pair toward the 23.6% Fibonacci retracement at 1.2643.
GBP/USD looks to halt a two-day losing streak, trading slightly higher near 1.2730 during the Asian hours on Tuesday. The GBP/USD pair receives upward support from the hawkish stance of the Bank of England (BoE), coupled with the speculation on the Federal Reserve’s (Fed) dovish stance on the interest rate trajectory in the first quarter of 2024.
However, the technical indicators for the GBP/USD pair are signaling a bearish momentum. The 14-day Relative Strength Index (RSI) below the 50 level indicates downward pressure, suggesting a weaker outlook for the EUR/USD pair.
Additionally, the Moving Average Convergence Divergence (MACD) line is positioned above the centerline but has crossed below the signal line. This shift indicates a potential transition to a bearish market sentiment.
The 14-day Exponential Moving Average (EMA) at 1.2705 aligned with the psychological level at 1.2700 appears to be the key support region. A breach below the region could put downward pressure on the GBP/USD pair to navigate the area toward the major support at 1.2650 lined up with the 23.6% Fibonacci retracement at 1.2643.
On the upside, the 1.2750 level could act as the major barrier following the psychological level at the 1.2800 level. A firm breakthrough above the latter could support the GBP/USD pair to approach December’s high at 1.2827 level before the major level at 1.2850.
GBP/USD: Daily Chart
-638397747563934773.png)
- EUR/JPY holds positive ground around 156.06 on Tuesday.
- After European inflation fell to 2.4% in November, traders increased their expectations of rate cuts in 2024.
- The anticipation that the Bank of Japan (BoJ) will exit its ultra-loose policy by the first half of 2024 might limit JPY’s downside.
- Investors await the Eurozone HCOB Manufacturing PMI for December.
The EUR/JPY cross snaps the two-losing streak during the early European session on Tuesday. However, the bearish outlook of the EUR/JPY remains intact as the cross holds below the key Exponential Moving Average (EMA) on the daily chart. The cross currently trades near 156.06, up 0.16% for the day.
The falling inflation might prompt the European Central Bank (ECB) to begin cutting interest rates in the second quarter of 2024. Traders raise their bets on a rate cut after eurozone inflation fell to 2.4% in November, from its peak above 10% a year earlier and just marginally over the ECB's target of 2%.
On the Japanese Yen front, the anticipation that the Bank of Japan (BoJ) will exit its ultra-loose policy by the first half of 2024 might cap the downside of the JPY and act as a tailwind for the EUR/JPY cross. The BoJ governor Kazuo Ueda said during the press conference on December 19 that policymakers will track more information to see if a virtuous cycle of wage and price is achievable to determine whether the central bank will normalize policy.
Looking ahead, traders will focus on the Eurozone HCOB Manufacturing PMI for December. Later this week, the German Unemployment report will be due on Wednesday. The Japanese Jibun Bank Manufacturing PMI, the German Consumer Price Index (CPI) will be released on Thursday.
- EUR/USD drifts lower to 1.1028 amid the rebound of the USD.
- EUR/USD maintains the bearish outlook above the key EMA; RSI indicator stands in bearish territory below the 50 midline.
- The key support level to watch is seen at 1.1000; 1.1080 acts as an immediate resistance level for the major pair.
The EUR/USD pair loses momentum for the fourth consecutive day during the early European session on Tuesday. The downtick of the major pair is backed by the recovery of the US Dollar (USD). At press time, EUR/USD is trading at 1.1028, down 0.07% on the day.
From the technical perspective, EUR/USD keeps the negative outlook unchanged on the four-hour chart as the major pair holds below the key 100-hour Exponential Moving Averages (EMA). However, the 14-day Relative Strength Index (RSI) stands in bearish territory below the 50 midline, indicating that further decline cannot be ruled out.
The key support level to watch is the confluence of the lower limit of the Bollinger Band and the psychological round mark at 1.1000. The next contention level is seen at the 100-hour EMA at 1.0973. Further south, the downside stop is located at 1.0929 (Low of December 20), followed by 1.0888 (Low of December 15).
On the upside, a high of December 29 at 1.1080 acts as an immediate resistance level for the major pair. The next hurdle will emerge at the 1.1100 psychological round mark. The additional upside filter to watch is 1.1139 (High of December 28), en route to 1.1240 (High of July 19).
EUR/USD four-hour chart
-638397710214794739.png)
- USD/CHF rises to near 0.8450 major level as the Greenback gains ground.
- US-Houthi clash in the Red Sea could reinforce the demand for the Safe-haven Swiss Franc.
- Traders are expected to adopt caution as recent US data indicated the slowing of the US economy.
USD/CHF has retraced its recent losses registered on Friday, trading higher near 0.8450 during the Asian session on Tuesday. The US Dollar (USD) receives upward support at the beginning of the year, with the US Dollar Index (DXY) edging above 101.50.
Given the recent decline in US labor data, Core PCE Inflation, and GDP Annualized, market participants are likely to exercise caution before making bids on the US Dollar (USD). These indicators support the notion that the US economy is slowing down in the fourth quarter, possibly heading towards a soft landing. This further reinforces the argument for Federal Reserve (Fed) rate cuts in 2024, exerting negative pressure on the USD.
The Chicago Purchasing Managers Index released by ISM-Chicago on Friday showed that business conditions in the Chicago region reduced to 46.9 in December from the previous 55.8, exceeding the market expectation of a 51.0 decline. ISM Manufacturing PMI figures and Meeting Minutes from the Federal Open Market Committee (FOMC) are scheduled to be released on Wednesday.
The naval clash in the Red Sea could fuel heightened risk aversion, which could increase the demand for the safe-haven Swiss Franc (CHF). Houthi militants attacked a Maersk container ship on Sunday, but the assault was thwarted by US helicopters. Following the incident, Iran sends a warship to the Red Sea. This situation raises the possibility of disruptions in the vital waterways for oil transportation, including the Red Sea and the Straits of Hormuz in the Gulf.
During the past week, the Swiss ZEW Survey – Expectations recorded a decline of 23.7 points in December, compared to the 29.6 decrease in November. On a surprising note, the KOF Swiss Leading Indicator improved to 97.8, surpassing the expected reading of 97.0. Looking ahead, the SVME Manufacturing Purchasing Managers Index (PMI) is scheduled for release on Wednesday, adding to the economic indicators to watch.
The Swiss National Bank (SNB) appears poised to adopt a proactive stance, as indicated in its recent Quarterly Bulletin. The bank has conveyed its readiness to actively intervene in the foreign exchange market to provide support for the Swiss Franc (CHF).
- Gold price regains positive traction and stalls its corrective slide from a multi-week top.
- Dovish Fed expectations and geopolitical risks continue to lend support to the XAU/USD.
- Rising US bond yields underpin the US Dollar and might keep a lid on any further gains.
Gold price (XAU/USD) attracts some buyers during the Asian session on Tuesday and for now, seems to have snapped a two-day-old losing streak. The precious metal is currently placed around the $2,070 area, up over 0.30% for the day, although it remains below a multi-week high touched last Thursday amid a relatively thin liquidity on the first trading day of 2024. The US Dollar (USD) prolongs its modest recovery from a five-month low for the third straight day in the wake of a further recovery in the US Treasury bond yields, which, in turn, is seen acting as a headwind for the commodity. That said, growing acceptance that the Federal Reserve (Fed) will soon start cutting interest rates favours bullish traders and supports prospects for additional gains.
Investors are pencilling in a series of rate cuts by the US central bank in 2024 and the bets were lifted by a higher-than-projected decline in the US Core Personal Consumption Expenditure (PCE) Price Index – the Fed's preferred inflation gauge. This comes on top of a still resilient US economy and ensures a soft landing, which should allow the US central bank to start easing its policy sooner rather than later. In fact, the CME group's FedWatch tool indicates a more than 85% chance that the Fed will deliver a rate cut at its March meeting and a cumulative of 150 basis points (bps) rate cut by the year-end. This, in turn, should cap the upside for the US bond yields and hold back the USD bulls from placing fresh bets, validating the positive outlook for the Gold price.
Furthermore, geopolitical instability as well as direct purchases from central banks suggest that the path of least resistance for the XAU/USD is to the upside. Traders, however, might prefer to wait on the sidelines ahead of important US macro releases scheduled at the beginning of a new month, including the closely watched monthly employment details or the NFP report on Friday. This, along with the FOMC meeting minutes on Wednesday, will influence the USD price dynamics and provide some meaningful impetus to the non-yielding Gold price.
Daily Digest Market Movers: Gold price remains supported by dovish Federal Reserve expectations
- Gold price registered a 13% annual rise in 2023, marking its best year since 2020, and seems poised to prolong its recent well-established appreciating trend.
- Hopes that the Federal Reserve will achieve a soft landing for the economy in 2024 and ease its policy as early as March lend support to the yellow metal.
- The US Dollar builds on its recovery from a five-month low amid a further rise in the US Treasury bond yields and might cap further gains for the XAU/USD.
- The yield on the benchmark 10-year US government bond recovered further from its lowest level since July touched last week and underpins the buck.
- Traders now look to the release of FOMC minutes on Wednesday and important US macro releases, including the NFP report, for some meaningful impetus.
- This week's busy economic docket also features the ISM Manufacturing PMI and JOLTS Job Openings on Wednesday, followed by the ADP report on Thursday.
- In the meantime, the safe-haven precious metal could draw support from geopolitical risks stemming from the war in Ukraine and in the Middle East.
Technical Analysis: Gold price could face immediate resistance near the $2,077-2078 region
From a technical perspective, the all-time high closing, around the $2,077-2,078 region printed last Wednesday, now seems to act as an immediate barrier ahead of the $2,088 zone, or the multi-week high. Some follow-through buying should allow the Gold price to reclaim the $2,100 round-figure mark. The subsequent move up has the potential to lift the XAU/USD further towards retesting the record peak, around the $2,144 area set in early December.
On the flip side, the $2,060-2,058 region now seems to protect the immediate downside ahead of the $2,048 horizontal zone and the $2,040 area. Failure to defend the said support levels might turn the Gold price vulnerable to accelerate the slide towards the $2,020 intermediate support en route to the 50-day Simple Moving Average (SMA), currently near the $2,006 region, and the $2,000 psychological mark.
US Dollar price today
The table below shows the percentage change of US Dollar (USD) against listed major currencies today. US Dollar was the strongest against the Swiss Franc.
| USD | EUR | GBP | CAD | AUD | JPY | NZD | CHF | |
| USD | 0.14% | 0.09% | 0.09% | -0.10% | 0.28% | 0.18% | 0.32% | |
| EUR | -0.14% | -0.04% | -0.04% | -0.22% | 0.15% | 0.05% | 0.18% | |
| GBP | -0.09% | 0.05% | 0.00% | -0.21% | 0.20% | 0.08% | 0.19% | |
| CAD | -0.09% | 0.05% | 0.00% | -0.17% | 0.20% | 0.10% | 0.22% | |
| AUD | 0.10% | 0.22% | 0.17% | 0.17% | 0.37% | 0.26% | 0.39% | |
| JPY | -0.30% | -0.14% | -0.20% | -0.18% | -0.36% | -0.10% | 0.02% | |
| NZD | -0.19% | -0.05% | -0.10% | -0.10% | -0.29% | 0.12% | 0.06% | |
| CHF | -0.32% | -0.15% | -0.20% | -0.20% | -0.43% | -0.01% | -0.11% |
The heat map shows percentage changes of major currencies against each other. The base currency is picked from the left column, while the quote currency is picked from the top row. For example, if you pick the Euro from the left column and move along the horizontal line to the Japanese Yen, the percentage change displayed in the box will represent EUR (base)/JPY (quote).
Gold FAQs
Why do people invest in Gold?
Gold has played a key role in human’s history as it has been widely used as a store of value and medium of exchange. Currently, apart from its shine and usage for jewelry, the precious metal is widely seen as a safe-haven asset, meaning that it is considered a good investment during turbulent times. Gold is also widely seen as a hedge against inflation and against depreciating currencies as it doesn’t rely on any specific issuer or government.
Who buys the most Gold?
Central banks are the biggest Gold holders. In their aim to support their currencies in turbulent times, central banks tend to diversify their reserves and buy Gold to improve the perceived strength of the economy and the currency. High Gold reserves can be a source of trust for a country’s solvency. Central banks added 1,136 tonnes of Gold worth around $70 billion to their reserves in 2022, according to data from the World Gold Council. This is the highest yearly purchase since records began. Central banks from emerging economies such as China, India and Turkey are quickly increasing their Gold reserves.
How is Gold correlated with other assets?
Gold has an inverse correlation with the US Dollar and US Treasuries, which are both major reserve and safe-haven assets. When the Dollar depreciates, Gold tends to rise, enabling investors and central banks to diversify their assets in turbulent times. Gold is also inversely correlated with risk assets. A rally in the stock market tends to weaken Gold price, while sell-offs in riskier markets tend to favor the precious metal.
What does the price of Gold depend on?
The price can move due to a wide range of factors. Geopolitical instability or fears of a deep recession can quickly make Gold price escalate due to its safe-haven status. As a yield-less asset, Gold tends to rise with lower interest rates, while higher cost of money usually weighs down on the yellow metal. Still, most moves depend on how the US Dollar (USD) behaves as the asset is priced in dollars (XAU/USD). A strong Dollar tends to keep the price of Gold controlled, whereas a weaker Dollar is likely to push Gold prices up.
- WTI prices gain ground on the growing possibility of Red Sea disruptions.
- US helicopters repelled a Houthi attack on a Maersk vessel on Sunday.
- Iran-led groups launched attacks on US forces and Israel in Gaza.
- US ExxonMobil Corp has officially transferred operations of West Qurna 1 oilfield to PetroChina.
West Texas Intermediate (WTI) price trades higher around $72.80 per barrel during the Asian session on Tuesday. The surge in crude oil prices is linked to a naval clash in the Red Sea. Houthi militants attacked a Maersk container ship on Sunday, but the assault was thwarted by US helicopters.
Following the incident, the possibility of disruptions in Middle East supply grows, with reports of an Iranian warship entering the Red Sea. Additionally, Iran-led groups launched attacks on US forces and Israel in Gaza, raising concerns about a broader conflict that could potentially close vital waterways for oil transportation, including the Red Sea and the Straits of Hormuz in the Gulf.
The downward pressure on Crude oil prices stems from concerns over slowing global economic growth and the escalating worry about increased supply, especially from producers outside the Organization of the Petroleum Exporting Countries and its allies (OPEC+). The oil group is grappling with weakening export demand in 2024, coinciding with a decline in its global market share to its lowest level due to output cuts and Angola's departure from the group. This raises doubts in the market about OPEC+ being able to adhere to the planned supply cuts of around 6 million barrels per day.
Furthermore, Basim Mohammed, deputy oil minister for upstream affairs in Iraq, informed Reuters that US ExxonMobil Corp has officially withdrawn from the West Qurna 1 oilfield in southern Iraq and has transferred its operations to PetroChina, the lead contractor. Iraq and PetroChina have ambitious plans to increase production to 600,000 barrels per day by the end of 2024.
- Indian Rupee loses traction on the modest rebound of the US Dollar.
- Finance Ministry said India's economy is expected to surpass the government's growth estimate of 6.5% in FY24.
- The US labor data, including US Nonfarm Payrolls (NFP), will be in the spotlight this week.
Indian Rupee (INR) trades on a soft note on the first trading day of 2024 on Tuesday. India’s Finance Ministry said in its half-yearly economic review report on Friday that India's economy is projected to surpass the government's growth estimate of 6.5% in FY24. The ministry further stated that the growth in consumption demand is also expected to continue. Additionally, the relatively steady Indian Rupee with substantial foreign currency reserves encourages confidence in the country's external sector.
The INR is likely to be influenced by the US Dollar (USD) dynamic this week while traders keep an eye on the US labor data, including US Nonfarm Payrolls (NFP), Unemployment Rate, and Average Hourly Earnings, due later on Friday.
Daily Digest Market Movers: Indian Rupee remains strong amid global factors
- The Reserve Bank of India (RBI) has constantly intervened in foreign currency markets on both sides in recent weeks, keeping the USD/INR pair in a narrow range, according to traders.
- The International Monetary Fund (IMF) stated in its annual report that India had intervened in selling dollars more than it deemed necessary.
- Indian Finance Ministry mentioned that the real GDP grew by 7.7% in H1 of FY24, following a 7.6% growth in Q2.
- India's current account deficit narrowed to $8.3 billion in the second quarter of 2023–24.
- The US Chicago Purchasing Managers' Index (PMI) arrived at 46.9 in December from the previous reading of 55.8, weaker than the expectation of 51.0.
- According to the CME Group's FedWatch tool, the markets are pricing in 88% odds of rate cuts in March.
Technical Analysis: Indian Rupee extends the longer-term range theme
Indian Rupee trades weaker on the day. The USD/INR pair has traded within a multi-month-old trading band of 82.80–83.40. According to the daily chart, buyers look to retain control as the pair holds above the key 100-period Exponential Moving Average (EMA). Furthermore, the 14-day Relative Strength Index (RSI) bounces back above the 50.0 midpoint, suggesting that further upside looks favorable.
The first support level will emerge at 83.00. A break below 83.00 will see a drop to the confluence of the lower limit of the trading range and a low of September 12 at 82.80. Further south, the next contention is located near a low of August 11 at 82.60. On the other hand, the immediate resistance level is near the upper boundary of the trading range at 83.40. The additional upside filter to watch is the year-to-date (YTD) high of 83.47, followed by the 84.00 psychological mark.
US Dollar price today
The table below shows the percentage change of US Dollar (USD) against listed major currencies today. US Dollar was the strongest against the Japanese Yen.
| USD | EUR | GBP | CAD | AUD | JPY | NZD | CHF | |
| USD | 0.15% | 0.10% | 0.08% | -0.04% | 0.33% | 0.24% | 0.30% | |
| EUR | -0.13% | -0.04% | -0.06% | -0.19% | 0.19% | 0.10% | 0.17% | |
| GBP | -0.10% | 0.04% | -0.02% | -0.18% | 0.24% | 0.13% | 0.18% | |
| CAD | -0.08% | 0.06% | 0.02% | -0.12% | 0.27% | 0.18% | 0.21% | |
| AUD | 0.04% | 0.18% | 0.14% | 0.11% | 0.38% | 0.28% | 0.35% | |
| JPY | -0.36% | -0.20% | -0.23% | -0.27% | -0.40% | -0.09% | -0.04% | |
| NZD | -0.23% | -0.08% | -0.12% | -0.16% | -0.30% | 0.12% | 0.01% | |
| CHF | -0.31% | -0.14% | -0.18% | -0.21% | -0.36% | 0.05% | -0.05% |
The heat map shows percentage changes of major currencies against each other. The base currency is picked from the left column, while the quote currency is picked from the top row. For example, if you pick the Euro from the left column and move along the horizontal line to the Japanese Yen, the percentage change displayed in the box will represent EUR (base)/JPY (quote).
Indian Rupee FAQs
What are the key factors driving the Indian Rupee?
The Indian Rupee (INR) is one of the most sensitive currencies to external factors. The price of Crude Oil (the country is highly dependent on imported Oil), the value of the US Dollar – most trade is conducted in USD – and the level of foreign investment, are all influential. Direct intervention by the Reserve Bank of India (RBI) in FX markets to keep the exchange rate stable, as well as the level of interest rates set by the RBI, are further major influencing factors on the Rupee.
How do the decisions of the Reserve Bank of India impact the Indian Rupee?
The Reserve Bank of India (RBI) actively intervenes in forex markets to maintain a stable exchange rate, to help facilitate trade. In addition, the RBI tries to maintain the inflation rate at its 4% target by adjusting interest rates. Higher interest rates usually strengthen the Rupee. This is due to the role of the ‘carry trade’ in which investors borrow in countries with lower interest rates so as to place their money in countries’ offering relatively higher interest rates and profit from the difference.
What macroeconomic factors influence the value of the Indian Rupee?
Macroeconomic factors that influence the value of the Rupee include inflation, interest rates, the economic growth rate (GDP), the balance of trade, and inflows from foreign investment. A higher growth rate can lead to more overseas investment, pushing up demand for the Rupee. A less negative balance of trade will eventually lead to a stronger Rupee. Higher interest rates, especially real rates (interest rates less inflation) are also positive for the Rupee. A risk-on environment can lead to greater inflows of Foreign Direct and Indirect Investment (FDI and FII), which also benefit the Rupee.
How does inflation impact the Indian Rupee?
Higher inflation, particularly, if it is comparatively higher than India’s peers, is generally negative for the currency as it reflects devaluation through oversupply. Inflation also increases the cost of exports, leading to more Rupees being sold to purchase foreign imports, which is Rupee-negative. At the same time, higher inflation usually leads to the Reserve Bank of India (RBI) raising interest rates and this can be positive for the Rupee, due to increased demand from international investors. The opposite effect is true of lower inflation.
- Australian Dollar remains slightly weak as the US Dollar continues to gain ground.
- Australian currency declined by 0.06% against the Greenback in 2023.
- China's Caixin Manufacturing PMI improved to 50.8 in December from 50.7 prior.
- Recent US data led the market bias toward the Fed’s dovish stance in early 2024.
The Australian Dollar (AUD) lingers near 0.6810 on Tuesday after a rebound on Friday. The AUD/USD pair experienced a 0.06% decline in 2023, extending its three-year losing streak. However, the pair saw gains in the past two months, attributed to a weaker US Dollar (USD) as there has been a slight dip in United States (US) inflation recently. The easing in US Inflation is leading to market speculation on the US Federal Reserve (Fed) to cut interest rates in early 2024.
Australia’s Dollar demonstrated resilience, fueled by an enhanced risk appetite and robust inflation and housing prices. The recent meeting minutes underscored the Reserve Bank of Australia's (RBA) commitment to scrutinizing additional data to gauge risk balance before deciding on future interest rates. The anticipation that the RBA will probably refrain from a rate cut in the upcoming February policy meeting adds support to maintaining the strength of the Australian Dollar (AUD).
China's Caixin Manufacturing Purchasing Managers Index (PMI) displayed improvement in December, registering a reading of 50.8, surpassing both the market consensus of 50.4 and the previous reading of 50.7. This positive surprise in manufacturing data could potentially bolster the Aussie Dollar (AUD), given the significant trade ties between China and Australia.
The US Dollar Index (DXY) continues to gain ground, but it may encounter challenges again as market participants observed a dip in recent US labor data, Core PCE Inflation, and GDP Annualized. The recent release of the Chicago Purchasing Managers Index by ISM-Chicago on Friday indicated an easing of business conditions across Illinois, Indiana, and Michigan in December.
These indicators validate the notion that the US economy is slowing down in the fourth quarter, signaling a potential soft landing. This reinforces the argument for Fed rate cuts in 2024 and exerts downward pressure on the USD.
Australia's Judo Bank Composite and Services PMI data for December are set to be released on Thursday. On the US docket, Wednesday will be marked by the scrutiny of ISM Manufacturing PMI figures and the Meeting Minutes from the Federal Open Market Committee (FOMC).
Daily Digest Market Movers: Australian Dollar moves sideways amid US Dollar improves
- Judo Bank Manufacturing PMI eased to 47.6 in December from the previous reading of 47.8.
- China’s NBS Manufacturing PMI for December reduced to the reading of 49.0 from the previous 49.4 figures. The market expectation was an increase to 49.5 readings. While NBS Non-Manufacturing PMI improved to 50.4 from the 50.2 prior but fell short of the 50.5 expected.
- The Chicago Purchasing Managers Index reduced to 46.9 in December from the previous 55.8.
Technical Analysis: Australian Dollar hovers near the psychological support at 0.6800
The Australian Dollar hovers around 0.6810 on Tuesday. The prevailing bullish sentiment could influence the AUD/USD pair to surpass again the major resistance level at 0.6850 following the psychological level of 0.6900. On the downside, the AUD/USD pair could find the key support at the psychological level at 0.6800 aligned with the nine-day Exponential Moving Average (EMA) at 0.6799. A breach below this crucial support zone could potentially lead the AUD/USD pair to navigate the major support at 0.6750 followed by the 23.6% Fibonacci retracement level at 0.6725.
AUD/USD: Daily Chart
-638397603445764207.png)
Australian Dollar price today
The table below shows the percentage change of Australian Dollar (AUD) against listed major currencies today. Australian Dollar was the weakest against the US Dollar.
| USD | EUR | GBP | CAD | AUD | JPY | NZD | CHF | |
| USD | 0.14% | 0.11% | 0.05% | 0.07% | 0.26% | 0.29% | 0.24% | |
| EUR | -0.12% | -0.01% | -0.06% | -0.05% | 0.13% | 0.17% | 0.12% | |
| GBP | -0.11% | 0.02% | -0.06% | -0.07% | 0.15% | 0.17% | 0.10% | |
| CAD | -0.05% | 0.07% | 0.06% | 0.03% | 0.21% | 0.24% | 0.20% | |
| AUD | -0.08% | 0.05% | 0.04% | -0.03% | 0.18% | 0.22% | 0.17% | |
| JPY | -0.27% | -0.11% | -0.15% | -0.21% | -0.18% | 0.04% | -0.01% | |
| NZD | -0.29% | -0.16% | -0.17% | -0.25% | -0.23% | -0.02% | -0.15% | |
| CHF | -0.25% | -0.09% | -0.10% | -0.17% | -0.17% | 0.04% | 0.07% |
The heat map shows percentage changes of major currencies against each other. The base currency is picked from the left column, while the quote currency is picked from the top row. For example, if you pick the Euro from the left column and move along the horizontal line to the Japanese Yen, the percentage change displayed in the box will represent EUR (base)/JPY (quote).
Australian Dollar FAQs
What key factors drive the Australian Dollar?
One of the most significant factors for the Australian Dollar (AUD) is the level of interest rates set by the Reserve Bank of Australia (RBA). Because Australia is a resource-rich country another key driver is the price of its biggest export, Iron Ore. The health of the Chinese economy, its largest trading partner, is a factor, as well as inflation in Australia, its growth rate and Trade Balance. Market sentiment – whether investors are taking on more risky assets (risk-on) or seeking safe-havens (risk-off) – is also a factor, with risk-on positive for AUD.
How do the decisions of the Reserve Bank of Australia impact the Australian Dollar?
The Reserve Bank of Australia (RBA) influences the Australian Dollar (AUD) by setting the level of interest rates that Australian banks can lend to each other. This influences the level of interest rates in the economy as a whole. The main goal of the RBA is to maintain a stable inflation rate of 2-3% by adjusting interest rates up or down. Relatively high interest rates compared to other major central banks support the AUD, and the opposite for relatively low. The RBA can also use quantitative easing and tightening to influence credit conditions, with the former AUD-negative and the latter AUD-positive.
How does the health of the Chinese Economy impact the Australian Dollar?
China is Australia’s largest trading partner so the health of the Chinese economy is a major influence on the value of the Australian Dollar (AUD). When the Chinese economy is doing well it purchases more raw materials, goods and services from Australia, lifting demand for the AUD, and pushing up its value. The opposite is the case when the Chinese economy is not growing as fast as expected. Positive or negative surprises in Chinese growth data, therefore, often have a direct impact on the Australian Dollar and its pairs.
How does the price of Iron Ore impact the Australian Dollar?
Iron Ore is Australia’s largest export, accounting for $118 billion a year according to data from 2021, with China as its primary destination. The price of Iron Ore, therefore, can be a driver of the Australian Dollar. Generally, if the price of Iron Ore rises, AUD also goes up, as aggregate demand for the currency increases. The opposite is the case if the price of Iron Ore falls. Higher Iron Ore prices also tend to result in a greater likelihood of a positive Trade Balance for Australia, which is also positive of the AUD.
How does the Trade Balance impact the Australian Dollar?
The Trade Balance, which is the difference between what a country earns from its exports versus what it pays for its imports, is another factor that can influence the value of the Australian Dollar. If Australia produces highly sought after exports, then its currency will gain in value purely from the surplus demand created from foreign buyers seeking to purchase its exports versus what it spends to purchase imports. Therefore, a positive net Trade Balance strengthens the AUD, with the opposite effect if the Trade Balance is negative.
- USD/CAD oscillates in a range and is influenced by a combination of diverging forces.
- Rising US bond yields act as a tailwind for the USD and lend some support to the pair.
- An uptick in Crude Oil prices is seen underpinning the Loonie and capping the upside.
The USD/CAD pair struggles to gain any meaningful traction on the first day of a new week and oscillates in a narrow trading band during the Asian session. Spot prices currently trade around mid-1.3200s, nearly unchanged for the day amid mixed cues and relatively thin liquidity conditions.
A further recovery in the US Treasury bond yields assists the US Dollar (USD) in attracting some buyers for the third straight day, which, in turn, is seen as a key factor lending some support to the USD/CAD pair. That said, an uptick in Crude Oil prices is seen underpinning the commodity-linked Loonie and acting as a headwind for spot prices. Furthermore, dovish Federal Reserve (Fed) expectations might hold back the USD bulls from placing aggressive bets and cap the major.
Investors seem convinced and are pricing in a greater chance that the US central bank will start cutting interest rates as early as March. The bets were reaffirmed by a higher-than-projected decline in the US Core Personal Consumption Expenditure (PCE) Price Index – the Fed's preferred inflation gauge. This comes on top of a still resilient US economy and ensures a soft landing in 2024, which should allow the US central bank to start easing its policy sooner rather than later.
Meanwhile, the Bank of Canada (BoC) Governor Tiff Macklem recently said that the central bank could also start cutting rates sometime in 2024. This leaves the Canadian Dollar (CAD) at the mercy of Oil price dynamics and the sentiment surrounding the Greenback. Nevertheless, the mixed fundamental backdrop warrants some caution before positioning for an extension of the USD/CAD pair's modest bounce from the 1.3175 area, or a five-month low touched last week.
Traders might also prefer to wait on the sidelines ahead of important US macro releases scheduled at the beginning of a new month. This week's busy US economic docket features the ISM Manufacturing PMI and JOLTS Job Openings on Wednesday, followed by the ADP report on Thursday, and the closely-watched NFP on Friday. Investors will also confront the release of FOMC minutes on Wednesday, which might provide cues about the timing of the first rate cut.
Technical levels to watch
- The Japanese Yen kicks off the new year on a softer note against the US Dollar.
- Bets that the BoJ will exit the negative interest rates regime should help limit further losses.
- Dovish Fed expectations cap the USD recovery and should act as a headwind for USD/JPY.
The Japanese Yen (JPY) ticks lower against its American counterpart amid relatively thin liquidity during the Asian session on Monday, albeit remains well within the striking distance of a five-month high touched last Thursday. Market players seem convinced that the Bank of Japan (BoJ) will exit its ultra-loose policy and lift interest rates into positive territory by the first half of 2024. The current pricing suggests a strong possibility of such an action in April, after the annual wage negotiations in March. The BoJ, meanwhile, has caught investors off guard in the past with changes to its policy settings and hence, a move at the January meeting cannot be ruled out completely. This, in turn, could act as a tailwind for the domestic currency.
The US Dollar (USD), on the other hand, has taken a tumble in recent weeks on the back of rising bets for a series of interest rate cuts by the Federal Reserve (Fed) in 2024. In fact, the markets anticipate the first rate cut as early as March and are pricing in 150 basis points (bps) of cumulative cuts by the end of this year. The expectations were reaffirmed by slightly higher than projected decline in the US Core Personal Consumption Expenditure (PCE) Price Index data – the Fed's preferred inflation gauge. This ensures that the US central bank may achieve a soft landing for the economy in 2024 and soften its hawkish stance, which should keep the USD bulls on the defensive and keep a lid on any meaningful appreciating move for the USD/JPY pair.
Daily Digest Market Movers: Japanese Yen to draw support from hawkish BoJ expectations
- The Japanese Yen snaps a three-day winning streak against the US Dollar on Tuesday, though the near-term bias seems tilted in favour of bullish traders.
- Bets for an imminent shift in the Bank of Japan's policy stance after the annual wage negotiations in March might continue to act as a tailwind for the JPY.
- Western Japan was hit by a 7.6 magnitude earthquake on Monday that led to a 1.2-meter tsunami, though had limited impact on the markets amid thin liquidity.
- Dovish Federal Reserve expectations keep a lid on the recent US Dollar recovery from its lowest level since late July and act as a headwind for the USD/JPY pair.
- The markets have priced in the possibility that the Fed will cut rates six times this year, starting as early as March, amid hopes for a soft landing for the economy.
- Traders now look to the key US macro data scheduled at the beginning of a new month, including the NFP report on Friday, for some meaningful impetus.
- Investors will further confront the release of FOMC meeting minutes on Wednesday, which will be scrutinized for cues about the timing of the first rate cut.
- This week's US economic docket also features the ISM Manufacturing PMI and JOLTS Job Openings on Wednesday, followed by the ADP report on Thursday.
Technical Analysis: USD/JPY bears have the upper hand, 200-day SMA holds the key
From a technical perspective, the recent breakdown and acceptance below the 200-day Simple Moving Average (SMA) was seen as a fresh trigger for the USD/JPY bears. Moreover, oscillators on the daily chart are yet to signal oversold conditions and support prospects for deeper losses. Hence, any subsequent move up might still be seen as a selling opportunity and runs the risk of fizzling out quickly ahead of the 142.00 round figure. That said, some follow-through buying could trigger a short-covering move and lift spot prices beyond the 142.40 intermediate hurdle, towards retesting the 200-day SMA breakpoint, currently near the 143.00 mark.
On the flip side, the 141.00 round figure could protect the immediate downside ahead of the multi-month low, around the 140.25 region touched last week, and the 140.00 psychological mark. The latter should act as a key pivotal point, which if broken decisively could make the USD/JPY pair vulnerable to accelerate the fall towards the 139.35 region en route to the 139.00 mark, the 138.75 area and the 138.00 mark (July 28 low).
Japanese Yen price today
The table below shows the percentage change of Japanese Yen (JPY) against listed major currencies today. Japanese Yen was the strongest against the New Zealand Dollar.
| USD | EUR | GBP | CAD | AUD | JPY | NZD | CHF | |
| USD | 0.07% | 0.03% | 0.00% | -0.03% | 0.17% | 0.15% | 0.12% | |
| EUR | -0.06% | -0.03% | -0.06% | -0.09% | 0.10% | 0.06% | 0.06% | |
| GBP | -0.03% | 0.03% | -0.02% | -0.09% | 0.15% | 0.10% | 0.07% | |
| CAD | -0.01% | 0.05% | 0.02% | -0.04% | 0.17% | 0.14% | 0.11% | |
| AUD | 0.03% | 0.09% | 0.05% | 0.03% | 0.20% | 0.17% | 0.15% | |
| JPY | -0.17% | -0.09% | -0.14% | -0.16% | -0.19% | -0.02% | -0.04% | |
| NZD | -0.13% | -0.06% | -0.09% | -0.14% | -0.18% | 0.04% | -0.08% | |
| CHF | -0.13% | -0.03% | -0.06% | -0.10% | -0.16% | 0.09% | 0.03% |
The heat map shows percentage changes of major currencies against each other. The base currency is picked from the left column, while the quote currency is picked from the top row. For example, if you pick the Euro from the left column and move along the horizontal line to the Japanese Yen, the percentage change displayed in the box will represent EUR (base)/JPY (quote).
Japanese Yen FAQs
What key factors drive the Japanese Yen?
The Japanese Yen (JPY) is one of the world’s most traded currencies. Its value is broadly determined by the performance of the Japanese economy, but more specifically by the Bank of Japan’s policy, the differential between Japanese and US bond yields, or risk sentiment among traders, among other factors.
How do the decisions of the Bank of Japan impact the Japanese Yen?
One of the Bank of Japan’s mandates is currency control, so its moves are key for the Yen. The BoJ has directly intervened in currency markets sometimes, generally to lower the value of the Yen, although it refrains from doing it often due to political concerns of its main trading partners. The current BoJ ultra-loose monetary policy, based on massive stimulus to the economy, has caused the Yen to depreciate against its main currency peers. This process has exacerbated more recently due to an increasing policy divergence between the Bank of Japan and other main central banks, which have opted to increase interest rates sharply to fight decades-high levels of inflation.
How does the differential between Japanese and US bond yields impact the Japanese Yen?
The BoJ’s stance of sticking to ultra-loose monetary policy has led to a widening policy divergence with other central banks, particularly with the US Federal Reserve. This supports a widening of the differential between the 10-year US and Japanese bonds, which favors the US Dollar against the Japanese Yen.
How does broader risk sentiment impact the Japanese Yen?
The Japanese Yen is often seen as a safe-haven investment. This means that in times of market stress, investors are more likely to put their money in the Japanese currency due to its supposed reliability and stability. Turbulent times are likely to strengthen the Yen’s value against other currencies seen as more risky to invest in.
- GBP/USD loses ground around 1.2725 in the first trading day of 2024.
- The markets are pricing in 88% possibility of rate cuts in March, according to the CME Group's FedWatch tool.
- Investors are pricing as many as six quarter-point rate cuts from the Bank of England (BoE) during 2024.
- UK S&P Global/CIPS Manufacturing PMI and US S&P Global Manufacturing PMI reports will be released later on Tuesday.
The GBP/USD pair posts modest losses during the early Asian session on Tuesday. The modest rebound in the US Dollar (USD) lends some support to the major pair. At press time, GBP/USD is trading near 1.2725, down 0.04% for the day.
After the US Federal Reserve's (Fed) final meeting of the year earlier in December, Fed officials held rates steady for the third straight month and signaled a series of interest rate cuts in 2024 as inflation eases faster than estimated. Traders are betting on aggressive rate cuts, starting as early as March. The markets are pricing in 88% odds rate cuts in March, according to the CME Group's FedWatch tool.
Data released on Friday revealed that the US Chicago Purchasing Managers' Index (PMI) arrived at 46.9 in December from 55.8 in November, weaker than the estimation of 51.0. Market players will take more cues from the US Nonfarm Payrolls (NFP) due on Friday. The figure is projected to show an increase of 163K in December versus 199K prior.
On the British Pound front, the Bank of England (BoE) said it is premature to talk about cutting rates. However, investors are pricing as many as six quarter-point rate cuts in 2024. The next BoE monetary policy meeting will be on February 1.
Later on Tuesday, the UK S&P Global/CIPS Manufacturing PMI for December will be released. Also, the US S&P Global Manufacturing PMI will be due. The highlight this week will be the Federal Open Market Committee (FOMC) minutes on Wednesday and December’s US employment data, including US Nonfarm Payrolls, Unemployment Rate, and Average Hourly Earnings, due on Friday.
China's Caixin Manufacturing Purchasing Managers' Index (PMI) increased slightly to 50.8 in December, compared with November’s expansion of 50.7, according to the latest data released on Tuesday.
The data beat the market expectations of a 50.4 print.
Key highlights (via Caixin)
“Output and new orders both increase at quicker rates...
...but firms maintain a cautious approach to employment.”
“Inflationary pressures remain soft.”
"Both supply and demand expanded as the market continued its upward trend, boosting production and sales. The subindexes for output and total new orders reached new highs since May and February, respectively, with particularly strong demand for consumer goods,” said Wang Zhe, an economist at Caixin Insight Group.
"But overseas purchasing power remained limited, with the gauge for new export orders in contraction for the sixth consecutive month, despite a softer rate of contraction," Wang added.
On Sunday, China’s National Bureau of Statistics (NBS) released the country’s official Manufacturing Purchasing Managers' Index (PMI), which eased further to 49.0 as against the 49.4 contraction reported in November. The market consensus was for a 49.5 readout.
AUD/USD reaction to China’s PMI data
The upside surprise in the Chinese Manufacturing PMI lends support to the Aussie Dollar, with AUD/USD bouncing off session lows of 0.6806 to now trade at 0.6817, up 0.08% on the day.
Australian Dollar price today
The table below shows the percentage change of Australian Dollar (AUD) against listed major currencies today. Australian Dollar was the strongest against the Japanese Yen.
| USD | EUR | GBP | CAD | AUD | JPY | NZD | CHF | |
| USD | -0.01% | 0.02% | -0.07% | -0.08% | 0.20% | 0.06% | 0.05% | |
| EUR | 0.02% | 0.04% | -0.05% | -0.06% | 0.22% | 0.08% | 0.07% | |
| GBP | -0.02% | -0.04% | -0.09% | -0.13% | 0.19% | 0.04% | 0.01% | |
| CAD | 0.07% | 0.05% | 0.08% | -0.01% | 0.27% | 0.13% | 0.12% | |
| AUD | 0.08% | 0.06% | 0.10% | -0.01% | 0.28% | 0.13% | 0.13% | |
| JPY | -0.21% | -0.22% | -0.18% | -0.28% | -0.26% | -0.13% | -0.14% | |
| NZD | -0.06% | -0.07% | -0.03% | -0.14% | -0.16% | 0.16% | -0.07% | |
| CHF | -0.05% | -0.04% | 0.00% | -0.10% | -0.13% | 0.18% | 0.03% |
The heat map shows percentage changes of major currencies against each other. The base currency is picked from the left column, while the quote currency is picked from the top row. For example, if you pick the Euro from the left column and move along the horizontal line to the Japanese Yen, the percentage change displayed in the box will represent EUR (base)/JPY (quote).
On Tuesday, the People’s Bank of China (PBoC) set the USD/CNY central rate for the trading session ahead at 7.0770 as compared to 7.0971 Reuters estimates.
- EUR/USD stays calm after pulling back from recent highs as US Dollar improves.
- Euro advanced by 3.16% against the Greenback in the year 2023.
- DXY may be retested on the market’s bets on the Fed’s easing in early 2024.
EUR/USD hovers around 1.1030 during the Asian session on Tuesday post pulling back from the recent high of 1.1139 reached on Thursday. In the year 2023, the EUR/USD pair closed at 1.1036, up by 3.16% after two consecutive years of decline. The pair received upward support in the previous three months as the market recently witnessed a slight decline in United States (US) inflation.
The US Dollar Index (DXY) trades around 101.40 after posting gains in the recent sessions. However, the DXY faces challenges as the market bets on the dovish stance of the US Federal Reserve (Fed) about the interest rate trajectory in early 2024.
The Chicago Purchasing Managers Index released by ISM-Chicago on Friday showed that business conditions across Illinois, Indiana, and Michigan reduced to 46.9 in December from the previous 55.8.
The market participants witnessed a decline in the recent US labor data, Core PCE Inflation, and GDP Annualized. These figures confirm the theory that the US economy is losing pace in the fourth quarter, and on its way to a soft landing. This strengthens the case for Fed rate cuts in 2024 and adds negative pressure on the USD.
In the Eurozone, Consumer Inflation declined in November but yearly figures remain above the 2.0% target. In contrast, December’s PMI report showed easing in both services and manufacturing. The annual Spanish consumer prices have held firm at 3.3%, signaling persistent inflation in certain European countries. This could reinforce the European Central Bank's (ECB) hawkish stance and provide a solid foundation for Euro support.
Traders await more data from the Eurozone for fresh impetus including Harmonized Index of Consumer Prices data due on Friday. On the US docket, ISM Manufacturing PMI figures and Meeting Minutes from the Federal Open Market Committee (FOMC) will be eyed on Wednesday.
- NZD/USD trades on a softer note near 0.6313 on the downbeat Chinese economic data.
- The Chinese NBS Manufacturing PMI came in at 49.0 in December vs. 49.4 prior, worse than expected.
- The markets expect that the Fed will begin its easing cycle with a quarter-point drop in March.
- Market players await December's Caixin Manufacturing PMI and US S&P Global Manufacturing PMI, due on Tuesday.
The NZD/USD pair edges lower during the only Asian trading hours on Tuesday. The weaker-than-expected Chinese economic data exerts some selling pressure on the New Zealand Dollar (NZD). At press time, the pair is trading at 0.6313, losing 0.13% on the day.
China’s National Bureau of Statistics (NBS) showed on Sunday that the nation’s NBS Manufacturing Purchasing Managers' Index (PMI) eased to 49.0 in December from 49.4 in the previous month, falling short of the market estimate of 49.5 in November. Meanwhile, the NBS Non-Manufacturing PMI came in at 50.4 in December from 50.2 in November, missing the expectation of 50.5.
The risk of deflation in China has increased, and it will need a large dosage of fiscal and monetary stimulus in 2024. The negative developments surrounding the Chinese economy could weigh on the China-proxy New Zealand Dollar (NZD) and act as a headwind for the NZD/USD pair.
On the other hand, the downside of the pair might be capped by the anticipation that the US Federal Reserve (Fed) will cut the interest rate in 2024. The markets expect that the Fed will begin its easing cycle with a quarter-point drop in March, followed by similar cuts in May and June to maintain pace with cooling inflation.
Moving on, traders will focus on China’s Caixin Manufacturing PMI for December and the US S&P Global Manufacturing PMI on Tuesday. On Wednesday, attention will shift to the minutes of the Federal Open Market Committee (FOMC). The highly anticipated US Nonfarm Payrolls (NFP) report will be released on Friday. Defeat girls could keep a clear direction for the NZD/USD pair.
China’s official Manufacturing Purchasing Managers' Index (PMI) came in at its third straight month of contraction at 49.0 from the previous reading of 49.4, the latest data published by the country’s National Bureau of Statistics (NBS) showed on Tuesday. Markets expected a 49.5 readout in the reported month.
The NBS Non-Manufacturing PMI arrived at 50.4 in December versus 50.2 in November, weaker than the estimation of 50.5.
Market reaction
At the time of writing, the AUD/USD pair is trading around 0.6818, up 0.01% on the day.
Australian Dollar FAQs
What key factors drive the Australian Dollar?
One of the most significant factors for the Australian Dollar (AUD) is the level of interest rates set by the Reserve Bank of Australia (RBA). Because Australia is a resource-rich country another key driver is the price of its biggest export, Iron Ore. The health of the Chinese economy, its largest trading partner, is a factor, as well as inflation in Australia, its growth rate and Trade Balance. Market sentiment – whether investors are taking on more risky assets (risk-on) or seeking safe-havens (risk-off) – is also a factor, with risk-on positive for AUD.
How do the decisions of the Reserve Bank of Australia impact the Australian Dollar?
The Reserve Bank of Australia (RBA) influences the Australian Dollar (AUD) by setting the level of interest rates that Australian banks can lend to each other. This influences the level of interest rates in the economy as a whole. The main goal of the RBA is to maintain a stable inflation rate of 2-3% by adjusting interest rates up or down. Relatively high interest rates compared to other major central banks support the AUD, and the opposite for relatively low. The RBA can also use quantitative easing and tightening to influence credit conditions, with the former AUD-negative and the latter AUD-positive.
How does the health of the Chinese Economy impact the Australian Dollar?
China is Australia’s largest trading partner so the health of the Chinese economy is a major influence on the value of the Australian Dollar (AUD). When the Chinese economy is doing well it purchases more raw materials, goods and services from Australia, lifting demand for the AUD, and pushing up its value. The opposite is the case when the Chinese economy is not growing as fast as expected. Positive or negative surprises in Chinese growth data, therefore, often have a direct impact on the Australian Dollar and its pairs.
How does the price of Iron Ore impact the Australian Dollar?
Iron Ore is Australia’s largest export, accounting for $118 billion a year according to data from 2021, with China as its primary destination. The price of Iron Ore, therefore, can be a driver of the Australian Dollar. Generally, if the price of Iron Ore rises, AUD also goes up, as aggregate demand for the currency increases. The opposite is the case if the price of Iron Ore falls. Higher Iron Ore prices also tend to result in a greater likelihood of a positive Trade Balance for Australia, which is also positive of the AUD.
How does the Trade Balance impact the Australian Dollar?
The Trade Balance, which is the difference between what a country earns from its exports versus what it pays for its imports, is another factor that can influence the value of the Australian Dollar. If Australia produces highly sought after exports, then its currency will gain in value purely from the surplus demand created from foreign buyers seeking to purchase its exports versus what it spends to purchase imports. Therefore, a positive net Trade Balance strengthens the AUD, with the opposite effect if the Trade Balance is negative.


© 2000-2026. Уcі права захищені.
Cайт знаходитьcя під керуванням TeleTrade DJ. LLC 2351 LLC 2022 (Euro House, Richmond Hill Road, Kingstown, VC0100, St. Vincent and the Grenadines).
Інформація, предcтавлена на cайті, не є підcтавою для прийняття інвеcтиційних рішень і надана виключно для ознайомлення.
Компанія не обcлуговує та не надає cервіc клієнтам, які є резидентами US, Канади, Ірану, Ємену та країн, внеcених до чорного cпиcку FATF.
Проведення торгових операцій на фінанcових ринках з маржинальними фінанcовими інcтрументами відкриває широкі можливоcті і дає змогу інвеcторам, готовим піти на ризик, отримувати виcокий прибуток. Але водночаc воно неcе потенційно виcокий рівень ризику отримання збитків. Тому перед початком торгівлі cлід відповідально підійти до вирішення питання щодо вибору інвеcтиційної cтратегії з урахуванням наявних реcурcів.
Викориcтання інформації: при повному або чаcтковому викориcтанні матеріалів cайту поcилання на TeleTrade як джерело інформації є обов'язковим. Викориcтання матеріалів в інтернеті має cупроводжуватиcь гіперпоcиланням на cайт teletrade.org. Автоматичний імпорт матеріалів та інформації із cайту заборонено.
З уcіх питань звертайтеcь за адреcою pr@teletrade.global.
переклади