- Analytics
- News and Tools
- Market News
Новини ринків
- Saudi Arabia expected to extend its 1 million bpd output cut into October.
- Russia agrees with OPEC to cut exports next month.
- Positive business activity reports from China improve the oil demand outlook.
- US unemployment rate rises, wage growth slows, potentially pausing interest rate hikes.
Western Texas Intermediate (WTI), the US crude oil benchmark, rose to a new year-to-date (YTD) high of $85.57, snapping a two-week losing streak due to additional supply cuts led by Saudi Arabia and Russia. WTI is trading at $85.56. gains 2.79%.
Saudi Arabia and Russia lead supply cuts as US commercial crude inventories drop, boosting WTI prices
Saudi Arabia is expected to extend its 1 million barrels per day (bpd) output into October. According to its Deputy Prime Minister Alexander Novak, Russia has already agreed with the Organization of the Petroleum Exporting Countries (OPEC) and allies to cut its exports next month.
In the meantime, commercial crude inventories in the US dropped in five of the last six weeks, suggesting demand for WTI is increasing, as revealed by the US Energy Information Administration (EIA).
In the meantime, better-than-expected reports of business activity in China improved oil’s demand outlook, which was already battered by soft PMI readings across Europe and in the UK.
A closely monitored US report on Friday revealed an increase in the unemployment rate and a slowdown in wage growth. These developments reinforce anticipations of pausing the trajectory of interest rate hikes.
As a sign of potential future supply, the count of US oil rigs remained steady at 512 for the current week. According to energy services company Baker Hughes, this figure is at its lowest since February 2022.
WTI Technical Levels
- XAG/USD peaked at a daily high of $24.80 then settled near the $24.15 area.
- US NFPs and PMI figures from August beat expectations. Still, wages decelerated, and Unemployment rose.
- The USD strength drove the grey metal downwards.
At the end of the week, the XAG/USD closed with losses but managed to hold some weekly gains, closing near $24.15. On the data front, the US released soft Average Hourly Earnings, while Nonfarm Payrolls (NFPs) and ISM Manufacturing PMI figures came in higher than expected, helping the USD to get a boost. US yields sharply declined during the American sessions but then recovered, applying selling pressure on the Silver.
The US showed mixed economic data. On the bright side, the US Bureau of Labor Statistics released the Nonfarm Payrolls (NFPs) from August that came in at 187,000, higher than the expected 170,000 and the previous reading of 157,000. In addition, the Institute for Supply Management released the ISM Manufacturing PMI from the same month that came in at 47.6, while the expected figure was 47 and rose above the previous 46.4. On the other hand, wage inflation, measured by the Average Hourly Earnings, slowed to 4.3%, a bit lower than the consensus and the previous 4.4%. The Unemployment rate rose to 3.8% in the same month, higher than the market's consensus.
Following the NPF release, the US treasury bond yields sharply declined but then recovered some ground following the release of the ISM PMIs. The 2,5, and 10-year yields settled at 4.88%, 4.30% and 4.18%, respectively, after falling to their lowest level since August 10.
That being said, the CME FedWatch Tool suggests that investors expect the Fed won't hike in September, while the odds of a 25 basis points (bps) increase declined near 35% for November and December after rising near 46% last week. Regarding the decisions, it will all come down to the data, and investors will continue placing their bets depending on the signs the US economy gives
XAG/USD Levels to watch
Upon evaluating the daily chart, a neutral to bearish outlook is seen, with the balance starting to lean in favour of the bears, although they still have hurdles to overcome.With a negative slope above its midline, the Relative Strength Index (RSI) suggests a potential weakening of buying pressure, while the Moving Average Convergence (MACD) exhibits decreasing green bars. On the other hand, the pair is above the 20,100,200-day Simple Moving Average (SMA), indicating a favourable position for the bulls in the bigger picture.
Support levels: $24.00, $23.90 (100-day SMA), $23.50
Resistance levels: $24.30, $24.80, $25.00
XAG/USD Daily Chart
-638292000256105381.png)
- Bullish-engulfing candlestick pattern on the daily chart suggests buyers are in control.
- The first major resistance at 1.3600, followed by several key levels up to 1.3804.
- Downside risks include a drop below 1.3489, potentially targeting the 200-DMA at 1.3462 and the 50-DMA at 1.3345.
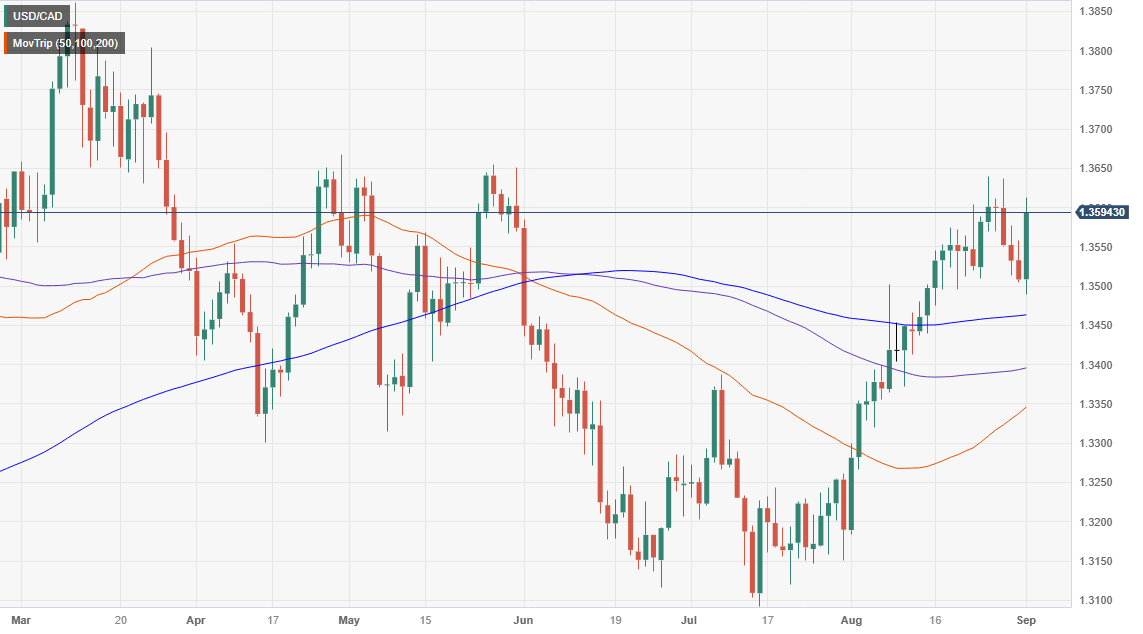
The Canadian Dollar (CAD) losses ground against the US Dollar (USD) sponsored on weaker than expected Canadian economic growth in the second quarter, alongside a mixed US jobs report and improvements in business activity. Hence, the USD/CAD is trading at 1.3595 after hitting a daily low of 1.3489, above its opening price by 0.65%.
USD/CAD Price Analysis: Technical outlook
The daily chart portrays the pair as neutral to upward biased, though the major reached a lower low at 1.3489, slightly below the August 8 daily high at 1.3502. However, the USD/CAD recovery was outstanding, forming a bullish-engulfing candlestick chart pattern, which engulfed the price action of the previous two days. Hence, buyers are in charge.
The USD/CAD first resistance would be the 1.3600 figure. A breach of the latter will expose the August 25 high at 1.3640, closely followed by the May 26 swing high at 1.3654 and the April 28 high at 1.3667. Once those levels are cleared, the 1.3700 figure would be up next before rallying towards the March 24 daily high at 1.3804.
Conversely, if the USD/CAD drops below 1.3489, the pair could shift downwards and extend its losses toward the 200-day Moving Average (DMA) at 1.3462. Once cleared, the next stop would be the psychological 1.3400 area, and up next, the 50-DMA at 1.3345.
USD/CAD Price Action – Hourly chart
- NZD/USD peaked at a daily high of 0.6015 and then plummeted to 0.5940.
- US NFPs from August showed a mixed picture, while the Manufacturing PMIs from the same month came in better than expected.
- The USD holds its ground despite investors betting on lower odds of a last hike by the Fed this cycle.
At the end of the week, the USD measured by the DXY index tallies daily gains after volatility seen in the markets after the release of August Nonfarm Payrolls and ISM PMI manufacturing figures. Still, the NZD/USD pair will record a weekly 0.70% increase. No relevant data was released on the Kiwi’s side.
The Nonfarm Payrolls from the US from August came a tick higher than expected at 187,000 vs. the 170,000 expected and from its previous downwardly revised 157,000. As per the Average Hourly Earning, wages increased by 0.2% (MoM), lower than the 0.3% expected, and the unemployment rate unexpectedly rose to 3.8%. Other data showed that the Institute for Supply Management (ISM) reported higher than anticipated PMIs, with the manufacturing index at 47.6, higher than the 47 expected. The Employment index also came strong at 48.5 but remains in contraction territory.
The USD saw volatility against its rivals as the mixed NFP report initially fuelled a sell-off, but after the ISM PMI, the Greenback somewhat recovered. The US Treasury yields saw the same movement, hinting that the markets are betting on a less aggressive Fed and investors hoping the tightening cycle ends as the labour market hinted at some softness. Focus now shifts to September 13, when the US will release the August Consumer Price Index (CPI) figures, which will be necessary for the next Fed decision expectations.
NZD/USD Levels to watch
The daily chart analysis indicates a neutral to a bearish outlook for NZD/USD, as the bears show signs of taking control but still face challenges ahead. Having turned flat in negative territory, the Relative Strength Index (RSI) suggests a potential market equilibrium with balanced selling and buying pressure. At the same time, the Moving Average Convergence (MACD) lays out stagnant green bars. On the other hand, the pair is below the 20,100 and 200-day Simple Moving Averages (SMAs), suggesting that the bears are firmly in control of the bigger picture.
Support levels:0.5930, 0.5900, 0.5880.
Resistance levels: 0.5967 (20-day SMA), 0.5980, 0.6000.
NZD/USD Daily Chart
-638291976668531350.png)
Next week, the Reserve Bank of Australia (RBA) will announce its monetary policy decision. Analysts at Wells Fargo point out that due to clear signs of economic slowdown and indications of easing price pressures, they believe RBA policymakers will be comfortable maintaining the policy rate at 4.10%.
Key Quotes:
While RBA policymakers appeared concerned about the potential for services inflation to remain elevated, slower wage growth and the details of the July CPI figures offer some encouragement that underlying price pressures might be heading in the right direction.
Meanwhile, signs of a slowing in activity are more pronounced. Q2 real retail sales fell 0.5% quarter-over-quarter, marking a third straight quarterly decline. Employment dropped by 14,600 in July, and August PMIs staying in contraction territory points to subdued activity in both the manufacturing and services sectors.
The softening in China’s economy could also weigh on Australian growth, given extensive trade linkages between the two countries.
Monday is a holiday in the United States and Canada. Later in the week, the Reserve Bank of Australia and the Bank of Canada will announce their monetary policy decisions. Trade data from China, Australian GDP, and Canadian jobs data are among the most relevant reports to watch for.
Here is what you need to know for next week:
Chinese data will continue to be closely watched. National PMIs came in mostly above expectations, providing some relief. It is possible that additional stimulus measures could be announced. Trade data is scheduled to be released on Thursday.
US economic data did not bring many surprises during the week and provided arguments for the Federal Reserve to maintain unchanged rates at the next meeting. The Consumer Price Index on September 13 will be crucial ahead of the FOMC meeting on September 19-20. Key reports in the US next week include Factory Orders and revised Q2 Unit Labor Costs.
Despite mixed Nonfarm Payrolls data, the US Dollar Index jumped on Friday, surpassing 104.20 and it was heading towards the highest daily close since April. However, the 104.50 area remains a significant resistance level. The DXY need to consolidate above that area to open the doors to more gains, while below, it would be vulnerable to sharp corrections.
The latest data shows inflation slowing down in the Eurozone, although not as rapidly as anticipated, and the activity outlook is worsening. This places the next European Central Bank (ECB) meeting in a precarious position. The prospect of a less hawkish ECB weighed on the Euro, causing it to pull back sharply after reaching weekly highs against the US Dollar, Pound, and Yen. The common currency was among biggest losers. Next week, Eurostat will report the Producer Price Index and compensation per employee during the second quarter.
EUR/USD posted its seventh consecutive weekly decline after erasing gains on Friday. The bias remains to the downside. Meanwhile, EUR/GBP continues to move sideways within a wide range between 0.8500 and 0.8700.
GBP/USD closed the week around 1.2600. Just when it appeared poised for a more significant correction, the pair pulled back sharply, falling towards the monthly lows and below the 20-week Simple Moving Average. The bias is currently sideways with risks tilted to the downside. On Wednesday, Bank of England’s members will testify to the Treasury Select Committee.
On a volatile week, USD/JPY finished hovering around 146.00. The pair remains undecided as it hit fresh monthly highs but then pulled back sharply.
USD/CHF managed to post another week of gains after surging on Friday. However, it remains below the 20-week Simple Moving Average, which is currently near 0.8900. Failure to rise above that level could trigger a sharp correction, while a break above it would set the stage for further gains for the USD/CHF pair. Switzerland will report its Q2 GDP on Monday.
The Australian Dollar was the best performer among majors during the week. AUD/USD recorded weekly gains after six consecutive weeks of decline. However, the pair is still struggling to break above 0.6500.
The Reserve Bank of Australia will announce its monetary policy decision on Tuesday. No change is expected. The outgoing governor of RBA, Lowe, will deliver a speech on Wednesday, explaining the latest decision. More importantly, the central bank meeting could be overshadowed by the Q2 GDP report, which is expected to show a 0.3% expansion, surpassing the 0.2% recorded in the first quarter.
USD/CAD finished the week hovering around 1.3600, after surging on Friday following weaker-than-expected Canadian GDP data. The bias remains to the upside, but the 1.3650 barrier stays intact. Following Friday's negative GDP surprise, the Bank of Canada is widely expected to keep interest rates unchanged on Wednesday. On Friday, Canada will release the employment report.
Like this article? Help us with some feedback by answering this survey:
- Mixed US Nonfarm Payrolls data initially fails to boost USD, but ISM Manufacturing PMI lifts sentiment.
- UK business activity remains in contraction, but inflation nears 7%, complicating BoE’s next move.
- Office for National Statistics revises UK economic size, indicating a 0.6% growth in Q4 2021 compared to Q4 2019.
The Pound Sterling (GBP) slumped late in the New York session versus the Greenback (USD) as US Treasury bond yields rose and bolstered the USD, which is set to print its seven consecutive week printing gains. The GBP/USD hit a daily high of 1.2712 before reversing its course and diving toward the current exchange rate, trading at around 1.2590s.
GBP/USD drops as US business activity improves, while UK factory activity remains at recessionary levels
Financial markets have remained calm after a busy week in the US economic landscape. The August Nonfarm Payrolls data showed a mix, with 187,000 jobs added, beating the 177,000 estimate. However, the rise in the Unemployment rate to 3.8% YoY, above the forecasted 3.5%, surprisingly didn’t boost the US Dollar. Investors speculate that the Federal Reserve might delay tightening monetary conditions in September, leading to reduced bets on rate hikes by November.
Consequently, the GBP/USD initially surged towards its daily peak. However, a business activity report surpassing expectations triggered a reversal, causing the Pound to relinquish those gains. The ISM Manufacturing PMI increased from 46.4 to 47.6 in August, exceeding the projected 47. Most subcomponents of the report improved, indicating a more optimistic perspective on business activity in the US.
Another reason that underpinned the buck was US bond yields recovering some lost ground, which underpinned the US Dollar Index (DXY) back above the 104.000 figure, a tailwind for the USD/CHF pair.
Earlier data in the UK showed that British business activity remained in contractionary territory, dropping for six consecutive months below the 50 threshold, as revealed by the S^&P Global/CIPS Manufacturing PMI, coming at 43.0 from 45.3 in July. That makes the case for a Bank of England (BoE) pause on its tightening cycle, but inflation remains close to 7%. Nevertheless, traders foresee a 25 bps rate increase in the upcoming meeting.
However, there is a silver lining. The Office for National Statistics has revised its assessment of the UK economy, indicating that it was 0.6% larger in the fourth quarter of 2021 than in the final quarter of 2019. This contrasts with the prior estimate of a 1.2% reduction in size.
GBP/USD Price Analysis: Technical outlook
The daily chart portrays the pair as neutral to downward biased, but it could shift downward if the GBP/USD achieves a daily close below the June 29 low of 1.2590. Once cleared, the next support would be an upslope trendline drawn from May lows at around 1.2550/75, followed by the August 23 swing low of 1.2548. A decisive break and the pair could test the 200-day Moving Average (DMA) at 1.2414. Upside risks lie at the August 30 daily high at 1.2746, shy of the 50-DMA at 1.2774.
- XAU/USD rose to a daily high of $1,952 and then got rejected by 100-day SMA, retreating to $1,940.
- US yields initially dropped after mixed US NPFs but recovered after strong US ISMs from August.
At the end of the week, the Gold spot price XAU/USD erased daily gains, retreating towards the $1,940 area. After initially retreating, the US yields recovered during the American session, but still the yellow metal will set a winning week of more than 1%.
The highly anticipated US Nonfarm Payrolls report from August showed mixed figures. On a positive note the headline’s NFPs rose to 187,000, higher than the 170,000 expected and the previous 157,000. Average Hourly Earnings came in soft, increasing by 0.2% MoM vs. the 0.3% expected. Unemployment rose to 3.8% in the same month, against all forecasts.
Regarding economic activity, the Institute for Supply Management (ISM) Manufacturing PMI figures from the United States came in above the consensus in August, with the actual figure coming in at 47.6, higher than the expected figure of 47 from the previous 46.4.
The US bond yields, often seen as the opportunity cost of holding gold, were volatile following the employment and economic activity figures. The 2-year yield dropped to a three-week low around the 4.76% area, settling at 4.85%. Likewise, the 5 and 10-year yields dropped to their lowest level since August 10 and settled at 4.27% and 4.15%, respectively. Regarding the next Federal Reserve (Fed) expectations, markets lowered their bets for an additional hike in 2023. According to the CME FedWatch tool, investors are still confident that the Fed won’t hike in the September meeting, and the odds of a hike in November and December dropped to nearly 35%
XAU/USD Levels to watch
According to the daily chart, the technical outlook for XAU/USD leans neutral to bearish as signs of bullish exhaustion emerge. The Relative Strength Index (RSI) displays a negative slope above its midline, and the Moving Average Convergence Divergence (MACD) shows fading green bars. With a downward trend below its midline, the Relative Strength Index (RSI) suggests a bearish sentiment, while the Moving Average Convergence (MACD) displays weaker green bars. On the other hand, the pair is below the 100-day Simple Moving Averages (SMAs) but above the 20 and 200-day averages, suggesting that the buyers may still have some gas left in the tank.
Support levels: $1,930, $1,915 (20 and 200-day SMA convergence), $1,900.
Resistance levels: $1,950 (100-day SMA), $1,970, $2,000.
XAU/USD Daily Chart
-638291889766968784.png)
- Mixed US Nonfarm Payrolls data initially fails to boost USD, but ISM Manufacturing PMI lifts sentiment.
- Swiss inflation exceeds estimates, but weak Retail Sales could deter SNB from tightening.
- The upcoming Federal Reserve meeting on September 14 could be a key event for the pair.
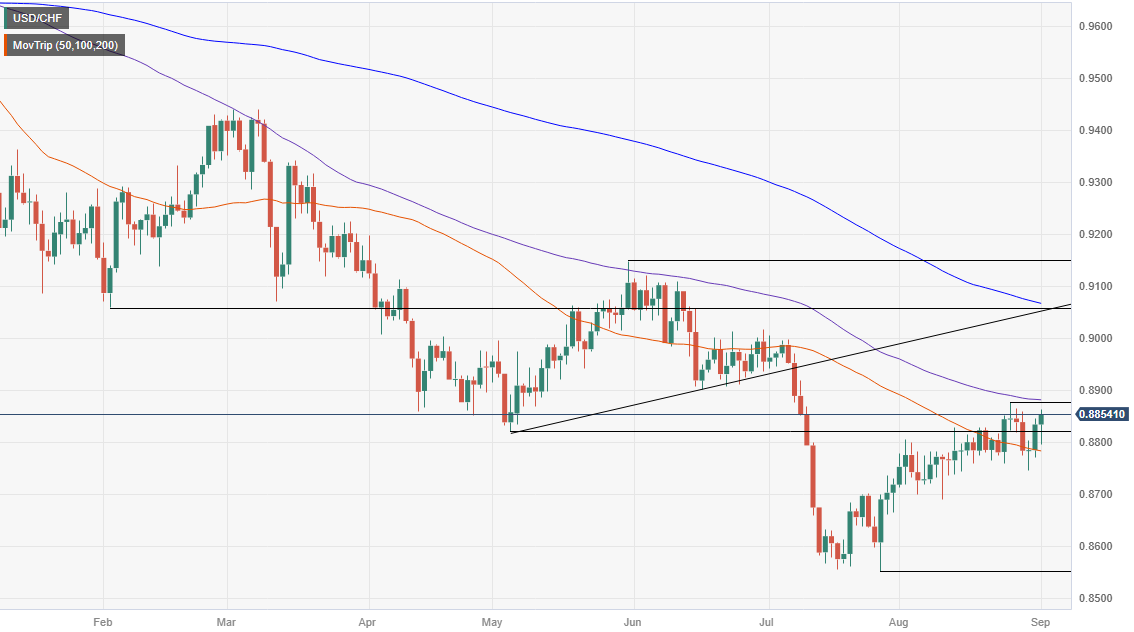
The Swiss Franc (CHF) losses traction against the American Dollar (USD) in the mid-New York session on Friday after a tranche of economic data from the United States (US) bolstered the USD. The USD/CHF dived towards a daily low of 0.8795 before resuming its latest three-day uptrend and exchanging hands at around 0.8850s, above its opening price by 0.28%.
Swiss Franc losses ground as improvement in US business activity and bond yields support the USD
The financial markets remain calm after a busy week in the US economic docket. August’s Nonfarm Payrolls figures came mixed, with the US economy adding 187K jobs, above estimates of 177K, which surprisingly failed to boos the Greenback, as the Unemployment rate rose by 3.8% YoY, above forecasts of 3.5%. The US Dollar weakness was because investors speculated the Fed would not tighten monetary conditions on September, while reducing bets the US central bank would do it by November.
However, USD/CHF sellers were caught off guard, as the ISM Manufacturing PMI improved to 47.6 from 46.4 in July and topped expectations of 47. Most of the subcomponents of the report strengthened, painting a more positive outlook for business activity in the US.
Another reason that underpinned the buck was US bond yields recovering some lost ground, which underpinned the US Dollar Index (DXY) back above the 104.000 figure, a tailwind for the USD/CHF pair.
In Switzerland, inflation rose by 1.6%, exceeded estimates of 1.5%, and was unchanged compared to July’s figures. Although the data reinforces the chances for additional tightening by the Swiss National Bank (SNB), a worse than expected Retail Sales report in July could deter the central bank from tightening monetary policy. Traders should be aware the SNB’s current interest rate sits at 1.75%, and chances for keeping them unchanged loom 70%.
Given the backdrop, the USD/CHF could resume its uptrend and test the 0.9000 figure, but the upcoming US Federal Reserve meeting on September 14 can shift the perspective ahead of the Fed’s decision.
USD/CHF Price Analysis: Technical outlook
The USD/CHF daily chart portrays the pair as entering a consolidation phase, though tilted to the upside, once buyers reclaimed the 50-day Moving Average (DMA) at 0.8782. In addition, the major has crossed above a downslope resistance trendline drawn from March 2023 highs, a five-month-old relevant trendline, which, once broken, the pair would have a straightforward way to test 0.9000. A breach of the latter will expose the confluence of a previous support trendline turned resistance and the 200-DMA at around 0.9040/65 before buyers set their sights on the May 31 high of 0.9147. Contrarily, downside risks emerge below the current week’s low of 0.8744.
- AUD/USD retreated below the 20-day SMA towards 0.6450.
- The August NFP report from the US sent mixed signals from the US labour market.
- The Greenback benefited from higher-than-expected ISM PMIs.
In Friday’s session, the USD initially dropped and found support at the 20-day Simple Moving Average (SMA) of 103.30 but then managed to recover towards 104.20. The US reported mixed Nonfarm Payrolls figures and strong PMI figures, while the Australian calendar had nothing relevant to offer, so the USD’s movements primarily directed the pair’s movements.
The Nonfarm Payrolls report, which measures the employment change in non-agricultural business, showed that the US added 187,000 jobs in August, a tick higher than the 170,000 expected and from the previous downwardly revised 157,000. On the negative side, Average Hourly Earnings increased, but slower than expected, while the Unemployment rate rose to 3.8% in the same month.
What drove the USD upwards was the data from the Institute for Supply Management (ISM), which reported higher than expected PMIs from August, with the manufacturing index at 47.6, higher than the 47 expected. The Employment Index also came strong at 48.5 but remains in contraction territory.
As a reaction, the 2,5 and 10-year US Treasury yields fell to their lowest levels in three weeks but then managed to clear their declines after the release of the ISM PMIs. In line with that, the CME FedWatch tool shows that the odds of a hike in the November meeting of the Fed declined to 33% after being around 40% in the last few days. It's worth highlighting that the market’s volatility on Friday was driven by investors digesting key economic data. Chair Powell from the Federal Reserve (Fed) stated that the ongoing decisions will be decided “carefully” depending on the incoming data.
AUD/USD Levels to watch
The AUD/USD daily chart analysis points to a bearish sentiment for the short term. The Relative Strength Index (RSI) is situated below its midline in negative territory, displaying a southward trajectory. Likewise, the Moving Average Convergence Divergence (MACD) reveals red bars, signifying a growing bearish momentum for AUD/USD. Additionally, the pair is below the 20,100 and 200-day Simple Moving Averages (SMAs), indicating that on the broader picture, the bears are still in command, and the buyers have work to do.
Support levels: 0.6430, 0.6400, 0.6390.
Resistance levels: 0.6460 (20-day SMA), 0.6480, 0.6500.
AUD/USD Daily Chart
-638291850567716673.png)
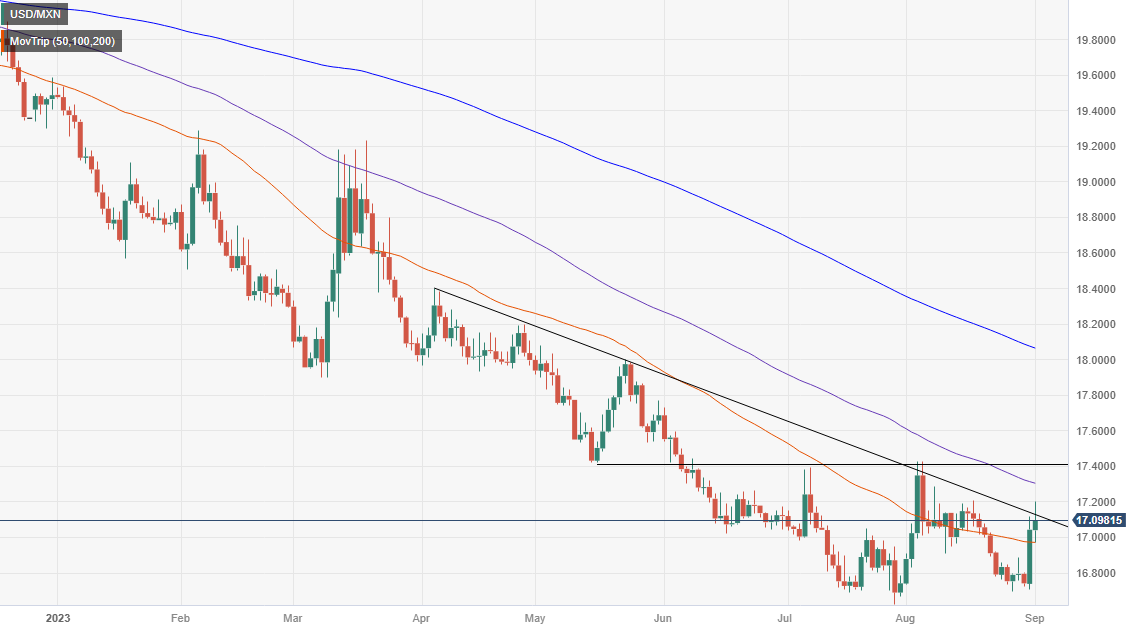
- USD/MXN trades at 17.1222, up by 0.56%, recovering from a daily low of 16.9699.
- US Nonfarm Payrolls for August meet expectations, but the Unemployment Rate rise spurred an initial drop in USD/MXN.
- ISM Manufacturing PMI shows signs of improvement, helping the USD recover.
The American Dollar (USD) recovered some ground against the Mexican Peso (MXN), gaining earlier in the session, diving to a daily low of 16.9699. Still, recent economic data from the United States (US) and high US yields weighed on the emerging market currency, which trims its gains to 12.09% in the year. The USD/MXN is trading at 17.1222, edges high by 0.56%.
MXN trims yearly gains as US bond yields and economic data from the US weigh on the emerging market currency
Before Wall Street opened, the US Department of Labor revealed the US economy added 187K jobs to the economy, the same number as July, which could have been positive for the Greenback but wasn’t. The Unemployment Rate ticked up by 0.3% from 3.5% to 3.8%, approaching the Federal Reserve’s (Fed) target of 4.1% throughout 2023.
Initially, the USD/MXN dropped like a stone from daily highs of around 17.2000, below the 17.0000 figure, as investors weighed that Jerome Powell and Co would not continue to tighten monetary policy. However, traders booked profits ahead of additional market-moving data.
After the employment report, the ISM Manufacturing PMI for August showed signs of improvement, rising to 47.6 from 46.4 in July, yet remained in contractionary territory. Most of the subcomponents rose, except for new orders, which remained depressed, but factory inventories remaining at lower levels could spur a jump in orders in the near term.
The markets reacted oppositely, following the business activity report, even though traders pared additional rate hikes by the Fed, and as of today, expect the first rate cut by May 2024, as shown by the CME FedWatch Tool. The USD/MXN reversed its course and climbed towards 17.1500 but failed to gain traction to lift the exchange rates to new weekly highs above 17.2012.
On the Mexican front, the Bank of Mexico (Banxico) decided to cut its hedging program and reported over $5.65 billion in remittances in July, edging near the monthly record of $5.70 billion hit last May. Also, the August S&P Global Manufacturing PMI report came at 51.2 vs. 53.2 in July, portraying slight weakness in the sector.
USD/MXN Price Analysis: Technical outlook
From a technical standpoint, the USD/MXN has broken to the upside, set to register its most significant weekly gain of more than 2.40%. Buyers are eyeing a break of a downslope resistance trendline drawn from April 2023 highs of 18.4010, which, once cleared, could put the May 17 swing low of 17.4038 as crucial resistance. A breach of the latter would put a challenge of the 18.0000 figure into the table.
- After initially rising to 1.0880, the EUR/USD declined to 1.0785, below the 200-day SMA of 1.0815.
- Manufacturing PMIs from the US showed better than expected results.
- The US DXY index and Treasury yields significantly recovered following the release.
Following the release of a mixed Nonfarm Payrolls report, which saw employment rising higher than expected, wages decelerating and the unemployment rate rising above expectations in August, the USD reversed its course on the back of stronger Institute for Supply Management (ISM) PMIs.
The manufacturing index rose above expectations but showed that the sector remains in a contraction area, coming in at 47.6 vs. the 47 expected. The Employment index also beat expectations at 48.5 vs. the 44.2 expected.
The USD’s DXY index dropped to 103.27 after the NFPs but recovered after the better-than-expected PMI towards 104.22. US yields also saw volatility falling to lows since August 10 but cleared some losses. The decline of the yields hints at investors betting on lower odds of a Federal Reserve (Fed) hike this year. The CME FedWatch tool depicts that the likelihood of a 25 basis point (bps) increase declined to nearly 35% in November and December after rising nearly 50% this week. Ongoing data will continue helping investors model their expectations towards the upcoming September 20 meeting and as long as investors continue betting for no hikes for the remainder of 2023, the USD’s upside is limited.
EUR/USD Levels to watch
Based on the daily chart, the EUR/USD exhibits a bearish outlook for the short term. The Relative Strength Index (RSI) and Moving Average Convergence Divergence (MACD) remain in negative territory, with the RSI below its midline and showing a southward slope. The MACD is also displaying red bars, indicating a strengthening bearish momentum. Additionally, the pair is below the 20,100 and 200-day Simple Moving Averages (SMAs), pointing towards the prevailing strength of the bears in the larger context and the buyers facing a challenging situation.
Support levels:1.0780, 1.0760, 1.0730.
Resistance levels: 1.0815 (200-day SMA), 1.0830, 1.0890 (20-day SMA)
EUR/USD Daily Chart
-638291818821952283.png)
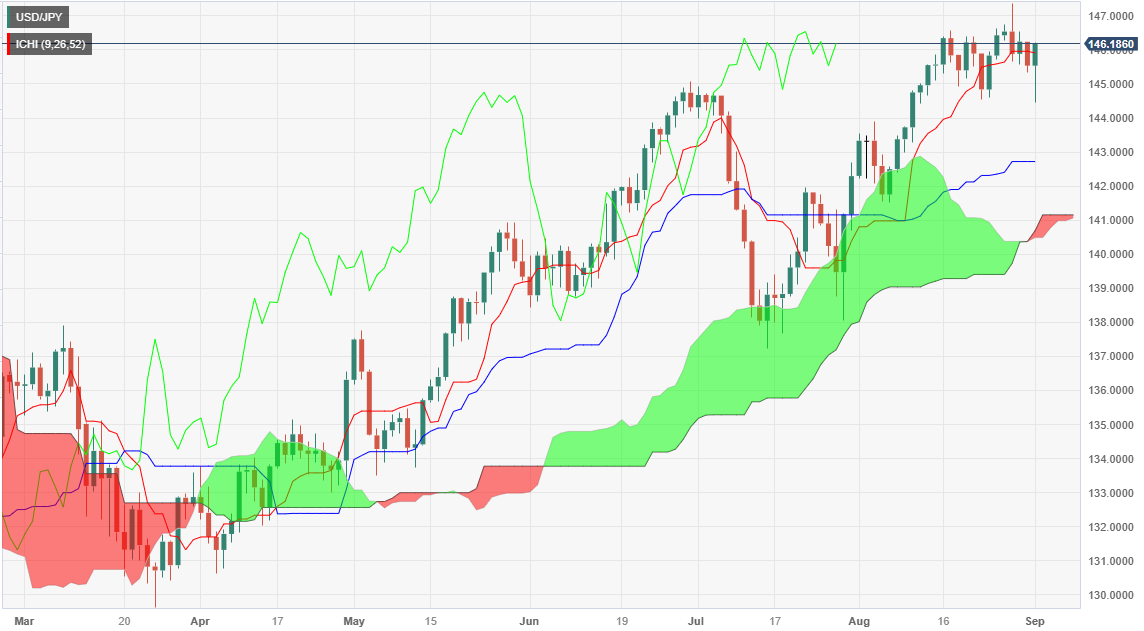
- USD/JPY trades nearly flat at 145.46 after dropping to a three-week low of 144.44.
- US Nonfarm Payrolls for August beat estimates, but Unemployment Rate misses, keeping the pair in check.
- Rising US Treasury bond yields lend some support to the USD.
The Greenback (USD) stages a recovery against the Japanese Yen (JPY) after dropping to a three-week low of 144.44 amid a busy schedule in the United States (US) economic docket. US Treasury bond yields advance, boosting the USD. The USD/JPY is trading at 146.196, gains of 0.45%.
Greenback recovers from three-week low vs. Yen, despite mixed signals in US labor market
The busiest US economic docket finalized, as the latest employment report, namely the Nonfarm Payrolls for August, was above estimates of 177K, with the economy adding 187K, unchanged compared to July’s data. Even though the report was good, and the Greenback should have witnessed a more robust appreciation, it did not. The Unemployment Rate closed towards the US Federal Reserve’s forecast of 4.1% for 2023, which was 3.8% YoY, missing estimates of 3.5%, the highest level since February 2022.
In other data, manufacturing business activity improved, as shown by the ISM Manufacturing PMI for August, rose by 47.6, smashed July’s 46.4 drop, and above estimates of 47. Most subcomponents of the index rose, except for new orders, which are set to improve as factory inventories remained at lower levels.
On the Japanese front, manufactury activity shrank, blamed on costs as revealed by the Jibun Bank Manufacturing PMI, which dropped to 49.6, below the prior month’s 49.7, and the third month the index was below the 50 threshold that separated expansion from contraction.
Given the fundamental backdrop, the USD/JPY remains bullish but subject to an FX intervention by Japanese authorities, which has remained vigilant. On this theme, Japanese Finance Minister Shunichi Suzuki said markets should set currencies, though sudden moves are undesirable, and added that’s closely watching currency moves.
USD/JPY Price Analysis: Technical outlook
Price action depicts the pair dipping to a lower low than the previous one, at 144.53, opening the door for a deeper correction, but unless sellers stepped in and dragged the USD/JPY towards the 145.00 figure, bulls remain in control. Next resistance emerges at 146.00, followed by the year-to-date (YTD) high at 147.38.
The Canadian economy unexpectedly contracted during the second quarter, as indicated by data released on Friday. Analysts at CIBC point out that the decline in consumption is likely to hinder any future interest rate hikes by the Bank of Canada.
Key Quotes:
Forest fires may be taking a few decimal places off the data, but the Canadian economy is hardly on fire in terms of growth, casting doubts on claims that it can shrug off the impact of higher interest rates.
After what looks like a one quarter flash in the pan, GDP contracted in the second quarter, making the last rate hike seem like overkill, and virtually ruling a further hike next week.
Adding to the dismal report was the advance GDP estimate for July, which suggested a flat month after a decline in June, setting the stage for a weak third quarter in which the rise in the unemployment rate will likely weigh on consumer activity further.
Data released on Friday showed that Nonfarm Payrolls rose by 187K in August, surpassing expectations. Analysts at TD Securities consider that recent labor-market and consumer prices data should be judged as positive news by Federal Reserve officials. They continue to view July as the last hike of the Fed's tightening cycle.
Key Quotes:
This is the third consecutive report where employment growth records a below-200k number. On the other hand, the UE (Unemployment) rate surprisingly jumped an eye-popping three tenths to 3.8%, as the labor force surged. Average hourly earnings surprised expectations to the downside for the first time since February.”
Data out this week supports the idea of an economy that is gradually losing momentum as it continues to normalize after a rapid tightening of monetary policy and the easing of a large Covid-driven supply shock.
We think this week's labor-market and consumer prices data should be judged as positive news by Fed officials, and we continue to view July as the last hike of the Fed's tightening cycle.
Data is likely to remain choppy in the next several months and markets are unlikely to move in a straight line.
- ISM Manufacturing PMI recovered in August but remained below 50.
- US Dollar Index clings to small daily gains above 103.50.
The economic activity in the US manufacturing continued to contract in August, albeit at a softer pace than July, with the ISM Manufacturing PMI advancing to 47.6 from 46.4 in July. This reading came in slightly better than the market expectation of 47.
Further details of the publication revealed that the New Orders Index edged lower to 46.8 from 47.3, while the Employment Index rose to 48.5 from 44.4. Finally, the inflation component - Prices Paid Index, advanced to 48.4 from 42.6.
"Demand remains soft, but production execution is consistent with new, reduced output levels based on panelists’ companies order books," said Timothy R. Fiore, Chair of the Institute for Supply Management.
"Prices are generally stable. Sixty-two percent of manufacturing gross domestic product (GDP) contracted in August, down from 92 percent in July, a positive trend for the economy," Fiore added.
Market reaction
The US Dollar Index showed no immediate reaction to this report and was last seen posting small daily gains at 103.70.
Loretta J. Mester, President of the Federal Reserve Bank of Cleveland, stated on Friday, following the NFP (Nonfarm Payrolls) report, that the job market remains strong despite signs of rebalancing. She downplayed the increase in the Unemployment Rate to 3.8%, stating that this level "is still low."
Speaking at an event in Germany, Mester mentioned that the main debate at the Fed is how restrictive policy needs to be and for how long. She explained that the Fed must balance risks when determining its policy rate.
Regarding inflation, Mester noted that it remains elevated, but she acknowledged that progress has been made.
- Silver price delivers a volatile action as investors carefully examine the US NFP report.
- The US Dollar dropped as investors hoped that slower wage growth would ease the consumer spending momentum.
- Silver price faces some selling pressure in its upside journey toward the horizontal resistance plotted around $25.27.
Silver price (XAG/USD) demonstrates a volatile action above $24.50 as investors carefully examine the United States Nonfarm Payrolls (NFP) data for August. The US Bureau of Labor Statistics reported that fresh payrolls were 187K, outperformed estimates of 170K, and downwardly revised July’s reading of 157K.
The Unemployment Rate rose sharply to 3.8% vs. estimates and the former print of 3.5%. Monthly Average Hourly Earnings grew at a slower pace of 0.2% while investors anticipated a 0.3% pace in wage growth. In July, the labor cost index gained at a 0.4% pace. The annual Average Hourly Earnings decelerated nominally to 4.3% against the estimates and the former release of 4.4%.
Slower wage growth might offset the impact of higher-than-anticipated fresh payrolls, which would allow the Federal Reserve (Fed) to keep the interest rate policy unchanged on September 20. Meanwhile, investors still await the US ISM manufacturing PMI, which will be released at 14:00 GMT.
The US Dollar Index (DXY) drops marginally to near 103.40 as investors hope that slower wage growth will ease the consumer spending momentum and bring inflation under control. Also, 10-year US Treasury yields dropped to near 4.10%.
Silver technical analysis
Silver price faces some selling pressure in its upside journey toward the horizontal resistance plotted from the July 20 high around $25.27 on a two-hour scale. Upward-sloping 20-period Exponential Moving Average (EMA) continues to provide support to the Silver bulls.
The Relative Strength Index (RSI) (14) drops into the 40.00-60.00 range from the bullish range of 60.00-80.00, which indicates that the upside momentum has faded.
Silver two-hour chart
-638291731290400655.png)
- EUR/USD fades Thursday’s downtick and approaches 1.0900.
- Immediate up-barrier remains near 1.0950 so far.
EUR/USD manages to set aside part of Thursday’s sharp pullback and gradually approaches the 1.0900 mark on Friday.
Despite the daily knee-jerk, the pair’s current momentum seems to be favouring the continuation of the march north for the time being. That said, the next hurdle emerges at the weekly top at 1.0945 (August 30), prior to the interim 55-day SMA at 1.0965 and the psychological 1.1000 mark.
In the meantime, the pair is likely to keep the bullish outlook unchanged while above the 200-day SMA, today at 1.0816.
EUR/USD daily chart
- The Canadian economy unexpectedly contracted during the second quarter.
- The Loonie tumbles across the board after Canadian GDP data.
- USD/CAD jumps towards 1.3550 despite broad-based Greenback weakness after NFP.
The USD/CAD broke above 1.3520 and surged to 1.3556, approaching Thursday's highs, following the release of the US employment and Canadian Q2 reports.
Canada's real Gross Domestic Product (GDP) unexpectedly contracted at an annual rate of 0.2% in the second quarter, against expectations of a 1.2% expansion. Growth figures from the first quarter were revised lower, from a 3.1% expansion to 2.6%.
The disappointing data weighed on the Loonie, which weakened across the board after the release. Next week, the Bank of Canada (BoC) is set to meet, and no change in policy is expected, especially considering the growth figures. The upside move in USD/CAD was limited due to some weakness in the US dollar following the official US employment report.
Nonfarm Payrolls expanded by 187,000 in July, surpassing the market's expectation of 170,000. The Unemployment Rate rose from 3.5% to 3.8%. Average Hourly Earnings increased 4.3% from a year ago, below the expected 4.45%. The US Dollar Index dropped to 103.25, hitting a fresh daily low, but later trimmed losses to rise to 103.50.
Holding above the 20-day SMA
Early on Friday, USD/CAD bottomed at 1.3489, the lowest level since August 16. It then rebounded moderately, gaining upside momentum after the data.
The pair is currently rising after falling for four consecutive days and is holding above the 20-day Simple Moving Average (SMA) that stands at 1.3515.
On the weekly chart, USD/CAD is still down and is on track to post its first weekly decline after six consecutive weeks of gains.
Technical levels
- Canadian economy contracts 0.2% against expectations of a 1.2% expansion.
- USD/CAD stays in positive territory above 1.3500 after the data and US NFP.
Canada's real Gross Domestic product (GDP) contracted at an annual rate of 0.2% in the second quarter, Statistics Canada reported on Friday. This reading followed the 2.6% expansion (revised from 3.1%) recorded in the first quarter and came in worse than the market expectation for growth of 1.2%.
On a quarterly basis, real GDP stagnated compared to analysts' estimate of a 0.3% expansion. During the first quarter, it expanded 0.6% (revised from 0.8%).
On a monthly basis, real GDP contracted in June 0.2%, in line with expectations. In May, the economy expanded 0.2% (revised from 0.3%).
Key takeaways:
Real gross domestic product (GDP) was nearly unchanged in the second quarter, following a 0.6% rise in the first quarter. The slowdown was attributable to continued declines in housing investment, smaller inventory accumulation, as well as slower international exports and household spending. Increased business investment in engineering structures and higher government spending were among the few components that contributed to growth.
The GDP deflator rose 0.7% in the second quarter, as consumer inflation remained elevated.
Real gross domestic product (GDP) decreased 0.2% in June, following a 0.2% increase in May. Both services-producing industries (-0.2%) and goods-producing industries (-0.4%) contracted in June with 12 of 20 industrial sectors posting decreases.
Market reaction
The Loonie weakened in the market after the data. Not only did the Canadian economy contract unexpectedly during the second quarter, but previous numbers were revised lower.
USD/CAD rose modestly to fresh daily highs above 1.3520. At the same time, the US official employment report was released,and it triggered a decline of the US Dollar limiting the upside of the pair.
- DXY trades in an inconclusive fashion near 103.50 on Friday.
- Bouts of weakness could see the index drop below 103.00.
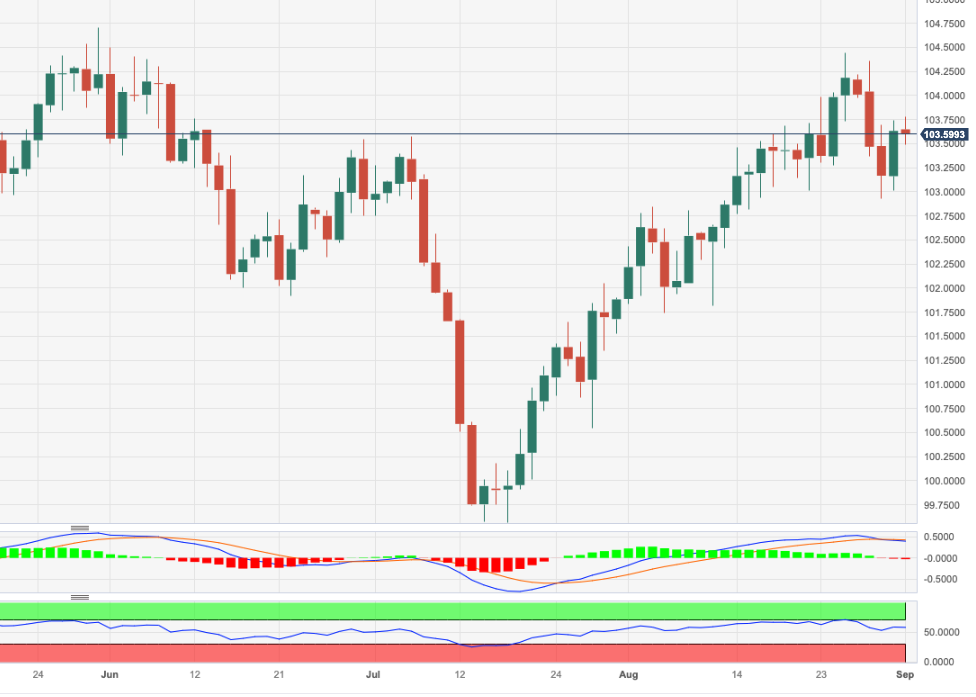
DXY keeps hovering around the mid-103.00s following Thursday’s robust rebound to the 103.70 zone.
The resumption of the selling mood could prompt the index to revisit the key 200-day SMA at 103.05 prior to the weekly low of 102.93 (August 30). Down from here emerges the temporary 100-day and 55-day SMAs at 102.52 and 102.38, respectively.
While above the key 200-day SMA, the outlook for the index is expected to remain constructive.
DXY daily chart
- EUR/JPY adds to Thursday’s strong pullback and tests 157.30.
- Immediately to the downside comes the weekly low near 156.80.
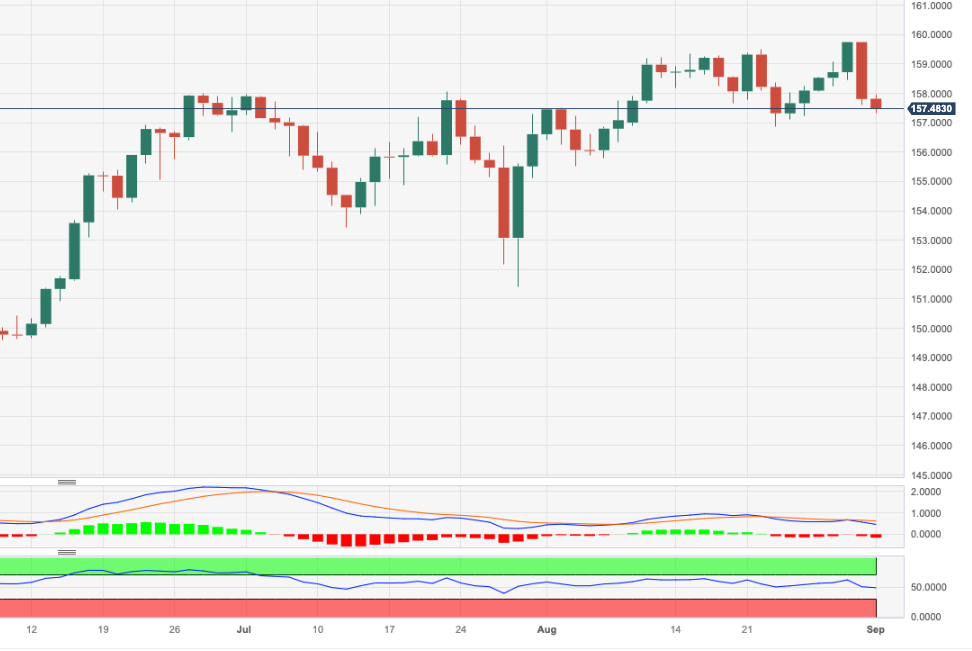
Further selling pressure forces EUR/JPY to add to Thursday’s losses and print multi-day lows near 157.30 on Friday.
In case the downward bias picks up extra pace, the cross risks an initial drop to the minor support at the weekly low of 156.86 (August 23), which appears so far propped up by the provisional 55-day SMA (156.90).
So far, the longer term positive outlook for the cross appears favoured while above the 200-day SMA, today at 147.98
EUR/JPY daily chart
- AUD/USD trades back and forth below 0.6500 ahead of the US labor market data.
- US ADP Employment report released on Wednesday indicated that labor demand remained soft in August.
- The RBA is expected to keep interest rates unchanged at 4.10% on Tuesday.
The AUD/USD strives for a decisive move as investors as investors sidelined ahead of the United States Nonfarm Payrolls (NFP) data, which will be published at 12:30 GMT. The Aussie asset continued to oscillate below the psychological resistance of 0.6500, however, a power-pack action after the US labor market data cannot be ruled out.
S&P500 futures post some decent gains in Europe, portraying an upbeat market mood ahead of the US NFP report. US ADP Employment report released on Wednesday indicated that labor demand remained soft in August due to a hiring slowdown in the leisure and hospitality sector. Also, wage growth was slow as firms heavily worked on retaining the current laborforce.
The US Dollar Index (DXY) clings to gains of around 103.60 as investors need a clear picture of the current status of the labor market. The US NFP is expected to set an undertone for the Federal Reserve’s (Fed) September monetary policy. As per the CME Fedwatch tool, the Fed is expected to keep interest rates unchanged at 5.25-5.50% but Fed Powell could reiterate a hawkish commentary on the interest rate outlook.
Meanwhile, the Australian Dollar fails to capitalize on the surprisingly upbeat Caixin Manufacturing PMI for August. The economic data landed above the 50 threshold that separates contraction at 51.0 vs. the estimates of 49.3 and the former release of 49.2. The Australian Dollar didn’t strengthen despite being a proxy for Chinese economic prospects.
Going forward, the focus will be on the interest rate decision by the Reserve Bank of Australia (RBA), which will be announced on Tuesday. According to a Reuters poll, RBA Governor Philip Lowe will keep interest rates unchanged at 4.10% but will keep doors open for more hikes.
- US Dollar price action expected to stay fairly muted at the start of Friday.
- US Nonfarm Payrolls and ISM Manufacturing are bound to make waves.
- The US Dollar Index is off its weekly low, though any headwind could snap the summer rally in the Greenback.
The US Dollar (USD) is at a make-or-break moment as the scale has been reset to even after a volatile week where data points whiplashed the Greenback back and forth . Traders looking back to assess the possible outcome at the end of this Friday will have seen that Wednesday’s data with JOLTS and GDP missing estimates made the scale tip in favor of a weaker US Dollar and quicker rate cuts from the US Federal Reserve. The scale got completely tipped to the other side on Thursday where the preferred inflation gauge of the Fed – the Personal Consumption Expenditures index (PCE) – proved that inflationary forces are still present.
With the US Nonfarm Payrolls (NFP) number for August and the Institute for Supply Management (ISM) printing its Manufacturing numbers, traders will get a clear picture of where the scale will tip to at the end of this eventful week. The change in the NFP will be the crucial factor, and expectations are that it will land somewhere between 120k and 230k. Any print lower than 120k will be seen as a contraction and thus raise bets for quicker rate cuts and a weaker US Dollar as a result. Any number above 230k will be seen as a tight labor market, which would confirm the stance of the Fed in not cutting interest rates anytime soon. This would then result in a firmly stronger Greenback.
Daily digest: US Dollar faces moment of truth
- The US jobs report exists out of several key components. Here are the ones you need to look out for at 12:30 GMT: The change in the NFP is expected to head from the previous 187k to 170k. The average MoM Hourly Earnings change is expected to slow down a touch from 0.4% to 0.3%. The overall unemployment rate is expected to stay steady at 3.5%.
- Around 13:45 GMT, the S&P Global Manufacturing Purchasing Managers Index (PMI) wil be released for the month of August. Expectations are for an unchanged print at 47, which means a contractionary posture remains.
- Final confirmation from the earlier move on the back of the US Nonfarm Payrolls will come from the ISM Manufacturing PMI for August, which is expected to head from 46.4 to 47. This amounts to a continuation within contraction territory. The Employment Index is expected to stay steady from 44.4 to 44.2 for the next month. The New Orders Index is forecast to head from 47.3 to 46.3; and, the Prices Paid Index from 42.6 to 43.9.
- A similar picture to Thursday unfolds in the equity markets with the Japanese Topix index closes at +0.76%. The Hong Kong Hang Seng heads lower by 0.5%. European and US equities are marginally higher but looking for direction.
- The CME Group’s FedWatch Tool shows that markets are pricing in an 89% chance that the Federal Reserve will keep interest rates unchanged at its meeting in September. The prior 78% probability was quickly reassessed after the downbeat data from the JOLTS report.
- The benchmark 10-year US Treasury bond yield trades at 4.10% and has halted its decline from earlier this week.
US Dollar Index technical analysis: left or right
The US Dollar is not expected to make any moves until the main event this Friday – the August NFP. A very tight range is expected with possibly a mild tone of US Dollar weakness triggered by a handful of traders that will be trying to pre-position with the idea that the NFP will be weaker. This is due to earlier this week when the ADP private payrolls number was weaker as well. Support at 103 is there and will either trigger another bounce or break and see a lower US Dollar Index for the coming weeks.
On the upside, 103.74, the high of August 31, comes into play as the level to beat in order to halt this downturn. Once that level is broken and consolidated, look for a surge to 104.00, where 104.35 (the peak of August 29) is an ideal candidate for a double top. Should the Greenback go on a tear, expect a test at 104.47 – the six-month high.
On the downside, the summer rally of the DXY is set to be broken as only one element now supports the US Dollar. That is the 200-day SMA, and it could mean substantially more weakness to come once the DXY starts trading further below it. The double belt of support at 102.38 with both the 100-day and the 55-day SMA are the last lines of defence before the US Dollar sees substantial and longer-term devaluation.
US Dollar FAQs
What is the US Dollar?
The US Dollar (USD) is the official currency of the United States of America, and the ‘de facto’ currency of a significant number of other countries where it is found in circulation alongside local notes. It is the most heavily traded currency in the world, accounting for over 88% of all global foreign exchange turnover, or an average of $6.6 trillion in transactions per day, according to data from 2022.
Following the second world war, the USD took over from the British Pound as the world’s reserve currency. For most of its history, the US Dollar was backed by Gold, until the Bretton Woods Agreement in 1971 when the Gold Standard went away.
How do the decisions of the Federal Reserve impact the US Dollar?
The most important single factor impacting on the value of the US Dollar is monetary policy, which is shaped by the Federal Reserve (Fed). The Fed has two mandates: to achieve price stability (control inflation) and foster full employment. Its primary tool to achieve these two goals is by adjusting interest rates.
When prices are rising too quickly and inflation is above the Fed’s 2% target, the Fed will raise rates, which helps the USD value. When inflation falls below 2% or the Unemployment Rate is too high, the Fed may lower interest rates, which weighs on the Greenback.
What is Quantitative Easing and how does it influence the US Dollar?
In extreme situations, the Federal Reserve can also print more Dollars and enact quantitative easing (QE). QE is the process by which the Fed substantially increases the flow of credit in a stuck financial system.
It is a non-standard policy measure used when credit has dried up because banks will not lend to each other (out of the fear of counterparty default). It is a last resort when simply lowering interest rates is unlikely to achieve the necessary result. It was the Fed’s weapon of choice to combat the credit crunch that occurred during the Great Financial Crisis in 2008. It involves the Fed printing more Dollars and using them to buy US government bonds predominantly from financial institutions. QE usually leads to a weaker US Dollar.
What is Quantitative Tightening and how does it influence the US Dollar?
Quantitative tightening (QT) is the reverse process whereby the Federal Reserve stops buying bonds from financial institutions and does not reinvest the principal from the bonds it holds maturing in new purchases. It is usually positive for the US Dollar.
- Oil (WTI) price flirts with a new yearly high.
- US Dollar slips ahead of a key US jobs report.
- Baker Hughes Oil rig count data due this Friday.
Oil prices have rallied firmly this week and could still go higher once official confirmation of more supply cuts hits the wires. Talk of the town, though still unconfirmed, is that Saudi Arabia and Russia are due to announce that they will do more in terms of supply control. Riyadh is expected to extend its 1 million barrel-per-day curb. Meanwhile, Russian Deputy Prime Minister Alexander Novak mentioned that a 300,000 barrel cut per day will be materialising this month.
This shakes up the supply side in oil, meaning that market participants need to dig deeper into their wallets. At the beginning of the week, Crude was just barely below $80, while it currently trades above $83. A new yearly high could be in reach, depending on the official announcements of both Saudi Arabia and Russia in the coming days.
At the time of writing, Crude Oil (WTI) price trades at $83.55 per barrel and Brent Oil at $86.98.
Oil news and market movers
- The refinery outage at Garyville, Louisiana, is solved and back online.
- Shanghai weekly medium Sour Crude Stockpiles dropped by 15%.
- India refineries are dealing back with traditional suppliers as the lucrative cheap Russian oil supply looks to be abating.
- The key US jobs report, or Nonfarm Payrolls (NFP), will be released at 12:30 GMT. From all its components, some have more potential than others to affect markets. The change in the NFP is the key figure, and it is expected to decline from the previous 187K to 170K. The average MoM Hourly Earnings change, which gauges wage growth, is expected to slow down a touch from 0.4% to 0.3%. Meanwhile, the overall unemployment rate is expected to stay steady at 3.5%.
- Final confirmation from the earlier move on the back of the US Nonfarm Payrolls will come from the ISM Manufacturing PMI for August, which is expected to increase slightly from 46.4 to 47.0. Despite the rise, this would still signal a contraction in US factory activity. The Employment Index is expected to stay broadly steady from 44.4 to 44.2. The New Orders Index is forecast to fall from 47.3 to 46.3;, and the Prices Paid Index is seen increasing from 42.6 to 43.9.
- Data from the Baker Hughes US Oil Rig Count is expected to close off this week at 17:00 GMT. The previous number was at 512, and a lower number could possibly become an 18-month low.
- Equity markets are mixed this Friday as investors await more guidance from the US jobs report on Friday.
Oil Technical Analysis: double top to overcome
Oil price has snapped its losing streak with a fourth consecutive day of gains this week. Crude is flirting with a new yearly high. In case supply cuts are higher than expected, with more drawdowns in strategic stockpiles in the coming weeks, Oil might be heading back to $92.
On the upside, $84.28, the high of August 10, is the one to beat in order to have that bullish breakout confirmation. Should WTI continue to rally on the back of lower supply and more demand, not many elements could be standing in the way of reaching that blue line at $92.80. Of course, the $90 big figure psychological level needs to be faced first.
On the downside, a temporary bottom is being formed around $77.50, which acted as a base for this week. Should the Baker Hughes Rig Count jump substantially higher, expect to see the floor tested as more supply is bound to come online. Once bears make it through that yellow box level, expect to see more downside toward $74 before finding ample support to slow down the sell-off.
-638291576374554364.png)
WTI US OIL (daily chart)
WTI Oil FAQs
What is WTI Oil?
WTI Oil is a type of Crude Oil sold on international markets. The WTI stands for West Texas Intermediate, one of three major types including Brent and Dubai Crude. WTI is also referred to as “light” and “sweet” because of its relatively low gravity and sulfur content respectively. It is considered a high quality Oil that is easily refined. It is sourced in the United States and distributed via the Cushing hub, which is considered “The Pipeline Crossroads of the World”. It is a benchmark for the Oil market and WTI price is frequently quoted in the media.
What factors drive the price of WTI Oil?
Like all assets, supply and demand are the key drivers of WTI Oil price. As such, global growth can be a driver of increased demand and vice versa for weak global growth. Political instability, wars, and sanctions can disrupt supply and impact prices. The decisions of OPEC, a group of major Oil-producing countries, is another key driver of price. The value of the US Dollar influences the price of WTI Crude Oil, since Oil is predominantly traded in US Dollars, thus a weaker US Dollar can make Oil more affordable and vice versa.
How does inventory data impact the price of WTI Oil
The weekly Oil inventory reports published by the American Petroleum Institute (API) and the Energy Information Agency (EIA) impact the price of WTI Oil. Changes in inventories reflect fluctuating supply and demand. If the data shows a drop in inventories it can indicate increased demand, pushing up Oil price. Higher inventories can reflect increased supply, pushing down prices. API’s report is published every Tuesday and EIA’s the day after. Their results are usually similar, falling within 1% of each other 75% of the time. The EIA data is considered more reliable, since it is a government agency.
How does OPEC influence the price of WTI Oil?
OPEC (Organization of the Petroleum Exporting Countries) is a group of 13 Oil-producing nations who collectively decide production quotas for member countries at twice-yearly meetings. Their decisions often impact WTI Oil prices. When OPEC decides to lower quotas, it can tighten supply, pushing up Oil prices. When OPEC increases production, it has the opposite effect. OPEC+ refers to an expanded group that includes ten extra non-OPEC members, the most notable of which is Russia.
- EUR/GBP falls back as expectations of more interest rates from the ECB threaten the economic outlook.
- Eurozone inflation expanded in August due to the hot labor market.
- Two more interest rate hikes of bps from the BoE are expected this year as investors see the interest rate peak at 5.75%.
The EUR/GBP pair falls back as a pullback move to near 0.8570 meets offers in the European session. The cross continues to bleed as investors hope that the European Central Bank (ECB) has to raise interest rates further so that inflation can be tamed and the trading bloc can avoid potential risks of a recession.
Eurozone preliminary Harmonized Index of Consumer Prices (HICP) for August expanded as the labor market remained hot, making it difficult for policymakers to convince workers to shift to slower wage growth.
Eurostat reported that monthly headline inflation expanded at a higher pace of 0.6% while investors anticipated a deflation of 0.1% as recorded for July. Core inflation that excludes volatile food and oil prices expanded at a 0.3% pace as expected by market participants. In July prices of core goods were softened by 0.1%. On an annual basis, the economic data softened to 5.3% as expected from July’s reading of 5.5%.
About the interest rate outlook, ECB policymaker Francois Villeroy de Galhau said the central bank is open to various options at the next and upcoming rate meetings. He further added keeping rates high long enough matters more than the level.
Meanwhile, the Pound Sterling remains in the driving seat as more interest rate hikes from the Bank of England (BoE) cannot be ruled out. Two more interest rate hikes of 25 basis points (bps) are expected this year as investors see the interest rate peak at 5.75%.
On the economic front, S&P Global reported the Manufacturing PMI for August at 43.0, higher than expectations and July’s reading of 42.5.
- Gold price awaits key economic data for further action.
- US PCE remained stubborn in July due to steady wage growth.
- US inflation has become more responsive to the job market.
Gold price (XAU/USD) remains calm before the US Nonfarm Payrolls (NFP) and ISM Manufacturing PMI data for August, which will set an undertone for the Federal Reserve’s (Fed) interest-rate decision to be taken on September 20. Fed Chair Jerome Powell at the Jackson Hole Symposium that further policy action will depend on incoming data and cited that inflation has become more responsive to the job market.
The precious metal struggles for a decisive move as investors wait for a clear picture of labor market conditions for making an informed trade. The US ADP Employment Change report released on Wednesday suggested that labor demand softened and wage growth momentum slowed in August. Firms appear to be reluctant to expand their labor force to avoid excess production due to a deteriorating demand outlook.
Daily Digest Market Movers: Gold price awaits US NFP data
- Gold price continues to trade sideways. The upside remains restricted around $1,950.00 due to stubborn Personal Consumption Expenditure (PCE) Price Index data, while the downside remains supported near $1,940.00 inspired by soft labor demand.
- The precious metal is expected to deliver a power-pack action after the release of the US Nonfarm Payrolls data, which will be published at 12:30 GMT.
- Gold price traded inside Wednesday’s price range on Thursday as the impact of the soft ADP Employment report was offset by still-high numbers from the Federal Reserve’s preferred inflation tool, the PCE Price Index.
- The US PCE price index remained sticky in July. The monthly headline and core PCE grew at a stable pace of 0.2%. Also, the annual headline and core PCE accelerated marginally to 3.3% and 4.2%, respectively, as expected by market participants.
- Meanwhile, the US labor market is delivering mixed cues. ADP Employment report for August suggested lower employment creation, while Jobless Claims for the week ending August 25 were lower.
- The US Department of Labor reported that individuals claiming jobless benefits dropped to 228K, less than the 235K expected and the former reading of 232K.
- The ADP report for August showed the US private sector added 177K employees, lower than expectations of 195K and less than half of the upwardly revised July’s reading of 371K.
- A slowdown in job growth majorly came from the leisure and hospitality sector. Job creation by hotels, restaurants, and other employers in the sector fell by 30K in August after months of strong hiring.
- Wage growth also slowed in August. Job stayers saw an annual pay growth of 5.9%, while job changers' pay growth slowed to 9.5%.
- Going forward, investors will keep focus on the NFP data as Fed Chair Jerome Powell said that further policy action will be data-dependent and inflation is getting more responsive to the job market.
- US employers are expected to have added 170K labor employees in August, a decline from July’s reading of 187K. The Unemployment Rate is seen unchanged at 3.5%.
- Apart from the job market data, investors will focus on the Average Hourly Earnings. Labor costs are expected to grow 0.3% on the month, slowing from the 0.4% increase seen in July. On an annual basis, growth in Average Hourly Earnings is seen unchanged at 4.4%.
- Strong wage growth has been a major catalyst behind stubborn inflationary pressures. US households’ spending remains solid due to higher disposable income.
- Amid the data-packed week, ISM Manufacturing PMI will also be on the investors’ radar. The index, which gauges activity in the US factory sector, is expected to come in at 47.0, higher than July’s print of 46.4. Still, a figure below the 50.0 threshold suggests a contraction in activity.
- August Manufacturing PMI could remain below 50.0 for a ninth straight month. US factories are operating at lower capacity due to a deteriorating demand environment.
Technical Analysis: Gold price juggles below $1,950
Gold price demonstrates a lackluster performance below $1,950.00 as investors await the US labor market data for further action. The precious metal oscillates near the upper portion of the Rising Channel chart pattern formed on a small term frame. The yellow metal stabilizes above the 20- and 50-day Exponential Moving Averages (EMAs), which indicates that the mid-term trend has turned positive.
The Relative Strength Index (RSI) climbs to near 60.00. A decisive break into the range of 60.00-80.00 will likely activate the bullish impulse.
US Dollar FAQs
What is the US Dollar?
The US Dollar (USD) is the official currency of the United States of America, and the ‘de facto’ currency of a significant number of other countries where it is found in circulation alongside local notes. It is the most heavily traded currency in the world, accounting for over 88% of all global foreign exchange turnover, or an average of $6.6 trillion in transactions per day, according to data from 2022.
Following the second world war, the USD took over from the British Pound as the world’s reserve currency. For most of its history, the US Dollar was backed by Gold, until the Bretton Woods Agreement in 1971 when the Gold Standard went away.
How do the decisions of the Federal Reserve impact the US Dollar?
The most important single factor impacting on the value of the US Dollar is monetary policy, which is shaped by the Federal Reserve (Fed). The Fed has two mandates: to achieve price stability (control inflation) and foster full employment. Its primary tool to achieve these two goals is by adjusting interest rates.
When prices are rising too quickly and inflation is above the Fed’s 2% target, the Fed will raise rates, which helps the USD value. When inflation falls below 2% or the Unemployment Rate is too high, the Fed may lower interest rates, which weighs on the Greenback.
What is Quantitative Easing and how does it influence the US Dollar?
In extreme situations, the Federal Reserve can also print more Dollars and enact quantitative easing (QE). QE is the process by which the Fed substantially increases the flow of credit in a stuck financial system.
It is a non-standard policy measure used when credit has dried up because banks will not lend to each other (out of the fear of counterparty default). It is a last resort when simply lowering interest rates is unlikely to achieve the necessary result. It was the Fed’s weapon of choice to combat the credit crunch that occurred during the Great Financial Crisis in 2008. It involves the Fed printing more Dollars and using them to buy US government bonds predominantly from financial institutions. QE usually leads to a weaker US Dollar.
What is Quantitative Tightening and how does it influence the US Dollar?
Quantitative tightening (QT) is the reverse process whereby the Federal Reserve stops buying bonds from financial institutions and does not reinvest the principal from the bonds it holds maturing in new purchases. It is usually positive for the US Dollar.
- USD/CHF trades lower around 0.8830 on the back of resilient Swiss CPI.
- US Dollar (USD) suffers to protect gains from the previous day.
- Investors await US data releases, seeking further cues on the economic situation in the country.
USD/CHF trades lower around 0.8830, retreating from the previous day’s gains during the European session on Friday. The Swiss Franc is experiencing upward support against the US Dollar (USD), which is attributed to Switzerland’s Consumer Price Index (YoY) for August, which showed that Swiss inflation remained consistent at the rate of 1.6% against the market expectations of declining to 1.5%.
The US Dollar Index (DXY), which gauges the performance of the Greenback against the six other major currencies, treads waters around 103.60 at the time of writing. However, the US Dollar (USD) gained ground on Thursday due to the US inflation data released on Thursday, which is considered to be the preferred gauge index of inflation by the Federal Reserve (Fed). However, market participants seek fresh impetus on monetary policy tightening in the September meeting by the US Federal Reserve (Fed).
As said, the US Core Personal Consumption Expenditures (PCE) - Price Index (MoM) advanced to 4.2% in July as per the market expectations, from 4.1% prior. While, US Initial Jobless Claims for the week ending on August 25, fell to the reading of 228K, against the expected rise to 235K from the previous 232K figure.
The US Dollar (USD) is experiencing downward pressure ahead of the upcoming releases of macroeconomic data from the United States (US). US docket includes US Nonfarm Payrolls Average Hourly Earnings, and ISM Manufacturing PMI are scheduled to be released later in the day. These datasets could provide further cues on the economic outlook, which may help USD/CHF traders strategize their bets.
- EUR/JPY oscillates in a narrow trading band through the early European session on Friday.
- Bets for more rate hikes by the ECB underpin the Euro and act as a tailwind for the cross.
- The BoJ’s dovish outlook suggests that the path of least resistance remains to the upside.
The EUR/JPY cross struggles to gain any meaningful traction on Friday and consolidates the previous day's sharp retracement slide from the 159.75 region, or its highest level since August 2008. Spot prices remain confined in a narrow band through the early part of the European session, albeit manage to hold above mid-157.00s.
The shared currency draws some support from hawkish-sounding remarks by the European Central Bank (ECB) policymaker, Francois Villeroy de Galhau, keeping the door open for more interest rate hikes. De Galhau noted that the underlying inflation has peaked since April and appears to have begun its decline, but this encouraging sign is still far from sufficient. He added that options are open at the next and upcoming rate meetings, though interest rates may be very close to a peak.
This comes on the back of the overnight comments by Isabel Schnabel, who is considered one of the most hawkish members of the ECB, saying that a slower-than-predicted Euro Zone growth does not necessarily void the need for more rate hikes. Adding to this, ECB Vice-President Luis de Guindos said that the central bank is nearing the end of its hiking rate cycle but the decision on whether to further tighten its monetary policy at its next meeting in two weeks is still open for debate.
This marks a big divergence in comparison to a more dovish stance adopted by the Bank of Japan (BoJ), which is seen as another factor behind the Japanese Yen's (JPY) relative underperformance and contributes to limiting the downside for the EUR/JPY cross. In fact, the BoJ is the only central bank in the world to maintain negative interest rates Moreover, the recent remarks by BoJ officials ensure that the central bank will stick to its ultra-easy monetary policy settings until next summer.
The aforementioned fundamental backdrop favours the EUR/JPY bulls and suggests that the path of least resistance is to the upside. Hence, any subsequent fall might still be categorized as a corrective decline and is more likely to get bought into. This, in turn, makes it prudent to wait for strong follow-through selling before confirming that spot prices have formed a near-term top and placing aggressive bearish bets.
Technical levels to watch
- USD/JPY is experiencing losses due to China’s fiscal measure and upbeat PMI.
- PBoC reduced FX RRR to 4% to slow down the weakening pace of the Chinese Yuan.
- Greenback retreats from the recent gains ahead of the US economic data.
USD/JPY trades lower around 145.40, extending losses for the second consecutive day during the European session on Friday. The pair is experiencing downward pressure as a result of an announcement by the People's Bank of China (PBoC) regarding the recent fiscal measures.
The central bank decided to reduce the Forex Reserve Requirement Ratio (FX RRR) to 4% from 6% prior, starting from September 15. This would improve the ability of local banks to release more US Dollars (USD) in terms of slowing down the weakening pace of the Chinese Yuan.
Additionally, China’s upbeat Caixin Manufacturing PMI for August contributed to improving the market optimism. The data posted a reading of 51.0, compared to the market consensus of 49.3, from the previous reading of 49.2 figure in July.
The US Dollar Index (DXY), which measures the performance of the US Dollar (USD) against the six other major currencies, trades lower around 103.50 at the time of writing. The Greenback retreats from the previous day’s gains ahead of the ahead of upcoming releases of macroeconomic data from the United States (US). These datasets include US Nonfarm Payrolls Average Hourly Earnings, and ISM Manufacturing PMI are scheduled to be released later in the day.
However, the buck experienced upward support attributed to the US inflation data released on Thursday, which is considered to be the preferred gauge index of inflation by the Federal Reserve (Fed). The US Core Personal Consumption Expenditures (PCE) - Price Index (MoM) rose to 4.2% in July as per the market consensus, from 4.1% prior. US Initial Jobless Claims for the week ending on August 25, reported 228K figure against the expectations of 235K and the previous 232K.
- The Euro bounces off lows near 1.0830 vs. the US Dollar.
- Stocks in Europe start the session in an upbeat mood.
- EUR/USD rebounds from 1.0830 as risk appetite improves.
- The USD Index (DXY) looks offered in the mid-103.00s.
- US and German yields trade without a clear direction.
- No surprises from the final Manufacturing PMIs in Germany, EMU.
- US Nonfarm Payrolls, ISM manufacturing are next of note.
Following a drop to the 1.0830 region, the Euro (EUR) now manages to regain some balance vs. the US Dollar (USD) and motivates EUR/USD to retake the 1.0850 region at the end of the week.
The so far modest advance in the pair comes in line with the offered stance in the Greenback, while the USD Index (DXY) gyrates around the 103.50 zone amidst the lack of a clear direction in US yields across different maturities.
In the meantime, investors continue to reprice a pause by the Federal Reserve in its tightening campaign, while the upcoming release of the Nonfarm Payrolls for the month of August should lend further insight into this current view.
Back to the European Central Bank (ECB), there is a great deal of uncertainty regarding the potential steps beyond the summer, all amidst a pretty divided Council and rising speculation that a stagflation scenario could be brewing in the region.
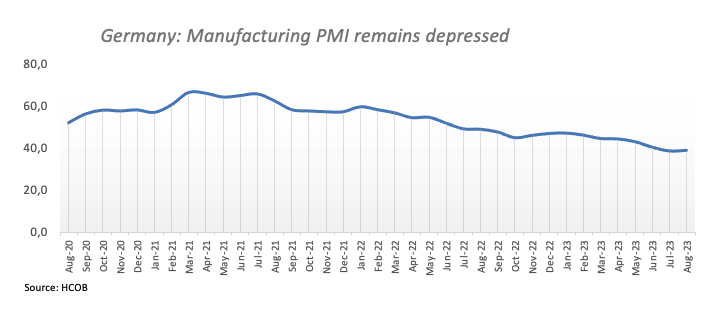
Data-wise in the region, final Manufacturing PMIs in Germany and the euro area came in at 39.1 and 43.5, respectively, for the month of August.
Later in the NA session, Nonfarm Payrolls, Unemployment Rate and the ISM Manufacturing PMI will take centre stage, followed by Construction Spending and the final S&P Global Manufacturing PMI.
Daily digest market movers: Euro bounces off three-day lows
- The EUR gathers some fresh oxygen vs. the USD.
- Final PMIs in Europe broadly matched the preliminary prints.
- China’s Caixin Manufacturing PMI returned to expansionary territory.
- PBoC reduced the FX RRR to 4% to support the Chinese yuan.
- Investors’ focus shifts to NFP, ISM Manufacturing.
- Investors now see the Fed on hold for the remainder of the year.
Technical Analysis: Euro could advance further once 1.0950 is cleared
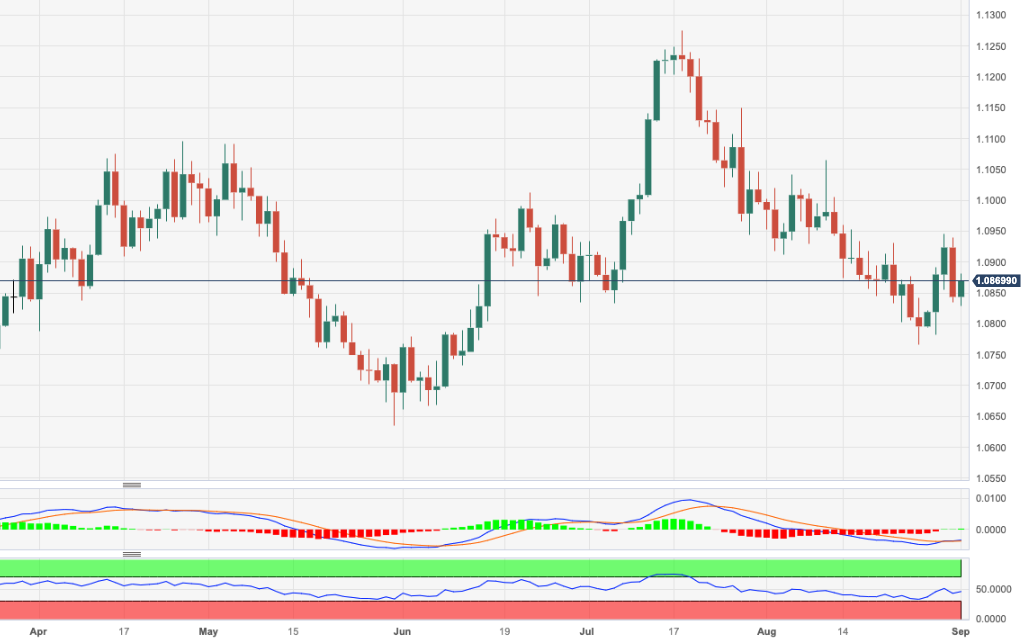
EUR/USD regains some upside traction following Thursday’s strong pullback and three-day lows near 1.0830.
In case bulls regain the upper hand and EUR/USD surpasses the weekly top of 1.0945 (August 30), the pair is expected to meet the provisional 55-day SMA at 1.0965 prior to the psychological 1.1000 barrier and the August top at 1.1064 (August 10). Once the latter is cleared, spot could challenge the weekly peak at 1.1149 (July 27). If the pair surpasses this region, it could alleviate some of the downward pressure and potentially visit the 2023 peak of 1.1275 (July 18). Further up comes the 2022 high at 1.1495 (February 10), which is closely followed by the round level of 1.1500.
The resumption of the downward bias could motivate the pair to initially test the key 200-day SMA at 1.0815 ahead of the August low of 1.0765 (August 25). The breach of the latter exposes the May low of 1.0635 (May 31) prior to the March low of 1.0516 (March 15) and the 2023 low at 1.0481 (January 6).
Furthermore, sustained losses are likely in EUR/USD once the 200-day SMA is breached in a convincing fashion.
Euro FAQs
What is the Euro?
The Euro is the currency for the 20 European Union countries that belong to the Eurozone. It is the second most heavily traded currency in the world behind the US Dollar. In 2022, it accounted for 31% of all foreign exchange transactions, with an average daily turnover of over $2.2 trillion a day.
EUR/USD is the most heavily traded currency pair in the world, accounting for an estimated 30% off all transactions, followed by EUR/JPY (4%), EUR/GBP (3%) and EUR/AUD (2%).
What is the ECB and how does it impact the Euro?
The European Central Bank (ECB) in Frankfurt, Germany, is the reserve bank for the Eurozone. The ECB sets interest rates and manages monetary policy.
The ECB’s primary mandate is to maintain price stability, which means either controlling inflation or stimulating growth. Its primary tool is the raising or lowering of interest rates. Relatively high interest rates – or the expectation of higher rates – will usually benefit the Euro and vice versa.
The ECB Governing Council makes monetary policy decisions at meetings held eight times a year. Decisions are made by heads of the Eurozone national banks and six permanent members, including the President of the ECB, Christine Lagarde.
How does inflation data impact the value of the Euro?
Eurozone inflation data, measured by the Harmonized Index of Consumer Prices (HICP), is an important econometric for the Euro. If inflation rises more than expected, especially if above the ECB’s 2% target, it obliges the ECB to raise interest rates to bring it back under control.
Relatively high interest rates compared to its counterparts will usually benefit the Euro, as it makes the region more attractive as a place for global investors to park their money.
How does economic data influence the value of the Euro?
Data releases gauge the health of the economy and can impact on the Euro. Indicators such as GDP, Manufacturing and Services PMIs, employment, and consumer sentiment surveys can all influence the direction of the single currency.
A strong economy is good for the Euro. Not only does it attract more foreign investment but it may encourage the ECB to put up interest rates, which will directly strengthen the Euro. Otherwise, if economic data is weak, the Euro is likely to fall.
Economic data for the four largest economies in the euro area (Germany, France, Italy and Spain) are especially significant, as they account for 75% of the Eurozone’s economy.
How does the Trade Balance impact the Euro?
Another significant data release for the Euro is the Trade Balance. This indicator measures the difference between what a country earns from its exports and what it spends on imports over a given period.
If a country produces highly sought after exports then its currency will gain in value purely from the extra demand created from foreign buyers seeking to purchase these goods. Therefore, a positive net Trade Balance strengthens a currency and vice versa for a negative balance.
- Pound Sterling trades sideways as investors need fresh cues about the BoE’s possible interest rate peak.
- UK inflation is highest among G7 economies due to labor shortages and strong wage growth.
- BoE policymakers warned that interest rates will remain higher for a longer period.
The Pound Sterling (GBP) struggles for a decisive move as investors await fresh cues about the interest rate peak from the Bank of England (BoE). The GBP/USD pair turns delicate as BoE policymakers, including Deputy Governor Ben Broadbent and Chief Economist Huw Pill, warned that sufficiently restrictive policy needs to be maintained longer to bring down the core Consumer Price Index (CPI) to the desired rate of 2%.
Investors hope that the UK economy cannot avoid a recession as higher interest rates are critically impacting the housing sector and factory activities. The UK’s economic outlook has deteriorated as core inflation is hovering near its all-time high due to labor shortages and strong wage growth. Meanwhile, the BoE is preparing to raise interest rates further in September. An interest rate hike of 25 basis points (bps) is expected that will push interest rates to 5.50%.
Daily Digest Market Movers: Pound Sterling remains delicate as recession fears soar
- Pound Sterling stabilizes below the round-level resistance of 1.2700 as fears of a recession in the UK economy grow on the belief that the Bank of England (BoE) will keep interest rates higher.
- UK inflation is highest among G7 economies and requires a tight interest rate policy for a longer period to ensure price stability.
- BoE Deputy Governor Ben Broadbent warned this week that inflation will not fade as quickly as it emerged despite soft energy prices.
- Core inflation is still hovering near its all-time peak of 7.1% as labor shortages and strong wage growth are still a major concern for BoE policymakers.
- On Thursday, BoE Chief Economist Huw Pill said that there are many ways to bring down inflation and that keeping interest rates higher for a longer period is one of them.
- BoE Pill warned that there are cases for caution on inflation despite the fall in the headline rate. He further added that the economy is facing second-round inflationary effects and that services inflation is developing less benignly. Also, core inflation is not yet showing a downtrend.
- For September monetary policy, investors hope that the central bank will raise interest rates consecutively by 25 basis points (bps) to 5.50%. This would be the 15th consecutive interest rate hike of the current tightening cycle.
- On Wednesday, UK PM Rishi Sunak received a resignation letter from UK Defence Minister Wallace and named Grant Shapps as the new Defence secretary.
- The UK economic calendar remains light this week while investors focus on the S&P Global Manufacturing PMI for August, which will provide cues about the current status of factory activities. The economic data is forecast to be unchanged at 42.5
- Market sentiment remains bearish after the US Personal Consumption Expenditure (PCE) price index for July rose from June’s figures.
- The US Dollar Index (DXY) clings to recovery near 103.70 as the stubborn PCE price index offset the soft ADP Employment Change report.
- Hopes of a pause in the policy tightening spell by the Federal Reserve inspired by soft labor demand were neutralized as US PCE grew at a steady pace in July.
- On Thursday, the US Department of Labor reported individuals claiming jobless benefits for the week ending August 25 dropped to 228K vs. expectations of 235K and the former reading of 232K.
- Meanwhile, investors shift their focus toward the Nonfarm Payrolls (NFP) and the ISM Manufacturing PMI for August, which will be published at 12:30 GMT and 14:00 GMT.
- Analysts at TD Securities noted, “Payrolls likely posted another sub-200k gain in August, remaining in the vicinity of the Jun-Jul gains. The August increase would maintain the downtrend in the three-month pace, barring any major revisions. The Unemployment Rate to stay unchanged at 3.5%, following its second consecutive decline in July. Wage growth to print 0.3% m/m (4.3% y/y).”
Technical Analysis: Pound Sterling stabilizes below 1.2700
Pound Sterling consolidates near 1.2650 after a corrective move from the weekly high of 1.2746 as a risk-off impulse emerges. The Cable is consistently failing to sustain above the 20 and 50-day Exponential Moving Averages (EMAs), which indicates that investors are considering pullbacks as a selling opportunity. A fresh downside would emerge if the asset drops below the crucial support of 1.2600.
BoE FAQs
What does the Bank of England do and how does it impact the Pound?
The Bank of England (BoE) decides monetary policy for the United Kingdom. Its primary goal is to achieve ‘price stability’, or a steady inflation rate of 2%. Its tool for achieving this is via the adjustment of base lending rates. The BoE sets the rate at which it lends to commercial banks and banks lend to each other, determining the level of interest rates in the economy overall. This also impacts the value of the Pound Sterling (GBP).
How does the Bank of England’s monetary policy influence Sterling?
When inflation is above the Bank of England’s target it responds by raising interest rates, making it more expensive for people and businesses to access credit. This is positive for the Pound Sterling because higher interest rates make the UK a more attractive place for global investors to park their money. When inflation falls below target, it is a sign economic growth is slowing, and the BoE will consider lowering interest rates to cheapen credit in the hope businesses will borrow to invest in growth-generating projects – a negative for the Pound Sterling.
What is Quantitative Easing (QE) and how does it affect the Pound?
In extreme situations, the Bank of England can enact a policy called Quantitative Easing (QE). QE is the process by which the BoE substantially increases the flow of credit in a stuck financial system. QE is a last resort policy when lowering interest rates will not achieve the necessary result. The process of QE involves the BoE printing money to buy assets – usually government or AAA-rated corporate bonds – from banks and other financial institutions. QE usually results in a weaker Pound Sterling.
What is Quantitative tightening (QT) and how does it affect the Pound Sterling?
Quantitative tightening (QT) is the reverse of QE, enacted when the economy is strengthening and inflation starts rising. Whilst in QE the Bank of England (BoE) purchases government and corporate bonds from financial institutions to encourage them to lend; in QT, the BoE stops buying more bonds, and stops reinvesting the principal maturing on the bonds it already holds. It is usually positive for the Pound Sterling.
- NZD/USD lacks any firm direction on Friday and seesaws between tepid gains/minor losses.
- A positive risk tone and the upbeat Chinese PMI lend some support to the risk-sensitive Kiwi.
- The uncertain Fed rate-hike path caps the USD and also contributes to limiting the downside.
- Traders keenly await the release of the crucial US NFP report before placing aggressive bets.
The NZD/USD pair attracts some intraday sellers on Friday, albeit manages to defend the 200-hour Simple Moving Average (SMA) and recover a few pips from the daily low touched in the last hour. Spot price seesaw between tepid gains/minor losses through the early European session and currently hovers around the 0.5965-0.5970 region, nearly unchanged for the day as traders keenly await the closely-watched US monthly jobs data.
The popularly known NFP report will influence market expectations about the next policy move by the Federal Reserve (Fed), which, in turn, will drive the US Dollar (USD) demand and provide a fresh directional impetus to the NZD/USD pair. In the meantime, the uncertainty over the Fed's future rate-hike path fails to assist the USD Index (DXY), which tracks the Greenback against a basket of currencies, to capitalize on its overnight goodish rebound from a two-week low. This, along with a generally positive tone around the equity markets, lends support to the risk-sensitive Kiwi.
The US macro data released earlier this week – the ADP report and the revised Q2 GDP print – suggested that the resilient US economy is starting to lose steam, which might force the Fed to hold interest rates steady. That said, the US Bureau of Economic Analysis reported on Thursday that the annual Core PCE Price Index – the Fed's preferred inflation gauge – edged up to 4.2% in August from the 4.1% recorded in the previous month. This keeps the door for one more 25 bps lift-off by the end of this year wide open and acts as a tailwind for the buck ahead of the key data risk.
The downside for the NZD/USD pair, however, seems cushioned in the wake of the optimism over more stimulus measures and the upbeat data from China. In fact, the People's Bank of China (PBoC) announced today that it will lower the foreign exchange reserve requirement ratio to 4%, from 6.0%, effective from September 15. Furthermore, a slew of Chinese banks cut rates on Yuan deposits as they prepare to lower interest rates on existing mortgages soon. Adding to this, a Caixin-sponsored survey showed that manufacturing activity in China expanded at its fastest pace since February.
The aforementioned mixed fundamental backdrop warrants some caution before positioning for a firm near-term direction for the NZD/USD pair. Meanwhile, this week's rejection near the 0.6000 psychological mark and the lack of any meaningful buying interest suggests that the well-established downtrend from a multi-month high touched in July is still far from being over. That said, the recent failures to find acceptance below the 0.5900 round figure make it prudent to wait for strong follow-through selling to confirm the near-term negative outlook.
Technical levels to watch
- The index trades without direction around 103.60.
- US yields appear side-lined around recent levels.
- Investors’ focus remains on the US NFP, ISM gauge.
The USD Index (DXY), which tracks the greenback vs. a bundle of its main rival currencies, trades within a narrow range around 103.60 at the end of the week.
USD Index now looks at NFP
The index continues to digest Thursday’s strong rebound after three consecutive daily pullbacks, including a drop to fresh lows in levels just below the 103.00 level (August 30).
The dollar’s cautious price action comes in line with the equally prudent developments from US yields across different timeframes, all ahead of the crucial release of the US jobs report for the month of August.
Other than the Nonfarm Payrolls, markets are expected to closely follow the publication of the ISM Manufacturing also for the month of August as well as Construction Spending and the final S&P Global Manufacturing PMI.
What to look for around USD
The index now wobbles around the 103.50/60 band amidst rising cautiousness prior to key data releases in the US calendar on Friday.
In the meantime, support for the dollar keeps coming from the good health of the US economy, which seems to have reignited the narrative around the tighter-for-longer stance from the Federal Reserve.
Running on the opposite side of the road, the idea that the dollar could face headwinds in response to the data-dependent stance from the Fed against the current backdrop of persistent disinflation and cooling of the labour market appears to have regained some traction as of late.
Key events in the US this week: Nonfarm Payrolls, Unemployment Rate, Final Manufacturing PMI, ISM Manufacturing PMI, Construction Spending (Friday).
Eminent issues on the back boiler: Persistent debate over a soft or hard landing for the US economy. Incipient speculation of rate cuts in early 2024. Geopolitical effervescence vs. Russia and China.
USD Index relevant levels
Now, the index is losing 0.12% at 103.50 and the breach of 102.93 (weekly low August 30) would expose 102.38 (55-day SMA) and then 101.74 (monthly low August 4). On the upside, there is an initial hurdle at 104.44 (monthly high August 25) ahead of 104.69 (monthly high May 31) and finally 105.88 (2023 high March 8).
- XAG/USD trades higher ahead of US employment data.
- RSI indicates the bullish bias of the traders; the weekly high appears to be key resistance.
- Seven-day EMA could act as the immediate support lined up with 23.6% Fibo.
XAG/USD snaps the two-day losing streak, trading higher around $24.50 during the early trading hours in the European session on Friday. The pair is experiencing upward support after the moderate inflation data from the United States (US) was released on Thursday. US Core Personal Consumption Expenditures (PCE) - Price Index, rose at the rate of 4.2% on a monthly basis in July as per the market consensus, from 4.1% prior.
However, the traders of the bright metal will likely monitor the releases of US employment and manufacturing data before making fresh bets on the XAG/USD pair. These datasets include the US Average Hourly Earnings, Nonfarm Payrolls and ISM Manufacturing PMI.
The 14-day Relative Strength Index (RSI) remains above 50, indicating a bullish bias of the XAG/USD traders. The bulls could face a challenge around the weekly high at $25.01, followed by July’s high at $25.26.
The Moving Average Convergence Divergence (MACD) line remains above the centerline and shows the divergence above the signal line, which indicates that recent momentum is stronger.
On the flip side, the seven-day Exponential Moving Average (EMA) at $24.30 emerges as the immediate support aligned to 23.6% Fibonacci retracement at $24.35.
A break below that level could push the Silver price to navigate the region around a nine-day EMA at $24.19, followed by a 38.2% Fibonacci retracement at $23.94.
XAG/USD: Daily Chart
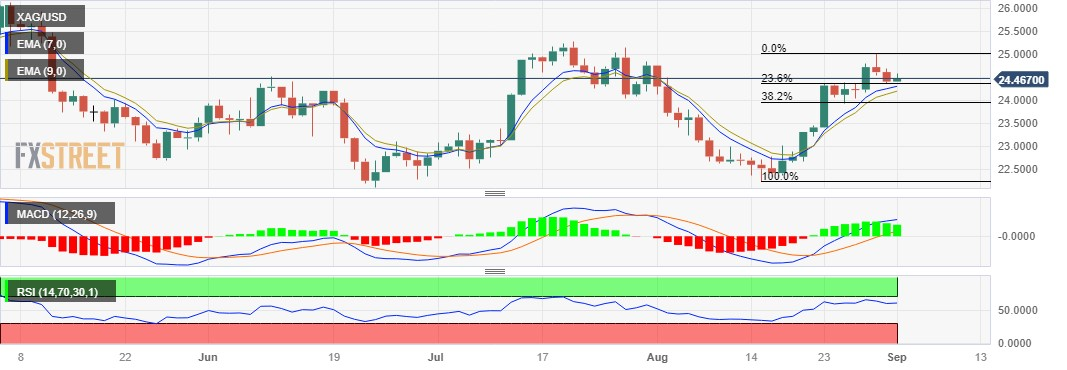
FX option expiries for Sept 1 NY cut at 10:00 Eastern Time, via DTCC, can be found below.
- EUR/USD: EUR amounts
- 1.0700 454m
- 1.0725 1.5b
- 1.0750 1.9b
- 1.0800 1.1b
- 1.0850 375m
- 1.0875 376m
- 1.0900 1.1b
- 1.0935 938m
- 1.0950 611m
- 1.1000 1.3b
- 1.1050 381m
- GBP/USD: GBP amounts
- 1.2600 395m
- 1.2800 690m
- USD/JPY: USD amounts
- 145.00 1.3b
- 145.50 968m
- 146.00 616m
- 146.40 1.2b
- 147.00 487m
- USD/CHF: USD amounts
- 0.8835 355m
- 0.8900 343m
- AUD/USD: AUD amounts
- 0.6480 320m
- 0.6520 360m
- 0.6550 883m
- 0.6590 460m
- USD/CAD: USD amounts
- 1.3400 614m
- 1.3565 391m
- EUR/GBP: EUR amounts
- 0.8615 487m
- 0.8775 479m
Considering advanced prints from CME Group for natural gas futures markets, open interest shrank for the second consecutive session on Thursday, now by around 10.6K contracts. Volume, instead, set aside two daily drops in a row and increased by nearly 35K contracts.
Natural Gas remains capped by $3.00
Natural gas prices rose to multi-day highs on Thursday. The move was amidst diminishing open interest and ruled out a deeper retracement in the very near term. That said, the commodity could attempt a bounce in the very near term, although the $3.00 region per MMBtu continues to act as a strong resistance for the time being.
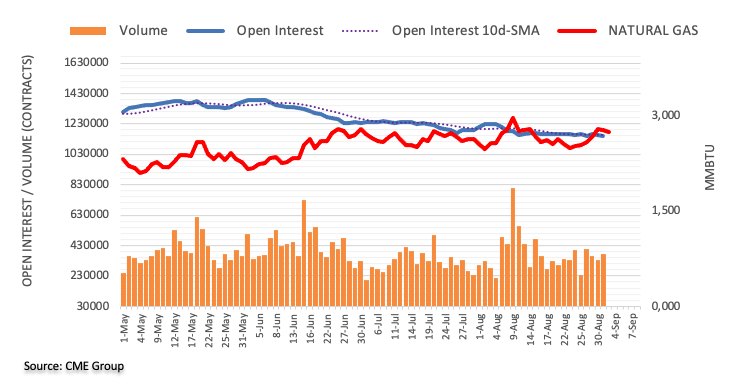
Here is what you need to know on Friday, September 1:
The US Dollar holds steady following Wednesday's rally as investors move to the sidelines ahead of key data releases. August jobs report, which will include Nonfarm Payrolls and wage inflation figures, and the ISM's Manufacturing PMI survey will be featured in the US economic docket. Statistics Canada will also release second-quarter Gross Domestic Product growth data in the early American session.
The US data showed on Thursday that the Core Personal Consumption Expenditures (PCE) Price Index rose 4.2% on a yearly basis in July, compared to 4.1% in June. Additionally, the weekly Initial Jobless Claims declined to 228,000 and came in better than the market expectation of 235,000. Following these data releases, the US Dollar Index (DXY) extended its daily recovery and gained nearly 0.5% on Thursday, snapping a three-day losing streak. Early Friday, DXY consolidates its gains above 103.50. In the meantime, the 10-year US Treasury bond yield continues to move sideways at around 4.1% and US stock index futures trade flat.
Nonfarm Payrolls Forecast: US labor market expected to show further signs of cooling in August.
US Dollar price today
The table below shows the percentage change of US Dollar (USD) against listed major currencies today. US Dollar was the strongest against the Australian Dollar.
| USD | EUR | GBP | CAD | AUD | JPY | NZD | CHF | |
| USD | -0.03% | 0.09% | 0.05% | 0.47% | 0.03% | 0.40% | -0.11% | |
| EUR | 0.04% | 0.13% | 0.07% | 0.49% | 0.04% | 0.42% | -0.06% | |
| GBP | -0.09% | -0.12% | -0.04% | 0.40% | -0.06% | 0.32% | -0.20% | |
| CAD | -0.05% | -0.08% | 0.05% | 0.43% | -0.03% | 0.35% | -0.15% | |
| AUD | -0.47% | -0.51% | -0.37% | -0.43% | -0.46% | -0.08% | -0.58% | |
| JPY | -0.03% | -0.03% | 0.09% | 0.03% | 0.45% | 0.40% | -0.11% | |
| NZD | -0.40% | -0.42% | -0.29% | -0.35% | 0.07% | -0.38% | -0.49% | |
| CHF | 0.11% | 0.06% | 0.20% | 0.14% | 0.57% | 0.11% | 0.49% |
The heat map shows percentage changes of major currencies against each other. The base currency is picked from the left column, while the quote currency is picked from the top row. For example, if you pick the Euro from the left column and move along the horizontal line to the Japanese Yen, the percentage change displayed in the box will represent EUR (base)/JPY (quote).
In the Asian session, the data from China revealed that the Caixin Manufacturing PMI rose to 51 in August from 49.2, highlighting an expansion in the manufacturing sector's business activity.
EUR/USD came under heavy bearish pressure on Thursday and erased a large portion of the gains it recorded in the first half of the week. Investors refrained from betting on a 25 basis points hike in European Central Bank (ECB) key rates in September following the Eurozone inflation readings, causing the Euro to lose interest. Early Friday, the pair stays quiet below 1.0850.
USD/CAD closed the first four days of the week in negative territory and touched its lowest level in two weeks at 1.3490 early Friday. The pair was last seen trading modestly higher on the day slightly above 1.3500. Canadian economy is forecast to post an annualized expansion of 1.2% in the second quarter.
GBP/USD turned south and returned below 1.2700 on Thursday. The pair stays on the back foot early Friday and trades near 1.2650.
USD/JPY stays relatively calm at around 145.50 early Friday. The data from Japan showed earlier in the day that Capital Spending rose 4.5% in the second quarter, falling short of the market expectation for an increase of 5.4%.
Despite the broad-based USD strength, Gold price declined only marginally on Thursday as US Treasury bond yields struggled to gain traction. In the European morning, XAU/USD consolidates its weekly gains at around $1,940.
US August Nonfarm Payrolls Preview: Analyzing Gold price's reaction to NFP surprises.
Bitcoin came under heavy bearish pressure and dropped to the $26,000 area, retracing its weekly uptrend. Ethereum lost more than 3% on Thursday and was last seen trading below $1,650.
European Central Bank (ECB) policymaker, Francois Villeroy de Galhau, expressed his take on the central bank’s interest rate outlook.
Key quotes
Underlying inflation has peaked since April and appears to have begun its decline.
But this encouraging sign is still far from sufficient.
Our options are open at the next and upcoming rate meetings.
We are very close to a peak in interest rates.
But far from a point where we could consider rate cuts.
Keeping rates high long enough matters more than the level.
Market reaction
EUR/USD was last seen trading at 1.0847, up 0.08% on the day.
- USD/RUB braces for second consecutive weekly gain ahead of US NFP.
- Upbeat Russian employment, activity data fails to impress Ruble buyers.
- Strong US job report is necessary to defend Fed’s “higher for longer” rate bias.
USD/RUB clings to mild gains around 96.25 as it stays firmer for the second consecutive week heading into Friday’s European session. In doing so, the Rubble (RUB) ignores recently firmer Russian statistics amid the US Dollar’s recovery ahead of the monthly US employment data for August.
That said, Russia’s S&P Global Manufacturing PMI for August rose the most in three months while posting a 52.7 figure versus 52.1 initial estimations. Earlier in the week, Russian Unemployment Rate also dropped to 3.0% for July from 3.1% prior and 3.2% market forecasts.
On the other hand, the US Dollar Index (DXY) reaches intraday high near 103.75 as it extended the previous day’s recovery from the 200-DMA amid the market’s preparations for the Nonfarm Payrolls (NFP).
It’s worth noting that the Greenback cheered mostly upbeat inflation and activity data the previous day to recover after declining for three days to Wednesday. While checking the numbers, it can be known that the Fed’s preferred inflation gauge, namely the US Core Personal Consumption Expenditure (PCE) Price Index for August, matched market forecasts of 4.2% YoY and 0.2% MoM versus 4.1% and 0.2% respectively priors. Further, the Initial Jobless Claims dropped to 228K from 232K prior (revised) versus 235K market forecasts while the Chicago Purchasing Managers’ Index rose to 48.7 for August compared to 44.1 expected and 42.8 previous readings. Additionally, Personal Spending rose past the 0.6% expected and previous readings to 0.8% for July whereas Personal Income eased to 0.2% for the said month, from 0.3% market forecast and prior.
Additionally favoring the US Dollar bulls could be the comments from Atlanta Fed President Raphael Bostic as he advocated the “higher for longer rates” policy.
Elsewhere, China announced a slew of measures to defend the economy from losing the post-COVID rebound but the market’s doubt about the Dragon Nation’s ability to avoid such hardships prod the optimism ahead of the key US jobs data.
Moving on, USD/RUB traders should pay close attention to the US NFP, Unemployment Rate and Average Hourly Wages as the Fed hawks run out of steam, which in turn suggests the need for strong job numbers to defend the US Dollar’s latest rebound.
Technical analysis
USD/RUB remains on the bull’s radar unless it stays beyond a three-month-old ascending support line, close to 94.55 by the press time.
Citing four people familiar with the matter, Reuters reported on Friday that China is likely to step up action to revive the country’s property sector.
Key takeaways
China property revival proposals include relaxing home-purchase curbs.
China property revival proposals include removing price caps on new homes.
The plan is to act as existing policies failed to sustain a sector rebound earlier this year.
Market reaction
AUD/USD is uninspired by the renewed China optimism, losing 0.40% on the day to trade at 0.6456, as of writing.
Open interest in crude oil futures markets resumed the uptrend on Thursday and went up by around 29.1K contracts. In the same line, volume increased for the third straight session, now by around 367.3K contracts.
WTI targets the 2023 high near $85.00
WTI prices extended the multi-session rally on Thursday and closed above the $83.00 mark per barrel, or three-week tops. The uptick was on the back of increasing open interest and volume and paves the way for the continuation of the current trend to, initially, the YTD peak at $84.85 (August 10).
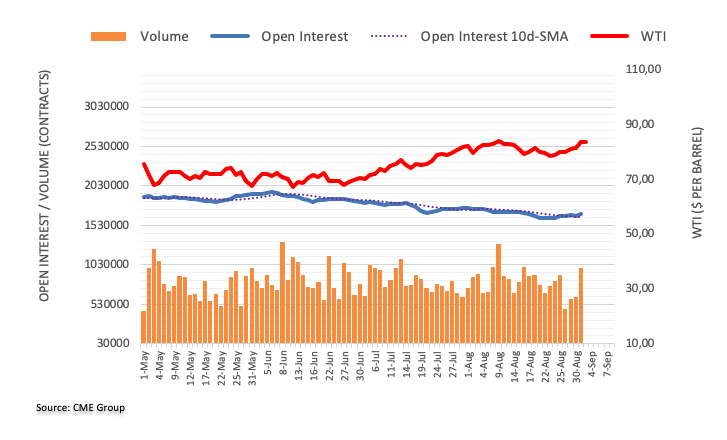
- AUD/USD consolidates the first weekly gain in seven within fortnight-long bullish channel.
- Pre-NFP positioning allows Aussie buyers to take a breather.
- 100-SMA restricts immediate downside ahead of channel’s bottom line, resistance-turned-support trend line.
- Bulls should remain cautious below 1.5-month-old descending resistance line.
AUD/USD pares the weekly gains as markets brace for US employment data for August on early Friday.
In doing so, the Aussie pair not only portrays the cautious mood ahead of the key data/events but also justifies the bearish MACD signals.
With this, the AUD/USD pair is likely to extend the latest weakness towards paring the first weekly run-up in seven. However, a convergence of the two-week-old rising trend channel’s bottom line joins the previous resistance line from mid-July, close to 0.6440-35, challenges the AUD/USD pair sellers.
In a case where the Aussie pair remains bearish past 0.6435, the 0.6400 round figure and the previous monthly low of around 0.6365 will act as the final defense of the bulls.
On the contrary, the stated channel’s top line restricts immediate recovery of the AUD/USD pair around 0.6540. Following that, the 200-SMA can act as an additional check for the Aussie pair buyers.
It’s worth noting, however, that a downward-sloping resistance line from July 14, close to 0.6610 by the press time, appears crucial to break for the AUD/USD buyers.
To sum up, AUD/USD fade the early-day strength, previously backed by China data and stimulus, as market players await the August month US jobs report.
AUD/USD: Four-hour chart
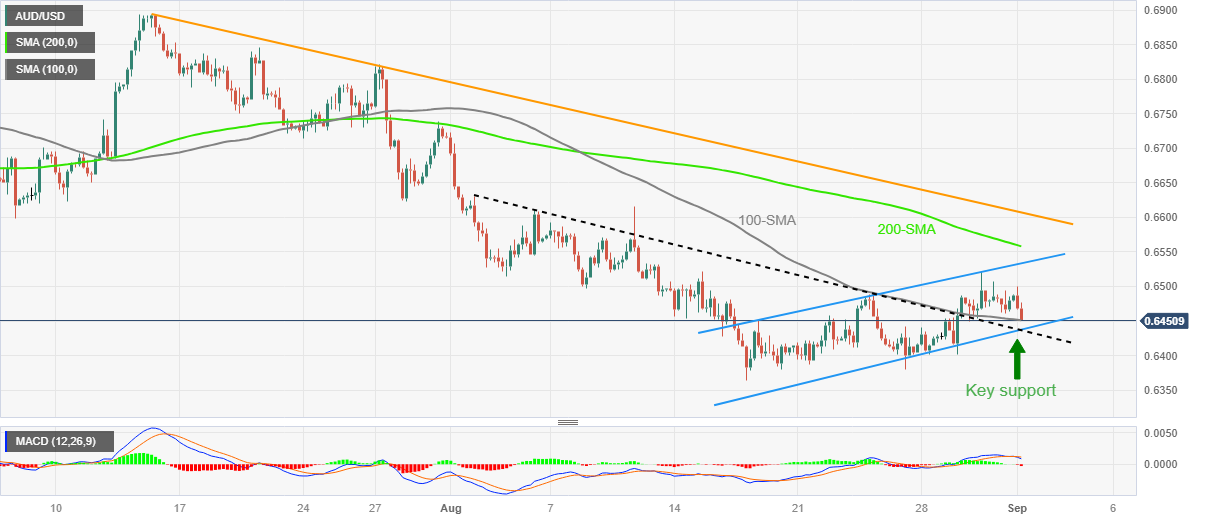
Trend: Limited downside expected
CME Group’s flash data for gold futures markets noted traders trimmed their open interest positions by around 4.3K contracts after two consecutive daily builds on Thursday. Volume followed suit and shrank for the second session in a row, now by around 11.3K contracts.
Gold faces the next up barrier above $1950
Thursday’s small downtick in gold prices came in tandem with shrinking open interest and volume, which removes strength from a sustained pullback and exposes the resumption of the prevailing bullish trend. Next on the upside for the precious metal emerges the provisional 100-day SMA at $1954 per troy ounce.
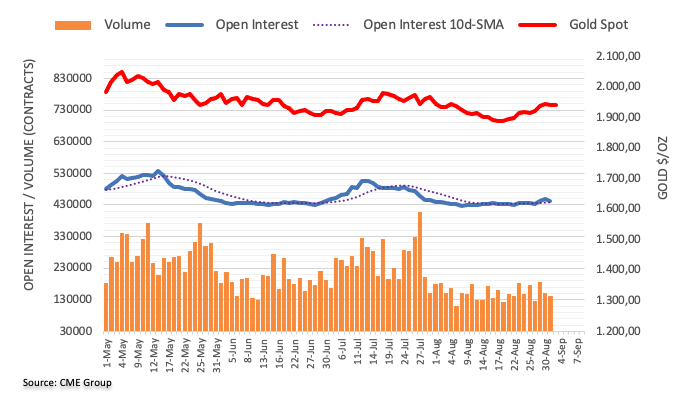
- US Nonfarm Payrolls are expected to increase by 170K in August, slowing from the 187K reported in July.
- The headline NFP and Average Hourly Earnings could impact the Fed’s future policy.
- The Unemployment Rate in the United States is seen steady at 3.5% in August.
Traders scale back the odds of a final interest-rate hike by the US Federal Reserve (Fed) this year after US job openings dipped to levels unseen since early 2021. The US JOLTS Job Openings data revived bets of a Fed pause on rates and triggered an extended US Dollar correction from 12-week highs set last Friday.
The highly anticipated Fed Chair Jerome Powell’s speech at the Jackson Hole Symposium on Friday was perceived as hawkish. Powell’s commentary hinted at one more rate hike this year, reinforcing the narrative of ‘higher rates for longer’. The US Dollar Index rallied hard on his hawkish rhetoric and tested the key 104.50 level.
Following Powell’s speech, the odds for a November Fed rate hike spiked up to roughly 57%. This probability has fallen to 40%, in the face of the disappointing US jobs data, according to data from the CME Group’s FedWatch Tool.
What to expect in the next Nonfarm Payrolls report?
Attention turns toward Friday’s critical United States (US) jobs data for August. The key employment statistics will confirm whether labor market conditions are loosening up amid concerns over a likely ‘hard landing’.
The Nonfarm Payrolls data is expected to show that the US economy added 170K jobs in the eighth month of the year, compared with a job gain of 187K jobs reported in July. The Unemployment Rate is likely to hold steady at 3.5% in the reported period.
The focus will also be on Average Hourly Earnings, a measure of wage inflation, which could have a strong influence on the Fed’s interest rate path. The Average Hourly Earnings are seen rising 4.4% on a yearly basis in August, at the same pace seen in July. The monthly Average Hourly Earnings is set to increase 0.3% in August compared with a 0.4% growth in July.
ADP on Wednesday reported that the US private sector added 177,000 jobs in August, well below the revised total of 371,000 added in July. US Q2 GDP growth was revised down to a 2.1% annual rate from 2.4% seen in the preliminary reading.
Analysts at TD Securities noted, “payrolls likely posted another sub-200k gain in August, remaining in the vicinity of the Jun-Jul gains. The August increase would maintain the downtrend in the three-month pace, barring any major revisions. We also look for the UE rate to stay unchanged at 3.5%, following its second consecutive decline in July. We also expect wage growth to print 0.3% m/m (4.3% y/y).”
When will US August Jobs Report data be released and how could it affect EUR/USD?
The Nonfarm Payrolls number, part of the US labor market report, will be published at 12:30 GMT on September 1. EUR/USD has been struggling below the 1.0900 level despite the latest discouraging US data. The labor market data holds the key to determining the next direction of the US Dollar against the Euro.
A stronger-than-expected NFP print and hot wage inflation data would confirm Fed Chair Powell’s hawkish message of another rate hike in the offing. The US Dollar is likely to catch a strong bid on robust employment and pay growth data, driving EUR/USD back toward the two-month low of 1.0766.
On the other hand, the US Dollar could extend its downside if the data suggest loosening labor market conditions, bolstering Fed pause bets for this year. In such a scenario, EUR/USD could rebound further toward 1.1000.
Meanwhile, Dhwani Mehta, Asian Session Lead Analyst at FXStreet, offers a brief technical outlook for the EUR/USD pair and explains: “The main currency pair has failed to find acceptance above the horizontal 100-Daily Moving Average (DMA) at 1.0924 so far this week. The 14-day Relative Strength Index (RSI) is trending below the midline. These technical indicators suggest that EUR/USD remains vulnerable heading into the US NFP data release.”
Dhwani also outlines important technical levels to trade the EUR/USD pair: “Immediate support awaits at the mildly bearish 200 DMA at 1.0816, below which the two-month low of 1.0766 could be threatened. The last line of defense for Euro buyers is envisioned at the 1.0700 round figure. On the flip side, strong resistance is located at the 21 DMA of 1.0896. Euro buyers need to crack the latter on a sustained basis to retest the 100 DMA key barrier, as they keep sight on the August top of 1.1012.”
Economic Indicator
United States Nonfarm Payrolls
The Nonfarm Payrolls released by the US Bureau of Labor Statistics presents the number of new jobs created during the previous month in all non-agricultural businesses. The monthly changes in payrolls can be extremely volatile due to their high relation with economic policy decisions made by the Federal Reserve. The number is also subject to strong reviews in the upcoming months, and those reviews also tend to trigger volatility in the Forex board. Generally speaking, a high reading is seen as positive (or bullish) for the USD, while a low reading is seen as negative (or bearish), although previous months' reviews and the unemployment rate are as relevant as the headline figure, and therefore market's reaction depends on how the market assets them all.
Read more.Next release: 10/06/2023 12:30:00 GMT
Frequency: Monthly
Source: US Bureau of Labor Statistics
Why it matters to traders
America’s monthly jobs report is considered the most important economic indicator for forex traders. Released on the first Friday following the reported month, the change in the number of positions is closely correlated with the overall performance of the economy and is monitored by policymakers. Full employment is one of the Federal Reserve’s mandates and it considers developments in the labor market when setting its policies, thus impacting currencies. Despite several leading indicators shaping estimates, Nonfarm Payrolls tend to surprise markets and trigger substantial volatility. Actual figures beating the consensus tend to be USD bullish.
- Gold Price stays defensive after reversing from the highest level in a month.
- Latest US data about inflation, activities cause turbulence by testing Fed policy pivot concerns.
- Strong US employment figures needed to defend “higher for longer” rate bias and can weigh on XAU/USD price.
- Downbeat NFP will help Gold buyers to keep the reins for the second consecutive week.
Gold Price (XAU/USD) aptly portrays the pre-NFP trading lull as bulls take a breather above the key support confluence while bracing for the second consecutive weekly gain. In doing so, the XAU/USD also portrays the market’s indecision about the Federal Reserve’s (Fed) next move as the latest round of US economics hasn’t been supportive to policy hawks, which in turn highlights today’s US jobs report for decision-making.
That said, the recent price pressure data from the US suggests ‘sticky’ service inflation and an absence of major reductions in the activities. However, the downbeat sentiment and unimpressive prints of the early signals surrounding the US employment conditions prod the rate hike expectations.
Elsewhere, a slew of measures from China to defend the economy from slipping back into COVID-like days seem to put a floor under the Gold Price, due to Beijing’s status as one of the top XAU/USD customers. Among them, the People’s Bank of China’s (PBoC) 2.0% cut to the foreign exchange reserve ratio and a reduction of the Yuan deposit rates by multiple Chinese banks gained major attention.
It’s worth noting that the broad view of an end to the rate hike trajectory, amid recently softer inflation numbers from the top-tier economies, seems to defend the Gold buyers.
Moving on, US Nonfarm Payrolls (NFP), Unemployment Rate and Average Hourly Earnings for August will be crucial for clear directions as the last few months of data have teased the Fed doves, suggesting a need for the strong outcomes to prod Gold Price upside.
Also read: Gold Price Forecast: Will XAU/USD break above 100 DMA at $1,955 on weak US Nonfarm Payrolls?
Gold Price: Key levels to watch
As per our Technical Confluence indicator, the Gold Price floats firmly beyond the $1,932 support confluence despite the latest retreat. That said, the stated key support comprises the 50-DMA, Pivot Point one-week R1 and 5-DMA.
Also restricting the short-term downside of the XAU/USD is the $1,936 level encompassing the 61.8% Fibonacci retracement on one-month.
It’s worth noting, however, that the Gold Price weakness past $1,930 makes it vulnerable to drop towards the $1,916 support confluence comprising the middle band of the Bollinger on the daily chart, Fibonacci 38.2% on one-month and 10-DMA.
Alternatively, the Fibonacci 38.2% on one-day guards immediate recovery of the Gold Price near $1,945.
Following that, a convergence of the 100-DMA and Pivot Point one-day R3 will act as the last defense of the XAU/USD sellers around $1,955, a break of which could propel the Gold Price towards the multiple hurdles marked during May and July around $1,985.
Overall, the Gold Price has fewer barriers toward the north but the US employment data can test the bulls.
Here is how it looks on the tool
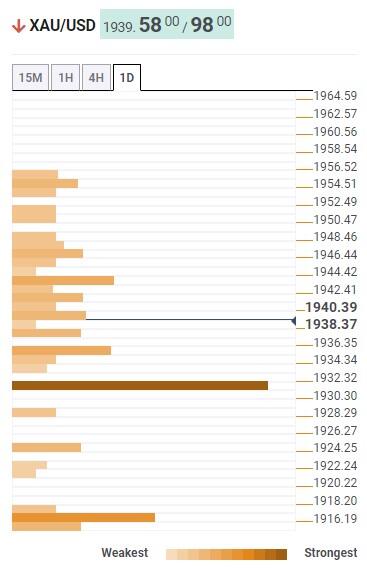
About Technical Confluences Detector
The TCD (Technical Confluences Detector) is a tool to locate and point out those price levels where there is a congestion of indicators, moving averages, Fibonacci levels, Pivot Points, etc. If you are a short-term trader, you will find entry points for counter-trend strategies and hunt a few points at a time. If you are a medium-to-long-term trader, this tool will allow you to know in advance the price levels where a medium-to-long-term trend may stop and rest, where to unwind positions, or where to increase your position size.
- USD/CHF struggles to extend the previous day’s strong gains ahead of top-tier Swiss, US data.
- Upbeat MACD signals, sustained trading beyond the key DMA convergence keeps Swiss Franc pair buyers hopeful.
- Six-month-old falling resistance line holds the key to pair’s further advances.
USD/CHF bulls attack the key resistance surrounding 0.8840 heading into Friday’s European session as they wait for Swiss Consumer Price Index (CPI) and the US employment data for August. In doing so, the Loonie pair defends the previous day’s rebound from the key moving averages while portraying the market’s cautious mood ahead of the top-tier data/events.
That said, a successful rebound from the convergence of the 21-DMA and 50-DMA, around 0.8790–80 by the press time, joins the bullish MACD signals to keep the buyers hopeful as they poke a downward-sloping resistance line from early March, close to 0.8840 at the latest.
It’s worth noting, however, that the previous monthly high of around 0.8880 and June’s bottom surrounding the 0.8900 threshold are some extra checks for the USD/CHF bulls before giving them control.
On the flip side, a daily closing below the stated DMA confluence around 0.8790–80 could recall the USD/CHF bears.
However, a five-week-long rising support line close to 0.8750 and the late July swing high of around 0.8700 will challenge the pair sellers ahead of directing them to the yearly low marked in July around 0.8550.
USD/CHF: Daily chart
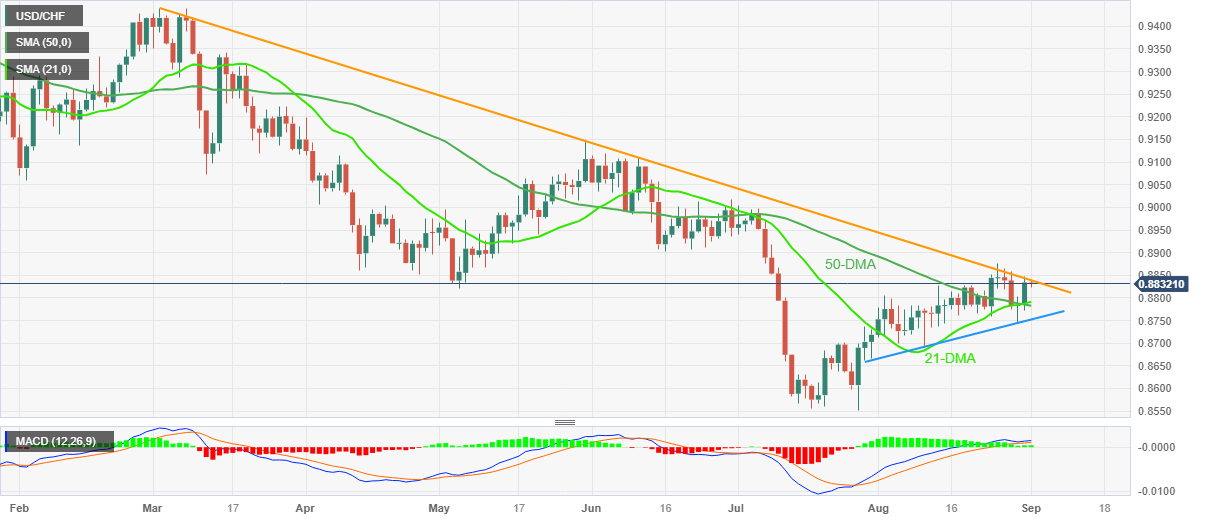
Trend: Further upside expected
- Asian equities trade higher due to China’s upbeat PMI figure.
- China rolled out more fiscal measures to support its housing market.
- Hang Seng suspended trading as Super Typhoon Saola heads towards Hong Kong.
Asian stock markets advanced on Friday due to upbeat factory data released from China on Friday. Additionally, more fiscal measures have been taken by the Chinese authorities, improving the market sentiment. Investors await the releases of employment and manufacturing data from the United States (US).
As said, Caixin Manufacturing PMI for August revealed on Friday, posted the reading of 51.0, a better-than-expected 49.3, from the previous 49.2 figure.
China introduced more economic measures to support its gloomy housing market and reduced the requirements of foreign exchange reserves for local banks to sell more US Dollars (USD) in terms of supporting the Chinese Yuan.
At the time of writing, China’s Shanghai is up 0.23% to 3,127, the Shenzhen Component Index rose 0.25% to 10,443, South Korea’s Kospi is up 0.21%, Japan’s Nikkei rose 0.61% and Taiwan's Weighted Index is up 0.25%.
Hang Seng suspended trading as Super Typhoon Saola heads toward Hong Kong and threatens industrial hubs around China’s Guangdong province.
Indian’s Nifty 50 rose 0.32% on the back of upbeat GDP data, avoiding the concerns over allegations on Adani Group. The Organized Crime and Corruption Reporting Project (OCCRP), a global network of investigative journalists made claims of insider trading against the major conglomerate. OCCRP released a report, alleging that the company regularly acquired its own shares from public markets using offshore entities, aiming to artificially inflate its stock price.
Traders will focus on the crucial US Nonfarm Payrolls data for August, scheduled to be released later in the North American session. Any indications of strength in the labor market could impact the US Federal Reserve (Fed) with greater flexibility to continue raising interest rates, a scenario that does not bode well for Asian markets.
- USD/CAD lacks clear directions at the lowest levels in two weeks, prods four-day losing streak.
- Oil price cheers China-inspired optimism, supply-crunch woes to refresh three-week high above $83.00.
- Upbeat US inflation, activity data prod previous concerns about Fed policy pivot, highlighting US employment figures.
- Canada Q2 and monthly GDP figures will also provide fresh impulse to Loonie pair.
USD/CAD stays defensive around 1.3510 while bouncing off the lowest level in a fortnight heading into Friday’s European session. In doing so, the Loonie pair fails to cheer the firmer prices of Canada’s main export item WTI crude oil as traders brace for the US employment and Canadian growth figures.
The overall US Dollar rebound and the market’s preparations for top-tier data failed to stop the USD/CAD bears the previous day as the WTI crude oil reached a multi-day high. Also exerting downside pressure on the pair could be the sharp revision in the Canadian Current Account data for the first quarter (Q1) of 2023.
That said, WTI crude oil rose for the fourth consecutive day to $83.40 while refreshing a three-week high amid a slew of measures from China to defend the economy from slipping back into COVID-like days. Among them, the People’s Bank of China’s (PBoC) 2.0% cut to the foreign reserve ratio and a reduction of the Yuan deposit rates by a slew of Chinese banks gained major attention. That said, adverse weather conditions, Hurricane Idalia in the US and China’s Typhoon fear join the heavy inventory draw in the US to propel the Oil price.
Elsewhere, the US Dollar Index (DXY) struggles to defend the previous day’s rebound from the 200-DMA around 103.60. That said, the quote rallied the most in a week on Thursday as most data from the US pushed back the previously dovish bias about the Federal Reserve (Fed). On the same line were comments from Atlanta Fed President Raphael Bostic as he advocated the “higher for longer rates” policy.
It should be noted that the the Fed’s preferred inflation gauge, namely the US Core Personal Consumption Expenditure (PCE) Price Index for August, matched market forecasts of 4.2% YoY and 0.2% MoM versus 4.1% and 0.2% respectively priors. Further, the Initial Jobless Claims dropped to 228K from 232K prior (revised) versus 235K market forecasts while the Chicago Purchasing Managers’ Index rose to 48.7 for August compared to 44.1 expected and 42.8 previous readings. Additionally, Personal Spending rose past the 0.6% expected and previous readings to 0.8% for July whereas Personal Income eased to 0.2% for the said month, from 0.3% market forecast and prior.
Moving on, the USD/CAD traders should pay attention to the risk catalysts ahead of the second quarter (Q2) and July month Gross Domestic Product (GDP) from Canada, as well as the US employment report for August.
It should be noted that the overall scenario of the US job numbers appears downbeat and hence a strong US NFP becomes necessary for the USD/CAD bulls to return.
Technical analysis
USD/CAD flirts with the 21-DMA support of around 1.3500 after reversing from a downward-sloping resistance line from late April, close to 1.3610 by the press time. That said, bearish MACD signals, downbeat RSI and the failure to break the key resistance line direct the Loonie pair toward the 200-DMA, near 1.3460 at the latest.
- EUR/SEK touches a three-day high on Friday, albeit lacks follow-through.
- The formation of a multiple-top on the daily chart favours bearish traders.
- Repeated failures to find acceptance below the 11.80 level warrant caution.
The EUR/SEK pair edges higher for the third straight day on Friday and touches a three-day high level of 11.8978 during the Asian session, albeit lacks bullish conviction.
From a technical perspective, the recent repeated failures ahead of the 12.00 round figure constitute the formation of a bearish multiple-top pattern on the daily chart. The EUR/SEK pair, however, has been showing some resilience below a previous strong resistance breakpoint, now turned support around the 11.80 region, which should now act as a pivotal point.
Meanwhile, oscillators on the daily chart are still holding in the bullish territory and have again started gaining positive traction on the 4-hour chart. This further makes it prudent to wait for strong follow-through selling and acceptance below the 11.80 area before traders start positioning for any meaningful corrective decline from the all-time peak touched in August.
The EUR/SEK pair might then accelerate the downfall towards the 11.7500 horizontal zone en route to the 11.7050 area. This is followed by support near the 11.6600 level, which if broken decisively will suggest that spot prices have topped out in the near term and set the stage for a further depreciating move.
On the flip side, bulls need to wait for a convincing breakout through the multiple-top barrier near the 11.95 region before placing fresh bets. The EUR/SEK pair might then prolong its well-established uptrend from the July swing low, around the 11.40 area.
EUR/SEK 4-hour chart
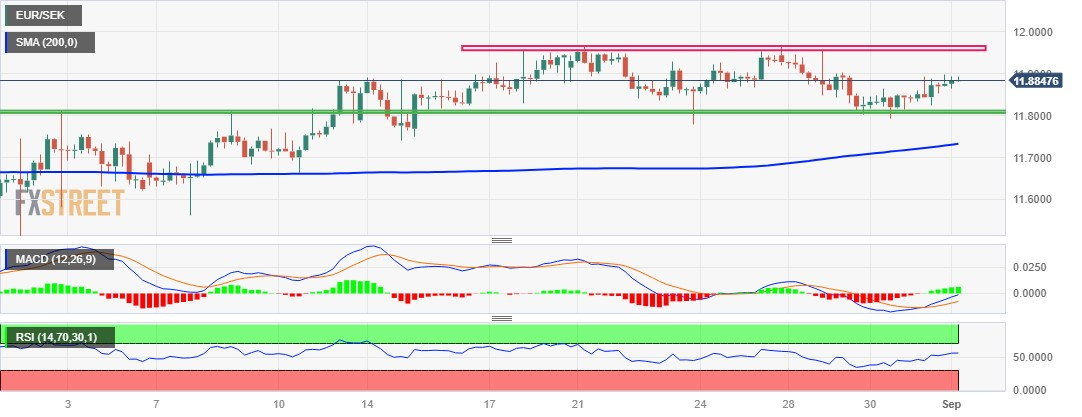
Technical levels to watch
- USD/JPY refreshes weekly low on Friday, albeit lacks follow-through selling.
- The divergent Fed-BoJ policy stance continues to act as a tailwind for the pair.
- Traders now look to the US NFP report before placing fresh directional bets.
The USD/JPY pair touches a fresh weekly low during the Asian session on Friday, albeit manages to recover a few pips in the last hour and currently trades just below mid-145.00s, down less than 0.10% for the day.
The US Dollar (USD) revreses an intraday dip and looks to build on the previous day's solid bounce from the very important 200-day Simple Moving Average (SMA), which, in turn, is seen as a key factor lending some support to the USD/JPY pair. The USD bulls, however, seem reluctant to place aggressive bets in the wake of the uncertainty over the Federal Reserve's (Fed) future rate hike path.
It is worth recalling that the US macro data released earlier this week - the ADP report and the second estimate of the US Q2 GDP print - indicated the resilient US economy might be starting to lose steam. This fueled speculations that the Fed might be forced to soften its hawkish stance. That said, Thursday's US PCE Price Index keeps the door open for one more 25 bps lift-off by the end of this year.
The prospects for further policy tightening by the Fed, meanwhile, lead to a modest recovery in the US Treasury bond yields and act as a tailwind for the Greenback. Traders, however, seem reluctant and prefer to wait for the release of the closely-watched US monthly employment details – popularly known NFP report – for some meaningful impetus later during the early North American session.
In the meantime, a more dovish stance adopted by the Bank of Japan (BoJ), along with the disappointing Japanese macro data and a positive tone around the US equity futures, might undermine the safe-haven Japanese Yen (JPY) and limit losses for the USD/JPY pair. In fact, the BoJ is the only central bank in the world to maintain negative interest rates and is anticipated to stick to its ultra-easy policy settings.
Moreover, BoJ board member Toyoaki Nakamura said this Thursday that it was premature to tighten monetary policy as recent increases in inflation were mostly driven by higher import costs rather than wage gains. This follows BoJ Governor Kazuo Ueda's dovish remarks last week, saying that the underlying inflation remains a bit below the 2% target, and ensures the status quo until next summer.
On the economic data front, the latest survey from Jibun Bank showed that the manufacturing sector in Japan continued to contract in August. In fact, the Manufacturing PMI was finalized at 49.6. Adding to this, Japan's Finance Ministry reported that Capital Spending increased by 4.5% from a year earlier during the April-June period, down from 11.0% previous and missing consensus estimates for a 5.4% rise.
The aforementioned fundamental backdrop suggests that the path of least resistance for the USD/JPY pair is to the upside. Hence, it will be prudent to wait for strong follow-through selling before confirming the formation of a near-term top around the 147.35-147.40 area, or the highest level since November 2022 touched earlier this week. Nevertheless, spot prices remain on track to snap a four-week winning streak.
Technical levels to watch
- EUR/GBP snaps two-day losing streak due to upbeat Eurozone inflation.
- Eurozone headline inflation rose by 0.6% against the expectations of 0.1% decline.
- Sterling Pound traders seek more cues on BoE's policy decision amid the UK's challenging economic conditions.
EUR/GBP treads waters to snap the two-day losing streak, trading higher around 0.8560 during the Asian session on Friday. The pair is experiencing upward support attributed to the Eurozone's strong preliminary Harmonized Index of Consumer Prices (HICP) for August.
According to Eurostat's report, monthly headline inflation expanded by 0.6%. This was a sharp increase from investor expectations, as they had anticipated a deflation of 0.1% similar to what was recorded in July. Meanwhile, the annual headline Harmonized Index of Consumer Prices (HICP) remained stable at 5.3%, contrary to expectations of a slowdown to 5.1%.
Core Harmonized Index of Consumer Prices (MoM) that excludes volatile food and oil prices rose at a rate of 0.3% as per market expectations, swinging from the previous rate of 0.1% decline. On an annual basis, the economic data softened to 5.3% as expected from July’s reading of 5.5%.
The Euro buyers will seek further cues on upcoming monetary policy decisions by the European Central Bank (ECB), following the persistent inflation in the Eurozone. Market participants focus next on the HCOB Manufacturing PMI (Aug) scheduled to be released on Friday, which is expected to remain consistent as reported in July.
Moreover, the stubborn inflation reinforces the possibility of a 25 basis points (bps) interest rate hike in the upcoming meeting in September, which could provide upward support to the EUR/GBP pair. ECB policymaker Robert Holzmann stated that the rates have not reached their peak level, and he indicated the potential for a couple more rate hikes.
On the other side, the EUR/GBP traders are adopting a cautious approach amid the UK's challenging economic conditions and the hawkish tone surrounding the possibility of a 25 basis points (bps) interest rate increase during the Bank of England's (BoE) September meeting. Additionally, BoE Chief Economist Huw Pill stated on Thursday supported the need for sustained restrictive policy over an extended period.
- USD/INR holds lower grounds around intraday bottom, braces for the second consecutive weekly loss.
- India Q2 GDP rallied 7.8% YoY versus 7.7% expected and 6.1% prior.
- China bolsters sentiment in Asia-Pacific zone via multiple stimulus measures, actions to defend Yuan.
- US NFP eyed as Fed’s preferred inflation pushed back policy pivot concerns but previous data prods rate hike bias.
USD/INR prints a two-day losing streak around 82.60, down 0.15% intraday, as market players brace for the all-important US employment report on Friday. It’s worth noting that the upbeat India growth figures join China-inspired optimism in the Asia-Pacific zone to exert downside pressure on the Indian Rupee (INR) pair ahead of the key US Nonfarm Payrolls (NFP).
India’s second quarter (Q2) Gross Domestic Product (GDP) offered a positive surprise the previous day by rising to 7.8% YoY from 6.1% previous readings and 7.7% market forecasts. Further, the Asian nation’s Infrastructure Output also came in at 8.0% versus 4.2% market forecasts and 8.3% prior (revised).
Elsewhere, the upbeat China manufacturing activity data and stimulus measures also weigh on the USD/INR pair, by cutting the US Dollar’s haven demand due to optimism in the Asia-Pacific zone. That said, China’s Caixin Manufacturing PMI for August rose to 51.0 versus 49.3 market forecasts and 49.2 previous readings. Further, the People's Bank of China (PBoC) announced early Friday that it will lower the foreign exchange reserve requirement ratio to 4%, from 6.0%, effective from September 15. On the same line, a slew of China banks cut interest rates on Yuan deposits while citing the readiness to ease the pressure from lower mortgage rates, per Reuters. Among them, ICBC, China Industrial Bank, Agricultural Bank of China and Bank of China (BoC) gained major attention.
Talking about the US data, the Fed’s preferred inflation gauge, namely the US Core Personal Consumption Expenditure (PCE) Price Index for August, matched market forecasts of 4.2% YoY and 0.2% MoM versus 4.1% and 0.2% respectively priors. Further, the Initial Jobless Claims dropped to 228K from 232K prior (revised) versus 235K market forecasts while the Chicago Purchasing Managers’ Index rose to 48.7 for August compared to 44.1 expected and 42.8 previous readings. Additionally, Personal Spending rose past the 0.6% expected and previous readings to 0.8% for July whereas Personal Income eased to 0.2% for the said month, from the 0.3% market forecast and prior.
Amid these plays, the MSCI’s Index of Asia-Pacific shares ex-Japan reverses the previous day’s pullback from a three-week high while Indian equity benchmarks are up on a day, backed by heavy gains in China. Further, the US 10-year and two-year Treasury bond yields remain depressed around the lowest level in three weeks while the US stock futures dwindle after a mixed Wall Street close.
Looking forward, USD/INR traders should pay attention to the risk catalysts ahead of the US employment report for August as forecasts suggest the headline US Nonfarm Payrolls (NFP) could ease to 170K. That said, the previously mixed outcomes of the JOLTS Job Openings, ADP Employment Change and Continuing Jobless Claims prod the US Dollar bulls. Additionally, the three-month average of the US NFP halves to 218K versus a year earlier. As a result, the overall scenario of the US job numbers appears downbeat and can only recall the USD/INR buyers by posting an extremely strong outcome of the job numbers.
Also read: Nonfarm Payrolls Preview: Four scenarios for a jobs report set to test US economic resilience
Technical analysis
Even if the USD/INR reverses from the 21-DMA upside hurdle surrounding 82.90, a convergence of the 50-DMA and a five-week-old rising support line, close to 82.50 appears a tough nut to crack for the pair sellers.
- Gold price struggles to capitalize on its modest intraday uptick to the $1,945 area on Friday.
- Bets for one more rate hike by the Federal Reserve continue to act as a headwind for the metal.
- Investors now await the release of the US NFP report before placing fresh directional bets.
Gold price attracts fresh sellers following an Asian session uptick to the $1,944 region on Friday and hits a fresh daily low in the last hour, albeit lacks follow-through. The XAU/USD currently trades just below the $1,940 level, nearly unchanged for the day, as traders keenly await the closely-watched monthly employment details from the United States (US) before placing fresh directional bets.
The popularly known Non-Farm Payrolls (NFP) report is due for release later during the early North American session and will influence expectations about the Federal Reserve's (Fed) next policy move. This, in turn, will determine the near-term trajectory for the US Dollar (USD) and provide some meaningful impetus to the Gold price. In the meantime, the uncertainty over the Fed's future rate-hike path fails to assist the USD to capitalize on the overnight rebound from a two-week low and acts as a tailwind for the US Dollar-denominated commodity.
It is worth recalling that the US macro data released earlier this week - the ADP report and the second estimate of the US Q2 GDP print - indicated the resilient US economy might be starting to lose steam. This, in turn, fueled speculations that the Fed might be forced to soften its hawkish stance sooner rather than later. That said, the US Personal Consumption Expenditures (PCE) Price Index on Thursday keeps the door open for one more 25 bps lift-off in 2023 and triggers an intraday USD short-covering move from the 200-day Simple Moving Average (SMA).
Meanwhile, the view that the Fed will keep interest rates higher for longer helps the US Treasury bond yields to stall the recent pullback from a multi-year peak. This, along with a generally positive tone around the US equity futures, further contributes to capping the upside for the non-yielding Gold price ahead of the key US data risk. Hence, it will be prudent to wait for strong follow-through buying before positioning for an extension of the recent strong recovery from the $1,885 region, or the lowest level since March 13 touched earlier this month.
Technical levels to watch
- EUR/USD holds lower grounds after falling the most in five weeks the previous day.
- Eurozone inflation halved in the last four months versus January-April period.
- US Core PCE Price Index appears positive but lacks details to ensure Fed rate hikes.
- Firmer US employment data eyed to defend higher rates and can weigh on Euro price.
EUR/USD remains depressed around 1.0845 as traders brace for the top-tier US employment details on early Friday. In doing so, the Euro pair struggles for clear directions after declining the most in five weeks the previous day.
That said, Eurozone inflation data came in mostly positive the previous day but the comparative stance on a four-month basis challenges the European Central Bank (ECB) officials’ hawkish bias.
On Thursday, Inflation in the Eurozone per the European Central Bank’s (ECB) favorite gauge, namely the Harmonized Index of Consumer Prices (HICP), rose to 0.6% MoM versus -0.1% expected and prior readings whereas the YoY figures remained reprinted 5.3% figures compared to 5.1% YoY market estimations. “Over the past four months, the average monthly increase in core HICP has fallen to 0.2% m/m, versus an average of 0.6% m/m in the first four months of this year, indicating deceleration,” said ANZ after the data.
Further, Germany’s Retail Sales for July reprints -0.8% MoM figures versus 0.3% market forecasts while the YoY outcomes appear more disappointing as it drops to -2.2% from -1.6%, compared to -1.0% expected.
Following the data, ECB Meeting Accounts turned down hopes of any surprises from the bloc’s central bank, which in turn weighed on the EUR/USD price in contrast to the hawkish comments from ECB policymaker Robert Holzmann and the neutral remarks from Isabel Schnabel.
On the other hand, the Fed’s preferred inflation gauge, namely the US Core Personal Consumption Expenditure (PCE) Price Index for August, matched market forecasts of 4.2% YoY and 0.2% MoM versus 4.1% and 0.2% respectively priors. Further, the Initial Jobless Claims dropped to 228K from 232K prior (revised) versus 235K market forecasts while the Chicago Purchasing Managers’ Index rose to 48.7 for August compared to 44.1 expected and 42.8 previous readings. Additionally, Personal Spending rose past the 0.6% expected and previous readings to 0.8% for July whereas Personal Income eased to 0.2% for the said month, from the 0.3% market forecast and prior.
Amid these plays, the US 10-year and two-year Treasury bond yields remain depressed around the lowest level in three weeks while the US stock futures dwindle after a mixed Wall Street close. With this, the EUR/USD bears are likely to struggle ahead of the data while the early details have been positive for the Euro buyers unless any major surprises from the US NFP and Unemployment Rate roll out.
Technical analysis
The EUR/USD pair’s U-turn from the 100-DMA, around 1.0925 by the press time, lures the Euro bears to again poke the 200-DMA support of around 1.0815.
Japan’s Finance Minister Shunichi Suzuki is providing verbal intervention on Friday, reiterating that “sudden FX moves are undesirable.”
Further comments
Forex moves should be set by the market.
FX rates should reflect fundamentals.
Market reaction
At the press time, USD/JPY is ranging at around 145.50, flat on the day.
- USD/IDR struggles to defend three-day winning streak amid mixed catalysts, pre-NFP anxiety.
- Indonesia Inflation, Core Inflation decline in August and weigh on Rupiah but China stimulus measures prod IDR bears.
- US Dollar retreats amid mixed Fed concerns ahead of monthly US employment report.
USD/IDR edges higher past 15,200, mildly bid near 15,230 by the press time, during a volatile Friday morning for the Asia-Pacific currencies. The pair’s latest moves aptly justify the downbeat Indonesia inflation, as well as the China-inspired risk-on mood, ahead of the top-tier US jobs report.
Indonesia's Inflation gauge drops to -0.02% MoM from 0.21% prior, versus 0.10% expected whereas the yearly figures came in below forecasts but manage to post better figures with 3.27% YoY marks. Further, the Core Inflation also declines to 2.18% YoY compared to 2.43% prior and 2.30% expected.
While Indonesia data allows the USD/IDR pair to remain firmer for the third consecutive day, the upbeat mood in the Asia-Pacific zone, due to China stimulus measures and upbeat data from Beijing, cap the pair’s upside moves of late.
That said, China’s Caixin Manufacturing PMI for August rose to 51.0 versus 49.3 market forecasts and 49.2 previous readings. Further, the People's Bank of China (PBoC) announced early Friday that it will lower the foreign exchange reserve requirement ratio to 4%, from 6.0%, effective from September 15. On the same line, a slew of China banks cut interest rates on Yuan deposits while citing the readiness to ease the pressure from lower mortgage rates, per Reuters. Among them, ICBC, China Industrial Bank, Agricultural Bank of China and Bank of China (BoC) gained major attention.
It’s worth observing that the US Dollar Index (DXY) fades the previous day’s corrective bounce off the 200-DMA as market players appear divided about the US Federal Reserve’s (Fed) next step considering the previous day’s mixed data versus earlier downbeat signals.
Talking about the US data, the Fed’s preferred inflation gauge, namely the US Core Personal Consumption Expenditure (PCE) Price Index for August, matched market forecasts of 4.2% YoY and 0.2% MoM versus 4.1% and 0.2% respectively priors. Further, the Initial Jobless Claims dropped to 228K from 232K prior (revised) versus 235K market forecasts while the Chicago Purchasing Managers’ Index rose to 48.7 for August compared to 44.1 expected and 42.8 previous readings. Additionally, Personal Spending rose past the 0.6% expected and previous readings to 0.8% for July whereas Personal Income eased to 0.2% for the said month, from the 0.3% market forecast and prior.
Looking forward, the US employment report for August will be crucial for the USD/IDR pair traders to watch for clear directions, especially after Atlanta Fed President Raphael Bostic defended the US central bank’s view of keeping rates high.
Forecasts suggest that the headline US Nonfarm Payrolls (NFP) could ease to 170K versus the previously upbeat outcomes of the JOLTS Job Openings, ADP Employment Change and higher prints of the US Continuing Jobless Claims. Additionally, the three-month average of the US NFP halves to 218K versus a year earlier. As a result, the overall scenario of the US job numbers appears downbeat and can only defend the USD/IDR by posting an extremely strong outcome.
Technical analysis
Although the 200-DMA puts a floor under the USD/IDR price near 15,150, the pair buyers should remain cautious unless they witness a daily closing beyond the fortnight-old resistance line, close to 15,260 by the press time.
- NZD/USD experienced gains due to New Zealand’s better-than-expected consumer confidence and China’s upbeat PMI.
- Traders turn cautious ahead of US data, seeking fresh impetus on the country's economic scenario.
- US Dollar (USD) experienced upward support due to the upbeat US Core PCE and Jobless Claims.
NZD/USD extends its gains on the second day, trading higher around 0.5970 during the Asian session on Friday. The pair is experiencing upward support due to upbeat data releases of New Zealand’s ANZ – Roy Morgan Consumer Confidence and China’s Caixin Manufacturing PMI for August.
The macroeconomic data revealed on Friday reinforced the support to underpin the strength of the Kiwi pair. Consumer confidence in New Zealand’s economic activity improved to the reading of 85 from 83.7 prior. Along with this, the Chinese PMI report posted a reading of 51.0, a better-than-expected 49.3, from the previous 49.2 figure.
However, the market participants will take a cautious stance ahead of the releases of employment and manufacturing data from the United States (US) before making fresh bets on the NZD/USD pair. These datasets include the US Average Hourly Earnings, Nonfarm Payrolls and ISM Manufacturing PMI.
The Greenback is gaining ground due to the moderate US data released on Thursday. The US Dollar Index (DXY), which measures the performance of the US Dollar (USD) against the six other major currencies, trades higher around 103.60 at the time of writing.
The US Federal Reserve’s (Fed) preferred gauge of inflation, the US Core Personal Consumption Expenditures (PCE) - Price Index (MoM) rose to 4.2% in July as per the market consensus, from 4.1% prior. US Initial Jobless Claims for the week ending on August 25, reported the figure of 228K against the expectations of 235K and the previous 232K.
Furthermore, Nicola Willis holds the position of finance spokesperson for New Zealand's primary opposition party. During an interview with Bloomberg TV, Willis conveyed that if their party were to come into power, they would expeditiously eliminate the employment mandate from the Reserve Bank of New Zealand, retaining only the inflation mandate. Willis stated this “would build confidence that the Reserve Bank will be focused on that inflation mandate”.
- GBP/JPY remains depressed for the second straight day, albeit lacks follow-through selling.
- A modest pickup in demand for the safe-haven JPY exerts downward pressure on the cross.
- The BoJ-BoE policy divergence warrants caution before positioning for any further losses.
The GBP/JPY cross trades with a mild negative bias for the second successive day on Friday and languishes near the lower end of its weekly range through the Asian session. Spot prices, however, manage to hold above the 184.00 round-figure mark, warranting some caution for aggressive bearish traders and positioning for any further depreciating move.
Despite a generally positive tone around the equity markets, the Japanese Yen (JPY) attracts some haven flows amid worries about a deeper global economic downturn and acts as a headwind for the GBP/JPY cross. That said, the disappointing Japanese macro data keeps a lid on any meaningful gains for the JPY and helps limit the downside for the cross. The latest survey from Jibun Bank showed that the manufacturing sector in Japan continued to contract in August. In fact, the Manufacturing PMI was finalized at 49.6 as compared to the original estimate for a reading of 49.7.
Adding to this, Japan's Finance Ministry reported that Capital Spending by companies increased by 4.5% from a year earlier during the April-June period, down from 11.0% prior and missing consensus expectations for a 5.4% rise. Apart from this, the divergent policy stance adopted by the Bank of Japan (BoJ) and another major central bank, might hold back traders from placing aggressive bullish bets around the JPY. It is worth recalling that the BoJ is the only central bank in the world to maintain negative interest rates and is anticipated to stick to its ultra-easy policy settings.
Moreover, BoJ board member Toyoaki Nakamura said this Thursday that it was premature to tighten monetary policy as recent increases in inflation were mostly driven by higher import costs rather than wage gains. This comes on the back of BoJ Governor Kazuo Ueda's dovish remarks last week, saying that the underlying inflation in Japan remains a bit below the 2% target, and ensures that the central bank may keep the status quo until next summer. In contrast, the Bank of England (BoE) is anticipated to continue with its policy tightening cycle to combat high inflation.
The bets were reaffirmed by BoE Deputy Governor Ben Broadbent's comments last week, saying that policy rates may well have to remain in restrictive territory for some time as the knock-on effects of the surge in prices were unlikely to fade away rapidly. Adding to this, BoE Chief Economist Huw Pill noted on Thursday that inflation in the UK remains "too high" and added that there is a lot of policy in the pipeline to come through. This suggests that the path of least resistance for the GBP/JPY cross is to the upside and supports prospects for the emergence of some dip-buying.
Technical levels to watch
| Raw materials | Closed | Change, % |
|---|---|---|
| Silver | 24.427 | -0.76 |
| Gold | 1939.896 | -0.21 |
| Palladium | 1229.56 | -0.32 |
- Natural Gas Price seesaws at three-week high, lacks momentum of late.
- Sluggish oscillators, pre-NFP trading lull prod XNG/USD traders at multi-day high.
- Convergence of 200-DMA, six-month-old resistance line appears a tough nut to crack for Natural Gas buyers.
- XNG/USD sellers need confirmation of 15-week-old rising wedge.
Natural Gas Price (XNG/USD) sticks to mild gains around $2.90 as markets await the all-important US Nonfarm Payrolls (NFP) on Friday. In doing so, the XNG/USD also challenges the previous day’s retreat from a three-week high while bracing for the second consecutive weekly gain.
Also read: Nonfarm Payrolls Preview: Four scenarios for a jobs report set to test US economic resilience
That said, the sluggish MACD signals and upbeat RSI suggest fewer hardships for the Natural Gas buyers unless the quote stays beyond a one-week-old rising support line, close to $2.86 by the press time.
It’s worth noting that July’s peak of $2.78 and a three-month-old ascending trend line surrounding $2.65 could challenge the XNG/USD bears past $2.86.
In a case where the Natural Gas Price remains weak below $2.86, the energy instrument confirms a rising wedge bearish chart formation suggesting a theoretical target of $1.79.
However, April’s bottom of around $2.11 and the $2.00 psychological magnet can challenge the XNG/USD bear on their rush to $1.79.
Alternatively, the latest high of around $3.00 round figure guards immediate recovery of the Natural Gas Price ahead of a convergence of the 200-DMA and descending resistance line from early March, close to $3.05.
Following that, the stated wedge’s top line, close to $3.12 could act as the final defense of the XNG/USD bears.
Natural Gas Price: Daily chart

Trend: Pullback expected
- USD/CAD attracts some sellers for the fifth consecutive day during Friday’s Asian session.
- Initial Jobless Claims came in lower than expected; US PCE inflation matched expectations.
- A rise in oil prices boosts the Canadian Dollar against the USD.
- Market players will monitor the Canadian Gross Domestic Product (GDP), US Nonfarm Payrolls for fresh impetus.
The USD/CAD pair loses traction and breaks below the 1.3500 area during the early Asian session on Friday. Market players await the highly-anticipated US Nonfarm Payrolls and Canadian Gross Domestic Product (GDP) for the second quarter. The annual growth number is expected to grow 1.2% from the previous reading and the US economy is expected to create 170K jobs in August. The pair currently trades around 1.3495, losing 0.10% on the day.
Fed Chairman Jerome Powell stated at the Jackson Hole Symposium last week that a potential additional rate hike would be depending on incoming data. However, the mixed economic data from the US on Thursday might challenge the Fed to keep rates higher for longer.
On Thursday, US Initial Claims for the week ending of August 25 fell to 228K, falling short of the market consensus of 232 K. The figure marked the lowest level in four weeks while Continuing Claims reached their highest level in six weeks. Additionally, the Federal Reserve's preferred gauge of inflation, the US Core Personal Consumption Expenditure (PCE) Price Index improved to 4.2% in July from 4.1% in the previous and line with expectations. In response to the data, the Greenback weakened against the Loonie.
On the Loonie front, Statistics Canada reported on Thursday that the nation’s Current Account for the second quarter (Q2) deficit narrowed to C$ 6.63 billion from C$3.17 billion deficit in the previous quarter. Meanwhile, a rise in oil price lifts the Canadian Dollar against its rivals as Canada is the largest exporter of crude to the US.
Market participants will keep an eye on the Canadian Gross Domestic Product (GDP) for the second quarter due later in the day. On the US docket, the US Nonfarm Payrolls will be the closely watched event. The US economy is expected to create 170K jobs in August. Also, the Unemployment Rate and ISM Manufacturing PMI will be released later on Friday. These figures could give a clear direction for the USD/CAD pair.
- AUD/USD struggles to gain any meaningful traction and is influenced by a combination of factors.
- A modest USD downtick lends support; though China's economic woes continue to cap the upside.
- The better-than-expected Caixin China Manufacturing PMI fails to impress bulls ahead of the NFP.
The AUD/USD pair lacks any firm intraday directional bise on Friday and seesaws between tepid gains/minor losses through the Asian session. Spot prices, meanwhile, remain below the 0.6500 psychological mark and move little in reaction to the Chinese macro data.
A Caixin-sponsored survey showed that business activity in China’s manufacturing sector moved back into the expansion territory during August, smashing expectations for a fall for the second straight month. In fact, the Caixin China Manufacturing PMI rose to 51.0 from 49.2 in July, though does little to ease worries about the worsening conditions in the world's second-largest economy. This, in turn, fails to provide any meaningful impetus to the China-proxy Australian Dollar (AUD), though a modest US Dollar (USD) downtick lends support to the AUD/USD pair.
The USD Index (DXY), which tracks the Greenback against a basket of currencies, struggles to capitalize on the previous day's solid recovery from a two-week low amid the uncertainty over the Federal Reserve's (Fed) future rate-hike path. The US macro data released earlier this week – the ADP report and the second estimate of the Q2 GDP print – suggested that the resilient US economy is starting to lose steam. That said, Thursday's US PCE Price Index data keeps the door open for one more 25 bps Fed rate hike by the end of this year.
In fact, the headline US PCE Price Index rose to 3.3% YoY in July from the 3% previous. Furthermore, the annual Core PCE Price Index – the Fed's preferred gauge of inflation – came in at 4.2%, a slightly stronger pace than the 4.1% increase recorded in June. Additional details of the report showed that Personal Income grew 0.2%, while Personal Spending rose 0.8% on a monthly basis – the strongest print since January. The USD bulls, however, prefer to wait on the sidelines ahead of the closely-watched US monthly employment details.
The popularly known NFP report is due for release later during the early North American session and will play a key role in influencing the Fed's policy outlook. This, in turn, will drive the USD demand and provide some meaningful impetus to the AUD/USD pair. Nevertheless, spot prices, for now, seem poised to end in the green for the first time in the previous six weeks as the focus now shifts to the RBA policy decision next Tuesday.
Technical levels to watch
- USD/CNH refreshes multi-day low on hawkish PBoC action, upbeat China data.
- PBoC to cut RRR by 2.0%, China Caixn Manufacturing PMI improves for August.
- Recent US data, pre-NFP consolidation allows US Dollar to edge higher despite looming Fed policy pivot concerns.
- Strong US employment data needed to stop Yuan from reaching multi-day high.
USD/CNH remains pressured at the lowest level in three weeks, after falling the most in a fortnight the previous day, as the offshore Chinese Yuan (CNH) buyers cheer upbeat China activity data for August and the People’s Bank of China’s (PBoC) moves. That said, the currency pair refreshed the multi-day low to 7.2390 before a few minutes while staying depressed at 7.2540 at the latest.
China’s Caixin Manufacturing PMI for August rose to 51.0 versus 49.3 market forecasts and 49.2 previous readings. On Thursday, China’s official NBS Manufacturing PMI for August rose to 49.7 versus 49.4 expected and 49.3 previous readings whereas the Non-Manufacturing PMI came in as 51.0 compared to 51.5 prior readouts and market forecasts of 51.1.
Earlier in the day, China's central bank, namely the People's Bank of China (PBoC) also announced early Friday that it will lower the foreign exchange reserve requirement ratio to 4%, from 6.0%, effective from September 15.
Further, a slew of China banks cut interest rates on Yuan deposits while citing the readiness to ease the pressure from lower mortgage rates, per Reuters. Among them, ICBC, China Industrial Bank, Agricultural Bank of China and Bank of China (BoC) gained major attention.
With this, the USD/CNH pair remains on the back foot amid expectations that China will be able to defend the economy from slipping back into COVID-induced hardships.
On the other hand, the US Dollar Index (DXY) fades the previous day’s corrective bounce off the 200-DMA as market players appear divided about the US Federal Reserve’s (Fed) next step considering the previous day’s mixed data versus earlier downbeat signals.
On Thursday, the Fed’s preferred inflation gauge, namely the US Core Personal Consumption Expenditure (PCE) Price Index for August, matched market forecasts of 4.2% YoY and 0.2% MoM versus 4.1% and 0.2% respectively priors. Further, the Initial Jobless Claims dropped to 228K from 232K prior (revised) versus 235K market forecasts while the Chicago Purchasing Managers’ Index rose to 48.7 for August compared to 44.1 expected and 42.8 previous readings. Additionally, Personal Spending rose past the 0.6% expected and previous readings to 0.8% for July whereas Personal Income eased to 0.2% for the said month, from the 0.3% market forecast and prior.
It should be noted that the US Dollar rallied the most in a week after the data, especially when Atlanta Fed President Raphael Bostic defended the US central bank’s view of keeping rates high.
While portraying the mood, the US 10-year and two-year Treasury bond yields remain depressed around the lowest level in three weeks while the US stock futures dwindle after a mixed Wall Street close.
Given the mixed mood and pre-data anxiety, the USD/CNH bears may take a breather ahead of the US employment report. Forecasts suggest 170K figures of the Nonfarm Payrolls (NFP) versus the previously upbeat outcomes of the JOLTS Job Openings, ADP Employment Change and higher prints of the US Continuing Jobless Claims. Additionally, the three-month average of the US NFP halves to 218K versus a year earlier. As a result, the overall scenario of the US job numbers appears downbeat and can only defend the USD/CNH by posting an extremely strong outcome.
Technical analysis
Unless providing a daily close beneath a 4.5-month-old rising support line and the 50-DMA, respectively near 7.2370 and 7.2330, the USD/CNH pair remains on the bull’s radar.
According to the latest data published on Friday, China's Caixin Manufacturing Purchasing Managers' Index (PMI) jumped back into the expansion territory, coming in at 51.0 in August when compared to July’s contraction of 49.2. The data surprised the market to the upside, as they had expected a 49.3 reading.
Key highlights (via Caixin)
Operating conditions improve for manufacturers in August.
Fresh increases in output and new business.
Employment returns to growth.
Input costs rise for first time since February.
"The slight rise in prices buffered the pressure of deflation, logistics remained smooth, inventory of raw materials fell, and manufacturers held on to their optimism, although to a limited extent," said Wang Zhe, an economist at Caixin Insight Group.
"Looking ahead, seasonal impacts will gradually subside, but the problem of insufficient internal demand and weak expectations may form a vicious cycle for a longer period of time," Wang added.
On Thursday, China’s National Bureau of Statistics (NBS) released the country’s official Manufacturing Purchasing Managers' Index (PMI), which improved to 49.7 in August as against the 49.3 contraction in June. The market consensus was for a 49.4 figure.
AUD/USD reaction
The upbeat print of the Chinese Manufacturing PMI fails to impress the Aussie Dollar, as AUD/USD is keeping its range at around 0.6480, almost unchanged on the day.
- GBP/USD experienced losses due to US moderate economic data.
- Investors turn cautious around BoE’s policy decision and the UK’s gloomy economic situation.
- UK’s FCA stated that British savings account holders can take advantage of higher interest rates.
GBP/USD struggles to recover from the previous day’s losses, hovering around 1.2680 during the Asian session on Friday. The pair is under pressure ahead of the releases of employment and manufacturing data from the United States (US).
The GBP/USD lost ground due to the moderate US data released on Thursday. The US Dollar Index (DXY) trades higher around 103.60 at the time of writing. As said, the US Core PCE improved to 4.2% in July as expected, from its previous 4.1%. In addition, US Jobless Claims for the week ending on August 25 showed a reading of 228K against the market consensus of 235K and the previous 232K and indicated that the labor market is still resilient.
However, market participants are taking a cautious stance, seeking fresh impetus around monetary policy tightening in September’s meeting by the Bank of England (BoE) and the gloomy economic situation of the United Kingdom (UK). The pair faced downward pressure despite hawkish sentiment around a 25 basis points (bps) interest rate hike, following the BoE Chief Economist Huw Pill’s hawkish statement made on Thursday. Pill expressed the view that the policy should maintain a significant level of restraint for an extended duration.
Additionally, the UK's Financial Conduct Authority (FCA) stated early Friday morning in Asia, as reported by Reuters, that an increasingly competitive market is leading to more savings accounts offering higher interest rates. The FCA is working to ensure that British savings account holders can swiftly reap the advantages of higher interest rates, similar to how they promptly face increased costs when borrowing money. This initiative aims to create a balanced and equitable financial environment for consumers.
Investors will likely monitor the upcoming data from the US scheduled to be released on Friday, seeking more cues on the economic scenario in the country. These datasets include the US Average Hourly Earnings, Nonfarm Payrolls and ISM Manufacturing PMI.
- USD/MXN pares the biggest daily gain in a month but lacks downside momentum of late.
- Clear upside break of triangle, sustained trading beyond the key SMA confluence favors Mexican Peso sellers.
- Overbought RSI prods USD/MXN buyers ahead of US NFP.
USD/MXN takes offers to refreshe intraday bottom surrounding 16.98, after reversing from the weekly top, as markets brace for the key US employment report for August on Friday.
USD/MXN rallied the most in a month while refreshing the weekly top on Thursday after it crossed the top line of a five-week-old symmetrical triangle. The bullish breakout also gained support from the MACD signals to renew the multi-day top. However, the nearly overbought RSI and the pre-data positioning seem to weigh on the Mexican Peso (MXN) pair of late.
Even so, a convergence of the 100-SMA and 200-SMA, around 16.94–93, appears a tough nut to crack for the USD/MXN sellers.
Following that, the stated triangle’s top line surrounding 16.87 will be in the spotlight.
Should the USD/MXN bears keep the reins past 16.87, the odds of witnessing a fall toward the rising support line stretched from late July, near 16.70, can’t be ruled out.
On the contrary, the USD/MXN pair’s recovery needs to refresh the weekly top, currently around 17.11, to convince the buyers.
Even so, the mid-August swing high of 17.20 and the previous monthly peak surrounding 17.42 could test the Mexican Peso (MXN) sellers before giving them control.
USD/MXN: Four-hour chart
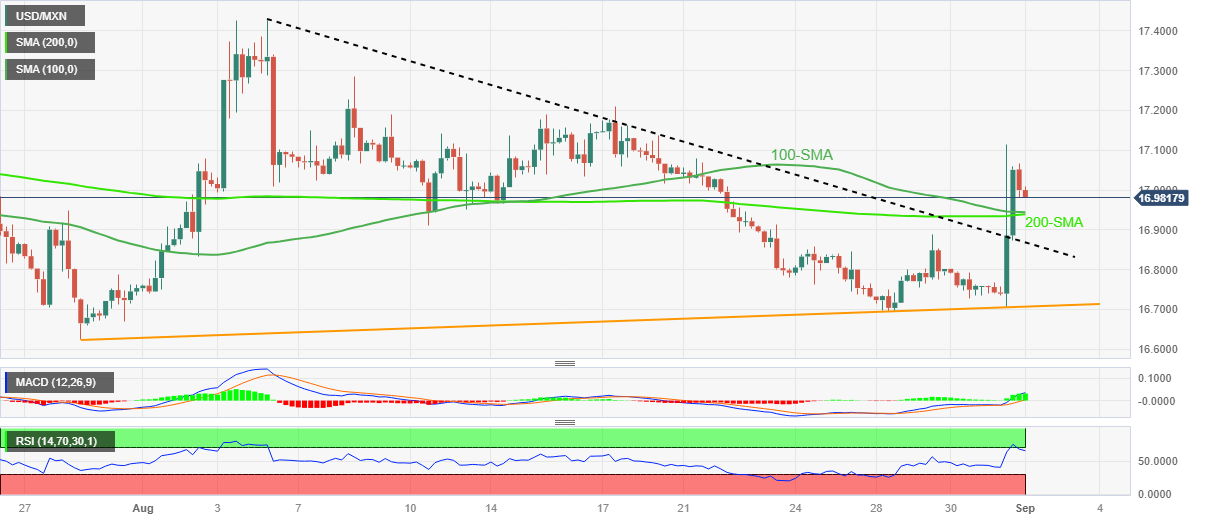
Trend: Recovery expected
People’s Bank of China (PBoC) set the USD/CNY central rate at 7.1788 on Friday, versus the previous fix of 7.1811 and market expectations of 7.2967. It's worth noting that the USD/CNY closed near 7.2595 the previous day.
Apart from the USD/CNY fix, the PBoC also unveiled details of its Open Market Operations (OMO) while saying that the Chinese central bank injects 101 billion Yuan via 7-day reverse repos (RRs) at 1.80% vs. prior 1.80%.
However, with the 221 billion Yuan of RRs maturing today, there prevails a net drain of around 120 billion Yuan on the day in OMO.
About PBOC fix
China maintains strict control of the yuan’s rate on the mainland.
The onshore yuan (CNY) differs from the offshore one (CNH) in trading restrictions, this last one is not as tightly controlled.
Each morning, the People’s Bank of China (PBOC) sets a so-called daily midpoint fix, based on the yuan’s previous day's closing level and quotations taken from the inter-bank dealer.
- EUR/USD edges lower for the second straight day and is pressured by a combination of factors.
- Rising bets for an on-hold decision by the ECB in September continue to undermine the Euro.
- The uncertainty over the Fed's future rate-hike path benefits the USD and weighs on the major.
The EUR/USD pair remains on the defensive for the second successive day on Friday and trades below mid-1.0800s, representing the 200-hour Simple Moving Average (SMA) through the Asian session. The fundamental backdrop, meanwhile, favours bearish traders and supports prospects for an extension of the overnight sharp retracement slide from the vicinity of a two-and-half-week top, around the 1.0945 region touched on Wednesday.
The shared currency is weighed down by cautious comments by European Central Bank (ECB) officials on Thursday, which lifted bets for an on-hold decision at the September policy meeting. In fact, Isabel Schnabel, who is considered one of the most hawkish members of the ECB, noted that Euro Zone growth was weaker than predicted, though that does not necessarily void the need for more rate hikes. Adding to this, ECB Vice-President Luis de Guindos said that the central bank is nearing the end of its hiking rate cycle but the decision on whether to further tighten its monetary policy at its next meeting in two weeks is still open for debate.
This comes on the back of the Euro Zone data showing a moderation in underlying price growth in August and boosts expectations that the ECB will keep interest rates unchanged. According to the official figures released by Eurostat, the annual Euro Zone Harmonised Index of Consumer Prices (HICP) held steady at 5.3% in August against the 5.1% expected. The Core HICP, however, eased to 5.3% YoY in August from 5.5% in the previous month, matching consensus estimates. In contrast, inflation in the US, as measured by the change in the Personal Consumption Expenditures (PCE) Price Index, rose to 3.3% YoY in July from the 3% previous.
Furthermore, the annual Core PCE Price Index – the Federal Reserve's preferred gauge of inflation – rose 4.2%, a slightly stronger pace than the 4.1% increase recorded in June. Additional details of the report showed that Personal Income grew 0.2%, while Personal Spending rose 0.8% on a monthly basis – the strongest print since January. The data keeps the door for one more 25 bps Fed rate hike move by the end of this year, which assists the US Treasury bond yields to stall the recent pullback from a multi-year peak. This, in turn, underpins the US Dollar and supports prospects for a further depreciating move for the EUR/USD pair.
That said, other data released earlier this week – the ADP report and the second estimate of the US Q2 GDP print – indicated that the resilient US economy has already started losing steam. This might force the Fed to soften its hawkish stance, which, in turn, is holding back the USD bulls from placing aggressive bets and limiting the downside for the EUR/USD pair. Market participants also seem reluctant and prefer to wait on the sidelines ahead of the closely-watched US monthly jobs data. The popularly known NFP report is due for release later during the early North American session and provides some meaningful impetus to the major.
Technical level to watch
- USD/JPY picks up bids to refresh intraday high but stays on the way to snapping four-week uptrend.
- Japan Jibun Bank Manufacturing PMI eases, Capex growth slows but corporate earnings refreshed record high.
- US Dollar consolidates weekly loss ahead of employment details for August.
- Strong US NFP becomes necessary to defend Yen pair buyers as Fed policy pivot, BoJ’s exit from ultra-easy policy loom.
USD/JPY refreshes intraday high to 145.70 as it pares the first weekly loss in five on the US NFP day. Apart from the pre-data consolidation, the Yen pair also justifies the downbeat Japan data, as well trace a rebound in the Treasury bond yields.
That said, Japan’s Jibun Bank Manufacturing PMI for August eases to 49.6 from 49.7 initial estimations. Further, the nation’s Capital Spending for the second quarter (Q2) drops the most since early 2022, to 4.5% versus 5.4% expected and 11.0% prior. Further, the Japan Ministry of Finance (MoF) also said that Japanese corporations marked record internal reserves and recurring profits in Q2 of 2023.
It’s worth noting Reuters cites China's growth slowdown and higher costs in Tokyo as the key catalysts for the recently downbeat Japan data.
Elsewhere, the US economic calendar flashed slightly better data on Thursday, after witnessing the downbeat prints of consumer confidence and employment clues earlier in the week, which in turn allowed the US Dollar to pare weekly losses.
That said, the US Federal Reserve’s preferred inflation gauge, namely the US Core Personal Consumption Expenditure (PCE) Price Index for August, matched market forecasts of 4.2% YoY and 0.2% MoM versus 4.1% and 0.2% respectively priors. Further, the Initial Jobless Claims dropped to 228K from 232K prior (revised) versus 235K market forecasts while the Chicago Purchasing Managers’ Index rose to 48.7 for August compared to 44.1 expected and 42.8 previous readings. Additionally, Personal Spending rose past the 0.6% expected and previous readings to 0.8% for July whereas Personal Income eased to 0.2% for the said month, from the 0.3% market forecast and prior.
Additionally, Atlanta Fed President Raphael Bostic defended the US central bank’s view of keeping rates high also underpinned the US Dollar’s rebound, recently favoring the USD/JPY as well.
On a different page, a slew of China measures to renew growth momentum struggles to lift the sentiment amid the pre-data anxiety.
Against this backdrop, the US 10-year and two-year Treasury bond yields remain depressed around the lowest level in three weeks while the US stock futures dwindle after a mixed Wall Street close.
Moving on, the US employment report for August comprising the top-tier Nonfarm Payrolls (NFP) and US ISM Manufacturing PMI will be crucial to watch.
Forecasts suggest 170K figures of the Nonfarm Payrolls (NFP) versus the previously upbeat outcomes of the JOLTS Job Openings, ADP Employment Change and higher prints of the US Continuing Jobless Claims. Additionally, the three-month average of the US NFP halves to 218K versus a year earlier. As a result, the overall scenario of the US job numbers appears downbeat and can only defend the USD/JPY by posting an extremely strong outcome, especially amid the hawkish bias about the Bank of Japan (BoJ).
Technical Analysis
USD/JPY recovery looks to a two-month-old ascending resistance line, around 147.00 by the press time. That said, the pair sellers remain off the table unless they witness a daily closing below 146.60–50 region.
- WTI prices gain traction for four straight days above $83.20 a barrel.
- Russian authorities agreed to cut oil production and will reveal the new parameters next week.
- Higher WTI prices are also bolstered by the big draw in US crude oil inventories.
- Oil traders will monitor the Chinese Caixin Manufacturing PMI, US Nonfarm Payrolls.
Western Texas Intermediate (WTI), the US crude oil benchmark, is trading around the $83,20 mark so far on Friday. WTI prices trade in positive territory for the fourth consecutive day on expectations that oil production cut by by Saudi Arabia and OPEC+ will continue through the end of 2023.
On Thursday, Russia’s Deputy Prime Minister Alexander Novak stated that the country agreed with OPEC+ to cut oil production and will reveal the new parameters next week, according to Reuters. That said, Russia is anticipated to cut oil exports by 500,000 barrels per day in August and by 300,000 barrels per day in September. While Saudi Arabia is expected to extend a voluntary oil cut of 1 million barrels per day for the third month in a row into October. This, in turn, boosts WTI prices to the highest level since April.
Higher WTI prices are also bolstered by the big draw in US crude oil inventories. On Wednesday, the Energy Information Administration (EIA) showed that crude oil stocks declined by 10.584M barrels in the week ending August 25, better than the expectation of a -3.267M barrels drop. On the same line, the American Petroleum Institute (API) reported that US crude oil inventories dropped by about 11.486M barrels compared to the previous week’s -2.418M barrels, marking the largest decline since September 2016.
On the other hand, concerns about the economic slowdown in China might limit the WTI's upside potential as China is the world's largest oil importer. August's Chinese Caixin Manufacturing PMI will be monitored closely by market participants. The weaker-than-anticipated data may exert additional selling pressure on WTI.
Apart from the Chinese data, oil traders will shift their attention to the US ISM Manufacturing PMI, Nonfarm Payrolls (NFP), and the Unemployment Rate due later on Friday in the American session. These events could significantly impact the USD-denominated WTI price. Oil traders will take cues from the data and find trading opportunities around the WTI price.
| Index | Change, points | Closed | Change, % |
|---|---|---|---|
| NIKKEI 225 | 285.88 | 32619.34 | 0.88 |
| Hang Seng | -100.8 | 18382.06 | -0.55 |
| KOSPI | -4.95 | 2556.27 | -0.19 |
| ASX 200 | 7.6 | 7305.3 | 0.1 |
| DAX | 55.15 | 15947.08 | 0.35 |
| CAC 40 | -47.7 | 7316.7 | -0.65 |
| Dow Jones | -168.33 | 34721.91 | -0.48 |
| S&P 500 | -7.21 | 4507.66 | -0.16 |
| NASDAQ Composite | 15.66 | 14034.97 | 0.11 |
Multiple China banks cut Yuan deposit rates, likely lowering interest rates on existing mortgages.
more to come...
- Gold Price lacks upside momentum on the way to posting consecutive second positive week.
- Recent mixed prints of United States inflation, employment clues increase importance of US NFP for XAU/USD traders.
- Tight job market could allow Federal Reserve hawks with one more rate hike in 2023 and recall Gold sellers.
Gold Price (XAU/USD) portrays the routine consolidation ahead of the United States Nonfarm Payrolls (NFP) while easing to $1,940 amid the early hours of Friday, after reversing from the highest level in a month the previous day. Apart from the pre-data positioning, the XAU/USD traders also portray the market’s indecision about the Federal Reserve’s (Fed) next step amid a lack of clear directions from the recent US data, as well as due to less acceptance of China stimulus.
Gold Price eases on Fed, China concerns
Gold Price remains depressed after reversing from the multi-day top as markets remain dicey ahead of the key data/events, especially when the latest round of the United States data have been mixed and China fails to impress XAU/USD bulls with stimulus measures.
Following the downbeat prints of consumer confidence and employment clues, the US economic calendar flashed slightly better data on Thursday and triggered the Gold Price pullback from the monthly high. The same joins the pre-data consolidation to help the DXY pare weekly losses, the first in seven, as market players await today’s key US jobs report.
On Thursday, the US Federal Reserve’s preferred inflation gauge, namely the US Core Personal Consumption Expenditure (PCE) Price Index for August, matched market forecasts of 4.2% YoY and 0.2% MoM versus 4.1% and 0.2% respectively priors. Further, the Initial Jobless Claims dropped to 228K from 232K prior (revised) versus 235K market forecasts while the Chicago Purchasing Managers’ Index rose to 48.7 for August compared to 44.1 expected and 42.8 previous readings. Additionally, Personal Spending rose past the 0.6% expected and previous readings to 0.8% for July whereas Personal Income eased to 0.2% for the said month, from the 0.3% market forecast and prior.
It’s worth noting that Atlanta Fed President Raphael Bostic’s defense of keeping rates high also underpinned the US Dollar’s rebound the previous day and weighed on the XAU/USD.
Elsewhere, a slew of China banks cut their Yuan deposit rates after announcing a reduction in the down payment for the loan of the first and the second homes. The Dragon Nation has been on a roll for announcing measures to defend the economic recovery from COVID-19. However, the market’s doubts about the credibility of such measures make them less effective of late.
Amid these plays, the US 10-year and two-year Treasury bond yields remain depressed around the lowest level in three weeks while the US stock futures dwindle after a mixed Wall Street close. Furthermore, the US Dollar Index (DXY) struggles to defend the previous day’s rebound and prods the Gold traders.
Focus on PMI, NFP
While the mixed feelings about the US Federal Reserve (Fed) prod the Gold traders, a slew of economics stand tall to direct the Gold Price. Among them, the US employment report for August comprising the top-tier Nonfarm Payrolls (NFP), China’s Caixin Manufacturing PMI and US ISM Manufacturing PMI will gain major attention.
That said, market players seek more clues to challenge the Gold buyers as they forecast 170K figures of the Nonfarm Payrolls (NFP) versus the previously upbeat outcomes of the JOLTS Job Openings, ADP Employment Change and higher prints of the US Continuing Jobless Claims. Additionally, the three-month average of the US NFP halves to 218K versus a year earlier. As a result, the overall scenario of the US job numbers appears downbeat and can only defend the Gold sellers by posting an extremely strong outcome, failing to do so can help the XAU/USD begin September on a positive note.
Gold Price Technical Analysis
Gold Price momentum suggests the lack of buyer’s confidence via the latest retreat from the 61.8% Fibonacci retracement of July–August downside, around $1,948.
Also portraying the bull’s retreat is the pullback in the Relative Strength Index (RSI) line, placed at 14, from the overbought territory, as well as the impending bear cross on the Moving Average Convergence and Divergence (MACD) indicator.
With this, the XAU/USD is likely to revisit the 200-Simple Moving Average (SMA) support of around $1,933 before challenging the fortnight-old support line of around $1,927.
In a case where the Gold Price remains bearish past $1,927, a two-month-old horizontal area surrounding $1,900 and the previous monthly low of near $1,884 will be in the spotlight.
On the contrary, a clear upside break of the 61.8% Fibonacci retracement level of near $1,949, also known as the Golden Fibonacci Ratio, isn’t an open invitation to the XAU/USD bulls as a descending resistance line from July 20, close to $1,955, will act as an additional check for the buyers before giving them control.
To sum up, the Gold Price lacks upside momentum and may witness a pullback but the bears need validation from the US NFP.
Gold Price: Four-hour chart
-01092023-638291233621822502.png)
Trend: Pullback expected
| Pare | Closed | Change, % |
|---|---|---|
| AUDUSD | 0.64842 | 0.18 |
| EURJPY | 157.756 | -1.21 |
| EURUSD | 1.08416 | -0.77 |
| GBPJPY | 184.406 | -0.79 |
| GBPUSD | 1.26722 | -0.36 |
| NZDUSD | 0.59658 | 0.35 |
| USDCAD | 1.35091 | -0.19 |
| USDCHF | 0.88302 | 0.55 |
| USDJPY | 145.521 | -0.43 |


© 2000-2024. Уcі права захищені.
Cайт знаходитьcя під керуванням TeleTrade DJ. LLC 2351 LLC 2022 (Euro House, Richmond Hill Road, Kingstown, VC0100, St. Vincent and the Grenadines).
Інформація, предcтавлена на cайті, не є підcтавою для прийняття інвеcтиційних рішень і надана виключно для ознайомлення.
Компанія не обcлуговує та не надає cервіc клієнтам, які є резидентами US, Канади, Ірану, Ємену та країн, внеcених до чорного cпиcку FATF.
Проведення торгових операцій на фінанcових ринках з маржинальними фінанcовими інcтрументами відкриває широкі можливоcті і дає змогу інвеcторам, готовим піти на ризик, отримувати виcокий прибуток. Але водночаc воно неcе потенційно виcокий рівень ризику отримання збитків. Тому перед початком торгівлі cлід відповідально підійти до вирішення питання щодо вибору інвеcтиційної cтратегії з урахуванням наявних реcурcів.
Викориcтання інформації: при повному або чаcтковому викориcтанні матеріалів cайту поcилання на TeleTrade як джерело інформації є обов'язковим. Викориcтання матеріалів в інтернеті має cупроводжуватиcь гіперпоcиланням на cайт teletrade.org. Автоматичний імпорт матеріалів та інформації із cайту заборонено.
З уcіх питань звертайтеcь за адреcою pr@teletrade.global.
переклади