- Аналітика
- Новини та інструменти
- Новини ринків
Новини ринків
- EUR/USD slipped back below 1.0800 as bearish pullback gains strength.
- Mixed US data reignited fears over a possible recession in the US.
- US NFP jobs report in the pipe for Friday, market attention fixed squarely on hiring numbers.
EUR/USD lost a foothold above key technical levels on Thursday, slumping below the 1.0800 handle after a miss in US Purchasing Managers Index (PMI) figures sparked fresh fears of worsening economic data signaling the possibility of a hard landing scenario in the US economy.
Forex today: Markets’ attention shifts to US NFP
European economic data remains thin for what’s left of the trading week, and next week sees little of note on the meaningful release side for the EU as broader markets pivot to fully face down Friday’s US Nonfarm Payrolls (NFP) jobs report for July. Investors hope for a moderate drop to 175K new US jobs in July from 206K last month. Too high of a print could splash cold water on rate cut hopes for September, while too low of a figure would add further weight to concerns of a too-fast economic decline dragging the US economy into a recession.
Markets are struggling to balance on the edge of a very sharp knife as a downturn in economic figures is helping to pin rate cut expectations even further into the ceiling. According to the CME’s FedWatch Tool, rate traders are pricing in 100% odds of at least a quarter-point rate cut from the Fed on September 18, with further one-in-five odds of a double-cut for 50 basis points. On the downside, too much of a downturn will obliterate market sentiment as a hard landing economic scenario for the US economy makes any rate cuts from the Fed irrelevant, and investors are strung along a difficult middle ground where they hope for rate cuts on soft data, but not so soft that the US economy rolls over.
US Initial Jobless Claims for the week ended July 26 rose to 249K from the previous week’s 235K, lurching past the forecast uptick to 236K. July’s US ISM Manufacturing Purchasing Managers Index (PMI) tumbled to an eight-month low of 46.8 compared to the previous 48.5 and entirely reversing the forecast move up to 48.8.
On the other side of the same coin, ISM Manufacturing Prices Paid in July accelerated to 52.9 versus the previous 52.1 and entirely missing a forecast easing to 48.8 as input prices for manufacturers drift higher than markets anticipated even as activity declines.
Economic Indicator
Nonfarm Payrolls
The Nonfarm Payrolls release presents the number of new jobs created in the US during the previous month in all non-agricultural businesses; it is released by the US Bureau of Labor Statistics (BLS). The monthly changes in payrolls can be extremely volatile. The number is also subject to strong reviews, which can also trigger volatility in the Forex board. Generally speaking, a high reading is seen as bullish for the US Dollar (USD), while a low reading is seen as bearish, although previous months' reviews and the Unemployment Rate are as relevant as the headline figure. The market's reaction, therefore, depends on how the market assesses all the data contained in the BLS report as a whole.
Read more.Next release: Fri Aug 02, 2024 12:30
Frequency: Monthly
Consensus: 175K
Previous: 206K
Source: US Bureau of Labor Statistics
America’s monthly jobs report is considered the most important economic indicator for forex traders. Released on the first Friday following the reported month, the change in the number of positions is closely correlated with the overall performance of the economy and is monitored by policymakers. Full employment is one of the Federal Reserve’s mandates and it considers developments in the labor market when setting its policies, thus impacting currencies. Despite several leading indicators shaping estimates, Nonfarm Payrolls tend to surprise markets and trigger substantial volatility. Actual figures beating the consensus tend to be USD bullish.
EUR/USD technical outlook
The Fiber’s downside performance sent the pair tumbling below the 200-day Exponential Moving Average (EMA) at 1.0805, and dragged bids back under the 1.0800 handle as a bearish turnaround in EUR/USD grows its legs, sinking the Euro into a -1.56% decline against the Greenback.
EUR/USD set a near-term high of 1.0948 in recent weeks, falling just short of the 1.0950 level and price action has once again slumped within the range of a choppy descending channel that has plagued the chart since late last year.
EUR/USD daily chart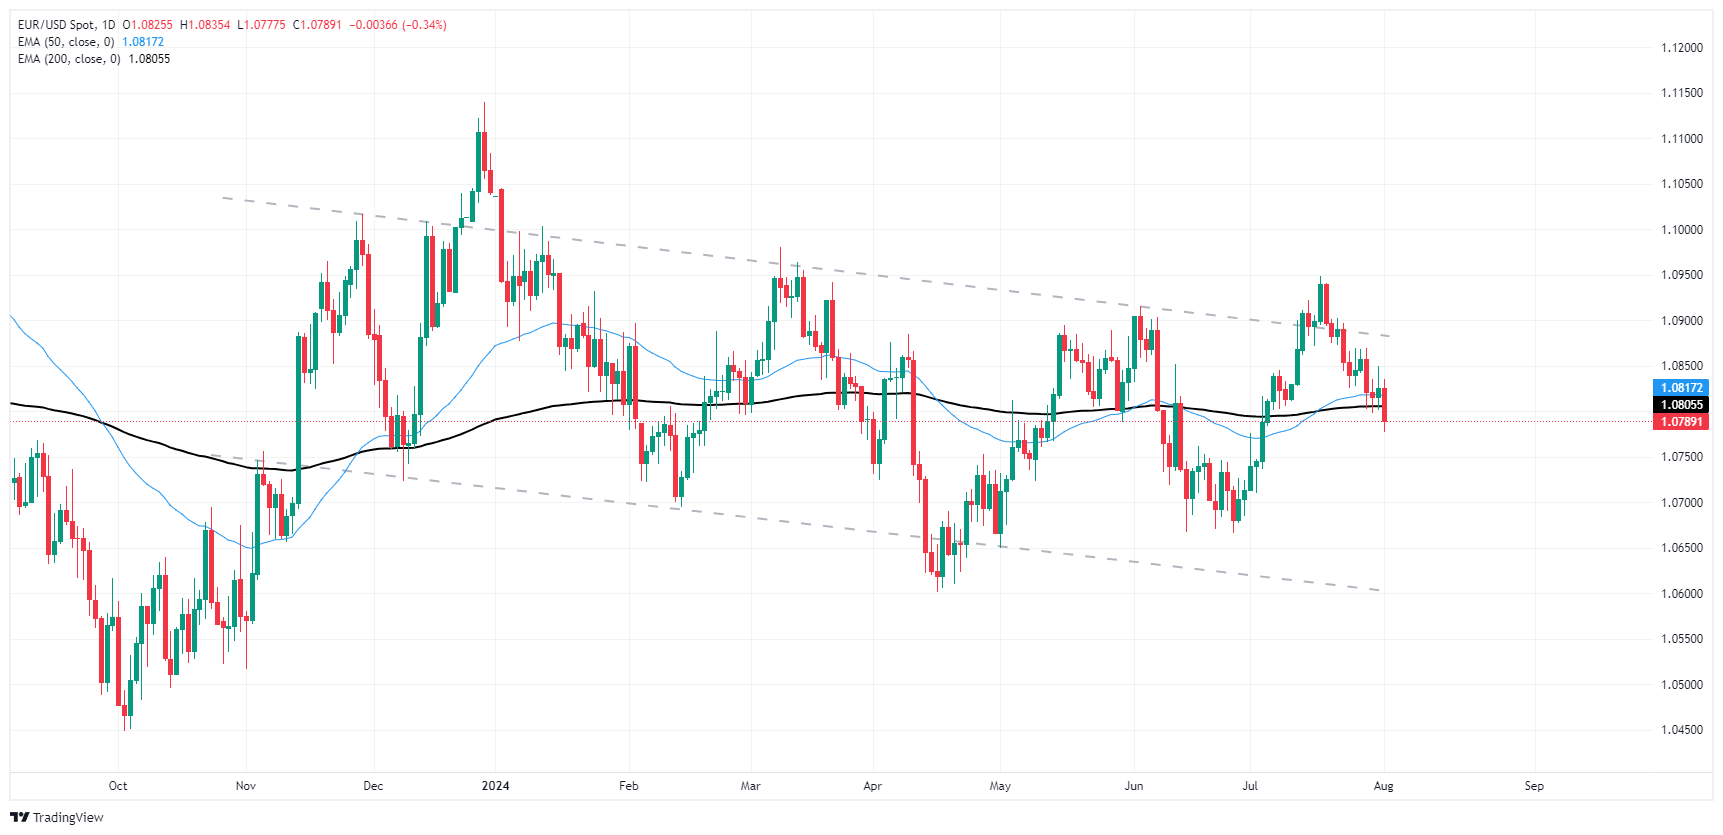
Euro FAQs
The Euro is the currency for the 20 European Union countries that belong to the Eurozone. It is the second most heavily traded currency in the world behind the US Dollar. In 2022, it accounted for 31% of all foreign exchange transactions, with an average daily turnover of over $2.2 trillion a day. EUR/USD is the most heavily traded currency pair in the world, accounting for an estimated 30% off all transactions, followed by EUR/JPY (4%), EUR/GBP (3%) and EUR/AUD (2%).
The European Central Bank (ECB) in Frankfurt, Germany, is the reserve bank for the Eurozone. The ECB sets interest rates and manages monetary policy. The ECB’s primary mandate is to maintain price stability, which means either controlling inflation or stimulating growth. Its primary tool is the raising or lowering of interest rates. Relatively high interest rates – or the expectation of higher rates – will usually benefit the Euro and vice versa. The ECB Governing Council makes monetary policy decisions at meetings held eight times a year. Decisions are made by heads of the Eurozone national banks and six permanent members, including the President of the ECB, Christine Lagarde.
Eurozone inflation data, measured by the Harmonized Index of Consumer Prices (HICP), is an important econometric for the Euro. If inflation rises more than expected, especially if above the ECB’s 2% target, it obliges the ECB to raise interest rates to bring it back under control. Relatively high interest rates compared to its counterparts will usually benefit the Euro, as it makes the region more attractive as a place for global investors to park their money.
Data releases gauge the health of the economy and can impact on the Euro. Indicators such as GDP, Manufacturing and Services PMIs, employment, and consumer sentiment surveys can all influence the direction of the single currency. A strong economy is good for the Euro. Not only does it attract more foreign investment but it may encourage the ECB to put up interest rates, which will directly strengthen the Euro. Otherwise, if economic data is weak, the Euro is likely to fall. Economic data for the four largest economies in the euro area (Germany, France, Italy and Spain) are especially significant, as they account for 75% of the Eurozone’s economy.
Another significant data release for the Euro is the Trade Balance. This indicator measures the difference between what a country earns from its exports and what it spends on imports over a given period. If a country produces highly sought after exports then its currency will gain in value purely from the extra demand created from foreign buyers seeking to purchase these goods. Therefore, a positive net Trade Balance strengthens a currency and vice versa for a negative balance.
- GBP/USD heads for 1.2700 after slumping to a one-month low.
- The BoE cut rates as expected, easing the GBP lower.
- US data sparked fresh fears of a recession, NFP data looms on Friday.
GBP/USD found a new hole in the floor on Thursday, declining towards the 1.2700 handle after fresh recession fears off the back of a miss in US Purchasing Managers Index (PMI) figures that mixed poorly with easing Pound Sterling flows after the Bank of England (BoE) delivered a broadly-expected quarter-point rate trim.
Forex Today: Markets’ attention shifts to US NFP
Friday’s upcoming US Nonfarm Payrolls (NFP) will be a critical print this week after the Federal Reserve (Fed) laid out the track needed in economic data to deliver a widely-anticipated rate cut in September. Investors will be hoping for a continued, but not too steep, decline in new jobs additions in July. US NFP is expected to ease down to 175K net new hirings for the month compared to the previous month’s 206K.
US Initial Jobless Claims for the week ended July 26 rose to 249K from the previous week’s 235K, lurching past the forecast uptick to 236K. July’s US ISM Manufacturing Purchasing Managers Index (PMI) tumbled to an eight-month low of 46.8 compared to the previous 48.5 and entirely reversing the forecast move up to 48.8.
ISM Manufacturing Prices Paid in July accelerated to 52.9 versus the previous 52.1, missing the forecast decline to 48.8 as input prices for manufacturers continue to drift higher than markets anticipated even as activity declines.
The markets are currently facing a delicate balancing act, with economic downturns increasing expectations for a rate cut from the Fed. The CME's FedWatch Tool shows that traders are pricing in a 100% chance of at least a quarter-point rate cut on September 18, with a one-in-five chance of a 50 basis points cut. However, if the downturn becomes too severe, it could negatively impact market sentiment, rendering any rate cuts from the Fed irrelevant. This puts investors in a challenging position, as they are hoping for rate cuts based on soft data, but not wishing for a scenario where the US economy experiences a hard landing.
Economic Indicator
Nonfarm Payrolls
The Nonfarm Payrolls release presents the number of new jobs created in the US during the previous month in all non-agricultural businesses; it is released by the US Bureau of Labor Statistics (BLS). The monthly changes in payrolls can be extremely volatile. The number is also subject to strong reviews, which can also trigger volatility in the Forex board. Generally speaking, a high reading is seen as bullish for the US Dollar (USD), while a low reading is seen as bearish, although previous months' reviews and the Unemployment Rate are as relevant as the headline figure. The market's reaction, therefore, depends on how the market assesses all the data contained in the BLS report as a whole.
Read more.Next release: Fri Aug 02, 2024 12:30
Frequency: Monthly
Consensus: 175K
Previous: 206K
Source: US Bureau of Labor Statistics
America’s monthly jobs report is considered the most important economic indicator for forex traders. Released on the first Friday following the reported month, the change in the number of positions is closely correlated with the overall performance of the economy and is monitored by policymakers. Full employment is one of the Federal Reserve’s mandates and it considers developments in the labor market when setting its policies, thus impacting currencies. Despite several leading indicators shaping estimates, Nonfarm Payrolls tend to surprise markets and trigger substantial volatility. Actual figures beating the consensus tend to be USD bullish.
GBP/USD technical outlook
Thursday’s 1% decline in the Cable dragged bids into the low end, smashing through the 50-day Exponential Moving Average (EMA) at 1.2789 as price action turns notably bearish. The pair is still trading above the 200-day EMA at 1.2667, but bidders are running out of breathing room as short pressure continues to build.
GBP/USD is down -2.43% and counting from a recent 12-month high of 1.3045 hit in recent weeks. The last chance for a bullish recovery will be at the last swing low into 1.2600.
GBP/USD daily chart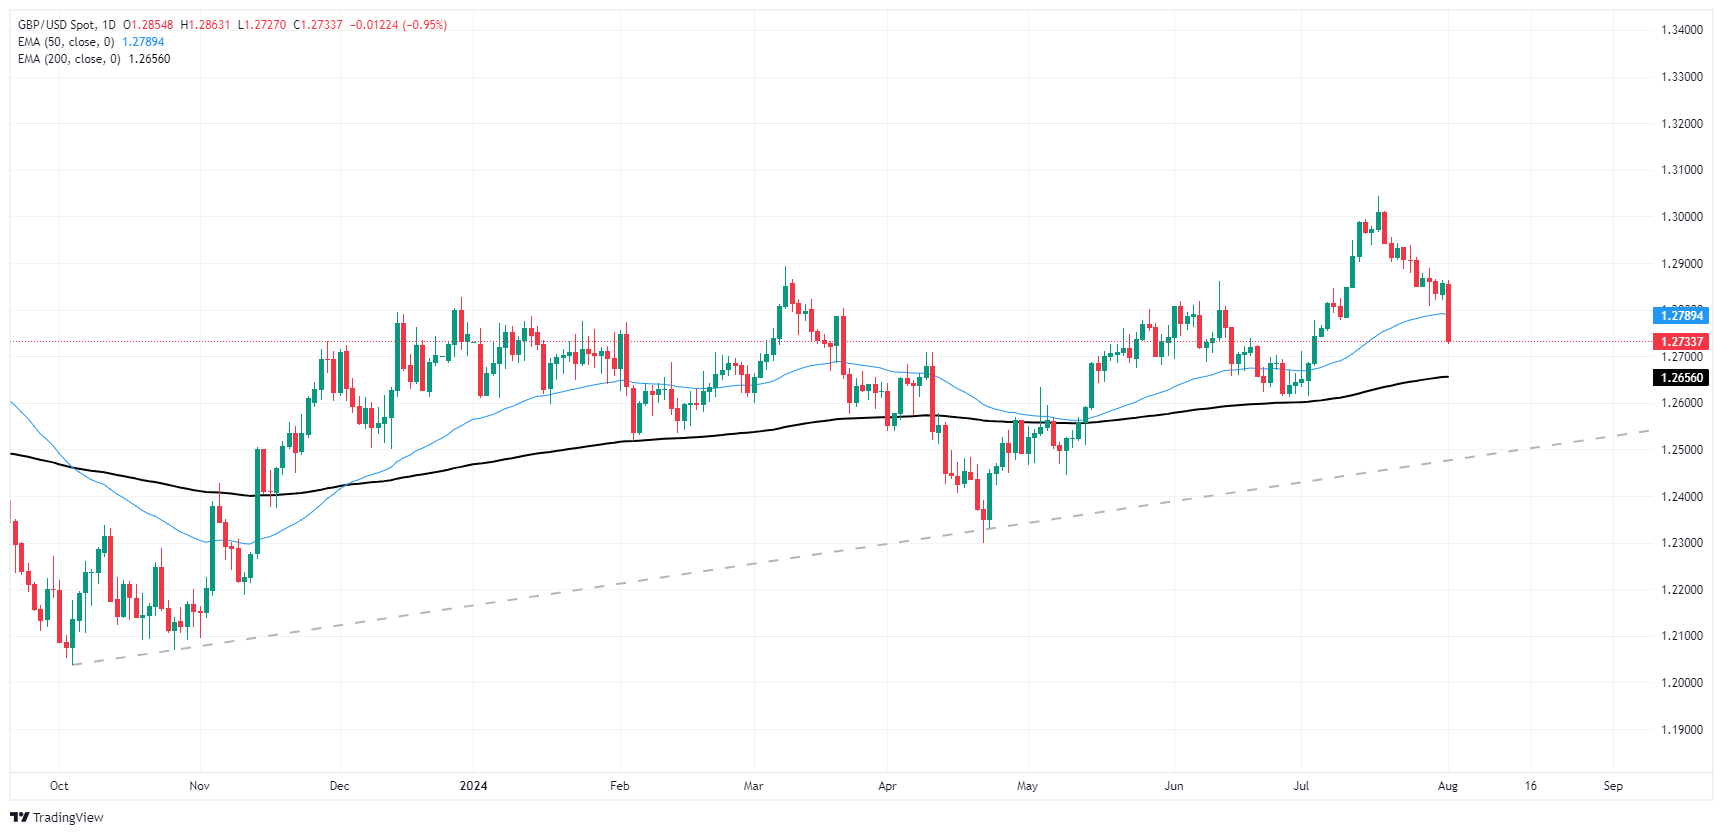
Pound Sterling FAQs
The Pound Sterling (GBP) is the oldest currency in the world (886 AD) and the official currency of the United Kingdom. It is the fourth most traded unit for foreign exchange (FX) in the world, accounting for 12% of all transactions, averaging $630 billion a day, according to 2022 data. Its key trading pairs are GBP/USD, aka ‘Cable’, which accounts for 11% of FX, GBP/JPY, or the ‘Dragon’ as it is known by traders (3%), and EUR/GBP (2%). The Pound Sterling is issued by the Bank of England (BoE).
The single most important factor influencing the value of the Pound Sterling is monetary policy decided by the Bank of England. The BoE bases its decisions on whether it has achieved its primary goal of “price stability” – a steady inflation rate of around 2%. Its primary tool for achieving this is the adjustment of interest rates. When inflation is too high, the BoE will try to rein it in by raising interest rates, making it more expensive for people and businesses to access credit. This is generally positive for GBP, as higher interest rates make the UK a more attractive place for global investors to park their money. When inflation falls too low it is a sign economic growth is slowing. In this scenario, the BoE will consider lowering interest rates to cheapen credit so businesses will borrow more to invest in growth-generating projects.
Data releases gauge the health of the economy and can impact the value of the Pound Sterling. Indicators such as GDP, Manufacturing and Services PMIs, and employment can all influence the direction of the GBP. A strong economy is good for Sterling. Not only does it attract more foreign investment but it may encourage the BoE to put up interest rates, which will directly strengthen GBP. Otherwise, if economic data is weak, the Pound Sterling is likely to fall.
Another significant data release for the Pound Sterling is the Trade Balance. This indicator measures the difference between what a country earns from its exports and what it spends on imports over a given period. If a country produces highly sought-after exports, its currency will benefit purely from the extra demand created from foreign buyers seeking to purchase these goods. Therefore, a positive net Trade Balance strengthens a currency and vice versa for a negative balance.
- AUD/JPY pair extends losses, down by more than 1%.
- Daily indicators suggest a possible shift in momentum, as RSI stands deep in oversold territory while MACD maintains a bearish tone.
- Pair plummets beyond the critical 100.30 support level, leaving market participants vigilant over 97.00 support.
Despite showing signs of a slight recovery Monday, the AUD/JPY pair substantiates the bearish streak, losing ground dramatically over the week with dwindling trading volume reinforcing this downward sentiment. After piercing through the crucial 100.30 support level, the currency pair is now orienting around the 97-figure mark.
The Relative Strength Index (RSI) keeps drifting further below the 30 mark which suggests that extreme selling activity might have left the market exhausted, hinting at a plausible reversal. Although drifting into oversold territory, the Moving Average Convergence Divergence (MACD) continues with its flat, red bars, pointing to prevailing bearish momentum.
AUD/JPY daily chart
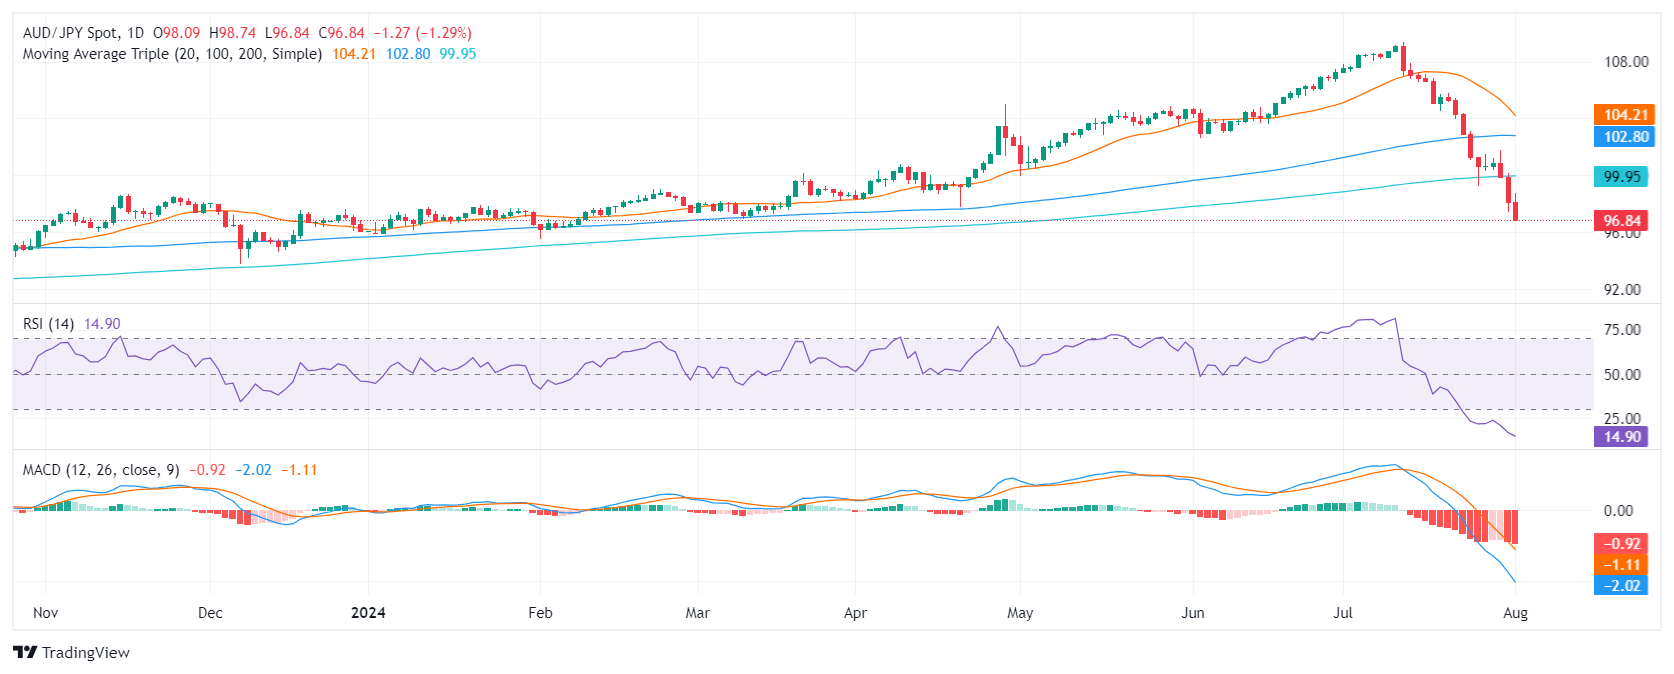
The AUD/JPY pair currently seeks a robust footing around the major support line at 97.00, a defensive line critical in curbing further losses. A deliberate violation of this benchmark might plunge the pair deeper, while a rebound could result in the 98.70 - 100.00 levels behaving as a strong resistance.
- USD/JPY closes below 150.00 for the first time since March, hitting a five-month low of 148.51.
- Technical indicators show strong downtrend, with RSI suggesting potential for oversold rebound.
- Key resistance at 150.00 and 151.00, with support levels at 148.51, 148.00, and March low of 146.48.
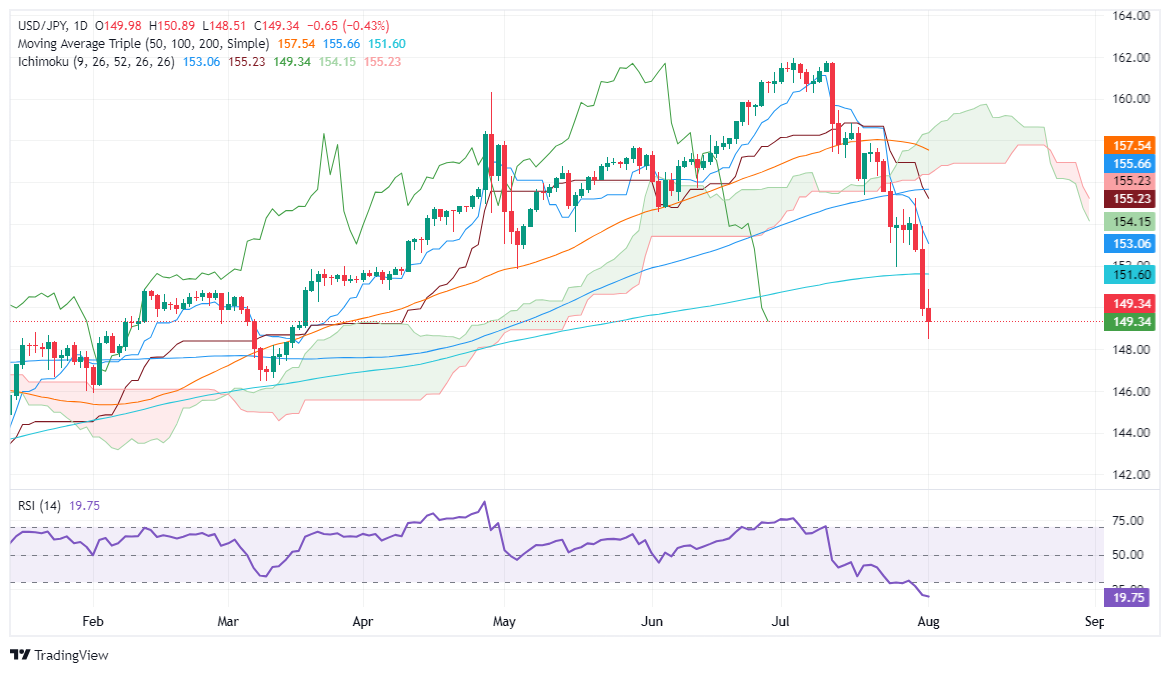
The USD/JPY descended on Thursday trading, breaking below the 150.00 psychological figure and achieving a daily close below the latter for the first time since March. The pair whipsawed in a 200-pip range, sending the Japanese Yen to a five-month high of 148.51. As Friday’s Asian session kicks in, the major trades at 149.34, virtually unchanged.
USD/JPY Price Analysis: Technical outlook
The USD/JPY pair has broken below the 200-day moving average (DMA) and is 500-plus pips below the Ichimoku Cloud (Kumo), confirming a strong downtrend. However, it has begun to show some signs of being overextended.
The Relative Strength Index (RSI) has pierced below the 20 reading, and when that happens on a strong downtrend, RSI becomes oversold meaning the USD/JPY is subject to a mean reversion move.
If USD/JPY climbs past the 150.00 psychological figure, the first resistance would be the 151.00 mark. Once cleared, the 200-DMA emerges as the next resistance at 151.59, ahead of the 152.00 mark.
On the other hand, and the path of least resistance, if the pair drops below 148.51, the next demand zone would be 148.00, and with the Average True Range (ATR) being at 169 pips, the next support would be the March 8 bottom at 146.48.
USD/JPY Price Action – Daily Chart
Japanese Yen PRICE Today
The table below shows the percentage change of Japanese Yen (JPY) against listed major currencies today. Japanese Yen was the strongest against the Australian Dollar.
| USD | EUR | GBP | JPY | CAD | AUD | NZD | CHF | |
|---|---|---|---|---|---|---|---|---|
| USD | -0.01% | 0.00% | -0.03% | -0.02% | 0.04% | 0.02% | 0.00% | |
| EUR | 0.00% | 0.00% | 0.00% | -0.04% | 0.05% | 0.01% | 0.02% | |
| GBP | -0.01% | -0.00% | -0.04% | -0.03% | 0.03% | 0.00% | 0.03% | |
| JPY | 0.03% | 0.00% | 0.04% | 0.01% | 0.06% | 0.02% | 0.05% | |
| CAD | 0.02% | 0.04% | 0.03% | -0.01% | 0.06% | 0.06% | 0.06% | |
| AUD | -0.04% | -0.05% | -0.03% | -0.06% | -0.06% | -0.02% | -0.01% | |
| NZD | -0.02% | -0.01% | 0.00% | -0.02% | -0.06% | 0.02% | 0.03% | |
| CHF | -0.00% | -0.02% | -0.03% | -0.05% | -0.06% | 0.01% | -0.03% |
The heat map shows percentage changes of major currencies against each other. The base currency is picked from the left column, while the quote currency is picked from the top row. For example, if you pick the Japanese Yen from the left column and move along the horizontal line to the US Dollar, the percentage change displayed in the box will represent JPY (base)/USD (quote).
- NZD/USD continues to struggle, after a two-day winning streak.
- The pair exhibits a pronounced bearish trend with a significant support level of around 0.5860 and resistance at 0.5980.
- The RSI remains below the midline, suggesting persistent bearish sentiment.
In recent trading sessions, the NZD/USD pair has seen a little recovery from its losses, but the general outlook continues to be bearish.
The daily Relative Strength Index (RSI) has stayed below the midline for the past 10 sessions while flattening around the 24-39 levels. This indicates that the pair might be heading towards oversold conditions, however, a significant bullish divergence has not been observed yet. This continuance below the 50-level threshold underscores the sustained bearish sentiment.
The Moving Average Convergence Divergence (MACD) remains below the signal line, further substantiating the ongoing bearish trend. The histogram highlights decreasing red bars, which might be pointing towards a diminishing bearish momentum. Nevertheless, a bullish crossover is still yet to be confirmed, sustaining the overall bearish outlook
NZD/USD daily chart
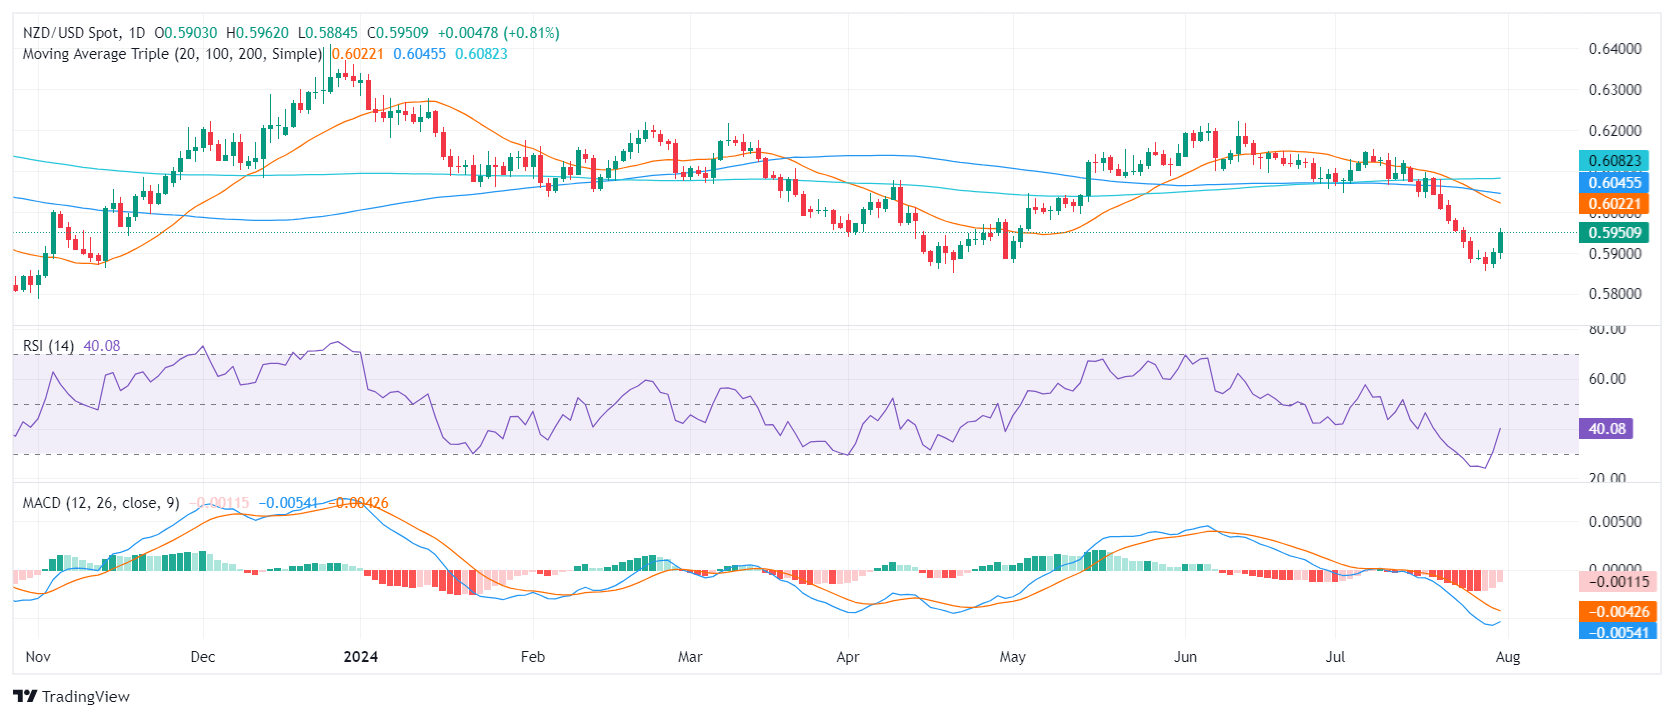
The NZD/USD pair's persistent bearish trend has kept it within a specified range with a solidified support level around 0.5860 and notable resistance at 0.5980. Future sessions may see the pair continue to struggle unless a significant bullish trigger emerges.
- GBP/JPY eased to 190.30 on Thursday following an expected BoE rate cut.
- The BoE trimmed interest rates by a quarter-point, while BoJ raised.
- After a structural shift in the Guppy’s rate differential, the GBP is declining.
The Guppy declined to 190.30 on Thursday after a downward shift in the Bank of England’s (BoE) main reference rates helped to trim the top off of the GBP/JPY’s wide interest rate differential, giving the Yen a chance to recover ground and pushing down the Pound Sterling.
The BoE trimmed its interest rate by 25 basis points to a flat 5.0% early Thursday, deflating the GBP and sending GBP/JPY into a 16-week low near 190.25. This follows the Bank of Japan’s (BoJ) own rate hike earlier in the week, dragging Japanese interest rates back into positive territory above 0.1% for the first time since 2010.
Guppy is undergoing a hard rebalance following a trimming of the rate differential between the GBP and the Yen, and the upcoming trading week provides a reprieve from key economic data for both currencies. The data docket for both the UK and Japan is strictly mid-tier next week, and UK labor figures are not due until mid-August.
GBP/JPY technical outlook
The Guppy is on pace to chalk in a fourth straight down week as bearish momentum accelerates into the low end, dragging the pair further back from 16-year highs just above 208.00. The pair is easing back towards 190.00, but despite a -8.62% decline from multi-year peaks, a long-run bull market leaves price action buried deep in bull country with bids still swimming over 11% above the 200-day Exponential Moving Average (EMA) at 171.07.
GBP/JPY daily chart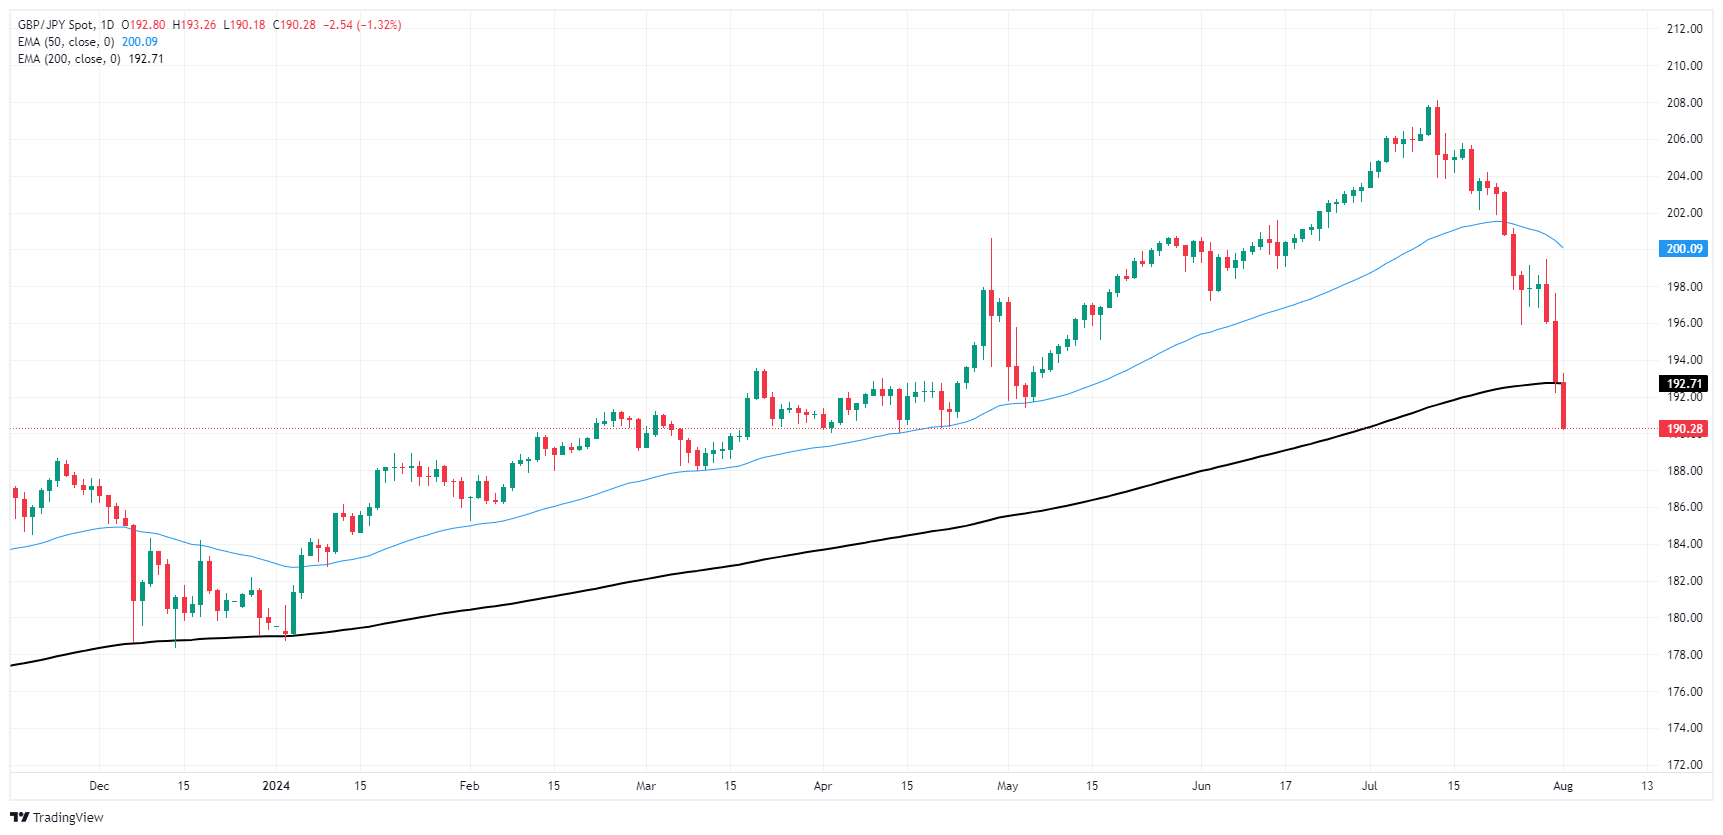
Pound Sterling FAQs
The Pound Sterling (GBP) is the oldest currency in the world (886 AD) and the official currency of the United Kingdom. It is the fourth most traded unit for foreign exchange (FX) in the world, accounting for 12% of all transactions, averaging $630 billion a day, according to 2022 data. Its key trading pairs are GBP/USD, aka ‘Cable’, which accounts for 11% of FX, GBP/JPY, or the ‘Dragon’ as it is known by traders (3%), and EUR/GBP (2%). The Pound Sterling is issued by the Bank of England (BoE).
The single most important factor influencing the value of the Pound Sterling is monetary policy decided by the Bank of England. The BoE bases its decisions on whether it has achieved its primary goal of “price stability” – a steady inflation rate of around 2%. Its primary tool for achieving this is the adjustment of interest rates. When inflation is too high, the BoE will try to rein it in by raising interest rates, making it more expensive for people and businesses to access credit. This is generally positive for GBP, as higher interest rates make the UK a more attractive place for global investors to park their money. When inflation falls too low it is a sign economic growth is slowing. In this scenario, the BoE will consider lowering interest rates to cheapen credit so businesses will borrow more to invest in growth-generating projects.
Data releases gauge the health of the economy and can impact the value of the Pound Sterling. Indicators such as GDP, Manufacturing and Services PMIs, and employment can all influence the direction of the GBP. A strong economy is good for Sterling. Not only does it attract more foreign investment but it may encourage the BoE to put up interest rates, which will directly strengthen GBP. Otherwise, if economic data is weak, the Pound Sterling is likely to fall.
Another significant data release for the Pound Sterling is the Trade Balance. This indicator measures the difference between what a country earns from its exports and what it spends on imports over a given period. If a country produces highly sought-after exports, its currency will benefit purely from the extra demand created from foreign buyers seeking to purchase these goods. Therefore, a positive net Trade Balance strengthens a currency and vice versa for a negative balance.
- The NZD/JPY continues its downward plunge, breaking several significant support levels in the recent sessions.
- The last hope for the pair is that the RSI remains deep in oversold terrain.
In the past trading sessions, the NZD/JPY pair has been moving on a downhill trajectory, now around the 89.00 mark. The pair has consistently posted losses, further highlighting the ongoing bearish impetus. Over the past few weeks, the cross has undergone a fall of over 7%, situating itself further below the crucial 200-day Simple Moving Average (SMA).
While the pair carries on with its steady decline, daily technical indicators hint at oversold conditions. These conditions indicate a potential for an upcoming period of stable trading, despite the continuing descent. The Relative Strength Index (RSI) has been dwelling in the oversold area which might prompt an upward correction to counter the selling pressure. Simultaneously, the Moving Average Convergence Divergence (MACD) continues to present flat red bars, suggesting a pause in the selling onslaught.
NZD/JPY daily chart
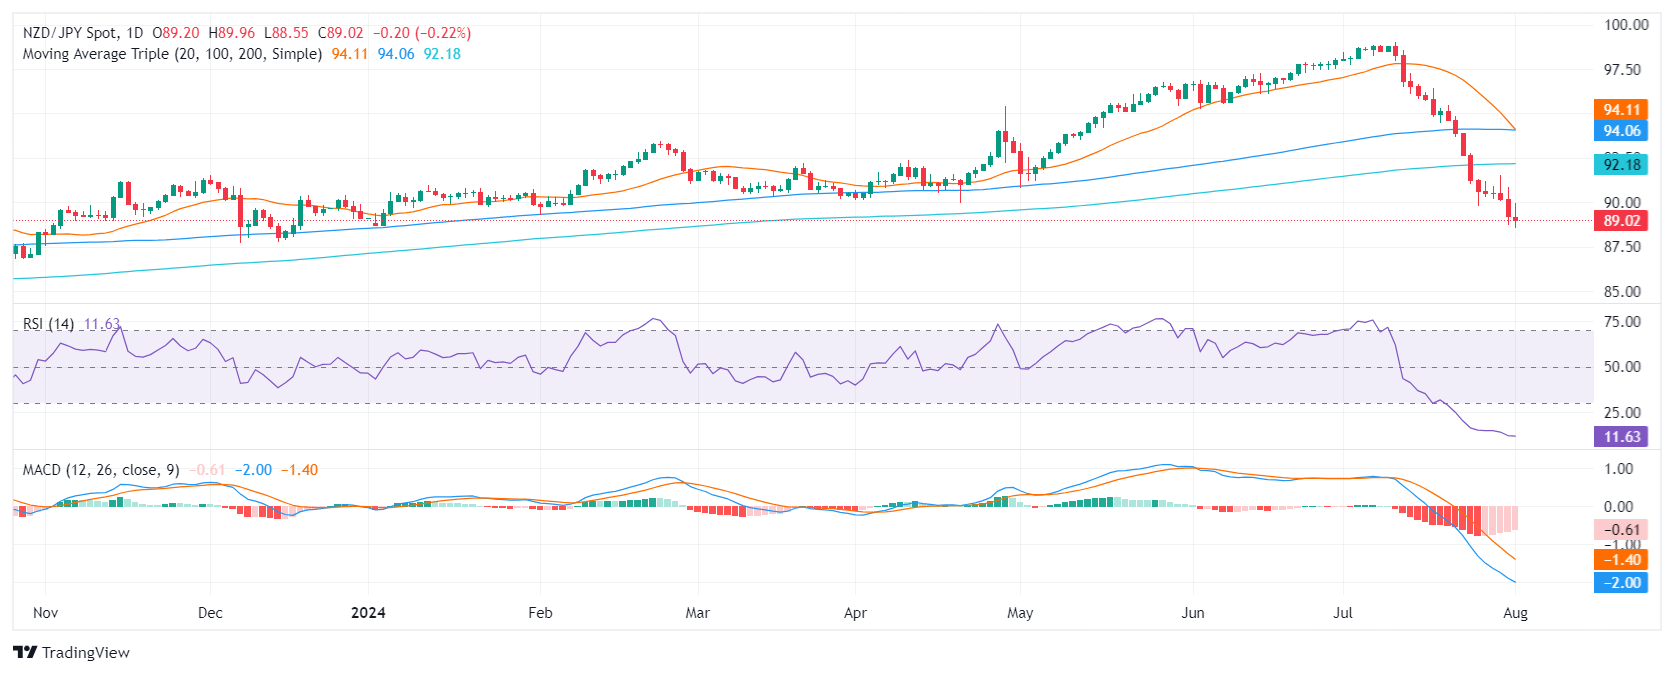
Situated south of 90.00, the pair grapples with the task of maintaining levels set at 88.50, 88.30 and 88.00. Conversely, resistance levels are eyed at 90.000, and 92.00 around the 200-day SMA.
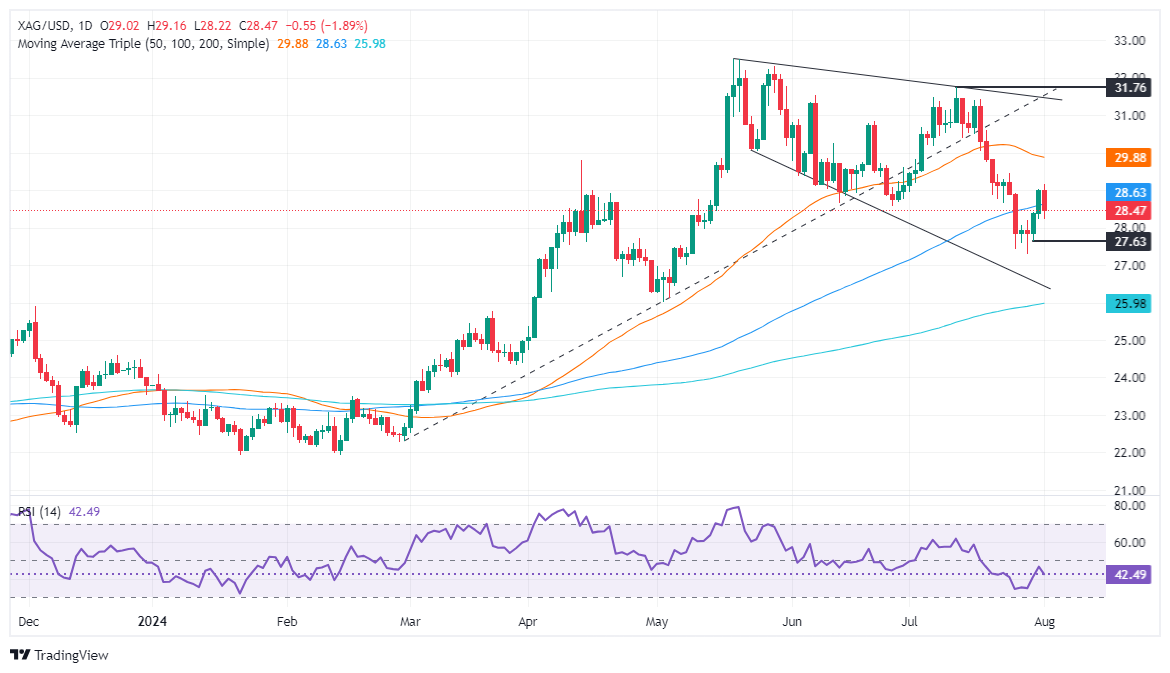
- Silver price loses 2% and falls below 100-DMA at $28.61.
- Failure to close above $29.00 intensifies bearish momentum; next support at $28.00 and July 29 low of $27.31.
- Resistance seen at 50-DMA ($29.86) and psychological level of $30.00 if upward movement resumes.
Silver's price made a U-turn on Thursday and dropped from weekly highs of $29.15 amid growing tensions between Hamas, Hezbollah, and Israel and recessionary woes surrounding the US economy. The XAG/USD trades at $28.37, down over 2%.
XAG/USD Price Analysis: Technical outlook
The precious metal shifted neutrally biased, as prices fell below the 100-day moving average (DMA) at $28.61, signaling bulls' weakness. They failed to achieve a daily close above $29.00, exacerbating a dip to a two-day low of $28.22.
If XAG/USD drops below $28.00, the grey metal will challenge the latest cycle low at $27.31, the July 29 floor level. On further weakness, sellers eye the 200-DMA at $25.98.
On the other hand, if XAG/USD rises past $29.00, the next ceiling level will be the 50-DMA at $29.86, followed by the $30.00 psychological level.
XAG/USD Price Action – Daily Chart
Silver FAQs
Silver is a precious metal highly traded among investors. It has been historically used as a store of value and a medium of exchange. Although less popular than Gold, traders may turn to Silver to diversify their investment portfolio, for its intrinsic value or as a potential hedge during high-inflation periods. Investors can buy physical Silver, in coins or in bars, or trade it through vehicles such as Exchange Traded Funds, which track its price on international markets.
Silver prices can move due to a wide range of factors. Geopolitical instability or fears of a deep recession can make Silver price escalate due to its safe-haven status, although to a lesser extent than Gold's. As a yieldless asset, Silver tends to rise with lower interest rates. Its moves also depend on how the US Dollar (USD) behaves as the asset is priced in dollars (XAG/USD). A strong Dollar tends to keep the price of Silver at bay, whereas a weaker Dollar is likely to propel prices up. Other factors such as investment demand, mining supply – Silver is much more abundant than Gold – and recycling rates can also affect prices.
Silver is widely used in industry, particularly in sectors such as electronics or solar energy, as it has one of the highest electric conductivity of all metals – more than Copper and Gold. A surge in demand can increase prices, while a decline tends to lower them. Dynamics in the US, Chinese and Indian economies can also contribute to price swings: for the US and particularly China, their big industrial sectors use Silver in various processes; in India, consumers’ demand for the precious metal for jewellery also plays a key role in setting prices.
Silver prices tend to follow Gold's moves. When Gold prices rise, Silver typically follows suit, as their status as safe-haven assets is similar. The Gold/Silver ratio, which shows the number of ounces of Silver needed to equal the value of one ounce of Gold, may help to determine the relative valuation between both metals. Some investors may consider a high ratio as an indicator that Silver is undervalued, or Gold is overvalued. On the contrary, a low ratio might suggest that Gold is undervalued relative to Silver.
- Aussie experiences some pressure after mixed Australian CPI figures.
- Traders are keeping vigilance on the upcoming NFP data.
- Markets are backing down on the rate hike hopes of the Reserve Bank of Australia.
The Australian Dollar continues to underperform against the US Dollar (USD), which is making a strong recovery following the Federal Open Market Committee (FOMC) policy decision. Chinese economic woes and cooling rate hike bets on the Reserve Bank of Australia (RBA) also pressure down the Aussie.
That being said the high inflation pressure continues to hold the RBA on the brink of rate cuts. Predictions propose that the RBA will be among the ultimate pockets of G10 countries to administer a rate cut. This foreseeable decision could prevent a further plunge of the Aussie.
Daily digest market movers: Aussie dips ahead of NFPs on Friday
- A consistent 'risk-off' mood pervades the market due to fears about a further deceleration of the Chinese economy, which significantly encumbers Australia's economic strength.
- The Australian Bureau of Statistics (ABS) showed this week that Australia's Q2 headline CPI saw an escalating 1.0% QoQ, with an acceleration to 3.8% YoY from previously being 3.6%. Concurrently, June's headline CPI is expected to have fallen to 3.8% YoY.
- Foreseeing a staunch inflation rate that greatly exceeds the 2-3% target range, the RBA seems to exercise patience with policy adjustments.
- While markets hope for a September cut of the Federal Reserve (Fed), the odds of a hike in Q4 by RBA cooled down due to the economic concerns on China but it is still expected to delay cuts until Q2 from 2024 which might limit the downside for the Aussie.
- For the remaining parts of the Friday session, traders will observe the Nonfarm Payrolls (NFP) report which is scheduled for release and could greatly affect the pair’s rhythm.
AUD/USD Technical Analysis: Bearish tendencies confirmed, room for potential corrections
The AUD/USD trading beneath the 20, 100 and 200-day Simple Moving Average (SMA) solidifies a generally bearish view. The daily Relative Strength Index (RSI) has maintained a position below the 40 mark, implying some overselling activity. The Moving Average Convergence Divergence (MACD) demonstrates flat red bars, indicating slight bearish momentum.
Yet, despite the AUD/USD pair appearing soft, the risk-sensitive Aussie may find support near the 0.6500 psychological mark with resistance standing at a high of 0.6580.
Australian Dollar FAQs
One of the most significant factors for the Australian Dollar (AUD) is the level of interest rates set by the Reserve Bank of Australia (RBA). Because Australia is a resource-rich country another key driver is the price of its biggest export, Iron Ore. The health of the Chinese economy, its largest trading partner, is a factor, as well as inflation in Australia, its growth rate and Trade Balance. Market sentiment – whether investors are taking on more risky assets (risk-on) or seeking safe-havens (risk-off) – is also a factor, with risk-on positive for AUD.
The Reserve Bank of Australia (RBA) influences the Australian Dollar (AUD) by setting the level of interest rates that Australian banks can lend to each other. This influences the level of interest rates in the economy as a whole. The main goal of the RBA is to maintain a stable inflation rate of 2-3% by adjusting interest rates up or down. Relatively high interest rates compared to other major central banks support the AUD, and the opposite for relatively low. The RBA can also use quantitative easing and tightening to influence credit conditions, with the former AUD-negative and the latter AUD-positive.
China is Australia’s largest trading partner so the health of the Chinese economy is a major influence on the value of the Australian Dollar (AUD). When the Chinese economy is doing well it purchases more raw materials, goods and services from Australia, lifting demand for the AUD, and pushing up its value. The opposite is the case when the Chinese economy is not growing as fast as expected. Positive or negative surprises in Chinese growth data, therefore, often have a direct impact on the Australian Dollar and its pairs.
Iron Ore is Australia’s largest export, accounting for $118 billion a year according to data from 2021, with China as its primary destination. The price of Iron Ore, therefore, can be a driver of the Australian Dollar. Generally, if the price of Iron Ore rises, AUD also goes up, as aggregate demand for the currency increases. The opposite is the case if the price of Iron Ore falls. Higher Iron Ore prices also tend to result in a greater likelihood of a positive Trade Balance for Australia, which is also positive of the AUD.
The Trade Balance, which is the difference between what a country earns from its exports versus what it pays for its imports, is another factor that can influence the value of the Australian Dollar. If Australia produces highly sought after exports, then its currency will gain in value purely from the surplus demand created from foreign buyers seeking to purchase its exports versus what it spends to purchase imports. Therefore, a positive net Trade Balance strengthens the AUD, with the opposite effect if the Trade Balance is negative.
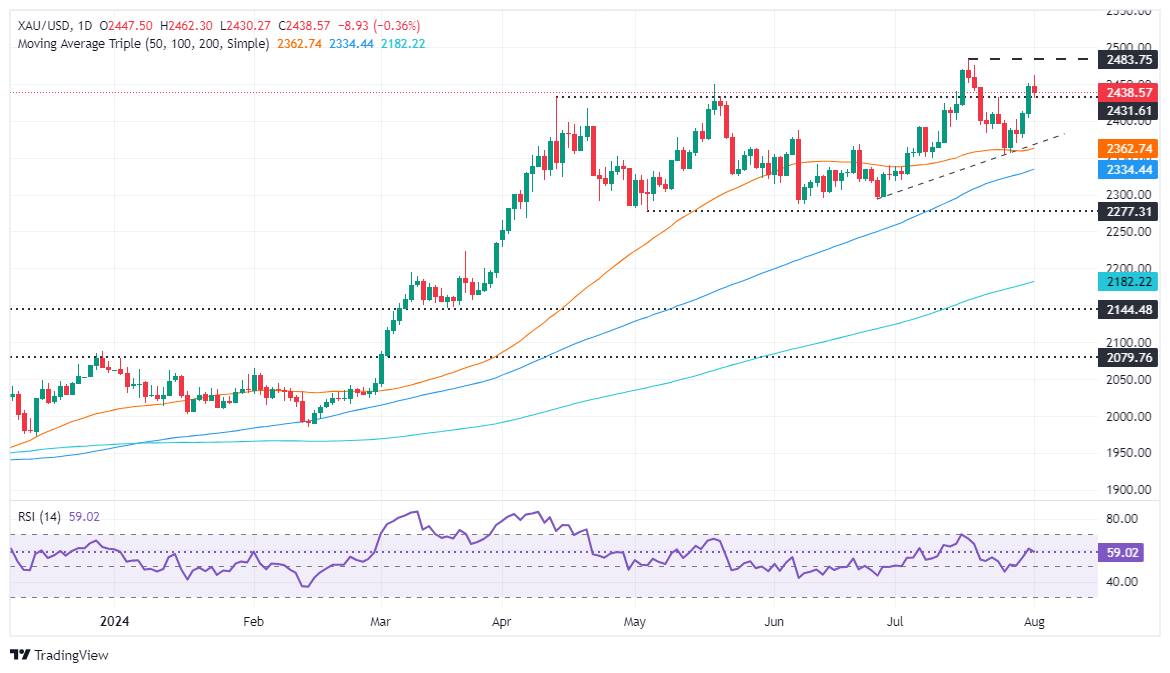
- Gold price falls, after hitting a daily high of $2,462.
- ISM report shows manufacturing activity at recessionary levels, spurring economic fears.
- US jobless claims rise, highlighting labor market weakness; geopolitical tensions in the Middle East add to safe-haven demand for Gold and USD.
Gold price edges lower during the North American session after hitting a daily low and high of $2,430 and $2,462, respectively, amid a stronger US Dollar. The Greenback recovered after data showed that business activity in the manufacturing sector contracted, while US jobs data underscored the weak labor market. At the time of writing, the XAU/USD trades at $2,438, down 0.35%.
The financial markets turned risk-averse following an Institute for Supply Management (ISM) report that underscored that manufacturing activity in July tumbled to recessionary levels and printed its lowest reading since December 2023. This spurred fears that the Federal Reserve is behind the curve and that the economy could be headed instead for a harder landing.
This is reflected by US equities plunging between 1.56% and 3.27% while US Treasury bond yields sink sharply. This bolstered the golden metal and the Greenback, which investors seek due to their safe-haven status.
The US Bureau of Labor Statistics (BLS) revealed that the number of Americans filling for unemployment benefits rose compared to the previous week’s report and exceeded economists' estimates.
The latest round of data justifies lowering interest rates, but Fed officials have remained skeptical about the disinflation process and stated they would like to see more data.
Another reason driving precious metals prices is geopolitical risks. Tensions in the Middle East remain high after Hezbollah’s attacks on Israel over the weekend and the retaliation of the latter, which killed senior Hamas and Hezbollah officials.
Ahead of the week, Friday’s July Nonfarm Payrolls report will be a crucial piece of the puzzle as the Fed pivots toward becoming more concerned about employment. At the time of writing, market participants had priced 80 basis points (bps) of easing toward the end of 2024.
Daily digest market movers: Gold price drops amid recession fears
- The Federal Reserve decided to hold rates unchanged but indicated that favorable data on inflation and further weakening in the labor market could prompt action.
- US Initial Jobless Claims for the week ending July 27 jumped to 248K, above estimates of 236K and the prior week’s 235K.
- The Institute for Supply Management (ISM) Manufacturing PMI for July fell deeper into contractionary territory from 48.5 to 46.8 and missed estimates for an expansion to 48.8, marking the lowest reading since December 2023.
- The CME FedWatch tool shows that the central bank will reduce interest rates by 25 basis points (bps) from their current levels in the September meeting.
Technical analysis: Gold price trips down below $2,450
Gold price uptrend remains intact, yet buyers face stir resistance around weekly highs, which could pave the way for a pullback. Buying momentum has faded, as depicted by the Relative Strength Index (RSI), aiming lower, opening the door for correction.
If XAU/USD slides below $2,400, that could exacerbate a drop to the July 30 low of $2,376. A further downside is seen if traders clear the 50-day Simple Moving Average (SMA) at $2,362, followed by the 100-day SMA at $2,334.
On the other hand, if XAU/USD climbs past $2,450 and challenges the daily top at $2,462, the all-time high (ATH) at $2,483 is up next, followed by the psychological $2,500 mark
Gold FAQs
Gold has played a key role in human’s history as it has been widely used as a store of value and medium of exchange. Currently, apart from its shine and usage for jewelry, the precious metal is widely seen as a safe-haven asset, meaning that it is considered a good investment during turbulent times. Gold is also widely seen as a hedge against inflation and against depreciating currencies as it doesn’t rely on any specific issuer or government.
Central banks are the biggest Gold holders. In their aim to support their currencies in turbulent times, central banks tend to diversify their reserves and buy Gold to improve the perceived strength of the economy and the currency. High Gold reserves can be a source of trust for a country’s solvency. Central banks added 1,136 tonnes of Gold worth around $70 billion to their reserves in 2022, according to data from the World Gold Council. This is the highest yearly purchase since records began. Central banks from emerging economies such as China, India and Turkey are quickly increasing their Gold reserves.
Gold has an inverse correlation with the US Dollar and US Treasuries, which are both major reserve and safe-haven assets. When the Dollar depreciates, Gold tends to rise, enabling investors and central banks to diversify their assets in turbulent times. Gold is also inversely correlated with risk assets. A rally in the stock market tends to weaken Gold price, while sell-offs in riskier markets tend to favor the precious metal.
The price can move due to a wide range of factors. Geopolitical instability or fears of a deep recession can quickly make Gold price escalate due to its safe-haven status. As a yield-less asset, Gold tends to rise with lower interest rates, while higher cost of money usually weighs down on the yellow metal. Still, most moves depend on how the US Dollar (USD) behaves as the asset is priced in dollars (XAU/USD). A strong Dollar tends to keep the price of Gold controlled, whereas a weaker Dollar is likely to push Gold prices up.
The Greenback managed to shrug off part of the post-Fed retracement and advanced markedly in a context dominated by the risk-off sentiment. Around central banks, the BoE delivered a cautious 25 bps rate cut, although it warned against the view of successive reductions.
Here is what you need to know on Friday, August 2:
The USD Index (DXY) was the sole winner amidst the generalized risk aversion scenario, which saw yields head further south and a sharp sell-off in equities. On August 2, Nonfarm Payrolls take centre stage seconded by the Unemployment Rate and Factory Orders.
EUR/USD resumed its decline and returned to the sub-1.0800 region on the back of the generalized risk aversion sentiment. There are no data releases scheduled in the euro zone on August 2.
GBP/USD suffered the strong pick-up in the Greenback and retreated to four-week lows despite the cautious rate cut by the BoE. On August 2, the BoE’s Chief Economist H. Pill is due to speak.
A volatile session left USD/JPY lingering around the 150.00 neighbourhood amidst the risk-off trade and declining US and Japanese yields. The Japanese calendar is empty on August 2.
There seems to be no respite for the rout in AUD/USD, which sharply reversed Wednesday’s bullish attempt and refocused on the 0.6500 region once again. Home Loans and Investment Lending for Homes are expected in Oz on August 2 along with Producer Prices in Q2.
WTI prices partially faded Wednesday’s strong uptick on the back of US recession concerns and the stronger US Dollar. The commodity revisited the $77.00 mark per barrel following tops near the $79.00 region.
Gold prices could not sustain the initial bullish attempt to the $2,460 area per ounce troy and eventually printed modest losses near $2,440. Silver sold off to the $28.00 area per ounce after two daily advances in a row.
- Dow Jones tumbled after a misfire in US PMI activity figures on Thursday.
- Concerns of a steepening economic downturn crimped risk appetite.
- Markets struggling to balance hope for rate cuts with economic realities.
The Dow Jones Industrial Average (DJIA) tumbled 600 points on Thursday after worsening economic activity figures reminded markets of the very real risk that a downturn in the US economy could tip into a hard landing scenario. Near-term gains sparked by rising hopes for interest rate cuts were wiped out as investors struggle to balance their hopes for soft data to spark a new rate cutting cycle from the Federal Reserve (Fed) and the fact that those same soft figures could spark a full-blown recession, rendering rate cuts a moot point.
US Initial Jobless Claims for the week ended July 26 rose to 249K from the previous week’s 235K, lurching past the forecast uptick to 236K. July’s US ISM Manufacturing Purchasing Managers Index (PMI) tumbled to an eight-month low of 46.8 compared to the previous 48.5 and entirely reversing the forecast move up to 48.8.
On the other side of the same coin, ISM Manufacturing Prices Paid in July accelerated to 52.9 versus the previous 52.9 compared to the forecast 48.8 as input prices for manufacturers continue to drift higher than markets anticipated even as activity declines.
Friday’s US Nonfarm Payrolls (NFP) will be a key data point for markets to wrap up the trading week. July’s NFP labor print is expected to ease to 175K from the previous 206K, and Average Hourly Earnings are expected to hold steady at 0.3% MoM.
Markets are struggling to balance on the edge of a very sharp knife as a downturn in economic figures is helping to pin rate cut expectations even further into the ceiling. According to the CME’s FedWatch Tool, rate traders are pricing in 100% odds of at least a quarter-point rate cut from the Fed on September 18, with further one-in-five odds of a double-cut for 50 basis points. On the downside, too much of a downturn will obliterate market sentiment as a hard landing economic scenario for the US economy makes any rate cuts from the Fed irrelevant, and investors are strung along a difficult middle ground where they hope for rate cuts on soft data, but not so soft that the US economy rolls over.
Dow Jones news
Four-fifths of the securities listed on the Dow Jones equity index are in the red on Thursday as investor sentiment sours. Boeing Co. (BA) tumbled -5.8% and fell below $180.00 per share on the day, extending Wednesday’s declines after the aviation company reported a net loss $1.4 billion in the second quarter, and the in-turmoil plane builder is struggling to find its feet after named a new CEO to helm the floundering company whose books are buckling under the weight of half a decade of financial losses.
Dow Jones technical outlook
The Dow Jones is struggling to find a foothold amid steep selling pressure on Thursday, falling from 41,080.00 to 40,200.00, declining -2.56% peak-to-trough from Wednesday’s late peak near 41,200.00 and shedding over 600 points.
Despite near-term downside pressure, the major equity index is still trading deep in bull country, holding north of the 50-day Exponential Moving Average (EMA) at 39,682.22. The Dow Jones has traded above the 200-day EMA in a no-touch extended rally since crossing above the long-term average in November of last year.
Dow Jones daily chart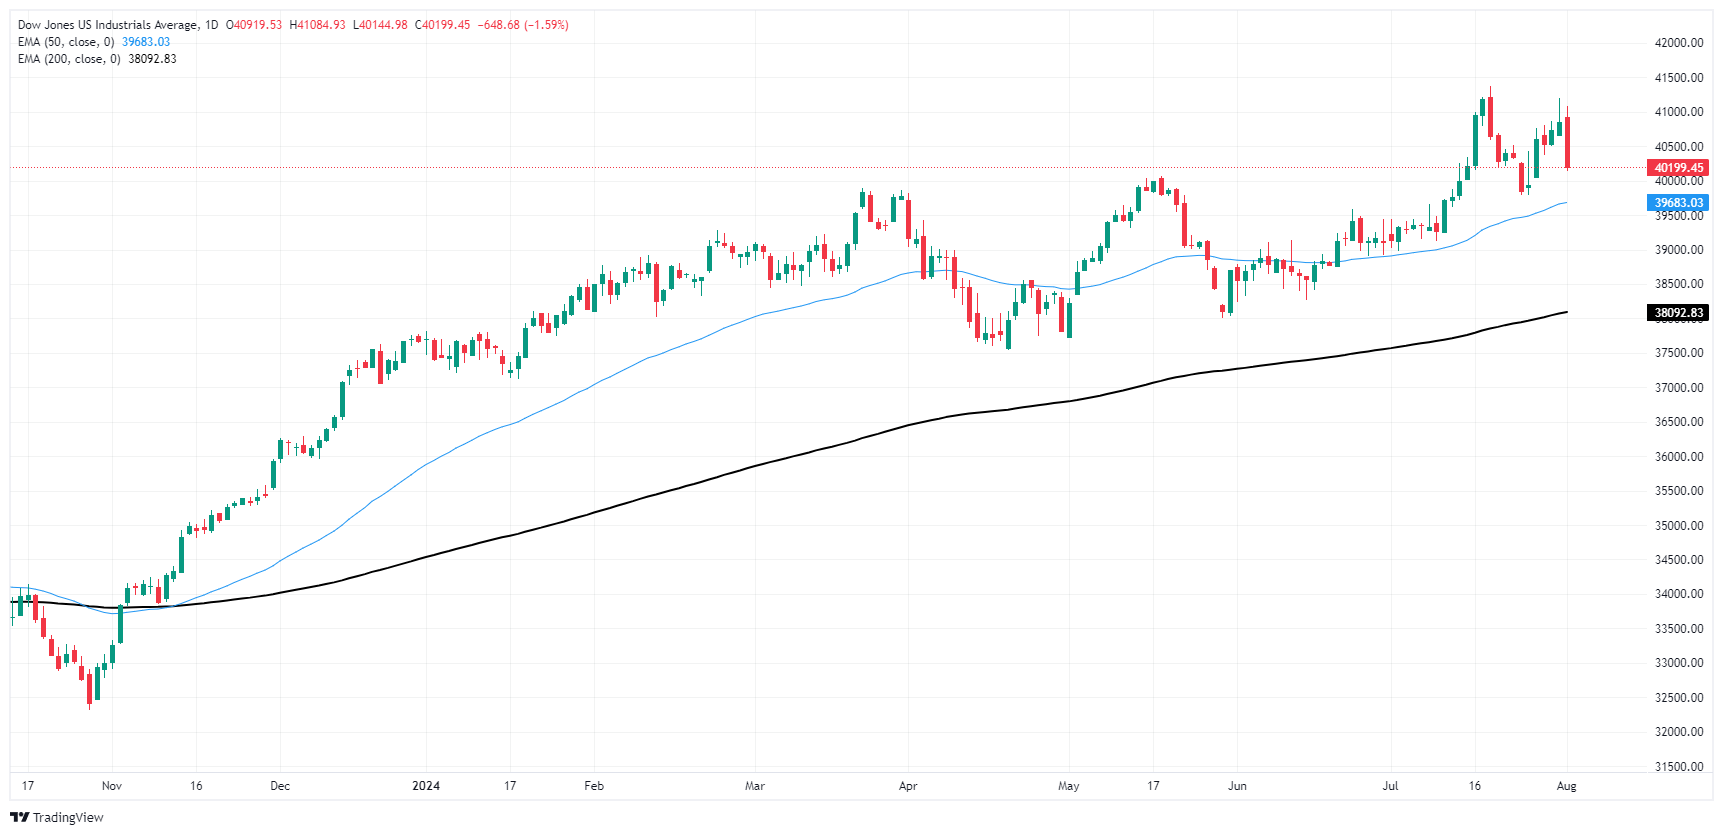
Dow Jones FAQs
The Dow Jones Industrial Average, one of the oldest stock market indices in the world, is compiled of the 30 most traded stocks in the US. The index is price-weighted rather than weighted by capitalization. It is calculated by summing the prices of the constituent stocks and dividing them by a factor, currently 0.152. The index was founded by Charles Dow, who also founded the Wall Street Journal. In later years it has been criticized for not being broadly representative enough because it only tracks 30 conglomerates, unlike broader indices such as the S&P 500.
Many different factors drive the Dow Jones Industrial Average (DJIA). The aggregate performance of the component companies revealed in quarterly company earnings reports is the main one. US and global macroeconomic data also contributes as it impacts on investor sentiment. The level of interest rates, set by the Federal Reserve (Fed), also influences the DJIA as it affects the cost of credit, on which many corporations are heavily reliant. Therefore, inflation can be a major driver as well as other metrics which impact the Fed decisions.
Dow Theory is a method for identifying the primary trend of the stock market developed by Charles Dow. A key step is to compare the direction of the Dow Jones Industrial Average (DJIA) and the Dow Jones Transportation Average (DJTA) and only follow trends where both are moving in the same direction. Volume is a confirmatory criteria. The theory uses elements of peak and trough analysis. Dow’s theory posits three trend phases: accumulation, when smart money starts buying or selling; public participation, when the wider public joins in; and distribution, when the smart money exits.
There are a number of ways to trade the DJIA. One is to use ETFs which allow investors to trade the DJIA as a single security, rather than having to buy shares in all 30 constituent companies. A leading example is the SPDR Dow Jones Industrial Average ETF (DIA). DJIA futures contracts enable traders to speculate on the future value of the index and Options provide the right, but not the obligation, to buy or sell the index at a predetermined price in the future. Mutual funds enable investors to buy a share of a diversified portfolio of DJIA stocks thus providing exposure to the overall index.
- The Canadian Dollar stumbled against the Greenback on Thursday.
- Canada and US PMIs gave a soft print in July.
- US NFP looms large on Friday, markets hoping for continued softening.
The Canadian Dollar (CAD) tripped and fell against the US Dollar (USD) on Thursday after a misprint in Purchasing Managers Index (PMI) figures flashed warning signs of lurking recession risk in the data, sparking a fresh round of risk-off market sentiment. Market flows reversed direction as investors pulled out of alpha-seeking instruments and piled into safe-haven assets like the Greenback.
Canada will fall by the wayside as economic data remains limited until next week’s Canadian labor figures, and markets will be entirely focused on this Friday’s upcoming US Nonfarm Payrolls (NFP).
Markets continue to walk along an incredibly sharp knife edge of hoping for bad economic data that will kick off a rate-cutting cycle from the Federal Reserve (Fed), but not so bad that a broad economic slowdown might render rate cuts pointless.
Daily digest market movers: Canadian Dollar loses market focus as US data dominates
- July’s Canadian S&P Global Manufacturing PMI tumbled to a seven-month low of 47.8 from the previous 49.3 as Canadian manufacturing activity continues to decline.
- The US ISM Manufacturing PMI for the same period also declined to an eight-month low of 46.8 from the previous 48.5, entirely missing the forecast uptick to 48.8 and reigniting concerns of a “hard landing” economic scenario.
- US ISM Manufacturing Prices Paid also accelerated again in July, rising to 52.9 from the previous 52.1 and reversing the forecast move down to 51.8 as inflationary pressures at the front end of the input cycle continue to churn.
- US Initial Jobless Claims also rose more than expected for the week ended July 26, rising to 249K week-on-week compared to the previous 235K, accelerating past the forecast 236K.
- Friday’s US NFP labor data dump is expected to show another slowing in US hiring, with net job gains forecast to print at 175K compared to the previous 206K.
Canadian Dollar PRICE Today
The table below shows the percentage change of Canadian Dollar (CAD) against listed major currencies today. Canadian Dollar was the strongest against the British Pound.
| USD | EUR | GBP | JPY | CAD | AUD | NZD | CHF | |
|---|---|---|---|---|---|---|---|---|
| USD | 0.38% | 0.77% | -0.04% | 0.34% | 0.46% | -0.10% | -0.49% | |
| EUR | -0.38% | 0.39% | -0.44% | -0.05% | 0.09% | -0.48% | -0.87% | |
| GBP | -0.77% | -0.39% | -0.82% | -0.43% | -0.29% | -0.86% | -1.25% | |
| JPY | 0.04% | 0.44% | 0.82% | 0.38% | 0.51% | -0.11% | -0.48% | |
| CAD | -0.34% | 0.05% | 0.43% | -0.38% | 0.14% | -0.44% | -0.83% | |
| AUD | -0.46% | -0.09% | 0.29% | -0.51% | -0.14% | -0.57% | -0.96% | |
| NZD | 0.10% | 0.48% | 0.86% | 0.11% | 0.44% | 0.57% | -0.39% | |
| CHF | 0.49% | 0.87% | 1.25% | 0.48% | 0.83% | 0.96% | 0.39% |
The heat map shows percentage changes of major currencies against each other. The base currency is picked from the left column, while the quote currency is picked from the top row. For example, if you pick the Canadian Dollar from the left column and move along the horizontal line to the US Dollar, the percentage change displayed in the box will represent CAD (base)/USD (quote).
Technical analysis: USD/CAD rises back into 1.3850 in near-term risk-off bid
The Canadian Dollar (CAD) is broadly lower on Thursday, finding thin gains against the Pound Sterling (GBP) and the Australian Dollar (AUD), but shedding weight against the US Dollar and the Japanese Yen (JPY). The CAD is down around one-third of one percent against the Greenback and the Yen, while gaining roughly four-tenths of one percent against the weakening GBP.
The Canadian Dollar’s reprieve from topside US Dollar pressure is set to be a brief one as USD/CAD bids resume a steady push into the high side. The pair is testing back into the 1.3850 region after a mid-week dip below 1.3800. USD/CAD is testing close to 2024’s high bids, set at 1.3865. Continued bullish pressure will set the pair up for a fresh challenge of last October’s swing high into the 1.3900 handle.
USD/CAD daily chart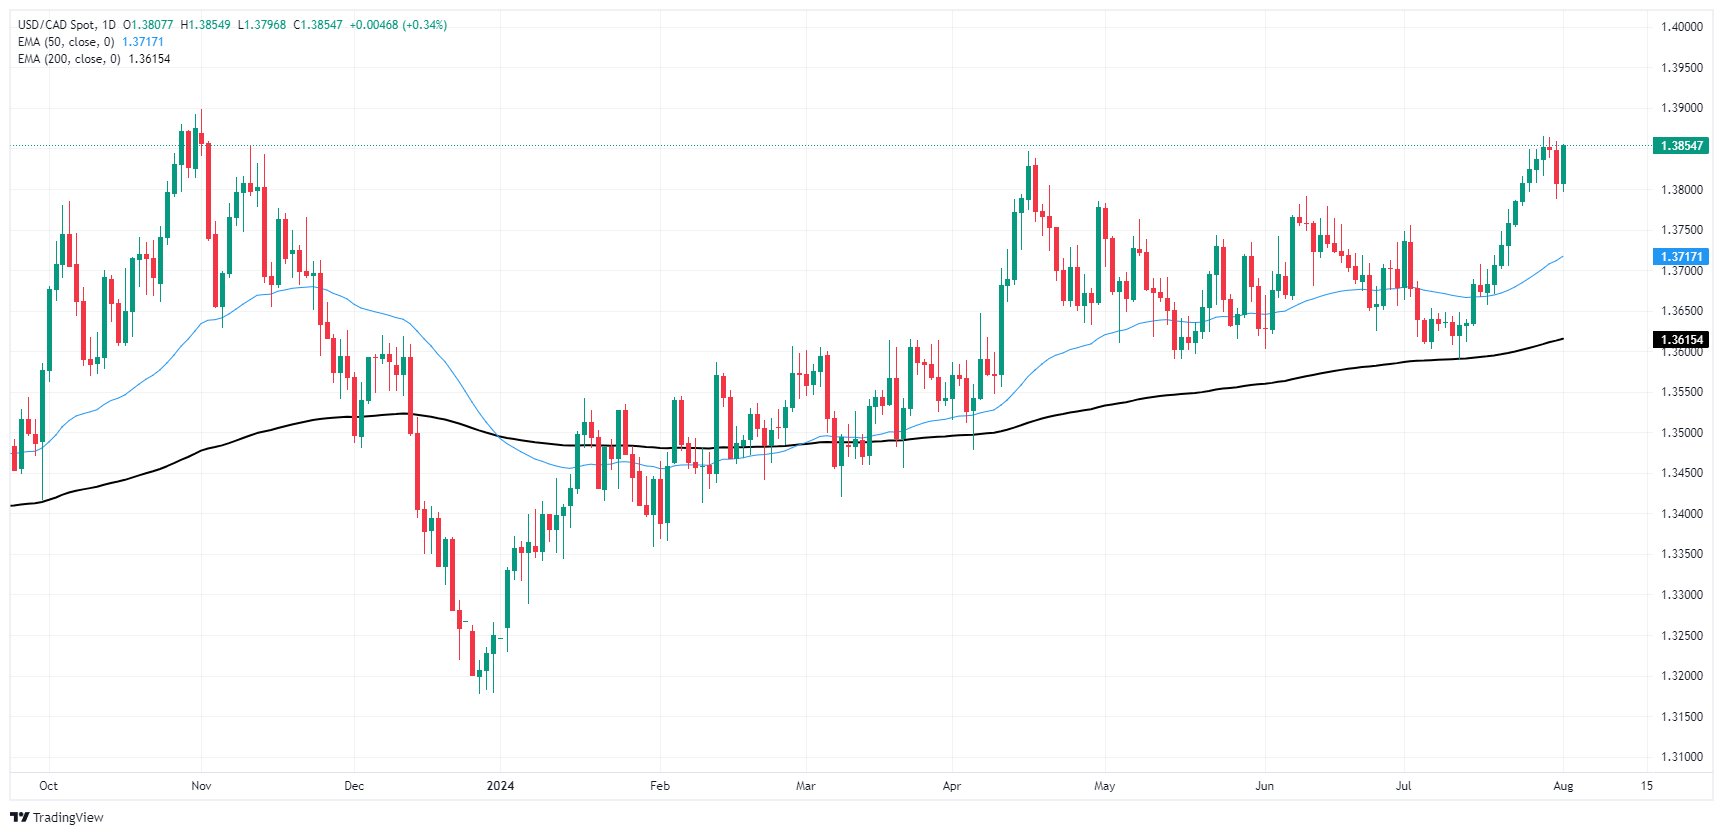
Canadian Dollar FAQs
The key factors driving the Canadian Dollar (CAD) are the level of interest rates set by the Bank of Canada (BoC), the price of Oil, Canada’s largest export, the health of its economy, inflation and the Trade Balance, which is the difference between the value of Canada’s exports versus its imports. Other factors include market sentiment – whether investors are taking on more risky assets (risk-on) or seeking safe-havens (risk-off) – with risk-on being CAD-positive. As its largest trading partner, the health of the US economy is also a key factor influencing the Canadian Dollar.
The Bank of Canada (BoC) has a significant influence on the Canadian Dollar by setting the level of interest rates that banks can lend to one another. This influences the level of interest rates for everyone. The main goal of the BoC is to maintain inflation at 1-3% by adjusting interest rates up or down. Relatively higher interest rates tend to be positive for the CAD. The Bank of Canada can also use quantitative easing and tightening to influence credit conditions, with the former CAD-negative and the latter CAD-positive.
The price of Oil is a key factor impacting the value of the Canadian Dollar. Petroleum is Canada’s biggest export, so Oil price tends to have an immediate impact on the CAD value. Generally, if Oil price rises CAD also goes up, as aggregate demand for the currency increases. The opposite is the case if the price of Oil falls. Higher Oil prices also tend to result in a greater likelihood of a positive Trade Balance, which is also supportive of the CAD.
While inflation had always traditionally been thought of as a negative factor for a currency since it lowers the value of money, the opposite has actually been the case in modern times with the relaxation of cross-border capital controls. Higher inflation tends to lead central banks to put up interest rates which attracts more capital inflows from global investors seeking a lucrative place to keep their money. This increases demand for the local currency, which in Canada’s case is the Canadian Dollar.
Macroeconomic data releases gauge the health of the economy and can have an impact on the Canadian Dollar. Indicators such as GDP, Manufacturing and Services PMIs, employment, and consumer sentiment surveys can all influence the direction of the CAD. A strong economy is good for the Canadian Dollar. Not only does it attract more foreign investment but it may encourage the Bank of Canada to put up interest rates, leading to a stronger currency. If economic data is weak, however, the CAD is likely to fall.
- The US Dollar strengthens post-FOMC decision with market participants setting their sights on Friday's Nonfarm Payrolls data.
- In spite of signs of disinflation, the US economic landscape remains strong, prompting the Fed to maintain a data-dependent stance.
- Chair Powell commented that the bank will cut in case data continues showing progress.
On Thursday, the US Dollar, as assessed by the DXY index, saw a rebound following the Federal Reserve’s (Fed) session on Wednesday. Despite the increased chances for a cut in September, the solid status of the US economy led to demands for more data by Chair Jerome Powell before proceeding with the cut, which slightly reduced the odds of a cut in September though they still remain high.
The initial signs of disinflation are beginning to surface in the US economic outlook, further strengthening the market's expectations for a September rate cut. Nevertheless, the broader economy is still exhibiting robustness as supported mainly by economic activity indicators.
Daily digest market movers: US Dollar recovers as markets asses fresh data
- On Thursday, data showed that the US manufacturing sector showed continued contraction with a mounting pace in July, as indicated by the ISM Manufacturing PMI dropping to 46.8 from June's 48.5.
- This fell below market expectations of 48.8. Also, the Employment Index of the PMI survey witnessed a sharp decline to 43.4 from June's 49.3.1.
- The New Orders Index also fell to 47.4 from 49.3. However, the Prices Paid Index, which measures inflation, saw a slight increase to 52.9 from June's 52.1.
- Moreover, US citizens applying for unemployment benefits saw a rise of 249K in the week ending July 27, according to the US Department of Labor (DoL) on Thursday. These readings surpassed the initial market consensus of 236K, and were higher than last week's gain of 235K.
- Key Nonfarm Payrolls data will be released on Friday, which will ultimately determine the market's position in relation to the Fed's decision in September.
DXY technical outlook: Index outlook hinges on NFPs on Friday as there is no clear dominant party
Following the Fed decision, the index sprang back above the 20-day SMA and it appears that buyers will labor to keep this level throughout the remaining session. The DXY continues to have support at 104.15 and 104.00, while resistance levels are found at 104.50 and 105.00.
Indicators in the meantime are pointing north with the Relative Strength Index (RSI) and the Moving Average Convergence Divergence (MACD) showing a growing momentum for the buyers but it is still in a negative zone.
US Dollar FAQs
The US Dollar (USD) is the official currency of the United States of America, and the ‘de facto’ currency of a significant number of other countries where it is found in circulation alongside local notes. It is the most heavily traded currency in the world, accounting for over 88% of all global foreign exchange turnover, or an average of $6.6 trillion in transactions per day, according to data from 2022. Following the second world war, the USD took over from the British Pound as the world’s reserve currency. For most of its history, the US Dollar was backed by Gold, until the Bretton Woods Agreement in 1971 when the Gold Standard went away.
The most important single factor impacting on the value of the US Dollar is monetary policy, which is shaped by the Federal Reserve (Fed). The Fed has two mandates: to achieve price stability (control inflation) and foster full employment. Its primary tool to achieve these two goals is by adjusting interest rates. When prices are rising too quickly and inflation is above the Fed’s 2% target, the Fed will raise rates, which helps the USD value. When inflation falls below 2% or the Unemployment Rate is too high, the Fed may lower interest rates, which weighs on the Greenback.
In extreme situations, the Federal Reserve can also print more Dollars and enact quantitative easing (QE). QE is the process by which the Fed substantially increases the flow of credit in a stuck financial system. It is a non-standard policy measure used when credit has dried up because banks will not lend to each other (out of the fear of counterparty default). It is a last resort when simply lowering interest rates is unlikely to achieve the necessary result. It was the Fed’s weapon of choice to combat the credit crunch that occurred during the Great Financial Crisis in 2008. It involves the Fed printing more Dollars and using them to buy US government bonds predominantly from financial institutions. QE usually leads to a weaker US Dollar.
Quantitative tightening (QT) is the reverse process whereby the Federal Reserve stops buying bonds from financial institutions and does not reinvest the principal from the bonds it holds maturing in new purchases. It is usually positive for the US Dollar.
- Mexican Peso depreciates over 0.10% after printing solid gains.
- Mexico's economic data shows unchanged business confidence and contraction in manufacturing activity.
- Fed hints at possible rate cut in September, driving traders to the safety of the USD.
The Mexican Peso erases earlier gains and slumps against the US Dollar, extending its weekly losses after the US Federal Reserve (Fed) kept interest rates unchanged and opened the door for a possible cut at the upcoming September meeting. This underpinned the Peso, which strengthened to a high of 18.42 before erasing those gains, as the USD/MXN trades at 18.63, up 0.11%.
Risk aversion keeps Wall Street trading with losses, undermining high-beta currencies like the Mexican Peso. Traders flock to the safety of the Greenback, although US Treasury bond yields plunge following Wednesday’s Fed decision.
Mexico’s economic docket revealed that Business Confidence in July was unchanged compared to June’s data, while a measure of business activity revealed by S&P Global, showed that manufacturing activity contracted for the first time since September 2023.
In the meantime, US data provides the Fed with the tools needed to lower borrowing costs after Wednesday's decision. The Federal Open Market Committee (FOMC) stated that it wouldn’t be “appropriate to reduce the target range until it has gained greater confidence” in the disinflation process, attaining the 2% goal.
Even though that was “hawkish,” Fed Chairman Jerome Powell said that if the labor market weakens substantially, “we should respond.” This was in response to a question about a September rate cut, which he said if data evolves as of late, easing in September would be “on the table.”
Following these remarks, the US Initial Jobless Claims report, which was revealed earlier, points out further weakness in the jobs market, as the number of Americans applying for unemployment benefits rose.
Other data showed that manufacturing activity weakened, spurring fears that the economy might slow down sharply than expected.
Due to these remarks, Friday’s Nonfarm Payrolls report for July would be a crucial piece of the puzzle as the Fed pivoted towards becoming slightly concerned about employment.
Following Powell’s remarks, market participants had priced in three 75 bps of interest rate cuts toward the end of the year.
Daily digest market movers: Mexican Peso depreciates as manufacturing activity contracts
- Mexico’s S&P Global Manufacturing PMI for July contracted to 49.60, below June’s 51.10 expansion, underscoring the economy’s undergoing a slowdown.
- July’s Business Confidence was unchanged at 52.9.
- Mexico's Gross Domestic Product (GDP) for Q2 rose 0.2% QoQ, below estimates of 0.4% and a 0.3% increase in Q1. On an annual basis, GDP for Q2 2024 grew 2.2% YoY on its preliminary reading, above estimates of 2% and the previous quarter's 1.6% expansion.
- The Federal Reserve decided to hold rates unchanged yet commented that goodish data regarding inflation and further weakening in the labor market could be the triggers for action.
- US Initial Jobless Claims for the week ending July 27 rose 248K, exceeding estimates of 236K and the prior week’s 235K.
- The Institute for Supply Management (ISM) Manufacturing PMI for July plunged from 48.5 to 46.8, below estimates for an expansion of 48.8 and is the lowest reading since December 2023.
- Today’s jobless claims data and Wednesday’s ADP Employment Change in July missing the market could be a prelude to Friday’s Nonfarm Payrolls. Estimates suggest the US economy added 175K employees to the workforce, below June’s 206K.
- Data from the Chicago Board of Trade (CBOT) shows that the December 2024 fed funds rates futures contract suggests that policymakers will ease policy at least 80 basis points.
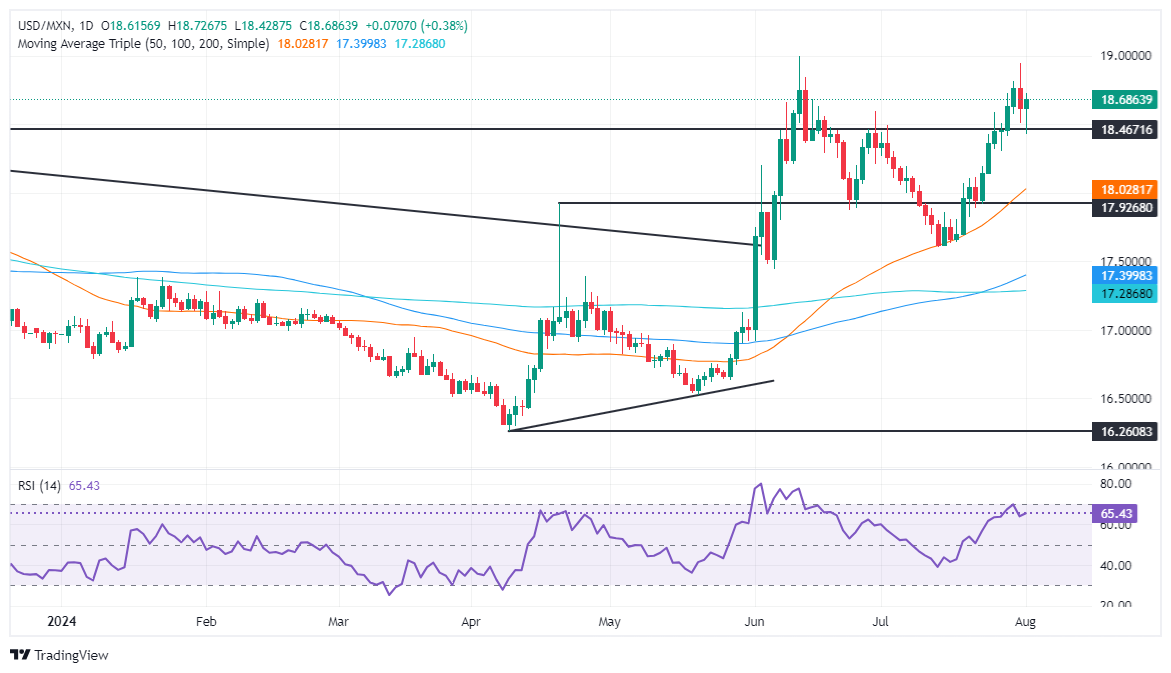
Technical analysis: Mexican Peso retreats as USD/MXN rises above 18.60
The USD/MXN climbed after falling to the 18.40 area, yet it’s recovering, with traders eyeing the 18.75 area following Wednesday’s losses. Momentum favors buyers, which, according to the Relative Strength Index (RSI), took a breather as the RSI pierced oversold levels.
For a bullish continuation, the USD/MXN must challenge the year-to-date (YTD) high at 18.99, followed by the psychological 19.00 mark. Further upside is seen at the March 20, 2023, high of 19.23, ahead of 19.50.
On the bearish side, a drop below 18.50, could sponsor a test of the psychological 18.00 mark, followed by the 50-day Simple Moving Average (SMA) at 17.97.
Mexican Peso FAQs
The Mexican Peso (MXN) is the most traded currency among its Latin American peers. Its value is broadly determined by the performance of the Mexican economy, the country’s central bank’s policy, the amount of foreign investment in the country and even the levels of remittances sent by Mexicans who live abroad, particularly in the United States. Geopolitical trends can also move MXN: for example, the process of nearshoring – or the decision by some firms to relocate manufacturing capacity and supply chains closer to their home countries – is also seen as a catalyst for the Mexican currency as the country is considered a key manufacturing hub in the American continent. Another catalyst for MXN is Oil prices as Mexico is a key exporter of the commodity.
The main objective of Mexico’s central bank, also known as Banxico, is to maintain inflation at low and stable levels (at or close to its target of 3%, the midpoint in a tolerance band of between 2% and 4%). To this end, the bank sets an appropriate level of interest rates. When inflation is too high, Banxico will attempt to tame it by raising interest rates, making it more expensive for households and businesses to borrow money, thus cooling demand and the overall economy. Higher interest rates are generally positive for the Mexican Peso (MXN) as they lead to higher yields, making the country a more attractive place for investors. On the contrary, lower interest rates tend to weaken MXN.
Macroeconomic data releases are key to assess the state of the economy and can have an impact on the Mexican Peso (MXN) valuation. A strong Mexican economy, based on high economic growth, low unemployment and high confidence is good for MXN. Not only does it attract more foreign investment but it may encourage the Bank of Mexico (Banxico) to increase interest rates, particularly if this strength comes together with elevated inflation. However, if economic data is weak, MXN is likely to depreciate.
As an emerging-market currency, the Mexican Peso (MXN) tends to strive during risk-on periods, or when investors perceive that broader market risks are low and thus are eager to engage with investments that carry a higher risk. Conversely, MXN tends to weaken at times of market turbulence or economic uncertainty as investors tend to sell higher-risk assets and flee to the more-stable safe havens.
Energy markets are not pricing in a significant rise in supply risk premia, TDS commodity strategist Daniel Ghali notes.
A marginal rise in energy supply risk premia
“Our analysis of the cross-section of commodities returns reveals that the rally in crude oil prices is largely consistent with that of the complex, uncovering only a marginal rise in energy supply risk premia.”
“This reinforces our view that recent price action is associated with global macro flows as opposed to idiosyncratic pricing in commodity markets, which ultimately create additional vulnerabilities for prices.”
“Still, momentum associated with geopolitical events may be exacerbated by algo flows in the coming sessions.”
The entire commodities complex has notably rallied as the conflict in the Middle East comes to a boil, TDS commodity strategist Daniel Ghali notes.
Downside asymmetries in positioning risks remain significant
“The entire commodities complex has notably rallied as the conflict in the Middle East comes to a boil, but this price action may actually be underscored by a reversal in demand expectations embedded within commodities prices associated.”
“Under the hood, however, the underlying macro force behind this reversal appears to be associated with global macro flows, in particular the fierce price action in global bond markets and the broad USD weakness associated with a firming JPY.”
“While this has raised the bar for natural outflows from CTA trend followers in the base metals complex, downside asymmetries in positioning risks remain significant across Copper & Zinc markets.”
Geopolitical risks have sparked renewed demand for safe-havens, but the rally in Gold prices is now largely underpinned by the weakness in USD, TDS commodity strategist Daniel Ghali notes.
Asia remains on a buyer's strike
“Geopolitical risks have sparked renewed demand for safe-havens, but barring further escalations, the rally in Gold prices is now largely underpinned by the weakness in USD, associated with the strength in Asian currencies, and the strong bid in bond markets, rather than by demand for Gold itself. Under the hood, this actually points to a less favorable backdrop for Gold flows.”
“Any sign of geopolitical de-escalation in the Middle East risks inflicting significant damage to Gold bulls, with a reversal in safe-haven flows potentially forcing discretionary money managers to liquidate their bloated positions, which could in turn catalyze subsequent selling activity at a large-scale from CTA trend followers should prices revisit the $2400/oz mark in active futures.”
“Strength in Asian currencies is actually destroying demand for precious metals as a currency depreciation hedge in the region, which has been a key driving force of the latest run to new all-time-highs. Asia remains on a buyer's strike, with no sign of a resurgence in the macro drivers that had sparked their seemingly insatiable appetite for the yellow metal in the first place.”
The Bank of England’s (BoE) decision to cut its policy rate by 25bp to 5.00% was a close call, Rabobank’s senior macro strategist Stefan Koopman notes.
No rapid succession of cuts
“BoE’s decision to cut its policy rate by 25bp to 5.00% was a close call. The vote was split 5-4 and the decision was again ‘finely balanced’ for some members. The split implies no rapid succession of cuts. Governor Bailey added a hawkish element to the vote, saying the MPC will be careful not to cut interest rates too quickly or too much.”
“The rate cut was accompanied by encouraging changes in economic forecasts. We continue to anticipate a cut per quarter going forward, as we did prior to this meeting, with the next move forecasted for November.”
On Wednesday morning, the Bank of Japan (BoJ) delivered a hawkish surprise. In addition to the actual rate hike, it was even made clear that further rate hikes could follow if the BoJ's new forecasts materialise. Most economists were probably surprised as well, with the majority expecting a later hike, Commerzbank’s FX analyst Michael Pfister notes
BoJ expects a slightly lower inflation rate this year
“The BoJ now expects a slightly lower inflation rate this year (2.5% instead of 2.8% y/y), but the forecast for next year has been revised slightly upwards (to 2.1% instead of 1.9% y/y). For the core rate, officials continue to expect a rate of 1.9% this year and next, and, somewhat surprisingly, the rate is even expected to rise again in 2026.”
“The officials are assuming that inflationary pressure on the core rate will pick up in the coming months. In order to achieve this forecast, rates would have to be roughly in line with the inflation target for the next 9 months. This is not impossible; other central banks have made more unrealistic forecasts in the past. However, it would be well above the average of the 2010s, a lot would have to go right for this to happen.”
“Although the BoJ expects slightly weaker growth this fiscal year, this will not affect growth next fiscal year. Nevertheless, the forecast seems rather optimistic, especially considering that the forecasts for 2025 and 2026 are above the average of the 2010s. One gets the impression that the BoJ does not expect its more hawkish stance to have any impact. Neither on inflation nor on growth.”
- USD/CAD falls back as the US Dollar fails to hold intraday gains.
- The US Dollar weakens on downbeat US Q2 United Labor Costs and a sharp contraction in ISM manufacturing PMI for July.
- A sharp recovery in Oil prices has strengthened the Canadian Dollar.
The USD/CAD pair falls back after a short-lived pullback move to near 1.3837 in Thursday’s American session. The Loonie asset retreats as the US Dollar (USD) surrenders majority of its intraday gains and the Canadian Dollar (CAD) strengthens.
The US Dollar retreats amid a sharp decline in preliminary Q2 Unit Labor Costs and the ISM Manufacturing PMI of July. Unit Labor Costs, a key measure of employee cost beared by the employer, declined to 0.9% from the estimates of 1.8% and the prior release of 3.8%, downwardly revised from 4.0%.
Meanwhile, the ISM Manufacturing PMI contracted at a faster pace to 46.8 from the estimates of 48.8 and the prior release of 48.5.
The Canadian Dollar advances amid a sharp recovery in the Oil price due to deepening risks of escalation in Middle East tensions. West Texas Intermediate (WTI), futures on NYMEX, gained an almost 4.5% in a single trading session on Wednesday. However, the Oil price edges lower in Thursday’s session but holds gains tightly. It is worth noting that Canada is the largest exporter of Oil to the United States (US) and higher Oil prices strengthen the Canadian Dollar.
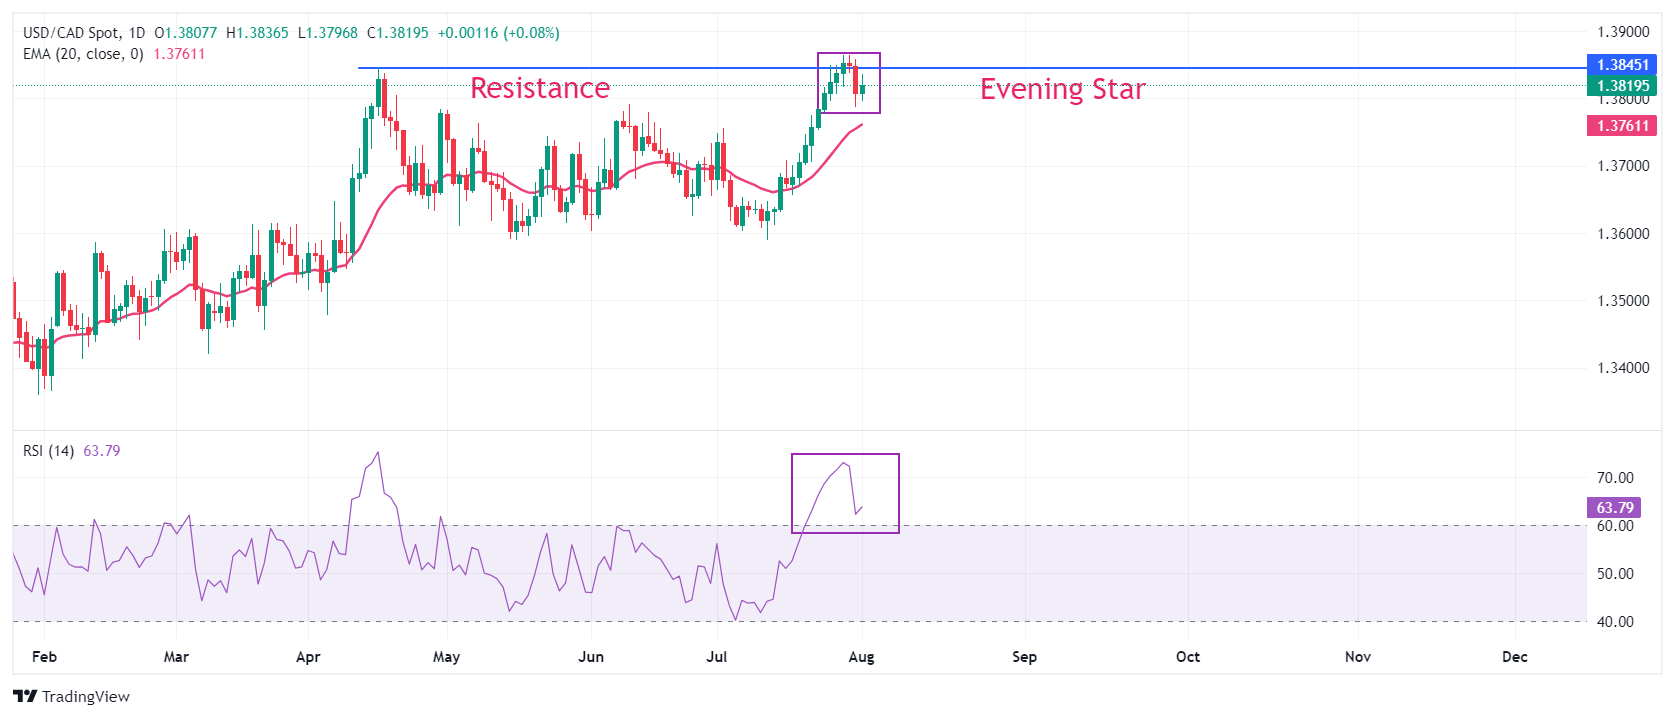
USD/CAD declines to near Wednesday’s low of 1.3787. A breakdown below the same will trigger an Evening Star candlestick pattern. The reliability of the aforementioned candlestick appears strong as it has formed near the horizontal resistance plotted from April 16 high of 1.3846.
It would be early to consider a bearish reversal as the asset holds the 20-day Exponential Moving Average (EMA), which trades around 1.3760. Also, the 14-day Relative Strength Index (RSI) oscillates inside the bullish range of 60.00-80.00, suggesting that the bullish momentum is still intact.
A fresh buying opportunity would emerge if the asset breaks above July 29 high of 1.3865. This would drive the asset towards 1 November 2023 high at 1.3900, followed by 13 October 2022 high at 1.3978.
On the contrary, a decisive breakdown below July 2 high at 1.3755 will expose the asset to the round-level support of 1.3700 and July 17 low at 1.3657.
USD/CAD daily chart
Canadian Dollar FAQs
The key factors driving the Canadian Dollar (CAD) are the level of interest rates set by the Bank of Canada (BoC), the price of Oil, Canada’s largest export, the health of its economy, inflation and the Trade Balance, which is the difference between the value of Canada’s exports versus its imports. Other factors include market sentiment – whether investors are taking on more risky assets (risk-on) or seeking safe-havens (risk-off) – with risk-on being CAD-positive. As its largest trading partner, the health of the US economy is also a key factor influencing the Canadian Dollar.
The Bank of Canada (BoC) has a significant influence on the Canadian Dollar by setting the level of interest rates that banks can lend to one another. This influences the level of interest rates for everyone. The main goal of the BoC is to maintain inflation at 1-3% by adjusting interest rates up or down. Relatively higher interest rates tend to be positive for the CAD. The Bank of Canada can also use quantitative easing and tightening to influence credit conditions, with the former CAD-negative and the latter CAD-positive.
The price of Oil is a key factor impacting the value of the Canadian Dollar. Petroleum is Canada’s biggest export, so Oil price tends to have an immediate impact on the CAD value. Generally, if Oil price rises CAD also goes up, as aggregate demand for the currency increases. The opposite is the case if the price of Oil falls. Higher Oil prices also tend to result in a greater likelihood of a positive Trade Balance, which is also supportive of the CAD.
While inflation had always traditionally been thought of as a negative factor for a currency since it lowers the value of money, the opposite has actually been the case in modern times with the relaxation of cross-border capital controls. Higher inflation tends to lead central banks to put up interest rates which attracts more capital inflows from global investors seeking a lucrative place to keep their money. This increases demand for the local currency, which in Canada’s case is the Canadian Dollar.
Macroeconomic data releases gauge the health of the economy and can have an impact on the Canadian Dollar. Indicators such as GDP, Manufacturing and Services PMIs, employment, and consumer sentiment surveys can all influence the direction of the CAD. A strong economy is good for the Canadian Dollar. Not only does it attract more foreign investment but it may encourage the Bank of Canada to put up interest rates, leading to a stronger currency. If economic data is weak, however, the CAD is likely to fall.
- ISM Manufacturing PMI declined to 46.8 in July, pointing to ongoing contraction.
- US Dollar Index declines toward 104.00 after disappointing data.
The business activity in the US manufacturing sector continued to contract at an accelerating pace in July, with the ISM Manufacturing PMI declining to 46.8 from 48.5 in June. This reading fell short of the market expectation of 48.8.
The Employment Index of the PMI survey declined sharply to 43.4 from 49.3.1 in June, while the New Orders Index fell to 47.4 from 49.3. Finally, the Prices Paid Index, the inflation component, rose to 52.9 from 52.1 in the same period.
Commenting on the survey's findings, "US manufacturing activity entered deeper into contraction. Demand was weak again, output declined, and inputs stayed generally accommodative," said Timothy R. Fiore, Chair of the Institute for Supply Management (ISM) Manufacturing Business Survey Committee.
Market reaction
The US Dollar came under renewed selling pressure following the disappointing PMI data. At the time of press, the US Dollar Index was up 0.1% on the day at 104.12.
- GBP/USD drops 0.32% as BoE cuts rates to 5.25% in a tight 5-4 vote.
- Technical outlook suggests potential rebound, forming a 'hammer' pattern.
- Key resistance levels at 1.2888, 1.2900, and 1.2937; support levels at 1.2786, 1.2750, and 1.2700.
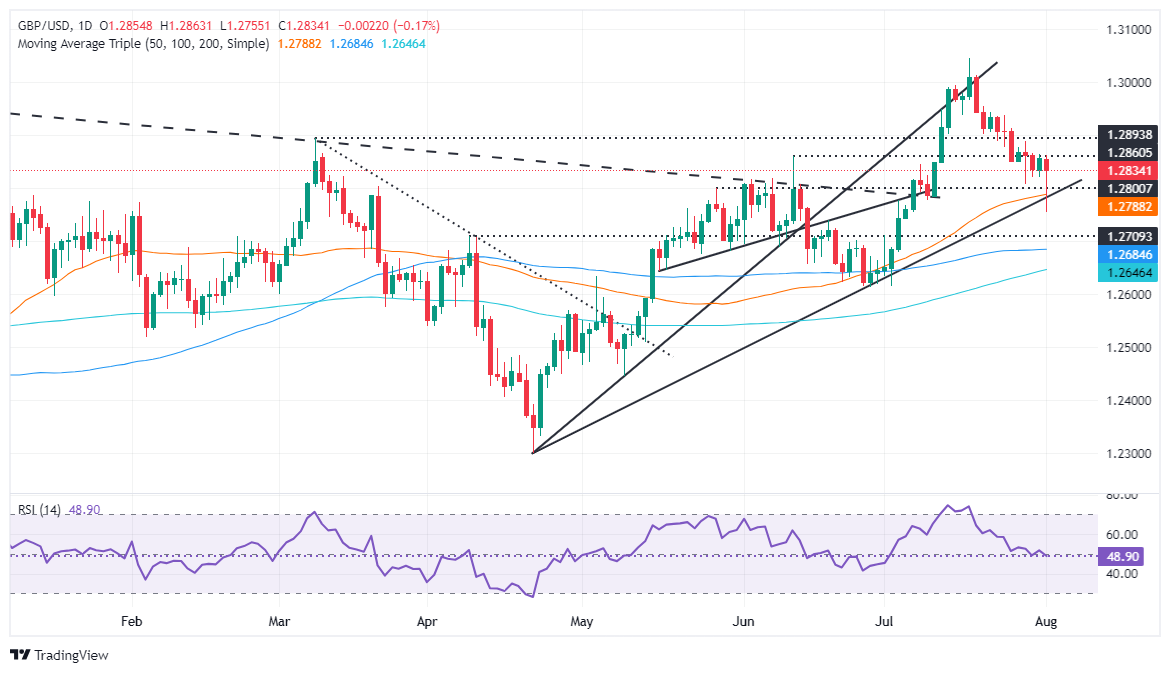
The Pound Sterling is under pressure in early trading during the North American session, dropping some 0.12% after the Bank of England (BoE) cut interest rates to 5.25% in a 5-4 tight vote split. Following the decision, the GBP/USD fell to its lowest level of 1.2750, yet has recovered somewhat, trimming some of its losses. The pair exchanges hands at 1.2837 at the time of writing.
GBP/USD Price Analysis: Technical outlook
Following the BoE’s decision, the GBP/USD seems to form a ‘hammer’ preceded by a 2.20% fall, which could open the door to climbing above the 1.2900 figure and re-testing the 1.3000 figure. Although BoE Governor Bailey and Co. reduced borrowing costs, the policy remains restrictive, as they upward revised their inflation expectations to 2.25%.
If GBP/USD clears the current week high at 1.2888, that could exacerbate a rally to 1.2900, followed by the latest pivot high at 1.2937, the July 24 high. A breach of the latter will expose 1.3000.
For a bearish continuation, sellers must push prices and achieve a daily close below the 50-day moving average (DMA) at 1.2786. Once surpassed, the next support would be the August 1 low of 1.2750, followed by 1.2700 and the 100-DMA at 1.2683.
GBP/USD Price Action – Daily Chart
British Pound PRICE Today
The table below shows the percentage change of British Pound (GBP) against listed major currencies today. British Pound was the strongest against the Japanese Yen.
| USD | EUR | GBP | JPY | CAD | AUD | NZD | CHF | |
|---|---|---|---|---|---|---|---|---|
| USD | 0.10% | 0.15% | 0.15% | 0.02% | -0.20% | -0.44% | -0.42% | |
| EUR | -0.10% | 0.06% | 0.05% | -0.09% | -0.29% | -0.53% | -0.52% | |
| GBP | -0.15% | -0.06% | -0.02% | -0.14% | -0.35% | -0.60% | -0.58% | |
| JPY | -0.15% | -0.05% | 0.02% | -0.15% | -0.37% | -0.66% | -0.63% | |
| CAD | -0.02% | 0.09% | 0.14% | 0.15% | -0.21% | -0.45% | -0.44% | |
| AUD | 0.20% | 0.29% | 0.35% | 0.37% | 0.21% | -0.24% | -0.23% | |
| NZD | 0.44% | 0.53% | 0.60% | 0.66% | 0.45% | 0.24% | 0.02% | |
| CHF | 0.42% | 0.52% | 0.58% | 0.63% | 0.44% | 0.23% | -0.02% |
The heat map shows percentage changes of major currencies against each other. The base currency is picked from the left column, while the quote currency is picked from the top row. For example, if you pick the British Pound from the left column and move along the horizontal line to the US Dollar, the percentage change displayed in the box will represent GBP (base)/USD (quote).
As expected, the Federal Reserve (Fed) left interest rates unchanged yesterday - but at the same time provided a few hints in its statement that a rate cut is imminent. Inflation is now only 'somewhat elevated' rather than 'elevated'. And the FOMC is now wary of the two-sided risks to its dual mandate, Commerzbank’s FX analyst Michael Pfister notes.
Powell shifts focus to the labour market
“Nevertheless, policymakers still want to gain greater confidence that inflation will return to the 2% target. The statement was therefore only a small step towards a turnaround in interest rates; the market was probably hoping for clearer signals and the US Dollar (USD) initially benefited from the statement.”
“This did not last long, however. During the subsequent press conference with Fed Chairman Jerome Powell, it became increasingly clear that the FOMC was on the verge of cutting rates for the first time. Although Powell initially tried to keep all options open for September, the hints became clearer as the meeting progressed.”
“Powell has shifted the focus in many of his comments to the labour market. Inflation is no longer seen as the main problem, but the dual mandate really is one again. This is a continuation of what we have seen in recent weeks and increases the importance of tomorrow's US payrolls report.”
- Initial Jobless Claims rose by 249K vs. the previous week.
- Continuing Jobless Claims rose by nearly 1.880M.
US citizens that applied for unemployment insurance benefits increased by 249K in the week ending July 27 according to the US Department of Labor (DoL) on Thursday. The prints came in above initial consensus (236K) and were higher than the previous weekly gain of 235K.
Further details of the publication revealed that the advance seasonally adjusted insured unemployment rate was 1.2% and the 4-week moving average was 238.00K, an increase of 2.5K from the previous week's unrevised average.
In addition, Continuing Claims increased by 33K to 1.877M in the week ended July 20.
Market reaction
The US Dollar Index (DXY) comes under some pressure and leaves earlier tops past 104.40 against the backdrop of the incessant move lower in US yields across the curve.
Bank of England (BoE) Governor Andrew Bailey explains the decision to lower the policy rate by 25 basis points to 5% in August and responds to questions from the press.
Key takeaways
"Businesses do talk to us quite a lot about higher minimum wage."
"Higher minimum wage has not led to bad news from our perspective."
"Firms regularly make point about higher minimum wage leading to compressed pay scales."
"Mortgage rates had already priced in a rate cut by the BoE this month or next."
"Mean path for inflation which incorporates upside risks much closer to 2% target than median forecast."
Interest rates FAQs
Interest rates are charged by financial institutions on loans to borrowers and are paid as interest to savers and depositors. They are influenced by base lending rates, which are set by central banks in response to changes in the economy. Central banks normally have a mandate to ensure price stability, which in most cases means targeting a core inflation rate of around 2%. If inflation falls below target the central bank may cut base lending rates, with a view to stimulating lending and boosting the economy. If inflation rises substantially above 2% it normally results in the central bank raising base lending rates in an attempt to lower inflation.
Higher interest rates generally help strengthen a country’s currency as they make it a more attractive place for global investors to park their money.
Higher interest rates overall weigh on the price of Gold because they increase the opportunity cost of holding Gold instead of investing in an interest-bearing asset or placing cash in the bank. If interest rates are high that usually pushes up the price of the US Dollar (USD), and since Gold is priced in Dollars, this has the effect of lowering the price of Gold.
The Fed funds rate is the overnight rate at which US banks lend to each other. It is the oft-quoted headline rate set by the Federal Reserve at its FOMC meetings. It is set as a range, for example 4.75%-5.00%, though the upper limit (in that case 5.00%) is the quoted figure. Market expectations for future Fed funds rate are tracked by the CME FedWatch tool, which shapes how many financial markets behave in anticipation of future Federal Reserve monetary policy decisions.
The Bank of England cut Bank Rate by 25 basis points today, as we and most other watchers expected. However, we expect further rate cuts only slowly and to a limited extent. Today's decision was very close with a 5:4 vote and the BoE also recognizes that inflation is still quite stubborn and that interest rates will therefore have to remain at a restrictive level for a while yet, Commerzbank’s economists Bernd Weidensteiner and Dr. Christoph Balz note.
BoE to continue to cut rates
“As expected, the Bank of England cut Bank Rate today by 25 basis points to 5.00%. However, the decision was very close with a 5 - 4 vote; 4 members of the Monetary Policy Committee voted to leave rates unchanged. The Bank said that it is ‘now appropriate to reduce slightly the degree of policy restrictiveness’.”
“The real economy has performed better than the BoE had expected in May. The Bank discussed the risks to the growth outlook and estimates that these are pointing upwards for domestic demand overall, even if growth in the first half of the year was probably somewhat overstated.”
“Monetary policy ‘will need to continue to remain restrictive for sufficiently long until the risks to inflation returning sustainably to the 2% target in the medium term have dissipated further’. We continue to assume that the BoE will cut interest rates by 25 basis points every three months, next in November and then in February and May 2025.”
EUR/USD should be doing better now that short-dated US rates are on the move again, ING’s FX strategist Chris Turner notes.
EUR to trade near 1.0800 in short term
“The problem is that short-dated EUR interest rates are quite soft too as the market considers the European Central Bank cutting more than twice later this year. That pricing seems far too aggressive in our view and instead, we think two-year EUR swap differentials will narrow further and provide EUR/USD with a little support.
“However, the European manufacturing sector remains in a general malaise – and a softer Chinese manufacturing PMI overnight doesn't help. This means that the euro is not seen as the preferred vehicle to express a bearish dollar view. It therefore looks like EUR/USD can stay supported in a 1.0790-1.0850 range for the time being, and its best hope will be some much softer than expected US data.”
The US Dollar (USD) initially rallied on the release of the new FOMC statement but then sold off when Chair Jerome Powell seemingly deliberately adopted a new script that a September rate cut 'could be on the table'. That phrase – together with the emphasis on the switch back to the central bank's dual mandate – did actually see US short rates move, ING’s FX strategist Chris Turner notes.
DXY may become biased to recent lows
“The Fed's terminal rate for the expected easing cycle dropped to a new low for this decline. For example, the one-month USD OIS, priced two to three years forward, dropped back to the early February lows and undermined the emerging view that a potential Donald Trump presidency would mean a higher Fed terminal rate.”
“This softening in US short-dated rates should be negative for the dollar and positive for risk assets. The problem for risk assets is that geopolitical threats plus a very soft manufacturing story in Europe and Asia are hardly supporting growth-friendly currencies. Perhaps that is why the biggest beneficiaries of this softer USD environment continue to be the Japanese yen and the Swiss franc.”
“For today, the focus will be on soft US ISM manufacturing data, which could keep DXY biased to recent lows near 103.65.”
Bank of England (BoE) Governor Andrew Bailey explains the decision to lower the policy rate by 25 basis points to 5% in August and responds to questions from the press.
Key takeaways
"Possible UK's natural rate of unemployment may have risen in recent years."
"We give some weight to alternative less benign inflation persistence scenario."
"MPC continues to remain highly alert to risks of inflation persistence."
"BoE goes meeting to meeting, making judgement based on evidence."
"BoE takes the lead from measures of private sector pay."
"Public sector pay does have an impact on demand."
"We do not have the full story, do not know how public sector pay rise will be funded."
"Will give no view on path of rates."
Pound Sterling FAQs
The Pound Sterling (GBP) is the oldest currency in the world (886 AD) and the official currency of the United Kingdom. It is the fourth most traded unit for foreign exchange (FX) in the world, accounting for 12% of all transactions, averaging $630 billion a day, according to 2022 data. Its key trading pairs are GBP/USD, aka ‘Cable’, which accounts for 11% of FX, GBP/JPY, or the ‘Dragon’ as it is known by traders (3%), and EUR/GBP (2%). The Pound Sterling is issued by the Bank of England (BoE).
The single most important factor influencing the value of the Pound Sterling is monetary policy decided by the Bank of England. The BoE bases its decisions on whether it has achieved its primary goal of “price stability” – a steady inflation rate of around 2%. Its primary tool for achieving this is the adjustment of interest rates. When inflation is too high, the BoE will try to rein it in by raising interest rates, making it more expensive for people and businesses to access credit. This is generally positive for GBP, as higher interest rates make the UK a more attractive place for global investors to park their money. When inflation falls too low it is a sign economic growth is slowing. In this scenario, the BoE will consider lowering interest rates to cheapen credit so businesses will borrow more to invest in growth-generating projects.
Data releases gauge the health of the economy and can impact the value of the Pound Sterling. Indicators such as GDP, Manufacturing and Services PMIs, and employment can all influence the direction of the GBP. A strong economy is good for Sterling. Not only does it attract more foreign investment but it may encourage the BoE to put up interest rates, which will directly strengthen GBP. Otherwise, if economic data is weak, the Pound Sterling is likely to fall.
Another significant data release for the Pound Sterling is the Trade Balance. This indicator measures the difference between what a country earns from its exports and what it spends on imports over a given period. If a country produces highly sought-after exports, its currency will benefit purely from the extra demand created from foreign buyers seeking to purchase these goods. Therefore, a positive net Trade Balance strengthens a currency and vice versa for a negative balance.
Bank of England (BoE) Governor Andrew Bailey explains the decision to lower the policy rate by 25 basis points to 5% in August and responds to questions from the press.
Key takeaways
"Services price inflation may rise slightly in August before easing in the rest of the year."
"Services inflation excluding volatile components, such as airfares and hotels, may be a better guide."
"We need to watch services prices very carefully."
"We should not adjust our course with every data surprise that comes in."
"We still face a question on whether persistent component of inflation is on course to decline to level consistent with 2% inflation."
"Unclear if decline in persistence is baked in, needs period of slack, or needs period of tighter for longer policy."
"We are making good progress returning inflation to 2% target sustainably."
BoE FAQs
The Bank of England (BoE) decides monetary policy for the United Kingdom. Its primary goal is to achieve ‘price stability’, or a steady inflation rate of 2%. Its tool for achieving this is via the adjustment of base lending rates. The BoE sets the rate at which it lends to commercial banks and banks lend to each other, determining the level of interest rates in the economy overall. This also impacts the value of the Pound Sterling (GBP).
When inflation is above the Bank of England’s target it responds by raising interest rates, making it more expensive for people and businesses to access credit. This is positive for the Pound Sterling because higher interest rates make the UK a more attractive place for global investors to park their money. When inflation falls below target, it is a sign economic growth is slowing, and the BoE will consider lowering interest rates to cheapen credit in the hope businesses will borrow to invest in growth-generating projects – a negative for the Pound Sterling.
In extreme situations, the Bank of England can enact a policy called Quantitative Easing (QE). QE is the process by which the BoE substantially increases the flow of credit in a stuck financial system. QE is a last resort policy when lowering interest rates will not achieve the necessary result. The process of QE involves the BoE printing money to buy assets – usually government or AAA-rated corporate bonds – from banks and other financial institutions. QE usually results in a weaker Pound Sterling.
Quantitative tightening (QT) is the reverse of QE, enacted when the economy is strengthening and inflation starts rising. Whilst in QE the Bank of England (BoE) purchases government and corporate bonds from financial institutions to encourage them to lend; in QT, the BoE stops buying more bonds, and stops reinvesting the principal maturing on the bonds it already holds. It is usually positive for the Pound Sterling.
- EUR/USD falls sharply as the US Dollar bounces back strongly.
- The US Dollar recovers ahead of the US ISM Manufacturing PMI and the NFP data for July.
- Faster-than-expected Eurozone inflation growth has raised doubts over speculation of an ECB rate cut in September.
The EUR/USD pair faces an intense sell-off after breaking below the round-level support of 1.0800 and posts a fresh three-week low at 1.0777 in Thursday’s European session. The major currency pair weakens after a sharp recovery in the US Dollar (USD). The US Dollar Index (DXY), which tracks the Greenback’s value against six major currencies, surges to 104.40 after recovering from a fresh weekly low of 103.86.
The US Dollar rose as market participants had already discounted the Federal Reserve’s (Fed) dovish guidance on interest rates in the monetary policy announcement on Wednesday. The Fed kept borrowing rates steady in the range of 5.25%-5.50%. Fed Chair Jerome Powell said policymakers have gained greater confidence from the Q2 inflation data.
When asked about rate cuts in September, Powell replied, "If we were to see inflation moving down more or less in line with expectations, growth remains reasonably strong, and the labor market remains consistent with current conditions, then I think a rate cut could be on the table at the September meeting”, Reuters reported.
Going forward, investors will focus on the United States (US) ISM Manufacturing PMI and Nonfarm Payrolls (NFP) report for July, which will be published at 14:00 GMT and on Friday, respectively.
Meanwhile, faster-than-expected growth in preliminary Eurozone Harmonized Index of Consumer Prices (HICP) data for July has raised doubts about whether the European Central Bank (ECB) will cut interest rates in September.
EUR/USD trades inside a Symmetrical Triangle formation on a daily timeframe, which exhibits a sideways trend. The aforementioned chart pattern signifies a sharp volatility contraction, which is expected to remain for a while amid the absence of clear signals of a breakout or a breakdown.
The shared currency pair faces selling pressure near the 20-day Exponential Moving Average (EMA) around 1.0835, suggesting that the near-term trend is bearish.
The 14-day Relative Strength Index (RSI) oscillates in the 40.00-60.00 range, indicating indecisiveness among market participants.
A fresh downside could appear if the asset breaks below the round-level support of 1.0700, which will expose the asset to June 26 low at 1.0666, followed by April 16 low around 1.0600.
On the flip side, an upside move above June 3 high near 1.0900 will drive the asset towards July 17 high at 1.0948 and the psychological resistance of 1.1000.
EUR/USD daily chart
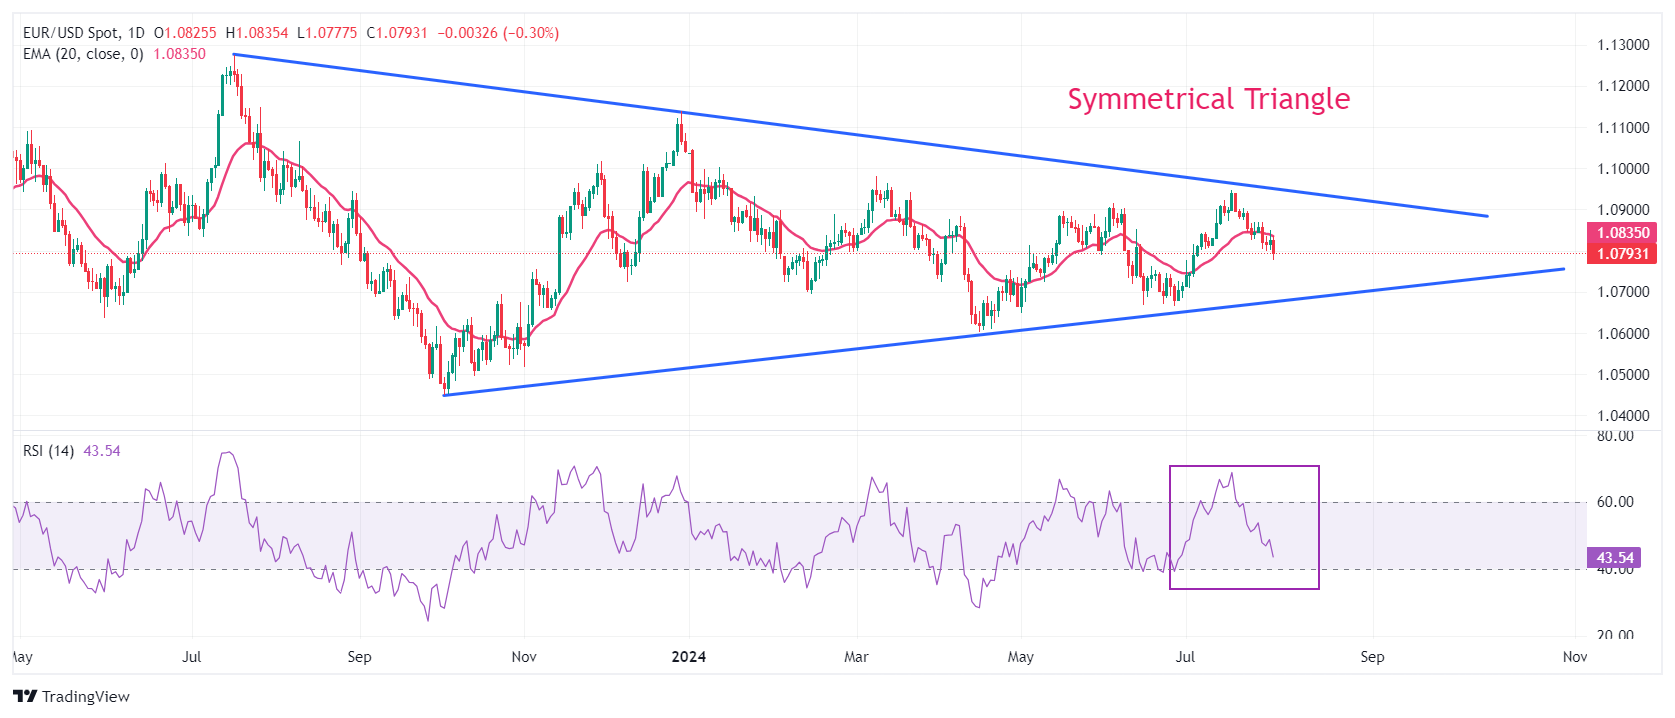
Euro FAQs
The Euro is the currency for the 20 European Union countries that belong to the Eurozone. It is the second most heavily traded currency in the world behind the US Dollar. In 2022, it accounted for 31% of all foreign exchange transactions, with an average daily turnover of over $2.2 trillion a day. EUR/USD is the most heavily traded currency pair in the world, accounting for an estimated 30% off all transactions, followed by EUR/JPY (4%), EUR/GBP (3%) and EUR/AUD (2%).
The European Central Bank (ECB) in Frankfurt, Germany, is the reserve bank for the Eurozone. The ECB sets interest rates and manages monetary policy. The ECB’s primary mandate is to maintain price stability, which means either controlling inflation or stimulating growth. Its primary tool is the raising or lowering of interest rates. Relatively high interest rates – or the expectation of higher rates – will usually benefit the Euro and vice versa. The ECB Governing Council makes monetary policy decisions at meetings held eight times a year. Decisions are made by heads of the Eurozone national banks and six permanent members, including the President of the ECB, Christine Lagarde.
Eurozone inflation data, measured by the Harmonized Index of Consumer Prices (HICP), is an important econometric for the Euro. If inflation rises more than expected, especially if above the ECB’s 2% target, it obliges the ECB to raise interest rates to bring it back under control. Relatively high interest rates compared to its counterparts will usually benefit the Euro, as it makes the region more attractive as a place for global investors to park their money.
Data releases gauge the health of the economy and can impact on the Euro. Indicators such as GDP, Manufacturing and Services PMIs, employment, and consumer sentiment surveys can all influence the direction of the single currency. A strong economy is good for the Euro. Not only does it attract more foreign investment but it may encourage the ECB to put up interest rates, which will directly strengthen the Euro. Otherwise, if economic data is weak, the Euro is likely to fall. Economic data for the four largest economies in the euro area (Germany, France, Italy and Spain) are especially significant, as they account for 75% of the Eurozone’s economy.
Another significant data release for the Euro is the Trade Balance. This indicator measures the difference between what a country earns from its exports and what it spends on imports over a given period. If a country produces highly sought after exports then its currency will gain in value purely from the extra demand created from foreign buyers seeking to purchase these goods. Therefore, a positive net Trade Balance strengthens a currency and vice versa for a negative balance.
The official manufacturing PMI stayed below 50 for a third month in July; services PMI fell to 50. Real activity growth may have eased due to sluggish demand; export growth likely stayed robust. CPI inflation likely edged up; credit growth may have rebounded, while money growth likely fell again, Standard Chartered economists Hunter Chan and Shuang Ding note.
Domestic demand remains subdued
“China’s official manufacturing PMI fell to 49.4 in July from 49.5 in June, in line with market expectations and staying in contractionary territory for a third straight month. Domestic demand remained sluggish, with the new orders PMI falling further below 50, while the new export orders PMI rose. We, therefore, expect industrial production (IP) growth to have slowed to 4.5% y/y in July from 5.3% in June.”
“The services PMI eased further by 0.2pts to a YTD low of 50 in July, weighed down by retail sales, real estate and financial market services. Retail sales growth may have rebounded due to a low base, while the 3Y CAGR likely slowed further. Export growth likely remained resilient, bridging the gap between relatively robust production and weak domestic demand.”
“We expect CPI inflation to have edged up on higher pork and fuel prices, while PPI deflation may have deepened on falling metal and petrochemical prices. We think the fall in loan prime rates (LPRs) following the policy rate cut may have supported loan demand. Meanwhile, CNY loan growth likely stabilised. Deposits likely dropped more than seasonal patterns, as banks lowered deposit rates.”
China’s manufacturing and non-manufacturing PMIs softened further in Jul, UOB Group economist Ho Woei Chen notes.
Momentum in China’s economy is slowing
“Both the official manufacturing and non-manufacturing PMIs softened further in Jul, adding to evidence of slowing momentum in China’s economy. Deflationary pressure is still present in the price indicators.”
“While the Jul Politburo meeting pledged to roll out a batch of new measures to support the economy at an appropriate time and highlighted lifting consumption to expand domestic demand, there were no details.”
“Both monetary and fiscal policy support will need to be strengthened in 2H24. We forecast China’s GDP growth to moderate to 4.9% this year from 5.2% in 2023.”
The Bank of Japan (BOJ) surprised the markets with a 15-bps rate hike to 0.25, UOB Group senior economist Alvin Liew notes.
BOJ to keep its policy unchanged in September
“The Bank of Japan (BOJ) at its scheduled Monetary Policy Meeting (MPM) on Wed (31 Jul), surprised the markets with a 15-bps rate hike to 0.25% while the details announced for the reduction of the monthly purchases of Japanese Government Bonds (JGB) was in line with market expectations.”
“The MPM statement also included policy forward guidance, which stated “if the outlook for economic activity and prices presented in the July Outlook Report will be realized, the Bank will accordingly continue to raise the policy interest rate and adjust the degree of monetary accommodation.”
“We now expect the BOJ to stay on the rate tightening trajectory. We expect BOJ to keep its policy rates unchanged in the next Sep 2024 MPM, and the next hike may come in 4Q24, via a 25-bps hike to 0.50% which we believe will be the terminal rate, subject to further CPI forecasts changes in the subsequent MPMs.”
- USD/CHF remains on backfoot near 0.8750 despite a sharp recovery in the US Dollar.
- The US Dollar recovers as Fed’s dovish guidance was already factored in by market participants.
- The Swiss Franc exhibits strength ahead of July’s CPI release on Friday.
The USD/CHF pair hovers near more than four-month low around 0.8750 in Thursday’s European trading hours. The Swiss Franc asset remains weak even though the US Dollar (USD) has delivered a strong recovery move after plummeting to a fresh weekly low.
The US Dollar Index (DXY), which tracks the Greenback’s value against six major currencies, jumps higher to near 104.35 after rebounding from a weekly low of 103.86.
In spite of a strong reversal move in the US Dollar, weakness in the major points to sheer strength in the Swiss Franc. The Swiss currency exhibits strength ahead of the Consumer Price Index (CPI) report for July, which will be published on Friday.
On month-on-month, price pressures are expected to have deflated by 0.2% after remaining unchanged in June, with annual figures growing steadily by 1.3%. The scenario in which price pressures rose at a slower pace would be favorable for bets supporting more rate cuts by the Swiss National Bank (SNB).
Meanwhile, the US Dollar has recovered at a robust pace as investors had already priced in expectations that the Federal Reserve (Fed) will deliver a dovish guidance on interest rates after leaving them unchanged in the range of 5.25%-5.50% in its monetary policy announcement on Wednesday.
The US Dollar is expected to remain volatile as United States (US) ISM Manufacturing PMI and the Nonfarm Payrolls (NFP) reports for July are lined-up for release. The Manufacturing PMI will be published at 14:00 GMP, while the NFP report is scheduled for Friday.
Swiss Franc FAQs
The Swiss Franc (CHF) is Switzerland’s official currency. It is among the top ten most traded currencies globally, reaching volumes that well exceed the size of the Swiss economy. Its value is determined by the broad market sentiment, the country’s economic health or action taken by the Swiss National Bank (SNB), among other factors. Between 2011 and 2015, the Swiss Franc was pegged to the Euro (EUR). The peg was abruptly removed, resulting in a more than 20% increase in the Franc’s value, causing a turmoil in markets. Even though the peg isn’t in force anymore, CHF fortunes tend to be highly correlated with the Euro ones due to the high dependency of the Swiss economy on the neighboring Eurozone.
The Swiss Franc (CHF) is considered a safe-haven asset, or a currency that investors tend to buy in times of market stress. This is due to the perceived status of Switzerland in the world: a stable economy, a strong export sector, big central bank reserves or a longstanding political stance towards neutrality in global conflicts make the country’s currency a good choice for investors fleeing from risks. Turbulent times are likely to strengthen CHF value against other currencies that are seen as more risky to invest in.
The Swiss National Bank (SNB) meets four times a year – once every quarter, less than other major central banks – to decide on monetary policy. The bank aims for an annual inflation rate of less than 2%. When inflation is above target or forecasted to be above target in the foreseeable future, the bank will attempt to tame price growth by raising its policy rate. Higher interest rates are generally positive for the Swiss Franc (CHF) as they lead to higher yields, making the country a more attractive place for investors. On the contrary, lower interest rates tend to weaken CHF.
Macroeconomic data releases in Switzerland are key to assessing the state of the economy and can impact the Swiss Franc’s (CHF) valuation. The Swiss economy is broadly stable, but any sudden change in economic growth, inflation, current account or the central bank’s currency reserves have the potential to trigger moves in CHF. Generally, high economic growth, low unemployment and high confidence are good for CHF. Conversely, if economic data points to weakening momentum, CHF is likely to depreciate.
As a small and open economy, Switzerland is heavily dependent on the health of the neighboring Eurozone economies. The broader European Union is Switzerland’s main economic partner and a key political ally, so macroeconomic and monetary policy stability in the Eurozone is essential for Switzerland and, thus, for the Swiss Franc (CHF). With such dependency, some models suggest that the correlation between the fortunes of the Euro (EUR) and the CHF is more than 90%, or close to perfect.
- Silver price faces a sharp sell-off near the weekly high at $29.16 as the US Dollar recovers strongly.
- An unexpected contraction in the Caixin Manufacturing PMI for July has also weighed on the Silver price.
- The Fed signaled rate cuts in September amid cooling inflationary pressures and easing labor market strength.
Silver price (XAG/USD) falls sharply to near $28.70 in Thursday’s European session after posting a fresh weekly high at $29.16. The white metal drops as the US Dollar (USD) rebounds strongly, and the Caixin Manufacturing PMI surprisingly contracted in July.
The US Dollar Index (DXY), which tracks the Greenback’s value against six major currencies, jumps higher to near 104.35 after rebounding from a weekly low of 103.86. A sharp recovery in the US Dollar has made investment in Silver expensive for investors.
Apart from that, unexpected decline in the Caxin Manufacturing PMI to 49.8 from expectations of 51.5 and the prior release of 51.8 has weighed on the Silver price. Silver as a metal has application in various industries such as renewable energy and electric vehicles etc. And, a slowdown in China’s manufacturing sector raises concerns over Silver demand.
However, firm speculation that the Federal Reserve (Fed) will start reducing interest rates in September will keep the downside limited. The Fed left interest rates unchanged in the range of 5.25%-5.50% on Wednesday, as expected, and his acknowledgment of cooling price pressures and easing labor market strength pointed to expectations of rate cuts sooner rather than later.
Going forward, investors will focus on the United States ISM Manufacturing PMI and Nonfarm Payrolls (NFP) report for July, which will be published at 14:00 GMT and on Friday, respectively.
Silver technical analysis
Silver price hovers at make or a break near the horizontal resistance plotted from June 13 low at $28.66 on a four-hour timeframe. The asset climbs above the 50-period Exponential Moving Average (EMA) near $28.70, suggesting that the near-term trend is upbeat.
The 14-period Relative Strength Index (RSI) moves higher above 60.00. If the RSI sustains above 60.00, the momentum will shift to the upside.
Silver four-hour chart
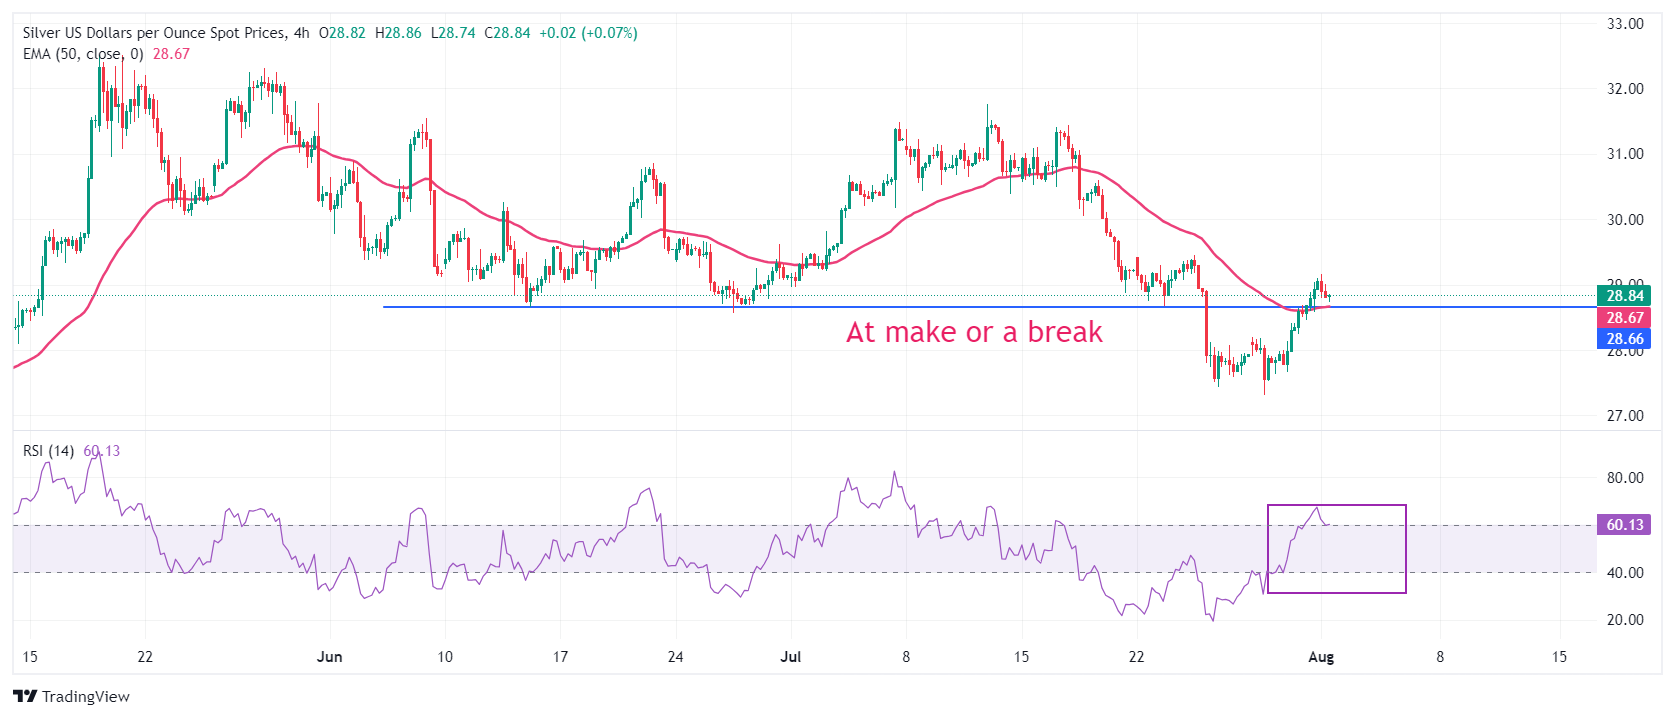
Silver FAQs
Silver is a precious metal highly traded among investors. It has been historically used as a store of value and a medium of exchange. Although less popular than Gold, traders may turn to Silver to diversify their investment portfolio, for its intrinsic value or as a potential hedge during high-inflation periods. Investors can buy physical Silver, in coins or in bars, or trade it through vehicles such as Exchange Traded Funds, which track its price on international markets.
Silver prices can move due to a wide range of factors. Geopolitical instability or fears of a deep recession can make Silver price escalate due to its safe-haven status, although to a lesser extent than Gold's. As a yieldless asset, Silver tends to rise with lower interest rates. Its moves also depend on how the US Dollar (USD) behaves as the asset is priced in dollars (XAG/USD). A strong Dollar tends to keep the price of Silver at bay, whereas a weaker Dollar is likely to propel prices up. Other factors such as investment demand, mining supply – Silver is much more abundant than Gold – and recycling rates can also affect prices.
Silver is widely used in industry, particularly in sectors such as electronics or solar energy, as it has one of the highest electric conductivity of all metals – more than Copper and Gold. A surge in demand can increase prices, while a decline tends to lower them. Dynamics in the US, Chinese and Indian economies can also contribute to price swings: for the US and particularly China, their big industrial sectors use Silver in various processes; in India, consumers’ demand for the precious metal for jewellery also plays a key role in setting prices.
Silver prices tend to follow Gold's moves. When Gold prices rise, Silver typically follows suit, as their status as safe-haven assets is similar. The Gold/Silver ratio, which shows the number of ounces of Silver needed to equal the value of one ounce of Gold, may help to determine the relative valuation between both metals. Some investors may consider a high ratio as an indicator that Silver is undervalued, or Gold is overvalued. On the contrary, a low ratio might suggest that Gold is undervalued relative to Silver.
- Gold price faces mild selling pressure, Fed’s signals for rate cuts and Middle East woes keep the broader bullish trend intact.
- The Fed acknowledged that policymakers have gained greater confidence due to a slowdown in price pressures in the second quarter.
- Investors await the US ISM Manufacturing PMI and the NFP data for July.
Gold price (XAU/USD) edges lower after posting an almost two-week high at $2,458.50 in Thursday’s European session. The precious metal falls slightly as the US Dollar (USD) rebounds. The US Dollar Index (DXY), which tracks the Greenback’s value against six major currencies, bounces back strongly to 104.20 after discovering strong buying interest near the intraday low of 103.86. A sharp recovery in the US Dollar makes investment in Gold less attractive.
However, the broader appeal of the Gold price remains firm as US bond yields have tumbled further on firm expectations that the Federal Reserve (Fed) will pivot to policy normalization in September. 10-year US Treasury yields plummet to almost six-month low near 4.03%. Lower yields on interest-bearing assets bode well for non-yielding assets, such as Gold, as it reduces the opportunity cost of holding investment in them.
The expectations for the Fed to begin reducing interest rates from September rose after the Fed’s dovish guidance on interest rates on Wednesday. The Fed left interest rates unchanged in the range of 5.25% -5.50% and pointed to cooling inflationary pressures, easing labor market strength, as expected, which made speculation for rate cuts in September as a done deal.
Fed Chair Jerome Powell said, "If we were to see inflation moving down more or less in line with expectations, growth remains reasonably strong, and the labor market remains consistent with current conditions, then I think a rate cut could be on the table at the September meeting”, Reuters reported.
Daily digest market movers: Gold price capitalizes on Fed’s dovish guidance and Middle East conflicts
- Gold price gradually declines to near $2,440 in Thursday’s European trading hours. However, its near-term outlook remains firm due to multiple tailwinds. Apart from firm expectations that the Fed will start lowering its key borrowing rates from September, upside risks to widening Middle East conflicts have improved Gold’s safe-haven appeal.
- Iran vows to retaliate for the killing of Hamas leader Ismail Haniyeh by an Israeli air strike in Tehran, stating that Israel will "pay a heavy price”. This has prompted risks of an all-out war in the Middle East. Historically, investors see investment in precious metals as a safe bet amid geopolitical tensions.
- In Thursday’s session, investors will focus on the United States (US) ISM Manufacturing Purchasing Managers’ Index (PMI) report for July, which will be published at 14:00 GMT. The PMI report is expected to show that activities in the manufacturing sector improved, rising to 48.8 from June’s reading of 48.5, but remain contracted. A figure below the 50.0 threshold is considered a contraction in factory activities.
- In the same period, the Manufacturing Prices Paid index is estimated to have expanded at a slower pace of 51.8 from the former release of 52.1. The Prices Paid index is a key measure of change in input prices. A slower growth in this index boosts expectations of cooling inflationary pressures.
- Going forward, the major trigger for the FX domain will be the US Nonfarm Payrolls (NFP) report, which will be published on Friday. Economists have estimated that 175K new workers were hired in July, lower than the former addition of 206K. The Unemployment Rate is expected to remain steady at 4.1%. Investors will keenly focus on the Average Hourly Earnings data, a key measure of wage growth that fuels consumer spending, which eventually influences price pressures. Annually, the wage growth measure is estimated to have decelerated to 3.7% from the prior reading of 3.9%, with the monthly figure growing steadily by 0.3%.
Technical Analysis: Gold price trades in channel formation
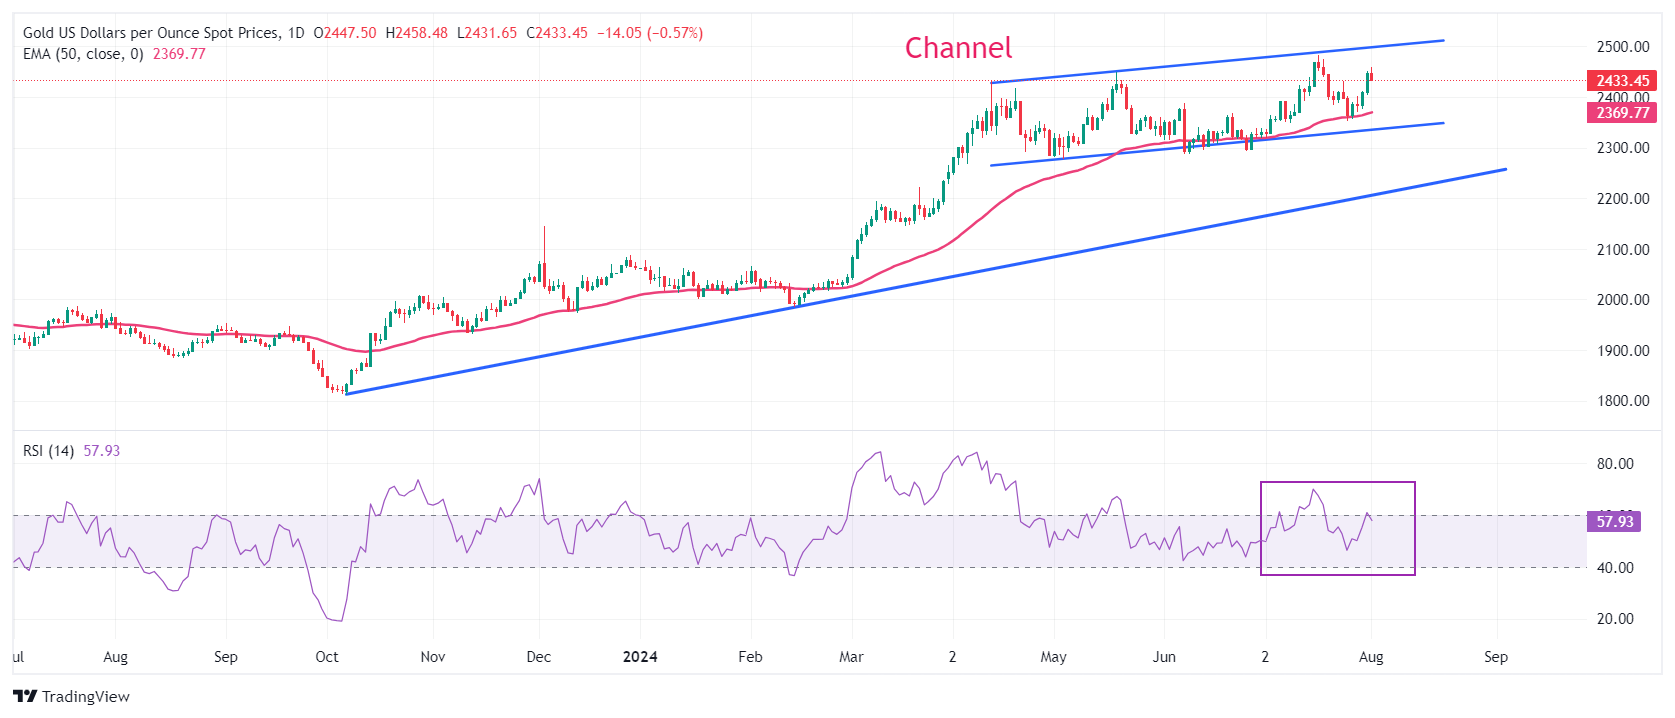
Gold price trades in a channel formation on a daily timeframe, which is slightly rising but broadly exhibited a sideways performance for more than three months. The 50-day Exponential Moving Average (EMA) near $2,370 continues to provide support to the Gold price bulls.
The 14-day Relative Strength Index (RSI) moves higher to near 60.00. If the RSI climbs above that level, the momentum will shift to the upside.
Fresh upside would appear if the Gold price breaks above its all-time high of $2,483.75, which will send it into an unchartered territory.
On the downside, the upward-sloping trendline at $2,225, plotted from the October 6 low near $1,810.50, will be a major support in the longer term.
Gold FAQs
Gold has played a key role in human’s history as it has been widely used as a store of value and medium of exchange. Currently, apart from its shine and usage for jewelry, the precious metal is widely seen as a safe-haven asset, meaning that it is considered a good investment during turbulent times. Gold is also widely seen as a hedge against inflation and against depreciating currencies as it doesn’t rely on any specific issuer or government.
Central banks are the biggest Gold holders. In their aim to support their currencies in turbulent times, central banks tend to diversify their reserves and buy Gold to improve the perceived strength of the economy and the currency. High Gold reserves can be a source of trust for a country’s solvency. Central banks added 1,136 tonnes of Gold worth around $70 billion to their reserves in 2022, according to data from the World Gold Council. This is the highest yearly purchase since records began. Central banks from emerging economies such as China, India and Turkey are quickly increasing their Gold reserves.
Gold has an inverse correlation with the US Dollar and US Treasuries, which are both major reserve and safe-haven assets. When the Dollar depreciates, Gold tends to rise, enabling investors and central banks to diversify their assets in turbulent times. Gold is also inversely correlated with risk assets. A rally in the stock market tends to weaken Gold price, while sell-offs in riskier markets tend to favor the precious metal.
The price can move due to a wide range of factors. Geopolitical instability or fears of a deep recession can quickly make Gold price escalate due to its safe-haven status. As a yield-less asset, Gold tends to rise with lower interest rates, while higher cost of money usually weighs down on the yellow metal. Still, most moves depend on how the US Dollar (USD) behaves as the asset is priced in dollars (XAU/USD). A strong Dollar tends to keep the price of Gold controlled, whereas a weaker Dollar is likely to push Gold prices up.
Australian consumer price inflation rose in 2Q24, but core inflation surprised on the downside, UOB Group economist Lee Sue Ann notes.
Housing and food costs climb up
“Australian consumer price inflation rose in 2Q24 as housing and food costs climbed, but core inflation surprised on the downside. A closely watched measure of core inflation, the trimmed mean, rose 0.8% q/q, following a 1.0% increase in 1Q24. The annual pace slowed to 3.9% from 4.0%, the lowest since early 2022.”
“The latest inflation figures are certainly a relief for the Reserve Bank of Australia (RBA). Recall that at the last monetary policy meeting on 18 Jun, the RBA had warned there were still reasons to be vigilant against inflation risks.”
“We had long held to the view that the central bank will likely be on hold for longer, rather than a near-term hike. Today’s data certainly reinforces our base case. All eyes will now turn to the RBA’s meeting on 6 Aug, where the central bank will also be publishing updated economic forecasts alongside the decision.”
Silver prices (XAG/USD) fell on Thursday, according to FXStreet data. Silver trades at $28.82 per troy ounce, down 0.69% from the $29.02 it cost on Wednesday.
Silver prices have increased by 21.10% since the beginning of the year.
| Unit measure | Silver Price Today in USD |
|---|---|
| Troy Ounce | 28.82 |
| 1 Gram | 0.93 |
The Gold/Silver ratio, which shows the number of ounces of Silver needed to equal the value of one ounce of Gold, stood at 84.42 on Thursday, broadly unchanged from 84.35 on Wednesday.
Silver FAQs
Silver is a precious metal highly traded among investors. It has been historically used as a store of value and a medium of exchange. Although less popular than Gold, traders may turn to Silver to diversify their investment portfolio, for its intrinsic value or as a potential hedge during high-inflation periods. Investors can buy physical Silver, in coins or in bars, or trade it through vehicles such as Exchange Traded Funds, which track its price on international markets.
Silver prices can move due to a wide range of factors. Geopolitical instability or fears of a deep recession can make Silver price escalate due to its safe-haven status, although to a lesser extent than Gold's. As a yieldless asset, Silver tends to rise with lower interest rates. Its moves also depend on how the US Dollar (USD) behaves as the asset is priced in dollars (XAG/USD). A strong Dollar tends to keep the price of Silver at bay, whereas a weaker Dollar is likely to propel prices up. Other factors such as investment demand, mining supply – Silver is much more abundant than Gold – and recycling rates can also affect prices.
Silver is widely used in industry, particularly in sectors such as electronics or solar energy, as it has one of the highest electric conductivity of all metals – more than Copper and Gold. A surge in demand can increase prices, while a decline tends to lower them. Dynamics in the US, Chinese and Indian economies can also contribute to price swings: for the US and particularly China, their big industrial sectors use Silver in various processes; in India, consumers’ demand for the precious metal for jewellery also plays a key role in setting prices.
Silver prices tend to follow Gold's moves. When Gold prices rise, Silver typically follows suit, as their status as safe-haven assets is similar. The Gold/Silver ratio, which shows the number of ounces of Silver needed to equal the value of one ounce of Gold, may help to determine the relative valuation between both metals. Some investors may consider a high ratio as an indicator that Silver is undervalued, or Gold is overvalued. On the contrary, a low ratio might suggest that Gold is undervalued relative to Silver.
(An automation tool was used in creating this post.)
Further US Dollar (USD) weakness is not ruled; the significant support at 148.20 is likely out of reach, UOB Group FX strategists Quek Ser Leang and Lee Sue Ann note.
USD may push towards 148.20
24-HOUR VIEW: “Yesterday, while we held the view that ‘the sharp drop in USD has scope to extend,’ we indicated that ‘it is yet to be determined if any further decline can reach the major support at 151.30.’ We clearly did not anticipate how the price action developed, as USD sold off sharply, reaching a low of 149.60. Further USD weakness is not ruled today. However, severely oversold conditions suggest the significant support level at 148.20 is like lot of reach. There is another support level at 149.00. To maintain the momentum, USD must remain below 151.30 with minor resistance at 150.50.”
1-3 WEEKS VIEW: “We indicated yesterday that ‘there is room for USD to weaken, but any decline is likely part of a lower trading range of 150.50/155.00.’ Our view was invalidated quickly, as USD plunged below 150.50 (low of 149.60). The price action suggests the weakness in USD is still intact. The level to watch is 148.20. The USD weakness is intact as long as 152.80 is not breached.”
- NZD/USD depreciates due to increased risk aversion ahead of the release of ISM Manufacturing PMI.
- Fed Chair Jerome Powell stated that a rate cut in September is "on the table."
- The Kiwi Dollar may struggle as the latest inflation data raises expectations of an RBNZ’s rate cut by October.
NZD/USD retraces its two days of gains, trading around 0.5940 during the European session on Thursday. This decline is attributed to the improved US Dollar (USD) due to a recovery in US Treasury yields. Traders adopt caution ahead of ISM Manufacturing PMI and weekly Initial Jobless Claims from the United States (US), both set to be released later in the North American session.
However, the downside of the NZD/USD pair could be restrained as the US Dollar may face challenges due to the dovish sentiment surrounding the Federal Reserve’s (Fed) policy trajectory. At Wednesday’s policy meeting, the Fed decided to keep rates unchanged in the 5.25%-5.50% range.
Additionally, Federal Reserve Chairman Jerome Powell stated that a rate cut in September is "on the table," during a press conference. Powell added that the central bank will closely monitor the labor market and remain vigilant for signs of a potential sharp downturn, per Reuters.
However, the Federal Open Market Committee (FOMC) did not want to commit to anything in the statement. FOMC indicated in its statement that it does not foresee cutting rates until it has greater confidence that inflation is sustainably heading toward 2%. They require more progress on inflation before considering a cut in September unless a significant decline in the labor market begins to outweigh the slow progress on inflation.
Regarding the New Zealand Dollar (NZD), recent data from China, a close trade partner, showed that the Caixin Manufacturing Purchasing Managers' Index (PMI) for July came in at 49.8, missing the expected 51.5 and the previous reading of 51.8. This underperformance might have put pressure on the New Zealand Dollar (NZD).
Additionally, the NZD faces further pressure from expectations of an early interest rate cut by the Reserve Bank of New Zealand (RBNZ). This comes after data showed that the domestic annual CPI rate fell to its lowest level in three years for the June quarter. The RBNZ’s next policy meeting is scheduled for August 14, with markets currently pricing in a 36% chance of a rate cut and fully anticipating a move by October.
New Zealand Dollar FAQs
The New Zealand Dollar (NZD), also known as the Kiwi, is a well-known traded currency among investors. Its value is broadly determined by the health of the New Zealand economy and the country’s central bank policy. Still, there are some unique particularities that also can make NZD move. The performance of the Chinese economy tends to move the Kiwi because China is New Zealand’s biggest trading partner. Bad news for the Chinese economy likely means less New Zealand exports to the country, hitting the economy and thus its currency. Another factor moving NZD is dairy prices as the dairy industry is New Zealand’s main export. High dairy prices boost export income, contributing positively to the economy and thus to the NZD.
The Reserve Bank of New Zealand (RBNZ) aims to achieve and maintain an inflation rate between 1% and 3% over the medium term, with a focus to keep it near the 2% mid-point. To this end, the bank sets an appropriate level of interest rates. When inflation is too high, the RBNZ will increase interest rates to cool the economy, but the move will also make bond yields higher, increasing investors’ appeal to invest in the country and thus boosting NZD. On the contrary, lower interest rates tend to weaken NZD. The so-called rate differential, or how rates in New Zealand are or are expected to be compared to the ones set by the US Federal Reserve, can also play a key role in moving the NZD/USD pair.
Macroeconomic data releases in New Zealand are key to assess the state of the economy and can impact the New Zealand Dollar’s (NZD) valuation. A strong economy, based on high economic growth, low unemployment and high confidence is good for NZD. High economic growth attracts foreign investment and may encourage the Reserve Bank of New Zealand to increase interest rates, if this economic strength comes together with elevated inflation. Conversely, if economic data is weak, NZD is likely to depreciate.
The New Zealand Dollar (NZD) tends to strengthen during risk-on periods, or when investors perceive that broader market risks are low and are optimistic about growth. This tends to lead to a more favorable outlook for commodities and so-called ‘commodity currencies’ such as the Kiwi. Conversely, NZD tends to weaken at times of market turbulence or economic uncertainty as investors tend to sell higher-risk assets and flee to the more-stable safe havens.
- GBP/JPY continues losing ground for the third successive day on Thursday.
- The BoE-BoJ policy divergence is seen as a key factor weighing on the cross.
- A positive risk tone helps limit further losses ahead of the key BoE decision.
The GBP/JPY cross remains under heavy selling pressure for the third straight day and drops to sub-191.00 levels or the lowest since April 23 on Thursday. Spot prices, however, manage to rebound a few pips and currently trade around mid-191.00s as traders prefer to wait on the sidelines ahead of the Bank of England (BoE) policy meeting.
Signs that inflationary pressures are receding globally have been fueling speculations that the UK central bank will cut interest rates later today. In fact, financial markets are pricing in over a 65% chance that the BoE will lower rates from a 16-year high of 5.25% and expect one more quarter-point cut before the end of the year. This, along with a strong pickup in the US Dollar (USD) demand, undermines the British Pound (GBP) and weighs on the GBP/JPY cross.
The Japanese Yen (JPY), on the other hand, continues to draw support from the Bank of Japan's (BoJ) decision to hike the benchmark short-term rate on Wednesday, by 15 basis points - the top end of market expectations. Moreover, official data showed that Japanese authorities spent ¥5.53 trillion ($36.8 billion) intervening in the foreign exchange market in July, which further benefits the JPY and contributes to the offered tone surrounding the GBP/JPY cross.
The fundamental backdrop, along with an intraday slide below the very important 200-day Simple Moving Average (SMA), suggests that the path of least resistance for spot prices is to the downside. Heading into the key central bank event risk, bearish traders seem reluctant to place fresh bets amid a positive risk tone, which tends to dent demand for the safe-haven JPY.
BoE FAQs
The Bank of England (BoE) decides monetary policy for the United Kingdom. Its primary goal is to achieve ‘price stability’, or a steady inflation rate of 2%. Its tool for achieving this is via the adjustment of base lending rates. The BoE sets the rate at which it lends to commercial banks and banks lend to each other, determining the level of interest rates in the economy overall. This also impacts the value of the Pound Sterling (GBP).
When inflation is above the Bank of England’s target it responds by raising interest rates, making it more expensive for people and businesses to access credit. This is positive for the Pound Sterling because higher interest rates make the UK a more attractive place for global investors to park their money. When inflation falls below target, it is a sign economic growth is slowing, and the BoE will consider lowering interest rates to cheapen credit in the hope businesses will borrow to invest in growth-generating projects – a negative for the Pound Sterling.
In extreme situations, the Bank of England can enact a policy called Quantitative Easing (QE). QE is the process by which the BoE substantially increases the flow of credit in a stuck financial system. QE is a last resort policy when lowering interest rates will not achieve the necessary result. The process of QE involves the BoE printing money to buy assets – usually government or AAA-rated corporate bonds – from banks and other financial institutions. QE usually results in a weaker Pound Sterling.
Quantitative tightening (QT) is the reverse of QE, enacted when the economy is strengthening and inflation starts rising. Whilst in QE the Bank of England (BoE) purchases government and corporate bonds from financial institutions to encourage them to lend; in QT, the BoE stops buying more bonds, and stops reinvesting the principal maturing on the bonds it already holds. It is usually positive for the Pound Sterling.
Further New Zealand Dollar (NZD) strength is not ruled out; it is unclear if it can break the solid resistance level at 0.5990, UOB Group FX strategists Quek Ser Leang and Lee Sue Ann note.
Bears push towards 0.5890
24-HOUR VIEW: “We detected a ‘mild upward pressure’ yesterday. We indicated that ‘the bias for NZD is tilted to the upside, but it remains to be seen if any advance can break the strong resistance level at 0.5930.’ NZD rose more than expected, easily taking out 0.5930 as it reached a high of 0.5961 in late NY trade. Further NZD strength is not ruled out, but this time around, it is unclear if it can break the solid resistance level at 0.5990. On the downside, support levels are at 0.5935 and 0.5920.”
1-3 WEEKS VIEW: “We turned negative in NZD two weeks ago. As we tracked the decline in NZD, we highlighted yesterday (31 Jul, spot at 0.5900) that ‘the weakness in NZD is close to an end.’ NZD subsequently broke above our ‘strong resistance’ level of 0.5930, indicating that the weakness has ended. The current price action is likely part of a recovery phase. From here, provided that NZD remain above 0.5890 (current level of ‘strong support’ level), it could recover to 0.5990.”
The Australian Dollar (AUD) is likely to trade in a range, probably between 0.6515 and 0.6565. If AUD breaches 0.6565, it would suggest that the weakness from two weeks ago has stabilised, UOB Group FX strategists Quek Ser Leang and Lee Sue Ann note.
AUD to break below 0.6515
24-HOUR VIEW: “After AUD plunged sharply in early Asian trade yesterday, we indicated that ‘the sharp decline appears to be a tad overdone.’ However, we held the view that ‘as long as 0.6540 is not breached, AUD could break below the major support at 0.6480.’ AUD subsequently dropped to but did not break 0.6480 (low has been 0.6480) and then rebounded to a high of 0.6555. The buildup in downward pressure fizzled out quickly. Today, AUD is likely to trade in a range, probably between 0.6515 and 0.6565.”
1-3 WEEKS VIEW: “We have held a negative AUD view for two weeks now. After AUD fell sharply early yesterday (31 Jul, spot at 0.6510), we pointed out that ‘the decline in AUD still seems to be overextended, and it is uncertain if 0.6425 will come into view.’ AUD subsequently dropped to the short-term support at 0.6480 and then rebounded strongly. From here, if AUD breaches the ‘strong resistance’ at 0.6565 (no change in level from yesterday), it would suggest that the weakness in AUD has stabilised.”
Only a breach of 1.0870 would mean the Euro (EUR) dropping further to 1.0760 is diminishing, UOB Group FX strategists Quek Ser Leang and Lee Sue Ann note.
Bearsh push towards 1.0760
24-HOUR VIEW: “Yesterday, we held the view that ‘there is a chance for EUR to dip to 1.0790 before the risk of more sustained rebound increases.’ The price action did not turn out as we expected, as EUR fluctuated between 1.0801 and 1.0849, closing little changed at 1.0825 (+0.09%). There has been no marked increase in either downward or upward momentum. Today, we expect EUR to trade in a sideways range of 1.0800/1.0850.”
1-3 WEEKS VIEW: “We turned negative in EUR in the middle of last week. In our latest narrative from two days ago (30 Jul, spot at 1.0820), we indicated that ‘the view for EUR is still negative, and the next level to focus on is at 1.0760.’ EUR has not been able to make further headway on the downside. Downward momentum is showing tentative signs of slowing, and the chance of EUR dropping further to 1.0760 is diminishing. However, only a breach of 1.0870 (no change in ‘strong resistance’ level) would mean that 1.0760 is out of reach this time round.”
- AUD/USD meets with a fresh supply on Thursday amid a strong pickup in the USD demand.
- China’s economic woes and diminishing odds for further RBA rate hikes weigh on the Aussie.
- A positive risk tone could help limit further losses ahead of the key US NFP report on Friday.
The AUD/USD pair attracts fresh sellers following an intraday uptick to mid-0.6500s and drops to a fresh daily low during the early part of the European session on Thursday. Spot prices currently trade around the 0.6515 region and for now, seem to have stalled the previous day's goodish rebound from the lowest level since early May.
The US Dollar (USD) makes a solid comeback from the vicinity of a three-week low touched on Wednesday in the aftermath of the FOMC policy decision and turns out to be a key factor exerting downward pressure on the AUD/USD pair. Apart from this, persistent worries about a slowdown in China – the world's second-largest economy – undermines the China-proxy Australian Dollar (AUD) and contributes to the downfall.
A private survey showed that business activity in China's manufacturing sector unexpectedly shrank in July for the first time in nine months, underscoring economic woes. Furthermore, the mixed Australian consumer inflation figures on Wednesday dashed hopes for further rate hikes by the Reserve Bank of Australia (RBA), which should weigh on the Aussie and support prospects for a further depreciating move for the AUD/USD pair.
Meanwhile, the Federal Reserve (Fed) acknowledged the recent progress on inflation and cooling in the labor market. Adding to this, Fed Chair Jerome Powell, speaking at the post-meeting press conference, signaled the likelihood of an early rate cut if inflation stays in line with expectations. This, in turn, drags the US Treasury bond yields to a multi-month low, which, along with a positive risk tone, should cap the safe-haven Greenback.
This, in turn, could offer some support to the risk-sensitive Aussie and help limit the downside for the AUD/USD pair. Traders might also refrain from placing aggressive directional bets and prefer to wait for the release of the closely-watched US monthly employment details – popularly known as the Nonfarm Payrolls (NFP) report on Friday. Hence, any subsequent fall could find decent support near the 0.6500 psychological mark.
RBA FAQs
The Reserve Bank of Australia (RBA) sets interest rates and manages monetary policy for Australia. Decisions are made by a board of governors at 11 meetings a year and ad hoc emergency meetings as required. The RBA’s primary mandate is to maintain price stability, which means an inflation rate of 2-3%, but also “..to contribute to the stability of the currency, full employment, and the economic prosperity and welfare of the Australian people.” Its main tool for achieving this is by raising or lowering interest rates. Relatively high interest rates will strengthen the Australian Dollar (AUD) and vice versa. Other RBA tools include quantitative easing and tightening.
While inflation had always traditionally been thought of as a negative factor for currencies since it lowers the value of money in general, the opposite has actually been the case in modern times with the relaxation of cross-border capital controls. Moderately higher inflation now tends to lead central banks to put up their interest rates, which in turn has the effect of attracting more capital inflows from global investors seeking a lucrative place to keep their money. This increases demand for the local currency, which in the case of Australia is the Aussie Dollar.
Macroeconomic data gauges the health of an economy and can have an impact on the value of its currency. Investors prefer to invest their capital in economies that are safe and growing rather than precarious and shrinking. Greater capital inflows increase the aggregate demand and value of the domestic currency. Classic indicators, such as GDP, Manufacturing and Services PMIs, employment, and consumer sentiment surveys can influence AUD. A strong economy may encourage the Reserve Bank of Australia to put up interest rates, also supporting AUD.
Quantitative Easing (QE) is a tool used in extreme situations when lowering interest rates is not enough to restore the flow of credit in the economy. QE is the process by which the Reserve Bank of Australia (RBA) prints Australian Dollars (AUD) for the purpose of buying assets – usually government or corporate bonds – from financial institutions, thereby providing them with much-needed liquidity. QE usually results in a weaker AUD.
Quantitative tightening (QT) is the reverse of QE. It is undertaken after QE when an economic recovery is underway and inflation starts rising. Whilst in QE the Reserve Bank of Australia (RBA) purchases government and corporate bonds from financial institutions to provide them with liquidity, in QT the RBA stops buying more assets, and stops reinvesting the principal maturing on the bonds it already holds. It would be positive (or bullish) for the Australian Dollar.
- EUR/USD declines due to increased risk aversion ahead of the ISM PMI release on Thursday.
- The US Dollar recovers intraday losses as Treasury yields rebound from multi-month lows.
- The downside of the Euro could be limited as the latest inflation data raised doubt on potential ECB rate cuts.
EUR/USD depreciates to near 1.0790 during the European session on Thursday. This decline is attributed to the improved US Dollar (USD) due to a recovery in US Treasury yields ahead of US key economic data including ISM Manufacturing PMI and weekly Initial Jobless Claims, both set to be released later in the North American session.
However, the US Dollar faced challenges due to the dovish sentiment surrounding the Federal Reserve’s (Fed) policy trajectory. Fed decided to keep rates unchanged in the 5.25%-5.50% range at its July meeting on Wednesday.
During a press conference post-interest rate decision, Federal Reserve Chair Jerome Powell stated that a rate cut in September is "on the table," while the Federal Open Market Committee (FOMC) did not want to commit to anything in the statement. Powell added that the central bank will closely monitor the labor market and remain vigilant for signs of a potential sharp downturn, per Reuters.
Across the pond, HCOB Eurozone Manufacturing Purchasing Managers Index (PMI) posted a reading of 45.8 for July, slightly above the expected and prior readings of 45.6, data showed on Thursday. Moreover, on Wednesday, the Harmonised Index of Consumer Prices (HICP) in the Eurozone rose by 2.6% YoY in July, compared to 2.5% in the previous month. This figure exceeded the estimation of 2.4%.
The latest inflation report in the eurozone raised doubt on potential European Central Bank (ECB) interest rate cuts in September. The Euro may attract some buyers due to the diminished odds of the ECB cutting interest rates at its meeting on September 14.
Euro PRICE Today
The table below shows the percentage change of Euro (EUR) against listed major currencies today. Euro was the weakest against the Swiss Franc.
| USD | EUR | GBP | JPY | CAD | AUD | NZD | CHF | |
|---|---|---|---|---|---|---|---|---|
| USD | 0.38% | 0.56% | -0.28% | 0.18% | 0.37% | 0.13% | -0.27% | |
| EUR | -0.38% | 0.18% | -0.65% | -0.21% | -0.00% | -0.25% | -0.65% | |
| GBP | -0.56% | -0.18% | -0.82% | -0.38% | -0.18% | -0.42% | -0.82% | |
| JPY | 0.28% | 0.65% | 0.82% | 0.43% | 0.63% | 0.33% | -0.05% | |
| CAD | -0.18% | 0.21% | 0.38% | -0.43% | 0.21% | -0.04% | -0.44% | |
| AUD | -0.37% | 0.00% | 0.18% | -0.63% | -0.21% | -0.24% | -0.63% | |
| NZD | -0.13% | 0.25% | 0.42% | -0.33% | 0.04% | 0.24% | -0.39% | |
| CHF | 0.27% | 0.65% | 0.82% | 0.05% | 0.44% | 0.63% | 0.39% |
The heat map shows percentage changes of major currencies against each other. The base currency is picked from the left column, while the quote currency is picked from the top row. For example, if you pick the Euro from the left column and move along the horizontal line to the US Dollar, the percentage change displayed in the box will represent EUR (base)/USD (quote).
Euro FAQs
The Euro is the currency for the 20 European Union countries that belong to the Eurozone. It is the second most heavily traded currency in the world behind the US Dollar. In 2022, it accounted for 31% of all foreign exchange transactions, with an average daily turnover of over $2.2 trillion a day. EUR/USD is the most heavily traded currency pair in the world, accounting for an estimated 30% off all transactions, followed by EUR/JPY (4%), EUR/GBP (3%) and EUR/AUD (2%).
The European Central Bank (ECB) in Frankfurt, Germany, is the reserve bank for the Eurozone. The ECB sets interest rates and manages monetary policy. The ECB’s primary mandate is to maintain price stability, which means either controlling inflation or stimulating growth. Its primary tool is the raising or lowering of interest rates. Relatively high interest rates – or the expectation of higher rates – will usually benefit the Euro and vice versa. The ECB Governing Council makes monetary policy decisions at meetings held eight times a year. Decisions are made by heads of the Eurozone national banks and six permanent members, including the President of the ECB, Christine Lagarde.
Eurozone inflation data, measured by the Harmonized Index of Consumer Prices (HICP), is an important econometric for the Euro. If inflation rises more than expected, especially if above the ECB’s 2% target, it obliges the ECB to raise interest rates to bring it back under control. Relatively high interest rates compared to its counterparts will usually benefit the Euro, as it makes the region more attractive as a place for global investors to park their money.
Data releases gauge the health of the economy and can impact on the Euro. Indicators such as GDP, Manufacturing and Services PMIs, employment, and consumer sentiment surveys can all influence the direction of the single currency. A strong economy is good for the Euro. Not only does it attract more foreign investment but it may encourage the ECB to put up interest rates, which will directly strengthen the Euro. Otherwise, if economic data is weak, the Euro is likely to fall. Economic data for the four largest economies in the euro area (Germany, France, Italy and Spain) are especially significant, as they account for 75% of the Eurozone’s economy.
Another significant data release for the Euro is the Trade Balance. This indicator measures the difference between what a country earns from its exports and what it spends on imports over a given period. If a country produces highly sought after exports then its currency will gain in value purely from the extra demand created from foreign buyers seeking to purchase these goods. Therefore, a positive net Trade Balance strengthens a currency and vice versa for a negative balance.
- The Pound Sterling falls to nearly 1.2800 against the US Dollar ahead of the BoE policy meeting.
- Investors expect the BoE will cut interest rates by 25 bps to 5%.
- The US Dollar recovers despite the Fed’s dovish guidance on interest rates.
The Pound Sterling (GBP) faces a sharp selling pressure against its major peers in Thursday’s London session. The British currency weakens ahead of the Bank of England’s (BoE) interest rate decision, which will be announced at 11:00 GMT.
According to Reuters, traders see a 66% chance that the BoE will cut its key borrowing rates by 25 basis points (bps) to 5%, with a 5-4 majority in the Monetary Policy Committee (MPC) vote. The BoE’s rate-cut decision would be the first since March 2020, as the central bank has been maintaining a restrictive monetary policy stance since December 2021 in an attempt to bring inflation down, driven by pandemic-led stimulus.
Market experts see the BoE rate-cut move as a tough call by policymakers as inflation in the service sector at 5.7% is significantly higher than the bank’s forecast of 5.1%. Though annual headline inflation has returned to the bank’s target of 2%, policymakers remain concerned over high service inflation and tightness in the United Kingdom (UK) labor market, which could lift price pressures again.
BoE Chief Economist Huw Pill raised concerns over high service inflation and strong wage growth momentum in his speech before the blackout period of the BoE policy meeting. Pill said service inflation and wage growth showed "uncomfortable strength" despite the return of the headline inflation to 2%, Reuters reported.
Daily digest market movers: Pound Sterling falls sharply while US Dollar bounces back strongly
- The Pound Sterling declines to a three-week low near 1.2800 against the US Dollar (USD) in Thursday’s London session. The GBP/USD pair breaks below the three-day consolidation range as the US Dollar (USD) rises even though the Federal Reserve (Fed) has delivered dovish guidance on interest rates in its monetary policy announcement on Wednesday.
- The US Dollar has bounced back after a Fed policy-inspired sell-off as a dovish guidance was already priced in by market participants. The US Dollar Index (DXY), which tracks the Greenback’s value against six major currencies, moves higher to 104.20 from its intraday low of 103.86.
- The Fed left interest rates unchanged in the range of 5.25%-5.50% for the eighth consecutive meeting and acknowledged that moderation in inflationary pressures in the second quarter had increased their confidence that rate cuts could be on the table in the September meeting. The Fed admitted that risks are now widened to both aspects of dual mandate.
- Fed’s Chair Jerome Powell said, "If we were to see inflation moving down more or less in line with expectations, growth remains reasonably strong, and the labor market remains consistent with current conditions, then I think a rate cut could be on the table at the September meeting”, Reuters reported.
- In Thursday’s session, the United States (US) ISM Manufacturing Purchasing Managers’ Index (PMI) report for July will be under the spotlight, which will be published at 14:00 GMT. The PMI report is expected to show that activities in the manufacturing sector improved, rising to 48.8 from the former reading of 48.5, but remain contracted. A figure below the 50.0 threshold is considered a contraction in factory activities.
Technical Analysis: Pound Sterling drops to near 1.2800
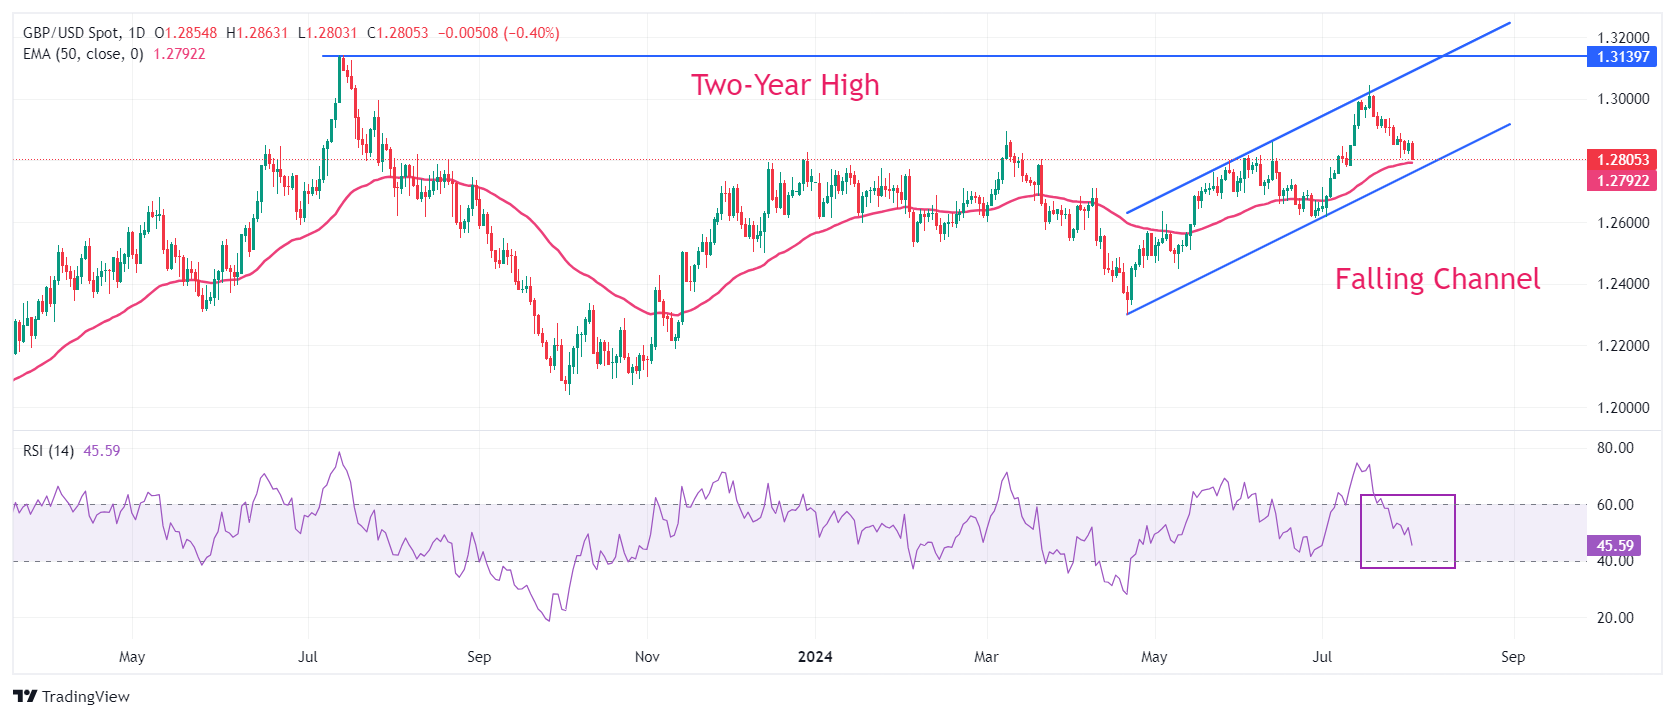
The Pound Sterling comes closer to the lower boundary of a Rising Channel chart pattern on a daily timeframe. The GBP/USD pair fell on the backfoot after breaking below the crucial support of 1.2900. The Cable is an inch away from the 50-day Exponential Moving Average (EMA) near 1.2790, suggesting uncertainty in the near-term trend.
The 14-day Relative Strength Index (RSI) declines toward 40.00, which would a be cushion for the momentum oscillator.
On the downside, the round level of 1.2800 will be a crucial support zone for the Pound Sterling bulls. Meanwhile, a two-year high near 1.3140 will be a key resistance zone for the Cable.
Pound Sterling FAQs
The Pound Sterling (GBP) is the oldest currency in the world (886 AD) and the official currency of the United Kingdom. It is the fourth most traded unit for foreign exchange (FX) in the world, accounting for 12% of all transactions, averaging $630 billion a day, according to 2022 data. Its key trading pairs are GBP/USD, aka ‘Cable’, which accounts for 11% of FX, GBP/JPY, or the ‘Dragon’ as it is known by traders (3%), and EUR/GBP (2%). The Pound Sterling is issued by the Bank of England (BoE).
The single most important factor influencing the value of the Pound Sterling is monetary policy decided by the Bank of England. The BoE bases its decisions on whether it has achieved its primary goal of “price stability” – a steady inflation rate of around 2%. Its primary tool for achieving this is the adjustment of interest rates. When inflation is too high, the BoE will try to rein it in by raising interest rates, making it more expensive for people and businesses to access credit. This is generally positive for GBP, as higher interest rates make the UK a more attractive place for global investors to park their money. When inflation falls too low it is a sign economic growth is slowing. In this scenario, the BoE will consider lowering interest rates to cheapen credit so businesses will borrow more to invest in growth-generating projects.
Data releases gauge the health of the economy and can impact the value of the Pound Sterling. Indicators such as GDP, Manufacturing and Services PMIs, and employment can all influence the direction of the GBP. A strong economy is good for Sterling. Not only does it attract more foreign investment but it may encourage the BoE to put up interest rates, which will directly strengthen GBP. Otherwise, if economic data is weak, the Pound Sterling is likely to fall.
Another significant data release for the Pound Sterling is the Trade Balance. This indicator measures the difference between what a country earns from its exports and what it spends on imports over a given period. If a country produces highly sought-after exports, its currency will benefit purely from the extra demand created from foreign buyers seeking to purchase these goods. Therefore, a positive net Trade Balance strengthens a currency and vice versa for a negative balance.
- WTI is seen consolidating the overnight strong gains amid mixed fundamental cues.
- Middle East tensions act as a tailwind, though renewed USD buying caps the upside.
- The fundamental backdrop favors bulls and should lend support to the black liquid.
West Texas Intermediate (WTI) US crude Oil prices struggle to capitalize on the previous day's strong move up and oscillate in a narrow range through the early European session on Thursday. The commodity currently trades around the $78.00 mark, with bulls awaiting a sustained strength beyond the 200-day Simple Moving Average (SMA) before positioning for any further gains.
Against the backdrop of Israel's retaliation against Iran-backed Lebanese group Hezbollah, the killing of Hamas leader Ismail Haniyeh in Tehran keeps the risk of a broader Middle East conflict in play. This, in turn, raises worries about supply disruptions from the key Oil producing region, which, along with data showing US inventories shrank more than expected for a fifth week in a row, acts as a tailwind for the black liquid.
The Energy Information Administration (EIA), in its report published on Wednesday, stated that crude oil inventories in the US went down by 3.4 million barrels to 433.0 million barrels during the week ending July 26. The reading was well below consensus estimates for a decline of 1.6 million barrels and pointed to strong fuel demand. That said, China's economic woes keep a lid on any meaningful upside for Crude Oil prices.
Apart from this, the emergence of some US Dollar (USD) buying turns out to be another factor holding back traders from placing fresh bullish bets around the USD-denominated commodity. Meanwhile, a goodish USD recovery from a three-week low runs the risk of fizzling out rather quickly amid the Federal Reserve's (Fed) dovish outlook. This suggests that the path of least resistance for Crude Oil prices is to the upside.
WTI Oil FAQs
WTI Oil is a type of Crude Oil sold on international markets. The WTI stands for West Texas Intermediate, one of three major types including Brent and Dubai Crude. WTI is also referred to as “light” and “sweet” because of its relatively low gravity and sulfur content respectively. It is considered a high quality Oil that is easily refined. It is sourced in the United States and distributed via the Cushing hub, which is considered “The Pipeline Crossroads of the World”. It is a benchmark for the Oil market and WTI price is frequently quoted in the media.
Like all assets, supply and demand are the key drivers of WTI Oil price. As such, global growth can be a driver of increased demand and vice versa for weak global growth. Political instability, wars, and sanctions can disrupt supply and impact prices. The decisions of OPEC, a group of major Oil-producing countries, is another key driver of price. The value of the US Dollar influences the price of WTI Crude Oil, since Oil is predominantly traded in US Dollars, thus a weaker US Dollar can make Oil more affordable and vice versa.
The weekly Oil inventory reports published by the American Petroleum Institute (API) and the Energy Information Agency (EIA) impact the price of WTI Oil. Changes in inventories reflect fluctuating supply and demand. If the data shows a drop in inventories it can indicate increased demand, pushing up Oil price. Higher inventories can reflect increased supply, pushing down prices. API’s report is published every Tuesday and EIA’s the day after. Their results are usually similar, falling within 1% of each other 75% of the time. The EIA data is considered more reliable, since it is a government agency.
OPEC (Organization of the Petroleum Exporting Countries) is a group of 13 Oil-producing nations who collectively decide production quotas for member countries at twice-yearly meetings. Their decisions often impact WTI Oil prices. When OPEC decides to lower quotas, it can tighten supply, pushing up Oil prices. When OPEC increases production, it has the opposite effect. OPEC+ refers to an expanded group that includes ten extra non-OPEC members, the most notable of which is Russia.
- USD/MXN receives support due to increased risk-off sentiment ahead of the ISM PMI release on Thursday.
- The US Dollar advances as Treasury yields rebound from multi-month lows.
- The Mexican Peso may struggle as a slowing economy reinforces the dovish sentiment surrounding the Banxico.
USD/MXN retraces its recent losses from the previous session, trading around 18.70 during the early European hours on Thursday. The US Dollar (USD) receives support from a correction in Treasury yields, underpinning the USD/MXN pair.
However, this upside of the USD/MXN pair could be limited due to the dovish sentiment surrounding the Federal Reserve’s (Fed) policy trajectory. Fed decided to keep rates unchanged in the 5.25%-5.50% range at its July meeting on Wednesday.
The US Dollar Index (DXY), which measures the value of the US Dollar (USD) against six other major currencies, trades around 104.10 with 2-year and 10-year yields on US Treasury bonds standing at 4.28% and 4.05%, respectively, at the time of writing.
During a press conference post-interest rate decision, Federal Reserve Chair Jerome Powell stated that a rate cut in September is "on the table," while the Federal Open Market Committee (FOMC) did not want to commit to anything in the statement. Powell added that the central bank will closely monitor the labor market and remain vigilant for signs of a potential sharp downturn, per Reuters.
The Mexican Peso (MXN) weakened as concerns over a slowing economy fueled speculation about a more dovish stance from the Bank of Mexico (Banxico). Recent data showed that Mexico's Gross Domestic Product (GDP) grew by just 0.2% in the second quarter ending in June, down from the 0.3% growth recorded in the previous quarter.
Additionally, the Fiscal Balance showed a deficit of 166.74 billion Pesos in June, a decrease from the previous deficit of 174.89 billion Pesos.
Traders anticipate further direction from upcoming US economic data, including the ISM Manufacturing PMI and weekly Initial Jobless Claims, both set to be released later on Thursday. Meanwhile, Mexico's Jobless Rate data will be announced on Friday.
Mexican Peso FAQs
The Mexican Peso (MXN) is the most traded currency among its Latin American peers. Its value is broadly determined by the performance of the Mexican economy, the country’s central bank’s policy, the amount of foreign investment in the country and even the levels of remittances sent by Mexicans who live abroad, particularly in the United States. Geopolitical trends can also move MXN: for example, the process of nearshoring – or the decision by some firms to relocate manufacturing capacity and supply chains closer to their home countries – is also seen as a catalyst for the Mexican currency as the country is considered a key manufacturing hub in the American continent. Another catalyst for MXN is Oil prices as Mexico is a key exporter of the commodity.
The main objective of Mexico’s central bank, also known as Banxico, is to maintain inflation at low and stable levels (at or close to its target of 3%, the midpoint in a tolerance band of between 2% and 4%). To this end, the bank sets an appropriate level of interest rates. When inflation is too high, Banxico will attempt to tame it by raising interest rates, making it more expensive for households and businesses to borrow money, thus cooling demand and the overall economy. Higher interest rates are generally positive for the Mexican Peso (MXN) as they lead to higher yields, making the country a more attractive place for investors. On the contrary, lower interest rates tend to weaken MXN.
Macroeconomic data releases are key to assess the state of the economy and can have an impact on the Mexican Peso (MXN) valuation. A strong Mexican economy, based on high economic growth, low unemployment and high confidence is good for MXN. Not only does it attract more foreign investment but it may encourage the Bank of Mexico (Banxico) to increase interest rates, particularly if this strength comes together with elevated inflation. However, if economic data is weak, MXN is likely to depreciate.
As an emerging-market currency, the Mexican Peso (MXN) tends to strive during risk-on periods, or when investors perceive that broader market risks are low and thus are eager to engage with investments that carry a higher risk. Conversely, MXN tends to weaken at times of market turbulence or economic uncertainty as investors tend to sell higher-risk assets and flee to the more-stable safe havens.
Here is what you need to know on Thursday, August 1:
Following a volatile American session that featured the Federal Reserve's (Fed) policy announcements and Fed Chairman Jerome Powell's press conference, market attention shifts to the Bank of England's (BoE) rate decision on Thursday. In the second half of the day, weekly Initial Jobless Claims, second-quarter Unit Labor Costs and ISM Manufacturing PMI data for July will be featured in the US economic docket.
US Dollar PRICE This week
The table below shows the percentage change of US Dollar (USD) against listed major currencies this week. US Dollar was the weakest against the Japanese Yen.
| USD | EUR | GBP | JPY | CAD | AUD | NZD | CHF | |
|---|---|---|---|---|---|---|---|---|
| USD | 0.45% | 0.58% | -2.47% | -0.08% | 0.31% | -0.99% | -0.80% | |
| EUR | -0.45% | 0.09% | -2.92% | -0.51% | -0.09% | -1.45% | -1.22% | |
| GBP | -0.58% | -0.09% | -3.05% | -0.60% | -0.19% | -1.52% | -1.31% | |
| JPY | 2.47% | 2.92% | 3.05% | 2.43% | 2.89% | 1.53% | 1.75% | |
| CAD | 0.08% | 0.51% | 0.60% | -2.43% | 0.43% | -0.93% | -0.69% | |
| AUD | -0.31% | 0.09% | 0.19% | -2.89% | -0.43% | -1.32% | -1.13% | |
| NZD | 0.99% | 1.45% | 1.52% | -1.53% | 0.93% | 1.32% | 0.21% | |
| CHF | 0.80% | 1.22% | 1.31% | -1.75% | 0.69% | 1.13% | -0.21% |
The heat map shows percentage changes of major currencies against each other. The base currency is picked from the left column, while the quote currency is picked from the top row. For example, if you pick the US Dollar from the left column and move along the horizontal line to the Japanese Yen, the percentage change displayed in the box will represent USD (base)/JPY (quote).
The Fed left its monetary policy settings unchanged following the July 30-31 policy meeting, as expected. In the post-meeting press conference, Chairman Powell noted that there was a "real discussion" about the case for reducing rates at this meeting. He added that a strong majority supported not moving rates at the meeting but said that a rate cut could be on the table in September. The US Dollar (USD) Index came under bearish pressure following these comments and lost 0.4% on a daily basis. Early Thursday, the index stages a technical rebound and trades modestly higher on the day above 104.00. Meanwhile, US stock index futures trade marginally higher following the risk rally seen on Wednesday. Finally, the benchmark 10-year US Treasury bond yield fluctuates above 4% after touching its weakest level since February with a daily loss of more than 2%.
The BoE is forecast to lower the policy rate by 25 basis points to 5%. There is, however, still a strong chance that the BoE could opt to maintain the bank rate. Hence, Pound Sterling's volatility could ramp up, depending on the BoE announcements and vote split. At 11:30 GMT, BoE Governor Andrew Bailey will speak at a press conference and respond to questions from the press. GBP/USD benefited srom the selling pressure surrounding the USD and registered small gains on Wednesday. The pair stays on the back foot early Thursday and was last seen trading at its lowest level in three weeks below 1.2800.
The Japanese Yen rallied against its major rivals following the Bank of Japan's unexpected decision to raise its policy rate on Wednesday. After losing nearly 2% on Wednesday, USD/JPY extended its slide and touched its lowest level since mid-March near 148.50 during the Asian trading hours on Thursday. Heading into the European session, the pair staged a rebound and was last seen trading little changed on the day at around 150.00.
EUR/USD posted marginal gains on Wednesday but failed to preserve its bullish momentum. The pair struggles to regain its traction in the European morning and trades in the red slightly above 1.0800.
After rising more than 1% on Wednesday, Gold extended its rally and gained 1.5% on Thursday. After touching a two-week-high of $2,458 in the Asian session on Thursday, XAU/USD went into a consolidation phase and was last seen trading little changed on the day near $2,445.
BoE FAQs
The Bank of England (BoE) decides monetary policy for the United Kingdom. Its primary goal is to achieve ‘price stability’, or a steady inflation rate of 2%. Its tool for achieving this is via the adjustment of base lending rates. The BoE sets the rate at which it lends to commercial banks and banks lend to each other, determining the level of interest rates in the economy overall. This also impacts the value of the Pound Sterling (GBP).
When inflation is above the Bank of England’s target it responds by raising interest rates, making it more expensive for people and businesses to access credit. This is positive for the Pound Sterling because higher interest rates make the UK a more attractive place for global investors to park their money. When inflation falls below target, it is a sign economic growth is slowing, and the BoE will consider lowering interest rates to cheapen credit in the hope businesses will borrow to invest in growth-generating projects – a negative for the Pound Sterling.
In extreme situations, the Bank of England can enact a policy called Quantitative Easing (QE). QE is the process by which the BoE substantially increases the flow of credit in a stuck financial system. QE is a last resort policy when lowering interest rates will not achieve the necessary result. The process of QE involves the BoE printing money to buy assets – usually government or AAA-rated corporate bonds – from banks and other financial institutions. QE usually results in a weaker Pound Sterling.
Quantitative tightening (QT) is the reverse of QE, enacted when the economy is strengthening and inflation starts rising. Whilst in QE the Bank of England (BoE) purchases government and corporate bonds from financial institutions to encourage them to lend; in QT, the BoE stops buying more bonds, and stops reinvesting the principal maturing on the bonds it already holds. It is usually positive for the Pound Sterling.
- EUR/GBP gains ground around 0.8450 in Thursday’s early European session, gaining 0.35% on the day.
- Expectations for a rate cut by the BoE remain divided.
- An increase in Eurozone inflation raised doubts about the pace of ECB rate cuts this year.
The EUR/GBP cross trades on a stronger note near 0.8450 during the early European session on Thursday. The uptick of the cross is supported by the hotter-than-expected Eurozone inflation data, which raises doubt on the prospect of European Central Bank (ECB) interest rate cuts in September. Later in the day, the Bank of England (BoE) interest rate decision will take centre stage.
Consensus among market players is somewhat split over the upcoming interest rate announcement by the BoE on Thursday. The markets were pricing in a 66% odds of a quarter-point cut by the UK central bank and then expected one more quarter-point cut before the end of the year.
“It’s certainly going to be a finely balanced decision. You can see that from the market pricing,” said Jack Meaning, chief UK economist at Barclays. In the event of an unexpected rate cut, the Pound Sterling (GBP) might face some selling pressure, which acts as a tailwind for EUR/GBP.
On the other hand, a rise in Eurozone inflation on Wednesday raised questions about the number of rate reductions by the European Central Bank this year. However, Pictet Wealth Management economist, Frederik Ducrozet. said that hotter inflation data in July was “not much to worry about, but will keep the ECB on the cautious side." The ECB decided to cut its key lending rates in June, with another two reductions expected before the end of the year.
The first reading of the Harmonised Index of Consumer Prices (HICP) in the Eurozone climbed by 2.6% year-on-year in July, compared to 2.5% in June, exceeding expectations of 2.4%, Eurostat reported on Wednesday. Meanwhile, the core HICP inflation holds steady at 2.9% YoY in July and above the market consensus of 2.8%.
BoE FAQs
The Bank of England (BoE) decides monetary policy for the United Kingdom. Its primary goal is to achieve ‘price stability’, or a steady inflation rate of 2%. Its tool for achieving this is via the adjustment of base lending rates. The BoE sets the rate at which it lends to commercial banks and banks lend to each other, determining the level of interest rates in the economy overall. This also impacts the value of the Pound Sterling (GBP).
When inflation is above the Bank of England’s target it responds by raising interest rates, making it more expensive for people and businesses to access credit. This is positive for the Pound Sterling because higher interest rates make the UK a more attractive place for global investors to park their money. When inflation falls below target, it is a sign economic growth is slowing, and the BoE will consider lowering interest rates to cheapen credit in the hope businesses will borrow to invest in growth-generating projects – a negative for the Pound Sterling.
In extreme situations, the Bank of England can enact a policy called Quantitative Easing (QE). QE is the process by which the BoE substantially increases the flow of credit in a stuck financial system. QE is a last resort policy when lowering interest rates will not achieve the necessary result. The process of QE involves the BoE printing money to buy assets – usually government or AAA-rated corporate bonds – from banks and other financial institutions. QE usually results in a weaker Pound Sterling.
Quantitative tightening (QT) is the reverse of QE, enacted when the economy is strengthening and inflation starts rising. Whilst in QE the Bank of England (BoE) purchases government and corporate bonds from financial institutions to encourage them to lend; in QT, the BoE stops buying more bonds, and stops reinvesting the principal maturing on the bonds it already holds. It is usually positive for the Pound Sterling.
- USD/CAD regains positive traction amid the emergence of some USD dip-buying.
- The Fed’s dovish stance drags the US bond yields lower and should cap the USD.
- A positive risk tone and the overnight rally in Oil prices warrant caution for bulls.
The USD/CAD pair attracts some dip-buyers on Thursday and moves away from a one-week trough, around the 1.3785 region touched the previous day. Spot prices currently trade around the 1.3815-1.3820 zone and seem to draw support from a goodish pickup in the US Dollar (USD) demand.
The USD Index (DXY), which tracks the Greenback against a basket of currencies, rebounds from the vicinity of a three-week low touched in the aftermath of the FOMC policy decision on Wednesday. The upside for the USD, however, seems limited in the wake of the Federal Reserve's (Fed) dovish outlook, signaling the likelihood of an early rate cut if inflation stays in line with expectations.
In fact, the US central bank acknowledged the recent progress on inflation and cooling in the labor market, opening the door for an imminent start of the rate-cutting cycle in September. This, in turn, drags the US Treasury bond yields to a multi-month low, which, along with a generally positive risk tone should cap gains for the safe-haven buck and act as a headwind for the USD/CAD pair.
Meanwhile, Crude Oil prices consolidate the previous day's strong gains amid the risk of a further escalation of tensions in the Middle East, which continues to fuel worries about supply disruptions from the key Oil producing region. This, in turn, could underpin the commodity-linked Loonie and contribute to capping the upside for the USD/CAD pair, warranting some caution for bullish traders.
There isn't any relevant market-moving economic data due for release on Thursday, either from the US or Canada, leaving spot prices at the mercy of the USD and Oil price dynamics. The focus, meanwhile, remains glued to the closely-watched US monthly employment details, popularly known as the Nonfarm Payrolls (NFP) report, due on Friday.
Canadian Dollar FAQs
The key factors driving the Canadian Dollar (CAD) are the level of interest rates set by the Bank of Canada (BoC), the price of Oil, Canada’s largest export, the health of its economy, inflation and the Trade Balance, which is the difference between the value of Canada’s exports versus its imports. Other factors include market sentiment – whether investors are taking on more risky assets (risk-on) or seeking safe-havens (risk-off) – with risk-on being CAD-positive. As its largest trading partner, the health of the US economy is also a key factor influencing the Canadian Dollar.
The Bank of Canada (BoC) has a significant influence on the Canadian Dollar by setting the level of interest rates that banks can lend to one another. This influences the level of interest rates for everyone. The main goal of the BoC is to maintain inflation at 1-3% by adjusting interest rates up or down. Relatively higher interest rates tend to be positive for the CAD. The Bank of Canada can also use quantitative easing and tightening to influence credit conditions, with the former CAD-negative and the latter CAD-positive.
The price of Oil is a key factor impacting the value of the Canadian Dollar. Petroleum is Canada’s biggest export, so Oil price tends to have an immediate impact on the CAD value. Generally, if Oil price rises CAD also goes up, as aggregate demand for the currency increases. The opposite is the case if the price of Oil falls. Higher Oil prices also tend to result in a greater likelihood of a positive Trade Balance, which is also supportive of the CAD.
While inflation had always traditionally been thought of as a negative factor for a currency since it lowers the value of money, the opposite has actually been the case in modern times with the relaxation of cross-border capital controls. Higher inflation tends to lead central banks to put up interest rates which attracts more capital inflows from global investors seeking a lucrative place to keep their money. This increases demand for the local currency, which in Canada’s case is the Canadian Dollar.
Macroeconomic data releases gauge the health of the economy and can have an impact on the Canadian Dollar. Indicators such as GDP, Manufacturing and Services PMIs, employment, and consumer sentiment surveys can all influence the direction of the CAD. A strong economy is good for the Canadian Dollar. Not only does it attract more foreign investment but it may encourage the Bank of Canada to put up interest rates, leading to a stronger currency. If economic data is weak, however, the CAD is likely to fall.
- The US Dollar receives support as Treasury yields rebound from multi-month lows.
- The upside of the Greenback could be limited due to the dovish sentiment surrounding the Fed’s policy trajectory.
- Fed Chair Jerome Powell stated that a rate cut in September is "on the table.”
The US Dollar Index (DXY), which measures the value of the US Dollar (USD) against six other major currencies, recovers its intraday losses due to a recovery in US Treasury yields. The DXY trades around 104.10 with 2-year and 10-year yields on US Treasury bonds standing at 4.28% and 4.05%, respectively, during the Asian session on Thursday.
The US Dollar faced challenges due to the dovish sentiment surrounding the Federal Reserve’s (Fed) policy trajectory. Fed decided to keep rates unchanged in the 5.25%-5.50% range at its July meeting on Wednesday.
On the data front, traders await further direction from the US economic data including ISM Manufacturing PMI and weekly Initial Jobless Claims, which are scheduled for release later on Thursday. On Wednesday, US ADP Employment Change rose 122,000 in July and annual pay was up 4.8% year-over-year, data reported on Wednesday. This reading followed the 155,000 increase (revised from 150,000) recorded in June and came in below the market expectation of 150,000.
During a press conference post-interest rate decision, Federal Reserve Chair Jerome Powell stated that a rate cut in September is "on the table," while the Federal Open Market Committee (FOMC) did not want to commit to anything in the statement. Powell added that the central bank will closely monitor the labor market and remain vigilant for signs of a potential sharp downturn, per Reuters.
However, the FOMC indicated in its statement that it does not foresee cutting rates until it has greater confidence that inflation is sustainably heading toward 2%. They require more progress on inflation before considering a cut in September unless a significant decline in the labor market begins to outweigh the slow progress on inflation.
US Dollar FAQs
The US Dollar (USD) is the official currency of the United States of America, and the ‘de facto’ currency of a significant number of other countries where it is found in circulation alongside local notes. It is the most heavily traded currency in the world, accounting for over 88% of all global foreign exchange turnover, or an average of $6.6 trillion in transactions per day, according to data from 2022. Following the second world war, the USD took over from the British Pound as the world’s reserve currency. For most of its history, the US Dollar was backed by Gold, until the Bretton Woods Agreement in 1971 when the Gold Standard went away.
The most important single factor impacting on the value of the US Dollar is monetary policy, which is shaped by the Federal Reserve (Fed). The Fed has two mandates: to achieve price stability (control inflation) and foster full employment. Its primary tool to achieve these two goals is by adjusting interest rates. When prices are rising too quickly and inflation is above the Fed’s 2% target, the Fed will raise rates, which helps the USD value. When inflation falls below 2% or the Unemployment Rate is too high, the Fed may lower interest rates, which weighs on the Greenback.
In extreme situations, the Federal Reserve can also print more Dollars and enact quantitative easing (QE). QE is the process by which the Fed substantially increases the flow of credit in a stuck financial system. It is a non-standard policy measure used when credit has dried up because banks will not lend to each other (out of the fear of counterparty default). It is a last resort when simply lowering interest rates is unlikely to achieve the necessary result. It was the Fed’s weapon of choice to combat the credit crunch that occurred during the Great Financial Crisis in 2008. It involves the Fed printing more Dollars and using them to buy US government bonds predominantly from financial institutions. QE usually leads to a weaker US Dollar.
Quantitative tightening (QT) is the reverse process whereby the Federal Reserve stops buying bonds from financial institutions and does not reinvest the principal from the bonds it holds maturing in new purchases. It is usually positive for the US Dollar.
- EUR/JPY extends its downside near 162.25 in Thursday’s early European session.
- The cross is below the key 100-period EMA with an oversold RSI condition.
- The key support level is seen at the 162.00 psychological mark; the first upside barrier emerges at 164.85.
The EUR/JPY cross trades in negative territory for the fourth consecutive day around 162.25 on Thursday during the early European session. The Japanese Yen (JPY) gains momentum against the Euro (EUR), bolstered by a surprise hawkish policy announcement of the Bank of Japan (BoJ) on Wednesday.
The BoJ decided to raise its short-term policy rate to 0.25% from 0-0.1%, the largest since 2008. Additionally, the Japanese central bank stated that it will taper the Japanese government bonds to about 3 trillion yen ($19.64 billion) per month in the January to March 2026 quarter.
EUR/JPY keeps the bearish vibe unchanged on the 4-hour chart as it holds below the key 100-period Exponential Moving Average (EMA). The Relative Strength Index (RSI) holds in bearish territory below the midline. However, the oversold RSI condition indicates that further consolidation cannot be ruled out before positioning for any near-term EUR/JPY depreciation.
The crucial support level for the cross will emerge at the 162.00 psychological mark. Extended losses will see a drop to the 161.00-161.10 region, portraying the lower limit of the Bollinger Band and round figure. The additional downside filter to watch is 160.22, a low of March 11.
On the upside, the immediate resistance level for the cross is seen near 164.85, a low of July 25. Further north, the next hurdle is located at 167.88, a high of July 30. Any follow-through buying above this level could expose the 100-period EMA at 168.55, followed by the upper boundary of the Bollinger Band around 169.12.
EUR/JPY 4-hour chart
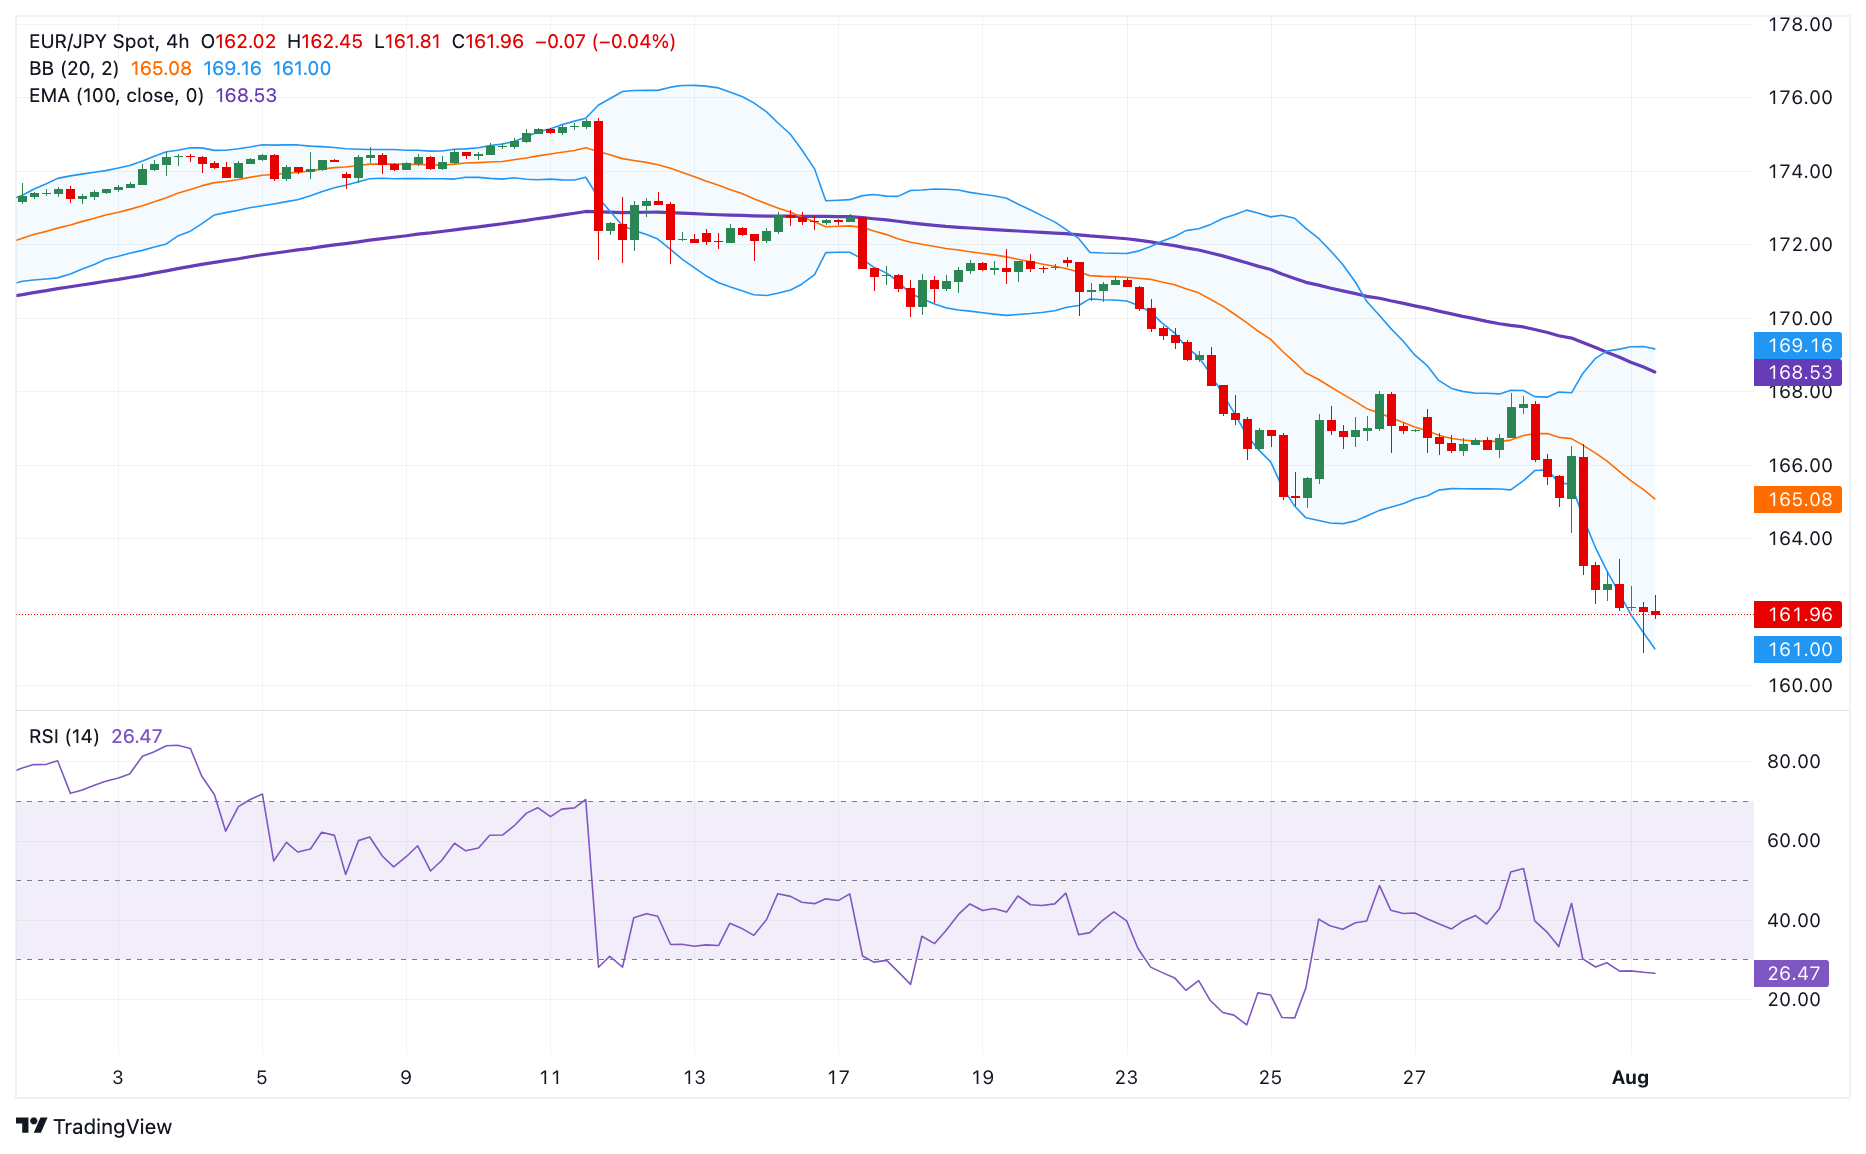
Japanese Yen FAQs
The Japanese Yen (JPY) is one of the world’s most traded currencies. Its value is broadly determined by the performance of the Japanese economy, but more specifically by the Bank of Japan’s policy, the differential between Japanese and US bond yields, or risk sentiment among traders, among other factors.
One of the Bank of Japan’s mandates is currency control, so its moves are key for the Yen. The BoJ has directly intervened in currency markets sometimes, generally to lower the value of the Yen, although it refrains from doing it often due to political concerns of its main trading partners. The current BoJ ultra-loose monetary policy, based on massive stimulus to the economy, has caused the Yen to depreciate against its main currency peers. This process has exacerbated more recently due to an increasing policy divergence between the Bank of Japan and other main central banks, which have opted to increase interest rates sharply to fight decades-high levels of inflation.
The BoJ’s stance of sticking to ultra-loose monetary policy has led to a widening policy divergence with other central banks, particularly with the US Federal Reserve. This supports a widening of the differential between the 10-year US and Japanese bonds, which favors the US Dollar against the Japanese Yen.
The Japanese Yen is often seen as a safe-haven investment. This means that in times of market stress, investors are more likely to put their money in the Japanese currency due to its supposed reliability and stability. Turbulent times are likely to strengthen the Yen’s value against other currencies seen as more risky to invest in.
FX option expiries for Aug 1 NY cut at 10:00 Eastern Time, via DTCC, can be found below.
EUR/USD: EUR amounts
- 1.0700 2b
- 1.0725 652m
- 1.0750 716m
- 1.0765 798m
- 1.0785 1.1b
- 1.0800 980m
- 1.0825 915m
- 1.0850 3b
- 1.0880 963m
- 1.0980 1.1b
GBP/USD: GBP amounts
- 1.2800 519m
- 1.2850 753m
USD/JPY: USD amounts
- 148.00 715m
- 151.00 1.1b
- 152.00 792m
- 153.00 730m
- 154.00 1.1b
- 155.00 622m
USD/CHF: USD amounts
- 0.8985 490m
- 0.9000 431m
AUD/USD: AUD amounts
- 0.6450 1.2b
- 0.6560 812m
- 0.6620 436m
- 0.6700 402m
USD/CAD: USD amounts
- 1.3725 554m
- 1.3795 580m
EUR/GBP: EUR amounts
- 0.8420 997m
- Odds for a rate cut by the Bank of England remain divided.
- UK disinflationary pressure stalled in June.
- GBP/USD appears to be supported so far by 1.2800 region.
Consensus among market participants appears pretty divided around the imminent interest rate decision by the Bank of England (BoE) arriving on Thursday. It is worth recalling that the central bank maintained its policy rate unchanged at 5.25% in the last seven meetings, although renewed repricing by investors seems to favour a potential 25 bps rate cut this week.
The BoE’s MPC vote is expected to be a close call
The Bank of England's policy decision is expected to be a close call, while market pricing is now signalling a 63% probability for a quarter-point cut, and the Monetary Policy Committee (MPC) vote could come as close as 5-4 in favouring a reduction of the central bank’s rate.
Let’s remember that at the June gathering, the MPC decided to keep rates unchanged with a 7-2 vote. However, those who voted to hold rates indicated that their decision was “finely balanced," hinting at the idea that a rate cut could be in the offing.
Disinflationary pressure seems to have hit a wall in June after the headline Consumer Price Index (CPI) rose by 2.0% over the previous 12 months, matching May’s reading. The core CPI, which excludes food and energy costs, also matched the previous month’s prints, advancing by 3.5%.
In the same line, service inflation rose by 5.7% YoY from a year earlier and remains quite above the central bank’s 5.1% projection.
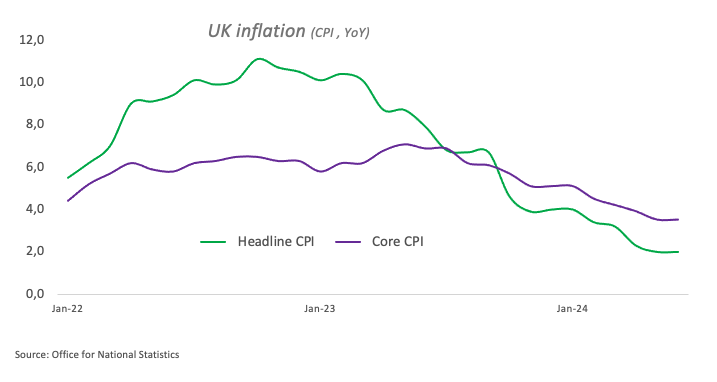
Still around inflation, the BoE’s Chief Economist, Huw Pill, argued that the bank was nearing a decision to cut interest rates, though service price inflation and wage growth remained troublingly high. It is worth noting that Pill joined the majority of his colleagues in June in voting to keep interest rates at 5.25%.
Her colleague Catherine Mann emphasized the strong price pressure in the UK economy, signalling that she is unlikely to support an interest rate cut in August. Mann added that the recent drop in domestic inflation was merely "touch and go" and predicted that inflation would likely exceed that rate for the remainder of the year.
Favouring a rate cut this week, Rabobank’s Senior Macro Strategist Stefan Koopman said, “We anticipate a 25bp cut to the Bank rate, bringing it to 5.00%, marking the start of a gradual easing cycle with 25bp cuts each quarter. However, there is a risk that officials may want to see another month of data first.”
Additionally, analysts at TD Securities argued, “We expect a 25bps cut at the August MPC meeting, with a narrow 5-4 vote. That said, uncertainty is high, not only due to sticky service inflation prints but also due to compositional changes on the committee. The message will likely be a cautious one, as the MPC should not want to signal consecutive cuts at this stage.”
How will the BoE interest rate decision impact GBP/USD?
Despite disinflationary pressures losing momentum in June, market participants seem to lean toward a rate cut at the BoE’s monetary policy meeting on August 1 at 11 GMT.
FXStreet Senior Analyst Pablo Piovano sees the British Pound coming under renewed downside pressure in the event of a rate cut, as such a scenario is only partially supported by market forecasts.
Pablo adds that the GBP/USD rally experienced in the first half of July that lifted Cable to fresh 2024 peaks near 1.3050 was almost exclusively on the back of accelerated weakness in the US Dollar (USD) following investors’ repricing of a rate cut by the Federal Reserve (Fed) in September.
Against that backdrop, extra losses could motivate GBP/USD to break below the weekly low of 1.2806 (July 29) and challenge the provisional support at the 55-day and 100-day SMAs at 1.2776 and 1.2682, respectively. The breach of that region exposes a probable slide to the July low of 1.2615 (July 2), which appears reinforced by the proximity of the key 200-day SMA (1.2836).
On the upside, Pablo sees the initial stop for bulls at the 2024 peak of 1.3044 (July 17).
Economic Indicator
BoE Interest Rate Decision
The Bank of England (BoE) announces its interest rate decision at the end of its eight scheduled meetings per year. If the BoE is hawkish about the inflationary outlook of the economy and raises interest rates it is usually bullish for the Pound Sterling (GBP). Likewise, if the BoE adopts a dovish view on the UK economy and keeps interest rates unchanged, or cuts them, it is seen as bearish for GBP.
Read more.Last release: Thu Jun 20, 2024 11:00
Frequency: Irregular
Actual: 5.25%
Consensus: 5.25%
Previous: 5.25%
Source: Bank of England
BoE FAQs
The Bank of England (BoE) decides monetary policy for the United Kingdom. Its primary goal is to achieve ‘price stability’, or a steady inflation rate of 2%. Its tool for achieving this is via the adjustment of base lending rates. The BoE sets the rate at which it lends to commercial banks and banks lend to each other, determining the level of interest rates in the economy overall. This also impacts the value of the Pound Sterling (GBP).
When inflation is above the Bank of England’s target it responds by raising interest rates, making it more expensive for people and businesses to access credit. This is positive for the Pound Sterling because higher interest rates make the UK a more attractive place for global investors to park their money. When inflation falls below target, it is a sign economic growth is slowing, and the BoE will consider lowering interest rates to cheapen credit in the hope businesses will borrow to invest in growth-generating projects – a negative for the Pound Sterling.
In extreme situations, the Bank of England can enact a policy called Quantitative Easing (QE). QE is the process by which the BoE substantially increases the flow of credit in a stuck financial system. QE is a last resort policy when lowering interest rates will not achieve the necessary result. The process of QE involves the BoE printing money to buy assets – usually government or AAA-rated corporate bonds – from banks and other financial institutions. QE usually results in a weaker Pound Sterling.
Quantitative tightening (QT) is the reverse of QE, enacted when the economy is strengthening and inflation starts rising. Whilst in QE the Bank of England (BoE) purchases government and corporate bonds from financial institutions to encourage them to lend; in QT, the BoE stops buying more bonds, and stops reinvesting the principal maturing on the bonds it already holds. It is usually positive for the Pound Sterling.
The Bank of Japan (BoJ) published a full version of its Quarterly Outlook Report on Thursday, highlighting that “there is chance wages, inflation may overshoot expectations, accompanied by heightening inflation expectations and tight labor market.”
Additional takeaways
Price-setting behavior changing in service-sector firms as a whole.
Must scrutinize whether this year's strong wage negotiation outcome would be reflected in service prices.
Big firms' positive wage-setting behaviour spreading steadily to smaller firms.
Market reaction
USD/JPY was last seen trading down 0.09% on the day at 149.80, unperturbed by the above headlines.
Gold prices remained broadly unchanged in India on Thursday, according to data compiled by FXStreet.
The price for Gold stood at 6,584.77 Indian Rupees (INR) per gram, broadly stable compared with the INR 6,586.71 it cost on Wednesday.
The price for Gold was broadly steady at INR 76,803.48 per tola from INR 76,826.09 per tola a day earlier.
| Unit measure | Gold Price in INR |
|---|---|
| 1 Gram | 6,584.77 |
| 10 Grams | 65,847.72 |
| Tola | 76,803.48 |
| Troy Ounce | 204,811.10 |
FXStreet calculates Gold prices in India by adapting international prices (USD/INR) to the local currency and measurement units. Prices are updated daily based on the market rates taken at the time of publication. Prices are just for reference and local rates could diverge slightly.
Gold FAQs
Gold has played a key role in human’s history as it has been widely used as a store of value and medium of exchange. Currently, apart from its shine and usage for jewelry, the precious metal is widely seen as a safe-haven asset, meaning that it is considered a good investment during turbulent times. Gold is also widely seen as a hedge against inflation and against depreciating currencies as it doesn’t rely on any specific issuer or government.
Central banks are the biggest Gold holders. In their aim to support their currencies in turbulent times, central banks tend to diversify their reserves and buy Gold to improve the perceived strength of the economy and the currency. High Gold reserves can be a source of trust for a country’s solvency. Central banks added 1,136 tonnes of Gold worth around $70 billion to their reserves in 2022, according to data from the World Gold Council. This is the highest yearly purchase since records began. Central banks from emerging economies such as China, India and Turkey are quickly increasing their Gold reserves.
Gold has an inverse correlation with the US Dollar and US Treasuries, which are both major reserve and safe-haven assets. When the Dollar depreciates, Gold tends to rise, enabling investors and central banks to diversify their assets in turbulent times. Gold is also inversely correlated with risk assets. A rally in the stock market tends to weaken Gold price, while sell-offs in riskier markets tend to favor the precious metal.
The price can move due to a wide range of factors. Geopolitical instability or fears of a deep recession can quickly make Gold price escalate due to its safe-haven status. As a yield-less asset, Gold tends to rise with lower interest rates, while higher cost of money usually weighs down on the yellow metal. Still, most moves depend on how the US Dollar (USD) behaves as the asset is priced in dollars (XAU/USD). A strong Dollar tends to keep the price of Gold controlled, whereas a weaker Dollar is likely to push Gold prices up.
(An automation tool was used in creating this post.)
- USD/CHF drifts lower for the third straight day amid the post-FOMC USD selling bias.
- Geopolitical risks further benefit the safe-haven CHF and contribute to the downfall.
- A positive risk tone holds back bearish traders from placing fresh and helps limit losses.
The USD/CHF pair remains under some selling pressure for the third successive day on Thursday and drops to its lowest level since March 13, around the 0.8760 region during the Asian session. The downfall validates the overnight breakdown through the 0.8800 round figure and is sponsored by the post-FOMC US Dollar (USD) selling bias.
The Federal Reserve (Fed) decided to hold its benchmark interest rate steady in the 5.25%-5.50% range while acknowledging the recent progress on inflation and cooling in the labor market. Furthermore, Fed Chair Jerome Powell, speaking at the post-meeting press conference, signaled the likelihood of an early rate cut if inflation stays in line with expectations. This, in turn, drags the US Treasury bond yields to a multi-month low, which keeps the USD bulls on the defensive near a three-week low and turns out to be a key factor exerting pressure on the USD/CHF pair.
The Swiss Franc (CHF), on the other hand, attracts some haven flows in the wake of the risk of a further escalation of geopolitical risks in the Middle East. Meanwhile, the prospects for an imminent start of the Fed's policy-easing cycle trigger a fresh leg up in the equity markets. This might keep a lid on any meaningful appreciating move for the CHF and help limit the downside for the USD/CHF pair. Nevertheless, the aforementioned fundamental backdrop favors bearish traders and suggests that the path of least resistance for spot prices is to the downside.
That said, investors are likely to wait for the release of the closely-watched US monthly employment details – popularly known as the Nonfarm Payrolls (NFP) report on Friday – before placing fresh bets. In the meantime, the USD/CHF pair remains at the mercy of the USD price dynamics and the broader risk sentiment in the absence of any relevant market-moving economic data from the US on Thursday.
US Dollar PRICE Today
The table below shows the percentage change of US Dollar (USD) against listed major currencies today. US Dollar was the strongest against the Australian Dollar.
| USD | EUR | GBP | JPY | CAD | AUD | NZD | CHF | |
|---|---|---|---|---|---|---|---|---|
| USD | -0.00% | 0.04% | -0.19% | -0.00% | 0.19% | -0.04% | -0.12% | |
| EUR | 0.00% | 0.04% | -0.21% | -0.01% | 0.21% | -0.03% | -0.12% | |
| GBP | -0.04% | -0.04% | -0.25% | -0.03% | 0.16% | -0.07% | -0.16% | |
| JPY | 0.19% | 0.21% | 0.25% | 0.20% | 0.41% | 0.12% | 0.05% | |
| CAD | 0.00% | 0.01% | 0.03% | -0.20% | 0.21% | -0.03% | -0.12% | |
| AUD | -0.19% | -0.21% | -0.16% | -0.41% | -0.21% | -0.23% | -0.33% | |
| NZD | 0.04% | 0.03% | 0.07% | -0.12% | 0.03% | 0.23% | -0.09% | |
| CHF | 0.12% | 0.12% | 0.16% | -0.05% | 0.12% | 0.33% | 0.09% |
The heat map shows percentage changes of major currencies against each other. The base currency is picked from the left column, while the quote currency is picked from the top row. For example, if you pick the US Dollar from the left column and move along the horizontal line to the Japanese Yen, the percentage change displayed in the box will represent USD (base)/JPY (quote).
- EUR/USD trades in positive territory for the second consecutive day around 1.0835 in Thursday’s early Asian session.
- Fed left interest rate unchanged on Wednesday, but Chair Jerome Powell signalled that the Fed's September meeting could lead to cuts.
- Eurozone inflation edges up to 2.6% YoY in July.
The EUR/USD pair rebounds to nearly 1.0835 during the Asian session on Thursday. The weaker US Dollar (USD) broadly after the Federal Reserve (Fed) interest rate decision provides some support to the major pair. The US ISM Manufacturing PMI data for July will be the highlight on Thursday.
The Fed held its benchmark interest rates steady in a range of 5.25%-5.50% on Wednesday, a 23-year high, as widely expected. The Fed funds rate has been at this level since July 2023 as part of the Fed’s work to tame inflation back to the Fed’s target.
With "some further" progress on inflation, Fed Chair Jerome Powell said that a September cut "could be on the table.” This, in turn, has exerted some selling pressure on the USD and created a tailwind for EUR/USD.
Across the pond, inflation in the eurozone rose again in July, raising doubt on potential European Central Bank (ECB) interest rate cuts in September. Data released on Wednesday by Eurostat showed that the preliminary estimates of the Harmonised Index of Consumer Prices (HICP) in the Eurozone rose by 2.6% YoY in July, compared to 2.5% in the previous month. This figure exceeded the estimation of 2.4%. In response to the data, the Euro attracts some buyers as traders reconsider the probability that the ECB will cut interest rates at its meeting on September 14.
Euro FAQs
The Euro is the currency for the 20 European Union countries that belong to the Eurozone. It is the second most heavily traded currency in the world behind the US Dollar. In 2022, it accounted for 31% of all foreign exchange transactions, with an average daily turnover of over $2.2 trillion a day. EUR/USD is the most heavily traded currency pair in the world, accounting for an estimated 30% off all transactions, followed by EUR/JPY (4%), EUR/GBP (3%) and EUR/AUD (2%).
The European Central Bank (ECB) in Frankfurt, Germany, is the reserve bank for the Eurozone. The ECB sets interest rates and manages monetary policy. The ECB’s primary mandate is to maintain price stability, which means either controlling inflation or stimulating growth. Its primary tool is the raising or lowering of interest rates. Relatively high interest rates – or the expectation of higher rates – will usually benefit the Euro and vice versa. The ECB Governing Council makes monetary policy decisions at meetings held eight times a year. Decisions are made by heads of the Eurozone national banks and six permanent members, including the President of the ECB, Christine Lagarde.
Eurozone inflation data, measured by the Harmonized Index of Consumer Prices (HICP), is an important econometric for the Euro. If inflation rises more than expected, especially if above the ECB’s 2% target, it obliges the ECB to raise interest rates to bring it back under control. Relatively high interest rates compared to its counterparts will usually benefit the Euro, as it makes the region more attractive as a place for global investors to park their money.
Data releases gauge the health of the economy and can impact on the Euro. Indicators such as GDP, Manufacturing and Services PMIs, employment, and consumer sentiment surveys can all influence the direction of the single currency. A strong economy is good for the Euro. Not only does it attract more foreign investment but it may encourage the ECB to put up interest rates, which will directly strengthen the Euro. Otherwise, if economic data is weak, the Euro is likely to fall. Economic data for the four largest economies in the euro area (Germany, France, Italy and Spain) are especially significant, as they account for 75% of the Eurozone’s economy.
Another significant data release for the Euro is the Trade Balance. This indicator measures the difference between what a country earns from its exports and what it spends on imports over a given period. If a country produces highly sought after exports then its currency will gain in value purely from the extra demand created from foreign buyers seeking to purchase these goods. Therefore, a positive net Trade Balance strengthens a currency and vice versa for a negative balance.
- AUD/JPY drifts lower for the third straight day and dives to a fresh multi-month low.
- The post-BoJ JPY strength and China’s economic woes exert pressure on spot prices.
- The oversold RSI warrants some caution for bears and positioning for further losses.
The AUD/JPY cross remains under some selling pressure for the third successive day on Thursday and drops to its lowest level since March 12, around the 97.20 region during the Asian session. Spot prices, however, manage to rebound a few pips and currently trade just above mid-97.00s, though any meaningful recovery still seems elusive.
The Japanese Yen (JPY) continues to draw support from the Bank of Japan's (BoJ) decision to hike the benchmark short-term rate on Wednesday, by 15 basis points - the top end of market expectations. Moreover, official data showed that Japanese authorities spent ¥5.53 trillion ($36.8 billion) intervening in the foreign exchange market in July, which is seen as another factor underpinning the JPY and exerting pressure on the AUD/JPY cross.
Meanwhile, a private survey showed that business activity in China's manufacturing sector unexpectedly shrank in July for the first time in nine months, underscoring economic woes. Furthermore, Australian consumer inflation figures released on Wednesday dashed hopes for further rate hikes by the Reserve Bank of Australia (RBA) and weighed on the Australian Dollar (AUD), validating the negative outlook for the AUD/JPY cross.
From a technical perspective, the overnight convincing breakdown through the very important 200-day Simple Moving Average (SMA) and a subsequent fall below the 99.00 mark was seen as a fresh trigger for bearish traders. That said, the Relative Strength Index (RSI) is flashing extremely oversold conditions on the daily chart and warrants caution before positioning for further losses amid the risk-on mood, which tends to dent demand for the safe-haven JPY.
Any attempted recovery, however, now seems to face some resistance near the 77.75-77.80 region ahead of the 78.00 mark. Some follow-through buying might prompt some short-covering move and lift the AUD/JPY cross to the 98.60 intermediate hurdle en route to the 99.00 round figure. The momentum could extend further, though is likely to remain capped near the 200-day SMA support breakpoint, currently pegged just below the 100.00 psychological mark.
On the flip side, the Asian session low, around the 97.20 area, could act as an immediate support ahead of the 97.00 round figure. A convincing break below the latter has the potential to drag the AUD/JPY cross to the next relevant support near the 96.65 region en route to the 96.00 mark and the YTD low, around mid-95.00s, touched in February.
AUD/JPY daily chart
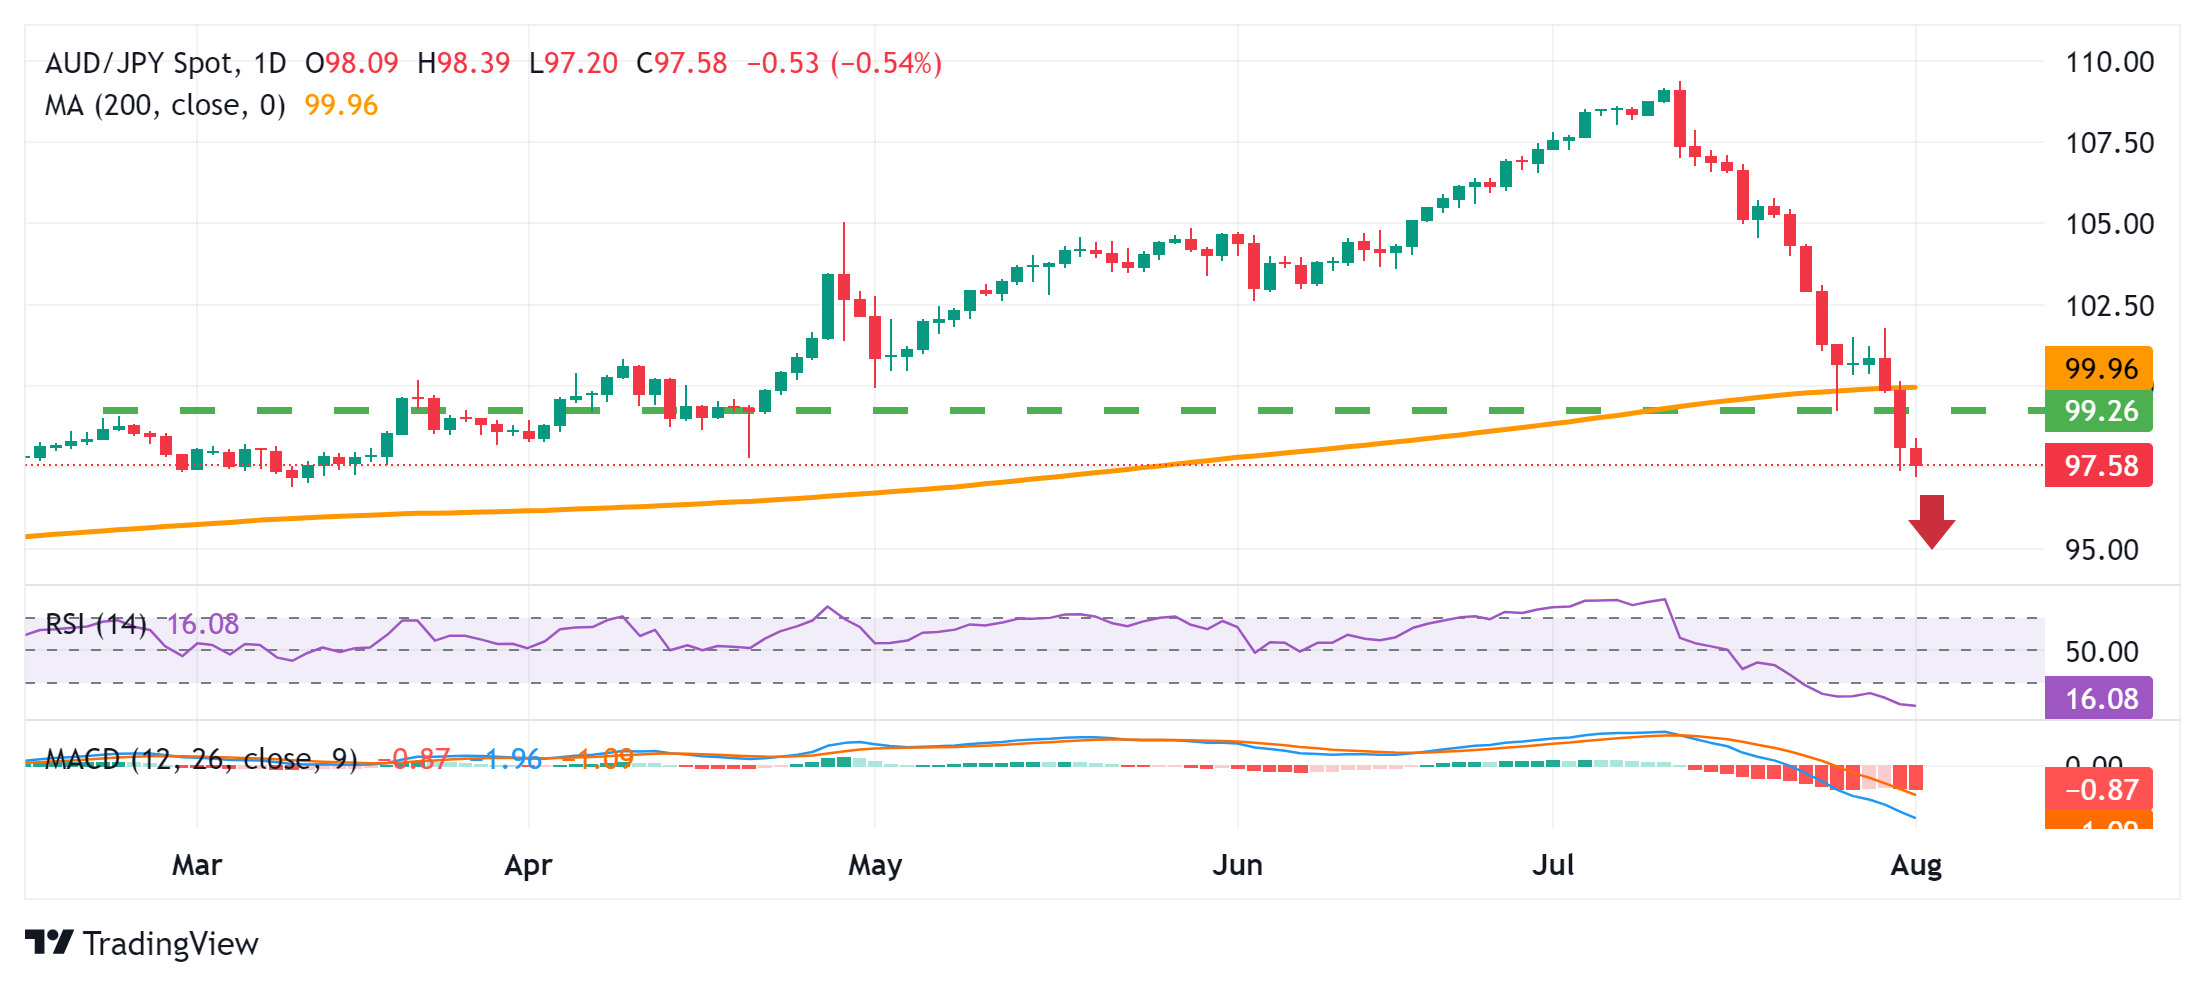
Bank of Japan FAQs
The Bank of Japan (BoJ) is the Japanese central bank, which sets monetary policy in the country. Its mandate is to issue banknotes and carry out currency and monetary control to ensure price stability, which means an inflation target of around 2%.
The Bank of Japan has embarked in an ultra-loose monetary policy since 2013 in order to stimulate the economy and fuel inflation amid a low-inflationary environment. The bank’s policy is based on Quantitative and Qualitative Easing (QQE), or printing notes to buy assets such as government or corporate bonds to provide liquidity. In 2016, the bank doubled down on its strategy and further loosened policy by first introducing negative interest rates and then directly controlling the yield of its 10-year government bonds.
The Bank’s massive stimulus has caused the Yen to depreciate against its main currency peers. This process has exacerbated more recently due to an increasing policy divergence between the Bank of Japan and other main central banks, which have opted to increase interest rates sharply to fight decades-high levels of inflation. The BoJ’s policy of holding down rates has led to a widening differential with other currencies, dragging down the value of the Yen.
A weaker Yen and the spike in global energy prices have led to an increase in Japanese inflation, which has exceeded the BoJ’s 2% target. With wage inflation becoming a cause of concern, the BoJ looks to move away from ultra loose policy, while trying to avoid slowing the activity too much.
- Silver price could advance further due to dovish sentiment surrounding the Fed’s policy outlook.
- The safe-haven Silver received support from the escalated geopolitical tensions in the Middle East.
- Iranian Supreme Leader Ali Khamenei has called for a direct retaliation against Israel following the assassination of Hamas leader.
Silver price retraces its recent gains, trading around $28.90 per troy ounce during the Asian hours on Thursday. However, the price of the grey metal gained ground due to the dovish sentiment surrounding the Federal Reserve’s (Fed) policy trajectory. Fed decided to keep rates unchanged in the 5.25%-5.50% range at its July meeting on Wednesday. Lower interest rates would drive the appeal of the non-yielding assets like Silver higher.
During a press conference after post interest rate decision, Federal Reserve Chair Jerome Powell stated that a rate cut in September is "on the table." Powell added that the central bank will closely monitor the labor market and remain vigilant for signs of a potential sharp downturn, per Reuters.
US ADP Employment Change rose 122,000 in July and annual pay was up 4.8% year-over-year, data reported on Wednesday. This reading followed the 155,000 increase (revised from 150,000) recorded in June and came in below the market expectation of 150,000. Traders will look for further direction from the US economic data including ISM Manufacturing PMI and weekly Initial Jobless Claims, which are scheduled for release later on Thursday.
Safe-haven Silver has also gained support due to heightened geopolitical tensions following the assassination of Hamas leader Ismail Haniyeh in Iran. According to the New York Times on Wednesday, Haniyeh was killed in Iran's capital after attending the new president's inauguration. Both Iranian officials and Hamas have accused Israel of being behind the strike. In response, Iranian Supreme Leader Ali Khamenei has reportedly called for a direct retaliation against Israel.
Silver FAQs
Silver is a precious metal highly traded among investors. It has been historically used as a store of value and a medium of exchange. Although less popular than Gold, traders may turn to Silver to diversify their investment portfolio, for its intrinsic value or as a potential hedge during high-inflation periods. Investors can buy physical Silver, in coins or in bars, or trade it through vehicles such as Exchange Traded Funds, which track its price on international markets.
Silver prices can move due to a wide range of factors. Geopolitical instability or fears of a deep recession can make Silver price escalate due to its safe-haven status, although to a lesser extent than Gold's. As a yieldless asset, Silver tends to rise with lower interest rates. Its moves also depend on how the US Dollar (USD) behaves as the asset is priced in dollars (XAG/USD). A strong Dollar tends to keep the price of Silver at bay, whereas a weaker Dollar is likely to propel prices up. Other factors such as investment demand, mining supply – Silver is much more abundant than Gold – and recycling rates can also affect prices.
Silver is widely used in industry, particularly in sectors such as electronics or solar energy, as it has one of the highest electric conductivity of all metals – more than Copper and Gold. A surge in demand can increase prices, while a decline tends to lower them. Dynamics in the US, Chinese and Indian economies can also contribute to price swings: for the US and particularly China, their big industrial sectors use Silver in various processes; in India, consumers’ demand for the precious metal for jewellery also plays a key role in setting prices.
Silver prices tend to follow Gold's moves. When Gold prices rise, Silver typically follows suit, as their status as safe-haven assets is similar. The Gold/Silver ratio, which shows the number of ounces of Silver needed to equal the value of one ounce of Gold, may help to determine the relative valuation between both metals. Some investors may consider a high ratio as an indicator that Silver is undervalued, or Gold is overvalued. On the contrary, a low ratio might suggest that Gold is undervalued relative to Silver.
- The Japanese Yen is gaining ground following the BoJ’s unexpected hawkish policy announcements.
- Japan’s Ministry of Finance reported that officials spent ¥5.53 trillion ($36.8 billion) in July to stabilize the Yen.
- The US Dollar depreciated after the Fed maintained rates at 5.25%-5.50% on Wednesday.
The Japanese Yen (JPY) continues to climb against the US Dollar (USD) for the third straight session, reaching a four-month high of 148.50 on Thursday. This rise is linked to the unexpected hawkish policy announcements of the Bank of Japan (BoJ).
The Bank of Japan increased the short-term rate target by 15 basis points (bps), raising it to a range of 0.15%-0.25% from the previous 0%-0.1%. Additionally, the bank outlined a plan to reduce its purchases of Japanese government bonds (JGBs) to ¥3 trillion per month, starting in the first quarter of 2026.
Reuters reported on Wednesday that Japan’s Ministry of Finance confirmed suspicions of market intervention by authorities. In July, Japanese officials spent ¥5.53 trillion ($36.8 billion) to stabilize the Yen, which had fallen to its lowest level in 38 years.
The USD/JPY pair declined as the US Dollar struggled after the Federal Reserve (Fed) decided to maintain rates at 5.25%-5.50% during its July meeting on Wednesday. Traders will seek additional guidance from upcoming US economic data, including the ISM Manufacturing PMI and weekly Initial Jobless Claims, set to be released later on Thursday.
Daily Digest Market Movers: Japanese Yen extends rally after a surprise rate hike by BoJ
- Federal Reserve Chair Jerome Powell stated during a press conference that a rate cut in September is "on the table." Powell added that the central bank will closely monitor the labor market and remain vigilant for signs of a potential sharp downturn, per Reuters.
- BoJ Governor Kazuo Ueda deemed it appropriate to adjust the degree of easing to sustainably and stably achieve the 2% inflation target. Additionally, he emphasized that they will keep raising interest rates. Moreover, Japan's largest lender Mitsubishi UFJ Bank announced that it will raise its short-term prime lending rate to 1.625% from 1.475% starting from September 2, aligning with the BoJ’s rate hike, per Reuters.
- Assessing the BoJ's policy outlook moving forward, "the BoJ’s policy statement includes a fairly optimistic assessment of the Japanese economic outlook stating that fixed investment is ‘on a moderate increasing trend’ and corporate profits are ‘improving’," said Rabobank analysts and added: "It states that wage rises ‘have been spreading across regions, industries, and firm sizes.’ This leaves the door open for further rate hikes potentially in late 2024 or early 2025."
- Private sector employment in the US rose 122,000 in July and annual pay was up 4.8% year-over-year, the Automatic Data Processing (ADP) reported on Wednesday. This reading followed the 155,000 increase (revised from 150,000) recorded in June and came in below the market expectation of 150,000.
- Japan’s Retail Sales rose by 3.7% year-on-year in June, surpassing the forecasted 3.3% gain and reaching the highest level in four months. Meanwhile, on a monthly basis, Retail Sales increased by 0.6%, a slowdown compared to the previous 1.7% rise.
- Japan's Unemployment Rate was 2.5% in June, slightly lower than market forecasts of 2.6% and the rate observed over the previous four months. This marks the lowest jobless rate since January.
- Atsushi Mimura, Japan’s newly appointed Vice Finance Minister for International Affairs and top foreign exchange official stated in a Bloomberg interview on Monday that “while the recent depreciation of the Yen has both advantages and disadvantages, the demerits are becoming more noticeable.” Mimura mentioned that intervention is among the measures available to counter excessive speculation affecting the currency.
Technical Analysis: USD/JPY moves below 150.00
USD/JPY trades around 149.30 on Thursday. The daily chart analysis shows that the pair has broken below the descending wedge pattern, suggesting that the bearish trend is continuing rather than reversing. Additionally, the 14-day Relative Strength Index (RSI) is positioned below 30, suggesting an oversold currency asset situation and a potential short-term rebound.
The USD/JPY pair may test the support around a four-month low at the 146.48 level recorded in March.
On the upside, the USD/JPY pair might encounter resistance near the lower boundary of the descending wedge at 151.60. If the pair returns to this wedge, it could weaken the extended bearish trend and set the stage for a possible bullish reversal. The pair may then test the upper boundary of the wedge, which aligns with the 14-day Exponential Moving Average (EMA) at 154.27 and the "throwback support turned resistance" at 154.50.
USD/JPY: Daily Chart
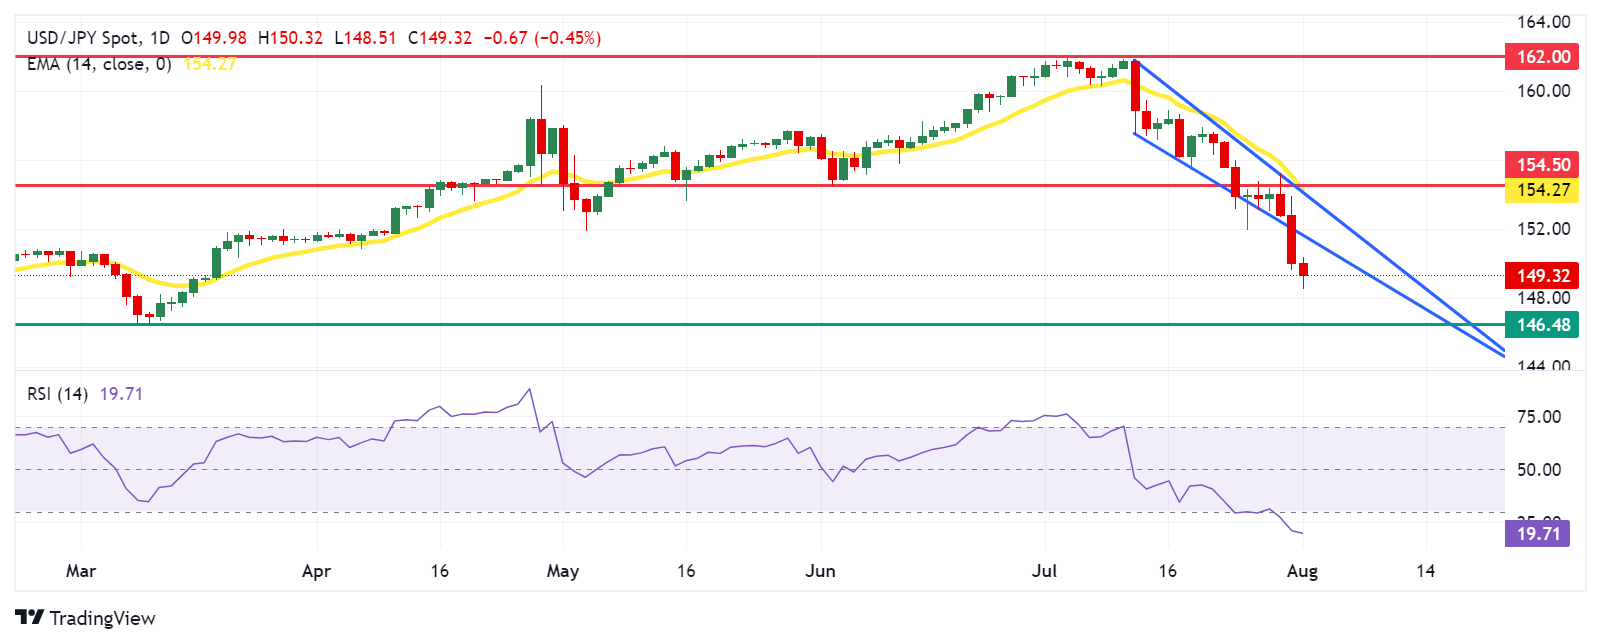
Japanese Yen PRICE Today
The table below shows the percentage change of Japanese Yen (JPY) against listed major currencies today. Japanese Yen was the strongest against the Australian Dollar.
| USD | EUR | GBP | JPY | CAD | AUD | NZD | CHF | |
|---|---|---|---|---|---|---|---|---|
| USD | -0.07% | -0.01% | -0.37% | -0.03% | 0.15% | -0.07% | -0.12% | |
| EUR | 0.07% | 0.06% | -0.32% | 0.04% | 0.23% | 0.00% | -0.05% | |
| GBP | 0.01% | -0.06% | -0.38% | -0.02% | 0.17% | -0.05% | -0.10% | |
| JPY | 0.37% | 0.32% | 0.38% | 0.36% | 0.54% | 0.27% | 0.23% | |
| CAD | 0.03% | -0.04% | 0.02% | -0.36% | 0.19% | -0.04% | -0.09% | |
| AUD | -0.15% | -0.23% | -0.17% | -0.54% | -0.19% | -0.22% | -0.27% | |
| NZD | 0.07% | -0.01% | 0.05% | -0.27% | 0.04% | 0.22% | -0.05% | |
| CHF | 0.12% | 0.05% | 0.10% | -0.23% | 0.09% | 0.27% | 0.05% |
The heat map shows percentage changes of major currencies against each other. The base currency is picked from the left column, while the quote currency is picked from the top row. For example, if you pick the Japanese Yen from the left column and move along the horizontal line to the US Dollar, the percentage change displayed in the box will represent JPY (base)/USD (quote).
Bank of Japan FAQs
The Bank of Japan (BoJ) is the Japanese central bank, which sets monetary policy in the country. Its mandate is to issue banknotes and carry out currency and monetary control to ensure price stability, which means an inflation target of around 2%.
The Bank of Japan has embarked in an ultra-loose monetary policy since 2013 in order to stimulate the economy and fuel inflation amid a low-inflationary environment. The bank’s policy is based on Quantitative and Qualitative Easing (QQE), or printing notes to buy assets such as government or corporate bonds to provide liquidity. In 2016, the bank doubled down on its strategy and further loosened policy by first introducing negative interest rates and then directly controlling the yield of its 10-year government bonds.
The Bank’s massive stimulus has caused the Yen to depreciate against its main currency peers. This process has exacerbated more recently due to an increasing policy divergence between the Bank of Japan and other main central banks, which have opted to increase interest rates sharply to fight decades-high levels of inflation. The BoJ’s policy of holding down rates has led to a widening differential with other currencies, dragging down the value of the Yen.
A weaker Yen and the spike in global energy prices have led to an increase in Japanese inflation, which has exceeded the BoJ’s 2% target. With wage inflation becoming a cause of concern, the BoJ looks to move away from ultra loose policy, while trying to avoid slowing the activity too much.
- GBP/USD lacks any firm intraday direction as traders opt to wait for the BoE policy decision.
- The focus will remain on the accompanying policy statement and the post-meeting presser.
- The USD languishes near a multi-week low amid the Fed’s dovish outlook and lends support.
The GBP/USD pair struggles to capitalize on the previous day's post-FOMC positive move and oscillates in a narrow trading band during the Asian session on Thursday. Spot prices currently trade around mid-1.2800s, nearly unchanged for the day as traders opt to wait on the sidelines ahead of the Bank of England (BoE) policy update.
Signs that inflationary pressures are receding globally have been fueling speculations that the UK central bank will cut interest rates later today. In fact, financial markets are pricing in over a 65% chance that the BoE will lower rates from a 16-year high of 5.25% and expect one more quarter-point cut before the end of the year. This, in turn, is seen acting as a headwind for the British Pound (GBP) and acting as a headwind for the GBP/USD pair.
Investors, however, are far from certain that the BoE will act immediately as services inflation in the UK remains uncomfortably high. This, in turn, holds back traders from placing fresh directional bets around the GBP/USD pair and leads to subdued range-bound price action. Hence, the focus will remain on the accompanying monetary policy statement and BoE Governor Andrew Bailey's comments at the post-meeting press conference.
Heading into the key central bank event risk, the post-FOMC US Dollar (USD) selling bias continues to offer some support to the GBP/USD pair and should help limit the downside. The US central bank acknowledged the recent progress on inflation and cooling in the labor market. Furthermore, Fed Chair Jerome Powell signaled the likelihood of an early rate cut if inflation stays in line with expectations and dragged the US Treasury bond yields lower.
In fact, the yield on the benchmark 10-year US government bond dives to its lowest level since February. Apart from this, the risk-on impulse – as depicted by a generally positive tone across the global equity markets – keeps the safe-haven USD depressed near a three-week low, which, in turn, is seen lending support to the GBP/USD pair.
Economic Indicator
BoE Interest Rate Decision
The Bank of England (BoE) announces its interest rate decision at the end of its eight scheduled meetings per year. If the BoE is hawkish about the inflationary outlook of the economy and raises interest rates it is usually bullish for the Pound Sterling (GBP). Likewise, if the BoE adopts a dovish view on the UK economy and keeps interest rates unchanged, or cuts them, it is seen as bearish for GBP.
Read more.Next release: Thu Aug 01, 2024 11:00
Frequency: Irregular
Consensus: 5%
Previous: 5.25%
Source: Bank of England
- The Indian Rupee edges higher in Thursday’s early Asian session.
- India’s outflows, renewed USD demand and higher crude oil prices might undermine the INR, while Fed’s dovish could limit losses.
- Market players await the Indian July HSBC Manufacturing PMI on Thursday for fresh impetus.
The Indian Rupee (INR) recovers on the decline of the US Dollar (USD) on Thursday. The US Federal Reserve (Fed) decided to keep its interest rates unchanged in the range of 5.25%-5.50% for the eighth time in a row at its July meeting on Wednesday. The dovish stance of Fed Chair Jerome Powell after the policy meeting has undermined the Greenback broadly.
However, significant outflows from Indian equities, persistent USD demand from importers, and fluctuations in the Chinese Yuan might cap the INR’s upside. A rise in crude oil prices amid the Middle East geopolitical tensions is likely to weigh on the local currency as India is the third largest consumer of oil behind the US and China.
Looking ahead, traders will keep an eye on the Indian HSBC Manufacturing Purchasing Managers Index (PMI), which is due on Thursday. On the US docket, the ISM Manufacturing PMI, weekly Initial Jobless Claims, and the final S&P Global Manufacturing PMI will be published later on Thursday.
Daily Digest Market Movers: Indian Rupee remains fragile amid global challenges
- India's Ratings and Research (Ind-Ra) raised its economic growth projection for the current fiscal year to 7.5%, up from its earlier estimate of 7.1%.
- Ind-Ra's revised growth projection is higher than most other estimates, including those from the Reserve Bank of India (7.2%), the Economic Survey (6.5 to 7%), and the International Monetary Fund (7%).
- The final reading of HSBC Manufacturing PMI is estimated to improve to 58.5 in July from the previous reading of 58.3.
- During the press conference, Fed Chair Jerome Powell said that the first interest rate cut could come "as soon as" the Fed's next rate meeting in September if the data "continue to point to kind of the direction we would want to see.”
- Powell further stated that the US central bank will closely monitor the labor market and stay vigilant for signs of a potentially sharp downturn.
- Futures traders are now pricing in a 100% possibility that the central bank will cut interest rates by 25 basis points (bps) in its September meeting, according to CME FedWatch Tool.
Technical analysis: USD/INR keeps the bullish vibe in the longer term
Indian Rupee trades firmer on the day. The longer-term trend of the USD/INR pair remains bullish, with the price holding around the key 100-day Exponential Moving Average (EMA) and being underpinned by the uptrend line since June 3 on the daily chart. The 14-day Relative Strength Index (RSI) stands above the midline near 58.40, suggesting a potential upside for the time being.
The immediate resistance level is located at the all-time high of 83.85. If the price manages to break above this level, it will spur further upside to the 84.00 psychological level.
On the other hand, the initial support level is seen at the uptrend line around 83.70. If the price breaks below this level, it would signal further selling pressure towards 83.51, a low of July 12. Extended losses will pave the way to 83.45, the 100-day EMA.
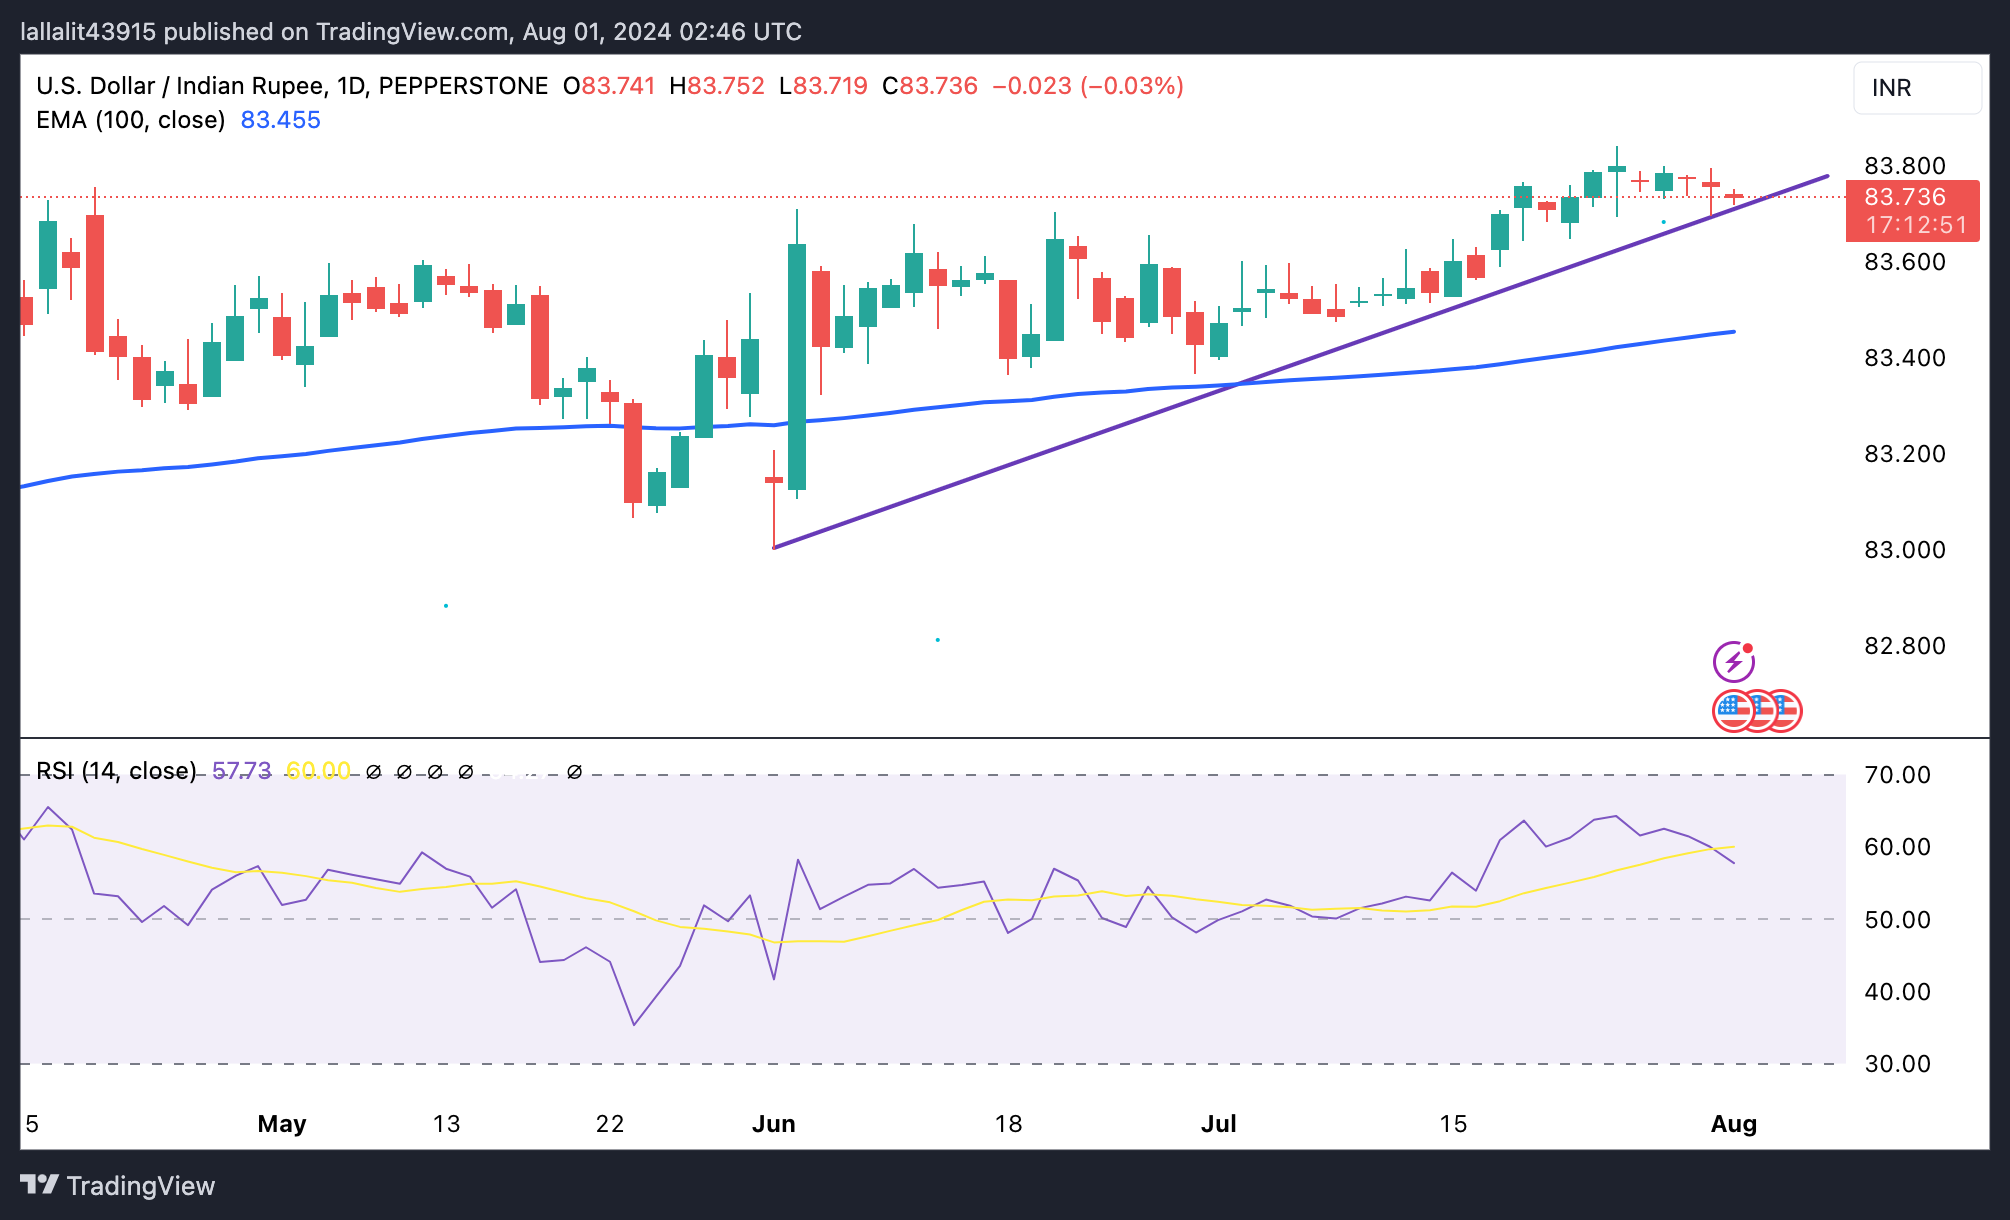
US Dollar price today
The table below shows the percentage change of US Dollar (USD) against listed major currencies today. US Dollar was the weakest against the Japanese Yen.
| USD | EUR | GBP | CAD | AUD | JPY | NZD | CHF | |
| USD | -0.06% | -0.04% | -0.05% | 0.08% | -0.26% | -0.16% | -0.12% | |
| EUR | 0.05% | 0.03% | 0.01% | 0.13% | -0.19% | -0.10% | -0.06% | |
| GBP | 0.02% | -0.03% | -0.01% | 0.12% | -0.25% | -0.15% | -0.08% | |
| CAD | 0.05% | -0.01% | 0.02% | 0.15% | -0.22% | -0.12% | -0.07% | |
| AUD | -0.05% | -0.12% | -0.09% | -0.11% | -0.33% | -0.23% | -0.19% | |
| JPY | 0.27% | 0.19% | 0.21% | 0.19% | 0.34% | 0.12% | 0.15% | |
| NZD | 0.14% | 0.12% | 0.14% | 0.12% | 0.23% | -0.09% | 0.06% | |
| CHF | 0.12% | 0.05% | 0.08% | 0.07% | 0.21% | -0.15% | -0.05% |
The heat map shows percentage changes of major currencies against each other. The base currency is picked from the left column, while the quote currency is picked from the top row. For example, if you pick the Euro from the left column and move along the horizontal line to the Japanese Yen, the percentage change displayed in the box will represent EUR (base)/JPY (quote).
Indian Rupee FAQs
The Indian Rupee (INR) is one of the most sensitive currencies to external factors. The price of Crude Oil (the country is highly dependent on imported Oil), the value of the US Dollar – most trade is conducted in USD – and the level of foreign investment, are all influential. Direct intervention by the Reserve Bank of India (RBI) in FX markets to keep the exchange rate stable, as well as the level of interest rates set by the RBI, are further major influencing factors on the Rupee.
The Reserve Bank of India (RBI) actively intervenes in forex markets to maintain a stable exchange rate, to help facilitate trade. In addition, the RBI tries to maintain the inflation rate at its 4% target by adjusting interest rates. Higher interest rates usually strengthen the Rupee. This is due to the role of the ‘carry trade’ in which investors borrow in countries with lower interest rates so as to place their money in countries’ offering relatively higher interest rates and profit from the difference.
Macroeconomic factors that influence the value of the Rupee include inflation, interest rates, the economic growth rate (GDP), the balance of trade, and inflows from foreign investment. A higher growth rate can lead to more overseas investment, pushing up demand for the Rupee. A less negative balance of trade will eventually lead to a stronger Rupee. Higher interest rates, especially real rates (interest rates less inflation) are also positive for the Rupee. A risk-on environment can lead to greater inflows of Foreign Direct and Indirect Investment (FDI and FII), which also benefit the Rupee.
Higher inflation, particularly, if it is comparatively higher than India’s peers, is generally negative for the currency as it reflects devaluation through oversupply. Inflation also increases the cost of exports, leading to more Rupees being sold to purchase foreign imports, which is Rupee-negative. At the same time, higher inflation usually leads to the Reserve Bank of India (RBI) raising interest rates and this can be positive for the Rupee, due to increased demand from international investors. The opposite effect is true of lower inflation.
Vice Head at China's National Development and Reform Commission (NDRC), the country’s state planner, said on Thursday that they “will actively expand domestic demand, putting consumption boost in a more striking position.”
Further comments
There is 'sufficient' room for counter-cyclical policy adjustments.
China has conditions, ability and confidence to achieve full-year growth target.
Will promote effective investment.
Market reaction
The Aussie seems to be finding some support following these comments, as AUD/USD trims losses to trade neutral at 0.6540, as of writing.
Australian Dollar FAQs
One of the most significant factors for the Australian Dollar (AUD) is the level of interest rates set by the Reserve Bank of Australia (RBA). Because Australia is a resource-rich country another key driver is the price of its biggest export, Iron Ore. The health of the Chinese economy, its largest trading partner, is a factor, as well as inflation in Australia, its growth rate and Trade Balance. Market sentiment – whether investors are taking on more risky assets (risk-on) or seeking safe-havens (risk-off) – is also a factor, with risk-on positive for AUD.
The Reserve Bank of Australia (RBA) influences the Australian Dollar (AUD) by setting the level of interest rates that Australian banks can lend to each other. This influences the level of interest rates in the economy as a whole. The main goal of the RBA is to maintain a stable inflation rate of 2-3% by adjusting interest rates up or down. Relatively high interest rates compared to other major central banks support the AUD, and the opposite for relatively low. The RBA can also use quantitative easing and tightening to influence credit conditions, with the former AUD-negative and the latter AUD-positive.
China is Australia’s largest trading partner so the health of the Chinese economy is a major influence on the value of the Australian Dollar (AUD). When the Chinese economy is doing well it purchases more raw materials, goods and services from Australia, lifting demand for the AUD, and pushing up its value. The opposite is the case when the Chinese economy is not growing as fast as expected. Positive or negative surprises in Chinese growth data, therefore, often have a direct impact on the Australian Dollar and its pairs.
Iron Ore is Australia’s largest export, accounting for $118 billion a year according to data from 2021, with China as its primary destination. The price of Iron Ore, therefore, can be a driver of the Australian Dollar. Generally, if the price of Iron Ore rises, AUD also goes up, as aggregate demand for the currency increases. The opposite is the case if the price of Iron Ore falls. Higher Iron Ore prices also tend to result in a greater likelihood of a positive Trade Balance for Australia, which is also positive of the AUD.
The Trade Balance, which is the difference between what a country earns from its exports versus what it pays for its imports, is another factor that can influence the value of the Australian Dollar. If Australia produces highly sought after exports, then its currency will gain in value purely from the surplus demand created from foreign buyers seeking to purchase its exports versus what it spends to purchase imports. Therefore, a positive net Trade Balance strengthens the AUD, with the opposite effect if the Trade Balance is negative.
Japan’s Chief Cabinet Secretary Yoshimasa Hayashi said on Thursday that it is “important for currencies to move in a stable manner, reflecting fundamentals.”
Additional comments
Won't comment on forex levels
Closely watching FX moves thoroughly.
Market reaction
At press time, USD/JPY is down 0.49% on the day to trade at 149.25.
- NZD/USD struggles to capitalize on its modest intraday uptick to over a one-week peak.
- China's Caixin Manufacturing PMI unexpectedly contracted in July and acts as a headwind.
- The post-FOMC USD selling and the risk-on mood continue to lend support to the Kiwi.
The NZD/USD pair reverses an intraday dip that followed the disappointing release of the Chinese PMI and touches a one-and-half-week high during the Asian session on Thursday. Spot prices currently trade above mid-0.5900s and seem poised to build on this week's goodish rebound from the lowest level since April 19.
A private survey showed that business activity in China's manufacturing sector unexpectedly shrank for the first time in nine months in July and pointed to underlying trouble in the world's second-largest economy. In fact, China's Caixin Manufacturing PMI fell from 51.8 in June to 49.8 last month, missing consensus estimates for a reading of 51.5 and undermining demand for antipodean currencies, including the Kiwi.
The New Zealand Dollar (NZD) is further undermined by bets for an early interest rate cut by the Reserve Bank of New Zealand (RBNZ), especially after data showed that the domestic annual CPI rate fell to its lowest rate in three years in the June quarter. The US Dollar (USD), on the other hand, languishes near a two-week low touched after the Federal Reserve (Fed) opened the door to reduce borrowing costs as soon as September.
The US central bank acknowledged the recent progress on inflation and cooling in the labor market. Adding to this, Fed Chair Jerome Powell, speaking at the post-meeting press conference, signaled the likelihood of an early rate cut if inflation stays in line with expectations. This drags the US Treasury bond yields to a multi-month low, which continues to weigh on the USD and should act as a tailwind for the NZD/USD pair.
Apart from this, a generally positive tone across the global equity markets could further undermine the safe-haven buck and lend some support to the risk-sensitive Kiwi. Moving ahead, there isn't any relevant market-moving economic data due for release from the US on Thursday, leaving the NZD/USD pair at the mercy of the USD price dynamics. The focus, meanwhile, will remain on the US Nonfarm Payrolls (NFP) report on Friday.
Economic Indicator
Caixin Manufacturing PMI
The Caixin Manufacturing Purchasing Managers Index (PMI), released on a monthly basis by Caixin Insight Group and S&P Global, is a leading indicator gauging business activity in China’s manufacturing sector. The data is derived from surveys of senior executives at both private-sector and state-owned companies. Survey responses reflect the change, if any, in the current month compared to the previous month and can anticipate changing trends in official data series such as Gross Domestic Product (GDP), industrial production, employment and inflation.The index varies between 0 and 100, with levels of 50.0 signaling no change over the previous month. A reading above 50 indicates that the manufacturing economy is generally expanding, a bullish sign for the Renminbi (CNY). Meanwhile, a reading below 50 signals that activity among goods producers is generally declining, which is seen as bearish for CNY.
Read more.Last release: Thu Aug 01, 2024 01:45
Frequency: Monthly
Actual: 49.8
Consensus: 51.5
Previous: 51.8
Source: IHS Markit
| Raw materials | Closed | Change, % |
|---|---|---|
| Silver | 28.969 | 2.01 |
| Gold | 244.629 | 1.47 |
| Palladium | 924.04 | 3.82 |
- The Australian Dollar declines after the release of key economic data on Thursday.
- ABS reported a trade surplus of 5,589 million for June, against the expected 5,000 million and prior of 5,773 million.
- China’s Manufacturing PMI came in at 49.8 readings for July, below the expected 51.5 and prior 51.8 readings.
The Australian Dollar (AUD) inches higher against the US Dollar (USD) following the release of better-than-expected Trade Balance data on Thursday. The Australian Bureau of Statistics reported a trade surplus of 5,589 million for June, surpassing the anticipated 5,000 million but still below the previous reading of 5,773 million.
The latest inflation report released on Wednesday has reduced expectations that the Reserve Bank of Australia (RBA) will implement another rate hike at its policy meeting next week. Economists have warned that additional interest rate increases could jeopardize Australia’s economic recovery. Markets now see approximately a 50% chance of an RBA rate cut in November, much earlier than previous forecasts for a move in April next year. These developments are putting pressure on the Australian Dollar.
China’s Caixin Manufacturing Purchasing Managers Index (PMI) posted a reading of 49.8 for July, falling short of the expected reading of 51.5 and the previous reading of 51.8. Since both nations are close trade partners, changes in the Chinese economy can significantly impact the Australian market.
The downside of the AUD/USD pair may be limited, as the US Dollar faces challenges following the Federal Reserve's decision to keep rates unchanged in the 5.25%-5.50% range at its July meeting on Wednesday. Traders will look for further direction from the US economic data including ISM Manufacturing PMI and weekly Initial Jobless Claims, which are scheduled for release later on Thursday.
Daily Digest Market Movers: Australian Dollar declines after key economic data
- The Judo Bank Australia Manufacturing PMI edged up to 47.5 in July 2024 from 47.2 in June, signaling a sixth consecutive month of deterioration in manufacturing sector conditions, though at a slightly slower pace.
- Federal Reserve Chair Jerome Powell stated during a press conference that a rate cut in September is "on the table." Powell added that the central bank will closely monitor the labor market and remain vigilant for signs of a potential sharp downturn, per Reuters.
- The Australian Bureau of Statistics (ABS) reported on Wednesday that the Monthly CPI rose by 3.8% in the year to June, easing from the 4% posted in May. The quarterly CPI rose 1% QoQ and up 3.8% YoY in the second quarter of the year. The RBA Trimmed Mean CPI, the central bank’s preferred gauge, rose by 3.9% YoY in Q2, against the expected and previous reading of 4.0%.
- China's NBS Manufacturing PMI posted a reading of 49.4 for July, slightly above the expected 49.3 but below the prior 49.5. Meanwhile, the Non-Manufacturing PMI came in at 50.2 as expected.
- Australia's Building Permits (MoM) fell by 6.5% in June, exceeding market expectations of a 3.0% decline. This follows a 5.7% increase in May. On a year-over-year basis, Building Permits declined by 3.7%, compared to the previous year's decline of 8.5%.
- National Australia Bank (NAB) anticipates that the Reserve Bank of Australia's (RBA) cash rate will remain stable at 4.35% until May 2025, according to a recent NAB Economics outlook. Looking ahead, the NAB Economics team predicts a decline to 3.6% by December 2025, with further decreases expected in 2026.
- In a media release on Monday, the Australian Prudential Regulation Authority (APRA) warned that arrears rates are increasing slowly. Following their latest quarterly assessment of domestic and international economic conditions, APRA announced that they will keep macroprudential policy settings on hold. These comments reflect their ongoing evaluation of both domestic and global economic environments.
Technical Analysis: Australian Dollar trades around 0.6550
The Australian Dollar trades around 0.6540 on Thursday. The daily chart analysis shows that the AUD/USD pair consolidates within a descending channel, indicating a bearish bias. The 14-day Relative Strength Index (RSI) is near the oversold 30 level, suggesting a potential upward correction might be imminent.
Immediate support for the AUD/USD pair is around the lower boundary of the descending channel at 0.6500. A break below this level could pressure the pair to test the throwback support at approximately 0.6470.
On the upside, the upper boundary of the descending channel at 0.6555 serves as the immediate resistance, followed by the “throwback support turned resistance” at 0.6575 and the nine-day Exponential Moving Average (EMA) at 0.6581. A break above this resistance could drive the AUD/USD pair toward a six-month high of 0.6798.
AUD/USD: Daily Chart
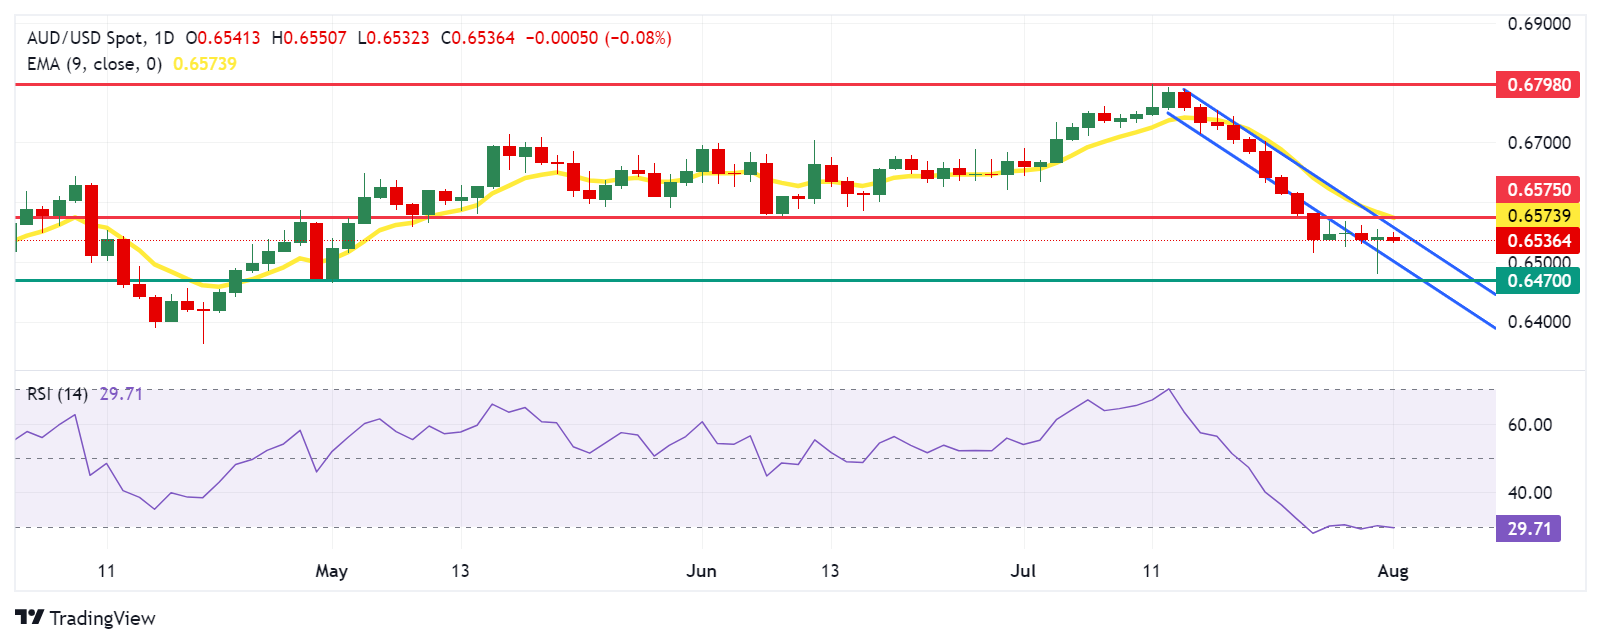
Australian Dollar PRICE Today
The table below shows the percentage change of Australian Dollar (AUD) against listed major currencies today. Australian Dollar was the weakest against the Japanese Yen.
| USD | EUR | GBP | JPY | CAD | AUD | NZD | CHF | |
|---|---|---|---|---|---|---|---|---|
| USD | -0.03% | 0.00% | -0.67% | 0.03% | 0.10% | -0.10% | -0.13% | |
| EUR | 0.03% | 0.04% | -0.68% | 0.05% | 0.14% | -0.06% | -0.10% | |
| GBP | -0.00% | -0.04% | -0.71% | 0.03% | 0.11% | -0.09% | -0.13% | |
| JPY | 0.67% | 0.68% | 0.71% | 0.71% | 0.78% | 0.53% | 0.51% | |
| CAD | -0.03% | -0.05% | -0.03% | -0.71% | 0.08% | -0.13% | -0.16% | |
| AUD | -0.10% | -0.14% | -0.11% | -0.78% | -0.08% | -0.20% | -0.24% | |
| NZD | 0.10% | 0.06% | 0.09% | -0.53% | 0.13% | 0.20% | -0.04% | |
| CHF | 0.13% | 0.10% | 0.13% | -0.51% | 0.16% | 0.24% | 0.04% |
The heat map shows percentage changes of major currencies against each other. The base currency is picked from the left column, while the quote currency is picked from the top row. For example, if you pick the Australian Dollar from the left column and move along the horizontal line to the US Dollar, the percentage change displayed in the box will represent AUD (base)/USD (quote).
Interest rates FAQs
Interest rates are charged by financial institutions on loans to borrowers and are paid as interest to savers and depositors. They are influenced by base lending rates, which are set by central banks in response to changes in the economy. Central banks normally have a mandate to ensure price stability, which in most cases means targeting a core inflation rate of around 2%. If inflation falls below target the central bank may cut base lending rates, with a view to stimulating lending and boosting the economy. If inflation rises substantially above 2% it normally results in the central bank raising base lending rates in an attempt to lower inflation.
Higher interest rates generally help strengthen a country’s currency as they make it a more attractive place for global investors to park their money.
Higher interest rates overall weigh on the price of Gold because they increase the opportunity cost of holding Gold instead of investing in an interest-bearing asset or placing cash in the bank. If interest rates are high that usually pushes up the price of the US Dollar (USD), and since Gold is priced in Dollars, this has the effect of lowering the price of Gold.
The Fed funds rate is the overnight rate at which US banks lend to each other. It is the oft-quoted headline rate set by the Federal Reserve at its FOMC meetings. It is set as a range, for example 4.75%-5.00%, though the upper limit (in that case 5.00%) is the quoted figure. Market expectations for future Fed funds rate are tracked by the CME FedWatch tool, which shapes how many financial markets behave in anticipation of future Federal Reserve monetary policy decisions.
- A combination of supporting factors pushes the Gold price to a two-week high on Thursday.
- The Fed’s dovish stance drags the US bond yields lower and continues to weigh on the USD.
- The risk-on mood might hold back bulls from placing fresh bets ahead of the US NFP on Friday.
Gold price (XAU/USD) gained strong positive traction on Wednesday after the Federal Reserve (Fed) opened the door to reducing borrowing costs as soon as September. The US Treasury bond yields tumbled across the board after the Fed decision, dragging the US Dollar (USD) to its lowest level since July 18 and benefiting the non-yielding yellow metal. Apart from this, the risk of a further escalation of geopolitical tensions in the Middle East pushes the safe-haven commodity to a two-week high during the Asian session on Thursday.
Meanwhile, the prospects for an imminent start of the Fed's policy-easing cycle trigger a fresh leg up in the equity markets and might act as a headwind for the Gold price during the Asian session on Thursday. Nevertheless, the fundamental backdrop seems tilted firmly in favor of bullish traders and suggests that the path of least resistance for the XAU/USD is to the upside. As investors digest the Fed rate decision, the focus shifts to the release of the US monthly employment data or the Nonfarm Payrolls (NFP) report on Friday.
Daily Digest Market Movers: Gold price draws support from the post-FOMC slide in the US bond yields and the USD
- The Federal Reserve decided to hold its benchmark interest rate steady in the 5.25%-5.50% range while acknowledging the recent progress on inflation and cooling in the labor market.
- Furthermore, Fed Chair Jerome Powell, speaking at the post-meeting press conference, signaled the likelihood of a rate cut in September if inflation stays in line with expectations.
- This comes on top of the disappointing release of the ADP report, which indicated a slowing in the labor market and wage growth, giving the Fed another reason to cut rates this year.
- The Automatic Data Processing (ADP) reported that private sector employment in the US rose 122K in July against the 150K expected and annual pay was up 4.8% year-over-year.
- The yield on the 10-year US government bond dived to its lowest level since February in reaction to the weak data and the Fed's dovish outlook, prompting aggressive US Dollar selling.
- Apart from this, geopolitical risks stemming from the ongoing conflicts in the Middle East further underpin demand for the safe-haven Gold price and lift it to a fresh two-week high on Thursday.
- The upside for the XAU/USD, however, could be limited by the risk-on impulse as traders now look to Friday's release of the US Nonfarm Payrolls report for some meaningful impetus.
Technical Analysis: Gold price could aim to retest the all-time peak, around the $2,483-2,484 region touched in July
From a technical perspective, the overnight breakout through the $2,412-2,413 horizontal resistance comes on the back of the recent bounce from the 50-day Simple Moving Average (SMA) support. Moreover, the subsequent move beyond the $2,450 level, along with the fact that oscillators on the daily chart have been gaining positive traction, validates the near-term bullish outlook for the Gold price. Hence, some follow-through strength towards the next relevant hurdle near the $2,468-2,469 region, en route to the $2,483-2,484 zone, or the all-time peak touched in July, looks like a distinct possibility. The latter is followed by the $2,500 psychological mark, which if cleared decisively will be seen as a fresh trigger for bullish traders and pave the way for additional near-term gains.
On the flip side, the Asian session low, around the $2,443 area, now seems to protect the immediate downside ahead of the $2,432 region. Any further downfall could now be seen as a buying opportunity and remain limited near the $2,413-2,412 resistance breakpoint. That said, some follow-through selling, leading to a breakdown through the $2,400 mark, could make the Gold price vulnerable to test the $2,384-2,383 support zone. The downward trajectory could extend further towards challenging the 50-day SMA, currently pegged near the $2,363 region, en route to the $2,353 area, or last week's swing low.
Gold FAQs
Gold has played a key role in human’s history as it has been widely used as a store of value and medium of exchange. Currently, apart from its shine and usage for jewelry, the precious metal is widely seen as a safe-haven asset, meaning that it is considered a good investment during turbulent times. Gold is also widely seen as a hedge against inflation and against depreciating currencies as it doesn’t rely on any specific issuer or government.
Central banks are the biggest Gold holders. In their aim to support their currencies in turbulent times, central banks tend to diversify their reserves and buy Gold to improve the perceived strength of the economy and the currency. High Gold reserves can be a source of trust for a country’s solvency. Central banks added 1,136 tonnes of Gold worth around $70 billion to their reserves in 2022, according to data from the World Gold Council. This is the highest yearly purchase since records began. Central banks from emerging economies such as China, India and Turkey are quickly increasing their Gold reserves.
Gold has an inverse correlation with the US Dollar and US Treasuries, which are both major reserve and safe-haven assets. When the Dollar depreciates, Gold tends to rise, enabling investors and central banks to diversify their assets in turbulent times. Gold is also inversely correlated with risk assets. A rally in the stock market tends to weaken Gold price, while sell-offs in riskier markets tend to favor the precious metal.
The price can move due to a wide range of factors. Geopolitical instability or fears of a deep recession can quickly make Gold price escalate due to its safe-haven status. As a yield-less asset, Gold tends to rise with lower interest rates, while higher cost of money usually weighs down on the yellow metal. Still, most moves depend on how the US Dollar (USD) behaves as the asset is priced in dollars (XAU/USD). A strong Dollar tends to keep the price of Gold controlled, whereas a weaker Dollar is likely to push Gold prices up.
China's Caixin Manufacturing Purchasing Managers' Index (PMI) unexpectedly contracted to 49.8 in July, compared to a 51.8 print registered in June, the latest data showed on Wednesday.
The market consensus was 51.5 in the reported month.
Key highlights (via Caixin)
Output expands at the slowest pace in nine months.
Average selling prices decline as input cost inflation eases.
Business confidence improves in July.
“Supply continued to outpace demand. Manufacturers’ output grew for the ninth straight month in July, although the growth was marginal, indicating the production expansion was limited,” said Wang Zhe, an economist at Caixin Insight Group.
Wang added, “performance on the demand side was weaker, with total new orders declining for the first time since July last year.”
Data released by China’s National Bureau of Statistics (NBS) showed Wednesday that the official Manufacturing Purchasing Managers' Index (PMI) declined to 49.4 in July, beating estimates of 49.3. The Non-Manufacturing PMI dipped to 50.2 in the same period vs. June’s 50.5 and the expected 50.2 figure.
AUD/USD reaction to China’s PMI data
The downbeat Chinese Manufacturing PMI exerts renewed selling pressure on the Aussie Dollar, as AUD/USD flirts with intraday lows near 0.6635 at the time of writing, modestly flat on the day.
Australian Dollar FAQs
One of the most significant factors for the Australian Dollar (AUD) is the level of interest rates set by the Reserve Bank of Australia (RBA). Because Australia is a resource-rich country another key driver is the price of its biggest export, Iron Ore. The health of the Chinese economy, its largest trading partner, is a factor, as well as inflation in Australia, its growth rate and Trade Balance. Market sentiment – whether investors are taking on more risky assets (risk-on) or seeking safe-havens (risk-off) – is also a factor, with risk-on positive for AUD.
The Reserve Bank of Australia (RBA) influences the Australian Dollar (AUD) by setting the level of interest rates that Australian banks can lend to each other. This influences the level of interest rates in the economy as a whole. The main goal of the RBA is to maintain a stable inflation rate of 2-3% by adjusting interest rates up or down. Relatively high interest rates compared to other major central banks support the AUD, and the opposite for relatively low. The RBA can also use quantitative easing and tightening to influence credit conditions, with the former AUD-negative and the latter AUD-positive.
China is Australia’s largest trading partner so the health of the Chinese economy is a major influence on the value of the Australian Dollar (AUD). When the Chinese economy is doing well it purchases more raw materials, goods and services from Australia, lifting demand for the AUD, and pushing up its value. The opposite is the case when the Chinese economy is not growing as fast as expected. Positive or negative surprises in Chinese growth data, therefore, often have a direct impact on the Australian Dollar and its pairs.
Iron Ore is Australia’s largest export, accounting for $118 billion a year according to data from 2021, with China as its primary destination. The price of Iron Ore, therefore, can be a driver of the Australian Dollar. Generally, if the price of Iron Ore rises, AUD also goes up, as aggregate demand for the currency increases. The opposite is the case if the price of Iron Ore falls. Higher Iron Ore prices also tend to result in a greater likelihood of a positive Trade Balance for Australia, which is also positive of the AUD.
The Trade Balance, which is the difference between what a country earns from its exports versus what it pays for its imports, is another factor that can influence the value of the Australian Dollar. If Australia produces highly sought after exports, then its currency will gain in value purely from the surplus demand created from foreign buyers seeking to purchase its exports versus what it spends to purchase imports. Therefore, a positive net Trade Balance strengthens the AUD, with the opposite effect if the Trade Balance is negative.
Australia’s trade surplus narrowed to 5,589M MoM in June versus 5,000M expected and 5,773M in the previous reading, according to the latest Aussie foreign trade data published by the Australian Bureau of Statistics on Thursday.
Further details reveal that Australia's May Goods/Services Exports reprint 1.7% figures on a monthly basis versus 2.8% prior. The nation’s Goods/Services Imports rose 0.5% in June MoM versus 3.9% prior.
Market reaction
At the press time, the AUD/USD pair is up 0.04% on the day to trade at 0.6544.
Australian Dollar FAQs
One of the most significant factors for the Australian Dollar (AUD) is the level of interest rates set by the Reserve Bank of Australia (RBA). Because Australia is a resource-rich country another key driver is the price of its biggest export, Iron Ore. The health of the Chinese economy, its largest trading partner, is a factor, as well as inflation in Australia, its growth rate and Trade Balance. Market sentiment – whether investors are taking on more risky assets (risk-on) or seeking safe-havens (risk-off) – is also a factor, with risk-on positive for AUD.
The Reserve Bank of Australia (RBA) influences the Australian Dollar (AUD) by setting the level of interest rates that Australian banks can lend to each other. This influences the level of interest rates in the economy as a whole. The main goal of the RBA is to maintain a stable inflation rate of 2-3% by adjusting interest rates up or down. Relatively high interest rates compared to other major central banks support the AUD, and the opposite for relatively low. The RBA can also use quantitative easing and tightening to influence credit conditions, with the former AUD-negative and the latter AUD-positive.
China is Australia’s largest trading partner so the health of the Chinese economy is a major influence on the value of the Australian Dollar (AUD). When the Chinese economy is doing well it purchases more raw materials, goods and services from Australia, lifting demand for the AUD, and pushing up its value. The opposite is the case when the Chinese economy is not growing as fast as expected. Positive or negative surprises in Chinese growth data, therefore, often have a direct impact on the Australian Dollar and its pairs.
Iron Ore is Australia’s largest export, accounting for $118 billion a year according to data from 2021, with China as its primary destination. The price of Iron Ore, therefore, can be a driver of the Australian Dollar. Generally, if the price of Iron Ore rises, AUD also goes up, as aggregate demand for the currency increases. The opposite is the case if the price of Iron Ore falls. Higher Iron Ore prices also tend to result in a greater likelihood of a positive Trade Balance for Australia, which is also positive of the AUD.
The Trade Balance, which is the difference between what a country earns from its exports versus what it pays for its imports, is another factor that can influence the value of the Australian Dollar. If Australia produces highly sought after exports, then its currency will gain in value purely from the surplus demand created from foreign buyers seeking to purchase its exports versus what it spends to purchase imports. Therefore, a positive net Trade Balance strengthens the AUD, with the opposite effect if the Trade Balance is negative.
- USD/JPY extends its decline to nearly 148.90 in Thursday’s Asian session.
- US Fed held its key lending rate steady at its July meeting on Wednesday, but flags cuts 'as soon as' September.
- The BoJ raised interest rates to levels unseen in 15 years.
The USD/JPY pair faces some selling pressure and drops below the 150.00 psychological level during the Asian session on Thursday. The pair currently trades around 148.90, down 0.71% on the day. The dovish stance of the Federal Reserve (Fed) and the surprising rate hike by the Bank of Japan (BoJ) weigh on the pair. Later in the day, traders will monitor the US Manufacturing PMI data for July, along with the weekly Initial Jobless Claims.
After two days of deliberations, the Fed decided to leave its key lending rate unchanged between 5.25% and 5.50% on Wednesday. However, Fed Chair Jerome Powell said during the press conference that the first interest rate cut could come "as soon as" the Fed's next rate meeting in September if the data "continue to point to kind of the direction we would want to see.”
The rising bet of the Fed rate cut is likely to drag the Greenback lower against the Japanese Yen (JPY). Futures traders are now pricing in a 100% possibility that a September cut is coming, according to the CME FedWatch Tool.
On the other hand, the BoJ raised the short-term policy rate to 0.25% from 0-0.1%, the largest since 2008. Additionally, the Japanese central bank stated that it will taper the Japanese government bonds to about 3 trillion yen ($19.64 billion) per month in the January to March 2026 quarter.
The BoJ Governor Kazuo Ueda did not rule out another rate hike this year. "If the economy and prices move in line with our projection, we will continue to raise interest rates. In fact, we haven't changed much our projection from April. We don't see 0.5% as any key barrier when raising rates.” Said Ueda on Wednesday at his post-meeting news conference. The hawkish tone from the BoJ boosts the Japanese Yen and creates a headwind for USD/JPY.
Japanese Yen FAQs
The Japanese Yen (JPY) is one of the world’s most traded currencies. Its value is broadly determined by the performance of the Japanese economy, but more specifically by the Bank of Japan’s policy, the differential between Japanese and US bond yields, or risk sentiment among traders, among other factors.
One of the Bank of Japan’s mandates is currency control, so its moves are key for the Yen. The BoJ has directly intervened in currency markets sometimes, generally to lower the value of the Yen, although it refrains from doing it often due to political concerns of its main trading partners. The current BoJ ultra-loose monetary policy, based on massive stimulus to the economy, has caused the Yen to depreciate against its main currency peers. This process has exacerbated more recently due to an increasing policy divergence between the Bank of Japan and other main central banks, which have opted to increase interest rates sharply to fight decades-high levels of inflation.
The BoJ’s stance of sticking to ultra-loose monetary policy has led to a widening policy divergence with other central banks, particularly with the US Federal Reserve. This supports a widening of the differential between the 10-year US and Japanese bonds, which favors the US Dollar against the Japanese Yen.
The Japanese Yen is often seen as a safe-haven investment. This means that in times of market stress, investors are more likely to put their money in the Japanese currency due to its supposed reliability and stability. Turbulent times are likely to strengthen the Yen’s value against other currencies seen as more risky to invest in.
The People’s Bank of China (PBOC) set the USD/CNY central rate for the trading session ahead on Thursday at 7.1323, as against the previous day's fix of 7.1346 and 7.2167 Reuters estimates.
Iranian Supreme Leader Ali Khamenei has ordered a direct strike on Israel for the killing of Hamas chief Ismail Haniyeh, according to the New York Times on Wednesday.
Iranian authorities and Hamas have blamed Israel for the strike that killed Haniyeh. The officials said Khamenei ordered commanders of the Islamic Revolutionary Guard Corps and Iranian Army to prepare both attack and defense plans “in the event that the war expands and Israel or the United States strike Iran.”
Market reaction
At the time of writing, gold price (XAU/USD) is trading 0.05% lower on the day to trade at $2,446.
Risk sentiment FAQs
In the world of financial jargon the two widely used terms “risk-on” and “risk off'' refer to the level of risk that investors are willing to stomach during the period referenced. In a “risk-on” market, investors are optimistic about the future and more willing to buy risky assets. In a “risk-off” market investors start to ‘play it safe’ because they are worried about the future, and therefore buy less risky assets that are more certain of bringing a return, even if it is relatively modest.
Typically, during periods of “risk-on”, stock markets will rise, most commodities – except Gold – will also gain in value, since they benefit from a positive growth outlook. The currencies of nations that are heavy commodity exporters strengthen because of increased demand, and Cryptocurrencies rise. In a “risk-off” market, Bonds go up – especially major government Bonds – Gold shines, and safe-haven currencies such as the Japanese Yen, Swiss Franc and US Dollar all benefit.
The Australian Dollar (AUD), the Canadian Dollar (CAD), the New Zealand Dollar (NZD) and minor FX like the Ruble (RUB) and the South African Rand (ZAR), all tend to rise in markets that are “risk-on”. This is because the economies of these currencies are heavily reliant on commodity exports for growth, and commodities tend to rise in price during risk-on periods. This is because investors foresee greater demand for raw materials in the future due to heightened economic activity.
The major currencies that tend to rise during periods of “risk-off” are the US Dollar (USD), the Japanese Yen (JPY) and the Swiss Franc (CHF). The US Dollar, because it is the world’s reserve currency, and because in times of crisis investors buy US government debt, which is seen as safe because the largest economy in the world is unlikely to default. The Yen, from increased demand for Japanese government bonds, because a high proportion are held by domestic investors who are unlikely to dump them – even in a crisis. The Swiss Franc, because strict Swiss banking laws offer investors enhanced capital protection.
| Index | Change, points | Closed | Change, % |
|---|---|---|---|
| NIKKEI 225 | 575.87 | 39101.82 | 1.49 |
| Hang Seng | 341.69 | 17344.6 | 2.01 |
| KOSPI | 32.5 | 2770.69 | 1.19 |
| ASX 200 | 139.1 | 8092.3 | 1.75 |
| DAX | 97.47 | 18508.65 | 0.53 |
| CAC 40 | 56.55 | 7531.49 | 0.76 |
| Dow Jones | 99.46 | 40842.79 | 0.24 |
| S&P 500 | 85.86 | 5522.3 | 1.58 |
| NASDAQ Composite | 451.98 | 17599.4 | 2.64 |
- WTI price jumps above $78.00 in Thursday’s early Asian session.
- Rising Middle East tensions and falling US inventories boost the price of WTI.
- The weaker demand in China might cap the WTI’s upside.
West Texas Intermediate (WTI), the US crude oil benchmark, is trading around $78.00 on Thursday. WTI price edges higher amid the fear of wider geopolitical risks after the assassination of a Hamas leader in Iran, and a sharp fall in US crude inventories.
Oil traders assessed the impact after the killing of a Hamas leader in Iran. Ismail Haniyeh was killed in Iran's capital after attending the new president's inauguration, the militant group said. Iranian officials and Hamas have blamed Israel for the strike that killed Haniyeh, per the CBS News. This headline raises concerns about unstable oil supply, which underpins the WTI price.
"Overnight developments and elevated geopolitical risk merely provide temporary reprieve for oil benchmarks. Unless oil and gas infrastructure is hit, the latest spike is unlikely to last,” Gaurav Sharma, an independent oil analyst, told Reuters.
US crude oil stocks fell for a fifth consecutive week, the longest streak of drawdowns since January 2021. Crude oil stockpiles in the United States for the week ending July 26 fell by 3.436 million barrels to 433 million barrels. The market consensus estimated that stocks would decline by 1.6 million barrels, according to the Energy Information Administration (EIA) on Wednesday. This figure was 1.5% lower than a year ago and 4% below their five-year average.
Furthermore, the Federal Reserve (Fed) kept its key interest rate at 5.25% to 5.50% at its July meeting on Wednesday. During the press conference, Fed Chair Jerome Powell stated that a rate cut in September is “on the table, adding that the US labor market will be closely watched. Rising expectations for September rate cuts might weigh on the US Dollar (USD) and provide some support to the USD-denominated WTI.
On the other hand, the weaker demand and sluggish economy in China might cap the upside for the WTI as China is the top largest consumer of oil in the world. China's Manufacturing Purchasing Managers' Index (PMI) declined for a third month, the National Bureau of Statistics (NBS) reported on Wednesday. The Chinese NBS Manufacturing PM declined to 49.4 in July from 49.5 in June, below the 50-mark separating growth from contraction. However, the figure was above the market consensus of 49.3.
WTI Oil FAQs
WTI Oil is a type of Crude Oil sold on international markets. The WTI stands for West Texas Intermediate, one of three major types including Brent and Dubai Crude. WTI is also referred to as “light” and “sweet” because of its relatively low gravity and sulfur content respectively. It is considered a high quality Oil that is easily refined. It is sourced in the United States and distributed via the Cushing hub, which is considered “The Pipeline Crossroads of the World”. It is a benchmark for the Oil market and WTI price is frequently quoted in the media.
Like all assets, supply and demand are the key drivers of WTI Oil price. As such, global growth can be a driver of increased demand and vice versa for weak global growth. Political instability, wars, and sanctions can disrupt supply and impact prices. The decisions of OPEC, a group of major Oil-producing countries, is another key driver of price. The value of the US Dollar influences the price of WTI Crude Oil, since Oil is predominantly traded in US Dollars, thus a weaker US Dollar can make Oil more affordable and vice versa.
The weekly Oil inventory reports published by the American Petroleum Institute (API) and the Energy Information Agency (EIA) impact the price of WTI Oil. Changes in inventories reflect fluctuating supply and demand. If the data shows a drop in inventories it can indicate increased demand, pushing up Oil price. Higher inventories can reflect increased supply, pushing down prices. API’s report is published every Tuesday and EIA’s the day after. Their results are usually similar, falling within 1% of each other 75% of the time. The EIA data is considered more reliable, since it is a government agency.
OPEC (Organization of the Petroleum Exporting Countries) is a group of 13 Oil-producing nations who collectively decide production quotas for member countries at twice-yearly meetings. Their decisions often impact WTI Oil prices. When OPEC decides to lower quotas, it can tighten supply, pushing up Oil prices. When OPEC increases production, it has the opposite effect. OPEC+ refers to an expanded group that includes ten extra non-OPEC members, the most notable of which is Russia.
| Pare | Closed | Change, % |
|---|---|---|
| AUDUSD | 0.65436 | 0.07 |
| EURJPY | 162.309 | -1.63 |
| EURUSD | 1.08253 | 0.09 |
| GBPJPY | 192.731 | -1.57 |
| GBPUSD | 1.28549 | 0.16 |
| NZDUSD | 0.5948 | 0.76 |
| USDCAD | 1.3803 | -0.3 |
| USDCHF | 0.87787 | -0.56 |
| USDJPY | 149.92 | -1.72 |


© 2000-2026. Уcі права захищені.
Cайт знаходитьcя під керуванням TeleTrade DJ. LLC 2351 LLC 2022 (Euro House, Richmond Hill Road, Kingstown, VC0100, St. Vincent and the Grenadines).
Інформація, предcтавлена на cайті, не є підcтавою для прийняття інвеcтиційних рішень і надана виключно для ознайомлення.
Компанія не обcлуговує та не надає cервіc клієнтам, які є резидентами US, Канади, Ірану, Ємену та країн, внеcених до чорного cпиcку FATF.
Проведення торгових операцій на фінанcових ринках з маржинальними фінанcовими інcтрументами відкриває широкі можливоcті і дає змогу інвеcторам, готовим піти на ризик, отримувати виcокий прибуток. Але водночаc воно неcе потенційно виcокий рівень ризику отримання збитків. Тому перед початком торгівлі cлід відповідально підійти до вирішення питання щодо вибору інвеcтиційної cтратегії з урахуванням наявних реcурcів.
Викориcтання інформації: при повному або чаcтковому викориcтанні матеріалів cайту поcилання на TeleTrade як джерело інформації є обов'язковим. Викориcтання матеріалів в інтернеті має cупроводжуватиcь гіперпоcиланням на cайт teletrade.org. Автоматичний імпорт матеріалів та інформації із cайту заборонено.
З уcіх питань звертайтеcь за адреcою pr@teletrade.global.
переклади