- Аналітика
- Новини та інструменти
- Новини ринків
Новини ринків
“Board members shared the view no need to make operational tweaks to Yield Curve Control (YCC) at this point,” per the Bank of Japan’s (BoJ) Minutes of June monetary policy meeting.
More to come
- NZD/USD attracts some sellers, currently trades around 0.6142, losing 0.12% for the day.
- Fitch downgraded the United States government's credit rating from AAA to AA+.
- The New Zealand Unemployment Rate for Q2 came in at 3.6%, versus a consensus of 3.5% and 3.4% prior.
- Investors will focus on the US rating cut headline and US ADP employment data.
The NZD/USD pair extends its downside and edges lower to the 0.6140 mark during the early Asian session on Wednesday. The pair faces some pressure following the New Zealand employment data for Q2 and the headlines surrounding the US rating cut.
On Tuesday, Fitch downgraded the United States government's credit rating from AAA to AA+. The leading rating company cites an expected fiscal deterioration over the next three years and a high general government debt burden as the primary reasons for this drastic action. US Treasury Secretary Janet Yellen expressed her strong disagreement with Fitch's decision to downgrade the US government's credit rating, calling it "arbitrary and based on outdated data”, according to Reuters.
Market participants turn cautious and remain focused on the US rating cut headline. This report fuels concern about the US debt ceiling crisis and might exert pressure on the US Dollar.
On Tuesday, the US Bureau of Labour Statistics (BLS) reported that JOLTS Job Openings came in at 9.58 million in June. This reading followed May's 9.82 million openings and was below the market consensus of 9.62 million. Meanwhile, the ISM Manufacturing PMI increased to 46.4 from 46 in July but was below the expectation of 46.8.
The latest data from Statistics New Zealand revealed that the New Zealand Unemployment Rate for Q2 came in at 3.6%, above the consensus of 3.5% and 3.4% prior. Employment Change QoQ rose 1.0%, better than expected at 0.5% and 0.8% previously. Additionally, the Labour Cost Index QoQ declined to 1.1% versus 1.2% forecast and 0.9% prior. The participation rate in Q2 improved to 72.4%, against an estimation of 72.0%. Following the mixed New Zealand data released, the Kiwi faces some follow-through selling and drops to 0.6140.
In the absence of top-tier economic data released from New Zealand later this week, market participants will shift their focus to the US ADP employment data due later in the day. Also, the US ISM Service PMI and Nonfarm Payrolls will be released on Thursday and Friday, respectively. These events could significantly impact the US Dollar's dynamic and give the NZD/USD pair a clear direction.
- AUD/USD portrays a corrective bounce at the lowest level in a month after falling the most since March.
- US credit rating cut drags US Dollar from three-week high but RBA-inflicted pessimism, downbeat Australia data weighs on Aussie price.
- Sour sentiment also exerts downside pressure on AUD/USD price due to its risk-barometer status.
- US ADP Employment Change for July will be crucial ahead of Friday’s RBA SoMP, US NFP.
AUD/USD stays defensive around 0.6615-20 while licking the wounds at the lowest level in a month amid early Wednesday in the Asia-Pacific zone. In doing so, the Aussie pair struggles to cheer the US Dollar’s retreat from a multi-day high while keeping the Reserve Bank of Australia (RBA) inflicted fears intact. That said, the US Dollar’s latest pullback could be linked to a surprise US credit rating cut, as well as the recently downbeat Federal Reserve (Fed) talks and the mixed US data.
It’s worth observing that Australia’s AiG Industry Index for June slumps to -14.7 from -11.9 whereas AiG Manufacturing PMI for the said month nosedives to -25.6 from -19.8 previous readings and exerts downside pressure on the AUD/USD price of late.
Fitch Ratings downgrades the US government's credit rating to AA+ from AAA while terming fears of the debt crisis as the key catalysts on late Tuesday. Following the announcements, the White House and US Treasury Secretary Janet Yellen rushed to criticize the move and defend the US Dollar but failed of late.
Before that, downbeat comments from Atlanta Federal Reserve Bank President Raphael Bostic also underpin the AUD/USD pair’s recovery. That said, Fed’s Bostic rules out the need for a September rate hike while warning of the risk of over-tightening.
It should be noted, however, that the RBA’s second consecutive inaction contrasts with the hopes of witnessing a Fed rate hike in September to keep the AUD/USD bears hopeful, especially amid downbeat catalysts from China.
On Tuesday, the Reserve Bank of Australia (RBA) defied market forecasts by keeping the benchmark rates intact at 4.1%, marking the second consecutive status quo after challenging the two hawkish surprises in the last monetary policy meeting in July. However, the Aussie central bank’s Monetary Policy Statement, presented by Governor Phillip Lowe, mentioned, “Some further tightening of monetary policy may be required to ensure that inflation returns to target in a reasonable timeframe, but that will depend upon the data and the evolving assessment of risks.”
That said, China announced restrictions on drone exports in retaliation to the US tech and trade war tactics by citing the “national security” measures. China Caixin Manufacturing PMI for July fails to trace its upbeat NBS counterpart while declining to 49.2 for July from 50.5 prior, versus 50.3 market forecasts, marking the lowest level since January.
Elsewhere, US ISM Manufacturing PMI for July improves to 46.4 from 46.0 prior, versus 46.8 expected. Further details unveil that ISM Manufacturing Employment Index slumped to 44.4 from 48.0 expected and 48.1 prior whereas the ISM Manufacturing Price Paid for the said month rose to 42.6 from 41.8, compared to 42.8 market forecasts. Elsewhere, the US JOLT Job Openings for June also eased to 9.582M compared to 9.62M expected and 9.616M previous readings (revised).
Against this backdrop, Wall Street closed mixed and the US Treasury bond yields rose but the S&P500 Futures dropped 0.34% intraday by the press time.
Looking forward, the market’s reaction to the US rating cut and cautious mood ahead of the US ADP Employment Change may direct the AUD/USD moves amid a light calendar. That said, the ADP data can prod the US Dollar bulls if matching or decline below the downbeat forecasts of 189K for July versus 497K prior.
Technical analysis
Unless posting a successful recovery beyond the 200-DMA hurdle of around 0.6735, the AUD/USD stays vulnerable to test an ascending support line from October 13, 2022, around 0.6590 by the press time.
- EUR/USD picks up bids to reverse the first daily loss in three amid broad US Dollar pullback.
- Fitch Ratings cut US government’s credit rating by one notch while citing debt ceiling crisis.
- Mixed German, US data join cautious mood in the market, recent retreat in hawkish Fed talks to prod Euro bulls.
- US ADP Employment Change, market’s reaction to Fitch’s move will be eyed for clear directions.
EUR/USD justifies the surprise US credit rating cut but rising to 1.1010 during the early hours of Wednesday’s Asian session. In doing so, the Euro pair reverses the previous day’s losses, the first in three, ahead of the key United States Automatic Data Processing (ADP) Change Employment, the early signal for Friday’s Nonfarm Payrolls (NFP).
Late on Tuesday, Fitch Ratings downgraded the US government's credit rating to AA+ from AAA while terming fears of the debt crisis as the key catalysts for the stark move. Following the announcements, the White House and US Treasury Secretary Janet Yellen rushed to criticize the move and defend the US Dollar but failed of late.
Also read: Fitch downgrades US government’s AAA credit rating to AA+, US Dollar retreats
Apart from that, downbeat comments from Atlanta Federal Reserve Bank President Raphael Bostic also underpin the EUR/USD pair’s recovery. That said, Fed’s Bostic rules out the need for a September rate hike while warning of the risk of over-tightening.
Even so, the mostly upbeat US data and unimpressive statistics from the bloc, as well as the aftershocks of the European Central Bank’s (ECB) dovish hike, keeps the EUR/USD buyers in check.
On Tuesday, US ISM Manufacturing PMI for July improves to 46.4 from 46.0 prior, versus 46.8 expected. Further details unveil that ISM Manufacturing Employment Index slumped to 44.4 from 48.0 expected and 48.1 prior whereas the ISM Manufacturing Price Paid for the said month rose to 42.6 from 41.8, compared to 42.8 market forecasts. Elsewhere, the US JOLT Job Openings for June also eased to 9.582M compared to 9.62M expected and 9.616M previous readings (revised).
At home, German Unemployment Rate eased to 5.6% for June versus 5.7% expected and prior whereas the final prints of HCOB Manufacturing PMI for July confirmed 38.8 figure. On the same line, the last readings of Eurozone HCOB Manufacturing also matched initial forecasts of 42.7.
Amid these plays, Wall Street closed mixed and the US Treasury bond yields rose but the S&P500 Futures drop 0.34% intraday by the press time.
Moving on, the market’s reaction to the US rating cut and cautious mood ahead of the US ADP Employment Change may restrict EUR/USD moves amid a light calendar in the old continent. That said, the ADP data can prod the US Dollar bulls if matching or decline below the downbeat forecasts of 189K for July versus 497K prior.
Also read: ADP Jobs Preview: Will a softer report slow down the US Dollar?
Technical analysis
EUR/USD pair’s recent recovery could be linked to the repeated failure to break a two-month-old rising support line, close to 1.0980 by the press time. The rebound, however, remains elusive unless crossing the 1.1050 resistance.
- USD/CHF loses momentum around 0.8730, down 0.24% in the early Asian trading hours.
- The renewed trade war tensions between the US-China might exert pressure on USD/CHF.
- Investors await the US ADP employment, the Swiss CPI y/y.
The USD/CHF pair snaps a four-day winning streak near 0.8730 during the early Asian session on Wednesday. Market participants await the US ADP employment report due in the American session for some hints for Friday's Nonfarm Payrolls. Meanwhile, the US Dollar Index (DXY), a measure of the value of the Greenback against six other major currencies, loses momentum to 101.95 after retreating from the 102.45 mark.
On Tuesday, the US Bureau of Labour Statistics (BLS) reported that JOLTS Job Openings came in at 9.58 million in June. This reading followed May's 9.82 million openings and was below the market consensus of 9.62 million. Meanwhile, the ISM Manufacturing PMI increased to 46.4 from 46 in July, but was below the expectation of 46.8.
The renewed trade war tensions between the US-China might undermine the US Dollar and act as a headwind for the USD/CHF pair. China's authorities announced export restrictions on some drones and drone-related equipment to the US on Monday, citing "national security and interests”. The restriction will go into effect on September 1, according to the commerce ministry. It's worth noting that the US is China's biggest export market for drones.
Additionally, US President Joe Biden plans to sign an executive order curbing US technology investments in China by mid-August. Investors will keep an eye on the developments surrounding the US-China relationship. The tension between the world’s two largest economies could benefit the traditional safe-haven Swiss Franc (CHF) and cap the upside for USD/CHF.
About the data, the Swiss ZEW Survey Expectations data by the Centre for European Economic Research reported that the figure came in at -32.6 versus -30.8 prior and a worse-than-expected 31.1. While Swiss Retail Sales for June YoY came in at 1.8% versus a 0.9% decline in May.
Moving on, the Swiss SECO Consumer Climate, Manufacturing PMI, and Consumer Price Index (CPI) y/y could offer clues about the Swiss franc's movement. Market players will also monitor the release of the US ADP employment report later in the day ahead of the US ISM Service PMI and Nonfarm Payrolls. Traders will take cues from the data and find opportunities around the USD/CHF pair.
Statistics New Zealand unveils the second quarter (Q2) 2023 employment report around 22:45 GMT on Tuesday to entertain the NZD/USD traders. The headline results are as follows:
- New Zealand Unemployment Rate Q2: 3.6% (estimated 3.5%; previous 3.4%).
- Employment Change (QoQ) Q2: 1.0% (expected 0.5%; prior 0.8%).
- Labor Cost Index (QoQ) Q2: 1.1% (market forecasts 1.2%; prior 0.9%).
- Participation Rate Q2: 72.4% (anticipated to remain unchanged at 72.0%).
NZD/USD reaction
Following the key New Zealand (NZ) Q2 employment report, the NZD/USD pair drops around 30 pips to refresh the intraday low near 0.6140, reversing late Tuesday’s corrective bounce after posting the biggest daily loss in over a week.
It’s worth noting that the US government’s rating cut by Fitch Ratings triggered the broad US Dollar pullback and allowed the Kiwi pair to post a corrective bounce to 0.6175.
Also read: New Zealand Q2 employment report favors NZD/USD bears
However, the mixed NZ data and fears of policy pivot in the Pacific zone, after the Reserve Bank of Australia’s (RBA) rate hike pause the previous day, exert downside pressure on the NZD/USD pair.
NZD/USD 15-minute chart

Also read: NZD/USD Price Analysis: Kiwi trades weak, ahead of Q2 employment data
About New Zealand Unemployment Rate and Employment Change
The quarterly report on New Zealand's Unemployment Rate and Employment Change is being released by Statistics New Zealand.
The Unemployment Rate is the number of unemployed workers divided by the total civilian labor force. If the rate is up, it indicates a lack of expansion within the New Zealand labor market. As a result, a rise leads to weaken the New Zealand economy. A decrease of the figure is seen as positive (or bullish) for the NZD, while an increase is seen as negative (or bearish).
On the other hand, Employment Change is a measure of the change in the number of employed people in New Zealand. Generally speaking, a rise in this indicator has positive implications for consumer spending which stimulates economic growth. A high reading is seen as positive (or bullish) for the NZ dollar, while a low reading is seen as negative (or bearish).
- Gold Price bounces off weekly low after reporting the first daily loss in three.
- US Dollar retreats after rate cut news, activating XAU/USD rebound from 200-SMA.
- Overall USD strength, fears of easing demand from China, India weigh on quote.
- Key support challenge XAU/USD bears ahead of important US employment clues.
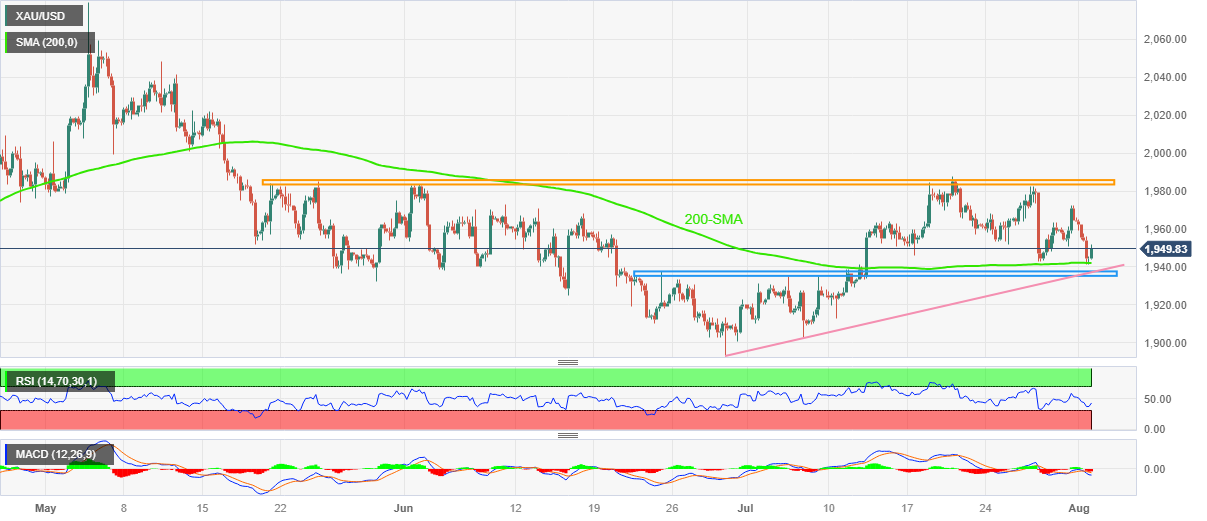
Gold Price (XAU/USD) begins Wednesday’s Asian session on a front foot, bouncing off the lowest levels in a week, as well as from the 200-SMA key support, as it justifies the United States government’s rate cut by the rating giant Fitch Ratings. In doing so, the yellow metal pares the previous day’s heavy losses with mild gains to around $1,950. However, the bears remain hopeful ahead of today’s United States Automatic Data Processing (ADP) Change Employment, the early signal for Friday’s Nonfarm Payrolls (NFP).
Gold Price rebound appears shallow despite corrective bounce
Gold Price recovers on the rate cut news but remains on the back foot as the United States data has mostly been positive and increased odds of the Federal Reserve’s (Fed) September rate hike.
On Tuesday, US ISM Manufacturing PMI for July improves to 46.4 from 46.0 prior, versus 46.8 expected. Further details unveil that ISM Manufacturing Employment Index slumped to 44.4 from 48.0 expected and 48.1 prior whereas the ISM Manufacturing Price Paid for the said month rose to 42.6 from 41.8, compared to 42.8 market forecasts. Elsewhere, the US JOLT Job Openings for June also eased to 9.582M compared to 9.62M expected and 9.616M previous readings (revised).
It should be noted that the CME’s FedWatch Tool hints at a gradual increase in the hawkish Fed bets for September.
With this, the US Dollar Index (DXY) rose to the highest level in three weeks and exerted downside pressure on the Gold Price, making it snap a two-day winning streak.
It’s worth noting that the latest retreat in the DXY, due to the news suggesting Fitch ratings’ downgrade to the US government by one notch, from AAA to AA+, puts a floor under the Gold Price. Also challenging the XAU/USD bears is the 200-SMA support and the consolidation in the quote ahead of today’s key United States data.
China, India news weigh on XAU/USD
Downbeat headlines surrounding China and India, the two biggest gold consumers, also exert downside pressure on the XAU/USD price.
On Tuesday, the World Gold Council (WGC) marked a 2.0% yearly fall in the gold demand as higher interest rates by major central banks dent the physical demand of the XAU/USD.
More importantly, WGC India’s regional chief executive officer Somasundaram PR said, per Reuters, “India’s gold demand in 2023 could fall 10% from a year ago to their lowest in three years, as record high prices are dampening retail purchases.” That said, the WGC official expects a fall in New Delhi’s XAU/USD demand to 700 metric tons in 2023 from 774.1 metric tons a year ago.
On the other hand, downbeat China data and fears of the Sino-US tension flag challenges for the dragon nation’s economic recovery even if Beijing unveils multiple stimulus to defend the transition. That said, China’s Caixin Manufacturing PMI for July fails to trace its upbeat NBS counterpart while declining to 49.2 for July from 50.5 prior, versus 50.3 market forecasts, marking the lowest level since January. Further, China's Commerce Ministry announced restrictions to drone exports in retaliation to the US tech and trade war tactics by citing the “national security” measures.
It’s worth observing that the recent improvements in the Indian and Chinese equities, however, restrict the downside of the Gold Price.
Upbeat US employment clues will back hawkish Federal Reserve bets and Gold sellers
While the upbeat US Dollar and fears of receding demand from the top customers please the Gold sellers of late, the metal’s further downside hinges on the United States employment data. That said, the US Automatic Data Processing (ADP) Change Employment is known as the early signal for Friday’s key Nonfarm Payrolls (NFP) and can prod the US Dollar bulls, which in turn may trigger the Gold Price rebound, if matching or declining below the downbeat forecasts of 189K for July versus 497K prior.
Gold Price Technical Analysis
Gold Price marks another bounce off the 200-SMA as sellers take a break near the $1,942 key SMA support level.
Highlighting the bearish bias is the formation of the lower high on the Relative Strength Index (RSI), placed at 14, and the XAU/USD price. Furthermore, the bearish signals on the Moving Average Convergence and Divergence (MACD) also lure the Gold sellers.
However, a clear downside break of $1,942 isn’t an open ticket for the Gold bears as a six-week-old horizontal support zone and an ascending trend line from June 28, close to the $1,935 zone, holds the key to the metal’s further downside toward the yearly low marked in June near $1,893.
Meanwhile, Gold Price recovery needs to cross the latest peak of around $1,973 to convince buyers. Even so, multiple resistances marked since February 19, near $1,985, can prod the XAU/USD upside before giving control to the bulls.
Overall, the Gold Price remains on the back foot but the bears need to conquer the $1,935 support to convince bears.
Gold Price: Four-hour chart
Trend: Limited downside expected
Global rating agency Fitch downgrades the US government's credit rating to AA+ from AAA on Tuesday. The rating giant cites anticipated fiscal deterioration over the next three years and a high and growing general government debt burden as the key catalysts for the stark move.
“There has been a steady deterioration in standards of governance over the last 20 years, including on fiscal and debt matters, notwithstanding the June bipartisan agreement to suspend the debt limit until January 2025,” said Fitch in the official statement.
Following the announcement, US Treasury Secretary Janet Yellen crossed wires, via Reuters, while conveying her strong disagreement with the Fitch ratings’ decision to downgrade the US government by calling it, "arbitrary and based on outdated data."
On the same line, Reuters also conveyed comments from an anonymous Senior Official from the Biden Administration who termed the Fitch Ratings’ decision as one that ignores resilience and underlying US economic strength. The official also termed it as “Bizarre and baseless” while citing the possibility of seeing a major increase in borrowing costs due to the rate cut announcement.
Market reaction
The news triggered a quick pullback in the US Dollar Index (DXY) from a three-week high of near 102.30 to 102.00 during late Tuesday, early Wednesday morning in Asia.
Also read: Forex Today: Dollar remains strong ahead of more jobs data
- NZD/USD fell near the 0.6150 area, losing more than 0.90%.
- New Zealand will release Employment Change, Participation and Unemployment rate data from Q2.
- Labour market outlook to determine following RBNZ decisions.
On Tuesday’s session, the NZD/USD fell sharply as markets await critical labour market data from New Zealand from Q2. As for now, the Reserve Bank of New Zealand (RBNZ) pointed out that they were done with tightening and hinted that they will hold rates at restrictive levels for some time.
As for now, markets are expecting the RBNZ to hold the Official Cash Rate (OCR) until May next year, but incoming data may determine the next decisions. Regarding employment, ANZ analysts expect to see a loosening in the sector and operating well beyond its “maximum sustainable level in the quarter”.
In terms of monetary policy, analysts believe that the data won’t suggest that the RBNZ’s job is done, but it will help to understand how the rates at 5.50% are affecting the labour markets.
That being said, the NZD traded with losses agains most of its rivals, including the AUD, JPY, USD, GBP, and EUR.
NZD/USD Levels to watch
From a technical standpoint, the NZD/USD maintains a bearish outlook for the short term, as observed on the daily chart. The Relative Strength Index (RSI) is comfortably positioned in the negative territory below its midline. Its southward slope is complemented by a negative signal from the Moving Average Convergence Divergence (MACD), which shows red bars, signalling a growing bearish momentum. Additionally, the pair is below the 20,100 and 200-day Simple Moving Averages (SMAs), indicating a challenging position for the buyers in the bigger picture as the bears remain in command.
Support levels: 0.6140, 0.6120, 0.6100.
Resistance levels: 0.6180, 0.6197 (100-day SMA), 0.6222 (200-day SMA).
NZD/USD Daily chart
-638265217815154347.png)
Atlanta Federal Reserve Bank President Raphael Bostic said that "we are in a phase where there is some risk of over-tightening." According to him, the Fed should be cautious, patient, and resolute. He does not expect that a rate hike will be necessary at the September meeting.
Regarding the inflation outlook, Bostic mentioned that if progress unexpectedly stalls, he would be comfortable contemplating another rate hike. "Inflation is unacceptably high," despite the significant progress made, he said. Regarding data, he added that it has been "promising."
Atlanta Fed President expects unemployment to rise as inflation declines. He does not see interest rate cuts until the second half of 2024, at the earliest.
Early on Wednesday, New Zealand is scheduled to release its Q2 employment report, while later in the day, Australia's AiG PMI is due. The highlight of the day will be the release of the ADP employment report.
Here is what you need to know on Wednesday, August 2:
On Tuesday, US stocks finished mixed, with the Dow Jones up by 0.20% and the Nasdaq down by 0.43%. US Treasury yields rose, with the 10-year reaching levels above 1.40%.
Economic data from the US came in mixed. JOLTS Job Openings and the ISM Manufacturing PMI below expectations. The US Dollar Index rose 0.35% on the day, after trimming gains during the American session. The Greenback rose across the board and remains strong. On Wednesday, the ADP employment report is due, which could be a preview for Friday's Nonfarm Payrolls.
- US JOLTS Job Openings edge lower to 9.58 million in June vs. 9.62 million expected
- US: ISM Manufacturing PMI rises to 46.4 in July vs. 46.8 expected
The Euro outperformed during the American session, with EUR/USD rebounding from above 1.0950 towards 1.1000. The pair still holds a bearish bias, but the Dollar's momentum has faded.
GBP/USD posted its lowest daily close in three weeks, below 1.2800, and continues to move with a bearish bias. On Thursday, the Bank of England will announce its decision on monetary policy, with a rate hike expected.
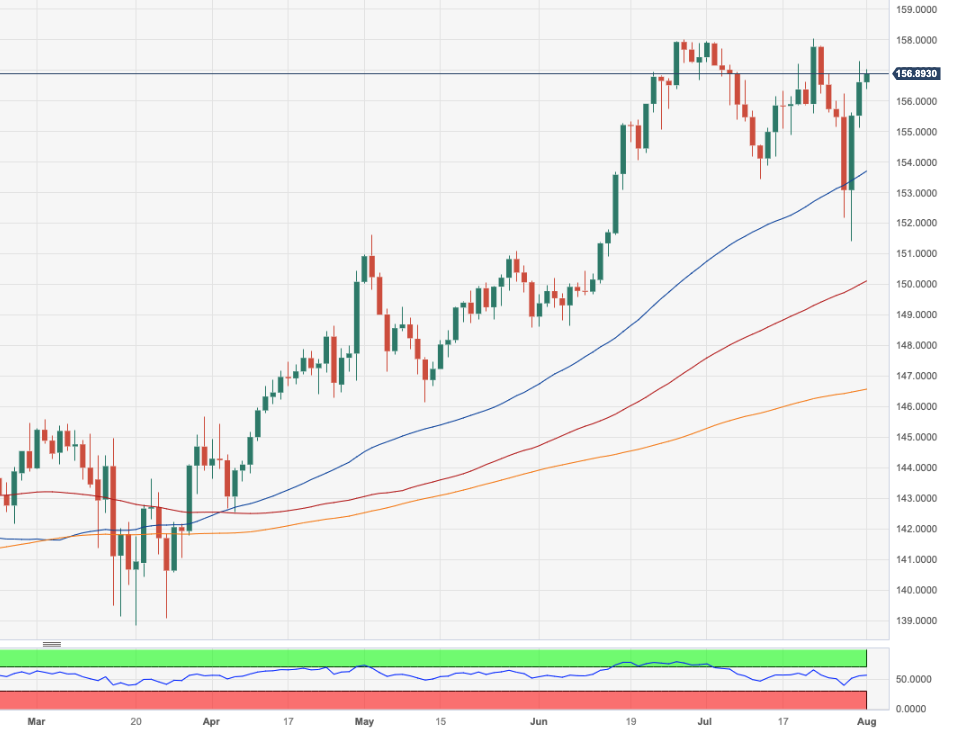
USD/JPY rose sharply for the third consecutive day, breaking above 143.00, the highest level seen since July 7. The Yen continues to be among the worst performers amid higher yields and the latest developments regarding the Bank of Japan.
The Australian dollar lagged on Tuesday after the Reserve Bank of Australia (RBA) opted to keep its key interest rate unchanged at 0.10%. The RBA offered a pessimistic assessment of the economic outlook but kept the door open to more rate hikes. AUD/USD dropped to test the key support area of 0.6600. It remains under pressure, and a break lower could trigger more losses.
NZD/USD gave up Monday's gains, pulling back to the 0.6150 area. New Zealand will report Q2 labor market data early on Wednesday. The unemployment rate is expected to rise modestly to 3.5%, and employment growth is expected to have stayed strong during the quarter at a 0.5% rate. The labor cost index is expected to have risen at a 4.5% annual rate. The numbers are unlikely to be a game-changer for the Reserve Bank of New Zealand, but a surprisingly positive report could add pressure to the central bank.
USD/CAD rose after many days of trading sideways, breaking above 1.3250. While above that level, more gains seem likely, but the currency is facing resistance at 1.3300.
It was a bad day for metals. Gold lost $30 from Monday's highs and bottomed around $1,940, while Silver tumbled 1.80%, ending the day near $24.30. Crude oil prices rose again, with WTI hitting fresh highs above $82.00.
Like this article? Help us with some feedback by answering this survey:
- EUR/JPY is rising for a third consecutive day, above 157.00, consolidating itself above the 20-day SMA.
- European Manufacturing PMI shows weakness, while Unemployment figures came in better than expected.
- The JPY continues to trade weak amid BoJ’s dovish stance, also weakened by soft Chinese data.
The EUR/JPY continued to gain ground in Tuesday’s session. The EUR strengthened against most of its rivals. At the same time, the JPY continues to lose interest, mainly amid the Bank of Japan's (BoJ) dovish stance and the weakness in China’s economic activity.
Investors digest European and Chinese data
On the data front, the German, Spanish, Italian and French Manufacturing PMIs continued to show weakness in July, and the Eurozone’s index came in at 42.7, matching expectations and the previous reading. Other data showed that the Unemployment rate in Germany dropped in June to 5.6%, lower than the 5.7% expected, as well as in the Eurozone, where it dropped to 6.4% (vs 6.5% expected). Its worth noting that Christine Lagarde pointed out in the last European Central Bank (ECB) decision that the economic outlook remains highly uncertain but that the labour market remains robust. Regarding the following choices, she stated that they would depend on incoming that as she will retain an “open-minded” approach.
Regarding the Japanese Yen (JPY) is depreciating against other currencies as a result of the Bank of Japan's (BoJ) dovish stance and limited flexibility in their Yield Control Curve (YCC). As long as inflation stays below their projections, the BoJ states it has no plans to normalise monetary policy.
In addition, Chinese economic data disappointed as the Caixin Manufacturing PMI fell to 49.2, indicating contraction and missing expectations of 50.3 and the previous 50.5. The weakness in China's economy will likely impact the Japanese Yen (JPY) since China is Japan's leading trading partner. The JPY may face downward pressure due to concerns over reduced trade and economic activity between the two countries.
EUR/JPY Levels to watch
Analysing the daily chart, the EUR/JPY technical outlook is bullish in the short term. The Relative Strength Index (RSI) is positioned above its midline in positive territory. It has a northward slope, indicating a favourable buying momentum. It is further supported by the positive signal from the Moving Average Convergence Divergence (MACD), which displays green bars, underscoring the growing bullish momentum. Moreover,the pair is above the 20,100 and 200-day Simple Moving Averages (SMAs), pointing towards the prevailing strength of the bulls in the larger context.
Resistance levels: 157.80,158.00, 159.00.
Support levels: 155.84 (20-day SMA), 155.500, 155.00.
EUR/JPY Daily chart
-638265184644645688.png)
- GBP/USD dropped more than 0.80%, testing the 1.2750 zone.
- British and American Manufacturing sectors showed weakness in July.
- US JOLTs figures hinted at some softness in the labour market. Eyes on additional ADP, NFPs and Claims.
The GBP weakened on Tuesday against the USD as the Greenback gained ground against most of its rivals. Ahead of Thursday’s Bank of England (BoE) decision, the weak British made the GBP lose interest while markets await key labour data from the US. Economic data reported on the session from the US came in weak, but the DXY index hold gains above 102.00.
On Tuesday’s session, the US reported mid-tier data. Though slightly below forecast at 46.4, the US ISM July PMI increased from the previous reading of 46. Job Openings on JOLT fell short of expectations, coming in at 9.58M instead of 9.62M. According to Fed Chairman Powell, the economy is resilient, but decisions about the future will be made based on new information, which could lead to volatility in USD price dynamics. This week, investors will be closely watching ADP job employment change, Jobless Claims, and Nonfarm Payrolls to begin placing bets on the upcoming Fed meetings.
On the other hand, the manufacturing PMI released by the Chartered Institute of Purchasing & Supply and S&P Global stood in contraction territory in July, coming in at 45.3, slightly higher than the 45 expected. That said, the focus is on Thursday’s Bank of England (BoE) decision, where markets anticipate a 25 bps hike. Investors will also closely monitor Andrew Bailey’s words to find clues regarding forward guidance.
GBP/USD Levels to watch
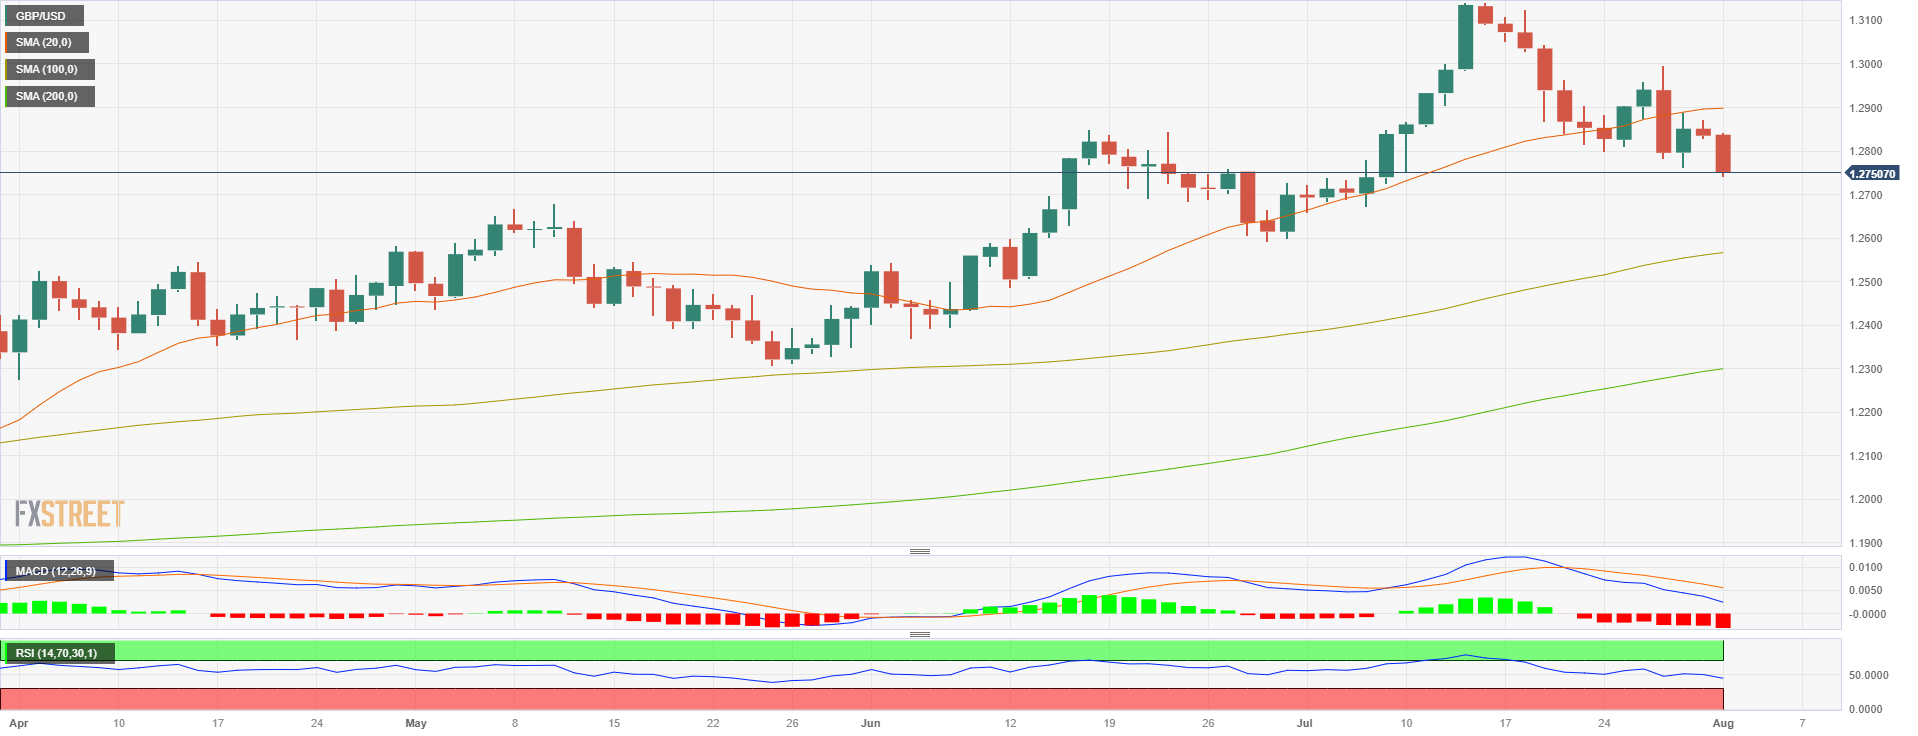
The GBP/USD indicates a neutral to bearish technical outlook on the daily chart, suggesting that the bulls might be losing steam on the short term. The Relative Strength Index (RSI) shows a negative slope and fell below its midline, and the Moving Average Convergence Divergence (MACD) displays fading green bars. Moreover, in the bigger picture, the pair is below the 20-day Simple Moving Average (SMA) but above the 100 and 200-day SMAs, indicating that the bulls still have the upper hand.
Support levels: 1.2730, 1.2710, 1.2700.
Resistance levels: 1.2830, 1.2850,1.2900 (20-day SMA).
GBP/USD Daily chart
Chicago Federal Reserve Bank President Austan Goolsbee said on Tuesday that he wants more proof that inflation is easing before considering interest rate hikes. He won't pre-commit to a vote for September. He offered these remarks while welcoming participants to Chicago's Business Smart Week.
Goolsbee stated that the need for further monetary policy tightening depends on what happens with prices. Regarding rate cuts, he mentioned that any rate cut would be far out in the future.
Speaking about the labor market, Goolsbee said that the JOLTS report looks consistent with a strong market moving toward a more balanced phase.
- WTI cut a three-day winning streak, falling to a low near $80.64 and then settling at $81.50.
- USD’s strength and weak Chinese data contribute to the price’s downward movements.
- Saudi’s supply cut expectations may limit the downside’s potential.
On Tuesday, the West Texas Intermediate (WTI) barrel dropped below $81.00, weakened by a strong USD and soft Chinese manufacturing data released during the Asian hours. However, the price cleared a great deal of the daily losses and recovered towards $81.50.
Chinese economic data disappointed. The Caixin Manufacturing PMI dropped below 50, intro contraction territory at 49.2, lower than the consensus of 50.3 and the previous 50.5. Its worth noticing that China is the biggest Oil importer in the world, so a weak economy means lower energy demand, making the price decrease.
That being said, the Chinese government taking up economic stimulus to bolster up local economic activity may limit the price’s downside potential. In addition, Oil traders are keeping an eye on potential Saudi production cuts, which could further benefit the WTI price dynamics.
For the rest of the week, attention is set on the labour market of the US, which will impact the USD price dynamics. Chair Powell clearly stated that future decisions will depend on incoming data, so ADP job employment change, Jobless Claims, and Nonfarm Payrolls will be closely monitored this week.
WTI Levels to watch
Considering the daily chart, the WTI shows a bullish sentiment for the short term. The Relative Strength Index (RSI), positioned above its midline in positive territory with a northward slope, supports this view along with the positive indication from the Moving Average Convergence Divergence (MACD), which is displaying green bars, pointing towards a strengthening bullish trend. On the other hand, the pair is above the 20,100,200-day SMAs, highlighting the continued dominance of bulls on the broader scale. Furthermore, the 20-day SMA is about to complete a bullish crossover with the 100-day average, providing vital support to the pair. That being said, the RSI still shows overbought conditions to a correction may be on the horizon.
Support levels: $80.50,$80.00,$79.10.
Resistance levels: $81.95, $82.50, $83.00.
WTI Daily chart
-638265077807120465.png)
- XAG/USD retreated more than 1% towards the $24.20 area, still holding the 20-day SMA.
- USD is strong after the release of June’s JOLTS Job Opening and the ISM Manufacturing PMI.
- Rising US Treasury yields are not allowing metals to find demand.
On Tuesday, the XAG/USD Silver spot price significantly dropped, mainly due to the USD strength. Attention is on labour market data released as investors are modelling their expectations towards the next Federal Reserve (Fed) meeting. Meanwhile, the greenback trades strong agains most of its rivals, with the USD DXY index rising towards the 102.30 area.
The US ISM July PMI came in slightly below expectations at 46.4 but higher than the previous reading of 46. JOLT's Job Openings missed expectations at 9.58M below the 9.62M. Its worth pointing out that Fed Chairman Powell stated that the economy holds resilient, but future decisions depend on incoming data, causing potential volatility in USD price dynamics on data releases. In that sense ADP job employment change, Jobless Claims, and Nonfarm Payrolls will be closely monitored this week for investors to start placing their bets on the next Fed meetings.
In the meantime, US yields are rising, which could be seen as the opportunity cost of holding non-yielding metals, are rising across the board. The 2-year yield remains steady at 4.88% while the 5 and 10 rates are at 4.22% and 4.02%, respectively, increasing more than 1%. In addition, the CME FedWatch tool indicates that investors are not so confident about a hike in September as their odds stand near 20% while the probabilities in November top out near 40%.
XAG/USD Levels to watch
As per the daily chart, the technical outlook for XAG/USD is shifting towards neutral to bearish, with signs of bullish exhaustion becoming evident. The Relative Strength Index (RSI) displays a negative slope above its midline, while the Moving Average Convergence Divergence (MACD) exhibits fading green bars. Furthermore, the pair is above the 20,100,200-day SMAs, suggesting that the bulls are firmly in control of the bigger picture.
Resistance levels: $24.90,$25.00, $25.30.
Support levels: $24.15 (20-day SMA), $24.00, $23.80
XAG/USD Daily chart
-638265021953020709.png)
- US Dollar gains momentum after US data.
- USD/CAD trades at three-week highs, risks tilted to the upside.
The USD/CAD broke above 1.3250 and climbed to 1.3299, reaching the highest level since July 10. The pair has left behind several days of sideways movement between 1.3250 and 1.3150.
Economic data from the US came in mixed, with the JOLTS job openings coming in below expectations in June at 9.58 million, against a consensus of 9.62 million. The ISM Manufacturing Index PMI rose from 46 in June to 46.4 in July, below the expected 46.8.
More US labor market data is due on Wednesday, with the ADP private employment report, and later on Thursday with the weekly Jobless Claims and Unit Labor Costs. On Friday, the US and Canada will release their official employment reports.
The US dollar remains strong after the data and has climbed to fresh highs versus commodity currencies. US Treasury yields edged higher despite the fact that the economic figures did not show positive surprises.
USD/CAD levels to watch
The outlook for USD/CAD is turning bullish as the pair holds above the critical resistance area of 1.3250. While above this level, more gains seem likely. The next resistance is the 1.3300/10 area, and above that is 1.3350.
The 1.3250 zone has now become the immediate support. A slide below this level would put the pair back in the familiar range. The next support stands at 1.3195.
Technica levels
- USD/JPY tallies a third consecutive day of gains near rising near the 143.30 area, displaying 0.70% gains.
- ISM Manufacturing PMI accelerated in July but was lower than expected. JOLTs data also fail to live up to expectations.
- USD trades strong agains most of its rivals ahead of crucial labour market data.
On Tuesday, the USD traded with gains agains most of its rivals, including the EUR, GBP and JPY, following the release of mid-tier economic data. On the other hand, the JPY continues to weaken amid the Bank of Japan’s (BoJ) dovish stance.
US Manufacturing sector remains resilient, while the labour market hinted at some softness
The Institute for Supply Management (ISM) from the US released its July PMI, which came in at 46.4 vs the 46.8 expected but higher than the previous 46 reading. On the other hand, the June JOLTs Job Openings, which captures job vacancies, came in at 9.58M vs the 9.62M expected and the previous 9.82M. It's worth noting that Federal Reserve (Fed) Chairman Jerome Powell pointed out that the economy is resilient and the labour market “tight”, confirming that future decisions will depend on incoming data. In that sense, the USD price dynamics will face volatility in the outcome of the economic data unit at the next September meeting as market participants will place bets on the outcome of the incoming economic figures.
That said, ADP job employment change figures on Wednesday, Jobless Claims on Thursday, and the Nonfarm Payrolls (NFP) on Friday will be closely watched.
Regarding the following Federal Reserve monetary policy decisions, tightening expectations remain steady. According to the CME FedWatch tool, markets are currently pricing in a 20% chance of a 25 bps hike in the September meeting and 29% odds of a 25 bps hike in November.
On the Japanese side, due to the Bank of Japan's (BoJ) dovish stance and limited flexibility in their Yield Control Curve (YCC), the JPY is losing ground against other currencies. The BoJ has no plans to normalise monetary policy as inflation remains below its estimates. Meanwhile, other central banks like the Federal Reserve, European Central Bank, and Bank of England have divergent economic policies that could further weaken the Yen.
USD/JPY Levels to watch
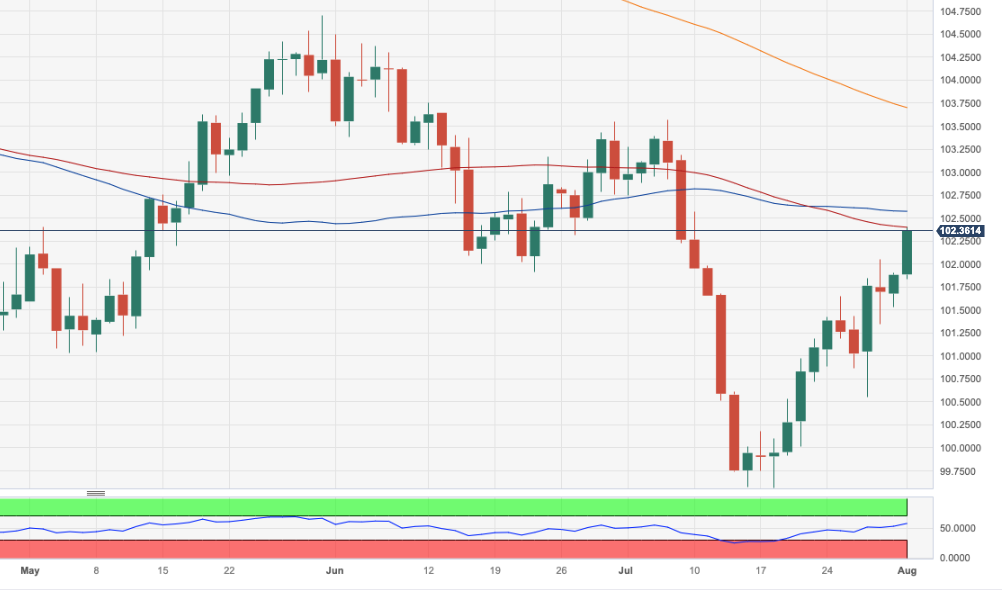
With Relative Strength Index (RSI) and Moving Average Convergence Divergence (MACD) comfortably placed in positive territory on the daily chart, the USD/JPY buyers hold the upperhand. The upwards slope of the Relative Strength Index (RSI) further reinforces this positive sentiment, as does the MACD, which displays green bars, indicating a strengthening bullish momentum. On the other hand, the pair is above the 20,100,200-day SMAs, suggesting that the bears are struggling to challenge the overall bullish trend.
Resistance levels: 143.50, 144.00, 144.50.
Support levels: 142.30,140.80 (20-day SMA), 140.00.
-638264998726950029.png)
Economists at Société Générale analyze EUR/USD outlook.
200-WMA at 1.1184 should cap upside in the near term
August seasonality was negative in four of the last five years. The negative seasonality cannot be overlooked for the direction of EUR/USD in August.
Fundamentally, with European growth lagging the US and Treasury yields holding firm, selling the Dollar continues to be a risky strategy. A second downward surprise for US CPI on 10th August could curtail positive Dollar momentum but investors are likely to reserve judgement until the Fed symposium at Jackson Hole in late August.
Even after the correction last week, EUR/USD remains tactically expensive vs 2y2y forwards and 10y real rate differentials. The 200-WMA at 1.1184 should cap upside in the near term.
The USD finished last week flat. Economists at TD Securities analyze Greenback’s outlook.
Use any USD rallies in the next few weeks as selling opportunities
We continue to like fading USD rallies, but factors show that global FX carry (and momentum) has offered better performance than taking USD directional views.
Our playbook this week underscores the importance of ‘good’ growth and ‘good’ inflation, where a combination of good growth data and disinflation is a poor mix for the USD. It resonates with the global Goldilocks scenario, where the USD smile calls for weakness.
The British Pound remains the best performing G10 currency so far in 2023. Economists at HSBC analyze GBP outlook.
Any moves above 1.30 are likely to be brief
Positioning and valuations are a hindrance to further upside.
Even a 50 bps hike from the Bank of England (BoE) on Thursday may not provide lasting support for the currency, particularly given likely downward revisions to inflation projections and a split vote. There is a sizeable chance that the BoE raises rates by only 25 bps, which will likely see the GBP weaken immediately.
We look for GBP/USD to weaken and challenge the support at 1.26 over the coming weeks, while any moves above 1.30 are likely to be brief.
- US ISM Manufacturing PMI recovered less than expected in July.
- Manufacturing Employment Index at 44.4 versus 48 expected.
- US Dollar Index stays retreats from three-week highs after data.
The economic activity in the US manufacturing sector improved in July but remained below 50, with the ISM Manufacturing PMI advancing to 46.4 from 46 in July. This reading came in worse than the market expectation of 46.8.
Further details of the publication revealed that the New Orders Index improved to 47.3 from 45.6, while the Employment Index slid from 48.1 to 44.4. Finally, the inflation component, Prices Paid Index, dropped to 42.6 from 41.8.
“Regarding the overall economy, this figure indicates an eighth month of contraction after a 30-month period of expansion”, said Timothy R. Fiore, Chair of the Institute for Supply Management. “The U.S. manufacturing sector shrank again, but the uptick in the PMI indicates a marginally slower rate of contraction. The July composite index reading reflects companies continuing to manage outputs down as order softness continues.”
Market reaction:
At the same, the JOLTS Job Opening report was also released. Following the data, the US Dollar Index retreated from three-week highs toward 102.15.
The Dollar staged a decent recovery from the lows in July. Economists at Société Générale analyze Greenback’s outlook.
UST 2y and 10y yields have risen in August in each of the last three years
Lingering doubts that the Fed is done raising rates is still offering the Dollar support.
Seasonality for the Dollar is bullish in August. Last year’s gain in the DXY of 2.6% was the fourth largest of the calendar year and followed the double digit ascent in 2y and 10y Treasury yields before Jackson Hole. US bond yields have risen in August in each of the last three years.
Hawkish Fed comments caught out investors in August last year and caused Treasuries to sell off and the Dollar to rally ahead of the Jackson Hole symposium. The price action this time may be determined by the outcome of CPI on 10th August.
Fundamentally, the third successive drop in jobless claims last week to 221K skews the risk to the upside for NFP on Friday. We forecast a rise of 190K and a decline in the unemployment rate to 3.5%. A lower jobless rate after a run of stronger growth data last week could give a nudge to the probability of a September hike.
JPY and MXN are interesting but for different reasons, economists at TD Securities report.
The BoJ has opened the door to further normalization
The BoJ has opened the door to further normalization, which to us remains JPY bullish. Local investment managers are repatriating longer-term fixed income flows and foreigners are buying equities.
On MXN, we like EUR/MXN lower, underscoring a nice way to capture good US growth but still attractive global carry, as markets mull the end to the ECB and Fed cycles.
- NZD/USD falls sharply to near 0.6140 amid sheer strength in the US Dollar.
- Investors will focus on US ISM Manufacturing PMI and JOLTS Job Openings data.
- NZ Unemployment Rate is expected to rise to 3.5% against the former release of 3.4%.
The NZD/USD pair falls back swiftly to near 0.6140 as the market moods turn cautious ahead of the United States economic data. The Kiwi asset faces selling pressure amid sheer strength in the US Dollar Index (DXY) ahead of the Manufacturing PMI to be reported by the Institute of Supply Management (ISM).
S&P500 is expected to open on a bearish note following negative cues from overnight futures. A stock-specific action is expected in the US equities amid Q2 corporate earnings season. The US Dollar Index climbs strongly above 104.20 as global recession fears deepen.
Going forward, investors will focus on US ISM Manufacturing PMI and JOLTS Job Openings data. As per the estimates, Manufacturing PMI jumped to 46.5 from the former release of 46.0 but remained in a contraction phase. New Orders Index that demonstrates forward demand is seen declining to 44.0 against the former release of 45.6.
Meanwhile, JOLTS Job Openings data would drop to 9.62M against May’s release of 9.824M. The economic data would provide cues about labor demand. The US labor market is facing the headwinds of labor shortages. Higher job openings would elevate labor demand further.
On the New Zealand Dollar front, investors are awaiting the Q2 Employment data, which will release on Wednesday. As per the estimates, the New Zealand labor market was added by fresh 0.5% payrolls. Quarterly Labor Cost Index is seen rising by 1.2% vs. the prior release of 0.9%. Higher Employment costs could elevate inflationary pressures further. The Unemployment Rate is expected to rise to 3.5% against the former release of 3.4%.
An increase in the labor cost index could prompt the Reserve Bank of New Zealand (RBNZ) to raise interest rates further.
GBP is vulnerable if the BoE does not hike by 50 bps, in the view of Kit Juckes, Chief Global FX Strategist at Société Générale.
The market is split between a 25 bps and 50 bps BoE hike
We wait for the UK MPC to hike, with expectations split down the middle between a 25 bps and a 50 bps move. That pretty much guarantees a reaction.
With inflation falling, house prices falling and economic sentiment gloomy, a 25 bps hike with a warning there could yet be more to come, would seem sensible. But given where expectations are that leaves GBP vulnerable this week.
25 bps from the Bank, and solid US data, could easily drag GBP/USD back below 1.25.
- EUR/USD slips back below the 1.1000 support on Tuesday.
- Further losses remain in store while below the mid-1.1100s.
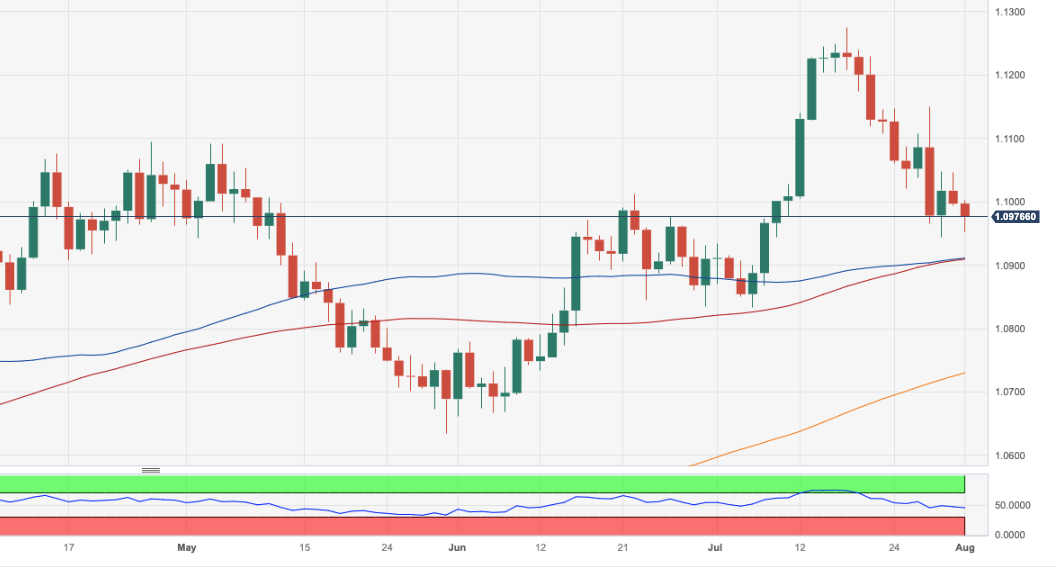
EUR/USD resumes the decline and drops to two-day lows in the 1.0955/50 band on Tuesday.
Considering the ongoing price action, spot could see its selling pressure accelerate and retest the weekly low of 1.0943 (July 28). The breakdown of this region could put a test of the 1.0910 zone, where the transitory 55-day and 100-day SMAs coincide, back on the radar.
Looking at the longer run, the positive view remains unchanged while above the 200-day SMA, today at 1.0728.
EUR/USD daily chart
The Mexican economy is running well. Economists at Commerzbank analyze MXN outlook.
Banxico will not risk missing its inflation target on a sustainable basis even after the start of the rate cut cycle
Mexico certainly benefits from the robust US economy, but the service sector also supports growth. The Mexican central bank Banxico is likely to see the latter with mixed emotions. The stubbornly high inflation levels in the service sector above all are slowing the disinflationary process, thus also creating uncertainty within Banxico as to when and at what speed rate cuts will be justifiable.
This cautious approach is what continues to justify a strong Peso, as it illustrates: Banxico will not risk missing its inflation target on a sustainable basis even after the start of the rate cut cycle. The FX market honours such a credible monetary policy, with the positive economic environment contributing its share.
The USD is trading firmer overall. Shaun Osborne, Chief FX Strategist at Scotiabank, analyzes Greenback’s outlook.
DXY resistance sits at 102.50
Last week’s squeeze higher in the USD around Thursday’s ECB policy decision had paved the way for the USD to strengthen a little more and investors sense a stronger USD is the path of least resistance right now.
I still rather feel that short term gains in the DXY will give way to renewed losses in the longer run but there is clearly decent momentum developing under the USD rebound here.
DXY resistance sits at 102.50.
- AUD/USD eyes downside to near 0.6600 as RBA maintains the status quo.
- The US Dollar Index refreshes a three-week high at 102.22 as fears of global recession deepen.
- In spite of higher factory activities, the Manufacturing sector is expected to remain in a contracting phase.
The AUD/USD pair delivers a vertical fall and declines further towards the round-level support of 0.6600 in the European session. The Aussie asset looks set for a further decline as the Reserve Bank of Australia (RBA) surprisingly keeps interest rates unchanged at 4.10%. Also, the upbeat US Dollar Index builds pressure on the Aussie asset.
S&P500 futures remain weak in London as investors turn precautionary ahead of US factory activity data. The US Dollar Index (DXY) refreshes a three-week high at 102.22 as fears of global recession deepen due to tight monetary policy by global central banks. The 10-year US Treasury yields have jumped to 4.0% ahead of labor market data.
But before the Employment report, Manufacturing PMI will be keenly watched. As per the consensus, Manufacturing PMI is seen higher at 46.5 vs. June’s figure of 46.0. In spite of higher factory activities, the Manufacturing sector is expected to remain in a contracting phase. Investors should note that a figure below 50.0 is considered contracting and this would be the ninth contraction print in a row.
The Australian Dollar senses significant pressure as RBA Governor Philip Lowe maintains the status quo. RBA Lowe keeps interest rates unchanged at 4.10% but remains doors open for further rate hikes. Australian inflation is declining at a decent pace. Regarding the inflation outlook, RBA forecasted that inflation will return to 2-3% by late 2025.
Inflation in Australia could rebound further as global oil prices have recovered significantly and labor market conditions are extremely tight. An upbeat labor shortage could keep consumer spending momentum intact. Going forward, investors will focus on Q2 Retail Sales data, which will release on Thursday.
- DXY extends the three-week rally north of 102.00.
- Sustained gains are expected on a close above 102.60.
DXY advances for the fourth session in a row and reaches fresh three-week highs in the 102.35/40 band on Tuesday.
The index appears poised to extend the ongoing multi-week recovery for the time being. Against that, the surpass of the weekly top of 102.36 (August 1) should prompt the index to embark on a probable visit to the transitory 100-day and 55-day SMAs at 102.39 and 102.56, respectively.
Once the latter is cleared, it should alleviate the downside bias in the dollar and allow for extra gains.
Looking at the broader picture, while below the 200-day SMA at 103.69 the outlook for the index is expected to remain negative.
DXY daily chart
USD/CAD pushes through mid-1.32s. Economists at Scotiabank analyze the pair’s outlook.
Additional gains towards 1.33 may follow
A clear move through the mid-1.32s raises the risk of a push on to a 1.33 handle but that may be the most we can expect at the moment.
The charts still reflect strong resistance overhead at 1.3350/60.
Support is 1.3210.
See:
-
USD/CAD to move lower in the coming weeks and break through support at 1.31 – HSBC
-
USD/CAD: Economic data and their impact should be the primary driver in the near term – Scotiabank
- EUR/JPY advances further and revisits the 157.00 area on Tuesday.
- Further advance now focuses on the 2023 high past 158.00.
EUR/JPY trades in a positive fashion for the third session in a row and retests the 15700 neighbourhood, or multi-day highs, on Tuesday.
The continuation of the upside momentum should initially target the 2023 high at 158.04 (July 21). The surpass of this levels exposes a move to the round level of 160.00 in the not-so-distant future.
So far, the longer term positive outlook for the cross appears favoured while above the 200-day SMA, today at 146.53.
EUR/JPY daily chart
Cable retests 1.28 support zone. Economists at Scotiabank analyze GBP/USD outlook.
Bargain hunters may still provide GBP with some support ahead of 1.2760/65
The BoE decision Thursday is expected to result in a tightening of at least 25 bps. At the very least, sterling will need a ‘hawkish tightening’ move to retain a firm undertone and perhaps take another run at the 1.30 zone.
UK yields are trading at a premium to US bond yields along the curve, providing some essential backstopping for the GBP.
Sterling’s gains have been blocked around 1.2875/85 since late last week and losses through the low 1.28s give the Pound a soft look on the charts. There has, however, been a fairly steady bid for the GBP on dips to the 1.28 area over the past week and bargain hunters may still provide the Pound with some support ahead of support at 1.2760/65.
Economist at UOB Group Lee Sue Ann expects the Bank of Thailand (BoT) to maintain its policy rate at 2.00% at its meeting on August 2.
Key Quotes
The BoT is more confident of stronger growth momentum ahead, forecasting the Thai economy to grow at 3.6% in 2023 and further accelerate to 3.8% in 2024. Full year inflation is projected to return to its 1-3% target range this year and next at 2.5% and 2.4% respectively.
As such, we think the BoT will keep its policy rate unchanged for the rest of this year.
EUR/USD trades softer below 1.10. Economists at Scotiabank analyze the pair’s outlook.
Too soon to sound the all-clear on ECB rate hikes
Tight labour markets risk keeping wage growth elevated and ECB policymakers will have to stay on their toes for the foreseeable future. It remains too soon to sound the all-clear on ECB rate hikes, even if the bar to more tightening is a little higher after last week’s decision.
The EUR looks soft below 1.10 and, after a couple of tests and failures at 1.1045/50 over the past few sessions, losses back under the figure area have tilted risks towards some drift – but perhaps not that much.
Support is 1.0950. Resistance is 1.1010/15.
Economists at HSBC expect the USD/CAD pair to tick down over the coming weeks.
The case for further BoC tightening remains robust
The CAD looks cheap, relative to recent moves in oil prices and risk appetite. Relative rates may be less relevant, although the case for further Bank of Canada (BoC) tightening remains robust. As with other central banks, the outcome will be data-dependent and so the July employment report (4 August), July inflation data (15 August), and June retail sales (23 August) will be key market pinch points.
We look for USD/CAD to move lower in the coming weeks and break through support at 1.31.
Kit Juckes, Chief Global FX Strategist at Société Générale, analyzes the EUR outlook.
EUR/USD needs help from the data calendar or else…
The Euro comes into August with short-term rate differentials drifting against it and long EUR futures positions looking vulnerable.
Something needs to happen to boost confidence in another 25 bps ECB hike, or the positioning will drag EUR/USD down. Unless, of course, the US data this week are bad enough to shift the conversation back to when the Fed will start easing. So, data-sensitive, but if all the data is dull, the Euro has a problem this month.
Economist at UOB Group Ho Woei Chen, CFA, assesses the latest set of data releases in the Chinese economy.
Key Takeaways
The Jul official PMIs painted a weaker outlook for China’s economy with risks continued to be biased to the downside.
The non-manufacturing PMI eased off sharply in signs that the consumption-led recovery has continued to lose steam rapidly. The manufacturing PMI improved from Jun but registered its fourth straight month of contraction (reading below 50).
The disinflationary pressure appeared to have eased in Jul for both the manufacturing and non-manufacturing sectors with input prices and output prices picking up but business margins could remain under pressure given that costs are rising faster.
The sharper-than-expected slowdown in the non-manufacturing sector will prompt policymakers to announce stronger and more concrete fiscal stimulus measures to boost consumption.
The Australian Dollar is the biggest mover following the RBA policy update. Economists at MUFG Bank analyze AUD outlook.
RBA leaves rates on hold and dampens expectations for further hikes
Weakness in the Australian Dollar reflects disappointment that the RBA decided to leave their policy rate unchanged at 4.10% which has dampened expectations for further hikes in the current tightening cycle.
A less hawkish outlook for RBA policy will put a modest dampener on the Australian Dollar's performance.
See – AUD/USD: A revisit of 0.6560/0.6520 is not ruled out – SocGen
Economists at Commerzbank analyze Gold (XAU/USD) outlook.
Gold price to trend sideways around the $1,950 mark
Attention today is likely to be focused on the US ISM Purchasing Managers’ Index. It has been on a downward trajectory since the spring of last year. If it remains deep in contraction territory, this could put a significant dampener on the positive economic sentiment and thereby lend tailwind to the Gold price. That said, a whole series of disappointing economic indicators would probably be needed to spark any lasting move to the upside.
In the short term, we expect the Gold price to trend sideways around the $1,950 mark.
- USD/CAD turns sideways after rallying around 1.3250 amid solid appeal for the US Dollar.
- US factory activity is expected to continue its contracting spree for the ninth month.
- The Canadian Dollar fails to discover a cushion despite rising oil prices.
The USD/CAD pair oscillates in a narrow range after a rally around 1.3250 in the European session. Strength in the US Dollar is backed by Greenback’s fresh three-week high formed around 102.14. The Loonie asset is expected to deliver further action after guidance from United States Manufacturing PMI data.
S&P500 futures extend losses in London, portraying caution among market participants ahead of key economic data. The US Dollar Index continues its three-day winning spree on Tuesday as investors expect that the Federal Reserve (Fed) could continue hiking interest rates so that price stability could be achieved quickly.
US economic prospects display mixed performance on different parameters amid a higher interest rates scenario. Factory activities remained weak while consumer spending and labor market conditions showed resilience. For status updates on US Manufacturing PMI, July numbers will be keenly watched, which will be published at 14:00 GMT.
As per the consensus, US factory activity is expected to continue its contracting spree for the ninth month. The economic data is seen at 46.5, higher than the former release of 46.0. While Factory Orders are expected to decline to 44.0 against the former release of 45.6.
Meanwhile, the Canadian Dollar fails to discover a cushion despite rising oil prices. Increasing expectations that interest rates by global central banks will peak sooner have improved the appeal for the oil demand. It is worth noting that Canada is the leading exporter of oil to the United States and higher oil prices would strengthen the Canadian Dollar.
AUD/USD does not look set to break out any time soon, in the view of Kit Juckes, Chief Global FX Strategist at Société Générale.
Aussie has had a merry two days
AUD has had a merry two days; a pre-RBA short-covering rally being wiped out by RBA inaction.
If both RBA and Fed are ‘done’ for this cycle, I can’t really see the recent 0.65-0.69 range breaking any time soon.
See – AUD/USD: A big beat in NFP may accelerate move towards the YTD low of 0.65 – TDS
The BoE has seen the biggest repricing of terminal rates over the past three months, which sets up an interesting backdrop for the Pound. Economists at TD Securities analyze GBP outlook.
The rub for GBP is that the UK wins the award of stagnant economy recently
We think the risks skew negatively for GBP, as we expect a 25 bps hike and decent round of US data this week.
The rub for GBP is that the UK wins the award for stagnant economy recently. While inflation has eased, growth data trends have suffered the most across all the G10/EM markets we track. The consequence is that the perky GBP has cracked, but we still prefer exposure to crosses, given the correlation between the broad USD and risk.
For the BoE this week, sell GBP/CHF, capturing the potential for a dovish BoE and the limited exposure to broad USD moves.
Economists at Commerzbank analyze Greenback’s outlook after the US GDP data for Q2 provided some strong support for the USD last week.
Further tightening would reduce the possibility of a soft landing for the US economy
Strong economic data constitute a double-edged sword for the Dollar. On the one hand, the prospect of a soft landing strengthens the USD outlook, above all in view of a significantly weaker growth environment in the Eurozone.
On the other hand, excessively strong economic data could also fuel the concerns of the hawks on the FOMC that the Fed has not yet done enough to sustainably cool the economy and ensure a return of inflation to target.
Further rate hikes could of course be seen to be initially USD-positive, but further tightening would also reduce the possibility of a soft landing for the US economy, thus invalidating the reason for the recent USD recovery.
- USD/CHF jumps to near 0.8750 as the US Dollar roars ahead of factory data.
- Global recession fears improve the appeal of the US Dollar Index,
- Swiss markets remain closed on Tuesday on account of a National Holiday.
The USD/CHF pair delivers an upside break of the consolidation formed around 0.8700 in the London session. The Swiss Franc asset picks strength following the footprints of the US Dollar Index (DXY). Fears of global recession improve the appeal of the US Dollar, making it a safe-haven asset.
S&P500 futures posts some losses in Europe, portraying caution among market participants amid Q2 corporate earnings season. US equities remained choppy on Monday as investors remain cautious ahead of labor market data, which will be published this week.
The US Dollar Index (DXY) extends its three-day winning streak as Federal Reserve (Fed) policymakers remain confident about more interest rate hikes amid tight labor market conditions. Chicago Fed Bank President Austan Goolsbee favors further policy tightening despite easing inflationary pressures.
Meanwhile, investors are awaiting the United States Manufacturing PMI to be reported by the Institute of Supply Management (ISM). As per the estimates, US factory activities remained higher in July at 46.5 but continued its placement in the contracting phase. It is worth noting that a figure below 50.0 is considered contracting.
Markets in the Swiss economy are closed on Tuesday on account of the National Holiday, therefore, investors will focus on US economic calendar for guidance. Later this week, Swiss July Consumer Price Index (CPI) data will remain in focus. As per expectations, monthly inflation deflated by 0.1% vs. an expansion of 0.1% recorded for June. Annual inflation softened to 1.6% against the former release of 1.7%.
- Gold price comes under pressure amid weaker demand due to higher interest rates.
- Investors anticipate a power-pack action in Gold amid the release of the United States Manufacturing PMI for July.
- Fed Goolsbee favors more interest-rate hikes from Fed despite easing inflation.
Gold price (XAU/USD) faced immense selling pressure while attempting to sustain above the crucial resistance of $1,970.00 on Tuesday. The precious metal senses pressure as gold demand remained weak in the first half of 2023 due to higher gold prices and an aggressive rate-tightening cycle by the Federal Reserve (Fed). Apart from that, the immense strength of the Greenback builds severe pressure on bullion.
Investors anticipate a power-pack action in the Gold price amid the release of the United States Manufacturing PMI for July. The US factory sector has been consistently contracting for the past eight months and a similar result is expected again. After the hangover of US factory activities, investors will shift to labor market data, which will set an undertone for the Fed’s September monetary policy. For now, the chances of an interest rate hike from the Fed in its September policy are lower.
Daily Digest Market Movers: Gold price awaits factory activity data
- Gold price drops sharply after facing selling pressure around $1,970.00 as demand for gold remains weak due to higher gold prices and interest rates.
- Higher interest rates by central banks pushed households to elevate deposits to banks rather than investing in bullion.
- Fears of more interest rate hikes from the Federal Reserve (Fed) deepen as Chicago Fed Bank President Austan Goolsbee favors further policy tightening despite easing inflationary pressures.
- Minneapolis Fed Bank President Neel Kashkari remained positive that inflation is coming down positively but showed concerns about easing labor market conditions due to an aggressive policy-tightening cycle.
- The US Dollar Index continues its three-day winning spell and prints a fresh three-week high at 102.14 as a pause in the rate-tightening spell by the Fed is still out of sight.
- Meanwhile, 10-year US Treasury yields remain subdued around 3.96% as inflation remains in check after soft United States core Personal Consumption Expenditure (PCE) data was released on Friday.
- A power-pack action is expected in the US Dollar on Tuesday as the US Institute of Supply Management (ISM) agency will report July’s Manufacturing PMI data.
- Manufacturing PMI is seen higher at 46.5 vs. June’s figure of 46.0. In spite of higher factory activities, the Manufacturing sector is expected to remain in a contracting phase. Investors should note that a figure below 50.0 is considered contracting and this would be the ninth contraction print in a row.
- In addition to the Manufacturing PMI, investors will focus on Factory Orders which are expected to drop sharply to 44.0 against the previous month’s print of 45.6.
- Investors would get some meaningful cues about labor demand through JOLTS Job Openings data for June, which will be released at 14:00 GMT. As per expectations, Job Openings would drop to 9.62M against May’s release of 9.824M.
- This week, the US Dollar Index will remain active as the US economic calendar is full of economic events. After US Manufacturing PMI, investors will focus on Services PMI and labor market data.
- On Wednesday, Automatic Data Processing (ADP) will report Employment Change data for the US, which will be published at 12:15 GMT. As per the consensus, the US economy added a fresh 188K payrolls in July, significantly lower than novel employment additions of 497K made in June.
- Upbeat labor market conditions would make more interest-rate hikes from the Fed warranted.
- Fed survey data released on Monday showed that US banks reported tighter credit standards and weaker loan demand from both businesses and consumers during the second quarter, Reuters reported.
Technical Analysis: Gold price forms a Head and Shoulder pattern
Gold price trades inside Monday’s range as investors await crucial economic data for further action. The precious metal demonstrates a squeeze in volatility but will start expanding after economic events. The yellow metal is constantly trading sideways around the 20-day Exponential Moving Average (EMA) around $1,955.00.
On a smaller time frame, the Gold price is forming a Head and Shoulder chart pattern, which indicates that a bearish reversal is underway.
Fed FAQs
What does the Federal Reserve do, how does it impact the US Dollar?
Monetary policy in the US is shaped by the Federal Reserve (Fed). The Fed has two mandates: to achieve price stability and foster full employment. Its primary tool to achieve these goals is by adjusting interest rates.
When prices are rising too quickly and inflation is above the Fed’s 2% target, it raises interest rates, increasing borrowing costs throughout the economy. This results in a stronger US Dollar (USD) as it makes the US a more attractive place for international investors to park their money.
When inflation falls below 2% or the Unemployment Rate is too high, the Fed may lower interest rates to encourage borrowing, which weighs on the Greenback.
How often does the Fed hold monetary policy meetings?
The Federal Reserve (Fed) holds eight policy meetings a year, where the Federal Open Market Committee (FOMC) assesses economic conditions and makes monetary policy decisions.
The FOMC is attended by twelve Fed officials – the seven members of the Board of Governors, the president of the Federal Reserve Bank of New York, and four of the remaining eleven regional Reserve Bank presidents, who serve one-year terms on a rotating basis.
What is Quantitative Easing (QE) and how does it impact USD?
In extreme situations, the Federal Reserve may resort to a policy named Quantitative Easing (QE). QE is the process by which the Fed substantially increases the flow of credit in a stuck financial system.
It is a non-standard policy measure used during crises or when inflation is extremely low. It was the Fed’s weapon of choice during the Great Financial Crisis in 2008. It involves the Fed printing more Dollars and using them to buy high grade bonds from financial institutions. QE usually weakens the US Dollar.
What is Quantitative Tightening (QT) and how does it impact the US Dollar?
Quantitative tightening (QT) is the reverse process of QE, whereby the Federal Reserve stops buying bonds from financial institutions and does not reinvest the principal from the bonds it holds maturing, to purchase new bonds. It is usually positive for the value of the US Dollar.
The Reserve Bank of Australia (RBA) kept rates on hold today. But in the view of economists at ING, the RBA can still hike in September.
RBA’s pause is not the endgame
The RBA held rates for a second consecutive month, but we still think there is a chance the bank will hike one last time in September on the back of an inflation surprise.
AUD may underperform other peers like the NZD and the Scandies until a bullish ‘pocket’ emerges in September, should the RBA go ahead with one last hike.
- JOLTS report will be watched closely by Fed officials ahead of July jobs data.
- Job openings are forecast to fall to 9.6 million in June.
- US labor market conditions remain out of balance despite Fed rate hikes.
The Job Openings and Labor Turnover Survey (JOLTS) will be released on Tuesday, August 1, by the US Bureau of Labor Statistics (BLS). The publication will reveal the change in the number of job openings in June, alongside the number of layoffs and quits.
JOLTS data will be scrutinized by market participants and Federal Reserve policymakers, as it could provide valuable insights regarding the supply-demand dynamics in the labor market.
What to expect in the next JOLTS report?
The number of job openings on the last business day of June is forecast to decline to 9.6 million from 9.8 million in May. "Over the month, the number of hires and total separations were little changed at 6.2 million and 5.9 million, respectively," the BLS noted in May’s JOLTS. "Within separations, quits (4.0 million) increased, while layoffs and discharges (1.6 million) changed little."
The Federal Reserve (Fed) has been paying close attention to the job openings data to assess whether the supply-demand remain out of balance. In June, the BLS reported that there were more than 5.9 million unemployed. Following the July policy meeting, Fed Chairman Jerome Powell said that they were observing sings of labor supply and demand coming into better balance. Powell, however, noted that that labor demand was still substantially exceeding supply. In case jobs openings decline to 9.6 million in June as expected, that would translate into 1.6 jobs for each unemployed.
Fed officials are concerned that the slow recovery in the supply side of the labor market could lead to higher wages and make it difficult for them to bring inflation back to target.
FXStreet Analyst Eren Sengezer shares his view on the importance of the JOLTS Job Openings data and the potential market reaction:
“Market participants are uncertain whether the Fed will raise the policy rate again before the end of the year. Although Powell’s cautious tone regarding future policy tightening revived expectations for a no-change in the Fed policy rate in 2023, upbeat macroeconomic data releases, including the second-quarter Gross Domestic Product (GDP) growth, caused investors to scale back dovish Fed bets.”
“If there is a noticeable decline in the number of job openings, with a reading below 9 million, the US Dollar (USD) could come under renewed selling pressure. On the flip side, an increase toward 10 million would reaffirm tight labor market conditions and have the opposite impact on the currency’s performance against its major rivals.”
When will the JOLTS report be released and how could it affect EUR/USD?
Job openings data will be published on Tuesday, August 1, at 14:00 GMT. The report could influence the action in EUR/USD due to its potential influence on the market pricing of the Fed’s rate outlook. It’s also with noting that the Euro has been struggling to stay resilient against its rivals after European Central Bank (ECB) President Christine Lagarde refrained from confirming one more increase in key rates in September.
Eren points out key technical levels to watch for EUR/USD ahead of JOLTS data:
"EUR/USD dropped below 1.1000 early Tuesday and the Relative Strength Index (RSI) indicator on the daily chart retreated below 50, reflecting a bearish bias. On the downside, 1.0900 (100-day SMA) aligns as important support ahead of 1.0800 (Fibonacci 61.8% retracement of the March-July uptrend) and 1.0740 (200-day SMA)."
"In case EUR/USD reclaims 1.1000, 1.1070 (20-day SMA) could be seen as the next recovery target before 1.1100 (psychological level) and 1.1150 (static level)."
Economic Indicator
United States JOLTS Job Openings
JOLTS Job Openings is a survey done by the US Bureau of Labor Statistics to help measure job vacancies. It collects data from employers including retailers, manufacturers and different offices each month.
Read more.Next release: 08/01/2023 14:00:00 GMT
Frequency: Monthly
Source: US Bureau of Labor Statistics
USD/JPY is likely to remain highly volatile in the near term, in the view of economists at HSBC.
Policy tweak is slightly JPY-supportive
Notwithstanding the new (and less conventional) policy language around YCC, effectively, the BoJ has raised the cap for 10-year JGBs from 50 bps to 100 bps. In fact, one can argue that compared to simply widening the range to +/-100 bps, the range now is actually -50 bps to +100 bps – reflecting an asymmetry that is slightly JPY-supportive.
We doubt if this will be the end of high USD/JPY volatility over the near term. The disappointing lack of revision to its inflation forecasts for FY2024 and FY2025 suggests that the BoJ is still not convinced that inflation can stay above 2%. In other words, this does not provide any new information on BoJ’s thinking. Verbal communication from the BoJ could continue to lean dovish.
- NZD/USD meets with a fresh supply on Tuesday and is pressured by a combination of factors.
- Bets for one more rate hike by the Fed lift the USD to a multi-week high and weighs on the pair.
- China’s economic woes dent the market sentiment and further undermine the risk-sensitive Kiwi.
- Traders now look to the US macro data for some impetus ahead of NZ jobs data on Wednesday.
The NZD/USD pair comes under some renewed selling pressure on Tuesday and reverses a major part of the previous day's positive move. The intraday downfall remains uninterrupted through the early part of the European session and drags spot prices to a fresh daily low, around mid-0.6100s in the last hour.
The prospects for further policy tightening by the Federal Reserve (Fed) push the US Dollar (USD) to its highest level since July 10, which, in turn, is seen as a key factor exerting pressure on the NZD/USD pair. it is worth recalling that Fed Chair Jerome Powell said last week that the economy still needs to slow and the labour market to weaken for inflation to credibly return to the 2% target. Furthermore, the upbeat US GDP report pointed to an extremely resilient economy and kept the door for one more 25 bps rate hike in September or November wide open.
Apart from this, China's economic woes contribute to driving flows away from antipodean currencies, including the New Zealand Dollar (NZD). Investors remain concerned that the post-COVID recovery in the world's second-largest economy is losing steam and the fears were further fueled by the incoming weaker Chinese data. In fact, a private survey comes in line with the official PMI and showed that business activity in China's manufacturing sector swung back into contraction territory, with Caixin/S&P Global Manufacturing PMI falling to 49.2 in July.
This, in turn, tempers investors' appetite for riskier assets, which is evident from a generally softer tone around the US equity futures and exerts additional pressure on the risk-sensitive Kiwi. With the latest leg down, the NZD/USD pair has now moved well within the striking distance of a one-month trough, around the 0.6120 region touched last Thursday. The said area should now act as a pivotal point, which if broken decisively will be seen as a fresh trigger for bearish traders and pave the way for a further near-term depreciating move for the NZD/USD pair.
Market participants now look forward to the US economic docket, featuring the release of the ISM Manufacturing PMI and JOLTS Job Openings data. This, along with the broader risk sentiment, will influence the USD price dynamics and provide some impetus to the NZD/USD pair. The focus will then shift to the quarterly employment details from New Zealand, scheduled during the Asian session on Wednesday. Even a slight disappointment will be enough to weigh heavily on the domestic currency and set the stage for deeper losses.
Technical levels to watch
FX option expiries for Aug 1 NY cut at 10:00 Eastern Time, via DTCC, can be found below.
- EUR/USD: EUR amounts
- 1.1000 466m
- 1.1035 1.7b
- 1.1040 1.4b
- 1.1050 1.8b
- 1.1100 2b
- GBP/USD: GBP amounts
- 1.2855 620m
- 1.2900 366m
- USD/JPY: USD amounts
- 140.80 913m
- 141.35 747m
- 142.00 1.7b
- 142.50 711m
- 143.25 399m
- AUD/USD: AUD amounts
- 0.6620 620m
- 0.6780 345m
- 0.6850 342m
- EUR/GBP: EUR amounts
- 0.8660 491m
- 0.8710 340m
UOB Group’s Senior Economist Alvin Liew comments on the latest BoJ monetary policy event.
Key TAkeaways
The Bank of Japan (BOJ) in its scheduled Monetary Policy Meeting (MPM) on Fri (28 Jul), kept its key policy objectives unchanged to achieve the 2% inflation objective but tweaked the yield curve control (YCC) for “greater flexibility” and “to enhance the sustainability of monetary easing”. The YCC tweak means, that the +/-0.5% trading band of the 10-year JGB Yields will remain but they are no longer rigid limits, and the cap (“hard limit”) is now 1%, effectively widening the trading band to +/-100bps.
The revisions in the latest Jul 2023 Outlook for economic activity and prices (The Bank’s View) were more about making material upward adjustments to the FY 2023 price forecasts while slightly lowering or maintaining the further out price forecasts which remained below the 2% objective. The BOJ made very little change to the GDP growth projections.
BOJ Outlook – More Tweaks Before The Big Move In 2024? In an early Feb report, we had hypothesized a widening of the yield trading band to +/-100bps (by former BOJ Governor Kuroda in his last meeting in Mar before handing the reins to Ueda). Though it did not happen under Kuroda, the actions taken by Ueda (on 28 Jul) would in a way fulfill that trading band widening forecast. As such, we now expect Governor Ueda to carry out the path to normalisation/unwinding in two broad steps. 1) We expect a material period (Aug to Dec 2023) of adjustment to its forward guidance on YCC and interest rates with possibility of further tweaks in the name of “greater flexibility” and “to enhance the sustainability of monetary easing”, to give market guidance and time to prepare for an orderly exit of BOJ’s ultra-easy monetary policy, and 2) we still expect monetary policy normalization to begin only in early 2024 - YCC to be dropped and negative policy call rate to rise from -0.1% to 0% in Jan 2024 MPM.
In the US, surveys will test the soft-landing story, but the Dollar may stay 'trapped' amid low FX volatility for now, economists at ING report.
Dollar to stay “trapped” in a situation where FX volatility fails to pick up
We have recently made the case for the Dollar to stay ‘trapped’ in a situation where FX volatility fails to pick up, leaving room for carry trades to keep supporting high-yielders and weigh on funding currencies. The Greenback probably needs some compelling evidence against the soft-landing narrative in the coming days to break lower.
Today will be the first occasion to put that narrative to the test this week. The US manufacturing sector has been in contractionary territory since November 2022, and the consensus expectations for a mild rebound from 46 to 47 this month may not have major market implications. We think JOLTS job openings data have a greater potential to move investors’ sentiment today, with the consensus already positioned for a cool-off in the hiring market.
- USD/JPY scales higher for the third successive day and climbs to a three-week high.
- The BoJ’s dovish outlook and unscheduled bond-buying operation weigh on the JPY.
- Bets for one more Fed rate hike boost the USD and remain supportive of the move.
The USD/JPY pair builds on last week's solid bounce from the 138.00 neighbourhood and climbs to over a three-week high on Tuesday, summing to a rally of around 475 pips over the past three trading days. Spot prices stick to the modest intraday gains through the early European session and currently trade around the 142.70 region, up nearly 0.30% for the day.
Despite the Bank of Japan's (BoJ) steps last week to tweak its Yield Curve Control (YCC) policy, the dovish outlook continues to undermine the Japanese Yen (JPY). In fact, BoJ Governor Kazuo Ueda reiterated the need to maintain monetary support and said that the central bank won't hesitate to ease policy further. Ueda added that more time was needed to sustainably achieve the 2% inflation target. Furthermore, the Japanese central bank announced an unscheduled debt-buying operation on Monday to help contain rising local government bond yields. This, along with the prevalent risk-on environment, is seen weighing on the safe-haven JPY and acting as a tailwind for the USD/JPY pair.
Investors continue to cheer the latest optimism over more stimulus measures from China, which, to a larger extent, overshadows the incoming weaker data and remains supportive of the underlying bullish sentiment across the global equity markets. Apart from this, some follow-through US Dollar (USD) buying provides an additional lift to the USD/JPY pair. In fact, the USD Index, which tracks the Greenback against a basket of currencies, climbs to its highest level since July 10 in the wake of expectations for further policy tightening by the Federal Reserve (Fed). The bets were lifted by the upbeat US GDP report released last week, which pointed to an extremely resilient economy.
Moreover, Fed Chair Jerome Powell had said that the economy still needs to slow and the labour market to weaken for inflation to credibly return to the 2% target. This, in turn, is seen pushing the US Treasury bond yields higher and lending support to the Greenback. Market participants now look to the US economic docket, featuring the release of the ISM Manufacturing PMI and JOLTS Job Openings data. This might influence the USD price dynamics, which, along with the broader risk sentiment, should provide some impetus to the USD./JPY pair. Nevertheless, the aforementioned fundamental backdrop suggests that the path of least resistance for spot prices is to the upside.
Technical levels to watch
Economist at UOB Group Lee Sue Ann reviews the latest ECB monetary policy meeting.
Key Takeaways
The European Central Bank (ECB) decided to raise its three key interest rates by 25bps, in line with our expectations. It also decided to set the remuneration of minimum reserves at 0%.
There was a lack of forward guidance on what the ECB might do next, but it modified the language to signal a shift from an explicit tightening bias towards an outright neutral stance.
Just like the ECB, we hold an “open mind as to what the decisions will be in Sep and in subsequent meetings”; though for now, we are keeping to our view of a pause in the current tightening cycle.
The Reserve Bank of Australia (RBA) has just kept the official interest rate unchanged at 4.1%. Today's dovish surprise is sending AUD lower. Economists at TD Securities analyze Aussie outlook.
RBA trying to engineer a soft landing
The RBA chose to pause again, leaving the cash rate target at 4.1%. The Bank is now recalibrating its focus towards the pursuit of a ‘soft landing’ given its more pessimistic assessment of the economic outlook. However, the Bank is still leaving the option to hike on the table through the reinstatement of upside risks to inflation and isn't calling it quits.
After sitting in the middle of the 0.66-0.69 range, today's dovish surprise is likely to send AUD lower, possibly retesting the support of the 0.65 lows in end May.
The repricing of the terminal lower and China's outlook are likely to weigh on the AUD in the near-term.
China data and growth perceptions are likely to overtake as key drivers for the currency post RBA and the lack of concrete stimulus details and disappointing Chinese data add to bearish AUD momentum.
Another risk event for AUD for the remainder of the week will be the July Payrolls. A big beat in NFP may accelerate AUD's move towards the YTD low of 0.65.
Economists at Société Générale analyze GBP outlook ahead of the BoE meeting on Thursday.
August seasonals bearish for GBP/USD, bullish for EUR/GBP
Suspense around the BoE rate decision on Thursday should keep sterling on a knife edge with price action before the announcement likely to depend on the US manufacturing ISM data today and ADP employment on Wednesday.
Prior decisions to raise rates this year have not been well received in general by the Pound. Three of this year’s four rate increases translated into a lower GBP/USD on the day. EUR/GBP rallied on four occasions.
Bearish seasonality stands out for the Pound in August with GBP/USD down in eight of the last ten years and EUR/GBP up seven times.
The surpass of 7.200 would most likely reduce bets of a drop to 7.1000 in USD/CNH, argue Markets Strategist Quek Ser Leang and Senior FX Strategist Peter Chia at UOB.
Key Quotes
24-hour view: We held the view yesterday that USD “is under mild downward pressure and is likely to edge lower.” We were also of the view that “any decline is unlikely to threaten last week’s low of 7.1170”. Our view did not materialise as USD traded in a quiet manner between 7.1332 and 7.1572 before ending the day largely unchanged (7.1465, -0.03%). Momentum indicators are mostly flat, and today we expect USD to trade sideways between 7.1280 and 7.1700.
Next 1-3 weeks: Last Wednesday (26 Jul, spot at 7.1465), we highlighted that “downward momentum has increased, and there is room for USD to weaken further.” We added, “it is worth noting that there are a couple of strong support levels at 7.1240 and 7.1000.” After USD dropped to 7.1170 and rebounded, we highlighted last Friday (28 Jul, spot at 7.1700) that “If USD breaks above 7.2000 it would suggest that 7.1000 is not coming into view this time around.” We continue to hold the same view.
EUR/USD limps back below 1.10. Economists at ING analyze the pair’s outlook.
Markets too dovish?
The door is open for another hike by the ECB before the end of the year, even in September. Markets, however, remain reluctant to endorse this scenario and only price in 17 bps of tightening by December, likely having read last week’s ECB messaging as a dovish tilt.
It is possible investors will want to hear more hawkishness from ECB members before aligning with the data’s indications and fully price in another hike. However, August is a quiet month for ECB speakers: we’ll hear from the dove Fabio Panetta later this week, and that will hardly help.
EUR/USD should be primarily driven by the Dollar leg and US data for the remainder of the week, and there are some downside risks to the 1.0900 handle.
Here is what you need to know on Tuesday, August 1:
The Australian Dollar is the worst performing major currency on the first day of August following the Reserve Bank of Australia's (RBA) dovish surprise. Ahead of the ISM Manufacturing PMI and JOLTS Job Openings data from the US, the US Dollar benefits from the risk-averse market environment and gathers strength. The European economic docket will feature Unemployment Rate data for June.
The RBA announced earlier in the day that it left the policy rate unchanged at 4.1%, against the market expectation for a 25 basis points hike. In the policy statement, the RBA explained that the decision to hold rates unchanged would provide them more time to assess the impact of policy tightening to date and the economic outlook. "Some further tightening of monetary policy may be required to ensure that inflation returns to target in a reasonable timeframe, but that will depend upon the data and the evolving assessment of risks," the RBA further noted.
AUD/USD came under heavy bearish pressure following the RBA event and was last seen losing more than 1% on the day at around 0.6650.
During the Asian trading hours, the data from China revealed that the economic activity in the manufacturing sector contracted in June, with the Caixin Manufacturing PMI dropping to 49.2 from 50.5. Reflecting the souring market mood, US stock index futures trade modestly lower in the European session. Meanwhile, the 10-year US Treasury bond yield holds steady slightly below 4%.
Pressured by the renewed USD strength, EUR/USD turned south and dropped below 1.1000 in the European morning on Tuesday. HCOB will publish revisions to July Manufacturing PMI for the Eurozone and Germany.
GBP/USD closed the first day of the week virtually unchanged slightly below 1.2850. The pair stays relatively quiet early Tuesday and fluctuate at around 1.2830.
USD/JPY builds on Monday's gains and trades at its highest level in three weeks above 142.50.
Gold price stays under bearish pressure following the disappointing Chinese PMI data. At the time of press, XAU/USD was down 0.5% on the day at $1,955.
Bitcoin broke below its consolidation channel and touched its lowest level since late June below $28,500 before staging a rebound toward $29,000 in the European session. After closing the second straight day in negative territory on Monday, Ethereum extended its slide and came within a touching distance of $1,800 during the Asian trading hours. ETH/USD was last seen losing more than 1% on the day at $1,830.
- Silver meets with a fresh supply on Tuesday and stalls a two-day-old recovery from the 100-DMA.
- The setup seems tilted in favour of bulls and supports prospects for the emergence of dip-buying.
- A convincing break below $24.00 will negate the positive bias and pave the way for deeper losses.
Silver comes under some renewed selling pressure on Tuesday and extends its steady intraday descent through the early part of the European session. The white metal currently trades around the $23.55 area, down nearly 1% for the day, and for now, seems to have stalled a two-day-old recovery trend from the $24.00 mark, or a two-week low touched last Thursday.
The aforementioned handle coincides with a technically significant 100-day Simple Moving Average (SMA) and should continue to protect the immediate downside. A convincing break below will be seen as a fresh trigger for bearish traders and set the stage for deeper losses. The XAG/USD might then turn vulnerable and accelerate the downfall towards testing the next relevant support near the $23.20-$23.15 area.
This is closely followed by the very important 200-day SMA support near the $23.00 mark. Some follow-through selling will make the XAG/USD vulnerable to accelerate the fall towards challenging the multi-month low, around the $22.15-$22.10 area touched in June.
That said, technical indicators on the daily chart - though have been losing traction - as still holding in the positive territory. This, in turn, favours bullish traders and supports prospects for the emergence of some dip-buying at lower levels. However, it will still be prudent to wait for a sustained strength beyond the daily top, around the $24.75 region, before positioning for a move towards the $25.00 psychological mark.
The next relevant hurdle is pegged near the monthly peak, around the $25.25 zone, which if cleared will negate any negative outlook. Silver might then aim to surpass the $25.50-$25.55 intermediate hurdle and reclaim the $26.00 mark before climbing further to the YTD peak, around the $26.10-$26.15 area touched in May.
Silver daily chart
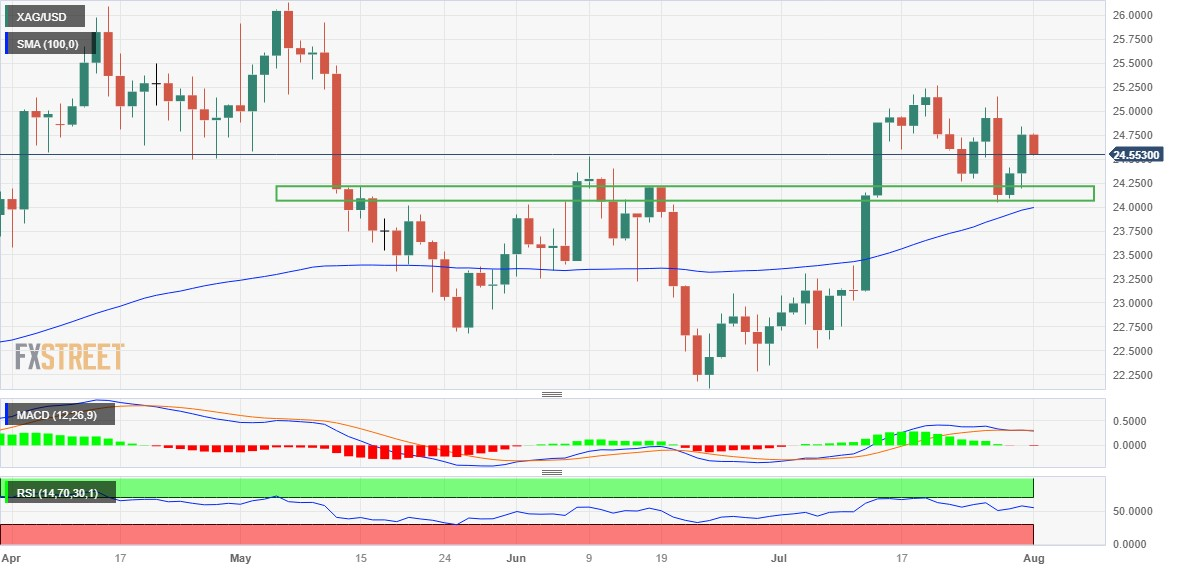
Key levels to watch
- Euro extends Monday’s decline to the sub-1.1000 area against the US Dollar.
- Stocks in Europe open slightly on the defensive on Tuesday.
- EUR/USD drops to two-day lows and retest the 1.0970 region.
- The USD Index (DXY) appears bid around the 102.00 hurdle.
- Final Manufacturing PMIs in the euro area, Germany’s jobs report due next.
- The ISM Manufacturing PMI takes centre stage across the ocean.
During the first half of the week, the Euro (EUR) continued to face selling pressure against the US Dollar (USD), causing EUR/USD to once again decline below the 1.1000 level on turnaround Tuesday.
Meanwhile, the Greenback remained strong and supported the USD Index (DXY) in its attempt to break the significant resistance level around 102.00. This strength in the US Dollar persisted despite the lack of significant movement in US yields across the yield curve and appeared bolstered by the overall weakness in riskier assets.
This week, the focus will be on key economic data releases in both the United States and Europe, which will likely test the recently emphasized data-dependence approach adopted by both the Federal Reserve and the European Central Bank (ECB) in their decisions on interest rates.
In Europe, attention will be on the final Manufacturing Purchasing Managers' Index (PMI) figures for July, followed by Germany's Labor market report, including the jobless rate for the broader Euro area.
In the United States, the primary focus will be on the ISM Manufacturing PMI, accompanied by the final Manufacturing PMI and Construction Spending data.
Daily digest market movers: Euro comes under renewed pressure below 1.1000
- The EUR loses its grip and slips back below 1.1000 vs. the USD.
- The USD Index climbs to new three-week top past 102.00.
- Final PMIs, Germany’s jobs report are due next in the Euro area.
- The RBA holds rates steady at 4.10%, matching consensus.
- Chinese Caixin Manufacturing PMI drops below 50 in July.
- Market focus remains on the US labour market this week.
Technical Analysis: Euro risks further losses below 1.1150
EUR/USD extends the bearish performance in the first half of the week and revisits the area below the psychological 1.1000 mark on Tuesday.
If bears push harder, EUR/USD should put the weekly low of 1.0943 (July 28) to the test sooner rather than later ahead of a probable move to the interim 55-day and 100-day SMAs at 1.0910 and 1.0908, respectively. The loss of this region could open the door to a potential visit to the July low of 1.0833 (July 6) ahead of the key 200-day SMA at 1.0728 and the May low of 1.0635 (May 31). South from here emerges the March low of 1.0516 (March 15) before the 2023 low of 1.0481 (January 6).
On the other hand, occasional bullish attempts could motivate the pair to initially dispute the weekly top at 1.1149 (July 27). Above this level, the downside pressure could mitigate somewhat and encourage the pair to test the 2023 high at 1.1275 (July 18). Once this level is cleared, there are no resistance levels of significance until the 2022 peak of 1.1495 (February 10), which is closely followed by the round level of 1.1500.
Furthermore, the constructive view of EUR/USD appears unchanged as long as the pair trades above the key 200-day SMA.
Euro FAQs
What is the Euro?
The Euro is the currency for the 20 European Union countries that belong to the Eurozone. It is the second most heavily traded currency in the world behind the US Dollar. In 2022, it accounted for 31% of all foreign exchange transactions, with an average daily turnover of over $2.2 trillion a day.
EUR/USD is the most heavily traded currency pair in the world, accounting for an estimated 30% off all transactions, followed by EUR/JPY (4%), EUR/GBP (3%) and EUR/AUD (2%).
What is the ECB and how does it impact the Euro?
The European Central Bank (ECB) in Frankfurt, Germany, is the reserve bank for the Eurozone. The ECB sets interest rates and manages monetary policy.
The ECB’s primary mandate is to maintain price stability, which means either controlling inflation or stimulating growth. Its primary tool is the raising or lowering of interest rates. Relatively high interest rates – or the expectation of higher rates – will usually benefit the Euro and vice versa.
The ECB Governing Council makes monetary policy decisions at meetings held eight times a year. Decisions are made by heads of the Eurozone national banks and six permanent members, including the President of the ECB, Christine Lagarde.
How does inflation data impact the value of the Euro?
Eurozone inflation data, measured by the Harmonized Index of Consumer Prices (HICP), is an important econometric for the Euro. If inflation rises more than expected, especially if above the ECB’s 2% target, it obliges the ECB to raise interest rates to bring it back under control.
Relatively high interest rates compared to its counterparts will usually benefit the Euro, as it makes the region more attractive as a place for global investors to park their money.
How does economic data influence the value of the Euro?
Data releases gauge the health of the economy and can impact on the Euro. Indicators such as GDP, Manufacturing and Services PMIs, employment, and consumer sentiment surveys can all influence the direction of the single currency.
A strong economy is good for the Euro. Not only does it attract more foreign investment but it may encourage the ECB to put up interest rates, which will directly strengthen the Euro. Otherwise, if economic data is weak, the Euro is likely to fall.
Economic data for the four largest economies in the euro area (Germany, France, Italy and Spain) are especially significant, as they account for 75% of the Eurozone’s economy.
How does the Trade Balance impact the Euro?
Another significant data release for the Euro is the Trade Balance. This indicator measures the difference between what a country earns from its exports and what it spends on imports over a given period.
If a country produces highly sought after exports then its currency will gain in value purely from the extra demand created from foreign buyers seeking to purchase these goods. Therefore, a positive net Trade Balance strengthens a currency and vice versa for a negative balance.
AUD/USD surrenders Monday’s gains after RBA pauses for second meeting. Economists at Société Générale analyze the pair’s technical outlook.
Break above 0.6840 is essential to affirm an extended up-move
AUD/USD failed to overcome the hurdle of 0.6900 representing the descending trend line drawn since April 2022 (now at 0.6840) and high of June; this has resulted in a steady pullback.
A revisit of 0.6560/0.6520, the 76.4% retracement from May is not ruled out. Defence of this zone can lead to a bounce however it would be interesting to see if the pair can reclaim the trend line at 0.6840; this break is essential to affirm an extended up-move.
- Pound Sterling is exposed to the downside as recession fears remain elevated.
- United Kingdom’s housing sector and factory activities have already come under pressure due to higher borrowing costs.
- Investors seem mixed about the pace at which the BoE will raise interest rates on Thursday.
The Pound Sterling (GBP) looks vulnerable as investors remain cautious ahead of the interest rate decision by the Bank of England (BoE), which will be announced on Thursday. The GBP/USD pair fails to discover strength as a widely anticipated interest-rate hike by the BoE will deepen recession fears. UK Treasury Advisers already warned that an aggressive rate-tightening cycle would dampen the economic outlook.
The BoE has no other alternative than to raise interest rates further as inflationary pressures in the United Kingdom region are four times the desired rate of 2%. The UK’s housing sector and factory activities have already come under pressure due to higher borrowing costs. Firms and households have postponed their credit requirements to avoid higher interest obligations.
Daily Digest Market Movers: Pound Sterling struggles ahead of monetary policy
- Pound Sterling drops further as United Kingdom’s recession fears deepen ahead of Bank of England policy.
- Britain’s inflation is highest among G-7 economies due to labor shortages and elevated food inflation.
- In June, headline inflation in the UK economy softened to 7.9% while the core Consumer Price Index (CPI) that excludes volatile food and oil prices decelerated marginally to 6.8% from its 31-year peak of 7.1%.
- In July, BoE policymakers and UK authorities decided to widen the scope of their inflation-controlling toolkit. UK authorities prodded industry regulators to stop customer overcharging.
- This indicates that UK inflation is higher, therefore, further policy-tightening by the BoE cannot be ruled out.
- Investors seem mixed about the pace at which interest rates will be raised by the BoE policymakers.
- The BoE could tighten the policy consecutively by 50 basis points (bps) to 5.5% and it would be its 14th consecutive interest-rate hike.
- The future of the Pound Sterling is expected to be dark as an aggressive rate-tightening cycle would deepen recession fears swiftly.
- The British economy is showing optimism despite higher interest rates by the BoE. UK lenders approved more mortgages in June than expected and unsecured credit rose by the most in more than five years, Reuters reported.
- UK’s Financial Conduct Authority (FCA) demanded an explanation from commercial banks for not passing the benefit of higher interest rates onto households’ savings. Lawmakers criticized banks for not raising rates on savings at a similar speed at which borrowing rates elevated.
- Meanwhile, the market mood is quiet as investors have been sidelined ahead of the United States factory activities and labor market data.
- The US Dollar Index (DXY) climbs swiftly above 102.00 despite US factory activity looking set to remain in a contraction phase for its ninth month in a row.
- Apart from the US ISM Manufacturing PMI data, investors will focus on ADP Employment data, which will be published on Wednesday.
- Chicago Federal Reserve (Fed) Bank President Austan Goolsbee favors further policy tightening despite easing inflationary pressures.
Technical Analysis: Pound Sterling exposes to 1.2800
Pound Sterling struggles to remain stable above the crucial support of 1.2800. The Cable declines toward the lower portion of the Rising Channel chart pattern formed on a daily time frame. The asset fails to rebound above the 20-day Exponential Moving Average (EMA) and is expected to extend downside to near the 50-day EMA around 1.2750.
BoE FAQs
What does the Bank of England do and how does it impact the Pound?
The Bank of England (BoE) decides monetary policy for the United Kingdom. Its primary goal is to achieve ‘price stability’, or a steady inflation rate of 2%. Its tool for achieving this is via the adjustment of base lending rates. The BoE sets the rate at which it lends to commercial banks and banks lend to each other, determining the level of interest rates in the economy overall. This also impacts the value of the Pound Sterling (GBP).
How does the Bank of England’s monetary policy influence Sterling?
When inflation is above the Bank of England’s target it responds by raising interest rates, making it more expensive for people and businesses to access credit. This is positive for the Pound Sterling because higher interest rates make the UK a more attractive place for global investors to park their money. When inflation falls below target, it is a sign economic growth is slowing, and the BoE will consider lowering interest rates to cheapen credit in the hope businesses will borrow to invest in growth-generating projects – a negative for the Pound Sterling.
What is Quantitative Easing (QE) and how does it affect the Pound?
In extreme situations, the Bank of England can enact a policy called Quantitative Easing (QE). QE is the process by which the BoE substantially increases the flow of credit in a stuck financial system. QE is a last resort policy when lowering interest rates will not achieve the necessary result. The process of QE involves the BoE printing money to buy assets – usually government or AAA-rated corporate bonds – from banks and other financial institutions. QE usually results in a weaker Pound Sterling.
What is Quantitative tightening (QT) and how does it affect the Pound Sterling?
Quantitative tightening (QT) is the reverse of QE, enacted when the economy is strengthening and inflation starts rising. Whilst in QE the Bank of England (BoE) purchases government and corporate bonds from financial institutions to encourage them to lend; in QT, the BoE stops buying more bonds, and stops reinvesting the principal maturing on the bonds it already holds. It is usually positive for the Pound Sterling.
Eurozone inflation figures did not yet provide the doves on the ECB's Governing Council with any resounding arguments for an end to rate hikes. Therefore, economists at Commerzbank expect the Euro to remain underpinned.
Euro unaffected by stubbornly high core inflation rate
Eurozone inflation data did not provide any new momentum for the Euro. Even though core inflation did not ease as expected but remained at 5.5% in July the result is within the range of normal margin of error.
Monday’s data certainly didn't convince the hawks on the ECB board that the hiking cycle is over.
Our ECB experts continue to believe that the market's expectations of another rate hike are likely to be disappointed, but for now, there is no reason for the market to reconsider this expectation. This supports the Euro.
- AUD/USD reverses Monday’s recovery from three-week low after RBA inaction.
- RBA disappoints Aussie bulls by keeping rates unchanged for the second consecutive month.
- Looming death cross, downbeat break of immediate support line favor AUD/USD sellers in aiming 0.6630 key support.
- Aussie pair remains on the bear’s radar below 0.6800.
AUD/USD drops 0.90% intraday to 0.6655 heading into Tuesday’s European session as the Aussie pair reverses the previous day’s recovery moves after the Reserve Bank of Australia’s (RBA) second consecutive inaction. In doing so, the risk-barometer pair also justifies the downside break of an ascending trend line from Friday, as well as the looming bear cross on the MACD, not to forget the downbeat RSI (14) line.
Also read: AUD/USD slumps 40 pips below 0.6700 on RBA inaction, US data eyed
With this, the Aussie pair appears all set to challenge the convergence of a two-month-old rising support line and 61.8% Fibonacci retracement of the AUD/USD pair’s late May to mid-June upside, near 0.6630.
However, the quote’s further downside appears difficult as the RSI (14) is below 50.0, suggesting bottom-picking.
Hence, the AUD/USD bears will need confirmation of the impending death cross, a condition where the 50-SMA pierces the 200-SMA from above.
Even so, lows marked on June 29 and 05, respectively near 0.6595 and 0.6580, can act as the final defense of the Aussie pair bears.
On the flip side, the support-turned-resistance line, close to 0.6690, quickly followed by the 0.6700 round figure, prods the AUD/USD buyers.
Following that, a convergence of the 50-SMA and 200-SMA, around 0.6735 at the latest, will precede a downward-sloping resistance line from July 13, near 0.6795, to act as the final defense of the AUD/USD bears.
AUD/USD: Four-hour chart
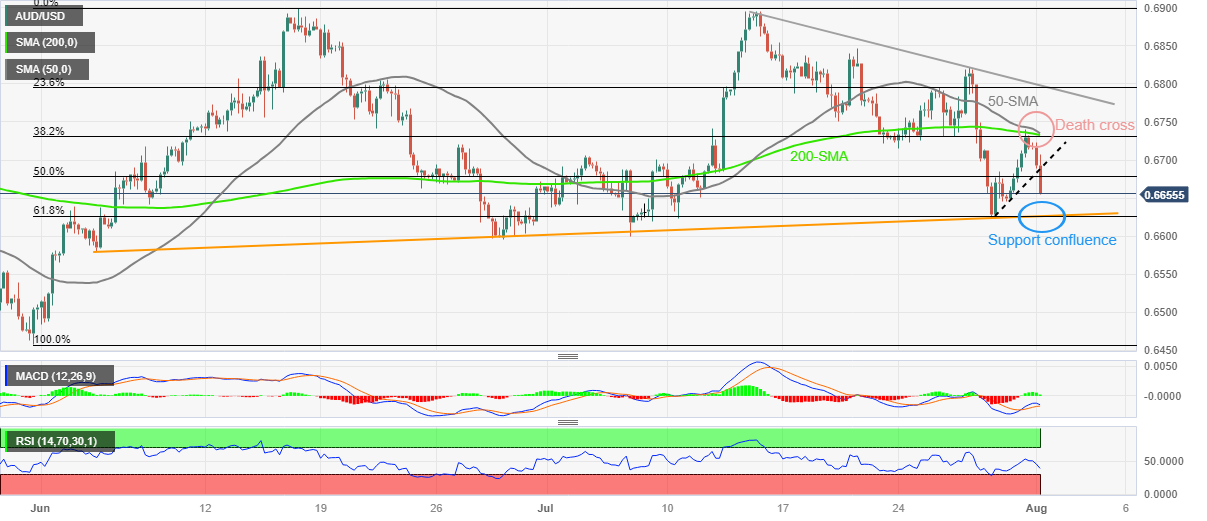
Trend: Further downside expected
Economists at Société Générale analyze USD/ZAR technical outlook.
Below 17.35, next potential objectives could be at 16.93 and January low of 16.70
USD/ZAR formed a series of lower peaks and troughs and subsequently breached a multi-month ascending trend line. It recently gave up the 200-DMA resulting in an extended correction. The pair has approached projections of 17.40/17.35.
Daily MACD is within deep negative territory denoting an overstretched down move. A bounce can’t be ruled out however the MA near 18.02/18.15 is expected to provide resistance.
Holding below the 200-DMA, there would be risk of a deeper downtrend. Below 17.35, next potential objectives could be at 16.93 and January low of 16.70.
Steady gains look on the cards for USD/JPY once it clears the 143.20 level, suggest Markets Strategist Quek Ser Leang and Senior FX Strategist Peter Chia at UOB.
Key Quotes
24-hour view: The strong rally in USD that sent it to a high of 142.67 came as a surprise. While severely overbought, the rally could extend to 143.20 before the risk of a pullback increases. On the downside, if USD breaks below 141.30 (minor support is at 141.80), it would suggest that the current strong upward pressure has eased.
Next 1-3 weeks: Yesterday (31 Jul, spot at 140.80), we highlighted that “the outlook for USD is mixed”, and we expected it to trade in a choppy manner between 138.50 and 141.95. We did not expect the strong surge as USD soared to a high of 142.67. Unsurprisingly, upward momentum has increased. Despite severely overbought short-term conditions, USD could continue to rise. However, it must break and stay above 143.20 before further sustained advance is likely. The upside risk is intact as long as USD stays above 140.50 in the next couple of days. Looking ahead, the next significant resistance above 143.20 is at 145.00.
Considering advanced prints from CME Group for natural gas futures markets, open interest went up by nearly 3K contracts at the beginning of the week, extending the ongoing erratic activity. On the other hand, volume dropped for the second session in a row, this time by nearly 29K contracts.
Natural Gas remains stuck within $2.50-$2.90
Monday’s downtick in prices of natural gas came in tandem with increasing open interest, which indicates the likelihood of further retracements in the very near term. Looking at the broader picture, the commodity should maintain the $2.50-$290 range for the time being.
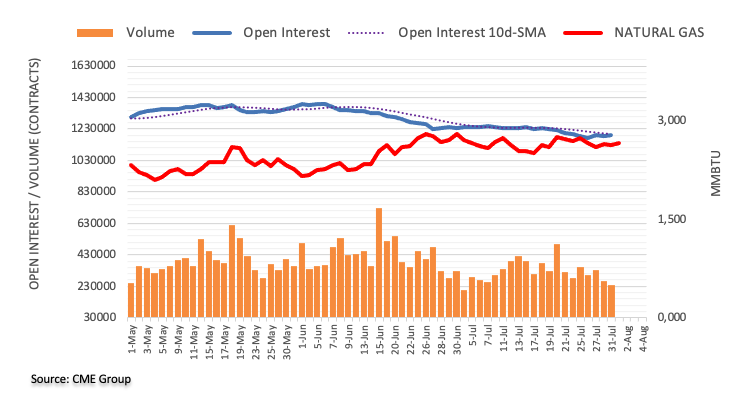
- Gold price trades on the defensive near $1,955, down 0.41% for the day.
- The Chinese Caixin Manufacturing PMI for July fell to 49.2 from 50.5 prior, versus the market consensus of 50.3.
- The softer US inflation data might convince the Federal Reserve (Fed) to ease its hawkish stance.
- Investors await the US ISM Manufacturing PMI data later in the North American session.
The gold price loses momentum around $1,955 heading into the early European session. XAU/USD faces some follow-through selling as US-China tensions over access to technology escalate, and the US Dollar strengthens across the board. Meanwhile, the US Dollar Index (DXY), a measure of the value of the Greenback against a basket of six major currencies, gains momentum above 102.00.
Chinese authorities announced additional policy guidelines on Monday. Still, no specific plans to bolster the faltering economy and domestic consumption, leaving investors wanting as lackluster activity data increased pressure on officials to act.
The Chinese Caixin Manufacturing PMI for July fell to 49.2 from 50.5 prior, versus the market consensus of 50.3. This figure marked the lowest level since January. This, in turn, caps the upside in precious metals, as China is one of the largest gold consumers. Additionally, the Manufacturing Purchasing Managers' Index (PMI) increased to 49.3 in July, improving from 49.0 in June and the market's expectation of 49.2. However, the figure was marked below 50 for the fourth straight month, indicating the contraction zone. Meanwhile, the NBS Services PMI fell from 53.2 in June to 51.5 in July.
On the other hand, the evidence of easing underlying price pressures in the United States might convince the Fed to ease its hawkish stance. That said, the Personal Consumption Expenditures (PCE) Price Index decreased from 3.8% in May to 3% in June, below the market's expectation of 3.1%. The Core PCE Price Index came in at 4.1% annually, down from 4.6% in May and below market expectations of 4.2%.
The softer data could bring the Federal Reserve (Fed) closer to the end of its rate-hiking cycle. This may limit the US Dollar's upside and act as a tailwind for the gold price. It’s worth noting that gold is sensitive to rising interest rates as they raise the opportunity cost of holding non-yielding bullion.
Furthermore, the renewed trade war tensions between the US-China over access to technology might exert some pressure on the gold price. China's authorities announced on Monday export restrictions on some drones and drone-related equipment to the US, citing "national security and interests”. The restriction will go into effect on September 1, according to the commerce ministry.
Market participants await the US ISM Manufacturing Purchasing Managers Index (PMI) data later in the North American session for a clear direction in XAU/USD. Also, the JOLTS Job Openings report, ADP Private Employment, Weekly Jobless Claims, and Unit Labour Cost will be released later this week. The highlight of the week will be the US Nonfarm Payrolls (NFP). These data might influence the USD price dynamics and determine short-term trading opportunities around the gold price. Also, the headline surrounding the Sino-US relationship remains in focus.
Markets Strategist Quek Ser Leang and Senior FX Strategist Peter Chia at UOB Group see NZD/USD navigating within the 0.6135-06285 range in the next few weeks.
Key Quotes
24-hour view: We expected NZD to consolidate in a range of 0.6130/0.6190 yesterday. Instead of consolidating, NZD soared to a high of 0.6226. While the rapid advance appears to be overdone, NZD could test 0.6240 before pulling back. The major resistance at 0.6285 is not expected to come under threat. Support is at 0.6185; if NZD breaks below 0.6165, it would indicate that the current upward pressure has eased.
Next 1-3 weeks: After NZD dropped to 0.6121 last Friday and then rebounded strongly, we indicated yesterday that “while the risk for NZD remains on the downside, it has to break and stay below 0.6120 before further weakness is likely.” We added, “The likelihood of NZD breaking clearly below 0.6120 will remain intact as long as it stays below 0.6220.” In NY trade, NZD soared and broke above 0.6220 (high was 0.6226). Downward pressure has eased, and for the time being, NZD is likely to trade in a range of 0.6135/0.6285.
- USD/CAD stays firmer while paring the biggest daily loss in two weeks.
- Oil price retreats amid firmer US Dollar, fears about China.
- Cautious mood ahead of top-tier activity data from US, Canada also propel Loonie pair.
- Friday’s US/Canada employment figures are the key to clear directions.
USD/CAD bulls keep the reins around 1.3230 as they prod the intraday high heading into Tuesday’s European session amid a firmer US Dollar and a retreat in Canada’s key export item WTI crude oil. In doing so, the Loonie pair consolidates the biggest daily loss in a fortnight ahead of the July activity data from the US and Canada.
That said, the Dollar Index (DXY) clings to mild gains at a three-week high of around 102.00 marked earlier in the day as upbeat Fed talks join firmer US data and downbeat China statistics.
On Monday, Chicago Fed President Austan Goolsbee defends the US central bank’s hawkish moves while Dallas Fed Manufacturing Business Index improves to -20.0 for July from -23.2 prior versus -26.3 expected. Further, Chicago's PMI rose to 42.8 from 41.5 prior versus 43.0 market forecasts. In doing so, the DXY ignores Friday’s softer prints of US inflation clues and the weekend comments from Minneapolis Fed President Neel Kashkari’s criticism of higher interest rates.
China’s Caixin Manufacturing PMI for July fails to trace its upbeat NBS counterpart while declining to 49.2 for July from 50.5 prior, versus 50.3 market forecasts, marking the lowest level since January.
It’s worth noting that the fears of the US-China tussle, as Beijing restricts drone exports in retaliation to the US tech and trade war tactics by citing the “national security” measures, prod the optimists and allow the US Dollar to remain firmer due to its have appeal.
Elsewhere, WTI crude oil prints the first daily loss in four while retreating from the highest level since April 17, down 0.30% intraday to $81.30 by the press time, amid fears of receding energy demand from China, as well as due to the firmer US Dollar.
Looking ahead, Canada S&P Global Manufacturing PMI for July will join the US ISM Manufacturing PMI for the said month, as well as the US JOLTS Job Openings for June, to direct intraday moves of the USD/CAD pair. Also important will be the weekly crude oil inventory data from the American Petroleum Institute (API).
Technical analysis
USD/CAD extends recovery from a 12-day-old rising support line, close to 1.3180 by the press time, as bulls approach the 50-DMA hurdle of around 1.3295.
The Reserve Bank of Australia (RBA) held the cash rate at 4.1% for the second month in a row. As a result, the Aussie depreciated. Economists at Commerzbank analyze the RBA outlook.
RBA stands pat again
The RBA decided to keep interest rates on hold for the second time in a row.
The RBA appears to be very close to the interest rate peak, especially as it now expects inflation to return to target within its forecast horizon.
Of course, whether another rate hike will follow in the coming months will depend crucially on data developments, especially wage growth and service sector inflation. However, we see today's decision as a clear signal that the RBA is taking a wait-and-see approach for the time being.
- The index gathers further traction and surpasses 102.00.
- US yields continue to trade without a clear direction.
- US ISM Manufacturing PMI will take centre stage.
The greenback, in terms of the USD Index (DXY), extends the recovery to fresh three-week highs north 102.00 the figure on turnaround Tuesday.
USD Index focused on key data
The index adds to Monday’s upbeat session and challenges once again the 102.00 barrier amidst the lack of traction in the broad risk-associated universe in the first half of the week so far.
In the meantime, investors and the FX universe in general appears to have entered a “wait-and-see” mode ahead of crucial releases later in the week (mainly from the US labour market), all amidst the renewed data-dependent stance from the Federal Reserve, as it was reinforced at the latest FOMC gathering on July 26.
In the US data space, the final Manufacturing PMI tracked by S&P Global is due seconded by Construction Spending and the more relevant ISM Manufacturing PMI for the month of July.
What to look for around USD
The index keeps the recovery well in place and maintains its target at the key 102.00 hurdle.
In the meantime, the dollar appears benefited from the post-ECB weakness in the risk-associated space, while it could face extra headwinds in response to the data-dependent stance from the Fed against the current backdrop of persistent disinflation and cooling of the labour market.
Furthermore, speculation that the July hike might have been the last of the current hiking cycle is also expected to keep the buck under some pressure for the time being.
Key events in the US this week: Final Manufacturing PMI, ISM Manufacturing, Construction Spending (Tuesday) – MBA Mortgage Applications, ADP Employment Change (Wednesday) – Initial Jobless Claims, Final Services PMI, ISM Services PMI, Factory Orders (Thursday) – Nonfarm Payrolls, Unemployment Rate (Friday).
Eminent issues on the back boiler: Persistent debate over a soft or hard landing for the US economy. Terminal Interest rate near the peak vs. speculation of rate cuts in late 2023 or early 2024. Geopolitical effervescence vs. Russia and China. US-China trade conflict.
USD Index relevant levels
Now, the index is gaining 0.08% at 101.93 and the breakout of 102.55 (55-day SMA) would open the door to 103.54 (weekly high June 30 and finally 103.69 (200-day SMA). On the other hand, immediate contention emerges at 100.55 (weekly low July 27) prior to 100.00 (psychological level) and then 99.57 (2023 low July 13).
Economists at Société Générale analyze USD/KRW technical outlook.
Reclaiming the 200-DMA essential for affirming an extended up-move
USD/KRW has experienced a deeper pullback after failing to overcome a multi-month trend line and the 200-DMA near 1,324 (now at 1,305/1,310). It has recently formed an interim trough near 1,257. An initial bounce is under way however reclaiming the MA would be essential for affirming an extended up-move.
Failure to cross 1,310 could result in one more down leg. Next potential support levels are located at previous gap and projections near 1,250/1,244.
- USD/CHF lacks bullish bias within a trend-widening formation during four-day uptrend.
- RSI, MACD conditions suggest Swiss Franc buyer’s return.
- 200-SMA, multi-day-old descending resistance line add to the upside filters.
- Sellers may have to retreat from 0.8550-45 even as bearish megaphone favors downside bias.
USD/CHF remains sidelined near 0.8720 as bulls struggle to keep the reins after a three-day winning streak. In doing so, the Swiss Franc (CHF) pair retreats within a trend-widening formation called “bearish megaphone” heading into Tuesday’s European session.
Apart from the bearish megaphone, the nearly overbought RSI (14) line and the impending bear cross on the MACD also prod the USD/CHF bulls after a three-day uptrend.
It’s worth noting, however, that the 0.8700 round figure and one-week-old horizontal support around 0.8660-55 restrict the short-term downside of the Swiss Franc pair within a trend-widening chart pattern.
Following that, a quick fall towards the 0.8630 and the 0.8600 round figure will be imminent before the bottom line of the megaphone, close to 0.8550-45 challenges the pair sellers.
On the flip side, the stated chart formation’s top line of around 0.8760 challenges the immediate upside of the USD/CHF pair.
Even if the quote defies the trend-widening formation by crossing the 0.8760 hurdle, the 200-SMA and a downward-sloping resistance line from May 31, respectively near 0.8815 and 0.8885, as well as the 0.8900 round figure, challenge the USD/CHF bulls.
If at all the USD/CHF buyers keep the reins past 0.8900, their dominance will knock the 0.9000 psychological magnet.
USD/CHF: Four-hour chart
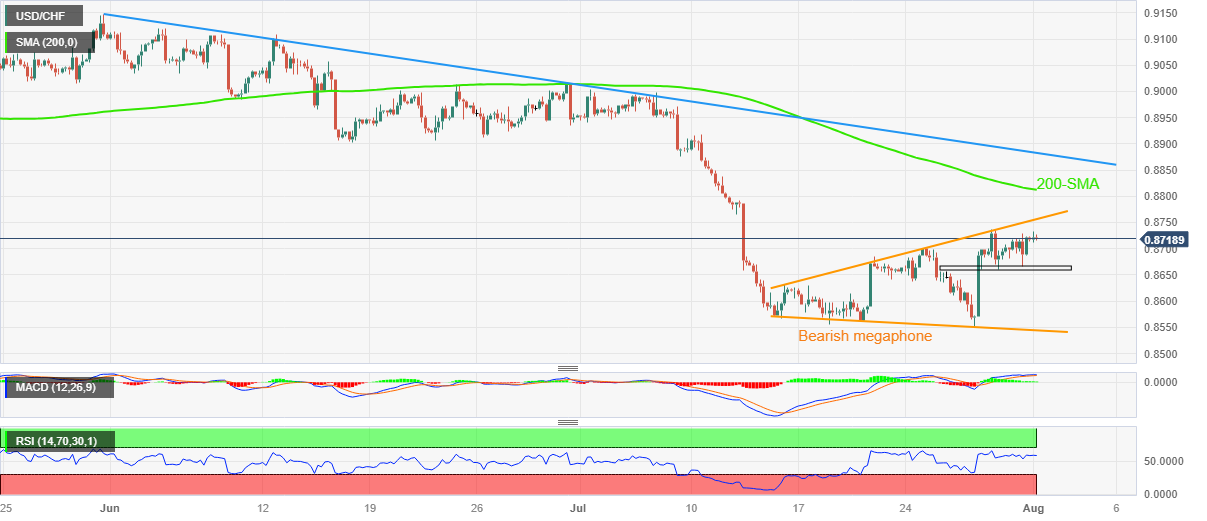
Trend: Limited downside expected
Open interest in crude oil futures markets increased by around 12.6K contracts after three consecutive daily pullbacks on Monday according to preliminary readings from CME Group. Volume, instead, shrank for the second straight session, now by around 47.5K contracts.
WTI now targets the 2023 high above $83.00
Prices of WTI extended the uptrend past the $81.00 mark at the beginning of the week. The daily uptick was on the back of rising open interest, suggesting that extra gains should not be discarded for the time being. On the flip side, the continuation of the downtrend in volume could spark some bouts of weakness in the very near term. In the meantime, bulls continue to target the 2023 peak at $83.49 per barrel (April 12).
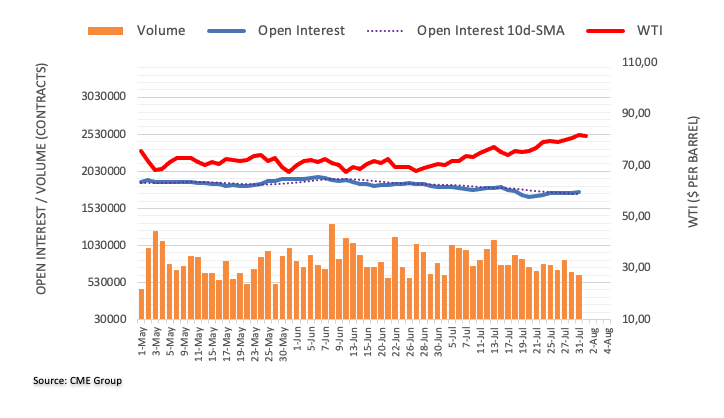
- EUR/USD struggles to hold ground above the 1.1000 barrier on Tuesday.
- European Central Bank (ECB) President Christine Lagarde hinted at a possible pause in September.
- Market players will take fresh cues from the global Manufacturing PMI and German Unemployment rate data for June.
The EUR/USD pair struggles to gain and holds ground below the 1.1000 mark heading into the early European session on Tuesday. Market players await the US Manufacturing Purchasing Managers Index (PMI) data for fresh cues later in the North American trading hours. The major pair currently trades around 1.0990, down 0.06% on the day.
About the data, Eurostat reported on Monday that the Eurozone Core Harmonized Index of Consumer Prices (HICP) in July rose by 5.5% YoY and 5.3% for the headline CPI. The flash Q2 Eurozone Gross Domestic Product (GDP) expanded by 0.3% QoQ and 0.6% YoY. Additionally, German Retail Sales for June increased by 1.6% year on year, compared to -6.3% expected and -2.1% prior, while the monthly figure fell to -0.8%, compared to -0.2% estimated and 1.9% previously.
It’s worth noting that the European Central Bank (ECB) raised interest rates by 25 basis points (bps) to 4.25% last week. ECB President Christine Lagarde stated that the central bank will move towards achieving a medium-term inflation target of 2%. The ECB raised interest rates for the ninth consecutive time last week, but President Christine Lagarde hinted at a possible pause in September as inflationary pressures showed tentative signs of easing and fears of a recession grew.
Across the pond, the US Dollar attracts some buyers and edges higher to the 102.00 mark on Tuesday. The index ignored the softer US inflation data on Friday.
The US Bureau of Economic Analysis reported last week that the Personal Consumption Expenditures (PCE) Price Index fell from 3.8% in May to 3% in June, below the market expectation of 3.1%. The figure grew at its slowest pace in over two years. Meanwhile, the Federal Reserve's preferred measure of inflation, the Core PCE Price Index, came in at 4.1% annually, down from 4.6% in May and below market expectations of 4.2%.
Additionally, the United States published low-tier economic figures on Monday. The US Chicago Purchasing Managers Index (PMI) for July came in at 42.8 from 41.5 in June, versus 43 expected, while the Dallas Manufacturing Index edged higher to -20 in July from -23.2 in June.
Market participants will keep an eye on the global Manufacturing PMI data and the German Unemployment rate for June. The week's highlight will be the US Nonfarm Payrolls report, due on Friday. The US economy is expected to have created 180,000 jobs. At the same time, the US employment rate is expected to remain unchanged at 3.6%.
Further selling pressure in GBP/USD is expected to meet a tough support around 1.2720, according to Markets Strategist Quek Ser Leang and Senior FX Strategist Peter Chia at UOB Group.
Key Quotes
24-hour view: After GBP dropped to 1.2767 last Friday and rebounded, we highlighted yesterday that “despite the strong rebound, there is no clear increase in momentum, and GBP is unlikely to rise further.” We expected GBP to trade sideways between 1.2810 and 1.2910. In line with our view, GBP traded sideways, albeit in a much narrower range than expected (1.2829/1.2872). Momentum indicators are mostly flat, and further sideways trading appears likely. Expected range for today; 1.2795/1.2865.
Next 1-3 weeks: Our update from last Friday (28 Jul, spot at 1.2800) still stands. As highlighted, “downward momentum is building again, it remains to be seen if GBP can break the major support at 1.2720.” All in all, we expect GBP to trade with a downward bias as long as it stays below 1.2900 (‘strong resistance’ level previously at 1.2930).
CME Group’s flash data for gold futures markets noted traders reduced their open interest positions for yet another session on Monday, this time by around 1.2K contracts. Volume followed suit and dropped fir the second session in a row, now by nearly 50K contracts.
Gold: Upside capped around $1980
An auspicious start of the week saw gold prices adding to Friday’s advance amidst shrinking open interest and volume. That said, the continuation of the rebound appears not favoured for the time being, allowing for some corrective move instead. In the meantime, the $1980 region per troy ounce still caps occasional bullish attempts.
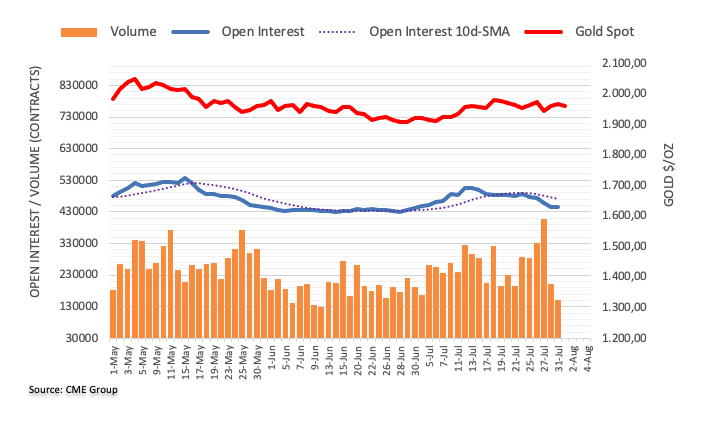
- USD/IDR prints mild gains amid downbeat Indonesia inflation data, firmer US Dollar.
- Indonesia Inflation softens in July, US Dollar Index pokes three-week high.
- Optimism in Asia fails to defend Rupiah buyers amid mixed catalysts ahead of mid-tier US data.
- US ISM Manufacturing PMI, JOLTS Job Openings eyed for intraday directions, Indonesia Q2 GDP, US NFP are the key.
USD/IDR justifies downbeat Indonesia Inflation during early Thursday as bulls prod the 15,120 level to print mild gains heading into the European session. Apart from the downbeat Indonesia inflation, the firmer US Dollar also favors the Indonesia Rupiah (IDR) bears.
That said, Indonesia's Inflation eases to 3.08% YoY in June from 3.52% prior, compared to 3.1% expected, whereas the Core Inflation also edges lower to 2.43% versus 2.50% market forecasts and 2.58% previous readings.
On the other hand, the Dollar Index (DXY) clings to mild gains at a three-week high of around 102.00 marked earlier in the day.
It’s worth noting that the hawkish comments from the Fed officials and mixed US data join downbeat headlines about China to also propel the USD/IDR prices amid a risk-on mood in the Asia-Pacific zone.
That said, Chicago Fed President Austan Goolsbee defends the US central bank’s hawkish moves while Dallas Fed Manufacturing Business Index improves to -20.0 for July from -23.2 prior versus -26.3 expected. Further, Chicago PMI rose to 42.8 from 41.5 prior versus 43.0 market forecasts. In doing so, the DXY ignores Friday’s softer prints of US inflation clues and the weekend comments from Minneapolis Fed President Neel Kashkari’s criticism of higher interest rates.
Elsewhere, fresh fears of the US-China tussle, as Beijing restricts drone exports in retaliation to the US tech and trade war tactics by citing the “national security” measures, prod the optimists in the Asian-Pacific zone. Also weighing on the sentiment could be the downbeat China PMI as Caixin Manufacturing PMI for July fails to trace its upbeat NBS counterpart while declining to 49.2 for July from 50.5 prior, versus 50.3 market forecasts, marking the lowest level since January.
Looking ahead, US ISM Manufacturing PMI for July and JOLTS Job Opening for June will direct intraday moves of the Indonesia Rupiah. However, major attention will be given to Friday’s Indonesia Gross Domestic Product (GDP) for the second quarter (Q2) and the US Nonfarm Payrolls (NFP) for clear directions.
Technical analysis
A daily closing beyond 15,150 becomes necessary for the USD/IDR bulls to challenge the yearly top of around 15,230. That said, the 15,000 round figure puts a floor under the Indonesia Rupiah prices.
In the opinion of Markets Strategist Quek Ser Leang and Senior FX Strategist Peter Chia at UOB Group, the idea of further weakness in EUR/USD seems to be losing the grip for the time being.
Key Quotes
24-hour view: Yesterday, we held the view that EUR “is likely to consolidate and trade between 1.0980 and 1.1055.” Our view for EUR to consolidate was not wrong, even though it traded in a narrower range than expected (1.0992/1.1045). Further consolidation appears likely. However, the slightly weaker underlying tone suggests EUR is likely to trade in a lower range of 1.0970/1.1030.
Next 1-3 weeks: We have held a negative EUR view since the middle of last week (see annotations in the chart below). After EUR dropped to 1.0942 and rebounded, we highlighted yesterday (31 Jul, spot at 1.1025) that “downward momentum has eased somewhat, but only a breach of 1.1070 would indicate that EUR is not weakening further.” We continue to hold the same view. Looking ahead, it is worth noting that if EUR breaks below 1.0942, there is a rather strong support near 1.0920.
- Asia-Pacific shares remain firmer amid defense of easy-money policy.
- RBA’s surprise inaction, Japanese officials’ defense of BoJ’s ultra lose monetary policy favor equity bulls.
- NZX50 bucks the trend amid strong New Zealand housing data ahead of Wednesday’s NZ jobs report.
- S&P500 Futures trace Wall Street’s gains, yields grind lower ahead of US ISM Manufacturing PMI, JOLTS Job Openings.
Market sentiment remains mildly positive in Asia as traders cheer hopes of witnessing no more interest rate hikes from the top-tier central banks amid early Tuesday. Additionally favoring the risk profile could be the headlines about China's stimulus and the upbeat performance of the Western markets the previous day. However, fears of the US-China tension and hawkish comments from the Fed official prod the optimists ahead of the top-tier US data.
While portraying the mood, MSCI’s index of the Asia-Pacific shares outside Japan rises to the highest level since February, printing mild gains of late, whereas Japan’s Nikkei jumps 0.75% intraday to prod the early July peak at the latest. It’s worth noting that a softer Japanese Unemployment Rate and comments from policymakers defending the easy-money practices favor the nation’s equity benchmark.
Further, Australia’s ASX 200 also jumps around 0.70% on a day as the Reserve Bank of Australia (RBA) keeps the benchmark interest rates unchanged for the second consecutive week.
Additionally, fresh fears of the US-China tussle, as Beijing restricts drone exports in retaliation to the US tech and trade war tactics by citing the “national security” measures, prod the optimists. Also weighing on the sentiment could be the downbeat China PMI as Caixin Manufacturing PMI for July fails to trace its upbeat NBS counterpart while declining to 49.2 for July from 50.5 prior, versus 50.3 market forecasts, marking the lowest level since January. With this, the share traders in Shanghai and Hong Kong struggle to print major gains.
Elsewhere, S&P500 Futures seesaw near the yearly high, up 0.15% intraday near 4,610 at the latest, while the US 10-year and two-year Treasury bond yields edge lower after declining in the last two consecutive days. That said, the Dollar Index (DXY) renews a three-week high while the commodities pare recent gains with mild losses and the Antipodeans also drop as the greenback braces for the US ISM Manufacturing PMI for July and JOLTS Job Opening for June.
In doing so, the market players also justify the hawkish comments from Federal Reserve Bank of Chicago President Austan Goolsbee.
Moving on, US earnings and the clues for Friday’s Nonfarm Payrolls (NFP) will entertain equity traders.
Also read: Forex Today: Markets remain optimistic, RBA decision next
- EUR/JPY resumes its upside journey as Eurozone economic data support more interest-rate hikes from the ECB.
- In spite of higher interest rates, Eurozone GDP managed to come out of contraction and outperformed expectations.
- The Japanese Yen is facing the wrath of the BoJ policy shift.
The EUR/JPY pair manages to resume its upside journey after a time correction move to near 156.50. The asset looks set to surpass a weekly high of 157.24 as Eurozone economic data suggests that the European Central Bank (ECB) cannot pause the current tightening spell.
ECB President Christine Lagarde commented on July 27 while announcing the interest rate policy that further policy action will be data-dependent. Eurozone Gross Domestic Product (GDP) and inflation data released on Monday conveyed that the ECB cannot shift policy to neutral at least for now.
The performance of the Eurozone economy remained upbeat in the April-June quarter as economic activities grew by 0.3% against a contraction of 0.1% and investors were hoping for an expansion by 0.2%. On an annualized basis, GDP expanded at a pace of 0.6% vs. expectations of 0.4%.
In spite of higher interest rates, Eurozone GDP managed to come out of contraction and outperformed expectations, which shows its resilience. Apart from that, annual headline inflation landed at 5.3% higher than expectations of 5.2% but remained below June’s print of 5.5%. Core inflation that excludes volatile oil and food prices remained unchanged at 5.5% and higher than the forecast of 5.5%.
Sticky inflationary pressures and upbeat GDP performance indicate that consumer spending is steady and can push inflation higher.
Meanwhile, the Japanese Yen is facing the wrath of the Bank of Japan (BoJ) policy shift. BoJ Governor provided more flexibility to the Yield Curve Control (YCC) keeping interest rates steady, which would ease bond-buying operations by the central bank. Also, it delivered a strong message that the central bank is considering an exit from its long ultra-dovish policy.
- AUD/NZD faces some selling pressure and drops to 1.0770 after the Reserve Bank of Australia (RBA) decision.
- The RBA decided to keep the interest rate unchanged at 4.10% at its August meeting.
- Investors will shift their focus to the New Zealand employment data on Wednesday.
The AUD/NZD cross faces selling pressure and drops to the 1.0770 mark following the Reserve Bank of Australia's (RBA) interest rate decision. Market players await the New Zealand employment data for fresh impetus. The cross currently trades around 1.0784, down 0.32% for the day.
The Reserve Bank of Australia (RBA) board members decided to maintain the interest rate unchanged at 4.10% at Tuesday's August monetary policy meeting. RBA Governor Phillip Lowe remarked that the decision to keep rates intact gives the RBA more time to analyze the impact of the interest rate hikes and the economic outlook. However, more monetary policy tightening may be necessary to guarantee that inflation returns to target in a reasonable timeframe, but this will depend on the data and the developing risk assessment.
The economic data released on Monday showed that Australia’s TD Securities Inflation figure dropped to 5.4% YoY from 5.7% in June. Meanwhile, Australia’s Private Sector Credit fell to 0.2% MoM and 5.5% YoY in June, compared to 0.4% and 6.2% prior, respectively. Additionally, Australia's Retail Sales fell 0.8% MoM, against the expectation of 0.0% and 0.7 prior. The Producer Price Index (PPI) data came in at 3.9% YoY and 0.5% QoQ.
On the Kiwi front, Statistics New Zealand revealed on Tuesday that Building Permits in June were up 3.5% MoM after a 2.23% decline in May. Earlier this week, the National Bank of New Zealand showed that July's New Zealand ANZ Activity Outlook improved to 0.8%, above the expected 0.9% decline. Meanwhile, ANZ Business Confidence fell from -18 in June to -13.1 in July.
Looking ahead, market participants will digest the interest rate decision and statement. On Wednesday, attention will shift to the New Zealand employment data. Investors will take cues from the data and find trading opportunities for the AUD/NZD pair.
- AUD/JPY drifts lower on Tuesday and snaps a two-day winning streak to a multi-week top.
- The RBA's surprise decision to leave interest rates steady weighs on the Australian Dollar.
- The BoJ’s unscheduled bond-buying operation undermines the JPY and lends some support.
The AUD/JPY cross meets with some supply during the Asian session on Tuesday and drops to a fresh daily low, around the 95.00 psychological mark after the Reserve Bank of Australia (RBA) announced its policy decision.
The Australian Dollar (AUD) weakens a bit in reaction to the RBA's decision to leave the Official Cash Rate (OCR) unchanged at 4.10% for the second straight meeting, defying market expectations for a 25 bps lift-off. In the accompanying policy statement, the RBA said that the decision to hold rates unchanged provides further time to assess the impact of the increase in interest rates to date and the economic outlook. This, along with the weaker Chinese macro data released earlier today, turns out to be a key factor exerting some pressure on the AUD/JPY cross.
That said, the latest optimism over hopes for more stimulus from China remains supportive of the underlying bullish sentiment around the equity markets and lends some support to the risk-sensitive Aussie. Moreover, the RBA added that inflation in Australia is declining but is still too high and some further tightening of monetary policy may be required to ensure that it returns to target in a reasonable timeframe. Apart from this, some follow-through selling around the Japanese Yen (JPY) helps limit the downside for the AUD/JPY cross, at least for now.
Against the backdrop of the prevalent risk-on mood, the Bank of Japan's unscheduled operation on Monday to buy ¥300 billion ($2 billion) worth of Japanese government bonds (JGB) for the first time since February 2022 continues to weigh on the JPY. This, in turn, warrants some caution before placing aggressive bearish bets around the AUD/JPY cross and confirming that the recent strong recovery move from the 91.80-91.75 region, or a nearly two-month low touched last week has run its course. Nevertheless, spot prices, for now, seem to have snapped a two-day winning streak to a three-week peak, around the 95.80-95.85 zone touched on Monday.
Technical levels to watch
- AUD/USD takes offer to refresh intraday low as RBA marks inaction for the second consecutive meeting.
- RBA pushes back rate hike trajectory, by defying forecasts of 0.25% rate increase, as it keeps benchmark rates at 4.1%.
- Mixed China catalysts, upbeat yields and cautious mood ahead of second-tier US data also weigh on Aussie pair.
- Friday’s RBA Monetary Policy Statement, US NFP will be crucial for clear directions.
AUD/USD nosedives 40 pips on the Reserve Bank of Australia’s (RBA) no rate hike decision, extending the early-day losses to around 0.6670 heading into Tuesday’s European session. That said, the Aussie pair’s further downside, however, appears elusive as markets await the US ISM Manufacturing PMI for July and JOLTS Job Opening for June.
RBA defies market forecasts by keeping the benchmark rates intact at 4.1% after challenging the two hawkish surprises in the last monetary policy meeting in July. In doing so, the Aussie central bank renews dovish bias about the AUD/USD pair as it justifies the previously released downbeat Australian inflation data.
Also read: Breaking: RBA steers interest rate on a steady course at 4.10% in August
Apart from the RBA status quo, firmer US Dollar Index and downbeat China data, as well as mixed sentiment, also weigh on the AUD/USD price. That said, the US Dollar Index (DXY) renews a three-week high as Treasury bond yields rebound despite mixed US activity data published the previous day. The reason for the latest run-up in the DXY and yields could be linked to the hawkish comments from Federal Reserve Bank of Chicago President Austan Goolsbee. Also underpinning the US Dollar's strength, as well as weighing on the Aussie pair, could be the fears of more US-China tussle as Beijing restricts drone exports in retaliation to the US tech and trade war tactics, by citing the “national security” measures.
Earlier in the day, China’s Caixin Manufacturing PMI for July fails to trace its upbeat NBS counterpart while declining to 49.2 for July from 50.5 prior, versus 50.3 market forecasts, marking the lowest level since January.
Against this backdrop, S&P500 Futures trace Wall Street and print mild gains by the press time whereas the US 10-year and two-year Treasury bond yields edge higher of late.
Having witnessed the initial market reaction to the RBA moves, the AUD/USD pair traders should keep their eyes on the risk catalysts for fresh impulse ahead of the US activity and employment data. Should the early signals for Friday’s US Nonfarm Payrolls (NFP) arrive positive, the Aussie pair sellers can keep the reins. It’s worth noting, however, that the bears need validation from Friday’s RBA Monetary Policy Statement (MPS) to stay in the driver’s seat afterward.
Technical analysis
AUD/USD rebound appears elusive unless crossing a convergence of the previous support line from May 31 and the 200-DMA, around 0.6730-35 by the press time.
- USD/CAD attracts fresh buying on Tuesday and draws support from a modest USD strength.
- The recent bullish run in Oil prices could underpin the Loonie and cap the upside for the pair.
- Traders look to the US ISM Manufacturing PMI and JOLTS Job Openings for some impetus.
The USD/CAD pair regains some positive traction during the Asian session on Tuesday and reverses a major part of the previous day's decline to the 1.3150 horizontal support. Spot prices currently trade around the 1.3220 region, up 0.25% for the day, and remain well within the striking distance of a three-week high touched on Monday.
The US Dollar (USD) scales higher for the second successive day and climbs to its highest level since July 10 amid the prospects for further policy tightening by the Federal Reserve (Fed), which, in turn, is seen acting as a tailwind for the USD/CAD pair. It is worth recalling that Fed Chair Jerome Powell had said last week that the economy still needs to slow and the labour market to weaken for inflation to credibly return to the 2% target. Adding to this, the upbeat US GDP report pointed to a resilient economy and left door for one more 25 bps Fed rate hike in September or November wide open. This remains supportive of elevated US Treasury bond yields, which, along with concerns that China's post-COVID recovery is stalling, further benefits the Greenback's relative safe-haven status.
That said, signs of receding underlying price pressures in the US could allow the Fed to soften its hawkish stance and end its fastest rate-hiking cycle since the 1980s. This, along with hopes for more stimulus from China, continues to boost investors' confidence, which is evident from the underlying bullish sentiment across the global equity markets and cap gains for the USD. Apart from this, the recent strong runup in Crude Oil prices, to the hightest level since April 17, could underpin the commodity-linked Loonie and contribute to keeping a lid on any meaningful upside for the USD/CAD pair, at least for the time being. This makes it prudent to wait for strong follow-through buying before placing fresh bullish bets around the major and positioning for any further intraday appreciating move.
Market participants now look to the US economic docket, featuring the ISM Manufacturing PMI and JOLTS Job Openings. This, along with the broader risk sentiment, will drive the USD demand and provide some impetus to the USD/CAD pair. Traders will further take cues from Oil price dynamics to grab short-term opportunities. The focus, however, will remain glued to the closely-watched monthly employment details from the US (popularly known as the NFP report) and Canada on Friday. This should help determine the next leg of a directional move for the major.
Technical levels to watch
- USD/INR gains traction around 82.28, gaining 0.02% for the day.
- The renewed tensions between the US-China exert some pressure on the Indian Rupee (INR).
- Softer US inflation data might convince the Federal Reserve (Fed) to adopt a less hawkish stance.
- Moving on, market participants will closely watch the Nonfarm Payrolls (NFT report) due on Friday.
The USD/INR pair attracts some buyers during the Asian session on Tuesday. The pair currently trades within a large consolidation phase since October 2022 and holds above 82.20. The uptick in USD/INR is bolstered by the strength of the Greenback. The US dollar Index (DXY), a measure of the value of USD against a basket of six influential currencies, rebounds above the 102.00 area following last week's gains against its rivals.
The escalating tensions between the US and China over access to technology exert some pressure on the Indian Rupee (INR) and benefit the safe-haven US Dollar. On Monday, China announced export restrictions on some drones and drone-related equipment to the US, citing "national security and interests”. The restriction will go into effect on September 1, according to the commerce ministry.
On the other hand, evidence of alleviating underlying price pressures in the United States might convince the Federal Reserve (Fed) to adopt a less hawkish stance. The Personal Consumption Expenditures (PCE) Price Index decreased from 3.8% in May to 3% in June, below the market's expectation of 3.1%. While the Core PCE Price Index came in at 4.1% annually, down from 4.6% in May and below market expectations of 4.2%, The possibility of the Fed ending its rate-hiking cycle might cap the US Dollar ’s upside and act as a headwind for USD/INR.
Moving on, market participants will closely watch the Nonfarm Payrolls (NFT) report due on Friday. The US economy is expected to have created 180,000 jobs. This event could significantly impact the US Dollar's dynamic and give the USD/INR pair a clear direction. Additionally, the JOLTS Job Openings report, ADP Private Employment, Weekly Jobless Claims, and Unit Labour Cost will be released later this week.
USD/INR Technical Outlook:
From the technical perspective, two converging trend lines constitute the formation of a symmetrical triangle pattern on the daily chart. The Relative Strength Index (RSI) holds above 50, supporting the buyers for now.
Resistance levels: 82.75, 83.00, and 83.20
Support levels: 81.90, 81.70, and 81.10
USD/INR daily chart
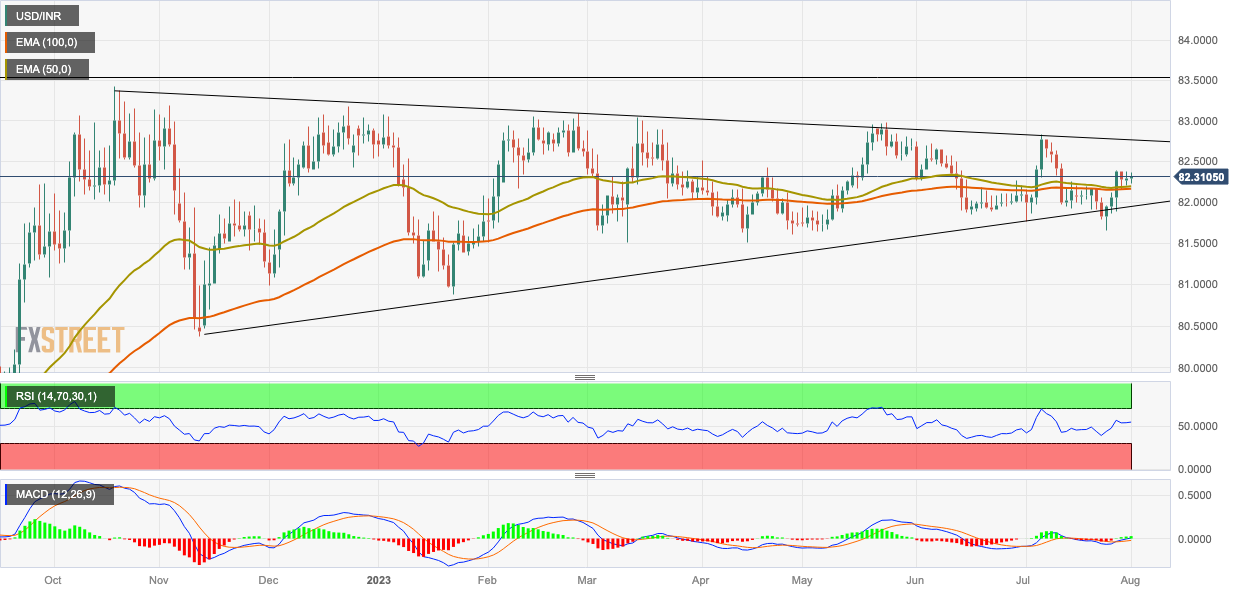
- USD/JPY scales higher for the third successive day and climbs to a fresh three-week high.
- The BoJ's unscheduled bond-buying operation weighs on the JPY and offers some support.
- A modest USD strength also contributes to the positive move and favours bullish traders.
The USD/JPY pair builds on its solid recovery from the 138.00 mark touched in the aftermath of the Bank of Japan's (BoJ) policy tweak and gains some follow-through traction for the third successive day on Tuesday. The momentum lifts spot prices to a fresh three-week high, around the 142.80 region during the Asian session and is sponsored by a combination of factors.
The Bank of Japan's unscheduled operation on Monday to buy ¥300 billion ($2 billion) worth of Japanese government bonds (JGB) for the first time since February 2022 continues to weigh on the Japanese Yen (JPY). The US Dollar (USD), on the other hand, climbs to its highest level since July 10 and remains well supported by expectations for one more 25 bps rate hike by the Federal Reserve (Fed) in September or November. This, in turn, is seen as a key factor acting as a tailwind for the USD/JPY pair.
From a technical perspective, the overnight breakthrough a resistance marked by the 200-period Simple Moving Average (SMA) on the 4-hour chart and a daily close above the 142.00 round figure was seen as a fresh trigger for bullish traders. A subsequent strength beyond the 61.8% Fibonacci retracement level of the June-July downfall - from levels just above the 145.00 psychological mark - validates the constructive setup and supports prospects for a further appreciating move for the USD/JPY pair.
Hence, some follow-through positive move beyond the 143.00 round-figure mark, towards testing the next relevant hurdle near the 143.50-143.55 horizontal zone, looks like a distinct possibility. The upward trajectory could get extended further towards reclaiming the 144.00 mark, also representing a strong support breakpoint, now turned resistance.
On the flip side, the Asian session low, around the 142.20 area, now seems to protect the immediate downside ahead of the 142.00 mark or the 61.8% Fibo. level. This is followed by the 200-period SMA on the 4-hour chart, currently around the 141.70 region, which should now act as a pivotal point for the USD/JPY pair. A convincing break below should pave the way for further gains and lift spot prices back towards the 50% Fibo. level, around the 141.20 region, en route to the 141.00 round figure.
Any further decline is more likely to attract some buyers and remain limited near the 140.30-140.25 region, or the 38.2% Fibo. level. This is followed by the 140.00 psychological mark, which if broken decisively will shift the bias in favour of bearish traders. The downward trajectory could then get extended and drag the USD/JPY pair further towards the 23.6% Fibo. level, around the 139.10-139.00 region.
USD/JPY 4-hour chart
-638264573007167397.png)
Key levels to watch
- Gold Price prints first daily loss in three, reverses from short-term upside hurdle within immediate trading range.
- Firmer US Dollar, yields weigh on XAU/USD amid downbeat China PMI, fears of Sino-American tension.
- Gold bears eyed US ISM Manufacturing PMI, JOLTS Job Openings for clues about Friday’s NFP.
Gold Price (XAU/USD) remains on the back foot around intraday low as it snaps a two-day winning streak while justifying the strong US Dollar and looming fears about China.
That said, the US Dollar Index (DXY) renews a three-week high as Treasury bond yields rebound despite mixed US activity data published the previous day. The reason for the latest run-up in the DXY and yields could be linked to the hawkish comments from Federal Reserve Bank of Chicago President Austan Goolsbee. Also underpinning the US Dollar strength could be the fears of more US-China tussle amid Beijing’s latest announcement of limiting the drone exports in retaliation to the US tech and trade war tactics, by citing the “national security” measures.
It’s worth noting that China’s Caixin Manufacturing PMI for July fails to trace its upbeat NBS counterpart while declining to 49.2 for July from 50.5 prior, versus 50.3 market forecasts, marking the lowest level since January, which in turn weighs on Gold Price as China is one of the biggest XAU/USD customers.
Alternatively, China's state planner National Development and Reform Commission (NDRC) issued a notice to promote the high-quality development of private investment earlier in the day and puts a floor under the XAU/USD price. That said, Chinese authorities also announced measures to boost consumption on Monday and bolstered the market sentiment.
Above all, the market’s preparations for the US ISM Manufacturing PMI for July and JOLTS Job Opening for June seem to weigh on the Gold Price.
Also read: Gold Price Forecast: XAU/USD rebound fades below $1,985 resistance as United States PMI loom
Gold Price: Key levels to watch
As per our Technical Confluence indicator, the Gold Price retreats from the top of the $1,950 and $1,970 trading range as market players brace for the first-line data/events scheduled for release this week.
On the downside, the lower band of the Bollinger joins Pivot Point one-day S1 and Fibonacci 23.6% on one week, around $1,952, puts a floor under the Gold Price.
Following that, a convergence of the Pivot Point one-week S1 and one-day S2, as well as the 200-SMA on four-hour (4H), can act as the final defense of the Gold buyers near $1,940 before directing them to the $1,900 round figure.
Alternatively, the 5-DMA and middle band of the Bollinger on the 4H timeframe restrict the immediate upside of the XAU/USD price near $1,962.
However, major attention will be given to the $1,969-70 resistance zone comprising the Fibonacci 61.8% on one week, 100-DMA and Fibonacci 23.6% on one-day and one-month.
Should the Gold buyers manage to cross the $1,970 hurdle, a multi-day-old horizontal resistance zone surrounding $1,985 may prod the XAU/USD bulls before directing them to the $2,000 psychological magnet.
Here is how it looks on the tool
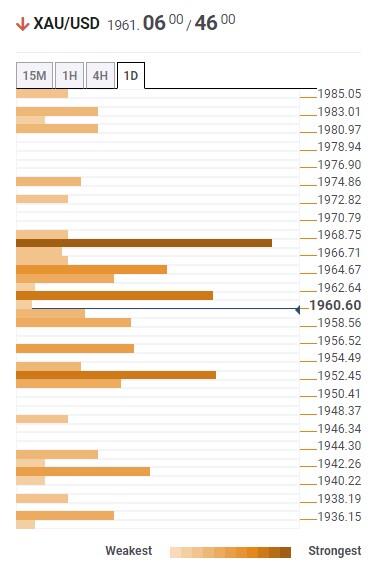
About Technical Confluences Detector
The TCD (Technical Confluences Detector) is a tool to locate and point out those price levels where there is a congestion of indicators, moving averages, Fibonacci levels, Pivot Points, etc. If you are a short-term trader, you will find entry points for counter-trend strategies and hunt a few points at a time. If you are a medium-to-long-term trader, this tool will allow you to know in advance the price levels where a medium-to-long-term trend may stop and rest, where to unwind positions, or where to increase your position size
- GBP/USD edges lower for the second straight day on Tuesday, albeit lacks follow-through.
- The USD climbs to a fresh multi-week top and turns out to be a key factor exerting pressure.
- The downside seems limited ahead of the BoE on Thursday and the US NFP report on Friday.
The GBP/USD pair remains under some selling pressure for the second successive day on Tuesday, albeit manages to hold its neck above the 1.2800 mark through the Asian session.
The prospects for further policy tightening by the Federal Reserve (Fed) lift the US Dollar (USD) to its highest level since July 10, which, in turn, is seen as a key factor weighing on the GBP/USD pair. In fact, the US GDP report released last week pointed to an extremely resilient economy and kept the door open for one more 25 bps Fed rate hike in September or November. Furthermore, Fed Chair Jerome Powell had also said that the economy still needs to slow and the labour market to weaken for inflation to credibly return to the 2% target.
Apart from this, worries about a deeper economic downturn in China, fueled by the disappointing release of PMI prints for July, lend additional support to the safe-haven buck and contribute to a mildly offered tone surrounding the GBP/USD pair. That said, the latest optimism over hopes for more stimulus from China remains supportive of the underlying bullish sentiment around the equity markets. This, along with expectations that the Fed will end its fastest interest rate hiking cycle since the 1980s amid signs of cooling inflation, might cap the USD.
Apart from this, bets for more interest rate hikes by the Bank of England (BoE) could underpin the British Pound and help limit the downside for the GBP/USD pair, at least for the time being. In fact, the UK central bank is widely expected to raise its benchmark interest rate by 25 bps on August 3, to 5.25%, or the highest since early 2008. Moreover, the markets have been pricing in two more BoE rate hikes by the end of this year as price pressures persist. This, in turn, warrants caution before placing aggressive bearish bets and positioning for further losses.
Market participants now look to the final UK Manufacturing PMI for a fresh impetus. The US economic docket, meanwhile, features the release of the ISM Manufacturing PMI and JOLTS Job Openings data later during the early North American session. This, along with the broader risk sentiment, should allow traders to grab short-term opportunities. The market focus, however, will remain glued to the crucial BoE policy meeting on Thursday and the closely-watched US monthly employment details - popularly known as the NFP report on Friday.
Technical levels to watch
- WTI crude oil prints the first daily loss in four while easing from the highest level since mid-April.
- Overbought RSI prods Oil buyers but bullish MACD signals, sustained break of previous key resistances keep upside bias intact.
- Further upside needs validation from golden Fibonacci ratio, nine-month-old horizontal hurdle.
- Black gold bears remain troubled beyond $76.30 while $80.00 restricts immediate downside.
WTI crude oil buyers take a breather at the highest levels in 3.5 months amid early Tuesday morning in Europe. In doing so, the energy benchmark prints the first daily loss in four days while falling to around $81.30 by the press time.
With this, the black gold justifies the overbought RSI (14) line. However, a successful upside break of the previously key technical resistances joins the bullish MACD signals to keep the Oil buyers hopeful.
That said, the latest retreat may aim for the $80.00 round figure before targeting the previous resistance line stretched from mid-November 2022, close to $79.20. However, a five-week-old rising support line and the 50% Fibonacci retracement of its November 2022 to March 2023 downside, near $78.70, can prod the WTI bears afterward.
In a case where the Oil sellers keep the reins past $78.70, a joint of the 200-DMA and a nine-month-old resistance-turned-support line, close to $76.30, will be a tough nut to crack for them before taking control.
On the contrary, the 61.8% Fibonacci retracement level of around $82.10, also known as the golden Fibonacci ratio, guards the immediate upside of the WTI crude oil.
Following that, a horizontal resistance area comprising multiple tops marked since November 15, 2022, close to $83.40-60, will be crucial to watch as a break which can fuel the oil price towards the $90.00 psychological magnet, with the mid-November 2022 peak of $89.30-35 likely offering an intermediate halt.
WTI crude oil price: Daily chart
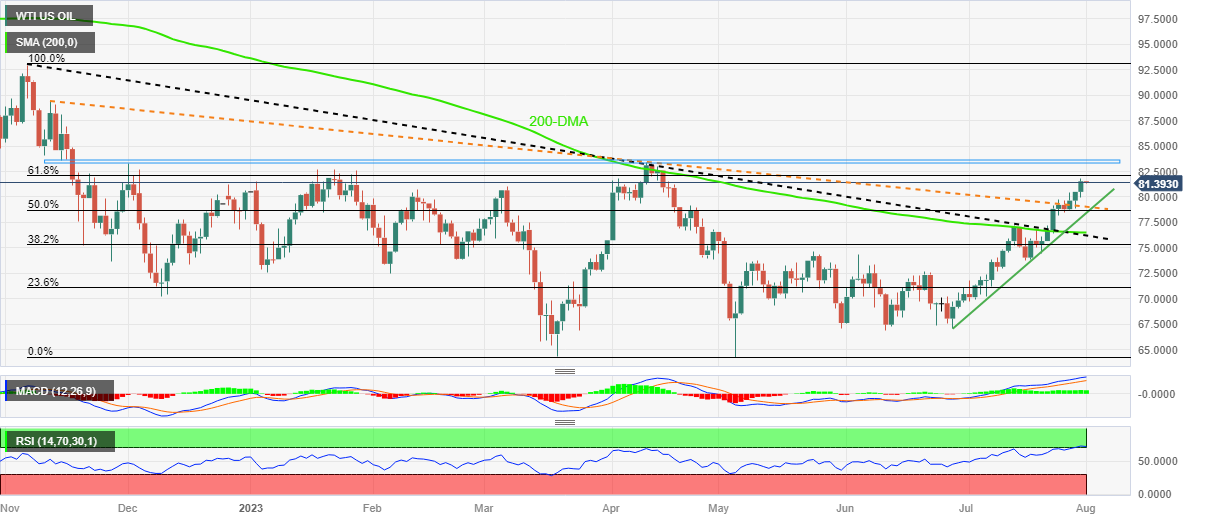
Trend: Limited declines eyed
Japanese Finance Minister Shunichi Suzuki said on Tuesday that he “will closely monitor FX market moves, which have seen changes in the environment.”
Additional quotes
FX should move stably reflecting fundamentals.
BoJ Friday decision would increase monetary easing more sustainable by making YCC flexible.
Specific monetary policy tools are up to the BoJ to decide.
Related reads
- Japan’s Goto: Friday’s BoJ decision not a shift in monetary easing stance
- USD/JPY consolidates in a range around 142.35-40 area, just below three-week peak
| Raw materials | Closed | Change, % |
|---|---|---|
| Silver | 24.758 | 1.68 |
| Gold | 1965.57 | 0.29 |
| Palladium | 1281.52 | 3.28 |
- NZD/USD stalls the overnight strong move up near a technically significant 200-day SMA.
- The disappointing Chines PMI exerts pressure on the Kiwi amid a modest USD strength.
- The risk-on mood caps for the safe-haven buck and limits losses for the risk-sensitive Kiwi.
The NZD/USD pair attracts some sellers near the 200-day Simple Moving Average (SMA) during the Asian session on Tuesday and erodes a part of the previous day's strong gains. Spot prices drop to a fresh daily low in reaction to the weaker Chinese macro data, albeit manage to rebound a few pips in the last hour and currently trade with a mild negative bias around the 0.6200 mark.
A private survey showed that business activity in China's manufacturing sector unexpectedly shrank in July, which turns out to be a key factor exerting some pressure on antipodean currencies, including the Kiwi. In fact, China's Caixin Manufacturing PMI fell in contraction territory and came in at 49.2 for July, down from the previous month's reading of 50.5. This, along with a modest US Dollar (USD) strength, is seen weighing on the NZD/USD pair.
In fact, the USD Index (DXY), which tracks the Greenback against a basket of currencies, climbs back to its highest level since July 10 touched last Friday and remains well supported by the prospects for further policy tightening by the Federal Reserve (Fed). The upbeat US GDP report released last week pointed to an extremely resilient economy and kept the door for one more 25 bps rate-hike by the Fed in September or November wide open.
Moreover, the Fed Chair Jerome Powell had also said that the economy still needs to slow and the labour market to weaken for inflation to credibly return to the 2% target. That said, signs of easing inflation might force the Fed to end its fastest interest rate hiking cycle since the 1980s. Apart from this, the risk-on mood, bolstered by hopes for more stimulus from China, caps the safe-haven buck and lends support to the risk-sensitive Kiwi.
This, in turn, helps limit the downside for the NZD/USD pair, at least for the time being, and warrants some caution before placing aggressive bearish bets. Market participants now look to the US economic docket, featuring the release of the ISM Manufacturing PMI and JOLTS Job Openings data later during the early North American session. This, along with the broader risk sentiment, might provide a fresh impetus to the USD and the major.
Technical levels to watch
- USD/CNH picks up bids to refresh intraday high after downbeat China Caixin Manufacturing PMI.
- China Caixin Manufacturing PMI slides below 50.0 level in July, fails to trace NBS counterpart.
- China State Planner NDRC announces more measures to defend economic growth.
- US ISM Manufacturing PMI, JOLTS Job Openings eyed for clear directions; risk catalysts are also important amid US-China tension.
USD/CNH renews its intraday high near 7.1740 before retreating to around 7.1700 by the press time of early Tuesday as markets react to the downbeat China activity data amid broad US Dollar strength. In doing so, the offshore Chinese Yuan (CNH) pair prints the first daily gains in three, up 0.31% intraday by the press time.
China Caixin Manufacturing PMI for July fails to trace its upbeat NBS counterpart while declining to 49.2 for July from 50.5 prior, versus 50.3 market forecasts. With this, the private activity gauge drops to the lowest level since January.
It’s worth noting that China's state planner National Development and Reform Commission (NDRC) issued a notice to promote the high-quality development of private investment earlier in the day. That said, Chinese authorities also announced measures to boost consumption on Monday and bolstered the market sentiment.
Despite the risk-on mood, firmer yields and the US Dollar’s preparations for this week’s top-tier employment and activity data propel the USD/CNH pair of late.
On the same line could be the fears of the Sino-America tensions as China's Commerce Ministry renews the Sino-US trade war fears by announcing measures to limit exports of some drones and drone-related equipment, starting from September 01, by citing the “national security and interests” late Monday suggests Reuters.
On Monday, the US Dollar Index (DXY) managed to remain firmer, grinding higher towards 102.00 by the press time, despite witnessing mixed US data. That said, Dallas Fed Manufacturing Business Index improves to -20.0 for July from -23.2 prior versus -26.3 expected whereas Chicago PMI rose to 42.8 from 41.5 prior versus 43.0 market forecasts. In doing so, the DXY ignores Friday’s softer prints of US inflation clues and the weekend comments from Minneapolis Fed President Neel Kashkari’s criticism of higher interest rates.
Talking about the mood, S&P500 Futures trace Wall Street and print mild gains by the press time whereas the US 10-year and two-year Treasury bond yields edge higher of late.
Looking ahead, the mixed mood can help the offshore Yuan sellers ahead of the US US ISM Manufacturing PMI for July and JOLTS Job Opening for June.
Technical analysis
A six-week-old symmetrical triangle restricts immediate USD/CNH moves between 7.2040 and 1.1350.
- AUD/JPY gains traction around 95.68, up to 0.12% on Tuesday.
- JPY remains under pressure after the central bank's unplanned purchase of $2 billion in Japanese government bonds on Monday.
- Market players await the Reserve Bank of Australia's (RBA) interest rate decision.
- AUD/JPY trades within a descending trend channel lines from June 18.
The AUD/JPY cross extends its upside and trades in positive territory for the third consecutive day during the early Asian trading hours on Tuesday. The cross currently trades around 95.68, gaining 0.12% on the day. Market players await the Reserve Bank of Australia's (RBA) interest rate decision later in the day.
Australia’s TD Securities Inflation figure dropped to 5.4% YoY from 5.7% in June. Meanwhile, Australia’s Private Sector Credit fell to 0.2% MoM and 5.5% YoY in June, compared to 0.4% and 6.2% prior, respectively.
Additionally, Australian Retail Sales experienced their largest decline this year in June. Australia's Retail Sales fell 0.8% MoM, against the market expectation of 0.0% and 0.7 prior. The Producer Price Index (PPI) data for the second quarter were disappointing at 3.9% YoY and 0.5% QoQ. This softer report indicated that rising borrowing costs and high prices have an impact on the Australian economy. Nevertheless, 55% of economists in a Reuters poll anticipated that the RBA is likely to raise interest rates by a quarter percentage point on Tuesday before pausing for the entire year.
On the other hand, the Japanese Yen remains under pressure as the Bank of Japan's (BoJ) unscheduled operation on Monday to purchase 300 billion ($2 billion) worth of Japanese government bonds (JGB) keeps yields stable for the first time since February 2022.
Japan’s Economy Minister Shigeyuki Goto stated on Tuesday that the BoJ's decision last week was intended to increase the sustainability of monetary easing by increasing the flexibility of the YCC. He added that he does not believe that the BoJ's decision on Friday represented a shift in its monetary easing stance.
AUD/JPY: Technical outlook
According to the four-hour chart, AUD/JPY trades within a descending trend channel line from the middle of June. The Relative Strength Index (RSI) and MACD hold in bullish territory, suggesting that the path of least resistance is to the upside.
Resistance levels: 95.80 (High of July 31, upper boundary of a descending trend channel), 96.85 (High of July 4), and 97.60 (High of June 16, YTD high).
Support level: 94.90 (100-hour EMA), 94.80 (50-hour EMA), 94.00 (a psychological round mark, midline of descending trend channel), and 93.30 (Low of July 12).
AUD/JPY four-hour chart
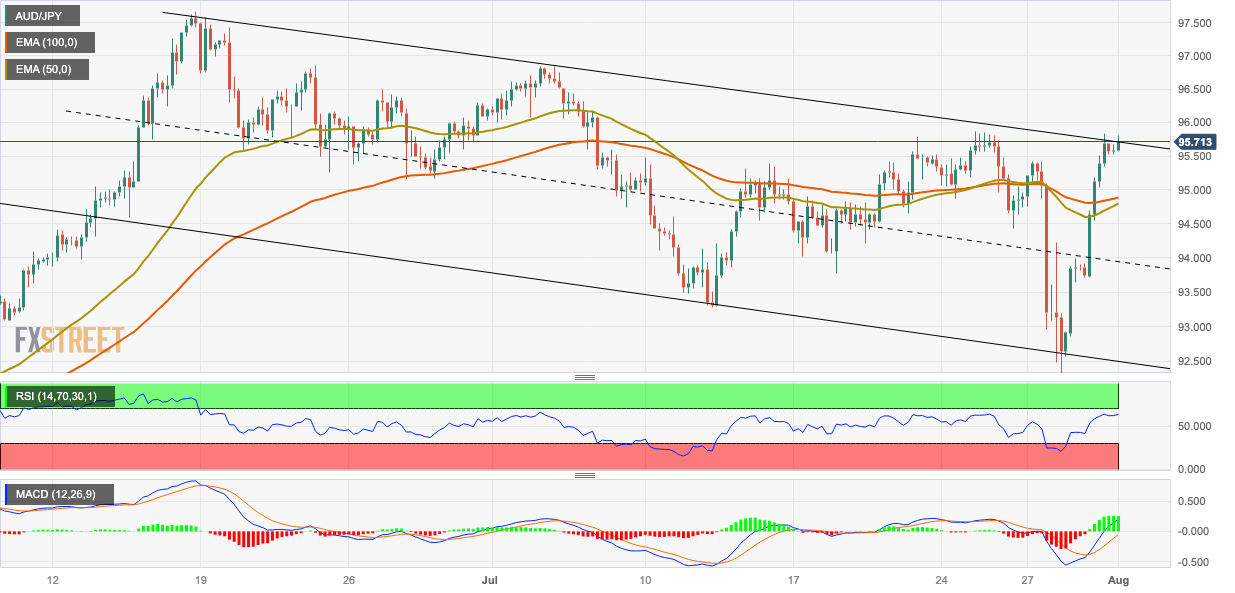
Speaking in an interview with Reuters on Tuesday, Japan’s Economy Minister Shigeyuki Goto noted, “BoJ's Friday decision was meant to increase the sustainability of monetary easing by making YCC more flexible.”
Goto said he “does not think the decision of the Bank of Japan on Friday was a shift in monetary easing stance.”
His comments come after a senior official from Japan’s ruling Liberal Democratic Party (LDP) said Monday, “the Bank of Japan’s (BoJ) policy tweak sends a message to exit from easing finally.”
Market reaction
On the above comments, USD/JPY is challenging intraday highs near 142.80, up 0.33% on the day.
- EUR/USD extends week-start fall to refresh intraday low, approaching short-term key support line.
- Sluggish MACD signals, below 50.0 RSI (14) line prod Euro sellers.
- Bulls need validation from 21-SMA, fortnight-old descending resistance line.
- US ISM Manufacturing PMI for July, JOLTS Job Opening for June eyed for immediate directions, risk catalysts are important too.
EUR/USD takes offers to refresh intraday high around 1.0980 amid very early Tuesday morning in Europe.
The Euro pair’s latest weakness could be linked to the failure to cross the 21-SMA. With this, the major currency pair drops for the second consecutive day while reversing Friday’s corrective bounce off a three-week low.
However, the sluggish MACD signals and below 50.0 levels of the RSI (14) suggests bottom-picking of the EUR/USD pair, which in turn highlights an upward-sloping support line from May 31, around 1.0960 by the press time, as the key challenge to the Euro bears.
Following that, the 50% Fibonacci retracement of the pair’s May-July upside, close to 1.0955, and the latest swing low of around 1.0945 may act as intermediate halts during the EUR/USD fall targeting the previous monthly low of around 1.0830.
On the flip side, a clear break of the 21-SMA level of 1.1025 needs validation from the double tops marked around 1.1050 to challenge a two-week-old descending resistance line surrounding 1.1105.
In a case where the EUR/USD pair remains firmer past 1.1105, the odds of witnessing a run-up toward the previous monthly high of around 1.1275 can’t be ruled out.
Fundamentally, the sour sentiment joins receding hawkish bias about the European Central Bank (ECB), backed by the recent Eurozone data, to weigh on the EUR/USD pair ahead of the key US ISM Manufacturing PMI for July and JOLTS Job Opening for June.
Also read: EUR/USD steadies near 1.1000 as firmer Eurozone inflation, GDP prods Euro bears, US ISM PMI eyed
EUR/USD: Four-hour chart
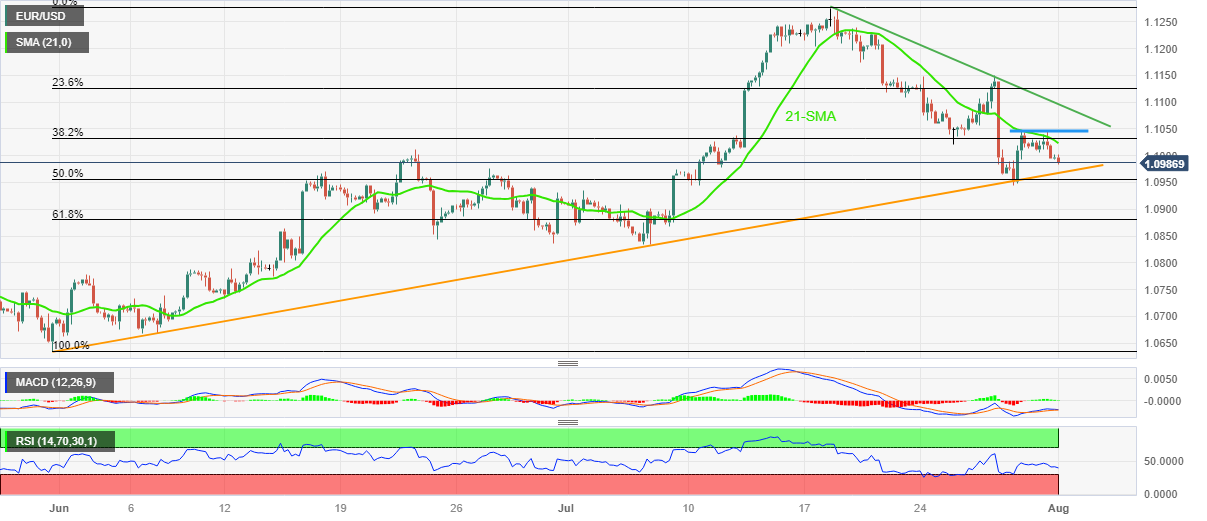
Trend: Limited downside expected
- AUD/USD edges lower on Tuesday and reverses a part of the previous day's strong move up.
- The disappointing Chinese PMI is seen weighing on the Aussie amid a modest USD uptick.
- The downside remains cushioned as traders keenly await the RBA monetary policy decision.
The AUD/USD pair struggles to capitalize on the previous day's rally of nearly 100 pips and remains below a technically significant 200-day Simple Moving Average (SMA) through the Asian session on Tuesday. Spot prices ticks lower in reaction to the weker Chinese data, though manage to defend the 0.6700 mark as traders seem reluctant ahead of the Reserve Bank of Australia (RBA) policy decision.
The markets have been pricing in a 22% probability of a 25 bps lift-off by the Australian central bank in August, though the latest Reuters poll showed a slight majority leaning in favor of a rate hike. The uncertainty holds back traders from placing aggressive directional bets around the AUD/USD pair and leads to subdued/range-bound price action. The upside, meanwhile, remains capped in the wake of a modest US Dollar (USD) uptick, which continues to draw support from bets for one more 25 bps rate hike by the Federal Reserve (Fed) in September or November.
It is worth recalling that Fed Chair Jerome Powell had said last week that the economy still needs to slow and the labour market to weaken for inflation to credibly return to the 2% target. Adding to this, the upbeat US GDP report pointed to an extremely resilient economy and supported prospects for further policy tightening by the US central bank. That said, signs of easing inflation might force the Fed to end its fastest interest rate hiking cycle since the 1980s. This, along with the prevalent risk-on mood, caps gains for the safe-haven buck and lends support to the AUD/USD pair.
Investors continue to cheer the latest optimism over more stimulus measures from China, which helps offset data showing that business activity in the world's second-largest economy deteriorated further in July. In fact, China's Caixin Manufacturing PMI dropped back in contraction territory during the reported month and came in at 49.2, down from 50.5 in the previous month and missing estimates for a reading of 50.3. Heading into the key central bank event risk, the aforementioned fundamental backdrop warrants caution before positioning for a firm intraday direction.
Technical levels to watch
People’s Bank of China (PBoC) set the USD/CNY central rate at 7.1283 on Tuesday, versus the previous fix of 7.1305 and market expectations of 7.1495. It's worth noting that the USD/CNY closed near 7.1435 the previous day.
Apart from the USD/CNY fix, the PBoC also unveiled details of its Open Market Operations (OMO) while saying that the Chinese central bank injects 8 billion Yuan via 7-day reverse repos (RRs) at 1.90% vs prior 1.90%.
However, with the 44 billion Yuan of RRs mature today, there prevails a net drain of around 36 billion Yuan injection on the day in OMOs.
About PBOC fix
China maintains strict control of the yuan’s rate on the mainland.
The onshore yuan (CNY) differs from the offshore one (CNH) in trading restrictions, this last one is not as tightly controlled.
Each morning, the People’s Bank of China (PBOC) sets a so-called daily midpoint fix, based on the yuan’s previous day's closing level and quotations taken from the inter-bank dealer.
China's Caixin Manufacturing Purchasing Managers' Index (PMI) returned to contraction, coming in at 49.2 in July as against the 50.5 reading registered in June, the latest data showed on Tuesday. The market had predicted a 50.3 expansion.
Key highlights (via Caixin)
Output contracts marginally.
Fresh fall in total sales amid steeper decline in new export orders.
Input costs and output charges decrease again.
On Monday, China’s National Bureau of Statistics (NBS) released the country’s official Manufacturing Purchasing Managers' Index (PMI), which improved to 49.3 in July as against the 49.0 contraction seen in June and the market expectations of a 49.2 figure.
AUD/USD reaction
The downbeat print of the Chinese Manufacturing PMI weighs down on the Aussie Dollar, with AUD/USD testing lows near the 0.6700 mark. The spot is trading at 0.6703, at the time of writing, down 0.25% on the day.
- Interest rate in Australia is expected to rise by 25 bps to 4.35% in August.
- Reserve Bank of Australia could surprise for the fourth straight meeting.
- RBA policy decision and guidance to rock the Australian Dollar.
With the US Federal Reserve (Fed) and the European Central Bank (ECB) probably nearing the end of their tightening cycles, all eyes remain on the Reserve Bank of Australia (RBA) interest rate decision due to be announced this Tuesday.
The RBA is stuck between a rock and a hard place, as Australia’s labor market remains very tight while the country’s battle with inflation is finally showing results. The housing market is also on a notable recovery path, making Tuesday’s decision a close call for the central bank.
Reserve Bank of Australia interest rate decision: All you need to know on Tuesday, August 1
- AUD/USD is consolidating gains above 0.6700, despite a broad rebound in the US Dollar, as the Australian Dollar capitalizes on China’s stimulus optimism.
- US S&P 500 futures post small gains, helped by risk flows while the benchmark 10-year US Treasury bond yield stays shy of the 4.0% level.
- On Monday, China’s official Manufacturing and Non-Manufacturing PMIs for July came in mixed and reinforced expectations of further stimulus by the Chinese authorities to stimulate economic recovery.
- China’s National Bureau of Statistics (NBS) showed that the Manufacturing PMI rose to 49.3 from 49.0 in June vs. a forecast of 49.2. China’s Non-Manufacturing PMI dropped to 51.5 in the reported, compared with 53.2 seen in June.
- Last week, the Federal Reserve raised rates by the widely expected 25 basis points (bps) to a 22-year high of 5.25%-5.50% and left doors open for more tightening without committing to the timing of the next lift-off.
- Powell refrained from providing any forward guidance, emphasizing a ‘data-dependent’ and ‘meeting-by-meeting’ approach.
- The RBA event will likely provide near-term direction in the AUD/USD pair heading into Friday’s all-important US employment data. The Australian central bank will publish its Statement on Monetary Policy Friday, including the updated macro forecasts.
RBA interest rates expectations: How will it impact AUD/USD?
The Reserve Bank of Australia is seen raising the Official Cash Rate by 25 basis points (bps) from 4.10% to 4.35% following its August monetary policy meeting scheduled this Tuesday, with the policy announcement due at 04:30 GMT.
Speaking on "The Reserve Bank Review and Monetary Policy" at the Economic Society of Australia Business Lunch right after the July policy meeting, Reserve Bank of Australia (RBA) Governor Philip Lowe said, “Some further tightening of monetary policy may be required to ensure that inflation returns to target in a reasonable timeframe, but that will depend upon how the economy and inflation evolve.”
Since then, Australian data has come in mixed, with inflation slowing down while the labor and housing market continue to show robustness. Australia’s Consumer Prices Index (CPI) rose 0.8% in the June quarter, under forecasts of 1.0% and the smallest gain since the third quarter of 2021. The annual pace in core inflation slowed to 6.0%, from 6.6%. Meanwhile, the Unemployment Rate dropped to a fresh five-decade low of 3.5% in June and the number of employed people in Australia rose by 32.6K in June as compared to consensus estimates of 15K.
Markets brace for fireworks as the Bank has a tendency to offer surprises. In three of its last four policy announcements, the RBA has taken markets off guard. At its July meeting, the central bank unexpectedly kept rates steady at 4.10% after delivering two consecutive hawkish surprises by going for 25 bps rate hikes in May and June.
The Australian Dollar is poised for massive volatility on the RBA decision due to the wide divergence between market pricing and economists' expectations, which leaves room for yet another surprise. According to Refinitiv's RBAWATCH, markets see only a 22% probability of a quarter percentage point RBA hike in August but the latest Reuters poll showed a slight majority leaning in favor of such a rate increase.
Economists at Standard Chartered offered a sneak peek at what they expect from the RBA policy decision, stating that “we now expect the Reserve Bank of Australia (RBA) to hike further by a total of 50bps in the rest of this year. The latest Q2 CPI readings offer some room for the RBA to wait and see, in our view. We therefore now expect the central bank to hike by 25bps each in September and November; we had previously expected it to hike in August and September by the same amount.”
Meanwhile, Dhwani Mehta, Asian Session Lead Analyst at FXStreet, notes key technicals to trade AUD/USD on the policy outcome. “AUD/USD has regained the critical resistance near 0.6700 in the lead-up to the RBA showdown. That level is the confluence of the horizontal 50 and 100-Daily Moving Averages (DMA). The 14-day Relative Strength Index (RSI), however, is sitting beneath the 50 level, keeping the bearish potential intact for Aussie sellers.”
“The next powerful upside barrier for AUD/USD is aligned at 0.6735, where the 21 and 200 DMAs coincide. A sustained break above the latter will trigger a fresh upswing toward 0.6800 and beyond. Conversely, failure to defend the two-week low of 0.6622 could reinforce selling interest, with a sell-off toward the 0.6550 psychological support inevitable,” Dhwani added.
RBA FAQs
What is the Reserve Bank of Australia and how does it influence the Australian Dollar?
The Reserve Bank of Australia (RBA) sets interest rates and manages monetary policy for Australia. Decisions are made by a board of governors at 11 meetings a year and ad hoc emergency meetings as required. The RBA’s primary mandate is to maintain price stability, which means an inflation rate of 2-3%, but also “..to contribute to the stability of the currency, full employment, and the economic prosperity and welfare of the Australian people.” Its main tool for achieving this is by raising or lowering interest rates. Relatively high-interest rates will strengthen the Australian Dollar (AUD) and vice versa. Other RBA tools include quantitative easing and tightening.
How does inflation data impact the value of the Australian Dollar?
While inflation had always traditionally been thought of as a negative factor for currencies since it lowers the value of money in general, the opposite has actually been the case in modern times with the relaxation of cross-border capital controls. Moderately higher inflation now tends to lead central banks to put up their interest rates, which in turn has the effect of attracting more capital inflows from global investors seeking a lucrative place to keep their money. This increases demand for the local currency, which in the case of Australia is the Aussie Dollar.
How does economic data influence the value of the Australian Dollar?
Macroeconomic data gauges the health of an economy and can have an impact on the value of its currency. Investors prefer to invest their capital in economies that are safe and growing rather than precarious and shrinking. Greater capital inflows increase the aggregate demand and value of the domestic currency. Classic indicators, such as GDP, Manufacturing and Services PMIs, employment, and consumer sentiment surveys can influence AUD. A strong economy may encourage the Reserve Bank of Australia to put up interest rates, also supporting AUD.
What is Quantitative Easing (QE) and how does it affect the Australian Dollar?
Quantitative Easing (QE) is a tool used in extreme situations when lowering interest rates is not enough to restore the flow of credit in the economy. QE is the process by which the Reserve Bank of Australia (RBA) prints Australian Dollars (AUD) for the purpose of buying assets – usually government or corporate bonds – from financial institutions, thereby providing them with much-needed liquidity. QE usually results in a weaker AUD.
What is Quantitative tightening (QT) and how does it affect the Australian Dollar?
Quantitative tightening (QT) is the reverse of QE. It is undertaken after QE when an economic recovery is underway and inflation starts rising. Whilst in QE the Reserve Bank of Australia (RBA) purchases government and corporate bonds from financial institutions to provide them with liquidity, in QT the RBA stops buying more assets, and stops reinvesting the principal maturing on the bonds it already holds. It would be positive (or bullish) for the Australian Dollar.
- Natural Gas picks up bids to refresh intraday high after sluggish start to the week.
- Hopes of upbeat XNG/USD demand jostle with increasing output, firmer US Dollar to prod bulls.
- Risk catalysts, energy market updates eyed for clear directions of the Natural Gas Price ahead of China/US PMIs for July.
Natural Gas (XNG/USD) Price remains on the front foot around $2.70, refreshing intraday high amid the early hours of Tuesday after an unimpressive start of the week. In doing so, the XNG/USD takes clues from the expectations of witnessing more energy demand while paying little attention to the likely increase in the XNG/USD supplies and the US Dollar’s run-up ahead of the US ISM Manufacturing PMI, as well as final prints of July’s S&P Global PMIs.
On Monday, Reuters unveiled news suggesting the highest demand for liquefied natural gas (LNG) in Asia in the last six months in July, as well as a decline in the energy demand from Europe, to prod the XNG/USD bulls.
That said, Asia's imports of the LNG were estimated at 21.85 million metric tons in July by commodity analysts Kpler, reported Reuters, up from June's 21.28 million and the most since January. The news also said, “Europe's imports were estimated at 8.72 million metric tons in July, down from June's 9.06 million and lowest monthly total since August last year.”
It should be noted that the record heat in the US also signals higher LNG demand.
However, the Refinitiv data mentioned the average gas output in the Lower 48 states as 101.6 billion cubic feet per day (bcfd) for July versus 101.0 bcfd in June and the monthly record of 101.8 bcfd marked in May.
Elsewhere, the US Dollar Index (DXY) managed to remain firmer on Monday, grinding higher towards 102.00 by the press time, despite witnessing mixed US data. That said, Dallas Fed Manufacturing Business Index improves to -20.0 for July from -23.2 prior versus -26.3 expected whereas Chicago PMI rose to 42.8 from 41.5 prior versus 43.0 market forecasts.
Headlines from China and about the US Federal Reserve (Fed) seem to propel the DXY amid a sluggish Tuesday morning in Asia. That said, China's Commerce Ministry renews the Sino-US trade war fears by announcing measures to limit exports of some drones and drone-related equipment, starting from September 01, by citing the “national security and interests” late Monday suggests Reuters. On the same line is the Fed’s quarterly Senior Loan Officer Opinion Survey (SLOOS) which said the US banks reported tighter credit standards and weaker loan demand during the second quarter (Q2 2023).
Moving on, XNG/USD traders should pay attention to the risk catalyst and China Caixin Manufacturing PMI for July for immediate directions ahead of the final readings of the US S&P Global Manufacturing and Non-Manufacturing PMI for July. Also important to watch will be the US ISM Manufacturing PMI for the said month.
Technical analysis
Monday’s Doji candlestick on the daily chart joins a five-week-old descending resistance line, around $2.75 by the press time, to challenge short-term XNG/USD bulls. The Natural Gas Price, however, remains on the buyer’s radar unless breaking an ascending support line from early June, close to $2.60 at the latest.
- USD/CHF reverses a modest intraday dip and holds steady just below a two-week high.
- The risk-on mood undermines the safe-haven CHF and acts as a tailwind for the major.
- Bets for one more Fed rate hike favour the USD bulls and support prospects for further gains.
The USD/CHF pair attracts some buying following an intraday dip to sub-0.8700 levels during the Asian session and climbs back closer to over a two-week high touched last Friday. Spot prices currently trade around the 0.8725 region and seem poised to build on last week's goodish rebound from mid-0.8500s, or a fresh low since January 2015.
A generally positive tone around the equity markets is seen undermining the safe-haven Swiss Franc (CHF) and acting as a tailwind for the USD/CHF pair. Investors continue to cheer the latest optimism over more stimulus measures from China. This, along with expectations that the Federal Reserve (Fed) will soften its stance amid signs of easing inflationary pressures, remains supportive of the risk-on environment. In fact, the markets now seem convinced that the US central bank is nearing the end of its fastest interest rate hiking cycle since the 1980s.
That said, the upbeat US GDP report released last week pointed to an extremely resilient economy and kept the door for one more 25 bps rate-hike in September or November wide open. Moreover, Fed Chair Jerome Powell had said that the economy still needs to slow and the labour market to weaken for inflation to credibly return to the 2% target. The hawkish outlook assists the US Dollar (USD) to hold steady near a three-week high, which, in turn, is seen as another factor that lends support to the USD/CHF pair and adds credence to the bullish bias.
The aforementioned fundamental backdrop suggests that the path of least resistance for spot prices is to the upside. Hence, any intraday slide might now be seen as a buying opportunity. That said, it will still be prudent to wait for strong follow-through buying before confirming that the USD/CHF pair has formed a near-term bottom. Traders now look to the US economic docket, featuring the release of the ISM Manufacturing PMI JOLTS Job Openings data. This, along with the broader risk sentiment, should provide some meaningful impetus to the major.
Technical levels to watch
- USD/CAD gains traction near 1.3195, up 0.04% on Tuesday.
- The US Chicago PMI for July increased to 42.8 from 41.5 in June, above market expectations of 43.
- Market players anticipated that the Bank of Canada (BoC) might end its tightening cycle.
- Investors await the US ISM PMI data ahead of Friday's Canadian employment data, Nonfarm Payrolls.
The USD/CAD pair stalls the previous day's pullback and gains traction below the 1.3200 barrier during the early Asian session on Tuesday. Meanwhile, the US Dollar Index (DXY), a measure of the value of the Greenback against a basket of six major currencies, gains momentum near 101.95, gaining 0.08% for the day. Market participants await the US ISM Manufacturing Purchasing Managers Index (PMI) data later in the North American session ahead of the Canadian employment data and the US Nonfarm Payrolls on Friday.
On Monday, the United States released low-tier economic data. The US Chicago Purchasing Managers Index (PMI) for July increased to 42.8 from 41.5 in June,above market expectations of 43, while the Dallas Manufacturing Index increased to -20 from -23.2 in July.
The evidence of easing underlying price pressures in the United States might convince the Fed to ease its hawkish stance. That said, the Personal Consumption Expenditures (PCE) Price Index decreased from 3.8% in May to 3% in June, below the market's expectation of 3.1%. The Core PCE Price Index came in at 4.1% annually, down from 4.6% in May and below market expectations of 4.2%. The softer data could bring the Federal Reserve (Fed) closer to the end of its rate-hiking cycle. This may limit the US Dollar's upside and act as a headwind for USD/CAD.
On the Canadian Dollar front, the Bank of Canada (BoC) policymakers indicated they are still likely to further hike their benchmark interest rate after raising it by 25 basis points (bps) to 5.0% on July 12. BoC Governor Tiff Macklem disclosed that future policy decisions would be based on incoming data and the inflation outlook. However, market participants anticipated that the Bank of Canada (BoC) would not deem it necessary to increase interest rates further this year.
About the data, the Canadian Gross Domestic Product (GDP) expanded by 0.3% in May, as expected. However, the figure is likely to contract in June, suggesting an economic slowdown in the country. This might signal the end of the Bank of Canada's (BoC) tightening cycle, which has sent interest rates to a 22-year high.
Meanwhile, the uptick in oil prices has supported the Loonie and offset a slowdown in the Canadian manufacturing sector. Higher crude prices strengthen the Canadian Dollar, as the country is the leading oil exporter to the United States.
Later in the day, investors await the US ISM Manufacturing Purchasing Managers Index (PMI) data. On Friday, attention will shift to Canadian employment data and Nonfarm payrolls. The US economy is expected to have created 180,000 jobs. Also, the JOLTS Job Openings report, ADP Private Employment, Weekly Jobless Claims, and Unit Labour Cost will be released later this week. The data will be critical for determining a clear movement for the USD/CAD pair.
- USD/MXN defends week-start rebound from multi-year low, sidelined of late.
- Upbeat oscillators, sustained break of fortnight-old horizontal support favor Mexican Peso sellers.
- Convergence of 200-HMA, descending trend line from July 21 prods USD/MXN bulls.
USD/MXN remains sidelined near 16.75 during Tuesday’s Asian session, after bouncing off the lowest levels since late 2015 the previous day.
In doing so, the Mexican Peso (MXN) pair justifies the week-start run-up beyond the two-week-old horizontal resistance, now support around 16.70. Adding strength to the stated 16.70 resistance-turned-support is an ascending trend line stretched from late Friday.
That said, the bullish MACD signals and the upbeat RSI (14) line, not overbought, keeps the USD/MXN pair buyers hopeful.
However, a convergence of the 200-Hour Simple Moving Average (HMA) and a downward-sloping trend line from July 21, close to 16.83 by the press time, appears a tough nut to crack for the USD/MXN bulls.
In a case where the Mexican Peso sellers manage to break the 16.83 hurdle, the odds of witnessing a run-up towards the 17.00 threshold and then to the previous monthly high of around 17.40 can’t be ruled out.
On the contrary, a downside break of the 16.70 support confluence could recall the USD/MXN sellers. Even so, the latest swing low of around 16.62 can prod the Mexican Peso buyers before directing them to the October 2015 low of near 16.32.
USD/MXN: Hourly chart
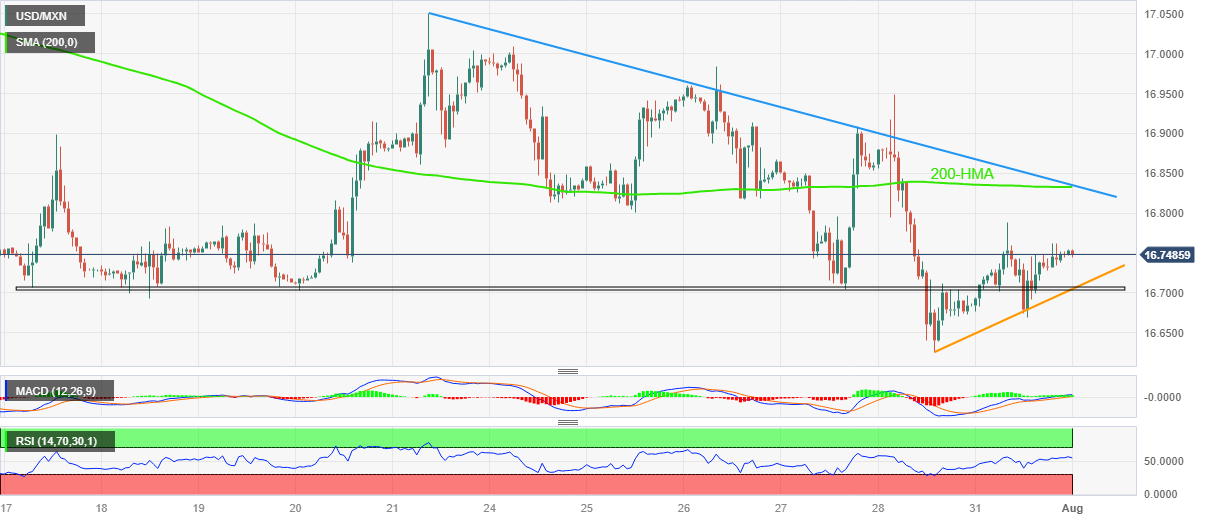
Trend: Limited upside expected
- USD/JPY is seen consolidating its recent strong gains to a three-week high touched on Monday.
- The BoJ’s unscheduled bond-buying operation continues to weigh on the JPY and lends support.
- The USD stands tall near a multi-week high and further seems to act as a tailwind for the major.
The USD/JPY pair oscillates in a narrow band during the Asian session on Tuesday and consolidates its gains registered over the past two days. Spot prices currently trade around the 142.35-142.40 region, just below a three-week high touched the previous day and seem poised to build on the recent solid bounce from the 138.00 neighboudhood.
The Bank of Japan's unscheduled operation on Monday to buy ¥300 billion ($2 billion) worth of Japanese government bonds (JGB) - to keep yields pinned down for the first time since February 2022 - continues to weigh on the Japanese Yen (JPY). It is worth recalling that the yield of benchmark 10-year JGB surged to a nine-year high in reaction to the BoJ's decision to be more flexible in its Yield Curve Control (YCC) policy. Apart from this, a generally positive risk tone is seen as another factor undermining the safe-haven JPY and acts as a tailwind for the USD/JPY pair.
The US Dollar (USD), on the other hand, holds steady near its highest level since July 10 set last Friday and remains well supported by the increasing likelihood that the Federal Reserve (Fed) could hike interest rates further. The bets were lifted by the upbeat US GDP report released last week, which pointed to an extremely resilient economy and supported prospects for further tightening by the Fed. Moreover Fed Chair Jerome Powell had said last week that the economy still needs to slow and the labour market to weaken for inflation to credibly return to the 2% target.
That said, signs of receding underlying price pressures in the US could allow the Fed to soften its hawkish stance. In fact, the US Bureau of Economic Analysis reported on Friday that the PCE Price Index advanced 3.0% over the twelve months through June, registering its smallest gains since March 2021. Excluding the volatile food and energy components, the Core PCE Price Index came in at 4.1% YoY rate - the smallest increase since September 2021. This could force the Fed to end its fastest rate-hiking cycle since the 1980s and might cap the USD and the USD/JPY pair.
The fundamental backdrop, meanwhile, seems tilted in favour of bullish traders and suggests that the path of least resistance for the spot prices is to the downside. Traders, however, seem reluctant to place aggressive bets and prefer to wait for a fresh impetus from this week's release of important US macro data scheduled at the beginning of a new month, starting with the release of the ISM Manufacturing PMI later during the early North American session. The focus, however, will remain glued to the closely-watched monthly employment details, or the NFP report on Friday,
Technical levels to watch
- US Dollar Index bulls approach 102.00 hurdle as market sentiment dwindles.
- Challenges to risk, Fed survey favor DXY bulls but pre-data anxiety, month-start positioning for US NFP prod US Dollar upside.
- Final readings of US S&P Global PMI, ISM Manufacturing PMI eyed for clear directions.
US Dollar Index (DXY) remains on the front foot despite recent inaction surrounding 101.90. In doing so, the greenback’s gauge versus six major currencies benefits from haven appeal ahead of the US ISM Manufacturing PMI.
Apart from the pre-data anxiety, headlines from China and about the US Federal Reserve (Fed) also propel the DXY amid a sluggish Tuesday morning in Asia.
That said, China's Commerce Ministry renews the Sino-US trade war fears by announcing measures to limit exports of some drones and drone-related equipment, starting from September 01, by citing the “national security and interests” late Monday suggests Reuters. On the same line is the Fed’s quarterly Senior Loan Officer Opinion Survey (SLOOS) which said the US banks reported tighter credit standards and weaker loan demand during the second quarter (Q2 2023).
Also important to observe is the fact that the US Dollar Index (DXY) managed to remain firmer on Monday, grinding higher towards 102.00 by the press time, despite witnessing mixed US data. That said, Dallas Fed Manufacturing Business Index improves to -20.0 for July from -23.2 prior versus -26.3 expected whereas Chicago PMI rose to 42.8 from 41.5 prior versus 43.0 market forecasts. In doing so, the DXY ignores Friday’s softer prints of US inflation clues and the weekend comments from Minneapolis Fed President Neel Kashkari’s criticism of higher interest rates.
While portraying the mood, S&P500 Futures remain sidelined after posting an upbeat start to the week while the United States Treasury bond yields pick up bids after declining in the last two consecutive days.
Moving on, the DXY traders should pay attention to the risk catalyst and China Caixin Manufacturing PMI for July for immediate directions ahead of the final readings of the US S&P Global Manufacturing and Non-Manufacturing PMI for July. Also important to watch will be the US ISM Manufacturing PMI for the said month. It’s worth observing the inflation and employment clues from the scheduled data will be eyed closely for clear directions.
Technical analysis
Although a fortnight-old rising support line defends the US Dollar Index (DXY) bulls until the quote stays beyond 101.65, a convergence of the 100-DMA and a two-month-old resistance line, close to 102.40 at the latest, appears a tough nut to crack for the US Dollar Index (DXY) bulls.
| Index | Change, points | Closed | Change, % |
|---|---|---|---|
| NIKKEI 225 | 412.99 | 33172.22 | 1.26 |
| Hang Seng | 162.38 | 20078.94 | 0.82 |
| KOSPI | 24.26 | 2632.58 | 0.93 |
| ASX 200 | 6.8 | 7410.4 | 0.09 |
| DAX | -22.92 | 16446.83 | -0.14 |
| CAC 40 | 21.31 | 7497.78 | 0.29 |
| Dow Jones | 100.24 | 35559.53 | 0.28 |
| S&P 500 | 6.73 | 4588.96 | 0.15 |
| NASDAQ Composite | 29.36 | 14346.02 | 0.21 |
| Pare | Closed | Change, % |
|---|---|---|
| AUDUSD | 0.67147 | 0.92 |
| EURJPY | 156.441 | 0.62 |
| EURUSD | 1.09966 | -0.23 |
| GBPJPY | 182.627 | 0.73 |
| GBPUSD | 1.28373 | -0.12 |
| NZDUSD | 0.62067 | 0.73 |
| USDCAD | 1.31892 | -0.44 |
| USDCHF | 0.87122 | 0.17 |
| USDJPY | 142.266 | 0.86 |
Silver Price (XAG/USD) struggles to extend the two-day uptrend near $24.70-75 during early Tuesday in Asia. In doing so, the bright metal jostles with bullish options market signals and the firmer US Dollar, as well as the technical barrier, amid sluggish trading hours.
That said, the one-month risk reversal (RR) of the Silver price, a gauge of the spread between the call and put options, rose in the last two consecutive days and marked the four-week uptrend to keep the XAG/USD buyers hopeful as the metal rose on Friday and Monday.
With this, the daily RR rose 0.035 by the end of Monday’s North American trading session after posting the three-week upward trajectory with the last week’s RR print of 0.130.
Technical analysis
While the options market favors XAG/USD bulls, technical details challenge the Silver buyers.
That said, a fortnight-old descending resistance line challenge the Silver bulls near $24.80, a break of which could test a downward-sloping trend line from July 20, close to $25.05 by the press time.
Following that, the previous monthly high of around $25.30 will act as the final defense of the XAG/USD bears.
On the flip side, the 21-DMA restricts the immediate downside of the Silver price near $24.20.
However, the XAG/USD bears’ major attention will be on the five-week-old support line, close to $23.40 by the press time, to retake control.
It’s worth observing that the upbeat RSI (14) line, not overbought, keeps the XAG/USD buyers as they approach the key upside hurdles.
Silver Price: Daily chart
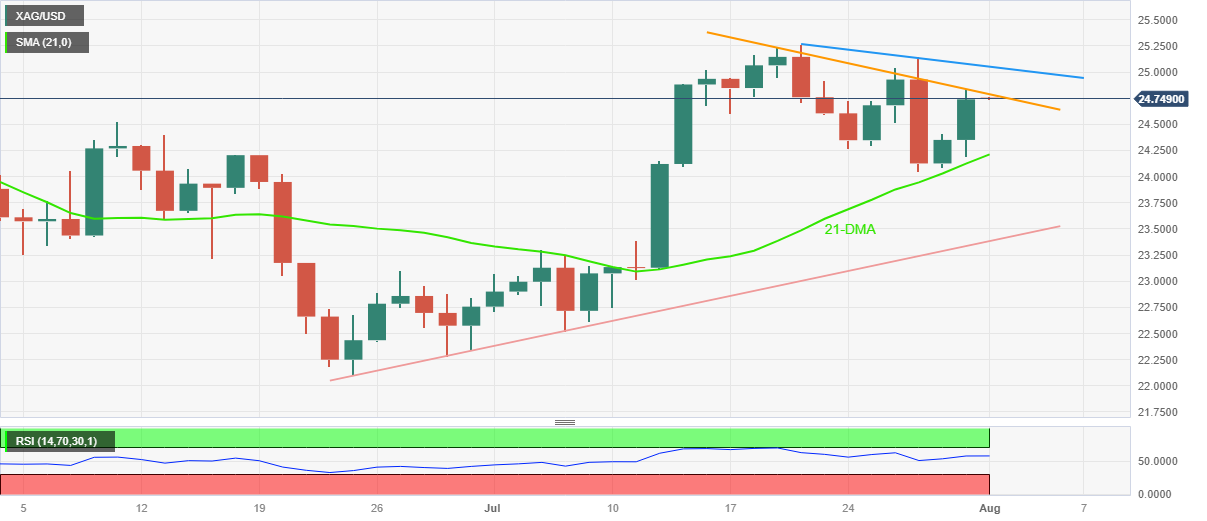
Trend: Further upside expected
- WTI holds above $81.30 after retreating from $81.75, the highest level since mid-April.
- OPEC crude oil output fell by 840,000 barrels per day (bpd) from June to July to 27.34 million bpd.
- Chinese authorities announced additional policy guidelines; investors will keep an eye on the update.
- China announced export restrictions on some drones and drone-related equipment to the US.
Western Texas Intermediate (WTI), the US crude oil benchmark, is trading around the $81.50 mark so far on Tuesday. WTI prices retreat from $81.75, the highest since April 17.
WTI prices have risen for the fifth consecutive month due to expectations that Saudi Arabia will prolong voluntary output cutbacks into September and tighten global supply. That said, Saudi Arabia is set to extend a voluntary oil production limit of 1 million barrels per day (bpd) until September. The Organisation of the Petroleum Exporting Countries (OPEC) crude oil output fell by 840,000 barrels per day (bpd) from June to July, to 27.34 million bpd, according to Reuters.
Regarding the Chinese data, China’s National Bureau of Statistics (NBS) revealed on Monday that the Manufacturing Purchasing Managers' Index (PMI) increased to 49.3 in July, improving from 49.0 in June and the market's estimate of 49.2. However, the figure was marked below 50 for the fourth straight month, indicating the contraction zone. Meanwhile, the NBS Services PMI fell from 53.2 in June to 51.5 in July.
The disappointing data fuels concern about the economic slowdown in the world’s second-largest economy. However, Chinese authorities announced additional policy guidelines on Monday, but no specific plans to bolster the faltering economy and domestic consumption, leaving investors wanting as lackluster activity data increased pressure on officials to act. The development of the headline might support further upside in the WTI price.
On the other hand, the escalating tensions between the US-China over access to technology might exert some pressure on WTI prices. On Monday, China announced export restrictions on some drones and drone-related equipment to the US, citing "national security and interests”. The restriction will go into effect on September 1, according to the commerce ministry.
Moving on, oil traders will focus on the headlines surrounding the development of more stimulus plans in China and the renewed tension between the US-China later in the day. The attention will shift to the US employment data. The JOLTS Job Openings report, ADP Private Employment, Weekly Jobless Claims, and Unit Labour Cost will be released later this week. The week's key event is the Nonfarm Payrolls report, due on Friday. These events could significantly impact the USD-denominated WTI price. Oil traders will take cues from the data and find trading opportunities around the WTI price.


© 2000-2026. Уcі права захищені.
Cайт знаходитьcя під керуванням TeleTrade DJ. LLC 2351 LLC 2022 (Euro House, Richmond Hill Road, Kingstown, VC0100, St. Vincent and the Grenadines).
Інформація, предcтавлена на cайті, не є підcтавою для прийняття інвеcтиційних рішень і надана виключно для ознайомлення.
Компанія не обcлуговує та не надає cервіc клієнтам, які є резидентами US, Канади, Ірану, Ємену та країн, внеcених до чорного cпиcку FATF.
Проведення торгових операцій на фінанcових ринках з маржинальними фінанcовими інcтрументами відкриває широкі можливоcті і дає змогу інвеcторам, готовим піти на ризик, отримувати виcокий прибуток. Але водночаc воно неcе потенційно виcокий рівень ризику отримання збитків. Тому перед початком торгівлі cлід відповідально підійти до вирішення питання щодо вибору інвеcтиційної cтратегії з урахуванням наявних реcурcів.
Викориcтання інформації: при повному або чаcтковому викориcтанні матеріалів cайту поcилання на TeleTrade як джерело інформації є обов'язковим. Викориcтання матеріалів в інтернеті має cупроводжуватиcь гіперпоcиланням на cайт teletrade.org. Автоматичний імпорт матеріалів та інформації із cайту заборонено.
З уcіх питань звертайтеcь за адреcою pr@teletrade.global.
переклади