- Аналітика
- Новини та інструменти
- Новини ринків
Новини ринків
Federal Reserve (Fed) Board of Governors member Adriana Kugler is cautiously optimistic that progress on disinflation will continue with the Fed avoiding any significant deterioration in the domestic labor market. The Fed's Kugler delivered prepared remarks while speaking at the Stanford Institute for Economic Policy Research.
Key highlights
- US economy appears to have dodged a wage price spiral.
- Fed actions have helped to bring down inflationary pressures, and helped to anchor inflation expectations.
- Fed's Kugler remains cautiously optimistic inflation will fall without job market damage.
- Signs that firms are adjusting prices slower helps to bolster disinflation confidence.
- Inflation pressures have cooled significantly.
- Fed has faced less of a tradeoff between inflation and jobs.
- Workers and employers are better at finding each other currently.
- Goods and labor shortages have both declined.
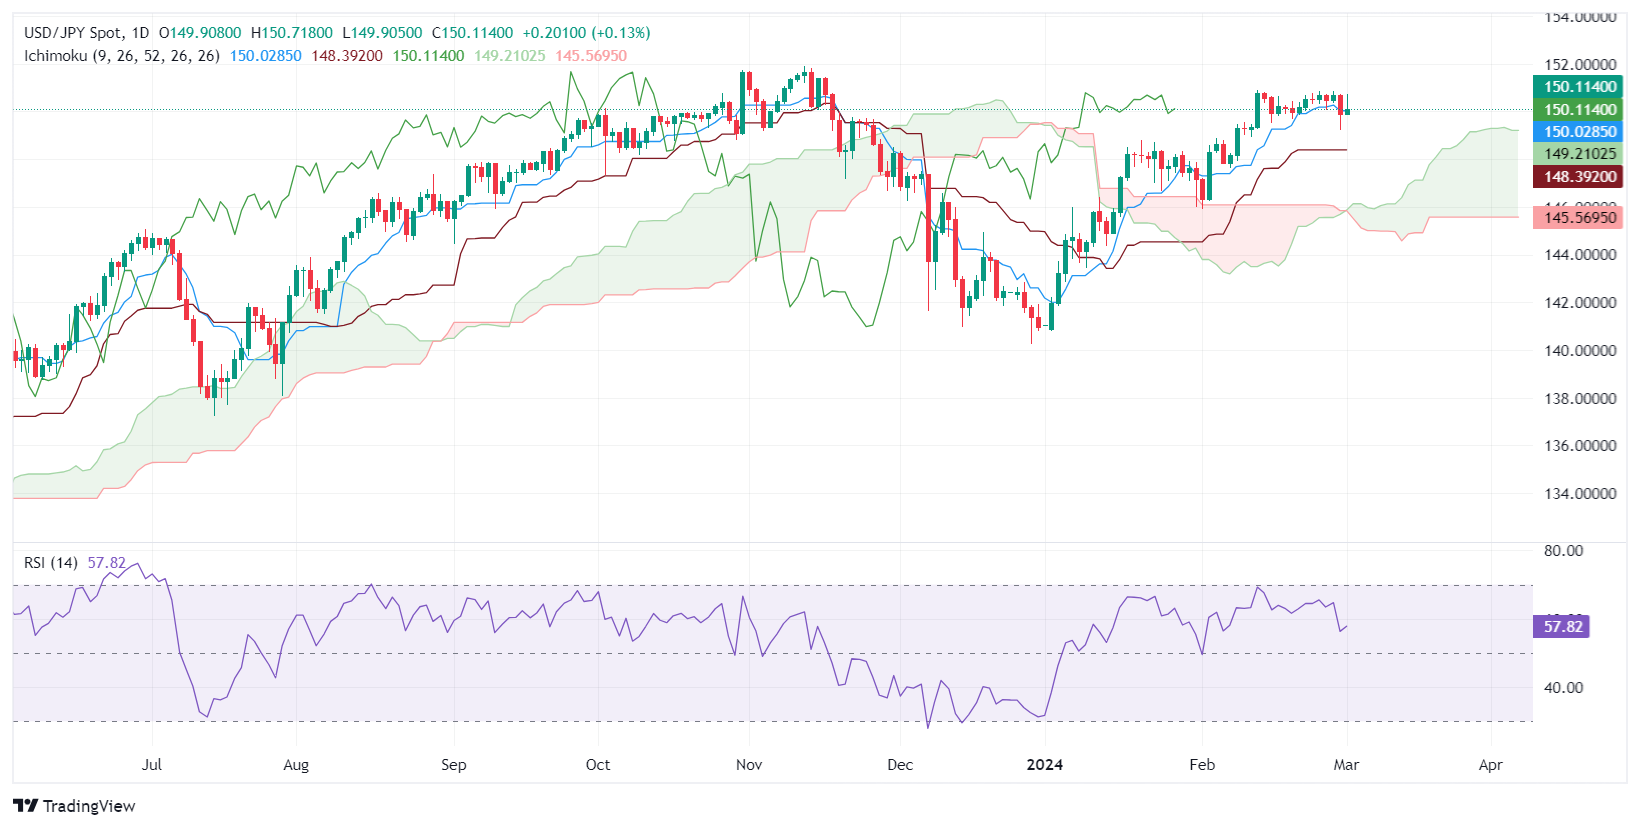
- USD/JPY bounces back to 150.12, recovering after BoJ Governor's dovish comments trigger USD rally.
- Technical analysis suggests potential for further gains, with eyes on surpassing February highs.
- Key support and resistance levels outlined, with a close eye on 150.00 as a pivotal point for direction.
The USD/JPY stages a recovery after diving to a two-week low of 149.21, climbing above the 150.00 figure on Friday amidst dovish comments by the Bank of Japan (BoJ) Governor Kazuo Ueda during the Asian session. That favored the Greenback, which paired Thursday’s losses, and currently stands at 150.12, up by a modest 0.10%.
USD/JPY Price Analysis: Technical outlook
From a technical perspective, the USD/JPY resumed its uptrend, clearing the Tenkan-sen at 150.02, with buyers eyeing further gains past that level. The next cycle high would be the February 28 high at 150.85, before reaching 151.00. Upside risks emerge once surpassed, with the next supply zone seen at last year’s high of 151.91.
Conversely, if sellers achieve a daily close below 150.00, the next support emerges at the confluence of the February 29 low and Senkou span A at 149.21 before challenging 149.00. The Kijun-sen lies beneath that area, at 148.39.
USD/JPY Price Action – Daily Chart
- Gold price catapults to $2,088.33, marking a significant rally in response to US economic reports and bond yield dynamics.
- Mixed manufacturing PMI reports fuel Gold's ascent with ISM data indicating contraction in US manufacturing sector.
- Declining US Treasury yields bolster Gold's attractiveness, pushing XAU/USD to new year-to-date peak.
Gold price soars to a new year-to-date high of $2,088.33 in Friday’s North American session, following the release of mixed economic data, as S&P Global revealed the economy in the United States is expanding. On the other hand, the Institute for Supply Management (ISM) reported that manufacturing activity is contracting, overshadowing the first report. The XAU/USD exchanges hands at $2,084.89, up more than 2.3%.
On Friday, S&P Global revealed that manufacturing conditions improved at the fastest pace since July 2022. The Manufacturing PMI for February was 52.2, up from 50.7. Chris Williamson, Chief Business Economist at S&P Global, said, “Manufacturing is showing encouraging signs of pulling out of the malaise that has dogged the goods-producing sector over much of the past two years.”
Later, the ISM February Manufacturing PMI came to 47.8, down from 49.1. Timothy Fiore, Chair of the Institute for Supply Management, noted, “The U.S. manufacturing sector continued to contract (and at a faster rate compared to January), with demand slowing, output easing and inputs remaining accommodative.”
The data sponsored a leg up in Gold prices after US Treasury bond yields plunged on expectations that rate cuts could arrive sooner than expected.
That said, XAU/USD prices embarked on an aggressive rally, hitting a new YTD high of $2,087.45 as US Treasury bond yields tumbled. The US 10-year Treasury bond yield dropped five and a half basis points (bps) to 4.197%, while real yields measured by 10-year Treasury Inflation-Protected Securities (TIPS) yield, falling from 1.934% to 1.878%. All of this weighed on the US Dollar (USD).
Daily digest market movers: Gold price surges as US economy gives mixed signals
- Following the data, interest rate probabilities measured by the CME FedWatch Tool suggest traders are expecting the first cut in June, with odds increasing to 53.2% at the time of writing.
- A slew of Federal Reserve speakers have crossed the wires.
- Atlanta Fed President Raphael Bostic said the Fed will need to hold rates higher for longer.
- Federal Reserve Governor Chris Waller and Dallas Fed President Lorie Logan talked about the Fed’s balance sheet.
- Chicago Fed President Austan Goolsbee said that he’s perplexed by the housing services inflation rate and added he remains uncertain where interest rates would settle. On Thursday he said that policy is restrictive, and the question is, “How long do we want to remain restrictive.”
- Richmond Fed President Thomas Barkin delivered hawkish remarks, saying, "We’ll see if there are rate cuts this year.” Barkin added that if numbers remain inconsistent, they should take that into consideration, emphasizing that he is in no rush to ease policy.
- San Francisco Fed President Mary Daly said the Fed’s policy is in a good place, and the bank is ready to cut rates when the data demands it.
- Atlanta Fed President Raphael Bostic commented that economic data should guide the Fed on when to start rate cuts, which, according to him, could happen in the summer. Bostic acknowledged that inflation is slowing down, but they have to stay “vigilant and attentive.”
- On Wednesday, New York Federal Reserve President John Williams said the rate-cut decision will depend on incoming data and stated the central bank has come a long way to bring down inflation to the 2% target, but there is more work to do.
- Boston Fed Bank President Susan Collins sees the Fed’s path to 2% as bumpy due to tight labor market conditions and higher inflation readings in January. Collins expects that the Fed will start reducing interest rates later this year.
- On Tuesday, Federal Reserve Governor Michelle Bowman said she’s in no rush to cut rates, given upside risks to inflation that could stall progress or cause a resurgence in price pressure. She added that inflation would decline “slowly,” and she will remain “cautious in my approach to considering future changes in the stance of policy.”
- Previous data releases in the week:
- The US Bureau of Economic Analysis revealed the Core PCE report, with annual figures decelerating from December’s 2.9% to 2.8% YoY in January. Headline inflation edged lower from 2.6% to 2.4% YoY in January, aligned with the consensus.
- Initial Jobless Claims in the US for the week ending February 24 of 215K, exceeded estimates of 210K and the previous reading of 202K.
- Housing data from the US was revealed by the National Association of Realtors, Pending Home Sales dropped from 5.7% MoM in January to -4.9%.
- Chicago PMI in February came at 44.0, below the consensus of 48.0 and the previous reading of 46.
- The Gross Domestic Product (GDP) for the final quarter of 2023 was reported at 3.2% YoY, slightly below the preliminary estimate of 3.3%.
- US Retail Sales Inventories rose 0.3% MoM in January, below 0.4% in the previous month's data, while Wholesale Inventories declined -0.1% MoM, missing estimates of 0.1%.
- US Durable Goods Orders dropped -6.1% MoM, more than the -4.5% contraction expected and the -0.3% dip observed in December.
- The S&P/Case Shiller Home Price Index for December rose 6.1% YoY, outpacing estimates of 6% and November’s 5.4% reading.
- US New Home Sales rose by 1.5% from 0.651M to 0.661M, less than the 0.68M expected.
- The US Dollar Index (DXY), which gauges the Greenback’s value against six major currencies, slumped 0.29%, down at 103.85.
Technical analysis: Gold soars as buyers eye $2,100
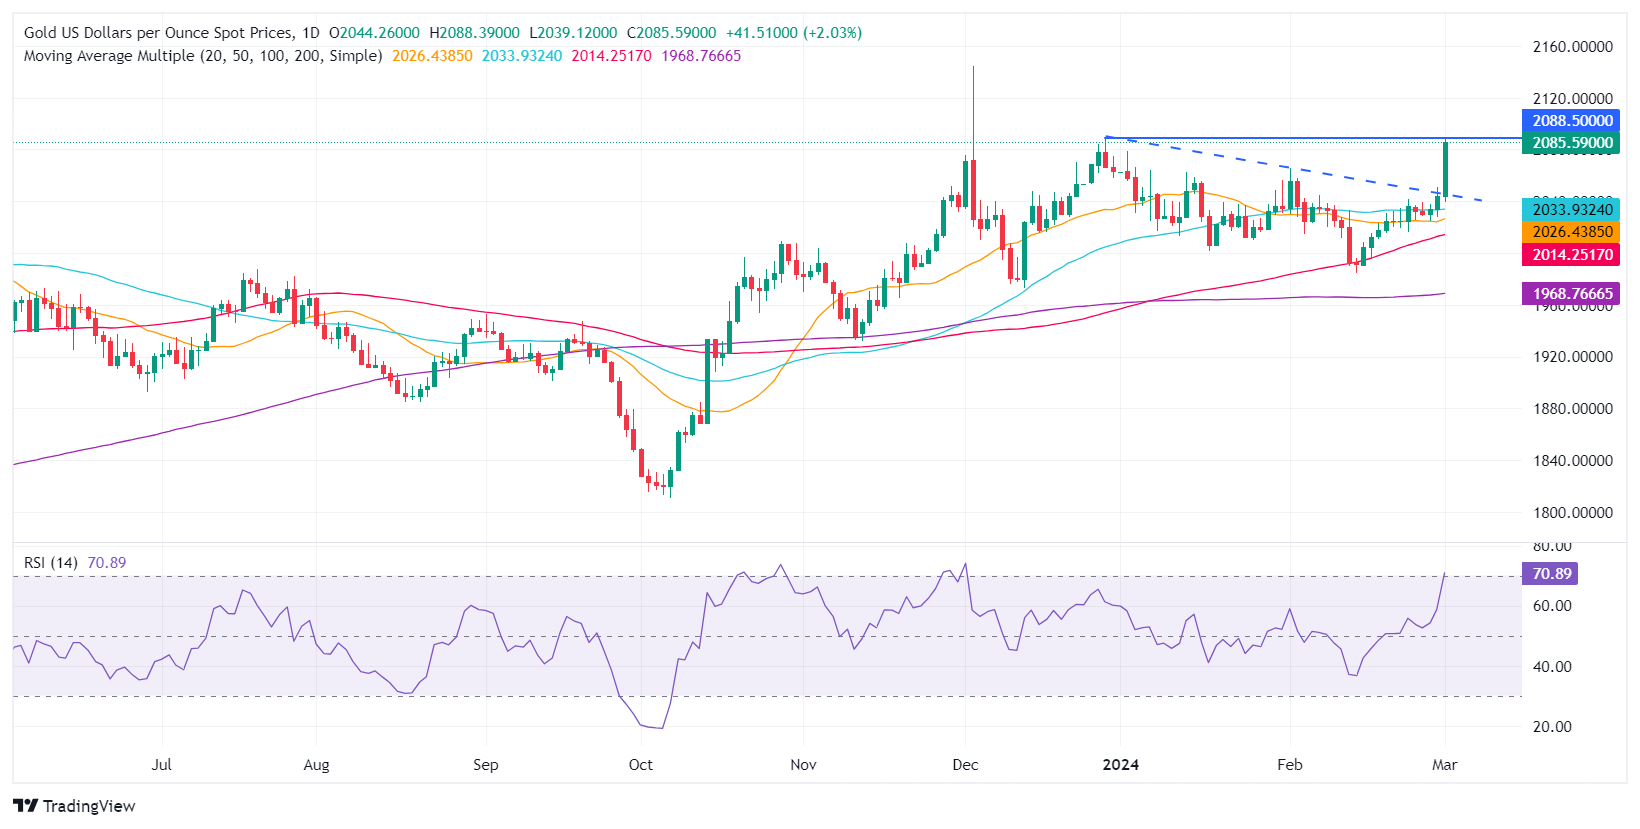
Gold is rallying sharply on its way toward the $2,100.00 figure. It cleared several key resistance levels, like the $2,050 psychological level and the February 1 high at $2,065.60. Nevertheless, it meanders within the $2,065-$2,090 area as buyers take a breather ahead of testing the all-time high of $2,146.79.
On the flip side, XAU/USD’s first support is $2,065.60, followed by the $2,050 mark. Once cleared, Gold’s next floor would be the February 16 swing low of $2,016.15 and the October 27 daily high-turned-support at $2,009.42. Once cleared, that will expose key technical support levels like the 100-day SMA at $2,009.42, followed by the 200-day SMA at $1,968.00.
Gold FAQs
Why do people invest in Gold?
Gold has played a key role in human’s history as it has been widely used as a store of value and medium of exchange. Currently, apart from its shine and usage for jewelry, the precious metal is widely seen as a safe-haven asset, meaning that it is considered a good investment during turbulent times. Gold is also widely seen as a hedge against inflation and against depreciating currencies as it doesn’t rely on any specific issuer or government.
Who buys the most Gold?
Central banks are the biggest Gold holders. In their aim to support their currencies in turbulent times, central banks tend to diversify their reserves and buy Gold to improve the perceived strength of the economy and the currency. High Gold reserves can be a source of trust for a country’s solvency. Central banks added 1,136 tonnes of Gold worth around $70 billion to their reserves in 2022, according to data from the World Gold Council. This is the highest yearly purchase since records began. Central banks from emerging economies such as China, India and Turkey are quickly increasing their Gold reserves.
How is Gold correlated with other assets?
Gold has an inverse correlation with the US Dollar and US Treasuries, which are both major reserve and safe-haven assets. When the Dollar depreciates, Gold tends to rise, enabling investors and central banks to diversify their assets in turbulent times. Gold is also inversely correlated with risk assets. A rally in the stock market tends to weaken Gold price, while sell-offs in riskier markets tend to favor the precious metal.
What does the price of Gold depend on?
The price can move due to a wide range of factors. Geopolitical instability or fears of a deep recession can quickly make Gold price escalate due to its safe-haven status. As a yield-less asset, Gold tends to rise with lower interest rates, while higher cost of money usually weighs down on the yellow metal. Still, most moves depend on how the US Dollar (USD) behaves as the asset is priced in dollars (XAU/USD). A strong Dollar tends to keep the price of Gold controlled, whereas a weaker Dollar is likely to push Gold prices up.
- EUR/USD vaults back into 1.0840 following market pivot.
- Market risk sentiment sees a late-week recovery on Friday.
- US Manufacturing PMI unexpectedly declines, sparking rate cut hopes.
EUR/USD caught a bounce from 1.0800 after markets pivoted into a risk-on stance following Friday’s US ISM Manufacturing Purchasing Managers Index (PMI) declined, flubbing forecasts and stepping deeper into contraction territory. Slipping economic figures are sparking renewed hopes of Federal Reserve (Fed) rate cuts.
Meanwhile, the Fed’s latest Monetary Policy Report shows the central bank is firming up faith in inflation reaching the 2% target. The European Harmonized Index of Consumer Prices (HICP) inflation fell less than expected in February, helping to provide some sentiment support for the Euro (EUR) on Friday.
Daily digest market movers: EUR/USD attempts to re-enter upper bound of range on US PMI miss
- Pan-European Core HICP inflation came in above expectations for the year ended February, printing at 3.1% YoY versus the forecasted decline to 2.9% from 3.3%.
- Headline YoY HICP inflation slipped to 2.6% versus the forecast 2.5%, previously 2.8% .
- February’s US ISM Manufacturing PMI slips to 47.8 versus forecasted increase to 49.5 from previous 49.1.
- The University of Michigan’s Consumer Sentiment survey index for February also slipped to 76.9, down from the steady forecast of 79.6.
- ISM Manufacturing Prices Paid for February also declined to 52.5, versus the forecast uptick to 53.0 from the previous 52.9.
- Next week sees another US Nonfarm Payrolls (NFP) Friday with the ADP Employment Change preview slated for Wednesday.
- The European Central Bank’s (ECB) latest rate call is also coming next week, slated for Thursday.
Euro price today
The table below shows the percentage change of Euro (EUR) against listed major currencies today. Euro was the strongest against the Japanese Yen.
| USD | EUR | GBP | CAD | AUD | JPY | NZD | CHF | |
| USD | -0.33% | -0.24% | -0.11% | -0.49% | 0.02% | -0.31% | -0.05% | |
| EUR | 0.32% | 0.08% | 0.20% | -0.16% | 0.35% | 0.01% | 0.27% | |
| GBP | 0.24% | -0.08% | 0.11% | -0.25% | 0.27% | -0.07% | 0.19% | |
| CAD | 0.11% | -0.19% | -0.11% | -0.36% | 0.17% | -0.18% | 0.08% | |
| AUD | 0.48% | 0.16% | 0.24% | 0.35% | 0.51% | 0.17% | 0.43% | |
| JPY | -0.03% | -0.35% | -0.27% | -0.15% | -0.51% | -0.34% | -0.07% | |
| NZD | 0.30% | -0.02% | 0.06% | 0.19% | -0.18% | 0.33% | 0.26% | |
| CHF | 0.05% | -0.28% | -0.19% | -0.08% | -0.44% | 0.08% | -0.26% |
The heat map shows percentage changes of major currencies against each other. The base currency is picked from the left column, while the quote currency is picked from the top row. For example, if you pick the Euro from the left column and move along the horizontal line to the Japanese Yen, the percentage change displayed in the box will represent EUR (base)/JPY (quote).
Technical analysis: EUR/USD remains rangebound, finds bullish pickup on Friday
EUR/USD recovered from familiar near-term lows at the 1.0800 handle, rising into 1.0840, and is set to wrap up the trading week close to where it started. Little directional momentum kept the pair in a sideway range for the entire trading week, marked in between 1.0860 and 1.0800.
EUR/USD remains mired in the 200-day Simple Moving Average (SMA) at 1.0830. The pair remains up around 1.3% from the last swing low into 1.0695 in early February.
EUR/USD hourly chart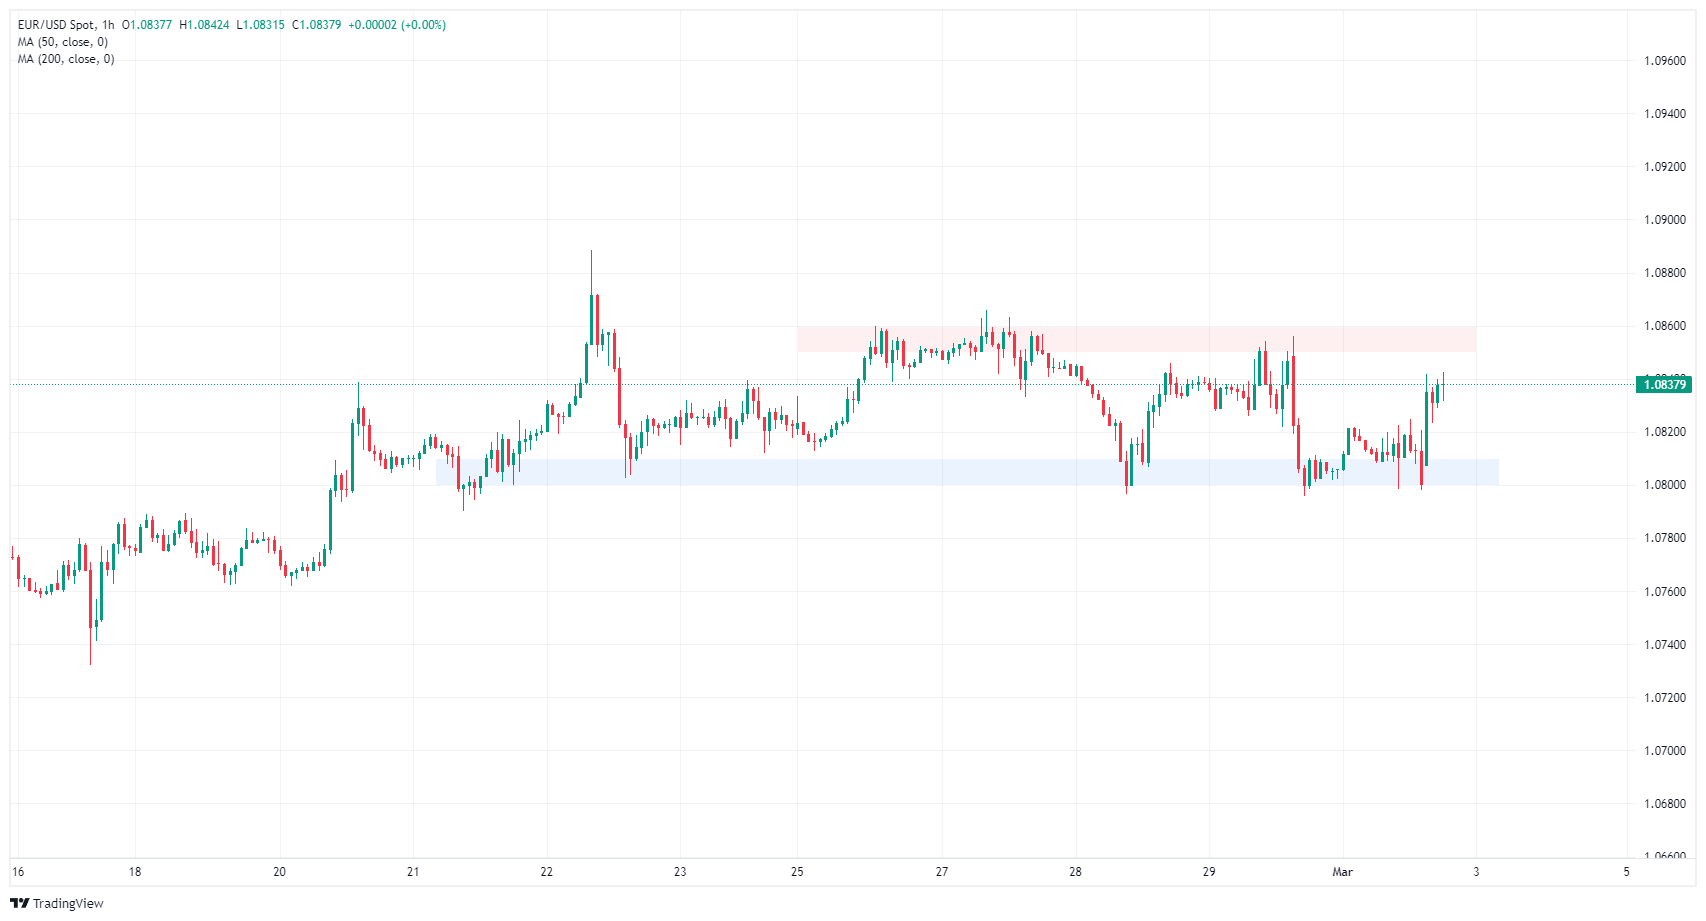
EUR/USD daily chart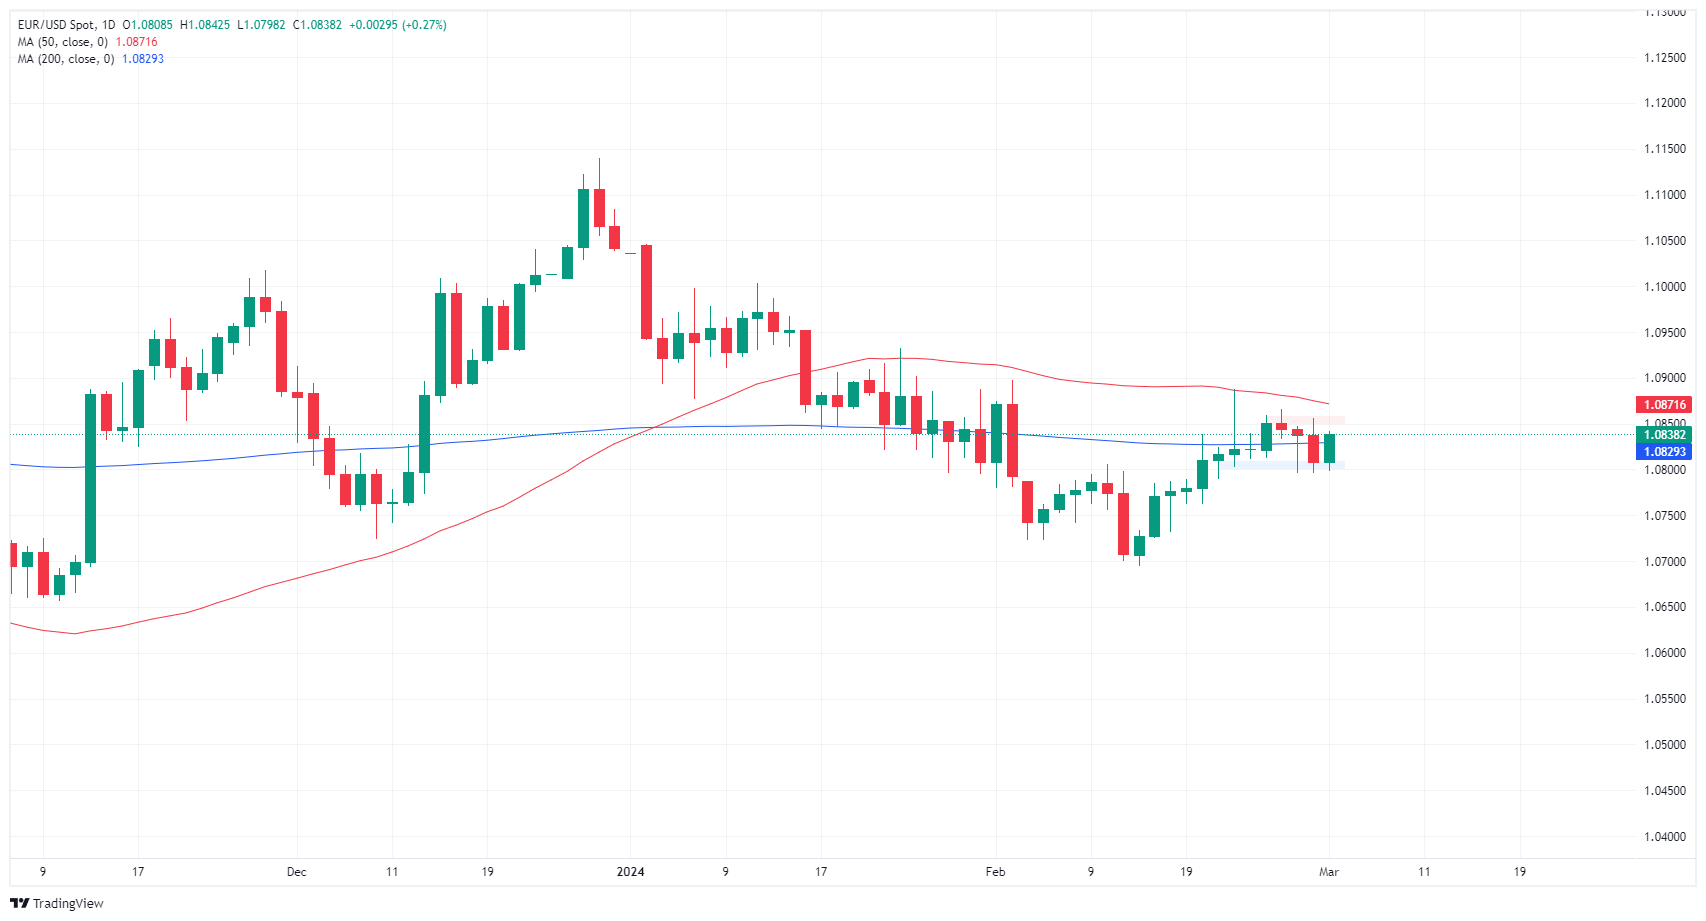
Euro FAQs
What is the Euro?
The Euro is the currency for the 20 European Union countries that belong to the Eurozone. It is the second most heavily traded currency in the world behind the US Dollar. In 2022, it accounted for 31% of all foreign exchange transactions, with an average daily turnover of over $2.2 trillion a day.
EUR/USD is the most heavily traded currency pair in the world, accounting for an estimated 30% off all transactions, followed by EUR/JPY (4%), EUR/GBP (3%) and EUR/AUD (2%).
What is the ECB and how does it impact the Euro?
The European Central Bank (ECB) in Frankfurt, Germany, is the reserve bank for the Eurozone. The ECB sets interest rates and manages monetary policy.
The ECB’s primary mandate is to maintain price stability, which means either controlling inflation or stimulating growth. Its primary tool is the raising or lowering of interest rates. Relatively high interest rates – or the expectation of higher rates – will usually benefit the Euro and vice versa.
The ECB Governing Council makes monetary policy decisions at meetings held eight times a year. Decisions are made by heads of the Eurozone national banks and six permanent members, including the President of the ECB, Christine Lagarde.
How does inflation data impact the value of the Euro?
Eurozone inflation data, measured by the Harmonized Index of Consumer Prices (HICP), is an important econometric for the Euro. If inflation rises more than expected, especially if above the ECB’s 2% target, it obliges the ECB to raise interest rates to bring it back under control.
Relatively high interest rates compared to its counterparts will usually benefit the Euro, as it makes the region more attractive as a place for global investors to park their money.
How does economic data influence the value of the Euro?
Data releases gauge the health of the economy and can impact on the Euro. Indicators such as GDP, Manufacturing and Services PMIs, employment, and consumer sentiment surveys can all influence the direction of the single currency.
A strong economy is good for the Euro. Not only does it attract more foreign investment but it may encourage the ECB to put up interest rates, which will directly strengthen the Euro. Otherwise, if economic data is weak, the Euro is likely to fall.
Economic data for the four largest economies in the euro area (Germany, France, Italy and Spain) are especially significant, as they account for 75% of the Eurozone’s economy.
How does the Trade Balance impact the Euro?
Another significant data release for the Euro is the Trade Balance. This indicator measures the difference between what a country earns from its exports and what it spends on imports over a given period.
If a country produces highly sought after exports then its currency will gain in value purely from the extra demand created from foreign buyers seeking to purchase these goods. Therefore, a positive net Trade Balance strengthens a currency and vice versa for a negative balance.
The Greenback ended the week on a slight bearish note, as investors continued to price in a potential interest rate cut by the Fed in June, while unexpected weakness in key fundamentals also put the currency under pressure, allowing instead some breathing room in the risk-associated universe.
Data-driven selling pressure dragged the USD Index (DXY) back to the 103.80 region on Friday, prompting the index to end its second consecutive week in negative territory. Next week, the focus of attention will be on Non-farm Payrolls and the Unemployment Rate on March 8. Before those events, the final S&P Global Services PMI, the ISM Services PMI, and Factory Orders are due on March 5. Moving forward, the ADP report, Wholesale Inventories, and Fed Beige Book are expected on March 6, seconded by the usual Initial Jobless Claims and Balance of Trade figures on March 7.
On the domestic calendar, the final HCOB Services PMI is due in Germany and the euro area on March 5. On March 6, Germany’s Trade Balance will be on tap, followed by the ECB meeting and press conference by President Lagarde on March 7. Furthermore, another revision of the EMU Q4 GDP Growth Rate is expected at the end of the week. EUR/USD regained composure in the latter part of the week and looked to consolidate the breakout of the 1.0800 hurdle.
In the UK, the BRC Retail Sales Monitor and the final S&P Global Services PMI are scheduled for March 5. Next on tap will be the S&P Global Construction PMI and the release of the Spring Budget 2024 on March 6. GBP/USD rebounded markedly and reclaimed the area around 1.2650 at the end of the week on the back of renewed weakness in the Greenback.
USD/JPY traded in an erratic performance and closed its first week with losses following four advances in a row. Data-wise, in Japan, Q4 Capital Spending is due on March 4, ahead of weekly Foreign Bond Investment figures on March 7. The busy session on March 8 will see Household Spending, Bank Lending, the flash Coincident Index, the Leading Economic Index, and the Eco Watchers Survey.
In Oz, Building Permits and the final Judo Bank Services PMI are due on March 4, prior to the Ai Group Industry Index. On March 6, the Q4 GDP Growth Rate takes centre stage ahead of the Balance of Trade results, Home Loans, and Investment Lending for Homes, all due on March 7. It was a negative week for AUD/USD despite the bounce in the latter part of the week, ending a three-week positive streak.
In Canada, the Ivey PMI and the interest rate decision by the Bank of Canada (BoC) are due on March 6. In addition, Balance of Trade prints and Building Permits are expected on March 7, seconded by the labour market report on March 8. The USD/CAD closed its third consecutive week of gains, although the upside still appears limited by the 1.3600 barrier.
In China, the Caixin Services PMI comes on March 5 seconded by the Balance of Trade readings on March 7. Finally, the Inflation Rate and Producer Prices are expected on March 9. USD/CNH extended its range-bound theme above the 7.2000 region.
Anticipating Economic Perspectives: Voices on the Horizon
- BoJ’s K. Ueda speaks on March 5 along with Fed’s M. Barr.
- Fed’s J. Powell testifies and M. Daly speaks on March 6.
- Fed’s J. Powell testifies on March 7.
- On February 29 will speak, Fed's R. Bostic, A. Goolsbee and L. Mester.
- Fed's J. Williams is also due on March 8.
Central Banks: Upcoming Meetings to Shape Monetary Policies
- The Malaysian central bank (BNM) meets on March 7 and is expected to leave its policy rate unchanged at 3.00%.
- No surprises are expected at the ECB event on March 7.
- Mexican Peso strengthens with USD/MXN targeting 17.00 level following divergent US manufacturing reports.
- Mexico's Business Confidence slightly falls, yet solid US business activity could impact Banxico's easing timeline.
- Analysts predict inflation pressure and economic slowdown in Mexico amidst election campaign developments.
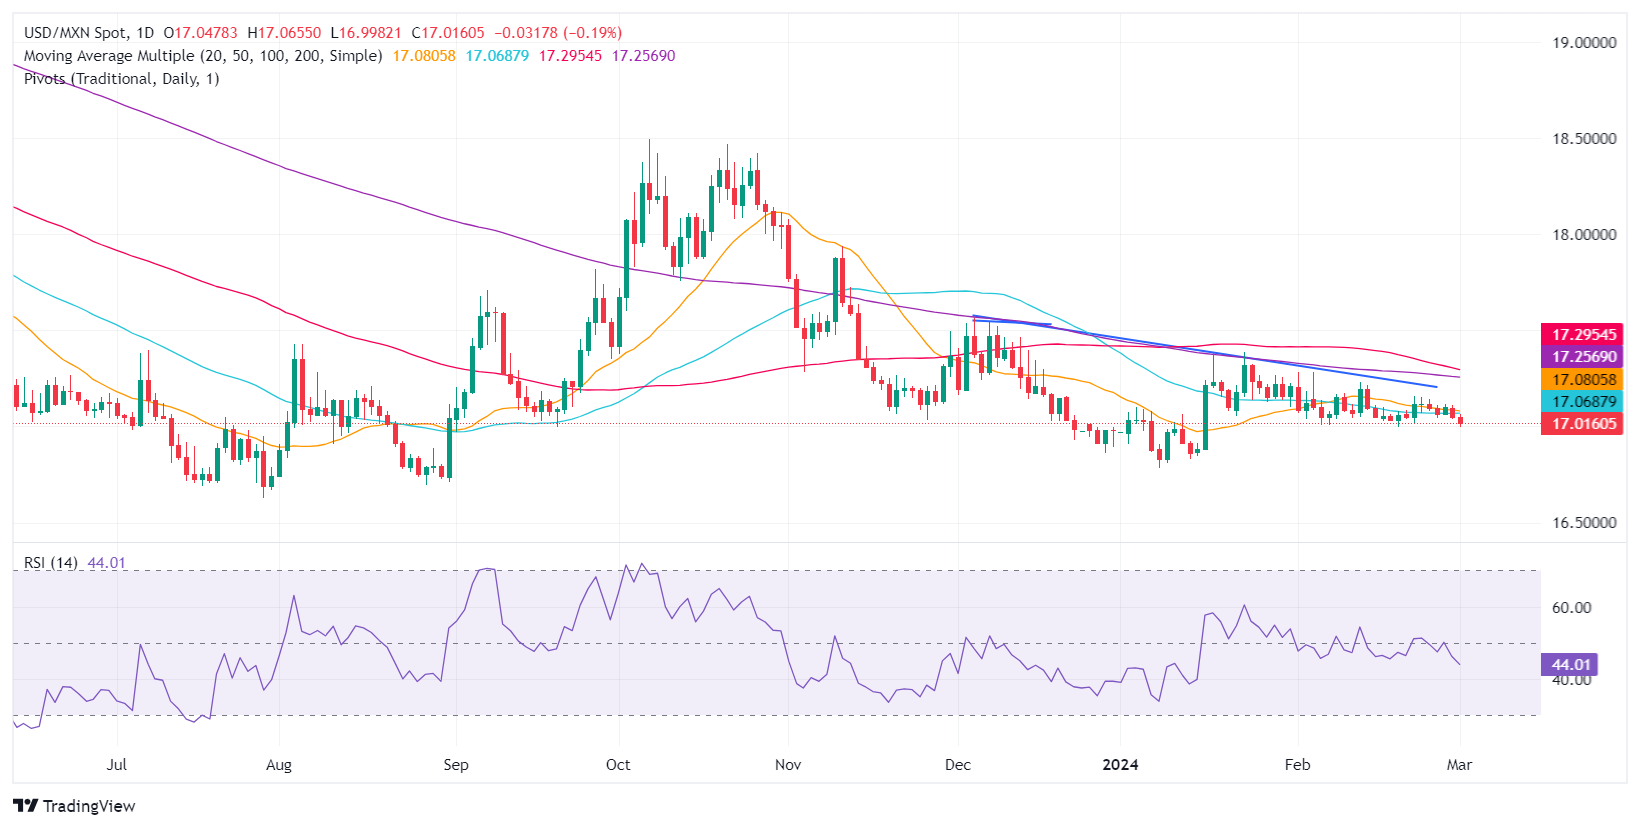
Mexican Peso begins Friday’s session with solid gains against the US Dollar after economic data from the United States (US) was mixed. Business activity in the manufacturing sector was reported positively by S&P Global, while the Institute for Supply Management (ISM) suggests the economy is contracting. The USD/MXN is falling 0.24%, trading at 17.01, with sellers eyeing the 17.00 figure.
Mexico’s economic docket revealed that Business Confidence in February dipped a tenth lower than in January, though market participants ignored it. S&P Global revealed that business activity remains solid, which could deter Bank of Mexico (Banxico) officials from easing policy as soon as the March meeting.
Banxico’s poll shows that private sector analysts expect headline and core inflation will remain above the Central Bank’s target. They estimate a slowdown in the economy and foresee 175 basis points of monetary policy easing toward the end of 2024.
Meanwhile, Mexico’s General Elections campaign started on March 1. Polls suggest the ruling party’s nominee, Claudia Sheinbaum, maintains her lead over Xochitl Galvez. Parametria’s poll sees Sheinbaum's support at 49%, while Galvez, the candidate of the opposition, stands at 29%.
Aside from this, the US docket reveals a deceleration in business activity after a slew of Federal Reserve speakers crossed the wires.
Daily digest market movers: Mexican Peso boosted by broad US Dollar weakness
- Mexico’s Business Confidence in February was 54.3, down from 54.4, the National Statistics Agency (INEGI) revealed.
- Mexico’s S&P Global February Manufacturing PMI rises to 52.3 from 50.0 in January.
- Banxico’s February private analysts poll projections for 2024:
- General inflation is foreseen at 4.10%, while underlying is expected at 4.06%.
- The economy is expected to grow 2.40%, unchanged from January.
- The USD/MXN exchange rate would end the year at 18.31, down from 18.50.
- Interest rates are expected to be lowered from 11.25% to 9.50%.
- During Banxico’s quarterly report, policymakers acknowledged the progress on inflation and urged caution against premature interest rate cuts. Governor Victoria Rodriguez Ceja said adjustments would be gradual, while Deputy Governors Galia Borja and Jonathan Heath called for prudence. The latter specifically warned against the risks of an early rate cut.
- Banxico updated its economic growth projections for 2024 from 3.0% to 2.8% YoY and maintained 1.5% for 2025.
- Mexico’s economy is expected to slow down due to higher interest rates set by Banxico at 11.25%. That’s the main reason that sparked a shift in three of the five governors of the Mexican Central Bank, who are eyeing the first rate cut at the March 21 meeting.
- The latest inflation report in Mexico showed that headline and underlying inflation continued to dip toward Banxico’s goal of 3%, plus or minus 1%, while economic growth exceeded estimates but finished below Q3’s 3.3%.
- Mexico’s economic data released during the week thus far:
- The Unemployment Rate rose from 2.6% to 2.9% YoY in January, exceeding estimates of 2.8%.
- The Balance of Trade for January revealed the country posted a trade deficit of $302 million.
- Mexico’s Consumer Price Index (CPI) in the first half of February was 4.45%, down from 4.9% YoY.
- Mexico’s Core CPI slowed from 4.78% to 4.63% on an annual basis.
- Mexico’s GDP for Q4 2023 exceeded estimates of 2.4% YoY and hit 2.5%, less than Q3 2023 print of 3.3%.
- Economic trade issues between Mexico and the US could depreciate the Mexican currency if the Mexican government fails to resolve its steel and aluminum dispute with the United States. US Trade Representative Katherine Tai warned the US could reimpose tariffs on the commodities.
- S&P Global revealed that manufacturing activity in February in the United States *US( expanded sharply, with the PMI edging up from 50.7 to 52.2. Later, the Institute for Supply Management (ISM) reported that February Manufacturing PMI came at 47.8, below estimates of 49.5 and January’s 49.1.
Technical analysis: Mexican Peso climbs as USD/MXN hovers below 50-day SMA
The USD/MXN has edged lower and hovers around the 17.00 figure, threatening to extend its losses below the latter. Momentum favors sellers, as depicted by the Relative Strength Index (RSI) standing in bearish territory. If they reclaim 17.00, the first support would be the year-to-date low of 16.78, followed by the 2023 low of 16.62.
Conversely, if buyers keep the exchange rate above 17.00, that will keep them hopeful for higher prices, though they must reclaim the 50-day Simple Moving Average (SMA) standing at 17.06. A breach of the latter will expose the 17.20 area, followed by the 200-day SMA at 17.25 and the 100-day SMA at 17.30.
USD/MXN Price Action – Daily Chart
Mexican Peso FAQs
What key factors drive the Mexican Peso?
The Mexican Peso (MXN) is the most traded currency among its Latin American peers. Its value is broadly determined by the performance of the Mexican economy, the country’s central bank’s policy, the amount of foreign investment in the country and even the levels of remittances sent by Mexicans who live abroad, particularly in the United States. Geopolitical trends can also move MXN: for example, the process of nearshoring – or the decision by some firms to relocate manufacturing capacity and supply chains closer to their home countries – is also seen as a catalyst for the Mexican currency as the country is considered a key manufacturing hub in the American continent. Another catalyst for MXN is Oil prices as Mexico is a key exporter of the commodity.
How do decisions of the Banxico impact the Mexican Peso?
The main objective of Mexico’s central bank, also known as Banxico, is to maintain inflation at low and stable levels (at or close to its target of 3%, the midpoint in a tolerance band of between 2% and 4%). To this end, the bank sets an appropriate level of interest rates. When inflation is too high, Banxico will attempt to tame it by raising interest rates, making it more expensive for households and businesses to borrow money, thus cooling demand and the overall economy. Higher interest rates are generally positive for the Mexican Peso (MXN) as they lead to higher yields, making the country a more attractive place for investors. On the contrary, lower interest rates tend to weaken MXN.
How does economic data influence the value of the Mexican Peso?
Macroeconomic data releases are key to assess the state of the economy and can have an impact on the Mexican Peso (MXN) valuation. A strong Mexican economy, based on high economic growth, low unemployment and high confidence is good for MXN. Not only does it attract more foreign investment but it may encourage the Bank of Mexico (Banxico) to increase interest rates, particularly if this strength comes together with elevated inflation. However, if economic data is weak, MXN is likely to depreciate.
How does broader risk sentiment impact the Mexican Peso?
As an emerging-market currency, the Mexican Peso (MXN) tends to strive during risk-on periods, or when investors perceive that broader market risks are low and thus are eager to engage with investments that carry a higher risk. Conversely, MXN tends to weaken at times of market turbulence or economic uncertainty as investors tend to sell higher-risk assets and flee to the more-stable safe havens.
- GBP/USD rallies back into technical midrange near 1.2650.
- Broad-market risk appetite knocks Greenback lower.
- US ISM Manufacturing PMI fell back in February, price pressures easing.
GBP/USD caught an intraday bump on Friday after a surprise miss in the US ISM Manufacturing Purchasing Managers Index (PMI) sparked renewed risk appetite on the back of fresh hopes for easing inflation to kick off a round of rate cuts from the Federal Reserve (Fed).
ISM Manufacturing PMI: declines to 47.8 in February vs. 49.5 expected
The US ISM Manufacturing PMI for February slid to 47.8 versus the forecast uptick to 49.5 from the previous month's 49.1. Easing PMI sentiment is helping to bolster renewed hopes for rate cuts from the Fed, with rate trim expectations further bolstered by the Fed's latest Monetary Policy Report, wherein the Fed reaffirmed its stance that inflation is back on its way to the top of the 2% target band.
Fed's MPR: Inflation expectations are broadly consistent with 2% goal
This week and next week both see a thin showing in economic figures from the UK to drive the Pound Sterling, but traders will be pivoting to face next week's hefty labor data from the US. Next Tuesday sees the Services component of the ISM PMI figures, followed by the ADP Employment Change preview for February on Wednesday, and next week will close with a bang with the latest US Nonfarm Payrolls (NFP) print.
GBP/USD technical outlook
GBP/USD caught a ride on Monday, bumping back into the 200-hour Simple Moving Average (SMA) near 1.2650 after falling to a near-term low at the 1.2600 handle. Near-term technical momentum has been flat to bearish in the pair, and Thursday's peak just above 1.2680 remains a key technical ceiling for bullish momentum.
GBP/USD struggled to push over 1.2700 this week, getting rejected from the key handle multiple times before falling back to familiar technical levels. Bullish support is still priced in from the 200-day SMA near 1.2576.
GBP/USD hourly chart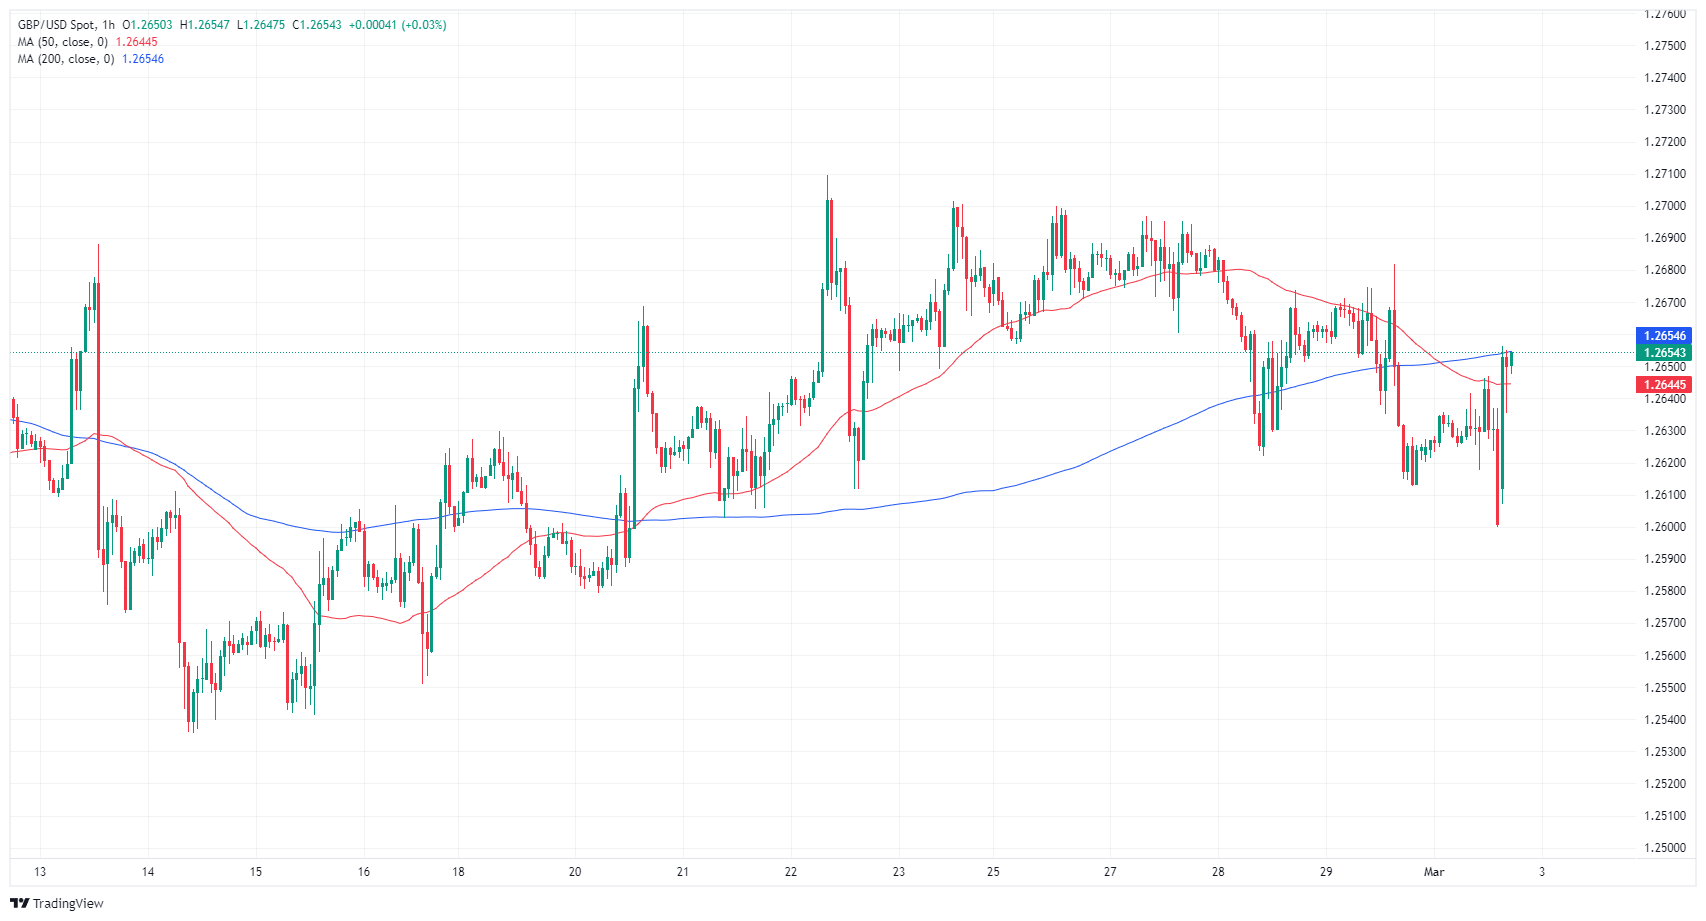
GBP/USD daily chart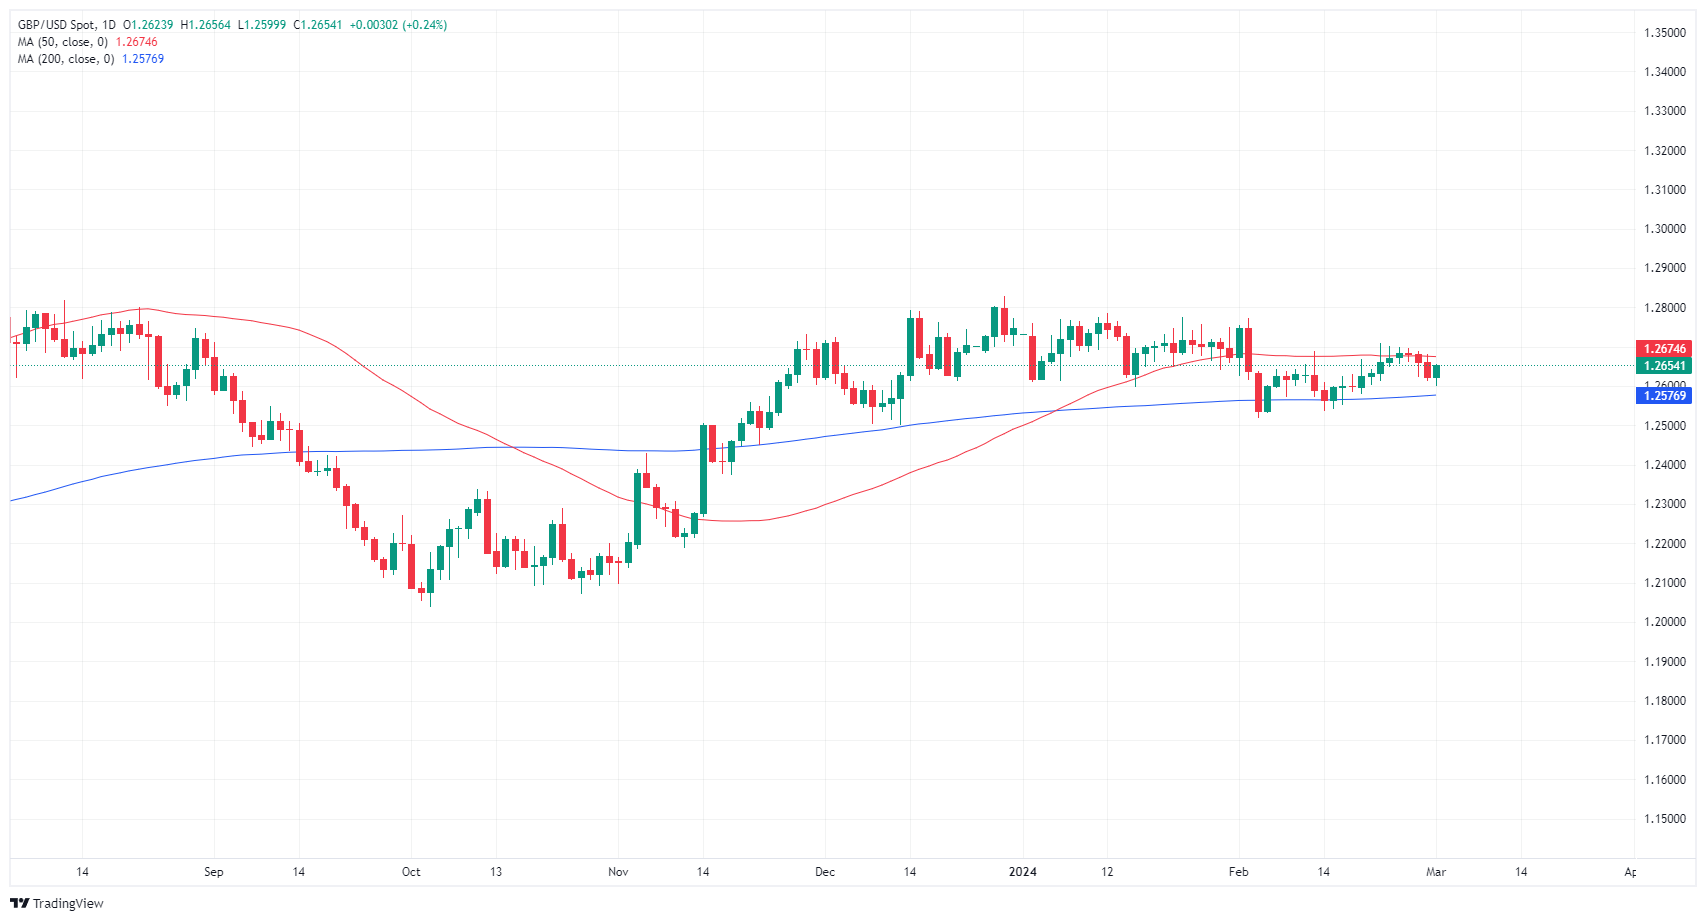
- USD/CAD flubs 1.3600 once again.
- Canada Manufacturing PMI recovers but still in contraction.
- US ISM Manufacturing PMI declined, flaunting forecasts.
USD/CAD fumbled the 1.3600 handle on Friday after a worse-than-expected US ISM Manufacturing Purchasing Managers Index (PMI) for February unexpectedly declined. The US Dollar (USD) was dragged broadly lower, sending the USD/CAD pair back into familiar technical territory near 1.3550.
Canada saw a decline in its S&P Global Manufacturing PMI on Friday, but market attention was focused on the day’s key US data print. Next week brings the latest rate call from the Bank of Canada (BoC) slated for next Wednesday, and next week will wrap up with another US Nonfarm Payrolls (NFP) on Friday alongside Canadian labor figures.
Daily digest market movers: USD/CAD falls back into range after ISM PMI miss
- Canada’s S&P Global Manufacturing PMI for February printed at 49.7 compared to the previous 48.3, an improvement but still in contraction territory below 50.0.
- The US ISM Manufacturing PMI for February fell to 47.8 versus the forecasted uptick to 49.5 from 49.1.
- ISM Manufacturing PMI: declines to 47.8 in February vs. 49.5 expected.
- The University of Michigan Consumer Sentiment survey index also eased to 76.9 in February, down from the forecast of a hold at the previous 79.6.
- ISM Manufacturing Prices Paid also ticked lower to 52.5, down from the 53.0 forecast and the previous month’s 52.9.
- Easing data is sparking investor risk appetite as inflation figures up odds of a Federal Reserve (Fed) rate cut.
- Fed’s Monetary Policy Report: Inflation expectations are broadly consistent with 2% goal
Canadian Dollar price today
The table below shows the percentage change of Canadian Dollar (CAD) against listed major currencies today. Canadian Dollar was the weakest against the Australian Dollar.
| USD | EUR | GBP | CAD | AUD | JPY | NZD | CHF | |
| USD | -0.23% | -0.16% | -0.14% | -0.47% | 0.07% | -0.31% | 0.01% | |
| EUR | 0.25% | 0.09% | 0.09% | -0.22% | 0.33% | -0.07% | 0.26% | |
| GBP | 0.16% | -0.08% | -0.01% | -0.31% | 0.24% | -0.14% | 0.17% | |
| CAD | 0.14% | -0.06% | 0.02% | -0.28% | 0.24% | -0.14% | 0.17% | |
| AUD | 0.47% | 0.23% | 0.30% | 0.28% | 0.55% | 0.16% | 0.48% | |
| JPY | -0.08% | -0.31% | -0.23% | -0.24% | -0.54% | -0.37% | -0.06% | |
| NZD | 0.31% | 0.07% | 0.12% | 0.15% | -0.16% | 0.38% | 0.28% | |
| CHF | -0.01% | -0.25% | -0.17% | -0.18% | -0.48% | 0.07% | -0.32% |
The heat map shows percentage changes of major currencies against each other. The base currency is picked from the left column, while the quote currency is picked from the top row. For example, if you pick the Euro from the left column and move along the horizontal line to the Japanese Yen, the percentage change displayed in the box will represent EUR (base)/JPY (quote).
Technical analysis: USD/CAD drifts back into the bottom end of near-term congestion below 1.3600
USD/CAD fell from an intraday high near 1.3600 to retest 1.3550 on Friday as the pair continues to grapple with near-term consolidation. A heavy supply zone at the 1.3600 handle is keeping bullish momentum pinned.
Higher highs are keeping daily candlesticks on the bullish side, but USD/CAD continues to wrestle with the 200-day Simple Moving Average (SMA) at 1.3477. A lack of topside momentum could drag the pair back into consolidation at the long-term moving average if buyers can’t break the 1.3600 level decisively.
USD/CAD hourly chart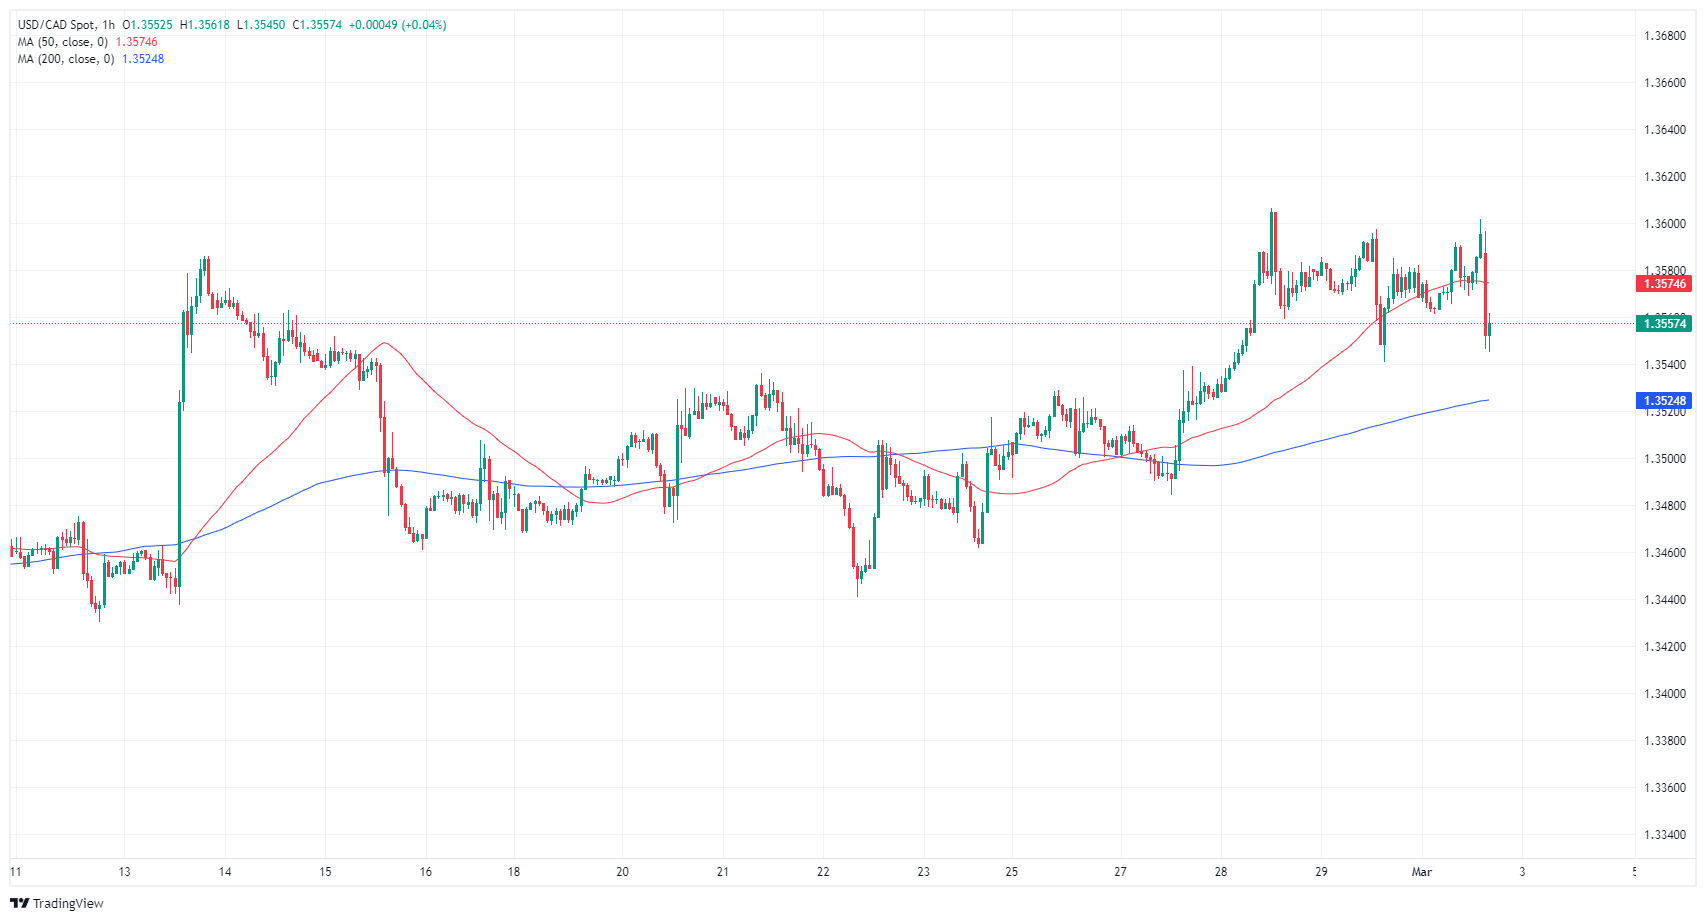
USD/CAD daily chart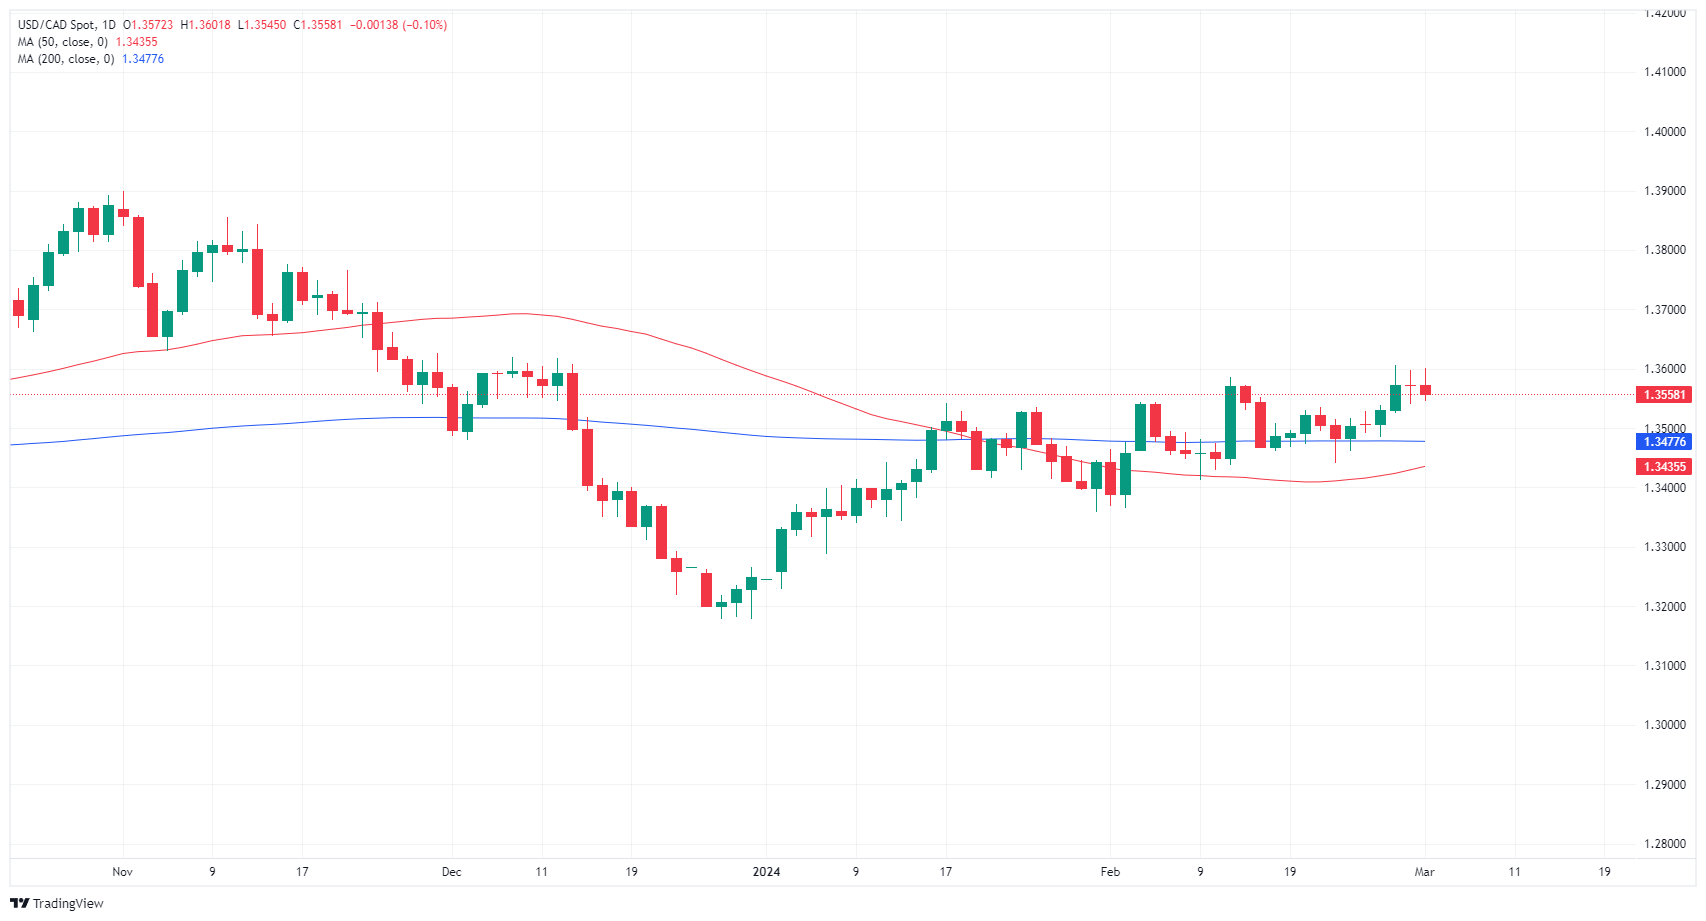
Canadian Dollar FAQs
What key factors drive the Canadian Dollar?
The key factors driving the Canadian Dollar (CAD) are the level of interest rates set by the Bank of Canada (BoC), the price of Oil, Canada’s largest export, the health of its economy, inflation and the Trade Balance, which is the difference between the value of Canada’s exports versus its imports. Other factors include market sentiment – whether investors are taking on more risky assets (risk-on) or seeking safe-havens (risk-off) – with risk-on being CAD-positive. As its largest trading partner, the health of the US economy is also a key factor influencing the Canadian Dollar.
How do the decisions of the Bank of Canada impact the Canadian Dollar?
The Bank of Canada (BoC) has a significant influence on the Canadian Dollar by setting the level of interest rates that banks can lend to one another. This influences the level of interest rates for everyone. The main goal of the BoC is to maintain inflation at 1-3% by adjusting interest rates up or down. Relatively higher interest rates tend to be positive for the CAD. The Bank of Canada can also use quantitative easing and tightening to influence credit conditions, with the former CAD-negative and the latter CAD-positive.
How does the price of Oil impact the Canadian Dollar?
The price of Oil is a key factor impacting the value of the Canadian Dollar. Petroleum is Canada’s biggest export, so Oil price tends to have an immediate impact on the CAD value. Generally, if Oil price rises CAD also goes up, as aggregate demand for the currency increases. The opposite is the case if the price of Oil falls. Higher Oil prices also tend to result in a greater likelihood of a positive Trade Balance, which is also supportive of the CAD.
How does inflation data impact the value of the Canadian Dollar?
While inflation had always traditionally been thought of as a negative factor for a currency since it lowers the value of money, the opposite has actually been the case in modern times with the relaxation of cross-border capital controls. Higher inflation tends to lead central banks to put up interest rates which attracts more capital inflows from global investors seeking a lucrative place to keep their money. This increases demand for the local currency, which in Canada’s case is the Canadian Dollar.
How does economic data influence the value of the Canadian Dollar?
Macroeconomic data releases gauge the health of the economy and can have an impact on the Canadian Dollar. Indicators such as GDP, Manufacturing and Services PMIs, employment, and consumer sentiment surveys can all influence the direction of the CAD. A strong economy is good for the Canadian Dollar. Not only does it attract more foreign investment but it may encourage the Bank of Canada to put up interest rates, leading to a stronger currency. If economic data is weak, however, the CAD is likely to fall.
- XAU/USD climbs back over $2,060.00 on Friday.
- A miss on US ISM PMI numbers are fueling investor appetite.
- Hopes for Fed rate cuts mount with each data print that suggests easing inflation.
Spot Gold caught a bump on Friday after the US ISM Manufacturing Purchasing Manager Index (PMI) came in below expectations, sparking renewed hopes of the Federal Reserve (Fed) delivering rate cuts sooner rather than later.
The US ISM Manufacturing PMI for February unexpectedly slid back on Friday, printing at 47.8 versus the forecast increase to 49.5 against the previous month's 49.1.
Read more: ISM Manufacturing PMI declines to 47.8 in February vs. 49.5 expected
The Fed's latest Monetary Policy Report revealed the Fed is cautiously optimistic that inflation is coming under control, albeit with some notable sticking points in a still-tight labor market and stubborn shelter and rent prices inflation caused by housing supply constraints.
Federal Reserve MPR: Inflation expectations are broadly consistent with 2% goal
Technical outlook
Spot Gold is rallying hard on Friday, crossing $2,060.00 in the early US session and cracked $2,080.00 at the time of writing. Near-term XAU/USD bids caught a technical bounce from the 200-hour Simple Moving Average (SMA) near $2,030.00.
XAU/USD daily candlesticks are set for a break of the $2,100.00 price handle, and the nearest technical ceiling beyond that rests near all-time highs near $2,144.48 set in early December.
XAU/USD hourly chart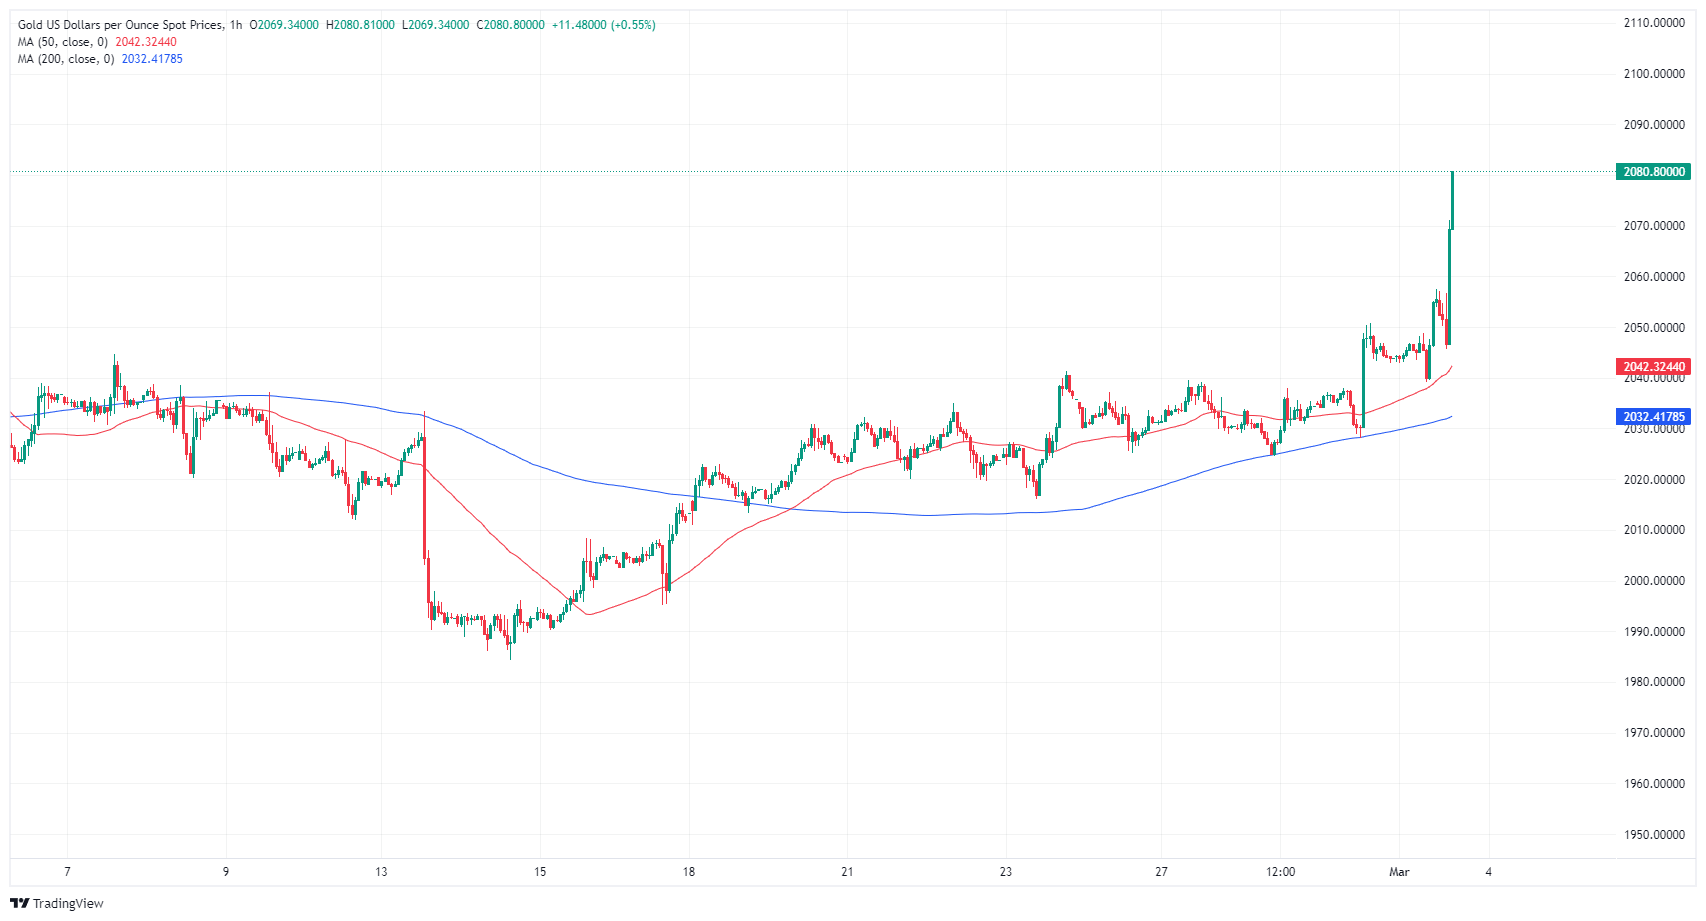
XAU/USD daily chart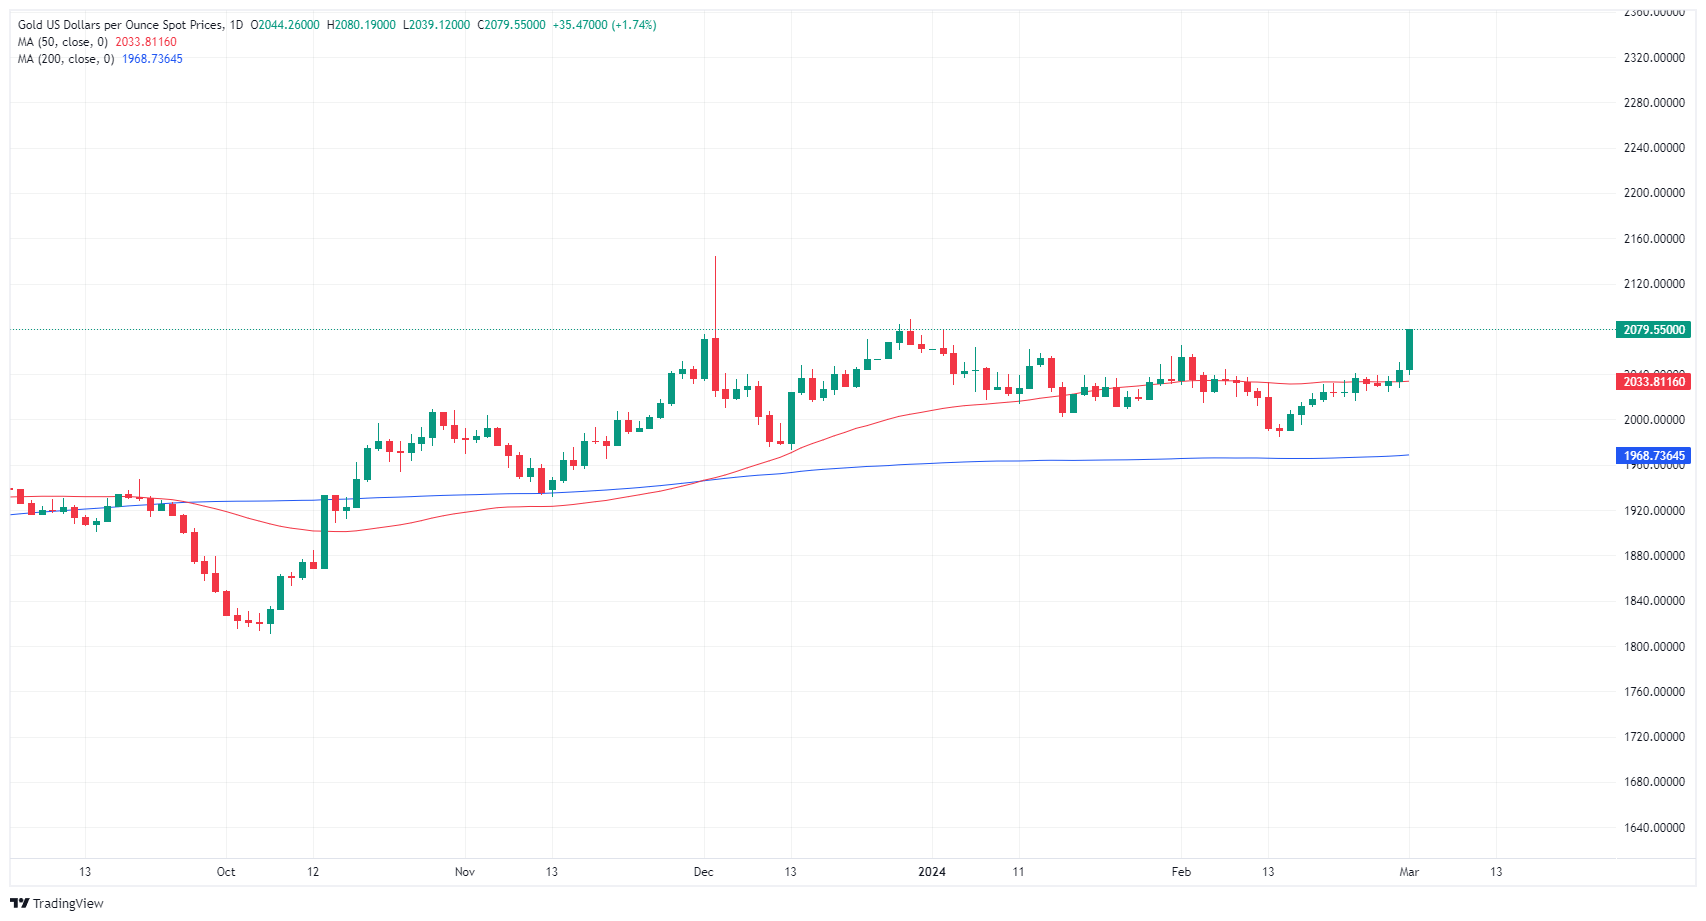
- The DXY Index trades bearishly at 103.7, marking a weak end to the week.
- US ISM Manufacturing PMI came disappointingly lower at 47.8, far off the anticipated 49.5.
- The expectations for the easing cycle to start in June remain intact.
The US Dollar Index (DXY) initiates a new month of trading on Friday with a slightly lower open at the 103.7 level. This fall is primarily driven by a contraction in the US manufacturing sector in February. Despite an overall slump in the manufacturing sector’s performance, Federal Reserve (Fed) officials maintain poker faces and have refused to start cutting rates.
In the meantime, while the US economy is displaying mixed signs, the markets are aligned with the Fed’s forecasts and are now expecting 75 bps of easing in 2024, starting in June.
Daily digest market movers: US Dollar weakens as ISM PMIs display signs of softness in US economic activity
- Data from the Institute for Supply Manufacturing (ISM) reveals weak figures for February. The report revealed that the Manufacturing PMI dropped to 47.8 from 49.1 in January, significantly missing the market expectation of 49.5.
- Manufacturing Prices came in at 52.5 versus the previous 52.9, while the Employment Index declined to 45.9 from 47.1.
- The New Orders Index retreated to 49.2 from 52.5.
- For upcoming Fed meetings, markets have priced in a hold at the next March meeting, and the odds of a cut remain low for May. For the June meeting, those probabilities rise to 50%, according to the CME FedWatch Tool.
Technical analysis: DXY bulls fail to hold the line and retreat below the 100-day SMA
The indicators on the daily chart reflect a mixed outlook for the index. The Relative Strength Index (RSI) is in positive territory but demonstrates a negative slope, which signifies a loss in buying momentum and a potential shift in market sentiment. However, it remains in the positive region, indicating that the buying force, though weakening, is still in place.
Meanwhile, the flat red bars of the Moving Average Convergence Divergence (MACD) paint a picture of a temporary stall in the trend, pointing to an indecisive market.
In terms of the Simple Moving Averages (SMAs), the index trades below the 20 and 100-day SMAs, suggesting that it has been experiencing some short-term selling pressure. Yet, the fact that it remains above the 200-day SMA indicates that the longer-term uptrend is still intact, revealing that bulls are managing to sustain their stance against bearish forces in the grand scheme of things.
US Dollar FAQs
What is the US Dollar?
The US Dollar (USD) is the official currency of the United States of America, and the ‘de facto’ currency of a significant number of other countries where it is found in circulation alongside local notes. It is the most heavily traded currency in the world, accounting for over 88% of all global foreign exchange turnover, or an average of $6.6 trillion in transactions per day, according to data from 2022.
Following the second world war, the USD took over from the British Pound as the world’s reserve currency. For most of its history, the US Dollar was backed by Gold, until the Bretton Woods Agreement in 1971 when the Gold Standard went away.
How do the decisions of the Federal Reserve impact the US Dollar?
The most important single factor impacting on the value of the US Dollar is monetary policy, which is shaped by the Federal Reserve (Fed). The Fed has two mandates: to achieve price stability (control inflation) and foster full employment. Its primary tool to achieve these two goals is by adjusting interest rates.
When prices are rising too quickly and inflation is above the Fed’s 2% target, the Fed will raise rates, which helps the USD value. When inflation falls below 2% or the Unemployment Rate is too high, the Fed may lower interest rates, which weighs on the Greenback.
What is Quantitative Easing and how does it influence the US Dollar?
In extreme situations, the Federal Reserve can also print more Dollars and enact quantitative easing (QE). QE is the process by which the Fed substantially increases the flow of credit in a stuck financial system.
It is a non-standard policy measure used when credit has dried up because banks will not lend to each other (out of the fear of counterparty default). It is a last resort when simply lowering interest rates is unlikely to achieve the necessary result. It was the Fed’s weapon of choice to combat the credit crunch that occurred during the Great Financial Crisis in 2008. It involves the Fed printing more Dollars and using them to buy US government bonds predominantly from financial institutions. QE usually leads to a weaker US Dollar.
What is Quantitative Tightening and how does it influence the US Dollar?
Quantitative tightening (QT) is the reverse process whereby the Federal Reserve stops buying bonds from financial institutions and does not reinvest the principal from the bonds it holds maturing in new purchases. It is usually positive for the US Dollar.
The latest Monetary Policy Report from the Federal Reserve (Fed) highlights the US central bank's stance on the current economic and inflation outlook, and what it will take for Fed policymakers to feel comfortable enough to begin cutting interest rates.
Key highlights
- Inflation expectations are broadly consistent with 2% goal.
- Labor market remains tight, demand has eased, and supply has trended higher.
- 6-month Core PCE rose 2.5% at an annualized rate, short-term inflation measures may exaggerate idiosyncratic temporary factors.
- It remains inappropriate to reduce target range until Fed has greater confidence inflation will move sustainably toward 2%.
- Higher rates, tighter underwriting, zoning and other regulations have constrained housing supply.
- Risks to achieving Fed goals moving into better balance, Fed remains attentive to inflation risks.
- Strong labor market, work from home, and cash payments have supported housing demand, limiting effect of higher rates.
- Rapid adoption of new technologies like AI and robotics could boost productivity growth above current moderate pace.
- Softening in market rents points to a continued deceleration in housing services prices over the next year.
- Ongoing softening of labor demand and improvements in labor supply should contribute to a further slowing in core services price inflation.
Another shutdown is looming in the US. What does all this mean for the Dollar? Economists at Commerzbank analyze Greenback’s outlook.
Yet another shutdown in the US?
This is not the first time that a shutdown is looming. There have also been longer actual shutdowns until an agreement was reached in Congress. In the end, a solution was always found, because neither of the two major parties had any interest in letting it come to the worst case (i.e. a default). Each is flexing its muscles and trying to come up with convincing arguments for its point of view. In the end, there will probably be a solution, even if it's just another transitional financing arrangement that doesn't solve the problem but postpones it into the future.
I therefore see little, if any, influence of this primarily political debate on the US Dollar. So far, the USD has not reacted either. Perhaps the market is also slowly becoming dull after the many impending shutdowns, which is why nobody cares.
Expectations on the March 6 UK Budget may slowly start to feed into the Pound Sterling (GBP) price action. Economists at ING analyze how the Spring Budget could impact the GBP.
GBP would again come under pressure were Chancellor Hunt to misread the mood of gilt investors
Continued investor interest in the carry trade should keep Sterling reasonably well bid. And given our medium-term fair value calculations that GBP/USD is some 7% undervalued and that the Dollar will roll lower later this year, we remain happy with a 12-month target at just over 1.3000.
Were Chancellor Hunt to misread the mood of gilt investors and cause another upset, Sterling would again come under pressure. Short-term models suggest a 2% sell-off in Sterling could happen quite easily were investors to again demand a risk premium of Sterling asset markets.
On the positive side for Sterling, there is some speculation that Chancellor Hunt is looking at improving incentives for global multinationals to list in the UK or for British savers to direct investments towards UK asset markets as well. These measures probably will not quite extend as far as the US Homeland Investment Act – a major support for the Dollar – but should be monitored nonetheless.
Much of the adjustment to US rate expectations may be complete for now. Therefore, further USD gains will be more difficult, economists at HSBC say.
DXY gains will probably rely more on a dovish ECB than a hawkish Fed
The challenge for the USD from here is that a large portion of the market’s rate reappraisal is likely already complete. The market is currently priced for the first Fed cut in June, in line with our economists’ expectations. The Fed’s next policy meeting is on 19-20 March when a status quo on policy rate is widely expected.
US Dollar Index (DXY) gains will probably rely more on a dovish European Central Bank (ECB) than a hawkish Fed; while Japan’s intervention threat will likely cap USD gains vs. the JPY. As such, DXY is likely to track sideways over the next few weeks.
- EUR/USD bounces back from weekly lows, lifted by higher-than-expected Eurozone inflation figures.
- European and US yields rise, supporting the euro amid expectations of ECB and Fed rate moves.
- Comments from ECB's Holzmann and Richmond Fed's Barkin influence market sentiment on monetary policy.
The EUR/USD stages a recovery after falling to weekly lows of 1.0795 and climbs back above the 1.0800 figure, trading at 1.0817, up 0.11%. Inflation data from the Eurozone (EU) spurred a leg-up, as data exceeded estimates, while traders digest the release of Manufacturing PMI data
The major rebounds after EU’s data exceeds forecasts
EU inflation was revealed in the mid-European session, with figures edging lower but exceeding economists' forecasts. The EU Harmonized Index of Consumer Prices (HICP) rose 2.6% YoY above estimates of 2.5%. Core HICP increased 3.1% YoY, above the consensus of 2.9% but lower than January’s 3.3%.
Consequently, yields in Europe and the US rose, thus providing a tailwind for the EUR/USD. Investors continued to project 90 basis points of rate cuts in 2024, expecting the first rate cut in June. Economists at Nordea and Commerzbank estimate the European Central Bank (ECB) would slash rates gradually, based on the thesis that wage increases loom.
Following the data, ECB Robert Holzmann commented they need to remain attentive to risk to inflation, adding they can’t rush decisions on rates.
Across the pond, the Richmond Fed President Thomas Barkin delivered hawkish remarks, saying, "We’ll see if there are rate cuts this year.” Barkin added that if numbers remain inconsistent, they should take that into consideration, emphasizing that he is in no rush to ease policy.
S&P Global revealed that manufacturing activity in February expanded sharply, with the PMI edging up from 50.7 to 52.2. Later, the Institute for Supply Management (ISM) reported that February Manufacturing PMI came at 47.8, below estimates of 49.5 and January’s 49.1.
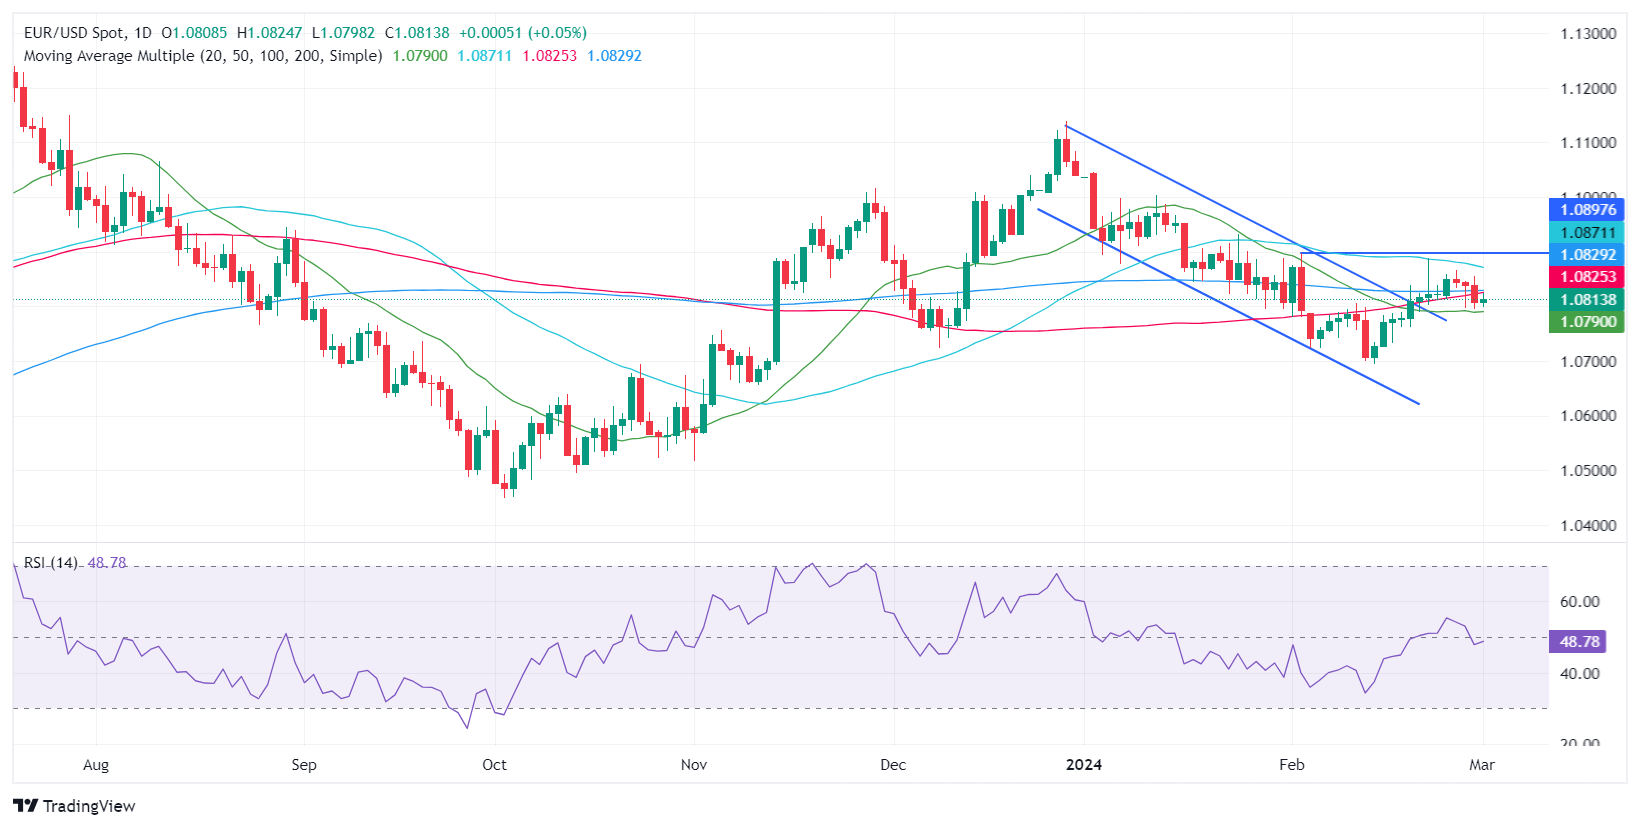
EUR/USD Price Analysis: Technical outlook
During the week, the EUR/USD fell below the 1.0800 figure, but sellers failed to push prices toward the February 20 low of 1.0761, which would have exacerbated a deeper pullback to 1.0700. However, Relative Strength Index (RSI) studies are about to turn bullish, opening the door for further upside. If buyers lift the pair above the 200-day moving average (DMA) of 1.0828, the Euro will remain bid and reach for the 50-DMA at 1.0871.
EUR/USD Price Action – Daily Chart
Gold prices have held above the key $2,000 level since December. Economists at ING analyze the yellow metal’s outlook.
Gold still shines on safe-haven demand
Ongoing geopolitical risk in Ukraine and the Middle East continue to provide support to Gold.
Prices hit an all-time high of $2,077.49 on 27 December 2023. Still, we believe the Federal Reserve's wait-and-see approach will keep the rally in check.
We expect prices to average $2,025 over the first quarter.
See – Gold Price Forecast: XAU/USD to trade higher this year – ING
NZD/USD consolidates after the recent decline post-RBNZ meeting. Economists at OCBC Bank analyze the pair’s outlook.
Some unwinding of Kiwi longs may still be underway
For now, rates are likely to remain at restrictive level for sustained period to meet inflation objective.
Some unwinding of Kiwi longs may still be underway but after the washout, NZD remains attractive, given yield appeal as RBNZ is likely to be one of the last amongst DM central banks to cut rates.
Some degree of policy divergence with the Fed is possible in 2H 2024 and eventual stabilisation in China economy should also be supportive of NZD.
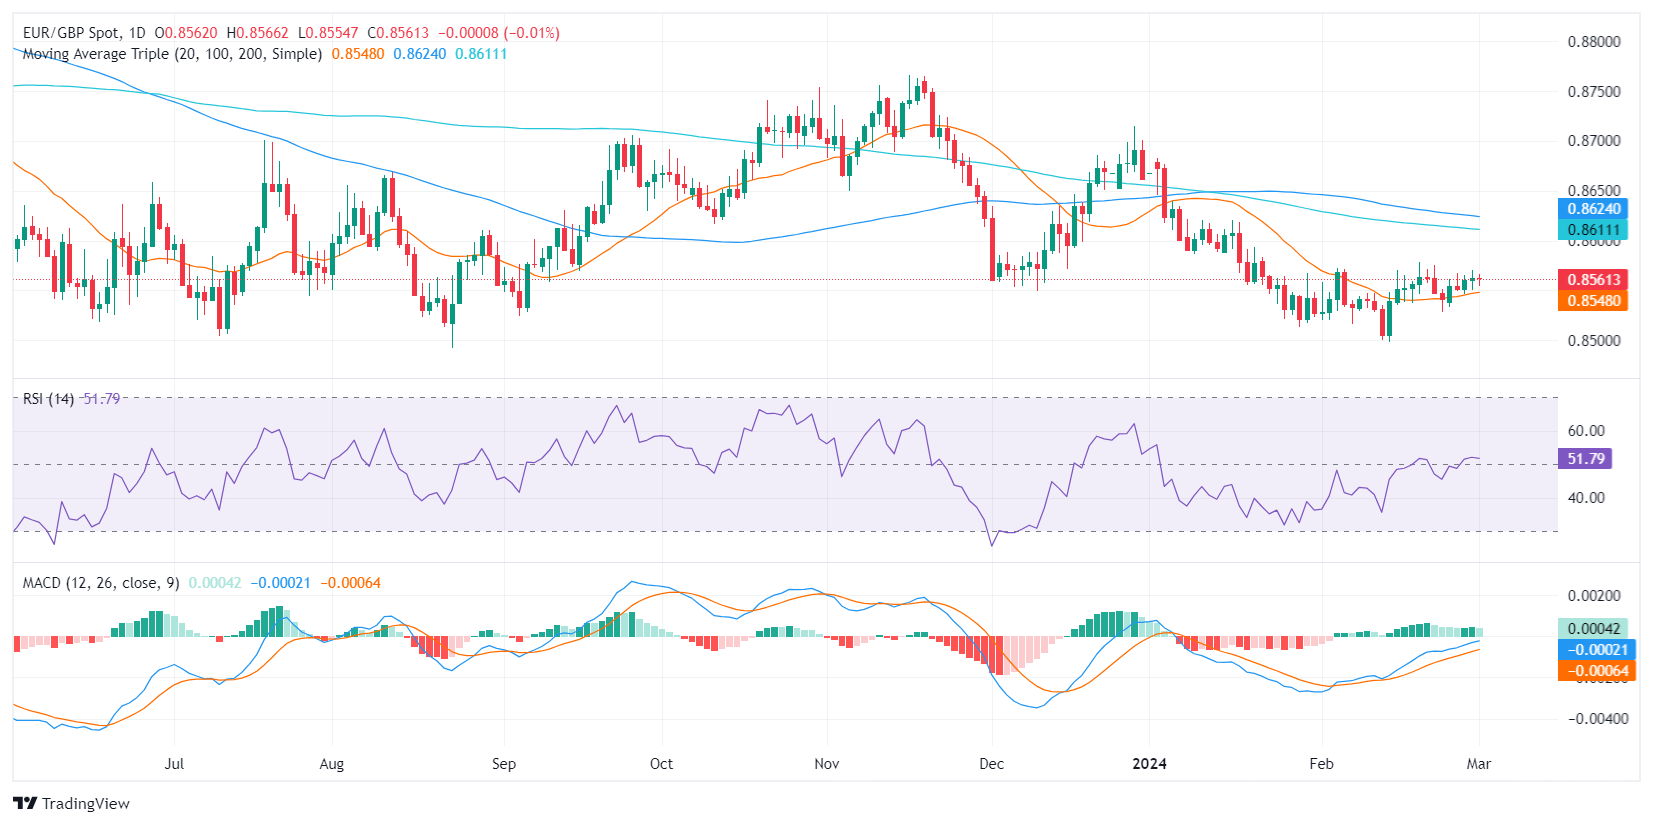
- The EUR/GBP is currently trading at 0.8560, revealing a mild daily gain in Friday's session.
- The HICP from the EU grew at a higher pace than expected in February,
- Focus now turns to the ECB decision next week, with a hold already priced in.
The EUR/GBP currency pair is currently trading at around 0.8560, registering slight gains after the report of the Harmonized Index of Consumer Prices (HICP) from the Eurozone from February which came in higher than expected. Focus now shifts to next week's European Central Bank (ECB).
Inflation data for the Eurozone in February was slightly above expectations, with the headline rate rising 2.6% year-over-year, compared to the anticipated 2.5%, and down from 2.8% in January. The core inflation rate also exceeded forecasts, coming in at 3.1% year-over-year versus the expected 2.9%, down from January's 3.3%. These figures indicate that while inflation is gradually decreasing, the decrease is not occurring linearly.
Regarding expectations on the next ECB meetings, markets seem to be eying June for the beginning of the easing cycle. For next week, a hold is being priced in while the odds of a cut in April remain low, near 25%. On the Bank of England’s hand, markets are delaying the first cut to August, which seems to give the Pound a slight advantage.
EUR/GBP technical analysis
In recent sessions, the Relative Strength Index (RSI) has fluttered around the neutral area, suggesting a balance between buyers and sellers. The slight increase over the several previous days signals a nascent positive momentum for EUR/GBP, nonetheless, the market is yet to choose a definite direction.
The Moving Average Convergence Divergence (MACD) histogram's flat green bars display a pause in the pair's bullish momentum, implying indecision in the market. Low volatility and the market’s hesitation to choose a direction validate this outlook.
However, the pair remaining above the 20-day Simple Moving Averages (SMAs), while being below the 100 and 200-day SMA, asserts that bears have a grip on the larger timeframe but the bulls are in front for the shorter timeframe.
There is a risk that the BoC will turn a notch more dovish at the March meeting. Thus, the Canadian Dollar (CAD) could come under pressure in the next week, economists at ING say.
Mixed data points to BoC’s holding pattern
Policymakers are now looking at a pretty mixed bag when it comes to data. Crucially, the unwinding of rate cut bets in Canada appears much more a consequence of rebounding Fed rate expectations than domestic factors. Ultimately, we think the market is underpricing both Fed and BoC easing cycles, but March may be too early for a big dovish repricing.
We expect next week’s BoC meeting to be of relatively limited relevance for markets. There is a risk that the message turns a bit more dovish (opening more explicitly to rate cuts) and hits CAD, but that should not change the picture dramatically for the Loonie considering how much BoC expectations are tied to Fed pricing.
We expect a stable USD/CAD in March before a USD-led decline in the pair materialises from the second quarter.
Richmond Federal Reserve Bank President Thomas Barkin said on Friday that he expects overall inflation numbers are likely to come down over the next few months, per Reuters.
Key takeaways
"But if monthly numbers come in inconsistent with that, we have to take that into account."
"I am not in a hurry to cut rates."
"I still see wage and inflation pressures."
"Yesterday was a high inflation report."
"We'll see if there are rate cuts this year, all depends on the progress on inflation."
"Interests costs as percent of revenues is a data point I am interested in."
"The economy will tell us what to do on policy."
Market reaction
These comments don't seem to be having a significant impact on the US Dollar's valuation. At the time of press, the US Dollar Index was unchanged on the day at 104.15.
Although the Gold market is likely to pick up in the medium to long term, there is a lack of momentum in the short term, which also means that the price recovery on the Platinum market will be a wait-and-see affair despite the undersupply, strategists at Commerzbank say.
Gold market is likely to pick up in the medium to long term
Next Wednesday, the World Platinum Investment Council (WPIC) will present its annual results for 2023 in its new quarterly report: Back in November, the WPIC had already forecast a record deficit of 1 million ounces for last year, which incidentally did not prevent the platinum price from ending the year down a good 7% despite the year-end rally. The start to this year is hardly any better.
In our view, however, the price has fallen too low. After all, demand is expected to exceed supply again this year, even if the gap will probably be much smaller than last year. As soon as the Gold price starts to rise, we therefore expect Platinum prices to rise.
Sterling remains rangebound against the USD but dips to the 1.2600 area remain well-supported, economists at Scotiabank say.
Cable to strengthen and regain the mid/upper 1.2700s on a break past 1.2680/1.2685
Sterling sits a little below the mid-point of its two-month trading range after dropping back from levels near 1.2700 at the start of the week.
Short-term trend momentum is leaning bearish but there are signs of firm support on dips to the low 1.2600s on the intraday chart.
Spot gains need to extend through short-term resistance at 1.2680/1.2685 in the next day or so to allow the Pound to strengthen and regain the mid/upper 1.2700s.
USD/CAD trades little changed on the session. Economists at Scotiabank analyze the pair’s outlook.
Further strength in commodity prices may give the CAD reason to improve
Further strength in commodity prices may give the CAD reason to improve but, for now, negative spreads and changeable risk appetite seem likely to keep it subdued.
The USD’s early 2024 uptrend remains intact on the chart short-term price action does suggest some resistance developing around the 1.3600 point. High upper shadows on the daily candle chart imply firm selling pressure on USD gains above the figure.
The intraday chart actually shows a clear, bearish rejection of Thursday’s push to the figure zone. Trend momentum remains USD-bullish, however, and spot losses need to extend below 1.3540 to put any sort of technical pressure on the USD from here.
- The US Dollar trades flat ahead of last data points for this week.
- Markets brace for no less than six Fed speakers and the release of the Monetary Policy report.
- The US Dollar Index orbits around 104.00, unable to break away in either way.
The US Dollar (USD) is flat in the European trading session as markets brace for the last economic data releases for the week. Looking back at this week, it becomes clear that markets are still clueless about what to do next. The US Federal Reserve says it remains data dependent, and recent data could build a case for one more rate hike in order to control the second-round effects of inflation. Meanwhile, Fed speakers are pushing back this narrative, and comments this week were all about when and how many interest-rate cuts the Fed will perform.
On the economic front, some last numbers could still trigger a move in the US Dollar. Friday’s calendar features the Manufacturing Purchasing Managers Index (PMI) releases from both S&P Global and the Institute for Supply Management for February, as well as the University of Michigan Consumer Sentiment and Inflation Expectations data. To top it off, six Fed speakers and the release of the Monetary Policy Report will deliver more guidance to the markets.
Daily digest market movers: Divergence taking place
- This Friday is set to kick off near 14:45 GMT, with the final reading of the S&P Global Manufacturing PMI for February. Expectations are for an unchanged reading at 51.5.
- At 15:00 GMT, both the University of Michigan and the Institute for Supply Management (ISM) will release its data:
- For the final February reading from the University of Michigan:
- Consumer Sentiment is expected to remain unchanged at 79.6.
- The Inflation expectations were in the preliminary number at 2.9%. There is no forecast available for the final reading.
- The ISM PMI data release will contain the following elements:
- The headline Manufacturing PMI is seen increasing from 49.1 to 49.5.
- The Manufacturing Employment subcomponent was previously at 47.1. No forecast is available.
- The New Orders Index was at 52.5, with no forecast available.
- The Prices Paid Index is expected to tick up from 52.9 to 53.0.
- For the final February reading from the University of Michigan:
- The Federal Reserve has its own schedule this Friday:
- Fed Board of Governors member Christopher Waller and Dallas Fed President Lorie Logan are set to participate in a panel at 15:15 GMT.
- Raphael Bostic, head of the Atlanta Fed, is due to speak at 17:15 GMT.
- San Francisco Fed President Mary Daly and Federal Reserve Bank of Kansas City President Jeffrey Schmid will participate in a panel discussion at 18:30 GMT.
- Fed Board of Governors member Adriana Kugler will speak at around 20:30 GMT.
- At 16:00 GMT, the Fed will release its Monetary Policy Report which will be sent to Congress before the semi-annual hearings take place next week.
- Equities are in the green across the board from Asia to US futures. During the Asian trading session, Nasdaq futures have already hit an all-time high.
- According to the CME Group’s FedWatch Tool, expectations for a Fed pause in the March 20 meeting are at 97%, while chances of a rate cut stand at 3%.
- The benchmark 10-year US Treasury Note trades around 4.27%, broadly unchanged for the past three days.
US Dollar Index Technical Analysis: 104.00 as magnet
The US Dollar Index (DXY) has not moved much and is set to close the week with a minor gain. The divergence between Fed speakers commenting on Fed rate cuts and recent inflation data opening the possibility of another rate hike is creating a vacuum in which the US Dollar is unable to move. It looks like traders will keep their powder dry until next week, when the US Jobs Report will be released and Fed’s Chairman Jerome Powell will testify in Congress.
To the upside, the 100-day Simple Moving Average (SMA) near 103.97 has been broken for now and should not see a retest anywhere later this Friday. Should the US Dollar be able to cross 104.60, 105.12 is the next key level to keep an eye on. One step beyond there comes 105.88, the high from November 2023. Ultimately, 107.20 – the high of 2023 – could come back into scope.
Looking down, the 200-day Simple Moving Average at 103.74 has been broken twice recently, making it a weak support. The 200-day SMA should not let go that easily though, so a small retreat back to that level could be more than granted. Ultimately, should it lose its force, prices could fall to 103.16, the 55-day SMA, before testing 103.00.
US Dollar FAQs
What is the US Dollar?
The US Dollar (USD) is the official currency of the United States of America, and the ‘de facto’ currency of a significant number of other countries where it is found in circulation alongside local notes. It is the most heavily traded currency in the world, accounting for over 88% of all global foreign exchange turnover, or an average of $6.6 trillion in transactions per day, according to data from 2022.
Following the second world war, the USD took over from the British Pound as the world’s reserve currency. For most of its history, the US Dollar was backed by Gold, until the Bretton Woods Agreement in 1971 when the Gold Standard went away.
How do the decisions of the Federal Reserve impact the US Dollar?
The most important single factor impacting on the value of the US Dollar is monetary policy, which is shaped by the Federal Reserve (Fed). The Fed has two mandates: to achieve price stability (control inflation) and foster full employment. Its primary tool to achieve these two goals is by adjusting interest rates.
When prices are rising too quickly and inflation is above the Fed’s 2% target, the Fed will raise rates, which helps the USD value. When inflation falls below 2% or the Unemployment Rate is too high, the Fed may lower interest rates, which weighs on the Greenback.
What is Quantitative Easing and how does it influence the US Dollar?
In extreme situations, the Federal Reserve can also print more Dollars and enact quantitative easing (QE). QE is the process by which the Fed substantially increases the flow of credit in a stuck financial system.
It is a non-standard policy measure used when credit has dried up because banks will not lend to each other (out of the fear of counterparty default). It is a last resort when simply lowering interest rates is unlikely to achieve the necessary result. It was the Fed’s weapon of choice to combat the credit crunch that occurred during the Great Financial Crisis in 2008. It involves the Fed printing more Dollars and using them to buy US government bonds predominantly from financial institutions. QE usually leads to a weaker US Dollar.
What is Quantitative Tightening and how does it influence the US Dollar?
Quantitative tightening (QT) is the reverse process whereby the Federal Reserve stops buying bonds from financial institutions and does not reinvest the principal from the bonds it holds maturing in new purchases. It is usually positive for the US Dollar.
The US Dollar Index (DXY) is down modestly on the session so far but is heading for a mild gain on the week. Shaun Osborne, Chief FX Strategist at Scotiabank, analyzes Greenback’s outlook.
A few more months of data are needed to persuade the Fed that prices are moving sustainably towards 2%
US core PCE data was in line with market forecasts of a 0.4% MoM gain. With a firmer number largely discounted by markets, the on-consensus outcome was treated more like a dovish surprise. The 3m annualized reading did edge up modestly (2.2%, from 2.1%) but holding close to 2% will likely reassure policymakers that underlying pressures are abating slowly. A few more months of data are needed to persuade the Fed that prices are moving sustainably towards 2%.
The index remains relatively ‘rich’ versus spread-based fair value, according to my estimate at least. That still rather suggests to me that the USD may find it hard to advance significantly, without more support from firmer data and/or higher yields at this point.
EUR/USD dips to the 1.0800 area continue to find support, economists at Scotiabank say.
Intraday resistance is 1.0845/1.0850
Eurozone CPI data reflected slower-than-expected progress on inflation. The data showed a 2.6% YoY gain for headline prices and 3.1% YoY for core, down from 2.8% and 3.3% respectively in January. Prices were expected to drop to 2.5% YoY for headline and 2.9% for core. These data will support those ECB policymakers who advocate waiting until mid-year before assessing rate cuts.
Spot retains a heavy undertone on the daily chart but the EUR continues to meet support on dips and intraday price signals suggest decent support at or near 1.0800 area still.
Intraday resistance is 1.0845/1.0850 and (stronger) at 1.0890.
- AUD/USD recovers vertically from 0.6490 as the US Dollar turns subdued.
- The market participants hope that the Fed will announce a rate cut in June.
- Upbeat Caixin Manufacturing PMI improves the appeal of the Australian Dollar.
The AUD/USD pair delivers a V-shape recovery from 0.6490 as investors hope the Federal Reserve (Fed) will start reducing interest rates from the June policy meeting. The Aussie asset recovers sharply as the US Dollar comes under pressure.
There is a mixed action in the global market as S&P 500 futures are down in the European session while risk-perceived currencies are performing better against the US Dollar. The US Dollar Index, which measures the US Dollar’s value against six rival currencies, falls slightly to 104.00.
Market expectations for rate cuts by the Fed in the June meeting remain firm as the annual core inflation data grew at the slowest pace of 2.8% in their years. However, the Federal Reserve (Fed) is still not ready to unwind the restrictive policy stance sooner as they need more confidence that inflation will return to the 2% target.
Fed policymakers want to analyze more data to confirm whether January’s high inflation data was a one-time blip or price pressures are flaring up again.
Going forward, market participants will look to the United States Manufacturing PMI data for February, which will be published at 15:00 GMT.
Meanwhile, the Australian Dollar performs stronger on February's upbeat Caixin Manufacturing PMI. Surprisingly, the economic data rose to 50.9 from expectations of 50.6 and the prior reading of 50.8. The Australian economy is China's leading trading partner, and an improvement in the latter's economic prospects eventually strengthens the Australian Dollar's appeal.
Gold has been trading in a narrow range so far this year. Economists at ING analyze the yellow metal’s outlook.
Downside risks revolve around US monetary policy and Dollar strength
We expect Gold prices to trade higher this year as safe-haven demand continues to be supportive amid geopolitical uncertainty with ongoing wars and the upcoming US election.
We forecast prices to average $2,150 in the fourth quarter and $2,081 in 2024 on the assumption that the Fed starts cutting rates in the second quarter of the year and the Dollar weakens.
Downside risks revolve around US monetary policy and Dollar strength. The higher-for-longer narrative could see a stronger Dollar for longer and weaker Gold prices.
- WTI Oil jumps to $78, trying to break higher.
- Oil traders are seeing bullish signals as US macroeconomic data points to a recovery and OPEC looks set to lengthen its production cuts.
- The US Dollar Index is back above 104.00, though it is unable to clearly break away from a pivotal level.
Oil prices jumped on Friday, trading above $78 in the European trading session, in what already has been a profitable week for Oil. Markets are on the lookout for confirmation that OPEC will prolong its current production cuts into the second quarter of the year. Although these production cuts are voluntary, they are a key factor in helping sustain Oil prices at the current levels.
Meanwhile, the US Dollar Index (DXY) is trading in a very tight range despite the release of important economic data and a whole army of US Federal Reserve speakers releasing comments to the markets throughout the week. Tensions are building up in markets: While Fed officials talk about the timing for an interest-rate rate cut or the number of upcoming cuts, recent inflation data points to the possibility of a rate hike to counterweight the possible second-round effects in inflation.
Crude Oil (WTI) trades at $78.50 per barrel, and Brent Oil trades at $82.45 per barrel at the time of writing.
Oil news and market movers: OPEC production cuts are necessity
- This week's US stockpile data revealed that the US is restocking at a ferocious pace. Data from the American Petroleum Institute and the Energy Information Administration pointed to a substantial build in stock.
- At 18:00 GMT, the weekly Baker Hughes Oil Rig Count will be published. The previous reading was at 503.
- OPEC has no choice but to prolong current production cuts if it does not want to trigger a substantial nosedive move in Crude prices.
- A significant part of the Libyan Oil supply came back online after protests ended at one of its major Oil fields.
Oil Technical Analysis: Risk of OPEC dropping the ball
Oil prices get support from the fact that traders expect OPEC to do whatever is needed to maintain the current price levels. That of course is a bit of a gamble as the current production cuts among OPEC countries are voluntary, and can only be confirmed after real export numbers are published.. Should OPEC really want to matter, not only a prolonging but a deepening further of these production cuts could be needed.
Oil bulls are focusing on the double top near $79.66, ahead of $80.00. Once through that area, quite a large room opens up towards $86.90, which would mean a nearly 10% gain. Just ahead of $90, $89.64 could stand in the way of heading towards $100.00.
On the downside, the 200-day Simple Moving average (SMA) near $77.72 is the first point of contact to provide some support. Quite close following suit are the 100-day and the 55-day SMAs near $76.25 and $74.83, respectively. Add the pivotal level near $75.27, and it looks like the downside is very limited and well-equipped to resist the selling pressure..
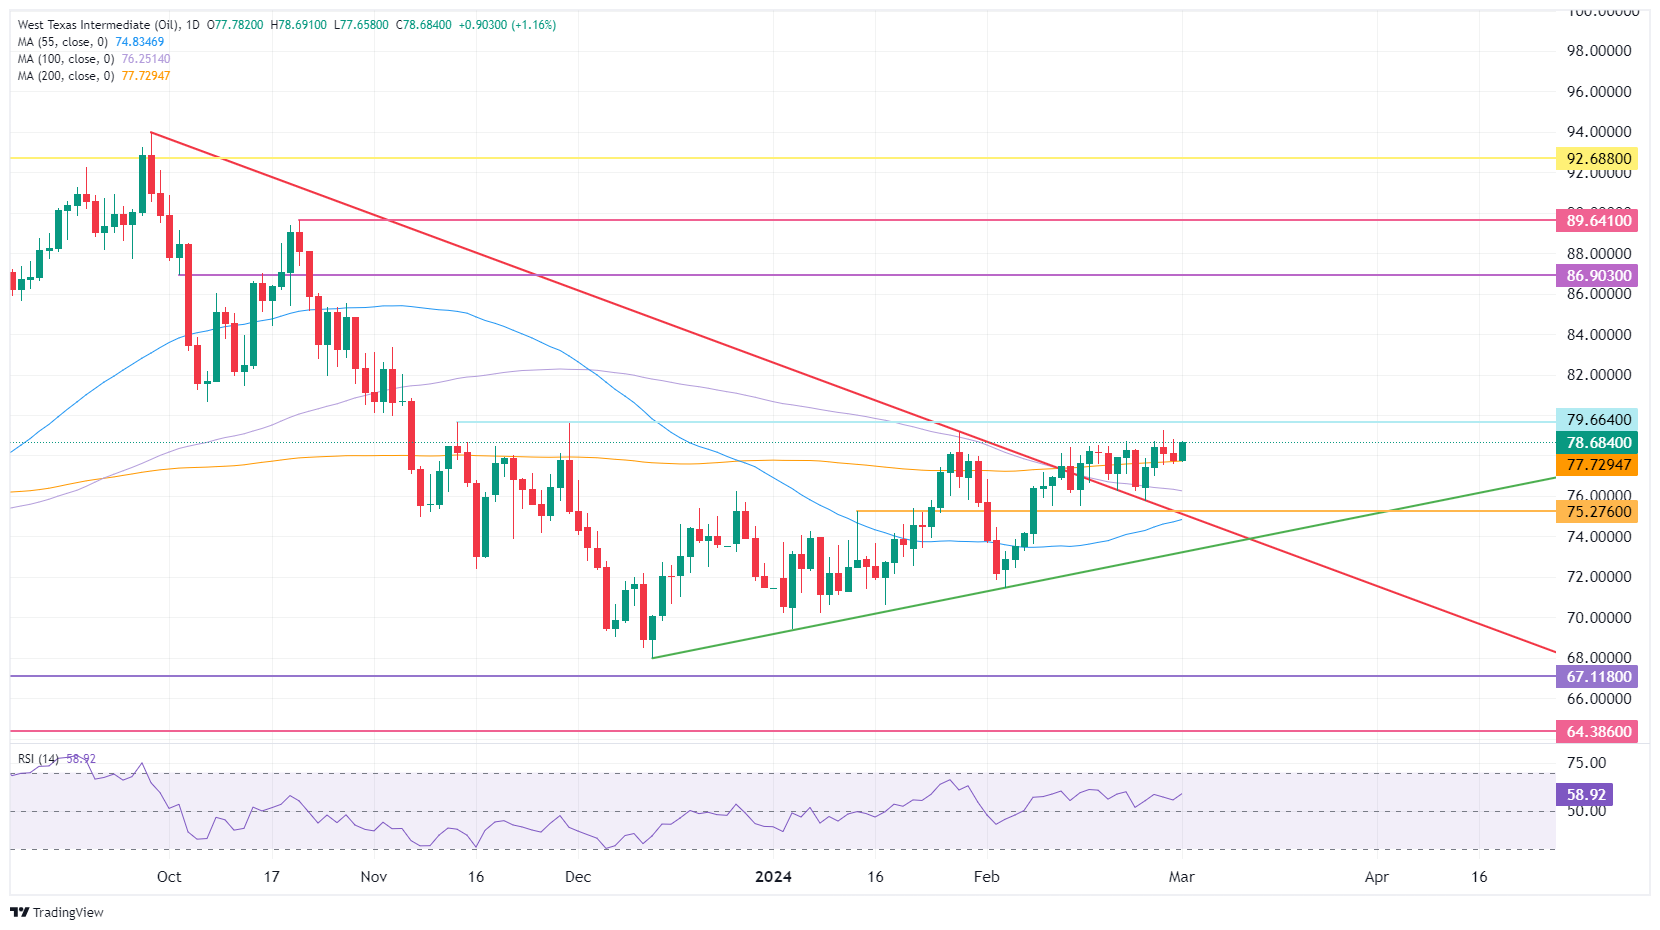
US WTI Crude Oil: Daily Chart
WTI Oil FAQs
What is WTI Oil?
WTI Oil is a type of Crude Oil sold on international markets. The WTI stands for West Texas Intermediate, one of three major types including Brent and Dubai Crude. WTI is also referred to as “light” and “sweet” because of its relatively low gravity and sulfur content respectively. It is considered a high quality Oil that is easily refined. It is sourced in the United States and distributed via the Cushing hub, which is considered “The Pipeline Crossroads of the World”. It is a benchmark for the Oil market and WTI price is frequently quoted in the media.
What factors drive the price of WTI Oil?
Like all assets, supply and demand are the key drivers of WTI Oil price. As such, global growth can be a driver of increased demand and vice versa for weak global growth. Political instability, wars, and sanctions can disrupt supply and impact prices. The decisions of OPEC, a group of major Oil-producing countries, is another key driver of price. The value of the US Dollar influences the price of WTI Crude Oil, since Oil is predominantly traded in US Dollars, thus a weaker US Dollar can make Oil more affordable and vice versa.
How does inventory data impact the price of WTI Oil
The weekly Oil inventory reports published by the American Petroleum Institute (API) and the Energy Information Agency (EIA) impact the price of WTI Oil. Changes in inventories reflect fluctuating supply and demand. If the data shows a drop in inventories it can indicate increased demand, pushing up Oil price. Higher inventories can reflect increased supply, pushing down prices. API’s report is published every Tuesday and EIA’s the day after. Their results are usually similar, falling within 1% of each other 75% of the time. The EIA data is considered more reliable, since it is a government agency.
How does OPEC influence the price of WTI Oil?
OPEC (Organization of the Petroleum Exporting Countries) is a group of 13 Oil-producing nations who collectively decide production quotas for member countries at twice-yearly meetings. Their decisions often impact WTI Oil prices. When OPEC decides to lower quotas, it can tighten supply, pushing up Oil prices. When OPEC increases production, it has the opposite effect. OPEC+ refers to an expanded group that includes ten extra non-OPEC members, the most notable of which is Russia.
There are increasing signals that the Bank of Japan (BoJ) might soon normalise monetary policy – including interest rate policy. Economists at Commerzbank analyze how a "normalisation" of monetary policy could impact the Japanese Yen (JPY).
Not every rate hike heralds a new era
Our forecast takes into account the possibility that the first steps towards monetary policy normalisation will soon be taken. The Yen could benefit from this. However, we expect this to be of limited duration.
As in 2000 and 2006, the first interest rate hikes would probably stifle inflation. And then there will be no further normalisation.

Source: Commerzbank Research
- Wall Street's main indexes closed in positive territory on Thursday.
- US stock index futures trade mixed ahead of the opening bell on Friday.
- Markets lean toward a Fed rate cut in June after inflation data.
S&P 500 futures fall 0.14%, Dow Jones futures drop 0.15%, and Nasdaq futures are unchanged.
S&P 500 (SPX), Dow Jones (DJIA), and Nasdaq (IXIC) indexes closed on Thursday with a 0.52% gain, a 0.12% increase, and a 0.90% rise, respectively.
What to know before stock market opens
The Technology Sector rose 1.3% on Thursday as the best-performing major S&P sector for the day. The Health Sector was the biggest loser of the equity sectors, falling 0.68%.
Hormel Foods Corp. (HRL) was the biggest gainer on the day, rising more than 14% and closing at $35.32. Xcel Energy Inc. (XEL) fell 8.6% to end at $52.69, beating out Bath & Body Works Inc. (BBWI) as the day's loss-leader, with BBWI shares falling 5.44% and hitting $45.70 at the closing bell.
Inflation in the US, as measured by the change in Personal Consumption Expenditures (PCE) Price Index, declined to 2.4% on a yearly basis in January, the US Bureau of Economic Analysis (BEA) reported on Thursday. This reading followed the 2.6% increase recorded in December and came in line with the market expectation. On a monthly basis, the PCE Price Index rose 0.3% as forecast. The Core PCE Price Index, which excludes volatile food and energy prices, rose 2.8% on a yearly basis, matching analysts' estimates.
The CME FedWatch Tool shows that markets are pricing in a nearly 70% probability that the Federal Reserve (Fed) will lower the policy rate by 25 basis points in June.
Fed FAQs
What does the Federal Reserve do, how does it impact the US Dollar?
Monetary policy in the US is shaped by the Federal Reserve (Fed). The Fed has two mandates: to achieve price stability and foster full employment. Its primary tool to achieve these goals is by adjusting interest rates.
When prices are rising too quickly and inflation is above the Fed’s 2% target, it raises interest rates, increasing borrowing costs throughout the economy. This results in a stronger US Dollar (USD) as it makes the US a more attractive place for international investors to park their money.
When inflation falls below 2% or the Unemployment Rate is too high, the Fed may lower interest rates to encourage borrowing, which weighs on the Greenback.
How often does the Fed hold monetary policy meetings?
The Federal Reserve (Fed) holds eight policy meetings a year, where the Federal Open Market Committee (FOMC) assesses economic conditions and makes monetary policy decisions.
The FOMC is attended by twelve Fed officials – the seven members of the Board of Governors, the president of the Federal Reserve Bank of New York, and four of the remaining eleven regional Reserve Bank presidents, who serve one-year terms on a rotating basis.
What is Quantitative Easing (QE) and how does it impact USD?
In extreme situations, the Federal Reserve may resort to a policy named Quantitative Easing (QE). QE is the process by which the Fed substantially increases the flow of credit in a stuck financial system.
It is a non-standard policy measure used during crises or when inflation is extremely low. It was the Fed’s weapon of choice during the Great Financial Crisis in 2008. It involves the Fed printing more Dollars and using them to buy high grade bonds from financial institutions. QE usually weakens the US Dollar.
What is Quantitative Tightening (QT) and how does it impact the US Dollar?
Quantitative tightening (QT) is the reverse process of QE, whereby the Federal Reserve stops buying bonds from financial institutions and does not reinvest the principal from the bonds it holds maturing, to purchase new bonds. It is usually positive for the value of the US Dollar.
Assessing the latest developments in financial markets, “with positive month-end sentiment dominating the end of yesterday’s session, it was not only the S&P 500 eking out yet another all-time high, but there was also a new record high for the NASDAQ (+0.90%), which moved above its previous peak from November 2021,” said Jim Reid, global head of economics and thematic research at Deutsche Bank, and continued:
“Consistent with the narrative of the year so far, the Magnificent 7 outperformed (+1.22%), with Amazon (+2.08%) and Nvidia (+1.87%) leading the way. The equity picture had been more subdued in Europe, where the STOXX 600 ended the day unchanged, although the German DAX (+0.44%) continued to outperform yesterday. Indeed, yesterday’s advance was the 7th consecutive gain for the DAX, taking the index up to a fresh all-time high.”
Atlanta Fed President Raphael Bostic said on Thursday that it might be appropriate to start reducing rates in summer. San Francisco Fed President Mary Daly argued that cutting rates too quickly could cause inflation to get stuck and Cleveland Fed President Loretta Mester noted that they can't expect last year's disinflation to continue.
Earlier in the week, the BEA downwardly revised the annualized Gross Domestic Product (GDP) growth of the US in the fourth quarter to 3.2% from 3.3% in the initial estimate.
S&P 500 FAQs
What is the S&P 500?
The S&P 500 is a widely followed stock price index which measures the performance of 500 publicly owned companies, and is seen as a broad measure of the US stock market. Each company’s influence on the computation of the index is weighted based on market capitalization. This is calculated by multiplying the number of publicly traded shares of the company by the share price. The S&P 500 index has achieved impressive returns – $1.00 invested in 1970 would have yielded a return of almost $192.00 in 2022. The average annual return since its inception in 1957 has been 11.9%.
How are companies chosen to be included in the S&P 500?
Companies are selected by committee, unlike some other indexes where they are included based on set rules. Still, they must meet certain eligibility criteria, the most important of which is market capitalization, which must be greater than or equal to $12.7 billion. Other criteria include liquidity, domicile, public float, sector, financial viability, length of time publicly traded, and representation of the industries in the economy of the United States. The nine largest companies in the index account for 27.8% of the market capitalization of the index.
How can I trade the S&P 500?
There are a number of ways to trade the S&P 500. Most retail brokers and spread betting platforms allow traders to use Contracts for Difference (CFD) to place bets on the direction of the price. In addition, that can buy into Index, Mutual and Exchange Traded Funds (ETF) that track the price of the S&P 500. The most liquid of the ETFs is State Street Corporation’s SPY. The Chicago Mercantile Exchange (CME) offers futures contracts in the index and the Chicago Board of Options (CMOE) offers options as well as ETFs, inverse ETFs and leveraged ETFs.
What factors drive the S&P 500?
Many different factors drive the S&P 500 but mainly it is the aggregate performance of the component companies revealed in their quarterly and annual company earnings reports. US and global macroeconomic data also contributes as it impacts on investor sentiment, which if positive drives gains. The level of interest rates, set by the Federal Reserve (Fed), also influences the S&P 500 as it affects the cost of credit, on which many corporations are heavily reliant. Therefore, inflation can be a major driver as well as other metrics which impact the Fed decisions.
- EUR/USD treads cautiously as the Eurozone’s inflation rises moderately in February.
- The annual headline and core inflation rose by 2.6% and 3.1%, respectively.
- The ISM Manufacturing PMI will guide the US Dollar for February.
The EUR/USD pair walks on thin ice near the crucial support of 1.0800 in Friday’s European session. The major currency pair exhibits a nominal decline as inflation in the Eurozone economy turned out more stubborn than expected in February.
The Eurostat reported that the preliminary annual Harmonized Index of Consumer Prices rose by 2.6% while investors anticipated to increase by 2.5%. In January, the inflation data was up by 2.8%. The monthly HICP grew strongly by 0.6% after contracting 0.4% in January.
The annual core inflation data, which excludes volatile items such as food and oil prices, grew at a higher pace of 3.1% against expectations of 2.9%, but the pace was lower than January’s reading of 3.3%. The monthly core inflation data rose 0.7% after deflating 0.9% in January.
The price pressures have grown moderately but remain higher than expectations. This would indicate that the progress in inflation declining towards the 2% target is slow, which could push back expectations of rate cuts by the European Central Bank (ECB) in the June policy meeting.
Meanwhile, the US Dollar turns sideways above 104.00 after a strong recovery as the expected decline in the United States core Personal Consumption Expenditure Price Index (PCE) data for January has capped market expectations for rate cuts by the Federal Reserve (Fed) in the June policy meeting.
In today’s session, investors will focus on the US ISM Manufacturing PMI for February, which will be published at 15:00 GMT. The expectations for the factory data show that it will come out at 49.5, higher than the prior reading of 49.1.
(The story was corrected at 11:22 GMT to say in the fourth paragraph that this would indicate that the progress in inflation declining towards the 2% target is slow, not 22%)
Euro Area inflation continued to slow down in February. Economists at Nordea continue to expect the first rate cut in June
Euro area inflation falls
Euro Area headline inflation slowed down to 2.6% (2.8% in January) and core inflation to 3.1% (3.3%) in February.
Given the new inflation numbers and our view on a gradually cooler labour market we continue to expect the ECB to start cutting rates in June. The chances that rates would be cut earlier are rather small after today’s inflation numbers but on the other hand, the ECB has to be rather hawkish not to see the fading inflationary trends and weak macro picture and to delay the cuts even further.
The price of Gold rose to a four-week high of just over $2,050 on Thursday. Economists at Commerzbank analyze the yellow metal’s outlook.
Gold price rises despite higher US inflation data
The price increase must come as a surprise, as the Fed's preferred inflation gauge, the price index for consumer spending (PCE) excluding energy and food, rose by 0.4% in January compared to the previous month, thus providing no arguments for earlier Fed rate cuts.
According to Fed Fund Futures, the first interest rate cut by the US central bank is not fully priced in until July. We also point out that the price increase has actually accelerated again in the last six months and moved away from the Fed's inflation target. Explanations that the Gold price rose because the increase in the PCE price index was as high as expected are therefore not convincing. It is also possible that some market participants had expected an even stronger rise in the PCE price index.
Sometimes you have to be satisfied with being unable to explain a price movement fundamentally. Whether this will last longer than one day is another matter.
- Gold price bounces from $2,040 as investors see the Fed reducing interest rates in June.
- Fed policymakers are reluctant to offer concrete timing for rate cuts.
- The US Dollar will be guided by the ISM manufacturing PMI.
Gold price (XAU/USD) rebounds from $2,040 in Friday’s European session as market expectations for rate cuts in the June policy meeting remain alive. The United States core Personal Consumption Expenditure Price Index (PCE) data for January, released on Thursday, was in line with expectations.
The annual US core inflation data decelerated to 2.8%. This was the lowest increase in three years. However, bets supporting rate cuts have not intensified as the impact of soft annual core inflation figure was offset by a 0.4% month-on-month increase in the same.
Although the pace at which monthly core PCE grew in January was already expected, it was higher than the growth rate of 0.2%, which is necessary for inflation to return sustainably to the 2% target.
The moderate slowdown in price pressures fails to move market expectations for rate cuts in the June meeting. Therefore, investors will shift focus to the testimony of Fed Chair Jerome Powell before Congress and the labor market data for February, which are scheduled for next week. This will provide meaningful insights into the interest rate outlook.
But before that, the US Institute of Service Management (ISM) Manufacturing PMI data for February will be in the spotlight, which will be published at 15:00 GMT.
Daily Digest Market Movers: Gold price bounces back while US Dollar remains sideways
- Gold price is anticipated to deliver a positive close for the second straight week.
- The precious metal remains slightly bullish even though investors hope that the expected decline in the United States core PCE Price Index data for January is insufficient to force Federal Reserve (Fed) policymakers to favor interest-rate normalization in the June policy meeting strongly.
- The annual core inflation growth rate was the lowest in three years, but monthly figures were up by 0.4% – twice the pace necessary for achieving price stability.
- As per the CME FedWatch tool, chances for a rate cut of 25 basis points (bps) in the June meeting remain almost unchanged at around 52% after the release of crucial inflation data. For the March and May meetings, investors see interest rates remaining unchanged in the range of 5.25%-5.50%.
- Meanwhile, the US Dollar Index (DXY), which gauges the US Dollar’s value against six major currencies, oscillates in a tight range around 104.20 after a solid recovery.
- On Thursday, New York Fed Bank President John Williams said the next move for us will be the interest rate cut, which he expects later this year. Williams added that monetary policy is in a good place, and he doesn’t see the need to raise interest rates again.
- Chicago Federal Reserve Bank President Austan Goolsbee also said that interest rates are pretty restrictive and our focus is on its duration. Goolsbee warned that the policy remaining restrictive could impact the labor market, which stayed resilient despite the aggressive rate-tightening campaign in 2022-2023.
- In today’s session, investors will focus on the ISM Manufacturing PMI data for February, which will provide insights into the US economic outlook.
- According to economists, Manufacturing PMI will show a rise of 49.5, from 49.1 in January. This will indicate that factory data remains below the 50.0 threshold for 16 straight months.
Technical Analysis: Gold price advances above $2.040
Gold price rises to near the downward-sloping border of the Symmetrical Triangle pattern, which has formed since the December 28 high at $2,088. The upward-sloping border of the aforementioned chart pattern started from the December 13 low at $1,973.
A Symmetrical Triangle could break out in either direction. However, the odds marginally favor a move in the direction of the trend before the formation of the triangle – in this case, up. A decisive break above or below the triangle boundary lines would indicate a breakout is underway.
The 14-period Relative Strength Index (RSI) climbs above 60.00. A decisive break above the same would trigger a bullish momentum. Also, the absence of divergence and oversold signals strengthens Gold bulls.
Gold FAQs
Why do people invest in Gold?
Gold has played a key role in human’s history as it has been widely used as a store of value and medium of exchange. Currently, apart from its shine and usage for jewelry, the precious metal is widely seen as a safe-haven asset, meaning that it is considered a good investment during turbulent times. Gold is also widely seen as a hedge against inflation and against depreciating currencies as it doesn’t rely on any specific issuer or government.
Who buys the most Gold?
Central banks are the biggest Gold holders. In their aim to support their currencies in turbulent times, central banks tend to diversify their reserves and buy Gold to improve the perceived strength of the economy and the currency. High Gold reserves can be a source of trust for a country’s solvency. Central banks added 1,136 tonnes of Gold worth around $70 billion to their reserves in 2022, according to data from the World Gold Council. This is the highest yearly purchase since records began. Central banks from emerging economies such as China, India and Turkey are quickly increasing their Gold reserves.
How is Gold correlated with other assets?
Gold has an inverse correlation with the US Dollar and US Treasuries, which are both major reserve and safe-haven assets. When the Dollar depreciates, Gold tends to rise, enabling investors and central banks to diversify their assets in turbulent times. Gold is also inversely correlated with risk assets. A rally in the stock market tends to weaken Gold price, while sell-offs in riskier markets tend to favor the precious metal.
What does the price of Gold depend on?
The price can move due to a wide range of factors. Geopolitical instability or fears of a deep recession can quickly make Gold price escalate due to its safe-haven status. As a yield-less asset, Gold tends to rise with lower interest rates, while higher cost of money usually weighs down on the yellow metal. Still, most moves depend on how the US Dollar (USD) behaves as the asset is priced in dollars (XAU/USD). A strong Dollar tends to keep the price of Gold controlled, whereas a weaker Dollar is likely to push Gold prices up.
USD/JPY extends rebound from Thursday’s low of 149.21. Economists at Société Générale analyze the pair’s outlook.
A revisit of last year’s high near 152.00 is on the cards
USD/JPY recently crossed above both 50-DMA and 200-DMA resulting in extension of its bounce. It has experienced a brief pause recently.
Daily MACD has turned flat but remains anchored in positive territory denoting prevalence of upward momentum.
A revisit of last year’s high near 152.00 can’t be ruled out. If this is overcome, a larger uptrend is likely towards next projections at 154.50/155.00.
The 200-DMA near 146.00 is crucial support near term.
The Eurozone annual Harmonised Index of Consumer Prices (HICP) rose 2.6% in February, cooling from a 2.8% increase in January, the official data published by Eurostat showed on Friday. The market forecast was for a 2.5% growth in the reported period.
The Core HICP inflation fell further to 3.1% YoY in February, compared with January’s 3.3% reading, beating expectations of 2.9%.
Over the month, the bloc’s HICP rebounded 0.6% in February vs. a 0.4% decrease reported in January. The core HICP inflation arrived at +0.7% MoM in the same period, as against a 0.9% decline seen previously.
The European Central Bank’s (ECB) inflation target is 2.0%. The old continent’s HICP inflation data significantly influences the market’s pricing of the ECB interest rate outlook.
Key details from the Eurozone inflation report (via Eurostat).
Looking at the main components of euro area inflation, food, alcohol & tobacco is expected to have the highest annual rate in February (4.0%, compared with 5.6% in January), followed by services (3.9%, compared with 4.0% in January), non-energy industrial goods (1.6%, compared with 2.0% in January) and energy (-3.7%, compared with -6.1% in January).
Separately, the Eurozone Unemployment Rate ticked lower to 6.4% in January vs. December’s revised 6.5%.
EUR/USD reaction to the Eurozone inflation report
The Euro is unperturbed by the hotter-than-expected Eurozone inflation data. EUR/USD is trading 0.12% higher on the day at 1.0813, at the press time.
Euro price today
The table below shows the percentage change of Euro (EUR) against listed major currencies today. Euro was the strongest against the Japanese Yen.
| USD | EUR | GBP | CAD | AUD | JPY | NZD | CHF | |
| USD | -0.13% | -0.05% | 0.03% | -0.06% | 0.34% | -0.12% | 0.07% | |
| EUR | 0.13% | 0.08% | 0.13% | 0.07% | 0.47% | 0.01% | 0.20% | |
| GBP | 0.06% | -0.07% | 0.06% | 0.00% | 0.40% | -0.06% | 0.13% | |
| CAD | -0.01% | -0.13% | -0.05% | -0.06% | 0.34% | -0.12% | 0.06% | |
| AUD | 0.07% | -0.07% | 0.01% | 0.06% | 0.40% | -0.06% | 0.12% | |
| JPY | -0.33% | -0.46% | -0.38% | -0.33% | -0.41% | -0.47% | -0.26% | |
| NZD | 0.11% | -0.02% | 0.06% | 0.13% | 0.06% | 0.45% | 0.20% | |
| CHF | -0.05% | -0.19% | -0.11% | -0.06% | -0.12% | 0.28% | -0.18% |
The heat map shows percentage changes of major currencies against each other. The base currency is picked from the left column, while the quote currency is picked from the top row. For example, if you pick the Euro from the left column and move along the horizontal line to the Japanese Yen, the percentage change displayed in the box will represent EUR (base)/JPY (quote).
The US Dollar has entered a consolidative phase. The Dollar may still struggle to find clear direction in March, but economists at ING expect USD bearish pressure to intensify from the second quarter.
A higher bar for a lower Dollar?
From a market perspective, the notion of resilient US inflation and activity data has now been fully digested. Investors are comfortable with three 25 bps cuts priced in by December as there is just not enough data evidence to turn more dovish now. Similarly, a rate cut before June seems unlikely. All this is translating into a resilient Dollar, with EUR/USD trading at 1.0800, which looks fair to us given market conditions.
US data is not set to lose any of its centrality for markets in the new month: expectations are probably that we will start seeing some softening in February’s data, starting with payrolls. But while we have recently observed a dovish asymmetry in rate expectations, the bond reality check in February may have set the bar a bit higher (‘lower’, from a US data perspective) for a new round of enthusiastic easing bets.
Our view remains that 2Q is when US data will prove soft enough to take the Dollar lower, and we see a USD decline only accelerating decisively in the summer.
USD/INR continues to hold within the 82.50-83.50 range of the six months. Economists at Commerzbank analyze Rupee’s outlook after extraordinary GDP surprise in India.
Strong Q4 GDP growth
Q4 GDP grew by a stronger-than-expanded 8.4% YoY and Q3 was revised up to 8.1% from 7.6% initially.
The government revised up the growth forecast for the current fiscal year 2023-2024 to 7.6% from 7.3% previously. For the next fiscal year 2024-2025, the outlook remains positive and we could see above 7% growth.
For PM Modi, it will provide yet another boost to his popularity ahead of the federal elections to be held in April and May. For RBI, the strong growth momentum will only reinforce their bias to stay on hold at 6.5% for the foreseeable future.
The stable inflation picture and the strong economic outlook should continue to support INR.
- AUD/JPY breaks its four-day losing streak on Friday.
- BoJ Governor Kazuo Ueda expresses skepticism regarding inflation reaching the 2% target.
- S&P/ASX 200 Index tracked gains on Wall Street, supporting the AUD.
AUD/JPY snaps its four-day losing streak, improving to near 97.80 during the European session on Friday. The Australian Dollar (AUD) bolsters by the rise in the S&P/ASX 200 Index and gains on Wall Street, supporting the AUD/JPY cross.
Furthermore, positive data such as the Judo Bank Manufacturing PMI on Friday, which showed a slight improvement in Australia's manufacturing sector, and recent Retail Sales and Private Capital Expenditure data have contributed to the strength of the Aussie Dollar (AUD).
Additionally, the Aussie Dollar (AUD) might have received upward support from the Judo Bank Manufacturing PMI indicated a slight improvement in Australia's manufacturing sector, with the February reading rising to 47.8 from 47.7 in the previous period. Additionally, the recent Retail Sales and Private Capital Expenditure data bolstered the AUD on Thursday.
The Japanese Yen (JPY) could have struggled after the Bank of Japan (BoJ) Governor Kazuo Ueda expressed skepticism regarding the sustainability of Japanese inflation reaching the 2% price growth target. Ueda mentioned that the recent economic downturn represents a rebound from previously robust quarters. Inflationary pressures are subsiding at an accelerated rate, offering some relief. This could prompt the BoJ to delay its plans to tighten monetary policy, which in turn, undermines the Japanese Yen.
BoJ Governor Ueda stated that anticipated wage negotiations are expected to provide additional support. Japan's economic recovery is projected to persist gradually. He emphasizes the importance of evaluating the collective results of wage negotiations and firm hearings before assessing wage data. Expectations are for a rebound in Japan's consumption, particularly with promising outcomes anticipated from spring wage talks.
- The US ISM Manufacturing PMI is expected to have risen modestly in February.
- Market players will also pay attention to the ISM Prices Paid Index and the Employment Index.
- EUR/USD trapped between Fibonacci levels, as PCE inflation did not move the bar.
The Institute for Supply Management(ISM) will publish the February United States (US) Manufacturing Purchasing Managers’ Index (PMI) on Friday, the first business day of March. The report is considered a reliable indicator of the US manufacturing sector's health, and the direction of the overall economy. The figures are expressed in percentages, with anything above 50.0 indicating expansion and readings below reflecting business contraction.
The US February Manufacturing PMI is foreseen at 49.5, improving from the December reading of 49.1 but still falling short of the desired threshold. According to the official release, “the manufacturing sector contracted in January for the 15th consecutive month following one month of “unchanged” status (a PMI reading of 50) and 28 months of growth prior to that.”
What to expect from the ISM manufacturing PMI report?
Back in January, the ISM Manufacturing PMI was pretty encouraging, as responders to the survey noted an increase in sales and more stable costs. Still, many noted a slowdown in new orders and continuously slow demand.
The ISM Manufacturing PMI is divided into several subcomponents, some of which are closely watched by speculative interest. In January, the New Orders Index moved into expansion territory at 52.5, somehow suggesting an improving demand outlook. At the same time, the Prices Index registered 52.9, up 7.7 percentage points compared to the December reading. The Price Index gauges the price change that US manufacturers pay for their inputs, and such an advance signaled heating price pressures. Finally, the Employment Index registered 47.1, down from December’s figure of 47.5.
Generally speaking, a headline reading above 50.0 should indicate above-expectations expansion and financial markets should welcome the positive news. As a result, high-yielding assets such as stocks may run higher, while the US Dollar may come under selling pressure amid risk appetite. Investors will also welcome signs of further expansion, such as an increase in the New Orders sub-component and easing price pressures.
Regarding inflation, the US released the January Core Personal Consumption Expenditures (PCE) Price Index. The Bureau of Economic Analysis (BEA) reported the Federal Reserve’s (Fed) favorite inflation gauge on Thursday, with the figures meeting market expectations. The Core PCE Price Index increased 0.4% MoM, doubling the previous 0.2% advance, while the annual rate printed at 2.8% easing from 2.9% in December.
In line with expectations data barely moved the bar. Market participants continue to bet on a Fed’s rate cut in June, with the odds for a 25 basis points (bps) cut standing at around 52%, unchanged from pre-release levels.
When will the ISM Manufacturing Purchasing Managers’ Index report be released, and how could it affect EUR/USD?
The ISM Manufacturing PMI report is scheduled for release at 15:00 GMT on Friday. Ahead of the data release, the US Dollar struggles to regain its footing. The EUR/USD pair fell pretty much straight ever since hitting 1.1139 by the end of December, bottoming mid-February at 1.0694.
Valeria Bednarik, FXStreet Chief Analyst, notes: “Measuring the December/February slump, the 38.2% Fibonacci retracement comes at 1.0865, where sellers rejected advances in the last few days. So far, buyers defended the downside at around the 23.6% retracement of the same slide at 1.0799, with EUR/USD trading mid-way between Fibonacci levels. The pair would need to break any of those extremes to become more attractive to speculative interest.”
Bednarik adds, “The ongoing advance seems a mere correction, and even if the pair manages to extend gains beyond the 1.0860 area, EUR/USD would need to break through 1.0970, the 61.8% retracement, to confirm a sustainable recovery. EUR self–weakness, however, plays against the bullish case. To the downside, the 1.0800 area is indeed providing support, with a break below it opening the door to a retest of the monthly low. In the meantime, the pair will likely extend its consolidative phase ahead of a directional catalyst that could affect the market’s perspective about upcoming Fed moves.”
Economic Indicator
United States ISM Manufacturing PMI
The Institute for Supply Management (ISM) Manufacturing Purchasing Managers Index (PMI), released on a monthly basis, is a leading indicator gauging business activity in the US manufacturing sector. The indicator is obtained from a survey of manufacturing supply executives based on information they have collected within their respective organizations. Survey responses reflect the change, if any, in the current month compared to the previous month. A reading above 50 indicates that the manufacturing economy is generally expanding, a bullish sign for the US Dollar (USD). A reading below 50 signals that factory activity is generally declining, which is seen as bearish for USD.
Read more.Next release: 03/01/2024 15:00:00 GMT
Frequency: Monthly
Source: Institute for Supply Management
Why it matters to traders
The Institute for Supply Management’s (ISM) Manufacturing Purchasing Managers Index (PMI) provides a reliable outlook on the state of the US manufacturing sector. A reading above 50 suggests that the business activity expanded during the survey period and vice versa. PMIs are considered to be leading indicators and could signal a shift in the economic cycle. Stronger-than-expected prints usually have a positive impact on the USD. In addition to the headline PMI, the Employment Index and the Prices Paid Index numbers are watched closely as they shine a light on the labour market and inflation.
Risk sentiment FAQs
What do the terms"risk-on" and "risk-off" mean when referring to sentiment in financial markets?
In the world of financial jargon the two widely used terms “risk-on” and “risk off'' refer to the level of risk that investors are willing to stomach during the period referenced. In a “risk-on” market, investors are optimistic about the future and more willing to buy risky assets. In a “risk-off” market investors start to ‘play it safe’ because they are worried about the future, and therefore buy less risky assets that are more certain of bringing a return, even if it is relatively modest.
What are the key assets to track to understand risk sentiment dynamics?
Typically, during periods of “risk-on”, stock markets will rise, most commodities – except Gold – will also gain in value, since they benefit from a positive growth outlook. The currencies of nations that are heavy commodity exporters strengthen because of increased demand, and Cryptocurrencies rise. In a “risk-off” market, Bonds go up – especially major government Bonds – Gold shines, and safe-haven currencies such as the Japanese Yen, Swiss Franc and US Dollar all benefit.
Which currencies strengthen when sentiment is "risk-on"?
The Australian Dollar (AUD), the Canadian Dollar (CAD), the New Zealand Dollar (NZD) and minor FX like the Ruble (RUB) and the South African Rand (ZAR), all tend to rise in markets that are “risk-on”. This is because the economies of these currencies are heavily reliant on commodity exports for growth, and commodities tend to rise in price during risk-on periods. This is because investors foresee greater demand for raw materials in the future due to heightened economic activity.
Which currencies strengthen when sentiment is "risk-off"?
The major currencies that tend to rise during periods of “risk-off” are the US Dollar (USD), the Japanese Yen (JPY) and the Swiss Franc (CHF). The US Dollar, because it is the world’s reserve currency, and because in times of crisis investors buy US government debt, which is seen as safe because the largest economy in the world is unlikely to default. The Yen, from increased demand for Japanese government bonds, because a high proportion are held by domestic investors who are unlikely to dump them – even in a crisis. The Swiss Franc, because strict Swiss banking laws offer investors enhanced capital protection.
- Silver comes under fresh selling pressure and reverses a part of the overnight gains.
- The technical setup favours bearish traders and supports prospects for further losses.
- A sustained move beyond the $22.20-$22.25 confluence will negate the negative bias.
Silver (XAG/USD) meets with some supply following an intraday uptick to the $22.80 region on Friday and erodes a part of the previous day's positive move to a multi-day peak. The intraday descent extends through the early part of the European session and drags the white metal to a fresh daily low, back closer to the mid-$22.00s in the last hour.
Looking at the broader picture, the recent failure to find acceptance above the very important 200-day Simple Moving Average (SMA) and a subsequent downfall favours bearish traders. Moreover, oscillators on the daily chart have just started gaining negative traction and suggest that the path of least resistance for the XAG/USD is to the downside.
Hence, some follow-through descent back towards testing the weekly low, around the $22.30-$22.25 area, en route to the sub-$22.00 level, or the two-month trough touched in January, looks like a distinct possibility. The downward trajectory could extend further and eventually drag the XAG/USD to the next relevant support near the $21.40-$21.35 region.
On the flip side, the daily swing high, around the $22.75-$22.80 zone, might continue to act as an immediate hurdle ahead of the $23.00 round figure. A sustained strength beyond the latter might trigger a short-covering rally, though is likely to attract fresh sellers and remain capped near the $23.20-$22.25 confluence, comprising the 100- and the 200-day SMAs.
This is followed by the monthly swing high, around mid-$23.00s, which if cleared decisively will negate any near-term negative outlook and shift the bias in favour of bullish traders. The XAG/USD might then aim to reclaim the $24.00 round figure and climb further towards the $24.30-$24.35 intermediate hurdle en route to the $24.50 supply zone.
Silver daily chart
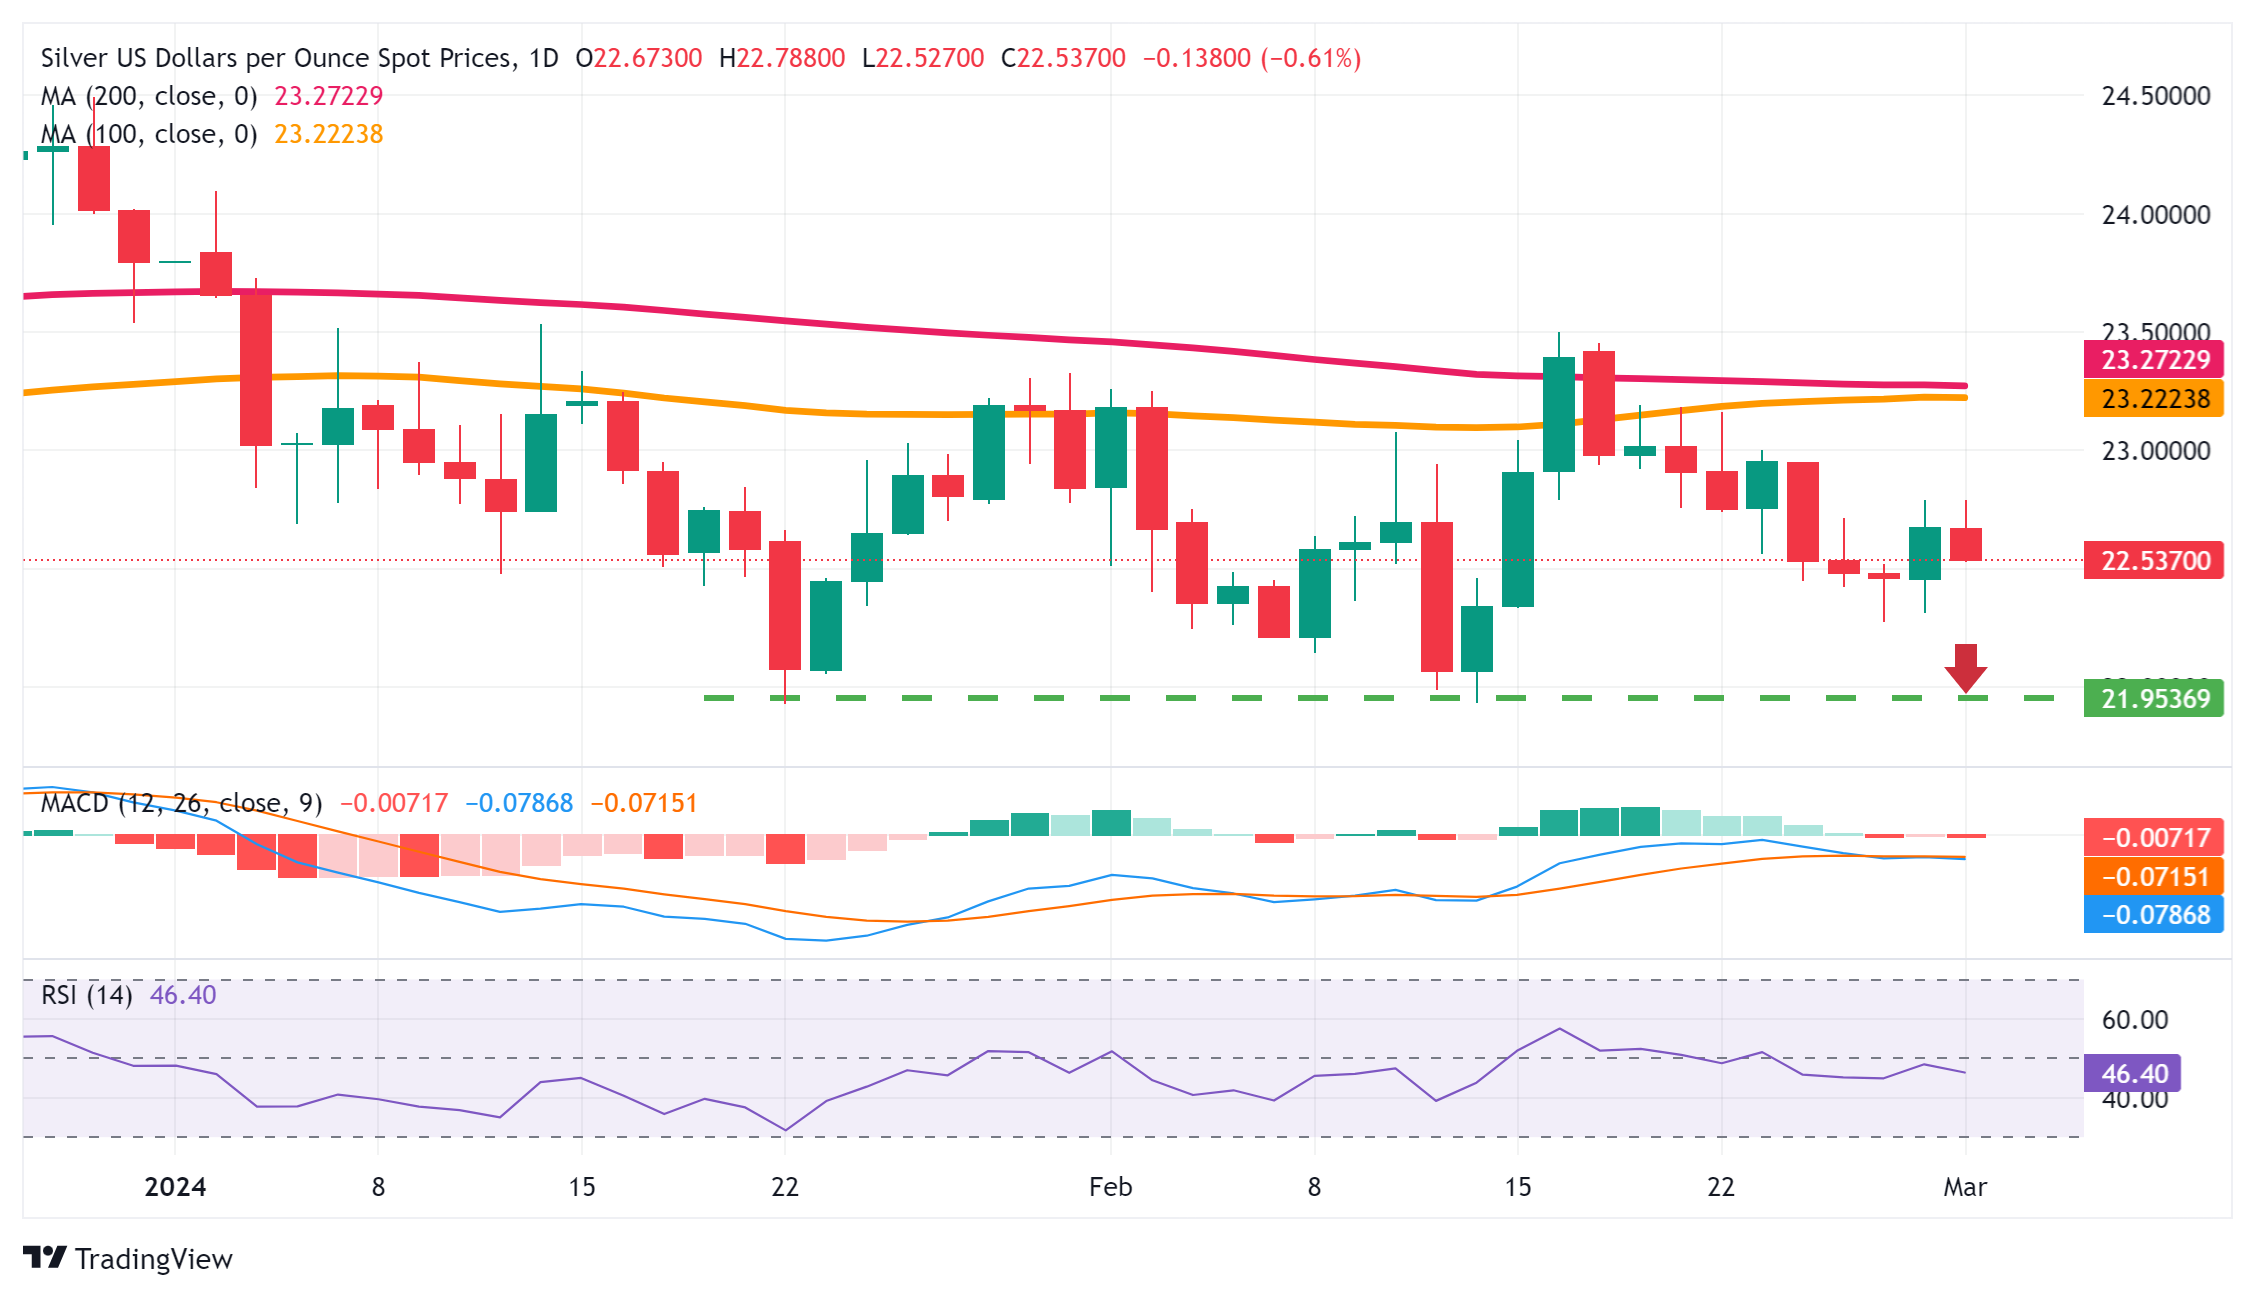
Economists at MUFG Bank do not expect the EUR/USD pair to move sustainably higher over the short term.
There is a bigger risk of a sooner pivot from the ECB than the Fed
The ECB remains overly cautious in our view and we maintain over the short term that there is a bigger risk of a sooner pivot from the ECB than the Fed.
The updated forecasts next week will see cuts to both GDP growth and inflation. Inflation forecasts for 2025 and 2026 are already around target at 2.1% and 1.9% so that will make it difficult for EUR/USD to make any sustained move higher over the near term.
- NZD/USD positions below 0.6100 after recovering intraday losses.
- The pair could find the immediate resistance zone around the 23.6% Fibonacci retracement level of 0.6124 and the nine-day EMA at 0.6127.
- Technical analysis indicates a confirmation of the bearish sentiment.
NZD/USD moves sideways with a bias to continue its losing streak that began on February 23. The pair hovers around 0.6090 during the European session on Friday, positioned just below the immediate resistance of the psychological level at 0.6100.
A breakthrough above the latter could exert upward support for the NZD/USD pair to explore the resistance zone around the 23.6% Fibonacci retracement level of 0.6124, in conjunction with the nine-day Exponential Moving Average (EMA) at 0.6127.
Further resistance barriers are anticipated around the major level of 0.6150, followed by the psychological level of 0.6200 and February’s high at 0.6219.
Based on the technical analysis of the Moving Average Convergence Divergence (MACD), the NZD/USD pair appears to exhibit a downward sentiment. The MACD line is positioned below both the centerline and the signal line, indicating a bearish trend. Furthermore, the 14-day Relative Strength Index (RSI) is below the 50 level, suggesting a confirmation of the bearish sentiment.
On the downside, the NZD/USD pair could find key support at the major support level of 0.6050 followed by February’s low at 0.6037. A break below this level could prompt the pair to navigate the support region around the psychological level of 0.6000.
NZD/USD: Daily Chart
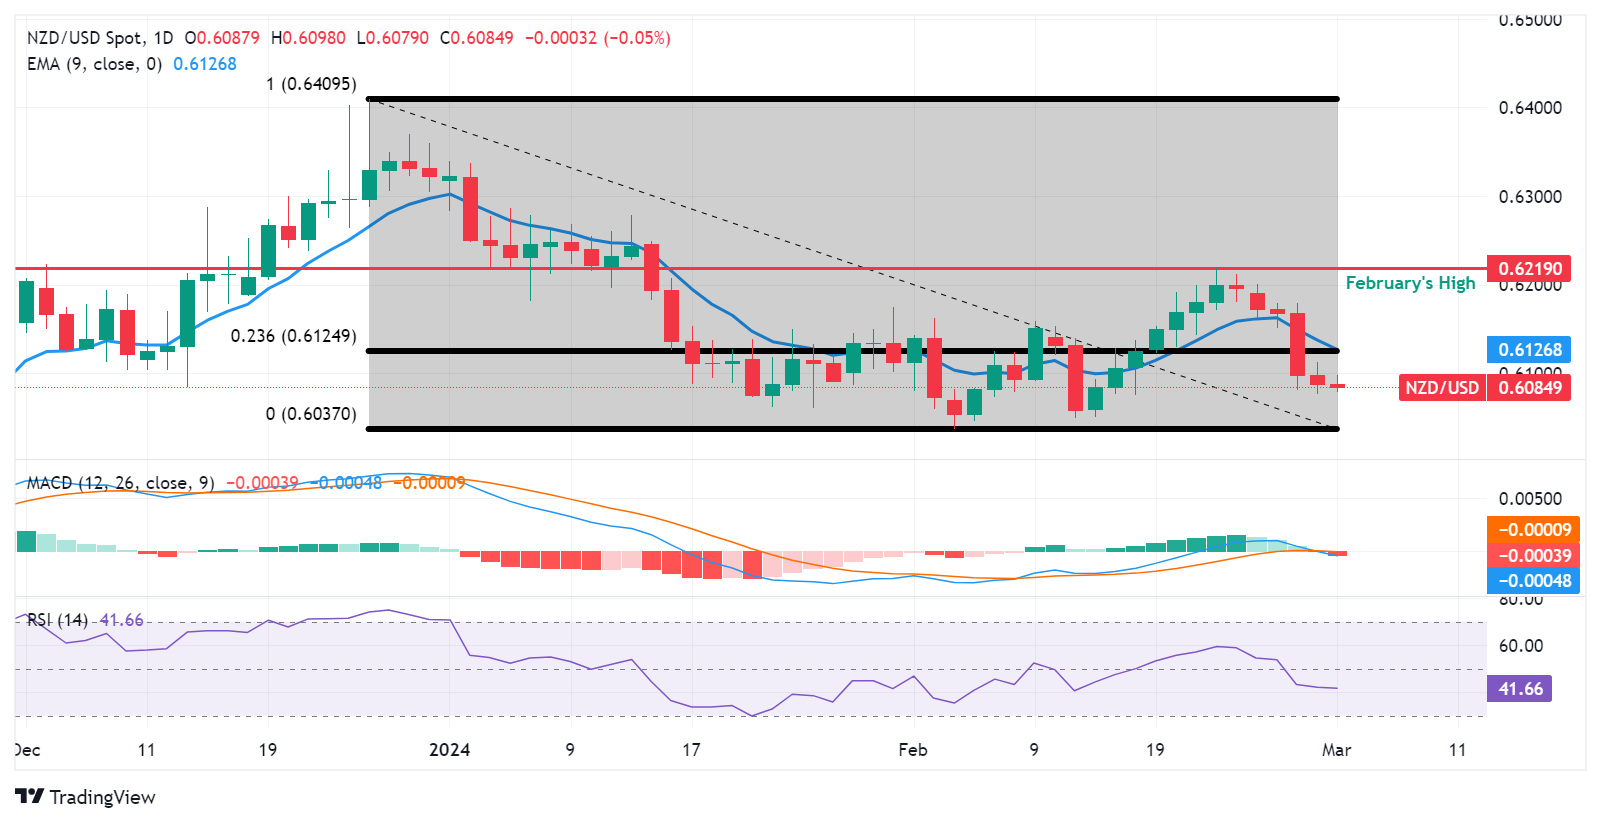
EUR/USD could close the week fairly unchanged, economists at Commerzbank say.
The Euro will hardly be able to benefit from a core rate that falls less sharply than expected
Today's data on February inflation in the Eurozone could cause some movement in the Euro. We expect a seasonally adjusted monthly rate of change of 0.4%, which signals that the disinflation process in the Eurozone has recently slowed down. However, this might not stop those who are paying attention to the overall rate from perhaps allowing the Euro to dip once again. After all, the fact that June is now well cemented in the market as the start of the ECB's interest rate cutting cycle makes it difficult for the Euro to benefit from higher inflation rates.
The Euro will hardly be able to benefit from a core rate that falls less sharply than expected. The market may rather focus on the somewhat sharper fall in the headline rate, which could lead a few more to believe that an ECB rate cut is possible before June after all. That would then argue for lower EUR/USD quotes. But to be honest, I don't expect any major moves in this direction, especially not so close to the ECB meeting, which will give us more information.
I can therefore well imagine that EUR/USD will close the week relatively unchanged around 1.0800. But if I had to choose a side, I would probably pick the weaker side in EUR/USD.
- USD/CHF advances to 0.8860 as higher US core PCE inflation data strengthens US Dollar.
- The Swiss Franc remains on the back foot as the SNB is expected to lead the global rate-cut cycle.
- Investors await the US Manufacturing PMI for fresh insights on the economic outlook.
The USD/CHF pair extends its upside to 0.8860 in Friday’s European session. The Swiss Franc asset strengthens due to firm US Dollar and hopes that the Swiss National Bank (SNB) will lead the rate-cut cycle.
The US Dollar Index (DXY), which gauges Greenback’s value against six major currencies, has turned sideways around 104.20 after a sharp recovery from 103.70.
The appeal for the US Dollar improves due to higher United States monthly core Personal Consumption Expenditure Price Index (PCE) data for January, indicating that the Federal Reserve’s (Fed) path to 2% inflation would be bumpy. The monthly core inflation grew by 0.4% as expected, higher than the 0.2% pace necessary to achieve price stability.
Meanwhile, cooling price pressures in the Swiss economy have prompted a chance of rate cuts by the SNB in March. In January, inflation fell to 1.3% against expectations of 1.7%, allowing the SNB to pivot to a dovish monetary policy stance.
In today’s session, market participants will focus on the US ISM Manufacturing PMI for February, which will be published at 15:00 GMT. Investors anticipate factory data to come at 49.5, higher than 49.1 in January but will remain below the 50.0 threshold.
USD/CHF delivers a vertical upside move after a breakout of the consolidation formed between the 0.8778-0.8824 range in a four-hour timeframe. The consolidation formation indicates a sharp contraction in volatility, which exhibits narrow ticks and low volume. A breakout of the same results in a volatility expansion, followed by wider ticks and heavy volume.
The near-term outlook is bullish as the 20-period Exponential Moving Average (EMA) at 0.8821 is sloping higher.
The 14-period Relative Strength Index (RSI) shifts into the bullish range of 60.00-80.00, indicating a positive momentum has been triggered.
Fresh upside would emerge if the asset breaks above the three-month high around 0.8886, which would unlock upside towards September 20 low at 0.8932 and November 8 low at 0.8976.
On the contrary, a breakdown below February 13 low at 0.8746 would expose the asset to the round-level support of 0.8700, followed by February 1 high around 0.8650.
USD/CHF four-hour chart
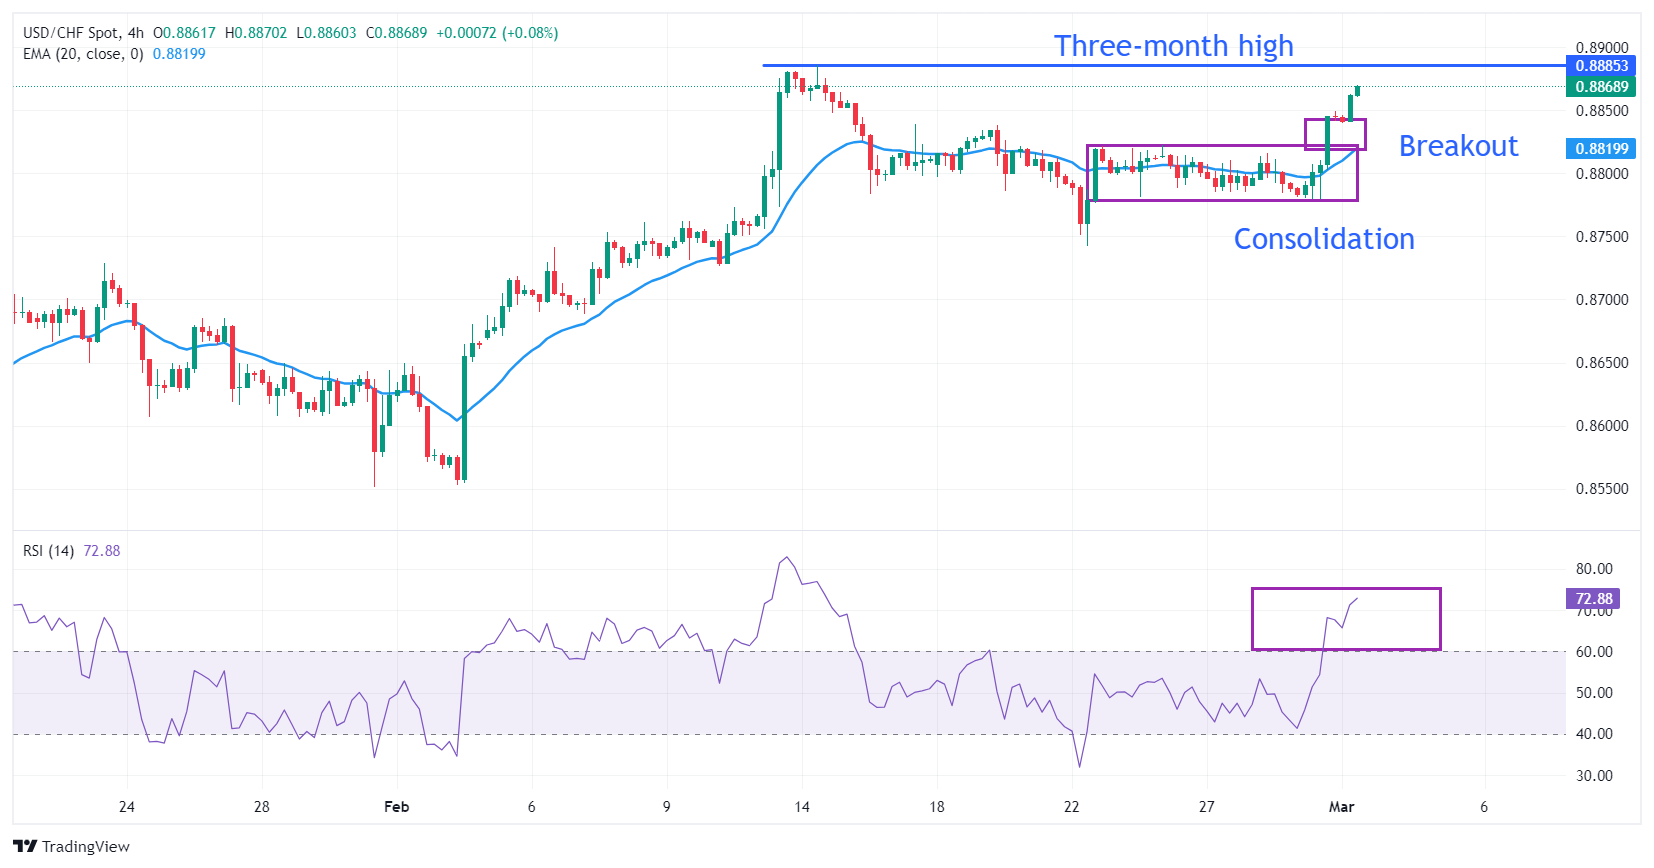
The US Dollar (USD) consolidates gains following Thursday’s rebound. Economists at ING analyze Greenback’s outlook.
There are some upside risks for the Dollar today
Today, the ISM manufacturing index will be in focus. There is a risk that it hits the 50.0 mark (or above) for the first time since October 2022, which can reinforce expectations of an extra-resilient economic environment in 1Q.
Given the index has been in contraction for a very long time, downside surprises may not have the same impact as a rebound to 50+. So, there are some upside risks for the Dollar today, although data in the Eurozone can also play a role in price action before the weekend.
All in all, we stand by our call for DXY to end the week above 104.00.
- USD/MXN struggles to move into the positive territory on Friday.
- Jobless Rate increased to 2.9% YoY from the previous reading of 2.6%.
- Fed's first-rate cut could be delayed due to recent US GDP and PCE figures.
USD/MXN recovers its intraday losses and holds steady near 17.05 during the early European session on Friday, closely trading around the weekly low at 17.03 recorded on Thursday. The Mexican Peso (MXN) has gained traction against the US Dollar (USD), buoyed by positive labor market data released in the previous session for January.
The jobless Rate rose to 2.9% YoY from 2.6% prior, exceeding expectations of a 2.8% rise but maintaining a relatively tight labor market. While the seasonally adjusted rate stood at 2.8% in January. Furthermore, the Bank of Mexico (Banxico) will release January’s Fiscal Balance on Saturday. Banxico revised its economic growth projection for 2024 to 2.8% while maintaining the projection at 1.5% for 2025.
Deputy Governors Jonathan Heath and Omar Mejia advocated for a gradual approach to rate adjustments, emphasizing the importance of maintaining higher rates over an extended period. Additionally, Deputy Governor Irene Espinosa underscored the need for Banxico to consider both external and internal factors that impact inflation when making policy decisions.
The US Dollar Index (DXY) hovers near 104.10, with the improved US Treasury bond yields, which stand at 4.63% for the 2-year and 4.25% for the 10-year bonds at the time of publication. However, market expectations for the Federal Reserve's first-rate cut have been pushed back due to recent data, including Gross Domestic Product (GDP) figures and the US Personal Consumption Expenditures - Price Index from the United States (US), providing support for the US Dollar (USD).
According to the CME FedWatch Tool, the probability of rate cuts in March stands at 3.0%, while the likelihood of cuts in May and June is estimated at 23.1% and 52.2%, respectively. Investors are now awaiting the final US S&P Global Manufacturing PMI for February, scheduled for release on Friday.
Today, Eurostat will release preliminary February HCIP inflation data for the Euro area. Economists at ING analyze Euro’s (EUR) outlook ahead of the report.
EUR/USD to face another month of domination by the Dollar leg
Today, flash inflation estimates for the Eurozone area are published, and the consensus is for a slowdown to 2.5% in the headline rate and to 2.9% in the core rate.
A deviation from expectations could trigger short-term swings in Eurozone rates and the Euro, but should not really have a big impact on the narrative that Christine Lagarde and the Governing Council look set to reiterate next week.
The ECB remains on the hunt for more conclusive evidence of disinflation, and EUR/USD looks likely to face another month of domination by the Dollar leg rather than experiencing fresh Eurozone-led dynamics.
- Pound Sterling treads with caution amid volatile market sentiment.
- High UK wage growth and service inflation are keeping price pressures sticky.
- Investors await the UK and US Manufacturing PMIs for fresh guidance.
The Pound Sterling (GBP) finds temporary support in Friday’s European session after closing negatively on Thursday. The GBP/USD pair may face more heat as higher monthly United States core Personal Consumption Expenditure Price Index (PCE) data for January has capped hopes of rate cuts by the Federal Reserve (Fed) in the June policy meeting.
US monthly core inflation data rose by 0.4% in January against a 0.1% increase in December, which was revised down from 0.2%. Price pressures were expected to grow at a higher pace, but the momentum is inconsistent with the agenda of achieving a 2% inflation target.
Meanwhile, a slightly uncertain market mood keeps the Pound Sterling on edge. In the broader term, the Pound Sterling could benefit from hopes that the Bank of England (BoE) will begin reducing interest rates after the Fed.
Investors anticipate that the BoE and the Fed will start cutting interest rates in August and June, respectively. This will ease policy divergence between the central banks for some time. The Pound Sterling would attract higher foreign inflows if the BoE maintained a hawkish stance for a longer period than other central banks.
In today’s session, the UK’s S&P Global/CIPS Manufacturing PMI and the US ISM Manufacturing PMI for February will be in focus. The UK Manufacturing PMI is expected to remain unchanged at 47.1. While the US Manufacturing PMI is anticipated to have risen to 49.5 from 49.1 in January.
Daily Digest Market Movers: Pound Sterling awaits UK/US Manufacturing PMI data
- Pound Sterling discovers interim support near 1.2600 after a sharp sell-off. The downside remains favored amid a cautious market mood.
- The US Dollar Index, which measures Greenback’s value against six major currencies, remains firm above 104.00.
- The market sentiment is slightly uncertain as the United States core PCE Price Index data for January, released on Thursday, was in line with expectations. The annual core inflation data indicated that inflation is gradually declining but is insufficient to allow Federal Reserve policymakers to favor normalization of policy stance at the current stage.
- The annual core PCE Price Index was the lowest in three years at 2.8%, as expected by market participants. The monthly core inflation data grew in line with expectations by 0.4%. The pace at which monthly price pressures rose is higher than what is required to bring down inflation to the 2% target.
- The underlying inflation data has kept hopes of rate cuts in the June meeting alive. As per the CME FedWatch tool, traders see a 52% chance for a rate cut by 25 basis points (bps). The probability of a rate cut in June remains unchanged after the release of the crucial inflation data.
- On the United Kingdom front, investors seek fresh cues about when the Bank of England will start reducing interest rates.
- The latest poll from Reuters showed that a rate-cut move from the BoE will come in the third quarter of this year. A slim majority is expecting it in the month of August.
- Currently, BoE policymakers believe that rate cuts would be discussed only after gaining confidence that inflation will come down to the desired rate of 2%.
- BoE policymakers are worried about the pace at which wage growth and service inflation are rising. The momentum in the aforementioned inflation indicators is higher than necessary for returning inflation sustainably to the 2% target.
Technical Analysis: Pound Sterling manages to hold above 1.2600
Pound Sterling finds buying interest near the round-level support of 1.2600. The pair drops toward the 20 and 50-day Exponential Moving Averages (EMAs), which trade around 1.2640.
The near-term trend is sideways as the asset oscillates inside the Descending Triangle formation on a daily timeframe. The downward-sloping border of the aforementioned chart pattern is placed from December 28 high at 1.2827, while the horizontal support is plotted from December 13 low near 1.2500.
A Descending Triangle pattern exhibits indecisiveness among market participants but with a slight downside bias due to the formation of lower highs and flat lows.
The 14-period Relative Strength Index (RSI) remains inside the 40.00-60.00 region, indicating a sharp contraction in volatility.
Pound Sterling FAQs
What is the Pound Sterling?
The Pound Sterling (GBP) is the oldest currency in the world (886 AD) and the official currency of the United Kingdom. It is the fourth most traded unit for foreign exchange (FX) in the world, accounting for 12% of all transactions, averaging $630 billion a day, according to 2022 data.
Its key trading pairs are GBP/USD, aka ‘Cable’, which accounts for 11% of FX, GBP/JPY, or the ‘Dragon’ as it is known by traders (3%), and EUR/GBP (2%). The Pound Sterling is issued by the Bank of England (BoE).
How do the decisions of the Bank of England impact on the Pound Sterling?
The single most important factor influencing the value of the Pound Sterling is monetary policy decided by the Bank of England. The BoE bases its decisions on whether it has achieved its primary goal of “price stability” – a steady inflation rate of around 2%. Its primary tool for achieving this is the adjustment of interest rates.
When inflation is too high, the BoE will try to rein it in by raising interest rates, making it more expensive for people and businesses to access credit. This is generally positive for GBP, as higher interest rates make the UK a more attractive place for global investors to park their money.
When inflation falls too low it is a sign economic growth is slowing. In this scenario, the BoE will consider lowering interest rates to cheapen credit so businesses will borrow more to invest in growth-generating projects.
How does economic data influence the value of the Pound?
Data releases gauge the health of the economy and can impact the value of the Pound Sterling. Indicators such as GDP, Manufacturing and Services PMIs, and employment can all influence the direction of the GBP.
A strong economy is good for Sterling. Not only does it attract more foreign investment but it may encourage the BoE to put up interest rates, which will directly strengthen GBP. Otherwise, if economic data is weak, the Pound Sterling is likely to fall.
How does the Trade Balance impact the Pound?
Another significant data release for the Pound Sterling is the Trade Balance. This indicator measures the difference between what a country earns from its exports and what it spends on imports over a given period.
If a country produces highly sought-after exports, its currency will benefit purely from the extra demand created from foreign buyers seeking to purchase these goods. Therefore, a positive net Trade Balance strengthens a currency and vice versa for a negative balance.
FX option expiries for Mar 1 NY cut at 10:00 Eastern Time, via DTCC, can be found below.
- EUR/USD: EUR amounts
- 1.0800 1.3b
- 1.0865 1.6b
- USD/JPY: USD amounts
- 148.15 593m
- 149.00 830m
- 150.35 903m
- USD/CAD: USD amounts
- 1.3310 707m
- 1.3410 530m
The Norwegian Krone (NOK) has weakened slightly since the start of the year. Economists at Nordea analyze EUR/NOK outlook.
EUR/NOK to trade around 11.25 by year-end
We believe that EUR/NOK will trade broadly sideways around 11.50 until the summer, but that does not mean it will move along a straight line.
When rates abroad are lowered during the second half of 2024, we see NOK faring better and expect EUR/NOK to trade around 11.25 by the end of 2024.
Looking at technical levels, we see that 11.20 area has been a solid bottom for EUR/NOK while the area around 12.00 has been a ceiling EUR/NOK rarely has been over.
Here is what you need to know on Friday, March 1:
The US Dollar (USD) outperformed its rivals on Thursday, with the USD Index (DXY) registering its highest daily close in over a week above 104.00. The DXY stays in a consolidation phase early Friday as focus shifts to ISM Manufacturing PMI for February. In the European session, Eurostat will release Harmonized Index of Consumer Price (HICP) for February. Several Federal Reserve (Fed) policymakers will be delivering speeches ahead of the weekend as well.
Eurozone Inflation Preview: Sticky core prices set to boost Euro.
Inflation in the US, as measured by the change in Personal Consumption Expenditures (PCE) Price Index, declined to 2.4% on a yearly basis in January, the US Bureau of Economic Analysis reported on Thursday. This reading followed the 2.6% increase recorded in December and came in line with the market expectation. On a monthly basis, the PCE Price Index rose 0.3% as forecast. The Core PCE Price Index, which excludes volatile food and energy prices, rose 2.8% on a yearly basis, matching analysts' estimate.
US Dollar price this week
The table below shows the percentage change of US Dollar (USD) against listed major currencies this week. US Dollar was the strongest against the New Zealand Dollar.
| USD | EUR | GBP | CAD | AUD | JPY | NZD | CHF | |
| USD | 0.09% | 0.34% | 0.46% | 0.85% | -0.11% | 1.50% | 0.45% | |
| EUR | -0.09% | 0.25% | 0.36% | 0.76% | -0.20% | 1.40% | 0.35% | |
| GBP | -0.34% | -0.25% | 0.12% | 0.51% | -0.45% | 1.16% | 0.11% | |
| CAD | -0.46% | -0.37% | -0.12% | 0.43% | -0.58% | 1.05% | -0.01% | |
| AUD | -0.87% | -0.76% | -0.50% | -0.38% | -0.96% | 0.67% | -0.39% | |
| JPY | 0.11% | 0.20% | 0.49% | 0.57% | 0.94% | 1.62% | 0.55% | |
| NZD | -1.53% | -1.42% | -1.17% | -1.06% | -0.67% | -1.63% | -1.06% | |
| CHF | -0.45% | -0.35% | -0.11% | 0.01% | 0.41% | -0.56% | 1.06% |
The heat map shows percentage changes of major currencies against each other. The base currency is picked from the left column, while the quote currency is picked from the top row. For example, if you pick the Euro from the left column and move along the horizontal line to the Japanese Yen, the percentage change displayed in the box will represent EUR (base)/JPY (quote).
The benchmark 10-year US Treasury bond yield retreated below 4.3% with the initial reaction to PCE inflation data and Wall Street's main indexes opened in positive territory, causing the USD to lose interest on Thursday. Souring market mood later in the American session and month-end flows, however, helped the currency regain its traction. Early Friday, the 10-year US yield stays flat at around 4.25% and US stock index futures trade modestly higher.
During the Asian trading hours, the data from China showed that the NBS Manufacturing PMI edged lower to 49.1 in February as expected, while the NBS Non-Manufacturing PMI and Caixin Manufacturing PMI improved to 51.4 and 50.9, respectively in the same period. AUD/USD staged a rebound in the Asian session and was last seen trading in positive territory slightly above 0.6500.
Australian Dollar consolidates amid a stable US Dollar, US Manufacturing PMI eyed.
After declining sharply on hawkish comments from Bank of Japan (BoJ) officials on Thursday, USD/JPY reversed its direction and climbed above 150.00 early Friday. The data from Japan showed that the Unemployment Rate ticked down to 2.4% in January from 2.5%.
Japanese Yen continues losing ground against USD amid divergent BoJ-Fed policy expectations.
EUR/USD lost 0.3% and registered its largest one-day decline since mid-February on Thursday. The pair, however, managed to stabilize above 1.0800 early Friday.
Despite the broad-based USD strength, Gold capitalized on retreating US yields and gathered bullish momentum, advancing to its highest level since early February at $2,050 on Thursday. XAU/USD stays in a consolidation phase slightly below this level in the European morning.
Gold price consolidates below one-month top, downside potential seems limited.
GBP/USD posted daily losses for the second straight day on Thursday. The pair stays below 1.2650 in the European morning on Friday.
- EUR/GBP posts modest gains around 0.8560 in Friday’s early European session.
- Markets expect the first rate cut from the ECB in June meeting 25 bps and a total 75bps for this year.
- BoE’s Ramsden said he wants to see how long inflation will remain elevated before considering a shifting monetary policy stance.
The EUR/GBP pair holds positive ground above the mid-0.8500s during the early European trading hours on Friday. Investors await the Eurozone Harmonized Index of Consumer Prices (HICP) for fresh impetus. The cross currently trades near 0.8560, down 0.01% on the day.
The European Central Bank (ECB) is anticipated to take another step in its policy normalization process. The ECB President Christine Lagarde would rule out rate cuts at the March meeting, but financial markets believe that the first potential rate cuts might occur in the June meeting. The markets repriced policy easing expectations in February from around 150 basis points (bps) worth of rate cuts to 87 bps and expect the first rate cut in June of 25 bps and a total of 75 bps for this year.
The Bank of England (BoE) Deputy Governor Dave Ramsden said he wants to see how long inflation will remain elevated before considering shifting monetary policy stance. The BoE policymakers pushed back against market expectations for early interest rate cuts, which lift the Pound Sterling (GBP) and cap the downside of the EUR/GBP cross.
Looking ahead, market players will keep an eye on the Eurozone Harmonized Index of Consumer Prices (HICP) due on Friday, along with the HCOB Manufacturing PMI from Italy, France, and Germany. Additionally, the BoE's Huw Pill is set to speak later in the day. The attention will shift to the ECB interest rate decision next week. This event might trigger the volatility in the market and traders could find trading opportunities around the EUR/GBP cross.
- EUR/JPY could meet the psychological resistance at the 163.00 level following February’s high at 163.72.
- EUR/JPY cross could find immediate support at the major level of 162.50.
- 14-day RSI indicates a bullish sentiment for the cross.
EUR/JPY retraces its recent losses, trading higher around 162.70 during the Asian session on Friday, following the psychological barrier of 163.00 level. A breakthrough above this barrier could lead the cross to explore the further resistance zone around the major level of 163.50 followed by February’s high at 163.72.
Technical analysis indicates a bullish sentiment for the EUR/JPY cross. The 14-day Relative Strength Index (RSI) is positioned above the 50 mark, signaling strength in the upward momentum.
However, the Moving Average Convergence Divergence (MACD) line is aligned with the signal line, indicating a convergence, while remaining above the centerline. Although the MACD is a lagging indicator, this configuration suggests a subdued momentum for the EUR/JPY cross at the moment.
On the downside, the EUR/JPY cross may encounter immediate support at the major level of 162.50, followed by the psychological level of 162.00. A breach below this support level could exert downward pressure on the pair, potentially testing the 21-day Exponential Moving Average (EMA) at 161.86.
Additionally, a further support zone for the EUR/JPY cross is anticipated around the major level of 161.50, with another significant support level near the 23.6% Fibonacci retracement level at 161.23.
EUR/JPY: Daily Chart
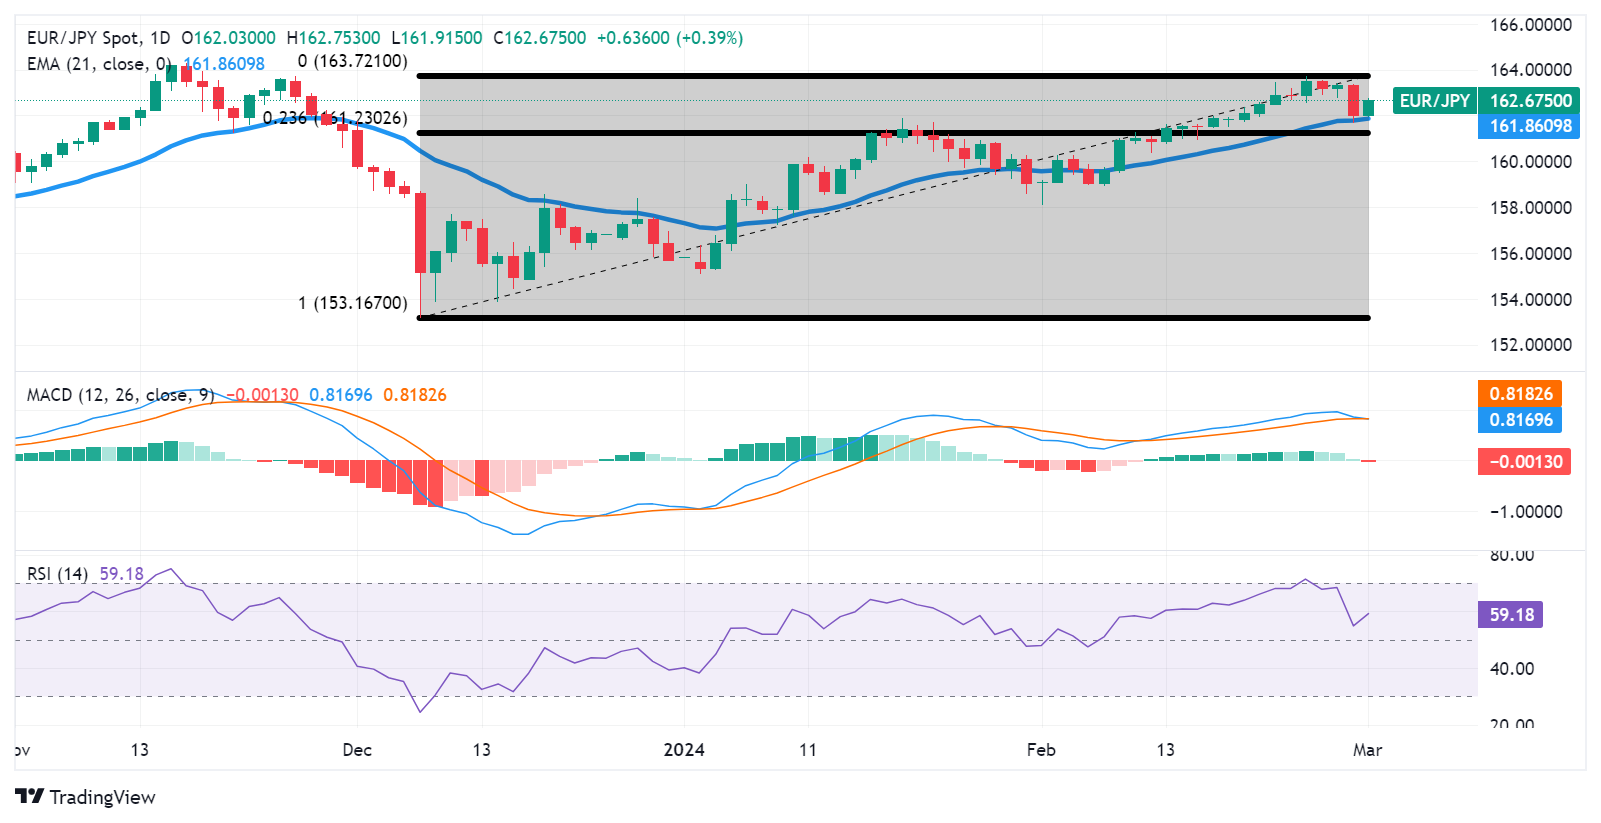
- EUR/USD holds positive ground near 1.0811 despite the stronger USD.
- The ECB is expected to cut its forecasts for inflation and growth at its March meeting next week.
- The US PCE figures were in line with expectations, with the Core PCE at 2.8% YoY in January.
- Investors await the first reading of the Eurozone HICP and the US ISM Manufacturing PMI report on Friday.
The EUR/USD pair snaps the three-day losing streak during the early European session on Friday. The major pair recovers despite the renewed US Dollar (USD) demand. Market players will take more cues from the Eurozone inflation data due later in the day. At press time, EUR/USD is trading at 1.0811, gaining 0.03% on the day.
Eurozone inflation declined further last month, triggering speculation for the European Central Bank (ECB) to start lowering interest rates from record highs later this year. Next week, the ECB will announce its interest rate decision on March 7, with no change in rate expected. The ECB is expected to cut its forecasts for inflation and growth at its March meeting while emphasizing the need for further data to ensure that growing wages do not cause price pressures before cutting borrowing rates.
The US January Personal Consumption Expenditure (PCE) Price Index was in line with expectations, with the headline PCE at 2.4% YoY and the Core PCE at 2.8% YoY. The report confirms that the US inflation rate is continuing to decelerate further. However, Federal Reserve (Fed) officials are likely to wait for more inflation data and still have no reason to hurry into cutting rates. Meanwhile, the escalating geopolitical tensions in the Middle East would also likely favor safe-haven assets like the US Dollar (USD).
Market participants await the first reading of the Eurozone Harmonized Index of Consumer Prices (HICP) for February and the US ISM Manufacturing PMI, due on Friday. Next week, the ECB interest rate decision will be in the spotlight. These events could give a clear direction to the EUR/USD pair.
- WTI edges higher on Friday, though the intraday uptick lacks bullish conviction.
- Mixed demand-supply cues hold back traders from placing fresh directional bets.
- Acceptance above the 200-day SMA supports prospects for further near-term gains.
West Texas Intermediate (WTI) US Crude Oil prices attract some buying near a technically significant 200-day Simple Moving Average (SMA) during the Asian session on Friday and for now, seem to have snapped a two-day losing streak. The commodity currently trades just above the $78.00/barrel mark, though remains well below a one-month high touched on Wednesday.
Easing inflation in the US should allow the Federal Reserve (Fed) to start cutting interest rates in June, which is anticipated to boost fuel demand in the world's largest Oil consumer. This, along with a modest US Dollar (USD) downtick, which tends to benefit the USD-denominated commodities, acts as a tailwind for the black liquid. Meanwhile, the expected continuation of the OPEC+ production cuts to the end of the second quarter of 2024 points to softer demand outlook. Apart from this, signs of higher supplies keep a lid on any further gains for Crude Oil prices.
In fact, record-high US production and higher output from OPEC signalled that global oil markets may not be as tight as initially expected. Furthermore, a recession in Japan and the UK, along with the darkening economic outlook for the Eurozone economy, points a weak picture for Crude demand. This might hold back traders from placing aggressive bullish bets around Crude Oil prices and continue to cap the upside. Nevertheless, the commodity remains on track to register strong weekly gains, marking the third week of a positive move in the previous four.
From a technical perspective, the recent breakout and acceptance above the very important 200-day SMA favours bullish traders. That said, the commodity's repeated failures to find acceptance above the $79.00/barrel mark warrant some caution before positioning for any further gains amid mixed oscillators on the daily chart.
China's Commerce Ministry is out with a statement on Friday following the conclusion of a two-day national trade work conference.
Key quotes
“China's trade faces a complex, severe and uncertain external environment.”
“Ministry vowed to help companies explore markets to get orders and to expand imports to ensure domestic demand.”
Related reads
- Australian Dollar maintains position amid a subdued US Dollar, awaits US Manufacturing PMI
- China NBS Manufacturing PMI eased to 49.1 in February, Services PMI improved to 51.4
- USD/CAD loses ground as WTI oil price improves to near $78.10 during the Asian hours.
- Canadian Dollar might have received support on the upbeat Canadian GDP Annualized.
- CME FedWatch Tool suggests the probability of rate cuts in March is at 3.0%.
USD/CAD breaks the winning streak that began on February 23, which could be attributed to the improved Crude oil prices as Canada is the largest oil exporter to the United States (US). The pair edges lower to near 1.3560 during the Asian session on Friday.
Additionally, upbeat Canada’s Gross Domestic Product (GDP) Annualized might have provided some support to underpinning the Canadian Dollar (CAD). The data reported a growth of 1.0% in the fourth quarter of 2023. The market expectation was an increase of 0.8% against the previous decline of 0.5%. Moreover, GDP (QoQ) rose by 0.2% against the previous decline of 0.1%.
The West Texas Intermediate (WTI) oil price is showing improvement, nearing $78.10, as speculation arises regarding the potential extension of supply cuts by the Organization of the Petroleum Exporting Countries and its allies (OPEC+) and ongoing tensions in the Middle East.
Recent data, including Gross Domestic Product (GDP) figures and the US Personal Consumption Expenditures - Price Index from the United States (US), has led to a postponement in market expectations for the Federal Reserve's (Fed) first-rate cut. This has provided support for the US Dollar (USD). Investors are now awaiting the final US S&P Global Manufacturing PMI for February, scheduled for release on Friday.
According to the CME FedWatch Tool, the probability of rate cuts in March is at 3.0%, with expectations decreasing to 23.1% in May and increasing to 52.2% in June. Atlanta Fed President Raphael W. Bostic commented that recent inflation data indicates a challenging path toward achieving the central bank's 2% inflation target. Moreover, Chicago Fed President Austan Dean Goolsbee anticipates the first-rate cuts later this year but refrained from specifying the exact timeline.
- GBP/USD stages a modest recovery from a one-week low amid a modest USD downtick.
- Bets that the Fed will not cut rates before the June policy meeting should limit USD losses.
- Traders now look to the US ISM PMI and Consumer Sentiment Index for a fresh impetus.
The GBP/USD pair attracts some buying during the Asian session on Friday and for now, seems to have snapped a two-day losing streak to a one-week low, around the 1.2615-1.2610 region touched the previous day. Spot prices currently trade around the 1.2630-1.2635 zone and remain at the mercy of the US Dollar (USD) price dynamics.
The US Personal Consumption Expenditures (PCE) Price Index released on Thursday showed that annual inflation in January was the lowest in three years and reaffirmed bets for an eventual rate cut by the Federal Reserve (Fed). This, in turn, fails to assist the USD Index (DXY), which tracks the Greenback against a basket of currencies, to capitalize on the previous day's bounce from a technically significant 200-day Simple Moving Average (SMA). Apart from this, the prevalent risk-on environment is seen as another factor undermining the Greenback's relative safe-haven status and lending some support to the GBP/USD pair.
The British Pound (GBP), on the other hand, draws support from the fact that the Bank of England (BoE) policymakers have been trying to push back against market expectations for early interest rate cuts. This further contributes to the bid tone surrounding the GBP/USD pair. That said, growing acceptance that the Fed will wait until the June policy meeting before lowering borrowing costs, bolstered by hawkish remarks by several FOMC officials, remains supportive of elevated US Treasury bond yields. This, in turn, should act as a tailwind for the USD and hold back bulls from placing aggressive bets around the GBP/USD pair.
Market participants now look to the release of the final UK Manufacturing PMI, which, along with a scheduled speech by the BoE Chief Economist Huw Pill, could provide some impetus. Later during the early North American session, traders will take cues from the US ISM Manufacturing PMI, the revised Michigan Consumer Sentiment Index and Fed Speak. Apart from this, the US bond yields, and the broader risk sentiment will drive the USD and produce short-term opportunities around the GBP/USD pair. Nevertheless, spot prices seem poised to register weekly losses ahead of important US macro data scheduled at the beginning of a new month.
- Gold price remains well supported by bets for an imminent Fed rate cut later this year.
- The prevalent risk-on environment keeps a lid on any further gains for the XAU/USD.
- Thursday’s sustained breakout through the $2,040-2,042 hurdle favours bullish traders.
Gold price (XAU/USD) holds steady around the $2,045 region during the Asian session on Friday and remains well within the striking distance of a nearly one-month peak touched the previous day. The US Personal Consumption Expenditures (PCE) Price Index released on Thursday showed that annual inflation in January was the lowest in three years, opening the door for an eventual interest rate cut by the Federal Reserve (Fed). This fails to assist the US Dollar (USD) to build on the overnight solid rebound from a technically significant 200-day SMA and turns out to be a key factor acting as a tailwind for the precious metal.
That said, comments by a slew of influential FOMC members suggest that the US central bank was in no hurry to cut interest rates. Moreover, investors seem convinced that the Fed will wait until the June policy meeting before lowering borrowing costs. This, in turn, remains supportive of elevated US Treasury bond yields and caps the upside for the non-yielding Gold price. Apart from this, the prevalent strong bullish sentiment across the global equity markets is seen as another factor holding back traders from placing fresh bullish bets around the safe-haven XAU/USD, warranting caution before positioning for further gains.
Daily Digest Market Movers: Gold price lacks follow-through buying amid Fed’s hawkish outlook
- The US inflation data came in line with market expectations, suggesting that the Federal Reserve is going to stay on track to cut interest rates later this year and lending some support to the Gold price.
- The Core US PCE Price Index – the Fed's preferred inflation gauge that excludes food and energy prices – climbed 0.4% in January and the yearly rate eased to 2.4% from 2.6% in the previous month.
- Meanwhile, the CME Group's FedWatch Tool indicates that markets are still pricing in the possibility of the first interest rate cut in June and the bets were reaffirmed by comments by several Fed officials.
- Atlanta Fed President Raphael Bostic said that the speed at which US inflation is easing means it will likely be appropriate for the US central bank to start cutting interest rates during the summertime.
- San Francisco Fed President Mary Daly said central bank officials are ready to lower interest rates as needed but emphasized there is no urgent need to do so given the strength of the US economy.
- Cleveland Fed President Loretta Mester said the recent inflation data suggests that policymakers have more work to do to cool price pressures but didn't change her view for three rate cuts this year.
- New York Fed President John Williams reiterated that the next move for the US central bank is likely to be cut to its interest rate target, though noted there is no sense of urgency to do that.
- The US Treasury bond yields aren’t far from their recent highs, which, along with an extension of the risk-on rally across the global equity markets, keeps a lid on further gains for the safe-haven XAU/USD.
Technical analysis: Gold price bulls might aim to test the next relevant hurdle near the $2,065 area
From a technical perspective, the overnight breakout through the $2,040-2,042 horizontal resistance was seen as a fresh trigger for bullish traders. Moreover, oscillators on the daily chart have been gaining positive traction and support prospects for an extension of the recent goodish rebound from the YTD low, around the $1,984 region touched in February. Hence, a subsequent strength towards the next relevant hurdle near the $2,065 region, en route to the $2,100 round figure, looks like a distinct possibility.
On the flip side, weakness back below the $2,040-2,042 resistance-turned-support might now be seen as a buying opportunity and is more likely to find decent support near the $2,025-2,024 area, or the weekly low. This is followed by the 100-day Simple Moving Average (SMA), currently near the $2,014 region. This is followed by the $2,000 psychological mark, which if broken might shift the near-term bias in favour of bearish traders and drag the Gold price to the $1,984 support en route to the very important 200-day SMA, near the $1,969-1,968 zone.
US Dollar price today
The table below shows the percentage change of US Dollar (USD) against listed major currencies today. US Dollar was the strongest against the Japanese Yen.
| USD | EUR | GBP | CAD | AUD | JPY | NZD | CHF | |
| USD | -0.14% | -0.06% | -0.07% | -0.20% | 0.17% | -0.18% | -0.05% | |
| EUR | 0.13% | 0.07% | 0.05% | -0.06% | 0.31% | -0.05% | 0.09% | |
| GBP | 0.06% | -0.07% | -0.04% | -0.13% | 0.24% | -0.12% | 0.01% | |
| CAD | 0.09% | -0.03% | 0.04% | -0.09% | 0.28% | -0.08% | 0.04% | |
| AUD | 0.20% | 0.06% | 0.13% | 0.11% | 0.37% | 0.02% | 0.15% | |
| JPY | -0.16% | -0.31% | -0.23% | -0.26% | -0.36% | -0.34% | -0.22% | |
| NZD | 0.16% | 0.02% | 0.11% | 0.09% | -0.04% | 0.34% | 0.11% | |
| CHF | 0.04% | -0.08% | 0.00% | -0.05% | -0.13% | 0.24% | -0.12% |
The heat map shows percentage changes of major currencies against each other. The base currency is picked from the left column, while the quote currency is picked from the top row. For example, if you pick the Euro from the left column and move along the horizontal line to the Japanese Yen, the percentage change displayed in the box will represent EUR (base)/JPY (quote).
Gold FAQs
Why do people invest in Gold?
Gold has played a key role in human’s history as it has been widely used as a store of value and medium of exchange. Currently, apart from its shine and usage for jewelry, the precious metal is widely seen as a safe-haven asset, meaning that it is considered a good investment during turbulent times. Gold is also widely seen as a hedge against inflation and against depreciating currencies as it doesn’t rely on any specific issuer or government.
Who buys the most Gold?
Central banks are the biggest Gold holders. In their aim to support their currencies in turbulent times, central banks tend to diversify their reserves and buy Gold to improve the perceived strength of the economy and the currency. High Gold reserves can be a source of trust for a country’s solvency. Central banks added 1,136 tonnes of Gold worth around $70 billion to their reserves in 2022, according to data from the World Gold Council. This is the highest yearly purchase since records began. Central banks from emerging economies such as China, India and Turkey are quickly increasing their Gold reserves.
How is Gold correlated with other assets?
Gold has an inverse correlation with the US Dollar and US Treasuries, which are both major reserve and safe-haven assets. When the Dollar depreciates, Gold tends to rise, enabling investors and central banks to diversify their assets in turbulent times. Gold is also inversely correlated with risk assets. A rally in the stock market tends to weaken Gold price, while sell-offs in riskier markets tend to favor the precious metal.
What does the price of Gold depend on?
The price can move due to a wide range of factors. Geopolitical instability or fears of a deep recession can quickly make Gold price escalate due to its safe-haven status. As a yield-less asset, Gold tends to rise with lower interest rates, while higher cost of money usually weighs down on the yellow metal. Still, most moves depend on how the US Dollar (USD) behaves as the asset is priced in dollars (XAU/USD). A strong Dollar tends to keep the price of Gold controlled, whereas a weaker Dollar is likely to push Gold prices up.
- NZD/USD snaps its losing streak on hawkish remarks from RBNZ Governor Adrian Orr.
- Governor Orr noted that while inflation remains elevated, it is trending downward.
- Market expectations for the Fed’s first-rate cut have been pushed back due to recent US data.
NZD/USD broke its four-day losing streak following comments from Reserve Bank of New Zealand (RBNZ) Governor Adrian Orr on Friday. Orr stated that the central bank anticipates commencing policy normalization in 2025. As a result, the pair climb higher, reaching near 0.6090 during the Asian session.
Governor Orr mentioned that the economy is progressing as expected, with inflation expectations decreasing. While inflation remains elevated, it is on a downward trend. Orr emphasized the need for monetary policy to remain restrictive for some time. He also expressed expectations for economic growth to pick up in 2024.
The US Dollar Index (DXY) is slightly lower, hovering near 104.10, despite the improved US Treasury bond yields, which stand at 4.63% for the 2-year and 4.25% for the 10-year bonds at the time of publication. However, market expectations for the Federal Reserve's first-rate cut have been pushed back due to recent Gross Domestic Product (GDP) data from the United States (US), providing support for the US Dollar (USD).
The Greenback gained ground following the release of the Federal Reserve's preferred inflation gauge, the US Personal Consumption Expenditures - Price Index, which met expectations. Investors are now focusing on the final US S&P Global Manufacturing PMI for February, scheduled for release on Friday.
The US Personal Consumption Expenditure (PCE) Price Index expanded by 2.4% year-over-year (YoY) in January, down from the previous reading of 2.6%, aligning with market expectations. On a month-over-month basis, the index increased by 0.3%, compared to a 0.1% increase in the prior period.
Meanwhile, the US Core PCE, the Federal Reserve's preferred inflation measure, grew by 2.8% YoY, slightly lower than December's 2.9%, in line with consensus estimates. On a monthly basis, the core PCE rose by 0.4%, surpassing the previous 0.1% increase.
- Indian Rupee trades on a stronger note amid the decline of USD.
- The pace of Indian GDP growth was the strongest among major economies last quarter.
- India’s S&P Global Manufacturing PMI and the US ISM Manufacturing PMI Index will be the highlights on Friday.
Indian Rupee (INR) recovers some lost ground on Friday. However, the US Dollar (USD) demand from foreign and state-run banks might cap an uptick of the pair. The pace of GDP growth in the Indian economy was the strongest among major economies last quarter. Prime Minister Narendra Modi's administration has been swiftly attracting multinational corporations to establish factories in the country while spending billions of dollars to improve highways, ports, airports, and trains.
The International Monetary Fund (IMF) forecast India's GDP will grow by 6.5% in 2024. Nonetheless, the rebound in oil prices and elevated domestic inflation might cap the upside of the USD/INR pair.
Investors will focus on India’s S&P Global Manufacturing PMI ahead of the US ISM Manufacturing PMI Index, due on Friday. Also, Fed’s Williams, Logan, Waller, Bostic, Daly, and Kluger are set to speak later in the day. The stronger-than-expected US PMI data might trigger speculation about the delay of interest rate cuts, which will provide some support to the Greenback and USD/INR.
Daily Digest Market Movers: Indian Rupee remains strong amid the uncertainties
- The Indian economy grew by 8.4% during the October-December quarter of FY24, better than the estimation of 7.3%, according to the Statistics Ministry.
- India’s GDP Annual growth rate expanded by 7.6% from 7.2%.
- The US Personal Consumption Expenditure (PCE) Price Index eased from 2.6% to 2.4% YoY, in line with market expectations.
- The Core PCE, the Fed preferred inflation gauge, rose by 2.8% YoY in January compared to December’s reading of. 2.9%, matching the consensus.
- Atlanta Fed President Raphael Bostic said that the recent inflation data indicates the road back to the central bank’s 2% inflation target will be “bumpy.”, while Chicago Fed President Austan Goolsbee, stated that he expects the first rate cuts later this year, but he cannot specify the timeline.
- Investors have already fully priced out a Fed rate cut in March but priced in 50% odds of a rate cut in the June meeting.
Technical Analysis: Indian Rupee remains capped in the longer-term range-bound theme
Indian Rupee trades strongly on the day. USD/INR remains confined within a multi-month-old descending trend channel between 82.70 and 83.20 since December 8, 2023.
In the short term, USD/INR keeps the negative bias unchanged as the pair is still below the 100-day Exponential Moving Average on the daily timeframe. Furthermore, the 14-day Relative Strength Index (RSI) holds in the negative zone below the 50.0 midline, supporting the sellers for the time being.
The initial support level for the pair is seen at the lower limit of the descending trend channel at 82.70. A breach of this level might convince USD bears to extend the pair’s downtrend near a low of August 23 at 82.45, followed by a low of June 1 at 82.25.
In the case of a bullish trading environment, the critical upside barrier will emerge at the 83.00 mark, portraying the confluence of the 100-day EMA and a psychological round figure. Further north, the next hurdle to watch is a high of January 2 at 83.35, and finally at 84.00.
US Dollar price today
The table below shows the percentage change of US Dollar (USD) against listed major currencies today. US Dollar was the weakest against the Australian Dollar.
| USD | EUR | GBP | CAD | AUD | JPY | NZD | CHF | |
| USD | -0.13% | -0.06% | -0.09% | -0.20% | 0.17% | -0.12% | -0.03% | |
| EUR | 0.13% | 0.08% | 0.03% | -0.06% | 0.31% | 0.00% | 0.11% | |
| GBP | 0.06% | -0.07% | -0.04% | -0.13% | 0.24% | -0.07% | 0.03% | |
| CAD | 0.09% | -0.03% | 0.04% | -0.09% | 0.28% | -0.02% | 0.07% | |
| AUD | 0.20% | 0.04% | 0.13% | 0.09% | 0.37% | 0.06% | 0.16% | |
| JPY | -0.17% | -0.29% | -0.21% | -0.26% | -0.34% | -0.29% | -0.20% | |
| NZD | 0.13% | -0.02% | 0.06% | 0.04% | -0.07% | 0.29% | 0.10% | |
| CHF | 0.04% | -0.10% | -0.02% | -0.06% | -0.15% | 0.22% | -0.09% |
The heat map shows percentage changes of major currencies against each other. The base currency is picked from the left column, while the quote currency is picked from the top row. For example, if you pick the Euro from the left column and move along the horizontal line to the Japanese Yen, the percentage change displayed in the box will represent EUR (base)/JPY (quote).
Indian Rupee FAQs
What are the key factors driving the Indian Rupee?
The Indian Rupee (INR) is one of the most sensitive currencies to external factors. The price of Crude Oil (the country is highly dependent on imported Oil), the value of the US Dollar – most trade is conducted in USD – and the level of foreign investment, are all influential. Direct intervention by the Reserve Bank of India (RBI) in FX markets to keep the exchange rate stable, as well as the level of interest rates set by the RBI, are further major influencing factors on the Rupee.
How do the decisions of the Reserve Bank of India impact the Indian Rupee?
The Reserve Bank of India (RBI) actively intervenes in forex markets to maintain a stable exchange rate, to help facilitate trade. In addition, the RBI tries to maintain the inflation rate at its 4% target by adjusting interest rates. Higher interest rates usually strengthen the Rupee. This is due to the role of the ‘carry trade’ in which investors borrow in countries with lower interest rates so as to place their money in countries’ offering relatively higher interest rates and profit from the difference.
What macroeconomic factors influence the value of the Indian Rupee?
Macroeconomic factors that influence the value of the Rupee include inflation, interest rates, the economic growth rate (GDP), the balance of trade, and inflows from foreign investment. A higher growth rate can lead to more overseas investment, pushing up demand for the Rupee. A less negative balance of trade will eventually lead to a stronger Rupee. Higher interest rates, especially real rates (interest rates less inflation) are also positive for the Rupee. A risk-on environment can lead to greater inflows of Foreign Direct and Indirect Investment (FDI and FII), which also benefit the Rupee.
How does inflation impact the Indian Rupee?
Higher inflation, particularly, if it is comparatively higher than India’s peers, is generally negative for the currency as it reflects devaluation through oversupply. Inflation also increases the cost of exports, leading to more Rupees being sold to purchase foreign imports, which is Rupee-negative. At the same time, higher inflation usually leads to the Reserve Bank of India (RBI) raising interest rates and this can be positive for the Rupee, due to increased demand from international investors. The opposite effect is true of lower inflation.
- India’s Nifty and Sensex are set to open higher on Friday, tracking positive global stocks.
- Nifty and Sensex settled slightly higher on Thursday after losing over 1.0% a day before.
- US Core PCE inflation came in line with estimates, India’s GDP blewout with 8.4% YoY in Q3.
The Sensex 30 and Nifty 50, India’s key benchmark indices, eye a positive opening on Friday after outstanding India’s growth numbers.
Gift Nifty futures are up nearly 0.25% on the day so far, pointing to an upbeat start while traders could take the positive lead from Wall Street and Asian stock markets.
The National Stock Exchange (NSE) Nifty 50 closed 0.14% higher at 21,982.80 and the Bombay Stock Exchange (BSE) Sensex 30 gained 0.27% on the day to finish at 72,500.30.
Stock market news
- On Thursday, top gainers on Nifty were IndusInd Bank, Tata Consumer Products, Britannia, Adani Enterprises and Adani Ports. Meanwhile, the main losers were Apollo Hospitals, Eicher Motors, Bajaj Auto, Bharti Airtel and UPL.
- Shriram Finance will replace UPL in the Nifty 50 index from March 28.
- Foreign direct investment (FDI) inflows in India declined 13% to USD 32.03 billion in April-December 2023, according to the latest government data.
- Brightcom Group tanked 7% after the Securities and Exchange Board of India (SEBI) refused to lift restrictions on promoter.
- Reliance, Viacom 18 and Walt Disney announced a binding agreement to merge their business on Wednesday.
- India's Gross Domestic Product (GDP) expanded by 8.4% on an annual basis in the third quarter (October-December), as against a 7.6% in the previous quarter, data released by the National Statistical Office (NSO) showed Thursday.
- The US stock markets closed higher on Thursday after the key US Personal Consumption Expenditures (PCE) Price Index increased 0.4% for the month and 2.8% from a year ago, as expected.
- Markets are currently pricing in just about a 20% chance that the US Federal Reserve (Fed) could begin easing rates in May, much lower than an over 90% chance a month ago, according to the CME FedWatch Tool. For the June meeting, the probability for a rate cut now stands at about 62%, down from 70% seen a week ago.
- Attention now turns toward the US ISM Manufacturing PMI for fresh trading incentives.
Sensex FAQs
What is the Sensex?
The Sensex is a name for one of India’s most closely monitored stock indexes. The term was coined in the 1980s by analyst Deepak Mohoni by mashing the words sensitive and index together. The index plots a weighted average of the share price of 30 of the most established stocks on the Bombay Stock Exchange. Each corporation's weighting is based on its “free-float capitalization”, or the value of all its shares readily available for trading.
What factors drive the Sensex?
Given it is a composite, the value of the Sensex is first and foremost dependent on the performance of its constituent companies as revealed in their quarterly and annual results. Government policies are another factor. In 2016 the government decided to phase out high value currency notes, for example, and certain companies saw their share price fall as a result. When the government decided to cut corporation tax in 2019, meanwhile, the Sensex gained a boost. Other factors include the level of interest rates set by the Reserve Bank of India, since that dictates the cost of borrowing, climate change, pandemics and natural disasters
What are the key milestones for the Sensex?
The Sensex started life on April 1 1979 at a base level of 100. It reached its highest recorded level so far, at 73,328, on Monday, January 15, 2024 (this is being written in Feb 2024). The Index closed above the 10,000 mark for the first time on February 7, 2006. On March 13, 2014 the Sensex closed higher than Hong Kong’s Hang Seng index to become the major Asian stock index with the highest value. The index’s biggest gain in a single day occurred on April 7, 2020, when it rose 2,476 points; its deepest single-day loss occurred on January 21, 2008, when it plunged 1,408 points due the US subprime crisis.
What major corporations are in the Sensex?
Major companies within the Sensex include Reliance Industries Ltd, HDFC Bank, Axis Bank, ITC Ltd, Bharti Airtel Ltd, Tata Steel, HCL Technologies, Infosys, State Bank of India, Sun Pharma, Tata Consultancy Services and Tech Mahindra.
| Raw materials | Closed | Change, % |
|---|---|---|
| Silver | 22.668 | 1 |
| Gold | 2043.816 | 0.44 |
| Palladium | 940.79 | 1.93 |
- The Japanese Yen drifts lower on Friday and retreats further from over a two-week high.
- The BoJ policy uncertainty and the risk-on environment undermine the safe-haven JPY.
- Firming expectations for a June Fed rate cut move might cap the upside for the USD.
The Japanese Yen (JPY) strengthened sharply against its American counterpart and shot to over a two-week high on Thursday after the Bank of Japan (BoJ) board member Hajime Takata dropped the clearest hint of a looming rate hike. That said, the BoJ Governor Kazuo Ueda sounded a bit cautious and tempered speculations about an imminent shift in the policy stance. Moreover, investors seem convinced that a recession in Japan could force the BoJ to delay its plan to pivot away from the ultra-loose policy. This, along with an extension of the recent risk-on rally in the equity markets, kept a lid on any further gains for the safe-haven JPY.
Apart from this, the emergence of some US Dollar (USD) buying assisted the USD/JPY pair to rebound around 75 pips from the 149.20 area and gain some positive traction during the Asian session on Friday. Meanwhile, the US Personal Consumption Expenditures (PCE) Price Index for January matched expectations and showed that the annual increase in inflation was the smallest in nearly three years. This reaffirmed market bets that the Federal Reserve (Fed) will start cutting interest rates at the June policy meeting. This could hold back the USD bulls from placing aggressive bets and cap any further upside for the currency pair.
Daily digest market movers: Japanese Yen drifts lower despite hawkish BoJ talk
- The Bank of Japan board member Hajime Takata said that the central bank must consider an exit from its ultra-loose policy as the achievement of the 2% inflation target is becoming within sight and boosted the Japanese Yen on Thursday.
- In contrast, the BoJ Governor Kazuo Ueda said that it was too early to conclude that inflation was close to sustainably meeting the central bank's 2% target and stressed the need to confirm whether a positive wage-inflation cycle would kick off.
- A private-sector survey showed this Friday that Japan's factory activity shrank at the fastest pace in over three-and-a-half years in February, with the final au Jibun Bank Japan Manufacturing PMI shrinking to 47.2 from 48.0 in January.
- The data suggested that weakening demand has worsened the economic outlook and comes on top of an unexpected economic contraction during the fourth quarter, which could delay the BoJ's plans to tighten its policy in the coming months.
- The US Dollar attracted fresh buying after an initial dip that followed the release of the US inflation data and registered its second straight monthly gain, assisting the USD/JPY pair to stage a goodish bounce from over a two-week trough.
- The Core US PCE Price Index – the Federal Reserve's preferred inflation gauge that excludes food and energy – climbed 0.4% in January and the yearly rate eased to 2.4% from 2.6%, matching estimates and reaffirming June rate cut bets.
- Separately, the US Department of Labor reported that the number of American citizens applying for unemployment insurance benefits for the first time increased more than expected, by 13K to 215K in the week ending February 24.
- Atlanta Fed President Raphael Bostic said that it would probably be appropriate to reduce the policy rate in the summertime and that the last few inflation readings had shown that it is going to be a bumpy path back toward the 2% target.
- San Francisco Fed President Mary C. Daly noted that the US central bank shouldn't hasten to reduce interest rates as the economy remains firm and sees little risk of faltering, though is ready to do so when the macro data demands it.
- Cleveland Fed President Loretta J. Mester said that inflation remains a challenge that the US central bank needs to overcome, but rate cuts should resume later this year as long as the incoming economic data gives enough room to operate.
- New York Fed President, John Williams, acknowledged that the resilience of the US economy is remarkable and expects the US central bank to cut interest rates later this year, but doesn't see the sense of urgency for immediate action.
- Traders now look to the US economic docket, featuring the release of the ISM Manufacturing PMI and the revised Michigan Consumer Sentiment Index, which, along with Fed speak, should influence the USD and provide some impetus.
Technical analysis: USD/JPY needs to break through a short-term trading range
From a technical perspective, any subsequent move up is likely to confront stiff resistance near the 150.65-150.70 region. This is closely followed by a multi-month peak, around the 150.90 zone touched on February 13, which if cleared decisively will be seen as a fresh trigger for bullish traders. Given that oscillators on the daily chart are holding comfortably in the positive territory, the USD/JPY pair might then climb to the 151.45 hurdle en route to the 152.00 neighbourhood, or a multi-decade peak set in October 2022 and retested in November 2023.
On the flip side, the 150.00 psychological mark now seems to protect the immediate downside, below which spot prices could slide back towards the overnight swing low, around the 149.20 area. Some follow-through selling, leading to a subsequent break below the 149.00 mark, might shift the bias in favour of bearish traders and make the USD/JPY pair vulnerable.
Japanese Yen price today
The table below shows the percentage change of Japanese Yen (JPY) against listed major currencies today. Japanese Yen was the strongest against the US Dollar.
| USD | EUR | GBP | CAD | AUD | JPY | NZD | CHF | |
| USD | -0.16% | -0.08% | -0.05% | -0.13% | 0.17% | -0.16% | -0.04% | |
| EUR | 0.16% | 0.08% | 0.09% | 0.03% | 0.34% | 0.00% | 0.12% | |
| GBP | 0.09% | -0.07% | 0.02% | -0.04% | 0.27% | -0.07% | 0.05% | |
| CAD | 0.05% | -0.09% | -0.01% | -0.06% | 0.25% | -0.09% | 0.02% | |
| AUD | 0.13% | -0.03% | 0.05% | 0.06% | 0.31% | -0.04% | 0.08% | |
| JPY | -0.17% | -0.33% | -0.25% | -0.24% | -0.29% | -0.34% | -0.21% | |
| NZD | 0.16% | 0.00% | 0.09% | 0.10% | 0.03% | 0.33% | 0.12% | |
| CHF | 0.04% | -0.12% | -0.03% | -0.02% | -0.08% | 0.23% | -0.12% |
The heat map shows percentage changes of major currencies against each other. The base currency is picked from the left column, while the quote currency is picked from the top row. For example, if you pick the Euro from the left column and move along the horizontal line to the Japanese Yen, the percentage change displayed in the box will represent EUR (base)/JPY (quote).
Japanese Yen FAQs
What key factors drive the Japanese Yen?
The Japanese Yen (JPY) is one of the world’s most traded currencies. Its value is broadly determined by the performance of the Japanese economy, but more specifically by the Bank of Japan’s policy, the differential between Japanese and US bond yields, or risk sentiment among traders, among other factors.
How do the decisions of the Bank of Japan impact the Japanese Yen?
One of the Bank of Japan’s mandates is currency control, so its moves are key for the Yen. The BoJ has directly intervened in currency markets sometimes, generally to lower the value of the Yen, although it refrains from doing it often due to political concerns of its main trading partners. The current BoJ ultra-loose monetary policy, based on massive stimulus to the economy, has caused the Yen to depreciate against its main currency peers. This process has exacerbated more recently due to an increasing policy divergence between the Bank of Japan and other main central banks, which have opted to increase interest rates sharply to fight decades-high levels of inflation.
How does the differential between Japanese and US bond yields impact the Japanese Yen?
The BoJ’s stance of sticking to ultra-loose monetary policy has led to a widening policy divergence with other central banks, particularly with the US Federal Reserve. This supports a widening of the differential between the 10-year US and Japanese bonds, which favors the US Dollar against the Japanese Yen.
How does broader risk sentiment impact the Japanese Yen?
The Japanese Yen is often seen as a safe-haven investment. This means that in times of market stress, investors are more likely to put their money in the Japanese currency due to its supposed reliability and stability. Turbulent times are likely to strengthen the Yen’s value against other currencies seen as more risky to invest in.
- Australian Dollar strengthened in response to the increase in the S&P/ASX 200 Index.
- Australian capital market surged to new record highs, buoyed by gains in Wall Street overnight.
- Chinese Manufacturing PMI declined to 49.1 and Non-Manufacturing PMI improved to 51.4 in February.
- US Dollar Index (DXY) maintains stability amid the improved US Treasury yields.
The Australian Dollar (AUD) remains in positive territory on Friday, buoyed by a rise in the S&P/ASX 200 Index to new record highs, coupled with gains in Wall Street overnight. However, the AUD/USD pair saw some retracement on Thursday as the US Dollar (USD) strengthened following the release of the Federal Reserve's preferred inflation gauge, the US Personal Consumption Expenditures - Price Index, which met expectations.
Australian Dollar received a boost after the release of Australia's Retail Sales and Private Capital Expenditure data on Thursday. Additionally, the Judo Bank Manufacturing PMI indicated a slight improvement in Australia's manufacturing sector, with the February reading rising to 47.8 from 47.7 in the previous period.
The US Dollar Index (DXY) remains stable with the uptick in US Treasury yields. The delay in expectations for the Federal Reserve's first rate cut, prompted by recent Gross Domestic Product (GDP) data from the United States (US), has lent support to the Greenback. Investors are now turning their attention to the final US S&P Global Manufacturing PMI for February, which is due to be released on Friday.
Daily Digest Market Movers: Australian Dollar improves on higher equity market
- The seasonally adjusted Australian Retail Sales (MoM) grew by 1.1% in January, lower than expected 1.5% but swinging from the previous decline of 2.7%.
- Australian Private Capital Expenditure improved by 0.8% in the fourth quarter of 2023, from the expected 0.5% and 0.6% prior.
- Australian Monthly Consumer Price Index (CPI) was unchanged at 3.4% for January, which was below market expectations of 3.5%.
- Warren Hogan, Chief Economist Advisor at Judo Bank, expressed concerns about Australia's manufacturing sector, stating that it is not experiencing growth. This observation calls into question the notion of a post-pandemic manufacturing revival.
- Chinese Manufacturing PMI met expectations at 49.1 in February but fell slightly from the previous reading of 49.2. Non-manufacturing PMI improved to 51.4 from the prior 50.7, surpassing the expected reading of 50.8.
- Atlanta Fed President Raphael W. Bostic remarked that recent inflation data suggests the path to achieving the central bank's 2% inflation target will be challenging.
- Chicago Fed President Austan Dean Goolsbee stated that he anticipates the first-rate cuts later this year but refrained from specifying the exact timeline.
- New York Federal Reserve (Fed) President John Williams stated on Wednesday that while there remains some ground to cover in reaching the Fed's 2% inflation target, the possibility of interest rate cuts this year is on the table, contingent upon incoming data.
- According to the CME FedWatch Tool, the probability of rate cuts in March stands at 3.0%, while the likelihood of cuts in May and June is estimated at 23.1% and 52.2%, respectively.
- US Personal Consumption Expenditure (PCE) Price Index grew by 2.4% YoY in January, against the 2.6% prior, in line with the market expectation. The index increased by 0.3% month-over-month, against 0.1% prior.
- US Core PCE (YoY), the Fed preferred inflation gauge, rose by 2.8% compared to December’s reading of 2.9, matching with the consensus. The monthly figure showed a rise of 0.4% as expected, above the previous rise of 0.1%.
- The preliminary US Gross Domestic Product Annualized grew by 3.2% in the fourth quarter of 2023, slightly below market expectations of remaining steady at 3.3%.
- The preliminary US Gross Domestic Product Price Index (Q4) increased by 1.7% against the expected and previous rise of 1.5%.
- US Housing Price Index (MoM) increased by 0.1% in December, falling short of the 0.3% expected and 0.4% prior.
Technical Analysis: Australian Dollar hovers around the psychological level of 0.6500
The Australian Dollar hovers around the psychological level of 0.6500 on Friday. A breach below this level could potentially trigger a downward move in the AUD/USD pair, targeting the area around the major support level of 0.6450 and February’s low at 0.6442. Conversely, on the upside, immediate resistance is observed around the 14-day Exponential Moving Average (EMA) at 0.6526, followed by the 23.6% Fibonacci retracement level at 0.6543 and the major level of 0.6550. If the pair breaks above this resistance zone, it may approach the psychological level of 0.6600.
AUD/USD: Daily Chart
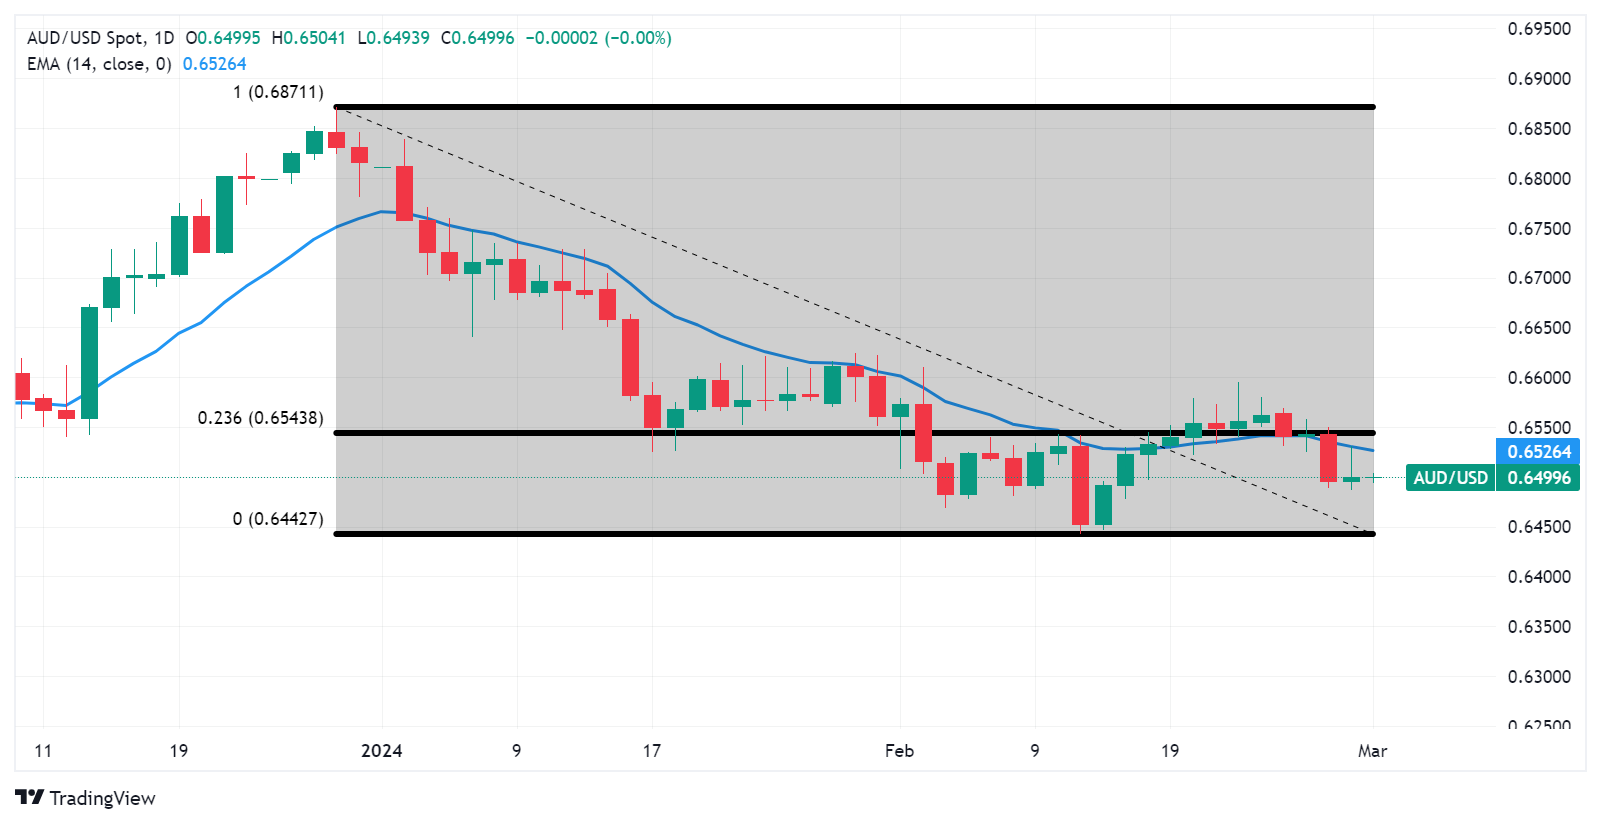
Australian Dollar price today
The table below shows the percentage change of Australian Dollar (AUD) against listed major currencies today. Australian Dollar was the strongest against the Japanese Yen.
| USD | EUR | GBP | CAD | AUD | JPY | NZD | CHF | |
| USD | -0.13% | -0.05% | -0.06% | -0.08% | 0.17% | -0.13% | -0.04% | |
| EUR | 0.13% | 0.08% | 0.06% | 0.06% | 0.31% | 0.01% | 0.09% | |
| GBP | 0.06% | -0.08% | -0.02% | -0.01% | 0.24% | -0.07% | 0.02% | |
| CAD | 0.06% | -0.06% | 0.02% | 0.00% | 0.26% | -0.06% | 0.03% | |
| AUD | 0.08% | -0.06% | 0.02% | 0.00% | 0.26% | -0.06% | 0.03% | |
| JPY | -0.17% | -0.30% | -0.22% | -0.25% | -0.25% | -0.31% | -0.21% | |
| NZD | 0.13% | -0.02% | 0.06% | 0.07% | 0.04% | 0.30% | 0.08% | |
| CHF | 0.04% | -0.10% | -0.01% | -0.03% | -0.03% | 0.22% | -0.08% |
The heat map shows percentage changes of major currencies against each other. The base currency is picked from the left column, while the quote currency is picked from the top row. For example, if you pick the Euro from the left column and move along the horizontal line to the Japanese Yen, the percentage change displayed in the box will represent EUR (base)/JPY (quote).
Australian Dollar FAQs
What key factors drive the Australian Dollar?
One of the most significant factors for the Australian Dollar (AUD) is the level of interest rates set by the Reserve Bank of Australia (RBA). Because Australia is a resource-rich country another key driver is the price of its biggest export, Iron Ore. The health of the Chinese economy, its largest trading partner, is a factor, as well as inflation in Australia, its growth rate and Trade Balance. Market sentiment – whether investors are taking on more risky assets (risk-on) or seeking safe-havens (risk-off) – is also a factor, with risk-on positive for AUD.
How do the decisions of the Reserve Bank of Australia impact the Australian Dollar?
The Reserve Bank of Australia (RBA) influences the Australian Dollar (AUD) by setting the level of interest rates that Australian banks can lend to each other. This influences the level of interest rates in the economy as a whole. The main goal of the RBA is to maintain a stable inflation rate of 2-3% by adjusting interest rates up or down. Relatively high interest rates compared to other major central banks support the AUD, and the opposite for relatively low. The RBA can also use quantitative easing and tightening to influence credit conditions, with the former AUD-negative and the latter AUD-positive.
How does the health of the Chinese Economy impact the Australian Dollar?
China is Australia’s largest trading partner so the health of the Chinese economy is a major influence on the value of the Australian Dollar (AUD). When the Chinese economy is doing well it purchases more raw materials, goods and services from Australia, lifting demand for the AUD, and pushing up its value. The opposite is the case when the Chinese economy is not growing as fast as expected. Positive or negative surprises in Chinese growth data, therefore, often have a direct impact on the Australian Dollar and its pairs.
How does the price of Iron Ore impact the Australian Dollar?
Iron Ore is Australia’s largest export, accounting for $118 billion a year according to data from 2021, with China as its primary destination. The price of Iron Ore, therefore, can be a driver of the Australian Dollar. Generally, if the price of Iron Ore rises, AUD also goes up, as aggregate demand for the currency increases. The opposite is the case if the price of Iron Ore falls. Higher Iron Ore prices also tend to result in a greater likelihood of a positive Trade Balance for Australia, which is also positive of the AUD.
How does the Trade Balance impact the Australian Dollar?
The Trade Balance, which is the difference between what a country earns from its exports versus what it pays for its imports, is another factor that can influence the value of the Australian Dollar. If Australia produces highly sought after exports, then its currency will gain in value purely from the surplus demand created from foreign buyers seeking to purchase its exports versus what it spends to purchase imports. Therefore, a positive net Trade Balance strengthens the AUD, with the opposite effect if the Trade Balance is negative.
China’s official Manufacturing Purchasing Managers' Index (PMI) eased to 49.1 in February from the previous reading of 49.2, the latest data published by the country’s National Bureau of Statistics (NBS) showed on Friday. Markets expected a 49.1 readout in the reported month.
The NBS Non-Manufacturing PMI improved to 51.4 in February versus 50.7 in January, stronger than the estimation of 50.8.
Market reaction
At the time of writing, the AUD/USD pair is trading around 0.6505, up 0.09% on the day.
The People’s Bank of China (PBoC) set the USD/CNY central rate for the trading session ahead on Friday at 7.1059 as compared to 7.2011 Reuters estimates.
- The US Dollar Index (DXY) holds positive ground around 104.13 in Friday’s early Asian session.
- The US Core PCE rose by 2.8% YoY in January vs. December’s reading. 2.9%.
- Fed officials said in recent days that they expect to begin cutting rates this year.
The US Dollar Index (DXY) recovers above the 104.00 barrier during the early Asian trading hours on Friday. The prospect that the Federal Reserve (Fed) might delay rate cuts amid high US inflation lifts the US Dollar (USD) Index. The DXY is trading at 104.13, gaining 0.01% on the day.
The US Personal Consumption Expenditure (PCE) Price Index eased from 2.6% in December to 2.4% in January YoY. Meanwhile, the Core PCE climbed by 2.8% YoY in January compared to the December’s reading of. 2.9%. Both figures came in line with the market expectation, according to the US Bureau of Economic Analysis.
Investors anticipate the Fed to start cutting the interest rate by summer. However, the timing and details of the easing policy are uncertain as inflation could be more stubborn than previously;y expected and it triggered the speculation that the Fed to hold the rate high for longer.
Several Fed officials emphasized that the policymakers will wait for the additional evidence of inflation data before consider to lower the interest rate. Atlanta Fed President Raphael Bostic said that the recent inflation data indicates the road back to the central bank’s 2% inflation target will be “bumpy. Chicago Fed President Austan Goolsbee stated that he expects the first rate cuts later this year, but he cannot specify the timeline.
Investors will take more cues from the US ISM Manufacturing PMI, Michigan Consumer Sentiment Index, and S&P Global Manufacturing PMI, due on Friday. Fed’s Williams, Logan, Waller, Bostic, Daly, and Kluger are set to speak later in the day. These events could provide a clear direction to the US dollar Index.
The Reserve Bank of New Zealand (RBNZ) Governor Orr said on Friday that inflation in New Zealand is still too high, but is falling. Orr further stated that the central bank expects to begin normalizing policy in 2025.
Key quotes
“The economy is evolving as anticipated.”
“Inflation expectations have fallen.”
“Inflation is still too high but is falling.”
“Monetary policy needs to stay restrictive for some time.”
“Expects to begin normalizing policy in 2025.”
“Expect economic growth to begin picking up in 2024.”
Market reaction
The NZD/USD pair is trading lower by 0.03% on the day to trade at 0.6086, as of writing.
| Index | Change, points | Closed | Change, % |
|---|---|---|---|
| NIKKEI 225 | -41.84 | 39166.19 | -0.11 |
| Hang Seng | -25.41 | 16511.44 | -0.15 |
| KOSPI | -9.93 | 2642.36 | -0.37 |
| ASX 200 | 38.3 | 7698.7 | 0.5 |
| DAX | 76.97 | 17678.19 | 0.44 |
| CAC 40 | -26.96 | 7927.43 | -0.34 |
| Dow Jones | 47.37 | 38996.39 | 0.12 |
| S&P 500 | 26.51 | 5096.27 | 0.52 |
| NASDAQ Composite | 144.18 | 16091.92 | 0.9 |
| Pare | Closed | Change, % |
|---|---|---|
| AUDUSD | 0.64968 | 0.07 |
| EURJPY | 162.03 | -0.71 |
| EURUSD | 1.08043 | -0.3 |
| GBPJPY | 189.332 | -0.66 |
| GBPUSD | 1.26241 | -0.27 |
| NZDUSD | 0.60862 | -0.18 |
| USDCAD | 1.35789 | 0.02 |
| USDCHF | 0.88457 | 0.67 |
| USDJPY | 149.976 | -0.43 |
- USD/CHF recovers some lost ground around 0.8845 in Friday’s early Asian session.
- US PCE rose by 2.4% YoY in January vs. 2.6% prior; Core PCE eased to 2.8% YoY vs. 2.9% previously.
- Switzerland's GDP grew by 0.3% QoQ in the fourth quarter (Q4) of 2023.
The USD/CHF pair holds positive ground around the mid-0.8800s during the early Asian trading hours on Friday. The recovery of the pair is bolstered by the firmer US dollar (USD). Investors await the Swiss Real Retail Sales and US ISM Manufacturing PMI, due on Friday. The pair currently trades near 0.8845, gaining 0.04% on the day.
On Thursday, the US Personal Consumption Expenditures Price Index (PCE) rose by 2.4% YoY in January, a slowdown from December’s reading of 2.6%. The Federal Reserve's (Fed) preferred inflation gauge, Core PCE, eased to 2.8% YoY from 2.9% in the previous reading, in line with the estimation.
Furthermore, the weekly Initial Jobless Claims for the week ending February 24 totaled 215K from the previous reading of 202K, worse than the expectation of 210K. Continuing Claims rose to 1.905 million, higher than the forecast of 1.874 million.
The January inflation data increases uncertainty and delays expectations of a rate cut, which boosts the US Dollar (USD) against its rivals. The Fed officials will monitor the inflation data, and the policymakers will likely set the table for interest-rate cuts later this year.
On the Swiss front, Switzerland's Gross Domestic Product (GDP) grew by 0.3% QoQ in the fourth quarter (Q4) of 2023, better than the estimation of 0.1%, according to the State Secretariat for Economic Affairs (SECO) on Thursday.
Moving on, traders will monitor the Swiss January Real Retail Sales, which is estimated to improve from a 0.8% decline to a 0.4% rise. Also, the US ISM Manufacturing PMI, Michigan Consumer Sentiment Index, and S&P Global Manufacturing PMI will be released from the US docket. Traders will take cues from the data and find trading opportunities around the USD/CHF pair.


© 2000-2026. Уcі права захищені.
Cайт знаходитьcя під керуванням TeleTrade DJ. LLC 2351 LLC 2022 (Euro House, Richmond Hill Road, Kingstown, VC0100, St. Vincent and the Grenadines).
Інформація, предcтавлена на cайті, не є підcтавою для прийняття інвеcтиційних рішень і надана виключно для ознайомлення.
Компанія не обcлуговує та не надає cервіc клієнтам, які є резидентами US, Канади, Ірану, Ємену та країн, внеcених до чорного cпиcку FATF.
Проведення торгових операцій на фінанcових ринках з маржинальними фінанcовими інcтрументами відкриває широкі можливоcті і дає змогу інвеcторам, готовим піти на ризик, отримувати виcокий прибуток. Але водночаc воно неcе потенційно виcокий рівень ризику отримання збитків. Тому перед початком торгівлі cлід відповідально підійти до вирішення питання щодо вибору інвеcтиційної cтратегії з урахуванням наявних реcурcів.
Викориcтання інформації: при повному або чаcтковому викориcтанні матеріалів cайту поcилання на TeleTrade як джерело інформації є обов'язковим. Викориcтання матеріалів в інтернеті має cупроводжуватиcь гіперпоcиланням на cайт teletrade.org. Автоматичний імпорт матеріалів та інформації із cайту заборонено.
З уcіх питань звертайтеcь за адреcою pr@teletrade.global.
переклади