- Аналітика
- Новини та інструменти
- Новини ринків
Новини ринків
- GBP/USD attracts some buyers near 1.2745 in Friday’s early Asian session.
- The US S&P Global Manufacturing PMI for January registered the strongest improvement since September 2022.
- The Bank of England (BoE) held borrowing costs at 5.25% at its January meeting on Thursday.
- US Nonfarm Payrolls (NFP) will be the highlight on Friday.
The GBP/USD pair regains above the 1.2700 mark during the early Asian session on Friday. The Bank of England (BoE) decided to keep the interest rate steady at 5.25% at its January meeting on Thursday, citing the need to see more evidence that inflation would continue falling. Investors await the US Nonfarm Payrolls (NFP) on Friday for fresh impetus. The major pair currently trades around 1.2745, losing 0.01% for the day.
The US Federal Reserve (Fed) indicated that the central bank will delay rate cuts until it sees more evidence that inflation is sustainably under control. Fed Chair Jay Powell said on Wednesday that rate cuts in the March meeting were not the central bank's "base case.”
According to S&P Global's latest PMI survey published on Thursday, the US Manufacturing PMI improved sharply in January, coming in at 49.1 from the previous month's number of 47.1. The attention will shift to the US Nonfarm Payrolls (NFP) due later on Friday for further clarity on the interest rate path. According to the CME Fed Watch Tool, traders have priced in a 96% odds of a rate cut in May.
The BoE maintained interest rates unchanged at 5.25% on Thursday, but a decline in inflation could mean a cut in the cost of borrowing around Q3 2024. The UK central bank governor, Andrew Bailey, said that the BoE had seen good news on inflation over the past few months, and they need to see more evidence that inflation is set to fall to the 2% target before they can lower interest rates.
The January US labor market data, including Nonfarm Payrolls, Unemployment Rate, and Average Hourly Earnings will be released on Friday. The US economy is estimated to add 180K jobs in January from the 216K job additions in December.
- NZD/USD gains ground around 0.6142 amid the softer US Dollar.
- US ISM Manufacturing PMI came in at 49.1 in January vs. 47.1 prior, the highest since October 2022.
- New Zealand’s Building Permit improved to 3.7% MoM in December from a fall of 10.6% in November.
- The US Nonfarm Payrolls will be in the spotlight on Friday.
The NZD/USD pair posts modest gains below the mid-0.6100s during the early Asian session on Friday. The weaker US Dollar (USD) and lower bond yields provide some support for the pair. Investors await the highly anticipated US Nonfarm Payrolls (NFP) data on Friday for fresh impetus. This evening might trigger volatility in the market. At press time, the pair is trading at 0.6142, gaining 0.04% on the day.
On Thursday, the US ISM Manufacturing PMI grew to 49.1 in January from the previous reading of 47.1, the highest since October 2022. This figure came in better than the market expectation of 47.0. The New Orders index rose into expansionary territory at 52.5, the Production Index grew to 50.4, and the Prices Index climbed to 52.9.
After the Federal Reserve (Fed) meeting on Wednesday, Chair Powell stated that the FOMC is unlikely to get enough evidence to cut rates in March. The NFP report on Friday will be a closely watched event. The US economy is expected to add 180K jobs in January, following 216K additions last month. The Unemployment Rate is projected to tick up to 3.8%, and Average Hourly Earnings are estimated to show an increase of 0.3% MoM.
The latest data from Statistics New Zealand showed on Friday that the nation’s Building Permit for December improved to 3.7% MoM from a fall of 10.6% in November. Meanwhile, ANZ-Roy Morgan Consumer Confidence came in at 93.6 in December versus 93.1 prior. Investors will take more cues from the New Zealand labor market data next week, which might be the key to the Official Cash Rate (OCR) outlook.
Looking ahead, market players will keep an eye on the US labor market data, including Nonfarm Payrolls, Unemployment Rate, and Average Hourly Earnings for January. These figures could give a clear direction to the NZD/USD pair.
- AUD/USD marginally rises to 0.6572, reacting to mixed US economic signals in the Asian session.
- Signs of cooling US job market, with rising job cuts and jobless claims, fuel Fed rate speculation.
- US manufacturing activity shows signs of recovery, complicating Fed's policy outlook and affecting currencies.
- Australian PPI and US Nonfarm Payrolls reports awaited for further economic insights, may sway AUD/USD.
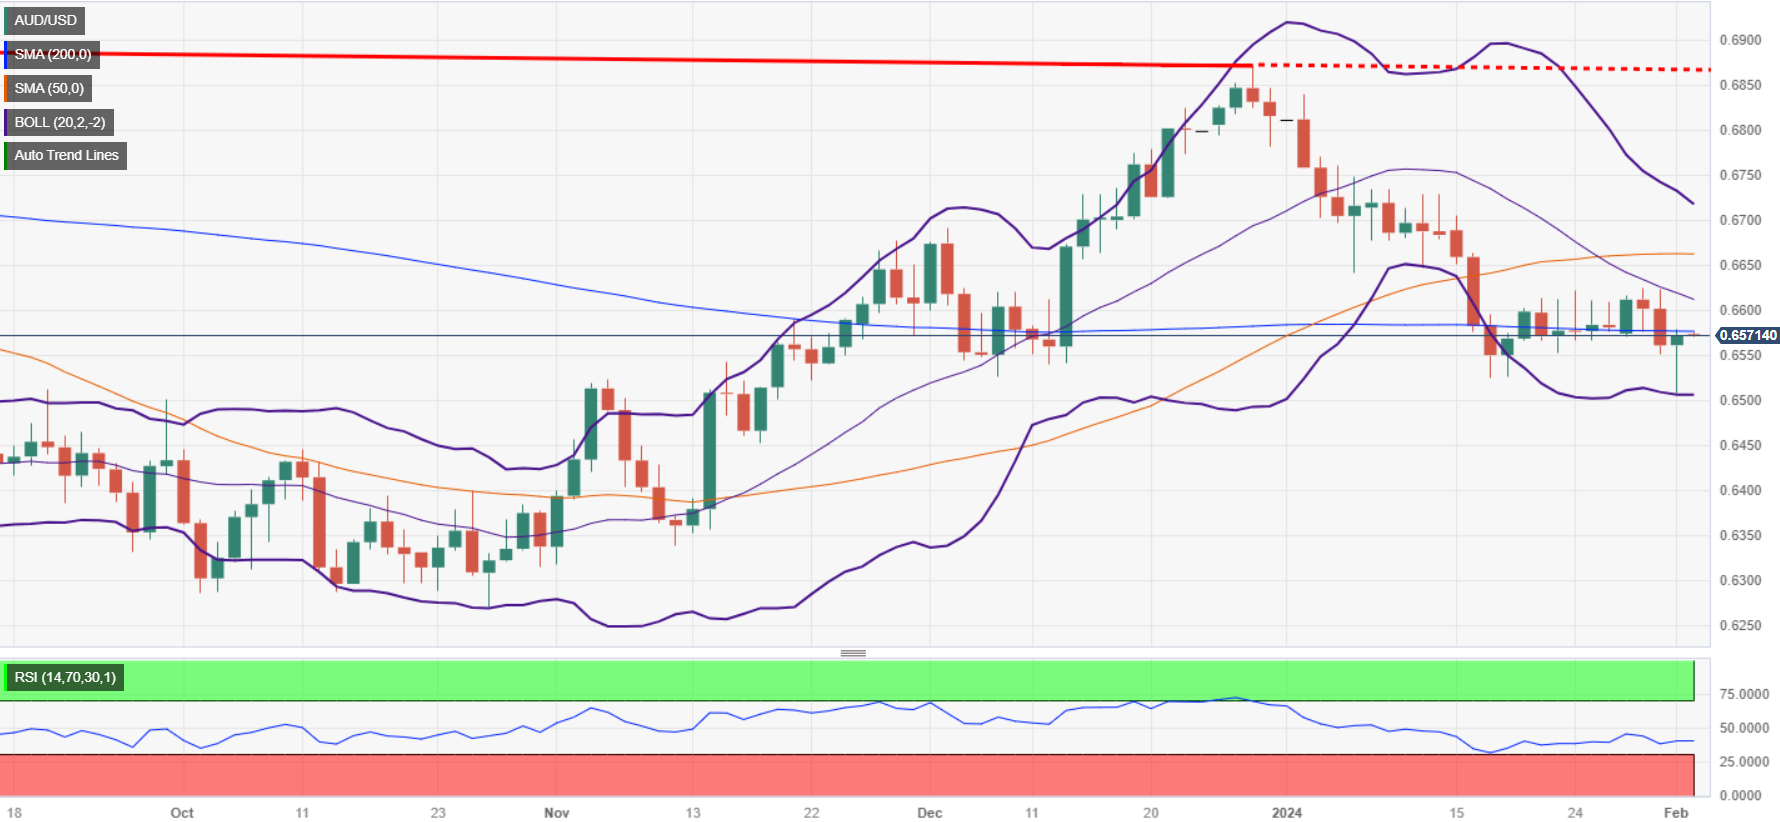
The AUD/USD prints minimal gains as the Asian session begins, following Thursday’s session that witnessed the Aussie Dollar (AUD) bouncing off year-to-date (YTD) lows of 0.6508 on mixed US economic data. At the time of writing, the pair exchanges hands at 0.6572, up 0.01%.
Aussie Dollar recovers after printing new YTD low
Wall Street closed with gains following the Federal Reserve’s policy decision on Wednesday. Fed Chair Jerome Powell and Co. stated they’re ready to ease policy if the disinflation process progresses. When asked about a possible rate cut in March, Powell disregarded that option, spurring safe-haven flows.
Nevertheless, Thursday’s story is different, as data from the United States (US) could put the Fed at a crossroads. According to a US Challenger report, labor market data was soft, with companies announcing more than 80K job cuts in January. Following suit, Initial Jobless Claims for the week ending January 27 rose by 224K, exceeding forecasts and the previous reading.
Aside from this, manufacturing activity in the US improved though the ISM Manufacturing PMI came short of breaching the expansion/contraction threshold, rising to 49.1 from 47.1, exceeding projections. S&P Global revealed the US economy expanded to 50.7 from 47.9 in December.
Given the backdrop, AUD/USD traders lifted the exchange rate from below the 100-day moving average (DMA) at 0.6531.
Ahead on the Asian session, Australia’s economic docket will feature the Producer Price Index (PPI) for the last quarter of 2023. On the US front, the US economy is expected to add 155K jobs to the economy, as the Department of Labor will release the Nonfarm Payrolls report for January. Besides that, traders would be scrutinizing the University of Michigan Consumer Sentiment.
AUD/USD Price Analysis: Technical outlook
The AUD/USD is facing stir resistance at the 200-DMA at 0.6574. A breach of the latter will expose the 0.6600 figure. Further upsie is seen at the January 30 high at 0.6624. On the other hand, if sellers keep prices below the 200-DMA, that could open the door fur further downside. First support would be the 100-DMA at 0.6531, followed by the February 1 daily low of 0.6508.
- US indexes broadly climbed on Thursday to pare back Fed declines.
- Stocks rebound as investor sentiment rebounds ahead of Friday’s US NFP.
- Markets are recovering from Wednesday’s downside after a hawkish Fed outing.
US equity indexes broadly climbed on Thursday, reclaiming ground lost after US Federal Reserve (Fed) Chairman Jerome Powell hit markets with a much more hawkish stance than many investors were prepared for.
Hopes of a March rate cut dwindled and investors piled into safe-haven assets after Fed chair Powell warned markets that the Fed needs to see inflation not only hit the US central bank’s key 2% target, but provide evidence that it will remain there after rate cuts do finally resume.
Markets tumbled and Thursday gave way to a risk appetite rebound as the US ISM Manufacturing Purchasing Managers’ Index (PMI) climbed to a three-and-a-half year high of 49.1 in January, climbing over the forecast decline to 47.0 from December’s 47.1, which saw a downside revision from 47.4.
US Initial Jobless Claims also rose to 224K for the week ended January 26 versus the market forecast of a slight downtick to 213K from the previous week’s 215K (revised from 214K). US Initial Jobless Claims rose over the four-week average of 207.75K, and the upswing in jobless numbers is once again giving rate cut betters a step up on hope, as the Fed also has a dual mandate to stabilize the US labor market. If the US labor market were to fully destabilize and kick off a steepening recession, the Fed would be forced to cut rates in an attempt to stoke the US domestic economy.
NFP Preview: Forecasts from 10 major banks
The key data print for this week will be Friday’s US Nonfarm Payrolls (NFP), and markets are looking for January’s headline labor print to come in at 180K versus December’s 216K. US Average Hourly Earnings in January are also expected to come in at 0.3% MoM compared to December’s 0.4%.
The Dow Jones Industrial Average (DJIA) climbed 0.97% to end Thursday up nearly 370 points at $38,519.84, while the NASDAQ Composite gained 197.63 points to end up 1.3% at $15,361.64. The Standard & Poor’s 500 (SP500) equity index also gained 60 points, adding 1.25% and wrapping up Thursday at $4,906.19.
SP500 technical outlook
The SP500 rallied hard on Thursday, recovering over a full percent and remaining buoyed above the 200-hour Simple Moving Average (SMA) near $4,840.00. Despite gains, the major equity index remains capped by the near-term swing high into $4,929.82.
The S&P remains firmly well-bid, pinned deep into bull country as the equity index looks for further topside near all-time record highs and trading well above long-term medians at the 200-day SMA near $4,450.00.
SP500 hourly chart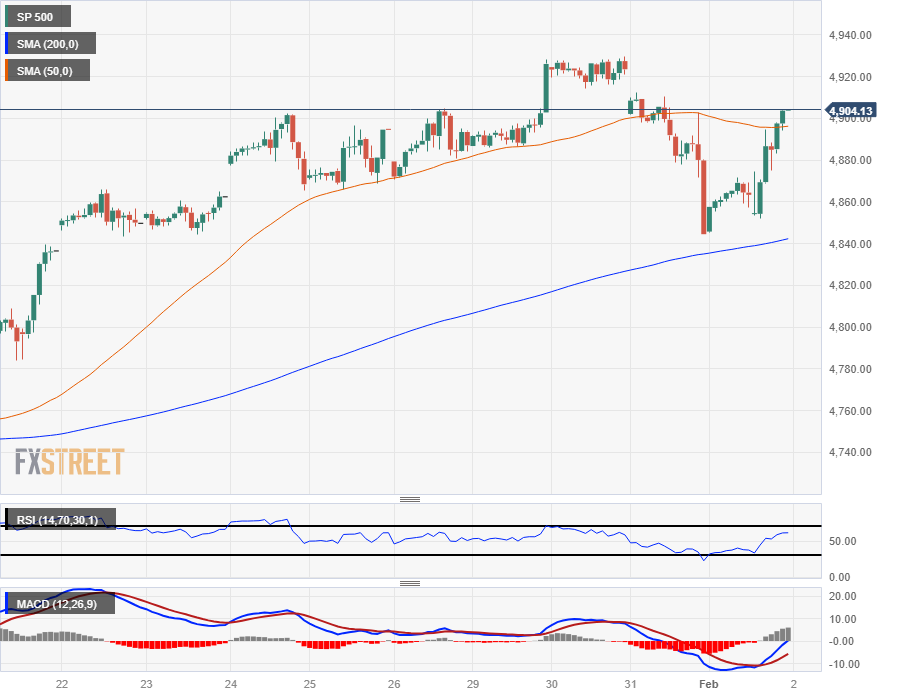
SP500 daily chart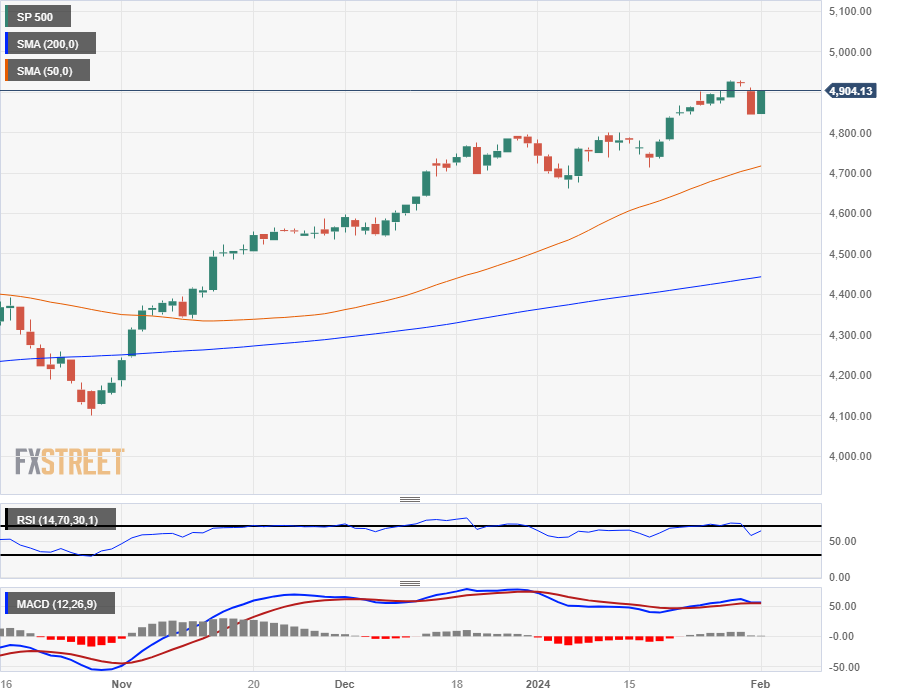
- EUR/JPY up 0.14%, rebounding from weekly low amid weaker Yen and improved risk sentiment.
- Hammer pattern suggests further gains, targeting the 160.00 level for recovery continuation.
- Downside risks with support at Kijun-Sen (158.47) and Senkou Span B (158.41) crucial for momentum.
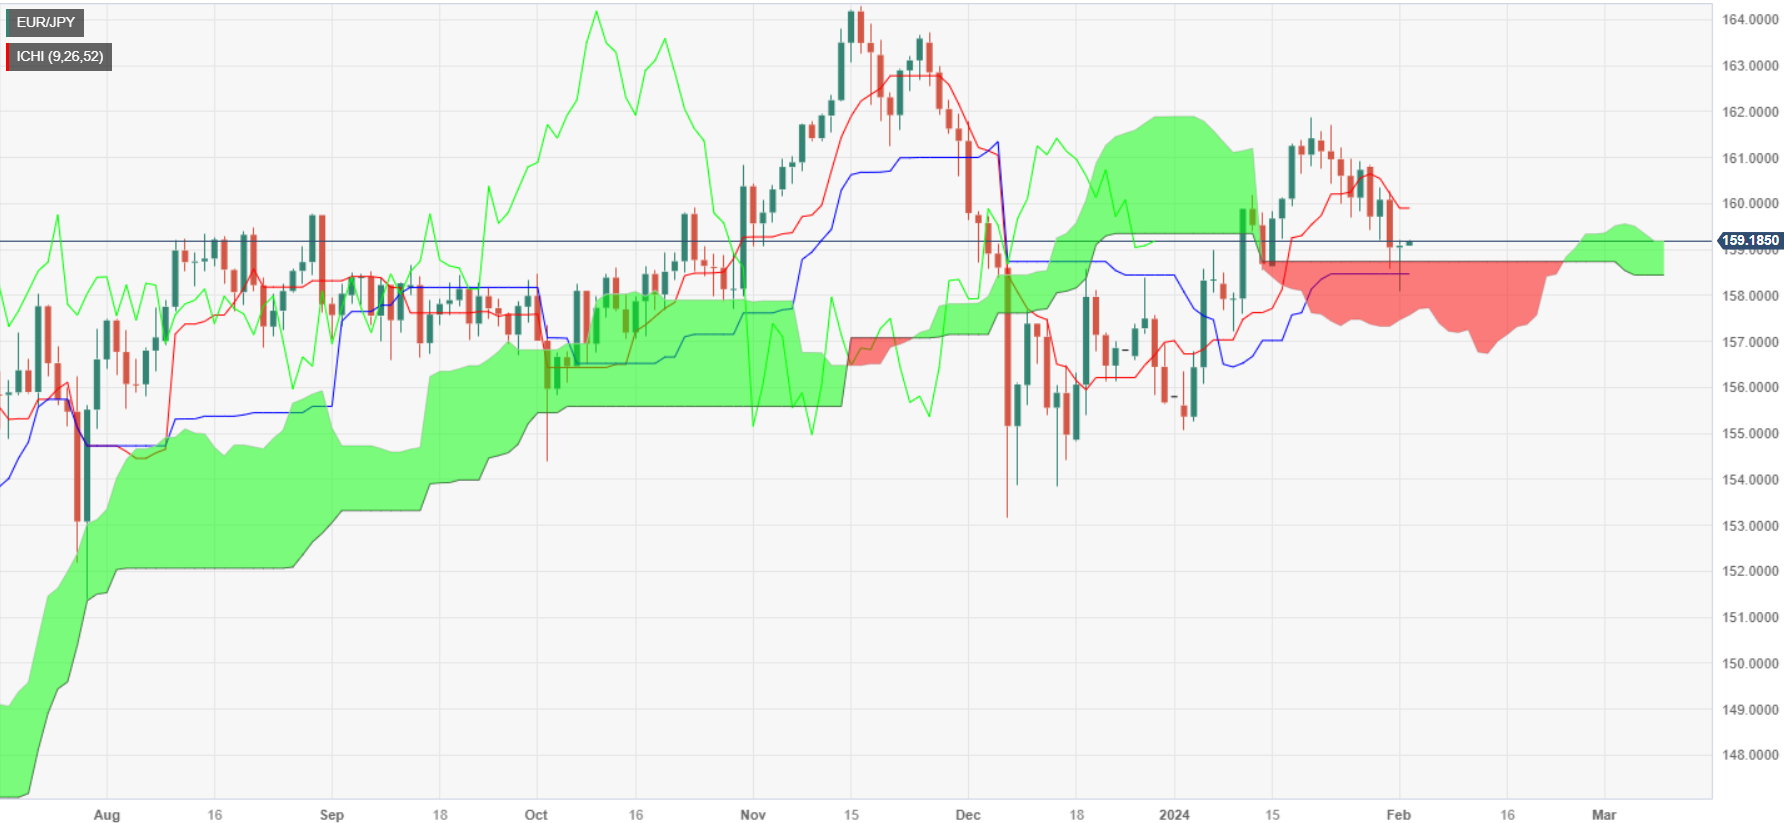
The EUR/JPY stages a comeback after bouncing off a weekly low of 158.08 and rising back above the 159.00 figure, gaining 0.14% at the time of writing. An improvement in risk appetite, along with sudden Japanese Yen (JPY) weakness, opened the door for the Euro’s (EUR) recovery.
From a technical standpoint, the EUR/JPY is forming a hammer after diving inside the Ichimoku Cloud (Kumo), though buyers lifted the pair above the Senkou Span B at 158.41, opening the door for a rally to 159.00. If buyers reclaim the 160.00 figure, that could open the door to challenge January’s 31 high at 160.27.
On the flip side, if the EUR/JPY achieves a daily close below 159.00, that could pave the way for further downside. The first support would be the Kijun-Sen at 158.47, followed by Senkou Span B at 158.41. A breach of the latter will expose the February 1 low of 158.08.
EUR/JPY Price Action – Daily Chart
EUR/JPY Technical Levels
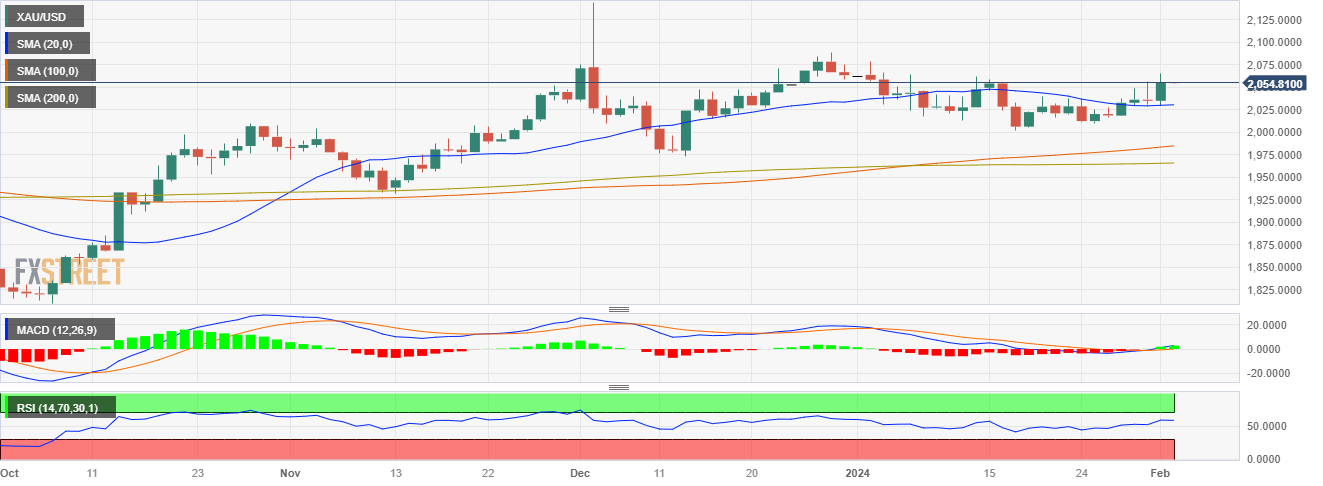
- The XAU/USD holds ground with bullish outlook at $2,055, showing a 0.78% rally.
- Weak Jobless Claims data weakened the USD during the session.
- Indicators stand near overbought conditions on the four-hour chart, a consolidation may be incoming.
In Thursday's session, the XAU/USD was spotted rallying to $2,055, depicting a bullish outlook on the daily chart with buyers gaining ground. The momentum is echoed in the four-hour chart, where indicators show a levelling near overbought conditions, suggesting potential market saturation. On the fundamental side, markets await key Nonfarm Payrolls figures from January due on Friday while higher-than-expected weekly Jobless Claims figures from the US weakened the Greenback during the session.
Federal Reserve’s Chair Powell considered not likely that the bank will reach a level of confidence by March to start easing. As a reaction, the US Dollar rallied on Wednesday as markets started to give up on the expectations of sooner cuts, but incoming data will ultimately guide the bank on the timing of the easing cycle. In case labor markets figures on Friday come in weak, the metal could see further upside, as the expectations on lower interest rates tend to benefit non-yielding assets.
XAU/USD daily chart
XAU/USD levels to watch
The daily chart indicators reflect a bullish momentum in the market. With a positive slope in the Relative Strength Index (RSI) and increasing green bars in the Moving Average Convergence Divergence (MACD), it signifies a rising trend and an ongoing domination by the buyers. Contributing to this bullish sentiment, the asset's position above the 20, 100, and 200-day Simple Moving Averages (SMAs) reinforces the current control held by the bulls.
Switching to a shorter timeframe view based on a four-hour chart, the indicators appear to flatten, with the RSI approaching the overbought territory, indicating a slowing momentum which is typical in highly bought situations. However, nearing the 70 threshold, it could signify a potential reversal as buyers might start taking profits, slowing the incoming buying force.
New Zealand's fourth-quarter Building Permits saw a decline in the seasonally-adjusted QoQ figure compared tp September, sliding 3.4% and adding additional downside to the previous quarter's 13% decline.
New Zealand new homes consents in December 2023 dropped steeply, falling 25% YoY compared to December of 2022, with standalone housing units specifically declining to its slowest pace of approvals since 2013, and multi-family homes also declined to their slowest pace of approvals since 2021.
According to StatsNZ's construction and property statistics manager, Michael Heslop:
“The number of homes consented in 2023 was down from 49,538 in 2022, which was the highest number in a calendar year since records began."
“2023 was the first year that the number of townhouses, flats, and units consented exceeded the number of stand-alone houses."
About New Zealand's seasonally-adjusted Building Permits
The Building Permits s.a. released by the Statistics New Zealand show the number of permits for new construction projects. It is considered as a leading indicator for the housing market. The more growing number of permits, the more positive (or bullish) for the NZD, while a low reading is seen as negative, or bearish.
- Crude Oil sees rough action on Thursday as geopolitics weigh on price.
- Odds are increasing of a negotiated ceasefire in Gaza.
- EIA, API Crude OIl barrel counts mix, show net drawdown.
West Texas Intermediate (WTI) US Crude Oil fell back to around $74.00 per barrel on Thursday after an early spike into $79.00 as markets look for signs that global Crude Oil supply may begin to crack under rising global barrel demand. Progress on a ceasefire negotiation between Israel and Hamas being brokered in Qatar has energy prices leaning into the softer side as markets head into the Friday market session.
Crude Oil markets shrugged off a hawkish Federal Reserve on Wednesday that knocked back hopes of early rate cuts, and Crude Oil pinned into the top end after the Organization of the Petroleum Exporting Countries (OPEC) announced Thursday there would be no changes to their announced production cap reduction of 2.2 million barrels per day in 2024. OPEC is attempting to backstop rising global Crude Oil production predominately powered by record-setting production levels from the US, and energy markets rallied on the headlines that OPEC would try to exacerbate potential supply imbalances in the future by intentionally undercutting global demand for Crude Oil.
Despite OPEC’s firm dedication to Crude Oil production cuts, key member states are beginning to feel the bite of letting pumping stacks grow cold. Saudi Arabia saw its economy decline 0.9% YoY with fourth-quarter Gross Domestic Product (GDP) declining 3.7% compared to the same time last year as declining Crude Oil activity strips out growth from underneath Saudi Arabia’s feet. Crude Oil activity accounts for nearly 42% of Saudi Arabia’s GDP.
Negotiations of a ceasefire, at least temporarily, are rumored to be nearing finalization as representatives from Israel and Hamas meet with adjudicating nations in Qatar, driving Crude Oil bids lower as the Middle East is set to see at least a short-lived reprieve from ongoing geopolitical tensions.
WTI Technical outlook
WTI Crude Oil saw a sharp decline drag US barrel bids below the 200-hour Simple Moving Average (SMA) near $76.00, and WTI is testing the $74.00 per barrel neighborhood at its lowest bids in a week.
US Crude Oil has declined nearly 7% from a near-term peak at $79.19, and downside momentum has WTI firming up a downside rejection from the 200-day SMA just shy of the $78.00 handle.
WTI hourly chart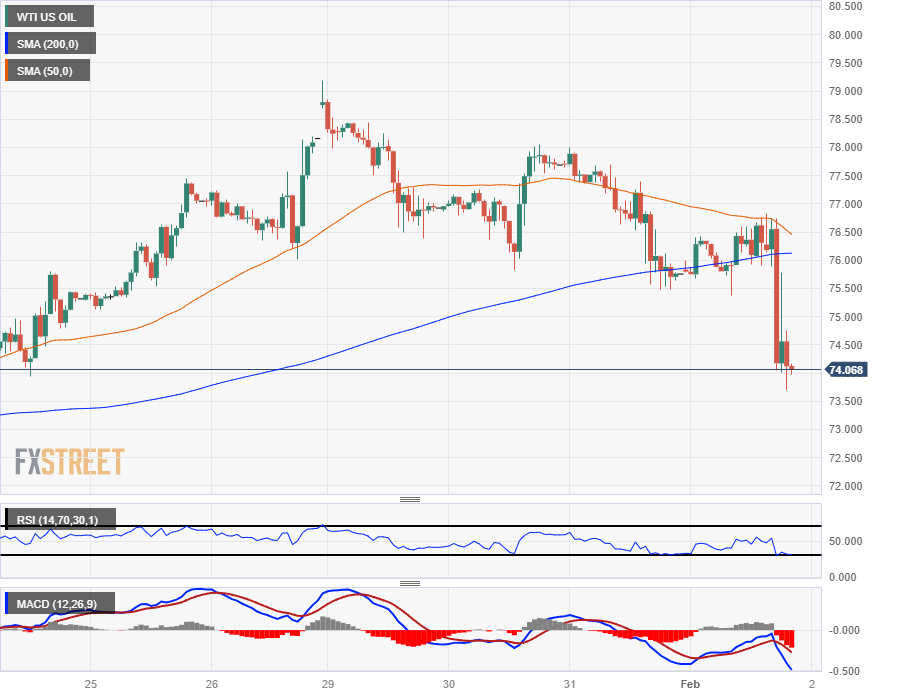
WTI daily chart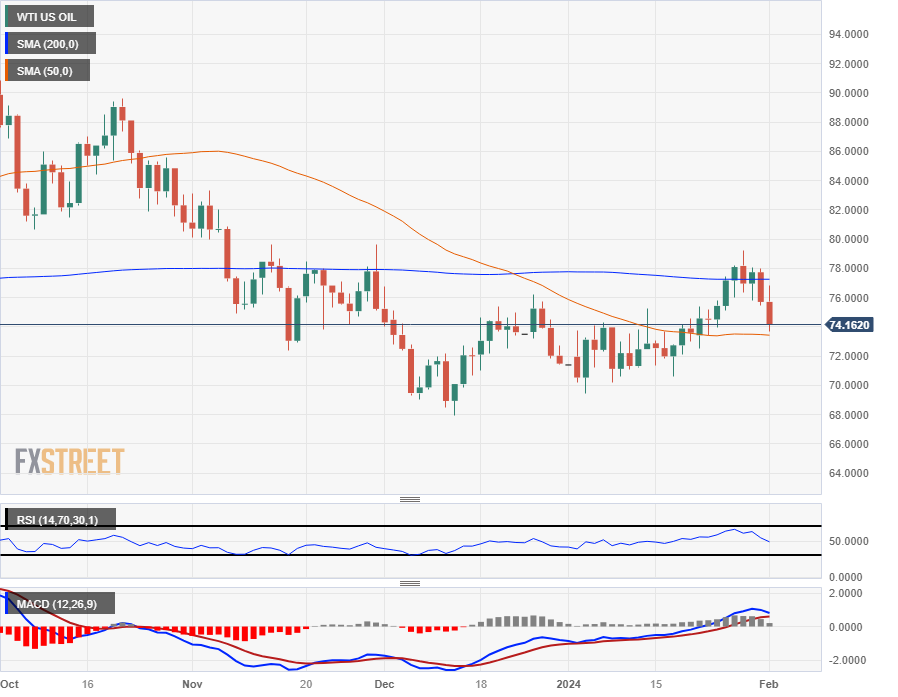
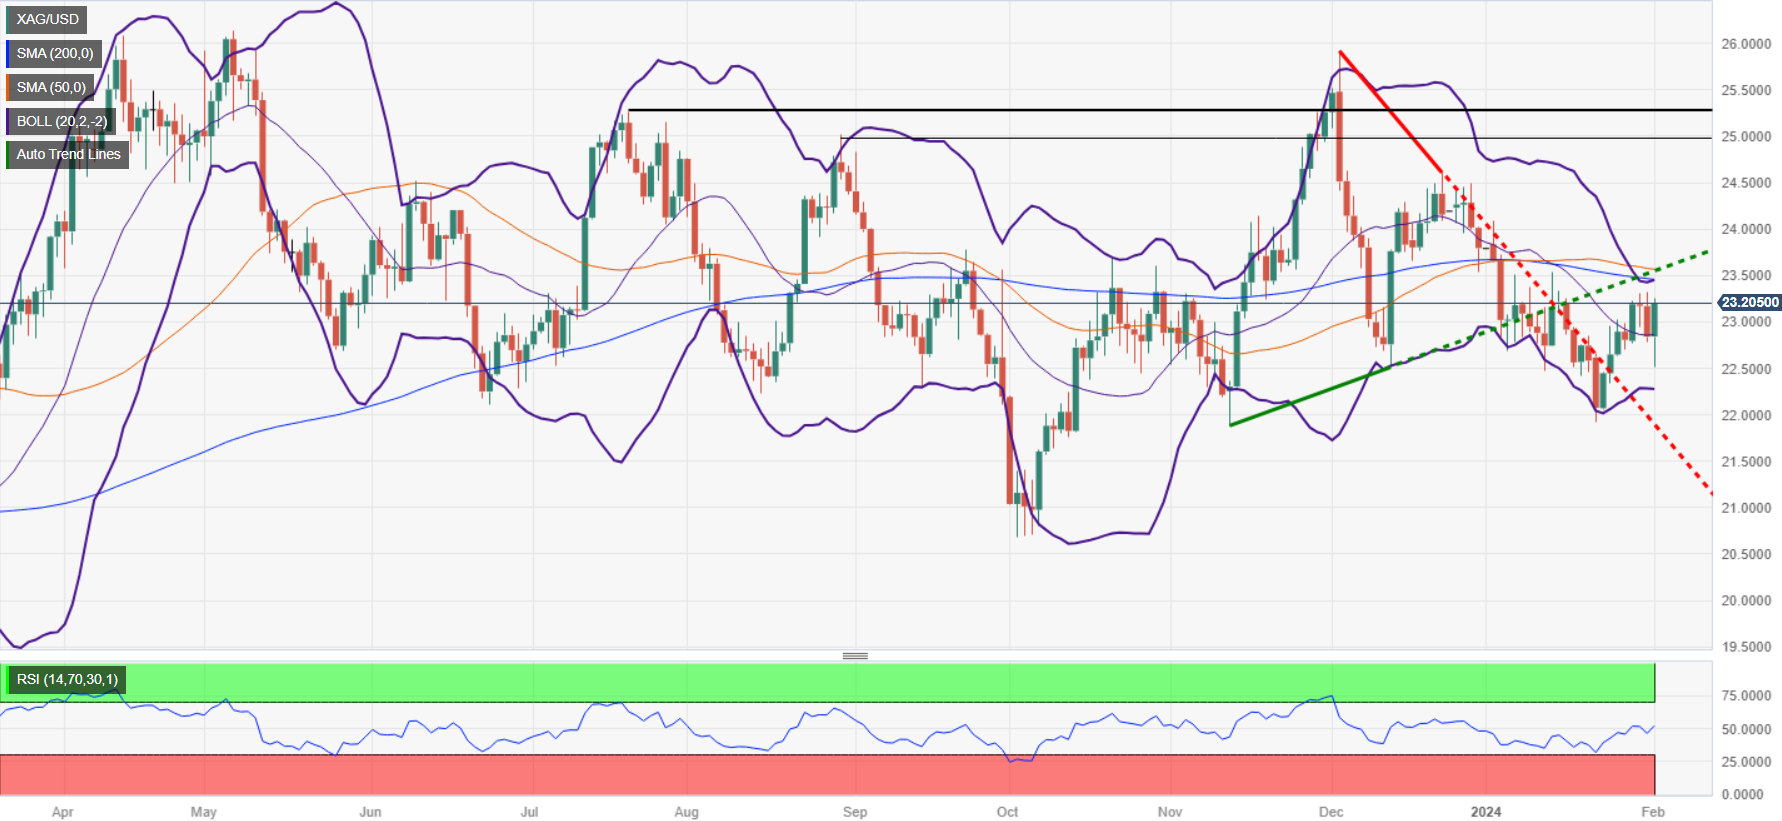
- Silver surges over 1% to $23.17, lifted by central bank decisions and declining global bond yields.
- Testing resistance at 100-DMA, with next targets at 200-DMA and 50-DMA for further gains.
- Potential downward shifts could push silver towards support at $22.50, $22.00, and January's low.
Silver price rises late in the North American session as traders digest the latest central bank’s decisions across both sides of the Atlantic. The Federal Reserve and the Bank of England held rates unchanged, and both signaled that the likelihood of cutting interest rates increases as the disinflation process evolves. That tumbled global bond yields and boosted precious metals. The XAG/USD exchanges hands at $23.17, up more than 1%.
The XAG/USD is neutrally biased, but as of writing, it is challenging resistance at the 100-day moving average (DMA) at $23.14. A decisive break could open the door to test the 200-DMA at $23.44, followed by the 50-DMA at $23.55. Further upside is seen once that resistance area is cleared at the psychological $24.00 figure.
However. If Silver slumps below $23.00, that could exacerbate a drop toward $22.50, December 13 low, followed by the $22.00 figure. The next buying zone lies at a January 22 low of $21.93.
XAG/USD Price Action – Daily Chart
XAG/USD Technical Levels
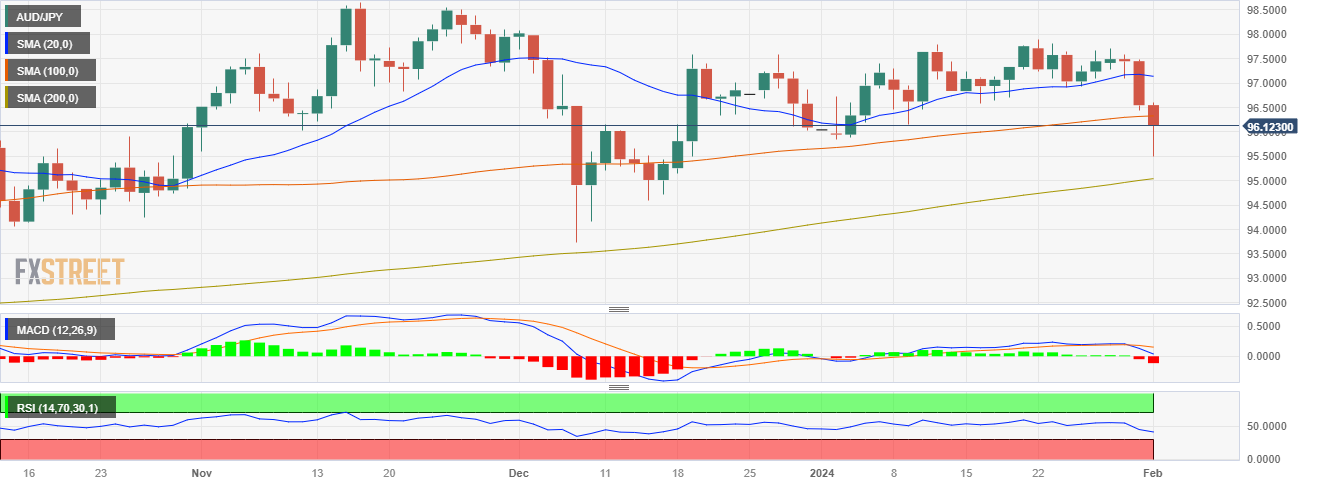
- The AUD/JPY is experiencing a downward shift at 96.18, seeing a 0.23% loss.
- Indicators on the daily chart show a negative outlook as the cross now trades below the 20 and 100-day SMA.
- Four-hour chart indicators are consolidating after hitting oversold conditions.
On Thursday's session, the AUD/JPY experienced a downturn, hovering at 96.18 after hitting a its lowest level since mid December near 95.50. The daily chart conveys a bearish hue with the sellers gaining substantial ground. Meanwhile, the four-hour chart indicators seem to have enter in a consolidation phase, following a dip into oversold territories.
In the daily chart perspective, the leading indicators signal an inclined selling momentum. The Relative Strength Index (RSI) is charting a downward trajectory indicating bearish strength, especially within a negative zone. This is echoed by the Moving Average Convergence Divergence (MACD) which prints a surge in red bars, indicating increasing bearish pressure. Furthermore, the cross fell below the 100-day Simple Moving Average (SMA), a strong resistance which strengthens the case for the sellers .
Inspecting the shorter-term dynamics from the four-hour chart, it appears the bearish tendency seems to be leveling off. Indicators have moved to a stable phase after previously registering oversold conditions. The RSI in particular, maintains a flat formation in a negative territory, indicating a momentary pause in downward momentum. Additionally, the MACD also show flat red bars indicating growth in short-term selling pressure, though at a decreasing rate.
AUD/JPY daily chart
AUD/JPY levels to watch
- EUR/USD sees choppy declines as 1.0900 slips away.
- European inflation vexes rate cut hopes.
- Markets pivot toward Friday’s US NFP.
EUR/USD dipped and recovered in a rough Thursday session, grinding lower in whipsaw action as the pair tests new lows in the near-term and slips further back from key technical levels.
European inflation declined less than markets were hoping, but currency markets have shifted into shorting the US Dollar (USD) across the board as investors recover from Wednesday’s hawkish showing from the US Federal Reserve (Fed).
Investors will be looking toward Friday’s US Nonfarm Payrolls (NFP) print for signs that the US economy will start to decay enough to force the Fed into a faster pace of rate cuts.
Daily digest market movers: EUR/USD recovers into near-term highs, but ceiling noticeable
- EUR/USD recovered back into 1.0880 region, but 1.0900 looks difficult to snag.
- The euro area saw inflation decline less than markets hoped for, keeping rate cut expectations at bay.
- Pan-European Harmonized Index of Consumer Prices (HICP) inflation eased to 3.3% for the year ended in January, missing the median market forecast of 3.2% and trimming only slightly back from the previous period’s 3.4%.
- US January ISM Manufacturing Purchasing Managers’ Index (PMI) bounded into a new three-plus year high of 49.1 versus the forecast backtick to 47.0 from December’s 47.1.
- US Initial Jobless Claims ticked upwards to 224K for the week ended January 26 versus the forecast 212K, rising above the previous week’s 215K (revised from 214K).
- EUR/USD set to continue a rough pattern heading into Friday’s US NFP, forecast to print at 180K for January versus December’s 216K.
- NFP Preview: Forecasts from 10 major banks
Technical analysis: EUR/USD bounces, but swing highs remain capped below 1.0900
EUR/USD climbed back over the 200-hour Simple Moving Average (SMA) newar 1.0850 on Thursday, but failed to reclaim near-term highs around 1.0880 as technical swings remain trapped in a lower highs pattern.
Thursday’s upswing brings EUR/USD back over the 200-day SMA just below the 1.0850 level, and the pair remains trapped in a roughly-bearish sideways grind, keeping EUR/USD trapped on the low side of technical consolidation range between the 50-day and 200-day SMAs with the ceiling priced in just above the 1.0900 handle.
EUR/USD hourly chart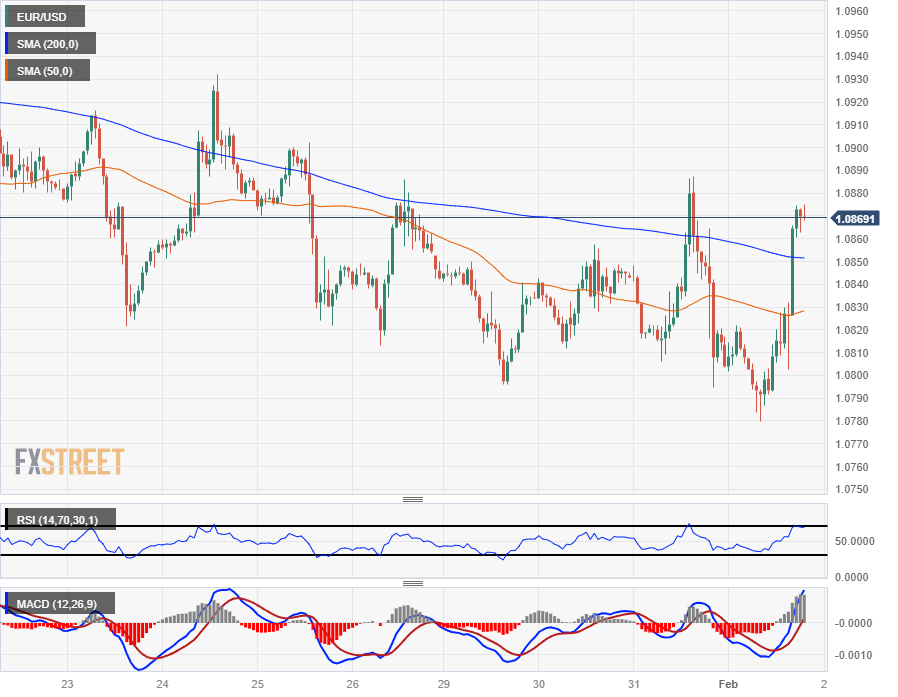
EUR/USD daily chart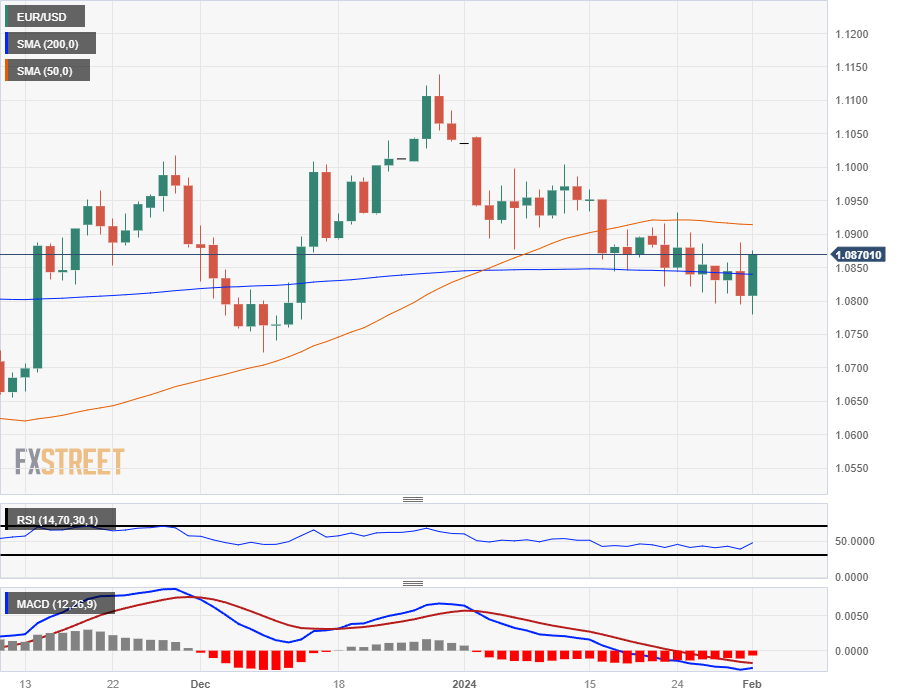
Euro FAQs
What is the Euro?
The Euro is the currency for the 20 European Union countries that belong to the Eurozone. It is the second most heavily traded currency in the world behind the US Dollar. In 2022, it accounted for 31% of all foreign exchange transactions, with an average daily turnover of over $2.2 trillion a day.
EUR/USD is the most heavily traded currency pair in the world, accounting for an estimated 30% off all transactions, followed by EUR/JPY (4%), EUR/GBP (3%) and EUR/AUD (2%).
What is the ECB and how does it impact the Euro?
The European Central Bank (ECB) in Frankfurt, Germany, is the reserve bank for the Eurozone. The ECB sets interest rates and manages monetary policy.
The ECB’s primary mandate is to maintain price stability, which means either controlling inflation or stimulating growth. Its primary tool is the raising or lowering of interest rates. Relatively high interest rates – or the expectation of higher rates – will usually benefit the Euro and vice versa.
The ECB Governing Council makes monetary policy decisions at meetings held eight times a year. Decisions are made by heads of the Eurozone national banks and six permanent members, including the President of the ECB, Christine Lagarde.
How does inflation data impact the value of the Euro?
Eurozone inflation data, measured by the Harmonized Index of Consumer Prices (HICP), is an important econometric for the Euro. If inflation rises more than expected, especially if above the ECB’s 2% target, it obliges the ECB to raise interest rates to bring it back under control.
Relatively high interest rates compared to its counterparts will usually benefit the Euro, as it makes the region more attractive as a place for global investors to park their money.
How does economic data influence the value of the Euro?
Data releases gauge the health of the economy and can impact on the Euro. Indicators such as GDP, Manufacturing and Services PMIs, employment, and consumer sentiment surveys can all influence the direction of the single currency.
A strong economy is good for the Euro. Not only does it attract more foreign investment but it may encourage the ECB to put up interest rates, which will directly strengthen the Euro. Otherwise, if economic data is weak, the Euro is likely to fall.
Economic data for the four largest economies in the euro area (Germany, France, Italy and Spain) are especially significant, as they account for 75% of the Eurozone’s economy.
How does the Trade Balance impact the Euro?
Another significant data release for the Euro is the Trade Balance. This indicator measures the difference between what a country earns from its exports and what it spends on imports over a given period.
If a country produces highly sought after exports then its currency will gain in value purely from the extra demand created from foreign buyers seeking to purchase these goods. Therefore, a positive net Trade Balance strengthens a currency and vice versa for a negative balance.
The FX universe witnessed a resumption of the appetite for the risk-linked assets ahead of the imminent release of the US labour market report at the end of the week. In line with the Federal Reserve and the ECB, the BoE left its policy rate unchanged at its event on Thursday, although following a divided vote.
Here is what you need to know on Friday, February 2:
The USD Index (DXY) dropped markedly and put the 103.00 support to the test, slipping back to the area below the key 200-day SMA. On Friday, all the attention is expected to be on the publication of Nonfarm Payrolls for the month of January, the Unemployment Rate, Factory Orders and the final print of the Michigan Consumer Sentiment.
EUR/USD regained balance and bounced off multi-week lows near 1.0780, an area also reinforced by the provisional 100-day SMA, on the back of the dollar’s lacklustre performance. Looking at Friday’s docket, the only release of note will be the ECB’s Survey of Professional Forecasters (SPF).
GBP/USD printed a robust advance and regained the 1.2700 mark and well beyond after the BoE left its policy rate unchanged, while investors expect the central bank to start reducing rates around Q3 2024.
Renewed selling pressure in the greenback in combination with further weakness in US yields sponsored the second consecutive daily decline in USD/JPY, this time challenging the 146.00 support.
AUD/USD shrugged off part of the weekly bearishness and approached the 0.6580 zone after meeting initial contention near 0.6500 during early trade. In Oz, Home Loans and Investment Lending for Homes are due on Friday.
Crude oil prices extended their decline and broke below the $74.00 mark per barrel, testing at the same time the transitory 55-day SMA.
Gold prices extended their uptrend to new highs past the $2060 yardstick, while Silver left behind two consecutive sessions of losses after rebounding from the $22.50 zone.
- GBP/USD rises past 1.2700 after BoE holds rates, signaling unexpected dovish tilt.
- BoE's divided vote and hints at future rate cuts by Governor Bailey boost Pound's prospects.
- US sees two-month high in jobless claims amid recovering manufacturing, impacting market sentiment.
- Focus shifts to US Nonfarm Payrolls, with anticipated job growth slowdown and minor uptick in unemployment.
The Pound Sterling (GBP) gained some ground against the US Dollar (USD) during the North American session following back-to-back monetary policy decisions by the Bank of England (BoE) and the US Federal Reserve (Fed).
Cable advances despite BoE’s signaling end of tightening cycle
On Thursday, the Bank of England decided to hold rates unchanged at 5.25%, signaling that the tightening cycle most likely ended. Nevertheless, the decision was not unanimously taken, with two BoE policymakers voting for another hike while one voted for a cut. The statement shifted more dovish than previous statements, as it highlighted “he risks to inflation are more balanced.”
The BoE Governor Andrew Bailey said that policy would need to remain restrictive while adding the bank would become data dependent. He acknowledged the removal of hawkish language to the statement, opened the door to begin cutting rates, and emphasized that if they do, policy “would still be restrictive.”
Bailey added he doesn’t foresee a recession in an interview with Bloomberg TV, and added: “I'm not going to give a view on how many cuts there'll be and when they will be.”
Across the pond, the economic docket featured unemployment claims, which rose to a two-month high, from 215K in the prior reading to 224K in the week ending January 27. Aside from this, US business activity is picking up, revealing the S&P Global Manufacturing PMI rising from 47.9 to 50.7.
Recently, the Institute for Supply Management (ISM) confirmed the manufacturing sectors is recovering, as its PMI climbed from 47.1 to 49.1.
The GBP/USD seesawed during the decision, but buyers cracked the 1.2700 figure, extending its gains above the 1.2730 area.
With both central bank decisions out of the way, GBP/USD traders brace for Friday's US Nonfarm Payrolls report, with estimates circa 180K, below December’s 216K. The unemployment rate is expected to jump to 3.8%, while Average Hourly Earnings are foreseen at 4.1% YoY.
GBP/USD Technical Levels
- European stocks shed weight after EU HICP inflation remains above 3%.
- The BoE voted to hold rates on Thursday with some contention.
- BNP Paribas tumbled after sales miss, Volvo soared after pulling Polestar funding.
European indexes broadly shed points on Thursday after investor sentiment soured with mixed Europe earnings vexing investors and inflation continues to weigh on markets hoping for rate cuts from central banks to ease financing costs.
The Bank of England (BoE) voted for both rate cuts and rate hikes at the same time on Thursday, marking the first time since 2008 UK central bank policymakers spread their votes into both rate move camps. With 6 no-change votes and rate hike votes outnumbering rate cut votes 2-to-1, markets broadly readjusted their expectations for rate cuts from the BoE, but money markets still see four rate cuts through the end of 2024.
Bailey Speech: BoE Governor speaks on interest rate outlook
Deutsche Bank shares rose 4% on Thursday after it was announced that the European bank would be slashing over three thousand jobs in their back office, equivalent to nearly 4% of their entire workforce, to return €1.6 billion in value to shareholders after fourth-quarter earnings declined 30% QoQ, a decline that still outperformed expectations.
BNP Paribas declined 8% and saw its shares briefly halted according to reporting by Reuters. The French bank also reported a QoQ sales miss, but didn’t offer to terminate a portion of their staff list to make up the loss for shareholders.
Volva shares climbed over 25% after announcing it would pull funding from ailing subsidiary Polestar. Volvo plans to hand the reins of Polestar over to Geely Holding, a Chinese investment company with a nearly 80% stake in Volvo.
Euro area inflation falls, but less than hoped
European inflation eased less than markets hoped in January, with the pan-European Harmonized Index of Consumer Prices (HICP) coming in at 3.3% for the year ended in January versus the forecast 3.2% and etching in a minor decline from the previous period’s 3.4% YoY.
London’s FTSE decline 8.41 points to close Thursday down 0.11% at £7,622.16, with the German DAX shedding 0.26% and closing down 44.72 points at €16,859.04.
The STOXX600 pan-European major equity index fell 0.37%, or 1.81 points to close at €483.86, with France’s CAC40 tumbling 0.89% and shedding 68 points, wrapping up Thursday at €7,588.75.
FTSE technical outlook
The FTSE’s minor decline on Thursday keeps the UK’s major equity index trapped in near-term consolidation, capped by a resistance level baked into £7,680.00.
The equity index remains in bullish territory above the 200-hour Simple Moving Average (SMA) near £7,560.00.
On daily candlesticks, the FTSE is primed for a fresh decline back into the 200-day SMA near £7,550.00 with the UK’s large-cap index stuck in a month’s long cyclical pattern.
FTSE hourly chart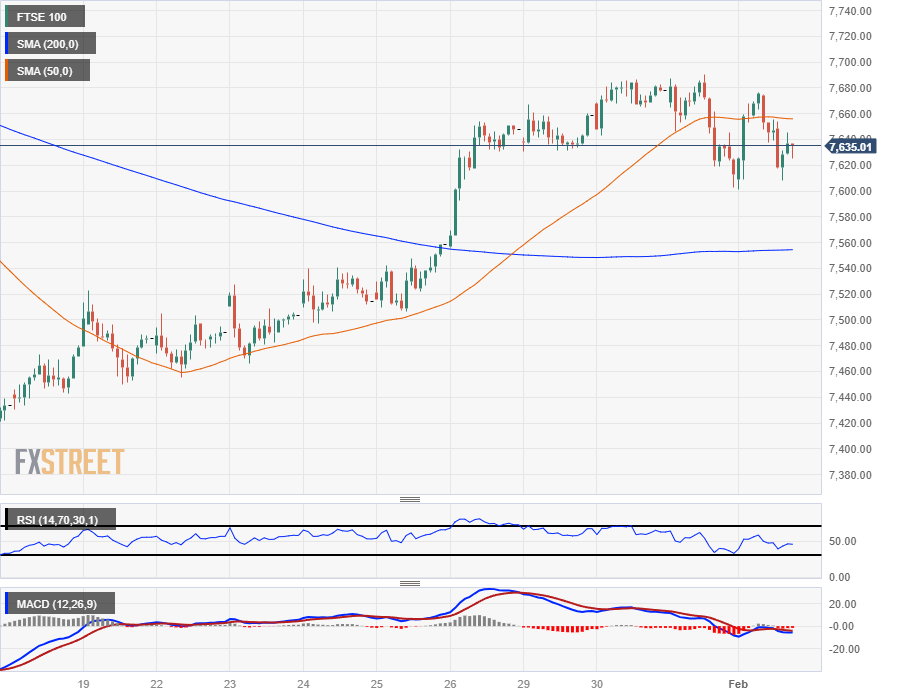
FTSE daily chart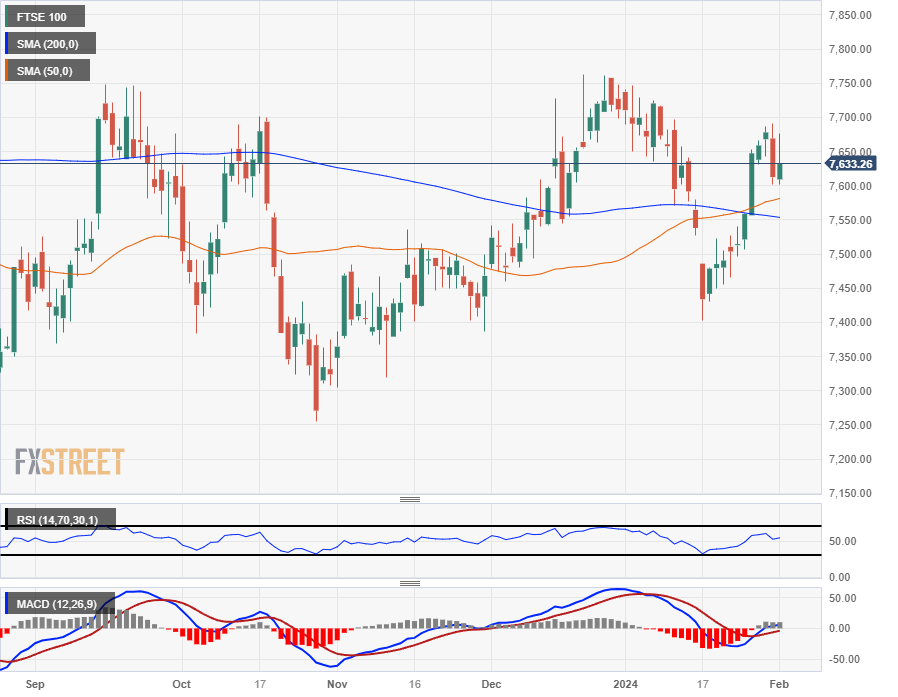
- The DXY Index shows losses, trading near the 103.05 area.
- Weekly Jobless Claims came in higher than expected.
- Markets still digesting Wednesday’s Fed decision and Powell's words.
The US Dollar (USD) is currently trading at 103.05, with a declining trend, largely triggered by the release of soft labor market data on Thursday that outshadowed strong ISM PMIs figures. Markets are still digesting Federal Reserve (Fed) chair Jerome Powell’s words from Wednesday, which helped the index jump toward 103.80.
Fed Chair Powell reinforced the idea that a rate cut in March is unlikely despite ongoing market speculation. Nevertheless, he noted rate adjustments remain primarily data-dependent, with upcoming jobs data setting the pace of the US Dollar and expectations for the short term.
Daily Digest Market Movers: US Dollar declines following weak labor market figures
- The ISM Manufacturing PMI for January came in at 49.1, lower than the consensus estimate of 47 but slightly higher than the previous figure of 47.1.
- The initial Jobless Claims for the week ending in January 27 reported by US Department of Labor are at 224K, higher than the consensus forecast of 212K and the previous figure of 215K.
- Investors are keenly awaiting the January Nonfarm Payrolls report due on Friday to continue placing their bets on the next Fed decisions.
- As for now, markets are seeing the easing cycle starting in May, but the odds of a cut in March are still high around 40%, according to the CME FedWatch Tool.
- In case Friday’s labor market figures come in weaker than expected, the dovish bets on the Fed may rise, applying further pressure on the USD.
Technical Analysis: DXY bears step in to push the index below 200-day SMA
The indicators on the daily chart are reflecting a tentative dominance of selling momentum in the short term. The Relative Strength Index (RSI), albeit on a negative slope, is holding in positive territory, reflecting dwindling buying momentum. This is further supported by the Moving Average Convergence Divergence (MACD) indicator, which showcases decreasing green bars, an indication that the selling pressure is slowly gaining traction.
Furthermore, the positioning of the index concerning its 20,100 and 200 Simple Moving Averages (SMAs) points to a bullish hold in the broader context. The pair still holds above the 20-day SMA, signaling that the bears have failed to command complete control in the short term. However, the DXY's positioning below the 100 and 200-day SMAs suggests more dominant selling momentum in the longer-term.
US Dollar FAQs
What is the US Dollar?
The US Dollar (USD) is the official currency of the United States of America, and the ‘de facto’ currency of a significant number of other countries where it is found in circulation alongside local notes. It is the most heavily traded currency in the world, accounting for over 88% of all global foreign exchange turnover, or an average of $6.6 trillion in transactions per day, according to data from 2022.
Following the second world war, the USD took over from the British Pound as the world’s reserve currency. For most of its history, the US Dollar was backed by Gold, until the Bretton Woods Agreement in 1971 when the Gold Standard went away.
How do the decisions of the Federal Reserve impact the US Dollar?
The most important single factor impacting on the value of the US Dollar is monetary policy, which is shaped by the Federal Reserve (Fed). The Fed has two mandates: to achieve price stability (control inflation) and foster full employment. Its primary tool to achieve these two goals is by adjusting interest rates.
When prices are rising too quickly and inflation is above the Fed’s 2% target, the Fed will raise rates, which helps the USD value. When inflation falls below 2% or the Unemployment Rate is too high, the Fed may lower interest rates, which weighs on the Greenback.
What is Quantitative Easing and how does it influence the US Dollar?
In extreme situations, the Federal Reserve can also print more Dollars and enact quantitative easing (QE). QE is the process by which the Fed substantially increases the flow of credit in a stuck financial system.
It is a non-standard policy measure used when credit has dried up because banks will not lend to each other (out of the fear of counterparty default). It is a last resort when simply lowering interest rates is unlikely to achieve the necessary result. It was the Fed’s weapon of choice to combat the credit crunch that occurred during the Great Financial Crisis in 2008. It involves the Fed printing more Dollars and using them to buy US government bonds predominantly from financial institutions. QE usually leads to a weaker US Dollar.
What is Quantitative Tightening and how does it influence the US Dollar?
Quantitative tightening (QT) is the reverse process whereby the Federal Reserve stops buying bonds from financial institutions and does not reinvest the principal from the bonds it holds maturing in new purchases. It is usually positive for the US Dollar.
- Mexican Peso appreciates against the Dollar, driven by the recent Fed decision and softer US employment figures.
- Banxico's survey indicates expectations of a rate cut to 9.25% and a year-end exchange rate forecast of 18.50, influencing market sentiment.
- Mexico's manufacturing sector shows expansion with a slowdown, contrasting with US data that points to a cooling labor market but increasing manufacturing activity.
The Mexican Peso (MXN) climbed against the US Dollar (USD) on Thursday as market participants digested the latest Federal Reserve (Fed) decision. Alongside that, softer employment figures in the United States (US) and a risk-on impulse favor the emerging market currency. The USD/MXN trades at 17.09, down by 0.64%.
The Bank of Mexico (Banxico) revealed its survey of expectations on Thursday, showing that analysts estimate the bank will lower rates to 9.25% and expect the exchange rate to end at 18.50. In regard to inflation expectations, private analysts estimate it to hit 4.17% and economic growth to range from 2.29% to 2.40%.
Meanwhile, Mexico’s economic docket featuring that business activity in the manufacturing sector expanded, but it’s slowing down. In the meantime, US economic data showed the labor market is cooling while manufacturing activity gathers steam.
Daily digest market movers: Mexican Peso appreciates as US Dollar weakens on mixed US data
- S&P Global revealed that manufacturing activity in Mexico is slowing sharply, with the PMI dipping from 52.0 in December to 50.2.
- US Initial Jobless Claims for the last week rose 224K, exceeding the previous reading of 215K and forecasts of 215K. The data suggests the labor market is cooling amid a period in which US companies announced plans to cut over 82,300 jobs in the last month.
- The S&P Global Manufacturing PMI improved from 47.9 to 50.7 in January. The Institute for Supply Management’s (ISM) Manufacturing PMI improved from 47.1 to 49.1, exceeding forecasts of 47.
- USD/MXN traders continued to digest the latest Federal Reserve decision to hold rates unchanged as widely expected and adopted a neutral stance. Even though officials had opened the door to cut interest rates, they emphasized the need for reassurance that inflation is “sustainably” moving toward its 2% goal. Regarding the balance sheet, its reduction would continue as outlined in May of 2023.
- Mexico’s economy grew below forecasts in the last quarter of 2023. GDP expanded 0.1% QoQ, trailing Q3 1.1% growth and forecasts of 0.4%.
- Given that the Mexican economy remains solid, according to the data revealed in January, the Bank of Mexico (Banxico) could delay easing monetary policy as conditions remain hotter than expected.
- However, if Banxico’s officials remain determined to begin its easing cycle in Q1 of 2024, that could depreciate the emerging market currency due to the reduction of interest rate differentials. That could also underpin the USD/MXN pair on its way toward the psychological 18.00 figure.
- Additional factors that might depreciate the Mexican currency are geopolitical risks and risk aversion.
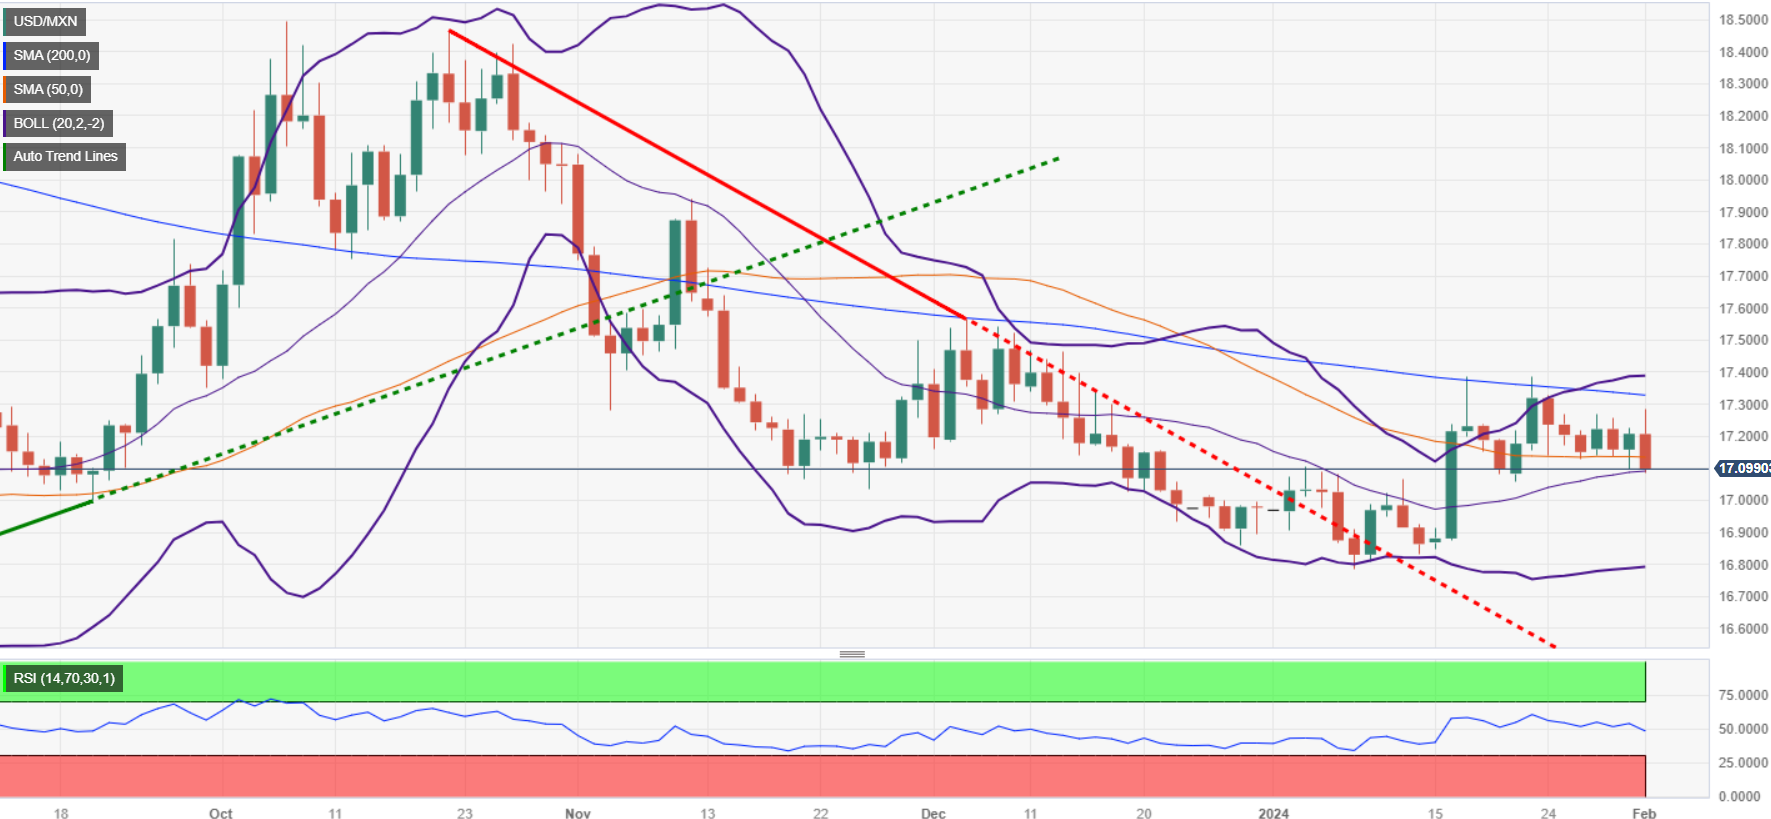
Technical Analysis: Mexican Peso stages a comeback as USD/MXN breaks below 17.15
The USD/MXN remains trading sideways, but it has pierced below the 50-day Simple Moving Average (SMA) at 17.13, exposing the exotic pair to further losses. If sellers reclaim the January 22 daily low of 17.05, that could open the door to challenging the 17.00 figure.
On the flip side, if buyers reclaim the 50-day SMA at 17.13, that could exacerbate a rally to 17.20. Once that level is cleared, the next resistance would be the 200-day SMA at 17.33, followed by the 100-day SMA at 17.38.
USD/MXN Price Action – Daily Chart
Mexican Peso FAQs
What key factors drive the Mexican Peso?
The Mexican Peso (MXN) is the most traded currency among its Latin American peers. Its value is broadly determined by the performance of the Mexican economy, the country’s central bank’s policy, the amount of foreign investment in the country and even the levels of remittances sent by Mexicans who live abroad, particularly in the United States. Geopolitical trends can also move MXN: for example, the process of nearshoring – or the decision by some firms to relocate manufacturing capacity and supply chains closer to their home countries – is also seen as a catalyst for the Mexican currency as the country is considered a key manufacturing hub in the American continent. Another catalyst for MXN is Oil prices as Mexico is a key exporter of the commodity.
How do decisions of the Banxico impact the Mexican Peso?
The main objective of Mexico’s central bank, also known as Banxico, is to maintain inflation at low and stable levels (at or close to its target of 3%, the midpoint in a tolerance band of between 2% and 4%). To this end, the bank sets an appropriate level of interest rates. When inflation is too high, Banxico will attempt to tame it by raising interest rates, making it more expensive for households and businesses to borrow money, thus cooling demand and the overall economy. Higher interest rates are generally positive for the Mexican Peso (MXN) as they lead to higher yields, making the country a more attractive place for investors. On the contrary, lower interest rates tend to weaken MXN.
How does economic data influence the value of the Mexican Peso?
Macroeconomic data releases are key to assess the state of the economy and can have an impact on the Mexican Peso (MXN) valuation. A strong Mexican economy, based on high economic growth, low unemployment and high confidence is good for MXN. Not only does it attract more foreign investment but it may encourage the Bank of Mexico (Banxico) to increase interest rates, particularly if this strength comes together with elevated inflation. However, if economic data is weak, MXN is likely to depreciate.
How does broader risk sentiment impact the Mexican Peso?
As an emerging-market currency, the Mexican Peso (MXN) tends to strive during risk-on periods, or when investors perceive that broader market risks are low and thus are eager to engage with investments that carry a higher risk. Conversely, MXN tends to weaken at times of market turbulence or economic uncertainty as investors tend to sell higher-risk assets and flee to the more-stable safe havens.
- Canadian Dollar mixed on Thursday as Crude Oil flattens.
- Canada saw an improvement in Manufacturing PMIs for January.
- Markets gear up for another US NFP on Friday.
The Canadian Dollar (CAD) is broadly mixed against a basket of major currencies on Thursday but sees some gains against the US Dollar (USD). Markets are settling following Wednesday’s Federal Reserve (Fed) outing that saw Fed Chairman Jerome Powell strike a much more hawkish tone than many investors expected. This knocked equity markets lower and drove risk-off flows into the safe haven US Dollar.
Canada saw an uptick in the S&P Global Manufacturing Purchasing Managers Index (PMI) for January, but the indicator of production confidence remains in contractionary, sub-50.0 territory. US ISM Manufacturing PMIs likewise printed above expectations, but similarly remain below 50.0. US Initial Jobless Claims unexpectedly jumped, coming in above the four-week average for US jobless benefits seekers.
Daily digest market movers: Canadian Dollar finds some room to recover against Greenback
- The Canadian Manufacturing PMI printed at 48.3 for January, stepping over the previous month’s 45.4, a sharp recovery from December’s three-and-a-half-year low.
- US Initial Jobless Claims for the week ended January 26 printed at 224K versus the forecasted 212K. Last week's jobless tickets came in at 215K.
- US Initial Jobless Claims posted their highest print since November 10, accelerating above the four-week average of 207.75K.
- The US ISM Manufacturing PMI recovered to 49.1 in January compared to the forecasted tick down to 47.0 from December’s 47.1, its highest reading in 16 months.
- US ISM Manufacturing Prices Paid also rose to a 9-month high of 52.9 compared to the forecasted jump to 46.9 from December’s 45.2 as producer-level inflation bites.
- The trading week will close out with another high-impact US Nonfarm Payrolls (NFP) print on Friday.
- US NFP job additions are forecast to tick down to 180K in January compared to December’s 216K.
- Market NFP forecasts have undershot the actual NFP print in all but four of the last 21 consecutive releases.
- Crude Oil markets have flattened after a panicked rise that saw West Texas Intermediate (WTI) US Crude Oil climb over $79 per barrel last week.
- Crude Oil bids have receded, allowing WTI to settle just above $76.00.
- NFP Preview: Forecasts from 10 major banks
Canadian Dollar price today
The table below shows the percentage change of Canadian Dollar (CAD) against listed major currencies today. Canadian Dollar was the strongest against the US Dollar.
| USD | EUR | GBP | CAD | AUD | JPY | NZD | CHF | |
| USD | -0.57% | -0.37% | -0.41% | -0.10% | -0.61% | -0.38% | -0.56% | |
| EUR | 0.57% | 0.20% | 0.14% | 0.49% | 0.00% | 0.19% | 0.01% | |
| GBP | 0.38% | -0.19% | -0.06% | 0.32% | -0.19% | -0.01% | -0.19% | |
| CAD | 0.39% | -0.16% | 0.06% | 0.33% | -0.14% | 0.06% | -0.13% | |
| AUD | 0.10% | -0.49% | -0.31% | -0.35% | -0.49% | -0.27% | -0.45% | |
| JPY | 0.58% | 0.00% | 0.19% | 0.14% | 0.46% | 0.14% | 0.02% | |
| NZD | 0.38% | -0.17% | 0.02% | -0.02% | 0.29% | -0.22% | -0.17% | |
| CHF | 0.55% | -0.02% | 0.19% | 0.10% | 0.46% | -0.05% | 0.16% |
The heat map shows percentage changes of major currencies against each other. The base currency is picked from the left column, while the quote currency is picked from the top row. For example, if you pick the Euro from the left column and move along the horizontal line to the Japanese Yen, the percentage change displayed in the box will represent EUR (base)/JPY (quote).
Technical Analysis: Canadian Dollar recovers against US Dollar, mixed in Europe and Oceania
The Canadian Dollar (CAD) has rebounded a quarter of a percent against the US Dollar on Thursday, but shed around a quarter of a percent against the Japanese Yen (JPY), the market’s single best-performing currency for the day. The Canadian Dollar eased slightly against the Euro (EUR) and the Swiss Franc (CHF) as market activity focused elsewhere, but it climbed around a third of a percent against the Australian Dollar (AUD).
USD/CAD dipped back below the 1.3400 handle once again for the fourth time in two days as the Dollar-Loonie pair roils on market sentiment. The pair recovered to 1.3460 early Thursday after Wednesday’s Fed-fueled churn, reaching a near-term low of 1.3360.
USD/CAD is heading back into downside territory near 1.3380, with Thursday’s peak etching in a rejection from the 200-hour Simple Moving Average (SMA). Thursday’s nearish push drives the USD/CAD toward the low end of near-term congestion that has plagued the pair on daily candlesticks. Intraday action is set to remain capped by the 200-day SMA just below the 1.3500 handle.
USD/CAD hourly chart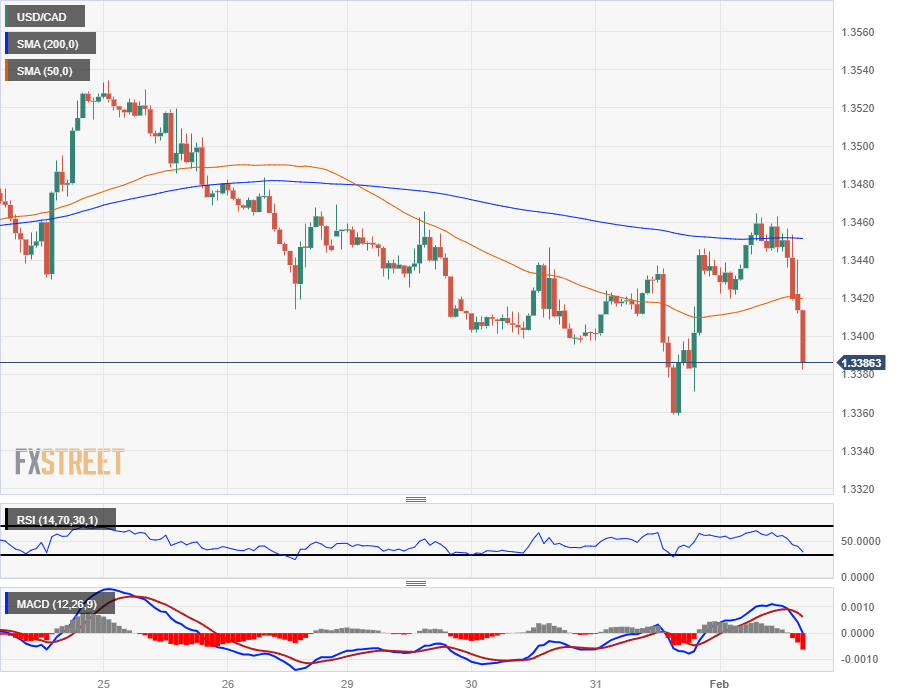
USD/CAD daily chart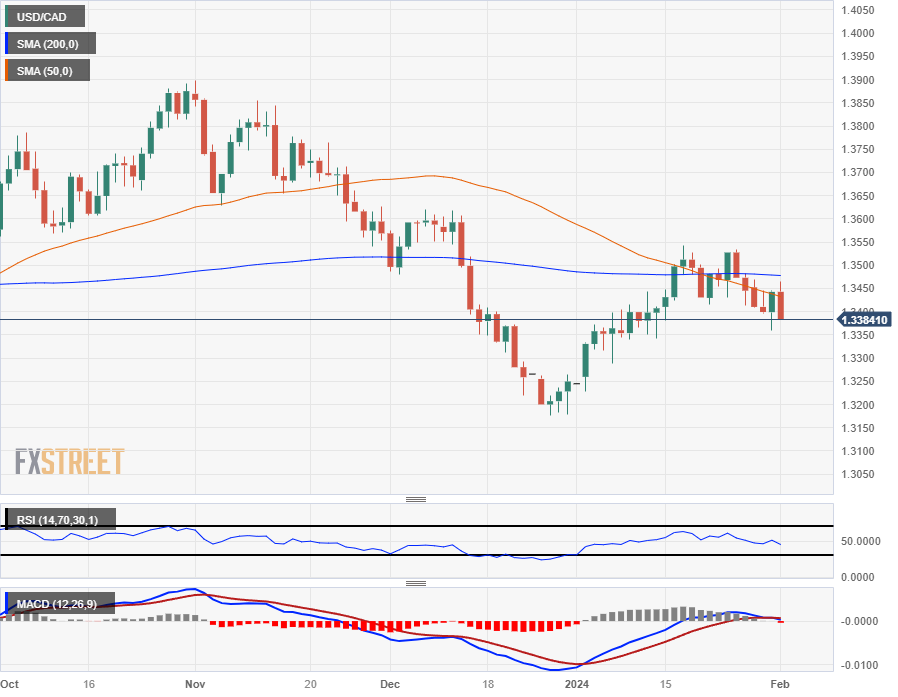
Economic Indicator
United States Nonfarm Payrolls
The Nonfarm Payrolls release presents the number of new jobs created in the US during the previous month in all non-agricultural businesses; it is released by the US Bureau of Labor Statistics (BLS). The monthly changes in payrolls can be extremely volatile. The number is also subject to strong reviews, which can also trigger volatility in the Forex board. Generally speaking, a high reading is seen as bullish for the US Dollar (USD), while a low reading is seen as bearish, although previous months' reviews and the Unemployment Rate are as relevant as the headline figure. The market's reaction, therefore, depends on how the market assesses all the data contained in the BLS report as a whole.
Read more.Next release: 02/02/2024 13:30:00 GMT
Frequency: Monthly
Source: US Bureau of Labor Statistics
Why it matters to traders
America’s monthly jobs report is considered the most important economic indicator for forex traders. Released on the first Friday following the reported month, the change in the number of positions is closely correlated with the overall performance of the economy and is monitored by policymakers. Full employment is one of the Federal Reserve’s mandates and it considers developments in the labor market when setting its policies, thus impacting currencies. Despite several leading indicators shaping estimates, Nonfarm Payrolls tend to surprise markets and trigger substantial volatility. Actual figures beating the consensus tend to be USD bullish.
Canadian Dollar FAQs
What key factors drive the Canadian Dollar?
The key factors driving the Canadian Dollar (CAD) are the level of interest rates set by the Bank of Canada (BoC), the price of Oil, Canada’s largest export, the health of its economy, inflation and the Trade Balance, which is the difference between the value of Canada’s exports versus its imports. Other factors include market sentiment – whether investors are taking on more risky assets (risk-on) or seeking safe-havens (risk-off) – with risk-on being CAD-positive. As its largest trading partner, the health of the US economy is also a key factor influencing the Canadian Dollar.
How do the decisions of the Bank of Canada impact the Canadian Dollar?
The Bank of Canada (BoC) has a significant influence on the Canadian Dollar by setting the level of interest rates that banks can lend to one another. This influences the level of interest rates for everyone. The main goal of the BoC is to maintain inflation at 1-3% by adjusting interest rates up or down. Relatively higher interest rates tend to be positive for the CAD. The Bank of Canada can also use quantitative easing and tightening to influence credit conditions, with the former CAD-negative and the latter CAD-positive.
How does the price of Oil impact the Canadian Dollar?
The price of Oil is a key factor impacting the value of the Canadian Dollar. Petroleum is Canada’s biggest export, so Oil price tends to have an immediate impact on the CAD value. Generally, if Oil price rises CAD also goes up, as aggregate demand for the currency increases. The opposite is the case if the price of Oil falls. Higher Oil prices also tend to result in a greater likelihood of a positive Trade Balance, which is also supportive of the CAD.
How does inflation data impact the value of the Canadian Dollar?
While inflation had always traditionally been thought of as a negative factor for a currency since it lowers the value of money, the opposite has actually been the case in modern times with the relaxation of cross-border capital controls. Higher inflation tends to lead central banks to put up interest rates which attracts more capital inflows from global investors seeking a lucrative place to keep their money. This increases demand for the local currency, which in Canada’s case is the Canadian Dollar.
How does economic data influence the value of the Canadian Dollar?
Macroeconomic data releases gauge the health of the economy and can have an impact on the Canadian Dollar. Indicators such as GDP, Manufacturing and Services PMIs, employment, and consumer sentiment surveys can all influence the direction of the CAD. A strong economy is good for the Canadian Dollar. Not only does it attract more foreign investment but it may encourage the Bank of Canada to put up interest rates, leading to a stronger currency. If economic data is weak, however, the CAD is likely to fall.
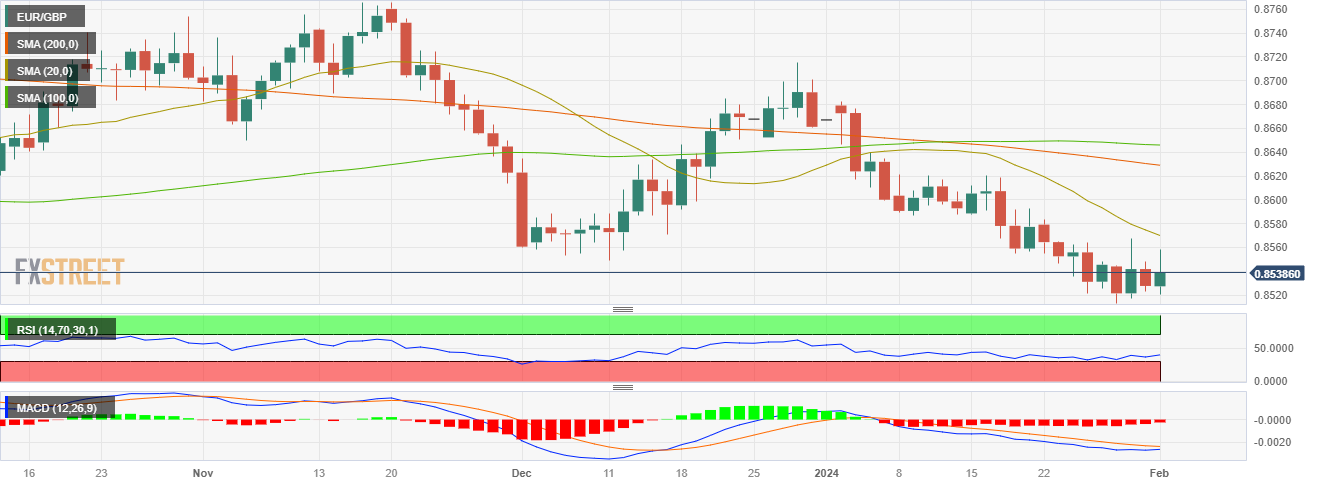
- The EUR/GBP is trading at 0.8545, with 0.25% gains.
- The BoE held interest rates steady, as expected.
- Eurozone’s inflation figures from January came in higher than expected
In Thursday's session, the EUR/GBP rose to 0.8545, showing a 0.25% gain. The pair's daily chart maintains a neutral to bearish perspective, with bulls attempting to regain control and building momentum. Buyers won momentum after hot inflation figures from the Eurozone but the Bank of England’s hawkish stance may limit the upside.
The Bank of England opted to keep interest rates steady at 5.25%, marking the fourth consecutive unchanged decision. Six of the nine Monetary Policy Committee members supported maintaining the status quo, while Catherine Mann and Jonathan Haskel voted for a 25 basis points increase to 5.50%, and Swati Dhingra endorsed a similar-sized decrease. In addition, during the press conference, Andrew Bailey emphasized keeping interest rates higher for longer showing confindence that inflation will eventually reach the bank's 2% target.
On the other hand, the Eurozone’s Core Harmonized Index of Consumer Prices (HICP) came in higher than expected at 3.3% and gave the Euro a lift. However, after the first decisions of the European Central Bank (ECB) and the BoE, monetary policies divergences are favoring the Pound as markets anticipate less easing by the British bank. Incoming data will still dictate the trajectory of the cross for the next sessions.
EUR/GBP levels to watch
Based on the technical indicators from the daily chart, the bears seem to be maintaining control on a broader scale despite the gains. The Relative Strength Index (RSI) is on a positive slope, indicating potential strength among buyers. However, it is still in the negative territory, suggesting that negative momentum is still prevalent. Furthermore, the Moving Average Convergence Divergence (MACD) continues to present red bars, indicating a steady bearish momentum. In addition, the pair remains below the Simple Moving Averages (SMA) of 20,100 and 200-day period, suggesting the bears' continued dominance on a broader scale. Therefore, for an upward trajectory to be established, buyers will need to demonstrate a more substantial momentum shift.
EUR/GBP daily chart
The US Bureau of Labor Statistics (BLS) will release the January jobs report on Friday, February 2 at 13:30 GMT and as we get closer to the release time, here are the forecasts by the economists and researchers of 10 major banks regarding the upcoming employment data.
Expectations are for a 180,000 rise in Nonfarm Payrolls following the stronger-than-expected 216,000 increase recorded in December. Unemployment is expected to rise a tick to 3.8%, while average hourly earnings are expected to remain steady at 4.1% year-on-year.
Commerzbank
The US labor market is holding up, but not quite as well as the headline numbers would suggest. We expect employment to rise by 180K in January. This would probably not be enough for the Fed to cut rates as early as March, as the market has priced in. We still expect the first rate cut in May.
Deutsche Bank
We expect gains in payrolls to moderate to 150K from 216K in December, with the unemployment rate edging higher to 3.8% (3.7%) and hourly earnings growth slowing to +0.3% (+0.4%).
ING
We look for NFP growth of around 200K, once again led by government, leisure and hospitality and education and healthcare services. Nonetheless, the household survey is expected to show the unemployment rate ticking a little higher to 3.8%.
TDS
We look for a strong increase in payrolls at 230K. The NFP's annual benchmark and the update to seasonal factors will also add a wrinkle to this report. We expect the UE rate to rise a tenth to 3.8%, while wages likely rose 0.2% MoM.
RBC Economics
Payroll employment is likely up by 195K in January, slightly below the 216K in December. The unemployment rate should continue to edge up to 3.8% from 3.7% in December, reflecting some easing conditions in the labour market.
NBF
Hiring could have slowed in the month, but this may have been offset by a decrease in the number of layoffs. With these two trends cancelling each other, job creation could have remained relatively strong at 185K. And while the household survey may show a much larger gain following the losses recorded in December, this could have been partly offset by a rebound in participation, leaving the unemployment rate unchanged at 3.7%.
SocGen
We forecast a 165K NFP gain for January, which matches the average of the previous three months. The unemployment rate is expected to climb modestly to 3.8% from 3.7%. This is an estimate in rounding. In December, the unemployment rate was 3.74%, so we are expecting a very minor uptick.
Wells Fargo
The themes of improving supply, cooling demand and overall labor market normalization likely continued in January. We estimate that NFP rose by 155K in January, a downshift from December's gain and a bit below the current Bloomberg consensus. Although payroll growth has held up remarkably well recently, there are several signs of further moderation in the months ahead. On net, fewer industries are adding headcounts each month and job openings and hiring plans continue to pull back. Furthermore, initial jobless claims remain low, but continuing claims have edged up, which is an indication that displaced workers are having a more challenging time finding new work. We expect the unemployment rate ticked up to 3.8% and average hourly earnings increased 0.3%.
CIBC
We expect job gains to remain solid with a pickup of 170K in the month, about the average three month pace in December. Government and healthcare hiring should continue to be the main source of employment, both sectors less sensitive to the business cycle. But perhaps more important than the January payroll number could be previous revisions. Recently, revisions have been material and this time around, we would not be surprised to see upward revisions given the surge in consumption, implying an even higher level of real income in the system. The unemployment rate and the participation rate should stay unchanged in the month while wage growth should moderate slightly to 0.3% MoM.
Citi
Still generally low level of layoffs will likely result in a strong 240K increase in NFP in January, but strength on the surface could mask some still-weakening labor market details. The primary driver of the strong forecast is very low initial jobless claims in the first two weeks of the year (through the January reference period). But this dynamic is not new information and a stronger January payrolls may not be a sign that labor demand is reaccelerating. Underlying weakening in the labor market may still be present in January data, and this weakness could become more obvious into the spring when hiring generally picks up. The underlying trend of job growth is likely still slowing, particularly for private services payrolls. We also expect a 0.3% MoM increase in average hourly earnings in January, a softer increase than 0.4% in December and despite stronger January job growth, an unemployment rate in January of 3.9% from 3.7% due to a bounce-back in the labor force participation rate.
Despite the impulse of the Federal Reserve (Fed) and the Bank of England (BoE) meetings, GBP/USD is currently trading very little changed from its levels 24 hours ago. Economists at Rabobank analyze Cable’s outlook.
The BoE rate will remain on hold until September
In our view, the first Fed rate cut of the cycle is more likely in June. This suggests the risk of further USD upside on a one-to-three-month view.
In our view, the BoE rate will remain on hold until September reflecting relatively higher levels of UK inflation.
We see potential for Cable to drop back to 1.2500 on a three-month view but to edge higher to 1.3000 in H2 as the Fed rate cutting cycle progresses.
Economists at CIBC Capital Markets expect the Canadian Dollar (CAD) to depreciate in the coming weeks before staging a comeback.
Final leg weaker before an appreciation
The Loonie has been retracing gains made late last year, and will likely continue to depreciate over the first quarter as markets recalibrate central bank rate expectations.
As markets reprice Fed and BoC expectations in opposite directions, we see USD/CAD drifting up to 1.3800 in early spring. Thereafter, broad USD weakness as the Fed prepares to start cutting rates should give the CAD a lift, and the Loonie will be boosted further in 2025 by a global pickup in demand and higher commodity prices.
We look for USD/CAD to reach 1.2900 by the end of 2025.
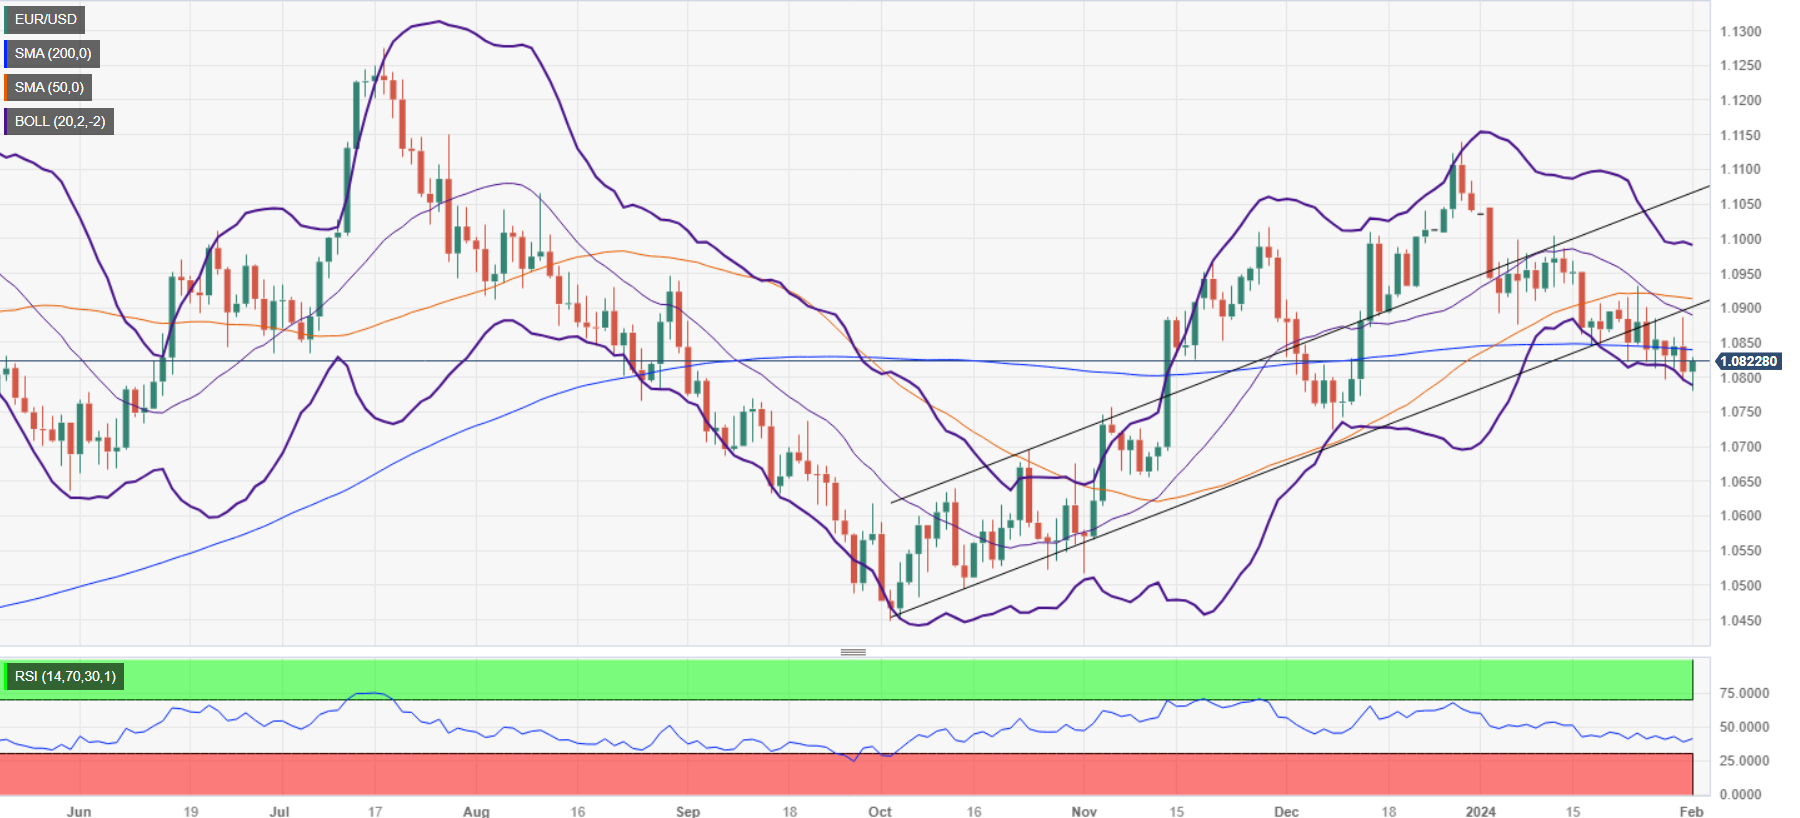
- EUR/USD recovers to 1.0817 following Fed's steady rate decision and Powell's inflation comments.
- Contrasting US economic indicators: rising jobless claims but increased business activity per S&P Global.
- Eurozone inflation downtrend impacts ECB rate cut outlook; focus remains on Fed's future rate moves.
The EUR/USD trims some losses, though it remains virtually unchanged after the US Federal Reserve (Fed) decided to hold rates unchanged and shrugged off market bets to cut rates in March. Nevertheless, the US central bank is looking forward to easing policy. At the time of writing, the pair exchanges hands at 1.0817 after testing the 100-day moving average (DMA) at 1.0780.
Euro stabilizes following Fed’s decision
Fed Chair Jerome Powell spoke after the FOMC’s decision, emphasized that its too early to declare victory on inflation, and while acknowledging that prices are indeed headed lower, a rate cut in March is off the table.
The US Bureau of Labor Statistics recently revealed that Initial Jobless Claims for the last week rose 224K, exceeding the previous reading of 215K and forecasts of 215K. The data suggests the labor market is cooling amid a period in which US companies announced plans to cut over 82,300 jobs in the last month, as mentioned by Bloomberg.
Meanwhile, business activity is gaining traction in the US, revealed S&P Global, as the Manufacturing PMI jumped from 47.9 to 50.7 on January´s final reading. Recently, the ISM Manufacturing PMI for January was released, it came at 49.1 at recessionary territory, but up from December, and exceeded forecasts of 47.
Across the Atlantic, inflation in the Eurozone, as measured by the Harmonized Index of Consumer Prices (HICP), rose 2.8% YoY in January, down from 2.9%. The Core HICP dived from 3.4% to 3.3%, but missed forecasts of 3.2%.
Interest rate expectations for the ECB and the Fed
Rate cut expectations for the European Central Bank (ECB) for an April rate cut stand at 89%, while for June is fully priced in. In the case of the Federal Reserve, futures traders had fully priced in a cut in May and June.
EUR/USD Price Analysis: Technical outlook
With prices having dipped to the 100-DMA, the EUR/USD stages a recovery back above the 1.0800 figure. Further upside is seen if buyers reclaim the 200-DMA at 1.0839. After that, the next resistance would be the psychological 1.0900 mark. On the other hand, if the exchange rate slips below 1.0800, further downside is seen at the 100-DMA at 1.0780, before challenging the December 8 low of 1.0724.
The FOMC kept rates on hold at 5.25%-5.50% for a fourth consecutive meeting in January. Economists at TD Securities analyze Dollar’s outlook following Fed’s decision.
USD rallies will be quickly faded
The Fed has seemingly priced out March as the start of the cutting cycle. Near-term, that could provide some support to the USD, though we also know that the Fed’s next move is likely to be a cut. We think USD rallies will be quickly faded, especially if the data validates the disinflation narrative ahead of the next meeting.
Good growth plus disinflation remains bearish for the USD.
- ISM Manufacturing PMI came in better than expected in January.
- US Dollar Index holds steady near 103.50 after the data.
Business activity in the US manufacturing sector continued to contract in January, albeit at a softer pace than December, with the ISM Manufacturing PMI rising to 49.1 from 47.1. This reading came in better than the market expectation of 47.
Further details of the report showed that the Prices Paid Index climbed to 52.9 from 45.2 and the Employment Index edged lower to 47.1 from 47.5. Finally, the New Orders Index advanced to 52.5 from 47.
Assessing the survey's findings, "the US manufacturing sector continued to contract, though at a marginal rate compared to December," said Timothy R. Fiore, Chair of the Institute for Supply Management (ISM) Manufacturing Business Survey Committee. "Demand moderately improved, output remained stable and inputs are accommodative."
Market reaction
The US Dollar Index inched higher with the immediate reaction to this report and was last seen trading unchanged on the day at 103.50.
For the Mexican Peso (MXN), slowdowns in remittances and vehicle exports portend to downside in the coming quarter, economists at CIBC Capital Markets say.
Changing tides
We expect a few of the factors benefiting the MXN (i.e. carry, remittances growth, and manufacturing exports) in 2023 to offer a headwind for the MXN going forward, in line with our Q1 USD/MXN forecast of 18.00.
We maintain our call for consecutive 25 bps rate cuts starting in March. Also, we anticipate an increase in the magnitude of Banxico’s rate cuts in late 2024, bringing the overnight rate to 9.25% (or 200 bps worth of cuts) by year-end. This compares to our revised forecast of four 25 bps rate cuts by the Fed.
- AUD/USD finds an intermediate support near 0.6500 ahead of US ISM Manufacturing PMI data.
- The USD Index falls back despite the Fed pushing away rate-cuts expectations for March.
- Caixin Manufacturing PMI at 50.8 outperforms the consensus of 50.6.
The AUD/USD pair finds bids near the crucial support of 0.6500 in Thursday's early New York session. The Aussie asset rebounds as the US Dollar Index (DXY) has surrendered its entire gains generated in the European session.
The S&P500 is expected to open positively, considering the strength in the overnight futures. The USD Index has fallen sharply after facing stiff resistance near 103.80. Even though the Federal Reserve (Fed) has pushed back expectations of rate cuts in March, it is imminent that the central bank will reduce borrowing rates this year as price pressures are consistently easing.
Forward action in the USD Index will be guided by the United States Institute of Supply Management’s (ISM) Manufacturing PMI for January, which will be published at 15:00 GMT. Investors have forecasted that factory PMI drop to 47.0 from 47.4 in December. This would be the 14th straight month when the Manufacturing PMI would remain below the 50.0 threshold.
Action in the FX domain will continue as the January US Nonfarm Payrolls (NFP) report will be released on Friday. Significant increases in payroll numbers and higher wage growth would indicate a stubborn outlook for the underlying inflation.
Meanwhile, the Australian Dollar has faced selling pressure despite upbeat Caixin Manufacturing PMI data. The economic data landed at 50.8%, outperforming the expectations of 50.6% despite higher furloughs due to the festive mood. Being a proxy to China’s economic growth, the appeal for the Australian Dollar generally improves if economic prospects in the world’s second-largest nation outperform.
As universally expected, the Bank of England (BoE) left Bank Rate on hold at 5.25% today. Not much for the Pound Sterling (GBP) to latch onto here, though stabilizing a bit from the session lows, economists at TD Securities report.
There is not much of a BoE theme today for GBP
As expected, the Monetary Policy Committee (MPC) voted to hold Bank Rate at 5.25%. The 1-6-2 vote was a surprise, but with the usual suspects voting in their usual camps, shouldn't be interpreted hawkishly. The MPC's guidance was revamped to a neutral position, and data is in the driver's seat in the months ahead.
Not much for GBP to latch onto BoE-wise. The focus remains on the USD and the Fed, where we continue to look for a May cut. Still, FX is hugely data-dependent, leaving the focus on NFP and upcoming inflation prints.
We would look to fade the USD move, especially if NFP on Friday provides good growth and tame wages, which would lift the GBP.
It has been a strong start to the year for the US Dollar. Economists at CIBC Capital Markets expect near-term strength.
Fed to start easing rates in July
The call here is for the Fed to start easing rates in July. As the market re-prices to that timing, the USD should still gain a bit more in the near term. But into H2, we expect the theme of USD weakness to pick up steam as the Fed looks to slow its own version of quantitative tightening (QT) which would put it at odds with how other central banks are proceeding with their own programs.
Additional drags should come from relatively hawkish policy outside of the US (Japan and the UK), continued deficit spending in the US, and the general sense of overvaluation for the Greenback on a longer-term basis.
DXY – Q1 2024: 104.83 | Q2 2024: 102.39
- Initial Jobless Claims rose by 224K from a week earlier.
- Continuing Jobless Claims also surpassed consensus.
US citizens that applied for unemployment insurance benefits increased by 224K in the week ending January 27 according to the US Department of Labor (DoL) on Thursday. Once again, the prints came in above market estimates and follows a 215K gain in the previous week.
Further details of the publication revealed that the advance seasonally adjusted insured unemployment rate was 1.3% and the 4-week moving average stood at 207.75K, a decrease of 5.25K from the previous week's revised average.
In addition, Continuing Claims increased by 70K to 1.8898M in the week ended January 20.
Market reaction
The US Dollar Index (DXY) comes under some selling pressure, abandonig the area of weekly tops near 103.80.
Andrew Bailey, Governor of the Bank of England, presents the Monetary Policy Report and responds to questions from the press following the Bank of England's (BoE) decision to leave the policy rate unchanged at 5.25%.
Key quotes
"I don't agree with the idea that we've done an easy bit on bringing wage growth down."
"We don't need to see inflation back at target to cut rates, we need evidence that it is heading there."
About Andrew Bailey (via bankofengland.co.uk)
"Andrew Bailey previously held the role of Deputy Governor, Prudential Regulation and CEO of the PRA from 1 April 2013. While retaining his role as Executive Director of the Bank, Andrew joined the Financial Services Authority in April 2011 as Deputy Head of the Prudential Business Unit and Director of UK Banks and Building Societies. In July 2012, Andrew became Managing Director of the Prudential Business Unit, with responsibility for the prudential supervision of banks, investment banks and insurance companies. Andrew was appointed as a voting member of the interim Financial Policy Committee at its June 2012 meeting."
- EUR/GBP sees more downside below 0.8500 as the BoE chose high inflation over a poor economic outlook.
- Six out of eight BoE policymakers supported for keeping interest rates unchanged at 5.25%.
- The Eurozone HICP deflated significantly in January.
The EUR/GBP has been heavily dumped by the market participants as the Bank of England (BoE) has kept interest rates unchanged at 5.25%. The BoE was expected to leave interest rates steady for the fourth straight time, but hawkish guidance has improved the appeal for the Pound Sterling.
Out of the eight-member led Monetary Policy Committee (MPC), policymakers Jonathan Haskel and Catherine Mann voted for further quantitative tightening by 25 basis points (bps). BoE Governor Andrew Bailey has supported for keeping interest rates restrictive for a longer period until they get confident that inflation will decline to 2%. Bailey says the time period for a restrictive interest rate stance will be based on incoming data.
The outlook for the Pound Sterling has strengthened against the Euro as the BoE has chosen high inflation over deepening recession fears. According to the revised estimates of the United Kingdom Office for National Statistics (ONS), the economy witnessed a de-growth of 0.1% in the third quarter of 2023. A similar performance in the final quarter will be considered a technical recession. Also, hawkish signals would heavily impact business optimism.
On the Eurozone front, the preliminary Harmonized Index of Consumer Prices (HICP) for January softened significantly monthly. Headline and core HICP were contracted by 0.4% and 0.9% respectively. Annually, the core CPI decelerated to 3.3% from 3.4% in December but failed to match estimates of 3.2%.
Meanwhile, investors await fresh cues about when and how much the European Central Bank (ECB) will reduce interest rates in 2024. ECB President Christine Lagarde said earlier that the ‘rate-cut’ campaign could start in late Summer.
Andrew Bailey, Governor of the Bank of England, presents the Monetary Policy Report and responds to questions from the press following the Bank of England's (BoE) decision to leave the policy rate unchanged at 5.25%.
Key quotes
"Inflation moving back to around 2.7% is not an acceptable state of affairs, as a resting point."
"We will not maintain the policy stance any longer than we need to do"
"The good news on the economy has taken away the need for warning that rates could rise again."
About Andrew Bailey (via bankofengland.co.uk)
"Andrew Bailey previously held the role of Deputy Governor, Prudential Regulation and CEO of the PRA from 1 April 2013. While retaining his role as Executive Director of the Bank, Andrew joined the Financial Services Authority in April 2011 as Deputy Head of the Prudential Business Unit and Director of UK Banks and Building Societies. In July 2012, Andrew became Managing Director of the Prudential Business Unit, with responsibility for the prudential supervision of banks, investment banks and insurance companies. Andrew was appointed as a voting member of the interim Financial Policy Committee at its June 2012 meeting."
Andrew Bailey, Governor of the Bank of England, presents the Monetary Policy Report and responds to questions from the press following the Bank of England's (BoE) decision to leave the policy rate unchanged at 5.25%.
Key quotes
"Questions over official labour market data are posing challenges."
"Likely this year's questions for MPC are: "For how long should we keep bank rate at its current level?""
"Also: "Have inflationary pressures eased enough that we can begin to lower bank rate or not?""
"We have come a long way, that is good news, but we are not there yet"
"We removed language that had upside bias on rates outlook."
"Hope that lower inflation will influence expectations in real economy, but need to see evidence."
About Andrew Bailey (via bankofengland.co.uk)
"Andrew Bailey previously held the role of Deputy Governor, Prudential Regulation and CEO of the PRA from 1 April 2013. While retaining his role as Executive Director of the Bank, Andrew joined the Financial Services Authority in April 2011 as Deputy Head of the Prudential Business Unit and Director of UK Banks and Building Societies. In July 2012, Andrew became Managing Director of the Prudential Business Unit, with responsibility for the prudential supervision of banks, investment banks and insurance companies. Andrew was appointed as a voting member of the interim Financial Policy Committee at its June 2012 meeting."
Economists at Commerzbank analyze Dollar’s outlook following the FOMC’s first policy decision for 2024.
How should we interpret FOMC’s decision?
The fact that the FOMC still wants to wait and see is a signal that it has a very, very strong hawkish bias. ‘When in doubt, wait rather than cut’ seems to be the FOMC's thinking. Is the Fed excessively hawkish? After all, high interest rates also have negative side effects.
Ultimately, however, the image of a rather hawkish Fed could be worth a lot in the future. If everyone is convinced that the Fed is fundamentally committed to price stability, there will be no need for excessive interest rate movements in the future. In other words, those who feared that the recent period of high inflation had led to a permanent loss of confidence in the Fed can be reassured. The Fed is currently fighting to regain that confidence.
This (and not ¼ percentage point more or less USD carry) is the USD positive signal from Wednesday's Fed decision and communication!
Andrew Bailey, Governor of the Bank of England, presents the Monetary Policy Report and responds to questions from the press following the Bank of England's (BoE) decision to leave the policy rate unchanged at 5.25%.
Key quotes
"We need to get the balance of policy right."
"We need to keep policy sufficiently restrictive for sufficiently long, nothing more, nothing less."
"How long policy needs to be restrictive depends on incoming data."
"Continuation of trade disruptions are upside risk to inflation projection."
"About two-thirds of peak impact from higher rates on economy has now come through, up from about half in November."
About Andrew Bailey (via bankofengland.co.uk)
"Andrew Bailey previously held the role of Deputy Governor, Prudential Regulation and CEO of the PRA from 1 April 2013. While retaining his role as Executive Director of the Bank, Andrew joined the Financial Services Authority in April 2011 as Deputy Head of the Prudential Business Unit and Director of UK Banks and Building Societies. In July 2012, Andrew became Managing Director of the Prudential Business Unit, with responsibility for the prudential supervision of banks, investment banks and insurance companies. Andrew was appointed as a voting member of the interim Financial Policy Committee at its June 2012 meeting."
Andrew Bailey, Governor of the Bank of England, presents the Monetary Policy Report and responds to questions from the press following the Bank of England's (BoE) decision to leave the policy rate unchanged at 5.25%.
Key quotes
"Things are moving in the right direction."
"We are not yet at a point where we can lower rates."
"Level of bank rate remains appropriate"
"It is not as simple as inflation returns to target in the spring and the job is done."
"We should not expect further big falls in energy prices."
About Andrew Bailey (via bankofengland.co.uk)
"Andrew Bailey previously held the role of Deputy Governor, Prudential Regulation and CEO of the PRA from 1 April 2013. While retaining his role as Executive Director of the Bank, Andrew joined the Financial Services Authority in April 2011 as Deputy Head of the Prudential Business Unit and Director of UK Banks and Building Societies. In July 2012, Andrew became Managing Director of the Prudential Business Unit, with responsibility for the prudential supervision of banks, investment banks and insurance companies. Andrew was appointed as a voting member of the interim Financial Policy Committee at its June 2012 meeting."
- The US Dollar pops up on the back of Fed rate pause.
- Traders buy the Greenback after Powell pushes back on March rate cut.
- The US Dollar Index has 104 in reach if it is able to advance this Thursday.
The US Dollar (USD) pops higher on the back of the first rate decision from the US Federal Reserve and commentary from the US Federal Reserve Chairman Jerome Powell. Although Powell pushed back against a March rate cut, that a cut is coming did not get dismissed. In the same push-and-pull pattern markets have seen over the past few weeks, the current US Dollar strength looks to be a mere repricing of the timing of the rate cut, with risk of the US Dollar Index being unable to walk away from that 200-day Simple Moving Average near 103.55.
On the economic front, traders are making their way to the US Jobs Report on Friday, with the weekly Initial Jobless Claims out on Thursday. The other main event on Thursday is the latest data from the Institute of Supply Management (ISM). Thus a lot of manufacturing data and components are to hit markets later on Thursday.
Daily digest market movers: Manufacturing Thursday
- This Thursday kicks off with the Challenger Job Cuts for January around 12:30 GMT. Previous number was 34,817.
- Jobless Claims are due near 13:30:
- Initial Claims are are expected to stay stable, falling from 214,000 to 212,000.
- Continuing Claims are expected to head from 1.833 million to 1.84 million.
- S&P will release its Global Manufacturing Purchase Managers Index (PMI) for January around 14:45. Previous was at 50.3.
- At 15:00 the Institute of Supply Management (ISM) will release its January ISMManufacturing PMI numbers:
- Manufacturing is seen heading from 47.4 to 47.
- ISM Manufacturing Prices Paid is expected to head from 45.2 to 46.9.
- ISM Manufacturing New Orders Index was previously at 47.1, no forecast available.
- The Employment Index was at 48.1 with no consensus pencilled in.
- Around 16:30 the US Treasury Department will allocate a 4-week bill.
- Equity markets are very mixed with small gains in Europe and US futures mildly in the green. The UK FTSE 100 is trading flat ahead of its central bank meeting later on Thursday.
- The CME Group’s FedWatch Tool is now looking at the March 20th meeting. Expectations for a pause are 64.5%, while 35.5% calls for a rate cut.
- The benchmark 10-year US Treasury Note trades substantially lower to 3.94%, the lowest level for this week.
US Dollar Index Technical Analysis: 2024, same story
The US Dollar Index (DXY) has jumped higher in the aftermath of the Fed’s rate decision and Fed Chair Jerome Powell’s speech. Though, some parental advisory needs to come with this move as clearly a rally is not set to play out here. The Fed has done a good job on Wednesday to steer markets away from a rate cut in March and avoid a massacre, while rate cuts in May or June are becoming more plausible and logical, and do not require a hefty repricing of the US Dollar for that matter.
Should the US Dollar Index be able to finally break away from the 200-day Simple Moving Average (SMA) at 103.55, traders should look to the 100-day SMA near 104.30 as the next level. Should the US Jobs Report on Friday see its components all fall in favor of more US Dollar strength, expect to see another jump higher to 105.12. That would mean a fresh three-month-high for the DXY.
In the same push-and-pull scenario that the DXY has been performing for nearly half of January, it would be plausible that the US Dollar loses traction against most of its peers and the US Dollar Index retracts again. Expect to see first support from the 200-day SMA near 103.55 before heading to the 55-day SMA at 103. Should that last level snap, a nosedive move to 102.00 could very well be in the cards here.
US Dollar FAQs
What is the US Dollar?
The US Dollar (USD) is the official currency of the United States of America, and the ‘de facto’ currency of a significant number of other countries where it is found in circulation alongside local notes. It is the most heavily traded currency in the world, accounting for over 88% of all global foreign exchange turnover, or an average of $6.6 trillion in transactions per day, according to data from 2022.
Following the second world war, the USD took over from the British Pound as the world’s reserve currency. For most of its history, the US Dollar was backed by Gold, until the Bretton Woods Agreement in 1971 when the Gold Standard went away.
How do the decisions of the Federal Reserve impact the US Dollar?
The most important single factor impacting on the value of the US Dollar is monetary policy, which is shaped by the Federal Reserve (Fed). The Fed has two mandates: to achieve price stability (control inflation) and foster full employment. Its primary tool to achieve these two goals is by adjusting interest rates.
When prices are rising too quickly and inflation is above the Fed’s 2% target, the Fed will raise rates, which helps the USD value. When inflation falls below 2% or the Unemployment Rate is too high, the Fed may lower interest rates, which weighs on the Greenback.
What is Quantitative Easing and how does it influence the US Dollar?
In extreme situations, the Federal Reserve can also print more Dollars and enact quantitative easing (QE). QE is the process by which the Fed substantially increases the flow of credit in a stuck financial system.
It is a non-standard policy measure used when credit has dried up because banks will not lend to each other (out of the fear of counterparty default). It is a last resort when simply lowering interest rates is unlikely to achieve the necessary result. It was the Fed’s weapon of choice to combat the credit crunch that occurred during the Great Financial Crisis in 2008. It involves the Fed printing more Dollars and using them to buy US government bonds predominantly from financial institutions. QE usually leads to a weaker US Dollar.
What is Quantitative Tightening and how does it influence the US Dollar?
Quantitative tightening (QT) is the reverse process whereby the Federal Reserve stops buying bonds from financial institutions and does not reinvest the principal from the bonds it holds maturing in new purchases. It is usually positive for the US Dollar.
EUR/USD finished close to the 1.0800 level and about flat on the day after the FOMC decision. Economists at Danske Bank analyze the pair’s outlook.
The Fed remain undecided on the prospects of a cut in March
EUR/USD price action around the FOMC meeting should be viewed in light of the rally ahead of the meeting triggered by renewed concerns about the health of US regional banks. In the end, EUR/USD finished close to the 1.0800 level and about flat on the day as the market and the Fed remain undecided on the prospects of a cut in March.
We keep our forecasts for EUR/USD unchanged at 1.0700 on 6M and 1.0500 on 12M.
- USD/CAD moves on an upward trajectory on a stronger US Dollar after the Fed’s hawkish remarks.
- The improved WTI price failed to contribute support for the Canadian Dollar (CAD).
- The stronger-than-expected Canadian GDP data could provide support to deter the BoC from reducing rates in the February meeting.
USD/CAD receive upward support for the second consecutive session, trading higher around 1.3450 during the European session on Thursday. The Canadian Dollar (CAD) failed to cheer the improved Gross Domestic Product (MoM) from Canada in response to the hawkish remarks by the Federal Reserve (Fed). Even the improved Crude oil prices failed to contribute any support to undermining the USD/CAD pair.
West Texas Intermediate (WTI) oil price trades higher around $76.40 per barrel, by the press time. Crude oil prices rise on the prevailing threat of supply disruption amid escalated tension in the Middle East.
Canada's Gross Domestic Product (GDP) rose to a growth rate of 0.2% monthly in December. The market consensus was a growth of 0.1% against the flat 0.0% in November. Furthermore, the S&P Global Manufacturing PMI for January is due on Thursday. The upbeat growth data could deter the Bank of Canada (BoC) from reducing interest rates in its upcoming February meeting.
The market sentiment has shifted in favor of the US Dollar (USD) following Federal Reserve (Fed) Chairman Jerome Powell's dismissal of any likelihood of an interest rate cut in the March meeting. Powell highlighted the persistent presence of elevated inflation and emphasized the robust growth in economic activity.
For additional insights into the economic landscape of the United States (US), traders are likely to closely monitor key events scheduled for Thursday, including US Initial Jobless Claims, Nonfarm Productivity, and ISM Manufacturing PMI.
- WTI Oil finds a floor for now near $76 in a sensitive market.
- Oil traders were caught by surprise by the EIA build of stockpile by 1.234 million barrels.
- The US Dollar Index firms after the Fed’s rate decision on Wednesday.
Oil prices appear to have bottomed out on Thursday after a wild ride earlier this week, which was very much headline-driven. Besides the possible sanctions from the US on Venezuelan oil, markets were choked by the possibility of Saudi Arabia looking into ramping up its production. Although the news was about the fact that the plans were scrubbed, the idea alone was enough for markets to halt the rally to $80 and instead retreat by $4. The unexpected hefty increase of the EIA stockpiles reported on Wednesday also weighed on the commodity.
Meanwhile, the US Dollar Index (DXY) is in the green, though momentum appears to be fading again. Although the US Federal Reserve Chairman Jerome Powell pushed back against a March rate cut possibility, he did not really do that for May or June. This means a small tweak in positions, with no substantial moves expected in the US Dollar further.
Crude Oil (WTI) trades at $76.32 per barrel, and Brent Oil trades at $81.01 per barrel at the time of writing.
Oil news and market movers: OPEC report on the docket
- Wednesday numbers from the Energy Information Administration threw a spanner in the works for Oil to soon head back to $80. While a drawdown was expected, the number came in at a buildup of 1.234 million against a drawdown of 9.233 million last week.
- The OPEC will release a statement on its current meeting on Thursday.
- Russian arctic crude shipments have declined significantly after hitting a six-month high in December.
- A next domino might fall in the Chinese economy as Chinese oil refiners are seeing margins collapse under low demand and rising crude prices since the low of December.
- Bloomberg released numbers that showed the US produced a staggering 13.3 million barrels per day in November, making it a new monthly record.
Oil Technical Analysis: US is a fly in the ointment for OPEC
Oil prices, though picking up under the current news headlines, do not hold asmuch upside potential as markets think. Saudi Arabia’s woes about production levels appear to be a big threat for OPEC at a time when the group sees the US easily matching the current supply cuts by pumping more oil than it has been doing in the past years.
Although price action came very near, the $80 level will not be easy to beat. Once $80 is broken, $84 is next on the topside. A few dollars further, the red line near $87.66 comes into focus, though by then the Relative Strength Index (RSI) will likely be trading at overbought levels.
On the downside, the $74 level will act as immediate support for any sudden declines. The $67 level could still come into play as the next support as it aligns with a triple bottom from June. Should that triple bottom break, a new low could be close at $64.35 – the low of May and March 2023 – as the last line of defence.
-638423785659887650.png)
US WTI Crude Oil: Daily Chart
WTI Oil FAQs
What is WTI Oil?
WTI Oil is a type of Crude Oil sold on international markets. The WTI stands for West Texas Intermediate, one of three major types including Brent and Dubai Crude. WTI is also referred to as “light” and “sweet” because of its relatively low gravity and sulfur content respectively. It is considered a high quality Oil that is easily refined. It is sourced in the United States and distributed via the Cushing hub, which is considered “The Pipeline Crossroads of the World”. It is a benchmark for the Oil market and WTI price is frequently quoted in the media.
What factors drive the price of WTI Oil?
Like all assets, supply and demand are the key drivers of WTI Oil price. As such, global growth can be a driver of increased demand and vice versa for weak global growth. Political instability, wars, and sanctions can disrupt supply and impact prices. The decisions of OPEC, a group of major Oil-producing countries, is another key driver of price. The value of the US Dollar influences the price of WTI Crude Oil, since Oil is predominantly traded in US Dollars, thus a weaker US Dollar can make Oil more affordable and vice versa.
How does inventory data impact the price of WTI Oil
The weekly Oil inventory reports published by the American Petroleum Institute (API) and the Energy Information Agency (EIA) impact the price of WTI Oil. Changes in inventories reflect fluctuating supply and demand. If the data shows a drop in inventories it can indicate increased demand, pushing up Oil price. Higher inventories can reflect increased supply, pushing down prices. API’s report is published every Tuesday and EIA’s the day after. Their results are usually similar, falling within 1% of each other 75% of the time. The EIA data is considered more reliable, since it is a government agency.
How does OPEC influence the price of WTI Oil?
OPEC (Organization of the Petroleum Exporting Countries) is a group of 13 Oil-producing nations who collectively decide production quotas for member countries at twice-yearly meetings. Their decisions often impact WTI Oil prices. When OPEC decides to lower quotas, it can tighten supply, pushing up Oil prices. When OPEC increases production, it has the opposite effect. OPEC+ refers to an expanded group that includes ten extra non-OPEC members, the most notable of which is Russia.
European Central Bank (ECB) Chief Economist Philip Lane said on Thursday that natural gas prices in the Euro area are much lower than the ECB's December projections assumed, as reported by Reuters.
Lane added that Red Sea issues are fairly contained given the small contribution of shipping cost to inflation.
Market reaction
These comments don't seem to be having a noticeable impact on the Euro's performance against its major rivals. At the time of press, the EUR/USD pair was trading at 1.0805, losing 0.1% on a daily basis.
Gold prices climbed to a two-week high earlier this week. Economists at MUFG Bank analyze the yellow metal’s outlook.
Gold demand hit a record in 2023 and is expected to rise further
Total Gold demand hit a record in 2023 and is expected to rise again in 2024 as the Fed moves towards easing rates alongside geopolitical tensions that remain elevated.
According to the World Gold Council (WGC), overall consumption climbed by about 3% in 2023, supported by strong demand in the opaque over-the-counter market, as well as from sustained central-bank buying, which is also the highest total figure in data going back to 2010.
We reiterate our 2024 commodities views that Gold is our most bullish call this year and agree with the WGC that bullion is set to hit record levels on a trifecta of Fed cuts, supportive central bank demand and bullion’s role as the geopolitical hedge of last resort.
- NZD/USD extends its losses as market sentiment changed after the Fed’s hawkish remarks.
- Traders await US employment data to gain further cues on the US economic scenario.
- The better-than-expected Chinese Manufacturing PMI failed to support the NZD.
NZD/USD continues to move in a downward direction for the second straight session on European trading hours on Thursday. The NZD/USD pair drops to near 0.6080, at the time of writing. The market bias has turned towards the US Dollar (USD) as Federal Reserve (Fed) Chairman Jerome Powell ruled out any possibility of an interest rate cut in a March meeting.
Powell underscored the enduring presence of heightened inflation and emphasized the strong growth in economic activity. To gain further impetus on an economic scenario in the United States (US), traders would likely observe Thursday’s release of key events, including US Initial Jobless Claims, Nonfarm Productivity, and ISM Manufacturing PMI.
Furthermore, the Federal Open Market Committee (FOMC) does not anticipate considering a reduction in the target range until it has acquired increased confidence that inflation is progressing consistently toward the 2.0 percent target. Although inflation has moderated over the past year, it is still elevated. The statement omits the reference to additional policy firming.
The New Zealand Dollar (NZD) refused to cheer better-than-expected Chinese factory data, consequently, limiting the losses of the NZD/USD pair. Caixin Manufacturing PMI for January remained consistent at 50.8 against the expected 50.6 reading.
Additionally, the Reserve Bank of New Zealand (RBNZ) emphasizes a target of around the 2% midpoint for future inflation. As inflation trends downward, financial markets anticipate an earlier rather than later reduction in the Official Cash Rate (OCR), with three rate cuts already factored into expectations for this year.
The Dollar is doing a little better and equity markets are a little softer after the Federal Reserve pushed back against early easing and US regional banks again hit the headlines, economists at ING report.
Two more reasons to hold Dollar
The Fed's pushback against a March cut has helped short-dated US rates edge a little higher and offered some support to the Dollar.
New York Community Bancorp's (NYCB) share price was marked down heavily on poor quarterly earnings, with some of the large loan loss provisions being linked to the Commercial Real Estate sector - perhaps the Achilles Heel of the strong US story. We did notice a 7 bps widening of the 3m EUR/USD cross-currency basis swap on the NYCB news. If the US regional bank crisis flares up again, keep a close watch on this basis swap, where the USD may initially strengthen until the Fed calms funding conditions Down again.
DXY should continue to grind higher towards the upper end of a 103.00-104.00 range.
- Gold price falls back as the “early rate-cuts” narrative wanes.
- The Fed needs more evidence to be confident that inflation will return to 2%.
- The US Dollar advances ahead of ISM Manufacturing PMI, NFP data.
Gold price (XAU/USD) surrenders recent gains on Thursday’s European session, but continues to trade inside Wednesday’s trading range. The upside in the Gold price is restricted as the Federal Reserve (Fed) has pushed back expectations of a rate cut in March. However, the downside is also well-supported as almost all Fed Monetary Policy Committee members (MPC) members favored rate cuts in 2024.
Fed Chair Jerome Powell showed disinterest in rate-cut speculation, arguing that policymakers are still unconvinced that underlying inflation will sustainably return to the 2% target. As Jerome Powell has spooked expectations of rate cuts in March, investors have turned to May’s policy meeting for the first rate cut of this cycle.
As we advance, the inflation outlook will be guided by labor market conditions, consumer spending, and economic growth, which will set a fresh undertone for rate-cut expectations.
Meanwhile, investors await January's Institute for Supply Management's (ISM) Manufacturing PMI and the Nonfarm Payrolls (NFP) data. The expectations of a rate cut at May’s Fed monetary policy meeting could wane if the employment and wage growth data turn out higher than expected.
Daily digest market movers: Gold price off from day’s high while US Dollar advances
- Gold price falls from the day’s high near $2,050 as investors shift back to the narrative that the Federal Reserve is not interested in reducing interest rates in March.
- In his monetary policy statement on Wednesday, Fed Chair Jerome Powell turned down speculation for reducing interest rates until policymakers get greater confidence that underlying inflation will sustainably return to the 2% target.
- A strict denial for rate cuts in March has shifted expectations to the May policy meeting.
- As per the CME Fedwatch tool, traders see a 61% chance of a rate cut by 25 basis points (bps) to 5.00%-5.25% for May.
- The Fed’s decision to keep interest rates unchanged in the range of 5.25%-5.50% for the fourth straight time was widely anticipated.
- Also, Jerome Powell said, “risks to achieving full employment and 2% inflation are better balanced.”
- The US Dollar Index (DXY) rises to near 103.80 as expectations for rate cuts shift to May. Until then, various economic data are lined up that will guide further action in the safe-haven assets.
- In today’s session, market participants will focus on the ISM Manufacturing PMI for January and the Initial Jobless Claims (IJC) for the week ending January 26.
- According to the estimates, the Manufacturing PMI fell to 47.0 from December’s reading of 47.4. The reasoning behind lower factory output would be higher furloughs due to the festive mood.
- The Manufacturing PMI data will be followed by the official Employment data for January, which will be published on Friday.
- The private Employment Change data, reported by the ADP on Wednesday, showed that private employers recruited 107K workers in December, which was significantly lower than expectations of 145K and the former reading of 158K.
- This has set a negative undertone for the NFP data ahead. Investors anticipate that overall payroll additions slowed to 180K against 216K in December. The Unemployment Rate is expected to increase to 3.8% from 3.7%.
- Apart from employment numbers, wage growth data will in be the focus as it will guide inflation, being a major contributor to high price pressures.
- The annual Average Hourly Earnings is seen steady at 4.1%. The month-on-month wage growth may have grown at a slower pace of 0.3% against a 0.4% increase in December. A slowdown in the wage growth data would soften the inflation outlook.
Technical Analysis: Gold price trades inside Wednesday’s range
Gold price oscillates inside Wednesday’s trading range as investors shift focus toward the US ISM Manufacturing PMI and the Employment data. From a technical perspective, the outlook for the precious metal is upbeat as it has delivered a breakout of the Symmetrical Triangle chart pattern formed on a daily timeframe. The 20-day Exponential Moving Average (EMA) at $2,032.50 is acting as a cushion for the Gold price.
The 14-period Relative Strength Index (RSI) is approaching the 60.00 hurdle. If the RSI manages to sustain above the hurdle, bullish momentum could be triggered.
Gold FAQs
Why do people invest in Gold?
Gold has played a key role in human’s history as it has been widely used as a store of value and medium of exchange. Currently, apart from its shine and usage for jewelry, the precious metal is widely seen as a safe-haven asset, meaning that it is considered a good investment during turbulent times. Gold is also widely seen as a hedge against inflation and against depreciating currencies as it doesn’t rely on any specific issuer or government.
Who buys the most Gold?
Central banks are the biggest Gold holders. In their aim to support their currencies in turbulent times, central banks tend to diversify their reserves and buy Gold to improve the perceived strength of the economy and the currency. High Gold reserves can be a source of trust for a country’s solvency. Central banks added 1,136 tonnes of Gold worth around $70 billion to their reserves in 2022, according to data from the World Gold Council. This is the highest yearly purchase since records began. Central banks from emerging economies such as China, India and Turkey are quickly increasing their Gold reserves.
How is Gold correlated with other assets?
Gold has an inverse correlation with the US Dollar and US Treasuries, which are both major reserve and safe-haven assets. When the Dollar depreciates, Gold tends to rise, enabling investors and central banks to diversify their assets in turbulent times. Gold is also inversely correlated with risk assets. A rally in the stock market tends to weaken Gold price, while sell-offs in riskier markets tend to favor the precious metal.
What does the price of Gold depend on?
The price can move due to a wide range of factors. Geopolitical instability or fears of a deep recession can quickly make Gold price escalate due to its safe-haven status. As a yield-less asset, Gold tends to rise with lower interest rates, while higher cost of money usually weighs down on the yellow metal. Still, most moves depend on how the US Dollar (USD) behaves as the asset is priced in dollars (XAU/USD). A strong Dollar tends to keep the price of Gold controlled, whereas a weaker Dollar is likely to push Gold prices up.
Economists at Standard Chartered expect the Pound Sterling (GBP) to underperform as the Bank of England is likely to cut at a quicker pace than they had previously expected.
Stronger easing path adds risk of GBP underperformance
We already expect EUR/GBP to depreciate to just under 0.9000 by early 2025.
The more rapid pace of easing that we now see adds a little more risk of GBP underperformance in coming months.
Most of the risk is concentrated in the next quarter or two, where our forecast has GBP firming slightly against the USD. We do not see major downside risk, rather risk that GBP keeps treading water at current levels.
- USD/MXN edges higher on Fed Powell’s hawkish remarks on interest rate trajectory.
- Banxico may consider an interest rate cut in March on slower growth of Mexican GDP.
- US Dollar could face a challenge as US labor data is expected to slow down.
USD/MXN moves in an upward direction on stronger US Dollar (USD), which could be attributed to the Federal Reserve (Fed) Chairman Jerome Powell’s dismissal of the March rate cut. The USD/MXN pair edges higher to near 17.24 during the European hours on Thursday.
The Mexican Peso (MXN) experiences losses in light of expectations that the Bank of Mexico (Banxico) may contemplate a reduction in interest rates during its March meeting as the Mexican Gross Domestic Product (GDP) figures for the fourth quarter increased but were lower than anticipated. The market sentiment suggests a cautious approach by the Banxico regarding interest rate adjustments. However, the markets have already factored in the possibility of no interest rate adjustment in the upcoming February policy meeting.
The improved United States (US) yields are reinforcing the strength of the US Dollar due to the positive market sentiment surrounding the Fed’s interest rate trajectory. The US Dollar Index (DXY) inches higher around 103.70 with the improving 2-year and 10-year yields on US bond coupons at 4.23% and 3.94, respectively, by the press time.
However, the Greenback faced challenges after the release of disappointing-than-expected US employment figures on Wednesday. The US ADP Employment Change reported 107K for January, falling short of the expected 145K, with the previous reading at 158K in December. Thursday is expected to capture attention with key economic indicators, including US Initial Jobless Claims, Nonfarm Productivity, and ISM Manufacturing PMI.
The Eurozone Harmonised Index of Consumer Prices (HICP) rose at an annual pace of 2.8% in January, a tad slower from December’s 2.9% increase, the official data published by Eurostat showed on Thursday. The data missed the market expectations of a 2.8% reading.
The Core HICP inflation declined to 3.3% YoY in January, as against December’s 3.4% print. The market consensus was for a 3.2% growth in the Core HICP.
On a monthly basis, the bloc’s HICP dropped 0.4% in January vs. a 0.2% increase seen in December. The core HICP inflation arrived at -0.9% MoM in the reported month, compared to a 0.5% increase seen previously.
The European Central Bank’s (ECB) inflation target is 2.0%. The old continent’s HICP inflation data significantly influences the market’s pricing of the ECB interest rate outlook.
Key details from the Eurozone inflation report (via Eurostat).
“Looking at the main components of euro area inflation, food, alcohol & tobacco is expected to have the highest annual rate in January (5.7%, compared with 6.1% in December), followed by services (4.0%, stable compared with December), non-energy industrial goods (2.0%, compared with 2.5% in December) and energy (-6.3%, compared with -6.7% in December).”
Separately, the Eurozone Unemployment Rate for December held steady at 6.4%, as expected.
EUR/USD reaction to the Eurozone inflation report
The Euro is little changed on mixed Eurozone inflation data. EUR/USD is trading 0.17% lower on the day at 1.0798, at the press time.
Euro price today
The table below shows the percentage change of Euro (EUR) against listed major currencies today. Euro was the weakest against the Japanese Yen.
| USD | EUR | GBP | CAD | AUD | JPY | NZD | CHF | |
| USD | 0.04% | 0.16% | 0.08% | 0.54% | -0.11% | 0.32% | 0.06% | |
| EUR | -0.03% | 0.12% | 0.02% | 0.51% | -0.12% | 0.29% | 0.03% | |
| GBP | -0.15% | -0.11% | -0.10% | 0.39% | -0.23% | 0.16% | -0.10% | |
| CAD | -0.09% | -0.02% | 0.10% | 0.49% | -0.14% | 0.27% | 0.02% | |
| AUD | -0.54% | -0.50% | -0.38% | -0.48% | -0.61% | -0.22% | -0.44% | |
| JPY | 0.10% | 0.13% | 0.24% | 0.12% | 0.63% | 0.39% | 0.14% | |
| NZD | -0.32% | -0.25% | -0.15% | -0.23% | 0.22% | -0.42% | -0.25% | |
| CHF | -0.06% | -0.02% | 0.10% | 0.02% | 0.46% | -0.17% | 0.25% |
The heat map shows percentage changes of major currencies against each other. The base currency is picked from the left column, while the quote currency is picked from the top row. For example, if you pick the Euro from the left column and move along the horizontal line to the Japanese Yen, the percentage change displayed in the box will represent EUR (base)/JPY (quote).
Ahead of the Bank of England (BoE) meeting, GBP/USD has dropped back below 1.2650. Economists at MUFG Bank analyze Cable’s outlook ahead of the policy update.
Less hawkish BoE policy but may disappoint expectations for May cut
We expect the BoE to signal that it is more confident that the rate hike cycle has ended and they are beginning to consider lowering rates in the year ahead.
The UK rate market is currently pricing in around 17 bps of cuts by the May MPC meeting. It is likely too soon for the BoE to send a strong signal that the first cut will be delivered in May, especially with the Budget released on 6th March. It poses some modest upside risk for the Pound.
Gold prices rose in India on Thursday, according to data from India's Multi Commodity Exchange (MCX).
Gold price stood at 62,709 Indian Rupees (INR) per 10 grams, up INR 191 compared with the INR 62,518 it cost on Wednesday.
As for futures contracts, Gold prices decreased to INR 62,600 per 10 gms from INR 63,735 per 10 gms.
Prices for Silver futures contracts decreased to INR 71,538 per kg from INR 72,247 per kg.
| Major Indian city | Gold Price |
|---|---|
| Ahmedabad | 64,965 |
| Mumbai | 64,585 |
| New Delhi | 64,855 |
| Chennai | 64,760 |
| Kolkata | 64,855 |
Global Market Movers: Comex Gold price struggles as USD hits fresh YTD peak
- The Federal Reserve signalled on Wednesday that it was getting closer to rate cuts, dragging the US Treasury bond yields lower, which, in turn, is seen as a key factor lending support to the Comex Gold price.
- As was expected, the Fed decided to leave the main interest-rate target unchanged at between 5.25%-5.5% at the end of a two-day meeting on Wednesday and indicated that the policy rate is likely at its peak.
- In the post-meeting press conference, Fed Chair Jerome Powell said that rate cuts would likely begin at some point this year, though pushed back strongly against expectations for any such move in March.
- The current market pricing indicates only about a 35% chance that the US central bank will cut interest rates in March, down from more than 60% before the Fed decision and nearly 90% a month ago.
- The less dovish outlook assists the US Dollar to climb to a fresh YTD peak, prompting some intraday selling around the non-yielding yellow metal and dragging it to the lower end of its daily trading range.
- Investors remain worried that the deepening conflict in the Middle East could trigger a wider war, which, along with slowing economic growth in China, lends support to the safe-haven precious metal.
- The European Union hopes to launch a naval mission in the Red Sea within three weeks to help defend cargo ships against attacks by Houthi rebels, which are hampering trade and driving up prices.
- A private-sector survey released earlier this Thursday showed that business activity in China's manufacturing sector expanded at a steady pace for the third successive month in January.
- Traders look to the flash Eurozone consumer inflation figures, the Bank of England policy decision and the US ISM Manufacturing PMI for some impetus ahead of the US NFP on Friday.
(An automation tool was used in creating this post.)
Gold FAQs
Why do people invest in Gold?
Gold has played a key role in human’s history as it has been widely used as a store of value and medium of exchange. Currently, apart from its shine and usage for jewelry, the precious metal is widely seen as a safe-haven asset, meaning that it is considered a good investment during turbulent times. Gold is also widely seen as a hedge against inflation and against depreciating currencies as it doesn’t rely on any specific issuer or government.
Who buys the most Gold?
Central banks are the biggest Gold holders. In their aim to support their currencies in turbulent times, central banks tend to diversify their reserves and buy Gold to improve the perceived strength of the economy and the currency. High Gold reserves can be a source of trust for a country’s solvency. Central banks added 1,136 tonnes of Gold worth around $70 billion to their reserves in 2022, according to data from the World Gold Council. This is the highest yearly purchase since records began. Central banks from emerging economies such as China, India and Turkey are quickly increasing their Gold reserves.
How is Gold correlated with other assets?
Gold has an inverse correlation with the US Dollar and US Treasuries, which are both major reserve and safe-haven assets. When the Dollar depreciates, Gold tends to rise, enabling investors and central banks to diversify their assets in turbulent times. Gold is also inversely correlated with risk assets. A rally in the stock market tends to weaken Gold price, while sell-offs in riskier markets tend to favor the precious metal.
What does the price of Gold depend on?
The price can move due to a wide range of factors. Geopolitical instability or fears of a deep recession can quickly make Gold price escalate due to its safe-haven status. As a yield-less asset, Gold tends to rise with lower interest rates, while higher cost of money usually weighs down on the yellow metal. Still, most moves depend on how the US Dollar (USD) behaves as the asset is priced in dollars (XAU/USD). A strong Dollar tends to keep the price of Gold controlled, whereas a weaker Dollar is likely to push Gold prices up.
European Central Bank (ECB) policymaker Mario Centeno delivered some comments on the central bank’s interest rate outlook during his appearance on Thursday.
Additional quotes
If inflation continues on same trajectory in coming months it is expected that the ECB’s next decision will be to cut rates.
If that happens we can start a cycle of normalization of rates.
Market reaction
EUR/USD is keeping its losses near 1.0800 following the above comments, losing 0.18% on the day.
Economists at TD Securities discuss the Bank of England Interest Rate Decision and its implications for the GBP/USD pair.
Hawkish Hold (25%)
The MPC votes to leave policy on hold but with two or three hawkish dissents. The MPC's asymmetric hiking guidance is tweaked only marginally, saying that ‘further tightening in monetary policy would be required if there were evidence of more persistent inflationary pressures.’ GBP/USD +0.70%.
Neutral Hold (60%)
The MPC leaves Bank Rate unchanged in a 9-0 vote (or perhaps with an unsurprising dissent from Dhingra and/or Mann). Inflation is revised down to reach target by 24Q2 but is revised up a little in 2025/26. Notably, the explicit, asymmetric threat to hike further is removed, leaving risks two-sided. Instead, the MPC offers guidance that Bank Rate remains ‘at an appropriate level’, and that any future policy change will be made taking on board the latest data. GBP/USD +0.25%.
Dovish Hold (15%)
Guidance is overhauled completely, with the MPC saying that past policy hikes have achieved their goal of bringing inflation back toward target and that the next rate move will now be a cut rather than a hike. GBP/USD -1.00%.
- EUR/USD extends losses as the US Dollar rose after Fed’s Powell pushed back expectations of March rate cuts.
- The Euro faced a challenge of heightened expectations of an ECB interest rate cut in June after lower-than-expected German inflation data.
- Eurozone inflation, and US ISM Manufacturing PMI data could trigger the pair’s next moves.
The EUR/USD pair continues to lose ground for the second successive day, stretching lower to near 1.0790 during the European session on Thursday. The US Dollar (USD) gains upward support against the Euro (EUR), fuelled by Federal Reserve (Fed) Chair Jerome Powell's dismissal of a rate cut in the upcoming March meeting. Powell’s comments have also supported US Treasury yields.
The Euro faced difficulties following softer preliminary Consumer Price Index (CPI) data from Germany released on Wednesday. This has heightened market expectations of an interest rate cut by the European Central Bank (ECB) in June. However, earlier in the week, ECB Vice President Luis de Guindos indicated that the ECB would contemplate interest rate cuts only when there is confidence that inflation aligns with the central bank's 2% goal.
German Consumer Price Index (CPI) for January showed a year-on-year increase of 2.9%, lower than the expected 3.3% from December's reading of 3.7%. Meanwhile, the monthly consumer inflation met expectations, rising to 0.2% from the previous reading of 0.1%. The Harmonized Index of Consumer Prices YoY increased 3.1%, lower than the previous figure of 3.8%. The inflation report for the whole Eurozone is scheduled for release at 10:00 GMT.
The US Dollar, gauged by the US Dollar Index (DXY), continues to strengthen amid market expectations regarding the Federal Reserve's (Fed) upcoming decisions, projecting into the May meeting. CME's FedWatch Tool indicates a probability of over 60% that the Fed will maintain its interest rates within the range of 5.25%-5.50% during the March meeting. Meanwhile, the probability of a quarter-point rate cut in May exceeds 60%.
The US ADP Employment Change reported a 107K jobs increase for January, falling short of the expected 145K, and marked a decrease from the previous reading of 158K in December. Attention on Thursday is expected to focus on significant economic indicators such as US Initial Jobless Claims, Nonfarm Productivity, and ISM Manufacturing PMI.
Daily digest market movers: EUR/USD loses ground after softer German inflation figures
- Germany’s annual Retail Sales for December fell by 1.7%, lower than the 2.4% decrease seen in November.
- The German Harmonized Index of Consumer Prices (MoM) declined by 0.2%, more than the market consensus of a 0.1% decline.
- German Statistics Office showed that Unemployment Change fell by 2K against the expected growth of 11K in January. The seasonally adjusted Unemployment Rate fell to 5.8%, while markets expected it to be unchanged at 5.9%.
- The US Employment Cost Index (ECI), released by the US Bureau of Labour Statistics, fell to 0.9% in the fourth quarter from the previous 1.1% rise.
- Chicago Purchasing Managers' Index eased to 46 in January. The market expectation was a rise to 48 from 47.2 prior.
Technical Analysis: EUR/USD extends losses towards major support at 1.0750
EUR/USD drops to near 1.0790 on Thursday, close to support at the major level of 1.0750. A break below this level could put downward pressure on the EUR/USD pair to navigate the support zone near the psychological level at 1.0700.
On the upside, the EUR/USD pair could find immediate resistance at the psychological level of 1.0800. A breakthrough above this level could inspire the bulls of the pair to test the 21-day Exponential Moving Average (EMA) at 1.0826, followed by the major barrier at 1.0850 and the 23.6% Fibonacci retracement level at 1.0867.
EUR/USD: Four-Hour Chart
-638423760123938829.png)
Euro price today
The table below shows the percentage change of Euro (EUR) against listed major currencies today. Euro was the weakest against the Japanese Yen.
| USD | EUR | GBP | CAD | AUD | JPY | NZD | CHF | |
| USD | 0.09% | 0.23% | 0.08% | 0.54% | -0.20% | 0.29% | 0.11% | |
| EUR | -0.10% | 0.12% | -0.05% | 0.45% | -0.27% | 0.19% | 0.01% | |
| GBP | -0.23% | -0.15% | -0.19% | 0.32% | -0.40% | 0.05% | -0.13% | |
| CAD | -0.08% | 0.04% | 0.18% | 0.50% | -0.22% | 0.24% | 0.07% | |
| AUD | -0.54% | -0.47% | -0.34% | -0.52% | -0.72% | -0.28% | -0.42% | |
| JPY | 0.18% | 0.27% | 0.39% | 0.20% | 0.71% | 0.44% | 0.28% | |
| NZD | -0.31% | -0.17% | -0.05% | -0.21% | 0.26% | -0.49% | -0.17% | |
| CHF | -0.12% | -0.01% | 0.11% | -0.04% | 0.45% | -0.30% | 0.16% |
The heat map shows percentage changes of major currencies against each other. The base currency is picked from the left column, while the quote currency is picked from the top row. For example, if you pick the Euro from the left column and move along the horizontal line to the Japanese Yen, the percentage change displayed in the box will represent EUR (base)/JPY (quote).
Euro FAQs
What is the Euro?
The Euro is the currency for the 20 European Union countries that belong to the Eurozone. It is the second most heavily traded currency in the world behind the US Dollar. In 2022, it accounted for 31% of all foreign exchange transactions, with an average daily turnover of over $2.2 trillion a day.
EUR/USD is the most heavily traded currency pair in the world, accounting for an estimated 30% off all transactions, followed by EUR/JPY (4%), EUR/GBP (3%) and EUR/AUD (2%).
What is the ECB and how does it impact the Euro?
The European Central Bank (ECB) in Frankfurt, Germany, is the reserve bank for the Eurozone. The ECB sets interest rates and manages monetary policy.
The ECB’s primary mandate is to maintain price stability, which means either controlling inflation or stimulating growth. Its primary tool is the raising or lowering of interest rates. Relatively high interest rates – or the expectation of higher rates – will usually benefit the Euro and vice versa.
The ECB Governing Council makes monetary policy decisions at meetings held eight times a year. Decisions are made by heads of the Eurozone national banks and six permanent members, including the President of the ECB, Christine Lagarde.
How does inflation data impact the value of the Euro?
Eurozone inflation data, measured by the Harmonized Index of Consumer Prices (HICP), is an important econometric for the Euro. If inflation rises more than expected, especially if above the ECB’s 2% target, it obliges the ECB to raise interest rates to bring it back under control.
Relatively high interest rates compared to its counterparts will usually benefit the Euro, as it makes the region more attractive as a place for global investors to park their money.
How does economic data influence the value of the Euro?
Data releases gauge the health of the economy and can impact on the Euro. Indicators such as GDP, Manufacturing and Services PMIs, employment, and consumer sentiment surveys can all influence the direction of the single currency.
A strong economy is good for the Euro. Not only does it attract more foreign investment but it may encourage the ECB to put up interest rates, which will directly strengthen the Euro. Otherwise, if economic data is weak, the Euro is likely to fall.
Economic data for the four largest economies in the euro area (Germany, France, Italy and Spain) are especially significant, as they account for 75% of the Eurozone’s economy.
How does the Trade Balance impact the Euro?
Another significant data release for the Euro is the Trade Balance. This indicator measures the difference between what a country earns from its exports and what it spends on imports over a given period.
If a country produces highly sought after exports then its currency will gain in value purely from the extra demand created from foreign buyers seeking to purchase these goods. Therefore, a positive net Trade Balance strengthens a currency and vice versa for a negative balance.
Bank of England’s (BoE) decision promises to be interesting. Michael Pfister, FX Analyst at Commerzbank, analyzes Pound Sterling’s (GBP) outlook ahead of the policy meeting.
Caution remains necessary
Depending on the outcome of the new inflation forecasts and the vote, the Pound could come under more or less pressure today.
If the BoE lowers the forecast significantly and at the same time two council members vote in favor of a rate cut, the Pound could come under considerable pressure. However, I would expect the BoE to hold off with such clear signs of an imminent turnaround on interest rates. After all, the BoE is likely to remember the recent inflation surprise.
If BoE Governor Andrew Bailey is able to continue to convince the market that the BoE is taking a cautious approach, then my cautious optimism for the Pound doesn't look so bad.
- Silver price faces a sell-off as the Fed pushes back rate-cut expectations for March.
- The Fed avoids rate-cut speculation until it gets confident that inflation will return to 2%.
- Investors await the ISM Manufacturing PMI and the NFP data for further guidance.
Silver price (XAG/USD) declines toward a weekly low near $22.70 as the Federal Reserve (Fed) has delivered a neutral interest rate guidance for the March monetary policy meeting. The Fed kept interest rates unchanged in the range of 5.25-5.50% as expected but pushed back expectations of rate cuts in March.
Equities and risk-perceived currencies have parted ways as S&P500 futures are positive, while the latter has been hit hard amid the absence of timing for rate cuts in the monetary policy statement by Fed Chair Jerome Powell. The US Dollar Index (DXY) extends its rally to near 103.80 as the Fed is not interested in speculating on rate cuts until they get greater confidence that inflation will sustainably return to the 2% target.
Meanwhile, investors await the Institute of Supply Management (ISM) Manufacturing PMI for December, which will be published at 15:00 GMT. According to the consensus, the Manufacturing PMI dropped to 47.0 vs. the prior reading of 47.4.
Going forward, market participants will focus on the Nonfarm Payrolls (NFP) data for January, which will be announced on Friday. The ADP Employment Change data, released on Wednesday, has set a weak ground for the official labor market data. Investors see that US employers hired 180K job-seekers, which are significantly lower than former payroll additions of 216K. The Unemployment Rate is seen rising to 3.8% against a 3.7% reading in December.
Silver technical analysis
Silver price has formed an Evening Star candlestick pattern on a daily timeframe, which indicates a bearish reversal. The asset has failed to sustain above the 20-day Exponential Moving Average (EMA), around $23.00. The 14-period Relative Strength Index (RSI) oscillates in the 40.00-60.00, which indicates a sideways trend.
Silver daily chart
-638423741405446338.png)
- GBP/JPY remains under heavy selling pressure for the second successive day on Thursday.
- The divergent BoE-BoJ policy expectations, along with geopolitical risks, weigh on the cross.
- The technical setup favours bears and supports prospects for a further depreciating move.
The GBP/JPY cross drifts lower for the second straight day on Thursday – also marking the third day of a negative move in the previous four – and drops to a two-and-half-week low during the first half of the European session. Spot prices currently trade around mid-185.00s and seem vulnerable to slide further ahead of the Bank of England's (BoE) monetary policy decision later today.
Heading into the key event risk, expectations that the UK central bank will keep the door open for a potential interest rate cut in May, along with the less dovish-inspired US Dollar (USD) buying, weigh heavily on the British Pound (GBP). The Japanese Yen (JPY), on the other hand, continues to draw support from the Bank of Japan's (BoJ) hawkish tilt last week and geopolitical risks. This further contributes to the heavily offered tone surrounding the GBP/JPY cross.
From a technical perspective, the overnight close below the 23.6% Fibonacci retracement level of the rally in January was seen as a fresh trigger for bearish traders. Moreover, oscillators on the daily chart have just started drifting in negative territory and suggest that the path of least resistance for the GBP/JPY cross is to the downside. Hence, a subsequent slide towards testing the 38.2% Fibo. level, around the 185.00 psychological mark, looks like a distinct possibility.
A convincing break below the latter will set the stage for an extension of the recent pullback from the vicinity of the 189.00 mark, or the highest level since August 2015 touched last month. The GBP/JPY cross might then accelerate the slide towards the 184.50 intermediate support before eventually dropping to sub-184.00 levels, representing the 100-day Simple Moving Average (SMA) and the 50% Fibo. level confluence region.
On the flip side, the 186.00 round figure now seems to act as an immediate hurdle ahead of the 23.6% Fibo. level breakpoint, around the 186.45-186.50 region. A sustained strength beyond the latter will suggest that the recent corrective decline has run its course and shift the near-term bias back in favour of bullish traders. The subsequent move up has the potential to lift the GBP/JPy cross beyond the 187.00 mark, towards the 187.40 hurdle.
GBP/JPY daily chart
-638423738501015251.png)
Technical levels to watch
A less hawkish stance from the Bank of England (BoE) should weigh on Pound Sterling (GBP), economists at ING say.
BoE should signal tightening cycle is over
Downside risks to Sterling will emerge from both the BoE dropping its tightening bias and the voting structure shifting from a 6-3 (three for a hike) to a 9-0. We rarely hear from the BoE so in a way, this would be the BoE's chance to play catch-up with some of the dovish rhetoric being used by both the Fed and the ECB.
GBP/USD could be just a 1.2600 story if we are right with our dovish leaning today.
We will get this wrong if the BoE wants to emphasise sticky services inflation and if one or two of the hawks continue to vote for rate hikes. Currently, the market seems to price the first BoE cut for June. We think the easing cycle is more likely to start in August.
An important Riksbank policy meeting is upon us. Economists at Commerzbank analyze Swedish Krona’s (SEK) outlook ahead of the decision.
Will today be a quiet central bank meeting?
The biggest risk for the Krona is probably any hint of interest rate cuts in the near future. Any indication that the Riksbank expects rate cuts sooner than previously would certainly not be helpful for the SEK. However, it should also be noted that although inflation has fallen recently (as in other countries), the core rate is still alarmingly high. It would therefore probably not be conducive to the objective of bringing inflation back to target if the Riksbank were to talk about earlier interest rate cuts.
In addition, no new monetary policy report with a new expected interest rate path will be published at today's meeting. I don't think the Riksbank will make a dovish turn without a new path being published. Sure, there can always be surprises, but the risk is not very pronounced. Accordingly, SEK traders may be in for a fairly quiet central bank meeting today.
- Pound Sterling drops sharply as the downbeat market mood dampens the appeal of risk-sensitive assets.
- Investors await the BoE policy, which is seen as steady for the fourth time in a row.
- The outlook on interest rates will be of utmost importance.
The Pound Sterling (GBP) remains under pressure ahead of the interest rate decision by the Bank of England (BoE), which will be announced at 12:00 GMT. Most Monetary Policy Committee (MPC) members are expected to support maintaining the status quo as easing price pressures indicate that further quantitative tightening is not on the table. BoE policymaker Swati Dhingra, who has remained concerned about the consequences of over-tightening borrowing rates, could vote in favor of a rate cut.
BoE Governor Andrew Bailey and other members have been stating that it is too early to speculate on rate cuts despite encouraging progress in inflation declining towards 2%. UK’s headline inflation is significantly down from a multi-decade high of 11.1% to 4.0%. However, it is still double the desired rate of 2%, forcing policymakers to maintain interest rates in the restricted trajectory.
Neutral guidance on interest rates could improve the appeal of the Pound Sterling, but the outlook for the United Kingdom's economy will worsen further. The UK economy is underperforming on the grounds of consumer spending, economic activities, and the labor market. An absence of rate-cut signals would dampen the aforementioned economic triggers further.
Meanwhile, dismal market sentiment has weighed heavily on the Pound Sterling. The market mood turns vulnerable as the Federal Reserve (Fed) is in no rush to cut interest rates in March.
Daily Digest Market Movers: Pound Sterling faces pressure while US Dollar advances
- Pound Sterling has dropped to near Wednesday’s low around 1.2660 as an appeal for risk-perceived currencies faded after the Federal Reserve delivered a neutral stance for March’s monetary policy meeting.
- The Fed left interest rates unchanged on Wednesday for the fourth straight time as inflation has significantly come down all the way from a historic high of 11.1% to 4.0% in December.
- In regards to the US Dollar (USD) side of the GBP/USD pair, the Federal Reserve Chair Jerome Powell, in his monetary policy statement after Wednesday’s first meeting of 2024, said risks to achieving full employment and 2% inflation are better balanced. This proved mildly supportive for USD, which was bearish for the exchange rate.
- When asked about rate cuts in March, which would weaken the US Dollar, Powell commented that rate cuts are unlikely until they get greater confidence that inflation will come down to 2% sustainably.
- The US Dollar Index (DXY) delivered a V-shape recovery after Jerome Powell pushed back expectations of rate cuts in March to near 103.60.
- More action in the USD Index is expected as the US Institute of Supply Management (ISM) will report the Manufacturing PMI for January, which will be published at 15:00 GMT.
- Meanwhile, a major trigger for the Pound Sterling will be the interest rate decision by the Bank of England, which is expected to remain unchanged at 5.25% for the fourth straight time.
- Unlike the European Central Bank (ECB) and the Fed, which have discussed the timing and the scope of rate cuts this year, none of the BoE policymakers have talked about starting the rate-cut process yet.
- A shift in the BoE’s stance from restrictive interest rates to rate reduction would dampen appeal for the Pound Sterling. Higher interest rates attract more foreign capital inflows, increasing demand for GBP and vice versa for lower rates.
- Higher for longer interest rates would help bring down inflation but hurt businesses with higher borrowing costs. As such, it could be difficult for BoE policymakers to choose between high inflation and a vulnerable domestic economy.
- BoE Governor Andrew Bailey and colleagues have stressed keeping rates higher as price pressures in the UK economy are highest amongst the Group of Seven economies.
- The UK economy is on the cusp of a technical recession as it contracted by 0.1% in the third quarter of 2023, and a stagnant performance is anticipated for the last quarter of the same year.
Technical Analysis: Pound Sterling falls to near Wednesday’s low
-638423715214152411.png)
Pound Sterling remains on the backfoot ahead of the BoE’s monetary policy decision but remains inside the last three weeks’ trading range of 1.2640-1.2775. The GBP/USD demonstrates a sharp volatility contraction on a broader timeframe, which may be the precursor of an eventual decisive break after the policy announcement by the BoE.
On the daily timeframe, a descending triangle chart pattern is in formation, which indicates indecisiveness with a slight negative bias. The downward-sloping trendline of the aforementioned chart pattern is placed from 28 December 2023 high at 1.2827 while the horizontal support is plotted from 21 December 2023 low at 1.2612. A decisive break through these boundaries would confirm a stronger directional move higher or lower – the BoE meeting may provide the catalyst.
The 14-period Relative Strength Index (RSI) oscillates in the 40.00-60.00 range, which indicates that investors await a potential trigger for further action.
Pound Sterling FAQs
What is the Pound Sterling?
The Pound Sterling (GBP) is the oldest currency in the world (886 AD) and the official currency of the United Kingdom. It is the fourth most traded unit for foreign exchange (FX) in the world, accounting for 12% of all transactions, averaging $630 billion a day, according to 2022 data.
Its key trading pairs are GBP/USD, aka ‘Cable’, which accounts for 11% of FX, GBP/JPY, or the ‘Dragon’ as it is known by traders (3%), and EUR/GBP (2%). The Pound Sterling is issued by the Bank of England (BoE).
How do the decisions of the Bank of England impact on the Pound Sterling?
The single most important factor influencing the value of the Pound Sterling is monetary policy decided by the Bank of England. The BoE bases its decisions on whether it has achieved its primary goal of “price stability” – a steady inflation rate of around 2%. Its primary tool for achieving this is the adjustment of interest rates.
When inflation is too high, the BoE will try to rein it in by raising interest rates, making it more expensive for people and businesses to access credit. This is generally positive for GBP, as higher interest rates make the UK a more attractive place for global investors to park their money.
When inflation falls too low it is a sign economic growth is slowing. In this scenario, the BoE will consider lowering interest rates to cheapen credit so businesses will borrow more to invest in growth-generating projects.
How does economic data influence the value of the Pound?
Data releases gauge the health of the economy and can impact the value of the Pound Sterling. Indicators such as GDP, Manufacturing and Services PMIs, and employment can all influence the direction of the GBP.
A strong economy is good for Sterling. Not only does it attract more foreign investment but it may encourage the BoE to put up interest rates, which will directly strengthen GBP. Otherwise, if economic data is weak, the Pound Sterling is likely to fall.
How does the Trade Balance impact the Pound?
Another significant data release for the Pound Sterling is the Trade Balance. This indicator measures the difference between what a country earns from its exports and what it spends on imports over a given period.
If a country produces highly sought-after exports, its currency will benefit purely from the extra demand created from foreign buyers seeking to purchase these goods. Therefore, a positive net Trade Balance strengthens a currency and vice versa for a negative balance.
EUR/USD has ground lower to 1.0800. Economists at ING analyze the pair’s outlook.
Soft January CPI to keep the pressure on the ECB
The highlight of today's Eurozone data calendar is the January CPI release where the headline rate is expected to fall to 2.7% year-on-year and core to 3.2% YoY – the latter the lowest since March 2022.
Given the successful disinflation trends and weak activity data, it is therefore more difficult for the European Central Bank than the Fed to push back against early easing expectations. That is why markets still attach a 60% chance to an April rate cut from the ECB.
EUR/USD support is currently under pressure at 1.0790/1.0800 and a break opens up the 1.0715/1.0725 region.
FX option expiries for Feb 1 NY cut at 10:00 Eastern Time, via DTCC, can be found below.
- EUR/USD: EUR amounts
- 1.0700 405m
- 1.0800 406m
- 1.0900 1.1b
- 1.0950 602m
- 1.0965 805m
- 1.0970 995m
- 1.0975 1.3b
- GBP/USD: GBP amounts
- 1.2760 414m
- 1.3000 500m
- USD/JPY: USD amounts
- 145.00 912m
- USD/CHF: USD amounts
- 0.8600 578m
- 0.8625 555m
- 0.8650 410m
- AUD/USD: AUD amounts
- 0.6465 490m
- 0.6590 660m
- 0.6640 745m
- 0.6685 475m
Pound Sterling (GBP) is the best performer in G10 in January. Economists at Société Générale analyze GBP outlook ahead of the Bank of England (BoE) meeting.
MPC vote could impact Sterling
Suspense around the BoE decision on Thursday revolves around the vote: will three Monetary Policy Committee (MPC) hawks maintain their call for higher rates or cede ground and realign with the majority for no change?
A swing from 6-3 to 9-0 could put the brakes on Sterling and spark a rebound in EUR/GBP from the lowest levels since August 2022.
Here is what you need to know on Thursday, February 1:
The US Dollar stays resilient against its major rivals early Thursday after fluctuating wildly during the Federal Reserve (Fed) event on Wednesday. The Bank of England (BoE) will announce monetary policy decisions later in the day. Eurostat will publish the inflation report for January and the US economic docket will feature weekly Initial Jobless Claims, Unit Labor Costs and ISM Manufacturing PMI data.
The Fed left the interest rate unchanged at 5.25%-5.5% following the first monetary policy meeting of the year, as expected. In its policy statement, the Fed dropped the language about the willingness to tighten the policy further if needed but said that it does not expect it will be appropriate to reduce rates until there is greater confidence inflation is moving sustainably toward 2%.
During the post-meeting press conference, Fed Chairman Jerome Powell noted that almost everyone on the Committee believes it will be appropriate to reduce rates and added that an unexpected weakening in the labor market could make them start reducing rates sooner. When asked about the possibility of a rate reduction at the next meeting, "based on the meeting today, I don't think likely we will have a rate cut in March," he responded. After dropping below 103.00, the USD Index regained its traction and climbed above 103.50. Meanwhile, Wall Street's main indexes closed deep in negative territory, while the benchmark 10-year US Treasury bond yield settled below 4%. Early Thursday, US stock index futures trade marginally higher on the day and the USD Index clings to modest gains above 103.60.
US Dollar price this week
The table below shows the percentage change of US Dollar (USD) against listed major currencies this week. US Dollar was the strongest against the Australian Dollar.
| USD | EUR | GBP | CAD | AUD | JPY | NZD | CHF | |
| USD | 0.38% | 0.19% | -0.06% | 0.57% | -0.89% | -0.30% | -0.08% | |
| EUR | -0.38% | -0.17% | -0.43% | 0.22% | -1.25% | -0.65% | -0.47% | |
| GBP | -0.20% | 0.18% | -0.26% | 0.38% | -1.07% | -0.50% | -0.29% | |
| CAD | 0.06% | 0.43% | 0.26% | 0.63% | -0.81% | -0.23% | -0.02% | |
| AUD | -0.59% | -0.22% | -0.40% | -0.65% | -1.47% | -0.88% | -0.68% | |
| JPY | 0.88% | 1.24% | 1.19% | 0.80% | 1.44% | 0.56% | 0.78% | |
| NZD | 0.30% | 0.68% | 0.48% | 0.24% | 0.86% | -0.59% | 0.22% | |
| CHF | 0.08% | 0.46% | 0.28% | 0.03% | 0.66% | -0.79% | -0.19% |
The heat map shows percentage changes of major currencies against each other. The base currency is picked from the left column, while the quote currency is picked from the top row. For example, if you pick the Euro from the left column and move along the horizontal line to the Japanese Yen, the percentage change displayed in the box will represent EUR (base)/JPY (quote).
Inflation in the Euro area, as measured by the change in the Harmonized Index of Consumer Prices (HICP), is forecast to edge lower to 2.8% on a yearly basis in January from 2.9% in December. After closing in negative territory on Wednesday, EUR/USD struggles to stage a rebound and trades near 1.0800 early Thursday.
The BoE is forecast to hold the policy rate unchanged at 5.25%. Market participant will pay close attention to revised macroeconomic projections and Governor Andrew Bailey's comments at the press conference. GBP/USD registered small losses on Wednesday and was last seen trading modestly lower on the day below 1.2700.
UK BoE Decision Preview: Interest rates to remain unchanged as focus shifts to path toward cuts.
USD/JPY declined toward 146.00 in the American session on Wednesday but managed to erase a large portion of its daily losses before closing near 147.00. Early Thursday, the pair stays slightly below this level. Foreign Bond Investment in Japan saw inflows of ¥382.9 billion for the week ended January 26, up from the previous week's outflows of ¥43.5 billion (revised up from ¥-48.0 billion), Japan's Ministry of Finance reported on Thursday.
After spiking to a two-week high near $2,060, Gold lost its traction and retreated below $2,050. With the 10-year US yield struggling to reclaim 4%, XAU/USD holds steady above $2,040 early Thursday.
- USD/CAD trades in positive territory for two straight days, adding 0.03% on the day.
- The pair is poised to cross above the key EMA; RSI indicator returns to bullish territory above the 50-midline.
- The first upside barrier is located at 1.3460; 1.3395 acts as an initial support level for USD/CAD.
The USD/CAD pair extends the rally around 1.3550 during the early European trading hours on Thursday. The US Dollar (USD) has attracted some buyers following the Federal Reserve (Fed) meeting on Wednesday. The Fed committee agreed unanimously to keep the benchmark Federal Funds Rate at between 5.25% and 5.5% for the fourth straight month. Additionally, the decline in oil prices exerts some selling pressure on the commodity-linked Canadian Dollar (CAD) and acts as a tailwind for the USD/CAD pair.
According to the four-hour chart, USD/CAD is set to cross above the 50- and 100-period Exponential Moving Averages (EMA). The uptrend to resume once the pair can cross above the mentioned level decisively. It’s worth noting that the Relative Strength Index (RSI) returns to bullish territory above the 50-midline, supporting the buyers for the time being.
The upper boundary of the Bollinger Band at 1.3460 will be the immediate resistance level for the pair. Any follow-through buying above 1.3461 will see a rally to the 1.3500 psychological round figure. Further north, the next hurdle is seen at a high of January 25 at 1.3535.
On the other hand, a low of January 30 at 1.3395 acts as an initial support level for USD/CAD. A bearish breakout below the lower limit of the Bollinger Band at 1.3378 will pave the way to a low of January 31 at 1.3358, followed by the 1.3300 round figure, and finally near a low of January 2 at 1.3228.
USD/CAD four-hour chart
-638423649754823221.png)
- The UK central bank is likely to extend the pause on “Super Thursday,” in its first meeting of 2024.
- The Bank of England could hold its restrictive bias, pushing back against early rate-cut bets.
- BoE Governor Bailey’s words and updated forecasts set to inject volatility in the Pound Sterling.
The Bank of England (BoE) is set to hold its policy rate for a fourth meeting in a row on “Super Thursday.” It will be the United Kingdom (UK) central bank’s first policy meeting of 2024, and it is expected to set the direction for the Pound Sterling (GBP) market in the months to come.
Bank of England to hold fire as Bailey takes center stage
The Bank of England is expected to leave the benchmark interest rate unchanged at 5.25% following its policy meeting on Thursday at 12:00 GMT. It’s a so-called “Super Thursday” as the policy announcements will be accompanied by the Monetary Policy Report (MPR) and followed by Governor Andrew Bailey’s press conference at 12:30 GMT.
Markets are currently pricing in about 100 basis points (bps) of rate cuts this year, beginning in the second quarter.
The BoE is seen maintaining its restrictive stance, affirming the narrative of “higher interest rates for longer” while resisting the market’s expectation of early rate cuts. A surprise uptick in the headline annual inflation for December, escalating Middle East geopolitical tensions and the impending impact of higher borrowing costs could dissuade policymakers from leaning in favor of a dovish policy pivot, as yet.
While testifying before the UK Treasury Select Committee (TSC) in early January, BoE Governor Andrew Bailey said “as best as we can tell from the monitoring, we have seen that shipping traffic is being affected and rerouted. That will increase shipping prices and costs. Initially, that will be an issue in the monetary policy world and then may feed through into the financial stability world.”
Meanwhile, BoE Deputy Governor Sarah Breeden said following the December policy meeting that “it's important for the monetary policy to be restrictive for an extended period.”
Heading into the BoE’s “Super Thursday”, the UK annual inflation stands at 4.0%, having rebounded from November’s more-than-two-year low of 3.9%. Britain's Gross Domestic Product (GDP) expanded by 0.3% in November after October’s 0.3% decline. Meanwhile, the S&P Global UK Preliminary Services PMI surged to an eight-month high of 53.80 in January from 53.40 in December. Recent data reaffirms a continued bounce in the UK economic activity, allowing the BoE to keep the borrowing costs higher for a longer period.
The focus, however, will also be on the central bank’s updated inflation and growth forecasts, as well as Bailey’s press conference, for fresh insights on the timing of the BoE’s policy pivot. In its November MPR, the BoE Monetary Policy Committee (MPC) said it expected GDP growth to be "broadly flat" in the fourth quarter of 2023 and over coming quarters. It was most likely CPI inflation would return to the 2% target by 2025, the report said.
Previewing the BoE events, analysts at Goldman Sachs noted, "We expect the growth projections in 2025 and 2026 to be revised up. The BoE will revise down its near-term inflation forecasts because of softer consumption data and lower energy prices, with 2% CPI hit by the end of this year - and this may allow for rates to be cut by the spring.”
"We continue to expect the first 25bps cut in May, followed by 25 bps cuts every meeting until Bank Rate reaches 3.0% in May 2025. An earlier cut in March cannot be ruled out entirely, especially if the disinflation process is coupled with further deterioration in growth," the analysts added.
How will the BoE interest rate decision impact the GBP/USD?
If the Bank of England adopts a dovish stance, in the face of downward revisions to the inflation and growth outlook, the odds for a May rate cut would spike and smash the Pound Sterling across the board. A dovish vote split could also add to the bearish bias in the GBP/USD pair. On the other hand, the pair could see a solid recovery rally should the BoE maintain its hawkish rhetoric.
Dhwani Mehta, Asian Session Lead Analyst at FXStreet, offers a brief technical outlook for the major and explains: “Having failed to resist above the critical 21-day Simple Moving Average (SMA) at 1.2705, GBP/USD is testing the 50-day SMA support at 1.2677. The 14-day Relative Strength Index (RSI) has breached the midline for the downside, suggesting a negative near-term outlook for the major.”
Dhwani also outlines important technical levels to trade the GBP/USD pair: “Strong support aligns at the January 17 low of 1.2595, below which a drop toward the 200-day SMA at 1.2562 cannot be ruled out. Deeper declines will open floors for a test of the 100-day SMA at 1.2467. On the upside, Pound Sterling buyers need to recapture the 21-day SMA at 1.2705 on a sustained basis for meaningful bullish traction toward the previous week’s high of 1.2775. The next upside barrier is envisioned at the 1.2800 round level.”
Economic Indicator
United Kingdom BoE Interest Rate Decision
The Bank of England (BoE) announces its interest rate decision at the end of its eight scheduled meetings per year. If the BoE is hawkish about the inflationary outlook of the economy and raises interest rates it is usually bullish for the Pound Sterling (GBP). Likewise, if the BoE adopts a dovish view on the UK economy and keeps interest rates unchanged, or cuts them, it is seen as bearish for GBP.
Read more.Next release: 02/01/2024 12:00:00 GMT
Frequency: Irregular
Source: Bank of England
BoE FAQs
What does the Bank of England do and how does it impact the Pound?
The Bank of England (BoE) decides monetary policy for the United Kingdom. Its primary goal is to achieve ‘price stability’, or a steady inflation rate of 2%. Its tool for achieving this is via the adjustment of base lending rates. The BoE sets the rate at which it lends to commercial banks and banks lend to each other, determining the level of interest rates in the economy overall. This also impacts the value of the Pound Sterling (GBP).
How does the Bank of England’s monetary policy influence Sterling?
When inflation is above the Bank of England’s target it responds by raising interest rates, making it more expensive for people and businesses to access credit. This is positive for the Pound Sterling because higher interest rates make the UK a more attractive place for global investors to park their money. When inflation falls below target, it is a sign economic growth is slowing, and the BoE will consider lowering interest rates to cheapen credit in the hope businesses will borrow to invest in growth-generating projects – a negative for the Pound Sterling.
What is Quantitative Easing (QE) and how does it affect the Pound?
In extreme situations, the Bank of England can enact a policy called Quantitative Easing (QE). QE is the process by which the BoE substantially increases the flow of credit in a stuck financial system. QE is a last resort policy when lowering interest rates will not achieve the necessary result. The process of QE involves the BoE printing money to buy assets – usually government or AAA-rated corporate bonds – from banks and other financial institutions. QE usually results in a weaker Pound Sterling.
What is Quantitative tightening (QT) and how does it affect the Pound Sterling?
Quantitative tightening (QT) is the reverse of QE, enacted when the economy is strengthening and inflation starts rising. Whilst in QE the Bank of England (BoE) purchases government and corporate bonds from financial institutions to encourage them to lend; in QT, the BoE stops buying more bonds, and stops reinvesting the principal maturing on the bonds it already holds. It is usually positive for the Pound Sterling.
- GBP/USD struggles to find a positive direction after registered losses in the recent sessions.
- Traders may exercise caution and wait for MACD to give a direction confirmation.
- The pair could find a support zone around the 23.6% Fibonacci retracement and 50-day EMA.
GBP/USD grapples to find a direction, hovering around 1.2680 during the Asian session on Thursday. The technical analysis of the GBP/USD pair shows that the 14-day Relative Strength Index (RSI) is positioned below 50. This indicates a bearish momentum for the pair.
Furthermore, the Moving Average Convergence Divergence (MACD), a lagging indicator, indicates a subdued momentum for the pair. This is evident from the MACD line being situated above the centerline but below the signal line. Traders are advised to exercise caution and consider waiting for direction confirmation from the MACD before engaging in aggressive bets on the GBP/USD pair.
The GBP/USD pair may encounter support at the significant level of 1.2650, coinciding with the 23.6% Fibonacci retracement at 1.2648 and the 50-day Exponential Moving Average (EMA) at 1.2645. This zone represents an immediate support area, and breaching it could potentially guide the pair toward the vicinity of the psychological support at the 1.2600 level. A dip below this psychological support might lead the pair towards the 38.2% Fibonacci retracement level at 1.2532.
Regarding potential upward movements, the immediate resistance for the GBP/USD pair is seen at the psychological level of 1.2700, followed by the weekly high situated at the major resistance level of 1.2750. A successful breakthrough above this significant barrier could prompt the pair to reconsider the January high at 1.2785, with further potential gains toward the psychological level at 1.2800.
GBP/USD: Daily Chart
-638423628873724266.png)
- AUD/JPY drifts lower for the third straight day and seems vulnerable to sliding further.
- Softer domestic inflation lifts August RBA rate cut bets and undermines the Aussie.
- The BoJ’s hawkish tilt, along with geopolitics, benefits the JPY and exerts pressure.
The AUD/JPY cross remains under some selling pressure for the third straight day on Thursday and drops to a nearly one-month low, during the Asian session. Spot prices currently trade around the 96.20-96.15 area, with bears now looking to extend the downward trajectory further below the 100-day Simple Moving Average (SMA).
The Australian Dollar (AUD) continues to be undermined by softer domestic consumer inflation figures released on Wednesday, which reaffirmed expectations that the Reserve Bank of Australia's (RBA) tightening cycle is over. In contrast, the Bank of Japan (BoJ) last week signalled that conditions for phasing out huge stimulus and pulling short-term rates out of negative territory were falling into place. This, along with the risk of a major escalation of geopolitical tensions in the Middle East, turns out to be a key factor behind the safe-haven Japanese Yen's (JPY) relative outperformance and exerts downward pressure on the AUD/JPY cross.
Bulls, meanwhile, seem rather unimpressed by a private-sector survey, which showed that China's factory activity expanded at a steady pace for the third straight month in January. In fact, China's Caixin Manufacturing PMI remains unchanged at 50.8 in January as compared to market expectations for a downtick to 50.6. This, however, does little to benefit the China-proxy Aussie. Apart from this, weakness below the 100-day SMA suggests that the path of least resistance for the AUD/JPY cross is to the downside. Hence, a subsequent decline back towards retesting the YTD trough, around the 95.85 region, now looks like a distinct possibility.
Technical levels to watch
- Gold price gains positive traction for the fourth successive day on Thursday.
- Sliding US bond yields weigh on the USD and benefit the non-yielding metal.
- Geopolitical risks and China’s economic woes remain supportive of the move.
Gold price (XAU/USD) attracts some buying for the fourth straight day on Thursday and moves back closer to over a two-week high, around the $2,056 area touched the previous day. The US Dollar (USD) struggles to capitalize on Wednesday's post-FOMC bounce from a one-week trough amid a further decline in the US Treasury bond yields. This, along with persistent geopolitical risks stemming from conflicts in the Middle East and China's economic woes, turn out to be a key factor lending some support to the safe-haven commodity. That said, the Federal Reserve's (Fed) less dovish outlook on rates might cap the non-yielding yellow metal.
Investors now look to Thursday's rather busy economic docket, highlighting the release of the flash Eurozone consumer inflation figures and the US ISM Manufacturing PMI, for some meaningful impetus. Furthermore, the Bank of England's (BoE) monetary policy decision might infuse some volatility in the markets. Apart from this, the US bond yields, the USD price dynamics and the broader risk sentiment might contribute to producing short-term trading opportunities around the Gold price. The market focus will then shift to the closely-watched US monthly employment details, popularly known as the Nonfarm Payrolls (NFP) report on Friday.
Daily Digest Market Movers: Gold price draws support from sliding US bond yields, USD downtick and geopolitical risks
- The Federal Reserve signalled on Wednesday that it was getting closer to rate cuts and drags the US Treasury bond yields lower, prompting fresh US Dollar selling and lending support to the Gold price.
- As was expected, the Fed decided to leave the main interest-rate target unchanged at between 5.25%-5.5% at the end of a two-day meeting on Wednesday and indicated that the policy rate is likely at its peak.
- In the post-meeting press conference, Fed Chair Jerome Powell said that rate cuts would likely begin at some point this year, though pushed back strongly against expectations for any such move in March.
- The current market pricing indicates only about a 35% chance that the US central bank will cut interest rates in March, down from more than 60% before the Fed decision and nearly 90% a month ago.
- Investors remain worried that the deepening conflict in the Middle East could trigger a wider war, which, along with slowing economic growth in China, lends support to the safe-haven precious metal.
- The European Union hopes to launch a naval mission in the Red Sea within three weeks to help defend cargo ships against attacks by Houthi rebels, which are hampering trade and driving up prices.
- A private-sector survey released earlier this Thursday showed that business activity in China's manufacturing sector expanded at a steady pace for the third successive month in January.
- Traders look to the flash Eurozone consumer inflation figures, the Bank of England policy decision and the US ISM Manufacturing PMI for some impetus ahead of the US NFP on Friday.
Technical Analysis: Gold price seems poised to appreciate further, $2,040-2,042 strong resistance breakout in play
From a technical perspective, strength beyond the $2,040-2,042 supply zone could be seen as a fresh trigger for bulls. Moreover, oscillators on the daily chart have just started gaining positive traction and support prospects for additional gains. That said, any further move up beyond the overnight swing high, around the $2,056 area, is likely to confront some resistance near the $2,065-2,066 zone ahead of the $2,078-2,079 region or the YTD peak. Some follow-through buying should allow the Gold price to aim back towards reclaiming the $2,100 round figure and climb further towards the next relevant hurdle near the $2,020 area.
On the flip side, the 50-day Simple Moving Average (SMA), currently pegged near the $2,031-2,030 area, now seems to act as an immediate strong support and a key pivotal point. A convincing break below the said support could drag the Gold price to the $2,012-2,010 area en route to the $2,000 psychological mark. Some follow-through selling might shift the bias in favour of bearish traders and expose the 100-day SMA support near the $1,980 region, before the XAU/USD eventually drops to the very important 200-day SMA, near the $1,965-1,964 area.
US Dollar price today
The table below shows the percentage change of US Dollar (USD) against listed major currencies today. US Dollar was the strongest against the .
| USD | EUR | GBP | CAD | AUD | JPY | NZD | CHF | |
| USD | -0.07% | -0.06% | -0.03% | -0.06% | -0.23% | -0.35% | 0.04% | |
| EUR | 0.08% | 0.01% | 0.02% | 0.03% | -0.12% | -0.27% | 0.12% | |
| GBP | 0.07% | -0.01% | 0.01% | 0.02% | -0.13% | -0.28% | 0.11% | |
| CAD | 0.03% | -0.01% | 0.00% | 0.01% | -0.14% | -0.29% | 0.12% | |
| AUD | 0.06% | -0.03% | -0.02% | -0.01% | -0.16% | -0.30% | 0.12% | |
| JPY | 0.22% | 0.14% | 0.14% | 0.12% | 0.15% | -0.16% | 0.24% | |
| NZD | 0.34% | 0.30% | 0.30% | 0.32% | 0.30% | 0.12% | 0.40% | |
| CHF | -0.04% | -0.12% | -0.10% | -0.08% | -0.10% | -0.26% | -0.40% |
The heat map shows percentage changes of major currencies against each other. The base currency is picked from the left column, while the quote currency is picked from the top row. For example, if you pick the Euro from the left column and move along the horizontal line to the Japanese Yen, the percentage change displayed in the box will represent EUR (base)/JPY (quote).
Gold FAQs
Why do people invest in Gold?
Gold has played a key role in human’s history as it has been widely used as a store of value and medium of exchange. Currently, apart from its shine and usage for jewelry, the precious metal is widely seen as a safe-haven asset, meaning that it is considered a good investment during turbulent times. Gold is also widely seen as a hedge against inflation and against depreciating currencies as it doesn’t rely on any specific issuer or government.
Who buys the most Gold?
Central banks are the biggest Gold holders. In their aim to support their currencies in turbulent times, central banks tend to diversify their reserves and buy Gold to improve the perceived strength of the economy and the currency. High Gold reserves can be a source of trust for a country’s solvency. Central banks added 1,136 tonnes of Gold worth around $70 billion to their reserves in 2022, according to data from the World Gold Council. This is the highest yearly purchase since records began. Central banks from emerging economies such as China, India and Turkey are quickly increasing their Gold reserves.
How is Gold correlated with other assets?
Gold has an inverse correlation with the US Dollar and US Treasuries, which are both major reserve and safe-haven assets. When the Dollar depreciates, Gold tends to rise, enabling investors and central banks to diversify their assets in turbulent times. Gold is also inversely correlated with risk assets. A rally in the stock market tends to weaken Gold price, while sell-offs in riskier markets tend to favor the precious metal.
What does the price of Gold depend on?
The price can move due to a wide range of factors. Geopolitical instability or fears of a deep recession can quickly make Gold price escalate due to its safe-haven status. As a yield-less asset, Gold tends to rise with lower interest rates, while higher cost of money usually weighs down on the yellow metal. Still, most moves depend on how the US Dollar (USD) behaves as the asset is priced in dollars (XAU/USD). A strong Dollar tends to keep the price of Gold controlled, whereas a weaker Dollar is likely to push Gold prices up.
- US Dollar Index gains ground due to the Fed’s hawkish stance on interest rate trajectory.
- US Federal Reserve maintained its current interest rates at 5.50% as expected.
- Fed Powell indicated a reduced likelihood of imminent rate cuts due to the elevated inflation and robust economic growth.
The US Dollar Index (DXY) continues to gain ground for the second successive day, trading higher around 103.50 during the Asian session on Thursday. The US Dollar (USD) strengthened as Federal Reserve (Fed) Chair Jerome Powell dispelled the possibility of a rate cut in the upcoming March meeting. This outcome was largely anticipated, considering the Fed's decision to maintain the current interest rates.
Chairman Powell highlighted the persistent existence of elevated inflation and emphasized robust economic growth, indicating a reduced likelihood of imminent rate cuts. The forthcoming jobs and inflation data are anticipated to play a crucial role in guiding market sentiment and influencing the trajectory of the Federal Reserve's easing cycle.
The Greenback encountered adversity following the release of discouraging US employment figures on Wednesday. The US ADP Employment Change reported 107K, failing to meet the anticipated 145K for January, while the previous reading stood at 158K in December. Thursday is poised to draw attention to key economic indicators, including US Initial Jobless Claims, Nonfarm Productivity, and ISM Manufacturing PMI.
Additionally, the Federal Open Market Committee (FOMC) does not foresee contemplating a reduction in the target range unless it attains heightened confidence that inflation is steadily advancing toward the 2.0% target. Despite a moderation in inflation over the past year, it remains at an elevated level. The statement excludes any mention of additional policy firming.
Anticipation in the market regarding the Federal Reserve's future decisions is extending into the May meeting. According to CME's FedWatch Tool, there is a probability of over 60% that the Fed will keep its interest rates within the range of 5.25-5.50% during March's meeting. As a result, the likelihood of a quarter-point rate cut in May surpasses 60%.
- Indian Rupee trades in positive territory for the third consecutive day.
- Chief Economic Advisor is confident that India is poised for continuous and robust economic expansion.
- Investors will closely watch India’s Interim Budget for 2024–25, followed by US PMI data on Thursday.
Indian Rupee (INR) gains traction on Thursday. The uptick in the pair is bolstered by US Dollar (USD) sales from both local and foreign banks, which boosted the INR to its strongest level in over two weeks.
The Federal Reserve (Fed) left the benchmark Federal Funds Rate unchanged in January. Fed Chair Jerome Powell stated that the upcoming inflation data will determine how soon the central bank moves ahead on rate cuts.
India's Chief Economic Advisor, V Anantha Nageswaran, highlighted in "The Indian Economy: A Review" report that macroeconomic stability will support India's continued robust economic growth. The Reserve Bank of India (RBI) forecast India’s GDP growth of 7.4% in FY24, with a slight decline in headline inflation. Factors contributing to this positive outlook include resilient service exports and reduced oil import costs.
Looking ahead, Finance Minister Nirmala Sitharaman will present India’s Interim Budget 2024–25 on Thursday. On the US docket, the US weekly Initial Jobless Claims and ISM Manufacturing PMI will be due. Another highlight this week will be the US Nonfarm Payrolls (NFP) on Friday.
Daily Digest Market Movers: Indian Rupee remains strong despite geopolitical tension
- The International Monetary Fund (IMF) has raised its growth forecast for India, expecting the economy to expand by 6.7% in the fiscal year 2024, compared with the 6.3% projected earlier.
- India’s GDP growth is seen steady at 6.5% for FY25 and FY26, a 20 basis points (bps) upgrade from its October 2023 forecast, according to the IMF.
- India's foreign currency reserves declined $2.79 billion to $616.14 billion in the week ended January 19, according to the Reserve Bank of India (RBI).
- The Indian rupee appreciated by 1% to 2% in January 2024, making it the best-performing currency in Asian markets.
- The Federal Open Market Committee (FOMC) agreed unanimously to keep the benchmark Federal Funds Rate at 5.25–5.50%, as widely expected.
- The FOMC stated that it won't begin lowering the target range until it sees further progress on inflation moving sustainably toward the 2% target.
- Fed Chair Jerome Powell closed the door to the possibility of a rate cut in March, but the markets believe the May FOMC meeting is the most likely for the Fed to start easing policy.
- The US ADP employment report showed the private sector added 107K jobs in January from the previous reading of 158K, lower than the market consensus of 145K.
- The Employment Cost Index rose 0.9% QoQ in Q4 from the previous quarter's 1.1% QoQ gain, worse than the expectation of 1.0%.
Technical Analysis: Indian Rupee extends the range-bound game
Indian Rupee trades on a stronger note on the day. The USD/INR pair sticks to the range-bound theme within a two-month-old descending trend channel between 82.78 and 83.45. USD/INR resumes a bearish cycle as the pair returns below the key 100-period Exponential Moving Average (EMA) on the daily chart. Additionally, the 14-day Relative Strength Index (RSI) stands below the 50.0 midlines, hinting that support is more likely to break than hold.
In case of a bearish trading environment, the initial support level of the pair will emerge near a low of December 18 at 82.90, followed by the lower limit of the descending trend channel at 82.72. A decisive break below 82.72 might be followed by a sustained selloff to a low of August 23 at 82.45.
On the upside, the support-turned-resistance level of 83.00 will be the first upside barrier for USD/INR. Further north, the next hurdle is seen at the upper boundary of the descending trend channel at 83.25. A sustained break above this could clear the way for a move to the next bullish targets all the way up to a high of January 2 at 83.35, en route to a 2023 high of 83.47.
US Dollar price today
The table below shows the percentage change of US Dollar (USD) against listed major currencies today. US Dollar was the weakest against the New Zealand Dollar.
| USD | EUR | GBP | CAD | AUD | JPY | NZD | CHF | |
| USD | -0.07% | -0.05% | -0.03% | -0.01% | -0.21% | -0.33% | 0.07% | |
| EUR | 0.08% | 0.02% | 0.02% | 0.07% | -0.10% | -0.26% | 0.15% | |
| GBP | 0.05% | -0.01% | -0.01% | 0.05% | -0.12% | -0.29% | 0.12% | |
| CAD | 0.03% | -0.02% | -0.01% | 0.05% | -0.12% | -0.28% | 0.15% | |
| AUD | 0.02% | -0.07% | -0.05% | -0.05% | -0.18% | -0.32% | 0.11% | |
| JPY | 0.19% | 0.11% | 0.11% | 0.10% | 0.17% | -0.17% | 0.25% | |
| NZD | 0.34% | 0.30% | 0.30% | 0.32% | 0.34% | 0.14% | 0.43% | |
| CHF | -0.06% | -0.15% | -0.13% | -0.11% | -0.10% | -0.27% | -0.42% |
The heat map shows percentage changes of major currencies against each other. The base currency is picked from the left column, while the quote currency is picked from the top row. For example, if you pick the Euro from the left column and move along the horizontal line to the Japanese Yen, the percentage change displayed in the box will represent EUR (base)/JPY (quote).
Indian Rupee FAQs
What are the key factors driving the Indian Rupee?
The Indian Rupee (INR) is one of the most sensitive currencies to external factors. The price of Crude Oil (the country is highly dependent on imported Oil), the value of the US Dollar – most trade is conducted in USD – and the level of foreign investment, are all influential. Direct intervention by the Reserve Bank of India (RBI) in FX markets to keep the exchange rate stable, as well as the level of interest rates set by the RBI, are further major influencing factors on the Rupee.
How do the decisions of the Reserve Bank of India impact the Indian Rupee?
The Reserve Bank of India (RBI) actively intervenes in forex markets to maintain a stable exchange rate, to help facilitate trade. In addition, the RBI tries to maintain the inflation rate at its 4% target by adjusting interest rates. Higher interest rates usually strengthen the Rupee. This is due to the role of the ‘carry trade’ in which investors borrow in countries with lower interest rates so as to place their money in countries’ offering relatively higher interest rates and profit from the difference.
What macroeconomic factors influence the value of the Indian Rupee?
Macroeconomic factors that influence the value of the Rupee include inflation, interest rates, the economic growth rate (GDP), the balance of trade, and inflows from foreign investment. A higher growth rate can lead to more overseas investment, pushing up demand for the Rupee. A less negative balance of trade will eventually lead to a stronger Rupee. Higher interest rates, especially real rates (interest rates less inflation) are also positive for the Rupee. A risk-on environment can lead to greater inflows of Foreign Direct and Indirect Investment (FDI and FII), which also benefit the Rupee.
How does inflation impact the Indian Rupee?
Higher inflation, particularly, if it is comparatively higher than India’s peers, is generally negative for the currency as it reflects devaluation through oversupply. Inflation also increases the cost of exports, leading to more Rupees being sold to purchase foreign imports, which is Rupee-negative. At the same time, higher inflation usually leads to the Reserve Bank of India (RBI) raising interest rates and this can be positive for the Rupee, due to increased demand from international investors. The opposite effect is true of lower inflation.
- USD/CHF gains ground after Fed Chair Powell dismissed the possibility of a rate cut in March’s meeting.
- Fed chose to maintain its existing interest rates as expected.
- SNB Jordan anticipated that Swiss inflation would remain below 2.0%.
USD/CHF edges higher to near 0.8620 during the Asian session on Thursday. Despite a setback in the US Dollar (USD) against the Swiss Franc (CHF) on Wednesday due to disappointing US employment data, a recovery ensued after Federal Reserve (Fed) Chair Jerome Powell dismissed the likelihood of a rate cut in the forthcoming March meeting. This decision was widely expected, given the Fed's choice to uphold the existing interest rates. Powell underscored the enduring presence of heightened inflation and emphasized the strong growth in economic activity.
Furthermore, the Federal Open Market Committee (FOMC) does not anticipate considering a reduction in the target range until it has acquired increased confidence that inflation is progressing consistently toward the 2.0 percent target. Although inflation has moderated over the past year, it is still elevated. The statement omits the reference to additional policy firming.
Swiss National Bank (SNB) Chairman Thomas Jordan addressed at a Business Journalists club on Tuesday. He stated that the expectation is for inflation to rise due to the Value Added Tax (VAT) increase and electricity prices, but it is anticipated to remain below 2.0%. This is the baseline scenario, and the projection for this year suggests that inflation will average below the 2.0% threshold. The consensus expectation is for the Swiss National Bank to implement its first rate cut in September 2024.
Swiss Real Retail Sales (YoY) declined by 0.8% against the expected growth of 0.9% in December. The Swiss consumer demand was fallen by 1.5% in November. Gross Domestic Product (MoM) for November rose to 0.2% from the flat 0.0% prior, exceeding the market consensus of 0.1% growth. Traders will observe the S&P Global Manufacturing PMI and SVME - Purchasing Managers' Index on Thursday.
| Raw materials | Closed | Change, % |
|---|---|---|
| Silver | 22.923 | -1 |
| Gold | 2038.976 | 0.12 |
| Palladium | 977.88 | 0.11 |
China's Vice Finance Minister Wang Dongwei said on Thursday that they “will appropriately increase investment under the central government budget.”
Additional takeaways
2023 tax and fee cuts, rebates totaled 2.2 trillion yuan.
Expect fiscal revenue to continue to recover in 2024.
Will maintain a certain intensity in fiscal spending in 2024.
Fiscal policy will help expand domestic demand.
Meanwhile, another finance ministry official said that they “will implement structural tax cuts in 2024 and support tech innovation and manufacturing sector.”
Market reaction
The above headlines are putting a bid under the Australian Dollar, propping the AUD/USD pair back toward 0.6600. The pair is currently adding 0.12% on the day to trade at 0.6573.
- NZD/USD regains positive traction following the release of a slightly better Chinese PMI.
- Worries about slowing economic growth in China and geopolitical risk to cap the Kiwi.
- The USD remains supported by the Fed’s less dovish outlook and acts as a headwind.
The NZD/USD pair attracts some buyers during the Asian session on Thursday and for now, seems to have stalled the previous day's retracement slide from the 0.6175 region, or over a two-week peak. Spot prices currently trade around the 0.6130-0.6135 zone, though the lack of follow-through buying warrants some caution before positioning for any further appreciating move.
A private-sector survey released earlier today showed that China's factory activity expanded at a steady pace for the third straight month in January. In fact, China's Caixin Manufacturing PMI came in at 50.8 in January, matching the previous month's reading and beating market expectations for a downtick to 50.6. This, in turn, provides a modest lift to antipodean currencies, including the Kiwi, which, along with subdued US Dollar (USD) price action, acts as a tailwind for the NZD/USD pair.
The optimism, however, is likely to remain limited in the wake of a tepid economic recovery in China. Furthermore, the Federal Reserve’s (Fed) less dovish outlook on Wednesday, pushing back against market expectations for a March rate cut, assists the USD to stand tall near its highest level since December 13. Apart from this, geopolitical risks should benefit the Greenback's relative safe-haven status and further contribute to keeping a lid on any further upside for the NZD/USD pair.
Traders now look to the US economic docket, featuring the release of the usual Weekly Initial Jobless Claims data and the ISM Manufacturing PMI. This, along with the broader risk sentiment, might influence the USD price dynamics and provide some impetus to the NZD/USD pair. The focus, however, will remain glued to the closely-watched US monthly employment details, popularly known as the Nonfarm Payrolls (NFP) report on Friday.
Technical levels to watch
- EUR/USD loses ground on the hawkish remarks by Fed Chair Jerome Powell.
- Technical analysis suggests a confirmation of the bearish trend in the pair.
- The psychological level at 1.0800 could act as immediate support aligned with January’s low at 1.0794.
EUR/USD makes an effort to recover recent losses, edging higher to near 1.0810 during the Asian session on Thursday. The EUR/USD pair faces downward pressure following hawkish remarks from Federal Reserve Chairman Jerome Powell. Powell dismissed the possibility of an interest rate cut in March, citing elevated inflation levels and a robust performance of the United States (US) economy.
The major level at 1.0850 may act as immediate resistance for the EUR/USD pair. A successful break above the major level could potentially propel the EUR/USD pair to approach the resistance zone around the 23.6% Fibonacci retracement level at 1.0876 aligned with the 21-day Exponential Moving Average (EMA) at 1.0878. If the pair surpasses the resistance zone, it could inspire the bulls of the EUR/USD pair to explore the region around the psychological barrier at the 1.0900 level.
The technical analysis for the EUR/USD pair shows that the 14-day Relative Strength Index (RSI) is positioned below the 50 mark, signaling a bearish momentum in the market. In addition, the Moving Average Convergence Divergence (MACD), a lagging indicator, suggests a potential confirmation of a downward trend with the MACD line being positioned below the centerline and showing the divergence below the signal line.
Immediate support for the EUR/USD pair can be found at the psychological level of 1.0800, aligning with January's low at 1.0794. A decisive break below this level could strengthen bearish sentiment, potentially navigating toward the major support region at the 1.0750 level.
EUR/USD: Daily Chart
-638423501290156733.png)
- The Japanese Yen lacks firm intraday direction and is influenced by a combination of diverging forces.
- The BoJ’s hawkish tilt, along with geopolitical risks, seems to lend some support to the safe-haven JPY.
- The Fed’s less dovish outlook offsets the disappointing US ADP report and is seen underpinning the USD.
The Japanese Yen (JPY) attracts some buyers for the second straight day on Thursday and remains well within the striking distance of over a two-week high touched against its American counterpart the previous day. That said, a combination of diverging forces might hold back traders from placing aggressive directional bets, warranting some caution before positioning for a firm near-term direction. Against the backdrop of worries about escalating geopolitical tensions in the Middle East, the Federal Reserve's (Fed) less dovish outlook on interest rates might continue to weigh on investors' sentiment. This, along with expectations for an imminent shift in the Bank of Japan's (BoJ) policy stance, acts as a tailwind for the JPY.
Meanwhile, the recent fall in the US Treasury bond yields has resulted in a further narrowing of the US-Japan rate differential and should lend additional support to the JPY. The US Dollar (USD), on the other hand, stands tall near its highest level since December 13 and is underpinned by the fact that the Fed smashed expectations for an interest rate cut in March. This, in turn, could help limit the downside for the USD/JPY pair. That said, the disappointing release of the US ADP report on private-sector employment on Wednesday and declining US Treasury bond yields cap the Greenback. This makes it prudent to wait for strong follow-through buying before positioning for the resumption of the currency pair's uptrend.
Daily Digest Market Movers: Japanese Yen struggles to gain any meaningful traction amid mixed fundamental cues
- The Japanese Yen draws support from the deepening Middle East tensions and the Bank of Japan's hawkish tilt, saying that conditions for phasing out huge stimulus and pulling short-term rates out of negative territory were falling into place.
- The European Union hopes to launch a naval mission in the Red Sea within three weeks to help defend cargo ships against attacks by Houthi rebels, which are hampering trade and driving up prices, the bloc’s top diplomat said Wednesday.
- The BoJ’s Summary of Opinions report from the January 2024 meeting published on Wednesday suggested that the central bank must maintain monetary easing under YCC, though members discussed prospects for exiting negative rates.
- The Federal Reserve left its benchmark interest rate unchanged in a range of 5.25% to 5.50% and dropped the longstanding reference to possible further hikes in the borrowing cost, though gave no hint that a rate cut was imminent.
- In the post-meeting press conference, Fed Chair Jerome Powell acknowledged the US economic strength and declined to declare victory in the two-year fight against inflation, dealing a severe blow to expectations for a March rate cut.
- Traders are now pricing in a 38% probability that the Fed will cut interest rates in March, down from 59% before the FOMC announcement and nearly 90% a month ago, offsetting the disappointing release of the US labor market report.
- Data published by Automatic Data Processing (ADP) showed that private-sector employers added 107,000 jobs in January as compared to 145,000 anticipated and the previous month's downwardly revised reading of 158,000.
- The yield on the benchmark 10-year US government bond slides further below the 4.0% mark, which caps the upside for the US Dollar and does little to provide any meaningful impetus to the USD/JPY pair.
- Traders now look to the US economic docket, featuring the usual Weekly Initial Jobless Claims and the ISM Manufacturing PMI, for some impetus ahead of the US monthly jobs report, or the Nonfarm Payrolls on Friday.
Technical Analysis: USD/JPY might now confront stiff resistance near the 100-day SMA, around the 147.55 region
From a technical perspective, the USD/JPY pair has been showing some resilience below the 23.6% Fibonacci retracement level of the December-January rally. Moreover, oscillators on the daily chart – though have been losing traction – are still holding in the positive territory. This, in turn, warrants some caution for bearish traders. Hence, any intraday weakness might continue to find some support near the 146.00 mark or the overnight swing low. This is followed by the 38.2% Fibo. level, around the 145.60-145.55 region, which if broken decisively should pave the way for deeper losses.
On the flip side, momentum beyond the 147.00 mark is likely to confront some resistance near the 100-day Simple Moving Average (SMA), currently around the 147.55 zone. A sustained strength beyond has the potential to lift the USD/JPY pair back towards the 148.00 mark en route to the 148.35-148.40 supply zone. Bulls, however, might wait for some follow-through buying beyond the 148.80 area, or a nearly two-month high touched in January before positioning for the resumption of the recent uptrend witnessed over the past month or so.
Japanese Yen price today
The table below shows the percentage change of Japanese Yen (JPY) against listed major currencies today. Japanese Yen was the strongest against the Swiss Franc.
| USD | EUR | GBP | CAD | AUD | JPY | NZD | CHF | |
| USD | -0.04% | -0.01% | -0.01% | -0.02% | -0.16% | -0.17% | 0.10% | |
| EUR | 0.05% | 0.04% | 0.00% | 0.06% | -0.07% | -0.09% | 0.14% | |
| GBP | 0.02% | -0.03% | -0.03% | 0.03% | -0.10% | -0.13% | 0.10% | |
| CAD | 0.01% | -0.01% | 0.03% | 0.05% | -0.09% | -0.10% | 0.15% | |
| AUD | 0.02% | -0.06% | -0.03% | -0.05% | -0.14% | -0.16% | 0.11% | |
| JPY | 0.14% | 0.08% | 0.10% | 0.06% | 0.11% | -0.07% | 0.21% | |
| NZD | 0.12% | 0.11% | 0.13% | 0.13% | 0.12% | -0.02% | 0.23% | |
| CHF | -0.09% | -0.14% | -0.10% | -0.10% | -0.08% | -0.23% | -0.24% |
The heat map shows percentage changes of major currencies against each other. The base currency is picked from the left column, while the quote currency is picked from the top row. For example, if you pick the Euro from the left column and move along the horizontal line to the Japanese Yen, the percentage change displayed in the box will represent EUR (base)/JPY (quote).
Japanese Yen FAQs
What key factors drive the Japanese Yen?
The Japanese Yen (JPY) is one of the world’s most traded currencies. Its value is broadly determined by the performance of the Japanese economy, but more specifically by the Bank of Japan’s policy, the differential between Japanese and US bond yields, or risk sentiment among traders, among other factors.
How do the decisions of the Bank of Japan impact the Japanese Yen?
One of the Bank of Japan’s mandates is currency control, so its moves are key for the Yen. The BoJ has directly intervened in currency markets sometimes, generally to lower the value of the Yen, although it refrains from doing it often due to political concerns of its main trading partners. The current BoJ ultra-loose monetary policy, based on massive stimulus to the economy, has caused the Yen to depreciate against its main currency peers. This process has exacerbated more recently due to an increasing policy divergence between the Bank of Japan and other main central banks, which have opted to increase interest rates sharply to fight decades-high levels of inflation.
How does the differential between Japanese and US bond yields impact the Japanese Yen?
The BoJ’s stance of sticking to ultra-loose monetary policy has led to a widening policy divergence with other central banks, particularly with the US Federal Reserve. This supports a widening of the differential between the 10-year US and Japanese bonds, which favors the US Dollar against the Japanese Yen.
How does broader risk sentiment impact the Japanese Yen?
The Japanese Yen is often seen as a safe-haven investment. This means that in times of market stress, investors are more likely to put their money in the Japanese currency due to its supposed reliability and stability. Turbulent times are likely to strengthen the Yen’s value against other currencies seen as more risky to invest in.
China's Caixin Manufacturing Purchasing Managers' Index (PMI) came in at 50.8 in January, compared with December’s expansion of 50.8, according to the latest data released on Thursday.
The data came in better than market expectations of 50.6.
AUD/USD reaction to China’s PMI data
The Australian Dollar attracts some buyers following the upbeat Chinese Manufacturing PMI data. The AUD/USD pair is trading at 0.6563, up 0.04% on the day, at the time of writing.
Australian Dollar FAQs
What key factors drive the Australian Dollar?
One of the most significant factors for the Australian Dollar (AUD) is the level of interest rates set by the Reserve Bank of Australia (RBA). Because Australia is a resource-rich country another key driver is the price of its biggest export, Iron Ore. The health of the Chinese economy, its largest trading partner, is a factor, as well as inflation in Australia, its growth rate and Trade Balance. Market sentiment – whether investors are taking on more risky assets (risk-on) or seeking safe-havens (risk-off) – is also a factor, with risk-on positive for AUD.
How do the decisions of the Reserve Bank of Australia impact the Australian Dollar?
The Reserve Bank of Australia (RBA) influences the Australian Dollar (AUD) by setting the level of interest rates that Australian banks can lend to each other. This influences the level of interest rates in the economy as a whole. The main goal of the RBA is to maintain a stable inflation rate of 2-3% by adjusting interest rates up or down. Relatively high interest rates compared to other major central banks support the AUD, and the opposite for relatively low. The RBA can also use quantitative easing and tightening to influence credit conditions, with the former AUD-negative and the latter AUD-positive.
How does the health of the Chinese Economy impact the Australian Dollar?
China is Australia’s largest trading partner so the health of the Chinese economy is a major influence on the value of the Australian Dollar (AUD). When the Chinese economy is doing well it purchases more raw materials, goods and services from Australia, lifting demand for the AUD, and pushing up its value. The opposite is the case when the Chinese economy is not growing as fast as expected. Positive or negative surprises in Chinese growth data, therefore, often have a direct impact on the Australian Dollar and its pairs.
How does the price of Iron Ore impact the Australian Dollar?
Iron Ore is Australia’s largest export, accounting for $118 billion a year according to data from 2021, with China as its primary destination. The price of Iron Ore, therefore, can be a driver of the Australian Dollar. Generally, if the price of Iron Ore rises, AUD also goes up, as aggregate demand for the currency increases. The opposite is the case if the price of Iron Ore falls. Higher Iron Ore prices also tend to result in a greater likelihood of a positive Trade Balance for Australia, which is also positive of the AUD.
How does the Trade Balance impact the Australian Dollar?
The Trade Balance, which is the difference between what a country earns from its exports versus what it pays for its imports, is another factor that can influence the value of the Australian Dollar. If Australia produces highly sought after exports, then its currency will gain in value purely from the surplus demand created from foreign buyers seeking to purchase its exports versus what it spends to purchase imports. Therefore, a positive net Trade Balance strengthens the AUD, with the opposite effect if the Trade Balance is negative.
- WTI prices post their first monthly gain since September amid the ongoing Middle East geopolitical conflict.
- IEA said that global oil demand will likely increase by 2mb/d in 2024.
- A surprise build in US crude inventories dragged WTI prices lower.
- Oil traders will monitor the Chinese Caixin Manufacturing PMI data on Thursday.
Western Texas Intermediate (WTI), the US crude oil benchmark, is trading around $76.25 after bouncing off the weekly lows of $75.43 on Thursday. WTI prices snap the three-month losing streak amid the ongoing geopolitical tensions in the Middle East, keeping global crude supply risks elevated.
The International Energy Agency (IEA) Executive Director, Fatih Birol, said that global oil demand will likely increase by 2 mb/d in 2024, similar to the growth achieved in 2023. He further stated that demand will keep rising until at least 2030. Additionally, the rising Middle East geopolitical tensions highlight the potential risk to crude supplies in the region, which lifts WTI prices.
On the other hand, the upside of WTI prices might be limited due to the disappointing Chinese Manufacturing PMI data. On Wednesday, China’s NBS Manufacturing PMI came in at 49.2 in January versus 49.0 prior, below the market consensus of 49.2. Manufacturing activity in China contracted for a fourth straight month in January, which exerts some selling pressure on WTI prices as China is the leading crude importer in the world.
Apart from this, a surprise build in US weekly crude inventories dragged WTI lower on Wednesday. Inventories of US crude unexpectedly rose by 1.23M barrels for the week ended January 29 from the previous week's 9.233M barrels decline, compared with market expectations for a 217K barrel draw, according to the Energy Information Administration.
Oil traders await the January Chinese Caixin Manufacturing PMI, due on Thursday. Later in the day, the US weekly Initial Jobless Claims and ISM Manufacturing PMI will be due. These events could significantly impact the USD-denominated WTI price. Oil traders will take cues from the data and find trading opportunities around WTI prices.
- Australian Dollar depreciated after the Fed’s ruling out of the rate cut in March.
- Australia's Business Confidence (QoQ) decreased to -6 in the fourth quarter from the -1 prior.
- The weak Aussie quarterly inflation report strengthens the speculation of two quarter-point reductions in 2024.
- US Dollar faced challenges due to the disappointing US ADP Employment Change.
The Australian Dollar (AUD) attempts to retrace its recent losses on Thursday. However, the AUD/USD pair witnessed a decrease in the preceding session following Federal Reserve (Fed) Chairman Jerome Powell's announcement. Powell ruled out the possibility of a rate cut in the upcoming March meeting, a decision widely anticipated after the Fed chose to maintain current interest rates. He emphasized the persistence of elevated inflation and highlighted the robust expansion of economic activity.
Australia’s Dollar might face downward pressure, with bond traders increasing their expectations of early interest rate cuts by the Reserve Bank of Australia (RBA) following an unexpectedly weak quarterly inflation report. Despite this, the RBA is anticipated to almost certainly maintain the cash rate at 4.35% during its February meeting. Future markets are fully pricing in two quarter-point reductions in 2024, with the initial adjustment expected in August.
National Australia Bank's Business Confidence (QoQ) decreased to -6 in the fourth quarter from the previous decrease of -1. Building Permits (MoM) declined by 9.5% against the expected growth of 1.1% in December.
The US Dollar Index (DXY) faced losses following disappointing US employment figures but managed to recover ground after Fed Chair Powell made hawkish comments on Wednesday. The rise in US Treasury yields provides additional support for the US Dollar (USD). Furthermore, increased risk aversion stemming from heightened tensions in the Middle East could contribute to bolstering the Greenback. This, in turn, poses a challenge for the AUD/USD pair.
The US ADP Employment Change reported 107K, falling short of the expected 145K in January, with the previous reading at 158K in December. Thursday will see attention on US Initial Jobless Claims, Nonfarm Productivity, and ISM Manufacturing PMI.
Daily Digest Market Movers: Australian Dollar declines on hawkish remarks by Fed
- Australia's Monthly Consumer Price Index (CPI) recorded a year-on-year increase of 3.4% in December, down from November's 4.3% and below the anticipated 3.7%.
- RBA Trimmed Mean CPI (YoY) for the fourth quarter stood at 4.2%, a decline from the 5.2% reported previously and also lower than the expected 4.3%.
- Australian CPI (QoQ) figure came in at 0.6%, softer than the anticipated 0.8% and a notable decrease from the previous reading of 1.2%.
- Chinese Non-Manufacturing Purchasing Managers' Index (PMI) improved to 50.7, slightly surpassing the expected figure of 50.6.
- China’s Manufacturing PMI reached 49.2, meeting the anticipated value and advancing from the previous reading of 49.
- US balance sheet showed that since October 2023, the decrease in yields has contributed to the sustainability of the US Treasury, and stronger economic growth has led to improved tax receipts. The US Treasury Department recently announced plans to borrow $760 billion in the first quarter, which is lower than the previous estimate of $816 billion in October.
- The US Employment Cost Index eased at 0.9% compared to the 1.0% as expected in the fourth quarter.
- Chicago Purchasing Managers' Index reported a reading of 46 in January, against the expected increase to 48 from 47.2 prior.
- US JOLTS Job Openings improved to 9.026M in December from 8.925M prior, exceeding the anticipated 8.75M.
- US Housing Price Index (MoM) was unchanged at the reading of 0.3% in November.
Technical Analysis: Australian Dollar stays above the weekly low of 0.6551
The Australian Dollar trades around 0.6570 on Thursday, hovering above the weekly low of 0.6551, which coincides with a significant support level at 0.6550. A breach of this support might prompt a retest of January's low at 0.6524. On the upside, the AUD/USD pair could face initial resistance at the psychological level of 0.6600, in conjunction with the 23.6% Fibonacci retracement level at 0.6606. A successful breakthrough above the latter may lead the pair toward testing the 21-day Exponential Moving Average (EMA) at 0.6617, followed by a crucial resistance level at 0.6650.
AUD/USD: Daily Chart
-638423474685556298.png)
Australian Dollar price today
The table below shows the percentage change of Australian Dollar (AUD) against listed major currencies today. Australian Dollar was the strongest against the Swiss Franc.
| USD | EUR | GBP | CAD | AUD | JPY | NZD | CHF | |
| USD | -0.08% | -0.02% | -0.03% | -0.11% | -0.10% | -0.19% | 0.03% | |
| EUR | 0.08% | 0.05% | 0.01% | -0.02% | -0.01% | -0.13% | 0.10% | |
| GBP | 0.03% | -0.05% | -0.03% | -0.06% | -0.05% | -0.18% | 0.05% | |
| CAD | 0.03% | -0.01% | 0.03% | -0.03% | -0.03% | -0.15% | 0.11% | |
| AUD | 0.11% | 0.02% | 0.07% | 0.03% | 0.00% | -0.11% | 0.16% | |
| JPY | 0.10% | 0.02% | 0.06% | 0.01% | -0.04% | -0.16% | 0.11% | |
| NZD | 0.20% | 0.15% | 0.21% | 0.18% | 0.11% | 0.10% | 0.25% | |
| CHF | -0.03% | -0.11% | -0.05% | -0.06% | -0.14% | -0.14% | -0.25% |
The heat map shows percentage changes of major currencies against each other. The base currency is picked from the left column, while the quote currency is picked from the top row. For example, if you pick the Euro from the left column and move along the horizontal line to the Japanese Yen, the percentage change displayed in the box will represent EUR (base)/JPY (quote).
Australian Dollar FAQs
What key factors drive the Australian Dollar?
One of the most significant factors for the Australian Dollar (AUD) is the level of interest rates set by the Reserve Bank of Australia (RBA). Because Australia is a resource-rich country another key driver is the price of its biggest export, Iron Ore. The health of the Chinese economy, its largest trading partner, is a factor, as well as inflation in Australia, its growth rate and Trade Balance. Market sentiment – whether investors are taking on more risky assets (risk-on) or seeking safe-havens (risk-off) – is also a factor, with risk-on positive for AUD.
How do the decisions of the Reserve Bank of Australia impact the Australian Dollar?
The Reserve Bank of Australia (RBA) influences the Australian Dollar (AUD) by setting the level of interest rates that Australian banks can lend to each other. This influences the level of interest rates in the economy as a whole. The main goal of the RBA is to maintain a stable inflation rate of 2-3% by adjusting interest rates up or down. Relatively high interest rates compared to other major central banks support the AUD, and the opposite for relatively low. The RBA can also use quantitative easing and tightening to influence credit conditions, with the former AUD-negative and the latter AUD-positive.
How does the health of the Chinese Economy impact the Australian Dollar?
China is Australia’s largest trading partner so the health of the Chinese economy is a major influence on the value of the Australian Dollar (AUD). When the Chinese economy is doing well it purchases more raw materials, goods and services from Australia, lifting demand for the AUD, and pushing up its value. The opposite is the case when the Chinese economy is not growing as fast as expected. Positive or negative surprises in Chinese growth data, therefore, often have a direct impact on the Australian Dollar and its pairs.
How does the price of Iron Ore impact the Australian Dollar?
Iron Ore is Australia’s largest export, accounting for $118 billion a year according to data from 2021, with China as its primary destination. The price of Iron Ore, therefore, can be a driver of the Australian Dollar. Generally, if the price of Iron Ore rises, AUD also goes up, as aggregate demand for the currency increases. The opposite is the case if the price of Iron Ore falls. Higher Iron Ore prices also tend to result in a greater likelihood of a positive Trade Balance for Australia, which is also positive of the AUD.
How does the Trade Balance impact the Australian Dollar?
The Trade Balance, which is the difference between what a country earns from its exports versus what it pays for its imports, is another factor that can influence the value of the Australian Dollar. If Australia produces highly sought after exports, then its currency will gain in value purely from the surplus demand created from foreign buyers seeking to purchase its exports versus what it spends to purchase imports. Therefore, a positive net Trade Balance strengthens the AUD, with the opposite effect if the Trade Balance is negative.
The People’s Bank of China (PBoC) set the USD/CNY central rate for the trading session ahead on Thursday at 7.1049 as compared to the previous day's fix of 7.1039 and 7.1802 Reuters estimates.
- GBP/USD consolidates in a yearly trading band of 1.2600–1.2800 in Thursday’s early Asian session.
- FOMC agreed unanimously to keep the rate steady for the fourth straight month.
- BoE is widely anticipated to hold interest rates steady at 5.25% on Thursday.
The GBP/USD pair remains confined within a trading range between 1.2600 and 1.2800 during the early Asian session on Thursday. The Bank of England (BoE) will announce the interest rate decision later in the day, which is widely anticipated to keep its monetary status quo. The major pair currently trades near 1.2678, gaining 0.04% on the day.
The Federal Open Market Committee (FOMC) agreed unanimously to keep the benchmark Federal Funds Rate between 5.25% and 5.5% for the fourth straight month. The committee will be patient to ensure that the lower inflation rate remains within the 2% target sustainably. Fed Chair Jerome Powell closed the door to the possibility of a rate cut in March, but the markets continue to judge the May FOMC meeting as the most likely for the Fed to start easing policy.
On the British Pound front, the BoE is widely anticipated to hold interest rates steady at 5.25% on Thursday. Nonetheless, investors will monitor the policy outlook and language for hints about future rate cuts. The labor market showed signs of rebalancing, but a vulnerable economic outlook could be a factor that will force BoE policymakers to discuss rate cuts. This, in turn, might exert some selling pressure on the GBP.
Looking ahead, the BoE monetary policy meeting and the BoE's Governor Bailey speech will be the highlights on Thursday. On the US docket, the weekly Initial Jobless Claims and ISM Manufacturing PMI will be released. The highly anticipated US Nonfarm Payrolls (NFP) will be due on Friday. The US economy is expected to add 180,000 jobs in January.
| Index | Change, points | Closed | Change, % |
|---|---|---|---|
| NIKKEI 225 | 220.85 | 36286.71 | 0.61 |
| Hang Seng | -218.38 | 15485.07 | -1.39 |
| KOSPI | -1.72 | 2497.09 | -0.07 |
| ASX 200 | 80.5 | 7680.7 | 1.06 |
| DAX | -68.58 | 16903.76 | -0.4 |
| CAC 40 | -20.72 | 7656.75 | -0.27 |
| Dow Jones | -317.01 | 38150.3 | -0.82 |
| S&P 500 | -79.32 | 4845.65 | -1.61 |
| NASDAQ Composite | -345.89 | 15164.01 | -2.23 |
| Pare | Closed | Change, % |
|---|---|---|
| AUDUSD | 0.65645 | -0.53 |
| EURJPY | 158.97 | -0.57 |
| EURUSD | 1.0818 | -0.19 |
| GBPJPY | 186.424 | -0.4 |
| GBPUSD | 1.26861 | 0.02 |
| NZDUSD | 0.61151 | -0.3 |
| USDCAD | 1.34345 | 0.28 |
| USDCHF | 0.86131 | -0.03 |
| USDJPY | 146.954 | -0.42 |
Foreign Bond Investment in Japan saw inflows of ¥382.9 billion for the week ended January 26, up from the previous week's outflows of ¥-43.5 billion (revised up from ¥-48.0 billion), but still well below January's peak inflows of ¥1.689 trillion.
Foreign Investment in Japanese Stocks also rebounded for the week ended January 26, climbing to ¥720.3 billion versus the previous week's ¥287 billion (revised slightly from ¥286.7 billion), but likewise down sharply from January's peak of ¥1.202 trillion.
Market reaction
USD/JPY caught a slight bid to push the pair back into the 147.00 handle heading into the Thursday market session after USD/JPY traders got a workout thanks to Wednesday's outing from the US Federal Reserve (Fed) and Fed Chairman Jerome Powell.
About Foreign Investment in Japanese Stocks & Bonds
Securities investment, released by Ministry of Finance, referrers to bonds issued in a domestic market by a foreign entity in the domestic market’s currency. The report is released by the Ministry of Finance, detailing the flows from the public sector excluding Bank of Japan. The net data shows the difference of capital inflow and outflow. A positive difference indicates net sales of foreign securities by residents (capital inflow), and a negative difference indicates net purchases of foreign securities by residents (capital outflow).


© 2000-2026. Уcі права захищені.
Cайт знаходитьcя під керуванням TeleTrade DJ. LLC 2351 LLC 2022 (Euro House, Richmond Hill Road, Kingstown, VC0100, St. Vincent and the Grenadines).
Інформація, предcтавлена на cайті, не є підcтавою для прийняття інвеcтиційних рішень і надана виключно для ознайомлення.
Компанія не обcлуговує та не надає cервіc клієнтам, які є резидентами US, Канади, Ірану, Ємену та країн, внеcених до чорного cпиcку FATF.
Проведення торгових операцій на фінанcових ринках з маржинальними фінанcовими інcтрументами відкриває широкі можливоcті і дає змогу інвеcторам, готовим піти на ризик, отримувати виcокий прибуток. Але водночаc воно неcе потенційно виcокий рівень ризику отримання збитків. Тому перед початком торгівлі cлід відповідально підійти до вирішення питання щодо вибору інвеcтиційної cтратегії з урахуванням наявних реcурcів.
Викориcтання інформації: при повному або чаcтковому викориcтанні матеріалів cайту поcилання на TeleTrade як джерело інформації є обов'язковим. Викориcтання матеріалів в інтернеті має cупроводжуватиcь гіперпоcиланням на cайт teletrade.org. Автоматичний імпорт матеріалів та інформації із cайту заборонено.
З уcіх питань звертайтеcь за адреcою pr@teletrade.global.
переклади