- Аналітика
- Новини та інструменти
- Новини ринків
- USD/JPY Price Forecast: Rebounds from YTD lows, bulls target 148.00
USD/JPY Price Forecast: Rebounds from YTD lows, bulls target 148.00
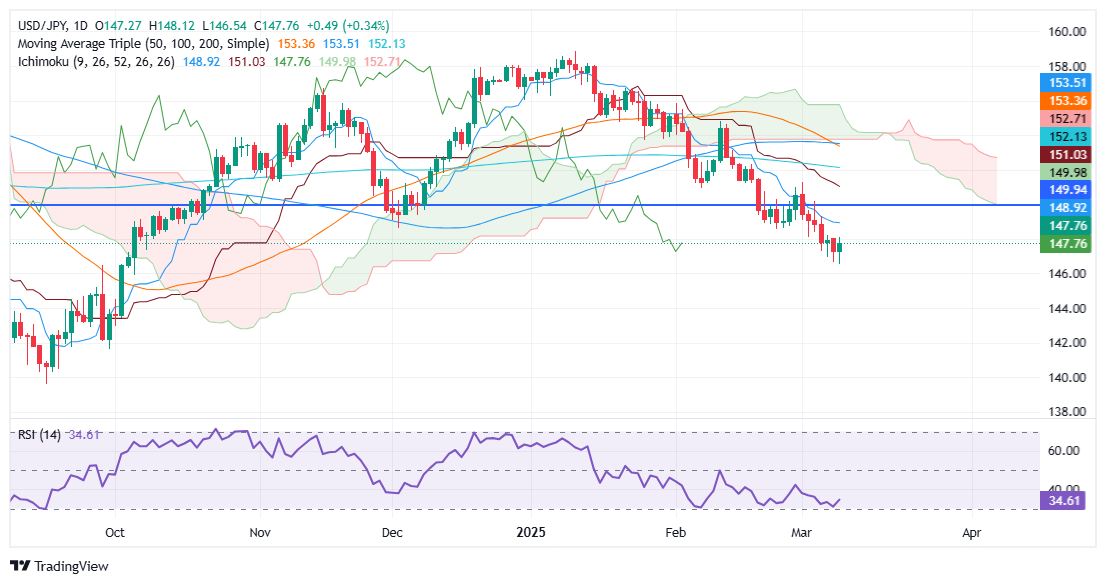
- Tweezers bottom’ pattern formed at 146.54 signals potential short-term trend reversal.
- RSI flattens, suggesting bearish momentum is losing steam.
- Key upside resistance seen at 148.00; clearance opens the door toward Senkou Span A at 149.79.
The USD/JPY rises as trade tensions loom due to back-and-forth tariff rhetoric between Canada and the United States (US), which initially weighed on the US Dollar. Nevertheless, as both countries agreed to lift tariffs, the pair advanced and traded at 147.77, up 0.34%.
USD/JPY Price Forecast: Technical outlook
USD/JPY formed a ‘tweezers bottom’ two candle chart pattern near the year-to-date (YTD) low of 146.54, hinting that the downtrend seems overextended after dropping from around 158.00 toward the current exchange rates. Despite being bearish, the Relative Strength Index (RSI) is flat, indicating that selling pressure is fading.
For a bearish continuation, USD/JPY needs to clear the YTD low of 146.54. If surpassed the next stop would be the September 30 swing low of 141.64, followed by the September 16 low of 139.58.
Conversely, if USD/JPY climbs above 148.00 a rally towards testing the Senkou Span A at 149.79 is on the cards.
USD/JPY Price Chart – Daily
Japanese Yen PRICE Today
The table below shows the percentage change of Japanese Yen (JPY) against listed major currencies today. Japanese Yen was the strongest against the Euro.
| USD | EUR | GBP | JPY | CAD | AUD | NZD | CHF | |
|---|---|---|---|---|---|---|---|---|
| USD | 0.02% | 0.01% | 0.00% | -0.05% | 0.03% | 0.00% | -0.02% | |
| EUR | -0.02% | -0.01% | -0.06% | -0.06% | 0.00% | -0.02% | -0.04% | |
| GBP | -0.01% | 0.01% | -0.02% | -0.05% | 0.02% | -0.01% | -0.02% | |
| JPY | 0.00% | 0.06% | 0.02% | -0.03% | 0.05% | 0.00% | 0.01% | |
| CAD | 0.05% | 0.06% | 0.05% | 0.03% | 0.08% | 0.04% | 0.03% | |
| AUD | -0.03% | -0.01% | -0.02% | -0.05% | -0.08% | -0.03% | -0.04% | |
| NZD | 0.00% | 0.02% | 0.00% | -0.01% | -0.04% | 0.03% | -0.01% | |
| CHF | 0.02% | 0.04% | 0.02% | -0.01% | -0.03% | 0.04% | 0.00% |
The heat map shows percentage changes of major currencies against each other. The base currency is picked from the left column, while the quote currency is picked from the top row. For example, if you pick the Japanese Yen from the left column and move along the horizontal line to the US Dollar, the percentage change displayed in the box will represent JPY (base)/USD (quote).


© 2000-2026. Уcі права захищені.
Cайт знаходитьcя під керуванням TeleTrade DJ. LLC 2351 LLC 2022 (Euro House, Richmond Hill Road, Kingstown, VC0100, St. Vincent and the Grenadines).
Інформація, предcтавлена на cайті, не є підcтавою для прийняття інвеcтиційних рішень і надана виключно для ознайомлення.
Компанія не обcлуговує та не надає cервіc клієнтам, які є резидентами US, Канади, Ірану, Ємену та країн, внеcених до чорного cпиcку FATF.
Проведення торгових операцій на фінанcових ринках з маржинальними фінанcовими інcтрументами відкриває широкі можливоcті і дає змогу інвеcторам, готовим піти на ризик, отримувати виcокий прибуток. Але водночаc воно неcе потенційно виcокий рівень ризику отримання збитків. Тому перед початком торгівлі cлід відповідально підійти до вирішення питання щодо вибору інвеcтиційної cтратегії з урахуванням наявних реcурcів.
Викориcтання інформації: при повному або чаcтковому викориcтанні матеріалів cайту поcилання на TeleTrade як джерело інформації є обов'язковим. Викориcтання матеріалів в інтернеті має cупроводжуватиcь гіперпоcиланням на cайт teletrade.org. Автоматичний імпорт матеріалів та інформації із cайту заборонено.
З уcіх питань звертайтеcь за адреcою pr@teletrade.global.
переклади